UNITED STATES
SECURITIES AND EXCHANGE COMMISSION
WASHINGTON, D.C. 20549
FORM N-CSR
CERTIFIED SHAREHOLDER REPORT OF REGISTERED MANAGEMENT
INVESTMENT COMPANIES
Investment Company Act file number: 811-21673
THE ALLIANCEBERNSTEIN POOLING PORTFOLIOS
(Exact name of registrant as specified in charter)
1345 Avenue of the Americas, New York, New York 10105
(Address of principal executive offices) (Zip code)
Joseph J. Mantineo
AllianceBernstein L.P.
1345 Avenue of the Americas
New York, New York 10105
(Name and address of agent for service)
Registrant’s telephone number, including area code: (800) 221-5672
Date of fiscal year end: August 31, 2008
Date of reporting period: February 29, 2008
| ITEM 1. | REPORTS TO STOCKHOLDERS. |
SEMI-ANNUAL REPORT
AllianceBernstein Pooling Portfolios
U.S. Value
U.S. Large Cap Growth
Global Real Estate Investment
International Value
International Growth
Small-Mid Cap Value
Small-Mid Cap Growth
Global Value
Global Research Growth
Short Duration Bond
Intermediate Duration Bond
Inflation-Protected Securities
High-Yield

February 29, 2008
Semi-Annual Report
Investment Products Offered
| • | Are Not FDIC Insured |
| • | May Lose Value |
| • | Are Not Bank Guaranteed |
The investment return and principal value of an investment in the Fund will fluctuate as the prices of the individual securities in which it invests fluctuate, so that your shares, when redeemed, may be worth more or less than their original cost. You should consider the investment objectives, risks, charges and expenses of the Fund carefully before investing. For a free copy of the Fund’s prospectus, which contains this and other information, visit our web site at www.alliancebernstein.com or call your financial advisor or AllianceBernstein® at (800) 227-4618. Please read the prospectus carefully before you invest.
You may obtain performance information current to the most recent month-end by visiting www.alliancebernstein.com.
This shareholder report must be preceded or accompanied by the Fund’s prospectus for individuals who are not current shareholders of the Fund.
You may obtain a description of the Fund’s proxy voting policies and procedures, and information regarding how the Fund voted proxies relating to portfolio securities during the most recent 12-month period ended June 30, without charge. Simply visit AllianceBernstein’s web site at www.alliancebernstein.com, or go to the Securities and Exchange Commission’s (the “Commission”) web site at www.sec.gov, or call AllianceBernstein at (800) 227-4618.
The Fund files its complete schedule of portfolio holdings with the Commission for the first and third quarters of each fiscal year on Form N-Q. The Fund’s Forms N-Q are available on the Commission’s web site at www.sec.gov. The Fund’s Forms N-Q may also be reviewed and copied at the Commission’s Public Reference Room in Washington, DC; information on the operation of the Public Reference Room may be obtained by calling (800) SEC-0330.
AllianceBernstein Investments, Inc. is an affiliate of AllianceBernstein L.P., the manager of the AllianceBernstein funds, and is a member of FINRA.
AllianceBernstein® and the AB Logo are registered trademarks and service marks used by permission of the owner, AllianceBernstein L.P.
April 24, 2008
This report provides management’s discussion of fund performance for the AllianceBernstein Pooling Portfolios (collectively, the “Portfolios”; individually, the “Portfolio”) for the semi-annual reporting period ended February 29, 2008.
The tables on pages 26 – 29 show each Portfolio’s performance for the six- and 12-month periods ended February 29, 2008, compared to their respective benchmarks. Additional performance can be found on pages 30 – 32. Each Portfolio’s benchmark is as follows: U.S. Value Portfolio—Russell 1000 Value Index; U.S. Large Cap Growth Portfolio—Russell 1000 Growth Index; Global Real Estate Investment Portfolio—Financial Times Stock Exchange (FTSE) European Public Real Estate Association (EPRA)/National Association of Real Estate Investment Trusts (NAREIT) Global Real Estate (RE) Index; International Value Portfolio—Morgan Stanley Capital International (MSCI) Europe, Australasia and Far East (EAFE) Value Index; International Growth Portfolio—MSCI EAFE Growth Index and MSCI AC World ex-U.S. Index; Small-Mid Cap Value Portfolio—Russell 2500 Value Index; Small-Mid Cap Growth Portfolio—Russell 2500 Growth Index; Global Value Portfolio—MSCI World Index; Global Research Growth Portfolio—MSCI World Index; Short Duration Bond Portfolio—Merrill Lynch 1-3 Year Treasury Index; Intermediate Duration Bond Portfolio—LB U.S. Aggregate Index; Inflation-Protected Securities Portfolio—LB 1-10 Year Treasury Inflation-Protected Securities (TIPS) Index; High-Yield Portfolio—LB U.S. High Yield 2% Issuer Cap Index.
U.S. Value Portfolio
Investment Objective and Policies
The Portfolio seeks long-term growth of capital. The Portfolio invests primarily in a diversified portfolio of equity securities of U.S. companies with relatively larger market capitalizations as compared to the overall U.S. equity market.
The Portfolio’s investment policies emphasize investment in companies that the Adviser’s Bernstein unit (“Bernstein”) determines to be undervalued. In selecting securities for the Portfolio, Bernstein uses its fundamental research to identify companies whose long-term earnings power and dividend-paying capability are not reflected in the current market price of their securities. Under normal circumstances, the Portfolio invests at least 80% of its net assets in equity securities issued by U.S. companies.
Investment Results
The Portfolio underperformed the benchmark, the Russell 1000 Value Index, for the six-month period ended February 29, 2008. Adverse stock selection within the financials sector offset the benefits of the Portfolio’s underweight position in the sector relative to the benchmark. Energy and consumer discretionary holdings also detracted from the Portfolio’s return, while strong performance from holdings within information technology contributed positively to the Portfolio’s performance. Benefits from the Portfolio’s overweight positions in materials and consumer staples were offset by underweight positions in utilities and energy relative to the benchmark.
| ALLIANCEBERNSTEIN POOLING PORTFOLIOS • | 1 |
The Portfolio also underperformed the benchmark for the 12-month period ended February 29, 2008. Again, stock selection within financials offset the benefits of the Portfolio’s underweight position in the sector. Energy and consumer discretionary holdings detracted from performance, while holdings within information technology and materials benefited the Portfolio’s return. Benefits from the Portfolio’s overweight positions in materials and consumer staples were offset by underweight positions in utilities and energy.
Market Review and Investment Strategy
The summer of 2007 saw heightened market anxiety, as rising delinquency rates for U.S. subprime mortgages led to deterioration in the housing and mortgage-related credit markets, sparking greater sensitivity to risk across capital markets. After rallying early in the fall of 2007 following the U.S. Federal Reserve’s (the “Fed’s”) interest rate cuts, U.S. stocks declined again amid the continuing global credit crisis and growing worries about the outlook for the economy and bank losses. These fears were realized in January and February of 2008, as financial institutions continued to write down assets and credit-market turmoil worsened. As a result, equity-market volatility has remained elevated from the unusually low level that had prevailed for an extended period before the subprime mortgage crisis struck.
Stress was concentrated in the financials, housing and consumer discretionary
sectors, all of which significantly underperformed the market. This led valuation spreads, the difference between over- and undervalued securities, to widen from the unusually low levels observed during the last several years to an average level. The U.S. Value Investment Policy Group (the “Group”) believes that anxiety creates opportunity, and continues to monitor the market for opportunities to take advantage of investor overreaction that may arise, for example, as a result of the ongoing stress in the credit markets. As always, the Group continues to tap the resources of its extensive research effort to help uncover the value opportunities that do exist.
U.S. Large Cap Growth Portfolio
Investment Objective and Policies
The Portfolio seeks long-term growth of capital. The Portfolio invests primarily in equity securities of U.S. companies with relatively larger market capitalizations as compared to the overall U.S. equity market. The Portfolio focuses on a relatively small number of large, intensively researched U.S. companies that the Adviser believes have strong management, superior industry positions, excellent balance sheets and superior earnings growth prospects. Under normal circumstances, the Portfolio invests at least 80% of its net assets in equity securities issued by large-cap U.S. companies. The Portfolio normally will invest in common stocks of companies with market capitalizations of at least $5 billion at the time of purchase. The Adviser looks for companies whose substantially above average prospective earnings growth is not fully reflected in current market valuations.
| 2 | • ALLIANCEBERNSTEIN POOLING PORTFOLIOS |
Investment Results
The Portfolio modestly underperformed its benchmark, the Russell 1000 Growth Index, for the six-month period ended February 29, 2008. The Portfolio lost the most ground relative to the benchmark in the financials sector largely due to adverse stock selection, although overweighting this underperforming sector in the Portfolio also detracted from performance relative to the benchmark. In the information technology and energy sectors, the Portfolio lagged the benchmark due to weaker stock selection. The Portfolio gained the most ground relative to the benchmark in the health care sector, due entirely to stronger stock selection. In the materials and industrials sectors, the Portfolio outperformed the benchmark due to superior stock selection.
The Portfolio again modestly underperformed its benchmark for the 12-month period ended February 29, 2008. Overweighting the underperforming financials sector and weak security selection accounted for most of the Portfolio’s underperformance. As in the six-month period, the Portfolio lagged the benchmark in the information technology and energy sectors due to adverse stock selection. In the health care, materials and industrial sectors, the Portfolio outperformed the benchmark primarily due to solid stock selection.
Market Review and Investment Strategy
U.S. equity markets were mixed for the 12-month period ended
February 29, 2008, with the S&P 500 Stock Index losing -3.60%. Growth stocks outperformed value stocks, with the Russell 1000 Growth Index up 0.40%, while the Russell 1000 Value Index lost -7.91%. The markets were significantly down in January 2008, with the S&P 500 Stock Index posting its worst return to start a new year since 1990 as investors became concerned the economy would slip into a recession.
The Portfolio’s performance continued to reflect the market’s reluctance to accept higher multiple growth stocks. The Portfolio’s U.S. Large Cap Growth Group (the “Group”) viewed this as an opportunity. The Group’s outlook that many of the stocks in the Portfolio have experienced precipitous price declines remains unchanged. Thus the Group continues to focus the Portfolio on companies with the strongest fundamentals, where the market has become indiscriminately negative. The Group has incorporated the slowing economy and a challenged U.S. consumer into the Portfolio’s construction by maintaining an underweight in consumer discretionary and credit-sensitive financial stocks.
Global Real Estate Investment Portfolio
Investment Objective and Policies
The Portfolio seeks total return from a combination of income and long-term growth of capital. The Portfolio invests primarily in equity securities of real estate investment trusts, or REITs, and other real estate industry companies, such as real estate operating companies, or REOCs. Under
| ALLIANCEBERNSTEIN POOLING PORTFOLIOS • | 3 |
normal circumstances, the Portfolio invests at least 80% of its net assets in these types of securities. The Portfolio’s investment policies emphasize investment in real estate companies Bernstein believes have strong property fundamentals and management teams. The Portfolio seeks to invest in real estate companies whose underlying portfolios are diversified geographically and by property type. The Portfolio may invest up to 20% of its total assets in mortgage-backed securities, which are securities that directly or indirectly represent participations in, or are collateralized by and payable from, mortgage loans secured by real property. The Portfolio has many of the same risks as direct ownership of real estate, including the risk that the value of real estate could decline due to a variety of factors affecting the real estate market.
Investment Results
The Portfolio outperformed the benchmark, the FTSE EPRA/NAREIT Global RE Index, for the six-month period ended February 29, 2008, although both the Portfolio and the benchmark performed in the negative. Outperformance versus the benchmark benefited from security selection and country exposure.
During the six-month period, security selection in Hong Kong and the U.S. were important contributors to the Portfolio’s relative performance. Conversely, the Portfolio’s holdings in Japanese developers detracted from relative performance. The Portfolio continued to benefit from investments in developers located in Hong Kong.
These developers’ business strategy typically combines exposures to residential markets in their development businesses, and exposures to office markets in their investment business. Residential apartment fundamentals in Hong Kong remain strong: Supply-demand is favorable for investors, with private housing vacancy under 3% and deliveries, or apartment units, at approximately half of long-term average take-up, or demand, rates. Household income is surging—comparisons versus 2006 were in the high single digits as of the end of 2007—and mortgage rates have declined versus a year ago. Unemployment rate is at less than 3.5%. In addition, corporate- and income-tax breaks have been announced.
Office fundamentals are also strong with demand driven by increases in staff and continued hiring into 2008, and by Chinese institutions that are expanding into Hong Kong. As a result, recent absorption of space has been strong. All of this bodes well for household confidence. However, this positive environment is somewhat tempered by concerns related to a global growth slowdown and the impact of the credit crisis on Hong Kong, a financial hub, so the contribution of the Portfolio’s Hong Kong investments weakened toward the end of the six-month period ended February 29, 2008.
The Portfolio’s U.S. health care positions also contributed to relative six-month outperformance. Investors’ fears of the impact of U.S. housing declines on seniors’ enrollment in assisted living and nursing home facilities diminished as facility occupancies
| 4 | • ALLIANCEBERNSTEIN POOLING PORTFOLIOS |
continued to strengthen, and business fundamentals remained solid. The Portfolio’s exposure to Japanese developers, however, detracted from performance. Japanese corporations have become cautious and economic growth has weakened. Recently, the credit crisis appears to have contributed to halting further improvement in local market rents. However, occupancy has remained high and expiring rents are below spot market rates (rental rates currently prevailing, and rates for spaces immediately available in the market), giving owners the opportunity to increase revenues as leases expire. The result of solid fundamentals was reflected in reported earnings for the Portfolio’s Japanese investments that were all in line or ahead of estimates.
The Portfolio outperformed the benchmark for the 12-month period ended February 29, 2008, with both the Portfolio and benchmark again performing in the negative. Consistent with semi-annual reporting period results, outperformance versus the benchmark benefited from security selection and country exposure during the 12-month period.
Security selection in Hong Kong, Australia and the U.S. drove relative performance for the 12-month period. The Portfolio’s Hong Kong investments benefited from a focus on residential developers. Limited apartment launches, low inventory and strong demand provided fundamental support to investor optimism. In the U.S., the Portfolio benefited from holding a major hotel name that received an
acquisition offer at a significant premium. In Australia, the Portfolio enjoyed strong stock selection in names exposed to the office markets, where market rents experienced a recovery over the 12-month period.
Japan’s real estate performance was poor with one of the Portfolio’s key overweights, a developer/owner, detracting from relative returns. However, property fundamentals were stable in the most important local markets. In particular, developers and investors exposed to the Tokyo central business district (CBD) enjoy solid supply-demand fundamentals. The majority of the Portfolio’s holdings in Japan develop and own office properties in Tokyo’s “Five Wards,” the most important CBD in the country and a place where vacancy rates are under 3%—one of the lowest among large CBD areas in the world—and rents have risen as of the last 12-month period.
Market Review and Investment Strategy
During the six-month period ended February 29, 2008, the decline in global real estate markets was pronounced, with the FTSE EPRA/NAREIT Global RE Index declining -10.59%. During the 12-month period ended February 29, 2008, the FTSE EPRA/NAREIT Global RE Index declined -17.15%.
During the six-month period ended February 29, 2008, commercial real estate equity markets experienced severe stress and a negative total return. The only major real estate market posting positive returns for the
| ALLIANCEBERNSTEIN POOLING PORTFOLIOS • | 5 |
semi-annual period was Hong Kong. During the period, the United States and global economies began to slow down under the weight of U.S. residential subprime mortgage defaults, which have impacted lenders and intermediaries’ balance sheets in North America and Europe. The global credit squeeze constrained liquidity in the Western world’s global financial markets, and contagion was felt in Australia and some Asian markets. The cost of borrowing has increased and availability of credit has diminished across most markets.
During the latter part of the semi-annual period, concerns over the impact of a credit cycle downturn on consumers, economic growth and real estate valuations dominated capital market sentiment and drove high real estate equity volatility.
Anxiety has been pronounced in real estate equity markets as investors tried to reprice risk in an environment where credit markets had seized up. Real estate has always benefited from liquid debt markets, and cheap and plentiful debt contributed to the real estate pricing strength of recent years. The ongoing credit troubles have severely impacted North America’s mortgage securitization activity, creating medium-term uncertainty. With commercial real estate fundamentals still solid, the ongoing debate for real estate has become how to price risk in an environment where the cost of debt is uncertain. In contrast with the U.S. residential real estate markets, U.S. and foreign commercial real estate fundamentals remain solid, and delin-
quencies in commercial real estate loans are at historically low levels.
The REIT Investment Policy Group (the “Group”) believes the Portfolio is well positioned to withstand a period of turmoil. Stock selection emphasizes companies with ample dividend coverage, reasonable leverage and high-quality tenants. The Group’s global scope will allow it to uncover new opportunities as it focuses on stocks unduly penalized by the market turmoil, attractively valued stocks in markets less affected by spillover from the subprime mortgage crisis, and niche segments where demand dynamics are relatively insulated from the credit crisis.
International Value Portfolio
Investment Objective and Policies
The Portfolio seeks long-term growth of capital. The Portfolio invests primarily in a diversified portfolio of equity securities of established companies selected from more than 40 industries and from more than 40 developed or emerging market countries. The Portfolio’s investment policies emphasize investment in companies that Bernstein determines to be undervalued. In selecting securities for the Portfolio, Bernstein uses its fundamental research to identify companies whose long-term earnings power is not reflected in the current market price of their securities.
Investment Results
The Portfolio underperformed the benchmark, the MSCI EAFE Value Index, for the six-month period ended February 29, 2008. Stock selection
| 6 | • ALLIANCEBERNSTEIN POOLING PORTFOLIOS |
within finance and capital equipment detracted from the Portfolio’s performance. On a sector level, overweights in technology/electronics and underweights in telecommunications and consumer staples also detracted from performance, while an underweight in finance added to performance.
The Portfolio slightly outperformed its benchmark for the 12-month period ended February 29, 2008, although both the Portfolio and the benchmark experienced negative returns. The Fund’s performance benefited from an overweight in the industrial commodities sector, as well as underweights in finance and construction and housing. Overweights in technology/electronics stocks also contributed to the Portfolio’s performance. As in the six-month period, stock selection in finance detracted from performance during the 12-month period.
Market Review and Investment Strategy
International equity returns were muted for the six- and 12-month periods ended February 29, 2008. Returns were affected by the fears that credit-market turmoil would spill over into the tangible, “real” economy. The six-month period was punctuated by anxiety about escalating losses among banks and insurers on mortgage-backed securities (MBS). The depth of the downturn in the U.S. housing market, and the possibility of a correction in the U.K. housing market, will be central to the ultimate level of losses on MBS among financial institutions.
The Bernstein Value Team (the “Team’s”) research and experience has taught it to keep portfolio risk proportionate with the value opportunity it identifies. After a lengthy period of compression, valuation spreads are beginning to widen. If this trend continues, the Team may see increased opportunities to raise the Portfolio’s concentration in undervalued industries and companies.
International Growth Portfolio
Investment Objective and Policies
The Portfolio seeks long-term growth of capital. The Portfolio invests primarily in an international portfolio of equity securities of companies located in both developed and emerging countries. The Portfolio’s investment process relies upon comprehensive fundamental company research produced by the Adviser’s large research team of analysts covering both developed and emerging markets around the globe. The Portfolio invests, under normal circumstances, in the equity securities of companies located in at least three countries (and normally substantially more) other than the United States.
Investment Results
The Portfolio outperformed the benchmark, the MSCI EAFE Growth Index, for the six- and 12-month periods ended February 29, 2008. The Portfolio also outperformed the MSCI AC World ex-U.S. Index for the same periods. (During the six-month period, however, both the Portfolio and the benchmarks performed in the negative.) The MSCI EAFE Growth Index will be the Portfolio’s primary benchmark going forward; the Adviser
| ALLIANCEBERNSTEIN POOLING PORTFOLIOS • | 7 |
believes that the MSCI EAFE Growth Index is a more appropriate benchmark for the Portfolio in light of the investment strategy of the Portfolio. During the 12-month period, the Portfolio’s largest contributor was an overweight in the energy sector, which outperformed. This outperformance was offset by an overweight in the financials sector, which underperformed. The International Growth Team (the “Team”) trimmed the Portfolio’s financials in both Europe and Australia in the six-month period, and reduced this sector overweight, mitigating some negative sector attribution.
Stock selection remained the dominant driver of the Portfolio’s returns. In particular, materials and telecommunications contributed most positively over both the six- and 12-month periods. European and select Japan industrials also added the most value to 12-month returns in the period ended February 29, 2008. Within materials, companies exposed to iron ore and coking coal (coal used to produce coke in the steel-making process) outperformed substantially as the bulk commodities continued to experience tight supply/demand conditions. While financials continued to be one of the Portfolio’s main detractors, the damage was mitigated over the six-month period, as the Team reduced the Portfolio’s exposure to capital markets companies in favor of exchanges and select asset managers.
Market Review and Investment Strategy
Global equity markets gained in the 12-month period ended February 29,
2008, despite a six-month period rife with anxiety about U.S. subprime mortgages, tremors in the credit markets and fears of slowing economic growth. Economic growth, moderating as of the six-month period, may make it harder for companies to exceed earnings expectations. As a result, global earnings revisions are decelerating, particularly as U.S. earnings have begun to disappoint after an exceptionally long run of upside earnings surprise.
In this vein, investors have gravitated toward the relative stability of large-capitalization companies, particularly in the more turbulent second half of 2007. As well, growth stocks, which tend to be more prized as widespread earnings surprise seems less assured, have outperformed, as highlighted by the MSCI World Growth versus MSCI World Value indices.
The Team has been positioning the Portfolio to capture the gains it expects as slowing economic growth widens valuation distinctions between ordinary companies and the more elite ranks of those better able to sustain upside earnings surprise. Companies in the Portfolio continued to demonstrate strong earnings revision increases relative to the benchmark and sector weightings reflect a diverse range of opportunities.
Small-Mid Cap Value Portfolio
Investment Objective and Policies
The Portfolio seeks long-term growth of capital. The Portfolio invests primarily in a diversified portfolio of equity securities of small- to
| 8 | • ALLIANCEBERNSTEIN POOLING PORTFOLIOS |
mid-capitalization U.S. companies generally representing 60-110 companies. For these purposes, “small- and mid-cap companies” are those that, at the time of investment, fall within the capitalization range between the smallest company in the Russell 2500 Value Index and the greater of $5 billion or the market capitalization of the largest company in the Russell 2500 Value Index. Under normal circumstances, the Portfolio invests at least 80% of its net assets in these types of securities.
The Portfolio’s investment policies emphasize investment in companies that Bernstein determines to be undervalued. In selecting securities for the Portfolio, Bernstein uses its fundamental research to identify companies whose long-term earnings power is not reflected in the current market price of their securities. The Portfolio may also invest up to 20% of its total assets in equity securities issued by non-U.S. companies.
As a permanent change in strategy, the Bernstein Value Equities Group (the “Group”) has broadened the permissible range of securities for the portfolio from 60-110 to 60-125. The Group believes that a more diversified portfolio, which generally holds a greater number of securities, can be a better way to manage portfolio risk. At this time, the Group is modestly expanding their upper limit of securities that the portfolio is generally allowed to hold in order to have more freedom to manage investment risk. The AllianceBernstein Pooling Portfolios prospectus, which becomes
effective on December 31, 2008, will reflect these changes. The Group reserves the right to employ this strategy on an as-needed basis.
Investment Results
The Portfolio outperformed its benchmark, the Russell 2500 Value Index, during both the six- and 12-month periods ended February 29, 2008. Both the Portfolio and the benchmark had negative returns for both periods. The Portfolio’s performance over both periods benefited from sizable contributions from sector selection and even more significant contributions from stock selection.
Favorable stock selection was broadly spread across a number of sectors but was more pronounced in the Portfolio’s industrial resource and capital equipment holdings, which benefited from continued strong global demand for their products. The Portfolio’s financial holdings also contributed positively to performance, aided by an underweight position in companies with more direct exposure to the U.S. mortgage finance contagion. Stock selection within consumer growth holdings was the most notable detractor from performance, as a slowing U.S. economy adversely impacted demand for many of the Portfolio’s holdings in products and services.
Sector selection contributions were also spread across a number of sectors but were more concentrated in the Portfolio’s overweight in industrial resources and capital equipment stocks. The Portfolio’s underweight position in energy was the most sig-
| ALLIANCEBERNSTEIN POOLING PORTFOLIOS • | 9 |
nificant detractor during both periods, as higher oil prices drove strong performance in the sector.
Market Review and Investment Strategy
In spite of significant earnings disappointments in 2007, consensus forecasts for 2008 appear to assume that small-capitalization stocks will regain their recent earnings growth edge versus large-capitalization stocks. The Small-Mid Cap Value Investment Policy Group (the “Group”) continues to believe that for smaller stocks as a whole, earnings expectations for 2008 remain too optimistic, valuations too high and valuation spreads between stocks too narrow. In 2007, stocks with greater overseas revenues did markedly better than those that were mostly domestic, and stocks reliant on the U.S. housing sector dramatically underperformed.
The Group’s Portfolio stance remains largely unchanged. The Group continues to emphasize companies with strong historical returns and current success at attractive valuations. These companies have benefited from breadth in their revenue streams, generating a higher share from international markets than the universe as a whole. On average, they also tend to be larger. Thus, the Group believes the Portfolio’s average market cap may be larger than the benchmark for some time to come.
Recent market distress, however, is beginning to create some new opportunities. While the Group’s fundamental and quantitative research
suggests caution, in a few instances the return potential appears sufficiently compelling to justify the risk. This research suggests that certain financials, specifically well-capitalized banks and consumer cyclical stocks—most notably those that make and sell high-priced discretionary consumer products—have traded down too far and thus offer attractive investment opportunities.
Small-Mid Cap Growth Portfolio
Investment Objective and Policies
The Portfolio seeks long-term growth of capital. The Portfolio invests primarily in a diversified portfolio of equity securities of U.S. companies with relatively smaller market capitalizations as compared to the overall U.S. equity market. Under normal circumstances, the Portfolio invests at least 80% of its net assets in small- and mid-cap companies. Because the Portfolio’s definition of small- to mid-cap companies is dynamic, the upper limit on market capitalization will change with the markets. Normally, the Portfolio invests in U.S. companies that the Adviser believes have strong management, superior industry positions, excellent balance sheets and superior earnings growth prospects. The Adviser relies heavily on the fundamental analysis and research of its internal research staff to select the Portfolio’s investments. The Portfolio may also invest up to 20% of its total assets in equity securities issued by non-U.S. companies.
Investment Results
The Portfolio underperformed its benchmark, the Russell 2500 Growth
| 10 | • ALLIANCEBERNSTEIN POOLING PORTFOLIOS |
Index, amidst a turbulent market for the six-month period ended February 29, 2008. Stock selection, a detractor during the six-month period, was hurt by the market shift to value in early 2008. By sector, stock selection was a negative contributor to performance in each of the six sectors of the Portfolio, with picks in technology proving to be particularly challenging. Relative returns benefited from favorable sector allocation: the benefit from being overweight in the strong-performing energy sector and underweight in the poor-performing financial sector more than offset the negative impact from being underweight in the strong-performing industrial sector. Holding a small amount of cash in a declining market also proved beneficial to relative returns.
The Portfolio declined marginally, yet outperformed its benchmark for the 12-month period ended February 29, 2008. Absolute returns for both the benchmark and the benchmark were negative for the 12-month period. Relative results were positively impacted by the Portfolio’s sizable exposure to faster-growing companies with strong earnings momentum—a segment of the market that led the overall benchmark for most of the period. Stock selection was a positive, as strong picks in consumer/commercial services and health care more than offset disappointing stock selection in technology. As was the case during the six-month period, sector allocation was a minor positive contributor, again benefiting from being overweight in the strong-performing energy sector and underweight in the poor-performing
financial sector, which more than offset the negative impact from an underweight in the strong-performing industrial sector.
Market Review and Investment Strategy
U.S. equity markets declined modestly during the 12-month period ended February 29, 2008. Although the first half of the reporting period was relatively calm, the latter half was dominated by escalating anxiety about losses in MBS and a widening credit crisis among financial institutions. Growth stocks started the period strongly, significantly outperforming value stocks during the first ten months of the reporting period. Over this time frame, companies with the strongest earnings revisions and positive earnings surprises—traditional hallmarks of successful growth investments—outperformed the market in the small-cap realm. The first two months of 2008, however, witnessed a dramatic reversal, with growth stocks giving back a sizable portion of the outperformance accumulated over the prior ten months.
Sector allocations within the Portfolio changed modestly during the six-month period ended February 29, 2008. The Portfolio’s Small Cap Growth Investment Team (the “Team”) reduced overweights in technology and consumer/commercial services, using these proceeds to move health care to a modest overweight and to narrow the large underweight in financials. The Portfolio’s largest sector overweight during the six-month period, was energy; the largest underweights remained in industrials and financials.
| ALLIANCEBERNSTEIN POOLING PORTFOLIOS • | 11 |
Consistent with the Team’s discipline, investments throughout the reporting period emphasized companies it believes may deliver surprisingly strong earnings growth and favorable earnings estimate revisions.
Global Value Portfolio
Investment Objective and Policies
The Portfolio seeks long-term growth of capital. The Portfolio will invest primarily in a diversified portfolio of equity securities of established companies selected from more than 40 industries and from more than 40 developed and emerging market countries, including the United States. The Portfolio normally invests in companies in at least three countries, generally including the United States. Other such countries currently include the developed nations in Europe and the Far East, Canada, Australia and emerging market countries worldwide. The Portfolio’s investment policies emphasize investment in companies that are determined by Bernstein to be undervalued. In selecting securities for the Portfolio, Bernstein uses its fundamental research to identify companies whose long-term earnings power is not reflected in the current market price of their securities.
Investment Results
For the six- and 12-month periods ended February 29, 2008, the Portfolio underperformed its benchmark, the MSCI World Index. For both periods, underperformance was due primarily to adverse security selection. For the six- and 12-month periods, stock selection within finance, industrial commodities and consumer cyclical detracted from the Portfolio’s
performance. On a sector level, an overweight in finance detracted considerably from performance for the six- and 12-month periods; underweights in consumer staples and utilities impacted the Portfolio’s performance negatively during both the six- and 12-month periods. Conversely, overweighting the industrial commodities sector during both periods was positive for the Portfolio.
Market Review and Investment Strategy
Global equity markets fell over the six- and 12-month periods ended February 29, 2008, according to the MSCI World Index, as investors worried about slowing economic growth coupled with rising inflation and further write-downs by financial companies. Returns were affected by the fears that credit-market turmoil would spill over into the tangible, “real” economy. The six-month period was punctuated by anxiety about escalating losses among banks and insurers on MBS. The depth of the downturn in the U.S. housing market, and the possibility of a correction in the U.K. housing market, will be central to the ultimate level of losses on MBS among financial institutions.
The Bernstein Value Team’s (the “Team’s”) investment philosophy is to keep portfolio risk proportionate with the value opportunity they identify. After a lengthy period of compression, valuation spreads are beginning to widen. If this trend continues, the Team may see increased opportunities to raise the Portfolio’s concentration in undervalued industries and companies.
| 12 | • ALLIANCEBERNSTEIN POOLING PORTFOLIOS |
Global Research Growth Portfolio
Investment Objective and Policies
The Portfolio seeks long-term growth of capital. The Portfolio invests primarily in a global portfolio of equity securities of companies within various market sectors selected by the Adviser for their growth potential. Examples of the types of market sectors into which the Adviser may invest the Portfolio’s assets include, but are not limited to, communications and information technology, health care, financial services, infrastructure, energy and natural resources, and consumer growth. The Adviser’s Global Research Growth Portfolio Oversight Group (the “Group”), in consultation with the research sector heads, is responsible for determining the market sectors into which the Portfolio’s assets are invested and the percentage allocation into each sector. The Adviser allocates the Portfolio’s investments among the selected market sectors based on its assessment of both current and forecasted economic and investment conditions. A research sector head for each sector is responsible for stock selection within that sector. Within each sector, stock selection emphasizes investment in companies representing the research sector head groups’ top picks for their respective sectors. The Portfolio invests, under normal circumstances, in the equity securities of companies based in at least three countries (and normally substantially more), one of which may be the United States. The Portfolio also invests in securities of companies in emerging markets.
Investment Results
The Portfolio outperformed the benchmark, the MSCI World Index, during the six-month period ended February 29, 2008, although both the Portfolio and the benchmark performed in the negative. Strong security selection attributed to a majority of the Portfolio’s relative outperformance during the semi-annual period. Stock selection in most sectors made a relative positive contribution to performance, with materials, energy and industrials making the most positive contributions. Security selection in the consumer discretionary, information technology and financial sectors were detractors from relative performance. The Portfolio’s underweight position in the utilities sector and overweight position in the information technology sector had a negative impact on relative performance. The Portfolio’s underweight in the consumer discretionary sector and overweight in the health care sector were positive contributors to relative performance.
On a country level, overweight positions in Brazil and India, and an underweight position in Japan made the most notable positive contributions to relative performance, while the Portfolio’s overweight position in Switzerland and underweight position in Canada detracted from relative performance. Positive security selection within the United Kingdom offset the relative negative contribution from security selection within Switzerland for the six-month period ended February 29, 2008.
| ALLIANCEBERNSTEIN POOLING PORTFOLIOS • | 13 |
The Portfolio also outperformed its benchmark during the 12-month period ended February 29, 2008. The outperformance can be attributed to favorable security selection in most sectors. Security selection in materials, industrials and energy was particularly meaningful for the period. Metals and mining company securities within the materials sector delivered exceptional relative performance for the period, fueled by the growing demand for raw materials in emerging countries. However, stock selection in financial and consumer discretionary sectors detracted from performance. Overall, sector selection was a modest drag on relative performance led by an overweight in the financial sector and an underweight in the utilities sector. An underweight in the consumer discretionary sector contributed positively to relative performance.
On a country level, overweight positions in Brazil, India and China, and an underweight position in Japan made the most notable contribution to relative performance. The Portfolio’s underweight positions in Germany and Canada, and an overweight position in Switzerland contributed negatively to relative performance. Positive security selection within the United Kingdom was a significant contributor to relative performance. Security selection in Switzerland, United States and Australia hindered relative performance for the six-month period.
Market Review and Investment Strategy
A number of financial institutions started to show significant losses on
mortgage-backed securities in the six-month period ended February 29, 2008. Though they originated in the U.S. subprime market, these securities had been repackaged and traded across the globe. Through this volatility, the Fed responded with a number of cuts to the Fed funds rate with the goal of injecting liquidity and restoring confidence in the U.S. financial system. Stocks reacted positively after the initial cut in September 2007; however, market strength proved temporary as investor anxiety increased about the far reaching effects of mortgage-related securities.
Global stock markets were volatile in the 12-month period ended February 29, 2008. A number of events grabbed the market’s attention during the period: the slowing U.S. housing market, the subprime mortgage crisis, the slowdown in U.S. economic growth and significant bank losses.
The Group made several notable changes in sector exposure during the 12-month period ended February 29, 2008. The Portfolio’s exposure to the financial sector was reduced from an overweight to a modest underweight. The Group deemphasized commercial banks and insurance while continuing to overweight capital markets. A small reduction was made in the health care sector, although the Portfolio remains overweight relative to the benchmark. The Group increased the size of the technology sector overweight, most notably adding to computer hardware and software stocks. Several utility stocks were introduced to the Portfolio, bringing the utility weighting from zero at the beginning of the period to a modest
| 14 | • ALLIANCEBERNSTEIN POOLING PORTFOLIOS |
underweight relative to the benchmark. Finally, the Group maintains an overweight in metals and mining stocks.
Short Duration Bond Portfolio
Investment Objective and Policies
The Portfolio seeks a moderate rate of income that is subject to taxes. The Portfolio invests primarily in investment-grade, U.S. Dollar- denominated fixed-income securities. Under normal circumstances, the Portfolio invests at least 80% of its net assets in fixed-income securities. The Portfolio seeks to maintain a relatively short duration of one to three years under normal market conditions. The Portfolio may invest in many types of fixed-income securities including corporate bonds, notes, U.S. Government and agency securities, asset-backed securities (ABS), mortgage-related securities and inflation-protected securities, as well as other securities of U.S. and non-U.S. issuers.
Investment Results
A broad liquidity crunch stemming from the subprime mortgage crisis caused the Portfolio to underperform its benchmark, the Merrill Lynch 1-3 Year Treasury Index, for both the six- and 12-month periods ended February 29, 2008, as Treasury yields fell and spreads widened across fixed-income markets. Detracting from the Portfolio’s relative performance for both periods were an underweight in U.S. government debt and exposure to subprime-related ABS and Alt-A mortgage securities, which underperformed. Alt-A, or “alternative” mortgages are home loans made with less than full documentation.
Market Review and Investment Strategy
The 12-month period ended February 29, 2008, has seen the return of volatility to the capital markets, as the credit crisis in the U.S. subprime mortgage market spilled over—in the form of a liquidity crunch—into other sectors and asset classes and even the overnight funding market. As investors flocked to the safety of the highest-quality securities, government bond yields fell worldwide and yield spreads widened across fixed-income markets.
Starting in September 2007, the Fed responded to the crisis with multiple interest rate cuts which aimed to restore confidence in the financial markets and put the economy on firmer footing. The Fed funds rate was reduced by a total 225 basis points for the reporting period, including an unprecedented 125 basis point reduction in January 2008. (Note: An additional interest rate cut by the Fed of 0.75% was enacted on March 18, 2008).
There was heightened demand for U.S. Treasuries during the semi-annual reporting period as investors sought less-risky assets in light of the subprime market volatility. For the six-month reporting period, U.S. Treasury holdings outperformed spread sectors on both an absolute- and duration-adjusted basis. Shorter-term yields fell most, with two-year yields losing 252 basis points to return 1.62%, while the 10-year yield lost 102 basis points to end the period at 3.51%. Intermediate-term U.S. Treasuries (5-10 Year) at 10.23% outperformed both shorter maturity
| ALLIANCEBERNSTEIN POOLING PORTFOLIOS • | 15 |
(1-3 Year) at 5.93% and longer maturity (15+ Year) Treasuries at 8.89% during the six-month reporting period, according to Merrill Lynch.
During the semi-annual reporting period, the Portfolio’s U.S. Investment Grade: Liquid Markets/Structured Products Investment Team (the “Team”) continued to underweight Treasuries and Agencies. As spreads have widened, more opportunities have been identified within the corporate sector. The Team has reduced the Portfolio’s overweight position in mortgages to fund opportunities in corporates.
Intermediate Duration Bond Portfolio
Investment Objective and Policies
The Portfolio seeks a moderate to high rate of income that is subject to taxes. The Portfolio invests primarily in investment-grade, U.S. Dollar-denominated fixed-income securities. Under normal circumstances, the Portfolio invests at least 80% of its net assets in fixed-income securities. The Portfolio seeks to maintain a relatively longer duration of three to six years under normal market conditions. The Portfolio may invest in many types of debt securities including corporate bonds, notes, U.S. Government and agency securities, asset-backed securities, mortgage-related securities and inflation-protected securities, as well as other securities of U.S. and non-U.S. issuers.
Investment Results
The Portfolio underperformed the benchmark, the LB U.S. Aggregate Index, for both the six- and 12-month
periods ended February 29, 2008. During both periods, the following positions detracted from the Portfolio’s performance: an underweight in Treasuries and Agencies, exposure to subprime-related ABS and collateralized debt obligations (CDOs) as well as Alt-A mortgage securities, an overweight in commercial mortgage-backed securities (CMBS), and positions in high yield and emerging markets. The Portfolio’s exposure to subprime-related ABS and CDOs, as well as Alt-A mortgage securities, detracted from performance despite their AAA and AA ratings. Yield curve positioning also detracted from the Portfolio’s performance.
Market Review and Investment Strategy
The 12-month period ended February 29, 2008, has seen the return of volatility to the capital markets, as the credit crisis in the U.S. subprime mortgage market spilled over—in the form of a liquidity crunch—into other sectors and asset classes and even the overnight funding market. As investors flocked to the safety of the highest-quality securities, government bond yields fell worldwide and yield spreads widened across fixed-income markets.
Starting in September 2007, the Fed responded to the crisis with multiple interest rate cuts, which aimed to restore confidence in the financial markets and put the economy on firmer footing. The Fed funds rate was reduced by a total 225 basis points for the reporting period, including an unprecedented 125 basis point reduction in January 2008. (Note: An additional interest rate cut by
| 16 | • ALLIANCEBERNSTEIN POOLING PORTFOLIOS |
the Fed of 0.75% was enacted on March 18, 2008).
There was heightened demand for U.S. Treasuries during the semi- annual reporting period, as investors sought less-risky assets in light of the subprime market volatility. U.S. Treasury holdings outperformed spread sectors on both an absolute- and duration-adjusted basis.
During the six-month period, the Portfolio’s U.S. Investment Grade: Core Fixed Income Team (the “Team”) continued to underweight Treasuries and Agencies. As spreads have widened, the Team has identified more opportunities within the corporate sector. The Team has reduced the Portfolio’s overweight position in mortgages to fund opportunities in corporates.
Inflation-Protected Securities Portfolio
Investment Objective and Policies
The Portfolio seeks a total return that exceeds the rate of inflation over the long term with income that is subject to taxes. The Portfolio invests primarily in U.S. Dollar-denominated inflation-protected securities. Under normal circumstances, the Portfolio invests at least 80% of its net assets in inflation-protected securities. The Portfolio’s investments in inflation-protected securities include inflation-protected debt securities of varying maturities issued by U.S. or non-U.S. governments, their agencies or instrumentalities and by corporations, and inflation derivatives. The Portfolio seeks to maintain a duration within
three years (plus or minus) of the duration of the LB 1-10 Year TIPS Index, which as of October 31, 2007, was 4.04 years. Assets not invested in inflation-protected securities may be invested in other types of debt securities including corporate bonds, notes, U.S. Government and agency securities, asset-backed securities, and mortgage-related securities as well as other securities of U.S. and non-U.S. issuers.
Investment Results
The Portfolio slightly underperformed its benchmark, the LB 1-10 Year TIPS Index, for both the six- and 12-month periods ended February 29, 2008. For both periods, the positive impact from yield curve positioning and exposure to Japanese government inflation- linked securities was offset by the negative impact from the Portfolio’s overall duration.
Market Review and Investment Strategy
Fear of the spreading financial crisis and its potential impact on the global economy drove fixed-income yield spreads sharply wider during the semi-annual reporting period. Investor risk aversion significantly increased as economic data pointed to a continued deteriorating economy. In an effort to stem the recent financial turmoil, the Fed moved aggressively to inject liquidity into the financial system and lowered official rates by a total 225 basis points for the reporting period, including an unprecedented 125 basis point reduction in January 2008. (Note: An additional interest rate cut by the Fed of 0.75% was enacted on March 18, 2008).
| ALLIANCEBERNSTEIN POOLING PORTFOLIOS • | 17 |
U.S. Treasuries posted a strong return of 8.40% for the six-month period ended February 29, 2008, benefiting from the recent flight to quality. Treasury yields fell sharply, with short-term yields edging below 2% as the yield curve steepened. The two-year yield declined 254 basis points to end the period at 1.62%, while the 10-year yield declined 105 basis points to end the period at 3.51%. The yield curve steepened 207 basis points between the two- and 10-year yields. TIPS (as represented by the LB 1-10 Year TIPS Index) posted an absolute return of 11.79% for the semi-annual reporting period. Ten-year TIPS outperformed comparable maturity Treasuries by approximately 110 basis points.
High-Yield Portfolio
Investment Objective and Policies
The Portfolio seeks a high total return by maximizing current income and, to the extent consistent with that objective, capital appreciation. The Portfolio invests primarily in high yield debt securities. Under normal circumstances, the Portfolio invests at least 80% of its net assets in these types of securities. The Portfolio invests in high yield, below-investment-grade debt securities, commonly known as “junk bonds.” The Portfolio seeks to maximize current income by taking advantage of market developments, yield disparities and variations in the creditworthiness of issuers.
Investment Results
The Portfolio underperformed the benchmark, the LB U.S. High Yield 2% Issuer Cap Index, for both the six- and 12-month periods ended February 29, 2008. Both industry and
security selection detracted from the Portfolio’s performance. The Portfolio’s underweight in the CCC-rated quality tier contributed positively as lower-quality high yield debt underperformed.
Detracting from performance for both periods was the Portfolio’s underweight in energy, which outperformed, as well as security selection within the cable, utility, wireless communication and lodging/leisure industries. Contributing positively to performance for the 12-month period was the Portfolio’s underweight in the housing industry, which underperformed. Security selection within the diversified media and paper/packaging industries contributed positively for both the six- and 12-month periods ended February 29, 2008.
Market Review and Investment Strategy
Fear of the spreading financial crisis and its potential impact on the global economy drove fixed-income yield spreads sharply wider during the reporting period. Investor risk aversion significantly increased during the semi-annual reporting period as economic data pointed to a continued deteriorating economy. In an effort to stem the recent financial turmoil, the Fed moved aggressively to inject liquidity into the financial system. The Fed funds rate was reduced by a total of 225 basis points for the reporting period, including an unprecedented 125 basis point reduction in January 2008. (Note: An additional interest rate cut by the Fed of 0.75% was enacted on March 18, 2008).
| 18 | • ALLIANCEBERNSTEIN POOLING PORTFOLIOS |
High yield returns were in negative territory for the reporting period, dampened by increased risk aversion. According to Lehman Brothers, the high yield market posted a return of -1.39% and notably underperformed Treasuries by -10.52% in duration-neutral terms. Treasury securities significantly outperformed during the period, benefiting from the flight to quality.
For the reporting period, lower-rated debt underperformed. By quality tier, BB-rated debt returned 1.16%, B-rated debt returned -0.87% and CCC-rated debt returned - -6.16%. Industry returns were somewhat mixed, with defensive issuers faring better and housing-related issuers performing worst. Outperforming industries included banking at 15.87%, pipelines at 5.40%, health care at 5.08%, utilities at 4.68% and supermarkets at 4.01%. Underperforming industries included building materials
at -7.14%, communications at -6.97%, brokerage at -6.88% and home construction at -5.88%. High yield spreads widened 299 basis points to end the reporting period at 735 basis points over Treasuries.
Recent data indicates that aggressive action by central banks around the world and robust demand from emerging-market economies may support continued global growth despite weakness in the United States. Global corporate credit metrics also remain strong. On a risk-adjusted basis, the Portfolio’s Global Credit Investment Team (the “Team”) believed that crossover securities (BBB-rated) represented value and therefore increased the Portfolio’s allocation during the reporting period. The Team also underweighted lower-rated CCC issuers as well as leveraged buyouts (LBOs) due to leverage concerns.
| ALLIANCEBERNSTEIN POOLING PORTFOLIOS • | 19 |
HISTORICAL PERFORMANCE
An Important Note About the Value of Historical Performance
The performance shown on the following pages represents past performance and does not guarantee future results. Current performance may be lower or higher than the performance information shown. You may obtain performance information current to the most recent month-end by visiting our website at www.alliancebernstein.com.
The investment return and principal value of an investment in the Portfolios will fluctuate, so that your shares, when redeemed, may be worth more or less than their original cost. You should consider the investment objectives, risks, charges and expenses of the Portfolios carefully before investing. For a free copy of the Portfolios’ prospectus, which contains this and other information, contact your AllianceBernstein representative or call 800.227.4618. You should read the prospectus carefully before you invest.
Please note: Shares of the Portfolios are offered exclusively to mutual funds advised by, and certain institutional clients of, AllianceBernstein that seek a blend of asset classes for investment. These share classes are not currently offered for direct investment from the general public. The AllianceBernstein Pooling Portfolios can be purchased at the relevant net asset value (NAV) without a sales charge or other fee. However, there are sales charges in connection to purchases of other AllianceBernstein share classes invested in these Pooling Portfolios. For additional information regarding other retail share classes and their sales charges and fees, please visit www.alliancebernstein.com. All fees and expenses related to the operation of the Portfolios have been deducted. Performance assumes reinvestment of distributions and does not account for taxes. During the reporting period, the Adviser waived a portion of its advisory fee or reimbursed the Global Research Growth Portfolio and the Global Value Portfolio for a portion their expenses to the extent necessary to limit their expenses on an annual basis to .15% of the average daily net assets of their shares. These waivers extend through the Portfolios’ current fiscal year and may be extended by the Adviser for additional one-year terms. Without the waivers, the Portfolios’ expenses would have been higher and their performance would have been lower than that shown.
Benchmark Disclosures
None of the indices listed below reflect fees and expenses associated with the active management of a mutual fund portfolio.
The unmanaged Russell 1000 Value Index contains those securities in the Russell 1000 Index with a less-than-average growth orientation. The unmanaged Russell 1000 Index is composed of 1000 of the largest capitalized companies that are traded in the United States.
The unmanaged Russell 1000 Growth Index contains those securities in the Russell 1000 Index with a greater-than-average growth orientation. The unmanaged Russell 1000 Index is composed of 1000 of the largest capitalized companies that are traded in the U.S.
The unmanaged FTSE EPRA/NAREIT Global RE Index is a free-floating, market capitalization-weighted index structured in such a way that it can be considered to represent general trends in all eligible real estate stocks worldwide. The Index is designed to reflect the stock performance of companies engaged in specific aspects of the North American, European and Asian real estate markets.
The MSCI World Index is a market capitalization-weighted index that measures the performance of stock markets in 23 countries. Returns for this Index are net. Net returns approximate the minimum possible dividend reinvestment—the dividend is
| 20 | • ALLIANCEBERNSTEIN POOLING PORTFOLIOS |
Historical Performance
(Historical Performance continued on next page)
HISTORICAL PERFORMANCE
(continued from previous page)
reinvested after deduction of withholding tax, applying the highest rate possible to non-resident individuals who do not benefit from double taxation treaties.
The unmanaged MSCI EAFE Value Index is a free-float adjusted market capitalization index that is designed to measure developed market value equity performance in 21 countries, excluding the U.S. and Canada. Returns for this Index are net. Net returns approximate the minimum possible dividend reinvestment—the dividend is reinvested after deduction of withholding tax, applying the highest rate possible to non-resident individuals who do not benefit from double taxation treaties.
The unmanaged MSCI EAFE Growth Index is a free-float adjusted market capitalization index that is designed to measure developed market growth equity performance in 21 countries, excluding the U.S. and Canada. Returns for this Index are net. Net returns approximate the minimum possible dividend reinvestment—the dividend is reinvested after deduction of withholding tax, applying the highest rate possible to non-resident individuals who do not benefit from double taxation treaties.
The unmanaged MSCI AC World (ex-U.S.) Index is a free float-adjusted market capitalization index that is designed to measure equity market performance in the global developed and emerging markets, excluding the U.S. Returns for this Index are net. Net returns approximate the minimum possible dividend reinvestment—the dividend is reinvested after deduction of withholding tax, applying the highest rate possible to non-resident individuals who do not benefit from double taxation treaties.
The unmanaged Russell 2500 Value Index contains those securities in the Russell 2500 Index with a less-than-average growth orientation. The unmanaged Russell 2500 Index includes 2500 small- and mid-cap U.S. stocks.
The unmanaged Russell 2500 Growth Index contains those securities in the Russell 2500 Index with a greater-than-average growth orientation. The unmanaged Russell 2500 Index includes 2500 small- and mid-cap U.S. stocks.
The unmanaged Merrill Lynch 1-3 Year Treasury Index is composed of U.S. government securities, including agency securities, with remaining maturities of one to three years.
The unmanaged LB U.S. Aggregate Index covers the U.S. investment-grade fixed-rate bond market, including government and credit securities, agency mortgage pass through securities, asset-backed securities and commercial mortgage-backed securities.
The unmanaged LB 1-10 Year TIPS Index is the 1-10 year maturity component of the unmanaged LB U.S. Treasury Inflation Notes Index and consists of inflation-protected securities issued by the U.S. Treasury.
The unmanaged LB U.S. High Yield 2% Issuer Cap Index covers the universe of fixed-rate, non-investment grade debt. Pay-in-kind (PIK) bonds, Eurobonds, and debt issues from countries designated as emerging markets (e.g., Argentina, Brazil, Venezuela, etc.) are excluded, but Canadian and global bonds (SEC registered) of issuers in non-emerging market countries are included. Original issue zeroes, step-up coupon structures and 144-As are also included in the Index.
An investor cannot invest directly in an index, and its results are not indicative of the performance of any specific investment, including the Portfolio.
A Word About Risk
U.S. Value Portfolio
Value investing does not guarantee a profit or eliminate risk. Not all companies whose stocks are considered to be value stocks are able to turn their business around or successfully employ corrective strategies which would result in stock prices that rise as initially expected.
(Historical Performance continued on next page)
| ALLIANCEBERNSTEIN POOLING PORTFOLIOS • | 21 |
Historical Performance
HISTORICAL PERFORMANCE
(continued from previous page)
U.S. Large Cap Growth Portfolio
The Portfolio concentrates its investments in a limited number of issues and an investment in the Portfolio is therefore subject to greater risk and volatility than investments in a more diversified portfolio. Growth investing does not guarantee a profit or eliminate risk. The stocks of these companies can have relatively high valuations. Because of these high valuations, an investment in a growth stock can be more risky than an investment in a company with more modest growth expectations.
Global Real Estate Investment Portfolio
An investment in the Portfolio is subject to certain risks associated with the direct ownership of real estate and with the real estate industry in general, including declines in the value of real estate, general and local economic conditions and interest rates. The Portfolio concentrates its investments in real estate-related investments and may therefore be subject to greater risks and volatility than a more diversified Portfolio. The Portfolio’s assets may be invested in foreign securities, which may magnify these fluctuations due to changes in foreign exchange rates and the possibility of substantial volatility due to political and economic uncertainties in foreign countries. Investment in the Portfolio includes risks not associated with funds that invest exclusively in U.S. issues. Because the Portfolio will invest in foreign currency-denominated securities, these fluctuations may be magnified by changes in foreign exchange rates.
International Value Portfolio
Value investing does not guarantee a profit or eliminate risk. Not all companies whose stocks are considered to be value stocks are able to turn their business around or successfully employ corrective strategies which would result in stock prices that rise as initially expected. Substantially all of the Portfolio’s assets will be invested in foreign securities, which may magnify fluctuations due to changes in foreign exchange rates and the possibility of substantial volatility due to political and economic uncertainties in foreign countries. Because the Portfolio may invest in emerging markets and in developing countries, an investment also has the risk that market changes or other factors affecting emerging markets and developing countries, including political instability and unpredictable economic conditions, may have a significant effect on the Portfolio’s net asset value.
International Growth Portfolio
Substantially all of the Portfolio’s assets will be invested in foreign securities which may magnify fluctuations due to changes in foreign exchange rates and the possibility of substantial volatility due to political and economic uncertainties in foreign countries. Growth investing does not guarantee a profit or eliminate risk. The Portfolio may invest in securities of emerging market nations. These investments have additional risks, such as illiquid or thinly traded markets, company management risk, heightened political instability and currency volatility. Accounting standards and market regulations in emerging market nations are not the same as those in the U.S.
Small-Mid Cap Value Portfolio
Value investing does not guarantee a profit or eliminate risk. Not all companies whose stocks are considered to be value stocks are able to turn their business around or successfully employ corrective strategies which would result in stock prices that rise as initially expected. The Portfolio concentrates its investments in the stocks of small- to mid-capitalization companies, which tend to be more volatile than large-cap companies. Small- and mid-cap stocks may have additional risks because these companies tend to have limited product lines, markets or financial resources. The Portfolio can invest in foreign securities, which may magnify these fluctuations due to changes in foreign exchange rates and the possibility of substantial volatility due to political and economic uncertainties in foreign countries. Because the Portfolio may
(Historical Performance continued on next page)
| 22 | • ALLIANCEBERNSTEIN POOLING PORTFOLIOS |
Historical Performance
HISTORICAL PERFORMANCE
(continued from previous page)
invest in emerging markets and in developing countries, an investment also has the risk that market changes or other factors affecting emerging markets and developing countries, including political instability and unpredictable economic conditions, may have a significant effect on the Portfolio’s net asset value.
Small-Mid Cap Growth Portfolio
The Portfolio concentrates its investments in the stocks of small- to mid-capitalization companies, which tend to be more volatile than large-cap companies. Small-cap stocks may have additional risks because these companies tend to have limited product lines, markets, financial resources or less liquidity (i.e., more difficulty when buying and selling more than the average daily trading volume of certain investment shares). The Portfolio can invest in foreign securities. Foreign markets can be more volatile than the U.S. market due to increased risks of adverse issuer, political, regulatory, market or economic developments. In addition, because the Portfolio will invest in foreign currency-denominated securities, fluctuations in the value of the Portfolio’s investments may be magnified by changes in foreign exchange rates. The Portfolio pursues an aggressive investment strategy and an investment in the Portfolio is subject to higher risk.
Global Value Portfolio
Value investing does not guarantee a profit or eliminate risk. Not all companies whose stocks are considered to be value stocks are able to turn their business around or successfully employ corrective strategies which would result in stock prices that rise as initially expected. A substantial amount of the Portfolio’s assets may be invested in foreign securities, which may magnify these fluctuations due to changes in foreign exchange rates and the possibility of substantial volatility due to political and economic uncertainties in foreign countries. Investment in the Portfolio includes risks not associated with funds that invest exclusively in U.S. issues. Because the Portfolio will invest in foreign currency-denominated securities, these fluctuations may be magnified by changes in foreign exchange rates.
Global Research Growth Portfolio
The Portfolio concentrates its investments in a limited number of industry sectors and issues, and an investment in the Portfolio is therefore subject to greater risk and volatility than investments in a more diversified portfolio. The Portfolio may invest a significant portion of its assets in foreign securities, which can be more volatile than U.S. securities due to changes in foreign exchange rates and the possibility of substantial volatility due to political and economic uncertainties in foreign countries. The Portfolio may invest in securities of emerging market nations. These investments have additional risks, such as those presented by illiquid securities or thinly traded markets, company management risks, heightened political instability and currency volatility. Accounting standards and market regulations in emerging market nations are not the same as those in the U.S. Growth investing does not guarantee a profit or eliminate risk. The stocks of these companies can have relatively high valuations. Because of these high valuations, an investment in a growth stock can be more risky than an investment in a company with more modest growth expectations. If a growth stock company should fail to meet these high earnings expectations, the price of these stocks can be severely negatively affected.
Short Duration Bond Portfolio
The Portfolio’s assets can be invested in foreign securities, which may magnify asset value fluctuations due to changes in foreign exchange rates and the possibility of substantial volatility due to political and economic uncertainties in foreign countries. Because the Portfolio may invest in emerging markets and in developing countries, an investment also has the risk that market changes or other factors affecting emerging
(Historical Performance continued on next page)
| ALLIANCEBERNSTEIN POOLING PORTFOLIOS • | 23 |
Historical Performance
HISTORICAL PERFORMANCE
(continued from previous page)
markets and developing countries, including political instability and unpredictable economic conditions, may have an impact on the Portfolio’s asset value. To increase yield, the Portfolio can use leverage, a speculative technique, which may increase share price fluctuation. Price fluctuation in the Portfolio’s securities may be caused by changes in the general level of interest rates or changes in bond credit quality ratings. Please note, as interest rates rise, existing bond prices fall and can cause the value of an investment in the Portfolio to decline. Changes in interest rates have a greater effect on bonds with longer maturities than on those with shorter maturities. Investments in the Portfolio are not guaranteed because of fluctuation in the net asset value of the underlying fixed-income related investments. Similar to direct bond ownership, bond funds have the same interest rate, inflation and credit risks that are associated with the underlying bonds owned by the Portfolio. Portfolio purchasers should understand that, in contrast to owning individual bonds, there are ongoing fees and expenses associated with owning shares of bond funds. The Portfolio may also invest a portion of its assets in below investment-grade securities which are subject to greater risk than higher-rated securities.
Intermediate Duration Bond Portfolio
The Portfolio may invest in convertible debt securities, preferred stock and dividend-paying stocks, U.S. government obligations and foreign fixed-income securities. The Portfolio may invest in mortgage-related and other asset-backed securities which are subject to prepayment risk; the risk that early payments on principal on some mortgage-related securities may occur during periods of falling mortgage rates and expose the Portfolio to a lower rate of return upon reinvestment of principal. The Portfolio may invest a portion of its assets in foreign securities, which may magnify fluctuations. Price fluctuations may also be caused by changes in interest rates or bond quality ratings. These changes have a greater effect on bonds with longer maturities than on those with shorter maturities. Please note, as interest rates rise, existing bond prices fall and can cause the value of an investment in the Portfolio to decline. Investments in the Portfolio are not guaranteed because of fluctuation in the net asset value of the underlying fixed-income related investments. Similar to direct bond ownership, bond funds have the same interest rate, inflation and credit risks that are associated with the underlying bonds owned by the Portfolio. Portfolio purchasers should understand that, in contrast to owning individual bonds, there are ongoing fees and expenses associated with owning shares of bond funds. The Portfolio may invest in high yield bonds, otherwise known as “junk bonds,” which involves a greater risk of default and price volatility than other bonds. Investing in below-investment grade presents special risks, including credit risk. The Portfolio is also subject to leverage risk. When a fund borrows money or otherwise leverages its portfolio, it may be volatile because leverage tends to exaggerate the effect of any increase or decrease in the value of a fund’s investments. A fund may create leverage through the use of reverse repurchase agreements, forward contracts or dollar rolls or by borrowing money.
Inflation-Protected Securities Portfolio
Among the principal risks of investing in the Portfolio are interest-rate risk, credit risk and market risk. Interest rate risk is the risk that changes in interest rates will affect the value of income-producing securities. Credit risk is the risk that a security issuer or the counterparty to certain derivatives will be unable or unwilling to make timely payments of income or principal. Market risk is the risk of losses from adverse changes in the market. To the extent the Portfolio invests in securities of non-U.S. issuers, it may have non-U.S. issuer risk and currency risk.
(Historical Performance continued on next page)
| 24 | • ALLIANCEBERNSTEIN POOLING PORTFOLIOS |
Historical Performance
HISTORICAL PERFORMANCE
(continued from previous page)
High-Yield Portfolio
The Portfolio can invest in foreign securities, including emerging markets, which may magnify fluctuations due to changes in foreign exchange rates and the possibility of substantial volatility due to political and economic uncertainties in foreign countries. Price fluctuation in the Portfolio’s securities may be caused by changes in the general level of interest rates or changes in bond credit quality ratings. Please note, as interest rates rise, existing bond prices fall and can cause the value of an investment in the Portfolio to decline. Changes in interest rates have a greater effect on bonds with longer maturities than on those with shorter maturities. High yield bonds, otherwise known as “junk bonds,” involve a greater risk of default and price volatility than other bonds. Investing in non-investment-grade securities presents special risks, including credit risk. Investments in the Portfolio are not guaranteed because of fluctuation in the net asset value of the underlying fixed-income related investments. Similar to direct bond ownership, bond funds have the same interest rate, inflation and credit risks that are associated with the underlying bonds owned by the Portfolio. Portfolio purchasers should understand that, in contrast to owning individual bonds, there are ongoing fees and expenses associated with owning shares of bond funds.
All Portfolios
While the equity Portfolios invest principally in common stocks and other equity securities and the fixed-income Portfolios invest principally in bonds and fixed-income securities, in order to achieve their investment objectives, the Portfolios may at times use certain types of investment derivatives, such as options, futures, forwards and swaps. These instruments involve risks different from, and in certain cases, greater than, the risks presented by more traditional investments. These risks are fully discussed in the Portfolios’ prospectus.
| ALLIANCEBERNSTEIN POOLING PORTFOLIOS • | 25 |
Historical Performance
HISTORICAL PERFORMANCE
(continued from previous page)
U.S. VALUE PORTFOLIO
| THE PORTFOLIO VS. ITS BENCHMARK PERIODS ENDED FEBRUARY 29, 2008 | Returns | |||||
| 6 Months | 12 Months | |||||
AllianceBernstein U.S. Value Portfolio | -13.47% | -10.57% | ||||
Russell 1000 Value Index | -10.38% | -7.91% | ||||
U.S. LARGE CAP GROWTH PORTFOLIO
| THE PORTFOLIO VS. ITS BENCHMARK PERIODS ENDED FEBRUARY 29, 2008 | Returns | |||||
| 6 Months | 12 Months | |||||
AllianceBernstein U.S. Large Cap Growth Portfolio | -7.27% | 0.29% | ||||
Russell 1000 Growth Index | -6.56% | 0.40% | ||||
GLOBAL REAL ESTATE INVESTMENT PORTFOLIO
| THE PORTFOLIO VS. ITS BENCHMARK PERIODS ENDED FEBRUARY 29, 2008 | Returns | |||||
| 6 Months | 12 Months | |||||
AllianceBernstein Global Real Estate Investment Portfolio | -9.87% | -16.70% | ||||
FTSE EPRA/NAREIT Global RE Index | -10.59% | -17.15% | ||||
See Historical Performance and Benchmark disclosures on pages 20 – 25.
(Historical Performance continued on next page)
| 26 | • ALLIANCEBERNSTEIN POOLING PORTFOLIOS |
Historical Performance
HISTORICAL PERFORMANCE
(continued from previous page)
INTERNATIONAL VALUE PORTFOLIO
| THE PORTFOLIO VS. ITS BENCHMARK PERIODS ENDED FEBRUARY 29, 2008 | Returns | |||||
| 6 Months | 12 Months | |||||
AllianceBernstein International Value Portfolio | -10.03% | -4.53% | ||||
MSCI EAFE Value Index | -8.25% | -5.07% | ||||
INTERNATIONAL GROWTH PORTFOLIO
| THE PORTFOLIO VS. ITS BENCHMARK PERIODS ENDED FEBRUARY 29, 2008 | Returns | |||||
| 6 Months | 12 Months | |||||
AllianceBernstein International Growth Portfolio | -0.19% | 7.48% | ||||
MSCI EAFE Growth Index | -1.20% | 6.92% | ||||
MSCI AC World ex-U.S. Index | -1.63% | 7.34% | ||||
SMALL-MID CAP VALUE PORTFOLIO
| THE PORTFOLIO VS. ITS BENCHMARK PERIODS ENDED FEBRUARY 29, 2008 | Returns | |||||
| 6 Months | 12 Months | |||||
AllianceBernstein Small-Mid Cap Value Portfolio | -8.47% | -5.48% | ||||
Russell 2500 Value Index | -12.63% | -15.50% | ||||
See Historical Performance and Benchmark disclosures on pages 20 – 25.
(Historical Performance continued on next page)
| ALLIANCEBERNSTEIN POOLING PORTFOLIOS • | 27 |
Historical Performance
HISTORICAL PERFORMANCE
(continued from previous page)
SMALL-MID CAP GROWTH PORTFOLIO
| THE PORTFOLIO VS. ITS BENCHMARK PERIODS ENDED FEBRUARY 29, 2008 | Returns | |||||
| 6 Months | 12 Months | |||||
AllianceBernstein Small-Mid Cap Growth Portfolio | -11.50% | -0.75% | ||||
Russell 2500 Growth Index | -8.82% | -4.27% | ||||
GLOBAL VALUE PORTFOLIO*
| THE PORTFOLIO VS. ITS BENCHMARK PERIODS ENDED FEBRUARY 29, 2008 | Returns | |||||
| 6 Months | 12 Months | |||||
AllianceBernstein Global Value Portfolio | -11.33% | -6.25% | ||||
MSCI World Index | -6.14% | -0.53% | ||||
GLOBAL RESEARCH GROWTH PORTFOLIO*
| THE PORTFOLIO VS. ITS BENCHMARK PERIODS ENDED FEBRUARY 29, 2008 | Returns | |||||
| 6 Months | 12 Months | |||||
AllianceBernstein Global Research Growth Portfolio | -3.72% | 1.19% | ||||
MSCI World Index | -6.14% | -0.53% | ||||
| * | These Portfolios are relatively new and have been in existence for less than two years. The returns reflected may not be illustrative of long-term performance. |
See Historical Performance and Benchmark disclosures on pages 20 – 25.
(Historical Performance continued on next page)
| 28 | • ALLIANCEBERNSTEIN POOLING PORTFOLIOS |
Historical Performance
HISTORICAL PERFORMANCE
(continued from previous page)
SHORT DURATION BOND PORTFOLIO
| THE PORTFOLIO VS. ITS BENCHMARK PERIODS ENDED FEBRUARY 29, 2008 | Returns | |||||
| 6 Months | 12 Months | |||||
AllianceBernstein Short Duration Bond Portfolio | 1.64% | 3.27% | ||||
Merrill Lynch 1-3 Year Treasury Index | 5.93% | 9.17% | ||||
INTERMEDIATE DURATION BOND PORTFOLIO
| THE PORTFOLIO VS. ITS BENCHMARK PERIODS ENDED FEBRUARY 29, 2008 | Returns | |||||
| 6 Months | 12 Months | |||||
AllianceBernstein Intermediate Duration Bond Portfolio | 4.34% | 5.76% | ||||
LB U.S. Aggregate Index | 5.67% | 7.30% | ||||
INFLATION-PROTECTED SECURITIES PORTFOLIO
| THE PORTFOLIO VS. ITS BENCHMARK PERIODS ENDED FEBRUARY 29, 2008 | Returns | |||||
| 6 Months | 12 Months | |||||
AllianceBernstein Inflation-Protected Securities Portfolio | 11.71% | 15.17% | ||||
LB 1-10 Year TIPS Index | 11.79% | 15.24% | ||||
HIGH-YIELD PORTFOLIO
| THE PORTFOLIO VS. ITS BENCHMARK PERIODS ENDED FEBRUARY 29, 2008 | Returns | |||||
| 6 Months | 12 Months | |||||
AllianceBernstein High-Yield Portfolio | -1.93% | -3.43% | ||||
LB U.S. High Yield 2% Issuer Cap Index | -1.39% | -3.08% | ||||
See Historical Performance and Benchmark disclosures on pages 20 – 25.
| ALLIANCEBERNSTEIN POOLING PORTFOLIOS • | 29 |
(Historical Performance continued on next page)
Historical Performance
HISTORICAL PERFORMANCE
(continued from previous page)
| AVERAGE ANNUAL RETURNS AS OF FEBRUARY 29, 2008 | |||
| NAV/SEC Returns† | |||
| AllianceBernstein U.S. Value Portfolio | |||
1 Year | -10.57 | % | |
Since Inception* | 5.36 | % | |
| AllianceBernstein U.S. Large Cap Growth Portfolio | |||
1 Year | 0.29 | % | |
Since Inception* | 6.61 | % | |
| AllianceBernstein Global Real Estate Investment Portfolio | |||
1 Year | -16.70 | % | |
Since Inception* | 13.24 | % | |
| AllianceBernstein International Value Portfolio | |||
1 Year | -4.53 | % | |
Since Inception* | 17.73 | % | |
| AllianceBernstein International Growth Portfolio | |||
1 Year | 7.48 | % | |
Since Inception* | 15.97 | % | |
| AllianceBernstein Small-Mid Cap Value Portfolio | |||
1 Year | -5.48 | % | |
Since Inception* | 7.41 | % | |
| AllianceBernstein Small-Mid Cap Growth Portfolio | |||
1 Year | -0.75 | % | |
Since Inception* | 11.12 | % | |
| AllianceBernstein Global Value Portfolio | |||
1 Year | -6.25 | % | |
Since Inception* | 4.13 | % | |
| AllianceBernstein Global Research Growth Portfolio | |||
1 Year | 1.19 | % | |
Since Inception* | 6.14 | % | |
| AllianceBernstein Short Duration Bond Portfolio | |||
1 Year | 3.27 | % | |
Since Inception* | 3.73 | % | |
| AllianceBernstein Intermediate Duration Bond Portfolio | |||
1 Year | 5.76 | % | |
Since Inception* | 4.87 | % | |
| AllianceBernstein Inflation-Protected Securities Portfolio | |||
1 Year | 15.17 | % | |
Since Inception* | 6.86 | % | |
| AllianceBernstein High-Yield Portfolio | |||
1 Year | -3.43 | % | |
Since Inception* | 4.54 | % | |
| * | Inception date: 5/20/05 for all Portfolios, except Global Research Growth Portfolio and Global Value Portfolio; their inception date is 6/1/06. |
| † | These Portfolios are offered at net asset value (NAV) and their SEC returns are the same as their NAV returns. |
Global Value Portfolio and Global Research Growth Portfolio are relatively new and have been in existence for less than two years. The returns reflected may not be illustrative of long-term performance.
See Historical Performance and Benchmark disclosures on pages 20 – 25.
(Historical Performance continued on next page)
| 30 | • ALLIANCEBERNSTEIN POOLING PORTFOLIOS |
Historical Performance
HISTORICAL PERFORMANCE
(continued from previous page)
| SEC AVERAGE ANNUAL RETURNS AS OF THE MOST RECENT CALENDAR QUARTER-END (MARCH 31, 2008) | |||
| SEC Returns | |||
| AllianceBernstein U.S. Value Portfolio | |||
1 Year | -12.87 | % | |
Since Inception* | 4.80 | % | |
| AllianceBernstein U.S. Large Cap Growth Portfolio | |||
1 Year | -2.04 | % | |
Since Inception* | 6.11 | % | |
| AllianceBernstein Global Real Estate Investment Portfolio | |||
1 Year | -15.36 | % | |
Since Inception* | 13.72 | % | |
| AllianceBernstein International Value Portfolio | |||
1 Year | -5.40 | % | |
Since Inception* | 17.52 | % | |
| AllianceBernstein International Growth Portfolio | |||
1 Year | 1.37 | % | |
Since Inception* | 14.29 | % | |
| AllianceBernstein Small-Mid Cap Value Portfolio | |||
1 Year | -7.16 | % | |
Since Inception* | 7.59 | % | |
| AllianceBernstein Small-Mid Cap Growth Portfolio | |||
1 Year | -3.12 | % | |
Since Inception* | 10.56 | % | |
| AllianceBernstein Global Value Portfolio | |||
1 Year | -8.40 | % | |
Since Inception* | 3.33 | % | |
| AllianceBernstein Global Research Growth Portfolio | |||
1 Year | -4.37 | % | |
Since Inception* | 3.62 | % | |
| AllianceBernstein Short Duration Bond Portfolio | |||
1 Year | 1.42 | % | |
Since Inception* | 3.12 | % | |
| * | Inception date: 5/20/05 for all Portfolios, except Global Value Portfolio and Global Research Growth Portfolio; their inception date is 6/1/06. |
Global Value Portfolio and Global Research Growth Portfolio are relatively new and have been in existence for less than two years. The returns reflected may not be illustrative of long-term performance.
See Historical Performance and Benchmark disclosures on pages 20 – 25.
(Historical Performance continued on next page)
| ALLIANCEBERNSTEIN POOLING PORTFOLIOS • | 31 |
Historical Performance
HISTORICAL PERFORMANCE
(continued from previous page)
| SEC AVERAGE ANNUAL RETURNS AS OF THE MOST RECENT CALENDAR QUARTER-END (MARCH 31, 2008) | |||
| SEC Returns | |||
| AllianceBernstein Intermediate Duration Bond Portfolio | |||
1 Year | 5.64 | % | |
Since Inception* | 4.72 | % | |
| AllianceBernstein Inflation-Protected Securities Portfolio | |||
1 Year | 14.78 | % | |
Since Inception* | 6.79 | % | |
| AllianceBernstein High-Yield Portfolio | |||
1 Year | -3.94 | % | |
Since Inception* | 4.30 | % | |
| * | Inception date: 5/20/05. |
See Historical Performance and Benchmark disclosures on pages 20 – 25.
| 32 | • ALLIANCEBERNSTEIN POOLING PORTFOLIOS |
Historical Performance
FUND EXPENSES
As a shareholder of the Fund, you incur two types of costs: (1) transaction costs, including sales charges (loads) on purchase payments, contingent deferred sales charges on redemptions and (2) ongoing costs, including management fees; distribution (12b-1) fees; and other Fund expenses. This example is intended to help you understand your ongoing costs (in dollars) of investing in the Fund and to compare these costs with the ongoing costs of investing in other mutual funds.
The Example is based on an investment of $1,000 invested at the beginning of the period and held for the entire period as indicated below.
Actual Expenses
The first line of the table below provides information about actual account values and actual expenses. You may use the information in this line, together with the amount you invested, to estimate the expenses that you paid over the period. Simply divide your account value by $1,000 (for example, an $8,600 account value divided by $1,000 = 8.6), then multiply the result by the number in the first line under the heading entitled “Expenses Paid During Period” to estimate the expenses you paid on your account during this period.
Hypothetical Example for Comparison Purposes
The second line of the table below provides information about hypothetical account values and hypothetical expenses based on the Fund’s actual expense ratio and an assumed annual rate of return of 5% before expenses, which is not the Fund’s actual return. The hypothetical account values and expenses may not be used to estimate the actual ending account balance or expenses you paid for the period. You may use this information to compare the ongoing costs of investing in the Fund and other funds by comparing this 5% hypothetical example with the 5% hypothetical examples that appear in the shareholder reports of other funds.
Please note that the expenses shown in the table are meant to highlight your ongoing costs only and do not reflect any transactional costs, such as sales charges (loads), or contingent deferred sales charges on redemptions. Therefore, the second line of the table is useful in comparing ongoing costs only, and will not help you determine the relative total costs of owning different funds. In addition, if these transactional costs were included, your costs would have been higher.
| Beginning Account Value September 1, 2007 | Ending Account Value February 29, 2008 | Expenses Paid During Period* | Annualized Expense Ratio* | |||||||||
| U.S. Value Portfolio | ||||||||||||
Actual | $ | 1,000 | $ | 865.32 | $ | 0.09 | 0.02 | % | ||||
Hypothetical** | $ | 1,000 | $ | 1,024.76 | $ | 0.10 | 0.02 | % | ||||
| U.S. Large Cap Growth Portfolio | ||||||||||||
Actual | $ | 1,000 | $ | 927.25 | $ | 0.10 | 0.02 | % | ||||
Hypothetical** | $ | 1,000 | $ | 1,024.76 | $ | 0.10 | 0.02 | % | ||||
| Global Real Estate Investment Portfolio | ||||||||||||
Actual | $ | 1,000 | $ | 901.31 | $ | 0.28 | 0.06 | % | ||||
Hypothetical** | $ | 1,000 | $ | 1,024.57 | $ | 0.30 | 0.06 | % | ||||
| International Value Portfolio | ||||||||||||
Actual | $ | 1,000 | $ | 899.73 | $ | 0.33 | 0.07 | % | ||||
Hypothetical** | $ | 1,000 | $ | 1,024.52 | $ | 0.35 | 0.07 | % | ||||
| ALLIANCEBERNSTEIN POOLING PORTFOLIOS • | 33 |
Fund Expenses
FUND EXPENSES
(continued from previous page)
| Beginning Account Value September 1, 2007 | Ending Account Value February 29, 2008 | Expenses Paid During Period* | Annualized Expense Ratio* | |||||||||
| International Growth Portfolio | ||||||||||||
Actual | $ | 1,000 | $ | 998.12 | $ | 0.35 | 0.07 | % | ||||
Hypothetical** | $ | 1,000 | $ | 1,024.52 | $ | 0.35 | 0.07 | % | ||||
| Small-Mid Cap Value Portfolio | ||||||||||||
Actual | $ | 1,000 | $ | 915.32 | $ | 0.19 | 0.04 | % | ||||
Hypothetical** | $ | 1,000 | $ | 1,024.66 | $ | 0.20 | 0.04 | % | ||||
| Small-Mid Cap Growth Portfolio | ||||||||||||
Actual | $ | 1,000 | $ | 885.00 | $ | 0.19 | 0.04 | % | ||||
Hypothetical** | $ | 1,000 | $ | 1,024.66 | $ | 0.20 | 0.04 | % | ||||
| Global Value Portfolio | ||||||||||||
Actual | $ | 1,000 | $ | 886.72 | $ | 0.70 | 0.15 | % | ||||
Hypothetical** | $ | 1,000 | $ | 1,024.12 | $ | 0.75 | 0.15 | % | ||||
| Global Research Growth Portfolio | ||||||||||||
Actual | $ | 1,000 | $ | 962.82 | $ | 0.73 | 0.15 | % | ||||
Hypothetical** | $ | 1,000 | $ | 1,024.12 | $ | 0.75 | 0.15 | % | ||||
| Short Duration Bond Portfolio | ||||||||||||
Actual | $ | 1,000 | $ | 1,016.36 | $ | 0.15 | 0.03 | % | ||||
Hypothetical** | $ | 1,000 | $ | 1,024.71 | $ | 0.15 | 0.03 | % | ||||
| Intermediate Duration Bond Portfolio | ||||||||||||
Actual | $ | 1,000 | $ | 1,043.44 | $ | 0.15 | 0.03 | % | ||||
Hypothetical** | $ | 1,000 | $ | 1,024.71 | $ | 0.15 | 0.03 | % | ||||
| Inflation Protected Securities Portfolio | ||||||||||||
Actual | $ | 1,000 | $ | 1,117.15 | $ | 0.21 | 0.04 | % | ||||
Hypothetical** | $ | 1,000 | $ | 1,024.66 | $ | 0.20 | 0.04 | % | ||||
| High-Yield Portfolio | ||||||||||||
Actual | $ | 1,000 | $ | 980.69 | $ | 0.30 | 0.06 | % | ||||
Hypothetical** | $ | 1,000 | $ | 1,024.57 | $ | 0.30 | 0.06 | % | ||||
| * | Expenses are equal to each Class’ annualized expense ratio, multiplied by the average account value over the period, multiplied by the 182/366 (to reflect the one-half year period). |
| ** | Assumes 5% return before expenses. |
| 34 | • ALLIANCEBERNSTEIN POOLING PORTFOLIOS |
Fund Expenses
PORTFOLIO SUMMARY
February 29, 2008 (unaudited)
U.S. VALUE PORTFOLIO
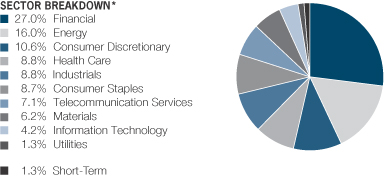
| * | All data are as of February 29, 2008. The Portfolio’s sector breakdown is expressed as a percentage of total investments and may vary over time. |
| Please Note: The sector classifications presented herein are based on the Global Industry Classification Standard (GICS) which was developed by Morgan Stanley Capital International and Standard and Poor’s. The components are divided into sector, industry group, and industry sub-indices as classified by the GICS for each of the market capitalization indices in the Broad Market. These sector classifications are broadly defined. The “Portfolio of Investments” section of the report reflects more specific industry information and is consistent with the investment restrictions discussed in the Portfolio’s prospectus. |
| ALLIANCEBERNSTEIN POOLING PORTFOLIOS • | 35 |
Portfolio Summary
PORTFOLIO SUMMARY
February 29, 2008 (unaudited)
U.S. LARGE CAP GROWTH PORTFOLIO

| * | All data are as of February 29, 2008. The Portfolio’s sector breakdown is expressed as a percentage of total investments and may vary over time. |
| Please Note: The sector classifications presented herein are based on the Global Industry Classification Standard (GICS) which was developed by Morgan Stanley Capital International and Standard and Poor’s. The components are divided into sector, industry group, and industry sub-indices as classified by the GICS for each of the market capitalization indices in the Broad Market. These sector classifications are broadly defined. The “Portfolio of Investments” section of the report reflects more specific industry information and is consistent with the investment restrictions discussed in the Portfolio’s prospectus. |
| 36 | • ALLIANCEBERNSTEIN POOLING PORTFOLIOS |
Portfolio Summary
PORTFOLIO SUMMARY
February 29, 2008 (unaudited)
GLOBAL REAL ESTATE INVESTMENT PORTFOLIO
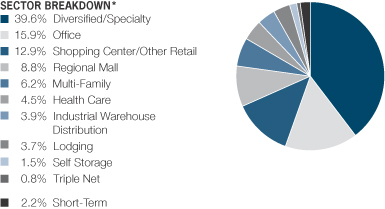
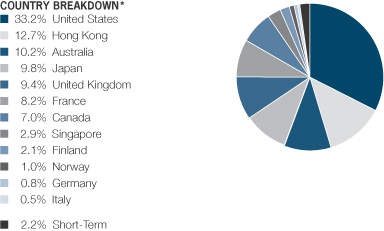
| * | All data are as of February 29, 2008. The Portfolio’s sector and country breakdowns are expressed as a percentage of total investments and may vary over time. |
| Please Note: The sector classifications presented herein are based on the sector categorization methodology of the Adviser. These sector classifications are broadly defined. The “Portfolio of Investments” section of the report reflects more specific industry information and is consistent with the investment restrictions discussed in the Portfolio’s prospectus. |
| ALLIANCEBERNSTEIN POOLING PORTFOLIOS • | 37 |
Portfolio Summary
PORTFOLIO SUMMARY
February 29, 2008 (unaudited)
INTERNATIONAL VALUE PORTFOLIO
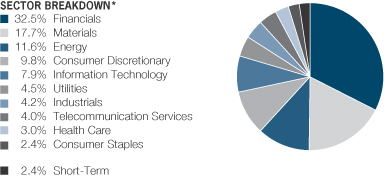
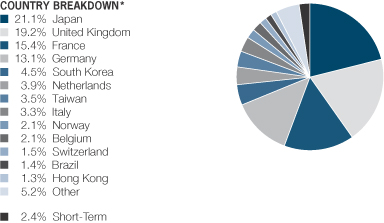
| * | All data are as of February 29, 2008. The Portfolio’s sector and country breakdowns are expressed as percentage of total investments and may vary over time. “Other” country weightings represents 1.3% or less in the following countries: Canada, China, Finland, Israel, Russia and Sweden. |
| Please Note: The sector classifications presented herein are based on the Global Industry Classification Standard (GICS) which was developed by Morgan Stanley Capital International and Standard and Poor’s. The components are divided into sector, industry group, and industry sub-indices as classified by the GICS for each of the market capitalization indices in the Broad Market. These sector classifications are broadly defined. The “Portfolio of Investments” section of the report reflects more specific industry information and is consistent with the investment restrictions discussed in the Portfolio’s prospectus. |
| 38 | • ALLIANCEBERNSTEIN POOLING PORTFOLIOS |
Portfolio Summary
PORTFOLIO SUMMARY
February 29, 2008 (unaudited)
INTERNATIONAL GROWTH PORTFOLIO
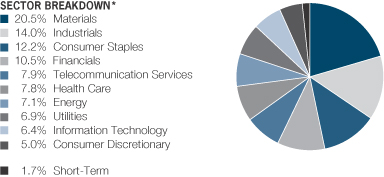
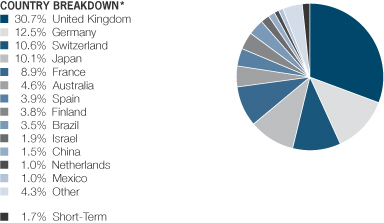
| * | All data are as of February 29, 2008. The Portfolio’s sector and country breakdowns are expressed as a percentage of total investments and may vary over time. “Other” country weightings represents 1.0% or less in the following countries: Czech Republic, Hong Kong, Italy, Luxembourg, Russia and Turkey. |
| Please Note: The sector classifications presented herein are based on the Global Industry Classification Standard (GICS) which was developed by Morgan Stanley Capital International and Standard and Poor’s. The components are divided into sector, industry group, and industry sub-indices as classified by the GICS for each of the market capitalization indices in the Broad Market. These sector classifications are broadly defined. The “Portfolio of Investments” section of the report reflects more specific industry information and is consistent with the investment restrictions discussed in the Portfolio’s prospectus. |
| ALLIANCEBERNSTEIN POOLING PORTFOLIOS • | 39 |
Portfolio Summary
PORTFOLIO SUMMARY
February 29, 2008 (unaudited)
SMALL-MID CAP VALUE PORTFOLIO
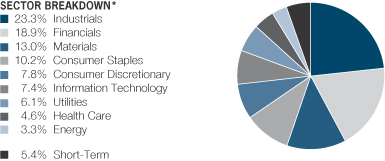
| * | All data are as of February 29, 2008. The Portfolio’s sector breakdown is expressed as a percentage of total investments and may vary over time. |
| Please Note: The sector classifications presented herein are based on the Global Industry Classification Standard (GICS) which was developed by Morgan Stanley Capital International and Standard and Poor’s. The components are divided into sector, industry group, and industry sub-indices as classified by the GICS for each of the market capitalization indices in the Broad Market. These sector classifications are broadly defined. The “Portfolio of Investments” section of the report reflects more specific industry information and is consistent with the investment restrictions discussed in the Portfolio’s prospectus. |
| 40 | • ALLIANCEBERNSTEIN POOLING PORTFOLIOS |
Portfolio Summary
PORTFOLIO SUMMARY
February 29, 2008 (unaudited)
SMALL-MID CAP GROWTH PORTFOLIO
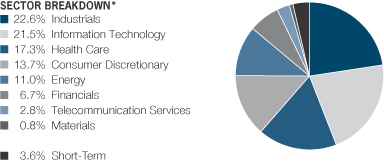
| * | All data are as of February 29, 2008. The Portfolio’s sector breakdown is expressed as a percentage of total investments and may vary over time. |
| Please Note: The sector classifications presented herein are based on the Global Industry Classification Standard (GICS) which was developed by Morgan Stanley Capital International and Standard and Poor’s. The components are divided into sector, industry group, and industry sub-indices as classified by the GICS for each of the market capitalization indices in the Broad Market. These sector classifications are broadly defined. The “Portfolio of Investments” section of the report reflects more specific industry information and is consistent with the investment restrictions discussed in the Portfolio’s prospectus. |
| ALLIANCEBERNSTEIN POOLING PORTFOLIOS • | 41 |
Portfolio Summary
PORTFOLIO SUMMARY
February 29, 2008 (unaudited)
GLOBAL VALUE PORTFOLIO
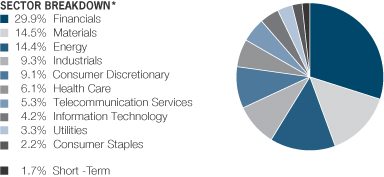
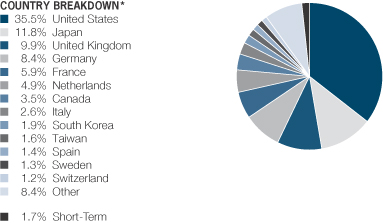
| * | All data are as of February 29, 2008. The Portfolio’s sector and country breakdowns are expressed as a percentage of total investments and may vary over time. “Other” country weightings represent 1.2% or less in the following countries: Australia, Belgium, Brazil, Cayman Islands, China, Finland, Hong Kong, India, Luxembourg, Norway, Singapore, South Africa and Thailand. |
| Please Note: The sector classifications presented herein are based on the Global Industry Classification Standard (GICS) which was developed by Morgan Stanley Capital International and Standard and Poor’s. The components are divided into sector, industry group, and industry sub-indices as classified by the GICS for each of the market capitalization indices in the Broad Market. These sector classifications are broadly defined. The “Portfolio of Investments” section of the report reflects more specific industry information and is consistent with the investment restrictions discussed in the Portfolio’s prospectus. |
| 42 | • ALLIANCEBERNSTEIN POOLING PORTFOLIOS |
Portfolio Summary
PORTFOLIO SUMMARY
February 29, 2008 (unaudited)
GLOBAL RESEARCH GROWTH PORTFOLIO
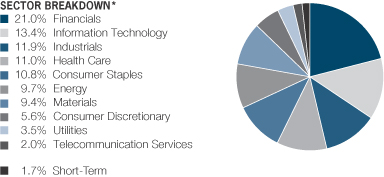
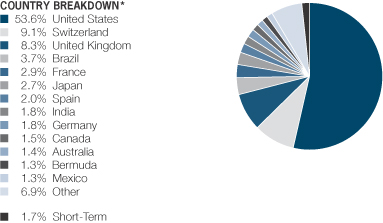
| * | All data are as of February 29, 2008. The Portfolio’s sector and country breakdowns are expressed as a percentage of total investments and may vary over time. “Other” country weightings represent 1.3% or less in the following countries: Cayman Islands, China, Finland, Hong Kong, Israel, Italy, Luxembourg, Netherlands, Russia, South Africa, South Korea, Sweden, Taiwan and Turkey. |
| Please Note: The sector classifications presented herein are based on the Global Industry Classification Standard (GICS) which was developed by Morgan Stanley Capital International and Standard and Poor’s. The components are divided into sector, industry group, and industry sub-indices as classified by the GICS for each of the market capitalization indices in the Broad Market. These sector classifications are broadly defined. The “Portfolio of Investments” section of the report reflects more specific industry information and is consistent with the investment restrictions discussed in the Portfolio’s prospectus. |
| ALLIANCEBERNSTEIN POOLING PORTFOLIOS • | 43 |
Portfolio Summary
PORTFOLIO SUMMARY
February 29, 2008 (unaudited)
SHORT DURATION BOND PORTFOLIO
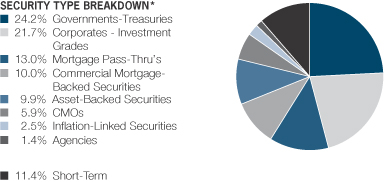
| * | All data are as of February 29, 2008. The Portfolio’s security type breakdown is expressed as a percentage of total investments and may vary over time. |
| 44 | • ALLIANCEBERNSTEIN POOLING PORTFOLIOS |
Portfolio Summary
PORTFOLIO SUMMARY
February 29, 2008 (unaudited)
INTERMEDIATE DURATION BOND PORTFOLIO
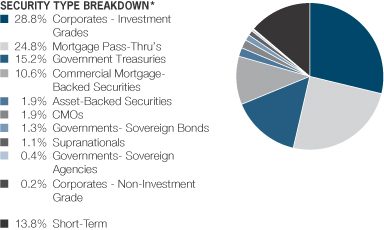
| * | All data are as of February 29, 2008. The Portfolio’s security type breakdown is expressed as a percentage of total investments and may vary over time. |
| ALLIANCEBERNSTEIN POOLING PORTFOLIOS • | 45 |
Portfolio Summary
PORTFOLIO SUMMARY
February 29, 2008 (unaudited)
INFLATION-PROTECTED SECURITIES PORTFOLIO
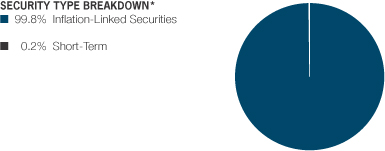
| * | All data are as of February 29, 2008. The Portfolio’s security type breakdown is expressed as a percentage of total investments and may vary over time. |
| 46 | • ALLIANCEBERNSTEIN POOLING PORTFOLIOS |
Portfolio Summary
PORTFOLIO SUMMARY
February 29, 2008 (unaudited)
HIGH-YIELD PORTFOLIO
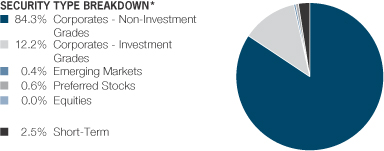
| * | All data are as of February 29, 2008. The Portfolio’s security type breakdown is expressed as a percentage of total investments and may vary over time. |
| ALLIANCEBERNSTEIN POOLING PORTFOLIOS • | 47 |
Portfolio Summary
U.S. VALUE PORTFOLIO
PORTFOLIO OF INVESTMENTS
February 29, 2008 (unaudited)
| Company | Shares | U.S. $ Value | |||
COMMON STOCKS – 98.5% | |||||
Financials – 26.9% | |||||
Capital Markets – 2.6% | |||||
Deutsche Bank AG | 114,500 | $ | 12,704,920 | ||
The Goldman Sachs Group, Inc. | 25,000 | 4,240,750 | |||
Merrill Lynch & Co., Inc. | 389,500 | 19,303,620 | |||
Morgan Stanley | 676,000 | 28,473,120 | |||
| 64,722,410 | |||||
Commercial Banks – 2.8% | |||||
Comerica, Inc. | 252,300 | 9,143,352 | |||
Fifth Third Bancorp | 430,500 | 9,858,450 | |||
Keycorp | 89,900 | 1,982,295 | |||
National City Corp. | 511,700 | 8,115,562 | |||
SunTrust Banks, Inc. | 79,800 | 4,638,774 | |||
U.S. Bancorp | 299,300 | 9,583,586 | |||
Wachovia Corp. | 395,000 | 12,094,900 | |||
Wells Fargo & Co. | 549,200 | 16,053,116 | |||
| 71,470,035 | |||||
Consumer Finance – 0.7% | |||||
Discover Financial Services | 1,137,300 | 17,161,857 | |||
Diversified Financial Services – 8.3% | |||||
Bank of America Corp. | 1,964,800 | 78,081,152 | |||
CIT Group, Inc. | 425,300 | 9,450,166 | |||
Citigroup, Inc. | 2,423,200 | 57,454,072 | |||
JPMorgan Chase & Co. | 1,587,000 | 64,511,550 | |||
| 209,496,940 | |||||
Insurance – 11.3% | |||||
ACE Ltd. | 354,700 | 19,948,328 | |||
Allstate Corp. | 488,800 | 23,330,424 | |||
American International Group, Inc. | 1,062,700 | 49,798,122 | |||
Chubb Corp. | 398,500 | 20,283,650 | |||
Everest Re Group Ltd. | 65,500 | 6,345,640 | |||
Fidelity National Financial, Inc. – Class A | 522,500 | 9,201,225 | |||
Genworth Financial, Inc. – Class A | 739,000 | 17,130,020 | |||
Hartford Financial Services Group, Inc. | 299,500 | 20,935,050 | |||
MetLife, Inc. | 365,500 | 21,294,030 | |||
Old Republic International Corp. | 625,200 | 8,577,744 | |||
PartnerRe Ltd. | 66,100 | 5,082,429 | |||
The Progressive Corp. | 883,600 | 16,196,388 | |||
RenaissanceRe Holdings Ltd. | 128,700 | 7,065,630 | |||
Safeco Corp. | 163,500 | 7,563,510 | |||
Torchmark Corp. | 101,400 | 6,110,364 | |||
The Travelers Cos, Inc. | 509,000 | 23,622,690 | |||
Unum Group | 715,800 | 16,398,978 | |||
XL Capital Ltd. – Class A | 204,900 | 7,388,694 | |||
| 286,272,916 | |||||
| 48 | • ALLIANCEBERNSTEIN POOLING PORTFOLIOS |
U.S. Value Portfolio—Portfolio of Investments
| Company | Shares | U.S. $ Value | |||
Thrifts & Mortgage Finance – 1.2% | |||||
Federal Home Loan Mortgage Corp. | 330,500 | $ | 8,321,990 | ||
Federal National Mortgage Association | 543,000 | 15,013,950 | |||
Washington Mutual, Inc. | 481,300 | 7,123,240 | |||
| 30,459,180 | |||||
| 679,583,338 | |||||
Energy – 16.0% | |||||
Oil, Gas & Consumable Fuels – 16.0% | |||||
Anadarko Petroleum Corp. | 372,300 | 23,730,402 | |||
BP PLC (Sponsored) (ADR) | 170,700 | 11,073,309 | |||
Chevron Corp. | 1,001,700 | 86,807,322 | |||
ConocoPhillips | 786,400 | 65,043,144 | |||
Exxon Mobil Corp. | 1,630,800 | 141,895,908 | |||
Marathon Oil Corp. | 467,000 | 24,825,720 | |||
Occidental Petroleum Corp. | 132,300 | 10,236,051 | |||
Royal Dutch Shell PLC (ADR) | 171,300 | 12,239,385 | |||
Total SA (ADR) | 162,000 | 12,213,180 | |||
Valero Energy Corp. | 267,600 | 15,459,252 | |||
| 403,523,673 | |||||
Consumer Discretionary – 10.6% | |||||
Auto Components – 1.1% | |||||
Autoliv, Inc. | 162,800 | 8,123,720 | |||
BorgWarner, Inc. | 242,200 | 10,441,242 | |||
Lear Corp.(a) | 49,800 | 1,373,484 | |||
Magna International, Inc. – Class A | 109,000 | 7,979,890 | |||
| 27,918,336 | |||||
Automobiles – 0.7% | |||||
General Motors Corp. | 778,000 | 18,111,840 | |||
Hotels, Restaurants & Leisure – 0.3% | |||||
McDonald’s Corp. | 143,200 | 7,748,552 | |||
Household Durables – 1.0% | |||||
Black & Decker Corp. | 123,600 | 8,499,972 | |||
Centex Corp. | 218,900 | 4,857,391 | |||
KB Home | 227,500 | 5,444,075 | |||
Newell Rubbermaid, Inc. | 90,900 | 2,063,430 | |||
Pulte Homes, Inc. | 262,000 | 3,547,480 | |||
| 24,412,348 | |||||
Leisure Equipment & Products – 0.3% | |||||
Brunswick Corp. | 420,500 | 6,849,945 | |||
Media – 3.5% | |||||
CBS Corp. – Class B | 617,300 | 14,086,786 | |||
Gannett Co., Inc. | 473,300 | 14,269,995 | |||
Idearc, Inc. | 517,200 | 2,492,904 | |||
Time Warner, Inc. | 1,016,500 | 15,867,565 | |||
| ALLIANCEBERNSTEIN POOLING PORTFOLIOS • | 49 |
U.S. Value Portfolio—Portfolio of Investments
| Company | Shares | U.S. $ Value | |||
Viacom, Inc. – Class B(a) | 368,800 | $ | 14,659,800 | ||
The Walt Disney Co. | 830,600 | 26,919,746 | |||
| 88,296,796 | |||||
Multiline Retail – 0.8% | |||||
Family Dollar Stores, Inc. | 383,000 | 7,334,450 | |||
Macy’s, Inc. | 556,300 | 13,729,484 | |||
| 21,063,934 | |||||
Specialty Retail – 2.1% | |||||
AutoNation, Inc.(a) | 175,700 | 2,559,949 | |||
The Gap, Inc. | 655,500 | 13,221,435 | |||
Home Depot, Inc. | 665,700 | 17,674,335 | |||
Lowe’s Cos, Inc. | 246,700 | 5,913,399 | |||
Ltd. Brands, Inc. | 282,000 | 4,300,500 | |||
Office Depot, Inc.(a) | 813,200 | 9,246,084 | |||
| 52,915,702 | |||||
Textiles, Apparel & Luxury Goods – 0.8% | |||||
Jones Apparel Group, Inc. | 864,600 | 12,199,506 | |||
VF Corp. | 106,935 | 8,131,337 | |||
| 20,330,843 | |||||
| 267,648,296 | |||||
Health Care – 8.8% | |||||
Health Care Equipment & Supplies – 0.2% | |||||
Covidien Ltd. | 95,000 | 4,065,050 | |||
Health Care Providers & Services – 1.3% | |||||
AmerisourceBergen Corp. – Class A | 156,700 | 6,537,524 | |||
Cardinal Health, Inc. | 213,400 | 12,620,476 | |||
McKesson Corp. | 234,800 | 13,796,848 | |||
| 32,954,848 | |||||
Pharmaceuticals – 7.3% | |||||
Eli Lilly & Co. | 296,100 | 14,810,922 | |||
GlaxoSmithKline PLC (ADR) | 301,400 | 13,234,474 | |||
Johnson & Johnson | 392,000 | 24,288,320 | |||
Merck & Co., Inc. | 507,800 | 22,495,540 | |||
Pfizer, Inc. | 3,323,600 | 74,049,808 | |||
Sanofi-Aventis SA (ADR) | 324,800 | 12,046,832 | |||
Wyeth | 563,300 | 24,571,146 | |||
| 185,497,042 | |||||
| 222,516,940 | |||||
Industrials – 8.8% | |||||
Aerospace & Defense – 1.0% | |||||
Lockheed Martin Corp. | 30,400 | 3,137,280 | |||
Northrop Grumman Corp. | 285,100 | 22,411,711 | |||
| 25,548,991 | |||||
| 50 | • ALLIANCEBERNSTEIN POOLING PORTFOLIOS |
U.S. Value Portfolio—Portfolio of Investments
| Company | Shares | U.S. $ Value | |||
Commercial Services & Supplies – 0.8% | |||||
Allied Waste Industries, Inc.(a) | 1,021,400 | $ | 10,561,276 | ||
Pitney Bowes, Inc. | 245,800 | 8,794,724 | |||
| 19,356,000 | |||||
Industrial Conglomerates – 5.0% | |||||
3M Co. | 98,900 | 7,753,760 | |||
General Electric Co. | 2,913,700 | 96,560,018 | |||
Tyco International Ltd. | 553,700 | 22,181,222 | |||
| 126,495,000 | |||||
Machinery – 1.9% | |||||
Caterpillar, Inc. | 218,100 | 15,775,173 | |||
Cummins, Inc. | 81,000 | 4,080,780 | |||
Eaton Corp. | 26,100 | 2,104,443 | |||
SPX Corp. | 132,300 | 13,534,290 | |||
Terex Corp.(a) | 161,100 | 10,866,195 | |||
| 46,360,881 | |||||
Road & Rail – 0.1% | |||||
Avis Budget Group, Inc.(a) | 273,600 | 3,127,248 | |||
| 220,888,120 | |||||
Consumer Staples – 8.7% | |||||
Beverages – 1.0% | |||||
The Coca-Cola Co. | 51,900 | 3,034,074 | |||
Coca-Cola Enterprises, Inc. | 224,800 | 5,491,864 | |||
Molson Coors Brewing Co. – Class B | 308,000 | 16,619,680 | |||
| 25,145,618 | |||||
Food & Staples Retailing – 1.7% | |||||
The Kroger Co. | 398,300 | 9,658,775 | |||
Safeway, Inc. | 458,600 | 13,180,164 | |||
Supervalu, Inc. | 557,600 | 14,637,000 | |||
Wal-Mart Stores, Inc. | 100,000 | 4,959,000 | |||
| 42,434,939 | |||||
Food Products – 2.5% | |||||
ConAgra Foods, Inc. | 419,900 | 9,279,790 | |||
Del Monte Foods Co. | 590,000 | 5,298,200 | |||
General Mills, Inc. | 198,500 | 11,114,015 | |||
Kellogg Co. | 210,100 | 10,656,272 | |||
Kraft Foods, Inc. – Class A | 173,300 | 5,401,761 | |||
Sara Lee Corp. | 953,700 | 12,045,231 | |||
Tyson Foods, Inc. – Class A | 573,300 | 8,261,253 | |||
| 62,056,522 | |||||
Household Products – 1.9% | |||||
Procter & Gamble Co. | 718,900 | 47,576,802 | |||
Tobacco – 1.6% | |||||
Altria Group, Inc. | 560,300 | 40,980,342 | |||
| 218,194,223 | |||||
| ALLIANCEBERNSTEIN POOLING PORTFOLIOS • | 51 |
U.S. Value Portfolio—Portfolio of Investments
| Company | Shares | U.S. $ Value | |||
Telecommunication Services – 7.1% | |||||
Diversified Telecommunication | |||||
AT&T, Inc. | 2,769,300 | $ | 96,454,719 | ||
Verizon Communications, Inc. | 1,396,500 | 50,720,880 | |||
| 147,175,599 | |||||
Wireless Telecommunication | |||||
Sprint Nextel Corp. | 2,560,100 | 18,202,311 | |||
Vodafone Group PLC (ADR) | 432,800 | 13,949,144 | |||
| 32,151,455 | |||||
| 179,327,054 | |||||
Materials – 6.2% | |||||
Chemicals – 2.7% | |||||
Ashland, Inc. | 162,300 | 7,168,791 | |||
Dow Chemical Co. | 718,800 | 27,091,572 | |||
E.I. Du Pont de Nemours & Co. | 585,000 | 27,155,700 | |||
Lubrizol Corp. | 123,500 | 7,200,050 | |||
| 68,616,113 | |||||
Containers & Packaging – 1.6% | |||||
Ball Corp. | 309,300 | 13,640,130 | |||
Owens-Illinois, Inc.(a) | 275,200 | 15,535,040 | |||
Smurfit-Stone Container Corp.(a) | 439,600 | 3,494,820 | |||
Sonoco Products Co. | 210,400 | 5,926,968 | |||
| 38,596,958 | |||||
Metals & Mining – 1.9% | |||||
Alcoa, Inc. | 784,000 | 29,117,760 | |||
ArcelorMittal | 250,200 | 19,020,204 | |||
| 48,137,964 | |||||
| 155,351,035 | |||||
Information Technology – 4.1% | |||||
Communications Equipment – 0.5% | |||||
Nokia OYJ (Sponsored) (ADR) | 379,300 | 13,658,593 | |||
Computers & Peripherals – 1.0% | |||||
Dell, Inc.(a) | 350,000 | 6,947,500 | |||
International Business Machines Corp. | 66,800 | 7,605,848 | |||
Lexmark International, Inc. – Class A(a) | 285,800 | 9,439,974 | |||
| 23,993,322 | |||||
Electronic Equipment & | |||||
Arrow Electronics, Inc.(a) | 328,700 | 10,718,907 | |||
Avnet, Inc.(a) | 442,200 | 14,906,562 | |||
Flextronics International Ltd.(a) | 1,218,278 | 12,353,339 | |||
| 52 | • ALLIANCEBERNSTEIN POOLING PORTFOLIOS |
U.S. Value Portfolio—Portfolio of Investments
| Company | Shares | U.S. $ Value | |||
Ingram Micro, Inc. – Class A(a) | 436,100 | $ | 6,659,247 | ||
Sanmina-SCI Corp.(a) | 599,600 | 989,340 | |||
Tech Data Corp.(a) | 167,500 | 5,586,125 | |||
Tyco Electronics Ltd. | 95,000 | 3,125,500 | |||
Vishay Intertechnology, Inc.(a) | 524,900 | 4,792,337 | |||
| 59,131,357 | |||||
IT Services – 0.3% | |||||
Electronic Data Systems Corp. | 441,500 | 7,646,780 | |||
| 104,430,052 | |||||
Utilities – 1.3% | |||||
Electric Utilities – 0.6% | |||||
Entergy Corp. | 143,700 | 14,763,738 | |||
Independent Power Producers & Energy Traders – 0.6% | |||||
Constellation Energy Group, Inc. | 162,700 | 14,374,545 | |||
Multi-Utilities – 0.1% | |||||
Wisconsin Energy Corp. | 85,125 | 3,713,153 | |||
| 32,851,436 | |||||
Total Common Stocks | 2,484,314,167 | ||||
SHORT-TERM INVESTMENTS – 1.3% | |||||
Investment Companies – 1.3% | |||||
AllianceBernstein Fixed-Income Shares, Inc. – Government STIF Portfolio(b) | 32,646,709 | 32,646,709 | |||
Total Investments – 99.8% | 2,516,960,876 | ||||
Other assets less liabilities – 0.2% | 4,912,475 | ||||
Net Assets – 100.0% | $ | 2,521,873,351 | |||
| (a) | Non-income producing security. |
| (b) | Investment in affiliated money market mutual fund. |
| Glossary: |
| ADR | – American Depositary Receipt |
| See notes to financial statements. |
| ALLIANCEBERNSTEIN POOLING PORTFOLIOS • | 53 |
U.S. Value Portfolio—Portfolio of Investments
U.S. LARGE CAP GROWTH PORTFOLIO
PORTFOLIO OF INVESTMENTS
February 29, 2008 (unaudited)
| Company | | U.S. $ Value | |||
COMMON STOCKS – 99.2% | |||||
Information Technology – 30.8% | |||||
Communications Equipment – 9.7% | |||||
Cisco Systems, Inc.(a) | 4,197,900 | $ | 102,302,823 | ||
Nokia OYJ (Sponsored) (ADR) | 1,540,700 | 55,480,607 | |||
Research In Motion Ltd.(a) | 860,600 | 89,330,280 | |||
| 247,113,710 | |||||
Computers & Peripherals – 9.1% | |||||
Apple, Inc.(a) | 1,037,935 | 129,762,634 | |||
Hewlett-Packard Co. | 2,136,800 | 102,074,936 | |||
| 231,837,570 | |||||
Internet Software & Services – 6.0% | |||||
Google, Inc. – Class A(a) | 324,670 | 152,978,010 | |||
Semiconductors & Semiconductor Equipment – 3.6% | |||||
Broadcom Corp. – Class A(a) | 1,054,100 | 19,933,031 | |||
MEMC Electronic Materials, Inc.(a) | 367,850 | 28,059,598 | |||
Nvidia Corp.(a) | 2,050,600 | 43,862,334 | |||
| 91,854,963 | |||||
Software – 2.4% | |||||
Adobe Systems, Inc.(a) | 863,500 | 29,056,775 | |||
Microsoft Corp. | 934,200 | 25,428,924 | |||
VMware, Inc. – Class A(a) | 145,200 | 8,518,884 | |||
| 63,004,583 | |||||
| 786,788,836 | |||||
Health Care – 21.5% | |||||
Biotechnology – 7.8% | |||||
Celgene Corp.(a) | 1,006,000 | 56,708,220 | |||
Genentech, Inc.(a) | 628,100 | 47,578,575 | |||
Gilead Sciences, Inc.(a) | 1,977,850 | 93,591,862 | |||
| 197,878,657 | |||||
Health Care Equipment & | |||||
Alcon, Inc. | 459,250 | 66,467,253 | |||
Hologic, Inc.(a) | 544,400 | 32,832,764 | |||
| 99,300,017 | |||||
Health Care Providers & | |||||
Medco Health Solutions, Inc.(a) | 1,274,200 | 56,459,802 | |||
WellPoint, Inc.(a) | 693,100 | 48,572,448 | |||
| 105,032,250 | |||||
Pharmaceuticals – 5.7% | |||||
Abbott Laboratories | 1,641,400 | 87,896,970 | |||
Teva Pharmaceutical Industries Ltd. (Sponsored) (ADR) | 1,187,700 | 58,280,439 | |||
| 146,177,409 | |||||
| 548,388,333 | |||||
| 54 | • ALLIANCEBERNSTEIN POOLING PORTFOLIOS |
U.S. Large Cap Growth Portfolio—Portfolio of Investments
| Company | | U.S. $ Value | |||
Consumer Staples – 11.0% | |||||
Beverages – 2.8% | |||||
The Coca-Cola Co. | 463,800 | $ | 27,113,748 | ||
PepsiCo, Inc. | 626,400 | 43,572,384 | |||
| 70,686,132 | |||||
Food & Staples Retailing – 2.0% | |||||
Costco Wholesale Corp. | 497,000 | 30,774,240 | |||
Wal-Mart Stores, Inc. | 432,600 | 21,452,634 | |||
| 52,226,874 | |||||
Food Products – 2.3% | |||||
WM Wrigley Jr Co. | 998,900 | 59,794,154 | |||
Household Products – 2.9% | |||||
Colgate-Palmolive Co. | 493,900 | 37,580,851 | |||
Procter & Gamble Co. | 537,500 | 35,571,750 | |||
| 73,152,601 | |||||
Tobacco – 1.0% | |||||
Altria Group, Inc. | 356,850 | 26,100,009 | |||
| 281,959,770 | |||||
Industrials – 10.6% | |||||
Aerospace & Defense – 3.7% | |||||
Honeywell International, Inc. | 1,321,085 | 76,015,231 | |||
Spirit Aerosystems Holdings, Inc. – Class A(a) | 694,200 | 18,757,284 | |||
| 94,772,515 | |||||
Construction & Engineering – 1.7% | |||||
Fluor Corp. | 309,600 | 43,111,800 | |||
Electrical Equipment – 1.4% | |||||
ABB Ltd. (Sponsored) (ADR) | 717,450 | 17,964,948 | |||
Emerson Electric Co. | 334,500 | 17,046,120 | |||
| 35,011,068 | |||||
Industrial Conglomerates – 1.3% | |||||
Textron, Inc. | 643,400 | 34,852,978 | |||
Machinery – 2.5% | |||||
Deere & Co. | 742,850 | 63,298,249 | |||
| 271,046,610 | |||||
Financials – 9.8% | |||||
Capital Markets – 5.0% | |||||
The Blackstone Group LP | 872,300 | 14,392,950 | |||
Franklin Resources, Inc. | 651,800 | 61,510,366 | |||
The Goldman Sachs Group, Inc. | 152,790 | 25,917,768 | |||
Lehman Brothers Holdings, Inc. | 507,900 | 25,897,821 | |||
| 127,718,905 | |||||
Diversified Financial Services – 4.8% | |||||
CME Group, Inc. – Class A | 194,005 | 99,582,766 | |||
NYSE Euronext | 359,800 | 23,628,066 | |||
| 123,210,832 | |||||
| 250,929,737 | |||||
| ALLIANCEBERNSTEIN POOLING PORTFOLIOS • | 55 |
U.S. Large Cap Growth Portfolio—Portfolio of Investments
| Company | | U.S. $ Value | ||||
Energy – 8.0% | ||||||
Energy Equipment & Services – 5.7% | ||||||
Baker Hughes, Inc. | 542,650 | $ | 36,514,919 | |||
Cameron International Corp.(a) | 519,500 | 22,068,360 | ||||
Schlumberger Ltd. | 1,020,650 | 88,235,192 | ||||
| 146,818,471 | ||||||
Oil, Gas & Consumable Fuels – 2.3% | ||||||
EOG Resources, Inc. | 483,500 | 57,531,665 | ||||
| 204,350,136 | ||||||
Materials – 5.5% | ||||||
Chemicals – 5.5% | ||||||
Air Products & Chemicals, Inc. | 490,000 | 44,751,700 | ||||
Monsanto Co. | 814,840 | 94,260,691 | ||||
| 139,012,391 | ||||||
Consumer Discretionary – 1.5% | ||||||
Hotels, Restaurants & Leisure – 0.9% | ||||||
McDonald’s Corp. | 117,350 | 6,349,809 | ||||
Yum! Brands, Inc. | 502,500 | 17,311,125 | ||||
| 23,660,934 | ||||||
Multiline Retail – 0.6% | ||||||
Kohl’s Corp.(a) | 150,900 | 6,705,996 | ||||
Target Corp. | 137,150 | 7,215,461 | ||||
| 13,921,457 | ||||||
| 37,582,391 | ||||||
Telecommunication Services – 0.5% | ||||||
Wireless Telecommunication | ||||||
America Movil SAB de CV Series L (ADR) | 220,100 | 13,307,246 | ||||
Total Common Stocks | 2,533,365,450 | |||||
SHORT-TERM INVESTMENTS – 1.1% | ||||||
Investment Companies – 1.1% | ||||||
AllianceBernstein Fixed-Income Shares, Inc. – Government STIF Portfolio(b) | 28,557,743 | 28,557,743 | ||||
Total Investments – 100.3% | 2,561,923,193 | |||||
Other assets less liabilities – (0.3)% | (8,918,121 | ) | ||||
Net Assets – 100.0% | $ | 2,553,005,072 | ||||
| (a) | Non-income producing security. |
| (b) | Investment in affiliated money market mutual fund. |
| Glossary: |
| ADR | – American Depositary Receipt |
| See notes to financial statements. |
| 56 | • ALLIANCEBERNSTEIN POOLING PORTFOLIOS |
U.S. Large Cap Growth Portfolio—Portfolio of Investments
GLOBAL REAL ESTATE INVESTMENT PORTFOLIO
PORTFOLIO OF INVESTMENTS
February 29, 2008 (unaudited)
| Company | Shares | U.S. $ Value | |||
COMMON STOCKS – 98.1% | |||||
Equity: Other – 45.0% | |||||
Diversified/Specialty – 39.7% | |||||
Alexandria Real Estate Equities, Inc. | 102,100 | $ | 9,372,780 | ||
British Land Co. PLC | 1,156,226 | 21,688,997 | |||
Canadian Real Estate Investment Trust | 561,062 | 15,391,084 | |||
DB RREEF Trust | 18,518,133 | 28,483,661 | |||
Digital Realty Trust, Inc. | 480,300 | 17,242,770 | |||
Entertainment Properties Trust | 174,300 | 8,169,441 | |||
Forest City Enterprises, Inc. – Class A | 87,673 | 3,081,706 | |||
General Property Group | 2,118,883 | 6,215,148 | |||
Hang Lung Properties Ltd. | 8,908,000 | 31,987,173 | |||
Henderson Land Development Co., Ltd. | 402,000 | 3,121,042 | |||
Kerry Properties Ltd. | 5,155,191 | 34,377,811 | |||
Land Securities Group PLC | 836,482 | 26,079,533 | |||
Lend Lease Corp. Ltd. | 1,889,000 | 24,129,233 | |||
Mitsubishi Estate Co., Ltd. | 1,068,000 | 26,027,668 | |||
Mitsui Fudosan Co., Ltd. | 916,000 | 18,598,432 | |||
Morguard Real Estate Investment Trust | 196,700 | 2,464,121 | |||
New World Development Co., Ltd. | 7,523,338 | 20,222,688 | |||
Plum Creek Timber Co., Inc. (REIT) | 57,100 | 2,323,399 | |||
Rayonier, Inc. | 389,922 | 16,591,181 | |||
Sino Land Co. | 3,119,018 | 7,801,373 | |||
Stockland | 1,178,272 | 7,625,251 | |||
Sumitomo Realty & Development | 367,000 | 6,263,240 | |||
Sun Hung Kai Properties Ltd. | 2,990,600 | 52,303,023 | |||
Tokyu Land Corp. | 889,000 | 5,991,919 | |||
Unibail | 218,718 | 53,251,556 | |||
Vornado Realty Trust | 227,900 | 19,043,324 | |||
| 467,847,554 | |||||
Health Care – 4.5% | |||||
HCP, Inc. | 256,900 | 7,496,342 | |||
Health Care REIT, Inc. | 234,500 | 9,652,020 | |||
Nationwide Health Properties, Inc. | 350,100 | 10,618,533 | |||
Omega Healthcare Investors, Inc. | 392,400 | 6,655,104 | |||
Ventas, Inc. | 439,500 | 18,379,890 | |||
| 52,801,889 | |||||
Triple Net – 0.8% | |||||
National Retail Properties, Inc. | 438,300 | 9,072,810 | |||
| 529,722,253 | |||||
Retail – 21.8% | |||||
Regional Mall – 8.9% | |||||
General Growth Properties, Inc. | 478,100 | 16,881,711 | |||
Macerich Co. | 137,400 | 8,793,600 | |||
Simon Property Group, Inc. | 436,600 | 36,587,080 | |||
| ALLIANCEBERNSTEIN POOLING PORTFOLIOS • | 57 |
Global Real Estate Investment Portfolio—Portfolio of Investments
| Company | Shares | U.S. $ Value | |||
Taubman Centers, Inc. | 241,900 | $ | 11,792,625 | ||
Westfield Group | 1,896,464 | 30,401,533 | |||
| 104,456,549 | |||||
Shopping Center/Other Retail – 12.9% | |||||
CapitaMall Trust | 10,524,800 | 24,138,213 | |||
Citycon Oyj | 2,289,271 | 13,648,823 | |||
Federal Realty Investment Trust | 72,200 | 5,175,296 | |||
Hammerson PLC | 772,800 | 16,850,588 | |||
Kimco Realty Corp. | 258,000 | 8,712,660 | |||
Klepierre | 611,900 | 35,734,083 | |||
Liberty International PLC | 647,000 | 12,301,593 | |||
Macquarie CountryWide Trust | 4,042,700 | 4,620,371 | |||
New World Department Store China Ltd.(a) | 53,722 | 69,509 | |||
Primaris Retail Real Estate Investment Trust | 461,599 | 7,227,067 | |||
RioCan Real Estate Investment Trust(b) | 132,100 | 2,754,068 | |||
RioCan Real Estate Investment Trust | 435,159 | 9,072,352 | |||
Tanger Factory Outlet Centers | 343,600 | 12,197,800 | |||
| 152,502,423 | |||||
| 256,958,972 | |||||
Office – 16.0% | |||||
Allied Properties Real Estate Investment Trust | 569,532 | 10,872,752 | |||
Beni Stabili Spa | 5,350,000 | 6,018,393 | |||
Boston Properties, Inc. | 109,900 | 9,470,083 | |||
Brookfield Properties Corp. | 365,724 | 6,817,095 | |||
Cominar Real Estate Investment Trust | 431,714 | 8,570,680 | |||
Derwent Valley Holdings PLC | 494,710 | 13,992,417 | |||
Dundee Real Estate Investment Trust | 230,500 | 8,020,955 | |||
Great Portland Estates PLC | 1,185,600 | 11,706,074 | |||
Highwoods Properties, Inc. | 207,500 | 6,117,100 | |||
ING Office Fund | 8,019,300 | 9,812,684 | |||
IVG Immobilien AG | 272,237 | 9,504,568 | |||
Japan Real Estate Investment Corp. – Class A | 1,220 | 13,576,264 | |||
Nippon Building Fund, Inc. – Class A | 721 | 8,870,454 | |||
Nomura Real Estate Office Fund, Inc. – Class A | 1,235 | 10,364,535 | |||
Norwegian Property ASA | 1,267,800 | 12,322,274 | |||
NTT Urban Development Corp. | 21,200 | 26,277,593 | |||
SL Green Realty Corp. | 55,200 | 5,050,800 | |||
Sponda OYJ | 854,562 | 11,001,183 | |||
| 188,365,904 | |||||
Residential – 7.7% | |||||
Multi-Family – 6.2% | |||||
Apartment Investment & Management Co. – Class A | 147,924 | 5,095,982 | |||
AvalonBay Communities, Inc. | 58,950 | 5,448,748 | |||
| 58 | • ALLIANCEBERNSTEIN POOLING PORTFOLIOS |
Global Real Estate Investment Portfolio—Portfolio of Investments
| Company | Shares | U.S. $ Value | ||||
Boardwalk Real Estate Investment Trust | 296,528 | $ | 11,080,823 | |||
Equity Residential | 402,284 | 15,359,203 | ||||
Essex Property Trust, Inc. | 48,200 | 5,062,928 | ||||
Home Properties, Inc. | 104,900 | 4,827,498 | ||||
Mid-America Apartment Communities, Inc. | 178,300 | 8,645,767 | ||||
Mirvac Group | 2,678,063 | 9,493,036 | ||||
UDR, Inc. | 351,750 | 7,861,612 | ||||
| 72,875,597 | ||||||
Self Storage – 1.5% | ||||||
Extra Space Storage, Inc. | 115,600 | 1,742,092 | ||||
Public Storage | 191,400 | 15,572,304 | ||||
| 17,314,396 | ||||||
| 90,189,993 | ||||||
Industrial – 3.9% | ||||||
Industrial Warehouse Distribution – 3.9% | ||||||
Ascendas Real Estate Investment Trust | 6,780,000 | 10,715,822 | ||||
First Industrial Realty Trust, Inc. | 189,600 | 5,760,048 | ||||
Prologis | 403,300 | 21,729,804 | ||||
Segro PLC | 810,323 | 8,284,974 | ||||
| 46,490,648 | ||||||
Lodging – 3.7% | ||||||
Ashford Hospitality Trust, Inc. | 802,100 | 5,333,965 | ||||
DiamondRock Hospitality Co. | 476,500 | 5,951,485 | ||||
FelCor Lodging Trust, Inc. | 237,000 | 2,990,940 | ||||
Fonciere Des Murs | 198,200 | 7,390,043 | ||||
Host Hotels & Resorts, Inc. | 751,357 | 12,164,470 | ||||
Starwood Hotels & Resorts Worldwide, Inc. | 39,900 | 1,888,467 | ||||
Strategic Hotels & Resorts, Inc. | 324,800 | 4,625,152 | ||||
Sunstone Hotel Investors, Inc. | 240,600 | 3,767,796 | ||||
| 44,112,318 | ||||||
Total Common Stocks | 1,155,840,088 | |||||
SHORT-TERM INVESTMENTS – 2.2% | ||||||
Investment Companies – 2.2% | ||||||
AllianceBernstein Fixed-Income Shares, Inc. – Government STIF Portfolio(c) | 25,501,191 | 25,501,191 | ||||
Total Investments – 100.3% | 1,181,341,279 | |||||
Other assets less liabilities – (0.3)% | (3,615,484 | ) | ||||
Net Assets – 100.0% | $ | 1,177,725,795 | ||||
| ALLIANCEBERNSTEIN POOLING PORTFOLIOS • | 59 |
Global Real Estate Investment Portfolio—Portfolio of Investments
| (a) | Non-income producing security. |
| (b) | Security is exempt from registration under Rule 144A of the Securities Act of 1933. This security is considered liquid and may be resold in transactions exempt from registration, normally to qualified institutional buyers. At February 29, 2008, the market value of this security amounted to $2,754,068 or 0.2% of net assets. |
| (c) | Investment in affiliated money market mutual fund. |
| See notes to financial statements. |
| 60 | • ALLIANCEBERNSTEIN POOLING PORTFOLIOS |
Global Real Estate Investment Portfolio—Portfolio of Investments
INTERNATIONAL VALUE PORTFOLIO
PORTFOLIO OF INVESTMENTS
February 29, 2008 (unaudited)
| Company | Shares | U.S. $ Value | |||
COMMON STOCKS – 95.9% | |||||
Financials – 31.8% | |||||
Capital Markets – 3.4% | |||||
Credit Suisse Group | 394,500 | $ | 19,396,005 | ||
Deutsche Bank AG | 218,200 | 24,368,297 | |||
| 43,764,302 | |||||
Commercial Banks – 16.5% | |||||
Bank Hapoalim BM | 1,664,800 | 7,113,230 | |||
Bank Leumi Le-Israel | 736,900 | 3,385,749 | |||
Barclays PLC | 2,319,600 | 21,739,990 | |||
BNP Paribas SA | 296,200 | 26,480,264 | |||
Credit Agricole SA | 731,161 | 19,832,635 | |||
HBOS PLC | 2,457,560 | 29,203,153 | |||
Kookmin Bank | 164,700 | 10,150,392 | |||
Mitsubishi UFJ Financial Group, Inc. | 2,959,500 | 26,083,117 | |||
Royal Bank of Scotland Group PLC (London Virt-X) | 3,574,571 | 27,025,596 | |||
Societe Generale | 168,381 | 18,016,648 | |||
Sumitomo Mitsui Financial Group, Inc. | 3,692 | 26,667,167 | |||
| 215,697,941 | |||||
Consumer Finance – 1.6% | |||||
ORIX Corp. | 140,810 | 21,052,347 | |||
Diversified Financial Services – 4.4% | |||||
Fortis(a) | 344,798 | 5,231 | |||
Fortis (Euronext Amsterdam) | 9,832 | 216,749 | |||
Fortis (Euronext Brussels) | 1,228,466 | 27,139,717 | |||
ING Groep NV | 922,011 | 30,640,001 | |||
| 58,001,698 | |||||
Insurance – 5.8% | |||||
Allianz SE | 166,300 | 28,791,504 | |||
Aviva PLC | 1,294,995 | 15,609,108 | |||
Fondiaria-Sai SpA (ordinary shares) | 207,700 | 9,217,728 | |||
Fondiaria-Sai SpA (saving shares) | 19,000 | 578,277 | |||
Muenchener Rueckversicherungs AG | 126,300 | 22,258,748 | |||
| 76,455,365 | |||||
Real Estate Management & | |||||
Leopalace21 Corp. | 44,000 | 899,071 | |||
| 415,870,724 | |||||
Materials – 17.5% | |||||
Chemicals – 5.1% | |||||
BASF SE | 349,500 | 44,470,102 | |||
Mitsubishi Chemical Holdings Corp. | 2,029,000 | 13,724,043 | |||
Mitsui Chemicals, Inc. | 1,280,000 | 9,076,017 | |||
| 67,270,162 | |||||
| ALLIANCEBERNSTEIN POOLING PORTFOLIOS • | 61 |
International Value Portfolio—Portfolio of Investments
| Company | Shares | U.S. $ Value | |||
Construction Materials – 0.4% | |||||
Buzzi Unicem SpA | 194,400 | $ | 4,769,371 | ||
Italcementi SpA | 27,800 | 565,505 | |||
| 5,334,876 | |||||
Metals & Mining – 10.5% | |||||
Antofagasta PLC | 308,300 | 4,913,776 | |||
ArcelorMittal (Euronext Paris) | 377,132 | 28,635,051 | |||
Cia Vale do Rio Doce (Sponsored) (ADR) | 471,700 | 13,830,244 | |||
JFE Holdings, Inc. | 656,000 | 29,229,903 | |||
Kazakhmys PLC | 405,200 | 12,342,666 | |||
Nippon Steel Corp. | 2,213,000 | 11,643,029 | |||
POSCO | 23,500 | 12,925,533 | |||
Xstrata PLC | 296,960 | 23,165,947 | |||
| 136,686,149 | |||||
Paper & Forest Products – 1.5% | |||||
Stora Enso Oyj – Class R | 727,900 | 9,089,797 | |||
Svenska Cellulosa AB – Class B | 643,200 | 10,557,937 | |||
| 19,647,734 | |||||
| 228,938,921 | |||||
Energy – 11.5% | |||||
International – 0.9% | |||||
LUKOIL (ADR) | 162,250 | 12,071,400 | |||
Oil, Gas & Consumable Fuels – 10.6% | |||||
China Petroleum & Chemical Corp. – Class H | 10,768,500 | 11,728,978 | |||
ENI SpA | 800,400 | 27,638,762 | |||
Petro-Canada | 284,000 | 13,593,335 | |||
Petroleo Brasileiro SA (Sponsored) (ADR) | 43,900 | 4,299,127 | |||
Royal Dutch Shell PLC (Euronext Amsterdam) | 1,079,952 | 38,618,602 | |||
StatoilHydro ASA | 903,150 | 27,520,142 | |||
Total SA | 190,800 | 14,368,013 | |||
| 137,766,959 | |||||
| 149,838,359 | |||||
Consumer Discretionary – 9.7% | |||||
Auto Components – 2.1% | |||||
Compagnie Generale des Etablissements Michelin – Class B | 167,400 | 16,487,276 | |||
Hyundai Mobis | 148,510 | 11,399,478 | |||
| 27,886,754 | |||||
Automobiles – 4.8% | |||||
Nissan Motor Co. Ltd. | 3,605,700 | 32,425,960 | |||
Renault SA | 285,900 | 30,547,408 | |||
| 62,973,368 | |||||
| 62 | • ALLIANCEBERNSTEIN POOLING PORTFOLIOS |
International Value Portfolio—Portfolio of Investments
| Company | Shares | U.S. $ Value | |||
Household Durables – 1.8% | |||||
Sharp Corp. | 935,000 | $ | 17,014,721 | ||
Taylor Wimpey PLC | 1,752,944 | 5,931,682 | |||
| 22,946,403 | |||||
Media – 1.0% | |||||
Lagardere SCA | 174,400 | 13,702,207 | |||
| 127,508,732 | |||||
Information Technology – 7.5% | |||||
Computers & Peripherals – 3.8% | |||||
Asustek Computer, Inc. | 2,249,000 | 6,208,916 | |||
Compal Electronics, Inc. (GDR)(b) | 2,179,452 | 9,698,562 | |||
Fujitsu Ltd. | 2,558,000 | 18,200,461 | |||
Toshiba Corp. | 2,116,000 | 15,871,544 | |||
| 49,979,483 | |||||
Electronic Equipment & Instruments – 1.0% | |||||
AU Optronics Corp. | 6,923,006 | 13,204,857 | |||
Semiconductors & Semiconductor Equipment – 2.7% | |||||
Hynix Semiconductor, Inc.(a) | 433,500 | 11,147,602 | |||
Samsung Electronics Co. Ltd. | 12,150 | 7,121,988 | |||
United Microelectronics Corp. | 27,215,479 | 16,154,101 | |||
| 34,423,691 | |||||
| 97,608,031 | |||||
Utilities – 4.5% | |||||
Electric Utilities – 3.3% | |||||
E.ON AG | 112,800 | 21,199,956 | |||
The Tokyo Electric Power Co. Inc | 871,100 | 22,380,343 | |||
| 43,580,299 | |||||
Multi-Utilities – 1.2% | |||||
RWE AG | 125,140 | 15,134,956 | |||
| 58,715,255 | |||||
Industrials – 4.2% | |||||
Aerospace & Defense – 1.1% | |||||
BAE Systems PLC | 1,488,100 | 14,165,190 | |||
Airlines – 1.6% | |||||
Air France-KLM | 298,000 | 8,028,837 | |||
Deutsche Lufthansa AG | 547,700 | 12,818,879 | |||
| 20,847,716 | |||||
| ALLIANCEBERNSTEIN POOLING PORTFOLIOS • | 63 |
International Value Portfolio—Portfolio of Investments
| Company | Shares | U.S. $ Value | |||
Marine – 1.5% | |||||
Mitsui OSK Lines Ltd. | 968,000 | $ | 12,572,263 | ||
Nippon Yusen KK | 820,000 | 7,577,146 | |||
| 20,149,409 | |||||
| 55,162,315 | |||||
Telecommunication Services – 4.0% | |||||
Diversified Telecommunication Services – 2.0% | |||||
China Netcom Group Corp. Ltd. | 5,620,000 | 17,324,627 | |||
Nippon Telegraph & Telephone Corp. | 2,031 | 8,856,650 | |||
| 26,181,277 | |||||
Wireless Telecommunication Services – 2.0% | |||||
Vodafone Group PLC | 7,993,937 | 25,736,173 | |||
| 51,917,450 | |||||
Health Care – 2.9% | |||||
Pharmaceuticals – 2.9% | |||||
AstraZeneca PLC | 152,800 | 5,711,261 | |||
GlaxoSmithKline PLC | 652,100 | 14,234,432 | |||
Sanofi-Aventis SA | 249,319 | 18,427,814 | |||
| 38,373,507 | |||||
Consumer Staples – 2.3% | |||||
Food & Staples Retailing – 1.5% | |||||
Koninklijke Ahold NV | 1,526,340 | 20,058,264 | |||
Food Products – 0.8% | |||||
Associated British Foods PLC | 634,800 | 10,636,737 | |||
| 30,695,001 | |||||
Total Common Stocks | 1,254,628,295 | ||||
NON-CONVERTIBLE - PREFERRED STOCKS – 0.4% | |||||
Information Technology – 0.4% | |||||
Semiconductors & Semiconductor Equipment – 0.4% | |||||
Samsung Electronics Co. Ltd. | 11,500 | 4,936,721 | |||
RIGHTS – 0.4% | |||||
Financials – 0.4% | |||||
Commercial Banks – 0.4% | |||||
Societe Generale(a) | 42,095 | 4,625,558 | |||
| 64 | • ALLIANCEBERNSTEIN POOLING PORTFOLIOS |
International Value Portfolio—Portfolio of Investments
| Company | Shares | U.S. $ Value | |||
SHORT-TERM INVESTMENTS – 2.3% | |||||
Investment Companies – 2.3% | |||||
AllianceBernstein Fixed-Income Shares, Inc. – Government STIF Portfolio(c) | 30,589,333 | $ | 30,589,333 | ||
Total Investments – 99.0% | 1,294,779,907 | ||||
Other assets less liabilities – 1.0% | 13,539,512 | ||||
Net Assets – 100.0% | $ | 1,308,319,419 | |||
FINANCIAL FUTURES CONTRACTS (see Note C)
| Type | Number of Contracts | Expiration Month | Original Value | Value at February 29, 2008 | Unrealized Appreciation/ (Depreciation) | |||||||
Purchased Contracts | ||||||||||||
EURO STOXX 50 | 204 | March 2008 | $ | 13,571,177 | $ | 11,524,041 | $ (2,047,136) | |||||
| (a) | Non-income producing security. |
| (b) | Security is exempt from registration under Rule 144A of the Securities Act of 1933. This security is considered liquid and may be resold in transactions exempt from registration, normally to qualified institutional buyers. At February 29, 2008, the market value of this security amounted to $9,698,562 or 0.7% of net assets. |
| (c) | Investment in affiliated money market mutual fund. |
| Glossary: |
| ADR | – American Depositary Receipt |
| GDR | – Global Depositary Receipt |
| See notes to financial statements. |
| ALLIANCEBERNSTEIN POOLING PORTFOLIOS • | 65 |
International Value Portfolio—Portfolio of Investments
INTERNATIONAL GROWTH PORTFOLIO
PORTFOLIO OF INVESTMENTS
February 29, 2008 (unaudited)
| Company | Shares | U.S. $ Value | |||
COMMON STOCKS – 98.5% | |||||
Materials – 20.5% | |||||
Chemicals – 6.5% | |||||
Bayer AG | 639,603 | $ | 49,252,520 | ||
Incitec Pivot Ltd. | 111,900 | 15,198,497 | |||
Syngenta AG | 77,605 | 22,312,164 | |||
| 86,763,181 | |||||
Metals & Mining – 14.0% | |||||
Anglo American PLC | 500,575 | 31,773,149 | |||
BHP Billiton PLC | 748,392 | 23,941,147 | |||
Cia Vale do Rio Doce (ADR) | 818,600 | 28,520,024 | |||
Rio Tinto PLC | 537,786 | 60,504,937 | |||
Xstrata PLC | 559,764 | 43,667,373 | |||
| 188,406,630 | |||||
| 275,169,811 | |||||
Industrials – 14.0% | |||||
Aerospace & Defense – 1.7% | |||||
BAE Systems PLC | 2,336,362 | 22,239,777 | |||
Commercial Services & Supplies – 0.4% | |||||
The Capita Group PLC | 456,965 | 5,921,048 | |||
Electrical Equipment – 2.9% | |||||
ABB Ltd. | 1,555,315 | 38,749,570 | |||
Industrial Conglomerates – 2.5% | |||||
Siemens AG | 261,850 | 33,715,837 | |||
Machinery – 0.7% | |||||
NGK Insulators Ltd. | 427,000 | 9,696,278 | |||
Trading Companies & | |||||
Mitsubishi Corp. | 826,300 | 25,210,795 | |||
Mitsui & Co. Ltd. | 2,441,000 | 53,085,475 | |||
| 78,296,270 | |||||
| 188,618,780 | |||||
Consumer Staples – 12.3% | |||||
Food & Staples Retailing – 1.5% | |||||
Tesco PLC | 2,469,490 | 19,514,849 | |||
Food Products – 5.9% | |||||
Nestle SA | 100,508 | 47,971,290 | |||
Unilever PLC | 1,004,415 | 31,645,337 | |||
| 79,616,627 | |||||
Household Products – 2.1% | |||||
Reckitt Benckiser PLC | 521,414 | 28,125,656 | |||
| 66 | • ALLIANCEBERNSTEIN POOLING PORTFOLIOS |
International Growth Portfolio—Portfolio of Investments
| Company | Shares | U.S. $ Value | |||
Personal Products – 1.2% | |||||
L’Oreal SA | 139,496 | $ | 16,554,242 | ||
Tobacco – 1.6% | |||||
British American Tobacco PLC | 554,179 | 20,779,894 | |||
| 164,591,268 | |||||
Financials – 10.5% | |||||
Capital Markets – 4.1% | |||||
3i Group PLC | 709,235 | 11,462,477 | |||
ICAP PLC | 1,060,239 | 13,201,540 | |||
Man Group PLC | 2,808,114 | 30,636,235 | |||
| 55,300,252 | |||||
Commercial Banks – 1.1% | |||||
Banco Santander Central Hispano SA | 340,714 | 6,088,401 | |||
China Construction Bank Corp. – Class H | 10,781,000 | 8,168,290 | |||
| 14,256,691 | |||||
Diversified Financial Services – 2.9% | |||||
Deutsche Boerse AG | 247,224 | 39,186,340 | |||
Insurance – 2.4% | |||||
Assicurazioni Generali SpA | 233,164 | 10,021,615 | |||
QBE Insurance Group Ltd. | 1,048,413 | 21,685,097 | |||
| 31,706,712 | |||||
| 140,449,995 | |||||
Telecommunication Services – 8.0% | |||||
Diversified Telecommunication Services – 2.9% | |||||
Telefonica SA | 1,346,028 | 38,949,454 | |||
Wireless Telecommunication | |||||
America Movil SAB de CV Series L (ADR) | 225,400 | 13,627,684 | |||
Turkcell Iletisim Hizmet AS (ADR) | 424,500 | 10,710,135 | |||
Vodafone Group PLC | 13,509,693 | 43,493,937 | |||
| 67,831,756 | |||||
| 106,781,210 | |||||
Health Care – 7.8% | |||||
Biotechnology – 1.0% | |||||
CSL Ltd./Australia | 416,979 | 13,985,232 | |||
Health Care Equipment & Supplies – 3.6% | |||||
Alcon, Inc. | 102,500 | 14,834,825 | |||
Essilor International SA | 323,986 | 19,237,571 | |||
Smith & Nephew PLC | 1,064,264 | 13,828,115 | |||
| 47,900,511 | |||||
| ALLIANCEBERNSTEIN POOLING PORTFOLIOS • | 67 |
International Growth Portfolio—Portfolio of Investments
| Company | Shares | U.S. $ Value | |||
Pharmaceuticals – 3.2% | |||||
Roche Holding AG | 93,157 | $ | 18,268,868 | ||
Teva Pharmaceutical Industries Ltd. (Sponsored) (ADR) | 515,200 | 25,280,864 | |||
| 43,549,732 | |||||
| 105,435,475 | |||||
Energy – 7.1% | |||||
Energy Equipment & Services – 1.5% | |||||
Technip SA | 111,261 | 9,083,032 | |||
WorleyParsons Ltd. | 325,976 | 11,158,187 | |||
| 20,241,219 | |||||
Oil, Gas & Consumable Fuels – 5.6% | |||||
China Shenhua Energy Co. Ltd. – Class H | 2,362,000 | 12,031,084 | |||
Gazprom OAO (Sponsored) (ADR) | 251,125 | 12,757,150 | |||
Petroleo Brasileiro SA (ADR) | 154,300 | 18,105,562 | |||
Royal Dutch Shell PLC (Euronext Amsterdam) – Class A | 389,719 | 13,934,938 | |||
Total SA | 237,462 | 17,881,850 | |||
| 74,710,584 | |||||
| 94,951,803 | |||||
Utilities – 6.9% | |||||
Electric Utilities – 2.2% | |||||
CEZ | 98,620 | 7,225,631 | |||
E.ON AG | 120,006 | 22,554,272 | |||
| 29,779,903 | |||||
Independent Power Producers & Energy Traders – 1.5% | |||||
Iberdrola Renovables(a) | 1,118,219 | 6,960,264 | |||
International Power PLC | 1,671,777 | 12,559,768 | |||
| 19,520,032 | |||||
Multi-Utilities – 3.2% | |||||
Suez SA | 338,055 | 21,491,146 | |||
Veolia Environnement | 240,588 | 21,405,981 | |||
| 42,897,127 | |||||
| 92,197,062 | |||||
Information Technology – 6.4% | |||||
Communications Equipment – 3.8% | |||||
Nokia OYJ | 1,435,273 | 51,565,892 | |||
Office Electronics – 0.9% | |||||
Konica Minolta Holdings, Inc. | 887,500 | 12,573,344 | |||
Software – 1.7% | |||||
Nintendo Co. Ltd. | 44,600 | 22,206,128 | |||
| 86,345,364 | |||||
| 68 | • ALLIANCEBERNSTEIN POOLING PORTFOLIOS |
International Growth Portfolio—Portfolio of Investments
| Company | Shares | U.S. $ Value | ||||
Consumer Discretionary – 5.0% | ||||||
Auto Components – 1.0% | ||||||
Denso Corp. | 337,500 | $ | 12,599,385 | |||
Automobiles – 1.7% | ||||||
Porsche Automobil Holding SE | 13,294 | 22,785,672 | ||||
Media – 1.4% | ||||||
Eutelsat Communications | 487,591 | 13,410,145 | ||||
SES (FDR) | 228,493 | 5,647,516 | ||||
| 19,057,661 | ||||||
Specialty Retail – 0.9% | ||||||
Esprit Holdings Ltd. | 990,300 | 12,358,182 | ||||
| 66,800,900 | ||||||
Total Common Stocks | 1,321,341,668 | |||||
SHORT-TERM INVESTMENTS – 1.7% | ||||||
Investment Companies – 1.7% | ||||||
AllianceBernstein Fixed-Income Shares, Inc. – Government STIF Portfolio(b) | 23,016,609 | 23,016,609 | ||||
Total Investments – 100.2% | 1,344,358,277 | |||||
Other assets less liabilities – (0.2)% | (2,464,987 | ) | ||||
Net Assets – 100.0% | $ | 1,341,893,290 | ||||
| (a) | Non-income producing security. |
| (b) | Investment in affiliated money market mutual fund. |
| Glossary: |
| ADR | – American Depositary Receipt |
| FDR | – Fiduciary Depositary Receipt |
| See notes to financial statements. |
| ALLIANCEBERNSTEIN POOLING PORTFOLIOS • | 69 |
International Growth Portfolio—Portfolio of Investments
SMALL-MID CAP VALUE PORTFOLIO
PORTFOLIO OF INVESTMENTS
February 29, 2008 (unaudited)
| Company | Shares | U.S. $ Value | |||
COMMON STOCKS – 94.5% | |||||
Industrials – 23.3% | |||||
Aerospace & Defense – 0.8% | |||||
Goodrich Corp. | 92,300 | $ | 5,466,929 | ||
Airlines – 2.2% | |||||
Alaska Air Group, Inc.(a) | 212,200 | 5,177,680 | |||
Continental Airlines, Inc. – Class B(a) | 181,300 | 4,383,834 | |||
Skywest, Inc. | 202,500 | 4,479,300 | |||
| 14,040,814 | |||||
Commercial Services & Supplies – 2.8% | |||||
IKON Office Solutions, Inc. | 645,300 | 4,594,536 | |||
Kelly Services, Inc. – Class A | 276,200 | 5,305,802 | |||
United Stationers, Inc.(a) | 176,800 | 8,726,848 | |||
| 18,627,186 | |||||
Electrical Equipment – 3.9% | |||||
Acuity Brands, Inc. | 103,600 | 4,600,876 | |||
Cooper Industries Ltd. – Class A | 127,200 | 5,333,496 | |||
EnerSys(a) | 334,800 | 7,697,052 | |||
Regal-Beloit Corp. | 215,300 | 7,948,876 | |||
| 25,580,300 | |||||
Machinery – 7.0% | |||||
AGCO Corp.(a) | 115,100 | 7,465,386 | |||
Briggs & Stratton Corp. | 284,300 | 5,080,441 | |||
Kennametal, Inc. | 261,300 | 7,935,681 | |||
Mueller Industries, Inc. | 245,000 | 7,038,850 | |||
SPX Corp. | 73,100 | 7,478,130 | |||
Terex Corp.(a) | 156,200 | 10,535,690 | |||
| 45,534,178 | |||||
Road & Rail – 5.3% | |||||
Arkansas Best Corp. | 232,800 | 6,218,088 | |||
Avis Budget Group, Inc.(a) | 492,900 | 5,633,847 | |||
Con-way, Inc. | 147,800 | 6,696,818 | |||
Ryder System, Inc. | 167,900 | 9,672,719 | |||
Werner Enterprises, Inc. | 359,500 | 6,395,505 | |||
| 34,616,977 | |||||
Trading Companies & Distributors – 1.3% | |||||
GATX Corp. | 238,700 | 8,588,426 | |||
| 152,454,810 | |||||
Financials – 18.9% | |||||
Commercial Banks – 5.7% | |||||
Central Pacific Financial Corp. | 328,500 | 6,073,965 | |||
The South Financial Group, Inc. | 452,000 | 6,522,360 | |||
Susquehanna Bancshares, Inc. | 285,000 | 5,668,650 | |||
Trustmark Corp. | 250,261 | 4,945,157 | |||
| 70 | • ALLIANCEBERNSTEIN POOLING PORTFOLIOS |
Small-Mid Cap Value Portfolio—Portfolio of Investments
| Company | Shares | U.S. $ Value | |||
UnionBanCal Corp. | 64,800 | $ | 3,017,736 | ||
Webster Financial Corp. | 246,800 | 6,902,996 | |||
Whitney Holding Corp. | 162,000 | 3,889,620 | |||
| 37,020,484 | |||||
Insurance – 8.1% | |||||
Arch Capital Group Ltd.(a) | 175,000 | 11,984,000 | |||
Aspen Insurance Holdings, Ltd. | 343,500 | 9,940,890 | |||
Fidelity National Financial, Inc. – Class A | 305,000 | 5,371,050 | |||
Old Republic International Corp. | 376,000 | 5,158,720 | |||
PartnerRe Ltd. | 14,800 | 1,137,972 | |||
Platinum Underwriters Holdings, Ltd. | 289,800 | 9,998,100 | |||
RenaissanceRe Holdings Ltd. | 35,000 | 1,921,500 | |||
StanCorp Financial Group, Inc. | 157,700 | 7,741,493 | |||
| 53,253,725 | |||||
Real Estate Investment Trusts (REITs) – 3.6% | |||||
Ashford Hospitality Trust, Inc. | 270,000 | 1,795,500 | |||
Digital Realty Trust, Inc. | 171,300 | 6,149,670 | |||
FelCor Lodging Trust, Inc. | 308,500 | 3,893,270 | |||
Mid-America Apartment Communities, Inc. | 74,000 | 3,588,260 | |||
Strategic Hotels & Resorts, Inc. | 101,000 | 1,438,240 | |||
Tanger Factory Outlet Centers | 102,800 | 3,649,400 | |||
Taubman Centers, Inc. | 66,300 | 3,232,125 | |||
| 23,746,465 | |||||
Thrifts & Mortgage Finance – 1.5% | |||||
Astoria Financial Corp. | 224,900 | 5,885,633 | |||
Provident Financial Services, Inc. | 322,000 | 3,860,780 | |||
| 9,746,413 | |||||
| 123,767,087 | |||||
Materials – 13.0% | |||||
Chemicals – 6.0% | |||||
Ashland, Inc. | 179,200 | 7,915,264 | |||
Celanese Corp. – Class A Series A | 84,800 | 3,298,720 | |||
Cytec Industries, Inc. | 152,900 | 8,758,112 | |||
Lubrizol Corp. | 61,900 | 3,608,770 | |||
Methanex Corp. | 170,600 | 4,914,986 | |||
Rockwood Holdings, Inc.(a) | 349,100 | 10,713,879 | |||
| 39,209,731 | |||||
Containers & Packaging – 2.1% | |||||
Aptargroup, Inc. | 150,800 | 5,651,984 | |||
Silgan Holdings, Inc. | 112,000 | 5,234,880 | |||
Sonoco Products Co. | 113,300 | 3,191,661 | |||
| 14,078,525 | |||||
Metals & Mining – 4.9% | |||||
Cleveland-Cliffs, Inc. | 33,390 | 3,988,769 | |||
Commercial Metals Co. | 263,800 | 8,035,348 | |||
| ALLIANCEBERNSTEIN POOLING PORTFOLIOS • | 71 |
Small-Mid Cap Value Portfolio—Portfolio of Investments
| Company | Shares | U.S. $ Value | |||
Quanex Corp. | 177,600 | $ | 9,137,520 | ||
Reliance Steel & Aluminum Co. | 68,100 | 3,776,826 | |||
Steel Dynamics, Inc. | 118,500 | 6,903,810 | |||
| 31,842,273 | |||||
| 85,130,529 | |||||
Consumer Staples – 10.2% | |||||
Beverages – 1.7% | |||||
Molson Coors Brewing Co. – Class B | 210,400 | 11,353,184 | |||
Food & Staples Retailing – 4.4% | |||||
Performance Food Group Co.(a) | 329,900 | 10,721,750 | |||
Ruddick Corp. | 345,710 | 11,149,148 | |||
Supervalu, Inc. | 275,900 | 7,242,375 | |||
| 29,113,273 | |||||
Food Products – 1.9% | |||||
Corn Products International, Inc. | 49,700 | 1,824,487 | |||
Del Monte Foods Co. | 409,800 | 3,680,004 | |||
Smithfield Foods, Inc.(a) | 119,600 | 3,294,980 | |||
Tyson Foods, Inc. – Class A | 248,900 | 3,586,649 | |||
| 12,386,120 | |||||
Tobacco – 2.2% | |||||
Universal Corp. | 248,400 | 14,136,444 | |||
| 66,989,021 | |||||
Consumer Discretionary – 7.8% | |||||
Auto Components – 2.8% | |||||
ArvinMeritor, Inc. | 618,700 | 6,985,123 | |||
Autoliv, Inc. | 61,500 | 3,068,850 | |||
TRW Automotive Holdings Corp.(a) | 387,100 | 8,547,168 | |||
| 18,601,141 | |||||
Automobiles – 0.4% | |||||
Thor Industries, Inc. | 98,200 | 2,993,136 | |||
Hotels Restaurants & Leisure – 0.5% | |||||
Papa John’s International, Inc.(a) | 117,600 | 3,075,240 | |||
Household Durables – 0.9% | |||||
Furniture Brands International, Inc. | 304,500 | 3,958,500 | |||
KB Home | 69,400 | 1,660,742 | |||
| 5,619,242 | |||||
Leisure Equipment & Products – 0.7% | |||||
Brunswick Corp. | 301,900 | 4,917,951 | |||
Multiline Retail – 0.8% | |||||
Big Lots, Inc.(a) | 197,450 | 3,327,032 | |||
Dillard’s, Inc. – Class A | 113,300 | 1,675,707 | |||
| 5,002,739 | |||||
| 72 | • ALLIANCEBERNSTEIN POOLING PORTFOLIOS |
Small-Mid Cap Value Portfolio—Portfolio of Investments
| Company | Shares | U.S. $ Value | |||
Specialty Retail – 0.9% | |||||
AutoNation, Inc.(a) | 320,438 | $ | 4,668,782 | ||
Office Depot, Inc.(a) | 84,400 | 959,628 | |||
| 5,628,410 | |||||
Textiles Apparel & Luxury Goods – 0.8% | |||||
Jones Apparel Group, Inc. | 240,100 | 3,387,811 | |||
VF Corp. | 21,200 | 1,612,048 | |||
| 4,999,859 | |||||
| 50,837,718 | |||||
Information Technology – 7.4% | |||||
Communications Equipment – 1.1% | |||||
CommScope, Inc.(a) | 170,500 | 7,140,540 | |||
Electronic Equipment & Instruments – 4.2% | |||||
Arrow Electronics, Inc.(a) | 225,900 | 7,366,599 | |||
AVX Corp. | 24,375 | 305,662 | |||
Checkpoint Systems, Inc.(a) | 188,400 | 4,559,280 | |||
Flextronics International Ltd.(a) | 46,097 | 467,424 | |||
Ingram Micro, Inc. – Class A(a) | 188,500 | 2,878,395 | |||
Insight Enterprises, Inc.(a) | 191,400 | 3,355,242 | |||
Sanmina-SCI Corp.(a) | 504,600 | 832,590 | |||
Tech Data Corp.(a) | 93,960 | 3,133,566 | |||
Vishay Intertechnology, Inc.(a) | 522,800 | 4,773,164 | |||
| 27,671,922 | |||||
Semiconductors & Semiconductor | |||||
Amkor Technology, Inc.(a) | 437,800 | 5,126,638 | |||
Spansion, Inc. – Class A(a) | 310,000 | 852,500 | |||
Teradyne, Inc.(a) | 183,000 | 2,194,170 | |||
Zoran Corp.(a) | 387,700 | 5,323,121 | |||
| 13,496,429 | |||||
| 48,308,891 | |||||
Utilities – 6.0% | |||||
Electric Utilities – 2.9% | |||||
Allegheny Energy, Inc. | 58,800 | 2,979,396 | |||
Northeast Utilities | 289,500 | 7,344,615 | |||
Reliant Energy, Inc.(a) | 378,000 | 8,618,400 | |||
| 18,942,411 | |||||
Gas Utilities – 1.0% | |||||
Atmos Energy Corp. | 253,091 | 6,580,366 | |||
Independent Power Producers & Energy | |||||
Constellation Energy Group, Inc. | 55,300 | 4,885,755 | |||
| ALLIANCEBERNSTEIN POOLING PORTFOLIOS • | 73 |
Small-Mid Cap Value Portfolio—Portfolio of Investments
| Company | Shares | U.S. $ Value | |||
Multi-Utilities – 1.4% | |||||
Puget Energy, Inc. | 124,600 | $ | 3,326,820 | ||
Wisconsin Energy Corp. | 135,500 | 5,910,510 | |||
| 9,237,330 | |||||
| 39,645,862 | |||||
Health Care – 4.6% | |||||
Health Care Providers & Services – 3.3% | |||||
Apria Healthcare Group, Inc.(a) | 155,400 | 3,373,734 | |||
Kindred Healthcare, Inc.(a) | 46,100 | 972,249 | |||
LifePoint Hospitals, Inc.(a) | 174,678 | 4,377,431 | |||
Molina Healthcare, Inc.(a) | 217,925 | 6,897,326 | |||
Omnicare, Inc. | 118,800 | 2,492,424 | |||
Universal Health Services, Inc. – Class B | 60,600 | 3,237,252 | |||
| 21,350,416 | |||||
Life Sciences Tools & Services – 1.3% | |||||
PerkinElmer, Inc. | 354,100 | 8,788,762 | |||
| 30,139,178 | |||||
Energy – 3.3% | |||||
Energy Equipment & Services – 2.2% | |||||
Exterran Holdings, Inc.(a) | 40,800 | 2,841,720 | |||
Oil States International, Inc.(a) | 213,100 | 8,984,296 | |||
Rowan Cos., Inc. | 71,000 | 2,862,010 | |||
| 14,688,026 | |||||
Oil, Gas & Consumable Fuels – 1.1% | |||||
Hess Corp. | 77,700 | 7,240,086 | |||
| 21,928,112 | |||||
Total Common Stocks | 619,201,208 | ||||
SHORT-TERM INVESTMENTS – 5.3% | |||||
Investment Companies – 5.3% | |||||
AllianceBernstein Fixed-Income Shares, Inc. – Government STIF Portfolio(b) | 35,129,599 | 35,129,599 | |||
Total Investments – 99.8% | 654,330,807 | ||||
Other assets less liabilities – 0.2% | 1,020,103 | ||||
Net Assets – 100.0% | $ | 655,350,910 | |||
| (a) | Non-income producing security. |
| (b) | Investment in affiliated money market mutual fund. |
| See notes to financial statements. |
| 74 | • ALLIANCEBERNSTEIN POOLING PORTFOLIOS |
Small-Mid Cap Value Portfolio—Portfolio of Investments
SMALL-MID CAP GROWTH PORTFOLIO
PORTFOLIO OF INVESTMENTS
February 29, 2008 (unaudited)
| Company | Shares | U.S. $ Value | |||
COMMON STOCKS – 97.2% | |||||
Industrials – 22.8% | |||||
Aerospace & Defense – 1.5% | |||||
Hexcel Corp.(a) | 464,900 | $ | 9,386,331 | ||
Air Freight & Logistics – 1.0% | |||||
CH Robinson Worldwide, Inc. | 120,100 | 6,097,477 | |||
Commercial Services & Supplies – 3.7% | |||||
FTI Consulting, Inc.(a) | 173,900 | 11,042,650 | |||
Stericycle, Inc.(a) | 233,500 | 12,583,315 | |||
| 23,625,965 | |||||
Construction & Engineering – 2.4% | |||||
Chicago Bridge & Iron Co. NV | 184,500 | 8,582,940 | |||
Granite Construction, Inc. | 228,200 | 6,889,358 | |||
| 15,472,298 | |||||
Electrical Equipment – 4.6% | |||||
Ametek, Inc. | 306,600 | 13,058,094 | |||
Baldor Electric Co. | 404,800 | 11,605,616 | |||
EnerSys(a) | 192,600 | 4,427,874 | |||
| 29,091,584 | |||||
Machinery – 8.0% | |||||
Astec Industries, Inc.(a) | 225,600 | 8,541,216 | |||
Bucyrus International, Inc. – Class A | 33,800 | 3,375,944 | |||
IDEX Corp. | 363,575 | 10,965,422 | |||
Joy Global, Inc. | 143,155 | 9,501,197 | |||
Kaydon Corp. | 130,200 | 5,560,842 | |||
Lincoln Electric Holdings, Inc. | 149,300 | 10,024,002 | |||
Valmont Industries, Inc. | 33,100 | 2,644,690 | |||
| 50,613,313 | |||||
Trading Companies & Distributors – 1.6% | |||||
MSC Industrial Direct Co. – Class A | 250,400 | 10,161,232 | |||
| 144,448,200 | |||||
Information Technology – 21.7% | |||||
Communications Equipment – 3.0% | |||||
Foundry Networks, Inc.(a) | 856,100 | 10,161,907 | |||
Netgear, Inc.(a) | 407,000 | 8,880,740 | |||
| 19,042,647 | |||||
Electronic Equipment & Instruments – 1.5% | |||||
Amphenol Corp. – Class A | 256,580 | 9,485,763 | |||
Internet Software & Services – 4.1% | |||||
DealerTrack Holdings, Inc.(a) | 358,800 | 7,344,636 | |||
Omniture, Inc.(a) | 318,500 | 7,319,130 | |||
VistaPrint Ltd.(a) | 368,600 | 11,581,412 | |||
| 26,245,178 | |||||
| ALLIANCEBERNSTEIN POOLING PORTFOLIOS • | 75 |
Small-Mid Cap Growth Portfolio—Portfolio of Investments
| Company | Shares | U.S. $ Value | |||
IT Services – 2.8% | |||||
Global Payments, Inc. | 173,100 | $ | 6,866,877 | ||
Iron Mountain, Inc.(a) | 351,100 | 10,561,088 | |||
| 17,427,965 | |||||
Semiconductors & Semiconductor Equipment – 6.1% | |||||
Hittite Microwave Corp.(a) | 276,700 | 9,161,537 | |||
Integrated Device Technology, Inc.(a) | 576,300 | 4,835,157 | |||
Intersil Corp. – Class A | 174,800 | 4,067,596 | |||
Lam Research Corp.(a) | 25,600 | 1,030,144 | |||
Microsemi Corp.(a) | 385,400 | 8,382,450 | |||
On Semiconductor Corp.(a) | 562,700 | 3,376,200 | |||
Verigy Ltd.(a) | 382,600 | 7,690,260 | |||
| 38,543,344 | |||||
Software – 4.2% | |||||
Activision, Inc.(a) | 419,154 | 11,421,946 | |||
McAfee, Inc.(a) | 249,700 | 8,307,519 | |||
Synchronoss Technologies, Inc.(a) | 424,700 | 6,829,176 | |||
| 26,558,641 | |||||
| 137,303,538 | |||||
Health Care – 17.4% | |||||
Biotechnology – 3.7% | |||||
Alexion Pharmaceuticals, Inc.(a) | 183,800 | 11,140,118 | |||
BioMarin Pharmaceutical, Inc.(a) | 141,300 | 5,375,052 | |||
OSI Pharmaceuticals, Inc.(a) | 128,600 | 4,623,170 | |||
Savient Pharmaceuticals, Inc.(a) | 113,200 | 2,567,376 | |||
| 23,705,716 | |||||
Health Care Equipment & Supplies – 7.1% | |||||
ArthroCare Corp.(a) | 266,100 | 10,683,915 | |||
Hologic, Inc.(a) | 222,400 | 13,412,944 | |||
NuVasive, Inc.(a) | 290,700 | 11,203,578 | |||
TomoTherapy, Inc.(a) | 723,200 | 9,524,544 | |||
| 44,824,981 | |||||
Health Care Providers & Services – 1.5% | |||||
HealthExtras, Inc.(a) | 337,300 | 9,292,615 | |||
Life Sciences Tools & Services – 4.3% | |||||
AMAG Pharmaceuticals, Inc.(a) | 202,300 | 8,854,671 | |||
Icon PLC SP (ADR)(a) | 200,100 | 13,226,610 | |||
WuXi PharmaTech Cayman, Inc. (ADR)(a) | 228,100 | 5,474,400 | |||
| 27,555,681 | |||||
Pharmaceuticals – 0.8% | |||||
Auxilium Pharmaceuticals, Inc.(a) | 66,900 | 2,143,476 | |||
XenoPort, Inc.(a) | 61,200 | 3,131,604 | |||
| 5,275,080 | |||||
| 110,654,073 | |||||
| 76 | • ALLIANCEBERNSTEIN POOLING PORTFOLIOS |
Small-Mid Cap Growth Portfolio—Portfolio of Investments
| Company | Shares | U.S. $ Value | |||
Consumer Discretionary – 13.8% | |||||
Diversified Consumer Services – 1.7% | |||||
Strayer Education, Inc. | 69,900 | $ | 10,883,430 | ||
Hotels, Restaurants & Leisure – 5.1% | |||||
Ctrip.com International Ltd. (ADR) | 96,600 | 5,855,892 | |||
Gaylord Entertainment Co.(a) | 78,100 | 2,350,029 | |||
Life Time Fitness, Inc.(a) | 251,600 | 7,311,496 | |||
Orient-Express Hotels Ltd. – Class A | 151,600 | 8,212,172 | |||
Sonic Corp.(a) | 391,300 | 8,346,429 | |||
| 32,076,018 | |||||
Internet & Catalog Retail – 1.4% | |||||
NetFlix, Inc.(a) | 284,900 | 8,997,142 | |||
Media – 1.5% | |||||
National CineMedia, Inc. | 434,100 | 9,354,855 | |||
Specialty Retail – 3.1% | |||||
Dick’s Sporting Goods, Inc.(a) | 380,900 | 10,505,222 | |||
GameStop Corp. – Class A(a) | 118,000 | 4,998,480 | |||
J Crew Group, Inc.(a) | 106,000 | 4,245,300 | |||
| 19,749,002 | |||||
Textiles Apparel & Luxury Goods – 1.0% | |||||
Lululemon Athletica, Inc.(a) | 241,500 | 6,496,350 | |||
| 87,556,797 | |||||
Energy – 11.1% | |||||
Energy Equipment & Services – 6.8% | |||||
Cameron International Corp.(a) | 223,700 | 9,502,776 | |||
Complete Production Services, Inc.(a) | 431,900 | 8,387,498 | |||
FMC Technologies, Inc.(a) | 116,500 | 6,600,890 | |||
Grant Prideco, Inc.(a) | 132,000 | 6,662,040 | |||
Oceaneering International, Inc.(a) | 87,300 | 5,238,000 | |||
Superior Energy Services, Inc.(a) | 165,100 | 6,717,919 | |||
| 43,109,123 | |||||
Oil, Gas & Consumable Fuels – 4.3% | |||||
Bill Barrett Corp.(a) | 164,400 | 7,618,296 | |||
Forest Oil Corp.(a) | 134,100 | 6,615,153 | |||
Newfield Exploration Co.(a) | 151,400 | 8,384,532 | |||
Penn Virginia Corp. | 106,400 | 4,528,384 | |||
| 27,146,365 | |||||
| 70,255,488 | |||||
Financials – 6.8% | |||||
Capital Markets – 6.5% | |||||
Affiliated Managers Group, Inc.(a) | 71,450 | 6,884,208 | |||
Greenhill & Co., Inc. | 154,320 | 10,032,343 | |||
Lazard Ltd. – Class A | 239,000 | 9,127,410 | |||
| ALLIANCEBERNSTEIN POOLING PORTFOLIOS • | 77 |
Small-Mid Cap Growth Portfolio—Portfolio of Investments
| Company | Shares | U.S. $ Value | ||||
MF Global Ltd.(a) | 322,300 | $ | 5,656,365 | |||
OptionsXpress Holdings, Inc. | 265,100 | 6,139,716 | ||||
Pzena Investment Management, Inc. – Class A | 305,000 | 3,318,400 | ||||
| 41,158,442 | ||||||
Commercial Banks – 0.3% | ||||||
Boston Private Financial Holdings, Inc. | 134,800 | 1,856,196 | ||||
| 43,014,638 | ||||||
Telecommunication Services – 2.8% | ||||||
Diversified Telecommunication Services – 1.3% | ||||||
Cbeyond, Inc.(a) | 206,000 | 3,376,340 | ||||
Time Warner Telecom, Inc. – Class A(a) | 290,500 | 4,630,570 | ||||
| 8,006,910 | ||||||
Wireless Telecommunication Services – 1.5% | ||||||
SBA Communications Corp. – Class A(a) | 309,900 | 9,622,395 | ||||
| 17,629,305 | ||||||
Materials – 0.8% | ||||||
Metals & Mining – 0.8% | ||||||
Allegheny Technologies, Inc. | 66,180 | 5,119,023 | ||||
Total Common Stocks | 615,981,062 | |||||
SHORT-TERM INVESTMENTS – 3.6% | ||||||
Investment Companies – 3.6% | ||||||
AllianceBernstein Fixed-Income Shares, Inc. – Government STIF Portfolio(b) | 22,820,052 | 22,820,052 | ||||
Total Investments – 100.8% | 638,801,114 | |||||
Other assets less liabilities – (0.8)% | (5,200,942 | ) | ||||
Net Assets – 100.0% | $ | 633,600,172 | ||||
| (a) | Non-income producing security. |
| (b) | Investment in affiliated money market mutual fund. |
| Glossary: |
| ADR | – American Depositary Receipt |
| See notes to financial statements. |
| 78 | • ALLIANCEBERNSTEIN POOLING PORTFOLIOS |
Small-Mid Cap Growth Portfolio—Portfolio of Investments
GLOBAL VALUE PORTFOLIO
PORTFOLIO OF INVESTMENTS
February 29, 2008 (unaudited)
| Company | Shares | U.S. $ Value | |||
COMMON STOCKS – 93.6% | |||||
Financials – 28.8% | |||||
Capital Markets – 3.9% | |||||
Credit Suisse Group | 1,500 | $ | 73,749 | ||
Deutsche Bank AG | 600 | 67,007 | |||
The Goldman Sachs Group, Inc. | 100 | 16,963 | |||
Merrill Lynch & Co., Inc. | 1,300 | 64,428 | |||
Morgan Stanley | 500 | 21,060 | |||
| 243,207 | |||||
Commercial Banks – 7.7% | |||||
Barclays PLC | 4,900 | 45,924 | |||
BNP Paribas SA | 900 | 80,460 | |||
Canadian Imperial Bank of Commerce/Canada | 201 | 13,640 | |||
Credit Agricole SA | 680 | 18,445 | |||
HBOS PLC | 4,450 | 52,879 | |||
Industrial Bank of Korea | 920 | 14,833 | |||
Kookmin Bank (ADR) | 200 | 12,246 | |||
Royal Bank of Canada | 600 | 30,108 | |||
Royal Bank of Scotland Group PLC (London Virt-X) | 8,522 | 64,431 | |||
Shinhan Financial Group Co. Ltd. | 270 | 14,544 | |||
Standard Bank Group Ltd. | 622 | 7,763 | |||
State Bank of India Ltd. (GDR)(a) | 390 | 42,434 | |||
Sumitomo Mitsui Financial Group, Inc. | 8 | 57,784 | |||
Unibanco - Uniao de Bancos Brasileiros SA (GDR) | 200 | 27,124 | |||
| 482,615 | |||||
Consumer Finance – 0.7% | |||||
ORIX Corp. | 300 | 44,853 | |||
Diversified Financial Services – 6.3% | |||||
Bank of America Corp. | 1,600 | 63,584 | |||
Citigroup, Inc. | 2,500 | 59,275 | |||
Fortis (Euronext Brussels) | 3,166 | 69,944 | |||
ING Groep NV | 2,800 | 93,049 | |||
JPMorgan Chase & Co. | 2,600 | 105,690 | |||
| 391,542 | |||||
Insurance – 9.1% | |||||
Allianz SE | 500 | 86,565 | |||
American International Group, Inc. | 1,600 | 74,976 | |||
Aviva PLC | 6,306 | 76,009 | |||
Fondiaria-Sai SpA (ordinary shares) | 1,100 | 48,818 | |||
Fondiaria-Sai SpA (saving shares) | 500 | 15,218 | |||
Genworth Financial, Inc. – Class A | 1,500 | 34,770 | |||
MetLife, Inc. | 1,100 | 64,086 | |||
Muenchener Rueckversicherungs AG | 400 | 70,495 | |||
Sanlam Ltd. | 7,300 | 17,348 | |||
The Travelers Cos, Inc. | 900 | 41,769 | |||
XL Capital Ltd. – Class A | 1,000 | 36,060 | |||
| 566,114 | |||||
| ALLIANCEBERNSTEIN POOLING PORTFOLIOS • | 79 |
Global Value Portfolio—Portfolio of Investments
| Company | Shares | U.S. $ Value | |||
Thrifts & Mortgage Finance – 1.1% | |||||
Federal Home Loan Mortgage Corp. | 1,300 | $ | 32,734 | ||
Federal National Mortgage Association | 1,200 | 33,180 | |||
| 65,914 | |||||
| 1,794,245 | |||||
Materials – 13.9% | |||||
Chemicals – 4.2% | |||||
BASF SE | 800 | 101,791 | |||
Dow Chemical Co. | 1,600 | 60,304 | |||
E.I. Du Pont de Nemours & Co. | 1,000 | 46,420 | |||
Mitsubishi Chemical Holdings Corp. | 8,500 | 57,494 | |||
| 266,009 | |||||
Construction Materials – 0.4% | |||||
Buzzi Unicem SpA | 1,000 | 24,534 | |||
Metals & Mining – 8.6% | |||||
Alcoa, Inc. | 1,300 | 48,282 | |||
Antofagasta PLC | 2,100 | 33,470 | |||
ArcelorMittal | 1,400 | 107,546 | |||
BHP Billiton Ltd. | 500 | 18,091 | |||
Gerdau Ameristeel Corp. | 2,300 | 34,047 | |||
Gerdau SA (ADR) | 1,100 | 36,047 | |||
JFE Holdings, Inc. | 1,400 | 62,381 | |||
Kazakhmys PLC | 1,400 | 42,645 | |||
Nippon Steel Corp. | 8,000 | 42,090 | |||
POSCO (ADR) | 200 | 27,060 | |||
Xstrata PLC | 890 | 69,429 | |||
Zinifex Ltd. | 1,600 | 16,098 | |||
| 537,186 | |||||
Paper & Forest Products – 0.7% | |||||
Stora Enso Oyj – Class R | 3,400 | 42,458 | |||
| 870,187 | |||||
Energy – 13.8% | |||||
Oil, Gas & Consumable Fuels – 13.8% | |||||
Chevron Corp. | 1,600 | 138,656 | |||
ConocoPhillips | 1,500 | 124,065 | |||
ENI SpA | 2,000 | 69,062 | |||
Exxon Mobil Corp. | 700 | 60,907 | |||
Marathon Oil Corp. | 1,500 | 79,740 | |||
Nippon Mining Holdings, Inc. | 4,500 | 26,653 | |||
Petro-Canada | 1,300 | 62,223 | |||
PTT PCL | 1,300 | 14,126 | |||
Repsol YPF SA | 2,500 | 86,242 | |||
Royal Dutch Shell PLC (Euronext Amsterdam) | 2,620 | 93,690 | |||
StatoilHydro ASA | 2,300 | 70,084 | |||
Total SA | 500 | 37,652 | |||
| 863,100 | |||||
| 80 | • ALLIANCEBERNSTEIN POOLING PORTFOLIOS |
Global Value Portfolio—Portfolio of Investments
| Company | Shares | U.S. $ Value | |||
Industrials – 9.0% | |||||
Aerospace & Defense – 1.7% | |||||
Bombardier, Inc. (b) | 7,100 | $ | 40,613 | ||
Northrop Grumman Corp. | 800 | 62,888 | |||
| 103,501 | |||||
Airlines – 2.1% | |||||
Air France-KLM | 1,900 | 51,191 | |||
Deutsche Lufthansa AG | 3,500 | 81,917 | |||
| 133,108 | |||||
Industrial Conglomerates – 0.5% | |||||
General Electric Co. | 900 | 29,826 | |||
Machinery – 2.4% | |||||
Parker Hannifin Corp. | 900 | 58,167 | |||
SPX Corp. | 500 | 51,150 | |||
Volvo Ab-b Shs – Class B | 2,900 | 43,054 | |||
| 152,371 | |||||
Marine – 1.8% | |||||
Mitsui OSK Lines Ltd. | 6,000 | 77,927 | |||
Neptune Orient Lines Ltd. | 7,000 | 15,297 | |||
Nippon Yusen KK | 2,000 | 18,481 | |||
| 111,705 | |||||
Trading Companies & Distributors – 0.5% | |||||
Finning International, Inc. | 1,000 | 28,194 | |||
| 558,705 | |||||
Consumer Discretionary – 8.7% | |||||
Auto Components – 0.7% | |||||
Compagnie Generale des Etablissements Michelin – Class B | 400 | 39,396 | |||
Hyundai Mobis | 90 | 6,908 | |||
| 46,304 | |||||
Automobiles – 2.4% | |||||
Hyundai Motor Co. | 340 | 9,791 | |||
Nissan Motor Co. Ltd. | 8,400 | 75,541 | |||
Renault SA | 600 | 64,108 | |||
| 149,440 | |||||
Household Durables – 1.6% | |||||
Black & Decker Corp. | 400 | 27,508 | |||
Sharp Corp. | 4,000 | 72,790 | |||
| 100,298 | |||||
Internet & Catalog Retail – 0.3% | |||||
Home Retail Group PLC | 3,200 | 16,346 | |||
| ALLIANCEBERNSTEIN POOLING PORTFOLIOS • | 81 |
Global Value Portfolio—Portfolio of Investments
| Company | Shares | U.S. $ Value | |||
Media – 2.9% | |||||
CBS Corp. – Class B | 2,700 | $ | 61,614 | ||
Time Warner, Inc. | 4,600 | 71,806 | |||
The Walt Disney Co. | 1,400 | 45,374 | |||
| 178,794 | |||||
Multiline Retail – 0.7% | |||||
Macy’s, Inc. | 1,700 | 41,956 | |||
Specialty Retail – 0.1% | |||||
Office Depot, Inc.(b) | 800 | 9,096 | |||
| 542,234 | |||||
Health Care – 5.9% | |||||
Health Care Providers & Services – 1.5% | |||||
AmerisourceBergen Corp. – Class A | 1,100 | 45,892 | |||
McKesson Corp. | 800 | 47,008 | |||
| 92,900 | |||||
Pharmaceuticals – 4.4% | |||||
AstraZeneca PLC | 700 | 26,164 | |||
GlaxoSmithKline PLC | 2,300 | 50,206 | |||
Merck & Co., Inc. | 500 | 22,150 | |||
Pfizer, Inc. | 5,200 | 115,856 | |||
Sanofi-Aventis SA | 800 | 59,130 | |||
| 273,506 | |||||
| 366,406 | |||||
Telecommunication Services – 5.1% | |||||
Diversified Telecommunication Services – 2.8% | |||||
AT&T, Inc. | 1,600 | 55,728 | |||
China Netcom Group Corp. Ltd. | 10,500 | 32,368 | |||
China Telecom Corp. Ltd. – Class H | 24,420 | 18,045 | |||
Tele2 AB – Class B | 2,100 | 36,911 | |||
Verizon Communications, Inc. | 900 | 32,688 | |||
| 175,740 | |||||
Wireless Telecommunication Services – 2.3% | |||||
Sprint Nextel Corp. | 3,600 | 25,596 | |||
Vodafone Group PLC | 36,612 | 117,871 | |||
| 143,467 | |||||
| 319,207 | |||||
Utilities – 3.2% | |||||
Electric Utilities – 3.2% | |||||
E.ON AG | 500 | 93,971 | |||
Kyushu Electric Power Co., Inc. | 1,700 | 42,833 | |||
The Tokyo Electric Power Co. Inc | 2,400 | 61,661 | |||
| 198,465 | |||||
| 82 | • ALLIANCEBERNSTEIN POOLING PORTFOLIOS |
Global Value Portfolio—Portfolio of Investments
| Company | Shares | U.S. $ Value | |||
Information Technology – 3.1% | |||||
Computers & Peripherals – 1.0% | |||||
Fujitsu Ltd. | 9,000 | $ | 64,036 | ||
Electronic Equipment & Instruments – 1.3% | |||||
AU Optronics Corp. (Sponsored) (ADR) | 1,680 | 32,055 | |||
Flextronics International Ltd.(b) | 2,538 | 25,735 | |||
Tech Data Corp.(b) | 700 | 23,345 | |||
| 81,135 | |||||
Semiconductors & Semiconductor Equipment – 0.8% | |||||
Hynix Semiconductor, Inc.(b) | 400 | 10,286 | |||
Samsung Electronics Co. Ltd. | 14 | 8,207 | |||
Siliconware Precision Industries Co. (Sponsored) (ADR) | 3,352 | 27,419 | |||
| 45,912 | |||||
| 191,083 | |||||
Consumer Staples – 2.1% | |||||
Food & Staples Retailing – 0.3% | |||||
Supervalu, Inc. | 800 | 21,000 | |||
Tobacco – 1.8% | |||||
Altria Group, Inc. | 1,500 | 109,710 | |||
| 130,710 | |||||
Total Common Stocks | 5,834,342 | ||||
WARRANTS – 0.7% | |||||
Information Technology – 0.7% | |||||
Computers & Peripherals – 0.2% | |||||
Compal Electronics, Inc., expiring 1/17/12(a)(b) | 17,974 | 16,374 | |||
Semiconductors & Semiconductor Equipment – 0.5% | |||||
Taiwan Semiconductor Manufacturing Co. Ltd., expiring 1/17/12(a)(b) | 9,346 | 18,534 | |||
United Microelectronics Corp., Deutshe Bank AG London, expiring 1/24/17(a)(b) | 19,638 | 11,645 | |||
Total Warrants | 46,553 | ||||
| ALLIANCEBERNSTEIN POOLING PORTFOLIOS • | 83 |
Global Value Portfolio—Portfolio of Investments
| Company | Shares | U.S. $ Value | |||
NON-CONVERTIBLE – PREFERRED STOCKS – 0.2% | |||||
Information Technology – 0.2% | |||||
Semiconductors & Semiconductor Equipment – 0.2% | |||||
Samsung Electronics Co. Ltd. | 25 | $ | 10,732 | ||
SHORT-TERM INVESTMENTS – 1.6% | |||||
Investment Companies – 1.6% | |||||
AllianceBernstein Fixed-Income Shares, Inc. – Government STIF Portfolio(c) | 100,396 | 100,396 | |||
Total Investments – 96.1% | 5,992,023 | ||||
Other assets less liabilities – 3.9% | 240,022 | ||||
Net Assets – 100.0% | $ | 6,232,045 | |||
FINANCIAL FUTURES CONTRACTS (see Note C)
| Type | Number of Contracts | Expiration Month | Original Value | Value at February 29, 2008 | Unrealized Appreciation/ (Depreciation) | ||||||||
Purchased Contracts | |||||||||||||
EURO STOXX 50 | 1 | March 2008 | $ | 66,525 | $ | 56,490 | $ | (10,035) | |||||
| (a) | Security is exempt from registration under Rule 144A of the Securities Act of 1933. These securities are considered liquid and may be resold in transactions exempt from registration, normally to qualified institutional buyers. At February 29, 2008, the aggregate market value of these securities amounted to $88,987 or 1.4% of net assets. |
| (b) | Non-income producing security. |
| (c) | Investment in affiliated money market mutual fund. |
| Glossary: |
| ADR | – American Depositary Receipt |
| GDR | – Global Depositary Receipt |
| See notes to financial statements. |
| 84 | • ALLIANCEBERNSTEIN POOLING PORTFOLIOS |
Global Value Portfolio—Portfolio of Investments
GLOBAL RESEARCH GROWTH PORTFOLIO
PORTFOLIO OF INVESTMENTS
February 29, 2008 (unaudited)
| Company | Shares | U.S. $ Value | |||
COMMON STOCKS – 90.8% | |||||
Financials – 19.3% | |||||
Capital Markets – 12.5% | |||||
3i Group PLC | 1,804 | $ | 29,156 | ||
The Blackstone Group LP | 5,100 | 84,150 | |||
Credit Suisse Group | 2,834 | 139,336 | |||
Janus Capital Group, Inc. | 1,600 | 38,752 | |||
Lehman Brothers Holdings, Inc. | 3,100 | 158,069 | |||
Macquarie Group Ltd. | 910 | 45,446 | |||
Man Group PLC | 6,193 | 67,565 | |||
Merrill Lynch & Co., Inc. | 1,900 | 94,164 | |||
MF Global Ltd.(a) | 1,200 | 21,060 | |||
UBS AG (Swiss Virt-X) | 3,616 | 117,985 | |||
| 795,683 | |||||
Commercial Banks – 1.5% | |||||
Banco Itau Holding Financeira SA (ADR) | 1,425 | 36,110 | |||
Banco Santander Central Hispano SA | 3,250 | 58,076 | |||
| 94,186 | |||||
Diversified Financial Services – 3.4% | |||||
Bolsa De Mercadorias E Futuros | 1,100 | 11,728 | |||
CME Group, Inc. – Class A | 109 | 55,949 | |||
JPMorgan Chase & Co. | 2,735 | 111,178 | |||
NYSE Euronext | 600 | 39,402 | |||
| 218,257 | |||||
Insurance – 1.9% | |||||
American International Group, Inc. | 1,200 | 56,232 | |||
MBIA, Inc. | 2,000 | 25,940 | |||
QBE Insurance Group Ltd. | 1,790 | 37,024 | |||
| 119,196 | |||||
| 1,227,322 | |||||
Information Technology – 12.4% | |||||
Communications Equipment – 2.9% | |||||
Cisco Systems, Inc.(a) | 2,548 | 62,095 | |||
Juniper Networks, Inc.(a) | 900 | 24,138 | |||
Nokia OYJ | 1,705 | 61,256 | |||
Research In Motion Ltd.(a) | 350 | 36,330 | |||
| 183,819 | |||||
Computers & Peripherals – 2.7% | |||||
Apple, Inc.(a) | 300 | 37,506 | |||
EMC Corp.(a) | 1,299 | 20,187 | |||
Hewlett-Packard Co. | 1,079 | 51,544 | |||
InnoLux Display Corp. | 3,119 | 8,606 | |||
International Business Machines Corp. | 500 | 56,930 | |||
| 174,773 | |||||
| ALLIANCEBERNSTEIN POOLING PORTFOLIOS • | 85 |
Global Research Growth Portfolio—Portfolio of Investments
| Company | Shares | U.S. $ Value | |||
Electronic Equipment & Instruments – 0.4% | |||||
Amphenol Corp. – Class A | 300 | $ | 11,091 | ||
Tyco Electronics Ltd. | 500 | 16,450 | |||
| 27,541 | |||||
Internet Software & Services – 1.8% | |||||
Alibaba.com Ltd.(a) | 2,500 | 6,059 | |||
Ebay, Inc.(a) | 1,600 | 42,176 | |||
Google, Inc. – Class A(a) | 134 | 63,138 | |||
| 111,373 | |||||
Semiconductors & Semiconductor Equipment –1.9% | |||||
Applied Materials, Inc. | 500 | 9,585 | |||
Broadcom Corp.-Class A(a) | 700 | 13,237 | |||
Intel Corp. | 1,700 | 33,915 | |||
Lam Research Corp.(a) | 300 | 12,072 | |||
MEMC Electronic Materials, Inc.(a) | 100 | 7,628 | |||
Nvidia Corp.(a) | 600 | 12,834 | |||
Taiwan Semiconductor Manufacturing Co. Ltd. (ADR) | 1,901 | 18,516 | |||
Tokyo Electron Ltd. | 200 | 12,396 | |||
| 120,183 | |||||
Software – 2.7% | |||||
Adobe Systems, Inc.(a) | 795 | 26,752 | |||
Microsoft Corp. | 2,600 | 70,772 | |||
Oracle Corp.(a) | 1,550 | 29,140 | |||
Salesforce.com, Inc.(a) | 400 | 23,888 | |||
Shanda Interactive Entertainment Ltd. (Sponsored) (ADR)(a) | 300 | 9,924 | |||
VMware, Inc. – Class A(a) | 200 | 11,734 | |||
| 172,210 | |||||
| 789,899 | |||||
Industrials – 11.1% | |||||
Aerospace & Defense – 3.5% | |||||
BAE Systems PLC | 7,362 | 70,079 | |||
Honeywell International, Inc. | 600 | 34,524 | |||
Lockheed Martin Corp. | 500 | 51,600 | |||
United Technologies Corp. | 900 | 63,459 | |||
| 219,662 | |||||
Air Freight & Logistics – 0.4% | |||||
United Parcel Service, Inc. – Class B | 400 | 28,096 | |||
Construction & Engineering – 0.4% | |||||
Fluor Corp. | 200 | 27,850 | |||
Electrical Equipment – 1.5% | |||||
ABB Ltd. | 1,209 | 30,121 | |||
| 86 | • ALLIANCEBERNSTEIN POOLING PORTFOLIOS |
Global Research Growth Portfolio—Portfolio of Investments
| Company | Shares | U.S. $ Value | |||
Cooper Industries Ltd. – Class A | 300 | $ | 12,579 | ||
Emerson Electric Co. | 1,000 | 50,960 | |||
| 93,660 | |||||
Industrial Conglomerates – 1.9% | |||||
General Electric Co. | 1,600 | 53,024 | |||
Siemens AG | 549 | 70,689 | |||
| 123,713 | |||||
Machinery – 1.3% | |||||
Atlas Copco AB – Class A | 1,318 | 20,484 | |||
Caterpillar, Inc. | 100 | 7,233 | |||
Danaher Corp. | 200 | 14,830 | |||
Deere & Co. | 300 | 25,563 | |||
Eaton Corp. | 200 | 16,126 | |||
| 84,236 | |||||
Trading Companies & Distributors – 2.1% | |||||
Mitsubishi Corp. | 1,700 | 51,868 | |||
Mitsui & Co. Ltd. | 3,000 | 65,242 | |||
Wolseley PLC | 1,236 | 15,125 | |||
| 132,235 | |||||
| 709,452 | |||||
Health Care – 10.3% | |||||
Biotechnology – 1.6% | |||||
Amylin Pharmaceuticals, Inc.(a) | 200 | 5,294 | |||
Basilea Pharmaceutica(a) | 50 | 9,567 | |||
Genentech, Inc.(a) | 500 | 37,875 | |||
Gilead Sciences, Inc.(a) | 1,000 | 47,320 | |||
| 100,056 | |||||
Health Care Equipment & Supplies – 2.0% | |||||
Alcon, Inc. | 300 | 43,419 | |||
Becton Dickinson & Co. | 400 | 36,168 | |||
Hologic, Inc.(a) | 400 | 24,124 | |||
Nobel Biocare Holding AG | 108 | 26,119 | |||
| 129,830 | |||||
Health Care Providers & Services – 2.2% | |||||
Aetna, Inc. | 900 | 44,640 | |||
Medco Health Solutions, Inc.(a) | 600 | 26,586 | |||
WellPoint, Inc.(a) | 1,000 | 70,080 | |||
| 141,306 | |||||
Pharmaceuticals – 4.5% | |||||
Abbott Laboratories | 800 | 42,840 | |||
Eli Lilly & Co. | 600 | 30,012 | |||
Merck & Co., Inc. | 800 | 35,440 | |||
Novartis AG | 280 | 13,830 | |||
Roche Holding AG | 329 | 64,520 | |||
| ALLIANCEBERNSTEIN POOLING PORTFOLIOS • | 87 |
Global Research Growth Portfolio—Portfolio of Investments
| Company | Shares | U.S. $ Value | |||
Schering-Plough Corp. | 1,300 | $ | 28,210 | ||
Teva Pharmaceutical Industries Ltd. (Sponsored) (ADR) | 1,400 | 68,698 | |||
| 283,550 | |||||
| 654,742 | |||||
Consumer Staples – 10.1% | |||||
Beverages – 1.3% | |||||
The Coca-Cola Co. | 900 | 52,614 | |||
SABMiller PLC | 1,446 | 30,042 | |||
| 82,656 | |||||
Food & Staples Retailing – 2.1% | |||||
Safeway, Inc. | 1,300 | 37,362 | |||
Wal-Mart de Mexico SAB de CV Series V | 16,168 | 58,936 | |||
Wal-Mart Stores, Inc. | 600 | 29,754 | |||
X 5 Retail Group NV (GDR)(a)(b) | 266 | 8,890 | |||
| 134,942 | |||||
Food Products – 4.3% | |||||
Archer-Daniels-Midland Co. | 1,300 | 58,630 | |||
Bunge Ltd. | 400 | 44,336 | |||
Nestle SA | 210 | 100,230 | |||
WM Wrigley Jr Co. | 1,200 | 71,832 | |||
| 275,028 | |||||
Personal Products – 1.1% | |||||
The Estee Lauder Cos, Inc. – Class A | 400 | 17,032 | |||
L’Oreal SA | 359 | 42,603 | |||
Oriflame Cosmetics SA | 169 | 11,292 | |||
| 70,927 | |||||
Tobacco – 1.3% | |||||
Altria Group, Inc. | 1,100 | 80,454 | |||
| 644,007 | |||||
Energy – 9.1% | |||||
Energy Equipment & Services – 3.5% | |||||
Baker Hughes, Inc. | 1,459 | 98,176 | |||
Cameron International Corp.(a) | 1,400 | 59,472 | |||
Technip SA | 811 | 66,208 | |||
| 223,856 | |||||
Oil, Gas & Consumable Fuels – 5.6% | |||||
Addax Petroleum Corp. | 1,173 | 53,629 | |||
China Shenhua Energy Co. Ltd. – Class H | 5,500 | 28,015 | |||
EOG Resources, Inc. | 1,000 | 118,990 | |||
Noble Energy, Inc. | 1,300 | 100,620 | |||
Petroleo Brasileiro SA (Sponsored) (ADR) | 300 | 29,379 | |||
Sasol Ltd. | 472 | 24,139 | |||
| 354,772 | |||||
| 578,628 | |||||
| 88 | • ALLIANCEBERNSTEIN POOLING PORTFOLIOS |
Global Research Growth Portfolio—Portfolio of Investments
| Company | Shares | U.S. $ Value | |||
Materials – 8.9% | |||||
Chemicals – 2.9% | |||||
Air Products & Chemicals, Inc. | 1,000 | $ | 91,330 | ||
Monsanto Co. | 800 | 92,544 | |||
| 183,874 | |||||
Metals & Mining – 6.0% | |||||
Cia Vale do Rio Doce (ADR) | 2,900 | 101,036 | |||
Cia Vale do Rio Doce (Sponsored) (ADR) | 1,380 | 40,462 | |||
Rio Tinto PLC | 1,140 | 128,258 | |||
Sterlite Industries India Ltd. (ADR)(a) | 1,400 | 29,190 | |||
Xstrata PLC | 1,043 | 81,365 | |||
| 380,311 | |||||
| 564,185 | |||||
Consumer Discretionary – 5.2% | |||||
Auto Components – 0.5% | |||||
Denso Corp. | 800 | 29,865 | |||
Automobiles – 0.5% | |||||
Fiat SpA | 1,649 | 34,853 | |||
Diversified Consumer Services – 0.8% | |||||
Apollo Group, Inc. – Class A(a) | 800 | 49,104 | |||
Hotels, Restaurants & Leisure – 0.7% | |||||
Ctrip.com International Ltd. (ADR) | 200 | 12,124 | |||
Wyndham Worldwide Corp. | 1,600 | 35,472 | |||
| 47,596 | |||||
Household Durables – 0.2% | |||||
Garmin Ltd. | 200 | 11,742 | |||
Media – 0.3% | |||||
Eutelsat Communications | 109 | 2,998 | |||
SES (FDR) | 120 | 2,966 | |||
Viacom, Inc. – Class B(a) | 400 | 15,900 | |||
| 21,864 | |||||
Multiline Retail – 1.0% | |||||
Kohl’s Corp.(a) | 800 | 35,552 | |||
Lotte Shopping Co. Ltd. | 90 | 30,461 | |||
| 66,013 | |||||
Specialty Retail – 0.6% | |||||
Esprit Holdings Ltd. | 1,500 | 18,719 | |||
Lowe’s Cos, Inc. | 700 | 16,779 | |||
| 35,498 | |||||
Textiles Apparel & Luxury Goods – 0.6% | |||||
Adidas AG | 583 | 36,995 | |||
| 333,530 | |||||
| ALLIANCEBERNSTEIN POOLING PORTFOLIOS • | 89 |
Global Research Growth Portfolio—Portfolio of Investments
| Company | Shares | U.S. $ Value | |||
Utilities – 2.5% | |||||
Independent Power Producers & Energy Traders –1.5% | |||||
Iberdrola Renovables(a) | 7,581 | $ | 47,187 | ||
International Power PLC | 6,581 | 49,442 | |||
| 96,629 | |||||
Multi-Utilities – 1.0% | |||||
Veolia Environnement | 701 | 62,371 | |||
| 159,000 | |||||
Telecommunication Services – 1.9% | |||||
Diversified Telecommunication Services – 0.7% | |||||
AT&T, Inc. | 400 | 13,932 | |||
Telefonica SA | 419 | 12,125 | |||
Verizon Communications, Inc. | 600 | 21,792 | |||
| 47,849 | |||||
Wireless Telecommunication Services – 1.2% | |||||
America Movil SAB de CV Series L (ADR) | 300 | 18,138 | |||
MTN Group Ltd. | 552 | 8,644 | |||
Turkcell Iletisim Hizmet AS (ADR) | 300 | 7,569 | |||
Vimpel-Communications (ADR) | 500 | 17,365 | |||
Vodafone Group PLC | 7,018 | 22,594 | |||
| 74,310 | |||||
| 122,159 | |||||
Total Common Stocks | 5,782,924 | ||||
WARRANTS – 1.4% | |||||
Utilities – 0.8% | |||||
Independent Power Producers & Energy Traders – 0.8% | |||||
NTPC Ltd., expiring 2/06/17(a)(b) | 9,923 | 50,022 | |||
Financials – 0.4% | |||||
Thrifts & Mortgage Finance – 0.4% | |||||
Housing Development Finance Corp., expiring 1/18/11(a) | 417 | 29,277 | |||
Information Technology – 0.2% | |||||
Electronic Equipment & Instruments – 0.2% | |||||
HON HAI Precision Industry Co., Ltd. Citigroup Global Markets, expiring 1/17/12(b) | 1,964 | 11,886 | |||
Total Warrants | 91,185 | ||||
| 90 | • ALLIANCEBERNSTEIN POOLING PORTFOLIOS |
Global Research Growth Portfolio—Portfolio of Investments
| Company | Shares | U.S. $ Value | |||
SHORT-TERM INVESTMENTS – 1.6% | |||||
Investment Companies – 1.6% | |||||
AllianceBernstein Fixed-Income Shares, Inc. – | 100,139 | $ | 100,139 | ||
Total Investments – 93.8% | 5,974,248 | ||||
Other assets less liabilities – 6.2% | 396,149 | ||||
Net Assets – 100.0% | $ | 6,370,397 | |||
| (a) | Non-income producing security. |
| (b) | Security is exempt from registration under Rule 144A of the Securities Act of 1933. These securities are considered liquid and may be resold in transactions exempt from registration, normally to qualified institutional buyers. At February 29, 2008, the aggregate market value of these securities amounted to $70,798 or 1.1% of net assets. |
| (c) | Investment in affiliated money market mutual fund. |
| Glossary: |
| ADR | – American Depositary Receipt |
| FDR | – Fiduciary Depositary Receipt |
| GDR | – Global Depositary Receipt |
| See notes to financial statements. |
| ALLIANCEBERNSTEIN POOLING PORTFOLIOS • | 91 |
Global Research Growth Portfolio—Portfolio of Investments
SHORT DURATION BOND PORTFOLIO
PORTFOLIO OF INVESTMENTS
February 29, 2008 (unaudited)
| Principal Amount (000) | U.S. $ Value | |||||
GOVERNMENTS - TREASURIES – 23.5% | ||||||
Treasuries – 23.5% | ||||||
U.S. Treasury Bonds | $ | 30,915 | $ | 33,890,569 | ||
U.S. Treasury Notes | 50,618 | 52,021,840 | ||||
4.50%, 5/15/17 | 29,235 | 31,493,872 | ||||
4.625%, 11/30/08 | 112,681 | 115,145,897 | ||||
4.75%, 12/31/08 | 51,720 | 52,992,777 | ||||
4.875%, 5/31/11 | 24,720 | 26,966,034 | ||||
Total Governments - Treasuries | 312,510,989 | |||||
CORPORATES - INVESTMENT | ||||||
Financial Institutions – 13.2% | ||||||
Banking – 5.7% | ||||||
Bank of America Corp. | 3,010 | 3,013,145 | ||||
BB&T Corp. | 3,035 | 3,250,840 | ||||
Citigroup, Inc. | 6,640 | 6,643,074 | ||||
Comerica, Inc. | 2,380 | 2,238,669 | ||||
Compass Bank | 1,615 | 1,686,662 | ||||
Credit Suisse USA, Inc. | 6,625 | 6,725,667 | ||||
Marshall & Ilsley Corp. | 5,123 | 5,165,275 | ||||
Morgan J P & Co., Inc. | 6,120 | 6,244,261 | ||||
National City Bank of Pennsylvania | 6,470 | 6,578,560 | ||||
NB Capital Trust IV | 3,345 | 3,478,235 | ||||
Royal Bank of Scotland Group PLC | 783 | 807,948 | ||||
UBS Preferred Funding Trust I | 1,377 | 1,516,050 | ||||
Union Planters Corp. | 3,867 | 4,221,542 | ||||
UnionBanCal Corp. | 5,212 | 5,165,785 | ||||
Royal Bank of Scotland Group PLC | 2,429 | 2,493,473 | ||||
| 92 | • ALLIANCEBERNSTEIN POOLING PORTFOLIOS |
Short Duration Bond Portfolio—Portfolio of Investments
| Principal Amount (000) | U.S. $ Value | |||||
US Bancorp | $ | 6,550 | $ | 6,685,827 | ||
Wachovia Corp. | 2,856 | 2,888,933 | ||||
Wells Fargo & Co. | 6,700 | 6,651,284 | ||||
| 75,455,230 | ||||||
Brokerage – 2.7% | ||||||
The Bear Stearns Co., Inc. | 6,820 | 6,705,226 | ||||
7.625%, 12/07/09 | 6,475 | 6,745,357 | ||||
Lehman Brothers Holdings, Inc. | 6,715 | 6,600,577 | ||||
7.875%, 11/01/09 | 2,726 | 2,853,342 | ||||
Merrill Lynch & Co., Inc. | 6,760 | 6,730,418 | ||||
Morgan Stanley | 6,635 | 6,791,321 | ||||
| 36,426,241 | ||||||
Finance – 2.5% | ||||||
American Express Co. | 2,976 | 2,987,839 | ||||
American General Finance Corp. | 5,240 | 5,239,597 | ||||
Capital One Bank | 4,160 | 4,133,696 | ||||
Capital One Financial Corp. | 395 | 397,165 | ||||
CIT Group, Inc. | 6,860 | 6,665,697 | ||||
General Electric Capital Corp. | 6,730 | 6,729,172 | ||||
Household Finance Corp. | 6,690 | 6,709,548 | ||||
| 32,862,714 | ||||||
Insurance – 1.1% | ||||||
Allstate Life Global Funding Trust | ||||||
Series 04-1 | 2,911 | 2,951,888 | ||||
Genworth Financial, Inc. | 2,218 | 2,250,915 | ||||
UnitedHealth Group, Inc. | 2,429 | 2,442,852 | ||||
WellPoint, Inc. | 6,800 | 6,867,803 | ||||
| 14,513,458 | ||||||
| ALLIANCEBERNSTEIN POOLING PORTFOLIOS • | 93 |
Short Duration Bond Portfolio—Portfolio of Investments
| Principal Amount (000) | U.S. $ Value | |||||
Other Finance – 0.2% | ||||||
ORIX Corp. | $ | 3,130 | $ | 3,126,391 | ||
REITS – 1.0% | ||||||
Simon Property Group LP | 6,665 | 6,616,486 | ||||
5.00%, 3/01/12 | 6,630 | 6,503,380 | ||||
| 13,119,866 | ||||||
| 175,503,900 | ||||||
Industrial – 6.3% | ||||||
Basic – 0.2% | ||||||
Celulosa Arauco Y Constitucion | 1,506 | 1,678,112 | ||||
United States Steel Corp. | 460 | 448,258 | ||||
| 2,126,370 | ||||||
Capital Goods – 0.5% | ||||||
Caterpillar Financial Services | 3,478 | 3,532,747 | ||||
Illinois Tool Works, Inc. | 2,624 | 2,691,062 | ||||
| 6,223,809 | ||||||
Communications - Media – 0.5% | ||||||
British Sky Broadcasting Group PLC | 6,350 | 6,564,687 | ||||
Communications - | ||||||
AT&T, Inc. | 6,670 | 6,757,144 | ||||
Nextel Communications, Inc. | 6,796 | 5,334,860 | ||||
Qwest Corp. | 3,930 | 4,101,937 | ||||
Vodafone Group PLC | 6,160 | 6,612,797 | ||||
| 22,806,738 | ||||||
Consumer Cyclical - Automotive – 0.5% | ||||||
Daimler Finance North America LLC | 5,900 | 6,191,967 | ||||
Consumer Cyclical - Retailers – 0.0% | ||||||
Limited Brands, Inc. | 846 | 789,062 | ||||
| 94 | • ALLIANCEBERNSTEIN POOLING PORTFOLIOS |
Short Duration Bond Portfolio—Portfolio of Investments
| Principal Amount (000) | U.S. $ Value | |||||
Consumer Non-Cyclical – 1.0% | ||||||
Abbott Laboratories | $ | 3,250 | $ | 3,261,287 | ||
Cia Brasileira De Bebida | 2,274 | 2,615,100 | ||||
Kraft Foods, Inc. | 1,639 | 1,652,710 | ||||
Baxter FinCo BV | 5,757 | 6,002,001 | ||||
| 13,531,098 | ||||||
Energy – 0.7% | ||||||
ConocoPhillips | 2,828 | 2,913,397 | ||||
Vastar Resources, Inc. | 6,390 | 6,609,759 | ||||
| 9,523,156 | ||||||
Technology – 0.3% | ||||||
Electronic Data Systems Corp. | 1,550 | 1,585,258 | ||||
International Business Machines Corp. | 2,869 | 2,926,343 | ||||
| 4,511,601 | ||||||
Transportation - Airlines – 0.2% | ||||||
United Air Lines, Inc. | 2,534 | 2,388,471 | ||||
Transportation - Railroads – 0.2% | ||||||
Norfolk Southern Corp. | 2,700 | 2,782,909 | ||||
Transportation - Services – 0.5% | ||||||
FedEx Corp. | 6,715 | 6,712,186 | ||||
| 84,152,054 | ||||||
Utility – 1.5% | ||||||
Electric – 1.5% | ||||||
Constellation Energy Group, Inc. | 6,420 | 6,602,052 | ||||
Pacific Gas & Electric Co. | 6,660 | 6,689,517 | ||||
PPL Electric Utilities Corp. | 6,380 | 6,648,623 | ||||
| 19,940,192 | ||||||
Total Corporates - Investment Grades | 279,596,146 | |||||
| ALLIANCEBERNSTEIN POOLING PORTFOLIOS • | 95 |
Short Duration Bond Portfolio—Portfolio of Investments
| Principal Amount (000) | U.S. $ Value | |||||
MORTGAGE PASS-THRU’S – 12.6% | ||||||
Agency ARMS – 9.3% | ||||||
Federal Home Loan Mortgage Corp. | $ | 5,259 | $ | 5,431,093 | ||
Series 2007 | 9,288 | 9,595,731 | ||||
5.944%, 2/01/37(c) | 6,452 | 6,660,210 | ||||
5.975%, 3/01/37(c) | 11,256 | 11,630,969 | ||||
6.03%, 10/01/37(c) | 71 | 72,923 | ||||
6.044%, 3/01/37(c) | 9,613 | 9,921,153 | ||||
6.093%, 1/01/37(c) | 8,034 | 8,316,243 | ||||
Federal National Mortgage Association | 3,622 | 3,749,347 | ||||
5.759%, 10/01/36(c) | 5,199 | 5,380,624 | ||||
5.848%-5.85%, 10/01/36-11/01/36(c) | 19,029 | 19,730,176 | ||||
5.912%, 6/01/36(c) | 6,763 | 7,012,741 | ||||
5.915%, 6/01/36(c) | 10,644 | 11,036,001 | ||||
Series 2007 | 5,076 | 5,194,137 | ||||
5.744%, 12/01/36(c) | 4,517 | 4,681,756 | ||||
5.786%, 8/01/37(c) | 15,053 | 15,973,816 | ||||
| 124,386,920 | ||||||
Agency Fixed Rate 30-Year – 2.4% | ||||||
Federal Gold Loan Mortgage Corp. | 15,135 | 15,465,961 | ||||
7.00%, 2/01/37 | 15,351 | 16,142,907 | ||||
| 31,608,868 | ||||||
Agency Fixed Rate 15-Year – 0.9% | ||||||
Federal National Mortgage Association | 1 | 507 | ||||
Series 1998 | 55 | 57,479 | ||||
Series 2001 | 205 | 212,647 | ||||
Series 2002 | 105 | 108,450 | ||||
Series 2005 | 548 | 565,139 | ||||
Series 2006 | 8,745 | 9,050,670 | ||||
Series 2007 | 1,844 | 1,905,598 | ||||
| 11,900,490 | ||||||
Total Mortgage Pass-Thru’s | 167,896,278 | |||||
| 96 | • ALLIANCEBERNSTEIN POOLING PORTFOLIOS |
Short Duration Bond Portfolio—Portfolio of Investments
| Principal Amount (000) | U.S. $ Value | |||||
COMMERCIAL MORTGAGE-BACKED SECURITIES – 9.7% | ||||||
Non-Agency Fixed Rate CMBS – 7.2% | ||||||
Banc of America Commercial Mortgage, Inc. | $ | 4,100 | $ | 3,854,809 | ||
Bear Stearns Commercial Mortgage | 10,615 | 10,864,556 | ||||
Series 2007-PW18, Class A4 | 3,100 | 2,939,575 | ||||
Credit Suisse Mortgage Capital Certificates | 3,500 | 3,296,024 | ||||
First Union-Lehman Brothers-Bank of America | 179 | 178,305 | ||||
GE Capital Commercial Mortgage Corp. | 5,665 | 5,557,351 | ||||
Greenwich Capital Commercial Funding Corp. | 8,500 | 8,314,321 | ||||
JPMorgan Chase Commercial Mortgage | 5,847 | 5,739,413 | ||||
Series 2006-CB17, Class A4 | 3,300 | 3,122,036 | ||||
Series 2007-LD11, Class C | 7,760 | 5,655,152 | ||||
LB Commercial Conduit Mortgage Trust | 10,000 | 7,407,822 | ||||
LB-UBS Commercial Mortgage Trust | 5,900 | 6,046,608 | ||||
Series 2003-C5, Class A3 | 7,435 | 7,287,020 | ||||
Series 2004-C7, Class A2 | 15,840 | 15,635,214 | ||||
Series 2007-C7, Class A3 | 3,800 | 3,670,723 | ||||
Nomura Asset Securities Corp. | 277 | 276,833 | ||||
| ALLIANCEBERNSTEIN POOLING PORTFOLIOS • | 97 |
Short Duration Bond Portfolio—Portfolio of Investments
| Principal Amount (000) | U.S. $ Value | |||||
Wachovia Bank Commercial Mortgage Trust | $ | 7,500 | $ | 5,439,358 | ||
| 95,285,120 | ||||||
Non-Agency Floating Rate CMBS – 2.5% | ||||||
Banc of America Large Loan, Inc. | 2,500 | 2,375,000 | ||||
Commercial Mortgage Pass-Through Certificates | 420 | 419,598 | ||||
Series 2005-FL11, Class D | 1,808 | 1,699,056 | ||||
Series 2007-FL14, Class C | 7,300 | 6,837,649 | ||||
Credit Suisse Mortgage Capital Certificates | 4,900 | 4,820,426 | ||||
Series 2007-TFLA, Class A2 | 8,000 | 7,439,834 | ||||
Lehman Brothers Floating Rate Commercial Mortgage Trust | 2,400 | 2,396,084 | ||||
Morgan Stanley Capital I | 2,000 | 1,900,000 | ||||
Series 2005-XLF, Class H | 1,000 | 945,000 | ||||
Wachovia Bank Commercial Mortgage Trust | 2,600 | 2,333,333 | ||||
Series 2007-WHL8, Class E | 2,725 | 2,402,449 | ||||
| 33,568,429 | ||||||
Total Commercial Mortgage-Backed Securities | 128,853,549 | |||||
ASSET-BACKED SECURITIES – 9.6% | ||||||
Home Equity Loans - Floating Rate – 5.1% | ||||||
ACE Securities Corp. | 18 | 13,032 | ||||
BNC Mortgage Loan Trust | 1,200 | 123,600 | ||||
| 98 | • ALLIANCEBERNSTEIN POOLING PORTFOLIOS |
Short Duration Bond Portfolio—Portfolio of Investments
| Principal Amount (000) | U.S. $ Value | |||||
Countrywide Asset-Backed Certificates | $ | 2,500 | $ | 2,254,298 | ||
First Franklin Mortgage Loan Trust | 83 | 65,104 | ||||
Home Equity Mortgage Trust | 644 | 579,388 | ||||
Series 2006-1, Class A2 | 4,010 | 1,406,410 | ||||
Household Home Equity Loan Trust | 1,899 | 1,653,982 | ||||
Series 2007-2, Class A2V | 2,800 | 2,621,500 | ||||
HSI Asset Securitization Corp. | 541 | 540,120 | ||||
Indymac Residential Asset Backed Trust | 3,350 | 3,034,892 | ||||
Lehman ABS Mortgage Loan Trust | 3,700 | 3,343,875 | ||||
Lehman XS Trust | 5,000 | 3,350,000 | ||||
Series 2006-1, Class 1M1 | 4,000 | 2,200,000 | ||||
Master Asset Backed Securities Trust | 2,000 | 1,954,811 | ||||
Merrill Lynch First Franklin Mortgage Loan Trust | 5,769 | 5,671,943 | ||||
Series 2007-3, Class A2B | 4,060 | 3,660,346 | ||||
Series 2007-5, Class 2A1 | 4,982 | 4,938,743 | ||||
Nationstar Home Equity Loan Trust | 3,100 | 2,811,796 | ||||
Newcastle Mortgage Securities Trust | 5,800 | 5,742,000 | ||||
Series 2007-1, Class 2A1 | 3,698 | 3,574,206 | ||||
| ALLIANCEBERNSTEIN POOLING PORTFOLIOS • | 99 |
Short Duration Bond Portfolio—Portfolio of Investments
| Principal Amount (000) | U.S. $ Value | |||||
Novastar Home Loan Equity | $ | 3,125 | $ | 2,736,937 | ||
Series 2007-2, Class M1 | 4,935 | 1,665,316 | ||||
Option One Mortgage Loan Trust | 4,215 | 4,110,944 | ||||
Soundview Home Equity Loan Trust | 4,185 | 4,077,759 | ||||
Specialty Underwriting & Residential Finance | 2,000 | 1,540,387 | ||||
Wells Fargo Home Equity Trust | 4,283 | 4,235,168 | ||||
| 67,906,557 | ||||||
Home Equity Loans - Fixed Rate – 2.9% | ||||||
American General Mortgage Loan Trust | 2,901 | 2,646,610 | ||||
Citifinancial Mortgage Securities, Inc. | 388 | 375,684 | ||||
Citigroup Mortgage Loan Trust, Inc. | 4,484 | 4,460,533 | ||||
Countrywide Asset-Backed Certificates | 3,500 | 2,521,495 | ||||
Credit-Based Asset Servicing & Securities, Inc. | 1,621 | 1,419,201 | ||||
Credit-Based Asset Servicing and | 2,180 | 1,524,918 | ||||
Series 2005-CB4, Class AF2 | 1,859 | 1,672,390 | ||||
Series 2005-RP2, Class AF2 | 1,800 | 1,751,625 | ||||
Series 2007-CB4, Class A2A | 2,500 | 2,490,551 | ||||
Flagstar Home Equity Loan Trust | 5,500 | 5,336,717 | ||||
| 100 | • ALLIANCEBERNSTEIN POOLING PORTFOLIOS |
Short Duration Bond Portfolio—Portfolio of Investments
| Principal Amount (000) | U.S. $ Value | |||||
Home Equity Mortgage Trust | $ | 1,076 | $ | 1,022,250 | ||
Series 2006-5, Class A1 | 2,925 | 1,317,752 | ||||
Household Home Equity Loan Trust | 7,610 | 7,128,101 | ||||
Nationstar NIM Trust | 147 | 109,965 | ||||
Security National Mortgage Loan Trust | 2,144 | 2,149,536 | ||||
Structured Asset Securities Corp. | 11,483 | 2,196,038 | ||||
| 38,123,366 | ||||||
Autos - Floating Rate – 0.8% | ||||||
Capital Auto Receivables Asset Trust FRN | 7,000 | 6,978,125 | ||||
GE Dealer Floorplan Master Note Trust | 4,360 | 4,257,816 | ||||
| 11,235,941 | ||||||
Other ABS - Floating Rate – 0.4% | ||||||
Mortgage Equity Conversion Asset Trust | 3,600 | 3,366,000 | ||||
Neapolitan Segregated Portfolio | 1,100 | 77,000 | ||||
Petra CRE CDO Ltd. | 1,865 | 1,433,428 | ||||
SLM Student Loan Trust | 163 | 162,411 | ||||
| 5,038,839 | ||||||
Credit Cards - Floating Rate – 0.3% | ||||||
Chase Issuance Trust | 4,000 | 3,909,376 | ||||
| ALLIANCEBERNSTEIN POOLING PORTFOLIOS • | 101 |
Short Duration Bond Portfolio—Portfolio of Investments
| Principal Amount (000) | U.S. $ Value | |||||
Other ABS - Fixed Rate – 0.1% | ||||||
DB Master Finance, LLC | $ | 1,600 | $ | 1,392,000 | ||
Total Asset-Backed Securities | 127,606,079 | |||||
CMOS – 5.7% | ||||||
Non-Agency Floating Rate – 2.4% | ||||||
Adjustable Rate Mortgage Trust | 4,155 | 1,454,250 | ||||
American Home Mortgage Investment Trust | 127 | 113,421 | ||||
Countrywide Alternative Loan Trust | 1,394 | 1,319,110 | ||||
Series 2006-OA14, Class 3A1 | 2,223 | 1,967,203 | ||||
Countrywide Home Loan Mortgage Pass | 167 | 144,071 | ||||
Deutsche ALT-A Securities, Inc. Alternate | 2,940 | 2,306,611 | ||||
Deutsche ALT-A Securities, Inc. Mortgage | 146 | 117,485 | ||||
Homebanc Mortgage Trust | 4,409 | 3,155,539 | ||||
Lehman XS Trust | 3,600 | 1,427,250 | ||||
MLCC Mortgage Investors, Inc. FRN | 127 | 115,582 | ||||
MortgageIT Trust | 1,729 | 1,062,278 | ||||
Sequoia Mortgage Trust | 3,998 | 3,424,258 | ||||
| 102 | • ALLIANCEBERNSTEIN POOLING PORTFOLIOS |
Short Duration Bond Portfolio—Portfolio of Investments
| Principal Amount (000) | U.S. $ Value | |||||
Structured Adjustable Rate Mortgage Loan | $ | 216 | $ | 166,348 | ||
Series 2005-9, Class 2A1 | 1,222 | 1,083,642 | ||||
Structured Asset Mortgage Investment, Inc. | 793 | 675,473 | ||||
Washington Mutual Mortgage Pass Through | 3,750 | 3,220,354 | ||||
Series 2006-AR11, Class 3A1A | 1,406 | 1,163,666 | ||||
Series 2006-AR4, Class 1A1B | 1,615 | 1,382,583 | ||||
Series 2006-AR9, Class 1AB2 | 4,575 | 4,359,853 | ||||
Series 2007-OA1, Class A1A | 3,497 | 2,887,075 | ||||
| 31,546,052 | ||||||
Non-Agency ARMS – 1.9% | ||||||
Adjustable Rate Mortgage Trust | 4,133 | 4,049,189 | ||||
Bear Stearns Alt-A Trust | 3,643 | 2,928,631 | ||||
Series 2007-1, Class 21A1 | 7,352 | 6,118,582 | ||||
Citigroup Mortgage Loan Trust, Inc. | 3,021 | 2,968,393 | ||||
Indymac Index Mortgage Loan Trust | 1,628 | 1,482,567 | ||||
JPMorgan Alternative Loan Trust | 5,522 | 5,480,129 | ||||
Residential Funding Mortgage Securities, Inc. | 2,611 | 2,563,761 | ||||
| 25,591,252 | ||||||
Non-Agency Fixed Rate – 0.9% | ||||||
Deutsche ALT-A Securities, Inc. Alternate | 1,684 | 1,683,633 | ||||
| ALLIANCEBERNSTEIN POOLING PORTFOLIOS • | 103 |
Short Duration Bond Portfolio—Portfolio of Investments
| Principal Amount (000) | U.S. $ Value | |||||
Deutsche Mortgage Securities, Inc. | $ | 2,694 | $ | 2,663,457 | ||
Merrill Lynch Mortgage Investors, Inc. | 1,636 | 1,614,573 | ||||
Nomura Asset Acceptance Corp. | 6,125 | 6,275,282 | ||||
| 12,236,945 | ||||||
Agency Floating Rate – 0.5% | ||||||
Federal National Mortgage Association | 3,854 | 3,897,717 | ||||
Series 2003-W13, Class AV2 | 471 | 470,807 | ||||
Freddie Mac Reference REMIC | 1,921 | 1,886,079 | ||||
| 6,254,603 | ||||||
Total CMOs | 75,628,852 | |||||
INFLATION-LINKED SECURITIES – 2.5% | ||||||
U.S. Treasury Notes | 31,491 | 32,797,552 | ||||
AGENCIES – 1.4% | ||||||
Agency Debentures – 1.4% | ||||||
Federal Home Loan Bank | 18,520 | 18,638,620 | ||||
SHORT-TERM INVESTMENTS – 11.1% | ||||||
Time Deposit – 11.1% | ||||||
State Street Euro Dollar | 147,327 | 147,326,782 | ||||
Total Investments – 97.1% | 1,290,854,847 | |||||
Other assets less liabilities – 2.9% | 38,785,916 | |||||
Net Assets – 100.0% | $ | 1,329,640,763 | ||||
| 104 | • ALLIANCEBERNSTEIN POOLING PORTFOLIOS |
Short Duration Bond Portfolio—Portfolio of Investments
FINANCIAL FUTURES CONTRACTS (see Note C)
| Type | Number of Contracts | Expiration Month | Original Value | Value at February 29, 2008 | Unrealized Appreciation/ (Depreciation) | |||||||||
Purchased Contracts | ||||||||||||||
U.S. T-Note 2 Yr Futures | 982 | June 2008 | $ | 110,692,660 | $ | 112,193,500 | $ | 1,500,840 | ||||||
U.S. T-Note 5 Yr Futures | 1,530 | June 2008 | 326,707,250 | 328,830,470 | 2,123,221 | |||||||||
Sold Contracts | ||||||||||||||
U.S. T-Note 10 Yr Futures | 903 | June 2008 | 103,245,084 | 105,904,969 | (2,659,884 | ) | ||||||||
| $ | 964,177 | |||||||||||||
| (a) | Position, or a portion thereof, has been segregated to collateralize margin requirements for open futures contracts. The market value of this security amounted to $770,801. |
| (b) | Variable rate coupon, rate shown as of February 29, 2008. |
| (c) | Floating Rate Security. Stated interest rate was in effect at February 29, 2008. |
| (d) | Security is exempt from registration under Rule 144A of the Securities Act of 1933. These securities are considered liquid and may be resold in transactions exempt from registration, normally to qualified institutional buyers. At February 29, 2008, the aggregate market value of these securities amounted to $64,366,195 or 4.8% of net assets. |
| (e) | Coupon rate adjusts periodically based upon a predetermined schedule. Stated interest rate in effect at February 29, 2008. |
| (f) | Illiquid security, valued at fair value. (See note A) |
| (g) | IO – Interest Only |
| The Portfolio currently owns investments collateralized by subprime mortgage loans. Subprime loans are offered to homeowners who do not have a history of debt or who have had problems meeting their debt obligations. Because repayment is less certain, subprime borrowers pay a higher rate of interest than prime borrowers. As of February 29, 2008, the Portfolio’s total exposure to subprime investments was 7.66%. These investments are valued in accordance with the Portfolio’s Valuation Policies. |
| Glossary: |
| TIPS | – Treasury Inflation Protected Security |
| See notes to financial statements. |
| ALLIANCEBERNSTEIN POOLING PORTFOLIOS • | 105 |
Short Duration Bond Portfolio—Portfolio of Investments
INTERMEDIATE DURATION BOND PORTFOLIO
PORTFOLIO OF INVESTMENTS
February 29, 2008 (unaudited)
| Principal Amount (000) | U.S. $ Value | |||||
CORPORATES - INVESTMENT | ||||||
Financial Institutions – 14.1% | ||||||
Banking – 5.6% | ||||||
Bank of America Corp. | $ | 1,970 | $ | 1,972,059 | ||
Bank of Tokyo-Mitsubishi UFJ L | 170 | 186,273 | ||||
BankAmerica Capital II | 1,950 | 2,024,576 | ||||
Barclays Bank PLC | 961 | 1,031,793 | ||||
Citicorp | 761 | 776,393 | ||||
Citigroup, Inc. | 4,345 | 4,347,012 | ||||
4.625%, 8/03/10(a) | 2,357 | 2,411,944 | ||||
5.286%, 6/09/09(a)(d) | 421 | 418,474 | ||||
Compass Bank | 4,989 | 4,824,308 | ||||
Credit Suisse First Boston USA, Inc. | 1,812 | 1,899,748 | ||||
Deutsche Bank Ag London | 4,225 | 4,431,307 | ||||
Huntington National Bank | 517 | 511,779 | ||||
JPMorgan Chase & Co. | 4,225 | 4,537,806 | ||||
JPMorgan Chase Capital XXV | 733 | 686,166 | ||||
KeyBank NA | 3,140 | 3,347,874 | ||||
Marshall & Ilsley Bank | 3,700 | 3,478,751 | ||||
Marshall & Ilsley Corp. | 3,377 | 3,404,867 | ||||
5.626%, 8/17/09(a) | 2,022 | 2,078,177 | ||||
MBNA Corp. | 1,362 | 1,370,470 | ||||
Morgan J P & Co., Inc. | 3,759 | 3,835,323 | ||||
MUFG Capital Finance 1 Ltd. | 770 | 674,781 | ||||
National City Bank of Pennsylvania | 4,245 | 4,316,227 | ||||
Intermediate Duration Bond Portfolio—Portfolio of Investments
| 106 | • ALLIANCEBERNSTEIN POOLING PORTFOLIOS |
| Principal Amount (000) | U.S. $ Value | |||||
National City Bank/Cleveland OH | $ | 4,225 | $ | 4,497,382 | ||
RBS Capital Trust III | 562 | 514,926 | ||||
Regions Financial Corp | 4,250 | 4,453,358 | ||||
Resona Bank Ltd. | 330 | 286,809 | ||||
Resona Preferred Global Securities | 619 | 576,388 | ||||
SouthTrust Corp. | 3,315 | 3,448,038 | ||||
Standard Chartered PLC | 4,800 | 4,241,592 | ||||
Suntrust Bank | 591 | 577,525 | ||||
UBS Preferred Funding Trust I | 2,319 | 2,553,173 | ||||
UFJ Finance Aruba AEC | 1,913 | 2,121,414 | ||||
Union Bank of California | 1,005 | 983,921 | ||||
Union Planters Corp. | 2,817 | 3,075,274 | ||||
Royal Bank of Scotland Group PLC | 2,824 | 2,898,957 | ||||
US Bancorp | 4,260 | 4,348,340 | ||||
Wachovia Corp. | 2,205 | 2,290,133 | ||||
5.625%, 12/15/08(a) | 1,324 | 1,339,267 | ||||
Washington Mutual, Inc. | 2,185 | 2,118,462 | ||||
4.20%, 1/15/10(a) | 341 | 321,939 | ||||
Wells Fargo & Co. | 1,808 | 1,839,027 | ||||
Zions Bancorporation | 1,420 | 1,329,509 | ||||
| 96,381,542 | ||||||
Brokerage – 2.2% | ||||||
Bear Stearns Co., Inc. | 4,125 | 3,584,266 | ||||
7.625%, 12/07/09(a) | 4,078 | 4,248,273 | ||||
The Goldman Sachs Group, Inc. | 3,321 | 3,326,629 | ||||
4.75%, 7/15/13(a) | 1,876 | 1,894,929 | ||||
| ALLIANCEBERNSTEIN POOLING PORTFOLIOS • | 107 |
Intermediate Duration Bond Portfolio—Portfolio of Investments
| Principal Amount (000) | U.S. $ Value | |||||
5.125%, 1/15/15(a) | $ | 1,590 | $ | 1,585,734 | ||
7.35%, 10/01/09(a) | 899 | 955,146 | ||||
Lehman Brothers Holdings, Inc. | 1,564 | 1,469,983 | ||||
6.50%, 7/19/17(a) | 1,315 | 1,299,885 | ||||
7.875%, 11/01/09(a) | 1,780 | 1,863,151 | ||||
Series MTNG | 1,065 | 1,025,462 | ||||
Merrill Lynch & Co., Inc. | 4,146 | 4,206,374 | ||||
6.05%, 5/16/16(a) | 1,607 | 1,589,484 | ||||
Series MTNC | 2,833 | 2,826,556 | ||||
Morgan Stanley | 4,375 | 4,478,075 | ||||
6.75%, 4/15/11(a) | 4,135 | 4,424,450 | ||||
| 38,778,397 | ||||||
Finance – 3.1% | ||||||
American Express Centurion | 2,567 | 2,588,560 | ||||
American Express Co. | 1,922 | 1,929,646 | ||||
American General Finance Corp. | 2,620 | 2,619,798 | ||||
Series MTNG | 1,705 | 1,743,664 | ||||
Capital One Bank | 1,515 | 1,502,789 | ||||
5.00%, 6/15/09(a) | 4,275 | 4,247,969 | ||||
Capital One Financial Corp. | 665 | 632,396 | ||||
5.50%, 6/01/15(a) | 484 | 446,522 | ||||
6.75%, 9/15/17(a) | 383 | 385,099 | ||||
CIT Group, Inc. | 3,725 | 3,619,493 | ||||
5.125%, 9/30/14(a) | 1,815 | 1,538,681 | ||||
5.85%, 9/15/16(a) | 3,790 | 3,234,663 | ||||
Countrywide Financial Corp. | 1,806 | 1,552,681 | ||||
Series MTN | 1,272 | 1,143,289 | ||||
Countrywide Home Loans, Inc. | 1,151 | 1,011,702 | ||||
General Electric Capital Corp. | 880 | 888,448 | ||||
4.375%, 11/21/11(a) | 1,213 | 1,245,438 | ||||
6.75%, 3/15/32(a) | 3,134 | 3,360,112 | ||||
| 108 | • ALLIANCEBERNSTEIN POOLING PORTFOLIOS |
Intermediate Duration Bond Portfolio—Portfolio of Investments
| Principal Amount (000) | U.S. $ Value | |||||
Household Finance Corp. | $ | 1,555 | $ | 1,559,544 | ||
HSBC Finance Corp. | 4,771 | 4,858,987 | ||||
7.00%, 5/15/12(a) | 2,095 | 2,267,069 | ||||
International Lease Finance Corp. | 4,190 | 4,297,855 | ||||
iStar Financial, Inc. | 1,544 | 1,289,581 | ||||
5.65%, 9/15/11(a) | 2,350 | 2,014,733 | ||||
SLM Corp. | 3,490 | 2,983,133 | ||||
| 52,961,852 | ||||||
Insurance – 1.9% | ||||||
Allied World Assurance Co. Holdings Ltd. | 1,820 | 1,897,394 | ||||
Allstate Life Global Funding Trust | 1,884 | 1,910,463 | ||||
Assurant, Inc. | 1,028 | 999,450 | ||||
Berkshire Hathaway Finance Corp. | 1,656 | 1,708,980 | ||||
GE Global Ins | 3,065 | 3,222,820 | ||||
Genworth Financial, Inc. | 1,651 | 1,665,557 | ||||
5.231%, 5/16/09(a) | 1,462 | 1,483,696 | ||||
Humana, Inc. | 1,094 | 1,120,754 | ||||
Liberty Mutual Group, Inc. | 993 | 1,019,307 | ||||
Prudential Financial, Inc. | 2,545 | 2,597,452 | ||||
UnitedHealth Group, Inc. | 1,589 | 1,598,062 | ||||
5.25%, 3/15/11(a) | 4,300 | 4,422,292 | ||||
WellPoint, Inc. | 4,327 | 4,370,144 | ||||
XL Capital Ltd. | 4,520 | 4,135,936 | ||||
| 32,152,307 | ||||||
REITS – 1.3% | ||||||
ERP Operating LP | 4,570 | 4,275,578 | ||||
HCP, Inc. | 4,630 | 4,003,510 | ||||
| ALLIANCEBERNSTEIN POOLING PORTFOLIOS • | 109 |
Intermediate Duration Bond Portfolio—Portfolio of Investments
| Principal Amount (000) | U.S. $ Value | |||||
Health Care REIT, Inc. | $ | 3,980 | $ | 3,577,483 | ||
Healthcare Realty Trust, Inc. | 2,373 | 2,176,774 | ||||
Mack-Cali Realty LP | 665 | 686,429 | ||||
Simon Property Group LP | 4,335 | 4,252,210 | ||||
5.625%, 8/15/14(a) | 3,236 | 3,251,834 | ||||
| 22,223,818 | ||||||
| 242,497,916 | ||||||
Industrial – 12.7% | ||||||
Basic – 1.0% | ||||||
BHP Billiton Finance USA Ltd. | 3,132 | 3,444,235 | ||||
Celulosa Arauco Y Constitucion | 999 | 1,113,170 | ||||
The Dow Chemical Co. | 220 | 239,742 | ||||
International Paper Co. | 1,772 | 1,776,926 | ||||
5.30%, 4/01/15(a) | 2,625 | 2,574,624 | ||||
Lubrizol Corp. | 805 | 819,511 | ||||
Packaging Corp. of America | 1,099 | 1,130,260 | ||||
United States Steel Corp. | 3,901 | 3,801,427 | ||||
7.00%, 2/01/18(a) | 1,260 | 1,248,036 | ||||
Westvaco Corp. | 670 | 683,015 | ||||
Weyerhaeuser Co. | 1,083 | 1,099,953 | ||||
| 17,930,899 | ||||||
Capital Goods – 1.2% | ||||||
Boeing Capital Corp. | 1,615 | 1,631,576 | ||||
6.50%, 2/15/12(a) | 205 | 225,577 | ||||
Caterpillar Financial Services | 2,246 | 2,281,354 | ||||
Hutchison Whampoa International Ltd. | 1,449 | 1,513,431 | ||||
Illinois Tool Works, Inc. | 1,727 | 1,771,137 | ||||
Lafarge SA | 2,204 | 2,309,675 | ||||
| 110 | • ALLIANCEBERNSTEIN POOLING PORTFOLIOS |
Intermediate Duration Bond Portfolio—Portfolio of Investments
| Principal Amount (000) | U.S. $ Value | |||||
Masco Corp. | $ | 4,795 | $ | 4,268,619 | ||
Textron Financial Corp. | 2,610 | 2,610,000 | ||||
Textron, Inc. | 875 | 894,015 | ||||
Tyco International Group SA | 1,250 | 1,313,391 | ||||
Waste Management, Inc. | 1,435 | 1,487,843 | ||||
| 20,306,618 | ||||||
Communications - Media – 1.2% | ||||||
British Sky Broadcasting Group PLC | 489 | 505,533 | ||||
BSKYB Finance UK PLC | 2,325 | 2,324,130 | ||||
Comcast Cable Communications Holdings, Inc. | 940 | 1,055,446 | ||||
9.455%, 11/15/22(a) | 1,731 | 2,146,130 | ||||
Comcast Cable Communications LLC | 1,463 | 1,515,861 | ||||
Comcast Cable Communications, Inc. | 859 | 871,216 | ||||
Comcast Corp. | 2,253 | 2,227,194 | ||||
5.50%, 3/15/11(a) | 2,767 | 2,837,224 | ||||
News America, Inc. | 1,383 | 1,379,653 | ||||
RR Donnelley & Sons Co. | 710 | 683,838 | ||||
Time Warner Entertainment Co. | 3,190 | 3,609,345 | ||||
WPP Finance Corp. | 886 | 981,790 | ||||
| 20,137,360 | ||||||
Communications - Telecommunications – 3.3% | ||||||
AT&T Corp. | 295 | 351,680 | ||||
AT&T, Inc. | 2,135 | 2,162,894 | ||||
British Telecommunications PLC | 4,581 | 5,152,759 | ||||
Embarq Corp. | 210 | 216,265 | ||||
7.082%, 6/01/16(a) | 5,970 | 5,944,126 | ||||
| ALLIANCEBERNSTEIN POOLING PORTFOLIOS • | 111 |
Intermediate Duration Bond Portfolio—Portfolio of Investments
| Principal Amount (000) | U.S. $ Value | |||||
New Cingular Wireless Services, Inc. | $ | 3,940 | $ | 4,351,813 | ||
8.75%, 3/01/31(a) | 1,429 | 1,785,686 | ||||
Pacific Bell Telephone Co. | 3,900 | 3,891,248 | ||||
Qwest Corp. | 3,735 | 3,800,362 | ||||
8.875%, 3/15/12(a) | 2,780 | 2,901,625 | ||||
Sprint Capital Corp. | 2,660 | 2,360,750 | ||||
8.375%, 3/15/12(a) | 3,219 | 2,832,720 | ||||
8.75%, 3/15/32(a) | 1,451 | 1,131,780 | ||||
Telecom Italia Capital SA | 3,815 | 3,798,896 | ||||
6.375%, 11/15/33(a) | 375 | 359,621 | ||||
Telefonos de Mexico SAB de CV | 3,828 | 3,844,078 | ||||
Verizon Communications, Inc. | 1,590 | 1,567,393 | ||||
Verizon New Jersey, Inc. | 2,200 | 2,290,917 | ||||
Vodafone Group PLC | 3,015 | 3,111,088 | ||||
7.75%, 2/15/10(a) | 4,075 | 4,374,537 | ||||
| 56,230,238 | ||||||
Consumer Cyclical - Automotive – 0.2% | ||||||
Daimler Finance North America | 698 | 713,000 | ||||
7.75%, 1/18/11(a) | 2,465 | 2,683,256 | ||||
| 3,396,256 | ||||||
Consumer Cyclical - Other – 0.9% | ||||||
MDC Holdings, Inc. | 4,540 | 4,413,171 | ||||
Starwood Hotels & Resorts Worldwide, Inc. | 2,676 | 2,745,704 | ||||
7.875%, 5/01/12(a) | 2,826 | 3,002,882 | ||||
Toll Brothers Finance Corp. | 405 | 370,644 | ||||
6.875%, 11/15/12(a) | 1,055 | 1,058,410 | ||||
Wyndham Worldwide Corp. | 4,535 | 4,233,241 | ||||
| 15,824,052 | ||||||
Consumer Non-Cyclical – 2.4% | ||||||
Abbott Laboratories | 2,124 | 2,131,377 | ||||
| 112 | • ALLIANCEBERNSTEIN POOLING PORTFOLIOS |
Intermediate Duration Bond Portfolio—Portfolio of Investments
| Principal Amount (000) | U.S. $ Value | |||||
Altria Group, Inc. | $ | 2,120 | $ | 2,642,241 | ||
Bunge Ltd Finance Corp. | 1,711 | 1,671,271 | ||||
5.875%, 5/15/13(a) | 2,720 | 2,829,020 | ||||
Cadbury Schweppes US Finance LLC | 3,480 | 3,523,928 | ||||
ConAgra Foods, Inc. | 641 | 702,105 | ||||
Fisher Scientific International, Inc. | 3,241 | 3,270,396 | ||||
6.75%, 8/15/14(a) | 1,166 | 1,189,716 | ||||
Kraft Foods, Inc. | 3,245 | 3,272,144 | ||||
The Kroger Co. | 1,100 | 1,194,467 | ||||
Baxter FinCo BV | 3,753 | 3,912,716 | ||||
Reynolds American, Inc. | 3,730 | 3,968,463 | ||||
7.625%, 6/01/16(a) | 3,655 | 3,870,586 | ||||
Safeway, Inc. | 683 | 684,769 | ||||
6.50%, 3/01/11(a) | 453 | 483,278 | ||||
Tyson Foods, Inc. | 3,785 | 3,720,515 | ||||
Wyeth | 2,212 | 2,311,454 | ||||
| 41,378,446 | ||||||
Energy – 1.1% | ||||||
Amerada Hess Corp. | 2,273 | 2,698,040 | ||||
Canadian Natural Resources Ltd. | 1,220 | 1,257,648 | ||||
ConocoPhillips | 1,854 | 1,909,985 | ||||
Gaz Capital for Gazprom | 7,890 | 7,442,637 | ||||
Statoilhydro Asa | 1,248 | 1,280,730 | ||||
The Premcor Refining Group, Inc. | 2,115 | 2,220,238 | ||||
Valero Energy Corp. | 2,588 | 2,789,530 | ||||
| 19,598,808 | ||||||
| ALLIANCEBERNSTEIN POOLING PORTFOLIOS • | 113 |
Intermediate Duration Bond Portfolio—Portfolio of Investments
| Principal Amount (000) | U.S. $ Value | |||||
Technology – 1.2% | ||||||
Computer Sciences Corp. | $ | 2,290 | $ | 2,320,949 | ||
Electronic Data Systems Corp. | 1,555 | 1,481,288 | ||||
Series B | 3,745 | 3,830,188 | ||||
International Business Machines Corp. | 455 | 465,288 | ||||
5.375%, 2/01/09(a) | 1,891 | 1,928,795 | ||||
Motorola, Inc. | 1,800 | 1,546,420 | ||||
7.50%, 5/15/25(a) | 290 | 256,592 | ||||
7.625%, 11/15/10(a) | 146 | 154,505 | ||||
Xerox Capital Trust I | 4,410 | 4,482,381 | ||||
Xerox Corp. | 720 | 748,043 | ||||
9.75%, 1/15/09(a) | 2,738 | 2,862,763 | ||||
| 20,077,212 | ||||||
Transportation - Airlines – 0.1% | ||||||
United Air Lines, Inc. | 1,800 | 1,696,227 | ||||
Transportation - Railroads – 0.1% | ||||||
Norfolk Southern Corp. | 1,770 | 1,824,352 | ||||
| 218,400,468 | ||||||
Utility – 1.7% | ||||||
Electric – 1.4% | ||||||
Carolina Power & Light Co. | 3,155 | 3,429,179 | ||||
Consumers Energy Co. | 734 | 734,115 | ||||
Enersis SA | 4,090 | 4,452,341 | ||||
Exelon Corp. | 1,295 | 1,366,395 | ||||
FirstEnergy Corp. | 1,300 | 1,376,583 | ||||
Series C | 1,436 | 1,566,209 | ||||
FPL Group Capital, Inc. | 2,855 | 3,010,184 | ||||
MidAmerican Energy Holdings Co. | 1,763 | 1,892,811 | ||||
| 114 | • ALLIANCEBERNSTEIN POOLING PORTFOLIOS |
Intermediate Duration Bond Portfolio—Portfolio of Investments
| Principal Amount (000) | U.S. $ Value | |||||
Nisource Finance Corp. | $ | 1,656 | $ | 1,806,762 | ||
Pacific Gas & Electric Co. | 1,700 | 1,719,387 | ||||
Progress Energy, Inc. | 574 | 622,446 | ||||
Public Service Company of Colorado | 874 | 1,020,478 | ||||
SPI Electricity & Gas Australia Holdings Pty Ltd. | 1,447 | 1,536,399 | ||||
| 24,533,289 | ||||||
Natural Gas – 0.3% | ||||||
Duke Energy Field Services Corp. | 506 | 546,465 | ||||
Enterprise Products Operating LP | 1,278 | 1,300,392 | ||||
Williams Cos, Inc. | 2,285 | 2,416,387 | ||||
| 4,263,244 | ||||||
| 28,796,533 | ||||||
Non Corporate Sectors – 0.2% | ||||||
Agencies - Government Sponsored – 0.2% | ||||||
Eksportfinans A/s | 4,075 | 4,448,718 | ||||
Total Corporates - Investment Grades | 494,143,635 | |||||
MORTGAGE PASS-THRU’S – 24.6% | ||||||
Agency Fixed Rate 30-Year – 20.7% | ||||||
Federal Gold Loan Mortgage Corp. | 5,950 | 5,680,560 | ||||
Series 2005 | 12,050 | 11,503,677 | ||||
Series 2006 | 195 | 186,077 | ||||
7.00%, 8/01/36-10/01/36(a) | 1,557 | 1,637,318 | ||||
Series 2007 | 6,229 | 6,293,349 | ||||
7.00%, 2/01/37(a) | 14,427 | 15,171,616 | ||||
| ALLIANCEBERNSTEIN POOLING PORTFOLIOS • | 115 |
Intermediate Duration Bond Portfolio—Portfolio of Investments
| Principal Amount (000) | U.S. $ Value | |||||
Federal National Mortgage Association | $ | 16,932 | $ | 16,753,348 | ||
5.50%, 4/01/33-7/01/33(a) | 23,344 | 23,571,720 | ||||
Series 2004 | 17,874 | 18,031,124 | ||||
Series 2005 | 27,218 | 26,070,459 | ||||
5.50%, 2/01/35(a) | 4,301 | 4,342,550 | ||||
6.00%, 4/01/35(a) | 14,310 | 14,687,571 | ||||
Series 2006 | 25,783 | 25,453,612 | ||||
6.50%, 9/01/36(a) | 42,528 | 44,098,847 | ||||
Series 2007 | 19,574 | 18,761,628 | ||||
5.00%, 7/01/36(a) | 6,865 | 6,785,691 | ||||
5.50%, 11/01/36-8/01/37(a) | 54,805 | 55,290,578 | ||||
6.50%, 11/01/37(a) | 6,054 | 6,276,740 | ||||
Series 2008 | 56,715 | 56,793,992 | ||||
| 357,390,457 | ||||||
Agency ARMS – 3.9% | ||||||
Federal Home Loan Mortgage Corp. | 31,811 | 32,896,794 | ||||
Series 2007 | 6,270 | 6,481,885 | ||||
6.116%, 1/01/37(a)(d) | 8,604 | 8,907,364 | ||||
Federal National Mortgage Association | 1,183 | 1,225,022 | ||||
5.912%, 6/01/36(a)(d) | 2,978 | 3,087,997 | ||||
5.975%, 11/01/36(a)(d) | 6,521 | 6,761,836 | ||||
Series 2007 | 4,953 | 5,256,143 | ||||
6.028%, 11/01/36(a)(d) | 2,719 | 2,819,271 | ||||
| 67,436,312 | ||||||
Total Mortgage Pass-Thru’s | 424,826,769 | |||||
GOVERNMENTS - TREASURIES – 15.2% | ||||||
Treasuries – 15.2% | ||||||
Mexican Bonos | MXN | 354,435 | 33,831,499 | |||
| 116 | • ALLIANCEBERNSTEIN POOLING PORTFOLIOS |
Intermediate Duration Bond Portfolio—Portfolio of Investments
| Principal Amount (000) | U.S. $ Value | |||||
Government of Poland | PLN | 42,900 | $ | 18,336,618 | ||
U.S. Treasury Bonds | $ | 81,875 | 82,917,597 | |||
U.S. Treasury Notes | 86,055 | 90,472,031 | ||||
4.25%, 11/15/17(a) | 33,689 | 35,612,945 | ||||
Total Governments - Treasuries | 261,170,690 | |||||
COMMERCIAL MORTGAGE-BACKED SECURITIES – 10.6% | ||||||
Non-Agency Fixed Rate CMBS – 10.5% | ||||||
Banc of America Commercial Mortgage, Inc. | 839 | 844,737 | ||||
Series 2004-4, Class A3 | 1,035 | 1,035,000 | ||||
Series 2004-6, Class A2 | 3,865 | 3,776,958 | ||||
Series 2006-5, Class A4 | 7,680 | 7,302,427 | ||||
Bear Stearns Commercial Mortgage Securities, Inc. | 2,500 | 2,356,487 | ||||
Series 2005-T18, Class A4 | 4,235 | 3,941,749 | ||||
Series 2006-PW12, Class A4 | 2,285 | 2,230,653 | ||||
Series 2007-PW18, Class A4 | 8,425 | 7,989,006 | ||||
Credit Suisse First Boston Mortgage Securities Corp. | 175 | 173,069 | ||||
Series 2004-C1, Class A4 | 1,815 | 1,728,453 | ||||
Series 2005-C1, Class A4 | 1,516 | 1,362,905 | ||||
Credit Suisse Mortgage Capital Certificates | 2,095 | 2,059,123 | ||||
Series 2006-C4, Class A3 | 6,475 | 6,161,321 | ||||
Series 2006-C5, Class A3 | 4,500 | 4,237,745 | ||||
| ALLIANCEBERNSTEIN POOLING PORTFOLIOS • | 117 |
Intermediate Duration Bond Portfolio—Portfolio of Investments
| Principal Amount (000) | U.S. $ Value | |||||
GE Capital Commercial Mortgage Corp. | $ | 3,265 | $ | 3,202,957 | ||
Greenwich Capital Commercial Funding Corp. | 1,102 | 1,032,810 | ||||
Series 2005-GG3, Class A2 | 1,823 | 1,783,177 | ||||
Series 2007-GG9, Class A4 | 3,800 | 3,600,802 | ||||
JPMorgan Chase Commercial Mortgage Securities Corp. | 1,720 | 1,680,615 | ||||
Series 2005-LDP1, Class A4 | 1,846 | 1,759,961 | ||||
Series 2005-LDP3, Class A2 | 2,810 | 2,748,651 | ||||
Series 2005-LDP4, Class A2 | 1,420 | 1,388,238 | ||||
Series 2006-CB14, Class A4 | 1,720 | 1,656,320 | ||||
Series 2006-CB15, Class A4 | 7,100 | 6,932,351 | ||||
Series 2006-CB17, Class A4 | 8,580 | 8,117,294 | ||||
Series 2007-LD11, Class A2 | 9,010 | 8,862,036 | ||||
LB-UBS Commercial Mortgage Trust | 4,900 | 4,597,742 | ||||
Series 2004-C2, Class A4 | 7,760 | 7,221,115 | ||||
Series 2004-C4, Class A4 | 6,015 | 5,921,094 | ||||
Series 2004-C8, Class A2 | 1,084 | 1,059,039 | ||||
Series 2005-C1, Class A4 | 4,209 | 3,902,597 | ||||
Series 2005-C7, Class A4 | 2,380 | 2,165,932 | ||||
Series 2006-C1, Class A4 | 6,557 | 6,034,020 | ||||
Series 2006-C6, Class A4 | 8,090 | 7,650,379 | ||||
| 118 | • ALLIANCEBERNSTEIN POOLING PORTFOLIOS |
Intermediate Duration Bond Portfolio—Portfolio of Investments
| Principal Amount (000) | U.S. $ Value | |||||
Series 2007-C6, Class A4 | $ | 5,725 | $ | 5,538,712 | ||
Series 2007-C7, Class A3 | 8,290 | 8,007,972 | ||||
Merrill Lynch Mortgage Trust | 2,100 | 1,938,140 | ||||
Series 2005-MKB2, Class A2 | 2,230 | 2,197,458 | ||||
Merrill Lynch/Countrywide Commercial Mortgage Trust | 5,385 | 5,323,557 | ||||
Series 2006-2, Class A4 | 3,075 | 3,037,818 | ||||
Morgan Stanley Capital I | 6,500 | 6,372,824 | ||||
Series 2005-HQ5, Class A4 | 5,186 | 4,927,408 | ||||
Series 2007-HQ13, Class A3 | 8,155 | 7,702,946 | ||||
Series 2007-T27, Class A4 | 9,860 | 9,452,140 | ||||
| 181,015,738 | ||||||
Non-Agency Floating Rate CMBS – 0.1% | ||||||
GS Mortgage Securities Corp. II | 1,855 | 1,706,600 | ||||
Total Commercial Mortgage-Backed Securities | 182,722,338 | |||||
ASSET-BACKED SECURITIES – 1.9% | ||||||
Home Equity Loans - Floating Rate – 1.7% | ||||||
Asset Backed Funding Certificates | 870 | 837,193 | ||||
Bear Stearns Asset Backed Securities, Inc. | 18 | 17,546 | ||||
Citigroup Mortgage Loan Trust, Inc. | 3,715 | 1,384,766 | ||||
Credit-Based Asset Servicing & Securities, Inc. | 776 | 772,411 | ||||
| ALLIANCEBERNSTEIN POOLING PORTFOLIOS • | 119 |
Intermediate Duration Bond Portfolio—Portfolio of Investments
| Principal Amount (000) | U.S. $ Value | |||||
GE-WMC Mortgage Securities LLC | $ | 1,523 | $ | 1,508,841 | ||
HFC Home Equity Loan Asset Backed Certificates | 1,161 | 1,046,244 | ||||
Home Equity Mortgage Trust | 1,040 | 364,755 | ||||
HSI Asset Securitization Corp. Trust | 201 | 200,202 | ||||
Lehman XS Trust | 4,865 | 2,894,675 | ||||
Merrill Lynch First Franklin Mortgage Loan Trust | 5,265 | 5,176,594 | ||||
Option One Mortgage Loan Trust | 1,785 | 528,360 | ||||
RAAC Series | 967 | 947,379 | ||||
Residential Asset Mortgage Products, Inc. | 577 | 545,904 | ||||
Series 2005-RZ1, Class A2 | 1,082 | 1,018,595 | ||||
Residential Funding Mortgage Securities II, Inc. | 622 | 621,132 | ||||
Saxon Asset Securities Trust | 189 | 189,038 | ||||
Specialty Underwriting & Residential Finance | 238 | 237,027 | ||||
Wells Fargo Home Equity Trust | 10,708 | 10,587,920 | ||||
| 28,878,582 | ||||||
| 120 | • ALLIANCEBERNSTEIN POOLING PORTFOLIOS |
Intermediate Duration Bond Portfolio—Portfolio of Investments
| Principal Amount (000) | U.S. $ Value | |||||
Other ABS - Floating Rate – 0.1% | ||||||
Neapolitan Segregated Portfolio | $ | 1,775 | $ | 124,250 | ||
Petra CRE CDO Ltd. | 2,220 | 1,706,279 | ||||
SLM Student Loan Trust | 517 | 513,851 | ||||
| 2,344,380 | ||||||
Home Equity Loans - Fixed Rate – 0.1% | ||||||
Citifinancial Mortgage Securities, Inc. | 818 | 668,401 | ||||
Home Equity Mortgage Trust | 639 | 607,298 | ||||
| 1,275,699 | ||||||
Other ABS - Fixed Rate – 0.0% | ||||||
DB Master Finance, LLC | 1,000 | 870,000 | ||||
Total Asset-Backed Securities | 33,368,661 | |||||
CMOS – 1.9% | ||||||
Non-Agency ARMS – 1.2% | ||||||
Bear Stearns Alt-A Trust | 3,874 | 3,114,341 | ||||
Series 2006-3, Class 22A1 | 1,812 | 1,531,617 | ||||
Series 2007-1, Class 21A1 | 2,420 | 2,014,214 | ||||
Citigroup Mortgage Loan Trust, Inc. | 4,316 | 4,240,562 | ||||
Series 2006-AR1, Class 3A1 | 4,653 | 4,637,055 | ||||
Indymac Index Mortgage Loan Trust | 2,176 | 1,981,473 | ||||
| ALLIANCEBERNSTEIN POOLING PORTFOLIOS • | 121 |
Intermediate Duration Bond Portfolio—Portfolio of Investments
| Principal Amount (000) | U.S. $ Value | |||||
Residential Funding Mortgage Securities, Inc. | $ | 2,725 | $ | 2,676,334 | ||
| 20,195,596 | ||||||
Non-Agency Floating Rate – 0.5% | ||||||
Countrywide Alternative Loan Trust | 1,664 | 1,574,064 | ||||
Series 2006-OA14, Class 3A1 | 5,035 | 4,455,020 | ||||
Countrywide Home Loan | 3,079 | 1,910,167 | ||||
JP Morgan Alternative Loan Trust | 552 | 548,265 | ||||
| 8,487,516 | ||||||
Non-Agency Fixed Rate – 0.2% | ||||||
Deutsche Mortgage Securities, Inc. | 3,361 | 3,323,571 | ||||
Agency Floating Rate – 0.0% | ||||||
Fannie Mae Grantor Trust | 392 | 376,309 | ||||
Total CMOs | 32,382,992 | |||||
GOVERNMENTS - SOVEREIGN BONDS – 1.3% | ||||||
Russian Federation | 19,831 | 22,606,987 | ||||
SUPRANATIONALS – 1.1% | ||||||
Asian Development Bank | 3,810 | 4,244,687 | ||||
European Investment Bank | 1,970 | 1,962,193 | ||||
Inter-American Development Bank | 4,180 | 4,545,202 | ||||
Nordic Investment Bank | 4,180 | 4,529,536 | ||||
| 122 | • ALLIANCEBERNSTEIN POOLING PORTFOLIOS |
Intermediate Duration Bond Portfolio—Portfolio of Investments
| Principal Amount (000) | U.S. $ Value | |||||
International Bank for Reconstruction & Development | $ | 2,340 | $ | 3,212,300 | ||
Total Supranationals | 18,493,918 | |||||
GOVERNMENTS - SOVEREIGN AGENCIES – 0.4% | ||||||
Landwirtschaftliche Rentenbank | 5,490 | 5,961,362 | ||||
Korea Development Bank | 1,335 | 1,361,609 | ||||
Total Governments - Sovereign Agencies | 7,322,971 | |||||
CORPORATES - NON-INVESTMENT GRADES – 0.2% | ||||||
Industrial – 0.2% | ||||||
Consumer Cyclical - Other – 0.2% | ||||||
Centex Corp. | 4,085 | 3,451,825 | ||||
SHORT-TERM INVESTMENTS – 13.7% | ||||||
Time Deposit – 13.7% | ||||||
State Street Euro Dollar | 236,014 | 236,014,123 | ||||
Total Investments – 99.6% | 1,716,504,909 | |||||
Other assets less liabilities – 0.4% | 7,158,456 | |||||
Net Assets – 100.0% | $ | 1,723,663,365 | ||||
INTEREST RATE SWAP TRANSACTIONS (see Note C)
| Rate Type | |||||||||||||
| Swap Counterparty | Notional Amount (000) | Termination Date | Payments made by the Portfolio | Payments received by the Portfolio | Unrealized Appreciation/ (Depreciation) | ||||||||
Lehman Brothers | $ | 10,000 | 12/04/11 | 3 Month LIBOR | 4.850 | % | $ | 632,991 | |||||
Lehman Brothers | 12,075 | 2/26/13 | 3 Month LIBOR | 3.746 | % | 210,492 | |||||||
Lehman Brothers | 171,095 | 11/28/17 | 3 Month LIBOR | 4.726 | % | 10,329,810 | |||||||
| ALLIANCEBERNSTEIN POOLING PORTFOLIOS • | 123 |
Intermediate Duration Bond Portfolio—Portfolio of Investments
FINANCIAL FUTURES CONTRACTS (see Note C)
| Type | Number of Contracts | Expiration Month | Original Value | Value at February 29, 2008 | Unrealized Appreciation/ (Depreciation) | |||||||||
Sold Contracts | ||||||||||||||
U.S T-Bond Futures | 158 | June 2008 | $ | 18,128,808 | $ | 18,742,750 | $ | (613,943 | ) | |||||
U.S. T-Note 10 Yr Futures | 267 | June 2008 | 30,527,616 | 31,314,094 | (786,477 | ) | ||||||||
U.S. T-Note 5 Yr Futures | 312 | June 2008 | 34,968,994 | 35,646,000 | (677,006 | ) | ||||||||
| $ | (2,077,426 | ) | ||||||||||||
FORWARD CURRENCY EXCHANGE CONTRACTS (see Note C)
| Contract Amount (000) | U.S. $ Value on Origination Date | U.S. $ Value at February 29, 2008 | Unrealized Appreciation/ (Depreciation) | |||||||||
Buy Contracts: | ||||||||||||
Japanese Yen settling 3/11/08 | 7,977 | $ | 75,027 | $ | 76,839 | $ | 1,812 | |||||
Japanese Yen settling 3/11/08 | 9,654,864 | 89,401,029 | 92,998,484 | 3,597,455 | ||||||||
Sale Contracts: | ||||||||||||
Japanese Yen settling 3/11/08 | 9,662,841 | 89,661,699 | 93,075,323 | (3,413,624 | ) | |||||||
Mexican Peso settling 3/31/08 | 363,374 | 33,131,847 | 33,808,793 | (676,946 | ) | |||||||
Polish Zloty settling 3/06/08 | 42,942 | 17,171,322 | 18,473,466 | (1,302,144 | ) | |||||||
| (a) | Position, or a portion thereof, has been segregated to collateralize forward currency exchange contracts. The aggregate market value of these securities amounted to $1,494,302,625. |
| (b) | Variable rate coupon, rate shown as of February 29, 2008. |
| (c) | Security is exempt from registration under Rule 144A of the Securities Act of 1933. These securities are considered liquid and may be resold in transactions exempt from registration, normally to qualified institutional buyers. At February 29, 2008, the aggregate market value of these securities amounted to $56,155,050 or 3.3% of net assets. |
| (d) | Floating Rate Security. Stated interest rate was in effect at February 29, 2008. |
| (e) | Position, or a portion thereof, has been segregated to collateralize margin requirements for open futures contracts. The market value of this security amounted to $1,671,011. |
| (f) | Coupon rate adjusts periodically based upon a predetermined schedule. Stated interest rate in effect at February 29, 2008. |
| (g) | Illiquid security, valued at fair value (see note A). |
| The Portfolio currently owns investments collateralized by subprime mortgage loans. Subprime loans are offered to homeowners who do not have a history of debt or who have had problems meeting their debt obligations. Because repayment is less certain, subprime borrowers pay a higher rate of interest than prime borrowers. As of February 29, 2008, the Portfolio’s total exposure to subprime investments was 1.59%. These investments are valued in accordance with the Portfolio’s Valuation Policies. |
| Currency | Abbreviations: |
| MXN | – Mexican Peso |
| PLN | – Polish Zloty |
| Glossary: |
| LIBOR | – London Interbank Offered Rates |
| See notes to financial statements. |
| 124 | • ALLIANCEBERNSTEIN POOLING PORTFOLIOS |
Intermediate Duration Bond Portfolio—Portfolio of Investments
INFLATION PROTECTED SECURITIES PORTFOLIO
PORTFOLIO OF INVESTMENTS
February 29, 2008 (unaudited)
| Principal Amount (000) | U.S. $ Value | |||||
INFLATION-LINKED SECURITIES – 99.6% | ||||||
U.S. Treasury Notes | ||||||
0.875%, 4/15/10 (TIPS) | $ | 26,746 | $ | 27,535,779 | ||
1.625%, 1/15/15-1/15/18 (TIPS) | 111,250 | 117,489,304 | ||||
1.875%, 7/15/13-7/15/15 (TIPS) | 99,180 | 107,190,864 | ||||
2.00%, 1/15/14-1/15/16 (TIPS) | 88,315 | 95,986,470 | ||||
2.375%, 1/15/17 (TIPS) | 82,168 | 91,687,588 | ||||
3.00%, 7/15/12 (TIPS) | 66,444 | 75,035,083 | ||||
3.375%, 1/15/12 (TIPS) | 72,770 | 82,571,269 | ||||
3.50%, 1/15/11 (TIPS) | 48,816 | 54,315,756 | ||||
4.25%, 1/15/10 (TIPS) | 51,773 | 56,577,920 | ||||
Total Inflation-Linked Securities | 708,390,033 | |||||
SHORT-TERM INVESTMENTS – 0.1% | ||||||
Time Deposit – 0.1% | ||||||
State Street Euro Dollar | 1,075 | 1,075,083 | ||||
Total Investments – 99.7% | 709,465,116 | |||||
Other assets less liabilities – 0.3% | 1,856,093 | |||||
Net Assets – 100.0% | $ | 711,321,209 | ||||
| Glossary: |
| TIPS | – Treasury Inflation Protected Security |
| See notes to financial statements. |
| ALLIANCEBERNSTEIN POOLING PORTFOLIOS • | 125 |
Inflation Protected Securities Portfolio—Portfolio of Investments
HIGH-YIELD PORTFOLIO
PORTFOLIO OF INVESTMENTS
February 29, 2008 (unaudited)
| Principal Amount (000) | U.S. $ Value | |||||
CORPORATES - NON-INVESTMENT | ||||||
Industrial – 60.4% | ||||||
Basic – 6.0% | ||||||
Arch Western Finance LLC | $ | 670 | $ | 659,950 | ||
Basell AF SCA | 1,445 | 1,011,500 | ||||
Citigroup (JSC Severstal) | 1,938 | 2,066,102 | ||||
Domtar Corp. | 2,500 | 2,350,000 | ||||
Evraz Group SA | 1,369 | 1,352,572 | ||||
Freeport-McMoRan Copper & Gold, Inc. | 4,280 | 4,536,800 | ||||
Georgia-Pacific Corp. | 905 | 848,437 | ||||
7.125%, 1/15/17(a)(b) | 1,095 | 1,018,350 | ||||
Hexion US Fin/Nova Scotia | 525 | 543,375 | ||||
Hexion US Finance Corp./Hexion Nova | 525 | 469,875 | ||||
Huntsman International LLC | 1,130 | 1,169,550 | ||||
Huntsman LLC | 801 | 853,065 | ||||
Ineos Group Holdings PLC | 1,575 | 1,181,250 | ||||
Jefferson Smurfit Corp. US | 630 | 587,475 | ||||
The Mosaic Co. | 2,875 | 3,090,625 | ||||
NewMarket Corp. | 615 | 602,700 | ||||
NewPage Corp. | 797 | 798,993 | ||||
Novelis, Inc. | 4,070 | 3,663,000 | ||||
Peabody Energy Corp. | 900 | 852,750 | ||||
7.375%, 11/01/16(a) | 1,095 | 1,133,325 | ||||
Series B | 1,815 | 1,849,031 | ||||
| 30,638,725 | ||||||
| 126 | • ALLIANCEBERNSTEIN POOLING PORTFOLIOS |
High-Yield Portfolio—Portfolio of Investments
| Principal Amount (000) | U.S. $ Value | |||||
Capital Goods – 6.4% | ||||||
Alion Science and Technology Corp. | $ | 270 | $ | 177,525 | ||
Allied Waste North America, Inc. | 1,603 | 1,570,940 | ||||
6.875%, 6/01/17(a) | 1,430 | 1,383,525 | ||||
Series B | 2,053 | 2,027,338 | ||||
7.375%, 4/15/14(a) | 655 | 630,438 | ||||
Associated Materials, Inc. | 1,635 | 1,038,225 | ||||
Berry Plastics Holding Corp. | 1,580 | 1,394,350 | ||||
10.25%, 3/01/16(a) | 555 | 438,450 | ||||
Bombardier, Inc. | 3,015 | 2,864,250 | ||||
8.00%, 11/15/14(a)(b) | 2,120 | 2,183,600 | ||||
Case Corp. | 2,935 | 2,949,675 | ||||
Case New Holland, Inc. | 2,990 | 2,990,000 | ||||
Crown Americas | 1,500 | 1,518,750 | ||||
L-3 Communications Corp. | 1,828 | 1,777,730 | ||||
Owens Brockway Glass Container, Inc. | 2,530 | 2,530,000 | ||||
Owens Corning, Inc. | 1,210 | 1,095,126 | ||||
7.00%, 12/01/36(a) | 1,555 | 1,173,888 | ||||
Plastipak Holdings, Inc. | 990 | 923,175 | ||||
Russell-Stanley Holdings, Inc. | 453 | 56,691 | ||||
Terex Corp. | 786 | 782,070 | ||||
Trinity Industries, Inc. | 1,300 | 1,261,000 | ||||
United Rentals North America, Inc. | 640 | 579,200 | ||||
7.75%, 11/15/13(a) | 2,075 | 1,691,125 | ||||
| 33,037,071 | ||||||
Communications - Media – 9.6% | ||||||
Allbritton Communications Co. | 1,351 | 1,344,245 | ||||
AMC Entertainment, Inc. | 2,250 | 2,115,000 | ||||
| ALLIANCEBERNSTEIN POOLING PORTFOLIOS • | 127 |
High-Yield Portfolio—Portfolio of Investments
| Principal Amount (000) | U.S. $ Value | |||||
Cablevision Systems Corp. | $ | 1,637 | $ | 1,575,613 | ||
CCH I Holdings LLC | 7,657 | 3,905,070 | ||||
CCH I LLC | 1,000 | 695,000 | ||||
Clear Channel Communications, Inc. | 5,809 | 3,833,940 | ||||
5.75%, 1/15/13(a) | 1,641 | 1,181,520 | ||||
CSC Holdings, Inc. | 2,565 | 2,475,225 | ||||
7.625%, 7/15/18(a) | 1,535 | 1,404,525 | ||||
7.875%, 2/15/18(a) | 640 | 590,400 | ||||
Dex Media West LLC | 444 | 415,695 | ||||
DirecTV Holdings LLC | 3,811 | 3,534,703 | ||||
EchoStar DBS Corp. | 1,080 | 1,063,800 | ||||
6.625%, 10/01/14(a) | 3,970 | 3,821,125 | ||||
7.125%, 2/01/16(a) | 850 | 835,125 | ||||
Idearc, Inc. | 1,710 | 1,008,900 | ||||
Intelsat Bermuda Ltd. | 2,812 | 2,801,455 | ||||
Intelsat Subsidiary Holding Co. Ltd. | 1,274 | 1,274,000 | ||||
Lamar Media Corp. | 475 | 437,000 | ||||
Liberty Media Corp. | 545 | 487,330 | ||||
7.875%, 7/15/09(a) | 350 | 355,888 | ||||
8.25%, 2/01/30(a) | 530 | 441,608 | ||||
LIN Television Corp. | 725 | 656,125 | ||||
Quebecor Media, Inc. | 3,255 | 2,986,462 | ||||
Rainbow National Services LLC | 764 | 783,100 | ||||
10.375%, 9/01/14(a)(b) | 473 | 503,745 | ||||
RH Donnelley Corp. | 1,285 | 751,725 | ||||
Series A-1 | 705 | 415,950 | ||||
| 128 | • ALLIANCEBERNSTEIN POOLING PORTFOLIOS |
High-Yield Portfolio—Portfolio of Investments
| Principal Amount (000) | U.S. $ Value | |||||
Series A-2 | $ | 748 | $ | 441,320 | ||
Series A-3 | 2,740 | 1,630,300 | ||||
Sirius Satellite Radio, Inc. | 545 | 449,625 | ||||
Univision Communications, Inc. | 1,190 | 1,100,750 | ||||
WDAC Subsidiary Corp. | 982 | 736,500 | ||||
WMG Holdings Corp. | 3,196 | 1,661,920 | ||||
XM Satellite Radio, Inc. | 1,415 | 1,291,187 | ||||
| 49,005,876 | ||||||
Communications - | ||||||
Alltel Corp. | 2,750 | 1,842,500 | ||||
American Tower Corp. | 310 | 308,450 | ||||
7.125%, 10/15/12(a) | 2,430 | 2,490,750 | ||||
Citizens Communications Co. | 1,977 | 1,818,840 | ||||
Cricket Communications, Inc. | 2,085 | 1,855,650 | ||||
Digicel Ltd. | 2,227 | 2,238,135 | ||||
Inmarsat Finance PLC | 1,835 | 1,848,762 | ||||
10.375%, 11/15/12(a)(e) | 1,037 | 1,003,297 | ||||
Level 3 Financing, Inc. | 835 | 632,513 | ||||
9.25%, 11/01/14(a) | 1,200 | 972,000 | ||||
Mobile Telesystems Finance SA | 2,858 | 2,927,875 | ||||
PanAmSat Corp. | 1,171 | 1,171,000 | ||||
Qwest Capital Funding, Inc. | 4,029 | 3,918,203 | ||||
Qwest Communications International, Inc. | 350 | 340,375 | ||||
Time Warner Telecom Holdings, Inc. | 740 | 740,000 | ||||
Windstream Corp. | 714 | 712,215 | ||||
8.625%, 8/01/16(a) | 810 | 824,175 | ||||
| 25,644,740 | ||||||
| ALLIANCEBERNSTEIN POOLING PORTFOLIOS • | 129 |
High-Yield Portfolio—Portfolio of Investments
| Principal Amount (000) | U.S. $ Value | |||||
Consumer Cyclical - Automotive – 7.3% | ||||||
Affinia Group, Inc. | $ | 45 | $ | 39,825 | ||
Allison Transmission | 235 | 200,925 | ||||
Ford Motor Co. | 5,020 | 3,426,150 | ||||
Ford Motor Credit Co. | 2,524 | 2,071,121 | ||||
7.127%, 1/13/12(a)(c) | 2,785 | 2,191,611 | ||||
8.00%, 12/15/16(a) | 1,000 | 818,967 | ||||
General Motors Acceptance Corp. | 2,700 | 2,033,662 | ||||
6.875%, 9/15/11(a) | 3,570 | 2,912,859 | ||||
8.00%, 11/01/31(a) | 2,170 | 1,640,503 | ||||
General Motors Corp. | 4,155 | 3,142,219 | ||||
8.375%, 7/15/33(a) | 6,705 | 5,129,325 | ||||
The Goodyear Tire & Rubber Co. | 550 | 572,000 | ||||
9.00%, 7/01/15(a) | 1,307 | 1,375,617 | ||||
Keystone Automotive Operations, Inc. | 1,436 | 875,960 | ||||
Lear Corp. | 1,835 | 1,472,588 | ||||
8.50%, 12/01/13(a) | 370 | 333,925 | ||||
8.75%, 12/01/16(a) | 3,010 | 2,596,125 | ||||
Tenneco, Inc. | 465 | 455,700 | ||||
TRW Automotive, Inc. | 5,330 | 4,850,300 | ||||
Visteon Corp. | 1,795 | 1,166,750 | ||||
| 37,306,132 | ||||||
Consumer Cyclical - Other – 7.5% | ||||||
Boyd Gaming Corp. | 737 | 679,883 | ||||
Broder Brothers Co. | 642 | 449,400 | ||||
DR Horton, Inc. | 250 | 230,625 | ||||
Gaylord Entertainment Co. | 1,307 | 1,202,440 | ||||
Greektown Holdings LLC | 550 | 519,750 | ||||
| 130 | • ALLIANCEBERNSTEIN POOLING PORTFOLIOS |
High-Yield Portfolio—Portfolio of Investments
| Principal Amount (000) | U.S. $ Value | |||||
Harrah’s Operating Co., Inc. | $ | 4,769 | $ | 2,861,400 | ||
5.75%, 10/01/17(a) | 514 | 292,980 | ||||
6.50%, 6/01/16(a) | 5,352 | 3,197,820 | ||||
Host Hotels & Resorts LP | 385 | 371,525 | ||||
Host Marriott LP | 2,935 | 2,780,912 | ||||
KB Home | 600 | 567,000 | ||||
7.75%, 2/01/10(a) | 410 | 391,037 | ||||
Levi Strauss & Co. | 742 | 706,755 | ||||
MGM Mirage | 3,952 | 3,532,100 | ||||
7.50%, 6/01/16(a) | 1,200 | 1,116,000 | ||||
7.625%, 1/15/17(a) | 2,080 | 1,960,400 | ||||
8.375%, 2/01/11(a) | 2,179 | 2,189,895 | ||||
Mohegan Tribal Gaming Auth | 1,245 | 1,064,475 | ||||
NCL Corp. Ltd. | 515 | 520,150 | ||||
Penn National Gaming, Inc. | 1,496 | 1,421,200 | ||||
Six Flags, Inc. | 1,250 | 775,000 | ||||
Station Casinos, Inc. | 8,445 | 5,172,563 | ||||
Turning Stone Resort Casino Enterprise | 1,097 | 1,080,545 | ||||
Universal City Development Partners | 913 | 941,531 | ||||
Universal City Florida Holding Co. | 630 | 618,975 | ||||
William Lyon Homes, Inc. | 1,107 | 653,130 | ||||
Wynn Las Vegas Capital Corp. | 3,435 | 3,297,600 | ||||
| 38,595,091 | ||||||
Consumer Cyclical - Restaurants – 0.1% | ||||||
Sbarro, Inc. | 415 | 340,300 | ||||
Consumer Cyclical - Retailers – 1.6% | ||||||
Autonation, Inc. | 175 | 143,500 | ||||
| ALLIANCEBERNSTEIN POOLING PORTFOLIOS • | 131 |
High-Yield Portfolio—Portfolio of Investments
| Principal Amount (000) | U.S. $ Value | |||||
Burlington Coat Factory Warehouse Corp. | $ | 555 | $ | 449,550 | ||
Couche-Tard, Inc. | 1,006 | 1,000,970 | ||||
GSC Holdings Corp. | 2,070 | 2,181,262 | ||||
Michaels Stores, Inc. | 885 | 773,269 | ||||
Rite Aid Corp. | 2,400 | 1,560,000 | ||||
9.25%, 6/01/13(a) | 870 | 711,225 | ||||
9.375%, 12/15/15(a) | 100 | 77,500 | ||||
9.50%, 6/15/17(a) | 1,919 | 1,468,035 | ||||
| 8,365,311 | ||||||
Consumer Non-Cyclical – 6.0% | ||||||
Albertson’s, Inc. | 2,220 | 2,009,575 | ||||
ARAMARK Corp. | 1,710 | 1,684,350 | ||||
Community Health Systems, Inc. | 2,266 | 2,223,513 | ||||
DaVita, Inc. | 1,219 | 1,206,810 | ||||
Dean Foods Co. | 921 | 805,875 | ||||
Del Monte Corp. | 395 | 375,250 | ||||
Dole Food Co., Inc. | 420 | 369,600 | ||||
8.875%, 3/15/11(a) | 718 | 603,120 | ||||
Elan Finance PLC/Elan Finance Corp. | 2,825 | 2,662,563 | ||||
Hanger Orthopedic Group, Inc. | 670 | 675,025 | ||||
HCA, Inc. | 4,848 | 4,048,080 | ||||
6.50%, 2/15/16(a) | 1,520 | 1,284,400 | ||||
6.75%, 7/15/13(a) | 1,650 | 1,452,000 | ||||
9.625%, 11/15/16(a)(i) | 2,665 | 2,751,612 | ||||
Healthsouth Corp. | 580 | 607,550 | ||||
IASIS Healthcare Corp. | 1,174 | 1,159,325 | ||||
Select Medical Corp. | 1,145 | 938,900 | ||||
Spectrum Brands, Inc. | 1,180 | 769,950 | ||||
| 132 | • ALLIANCEBERNSTEIN POOLING PORTFOLIOS |
High-Yield Portfolio—Portfolio of Investments
| Principal Amount (000) | U.S. $ Value | |||||
Stater Brothers Holdings | $ | 594 | $ | 591,030 | ||
Tenet Healthcare Corp. | 1,175 | 1,019,312 | ||||
9.875%, 7/01/14(a) | 1,700 | 1,587,375 | ||||
Universal Hospital Services, Inc. | 895 | 841,300 | ||||
Viant Holdings, Inc. | 567 | 462,105 | ||||
Visant Corp. | 883 | 852,095 | ||||
| 30,980,715 | ||||||
Energy – 3.8% | ||||||
Chesapeake Energy Corp. | 1,560 | 1,497,600 | ||||
6.625%, 1/15/16(a) | 2,195 | 2,137,381 | ||||
6.875%, 1/15/16(a) | 270 | 265,950 | ||||
7.50%, 9/15/13(a) | 805 | 827,138 | ||||
7.75%, 1/15/15(a) | 1,895 | 1,947,112 | ||||
CIE Generale De Geophysique | 1,285 | 1,291,425 | ||||
7.75%, 5/15/17(a) | 195 | 196,463 | ||||
Complete Production Services, Inc. | 650 | 624,813 | ||||
Forest Oil Corp. | 1,830 | 1,843,725 | ||||
Grant Prideco, Inc. | 856 | 881,680 | ||||
Hilcorp Energy I LP/Hilcorp Finance Co. | 760 | 716,300 | ||||
Opti Canada, Inc. | 313 | 308,305 | ||||
PetroHawk Energy Corp. | 776 | 791,520 | ||||
Plains Exploration & Production Co. | 1,155 | 1,152,112 | ||||
Pride International, Inc. | 634 | 659,360 | ||||
Range Resources Corp. | 940 | 970,550 | ||||
Southwestern Energy Co. | 395 | 406,850 | ||||
Tesoro Corp. | 1,180 | 1,129,850 | ||||
6.50%, 6/01/17(a) | 2,160 | 2,008,800 | ||||
| 19,656,934 | ||||||
| ALLIANCEBERNSTEIN POOLING PORTFOLIOS • | 133 |
High-Yield Portfolio—Portfolio of Investments
| Principal Amount (000) | U.S. $ Value | |||||
Other Industrial – 1.0% | ||||||
Central European Distribution Corp. | EUR | 173 | $ | 240,563 | ||
Central European Media Enterprises Ltd. | 398 | 569,179 | ||||
Noble Group Ltd. | $ | 2,000 | 1,777,256 | |||
RBS Global, Inc. and Rexnord Corp. | 1,295 | 1,165,500 | ||||
11.75%, 8/01/16(a) | 725 | 623,500 | ||||
Sensus Metering Systems, Inc. | 655 | 618,975 | ||||
| 4,994,973 | ||||||
Services – 0.7% | ||||||
Realogy Corp. | 2,530 | 1,796,300 | ||||
Service Corp. International | 1,000 | 995,000 | ||||
Travelport LLC | 535 | 470,800 | ||||
West Corp. | 500 | 437,500 | ||||
| 3,699,600 | ||||||
Technology – 4.1% | ||||||
Amkor Technology, Inc. | 3,480 | 3,382,142 | ||||
Avago Technologies Finance | 755 | 796,525 | ||||
CA, Inc. | 965 | 983,818 | ||||
First Data Corp. | 1,341 | 1,163,318 | ||||
Flextronics International Ltd. | 1,418 | 1,357,735 | ||||
Freescale Semiconductor, Inc. | 3,530 | 2,876,950 | ||||
10.125%, 12/15/16(a) | 910 | 646,100 | ||||
Iron Mountain, Inc. | 1,360 | 1,295,400 | ||||
Nortel Networks Corp. | 626 | 450,720 | ||||
Nortel Networks Ltd. | 1,025 | 953,250 | ||||
NXP BV/NXP Funding LLC | 1,000 | 807,500 | ||||
9.50%, 10/15/15(a) | 445 | 369,074 | ||||
| 134 | • ALLIANCEBERNSTEIN POOLING PORTFOLIOS |
High-Yield Portfolio—Portfolio of Investments
| Principal Amount (000) | U.S. $ Value | |||||
Seagate Technology HDD Holding | $ | 2,143 | $ | 2,121,570 | ||
Serena Software, Inc. | 875 | 831,250 | ||||
Sungard Data Systems, Inc. | 3,122 | 3,145,415 | ||||
| 21,180,767 | ||||||
Transportation - Airlines – 0.6% | ||||||
AMR Corp. | 1,675 | 1,566,125 | ||||
Continental Airlines, Inc. | 1,330 | 1,185,362 | ||||
Series RJO3 | 575 | 511,744 | ||||
| 3,263,231 | ||||||
Transportation - Services – 0.7% | ||||||
Avis Budget Car Rental | 1,660 | 1,386,100 | ||||
Hertz Corp. | 1,145 | 1,090,613 | ||||
10.50%, 1/01/16(a) | 1,175 | 1,116,250 | ||||
| 3,592,963 | ||||||
| 310,302,429 | ||||||
Utility – 10.5% | ||||||
Electric – 9.4% | ||||||
The AES Corp. | 2,430 | 2,460,375 | ||||
8.00%, 10/15/17(a) | 3,740 | 3,814,800 | ||||
8.75%, 5/15/13(a)(b) | 140 | 146,300 | ||||
Allegheny Energy Supply | 1,070 | 1,127,512 | ||||
8.25%, 4/15/12(a)(b) | 1,830 | 1,948,950 | ||||
Aquila, Inc. | 1,096 | 1,348,080 | ||||
CMS Energy Corp. | 835 | 898,450 | ||||
Dynegy Holdings, Inc. | 3,360 | 3,124,800 | ||||
8.375%, 5/01/16(a) | 3,180 | 3,108,450 | ||||
Dynegy-Roseton Danskammer | 312 | 312,426 | ||||
Series B | 1,222 | 1,221,236 | ||||
Edison Mission Energy | 3,840 | 3,772,800 | ||||
| ALLIANCEBERNSTEIN POOLING PORTFOLIOS • | 135 |
High-Yield Portfolio—Portfolio of Investments
| Principal Amount (000) | U.S. $ Value | |||||
7.50%, 6/15/13(a) | $ | 1,860 | $ | 1,906,500 | ||
7.75%, 6/15/16(a) | 695 | 715,850 | ||||
Energy Future Holdings Corp. | 1,545 | 1,522,752 | ||||
Mirant Americas Generation LLC | 3,550 | 3,141,750 | ||||
NRG Energy, Inc. | 420 | 410,025 | ||||
7.375%, 2/01/16-1/15/17(a) | 4,805 | 4,626,900 | ||||
Reliant Energy, Inc. | 598 | 608,465 | ||||
7.625%, 6/15/14(a) | 1,820 | 1,797,250 | ||||
7.875%, 6/15/17(a) | 1,840 | 1,810,100 | ||||
Sierra Pacific Resources | 960 | 1,020,845 | ||||
Teco Finance, Inc. | 500 | 500,650 | ||||
7.00%, 5/01/12(a)(b) | 722 | 778,545 | ||||
Texas Competitive Electric Holdings Co. LLC | 2,151 | 2,097,225 | ||||
TXU Corp. | 1,957 | 1,532,513 | ||||
Series Q | 3,106 | 2,229,353 | ||||
| 47,982,902 | ||||||
Natural Gas – 1.1% | ||||||
El Paso Corp. | 1,245 | 1,294,534 | ||||
Enterprise Products Operating LP | 3,450 | 3,387,655 | ||||
Regency Energy Partners | 1,089 | 1,089,000 | ||||
| 5,771,189 | ||||||
| 53,754,091 | ||||||
Non Corporate Sectors – 7.0% | ||||||
Derivatives - RACERS – 3.1% | ||||||
Racers | 18,550 | 16,135,254 | ||||
Derivatives - Total Return Swaps – 3.9% | ||||||
High Yield Total Return Trust | 22,505 | 20,066,133 | ||||
| 36,201,387 | ||||||
| 136 | • ALLIANCEBERNSTEIN POOLING PORTFOLIOS |
High-Yield Portfolio—Portfolio of Investments
| Principal Amount (000) | U.S. $ Value | |||||
Credit Default Index Holdings – 4.2% | ||||||
DJ CDX.NA.HY-100 – 4.2% | ||||||
CDX North America High Yield | $ | 18,810 | $ | 17,117,100 | ||
Dow Jones CDX HY | 4,312 | 4,312,196 | ||||
| 21,429,296 | ||||||
Financial Institutions – 1.3% | ||||||
Finance – 0.7% | ||||||
Residential Capital LLC | 2,355 | 1,342,350 | ||||
8.50%, 4/17/13(a) | 2,240 | 1,209,600 | ||||
8.875%, 6/30/15(a) | 2,055 | 1,089,150 | ||||
| 3,641,100 | ||||||
Insurance – 0.1% | ||||||
Crum & Forster Holdings Corp. | 760 | 739,100 | ||||
REITS – 0.5% | ||||||
American Real Estate Partners LP | 2,500 | 2,375,000 | ||||
| 6,755,200 | ||||||
Total Corporates - Non-Investment Grades | 428,442,403 | |||||
CORPORATES - INVESTMENT | ||||||
Industrial – 5.7% | ||||||
Basic – 1.3% | ||||||
International Steel Group, Inc. | 2,081 | 2,167,247 | ||||
United States Steel Corp. | 1,825 | 1,807,672 | ||||
Weyerhaeuser Co. | 3,165 | 2,987,105 | ||||
| 6,962,024 | ||||||
Communications - Telecommunications – 1.6% | ||||||
Nextel Communications, Inc. | 2,950 | 2,286,250 | ||||
Qwest Corp. | 2,240 | 1,965,600 | ||||
8.875%, 3/15/12(a) | 1,115 | 1,163,781 | ||||
| ALLIANCEBERNSTEIN POOLING PORTFOLIOS • | 137 |
High-Yield Portfolio—Portfolio of Investments
| Principal Amount (000) | U.S. $ Value | |||||
Sprint Capital Corp. | $ | 2,800 | $ | 1,960,000 | ||
8.75%, 3/15/32(a) | 1,180 | 920,400 | ||||
| 8,296,031 | ||||||
Consumer Cyclical - Other – 0.1% | ||||||
Starwood Hotels & Resorts Worldwide, Inc. | 539 | 572,737 | ||||
Consumer Cyclical - Retailers – 0.5% | ||||||
Limited Brands, Inc. | 2,028 | 1,805,295 | ||||
6.90%, 7/15/17(a) | 845 | 788,130 | ||||
| 2,593,425 | ||||||
Consumer Non-Cyclical – 1.6% | ||||||
Cadbury Schweppes US Finance LLC | 1,080 | 1,093,633 | ||||
Coventry Health Care, Inc. | 683 | 708,022 | ||||
Reynolds American, Inc. | 3,395 | 3,611,505 | ||||
7.625%, 6/01/16(a) | 1,800 | 1,906,171 | ||||
Ventas Realty LP/Ventas Capital Corp. | 832 | 819,520 | ||||
| 8,138,851 | ||||||
Energy – 0.2% | ||||||
Kerr-McGee Corp. | 894 | 977,432 | ||||
Technology – 0.4% | ||||||
Computer Sciences Corp. | 1,300 | 1,317,569 | ||||
Xerox Corp. | 535 | 553,279 | ||||
| 1,870,848 | ||||||
| 29,411,348 | ||||||
Financial Institutions – 4.3% | ||||||
Banking – 0.1% | ||||||
Royal Bank of Scotland Group PLC | 557 | 574,747 | ||||
Brokerage – 1.1% | ||||||
Bear Stearns Co., Inc. | 3,540 | 3,075,952 | ||||
Lehman Brothers Holdings, Inc. | 2,585 | 2,429,608 | ||||
| 5,505,560 | ||||||
| 138 | • ALLIANCEBERNSTEIN POOLING PORTFOLIOS |
High-Yield Portfolio—Portfolio of Investments
| Principal Amount (000) | U.S. $ Value | |||||
Finance – 2.2% | ||||||
Capital One Financial Corp. | $ | 663 | $ | 666,633 | ||
CIT Group, Inc. | 2,450 | 2,077,007 | ||||
5.40%, 1/30/16(a) | 515 | 431,714 | ||||
Countrywide Financial Corp. | 2,221 | 1,909,472 | ||||
Series MTN | 515 | 462,888 | ||||
Countrywide Home Loans, Inc. | 56 | 49,223 | ||||
iStar Financial, Inc. | 2,890 | 2,413,789 | ||||
SLM Corp. | 845 | 782,370 | ||||
5.00%, 10/01/13(a) | 2,000 | 1,698,818 | ||||
5.125%, 8/27/12(a) | 1,100 | 962,511 | ||||
| 11,454,425 | ||||||
Insurance – 0.7% | ||||||
Liberty Mutual Group, Inc. | 950 | 975,167 | ||||
7.80%, 3/15/37(a)(b) | 770 | 638,222 | ||||
MBIA, Inc. | 3,255 | 2,236,026 | ||||
| 3,849,415 | ||||||
Other Finance – 0.2% | ||||||
Aiful Corp. | 921 | 896,982 | ||||
| 22,281,129 | ||||||
Utility – 2.0% | ||||||
Electric – 0.6% | ||||||
FPL Group Capital, Inc. | 3,000 | 2,761,374 | ||||
Sierra Pacific Power Co. | 440 | 443,349 | ||||
| 3,204,723 | ||||||
Natural Gas – 1.4% | ||||||
Tennessee Gas Pipeline Co. | 570 | 566,194 | ||||
| ALLIANCEBERNSTEIN POOLING PORTFOLIOS • | 139 |
High-Yield Portfolio—Portfolio of Investments
| Principal Amount (000) | U.S. $ Value | |||||
Williams Cos, Inc. | $ | 3,744 | $ | 4,006,080 | ||
7.875%, 9/01/21(a) | 2,214 | 2,413,260 | ||||
| 6,985,534 | ||||||
| 10,190,257 | ||||||
Total Corporates - Investment Grades | 61,882,734 | |||||
| Shares | ||||||
PREFERRED STOCKS – 0.6% | ||||||
Federal Home Loan Mortgage Corp. | 36,525 | 940,519 | ||||
Federal National Mortgage Association | 54,625 | 1,398,400 | ||||
Sovereign REIT | 624 | 798,720 | ||||
Total Preferred Stocks | 3,137,639 | |||||
| Principal Amount (000) | ||||||
EMERGING MARKETS - | ||||||
Industrial – 0.4% | ||||||
Consumer Cyclical - Other – 0.2% | ||||||
Royal Caribbean Cruises Ltd. | $ | 846 | 897,390 | |||
Consumer Non-Cyclical – 0.2% | ||||||
Foodcorp Ltd. | EUR | 1,128 | 1,070,297 | |||
Total Emerging Markets - Corporate Bonds | 1,967,687 | |||||
| Shares | ||||||
EQUITIES – 0.0% | ||||||
Common Stock – 0.0% | ||||||
Phase Metrics(f)(k) | 90,400 | 904 | ||||
| 140 | • ALLIANCEBERNSTEIN POOLING PORTFOLIOS |
High-Yield Portfolio—Portfolio of Investments
| Principal Amount (000) | U.S. $ Value | |||||
SHORT-TERM INVESTMENTS – 2.5% | ||||||
Time Deposit - 2.5% | ||||||
State Street Euro Dollar | $ | 12,915 | $ | 12,914,502 | ||
Total Investments – 98.9% | 508,345,869 | |||||
Other assets less liabilities – 1.1% | 5,610,745 | |||||
Net Assets – 100.0% | $ | 513,956,614 | ||||
FORWARD CURRENCY EXCHANGE CONTRACTS (see Note C)
| Contract Amount (000) | U.S. $ Value on Origination Date | U.S. $ Value at February 29, 2008 | Unrealized Appreciation/ (Depreciation) | |||||||
Sale Contracts: | ||||||||||
Japanese Yen settling 3/11/08 | 1,496 | $ | 2,223,862 | $ | 2,269,739 | $ (45,877) | ||||
| (a) | Position, or a portion thereof, has been segregated to collateralize forward currency exchange contracts. The aggregate market value of these securities amounted to $494,389,890. |
| (b) | Security is exempt from registration under Rule 144A of the Securities Act of 1933. These securities are considered liquid and may be resold in transactions exempt from registration, normally to qualified institutional buyers. At February 29, 2008, the aggregate market value of these securities amounted to $111,328,025 or 21.7% of net assets. |
| (c) | Floating Rate Security. Stated interest rate was in effect at February 29, 2008. |
| (d) | Coupon rate adjusts periodically based upon a predetermined schedule. Stated interest rate in effect at February 29, 2008. |
| (e) | Indicates a security that has a zero coupon that remains in effect until a predetermined date at which time the stated coupon rate becomes effective until final maturity. |
| (f) | Illiquid security, valued at fair value (see Note A). |
| (g) | Security is exempt from registration under Rule 144A of the Securities Act of 1933. This security, which represents 0.0% of net assets as of February 29, 2008, is considered illiquid and restricted (see Note A). |
| Restricted Securities | Acquisition Date | Acquisition Cost | Market Value | Percentage of Net Assets | |||||||
Russell-Stanley Holdings, Inc. | |||||||||||
9.00%, 11/30/08 | 8/5/2005 | $ | 396,900 | $ | 56,691 | 0.01 | % | ||||
| (h) | Security is in default and is non-income producing. |
| (i) | Pay-In-Kind Payments (PIK). |
| (j) | Variable rate coupon, rate shown as of February 29, 2008. |
| (k) | Non-income producing security. |
| Currency | Abbreviations: |
| EUR | – Euro Dollar |
| See notes to financial statements. |
| ALLIANCEBERNSTEIN POOLING PORTFOLIOS • | 141 |
High-Yield Portfolio—Portfolio of Investments
STATEMENT OF ASSETS & LIABILITIES
February 29, 2008 (unaudited)
| U.S. Value | U.S. Large Cap Growth | Global Real Estate Investment | ||||||||||
| Assets | ||||||||||||
Investments in securities, at value | ||||||||||||
Unaffiliated issuers (cost $2,626,528,544, $2,422,442,548 and $1,177,532,694, respectively) | $ | 2,484,314,167 | $ | 2,533,365,450 | $ | 1,155,840,088 | ||||||
Affiliated issuers (cost $32,646,709, $28,557,743 and $25,501,191, respectively) | 32,646,709 | 28,557,743 | 25,501,191 | |||||||||
Foreign cash, at value (cost $0, $0 and $8,097,260, respectively) | –0 | – | –0 | – | 8,202,695 | |||||||
Receivable for investment securities sold | 11,791,137 | 24,068,250 | 7,629,800 | |||||||||
Dividends receivable | 7,647,013 | 974,036 | 2,511,358 | |||||||||
Receivable for shares of beneficial interest sold | 2,993,132 | 103,241 | 557 | |||||||||
Total assets | 2,539,392,158 | 2,587,068,720 | 1,199,685,689 | |||||||||
| Liabilities | ||||||||||||
Payable for investment securities purchased | 17,344,342 | 33,973,655 | 21,848,707 | |||||||||
Payable for shares of beneficial interest redeemed | 95,686 | –0 | – | 27,382 | ||||||||
Accrued expenses | 78,779 | 89,993 | 83,805 | |||||||||
Total liabilities | 17,518,807 | 34,063,648 | 21,959,894 | |||||||||
Net Assets | $ | 2,521,873,351 | $ | 2,553,005,072 | $ | 1,177,725,795 | ||||||
| Composition of Net Assets | ||||||||||||
Paid-in capital | $ | 2,664,131,352 | $ | 2,479,578,425 | $ | 1,278,231,236 | ||||||
Undistributed/(distributions in excess of) net investment income | 13,921,887 | 1,971,684 | (68,151,312 | ) | ||||||||
Accumulated net realized loss on investment and foreign currency transactions | (13,965,511 | ) | (39,467,939 | ) | (10,771,699 | ) | ||||||
Net unrealized appreciation/(depreciation) on investments and foreign currency denominated assets and liabilities | (142,214,377 | ) | 110,922,902 | (21,582,430 | ) | |||||||
Net Assets | $ | 2,521,873,351 | $ | 2,553,005,072 | $ | 1,177,725,795 | ||||||
Shares of beneficial interest outstanding—unlimited shares authorized, without par value | 246,222,006 | 227,543,393 | 110,625,332 | |||||||||
Net Asset Value | $ | 10.24 | $ | 11.22 | $ | 10.65 | ||||||
See notes to financial statements.
| 142 | • ALLIANCEBERNSTEIN POOLING PORTFOLIOS |
Statement of Assets & Liabilities
| International Value | International Growth | Small-Mid Cap Value | ||||||||||
| Assets | ||||||||||||
Investments in securities, at value | ||||||||||||
Unaffiliated issuers (cost $1,222,760,394, $1,165,579,536 and $650,461,900, respectively) | $ | 1,264,190,574 | $ | 1,321,341,668 | $ | 619,201,208 | ||||||
Affiliated issuers (cost $30,589,333, $23,016,609 and $35,129,599, respectively) | 30,589,333 | 23,016,609 | 35,129,599 | |||||||||
Foreign cash, at value (cost $7,830,172, $3,294,286 and $0, respectively)(a) | 8,168,406 | 3,353,565 | –0 | – | ||||||||
Receivable for investment securities sold | 6,497,452 | 5,842 | 974,671 | |||||||||
Dividends receivable | 2,281,406 | 3,249,406 | 1,087,520 | |||||||||
Receivable for shares of beneficial interest sold | 803 | 1,014 | 1,181 | |||||||||
Total assets | 1,311,727,974 | 1,350,968,104 | 656,394,179 | |||||||||
| Liabilities | ||||||||||||
Payable for investment securities purchased | 3,035,562 | 8,804,913 | 977,208 | |||||||||
Payable for variation margin on futures contracts | 218,962 | –0 | – | –0 | – | |||||||
Payable for shares of beneficial interest redeemed | 1,560 | 129,592 | –0 | – | ||||||||
Accrued expenses | 152,471 | 140,309 | 66,061 | |||||||||
Total liabilities | 3,408,555 | 9,074,814 | 1,043,269 | |||||||||
Net Assets | $ | 1,308,319,419 | $ | 1,341,893,290 | $ | 655,350,910 | ||||||
| Composition of Net Assets | ||||||||||||
Paid-in capital | $ | 1,245,846,815 | $ | 1,186,669,663 | $ | 665,526,845 | ||||||
Undistributed/(distributions in excess of) net investment income | (3,347,658 | ) | 2,480,797 | 2,127,858 | ||||||||
Accumulated net realized gain (loss) on investment and foreign currency transactions | 25,992,119 | (3,240,666 | ) | 18,956,899 | ||||||||
Net unrealized appreciation/(depreciation) on | 39,828,143 | 155,983,496 | (31,260,692 | ) | ||||||||
Net Assets | $ | 1,308,319,419 | $ | 1,341,893,290 | $ | 655,350,910 | ||||||
Shares of beneficial interest outstanding—unlimited shares authorized, without par value | 108,151,170 | 103,021,900 | 59,521,937 | |||||||||
Net Asset Value | $ | 12.10 | $ | 13.03 | $ | 11.01 | ||||||
| (a) | An amount equivalent to U.S. $1,114,930 has been segregated to collateralize margin requirements for open futures contracts outstanding at February 29, 2008 for the International Value Portfolio. |
See notes to financial statements.
| ALLIANCEBERNSTEIN POOLING PORTFOLIOS • | 143 |
Statement of Assets & Liabilities
| Small-Mid Cap Growth | Global Value | Global Research Growth | ||||||||||
| Assets | ||||||||||||
Investments in securities, at value | ||||||||||||
Unaffiliated issuers (cost $621,188,291, $6,199,992 and $5,740,743, respectively) | $ | 615,981,062 | $ | 5,891,627 | $ | 5,874,109 | ||||||
Affiliated issuers (cost $22,820,052, $100,396 and $100,139, respectively) | 22,820,052 | 100,396 | 100,139 | |||||||||
Foreign cash, at value (cost $0, $25,205 and $51,852, respectively) | –0 | – | 25,916 | 52,824 | ||||||||
Receivable for investment | 2,469,527 | 1,353 | 137,020 | |||||||||
Receivable for shares of | 1,891,114 | –0 | – | –0 | – | |||||||
Receivable due from Adviser | –0 | – | 258,218 | 326,139 | ||||||||
Dividends receivable | 52,437 | 14,675 | 11,384 | |||||||||
Total assets | 643,214,192 | 6,292,185 | 6,501,615 | |||||||||
| Liabilities | ||||||||||||
Payable for investment | 9,551,067 | –0 | – | 78,027 | ||||||||
Audit fee payable | 30,456 | 33,041 | 30,920 | |||||||||
Custody fee payable | 12,736 | 7,588 | 7,568 | |||||||||
Legal fee payable | 9,098 | 7,488 | 2,888 | |||||||||
Printing fee payable | 5,794 | 7,502 | 7,527 | |||||||||
Payable for variation margin on futures contracts | –0 | – | 1,073 | –0 | – | |||||||
Accrued expenses | 4,869 | 3,448 | 4,289 | |||||||||
Total liabilities | 9,614,020 | 60,140 | 131,219 | |||||||||
Net Assets | $ | 633,600,172 | $ | 6,232,045 | $ | 6,370,396 | ||||||
| Composition of Net Assets | ||||||||||||
Paid-in capital | $ | 630,868,487 | $ | 6,422,534 | $ | 6,100,851 | ||||||
Undistributed net investment income | 1,116,494 | 10,942 | 10,257 | |||||||||
Accumulated net realized gain | 6,822,420 | 116,649 | 124,649 | |||||||||
Net unrealized appreciation/(depreciation) on | (5,207,229 | ) | (318,080 | ) | 134,639 | |||||||
Net Assets | $ | 633,600,172 | $ | 6,232,045 | $ | 6,370,396 | ||||||
Shares of beneficial interest outstanding—unlimited | 53,231,741 | 637,276 | 608,803 | |||||||||
Net Asset Value | $ | 11.90 | $ | 9.78 | $ | 10.46 | ||||||
See notes to financial statements.
| 144 | • ALLIANCEBERNSTEIN POOLING PORTFOLIOS |
Statement of Assets & Liabilities
| Short Duration Bond | Intermediate Duration Bond | Inflation Protected Securities | ||||||||||
| Assets | ||||||||||||
Investments in securities, at value | ||||||||||||
Unaffiliated issuers (cost $1,315,395,515, $1,718,620,847 and $653,409,286, respectively) | $ | 1,290,854,847 | $ | 1,716,504,909 | $ | 709,465,116 | ||||||
Foreign cash, at value (cost $0, $276,752 and $0, respectively) | –0 | – | 284,917 | –0 | – | |||||||
Cash | 532,345 | (a) | –0 | – | –0 | – | ||||||
Receivable for investment | 26,113,145 | 69,485,878 | –0 | – | ||||||||
Interest receivable | 10,445,824 | 14,500,304 | 2,165,789 | |||||||||
Receivable for variation margin on futures contracts | 1,180,860 | –0 | – | –0 | – | |||||||
Receivable for shares of beneficial interest sold | 572,492 | 699 | –0 | – | ||||||||
Unrealized appreciation of forward currency exchange contracts | –0 | – | 3,599,267 | –0 | – | |||||||
Unrealized appreciation of swap contracts | –0 | – | 11,173,293 | –0 | – | |||||||
Total assets | 1,329,699,513 | 1,815,549,267 | 711,630,905 | |||||||||
| Liabilities | ||||||||||||
Due to custodian | –0 | – | 2,206,900 | –0 | – | |||||||
Payable for investment | –0 | – | 82,222,234 | –0 | – | |||||||
Unrealized depreciation of forward currency exchange contracts | –0 | – | 5,392,714 | –0 | – | |||||||
Payable for variation margin on futures contracts | –0 | – | 1,052,172 | –0 | – | |||||||
Premium received on swap | –0 | – | 921,344 | –0 | – | |||||||
Payable for shares of beneficial | –0 | – | 5,522 | 245,328 | ||||||||
Audit fee payable | 27,432 | 24,751 | 24,862 | |||||||||
Printing fee payable | 7,617 | 5,739 | 6,260 | |||||||||
Legal fee payable | 6,080 | 6,751 | 8,387 | |||||||||
Registration fee payable | 5,739 | –0 | – | 764 | ||||||||
Custody fee payable | 4,251 | 39,147 | 13,316 | |||||||||
Trustees’ fee payable | 3,976 | 371 | 324 | |||||||||
Accrued expenses | 3,655 | 8,257 | 10,455 | |||||||||
Total liabilities | 58,750 | 91,885,902 | 309,696 | |||||||||
Net Assets | $ | 1,329,640,763 | $ | 1,723,663,365 | $ | 711,321,209 | ||||||
| Composition of Net Assets | ||||||||||||
Paid-in capital | $ | 1,356,626,049 | $ | 1,710,305,397 | $ | 652,563,345 | ||||||
Undistributed net investment income | 3,138,437 | 3,597,480 | 5,159,795 | |||||||||
Accumulated net realized gain (loss) on investment and foreign | (6,547,231 | ) | 4,519,532 | (2,457,761 | ) | |||||||
Net unrealized appreciation/(depreciation) on investments and foreign currency denominated | (23,576,492 | ) | 5,240,956 | 56,055,830 | ||||||||
Net Assets | $ | 1,329,640,763 | $ | 1,723,663,365 | $ | 711,321,209 | ||||||
Shares of beneficial interest outstanding—unlimited shares authorized, without par value | 136,073,778 | 172,038,417 | 66,654,280 | |||||||||
Net Asset Value | $ | 9.77 | $ | 10.02 | $ | 10.67 | ||||||
| (a) | An amount of U.S. $528,420 has been segregated to collateralize margin requirements for open futures contracts outstanding at February 29, 2008 for the Short Duration Bond Portfolio. |
See notes to financial statements.
| ALLIANCEBERNSTEIN POOLING PORTFOLIOS • | 145 |
Statement of Assets & Liabilities
| High-Yield | ||||
| Assets | ||||
Investments in securities, at value | ||||
Unaffiliated issuers (cost $555,923,090) | $ | 508,345,869 | ||
Foreign cash, at value (cost $107,851) | 111,444 | |||
Cash | 30 | |||
Interest and dividends receivable | 10,338,058 | |||
Receivable for shares of beneficial interest sold | 24,052 | |||
Contribution from Adviser | 12,000 | |||
Total assets | 518,831,453 | |||
| Liabilities | ||||
Payable for investment securities purchased | 4,758,457 | |||
Unrealized depreciation of forward currency exchange contracts | 45,877 | |||
Accrued expenses | 70,505 | |||
Total liabilities | 4,874,839 | |||
Net Assets | $ | 513,956,614 | ||
| Composition of Net Assets | ||||
Paid-in capital | $ | 562,723,581 | ||
Undistributed net investment income | 2,279,239 | |||
Accumulated net realized loss on investment and foreign currency transactions | (3,428,288 | ) | ||
Net unrealized depreciation on investments and foreign currency denominated assets and liabilities | (47,617,918 | ) | ||
Net Assets | $ | 513,956,614 | ||
Shares of beneficial interest outstanding—unlimited shares authorized, without par value | 55,137,612 | |||
Net Asset Value | $ | 9.32 | ||
See notes to financial statements.
| 146 | • ALLIANCEBERNSTEIN POOLING PORTFOLIOS |
Statement of Assets & Liabilities
STATEMENT OF OPERATIONS
Six Months Ended February 29, 2008 (unaudited)
| U.S. Value | U.S. Large Cap Growth | Global Real Estate Investment | ||||||||||
| Investment Income | ||||||||||||
Dividends: | ||||||||||||
Unaffiliated issuers (net of foreign taxes withheld of $110,399, $23,675 and $1,109,117, respectively) | $ | 38,238,770 | $ | 9,543,914 | $ | 18,849,411 | ||||||
Affiliated issuers | 1,926,729 | 529,726 | 538,483 | |||||||||
Interest | –0 | – | –0 | – | 11,390 | |||||||
Total income | 40,165,499 | 10,073,640 | 19,399,284 | |||||||||
| Expenses | ||||||||||||
Custodian | 150,139 | 192,277 | 311,181 | |||||||||
Audit | 22,338 | 19,797 | 25,196 | |||||||||
Legal | 11,155 | 18,057 | 11,150 | |||||||||
Registration fees | 9,780 | 1,843 | 2,897 | |||||||||
Printing | 4,590 | 3,348 | 1,809 | |||||||||
Trustees’ fees | 1,472 | 1,347 | 1,511 | |||||||||
Miscellaneous | 20,324 | 18,867 | 14,300 | |||||||||
Total expenses | 219,798 | 255,536 | 368,044 | |||||||||
Net investment income | 39,945,701 | 9,818,104 | 19,031,240 | |||||||||
| Realized and Unrealized Gain (Loss) on Investment and Foreign Currency Transactions | ||||||||||||
Net realized gain (loss) on: | ||||||||||||
Investment transactions | (2,116,843 | ) | (3,647,421 | ) | 1,201,250 | |||||||
Foreign currency transactions | –0 | – | 667 | 570,124 | ||||||||
Net change in unrealized | (421,035,421 | ) | (197,355,645 | ) | (146,540,140 | ) | ||||||
Foreign currency denominated assets and liabilities | –0 | – | (52 | ) | 175,367 | |||||||
Net loss on investment and foreign currency transactions | (423,152,264 | ) | (201,002,451 | ) | (144,593,399 | ) | ||||||
Net Decrease in Net Assets from Operations | $ | (383,206,563 | ) | $ | (191,184,347 | ) | $ | (125,562,159 | ) | |||
See notes to financial statements.
| ALLIANCEBERNSTEIN POOLING PORTFOLIOS • | 147 |
Statement of Operations
| International Value | International Growth | Small-Mid Cap Value | ||||||||||
| Investment Income | ||||||||||||
Dividends: | ||||||||||||
Unaffiliated issuers (net | $ | 10,208,232 | $ | 15,295,424 | $ | 5,126,692 | ||||||
Affiliated issuers | 557,296 | 635,520 | 719,051 | |||||||||
Interest | 51,583 | 4,448 | –0 | – | ||||||||
Total income | 10,817,111 | 15,935,392 | 5,845,743 | |||||||||
| Expenses | ||||||||||||
Custodian | 431,920 | 413,993 | 83,400 | |||||||||
Audit | 25,826 | 26,593 | 22,712 | |||||||||
Legal | 15,338 | 17,159 | 11,000 | |||||||||
Printing | 3,670 | 3,554 | 4,608 | |||||||||
Registration fees | 2,514 | 2,391 | 2,584 | |||||||||
Trustees’ fees | 1,543 | 1,420 | 1,472 | |||||||||
Miscellaneous | 16,428 | 13,112 | 6,952 | |||||||||
Total expenses | 497,239 | 478,222 | 132,728 | |||||||||
Net investment income | 10,319,872 | 15,457,170 | 5,713,015 | |||||||||
| Realized and Unrealized Gain (Loss) on Investment and Foreign Currency Transactions | ||||||||||||
Net realized gain (loss) on: | ||||||||||||
Investment transactions | 59,235,167 | 6,959,953 | 22,404,680 | |||||||||
Futures contracts | (953,531 | ) | –0 | – | –0 | – | ||||||
Foreign currency transactions | 143,911 | 1,842,005 | –0 | – | ||||||||
Net change in unrealized | (206,936,526 | ) | (25,431,397 | ) | (86,910,497 | ) | ||||||
Futures contracts | (1,677,531 | ) | –0 | – | –0 | – | ||||||
Foreign currency denominated assets and liabilities | 326,218 | 215,348 | –0 | – | ||||||||
Net loss on investment and foreign currency transactions | (149,862,292 | ) | (16,414,091 | ) | (64,505,817 | ) | ||||||
Net Decrease in Net Assets from Operations | $ | (139,542,420 | ) | $ | (956,921 | ) | $ | (58,792,802 | ) | |||
See notes to financial statements.
| 148 | • ALLIANCEBERNSTEIN POOLING PORTFOLIOS |
Statement of Operations
| Small-Mid Cap Growth | Global Value | Global Research Growth | ||||||||||
| Investment Income | ||||||||||||
Dividends: | ||||||||||||
Unaffiliated issuers (net | $ | 1,108,755 | $ | 61,625 | $ | 39,995 | ||||||
Affiliated issuers | 253,755 | 1,940 | 1,496 | |||||||||
Interest | –0 | – | 67 | –0 | – | |||||||
Total income | 1,362,510 | 63,632 | 41,491 | |||||||||
| Expenses | ||||||||||||
Custodian | 92,539 | 53,013 | 73,333 | |||||||||
Audit | 21,957 | 14,229 | 20,452 | |||||||||
Legal | 15,872 | 4,021 | 9,806 | |||||||||
Printing | 3,934 | 3,239 | 3,333 | |||||||||
Trustees’ fees | 1,615 | 1,511 | 1,655 | |||||||||
Registration fees | 1,063 | 117 | 13 | |||||||||
Miscellaneous | 6,789 | 4,588 | 4,578 | |||||||||
Total expenses | 143,769 | 80,718 | 113,170 | |||||||||
Less: expenses waived and reimbursed by the Adviser | –0 | – | (75,568 | ) | (107,767 | ) | ||||||
Net expenses | 143,769 | 5,150 | 5,403 | |||||||||
Net investment income | 1,218,741 | 58,482 | 36,088 | |||||||||
| Realized and Unrealized Gain (Loss) on Investment and Foreign Currency Transactions | ||||||||||||
Net realized gain (loss) on: | ||||||||||||
Investment transactions | 8,304,860 | 223,329 | 239,289 | |||||||||
Futures contracts | –0 | – | (769 | ) | –0 | – | ||||||
Foreign currency transactions | –0 | – | 296 | 1,733 | ||||||||
Net change in unrealized | (90,692,374 | ) | (1,074,439 | )(a) | (498,944 | ) | ||||||
Futures contracts | –0 | – | (10,035 | ) | –0 | – | ||||||
Foreign currency denominated assets and liabilities | –0 | – | 3,780 | 1,405 | ||||||||
Net loss on investment and foreign currency transactions | (82,387,514 | ) | (857,838 | ) | (256,517 | ) | ||||||
Contribution from Adviser | 391,487 | –0 | – | –0 | – | |||||||
Net Decrease in Net Assets from Operations | $ | (80,777,286 | ) | $ | (799,356 | ) | $ | (220,429 | ) | |||
| (a) | Net of change in accrued foreign capital gains taxes of $(319). |
See notes to financial statements.
| ALLIANCEBERNSTEIN POOLING PORTFOLIOS • | 149 |
Statement of Operations
| Short Duration Bond | Intermediate Duration Bond | Inflation Protected Securities | ||||||||||
| Investment Income | ||||||||||||
Interest | $ | 30,563,491 | $ | 39,114,671 | $ | 12,369,921 | ||||||
Dividends: | ||||||||||||
Affiliated issuers | 3,286,019 | 4,492,342 | 234,171 | |||||||||
Total income | 33,849,510 | 43,607,013 | 12,604,092 | |||||||||
| Expenses | ||||||||||||
Custodian | 107,344 | 204,911 | 77,127 | |||||||||
Audit | 25,712 | 25,998 | 26,214 | |||||||||
Legal | 18,718 | 16,607 | 21,969 | |||||||||
Registration fees | 8,622 | 7,566 | 2,357 | |||||||||
Printing | 5,782 | 4,119 | 4,027 | |||||||||
Trustees’ fees | 2,584 | 1,164 | 1,163 | |||||||||
Miscellaneous | 9,698 | 14,490 | 7,655 | |||||||||
Total expenses | 178,460 | 274,855 | 140,512 | |||||||||
Net investment income | 33,671,050 | 43,332,158 | 12,463,580 | |||||||||
| Realized and Unrealized Gain (Loss) on Investment and Foreign Currency Transactions | ||||||||||||
Net realized gain (loss) on: | ||||||||||||
Investment transactions | (5,451,467 | ) | 9,130,657 | 661,627 | ||||||||
Futures contracts | 4,032,145 | 6,070,949 | –0 | – | ||||||||
Swap contracts | –0 | – | (2,098,430 | ) | –0 | – | ||||||
Foreign currency transactions | –0 | – | 5,493,279 | 1,000 | ||||||||
Net change in unrealized | (12,173,705 | ) | (772,920 | ) | 62,791,955 | |||||||
Futures contracts | 962,284 | (1,759,774 | ) | –0 | – | |||||||
Swap contracts | –0 | – | 11,103,568 | –0 | – | |||||||
Foreign currency denominated assets and liabilities | –0 | – | 1,999,009 | (1,000 | ) | |||||||
Net gain (loss) on investment and foreign currency transactions | (12,630,743 | ) | 29,166,338 | 63,453,582 | ||||||||
Net Increase in Net | $ | 21,040,307 | $ | 72,498,496 | $ | 75,917,162 | ||||||
See notes to financial statements.
| 150 | • ALLIANCEBERNSTEIN POOLING PORTFOLIOS |
Statement of Operations
| High-Yield | ||||
| Investment Income | ||||
Interest | $ | 20,381,562 | ||
Dividends | ||||
Affiliated issuers | 376,864 | |||
Total income | 20,758,426 | |||
| Expenses | ||||
Custodian | 96,053 | |||
Audit | 23,391 | |||
Legal | 9,173 | |||
Printing | 7,787 | |||
Registration fees | 3,078 | |||
Trustees’ fees | 1,762 | |||
Miscellaneous | 4,401 | |||
Total expenses | 145,645 | |||
Net investment income | 20,612,781 | |||
| Realized and Unrealized Loss on Investment and Foreign Currency Transactions | ||||
Net realized loss on: | ||||
Investment transactions | (1,384,011 | ) | ||
Foreign currency transactions | (177,671 | ) | ||
Net change in unrealized appreciation/depreciation of: | (29,646,486 | ) | ||
Foreign currency denominated assets and liabilities | (38,212 | ) | ||
Net loss on investment and foreign currency transactions | (31,246,380 | ) | ||
Net Decrease in Net Assets from Operations | $ | (10,633,599 | ) | |
See notes to financial statements.
| ALLIANCEBERNSTEIN POOLING PORTFOLIOS • | 151 |
Statement of Operations
STATEMENT OF CHANGES IN NET ASSETS
| U.S. Value | ||||||||
| Six Months Ended February 29, 2008 (unaudited) | Year Ended August 31, 2007 | |||||||
| Increase (Decrease) in Net Assets from Operations | ||||||||
Net investment income | $ | 39,945,701 | $ | 56,257,139 | ||||
Net realized gain (loss) on investment transactions | (2,116,843 | ) | 89,370,979 | |||||
Net change in unrealized appreciation/depreciation of investments | (421,035,421 | ) | 108,860,797 | |||||
Net increase (decrease) in net assets from operations | (383,206,563 | ) | 254,488,915 | |||||
| Dividends and Distributions to Shareholders from | ||||||||
Net investment income | (39,079,630 | ) | (52,995,329 | ) | ||||
Net realized gain on investment transactions | (95,463,929 | ) | (32,933,429 | ) | ||||
| Transactions in Shares of Beneficial Interest | ||||||||
Net increase | 466,283,886 | 582,747,277 | ||||||
Total increase (decrease) | (51,466,236 | ) | 751,307,434 | |||||
| Net Assets | ||||||||
Beginning of period | 2,573,339,587 | 1,822,032,153 | ||||||
End of period (including undistributed net investment income of $13,921,887 and $13,055,816, respectively) | $ | 2,521,873,351 | $ | 2,573,339,587 | ||||
See notes to financial statements.
| 152 | • ALLIANCEBERNSTEIN POOLING PORTFOLIOS |
Statement of Changes in Net Assets
| U.S. Large Cap Growth | ||||||||
| Six Months Ended February 29, 2008 (unaudited) | Year Ended August 31, 2007 | |||||||
| Increase (Decrease) in Net Assets from Operations | ||||||||
Net investment income | $ | 9,818,104 | $ | 17,976,460 | ||||
Net realized gain (loss) on investment transactions | (3,646,754 | ) | 44,348,882 | |||||
Net change in unrealized appreciation/depreciation of investments and foreign currency denominated assets and liabilities | (197,355,697 | ) | 239,926,025 | |||||
Net increase (decrease) in net assets from operations | (191,184,347 | ) | 302,251,367 | |||||
| Dividends and Distributions to Shareholders from | ||||||||
Net investment income | (11,377,320 | ) | (17,065,991 | ) | ||||
Net realized gain on investment transactions | (72,912,342 | ) | (34,002,042 | ) | ||||
| Transactions in Shares of Beneficial Interest | ||||||||
Net increase | 220,324,798 | 581,496,735 | ||||||
Total increase (decrease) | (55,149,211 | ) | 832,680,069 | |||||
| Net Assets | ||||||||
Beginning of period | 2,608,154,283 | 1,775,474,214 | ||||||
End of period (including undistributed net investment income of $1,971,684 and $3,530,900, respectively) | $ | 2,553,005,072 | $ | 2,608,154,283 | ||||
See notes to financial statements.
| ALLIANCEBERNSTEIN POOLING PORTFOLIOS • | 153 |
Statement of Changes in Net Assets
| Global Real Estate Investment | ||||||||
| Six Months Ended February 29, 2008 (unaudited) | Year Ended August 31, 2007 | |||||||
| Increase (Decrease) in Net Assets from Operations | ||||||||
Net investment income | $ | 19,031,240 | $ | 19,966,828 | ||||
Net realized gain on investment and foreign currency transactions | 1,771,374 | 115,315,357 | ||||||
Net change in unrealized appreciation/depreciation of investments and foreign currency denominated assets and liabilities | (146,364,773 | ) | (21,758,561 | ) | ||||
Net increase (decrease) in net assets from operations | (125,562,159 | ) | 113,523,624 | |||||
| Dividends and Distributions to Shareholders from | ||||||||
Net investment income | (100,090,903 | ) | (37,759,595 | ) | ||||
Net realized gain on investment transactions | (93,818,420 | ) | (34,464,347 | ) | ||||
| Transactions in Shares of Beneficial Interest | ||||||||
Net increase | 293,302,757 | 329,899,776 | ||||||
Total increase (decrease) | (26,168,725 | ) | 371,199,458 | |||||
| Net Assets | ||||||||
Beginning of period | 1,203,894,520 | 832,695,062 | ||||||
End of period (including undistributed/(distributions in excess of) net investment income of ($68,151,312) and $12,908,351, respectively) | $ | 1,177,725,795 | $ | 1,203,894,520 | ||||
See notes to financial statements.
| 154 | • ALLIANCEBERNSTEIN POOLING PORTFOLIOS |
Statement of Changes in Net Assets
| International Value | ||||||||
| Six Months Ended February 29, 2008 (unaudited) | Year Ended August 31, 2007 | |||||||
| Increase (Decrease) in Net Assets from Operations | ||||||||
Net investment income | $ | 10,319,872 | $ | 34,699,961 | ||||
Net realized gain on investment and foreign currency transactions | 58,425,547 | 117,651,909 | ||||||
Net change in unrealized appreciation/depreciation of investments and foreign currency denominated assets and liabilities | (208,287,839 | ) | 66,297,059 | |||||
Net increase (decrease) in net assets from operations | (139,542,420 | ) | 218,648,929 | |||||
| Dividends and Distributions to Shareholders from | ||||||||
Net investment income | (12,235,313 | ) | (43,737,315 | ) | ||||
Net realized gain on investment transactions | (125,292,275 | ) | (83,298,657 | ) | ||||
| Transactions in Shares of Beneficial Interest | ||||||||
Net increase | 269,405,236 | 227,000,390 | ||||||
Total increase (decrease) | (7,664,772 | ) | 318,613,347 | |||||
| Net Assets | ||||||||
Beginning of period | 1,315,984,191 | 997,370,844 | ||||||
End of period (including distributions in excess of net investment income of ($3,347,658) and ($1,432,217), respectively) | $ | 1,308,319,419 | $ | 1,315,984,191 | ||||
See notes to financial statements.
| ALLIANCEBERNSTEIN POOLING PORTFOLIOS • | 155 |
Statement of Changes in Net Assets
| International Growth | ||||||||
| Six Months Ended February 29, 2008 (unaudited) | Year Ended August 31, 2007 | |||||||
| Increase (Decrease) in Net Assets from Operations | ||||||||
Net investment income | $ | 15,457,170 | $ | 27,970,442 | ||||
Net realized gain on investment and foreign currency transactions | 8,801,958 | 71,373,202 | ||||||
Net change in unrealized appreciation/depreciation of investments and foreign currency denominated assets and liabilities | (25,216,049 | ) | 81,607,344 | |||||
Contribution from Adviser (see Note B) | – 0 | – | 208,060 | |||||
Net increase (decrease) in net assets from operations | (956,921 | ) | 181,159,048 | |||||
| Dividends and Distributions to Shareholders from | ||||||||
Net investment income | (18,970,923 | ) | (23,066,755 | ) | ||||
Net realized gain on investment transactions | (77,899,831 | ) | (37,513,182 | ) | ||||
| Transactions in Shares of Beneficial Interest | ||||||||
Net increase | 110,793,993 | 321,916,933 | ||||||
Total increase | 12,966,318 | 442,496,044 | ||||||
| Net Assets | ||||||||
Beginning of period | 1,328,926,972 | 886,430,928 | ||||||
End of period (including undistributed net investment income of $2,480,797 and $5,994,550, respectively) | $ | 1,341,893,290 | $ | 1,328,926,972 | ||||
See notes to financial statements.
| 156 | • ALLIANCEBERNSTEIN POOLING PORTFOLIOS |
Statement of Changes in Net Assets
| Small-Mid Cap Value | ||||||||
| Six Months Ended February 29, 2008 (unaudited) | Year Ended August 31, 2007 | |||||||
| Increase (Decrease) in Net Assets from Operations | ||||||||
Net investment income | $ | 5,713,015 | $ | 10,914,226 | ||||
Net realized gain on investment transactions | 22,404,680 | 36,891,517 | ||||||
Net change in unrealized appreciation/depreciation of investments | (86,910,497 | ) | 39,122,957 | |||||
Net increase (decrease) in net assets from operations | (58,792,802 | ) | 86,928,700 | |||||
| Dividends and Distributions to Shareholders from | ||||||||
Net investment income | (5,567,689 | ) | (10,199,314 | ) | ||||
Net realized gain on investment transactions | (35,875,349 | ) | (4,218,310 | ) | ||||
| Transactions in Shares of Beneficial Interest | ||||||||
Net increase | 107,185,415 | 131,640,240 | ||||||
Total increase | 6,949,575 | 204,151,316 | ||||||
| Net Assets | ||||||||
Beginning of period | 648,401,335 | 444,250,019 | ||||||
End of period (including undistributed net investment income of $2,127,858 and $1,982,532, respectively) | $ | 655,350,910 | $ | 648,401,335 | ||||
See notes to financial statements.
| ALLIANCEBERNSTEIN POOLING PORTFOLIOS • | 157 |
Statement of Changes in Net Assets
| Small-Mid Cap Growth | ||||||||
| Six Months Ended February 29, 2008 (unaudited) | Year Ended August 31, 2007 | |||||||
| Increase (Decrease) in Net Assets from Operations | ||||||||
Net investment income | $ | 1,218,741 | $ | 2,563,151 | ||||
Net realized gain on investment transactions | 8,304,860 | 64,759,157 | ||||||
Net change in unrealized appreciation/depreciation of investments | (90,692,374 | ) | 65,512,117 | |||||
Contribution from Adviser (see Note B) | 391,487 | 10,649 | ||||||
Net increase (decrease) in net assets from operations | (80,777,286 | ) | 132,845,074 | |||||
| Dividends and Distributions to Shareholders from | ||||||||
Net investment income | (1,177,347 | ) | (1,795,974 | ) | ||||
Net realized gain on investment transactions | (64,736,709 | ) | (8,679,868 | ) | ||||
| Transactions in Shares of Beneficial Interest | ||||||||
Net increase | 111,520,223 | 116,970,642 | ||||||
Total increase (decrease) | (35,171,119 | ) | 239,339,874 | |||||
| Net Assets | ||||||||
Beginning of period | 668,771,291 | 429,431,417 | ||||||
End of period (including undistributed net investment income of $1,116,494 and $1,075,100, respectively) | $ | 633,600,172 | $ | 668,771,291 | ||||
See notes to financial statements.
| 158 | • ALLIANCEBERNSTEIN POOLING PORTFOLIOS |
Statement of Changes in Net Assets
| Global Value | ||||||||
| Six Months Ended February 29, 2008 (unaudited) | Year Ended August 31, 2007 | |||||||
| Increase (Decrease) in Net Assets from Operations | ||||||||
Net investment income | $ | 58,482 | $ | 153,368 | ||||
Net realized gain on investment and foreign currency transactions | 222,856 | 306,718 | ||||||
Net change in unrealized appreciation/depreciation of investments and foreign currency denominated assets and liabilities | (1,080,694 | ) | 638,614 | |||||
Net increase (decrease) in net assets from operations | (799,356 | ) | 1,098,700 | |||||
| Dividends and Distributions to Shareholders from | ||||||||
Net investment income | (77,069 | ) | (163,304 | ) | ||||
Net realized gain on investment transactions | (383,098 | ) | (11,299 | ) | ||||
| Transactions in Shares of Beneficial Interest | ||||||||
Net increase (decrease) | 464,001 | (921 | ) | |||||
Total increase (decrease) | (795,522 | ) | 923,176 | |||||
| Net Assets | ||||||||
Beginning of period | 7,027,567 | 6,104,391 | ||||||
End of period (including undistributed net investment income of $10,942 and $29,529, respectively) | $ | 6,232,045 | $ | 7,027,567 | ||||
See notes to financial statements.
| ALLIANCEBERNSTEIN POOLING PORTFOLIOS • | 159 |
Statement of Changes in Net Assets
| Global Research Growth | ||||||||
| Six Months Ended February 29, 2008 (unaudited) | Year Ended August 31, 2007 | |||||||
| Increase (Decrease) in Net Assets from Operations | ||||||||
Net investment income | $ | 36,088 | $ | 110,914 | ||||
Net realized gain on investment and foreign currency transactions | 241,022 | 241,958 | ||||||
Net change in unrealized appreciation/depreciation of investments and foreign currency denominated assets and liabilities | (497,539 | ) | 573,845 | |||||
Contribution from Adviser (see Note B) | – 0 | – | 1,407 | |||||
Net increase (decrease) in net assets from operations | (220,429 | ) | 928,124 | |||||
| Dividends and Distributions to Shareholders from | ||||||||
Net investment income | (53,514 | ) | (107,736 | ) | ||||
Net realized gain on investment transactions | (270,004 | ) | – 0 | – | ||||
| Transactions in Shares of Beneficial Interest | ||||||||
Net increase (decrease) | (141,771 | ) | 191,692 | |||||
Total increase (decrease) | (685,718 | ) | 1,012,080 | |||||
| Net Assets | ||||||||
Beginning of period | 7,056,114 | 6,044,034 | ||||||
End of period (including undistributed net investment income of $10,257 and $27,683, respectively) | $ | 6,370,396 | $ | 7,056,114 | ||||
See notes to financial statements.
| 160 | • ALLIANCEBERNSTEIN POOLING PORTFOLIOS |
Statement of Changes in Net Assets
| Short Duration Bond | ||||||||
| Six Months Ended February 29, 2008 (unaudited) | Year Ended August 31, 2007 | |||||||
| Increase (Decrease) in Net Assets from Operations | ||||||||
Net investment income | $ | 33,671,050 | $ | 59,040,368 | ||||
Net realized gain (loss) on investment transactions | (1,419,322 | ) | 1,803,720 | |||||
Net change in unrealized appreciation/depreciation of investments | (11,211,421 | ) | (11,400,855 | ) | ||||
Net increase in net assets from operations | 21,040,307 | 49,443,233 | ||||||
| Dividends to Shareholders from | ||||||||
Net investment income | (34,749,852 | ) | (56,566,899 | ) | ||||
| Transactions in Shares of Beneficial Interest | ||||||||
Net increase | 71,274,279 | 319,088,440 | ||||||
Total increase | 57,564,734 | 311,964,774 | ||||||
| Net Assets | ||||||||
Beginning of period | 1,272,076,029 | 960,111,255 | ||||||
End of period (including undistributed net investment income of $3,138,437 and $4,217,239, respectively) | $ | 1,329,640,763 | $ | 1,272,076,029 | ||||
See notes to financial statements.
| ALLIANCEBERNSTEIN POOLING PORTFOLIOS • | 161 |
Statement of Changes in Net Assets
| Intermediate Duration Bond | ||||||||
| Six Months Ended February 29, 2008 (unaudited) | Year Ended August 31, 2007 | |||||||
| Increase (Decrease) in Net Assets from Operations | ||||||||
Net investment income | $ | 43,332,158 | $ | 66,911,146 | ||||
Net realized gain on investment and foreign currency transactions | 18,596,455 | 4,308,346 | ||||||
Net change in unrealized appreciation/depreciation of investments and foreign currency denominated assets and liabilities | 10,569,883 | (6,328,476 | ) | |||||
Net increase in net assets from operations | 72,498,496 | 64,891,016 | ||||||
| Dividends to Shareholders from | ||||||||
Net investment income | (46,251,172 | ) | (63,965,369 | ) | ||||
| Transactions in Shares of Beneficial Interest | ||||||||
Net increase | 97,764,315 | 522,445,198 | ||||||
Total increase | 124,011,639 | 523,370,845 | ||||||
| Net Assets | ||||||||
Beginning of period | 1,599,651,726 | 1,076,280,881 | ||||||
End of period (including undistributed net investment income of $3,597,480 and $6,516,494, respectively) | $ | 1,723,663,365 | $ | 1,599,651,726 | ||||
See notes to financial statements.
| 162 | • ALLIANCEBERNSTEIN POOLING PORTFOLIOS |
Statement of Changes in Net Assets
| Inflation Protected Securities | ||||||||
| Six Months Ended February 29, 2008 (unaudited) | Year Ended August 31, 2007 | |||||||
| Increase (Decrease) in Net Assets from Operations | ||||||||
Net investment income | $ | 12,463,580 | $ | 26,889,924 | ||||
Net realized gain (loss) on investment and foreign currency transactions | 662,627 | (1,253,928 | ) | |||||
Net change in unrealized appreciation/depreciation of investments and foreign currency denominated assets and liabilities | 62,790,955 | 785,322 | ||||||
Contribution from Adviser (see Note B) | – 0 | – | 36,099 | |||||
Net increase in net assets from operations | 75,917,162 | 26,457,417 | ||||||
| Dividends to Shareholders from | ||||||||
Net investment income | (29,900,723 | ) | (17,135,756 | ) | ||||
| Transactions in Shares of Beneficial Interest | ||||||||
Net increase | 21,755,685 | 187,017,626 | ||||||
Total increase | 67,772,124 | 196,339,287 | ||||||
| Net Assets | ||||||||
Beginning of period | 643,549,085 | 447,209,798 | ||||||
End of period (including undistributed net investment income of $5,159,795 and $22,596,938, respectively) | $ | 711,321,209 | $ | 643,549,085 | ||||
See notes to financial statements.
| ALLIANCEBERNSTEIN POOLING PORTFOLIOS • | 163 |
Statement of Changes in Net Assets
| High-Yield | ||||||||
| Six Months Ended February 29, 2008 (unaudited) | Year Ended August 31, 2007 | |||||||
| Increase (Decrease) in Net Assets from Operations | ||||||||
Net investment income | $ | 20,612,781 | $ | 30,554,985 | ||||
Net realized gain (loss) on investment and foreign currency transactions | (1,561,682 | ) | 2,557,322 | |||||
Net change in unrealized appreciation/depreciation of investments and foreign currency denominated assets and liabilities | (29,684,698 | ) | (13,322,061 | ) | ||||
Net increase (decrease) in net assets from operations | (10,633,599 | ) | 19,790,246 | |||||
| Dividends to Shareholders from | ||||||||
Net investment income | (20,546,577 | ) | (28,646,986 | ) | ||||
| Transactions in Shares of Beneficial Interest | ||||||||
Net increase | 49,303,445 | 178,758,796 | ||||||
Total increase | 18,123,269 | 169,902,056 | ||||||
| Net Assets | ||||||||
Beginning of period | 495,833,345 | 325,931,289 | ||||||
End of period (including undistributed net investment income of $2,279,239 and $2,213,035, respectively) | $ | 513,956,614 | $ | 495,833,345 | ||||
See notes to financial statements.
| 164 | • ALLIANCEBERNSTEIN POOLING PORTFOLIOS |
Statement of Changes in Net Assets
NOTES TO FINANCIAL STATEMENTS
February 29, 2008 (unaudited)
NOTE A
Significant Accounting Policies
The AllianceBernstein Pooling Portfolios (the “Trust”) was organized as a Massachusetts business trust on November 11, 2004 and is registered under the Investment Company Act of 1940 as a diversified, open-end management investment company. The Trust is currently comprised of thirteen separate series: AllianceBernstein U.S. Value Portfolio, AllianceBernstein U.S. Large Cap Growth Portfolio, AllianceBernstein Global Real Estate Investment Portfolio, AllianceBernstein International Value Portfolio, AllianceBernstein International Growth Portfolio, AllianceBernstein Small-Mid Cap Value Portfolio, AllianceBernstein Small-Mid Cap Growth Portfolio, AllianceBernstein Global Value Portfolio, AllianceBernstein Global Research Growth Portfolio, AllianceBernstein Short Duration Bond Portfolio, AllianceBernstein Intermediate Duration Bond Portfolio, AllianceBernstein Inflation Protected Securities Portfolio and AllianceBernstein High-Yield Portfolio (collectively, the “Portfolios”). Each series is considered to be a separate entity for financial reporting and tax purposes. Shares of the Portfolios are offered exclusively to mutual funds advised by and certain other institutional clients of AllianceBernstein L.P. (the “Adviser”). A Portfolio’s shares may be purchased at the relevant net asset value without a sales charge or other fee. The financial statements have been prepared in conformity with U.S. generally accepted accounting principles which require management to make certain estimates and assumptions that affect the reported amounts of assets and liabilities in the financial statements and amounts of income and expenses during the reporting period. Actual results could differ from those estimates. The following is a summary of significant accounting policies followed by the Portfolios.
1. Security Valuation
Portfolio securities are valued at their current market value determined on the basis of market quotations or, if market quotations are not readily available or are deemed unreliable, at “fair value” as determined in accordance with procedures established by and under the general supervision of the Trust’s Board of Trustees.
In general, the market value of securities which are readily available and deemed reliable are determined as follows. Securities listed on a national securities exchange (other than securities listed on the NASDAQ Stock Market, Inc. (“NASDAQ”)) or on a foreign securities exchange are valued at the last sale price at the close of the exchange or foreign securities exchange. If there has been no sale on such day, the securities are valued at the mean of the closing bid and asked prices on such day. Securities listed on more than one exchange are valued by reference to the principal exchange on which the securities are traded; securities listed only on NASDAQ are valued in accordance with the NASDAQ Official Closing Price; listed put or call options are valued at the last sale price. If there has been no sale on that day, such securities will be valued at the closing bid prices on that day; open futures contracts and options thereon are valued
| ALLIANCEBERNSTEIN POOLING PORTFOLIOS • | 165 |
Notes to Financial Statements
using the closing settlement price or, in the absence of such a price, the most recent quoted bid price. If there are no quotations available for the day of valuation, the last available closing settlement price is used; securities traded in the over-the-counter market, (“OTC”) are valued at the mean of the current bid and asked prices as reported by the National Quotation Bureau or other comparable sources; U.S. government securities and other debt instruments having 60 days or less remaining until maturity are valued at amortized cost if their original maturity was 60 days or less; or by amortizing their fair value as of the 61st day prior to maturity if their original term to maturity exceeded 60 days; fixed-income securities, including mortgage backed and asset backed securities, may be valued on the basis of prices provided by a pricing service or at a price obtained from one or more of the major broker/dealers. In cases where broker/dealer quotes are obtained, AllianceBernstein L.P. (the “Adviser”) may establish procedures whereby changes in market yields or spreads are used to adjust, on a daily basis, a recently obtained quoted price on a security; and OTC and other derivatives are valued on the basis of a quoted bid price or spread from a major broker/dealer in such security.
Securities for which market quotations are not readily available (including restricted securities) or are deemed unreliable are valued at fair value. Factors considered in making this determination may include, but are not limited to, information obtained by contacting the issuer, analysts, analysis of the issuer’s financial statements or other available documents. In addition, the Portfolios may use fair value pricing for securities primarily traded in non-U.S. markets because most foreign markets close well before the Portfolios value their securities at 4:00 p.m., Eastern Time. The earlier close of these foreign markets gives rise to the possibility that significant events, including broad market moves, may have occurred in the interim and may materially affect the value of those securities. To account for this, the Portfolios may frequently value many of their foreign equity securities using fair value prices based on third party vendor modeling tools to the extent available.
2. Currency Translation
Assets and liabilities denominated in foreign currencies and commitments under forward currency exchange contracts are translated into U.S. dollars at the mean of the quoted bid and asked prices of such currencies against the U.S. dollar. Purchases and sales of portfolio securities are translated into U.S. dollars at the rates of exchange prevailing when such securities were acquired or sold. Income and expenses are translated into U.S. dollars at rates of exchange prevailing when accrued.
Net realized gain or loss on foreign currency transactions represents foreign exchange gains and losses from sales and maturities of foreign fixed income investments, foreign currency exchange contracts, holding of foreign currencies, currency gains or losses realized between the trade and settlement dates on foreign investment transactions, and the difference between the amounts of
| 166 | • ALLIANCEBERNSTEIN POOLING PORTFOLIOS |
Notes to Financial Statements
dividends, interest and foreign withholding taxes recorded on the Portfolios’ books and the U.S. dollar equivalent amounts actually received or paid. Net unrealized currency gains and losses from valuing foreign currency denominated assets and liabilities at period end exchange rates are reflected as a component of net unrealized appreciation or depreciation of investments and foreign currency denominated assets and liabilities.
3. Taxes
It is each Portfolios’ policy to meet the requirements of the Internal Revenue Code applicable to regulated investment companies and to distribute all of its investment company taxable income and net realized gains, if any, to shareholders. Therefore, no provisions for federal income or excise taxes are required. The Portfolios may be subject to taxes imposed by countries in which they invest. Such taxes are generally based on income and/or capital gains earned or repatriated. Taxes are accrued and applied to net investment income, net realized gains and net unrealized appreciation/depreciation as such income and/or gains are earned.
4. Investment Income and Investment Transactions
Dividend income is recorded on the ex-dividend date or as soon as the Portfolio is informed of the dividend. Interest income is accrued daily. Investment transactions are accounted for on the date the securities are purchased or sold. Investment gains or losses are determined on the identified cost basis. The Portfolios amortize premiums and accrete discounts as adjustments to interest income.
5. Expenses
Expenses of the Trust are charged to each Portfolio in proportion to each Portfolio’s respective net assets.
6. Dividends and Distributions
Dividends and distributions to shareholders, if any, are recorded on the ex-dividend date. Income dividends and capital gains distributions are determined in accordance with federal tax regulations and may differ from those determined in accordance with U.S. generally accepted accounting principles. To the extent these differences are permanent, such amounts are reclassified within the capital accounts based on their federal tax basis treatment; temporary differences do not require such reclassification.
NOTE B
Advisory Fee and Other Transactions with Affiliates
The Trust has entered into an advisory agreement (the “Advisory Agreement”) with the Adviser. Under the terms of the Advisory Agreement, the Portfolios pay no advisory fees to the Adviser. The Adviser serves as investment manager and adviser of each of the Portfolios and continuously furnishes an investment program for each Portfolio and manages, supervises and conducts the affairs of each
| ALLIANCEBERNSTEIN POOLING PORTFOLIOS • | 167 |
Notes to Financial Statements
Portfolio, subject to the supervision of the Trust’s Board of Trustees. The Advisory Agreement provides that the Adviser or an affiliate will furnish, or pay the expenses of the Trust for, office space, facilities and equipment, services of executive and other personnel of the Trust and certain administrative services.
For the Global Value Portfolio and the Global Research Growth Portfolio, the Adviser has agreed to bear certain expenses so that total expenses do not exceed .15% of the average daily net assets on an annual basis for each Portfolio. This agreement automatically extends each year unless the Adviser provides written notice 60 days prior to the Portfolios’ fiscal year end. For the six months ended February 29, 2008, such reimbursements amounted to $75,568 and $107,767 for the Global Value Portfolio and the Global Research Growth Portfolio, respectively.
During the six months ended February 29, 2008, the Adviser reimbursed the Small-Mid Cap Growth Portfolio in the amount of $391,487 for trading losses incurred due to a trade entry error. During the year ended August 31, 2007, the Adviser reimbursed the International Growth Portfolio, Small-Mid Cap Growth Portfolio, Global Research Growth Portfolio and Inflation Protected Securities Portfolio in the amounts of $208,060, $10,649, $1,407 and $36,099, respectively, for trading losses incurred due to a trade entry error.
The Trust has entered into a distribution agreement (the “Distribution Agreement”) on behalf of each Portfolio with AllianceBernstein Investments, Inc., a wholly-owned subsidiary of the Adviser, the Portfolios’ principal underwriter (the “Underwriter”), to permit the Underwriter to distribute the Portfolios’ shares, which are sold at the net asset value without any sales charge.
Under the Distribution Agreement, the Trust is responsible for all expenses of the Portfolios, including, for example, certain administrative services, costs of printing Portfolio prospectuses and other reports to shareholders, any taxes levied against the Portfolios and brokerage fees and commissions in connection with the purchase and sale of portfolio securities, but not expenses incurred in promoting the sale of the Portfolios’ shares, which are borne by the Underwriter.
AllianceBernstein Investor Services, Inc. (“ABIS”), an indirect wholly-owned subsidiary of the Adviser, acts as the Portfolios’ registrar, transfer agent and dividend-disbursing agent.
The Portfolios may invest in the AllianceBernstein Fixed-Income Shares, Inc. —Government STIF Portfolio an open-end management investment company managed by the Adviser. The Government STIF Portfolio is offered as a cash management option to mutual funds, trusts, and other accounts managed by the Adviser, and is not available for direct purchase by members of the public. The Government STIF Portfolio pays no investment management fees.
| 168 | • ALLIANCEBERNSTEIN POOLING PORTFOLIOS |
Notes to Financial Statements
AllianceBernstein Fixed-Income Shares, Inc.—Prime STIF Portfolio, also an open-end management investment company managed by the Adviser and which had been offered as a cash management option, ceased operations on February 29, 2008. For the six months ended February 29, 2008, the Portfolios had purchases and sales of Government STIF Portfolio and Prime STIF Portfolio as follows:
| Government STIF Portfolio | Prime STIF Portfolio | |||||||||||
| Portfolio | Purchases | Sales | Purchases | Sales | ||||||||
U.S. Value | $ | 395,055,682 | $ | 465,152,389 | $ | –0– | $ | –0– | ||||
U.S. Large Cap Growth | 391,332,866 | 406,395,627 | –0– | –0– | ||||||||
Global Real Estate Investment | 180,378,101 | 180,881,470 | –0– | –0– | ||||||||
International Value | 224,152,066 | 224,767,677 | –0– | –0– | ||||||||
International Growth | 268,193,937 | 277,394,695 | –0– | –0– | ||||||||
Small-Mid Cap Value | 111,356,925 | 92,142,865 | –0– | –0– | ||||||||
Small-Mid Cap Growth | 156,423,112 | 144,904,094 | –0– | –0– | ||||||||
Global Value | 1,039,163 | 1,002,347 | –0– | –0– | ||||||||
Global Research Growth | 818,890 | 776,754 | –0– | –0– | ||||||||
Short Duration Bond | –0– | –0– | 441,716,874 | 574,808,306 | ||||||||
Intermediate Duration Bond | –0– | –0– | 900,401,764 | 1,015,385,419 | ||||||||
Inflation Protected Securities | –0– | –0– | 34,814,727 | 42,965,674 | ||||||||
High-Yield | –0– | –0– | 72,025,755 | 79,540,412 | ||||||||
Brokerage commissions paid on investment transactions and brokerage commissions paid to Sanford C. Bernstein & Co. LLC and Sanford C. Bernstein Limited, affiliates of the Adviser, for the six months ended February 29, 2008 were as follows:
| Portfolio | Total Commissions | Sanford C. Bernstein & Co. LLC | Sanford C. Bernstein Limited | ||||||
U.S. Value | $ | 488,570 | $ | –0– | $ | –0– | |||
U.S. Large Cap Growth | 1,342,261 | –0– | –0– | ||||||
Global Real Estate Investment | 538,063 | –0– | –0– | ||||||
International Value | 394,418 | –0– | –0– | ||||||
International Growth | 1,328,752 | –0– | –0– | ||||||
Small-Mid Cap Value | 169,925 | –0– | –0– | ||||||
Small-Mid Cap Growth | 490,978 | –0– | –0– | ||||||
Global Value | 1,503 | –0– | –0– | ||||||
Global Research Growth | 4,239 | –0– | –0– | ||||||
Short Duration Bond | –0– | –0– | –0– | ||||||
Intermediate Duration Bond | –0– | –0– | –0– | ||||||
Inflation Protected Securities | –0– | –0– | –0– | ||||||
High-Yield | –0– | –0– | –0– | ||||||
| ALLIANCEBERNSTEIN POOLING PORTFOLIOS • | 169 |
Notes to Financial Statements
NOTE C
Investment Transactions
Purchases and sales of investment securities (excluding U.S. government securities and short-term investments) for the six months ended February 29, 2008, were as follows:
| Portfolio | Purchases | Sales | ||||
U.S. Value | $ | 697,499,130 | $ | 241,964,056 | ||
U.S. Large Cap Growth | 1,498,049,538 | 1,323,993,468 | ||||
Global Real Estate Investment | 408,016,757 | 274,682,164 | ||||
International Value | 309,279,243 | 173,596,419 | ||||
International Growth | 713,195,533 | 650,369,749 | ||||
Small-Mid Cap Value | 146,380,372 | 91,970,114 | ||||
Small-Mid Cap Growth | 334,543,840 | 283,806,583 | ||||
Global Value | 1,153,410 | 1,150,165 | ||||
Global Research Growth | 2,630,618 | 3,220,311 | ||||
Short Duration Bond | 350,038,065 | 257,795,057 | ||||
Intermediate Duration Bond | 441,017,726 | 310,815,089 | ||||
Inflation Protected Securities | –0– | –0– | ||||
High-Yield | 94,869,524 | 41,056,066 | ||||
Purchases and sales of U.S. government securities for the six months ended February 29, 2008, were as follows:
| Portfolio | Purchases | Sales | ||||
U.S. Value | $ | –0– | $ | –0– | ||
U.S. Large Cap Growth | –0– | –0– | ||||
Global Real Estate Investment | –0– | –0– | ||||
International Value | –0– | –0– | ||||
International Growth | –0– | –0– | ||||
Small-Mid Cap Value | –0– | –0– | ||||
Small-Mid Cap Growth | –0– | –0– | ||||
Global Value | –0– | –0– | ||||
Global Research Growth | –0– | –0– | ||||
Short Duration Bond | 384,830,288 | 478,960,105 | ||||
Intermediate Duration Bond | 851,047,287 | 971,196,787 | ||||
Inflation Protected Securities | 43,657,554 | 32,177,695 | ||||
High-Yield | –0– | –0– | ||||
The cost of investments for federal income tax purposes was substantially the same as the cost for financial reporting purposes. Accordingly, gross unrealized appreciation and unrealized depreciation (excluding futures, foreign currency and swap transactions) are as follows:
| Gross Unrealized | Net Unrealized Appreciation/ (Depreciation) | ||||||||
| Portfolio | Appreciation | (Depreciation) | |||||||
U.S. Value | $ | 232,327,023 | $ | (374,541,400) | $ | (142,214,377) | |||
U.S. Large Cap Growth | 239,180,617 | (128,257,715) | 110,922,902 | ||||||
Global Real Estate Investment | 96,722,017 | (118,414,623) | (21,692,606) | ||||||
International Value | 156,404,418 | (114,974,238) | 41,430,180 | ||||||
International Growth | 199,614,743 | (43,852,611) | 155,762,132 | ||||||
| 170 | • ALLIANCEBERNSTEIN POOLING PORTFOLIOS |
Notes to Financial Statements
| Gross Unrealized | Net Unrealized Appreciation/ (Depreciation) | ||||||||||
| Portfolio | Appreciation | (Depreciation) | |||||||||
Small-Mid Cap Value | $ | 62,781,532 | $ | (94,042,224 | ) | $ | (31,260,692 | ) | |||
Small-Mid Cap Growth | 70,350,753 | (75,557,982 | ) | (5,207,229 | ) | ||||||
Global Value | 608,974 | (917,339 | ) | (308,365 | ) | ||||||
Global Research Growth | 734,363 | (600,997 | ) | 133,366 | |||||||
Short Duration Bond | 20,817,509 | (45,358,177 | ) | (24,540,668 | ) | ||||||
Intermediate Duration Bond | 25,733,619 | (27,849,557 | ) | (2,115,938 | ) | ||||||
Inflation Protected Securities | 56,055,830 | –0 | – | 56,055,830 | |||||||
High-Yield | 1,876,559 | (49,453,780 | ) | (47,577,221 | ) | ||||||
1. Financial Futures Contracts
Certain Portfolios may buy or sell financial futures contracts for the purpose of hedging its portfolio against adverse effects of anticipated movements in the market. The Portfolio bears the market risk that arises from changes in the value of these financial instruments and the imperfect correlation between movements in the price of the futures contracts and movements in the price of the securities hedged or used for cover.
At the time the Portfolio enters into a futures contract, the Portfolio deposits and maintains as collateral an initial margin with the broker, as required by the exchange on which the transaction is effected. Pursuant to the contract, the Portfolio agrees to receive from or pay to the broker an amount of cash equal to the daily fluctuation in the value of the contract. Such receipts or payments are known as variation margin and are recorded by the Portfolio as unrealized gains or losses. Risks may arise from the potential inability of a counterparty to meet the terms of the contract. When the contract is closed, the Portfolio records a realized gain or loss equal to the difference between the value of the contract at the time it was opened and the time it was closed.
2. Forward Currency Exchange Contracts
Certain Portfolios may enter into forward currency exchange contracts in order to hedge its exposure to changes in foreign currency exchange rates on its foreign portfolio holdings, to hedge certain firm purchase and sales commitments denominated in foreign currencies and for investment purposes. A forward currency exchange contract is a commitment to purchase or sell a foreign currency at a future date at a negotiated forward rate. The gain or loss arising from the difference between the original contract and the closing of such contract would be included in net realized gain or loss on foreign currency transactions.
Fluctuations in the value of open forward currency exchange contracts are recorded for financial reporting purposes as net unrealized appreciation or depreciation by the Portfolio.
The Portfolio’s custodian will place and maintain cash not available for investment or other liquid assets in a separate account of the Portfolio having a value at least equal to the aggregate amount of the Portfolio’s commitments under forward currency exchange contracts entered into with respect to position
| ALLIANCEBERNSTEIN POOLING PORTFOLIOS • | 171 |
Notes to Financial Statements
hedges. Risks may arise from the potential inability of a counterparty to meet the terms of a contract and from unanticipated movements in the value of a foreign currency relative to the U.S. dollar. The face or contract amount, in U.S. dollars reflects the total exposure the Portfolio has in that particular currency contract.
3. Dollar Rolls
Certain Portfolios may enter into dollar rolls. Dollar rolls involve sales by the Portfolio of securities for delivery in the current month and the Portfolio’s simultaneously contracting to repurchase substantially similar (same type and coupon) securities on a specified future date. During the roll period, the Portfolio forgoes principal and interest paid on the securities. The Portfolio is compensated by the difference between the current sales price and the lower forward price for the future purchase (often referred to as the “drop”) as well as by the interest earned on the cash proceeds of the initial sale. Dollar rolls involve the risk that the market value of the securities the Portfolio is obligated to repurchase under the agreement may decline below the repurchase price. Dollar rolls are speculative techniques and may be considered to be borrowings by the Portfolio. For the six months ended February 29, 2008, the Short Duration Bond Portfolio and Intermediate Duration Bond Portfolio earned drop income of $44,106 and $1,185, respectively, which is included in interest income in the accompanying statement of operations.
4. Swap Agreements
Certain Portfolios may enter into swaps to hedge its exposure to interest rates and credit risk or for investment purposes. A swap is an agreement that obligates two parties to exchange a series of cash flows at specified intervals based upon or calculated by reference to changes in specified prices or rates for a specified amount of an underlying asset. The payment flows are usually netted against each other, with the difference being paid by one party to the other.
Risks may arise as a result of the failure of the counterparty to the swap contract to comply with the terms of the swap contract. The loss incurred by the failure of a counterparty is generally limited to the net interim payment to be received by the Portfolio, and/or the termination value at the end of the contract. Therefore, the Portfolio considers the creditworthiness of each counterparty to a swap contract in evaluating potential credit risk. Additionally, risks may arise from unanticipated movements in interest rates or in the value of the underlying securities.
The Portfolio accrues for the interim payments on swap contracts on a daily basis, with the net amount recorded within unrealized appreciation/depreciation of swap contracts on the statement of assets and liabilities. Once the interim payments are settled in cash, the net amount is recorded as realized gain/loss on swaps, in addition to realized gain/loss recorded upon the termination of swap contracts on the statement of operations. Fluctuations in the value of swap contracts are recorded as a component of net change in unrealized appreciation/depreciation of investments.
| 172 | • ALLIANCEBERNSTEIN POOLING PORTFOLIOS |
Notes to Financial Statements
The Portfolio may enter into credit default swaps. The Portfolio may purchase credit protection on the referenced obligation of the credit default swap (“Buy Contract”) or provide credit protection on the referenced obligation of the credit default swap (“Sale Contract”). A sale/(buy) in a credit default swap provides upon the occurrence of a credit event, as defined in the swap agreement, for the Portfolio to buy/(sell) from/(to) the counterparty at the notional amount (the “Notional Amount”) and receive/(deliver) the principal amount of the referenced obligation. If a credit event occurs, the maximum payout amount for a Sale Contract is limited to the Notional Amount of the swap contract (“Maximum Payout Amount”). During the term of the swap agreement, the Portfolio receives/(pays) fixed payments from/(to) the respective counterparty, calculated at the agreed upon interest rate applied to the Notional Amount. These interim payments are recorded within unrealized appreciation/depreciation of swap contracts on the statement of assets and liabilities.
Credit default swaps may involve greater risks than if a Portfolio had invested in the referenced obligation directly. Credit default swaps are subject to general market risk, liquidity risk, counterparty risk and credit risk. If the Portfolio is a buyer and no credit event occurs, it will lose its investment. In addition, if the Portfolio is a seller and a credit event occurs, the value of the referenced obligation received by the Portfolio coupled with the periodic payments previously received, may be less than the Maximum Payout Amount it pays to the buyer, resulting in a loss to the Portfolio.
In certain circumstances, the Portfolio may hold Sale Contracts on the same referenced obligation and with the same counterparty it has purchased credit protection, which may reduce its obligation to make payments on Sale Contracts, if a credit event occurs.
NOTE D
Shares of Beneficial Interest
Transactions in shares of beneficial interest for each class were as follows:
| Shares | Amount | |||||||||||||||||
| Portfolio | Six Months Ended February 29, 2008 (unaudited) | Year Ended August 31, 2007 | Six Months Ended February 29, 2008 (unaudited) | Year Ended August 31, 2007 | ||||||||||||||
| U.S. Value | ||||||||||||||||||
Shares sold | 29,734,746 | 53,292,654 | $ | 353,607,555 | $ | 666,051,617 | ||||||||||||
Shares issued in reinvestment of dividends and distributions | 11,589,227 | 7,096,615 | 134,543,559 | 85,928,758 | ||||||||||||||
Shares redeemed | (1,916,942 | ) | (13,253,642 | ) | (21,867,228 | ) | (169,233,098 | ) | ||||||||||
Net increase | 39,407,031 | 47,135,627 | $ | 466,283,886 | $ | 582,747,277 | ||||||||||||
| ALLIANCEBERNSTEIN POOLING PORTFOLIOS • | 173 |
Notes to Financial Statements
| Shares | Amount | |||||||||||||||||
| Portfolio | Six Months Ended February 29, 2008 (unaudited) | Year Ended August 31, 2007 | Six Months Ended February 29, 2008 (unaudited) | Year Ended August 31, 2007 | ||||||||||||||
U.S. Large Cap Growth | ||||||||||||||||||
Shares sold | 17,975,223 | 52,869,919 | $ | 214,987,405 | $ | 630,201,049 | ||||||||||||
Shares issued in reinvestment of dividends and distributions | 6,447,452 | 4,337,854 | 84,289,661 | 51,068,033 | ||||||||||||||
Shares redeemed | (6,062,009 | ) | (8,101,694 | ) | (78,952,268 | ) | (99,772,347 | ) | ||||||||||
Net increase | 18,360,666 | 49,106,079 | $ | 220,324,798 | $ | 581,496,735 | ||||||||||||
Global Real Estate Investment | ||||||||||||||||||
Shares sold | 10,327,963 | 22,315,063 | $ | 125,910,482 | $ | 320,944,418 | ||||||||||||
Shares issued in reinvestment of dividends and distributions | 15,803,531 | 5,269,908 | 193,909,323 | 72,223,942 | ||||||||||||||
Shares redeemed | (2,121,310 | ) | (4,358,108 | ) | (26,517,048 | ) | (63,268,584 | ) | ||||||||||
Net increase | 24,010,184 | 23,226,863 | $ | 293,302,757 | $ | 329,899,776 | ||||||||||||
International Value | ||||||||||||||||||
Shares sold | 10,947,852 | 20,435,434 | $ | 146,956,655 | $ | 300,277,389 | ||||||||||||
Shares issued in reinvestment of dividends and distributions | 9,820,576 | 9,077,580 | 137,527,588 | 127,035,972 | ||||||||||||||
Shares redeemed | (1,082,051 | ) | (13,129,915 | ) | (15,079,007 | ) | (200,312,971 | ) | ||||||||||
Net increase | 19,686,377 | 16,383,099 | $ | 269,405,236 | $ | 227,000,390 | ||||||||||||
International Growth | ||||||||||||||||||
Shares sold | 4,646,822 | 22,025,812 | $ | 63,981,510 | $ | 293,045,111 | ||||||||||||
Shares issued in reinvestment of dividends and distributions | 6,672,623 | 4,649,330 | 96,870,754 | 60,579,937 | ||||||||||||||
Shares redeemed | (3,376,513 | ) | (2,307,372 | ) | (50,058,271 | ) | (31,708,115 | ) | ||||||||||
Net increase | 7,942,932 | 24,367,770 | $ | 110,793,993 | $ | 321,916,933 | ||||||||||||
Small-Mid Cap Value | ||||||||||||||||||
Shares sold | 6,119,223 | 12,272,393 | $ | 74,401,270 | $ | 154,827,469 | ||||||||||||
Shares issued in reinvestment of dividends and distributions | 3,466,360 | 1,186,117 | 41,443,038 | 14,417,624 | ||||||||||||||
Shares redeemed | (771,546 | ) | (2,832,032 | ) | (8,658,893 | ) | (37,604,853 | ) | ||||||||||
Net increase | 8,814,037 | 10,626,478 | $ | 107,185,415 | $ | 131,640,240 | ||||||||||||
| 174 | • ALLIANCEBERNSTEIN POOLING PORTFOLIOS |
Notes to Financial Statements
| Shares | Amount | |||||||||||||||||
| Portfolio | Six Months Ended February 29, 2008 (unaudited) | Year Ended August 31, 2007 | Six Months Ended February 29, 2008 (unaudited) | Year Ended August 31, 2007 | ||||||||||||||
Small-Mid Cap Growth | ||||||||||||||||||
Shares sold | 3,774,170 | 9,831,981 | $ | 51,391,998 | $ | 130,749,307 | ||||||||||||
Shares issued in reinvestment of dividends and distributions | 4,647,804 | 802,239 | 65,914,057 | 10,475,842 | ||||||||||||||
Shares redeemed | (400,065 | ) | (1,684,770 | ) | (5,785,832 | ) | (24,254,507 | ) | ||||||||||
Net increase | 8,021,909 | 8,949,450 | $ | 111,520,223 | $ | 116,970,642 | ||||||||||||
| Global Value | ||||||||||||||||||
Shares sold | 369 | 7,565 | $ | 3,835 | $ | 86,590 | ||||||||||||
Shares issued in reinvestment of dividends and distributions | 41,088 | 15,612 | 460,166 | 174,603 | ||||||||||||||
Shares redeemed | 0 | (23,391 | ) | 0 | (262,114 | ) | ||||||||||||
Net increase (decrease) | 41,457 | (214 | ) | $ | 464,001 | $ | (921 | ) | ||||||||||
Global Research Growth | ||||||||||||||||||
Shares sold | 0 | 11,768 | $ | 0 | $ | 130,880 | ||||||||||||
Shares issued in reinvestment of dividends and distributions | 27,179 | 9,862 | 323,517 | 107,736 | ||||||||||||||
Shares redeemed | (40,778 | ) | (4,220 | ) | (465,288 | ) | (46,924 | ) | ||||||||||
Net increase (decrease) | (13,599 | ) | 17,410 | $ | (141,771 | ) | $ | 191,692 | ||||||||||
Short Duration Bond | ||||||||||||||||||
Shares sold | 6,717,863 | 33,408,002 | $ | 66,268,558 | $ | 331,667,284 | ||||||||||||
Shares issued in reinvestment of dividends | 3,539,411 | 5,710,453 | 34,749,852 | 56,566,899 | ||||||||||||||
Shares redeemed | (3,022,382 | ) | (6,984,150 | ) | (29,744,131 | ) | (69,145,743 | ) | ||||||||||
Net increase | 7,234,892 | 32,134,305 | $ | 71,274,279 | $ | 319,088,440 | ||||||||||||
Intermediate Duration Bond | ||||||||||||||||||
Shares sold | 13,609,588 | 56,181,871 | $ | 134,846,717 | $ | 554,345,101 | ||||||||||||
Shares issued in reinvestment of dividends | 4,680,861 | 6,491,691 | 46,251,172 | 63,965,369 | ||||||||||||||
Shares redeemed | (8,345,006 | ) | (9,765,967 | ) | (83,333,574 | ) | (95,865,272 | ) | ||||||||||
Net increase | 9,945,443 | 52,907,595 | $ | 97,764,315 | $ | 522,445,198 | ||||||||||||
| ALLIANCEBERNSTEIN POOLING PORTFOLIOS • | 175 |
Notes to Financial Statements
| Shares | Amount | |||||||||||||||||
| Portfolio | Six Months Ended February 29, 2008 (unaudited) | Year Ended August 31, 2007 | Six Months Ended February 29, 2008 (unaudited) | Year Ended August 31, 2007 | ||||||||||||||
Inflation Protected Securities | ||||||||||||||||||
Shares sold | 2,352,814 | 23,092,999 | $ | 23,819,968 | $ | 224,665,176 | ||||||||||||
Shares issued in reinvestment of dividends | 2,987,085 | 1,771,826 | 29,900,723 | 17,135,756 | ||||||||||||||
Shares redeemed | (3,086,373 | ) | (5,602,787 | ) | (31,965,006 | ) | (54,783,306 | ) | ||||||||||
Net increase | 2,253,526 | 19,262,038 | $ | 21,755,685 | $ | 187,017,626 | ||||||||||||
| High-Yield | ||||||||||||||||||
Shares sold | 3,427,867 | 20,486,123 | $ | 33,805,246 | $ | 209,018,235 | ||||||||||||
Shares issued in reinvestment of dividends | 2,103,734 | 2,807,323 | 20,546,577 | 28,646,986 | ||||||||||||||
Shares redeemed | (517,942 | ) | (5,799,225 | ) | (5,048,378 | ) | (58,906,425 | ) | ||||||||||
Net increase | 5,013,659 | 17,494,221 | $ | 49,303,445 | $ | 178,758,796 | ||||||||||||
Commencement of Offering
The Portfolios commenced offering on May 20, 2005 (with the exception of the Global Value Portfolio and the Global Research Growth Portfolio each of which commenced operations on June 1, 2006), through the investments of cash and securities received in a tax free in-kind contributions from AllianceBernstein Wealth Appreciation Strategy, AllianceBernstein Balanced Wealth Strategy, AllianceBernstein Wealth Preservation Strategy and AllianceBernstein Blended Style Series-U.S. Large Cap Portfolio (“U.S. Large Cap Fund”). Prior to commencement of operations on May 20, 2005, the Trust had no operations other than the sale to the Adviser on April 15, 2005 of 10,000 shares for $10 each of the AllianceBernstein Small-Mid Cap Growth Portfolio.
NOTE E
Risks Involved in Investing in the Portfolios
Interest Rate Risk and Credit Risk — Interest rate risk is the risk that changes in interest rates will affect the value of the Portfolios’ investments in fixed-income debt securities such as bonds or notes. Increases in interest rates may cause the value of the Portfolios’ investments to decline. Credit risk is the risk that the issuer or guarantor of a debt security, or the counterparty to a derivative contract, will be unable or unwilling to make timely principal and/or interest payments, or to otherwise honor its obligations. The degree of risk for a particular security may be reflected in its credit risk rating. Credit risk is greater for medium quality and lower-rated securities. Lower-rated debt securities and similar unrated securities (commonly known as “junk bonds”) have speculative elements or are predominantly speculative risks.
| 176 | • ALLIANCEBERNSTEIN POOLING PORTFOLIOS |
Notes to Financial Statements
Foreign Securities Risk — Investing in securities of foreign companies or foreign governments involves special risks which include changes in foreign currency exchange rates and the possibility of future political and economic developments which could adversely affect the value of such securities. Moreover, securities of many foreign companies or foreign governments and their markets may be less liquid and their prices more volatile than those of comparable U.S. companies or of the U.S. government.
Concentration of Risk — Although the Global Real Estate Investment Portfolio does not invest directly in real estate, it invests primarily in Real Estate Equity Securities and has a policy of concentration of its investments in the real estate industry. Therefore, an investment in the Portfolio is subject to certain risks associated with the direct ownership of real estate and with the real estate industry in general. To the extent that assets underling the Portfolio’s investments are concentrated geographically, by property type or in certain other respects, the Portfolio may be subject to additional risks.
In addition, investing in Real Estate Investment Trusts (“REITs”) involves certain unique risks in addition to those risks associated with investing in the real estate industry in general. REITs are dependent upon management skills, are not diversified, and are subject to heavy cash flow dependency, default by borrowers and self-liquidation. REITs are also subject to the possibilities of failing to qualify for tax-free pass-through of income under the Code and failing to maintain their exemptions from registration under the 1940 Act. REITs (especially mortgage REITs) also are subject to interest rate risks.
Indemnification Risk — In the ordinary course of business, the Portfolios enter into contracts that contain a variety of indemnifications. The Portfolios’ maximum exposure under these arrangements is unknown. However, the Portfolios have not had prior claims or losses pursuant to these indemnification provisions and expect the risk of loss thereunder to be remote.
NOTE F
Distributions to Shareholders
The tax character of distributions to be paid for the year ending August 31, 2008 will be determined at the end of the current fiscal year. The tax character of distributions paid during the fiscal years ended August 31, 2007 and August 31, 2006 were as follows:
| U.S. Value | 2007 | 2006 | ||||
Distributions paid from: | ||||||
Ordinary income | $ | 62,740,936 | $ | 34,158,303 | ||
Long-term capital gains | 23,187,822 | 6,942,932 | ||||
Total distributions paid | $ | 85,928,758 | $ | 41,101,235 | ||
| ALLIANCEBERNSTEIN POOLING PORTFOLIOS • | 177 |
Notes to Financial Statements
| U.S. Large Cap Growth | 2007 | 2006 | ||||||
Distributions paid from: | ||||||||
Ordinary income | $ | 17,064,811 | $ | 7,679,880 | ||||
Long-term capital gains | 34,003,222 | 3,502,203 | ||||||
Total distributions paid | $ | 51,068,033 | $ | 11,182,083 | ||||
| Global Real Estate Investment | 2007 | 2006 | ||||||
Distributions paid from: | ||||||||
Ordinary income | $ | 39,472,928 | $ | 21,211,214 | ||||
Long-term capital gains | 32,751,014 | 2,951,088 | ||||||
Total distributions paid | $ | 72,223,942 | $ | 24,162,302 | ||||
| International Value | 2007 | 2006 | ||||||
Distributions paid from: | ||||||||
Ordinary income | $ | 89,354,218 | $ | 25,246,247 | ||||
Long-term capital gains | 37,681,754 | 7,729,686 | ||||||
Total distributions paid | $ | 127,035,972 | $ | 32,975,933 | ||||
| International Growth | 2007 | 2006 | ||||||
Distributions paid from: | ||||||||
Ordinary income | $ | 31,198,447 | $ | 12,483,325 | ||||
Long-term capital gains | 29,381,490 | 1,113,519 | ||||||
Total distributions paid | $ | 60,579,937 | $ | 13,596,844 | ||||
| Small-Mid Cap Value | 2007 | 2006 | ||||||
Distributions paid from: | ||||||||
Ordinary income | $ | 10,199,314 | $ | 4,362,192 | ||||
Long-term capital gains | 4,218,310 | – 0 | – | |||||
Total distributions paid | $ | 14,417,624 | $ | 4,362,192 | ||||
| Small-Mid Cap Growth | 2007 | 2006 | ||||||
Distributions paid from: | ||||||||
Ordinary income | $ | 8,517,111 | $ | 917,579 | ||||
Long-term capital gains | 1,958,731 | – 0 | – | |||||
Total distributions paid | $ | 10,475,842 | $ | 917,579 | ||||
| Global Value | 2007 | 2006 | ||||||
Distributions paid from: | ||||||||
Ordinary income | $ | 174,603 | $ | – 0 | – | |||
Long-term capital gains | – 0 | – | – 0 | – | ||||
Total distributions paid | $ | 174,603 | $ | – 0 | – | |||
| 178 | • ALLIANCEBERNSTEIN POOLING PORTFOLIOS |
Notes to Financial Statements
| Global Research Growth | 2007 | 2006 | ||||||
Distributions paid from: | ||||||||
Ordinary income | $ | 107,736 | $ | – 0 | – | |||
Long-term capital gains | – 0 | – | – 0 | – | ||||
Total distributions paid | $ | 107,736 | $ | – 0 | – | |||
| Short Duration Bond | 2007 | 2006 | ||||||
Distributions paid from: | ||||||||
Ordinary income | $ | 56,566,899 | $ | 37,754,560 | ||||
Long-term capital gains | – 0 | – | – 0 | – | ||||
Total distributions paid | $ | 56,566,899 | $ | 37,754,560 | ||||
| Intermediate Duration Bond | 2007 | 2006 | ||||||
Distributions paid from: | ||||||||
Ordinary income | $ | 63,965,369 | $ | 43,355,404 | ||||
Long-term capital gains | – 0 | – | – 0 | – | ||||
Total distributions paid | $ | 63,965,369 | $ | 43,355,404 | ||||
| Inflation Protected Securities | 2007 | 2006 | ||||||
Distributions paid from: | ||||||||
Ordinary income | $ | 17,135,755 | $ | 9,820,532 | ||||
Long-term capital gains | – 0 | – | 86,219 | |||||
Total distributions paid | $ | 17,135,755 | $ | 9,906,751 | ||||
| High-Yield | 2007 | 2006 | ||||||
Distributions paid from: | ||||||||
Ordinary income | $ | 28,646,986 | $ | 21,777,610 | ||||
Long-term capital gains | – 0 | – | – 0 | – | ||||
Total distributions paid | $ | 28,646,986 | $ | 21,777,610 | ||||
As of August 31, 2007, the components of accumulated earnings/(deficit) on a tax basis were as follows:
| Portfolio | Undistributed Ordinary Income | Undistributed Long-Term Gains | Accumulated Capital and Other Gains (Losses) | Unrealized Appreciation/ (Depreciation)(a) | Total Accumulated Earnings/ (Deficit)(b) | ||||||||||
U.S. Value | $ | 31,185,283 | $ | 67,877,741 | $ | –0– | $ | 276,429,097 | $ | 375,492,121 | |||||
U.S. Large Cap Growth | 3,530,900 | 44,646,607 | –0– | 300,723,149 | 348,900,656 | ||||||||||
Global Real Estate Investment | 99,408,955 | 73,308,399 | –0– | 46,248,687 | 218,966,041 | ||||||||||
International Value | 11,663,386 | 84,256,334 | –0– | 243,622,892 | 339,542,612 | ||||||||||
International Growth | 5,994,550 | 66,009,293 | –0– | 181,047,459 | 253,051,302 | ||||||||||
| ALLIANCEBERNSTEIN POOLING PORTFOLIOS • | 179 |
Notes to Financial Statements
| Portfolio | Undistributed Ordinary Income | Undistributed Long-Term Gains | Accumulated Capital and Other Gains (Losses) | Unrealized Appreciation/ (Depreciation)(a) | Total Accumulated Earnings/ (Deficit)(b) | |||||||||||||
Small-Mid Cap Value | $ | 15,159,964 | $ | 19,045,249 | $ | 0 | $ | 55,854,692 | $ | 90,059,905 | ||||||||
Small-Mid Cap Growth | 2,792,779 | 62,746,822 | 0 | 84,274,913 | 149,814,514 | |||||||||||||
Global Value | 214,535 | 89,160 | 0 | 765,339 | 1,069,034 | |||||||||||||
Global Research Growth | 56,486 | 127,963 | 0 | 629,043 | 813,492 | |||||||||||||
Short Duration Bond | 4,217,239 | 0 | (5,126,016 | ) | (12,366,964 | ) | (13,275,741 | ) | ||||||||||
Intermediate Duration Bond | 8,031,489 | 0 | (12,939,152 | ) | (7,783,775 | ) | (12,691,438 | ) | ||||||||||
Inflation Protected Securities | 22,763,912 | 0 | (1,683,708 | ) | (8,338,779 | ) | 12,741,425 | |||||||||||
High Yield | 2,210,490 | 0 | (1,731,135 | ) | (18,066,146 | ) | (17,586,791 | ) | ||||||||||
(a) | The difference between book-basis and tax-basis unrealized appreciation/(depreciation) is attributable primarily to the tax deferral of losses on wash sales, mark to market on passive foreign investment companies, mark to market on forward contracts, future contracts, swaps, and swap income (loss) accruals. |
(b) | The difference between book-basis and tax-basis components of accumulated earnings (deficit) is attributable primarily to deferral of post October capital or currency losses. |
(c) | On August 31, 2007, the Short Duration Bond Portfolio, Intermediate Duration Bond, Inflation Protected Securities, High-Yield Portfolios had a net capital loss carryforward of $4,091,526, $10,909,502, $757,919, $1,561,339 respectively, of which $529,195 expires in the year 2014 and $3,562,331 expires in the year 2015 for the Short Duration Portfolio, $596,899 expires in the year 2014 and $10,312,603 expires in the year 2015 for Intermediate Duration Bond Portfolio, $757,919 expires in the year 2015 for the Inflation Protected Securities Portfolio, and $1,561,339 expires in the year 2015 for the High-Yield Portfolio. To the extent future gains are offset by capital loss carryforward, such gains will not be distributed. Net capital and currency losses incurred after October 31, and within the taxable year are deemed arise on the first business day of Portfolio’s next taxable year. Short Duration Bond, Intermediate Duration Bond, Inflation Protected Securities, and High-Yield Portfolios elect to defer $1,034,490, $2,029,650, $925,789 and $169,796 of capital losses that are deemed to arise in the next taxable year. |
NOTE G
Legal Proceedings
On October 2, 2003, a purported class action complaint entitled Hindo, et al. v. AllianceBernstein Growth & Income Fund, et al. (“Hindo Complaint”) was filed against the Adviser, Alliance Capital Management Holding L.P. (“Alliance Holding”), Alliance Capital Management Corporation, AXA Financial, Inc., the AllianceBernstein Funds, certain officers of the Adviser (“AllianceBernstein defendants”), and certain other unaffiliated defendants, as well as unnamed Doe
| 180 | • ALLIANCEBERNSTEIN POOLING PORTFOLIOS |
Notes to Financial Statements
defendants. The Hindo Complaint was filed in the United States District Court for the Southern District of New York by alleged shareholders of two of the AllianceBernstein Funds. The Hindo Complaint alleges that certain of the AllianceBernstein defendants failed to disclose that they improperly allowed certain hedge funds and other unidentified parties to engage in “late trading” and “market timing” of AllianceBernstein Fund securities, violating Sections 11 and 15 of the Securities Act, Sections 10(b) and 20(a) of the Exchange Act and Sections 206 and 215 of the Advisers Act. Plaintiffs seek an unspecified amount of compensatory damages and rescission of their contracts with the Adviser, including recovery of all fees paid to the Adviser pursuant to such contracts.
Following October 2, 2003, 43 additional lawsuits making factual allegations generally similar to those in the Hindo Complaint were filed in various federal and state courts against the Adviser and certain other defendants. On September 29, 2004, plaintiffs filed consolidated amended complaints with respect to four claim types: mutual fund shareholder claims; mutual fund derivative claims; derivative claims brought on behalf of Alliance Holding; and claims brought under ERISA by participants in the Profit Sharing Plan for Employees of the Adviser. All four complaints include substantially identical factual allegations, which appear to be based in large part on the Order of the SEC dated December 18, 2003 as amended and restated January 15, 2004 (“SEC Order”) and the New York State Attorney General Assurance of Discontinuance dated September 1, 2004 (“NYAG Order”).
On April 21, 2006, the Adviser and attorneys for the plaintiffs in the mutual fund shareholder claims, mutual fund derivative claims, and ERISA claims entered into a confidential memorandum of understanding containing their agreement to settle these claims. The agreement will be documented by a stipulation of settlement and will be submitted for court approval at a later date. The settlement amount ($30 million), which the Adviser previously accrued and disclosed, has been disbursed. The derivative claims brought on behalf of Alliance Holding, in which plaintiffs seek an unspecified amount of damages, remain pending.
It is possible that these matters and/or other developments resulting from these matters could result in increased redemptions of the AllianceBernstein Mutual Funds’ shares or other adverse consequences to the AllianceBernstein Mutual Funds. This may require the AllianceBernstein Mutual Funds to sell investments held by those funds to provide for sufficient liquidity and could also have an adverse effect on the investment performance of the AllianceBernstein Mutual Funds. However, the Adviser believes that these matters are not likely to have a material adverse effect on its ability to perform advisory services relating to the AllianceBernstein Mutual Funds.
| ALLIANCEBERNSTEIN POOLING PORTFOLIOS • | 181 |
Notes to Financial Statements
NOTE H
Recent Accounting Pronouncements
On July 13, 2006, the Financial Accounting Standards Board (“FASB”) released FASB Interpretation No. 48 “Accounting for Uncertainty in Income Taxes” (“FIN 48”). FIN 48 provides guidance for how uncertain tax positions should be recognized, measured, presented and disclosed in the financial statements. FIN 48 requires the evaluation of tax positions taken or expected to be taken in the course of preparing a fund’s tax returns to determine whether the tax positions are “more-likely-than-not” of being sustained by the applicable tax authority. Tax positions not deemed to meet the more-likely-than-not threshold would be recorded in the current period. Adoption of FIN 48 is required for fiscal years beginning after December 15, 2006 and is to be applied to all open tax years as of the effective date. On February 29, 2008, the Portfolios implemented FIN 48 which supplements FASB 109, “Accounting for Income Taxes”. Management has analyzed the Portfolios’ tax positions taken on federal income tax returns for all open tax years (tax years ended August 31, 2004-2006) for purposes of implementing FIN 48, and has concluded that no provision for income tax is required in the Portfolios’ financial statements.
On September 20, 2006, the FASB released Statement of Financial Accounting Standards No. 157 “Fair Value Measurements” (“FAS 157”). FAS 157 establishes an authoritative definition of fair value, sets out a framework for measuring fair value, and requires additional disclosures about fair-value measurements. The application of FAS 157 is required for fiscal years beginning after November 15, 2007 and interim periods within those fiscal years. At this time, management is evaluating the implications of FAS 157 and its impact on the financial statements has not yet been determined.
On March 19, 2008, Financial Accounting Standards Board released Statement of Financial Accounting Standards No. 161, “Disclosures about Derivative Instruments and Hedging Activities” (“FAS 161”). FAS 161 requires qualitative disclosures about objectives and strategies for using derivatives, quantitative disclosures about fair value amounts of and gains and losses on derivative instruments, and disclosures about credit-risk-related contingent features in derivative agreements. The application of FAS 161 is required for fiscal years beginning after November 15, 2008 and interim periods within those fiscal years. At this time, management is evaluating the implications of FAS 161 and its impact on the financial statements has not yet been determined.
| 182 | • ALLIANCEBERNSTEIN POOLING PORTFOLIOS |
Notes to Financial Statements
FINANCIAL HIGHLIGHTS
Selected Data For A Share Of Beneficial Interest Outstanding Throughout Each Period
| U.S. Value | ||||||||||||
| Six Months Ended February 29, 2008 (unaudited) | Year Ended August 31, | May 20, 2005(a) to August 31, 2005 | ||||||||||
| 2007 | 2006 | |||||||||||
Net asset value, beginning of period | $ 12.44 | $ 11.41 | $ 10.32 | $ 10.00 | ||||||||
Income From Investment Operations | ||||||||||||
Net investment income(b) | .17 | .31 | .27 | .08 | ||||||||
Net realized and unrealized gain (loss) on investment transactions | (1.77 | ) | 1.22 | 1.11 | .28 | |||||||
Net increase (decrease) in net asset value from operations | (1.60 | ) | 1.53 | 1.38 | .36 | |||||||
Less: Dividends and Distributions | ||||||||||||
Dividends from net investment income | (.18 | ) | (.30 | ) | (.21 | ) | (.04 | ) | ||||
Distributions from net realized gain on investment transactions | (.42 | ) | (.20 | ) | (.08 | ) | – 0 | – | ||||
Total dividends and distributions | (.60 | ) | (.50 | ) | (.29 | ) | (.04 | ) | ||||
Net asset value, end of period | $ 10.24 | $ 12.44 | $ 11.41 | $ 10.32 | ||||||||
Total Return | ||||||||||||
Total investment return based on net asset value(c) | (13.47 | )% | 13.55 | % | 13.60 | % | 3.58 | % | ||||
Ratios/Supplemental Data | ||||||||||||
Net assets, end of period (000’s omitted) | $2,521,873 | $2,573,340 | $1,822,032 | $1,355,032 | ||||||||
Ratio to average net assets of: | ||||||||||||
Expenses | .02 | %(d) | .02 | % | .04 | % | .07 | %(d) | ||||
Net investment income | 3.00 | %(d) | 2.49 | % | 2.48 | % | 2.84 | %(d) | ||||
Portfolio turnover rate | 9 | % | 22 | % | 14 | % | 21 | % | ||||
See footnote summary on page 195.
| ALLIANCEBERNSTEIN POOLING PORTFOLIOS • | 183 |
Financial Highlights
Selected Data For A Share Of Beneficial Interest Outstanding Throughout Each Period
| U.S. Large Cap Growth | ||||||||||||
| Six Months Ended February 29, 2008 (unaudited) | Year Ended August 31, | May 20, 2005(a) to August 31, 2005 | ||||||||||
| 2007 | 2006 | |||||||||||
Net asset value, beginning of period | $ 12.47 | $ 11.09 | $ 10.73 | $ 10.00 | ||||||||
Income From Investment Operations | ||||||||||||
Net investment income(b) | .05 | .10 | .07 | .02 | ||||||||
Net realized and unrealized gain (loss) on investment transactions | (.90 | ) | 1.57 | .38 | .72 | |||||||
Net increase (decrease) in net asset value from operations | (.85 | ) | 1.67 | .45 | .74 | |||||||
Less: Dividends and Distributions | ||||||||||||
Dividends from net investment income | (.05 | ) | (.09 | ) | (.06 | ) | (.01 | ) | ||||
Distributions from net realized gain on investment transactions | (.35 | ) | (.20 | ) | (.03 | ) | – 0 | – | ||||
Total dividends and distributions | (.40 | ) | (.29 | ) | (.09 | ) | (.01 | ) | ||||
Net asset value, end of period | $ 11.22 | $ 12.47 | $ 11.09 | $ 10.73 | ||||||||
Total Return | ||||||||||||
Total investment return based on net asset value(c) | (7.27 | )% | 15.23 | % | 4.10 | % | 7.38 | % | ||||
Ratios/Supplemental Data | ||||||||||||
Net assets, end of period (000’s omitted) | $2,553,005 | $2,608,154 | $1,775,474 | $1,397,037 | ||||||||
Ratio to average net assets of: | ||||||||||||
Expenses | .02 | %(d) | .02 | % | .04 | % | .05 | %(d) | ||||
Net investment income | .72 | %(d) | .80 | % | .64 | % | .62 | %(d) | ||||
Portfolio turnover rate | 49 | % | 92 | % | 64 | % | 13 | % | ||||
See footnote summary on page 195.
| 184 | • ALLIANCEBERNSTEIN POOLING PORTFOLIOS |
Financial Highlights
Selected Data For A Share Of Beneficial Interest Outstanding Throughout Each Period
| Global Real Estate Investment | ||||||||||||
| Six Months Ended February 29, 2008 (unaudited) | Year Ended August 31, | May 20, 2005(a) to | ||||||||||
| 2007 | 2006 | |||||||||||
Net asset value, beginning of period | $ 13.90 | $ 13.14 | $ 10.74 | $ 10.00 | ||||||||
Income From Investment Operations | ||||||||||||
Net investment income(b) | .20 | .27 | .36 | .09 | (e) | |||||||
Net realized and unrealized gain (loss) on investment and foreign currency transactions | (1.28 | ) | 1.59 | 2.47 | .69 | |||||||
Net increase (decrease) in net asset value from operations | (1.08 | ) | 1.86 | 2.83 | .78 | |||||||
Less: Dividends and Distributions | ||||||||||||
Dividends from net investment income | (1.12 | ) | (.58 | ) | (.37 | ) | (.04 | ) | ||||
Distributions from net realized gain on investment transactions | (1.05 | ) | (.52 | ) | (.06 | ) | – 0 | – | ||||
Total dividends and distributions | (2.17 | ) | (1.10 | ) | (.43 | ) | (.04 | ) | ||||
Net asset value, end of period | $ 10.65 | $ 13.90 | $ 13.14 | $ 10.74 | ||||||||
Total Return | ||||||||||||
Total investment return based on net asset value(c) | (9.87 | )% | 14.33 | % | 27.18 | % | 7.80 | % | ||||
Ratios/Supplemental Data | ||||||||||||
Net assets, end of period (000’s omitted) | $1,177,726 | $1,203,895 | $832,695 | $508,737 | ||||||||
Ratio to average net assets of: | ||||||||||||
Expenses, net of waivers/reimbursements | .06 | %(d) | .06 | % | .09 | % | .15 | %(d) | ||||
Expenses, before waivers/reimbursements | .06 | %(d) | .06 | % | .09 | % | .16 | %(d) | ||||
Net investment income | 3.06 | %(d) | 1.90 | % | 3.07 | % | 3.14 | %(d)(e) | ||||
Portfolio turnover rate | 22 | % | 49 | % | 46 | % | 7 | % | ||||
See footnote summary on page 195.
| ALLIANCEBERNSTEIN POOLING PORTFOLIOS • | 185 |
Financial Highlights
Selected Data For A Share Of Beneficial Interest Outstanding Throughout Each Period
| International Value | ||||||||||||
| Six Months Ended February 29, 2008 (unaudited) | Year Ended August 31, | May 20, 2005(a) to August 31, 2005 | ||||||||||
| 2007 | 2006 | |||||||||||
Net asset value, beginning of period | $ 14.88 | $ 13.84 | $ 10.89 | $ 10.00 | ||||||||
Income From Investment Operations | ||||||||||||
Net investment income(b) | .11 | .42 | .38 | .10 | (e) | |||||||
Net realized and unrealized gain (loss) on investment and foreign currency transactions | (1.40 | ) | 2.29 | 3.04 | .87 | |||||||
Net increase (decrease) in net asset value from operations | (1.29 | ) | 2.71 | 3.42 | .97 | |||||||
Less: Dividends and Distributions | ||||||||||||
Dividends from net investment income | (.14 | ) | (.55 | ) | (.26 | ) | (.08 | ) | ||||
Distributions from net realized gain on investment transactions | (1.35 | ) | (1.12 | ) | (.21 | ) | – 0 | – | ||||
Total dividends and distributions | (1.49 | ) | (1.67 | ) | (.47 | ) | (.08 | ) | ||||
Net asset value, end of period | $ 12.10 | $ 14.88 | $ 13.84 | $ 10.89 | ||||||||
Total Return | ||||||||||||
Total investment return based on net asset value(c) | (10.03 | )% | 20.64 | % | 32.16 | % | 9.71 | % | ||||
Ratios/Supplemental Data | ||||||||||||
Net assets, end of period (000’s omitted) | $1,308,319 | $1,315,984 | $997,371 | $788,432 | ||||||||
Ratio to average net assets of: | ||||||||||||
Expenses, net of waivers/reimbursements | .07 | %(d) | .08 | % | .10 | % | .15 | %(d) | ||||
Expenses, before waivers/reimbursements | .07 | %(d) | .08 | % | .10 | % | .94 | %(d) | ||||
Net investment income | 1.52 | %(d) | 2.89 | % | 3.09 | % | 3.56 | %(d)(e) | ||||
Portfolio turnover rate | 13 | % | 31 | % | 27 | % | 23 | % | ||||
See footnote summary on page 195.
| 186 | • ALLIANCEBERNSTEIN POOLING PORTFOLIOS |
Financial Highlights
Selected Data For A Share Of Beneficial Interest Outstanding Throughout Each Period
| International Growth | ||||||||||||
| Six Months Ended February 29, 2008 (unaudited) | Year Ended August 31, | May 20, 2005(a) to August 31, 2005 | ||||||||||
| 2007 | 2006 | |||||||||||
Net asset value, beginning of period | $ 13.98 | $ 12.54 | $ 10.57 | $ 10.00 | ||||||||
Income From Investment Operations | ||||||||||||
Net investment income(b) | .16 | .34 | .23 | .05 | (e) | |||||||
Net realized and unrealized gain (loss) on investment and foreign currency transactions | (.09 | ) | 1.86 | 1.95 | .54 | |||||||
Contribution from Adviser | – 0 | – | .00 | (f) | – 0 | – | – 0 | – | ||||
Net increase in net asset value from operations | .07 | 2.20 | 2.18 | .59 | ||||||||
Less: Dividends and Distributions | ||||||||||||
Dividends from net investment income | (.20 | ) | (.27 | ) | (.19 | ) | (.02 | ) | ||||
Distributions from net realized gain on investment transactions | (.82 | ) | (.49 | ) | (.02 | ) | – 0 | – | ||||
Total dividends and distributions | (1.02 | ) | (.76 | ) | (.21 | ) | (.02 | ) | ||||
Net asset value, end of period | $ 13.03 | $ 13.98 | $ 12.54 | $ 10.57 | ||||||||
Total Return | ||||||||||||
Total investment return based on net asset value(c) | (.19 | )% | 18.08 | % | 20.88 | % | 5.93 | % | ||||
Ratios/Supplemental Data | ||||||||||||
Net assets, end of period (000’s omitted) | $1,341,893 | $1,328,927 | $886,431 | $517,594 | ||||||||
Ratio to average net assets of: | ||||||||||||
Expenses, net of waivers/reimbursements | .07 | %(d) | .07 | % | .11 | % | .15 | %(d) | ||||
Expenses, before waivers/reimbursements | .07 | %(d) | .07 | % | .11 | % | .24 | %(d) | ||||
Net investment income | 2.19 | %(d) | 2.50 | % | 1.96 | % | 1.78 | %(d)(e) | ||||
Portfolio turnover rate | 47 | % | 82 | % | 105 | % | 19 | % | ||||
See footnote summary on page 195.
| ALLIANCEBERNSTEIN POOLING PORTFOLIOS • | 187 |
Financial Highlights
Selected Data For A Share Of Beneficial Interest Outstanding Throughout Each Period
| Small-Mid Cap Value | ||||||||||||
Six Months (unaudited) | Year Ended August 31, | May 20, 2005(a) to August 31, 2005 | ||||||||||
| 2007 | 2006 | |||||||||||
Net asset value, beginning of period | $ 12.79 | $ 11.08 | $ 10.65 | $ 10.00 | ||||||||
Income From Investment Operations | ||||||||||||
Net investment income(b) | .10 | .24 | .16 | .04 | (e) | |||||||
Net realized and unrealized gain (loss) on investment transactions | (1.12 | ) | 1.80 | .40 | .63 | |||||||
Net increase (decrease) in net asset value from operations | (1.02 | ) | 2.04 | .56 | .67 | |||||||
Less: Dividends and Distributions | ||||||||||||
Dividends from net investment income | (.11 | ) | (.23 | ) | (.13 | ) | (.02 | ) | ||||
Distributions from net realized gain on investment transactions | (.65 | ) | (.10 | ) | – 0 | – | – 0 | – | ||||
Total dividends and distributions | (.76 | ) | (.33 | ) | (.13 | ) | (.02 | ) | ||||
Net asset value, end of period | $ 11.01 | $ 12.79 | $ 11.08 | $ 10.65 | ||||||||
Total Return | ||||||||||||
Total investment return based on net asset value(c) | (11.50 | )% | 18.64 | % | 5.24 | % | 6.72 | % | ||||
Ratios/Supplemental Data | ||||||||||||
Net assets, end of period (000’s omitted) | $655,351 | $648,401 | $444,250 | $320,038 | ||||||||
Ratio to average net assets of: | ||||||||||||
Expenses, net of waivers/reimbursements | .04 | %(d) | .04 | % | .07 | % | .15 | %(d) | ||||
Expenses, before waivers/reimbursements | .04 | %(d) | .04 | % | .07 | % | .34 | %(d) | ||||
Net investment income | 1.70 | %(d) | 1.93 | % | 1.45 | % | 1.62 | %(d)(e) | ||||
Portfolio turnover rate | 14 | % | 33 | % | 42 | % | 8 | % | ||||
See footnote summary on page 195.
| 188 | • ALLIANCEBERNSTEIN POOLING PORTFOLIOS |
Financial Highlights
Selected Data For A Share Of Beneficial Interest Outstanding Throughout Each Period
| Small-Mid Cap Growth | ||||||||||||
Six Months (unaudited) | Year Ended August 31, | May 20, 2005(a) to August 31, 2005 | ||||||||||
| 2007 | 2006 | |||||||||||
Net asset value, beginning of period | $ 14.79 | $ 11.84 | $ 10.99 | $ 10.00 | ||||||||
Income From Investment Operations | ||||||||||||
Net investment income(b) | .03 | .06 | .04 | .01 | (e) | |||||||
Net realized and unrealized gain (loss) on investment transactions | (1.51 | ) | 3.16 | .84 | .99 | |||||||
Contribution from Adviser | .01 | .00 | (f) | – 0 | – | – 0 | – | |||||
Net increase (decrease) in net asset value from operations | (1.47 | ) | 3.22 | .88 | 1.00 | |||||||
Less: Dividends and Distributions | ||||||||||||
Dividends from net investment income | (.03 | ) | (.04 | ) | (.03 | ) | (.01 | ) | ||||
Distributions from net realized gain on investment transactions | (1.39 | ) | (.23 | ) | – 0 | – | – 0 | – | ||||
Total dividends and distributions | (1.42 | ) | (.27 | ) | (.03 | ) | (.01 | ) | ||||
Net asset value, end of period | $ 11.90 | $ 14.79 | $ 11.84 | $ 10.99 | ||||||||
Total Return | ||||||||||||
Total investment return based on net asset value(c) | (11.50 | )% | 27.50 | % | 8.00 | % | 9.97 | % | ||||
Ratios/Supplemental Data | ||||||||||||
Net assets, end of period (000’s omitted) | $633,600 | $668,771 | $429,431 | $287,536 | ||||||||
Ratio to average net assets of: | ||||||||||||
Expenses, net of waivers/reimbursements | .04 | %(d) | .05 | % | .07 | % | .15 | %(d) | ||||
Expenses, before waivers/reimbursements | .04 | %(d) | .05 | % | .07 | % | .41 | %(d) | ||||
Net investment income | .35 | %(d) | .45 | % | .33 | % | .37 | %(d)(e) | ||||
Portfolio turnover rate | 42 | % | 88 | % | 83 | % | 21 | % | ||||
See footnote summary on page 195.
| ALLIANCEBERNSTEIN POOLING PORTFOLIOS • | 189 |
Financial Highlights
Selected Data For A Share Of Beneficial Interest Outstanding Throughout Each Period
| Global Value | |||||||||
| Six Months Ended February 29, 2008 (unaudited) | Year Ended August 31, 2007 | June 1, 2006(a) to August 31, 2006 | |||||||
Net asset value, beginning of period | $ 11.79 | $ 10.24 | $ 10.00 | ||||||
Income From Investment Operations | |||||||||
Net investment income(b)(e) | .10 | .26 | .07 | ||||||
Net realized and unrealized gain (loss) on investment and foreign currency transactions | (1.34 | ) | 1.59 | .17 | |||||
Net increase (decrease) in net asset value from operations | (1.24 | ) | 1.85 | .24 | |||||
Less: Dividends and Distributions | |||||||||
Dividends from net investment income | (.13 | ) | (.28 | ) | – 0 | – | |||
Distributions from net realized gain on investment transactions | (.64 | ) | (.02 | ) | – 0 | – | |||
Total dividends and distributions | (.77 | ) | (.30 | ) | – 0 | – | |||
Net asset value, end of period | $ 9.78 | $ 11.79 | $ 10.24 | ||||||
Total Return | |||||||||
Total investment return based on net asset value(c) | (11.33 | )% | 18.19 | % | 2.40 | % | |||
Ratios/Supplemental Data | |||||||||
Net assets, end of period (000’s omitted) | $6,232 | $7,028 | $6,104 | ||||||
Ratio to average net assets of: | |||||||||
Expenses, net of waivers/reimbursements | .15 | %(d) | .15 | % | .15 | %(d) | |||
Expenses, before waivers/reimbursements | 2.35 | %(d) | 2.71 | % | 5.11 | %(d) | |||
Net investment income(e) | 1.70 | %(d) | 2.26 | % | 2.95 | %(d) | |||
Portfolio turnover rate | 18 | % | 31 | % | 11 | % | |||
See footnote summary on page 195.
| 190 | • ALLIANCEBERNSTEIN POOLING PORTFOLIOS |
Financial Highlights
Selected Data For A Share Of Beneficial Interest Outstanding Throughout Each Period
| Global Research Growth | |||||||||
| Six Months Ended February 29, 2008 (unaudited) | Year Ended August 31, 2007 | June 1, 2006(a) to August 31, 2006 | |||||||
Net asset value, beginning of period | $ 11.34 | $ 9.99 | $ 10.00 | ||||||
Income From Investment Operations | |||||||||
Net investment income(b)(e) | .06 | .18 | .03 | ||||||
Net realized and unrealized gain (loss) on investment and foreign currency transactions | (.42 | ) | 1.35 | (.04 | ) | ||||
Contribution from Adviser | – 0 | – | .00 | (f) | – 0 | – | |||
Net increase (decrease) in net asset value from operations | (.36 | ) | 1.53 | (.01 | ) | ||||
Less: Dividends and Distributions | |||||||||
Dividends from net investment income | (.09 | ) | (.18 | ) | – 0 | – | |||
Distributions from net realized gain on investment transactions | (.43 | ) | – 0 | – | – 0 | – | |||
Total dividends and distributions | (.52 | ) | (.18 | ) | – 0 | – | |||
Net asset value, end of period | $ 10.46 | $ 11.34 | $ 9.99 | ||||||
Total Return | |||||||||
Total investment return based on net asset value(c) | (3.72 | )% | 15.35 | % | (.10 | )% | |||
Ratios/Supplemental Data | |||||||||
Net assets, end of period (000’s omitted) | $6,370 | $7,056 | $6,044 | ||||||
Ratio to average net assets of: | |||||||||
Expenses, net of waivers/reimbursements | .15 | %(d) | .15 | % | .15 | %(d) | |||
Expenses, before waivers/reimbursements | 3.14 | %(d) | 3.39 | % | 5.24 | %(d) | |||
Net investment income(e) | 1.00 | %(d) | 1.64 | % | 1.38 | %(d) | |||
Portfolio turnover rate | 39 | % | 80 | % | 14 | % | |||
See footnote summary on page 195.
| ALLIANCEBERNSTEIN POOLING PORTFOLIOS • | 191 |
Financial Highlights
Selected Data For A Share Of Beneficial Interest Outstanding Throughout Each Period
| Short Duration Bond | ||||||||||||
| Six Months Ended February 29, 2008 (unaudited) | Year Ended August 31, | May 20, 2005(a) to August 31, 2005 | ||||||||||
| 2007 | 2006 | |||||||||||
Net asset value, beginning of period | $ 9.87 | $ 9.93 | $ 10.04 | $ 10.00 | ||||||||
Income From Investment Operations | ||||||||||||
Net investment income(b) | .25 | .52 | .47 | .09 | (e) | |||||||
Net realized and unrealized loss on investment transactions | (.09 | ) | (.08 | ) | (.14 | ) | (.01 | ) | ||||
Net increase in net asset value from operations | .16 | .44 | .33 | .08 | ||||||||
Less: Dividends | ||||||||||||
Dividends from net investment income | (.26 | ) | (.50 | ) | (.44 | ) | (.04 | ) | ||||
Net asset value, end of period | $ 9.77 | $ 9.87 | $ 9.93 | $ 10.04 | ||||||||
Total Return | ||||||||||||
Total investment return based on net asset value(c) | 1.64 | % | 4.51 | % | 3.39 | % | .82 | % | ||||
Ratios/Supplemental Data | ||||||||||||
Net assets, end of period (000’s omitted) | $1,329,641 | $1,272,076 | $960,111 | $652,505 | ||||||||
Ratio to average net assets of: | ||||||||||||
Expenses, net of waivers/reimbursements | .03 | %(d) | .02 | % | .05 | % | .15 | %(d) | ||||
Expenses, before waivers/reimbursements | .03 | %(d) | .02 | % | .05 | % | .19 | %(d) | ||||
Net investment income | 5.08 | %(d) | 5.23 | % | 4.69 | % | 3.88 | %(d)(e) | ||||
Portfolio turnover rate | 63 | % | 138 | % | 185 | % | 83 | % | ||||
See footnote summary on page 195.
| 192 | • ALLIANCEBERNSTEIN POOLING PORTFOLIOS |
Financial Highlights
Selected Data For A Share Of Beneficial Interest Outstanding Throughout Each Period
| Intermediate Duration Bond | ||||||||||||
| Six Months Ended February 29, 2008 (unaudited) | Year Ended August 31, | May 20, 2005(a) to August 31, 2005 | ||||||||||
| 2007 | 2006 | |||||||||||
Net asset value, beginning of period | $ 9.87 | $ 9.86 | $ 10.12 | $ 10.00 | ||||||||
Income From Investment Operations | ||||||||||||
Net investment income(b) | .25 | .49 | .48 | .11 | ||||||||
Net realized and unrealized gain (loss) on investment and foreign currency transactions | .17 | – 0 | –(f) | (.28 | ) | .08 | ||||||
Net increase in net asset value from operations | .42 | .49 | .20 | .19 | ||||||||
Less: Dividends | ||||||||||||
Dividends from net investment income | (.27 | ) | (.48 | ) | (.46 | ) | (.07 | ) | ||||
Net asset value, end of period | $ 10.02 | $ 9.87 | $ 9.86 | $ 10.12 | ||||||||
Total Return | ||||||||||||
Total investment return based on net asset value(c) | 4.34 | % | 5.03 | % | 2.13 | % | 1.95 | % | ||||
Ratios/Supplemental Data | ||||||||||||
Net assets, end of period (000’s omitted) | $1,723,663 | $1,599,652 | $1,076,281 | $807,065 | ||||||||
Ratio to average net assets of: | ||||||||||||
Expenses | .03 | %(d) | .04 | % | .06 | % | .10 | %(d) | ||||
Net investment income | 5.08 | %(d) | 5.01 | % | 4.89 | % | 4.13 | %(d) | ||||
Portfolio turnover rate | 86 | % | 236 | % | 513 | % | 206 | % | ||||
See footnote summary on page 195.
| ALLIANCEBERNSTEIN POOLING PORTFOLIOS • | 193 |
Financial Highlights
Selected Data For A Share Of Beneficial Interest Outstanding Throughout Each Period
| Inflation Protected Securities | ||||||||||||
Six Months (unaudited) | Year Ended August 31, | May 20, 2005(a) to August 31, 2005 | ||||||||||
| 2007 | 2006 | |||||||||||
Net asset value, beginning of period | $ 9.99 | $ 9.91 | $10.01 | $ 10.00 | ||||||||
Income From Investment Operations | ||||||||||||
Net investment income(b) | .19 | .49 | .57 | .09 | (e) | |||||||
Net realized and unrealized gain (loss) on investment transactions | .95 | (.06 | ) | (.36 | ) | – 0 | – | |||||
Contribution from Adviser | – 0 | – | .00 | (f) | – 0 | – | – 0 | – | ||||
Net increase in net asset value from operations | 1.14 | .43 | .21 | .09 | ||||||||
Less: Dividends and Distributions | ||||||||||||
Dividends from net investment income | (.46 | ) | (.35 | ) | (.30 | ) | (.08 | ) | ||||
Distributions from net realized gain on investment transactions | – 0 | – | – 0 | – | (.01 | ) | – 0 | – | ||||
Total dividends and distributions | (.46 | ) | (.35 | ) | (.31 | ) | (.08 | ) | ||||
Net asset value, end of period | $ 10.67 | $ 9.99 | $ 9.91 | $ 10.01 | ||||||||
Total Return | ||||||||||||
Total investment return based on net asset value(c) | 11.71 | % | 4.44 | % | 2.11 | % | .92 | % | ||||
Ratios/Supplemental Data | ||||||||||||
Net assets, end of period (000’s omitted) | $711,321 | $643,549 | $447,210 | $263,128 | ||||||||
Ratio to average net assets of: | ||||||||||||
Expenses, net of waivers/reimbursements | .04 | %(d) | .04 | % | .07 | % | .15 | %(d) | ||||
Expenses, before waivers/reimbursements | .04 | %(d) | .04 | % | .07 | % | .52 | %(d) | ||||
Net investment income | 3.65 | %(d) | 4.98 | % | 5.83 | % | 4.34 | %(d)(e) | ||||
Portfolio turnover rate | 5 | % | 12 | % | 13 | % | 3 | % | ||||
See footnote summary on page 195.
| 194 | • ALLIANCEBERNSTEIN POOLING PORTFOLIOS |
Financial Highlights
Selected Data For A Share Of Beneficial Interest Outstanding Throughout Each Period
| High-Yield | ||||||||||||
Six Months (unaudited) | Year Ended August 31, | May 20, 2005(a) to August 31, 2005 | ||||||||||
| 2007 | 2006 | |||||||||||
Net asset value, beginning of period | $ 9.89 | $ 9.99 | $ 10.35 | $ 10.00 | ||||||||
Income From Investment Operations | ||||||||||||
Net investment income(b) | .39 | .77 | .75 | .20 | (e) | |||||||
Net realized and unrealized gain (loss) on investment and foreign currency transactions | (.57 | ) | (.15 | ) | (.35 | ) | .24 | |||||
Net increase (decrease) in net asset value from operations | (.18 | ) | .62 | .40 | .44 | |||||||
Less: Dividends and Distributions | ||||||||||||
Dividends from net investment income | (.39 | ) | (.72 | ) | (.75 | ) | (.09 | ) | ||||
Distributions from net realized gain on investment transactions | – 0 | – | – 0 | – | (.01 | ) | – 0 | – | ||||
Total dividends and distributions | (.39 | ) | (.72 | ) | (.76 | ) | (.09 | ) | ||||
Net asset value, end of period | $ 9.32 | $ 9.89 | $ 9.99 | $ 10.35 | ||||||||
Total Return | ||||||||||||
Total investment return based on net asset value(c) | (1.93 | )% | 6.22 | % | 4.06 | % | 4.38 | % | ||||
Ratios/Supplemental Data | ||||||||||||
Net assets, end of period (000’s omitted) | $513,957 | $495,833 | $325,931 | $258,236 | ||||||||
Ratio to average net assets of: | ||||||||||||
Expenses, net of waivers/reimbursements | .06 | %(d) | .06 | % | .09 | % | .20 | %(d) | ||||
Expenses, before waivers/reimbursements | .06 | %(d) | .06 | % | .09 | % | .45 | %(d) | ||||
Net investment income | 7.93 | %(d) | 7.50 | % | 7.47 | % | 7.42 | %(d)(e) | ||||
Portfolio turnover rate | 8 | % | 49 | % | 64 | % | 23 | % | ||||
| (a) | Commencement of operations. |
| (b) | Based on average shares outstanding during the period. |
| (c) | Total investment return is calculated assuming an initial investment made at the net asset value at the beginning of the period, reinvestment of all dividends and distributions at net asset value during the period, and redemption on the last day of the period. Total return does not reflect the deduction of taxes that a shareholder would pay on fund distributions or the redemption of fund shares. Total investment return calculated for a period of less than one year is not annualized. |
| (d) | Annualized. |
| (e) | Net of fees and expenses waived/reimbursed by the Adviser. |
| (f) | Amount is less than $0.005. |
| ALLIANCEBERNSTEIN POOLING PORTFOLIOS • | 195 |
Financial Highlights
TRUSTEES
William H. Foulk, Jr.(1), Chairman Marc O. Mayer, President and Chief Executive Officer David H. Dievler(1) John H. Dobkin(1) Michael J. Downey(1) | D. James Guzy(1) Nancy P. Jacklin(1) Garry L. Moody(1) Marshall C. Turner, Jr.(1) Earl D. Weiner(1) | |
| OFFICERS(2) | ||
Philip L. Kirstein, Senior Vice President and Independent Compliance Officer Bruce K. Aronow, Vice President Stephen Beinhacker, Vice President Henry S. D’Auria, Vice President Gershon M. Distenfeld, Sharon E. Fay, Vice President Marilyn G. Fedak, Vice President Norman M. Fidel, Vice President Eric J. Franco, Vice President David (Dutch) P. Handke, Jr., Vice President Eric P. Hewitt, Vice President Shawn E. Keegan, Vice President N. Kumar Kirpalani, Vice President Joran Laird, Vice President Samantha S. Lau, Vice President Lipkee Lu, Vice President James W. MacGregor, John P. Mahedy, Vice President Alison M. Martier, Vice President Christopher W. Marx, Vice President Teresa Marziano, Vice President Joel J. McKoan, Vice President Steven Nussbaum, Vice President | James K. Pang, Vice President Joseph G. Paul, Vice President Douglas J. Peebles, Vice President John D. Phillips, Vice President Jeffrey S. Phlegar, Vice President James G. Reilly, Vice President Michael J. Reilly, Vice President David Robinson, Vice President Robert W. Scheetz, Vice President Jane E. Schneirov, Vice President Lisa A. Shalett, Vice President Kevin F. Simms, Vice President Francis X. Suozzo, Vice President Christopher M. Toub, Vice President Wen-Tse Tseng, Vice President Paul Vogel, Vice President P. Scott Wallace, Vice President Janet A. Walsh, Vice President Andrew J. Weiner, Vice President Greg J. Wilensky, Vice President Raymond Wong, Vice President David Yuen, Vice President Kewjin Yuoh, Vice President Emilie D. Wrapp, Secretary Joseph J. Mantineo, Treasurer and Chief Financial Officer Thomas R. Manley, Controller | |
| 196 | • ALLIANCEBERNSTEIN POOLING PORTFOLIOS |
Trustees
Custodian State Street Bank and Trust Company
Principal Underwriter AllianceBernstein Investments, Inc.
Legal Counsel Seward & Kissel LLP | Transfer Agent AllianceBernstein Investor
Independent Registered Public KPMG LLP |
| (1) | Member of the Audit Committee, the Governance and Nominating Committee, and the Independent Directors Committee. |
| (2) | The management of and investment decisions for the AllianceBernstein Global Real Estate Portfolio are made by the REIT Investment Policy Group. Mr. Joseph G. Paul and Ms. Teresa Marziano are the senior most members of the Investment Policy Group. |
| The management of and investment decisions for the AllianceBernstein U.S. Value Portfolio are made by the U.S. Value Investment Policy Group. Ms. Marilyn G. Fedak, Mr. John P. Mahedy, Mr. Christopher W. Marx, Mr. John D. Phillips and Mr. David Yuen are the senior most members of the Investment Policy Group. |
| The management of and investment decisions for the AllianceBernstein Small-Mid Cap Value Portfolio are made by the Small-Mid Cap Value Investment Policy Group. Mr. Joseph G. Paul, Mr. James W. MacGregor and Mr. Andrew J. Weiner are the senior most members of the Investment Policy Group. |
| The management of and investment decisions for the AllianceBernstein International Value Portfolio are made by the International Value Investment Policy Group. Ms. Sharon E. Fay, Mr. Kevin F. Simms, Mr. Henry S. D’Auria and Mr. Eric J. Franco are the senior most members of the Investment Policy Group. |
| The management of and investment decisions for the AllianceBernstein U.S. Large Cap Growth Portfolio are made by the U.S. Large Cap Growth Team. Mr. James G. Reilly, Mr. Michael J. Reilly, Mr. David (Dutch) P. Handke, Jr. and Mr. P. Scott Wallace are the senior most members of the team. |
| The management of and investment decisions for the AllianceBernstein Small-Mid Cap Growth Portfolio are made by the Small-Mid Cap Growth Investment Team. Mr. Bruce K. Aronow, Mr. N. Kumar Kirpalani, Mr. Wen-Tse Tseng and Ms. Samantha S. Lau are the senior most members of the team. |
| The management of and investment decisions for the AllianceBernstein International Growth Portfolio are made by the International Growth Team. Mr. Christopher M. Toub, Mr. Stephen Beinhacker and Mr. James K. Pang and Ms. Lisa A. Shalett are the senior most members of the team. |
| The management of and investment decisions for the AllianceBernstein Short Duration Bond Portfolio are made by the U.S. Investment Grade: Liquid Markets/Structured Products Investment Team. Mr. Shawn E. Keegan, Mr. Lipkee Lu, Mr. Jeffrey S. Phlegar and Mr. Raymond Wong are the senior most members of the team. |
| The management of and investment decisions for the AllianceBernstein Intermediate Duration Bond Portfolio are made by the U.S. Investment Grade: Core Fixed Income Team. Mr. Greg J. Wilensky, Ms. Alison M. Martier, Mr. Shawn E. Keegan, Mr. Joran Laird, Mr. Douglas J. Peebles and Mr. Jeffrey S. Phlegar are the senior most members of the team. |
| ALLIANCEBERNSTEIN POOLING PORTFOLIOS • | 197 |
Trustees
| The management of and investment decisions for the AllianceBernstein High Yield Portfolio are made by the Global Credit Investment Team. Mr. Gershon Distenfeld, Mr. Joel J. McKoan and Mr. Douglas J. Peebles are the senior most members of the team. |
| Mr. Greg J. Wilensky, Director of Stable Value Investments, is the investment professional primarily responsible for the day-to-day management of the AllianceBernstein Inflation Protected Securities Portfolio. |
| The management of and investment decisions for the AllianceBernstein Global Research Growth Portfolio are made by the Global Research Growth Portfolio Oversight Group. Mr. Norman M. Fidel, Mr. Eric P. Hewitt, Dr. Steven Nussbaum, Mr, David Robinson, Ms. Jane E. Schneirov, Mr. Francis X. Suozzo, Mr Paul Vogel and Ms. Janet A. Walsh are the senior most members of the team. |
| The management of and investment decisions for the AllianceBernstein Global Value Portfolio are made by the Global Value Investment Policy Group. Ms. Sharon E. Fay, Mr. Kevin F. Simms, Mr. Henry S. D’Auria and Mr. Eric J. Franco are the senior most members of the team. |
| 198 | • ALLIANCEBERNSTEIN POOLING PORTFOLIOS |
Trustees
Information Regarding the Review and Approval of the Advisory Agreement in Respect of Each Portfolio
The disinterested trustees (the “trustees”) of The AllianceBernstein Pooling Portfolios (the “Trust”) approved the continuance of the Advisory Agreement with the Adviser in respect of each of AllianceBernstein Short Duration Bond Portfolio, AllianceBernstein Intermediate Duration Bond Portfolio, AllianceBernstein Inflation Protected Securities Portfolio, and AllianceBernstein High-Yield Portfolio (each, a “Portfolio” and collectively, the “Portfolios”) at a meeting held on October 30-November 1, 2007. This disclosure does not relate to AllianceBernstein Global Research Growth Portfolio, AllianceBernstein Global Value Portfolio, AllianceBernstein U.S. Value Portfolio, AllianceBernstein U.S. Large Cap Growth Portfolio, AllianceBernstein Global Real Estate Investment Portfolio, AllianceBernstein International Value Portfolio, AllianceBernstein International Growth Portfolio, AllianceBernstein Small-Mid Cap Value Portfolio and AllianceBernstein Small-Mid Cap Growth Portfolio.
Prior to approval of the continuance of the Advisory Agreement in respect of a Portfolio, the trustees had requested from the Adviser, and received and evaluated, extensive materials. They reviewed the proposed continuance of the Advisory Agreement with the Adviser and with experienced counsel who are independent of the Adviser who advised on the relevant legal standards. The trustees also reviewed an independent evaluation prepared by the Trust’s Senior Officer (who is also the Trust’s Independent Compliance Officer) of the reasonableness of the advisory fee in the Advisory Agreement wherein the Senior Officer concluded that the contractual fee (zero) for the Portfolios was reasonable. The trustees also discussed the proposed continuances in private sessions with counsel and the Trust’s Senior Officer.
The trustees noted that the Portfolios are designed as investment vehicles for certain AllianceBernstein institutional clients, including registered investment companies advised by the Adviser (the “Investing Funds”). The trustees further noted that the Advisory Agreement does not include the reimbursement provision for certain administrative expenses included in the advisory agreements of most of the open-end AllianceBernstein Funds. However, the Trust acknowledges in the Advisory Agreement that the Adviser will receive compensation for its services to the Portfolios from third parties (e.g., the Investing Funds who are shareholders of the Portfolios). The trustees noted that the current Investing Funds in the Portfolios are AllianceBernstein Balanced Wealth Strategy and AllianceBernstein Wealth Preservation Strategy of The AllianceBernstein Portfolios, certain of the Retirement Strategies (2000 to 2030) of AllianceBernstein Blended Style Series, Inc. and certain assets of the Rhode Island Higher Education Savings Trust (“RIHEST”).
The trustees considered their knowledge of the nature and quality of the services provided by the Adviser to the Portfolios gained from their experience as trustees or directors of most of the registered investment companies advised by the
| ALLIANCEBERNSTEIN POOLING PORTFOLIOS • | 199 |
Adviser, their overall confidence in the Adviser’s integrity and competence they have gained from that experience, the Adviser’s initiative in identifying and raising potential issues with the trustees and its responsiveness, frankness and attention to concerns raised by the trustees in the past, including the Adviser’s willingness to consider and implement organizational and operational changes designed to improve investment results and the services provided to the AllianceBernstein Funds. The trustees noted that they have four regular meetings each year, at each of which they receive presentations from the Adviser on the investment results of the Portfolios and review extensive materials and information presented by the Adviser.
The trustees also considered all other factors they believed relevant, including the specific matters discussed below. In their deliberations, the trustees did not identify any particular information that was all-important or controlling, and different trustees may have attributed different weights to the various factors. The trustees determined that the selection of the Adviser to manage each Portfolio, and the overall arrangements between each Portfolio and the Adviser as provided in the Advisory Agreement, including the advisory fee, were fair and reasonable in light of the services performed, expenses incurred and such other matters as the trustees considered relevant in the exercise of their business judgment. The material factors and conclusions that formed the basis for the trustees’ determination included the following:
Nature, Extent and Quality of Services Provided
The trustees considered the scope and quality of services provided by the Adviser under the Advisory Agreement, including the quality of the investment research capabilities of the Adviser and the other resources it has dedicated to performing services for the Portfolios. They also noted the professional experience and qualifications of a Portfolio’s portfolio management team and other senior personnel of the Adviser. The quality of administrative and other services, including the Adviser’s role in coordinating the activities of each Portfolio’s other service providers, also were considered. The trustees concluded that, overall, they were satisfied with the nature, extent and quality of services provided to each of the Portfolios under the Advisory Agreement.
Costs of Services Provided and Profitability
The trustees reviewed a schedule of the revenues, expenses and related notes indicating the profitability of each Portfolio (which pays no advisory fee to the Adviser and does not reimburse expenses to the Adviser) to the Adviser for calendar year 2006 that had been prepared with an updated expense allocation methodology arrived at in consultation with an independent consultant retained by the Trust’s Senior Officer. The trustees reviewed the assumptions and methods of allocation used by the Adviser in preparing fund-specific profitability data and noted that there are a number of potentially acceptable allocation methodologies for information of this type. The trustees noted that the profitability
| 200 | • ALLIANCEBERNSTEIN POOLING PORTFOLIOS |
information reflected all revenues and expenses of the Adviser’s relationships with the Portfolios, including those relating to its subsidiaries which provide transfer agency, distribution and brokerage services to the Portfolios and that the updated profitability methodology attributed revenues and expenses to the Portfolios relating to the Investing Funds and RIHEST. The trustees recognized that it is difficult to make comparisons of profitability from fund advisory contracts because comparative information is not generally publicly available and is affected by numerous factors. The trustees focused on the profitability of the Adviser’s relationships with the Portfolios before taxes and distribution expenses. The trustees concluded that they were satisfied that the Adviser’s level of profitability from its relationship with each Portfolio was not unreasonable. The trustees did not consider historical information about the profitability of the Portfolios to the Adviser for 2005 as the Portfolios did not commence operations until mid-2005. The 2005 profitability information for the AllianceBernstein Funds did not attribute profitability for the Portfolios, which pay no advisory fee to the Adviser, do not reimburse expenses to the Adviser, and were in operation for only a portion of 2005. The trustees noted, however, that they did review 2005 profitability information for the Investing Funds that are registered investment companies and had been satisfied that such profitability was not unreasonable. The trustees also considered that the Adviser bears certain costs in order to provide services to each Portfolio.
Fall-Out Benefits
The trustees considered the benefits to the Adviser and its affiliates from their relationships with the Portfolios other than the fees payable under the Advisory Agreement (none), including but not limited to benefits relating to soft dollar arrangements (whereby the Adviser receives brokerage and research services from many of the brokers and dealers that execute purchases and sales of securities on behalf of its clients on an agency basis), 12b-1 fees and sales charges received by the Trust’s principal underwriter (which is a wholly owned subsidiary of the Adviser) in respect of certain classes of shares of the Investing Funds that are registered investment companies, and brokerage commissions paid by the Portfolios to brokers affiliated with the Adviser. The trustees noted that while the Adviser’s affiliated transfer agent does not receive fees for providing services to the Portfolios (although it may be reimbursed for its out-of-pocket expenses), such affiliated transfer agent receives fees for providing services to the Investing Funds. The trustees noted that the Adviser is party to a program agreement with RIHEST and receives program fees for its advisory, distribution, recordkeeping and other services provided by it and its subsidiaries in connection with the CollegeBoundfund program, including its services in respect of the Portfolios. The trustees recognized that the Adviser’s profitability would be somewhat lower without these benefits. As discussed in more detail below, the trustees also noted that the Adviser is compensated by the Investing Funds for providing advisory services to them. The trustees understood that the Adviser also might derive reputational and other benefits from its association with the Portfolios.
| ALLIANCEBERNSTEIN POOLING PORTFOLIOS • | 201 |
Investment Results
In addition to the information reviewed by the trustees in connection with the meeting, the trustees receive detailed comparative performance information for each Portfolio at each regular Board meeting during the year. At the meeting, the trustees reviewed information prepared by Lipper showing the comparative performance of each Portfolio as compared to a group of funds selected by Lipper (the “Performance Group”) and as compared to a broader array of funds selected by Lipper (the “Performance Universe”), and information prepared by the Adviser showing performance of each Portfolio as compared to an index, in each case for periods ended July 31, 2007 over the 1-year period and the since inception period (May 2005 inception). In reviewing the comparative performance information the trustees noted that the Portfolios had a performance advantage in that the performance of virtually all of the Portfolios’ competitors was negatively affected by the fact they pay advisory fees whereas performance information for the Portfolios reflects their advisory fee of zero.
AllianceBernstein Short Duration Bond Portfolio
The trustees noted that the Portfolio was in the 5th quintile of the Performance Group and 4th quintile of the Performance Universe in the 1-year period and 4th quintile of the Performance Group and 5th quintile of the Performance Universe in the since inception period and that the Portfolio outperformed the Merrill Lynch 1-3 Year Treasury Index in both periods reviewed. Based on their review, and noting the recent inception date of the Portfolio, the trustees concluded that the Portfolio’s relative performance over time had been satisfactory.
AllianceBernstein Intermediate Duration Bond Portfolio
The trustees noted that the Portfolio was in the 4th quintile of the Performance Group and Performance Universe in both periods reviewed, and that the Portfolio underperformed the Lehman Brothers Aggregate Bond Index (the “Index”) in the 1-year period and outperformed the Index in the since inception period. Based on their review, and noting the recent inception date of the Portfolio, the trustees concluded that the Portfolio’s relative performance over time had been satisfactory.
AllianceBernstein Inflation Protected Securities Portfolio
The trustees noted that the Portfolio was in the 2nd quintile of the Performance Group and 3rd quintile of the Performance Universe in the 1-year period and 1st quintile of the Performance Group and Performance Universe in the since inception period, and that the Portfolio underperformed the Lehman 1-10 Year TIPS Index (the “Index”) in the 1-year period and outperformed the Index in the since inception period. Based on their review, the trustees concluded that the Portfolio’s relative performance over time had been satisfactory.
AllianceBernstein High Yield Portfolio
The trustees noted that the Portfolio was in the 5th quintile of the Performance Group and Performance Universe in both periods reviewed, and that the
| 202 | • ALLIANCEBERNSTEIN POOLING PORTFOLIOS |
Portfolio underperformed the Lehman Brothers U.S. High Yield 2% Issuer Cap Index in both periods reviewed. Based on their review and their discussion of the reasons for the Portfolio’s performance with the Adviser, the trustees retained confidence in the Adviser’s ability to advise the Portfolio and concluded that the Portfolio’s investment performance was understandable. The trustees informed the Adviser that they planned to continue to closely monitor the Portfolio’s performance.
Advisory Fees and Other Expenses
The trustees considered the advisory fee rate paid by each Portfolio to the Adviser (zero) and information prepared by Lipper concerning fee rates paid by other funds in the same Lipper category as the Portfolio at a common asset level. The trustees also reviewed certain information showing the fees paid to the Adviser by the Investing Funds. The trustees recognized that it is difficult to make comparisons of advisory fees because there are variations in the services that are included in the fees paid by other funds.
The trustees noted that because each Portfolio is designed as a vehicle in which the Investing Funds can invest their assets, the fee arrangements in the Advisory Agreement are unusual in that no advisory fee is payable by the Portfolios. However, the trustees noted that the Adviser is indirectly compensated for its services to the Portfolios by the Investing Funds. The trustees noted that the Investing Funds pay the Adviser advisory fees pursuant to advisory agreements with the Adviser (program agreement in the case of RIHEST) and that a portion of the fees paid by the Investing Funds to the Adviser may reasonably be viewed as compensating the Adviser for advisory services it provides to each Portfolio (the “implied fee”) and that the Adviser had represented to the Securities and Exchange Commission Staff and to the Trust’s former counsel that the implied fee rate is the same for all the institutional investors in the Portfolios (e.g., the Investing Funds). The trustees also noted that the Adviser had undertaken to work with the trustees to develop procedures to enable the trustees to monitor the implied fee rate and had made certain observations in that regard.
In considering the fee arrangements in respect of each Portfolio (including the payments to the Adviser by the Investing Funds), the trustees took into account the complexity of investment management for the Portfolios relative to other types of funds. The trustees evaluated the process of investing in each of the Portfolios as compared to investments in other types of securities. Based on their review, the trustees concluded that the advisory arrangements for the Portfolio, including the zero fee aspect of the Advisory Agreement with the Adviser, were satisfactory.
The trustees also considered the fees the Adviser charges other clients with a substantially similar investment style as the Portfolios. For this purpose, the trustees reviewed the Adviser’s Form ADV and the evaluation from the Trust’s
| ALLIANCEBERNSTEIN POOLING PORTFOLIOS • | 203 |
Senior Officer disclosing the institutional fee schedules for institutional products managed by the Adviser that have a substantially similar investment style as the Portfolios. The trustees noted that application of such fee schedules to the level of assets of a Portfolio pursuing a substantially similar investment style would result in a fee rate that would be higher than the rate paid by each Portfolio pursuant to the Advisory Agreement (zero). The trustees noted that the Adviser may, in some cases, agree to fee rates with large institutional clients that are lower than those reviewed by the trustees and that they had previously discussed with the Adviser its policies in respect of such negotiated arrangements.
The trustees also reviewed information that indicated that in the case of AllianceBernstein Intermediate Duration Bond Portfolio, the Adviser sub-advises a registered investment company with a similar investment style as the Portfolio at a higher fee schedule than the Portfolio.
The Adviser reviewed with the trustees the significantly greater scope of the services it provides the Portfolios relative to institutional clients and sub-advised funds. The Adviser also noted that since mutual funds are constantly issuing and redeeming shares, they are more difficult to manage than an institutional account, where the assets are relatively stable. In light of these facts, the trustees did not place significant weight on these fee comparisons.
The trustees also considered information provided by the Trust’s Senior Officer based on information provided by Lipper showing the total non-advisory expense ratio of each Portfolio compared to the non-advisory expenses of funds within two comparison groups created by Lipper: an Expense Group and an Expense Universe. In light of the zero advisory fee payable by each Portfolio, the Senior Officer concluded that comparative information about non-advisory expenses would be more useful than information about total expenses. Lipper described an Expense Group as a representative sample of funds comparable to a Portfolio and an Expense Universe as a broader group, consisting of all funds in a Portfolio’s investment classification/objective. The non-advisory expense ratio of each Portfolio was based on the Portfolio’s latest fiscal year non-advisory expense ratio. The trustees recognized that the non-advisory expense ratio information for the Portfolios potentially reflected on the Adviser’s provision of services, as the Adviser is responsible for coordinating services provided to the Portfolios by others. The trustees took note that it was likely that the non-advisory expense ratios of some funds in each Portfolio’s Lipper category also were lowered by waivers or reimbursements by those funds’ investment advisers, which in some cases were voluntary and perhaps temporary.
AllianceBernstein Short Duration Bond Portfolio
The trustees noted that the Portfolio’s total non-advisory expense ratio was lower than the Expense Group and Expense Universe medians. The trustees concluded that the Portfolio’s non-advisory expense ratio was satisfactory.
| 204 | • ALLIANCEBERNSTEIN POOLING PORTFOLIOS |
AllianceBernstein Intermediate Duration Bond Portfolio
The trustees noted that the Portfolio’s total non-advisory expense ratio was lower than the Expense Group and Expense Universe medians. The trustees concluded that the Portfolio’s non-advisory expense ratio was satisfactory.
AllianceBernstein Inflation Protected Securities Portfolio
The trustees noted that the Portfolio’s total non-advisory expense ratio was higher than the Expense Group median and lower than the Expense Universe median. The trustees concluded that the Portfolio’s non-advisory expense ratio was satisfactory.
AllianceBernstein High Yield Portfolio
The trustees noted that the Portfolio’s total non-advisory expense ratio was higher than the Expense Group and Expense Universe medians. The trustees concluded that the Portfolio’s non-advisory expense ratio was acceptable.
Economies of Scale
Since the Advisory Agreement does not provide for any compensation to be paid to the Adviser by the Portfolios, the trustees did not consider the extent to which fee levels in the Advisory Agreement reflect economies of scale. They did note, however, that the fee schedules for the Investing Funds that are registered investment companies incorporate breakpoints.
| ALLIANCEBERNSTEIN POOLING PORTFOLIOS • | 205 |
THE FOLLOWING SENIOR OFFICER’S FEE SUMMARIES ARE NOT PART OF THE SHAREHOLDER REPORT OR THE FINANCIAL STATEMENT
SUMMARY OF SENIOR OFFICER’S EVALUATION OF INVESTMENT ADVISORY AGREEMENT1
The following is a summary of the evaluation of the Investment Advisory Agreement between AllianceBernstein L.P. (the “Adviser”) and AllianceBernstein Pooling Portfolios (the “Trust” or the “Pooling Portfolios”) in respect of the following Portfolios:2
U.S. Value Portfolio
U.S. Large Cap Growth Portfolio
Global Real Estate Investment Portfolio
International Value Portfolio
International Growth Portfolio
Small-Mid Cap Value Portfolio
Small-Mid Cap Growth Portfolio
The Trust, which is designed to facilitate a “blended style” investment approach, represents a variety of asset classes and investment styles, and is available for investment only to institutional clients of the Adviser, including both registered investment companies and large managed separate accounts.
The evaluation of the Investment Advisory Agreement was prepared by Philip L. Kirstein, the Senior Officer of the Trust, for the Trustees of the Trust, as required by an August 2004 agreement between the Adviser and the New York State Attorney General (the “NYAG”). The Senior Officer’s evaluation of the Investment Advisory Agreement is not meant to diminish the responsibility or authority of the Board of Trustees of the Trust to perform its duties pursuant to Section 15 of the Investment Company Act of 1940 (the “40 Act”) and applicable state law. The purpose of the summary is to provide shareholders with a synopsis of the independent evaluation of the reasonableness of the advisory fees proposed to be paid by the Portfolios which was provided to the Trustees in connection with their review of the proposed approval of the continuance of the Investment Advisory Agreement. The Senior Officer’s evaluation considered the following factors:
| 1. | Advisory fees charged to institutional and other clients of the Adviser for like services; |
| 2. | Advisory fees charged by other mutual fund companies for like services; |
| 1 | It should be noted that the information in the fee summary was completed on April 23, 2007 and presented to the Board of Trustees on May 1-3, 2007. |
| 2 | Future references to the Portfolios do not include “AllianceBernstein.” The Portfolios of the Trust that are not discussed in this evaluation are Short Duration Bond Portfolio, Intermediate Duration Bond Portfolio, Inflation Protected Securities Portfolio, High Yield Portfolio, Global Research Growth Portfolio, and Global Value Portfolio. |
| 206 | • ALLIANCEBERNSTEIN POOLING PORTFOLIOS |
| 3. | Costs to the Adviser and its affiliates of supplying services pursuant to the advisory agreements, excluding any intra-corporate profit; |
| 4. | Profit margins of the Adviser and its affiliates from supplying such services; |
| 5. | Possible economies of scale as the Portfolios grow larger; and |
| 6. | Nature and quality of the Adviser’s services including the performance of the Portfolios. |
PORTFOLIO ADVISORY FEES, NET ASSETS, & EXPENSE RATIOS
Under the Investment Advisory Agreement, the Portfolios are not charged an advisory fee. The investment advisory contract also does not provide for the Adviser to be reimbursed for the cost of providing non-advisory services, which would include administration, distribution and transfer agent-related services, although the transfer agent of the Portfolios is reimbursed for out of pocket expenses. The Adviser is compensated by institutional clients of the Adviser (the “Institutional Clients”) that invest in the Pooling Portfolios. These clients include the AllianceBernstein Blended Style Series, Inc. – AllianceBernstein Retirement Strategies (“Retirement Strategies”)3, certain series of The AllianceBernstein Portfolios – AllianceBernstein Wealth Strategies (“Wealth Strategies”)4, AllianceBernstein Blended Style Series, Inc. – U.S. Large Cap Portfolio (“U.S. Large Cap Portfolio”) and the Rhode Island Higher Education Savings Trust (referred to herein as “CollegeBoundfund”). Set forth below are the advisory fee schedules of the Institutional Clients that invests in the Pooling Portfolios.
AllianceBernstein Blended Style Series, Inc.—AllianceBernstein Retirement Strategies
Each of the Retirement Strategies pays an advisory fee correlated to the percentage of equity investments held by the Retirement Strategy. This fee is discounted by a certain percentage depending on the asset level of the Retirement Strategy as indicated below:
| % Invested in Equity Investments | Advisory Fee | ||
Equal to or less than 60% Greater than 60% and less than 80% Equal to or greater than 80% | 0.55 0.60 0.65 | % % % |
| 3 | Includes AllianceBernstein 2000 Retirement Strategy, AllianceBernstein 2005 Retirement Strategy, AllianceBernstein 2010 Retirement Strategy, AllianceBernstein 2015 Retirement Strategy, AllianceBernstein 2020 Retirement Strategy, AllianceBernstein 2025 Retirement Strategy, AllianceBernstein 2030 Retirement Strategy, AllianceBernstein 2035 Retirement Strategy, AllianceBernstein 2040 Retirement Strategy and AllianceBernstein 2045 Retirement Strategy. Future references to the Retirement Strategies do not include “AllianceBernstein.” |
| 4 | Includes AllianceBernstein Balanced Wealth Strategy, AllianceBernstein Wealth Appreciation Strategy, AllianceBernstein Wealth Preservation Strategy. Future references to the Wealth Strategies do not include “AllianceBernstein.” |
| ALLIANCEBERNSTEIN POOLING PORTFOLIOS • | 207 |
| Net Asset Level | Discount | |
Assets equal to or less than $2.5 billion Assets greater than $2.5 billion and less than $5 billion Assets greater than $5 billion | n/a 10 basis points 15 basis points |
For example, a Retirement Strategy that invests less than 60% of its net assets in equities will pay 0.55% for its first $2.5 billion in net assets, 0.45% for its net assets greater than $2.5 billion and equal to or less than $5 billion and 0.40% for its net assets in excess of $5 billion. The advisory fee that is currently charged by the Adviser for each Retirement Strategy’s first $2.5 billion in net assets based on the aforesaid fee schedule is as follows:
| Retirement Strategy | Advisory Fee Based on % of Average Daily Net Assets | ||
2000 Retirement Strategy | 0.55 | % | |
2005 Retirement Strategy | 0.55 | % | |
2010 Retirement Strategy | 0.60 | % | |
2015 Retirement Strategy | 0.60 | % | |
2020 Retirement Strategy | 0.65 | % | |
2025 Retirement Strategy | 0.65 | % | |
2030 Retirement Strategy | 0.65 | % | |
2035 Retirement Strategy | 0.65 | % | |
2040 Retirement Strategy | 0.65 | % | |
2045 Retirement Strategy | 0.65 | % |
AllianceBernstein Blended Style Series, Inc.—U.S. Large Cap Portfolio, The AllianceBernstein Portfolios—AllianceBernstein Wealth Strategies
U.S. Large Cap Portfolio and the Wealth Strategies are charged by the Adviser an advisory fee based on a percentage of each fund’s average daily net assets:
| Fund | Advisory Fee Based on % of Average Daily Net Assets | ||||
| U.S. Large Cap Portfolio | First $2.5 billion | 0.65 | % | ||
| Next $2.5 billion | 0.55 | % | |||
| Excess of $5 billion | 0.50 | % | |||
| Wealth Appreciation Strategy | First $2.5 billion | 0.65 | % | ||
| Next $2.5 billion | 0.55 | % | |||
| Excess of $5 billion | 0.50 | % | |||
| Balanced Wealth Strategy | First $2.5 billion | 0.55 | % | ||
| Next $2.5 billion | 0.45 | % | |||
| Excess of $5 billion | 0.40 | % | |||
| Wealth Preservation Strategy | First $2.5 billion | 0.55 | % | ||
| Next $2.5 billion | 0.45 | % | |||
| Excess of $5 billion | 0.40 | % | |||
| 208 | • ALLIANCEBERNSTEIN POOLING PORTFOLIOS |
CollegeBoundfund
The Adviser serves as the program manager of the CollegeBoundfund, a 529 college-savings plan. Services provided by the Adviser as program manager for CollegeBoundfund include managing the assets of each Education Strategy of the plan that may invest in a combination of the Pooling Portfolios (the “Underlying Portfolios”), performing administrative related functions, servicing shareholder accounts, providing customer service to participants, maintaining the program and developing/updating a website where participants can access their personal accounts. As program manager, the Adviser is paid a program management fee equal to the total expense ratio (fixed) of each Education Strategy minus the weighted average of the expenses of the Underlying Portfolios in which the Strategy is invested. The weighted average of the expenses of the Underlying Portfolios may fluctuate over time, resulting in an increase or decrease in the program management fee since the total expense ratio is constant. Set forth below is a table showing the total expense ratios of the Education Strategies as of November 30, 2006.
| Portfolios | Total Expense Ratio5 | ||
Age-Based Education Strategies | |||
Age-Based Aggressive 2005-2007 | 0.94 | % | |
Age-Based Aggressive 2002-2004 | 0.94 | % | |
Age-Based Aggressive 1999-2001 | 0.90 | % | |
Age-Based Aggressive 1996-1998 | 0.86 | % | |
Age-Based Aggressive 1993-1995 | 0.82 | % | |
Age-Based Aggressive 1990-1992 | 0.78 | % | |
Age-Based Aggressive 1987-1989 | 0.74 | % | |
Age-Based Aggressive 1984-1986 | 0.74 | % | |
Age-Based Aggressive Pre-1984 | 0.74 | % | |
Age-Based 2005-2007 | 0.92 | % | |
Age-Based 2002-2004 | 0.88 | % | |
Age-Based 1999-2001 | 0.84 | % | |
Age-Based 1996-1998 | 0.80 | % | |
Age-Based 1993-1995 | 0.78 | % | |
Age-Based 1990-1992 | 0.76 | % | |
Age-Based 1987-1989 | 0.72 | % | |
Age-Based 1984-1986 | 0.72 | % | |
Age-Based Pre-1984 | 0.72 | % | |
Fixed Based Education Strategies | |||
Appreciation | 0.94 | % | |
Balanced | 0.80 | % | |
Preservation | 0.72 | % |
| 5 | The total expense ratios do not include an annual distribution fee of 0.25% payable to AllianceBernstein Investments, Inc., the program distributor and an affiliate of the Adviser, which is applied only to certain accounts that are established with the involvement of a financial adviser (“FA”). This charge is to fund compensation payable in the same amount by ABI to the FA for the FA’s services after such account is open at least one year. |
| ALLIANCEBERNSTEIN POOLING PORTFOLIOS • | 209 |
Set forth below are the most recent fiscal year and total expense ratios of the Portfolios. It should be noted that from inception of the Portfolios through August 31, 2006, except for U.S. Value Portfolio and U.S. Large Cap Growth Portfolio, the Adviser voluntarily agreed to limit total operating expenses of the Portfolios to ensure that their total expense ratios not exceed 15 basis points. During the most recently completed fiscal year, none of the Portfolios operated above its expense cap. For the current fiscal year those expense limitations are no longer in effect. Set forth below are the most recent fiscal year end and semi-annual total expense ratios of the Portfolios:
| Portfolio | Fiscal Year End | Total Expense Ratio | ||||||
| (08/31/06) | (02/28/07)6 | |||||||
| U.S. Value Portfolio | August 31 | 0.04 | % | 0.02 | % | |||
| U.S. Large Cap Growth Portfolio | August 31 | 0.04 | % | 0.02 | % | |||
| Global Real Estate Investment Portfolio | August 31 | 0.09 | % | 0.05 | % | |||
| International Value Portfolio | August 31 | 0.10 | % | 0.07 | % | |||
| International Growth Portfolio | August 31 | 0.11 | % | 0.07 | % | |||
| Small-Mid Cap Value Portfolio | August 31 | 0.07 | % | 0.05 | % | |||
| Small-Mid Cap Growth Portfolio | August 31 | 0.07 | % | 0.05 | % | |||
I. ADVISORY FEES CHARGED TO INSTITUTIONAL AND OTHER CLIENTS
Although the Portfolios are not charged an advisory fee, their shareholders, which include other investment companies and large institutional clients managed by the Adviser, pay the Adviser an investment advisory fee for managing their assets. In this regard, it is worth considering the advisory fees charged by the Adviser to institutional and other clients. The advisory fees charged to investment companies that the Adviser manages and sponsors are normally higher than those charged to similar sized institutional accounts, including pension plans and sub-advised investment companies.
The fee differential reflects, among other things, different services provided to such clients and different liabilities assumed. Services provided by the Adviser to investment companies, including the Portfolios, that are not provided to non-investment company clients and sub-advised investment companies include providing office space and personnel to serve as Fund Officers, who among other responsibilities make the certifications required under the Sarbanes–Oxley Act of 2002, and coordinating with and monitoring third party service providers such as Fund counsel, auditors, custodians, transfer agents and pricing services. The accounting, administrative, legal and compliance requirements for investment companies are more costly than those for institutional accounts due to the greater complexities and time required for investment companies, although a portion of the administrative expense of certain Institutional Clients that are investment companies are reimbursed by the Adviser to those Institutional Clients. It should be noted that those reimbursement agreements do not exist with
| 6 | Annualized for the six months ended February 28, 2007. |
| 210 | • ALLIANCEBERNSTEIN POOLING PORTFOLIOS |
respect to the Pooling Portfolios. In addition, managing the cash flow of an investment company may be more difficult than managing that of a stable pool of assets, such as an institutional account with little cash movement in either direction, particularly if the investment company experiences a net redemption and the Adviser is frequently forced to sell securities to raise cash for the redemption. However, managing an investment company with positive cash flow may be easier at times than managing a stable pool of assets. Finally, in recent years, investment advisers have been sued by institutional clients and have suffered reputational damage both by the attendant publicity and outcomes other than complete victories. Accordingly, the legal and reputational risks associated with institutional accounts are greater than previously thought, although still not equal to those related to the mutual fund industry.
Notwithstanding the Adviser’s view that managing an investment company is not comparable to managing other institutional accounts because the services provided are different and legal and reputational risks are greater, it is worth considering information regarding the advisory fees charged to institutional accounts that have investment styles substantially similar to those of the Portfolios.7 In addition to the AllianceBernstein Institutional fee schedule, set forth below are what would have been the effective advisory fees of certain of the Portfolios had the AllianceBernstein Institutional fee schedule been applicable to those Portfolios based on February 28, 2007 net assets, although it should be noted that the Portfolios are not charged an advisory fee by the Adviser.
| Portfolio | Portfolio Net Assets ($MIL) | AllianceBernstein (AB) Fee Schedule | Effective Fee | Portfolio Fee | ||||
| U.S. Value Portfolio | $2,233.6 | Diversified Value Schedule 65 bp on 1st $25 million 50 bp on next $25 million 40 bp on next $50 million 30 bp on next $100 million 25 bp on the balance Minimum Account Size: $2 m | 0.263% | 0.000% | ||||
| U.S. Large Cap Growth Portfolio | $2,194.5 | U.S. Large Cap Growth Schedule 80 bp on 1st $25 million 50 bp on next $25 million 40 bp on next $50 million 30 bp on next $100 million 25 bp on the balance Minimum Account Size: $10 m | 0.265% | 0.000% |
| 7 | The Adviser has indicated that with respect to institutional accounts with assets greater than $300 million, it will negotiate a fee schedule. Discounts that are negotiated vary based upon each client relationship. |
| ALLIANCEBERNSTEIN POOLING PORTFOLIOS • | 211 |
| Portfolio | Portfolio Net Assets ($MIL) | AllianceBernstein (AB) Fee Schedule | Effective Fee | Portfolio Fee | ||||
| Global Real Estate Investment Portfolio8 | $1,067.9 | Domestic REIT Strategy 70 bp on 1st $25 million 60 bp on next $25 million 50 bp on next $25 million Negotiable on the balance Minimum Account Size: $10m | 0.507%9 | 0.000% | ||||
| International Value Portfolio | $1,198.3 | International Strategic Value Schedule 90 bp on 1st $25 million 70 bp on next $25 million 60 bp on next $50 million 50 bp on the balance Minimum Account Size: $25m | 0.517% | 0.000% | ||||
| International Growth Portfolio | $1,102.5 | International Large Cap Growth Schedule 80 bp on 1st $25 million 60 bp on next $25 million 50 bp on next $50 million 40 bp on the balance Minimum Account Size: $25 m | 0.416% | 0.000% | ||||
| Small-Mid Cap Value Portfolio | $566.5 | Small & Mid Cap Value Schedule 95 bp on 1st $25 million 75 bp on next $25 million 65 bp on next $50 million 55 bp on the balance Minimum Account Size: $10m | 0.585% | 0.000% | ||||
| Small-Mid Cap Growth Portfolio | $552.5 | SMID Cap Growth Schedule 95 bp on 1st $25 million 75 bp on next $25 million 65 bp on next $50 million 55 bp on the balance Minimum Account Size: $10m | 0.586% | 0.000% |
| 8 | It should be noted that the Portfolio’s investment guidelines are not as restrictive as that of the institutional strategy. The Portfolio may invest in equity securities of non-U.S. real estate investment trusts (“REITS”) and other non-U.S. real estate industry companies in contrast to the institutional strategy, which invests primarily in equities of U.S. REITS and other U.S. real estate industry companies. |
| 9 | Assumes 50 bp on the balance. |
| 212 | • ALLIANCEBERNSTEIN POOLING PORTFOLIOS |
The Adviser manages the AllianceBernstein Mutual Funds (“ABMF”), which are open-end investment companies, and AllianceBernstein Variable Products Series Fund, Inc. (“AVPS”), which offers variable annuity and variable life contract policyholders the option to utilize certain AVPS portfolios as the investment option underlying their insurance contracts. The advisory schedules of these funds, implemented in January 2004 as a result of the Assurance of Discontinuance between the New York State Attorney General and the Adviser, contemplates eight categories with almost all of the AllianceBernstein funds in each category having the same advisory fee schedule. The Adviser charges the following fees for these funds:
| Portfolio | ABMF/AVPS Portfolio | Fee Schedule | Effective ABMF/AVPS Adv. Fee | |||
| U.S. Value Portfolio | Value Fund AVPS Value Portfolio | 0.55% on first $2.5 billion 0.45% on next $2.5 billion 0.40% on the balance | 0.55% | |||
| U.S. Large Cap Growth Portfolio | Large Cap Growth Fund, Inc.
AVPS Large Cap Growth Portfolio | 0.75% on first $2.5 billion 0.65% on next $2.5 billion 0.60% on the balance | 0.75% | |||
| Global Real Estate Investment Portfolio | Global Real Estate Fund, Inc.
AVPS Real Estate Investment Portfolio | 0.55% on first $2.5 billion 0.45% on next $2.5 billion 0.40% on the balance | 0.55% | |||
| International Value Portfolio | International Value Fund, Inc.
AVPS International Value Portfolio | 0.75% on first $2.5 billion 0.65% on next $2.5 billion 0.60% on the balance | 0.75% | |||
| International Growth Portfolio | International Growth Fund, Inc.
AVPS International Growth Portfolio | 0.75% on first $2.5 billion 0.65% on next $2.5 billion 0.60% on the balance | 0.75% | |||
| Small-Mid Cap Value Portfolio | Small/Mid Cap Value Fund
AVPS Small/Mid Cap Value Portfolio | 0.75% on first $2.5 billion 0.65% on next $2.5 billion 0.60% on the balance | 0.75% | |||
| Small-Mid Cap Growth Portfolio | Cap Fund, Inc.—Small/Mid Cap Growth Portfolio
AVPS Small Cap Growth Portfolio | 0.75% on first $2.5 billion 0.65% on next $2.5 billion 0.60% on the balance | 0.75% |
| ALLIANCEBERNSTEIN POOLING PORTFOLIOS • | 213 |
The Adviser also manages and sponsors retail mutual funds, which are organized in jurisdictions outside the United States, generally Luxembourg and Japan, and sold to non-United States resident investors. The Adviser charges the following fees for the Luxembourg funds that have a somewhat similar investment style as certain of the Portfolios:
| Portfolio | Luxembourg Fund | Fee10 | ||
| U.S. Value Portfolio | American Value Portfolio Class A Class I (Institutional) | 1.50% 0.70% | ||
| International Value Portfolio | Global Value Portfolio Class A Class I (Institutional) | 1.50% 0.70% |
The Alliance Capital Investment Trust Management mutual funds (“ACITM”), which are offered to investors in Japan, have an “all-in” fee to compensate the Adviser for investment advisory as well as fund accounting and administrative related services. The fee schedules of the ACITM mutual funds that have a somewhat similar investment style as certain of the Portfolios are as follows:
| Portfolio | ACITM Mutual Fund | Fee11 | ||
| U.S. Large Cap Growth Portfolio | Alliance American Premier Growth – Hedged /Non-Hedged | 0.95% | ||
| Alliance American Premier Growth F / FB / FVA12 | 0.70% | |||
| International Value Portfolio | Alliance International Diversified Value12 | 0.10%13 | ||
| AllianceBernstein International Value Equity A | 0.30%14 | |||
| AllianceBernstein Kokusai Value Stock12 | 0.70% | |||
| Bernstein Kokusai Strategic Value12 | 0.95% on first ¥1 billion 0.85% on next ¥1.5 billion 0.70% on next ¥2.5 billion 0.60% on next ¥5 billion 0.50% thereafter |
| 10 | Class A shares of the Luxembourg funds are charged an “all-in” fee, which covers investment advisory and distribution related services. |
| 11 | The Japanese Yen-U.S. dollar currency exchange rate quoted at 4 p.m. on March 6, 2007 by Reuters was ¥116.62 per $1. At that currency exchange rate, every ¥1 billion would be equivalent to approximately $8.6 million. |
| 12 | This ACITM fund is privately placed or institutional. |
| 13 | In addition to the 0.10%, the Adviser charges the institutional account 0.5175% for the first ¥2.5 billion, 0.375% for the next ¥2.5 billion, 0.3275% for the next ¥2.5 billion, 0.28% for the next ¥10 billion and 0.185% thereafter. |
| 14 | The fund is offered to two institutional clients that are charged a separate fee for managing their assets in addition to the 0.30%. The first client is charged 0.33% for the first ¥2.5 billion, 0.195% for the next ¥2.5 billion, 0.105% for the next ¥5 billion and 0.06% thereafter. The second client is charged 0.40% for the first ¥2.5 billion, 0.25% for the next ¥2.5 billion, 0.15% for the next ¥5 billion and 0.10% thereafter. |
| 214 | • ALLIANCEBERNSTEIN POOLING PORTFOLIOS |
The Adviser provides sub-advisory services to certain other investment companies managed by other fund families. The Adviser charges the fees set forth below for each of these sub-advisory relationships.
| Portfolio | Sub-advised Fund | Fee Schedule15 | ||
| U.S. Value Portfolio | Client # 1 | 0.25% on 1st $500 million 0.20% thereafter | ||
| Client # 216 | 0.50% on 1st $1 billion 0.40% on next $1 billion 0.30% on next $1 billion 0.20% thereafter | |||
| Client # 3 | 0.23% on 1st $300 million 0.20% thereafter | |||
| Client # 4 | 0.35% on 1st $200 million 0.30% thereafter | |||
| Client # 5 | 0.60% on 1st $10 million 0.50% on next $15 million 0.40% on next $25 million 0.30% on next $50 million 0.25% on next $50 million 0.225% on next $50 million 0.20% thereafter | |||
| Client # 6 | 0.27% on 1st $300 million 0.16% on next $700 million 0.13% thereafter | |||
| Client # 7 | 0.15% on 1st $1 billion 0.14% on next $2 billion 0.12% on next $2 billion 0.10% thereafter +/- Performance Fee17 | |||
| Client # 8 | 0.35% | |||
| Client # 9 | 0.20% |
| 15 | The advisory fees for each sub-advised account are based on the percentage of the sub-advised account’s net assets, not an aggregation of any of the sub-advised accounts shown. |
| 16 | This is a fee schedule of a fund managed by an affiliate of the Adviser. |
| 17 | The performance fee is calculated by multiplying the Base Fee during the period by an adjustment factor that considers the excess or under performance of the fund versus its benchmark, the Russell 1000 Value Index, over a cumulative 36-month period. |
| ALLIANCEBERNSTEIN POOLING PORTFOLIOS • | 215 |
| Portfolio | Sub-advised Fund | Fee Schedule15 | ||
| Client # 10 | 0.60% on 1st $10 million 0.50% on next $15 million 0.40% on next $25 million 0.30% on next $50 million 0.25% on next $50 million 0.225% on next $50 million 0.20% on next $50 million 0.175% on next $50 million 0.150% thereafter | |||
| U.S. Large Cap Growth Portfolio | Client # 1116 | 0.60% on 1st $1 billion 0.55% on next $500 million 0.50% on next $500 million 0.45% on next $500 million 0.40% thereafter | ||
| Client # 12 | 0.35% on 1st $50 million 0.30% on next $100 million 0.25% thereafter | |||
| Client # 13 | 0.40% on first $300 million 0.37% on next $300 million 0.35% on next $300 million 0.32% on next $600 million 0.25% thereafter | |||
| Client # 14 | 0.35% | |||
| International Value Portfolio | Client # 15 | 0.65% on 1st $75 million 0.50% on next $25 million 0.40% on next $200 million 0.35% on next $450 million 0.30% thereafter | ||
| Client # 1616 | 0.60% on 1st $1 billion 0.55% on next $500 million 0.50% on next $500 million 0.45% on next $500 million 0.40% thereafter | |||
| Client # 17 | 0.70% on 1st $25 million 0.45% on next $25 million 0.35% on next $200 million 0.33% thereafter | |||
| Client # 18 | 0.45% on 1st $200 million 0.36% on next $300 million 0.32% thereafter | |||
| Client # 19 | 0.55% on 1st $150 million 0.50% on next $150 million 0.20% thereafter | |||
| Client # 20 | 0.55% on 1st $150 million 0.40% thereafter |
| 216 | • ALLIANCEBERNSTEIN POOLING PORTFOLIOS |
| Portfolio | Sub-advised Fund | Fee Schedule15 | ||
| Client # 21 | 0.50% | |||
| Client # 22 | 0.30% | |||
| Client # 23 | 0.22% on 1st $1 billion 0.18% on next $1.5 billion 0.16% thereafter +/- Performance Fee18 | |||
| Client # 24 | 0.60% on 1st $50 million 0.40% on next $50 million 0.30% on next $300 million 0.25% thereafter | |||
| U.S. Small Cap-Mid Value Portfolio | Client # 25 | 0.50% on 1st $250 million 0.45% thereafter | ||
| Client # 26 | 0.72% on 1st $25 million 0.54% on next $250 million 0.50% thereafter | |||
| Client # 27 | 0.80% on 1st $25 million 0.60% thereafter | |||
| U.S. Small Cap-Mid Growth Portfolio | Client # 2816 | 0.30% | ||
| Client # 2916 | 0.60% on 1st $1 billion 0.55% on next $500 million 0.50% on next $500 million 0.45% on next $500 million 0.40% thereafter |
It is fair to note that the services the Adviser provides pursuant to sub-advisory agreements are generally confined to the services related to the investment process; in other words, they are not as comprehensive as the services provided to the Portfolios by the Adviser. In addition, to the extent that certain of these sub-advisory relationships are with affiliates of the Adviser, the fee schedules may not reflect arm’s-length bargaining or negotiations.
| II. | MANAGEMENT FEES CHARGED BY OTHER MUTUAL FUNDS COMPANIES FOR LIKE SERVICES. |
In the Pooling Portfolios’ Senior Officer’s Evaluation of the Investment Advisory Agreement, which the Trustees of the Trust reviewed, the Senior Officer mentioned previous evaluations that were written for the Retirement Strategies, Wealth Strategies and U.S. Large Cap Portfolio. In those evaluations, the Senior
| 18 | The performance fee is calculated by multiplying the Base Fee during the period by an adjustment factor that considers the excess or under performance of the fund versus its benchmark, the Morgan Stanley Capital International All World Index Excluding US (ACWI ex US), over a 60 month rolling period. |
| ALLIANCEBERNSTEIN POOLING PORTFOLIOS • | 217 |
Officer concluded that the investment advisory agreement for those Institutional Clients were reasonable and within range of what would have been negotiated at arm’s-length.
The Pooling Portfolios are not charged an advisory fee. However, as previously mentioned, the Institutional Clients that invest in the Pooling Portfolios do pay an advisory fee pursuant to their advisory agreements with the Adviser. The Adviser believes that the fee paid by the Institutional Clients includes a portion, referred by the Adviser as the “Implied Advisory Fee,” that may be reasonably viewed as compensation for services that the Adviser provides to the Pooling Portfolios. The Adviser further believes that the rate of the Implied Advisory Fee is the same for each Institutional Client invested in a series of the Pooling Portfolios.
Because of the Pooling Portfolios’ limited availability for investment, open only to certain institutional clients of the Adviser, the Pooling Portfolios have zero transfer agent (with the exception of certain transfer agent out of pocket expenses) and distribution fees, in addition to zero advisory fees. Such expense structure is rare in the industry. The UBS Relationship Funds, an open-end investment company managed by UBS Global Asset Management (Americas) Inc., was the only other fund family that was determined by the Adviser, the Senior Officer and Lipper, Inc. (“Lipper”) to have an expense structure comparable to the Pooling Portfolios.
Since there are not many funds of other fund families that have a similar expense structure as the Portfolios, Lipper, an analytical service not affiliated with the Adviser, compared the total expense ratios of the Portfolios to that of funds of a similar investment classification/objective with institutional class shares; however, Lipper excluded management, transfer agent and distribution fees from the total expense ratios of the Portfolios’ peers.19 Lipper’s analysis included the Portfolios’ rankings20 relative to their respective Lipper Expense Group (“EG”) and Lipper Expense Universe (“EU”).21
Lipper describes an EG as a representative sample of comparable funds. Lipper’s standard methodology for screening funds to be included in an EG entails the consideration of several fund criteria, including fund type, investment classification/objective, asset (size) comparability, load type,22 expense components
| 19 | Because the Portfolios are offered only to other investment companies and certain institutional clients managed by the Adviser, the Portfolios are not assessed a fee for transfer agent and distribution-related services although it should be noted that the transfer agent of the Portfolios is reimbursed for out of pocket expenses. |
| 20 | A ranking of “1” would mean that the Portfolio had the lowest total expense ratio in the Lipper peer group. |
| 21 | Note that there are limitations on expense category data because different funds categorize expenses differently. |
| 22 | Lipper excluded institutional classes or funds that had a 12b-1 or non 12b-1 service fee for this evaluation in order for the Portfolios’ EUs to not include multiple classes of the same funds. As a result, the EUs in this evaluation are much smaller in size compared to the evaluation dated January 23, 2007. |
| 218 | • ALLIANCEBERNSTEIN POOLING PORTFOLIOS |
and attributes. An EG will typically consist of seven to twenty funds. An EU is a much broader group, consisting of all institutional classes of funds of the same investment classification/objective as the subject Portfolio.23
With respect to International Value Portfolio and International Growth Portfolio, each of those Portfolios’ original EGs had an insufficient number of comparable peers. Consequently, at the request of the Adviser and the Senior Officer, Lipper expanded each of those Portfolios’ EGs to include peers that have a similar but not the same Lipper investment classification/objective. However, because Lipper had expanded the EGs of those Portfolios, under Lipper’s standard guidelines, each of the Portfolios’ EUs was also expanded to include the universe of those peers that had a similar but not the same Lipper investment classification/objective.24 The result of Lipper’s analysis is set forth below:
| Portfolio | Expense Ratio | Lipper Exp. Group Median (%)25 | Lipper Group Rank | Lipper Exp. Median (%) | Lipper Rank | |||||
| U.S. Value Portfolio | 0.039 | 0.043 | 6/14 | 0.082 | 9/49 | |||||
| U.S. Large Cap Growth Portfolio | 0.042 | 0.041 | 10/17 | 0.085 | 29/110 | |||||
| Global Real Estate Investment Portfolio26 | 0.089 | 0.229 | 1/6 | N/A | N/A | |||||
| International Value Portfolio27 | 0.101 | 0.117 | 6/16 | 0.170 | 15/57 | |||||
| International Growth Portfolio28 | 0.111 | 0.089 | 8/12 | 0.130 | 19/46 | |||||
| Small-Mid Cap Value Portfolio | 0.072 | 0.070 | 10/17 | 0.069 | 23/42 | |||||
| Small-Mid Cap Growth Portfolio | 0.073 | 0.081 | 4/19 | 0.098 | 31/92 |
| 23 | Except for asset (size) comparability, Lipper uses the same criteria for selecting a Lipper EG when selecting a Lipper EU. Unlike the Lipper EG, the Lipper EU allows for the same adviser to be represented by more than just one fund. In addition, multiple institutional class shares for the Portfolios’ peers are included. |
| 24 | It should be noted that the expansion such Portfolios’ EUs was not requested by the Adviser or the Senior Officer. They requested that only the EGs be expanded. |
| 25 | With respect to the Portfolios’ peers, the total expense ratios of those funds are net of management, transfer agent and distribution fees. |
| 26 | It should be noted that there was a significant change in the criteria used to select the Portfolio’s EG peers compared to the Portfolio’s EG peers selected to the Portfolio’s EG in the evaluation dated January 23, 2007. The peers that Lipper selected for this evaluation are more “global” compared to the primarily domestic peers that Lipper had selected previously. Lipper was not able to provide EU information due to the limited number of comparably global real estate funds. |
| 27 | The Portfolio’s EG includes the Portfolio, nine other International Multi-Cap Value funds (“IMLV”) and six International Large-Cap Growth funds (“ILCC”). The Portfolio’s EG includes the Portfolio and all other institutional funds of IMLV and ILCC, excluding outliers. |
| 28 | The Portfolio’s EG includes the Portfolio, four other International Large Cap Growth funds (“ILCG”) and seven International Multi-Cap Growth funds (“IMLG”). The Portfolio’s EG includes the Portfolio and all other institutional funds of ILCG and IMLG, excluding outliers. |
| ALLIANCEBERNSTEIN POOLING PORTFOLIOS • | 219 |
| III. | COSTS TO THE ADVISER AND ITS AFFILIATES OF SUPPLYING SERVICES PURSUANT TO THE ADVISORY FEE ARRANGEMENT, EXCLUDING ANY INTRA-CORPORATE PROFIT. |
The Adviser utilizes two profitability reporting systems, which operate independently but are aligned with each other, to estimate the Adviser’s profitability in connection with investment advisory services provided to the Portfolios. The Senior Officer has retained a consultant to provide independent advice regarding the alignment of the two profitability systems as well as the methodologies and allocations utilized by both profitability systems. The Adviser used a weighted average of the Adviser’s profitability with respect to the Institutional Clients that are invested in the Pooling Portfolios, in addition to any Portfolio’s specific revenue or expense item, to calculate the Adviser’s profitability. See Section IV for additional discussion.
| IV. | PROFIT MARGINS OF THE ADVISER AND ITS AFFILIATES FOR SUPPLYING SUCH SERVICES. |
The Pooling Portfolios’ profitability information, prepared by the Adviser for the Board of Directors, was reviewed by the Senior Officer and the consultant.
Certain of the Portfolios effected brokerage transactions through the Adviser’s affiliate, Sanford C. Bernstein & Co. LLC, and/or its U.K. based affiliate, Sanford C. Bernstein Ltd., collectively “SCB”, and paid commissions during the Portfolios’ recent fiscal year. The Adviser represented that SCB’s profitability from business conducted with the Portfolios is comparable to the profitability of SCB’s dealings with other similar third-party clients. In the ordinary course of business, SCB receives and pays liquidity rebates from electronic communications networks (“ECNs”) derived from trading for its clients, including the Portfolios. These credits and charges are not being passed on to any SCB client.
| V. | POSSIBLE ECONOMIES OF SCALE |
An independent consultant, retained by the Senior Officer, made a presentation to the Board of Trustees regarding economies of scale and/or scope. Based on the independent consultant’s initial survey, there was a consensus that fund management companies benefited from economies of scale. However, due to the lack of cost data, researchers had to infer facts about the costs from the behavior of fund expenses; there was a lack of consensus among researchers as to whether economies of scale were being passed on to the shareholders.
The independent consultant conducted further studies of the Adviser’s operations to determine the existence of economies of scale and/or scope within the Adviser. The independent consultant also analyzed patterns related to advisory fees at the industry level. In a recent presentation to the Board of Trustees, the independent consultant noted the potential for economies of scale and/or scope through the use of “pooling portfolios” and blend products. The independent consultant also remarked that there may be diseconomies as assets grow in less
| 220 | • ALLIANCEBERNSTEIN POOLING PORTFOLIOS |
liquid and active markets. It was also observed that various factors, including fund size, family size, asset class, and investment style, had an impact on advisory fees.
| VI. | NATURE AND QUALITY OF THE ADVISER’S SERVICES INCLUDING THE PERFORMANCE OF THE PORTFOLIOS. |
With assets under management of $742 billion as of March 31, 2007, the Adviser has the investment experience to manage and provide non-investment services to the Portfolios.
The information in the table below shows the 1 year and since inception29 gross performance returns and rankings of the Portfolios relative to their Lipper Performance Group (“PG”) and Lipper Performance Universe (“PU”)30 for the periods ended December 31, 2006.31
| Pooling Portfolio | Portfolio Return | PG Median | PU Median | PG Rank | PU Rank | |||||
U.S. Value Portfolio | ||||||||||
1 year | 22.69 | 18.29 | 19.80 | 1/14 | 9/81 | |||||
Since Inception | 18.03 | 16.43 | 18.32 | 6/14 | 43/73 | |||||
U.S. Large Cap Growth Portfolio | ||||||||||
1 year | 1.36 | 6.74 | 7.16 | 16/17 | 119/139 | |||||
Since Inception | 11.34 | 9.23 | 10.02 | 4/16 | 34/126 | |||||
Global Real Estate Investment Portfolio | ||||||||||
1 year | 43.77 | 43.44 | N/A | 3/6 | N/A | |||||
Since Inception | 34.54 | 37.34 | N/A | 4/5 | N/A | |||||
International Value Portfolio | ||||||||||
1 year | 36.98 | 29.56 | 30.33 | 1/10 | 1/27 | |||||
Since Inception | 37.43 | 30.89 | 30.16 | 1/9 | 1/23 | |||||
| 29 | It should be noted that the underlying data with regards to Lipper’s inception date performance return calculation only covers the period from the nearest month end after inception date through the period end date. In contrast to Lipper, the Adviser calculates the Portfolios’ performance using data that includes the partial month (May 20, 2005 through November 30, 2006). Note that the since inception gross performance return calculated by Lipper for U.S. Large Cap Growth Portfolio is less than the net performance return calculated by the Adviser on page 24. Normally, gross performance returns are higher than net performance returns. |
| 30 | A Portfolio’s PG and PU may not be identical to its respective EG and EU. The criteria for including and excluding a fund in a PG or PU is somewhat different from that of an EG or EU. In particular, PGs and PUs only include funds of the same Lipper investment classification/objective as the Portfolios, in contrast to certain of the Portfolios’ EGs and EUs, which may include funds of similar but not the same investment classification/objective. |
| 31 | The performance returns of the Portfolios’ peers are also adjusted for expenses (gross up). |
| ALLIANCEBERNSTEIN POOLING PORTFOLIOS • | 221 |
| Pooling Portfolio | Portfolio Return | PG Median | PU Median | PG Rank | PU Rank | |||||
International Growth Portfolio | ||||||||||
1 year | 18.45 | 23.87 | 24.80 | 5/5 | 14/14 | |||||
Since Inception | 23.51 | 28.96 | 28.95 | 5/5 | 12/12 | |||||
Small-Mid Cap Value Portfolio | ||||||||||
1 year | 15.25 | 18.57 | 17.76 | 14/17 | 41/53 | |||||
Since Inception | 14.49 | 19.10 | 17.62 | 15/15 | 40/42 | |||||
Small-Mid Cap Growth Portfolio | ||||||||||
1 year | 9.12 | 9.81 | 10.17 | 12/19 | 63/111 | |||||
Since Inception | 18.23 | 13.81 | 14.41 | 5/18 | 20/97 |
Set forth below are the 1 year and since inception net performance returns of the Portfolios (in bold) versus their benchmarks.32
| Periods Ending December 31, 2006 Annualized Performance (%) | ||||
| 1 Year | Since Inception33 | |||
U.S. Value Portfolio | 22.65 | 17.88 | ||
Russell 1000 Value Index | 22.25 | 18.03 | ||
U.S. Large Cap Growth Portfolio | 1.32 | 12.01 | ||
Russell 1000 Growth Index | 9.07 | 10.07 | ||
Global Real Estate Investment Portfolio | 43.64 | 33.69 | ||
FTSE / NAREIT Equity Index | 42.36 | 36.75 | ||
International Value Portfolio | 36.85 | 36.23 | ||
MSCI EAFE Value Index | 30.38 | 30.30 | ||
International Growth Portfolio | 18.32 | 22.39 | ||
MSCI EAFE Growth Index | 22.33 | 24.87 | ||
Small-Mid Cap Value Portfolio | 15.17 | 14.09 | ||
Russell 2500 Value Index | 20.18 | 18.14 | ||
Small-Mid Cap Growth Portfolio | 9.04 | 18.04 | ||
Russell 2500 Growth Index | 12.26 | 15.60 | ||
| 32 | The Adviser provided Portfolio and benchmark performance return information for periods through December 31, 2006. |
| 33 | The underlying data, which the Adviser used to calculate since inception performance returns for the Portfolios, covers the period from the Portfolios’ inception date, May 20, 2005, through December 31, 2006. On the other hand, the underlying data, which the Adviser used to calculate performance returns for the Portfolios’ benchmarks, covers the period from the nearest month end after the Portfolios’ inception date, May 31, 2005, through December 31, 2006. |
| 222 | • ALLIANCEBERNSTEIN POOLING PORTFOLIOS |
CONCLUSION:
Based on the factors discussed above the Senior Officer’s conclusion is that the proposed advisory fees for the Portfolios are reasonable and within the range of what would have been negotiated at arm’s-length in light of all the surrounding circumstances. This conclusion in respect of the Portfolios is based on an evaluation of all of these factors and no single factor was dispositive.
Dated: June 4, 2007
| ALLIANCEBERNSTEIN POOLING PORTFOLIOS • | 223 |
THE FOLLOWING SENIOR OFFICER’S FEE SUMMARIES ARE NOT PART OF THE SHAREHOLDER REPORT OR THE FINANCIAL STATEMENT
SUMMARY OF SENIOR OFFICER’S EVALUATION OF INVESTMENT ADVISORY AGREEMENT1
The following is a summary of the evaluation of the investment advisory agreement between AllianceBernstein L.P. (the “Adviser”) and AllianceBernstein Pooling Portfolios (the “Trust”) in respect of AllianceBernstein Global Research Growth Portfolio and AllianceBernstein Global Value Portfolio (each a “Portfolio” and collectively the “Portfolios”), prepared by Philip L. Kirstein, the Trust’s Senior Officer, for the Trustees of the Trust, as required by an August 2004 agreement between the Adviser and the New York State Attorney General.2 It should be noted that both of these Portfolios have not yet commenced operations. The Senior Officer’s evaluation of the investment advisory agreement is not meant to diminish the responsibility or authority of the Board of Trustees to perform its duties pursuant to Section 15 of the Investment Company Act of 1940 (the “40 Act”) and applicable state law. The purpose of the summary is to provide shareholders with a synopsis of the independent evaluation of the reasonableness of the advisory fees proposed by the Adviser which was provided to the trustees in connection with their review of the proposed initial approvals of the investment advisory agreement as applicable to the Portfolios.
The Trust is designed to facilitate a “blended style” investment approach, which represents a variety of asset classes and investment styles.3 The Trust is available for investment only to institutional clients of the Adviser, including both registered investment companies and large managed separate accounts.
The Portfolios will not pay a fee to the Adviser or its affiliates for advisory, transfer agency and distribution related services. The Adviser and its affiliates, including the transfer agent and principal underwriter of the Trust, will be indirectly compensated for their services to the Portfolios by the fees that they will receive for their services rendered to the investment companies and certain other large institutional accounts that invest in the Portfolios.
| 1 | It should be noted that the information in the fee summary was completed on April 24, 2006 and presented to the Board of Trustees on May 2, 2006 in accordance with the Assurance of Discontinuance between the New York State Attorney General and the Adviser. |
| 2 | Future references to the Portfolios do not include “AllianceBernstein.” |
| 3 | The other Pooling Portfolios that are not discussed in this evaluation are U.S. Value Portfolio, U.S. Large Cap Growth Portfolio, Global Real Estate Investment Portfolio, International Value Portfolio, International Growth Portfolio, Small-Mid Cap Value Portfolio, Small-Mid Cap Growth Portfolio, Short Duration Bond Portfolio, Intermediate Duration Bond Portfolio, Inflation Protected Securities Portfolio and High-Yield Portfolio. |
| 224 | • ALLIANCEBERNSTEIN POOLING PORTFOLIOS |
The Senior Officer’s evaluation considered the following factors:
| 1. | Management fees charged to institutional and other clients of the Adviser for like services; |
| 2. | Management fees charged by other mutual fund companies for like services; |
| 3. | Costs to the Adviser and its affiliates of supplying services pursuant to the advisory agreement, excluding any intra-corporate profit; |
| 4. | Profit margins of the Adviser and its affiliates from supplying such services; |
| 5. | Possible economies of scale as the Portfolios grow larger; and |
| 6. | Nature and quality of the Adviser’s services including the performance of the Portfolios. |
ADVISORY FEES AND EXPENSE CAPS & RATIOS
The Portfolios will not pay a fee to the Adviser for advisory services. However, the Adviser will be indirectly compensated for its services to the Portfolios by institutional clients (initially, a series of AllianceBernstein Blended Style Series, Inc.) that invest in the Portfolios. The Adviser expects that establishing the components of this service as Pooling Portfolios will enable the Adviser to make the service more widely available to other institutional investors. Set forth below is the proposed advisory fee schedule of the series of AllianceBernstein Blended Style Series, Inc. that will initially invest in the Portfolios:
| Fund | Advisory Fee Based on % of Average Daily Net Assets | ||||
| AllianceBernstein Blended Style Series, Inc.—Global Blend Portfolio | First $2.5 billion | 0.75 | % | ||
| Next $2.5 billion | 0.65 | % | |||
| Excess of $5 billion | 0.60 | % | |||
The Adviser has agreed to reimburse the Portfolios, if the Portfolios’ total operating expense ratios exceed the expense caps set forth below for the Portfolios. The waiver extends until August 31, 2007 and will automatically extend for additional one-year terms unless terminated by the Adviser upon at least 60 days written notice prior to the termination date of the undertaking.
| Portfolio | Expense Cap | ||
Global Research Growth Portfolio | 0.15 | % | |
Global Value Portfolio | 0.15 | % |
| I. | MANAGEMENT FEES CHARGED TO INSTITUTIONAL AND OTHER CLIENTS |
The management fees charged to investment companies which the Adviser manages and sponsors are normally higher than those charged to similar sized
| ALLIANCEBERNSTEIN POOLING PORTFOLIOS • | 225 |
institutional accounts, including pension plans and sub-advised investment companies. The fee differential reflects, among other things, different services provided to such clients, and different liabilities assumed. Services that will be provided by the Adviser to the Portfolios that are not provided to non-investment company clients will include providing office space and personnel to serve as Fund Officers, who among other responsibilities make the certifications required under the Sarbanes–Oxley Act of 2002, and coordinating with and monitoring the Trust’s third party service providers such as Fund counsel, auditors, custodians, transfer agents and pricing services. The accounting, administrative, legal and compliance requirements for the Portfolios will be more costly than those for institutional assets due to the greater complexities and time required for investment companies. Finally, in recent years, investment advisers have been sued by institutional clients and have suffered reputational damage both by the attendant publicity and outcomes other than complete victories. Accordingly, the legal and reputational risks associated with institutional accounts are greater than previously thought, although still not equal to those related to the mutual fund industry.
Notwithstanding the Adviser’s view that managing an investment company is not comparable to managing other institutional accounts because the services provided are different, it is worth considering information regarding the advisory fees charged to institutional accounts that have substantially similar investment styles as the Portfolios. In addition to the AllianceBernstein Institutional fee schedule, set forth below are what would have been the effective advisory fees of the Portfolios had the AllianceBernstein Institutional fee schedule been applicable to the Portfolios.
| Portfolio | Assumed Net Assets ($MIL) | AllianceBernstein (AB) Fee Schedule | Effective AB Inst. Adv. Fee | |||
| Global Research Growth Portfolio | $50.0 | Global Research Growth Schedule Minimum account size: $50m | 0.700% | |||
| Global Value Portfolio | $50.0 | Global Value Minimum account size: $25m | 0.700% |
| 226 | • ALLIANCEBERNSTEIN POOLING PORTFOLIOS |
The Adviser also manages the AllianceBernstein Mutual Funds. Certain of the AllianceBernstein Mutual Funds have substantially similar investment styles as the Portfolios and their fee schedules are as follows:
| Portfolio | AllianceBernstein Mutual Fund | Fee | ||
| Global Research Growth Portfolio | AllianceBernstein Global Research Growth Fund, Inc. | 0.75% on first $2.5 billion 0.65% on next $2.5 billion 0.60% on the balance | ||
| Global Value Portfolio | AllianceBernstein Trust—Global Value Fund | 0.75% on first $2.5 billion 0.65% on next $2.5 billion 0.60% on the balance |
The AllianceBernstein Variable Products Series Fund, Inc. (“AVPS”), which is managed by the Adviser and is available through variable annuity and variable life contracts offered by other financial institutions, offers investors the option to invest in a portfolio that has a substantially similar investment style as the Global Research Growth Portfolio. The following table shows the fee schedule of such AVPS portfolio:
| Portfolio | AVPS Portfolio | Fee Schedule | ||
| Global Research Growth Portfolio | Global Research Growth | 0.75% on first $2.5 billion 0.65% on next $2.5 billion 0.60% on the balance |
The Adviser also manages and sponsors retail mutual funds, which are organized in jurisdictions outside the United States, generally Luxembourg and Japan, and sold to non-United States resident investors. The Adviser charges the following “all-in” fees for Global Value and Global Growth, which have somewhat similar investment strategies as the Portfolios:
| Fund | Fee4 | |
Global Value | 1.50% | |
Global Growth | 1.70% |
The Adviser represented that it does not sub-advise any registered investment companies with a similar investment style as the Portfolios.
| 4 | The “all-in” fees shown are for the Class A shares of Global Value and Global Growth. Each fund’s “all-in” fee includes a fee for investment advisory services and a separate fee for distribution related services. |
| ALLIANCEBERNSTEIN POOLING PORTFOLIOS • | 227 |
| II. | MANAGEMENT FEES CHARGED BY OTHER MUTUAL FUND COMPANIES FOR LIKE SERVICES. |
As previously mentioned, the Adviser will not be directly paid an advisory fee by the Portfolios. However, the Adviser will be compensated for its services by investment companies and other large institutional accounts advised by the Adviser that invest in the Portfolios.5
Lipper, Inc. (“Lipper”), an analytical service that is not affiliated with the Adviser analyzed the total expense ratios of the Portfolios in comparison to the Portfolios’ Lipper Expense Groups6 and Lipper Expense Universes.7 Lipper describes a Lipper Expense Group as a representative sample of comparable funds and a Lipper Expense Universe as a broader group, consisting of all funds in the same investment classification/objections with a similar load type as the subject Portfolio. The result of that analysis is set forth below:
| Portfolio | Expense Ratio (%) | Lipper Group | Lipper Group Rank | Lipper Universe Median (%) | Lipper Rank | |||||
| Global Research Growth Portfolio8 | 0.150 | 0.298 | 2/12 | 0.195 | 65/169 | |||||
| Global Value Portfolio8 | 0.150 | 0.226 | 3/14 | 0.112 | 67/125 |
| III. | COSTS TO THE ADVISER AND ITS AFFILIATES OF SUPPLYING SERVICES PURSUANT TO THE MANAGEMENT FEE ARRANGEMENT, EXCLUDING ANY INTRA-CORPORATE PROFIT. |
See discussion below in Section IV.
| IV. | PROFIT MARGINS OF THE ADVISER AND ITS AFFILIATES FOR SUPPLYING SUCH SERVICES. |
Since the Portfolios have not yet commenced operations, there is no information regarding the Adviser’s profitability for the services that the Adviser will provide to the Portfolios. It should be noted that a consultant was retained by the Senior
| 5 | However, it would be worth noting the Lipper advisory fee comparisons of similar funds, such as AllianceBernstein Global Research Growth Fund, Inc. and AllianceBernstein Trust—Global Value Fund, which the Adviser manages and charges an advisory fee levied in the “normal” manner. See the Summary of Senior Officer’s Evaluation of Investment Advisory Agreement for these AllianceBernstein Mutual Funds. |
| 6 | Lipper uses the following criteria in screening funds to be included in each Portfolio’s expense group: fund type, investment classification/objective, load type and similar 12b-1/non-12b-1 service fees, asset (size) comparability, and expense components and attributes. A Lipper Expense Group will typically consist of seven to twenty funds. |
| 7 | Except for asset (size) comparability and load type, Lipper uses the same criteria for selecting a Lipper Expense Group when selecting a Lipper Expense Universe. Unlike the Lipper Expense Group, the Lipper Expense Universe allows for the same adviser to be represented by more than just one fund. |
| 8 | Since the Portfolio does not charge an advisory fee, the Portfolio’s anticipated total expense ratio is compared to the non-management fee ratio, which excludes management fees, 12b-1 fees and non 12b-1 service fees, of other peers that charge an advisory fee of the Lipper Expense Group. |
| 228 | • ALLIANCEBERNSTEIN POOLING PORTFOLIOS |
Officer to work with the Adviser’s personnel to align the Adviser’s two profitability reporting systems. The alignment, which now has been completed, will allow the Adviser’s management and the Trustees to receive consistent presentations of financial results and profitability although the two profitability reporting systems operate independently. Since the Portfolios will not be charged a fee for advisory, transfer agency and distribution related services, no direct profit will be earned by the Advisor and its affiliates for these services.
The Adviser will profit indirectly from the Portfolios through the fees that it will receive from the institutional clients that invest in the Portfolios. Indirect profits include profits from managing the assets of institutional clients and the provision by affiliates of transfer agency and distribution related services.
The Adviser will profit directly from commissions generated from any brokerage transaction effected by the Portfolios through the Adviser’s affiliates, Sanford C. Bernstein & Co., LLC (“SCB & Co.”) and Sanford C. Bernstein Limited (“SCB Ltd.”) in the U.K., collectively “SCB.” The Adviser represented that SCB’s profitability from business conducted with the Portfolios will be comparable to the profitability of SCB’s dealings with other comparable third-party clients. In the ordinary course of business, SCB receives and pays liquidity rebates from electronic communications networks (“ECNs”) derived from trading for its clients, which will include the Portfolios. These credits and charges are not being passed on to any SCB client. The Adviser also receives certain soft dollar benefits from brokers that execute agency trades for the Portfolios and other clients. These soft dollar benefits reduce the Adviser’s cost of doing business and increase its profitability.
| V. | POSSIBLE ECONOMIES OF SCALE |
Although the Portfolios will not be charged an advisory fee, it is still worth considering information on possible economies of scale. The Adviser has indicated that the breakpoints in the fee schedules of the institutional clients of the Adviser that are invested in the Portfolios reflect a sharing of economies of scale to the extent the breakpoints are reached. Based on some of the professional literature that has considered economies of scale in the mutual fund industry it is thought that to the extent economies of scale exist, they may more often exist across a fund family as opposed to a specific fund. This is because the costs incurred by the Adviser, such as investment research or technology for trading or compliance systems can be spread across a greater asset base as the fund family increases in size. It is also possible that as the level of services required to operate a successful investment company has increased over time, and advisory firms have made such investments in their business to provide improved services, there may be a sharing of economies of scale without a reduction in advisory fees.
An independent consultant made a presentation to the Board of Trustees and the Senior Officer regarding possible economies of scale or scope in the mutual
| ALLIANCEBERNSTEIN POOLING PORTFOLIOS • | 229 |
fund industry. Based on the presentation, it was evident that fund management companies benefit from economies of scale. However, due to lack of cost data, researchers had to infer facts about the costs from the behavior of fund expenses; there was a lack of consensus among researchers as to whether economies of scale were being passed on to the shareholders. It is contemplated that additional work will be performed to determine if the benefits of economies of scale or scope are being passed to shareholders by the Adviser. In the meantime, it is clear that to the extent a fund’s assets exceeds its initial breakpoint its shareholders benefit from a lower fee rate.
| VI. | NATURE AND QUALITY OF THE ADVISER’S SERVICES INCLUDING THE PERFORMANCE OF THE FUND. |
With assets under management of $617 billion as of March 31, 2006, the Adviser has the investment experience to manage and provide non-investment services (described in Section II) to the Portfolios.
Since there is no historical performance information for the Portfolios it is worth considering the performance information of funds managed by the Adviser that have substantially similar investment styles as the Portfolios. The following table shows the 1 and 3 year performance rankings of AllianceBernstein Global Research Growth Fund, Inc. and AllianceBernstein Trust—Global Value Fund, whose investment styles are substantially similar to the Portfolios, relative to these fund’s Lipper Performance Groups and Lipper Performance Universes for the periods ended December 31, 2005.9
| AllianceBernstein Global Research Growth Fund, Inc. | Group | Universe | ||
1 year | 1/4 | 3/12 | ||
3 year | 1/4 | 1/10 | ||
| AllianceBernstein Trust—Global Value Fund | Group | Universe | ||
1 year | 2/4 | 5/11 | ||
3 year | 2/4 | 4/9 |
| 9 | The performance rankings are for the Class A shares of the AllianceBernstein Mutual Funds. |
| 230 | • ALLIANCEBERNSTEIN POOLING PORTFOLIOS |
Set forth below are the 1, 3 year and since inception performance returns of the two funds managed by the Adviser that have substantially similar investment styles as the Portfolios for the periods ending December 31, 2005:10
| Periods Ending December 31, 2005 Annualized Performance | ||||||
| Fund | 1 Year | 3 Year | Since Inception | |||
AllianceBernstein Global Research Growth Fund, Inc. | 15.82 | 20.41 | 16.90 | |||
MSCI World Index (Net) | 9.49 | 18.69 | 14.84 | |||
MSCI World Growth (Net) | 9.41 | 15.83 | 12.65 | |||
AllianceBernstein Trust—Global Value Fund | 14.57 | 22.26 | 9.25 | |||
MSCI World Index (Net) | 9.49 | 18.69 | 5.30 | |||
CONCLUSION:
Based on the factors discussed above the Senior Officer’s conclusion is that the proposed fees for the Portfolios are reasonable and within the range of what would have been negotiated at arms-length in light of all the surrounding circumstances. This conclusion in respect of each Portfolio is based on an evaluation of all of these factors and no single factor was dispositive.
Dated: June 7, 2006
| 10 | The performance returns for the Class A shares of the AllianceBernstein Mutual Funds were provided by the Adviser. |
| ALLIANCEBERNSTEIN POOLING PORTFOLIOS • | 231 |
THE FOLLOWING SENIOR OFFICER’S FEE SUMMARIES ARE NOT PART OF THE SHAREHOLDER REPORT OR THE FINANCIAL STATEMENT
SUMMARY OF SENIOR OFFICER’S EVALUATION OF
INVESTMENT ADVISORY AGREEMENT1
The following is a summary of the evaluation of the Investment Advisory Agreement between AllianceBernstein L.P. (the “Adviser”) and AllianceBernstein Pooling Portfolios (the “Trust” or the “Pooling Portfolios”) with respect to the following Portfolios:2
Short Duration Bond Portfolio
Intermediate Duration Bond Portfolio
Inflation Protected Securities Portfolio
High-Yield Portfolio
The Trust, which is designed to facilitate a “blended style” investment approach, represents a variety of asset classes and investment styles, and is available for investment only to institutional clients of the Adviser, including both registered investment companies and large managed separate accounts.
The evaluation of the Investment Advisory Agreement was prepared by Philip L. Kirstein, the Senior Officer of the Trust, for the Trustees of the Trust, as required by an August 2004 agreement between the Adviser and the New York State Attorney General (the “NYAG”). The Senior Officer’s evaluation of the Investment Advisory Agreement is not meant to diminish the responsibility or authority of the Board of Trustees of the Trust to perform its duties pursuant to Section 15 of the Investment Company Act of 1940 (the “40 Act”) and applicable state law. The purpose of the summary is to provide shareholders with a synopsis of the independent evaluation of the reasonableness of the advisory fees proposed to be paid by the Portfolios which was provided to the Trustees in connection with their review of the proposed approval of the continuance of the Investment Advisory Agreement. The Senior Officer’s evaluation considered the following factors:
| 1. | Advisory fees charged to institutional and other clients of the Adviser for like services; |
| 2. | Advisory fees charged by other mutual fund companies for like services; |
| 3. | Costs to the Adviser and its affiliates of supplying services pursuant to the advisory agreements, excluding any intra-corporate profit; |
| 4. | Profit margins of the Adviser and its affiliates from supplying such services; |
| 1 | It should be noted that the Senior Officer’s fee evaluation was completed on October 18, 2007. |
| 2 | Future references to the Portfolios do not include “AllianceBernstein.” |
| 232 | • ALLIANCEBERNSTEIN POOLING PORTFOLIOS |
| 5. | Possible economies of scale as the Portfolios grow larger; and |
| 6. | Nature and quality of the Adviser’s services including the performance of the Portfolios. |
PORTFOLIO ADVISORY FEES, NET ASSETS, & EXPENSE RATIOS
Under the Investment Advisory Agreement, the Portfolios are not charged an advisory fee. The investment advisory contract also does not provide for the Adviser to be reimbursed for the cost of providing non-advisory services, which would include administration, distribution and transfer agent-related services, although the transfer agent of the Portfolios is reimbursed for out of pocket expenses. The Adviser is compensated by institutional clients of the Adviser (the “Institutional Clients”) that invest in the Pooling Portfolios. These clients include certain series of the AllianceBernstein Blended Style Series, Inc.—AllianceBernstein Retirement Strategies (“Retirement Strategies”)3, The AllianceBernstein Portfolios—AllianceBernstein Wealth Strategies (“Wealth Strategies”)4 and the Rhode Island Higher Education Savings Trust (referred to herein as “CollegeBoundfund”). Set forth below are the advisory fee schedules of the Institutional Clients that invests in the Pooling Portfolios.
AllianceBernstein Blended Style Series, Inc.—AllianceBernstein Retirement Strategies
Each of the Retirement Strategies pays an advisory fee correlated to the percentage of equity investments held by the Retirement Strategy. This fee is discounted by a certain percentage depending on the asset level of the Retirement Strategy as indicated below:
| % Invested in Equity Investments | Advisory Fee | ||
Equal to or less than 60% Greater than 60% and less than 80% Equal to or greater than 80% | 0.55 0.60 0.65 | % % % |
| Net Asset Level | Discount | |
Assets equal to or less than $2.5 billion Assets greater than $2.5 billion and less than $5 billion Assets greater than $5 billion | n/a 10 basis points 15 basis points |
| 3 | Includes AllianceBernstein 2000 Retirement Strategy, AllianceBernstein 2005 Retirement Strategy, AllianceBernstein 2010 Retirement Strategy, AllianceBernstein 2015 Retirement Strategy, AllianceBernstein 2020 Retirement Strategy, AllianceBernstein 2025 Retirement Strategy and AllianceBernstein 2030 Retirement Strategy. Future references to the Retirement Strategies do not include “AllianceBernstein.” |
| 4 | Includes AllianceBernstein Balanced Wealth Strategy and AllianceBernstein Wealth Preservation Strategy. Future references to the Wealth Strategies do not include “AllianceBernstein.” |
| ALLIANCEBERNSTEIN POOLING PORTFOLIOS • | 233 |
Accordingly, under the terms of the Investment Advisory Agreement, the Strategies will pay the Adviser at the following annual rates:
| Average Daily Net Assets | ||||||||
| Strategy | First $2.5 billion | Next $2.5 billion | In excess of $5 billion | |||||
| 2020, 2025, 2030 | 0.65% | 0.55 | % | 0.50 | % | |||
| 2010, 2015 | 0.60% | 0.50 | % | 0.45 | % | |||
| 2000, 2005 | 0.55% | 0.45 | % | 0.40 | % | |||
The AllianceBernstein Portfolios — Balanced Wealth Strategy and Wealth Preservation Strategy
The Adviser charges Balanced Wealth Strategy and Wealth Preservation Strategy an advisory fee based on a percentage of each fund’s average daily net assets:
| Fund | Advisory Fee Based on % of Average Daily Net Assets | |||
| Balanced Wealth Strategy | First $2.5 billion | 0.55% | ||
| Next $2.5 billion | 0.45% | |||
| Excess of $5 billion | 0.40% | |||
| Wealth Preservation Strategy | First $2.5 billion | 0.55% | ||
| Next $2.5 billion | 0.45% | |||
| Excess of $5 billion | 0.40% | |||
| 234 | • ALLIANCEBERNSTEIN POOLING PORTFOLIOS |
CollegeBoundfund
The Adviser serves as the program manager of the CollegeBoundfund, a 529 college-savings plan. Services provided by the Adviser as program manager for CollegeBoundfund include managing the assets of each Education Strategy of the plan that may invest in a combination of the Pooling Portfolios (the “Underlying Portfolios”), performing administrative related functions, servicing shareholder accounts, providing customer service to participants, maintaining the program and developing/updating a website where participants can access their personal accounts. As program manager, the Adviser is paid a program management fee equal to the total expense ratio (fixed) of each Education Strategy minus the weighted average of the expenses of the Underlying Portfolios in which the Strategy is invested. The weighted average of the expenses of the Underlying Portfolios may fluctuate over time, resulting in an increase or decrease in the program management fee since the total expense ratio is constant. Set forth below is a table showing the total expense ratios of the Education Strategies as of August 31, 2007:
| Portfolios | Total Expense Ratio5 | ||
Age-Based Education Strategies | |||
Age-Based Aggressive 2002-2004 | 0.94 | % | |
Age-Based Aggressive 1999-2001 | 0.90 | % | |
Age-Based Aggressive 1996-1998 | 0.86 | % | |
Age-Based Aggressive 1993-1995 | 0.82 | % | |
Age-Based Aggressive 1990-1992 | 0.78 | % | |
Age-Based Aggressive 1987-1989 | 0.74 | % | |
Age-Based Aggressive 1984-1986 | 0.74 | % | |
Age-Based Aggressive Pre-1984 | 0.74 | % | |
Age-Based 2005-2007 | 0.92 | % | |
Age-Based 2002-2004 | 0.88 | % | |
Age-Based 1999-2001 | 0.84 | % | |
Age-Based 1996-1998 | 0.80 | % | |
Age-Based 1993-1995 | 0.78 | % | |
Age-Based 1990-1992 | 0.76 | % | |
Age-Based 1987-1989 | 0.72 | % | |
Age-Based 1984-1986 | 0.72 | % | |
Age-Based Pre-1984 | 0.72 | % | |
Fixed Based Education Strategies | |||
Balanced | 0.80 | % | |
Preservation | 0.72 | % | |
| 5 | The total expense ratios do not include an annual distribution fee of 0.25% payable to ABI, the program distributor, which is applied only to certain accounts that are established with the involvement of a financial adviser (“FA”). This charge is to fund compensation payable in the same amount by ABI to the FA for the FA’s services after such account is open at least one year. |
| ALLIANCEBERNSTEIN POOLING PORTFOLIOS • | 235 |
The Portfolios’ net assets as of September 30, 2007 are as follows:
| Portfolio | Net Assets ($MM) | ||
Short Duration Bond Portfolio | $ | 1,286.0 | |
Intermediate Duration Bond Portfolio | $ | 1,632.1 | |
Inflation Protected Securities Portfolio | $ | 653.0 | |
High-Yield Portfolio | $ | 513.3 | |
Set forth below are the total expense ratios of the Portfolios. It should be noted that from inception of the Portfolios, the Adviser voluntarily agreed to limit total operating expenses of the Portfolios to ensure that their total expense ratios not exceed 15 basis points. During the most recently completed fiscal year, none of the Portfolios operated above their expense caps. For the current fiscal year those expense limitations are no longer in effect. Set forth below are the most recent fiscal year end and semi-annual total expense ratios of the Portfolios:
| Portfolio | Fiscal Year End | Total Expense Ratio (%) | ||||||
| (02/28/07)6 | (08/31/07) | |||||||
| Short Duration Bond Portfolio | August 31 | 0.03 | % | 0.02 | % | |||
| Intermediate Duration Bond Portfolio | August 31 | 0.04 | % | 0.04 | % | |||
| Inflation Protected Securities Portfolio | August 31 | 0.04 | % | 0.04 | % | |||
| High-Yield Portfolio | August 31 | 0.07 | % | 0.06 | % | |||
I. ADVISORY FEES CHARGED TO INSTITUTIONAL AND OTHER CLIENTS
Although the Portfolios are not charged an advisory fee, their shareholders, which include other investment companies and large institutional clients managed by the Adviser, pay the Adviser an investment advisory fee for managing their assets. In this regard, it is worth considering the advisory fees charged by the Adviser to institutional and other clients. The advisory fees charged to investment companies that the Adviser manages and sponsors are normally higher than those charged to similar sized institutional accounts, including pension plans and sub-advised investment companies. The fee differential reflects, among other things, different services provided to such clients and different liabilities assumed. Services provided by the Adviser to investment companies, including the Portfolios, that are not provided to non-investment company clients and sub-advised investment companies include providing office space and personnel to serve as Fund Officers, who among other responsibilities make the certifications required under the Sarbanes–Oxley Act of 2002, and coordinating with and monitoring third party service providers such as Fund counsel, auditors, custodians, transfer agents and pricing services. The accounting, administrative, legal and compliance requirements for investment companies are more costly than those for institutional client accounts due to the greater complexities
| 6 | Annualized for the six months ended February 28, 2007. |
| 236 | • ALLIANCEBERNSTEIN POOLING PORTFOLIOS |
and time required for investment companies, although a portion of the administrative expense of certain Institutional Clients that are investment companies are reimbursed by the Adviser to those Institutional Clients. It should be noted that those reimbursement agreements do not exist with respect to the Pooling Portfolios. In addition, managing the cash flow of an investment company may be more difficult than managing that of a stable pool of assets, such as an institutional account with little cash movement in either direction, particularly if the investment company experiences a net redemption and the Adviser is frequently forced to sell securities to raise cash for the redemption. However, managing an investment company with positive cash flow may be easier at times than managing a stable pool of assets. Finally, in recent years, investment advisers have been sued by institutional clients and have suffered reputational damage both by the attendant publicity and outcomes other than complete victories. Accordingly, the legal and reputational risks associated with institutional accounts are greater than previously thought, although still not equal to those related to the mutual fund industry.
Notwithstanding the Adviser’s view that managing an investment company is not comparable to managing other institutional accounts because the services provided are different and legal and reputational risks are greater, it is worth considering information regarding the advisory fees charged to institutional accounts that have investment styles substantially similar to those of the Portfolios.7 In addition to the AllianceBernstein Institutional fee schedule, set forth below are what would have been the effective advisory fees of certain of the Portfolios had the AllianceBernstein Institutional fee schedule been applicable to those Portfolios based on September 30, 2007 net assets, although it should be noted that the Portfolios are not charged an advisory fee by the Adviser.
| Portfolio | Portfolio ($MIL) | AllianceBernstein (AB) Fee Schedule | Effective Fee | |||
| Short Duration Bond Portfolio | $1,286.0 | Short Duration Institutional 40 bp on 1st $20 million 25 bp on next $80 million 20 bp on next $100 million 15 bp on the balance Minimum Account Size: $25m | 0.164% | |||
| Intermediate Duration Bond Portfolio | $1,632.1 | U.S. Core Plus 50 bp on 1st $30 million 20 bp on the balance Minimum Account Size: $25m | 0.206% |
| 7 | The Adviser has indicated that with respect to institutional accounts with assets greater than $300 million, it will negotiate a fee schedule. Discounts that are negotiated vary based upon each client relationship. |
| ALLIANCEBERNSTEIN POOLING PORTFOLIOS • | 237 |
| Portfolio | Portfolio ($MIL) | AllianceBernstein (AB) Fee Schedule | Effective Fee | |||
| Inflation Protected Securities Portfolio8 | $653.0 | U.S. TIPS Strategy 20 bp on 1st $10 million 15 bp on next $80 million 10 bp on the balance Minimum Account Size: $25m | 0.108% | |||
| High-Yield Portfolio | $513.3 | High Yield 65 bp on 1st $30 million 35 bp on the balance Minimum Account Size: $25m | 0.368% |
The Adviser manages the AllianceBernstein Mutual Funds (“ABMF”), which are open-end investment companies, and AllianceBernstein Variable Products Series Fund, Inc. (“AVPS”), which offers variable annuity and variable life contract policyholders the option to utilize certain AVPS portfolios as the investment option underlying their insurance contracts. The advisory schedules of these funds, implemented in January 2004 as a result of the Assurance of Discontinuance between the New York State Attorney General and the Adviser, contemplates eight categories with almost all of the AllianceBernstein funds in each category having the same advisory fee schedule. The Adviser charges the following fees for these funds:
| Portfolio | ABMF/AVPS Portfolio | Fee Schedule | Effective ABMF/ Adv. Fee | |||
| Intermediate Duration Bond Portfolio9 | Intermediate Bond Portfolio | 0.45% on first $2.5 billion 0.40% on next $2.5 billion 0.35% on the balance | 0.450% | |||
| High-Yield Portfolio | High Yield Fund, Inc.
AVPS High Yield Portfolio | 0.50% on first $2.5 billion 0.45% on next $2.5 billion 0.40% on the balance | 0.500% |
| 8 | It should be noted that the Portfolio’s investment guidelines are not as restrictive as that of the institutional strategy. The Portfolio may not invest in non-Treasury inflation-protected securities, in contrast to the institutional strategy, which invests primarily in U.S. Treasury inflation-protected securities. |
| 9 | The Adviser also manages Sanford C. Bernstein Fund II—Intermediate Duration Institutional Portfolio (“SCB”), an open-end mutual fund that has a similar investment style as the Portfolio. SCB II is charged by the Adviser an advisory fee rate of 0.50% on the first $1 billion and 0.45% thereafter. SCB II has an expense cap of 0.45% which effectively reduces the advisory fee. |
| 238 | • ALLIANCEBERNSTEIN POOLING PORTFOLIOS |
The Adviser manages Sanford C. Bernstein Fund, Inc. (“SCB Fund”), an open-end management investment company. Several portfolios of SCB Fund have a somewhat similar investment style as certain of the Portfolios and their advisory fee schedules are set forth below. Also presented in the table below are what would have been the effective advisory fees of the Portfolios had the SCB Fund fee schedules been applicable to the Portfolios based on September 30, 2007 net assets:
| Portfolio | SCB Fund Portfolio | Fee Schedule | SCB Fund Effective Fee | |||
| Short Duration Bond Portfolio | Short Duration Plus Portfolio10 | 50 bp on 1st $250 million 45 bp on next $500 million 40 bp thereafter | 0.439% | |||
| Intermediate Duration Bond Portfolio | Intermediate Duration Portfolio11 | 50 bp on 1st $1 billion 45 bp on next $2 billion 40 bp on next $2 billion 35 bp thereafter | 0.481% |
The Alliance Capital Investment Trust Management mutual funds (“ACITM”), which are offered to investors in Japan, have an “all-in” fee to compensate the Adviser for investment advisory as well as fund accounting and administrative related services. The fee schedule of the ACITM mutual fund that has a somewhat similar investment style as High Yield Portfolio is set forth below:
| Portfolio | ACITM Mutual Fund | ACITM Fee | ||
| High-Yield Portfolio | High Yield Open Fund | 1.00% |
| 10 | The SCB Fund Board approved an additional breakpoint of 45 basis points on first $750 million, 40 basis points in excess of $750 million on October 26, 2007. The Directors of the Portfolio were advised of this change on October 30, 2007. |
| 11 | The SCB Fund Board approved an additional breakpoint of 30 basis points in excess of $7 billion on October 26, 2007. The Directors of the Portfolio were advised of this change on October 30, 2007. |
| ALLIANCEBERNSTEIN POOLING PORTFOLIOS • | 239 |
The Adviser provides sub-advisory services to certain other investment companies managed by other fund families. The Adviser charges the fee set forth below for the following sub-advisory relationship. Also shown is what would have been the advisory fee of Intermediate Duration Bond Portfolio had the advisory fee schedule of the sub-advisory relationship been applicable to the Portfolio based on September 30, 2007 net assets:
| Portfolio | Fee Schedule | Sub-advised Effective Fee | ||||
| Intermediate Duration Bond Portfolio | Client # 1 | 0.30% on first $500 million 0.25% on next $500 million 0.20% on next $500 million 0.15% on next $1.5 billion 0.12% thereafter | 0.242% |
It is fair to note that the services the Adviser provides pursuant to sub-advisory agreements are generally confined to the services related to the investment process; in other words, they are not as comprehensive as the services provided to the Portfolios by the Adviser. In addition, to the extent that this is the only sub-advisory relationship and it is with an affiliate of the Adviser, the fee schedule may not reflect arm’s-length bargaining or negotiations.
| II. | MANAGEMENT FEES CHARGED BY OTHER MUTUAL FUNDS COMPANIES FOR LIKE SERVICES. |
In the Pooling Portfolios’ Senior Officer’s Evaluation of the Investment Advisory Agreement, which the Trustees of the Trust reviewed, the Senior Officer described previous evaluations that were written for the Retirement Strategies and Wealth Strategies. In those evaluations, the Senior Officer concluded that the investment advisory agreement for those Institutional Clients were reasonable and within range of what would have been negotiated at arm’s-length.
The Pooling Portfolios are not charged an advisory fee. However, as previously mentioned, the Institutional Clients that invest in the Pooling Portfolios do pay an advisory fee pursuant to their advisory agreements with the Adviser. The Adviser believes that the fee paid by the Institutional Clients includes a portion, referred by the Adviser as the “Implied Advisory Fee,” that may be reasonably viewed as compensation for services that the Adviser provides to the Pooling Portfolios. The Adviser further believes that the rate of the Implied Advisory Fee is the same for each Institutional Client invested in a series of the Pooling Portfolios.
Because of the Pooling Portfolios’ limited availability for investment, open only to certain institutional clients of the Adviser, the Pooling Portfolios have zero transfer agent (with the exception of certain transfer agent out of pocket expenses) and distribution fees, in addition to zero advisory fees. Such expense structure is rare in the industry. The UBS Relationship Funds, an open-end investment company managed by UBS Global Asset Management (Americas)
| 240 | • ALLIANCEBERNSTEIN POOLING PORTFOLIOS |
Inc., was the only other fund family that was determined by the Adviser, the Senior Officer and Lipper, Inc. (“Lipper”) to have an expense structure comparable to the Pooling Portfolios.
Since there are not many funds of other fund families that have a similar expense structure as the Portfolios, Lipper, an analytical service not affiliated with the Adviser, compared the total expense ratios of the Portfolios to that of funds of a similar investment classification/objective with institutional class shares; however, Lipper excluded management, transfer agent and distribution fees from the total expense ratios of the Portfolios’ peers.12 Lipper’s analysis included the Portfolios’ rankings13 relative to their respective Lipper Expense Group (“EG”) and Lipper Expense Universe (“EU”).14
Lipper describes an EG as a representative sample of comparable funds. Lipper’s standard methodology for screening funds to be included in an EG entails the consideration of several fund criteria, including fund type, investment classification/objective, asset (size) comparability, load type, expense components and attributes. An EG will typically consist of seven to twenty funds. An EU is a much broader group, consisting of all institutional classes of funds of the same investment classification/objective as the subject Portfolio.15 The result of Lipper’s analysis is set forth below:
| Portfolio | Expense Ratio | Lipper Group Median (%)16 | Lipper Group Rank | Lipper Median (%) | Lipper Rank | |||||
| Short Duration Bond Portfolio | 0.046 | 0.048 | 4/11 | 0.089 | 5/35 | |||||
| Intermediate Duration Bond Portfolio | 0.058 | 0.065 | 8/17 | 0.071 | 37/93 | |||||
| Inflation Protected Securities Portfolio | 0.068 | 0.063 | 7/10 | 0.097 | 9/20 | |||||
| High-Yield Portfolio | 0.095 | 0.092 | 11/18 | 0.082 | 42/71 |
| 12 | Because the Portfolios are offered only to other investment companies and certain institutional clients managed by the Adviser, the Portfolios are not assessed a fee for transfer agent and distribution-related services although it should be noted that the transfer agent of the Portfolios is reimbursed for out of pocket expenses. |
| 13 | A ranking of “1” would mean that the Portfolio had the lowest total expense ratio in the Lipper peer group. |
| 14 | Note that there are limitations on expense category data because different funds categorize expenses differently. |
| 15 | Except for asset (size) comparability, Lipper uses the same criteria for selecting an EG peer when selecting an EU peer. Unlike the Lipper EG, the Lipper EU allows for the same adviser to be represented by more than just one fund. In addition, multiple institutional class shares for the Portfolios’ peers are included. |
| 16 | With respect to the Portfolios’ peers, the total expense ratios of those funds are net of management, transfer agent and distribution fees. |
| ALLIANCEBERNSTEIN POOLING PORTFOLIOS • | 241 |
| III. | COSTS TO THE ADVISER AND ITS AFFILIATES OF SUPPLYING SERVICES PURSUANT TO THE ADVISORY FEE ARRANGEMENT, EXCLUDING ANY INTRA-CORPORATE PROFIT. |
The Adviser utilizes two profitability reporting systems, which operate independently but are aligned with each other, to estimate the Adviser’s profitability in connection with investment advisory services provided to the Portfolios. The Senior Officer has retained a consultant to provide independent advice regarding the alignment of the two profitability systems as well as the methodologies and allocations utilized by both profitability systems. See Section IV for additional discussion.
| IV. | PROFIT MARGINS OF THE ADVISER AND ITS AFFILIATES FOR SUPPLYING SUCH SERVICES. |
The Pooling Portfolios’ profitability information, prepared by the Adviser for the Board of Directors, was reviewed by the Senior Officer and the consultant. The Adviser used a weighted average of the Adviser’s profitability with respect to the Institutional Clients that are invested in the Pooling Portfolios, in addition to any Portfolio’s specific revenue or expense item, to calculate the Adviser’s profitability.
| V. | POSSIBLE ECONOMIES OF SCALE |
Although the Portfolios do not pay the Adviser an advisory fee, it is still worth considering information on possible economies of scale. The Adviser has indicated that economies of scale are being shared with shareholders through fee structures,17 subsidies and enhancement to services. Based on some of the professional literature that has considered economies of scale in the mutual fund industry, it is thought that to the extent economies of scale exist, they may more often exist across a fund family as opposed to a specific fund. This is because the costs incurred by the Adviser, such as investment research or technology for trading or compliance systems, can be spread across a greater asset base as the fund family increases in size. It is also possible that as the level of services required to operate a successful investment company has increased over time, and advisory firms have made such investments in their business to provide services, there may be a sharing of economies of scale without a reduction in advisory fees.
An independent consultant, retained by the Senior Officer, provided the Board of Trustees an update of the Deli 18 study on advisory fees and various fund characteristics. The preliminary results of the updated study, based on more recent data and using Lipper classifications, were found to be consistent with the results of the original study. The independent consultant observed patterns of lower advisory fees for funds with larger asset sizes and funds from larger family sizes
| 17 | Fee structures include fee reductions, pricing at scale and breakpoints in advisory fee schedules. |
| 18 | The Deli study was originally published in 2002 based on 1997 data. |
| 242 | • ALLIANCEBERNSTEIN POOLING PORTFOLIOS |
compared to funds with smaller asset sizes and funds from smaller family sizes, which according to the independent consultant is indicative of a sharing of economies of scale and scope. However, in less liquid and active markets, such is not the case, as the empirical analysis showed potential for diseconomies of scale in those markets. The empirical analysis also showed diminishing economies of scale and scope as funds surpassed a certain high level of assets.
| VI. | NATURE AND QUALITY OF THE ADVISER’S SERVICES INCLUDING THE PERFORMANCE OF THE PORTFOLIOS. |
With assets under management of $813 billion as of September 30, 2007, the Adviser has the investment experience to manage the portfolio assets of the Portfolios and provide non-investment services to the Portfolios.
The information in the table below shows the 1 year and since inception19 gross performance returns and rankings of the Portfolios relative to their Lipper Performance Group (“PG”) and Lipper Performance Universe (“PU”)20 for the periods ended July 31, 2007.21
Pooling Portfolio | Portfolio Return (%) | PG Median (%) | PU Median (%) | PG Rank | PU Rank | |||||
Short Duration Bond Portfolio | ||||||||||
1 year | 5.37 | 5.51 | 5.66 | 9/11 | 37/47 | |||||
Since Inception | 3.98 | 4.28 | 4.35 | 8/11 | 35/42 | |||||
Intermediate Duration Bond Portfolio | ||||||||||
1 year | 5.39 | 5.89 | 5.73 | 13/17 | 87/117 | |||||
Since Inception | 3.32 | 3.47 | 3.50 | 10/16 | 71/106 | |||||
Inflation Protected Securities Portfolio | ||||||||||
1 year | 4.63 | 4.60 | 4.68 | 4/10 | 15/27 | |||||
Since Inception | 2.90 | 2.38 | 2.38 | 1/10 | 5/26 | |||||
High-Yield Portfolio | ||||||||||
1 year | 6.05 | 6.96 | 7.47 | 15/18 | 70/81 | |||||
Since Inception | 5.61 | 7.07 | 7.42 | 15/17 | 65/71 |
| 19 | Inception gross performance returns, provided by Lipper, are for the periods from the nearest month-end after each Portfolio’s inception date through July 31, 2007. In contrast to Lipper, the Adviser calculates the Portfolios’ inception net performance using data that includes the partial month (May 20, 2005 through May 31, 2005). Note that the Lipper inception gross performance returns for all the fixed income Pooling Portfolios except for Short Duration Bond Portfolio are lower than the Adviser’s inception net performance returns. Normally, gross performance returns are higher than net performance returns. |
| 20 | A Portfolio’s PU may not be identical to its EU as the criteria for including/excluding a fund in/from a PU is somewhat different from that of an EU. |
| 21 | The performance returns of the Portfolios’ peers are also adjusted for expenses (gross up). |
| ALLIANCEBERNSTEIN POOLING PORTFOLIOS • | 243 |
Set forth below are the 1 year and since inception net performance returns of the Portfolios (in bold) versus their benchmarks.22
| Periods Ending July 31, 2007 Annualized Performance (%) | ||||
| 1 Year | Since Inception23 | |||
Short Duration Bond Portfolio | 5.32 | 3.97 | ||
Merrill Lynch 1-3 Yr. Treasury Index | 5.26 | 3.69 | ||
Inception Date: May 20, 2005 | ||||
Intermediate Duration Bond Portfolio | 5.33 | 3.63 | ||
Lehman Brothers Aggregate Bond Index | 5.58 | 3.05 | ||
Inception Date: May 20, 2005 | ||||
Inflation Protected Securities Portfolio | 4.56 | 2.97 | ||
Lehman Brothers 1-10 Yr. TIPS Index | 4.65 | 2.92 | ||
Inception Date: May 20, 2005 | ||||
High-Yield Portfolio | 5.96 | 5.91 | ||
Lehman Brothers U.S. High Yield 2% Issuer Cap Index | 6.44 | 6.26 | ||
Inception Date: May 20, 2005 | ||||
CONCLUSION:
Based on the factors discussed above the Senior Officer’s conclusion is that the proposed advisory fees for the Portfolios are reasonable and within the range of what would have been negotiated at arm’s-length in light of all the surrounding circumstances. This conclusion in respect of the Portfolios is based on an evaluation of all of these factors and no single factor was dispositive.
Dated: November 26, 2007
| 22 | The Adviser provided Portfolio and benchmark performance return information for periods through July 31, 2007. |
| 23 | The underlying data, which the Adviser used to calculate since inception performance returns for the Portfolios, covers the period from the Portfolios’ inception date, May 20, 2005, through July 31, 2007. On the other hand, the underlying data, which the Adviser used to calculate performance returns for the Portfolios’ benchmarks, covers the period from the nearest month end after the Portfolios’ inception date, May 31, 2005, through July 31, 2007. |
| 244 | • ALLIANCEBERNSTEIN POOLING PORTFOLIOS |
THIS PAGE IS NOT PART OF THE SHAREHOLDER REPORT OR THE FINANCIAL STATEMENTS
ALLIANCEBERNSTEIN FAMILY OF FUNDS
Wealth Strategies Funds
Balanced Wealth Strategy
Wealth Appreciation Strategy
Wealth Preservation Strategy
Tax-Managed Balanced Wealth Strategy
Tax-Managed Wealth Appreciation Strategy
Tax-Managed Wealth Preservation Strategy
Blended Style Funds
U.S. Large Cap Portfolio
International Portfolio
Tax-Managed International Portfolio
Growth Funds
Domestic
Growth Fund
Mid-Cap Growth Fund
Large Cap Growth Fund
Small Cap Growth Portfolio
Global & International
Global Health Care Fund
Global Research Growth Fund
Global Technology Fund
Greater China ‘97 Fund
International Growth Fund
International Research Growth Fund
Value Funds
Domestic
Balanced Shares
Focused Growth & Income Fund
Growth & Income Fund
Small/Mid Cap Value Fund
Utility Income Fund
Value Fund
Global & International
Global Real Estate Investment Fund*
Global Value Fund
International Value Fund
Taxable Bond Funds
Diversified Yield Fund*
Global Bond Fund*
High Income Fund*
Intermediate Bond Portfolio
Short Duration Portfolio
Municipal Bond Funds
National | Michigan |
Intermediate Municipal Bond Funds
Intermediate California
Intermediate Diversified
Intermediate New York
Closed-End Funds
AllianceBernstein Global High Income Fund
AllianceBernstein Income Fund
AllianceBernstein National Municipal Income Fund*
ACM Managed Dollar Income Fund
California Municipal Income Fund
New York Municipal Income Fund
The Spain Fund
Retirement Strategies Funds
2000 Retirement Strategy | 2020 Retirement Strategy | 2040 Retirement Strategy | ||
2005 Retirement Strategy | 2025 Retirement Strategy | 2045 Retirement Strategy | ||
2010 Retirement Strategy | 2030 Retirement Strategy | 2050 Retirement Strategy | ||
2015 Retirement Strategy | 2035 Retirement Strategy | 2055 Retirement Strategy |
We also offer Exchange Reserves,** which serves as the money market fund exchange vehicle for the AllianceBernstein mutual funds.
You should consider the investment objectives, risks, charges and expenses of any AllianceBernstein fund/portfolio carefully before investing. For free copies of our prospectuses, which contain this and other information, visit us online at www.alliancebernstein.com or contact your financial advisor. Please read the prospectus carefully before investing.
| * | Prior to March 1, 2007, Global Real Estate Investment Fund was named Real Estate Investment Fund. Prior to May 18, 2007, AllianceBernstein National Municipal Income Fund was named National Municipal Income Fund. Prior to November 5, 2007, Diversified Yield Fund was named Global Strategic Income Trust and Global Bond Fund was named Global Government Income Trust. Prior to January 28, 2008, High Income Fund was named Emerging Market Debt Fund. |
| ** | An investment in the Fund is not a deposit in a bank and is not insured or guaranteed by the Federal Deposit Insurance Corporation or any other government agency. Although the Fund seeks to preserve the value of your investment at $1.00 per share, it is possible to lose money by investing in the Fund. |
| ALLIANCEBERNSTEIN POOLING PORTFOLIOS • | 245 |
AllianceBernstein Family of Funds
ALLIANCEBERNSTEIN POOLING PORTFOLIOS
1345 Avenue of the Americas
New York, NY 10105
800.221.5672
| POOL-0152-0208 |  | |
| ITEM 2. | CODE OF ETHICS. |
Not applicable when filing a semi-annual report to shareholders.
| ITEM 3. | AUDIT COMMITTEE FINANCIAL EXPERT. |
Not applicable when filing a semi-annual report to shareholders.
| ITEM 4. | PRINCIPAL ACCOUNTANT FEES AND SERVICES. |
Not applicable when filing a semi-annual report to shareholders.
| ITEM 5. | AUDIT COMMITTEE OF LISTED REGISTRANTS. |
Not applicable to the registrant.
| ITEM 6. | SCHEDULE OF INVESTMENTS. |
Please see Schedule of Investments contained in the Report to Shareholders included under Item 1 of this Form N-CSR.
| ITEM 7. | DISCLOSURE OF PROXY VOTING POLICIES AND PROCEDURES FOR CLOSED-END MANAGEMENT INVESTMENT COMPANIES. |
Not applicable to the registrant.
| ITEM 8. | PORTFOLIO MANAGERS OF CLOSED-END MANAGEMENT INVESTMENT COMPANIES. |
Not applicable to the registrant.
| ITEM 9. | PURCHASES OF EQUITY SECURITIES BY CLOSED-END MANAGEMENT INVESTMENT COMPANY AND AFFILIATED PURCHASERS. |
Not applicable to the registrant.
| ITEM 10. | SUBMISSION OF MATTERS TO A VOTE OF SECURITY HOLDERS. |
There have been no material changes to the procedures by which shareholders may recommend nominees to the Fund’s Board of Directors since the Fund last provided disclosure in response to this item.
| ITEM 11. | CONTROLS AND PROCEDURES. |
(a) The registrant’s principal executive officer and principal financial officer have concluded that the registrant’s disclosure controls and procedures (as defined in Rule 30a-2(c) under the Investment Company Act of 1940, as amended) are effective at the reasonable assurance level based on their evaluation of these controls and procedures as of a date within 90 days of the filing date of this document.
(b) There were no changes in the registrant’s internal controls over financial reporting that occurred during the second fiscal quarter of the period that has materially affected, or is reasonably likely to materially affect, the registrant’s internal control over financial reporting.
| ITEM 12. | EXHIBITS. |
The following exhibits are attached to this Form N-CSR:
EXHIBIT NO. | DESCRIPTION OF EXHIBIT | |
| 12 (b) (1) | Certification of Principal Executive Officer Pursuant to Section 302 of the Sarbanes-Oxley Act of 2002 | |
| 12 (b) (2) | Certification of Principal Financial Officer Pursuant to Section 302 of the Sarbanes-Oxley Act of 2002 | |
| 12 (c) | Certification of Principal Executive Officer and Principal Financial Officer Pursuant to Section 906 of the Sarbanes-Oxley Act of 2002 | |
SIGNATURES
Pursuant to the requirements of the Securities Exchange Act of 1934 and the Investment Company Act of 1940, the registrant has duly caused this report to be signed on its behalf by the undersigned, thereunto duly authorized.
(Registrant): The AllianceBernstein Pooling Portfolios
| By: | /s/ Marc O. Mayer | |
| Marc O. Mayer | ||
| President | ||
| Date: | April 25, 2008 | |
Pursuant to the requirements of the Securities Exchange Act of 1934 and the Investment Company Act of 1940, this report has been signed below by the following persons on behalf of the registrant and in the capacities and on the dates indicated.
| By: | /s/ Marc O. Mayer | |
| Marc O. Mayer | ||
| President | ||
| Date: | April 25, 2008 | |
| By: | /s/ Joseph J. Mantineo | |
| Joseph J. Mantineo | ||
| Treasurer and Chief Financial Officer | ||
| Date: | April 25, 2008 | |