UNITED STATES
SECURITIES AND EXCHANGE COMMISSION
WASHINGTON, D.C. 20549
FORM N-CSR
CERTIFIED SHAREHOLDER REPORT OF REGISTERED
MANAGEMENT INVESTMENT COMPANIES
Investment Company Act file number: 811-21673
THE ALLIANCEBERNSTEIN POOLING PORTFOLIOS
(Exact name of registrant as specified in charter)
1345 Avenue of the Americas, New York, New York 10105
(Address of principal executive offices) (Zip code)
Joseph J. Mantineo
AllianceBernstein L.P.
1345 Avenue of the Americas
New York, New York 10105
(Name and address of agent for service)
Registrant’s telephone number, including area code: (800) 221-5672
Date of fiscal year end: August 31, 2011
Date of reporting period: February 28, 2011
| ITEM 1. | REPORTS TO STOCKHOLDERS. |
2
SEMI-ANNUAL REPORT
AllianceBernstein Pooling Portfolios
U.S. Value
U.S. Large Cap Growth
International Value
International Growth
Short Duration Bond
Intermediate Duration Bond
Bond Inflation Protection
High-Yield
Small-Mid Cap Value
Small-Mid Cap Growth
Multi-Asset Real Return
(formerly Global Real Estate Investment)
Volatility Management

February 28, 2011
Semi-Annual Report
Investment Products Offered
| • | Are Not FDIC Insured |
| • | May Lose Value |
| • | Are Not Bank Guaranteed |
The investment return and principal value of an investment in the Fund will fluctuate as the prices of the individual securities in which it invests fluctuate, so that your shares, when redeemed, may be worth more or less than their original cost. You should consider the investment objectives, risks, charges and expenses of the Fund carefully before investing. For a free copy of the Fund’s prospectus, which contains this and other information, visit our website at www.alliancebernstein.com or call your financial advisor or AllianceBernstein® at (800) 227-4618. Please read the prospectus carefully before you invest.
You may obtain performance information current to the most recent month-end by visiting www.alliancebernstein.com.
This shareholder report must be preceded or accompanied by the Fund’s prospectus for individuals who are not current shareholders of the Fund.
You may obtain a description of the Fund’s proxy voting policies and procedures, and information regarding how the Fund voted proxies relating to portfolio securities during the most recent 12-month period ended June 30, without charge. Simply visit AllianceBernstein’s website at www.alliancebernstein.com, or go to the Securities and Exchange Commission’s (the “Commission”) website at www.sec.gov, or call AllianceBernstein at (800) 227-4618.
The Fund files its complete schedule of portfolio holdings with the Commission for the first and third quarters of each fiscal year on Form N-Q. The Fund’s Forms N-Q are available on the Commission’s web site at www.sec.gov. The Fund’s Forms N-Q may also be reviewed and copied at the Commission’s Public Reference Room in Washington, DC; information on the operation of the Public Reference Room may be obtained by calling (800) SEC-0330. AllianceBernstein publishes full portfolio holdings for the Fund monthly at www.alliancebernstein.com.
AllianceBernstein Investments, Inc. (ABI) is the distributor of the AllianceBernstein family of mutual funds. ABI is a member of FINRA and is an affiliate of AllianceBernstein L.P., the manager of the funds.
AllianceBernstein® and the AB Logo are registered trademarks and service marks used by permission of the owner, AllianceBernstein L.P.
April 25, 2011
Semi-Annual Report
This report provides management’s discussion of fund performance for the AllianceBernstein Pooling Portfolios (collectively, the “Portfolios”; individually, the “Portfolio”) for the semi-annual reporting period ended February 28, 2011.
The tables on pages 30-32 show each Portfolio’s performance for the six- and 12-month periods ended February 28, 2011, compared to their respective benchmarks. Additional performance can be found on pages 33-36. Each Portfolio’s benchmark is as follows: U.S. Value Portfolio—Russell 1000 Value Index; U.S. Large Cap Growth Portfolio—Russell 1000 Growth Index; International Value Portfolio—Morgan Stanley Capital International (MSCI) Europe, Australasia and Far East (EAFE) Index; International Growth Portfolio—MSCI EAFE Index and MSCI EAFE Growth Index; Short Duration Bond Portfolio—Bank of America Merrill Lynch (BofAML) 1-3 Year Treasury Index; Intermediate Duration Bond Portfolio—Barclays Capital U.S. Aggregate Bond Index; Bond Inflation Protection Portfolio—Barclays Capital 1-10 Year Inflation Protected Securities (TIPS) Index; High-Yield Portfolio—Barclays Capital U.S. High Yield 2% Issuer Cap Index; Small-Mid Cap Value Portfolio—Russell 2500 Value Index; Small-Mid Cap Growth Portfolio—Russell 2500 Growth Index; Multi-Asset Real Return Portfolio—MSCI All Country (AC) World Commodity Producers Index and Financial Times Stock Exchange (FTSE) European Public Real Estate Association (EPRA)/National Association of Real Estate Investment Trusts
(NAREIT); Volatility Management—Standard & Poor’s (S&P) S&P 500 Stock Index.
U.S. Value Portfolio
Investment Objective and Policies
The Portfolio seeks long-term growth of capital. The Portfolio invests primarily in a diversified portfolio of equity securities of U.S. companies, emphasizing investments in companies that AllianceBernstein (the “Adviser”) believes are undervalued. The Portfolio uses the fundamental value approach of the Adviser’s Bernstein unit (“Bernstein”). This fundamental value approach seeks to identify investments that are considered to be undervalued because they are attractively priced relative to future earnings power and dividend-paying capability. The Adviser relies heavily on the fundamental analysis and research of Bernstein’s large internal research staff in making investment decisions for the Portfolio. Under normal circumstances, the Portfolio invests in at least 80% of its net assets in equity securities of U.S. companies.
Investment Results
During the six-month period ended February 28, 2011, the Portfolio outperformed its benchmark, the Russell 1000 Value Index. The primary contributor was security selection, while sector selection modestly offset some of these gains. Security selection in consumer growth, consumer cyclicals and consumer staples were the main drivers of relative performance. The sector overweights to consumer cyclicals and consumer staples detracted from returns.
| ALLIANCEBERNSTEIN POOLING PORTFOLIOS • | 1 |
During the 12-month period ended February 28, 2011, the Portfolio underperformed its benchmark. Security selection was the main detractor, led by selection in financials, technology and energy. Sector selection was neutral; an underweight in utilities detracted from returns while an underweight in financials contributed.
The Portfolio did not utilize derivatives during the six- and 12-month reporting periods.
Market Review and Investment Strategy
Cyclical sectors led for the six- and 12-month periods ended February 28, 2011. Defensive sectors and financials lagged, although the latter rebounded at the end of the reporting period. The Portfolio’s underperformance from the 12-month reporting period was due to its financial and technology holdings. In financials, the biggest detractors were big banks hurt by fears about regulatory reform and mortgage-securitization putbacks. Reflecting new research, positions were reduced in firms with the most exposure to these issues, while names were added with relatively less exposure, such as JPMorgan Chase, Wells Fargo and Capital One. This repositioning added to returns for the six-month reporting period. In technology, the market’s focus on headline-grabbing trends in tablet and cloud computing drove outperformance of high-growth tech firms at the expense of the more attractively valued names the Portfolio favors. The shortfall for the 12-month reporting period was partially offset by gains in media and consumer related holdings.
U.S. Large Cap Growth Portfolio
Investment Objective and Policies
The Portfolio seeks long-term growth of capital. The Portfolio invests primarily in the equity securities of a limited number of large, carefully selected, high-quality U.S. companies that are judged likely to achieve superior earnings growth. The Adviser tends to focus on companies that have strong management, superior industry positions, excellent balance sheets and superior earnings growth prospects.
Under normal circumstances, the Portfolio invests at least 80% of its net assets in equity securities of large-capitalization U.S. companies. For these purposes, “large capitalization U.S. companies” are those that, at the time of investment, have market capitalizations within the range of market capitalizations of companies appearing in the Russell 1000 Growth Index. The Portfolio normally will invest in common stocks of companies with market capitalizations of at least $5 billion at the time of purchase. Normally, about 50-70 companies will be represented in the Portfolio’s portfolio, with the 25 most highly regarded of these companies usually constituting approximately 70% of the Portfolio’s net assets. The Portfolio thus differs from more typical equity mutual funds by focusing on a relatively small number of intensively researched companies. The Portfolio also may invest in non-U.S. securities.
Investment Results
For the six-month period ended February 28, 2011, the Portfolio outperformed its benchmark, the Russell 1000 Growth Index, driven by
| 2 | • ALLIANCEBERNSTEIN POOLING PORTFOLIOS |
positive stock selection with additional support from sector allocation. Cyclicality was a common thread among top contributors which included energy company Schlumberger, alternative asset manager Blackstone and technology firm Nvidia. An underweight in the consumer staples sector, where, in general, the Portfolio sees modest growth opportunities, was the largest contribution from a sector allocation perspective. Stock selection in the materials, information technology, consumer discretionary, industrials and financials bolstered performance, while selection in the health care sector detracted for the six-month period. Investor disappointment over the final terms of Alcon’s acquisition by Novartis resulted in Alcon being the top detractor. Teva Pharmaceuticals and Goldman Sachs rounded out the top detractors for the six-month period.
For the 12-month period ended February 28, 2011, the Portfolio underperformed its benchmark. Negative stock selection in the health care and financials sectors, two industries shrouded in uncertainty by U.S. government reform efforts, drove the majority of underperformance. The largest individual detractors, Gilead Sciences and Goldman Sachs, reflected these themes. Although financials moved from negative returns in the beginning of the year to positive returns in the second half of the year, they continued to lag the benchmark. Health care holdings Alcon and Teva Pharmaceuticals rounded out the top detractors. On the positive side, technology stocks were the largest contributors, led by Apple and Nvidia
and an underweight in Microsoft. An underweight in the consumer staples sector also added to performance followed by stock selection in the materials and energy sectors.
The Portfolio did not utilize derivatives during the six- and 12-month reporting periods.
Market Review and Investment Strategy
2010 started off well, with economic growth and financial markets exceeding expectations. But pockets of turbulence in the second and third quarters left investors leery and anxious about the future—and focused on preserving rather than growing assets. By the fourth quarter, increasingly positive indicators put to rest the overriding fear in the market—that the economy would take a “double-dip” back into recession—and risk aversion subsided. Investor optimism about the direction of economic growth continued to strengthen into the beginning of 2011.
It is heartening to see investors starting to once again discriminate among companies based on fundamentals. This is what the Portfolio seeks to capture through research-based stock selection, so it remains positioned to benefit as more typical behavior gains momentum. The Portfolio continues to lean into the opportunity by investing in leading growth franchises at historically low valuations relative to their peers. The Portfolio has been constructed to have positive exposure to the economic recovery. While some of the established cyclically exposed
| ALLIANCEBERNSTEIN POOLING PORTFOLIOS • | 3 |
positions are starting to play out as expected, the research continues finding new examples of what is considered to be under-recognized growth potential.
International Value Portfolio
Investment Objective and Policies
The Portfolio seeks long-term growth of capital. The Portfolio invests primarily in a diversified portfolio of equity securities of established companies selected from more than 40 industries and from more than 40 developed and emerging market countries. These countries currently include the developed nations in Europe and the Far East, Canada, Australia and emerging market countries worldwide. Under normal market conditions, the Portfolio invests significantly (at least 40%—unless market conditions are not deemed favorable by the Adviser) in securities of non-U.S. companies. In addition, the Portfolio invests, under normal market conditions, in companies in at least three countries other than the United States.
The Portfolio invests in companies that Bernstein determines are undervalued, using a fundamental value approach. In selecting securities for the Portfolio, Bernstein uses its fundamental and quantitative research to identify companies whose stocks are priced low in relation to their perceived long-term earnings power.
Investment Results
For the six-month period ended February 28, 2011, the Portfolio outperformed its benchmark, the MSCI EAFE Index. Both sector selection and
security selection were positive. Stock selection in finance, consumer staples and energy added to returns. An overweight in the energy and industrial commodities sectors, as well as an underweight in the consumer staples sectors was beneficial to returns. Gains were slightly offset by negative security selection in technology.
For the 12-month period ended February 28, 2011, the Portfolio underperformed its benchmark. Security selection in the technology/electronics, consumer cyclicals and telecommunications sectors drove the underperformance. This was slightly offset by the positive impact of overweight positions in the industrial commodities sector, along with an underweight in consumer staples.
During both reporting periods, the Portfolio held forward currency and futures to implement active currency management, which was positive to performance.
International Growth Portfolio
Investment Objective and Policies
The Portfolio’s investment objective is long-term growth of capital. The Portfolio invests primarily in an international portfolio of companies selected by the Adviser whose growth potential appears likely to outpace market expectations. The Adviser’s growth analysts use proprietary research to seek to identify companies that grow while creating a significant amount of “economic value”-These companies typically exhibit solid, durable growth; strong, sustainable competitive advantages; high return on invested capital (ROIC) and robust
| 4 | • ALLIANCEBERNSTEIN POOLING PORTFOLIOS |
free cash flow. Under normal circumstances, the Portfolio invests in the equity securities of companies located in at least three countries (and normally substantially more) other than the United States. The Portfolio invests in securities of companies in both developed and emerging market countries. Geographic distribution of the Portfolio’s investments among countries or regions also will be a product of the stock selection process rather than a pre-determined allocation. The Portfolio may also invest in synthetic foreign equity securities, which are types of warrants used internationally that entitle a holder to buy or sell underlying securities. The Advisor expects that normally the Portfolio’s portfolio will tend to emphasize investments in larger capitalization companies. The Portfolio normally invests in 70-160 companies.
Currencies can have a dramatic impact on equity returns, significantly adding to returns in some years and greatly diminishing them in others. Currency and equity positions are evaluated separately. The Adviser may seek to hedge the currency exposure resulting from securities positions when it finds the currency exposure unattractive. To hedge a portion of its currency risk, the Portfolio may from time to time invest in currency-related derivatives, including forward currency exchange contracts, futures, options on futures, swaps and options. The Adviser may also seek investment opportunities by taking long or short positions in currencies through the use of currency-related derivatives.
Investment Results
The Portfolio underperformed its benchmark, the MSCI EAFE Index, for both the six- and 12-month periods ended February 28, 2011. For the six-month period, sector selection detracted. While the overweight in the energy sector was beneficial, the overweight in financials, specifically the property companies, detracted. Security selection was negative, particularly within industrials, financials and consumer discretionary sectors. Over the six-month period, the Portfolio suffered from a downdraft in risk appetite in general and for emerging markets in particular. Key detractors included Asian property developers, notably CapitaLand, Swedish fashion retailer Hennes & Mauritz (H&M) and U.K.-based Serco, an industrial services company. Contributors included some of the Portfolio’s exposures to strong agricultural trends, including fertilizer manufacturer K+S Group. The rapid rise in oil pricing buoyed the Portfolio’s energy-complex shares such as oil & gas exploration company Afren, while consolidation among global exchanges boosted Hong Kong Exchanges and Clearing Limited.
Over the 12-month period ended February 28, 2011, the Portfolio’s underperformance was largely the result of negative security selection within the industrials, information technology and consumer discretionary sectors. This was partially offset by strong stock selection across the materials and consumer staples sectors. Sector selection was also negative, particularly the overweight in financials and the underweight in the consumer
| ALLIANCEBERNSTEIN POOLING PORTFOLIOS • | 5 |
discretionary sector. CapitaLand, business process outsourcing company Capita and H&M detracted. Two agricultural commodity players, PotashCorp and K+S Group, were the strongest contributors as fundamentals for fertilizers improved. Hong Kong-based outsourcing company Li & Fung contributed positively helped by over a year of strong revenue growth.
During both reporting periods, the Portfolio utilized currency forwards and futures for hedging and non-hedging purposes, which contributed positively to performance.
International Market Review and Investment Strategy
Overall, international equity markets, as measured by the benchmark, posted solid returns during the six- and 12-month periods ended February 28, 2011, although markets were volatile. Markets were strong in March as investors shrugged off macroeconomic concerns. Risk aversion returned in May and June, due to uncertainties in the financial sector including mounting sovereign debt risks in Europe, discussions of stricter regulation of banks globally, and moderating growth expectations in China. Markets received some relief in July, moving sharply higher following positive earnings and a positive sentiment shift after BP stanched the flow of oil into the Gulf of Mexico. However, lackluster macroeconomic data led to equity markets underperforming again in August. Markets regained strength in September and October as the U.S. Federal Reserve’s second round
of quantitative easing injected liquidity
into global capital markets and ended the calendar year on a strong note, broadly speaking, as corporates delivered profit growth. While the benchmark overall rose in January and February 2011, emerging markets’ equities performance diverged from developed markets’ as inflationary pressures from rising commodities prices prompted rate hikes in Brazil and across Asia.
The International Value Pooling Portfolio emphasizes companies with strong free cash flow generation that are selling at attractive valuations. These opportunities are available across a wide range of sectors.
The International Growth Portfolio was significantly repositioned during the reporting period. The Portfolio’s stock selection process focuses on quality growth companies with high returns, good reinvestment opportunities, and strong competitive positions. The stocks in the Portfolio, in aggregate, have higher growth and profitability characteristics than the benchmark. The Portfolio’s management team, the International Growth Group (the “Team”) has concentrated into fewer names by adding to positions in its highest-conviction stocks and the Team believes this will increase the Portfolio’s outperformance potential. The Team is emphasizing emerging markets exposure both in its country allocation and stock selection, as it believes companies which can capitalize on satisfying burgeoning demand in rapidly growing regions can outperform.
| 6 | • ALLIANCEBERNSTEIN POOLING PORTFOLIOS |
Short Duration Bond Portfolio
Investment Objective and Policies
The Portfolio seeks a moderate rate of income that is subject to taxes. The Portfolio may invest in many types of fixed-income securities, including corporate bonds, notes, U.S. government and agency securities, asset-backed securities, mortgage-related securities, and inflation-protected securities, as well as other securities of U.S. and non-U.S. issuers. Under normal circumstances, the Portfolio invests at least 80% of its net assets in fixed-income securities. The Portfolio may invest up to 20% of its total assets in debt securities denominated in currencies other than the U.S. Dollar. The Portfolio may also invest up to 20% of its assets in hybrid instruments, which have characteristics of futures, options, currencies and securities. The Portfolio seeks to maintain a relatively short duration of one to three years under normal market conditions. The Portfolio may invest in variable, floating, and inverse floating rate investments. The Portfolio may also invest in zero coupon and interest-only or principal-only securities.
Investment Results
The Portfolio outperformed its benchmark, the Bank of America Merrill Lynch (BofAML) 1-3 Year Treasury Index, for both the six- and 12-month reporting periods ended February 28, 2011. For both periods, the Portfolio’s exposure to spread products, which significantly outperformed Treasury securities, was the primary positive driver of relative performance. Allocations to agency and non-agency mortgages, commercial mortgage-backed
securities (CMBS), asset-backed securities (ABS) and investment-grade corporates all contributed positively for both reporting periods. The Portfolio utilized derivative instruments including Treasury future positions to manage interest rate exposure, which had no material impact on performance.
Intermediate Duration Bond Portfolio
Investment Objective and Policies
The Portfolio seeks a moderate to high rate of income that is subject to taxes. The Portfolio may invest in many types of debt securities, including corporate bonds, notes, U.S. government and agency securities, asset-backed securities, mortgage-related securities, and inflation-protected securities, as well as other securities of U.S. and non-U.S. issuers. Under normal circumstances, the Portfolio invests at least 80% of its net assets in fixed-income securities. The Portfolio seeks to maintain a relatively longer duration of three to six years under normal market conditions. The Portfolio may invest up to 20% of its total assets in debt securities denominated in currencies other than the U.S. Dollar. The Portfolio may also invest up to 20% of its assets in hybrid instruments, which have characteristics of futures, options, currencies and securities. The Portfolio may invest in variable, floating, and inverse floating rate investments. The Portfolio may also invest in zero coupon and interest-only or principal-only securities.
| ALLIANCEBERNSTEIN POOLING PORTFOLIOS • | 7 |
Investment Results
The Portfolio outperformed its benchmark, the Barclays Capital U.S. Aggregate Bond Index, for both the six- and 12-month reporting periods ended February 28, 2011. For both reporting periods, the Portfolio’s sector allocation and security selection were the primary positive drivers of relative returns. Overweight allocations to CMBS and investment-grade corporate securities, as well as an underweight allocation to Treasuries and mortgage-backed securities, contributed positively. Security selection within the Portfolio’s corporate and mortgage holdings were positive while security selection within the CMBS allocation detracted.
During both reporting periods, the Portfolio utilized derivative instruments including Treasury futures and interest rate swaps in order to manage its duration and yield curve positioning. Overall yield curve positioning detracted for the six-month period, while duration positioning had no material impact. For the 12-month period, both yield curve and duration positioning contributed positively. The Portfolio also utilized currency forwards for hedging purposes, resulting in no currency impact.
Bond Inflation Protection Portfolio
Investment Objective and Policies
The Portfolio seeks to maximize real return without assuming what the Adviser considers to be undue risk. The Portfolio pursues its objective by investing principally in Treasury Inflation Protected Securities (“TIPS”) directly or by gaining indirect exposure to TIPS through
derivatives transactions such as total return swaps linked to TIPS. The Portfolio may invest in other fixed-income investments such as U.S. and non-U.S. government securities, corporate fixed-income securities and mortgage-related securities, as well as derivatives linked to such securities.
Under normal circumstances, the Portfolio invests at least of 80% of its net assets in fixed-income securities. While the Portfolio invests principally in investment grade securities, it may invest up to 15% of its total assets in fixed-income securities rated BB or B, or the equivalent by at least one national ratings agency (or deemed by the Adviser to be of comparable credit quality) which are not investment grade (“junk bonds”). The Portfolio may also invest in other inflation-indexed securities, issued by both U.S. and non-U.S. issuers, and in derivative instruments linked to these securities, such as options, futures, forwards, or swap agreements. The Portfolio may also invest in loan participations, structured securities, asset-backed securities, variable, floating, and inverse floating rate instruments, and preferred stock, and may use other investment techniques. The Portfolio may invest in fixed-income securities of any maturity and duration.
Investment Results
The Portfolio outperformed its benchmark, the Barclays Capital 1-10 Year TIPS Index, for both the six- and 12-month periods ended February 28, 2011. The Portfolio’s overweight in credit and CMBS contributed positively to relative performance for both periods. During both reporting
| 8 | • ALLIANCEBERNSTEIN POOLING PORTFOLIOS |
periods, the Portfolio utilized Treasury futures and interest rate swaps in order to manage duration and yield curve positioning. The Portfolio’s longer duration positioning detracted for the six-month period as interest rates rose, but contributed positively during the 12-month period as rates declined earlier in 2010. Yield curve positioning was positive for both periods.
The Portfolio also sold protection on several credit derivatives as a substitute for buying individual corporate bonds. During the six- and 12-month periods, spreads on these positions did not tighten as much as the spreads on the underlying corporate bonds; therefore, the Portfolio would have been better off owning the corporate bonds. The Portfolio also utilized currency forwards in order to hedge unwanted currency exposure or to create the desired currency exposure in the Portfolio. For the six-month period, currency positioning contributed positively, but detracted for the 12-month period. In order to combine the inflation protection offered by TIPS with the return potential of a multi-sector portfolio of bonds, the Portfolio used reverse repurchase agreements to create the necessary leverage.
High-Yield Portfolio
Investment Objective and Policies
The Portfolio seeks a high total return by maximizing current income and, to the extent consistent with that objective, capital appreciation. Under normal circumstances, the Portfolio invests at least 80% of its net assets in high yield debt securities. The Portfolio invests in a diversified mix of high yield,
below-investment grade debt securities, known as “junk bonds.” The Portfolio seeks to maximize current income by taking advantage of market developments, yield disparities and variations in the creditworthiness of issuers. The Portfolio may invest in debt securities with a range of maturities from short- to long-term. The Portfolio may also invest in U.S. Dollar-denominated and non-U.S. Dollar-denominated foreign fixed-income securities, as well as mortgage-related and other asset-backed securities, loan participations, inflation-protected securities, structured securities and preferred stocks. The Portfolio may use leverage for investment purposes by entering into transactions such as repurchase agreements and dollar rolls. The Portfolio may invest in variable, floating, and inverse floating rate investments. The Portfolio may also invest in zero coupon and interest-only or principal-only securities.
Investment Results
The Portfolio outperformed its benchmark, the Barclays U.S. High Yield 2% Issuer Cap Index, for both the six- and 12-month periods ended February 28, 2011. The Portfolio’s overweight in subordinated financial (banks and insurance) holdings within the capital structure contributed positively to relative performance for both periods. Overall security selection and an overweight position in the CCC-rated quality tier were also positive contributors for both periods. The Portfolio’s higher-volatility positioning earlier in 2010 contributed positively for the 12-month period. Within the Portfolio’s derivative positions, credit default swaps for hedging and non-hedging purposes contributed positively for
| ALLIANCEBERNSTEIN POOLING PORTFOLIOS • | 9 |
both periods, while interest rate swaps and currencies, for hedging purposes, and purchase options for non-hedging purposes, had no meaningful impact on performance for either period.
Fixed Income Market Review and Investment Strategy
The global economic recovery continued to strengthen and broaden during the reporting period, bolstering investors’ demand for risk assets. Global manufacturing, particularly in G7 countries, was especially strong as demand in emerging market economies continued to drive a robust export cycle. Equity markets rebounded, and interest rates rose globally. In the U.S., consumer sentiment improved, while the beleaguered job market began to show gains in private hiring and the unemployment rate receded from record levels. Some concerns emerged late in the reporting period, which investors eventually shrugged off. A spike in commodity prices, as well as unrest in the Middle East and North Africa temporarily unsettled markets. Peripheral European sovereign debt concerns, while remaining, eased somewhat as the European Union worked to stabilize the crisis. Fixed income sectors posted mixed results during the reporting period as higher interest rates began to weigh on fixed income markets. Nongovernment securities, particularly CMBS and corporate securities, significantly outperformed Treasuries. Treasury securities posted the weakest returns, as the safe haven premium government securities enjoyed during the fiscal crisis unwound as investors became less risk averse. U.S. Treasury yields rose
significantly during the period, and the yield curve steepened. The high yield market, as represented by the benchmark, provided strong returns for the reporting period. Rising equity markets, improving corporate fundamentals and strong investor demand for yield in a low rate environment generated a positive environment for high yield. Lower quality bonds outperformed, with defaults continuing to be a non-story. All high yield industries posted positive returns with technology and financial sectors (banks and insurance) providing the strongest returns. Noncyclical sectors, capital goods and transportation underperformed, but still provided strong absolute returns.
Small-Mid Cap Value Portfolio
Investment Objective and Policies
The Portfolio seeks long-term growth of capital. The Portfolio invests primarily in a diversified portfolio of equity securities of small- to mid-capitalization U.S. companies, generally representing 60-125 companies. Under normal circumstances, the Portfolio invests at least 80% of its net assets in small- to mid-cap companies. The Portfolio may invest in securities issued by non-U.S. companies and enter into forward commitments. The Portfolio may enter into derivatives transactions, such as options, futures, forwards, and swap agreements.
Investment Results
The Portfolio outperformed its benchmark, the Russell 2500 Value Index, for the six- and 12-month periods ended February 28, 2011. The
| 10 | • ALLIANCEBERNSTEIN POOLING PORTFOLIOS |
premium versus the benchmark was larger during the six-month period, chiefly because of strong stock selection; sector selection modestly contributed. In the 12-month period ended February 28, 2011, positive sector selection was nearly offset by negative stock selection. Broadly speaking, the Portfolio’s holdings benefited from company-specific restructuring programs and from a recovery in the broader economy.
In both periods, the Portfolio’s underweight in lagging financial stocks helped. During the six-month period, stock selection was broadly positive, most notably in procyclical sectors, such as industrial resources, capital equipment and consumer staples and cyclicals. It was weakest in energy, as the Portfolio did not hold some of the top performing companies. For the 12-month period, underperformance from consumer-related, financial and housing-related holdings outweighed strength in capital equipment and utilities holdings.
The Portfolio did not utilize derivatives during the six- and 12-month reporting periods.
Market Review and Investment Strategy
During the six- and 12-month periods ended February 28, 2011, smaller-cap stocks outpaced U.S. large-cap and global equities as many smaller-cap companies exhibited stronger earnings leverage to the improvement in economic conditions following extensive cost cuts during the recent recession. The benchmark trailed the Russell
2500 Index in both periods, as it had a larger weight in the lagging financial and utilities sectors, and a smaller weight in outperforming technology stocks. The Portfolio’s Small/Mid Cap Value Senior Investment Management Team (the “Team”) remains focused on identifying company-specific controversies that have been mispriced, in its view. As macroeconomic concerns continued to dominate investor sentiment regarding equities, the Team took the opportunity to add attractively valued high-quality companies with strong free cash flows. The Portfolio’s holdings span diverse sectors and its sector exposures have become more balanced, reflecting the breadth of the value opportunity. The Portfolio maintains a slight bias toward larger companies within the small- and mid-capitalization spectrum.
Small-Mid Cap Growth Portfolio
Investment Objective and Policies
The Portfolio invests primarily in a diversified portfolio of equity securities with relatively smaller capitalizations as compared to the overall market. Under normal circumstances, the Portfolio invests at least 80% of its net assets in the equity securities of small- and mid-cap U.S. companies.
The Portfolio may invest in any company and industry and any type of equity security with potential for capital appreciation. It invests in well-known and established companies and new and less-seasoned companies. The Portfolio’s investment policies emphasize investments in companies that are demonstrating improving financial
| ALLIANCEBERNSTEIN POOLING PORTFOLIOS • | 11 |
results and a favorable earnings outlook. The Portfolio may invest in foreign securities.
The Portfolio invests principally in equity securities but may also invest in other types of securities, such as preferred stocks. The Portfolio may also invest in reverse repurchase agreements and up to 20% of its total assets in rights and warrants.
Investment Results
The Portfolio outperformed its benchmark, the Russell 2500 Growth Index, for both the six- and 12-month periods ended February 28, 2011. Against a backdrop of sizeable gains for small- and mid-cap growth stocks, the Portfolio generated strong absolute and relative returns for the semi-annual and annual reporting periods. During both periods—albeit somewhat intermittently—investors rewarded companies that delivered stronger-than-expected fundamental results. As such, relative returns benefited from the Portfolio’s Small/Mid- Cap Group Investment Team’s (the “Team’s”) success in identifying such companies.
For both periods, stock selection was the key driver of outperformance. Over the six-month period, stock selection was broad based, but strongest within the technology sector. Over the 12-month period, the contribution from stock selection was broad based as well, with all sectors contributing positively to relative returns with the exception of financials. Sector allocation very modestly aided relative returns despite the
Fund’s small cash holdings which created a modest drag on relative performance during both the six- and 12-month periods, given the exceptionally strong market backdrop.
The Portfolio did not utilize derivatives during the six- and 12-month reporting periods.
Market Review and Investment Strategy
Bolstered by increased confidence in the sustainability of the economic recovery that began in the middle of 2009, U.S. equities, as represented by the S&P 500 Stock Index, posted their second consecutive year of solid double-digit gains in 2010. Small-cap growth stocks, which tend to be disproportionately sensitive to movements in the economy, as well as the increase in risk appetites that emerged during the second half of 2010, were by far the strongest performers, almost doubling the gains of the broader market, as represented by the S&P 500 Stock Index. Within the smaller-cap growth universe, as measured by the benchmark, more economically-sensitive sectors, such as technology, energy and industrials, posted the biggest gains; less cyclically-sensitive sectors of the market, such as consumer staples and health care, were notable laggards.
Driven by the Team’s bottom-up stock selection process, sector allocations changed modestly over the 12-month reporting period. Increases in the Portfolio’s active exposure to health care, consumer/commercial services and technology, were offset by a reduction in the relative weight of
| 12 | • ALLIANCEBERNSTEIN POOLING PORTFOLIOS |
industrials and energy. At the end of the reporting period, the Portfolio was overweight in consumer/commercial services, technology and health care while underweight in financials and industrials and equal weight the energy sector. Of note, the technology overweight skews toward companies with significant exposure to enterprise spending, whereas the Portfolio’s health care exposure is dominated by an emphasis in health care services holdings that more than offsets underweights in biotech and medical devices. Consistent with the Team’s discipline, investments throughout the reporting period emphasized companies expected to deliver surprisingly strong earnings growth and favorable earnings estimate revisions.
Multi-Asset Real Return
(formerly Global Real Estate Investment)
Investment Objective and Policies
Effective December 31, 2010, the Portfolio changed its name from Global Real Estate Investment Portfolio to Multi-Asset Real Return Portfolio and eliminated its policy of investing at least 80% of its net assets in equity securities of real estate investment trusts, and other real estate industry companies, such as real estate operating companies. The Portfolio’s new investment objective is to maximize real return over inflation.
The Portfolio pursues an aggressive investment strategy involving a variety of asset classes. The Portfolio invests primarily in instruments that the Adviser expects to outperform broad equity indices during periods of rising inflation. Under normal circumstances,
the Portfolio invests its assets principally in the following instruments that, in the judgment of the Adviser, are affected directly or indirectly by the level and change in rate of inflation: inflation-protected fixed-income securities, such as TIPS, and similar bonds issued by governments outside of the U.S., commodities, equity securities such as commodity-related stocks, real estate securities, utility securities, infrastructure related securities, securities and derivatives linked to the price of other assets (such as commodities, stock indices and real estate) and currencies. The Portfolio seeks inflation protection from global investments, both in developed and emerging market countries. The Portfolio invests in both U.S. and non-U.S. Dollar-denominated equity or fixed-income securities.
The Portfolio may invest in currencies for hedging or investment purposes, both in the spot market and through long- or short-positions in currency-related derivatives. The Portfolio may invest in derivatives such as options, futures, forwards, swap agreements or structured notes. The Portfolio may seek to gain exposure to physical commodities traded in the commodities markets through investments in a variety of derivative instruments including commodity index-linked notes.
The Portfolio’s benchmark was changed from the FTSE EPRA/NAREIT Developed Real Estate Index to the MSCI AC World Commodity Producers Index, because the new index more closely resembles its investments.
| ALLIANCEBERNSTEIN POOLING PORTFOLIOS • | 13 |
Investment Results
The Portfolio underperformed its new benchmark, the MSCI AC World Commodity Producers Index, for the six-month period ended February 28, 2011, and outperformed its old benchmark, the FTSE EPRA/NAREIT Developed Real Estate Index. Based on the Portfolio’s new investment objective, exposure to commodity-related equities was increased during the reporting period. All of the Portfolio’s main underlying components (commodity stocks, commodity futures and real estate stocks) had positive absolute performance; in particular, the commodity futures sector tallied strong performance relative to a passive commodity futures strategy, with value added by curve positioning of the futures contracts held and collateral management. However, relative to the pure commodity stock index, the Portfolio’s exposure to real estate and commodity futures brought down returns.
The Portfolio outperformed both its new and old benchmarks for the 12-month period ended February 28, 2011. Performance was helped by increased exposure to commodity-related equities. Performance due to the old mandate was negatively influenced by investments that carried either some execution risk (such as real estate developers with a regional or global scope), or where ongoing balance sheet improvement was deemed to be at risk due to a more uncertain environment.
For both reporting periods, the Portfolio utilized derivative instruments including total return swaps, futures
and currencies for hedging and non-hedging purposes, which had a positive impact on performance.
Market Review and Investment Strategy
Financial markets, as measured by the S&P 500 Stock Index and the benchmarks, rallied over the 12-month period ended February 28, 2011, despite a sharp downturn during the second quarter of 2010. Heightened investor anxiety about the European sovereign debt crisis, fears of a double-dip recession in the U.S. and the prospect of deflation in key developed economies resulted in a steep decline in global equity markets and other risk assets in the second quarter of 2010. Actions taken by policy makers in the third quarter, notably the European Central Bank’s deal with Greece in July, and U.S. Federal Reserve Chairman Ben Bernanke’s announcement of plans to inject liquidity into the financial markets in August, boosted investors’ risk appetites. This continued through the rest of 2010 and the first two months of 2011, aided by the market response in December to the U.S. tax package and encouraging economic data. These factors, coupled with fact that inflation in emerging economies is indeed evident, led to strong performance of equities and real assets.
Two years after the market collapse, global financial markets have recovered much of their losses, and fears of economic calamity have receded. However, considering that inflationary pressures exist in many regions of the world, opportunities to protect investors and for market participants to profit
| 14 | • ALLIANCEBERNSTEIN POOLING PORTFOLIOS |
from these conditions still remain. The Portfolio is well-positioned to invest opportunistically across a range of asset classes and market circumstances. The Real Asset Strategy Team (the “Team”) has taken decisive action to position the Portfolio to capture the upside that the Team believes real assets can deliver in the present environment. The Portfolio remains overweight in commodity futures relative to commodity stocks, while maintaining a neutral to slightly overweight stance in real estate equities.
Volatility Management Portfolio
Investment Objective and Policies
The Portfolio’s investment objective is long-term growth of capital and income. The Portfolio is designed to reduce the overall portfolio volatility and the effects of adverse equity market conditions for a blended style investor (the “Investing Fund”). The Portfolio will not pursue its investment objective of long-term growth of capital and income in isolation, but always with the goal of reducing an Investing Fund’s overall equity exposure when appropriate to mitigate equity risk. In other words, in making investment decisions for the Portfolio, the Adviser will consider the blended investing style of the investing fund and not necessarily the goal of achieving the Portfolio’s investment objective. The Portfolio will have the ability to invest in a wide array of asset classes, including U.S., non-U.S. and emerging market equity and fixed-income securities, commodities, Real Estate Investment Trusts (“REITs”) and other real estate-related securities, currencies, and inflation-protected
securities. The Portfolio will invest directly in equity securities, but it will also be able to invest without limit in derivative instruments, including futures, forwards, options, swaps and other financially linked investments.
To effectuate the Portfolio’s dynamic, opportunistic asset allocation approach, the Adviser may invest in derivatives rather than investing directly in equity securities. The Portfolio may use index futures, for example, to gain broad exposure to a particular segment of the market, while buying representative equity securities to achieve exposure to another. The Adviser will choose in each case based on concerns of cost and efficiency of access. The Portfolio’s holdings may be frequently adjusted to reflect the Adviser’s assessment of changing risks. The Adviser believes that these adjustments can also frequently be made efficiently and economically through the use of derivatives strategies. Similarly, when the Adviser decides to reduce (or eliminate) the Portfolio’s exposure to the equity markets, the Adviser may choose to gain this alternative exposure directly through securities purchases or indirectly through derivatives transactions. The asset classes selected may or may not be represented by the holdings of other of the Pooling Portfolios, because investment decisions for the Portfolio will be driven by risk mitigation concerns that may be best facilitated through exposure to asset classes not represented elsewhere in the Investing Fund’s overall exposure.
| ALLIANCEBERNSTEIN POOLING PORTFOLIOS • | 15 |
The Portfolio has the risk that it may not accomplish its purpose if the Adviser does not correctly assess the risk in equity markets and, consequently, its performance could be affected adversely.
Investment Results
The Portfolio underperformed its benchmark, the S&P 500 Stock Index, during the six-month period ended February 28, 2011, and outperformed since its inception, April 16, 2010, through February 28, 2011. The Portfolio delivered solid absolute performance during both time periods.
The Portfolio’s objective is to moderate risk. The reduction in risk was achieved through a decision to decrease exposure to equities below the Portfolio’s neutral target of 100% stocks and increase bonds in early May; the change in exposure was primarily implemented through the use of stock index and bond futures. The decision was taken in response to a sharp rise in market risk related to the European sovereign debt crisis.
Portfolio returns benefited from this decision as equity markets fell in May and June. The Portfolio began to increase its allocation to equities in July, reaching near neutral allocations by mid-October, as market risks began to subside, interest rates fell and equities became more attractive. Again, these changes were largely achieved through trades in stock index and bond futures. Over the course of the third quarter 2010, the Portfolio underperformed its neutral target, given its initial underweight to equi-
ties, but the impact on returns since inception remained positive. At the end of the reporting period, the Portfolio was invested at its neutral target and therefore performance and volatility were in line with that of the long-term strategic allocation.
Market Review and Investment Strategy
Equity market volatility rose sharply in April, 2010, on concerns of a potential debt default by Greece and the possible impact that would have on the world financial system and economic recovery. In reaction to this increase in risk, the Portfolio’s management team, the AllianceBernstein Dynamic Allocation Portfolio Team (“ADAPT”), sought to protect the Portfolio by reducing its exposure to equities and increasing its allocation to bonds. Volatility remained high into the summer, as investors were concerned about the European sovereign debt crisis and a possible double-dip recession. Beginning in July, however, ADAPT began to increase the Portfolio’s allocation to equities, as risks began to subside, interest rates fell, and equity valuations became more attractive.
Improving economic conditions set the stage for a strong equity market rally during the six-month period ending February 28, 2011. Financial conditions remained highly accommodative across the major developed economies, and low short-term interest rates and very steep yield curves encouraged risk-taking. The U.S. Federal Reserve announced additional stimulus through the purchase of bonds, or quantitative easing,
| 16 | • ALLIANCEBERNSTEIN POOLING PORTFOLIOS |
commonly referred to as “QEII”. In response, ADAPT continued to increase the allocation to equities during the period, reaching a full allocation in October. Economic
indicators exhibited strong momentum in many parts of the world over the remaining period, as capital spending rose, and surveys of manufacturing and services were strong.
| ALLIANCEBERNSTEIN POOLING PORTFOLIOS • | 17 |
HISTORICAL PERFORMANCE
An Important Note About the Value of Historical Performance
The performance shown on the following pages represents past performance and does not guarantee future results. Current performance may be lower or higher than the performance information shown. You may obtain performance information current to the most recent month-end by visiting our website at www.alliancebernstein.com. The investment return and principal value of an investment in the Fund will fluctuate, so that your shares, when redeemed, may be worth more or less than their original cost.
Investors should consider the investment objectives, risks, charges and expenses of the Fund/Portfolio carefully before investing. For copies of our prospectus or summary prospectus, which contain this and other information, visit us online at www.alliancebernstein.com or contact your AllianceBernstein Investments representative. Please read the prospectus and/or summary prospectus carefully before investing.
Please note: Shares of the Portfolios are offered exclusively to mutual funds advised by, and certain institutional clients of, AllianceBernstein that seek a blend of asset classes for investment. These share classes are not currently offered for direct investment from the general public. The AllianceBernstein Pooling Portfolios can be purchased at the relevant net asset value (NAV) without a sales charge or other fee. However, there are sales charges in connection to purchases of other AllianceBernstein share classes invested in these Pooling Portfolios. For additional information regarding other retail share classes and their sales charges and fees, please visit www.alliancebernstein.com. All fees and expenses related to the operation of the Portfolios have been deducted. Performance assumes reinvestment of distributions and does not account for taxes.
Benchmark Disclosures
None of the indices listed below reflect fees and expenses associated with the active management of a mutual fund portfolio.
The unmanaged Russell 1000® Value Index represents the performance of 1000 large-cap value companies within the U.S.
The unmanaged Russell 1000® Growth Index represents the performance of 1000 large-cap growth companies within the U.S.
The unmanaged MSCI EAFE Index (Europe, Australasia, Far East) (free float-adjusted market capitalization weighted) represents the equity market performance of developed markets, excluding the U.S. & Canada.
The unmanaged MSCI EAFE Growth Index (Europe, Australasia, Far East) (free float-adjusted market capitalization weighted) represents the growth equity market performance of developed markets, excluding the U.S. & Canada.
The unmanaged Bank of America Merrill Lynch® 1-3 Year U.S. Treasury Index represents the performance of U.S. dollar denominated sovereign debt publicly issued by the U.S. government in its domestic market with a remaining term to final maturity of 1-3 years.
The unmanaged Barclays Capital U.S. Aggregate Bond Index represents the performance of securities within the U.S. investment grade fixed rate bond market, with index components for government and corporate securities, mortgage pass-through securities, asset-backed securities, and commercial mortgage-backed securities.
The unmanaged Barclays Capital 1-10 Year TIPS Index represents the performance of Inflation-Protection securities issued by the U.S. Treasury.
The unmanaged Barclays Capital U.S High Yield 2% Issuer Cap Index is the 2% Issuer Cap component of the U.S. Corporate High Yield Index, which represents the
(Historical Performance continued on next page)
| 18 | • ALLIANCEBERNSTEIN POOLING PORTFOLIOS |
Historical Performance
HISTORICAL PERFORMANCE
(continued from previous page)
performance of fixed-income securities having a maximum quality rating of Ba1, a minimum amount outstanding of $150 million, and at least one year to maturity.
The unmanaged Russell 2500™ Value Index represents the performance of 2500 small- to mid-cap value companies within the U.S.
The unmanaged Russell 2500™ Growth Index represents the performance of 2500 small- to mid-cap growth companies within the U.S.
The unmanaged Russell 2500™ Index represents the performance of 2500 small to mid-cap companies within the U.S.
The MSCI AC World Commodity Producers Index is an equity-based index designed to reflect the performance related to commodity producers stocks. The Index is a free float-adjusted market capitalization-weighted index comprised of commodity producer companies based on the Global Industry Classification Standard.
The unmanaged Financial Times Stock Exchange® (FTSE) European Public Real Estate Association (EPRA)/National Association of Real Estate Investment Trusts (NAREIT) Developed Real Estate (RE) Index is designed to track the performance of listed real estate companies and REITs worldwide.
The unmanaged Standard & Poor’s (S&P®) 500 Stock Index includes 500 U.S. stocks and is a common representation of the performance of the overall U.S. stock market.
An investor cannot invest directly in an index, and its results are not indicative of the performance for any specific investment, including the Portfolios.
MSCI makes no express or implied warranties or representations, and shall have no liability whatsoever with respect to any MSCI data contained herein. The MSCI data may not be further redistributed or used as a basis for other indices, any securities or financial products. This report is not approved, reviewed or produced by MSCI.
A Word About Risk
U.S. Value Portfolio
| • | Market Risk: The value of the Portfolio’s assets will fluctuate as the stock or bond market fluctuates. The value of its investments may decline, sometimes rapidly and unpredictably, simply because of economic changes or other events that affect large portions of the market. It includes the risk that a particular style of investing, such as the Portfolio’s value approach, may be underperforming the market generally. |
| • | Derivatives Risk: Investments in derivatives may be illiquid, difficult to price, and leveraged so that small changes may produce disproportionate losses for the Portfolio, and may be subject to counterparty risk to a greater degree than more traditional investments. |
| • | Management Risk: The Portfolio is subject to management risk because it is an actively managed investment fund. The Adviser will apply its investment techniques and risk analyses in making investment decisions for the Portfolio, but there is no guarantee that its techniques will produce the intended results. |
U.S. Large Cap Growth Portfolio
| • | Market Risk: The value of the Portfolio’s assets will fluctuate as the stock or bond market fluctuates. The value of its investments may decline, sometimes rapidly and unpredictably, simply because of economic changes or other events that affect large portions of the market. It includes the risk that a particular style of investing, such as growth, may underperform the market generally. |
(Historical Performance continued on next page)
| ALLIANCEBERNSTEIN POOLING PORTFOLIOS • | 19 |
Historical Performance
HISTORICAL PERFORMANCE
(continued from previous page)
| • | Focused Portfolio Risk: This is the risk that investments in a limited number of companies may have more risk because changes in the value of a single security may have a more significant effect, either negative or positive, on the Portfolio’s net asset value. |
| • | Foreign (Non-U.S.) Risk: Investments in securities on non-U.S. issuers may involve more risk than those of U.S. issuers. These securities may fluctuate more widely in price and may be less liquid due to adverse market, economic, political, regulatory or other factors. |
| • | Management Risk: The Portfolio is subject to management risk because it is an actively managed investment fund. The Adviser will apply its investment techniques and risk analyses in making investment decisions for the Portfolio, but there is no guarantee that its techniques will produce the intended results. |
International Value Portfolio
| • | Market Risk: The value of the Portfolio’s assets will fluctuate as the stock or bond market fluctuates. The value of its investments may decline, sometimes rapidly and unpredictably, simply because of economic changes or other events that affect large portions of the market. It includes the risk that a particular style of investing, such as the Portfolio’s value approach, may be underperforming the market generally. |
| • | Foreign (Non-U.S.) Risk: Investment in securities of non-U.S. issuers may involve more risk than those of U.S. issuers. These securities may fluctuate more widely in price and may be less liquid due to adverse market, economic, political, regulatory or other factors. |
| • | Emerging Market Risk: Investments in emerging market countries may have more risk because the markets are less developed and less liquid as well as being subject to increased economic, political, regulatory or other uncertainties. |
| • | Currency Risk: Fluctuations in currency exchange rates may negatively affect the value of the Portfolio’s investments or reduce its returns. |
| • | Derivatives Risk: Investments in derivatives may be illiquid, difficult to price, and leveraged so that small changes may produce disproportionate losses for the Portfolio, and may be subject to counterparty risk to a greater degree than more traditional investments. |
| • | Management Risk: The Portfolio is subject to management risk because it is an actively managed investment fund. The Adviser will apply its investment techniques and risk analyses in making investment decisions for the Portfolio, but there is no guarantee that its techniques will produce the intended results. |
International Growth Portfolio
| • | Market Risk: The value of the Portfolio’s assets will fluctuate as the stock or bond market fluctuates. The value of its investments may decline, sometimes rapidly and unpredictably, simply because of economic changes or other events that affect large portions of the market. It includes the risk that a particular style of investing, such as the Portfolio’s growth approach, may underperform the market generally. |
(Historical Performance continued on next page)
| 20 | • ALLIANCEBERNSTEIN POOLING PORTFOLIOS |
Historical Performance
HISTORICAL PERFORMANCE
(continued from previous page)
| • | Foreign (Non-U.S.) Risk: Investment in securities of non-U.S. issuers may involve more risk than those of U.S. issuers. These securities may fluctuate more widely in price and may be less liquid due to adverse market, economic, political, regulatory or other factors. |
| • | Emerging Market Risk: Investments in emerging market countries may have more risk because the markets are less developed and less liquid as well as being subject to increased economic, political, regulatory or other uncertainties. |
| • | Currency Risk: Fluctuations in currency exchange rates may negatively affect the value of the Portfolio’s investments or reduce its returns. |
| • | Derivatives Risk: Investments in derivatives may be illiquid, difficult to price, and leveraged so that small changes may produce disproportionate losses for the Portfolio, and may be subject to counterparty risk to a greater degree than more traditional investments. |
| • | Management Risk: The Portfolio is subject to management risk because it is an actively managed investment fund. The Adviser will apply its investment techniques and risk analyses in making investment decisions for the Portfolio, but there is no guarantee that its techniques will produce the intended results. |
Short Duration Bond Portfolio
| • | Market Risk: The value of the Portfolio’s assets will fluctuate as the stock or bond market fluctuates. The value of its investments may decline, sometimes rapidly and unpredictably, simply because of economic changes or other events that affect large portions of the market. |
| • | Interest Rate Risk: Changes in interest rates will affect the value of investments in fixed-income securities. When interest rates rise, the value of investments in fixed-income securities tend to fall and this decrease in value may not be offset by higher income from new investments. Interest rate risk is generally greater for fixed income securities with longer maturities or durations. |
| • | Credit Risk: An issuer or guarantor of a fixed-income security, or the counterparty to a derivatives or other contract, may be unable or unwilling to make timely payments of interest or principal, or to otherwise honor its obligations. The issuer or guarantor may default causing a loss of the full principal amount of a security. The degree of risk for a particular security may be reflected in its credit rating. There is the possibility that the credit rating of a fixed-income security may be downgraded after purchase, which may adversely affect the value of the security. Investments in fixed-income securities with lower ratings tend to have a higher probability that an issuer will default or fail to meet its payment obligations. |
| • | Inflation Risk: This is the risk that the value of assets or income from investments will be less in the future as inflation decreases the value of money. As inflation increases, the value of each Portfolio’s assets can decline as can the value of the Portfolio’s distributions. |
| • | Foreign (Non-U.S.) Risk: Investment in securities of non-U.S. issuers may involve more risk than those of U.S. issuers. These securities may fluctuate |
(Historical Performance continued on next page)
| ALLIANCEBERNSTEIN POOLING PORTFOLIOS • | 21 |
Historical Performance
HISTORICAL PERFORMANCE
(continued from previous page)
more widely in price and may be less liquid due to adverse market, economic, political, regulatory or other factors. |
| • | Currency Risk: Fluctuations in currency exchange rates may negatively affect the value of the Portfolio’s investments or reduce its returns. |
| • | Derivatives Risk: Investments in derivatives may be illiquid, difficult to price, and leveraged so that small changes may produce disproportionate losses for the Portfolio, and may be subject to counterparty risk to a greater degree than more traditional investments. |
| • | Management Risk: The Portfolio is subject to management risk because it is an actively managed investment fund. The Adviser will apply its investment techniques and risk analyses in making investment decisions for the Portfolio, but there is no guarantee that its techniques will produce the intended results. |
Intermediate Duration Bond Portfolio
| • | Market Risk: The value of the Portfolio’s assets will fluctuate as the stock or bond market fluctuates. The value of its investments may decline, sometimes rapidly and unpredictably, simply because of economic changes or other events that affect large portions of the market. |
| • | Interest Rate Risk: Changes in interest rates will affect the value of investments in fixed-income securities. When interest rates rise, the value of investments in fixed-income securities tend to fall and this decrease in value may not be offset by higher income from new investments. Interest rate risk is generally greater for fixed income securities with longer maturities or durations. |
| • | Credit Risk: An issuer or guarantor of a fixed-income security, or the counterparty to a derivatives or other contract, may be unable or unwilling to make timely payments of interest or principal, or to otherwise honor its obligations. The issuer or guarantor may default causing a loss of the full principal amount of a security. The degree of risk for a particular security may be reflected in its credit rating. There is the possibility that the credit rating of a fixed-income security may be downgraded after purchase, which may adversely affect the value of the security. Investments in fixed-income securities with lower ratings tend to have a higher probability that an issuer will default or fail to meet its payment obligations. |
| • | Inflation Risk: This is the risk that the value of assets or income from investments will be less in the future as inflation decreases the value of money. As inflation increases, the value of each Portfolio’s assets can decline as can the value of the Portfolio’s distributions. This risk is significantly greater for fixed-income securities with longer maturities. |
| • | Foreign (Non-U.S.) Risk: Investment in securities of non-U.S. issuers may involve more risk than those of U.S. issuers. These securities may fluctuate more widely in price and may be less liquid due to adverse market, economic, political, regulatory or other factors. |
| • | Currency Risk: Fluctuations in currency exchange rates may negatively affect the value of the Portfolio’s investments or reduce its returns. |
(Historical Performance continued on next page)
| 22 | • ALLIANCEBERNSTEIN POOLING PORTFOLIOS |
Historical Performance
HISTORICAL PERFORMANCE
(continued from previous page)
| • | Derivatives Risk: Investments in derivatives may be illiquid, difficult to price, and leveraged so that small changes may produce disproportionate losses for the Portfolio, and may be subject to counterparty risk to a greater degree than more traditional investments. |
| • | Management Risk: The Portfolio is subject to management risk because it is an actively managed investment fund. The Adviser will apply its investment techniques and risk analyses in making investment decisions for the Portfolio, but there is no guarantee that its techniques will produce the intended results. |
Bond Inflation Protection Portfolio
| • | Market Risk: The value of the Portfolio’s assets will fluctuate as the bond market fluctuates. The value of the Portfolio’s investments may decline, sometimes rapidly and unpredictably, simply because of economic changes or other events that affect large portions of the market. |
| • | Interest Rate Risk: Changes in interest rates will affect the value of investments in fixed-income securities. When interest rates rise, the value of investments in fixed-income securities tend to fall and this decrease in value may not be offset by higher income from new investments. Interest rate risk is generally greater for fixed income securities with longer maturities or durations. |
| • | Credit Risk: An issuer or guarantor of a fixed-income security, or the counterparty to a derivatives or other contract, may be unable or unwilling to make timely payments of interest or principal, or to otherwise honor its obligations. The issuer or guarantor may default causing a loss of the full principal amount of a security. The degree of risk for a particular security may be reflected in its credit rating. There is the possibility that the credit rating of a fixed-income security may be downgraded after purchase, which may adversely affect the value of the security. Investments in fixed-income securities with lower ratings tend to have a higher probability that an issuer will default or fail to meet its payment obligations. |
| • | Inflation Risk: This is the risk that the value of assets or income from investments will be less in the future as inflation decreases the value of money. As inflation increases, the value of the Portfolio’s assets can decline as can the value of the Portfolio’s distributions. This risk is significantly greater for fixed-income securities with longer maturities. Although the Portfolio invests principally in inflation-protected investments, the value of its securities may be vulnerable to changes in expectations of inflation or interest rates. |
| • | Derivatives Risk: Investments in derivatives may be illiquid, difficult to price, and leveraged so that small changes may produce disproportionate losses for the Portfolio, and may be subject to counterparty risk to a greater degree than more traditional investments. |
| • | Foreign (Non-U.S.) Risk: Investments in securities of non-U.S. issuers may involve more risk than those of U.S. issuers. These securities may fluctuate more widely in price and may be less liquid due to adverse market, economic, political, regulatory or other factors. |
(Historical Performance continued on next page)
| ALLIANCEBERNSTEIN POOLING PORTFOLIOS • | 23 |
Historical Performance
HISTORICAL PERFORMANCE
(continued from previous page)
| • | Currency Risk: Fluctuations in currency exchange risk may negatively affect the value of the Portfolio’s investments or reduce its returns. |
| • | Leverage Risk: To the extent the Portfolio uses leveraging techniques, its NAV may be more volatile because leverage tends to exaggerate the effect of changes in interest rates and any increase or decrease in the value of the Portfolio’s investments. |
| • | Liquidity Risk: Liquidity risk exists when particular investments are difficult to purchase or sell, possibly preventing the Portfolio from selling out of these illiquid securities at an advantageous price. Derivatives and securities involving substantial market and credit risk tend to involve greater liquidity risk. |
| • | Management Risk: The Portfolio is subject to management risk because it is an actively managed investment fund. The Adviser will apply its investment techniques and risk analyses in making investment decisions, but there is no guarantee that its techniques will produce the intended results. |
High-Yield Portfolio
| • | Market Risk: The value of the Portfolio’s assets will fluctuate as the stock or bond market fluctuates. The value of its investments may decline, sometimes rapidly and unpredictably, simply because of economic changes or other events that affect large portions of the market. |
| • | Interest Rate Risk: Changes in interest rates will affect the value of investments in fixed-income securities. When interest rates rise, the value of investments in fixed-income securities tend to fall and this decrease in value may not be offset by higher income from new investments. Interest rate risk is generally greater for fixed income securities with longer maturities or durations. |
| • | Credit Risk: An issuer or guarantor of a fixed-income security, or the counterparty to a derivatives or other contract, may be unable or unwilling to make timely payments of interest or principal, or to otherwise honor its obligations. The issuer or guarantor may default causing a loss of the full principal amount of a security. The degree of risk for a particular security may be reflected in its credit rating. There is the possibility that the credit rating of a fixed-income security may be downgraded after purchase, which may adversely affect the value of the security. Investments in fixed-income securities with lower ratings tend to have a higher probability that an issuer will default or fail to meet its payment obligations. |
| • | Below Investment Grade Securities Risk: Investments in fixed-income securities with lower ratings (commonly known as “junk bonds”) tend to have a higher probability that an issuer will default or fail to meet its payment obligations. These securities may be subject to greater price volatility due to such factors as specific corporate developments, interest rate sensitivity, negative performance of the junk bond market generally and less secondary market liquidity. |
| • | Inflation Risk: This is the risk that the value of assets or income from investments will be less in the future as inflation decreases the value of money. As inflation increases, the value of each Portfolio’s assets can decline as |
(Historical Performance continued on next page)
| 24 | • ALLIANCEBERNSTEIN POOLING PORTFOLIOS |
Historical Performance
HISTORICAL PERFORMANCE
(continued from previous page)
can the value of the Portfolio’s distributions. This risk is significantly greater for fixed-income securities with longer maturities. |
| • | Foreign (Non-U.S.) Risk: Investment in securities of non-U.S. issuers may involve more risk than those of U.S. issuers. These securities may fluctuate more widely in price and may be less liquid due to adverse market, economic, political, regulatory or other factors. |
| • | Currency Risk: Fluctuations in currency exchange rates may negatively affect the value of the Portfolio’s investments or reduce its returns. |
| • | Leverage Risk: When the Portfolio borrows money or otherwise leverages its portfolio, the value of an investment in the Portfolio will be more volatile because leverage tends to exaggerate the effect of any increase or decrease in the value of the Portfolio’s investments. The Portfolio may create leverage through the use of reverse repurchase agreements, forward contracts or dollar rolls, or by borrowing money. |
| • | Derivatives Risk: Investments in derivatives may be illiquid, difficult to price, and leveraged so that small changes may produce disproportionate losses for the Portfolio, and may be subject to counterparty risk to a greater degree than more traditional investments. |
Small-Mid Cap Value Portfolio
| • | Market Risk: The value of the Portfolio’s assets will fluctuate as the stock or bond market fluctuates. The value of its investments may decline, sometimes rapidly and unpredictably, simply because of economic changes or other events that affect large portions of the market. It includes the risk that a particular style of investing, such as the Portfolio’s value approach, may underperform the market generally. |
| • | Capitalization Risk: Investments in small- and mid-capitalization companies may be more volatile than investments in large-cap companies. Investments in small-cap companies may have additional risks because these companies have limited product lines, markets or financial resources. |
| • | Foreign (Non-U.S.) Risk: Investment in securities of non-U.S. issuers may involve more risk than those of U.S. issuers. These securities may fluctuate more widely in price and may be less liquid due to adverse market, economic, political, regulatory or other factors. |
| • | Currency Risk: Fluctuations in currency exchange rates may negatively affect the value of the Portfolio’s investments or reduce its returns. |
| • | Derivatives Risk: Investments in derivatives may be illiquid, difficult to price, and leveraged so that small changes may produce disproportionate losses for the Portfolio, and may be subject to counterparty risk to a greater degree than more traditional investments. |
| • | Management Risk: The Portfolio is subject to management risk because it is an actively managed investment fund. The Adviser will apply its investment techniques and risk analyses in making investment decisions for the Portfolio, but there is no guarantee that its techniques will produce the intended results. |
(Historical Performance continued on next page)
| ALLIANCEBERNSTEIN POOLING PORTFOLIOS • | 25 |
Historical Performance
HISTORICAL PERFORMANCE
(continued from previous page)
Small-Mid Cap Growth Portfolio
| • | Market Risk: The value of the Portfolio’s assets will fluctuate as the stock or bond market fluctuates. The value of its investments may decline, sometimes rapidly and unpredictably, simply because of economic changes or other events that affect large portions of the market. It includes the risk that a particular style of investing, such as the Portfolio’s growth approach, may underperform the market generally. |
| • | Capitalization Risk: Investments in small- and mid-capitalization companies may be more volatile than investments in large-cap companies. Investments in small-cap companies may have additional risks because these companies have limited product lines, markets or financial resources. |
| • | Foreign (Non-U.S.) Risk: Investment in securities of non-U.S. issuers may involve more risk than those of U.S. issuers. These securities may fluctuate more widely in price and may be less liquid due to adverse market, economic, political, regulatory or other factors. |
| • | Derivatives Risk: Investments in derivatives may be illiquid, difficult to price, and leveraged so that small changes may produce disproportionate losses for the Portfolio, and may be subject to counterparty risk to a greater degree than more traditional investments. |
| • | Management Risk: The Portfolio is subject to management risk because it is an actively managed investment fund. The Adviser will apply its investment techniques and risk analyses in making investment decisions for the Portfolio, but there is no guarantee that its techniques will produce the intended results. |
Multi-Asset Real Return Portfolio
| • | Market Risk: The value of the Portfolio’s assets will fluctuate as the equity, commodity and bond markets fluctuate. The value of the Portfolio’s investments may decline, sometimes rapidly and unpredictably, simply because of economic changes or other events that affect large portions of the market. |
| • | Interest Rate Risk: Changes in interest rates will affect the value of investments in fixed-income securities. When interest rates rise, the value of investments in fixed-income securities tend to fall and this decrease in value may not be offset by higher income from new investments. Interest rate risk is generally greater for fixed income securities with longer maturities or durations. |
| • | Credit Risk: An issuer or guarantor of a fixed-income security, or the counterparty to a derivatives or other contract, may be unable or unwilling to make timely payments of interest or principal, or to otherwise honor its obligations. The issuer or guarantor may default causing a loss of the full principal amount of a security. The degree of risk for a particular security may be reflected in its credit rating. There is the possibility that the credit rating of a fixed-income security may be downgraded after purchase, which may adversely affect the value of the security. Investments in fixed-income securities with lower ratings tend to have a higher probability that an issuer will default or fail to meet its payment obligations. |
(Historical Performance continued on next page)
| 26 | • ALLIANCEBERNSTEIN POOLING PORTFOLIOS |
Historical Performance
HISTORICAL PERFORMANCE
(continued from previous page)
| • | Commodity Risk: Investments in commodities and commodity-linked derivative instruments, either directly or through the Subsidiary, may subject the Portfolio to greater volatility than investments in traditional securities. The value of commodity-linked derivative instruments may be affected by changes in overall market movements, commodity index volatility, changes in interest rates, or factors affecting a particular industry or commodity, such as drought, floods, weather, livestock disease, embargoes, tariffs and international economic, political and regulatory developments. |
| • | Derivatives Risk: The Portfolio’s investments in derivatives such as options, futures, forwards, and swaps may be illiquid, difficult to price, and leveraged so that small changes may produce disproportionate losses for the Portfolio, and may be subject to counterparty risk to a greater degree than more traditional investments. |
| • | Leverage Risk: To the extent the Portfolio uses leveraging techniques, its NAV may be more volatile because leverage tends to exaggerate the effect of changes in interest rates and any increase or decrease in the value of the Portfolio’s investments. |
| • | Liquidity Risk: Liquidity risk exists when particular investments are difficult to purchase or sell, possibly preventing the Portfolio from selling out of these illiquid securities at an advantageous price. The Portfolio invests in derivatives and securities involving substantial market and credit risk, which tend to involve greater liquidity risk. |
| • | Foreign (Non-U.S.) Risk: Investments in securities of non-U.S. issuers may involve more risk than those of U.S. issuers. These securities may fluctuate more widely in price and may be less liquid due to adverse market, economic, political, regulatory or other factors. |
| • | Currency Risk: Fluctuations in currency exchange risk may negatively affect the value of the Portfolio’s investments or reduce its returns. |
| • | Subsidiary Risk: By investing in the Subsidiary, the Portfolio is indirectly exposed to the risks associated with the Subsidiary’s investments, including its investments in commodities. There is no guarantee that the investment objective of the Subsidiary will be achieved. |
| • | Real Estate Risk: The Portfolio’s investments in real estate securities have many of the same risks as direct ownership of real estate, including the risk that the value of real estate could decline due to a variety of factors that affect the real estate market generally. Investments in REITs may have additional risks. REITs are dependent on the capability of their managers, may have limited diversification, and could be significantly affected by changes in taxes. |
| • | Diversification Risk: The Portfolio may have more risk because it is “non-diversified,” meaning that it can invest more of its assets in a smaller number of issuers and that adverse changes in the value of one security could have a more significant effect on the Portfolio’s NAV. |
| • | Management Risk: The Portfolio is subject to management risk because it is an actively managed investment fund. The Adviser will apply its investment |
(Historical Performance continued on next page)
| ALLIANCEBERNSTEIN POOLING PORTFOLIOS • | 27 |
Historical Performance
HISTORICAL PERFORMANCE
(continued from previous page)
techniques and risk analyses in making investment decisions, but there is no guarantee that its techniques will produce the intended results. |
Volatility Management Portfolio
| • | Market Risk: The value of the Portfolio’s assets will fluctuate as the equity, commodity and bond markets fluctuate. The value of the Portfolio’s investments may decline, sometimes rapidly and unpredictably, simply because of economic changes or other events that affect large portions of the market. |
| • | Interest Rate Risk: Changes in interest rates will affect the value of investments in fixed-income securities. When interest rates rise, the value of investments in fixed-income securities tend to fall and this decrease in value may not be offset by higher income from new investments. Interest rate risk is generally greater for fixed income securities with longer maturities or durations. |
| • | Credit Risk: An issuer or guarantor of a fixed-income security, or the counterparty to a derivatives or other contract, may be unable or unwilling to make timely payments of interest or principal, or to otherwise honor its obligations. The issuer or guarantor may default causing a loss of the full principal amount of a security. The degree of risk for a particular security may be reflected in its credit rating. There is the possibility that the credit rating of a fixed-income security may be downgraded after purchase, which may adversely affect the value of the security. Investments in fixed-income securities with lower ratings tend to have a higher probability that an issuer will default or fail to meet its payment obligations. |
| • | Foreign (Non-U.S.) Risk: Investments in securities of non-U.S. issuers may involve more risk than those of U.S. issuers. These securities may fluctuate more widely in price and may be less liquid due to adverse market, economic, political, regulatory or other factors. |
| • | Currency Risk: Fluctuations in currency exchange risk may negatively affect the value of the Portfolio’s investments or reduce its returns. |
| • | Emerging Market Risk: Investments in emerging market countries may have more risk because the markets are less developed and less liquid as well as being subject to increased economic, political, regulatory or other uncertainties. |
| • | Inflation Risk: This is the risk that the value of assets or income from investments will be less in the future as inflation decreases the value of money. As inflation increases, the value of the Portfolio’s assets can decline as can the value of the Portfolio’s distributions. This risk is significantly greater for fixed-income securities with longer maturities. |
| • | Commodity Risk: Investments in commodities and commodity-linked derivative instruments may subject the Portfolio to greater volatility than investments in traditional securities. The value of these investments may be affected by changes in overall market movements, commodity index volatility, changes in interest rates, or factors affecting a particular industry or commodity, such as drought, floods, weather, livestock disease, embargoes, tariffs and international economic, political and regulatory developments. |
(Historical Performance continued on next page)
| 28 | • ALLIANCEBERNSTEIN POOLING PORTFOLIOS |
Historical Performance
HISTORICAL PERFORMANCE
(continued from previous page)
| • | Derivatives Risk: Investments in derivatives may be illiquid, difficult to price, and leveraged so that small changes may produce disproportionate losses for the Portfolio, and may be subject to counterparty risk to a greater degree than more traditional investments. |
| • | Management Risk: The Portfolio is subject to management risk because it is an actively managed investment fund. The Adviser will apply its investment techniques and risk analyses in making investment decisions, but there is no guarantee that its techniques will produce the intended results. |
All Portfolios
While the equity Portfolios invest principally in common stocks and other equity securities and the fixed-income Portfolios invest principally in bonds and fixed-income securities, in order to achieve their investment objectives, the Portfolios may at times use certain types of investment derivatives, such as options, futures, forwards and swaps. These instruments involve risks different from, and in certain cases, greater than, the risks presented by more traditional investments. These risks are fully discussed in the Portfolios’ prospectus.
(Historical Performance continued on next page)
| ALLIANCEBERNSTEIN POOLING PORTFOLIOS • | 29 |
Historical Performance
HISTORICAL PERFORMANCE
(continued from previous page)
THE PORTFOLIOS VS. THEIR BENCHMARKS
PERIODS ENDED FEBRUARY 28, 2011
U.S. VALUE PORTFOLIO | Returns | |||||||||||
| 6 Months | 12 Months | |||||||||||
AllianceBernstein U.S. Value Portfolio | 28.17% | 19.69% | ||||||||||
Russell 1000 Value Index | 26.30% | 22.16% | ||||||||||
| U.S. LARGE CAP GROWTH PORTFOLIO | Returns | |||||||||||
| 6 Months | 12 Months | |||||||||||
AllianceBernstein U.S. Large Cap Growth Portfolio* | 34.44% | 21.61% | ||||||||||
Russell 1000 Growth Index | 31.04% | 24.94% | ||||||||||
* Includes the impact of proceeds received and credited to the Portfolio resulting from class action settlements, which enhanced the Portfolio’s performance by 0.01% for the 12-month period ended February 28, 2011.
|
| |||||||||||
| INTERNATIONAL VALUE PORTFOLIO | Returns | |||||||||||
| 6 Months | 12 Months | |||||||||||
AllianceBernstein International Value Portfolio | 26.51% | 18.79% | ||||||||||
MSCI EAFE Index | 23.77% | 20.00% | ||||||||||
| INTERNATIONAL GROWTH PORTFOLIO | Returns | |||||||||||
| 6 Months | 12 Months | |||||||||||
AllianceBernstein International Growth Portfolio | 14.04% | 11.48% | ||||||||||
MSCI EAFE Index | 23.77% | 20.00% | ||||||||||
MSCI EAFE Growth Index | 23.49% | 21.33% | ||||||||||
| Please keep in mind that high, double-digit returns are highly unusual and cannot be sustained. Investors should also be aware that these returns were primarily achieved during favorable market conditions. |
See Historical Performance and Benchmark disclosures on pages 18-29.
(Historical Performance continued on next page)
| 30 | • ALLIANCEBERNSTEIN POOLING PORTFOLIOS |
Historical Performance
HISTORICAL PERFORMANCE
(continued from previous page)
THE PORTFOLIOS VS. THEIR BENCHMARKS
PERIODS ENDED FEBRUARY 28, 2011
SHORT DURATION BOND PORTFOLIO | Returns | |||||||||||
| 6 Months | 12 Months | |||||||||||
AllianceBernstein Short Duration Bond Portfolio | 1.20% | 3.54% | ||||||||||
BofAML 1-3 Year Treasury Index | 0.09% | 1.46% | ||||||||||
| Returns | ||||||||||||
| INTERMEDIATE DURATION BOND PORTFOLIO | 6 Months | 12 Months | ||||||||||
AllianceBernstein Intermediate Duration Bond Portfolio | 0.36% | 7.19% | ||||||||||
Barclays Capital U.S. Aggregate Bond Index | -0.83% | 4.93% | ||||||||||
| Returns | ||||||||||||
| BOND INFLATION PROTECTION PORTFOLIO | 6 Months | 12 Months | ||||||||||
AllianceBernstein Bond Inflation Protection Portfolio | 4.12% | 8.17% | ||||||||||
Barclays Capital 1-10 Year TIPS Index | 2.62% | 5.91% | ||||||||||
| Returns | ||||||||||||
| HIGH-YIELD PORTFOLIO | 6 Months | 12 Months | ||||||||||
AllianceBernstein High-Yield Portfolio | 10.35% | 18.15% | ||||||||||
Barclays Capital U.S. High Yield 2% Issuer Cap Index | 10.05% | 17.34% | ||||||||||
| Please keep in mind that high, double-digit returns are highly unusual and cannot be sustained. Investors should also be aware that these returns were primarily achieved during favorable market conditions. |
See Historical Performance and Benchmark disclosures on pages 18-29.
(Historical Performance continued on next page)
| ALLIANCEBERNSTEIN POOLING PORTFOLIOS • | 31 |
Historical Performance
HISTORICAL PERFORMANCE
(continued from previous page)
THE PORTFOLIOS VS. THEIR BENCHMARKS
PERIODS ENDED FEBRUARY 28, 2011
SMALL-MID CAP VALUE PORTFOLIO | Returns | |||||||||||
| 6 Months | 12 Months | |||||||||||
AllianceBernstein Small-Mid Cap Value Portfolio | 36.03% | 29.68% | ||||||||||
Russell 2500 Value Index | 32.49% | 29.55% | ||||||||||
| SMALL-MID CAP GROWTH PORTFOLIO | Returns | |||||||||||
| 6 Months | 12 Months | |||||||||||
AllianceBernstein Small-Mid Cap Growth Portfolio* | 49.48% | 54.04% | ||||||||||
Russell 2500 Growth Index | 40.13% | 36.42% | ||||||||||
* Includes the impact of proceeds received and credited to the Portfolio resulting from class action settlements, which enhanced the Portfolio’s performance by 0.01% and 0.01% for the six- and 12-month periods ended February 28, 2011.
|
| |||||||||||
| MULTI-ASSET REAL RETURN PORTFOLIO | Returns | |||||||||||
| 6 Months | 12 Months | |||||||||||
AllianceBernstein Multi Asset Real Return Portfolio | 22.37% | 30.62% | ||||||||||
MSCI AC World Commodity Producers Index | 36.08% | 29.26% | ||||||||||
FTSE EPRA/NAREIT Developed Real Estate Index | 20.26% | 29.26% | ||||||||||
| Returns | ||||||||||||
| VOLATILITY MANAGEMENT PORTFOLIO | 6 Months | Since Inception | ||||||||||
AllianceBernstein Volatility Management Portfolio | 24.50% | 15.91% | ||||||||||
S&P 500 Stock Index | 27.73% | 11.50% | ||||||||||
| Please keep in mind that high, double-digit returns are highly unusual and cannot be sustained. Investors should also be aware that these returns were primarily achieved during favorable market conditions. |
See Historical Performance and Benchmark disclosures on pages 18-29.
(Historical Performance continued on next page)
| 32 | • ALLIANCEBERNSTEIN POOLING PORTFOLIOS |
Historical Performance
HISTORICAL PERFORMANCE
(continued from previous page)
| AVERAGE ANNUAL RETURNS AS OF FEBRUARY 28, 2011 | ||||
| NAV/SEC Returns† | ||||
| AllianceBernstein U.S. Value Portfolio | ||||
1 Year | 19.69 | % | ||
5 Year | 0.10 | % | ||
Since Inception* | 1.90 | % | ||
| AllianceBernstein U.S. Large Cap Growth Portfolio | ||||
1 Year | 21.61 | % | ||
5 Year | 1.83 | % | ||
Since Inception* | 4.88 | % | ||
| AllianceBernstein International Value Portfolio | ||||
1 Year | 18.79 | % | ||
5 Year | 0.00 | % | ||
Since Inception* | 4.87 | % | ||
| AllianceBernstein International Growth Portfolio | ||||
1 Year | 11.48 | % | ||
5 Year | -0.85 | % | ||
Since Inception* | 2.82 | % | ||
| AllianceBernstein Short Duration Bond Portfolio | ||||
1 Year | 3.54 | % | ||
5 Year | 3.42 | % | ||
Since Inception* | 3.26 | % | ||
| AllianceBernstein Intermediate Duration Bond Portfolio | ||||
1 Year | 7.19 | % | ||
5 Year | 6.51 | % | ||
Since Inception* | 6.00 | % | ||
| * | Inception date: 5/20/05. |
| † | These Portfolios are offered at net asset value (NAV) and their SEC returns are the same as their NAV returns. |
See Historical Performance and Benchmark disclosures on pages 18-29.
(Historical Performance continued on next page)
| ALLIANCEBERNSTEIN POOLING PORTFOLIOS • | 33 |
Historical Performance
HISTORICAL PERFORMANCE
(continued from previous page)
| AVERAGE ANNUAL RETURNS AS OF FEBRUARY 28, 2011 | ||||
| NAV/SEC Returns† | ||||
| AllianceBernstein Bond Inflation Protection Portfolio | ||||
1 Year | 8.17 | % | ||
5 Year | 6.29 | % | ||
Since Inception* | 5.54 | % | ||
| AllianceBernstein High-Yield Portfolio | ||||
1 Year | 18.15 | % | ||
5 Year | 9.71 | % | ||
Since Inception* | 9.47 | % | ||
| AllianceBernstein Small-Mid Cap Value Portfolio | ||||
1 Year | 29.68 | % | ||
5 Year | 7.30 | % | ||
Since Inception* | 8.54 | % | ||
| AllianceBernstein Small-Mid Cap Growth Portfolio | ||||
1 Year | 54.04 | % | ||
5 Year | 9.53 | % | ||
Since Inception* | 12.80 | % | ||
| AllianceBernstein Multi-Asset Return Portfolio | ||||
1 Year | 30.62 | % | ||
5 Year | 3.73 | % | ||
Since Inception* | 6.86 | % | ||
| AllianceBernstein Volatility Management Portfolio | ||||
6 Month | 24.50 | % | ||
Since Inception** | 15.91 | % | ||
| * | Inception date: 5/20/05. |
| ** | Inception date: 4/16/10. |
| † | These Portfolios are offered at net asset value (NAV) and their SEC returns are the same as their NAV returns. |
See Historical Performance and Benchmark disclosures on pages 18-29.
(Historical Performance continued on next page)
| 34 | • ALLIANCEBERNSTEIN POOLING PORTFOLIOS |
Historical Performance
HISTORICAL PERFORMANCE
(continued from previous page)
| SEC AVERAGE ANNUAL RETURNS AS OF THE MOST RECENT CALENDAR QUARTER-END (MARCH 31, 2011) | ||||
| SEC Returns | ||||
| AllianceBernstein U.S. Value Portfolio | ||||
1 Year | 12.12 | % | ||
5 Year | -0.09 | % | ||
Since Inception* | 1.88 | % | ||
| AllianceBernstein U.S. Large Cap Growth Portfolio | ||||
1 Year | 14.62 | % | ||
5 Year | 1.83 | % | ||
Since Inception* | 4.78 | % | ||
| AllianceBernstein International Value Portfolio | ||||
1 Year | 4.94 | % | ||
5 Year | -1.79 | % | ||
Since Inception* | 3.95 | % | ||
| AllianceBernstein International Growth Portfolio | ||||
1 Year | 4.77 | % | ||
5 Year | -1.57 | % | ||
Since Inception* | 2.84 | % | ||
| AllianceBernstein Short Duration Bond Portfolio | ||||
1 Year | 3.45 | % | ||
5 Year | 3.40 | % | ||
Since Inception* | 3.22 | % | ||
| AllianceBernstein Intermediate Duration Bond Portfolio | ||||
1 Year | 6.90 | % | ||
5 Year | 6.72 | % | ||
Since Inception* | 5.92 | % | ||
| * | Inception date: 5/20/05. |
See Historical Performance and Benchmark disclosures on pages 18-29.
(Historical Performance continued on next page)
| ALLIANCEBERNSTEIN POOLING PORTFOLIOS • | 35 |
Historical Performance
HISTORICAL PERFORMANCE
(continued from previous page)
SEC AVERAGE ANNUAL RETURNS AS OF THE MOST RECENT CALENDAR QUARTER-END (MARCH 31, 2011) | ||||
| SEC Returns | ||||
| AllianceBernstein Bond Inflation Protection Portfolio | ||||
1 Year | 9.17 | % | ||
5 Year | 6.66 | % | ||
Since Inception* | 5.60 | % | ||
| AllianceBernstein High-Yield Portfolio | ||||
1 Year | 14.04 | % | ||
5 Year | 9.76 | % | ||
Since Inception* | 9.38 | % | ||
| AllianceBernstein Small-Mid Cap Value Portfolio | ||||
1 Year | 21.00 | % | ||
5 Year | 7.10 | % | ||
Since Inception* | 8.71 | % | ||
| AllianceBernstein Small-Mid Cap Growth Portfolio | ||||
1 Year | 49.32 | % | ||
5 Year | 9.54 | % | ||
Since Inception* | 13.47 | % | ||
| AllianceBernstein Multi-Asset Return Portfolio | ||||
1 Year | 23.49 | % | ||
5 Year | 3.05 | % | ||
Since Inception* | 6.87 | % | ||
| AllianceBernstein Volatility Management Portfolio | ||||
6 Months | 14.96 | % | ||
Since Inception** | 15.07 | % | ||
| * | Inception date: 5/20/05. |
| ** | Inception date: 4/16/10. |
See Historical Performance and Benchmark disclosures on pages 18-29.
(Historical Performance continued on next page)
| 36 | • ALLIANCEBERNSTEIN POOLING PORTFOLIOS |
Historical Performance
FUND EXPENSES
(unaudited)
As a shareholder of the Fund, you incur two types of costs: (1) transaction costs, including sales charges (loads) on purchase payments, contingent deferred sales charges on redemptions and (2) ongoing costs, including management fees; distribution (12b-1) fees; and other Fund expenses. This example is intended to help you understand your ongoing costs (in dollars) of investing in the Fund and to compare these costs with the ongoing costs of investing in other mutual funds.
The Example is based on an investment of $1,000 invested at the beginning of the period and held for the entire period as indicated below.
Actual Expenses
The table below provides information about actual account values and actual expenses. You may use the information in this line, together with the amount you invested, to estimate the expenses that you paid over the period. Simply divide your account value by $1,000 (for example, an $8,600 account value divided by $1,000 = 8.6), then multiply the result by the number in the first line under the heading entitled “Expenses Paid During Period” to estimate the expenses you paid on your account during this period.
Hypothetical Example for Comparison Purposes
The table below provides information about hypothetical account values and hypothetical expenses based on the Fund’s actual expense ratio and an assumed annual rate of return of 5% before expenses, which is not the Fund’s actual return. The hypothetical account values and expenses may not be used to estimate the actual ending account balance or expenses you paid for the period. You may use this information to compare the ongoing costs of investing in the Fund and other funds by comparing this 5% hypothetical example with the 5% hypothetical examples that appear in the shareholder reports of other funds.
Please note that the expenses shown in the table are meant to highlight your ongoing costs only and do not reflect any transactional costs, such as sales charges (loads), or contingent deferred sales charges on redemptions. Therefore, the second line of the table is useful in comparing ongoing costs only, and will not help you determine the relative total costs of owning different funds. In addition, if these transactional costs were included, your costs would have been higher.
| Beginning Account Value September 1, 2010 | Ending Account Value February 28, 2011 | Expenses Paid During Period* | Annualized Expense Ratio* | |||||||||||||
| U.S. Value Portfolio | ||||||||||||||||
Actual | $ | 1,000 | $ | 1,281.67 | $ | 0.06 | 0.01 | % | ||||||||
Hypothetical** | $ | 1,000 | $ | 1,024.74 | $ | 0.05 | 0.01 | % | ||||||||
| U.S. Large Cap Growth Portfolio | ||||||||||||||||
Actual | $ | 1,000 | $ | 1,344.36 | $ | 0.12 | 0.02 | % | ||||||||
Hypothetical** | $ | 1,000 | $ | 1,024.70 | $ | 0.10 | 0.02 | % | ||||||||
| Multi-Asset Real Return | ||||||||||||||||
Actual | $ | 1,000 | $ | 1,223.68 | $ | 0.22 | 0.04 | % | ||||||||
Hypothetical** | $ | 1,000 | $ | 1,024.60 | $ | 0.20 | 0.04 | % | ||||||||
| International Value Portfolio | ||||||||||||||||
Actual | $ | 1,000 | $ | 1,265.13 | $ | 0.17 | 0.03 | % | ||||||||
Hypothetical** | $ | 1,000 | $ | 1,024.65 | $ | 0.15 | 0.03 | % | ||||||||
| ALLIANCEBERNSTEIN POOLING PORTFOLIOS • | 37 |
Fund Expenses
FUND EXPENSES
(unaudited)
(continued from previous page)
| Beginning Account Value September 1, 2010 | Ending Account Value February 28, 2011 | Expenses Paid During Period* | Annualized Expense Ratio* | |||||||||||||
| International Growth Portfolio | ||||||||||||||||
Actual | $ | 1,000 | $ | 1,140.35 | $ | 0.21 | 0.04 | % | ||||||||
Hypothetical** | $ | 1,000 | $ | 1,024.60 | $ | 0.20 | 0.04 | % | ||||||||
| Small-Mid Cap Value Portfolio | ||||||||||||||||
Actual | $ | 1,000 | $ | 1,360.26 | $ | 0.18 | 0.03 | % | ||||||||
Hypothetical** | $ | 1,000 | $ | 1,024.65 | $ | 0.15 | 0.03 | % | ||||||||
| Small-Mid Cap Growth Portfolio | ||||||||||||||||
Actual | $ | 1,000 | $ | 1,494.79 | $ | 0.25 | 0.04 | % | ||||||||
Hypothetical** | $ | 1,000 | $ | 1,024.60 | $ | 0.20 | 0.04 | % | ||||||||
| Short Duration Bond Portfolio | ||||||||||||||||
Actual | $ | 1,000 | $ | 1,012.00 | $ | 0.25 | 0.05 | % | ||||||||
Hypothetical** | $ | 1,000 | $ | 1,024.55 | $ | 0.25 | 0.05 | % | ||||||||
| Intermediate Duration Bond Portfolio | ||||||||||||||||
Actual | $ | 1,000 | $ | 1,003.56 | $ | 0.20 | 0.04 | % | ||||||||
Hypothetical** | $ | 1,000 | $ | 1,024.60 | $ | 0.20 | 0.04 | % | ||||||||
| Bond Inflation Protection Portfolio | ||||||||||||||||
Actual | $ | 1,000 | $ | 1,041.24 | $ | 0.66 | 0.13 | % | ||||||||
Hypothetical** | $ | 1,000 | $ | 1,024.15 | $ | 0.65 | 0.13 | % | ||||||||
| High-Yield Portfolio | ||||||||||||||||
Actual | $ | 1,000 | $ | 1,103.51 | $ | 0.26 | 0.05 | % | ||||||||
Hypothetical** | $ | 1,000 | $ | 1,024.55 | $ | 0.25 | 0.05 | % | ||||||||
| Volatility Management Portfolio | ||||||||||||||||
Actual | $ | 1,000 | $ | 1,245.04 | $ | 0.83 | 0.15 | % | ||||||||
Hypothetical** | $ | 1,000 | $ | 1,024.05 | $ | 0.75 | 0.15 | % | ||||||||
| * | Expenses are equal to each Class’ annualized expense ratio, multiplied by the average account value over the period, multiplied by the 181/365 (to reflect the one-half year period). |
| ** | Assumes 5% return before expenses. |
| 38 | • ALLIANCEBERNSTEIN POOLING PORTFOLIOS |
Fund Expenses
U.S. VALUE PORTFOLIO
PORTFOLIO SUMMARY
February 28, 2011 (unaudited)
PORTFOLIO STATISTICS
Net Assets ($mil): $2,334.0
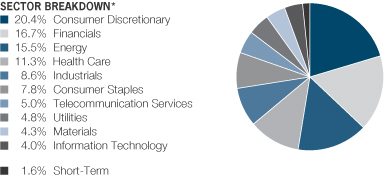
| * | All data are as of February 28, 2011. The Portfolio’s sector breakdown is expressed as a percentage of total investments and may vary over time. |
Please note: The sector classifications presented herein are based on the Global Industry Classification Standard (GICS) which was developed by Morgan Stanley Capital International and Standard & Poor’s. The components are divided into sector, industry group, and industry sub-indices as classified by the GICS for each of the market capitalization indices in the broad market. These sector classifications are broadly defined. The “Portfolio of Investments” section of the report reflects more specific industry information and is consistent with the investment restrictions discussed in the Portfolio’s prospectus.
| ALLIANCEBERNSTEIN POOLING PORTFOLIOS • | 39 |
Portfolio Summary
U.S. LARGE CAP GROWTH PORTFOLIO
PORTFOLIO SUMMARY
February 28, 2011 (unaudited)
PORTFOLIO STATISTICS
Net Assets ($mil): $2,324.3
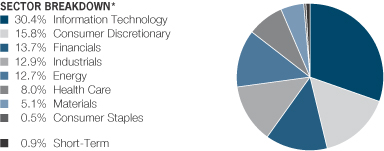
| * | All data are as of February 28, 2011. The Portfolio’s sector breakdown is expressed as a percentage of total investments and may vary over time. |
Please note: The sector classifications presented herein are based on the Global Industry Classification Standard (GICS) which was developed by Morgan Stanley Capital International and Standard & Poor’s. The components are divided into sector, industry group, and industry sub-indices as classified by the GICS for each of the market capitalization indices in the broad market. These sector classifications are broadly defined. The “Portfolio of Investments” section of the report reflects more specific industry information and is consistent with the investment restrictions discussed in the Portfolio’s prospectus.
| 40 | • ALLIANCEBERNSTEIN POOLING PORTFOLIOS |
Portfolio Summary
INTERNATIONAL VALUE PORTFOLIO
PORTFOLIO SUMMARY
February 28, 2011 (unaudited)
PORTFOLIO STATISTICS
Net Assets ($mil): $1,213.2
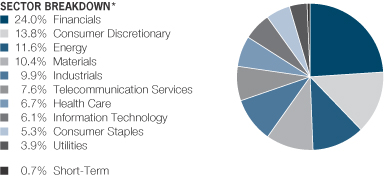
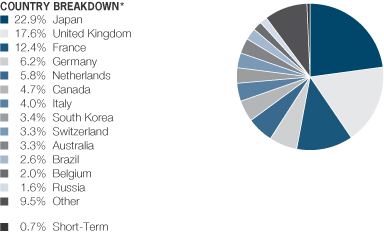
| * | All data are as of February 28, 2011. The Portfolio’s sector and country breakdowns are expressed as a percentage of total investments and may vary over time. The Portfolio also enters into derivative transactions, which may be used for hedging or investment purposes (see “Portfolio of Investments” section of the report for additional details). “Other” country weightings represent 1.6% or less in the following countries: Austria, China, Denmark, Hong Kong, India, New Zealand, Norway, Portugal, Singapore, South Africa, Taiwan and Turkey. |
Please note: The sector classifications presented herein are based on the Global Industry Classification Standard (GICS) which was developed by Morgan Stanley Capital International and Standard and Poor’s. The components are divided into sector, industry group, and industry sub-indices as classified by the GICS for each of the market capitalization indices in the broad market. These sector classifications are broadly defined. The “Portfolio of Investments” section of the report reflects more specific industry information and is consistent with the investment restrictions discussed in the Portfolio’s prospectus.
| ALLIANCEBERNSTEIN POOLING PORTFOLIOS • | 41 |
Portfolio Summary
INTERNATIONAL GROWTH PORTFOLIO
PORTFOLIO SUMMARY
February 28, 2011 (unaudited)
PORTFOLIO STATISTICS
Net Assets ($mil): $1,154.8
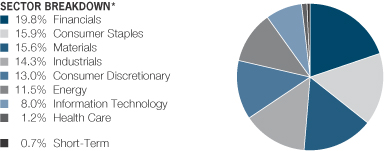
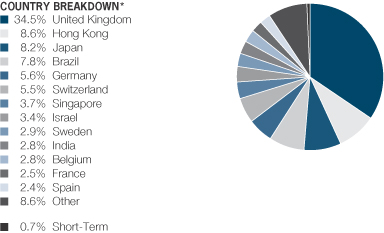
| * | All data are as of February 28, 2011. The Portfolio’s sector and country breakdowns are expressed as a percentage of total investments and may vary over time. The Portfolio also enters into derivative transactions, which may be used for hedging or investment purposes (see “Portfolio of Investments” section of the report for additional details). “Other” country weightings represent 2.0% or less in the following countries: Australia, Canada, China, Denmark, Indonesia, Italy, South Africa and Taiwan. |
Please note: The sector classifications presented herein are based on the Global Industry Classification Standard (GICS) which was developed by Morgan Stanley Capital International and Standard and Poor’s. The components are divided into sector, industry group, and industry sub-indices as classified by the GICS for each of the market capitalization indices in the broad market. These sector classifications are broadly defined. The “Portfolio of Investments” section of the report reflects more specific industry information and is consistent with the investment restrictions discussed in the Portfolio’s prospectus.
| 42 | • ALLIANCEBERNSTEIN POOLING PORTFOLIOS |
Portfolio Summary
SHORT DURATION BOND PORTFOLIO
PORTFOLIO SUMMARY
February 28, 2011 (unaudited)
PORTFOLIO STATISTICS
Net Assets ($mil): $1,318.4
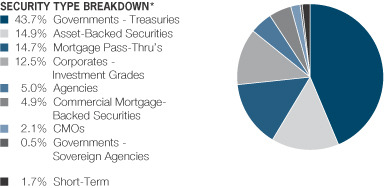
| * | All data are as of February 28, 2011. The Portfolio’s security breakdown is expressed as a percentage of total investments and may vary over time. The Portfolio also enters into derivative transactions, which may be used for hedging or investment purposes (see “Portfolio of Investments” section of the report for additional details). |
| ALLIANCEBERNSTEIN POOLING PORTFOLIOS • | 43 |
Portfolio Summary
INTERMEDIATE DURATION BOND PORTFOLIO
PORTFOLIO SUMMARY
February 28, 2011 (unaudited)
PORTFOLIO STATISTICS
Net Assets ($mil): $1,405.1
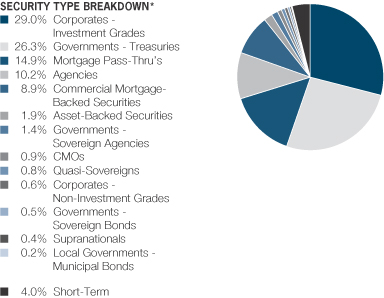
| * | All data are as of February 28, 2011. The Portfolio’s security breakdown is expressed as a percentage of total investments and may vary over time. The Portfolio also enters into derivative transactions, which may be used for hedging or investment purposes (see “Portfolio of Investments” section of the report for additional details). |
| 44 | • ALLIANCEBERNSTEIN POOLING PORTFOLIOS |
Portfolio Summary
BOND INFLATION PROTECTION PORTFOLIO
PORTFOLIO SUMMARY
February 28, 2011 (unaudited)
PORTFOLIO STATISTICS
Net Assets ($mil): $725.0
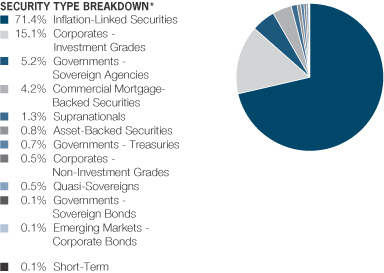
| * | All data are as of February 28, 2011. The Portfolio’s security breakdown is expressed as a percentage of total investments and may vary over time. The Portfolio also enters into derivative transactions, which may be used for hedging or investment purposes (see “Portfolio of Investments” section of the report for additional details). |
| ALLIANCEBERNSTEIN POOLING PORTFOLIOS • | 45 |
Portfolio Summary
HIGH-YIELD PORTFOLIO
PORTFOLIO SUMMARY
February 28, 2011 (unaudited)
PORTFOLIO STATISTICS
Net Assets ($mil): $533.6
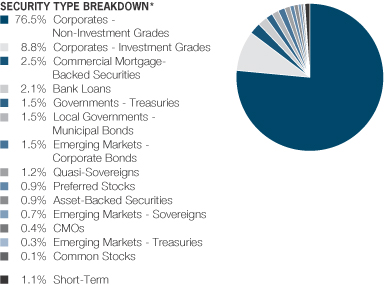
| * | All data are as of February 28, 2011. The Portfolio’s security breakdown is expressed as a percentage of total investments and may vary over time. The Portfolio also enters into derivative transactions, which may be used for hedging or investment purposes (see “Portfolio of Investments” section of the report for additional details). |
| 46 | • ALLIANCEBERNSTEIN POOLING PORTFOLIOS |
Portfolio Summary
SMALL-MID CAP VALUE PORTFOLIO
PORTFOLIO SUMMARY
February 28, 2011 (unaudited)
PORTFOLIO STATISTICS
Net Assets ($mil): $617.8
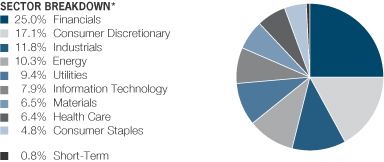
| * | All data are as of February 28, 2011. The Portfolio’s sector breakdown is expressed as a percentage of total investments and may vary over time. |
Please note: The sector classifications presented herein are based on the Global Industry Classification Standard (GICS) which was developed by Morgan Stanley Capital International and Standard & Poor’s. The components are divided into sector, industry group, and industry sub-indices as classified by the GICS for each of the market capitalization indices in the broad market. These sector classifications are broadly defined. The “Portfolio of Investments” section of the report reflects more specific industry information and is consistent with the investment restrictions discussed in the Portfolio’s prospectus.
| ALLIANCEBERNSTEIN POOLING PORTFOLIOS • | 47 |
Portfolio Summary
SMALL-MID CAP GROWTH PORTFOLIO
PORTFOLIO SUMMARY
February 28, 2011 (unaudited)
PORTFOLIO STATISTICS
Net Assets ($mil): $620.2
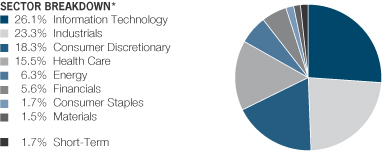
| * | All data are as of February 28, 2011. The Portfolio’s sector breakdown is expressed as a percentage of total investments and may vary over time. |
Please note: The sector classifications presented herein are based on the Global Industry Classification Standard (GICS) which was developed by Morgan Stanley Capital International and Standard & Poor’s. The components are divided into sector, industry group, and industry sub-indices as classified by the GICS for each of the market capitalization indices in the broad market. These sector classifications are broadly defined. The “Portfolio of Investments” section of the report reflects more specific industry information and is consistent with the investment restrictions discussed in the Portfolio’s prospectus.
| 48 | • ALLIANCEBERNSTEIN POOLING PORTFOLIOS |
Portfolio Summary
MULTI-ASSET REAL RETURN PORTFOLIO
PORTFOLIO SUMMARY
February 28, 2011 (unaudited)
PORTFOLIO STATISTICS
Net Assets ($mil): $1,047.6
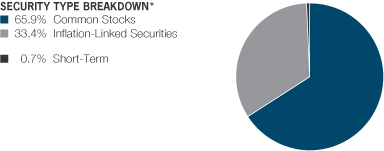
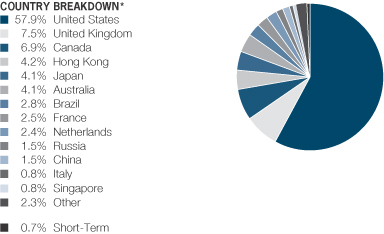
| * | All data are as of February 28, 2011. The Portfolio’s security and country breakdowns are expressed as a percentage of total investments and may vary over time. The Portfolio also enters into derivative transactions, which may be used for hedging or investment purposes (see “Portfolio of Investments” section of the report for additional details). “Other” country weightings represent 0.4% or less in the following countries: Finland, Germany, India, Israel, Luxembourg, Mongolia, Norway, Poland, South Africa, South Korea and Sweden. |
| ALLIANCEBERNSTEIN POOLING PORTFOLIOS • | 49 |
Portfolio Summary
VOLATILITY MANAGEMENT
PORTFOLIO SUMMARY
February 28, 2011 (unaudited)
PORTFOLIO STATISTICS
Net Assets ($mil): $346.8
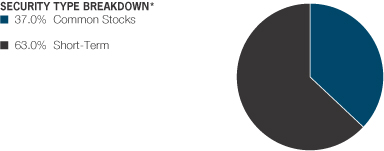
| * | All data are as of February 28, 2011. The Portfolio’s security breakdown is expressed as a percentage of total investments and may vary over time. The Portfolio also enters into derivative transactions, which may be used for hedging or investment purposes (see “Portfolio of Investments” section of the report for additional details). |
| 50 | • ALLIANCEBERNSTEIN POOLING PORTFOLIOS |
Portfolio Summary
U.S. VALUE PORTFOLIO
PORTFOLIO OF INVESTMENTS
February 28, 2011 (unaudited)
| Company | Shares | U.S. $ Value | ||||||
COMMON STOCKS – 97.2% | ||||||||
Consumer Discretionary – 20.2% | ||||||||
Auto Components – 1.6% | ||||||||
Lear Corp.(a) | 152,900 | $ | 16,176,820 | |||||
TRW Automotive Holdings Corp.(a) | 382,500 | 21,726,000 | ||||||
| 37,902,820 | ||||||||
Automobiles – 0.9% | ||||||||
Ford Motor Co.(a) | 1,010,000 | 15,200,500 | ||||||
General Motors Co.(a) | 163,600 | 5,485,508 | ||||||
| 20,686,008 | ||||||||
Hotels, Restaurants & Leisure – 0.5% | ||||||||
Royal Caribbean Cruises Ltd.(a) | 246,200 | 10,781,098 | ||||||
Household Durables – 1.9% | ||||||||
Fortune Brands, Inc. | 178,400 | 11,035,824 | ||||||
Garmin Ltd. | 525,700 | 17,847,515 | ||||||
NVR, Inc.(a) | 21,100 | 15,357,846 | ||||||
| 44,241,185 | ||||||||
Media – 9.2% | ||||||||
Cablevision Systems Corp. | 80,400 | 2,962,740 | ||||||
Comcast Corp. – Class A | 1,931,000 | 49,742,560 | ||||||
DIRECTV(a) | 553,000 | 25,421,410 | ||||||
Gannett Co., Inc. | 874,400 | 14,436,344 | ||||||
Interpublic Group of Cos., Inc. (The)(a) | 791,100 | 10,442,520 | ||||||
News Corp. – Class A | 1,800,400 | 31,272,948 | ||||||
Time Warner Cable, Inc. – Class A | 495,800 | 35,786,844 | ||||||
Time Warner, Inc. | 658,900 | 25,169,980 | ||||||
Viacom, Inc. – Class B | 453,700 | 20,262,242 | ||||||
| 215,497,588 | ||||||||
Multiline Retail – 1.5% | ||||||||
Kohl’s Corp.(a) | 348,700 | 18,791,443 | ||||||
Macy’s, Inc. | 637,600 | 15,238,640 | ||||||
| 34,030,083 | ||||||||
Specialty Retail – 4.6% | ||||||||
Foot Locker, Inc. | 783,900 | 15,576,093 | ||||||
Gap, Inc. (The) | 857,500 | 19,319,475 | ||||||
Limited Brands, Inc. | 362,300 | 11,600,846 | ||||||
Lowe’s Cos., Inc. | 793,400 | 20,763,278 | ||||||
Office Depot, Inc.(a) | 1,962,100 | 10,418,751 | ||||||
Ross Stores, Inc. | 269,300 | 19,400,372 | ||||||
TJX Cos., Inc. | 223,700 | 11,155,919 | ||||||
| 108,234,734 | ||||||||
| 471,373,516 | ||||||||
| ALLIANCEBERNSTEIN POOLING PORTFOLIOS • | 51 |
U.S. Value Portfolio—Portfolio of Investments
| Company | Shares | U.S. $ Value | ||||||
Financials – 16.5% | ||||||||
Capital Markets – 2.1% | ||||||||
Goldman Sachs Group, Inc. (The) | 135,500 | $ | 22,192,190 | |||||
Morgan Stanley | 927,500 | 27,528,200 | ||||||
| 49,720,390 | ||||||||
Commercial Banks – 4.8% | ||||||||
BB&T Corp. | 631,200 | 17,421,120 | ||||||
Comerica, Inc. | 325,300 | 12,654,170 | ||||||
Fifth Third Bancorp | 753,600 | 11,002,560 | ||||||
Wells Fargo & Co. | 2,203,100 | 71,072,006 | ||||||
| 112,149,856 | ||||||||
Consumer Finance – 0.8% | ||||||||
Capital One Financial Corp. | 369,300 | 18,380,061 | ||||||
Diversified Financial Services – 5.5% | ||||||||
Bank of America Corp. | 770,900 | 11,016,161 | ||||||
Citigroup, Inc.(a) | 4,849,800 | 22,697,064 | ||||||
JPMorgan Chase & Co. | 2,000,700 | 93,412,683 | ||||||
| 127,125,908 | ||||||||
Insurance – 3.3% | ||||||||
ACE Ltd. | 284,400 | 17,988,300 | ||||||
Allstate Corp. (The) | 189,300 | 6,015,954 | ||||||
Berkshire Hathaway, Inc.(a) | 184,400 | 16,094,432 | ||||||
Chubb Corp. | 116,800 | 7,087,424 | ||||||
Travelers Cos., Inc. (The) | 499,500 | 29,935,035 | ||||||
| 77,121,145 | ||||||||
| 384,497,360 | ||||||||
Energy – 15.3% | ||||||||
Energy Equipment & Services – 2.2% | ||||||||
Ensco PLC (Sponsored ADR) | 426,900 | 23,949,090 | ||||||
McDermott International, Inc.(a) | 532,000 | 12,209,400 | ||||||
Nabors Industries Ltd.(a) | 477,200 | 13,585,884 | ||||||
| 49,744,374 | ||||||||
Oil, Gas & Consumable Fuels – 13.1% | ||||||||
Chevron Corp. | 514,400 | 53,369,000 | ||||||
ConocoPhillips | 490,900 | 38,226,383 | ||||||
Devon Energy Corp. | 553,400 | 50,602,896 | ||||||
Forest Oil Corp.(a) | 519,300 | 18,429,957 | ||||||
Hess Corp. | 326,400 | 28,406,592 | ||||||
Marathon Oil Corp. | 803,700 | 39,863,520 | ||||||
Newfield Exploration Co.(a) | 341,300 | 24,843,227 | ||||||
Nexen, Inc. (New York) | 1,013,600 | 27,681,416 | ||||||
Occidental Petroleum Corp. | 43,000 | 4,384,710 | ||||||
Southern Union Co. | 478,800 | 13,655,376 | ||||||
| 52 | • ALLIANCEBERNSTEIN POOLING PORTFOLIOS |
U.S. Value Portfolio—Portfolio of Investments
| Company | Shares | U.S. $ Value | ||||||
Tesoro Corp.(a) | 292,900 | $ | 6,965,162 | |||||
| 306,428,239 | ||||||||
| 356,172,613 | ||||||||
Health Care – 11.1% | ||||||||
Biotechnology – 1.7% | ||||||||
Amgen, Inc.(a) | 344,100 | 17,662,653 | ||||||
Gilead Sciences, Inc.(a) | 565,800 | 22,054,884 | ||||||
| 39,717,537 | ||||||||
Health Care Providers & Services – 1.1% | ||||||||
Health Net, Inc.(a) | 305,800 | 8,996,636 | ||||||
UnitedHealth Group, Inc. | 406,400 | 17,304,512 | ||||||
| 26,301,148 | ||||||||
Pharmaceuticals – 8.3% | ||||||||
AstraZeneca PLC (Sponsored ADR) | 734,300 | 36,105,531 | ||||||
Forest Laboratories, Inc.(a) | 98,700 | 3,197,880 | ||||||
Johnson & Johnson | 1,175,500 | 72,222,720 | ||||||
Merck & Co., Inc. | 81,900 | 2,667,483 | ||||||
Pfizer, Inc. | 4,153,500 | 79,913,340 | ||||||
| 194,106,954 | ||||||||
| 260,125,639 | ||||||||
Industrials – 8.5% | ||||||||
Aerospace & Defense – 2.4% | ||||||||
Northrop Grumman Corp. | 626,000 | 41,741,680 | ||||||
Raytheon Co. | 255,600 | 13,089,276 | ||||||
| 54,830,956 | ||||||||
Airlines – 0.9% | ||||||||
Delta Air Lines, Inc.(a) | 1,967,800 | 22,118,072 | ||||||
Industrial Conglomerates – 2.0% | ||||||||
General Electric Co. | 2,245,500 | 46,975,860 | ||||||
Machinery – 3.2% | ||||||||
Eaton Corp. | 167,122 | 18,513,775 | ||||||
Ingersoll-Rand PLC | 523,700 | 23,723,610 | ||||||
Parker Hannifin Corp. | 295,600 | 26,361,608 | ||||||
SPX Corp. | 47,400 | 3,780,624 | ||||||
Terex Corp.(a) | 77,550 | 2,617,313 | ||||||
| 74,996,930 | ||||||||
| 198,921,818 | ||||||||
Consumer Staples – 7.7% | ||||||||
Beverages – 0.8% | ||||||||
Constellation Brands, Inc. – Class A(a) | 952,000 | 19,344,640 | ||||||
| ALLIANCEBERNSTEIN POOLING PORTFOLIOS • | 53 |
U.S. Value Portfolio—Portfolio of Investments
| Company | Shares | U.S. $ Value | ||||||
Food & Staples Retailing – 0.7% | ||||||||
Kroger Co. (The) | 518,600 | $ | 11,875,940 | |||||
Safeway, Inc. | 250,350 | 5,462,637 | ||||||
| 17,338,577 | ||||||||
Food Products – 3.0% | ||||||||
Archer-Daniels-Midland Co. | 537,400 | 19,980,532 | ||||||
Bunge Ltd. | 335,600 | 24,220,252 | ||||||
ConAgra Foods, Inc. | 346,500 | 8,024,940 | ||||||
Sara Lee Corp. | 273,525 | 4,682,748 | ||||||
Smithfield Foods, Inc.(a) | 512,500 | 11,864,375 | ||||||
| 68,772,847 | ||||||||
Household Products – 2.5% | ||||||||
Kimberly-Clark Corp. | 303,400 | 19,994,060 | ||||||
Procter & Gamble Co. (The) | 622,700 | 39,261,235 | ||||||
| 59,255,295 | ||||||||
Tobacco – 0.7% | ||||||||
Altria Group, Inc. | 607,000 | 15,399,590 | ||||||
| 180,110,949 | ||||||||
Telecommunication Services – 4.9% | ||||||||
Diversified Telecommunication Services – 3.9% | ||||||||
AT&T, Inc. | 1,672,800 | 47,474,064 | ||||||
CenturyLink, Inc. | 447,200 | 18,415,696 | ||||||
Verizon Communications, Inc. | 676,900 | 24,991,148 | ||||||
| 90,880,908 | ||||||||
Wireless Telecommunication | ||||||||
Vodafone Group PLC (Sponsored ADR) | 818,200 | 23,416,884 | ||||||
| 114,297,792 | ||||||||
Utilities – 4.8% | ||||||||
Electric Utilities – 1.2% | ||||||||
Edison International | 420,800 | 15,620,096 | ||||||
NV Energy, Inc. | 865,500 | 12,714,195 | ||||||
| 28,334,291 | ||||||||
Gas Utilities – 1.1% | ||||||||
Atmos Energy Corp. | 396,300 | 13,402,866 | ||||||
UGI Corp. | 378,917 | 12,083,663 | ||||||
| 25,486,529 | ||||||||
Independent Power Producers & Energy Traders – 0.7% | ||||||||
Constellation Energy Group, Inc. | 540,500 | 16,793,335 | ||||||
| 54 | • ALLIANCEBERNSTEIN POOLING PORTFOLIOS |
U.S. Value Portfolio—Portfolio of Investments
| Company | Shares | U.S. $ Value | ||||||
Multi-Utilities – 1.8% | ||||||||
Ameren Corp. | 273,500 | $ | 7,647,060 | |||||
CenterPoint Energy, Inc. | 383,800 | 6,087,068 | ||||||
CMS Energy Corp. | 666,800 | 12,842,568 | ||||||
NiSource, Inc. | 731,600 | 14,017,456 | ||||||
| 40,594,152 | ||||||||
| 111,208,307 | ||||||||
Materials – 4.2% | ||||||||
Chemicals – 2.2% | ||||||||
Dow Chemical Co. (The) | 888,900 | 33,031,524 | ||||||
EI du Pont de Nemours & Co. | 149,800 | 8,219,526 | ||||||
LyondellBasell Industries NV(a) | 277,700 | 10,574,816 | ||||||
| 51,825,866 | ||||||||
Metals & Mining – 2.0% | ||||||||
Alcoa, Inc. | 1,517,700 | 25,573,245 | ||||||
Commercial Metals Co. | 423,200 | 7,054,744 | ||||||
Reliance Steel & Aluminum Co. | 133,000 | 7,358,890 | ||||||
Steel Dynamics, Inc. | 396,800 | 7,324,928 | ||||||
| 47,311,807 | ||||||||
| 99,137,673 | ||||||||
Information Technology – 4.0% | ||||||||
Communications Equipment – 0.2% | ||||||||
Motorola Solutions, Inc.(a) | 117,228 | 4,529,690 | ||||||
Computers & Peripherals – 2.8% | ||||||||
Dell, Inc.(a) | 2,580,400 | 40,847,732 | ||||||
Hewlett-Packard Co. | 541,200 | 23,612,556 | ||||||
| 64,460,288 | ||||||||
Electronic Equipment, Instruments & Components – 0.5% | ||||||||
Tyco Electronics Ltd. | 309,400 | 11,150,776 | ||||||
Semiconductors & Semiconductor Equipment – 0.5% | ||||||||
Advanced Semiconductor Engineering, Inc. (ADR) | 38,100 | 217,932 | ||||||
Intel Corp. | 580,600 | 12,465,482 | ||||||
| 12,683,414 | ||||||||
| 92,824,168 | ||||||||
Total Common Stocks | 2,268,669,835 | |||||||
| ALLIANCEBERNSTEIN POOLING PORTFOLIOS • | 55 |
U.S. Value Portfolio—Portfolio of Investments
| Company | Shares | U.S. $ Value | ||||||
SHORT-TERM INVESTMENTS – 1.6% | ||||||||
Investment Companies – 1.6% | ||||||||
AllianceBernstein Fixed-Income Shares, Inc. – Government STIF Portfolio, 0.17%(b) (cost $36,476,008) | 36,476,008 | $ | 36,476,008 | |||||
Total Investments – 98.8% | 2,305,145,843 | |||||||
Other assets less liabilities – 1.2% | 28,806,198 | |||||||
Net Assets – 100.0% | $ | 2,333,952,041 | ||||||
| (a) | Non-income producing security. |
| (b) | Investment in affiliated money market mutual fund. The rate shown represents the 7-day yield as of period end. |
Glossary:
| ADR | – American Depositary Receipt |
See notes to financial statements.
| 56 | • ALLIANCEBERNSTEIN POOLING PORTFOLIOS |
U.S. Value Portfolio—Portfolio of Investments
U.S. LARGE CAP GROWTH PORTFOLIO
PORTFOLIO OF INVESTMENTS
February 28, 2011 (unaudited)
| Company | Shares | U.S. $ Value | ||||||
COMMON STOCKS – 99.3% | ||||||||
Information Technology – 30.4% | ||||||||
Communications Equipment – 4.0% | ||||||||
Cisco Systems, Inc.(a) | 928,200 | $ | 17,227,392 | |||||
Juniper Networks, Inc.(a) | 549,500 | 24,178,000 | ||||||
QUALCOMM, Inc. | 511,300 | 30,463,254 | ||||||
Riverbed Technology, Inc.(a) | 536,500 | 22,152,085 | ||||||
| 94,020,731 | ||||||||
Computers & Peripherals – 9.8% | ||||||||
Apple, Inc.(a) | 462,000 | 163,183,020 | ||||||
EMC Corp.(a) | 2,351,407 | 63,981,784 | ||||||
| 227,164,804 | ||||||||
Internet Software & Services – 4.6% | ||||||||
Google, Inc. – Class A(a) | 174,050 | 106,762,270 | ||||||
IT Services – 1.5% | ||||||||
Accenture PLC | 705,581 | 36,323,310 | ||||||
Semiconductors & Semiconductor Equipment – 3.4% | ||||||||
Broadcom Corp. – Class A | 964,857 | 39,771,406 | ||||||
Intel Corp. | 782,696 | 16,804,483 | ||||||
Marvell Technology Group Ltd.(a) | 1,207,400 | 22,071,272 | ||||||
| 78,647,161 | ||||||||
Software – 7.1% | ||||||||
Citrix Systems, Inc.(a) | 579,300 | 40,643,688 | ||||||
Intuit, Inc.(a) | 572,900 | 30,123,082 | ||||||
Oracle Corp. | 2,082,100 | 68,501,090 | ||||||
Rovi Corp.(a) | 461,500 | 25,576,330 | ||||||
| 164,844,190 | ||||||||
| 707,762,466 | ||||||||
Consumer Discretionary – 15.8% | ||||||||
Auto Components – 3.0% | ||||||||
BorgWarner, Inc.(a) | 256,900 | 19,938,009 | ||||||
Johnson Controls, Inc. | 1,193,300 | 48,686,640 | ||||||
| 68,624,649 | ||||||||
Automobiles – 0.6% | ||||||||
Ford Motor Co.(a) | 992,100 | 14,931,105 | ||||||
Hotels, Restaurants & Leisure – 2.4% | ||||||||
Carnival Corp. | 533,300 | 22,755,911 | ||||||
Starbucks Corp. | 983,500 | 32,435,830 | ||||||
| 55,191,741 | ||||||||
Household Durables – 0.7% | ||||||||
Stanley Black & Decker, Inc. | 217,800 | 16,515,774 | ||||||
| ALLIANCEBERNSTEIN POOLING PORTFOLIOS • | 57 |
U.S. Large Cap Growth Portfolio—Portfolio of Investments
| Company | Shares | U.S. $ Value | ||||||
Internet & Catalog Retail – 1.4% | ||||||||
Amazon.com, Inc.(a) | 186,040 | $ | 32,238,872 | |||||
Media – 4.0% | ||||||||
Comcast Corp. – Class A | 566,200 | 14,585,312 | ||||||
News Corp. – Class A | 2,040,600 | 35,445,222 | ||||||
Walt Disney Co. (The) | 997,200 | 43,617,528 | ||||||
| 93,648,062 | ||||||||
Multiline Retail – 1.0% | ||||||||
Kohl’s Corp.(a) | 423,300 | 22,811,637 | ||||||
Specialty Retail – 2.7% | ||||||||
Limited Brands, Inc. | 1,115,100 | 35,705,502 | ||||||
Lowe’s Cos., Inc. | 1,033,800 | 27,054,546 | ||||||
| 62,760,048 | ||||||||
| 366,721,888 | ||||||||
Financials – 13.7% | ||||||||
Capital Markets – 6.0% | ||||||||
Blackstone Group LP | 2,077,300 | 36,975,940 | ||||||
Goldman Sachs Group, Inc. (The) | 625,595 | 102,459,949 | ||||||
| 139,435,889 | ||||||||
Commercial Banks – 0.4% | ||||||||
Wells Fargo & Co. | 278,800 | 8,994,088 | ||||||
Diversified Financial Services – 6.2% | ||||||||
CME Group, Inc. – Class A | 68,575 | 21,346,026 | ||||||
JPMorgan Chase & Co. | 2,654,300 | 123,929,267 | ||||||
| 145,275,293 | ||||||||
Insurance – 1.1% | ||||||||
AON Corp. | 491,300 | 25,862,032 | ||||||
| 319,567,302 | ||||||||
Industrials – 12.9% | ||||||||
Aerospace & Defense – 2.3% | ||||||||
Goodrich Corp. | 346,200 | 29,852,826 | ||||||
Honeywell International, Inc. | 416,100 | 24,096,351 | ||||||
| 53,949,177 | ||||||||
Air Freight & Logistics – 2.7% | ||||||||
United Parcel Service, Inc. – Class B | 858,370 | 63,347,706 | ||||||
Electrical Equipment – 4.2% | ||||||||
Cooper Industries PLC | 659,300 | 42,425,955 | ||||||
Emerson Electric Co. | 574,411 | 34,269,360 | ||||||
Rockwell Automation, Inc. | 240,700 | 21,116,611 | ||||||
| 97,811,926 | ||||||||
| 58 | • ALLIANCEBERNSTEIN POOLING PORTFOLIOS |
U.S. Large Cap Growth Portfolio—Portfolio of Investments
| Company | Shares | U.S. $ Value | ||||||
Machinery – 3.5% | ||||||||
Danaher Corp. | 1,097,300 | $ | 55,523,380 | |||||
Deere & Co. | 37,520 | 3,382,428 | ||||||
Flowserve Corp. | 167,065 | 20,878,113 | ||||||
| 79,783,921 | ||||||||
Professional Services – 0.2% | ||||||||
Nielsen Holdings NV(a) | 167,347 | 4,449,757 | ||||||
| 299,342,487 | ||||||||
Energy – 12.8% | ||||||||
Energy Equipment & Services – 6.1% | ||||||||
Cameron International Corp.(a) | 519,100 | 30,694,383 | ||||||
Schlumberger Ltd. | 1,185,095 | 110,711,575 | ||||||
| 141,405,958 | ||||||||
Oil, Gas & Consumable Fuels – 6.7% | ||||||||
EOG Resources, Inc. | 368,255 | 41,358,719 | ||||||
Noble Energy, Inc. | 626,400 | 58,042,224 | ||||||
Occidental Petroleum Corp. | 254,900 | 25,992,153 | ||||||
Southwestern Energy Co.(a) | 413,800 | 16,336,824 | ||||||
Suncor Energy, Inc. (New York) | 281,600 | 13,240,832 | ||||||
| 154,970,752 | ||||||||
| 296,376,710 | ||||||||
Health Care – 8.1% | ||||||||
Biotechnology – 2.2% | ||||||||
Celgene Corp.(a) | 568,458 | 30,185,120 | ||||||
Gilead Sciences, Inc.(a) | 528,620 | 20,605,608 | ||||||
| 50,790,728 | ||||||||
Health Care Equipment & | ||||||||
Alcon, Inc. | 123,305 | 20,398,346 | ||||||
Health Care Providers & Services – 2.1% | ||||||||
Express Scripts, Inc. – Class A(a) | 626,815 | 35,239,539 | ||||||
McKesson Corp. | 175,200 | 13,889,856 | ||||||
| 49,129,395 | ||||||||
Pharmaceuticals – 2.9% | ||||||||
Allergan, Inc. | 509,000 | 37,752,530 | ||||||
Teva Pharmaceutical Industries Ltd. (Sponsored ADR) | 583,000 | 29,208,300 | ||||||
| 66,960,830 | ||||||||
| 187,279,299 | ||||||||
Materials – 5.1% | ||||||||
Chemicals – 5.1% | ||||||||
Dow Chemical Co. (The) | 1,444,300 | 53,670,188 | ||||||
Monsanto Co. | 601,661 | 43,253,409 | ||||||
| ALLIANCEBERNSTEIN POOLING PORTFOLIOS • | 59 |
U.S. Large Cap Growth Portfolio—Portfolio of Investments
| Company | Shares | U.S. $ Value | ||||||
Potash Corp. of Saskatchewan, Inc. | 336,600 | $ | 20,734,560 | |||||
| 117,658,157 | ||||||||
Consumer Staples – 0.5% | ||||||||
Food & Staples Retailing – 0.5% | ||||||||
Costco Wholesale Corp. | 170,400 | 12,744,216 | ||||||
Total Common Stocks | 2,307,452,525 | |||||||
SHORT-TERM INVESTMENTS – 0.9% | ||||||||
Investment Companies – 0.9% | ||||||||
AllianceBernstein Fixed-Income Shares, Inc. – Government STIF Portfolio, 0.17%(b) | 20,738,048 | 20,738,048 | ||||||
Total Investments – 100.2% | 2,328,190,573 | |||||||
Other assets less liabilities – (0.2)% | (3,888,994 | ) | ||||||
Net Assets – 100.0% | $ | 2,324,301,579 | ||||||
| (a) | Non-income producing security. |
| (b) | Investment in affiliated money market mutual fund. The rate shown represents the 7-day yield as of period end. |
Glossary:
| ADR | – American Depositary Receipt |
See notes to financial statements.
| 60 | • ALLIANCEBERNSTEIN POOLING PORTFOLIOS |
U.S. Large Cap Growth Portfolio—Portfolio of Investments
INTERNATIONAL VALUE PORTFOLIO
PORTFOLIO OF INVESTMENTS
February 28, 2011 (unaudited)
| Company | Shares | U.S. $ Value | ||||||
COMMON STOCKS – 98.0% | ||||||||
Financials – 23.7% | ||||||||
Capital Markets – 0.3% | ||||||||
Macquarie Group Ltd. | 77,900 | $ | 3,028,077 | |||||
Commercial Banks – 15.1% | ||||||||
Australia & New Zealand Banking Group Ltd. | 372,300 | 9,201,518 | ||||||
Banco do Brasil SA | 486,200 | 8,693,623 | ||||||
Bank of China Ltd. | 5,987,000 | 3,159,140 | ||||||
Barclays PLC | 3,189,800 | 16,553,872 | ||||||
BNP Paribas | 153,465 | 11,977,201 | ||||||
Danske Bank A/S(a) | 165,247 | 3,873,596 | ||||||
DnB NOR ASA | 457,000 | 7,073,110 | ||||||
Hana Financial Group, Inc. | 217,460 | 8,711,133 | ||||||
KB Financial Group, Inc. | 155,362 | 7,612,994 | ||||||
KBC Groep NV(a) | 275,400 | 11,517,184 | ||||||
Lloyds Banking Group PLC(a) | 5,447,800 | 5,501,548 | ||||||
National Australia Bank Ltd. | 898,400 | 23,752,681 | ||||||
National Bank of Canada | 90,400 | 6,965,513 | ||||||
Societe Generale | 310,470 | 21,830,911 | ||||||
Sumitomo Mitsui Financial Group, Inc. | 382,900 | 14,489,586 | ||||||
Turkiye Garanti Bankasi AS | 490,400 | 2,173,130 | ||||||
Turkiye Is Bankasi – Class C | 1,849,600 | 5,764,457 | ||||||
UniCredit SpA | 5,670,100 | 14,588,076 | ||||||
| 183,439,273 | ||||||||
Diversified Financial Services – 2.0% | ||||||||
ING Groep NV(a) | 1,130,900 | 14,186,598 | ||||||
ORIX Corp. | 84,240 | 9,487,250 | ||||||
| 23,673,848 | ||||||||
Insurance – 5.0% | ||||||||
Aegon NV(a) | 1,156,227 | 8,899,904 | ||||||
Allianz SE | 181,600 | 26,224,870 | ||||||
Aviva PLC | 1,824,600 | 13,849,521 | ||||||
Muenchener Rueckversicherungs AG | 73,000 | 12,205,309 | ||||||
| 61,179,604 | ||||||||
Real Estate Management & Development – 1.3% | ||||||||
Evergrande Real Estate Group Ltd. | 6,165,000 | 2,921,500 | ||||||
Mitsui Fudosan Co., Ltd. | 283,000 | 6,048,145 | ||||||
New World Development Ltd. | 3,805,224 | 6,914,630 | ||||||
| 15,884,275 | ||||||||
| 287,205,077 | ||||||||
| ALLIANCEBERNSTEIN POOLING PORTFOLIOS • | 61 |
International Value Portfolio—Portfolio of Investments
| Company | Shares | U.S. $ Value | ||||||
Consumer Discretionary – 13.7% | ||||||||
Auto Components – 2.6% | ||||||||
Bridgestone Corp. | 159,300 | $ | 3,275,607 | |||||
Faurecia(a) | 6,842 | 266,432 | ||||||
GKN PLC | 2,965,900 | 10,116,882 | ||||||
Magna International, Inc. – Class A | 139,200 | 6,855,766 | ||||||
NGK Spark Plug Co., Ltd. | 503,000 | 7,535,952 | ||||||
Sumitomo Rubber Industries Ltd. | 272,400 | 2,953,595 | ||||||
| 31,004,234 | ||||||||
Automobiles – 4.3% | ||||||||
Nissan Motor Co., Ltd. | 1,702,400 | 17,492,327 | ||||||
Renault SA(a) | 259,400 | 15,907,064 | ||||||
Toyota Motor Corp. | 399,500 | 18,667,585 | ||||||
| 52,066,976 | ||||||||
Hotels, Restaurants & Leisure – 0.3% | ||||||||
Thomas Cook Group PLC | 974,200 | 2,995,823 | ||||||
Household Durables – 2.4% | ||||||||
LG Electronics, Inc. | 65,790 | 6,494,648 | ||||||
Sharp Corp. | 915,000 | 9,968,612 | ||||||
Sony Corp. | 353,300 | 13,008,012 | ||||||
| 29,471,272 | ||||||||
Media – 2.7% | ||||||||
Informa PLC | 1,155,300 | 8,163,083 | ||||||
Lagardere SCA | 137,957 | 6,209,441 | ||||||
Vivendi SA | 638,860 | 18,208,047 | ||||||
| 32,580,571 | ||||||||
Multiline Retail – 0.4% | ||||||||
Marks & Spencer Group PLC | 96,793 | 544,995 | ||||||
PPR | 31,200 | 4,733,544 | ||||||
| 5,278,539 | ||||||||
Specialty Retail – 0.7% | ||||||||
Esprit Holdings Ltd. | 1,820,500 | 8,960,195 | ||||||
Textiles, Apparel & Luxury Goods – 0.3% | ||||||||
Yue Yuen Industrial Holdings Ltd. | 1,049,000 | 3,309,568 | ||||||
| 165,667,178 | ||||||||
Energy – 11.5% | ||||||||
Oil, Gas & Consumable Fuels – 11.5% | ||||||||
BP PLC | 3,490,800 | 28,141,634 | ||||||
China Petroleum & Chemical Corp. – Class H | 3,398,000 | 3,448,706 | ||||||
ENI SpA | 493,300 | 12,027,921 | ||||||
Gazprom OAO (Sponsored ADR) | 436,300 | 12,792,316 | ||||||
JX Holdings, Inc. | 928,000 | 6,537,269 | ||||||
| 62 | • ALLIANCEBERNSTEIN POOLING PORTFOLIOS |
International Value Portfolio—Portfolio of Investments
| Company | Shares | U.S. $ Value | ||||||
LUKOIL OAO (London) (Sponsored ADR) | 98,750 | $ | 7,030,012 | |||||
Nexen, Inc. (Toronto) | 521,520 | 14,230,349 | ||||||
OMV AG | 201,100 | 8,545,740 | ||||||
Penn West Petroleum Ltd. | 356,314 | 10,301,951 | ||||||
Royal Dutch Shell PLC (Euronext Amsterdam) – Class A | 808,086 | 29,090,813 | ||||||
Suncor Energy, Inc. (Toronto) | 152,248 | 7,155,209 | ||||||
| 139,301,920 | ||||||||
Materials – 10.3% | ||||||||
Chemicals – 2.7% | ||||||||
Agrium, Inc. (Toronto) | 118,800 | 11,264,326 | ||||||
Air Water, Inc. | 165,000 | 2,189,654 | ||||||
Clariant AG(a) | 200,500 | 3,309,488 | ||||||
DIC Corp. | 1,557,000 | 4,152,483 | ||||||
Incitec Pivot Ltd. | 699,700 | 3,156,984 | ||||||
Koninklijke DSM NV | 138,706 | 8,148,051 | ||||||
| 32,220,986 | ||||||||
Metals & Mining – 7.6% | ||||||||
Dowa Holdings Co., Ltd. | 488,000 | 3,449,095 | ||||||
Hindalco Industries Ltd. | 385,000 | 1,726,236 | ||||||
JFE Holdings, Inc. | 334,200 | 10,583,892 | ||||||
Rio Tinto PLC | 353,000 | 24,857,056 | ||||||
Tata Steel Ltd. | 573,100 | 7,740,689 | ||||||
ThyssenKrupp AG | 276,500 | 11,539,110 | ||||||
Vale SA (Sponsored ADR) (Local Preference Shares) | 747,900 | 22,414,563 | ||||||
Xstrata PLC | 431,480 | 9,868,416 | ||||||
| 92,179,057 | ||||||||
| 124,400,043 | ||||||||
Industrials – 9.7% | ||||||||
Aerospace & Defense – 0.9% | ||||||||
BAE Systems PLC | 2,110,300 | 11,285,228 | ||||||
Building Products – 1.7% | ||||||||
Asahi Glass Co., Ltd. | 980,000 | 13,702,626 | ||||||
Cie de St-Gobain | 107,000 | 6,390,990 | ||||||
| 20,093,616 | ||||||||
Construction & Engineering – 1.8% | ||||||||
Bouygues SA | 479,200 | 22,135,068 | ||||||
Electrical Equipment – 1.9% | ||||||||
Furukawa Electric Co., Ltd. | 1,048,000 | 4,475,607 | ||||||
Mitsubishi Electric Corp. | 553,000 | 6,571,002 | ||||||
Sumitomo Electric Industries Ltd. | 795,800 | 11,678,123 | ||||||
| 22,724,732 | ||||||||
| ALLIANCEBERNSTEIN POOLING PORTFOLIOS • | 63 |
International Value Portfolio—Portfolio of Investments
| Company | Shares | U.S. $ Value | ||||||
Industrial Conglomerates – 0.8% | ||||||||
Bidvest Group Ltd. | 245,253 | $ | 5,495,857 | |||||
SembCorp Industries Ltd. | 1,130,000 | 4,249,434 | ||||||
| 9,745,291 | ||||||||
Road & Rail – 0.7% | ||||||||
East Japan Railway Co. | 61,400 | 4,281,385 | ||||||
Firstgroup PLC | 700,200 | 4,154,992 | ||||||
| 8,436,377 | ||||||||
Trading Companies & Distributors – 1.9% | ||||||||
Mitsubishi Corp. | 548,400 | 15,257,724 | ||||||
Mitsui & Co., Ltd. | 460,800 | 8,423,402 | ||||||
| 23,681,126 | ||||||||
| 118,101,438 | ||||||||
Telecommunication Services – 7.5% | ||||||||
Diversified Telecommunication Services – 5.3% | ||||||||
France Telecom SA | 640,800 | 14,180,137 | ||||||
Nippon Telegraph & Telephone Corp. | 351,000 | 17,170,174 | ||||||
Telecom Corp. of New Zealand Ltd. | 2,460,332 | 3,870,055 | ||||||
Telecom Italia SpA (ordinary shares) | 9,707,700 | 15,155,870 | ||||||
Telecom Italia SpA (savings shares) | 4,931,400 | 6,526,981 | ||||||
Telenor ASA | 441,800 | 7,329,709 | ||||||
| 64,232,926 | ||||||||
Wireless Telecommunication Services – 2.2% | ||||||||
Vodafone Group PLC | 9,552,537 | 27,120,543 | ||||||
| 91,353,469 | ||||||||
Health Care – 6.5% | ||||||||
Pharmaceuticals – 6.5% | ||||||||
AstraZeneca PLC | 654,700 | 32,035,962 | ||||||
Novartis AG | 375,110 | 21,079,912 | ||||||
Roche Holding AG | 103,700 | 15,642,352 | ||||||
Sanofi-Aventis SA | 154,919 | 10,712,325 | ||||||
| 79,470,551 | ||||||||
Information Technology – 6.0% | ||||||||
Computers & Peripherals – 1.6% | ||||||||
Fujitsu Ltd. | 1,372,000 | 9,303,828 | ||||||
Lite-On Technology Corp. | 1,232,000 | 1,545,387 | ||||||
Pegatron Corp.(a) | 2,027,000 | 2,413,747 | ||||||
Toshiba Corp. | 993,000 | 6,525,056 | ||||||
| 19,788,018 | ||||||||
| 64 | • ALLIANCEBERNSTEIN POOLING PORTFOLIOS |
International Value Portfolio—Portfolio of Investments
| Company | Shares | U.S. $ Value | ||||||
Electronic Equipment, Instruments & Components – 1.0% | ||||||||
AU Optronics Corp.(a) | 13,470,790 | $ | 12,178,250 | |||||
IT Services – 1.3% | ||||||||
Cap Gemini SA | 265,900 | 15,545,998 | ||||||
Office Electronics – 0.4% | ||||||||
Konica Minolta Holdings, Inc. | 527,500 | 4,887,160 | ||||||
Semiconductors & Semiconductor Equipment – 1.7% | ||||||||
Powertech Technology, Inc. | 708,000 | 2,483,900 | ||||||
Samsung Electronics Co., Ltd. | 22,330 | 18,313,942 | ||||||
| 20,797,842 | ||||||||
| 73,197,268 | ||||||||
Consumer Staples – 5.2% | ||||||||
Beverages – 0.4% | ||||||||
Asahi Breweries Ltd. | 261,300 | 5,051,171 | ||||||
Food & Staples Retailing – 1.7% | ||||||||
Delhaize Group SA | 156,300 | 12,073,276 | ||||||
Koninklijke Ahold NV | 640,300 | 8,600,332 | ||||||
| 20,673,608 | ||||||||
Tobacco – 3.1% | ||||||||
Imperial Tobacco Group PLC | 492,200 | 15,794,833 | ||||||
Japan Tobacco, Inc. | 5,361 | 22,176,309 | ||||||
| 37,971,142 | ||||||||
| 63,695,921 | ||||||||
Utilities – 3.9% | ||||||||
Electric Utilities – 3.9% | ||||||||
E.ON AG | 730,600 | 23,996,404 | ||||||
EDP – Energias de Portugal SA | 2,210,300 | 8,385,194 | ||||||
Tokyo Electric Power Co., Inc. (The) | 566,000 | 14,650,834 | ||||||
| 47,032,432 | ||||||||
Total Common Stocks | 1,189,425,297 | |||||||
| ALLIANCEBERNSTEIN POOLING PORTFOLIOS • | 65 |
International Value Portfolio—Portfolio of Investments
| Company | Shares | U.S. $ Value | ||||||
SHORT-TERM INVESTMENTS – 0.7% | ||||||||
Investment Companies – 0.7% | ||||||||
AllianceBernstein Fixed-Income Shares, Inc. – Government STIF Portfolio, 0.17%(b) | 8,099,845 | $ | 8,099,845 | |||||
Total Investments – 98.7% | 1,197,525,142 | |||||||
Other assets less liabilities – 1.3% | 15,718,082 | |||||||
Net Assets – 100.0% | $ | 1,213,243,224 | ||||||
FUTURES CONTRACTS (see Note C)
| Type | Number of Contracts | Expiration Month | Original Value | Value at February 28, 2011 | Unrealized Appreciation/ (Depreciation) | |||||||||||||||
Purchased Contracts | ||||||||||||||||||||
Euro STOXX 50 Futures | 51 | March 2011 | $ | 2,004,970 | $ | 2,120,473 | $ | 115,503 | ||||||||||||
Topix Index Futures | 50 | March 2011 | 5,369,916 | 5,812,603 | 442,687 | |||||||||||||||
| $ | 558,190 | |||||||||||||||||||
FORWARD CURRENCY EXCHANGE CONTRACTS (see Note C)
| Counterparty & Description | Contract Amount (000) | U.S. $ Value on Origination Date | U.S. $ Value at | Unrealized Appreciation/ (Depreciation) | ||||||||||||
Buy Contracts: | ||||||||||||||||
Bank of America NA: | ||||||||||||||||
Swedish Krona settling 5/16/11 | 234,489 | $ | 36,402,856 | $ | 36,883,341 | $ | 480,485 | |||||||||
Credit Suisse London Branch (GFX): | ||||||||||||||||
Great British Pound settling 5/16/11 | 3,801 | 6,101,555 | 6,174,424 | 72,869 | ||||||||||||
Norwegian Krone settling 5/16/11 | 32,371 | 5,610,517 | 5,757,141 | 146,624 | ||||||||||||
Deutsche Bank AG London: | ||||||||||||||||
Norwegian Krone settling 5/16/11 | 298,812 | 50,661,901 | 53,143,331 | 2,481,430 | ||||||||||||
Swedish Krona settling 5/16/11 | 155,331 | 23,092,396 | 24,432,388 | 1,339,992 | ||||||||||||
Swiss Franc settling 5/16/11 | 46,191 | 47,958,760 | 49,749,186 | 1,790,426 | ||||||||||||
Swiss Franc settling 5/16/11 | 45,578 | 47,625,915 | 49,088,966 | 1,463,051 | ||||||||||||
HSBC BankUSA: | ||||||||||||||||
Great British Pound settling 5/16/11 | 29,001 | 45,979,055 | 47,109,836 | 1,130,781 | ||||||||||||
UBS AG: | ||||||||||||||||
Euro settling 5/16/11 | 77,512 | 105,290,750 | 106,860,503 | 1,569,753 | ||||||||||||
Westpac Banking Corp.: | ||||||||||||||||
Australian Dollar settling 5/16/11 | 27,136 | 27,183,488 | 27,371,862 | 188,374 | ||||||||||||
| 66 | • ALLIANCEBERNSTEIN POOLING PORTFOLIOS |
International Value Portfolio—Portfolio of Investments
| Counterparty & Description | Contract Amount (000) | U.S. $ Value on Origination Date | U.S. $ Value at | Unrealized Appreciation/ (Depreciation) | ||||||||||||
Sale Contracts: | ||||||||||||||||
Barclays Bank PLC Wholesale: | ||||||||||||||||
Japanese Yen settling 5/16/11 | 4,235,551 | $ | 51,662,512 | $ | 51,803,995 | $ | (141,483 | ) | ||||||||
BNP Paribas SA: | ||||||||||||||||
Australian Dollar settling 5/16/11 | 27,136 | 27,001,107 | 27,371,861 | (370,754 | ) | |||||||||||
Canadian Dollar settling 5/16/11 | 41,436 | 41,796,706 | 42,577,241 | (780,535 | ) | |||||||||||
Citibank NA: | ||||||||||||||||
Canadian Dollar settling 5/16/11 | 8,806 | 8,843,647 | 9,048,537 | (204,890 | ) | |||||||||||
Great British Pound settling 5/16/11 | 3,016 | 4,891,430 | 4,899,254 | (7,824 | ) | |||||||||||
Deutsche Bank AG London: | ||||||||||||||||
Euro settling 5/16/11 | 118,588 | 158,222,481 | 163,489,180 | (5,266,699 | ) | |||||||||||
Euro settling 5/16/11 | 22,163 | 30,272,552 | 30,554,615 | (282,063 | ) | |||||||||||
State Street Bank and Trust Co.: | ||||||||||||||||
Great British Pound settling 5/16/11 | 8,753 | 14,121,653 | 14,218,558 | (96,905 | ) | |||||||||||
UBS AG: | ||||||||||||||||
Swiss Franc settling 5/16/11 | 46,493 | 48,925,580 | 50,074,450 | (1,148,870 | ) | |||||||||||
| (a) | Non-income producing security. |
| (b) | Investment in affiliated money market mutual fund. The rate shown represents the 7-day yield as of period end. |
Glossary:
| ADR | – American Depositary Receipt |
See notes to financial statements.
| ALLIANCEBERNSTEIN POOLING PORTFOLIOS • | 67 |
International Value Portfolio—Portfolio of Investments
INTERNATIONAL GROWTH PORTFOLIO
PORTFOLIO OF INVESTMENTS
February 28, 2011 (unaudited)
| Company | Shares | U.S. $ Value | ||||||
COMMON STOCKS – 98.3% | ||||||||
Financials – 19.6% | ||||||||
Capital Markets – 2.7% | ||||||||
GP Investments Ltd. (BDR)(a) | 1,442,500 | $ | 5,722,142 | |||||
Man Group PLC | 2,882,052 | 13,466,524 | ||||||
UBS AG(a) | 593,662 | 11,779,901 | ||||||
| 30,968,567 | ||||||||
Commercial Banks – 6.6% | ||||||||
Banco Santander Brasil SA (ADR) | 370,500 | 4,512,690 | ||||||
Bank Rakyat Indonesia Persero TBK PT | 5,269,000 | 2,823,961 | ||||||
BNP Paribas | 146,900 | 11,464,834 | ||||||
HDFC Bank Ltd. | 144,800 | 6,567,083 | ||||||
HSBC Holdings PLC | 1,473,200 | 16,224,568 | ||||||
Itau Unibanco Holding SA (ADR) | 517,780 | 11,505,072 | ||||||
Standard Chartered PLC | 860,742 | 22,765,595 | ||||||
| 75,863,803 | ||||||||
Consumer Finance – 0.2% | ||||||||
Shriram Transport Finance Co., Ltd. | 176,300 | 2,891,189 | ||||||
Diversified Financial Services – 0.9% | ||||||||
BM&F Bovespa SA | 239,100 | 1,625,328 | ||||||
IG Group Holdings PLC | 1,280,052 | 9,324,535 | ||||||
| 10,949,863 | ||||||||
Insurance – 3.0% | ||||||||
Admiral Group PLC | 632,053 | 17,351,513 | ||||||
AIA Group Ltd.(a) | 3,111,000 | 9,087,731 | ||||||
Prudential PLC | 732,900 | 8,477,954 | ||||||
| 34,917,198 | ||||||||
Real Estate Management & Development – 5.8% | ||||||||
CapitaLand Ltd. | 6,066,000 | 15,612,328 | ||||||
CapitaMalls Asia Ltd. | 3,345,000 | 4,543,004 | ||||||
China Overseas Land & Investment Ltd. | 2,994,000 | 5,004,420 | ||||||
Hang Lung Group Ltd. | 787,800 | 4,836,271 | ||||||
Hang Lung Properties Ltd. | 7,209,000 | 30,883,924 | ||||||
Mitsubishi Estate Co., Ltd. | 291,000 | 5,966,377 | ||||||
| 66,846,324 | ||||||||
Thrifts & Mortgage Finance – 0.4% | ||||||||
Housing Development Finance Corp. | 316,000 | 4,420,135 | ||||||
| 226,857,079 | ||||||||
Consumer Staples – 15.7% | ||||||||
Beverages – 2.7% | ||||||||
Anheuser-Busch InBev NV | 565,437 | 31,578,384 | ||||||
| 68 | • ALLIANCEBERNSTEIN POOLING PORTFOLIOS |
International Growth Portfolio—Portfolio of Investments
| Company | Shares | U.S. $ Value | ||||||
Food & Staples Retailing – 4.2% | ||||||||
Olam International Ltd. | 9,956,000 | $ | 21,840,010 | |||||
Sugi Holdings Co., Ltd. | 20,500 | 492,550 | ||||||
Tesco PLC | 4,017,680 | 26,389,128 | ||||||
| 48,721,688 | ||||||||
Food Products – 0.4% | ||||||||
China Green Holdings Ltd. | 5,622,000 | 4,419,931 | ||||||
Household Products – 1.4% | ||||||||
Reckitt Benckiser Group PLC | 311,517 | 16,060,506 | ||||||
Personal Products – 0.5% | ||||||||
Hypermarcas SA(a) | 507,300 | 5,793,184 | ||||||
Tobacco – 6.5% | ||||||||
British American Tobacco PLC | 649,104 | 26,005,688 | ||||||
Imperial Tobacco Group PLC | 734,700 | 23,576,725 | ||||||
Japan Tobacco, Inc. | 6,075 | 25,129,841 | ||||||
| 74,712,254 | ||||||||
| 181,285,947 | ||||||||
Materials – 15.5% | ||||||||
Chemicals – 8.3% | ||||||||
Huabao International Holdings Ltd. | 3,312,000 | 4,180,400 | ||||||
Israel Chemicals Ltd. | 2,353,700 | 39,194,849 | ||||||
K&S AG | 528,500 | 40,854,721 | ||||||
Potash Corp. of Saskatchewan, Inc. | 186,900 | 11,513,040 | ||||||
| 95,743,010 | ||||||||
Metals & Mining – 7.2% | ||||||||
Agnico-Eagle Mines Ltd. | 81,600 | 5,740,560 | ||||||
Centamin Egypt Ltd.(a) | 1,091,700 | 2,105,092 | ||||||
Newcrest Mining Ltd. | 150,900 | 5,832,320 | ||||||
Rio Tinto PLC | 457,200 | 32,194,465 | ||||||
Vale SA (Sponsored ADR) – Class B | 669,200 | 22,906,716 | ||||||
Xstrata PLC | 620,720 | 14,196,541 | ||||||
| 82,975,694 | ||||||||
| 178,718,704 | ||||||||
Industrials – 14.2% | ||||||||
Air Freight & Logistics – 0.7% | ||||||||
Kuehne & Nagel International AG | 55,707 | 7,492,779 | ||||||
Commercial Services & Supplies – 3.5% | ||||||||
Aggreko PLC | 410,600 | 9,661,903 | ||||||
G4S PLC | 796,014 | 3,416,264 | ||||||
Serco Group PLC | 3,119,730 | 27,622,953 | ||||||
| 40,701,120 | ||||||||
| ALLIANCEBERNSTEIN POOLING PORTFOLIOS • | 69 |
International Growth Portfolio—Portfolio of Investments
| Company | Shares | U.S. $ Value | ||||||
Construction & Engineering – 0.4% | ||||||||
Larsen & Toubro Ltd. | 95,700 | $ | 3,233,556 | |||||
Larsen & Toubro Ltd. (GDR) | 33,600 | 1,139,712 | ||||||
| 4,373,268 | ||||||||
Electrical Equipment – 1.1% | ||||||||
Bharat Heavy Electricals Ltd. | 116,700 | 5,196,304 | ||||||
Vestas Wind Systems A/S(a) | 209,917 | 7,209,702 | ||||||
| 12,406,006 | ||||||||
Machinery – 2.9% | ||||||||
Fanuc Corp. | 143,100 | 22,353,527 | ||||||
Jain Irrigation Systems Ltd. | 2,105,612 | 8,530,768 | ||||||
Komatsu Ltd. | 95,300 | 2,923,677 | ||||||
| 33,807,972 | ||||||||
Professional Services – 4.2% | ||||||||
Capita Group PLC (The) | 3,006,400 | 35,456,981 | ||||||
Experian PLC | 680,200 | 8,626,055 | ||||||
Intertek Group PLC | 160,550 | 4,707,089 | ||||||
| 48,790,125 | ||||||||
Road & Rail – 0.4% | ||||||||
DSV A/S | 210,847 | 4,870,318 | ||||||
Transportation Infrastructure – 1.0% | ||||||||
China Merchants Holdings International Co., Ltd. | 2,600,000 | 11,033,676 | ||||||
| 163,475,264 | ||||||||
Consumer Discretionary – 12.8% | ||||||||
Distributors – 3.6% | ||||||||
Li & Fung Ltd. | 6,916,000 | 42,078,243 | ||||||
Diversified Consumer Services – 0.5% | ||||||||
Anhanguera Educacional Participacoes SA | 239,400 | 5,352,615 | ||||||
Hotels, Restaurants & Leisure – 0.4% | ||||||||
Ajisen China Holdings Ltd. | 1,226,800 | 1,880,118 | ||||||
Shangri-La Asia Ltd. | 1,174,333 | 2,768,288 | ||||||
| 4,648,406 | ||||||||
Household Durables – 0.4% | ||||||||
MRV Engenharia e Participacoes SA | 564,800 | 4,484,318 | ||||||
Multiline Retail – 0.3% | ||||||||
Don Quijote Co., Ltd. | 98,400 | 3,440,476 | ||||||
Specialty Retail – 7.1% | ||||||||
Fast Retailing Co., Ltd. | 66,500 | 10,440,813 | ||||||
Hennes & Mauritz AB – Class B | 1,015,950 | 33,195,459 | ||||||
Inditex SA | 372,230 | 26,975,235 | ||||||
| 70 | • ALLIANCEBERNSTEIN POOLING PORTFOLIOS |
International Growth Portfolio—Portfolio of Investments
| Company | Shares | U.S. $ Value | ||||||
Yamada Denki Co., Ltd. | 154,340 | $ | 11,789,818 | |||||
| 82,401,325 | ||||||||
Textiles, Apparel & Luxury Goods – 0.5% | ||||||||
Cie Financiere Richemont SA | 98,200 | 5,619,394 | ||||||
| 148,024,777 | ||||||||
Energy – 11.4% | ||||||||
Energy Equipment & Services – 8.0% | ||||||||
AMEC PLC | 1,532,021 | 28,992,906 | ||||||
Petrofac Ltd. | 1,288,000 | 29,163,076 | ||||||
Saipem SpA | 337,000 | 17,024,679 | ||||||
Technip SA | 177,100 | 17,502,672 | ||||||
| 92,683,333 | ||||||||
Oil, Gas & Consumable Fuels – 3.4% | ||||||||
Afren PLC(a) | 4,514,400 | 11,753,715 | ||||||
Petroleo Brasileiro SA (ADR) | 676,900 | 26,960,927 | ||||||
| 38,714,642 | ||||||||
| 131,397,975 | ||||||||
Information Technology – 7.9% | ||||||||
Communications Equipment – 0.5% | ||||||||
HTC Corp. | 171,000 | 6,176,617 | ||||||
Computers & Peripherals – 2.3% | ||||||||
Logitech International SA(a) | 1,422,061 | 27,028,806 | ||||||
Internet Software & Services – 1.0% | ||||||||
Yahoo! Japan Corp. | 30,919 | 11,656,654 | ||||||
Semiconductors & Semiconductor Equipment – 0.5% | ||||||||
Trina Solar Ltd. (Sponsored ADR)(a) | 195,200 | 5,387,520 | ||||||
Software – 3.6% | ||||||||
Aveva Group PLC | 256,960 | 6,662,279 | ||||||
SAP AG | 388,500 | 23,476,535 | ||||||
Temenos Group AG(a) | 297,370 | 11,277,485 | ||||||
| 41,416,299 | ||||||||
| 91,665,896 | ||||||||
Health Care – 1.2% | ||||||||
Pharmaceuticals – 1.2% | ||||||||
Aspen Pharmacare Holdings Ltd.(a) | 1,193,544 | 13,972,575 | ||||||
Total Common Stocks | 1,135,398,217 | |||||||
| ALLIANCEBERNSTEIN POOLING PORTFOLIOS • | 71 |
International Growth Portfolio—Portfolio of Investments
| Company | Shares | U.S. $ Value | ||||||
SHORT-TERM INVESTMENTS – 0.7% | ||||||||
Investment Companies – 0.7% | ||||||||
AllianceBernstein Fixed-Income Shares, Inc. – Government STIF Portfolio, 0.17%(b) (cost $8,460,708) | 8,460,708 | $ | 8,460,708 | |||||
Total Investments – 99.0% | 1,143,858,925 | |||||||
Other assets less liabilities – 1.0% | 10,980,076 | |||||||
Net Assets – 100.0% | $ | 1,154,839,001 | ||||||
FORWARD CURRENCY EXCHANGE CONTRACTS (see Note C)
| Counterparty & Description | Contract Amount (000) | U.S. $ Value on Origination Date | U.S. $ Value at February 28, 2011 | Unrealized Appreciation/ (Depreciation) | ||||||||||||
Buy Contracts: | ||||||||||||||||
Bank of America NA: | ||||||||||||||||
Japanese Yen settling 3/15/11 | 1,573,425 | $ | 18,864,424 | $ | 19,235,354 | $ | 370,930 | |||||||||
Barclays Bank PLC: | ||||||||||||||||
Japanese Yen settling 3/15/11 | 6,628,198 | 78,854,550 | 81,030,704 | 2,176,154 | ||||||||||||
Japanese Yen settling 3/15/11 | 2,704,239 | 32,486,864 | 33,059,723 | 572,859 | ||||||||||||
Citibank NA: | ||||||||||||||||
Canadian Dollar settling 3/15/11 | 2,285 | 2,251,963 | 2,351,245 | 99,282 | ||||||||||||
Deutsche Bank AG London: | ||||||||||||||||
Canadian Dollar settling 3/15/11 | 2,160 | 2,181,598 | 2,222,621 | 41,023 | ||||||||||||
Euro settling 3/15/11 | 117,419 | 155,427,530 | 162,005,962 | 6,578,432 | ||||||||||||
Swedish Krona settling 3/15/11 | 84,503 | 12,594,530 | 13,333,682 | 739,152 | ||||||||||||
Swedish Krona settling 3/15/11 | 80,310 | 11,969,595 | 12,672,071 | 702,476 | ||||||||||||
Swiss Franc settling 3/15/11 | 9,046 | 9,386,252 | 9,737,378 | 351,126 | ||||||||||||
HSBC BankUSA: | ||||||||||||||||
Great British Pound settling 3/15/11 | 14,910 | 23,654,864 | 24,235,898 | 581,034 | ||||||||||||
Hong Kong Dollar settling 3/15/11 | 29,074 | 3,740,359 | 3,733,632 | (6,727 | ) | |||||||||||
JP Morgan Chase Bank NA: | ||||||||||||||||
Canadian Dollar settling 3/15/11 | 3,834 | 3,844,110 | 3,945,153 | 101,043 | ||||||||||||
Morgan Stanley and Co.: | ||||||||||||||||
Australian Dollar settling 3/15/11 | 76,620 | 74,317,569 | 77,885,955 | 3,568,386 | ||||||||||||
Royal Bank of Canada: | ||||||||||||||||
Swedish Krona settling 6/15/11 | 222,244 | 34,174,035 | 34,896,387 | 722,352 | ||||||||||||
UBS AG: | ||||||||||||||||
Hong Kong Dollar settling 3/15/11 | 761,885 | 98,040,250 | 97,839,947 | (200,303 | ) | |||||||||||
Swedish Krona settling 3/15/11 | 48,910 | 7,558,816 | 7,717,482 | 158,666 | ||||||||||||
Westpac Banking Corp.: | ||||||||||||||||
Canadian Dollar settling 3/15/11 | 2,721 | 2,728,840 | 2,799,886 | 71,046 | ||||||||||||
| 72 | • ALLIANCEBERNSTEIN POOLING PORTFOLIOS |
International Growth Portfolio—Portfolio of Investments
| Counterparty & Description | Contract Amount (000) | U.S. $ Value on Origination Date | U.S. $ Value at February 28, 2011 | Unrealized Appreciation/ (Depreciation) | ||||||||||||
Sale Contracts: | ||||||||||||||||
Bank of America NA: | ||||||||||||||||
Australian Dollar settling 3/15/11 | 76,620 | $ | 75,309,032 | $ | 77,885,955 | $ | (2,576,923 | ) | ||||||||
BNP Paribas SA: | ||||||||||||||||
Japanese Yen settling 3/15/11 | 1,403,887 | 17,048,636 | 17,162,727 | (114,091 | ) | |||||||||||
Calyon: | ||||||||||||||||
Canadian Dollar settling 3/15/11 | 12,221 | 12,091,620 | 12,575,303 | (483,683 | ) | |||||||||||
Citibank NA: | ||||||||||||||||
Canadian Dollar settling 3/15/11 | 2,647 | 2,616,603 | 2,723,740 | (107,137 | ) | |||||||||||
Credit Suisse London Branch (GFX): | ||||||||||||||||
Great British Pound settling 3/15/11 | 7,295 | 11,499,838 | 11,857,872 | (358,034 | ) | |||||||||||
Japanese Yen settling 3/15/11 | 3,364,589 | 40,676,891 | 41,132,600 | (455,709 | ) | |||||||||||
Swedish Krona settling 3/15/11 | 44,678 | 6,478,171 | 7,049,718 | (571,547 | ) | |||||||||||
Deutsche Bank AG London: | ||||||||||||||||
Euro settling 3/15/11 | 36,320 | 48,487,200 | 50,111,622 | (1,624,422 | ) | |||||||||||
Hong Kong Dollar settling 3/15/11 | 56,040 | 7,218,998 | 7,196,559 | 22,439 | ||||||||||||
Hong Kong Dollar settling 3/15/11 | 44,370 | 5,718,917 | 5,697,918 | 20,999 | ||||||||||||
Swedish Krona settling 3/15/11 | 39,825 | 5,764,220 | 6,283,965 | (519,745 | ) | |||||||||||
HSBC BankUSA: | ||||||||||||||||
Canadian Dollar settling 6/15/11 | 10,965 | 11,076,541 | 11,257,964 | (181,423 | ) | |||||||||||
Great British Pound settling 6/15/11 | 4,744 | 7,585,229 | 7,702,533 | (117,304 | ) | |||||||||||
Hong Kong Dollar settling 3/15/11 | 33,752 | 4,350,163 | 4,334,373 | 15,790 | ||||||||||||
Hong Kong Dollar settling 3/15/11 | 635,662 | 81,853,500 | 81,630,609 | 222,891 | ||||||||||||
Morgan Stanley and Co.: | ||||||||||||||||
Great British Pound settling 3/15/11 | 132,124 | 208,523,382 | 214,764,843 | (6,241,461 | ) | |||||||||||
Swiss Franc settling 3/15/11 | 9,046 | 9,157,029 | 9,737,377 | (580,348 | ) | |||||||||||
Royal Bank of Canada: | ||||||||||||||||
Euro settling 3/15/11 | 10,588 | 14,266,377 | 14,608,531 | (342,154 | ) | |||||||||||
Societe Generale: | ||||||||||||||||
Great British Pound settling 3/15/11 | 1,795 | 2,833,767 | 2,917,736 | (83,969 | ) | |||||||||||
Standard Chartered Bank: | ||||||||||||||||
Hong Kong Dollar settling 3/15/11 | 21,135 | 2,727,765 | 2,714,120 | 13,645 | ||||||||||||
| (a) | Non-income producing security. |
| (b) | Investment in affiliated money market mutual fund. The rate shown represents the 7-day yield as of period end. |
Glossary:
| ADR | – American Depositary Receipt |
| BDR | – Brazilian Depositary Receipt |
| GDR | – Global Depositary Receipt |
See notes to financial statements.
| ALLIANCEBERNSTEIN POOLING PORTFOLIOS • | 73 |
International Growth Portfolio—Portfolio of Investments
SHORT DURATION BOND PORTFOLIO
PORTFOLIO OF INVESTMENTS
February 28, 2011 (unaudited)
| Principal Amount (000) | U.S. $ Value | |||||||
GOVERNMENTS - TREASURIES – 44.2% | ||||||||
United States – 44.2% | ||||||||
U.S. Treasury Notes | $ | 31,285 | $ | 31,199,467 | ||||
0.625%, 2/28/13 | 73,405 | 73,313,243 | ||||||
0.75%, 11/30/11-5/31/12 | 141,000 | 141,693,720 | ||||||
1.375%, 11/15/12-1/15/13 | 240,773 | 244,069,833 | ||||||
1.75%, 8/15/12 | 91,037 | 92,775,989 | ||||||
Total Governments - Treasuries | 583,052,252 | |||||||
ASSET-BACKED SECURITIES – 15.1% | ||||||||
Autos - Fixed Rate – 6.1% | ||||||||
Ally Auto Receivables Trust | 4,618 | 4,604,312 | ||||||
Bank of America Auto Trust | 8,610 | 8,913,897 | ||||||
Series 2009-3A, Class A4 | 12,380 | 12,759,260 | ||||||
Chrysler Financial Auto Securitization Trust | 5,013 | 5,082,918 | ||||||
Ford Credit Auto Owner Trust | 6,545 | 6,452,783 | ||||||
Harley-Davidson Motorcycle Trust | 2,905 | 2,905,640 | ||||||
Mercedes-Benz Auto Lease Trust | 6,540 | 6,523,042 | ||||||
Mercedes-Benz Auto Receivables Trust | 7,560 | 7,750,430 | ||||||
Nissan Auto Lease Trust | 10,555 | 10,696,536 | ||||||
Series 2010-B, Class A2 | 4,475 | 4,477,562 | ||||||
Nissan Auto Receivables Owner Trust | 3,628 | 3,614,251 | ||||||
Volkswagen Auto Lease Trust | 6,225 | 6,234,582 | ||||||
| 80,015,213 | ||||||||
| 74 | • ALLIANCEBERNSTEIN POOLING PORTFOLIOS |
Short Duration Bond Portfolio—Portfolio of Investments
| Principal Amount (000) | U.S. $ Value | |||||||
Autos - Floating Rate – 3.8% | ||||||||
BMW Floorplan Master Owner Trust | $ | 4,360 | $ | 4,404,121 | ||||
CNH Wholesale Master Note Trust | 14,000 | 14,135,117 | ||||||
Ford Credit Floorplan Master Owner Trust | 6,070 | 6,174,244 | ||||||
GE Dealer Floorplan Master Note Trust | 4,360 | 4,355,761 | ||||||
1.812%, 10/20/14(a)(b) | 5,438 | 5,515,582 | ||||||
Nissan Master Owner Trust | 8,345 | 8,447,285 | ||||||
Wheels SPV LLC | 6,541 | 6,577,548 | ||||||
| 49,609,658 | ||||||||
Credit Cards - Floating Rate – 3.0% | ||||||||
Chase Issuance Trust | 13,000 | 13,198,567 | ||||||
Discover Card Master Trust | 14,835 | 15,025,011 | ||||||
Series 2009-A2, Class A | 1,320 | 1,337,433 | ||||||
Series 2010-A1, Class A1 | 7,206 | 7,249,584 | ||||||
MBNA Credit Card Master Note Trust | 3,130 | 3,116,101 | ||||||
| 39,926,696 | ||||||||
Home Equity Loans - Floating Rate – 1.0% | ||||||||
BNC Mortgage Loan Trust | 1,200 | 16,671 | ||||||
Credit-Based Asset Servicing and Securitization LLC | 2,180 | 1,797,115 | ||||||
| ALLIANCEBERNSTEIN POOLING PORTFOLIOS • | 75 |
Short Duration Bond Portfolio—Portfolio of Investments
| Principal Amount (000) | U.S. $ Value | |||||||
HSBC Home Equity Loan Trust | $ | 1,121 | $ | 895,304 | ||||
Lehman ABS Mortgage Loan Trust | 3,370 | 1,503,211 | ||||||
Lehman XS Trust | 5,000 | 177,362 | ||||||
Series 2006-1, Class 1M1 | 4,000 | 203,088 | ||||||
Newcastle Mortgage Securities Trust | 1,901 | 1,656,941 | ||||||
Novastar Home Equity Loan | 4,935 | 694,190 | ||||||
Option One Mortgage Loan Trust | 2,009 | 1,631,647 | ||||||
Security National Mortgage Loan Trust | 258 | 255,542 | ||||||
Soundview Home Equity Loan Trust | 4,185 | 2,929,367 | ||||||
Specialty Underwriting & Residential Finance | 2,000 | 1,095,226 | ||||||
| 12,855,664 | ||||||||
Other ABS - Fixed Rate – 0.8% | ||||||||
CNH Equipment Trust | 5,261 | 5,245,221 | ||||||
GE Equipment Small Ticket LLC | 3,910 | 3,896,583 | ||||||
John Deere Owner Trust | 1,891 | 1,906,413 | ||||||
| 11,048,217 | ||||||||
Home Equity Loans - Fixed Rate – 0.4% | ||||||||
American General Mortgage Loan Trust | 2,308 | 2,187,961 | ||||||
| 76 | • ALLIANCEBERNSTEIN POOLING PORTFOLIOS |
Short Duration Bond Portfolio—Portfolio of Investments
| Principal Amount (000) | U.S. $ Value | |||||||
Credit-Based Asset Servicing and Securitization LLC | $ | 1,188 | $ | 1,046,083 | ||||
Series 2005-CB4, Class AF2 | 160 | 159,976 | ||||||
Home Equity Mortgage Trust | 2,295 | 353,373 | ||||||
Nationstar NIM Trust | 35 | 0 | ||||||
Structured Asset Securities Corp. | 8,495 | 1,327,815 | ||||||
| 5,075,208 | ||||||||
Total Asset-Backed Securities | 198,530,656 | |||||||
MORTGAGE PASS-THRU’S – 14.9% | ||||||||
Agency Fixed Rate 30-Year – 10.2% | ||||||||
Federal Home Loan Mortgage Corp. Gold | 1,871 | 2,033,791 | ||||||
Federal National Mortgage Association | 28,444 | 31,708,683 | ||||||
Series 2008 | 36,039 | 39,183,065 | ||||||
6.50%, 12/01/28-7/01/35 | 18,448 | 20,631,105 | ||||||
Series 2010 | 28,881 | 31,395,760 | ||||||
Government National Mortgage Association | 9,064 | 10,226,062 | ||||||
| 135,178,466 | ||||||||
Agency ARMs – 4.3% | ||||||||
Federal Home Loan Mortgage Corp. | 3,887 | 4,086,810 | ||||||
Series 2007 | 3,221 | 3,405,435 | ||||||
6.089%, 1/01/37(b) | 2,719 | 2,880,825 | ||||||
Federal National Mortgage Association | 1,844 | 1,947,535 | ||||||
Series 2003 | 982 | 1,032,504 | ||||||
| ALLIANCEBERNSTEIN POOLING PORTFOLIOS • | 77 |
Short Duration Bond Portfolio—Portfolio of Investments
| Principal Amount (000) | U.S. $ Value | |||||||
Series 2005 | $ | 5,337 | $ | 5,596,127 | ||||
3.097%, 10/01/35(d) | 3,125 | 3,286,218 | ||||||
Series 2006 | 9,276 | 9,793,550 | ||||||
5.507%, 5/01/36(b) | 3,713 | 3,898,921 | ||||||
5.661%, 7/01/36(d) | 3,077 | 3,234,673 | ||||||
5.716%, 11/01/36(b) | 3,890 | 4,111,578 | ||||||
Series 2007 | 5,226 | 5,501,243 | ||||||
5.444%, 2/01/37(b) | 3,552 | 3,763,254 | ||||||
6.25%, 1/01/37(b) | 1,569 | 1,649,083 | ||||||
Series 2009 | 2,488 | 2,626,544 | ||||||
| 56,814,300 | ||||||||
Agency Fixed Rate 15-Year – 0.4% | ||||||||
Federal National Mortgage Association | 14 | 14,984 | ||||||
Series 2001 | 92 | 99,870 | ||||||
Series 2002 | 62 | 67,367 | ||||||
Series 2005 | 167 | 181,676 | ||||||
Series 2006 | 3,070 | 3,352,997 | ||||||
Series 2007 | 933 | 1,017,882 | ||||||
| 4,734,776 | ||||||||
Total Mortgage Pass-Thru’s | 196,727,542 | |||||||
CORPORATES - INVESTMENT GRADES – 12.7% | ||||||||
Industrial – 9.1% | ||||||||
Capital Goods – 1.1% | ||||||||
Caterpillar, Inc. | 2,067 | 2,376,242 | ||||||
General Dynamics Corp. | 4,560 | 5,015,416 | ||||||
John Deere Capital Corp. | 3,605 | 3,601,431 | ||||||
5.25%, 10/01/12 | 2,735 | 2,923,072 | ||||||
| 13,916,161 | ||||||||
| 78 | • ALLIANCEBERNSTEIN POOLING PORTFOLIOS |
Short Duration Bond Portfolio—Portfolio of Investments
| Principal Amount (000) | U.S. $ Value | |||||||
Communications - Telecommunications – 1.3% | ||||||||
AT&T, Inc. | $ | 2,875 | $ | 3,076,813 | ||||
Cellco Partnership / Verizon Wireless | 5,900 | 6,522,179 | ||||||
New Cingular Wireless Services, Inc. | 5,160 | 5,593,471 | ||||||
Verizon Global Funding Corp. | 2,142 | 2,342,770 | ||||||
| 17,535,233 | ||||||||
Consumer Cyclical - Automotive – 0.7% | ||||||||
American Honda Finance Corp. | 6,114 | 6,198,159 | ||||||
Toyota Motor Credit Corp. | 3,065 | 3,075,075 | ||||||
| 9,273,234 | ||||||||
Consumer Cyclical - | ||||||||
Walt Disney Co. (The) | 3,624 | 3,951,490 | ||||||
Consumer Cyclical - Restaurants – 0.3% | ||||||||
McDonald’s Corp. | 3,595 | 3,811,660 | ||||||
Consumer Cyclical - Retailers – 0.5% | ||||||||
Costco Wholesale Corp. | 2,740 | 2,872,830 | ||||||
Wal-Mart Stores, Inc. | 3,500 | 3,760,928 | ||||||
| 6,633,758 | ||||||||
Consumer Non-Cyclical – 2.3% | ||||||||
Abbott Laboratories | 2,717 | 2,917,401 | ||||||
Avon Products, Inc. | 2,450 | 2,695,492 | ||||||
Baxter International, Inc. | 2,021 | 2,049,324 | ||||||
Bottling Group LLC | 3,599 | 3,941,682 | ||||||
GlaxoSmithKline Capital, Inc. | 2,844 | 3,076,796 | ||||||
Merck & Co., Inc. | 2,810 | 3,104,949 | ||||||
| ALLIANCEBERNSTEIN POOLING PORTFOLIOS • | 79 |
Short Duration Bond Portfolio—Portfolio of Investments
| Principal Amount (000) | U.S. $ Value | |||||||
PepsiCo, Inc. | $ | 2,802 | $ | 2,997,823 | ||||
Pfizer, Inc. | 6,003 | 6,235,172 | ||||||
Procter & Gamble Co. (The) | 3,132 | 3,163,308 | ||||||
| 30,181,947 | ||||||||
Energy – 1.1% | ||||||||
Apache Corp. | 2,890 | 3,127,333 | ||||||
BP Capital Markets PLC | 2,975 | 3,229,913 | ||||||
Chevron Corp. | 3,665 | 3,921,451 | ||||||
ConocoPhillips | 3,650 | 3,981,427 | ||||||
| 14,260,124 | ||||||||
Technology – 1.3% | ||||||||
Hewlett-Packard Co. | 1,408 | 1,449,508 | ||||||
International Business Machines Corp. | 6,055 | 6,192,897 | ||||||
Microsoft Corp. | 3,060 | 3,043,868 | ||||||
2.95%, 6/01/14 | 3,045 | 3,181,583 | ||||||
Oracle Corp. | 2,885 | 3,120,958 | ||||||
| 16,988,814 | ||||||||
Transportation - Services – 0.2% | ||||||||
United Parcel Service, Inc. | 3,095 | 3,317,475 | ||||||
| 119,869,896 | ||||||||
Financial Institutions – 3.4% | ||||||||
Banking – 1.7% | ||||||||
Bank of New York Mellon Corp. (The) | 1,785 | 1,924,653 | ||||||
JPMorgan Chase & Co. | 3,280 | 3,294,704 | ||||||
National Australia Bank Ltd. | 3,130 | 3,117,511 | ||||||
Royal Bank of Canada | 4,960 | 5,059,651 | ||||||
State Street Corp. | 3,015 | 3,252,736 | ||||||
| 80 | • ALLIANCEBERNSTEIN POOLING PORTFOLIOS |
Short Duration Bond Portfolio—Portfolio of Investments
| Principal Amount (000) | U.S. $ Value | |||||||
UnionBanCal Corp. | $ | 5,212 | $ | 5,622,086 | ||||
| 22,271,341 | ||||||||
Finance – 0.5% | ||||||||
General Electric Capital Corp. | 6,461 | 6,483,484 | ||||||
Insurance – 1.0% | ||||||||
Berkshire Hathaway Finance Corp | 5,705 | 5,704,669 | ||||||
Metropolitan Life Global Funding I | 7,700 | 7,873,982 | ||||||
| 13,578,651 | ||||||||
Other Finance – 0.2% | ||||||||
ORIX Corp. | 3,130 | 3,221,071 | ||||||
| 45,554,547 | ||||||||
Utility – 0.2% | ||||||||
Electric – 0.2% | ||||||||
Southern Co. | 2,001 | 2,119,987 | ||||||
Total Corporates - Investment Grades | 167,544,430 | |||||||
AGENCIES – 5.1% | ||||||||
Agency Debentures – 5.1% | ||||||||
Bank of America Corp. – FDIC Insured | 8,760 | 8,938,941 | ||||||
Citibank NA – FDIC Insured | 18,659 | 18,971,613 | ||||||
Goldman Sachs Group, Inc. (The) – FDIC Insured | 13,670 | 14,149,188 | ||||||
JPMorgan Chase & Co. – FDIC Insured | 10,565 | 10,787,266 | ||||||
Morgan Stanley – FDIC Insured | 6,000 | 6,113,022 | ||||||
Wells Fargo & Co. – FDIC Insured | 7,493 | 7,647,993 | ||||||
Total Agencies | 66,608,023 | |||||||
COMMERCIAL MORTGAGE-BACKED SECURITIES – 5.0% | ||||||||
Non-Agency Fixed Rate CMBS – 1.9% | ||||||||
DBUBS Mortgage Trust | 6,480 | 6,613,633 | ||||||
| ALLIANCEBERNSTEIN POOLING PORTFOLIOS • | 81 |
Short Duration Bond Portfolio—Portfolio of Investments
| Principal Amount (000) | U.S. $ Value | |||||||
JP Morgan Chase Commercial Mortgage Securities Corp. | $ | 5,950 | $ | 6,085,440 | ||||
Morgan Stanley Capital I | 3,125 | 3,170,333 | ||||||
NCUA Guaranteed Notes | 5,776 | 5,646,181 | ||||||
WF-RBS Commercial Mortgage Trust | 3,125 | 3,162,655 | ||||||
| 24,678,242 | ||||||||
Non-Agency Floating Rate CMBS – 1.6% | ||||||||
Banc of America Large Loan, Inc. | 2,500 | 2,329,256 | ||||||
Commercial Mortgage Pass Through Certificates | 831 | 800,514 | ||||||
Series 2007-FL14, Class C | 3,317 | 2,938,331 | ||||||
Credit Suisse Mortgage Capital Certificates | 4,900 | 4,764,456 | ||||||
Series 2007-TFLA, Class A2 | 8,000 | 7,514,393 | ||||||
Wachovia Bank Commercial Mortgage Trust | 2,600 | 1,452,915 | ||||||
Series 2007-WHL8, Class E | 2,725 | 1,883,741 | ||||||
| 21,683,606 | ||||||||
Agency CMBS – 1.5% | ||||||||
FHLMC Multifamily Structured Pass Through Certificates | 12,203 | 11,983,314 | ||||||
Series K009, Class A1 | 3,466 | 3,423,952 | ||||||
| 82 | • ALLIANCEBERNSTEIN POOLING PORTFOLIOS |
Short Duration Bond Portfolio—Portfolio of Investments
| Principal Amount (000) | U.S. $ Value | |||||||
Series K010, Class A1 | $ | 4,020 | $ | 4,059,510 | ||||
| 19,466,776 | ||||||||
Total Commercial Mortgage-Backed Securities | 65,828,624 | |||||||
CMOs – 2.1% | ||||||||
Non-Agency Floating Rate – 1.5% | ||||||||
Adjustable Rate Mortgage Trust | 2,290 | 7,756 | ||||||
Countrywide Alternative Loan Trust | 1,913 | 1,051,243 | ||||||
Homebanc Mortgage Trust | 2,862 | 2,167,932 | ||||||
Mortgage Equity Conversion Asset Trust | 3,145 | 3,016,234 | ||||||
NCUA Guaranteed Notes | 8,808 | 8,847,507 | ||||||
Sequoia Mortgage Trust | 2,767 | 2,263,958 | ||||||
Structured Adjustable Rate Mortgage Loan Trust | 120 | 98,640 | ||||||
Structured Asset Mortgage Investments, Inc. Series 2004-AR5, Class 1A1 | 630 | 562,603 | ||||||
WaMu Mortgage Pass Through Certificates Series 2006-AR4, Class 1A1B | 1,101 | 674,199 | ||||||
Series 2006-AR9, Class 1AB2 | 2,363 | 799,340 | ||||||
| 19,489,412 | ||||||||
Non-Agency Fixed Rate – 0.5% | ||||||||
Ford Credit Auto Lease Trust | 6,220 | 6,220,883 | ||||||
Merrill Lynch Mortgage Investors, Inc. | 763 | 743,300 | ||||||
| 6,964,183 | ||||||||
| ALLIANCEBERNSTEIN POOLING PORTFOLIOS • | 83 |
Short Duration Bond Portfolio—Portfolio of Investments
| Principal Amount (000) | U.S. $ Value | |||||||
Agency Floating Rate – 0.1% | ||||||||
Fannie Mae REMIC | $ | 244 | $ | 244,580 | ||||
Fannie Mae Whole Loan | 161 | 150,377 | ||||||
Freddie Mac Reference REMIC | 572 | 571,193 | ||||||
| 966,150 | ||||||||
Agency Fixed Rate – 0.0% | ||||||||
Fannie Mae REMIC | 624 | 622,861 | ||||||
Total CMOs | 28,042,606 | |||||||
GOVERNMENTS - SOVEREIGN AGENCIES – 0.5% | ||||||||
Netherlands – 0.5% | ||||||||
Achmea Hypotheekbank NV | 6,456 | 6,420,724 | ||||||
| Shares | ||||||||
SHORT-TERM INVESTMENTS – 1.7% | ||||||||
Investment Companies – 0.7% | ||||||||
AllianceBernstein Fixed-Income Shares, Inc. – Government STIF Portfolio, 0.17%(h) | 8,982,215 | 8,982,215 | ||||||
| Principal Amount (000) | ||||||||
Certificates of Deposit – 1.0% | ||||||||
Royal Bank of Canada NY | $ | 12,810 | 13,199,309 | |||||
Total Short-Term Investments | 22,181,524 | |||||||
Total Investments – 101.3% | 1,334,936,381 | |||||||
Other assets less liabilities – (1.3)% | (16,558,232 | ) | ||||||
Net Assets – 100.0% | $ | 1,318,378,149 | ||||||
| 84 | • ALLIANCEBERNSTEIN POOLING PORTFOLIOS |
Short Duration Bond Portfolio—Portfolio of Investments
FUTURES CONTRACTS (see Note C)
| Type | Number of Contracts | Expiration Month | Original Value | Value at February 28, 2011 | Unrealized Appreciation/ (Depreciation) | |||||||||||||||
Purchased Contracts | ||||||||||||||||||||
U.S. T-Note 2 Yr Futures | 1,289 | June 2011 | $ | 280,923,977 | $ | 281,384,673 | $ | 460,696 | ||||||||||||
Sold Contracts | ||||||||||||||||||||
U.S. T-Note 5 Yr Futures | 93 | June 2011 | 10,860,473 | 10,875,187 | (14,714 | ) | ||||||||||||||
U.S. T-Note 10 Yr Futures | 397 | June 2011 | 47,112,595 | 47,261,609 | (149,014 | ) | ||||||||||||||
| $ | 296,968 | |||||||||||||||||||
| (a) | Security is exempt from registration under Rule 144A of the Securities Act of 1933. These securities are considered liquid and may be resold in transactions exempt from registration, normally to qualified institutional buyers. At February 28, 2011, the aggregate market value of these securities amounted to $147,910,967 or 11.2% of net assets. |
| (b) | Floating Rate Security. Stated interest rate was in effect at February 28, 2011. |
| (c) | Illiquid security. |
| (d) | Variable rate coupon, rate shown as of February 28, 2011. |
| (e) | Fair valued. |
| (f) | Security is exempt from registration under Rule 144A of the Securities Act of 1933. These securities, which represent 0.00% of net assets as of February 28, 2011, are considered illiquid and restricted. |
| Restricted Securities | Acquisition Date | Cost | Market Value | Percentage of Net Assets | ||||||||||||
Nationstar NIM Trust | 4/04/07 | $ | 35,213 | $ | 0 | 0.00 | % | |||||||||
| (g) | IO – Interest Only |
| (h) | Investment in affiliated money market mutual fund. The rate shown represents the 7-day yield as of period end. |
| + | Position, or a portion thereof, has been segregated to meet the collateral requirements of the Term Asset-Backed Securities Loan Facility (“TALF”) program administered by the Federal Reserve Bank of New York. The market value of the collateral amounted to $31,853,556. |
Glossary:
| ABS | – Asset-Backed Securities |
| ARMs | – Adjustable Rate Mortgages |
| CMBS | – Commercial Mortgage-Backed Securities |
| CMOs | – Collateralized Mortgage Obligations |
| FDIC | – Federal Deposit Insurance Corporation |
| FHLMC | – Federal Home Loan Mortgage Corporation |
| REMIC | – Real Estate Mortgage Investment Conduit |
See notes to financial statements.
| ALLIANCEBERNSTEIN POOLING PORTFOLIOS • | 85 |
Short Duration Bond Portfolio—Portfolio of Investments
INTERMEDIATE DURATION BOND PORTFOLIO
PORTFOLIO OF INVESTMENTS
February 28, 2011 (unaudited)
| Principal Amount (000) | U.S. $ Value | |||||||
CORPORATES - INVESTMENT GRADES – 29.6% | ||||||||
Financial Institutions – 13.3% | ||||||||
Banking – 6.8% | ||||||||
American Express Co. | U.S.$ | 1,900 | $ | 2,172,857 | ||||
Bank of America Corp. | 1,710 | 1,778,752 | ||||||
7.625%, 6/01/19 | 1,700 | 1,987,599 | ||||||
Series L | 5,630 | 5,949,896 | ||||||
Bank of Tokyo-Mitsubishi | 170 | 173,175 | ||||||
BankAmerica Capital II | 1,950 | 1,979,250 | ||||||
Bear Stearns Cos. LLC (The) | 5,410 | 5,796,144 | ||||||
Citigroup, Inc. | 2,900 | 3,108,800 | ||||||
6.50%, 8/19/13 | 2,770 | 3,052,900 | ||||||
8.50%, 5/22/19 | 2,750 | 3,412,222 | ||||||
Compass Bank | 4,989 | 4,978,548 | ||||||
Goldman Sachs Group, Inc. (The) | 2,700 | 2,894,905 | ||||||
7.50%, 2/15/19 | 2,855 | 3,365,206 | ||||||
JPMorgan Chase & Co. | 3,955 | 3,861,512 | ||||||
Lloyds TSB Bank PLC | 3,820 | 3,850,724 | ||||||
M&I Marshall & Ilsley Bank | 3,700 | 3,856,181 | ||||||
Macquarie Group Ltd. | 3,420 | 3,380,694 | ||||||
Morgan Stanley | 1,615 | 1,702,895 | ||||||
5.50%, 7/24/20 | 5,325 | 5,380,630 | ||||||
6.60%, 4/01/12 | 960 | 1,018,123 | ||||||
National City Bank/Cleveland OH | 4,245 | 4,252,662 | ||||||
Nationwide Building Society | 3,415 | 3,505,935 | ||||||
Royal Bank of Scotland PLC (The) | 2,740 | 2,784,511 | ||||||
Santander US Debt SA Unipersonal | 3,400 | 3,317,156 | ||||||
| 86 | • ALLIANCEBERNSTEIN POOLING PORTFOLIOS |
Intermediate Duration Bond Portfolio—Portfolio of Investments
| Principal Amount (000) | U.S. $ Value | |||||||
Societe Generale | U.S.$ | 3,380 | $ | 3,360,126 | ||||
SouthTrust Corp. | 3,315 | 3,609,455 | ||||||
Standard Chartered PLC | 4,800 | 4,553,530 | ||||||
UFJ Finance Aruba AEC | 1,913 | 2,118,544 | ||||||
Unicredit Luxembourg Finance SA | 1,580 | 1,485,993 | ||||||
Union Bank NA | 1,005 | 1,090,762 | ||||||
Wachovia Corp. | 1,225 | 1,328,642 | ||||||
| 95,108,329 | ||||||||
Brokerage – 0.1% | ||||||||
Jefferies Group, Inc. | 1,330 | 1,426,706 | ||||||
Finance – 0.9% | ||||||||
General Electric Capital Corp. | 2,795 | 2,982,497 | ||||||
Series A | 2,713 | 2,787,266 | ||||||
HSBC Finance Corp. | 2,095 | 2,230,706 | ||||||
SLM Corp. | 4,650 | 4,802,579 | ||||||
| 12,803,048 | ||||||||
Insurance – 4.4% | ||||||||
Aetna, Inc. | 1,010 | 1,144,566 | ||||||
Aflac, Inc. | 555 | 568,086 | ||||||
Allied World Assurance Co. Holdings Ltd. | 1,820 | 2,039,725 | ||||||
Allstate Corp. (The) | 3,420 | 4,113,118 | ||||||
Assurant, Inc. | 1,028 | 1,089,804 | ||||||
CIGNA Corp. | 1,155 | 1,210,043 | ||||||
Coventry Health Care, Inc. | 665 | 690,362 | ||||||
6.125%, 1/15/15 | 260 | 276,870 | ||||||
6.30%, 8/15/14 | 2,060 | 2,200,712 | ||||||
| ALLIANCEBERNSTEIN POOLING PORTFOLIOS • | 87 |
Intermediate Duration Bond Portfolio—Portfolio of Investments
| Principal Amount (000) | U.S. $ Value | |||||||
Genworth Financial, Inc. | U.S.$ | 4,100 | $ | 4,119,705 | ||||
Guardian Life Insurance Co. of America | 1,605 | 1,867,122 | ||||||
Hartford Financial Services Group, Inc. | 685 | 692,699 | ||||||
5.50%, 3/30/20 | 3,221 | 3,310,357 | ||||||
Humana, Inc. | 1,514 | 1,636,136 | ||||||
6.45%, 6/01/16 | 285 | 314,496 | ||||||
7.20%, 6/15/18 | 610 | 695,186 | ||||||
Liberty Mutual Group, Inc. | 2,683 | 2,851,618 | ||||||
Lincoln National Corp. | 791 | 996,484 | ||||||
Markel Corp. | 1,685 | 1,912,763 | ||||||
Massachusetts Mutual Life Insurance Co. | 1,510 | 2,032,433 | ||||||
MetLife, Inc. | 1,460 | 1,497,163 | ||||||
7.717%, 2/15/19 | 1,159 | 1,426,636 | ||||||
Nationwide Mutual Insurance Co. | 2,585 | 3,081,584 | ||||||
Principal Financial Group, Inc. | 2,220 | 2,569,663 | ||||||
Prudential Financial, Inc. | 2,545 | 2,702,413 | ||||||
6.20%, 1/15/15 | 265 | 293,725 | ||||||
Series D | 200 | 237,780 | ||||||
Swiss Re Solutions Holding Corp. | 3,065 | 3,216,215 | ||||||
UnitedHealth Group, Inc. | 4,300 | 4,306,510 | ||||||
WellPoint, Inc. | 2,865 | 2,860,542 | ||||||
5.875%, 6/15/17 | 270 | 304,849 | ||||||
7.00%, 2/15/19 | 655 | 778,773 | ||||||
XL Group PLC | 4,520 | 4,772,004 | ||||||
| 61,810,142 | ||||||||
Other Finance – 0.2% | ||||||||
ORIX Corp. 4.71%, 4/27/15 | 3,328 | 3,394,906 | ||||||
| 88 | • ALLIANCEBERNSTEIN POOLING PORTFOLIOS |
Intermediate Duration Bond Portfolio—Portfolio of Investments
| Principal Amount (000) | U.S. $ Value | |||||||
REITS – 0.9% | ||||||||
ERP Operating LP | U.S.$ | 3,300 | $ | 3,615,361 | ||||
HCP, Inc. | 3,180 | 3,455,763 | ||||||
Healthcare Realty Trust, Inc. | 2,373 | 2,497,773 | ||||||
Simon Property Group LP | 3,575 | 3,539,336 | ||||||
| 13,108,233 | ||||||||
| 187,651,364 | ||||||||
Industrial – 12.8% | ||||||||
Basic – 2.2% | ||||||||
Anglo American Capital PLC | 1,901 | 2,544,795 | ||||||
AngloGold Ashanti Holdings PLC | 2,110 | 2,148,062 | ||||||
ArcelorMittal | 3,570 | 3,839,531 | ||||||
BHP Billiton Finance USA Ltd. | 3,132 | 3,701,877 | ||||||
Dow Chemical Co. (The) | 200 | 242,066 | ||||||
8.55%, 5/15/19 | 4,115 | 5,217,684 | ||||||
International Paper Co. | 2,625 | 2,827,855 | ||||||
7.50%, 8/15/21 | 797 | 952,586 | ||||||
Packaging Corp. of America | 1,329 | 1,430,719 | ||||||
PPG Industries, Inc. | 3,190 | 3,453,724 | ||||||
Rio Tinto Finance USA Ltd. | 3,260 | 3,774,487 | ||||||
Teck Resources Ltd. | 205 | 209,286 | ||||||
| 30,342,672 | ||||||||
Capital Goods – 0.4% | ||||||||
Holcim US Finance Sarl & Cie SCS | 299 | 311,138 | ||||||
Lafarge SA | 2,204 | 2,242,874 | ||||||
Republic Services, Inc. | 1,213 | 1,277,487 | ||||||
5.50%, 9/15/19 | 1,768 | 1,916,340 | ||||||
| 5,747,839 | ||||||||
| ALLIANCEBERNSTEIN POOLING PORTFOLIOS • | 89 |
Intermediate Duration Bond Portfolio—Portfolio of Investments
| Principal Amount (000) | U.S. $ Value | |||||||
Communications - Media – 2.4% | ||||||||
BSKYB Finance UK PLC | U.S.$ | 3,710 | $ | 4,120,727 | ||||
CBS Corp. | 3,655 | 3,886,533 | ||||||
Comcast Cable Communications Holdings, Inc. | 1,906 | 2,598,985 | ||||||
Comcast Corp. | 2,767 | 2,771,422 | ||||||
DirecTV Holdings LLC / DirecTV Financing Co., Inc. | 1,870 | 1,829,933 | ||||||
4.75%, 10/01/14 | 1,200 | 1,290,811 | ||||||
News America Holdings, Inc. | 670 | 771,874 | ||||||
News America, Inc. | 2,177 | 2,205,329 | ||||||
6.55%, 3/15/33 | 1,383 | 1,464,139 | ||||||
Reed Elsevier Capital, Inc. | 2,894 | 3,673,728 | ||||||
RR Donnelley & Sons Co. | 710 | 736,078 | ||||||
Time Warner Cable, Inc. | 1,325 | 1,530,102 | ||||||
Time Warner Entertainment Co. LP | 2,680 | 3,369,497 | ||||||
WPP Finance UK | 376 | 410,601 | ||||||
8.00%, 9/15/14 | 2,616 | 3,045,260 | ||||||
| 33,705,019 | ||||||||
Communications - Telecommunications – 1.4% | ||||||||
American Tower Corp. | 2,750 | 2,703,233 | ||||||
AT&T Corp. | 295 | 374,691 | ||||||
Embarq Corp. | 3,780 | 4,301,784 | ||||||
Qwest Corp. | 3,270 | 3,744,150 | ||||||
8.875%, 3/15/12 | 660 | 708,675 | ||||||
Telecom Italia Capital SA | 2,510 | 2,671,531 | ||||||
6.375%, 11/15/33 | 375 | 346,495 | ||||||
7.175%, 6/18/19 | 1,450 | 1,570,275 | ||||||
| 90 | • ALLIANCEBERNSTEIN POOLING PORTFOLIOS |
Intermediate Duration Bond Portfolio—Portfolio of Investments
| Principal Amount (000) | U.S. $ Value | |||||||
United States Cellular Corp. | U.S.$ | 3,150 | $ | 3,070,670 | ||||
| 19,491,504 | ||||||||
Consumer Cyclical - Automotive – 0.5% | ||||||||
Daimler Finance North America LLC | 1,105 | 1,133,872 | ||||||
7.30%, 1/15/12 | 1,178 | 1,243,635 | ||||||
Harley-Davidson Funding Corp. | 2,465 | 2,622,553 | ||||||
Nissan Motor Acceptance Corp. | 2,530 | 2,646,453 | ||||||
| 7,646,513 | ||||||||
Consumer Cyclical - Entertainment – 0.6% | ||||||||
Time Warner, Inc. | 1,460 | 1,467,486 | ||||||
7.625%, 4/15/31 | 2,810 | 3,320,692 | ||||||
Viacom, Inc. | 2,895 | 3,169,993 | ||||||
| 7,958,171 | ||||||||
Consumer Cyclical - Other – 0.6% | ||||||||
Marriott International, Inc. | 4,120 | 4,395,088 | ||||||
MDC Holdings, Inc. | 3,300 | 3,428,845 | ||||||
| 7,823,933 | ||||||||
Consumer Cyclical - | ||||||||
CVS Caremark Corp. | 1,460 | 1,692,489 | ||||||
Consumer Non-Cyclical – 1.2% | ||||||||
Ahold Finance USA LLC | 3,105 | 3,409,985 | ||||||
Altria Group, Inc. | 1,675 | 2,205,982 | ||||||
Bunge Ltd. Finance Corp. | 1,711 | 1,755,286 | ||||||
5.875%, 5/15/13 | 2,720 | 2,897,649 | ||||||
Cadbury Schweppes US Finance LLC | 3,480 | 3,775,438 | ||||||
Delhaize Group SA | 775 | 849,577 | ||||||
Fortune Brands, Inc. | 2,016 | 2,135,601 | ||||||
| ALLIANCEBERNSTEIN POOLING PORTFOLIOS • | 91 |
Intermediate Duration Bond Portfolio—Portfolio of Investments
| Principal Amount (000) | U.S. $ Value | |||||||
Safeway, Inc. | U.S.$ | 453 | $ | 453,000 | ||||
| 17,482,518 | ||||||||
Energy – 1.7% | ||||||||
Anadarko Petroleum Corp. | 3,050 | 3,344,786 | ||||||
6.45%, 9/15/36 | 877 | 883,555 | ||||||
Baker Hughes, Inc. | 1,300 | 1,473,043 | ||||||
Canadian Natural Resources Ltd. | 1,220 | 1,302,899 | ||||||
Hess Corp. | 1,793 | 2,207,890 | ||||||
Marathon Petroleum Corp. | 448 | 450,191 | ||||||
5.125%, 3/01/21(a) | 760 | 770,901 | ||||||
Nabors Industries, Inc. | 2,995 | 3,757,284 | ||||||
Noble Energy, Inc. | 2,858 | 3,601,660 | ||||||
Noble Holding International Ltd. | 251 | 255,844 | ||||||
Valero Energy Corp. | 1,635 | 1,763,985 | ||||||
Weatherford International Ltd. | 1,600 | 1,690,358 | ||||||
9.625%, 3/01/19 | 1,540 | 2,017,740 | ||||||
| 23,520,136 | ||||||||
Other Industrial – 0.3% | ||||||||
Noble Group Ltd. | 3,341 | 3,541,460 | ||||||
Technology – 0.7% | ||||||||
Agilent Technologies, Inc. | 505 | 512,900 | ||||||
Computer Sciences Corp. | 2,290 | 2,446,487 | ||||||
Motorola, Inc. | 1,800 | 1,866,159 | ||||||
7.50%, 5/15/25 | 290 | 325,392 | ||||||
Xerox Capital Trust I | 4,410 | 4,487,175 | ||||||
Xerox Corp. | 310 | 362,760 | ||||||
| 10,000,873 | ||||||||
| 92 | • ALLIANCEBERNSTEIN POOLING PORTFOLIOS |
Intermediate Duration Bond Portfolio—Portfolio of Investments
| Principal Amount (000) | U.S. $ Value | |||||||
Transportation - Airlines – 0.2% | ||||||||
Southwest Airlines Co. | U.S.$ | 1,695 | $ | 1,824,105 | ||||
5.75%, 12/15/16 | 1,115 | 1,202,949 | ||||||
| 3,027,054 | ||||||||
Transportation - Services – 0.5% | ||||||||
Asciano Finance Ltd. | 3,375 | 3,227,820 | ||||||
Con-way, Inc. | 2,269 | 2,070,648 | ||||||
Ryder System, Inc. | 930 | 1,028,772 | ||||||
7.20%, 9/01/15 | 908 | 1,053,560 | ||||||
| 7,380,800 | ||||||||
| 179,360,981 | ||||||||
Utility – 2.4% | ||||||||
Electric – 1.4% | ||||||||
Allegheny Energy Supply Co. LLC | 3,175 | 3,269,501 | ||||||
Constellation Energy Group, Inc. | 2,700 | 2,707,168 | ||||||
FirstEnergy Corp. | 58 | 59,974 | ||||||
Series C | 2,291 | 2,497,740 | ||||||
FPL Group Capital, Inc. | 2,855 | 2,925,144 | ||||||
Nisource Finance Corp. | 3,445 | 3,970,311 | ||||||
SPI Electricity & Gas Australia Holdings Pty Ltd. | 1,447 | 1,572,613 | ||||||
Teco Finance, Inc. | 745 | 757,363 | ||||||
5.15%, 3/15/20 | 915 | 947,461 | ||||||
Union Electric Co. | 315 | 366,054 | ||||||
| 19,073,329 | ||||||||
Natural Gas – 0.8% | ||||||||
Energy Transfer Partners LP | 972 | 1,108,129 | ||||||
7.50%, 7/01/38 | 3,329 | 3,880,276 | ||||||
EQT Corp. | 1,707 | 2,023,754 | ||||||
| ALLIANCEBERNSTEIN POOLING PORTFOLIOS • | 93 |
Intermediate Duration Bond Portfolio—Portfolio of Investments
| Principal Amount (000) | U.S. $ Value | |||||||
Williams Partners LP | U.S.$ | 4,178 | $ | 4,350,480 | ||||
| 11,362,639 | ||||||||
Other Utility – 0.2% | ||||||||
Veolia Environnement SA | 2,785 | 3,101,501 | ||||||
| 33,537,469 | ||||||||
Non Corporate Sectors – 1.1% | ||||||||
Agencies - Not Government Guaranteed – 1.1% | ||||||||
Gazprom Via Gaz Capital SA | 6,255 | 6,630,300 | ||||||
Petrobras International Finance Co. – Pifco | 5,100 | 5,292,005 | ||||||
TransCapitalInvest Ltd. for OJSC AK Transneft | 3,055 | 3,727,100 | ||||||
| 15,649,405 | ||||||||
Total Corporates - Investment Grades | 416,199,219 | |||||||
GOVERNMENTS - | ||||||||
Mexico – 1.0% | ||||||||
Mexican Bonos | MXN | 160,215 | 13,628,025 | |||||
United States – 25.8% | ||||||||
U.S. Treasury Bonds | U.S.$ | 16,860 | 17,083,918 | |||||
4.625%, 2/15/40 | 27,085 | 27,702,863 | ||||||
5.375%, 2/15/31 | 20,720 | 23,815,050 | ||||||
U.S. Treasury Notes | 50,720 | 51,270,311 | ||||||
2.25%, 1/31/15 | 17,104 | 17,509,811 | ||||||
2.50%, 3/31/15 | 63,975 | 66,019,001 | ||||||
2.625%, 11/15/20 | 18,725 | 17,519,578 | ||||||
3.375%, 11/15/19 | 15,870 | 16,091,926 | ||||||
3.625%, 2/15/20 | 83,460 | 85,950,780 | ||||||
3.75%, 11/15/18 | 37,815 | 39,909,294 | ||||||
| 362,872,532 | ||||||||
Total Governments - Treasuries | 376,500,557 | |||||||
| 94 | • ALLIANCEBERNSTEIN POOLING PORTFOLIOS |
Intermediate Duration Bond Portfolio—Portfolio of Investments
| Principal Amount (000) | U.S. $ Value | |||||||
MORTGAGE PASS-THRU’S – 15.2% | ||||||||
Agency Fixed Rate 30-Year – 14.2% | ||||||||
Federal Home Loan Mortgage Corp. Gold | U.S.$ | 4,610 | $ | 5,143,751 | ||||
Series 2006 | 103 | 105,459 | ||||||
Series 2007 | 3,154 | 3,390,986 | ||||||
Series 2008 | 3,615 | 4,055,711 | ||||||
Federal National Mortgage Association | 3,123 | 3,083,371 | ||||||
5.50%, 1/01/35-5/01/38 | 8,975 | 9,625,704 | ||||||
5.50%, 6/01/38 | 17,385 | 18,618,344 | ||||||
6.00%, 5/01/31-10/01/37 | 773 | 840,583 | ||||||
6.00%, 3/01/38-7/01/39 | 32,263 | 35,072,235 | ||||||
6.50%, 6/01/39 | 2,282 | 2,554,007 | ||||||
Series 2003 | 9,481 | 9,991,211 | ||||||
5.50%, 4/01/33-7/01/33 | 11,118 | 11,961,902 | ||||||
Series 2004 | 437 | 470,405 | ||||||
5.50%, 5/01/34-11/01/34 | 8,532 | 9,175,040 | ||||||
Series 2005 | 11,115 | 11,440,479 | ||||||
4.50%, 9/01/35-10/01/35 | 2,260 | 2,322,984 | ||||||
5.50%, 2/01/35 | 2,193 | 2,357,977 | ||||||
6.00%, 4/01/35 | 7,249 | 7,968,210 | ||||||
Series 2006 | 9 | 9,918 | ||||||
5.00%, 2/01/36 | 11,582 | 12,187,270 | ||||||
Series 2007 | 9,437 | 9,721,990 | ||||||
5.50%, 8/01/37 | 16,173 | 17,390,551 | ||||||
Series 2008 | 18,401 | 20,062,674 | ||||||
Series 2010 | 2,194 | 2,385,341 | ||||||
| 199,936,103 | ||||||||
Agency ARMs – 1.0% | ||||||||
Federal Home Loan Mortgage Corp. | 1,867 | 1,971,827 | ||||||
Series 2009 | 4,717 | 4,956,939 | ||||||
| ALLIANCEBERNSTEIN POOLING PORTFOLIOS • | 95 |
Intermediate Duration Bond Portfolio—Portfolio of Investments
| Principal Amount (000) | U.S. $ Value | |||||||
Federal National Mortgage Association | U.S.$ | 1,363 | $ | 1,432,749 | ||||
Series 2006 | 1,418 | 1,479,147 | ||||||
5.477%, 3/01/36(c) | 999 | 1,034,322 | ||||||
Series 2007 | 2,627 | 2,757,172 | ||||||
| 13,632,156 | ||||||||
Total Mortgage Pass-Thru’s | 213,568,259 | |||||||
AGENCIES – 10.4% | ||||||||
Agency Debentures – 10.4% | ||||||||
Federal Farm Credit Bank | 8,500 | 8,500,705 | ||||||
0.312%, 4/26/13(b) | 78,125 | 78,145,234 | ||||||
0.322%, 6/26/13(b) | 16,400 | 16,405,199 | ||||||
Federal National Mortgage Association | 11,645 | 11,645,007 | ||||||
0.293%, 10/18/12(b) | 3,400 | 3,400,003 | ||||||
6.25%, 5/15/29 | 12,375 | 14,835,509 | ||||||
6.625%, 11/15/30 | 10,490 | 13,168,066 | ||||||
Total Agencies | 146,099,723 | |||||||
COMMERCIAL MORTGAGE-BACKED SECURITIES – 9.1% | ||||||||
Non-Agency Fixed Rate | ||||||||
Banc of America Commercial Mortgage, Inc. | 6,845 | 7,294,241 | ||||||
Series 2007-4, Class A4 | 6,835 | 7,452,956 | ||||||
Bear Stearns Commercial Mortgage Securities | 6,455 | 6,974,517 | ||||||
Citigroup Commercial Mortgage Trust | 8,585 | 9,431,726 | ||||||
Commercial Mortgage Pass Through Certificates | 3,065 | 3,240,974 | ||||||
| 96 | • ALLIANCEBERNSTEIN POOLING PORTFOLIOS |
Intermediate Duration Bond Portfolio—Portfolio of Investments
| Principal Amount (000) | U.S. $ Value | |||||||
Credit Suisse Mortgage Capital Certificates | U.S.$ | 6,475 | $ | 6,924,594 | ||||
Series 2006-C5, Class A3 | 4,500 | 4,772,708 | ||||||
Greenwich Capital Commercial Funding Corp. | 1,470 | 1,575,702 | ||||||
JP Morgan Chase Commercial Mortgage Securities Corp. | 855 | 920,912 | ||||||
LB-UBS Commercial Mortgage Trust | 6,015 | 6,451,939 | ||||||
Series 2006-C6, Class A4 | 8,090 | 8,703,137 | ||||||
Series 2007-C1, Class A4 | 8,825 | 9,468,749 | ||||||
Merrill Lynch/Countrywide Commercial Mortgage Trust | 3,075 | 3,394,183 | ||||||
Series 2006-3, Class A4 | 6,885 | 7,332,172 | ||||||
Morgan Stanley Capital I | 8,155 | 8,612,865 | ||||||
Series 2007-IQ13, Class A4 | 4,035 | 4,211,793 | ||||||
Wachovia Bank Commercial Mortgage Trust | 8,565 | 9,281,689 | ||||||
Series 2006-C28, Class A4 | 7,235 | 7,748,760 | ||||||
Series 2007-C32, Class A3 | 6,885 | 7,339,479 | ||||||
| 121,133,096 | ||||||||
Agency CMBS – 0.3% | ||||||||
FHLMC Multifamily Structured Pass Through Certificates | 4,653 | 4,473,369 | ||||||
| ALLIANCEBERNSTEIN POOLING PORTFOLIOS • | 97 |
Intermediate Duration Bond Portfolio—Portfolio of Investments
| Principal Amount (000) | U.S. $ Value | |||||||
Non-Agency Floating Rate CMBS – 0.2% | ||||||||
GS Mortgage Securities Corp. II | U.S.$ | 1,855 | $ | 1,801,942 | ||||
Total Commercial Mortgage-Backed Securities | 127,408,407 | |||||||
ASSET - BACKED | ||||||||
Credit Cards - Floating Rate – 0.8% | ||||||||
Discover Card Master Trust | 11,000 | 11,140,891 | ||||||
Autos - Floating Rate – 0.4% | ||||||||
Wheels SPV LLC | 6,541 | 6,577,548 | ||||||
Autos - Fixed Rate – 0.3% | ||||||||
Ally Auto Receivables Trust | 4,555 | 4,567,056 | ||||||
Other ABS - Fixed Rate – 0.2% | ||||||||
CNH Equipment Trust | 2,905 | 2,896,935 | ||||||
Home Equity Loans - Floating | ||||||||
Citigroup Mortgage Loan Trust, Inc. | 3,715 | 579,101 | ||||||
HSBC Home Equity Loan Trust | 768 | 686,719 | ||||||
Lehman XS Trust | 3,539 | 54,695 | ||||||
Option One Mortgage Loan Trust | 1,785 | 13,452 | ||||||
| 1,333,967 | ||||||||
| 98 | • ALLIANCEBERNSTEIN POOLING PORTFOLIOS |
Intermediate Duration Bond Portfolio—Portfolio of Investments
| Principal Amount (000) | U.S. $ Value | |||||||
Home Equity Loans - Fixed | ||||||||
Asset Backed Funding Certificates | U.S.$ | 510 | $ | 485,933 | ||||
Citifinancial Mortgage Securities, Inc. | 480 | 449,417 | ||||||
| 935,350 | ||||||||
Total Asset-Backed Securities | 27,451,747 | |||||||
GOVERNMENTS - SOVEREIGN | ||||||||
Germany – 0.2% | ||||||||
Landwirtschaftliche Rentenbank | 2,695 | 3,024,898 | ||||||
United Kingdom – 1.2% | ||||||||
Royal Bank of Scotland PLC (The) | 10,450 | 10,498,603 | ||||||
2.625%, 5/11/12(a) | 6,000 | 6,140,952 | ||||||
| 16,639,555 | ||||||||
Total Governments - Sovereign Agencies | 19,664,453 | |||||||
CMOs – 0.9% | ||||||||
Non-Agency Fixed Rate – 0.5% | ||||||||
Bear Stearns Alt-A Trust | 2,817 | 2,045,306 | ||||||
Series 2006-3, Class 22A1 | 1,226 | 590,095 | ||||||
Series 2007-1, Class 21A1 | 1,906 | 1,155,999 | ||||||
Citigroup Mortgage Loan Trust, Inc. | 2,178 | 2,068,201 | ||||||
Indymac Index Mortgage Loan Trust | 1,596 | 914,709 | ||||||
| 6,774,310 | ||||||||
Non-Agency Floating Rate – 0.2% | ||||||||
Countrywide Alternative Loan Trust | 1,045 | 697,979 | ||||||
Series 2006-OA14, Class 3A1 | 4,332 | 2,380,694 | ||||||
| ALLIANCEBERNSTEIN POOLING PORTFOLIOS • | 99 |
Intermediate Duration Bond Portfolio—Portfolio of Investments
| Principal Amount (000) | U.S. $ Value | |||||||
Countrywide Home Loan Mortgage | U.S.$ | 2,874 | $ | 109,809 | ||||
| 3,188,482 | ||||||||
Non-Agency ARMs – 0.2% | ||||||||
Citigroup Mortgage Loan Trust, Inc. | 3,037 | 2,288,805 | ||||||
Agency Fixed Rate – 0.0% | ||||||||
Fannie Mae Grantor Trust | 392 | 296,904 | ||||||
Total CMOs | 12,548,501 | |||||||
QUASI-SOVEREIGNS – 0.8% | ||||||||
Quasi-Sovereign Bonds – 0.8% | ||||||||
Kazakhstan – 0.1% | ||||||||
KazMunayGas National Co. | 1,990 | 2,134,275 | ||||||
Malaysia – 0.3% | ||||||||
Petronas Capital Ltd. | 3,390 | 3,612,421 | ||||||
Russia – 0.4% | ||||||||
RSHB Capital SA for OJSC Russian | 5,677 | 6,236,185 | ||||||
Total Quasi-Sovereigns | 11,982,881 | |||||||
CORPORATES - NON-INVESTMENT GRADES – 0.6% | ||||||||
Industrial – 0.6% | ||||||||
Basic – 0.1% | ||||||||
Westvaco Corp. | 670 | 718,511 | ||||||
Consumer Cyclical - Other – 0.3% | ||||||||
Wyndham Worldwide Corp. | 4,535 | 4,828,968 | ||||||
| 100 | • ALLIANCEBERNSTEIN POOLING PORTFOLIOS |
Intermediate Duration Bond Portfolio—Portfolio of Investments
| Principal Amount (000) | U.S. $ Value | |||||||
Consumer Non-Cyclical – 0.2% | ||||||||
Universal Health Services, Inc. | U.S.$ | 2,345 | $ | 2,556,453 | ||||
Total Corporates - Non-Investment Grades | 8,103,932 | |||||||
GOVERNMENTS - SOVEREIGN BONDS – 0.5% | ||||||||
Poland – 0.2% | ||||||||
Poland Government International Bond | 2,894 | 2,930,175 | ||||||
6.375%, 7/15/19 | 460 | 511,750 | ||||||
| 3,441,925 | ||||||||
Russia – 0.3% | ||||||||
Russian Foreign Bond – Eurobond 7.50%, 3/31/30(a) | 3,326 | 3,849,637 | ||||||
Total Governments – Sovereign Bonds | 7,291,562 | |||||||
SUPRANATIONALS – 0.4% | ||||||||
European Investment Bank | 1,970 | 1,982,724 | ||||||
International Bank for Reconstruction & Development | 2,340 | 3,163,083 | ||||||
Total Supranationals | 5,145,807 | |||||||
LOCAL GOVERNMENTS - MUNICIPAL BONDS – 0.3% | ||||||||
United States – 0.3% | ||||||||
California State | 3,310 | 3,599,658 | ||||||
| Shares | ||||||||
SHORT-TERM INVESTMENTS – 4.0% | ||||||||
Investment Companies – 4.0% | ||||||||
AllianceBernstein Fixed-Income Shares, Inc. – Government STIF Portfolio, 0.17%(e) | 56,955,913 | 56,955,913 | ||||||
Total Investments – 101.9% | 1,432,520,619 | |||||||
Other assets less liabilities – (1.9)% | (27,385,589 | ) | ||||||
Net Assets – 100.0% | $ | 1,405,135,030 | ||||||
| ALLIANCEBERNSTEIN POOLING PORTFOLIOS • | 101 |
Intermediate Duration Bond Portfolio—Portfolio of Investments
FORWARD CURRENCY EXCHANGE CONTRACTS (see Note C)
| Counterparty & Description | Contract Amount (000) | U.S. $ Value on Origination Date | U.S. $ Value at February 28, 2011 | Unrealized Appreciation/ (Depreciation) | ||||||||||||
Sale Contracts: | ||||||||||||||||
HSBC Bank USA: | ||||||||||||||||
Mexican Nuevo Peso settling 4/11/11 | 166,993 | $ | 13,828,489 | $ | 13,748,509 | $ | 79,980 | |||||||||
INTEREST RATE SWAP TRANSACTIONS (see Note C)
| Rate Type | ||||||||||||||||||||
| Swap Counterparty | Notional Amount (000) | Termination Date | Payments made by the Portfolio | Payments received by the Portfolio | Unrealized Appreciation/ (Depreciation) | |||||||||||||||
JPMorgan Chase Bank, NA | $ | 76,380 | 11/17/13 | 1.026 | % | 3 Month LIBOR | $ | 317,550 | ||||||||||||
| (a) | Security is exempt from registration under Rule 144A of the Securities Act of 1933. These securities are considered liquid and may be resold in transactions exempt from registration, normally to qualified institutional buyers. At February 28, 2011, the aggregate market value of these securities amounted to $113,349,468 or 8.1% of net assets. |
| (b) | Floating Rate Security. Stated interest rate was in effect at February 28, 2011. |
| (c) | Variable rate coupon, rate shown as of February 28, 2011. |
| (d) | Illiquid security. |
| (e) | Investment in affiliated money market mutual fund. The rate shown represents the 7-day yield as of period end. |
| + | Position, or a portion thereof, has been segregated to meet the collateral requirements of the Term Asset-Backed Securities Loan Facility (“TALF”) program administered by the Federal Reserve Bank of New York. The market value of the collateral amounted to $17,718,439. |
Currency Abbreviations:
MXN – Mexican Nuevo Peso
Glossary:
| ABS | – Asset-Backed Securities |
| ARMs | – Adjustable Rate Mortgages |
| CMBS | – Commercial Mortgage-Backed Securities |
| CMOs | – Collateralized Mortgage Obligations |
| FHLMC | – Federal Home Loan Mortgage Corporation |
| OJSC | – Open Joint Stock Company |
| REIT | – Real Estate Investment Trust |
| TBA | – To Be Announced |
See notes to financial statements.
| 102 | • ALLIANCEBERNSTEIN POOLING PORTFOLIOS |
Intermediate Duration Bond Portfolio—Portfolio of Investments
BOND INFLATION PROTECTION PORTFOLIO
Portfolio of Investments
February 28, 2011 (unaudited)
| Principal Amount (000) | U.S. $ Value | |||||||
INFLATION - LINKED SECURITIES – 100.2% | ||||||||
United States – 100.2% | ||||||||
U.S. Treasury Inflation Index | U.S.$ | 17,344 | $ | 17,990,485 | ||||
1.25%, 7/15/20 (TIPS) | 36,841 | 37,932,306 | ||||||
1.375%, 1/15/20 (TIPS) | 39,891 | 41,723,889 | ||||||
1.625%, 1/15/15-1/15/18 (TIPS)(a) | 154,518 | 167,147,822 | ||||||
1.875%, 7/15/13-7/15/19 (TIPS) | 97,248 | 105,193,238 | ||||||
1.875%, 7/15/15 (TIPS)(a) | 43,284 | 47,599,429 | ||||||
2.00%, 7/15/14 (TIPS)(a) | 72,645 | 79,597,888 | ||||||
2.00%, 1/15/16-1/15/26 (TIPS) | 30,725 | 33,347,894 | ||||||
2.125%, 1/15/19 (TIPS)(a) | 25,403 | 28,315,982 | ||||||
2.375%, 1/15/17-1/15/25 (TIPS)(a) | 70,870 | 79,772,247 | ||||||
3.00%, 7/15/12 (TIPS)(a) | 44,948 | 48,063,203 | ||||||
3.375%, 1/15/12 (TIPS)(a) | 37,936 | 39,764,528 | ||||||
Total Inflation - Linked Securities | 726,448,911 | |||||||
CORPORATES - INVESTMENT GRADES – 21.2% | ||||||||
Industrial – 9.8% | ||||||||
Basic – 1.6% | ||||||||
Alcoa, Inc. | 1,580 | 1,684,901 | ||||||
AngloGold Ashanti Holdings PLC | 980 | 997,678 | ||||||
ArcelorMittal | 1,570 | 1,688,533 | ||||||
Dow Chemical Co. (The) | 1,370 | 1,737,115 | ||||||
International Paper Co. | 1,315 | 1,715,569 | ||||||
Lubrizol Corp. | 1,370 | 1,718,291 | ||||||
Xstrata Canada Financial Corp. | EUR | 1,215 | 1,693,171 | |||||
| 11,235,258 | ||||||||
Capital Goods – 0.5% | ||||||||
CRH Finance BV | 1,100 | 1,675,902 | ||||||
Republic Services, Inc. | U.S.$ | 1,675 | 1,764,048 | |||||
| 3,439,950 | ||||||||
Communications – Media – 1.6% | ||||||||
CBS Corp. | 1,290 | 1,371,718 | ||||||
| ALLIANCEBERNSTEIN POOLING PORTFOLIOS • | 103 |
Bond Inflation Protection Portfolio—Portfolio of Investments
| Principal Amount (000) | U.S. $ Value | |||||||
Comcast Corp. | U.S.$ | 1,295 | $ | 1,350,467 | ||||
News America, Inc. | 1,739 | 1,761,630 | ||||||
Reed Elsevier Capital, Inc. | 1,340 | 1,701,035 | ||||||
RR Donnelley & Sons Co. | 1,650 | 1,710,603 | ||||||
Time Warner Cable, Inc. | 1,435 | 1,657,129 | ||||||
WPP Finance UK | 1,565 | 1,709,017 | ||||||
| 11,261,599 | ||||||||
Communications - Telecommunications – 1.5% | ||||||||
American Tower Corp. | 1,355 | 1,331,957 | ||||||
Deutsche Telekom International Finance BV | GBP | 1,000 | 1,745,703 | |||||
Embarq Corp. | U.S.$ | 1,510 | 1,718,437 | |||||
Koninklijke KPN NV | EUR | 1,185 | 1,708,128 | |||||
Qwest Corp. | U.S.$ | 1,500 | 1,717,500 | |||||
Telecom Italia Capital SA | 1,165 | 1,076,444 | ||||||
United States Cellular Corp. | 1,715 | 1,671,810 | ||||||
| 10,969,979 | ||||||||
Consumer Cyclical - Automotive – 0.4% |
| |||||||
Daimler Finance North America LLC | 1,275 | 1,346,039 | ||||||
Harley-Davidson Funding Corp. | 1,640 | 1,744,822 | ||||||
| 3,090,861 | ||||||||
Consumer Cyclical - | ||||||||
Viacom, Inc. | 1,495 | 1,715,061 | ||||||
Consumer Cyclical - Other – 0.2% | ||||||||
Carnival PLC | EUR | 1,225 | 1,734,870 | |||||
| 104 | • ALLIANCEBERNSTEIN POOLING PORTFOLIOS |
Bond Inflation Protection Portfolio—Portfolio of Investments
| Principal Amount (000) | U.S. $ Value | |||||||
Consumer Cyclical - Retailers – 0.2% | ||||||||
Nordstrom, Inc. | U.S.$ | 1,515 | $ | 1,732,672 | ||||
Consumer Non-Cyclical – 1.0% | ||||||||
Altria Group, Inc. | 1,365 | 1,772,954 | ||||||
Bunge Ltd. Finance Corp. | 1,610 | 1,651,672 | ||||||
Delhaize Group SA | 1,515 | 1,660,785 | ||||||
Reynolds American, Inc. | 1,480 | 1,758,583 | ||||||
| 6,843,994 | ||||||||
Energy – 1.7% | ||||||||
Anadarko Petroleum Corp. | 1,500 | 1,644,977 | ||||||
Hess Corp. | 1,355 | 1,701,755 | ||||||
Marathon Petroleum Corp. | 230 | 231,125 | ||||||
5.125%, 3/01/21(b) | 390 | 395,594 | ||||||
Nabors Industries, Inc. | 1,330 | 1,668,510 | ||||||
Noble Energy, Inc. | 1,370 | 1,726,478 | ||||||
Valero Energy Corp. | 1,525 | 1,617,317 | ||||||
Weatherford International Ltd. | 1,560 | 1,648,099 | ||||||
Williams Cos., Inc. (The) | 1,410 | 1,762,334 | ||||||
| 12,396,189 | ||||||||
Technology – 0.5% | ||||||||
Agilent Technologies, Inc. | 249 | 252,895 | ||||||
Motorola, Inc. | 1,540 | 1,727,942 | ||||||
Xerox Corp. | 1,425 | 1,667,528 | ||||||
| 3,648,365 | ||||||||
Transportation - Airlines – 0.2% | ||||||||
Southwest Airlines Co. | 1,615 | 1,742,388 | ||||||
| ALLIANCEBERNSTEIN POOLING PORTFOLIOS • | 105 |
Bond Inflation Protection Portfolio—Portfolio of Investments
| Principal Amount (000) | U.S. $ Value | |||||||
Transportation - Services – 0.2% | ||||||||
Ryder System, Inc. | U.S.$ | 909 | $ | 918,539 | ||||
5.85%, 11/01/16 | 630 | 696,911 | ||||||
| 1,615,450 | ||||||||
| 71,426,636 | ||||||||
Financial Institutions – 8.3% | ||||||||
Banking – 3.9% | ||||||||
American Express Co. | 1,490 | 1,703,977 | ||||||
Bank of America Corp. | 1,710 | 1,778,752 | ||||||
Bank of Scotland PLC | EUR | 1,190 | 1,704,338 | |||||
Barclays Bank PLC | U.S.$ | 1,535 | 1,631,928 | |||||
BBVA Senior Finance SAU | EUR | 1,200 | 1,667,194 | |||||
Capital One Financial Corp. | U.S.$ | 1,445 | 1,665,286 | |||||
Citigroup, Inc. | 1,565 | 1,677,680 | ||||||
Goldman Sachs Group, Inc. (The) | 1,565 | 1,677,973 | ||||||
HSBC BANK PLC 01/14 FLT | 1,725 | 1,722,551 | ||||||
JPMorgan Chase & Co. | 1,745 | 1,703,752 | ||||||
M&I Marshall & Ilsley Bank | 1,770 | 1,844,713 | ||||||
Macquarie Group Ltd. | 1,470 | 1,650,810 | ||||||
Morgan Stanley | 1,670 | 1,687,446 | ||||||
National Australia Bank Ltd. | 1,050 | 1,087,635 | ||||||
Royal Bank of Scotland PLC (The) | 1,715 | 1,732,987 | ||||||
Santander International Debt SA | EUR | 1,200 | 1,660,845 | |||||
UBS AG/Stamford CT | U.S.$ | 1,610 | 1,731,885 | |||||
| 28,329,752 | ||||||||
Brokerage – 0.3% | ||||||||
Jefferies Group, Inc. | 1,639 | 1,758,173 | ||||||
| 106 | • ALLIANCEBERNSTEIN POOLING PORTFOLIOS |
Bond Inflation Protection Portfolio—Portfolio of Investments
| Principal Amount (000) | U.S. $ Value | |||||||
Finance – 0.2% | ||||||||
SLM Corp. | U.S.$ | 1,670 | $ | 1,734,071 | ||||
Insurance – 3.7% | ||||||||
Aetna, Inc. | 1,550 | 1,768,733 | ||||||
Allstate Corp. (The) | 1,725 | 1,759,500 | ||||||
CIGNA Corp. | 583 | 610,783 | ||||||
Genworth Financial, Inc. | 1,675 | 1,683,050 | ||||||
Hartford Financial Services Group, Inc. | 1,850 | 1,807,321 | ||||||
Humana, Inc. | 1,520 | 1,732,267 | ||||||
Lincoln National Corp. | 1,350 | 1,700,699 | ||||||
Markel Corp. | 543 | 616,398 | ||||||
Marsh & McLennan Cos., Inc. | 1,585 | 1,693,468 | ||||||
Metropolitan Life Global Funding I | 1,545 | 1,654,338 | ||||||
Nationwide Mutual Insurance Co. | 1,410 | 1,680,864 | ||||||
Principal Financial Group, Inc. | 1,445 | 1,672,596 | ||||||
Prudential Financial, Inc. | 1,425 | 1,694,185 | ||||||
Swiss Re Capital I LP | 1,815 | 1,796,850 | ||||||
UnitedHealth Group, Inc. | 1,600 | 1,602,422 | ||||||
WellPoint, Inc. | 685 | 683,934 | ||||||
7.00%, 2/15/19 | 890 | 1,058,181 | ||||||
XL Group PLC | 1,590 | 1,678,647 | ||||||
| 26,894,236 | ||||||||
REITS – 0.2% | ||||||||
HCP, Inc. | 1,167 | 1,192,820 | ||||||
| 59,909,052 | ||||||||
| ALLIANCEBERNSTEIN POOLING PORTFOLIOS • | 107 |
Bond Inflation Protection Portfolio—Portfolio of Investments
| Principal Amount (000) | U.S. $ Value | |||||||
Utility – 2.3% | ||||||||
Electric – 1.1% | ||||||||
Allegheny Energy Supply Co. LLC | U.S.$ | 1,355 | $ | 1,395,330 | ||||
Constellation Energy Group, Inc. | 1,355 | 1,358,598 | ||||||
Nisource Finance Corp. | 1,530 | 1,658,870 | ||||||
Ohio Power Co. | 350 | 374,785 | ||||||
PPL Energy Supply LLC | 1,550 | 1,716,475 | ||||||
Teco Finance, Inc. | 1,680 | 1,707,878 | ||||||
| 8,211,936 | ||||||||
Natural Gas – 1.2% | ||||||||
DCP Midstream LLC | 1,290 | 1,670,016 | ||||||
Enterprise Products Operating LLC | 1,525 | 1,690,996 | ||||||
EQT Corp. | 1,385 | 1,642,003 | ||||||
Spectra Energy Capital LLC | 1,395 | 1,687,261 | ||||||
Williams Partners LP | 1,660 | 1,722,529 | ||||||
| 8,412,805 | ||||||||
| 16,624,741 | ||||||||
Non Corporate Sectors – 0.8% | ||||||||
Agencies - Not Government Guaranteed – 0.8% | ||||||||
Gazprom Via Gaz Capital SA | 2,760 | 2,925,600 | ||||||
Petrobras International Finance Co. – Pifco | 2,805 | 2,910,603 | ||||||
| 5,836,203 | ||||||||
Total Corporates - Investment Grades | 153,796,632 | |||||||
GOVERNMENTS - SOVEREIGN AGENCIES – 7.2% | ||||||||
Australia – 0.4% | ||||||||
Suncorp-Metway Ltd. | 2,600 | 2,648,503 | ||||||
| 108 | • ALLIANCEBERNSTEIN POOLING PORTFOLIOS |
Bond Inflation Protection Portfolio—Portfolio of Investments
| Principal Amount (000) | U.S. $ Value | |||||||
Netherlands – 1.9% | ||||||||
NIBC Bank NV | EUR | 5,050 | $ | 7,069,083 | ||||
SNS Bank NV | 5,090 | 7,113,865 | ||||||
| 14,182,948 | ||||||||
United Kingdom – 1.3% | ||||||||
Lloyds TSB Bank PLC | GBP | 1,465 | 2,418,366 | |||||
Skipton Building Society | 1,485 | 2,433,145 | ||||||
West Bromwich Building Society | 1,490 | 2,447,662 | ||||||
Yorkshire Building Society | 1,490 | 2,438,831 | ||||||
| 9,738,004 | ||||||||
United States – 3.6% | ||||||||
Goldman Sachs Group, Inc. (The) – FDIC Insured | EUR | 18,510 | 25,948,979 | |||||
Total Governments - Sovereign Agencies | 52,518,434 | |||||||
COMMERCIAL MORTGAGE-BACKED SECURITIES – 5.8% | ||||||||
Non-Agency Fixed Rate CMBS – 5.4% | ||||||||
Banc of America Commercial Mortgage, Inc. | U.S.$ | 3,275 | 3,571,094 | |||||
Bear Stearns Commercial Mortgage Securities | 1,390 | 1,501,871 | ||||||
Citigroup Commercial Mortgage Trust | 3,445 | 3,784,775 | ||||||
Commercial Mortgage Pass Through Certificates | 3,350 | 3,542,337 | ||||||
Series 2007-C9, Class A4 | 4,250 | 4,643,243 | ||||||
| ALLIANCEBERNSTEIN POOLING PORTFOLIOS • | 109 |
Bond Inflation Protection Portfolio—Portfolio of Investments
| Principal Amount (000) | U.S. $ Value | |||||||
Greenwich Capital Commercial Funding Corp. | U.S.$ | 3,455 | $ | 3,690,988 | ||||
JP Morgan Chase Commercial Mortgage Securities Corp. | 3,925 | 4,293,890 | ||||||
Series 2007-C1, Class A4 | 3,375 | 3,568,424 | ||||||
LB-UBS Commercial Mortgage Trust | ||||||||
5.883%, 6/15/38 | 3,220 | 3,547,307 | ||||||
Series 2007-C1, Class A4 | 3,335 | 3,578,275 | ||||||
Merrill Lynch/Countrywide Commercial Mortgage Trust | 3,265 | 3,477,058 | ||||||
| 39,199,262 | ||||||||
Agency CMBS – 0.4% | ||||||||
FHLMC Multifamily Structured Pass Through Certificates | 3,258 | 3,199,042 | ||||||
Total Commercial Mortgage-Backed Securities | 42,398,304 | |||||||
SUPRANATIONALS – 1.9% | ||||||||
European Bank for Reconstruction & Development | BRL | 5,675 | 3,407,797 | |||||
European Investment Bank | U.S.$ | 3,500 | 3,512,299 | |||||
Inter-American Development Bank | 6,610 | 6,610,601 | ||||||
Total Supranationals | 13,530,697 | |||||||
ASSET - BACKED SECURITIES – 1.2% | ||||||||
Credit Cards - Floating Rate – 0.5% | ||||||||
American Express Credit Account Master Trust | 3,676 | 3,680,816 | ||||||
| 110 | • ALLIANCEBERNSTEIN POOLING PORTFOLIOS |
Bond Inflation Protection Portfolio—Portfolio of Investments
| Principal Amount (000) | U.S. $ Value | |||||||
Autos - Fixed Rate – 0.5% | ||||||||
Ford Credit Auto Owner Trust | U.S.$ | 3,120 | $ | 3,229,209 | ||||
Other ABS - Fixed Rate – 0.2% | ||||||||
CNH Equipment Trust | 1,467 | 1,462,804 | ||||||
Total Asset-Backed Securities | 8,372,829 | |||||||
GOVERNMENTS - TREASURIES – 0.9% | ||||||||
Mexico – 0.9% | ||||||||
Mexican Bonos | MXN | 80,365 | 6,835,916 | |||||
CORPORATES - NON-INVESTMENT GRADES – 0.8% | ||||||||
Industrial – 0.8% | ||||||||
Basic – 0.1% | ||||||||
United States Steel Corp. | U.S.$ | 815 | $ | 723,313 | ||||
Capital Goods – 0.1% | ||||||||
Case New Holland, Inc. | 618 | 690,615 | ||||||
Communications - Media – 0.2% | ||||||||
Ziggo Bond Co. BV | EUR | 760 | 1,124,797 | |||||
Consumer Non-Cyclical – 0.3% | ||||||||
Fresenius Medical Care US Finance, Inc. | U.S.$ | 715 | 691,763 | |||||
Universal Health Services, Inc. | 1,485 | 1,618,905 | ||||||
| 2,310,668 | ||||||||
Energy – 0.1% | ||||||||
Chesapeake Energy Corp. | 707 | 721,140 | ||||||
Total Corporates - Non-Investment Grades | 5,570,533 | |||||||
| ALLIANCEBERNSTEIN POOLING PORTFOLIOS • | 111 |
Bond Inflation Protection Portfolio—Portfolio of Investments
| Principal Amount (000) | U.S. $ Value | |||||||
QUASI - SOVEREIGNS – 0.7% | ||||||||
Quasi - Sovereign Bonds – 0.7% | ||||||||
Russia – 0.7% | ||||||||
RSHB Capital SA for OJSC Russian Agricultural Bank | U.S.$ | 4,365 | $ | 4,794,952 | ||||
GOVERNMENTS - SOVEREIGN BONDS – 0.1% | ||||||||
Poland – 0.1% | ||||||||
Poland Government International Bond | 777 | 786,713 | ||||||
EMERGING MARKETS - CORPORATE BONDS – 0.1% | ||||||||
Industrial – 0.1% | ||||||||
Energy – 0.1% | ||||||||
Ecopetrol SA | 590 | 682,925 | ||||||
| Shares | ||||||||
SHORT-TERM INVESTMENTS – 0.2% | ||||||||
Investment Companies – 0.2% | ||||||||
AllianceBernstein Fixed-Income Shares, Inc. – Government STIF Portfolio, | 1,321,471 | 1,321,471 | ||||||
Total Investments – 140.3% | 1,017,058,317 | |||||||
Other assets less liabilities – (40.3)% | (292,101,340 | ) | ||||||
Net Assets – 100.0% | $ | 724,956,977 | ||||||
FUTURES CONTRACTS (see Note C)
| Type | Number of Contracts | Expiration Month | Original Value | Value at February 28, 2011 | Unrealized Appreciation/ (Depreciation) | |||||||||||||||
Purchased Contracts | ||||||||||||||||||||
German Euro Bobl Futures | 62 | March 2011 | $ | 10,177,963 | $ | 10,025,556 | $ | (152,407) | ||||||||||||
| 112 | • ALLIANCEBERNSTEIN POOLING PORTFOLIOS |
Bond Inflation Protection Portfolio—Portfolio of Investments
| Type | Number of Contracts | Expiration Month | Original Value | Value at February 28, 2011 | Unrealized Appreciation/ (Depreciation) | |||||||||||||||
Sold Contracts | ||||||||||||||||||||
Japan Government Bonds 10 Yr Futures | 8 | March 2011 | $ | 13,675,383 | $ | 13,646,109 | $ | 29,274 | ||||||||||||
U.S. T-Note 5 Yr Futures | 643 | June 2011 | 75,089,077 | 75,190,812 | (101,735) | |||||||||||||||
U.S. T-Note 10 Yr Futures | 41 | June 2011 | 4,865,532 | 4,880,922 | (15,390 | ) | ||||||||||||||
| $ | (240,258 | ) | ||||||||||||||||||
FORWARD CURRENCY EXCHANGE CONTRACTS (see Note C)
| Counterparty & Description | Contract Amount (000) | U.S. $ Value on Origination Date | U.S. $ Value at February 28, 2011 | Unrealized Appreciation/ (Depreciation) | ||||||||||||
Buy Contracts: | ||||||||||||||||
Barclays Bank PLC Wholesale: | ||||||||||||||||
Norwegian Krone settling | 21,203 | $ | 3,702,554 | $ | 3,777,351 | $ | 74,797 | |||||||||
BNP Paribas SA: | ||||||||||||||||
Euro settling 3/07/11 | 146 | 199,658 | 201,926 | 2,268 | ||||||||||||
Citibank N.A.: | ||||||||||||||||
Brazilian Real settling 3/02/11 | 5,928 | 3,568,937 | 3,562,931 | (6,006 | ) | |||||||||||
Credit Suisse London Branch (GFX): | ||||||||||||||||
Norwegian Krone settling 4/15/11 | 20,320 | 3,466,394 | 3,620,067 | 153,673 | ||||||||||||
South Korean Won settling 4/18/11 | 10,025,843 | 8,881,073 | 8,859,734 | (21,339 | ) | |||||||||||
Goldman Sachs International: | ||||||||||||||||
Brazilian Real settling 3/02/11 | 5,928 | 3,568,507 | 3,562,931 | (5,576 | ) | |||||||||||
HSBC Bank USA: | ||||||||||||||||
Euro settling 3/07/11 | 158 | 215,869 | 217,760 | 1,891 | ||||||||||||
Morgan Stanley and Co. Inc: | ||||||||||||||||
Swedish Krona settling 4/15/11 | 25,171 | 3,877,827 | 3,965,732 | 87,905 | ||||||||||||
Standard Chartered Bank: | ||||||||||||||||
Indonesian Rupiah settling 3/25/11(1) | 32,447,175 | 3,532,627 | 3,674,999 | 142,372 | ||||||||||||
State Street Bank and Trust Co.: | ||||||||||||||||
Great British Pound settling 4/04/11 | 392 | 636,363 | 637,669 | 1,306 | ||||||||||||
New Zealand Dollar settling 4/08/11 | 4,692 | 3,507,809 | 3,520,816 | 13,007 | ||||||||||||
Sale Contracts: | ||||||||||||||||
Barclays Bank PLC Wholesale: | ||||||||||||||||
Japanese Yen settling 3/24/11 | 883,095 | 10,612,088 | 10,796,559 | (184,471 | ) | |||||||||||
Citibank N.A.: | ||||||||||||||||
Brazilian Real settling 3/02/11 | 5,928 | 3,568,507 | 3,562,931 | 5,576 | ||||||||||||
| ALLIANCEBERNSTEIN POOLING PORTFOLIOS • | 113 |
Bond Inflation Protection Portfolio—Portfolio of Investments
| Counterparty & Description | Contract Amount (000) | U.S. $ Value on Origination Date | U.S. $ Value at February 28, 2011 | Unrealized Appreciation/ (Depreciation) | ||||||||||||
Brazilian Real settling 4/04/11 | 5,928 | $ | 3,546,518 | $ | 3,543,126 | $ | 3,392 | |||||||||
Credit Suisse London Branch (GFX): | ||||||||||||||||
Canadian Dollar settling 3/25/11 | 6,803 | 6,849,738 | 6,998,975 | (149,237 | ) | |||||||||||
Goldman Sachs International: | ||||||||||||||||
Brazilian Real settling 3/02/11 | 5,928 | 3,520,402 | 3,562,931 | (42,529 | ) | |||||||||||
Royal Bank of Scotland PLC: | ||||||||||||||||
Great British Pound settling 4/04/11 | 7,592 | 12,102,490 | 12,337,933 | (235,443 | ) | |||||||||||
Mexican Nuevo Peso settling 4/11/11 | 39,868 | 3,281,349 | 3,282,330 | (981 | ) | |||||||||||
UBS AG: | ||||||||||||||||
Euro settling 3/07/11 | 5,253 | 7,195,514 | 7,247,827 | (52,313 | ) | |||||||||||
Euro settling 3/07/11 | 43,101 | 57,623,450 | 59,473,495 | (1,850,045 | ) | |||||||||||
| (1) | Contract represents non-deliverable forward where payment is received from or paid to a counterparty based on the net realized gain/loss on settlement date. |
INTEREST RATE SWAP TRANSACTIONS (see Note C)
| Rate Type | ||||||||||||||||||||
| Swap Counterparty | Notional Amount (000) | Termination Date | Payments made by the Portfolio | Payments received by the Portfolio | Unrealized Appreciation/ (Depreciation) | |||||||||||||||
Barclays Bank PLC | $ | 50,940 | 11/17/13 | 1.059 | % | 3 Month LIBOR | $ | 162,187 | ||||||||||||
CREDIT DEFAULT SWAP CONTRACTS ON CREDIT INDICES (see Note C)
| Swap Counterparty & Index | Fixed Deal (Pay) Receive Rate | Implied Credit Spread at February 28, 2011 | Notional Amount (000) | Market Value | Upfront Premiums (Paid) Received | Unrealized Appreciation/ (Depreciation) | ||||||||||||||||||
Sale Contracts | ||||||||||||||||||||||||
Bank of America: CDX –NAHYS14V1– | 5.00 | % | 3.52 | % | $ | 19,880 | $ | 1,295,602 | $ | 103,454 | $ | 1,192,148 | ||||||||||||
Bank of America: CDX – NAIGS14V1 – | 1.00 | 0.74 | 52,860 | 677,413 | 295,550 | 381,863 | ||||||||||||||||||
| * | Termination date |
| 114 | • ALLIANCEBERNSTEIN POOLING PORTFOLIOS |
Bond Inflation Protection Portfolio—Portfolio of Investments
REVERSE REPURCHASE AGREEMENTS (see Note C)
| Broker | Interest Rate | Maturity | U.S. $ Value at February 28, 2011 | |||||||||
Bank of America | 0.17 | % | 3/04/11 | $ | 24,920,044 | |||||||
Bank of America | 0.18 | % | 12/30/11 | 37,138,093 | ||||||||
Barclays Bank | 0.17 | % | 3/04/11 | 2,956,404 | ||||||||
Barclays Bank | 0.17 | % | 3/08/11 | 88,839,812 | ||||||||
Barclays Bank | 0.17 | % | 3/18/11 | 87,363,788 | ||||||||
Barclays Bank | 0.19 | % | 3/08/11 | 21,526,704 | ||||||||
Barclays Bank | 0.23 | % | 12/30/11 | 2,445,843 | ||||||||
Barclays Bank | 0.24 | % | 12/30/11 | 24,789,810 | ||||||||
| $ | 289,980,498 | |||||||||||
| (a) | Position, or a portion thereof, has been segregated to collateralize reverse repurchase agreements. The market value of the collateral amounted to $296,752,473. |
| (b) | Security is exempt from registration under Rule 144A of the Securities Act of 1933. These securities are considered liquid and may be resold in transactions exempt from registration, normally to qualified institutional buyers. At February 28, 2011, the aggregate market value of these securities amounted to $27,906,165 or 3.8% of net assets. |
| (c) | Floating Rate Security. Stated interest rate was in effect at February 28, 2011. |
| (d) | Investment in affiliated money market mutual fund. The rate shown represents the 7-day yield as of period end. |
Currency Abbreviations:
| BRL | – Brazilian Real |
| EUR | – Euro |
| GBP | – Great British Pound |
| MXN | – Mexican Nuevo Peso |
Glossary:
| ABS | – Asset-Backed Securities |
| CMBS | – Commercial Mortgage-Backed Securities |
| FDIC | – Federal Deposit Insurance Corporation |
| FHLMC | – Federal Home Loan Mortgage Corporation |
| OJSC | – Open Joint Stock Company |
| REIT | – Real Estate Investment Trust |
| TBA | – To Be Announced |
| TIPS | – Treasury Inflation Protected Security |
See notes to financial statements.
| ALLIANCEBERNSTEIN POOLING PORTFOLIOS • | 115 |
Bond Inflation Protection Portfolio—Portfolio of Investments
HIGH-YIELD PORTFOLIO
PORTFOLIO OF INVESTMENTS
February 28, 2011 (unaudited)
| Principal Amount (000) | U.S. $ Value | |||||||
CORPORATES - NON-INVESTMENT GRADES – 75.2% | ||||||||
Industrial – 59.9% | ||||||||
Basic – 6.9% | ||||||||
AK Steel Corp. | U.S.$ | 1,043 | $ | 1,063,860 | ||||
Aleris International, Inc. | 1,100 | 1,119,250 | ||||||
Algoma Acquisition Corp. | 1,050 | 956,812 | ||||||
Appleton Papers, Inc. | 435 | 450,225 | ||||||
Arch Western Finance LLC | 696 | 702,960 | ||||||
Basell Finance Co. BV | 569 | 642,970 | ||||||
Boise Paper Holdings LLC / Boise Finance Co. | 267 | 297,705 | ||||||
Celanese US Holdings LLC | 172 | 179,740 | ||||||
Consol Energy, Inc. | 525 | 578,813 | ||||||
Domtar Corp. Series GLOB | 626 | 688,600 | ||||||
Drummond Co., Inc. | 530 | 548,550 | ||||||
Evraz Group SA | 394 | 429,460 | ||||||
8.875%, 4/24/13(a) | 200 | 217,750 | ||||||
9.50%, 4/24/18(a) | 720 | 826,200 | ||||||
FMG Resources August 2006 Pty Ltd. | 425 | 440,938 | ||||||
Georgia-Pacific LLC | 595 | 632,188 | ||||||
8.25%, 5/01/16(a) | 375 | 422,813 | ||||||
Graphic Packaging International, Inc. | 500 | 537,500 | ||||||
Hexion US Finance Corp. / Hexion Nova Scotia Finance ULC | 279 | 269,584 | ||||||
Huntsman International LLC | 400 | 395,000 | ||||||
8.625%, 3/15/21(a) | 241 | 267,510 | ||||||
Ineos Group Holdings PLC | 1,725 | 1,742,250 | ||||||
Kerling PLC | EUR | 885 | 1,386,125 | |||||
| 116 | • ALLIANCEBERNSTEIN POOLING PORTFOLIOS |
High-yield Portfolio—Portfolio of Investments
| Principal Amount (000) | U.S. $ Value | |||||||
KRATON Polymers LLC/KRATON Polymers Capital Corp. | U.S.$ | 101 | $ | 103,020 | ||||
Lecta SA | EUR | 484 | 649,529 | |||||
Lyondell Chemical Co. | U.S.$ | 715 | 820,462 | |||||
MacDermid, Inc. | 675 | 718,875 | ||||||
Nalco Co. | 291 | 300,821 | ||||||
NewMarket Corp. | 615 | 641,137 | ||||||
NewPage Corp. | 397 | 262,020 | ||||||
11.375%, 12/31/14 | 750 | 748,125 | ||||||
Norske Skogindustrier ASA | 661 | 588,290 | ||||||
Nova Chemicals Corp. | 501 | 553,605 | ||||||
Novelis, Inc. | 1,976 | 2,178,540 | ||||||
Omnova Solutions, Inc. | 809 | 830,236 | ||||||
Peabody Energy Corp. | 545 | 615,850 | ||||||
Polymer Group, Inc. | 1,300 | 1,353,625 | ||||||
Polypore International, Inc. | 380 | 393,300 | ||||||
Rain CII Carbon LLC/CII Carbon Corp. | 501 | 534,818 | ||||||
Rhodia SA | EUR | 419 | 575,962 | |||||
6.875%, 9/15/20(a) | U.S.$ | 406 | 415,643 | |||||
Severstal OAO Via Steel Capital SA | 1,438 | 1,621,345 | ||||||
Solutia, Inc. | 268 | 294,800 | ||||||
Steel Dynamics, Inc. | 2,230 | 2,369,375 | ||||||
TPC Group LLC | 747 | 794,621 | ||||||
United States Steel Corp. | 825 | 860,062 | ||||||
7.375%, 4/01/20 | 370 | 391,275 | ||||||
Vedanta Resources PLC | 1,400 | 1,491,000 | ||||||
| ALLIANCEBERNSTEIN POOLING PORTFOLIOS • | 117 |
High-yield Portfolio—Portfolio of Investments
| Principal Amount (000) | U.S. $ Value | |||||||
Verso Paper Holdings LLC / Verso Paper, Inc. | U.S.$ | 360 | $ | 376,200 | ||||
Series B | 900 | 956,250 | ||||||
Weyerhaeuser Co. | 685 | 744,849 | ||||||
| 36,980,438 | ||||||||
Capital Goods – 5.1% | ||||||||
Alliant Techsystems, Inc. | 320 | 330,800 | ||||||
Ardagh Packaging Finance PLC | 320 | 340,800 | ||||||
BE Aerospace, Inc. | 333 | 347,153 | ||||||
Berry Plastics Corp. | 1,300 | 1,303,250 | ||||||
Bombardier, Inc. | 624 | 670,800 | ||||||
Building Materials Corp. of America | 689 | 726,034 | ||||||
7.50%, 3/15/20(a) | 499 | 520,831 | ||||||
CNH America LLC | 935 | 1,021,487 | ||||||
CPI International Acquisition, Inc. | 529 | 532,968 | ||||||
Grohe Holding GMBH | EUR | 834 | 1,186,843 | |||||
Manitowoc Co., Inc. (The) | U.S.$ | 700 | 761,250 | |||||
Masco Corp. | 160 | 163,724 | ||||||
7.125%, 3/15/20 | 1,500 | 1,562,208 | ||||||
Mohawk Industries, Inc. | 1,377 | 1,476,832 | ||||||
Nordenia Holdings AG | EUR | 517 | 796,906 | |||||
Owens-Brockway Glass Container, Inc. | U.S.$ | 1,780 | 1,822,275 | |||||
Plastipak Holdings, Inc. | 1,180 | 1,233,100 | ||||||
Ply Gem Industries, Inc. | 1,100 | 1,126,125 | ||||||
Pregis Corp. | EUR | 500 | 669,276 | |||||
RBS Global, Inc. / Rexnord LLC | U.S.$ | 365 | 395,113 | |||||
| 118 | • ALLIANCEBERNSTEIN POOLING PORTFOLIOS |
High-yield Portfolio—Portfolio of Investments
| Principal Amount (000) | U.S. $ Value | |||||||
Reynolds Group Issuer, Inc. / Reynolds Group Issuer LLC / Reynolds Group Issuer Lu | U.S.$ | 712 | $ | 729,800 | ||||
7.75%, 10/15/16(a) | 118 | 125,670 | ||||||
8.25%, 2/15/21(a) | 1,850 | 1,854,625 | ||||||
9.00%, 4/15/19(a) | 638 | 665,115 | ||||||
RSC Equipment Rental Inc/RSC | 750 | 793,125 | ||||||
10.25%, 11/15/19 | 500 | 570,000 | ||||||
Smurfit Kappa Acquisitions | EUR | 1,000 | 1,476,546 | |||||
Terex Corp. | U.S.$ | 536 | 561,460 | |||||
TransDigm, Inc. | 1,200 | 1,293,000 | ||||||
United Rentals North America, Inc. | 825 | 873,469 | ||||||
USG Corp. | 1,115 | 1,056,462 | ||||||
| 26,987,047 | ||||||||
Communications - Media – 7.7% | ||||||||
Allbritton Communications Co. | 1,410 | 1,476,975 | ||||||
Cablevision Systems Corp. | 1,750 | 1,907,500 | ||||||
CCH II LLC / CCH II Capital Corp. | 1,000 | 1,211,250 | ||||||
CCO Holdings LLC / CCO Holdings Capital Corp. | 1,625 | 1,653,438 | ||||||
7.00%, 1/15/19(a) | 625 | 634,375 | ||||||
7.875%, 4/30/18 | 664 | 708,820 | ||||||
8.125%, 4/30/20 | 219 | 236,246 | ||||||
Cengage Learning Acquisitions, Inc. | 850 | 881,875 | ||||||
Central European Media Enterprises Ltd. | EUR | 650 | 946,301 | |||||
Cequel Communications Holdings I LLC and Cequel Capital Corp. | U.S.$ | 1,015 | 1,073,363 | |||||
CET 21 spol sro | EUR | 66 | 97,907 | |||||
Charter Communications Operating LLC / Charter Communications Operating Capital | U.S.$ | 800 | 842,000 | |||||
| ALLIANCEBERNSTEIN POOLING PORTFOLIOS • | 119 |
High-yield Portfolio—Portfolio of Investments
| Principal Amount (000) | U.S. $ Value | |||||||
Citadel Broadcasting Corp. | U.S.$ | 220 | $ | 235,950 | ||||
Clear Channel Communications, Inc. | 391 | 383,180 | ||||||
10.75%, 8/01/16 | 1,635 | 1,594,125 | ||||||
Clear Channel Worldwide Holdings, Inc. | 35 | 38,850 | ||||||
Series B | 1,440 | 1,602,000 | ||||||
Columbus International, Inc. | 1,128 | 1,291,560 | ||||||
CSC Holdings LLC | 73 | 76,011 | ||||||
7.625%, 7/15/18 | 535 | 588,500 | ||||||
7.875%, 2/15/18 | 640 | 713,600 | ||||||
Dex One Corp. | 338 | 233,398 | ||||||
DISH DBS Corp. | 970 | 1,028,200 | ||||||
7.125%, 2/01/16 | 650 | 693,875 | ||||||
Intelsat Jackson Holdings SA | 1,100 | 1,130,250 | ||||||
11.25%, 6/15/16 | 612 | 654,840 | ||||||
Intelsat Luxembourg SA | 1,725 | 1,908,281 | ||||||
11.50%, 2/04/17(c) | 873 | 969,182 | ||||||
Lamar Media Corp. | 1,440 | 1,476,000 | ||||||
Liberty Media LLC | 545 | 568,163 | ||||||
LIN Television Corp. | 725 | 728,625 | ||||||
Local TV Finance LLC | 525 | 509,250 | ||||||
New York Times Co. (The) | 500 | 508,750 | ||||||
Nielsen Finance LLC / Nielsen Finance Co. | 360 | 389,250 | ||||||
Quebecor Media, Inc. | 2,455 | 2,553,200 | ||||||
Rainbow National Services LLC | 1,224 | 1,228,590 | ||||||
10.375%, 9/01/14(a) | 473 | 492,511 | ||||||
Sinclair Television Group, Inc. | 600 | 634,500 | ||||||
9.25%, 11/01/17(a) | 160 | 180,800 | ||||||
| 120 | • ALLIANCEBERNSTEIN POOLING PORTFOLIOS |
High-yield Portfolio—Portfolio of Investments
| Principal Amount (000) | U.S. $ Value | |||||||
Univision Communications, Inc. | U.S.$ | 470 | $ | 489,975 | ||||
9.75%, 3/15/15(a)(c) | 406 | 426,123 | ||||||
12.00%, 7/01/14(a) | 650 | 708,500 | ||||||
UPCB Finance III Ltd. | 385 | 383,556 | ||||||
Valassis Communications, Inc. | 500 | 493,750 | ||||||
WMG Holdings Corp. | 2,096 | 2,111,720 | ||||||
XM Satellite Radio, Inc. | 975 | 1,033,500 | ||||||
Ziggo Bond Co. BV | EUR | 800 | 1,183,997 | |||||
| 40,912,612 | ||||||||
Communications - Telecommunications – 4.9% | ||||||||
Cincinnati Bell, Inc. | U.S.$ | 750 | 719,063 | |||||
Clearwire Communications LLC/Clearwire | 1,200 | 1,308,000 | ||||||
Cricket Communications, Inc. | 1,060 | 1,094,950 | ||||||
Crown Castle International Corp. | 1,000 | 1,063,750 | ||||||
Digicel Group Ltd. | 1,083 | 1,234,620 | ||||||
Fairpoint Communications, Inc. | 1,966 | 9,830 | ||||||
Frontier Communications Corp. | 851 | 903,124 | ||||||
9.00%, 8/15/31 | 545 | 573,613 | ||||||
Level 3 Financing, Inc. | 685 | 673,013 | ||||||
9.25%, 11/01/14 | 1,200 | 1,239,000 | ||||||
MetroPCS Wireless, Inc. | 1,950 | 2,059,687 | ||||||
Mobile Telesystems Finance SA | 1,558 | 1,635,900 | ||||||
PAETEC Holdings Corp. | 1,045 | 1,125,987 | ||||||
Qwest Communications International, Inc. | 350 | 355,250 | ||||||
Sprint Capital Corp. | 1,315 | 1,185,144 | ||||||
8.75%, 3/15/32 | 1,180 | 1,227,200 | ||||||
| ALLIANCEBERNSTEIN POOLING PORTFOLIOS • | 121 |
High-yield Portfolio—Portfolio of Investments
| Principal Amount (000) | U.S. $ Value | |||||||
Sprint Nextel Corp. | U.S.$ | 1,000 | $ | 997,500 | ||||
Sunrise Communications Holdings SA | EUR | 350 | 524,036 | |||||
tw telecom holdings, Inc | U.S.$ | 1,039 | 1,114,327 | |||||
Vimpel Communications Via VIP Finance Ireland Ltd. OJSC | 1,560 | 1,688,700 | ||||||
Wind Acquisition Finance SA | 2,600 | 2,704,000 | ||||||
Windstream Corp. | 675 | 733,219 | ||||||
8.125%, 9/01/18 | 900 | 963,000 | ||||||
8.625%, 8/01/16 | 1,070 | 1,131,525 | ||||||
| 26,264,438 | ||||||||
Consumer Cyclical - | ||||||||
Affinia Group, Inc. | 305 | 311,100 | ||||||
9.00%, 11/30/14 | 545 | 555,900 | ||||||
Allison Transmission, Inc. | 560 | 609,000 | ||||||
ArvinMeritor, Inc. | 500 | 536,250 | ||||||
Cooper-Standard Automotive, Inc. | 625 | 675,000 | ||||||
Dana Holding Corp. | 140 | 141,400 | ||||||
6.75%, 2/15/21 | 111 | 112,388 | ||||||
Exide Technologies | 268 | 285,755 | ||||||
Ford Motor Co. | 1,000 | 1,088,447 | ||||||
Ford Motor Credit Co. LLC | 2,785 | 2,813,379 | ||||||
7.00%, 10/01/13 | 2,734 | 2,969,047 | ||||||
8.00%, 12/15/16 | 2,665 | 3,018,550 | ||||||
Goodyear Tire & Rubber Co. (The) | 1,464 | 1,573,800 | ||||||
8.75%, 8/15/20 | 857 | 944,842 | ||||||
Keystone Automotive Operations, Inc. | 1,436 | 574,400 | ||||||
Lear Corp. | 150 | 165,375 | ||||||
8.125%, 3/15/20 | 250 | 280,000 | ||||||
| 122 | • ALLIANCEBERNSTEIN POOLING PORTFOLIOS |
High-yield Portfolio—Portfolio of Investments
| Principal Amount (000) | U.S. $ Value | |||||||
Navistar International Corp. | U.S.$ | 1,010 | $ | 1,118,575 | ||||
Tenneco, Inc. | 330 | 342,375 | ||||||
Tower Automotive Holdings USA LLC / TA Holdings Finance, Inc. | 746 | 835,520 | ||||||
Uncle Acquisition 2010 Corp. | 402 | 428,130 | ||||||
| 19,379,233 | ||||||||
Consumer Cyclical - | ||||||||
AMC Entertainment Holdings, Inc. | 425 | 455,812 | ||||||
ClubCorp Club Operations, Inc. | 775 | 783,719 | ||||||
Greektown Holdings LLC | 525 | 0 | ||||||
NAI Entertainment Holdings LLC | 930 | 999,750 | ||||||
Pinnacle Entertainment, Inc. | 600 | 609,000 | ||||||
8.75%, 5/15/20 | 625 | 666,406 | ||||||
Regal Entertainment Group | 770 | 823,900 | ||||||
| 4,338,587 | ||||||||
Consumer Cyclical - Other – 6.1% | ||||||||
Beazer Homes USA, Inc. | 425 | 494,063 | ||||||
Boyd Gaming Corp. | 900 | 861,750 | ||||||
9.125%, 12/01/18(a) | 525 | 551,250 | ||||||
Broder Brothers Co. | 354 | 345,600 | ||||||
Caesars Entertainment Operating Co., Inc | 1,700 | 1,598,000 | ||||||
10.75%, 2/01/16 | 1,016 | 1,003,300 | ||||||
11.25%, 6/01/17 | 1,100 | 1,248,500 | ||||||
Chukchansi Economic Development | 540 | 405,000 | ||||||
CityCenter Holdings LLC / CityCenter | 1,111 | 1,158,217 | ||||||
| ALLIANCEBERNSTEIN POOLING PORTFOLIOS • | 123 |
High-yield Portfolio—Portfolio of Investments
| Principal Amount (000) | U.S. $ Value | |||||||
DR Horton, Inc. | U.S.$ | 1,180 | $ | 1,233,100 | ||||
Host Hotels & Resorts LP | 385 | 398,475 | ||||||
Series Q | 935 | 970,062 | ||||||
Isle of Capri Casinos, Inc. | 620 | 614,575 | ||||||
K Hovnanian Enterprises, Inc. | 655 | 520,725 | ||||||
10.625%, 10/15/16 | 500 | 541,875 | ||||||
KB Home | 125 | 126,875 | ||||||
Lennar Corp. | 2,500 | 2,493,750 | ||||||
Levi Strauss & Co. | 742 | 776,318 | ||||||
M/I Homes, Inc. | 540 | 549,450 | ||||||
Marina District Finance Co., Inc. | 255 | 265,838 | ||||||
9.875%, 8/15/18(a) | 745 | 776,663 | ||||||
MCE Finance Ltd. | 460 | 529,000 | ||||||
MGM Resorts International | 1,222 | 1,160,900 | ||||||
7.625%, 1/15/17 | 1,610 | 1,543,587 | ||||||
NCL Corp. Ltd. | 800 | 866,000 | ||||||
11.75%, 11/15/16 | 500 | 590,625 | ||||||
Quiksilver, Inc. | 650 | 645,125 | ||||||
Realogy Corp. | 570 | 592,800 | ||||||
Royal Caribbean Cruises Ltd. | 2,385 | 2,557,912 | ||||||
Seminole Indian Tribe of Florida | 94 | 92,592 | ||||||
7.75%, 10/01/17(a) | 531 | 563,524 | ||||||
Standard Pacific Corp. | 500 | 530,000 | ||||||
10.75%, 9/15/16 | 555 | 652,125 | ||||||
Starwood Hotels & Resorts Worldwide, Inc. | 2,065 | 2,199,225 | ||||||
7.875%, 5/01/12 | 539 | 567,298 | ||||||
| 124 | • ALLIANCEBERNSTEIN POOLING PORTFOLIOS |
High-yield Portfolio—Portfolio of Investments
| Principal Amount (000) | U.S. $ Value | |||||||
Station Casinos, Inc. | U.S.$ | 3,610 | $ | 361 | ||||
William Lyon Homes, Inc. | 847 | 724,185 | ||||||
Wynn Las Vegas LLC/Wynn Las Vegas Capital Corp. | 1,900 | 2,009,250 | ||||||
| 32,757,895 | ||||||||
Consumer Cyclical - | ||||||||
Burger King Corp. | 640 | 683,200 | ||||||
CKE Restaurants, Inc. | 750 | 841,875 | ||||||
Dunkin Finance Corp. | 384 | 388,800 | ||||||
Landry’s Restaurants, Inc. | 455 | 493,675 | ||||||
| 2,407,550 | ||||||||
Consumer Cyclical - Retailers – 2.7% | ||||||||
Asbury Automotive Group, Inc. | 77 | 78,925 | ||||||
8.375%, 11/15/20(a) | 357 | 374,850 | ||||||
AutoNation, Inc. | 120 | 124,800 | ||||||
Bon-Ton Department Stores, Inc. (The) | 1,195 | 1,226,369 | ||||||
Burlington Coat Factory Warehouse Corp. | 121 | 122,210 | ||||||
Giraffe Acquisition Corp. | 1,100 | 1,127,500 | ||||||
JC Penney Corp., Inc. | 525 | 504,000 | ||||||
Limited Brands, Inc. | 328 | 343,170 | ||||||
6.90%, 7/15/17 | 1,645 | 1,764,262 | ||||||
Macy’s Retail Holdings, Inc. | 960 | 1,024,800 | ||||||
5.90%, 12/01/16 | 1,495 | 1,595,912 | ||||||
Michaels Stores, Inc. | 500 | 516,250 | ||||||
11.375%, 11/01/16 | 565 | 617,263 | ||||||
Neiman Marcus Group, Inc. (The) | 619 | 648,519 | ||||||
Penske Automotive Group, Inc. | 250 | 258,125 | ||||||
| ALLIANCEBERNSTEIN POOLING PORTFOLIOS • | 125 |
High-yield Portfolio—Portfolio of Investments
| Principal Amount (000) | U.S. $ Value | |||||||
Rite Aid Corp. | U.S.$ | 580 | $ | 566,950 | ||||
8.00%, 8/15/20 | 1,000 | 1,081,250 | ||||||
9.50%, 6/15/17 | 445 | 409,400 | ||||||
Toys R US – Delaware, Inc. | 805 | 848,269 | ||||||
Toys R US, Inc. | 900 | 902,250 | ||||||
YCC Holdings LLC / Yankee Finance, Inc. | 130 | 133,900 | ||||||
| 14,268,974 | ||||||||
Consumer Non-Cyclical – 7.0% | ||||||||
ACCO Brands Corp. | 1,000 | 1,018,750 | ||||||
10.625%, 3/15/15 | 760 | 858,800 | ||||||
Alere, Inc. | 800 | 848,000 | ||||||
AMGH Merger Sub, Inc. | 720 | 775,800 | ||||||
ARAMARK Corp. | 1,710 | 1,786,950 | ||||||
Aurora Diagnostics Holdings / Aurora Diagnostics Financing, Inc. | 775 | 800,187 | ||||||
Bakkavor Finance 2 PLC | GBP | 500 | 800,632 | |||||
Bausch & Lomb, Inc. | U.S.$ | 390 | 422,175 | |||||
Biomet, Inc. | 520 | 586,300 | ||||||
BioScrip, Inc. | 500 | 527,500 | ||||||
Blue Merger Sub, Inc. | 255 | 257,550 | ||||||
Care UK Health & Social Care PLC | GBP | 525 | 923,877 | |||||
Catalent Pharma Solutions, Inc. | U.S.$ | 1,320 | 1,356,645 | |||||
CHS/Community Health Systems, Inc. | 891 | 944,460 | ||||||
ConvaTec Healthcare E SA | 521 | 556,167 | ||||||
Del Monte Corp. | 395 | 400,925 | ||||||
DJO Finance LLC / DJO Finance Corp. | 520 | 570,050 | ||||||
| 126 | • ALLIANCEBERNSTEIN POOLING PORTFOLIOS |
High-yield Portfolio—Portfolio of Investments
| Principal Amount (000) | U.S. $ Value | |||||||
Dole Food Co., Inc. | U.S.$ | 500 | $ | 533,750 | ||||
Elan Finance PLC / Elan Finance Corp. | 500 | 526,250 | ||||||
Elizabeth Arden, Inc. | 445 | 467,250 | ||||||
Gentiva Health Services, Inc. | 425 | 478,656 | ||||||
Giant Funding Corp. | 700 | 719,250 | ||||||
HCA Holdings, Inc. | 700 | 736,750 | ||||||
HCA, Inc. | 3,348 | 3,456,810 | ||||||
6.50%, 2/15/16 | 1,520 | 1,561,800 | ||||||
9.625%, 11/15/16(c) | 2,803 | 3,041,255 | ||||||
Healthsouth Corp. | 480 | 513,600 | ||||||
IASIS Healthcare LLC / IASIS Capital Corp. | 424 | 435,130 | ||||||
Jarden Corp. | 280 | 295,400 | ||||||
Mylan, Inc./PA | 125 | 137,344 | ||||||
7.875%, 7/15/20(a) | 750 | 838,125 | ||||||
NBTY, Inc. | 250 | 271,250 | ||||||
New Albertsons, Inc. | 1,220 | 972,950 | ||||||
Picard Bondco SA | EUR | 575 | 858,933 | |||||
Pilgrim’s Pride Corp. | U.S.$ | 950 | 933,375 | |||||
R&R Ice Cream PLC | EUR | 600 | 863,159 | |||||
Select Medical Corp. | U.S.$ | 500 | 485,000 | |||||
7.625%, 2/01/15 | 1,015 | 1,031,494 | ||||||
Stater Bros Holdings, Inc. | 275 | 286,687 | ||||||
SUPERVALU, Inc. | 1,205 | 1,198,975 | ||||||
Tenet Healthcare Corp. | 900 | 1,023,750 | ||||||
Universal Hospital Services, Inc. | 895 | 859,200 | ||||||
| ALLIANCEBERNSTEIN POOLING PORTFOLIOS • | 127 |
High-yield Portfolio—Portfolio of Investments
| Principal Amount (000) | U.S. $ Value | |||||||
Vanguard Health Holding Co. II LLC/Vanguard Holding Co. II Inc. | U.S.$ | 600 | $ | 610,500 | ||||
Visant Corp. | 550 | 595,375 | ||||||
Voyager Learning Exchange | 982 | 1 | ||||||
| 37,166,787 | ||||||||
Energy – 6.0% | ||||||||
Antero Resources Finance Corp. | 495 | 534,600 | ||||||
ATP Oil & Gas Corp. | 635 | 647,700 | ||||||
Basic Energy Services, Inc. | 500 | 518,750 | ||||||
Bluewater Holding BV | 600 | 480,000 | ||||||
Calfrac Holdings LP | 289 | 296,225 | ||||||
Chaparral Energy, Inc. | 300 | 305,250 | ||||||
8.875%, 2/01/17 | 900 | 949,500 | ||||||
Chesapeake Energy Corp. | 2,350 | 2,520,375 | ||||||
6.625%, 8/15/20 | 500 | 525,000 | ||||||
Cie Generale de Geophysique-Veritas | 167 | 172,845 | ||||||
7.75%, 5/15/17 | 195 | 206,213 | ||||||
Citgo Petroleum Corp. | 891 | 1,024,650 | ||||||
Complete Production Services, Inc. | 1,325 | 1,401,187 | ||||||
Continental Resources, Inc./OK | 150 | 159,750 | ||||||
Deepsea Metro I | 200 | 204,155 | ||||||
Denbury Resources, Inc. | 1,202 | 1,214,020 | ||||||
8.25%, 2/15/20 | 95 | 105,688 | ||||||
Energy XXI Gulf Coast, Inc. | 900 | 909,000 | ||||||
9.25%, 12/15/17(a) | 800 | 860,000 | ||||||
Expro Finance Luxembourg SCA | 114 | 117,135 | ||||||
Forest Oil Corp. | 1,915 | 1,982,025 | ||||||
| 128 | • ALLIANCEBERNSTEIN POOLING PORTFOLIOS |
High-yield Portfolio—Portfolio of Investments
| Principal Amount (000) | U.S. $ Value | |||||||
Hercules Offshore, Inc. | U.S.$ | 604 | $ | 599,470 | ||||
Hilcorp Energy I LP/Hilcorp Finance Co. | 1,425 | 1,482,000 | ||||||
McJunkin Red Man Corp. | 1,000 | 990,000 | ||||||
Newfield Exploration Co. | 1,135 | 1,211,612 | ||||||
Offshore Group Investments Ltd. | 1,100 | 1,232,000 | ||||||
OPTI Canada, Inc. | 1,588 | 865,460 | ||||||
Parker Drilling Co. | 520 | 559,000 | ||||||
Petrohawk Energy Corp. | 500 | 517,500 | ||||||
7.25%, 8/15/18 | 800 | 828,000 | ||||||
PHI, Inc. | 400 | 419,000 | ||||||
Pioneer Natural Resources Co. | 995 | 1,038,512 | ||||||
Plains Exploration & Production Co. | 847 | 882,998 | ||||||
7.75%, 6/15/15 | 1,089 | 1,143,450 | ||||||
Range Resources Corp. | 940 | 982,300 | ||||||
SandRidge Energy, Inc. | 775 | 837,000 | ||||||
Southwestern Energy Co. | 1,025 | 1,165,938 | ||||||
Tesoro Corp. | 680 | 715,700 | ||||||
6.50%, 6/01/17 | 1,460 | 1,503,800 | ||||||
| 32,107,808 | ||||||||
Other Industrial – 1.7% | ||||||||
Briggs & Stratton Corp. | 152 | 160,360 | ||||||
Brightstar Corp. | 650 | 695,500 | ||||||
Exova Ltd. | GBP | 500 | 815,995 | |||||
Interline Brands, Inc. | U.S.$ | 704 | 730,400 | |||||
KUKA AG | EUR | 711 | 1,054,667 | |||||
Liberty Tire Recycling | U.S.$ | 1,100 | 1,226,500 | |||||
| ALLIANCEBERNSTEIN POOLING PORTFOLIOS • | 129 |
High-yield Portfolio—Portfolio of Investments
| Principal Amount (000) | U.S. $ Value | |||||||
Mueller Water Products, Inc. | U.S.$ | 322 | $ | 356,615 | ||||
Neenah Foundry Co. | 315 | 311,848 | ||||||
New Enterprise Stone & Lime Co. | 950 | 971,375 | ||||||
Pipe Holdings PLC | GBP | 439 | 752,911 | |||||
Sensus USA, Inc. | U.S.$ | 655 | 664,825 | |||||
Yioula Glassworks SA | EUR | 900 | 1,068,081 | |||||
| 8,809,077 | ||||||||
Services – 1.5% | ||||||||
Mobile Mini, Inc. | U.S.$ | 309 | 329,085 | |||||
Realogy Corp. | 305 | 308,050 | ||||||
Service Corp. International/US | 2,000 | 2,125,000 | ||||||
ServiceMaster Co. (The) | 835 | 897,625 | ||||||
Ticketmaster Entertainment LLC / Ticketmaster Noteco, Inc. | 940 | 1,031,650 | ||||||
Travelport LLC | 1,635 | 1,596,169 | ||||||
West Corp. | 1,750 | 1,795,937 | ||||||
8.625%, 10/01/18(a) | 133 | 140,980 | ||||||
| 8,224,496 | ||||||||
Technology – 3.4% | ||||||||
Advanced Micro Devices, Inc. | 121 | 126,445 | ||||||
8.125%, 12/15/17 | 202 | 215,130 | ||||||
Alcatel-Lucent USA, Inc. | 1,260 | 1,096,200 | ||||||
Amkor Technology, Inc. | 260 | 275,600 | ||||||
Aspect Software, Inc. | 500 | 532,500 | ||||||
Buccaneer Merger Sub, Inc. | 250 | 270,000 | ||||||
CDW LLC / CDW Finance Corp. | 671 | 721,325 | ||||||
11.50%, 10/12/15(c) | 500 | 542,500 | ||||||
| 130 | • ALLIANCEBERNSTEIN POOLING PORTFOLIOS |
High-yield Portfolio—Portfolio of Investments
| Principal Amount (000) | U.S. $ Value | |||||||
Ceridian Corp. | U.S.$ | 450 | $ | 471,375 | ||||
CommScope, Inc. | 1,500 | 1,556,250 | ||||||
DCP LLC/DCP Corp. | 680 | 659,600 | ||||||
Eastman Kodak Co. | 251 | 242,843 | ||||||
First Data Corp. | 831 | 839,310 | ||||||
11.25%, 3/31/16 | 1,100 | 1,061,500 | ||||||
Freescale Semiconductor, Inc. | 1,380 | 1,443,825 | ||||||
10.125%, 12/15/16 | 1,200 | 1,296,000 | ||||||
Interactive Data Corp. | 750 | 840,000 | ||||||
Iron Mountain, Inc. | 1,360 | 1,366,800 | ||||||
NXP BV / NXP Funding LLC | 1,000 | 995,000 | ||||||
9.50%, 10/15/15 | 920 | 982,100 | ||||||
Sanmina-SCI Corp. | 500 | 515,000 | ||||||
Seagate Technology HDD Holdings | 503 | 514,317 | ||||||
Serena Software, Inc. | 875 | 918,750 | ||||||
SunGard Data Systems, Inc. | 800 | 826,000 | ||||||
| 18,308,370 | ||||||||
Transportation - Airlines – 0.8% | ||||||||
Air Canada | 500 | 538,750 | ||||||
AMR Corp. | 1,570 | 1,609,250 | ||||||
Continental Airlines 2003-ERJ1 Pass | 444 | 445,789 | ||||||
Continental Airlines, Inc. | 1,330 | 1,371,562 | ||||||
Delta Air Lines, Inc. | 391 | 426,190 | ||||||
| 4,391,541 | ||||||||
| ALLIANCEBERNSTEIN POOLING PORTFOLIOS • | 131 |
High-yield Portfolio—Portfolio of Investments
| Principal Amount (000) | U.S. $ Value | |||||||
Transportation - Railroads – 0.1% | ||||||||
Florida East Coast Railway Corp. | U.S.$ | 164 | $ | 171,380 | ||||
Kansas City Southern Railway | 311 | 371,645 | ||||||
| 543,025 | ||||||||
Transportation - Services – 1.1% | ||||||||
Avis Budget Car Rental LLC / Avis Budget Finance, Inc. | 1,660 | 1,730,550 | ||||||
Hapag-Lloyd AG | 500 | 548,750 | ||||||
Hertz Corp. (The) | 636 | 648,720 | ||||||
7.375%, 1/15/21(a) | 1,775 | 1,854,875 | ||||||
8.875%, 1/01/14 | 421 | 432,051 | ||||||
Swift Services Holdings, Inc. | 413 | 452,235 | ||||||
| 5,667,181 | ||||||||
| 319,515,058 | ||||||||
Financial Institutions – 8.9% | ||||||||
Banking – 2.1% | ||||||||
ABN Amro Bank NV | EUR | 980 | 1,041,310 | |||||
HBOS Capital Funding LP | U.S.$ 1,325 | 1,185,875 | ||||||
HT1 Funding GMBH | EUR | 825 | 899,382 | |||||
LBG Capital No.1 PLC | U.S.$ | 1,750 | 1,650,250 | |||||
Regions Bank/Birmingham AL | 600 | 549,780 | ||||||
Royal Bank of Scotland Group PLC | 2,715 | 2,334,900 | ||||||
Swedbank AB | GBP | 850 | 1,291,984 | |||||
Telenet Finance III Luxembourg S.C.A. | EUR | 1,000 | 1,380,709 | |||||
UT2 Funding PLC | 634 | 778,651 | ||||||
| 11,112,841 | ||||||||
Brokerage – 0.6% | ||||||||
E*Trade Financial Corp. | U.S.$ | 995 | 997,487 | |||||
| 132 | • ALLIANCEBERNSTEIN POOLING PORTFOLIOS |
High-yield Portfolio—Portfolio of Investments
| Principal Amount (000) | U.S. $ Value | |||||||
Lehman Brothers Holdings, Inc. | U.S.$ | 5,500 | $ | 1,423,125 | ||||
Nuveen Investments, Inc. | 900 | 920,250 | ||||||
| 3,340,862 | ||||||||
Finance – 4.2% | ||||||||
AGFC Capital Trust I | 2,245 | 1,347,000 | ||||||
Ally Financial, Inc. | 760 | 822,458 | ||||||
6.875%, 9/15/11 | 1,935 | 1,978,537 | ||||||
8.00%, 11/01/31 | 1,332 | 1,525,140 | ||||||
Series 8 | 1,657 | 1,772,990 | ||||||
Capmark Financial Group, Inc. | 1,666 | 781,892 | ||||||
CIT Group, Inc. | 6,252 | 6,312,207 | ||||||
International Lease Finance Corp. | 1,715 | 1,787,888 | ||||||
iStar Financial, Inc. | 850 | 850,531 | ||||||
5.70%, 3/01/14 | 1,100 | 1,056,000 | ||||||
Residential Capital LLC | 2,195 | 2,216,950 | ||||||
Springleaf Finance Corp. | 1,930 | 1,732,175 | ||||||
| 22,183,768 | ||||||||
Insurance – 1.4% | ||||||||
Genworth Financial, Inc. | 1,445 | 1,136,131 | ||||||
Hartford Financial Services Group, Inc. | 1,000 | 1,105,000 | ||||||
ING Capital Funding Trust III | 1,294 | 1,241,632 | ||||||
Liberty Mutual Group, Inc. | 495 | 495,000 | ||||||
MBIA Insurance Corp. | 2,385 | 1,502,550 | ||||||
Stoneheath RE | 250 | 221,250 | ||||||
XL Group PLC | 2,100 | 1,942,500 | ||||||
| 7,644,063 | ||||||||
| ALLIANCEBERNSTEIN POOLING PORTFOLIOS • | 133 |
High-yield Portfolio—Portfolio of Investments
| Principal Amount (000) | U.S. $ Value | |||||||
Other Finance – 0.4% | ||||||||
FTI Consulting, Inc. | U.S.$ | 500 | $ | 500,000 | ||||
Icahn Enterprises LP / Icahn Enterprises Finance Corp. | 750 | 776,250 | ||||||
iPayment, Inc. | 675 | 669,094 | ||||||
| 1,945,344 | ||||||||
REITS – 0.2% | ||||||||
Developers Diversified Realty Corp. | 1,000 | 1,170,932 | ||||||
Sabra Health Care LP/Sabra Capital Corp. | 174 | 183,570 | ||||||
| 1,354,502 | ||||||||
| 47,581,380 | ||||||||
Utility – 6.4% | ||||||||
Electric – 4.8% | ||||||||
AES Corp. (The) | 1,430 | 1,555,125 | ||||||
8.00%, 10/15/17 | 1,240 | 1,345,400 | ||||||
Calpine Corp. | 2,250 | 2,356,875 | ||||||
7.875%, 1/15/23(a) | 500 | 513,750 | ||||||
CMS Energy Corp. | 1,000 | 1,051,210 | ||||||
Dynegy Holdings, Inc. | 1,960 | 1,416,100 | ||||||
8.375%, 5/01/16 | 780 | 625,950 | ||||||
Dynegy Roseton / Danskammer Pass Through Trust | 1,222 | 1,188,395 | ||||||
Edison Mission Energy | 2,090 | 1,698,125 | ||||||
7.50%, 6/15/13 | 360 | 360,450 | ||||||
7.75%, 6/15/16 | 295 | 264,025 | ||||||
Energy Future Holdings Corp. | 448 | 466,526 | ||||||
10.875%, 11/01/17 | 304 | 252,320 | ||||||
Series P | 957 | 634,013 | ||||||
Series Q | 3,106 | 1,452,055 | ||||||
Energy Future Intermediate Holding Co. LLC / EFIH Finance, Inc. | 792 | 826,731 | ||||||
| 134 | • ALLIANCEBERNSTEIN POOLING PORTFOLIOS |
High-yield Portfolio—Portfolio of Investments
| Principal Amount (000) | U.S. $ Value | |||||||
GenOn Energy, Inc. | U.S.$ | 840 | $ | 842,100 | ||||
9.50%, 10/15/18(a) | 650 | 680,875 | ||||||
9.875%, 10/15/20(a) | 1,265 | 1,331,412 | ||||||
Homer City Funding LLC | 77 | 74,161 | ||||||
8.734%, 10/01/26 | 140 | 128,219 | ||||||
Mirant Americas Generation LLC | 725 | 764,875 | ||||||
NRG Energy, Inc. | 2,955 | 3,093,769 | ||||||
8.25%, 9/01/20(a) | 975 | 1,026,187 | ||||||
PPL Capital Funding, Inc. | 800 | 786,000 | ||||||
Texas Competitive Electric Holdings Co. LLC | 1,401 | 788,062 | ||||||
| 25,522,710 | ||||||||
Natural Gas – 1.6% | ||||||||
El Paso Corp. | 385 | 409,939 | ||||||
7.75%, 1/15/32 | 855 | 905,271 | ||||||
El Paso Pipeline Partners Operating Co. LLC | 550 | 606,882 | ||||||
Enterprise Products Operating LLC | 1,620 | 1,747,575 | ||||||
Inergy LP/Inergy Finance Corp. | 1,000 | 1,022,500 | ||||||
Kinder Morgan Finance Co. ULC | 1,765 | 1,840,012 | ||||||
MarkWest Energy Partners LP / MarkWest Energy Finance Corp. | 1,600 | 1,598,000 | ||||||
Targa Resources Partners LP / Targa Resources Partners Finance Corp. | 330 | 326,700 | ||||||
| 8,456,879 | ||||||||
| 33,979,589 | ||||||||
Total Corporates - Non-Investment Grades | 401,076,028 | |||||||
| ALLIANCEBERNSTEIN POOLING PORTFOLIOS • | 135 |
High-yield Portfolio—Portfolio of Investments
| Principal Amount (000) | U.S. $ Value | |||||||
CORPORATES - INVESTMENT GRADES – 9.0% | ||||||||
Financial Institutions – 5.5% | ||||||||
Banking – 3.5% | ||||||||
American Express Co. | U.S.$ | 900 | $ | 914,940 | ||||
Assured Guaranty Municipal Holdings, Inc. | 1,400 | 882,000 | ||||||
Barclays Bank PLC | EUR | 520 | 509,478 | |||||
5.926%, 12/15/16(a) | U.S.$ | 1,300 | 1,199,250 | |||||
BBVA International Preferred SA Unipersonal | 400 | 324,534 | ||||||
Series E | EUR | 750 | 1,060,836 | |||||
Bear Stearns Cos. LLC (The) | U.S.$ | 435 | 466,049 | |||||
Capital One Financial Corp. | 663 | 765,245 | ||||||
Citigroup, Inc. | 400 | 428,800 | ||||||
Cooperatieve Centrale Raiffeisen-Boerenleenbank BA/Netherlands | 1,100 | 1,149,500 | ||||||
Countrywide Financial Corp. | 1,221 | 1,308,085 | ||||||
Countrywide Home Loans, Inc. | 56 | 56,111 | ||||||
Credit Agricole SA | 1,100 | 981,750 | ||||||
Huntington BancShares, Inc. | 170 | 186,224 | ||||||
Itau Unibanco Holding SA | BRL | 900 | 562,462 | |||||
Merrill Lynch & Co., Inc. | U.S.$ | 365 | 379,748 | |||||
National Capital Trust II | 647 | 646,645 | ||||||
Societe Generale | EUR | 700 | 934,571 | |||||
UBS AG/Jersey | 820 | 1,007,087 | ||||||
Unicredito Italiano Capital Trust III | 1,300 | 1,385,815 | ||||||
Wachovia Bank NA | AUD | 2,050 | 1,888,761 | |||||
| 136 | • ALLIANCEBERNSTEIN POOLING PORTFOLIOS |
High-yield Portfolio—Portfolio of Investments
| Principal Amount (000) | U.S. $ Value | |||||||
Zions Bancorporation | U.S.$ | 1,480 | $ | 1,609,109 | ||||
| 18,647,000 | ||||||||
Finance – 0.2% | ||||||||
SLM Corp. | 255 | 264,619 | ||||||
8.00%, 3/25/20 | 525 | 557,156 | ||||||
Series A | ||||||||
5.00%, 10/01/13 | 400 | 413,578 | ||||||
| 1,235,353 | ||||||||
Insurance – 1.6% | ||||||||
American International Group, Inc. | ||||||||
6.25%, 3/15/37 | 1,461 | 1,336,815 | ||||||
8.175%, 5/15/58 | 725 | 795,687 | ||||||
Assured Guaranty US Holdings, Inc. | 952 | 718,760 | ||||||
Coventry Health Care, Inc. | ||||||||
5.875%, 1/15/12 | 683 | 709,147 | ||||||
5.95%, 3/15/17 | 60 | 62,288 | ||||||
6.125%, 1/15/15 | 30 | 31,946 | ||||||
6.30%, 8/15/14 | 185 | 197,637 | ||||||
Crum & Forster Holdings Corp. | 760 | 797,050 | ||||||
Liberty Mutual Group, Inc. | 450 | 478,281 | ||||||
Metlife Capital Trust IV | 750 | 808,125 | ||||||
Nationwide Mutual Insurance Co. | 575 | 685,459 | ||||||
Suncorp Metway Insurance Ltd. | AUD | 1,000 | 905,238 | |||||
XL Capital Finance Europe PLC | U.S.$ | 1,000 | 1,045,337 | |||||
| 8,571,770 | ||||||||
REITS – 0.2% | ||||||||
Entertainment Properties Trust | 842 | 886,205 | ||||||
ProLogis | 72 | 80,153 | ||||||
| 966,358 | ||||||||
| 29,420,481 | ||||||||
| ALLIANCEBERNSTEIN POOLING PORTFOLIOS • | 137 |
High-yield Portfolio—Portfolio of Investments
| Principal Amount (000) | U.S. $ Value | |||||||
Industrial – 3.0% | ||||||||
Basic – 0.4% | ||||||||
Commercial Metals Co. | U.S.$ | 500 | $ | 514,039 | ||||
Freeport-McMoRan Copper & Gold, Inc. | 485 | 538,350 | ||||||
Mosaic Co. (The) | 875 | 947,187 | ||||||
| 1,999,576 | ||||||||
Capital Goods – 0.1% | ||||||||
Tyco International Finance SA | 375 | 485,140 | ||||||
Communications - Media – 0.5% | ||||||||
DirecTV Holdings LLC / DirecTV Financing Co., Inc. | 811 | 836,344 | ||||||
Virgin Media Secured Finance PLC | 1,500 | 1,642,500 | ||||||
| 2,478,844 | ||||||||
Communications - Telecommunications – 0.3% | ||||||||
American Tower Corp. | 310 | 349,954 | ||||||
Qwest Corp. | 1,240 | 1,235,350 | ||||||
| 1,585,304 | ||||||||
Consumer Cyclical - Other – 0.3% | ||||||||
Toll Brothers Finance Corp. | 1,443 | 1,481,768 | ||||||
Consumer Cyclical - Retailers – 0.1% | ||||||||
CVS Caremark Corp. | 575 | 566,375 | ||||||
Consumer Non-Cyclical – 0.3% | ||||||||
Reynolds American, Inc. | 745 | 817,292 | ||||||
Ventas Realty LP / Ventas Capital Corp. | 832 | 882,688 | ||||||
| 1,699,980 | ||||||||
Energy – 0.4% | ||||||||
National Oilwell Varco, Inc. | 856 | 884,367 | ||||||
| 138 | • ALLIANCEBERNSTEIN POOLING PORTFOLIOS |
High-yield Portfolio—Portfolio of Investments
| Principal Amount (000) | U.S. $ Value | |||||||
TNK-BP Finance SA | ||||||||
7.25%, 2/02/20(a) | U.S.$ | 204 | $ | 222,115 | ||||
7.50%, 7/18/16(a) | 520 | 579,150 | ||||||
7.875%, 3/13/18(a) | 680 | 770,984 | ||||||
| 2,456,616 | ||||||||
Other Industrial – 0.1% | ||||||||
Noble Group Ltd. | 650 | 666,250 | ||||||
Services – 0.2% | ||||||||
Expedia, Inc. | 1,070 | 1,175,662 | ||||||
Technology – 0.1% | ||||||||
Motorola, Inc. | 470 | 527,359 | ||||||
Transportation - Services – 0.2% | ||||||||
Aviation Capital Group | 920 | 966,364 | ||||||
| 16,089,238 | ||||||||
Utility – 0.5% | ||||||||
Electric – 0.5% | ||||||||
Allegheny Energy Supply Co. LLC | 380 | 405,873 | ||||||
KCP&L Greater Missouri Operations Co. | 596 | 668,158 | ||||||
Oncor Electric Delivery Co. LLC | 490 | 538,275 | ||||||
6.80%, 9/01/18 | 315 | 365,786 | ||||||
Sierra Pacific Power Co. Series M | 440 | 496,629 | ||||||
| 2,474,721 | ||||||||
Total Corporates - Investment Grades | 47,984,440 | |||||||
COMMERCIAL MORTGAGE-BACKED SECURITIES – 2.5% | ||||||||
Non-Agency Fixed Rate CMBS – 2.5% | ||||||||
Citigroup/Deutsche Bank Commercial | 1,170 | 1,189,855 | ||||||
Credit Suisse First Boston Mortgage | 1,000 | 1,021,617 | ||||||
| ALLIANCEBERNSTEIN POOLING PORTFOLIOS • | 139 |
High-yield Portfolio—Portfolio of Investments
| Principal Amount (000) | U.S. $ Value | |||||||
Credit Suisse Mortgage Capital Certificates | U.S.$ | 2,375 | $ | 2,601,692 | ||||
JP Morgan Chase Commercial Mortgage | 1,100 | 1,163,042 | ||||||
Series 2007-CB18, Class A4 | 1,875 | 1,992,516 | ||||||
Series 2007-LD11, Class A4 | 2,000 | 2,154,180 | ||||||
LB-UBS Commercial Mortgage Trust | 1,875 | 2,008,567 | ||||||
Morgan Stanley Capital I | 1,125 | 1,156,351 | ||||||
Total Commercial Mortgage-Backed Securities | 13,287,820 | |||||||
BANK LOANS – 2.1% | ||||||||
Industrial – 1.8% | ||||||||
Basic – 0.0% | ||||||||
Novelis, Inc. | 90 | 91,097 | ||||||
Capital Goods – 0.5% | ||||||||
Harbor Freight Tools USA, Inc. / Central Purchasing, LLC | 1,300 | 1,311,921 | ||||||
Hawker Beechcraft Acquisition Company LLC | 1,234 | 1,249,187 | ||||||
| 2,561,108 | ||||||||
Communications - Telecommunications – 0.2% | ||||||||
Lightsquared LP | 1,320 | 1,301,571 | ||||||
Consumer Cyclical - Entertainment –0.4% | ||||||||
ClubCorp Club Operations Inc. | 550 | 555,500 | ||||||
Las Vegas Sands, LLC | 1,588 | 1,577,887 | ||||||
| 2,133,387 | ||||||||
| 140 | • ALLIANCEBERNSTEIN POOLING PORTFOLIOS |
High-yield Portfolio—Portfolio of Investments
| Principal Amount (000) | U.S. $ Value | |||||||
Consumer Cyclical - Other – 0.0% | ||||||||
Great Atlantic & Pacific Tea Company, | U.S.$ | 50 | $ | 50,563 | ||||
Other Industrial – 0.2% | ||||||||
Metaldyne LLC | 773 | 786,591 | ||||||
Services – 0.3% | ||||||||
Advantage Sales & Marketing Inc. | 225 | 226,179 | ||||||
Koosharem LLC | 1,408 | 1,238,835 | ||||||
| 1,465,014 | ||||||||
Technology – 0.2% | ||||||||
EchoStar Satellite Services, LLC | 1,000 | 1,000,000 | ||||||
| 9,389,331 | ||||||||
Financial Institutions – 0.3% | ||||||||
Finance – 0.3% | ||||||||
CIT Group, Inc. | 821 | 832,086 | ||||||
Springleaf Funding Company (fka AGFS | 875 | 882,437 | ||||||
| 1,714,523 | ||||||||
Total Bank Loans | 11,103,854 | |||||||
GOVERNMENTS - | ||||||||
Brazil – 0.4% | ||||||||
Brazilian Government International Bond | BRL | 2,950 | 2,025,709 | |||||
Greece – 0.5% | ||||||||
Hellenic Republic Government Bond | EUR | 3,300 | 2,523,735 | |||||
Mexico – 0.3% | ||||||||
Mexican Bonos Series MI10 | MXN | 20,000 | 1,827,070 | |||||
United States – 0.3% | ||||||||
U.S. Treasury Notes | U.S.$ | 1,700 | 1,698,938 | |||||
Total Governments - Treasuries | 8,075,452 | |||||||
| ALLIANCEBERNSTEIN POOLING PORTFOLIOS • | 141 |
High-yield Portfolio—Portfolio of Investments
| Principal Amount (000) | U.S. $ Value | |||||||
LOCAL GOVERNMENTS - MUNICIPAL BONDS – 1.4% | ||||||||
United States – 1.4% | ||||||||
Allegheny Cnty PA Hosp Dev Auth (West Penn Allegheny Hlth Sys) | U.S.$ | 555 | $ | 359,512 | ||||
Buckeye OH Tob Stlmnt Fin Auth | 605 | 399,899 | ||||||
California State (California GO) | 325 | 353,191 | ||||||
7.95%, 3/01/36 | 700 | 736,456 | ||||||
California Statewide CDA (Thomas Jefferson Sch Law) | 325 | 326,284 | ||||||
Cumberland Cnty PA Mun Auth (Asbury | 335 | 290,264 | ||||||
Illinois Finance Auth | 575 | 543,064 | ||||||
Illinois Finance Auth (Illinois Institute of Technology) | 275 | 207,229 | ||||||
Indiana Finance Auth (Kings Daughters Hospital) | 450 | 362,966 | ||||||
Kentucky Economic Development Finance Auth | 335 | 317,513 | ||||||
Los Angeles CA Regl Arpts Impt Corp (American Airlines, Inc.) | 395 | 395,695 | ||||||
Louisiana Pub Fac Auth (Ochsner Clinic Fndtn) | 560 | 455,594 | ||||||
Mid-Bay Bridge Auth FL | 665 | 664,940 | ||||||
Regional Transportation District (Denver | 800 | 729,928 | ||||||
| 142 | • ALLIANCEBERNSTEIN POOLING PORTFOLIOS |
High-yield Portfolio—Portfolio of Investments
| Principal Amount (000) | U.S. $ Value | |||||||
Texas Private Acvty Bond Srfc Trnsp Corp. (NTE Mobility Partners LLC Project) | U.S $ | 550 | $ | 551,908 | ||||
Tobacco Settlement Financing Corp. NJ | 570 | 341,590 | ||||||
Tobacco Settlement Financing Corp. VA | 445 | 255,590 | ||||||
Turlock CA Hlth Fac COP(Emanuel | 550 | 442,579 | ||||||
Total Local Governments - Municipal Bonds | 7,734,202 | |||||||
EMERGING MARKETS - CORPORATE | ||||||||
Financial Institutions – 0.1% | ||||||||
Banking – 0.1% | ||||||||
Banco Cruzeiro do Sul SA/Brazil | 500 | 493,212 | ||||||
8.875%, 9/22/20(a) | 390 | 376,350 | ||||||
| 869,562 | ||||||||
Industrial – 1.3% | ||||||||
Capital Goods – 0.1% | ||||||||
Cemex SAB de CV | 500 | 517,500 | ||||||
Consumer Cyclical - Retailers – 0.2% | ||||||||
Edcon Holdings Proprietary Ltd. | EUR | 850 | 1,032,203 | |||||
Consumer Non-Cyclical – 0.6% | ||||||||
CEDC Finance Corp. International, Inc. | U.S.$ | 1,000 | 1,082,500 | |||||
Foodcorp Pty Ltd. | EUR | 282 | 389,146 | |||||
8.875%, 6/15/12(a) | 378 | 530,749 | ||||||
JBS Finance II Ltd. | U.S.$ | 1,000 | 1,010,000 | |||||
| 3,012,395 | ||||||||
Other Industrial – 0.3% | ||||||||
New Reclamation Group Pty Ltd. (The) | EUR | 689 | 836,300 | |||||
| ALLIANCEBERNSTEIN POOLING PORTFOLIOS • | 143 |
High-yield Portfolio—Portfolio of Investments
| Principal Amount (000) | U.S. $ Value | |||||||
Savcio Holdings Pty Ltd. | EUR | 450 | $ | 600,796 | ||||
| 1,437,096 | ||||||||
Transportation - Services – 0.1% | ||||||||
Inversiones Alsacia SA | U.S.$ | 800 | 810,091 | |||||
| 6,809,285 | ||||||||
Total Emerging Markets - Corporate Bonds | 7,678,847 | |||||||
QUASI-SOVEREIGNS – 1.2% | ||||||||
Quasi-Sovereign Bonds – 1.2% | ||||||||
Kazakhstan – 0.5% | ||||||||
Kazatomprom | 875 | 941,762 | ||||||
KazMunayGas National Co. | 400 | 441,000 | ||||||
9.125%, 7/02/18(a) | 950 | 1,149,500 | ||||||
| 2,532,262 | ||||||||
Russia – 0.3% | ||||||||
RSHB Capital SA for OJSC Russian Agricultural Bank | 1,455 | 1,495,013 | ||||||
Trinidad & Tobago – 0.2% | ||||||||
Petroleum Co. of Trinidad & Tobago Ltd. | 750 | 915,000 | ||||||
Venezuela – 0.2% | ||||||||
Petroleos de Venezuela SA | 2,250 | 1,305,000 | ||||||
Total Quasi-Sovereigns | 6,247,275 | |||||||
| Shares | ||||||||
PREFERRED STOCKS – 0.9% | ||||||||
Financial Institutions – 0.9% | ||||||||
Banking – 0.2% | ||||||||
Zions Bancorporation. | 46,400 | 1,210,576 | ||||||
Finance – 0.5% | ||||||||
Ally Financial, Inc. | 1,687 | 1,607,764 | ||||||
Citigroup Capital XII | 39,000 | 1,036,191 | �� | |||||
| 144 | • ALLIANCEBERNSTEIN POOLING PORTFOLIOS |
High-yield Portfolio—Portfolio of Investments
Shares | U.S. $ Value | |||||||
Citigroup Capital XIII | 5,000 | $ | 135,600 | |||||
| 2,779,555 | ||||||||
REITS – 0.2% | ||||||||
Sovereign Real Estate Investment Trust | 624 | 711,360 | ||||||
| 4,701,491 | ||||||||
Non Corporate Sectors – 0.0% | ||||||||
Agencies - Government | ||||||||
Federal Home Loan Mortgage Corp. | 36,525 | 70,858 | ||||||
Federal National Mortgage Association | 54,625 | 106,519 | ||||||
| 177,377 | ||||||||
Total Preferred Stocks | 4,878,868 | |||||||
| Principal Amount (000) | ||||||||
ASSET-BACKED | ||||||||
Home Equity Loans - Fixed | ||||||||
Countrywide Asset-Backed Certificates | U.S.$ | 737 | 492,733 | |||||
Series 2006-15, Class A6 | ||||||||
5.826%, 10/25/46 | 1,472 | 1,114,057 | ||||||
Lehman XS Trust | 1,551 | 1,073,526 | ||||||
| 2,680,316 | ||||||||
Home Equity Loans - Floating | ||||||||
Credit-Based Asset Servicing and Securitization LLC | 1,750 | 999,357 | ||||||
GSAA Home Equity Trust | 1,581 | 925,164 | ||||||
| 1,924,521 | ||||||||
Total Asset-Backed Securities | 4,604,837 | |||||||
| ALLIANCEBERNSTEIN POOLING PORTFOLIOS • | 145 |
High-yield Portfolio—Portfolio of Investments
| Principal Amount (000) | U.S. $ Value | |||||||
EMERGING MARKETS - SOVEREIGNS – 0.6% | ||||||||
Argentina – 0.3% | ||||||||
Argentina Bonos | U.S.$ | 2,100 | $ | 1,918,000 | ||||
Ukraine – 0.3% | ||||||||
Ukraine Government International Bond | ||||||||
6.75%, 11/14/17(a) | 930 | 912,563 | ||||||
6.875%, 3/04/11(a) | 700 | 700,000 | ||||||
| 1,612,563 | ||||||||
Total Emerging Markets - Sovereigns | 3,530,563 | |||||||
CMOs – 0.4% | ||||||||
Non-Agency Floating Rate – 0.4% | ||||||||
Structured Asset Mortgage Investments, Inc. | 1,454 | 886,317 | ||||||
Washington Mutual Alternative Mortgage Pass-Through Certificates | 2,064 | 1,191,749 | ||||||
Total CMOs | 2,078,066 | |||||||
EMERGING MARKETS - | ||||||||
Turkey – 0.3% | ||||||||
Turkey Government Bond | TRY | 2,450 | 1,616,732 | |||||
| Shares | ||||||||
COMMON STOCKS – 0.1% | ||||||||
Broder Brothers Co. | 28,873 | 0 | ||||||
Fairpoint Communications, Inc.(j) | 7,175 | 165,025 | ||||||
Greektown Superholdings, Inc.(e)(g)(j) | 397 | 29,775 | ||||||
Neenah Enterprises, Inc.(e)(g) | 58,199 | 261,896 | ||||||
Total Common Stocks | 456,696 | |||||||
WARRANTS – 0.0% | ||||||||
Fairpoint Communications, Inc., | 12,231 | 0 | ||||||
| 146 | • ALLIANCEBERNSTEIN POOLING PORTFOLIOS |
High-yield Portfolio—Portfolio of Investments
| Principal Amount (000) | U.S. $ Value | |||||||
New Koosharem Corp. expiring 1/01/49(e)(g)(j) | U.S.$ | 1,991 | $ | 2 | ||||
Total Warrants | 2 | |||||||
| Contracts (k) | ||||||||
OPTION PURCHASED - CALL – 0.0% | ||||||||
IRS USD RTR Expiration: May 2011, Exercise Price: $2.2 (j) | 150,000 | 0 | ||||||
| Shares | ||||||||
SHORT-TERM INVESTMENTS – 1.1% | ||||||||
Investment Companies – 1.1% | ||||||||
AllianceBernstein Fixed-Income | 5,802,841 | 5,802,841 | ||||||
Total Investments – 98.6% | 526,156,523 | |||||||
Other assets less liabilities – 1.4% | 7,420,553 | |||||||
Net Assets – 100.0% | $ | 533,577,076 | ||||||
FUTURES CONTRACTS (see Note C)
| Type | Number of Contracts | Expiration Month | Original Value | Value at February 28, 2011 | Unrealized Appreciation/ (Depreciation) | |||||||||||||||
Purchased Contracts |
| |||||||||||||||||||
3MO EURIBOR Interest Rate Futures | 1,570 | June 2011 | $ | 111,597 | $ | 54,163 | $ (57,434) | |||||||||||||
FORWARD CURRENCY EXCHANGE CONTRACTS (see Note C)
| Counterparty & Description | Contract Amount (000) | U.S. $ Value on Origination Date | U.S. $ Value at February 28, 2011 | Unrealized Appreciation/ (Depreciation) | ||||||||||||
Buy Contracts: | ||||||||||||||||
State Street Bank and Trust Co.: | ||||||||||||||||
Australian Dollar settling 4/18/11 | 103 | $ | 101,652 | $ | 104,199 | $ | 2,547 | |||||||||
Great British Pound settling 4/04/11 | 27 | 43,914 | 44,138 | 224 | ||||||||||||
| ALLIANCEBERNSTEIN POOLING PORTFOLIOS • | 147 |
High-yield Portfolio—Portfolio of Investments
| Counterparty & Description | Contract Amount (000) | U.S. $ Value on Origination Date | U.S. $ Value at February 28, 2011 | Unrealized Appreciation/ (Depreciation) | ||||||||||||
Sale Contracts: | ||||||||||||||||
State Street Bank and Trust Co.: | ||||||||||||||||
Euro settling 3/07/11 | 435 | $ | 590,836 | $ | 599,747 | $ | (8,911 | ) | ||||||||
Euro settling 3/07/11 | 1,025 | 1,392,639 | 1,414,924 | (22,285 | ) | |||||||||||
Euro settling 3/07/11 | 1,003 | 1,358,058 | 1,383,631 | (25,573 | ) | |||||||||||
Euro settling 3/07/11 | 18,448 | 24,542,171 | 25,455,592 | (913,421 | ) | |||||||||||
Great British Pound settling 4/04/11 | 503 | 812,010 | 817,022 | (5,012 | ) | |||||||||||
Great British Pound settling 4/04/11 | 2,228 | 3,551,761 | 3,620,347 | (68,586 | ) | |||||||||||
INTEREST RATE SWAP TRANSACTIONS (see Note C)
| Rate Type | ||||||||||||||||
| Swap Counterparty | Notional Amount (000) | Termination Date | Payments made by the Portfolio | Payments received by the Portfolio | Unrealized Appreciation/ (Depreciation) | |||||||||||
JPMorgan Chase Bank, N.A. | $ | 38,350 | 12/23/17 | 3 Month LIBOR | 2.805% | $ (154,038 | ) | |||||||||
JPMorgan Chase Bank, N.A. | 51,250 | 12/23/15 | 2.14% | 3 Month LIBOR | 125,704 | |||||||||||
Morgan Stanley | 52,200 | 1/5/16 | 2.18% | 3 Month LIBOR | 96,075 | |||||||||||
Morgan Stanley | 39,100 | 1/5/18 | 3 Month LIBOR | 2.84% | (133,355 | ) | ||||||||||
CREDIT DEFAULT SWAP CONTRACTS ON CORPORATE AND SOVEREIGN ISSUES (see Note C)
| Swap Counterparty & Referenced Obligation | Fixed Deal (Pay) Receive Rate | Implied Credit Spread at February 28, 2011 | Notional Amount (000) | Market Value | Upfront Premiums (Paid) Received | Unrealized Appreciation/ (Depreciation) | ||||||||||||||||||
Buy Contracts | ||||||||||||||||||||||||
Goldman Sachs Bank: Hellenic Republic 5.90%, 10/22/22, 6/20/15* | (0.00 | )% | 9.643 | % | $ | 4,250 | $ | 67,194 | $ | — | $ | 67,194 | ||||||||||||
Morgan Stanley Capital Services Inc.: XL Capital LTD 5.25%, 9/15/14, 3/20/12* | (5.00 | ) | 1.03 | 1,260 | (65,610 | ) | 44,545 | (110,155 | ) | |||||||||||||||
Sale Contracts | ||||||||||||||||||||||||
Credit Suisse International: MGM Resorts International 5.875%, 02/27/14, 03/20/16* | 5.00 | 6.811 | 1,700 | (98,534 | ) | (55,250 | ) | (43,284 | ) | |||||||||||||||
| * | Termination date |
| 148 | • ALLIANCEBERNSTEIN POOLING PORTFOLIOS |
High-yield Portfolio—Portfolio of Investments
CREDIT DEFAULT SWAP CONTRACTS ON INDICES (see Note C)
| Swap Counterparty & Referenced Obligation | Fixed Deal (Pay) Receive Rate | Implied Credit Spread at February 28, 2011 | Notional Amount (000) | Market Value | Upfront Premiums (Paid) Received | Unrealized Appreciation/ (Depreciation) | ||||||||||||||||||
Sale Contracts | ||||||||||||||||||||||||
Barclays Capital Inc.: CDX NAIG-15V1 5 Year Index, 12/20/15* | 1.00 | % | 4.20 | % | $ | 500 | $ | (63,069) | $ | (71,178) | $ | 8,109 | ||||||||||||
| * | Termination date |
| (a) | Security is exempt from registration under Rule 144A of the Securities Act of 1933. These securities are considered liquid and may be resold in transactions exempt from registration, normally to qualified institutional buyers. At February 28, 2011, the aggregate market value of these securities amounted to $166,521,786 or 31.2% of net assets. |
| (b) | Floating Rate Security. Stated interest rate was in effect at February 28, 2011. |
| (c) | Pay-In-Kind Payments (PIK). |
| (d) | Security is in default and is non-income producing. |
| (e) | Illiquid security. |
| (f) | Security is exempt from registration under Rule 144A of the Securities Act of 1933. These securities, which represent 0.26% of net assets as of February 28, 2011, are considered illiquid and restricted. |
| Restricted Securities | Acquisition Date | Cost | Market Value | Percentage of Net Assets | ||||||||||||
Broder Brothers Co. | 8/31/07 | $ | 540,383 | $ | 345,600 | 0.06 | % | |||||||||
Yioula Glassworks SA | 6/09/09 | 579,169 | 1,068,081 | 0.20 | ||||||||||||
| (g) | Fair valued. |
| (h) | This position or a portion of this position represents an unsettled loan purchase. At February 28, 2011, the market value and unrealized gain of these unsettled loan purchases amounted to $1,000,000 and $0, respectively. The coupon rate will be determined at the time of settlement and will be based upon the London-Interbank Offered Rate (“LIBOR”) plus a premium which was determined at the time of purchase. |
| (i) | Variable rate coupon, rate shown as of February 28, 2011. |
| (j) | Non-income producing security. |
| (k) | One contract relates to 100 shares. |
| (l) | Investment in affiliated money market mutual fund. The rate shown represents the 7-day yield as of period end. |
Currency Abbreviations:
| AUD | – Australian Dollar |
| BRL | – Brazilian Real |
| EUR | – Euro |
| GBP | – Great British Pound |
| MXN | – Mexican Nuevo Peso |
| TRY | – Turkish Lira |
| ALLIANCEBERNSTEIN POOLING PORTFOLIOS • | 149 |
High-yield Portfolio—Portfolio of Investments
Glossary:
| CDA | – Community Development Authority |
| CMBS | – Commercial Mortgage-Backed Securities |
| CMOs | – Collateralized Mortgage Obligations |
| COP | – Certificate of Participation |
| LIBOR | – London Interbank Offered Rates |
| GO | – General Obligation |
| MBIA | – MBIA Insurance Corporation |
| OJSC | – Open Joint Stock Company |
| REIT | – Real Estate Investment Trust |
See notes to financial statements.
| 150 | • ALLIANCEBERNSTEIN POOLING PORTFOLIOS |
High-yield Portfolio—Portfolio of Investments
SMALL-MID CAP VALUE PORTFOLIO
PORTFOLIO OF INVESTMENTS
February 28, 2011 (unaudited)
| Company | Shares | U.S. $ Value | ||||||
COMMON STOCKS – 98.8% | ||||||||
Financials – 24.9% | ||||||||
Capital Markets – 0.9% | ||||||||
MF Global Holdings Ltd.(a) | 659,400 | $ | 5,716,998 | |||||
Commercial Banks – 7.4% | ||||||||
Associated Banc - Corp | 380,800 | 5,510,176 | ||||||
CapitalSource, Inc. | 815,000 | 6,177,700 | ||||||
City National Corp. | 63,900 | 3,764,349 | ||||||
Comerica, Inc. | 177,300 | 6,896,970 | ||||||
Popular, Inc.(a) | 1,591,066 | 5,170,965 | ||||||
Susquehanna Bancshares, Inc. | 417,000 | 3,986,520 | ||||||
Umpqua Holdings Corp. | 281,000 | 3,214,640 | ||||||
Webster Financial Corp. | 238,800 | 5,535,384 | ||||||
Whitney Holding Corp. | 363,900 | 5,160,102 | ||||||
| 45,416,806 | ||||||||
Insurance – 6.0% | ||||||||
Amtrust Financial Services, Inc. | 201,300 | 3,870,999 | ||||||
Aspen Insurance Holdings Ltd. | 221,100 | 6,533,505 | ||||||
Endurance Specialty Holdings Ltd. | 148,300 | 7,354,197 | ||||||
Fidelity National Financial, Inc. – Class A | 229,700 | 3,181,345 | ||||||
Platinum Underwriters Holdings Ltd. | 134,000 | 5,587,800 | ||||||
Reinsurance Group of America, Inc. – Class A | 92,400 | 5,580,036 | ||||||
Unum Group | 189,300 | 5,022,129 | ||||||
| 37,130,011 | ||||||||
Real Estate Investment Trusts | ||||||||
BioMed Realty Trust, Inc. | 297,700 | 5,403,255 | ||||||
BRE Properties, Inc. | 116,275 | 5,524,225 | ||||||
Camden Property Trust | 128,400 | 7,597,428 | ||||||
CBL & Associates Properties, Inc. | 204,600 | 3,652,110 | ||||||
DiamondRock Hospitality Co.(a) | 585,500 | 6,885,480 | ||||||
Entertainment Properties Trust | 118,900 | 5,667,963 | ||||||
Sunstone Hotel Investors, Inc.(a) | 519,001 | 5,574,071 | ||||||
Tanger Factory Outlet Centers | 195,600 | 5,212,740 | ||||||
| 45,517,272 | ||||||||
Real Estate Management & | ||||||||
Forest City Enterprises, Inc.(a) | 241,600 | 4,566,240 | ||||||
Thrifts & Mortgage Finance – 2.5% | ||||||||
First Niagara Financial Group, Inc. | 402,718 | 5,831,357 | ||||||
People’s United Financial, Inc. | 281,200 | 3,706,216 | ||||||
Washington Federal, Inc. | 315,250 | 5,601,992 | ||||||
| 15,139,565 | ||||||||
| 153,486,892 | ||||||||
| ALLIANCEBERNSTEIN POOLING PORTFOLIOS • | 151 |
Small-Mid Cap Value Portfolio—Portfolio of Investments
| Company | Shares | U.S. $ Value | ||||||
Consumer Discretionary – 17.1% | ||||||||
Auto Components – 3.5% | ||||||||
Cooper Tire & Rubber Co. | 219,500 | $ | 5,149,470 | |||||
Dana Holding Corp.(a) | 300,400 | 5,671,552 | ||||||
Federal-Mogul Corp.(a) | 228,500 | 4,800,785 | ||||||
TRW Automotive Holdings Corp.(a) | 103,100 | 5,856,080 | ||||||
| 21,477,887 | ||||||||
Hotels, Restaurants & Leisure – 2.0% | ||||||||
Royal Caribbean Cruises Ltd.(a) | 119,400 | 5,228,526 | ||||||
Wyndham Worldwide Corp. | 236,600 | 7,400,848 | ||||||
| 12,629,374 | ||||||||
Household Durables – 2.0% | ||||||||
American Greetings Corp. | 315,575 | 6,832,199 | ||||||
NVR, Inc.(a) | 7,690 | 5,597,243 | ||||||
| 12,429,442 | ||||||||
Media – 2.5% | ||||||||
Gannett Co., Inc. | 344,200 | 5,682,742 | ||||||
Interpublic Group of Cos., Inc. (The)(a) | 440,800 | 5,818,560 | ||||||
Meredith Corp. | 102,800 | 3,624,728 | ||||||
| 15,126,030 | ||||||||
Multiline Retail – 2.0% | ||||||||
Big Lots, Inc.(a) | 163,700 | 6,716,611 | ||||||
Saks, Inc.(a) | 439,100 | 5,378,975 | ||||||
| 12,095,586 | ||||||||
Specialty Retail – 4.1% | ||||||||
AnnTaylor Stores Corp.(a) | 323,900 | 7,517,719 | ||||||
Foot Locker, Inc. | 372,300 | 7,397,601 | ||||||
Office Depot, Inc.(a) | 971,850 | 5,160,524 | ||||||
Signet Jewelers Ltd.(a) | 125,824 | 5,519,899 | ||||||
| 25,595,743 | ||||||||
Textiles, Apparel & Luxury Goods – 1.0% | ||||||||
Jones Group, Inc. (The) | 460,200 | 6,120,660 | ||||||
| 105,474,722 | ||||||||
Industrials – 11.8% | ||||||||
Airlines – 0.6% | ||||||||
Alaska Air Group, Inc.(a) | 58,300 | 3,465,935 | ||||||
Building Products – 0.6% | ||||||||
Masco Corp. | 282,200 | 3,835,098 | ||||||
Commercial Services & Supplies – 0.8% | ||||||||
Avery Dennison Corp. | 122,300 | 4,882,216 | ||||||
Electrical Equipment – 3.0% | ||||||||
EnerSys(a) | 107,500 | 3,816,250 | ||||||
| 152 | • ALLIANCEBERNSTEIN POOLING PORTFOLIOS |
Small-Mid Cap Value Portfolio—Portfolio of Investments
| Company | Shares | U.S. $ Value | ||||||
General Cable Corp.(a) | 167,000 | $ | 7,251,140 | |||||
Thomas & Betts Corp.(a) | 135,250 | 7,491,498 | ||||||
| 18,558,888 | ||||||||
Machinery – 3.8% | ||||||||
Briggs & Stratton Corp. | 277,000 | 5,576,010 | ||||||
Mueller Industries, Inc. | 210,100 | 7,139,198 | ||||||
Terex Corp.(a) | 119,975 | 4,049,156 | ||||||
Trinity Industries, Inc. | 224,200 | 6,983,830 | ||||||
| 23,748,194 | ||||||||
Professional Services – 0.6% | ||||||||
Kelly Services, Inc. – Class A(a) | 180,400 | 3,792,008 | ||||||
Road & Rail – 0.6% | ||||||||
Con-way, Inc. | 112,900 | 3,676,024 | ||||||
Trading Companies & Distributors – 1.8% | ||||||||
Aircastle Ltd. | 322,300 | 3,893,384 | ||||||
WESCO International, Inc.(a) | 120,800 | 7,032,976 | ||||||
| 10,926,360 | ||||||||
| 72,884,723 | ||||||||
Energy – 10.2% | ||||||||
Energy Equipment & Services – 3.9% | ||||||||
Bristow Group, Inc.(a) | 121,700 | 5,831,864 | ||||||
Helix Energy Solutions Group, Inc.(a) | 416,900 | 6,420,260 | ||||||
Helmerich & Payne, Inc. | 112,100 | 7,285,379 | ||||||
Oil States International, Inc.(a) | 65,800 | 4,789,582 | ||||||
| 24,327,085 | ||||||||
Oil, Gas & Consumable Fuels – 6.3% | ||||||||
Forest Oil Corp.(a) | 216,300 | 7,676,487 | ||||||
Petroleum Development Corp.(a) | 119,900 | 5,626,907 | ||||||
Southern Union Co. | 274,100 | 7,817,332 | ||||||
Swift Energy Co.(a) | 156,400 | 6,717,380 | ||||||
Teekay Corp. | 209,700 | 7,215,777 | ||||||
Tesoro Corp.(a) | 159,100 | 3,783,398 | ||||||
| 38,837,281 | ||||||||
| 63,164,366 | ||||||||
Utilities – 9.3% | ||||||||
Electric Utilities – 4.6% | ||||||||
NV Energy, Inc. | 489,800 | 7,195,162 | ||||||
Pepco Holdings, Inc. | 390,800 | 7,319,684 | ||||||
Portland General Electric Co. | 297,025 | 6,956,325 | ||||||
Unisource Energy Corp. | 193,700 | 7,062,302 | ||||||
| 28,533,473 | ||||||||
| ALLIANCEBERNSTEIN POOLING PORTFOLIOS • | 153 |
Small-Mid Cap Value Portfolio—Portfolio of Investments
| Company | Shares | U.S. $ Value | ||||||
Gas Utilities – 2.3% | ||||||||
Atmos Energy Corp. | 218,700 | $ | 7,396,434 | |||||
UGI Corp. | 221,100 | 7,050,879 | ||||||
| 14,447,313 | ||||||||
Multi-Utilities – 2.4% | ||||||||
CMS Energy Corp. | 376,300 | 7,247,538 | ||||||
NiSource, Inc. | 391,000 | 7,491,560 | ||||||
| 14,739,098 | ||||||||
| 57,719,884 | ||||||||
Information Technology – 7.9% | ||||||||
Computers & Peripherals – 0.6% | ||||||||
NCR Corp.(a) | 192,200 | 3,671,020 | ||||||
Electronic Equipment, Instruments & Components – 5.2% | ||||||||
Anixter International, Inc. | 81,700 | 5,851,354 | ||||||
Arrow Electronics, Inc.(a) | 126,700 | 4,966,640 | ||||||
AU Optronics Corp. (Sponsored ADR)(a) | 614,424 | 5,517,527 | ||||||
Avnet, Inc.(a) | 121,100 | 4,142,831 | ||||||
Flextronics International Ltd.(a) | 676,200 | 5,470,458 | ||||||
Insight Enterprises, Inc.(a) | 318,900 | 5,832,681 | ||||||
| 31,781,491 | ||||||||
IT Services – 1.7% | ||||||||
Amdocs Ltd.(a) | 118,400 | 3,533,056 | ||||||
Convergys Corp.(a) | 492,600 | 6,930,882 | ||||||
| 10,463,938 | ||||||||
Software – 0.4% | ||||||||
Take-Two Interactive Software, Inc.(a) | 170,000 | 2,731,900 | ||||||
| 48,648,349 | ||||||||
Materials – 6.4% | ||||||||
Chemicals – 3.5% | ||||||||
Arch Chemicals, Inc. | 153,200 | 5,507,540 | ||||||
Cytec Industries, Inc. | 101,800 | 5,785,294 | ||||||
Huntsman Corp. | 361,600 | 6,382,240 | ||||||
PolyOne Corp.(a) | 272,900 | 3,787,852 | ||||||
| 21,462,926 | ||||||||
Metals & Mining – 2.9% | ||||||||
Commercial Metals Co. | 335,200 | 5,587,784 | ||||||
Reliance Steel & Aluminum Co. | 130,500 | 7,220,565 | ||||||
Steel Dynamics, Inc. | 292,800 | 5,405,088 | ||||||
| 18,213,437 | ||||||||
| 39,676,363 | ||||||||
Health Care – 6.4% | ||||||||
Health Care Equipment & Supplies – 1.1% | ||||||||
Kinetic Concepts, Inc.(a) | 145,900 | 7,144,723 | ||||||
| 154 | • ALLIANCEBERNSTEIN POOLING PORTFOLIOS |
Small-Mid Cap Value Portfolio—Portfolio of Investments
| Company | Shares | U.S. $ Value | ||||||
Health Care Providers & Services – 4.3% | ||||||||
AMERIGROUP Corp.(a) | 100,300 | $ | 5,752,205 | |||||
Health Net, Inc.(a) | 266,800 | 7,849,256 | ||||||
LifePoint Hospitals, Inc.(a) | 201,678 | 7,861,408 | ||||||
Molina Healthcare, Inc.(a) | 139,025 | 4,870,046 | ||||||
| 26,332,915 | ||||||||
Pharmaceuticals – 1.0% | ||||||||
Par Pharmaceutical Cos., Inc.(a) | 197,200 | 6,089,536 | ||||||
| 39,567,174 | ||||||||
Consumer Staples – 4.8% | ||||||||
Beverages – 1.2% | ||||||||
Constellation Brands, Inc. – Class A(a) | 372,294 | 7,565,014 | ||||||
Food Products – 3.6% | ||||||||
Bunge Ltd. | 76,800 | 5,542,656 | ||||||
Dole Food Co., Inc.(a) | 314,538 | 4,639,436 | ||||||
Smithfield Foods, Inc.(a) | 332,100 | 7,688,115 | ||||||
Tyson Foods, Inc. – Class A | 227,600 | 4,240,188 | ||||||
| 22,110,395 | ||||||||
| 29,675,409 | ||||||||
Total Common Stocks | 610,297,882 | |||||||
SHORT-TERM INVESTMENTS – 0.8% | ||||||||
Investment Companies – 0.8% | ||||||||
AllianceBernstein Fixed-Income Shares, Inc. – Government STIF Portfolio, 0.17%(b) | 4,769,678 | 4,769,678 | ||||||
Total Investments – 99.6% | 615,067,560 | |||||||
Other assets less liabilities – 0.4% | 2,747,984 | |||||||
Net Assets – 100.0% | $ | 617,815,544 | ||||||
| (a) | Non-income producing security. |
| (b) | Investment in affiliated money market mutual fund. The rate shown represents the 7-day yield as of period end. |
Glossary:
| ADR | – American Depositary Receipt |
See notes to financial statements.
| ALLIANCEBERNSTEIN POOLING PORTFOLIOS • | 155 |
Small-Mid Cap Value Portfolio—Portfolio of Investments
SMALL-MID CAP GROWTH PORTFOLIO
PORTFOLIO OF INVESTMENTS
February 28, 2011 (unaudited)
| Company | Shares | U.S. $ Value | ||||||
COMMON STOCKS – 98.8% | ||||||||
Information Technology – 26.3% | ||||||||
Communications Equipment – 4.9% | ||||||||
ADTRAN, Inc. | 135,670 | $ | 6,170,272 | |||||
Aruba Networks, Inc.(a) | 251,628 | 7,662,072 | ||||||
Polycom, Inc.(a) | 175,700 | 8,398,460 | ||||||
Riverbed Technology, Inc.(a) | 203,942 | 8,420,765 | ||||||
| 30,651,569 | ||||||||
Internet Software & Services – 1.5% | ||||||||
WebMD Health Corp. – Class A(a) | 155,770 | 9,034,660 | ||||||
IT Services – 2.1% | ||||||||
Alliance Data Systems Corp.(a) | 57,760 | 4,548,022 | ||||||
VeriFone Systems, Inc.(a) | 179,734 | 8,167,113 | ||||||
| 12,715,135 | ||||||||
Semiconductors & Semiconductor Equipment – 8.5% | ||||||||
Fairchild Semiconductor International, Inc.(a) | 439,120 | 7,732,903 | ||||||
Hittite Microwave Corp.(a) | 88,880 | 5,455,454 | ||||||
International Rectifier Corp.(a) | 244,380 | 7,854,373 | ||||||
Netlogic Microsystems, Inc.(a) | 163,618 | 6,772,149 | ||||||
ON Semiconductor Corp.(a) | 770,630 | 8,592,525 | ||||||
Skyworks Solutions, Inc.(a) | 245,090 | 8,808,535 | ||||||
Teradyne, Inc.(a) | 415,390 | 7,738,716 | ||||||
| 52,954,655 | ||||||||
Software – 9.3% | ||||||||
Aspen Technology, Inc.(a) | 469,842 | 7,155,694 | ||||||
Concur Technologies, Inc.(a) | 93,360 | 4,857,521 | ||||||
Fortinet, Inc.(a) | 186,981 | 7,636,304 | ||||||
Informatica Corp.(a) | 176,490 | 8,296,795 | ||||||
MICROS Systems, Inc.(a) | 158,110 | 7,532,360 | ||||||
Red Hat, Inc.(a) | 165,790 | 6,843,811 | ||||||
SuccessFactors, Inc.(a) | 206,673 | 7,421,628 | ||||||
TIBCO Software, Inc.(a) | 313,460 | 7,717,385 | ||||||
| 57,461,498 | ||||||||
| 162,817,517 | ||||||||
Industrials – 23.5% | ||||||||
Aerospace & Defense – 1.2% | ||||||||
Hexcel Corp.(a) | 389,285 | 7,221,237 | ||||||
Air Freight & Logistics – 2.2% | ||||||||
Atlas Air Worldwide Holdings, Inc.(a) | 105,304 | 7,190,157 | ||||||
Expeditors International of Washington, Inc. | 135,370 | 6,470,686 | ||||||
| 13,660,843 | ||||||||
| 156 | • ALLIANCEBERNSTEIN POOLING PORTFOLIOS |
Small-Mid Cap Growth Portfolio—Portfolio of Investments
| Company | Shares | U.S. $ Value | ||||||
Building Products – 0.9% | ||||||||
Simpson Manufacturing Co., Inc. | 204,130 | $ | 5,905,481 | |||||
Electrical Equipment – 1.6% | ||||||||
AMETEK, Inc. | 237,310 | 9,955,154 | ||||||
Machinery – 10.1% | ||||||||
Actuant Corp. – Class A | 305,140 | 8,635,462 | ||||||
Bucyrus International, Inc. – Class A | 68,160 | 6,206,650 | ||||||
Gardner Denver, Inc. | 59,990 | 4,387,669 | ||||||
IDEX Corp. | 195,655 | 8,068,812 | ||||||
Joy Global, Inc. | 107,965 | 10,513,632 | ||||||
Lincoln Electric Holdings, Inc. | 128,800 | 9,193,744 | ||||||
Middleby Corp.(a) | 92,020 | 8,251,433 | ||||||
Valmont Industries, Inc. | 70,140 | 7,159,891 | ||||||
| 62,417,293 | ||||||||
Marine – 1.3% | ||||||||
Kirby Corp.(a) | 144,948 | 8,021,422 | ||||||
Professional Services – 2.7% | ||||||||
Manpower, Inc. | 125,790 | 7,987,665 | ||||||
Robert Half International, Inc. | 274,440 | 8,754,636 | ||||||
| 16,742,301 | ||||||||
Road & Rail – 2.0% | ||||||||
Genesee & Wyoming, Inc. – Class A(a) | 129,690 | 6,755,552 | ||||||
Knight Transportation, Inc. | 301,240 | 5,606,076 | ||||||
| 12,361,628 | ||||||||
Trading Companies & Distributors – 1.5% | ||||||||
MSC Industrial Direct Co. – Class A | 144,430 | 9,126,532 | ||||||
| 145,411,891 | ||||||||
Consumer Discretionary – 18.4% | ||||||||
Distributors – 1.5% | ||||||||
LKQ Corp.(a) | 407,670 | 9,686,239 | ||||||
Hotels, Restaurants & Leisure – 5.8% | ||||||||
Chipotle Mexican Grill, Inc. – Class A(a) | 27,950 | 6,847,750 | ||||||
Life Time Fitness, Inc.(a) | 97,200 | 3,727,620 | ||||||
Orient-Express Hotels Ltd. – Class A(a) | 685,980 | 8,657,068 | ||||||
Panera Bread Co. – Class A(a) | 69,570 | 8,122,297 | ||||||
Wyndham Worldwide Corp. | 273,080 | 8,541,942 | ||||||
| 35,896,677 | ||||||||
Household Durables – 1.5% | ||||||||
Tempur-Pedic International, Inc.(a) | 195,670 | 9,184,750 | ||||||
| ALLIANCEBERNSTEIN POOLING PORTFOLIOS • | 157 |
Small-Mid Cap Growth Portfolio—Portfolio of Investments
| Company | Shares | U.S. $ Value | ||||||
Internet & Catalog Retail – 0.9% | ||||||||
NetFlix, Inc.(a) | 27,150 | $ | 5,611,091 | |||||
Media – 2.6% | ||||||||
Lamar Advertising Co.(a) | 193,690 | 7,509,361 | ||||||
National CineMedia, Inc. | 444,250 | 8,391,883 | ||||||
| 15,901,244 | ||||||||
Multiline Retail – 1.4% | ||||||||
Dollar Tree, Inc.(a) | 174,280 | 8,769,770 | ||||||
Specialty Retail – 4.7% | ||||||||
CarMax, Inc.(a) | 269,000 | 9,514,530 | ||||||
Dick’s Sporting Goods, Inc.(a) | 248,930 | 9,245,260 | ||||||
Ulta Salon Cosmetics & Fragrance, Inc.(a) | 248,500 | 10,369,905 | ||||||
| 29,129,695 | ||||||||
| 114,179,466 | ||||||||
Health Care – 15.5% | ||||||||
Biotechnology – 3.9% | ||||||||
Alexion Pharmaceuticals, Inc.(a) | 73,640 | 7,090,059 | ||||||
Human Genome Sciences, Inc.(a) | 159,040 | 3,980,771 | ||||||
InterMune, Inc.(a) | 84,490 | 3,093,179 | ||||||
Ironwood Pharmaceuticals, Inc.(a) | 138,069 | 1,688,584 | ||||||
Pharmasset, Inc.(a) | 20,273 | 1,013,650 | ||||||
United Therapeutics Corp.(a) | 110,960 | 7,482,033 | ||||||
| 24,348,276 | ||||||||
Health Care Equipment & Supplies – 3.1% | ||||||||
NxStage Medical, Inc.(a) | 279,400 | 5,764,022 | ||||||
Sirona Dental Systems, Inc.(a) | 149,790 | 7,558,403 | ||||||
Volcano Corp.(a) | 235,650 | 6,183,456 | ||||||
| 19,505,881 | ||||||||
Health Care Providers & Services – 5.6% | ||||||||
Centene Corp.(a) | 246,340 | 7,505,980 | ||||||
Healthspring, Inc.(a) | 243,270 | 9,156,683 | ||||||
HMS Holdings Corp.(a) | 140,115 | 10,587,090 | ||||||
Magellan Health Services, Inc.(a) | 154,780 | 7,426,344 | ||||||
| 34,676,097 | ||||||||
Health Care Technology – 1.6% | ||||||||
SXC Health Solutions Corp.(a) | 197,330 | 9,738,236 | ||||||
Life Sciences Tools & Services – 0.9% | ||||||||
Illumina, Inc.(a) | 79,400 | 5,510,360 | ||||||
| 158 | • ALLIANCEBERNSTEIN POOLING PORTFOLIOS |
Small-Mid Cap Growth Portfolio—Portfolio of Investments
| Company | Shares | U.S. $ Value | ||||||
Pharmaceuticals – 0.4% | ||||||||
Salix Pharmaceuticals Ltd.(a) | 78,760 | $ | 2,625,858 | |||||
| 96,404,708 | ||||||||
Energy – 6.3% | ||||||||
Energy Equipment & Services – 2.8% | ||||||||
FMC Technologies, Inc.(a) | 73,440 | 6,907,032 | ||||||
Oceaneering International, Inc.(a) | 63,100 | 5,277,053 | ||||||
Oil States International, Inc.(a) | 71,410 | 5,197,934 | ||||||
| 17,382,019 | ||||||||
Oil, Gas & Consumable Fuels – 3.5% | ||||||||
Concho Resources, Inc.(a) | 67,490 | 7,189,035 | ||||||
Range Resources Corp. | 115,170 | 6,253,731 | ||||||
SM Energy Co. | 113,753 | 8,243,680 | ||||||
| 21,686,446 | ||||||||
| 39,068,465 | ||||||||
Financials – 5.6% | ||||||||
Capital Markets – 4.3% | ||||||||
Affiliated Managers Group, Inc.(a) | 66,630 | 7,112,753 | ||||||
Greenhill & Co., Inc. | 75,330 | 5,410,954 | ||||||
Lazard Ltd. – Class A | 145,910 | 6,420,040 | ||||||
Stifel Financial Corp.(a) | 103,611 | 7,433,053 | ||||||
| 26,376,800 | ||||||||
Commercial Banks – 0.7% | ||||||||
Iberiabank Corp. | 78,388 | 4,490,848 | ||||||
Thrifts & Mortgage Finance – 0.6% | ||||||||
BankUnited, Inc.(a) | 137,231 | 3,890,499 | ||||||
| 34,758,147 | ||||||||
Consumer Staples – 1.7% | ||||||||
Food Products – 1.7% | ||||||||
Green Mountain Coffee Roasters, Inc.(a) | 258,408 | 10,537,878 | ||||||
Materials – 1.5% | ||||||||
Chemicals – 1.5% | ||||||||
Solutia, Inc.(a) | 410,820 | 9,535,132 | ||||||
Total Common Stocks | 612,713,204 | |||||||
| ALLIANCEBERNSTEIN POOLING PORTFOLIOS • | 159 |
Small-Mid Cap Growth Portfolio—Portfolio of Investments
| Company | Shares | U.S. $ Value | ||||||
SHORT-TERM INVESTMENTS – 1.7% | ||||||||
Investment Companies – 1.7% | ||||||||
AllianceBernstein Fixed-Income Shares, Inc. – Government STIF Portfolio, 0.17%(b) | 10,352,473 | $ | 10,352,473 | |||||
Total Investments – 100.5% | 623,065,677 | |||||||
Other assets less liabilities – (0.5)% | (2,827,364 | ) | ||||||
Net Assets – 100.0% | $ | 620,238,313 | ||||||
| (a) | Non-income producing security. |
| (b) | Investment in affiliated money market mutual fund. The rate shown represents the 7-day yield as of period end. |
See notes to financial statements.
| 160 | • ALLIANCEBERNSTEIN POOLING PORTFOLIOS |
Small-Mid Cap Growth Portfolio—Portfolio of Investments
MULTI-ASSET REAL RETURN PORTFOLIO
PORTFOLIO OF INVESTMENTS
February 28, 2011 (unaudited)
| Company | Shares | U.S. $ Value | ||||||
COMMON STOCKS – 64.5% | ||||||||
Energy – 18.7% | ||||||||
Coal & Consumable Fuels – 0.2% | ||||||||
China Shenhua Energy Co., Ltd. – Class H | 227,000 | $ | 946,473 | |||||
Peabody Energy Corp. | 18,600 | 1,218,114 | ||||||
| 2,164,587 | ||||||||
Integrated Oil & Gas – 12.7% | ||||||||
BG Group PLC | 205,400 | 5,001,614 | ||||||
BP PLC | 1,530,300 | 12,336,755 | ||||||
Chevron Corp. | 132,700 | 13,767,625 | ||||||
China Petroleum & Chemical Corp. – Class H | 3,048,000 | 3,093,483 | ||||||
ConocoPhillips | 98,500 | 7,670,195 | ||||||
ENI SpA | 247,200 | 6,027,371 | ||||||
Exxon Mobil Corp. | 296,300 | 25,342,539 | ||||||
Gazprom OAO (Sponsored ADR) | 258,800 | 7,588,016 | ||||||
Hess Corp. | 40,900 | 3,559,527 | ||||||
LUKOIL OAO (London) (Sponsored ADR) | 75,800 | 5,396,202 | ||||||
Marathon Oil Corp. | 94,300 | 4,677,280 | ||||||
Murphy Oil Corp. | 13,000 | 955,890 | ||||||
PetroChina Co., Ltd. – Class H | 610,000 | 832,405 | ||||||
Petroleo Brasileiro SA | 25,400 | 497,680 | ||||||
Petroleo Brasileiro SA (ADR) | 99,200 | 3,951,136 | ||||||
Petroleo Brasileiro SA (Sponsored ADR) | 51,200 | 1,800,704 | ||||||
Rosneft Oil Co. (GDR)(a) | 231,450 | 2,184,888 | ||||||
Royal Dutch Shell PLC (Euronext | 268,100 | 9,651,506 | ||||||
Royal Dutch Shell PLC – Class B | 142,500 | 5,094,131 | ||||||
Statoil ASA | 77,600 | 2,048,959 | ||||||
Suncor Energy, Inc. (Toronto) | 43,800 | 2,058,472 | ||||||
Total SA | 146,600 | 8,986,580 | ||||||
| 132,522,958 | ||||||||
Oil & Gas Exploration & Production – 5.8% | ||||||||
Afren PLC(b) | 493,100 | 1,283,838 | ||||||
Alliance Oil Co., Ltd. (GDR)(b) | 71,000 | 1,277,829 | ||||||
Anadarko Petroleum Corp. | 31,600 | 2,585,828 | ||||||
Canadian Natural Resources Ltd. | 159,300 | 8,022,798 | ||||||
Chesapeake Energy Corp. | 45,900 | 1,634,499 | ||||||
Cimarex Energy Co. | 6,000 | 696,780 | ||||||
CNOOC Ltd. | 1,677,000 | 3,824,569 | ||||||
Devon Energy Corp. | 68,100 | 6,227,064 | ||||||
EnCana Corp. | 52,200 | 1,696,748 | ||||||
EOG Resources, Inc. | 19,200 | 2,156,352 | ||||||
Inpex Corp. | 83 | 583,231 | ||||||
Newfield Exploration Co.(b) | 28,600 | 2,081,794 | ||||||
Nexen, Inc. (Toronto) | 239,100 | 6,524,153 | ||||||
Noble Energy, Inc. | 47,800 | 4,429,148 | ||||||
Occidental Petroleum Corp. | 58,300 | 5,944,851 | ||||||
| ALLIANCEBERNSTEIN POOLING PORTFOLIOS • | 161 |
Multi-Asset Real Return Portfolio—Portfolio of Investments
| Company | Shares | U.S. $ Value | ||||||
OGX Petroleo e Gas Participacoes SA(b) | 111,100 | $ | 1,298,771 | |||||
Penn West Petroleum Ltd. | 113,400 | 3,278,685 | ||||||
Talisman Energy, Inc. | 71,400 | 1,771,863 | ||||||
Tatneft (Sponsored ADR) | 14,200 | 592,850 | ||||||
Tullow Oil PLC | 99,410 | 2,322,438 | ||||||
Woodside Petroleum Ltd. | 67,100 | 2,922,677 | ||||||
| 61,156,766 | ||||||||
| 195,844,311 | ||||||||
Equity:Other – 14.9% | ||||||||
Diversified/Specialty – 12.9% | ||||||||
BioMed Realty Trust, Inc. | 135,245 | 2,454,697 | ||||||
British Land Co. PLC | 706,573 | 6,703,686 | ||||||
Canadian Real Estate Investment Trust | 118,500 | 4,045,746 | ||||||
Cheung Kong Holdings Ltd. | 296,000 | 4,631,838 | ||||||
Dexus Property Group | 5,823,000 | 5,094,062 | ||||||
Digital Realty Trust, Inc. | 117,700 | 6,923,114 | ||||||
Dundee Real Estate Investment Trust | 75,556 | 2,448,930 | ||||||
Evergrande Real Estate Group Ltd. | 7,616,000 | 3,609,107 | ||||||
Fonciere Des Regions | 31,200 | 3,389,795 | ||||||
Forest City Enterprises, Inc.(b) | 100,909 | 1,907,180 | ||||||
Hysan Development Co., Ltd. | 997,000 | 4,535,869 | ||||||
Kerry Properties Ltd. | 900,691 | 4,394,038 | ||||||
Land Securities Group PLC | 307,940 | 3,837,869 | ||||||
Lend Lease Group | 383,294 | 3,578,394 | ||||||
Mitsubishi Estate Co., Ltd. | 541,000 | 11,092,131 | ||||||
Mitsui Fudosan Co., Ltd. | 642,000 | 13,720,527 | ||||||
New World Development Ltd. | 1,591,157 | 2,891,357 | ||||||
Overseas Union Enterprise Ltd. | 589,000 | 1,335,448 | ||||||
Savills PLC | 282,059 | 1,735,426 | ||||||
Soho China Ltd. | 2,192,500 | 1,583,829 | ||||||
Sumitomo Realty & Development Co., Ltd. | 206,000 | 5,555,487 | ||||||
Sun Hung Kai Properties Ltd. | 973,600 | 15,822,578 | ||||||
Swire Pacific Ltd. | 198,000 | 2,778,698 | ||||||
Telecity Group PLC(b) | 463,179 | 3,587,002 | ||||||
Unibail-Rodamco SE | 36,098 | 7,263,580 | ||||||
UOL Group Ltd. | 452,000 | 1,585,141 | ||||||
Vornado Realty Trust | 47,700 | 4,451,841 | ||||||
Wereldhave NV | 37,000 | 3,758,804 | ||||||
Wheelock & Co., Ltd. | 202,000 | 738,073 | ||||||
| 135,454,247 | ||||||||
Health Care – 1.5% | ||||||||
Chartwell Seniors Housing Real Estate Investment Trust | 519,900 | 4,676,986 | ||||||
HCP, Inc. | 73,000 | 2,774,000 | ||||||
Health Care REIT, Inc. | 122,200 | 6,381,284 | ||||||
Ventas, Inc. | 32,300 | 1,790,066 | ||||||
| 15,622,336 | ||||||||
| 162 | • ALLIANCEBERNSTEIN POOLING PORTFOLIOS |
Multi-Asset Real Return Portfolio—Portfolio of Investments
| Company | Shares | U.S. $ Value | ||||||
Triple Net – 0.5% | ||||||||
Entertainment Properties Trust | 109,300 | $ | 5,210,331 | |||||
| 156,286,914 | ||||||||
Materials – 10.9% | ||||||||
Aluminum – 0.2% | ||||||||
Alcoa, Inc. | 75,000 | 1,263,750 | ||||||
Hindalco Industries Ltd. | 119,400 | 535,357 | ||||||
| 1,799,107 | ||||||||
Diversified Metals & Mining – 5.4% | ||||||||
African Rainbow Minerals Ltd. | 15,800 | 479,116 | ||||||
Anglo American PLC | 90,900 | 4,930,755 | ||||||
BHP Billiton Ltd. | 199,300 | 9,417,750 | ||||||
BHP Billiton PLC | 151,800 | 6,017,255 | ||||||
Capstone Mining Corp.(b) | 462,100 | 2,068,998 | ||||||
Dowa Holdings Co., Ltd. | 168,000 | 1,187,393 | ||||||
Freeport-McMoRan Copper & Gold, Inc. | 81,600 | 4,320,720 | ||||||
KGHM Polska Miedz SA | 32,000 | 1,960,886 | ||||||
Lundin Mining Corp.(b) | 294,300 | 2,317,323 | ||||||
Lynas Corp. Ltd.(b) | 267,600 | 539,035 | ||||||
Mitsubishi Materials Corp.(b) | 207,000 | 801,710 | ||||||
Mongolian Mining Corp.(b) | 369,000 | 468,120 | ||||||
Rio Tinto Ltd. | 35,600 | 3,108,434 | ||||||
Rio Tinto PLC | 136,800 | 9,632,990 | ||||||
Sumitomo Metal Mining Co., Ltd. | 88,000 | 1,667,099 | ||||||
Teck Resources Ltd. | 58,600 | 3,241,985 | ||||||
Xstrata PLC | 209,930 | 4,801,327 | ||||||
| 56,960,896 | ||||||||
Fertilizers & Agricultural | ||||||||
Incitec Pivot Ltd. | 320,100 | 1,444,262 | ||||||
Israel Chemicals Ltd. | 29,100 | 484,586 | ||||||
K&S AG | 17,300 | 1,337,345 | ||||||
Monsanto Co. | 38,900 | 2,796,521 | ||||||
Mosaic Co. (The) | 10,200 | 875,670 | ||||||
Yara International ASA | 13,000 | 690,249 | ||||||
| 7,628,633 | ||||||||
Forest Products – 0.2% | ||||||||
West Fraser Timber Co., Ltd. | 48,300 | 2,311,718 | ||||||
Gold – 1.6% | ||||||||
Barrick Gold Corp. | 67,000 | 3,536,370 | ||||||
Gold Fields Ltd. (Sponsored ADR) | 101,800 | 1,823,238 | ||||||
Goldcorp, Inc. | 114,900 | 5,488,661 | ||||||
IAMGOLD Corp. | 116,600 | 2,471,097 | ||||||
Newmont Mining Corp. | 34,600 | 1,912,342 | ||||||
| ALLIANCEBERNSTEIN POOLING PORTFOLIOS • | 163 |
Multi-Asset Real Return Portfolio—Portfolio of Investments
| Company | Shares | U.S. $ Value | ||||||
Real Gold Mining Ltd.(b) | 451,000 | $ | 681,861 | |||||
Yamana Gold, Inc. | 50,900 | 647,023 | ||||||
| 16,560,592 | ||||||||
Paper Products – 0.3% | ||||||||
Mondi PLC | 186,700 | 1,665,672 | ||||||
OJI Paper Co., Ltd. | 111,000 | 552,563 | ||||||
Svenska Cellulosa AB – Class B | 39,300 | 649,491 | ||||||
| 2,867,726 | ||||||||
Precious Metals & Minerals – 0.1% | ||||||||
Kazakhmys PLC | 38,800 | 911,999 | ||||||
Northam Platinum Ltd. | 94,600 | 673,133 | ||||||
| 1,585,132 | ||||||||
Steel – 2.4% | ||||||||
Angang Steel Co., Ltd. – Class H | 644,000 | 892,208 | ||||||
APERAM(b) | 2,970 | 122,810 | ||||||
ArcelorMittal (Euronext Amsterdam) | 59,400 | 2,181,550 | ||||||
Gerdau SA | 43,300 | 572,285 | ||||||
Hyundai Steel Co. | 17,500 | 2,019,000 | ||||||
JFE Holdings, Inc. | 114,000 | 3,610,304 | ||||||
Nippon Steel Corp. | 359,000 | 1,305,612 | ||||||
POSCO (ADR) | 18,300 | 1,886,364 | ||||||
Sumitomo Metal Industries Ltd. | 230,000 | 584,454 | ||||||
United States Steel Corp. | 8,000 | 459,920 | ||||||
Usinas Siderurgicas de Minas Gerais SA | 60,500 | 975,243 | ||||||
Vale SA | 52,300 | 1,769,738 | ||||||
Vale SA (Preference Shares) | 42,600 | 1,269,960 | ||||||
Vale SA (Sponsored ADR) (Local Preference Shares) | 174,900 | 5,241,753 | ||||||
Vale SA (Sponsored ADR) – Class B | 58,800 | 2,012,724 | ||||||
| 24,903,925 | ||||||||
| 114,617,729 | ||||||||
Retail – 5.9% | ||||||||
Regional Mall – 3.3% | ||||||||
BR Malls Participacoes SA | 399,500 | 3,805,791 | ||||||
CBL & Associates Properties, Inc. | 96,287 | 1,718,723 | ||||||
General Growth Properties, Inc. | 11,663 | 185,675 | ||||||
Multiplan Empreendimentos Imobiliarios SA | 113,205 | 2,208,579 | ||||||
Simon Property Group, Inc. | 140,302 | 15,438,832 | ||||||
Taubman Centers, Inc. | 50,100 | 2,779,548 | ||||||
Westfield Group | 847,696 | 8,451,648 | ||||||
| 34,588,796 | ||||||||
Shopping Center/Other Retail – 2.6% | ||||||||
Eurocommercial Properties N.V. | 73,844 | 3,540,479 | ||||||
Kimco Realty Corp. | 239,872 | 4,648,719 | ||||||
Klepierre | 140,141 | 5,471,522 | ||||||
| 164 | • ALLIANCEBERNSTEIN POOLING PORTFOLIOS |
Multi-Asset Real Return Portfolio—Portfolio of Investments
| Company | Shares | U.S. $ Value | ||||||
Link REIT (The) | 571,812 | $ | 1,773,656 | |||||
RioCan Real Estate Investment Trust (New York)(a) | 132,100 | 3,293,152 | ||||||
RioCan Real Estate Investment Trust (Toronto) | 76,248 | 1,900,805 | ||||||
Tanger Factory Outlet Centers | 58,749 | 1,565,661 | ||||||
Weingarten Realty Investors | 198,637 | 5,138,739 | ||||||
| 27,332,733 | ||||||||
| 61,921,529 | ||||||||
Residential – 5.3% | ||||||||
Multi-Family – 4.0% | ||||||||
BRE Properties, Inc. | 89,350 | 4,245,019 | ||||||
Camden Property Trust | 80,400 | 4,757,268 | ||||||
Colonial Properties Trust | 205,216 | 4,044,807 | ||||||
Equity Residential | 93,500 | 5,152,785 | ||||||
Essex Property Trust, Inc. | 36,904 | 4,567,977 | ||||||
GAGFAH SA | 83,200 | 985,354 | ||||||
Home Properties, Inc. | 51,072 | 3,009,162 | ||||||
Mid-America Apartment Communities, Inc. | 43,400 | 2,819,698 | ||||||
Rossi Residencial SA | 376,600 | 2,919,906 | ||||||
Stockland | 1,029,185 | 4,004,728 | ||||||
UDR, Inc. | 143,300 | 3,485,056 | ||||||
Wing Tai Holdings Ltd. | 1,257,000 | 1,468,151 | ||||||
| 41,459,911 | ||||||||
Self Storage – 1.3% | ||||||||
Big Yellow Group PLC | 546,760 | 2,870,874 | ||||||
Extra Space Storage, Inc. | 211,967 | 4,186,348 | ||||||
Public Storage | 43,717 | 4,907,233 | ||||||
U-Store-It Trust | 178,900 | 1,833,725 | ||||||
| 13,798,180 | ||||||||
| 55,258,091 | ||||||||
Office – 3.6% | ||||||||
Office – 3.6% | ||||||||
Allied Properties Real Estate Investment Trust | 116,200 | 2,658,768 | ||||||
Beni Stabili SpA | 2,158,846 | 2,214,815 | ||||||
Boston Properties, Inc. | 91,535 | 8,780,037 | ||||||
Castellum AB | 184,744 | 2,643,057 | ||||||
Cominar Real Estate Investment Trust | 80,093 | 1,819,415 | ||||||
Douglas Emmett, Inc. | 185,548 | 3,479,025 | ||||||
Duke Realty Corp. | 195,600 | 2,752,092 | ||||||
Great Portland Estates PLC | 452,900 | 2,854,674 | ||||||
Hongkong Land Holdings Ltd. | 569,000 | 3,913,271 | ||||||
Kilroy Realty Corp. | 66,453 | 2,575,054 | ||||||
NTT Urban Development Corp. | 1,489 | 1,551,899 | ||||||
Sponda Oyj | 339,340 | 1,850,252 | ||||||
| 37,092,359 | ||||||||
| ALLIANCEBERNSTEIN POOLING PORTFOLIOS • | 165 |
Multi-Asset Real Return Portfolio—Portfolio of Investments
| Company | Shares | U.S. $ Value | ||||||
Lodging – 3.0% | ||||||||
Lodging – 3.0% | ||||||||
DiamondRock Hospitality Co.(b) | 292,565 | $ | 3,440,564 | |||||
Great Eagle Holdings Ltd. | 536,000 | 1,789,717 | ||||||
Host Hotels & Resorts, Inc. | 286,600 | 5,273,440 | ||||||
Hyatt Hotels Corp.(b) | 69,286 | 3,169,834 | ||||||
InnVest Real Estate Investment Trust | 594,266 | 4,263,326 | ||||||
Intercontinental Hotels Group PLC | 159,400 | 3,544,785 | ||||||
LaSalle Hotel Properties | 155,000 | 4,372,550 | ||||||
Whitbread PLC | 102,800 | 2,978,410 | ||||||
Wyndham Worldwide Corp. | 85,300 | 2,668,184 | ||||||
| 31,500,810 | ||||||||
Industrials – 1.8% | ||||||||
Industrial Warehouse Distribution – 1.5% | ||||||||
AMB Property Corp. | 67,713 | 2,463,399 | ||||||
Ascendas Real Estate Investment Trust | 1,455,000 | 2,297,912 | ||||||
First Potomac Realty Trust | 100,181 | 1,615,919 | ||||||
Global Logistic Properties Ltd.(b) | 1,001,000 | 1,495,439 | ||||||
ProLogis | 350,057 | 5,691,927 | ||||||
ProLogis European Properties(b) | 264,700 | 1,827,637 | ||||||
| 15,392,233 | ||||||||
Mixed Office Industrial – 0.3% | ||||||||
Goodman Group | 5,089,400 | 3,647,583 | ||||||
| 19,039,816 | ||||||||
Food Beverage & Tobacco – 0.4% | ||||||||
Agricultural Products – 0.4% | ||||||||
Archer-Daniels-Midland Co. | 55,100 | 2,048,618 | ||||||
Bunge Ltd. | 29,100 | 2,100,147 | ||||||
| 4,148,765 | ||||||||
Total Common Stocks | 675,710,324 | |||||||
INFLATION-LINKED SECURITIES – 32.7% | ||||||||
United States – 32.7% | ||||||||
U.S. Treasury Inflation Index | ||||||||
0.625%, 4/15/13 (TIPS) | 37,795 | 39,416,071 | ||||||
2.00%, 4/15/12 (TIPS) | 82,126 | 85,776,666 | ||||||
3.00%, 7/15/12 (TIPS) | 59,807 | 63,951,757 | ||||||
3.375%, 1/15/12 (TIPS) | 146,405 | 153,462,483 | ||||||
Total Inflation-Linked Securities | 342,606,977 | |||||||
| 166 | • ALLIANCEBERNSTEIN POOLING PORTFOLIOS |
Multi-Asset Real Return Portfolio—Portfolio of Investments
| Company | Shares | U.S. $ Value | ||||||
WARRANTS – 0.0% | ||||||||
Equity:Other – 0.0% | ||||||||
Diversified/Specialty – 0.0% | ||||||||
Henderson Land Development Co., Ltd., expiring 6/01/11(b) | 368,400 | $ | 26,490 | |||||
SHORT-TERM INVESTMENTS – 0.7% | ||||||||
Investment Companies – 0.7% | ||||||||
AllianceBernstein Fixed-Income Shares, Inc. – Government STIF Portfolio, 0.17%(c) | 7,324,653 | 7,324,653 | ||||||
Total Investments – 97.9% | 1,025,668,444 | |||||||
Other assets less liabilities – 2.1% | 21,979,916 | |||||||
Net Assets – 100.0% | $ | 1,047,648,360 | ||||||
FUTURES CONTRACTS (see Note C)
| Type | Number of Contracts | Expiration Month | Original Value | Value at February 28, 2011 | Unrealized Appreciation/ (Depreciation) | |||||||||||||||
Purchased | ||||||||||||||||||||
Aluminum HG Futures | 181 | March 2011 | $ | 10,824,198 | $ | 11,654,138 | $ | 829,940 | ||||||||||||
Platinum Futures | 80 | April 2011 | 7,247,222 | 7,236,800 | (10,422 | ) | ||||||||||||||
Soybean Futures | 208 | May 2011 | 13,843,041 | 14,193,400 | 350,359 | |||||||||||||||
Sold Contracts | ||||||||||||||||||||
Brent Crude Oil Futures | 38 | April 2011 | 3,659,721 | 4,248,400 | (588,679 | ) | ||||||||||||||
Gasoline RBOB Futures | 17 | May 2011 | 2,070,584 | 2,077,097 | (6,513 | ) | ||||||||||||||
Gold 100 OZ Futures | 38 | April 2011 | 5,122,306 | 5,357,620 | (235,314 | ) | ||||||||||||||
Live Cattle Futures | 283 | April 2011 | 12,772,687 | 12,780,280 | (7,593 | ) | ||||||||||||||
Nickel Futures | 47 | March 2011 | 7,164,135 | 8,171,514 | (1,007,379 | ) | ||||||||||||||
| $ | (675,601 | ) | ||||||||||||||||||
| ALLIANCEBERNSTEIN POOLING PORTFOLIOS • | 167 |
Multi-Asset Real Return Portfolio—Portfolio of Investments
TOTAL RETURN SWAP CONTRACTS ON INDICES (see Note C)
| Receive Total Return on Reference Index | Index | # of Shares or Units | Floating Rate | Notional Amount (000) | Maturity Date | Counterparty | Unrealized Appreciation/ (Depreciation) | |||||||||||||||||
Receive | Dow Jones-UBS Commodity Index 2 Month Forward | 145,358 | 1-Month USD-LIBOR-BBA Plus a specified spread* | $ | 49,451 | 3/15/11 | | Barclays Bank PLC | | $ | 1,287,811 | |||||||||||||
Receive | Dow Jones-UBS Commodity Index 2 Month Forward | 147,817 | 1-Month USD-LIBOR-BBA Plus a specified spread* | 50,288 | 3/15/11 | | Barclays Bank PLC | | 1,309,597 | |||||||||||||||
Receive | Dow Jones-UBS Commodity Index 2 Month Forward | 43,985 | 1-Month USD-LIBOR-BBA Plus a specified spread* | 14,964 | 3/15/11 | | Barclays Bank PLC | | 389,689 | |||||||||||||||
Receive | Dow Jones-UBS Grains Subindex 3 Month Forward | 83,834 | 1-Month USD-LIBOR-BBA Plus a specified spread* | 9,858 | 3/15/11 | | Citibank, N.A. | | (27,359) | |||||||||||||||
Receive | Dow Jones-UBS Commodity Index 2 Month Forward | 146,942 | 1-Month USD-LIBOR-BBA Plus a specified spread* | 49,990 | 4/15/11 | | Credit Suisse International | | 1,301,666 | |||||||||||||||
Receive | Dow Jones-UBS Commodity Index 2 Month Forward | 80,974 | 1-Month USD-LIBOR-BBA Plus a specified spread* | 27,548 | 4/15/11 | | Credit Suisse International | | 717,298 | |||||||||||||||
Receive | Dow Jones-UBS Commodity Index 2 Month Forward | 108,257 | 1-Month USD-LIBOR-BBA Plus a specified spread* | 36,829 | 4/15/11 | | Credit Suisse International | | 958,981 | |||||||||||||||
Receive | Dow Jones-UBS Commodity Index 2 Month Forward | 339,535 | 1-Month USD-LIBOR-BBA Plus a specified spread* | 115,511 | 5/16/11 | | Goldman Sachs International | | 3,006,214 | |||||||||||||||
| $ | 8,943,897 | |||||||||||||||||||||||
| 168 | • ALLIANCEBERNSTEIN POOLING PORTFOLIOS |
Multi-Asset Real Return Portfolio—Portfolio of Investments
| * | BBA – British Bankers’ Association |
| (a) | Security is exempt from registration under Rule 144A of the Securities Act of 1933. These securities are considered liquid and may be resold in transactions exempt from registration, normally to qualified institutional buyers. At February 28, 2011, the aggregate market value of these securities amounted to $5,478,040 or 0.5% of net assets. |
| (b) | Non-income producing security. |
| (c) | Investment in affiliated money market mutual fund. The rate shown represents the 7-day yield as of period end. |
Glossary:
| ADR | – American Depository Receipt |
| GDR | – Global Depository Receipt |
| REIT | – Real Estate Investment Trust |
| TIPS | – Treasury Inflation Protected Security |
See notes to financial statements.
| ALLIANCEBERNSTEIN POOLING PORTFOLIOS • | 169 |
Multi-Asset Real Return Portfolio—Portfolio of Investments
VOLATILITY MANAGEMENT
PORTFOLIO OF INVESTMENTS
February 28, 2011 (unaudited)
| Company | Shares | U.S. $ Value | ||||||
COMMON STOCKS – 35.5% | ||||||||
Financials – 8.5% | ||||||||
Capital Markets – 0.6% | ||||||||
Ameriprise Financial, Inc. | 850 | $ | 53,822 | |||||
Bank of New York Mellon Corp. (The) | 4,250 | 129,157 | ||||||
Charles Schwab Corp. (The) | 3,400 | 64,498 | ||||||
Credit Suisse Group AG | 4,707 | 217,689 | ||||||
Daiwa Securities Group, Inc. | 7,000 | 37,866 | ||||||
Deutsche Bank AG | 3,891 | 250,932 | ||||||
E*Trade Financial Corp.(a) | 670 | 10,707 | ||||||
Federated Investors, Inc. – Class B | 300 | 8,268 | ||||||
Franklin Resources, Inc. | 500 | 62,810 | ||||||
Goldman Sachs Group, Inc. (The) | 1,800 | 294,804 | ||||||
Invesco Ltd. | 1,550 | 41,602 | ||||||
Investec PLC | 3,115 | 23,932 | ||||||
Janus Capital Group, Inc. | 600 | 8,058 | ||||||
Julius Baer Group Ltd. | 788 | 35,346 | ||||||
Legg Mason, Inc. | 500 | 18,125 | ||||||
Macquarie Group Ltd. | 1,440 | 55,975 | ||||||
Man Group PLC | 7,387 | 34,516 | ||||||
Morgan Stanley | 5,200 | 154,336 | ||||||
Nomura Holdings, Inc. | 14,800 | 93,855 | ||||||
Northern Trust Corp. | 850 | 43,834 | ||||||
Ratos AB | 707 | 26,382 | ||||||
SBI Holdings, Inc. | 32 | 5,069 | ||||||
State Street Corp. | 1,750 | 78,260 | ||||||
T Rowe Price Group, Inc. | 900 | 60,282 | ||||||
UBS AG(a) | 15,207 | 301,749 | ||||||
| 2,111,874 | ||||||||
Commercial Banks – 2.2% | ||||||||
Alpha Bank AE(a) | 3,410 | 22,731 | ||||||
Australia & New Zealand Banking Group Ltd. | 10,586 | 261,636 | ||||||
Banca Monte dei Paschi di Siena SpA(a) | 24,538 | 32,709 | ||||||
Banco Bilbao Vizcaya Argentaria SA | 17,575 | 216,656 | ||||||
Banco de Sabadell SA | 3,491 | 15,144 | ||||||
Banco de Valencia SA | 30 | 151 | ||||||
Banco Espirito Santo SA | 7,004 | 31,744 | ||||||
Banco Popular Espanol SA | 2,801 | 16,942 | ||||||
Banco Santander SA | 32,578 | 401,092 | ||||||
Bank Hapoalim BM(a) | 5,232 | 23,741 | ||||||
Bank Leumi Le-Israel BM | 5,181 | 23,873 | ||||||
Bank of Cyprus Public Co., Ltd. | 1,125 | 4,343 | ||||||
Bank of East Asia Ltd. | 2,200 | 9,572 | ||||||
Bank of Kyoto Ltd. (The) | 3,000 | 28,916 | ||||||
Bank of Yokohama Ltd. (The) | 5,000 | 26,990 | ||||||
Bankinter SA | 1,056 | 6,966 | ||||||
| 170 | • ALLIANCEBERNSTEIN POOLING PORTFOLIOS |
Volatility Management—Portfolio of Investments
| Company | Shares | U.S. $ Value | ||||||
Barclays PLC | 47,810 | $ | 248,116 | |||||
BB&T Corp. | 2,350 | 64,860 | ||||||
BNP Paribas | 3,960 | 309,059 | ||||||
BOC Hong Kong Holdings Ltd. | 15,500 | 48,199 | ||||||
Chiba Bank Ltd. (The) | 3,000 | 20,585 | ||||||
Chuo Mitsui Trust Holdings, Inc. | 7,000 | 29,897 | ||||||
Comerica, Inc. | 600 | 23,340 | ||||||
Commerzbank AG(a) | 3,167 | 27,396 | ||||||
Commonwealth Bank of Australia | 6,471 | 351,747 | ||||||
Credit Agricole SA | 3,877 | 68,062 | ||||||
Danske Bank A/S(a) | 1,107 | 25,949 | ||||||
DBS Group Holdings Ltd. | 7,000 | 78,210 | ||||||
Dexia SA(a) | 87 | 380 | ||||||
DnB NOR ASA | 4,130 | 63,921 | ||||||
Erste Group Bank AG | 790 | 41,675 | ||||||
Fifth Third Bancorp | 3,150 | 45,990 | ||||||
First Horizon National Corp.(a) | 885 | 10,178 | ||||||
Fukuoka Financial Group, Inc. | 7,000 | 31,786 | ||||||
Governor & Co. of the Bank of Ireland (The)(a) | 29,288 | 14,034 | ||||||
Hachijuni Bank Ltd. (The) | 2,000 | 12,698 | ||||||
Hang Seng Bank Ltd. | 3,200 | 51,064 | ||||||
Hiroshima Bank Ltd. (The) | 2,000 | 9,152 | ||||||
Hokuhoku Financial Group, Inc. | 4,000 | 9,228 | ||||||
HSBC Holdings PLC | 73,165 | 805,777 | ||||||
Huntington Bancshares, Inc. | 2,950 | 20,178 | ||||||
Intesa Sanpaolo SpA | 32,183 | 108,601 | ||||||
Iyo Bank Ltd. (The) | 1,000 | 9,410 | ||||||
Joyo Bank Ltd. (The) | 6,000 | 28,256 | ||||||
KBC Groep NV(a) | 573 | 23,963 | ||||||
KeyCorp | 3,000 | 27,420 | ||||||
Lloyds Banking Group PLC(a) | 170,670 | 172,354 | ||||||
M&T Bank Corp. | 400 | 35,220 | ||||||
Marshall & Ilsley Corp. | 1,800 | 13,986 | ||||||
Mitsubishi UFJ Financial Group, Inc. | 53,200 | 295,527 | ||||||
Mizuho Financial Group, Inc. | 83,803 | 172,745 | ||||||
Mizuho Trust & Banking Co., Ltd.(a) | 15,000 | 16,398 | ||||||
National Australia Bank Ltd. | 8,863 | 234,328 | ||||||
National Bank of Greece SA(a) | 3,995 | 37,141 | ||||||
Natixis(a) | 7,272 | 43,382 | ||||||
Nordea Bank AB | 13,514 | 153,734 | ||||||
Oversea-Chinese Banking Corp. Ltd. | 10,000 | 72,595 | ||||||
PNC Financial Services Group, Inc. | 1,800 | 111,060 | ||||||
Regions Financial Corp. | 4,300 | 32,852 | ||||||
Resona Holdings, Inc. | 7,400 | 40,427 | ||||||
Royal Bank of Scotland Group PLC(a) | 72,666 | 53,302 | ||||||
Shizuoka Bank Ltd. (The) | 3,000 | 28,276 | ||||||
Skandinaviska Enskilda Banken AB | 4,240 | 38,568 | ||||||
| ALLIANCEBERNSTEIN POOLING PORTFOLIOS • | 171 |
Volatility Management—Portfolio of Investments
| Company | Shares | U.S. $ Value | ||||||
Societe Generale | 2,628 | $ | 184,790 | |||||
Standard Chartered PLC | 9,478 | 250,682 | ||||||
Sumitomo Mitsui Financial Group, Inc. | 5,600 | 211,914 | ||||||
Sumitomo Trust & Banking Co., Ltd. (The) | 6,000 | 38,230 | ||||||
SunTrust Banks, Inc. | 1,700 | 51,289 | ||||||
Svenska Handelsbanken AB | 2,045 | 69,079 | ||||||
Swedbank AB(a) | 3,399 | 59,891 | ||||||
UniCredit SpA | 56,374 | 145,039 | ||||||
United Overseas Bank Ltd. | 5,000 | 71,127 | ||||||
US Bancorp | 6,600 | 183,018 | ||||||
Wells Fargo & Co. | 18,150 | 585,519 | ||||||
Westpac Banking Corp. | 12,441 | 300,268 | ||||||
Yamaguchi Financial Group, Inc. | 1,000 | 10,372 | ||||||
Zions Bancorporation | 600 | 14,016 | ||||||
| 7,459,466 | ||||||||
Consumer Finance – 0.1% | ||||||||
American Express Co. | 3,592 | 156,503 | ||||||
Capital One Financial Corp. | 1,600 | 79,632 | ||||||
Discover Financial Services | 1,850 | 40,238 | ||||||
SLM Corp.(a) | 1,650 | 24,453 | ||||||
| 300,826 | ||||||||
Diversified Financial Services – 0.7% | ||||||||
Bank of America Corp. | 34,850 | 498,006 | ||||||
Citigroup, Inc.(a) | 100,420 | 469,966 | ||||||
CME Group, Inc. – Class A | 250 | 77,820 | ||||||
Criteria Caixacorp SA | 4,652 | 33,694 | ||||||
Deutsche Boerse AG | 815 | 62,668 | ||||||
Eurazeo | 295 | 21,913 | ||||||
Exor SpA | 1,030 | 31,440 | ||||||
Groupe Bruxelles Lambert SA | 337 | 30,976 | ||||||
Hong Kong Exchanges and Clearing Ltd. | 4,300 | 93,539 | ||||||
ING Groep NV(a) | 20,704 | 259,722 | ||||||
IntercontinentalExchange, Inc.(a) | 250 | 32,050 | ||||||
Investor AB | 1,435 | 33,021 | ||||||
JPMorgan Chase & Co. | 13,500 | 630,315 | ||||||
Kinnevik Investment AB | 1,317 | 29,536 | ||||||
Leucadia National Corp. | 650 | 21,535 | ||||||
Moody’s Corp. | 700 | 22,330 | ||||||
NASDAQ OMX Group, Inc. (The)(a) | 500 | 14,305 | ||||||
NYSE Euronext | 900 | 33,300 | ||||||
ORIX Corp. | 440 | 49,554 | ||||||
Pargesa Holding SA | 356 | 32,838 | ||||||
Resolution Ltd. | 9,699 | 45,593 | ||||||
Singapore Exchange Ltd. | 2,000 | 12,463 | ||||||
| 2,536,584 | ||||||||
| 172 | • ALLIANCEBERNSTEIN POOLING PORTFOLIOS |
Volatility Management—Portfolio of Investments
| Company | Shares | U.S. $ Value | ||||||
Insurance – 1.0% | ||||||||
ACE Ltd. | 1,195 | $ | 75,584 | |||||
Admiral Group PLC | 991 | 27,206 | ||||||
Aegon NV(a) | 535 | 4,118 | ||||||
Aflac, Inc. | 1,650 | 97,119 | ||||||
Ageas | 12,730 | 40,387 | ||||||
AIA Group Ltd.(a) | 30,000 | 87,635 | ||||||
Allianz SE | 1,822 | 263,115 | ||||||
Allstate Corp. (The) | 1,850 | 58,793 | ||||||
American International Group, Inc.(a) | 500 | 18,530 | ||||||
AMP Ltd. | 9,684 | 52,569 | ||||||
AON Corp. | 1,150 | 60,536 | ||||||
Assicurazioni Generali SpA | 4,879 | 110,412 | ||||||
Assurant, Inc. | 350 | 14,221 | ||||||
Aviva PLC | 11,722 | 88,975 | ||||||
Berkshire Hathaway, Inc.(a) | 6,000 | 523,680 | ||||||
Chubb Corp. | 1,050 | 63,714 | ||||||
Cincinnati Financial Corp. | 550 | 18,727 | ||||||
Dai-ichi Life Insurance Co., Ltd. (The) | 33 | 59,687 | ||||||
Genworth Financial, Inc. – Class A(a) | 1,650 | 21,829 | ||||||
Hartford Financial Services Group, Inc. | 1,500 | 44,400 | ||||||
Insurance Australia Group Ltd. | 8,282 | 30,835 | ||||||
Legal & General Group PLC | 20,187 | 39,000 | ||||||
Lincoln National Corp. | 1,050 | 33,306 | ||||||
Loews Corp. | 1,100 | 47,575 | ||||||
Mapfre SA | 11,118 | 41,316 | ||||||
Marsh & McLennan Cos., Inc. | 1,850 | 56,314 | ||||||
MetLife, Inc. | 3,111 | 147,337 | ||||||
MS&AD Insurance Group Holdings | 2,200 | 58,111 | ||||||
Muenchener Rueckversicherungs AG | 788 | 131,750 | ||||||
NKSJ Holdings, Inc.(a) | 6,000 | 45,387 | ||||||
Principal Financial Group, Inc. | 1,100 | 37,686 | ||||||
Progressive Corp. (The) | 2,250 | 46,867 | ||||||
Prudential Financial, Inc. | 1,700 | 111,911 | ||||||
Prudential PLC | 10,609 | 122,722 | ||||||
QBE Insurance Group Ltd. | 4,325 | 80,122 | ||||||
RSA Insurance Group PLC | 13,580 | 30,953 | ||||||
Sampo Oyj – Class A | 1,984 | 61,406 | ||||||
SCOR SE | 854 | 25,086 | ||||||
Sony Financial Holdings, Inc. | 7 | 29,837 | ||||||
Standard Life PLC | 7,414 | 28,803 | ||||||
Suncorp-Metway Ltd. | 3,312 | 28,432 | ||||||
Swiss Reinsurance Co., Ltd. | 1,472 | 90,213 | ||||||
T&D Holdings, Inc. | 1,150 | 33,398 | ||||||
Tokio Marine Holdings, Inc. | 3,000 | 98,639 | ||||||
Torchmark Corp. | 300 | 19,575 | ||||||
Travelers Cos., Inc. (The) | 1,500 | 89,895 | ||||||
| ALLIANCEBERNSTEIN POOLING PORTFOLIOS • | 173 |
Volatility Management—Portfolio of Investments
| Company | Shares | U.S. $ Value | ||||||
Tryg AS | 450 | $ | 23,438 | |||||
Unum Group | 1,050 | 27,856 | ||||||
XL Group PLC | 1,100 | 25,685 | ||||||
Zurich Financial Services AG | 619 | 179,809 | ||||||
| 3,554,501 | ||||||||
Real Estate Investment Trusts | ||||||||
Ascendas Real Estate Investment Trust | 81,000 | 127,925 | ||||||
British Land Co. PLC | 40,118 | 380,624 | ||||||
CapitaMall Trust | 103,600 | 147,935 | ||||||
CFS Retail Property Trust | 116,541 | 223,886 | ||||||
Corio NV | 4,147 | 275,224 | ||||||
Gecina SA | 966 | 125,233 | ||||||
GPT Group | 93,295 | 296,323 | ||||||
Hammerson PLC | 34,858 | 264,130 | ||||||
ICADE | 1,051 | 117,842 | ||||||
Japan Real Estate Investment Corp. | 23 | 237,186 | ||||||
Klepierre | 4,993 | 194,942 | ||||||
Land Securities Group PLC | 34,052 | 424,391 | ||||||
Link REIT (The) | 99,500 | 308,630 | ||||||
Mirvac Group | 172,998 | 230,100 | ||||||
Nippon Building Fund, Inc. | 25 | 262,654 | ||||||
Plum Creek Timber Co., Inc. | 550 | 23,078 | ||||||
Stockland | 105,253 | 409,557 | ||||||
Unibail-Rodamco SE | 4,141 | 833,245 | ||||||
Westfield Group | 104,141 | 1,038,301 | ||||||
Westfield Retail Trust | 134,791 | 366,424 | ||||||
| 6,287,630 | ||||||||
Real Estate Management & | ||||||||
Aeon Mall Co., Ltd. | 4,120 | 109,883 | ||||||
CapitaLand Ltd. | 141,500 | 364,185 | ||||||
CapitaMalls Asia Ltd. | 84,900 | 115,307 | ||||||
China Overseas Land & Investment Ltd. | 168,000 | 280,809 | ||||||
City Developments Ltd. | 31,600 | 278,153 | ||||||
Daito Trust Construction Co., Ltd. | 200 | 16,389 | ||||||
Daiwa House Industry Co., Ltd. | 2,000 | 25,697 | ||||||
Hang Lung Group Ltd. | 3,000 | 18,417 | ||||||
Hang Lung Properties Ltd. | 100,500 | 430,550 | ||||||
Henderson Land Development Co., Ltd. | 51,300 | 327,650 | ||||||
IMMOFINANZ AG(a) | 6,501 | 28,708 | ||||||
Keppel Land Ltd. | 30,500 | 101,477 | ||||||
Kerry Properties Ltd. | 32,000 | 156,112 | ||||||
Mitsubishi Estate Co., Ltd. | 47,440 | 972,663 | ||||||
Mitsui Fudosan Co., Ltd. | 39,040 | 834,345 | ||||||
New World Development Ltd. | 127,800 | 232,231 | ||||||
Nomura Real Estate Holdings, Inc. | 4,380 | 89,181 | ||||||
| 174 | • ALLIANCEBERNSTEIN POOLING PORTFOLIOS |
Volatility Management—Portfolio of Investments
| Company | Shares | U.S. $ Value | ||||||
NTT Urban Development Corp. | 84 | $ | 87,548 | |||||
Sino Land Co., Ltd. | 124,600 | 228,289 | ||||||
Sumitomo Realty & Development Co., Ltd. | 19,990 | 539,098 | ||||||
Sun Hung Kai Properties Ltd. | 85,500 | 1,389,514 | ||||||
Wharf Holdings Ltd. | 62,500 | 412,937 | ||||||
Wheelock & Co., Ltd. | 2,000 | 7,308 | ||||||
| 7,046,451 | ||||||||
Thrifts & Mortgage Finance – 0.0% | ||||||||
Hudson City Bancorp, Inc. | 1,800 | 20,700 | ||||||
People’s United Financial, Inc. | 1,250 | 16,475 | ||||||
| 37,175 | ||||||||
| 29,334,507 | ||||||||
Industrials – 3.5% | ||||||||
Aerospace & Defense – 0.4% | ||||||||
BAE Systems PLC | 14,402 | 77,017 | ||||||
Boeing Co. (The) | 2,550 | 183,625 | ||||||
Cobham PLC | 10,443 | 38,274 | ||||||
European Aeronautic Defence and Space Co. NV(a) | 1,281 | 37,055 | ||||||
Finmeccanica SpA | 2,371 | 29,685 | ||||||
General Dynamics Corp. | 1,300 | 98,956 | ||||||
Goodrich Corp. | 450 | 38,804 | ||||||
Honeywell International, Inc. | 2,700 | 156,357 | ||||||
ITT Corp. | 650 | 37,655 | ||||||
L-3 Communications Holdings, Inc. | 400 | 31,716 | ||||||
Lockheed Martin Corp. | 1,050 | 83,118 | ||||||
Northrop Grumman Corp. | 1,000 | 66,680 | ||||||
Precision Castparts Corp. | 500 | 70,875 | ||||||
Raytheon Co. | 1,250 | 64,012 | ||||||
Rockwell Collins, Inc. | 550 | 35,442 | ||||||
Rolls-Royce Group PLC(a) | 7,748 | 77,767 | ||||||
Singapore Technologies Engineering Ltd. | 13,000 | 32,711 | ||||||
Thales SA | 649 | 24,586 | ||||||
United Technologies Corp. | 3,200 | 267,328 | ||||||
| 1,451,663 | ||||||||
Air Freight & Logistics – 0.2% | ||||||||
C.H. Robinson Worldwide, Inc. | 600 | 43,434 | ||||||
Deutsche Post AG | 3,536 | 65,017 | ||||||
Expeditors International of Washington, Inc. | 750 | 35,850 | ||||||
FedEx Corp. | 1,100 | 99,022 | ||||||
Kuehne & Nagel International AG | 245 | 32,953 | ||||||
TNT NV | 2,764 | 72,542 | ||||||
United Parcel Service, Inc. – Class B | 3,450 | 254,610 | ||||||
Yamato Holdings Co., Ltd. | 1,700 | 27,360 | ||||||
| 630,788 | ||||||||
| ALLIANCEBERNSTEIN POOLING PORTFOLIOS • | 175 |
Volatility Management—Portfolio of Investments
| Company | Shares | U.S. $ Value | ||||||
Airlines – 0.1% | ||||||||
All Nippon Airways Co., Ltd.(a) | 3,000 | $ | 10,851 | |||||
Cathay Pacific Airways Ltd. | 4,000 | 9,328 | ||||||
Deutsche Lufthansa (REG) (a) | 1,666 | 34,132 | ||||||
International Consolidated Airlines Group SA(a) | 8,889 | 32,441 | ||||||
Qantas Airways Ltd.(a) | 13,601 | 32,448 | ||||||
Singapore Airlines Ltd. | 2,000 | 21,374 | ||||||
Southwest Airlines Co. | 2,550 | 30,166 | ||||||
| 170,740 | ||||||||
Building Products – 0.1% | ||||||||
Asahi Glass Co., Ltd. | 4,000 | 55,929 | ||||||
Assa Abloy AB | 1,453 | 40,693 | ||||||
Cie de St-Gobain | 1,607 | 95,984 | ||||||
Daikin Industries Ltd. | 1,000 | 33,953 | ||||||
Geberit AG | 191 | 41,194 | ||||||
JS Group Corp. | 1,000 | 24,355 | ||||||
Masco Corp. | 1,200 | 16,308 | ||||||
TOTO Ltd. | 1,000 | 8,401 | ||||||
| 316,817 | ||||||||
Commercial Services & Supplies – 0.1% | ||||||||
Aggreko PLC | 1,053 | 24,778 | ||||||
Avery Dennison Corp. | 350 | 13,972 | ||||||
Brambles Ltd. | 4,045 | 29,319 | ||||||
Cintas Corp. | 400 | 11,248 | ||||||
Dai Nippon Printing Co., Ltd. | 2,000 | 27,075 | ||||||
Edenred(a) | 469 | 12,358 | ||||||
G4S PLC | 6,179 | 26,519 | ||||||
Iron Mountain, Inc. | 650 | 16,900 | ||||||
Pitney Bowes, Inc. | 700 | 17,626 | ||||||
Republic Services, Inc. – Class A | 1,050 | 31,091 | ||||||
RR Donnelley & Sons Co. | 700 | 13,034 | ||||||
Secom Co., Ltd. | 900 | 45,436 | ||||||
Securitas AB | 79 | 923 | ||||||
Serco Group PLC | 3,921 | 34,718 | ||||||
Stericycle, Inc.(a) | 300 | 25,926 | ||||||
Toppan Printing Co., Ltd. | 3,000 | 27,601 | ||||||
Waste Management, Inc. | 1,650 | 61,149 | ||||||
| 419,673 | ||||||||
Construction & Engineering – 0.1% | ||||||||
ACS Actividades de Construccion y Servicios SA | 399 | 18,305 | ||||||
Bouygues SA | 547 | 25,267 | ||||||
Ferrovial SA | 2,415 | 29,086 | ||||||
Fluor Corp. | 600 | 42,456 | ||||||
Fomento de Construcciones y Contratas SA | 242 | 7,737 | ||||||
Hochtief AG | 500 | 49,325 | ||||||
| 176 | • ALLIANCEBERNSTEIN POOLING PORTFOLIOS |
Volatility Management—Portfolio of Investments
| Company | Shares | U.S. $ Value | ||||||
Jacobs Engineering Group, Inc.(a) | 450 | $ | 22,527 | |||||
JGC Corp. | 1,000 | 22,707 | ||||||
Kajima Corp. | 4,000 | 10,723 | ||||||
Leighton Holdings Ltd. | 815 | 25,846 | ||||||
Obayashi Corp. | 2,000 | 8,997 | ||||||
Quanta Services, Inc.(a) | 700 | 15,967 | ||||||
Shimizu Corp. | 7,000 | 30,100 | ||||||
Skanska AB | 1,000 | 20,543 | ||||||
Vinci SA | 1,822 | 109,585 | ||||||
| 439,171 | ||||||||
Electrical Equipment – 0.3% | ||||||||
ABB Ltd. (REG)(a) | 9,247 | 226,421 | ||||||
Alstom SA | 464 | 27,690 | ||||||
Bekaert SA | 160 | 17,357 | ||||||
Emerson Electric Co. | 2,600 | 155,116 | ||||||
First Solar, Inc.(a) | 200 | 29,478 | ||||||
Furukawa Electric Co., Ltd. | 2,000 | 8,541 | ||||||
GS Yuasa Corp. | 1,000 | 7,250 | ||||||
Legrand SA | 1,711 | 71,821 | ||||||
Mitsubishi Electric Corp. | 8,000 | 95,060 | ||||||
Nidec Corp. | 500 | 46,639 | ||||||
Rockwell Automation, Inc. | 500 | 43,865 | ||||||
Roper Industries, Inc. | 350 | 29,445 | ||||||
Schneider Electric SA | 1,004 | 166,296 | ||||||
Sumitomo Electric Industries Ltd. | 3,200 | 46,959 | ||||||
Vestas Wind Systems A/S(a) | 1,139 | 39,119 | ||||||
| 1,011,057 | ||||||||
Industrial Conglomerates – 0.6% | ||||||||
3M Co. | 2,500 | 230,575 | ||||||
Delek Group Ltd. | 2 | 477 | ||||||
Fraser and Neave Ltd. | 2,000 | 8,855 | ||||||
General Electric Co. | 36,800 | 769,856 | ||||||
Hankyu Hanshin Holdings, Inc. | 5,000 | 24,144 | ||||||
Hutchison Whampoa Ltd. | 9,000 | 106,289 | ||||||
Keppel Corp. Ltd. | 5,000 | 44,431 | ||||||
Koninklijke Philips Electronics NV | 4,120 | 134,629 | ||||||
Orkla ASA | 3,785 | 34,487 | ||||||
SembCorp Industries Ltd. | 3,000 | 11,282 | ||||||
Siemens AG | 3,438 | 464,834 | ||||||
Smiths Group PLC | 1,491 | 32,412 | ||||||
Textron, Inc. | 950 | 25,735 | ||||||
Tyco International Ltd. | 1,673 | 75,854 | ||||||
| 1,963,860 | ||||||||
| ALLIANCEBERNSTEIN POOLING PORTFOLIOS • | 177 |
Volatility Management—Portfolio of Investments
| Company | Shares | U.S. $ Value | ||||||
Industrial Warehouse | ||||||||
AMB Property Corp. | 6,920 | $ | 251,750 | |||||
DCT Industrial Trust, Inc. | 8,660 | 48,669 | ||||||
EastGroup Properties, Inc. | 1,080 | 49,172 | ||||||
First Industrial Realty Trust, Inc.(a) | 2,550 | 28,586 | ||||||
First Potomac Realty Trust | 2,000 | 32,260 | ||||||
Global Logistic Properties Ltd.(a) | 74,200 | 110,851 | ||||||
Mapletree Logistics Trust | 74,800 | 53,134 | ||||||
ProLogis | 25,350 | 412,191 | ||||||
ProLogis European Properties(a) | 5,850 | 40,392 | ||||||
Segro PLC | 30,140 | 157,795 | ||||||
Warehouses De Pauw SCA | 390 | 20,829 | ||||||
| 1,205,629 | ||||||||
Machinery – 0.7% | ||||||||
Alfa Laval AB | 1,562 | 31,911 | ||||||
Amada Co., Ltd. | 1,000 | 9,010 | ||||||
Atlas Copco AB | 1,516 | 34,461 | ||||||
Atlas Copco AB – Class A | 2,919 | 73,391 | ||||||
Caterpillar, Inc. | 2,200 | 226,446 | ||||||
Cummins, Inc. | 700 | 70,784 | ||||||
Danaher Corp. | 1,850 | 93,610 | ||||||
Deere & Co. | 1,500 | 135,225 | ||||||
Dover Corp. | 650 | 41,763 | ||||||
Eaton Corp. | 600 | 66,468 | ||||||
Fanuc Corp. | 800 | 124,967 | ||||||
Fiat Industrial SpA(a) | 3,629 | 50,679 | ||||||
Flowserve Corp. | 200 | 24,994 | ||||||
Hexagon AB | 1,337 | 29,525 | ||||||
Hino Motors Ltd. | 2,000 | 11,108 | ||||||
Hitachi Construction Machinery Co., Ltd. | 1,200 | 30,129 | ||||||
IHI Corp. | 4,000 | 10,525 | ||||||
Illinois Tool Works, Inc. | 1,725 | 93,323 | ||||||
Ingersoll-Rand PLC | 1,105 | 50,057 | ||||||
Japan Steel Works Ltd. (The) | 1,000 | 10,476 | ||||||
Joy Global, Inc. | 359 | 34,959 | ||||||
Kawasaki Heavy Industries Ltd. | 10,000 | 40,468 | ||||||
Komatsu Ltd. | 4,000 | 122,715 | ||||||
Kone Oyj | 549 | 29,963 | ||||||
Kubota Corp. | 5,000 | 51,540 | ||||||
Kurita Water Industries Ltd. | 1,000 | 28,454 | ||||||
Makita Corp. | 300 | 12,702 | ||||||
MAN SE | 273 | 34,793 | ||||||
Metso Oyj | 538 | 27,830 | ||||||
Mitsubishi Heavy Industries Ltd. | 13,000 | 55,353 | ||||||
NGK Insulators Ltd. | 1,000 | 18,307 | ||||||
NTN Corp. | 1,000 | 5,384 | ||||||
| 178 | • ALLIANCEBERNSTEIN POOLING PORTFOLIOS |
Volatility Management—Portfolio of Investments
| Company | Shares | U.S. $ Value | ||||||
PACCAR, Inc. | 1,250 | $ | 62,663 | |||||
Pall Corp. | 400 | 21,744 | ||||||
Parker Hannifin Corp. | 550 | 49,049 | ||||||
Sandvik AB | 4,213 | 80,859 | ||||||
Scania AB | 1,009 | 22,504 | ||||||
Schindler Holding AG | 322 | 36,520 | ||||||
SembCorp Marine Ltd. | 7,000 | 29,608 | ||||||
SKF AB | 1,285 | 35,865 | ||||||
SMC Corp. | 200 | 34,330 | ||||||
Snap-On, Inc. | 200 | 11,486 | ||||||
Sumitomo Heavy Industries Ltd. | 4,000 | 28,218 | ||||||
THK Co., Ltd. | 400 | 10,579 | ||||||
Vallourec SA | 260 | 26,992 | ||||||
Volvo AB—Class B(a) | 6,034 | 104,435 | ||||||
Wartsila Oyj | 406 | 31,218 | ||||||
Weir Group PLC (The) | 868 | 24,197 | ||||||
Zardoya Otis SA | 1,413 | 22,018 | ||||||
| 2,313,605 | ||||||||
Marine – 0.0% | ||||||||
AP Moller – Maersk A/S (“A” Line of Shares) | 5 | 48,153 | ||||||
AP Moller – Maersk A/S (“B” Line of Shares) | 4 | 39,656 | ||||||
Kawasaki Kisen Kaisha Ltd. | 2,000 | 8,753 | ||||||
Mitsui OSK Lines Ltd. | 5,000 | 33,247 | ||||||
Nippon Yusen KK | 6,000 | 26,537 | ||||||
Orient Overseas International Ltd. | 500 | 4,061 | ||||||
| 160,407 | ||||||||
Mixed Office Industrial – 0.1% | ||||||||
Goodman Group | 262,040 | 187,804 | ||||||
ING Industrial Fund | 106,620 | 57,692 | ||||||
| 245,496 | ||||||||
Professional Services – 0.1% | ||||||||
Adecco SA | 448 | 30,208 | ||||||
Bureau Veritas SA | 607 | 46,873 | ||||||
Capita Group PLC (The) | 2,071 | 24,425 | ||||||
Dun & Bradstreet Corp. | 200 | 16,160 | ||||||
Equifax, Inc. | 400 | 14,300 | ||||||
Experian PLC | 2,795 | 35,445 | ||||||
Intertek Group PLC | 1,297 | 38,026 | ||||||
Robert Half International, Inc. | 500 | 15,950 | ||||||
SGS SA | 13 | 22,644 | ||||||
| 244,031 | ||||||||
Road & Rail – 0.2% | ||||||||
Central Japan Railway Co. | 6 | 53,776 | ||||||
CSX Corp. | 1,300 | 97,058 | ||||||
East Japan Railway Co. | 1,400 | 97,621 | ||||||
Keihin Electric Express Railway Co., Ltd. | 1,000 | 8,267 | ||||||
| ALLIANCEBERNSTEIN POOLING PORTFOLIOS • | 179 |
Volatility Management—Portfolio of Investments
| Company | Shares | U.S. $ Value | ||||||
Keio Corp. | 4,000 | $ | 26,772 | |||||
Kintetsu Corp. | 7,000 | 22,129 | ||||||
MTR Corp. | 9,000 | 33,407 | ||||||
Nippon Express Co., Ltd. | 7,000 | 30,253 | ||||||
Norfolk Southern Corp. | 1,250 | 81,975 | ||||||
Odakyu Electric Railway Co., Ltd. | 3,000 | 27,975 | ||||||
QR National Ltd.(a) | 7,202 | 23,465 | ||||||
Ryder System, Inc. | 150 | 7,175 | ||||||
Tobu Railway Co., Ltd. | 2,000 | 9,743 | ||||||
Tokyu Corp. | 5,000 | 23,223 | ||||||
Union Pacific Corp. | 1,700 | 162,197 | ||||||
West Japan Railway Co. | 7 | 29,080 | ||||||
| 734,116 | ||||||||
Trading Companies & | ||||||||
Fastenal Co. | 500 | 31,065 | ||||||
ITOCHU Corp. | 6,000 | 62,394 | ||||||
Marubeni Corp. | 7,000 | 53,729 | ||||||
Mitsubishi Corp. | 5,700 | 158,587 | ||||||
Mitsui & Co., Ltd. | 7,300 | 133,444 | ||||||
Noble Group Ltd. | 21,181 | 34,359 | ||||||
Sumitomo Corp. | 4,700 | 69,829 | ||||||
Toyota Tsusho Corp. | 600 | 11,393 | ||||||
Wolseley PLC(a) | 1,073 | 37,360 | ||||||
WW Grainger, Inc. | 200 | 26,642 | ||||||
| 618,802 | ||||||||
Transportation Infrastructure – 0.0% | ||||||||
Abertis Infraestructuras SA | 1,041 | 20,950 | ||||||
Aeroports de Paris | 505 | 44,769 | ||||||
Atlantia SpA | 1,286 | 29,474 | ||||||
Auckland International Airport Ltd. | 343 | 574 | ||||||
Transurban Group | 5,712 | 31,165 | ||||||
| 126,932 | ||||||||
| 12,052,787 | ||||||||
Information Technology – 2.9% | ||||||||
Communications Equipment – 0.4% | ||||||||
Alcatel-lucent(a) | 7,334 | 36,259 | ||||||
Cisco Systems, Inc.(a) | 19,150 | 355,424 | ||||||
F5 Networks, Inc.(a) | 300 | 35,403 | ||||||
Harris Corp. | 450 | 20,997 | ||||||
JDS Uniphase Corp.(a) | 750 | 18,502 | ||||||
Juniper Networks, Inc.(a) | 1,800 | 79,200 | ||||||
Motorola Mobility Holdings, Inc.(a) | 981 | 29,626 | ||||||
Motorola Solutions, Inc.(a) | 1,128 | 43,586 | ||||||
Nokia Oyj | 15,648 | 134,912 | ||||||
QUALCOMM, Inc. | 5,600 | 333,648 | ||||||
| 180 | • ALLIANCEBERNSTEIN POOLING PORTFOLIOS |
Volatility Management—Portfolio of Investments
| Company | Shares | U.S. $ Value | ||||||
Telefonaktiebolaget LM Ericsson – Class B | 12,584 | $ | 161,629 | |||||
Tellabs, Inc. | 1,250 | 6,738 | ||||||
| 1,255,924 | ||||||||
Computers & Peripherals – 0.6% | ||||||||
Apple, Inc.(a) | 3,200 | 1,130,272 | ||||||
Dell, Inc.(a) | 5,800 | 91,814 | ||||||
EMC Corp.(a) | 7,100 | 193,191 | ||||||
Fujitsu Ltd. | 8,000 | 54,250 | ||||||
Hewlett-Packard Co. | 7,850 | 342,495 | ||||||
Lexmark International, Inc. – Class A(a) | 250 | 9,383 | ||||||
Logitech International SA(a) | 147 | 2,794 | ||||||
NEC Corp. | 11,000 | 30,378 | ||||||
NetApp, Inc.(a) | 1,250 | 64,575 | ||||||
SanDisk Corp.(a) | 800 | 39,680 | ||||||
Toshiba Corp. | 17,000 | 111,708 | ||||||
Western Digital Corp.(a) | 800 | 24,464 | ||||||
| 2,095,004 | ||||||||
Electronic Equipment & Instruments & Components – 0.2% | ||||||||
Amphenol Corp. – Class A | 600 | 34,488 | ||||||
Corning, Inc. | 5,400 | 124,524 | ||||||
FLIR Systems, Inc. | 550 | 17,765 | ||||||
Foxconn International Holdings Ltd.(a) | 21,000 | 14,955 | ||||||
Fujifilm Holdings Corp. | 1,900 | 66,895 | ||||||
Hamamatsu Photonics KK | 300 | 11,572 | ||||||
Hirose Electric Co. Ltd. | 100 | 11,466 | ||||||
Hitachi High-Technologies Corp. | 400 | 9,328 | ||||||
Hitachi Ltd. | 19,000 | 115,642 | ||||||
Hoya Corp. | 1,800 | 43,189 | ||||||
Ibiden Co., Ltd. | 200 | 6,937 | ||||||
Jabil Circuit, Inc. | 650 | 13,929 | ||||||
Keyence Corp. | 200 | 54,750 | ||||||
Kyocera Corp. | 700 | 73,077 | ||||||
Molex, Inc. | 450 | 12,569 | ||||||
Murata Manufacturing Co., Ltd. | 800 | 59,639 | ||||||
Nippon Electric Glass Co., Ltd. | 1,000 | 16,775 | ||||||
Omron Corp. | 800 | 22,307 | ||||||
TDK Corp. | 500 | 33,845 | ||||||
| 743,652 | ||||||||
Internet Software & Services – 0.2% | ||||||||
Akamai Technologies, Inc.(a) | 600 | 22,518 | ||||||
eBay, Inc.(a) | 3,950 | 132,345 | ||||||
Google, Inc. – Class A(a) | 877 | 537,952 | ||||||
Monster Worldwide, Inc.(a) | 400 | 6,860 | ||||||
United Internet AG | 166 | 2,880 | ||||||
VeriSign, Inc. | 600 | 21,174 | ||||||
| ALLIANCEBERNSTEIN POOLING PORTFOLIOS • | 181 |
Volatility Management—Portfolio of Investments
| Company | Shares | U.S. $ Value | ||||||
Yahoo! Japan Corp. | 61 | $ | 22,997 | |||||
Yahoo!, Inc.(a) | 4,500 | 73,800 | ||||||
| 820,526 | ||||||||
IT Services – 0.4% | ||||||||
Amadeus IT Holding SA(a) | 829 | 16,156 | ||||||
Automatic Data Processing, Inc. | 1,700 | 85,000 | ||||||
Cap Gemini SA | 502 | 29,350 | ||||||
Cognizant Technology Solutions Corp. – Class A(a) | 1,050 | 80,713 | ||||||
Computer Sciences Corp. | 550 | 26,472 | ||||||
Computershare Ltd. | 2,690 | 26,417 | ||||||
Fidelity National Information Services, Inc. | 900 | 29,151 | ||||||
Fiserv, Inc.(a) | 500 | 31,635 | ||||||
International Business Machines Corp. | 4,300 | 696,084 | ||||||
Mastercard, Inc. – Class A | 350 | 84,196 | ||||||
Nomura Research Institute Ltd. | 1,300 | 30,512 | ||||||
NTT Data Corp. | 8 | 28,591 | ||||||
Paychex, Inc. | 1,100 | 36,993 | ||||||
SAIC, Inc.(a) | 1,000 | 16,340 | ||||||
Teradata Corp.(a) | 550 | 26,301 | ||||||
Total System Services, Inc. | 550 | 9,763 | ||||||
Visa, Inc. – Class A | 1,702 | 124,331 | ||||||
Western Union Co. (The) – Class W | 2,250 | 49,477 | ||||||
| 1,427,482 | ||||||||
Office Electronics – 0.1% | ||||||||
Brother Industries Ltd. | 700 | 11,056 | ||||||
Canon, Inc. | 4,700 | 227,289 | ||||||
Konica Minolta Holdings, Inc. | 2,000 | 18,529 | ||||||
Ricoh Co., Ltd. | 3,000 | 40,029 | ||||||
Xerox Corp. | 4,750 | 51,062 | ||||||
| 347,965 | ||||||||
Semiconductors & Semiconductor Equipment – 0.4% | ||||||||
Advanced Micro Devices, Inc.(a) | 1,950 | 17,960 | ||||||
Advantest Corp. | 200 | 4,171 | ||||||
Altera Corp. | 1,050 | 43,953 | ||||||
Analog Devices, Inc. | 1,000 | 39,880 | ||||||
Applied Materials, Inc. | 4,600 | 75,578 | ||||||
ARM Holdings PLC | 4,000 | 39,969 | ||||||
ASML Holding NV | 1,802 | 78,488 | ||||||
Broadcom Corp. – Class A | 1,550 | 63,891 | ||||||
Elpida Memory, Inc.(a) | 400 | 6,036 | ||||||
Infineon Technologies AG | 3,835 | 42,129 | ||||||
Intel Corp. | 19,250 | 413,297 | ||||||
KLA-Tencor Corp. | 550 | 26,851 | ||||||
Linear Technology Corp. | 750 | 25,920 | ||||||
| 182 | • ALLIANCEBERNSTEIN POOLING PORTFOLIOS |
Volatility Management—Portfolio of Investments
| Company | Shares | U.S. $ Value | ||||||
LSI Corp.(a) | 2,100 | $ | 13,209 | |||||
MEMC Electronic Materials, Inc.(a) | 750 | 10,178 | ||||||
Microchip Technology, Inc. | 650 | 23,992 | ||||||
Micron Technology, Inc.(a) | 2,950 | 32,833 | ||||||
National Semiconductor Corp. | 800 | 12,400 | ||||||
Novellus Systems, Inc.(a) | 300 | 11,988 | ||||||
NVIDIA Corp.(a) | 2,000 | 45,320 | ||||||
Rohm Co., Ltd. | 400 | 28,269 | ||||||
STMicroelectronics NV | 2,898 | 37,231 | ||||||
Sumco Corp.(a) | 1,500 | 27,583 | ||||||
Teradyne, Inc.(a) | 600 | 11,178 | ||||||
Texas Instruments, Inc. | 4,050 | 144,220 | ||||||
Tokyo Electron Ltd. | 700 | 46,046 | ||||||
Xilinx, Inc. | 900 | 29,925 | ||||||
| 1,352,495 | ||||||||
Software – 0.6% | ||||||||
Adobe Systems, Inc.(a) | 1,750 | 60,375 | ||||||
Autodesk, Inc.(a) | 800 | 33,640 | ||||||
Autonomy Corp. PLC(a) | 942 | 25,173 | ||||||
BMC Software, Inc.(a) | 600 | 29,700 | ||||||
CA, Inc. | 1,300 | 32,214 | ||||||
Citrix Systems, Inc.(a) | 650 | 45,604 | ||||||
Compuware Corp.(a) | 750 | 8,445 | ||||||
Dassault Systemes SA | 685 | 52,464 | ||||||
Electronic Arts, Inc.(a) | 1,100 | 20,680 | ||||||
Intuit, Inc.(a) | 950 | 49,951 | ||||||
Konami Corp. | 500 | 10,570 | ||||||
McAfee, Inc.(a) | 550 | 26,373 | ||||||
Microsoft Corp. | 26,000 | 691,080 | ||||||
Nintendo Co., Ltd. | 400 | 117,634 | ||||||
Novell, Inc.(a) | 1,200 | 7,056 | ||||||
Oracle Corp. | 13,350 | 439,215 | ||||||
Oracle Corp. Japan | 300 | 14,166 | ||||||
Red Hat, Inc.(a) | 650 | 26,832 | ||||||
Sage Group PLC (The) | 7,385 | 34,131 | ||||||
Salesforce.com, Inc.(a) | 400 | 52,908 | ||||||
SAP AG | 3,586 | 216,697 | ||||||
Square Enix Holdings Co., Ltd. | 200 | 3,734 | ||||||
Symantec Corp.(a) | 2,650 | 47,779 | ||||||
Trend Micro, Inc. | 400 | 12,499 | ||||||
| 2,058,920 | ||||||||
| 10,101,968 | ||||||||
Energy – 2.7% | ||||||||
Energy Equipment & Services – 0.4% | ||||||||
Baker Hughes, Inc. | 1,500 | 106,575 | ||||||
Cameron International Corp.(a) | 850 | 50,260 | ||||||
| ALLIANCEBERNSTEIN POOLING PORTFOLIOS • | 183 |
Volatility Management—Portfolio of Investments
| Company | Shares | U.S. $ Value | ||||||
Diamond Offshore Drilling, Inc. | 250 | $ | 19,558 | |||||
FMC Technologies, Inc.(a) | 400 | 37,620 | ||||||
Fugro NV | 457 | 38,443 | ||||||
Halliburton Co. | 3,150 | 147,861 | ||||||
Helmerich & Payne, Inc. | 350 | 22,747 | ||||||
Nabors Industries Ltd.(a) | 950 | 27,047 | ||||||
National Oilwell Varco, Inc. | 1,450 | 115,376 | ||||||
Noble Corp. | 893 | 39,926 | ||||||
Petrofac Ltd. | 951 | 21,533 | ||||||
Rowan Cos., Inc.(a) | 400 | 17,068 | ||||||
Saipem SpA | 758 | 38,293 | ||||||
Schlumberger Ltd. | 4,742 | 442,998 | ||||||
Seadrill Ltd. | 785 | 29,984 | ||||||
Subsea 7 SA | 1,136 | 29,264 | ||||||
Technip SA | 343 | 33,898 | ||||||
Tenaris SA | 2,373 | 53,615 | ||||||
Transocean Ltd.(a) | 1,317 | 108,542 | ||||||
WorleyParsons Ltd. | 2,351 | 72,715 | ||||||
| 1,453,323 | ||||||||
Oil, Gas & Consumable Fuels – 2.3% | ||||||||
Anadarko Petroleum Corp. | 1,700 | 139,111 | ||||||
Apache Corp. | 1,350 | 168,237 | ||||||
BG Group PLC | 14,129 | 344,050 | ||||||
BP PLC | 78,510 | 632,921 | ||||||
Cabot Oil & Gas Corp. | 350 | 15,981 | ||||||
Chesapeake Energy Corp. | 2,250 | 80,123 | ||||||
Chevron Corp. | 6,950 | 721,062 | ||||||
ConocoPhillips | 5,100 | 397,137 | ||||||
Consol Energy, Inc. | 800 | 40,568 | ||||||
Denbury Resources, Inc.(a) | 1,350 | 32,711 | ||||||
Devon Energy Corp. | 1,500 | 137,160 | ||||||
El Paso Corp. | 2,400 | 44,640 | ||||||
ENI SpA | 10,879 | 265,258 | ||||||
EOG Resources, Inc. | 900 | 101,079 | ||||||
EQT Corp. | 500 | 24,650 | ||||||
Exxon Mobil Corp. | 17,463 | 1,493,610 | ||||||
Galp Energia SGPS SA | 1,473 | 30,651 | ||||||
Hess Corp. | 1,050 | 91,381 | ||||||
Idemitsu Kosan Co., Ltd. | 100 | 11,825 | ||||||
Inpex Corp. | 9 | 63,242 | ||||||
JX Holdings, Inc. | 9,000 | 63,400 | ||||||
Marathon Oil Corp. | 2,450 | 121,520 | ||||||
Massey Energy Co. | 350 | 22,166 | ||||||
Murphy Oil Corp. | 650 | 47,795 | ||||||
Newfield Exploration Co.(a) | 450 | 32,756 | ||||||
Noble Energy, Inc. | 600 | 55,596 | ||||||
Occidental Petroleum Corp. | 2,800 | 285,516 | ||||||
| 184 | • ALLIANCEBERNSTEIN POOLING PORTFOLIOS |
Volatility Management—Portfolio of Investments
| Company | Shares | U.S. $ Value | ||||||
OMV AG | 455 | $ | 19,335 | |||||
Origin Energy Ltd. | 3,680 | 62,769 | ||||||
Peabody Energy Corp. | 950 | 62,216 | ||||||
Pioneer Natural Resources Co. | 400 | 40,936 | ||||||
QEP Resources, Inc. | 618 | 24,442 | ||||||
Range Resources Corp. | 550 | 29,865 | ||||||
Repsol YPF SA | 3,061 | 102,755 | ||||||
Royal Dutch Shell PLC – Class A | 14,816 | 532,973 | ||||||
Royal Dutch Shell PLC – Class B | 11,265 | 402,704 | ||||||
Santos Ltd. | 2,162 | 31,663 | ||||||
Southwestern Energy Co.(a) | 1,200 | 47,376 | ||||||
Spectra Energy Corp. | 2,200 | 58,850 | ||||||
Statoil ASA | 4,663 | 123,122 | ||||||
Sunoco, Inc. | 400 | 16,744 | ||||||
Tesoro Corp.(a) | 450 | 10,701 | ||||||
TonenGeneral Sekiyu KK | 3,000 | 35,427 | ||||||
Total SA | 8,832 | 541,402 | ||||||
Tullow Oil PLC | 3,706 | 86,580 | ||||||
Valero Energy Corp. | 1,950 | 54,951 | ||||||
Williams Cos., Inc. (The) | 2,000 | 60,720 | ||||||
Woodside Petroleum Ltd. | 2,273 | 99,005 | ||||||
| 7,908,682 | ||||||||
| 9,362,005 | ||||||||
Consumer Discretionary – 2.6% | ||||||||
Auto Components – 0.1% | ||||||||
Aisin Seiki Co., Ltd. | 800 | 30,640 | ||||||
Bridgestone Corp. | 2,700 | 55,519 | ||||||
Cie Generale des Etablissements Michelin – Class B | 728 | 59,337 | ||||||
Continental AG(a) | 339 | 28,724 | ||||||
Denso Corp. | 2,000 | 75,137 | ||||||
Goodyear Tire & Rubber Co. (The)(a) | 800 | 11,344 | ||||||
Johnson Controls, Inc. | 2,300 | 93,840 | ||||||
NGK Spark Plug Co., Ltd. | 1,000 | 14,982 | ||||||
Nokian Renkaat Oyj | 624 | 25,335 | ||||||
Stanley Electric Co., Ltd. | 400 | 7,367 | ||||||
Toyota Boshoku Corp. | 700 | 11,696 | ||||||
Toyota Industries Corp. | 700 | 24,280 | ||||||
| 438,201 | ||||||||
Automobiles – 0.6% | ||||||||
Bayerische Motoren Werke AG | 1,384 | 112,440 | ||||||
Daihatsu Motor Co., Ltd. | 1,000 | 15,816 | ||||||
Daimler AG(a) | 3,769 | 266,352 | ||||||
Fiat SpA | 3,629 | 33,701 | ||||||
Ford Motor Co.(a) | 12,920 | 194,446 | ||||||
Fuji Heavy Industries Ltd. | 4,000 | 34,468 | ||||||
| ALLIANCEBERNSTEIN POOLING PORTFOLIOS • | 185 |
Volatility Management—Portfolio of Investments
| Company | Shares | U.S. $ Value | ||||||
Harley-Davidson, Inc. | 800 | $ | 32,656 | |||||
Honda Motor Co., Ltd. | 6,900 | 301,131 | ||||||
Isuzu Motors Ltd. | 3,000 | 13,566 | ||||||
Mazda Motor Corp. | 10,000 | 25,898 | ||||||
Mitsubishi Motors Corp.(a) | 16,000 | 22,774 | ||||||
Nissan Motor Co., Ltd. | 10,400 | 106,861 | ||||||
Peugeot SA(a) | 718 | 28,758 | ||||||
Porsche Automobil Holding SE (Preference Shares) | 289 | 23,024 | ||||||
Renault SA(a) | 587 | 35,996 | ||||||
Suzuki Motor Corp. | 1,400 | 33,276 | ||||||
Toyota Motor Corp. | 11,000 | 514,001 | ||||||
Volkswagen AG | 282 | 42,898 | ||||||
Volkswagen AG (Preference Shares) | 711 | 120,909 | ||||||
Yamaha Motor Co., Ltd.(a) | 1,800 | 32,017 | ||||||
| 1,990,988 | ||||||||
Distributors – 0.0% | ||||||||
Genuine Parts Co. | 550 | 28,979 | ||||||
Jardine Cycle & Carriage Ltd. | 1,000 | 26,615 | ||||||
Li & Fung Ltd. | 10,000 | 60,842 | ||||||
| 116,436 | ||||||||
Diversified Consumer Services – 0.0% | ||||||||
Apollo Group, Inc. – Class A(a) | 450 | 20,367 | ||||||
Benesse Holdings, Inc. | 600 | 27,265 | ||||||
DeVry, Inc. | 200 | 10,850 | ||||||
H&R Block, Inc. | 1,050 | 15,950 | ||||||
| 74,432 | ||||||||
Hotels, Restaurants & Leisure – 0.3% | ||||||||
Carnival Corp. | 1,500 | 64,005 | ||||||
Carnival PLC | 612 | 27,359 | ||||||
Compass Group PLC | 7,861 | 70,734 | ||||||
Crown Ltd. | 3,417 | 29,176 | ||||||
Darden Restaurants, Inc. | 450 | 21,209 | ||||||
Genting Singapore PLC(a) | 25,000 | 37,645 | ||||||
International Game Technology | 1,000 | 16,460 | ||||||
Marriott International, Inc. – Class A | 1,000 | 39,210 | ||||||
McDonald’s Corp. | 3,650 | 276,232 | ||||||
OPAP SA | 1,548 | 32,321 | ||||||
Oriental Land Co., Ltd. | 200 | 20,024 | ||||||
Sands China Ltd.(a) | 18,000 | 42,788 | ||||||
Sky City Entertainment Group Ltd. | 1,522 | 3,738 | ||||||
Sodexo | 418 | 28,767 | ||||||
Starbucks Corp. | 2,550 | 84,099 | ||||||
Starwood Hotels & Resorts Worldwide, Inc. | 650 | 39,715 | ||||||
TABCORP Holdings Ltd. | 6,058 | 47,064 | ||||||
Wynn Macau Ltd. | 16,000 | 43,238 | ||||||
| 186 | • ALLIANCEBERNSTEIN POOLING PORTFOLIOS |
Volatility Management—Portfolio of Investments
| Company | Shares | U.S. $ Value | ||||||
Wynn Resorts Ltd. | 250 | $ | 30,733 | |||||
Yum! Brands, Inc. | 1,600 | 80,528 | ||||||
| 1,035,045 | ||||||||
Household Durables – 0.2% | ||||||||
DR Horton, Inc. | 950 | 11,248 | ||||||
Electrolux AB | 609 | 15,272 | ||||||
Fortune Brands, Inc. | 550 | 34,023 | ||||||
Harman International Industries, Inc. | 250 | 12,160 | ||||||
Leggett & Platt, Inc. | 500 | 11,530 | ||||||
Lennar Corp. – Class A | 500 | 10,080 | ||||||
Newell Rubbermaid, Inc. | 1,000 | 19,340 | ||||||
Panasonic Corp. | 8,200 | 110,765 | ||||||
Pulte Group, Inc.(a) | 1,150 | 7,935 | ||||||
Rinnai Corp. | 200 | 12,296 | ||||||
Sekisui Chemical Co., Ltd. | 1,000 | 7,902 | ||||||
Sekisui House Ltd. | 2,000 | 20,750 | ||||||
Sharp Corp. | 4,000 | 43,579 | ||||||
Sony Corp. | 4,200 | 154,638 | ||||||
Stanley Black & Decker, Inc. | 600 | 45,498 | ||||||
Whirlpool Corp. | 250 | 20,625 | ||||||
| 537,641 | ||||||||
Internet & Catalog Retail – 0.1% | ||||||||
Amazon.com, Inc.(a) | 1,250 | 216,612 | ||||||
Dena Co., Ltd. | 939 | 36,444 | ||||||
Expedia, Inc. | 650 | 12,909 | ||||||
NetFlix, Inc.(a) | 150 | 31,001 | ||||||
priceline.com, Inc.(a) | 200 | 90,776 | ||||||
Rakuten, Inc. | 30 | 26,663 | ||||||
| 414,405 | ||||||||
Leisure Equipment & Products – 0.1% | ||||||||
Hasbro, Inc. | 450 | 20,205 | ||||||
Mattel, Inc. | 1,200 | 30,072 | ||||||
Nikon Corp. | 1,300 | 30,539 | ||||||
Sankyo Co., Ltd. | 200 | 11,328 | ||||||
Sega Sammy Holdings, Inc. | 700 | 15,973 | ||||||
Shimano, Inc. | 200 | 9,960 | ||||||
| 118,077 | ||||||||
Media – 0.6% | ||||||||
British Sky Broadcasting Group PLC | 5,044 | 64,532 | ||||||
Cablevision Systems Corp. | 800 | 29,480 | ||||||
CBS Corp. – Class B | 2,350 | 56,071 | ||||||
Comcast Corp. – Class A | 9,600 | 247,296 | ||||||
Dentsu, Inc. | 1,100 | 35,118 | ||||||
DIRECTV – Class A(a) | 2,900 | 133,313 | ||||||
Discovery Communications, Inc. – | 950 | 40,955 | ||||||
| ALLIANCEBERNSTEIN POOLING PORTFOLIOS • | 187 |
Volatility Management—Portfolio of Investments
| Company | Shares | U.S. $ Value | ||||||
Eutelsat Communications | 1,123 | $ | 44,817 | |||||
Fuji Media Holdings, Inc. | 5 | 8,449 | ||||||
Gannett Co., Inc. | 800 | 13,208 | ||||||
Interpublic Group of Cos., Inc. (The)(a) | 1,650 | 21,780 | ||||||
McGraw-Hill Cos., Inc. (The) | 1,050 | 40,614 | ||||||
Modern Times Group AB | 353 | 23,624 | ||||||
News Corp. – Class A | 7,850 | 136,354 | ||||||
Omnicom Group, Inc. | 1,050 | 53,445 | ||||||
Pearson PLC | 3,391 | 57,837 | ||||||
Publicis Groupe SA | 877 | 50,025 | ||||||
Reed Elsevier NV | 4,977 | 65,651 | ||||||
Reed Elsevier PLC | 3,309 | 29,545 | ||||||
Scripps Networks Interactive, Inc. – | 300 | 15,582 | ||||||
SES SA (FDR) | 1,731 | 44,569 | ||||||
Singapore Press Holdings Ltd. | 1,000 | 3,053 | ||||||
Time Warner Cable, Inc. – Class A | 1,250 | 90,225 | ||||||
Time Warner, Inc. | 3,850 | 147,070 | ||||||
Viacom, Inc. – Class B | 2,100 | 93,786 | ||||||
Vivendi SA | 5,137 | 146,409 | ||||||
Walt Disney Co. (The) | 6,550 | 286,497 | ||||||
Washington Post Co. (The) – Class B | 50 | 21,655 | ||||||
WPP PLC | 5,248 | 72,225 | ||||||
| 2,073,185 | ||||||||
Multiline Retail – 0.1% | ||||||||
Big Lots, Inc.(a) | 250 | 10,258 | ||||||
Family Dollar Stores, Inc. | 450 | 22,536 | ||||||
Isetan Mitsukoshi Holdings Ltd. | 2,300 | 27,865 | ||||||
JC Penney Co., Inc. | 800 | 27,968 | ||||||
Kohl’s Corp.(a) | 1,000 | 53,890 | ||||||
Macy’s, Inc. | 1,450 | 34,655 | ||||||
Marks & Spencer Group PLC | 4,790 | 26,970 | ||||||
Next PLC | 1,569 | 50,398 | ||||||
Nordstrom, Inc. | 600 | 27,156 | ||||||
PPR | 190 | 28,826 | ||||||
Sears Holdings Corp.(a) | 150 | 12,497 | ||||||
Target Corp. | 2,450 | 128,747 | ||||||
| 451,766 | ||||||||
Specialty Retail – 0.3% | ||||||||
Abercrombie & Fitch Co. – Class A | 300 | 17,211 | ||||||
AutoNation, Inc.(a) | 200 | 6,728 | ||||||
AutoZone, Inc.(a) | 100 | 25,795 | ||||||
Bed Bath & Beyond, Inc.(a) | 900 | 43,335 | ||||||
Best Buy Co., Inc. | 1,100 | 35,464 | ||||||
CarMax, Inc.(a) | 773 | 27,341 | ||||||
Esprit Holdings Ltd. | 4,000 | 19,687 | ||||||
| 188 | • ALLIANCEBERNSTEIN POOLING PORTFOLIOS |
Volatility Management—Portfolio of Investments
| Company | Shares | U.S. $ Value | ||||||
Fast Retailing Co., Ltd. | 200 | $ | 31,401 | |||||
GameStop Corp. – Class A(a) | 500 | 9,975 | ||||||
Gap, Inc. (The) | 1,500 | 33,795 | ||||||
Hennes & Mauritz AB – Class B | 4,272 | 139,585 | ||||||
Home Depot, Inc. | 5,650 | 211,705 | ||||||
Inditex SA | 912 | 66,092 | ||||||
Kingfisher PLC | 7,188 | 29,720 | ||||||
Limited Brands, Inc. | 900 | 28,818 | ||||||
Lowe’s Cos., Inc. | 4,750 | 124,307 | ||||||
Nitori Holdings Co., Ltd. | 350 | 30,989 | ||||||
O’Reilly Automotive, Inc.(a) | 500 | 27,790 | ||||||
RadioShack Corp. | 350 | 5,180 | ||||||
Ross Stores, Inc. | 400 | 28,816 | ||||||
Shimamura Co., Ltd. | 100 | 9,687 | ||||||
Staples, Inc. | 2,500 | 53,250 | ||||||
Tiffany & Co. | 450 | 27,698 | ||||||
TJX Cos., Inc. | 1,350 | 67,324 | ||||||
Urban Outfitters, Inc.(a) | 450 | 17,271 | ||||||
Yamada Denki Co., Ltd. | 340 | 25,972 | ||||||
| 1,144,936 | ||||||||
Textiles, Apparel & Luxury Goods – 0.2% | ||||||||
Adidas AG | 874 | 56,128 | ||||||
Burberry Group PLC | 2,317 | 45,157 | ||||||
Christian Dior SA | 238 | 34,305 | ||||||
Cie Financiere Richemont SA | 2,181 | 124,805 | ||||||
Coach, Inc. | 1,000 | 54,920 | ||||||
Luxottica Group SpA | 932 | 28,954 | ||||||
LVMH Moet Hennessy Louis Vuitton SA | 1,023 | 161,339 | ||||||
NIKE, Inc. – Class B | 1,350 | 120,190 | ||||||
Pandora A/S(a) | 235 | 13,701 | ||||||
Polo Ralph Lauren Corp. – Class A | 250 | 31,678 | ||||||
Swatch Group AG (The) (SWX Exchange) | 144 | 61,338 | ||||||
VF Corp. | 300 | 28,701 | ||||||
| 761,216 | ||||||||
| 9,156,328 | ||||||||
Consumer Staples – 2.5% | ||||||||
Beverages – 0.5% | ||||||||
Anheuser-Busch InBev NV | 3,017 | 168,493 | ||||||
Asahi Breweries Ltd. | 1,600 | 30,929 | ||||||
Brown-Forman Corp. – Class B | 350 | 24,203 | ||||||
Carlsberg A/S | 534 | 56,718 | ||||||
Coca Cola Hellenic Bottling Co. SA | 672 | 18,291 | ||||||
Coca-Cola Amatil Ltd. | 2,530 | 30,606 | ||||||
Coca-Cola Co. (The) | 8,050 | 514,556 | ||||||
Coca-Cola Enterprises, Inc. | 1,150 | 30,245 | ||||||
Constellation Brands, Inc. – Class A(a) | 600 | 12,192 | ||||||
| ALLIANCEBERNSTEIN POOLING PORTFOLIOS • | 189 |
Volatility Management—Portfolio of Investments
| Company | Shares | U.S. $ Value | ||||||
Diageo PLC | 10,468 | $ | 204,655 | |||||
Dr Pepper Snapple Group, Inc. | 750 | 27,045 | ||||||
Foster’s Group Ltd. | 5,254 | 30,628 | ||||||
Heineken NV | 995 | 51,314 | ||||||
Kirin Holdings Co., Ltd. | 3,000 | 42,953 | ||||||
Molson Coors Brewing Co. – Class B | 550 | 25,152 | ||||||
PepsiCo, Inc. | 5,500 | 348,810 | ||||||
Pernod-Ricard SA | 827 | 76,195 | ||||||
SABMiller PLC | 3,969 | 133,708 | ||||||
| 1,826,693 | ||||||||
Food & Staples Retailing – 0.6% | ||||||||
Aeon Co., Ltd. | 2,500 | 31,543 | ||||||
Carrefour SA | 2,504 | 122,974 | ||||||
Colruyt SA | 451 | 22,665 | ||||||
Costco Wholesale Corp. | 1,500 | 112,185 | ||||||
CVS Caremark Corp. | 4,700 | 155,382 | ||||||
Delhaize Group SA | 310 | 23,946 | ||||||
FamilyMart Co., Ltd. | 500 | 18,937 | ||||||
J Sainsbury PLC | 910 | 5,622 | ||||||
Jeronimo Martins SGPS SA | 227 | 3,638 | ||||||
Kesko Oyj | 31 | 1,335 | ||||||
Koninklijke Ahold NV | 4,980 | 66,890 | ||||||
Kroger Co. (The) | 2,200 | 50,380 | ||||||
Lawson, Inc. | 600 | 29,545 | ||||||
Metro AG | 437 | 32,017 | ||||||
Safeway, Inc. | 1,250 | 27,275 | ||||||
Seven & I Holdings Co., Ltd. | 3,100 | 86,531 | ||||||
SUPERVALU, Inc. | 700 | 6,041 | ||||||
Sysco Corp. | 2,000 | 55,580 | ||||||
Tesco PLC | �� | 33,518 | 220,155 | |||||
Wal-Mart Stores, Inc. | 6,753 | 351,021 | ||||||
Walgreen Co. | 3,200 | 138,688 | ||||||
Wesfarmers Ltd. | 4,200 | 141,670 | ||||||
Wesfarmers Ltd. (Partially Protected Shares) | 1,163 | 39,668 | ||||||
Whole Foods Market, Inc. | 500 | 29,280 | ||||||
Woolworths Ltd. | 5,184 | 142,221 | ||||||
| 1,915,189 | ||||||||
Food Products – 0.7% | ||||||||
Ajinomoto Co., Inc. | 3,000 | 34,559 | ||||||
Archer-Daniels-Midland Co. | 2,200 | 81,796 | ||||||
Aryzta AG | 558 | 26,082 | ||||||
Associated British Foods PLC | 1,500 | 23,573 | ||||||
Campbell Soup Co. | 650 | 21,879 | ||||||
ConAgra Foods, Inc. | 1,500 | 34,740 | ||||||
Danone | 2,437 | 152,744 | ||||||
Dean Foods Co.(a) | 600 | 6,336 | ||||||
General Mills, Inc. | 2,200 | 81,708 | ||||||
| 190 | • ALLIANCEBERNSTEIN POOLING PORTFOLIOS |
Volatility Management—Portfolio of Investments
| Company | Shares | U.S. $ Value | ||||||
Golden Agri-Resources Ltd. | 44,000 | $ | 22,569 | |||||
Hershey Co. (The) | 550 | 28,776 | ||||||
HJ Heinz Co. | 1,100 | 55,242 | ||||||
Hormel Foods Corp. | 500 | 13,700 | ||||||
JM Smucker Co. (The) | 400 | 27,536 | ||||||
Kellogg Co. | 900 | 48,204 | ||||||
Kerry Group PLC | 712 | 25,948 | ||||||
Kraft Foods, Inc. – Class A | 6,000 | 191,040 | ||||||
Lindt & Spruengli AG | 1 | 31,318 | ||||||
McCormick & Co., Inc. | 450 | 21,443 | ||||||
Mead Johnson Nutrition Co. – Class A | 700 | 41,895 | ||||||
MEIJI Holdings Co., Ltd. | 600 | 28,291 | ||||||
Nestle SA | 13,790 | 780,776 | ||||||
Nissin Foods Holdings Co., Ltd. | 400 | 14,379 | ||||||
Parmalat SpA | 9,597 | 29,424 | ||||||
Sara Lee Corp. | 2,200 | 37,664 | ||||||
Tyson Foods, Inc. – Class A | 1,000 | 18,630 | ||||||
Unilever NV | 6,807 | 205,312 | ||||||
Unilever PLC | 5,363 | 159,006 | ||||||
Wilmar International Ltd. | 8,000 | 32,034 | ||||||
Yakult Honsha Co., Ltd. | 900 | 25,472 | ||||||
| 2,302,076 | ||||||||
Household Products – 0.3% | ||||||||
Clorox Co. | 500 | 33,880 | ||||||
Colgate-Palmolive Co. | 1,700 | 133,484 | ||||||
Henkel AG & Co. KGaA | 915 | 46,718 | ||||||
Henkel AG & Co. KGaA (Preference Shares) | 626 | 37,718 | ||||||
Kimberly-Clark Corp. | 1,400 | 92,260 | ||||||
Procter & Gamble Co. (The) | 9,700 | 611,585 | ||||||
Reckitt Benckiser Group PLC | 2,575 | 132,756 | ||||||
Unicharm Corp. | 300 | 11,615 | ||||||
| 1,100,016 | ||||||||
Personal Products – 0.1% | ||||||||
Avon Products, Inc. | 1,450 | 40,325 | ||||||
Beiersdorf AG | 454 | 27,253 | ||||||
Estee Lauder Cos., Inc. (The) – Class A | 400 | 37,764 | ||||||
Kao Corp. | 2,300 | 62,125 | ||||||
L’Oreal SA | 1,002 | 116,585 | ||||||
Shiseido Co., Ltd. | 1,400 | 28,571 | ||||||
| 312,623 | ||||||||
Tobacco – 0.3% | ||||||||
Altria Group, Inc. | 7,200 | 182,664 | ||||||
British American Tobacco PLC | 8,344 | 334,294 | ||||||
Imperial Tobacco Group PLC | 4,255 | 136,544 | ||||||
Japan Tobacco, Inc. | 19 | 78,596 | ||||||
Lorillard, Inc. | 500 | 38,385 | ||||||
| ALLIANCEBERNSTEIN POOLING PORTFOLIOS • | 191 |
Volatility Management—Portfolio of Investments
| Company | Shares | U.S. $ Value | ||||||
Philip Morris International, Inc. | 6,250 | $ | 392,375 | |||||
Reynolds American, Inc. | 1,150 | 39,468 | ||||||
Swedish Match AB | 501 | 15,827 | ||||||
| 1,218,153 | ||||||||
| 8,674,750 | ||||||||
Health Care – 2.4% | ||||||||
Biotechnology – 0.2% | ||||||||
Actelion Ltd.(a) | 892 | 49,503 | ||||||
Amgen, Inc.(a) | 3,250 | 166,822 | ||||||
Biogen Idec, Inc.(a) | 850 | 58,140 | ||||||
Celgene Corp.(a) | 1,600 | 84,960 | ||||||
Cephalon, Inc.(a) | 250 | 14,078 | ||||||
CSL Ltd. | 2,404 | 87,332 | ||||||
Genzyme Corp.(a) | 900 | 67,905 | ||||||
Gilead Sciences, Inc.(a) | 2,800 | 109,144 | ||||||
| 637,884 | ||||||||
Health Care Equipment & | ||||||||
Baxter International, Inc. | 2,000 | 106,300 | ||||||
Becton Dickinson and Co. | 800 | 64,000 | ||||||
Boston Scientific Corp.(a) | 5,250 | 37,590 | ||||||
CareFusion Corp.(a) | 750 | 20,490 | ||||||
Cie Generale d’Optique Essilor International SA | 840 | 60,029 | ||||||
CR Bard, Inc. | 350 | 34,216 | ||||||
DENTSPLY International, Inc. | 500 | 18,685 | ||||||
Fresenius SE | 873 | 79,803 | ||||||
Getinge AB | 1,073 | 26,207 | ||||||
Intuitive Surgical, Inc.(a) | 150 | 49,193 | ||||||
Medtronic, Inc. | 3,700 | 147,704 | ||||||
Olympus Corp. | 900 | 26,455 | ||||||
Smith & Nephew PLC | 2,561 | 29,665 | ||||||
Sonova Holding AG | 15 | 1,994 | ||||||
St Jude Medical, Inc.(a) | 1,200 | 57,456 | ||||||
Stryker Corp. | 1,200 | 75,912 | ||||||
Synthes, Inc. | 191 | 26,222 | ||||||
Terumo Corp. | 700 | 38,441 | ||||||
Varian Medical Systems, Inc.(a) | 400 | 27,712 | ||||||
Zimmer Holdings, Inc.(a) | 700 | 43,638 | ||||||
| 971,712 | ||||||||
Health Care Providers & Services – 0.3% | ||||||||
Aetna, Inc. | 1,350 | 50,436 | ||||||
AmerisourceBergen Corp. – Class A | 950 | 36,015 | ||||||
Cardinal Health, Inc. | 1,200 | 49,968 | ||||||
CIGNA Corp. | 950 | 39,966 | ||||||
Coventry Health Care, Inc.(a) | 500 | 15,100 | ||||||
| 192 | • ALLIANCEBERNSTEIN POOLING PORTFOLIOS |
Volatility Management—Portfolio of Investments
| Company | Shares | U.S. $ Value | ||||||
DaVita, Inc.(a) | 350 | $ | 27,780 | |||||
Express Scripts, Inc. – Class A(a) | 1,800 | 101,196 | ||||||
Fresenius Medical Care AG & Co. KGaA | 508 | 33,691 | ||||||
Humana, Inc.(a) | 600 | 39,006 | ||||||
Laboratory Corp. of America Holdings(a) | 350 | 31,546 | ||||||
McKesson Corp. | 900 | 71,352 | ||||||
Medco Health Solutions, Inc.(a) | 1,450 | 89,378 | ||||||
Patterson Cos., Inc. | 300 | 10,014 | ||||||
Quest Diagnostics, Inc. | 550 | 31,213 | ||||||
Sonic Healthcare Ltd. | 2,147 | 24,751 | ||||||
Tenet Healthcare Corp.(a) | 1,650 | 11,847 | ||||||
UnitedHealth Group, Inc. | 3,800 | 161,804 | ||||||
WellPoint, Inc.(a) | 1,350 | 89,734 | ||||||
| 914,797 | ||||||||
Health Care Technology – 0.0% | ||||||||
Cerner Corp.(a) | 250 | 25,113 | ||||||
Life Sciences Tools & Services – 0.1% | ||||||||
Agilent Technologies, Inc.(a) | 1,200 | 50,496 | ||||||
Life Technologies Corp.(a) | 650 | 34,690 | ||||||
PerkinElmer, Inc. | 400 | 10,600 | ||||||
Thermo Fisher Scientific, Inc.(a) | 1,350 | 75,357 | ||||||
Waters Corp.(a) | 300 | 24,915 | ||||||
| 196,058 | ||||||||
Pharmaceuticals – 1.5% | ||||||||
Abbott Laboratories | 5,350 | 257,335 | ||||||
Allergan, Inc. | 1,050 | 77,878 | ||||||
Astellas Pharma, Inc. | 1,900 | 74,710 | ||||||
AstraZeneca PLC | 6,025 | 294,817 | ||||||
Bayer AG | 3,455 | 268,486 | ||||||
Bristol-Myers Squibb Co. | 5,900 | 152,279 | ||||||
Chugai Pharmaceutical Co., Ltd. | 1,500 | 28,906 | ||||||
Daiichi Sankyo Co., Ltd. | 2,800 | 60,134 | ||||||
Dainippon Sumitomo Pharma Co., Ltd. | 1,000 | 9,724 | ||||||
Eisai Co., Ltd. | 1,100 | 41,208 | ||||||
Elan Corp. PLC(a) | 4,431 | 28,470 | ||||||
Eli Lilly & Co. | 3,500 | 120,960 | ||||||
Forest Laboratories, Inc.(a) | 950 | 30,780 | ||||||
GlaxoSmithKline PLC | 21,697 | 416,504 | ||||||
Hisamitsu Pharmaceutical Co., Inc. | 500 | 20,223 | ||||||
Hospira, Inc.(a) | 600 | 31,710 | ||||||
Johnson & Johnson | 9,500 | 583,680 | ||||||
Merck & Co., Inc. | 10,650 | 346,870 | ||||||
Mitsubishi Tanabe Pharma Corp. | 1,000 | 16,953 | ||||||
Mylan, Inc.(a) | 1,500 | 34,305 | ||||||
Novartis AG | 8,817 | 495,486 | ||||||
Novo Nordisk A/S – Class B | 1,820 | 229,397 | ||||||
Ono Pharmaceutical Co., Ltd. | 600 | 31,415 | ||||||
| ALLIANCEBERNSTEIN POOLING PORTFOLIOS • | 193 |
Volatility Management—Portfolio of Investments
| Company | Shares | U.S. $ Value | ||||||
Pfizer, Inc. | 27,650 | $ | 531,986 | |||||
Roche Holding AG | 2,936 | 442,873 | ||||||
Sanofi-Aventis SA | 4,382 | 303,006 | ||||||
Shionogi & Co., Ltd. | 1,200 | 22,799 | ||||||
Shire PLC | 2,349 | 66,524 | ||||||
Taisho Pharmaceutical Co., Ltd. | 1,000 | 21,912 | ||||||
Takeda Pharmaceutical Co., Ltd. | 3,100 | 154,442 | ||||||
Teva Pharmaceutical Industries Ltd. | 3,835 | 192,620 | ||||||
UCB SA | 10 | 372 | ||||||
Watson Pharmaceuticals, Inc.(a) | 450 | 25,196 | ||||||
| 5,413,960 | ||||||||
| 8,159,524 | ||||||||
Equity:Other – 2.0% | ||||||||
Diversified/Specialty – 1.3% | ||||||||
Affine SA | 100 | 2,681 | ||||||
Alexandria Real Estate Equities, Inc. | 2,260 | 181,252 | ||||||
Allgreen Properties Ltd. | 32,100 | 26,353 | ||||||
American Assets Trust, Inc.(a) | 1,300 | 28,028 | ||||||
Artis Real Estate Investment Trust | 3,100 | 43,969 | ||||||
Azrieli Group(a) | 1,400 | 38,443 | ||||||
BioMed Realty Trust, Inc. | 5,250 | 95,287 | ||||||
CA Immobilien Anlagen AG(a) | 3,540 | 60,890 | ||||||
Campus Crest Communities, Inc. | 1,200 | 17,184 | ||||||
Canadian Real Estate Investment Trust | 2,700 | 92,182 | ||||||
CapLease, Inc. | 2,300 | 12,351 | ||||||
CB Richard Ellis Group, Inc. – Class A(a) | 1,000 | 25,040 | ||||||
Cheung Kong Holdings Ltd. | 6,000 | 93,889 | ||||||
Cofinimmo | 570 | 79,504 | ||||||
Corrections Corp. of America(a) | 4,520 | 112,277 | ||||||
Country Garden Holdings Co. | 140,500 | 56,054 | ||||||
Cousins Properties, Inc. | 4,214 | 35,735 | ||||||
Daejan Holdings PLC | 200 | 9,412 | ||||||
Dexus Property Group | 199,080 | 174,159 | ||||||
DIC Asset AG | 1,200 | 17,154 | ||||||
Digital Realty Trust, Inc. | 3,660 | 215,281 | ||||||
Dundee Real Estate Investment Trust | 1,700 | 55,101 | ||||||
DuPont Fabros Technology, Inc. | 2,390 | 58,364 | ||||||
Eurobank Properties Real Estate Investment Co. | 820 | 7,480 | ||||||
F&C Commercial Property Trust Ltd. | 20,800 | 34,355 | ||||||
FKP Property Group | 36,190 | 32,096 | ||||||
Fonciere Des Regions | 970 | 105,388 | ||||||
Forest City Enterprises, Inc.(a) | 5,560 | 105,084 | ||||||
Franklin Street Properties Corp. | 3,220 | 48,397 | ||||||
H&R Real Estate Investment Trust | 5,900 | 129,714 | ||||||
Helical Bar PLC | 4,770 | 21,756 | ||||||
Hopson Development Holdings Ltd.(a) | 29,500 | 32,794 | ||||||
| 194 | • ALLIANCEBERNSTEIN POOLING PORTFOLIOS |
Volatility Management—Portfolio of Investments
| Company | Shares | U.S. $ Value | ||||||
Hysan Development Co., Ltd. | 32,500 | $ | 147,859 | |||||
ING UK Real Estate Income Trust Ltd. | 14,200 | 11,707 | ||||||
Inmobiliaria Colonial SA(a) | 139,400 | 15,199 | ||||||
Investors Real Estate Trust | 3,110 | 28,985 | ||||||
Invista Foundation Property | 14,700 | 9,182 | ||||||
IRP Property Investments Ltd. | 3,410 | 4,543 | ||||||
ISIS Property Ltd. | 2,280 | 3,796 | ||||||
Kenedix Realty Investment Corp. – Class A | 10 | 47,399 | ||||||
Kiwi Income Property Trust | 40,000 | 30,172 | ||||||
Klovern AB | 4,890 | 25,478 | ||||||
Kungsleden AB | 5,600 | 54,824 | ||||||
Lamda Development SA(a) | 500 | 2,656 | ||||||
Lexington Realty Trust | 5,480 | 51,896 | ||||||
London & Stamford Property PLC | 22,400 | 45,700 | ||||||
Minerva PLC(a) | 6,670 | 10,843 | ||||||
Morguard Real Estate Investment Trust | 1,700 | 24,672 | ||||||
Mucklow (A & J) Group PLC | 1,000 | 4,877 | ||||||
New World China Land Ltd. | 73,800 | 28,173 | ||||||
Nieuwe Steen Investments Funds NV | 1,750 | 35,958 | ||||||
Premier Investment Corp. | 5 | 24,350 | ||||||
Quintain Estates & Development PLC(a) | 21,370 | 14,980 | ||||||
Shui On Land Ltd. | 108,400 | 51,392 | ||||||
Singapore Land Ltd. | 7,000 | 39,993 | ||||||
Soho China Ltd. | 86,000 | 62,125 | ||||||
ST Modwen Properties PLC | 6,200 | 16,701 | ||||||
Standard Life Investment Property Income Trust PLC | 4,700 | 4,985 | ||||||
Suntec Real Estate Investment Trust | 90,000 | 104,978 | ||||||
Swire Pacific Ltd. | 3,000 | 42,101 | ||||||
TAG Immobilien AG(a) | 2,420 | 23,543 | ||||||
Tokyu Land Corp. | 15,870 | 91,271 | ||||||
Tokyu REIT, Inc. | 5 | 34,366 | ||||||
Top REIT, Inc. | 7 | 45,356 | ||||||
UK Commercial Property Trust Ltd. | 14,800 | 18,574 | ||||||
Unite Group PLC(a) | 6,580 | 21,444 | ||||||
United Urban Investment Corp. | 48 | 62,835 | ||||||
Vornado Realty Trust | 8,070 | 753,174 | ||||||
Washington Real Estate Investment Trust | 2,590 | 80,912 | ||||||
Wereldhave Belgium NV | 50 | 4,934 | ||||||
Wereldhave NV | 870 | 88,383 | ||||||
Weyerhaeuser Co. | 1,842 | 44,963 | ||||||
Wihlborgs Fastigheter AB | 1,560 | 45,059 | ||||||
Winthrop Realty Trust | 800 | 9,760 | ||||||
| 4,317,752 | ||||||||
Health Care – 0.6% | ||||||||
Chartwell Seniors Housing Real Estate Investment Trust | 5,800 | 52,177 | ||||||
| ALLIANCEBERNSTEIN POOLING PORTFOLIOS • | 195 |
Volatility Management—Portfolio of Investments
| Company | Shares | U.S. $ Value | ||||||
Extendicare Real Estate Investment Trust | 3,300 | $ | 34,238 | |||||
HCP, Inc. | 16,460 | 625,480 | ||||||
Health Care REIT, Inc. | 6,470 | 337,864 | ||||||
Healthcare Realty Trust, Inc. | 2,550 | 59,415 | ||||||
LTC Properties, Inc. | 1,000 | 29,220 | ||||||
Medical Properties Trust, Inc. | 4,580 | 53,723 | ||||||
National Health Investors, Inc. | 1,200 | 57,024 | ||||||
National Healthcare Corp. | 420 | 19,992 | ||||||
Nationwide Health Properties, Inc. | 5,200 | 222,248 | ||||||
Omega Healthcare Investors, Inc. | 3,990 | 95,640 | ||||||
Primary Health Properties PLC | 2,540 | 13,647 | ||||||
Senior Housing Properties Trust | 5,830 | 143,068 | ||||||
Universal Health Realty Income Trust | 460 | 18,294 | ||||||
Ventas, Inc. | 7,000 | 387,940 | ||||||
| 2,149,970 | ||||||||
Triple Net – 0.1% | ||||||||
Agree Realty Corp. | 400 | 10,212 | ||||||
Entertainment Properties Trust | 1,910 | 91,050 | ||||||
Getty Realty Corp. | 900 | 26,478 | ||||||
National Retail Properties, Inc. | 3,470 | 89,144 | ||||||
Realty Income Corp. | 4,720 | 169,778 | ||||||
| 386,662 | ||||||||
| 6,854,384 | ||||||||
Materials – 1.9% | ||||||||
Chemicals – 0.7% | ||||||||
Air Liquide SA | 1,182 | 153,028 | ||||||
Air Products & Chemicals, Inc. | 750 | 69,000 | ||||||
Airgas, Inc. | 250 | 15,645 | ||||||
Akzo Nobel NV | 1,204 | 81,842 | ||||||
Asahi Kasei Corp. | 5,000 | 34,673 | ||||||
BASF SE | 3,838 | 320,012 | ||||||
CF Industries Holdings, Inc. | 250 | 35,320 | ||||||
Daicel Chemical Industries Ltd. | 1,000 | 6,875 | ||||||
Dow Chemical Co. (The) | 4,000 | 148,640 | ||||||
Eastman Chemical Co. | 250 | 23,353 | ||||||
Ecolab, Inc. | 800 | 38,912 | ||||||
EI du Pont de Nemours & Co. | 3,150 | 172,840 | ||||||
FMC Corp. | 250 | 19,360 | ||||||
Givaudan SA | 29 | 28,919 | ||||||
Hitachi Chemical Co., Ltd. | 1,400 | 32,541 | ||||||
Incitec Pivot Ltd. | 9,134 | 41,212 | ||||||
International Flavors & Fragrances, Inc. | 250 | 14,238 | ||||||
Israel Chemicals Ltd. | 1,823 | 30,357 | ||||||
Israel Corp. Ltd. (The)(a) | 25 | 29,649 | ||||||
JSR Corp. | 1,500 | 32,261 | ||||||
K&S AG | 15 | 1,160 | ||||||
| 196 | • ALLIANCEBERNSTEIN POOLING PORTFOLIOS |
Volatility Management—Portfolio of Investments
| Company | Shares | U.S. $ Value | ||||||
Kansai Paint Co., Ltd. | 1,000 | $ | 9,526 | |||||
Kuraray Co., Ltd. | 1,500 | 21,304 | ||||||
Lanxess AG | 343 | 25,558 | ||||||
Linde AG | 706 | 107,898 | ||||||
Makhteshim-Agan Industries Ltd.(a) | 319 | 1,593 | ||||||
Mitsubishi Chemical Holdings Corp. | 5,500 | 40,336 | ||||||
Mitsubishi Gas Chemical Co., Inc. | 1,000 | 7,755 | ||||||
Mitsui Chemicals, Inc. | 9,000 | 33,800 | ||||||
Monsanto Co. | 1,850 | 132,997 | ||||||
Nitto Denko Corp. | 700 | 42,448 | ||||||
Novozymes A/S | 202 | 28,233 | ||||||
Orica Ltd. | 1,047 | 27,675 | ||||||
PPG Industries, Inc. | 550 | 48,609 | ||||||
Praxair, Inc. | 1,050 | 104,349 | ||||||
Sherwin-Williams Co. (The) | 300 | 24,636 | ||||||
Shin-Etsu Chemical Co., Ltd. | 1,700 | 98,285 | ||||||
Showa Denko KK | 4,000 | 8,819 | ||||||
Sigma-Aldrich Corp. | 400 | 25,556 | ||||||
Sika AG | 1 | 2,143 | ||||||
Solvay SA | 253 | 29,671 | ||||||
Sumitomo Chemical Co., Ltd. | 7,000 | 37,887 | ||||||
Syngenta AG | 395 | 132,685 | ||||||
Taiyo Nippon Sanso Corp. | 3,000 | 26,823 | ||||||
Toray Industries, Inc. | 6,000 | 45,545 | ||||||
Ube Industries Ltd. | 3,000 | 9,747 | ||||||
Umicore SA | 530 | 26,722 | ||||||
Wacker Chemie AG | 219 | 40,425 | ||||||
Yara International ASA | 733 | 38,919 | ||||||
| 2,509,781 | ||||||||
Construction Materials – 0.1% | ||||||||
CRH PLC (London) | 2,957 | 68,102 | ||||||
Fletcher Building Ltd. | 4,230 | 28,071 | ||||||
HeidelbergCement AG | 941 | 66,089 | ||||||
Holcim Ltd. | 1,025 | 75,308 | ||||||
Lafarge SA | 838 | 50,907 | ||||||
Vulcan Materials Co. | 450 | 20,632 | ||||||
| 309,109 | ||||||||
Containers & Packaging – 0.0% | ||||||||
Amcor Ltd. | 391 | 2,772 | ||||||
Ball Corp. | 600 | 21,660 | ||||||
Bemis Co., Inc. | 350 | 11,498 | ||||||
Owens-Illinois, Inc.(a) | 550 | 16,769 | ||||||
Sealed Air Corp. | 550 | 15,136 | ||||||
Toyo Seikan Kaisha Ltd. | 1,600 | 29,442 | ||||||
| 97,277 | ||||||||
| ALLIANCEBERNSTEIN POOLING PORTFOLIOS • | 197 |
Volatility Management—Portfolio of Investments
| Company | Shares | U.S. $ Value | ||||||
Metals & Mining – 1.0% | ||||||||
AK Steel Holding Corp. | 350 | $ | 5,593 | |||||
Alcoa, Inc. | 3,500 | 58,975 | ||||||
Allegheny Technologies, Inc. | 350 | 23,478 | ||||||
Alumina Ltd. | 19,342 | 47,386 | ||||||
Anglo American PLC | 5,510 | 298,883 | ||||||
Antofagasta PLC | 1,780 | 40,765 | ||||||
ArcelorMittal (Euronext Amsterdam) | 3,587 | 131,738 | ||||||
BHP Billiton Ltd. | 14,024 | 662,692 | ||||||
BHP Billiton PLC | 9,222 | 365,554 | ||||||
Boliden AB | 1,951 | 41,718 | ||||||
Cliffs Natural Resources, Inc. | 500 | 48,535 | ||||||
Eramet | 52 | 18,797 | ||||||
Eurasian Natural Resources Corp. PLC | 2,481 | 38,926 | ||||||
Fortescue Metals Group Ltd.(a) | 8,833 | 60,283 | ||||||
Freeport-McMoRan Copper & Gold, Inc. | 3,250 | 172,087 | ||||||
Fresnillo PLC | 1,708 | 44,315 | ||||||
JFE Holdings, Inc. | 1,900 | 60,172 | ||||||
Kazakhmys PLC | 928 | 21,813 | ||||||
Kobe Steel Ltd. | 10,000 | 27,370 | ||||||
Newcrest Mining Ltd. | 3,194 | 123,449 | ||||||
Newmont Mining Corp. | 1,700 | 93,959 | ||||||
Nippon Steel Corp. | 21,000 | 76,373 | ||||||
Norsk Hydro ASA | 4,164 | 34,354 | ||||||
Nucor Corp. | 1,100 | 52,756 | ||||||
Outokumpu Oyj | 1,228 | 22,046 | ||||||
OZ Minerals Ltd. | 24,439 | 40,661 | ||||||
Randgold Resources Ltd.(a) | 278 | 22,513 | ||||||
Rio Tinto Ltd. | 1,821 | 159,002 | ||||||
Rio Tinto PLC | 6,057 | 426,513 | ||||||
SSAB AB – Class A | 1,547 | 24,317 | ||||||
Sumitomo Metal Industries Ltd. | 14,000 | 35,575 | ||||||
Sumitomo Metal Mining Co., Ltd. | 2,000 | 37,889 | ||||||
ThyssenKrupp AG | 819 | 34,179 | ||||||
Titanium Metals Corp.(a) | 300 | 5,697 | ||||||
United States Steel Corp. | 500 | 28,745 | ||||||
Voestalpine AG | 727 | 33,615 | ||||||
Xstrata PLC | 8,597 | 196,623 | ||||||
| 3,617,346 | ||||||||
Paper & Forest Products – 0.1% | ||||||||
International Paper Co. | 1,500 | 41,670 | ||||||
MeadWestvaco Corp. | 550 | 16,143 | ||||||
Nippon Paper Group, Inc. | 1,000 | 27,505 | ||||||
OJI Paper Co., Ltd. | 6,000 | 29,868 | ||||||
Stora Enso Oyj | 2,992 | 33,705 | ||||||
Svenska Cellulosa AB – Class B | 1,716 | 28,359 | ||||||
UPM-Kymmene Oyj | 1,790 | 35,546 | ||||||
| 212,796 | ||||||||
| 6,746,309 | ||||||||
| 198 | • ALLIANCEBERNSTEIN POOLING PORTFOLIOS |
Volatility Management—Portfolio of Investments
| Company | Shares | U.S. $ Value | ||||||
Retail – 1.4% | ||||||||
Regional Mall – 0.7% | ||||||||
Alexander’s, Inc. | 140 | $ | 55,402 | |||||
CBL & Associates Properties, Inc. | 5,690 | 101,567 | ||||||
General Growth Properties, Inc. | 19,500 | 310,440 | ||||||
Glimcher Realty Trust | 4,080 | 37,536 | ||||||
Macerich Co. (The) | 5,370 | 271,937 | ||||||
Pennsylvania Real Estate Investment Trust | 2,210 | 31,912 | ||||||
Simon Property Group, Inc. | 13,070 | 1,438,223 | ||||||
Taubman Centers, Inc. | 1,750 | 97,090 | ||||||
| 2,344,107 | ||||||||
Shopping Center/Other Retail – 0.7% | ||||||||
Acadia Realty Trust | 1,660 | 32,868 | ||||||
Bunnings Warehouse Property Trust | 17,560 | 31,624 | ||||||
Calloway Real Estate Investment Trust | 4,000 | 102,064 | ||||||
Capital & Counties Properties PLC | 25,580 | 62,210 | ||||||
Capital Shopping Centres Group | 26,480 | 170,225 | ||||||
Cedar Shopping Centers, Inc. | 2,550 | 15,453 | ||||||
Charter Hall Retail REIT | 12,576 | 41,196 | ||||||
Citycon Oyj | 7,580 | 33,472 | ||||||
Crombie Real Estate Investment Trust | 1,400 | 18,834 | ||||||
Deutsche Euroshop AG | 2,115 | 79,839 | ||||||
Developers Diversified Realty Corp. | 10,470 | 149,721 | ||||||
Development Securities PLC | 5,070 | 16,979 | ||||||
Equity One, Inc. | 2,030 | 38,854 | ||||||
Eurocommercial Properties N.V. | 1,590 | 76,233 | ||||||
Federal Realty Investment Trust | 2,530 | 212,975 | ||||||
First Capital Realty, Inc. | 2,680 | 44,880 | ||||||
Immobiliare Grande Distribuzione | 4,900 | 10,278 | ||||||
Inland Real Estate Corp. | 3,500 | 32,970 | ||||||
Japan Retail Fund Investment Corp. | 64 | 110,156 | ||||||
Kimco Realty Corp. | 18,180 | 352,328 | ||||||
Kite Realty Group Trust | 2,600 | 14,664 | ||||||
Mercialys SA | 1,890 | 71,850 | ||||||
Primaris Retail Real Estate Investment Trust | 2,800 | 58,793 | ||||||
Ramco-Gershenson Properties Trust | 1,530 | 20,670 | ||||||
Regency Centers Corp. | 3,420 | 154,755 | ||||||
RioCan Real Estate Investment Trust (Toronto) | 10,300 | 256,771 | ||||||
Saul Centers, Inc. | 590 | 27,140 | ||||||
Shaftesbury PLC | 9,260 | 71,772 | ||||||
Tanger Factory Outlet Centers | 3,340 | 89,011 | ||||||
Urstadt Biddle Properties, Inc. | 800 | 15,512 | ||||||
Vastned Retail NV | 810 | 57,813 | ||||||
Weingarten Realty Investors | 4,970 | 128,574 | ||||||
| 2,600,484 | ||||||||
| 4,944,591 | ||||||||
| ALLIANCEBERNSTEIN POOLING PORTFOLIOS • | 199 |
Volatility Management—Portfolio of Investments
| Company | Shares | U.S. $ Value | ||||||
Office – 1.3% | ||||||||
Office – 1.3% | ||||||||
Allied Properties Real Estate Investment Trust | 1,700 | $ | 38,898 | |||||
Allreal Holding AG | 330 | 51,040 | ||||||
Alstria Office REIT-AG | 1,320 | 20,219 | ||||||
Befimmo SCA Sicafi | 670 | 55,963 | ||||||
Beni Stabili SpA | 39,400 | 40,421 | ||||||
Boston Properties, Inc. | 6,250 | 599,500 | ||||||
Brandywine Realty Trust | 5,400 | 66,420 | ||||||
Brookfield Properties Corp. | 15,500 | 271,854 | ||||||
CapitaCommercial Trust | 86,700 | 94,135 | ||||||
Castellum AB | 7,060 | 101,005 | ||||||
Champion REIT | 103,700 | 59,691 | ||||||
Charter Hall Office REIT | 20,313 | 66,186 | ||||||
CLS Holdings PLC(a) | 1,020 | 10,115 | ||||||
Cominar Real Estate Investment Trust | 2,600 | 59,062 | ||||||
Commonwealth Property Office Fund | 96,290 | 84,127 | ||||||
CommonWealth REIT | 2,930 | 84,120 | ||||||
Corporate Office Properties Trust | 2,750 | 98,643 | ||||||
Derwent London PLC | 4,200 | 115,912 | ||||||
Douglas Emmett, Inc. | 3,790 | 71,063 | ||||||
Duke Realty Corp. | 10,360 | 145,765 | ||||||
Fabege AB | 6,640 | 71,880 | ||||||
Government Properties Income Trust | 1,220 | 33,147 | ||||||
Great Portland Estates PLC | 12,780 | 80,554 | ||||||
Highwoods Properties, Inc. | 2,930 | 99,415 | ||||||
Hongkong Land Holdings Ltd. | 69,000 | 474,544 | ||||||
Hufvudstaden AB – Class A | 6,080 | 71,307 | ||||||
ING Office Fund | 112,230 | 70,034 | ||||||
Intervest Offices | 250 | 8,260 | ||||||
Japan Prime Realty Investment Corp. | 29 | 80,831 | ||||||
Kilroy Realty Corp. | 2,120 | 82,150 | ||||||
Liberty Property Trust | 4,630 | 156,355 | ||||||
Mack-Cali Realty Corp. | 3,220 | 109,287 | ||||||
Mori Trust Sogo Reit, Inc. | 4 | 41,959 | ||||||
Nomura Real Estate Office Fund, Inc. | 13 | 88,297 | ||||||
Norwegian Property ASA(a) | 20,500 | 36,564 | ||||||
Orix JREIT, Inc. | 10 | 57,687 | ||||||
Parkway Properties, Inc. | 900 | 14,589 | ||||||
Piedmont Office Realty Trust, Inc. | 2,900 | 58,000 | ||||||
PS Business Parks, Inc. | 790 | 49,802 | ||||||
PSP Swiss Property AG(a) | 1,830 | 145,980 | ||||||
SL Green Realty Corp. | 3,180 | 240,821 | ||||||
Societe de la Tour Eiffel | 220 | 19,222 | ||||||
Societe Immobiliere de Location pour l’Industrie et le Commerce | 590 | 76,198 | ||||||
Sponda Oyj | 11,410 | 62,213 | ||||||
| 200 | • ALLIANCEBERNSTEIN POOLING PORTFOLIOS |
Volatility Management—Portfolio of Investments
| Company | Shares | U.S. $ Value | ||||||
Swiss Prime Site AG(a) | 1,680 | $ | 124,139 | |||||
Technopolis PLC | 2,560 | 13,942 | ||||||
Tokyo Tatemono Co., Ltd. | 12,860 | 60,706 | ||||||
Vastned Offices/Industrial NV | 700 | 11,785 | ||||||
Workspace Group PLC | 47,540 | 18,548 | ||||||
Zueblin Immobilien Holding AG(a) | 1,790 | 7,804 | ||||||
| 4,600,159 | ||||||||
Residential – 1.2% | ||||||||
Manufactured Homes – 0.0% | ||||||||
Equity Lifestyle Properties, Inc. | 1,240 | 71,970 | ||||||
Sun Communities, Inc. | 790 | 27,318 | ||||||
| 99,288 | ||||||||
Multi-Family – 0.9% | ||||||||
Agile Property Holdings Ltd. | 57,600 | 73,097 | ||||||
Apartment Investment & Management Co. – Class A | 5,190 | 133,123 | ||||||
Associated Estates Realty Corp. | 1,600 | 26,000 | ||||||
AvalonBay Communities, Inc. | 3,850 | 465,965 | ||||||
Boardwalk Real Estate Investment Trust | 2,000 | 94,056 | ||||||
BRE Properties, Inc. | 2,670 | 126,852 | ||||||
Camden Property Trust | 2,800 | 165,676 | ||||||
Canadian Apartment Properties REIT | 3,200 | 63,931 | ||||||
China Resources Land Ltd. | 88,600 | 144,671 | ||||||
Colonia Real Estate AG(a) | 1,230 | 9,665 | ||||||
Colonial Properties Trust | 3,100 | 61,101 | ||||||
Conwert Immobilien Invest SE | 3,380 | 56,402 | ||||||
Deutsche Wohnen AG(a) | 3,400 | 51,071 | ||||||
Equity Residential | 12,650 | 697,141 | ||||||
Essex Property Trust, Inc. | 1,330 | 164,627 | ||||||
GAGFAH SA | 3,700 | 43,820 | ||||||
Grainger PLC | 12,880 | 21,178 | ||||||
Home Properties, Inc. | 1,550 | 91,326 | ||||||
Killam Properties, Inc. | 1,800 | 19,435 | ||||||
KWG Property Holding Ltd. | 48,000 | 31,150 | ||||||
Mid-America Apartment Communities, Inc. | 1,430 | 92,907 | ||||||
Northern Property Real Estate Investment Trust | 1,100 | 31,702 | ||||||
Patrizia Immobilien AG(a) | 1,000 | 8,114 | ||||||
Post Properties, Inc. | 2,050 | 79,950 | ||||||
Shenzhen Investment Ltd. | 108,800 | 33,935 | ||||||
Shimao Property Holdings Ltd. | 57,700 | 79,116 | ||||||
UDR, Inc. | 7,480 | 181,914 | ||||||
Wing Tai Holdings Ltd. | 24,200 | 28,265 | ||||||
Yanlord Land Group Ltd. | 23,500 | 25,218 | ||||||
| 3,101,408 | ||||||||
| ALLIANCEBERNSTEIN POOLING PORTFOLIOS • | 201 |
Volatility Management—Portfolio of Investments
| Company | Shares | U.S. $ Value | ||||||
Self Storage – 0.3% | ||||||||
Big Yellow Group PLC | 5,450 | $ | 28,616 | |||||
Extra Space Storage, Inc. | 3,600 | 71,100 | ||||||
Public Storage | 5,770 | 647,683 | ||||||
Safestore Holdings PLC | 7,640 | 17,885 | ||||||
Sovran Self Storage, Inc. | 1,180 | 45,784 | ||||||
U-Store-It Trust | 3,780 | 38,745 | ||||||
| 849,813 | ||||||||
Student Housing – 0.0% | ||||||||
American Campus Communities, Inc. | 2,720 | 90,902 | ||||||
Education Realty Trust, Inc. | 2,930 | 24,173 | ||||||
| 115,075 | ||||||||
| 4,165,584 | ||||||||
Telecommunication Services – 1.1% | ||||||||
Diversified Telecommunication | ||||||||
AT&T, Inc. | 20,400 | 578,952 | ||||||
Belgacom SA | 767 | 28,771 | ||||||
Bezeq Israeli Telecommunication Corp. Ltd. | 9,677 | 26,258 | ||||||
BT Group PLC | 32,400 | 96,235 | ||||||
CenturyLink, Inc. | 1,050 | 43,239 | ||||||
Deutsche Telekom AG | 11,846 | 159,416 | ||||||
Elisa Oyj | 1,060 | 24,216 | ||||||
France Telecom SA | 7,747 | 171,432 | ||||||
Frontier Communications Corp. | 3,396 | 28,832 | ||||||
Hellenic Telecommunications Organization SA | 713 | 7,314 | ||||||
Koninklijke KPN NV | 6,761 | 109,461 | ||||||
Nippon Telegraph & Telephone Corp. | 2,000 | 97,836 | ||||||
PCCW Ltd. | 16,000 | 6,970 | ||||||
Portugal Telecom SGPS SA | 1,580 | 18,432 | ||||||
Qwest Communications International, Inc. | 6,000 | 40,920 | ||||||
Singapore Telecommunications Ltd. | 33,000 | 76,836 | ||||||
Swisscom AG | 105 | 46,359 | ||||||
Tele2 AB – Class B | 968 | 22,102 | ||||||
Telecom Italia SpA (ordinary shares) | 39,139 | 61,105 | ||||||
Telecom Italia SpA (savings shares) | 14,099 | 18,661 | ||||||
Telefonica SA | 16,058 | 408,262 | ||||||
Telekom Austria AG | 684 | 9,768 | ||||||
Telenor ASA | 3,467 | 57,519 | ||||||
TeliaSonera AB | 9,382 | 78,949 | ||||||
Telstra Corp. Ltd. | 19,034 | 54,198 | ||||||
Verizon Communications, Inc. | 9,750 | 359,970 | ||||||
Windstream Corp. | 1,650 | 20,691 | ||||||
| 2,652,704 | ||||||||
| 202 | • ALLIANCEBERNSTEIN POOLING PORTFOLIOS |
Volatility Management—Portfolio of Investments
| Company | Shares | U.S. $ Value | ||||||
Wireless Telecommunication | ||||||||
American Tower Corp. – Class A(a) | 1,400 | $ | 75,544 | |||||
KDDI Corp. | 12 | 77,929 | ||||||
MetroPCS Communications, Inc.(a) | 900 | 12,960 | ||||||
Millicom International Cellular SA | 366 | 32,083 | ||||||
Mobistar SA | 10 | 639 | ||||||
NTT DoCoMo, Inc. | 64 | 120,229 | ||||||
Softbank Corp. | 3,200 | 131,565 | ||||||
Sprint Nextel Corp.(a) | 10,300 | 45,011 | ||||||
StarHub Ltd. | 1,000 | 2,063 | ||||||
Vodafone Group PLC | 220,086 | 624,844 | ||||||
| 1,122,867 | ||||||||
| 3,775,571 | ||||||||
Utilities – 1.1% | ||||||||
Electric Utilities – 0.6% | ||||||||
Acciona SA | 310 | 30,178 | ||||||
American Electric Power Co., Inc. | 1,650 | 59,037 | ||||||
Chubu Electric Power Co., Inc. | 2,700 | 71,265 | ||||||
Chugoku Electric Power Co., Inc. (The) | 1,200 | 25,741 | ||||||
CLP Holdings Ltd. | 8,000 | 65,161 | ||||||
Contact Energy Ltd.(a) | 901 | 4,175 | ||||||
Duke Energy Corp. | 4,550 | 81,854 | ||||||
E.ON AG | 7,525 | 247,157 | ||||||
EDF SA | 1,102 | 49,137 | ||||||
Edison International | 1,100 | 40,832 | ||||||
EDP – Energias de Portugal SA | 4,658 | 17,671 | ||||||
Enel SpA | 27,505 | 163,910 | ||||||
Entergy Corp. | 650 | 46,280 | ||||||
Exelon Corp. | 2,300 | 96,048 | ||||||
FirstEnergy Corp. | 1,416 | 54,233 | ||||||
Fortum Oyj | 1,927 | 59,675 | ||||||
Hokkaido Electric Power Co., Inc. | 100 | 2,148 | ||||||
Hokuriku Electric Power Co. | 1,100 | 27,735 | ||||||
Hongkong Electric Holdings Ltd. | 6,000 | 39,176 | ||||||
Iberdrola SA | 16,866 | 147,156 | ||||||
Kansai Electric Power Co., Inc. (The) | 3,200 | 84,041 | ||||||
Kyushu Electric Power Co., Inc. | 1,600 | 37,172 | ||||||
NextEra Energy, Inc. | 1,450 | 80,431 | ||||||
Northeast Utilities | 600 | 20,424 | ||||||
Pepco Holdings, Inc. | 750 | 14,048 | ||||||
Pinnacle West Capital Corp. | 350 | 14,780 | ||||||
PPL Corp. | 1,650 | 41,959 | ||||||
Progress Energy, Inc. | 1,000 | 45,710 | ||||||
Red Electrica Corp. SA | 368 | 19,777 | ||||||
Scottish & Southern Energy PLC | 3,857 | 77,679 | ||||||
Shikoku Electric Power Co., Inc. | 700 | 21,187 | ||||||
| ALLIANCEBERNSTEIN POOLING PORTFOLIOS • | 203 |
Volatility Management—Portfolio of Investments
| Company | Shares | U.S. $ Value | ||||||
Southern Co. | 2,900 | $ | 110,519 | |||||
Terna Rete Elettrica Nazionale SpA | 7,340 | 33,858 | ||||||
Tohoku Electric Power Co., Inc. | 1,800 | 41,936 | ||||||
Tokyo Electric Power Co., Inc. (The) | 5,900 | 152,721 | ||||||
Verbund AG | 658 | 25,198 | ||||||
| 2,150,009 | ||||||||
Gas Utilities – 0.1% | ||||||||
Enagas | 209 | 4,476 | ||||||
Gas Natural SDG SA | 1,654 | 28,260 | ||||||
Hong Kong & China Gas Co., Ltd. | 18,000 | 40,570 | ||||||
Nicor, Inc. | 150 | 7,911 | ||||||
Oneok, Inc. | 350 | 22,599 | ||||||
Osaka Gas Co., Ltd. | 8,000 | 30,465 | ||||||
Snam Rete Gas SpA | 5,586 | 30,564 | ||||||
Tokyo Gas Co., Ltd. | 11,000 | 49,176 | ||||||
| 214,021 | ||||||||
Independent Power Producers & | ||||||||
AES Corp. (The)(a) | 2,250 | 27,832 | ||||||
Constellation Energy Group, Inc. | 700 | 21,749 | ||||||
EDP Renovaveis SA(a) | 4,478 | 26,885 | ||||||
Electric Power Development Co., Ltd. | 200 | 6,319 | ||||||
Iberdrola Renovables SA | 1,621 | 6,083 | ||||||
International Power PLC | 5,295 | 28,786 | ||||||
NRG Energy, Inc.(a) | 850 | 16,991 | ||||||
| 134,645 | ||||||||
Multi-Utilities – 0.4% | ||||||||
AGL Energy Ltd. | 1,906 | 28,276 | ||||||
Ameren Corp. | 800 | 22,368 | ||||||
CenterPoint Energy, Inc. | 1,450 | 22,997 | ||||||
Centrica PLC | 21,500 | 118,892 | ||||||
CMS Energy Corp. | 800 | 15,408 | ||||||
Consolidated Edison, Inc. | 1,000 | 49,980 | ||||||
Dominion Resources, Inc. | 2,000 | 91,260 | ||||||
DTE Energy Co. | 600 | 28,248 | ||||||
GDF Suez | 5,197 | 210,793 | ||||||
Integrys Energy Group, Inc. | 250 | 12,243 | ||||||
National Grid PLC | 14,467 | 134,435 | ||||||
NiSource, Inc. | 950 | 18,202 | ||||||
PG&E Corp. | 1,350 | 62,181 | ||||||
Public Service Enterprise Group, Inc. | 1,750 | 57,225 | ||||||
RWE AG | 1,750 | 118,342 | ||||||
SCANA Corp. | 400 | 16,192 | ||||||
Sempra Energy | 850 | 45,245 | ||||||
Suez Environnement Co. | 2,173 | 47,086 | ||||||
TECO Energy, Inc. | 700 | 12,677 | ||||||
| 204 | • ALLIANCEBERNSTEIN POOLING PORTFOLIOS |
Volatility Management—Portfolio of Investments
| Company | Shares | U.S. $ Value | ||||||
United Utilities Group PLC | 4,104 | $ | 39,515 | |||||
Veolia Environnement | 828 | 27,243 | ||||||
Wisconsin Energy Corp. | 400 | 23,680 | ||||||
Xcel Energy, Inc. | 1,550 | 37,107 | ||||||
| 1,239,595 | ||||||||
Water Utilities – 0.0% | ||||||||
Severn Trent PLC | 63 | 1,524 | ||||||
| 3,739,794 | ||||||||
Lodging – 0.4% | ||||||||
Lodging – 0.4% | ||||||||
Ashford Hospitality Trust, Inc.(a) | 2,110 | 21,754 | ||||||
CDL Hospitality Trusts | 29,500 | 45,101 | ||||||
DiamondRock Hospitality Co.(a) | 6,320 | 74,323 | ||||||
FelCor Lodging Trust, Inc.(a) | 3,990 | 30,204 | ||||||
Hersha Hospitality Trust | 6,990 | 45,924 | ||||||
Hospitality Properties Trust | 5,110 | 117,530 | ||||||
Host Hotels & Resorts, Inc. | 29,610 | 544,824 | ||||||
InnVest Real Estate Investment Trust | 3,700 | 26,544 | ||||||
Intercontinental Hotels Group PLC | 2,079 | 46,234 | ||||||
LaSalle Hotel Properties | 2,950 | 83,220 | ||||||
Orient-Express Hotels Ltd. – Class A(a) | 4,130 | 52,121 | ||||||
Strategic Hotels & Resorts, Inc.(a) | 6,200 | 40,300 | ||||||
Sunstone Hotel Investors, Inc.(a) | 4,880 | 52,411 | ||||||
Whitbread PLC | 1,438 | 41,663 | ||||||
Wyndham Worldwide Corp. | 600 | 18,768 | ||||||
| 1,240,921 | ||||||||
Total Common Stocks | 122,909,182 | |||||||
RIGHTS – 0.0% | ||||||||
Financials – 0.0% | ||||||||
Real Estate Management & Development – 0.0% | ||||||||
Bunnings Warehouse Property Trust(a) | 3,628 | 222 | ||||||
IMMOFINANZ AG(a) | 6,501 | 28,707 | ||||||
Wharf Holdings Ltd.(a) | 6,250 | 11,676 | ||||||
| 40,605 | ||||||||
Telecommunication Services – 0.0% | ||||||||
Diversified Telecommunication Services – 0.0% | ||||||||
TeliaSonera AB(a) | 9,382 | 463 | ||||||
Total Rights | 41,068 | |||||||
SHORT-TERM INVESTMENTS – 60.2% | ||||||||
Investment Companies – 59.8% | ||||||||
AllianceBernstein Fixed-Income Shares, Inc. – Government STIF Portfolio, 0.17%(b) | 207,440,623 | 207,440,623 | ||||||
| ALLIANCEBERNSTEIN POOLING PORTFOLIOS • | 205 |
Volatility Management—Portfolio of Investments
| Principal Amount (000) | U.S. $ Value | |||||||
U.S. Treasuries – 0.4% | ||||||||
U.S. Treasury Bill Zero Coupon, 4/28/11 | $ | 1,500 | $ | 1,499,555 | ||||
Total Short-Term Investments | 208,940,178 | |||||||
Total Investments – 95.7% | 331,890,428 | |||||||
Other assets less liabilities – 4.3% | 14,909,647 | |||||||
Net Assets – 100.0% | $ | 346,800,075 | ||||||
FUTURES CONTRACTS (see Note C)
| Type | Number of Contracts | Expiration Month | Original Value | Value at February 28, 2011 | Unrealized Appreciation/ (Depreciation) | |||||||||||||||
Purchased Contracts | ||||||||||||||||||||
ASX SPI 200 Index Futures | 3 | March 2011 | $ | 365,465 | $ | 368,519 | $ | 3,054 | ||||||||||||
Euro STOXX 50 Futures | 30 | March 2011 | 1,175,014 | 1,247,337 | 72,323 | |||||||||||||||
FTSE 100 Index Futures | 7 | March 2011 | 667,194 | 679,757 | 12,563 | |||||||||||||||
Hang Seng Index Futures | 1 | March 2011 | 146,847 | 149,576 | 2,729 | |||||||||||||||
MSCI EAFE Mini Index Futures | 310 | March 2011 | 25,263,645 | 27,250,550 | 1,986,905 | |||||||||||||||
OMX 30 Index Futures | 12 | March 2011 | 215,244 | 214,143 | (1,101 | ) | ||||||||||||||
Russell 2000 Mini Index Futures | 132 | March 2011 | 10,212,437 | 10,862,280 | 649,843 | |||||||||||||||
S&P 500 E Mini Index Futures | 2,027 | March 2011 | 125,321,392 | 134,400,235 | 9,078,843 | |||||||||||||||
S&P Midcap 400 E Mini Index Futures | 247 | March 2011 | 22,136,523 | 23,857,730 | 1,721,207 | |||||||||||||||
Topix Index Futures | 6 | March 2011 | 657,796 | 697,512 | 39,716 | |||||||||||||||
| $ | 13,566,082 | |||||||||||||||||||
FORWARD CURRENCY EXCHANGE CONTRACTS (see Note C)
| Counterparty & Description | Contract Amount (000) | U.S. $ Value on Origination Date | U.S. $ Value at February 28, 2011 | Unrealized Appreciation/ (Depreciation) | ||||||||||||
Buy Contracts: | ||||||||||||||||
Calyon: | ||||||||||||||||
Euro settling 3/15/11 | 5,404 | $ | 7,230,822 | $ | 7,456,035 | $ | 225,213 | |||||||||
Credit Suisse London Branch (GFX): | ||||||||||||||||
Euro settling 3/15/11 | 2,575 | 3,508,412 | 3,552,793 | 44,381 | ||||||||||||
Euro settling 3/15/11 | 2,779 | 3,805,813 | 3,834,257 | 28,444 | ||||||||||||
State Street Bank and Trust Co.: | ||||||||||||||||
Australian Dollar settling 3/15/11 | 375 | 367,429 | 381,196 | 13,767 | ||||||||||||
| 206 | • ALLIANCEBERNSTEIN POOLING PORTFOLIOS |
Volatility Management—Portfolio of Investments
| Counterparty & Description | Contract Amount (000) | U.S. $ Value on Origination Date | U.S. $ Value at February 28, 2011 | Unrealized Appreciation/ (Depreciation) | ||||||||||||
Great British Pound settling 3/15/11 | 492 | $ | 767,185 | $ | 799,736 | $ | 32,551 | |||||||||
Japanese Yen settling 3/15/11 | 66,386 | 788,995 | 811,579 | 22,584 | ||||||||||||
Swiss Franc settling 3/15/11 | 352 | 363,659 | 378,903 | 15,244 | ||||||||||||
Sale Contracts: | ||||||||||||||||
Royal Bank of Scotland PLC: | ||||||||||||||||
Euro settling 3/15/11 | 21,350 | 29,109,444 | 29,457,135 | (347,691 | ) | |||||||||||
UBS AG: | ||||||||||||||||
Euro settling 6/15/11 | 591 | 806,721 | 814,342 | (7,621 | ) | |||||||||||
TOTAL RETURN SWAP CONTRACTS ON INDICES (see Note C)
| Receive Total Return on Reference Index | Index | # of Shares or Units | Floating Rate | Notional Amount (000) | Maturity Date | Counterparty | Unrealized Appreciation/ (Depreciation) | |||||||||||||||||
Receive | MSCI Daily TR Gross EAFE | 3,007 | 1-Month USD-LIBOR-BBA Plus a specified spread* | $ | 16,447 | 4/15/11 | Citibank | $ | 172,035 | |||||||||||||||
Receive | Russell 2000 Total Return index | 1,138 | 1-Month USD-LIBOR-BBA Less a specified spread* | 4,172 | 5/16/11 | Citibank | 19,273 | |||||||||||||||||
Receive | Russell 2000 Total Return index | 398 | 1-Month USD-LIBOR-BBA Less a specified spread* | 1,459 | 4/18/11 | | Morgan Stanley Capital Services | | 6,774 | |||||||||||||||
Receive | Russell 2000 Total Return index | 591 | 1-Month USD-LIBOR-BBA Less a specified spread* | 2,167 | 6/15/11 | | Morgan Stanley Capital Services | | 9,976 | |||||||||||||||
| $ | 208,058 | |||||||||||||||||||||||
| * | BBA – British Bankers’ Association |
| (a) | Non-income producing security. |
| (b) | Investment in affiliated money market mutual fund. The rate shown represents the 7-day yield as of period end. |
Glossary:
| FDR | – Fiduciary Depositary Receipt |
| LIBOR | – London Interbank Offered Rates |
| REG | – Registered Shares |
| REIT | – Real Estate Investment Trust |
See notes to financial statements.
| ALLIANCEBERNSTEIN POOLING PORTFOLIOS • | 207 |
Volatility Management—Portfolio of Investments
STATEMENT OF ASSETS & LIABILITIES
February 28, 2011 (unaudited)
| U.S. Value | U.S. Large Cap Growth | International Value | ||||||||||
| Assets | ||||||||||||
Investments in securities, at value | ||||||||||||
Unaffiliated issuers (cost $1,863,722,167, $1,757,909,012 and $1,046,995,767, respectively) | $ | 2,268,669,835 | $ | 2,307,452,525 | $ | 1,189,425,297 | ||||||
Affiliated issuers (cost $36,476,008, $20,738,048 and $8,099,845, respectively) | 36,476,008 | 20,738,048 | 8,099,845 | |||||||||
Cash(a) | – 0 | – | – 0 | – | 276,802 | |||||||
Foreign currencies, at value (cost $0, $0 and $7,054,511, respectively) | – 0 | – | – 0 | – | 7,119,887 | |||||||
Receivable for investment securities sold and foreign currency transactions | 31,591,574 | 24,172,863 | 4,835,990 | |||||||||
Dividends receivable | 6,012,949 | 3,136,411 | �� | 3,616,434 | ||||||||
Receivable for shares of beneficial interest sold | 92,575 | 27,884 | 46,473 | |||||||||
Unrealized appreciation of forward currency exchange contracts | – 0 | – | – 0 | – | 10,663,785 | |||||||
Receivable for variation margin on futures contracts | – 0 | – | – 0 | – | 94,105 | |||||||
Total assets | 2,342,842,941 | 2,355,527,731 | 1,224,178,618 | |||||||||
| Liabilities | ||||||||||||
Payable for investment securities purchased and foreign currency transactions | 8,059,556 | 28,857,753 | 2,376,157 | |||||||||
Payable for shares of beneficial interest redeemed | 751,398 | 2,285,536 | 183,064 | |||||||||
Unrealized depreciation of forward currency exchange contracts | – 0 | – | – 0 | – | 8,300,023 | |||||||
Accrued expenses | 79,946 | 82,863 | 76,150 | |||||||||
Total liabilities | 8,890,900 | 31,226,152 | 10,935,394 | |||||||||
Net Assets | $ | 2,333,952,041 | $ | 2,324,301,579 | $ | 1,213,243,224 | ||||||
| Composition of Net Assets | ||||||||||||
Paid-in capital | $ | 2,723,310,909 | $ | 2,128,716,661 | $ | 1,457,272,469 | ||||||
Undistributed net investment income | 7,889,516 | 6,068,080 | 4,938,069 | |||||||||
Accumulated net realized loss on investment and foreign currency transactions | (802,196,052 | ) | (360,026,675 | ) | (394,433,542 | ) | ||||||
Net unrealized appreciation on investments and foreign currency denominated assets and liabilities | 404,947,668 | 549,543,513 | 145,466,228 | |||||||||
Net Assets | $ | 2,333,952,041 | $ | 2,324,301,579 | $ | 1,213,243,224 | ||||||
Shares of beneficial interest outstanding—unlimited shares authorized, without par value | 256,427,735 | 194,314,205 | 140,479,554 | |||||||||
Net Asset Value | $ | 9.10 | $ | 11.96 | $ | 8.64 | ||||||
| (a) | An amount of $276,802 has been segregated to collateralize margin requirements for open futures contracts outstanding at February 28, 2011 for the International Value Portfolio. |
See notes to financial statements.
| 208 | • ALLIANCEBERNSTEIN POOLING PORTFOLIOS |
Statement of Assets & Liabilities
| International Growth | Short Duration Bond | Intermediate Duration Bond | ||||||||||
| Assets | ||||||||||||
Investments in securities, at value | ||||||||||||
Unaffiliated issuers (cost $1,009,539,757, $1,340,389,947 and $1,343,676,697, respectively) | $ | 1,135,398,217 | $ | 1,325,954,166 | $ | 1,375,564,706 | ||||||
Affiliated issuers (cost $8,460,708, $8,982,215 and $56,955,913, respectively) | 8,460,708 | 8,982,215 | 56,955,913 | |||||||||
Cash(a) | – 0 | – | 610,115 | 225,915 | ||||||||
Foreign currencies, at value (cost $7,676,239, $0 and $0, respectively) | 7,707,531 | – 0 | – | – 0 | – | |||||||
Unrealized appreciation of forward currency exchange contracts | 17,129,725 | – 0 | – | 79,980 | ||||||||
Receivable for investment securities sold and foreign currency transactions | �� | 15,556,826 | 88,073,165 | 5,678 | ||||||||
Dividends and interest receivable | 1,713,083 | 5,434,731 | 11,370,402 | |||||||||
Receivable for shares of beneficial interest sold | 232,626 | 164,820 | 121,289 | |||||||||
Receivable for variation margin on futures contracts | – 0 | – | 200,970 | – 0 | – | |||||||
Unrealized appreciation on interest rate swap contracts | – 0 | – | – 0 | – | 317,550 | |||||||
Other asset (see Note F) | – 0 | – | – 0 | – | 798,168 | |||||||
Total assets | 1,186,198,716 | 1,429,420,182 | 1,445,439,601 | |||||||||
| Liabilities | ||||||||||||
Due to custodian | – 0 | – | 83,405 | – 0 | – | |||||||
Payable for investment securities purchased | 16,620,713 | 82,175,391 | 22,788,877 | |||||||||
Unrealized depreciation of forward currency exchange contracts | 14,564,980 | – 0 | – | – 0 | – | |||||||
Payable for shares of beneficial interest redeemed | 113,027 | 303,953 | 551,505 | |||||||||
TALF loan payable | – 0 | – | 28,406,603 | 16,226,603 | ||||||||
Interest expense payable | – 0 | – | 13,791 | 7,878 | ||||||||
Collateral received on swap contracts | – 0 | – | – 0 | – | 670,000 | |||||||
Accrued expenses | 60,995 | 58,890 | 59,708 | |||||||||
Total liabilities | 31,359,715 | 111,042,033 | 40,304,571 | |||||||||
Net Assets | $ | 1,154,839,001 | $ | 1,318,378,149 | $ | 1,405,135,030 | ||||||
| Composition of Net Assets | ||||||||||||
Paid-in capital | $ | 1,399,309,243 | $ | 1,380,282,337 | $ | 1,366,288,748 | ||||||
Undistributed/(distributions in excess of) net investment income | (1,287,468 | ) | 4,235,173 | 3,806,442 | ||||||||
Accumulated net realized gain (loss) on investment and foreign currency transactions | (371,752,975 | ) | (52,000,548 | ) | 2,288,519 | |||||||
Net unrealized appreciation / (depreciation) on investments and foreign currency denominated assets and liabilities and other assets | 128,570,201 | (14,138,813 | ) | 32,751,321 | ||||||||
Net Assets | $ | 1,154,839,001 | $ | 1,318,378,149 | $ | 1,405,135,030 | ||||||
Shares of beneficial interest outstanding—unlimited shares authorized, without par value | 127,757,378 | 137,715,104 | 133,093,413 | |||||||||
Net Asset Value | $ | 9.04 | $ | 9.57 | $ | 10.56 | ||||||
| (a) | An amount equivalent to $610,115 has been segregated to collateralize margin requirements for open futures contracts outstanding at February 28, 2011 for the Short Duration Bond Portfolio. |
See notes to financial statements.
| ALLIANCEBERNSTEIN POOLING PORTFOLIOS • | 209 |
Statement of Assets & Liabilities
| Bond Inflation Protection | High-Yield | Small-Mid Cap Value | ||||||||||
| Assets | ||||||||||||
Investments in securities, at value | ||||||||||||
Unaffiliated issuers (cost $957,797,780, $474,207,990 and $468,359,453, respectively) | $ | 1,015,736,846 | $ | 520,353,682 | $ | 610,297,882 | ||||||
Affiliated issuers (cost $1,321,471, $5,802,841 and $4,769,678, respectively) | 1,321,471 | 5,802,841 | 4,769,678 | |||||||||
Cash(a) | 851,510 | 68,817 | – 0 | – | ||||||||
Foreign currencies, at value (cost $0, $192,921 and $0, respectively) | – 0 | – | 195,765 | – 0 | – | |||||||
Interest and dividends receivable | 5,248,660 | 9,756,005 | 391,277 | |||||||||
Unrealized appreciation on credit default swap contracts | 1,574,011 | 75,303 | – 0 | – | ||||||||
Receivable for investment securities sold | 1,136,877 | 2,719,150 | 9,123,179 | |||||||||
Unrealized appreciation of forward currency exchange contracts | 486,187 | 2,771 | – 0 | – | ||||||||
Premium paid on credit default swap contracts | 399,004 | – 0 | – | – 0 | – | |||||||
Unrealized appreciation on interest rate swap contracts | 162,187 | 221,779 | – 0 | – | ||||||||
Receivable for shares of beneficial interest sold | 38,594 | – 0 | – | 12,569 | ||||||||
Total assets | 1,026,955,347 | 539,196,113 | 624,594,585 | |||||||||
| Liabilities | ||||||||||||
Payable reverse repurchase agreements | 289,980,498 | – 0 | – | – 0 | – | |||||||
Payable for investment securities purchased | 7,760,470 | 3,900,967 | 5,784,356 | |||||||||
Unrealized depreciation of forward currency exchange contracts | 2,547,940 | 1,043,788 | – 0 | – | ||||||||
Payable for shares of beneficial interest redeemed | 995,171 | 97,404 | 941,539 | |||||||||
Collateral received on swap contracts | 520,000 | – 0 | – | – 0 | – | |||||||
Payable for variation margin on futures contracts | 128,400 | – 0 | – | – 0 | – | |||||||
Unrealized depreciation on interest rate swap contracts | – 0 | – | 287,393 | – 0 | – | |||||||
Unrealized depreciation on credit default swap contracts | – 0 | – | 153,439 | – 0 | – | |||||||
Premium received on credit default swap contracts | – 0 | – | 81,883 | – 0 | – | |||||||
Accrued expenses | 65,891 | 54,163 | 53,146 | |||||||||
Total liabilities | 301,998,370 | 5,619,037 | 6,779,041 | |||||||||
Net Assets | $ | 724,956,977 | $ | 533,577,076 | $ | 617,815,544 | ||||||
| Composition of Net Assets | ||||||||||||
Paid-in capital | $ | 659,373,614 | $ | 540,066,653 | $ | 523,148,725 | ||||||
Undistributed net investment income | 9,273,262 | 2,734,746 | 3,923,950 | |||||||||
Accumulated net realized loss on investment and foreign currency transactions | (1,099,437 | ) | (54,152,351 | ) | (51,195,560 | ) | ||||||
Net unrealized appreciation on investments and foreign currency denominated assets and liabilities | 57,409,538 | 44,928,028 | 141,938,429 | |||||||||
Net Assets | $ | 724,956,977 | $ | 533,577,076 | $ | 617,815,544 | ||||||
Shares of beneficial interest outstanding — unlimited shares authorized, without par value | 67,016,297 | 51,697,597 | 50,185,783 | |||||||||
Net Asset Value | $ | 10.82 | $ | 10.32 | $ | 12.31 | ||||||
| (a) | Amounts of $851,510 and $53,959 have been segregated to collateralize margin requirements for open futures contracts outstanding at February 28, 2011 for the Bond Inflation Protection Portfolio and High-Yield Portfolio, respectively. |
See notes to financial statements.
| 210 | • ALLIANCEBERNSTEIN POOLING PORTFOLIOS |
Statement of Assets & Liabilities
| Small-Mid Cap Growth | Multi-Asset Real Return* | Volatility Management | ||||||||||
| Assets | ||||||||||||
Investments in securities, at value | ||||||||||||
Unaffiliated issuers (cost $405,194,240, $911,034,332 and $107,576,744, respectively) | $ | 612,713,204 | $ | 1,018,343,791 | $ | 124,449,805 | ||||||
Affiliated issuers (cost $10,352,473, $7,324,653 and $207,440,623, respectively) | 10,352,473 | 7,324,653 | 207,440,623 | |||||||||
Cash(a) | – 0 | – | 7,886,457 | 13,861,801 | ||||||||
Foreign currencies, at value (cost $0, $1,934,219 and $219,158, respectively) | – 0 | – | 1,950,698 | 221,464 | ||||||||
Receivable for investment securities sold | 2,903,915 | 7,789,638 | 41,780 | |||||||||
Dividends and interest receivable | 72,743 | 2,900,767 | 255,747 | |||||||||
Receivable for shares of beneficial interest sold | 832 | 1,040 | – 0 | – | ||||||||
Unrealized appreciation on total return swap contracts | – 0 | – | 8,971,256 | 208,058 | ||||||||
Deferred offering expenses | – 0 | – | 29,624 | 15,700 | ||||||||
Receivable for variation margin on futures contracts | – 0 | – | 405 | 1,133,849 | ||||||||
Unrealized appreciation of forward currency exchange contracts | – 0 | – | – 0 | – | 382,184 | |||||||
Receivable due from Adviser | – 0 | – | – 0 | – | 17,093 | |||||||
Total assets | 626,043,167 | 1,055,198,329 | 348,028,104 | |||||||||
| Liabilities | ||||||||||||
Payable for investment securities purchased | 3,669,812 | 2,112,589 | 47,415 | |||||||||
Payable for shares of beneficial interest redeemed | 2,078,020 | 2,875,687 | 726,649 | |||||||||
Collateral received on swap contracts | – 0 | – | 2,420,000 | – 0 | – | |||||||
Offering expenses payable | – 0 | – | 35,000 | 16,889 | ||||||||
Unrealized depreciation on total return swap contracts | – 0 | – | 27,359 | – 0 | – | |||||||
Unrealized depreciation of forward currency exchange contracts | – 0 | – | – 0 | – | 355,312 | |||||||
Accrued expenses | 57,022 | 79,334 | 81,764 | |||||||||
Total liabilities | 5,804,854 | 7,549,969 | 1,228,029 | |||||||||
Net Assets | $ | 620,238,313 | $ | 1,047,648,360 | $ | 346,800,075 | ||||||
| Composition of Net Assets | ||||||||||||
Paid-in capital | $ | 384,967,309 | $ | 1,213,798,401 | $ | 304,511,115 | ||||||
Undistributed/(distributions in excess of) net investment income | 1,201,224 | (55,728,005 | ) | (278,201 | ) | |||||||
Accumulated net realized gain (loss) on investment and foreign currency transactions | 26,550,816 | (226,009,241 | ) | 11,889,044 | ||||||||
Net unrealized appreciation on investments and foreign currency denominated assets and liabilities | 207,518,964 | 115,587,205 | 30,678,117 | |||||||||
Net Assets | $ | 620,238,313 | $ | 1,047,648,360 | $ | 346,800,075 | ||||||
Shares of beneficial interest outstanding—unlimited shares authorized, without par value | 35,294,629 | 108,257,785 | 31,361,483 | |||||||||
Net Asset Value | $ | 17.57 | $ | 9.68 | $ | 11.06 | ||||||
| (a) | Amounts of $2,873,203 and $13,861,702 have been segregated to collateralize margin requirements for open futures contracts outstanding at February 28, 2011 for the Multi-Asset Real Return Portfolio and Volatility Management Portfolio, respectively. |
| * | Consolidated. |
See notes to financial statements.
| ALLIANCEBERNSTEIN POOLING PORTFOLIOS • | 211 |
Statement of Assets & Liabilities
STATEMENT OF OPERATIONS
Six Months Ended February 28, 2011 (unaudited)
| U.S. Value | U.S. Large Cap Growth | International Value | ||||||||||
| Investment Income | ||||||||||||
Dividends | ||||||||||||
Unaffiliated issuers (net of foreign taxes withheld of $21,524, $51,699 and $774,632, respectively) | $ | 23,285,671 | $ | 12,580,034 | $ | 10,629,423 | ||||||
Affiliated issuers | 31,009 | 2,034 | 11,261 | |||||||||
Interest | – 0 | – | – 0 | – | 3,008 | |||||||
Total income | 23,316,680 | 12,582,068 | 10,643,692 | |||||||||
| Expenses | ||||||||||||
Custodian | 83,037 | 106,040 | 126,075 | |||||||||
Audit | 19,147 | 18,799 | 18,892 | |||||||||
Legal | 18,480 | 22,305 | 17,585 | |||||||||
Printing | 7,378 | 7,459 | 5,879 | |||||||||
Trustees’ fees | 2,332 | 2,170 | 2,192 | |||||||||
Registration fees | 828 | 1,050 | 1,864 | |||||||||
Miscellaneous | 8,002 | 11,916 | 20,203 | |||||||||
Total expenses | 139,204 | 169,739 | 192,690 | |||||||||
Net investment income | 23,177,476 | 12,412,329 | 10,451,002 | |||||||||
| Realized and Unrealized Gain on Investment and Foreign Currency Transactions | ||||||||||||
Net realized gain on: | ||||||||||||
Investment transactions | 96,616,248 | 176,256,946 | 34,449,225 | |||||||||
Futures contracts | – 0 | – | – 0 | – | 254,582 | |||||||
Foreign currency transactions | 1,049 | 1,743 | 3,428,835 | |||||||||
Net change in unrealized appreciation/depreciation of: | ||||||||||||
Investments | 418,740,601 | 454,002,998 | 215,009,467 | |||||||||
Futures contracts | – 0 | – | – 0 | – | 868,105 | |||||||
Foreign currency denominated assets and liabilities | – 0 | – | – 0 | – | 114,194 | |||||||
Net gain on investment and foreign currency transactions | 515,357,898 | 630,261,687 | 254,124,408 | |||||||||
Net Increase in Net | $ | 538,535,374 | $ | 642,674,016 | $ | 264,575,410 | ||||||
See notes to financial statements.
| 212 | • ALLIANCEBERNSTEIN POOLING PORTFOLIOS |
Statement of Operations
| International Growth | Short Duration Bond | Intermediate Duration Bond | ||||||||||
| Investment Income | ||||||||||||
Dividends | ||||||||||||
Unaffiliated issuers (net of foreign taxes withheld of $269,047, $0 and $0, respectively) | $ | 7,422,579 | $ | – 0 | – | $ | – 0 | – | ||||
Affiliated issuers | 6,538 | 20,881 | 80,631 | |||||||||
Interest | 541 | 15,199,733 | 28,089,863 | |||||||||
Total income | 7,429,658 | 15,220,614 | 28,170,494 | |||||||||
| Expenses | ||||||||||||
Custodian | 142,420 | 90,319 | 101,928 | |||||||||
Audit | 20,130 | 21,358 | 20,843 | |||||||||
Legal | 18,478 | 15,747 | 17,552 | |||||||||
Printing | 5,720 | 5,967 | 5,093 | |||||||||
Trustees’ fees | 2,312 | 2,353 | 2,176 | |||||||||
Registration fees | – 0 | – | 3,982 | 1,033 | ||||||||
Miscellaneous | 26,164 | 6,697 | 3,930 | |||||||||
Total expenses before interest expense | 215,224 | 146,423 | 152,555 | |||||||||
Interest expense | – 0 | – | 185,840 | 109,429 | ||||||||
Total expenses | 215,224 | 332,263 | 261,984 | |||||||||
Net investment income | 7,214,434 | 14,888,351 | 27,908,510 | |||||||||
| Realized and Unrealized Gain (Loss) on Investment and Foreign Currency Transactions | ||||||||||||
Net realized gain (loss) on: | ||||||||||||
Investment transactions | 61,108,365 | (a) | (4,018,106 | ) | 6,643,484 | |||||||
Futures contracts | (202,405 | ) | (17,044 | ) | – 0 – | |||||||
Swap contracts | – 0 | – | – 0 | – | 55,509 | |||||||
Foreign currency transactions | (6,085,712 | ) | – 0 | – | (287,853 | ) | ||||||
Net change in unrealized appreciation/depreciation of: | ||||||||||||
Investments | 78,225,555 | (b) | 4,319,325 | (30,413,201 | ) | |||||||
Futures contracts | 31,086 | 392,269 | – 0 – | |||||||||
Swap contracts | – 0 | – | – 0 | – | 317,550 | |||||||
Foreign currency denominated assets and liabilities and other assets | 4,569,131 | – 0 | – | 545,762 | ||||||||
Net gain (loss) on investment and foreign currency transactions | 137,646,020 | 676,444 | (23,138,749 | ) | ||||||||
Net Increase in Net Assets from Operations | $ | 144,860,454 | $ | 15,564,795 | $ | 4,769,761 | ||||||
| (a) | Net of foreign capital gains taxes of $267,791. |
| (b) | Net of decrease in accrued foreign capital gains taxes of $430,113. |
See notes to financial statements.
| ALLIANCEBERNSTEIN POOLING PORTFOLIOS • | 213 |
Statement of Operations
| Bond Inflation Protection | High-Yield | Small-Mid Cap Value | ||||||||||
| Investment Income | ||||||||||||
Interest | $ | 14,014,269 | $ | 22,429,802 | $ | – 0 | – | |||||
Dividends | ||||||||||||
Unaffiliated issuers | – 0 | – | 173,658 | 4,371,472 | ||||||||
Affiliated issuers | 3,904 | 3,308 | 7,726 | |||||||||
Total income | 14,018,173 | 22,606,768 | 4,379,198 | |||||||||
| Expenses | ||||||||||||
Custodian | 72,698 | 81,812 | 55,347 | |||||||||
Legal | 24,448 | 16,652 | 17,298 | |||||||||
Audit | 20,815 | 30,046 | 18,483 | |||||||||
Printing | 4,877 | 4,338 | 4,984 | |||||||||
Registration fees | 2,212 | 543 | – 0 | – | ||||||||
Trustees’ fees | 2,172 | 2,172 | 2,275 | |||||||||
Miscellaneous | 5,920 | 2,353 | 673 | |||||||||
Total expenses | 133,142 | 137,916 | 99,060 | |||||||||
Interest expense | 313,985 | – 0 | – | – 0 | – | |||||||
Total expenses | 447,127 | 137,916 | 99,060 | |||||||||
Net investment income | 13,571,046 | 22,468,852 | 4,280,138 | |||||||||
| Realized and Unrealized Gain (Loss) on Investment and Foreign Currency Transactions | ||||||||||||
Net realized gain (loss) on: | ||||||||||||
Investment transactions | 2,516,907 | 11,486,344 | 38,877,755 | |||||||||
Futures contracts | 456,537 | – 0 | – | – 0 | – | |||||||
Swap contracts | 912,526 | (31,125 | ) | – 0 | – | |||||||
Foreign currency transactions | (3,319,317 | ) | (1,078,399 | ) | – 0 | – | ||||||
Net change in unrealized appreciation/depreciation of: | ||||||||||||
Investments | 11,885,240 | 18,602,493 | 133,186,565 | |||||||||
Futures contracts | (105,738 | ) | (57,434 | ) | – 0 | – | ||||||
Swap contracts | 3,209,666 | (108,796 | ) | – 0 | – | |||||||
Foreign currency denominated assets and liabilities | (993,460 | ) | (1,005,594 | ) | – 0 | – | ||||||
Net gain on investment and foreign currency transactions | 14,562,361 | 27,807,489 | 172,064,320 | |||||||||
Net Increase in Net Assets from Operations | $ | 28,133,407 | $ | 50,276,341 | $ | 176,344,458 | ||||||
See notes to financial statements.
| 214 | • ALLIANCEBERNSTEIN POOLING PORTFOLIOS |
Statement of Operations
| Small-Mid Cap Growth | Multi-Asset Real Return* | Volatility Management | ||||||||||
| Investment Income | ||||||||||||
Dividends | ||||||||||||
Unaffiliated issuers (net of foreign taxes withheld of $0, $655,517 and $47,823, respectively) | $ | 1,508,873 | $ | 12,271,080 | $ | 1,379,488 | ||||||
Affiliated issuers | 4,745 | 7,151 | 27,430 | |||||||||
Interest | – 0 | – | 73,087 | 85,836 | ||||||||
Total income | 1,513,618 | 12,351,318 | 1,492,754 | |||||||||
| Expenses | ||||||||||||
Custodian | 65,811 | 112,306 | 128,260 | |||||||||
Legal | 20,545 | 22,631 | 17,606 | |||||||||
Audit | 18,233 | 13,593 | 19,932 | |||||||||
Printing | 4,914 | 5,534 | 5,533 | |||||||||
Trustees’ fees | 2,467 | 2,361 | 2,046 | |||||||||
Registration fees | 1,026 | – 0 – | 1,152 | |||||||||
Amortization of offering expense | – 0 | – | 5,376 | 57,994 | ||||||||
Transfer agency | 0 | 1,848 | – 0 | – | ||||||||
Miscellaneous | 2,912 | 21,954 | 40,800 | |||||||||
Total expenses | 115,908 | 185,603 | 273,323 | |||||||||
Less: expenses waived and reimbursed by the Adviser (see Note B) | – 0 | – | – 0 | – | (25,579 | ) | ||||||
Net expenses | 115,908 | 185,603 | 247,744 | |||||||||
Net investment income | 1,397,710 | 12,165,715 | 1,245,010 | |||||||||
| Realized and Unrealized Gain (Loss) on Investment and Foreign Currency Transactions | ||||||||||||
Net realized gain (loss) on: | ||||||||||||
Investment transactions | 98,189,803 | 216,010,795 | 2,171,313 | |||||||||
Futures contracts | – 0 | – | (1,205,693 | ) | 23,497,522 | |||||||
Swap contracts | – 0 | – | 7,916,431 | 5,421,686 | ||||||||
Foreign currency transactions | – 0 | – | 6,741,279 | 55,592 | ||||||||
Net change in unrealized appreciation/depreciation of: Investments | 137,410,757 | (46,980,336 | ) | 17,920,267 | ||||||||
Futures contracts | – 0 | – | (675,601 | ) | 20,541,010 | |||||||
Swap contracts | – 0 | – | 8,943,897 | 563,173 | ||||||||
Foreign currency denominated assets and liabilities | – 0 | – | (3,609,082 | ) | 30,772 | |||||||
Net gain on investment and foreign currency transactions | 235,600,560 | 187,141,690 | 70,201,335 | |||||||||
Net Increase in Net Assets from Operations | $ | 236,998,270 | $ | 199,307,405 | $ | 71,446,345 | ||||||
| * | Consolidated. |
See notes to financial statements.
| ALLIANCEBERNSTEIN POOLING PORTFOLIOS • | 215 |
Statement of Operations
STATEMENT OF CHANGES IN NET ASSETS
| U.S. Value | ||||||||
| Six Months Ended February 28, 2011 (unaudited) | Year Ended August 31, 2010 | |||||||
| Increase (Decrease) in Net Assets from Operations | ||||||||
Net investment income | $ | 23,177,476 | $ | 45,262,410 | ||||
Net realized gain (loss) on investment transactions | 96,617,297 | (18,410,399 | ) | |||||
Net change in unrealized appreciation/depreciation of investments | 418,740,601 | 29,326,629 | ||||||
Net increase in net assets from operations | 538,535,374 | 56,178,640 | ||||||
| Dividends to Shareholders from | ||||||||
Net investment income | (23,922,204 | ) | (46,431,849 | ) | ||||
| Transactions in Shares of Beneficial Interest | ||||||||
Net decrease | (118,489,094 | ) | (163,382,517 | ) | ||||
Total increase (decrease) | 396,124,076 | (153,635,726 | ) | |||||
| Net Assets | ||||||||
Beginning of period | 1,937,827,965 | 2,091,463,691 | ||||||
End of period (including undistributed net investment income of $7,889,516 and $8,634,244, respectively) | $ | 2,333,952,041 | $ | 1,937,827,965 | ||||
See notes to financial statements.
| 216 | • ALLIANCEBERNSTEIN POOLING PORTFOLIOS |
Statement of Changes in Net Assets
| U.S. Large Cap Growth | ||||||||
| Six Months Ended February 28, 2011 (unaudited) | Year Ended August 31, 2010 | |||||||
| Increase (Decrease) in Net Assets from Operations | ||||||||
Net investment income | $ | 12,412,329 | $ | 24,279,434 | ||||
Net realized gain on investment and foreign currency transactions | 176,258,689 | 131,410,475 | ||||||
Net change in unrealized appreciation/depreciation of investments | 454,002,998 | (182,394,282 | ) | |||||
Net increase (decrease) in net assets from operations | 642,674,016 | (26,704,373 | ) | |||||
| Dividends to Shareholders from | ||||||||
Net investment income | (10,497,617 | ) | (24,398,886 | ) | ||||
| Transactions in Shares of Beneficial Interest | ||||||||
Net decrease | (231,495,340 | ) | (103,143,634 | ) | ||||
Total increase (decrease) | 400,681,059 | (154,246,893 | ) | |||||
| Net Assets | ||||||||
Beginning of period | 1,923,620,520 | 2,077,867,413 | ||||||
End of period (including undistributed net investment income of $6,068,080 and $4,153,368, respectively) | $ | 2,324,301,579 | $ | 1,923,620,520 | ||||
See notes to financial statements.
| ALLIANCEBERNSTEIN POOLING PORTFOLIOS • | 217 |
Statement of Changes in Net Assets
| International Value | ||||||||
| Six Months Ended February 28, 2011 (unaudited) | Year Ended August 31, 2010 | |||||||
| Increase (Decrease) in Net Assets from Operations | ||||||||
Net investment income | $ | 10,451,002 | $ | 30,035,342 | ||||
Net realized gain (loss) on investment and foreign currency transactions | 38,132,642 | (24,955,677 | ) | |||||
Net change in unrealized appreciation/depreciation of investments and foreign currency denominated assets and liabilities | 215,991,766 | (53,326,816 | ) | |||||
Net increase (decrease) in net assets from operations | 264,575,410 | (48,247,151 | ) | |||||
| Dividends to Shareholders from | ||||||||
Net investment income | (16,410,875 | ) | (26,785,904 | ) | ||||
| Transactions in Shares of Beneficial Interest | ||||||||
Net decrease | (47,994,012 | ) | (39,246,088 | ) | ||||
Total increase (decrease) | 200,170,523 | (114,279,143 | ) | |||||
| Net Assets | ||||||||
Beginning of period | 1,013,072,701 | 1,127,351,844 | ||||||
End of period (including undistributed net investment income of $4,938,069 and $10,897,942, respectively) | $ | 1,213,243,224 | $ | 1,013,072,701 | ||||
See notes to financial statements.
| 218 | • ALLIANCEBERNSTEIN POOLING PORTFOLIOS |
Statement of Changes in Net Assets
| International Growth | ||||||||
| Six Months Ended February 28, 2011 (unaudited) | Year Ended August 31, 2010 | |||||||
| Increase (Decrease) in Net Assets from Operations | ||||||||
Net investment income | $ | 7,214,434 | $ | 25,266,124 | ||||
Net realized gain on investment and foreign currency transactions | 54,820,248 | 90,079,372 | ||||||
Net change in unrealized appreciation/depreciation of investments and foreign currency denominated assets and liabilities | 82,825,772 | (64,066,383 | ) | |||||
Contributions from Adviser (see Note B) | – 0 | – | 2,055 | |||||
Net increase in net assets from operations | 144,860,454 | 51,281,168 | ||||||
| Dividends to Shareholders from | ||||||||
Net investment income | (35,308,481 | ) | (37,417,914 | ) | ||||
| Transactions in Shares of Beneficial Interest | ||||||||
Net increase (decrease) | 8,037,874 | (54,395,322 | ) | |||||
Total increase (decrease) | 117,589,847 | (40,532,068 | ) | |||||
| Net Assets | ||||||||
Beginning of period | 1,037,249,154 | 1,077,781,222 | ||||||
End of period (including distributions in excess of net investment income of ($1,287,468) and undistributed net investment income of $26,806,579, respectively) | $ | 1,154,839,001 | $ | 1,037,249,154 | ||||
See notes to financial statements.
| ALLIANCEBERNSTEIN POOLING PORTFOLIOS • | 219 |
Statement of Changes in Net Assets
| Short Duration Bond | ||||||||
| Six Months Ended February 28, 2011 (unaudited) | Year Ended August 31, 2010 | |||||||
| Increase (Decrease) in Net Assets from Operations | ||||||||
Net investment income | $ | 14,888,351 | $ | 31,831,659 | ||||
Net realized loss on investment transactions | (4,035,150 | ) | (7,448,381 | ) | ||||
Net change in unrealized appreciation/depreciation of investments | 4,711,594 | 48,207,366 | ||||||
Net increase in net assets from operations | 15,564,795 | 72,590,644 | ||||||
| Dividends to Shareholders from | ||||||||
Net investment income | (13,557,200 | ) | (34,462,838 | ) | ||||
| Transactions in Shares of Beneficial Interest | ||||||||
Net increase | 98,359,533 | 72,283,238 | ||||||
Total increase | 100,367,128 | 110,411,044 | ||||||
| Net Assets | ||||||||
Beginning of period | 1,218,011,021 | 1,107,599,977 | ||||||
End of period (including undistributed net investment income of $4,235,173 and $2,904,022, respectively) | $ | 1,318,378,149 | $ | 1,218,011,021 | ||||
See notes to financial statements.
| 220 | • ALLIANCEBERNSTEIN POOLING PORTFOLIOS |
Statement of Changes in Net Assets
| Intermediate Duration Bond | ||||||||
| Six Months Ended February 28, 2011 (unaudited) | Year Ended August 31, 2010 | |||||||
| Increase (Decrease) in Net Assets from Operations | ||||||||
Net investment income | $ | 27,908,510 | $ | 59,815,935 | ||||
Net realized gain on investment and foreign currency transactions | 6,411,140 | 22,137,463 | ||||||
Net change in unrealized appreciation/depreciation of investments and foreign currency denominated assets and liabilities and other assets | (29,549,889 | ) | 82,778,260 | |||||
Net increase in net assets from operations | 4,769,761 | 164,731,658 | ||||||
| Dividends and Distributions to Shareholders from | ||||||||
Net investment income | (29,798,323 | ) | (59,461,645 | ) | ||||
Net realized gain on investment transactions | (3,197,066 | ) | – 0 | – | ||||
| Transactions in Shares of Beneficial Interest | ||||||||
Net increase (decrease) | 79,937,913 | (32,598,755 | ) | |||||
Total increase | 51,712,285 | 72,671,258 | ||||||
| Net Assets | ||||||||
Beginning of period | 1,353,422,745 | 1,280,751,487 | ||||||
End of period (including undistributed net investment income of $3,806,442 and $5,696,255, respectively) | $ | 1,405,135,030 | $ | 1,353,422,745 | ||||
See notes to financial statements.
| ALLIANCEBERNSTEIN POOLING PORTFOLIOS • | 221 |
Statement of Changes in Net Assets
| Bond Inflation Protection | ||||||||
| Six Months Ended February 28, 2011 (unaudited) | Year Ended August 31, 2010 | |||||||
| Increase in Net Assets from Operations | ||||||||
Net investment income | $ | 13,571,046 | $ | 21,078,246 | ||||
Net realized gain on investment and foreign currency transactions | 566,653 | 3,018,898 | ||||||
Net change in unrealized appreciation/depreciation of investments and foreign currency denominated assets and liabilities | 13,995,708 | 32,239,025 | ||||||
Contributions from Adviser (see Note B) | – 0 | – | 40,508 | |||||
Net increase in net assets from operations | 28,133,407 | 56,376,677 | ||||||
| Dividends to Shareholders from | ||||||||
Net investment income | (19,696,303 | ) | (7,815,952 | ) | ||||
| Transactions in Shares of Beneficial Interest | ||||||||
Net increase | 48,755,958 | 32,882,470 | ||||||
Total increase | 57,193,062 | 81,443,195 | ||||||
| Net Assets | ||||||||
Beginning of period | 667,763,915 | 586,320,720 | ||||||
End of period (including undistributed net investment income of $9,273,262 and $15,398,519, respectively) | $ | 724,956,977 | $ | 667,763,915 | ||||
See notes to financial statements.
| 222 | • ALLIANCEBERNSTEIN POOLING PORTFOLIOS |
Statement of Changes in Net Assets
| High-Yield | ||||||||
| Six Months Ended February 28, 2011 (unaudited) | Year Ended August 31, 2010 | |||||||
| Increase in Net Assets from Operations | ||||||||
Net investment income | $ | 22,468,852 | $ | 46,330,382 | ||||
Net realized gain on investment and foreign currency transactions | 10,376,820 | 3,463,256 | ||||||
Net change in unrealized appreciation/depreciation of investments and foreign currency denominated assets and liabilities | 17,430,669 | 68,605,158 | ||||||
Net increase in net assets from operations | 50,276,341 | 118,398,796 | ||||||
| Dividends to Shareholders from | ||||||||
Net investment income | (26,412,437 | ) | (45,864,332 | ) | ||||
| Transactions in Shares of Beneficial Interest | ||||||||
Net increase (decrease) | 21,962,452 | (48,183,282 | ) | |||||
Total increase | 45,826,356 | 24,351,182 | ||||||
| Net Assets | ||||||||
Beginning of period | 487,750,720 | 463,399,538 | ||||||
End of period (including undistributed net investment income of $2,734,746 and $6,678,331, respectively) | $ | 533,577,076 | $ | 487,750,720 | ||||
See notes to financial statements.
| ALLIANCEBERNSTEIN POOLING PORTFOLIOS • | 223 |
Statement of Changes in Net Assets
| Small-Mid Cap Value | ||||||||
| Six Months Ended February 28, 2011 (unaudited) | Year Ended August 31, 2010 | |||||||
| Increase in Net Assets from Operations | ||||||||
Net investment income | $ | 4,280,138 | $ | 6,913,721 | ||||
Net realized gain on investment transactions | 38,877,755 | 56,197,199 | ||||||
Net change in unrealized appreciation/depreciation of investments | 133,186,565 | 22,264,911 | ||||||
Net increase in net assets from operations | 176,344,458 | 85,375,831 | ||||||
| Dividends to Shareholders from | ||||||||
Net investment income | (1,765,509 | ) | (7,444,369 | ) | ||||
| Transactions in Shares of Beneficial Interest | ||||||||
Net decrease | (57,288,458 | ) | (130,550,929 | ) | ||||
Total increase (decrease) | 117,290,491 | (52,619,467 | ) | |||||
| Net Assets | ||||||||
Beginning of period | 500,525,053 | 553,144,520 | ||||||
End of period (including undistributed net investment income of $3,923,950 and $1,409,321, respectively) | $ | 617,815,544 | $ | 500,525,053 | ||||
See notes to financial statements.
| 224 | • ALLIANCEBERNSTEIN POOLING PORTFOLIOS |
Statement of Changes in Net Assets
| Small-Mid Cap Growth | ||||||||
| Six Months Ended February 28, 2011 (unaudited) | Year Ended August 31, 2010 | |||||||
| Increase (Decrease) in Net Assets from Operations | ||||||||
Net investment income | $ | 1,397,710 | $ | 2,660,730 | ||||
Net realized gain on investment transactions | 98,189,803 | 94,435,638 | ||||||
Net change in unrealized appreciation/depreciation of investments | 137,410,757 | (5,407,109 | ) | |||||
Net increase in net assets from operations | 236,998,270 | 91,689,259 | ||||||
| Dividends to Shareholders from | ||||||||
Net investment income | (768,254 | ) | (2,538,112 | ) | ||||
| Transactions in Shares of Beneficial Interest | ||||||||
Net decrease | (136,584,815 | ) | (116,837,117 | ) | ||||
Total increase (decrease) | 99,645,201 | (27,685,970 | ) | |||||
| Net Assets | ||||||||
Beginning of period | 520,593,112 | 548,279,082 | ||||||
End of period (including undistributed net investment income of $1,201,224 and $571,768, respectively) | $ | 620,238,313 | $ | 520,593,112 | ||||
See notes to financial statements.
| ALLIANCEBERNSTEIN POOLING PORTFOLIOS • | 225 |
Statement of Changes in Net Assets
| Multi-Asset Real Return | ||||||||
| Six Months Ended February 28, 2011 (unaudited)* | Year Ended August 31, 2010 | |||||||
| Increase (Decrease) in Net Assets from Operations | ||||||||
Net investment income | $ | 12,165,715 | $ | 34,365,588 | ||||
Net realized gain on investment and foreign currency transactions | 229,462,812 | 52,640,919 | ||||||
Net change in unrealized appreciation/depreciation of investments and foreign currency denominated assets and liabilities | (42,321,122 | ) | 54,981,466 | |||||
Net increase in net assets from operations | 199,307,405 | 141,987,973 | ||||||
| Dividends to Shareholders from | ||||||||
Net investment income | (76,523,004 | ) | (26,734,353 | ) | ||||
Transactions in Shares of Beneficial Interest | ||||||||
Net decrease | (178,364 | ) | (184,748,328 | ) | ||||
Total increase (decrease) | 122,606,037 | (69,494,708 | ) | |||||
| Net Assets | ||||||||
Beginning of period | 925,042,323 | 994,537,031 | ||||||
End of period (including distributions in excess of net investment income of ($55,728,005) and undistributed net investment income of $8,629,284, respectively) | $ | 1,047,648,360 | $ | 925,042,323 | ||||
| * | Consolidated. |
See notes to financial statements.
| 226 | • ALLIANCEBERNSTEIN POOLING PORTFOLIOS |
Statement of Changes in Net Assets
| Volatility Management | ||||||||
| Six Months Ended February 28, 2011 (unaudited) | April 16, 2010(a) to August 31, 2010 | |||||||
| Increase (Decrease) in Net Assets from Operations | ||||||||
Net investment income | $ | 1,245,010 | $ | 1,072,668 | ||||
Net realized gain (loss) on investment and foreign currency transactions | 31,146,113 | (6,453,115 | ) | |||||
Net change in unrealized appreciation/depreciation of investments and foreign currency denominated assets and liabilities | 39,055,222 | (8,377,105 | ) | |||||
Net increase (decrease) in net assets from operations | 71,446,345 | (13,757,552 | ) | |||||
| Dividends and Distributions to Shareholders from | ||||||||
Net investment income | (2,676,402 | ) | – 0 | – | ||||
Net realized gain on investment transactions | (12,752,268 | ) | – 0 | – | ||||
| Transactions in Shares of Beneficial Interest | ||||||||
Net increase (decrease) | (5,469,925 | ) | 310,009,877 | |||||
Total increase | 50,547,750 | 296,252,325 | ||||||
| Net Assets | ||||||||
Beginning of period | 296,252,325 | – 0 | – | |||||
End of period (including distributions in excess of net investment income of ($278,201) and undistributed net investment income of $1,153,191, respectively) | $ | 346,800,075 | $ | 296,252,325 | ||||
| (a) | Commencement of operations. |
See notes to financial statements.
| ALLIANCEBERNSTEIN POOLING PORTFOLIOS • | 227 |
Statement of Changes in Net Assets
STATEMENT OF CASH FLOWS
Six Months Ended February 28, 2010 (unaudited)
| Bond Inflation Protection | ||||||||
| Increase (Decrease) in Cash from Operating Activities: | ||||||||
Interest and dividends received | $ | 12,575,467 | ||||||
Interest expense paid | (313,985 | ) | ||||||
Operating expenses paid | (153,318 | ) | ||||||
Net increase in cash from operating activities | $ | 12,108,164 | ||||||
| Investing Activities: | ||||||||
Purchases of long-term investments | (153,773,566 | ) | ||||||
Proceeds from disposition of long-term investments | 77,876,945 | |||||||
Proceeds from disposition of short-term investments, net | 2,816,646 | |||||||
Proceeds from swap contracts | 1,490,229 | |||||||
Proceeds from futures | 1,416,870 | |||||||
Variation margin received on futures contracts | 576,037 | |||||||
Net decrease in cash from investing activities | (69,596,839 | ) | ||||||
| Financing Activities: | ||||||||
Redemptions of beneficial interest, net | 29,648,508 | |||||||
Effect of exchange rate on cash | (3,480,015 | ) | ||||||
Increase in reverse repurchase agreements | 32,040,257 | |||||||
Net increase in cash from financing activities | 58,208,750 | |||||||
Net increase in cash | 720,075 | |||||||
Cash at beginning of period | 131,435 | |||||||
Cash at end of period | $ | 851,510 | ||||||
| Reconciliation of Net Increase in Net Assets from Operations to Net Increase in Cash from Operating Activities: | ||||||||
Net increase in net assets from operations | $ | 28,133,407 | ||||||
| Adjustments: | ||||||||
Decrease in interest and dividends receivable | $ | 49,049 | ||||||
Net accretion of bond discount and amortization of bond premium | 1,997,164 | |||||||
Inflation Index Adjustment | (3,488,919 | ) | ||||||
Decrease in accrued expenses | (20,176 | ) | ||||||
Net realized gain on investment and foreign currency transactions | (566,653 | ) | ||||||
Net change in unrealized appreciation/depreciation of investments and foreign currency denominated assets and liabilities | (13,995,708 | ) | ||||||
Total adjustments | (16,025,243 | ) | ||||||
Net increase in cash from operating activities | $ | 12,108,164 | ||||||
See notes to financial statements.
| 228 | • ALLIANCEBERNSTEIN POOLING PORTFOLIOS |
Statement of Cash Flows
NOTES TO FINANCIAL STATEMENTS
February 28, 2011 (unaudited)
NOTE A
Significant Accounting Policies
The AllianceBernstein Pooling Portfolios (the “Trust”) was organized as a Massachusetts business trust on November 11, 2004 and is registered under the Investment Company Act of 1940 as a diversified, open-end management investment company. The Trust is currently comprised of twelve separate series: AllianceBernstein U.S. Value Portfolio, AllianceBernstein U.S. Large Cap Growth Portfolio, AllianceBernstein International Value Portfolio, AllianceBernstein International Growth Portfolio, AllianceBernstein Short Duration Bond Portfolio, AllianceBernstein Intermediate Duration Bond Portfolio, AllianceBernstein Bond Inflation Protection Portfolio, AllianceBernstein High-Yield Portfolio AllianceBernstein Small-Mid Cap Value Portfolio, AllianceBernstein Small-Mid Cap Growth Portfolio, AllianceBernstein Multi-Asset Real Return Portfolio (formerly, AllianceBernstein Global Real Estate Investment Portfolio) and AllianceBernstein Volatility Management Portfolio (collectively, the “Portfolios”). As part of AllianceBernstein Multi-Asset Real Return Portfolio’s investment strategy, the Portfolio seeks to gain exposure to commodities and commodities-related instruments and derivatives primarily through investments in AllianceBernstein Cayman Inflation Pooling Subsidiary, Ltd., a wholly-owned subsidiary of the Portfolio organized under the laws of the Cayman Islands (the “Subsidiary”). This report presents the consolidated financial statements and portfolio of investments of AllianceBernstein Multi-Asset Real Return Portfolio and the Subsidiary. The AllianceBernstein Volatility Management Portfolio commenced operations on April 16, 2010. The Subsidiary commenced operations on October 18, 2010. Each series is considered to be a separate entity for financial reporting and tax purposes. Shares of the Portfolios are offered exclusively to mutual funds advised by and certain other institutional clients of AllianceBernstein L.P. (the “Adviser”). A Portfolio’s shares may be purchased at the relevant net asset value without a sales charge or other fee. The financial statements have been prepared in conformity with U.S. generally accepted accounting principles (“U.S. GAAP”) which require management to make certain estimates and assumptions that affect the reported amounts of assets and liabilities in the financial statements and amounts of income and expenses during the reporting period. Actual results could differ from those estimates. The following is a summary of significant accounting policies followed by the Portfolios.
1. Security Valuation
Portfolio securities are valued at their current market value determined on the basis of market quotations or, if market quotations are not readily available or are deemed unreliable, at “fair value” as determined in accordance with procedures established by and under the general supervision of the Trust’s Board of Trustees.
In general, the market value of securities which are readily available and deemed reliable are determined as follows. Securities listed on a national securities exchange (other than securities listed on the NASDAQ Stock Market, Inc.
| ALLIANCEBERNSTEIN POOLING PORTFOLIOS • | 229 |
Notes to Financial Statements
(“NASDAQ”)) or on a foreign securities exchange are valued at the last sale price at the close of the exchange or foreign securities exchange. If there has been no sale on such day, the securities are valued at the mean of the closing bid and asked prices on such day. Securities listed on more than one exchange are valued by reference to the principal exchange on which the securities are traded; securities listed only on NASDAQ are valued in accordance with the NASDAQ Official Closing Price; listed put or call options are valued at the last sale price. If there has been no sale on that day, such securities will be valued at the closing bid prices on that day; open futures contracts and options thereon are valued using the closing settlement price or, in the absence of such a price, the most recent quoted bid price. If there are no quotations available for the day of valuation, the last available closing settlement price is used; securities traded in the over-the-counter market (“OTC”) are valued at the mean of the current bid and asked prices as reported by the National Quotation Bureau or other comparable sources; U.S. government securities and other debt instruments having 60 days or less remaining until maturity are valued at amortized cost if their original maturity was 60 days or less; or by amortizing their fair value as of the 61st day prior to maturity if their original term to maturity exceeded 60 days; fixed-income securities, including mortgage backed and asset backed securities, may be valued on the basis of prices provided by a pricing service or at a price obtained from one or more of the major broker/dealers. In cases where broker/dealer quotes are obtained, the Adviser may establish procedures whereby changes in market yields or spreads are used to adjust, on a daily basis, a recently obtained quoted price on a security; and OTC and other derivatives are valued on the basis of a quoted bid price or spread from a major broker/dealer in such security. Investments in money market funds are valued at their net asset value each day.
Securities for which market quotations are not readily available (including restricted securities) or are deemed unreliable are valued at fair value. Factors considered in making this determination may include, but are not limited to, information obtained by contacting the issuer, analysts, analysis of the issuer’s financial statements or other available documents. In addition, the Portfolios may use fair value pricing for securities primarily traded in non-U.S. markets because most foreign markets close well before the Portfolios value their securities at 4:00 p.m., Eastern Time (see Note A.2).
In valuing the Term Asset-Backed Loan Facility (“TALF”) transactions, the Adviser utilizes a portfolio pricing service to price the TALF loans. The methodologies utilized by the vendor to value the TALF loans takes into consideration, among other factors, the deal characteristics, historical performance, market interest rates, and the value of the underlying collateral.
2. Fair Value Measurements
In accordance with U.S. GAAP regarding fair value measurements, fair value is defined as the price that the Portfolios would receive to sell an asset or pay to transfer a liability in an orderly transaction between market participants at the
| 230 | • ALLIANCEBERNSTEIN POOLING PORTFOLIOS |
Notes to Financial Statements
measurement date. The U.S. GAAP disclosure requirements establish a framework for measuring fair value, and a three-level hierarchy for fair value measurements based upon the transparency of inputs to the valuation of an asset or liability. Inputs may be observable or unobservable and refer broadly to the assumptions that market participants would use in pricing the asset or liability. Observable inputs reflect the assumptions market participants would use in pricing the asset or liability based on market data obtained from sources independent of the Portfolios. Unobservable inputs reflect the Portfolios’ own assumptions about the assumptions that market participants would use in pricing the asset or liability based on the best information available in the circumstances. Each investment is assigned a level based upon the observability of the inputs which are significant to the overall valuation. The three-tier hierarchy of inputs is summarized below.
| • | Level 1—quoted prices in active markets for identical investment |
| • | Level 2—other significant observable inputs (including quoted prices for similar investments, interest rates, prepayment speeds, credit risk, etc.) |
| • | Level 3—significant unobservable inputs (including the Portfolios’ own assumptions in determining the fair value of investments) |
The Short Duration Bond Portfolio and Intermediate Duration Bond Portfolio have elected the fair value option in valuing the TALF loan liability as permitted by U.S. GAAP regarding the fair value option for financial assets and financial liabilities. The fair value option permits a portfolio the opportunity to mitigate volatility in net assets caused by measuring related assets and liabilities differently. Consequently the Portfolios recorded the loan liability on the statement of assets and liabilities at fair value. The fair value option requires that the TALF loan be marked-to-market giving consideration to relevant market factors including changes in the market value of the collateral related to the TALF loan (see Note C.5). As of February 28, 2011, the Portfolios did not have a difference between the aggregate fair value and the aggregate unpaid principal balance of the TALF loans outstanding.
The following tables summarize the valuation of the Portfolios’ investments by the above fair value hierarchy levels as of February 28, 2011:
| U.S. Value Portflolio | ||||||||||||||||
| Investments in Securities | Level 1 | Level 2 | Level 3 | Total | ||||||||||||
Assets: | ||||||||||||||||
Common Stocks | $ | 2,268,669,835 | $ | — | $ | — | $ | 2,268,669,835 | ||||||||
Short-Term Investments | 36,476,008 | — | — | 36,476,008 | ||||||||||||
Total Investments in Securities | 2,305,145,843 | — | — | 2,305,145,843 | ||||||||||||
Other Financial Instruments* | — | — | — | — | ||||||||||||
Total | $ | 2,305,145,843 | $ | — | $ | — | $ | 2,305,145,843 | ||||||||
| ALLIANCEBERNSTEIN POOLING PORTFOLIOS • | 231 |
Notes to Financial Statements
| U.S. Large Cap Growth Portfolio | ||||||||||||||||
| Investments in Securities | Level 1 | Level 2 | Level 3 | Total | ||||||||||||
Assets: | ||||||||||||||||
Common Stocks | $ | 2,307,452,525 | $ | — | $ | — | $ | 2,307,452,525 | ||||||||
Short-Term Investments | 20,738,048 | — | — | 20,738,048 | ||||||||||||
Total Investments in Securities | 2,328,190,573 | — | — | 2,328,190,573 | ||||||||||||
Other Financial Instruments* | — | — | — | — | ||||||||||||
Total | $ | 2,328,190,573 | $ | — | $ | — | $ | 2,328,190,573 | ||||||||
| International Value Portfolio | ||||||||||||||||
| Investments in Securities | Level 1 | Level 2 | Level 3 | Total | ||||||||||||
Assets: | ||||||||||||||||
Common Stocks | ||||||||||||||||
Financials | $ | 15,659,136 | $ | 271,545,941 | $ | — | $ | 287,205,077 | ||||||||
Consumer Discretionary | 6,855,766 | 158,811,412 | — | 165,667,178 | ||||||||||||
Energy | 31,687,509 | 107,614,411 | — | 139,301,920 | ||||||||||||
Materials | 33,678,889 | 90,721,154 | — | 124,400,043 | ||||||||||||
Industrials | — | 118,101,438 | — | 118,101,438 | ||||||||||||
Telecommunication Services | — | 91,353,469 | — | 91,353,469 | ||||||||||||
Health Care | — | 79,470,551 | — | 79,470,551 | ||||||||||||
Information Technology | — | 73,197,268 | — | 73,197,268 | ||||||||||||
Consumer Staples | — | 63,695,921 | — | 63,695,921 | ||||||||||||
Utilities | — | 47,032,432 | — | 47,032,432 | ||||||||||||
Short-Term Investments | 8,099,845 | — | — | 8,099,845 | ||||||||||||
Total Investments in Securities | 95,981,145 | 1,101,543,997 | + | — | 1,197,525,142 | |||||||||||
Other Financial Instruments*: | ||||||||||||||||
Assets | ||||||||||||||||
Futures Contracts | 558,190 | — | — | 558,190 | # | |||||||||||
Forward Currency Exchange Contracts | — | 10,663,785 | — | 10,663,785 | ||||||||||||
Liabilities | ||||||||||||||||
Forward Currency Exchange Contracts | — | (8,300,023 | ) | — | (8,300,023 | ) | ||||||||||
Total | $ | 96,539,335 | $ | 1,103,907,759 | $ | — | $ | 1,200,447,094 | ||||||||
| 232 | • ALLIANCEBERNSTEIN POOLING PORTFOLIOS |
Notes to Financial Statements
| International Growth Portfolio | ||||||||||||||||
| Investments in Securities | Level 1 | Level 2 | Level 3 | Total | ||||||||||||
Assets: | ||||||||||||||||
Common Stocks | ||||||||||||||||
Financials | $ | 32,452,963 | $ | 194,404,116 | $ | — | $ | 226,857,079 | ||||||||
Consumer Staples | 5,793,184 | 175,492,763 | — | 181,285,947 | ||||||||||||
Materials | 44,340,716 | 134,377,988 | — | 178,718,704 | ||||||||||||
Industrials | 1,139,712 | 162,335,552 | — | 163,475,264 | ||||||||||||
Consumer Discretionary | 9,836,933 | 138,187,844 | — | 148,024,777 | ||||||||||||
Energy | 26,960,927 | 104,437,048 | — | 131,397,975 | ||||||||||||
Information Technology | 5,387,520 | 86,278,376 | — | 91,665,896 | ||||||||||||
Health Care | — | 13,972,575 | — | 13,972,575 | ||||||||||||
Short-Term Investments | 8,460,708 | — | — | 8,460,708 | ||||||||||||
Total Investments in Securities | 134,372,663 | 1,009,486,262 | + | — | 1,143,858,925 | |||||||||||
Other Financial Instruments*: | ||||||||||||||||
Assets | ||||||||||||||||
Forward Currency Exchange Contracts | — | 17,129,725 | — | 17,129,725 | ||||||||||||
Liabilities | ||||||||||||||||
Forward Currency Exchange Contracts | — | (14,564,980 | ) | — | (14,564,980 | ) | ||||||||||
Total | $ | 134,372,663 | $ | 1,012,051,007 | $ | — | $ | 1,146,423,670 | ||||||||
| Short Duration Bond Portfolio | ||||||||||||||||
| Investments in Securities | Level 1 | Level 2 | Level 3 | Total | ||||||||||||
Assets: | ||||||||||||||||
Governments – Treasuries | $ | — | $ | 583,052,252 | $ | — | $ | 583,052,252 | ||||||||
Asset-Backed Securities | — | 169,551,567 | 28,979,089 | 198,530,656 | ||||||||||||
Mortgage Pass-Thru’s | — | 196,727,542 | — | 196,727,542 | ||||||||||||
Corporates – Investment Grades | — | 167,544,430 | — | 167,544,430 | ||||||||||||
Agencies | — | 66,608,023 | — | 66,608,023 | ||||||||||||
Commercial Mortgage-Backed Securities | — | 44,945,532 | 20,883,092 | 65,828,624 | ||||||||||||
CMOs | — | 1,589,011 | 26,453,595 | 28,042,606 | ||||||||||||
Governments – Sovereign Agencies | — | 6,420,724 | — | 6,420,724 | ||||||||||||
Short-Term Investments | ||||||||||||||||
Investment Companies | 8,982,215 | — | — | 8,982,215 | ||||||||||||
Certificates of Deposit | — | 13,199,309 | — | 13,199,309 | ||||||||||||
Total Investments in Securities | 8,982,215 | 1,249,638,390 | + | 76,315,776 | 1,334,936,381 | |||||||||||
| ALLIANCEBERNSTEIN POOLING PORTFOLIOS • | 233 |
Notes to Financial Statements
| Investments in Securities | Level 1 | Level 2 | Level 3 | Total | ||||||||||||
Other Financial Instruments*: | ||||||||||||||||
Assets | ||||||||||||||||
Futures Contracts | $ | 460,696 | $ | — | $ | — | $ | 460,696 | # | |||||||
Liabilities | ||||||||||||||||
Futures Contracts | (163,728 | ) | — | — | (163,728 | )# | ||||||||||
TALF Loans | — | — | (28,406,603 | ) | (28,406,603 | ) | ||||||||||
Total | $ | 9,279,183 | $ | 1,249,638,390 | $ | 47,909,173 | $ | 1,306,826,746 | ||||||||
| Intermediate Duration Bond Portfolio | ||||||||||||||||
| Investments in Securities | Level 1 | Level 2 | Level 3 | Total | ||||||||||||
Assets: | ||||||||||||||||
Corporates – Investment Grades | $ | — | $ | 416,199,219 | $ | — | $ | 416,199,219 | ||||||||
Governments – Treasuries | — | 376,500,557 | — | 376,500,557 | ||||||||||||
Mortgage Pass-Thru’s | — | 213,568,259 | — | 213,568,259 | ||||||||||||
Agencies | — | 146,099,723 | — | 146,099,723 | ||||||||||||
Commercial | — | 79,049,492 | 48,358,915 | 127,408,407 | ||||||||||||
Asset-Backed Securities | — | 22,285,495 | 5,166,252 | 27,451,747 | ||||||||||||
Governments – | — | 19,664,453 | — | 19,664,453 | ||||||||||||
CMOs | — | 296,904 | 12,251,597 | 12,548,501 | ||||||||||||
Quasi-Sovereigns | — | 11,982,881 | — | 11,982,881 | ||||||||||||
Corporates – Non-Investment Grades | — | 8,103,932 | — | 8,103,932 | ||||||||||||
Governments – | — | 7,291,562 | — | 7,291,562 | ||||||||||||
Supranationals | — | 5,145,807 | — | 5,145,807 | ||||||||||||
Local Governments –Municipal Bonds | — | 3,599,658 | — | 3,599,658 | ||||||||||||
Short-Term Investments | 56,955,913 | — | — | 56,955,913 | ||||||||||||
Total Investments in Securities | 56,955,913 | 1,309,787,942 | 65,776,764 | 1,432,520,619 | ||||||||||||
Other Financial Instruments*: | ||||||||||||||||
Assets | ||||||||||||||||
Forward Currency Exchange Contracts | — | 79,980 | — | 79,980 | ||||||||||||
Interest Rate Swap Contracts | — | 317,550 | — | 317,550 | ||||||||||||
Liabilities | ||||||||||||||||
TALF Loans | — | — | (16,226,603 | ) | (16,226,603 | ) | ||||||||||
Total | $ | 56,955,913 | $ | 1,310,185,472 | $ | 49,550,161 | $ | 1,416,691,546 | ||||||||
| 234 | • ALLIANCEBERNSTEIN POOLING PORTFOLIOS |
Notes to Financial Statements
| Bond Inflation Protection Portfolio | ||||||||||||||||
| Investments in Securities | Level 1 | Level 2 | Level 3 | Total | ||||||||||||
Assets: | ||||||||||||||||
Inflation-Linked Securities | $ | — | $ | 726,448,911 | $ | — | $ | 726,448,911 | ||||||||
Corporates – Investment Grades | — | 153,796,632 | — | 153,796,632 | ||||||||||||
Governments – Sovereign Agencies | — | 52,518,434 | — | 52,518,434 | ||||||||||||
Commercial Mortgage-Backed Securities | — | 33,747,064 | 8,651,240 | 42,398,304 | ||||||||||||
Supranationals | — | 13,530,697 | — | 13,530,697 | ||||||||||||
Asset-Backed Securities | — | 6,910,025 | 1,462,804 | 8,372,829 | ||||||||||||
Governments – Treasuries | — | 6,835,916 | — | 6,835,916 | ||||||||||||
Corporates – Non-Investment Grades | — | 5,570,533 | — | 5,570,533 | ||||||||||||
Quasi-Sovereigns | — | 4,794,952 | — | 4,794,952 | ||||||||||||
Governments – Sovereign Bonds | — | 786,713 | — | 786,713 | ||||||||||||
Emerging Markets – Corporate Bonds | — | 682,925 | — | 682,925 | ||||||||||||
Short-Term Investments | 1,321,471 | — | — | 1,321,471 | ||||||||||||
Total Investments in Securities | 1,321,471 | 1,005,622,802 | 10,114,044 | 1,017,058,317 | ||||||||||||
Other Financial Instruments*: | ||||||||||||||||
Assets | ||||||||||||||||
Futures Contracts | 29,274 | — | — | 29,274 | # | |||||||||||
Forward Currency Exchange Contracts | — | 486,187 | — | 486,187 | ||||||||||||
Interest Rate Swap Contracts | — | 162,187 | — | 162,187 | ||||||||||||
Credit Default Swap Contracts | — | 1,574,011 | — | 1,574,011 | ||||||||||||
Liabilities | ||||||||||||||||
Futures Contracts | (269,532 | ) | — | — | (269,532 | )# | ||||||||||
Forward Currency Exchange Contracts | — | (2,547,940 | ) | — | (2,547,940 | ) | ||||||||||
Total | $ | 1,081,213 | $ | 1,005,297,247 | $ | 10,114,044 | $ | 1,016,492,504 | ||||||||
| ALLIANCEBERNSTEIN POOLING PORTFOLIOS • | 235 |
Notes to Financial Statements
| High-Yield Portfolio | ||||||||||||||||
| Investments in Securities | Level 1 | Level 2 | Level 3 | Total | ||||||||||||
Assets: | ||||||||||||||||
Corporates – Non-Investment Grades | $ | — | $ | 400,483,227 | $ | 592,801 | $ | 401,076,028 | ||||||||
Corporates – Investment Grades | — | 47,984,440 | — | 47,984,440 | ||||||||||||
Commercial Mortgage-Backed Securities | — | 7,765,817 | 5,522,003 | 13,287,820 | ||||||||||||
Bank Loans | — | — | 11,103,854 | 11,103,854 | ||||||||||||
Governments – Treasuries | — | 8,075,452 | — | 8,075,452 | ||||||||||||
Local Governments – Municipal Bonds | — | 7,734,202 | — | 7,734,202 | ||||||||||||
Emerging Markets – Corporate Bonds | — | 7,289,701 | 389,146 | 7,678,847 | ||||||||||||
Quasi-Sovereigns | — | 6,247,275 | — | 6,247,275 | ||||||||||||
Preferred Stocks | 2,559,744 | 2,319,124 | — | 4,878,868 | ||||||||||||
Asset-Backed Securities | — | — | 4,604,837 | 4,604,837 | ||||||||||||
Emerging Markets – Sovereigns | — | 3,530,563 | — | 3,530,563 | ||||||||||||
CMOs | — | — | 2,078,066 | 2,078,066 | ||||||||||||
Emerging Markets – Treasuries | — | 1,616,732 | — | 1,616,732 | ||||||||||||
Common Stocks | 165,025 | — | 291,671 | 456,696 | ||||||||||||
Warrants | — | — | 2 | 2 | ||||||||||||
Option Purchased – Call | — | — | – 0 | – | – 0 | – | ||||||||||
Short-Term Investments | 5,802,841 | — | — | 5,802,841 | ||||||||||||
Total Investments in Securities | 8,527,610 | 493,046,533 | + | 24,582,380 | 526,156,523 | |||||||||||
Other Financial Instruments*: | ||||||||||||||||
Assets | ||||||||||||||||
Forward Currency Exchange Contracts | — | 2,771 | — | 2,771 | ||||||||||||
Interest Rate Swap Contracts | — | 221,779 | — | 221,779 | ||||||||||||
Credit Default Swap Contracts | — | 75,303 | — | 75,303 | ||||||||||||
Liabilities | ||||||||||||||||
Futures Contracts | (57,434 | ) | — | — | (57,434 | )# | ||||||||||
Forward Currency Exchange Contracts | — | (1,043,788 | ) | — | (1,043,788 | ) | ||||||||||
Interest Rate Swap Contracts | — | (287,393 | ) | — | (287,393 | ) | ||||||||||
Credit Default Swap Contracts | — | (153,439 | ) | — | (153,439 | ) | ||||||||||
Total | $ | 8,470,176 | $ | 491,861,766 | $ | 24,582,380 | $ | 524,914,322 | ||||||||
| 236 | • ALLIANCEBERNSTEIN POOLING PORTFOLIOS |
Notes to Financial Statements
| Small-Mid Cap Value Portfolio | ||||||||||||||||
| Investments in Securities | Level 1 | Level 2 | Level 3 | Total | ||||||||||||
Assets: | ||||||||||||||||
Common Stocks | $ | 610,297,882 | $ | — | $ | — | $ | 610,297,882 | ||||||||
Short-Term Investments | 4,769,678 | — | — | 4,769,678 | ||||||||||||
Total Investments in Securities | 615,067,560 | — | — | 615,067,560 | ||||||||||||
Other Financial Instruments* | — | — | — | — | ||||||||||||
Total | $ | 615,067,560 | $ | — | $ | — | $ | 615,067,560 | ||||||||
| Small-Mid Cap Growth Portfolio | ||||||||||||||||
| Investments in Securities | Level 1 | Level 2 | Level 3 | Total | ||||||||||||
Assets: | ||||||||||||||||
Common Stocks | $ | 612,713,204 | $ | — | $ | — | $ | 612,713,204 | ||||||||
Short-Term Investments | 10,352,473 | — | — | 10,352,473 | ||||||||||||
Total Investments in Securities | 623,065,677 | — | — | 623,065,677 | ||||||||||||
Other Financial Instruments* | — | — | — | — | ||||||||||||
Total | $ | 623,065,677 | $ | — | $ | — | $ | 623,065,677 | ||||||||
| Multi-Asset Real Return Portfolio | ||||||||||||||||
| Investments in Securities | Level 1 | Level 2 | Level 3 | Total | ||||||||||||
Assets: | ||||||||||||||||
Common Stocks | ||||||||||||||||
Energy | $ | 116,626,234 | $ | 79,218,077 | $ | — | $ | 195,844,311 | ||||||||
Equity:Other | 43,064,175 | 113,222,739 | — | 156,286,914 | ||||||||||||
Materials | 49,854,333 | 64,763,396 | — | 114,617,729 | ||||||||||||
Retail | 42,684,224 | 19,237,305 | — | 61,921,529 | ||||||||||||
Residential | 45,928,984 | 9,329,107 | — | 55,258,091 | ||||||||||||
Office | 22,064,391 | 15,027,968 | — | 37,092,359 | ||||||||||||
Lodging | 23,187,898 | 8,312,912 | — | 31,500,810 | ||||||||||||
Industrials | 11,266,684 | 7,773,132 | — | 19,039,816 | ||||||||||||
Food Beverage & Tobacco | 4,148,765 | — | — | 4,148,765 | ||||||||||||
Inflation-Linked Securities | — | 342,606,977 | — | 342,606,977 | ||||||||||||
Warrants | 26,490 | — | — | 26,490 | ||||||||||||
Short-Term Investments | 7,324,653 | — | — | 7,324,653 | ||||||||||||
Total Investments in Securities | 366,176,831 | 659,491,613 | + | — | 1,025,668,444 | |||||||||||
Other Financial Instruments*: | ||||||||||||||||
Assets | ||||||||||||||||
Futures Contracts | 1,180,299 | — | — | 1,180,299 | # | |||||||||||
Interest Rate Swap Contracts | — | 8,971,256 | — | 8,971,256 | ||||||||||||
Liabilities | ||||||||||||||||
Futures Contracts | (1,855,900 | ) | — | — | (1,855,900 | )# | ||||||||||
Interest Rate Swap Contracts | — | (27,359 | ) | — | (27,359 | ) | ||||||||||
Total | $ | 365,501,230 | $ | 668,435,510 | $ | — | $ | 1,033,936,740 | ||||||||
| ALLIANCEBERNSTEIN POOLING PORTFOLIOS • | 237 |
Notes to Financial Statements
| Volatility Management Portfolio | ||||||||||||||||
| Investments in Securities | Level 1 | Level 2 | Level 3 | Total | ||||||||||||
Assets: | ||||||||||||||||
Common Stocks | ||||||||||||||||
Financials | $ | 6,503,394 | $ | 22,831,113 | $ | — | $ | 29,334,507 | ||||||||
Industrials | 5,751,598 | 6,301,189 | — | 12,052,787 | ||||||||||||
Information Technology | 7,778,865 | 2,323,103 | — | 10,101,968 | ||||||||||||
Energy | 5,486,636 | 3,875,369 | — | 9,362,005 | ||||||||||||
Consumer Discretionary | 4,485,200 | 4,671,128 | — | 9,156,328 | ||||||||||||
Consumer Staples | 4,320,733 | 4,354,017 | — | 8,674,750 | ||||||||||||
Health Care | 4,454,450 | 3,705,074 | — | 8,159,524 | ||||||||||||
Equity:Other | 4,993,158 | 1,861,226 | — | 6,854,384 | ||||||||||||
Materials | 1,506,788 | 5,239,521 | — | 6,746,309 | ||||||||||||
Retail | 4,233,883 | 710,708 | — | 4,944,591 | ||||||||||||
Office | 2,466,796 | 2,133,363 | — | 4,600,159 | ||||||||||||
Residential | 3,590,451 | 575,133 | — | 4,165,584 | ||||||||||||
Telecommunication Services | 1,206,119 | 2,569,452 | — | 3,775,571 | ||||||||||||
Utilities | 1,357,426 | 2,382,368 | — | 3,739,794 | ||||||||||||
Lodging | 1,107,923 | 132,998 | — | 1,240,921 | ||||||||||||
Rights | — | — | 41,068 | 41,068 | ||||||||||||
Short-Term Investments | ||||||||||||||||
Investment Companies | 207,440,623 | — | — | 207,440,623 | ||||||||||||
U.S. Treasury Bill | — | 1,499,555 | — | 1,499,555 | ||||||||||||
Total Investments in Securities | 266,684,043 | 65,165,317 | + | 41,068 | 331,890,428 | |||||||||||
Other Financial Instruments*: | ||||||||||||||||
Assets | ||||||||||||||||
Futures Contracts | 13,567,183 | — | — | 13,567,183 | # | |||||||||||
Forward Currency Exchange Contracts | — | 382,184 | — | 382,184 | ||||||||||||
Total Return Swap Contracts | — | 208,058 | — | 208,058 | ||||||||||||
Liabilities | ||||||||||||||||
Futures Contracts | (1,101 | ) | — | — | (1,101 | )# | ||||||||||
Forward Currency Exchange Contracts | — | (355,312 | ) | — | (355,312 | ) | ||||||||||
Total | $ | 280,250,125 | $ | 65,400,247 | $ | 41,068 | $ | 345,691,440 | ||||||||
| * | Other financial instruments are derivative instruments, such as futures, forwards and swap contracts, which are valued at the unrealized appreciation/depreciation on the instrument. |
| + | The earlier close of the foreign markets gives rise to the possibility that significant events, including broad market moves, may have occurred between the close of the foreign markets and the time at which the Portfolio values its securities which may materially affect the value of securities trading in such markets. To account for this, the Portfolio may frequently value many of its foreign equity securities using fair value prices based on third |
| 238 | • ALLIANCEBERNSTEIN POOLING PORTFOLIOS |
Notes to Financial Statements
party vendor modeling tools to the extent available. Accordingly, a significant portion of the Portfolio’s investments are categorized as Level 2 investments. |
| # | Only variation margin receivable/payable at period end is reported within the statement of assets and liabilities. Cumulative appreciation/(depreciation) of futures contracts is reported in the portfolio of investments. |
| ^ | Consolidated. |
Following is a reconciliation of investments in which significant unobservable inputs (Level 3) were used in determining fair value. The transfers between levels of the fair value hierarchy assumes the financial instrument was transferred at the end of the reporting period.
Short Duration Bond | Asset- Backed Securities | Commercial Mortgage- Backed Securities | CMOs | |||||||||
Balance as of 8/31/10 | $ | 37,026,985 | $ | 18,158,640 | $ | 11,137,158 | ||||||
Accrued discounts/(premiums) | 4,024 | (13 | ) | (6 | ) | |||||||
Realized gain (loss) | (1,600,236 | ) | — | (2,237 | ) | |||||||
Change in unrealized appreciation/depreciation | 3,954,016 | 3,278,361 | 3,154,948 | |||||||||
Net purchases (sales) | 3,729,417 | (553,896 | ) | 12,314,109 | ||||||||
Transfers in to Level 3 | — | — | — | |||||||||
Tranfers out of Level 3 | (14,135,117 | ) | — | (150,377 | ) | |||||||
Balance as of 2/28/11 | $ | 28,979,089 | $ | 20,883,092 | $ | 26,453,595 | ||||||
Net change in unrealized appreciation/depreciation from investments held as of 2/28/11* | $ | 2,356,308 | $ | 3,278,361 | $ | 3,137,142 | ||||||
| TALF Loans | Total | |||||||
Balance as of 8/31/10 | $ | (30,844,320 | ) | $ | 35,478,463 | |||
Accrued discounts/(premiums) | — | 4,005 | ||||||
Realized gain (loss) | — | (1,602,473 | ) | |||||
Change in unrealized appreciation/depreciation | — | 10,387,325 | ||||||
Net purchases (sales) | 2,437,717 | ** | 17,927,347 | |||||
Net transfers in to Level 3 | — | — | ||||||
Net transfers out of Level 3 | — | (14,285,494 | ) | |||||
Balance as of 2/28/11 | $ | (28,406,603 | ) | $ | 47,909,173 | |||
Net change in unrealized appreciation/depreciation from investments held as of 2/28/11* | $ | — | $ | 8,771,811 | ||||
| ALLIANCEBERNSTEIN POOLING PORTFOLIOS • | 239 |
Notes to Financial Statements
Intermediate Duration Bond | Commercial Mortgage- Backed Securities | Asset- Backed Securities | CMOs | |||||||||
Balance as of 8/31/10 | $ | 46,293,782 | $ | 3,076,443 | $ | 11,618,047 | ||||||
Accrued discounts/(premiums) | 58,865 | 467 | 214 | |||||||||
Realized gain (loss) | — | (1,925,070 | ) | 3,845 | ||||||||
Change in unrealized appreciation/depreciation | 2,006,268 | 3,177,727 | 1,745,832 | |||||||||
Net purchases (sales) | — | 836,685 | (1,116,341 | ) | ||||||||
Transfers in to Level 3 | — | — | — | |||||||||
Transfers out of Level 3 | — | — | — | |||||||||
Balance as of 2/28/11 | $ | 48,358,915 | $ | 5,166,252 | $ | 12,251,597 | ||||||
Net change in unrealized appreciation/depreciation from investments held as of 2/28/11* | $ | 2,006,268 | $ | 1,011,808 | $ | 1,745,832 | ||||||
| TALF Loans | Total | |||||||
Balance as of 8/31/10 | $ | (18,664,320 | ) | $ | 42,323,952 | |||
Accrued discounts/(premiums) | — | 59,546 | ||||||
Realized gain (loss) | — | (1,921,225 | ) | |||||
Change in unrealized appreciation/depreciation | — | 6,929,827 | ||||||
Net purchases (sales) | 2,437,717 | ** | 2,158,061 | |||||
Transfers in to Level 3 | — | — | ||||||
Transfers out of Level 3 | — | — | ||||||
Balance as of 2/28/11 | $ | (16,226,603 | ) | $ | 49,550,161 | |||
Net change in unrealized appreciation/depreciation from investments held as of 2/28/11* | $ | — | $ | 4,763,908 | ||||
Bond Inflation Protection | Commercial Mortgage- Backed Securities | Asset- Backed Securities | Total | |||||||||
Balance as of 8/31/10 | $ | 6,992,868 | $ | — | $ | 6,992,868 | ||||||
Accrued discounts/(premiums) | 631 | 4 | 635 | |||||||||
Realized gain (loss) | — | — | — | |||||||||
Change in unrealized appreciation/depreciation | 173,916 | (4,231 | ) | 169,685 | ||||||||
Net purchases (sales) | 1,483,825 | 1,467,031 | 2,950,856 | |||||||||
Transfers in to Level 3 | — | — | — | |||||||||
Transfers out of Level 3 | — | — | — | |||||||||
Balance as of 2/28/11 | $ | 8,651,240 | $ | 1,462,804 | $ | 10,114,044 | ||||||
Net change in unrealized appreciation/depreciation from investments held as of 2/28/11* | $ | 173,916 | $ | (4,231 | ) | $ | 169,685 | |||||
| 240 | • ALLIANCEBERNSTEIN POOLING PORTFOLIOS |
Notes to Financial Statements
High-Yield Portfolio | Corporates – Non-Investment Grades | Commercial Mortgage- Backed Securities | Bank Loans | |||||||||
Balance as of 8/31/10 | $ | 23,810,754 | $ | 4,928,247 | $ | 7,581,550 | ||||||
Accrued discounts/(premiums) | 58,514 | 58,810 | 141,562 | |||||||||
Realized gain (loss) | 1,316,148 | — | 529,832 | |||||||||
Change in unrealized appreciation/depreciation | (752,290 | ) | 534,946 | (7,892 | ) | |||||||
Net purchases (sales) | (20,379,404 | ) | — | 2,858,802 | ||||||||
Transfers in to Level 3 | — | — | — | |||||||||
Transfers out of Level 3 | (3,460,921 | ) | — | — | ||||||||
Balance as of 2/28/11 | $ | 592,801 | $ | 5,522,003 | $ | 11,103,854 | ||||||
Net change in unrealized appreciation/depreciation from Investments held as of 2/28/11* | $ | 153,204 | $ | 534,946 | $ | 433,545 | ||||||
| Emerging Markets – Corporate Bonds | Asset- Backed Securities | CMOs | ||||||||||
Balance as of 8/31/10 | $ | — | $ | 4,657,555 | $ | 3,200,554 | ||||||
Accrued discounts/(premiums) | — | 46,790 | 23,307 | |||||||||
Realized gain (loss) | — | 57,028 | 151,102 | |||||||||
Change in unrealized appreciation/depreciation | 1,339 | (196,856 | ) | (27,739 | ) | |||||||
Net purchases (sales) | 387,807 | 40,320 | (1,269,158 | ) | ||||||||
Transfers in to Level 3 | — | — | — | |||||||||
Transfers out of Level 3 | — | — | — | |||||||||
Balance as of 2/28/11 | $ | 389,146 | $ | 4,604,837 | $ | 2,078,066 | ||||||
Net change in unrealized appreciation/depreciation from Investments held as of 2/28/11* | $ | (103,908 | ) | $ | 60,478 | $ | 117,036 | |||||
| Common Stocks | Warrants | Option Purchased- Call*** | Total | |||||||||||||
Balance as of 8/31/10 | $ | 174,635 | $ | 161,168 | $ | – 0 | – | $ | 44,514,463 | |||||||
Accrued discounts/(premiums) | — | — | — | 328,983 | ||||||||||||
Realized gain (loss) | — | 161,549 | — | 2,215,659 | ||||||||||||
Change in unrealized appreciation/depreciation | 117,036 | (115,118 | ) | — | (446,574 | ) | ||||||||||
Net purchases (sales) | — | (207,597 | ) | — | (18,569,230 | ) | ||||||||||
Transfers in to Level 3 | — | — | — | — | ||||||||||||
Transfers out of Level 3 | — | — | — | (3,460,921 | ) | |||||||||||
Balance as of 2/28/11 | $ | 291,671 | $ | 2 | $ | – 0 | – | $ | 24,582,380 | |||||||
Net change in unrealized appreciation/depreciation from Investments held as of 2/28/11* | $ | 1,339 | $ | — | $ | – 0 | – | $ | 1,196,640 | |||||||
| ALLIANCEBERNSTEIN POOLING PORTFOLIOS • | 241 |
Notes to Financial Statements
Volatility Management Portfolio | Rights | Total | ||||||
Balance as of 8/31/10 | $ | — | $ | — | ||||
Accrued discounts/(premiums) | — | — | ||||||
Realized gain (loss) | — | — | ||||||
Change in unrealized appreciation/depreciation | 40,631 | 40,631 | ||||||
Net purchases (sales) | 437 | 437 | ||||||
Transfers in to Level 3 | — | — | ||||||
Transfers out of Level 3 | — | — | ||||||
Balance as of 2/28/11 | $ | 41,068 | $ | 41,068 | ||||
Net change in unrealized appreciation/depreciation from Investments held as of 2/28/11* | $ | 40,631 | $ | 40,631 | ||||
| * | The unrealized appreciation/depreciation is included in net change in unrealized appreciation/depreciation of investments in the accompanying statement of operations. |
| ** | Represents the partial payoff of the TALF loan. |
| *** | The Portfolio held a security with zero market value at period end. |
3. Currency Translation
Assets and liabilities denominated in foreign currencies and commitments under forward currency exchange contracts are translated into U.S. dollars at the mean of the quoted bid and asked prices of such currencies against the U.S. dollar. Purchases and sales of portfolio securities are translated into U.S. dollars at the rates of exchange prevailing when such securities were acquired or sold. Income and expenses are translated into U.S. dollars at rates of exchange prevailing when accrued.
Net realized gain or loss on foreign currency transactions represents foreign exchange gains and losses from sales and maturities of foreign fixed income investments, foreign currency exchange contracts, holding of foreign currencies, currency gains or losses realized between the trade and settlement dates on foreign investment transactions, and the difference between the amounts of dividends, interest and foreign withholding taxes recorded on the Portfolios’ books and the U.S. dollar equivalent amounts actually received or paid. Net unrealized currency gains and losses from valuing foreign currency denominated assets and liabilities at period end exchange rates are reflected as a component of net unrealized appreciation or depreciation of investments and foreign currency denominated assets and liabilities.
4. Taxes
It is each Portfolios’ policy to meet the requirements of the Internal Revenue Code applicable to regulated investment companies and to distribute all of its investment company taxable income and net realized gains, if any, to shareholders. Therefore, no provisions for federal income or excise taxes are required. The Portfolios may be subject to taxes imposed by countries in which they invest. Such taxes are generally based on income and/or capital gains earned or repatriated. Taxes are accrued and applied to net investment income, net realized gains and net unrealized appreciation/depreciation as such income and/or gains are earned.
| 242 | • ALLIANCEBERNSTEIN POOLING PORTFOLIOS |
Notes to Financial Statements
If, during a taxable year, the Subsidiary’s taxable losses (and other deductible items) exceed its income and gains, the net loss will not pass through to the Multi-Asset Real Return Portfolio as a deductible amount for Federal income tax purposes. Note that the loss from the Subsidiary contemplated activities also cannot be carried forward to reduce future Subsidiary’s income in subsequent years. However, if the Subsidiary’s taxable gains exceed its losses and other deductible items during a taxable year, the net gain will pass through to the Portfolio as income for Federal income tax purposes.
In accordance with U.S. GAAP requirements regarding accounting for uncertainties in income taxes, management has analyzed the Portfolios’ tax positions taken or expected to be taken on federal and state income tax returns for all open tax years (the current and the prior three tax years, as applicable) and has concluded that no provision for income tax is required in the Portfolios’ financial statements.
5. Investment Income and Investment Transactions
Dividend income is recorded on the ex-dividend date or as soon as the Portfolio is informed of the dividend. Interest income is accrued daily. Investment transactions are accounted for on the date the securities are purchased or sold. Investment gains or losses are determined on the identified cost basis. The Portfolios amortize premiums and accrete discounts as adjustments to interest income.
6. Expenses
Expenses of the Trust are charged to each Portfolio in proportion to each Portfolio’s respective net assets.
7. Dividends and Distributions
Dividends and distributions to shareholders, if any, are recorded on the ex-dividend date. Income dividends and capital gains distributions are determined in accordance with federal tax regulations and may differ from those determined in accordance with U.S. GAAP. To the extent these differences are permanent, such amounts are reclassified within the capital accounts based on their federal tax basis treatment; temporary differences do not require such reclassification.
NOTE B
Advisory Fee and Other Transactions with Affiliates
The Trust has entered into an advisory agreement (the “Advisory Agreement”) with the Adviser. Under the terms of the Advisory Agreement, the Portfolios pay no advisory fees to the Adviser. The Adviser serves as investment manager and adviser of each of the Portfolios and continuously furnishes an investment program for each Portfolio and manages, supervises and conducts the affairs of each Portfolio, subject to the supervision of the Trust’s Board of Trustees. The Advisory Agreement provides that the Adviser or an affiliate will furnish, or pay the expenses of the Trust for, office space, facilities and equipment, services of executive and other personnel of the Trust and certain administrative services. The Adviser has agreed to bear certain expenses to the extent necessary to limit
| ALLIANCEBERNSTEIN POOLING PORTFOLIOS • | 243 |
Notes to Financial Statements
the total portfolio operating expenses to .15% of average daily net assets for the Volatility Management Portfolio. For the period ended February 28, 2011, such reimbursement amounted to $25,579.
The Subsidiary has entered into a separate agreement with the Adviser for the management of the Subsidiary’s portfolio. The Adviser receives no compensation from the Subsidiary for its services under the agreement.
During the year ended August 31, 2010, the Adviser reimbursed the International Growth Portfolio and Bond Inflation Protection Portfolio in the amounts of $2,055 and $40,508, respectively, for trading losses incurred due to a trade entry error.
The Trust has entered into a distribution agreement (the “Distribution Agreement”) on behalf of each Portfolio with AllianceBernstein Investments, Inc., a wholly-owned subsidiary of the Adviser, the Portfolios’ principal underwriter (the “Underwriter”), to permit the Underwriter to distribute the Portfolios’ shares, which are sold at the net asset value without any sales charge.
Under the Distribution Agreement, the Trust is responsible for all expenses of the Portfolios, including, for example, certain administrative services, costs of printing Portfolio prospectuses and other reports to shareholders, any taxes levied against the Portfolios and brokerage fees and commissions in connection with the purchase and sale of portfolio securities, but not expenses incurred in promoting the sale of the Portfolios’ shares, which are borne by the Underwriter.
AllianceBernstein Investor Services, Inc. (“ABIS”), a wholly-owned subsidiary of the Adviser, acts as the Portfolios’ registrar, transfer agent and dividend-disbursing agent.
The Portfolios may invest in the AllianceBernstein Fixed-Income Shares, Inc.—Government STIF Portfolio, an open-end management investment company managed by the Adviser. The Government STIF Portfolio is offered as a cash management option to mutual funds and other institutional accounts of the Adviser, and is not available for direct purchase by members of the public. The Government STIF Portfolio pays no investment management fees but does bear its own expenses. A summary of the Portfolios’ transactions in shares of the Government STIF Portfolio for the six months ended February 28, 2011 is as follows:
| Portfolio | Market Value August 31, (000) | Purchases at Cost (000) | Sales Proceeds (000) | Market Value February 28, (000) | Dividend Income (000) | |||||||||||||||
U.S. Value | $ | 15,636 | $ | 438,594 | $ | 417,754 | $ | 36,476 | $ | 31 | ||||||||||
U.S. Large Cap Growth | 9,036 | 89,615 | 77,913 | 20,738 | 2 | |||||||||||||||
International Value | 8,377 | 142,796 | 143,073 | 8,100 | 11 | |||||||||||||||
| 244 | • ALLIANCEBERNSTEIN POOLING PORTFOLIOS |
Notes to Financial Statements
| Portfolio | Market Value August 31, (000) | Purchases at Cost (000) | Sales Proceeds (000) | Market Value February 28, (000) | Dividend Income (000) | |||||||||||||||
International Growth | $ | 16,754 | $ | 174,142 | $ | 182,435 | $ | 8,461 | $ | 7 | ||||||||||
Short Duration Bond | 26,879 | 214,511 | 232,408 | 8,982 | 21 | |||||||||||||||
Intermediate Duration Bond | 115,479 | 296,074 | 354,597 | 56,956 | 81 | |||||||||||||||
Bond Inflation Protection | 4,138 | 66,565 | 69,382 | 1,321 | 4 | |||||||||||||||
High-Yield | 0 | 72,134 | 66,331 | 5,803 | 3 | |||||||||||||||
Small-Mid Cap Value | 6,705 | 87,430 | 89,365 | 4,770 | 8 | |||||||||||||||
Small-Mid Cap Growth | 7,891 | 99,529 | 97,068 | 10,352 | 5 | |||||||||||||||
Multi-Asset Real Return | 5,549 | 220,925 | 219,149 | 7,325 | 7 | |||||||||||||||
Volatility Management | 151,708 | 133,749 | 78,016 | 207,441 | 27 | |||||||||||||||
Brokerage commissions paid on investment transactions and brokerage commissions paid to Sanford C. Bernstein & Co. LLC and Sanford C. Bernstein Limited, affiliates of the Adviser, for the six months ended February 28, 2011 were as follows:
| Portfolio | Total Commissions | Sanford C. Bernstein & Co. LLC | Sanford C. Bernstein Limited | |||||||||
U.S. Value | $ | 1,435,699 | $ | – 0 | – | $ | – 0 | – | ||||
U.S. Large Cap Growth | 1,404,421 | – 0 | – | – 0 | – | |||||||
International Value | 730,281 | – 0 | – | – 0 | – | |||||||
International Growth | 1,122,395 | – 0 | – | – 0 | – | |||||||
Short Duration Bond | – 0 | – | – 0 | – | – 0 | – | ||||||
Intermediate Duration Bond | – 0 | – | – 0 | – | – 0 | – | ||||||
Bond Inflation Protection | – 0 | – | – 0 | – | – 0 | – | ||||||
High-Yield | 3,316 | – 0 | – | – 0 | – | |||||||
Small-Mid Cap Value | 492,486 | – 0 | – | – 0 | – | |||||||
Small-Mid Cap Growth | 430,767 | – 0 | – | – 0 | – | |||||||
Multi-Asset Real Return | 1,011,469 | – 0 | – | 704 | ||||||||
Volatility Management | 11,888 | – 0 | – | – 0 | – | |||||||
NOTE C
Investment Transactions
Purchases and sales of investment securities (excluding U.S. government securities and short-term investments) for the six months ended February 28, 2011, were as follows:
| Portfolio | Purchases | Sales | ||||||
U.S. Value | $ | 569,694,795 | $ | 695,832,963 | ||||
U.S. Large Cap Growth | 1,038,538,702 | 1,273,437,469 | ||||||
International Value | 327,958,255 | 383,584,219 | ||||||
International Growth | 500,980,561 | 524,368,601 | ||||||
| ALLIANCEBERNSTEIN POOLING PORTFOLIOS • | 245 |
Notes to Financial Statements
| Portfolio | Purchases | Sales | ||||||
Short Duration Bond | $ | 151,564,234 | $ | 30,253,317 | ||||
Intermediate Duration Bond | 79,800,065 | 104,237,672 | ||||||
Bond Inflation Protection | 75,877,896 | 25,411,204 | ||||||
High-Yield | 145,872,100 | 139,760,657 | ||||||
Small-Mid Cap Value | 156,016,888 | 210,597,748 | ||||||
Small-Mid Cap Growth | 217,776,687 | 356,453,743 | ||||||
Multi-Asset Real Return | 635,135,798 | 1,029,406,643 | ||||||
Volatility Management | 33,739,416 | 9,960,324 | ||||||
Purchases and sales of U.S. government securities for the six months ended February 28, 2011, were as follows:
| Portfolio | Purchases | Sales | ||||||
U.S. Value | $ | – 0 | – | $ | – 0 | – | ||
U.S. Large Cap Growth | – 0 | – | – 0 | – | ||||
International Value | – 0 | – | – 0 | – | ||||
International Growth | – 0 | – | – 0 | – | ||||
Short Duration Bond | 387,521,303 | 359,017,652 | ||||||
Intermediate Duration Bond | 647,990,711 | 463,817,277 | ||||||
Bond Inflation Protection | 85,057,558 | 52,475,919 | ||||||
High-Yield | 1,698,810 | – 0 | – | |||||
Small-Mid Cap Value | – 0 | – | – 0 | – | ||||
Small-Mid Cap Growth | – 0 | – | – 0 | – | ||||
Multi-Asset Real Return | 406,455,168 | 65,456,981 | ||||||
Volatility Management | 5,910,418 | 58,058,743 | ||||||
The cost of investments for federal income tax purposes was substantially the same as the cost for financial reporting purposes. Accordingly, gross unrealized appreciation and unrealized depreciation (excluding futures, foreign currency and swap transactions) are as follows:
| Gross Unrealized | Net Unrealized Appreciation/ (Depreciation) | |||||||||||
Portfolio | Appreciation | (Depreciation) | ||||||||||
U.S. Value | $ | 433,476,268 | $ | (28,528,600 | ) | $ | 404,947,668 | |||||
U.S. Large Cap Growth | 555,687,427 | (6,143,914 | ) | 549,543,513 | ||||||||
International Value | 175,071,473 | (32,641,943 | ) | 142,429,530 | ||||||||
International Growth | 146,734,335 | (20,875,875 | ) | 125,858,460 | ||||||||
Short Duration Bond | 18,549,304 | (32,985,085 | ) | (14,435,781 | ) | |||||||
Intermediate Duration Bond | 55,266,875 | (23,378,866 | ) | 31,888,009 | ||||||||
Bond Inflation Protection | 58,628,284 | (689,218 | ) | 57,939,066 | ||||||||
High-Yield | 59,644,278 | (13,498,586 | ) | 46,145,692 | ||||||||
Small-Mid Cap Value | 147,998,044 | (6,059,615 | ) | 141,938,429 | ||||||||
Small-Mid Cap Growth | 208,830,166 | (1,311,202 | ) | 207,518,964 | ||||||||
Multi-Asset Real Return | 111,022,552 | (3,713,093 | ) | 107,309,459 | ||||||||
Volatility Management | 17,920,289 | (1,047,228 | ) | 16,873,061 | ||||||||
1. Derivative Financial Instruments
Certain Portfolios may use derivatives to earn income and enhance returns, to hedge or adjust the risk profile of its portfolio, to replace more traditional direct investments, or to obtain exposure to otherwise inaccessible markets. The
| 246 | • ALLIANCEBERNSTEIN POOLING PORTFOLIOS |
Notes to Financial Statements
Portfolios may also use derivatives for non-hedging purposes as a means of making direct investment in foreign currencies, as described below under “Currency Transactions”.
The principal types of derivatives utilized by the Portfolios, as well as the methods in which they may be used are:
| • | Futures Contracts |
Certain Portfolios may buy or sell futures contracts for the purpose of hedging their Portfolios against adverse effects of anticipated movements in the market or for investment purposes. The Portfolio bears the market risk that arises from changes in the value of these instruments and the imperfect correlation between movements in the price of the futures contracts and movements in the price of the securities hedged or used for cover. The Portfolio may also purchase or sell futures contracts for foreign currencies or options thereon for non-hedging purposes as a means of making direct investment in foreign currencies, as described below under “Currency Transactions”.
During the six months ended February 28, 2011, the International Growth Portfolio and International Value Portfolio held futures contracts for non-hedging purposes. Short Duration Portfolio, Bond Inflation Portfolio, Multi-Asset Real Return Portfolio and Volatility Management Portfolio held futures contracts for hedging and non-hedging purposes.
At the time the Portfolio enters into a futures contract, the Portfolio deposits and maintains as collateral an initial margin with the broker, as required by the exchange on which the transaction is effected. Pursuant to the contract, the Portfolio agrees to receive from or pay to the broker an amount of cash equal to the daily fluctuation in the value of the contract. Such receipts or payments are known as variation margin and are recorded by the Portfolio as unrealized gains or losses. Risks may arise from the potential inability of a counterparty to meet the terms of the contract. The credit/counterparty risk for exchange-traded futures contracts is generally less than privately negotiated futures contracts, since the clearinghouse, which is the issuer or counterparty to each exchange-traded future, provides a guarantee of performance. This guarantee is supported by a daily payment system (i.e., margin requirements).When the contract is closed, the Portfolio records a realized gain or loss equal to the difference between the value of the contract at the time it was opened and the time it was closed.
Use of long futures contracts subjects the Portfolio to risk of loss in excess of the amounts shown on the statement of assets and liabilities, up to the notional value of the futures contracts. Use of short futures contracts subjects the Portfolio to unlimited risk of loss. Under some circumstances, futures exchanges may establish daily limits on the amount that the price of
| ALLIANCEBERNSTEIN POOLING PORTFOLIOS • | 247 |
Notes to Financial Statements
a futures contract can vary from the previous day’s settlement price, which could effectively prevent liquidation of unfavorable positions.
| • | Forward Currency Exchange Contracts |
Certain Portfolios may enter into forward currency exchange contracts in order to hedge their exposure to changes in foreign currency exchange rates on their foreign portfolio holdings, to hedge certain firm purchase and sale commitments denominated in foreign currencies and for non-hedging purposes as a means of making direct investments in foreign currencies, as described below under “Currency Transactions”.
During the six months ended February 28, 2011, the International Growth Portfolio, International Value Portfolio, Bond Inflation Portfolio, Multi-Asset Real Return Portfolio and Volatility Management Portfolio held forward currency exchange contracts for hedging and non-hedging purposes. High-Yield Portfolio and Intermediate Duration Portfolio held forward currency exchange contracts for hedging purposes.
A forward currency exchange contract is a commitment to purchase or sell a foreign currency at a future date at a negotiated forward rate. The gain or loss arising from the difference between the original contract and the closing of such contract would be included in net realized gain or loss on foreign currency transactions. Fluctuations in the value of open forward currency exchange contracts are recorded for financial reporting purposes as unrealized appreciation and/or depreciation by the Portfolio. Risks may arise from the potential inability of a counterparty to meet the terms of a contract and from unanticipated movements in the value of a foreign currency relative to the U.S. dollar. The face or contract amount, in U.S. dollars reflects the total exposure the Portfolio has in that particular currency contract.
| • | Option Transactions |
For hedging and investment purposes, certain Portfolios may purchase and write (sell) put and call options on U.S. and foreign securities, including government securities, and foreign currencies that are traded on U.S. and foreign securities exchanges and over-the-counter markets. The Portfolio may also use options transactions for non-hedging purposes as a means of making direct investments in foreign currencies, as described below under “Currency Transactions”.
During the six months ended February 28, 2011, the High-Yield Portfolio held purchased options for non-hedging purposes.
The risk associated with purchasing an option is that the Portfolio pays a premium whether or not the option is exercised. Additionally, the Portfolio bears the risk of loss of the premium and change in market value should the counterparty not perform under the contract. Put and call options purchased are accounted for in the same manner as portfolio
| 248 | • ALLIANCEBERNSTEIN POOLING PORTFOLIOS |
Notes to Financial Statements
securities. The cost of securities acquired through the exercise of call options is increased by premiums paid. The proceeds from securities sold through the exercise of put options are decreased by the premiums paid.
When the Portfolio writes an option, the premium received by the Portfolio is recorded as a liability and is subsequently adjusted to the current market value of the option written. Premiums received from written options which expire unexercised are recorded by the Portfolio on the expiration date as realized gains from options written. The difference between the premium received and the amount paid on effecting a closing purchase transaction, including brokerage commissions, is also treated as a realized gain, or if the premium received is less than the amount paid for the closing purchase transaction, as a realized loss. If a call option is exercised, the premium received is added to the proceeds from the sale of the underlying security or currency in determining whether the Portfolio has realized a gain or loss. If a put option is exercised, the premium received reduces the cost basis of the security or currency purchased by the Portfolio. In writing an option, the Portfolio bears the market risk of an unfavorable change in the price of the security or currency underlying the written option. Exercise of an option written by the Portfolio could result in the Portfolio selling or buying a security or currency at a price different from the current market value. For the six months ended February 28, 2011, the Portfolios had no transactions in written options.
| • | Swap Agreements |
Certain Portfolios may enter into swaps to hedge their exposure to interest rates, credit risk, or currencies. The Portfolio may also enter into swaps for non-hedging purposes as a means of gaining market exposures or making direct investments in foreign currencies, as described below under “Currency Transactions”. A swap is an agreement that obligates two parties to exchange a series of cash flows at specified intervals based upon or calculated by reference to changes in specified prices or rates for a specified amount of an underlying asset. The payment flows are usually netted against each other, with the difference being paid by one party to the other. In addition, collateral may be pledged or received by the Portfolio in accordance with the terms of the respective swap agreements to provide value and recourse to the Portfolio or its counterparties in the event of default, bankruptcy or insolvency by one of the parties to the swap agreement.
Risks may arise as a result of the failure of the counterparty to the swap contract to comply with the terms of the swap contract. The loss incurred by the failure of a counterparty is generally limited to the net interim payment to be received by the Portfolio, and/or the termination value at the end of the contract. Therefore, the Portfolio considers the creditworthiness of each counterparty to a swap contract in evaluating potential counterparty risk. This risk is mitigated by having a netting
| ALLIANCEBERNSTEIN POOLING PORTFOLIOS • | 249 |
Notes to Financial Statements
arrangement between the Portfolio and the counterparty and by the posting of collateral by the counterparty to the Portfolio to cover the Portfolio’s exposure to the counterparty. Additionally, risks may arise from unanticipated movements in interest rates or in the value of the underlying securities. The Portfolio accrues for the interim payments on swap contracts on a daily basis, with the net amount recorded within unrealized appreciation/depreciation of swap contracts on the statement of assets and liabilities, where applicable. Once the interim payments are settled in cash, the net amount is recorded as realized gain/(loss) on swaps on the statement of operations, in addition to any realized gain/(loss) recorded upon the termination of swap contracts. Fluctuations in the value of swap contracts are recorded as a component of net change in unrealized appreciation/depreciation of swap contracts on the statement of operations.
Interest Rate Swaps:
The Portfolio is subject to interest rate risk exposure in the normal course of pursuing its investment objectives. Because the Portfolio holds fixed rate bonds, the value of these bonds may decrease if interest rates rise. To help hedge against this risk and to maintain its ability to generate income at prevailing market rates, the Portfolio may enter into interest rate swap contracts. Interest rate swaps are agreements between two parties to exchange cash flows based on a notional amount. The Portfolio may elect to pay a fixed rate and receive a floating rate, or, receive a fixed rate and pay a floating rate on a notional amount.
A Portfolio may enter into interest rate swap transactions to preserve a return or spread on a particular investment or portion of its portfolio, or protecting against an increase in the price of securities the Portfolio anticipates purchasing at a later date. Interest rate swaps involve the exchange by a Portfolio with another party of their respective commitments to pay or receive interest (e.g., an exchange of floating rate payments for fixed rate payments) computed based on a contractually-based principal (or “notional”) amount. Interest rate swaps are entered into on a net basis (i.e., the two payment streams are netted out, with the Portfolio receiving or paying, as the case may be, only the net amount of the two payments).
During the six months ended February 28, 2011, Bond Inflation Portfolio held interest rate swaps for hedging and non-hedging purposes. The High-Yield Portfolio held interest rate swaps for hedging purposes and Intermediate Duration Bond Portfolio held interest rate swaps for non-hedging purposes.
Credit Default Swaps:
The Portfolio may enter into credit default swaps to manage its exposure to the market or certain sectors of the market, to reduce its risk exposure
| 250 | • ALLIANCEBERNSTEIN POOLING PORTFOLIOS |
Notes to Financial Statements
to defaults by corporate and sovereign issuers held by the Portfolio, or to create exposure to corporate or sovereign issuers to which it is not otherwise exposed. The Portfolio may purchase credit protection (“Buy Contract”) or provide credit protection (“Sale Contract”) on the referenced obligation of the credit default swap. During the term of the swap agreement, the Portfolio receives/(pays) fixed payments from/(to) the respective counterparty, calculated at the agreed upon rate applied to the notional amount. The accrual for these interim payments is recorded within unrealized appreciation/depreciation of swap contracts on the statement of assets and liabilities. Upfront premiums paid or received in connection with credit default swap contracts are recognized as cost or proceeds on the statement of assets and liabilities and are amortized on a straight line basis over the life of the contract. Amortized upfront premiums are included in net realized gain/(loss) from swaps on the statement of operations. If the Portfolio is a buyer/(seller) of protection and a credit event occurs, as defined under the terms of the swap agreement, the Portfolio will either (i) receive from the seller/(pay to the buyer) of protection an amount equal to the notional amount of the swap contract (the “Maximum Payout Amount”) and deliver/(take delivery of) the referenced obligation or (ii) receive/(pay) a net settlement amount in the form of cash or securities equal to the notional amount of the swap less the recovery value of the referenced obligation.
During the six months ended February 28, 2011, the High-Yield Portfolio held credit default swaps for hedging and non-hedging purposes. The Bond Inflation Portfolio held credit default swaps for non-hedging purposes.
Credit default swaps may involve greater risks than if a Portfolio had invested in the referenced obligation directly. Credit default swaps are subject to general market risk, liquidity risk, counterparty risk and credit risk. If the Portfolio is a buyer of protection and no credit event occurs, it will lose the payments it made to its counterparty. If the Portfolio is a seller of protection and a credit event occurs, the value of the referenced obligation received by the Portfolio coupled with the periodic payments previously received, may be less than the Maximum Payout Amount it pays to the buyer, resulting in a net loss to the Portfolio.
Implied credit spreads over Treasuries of comparable maturity utilized in determining the market value of credit default swaps on issuers as of period end are disclosed in the portfolio of investments. The implied spreads serve as an indicator of the current status of the payment/ performance risk and typically reflect the market’s assessment of the likelihood of default by the issuer of the referenced obligation. The implied credit spread of a particular reference obligation also reflects the cost of buying/selling protection and may reflect upfront payments required to be made to enter into the agreement. Widening credit spreads typically represent a
| ALLIANCEBERNSTEIN POOLING PORTFOLIOS • | 251 |
Notes to Financial Statements
deterioration of the referenced obligation’s credit soundness and greater likelihood of default or other credit event occurring as defined under the terms of the agreement. A credit spread identified as “Defaulted” indicates a credit event has occurred for the referenced obligation.
At February 28, 2011, the Bond Inflation Protection Portfolio and High-Yield Portfolio had Sale Contracts outstanding with Maximum Payout Amounts aggregating $72,740,000 and $2,200,000, with net unrealized appreciation/depreciation of $1,574,011 and $(35,175), respectively, and terms of less than 5 years, as reflected in the portfolio of investments.
In certain circumstances Maximum Payout Amounts may be partially offset by recovery values of the respective referenced obligations, upfront premium received upon entering into the agreement, or net amounts received from settlement of buy protection credit default swap agreements entered into by the Portfolio for the same reference obligation with the same counterparty.
Total Return Swaps:
The Portfolio may enter into total return swaps in order take a “long” or “short” position with respect to an underlying referenced asset. The Portfolio is subject to market price volatility of the underlying referenced asset. A total return swap involves commitments to pay interest in exchange for a market linked return based on a notional amount. To the extent that the total return of the security, group of securities or index underlying the transaction exceeds or falls short of the offsetting interest obligation, the Portfolio will receive a payment from or make a payment to the counterparty.
During the six months ended February 28, 2011, the Multi-Asset Real Return Portfolio and Volatility Management Portfolio held total return swaps for hedging and non-hedging purposes.
Documentation governing the Portfolios’ swap transactions may contain provisions for early termination of a swap in the event the net assets of the Portfolio decline below specific levels set forth in the documentation (“net asset contingent features”). If these levels are triggered, the Portfolios’ counterparty has the right to terminate the swap and require the Portfolio to pay or receive a settlement amount in connection with the terminated swap transaction. As of February 28, 2011, the High-Yield Portfolio and the Multi-Asset Real Return Portfolio had swap contracts in liability positions with net asset contingent features. The fair value of such contracts amounted to $440,832 and $27,359, respectively, at February 28, 2011.
| 252 | • ALLIANCEBERNSTEIN POOLING PORTFOLIOS |
Notes to Financial Statements
At February 28, 2011, the Portfolios had entered into the following derivatives:
International | Asset Derivatives | Liability Derivatives | ||||||||||
| Derivative Type | Statement of Assets and Liabilities Location | Fair Value | Statement of Assets and Liabilities Location | Fair Value | ||||||||
Foreign exchange contracts | Unrealized appreciation of forward currency exchange contracts | $ | 10,663,785 |
| Unrealized depreciation of forward currency exchange contracts | $ | 8,300,023 |
| ||||
Equity contracts | Receivable/Payable for variation margin on futures contracts | 558,190 | * | |||||||||
Total | $ | 11,221,975 | $ | 8,300,023 | ||||||||
| * | Only variation margin receivable/payable at period end is reported within the statement of assets and liabilities. This amount reflects cumulative appreciation/(depreciation) of futures contracts as reported in the portfolio of investments. |
The effect of derivative instruments on the statement of operations for the six months ended February 28, 2011:
| Derivative Type | Location of Gain or (Loss) on Derivatives | Realized Gain or (Loss) on Derivatives | Change in Unrealized Appreciation or (Depreciation) | |||||||
Foreign exchange contracts | Net realized gain (loss) on foreign currency transactions; Net change in unrealized appreciation/depreciation of foreign currency denominated assets and liabilities | $ | 3,704,389 |
| $ | (22,325 | ) | |||
Equity contracts | Net realized gain (loss) on futures contracts; Net change in unrealized appreciation/depreciation of futures contracts | 254,582 | 868,105 | |||||||
Total | $ | 3,958,971 | $ | 845,780 | ||||||
For the six months ended February 28, 2011, the average monthly principal amount of foreign currency exchange contracts was $656,709,678, and average monthly original value of futures contracts was $6,540,506.
| ALLIANCEBERNSTEIN POOLING PORTFOLIOS • | 253 |
Notes to Financial Statements
International | Asset Derivatives | Liability Derivatives | ||||||||||||
| Derivative Type | Statement of Assets and Liabilities Location | Fair Value | Statement of Assets and Liabilities Location | Fair Value | ||||||||||
Foreign exchange contracts | Unrealized | $ | 17,129,725 |
| | Unrealized | | $ | 14,564,980 |
| ||||
Total | $ | 17,129,725 | $ | 14,564,980 | ||||||||||
The effect of derivative instruments on the statement of operations for the six months ended February 28, 2011:
| Derivative Type | Location of Gain or (Loss) on Derivatives | Realized Gain or (Loss) on Derivatives | Change in Unrealized Appreciation or (Depreciation) | |||||||
Foreign exchange contracts | Net realized gain (loss) on foreign currency transactions; Net change in unrealized appreciation/depreciation of foreign currency denominated assets and liabilities | $ | (5,671,471) |
| $ | 4,568,495 |
| |||
Equity contracts | Net realized gain (loss) on futures contracts; Net change in unrealized appreciation/depreciation of futures contracts | (202,405 | ) | 31,086 | ||||||
Total | $ | (5,873,876 | ) | $ | 4,599,581 | |||||
For the six months ended February 28, 2011, the average monthly principal amount of foreign currency exchange contracts was $881,069,277, and average monthly original value of futures contracts was $4,239,030.
| 254 | • ALLIANCEBERNSTEIN POOLING PORTFOLIOS |
Notes to Financial Statements
Short Duration | Asset Derivatives | Liability Derivatives | ||||||||||||
| Derivative Type | Statement of Assets and Liabilities Location | Fair Value | Statement of Assets and Liabilities Location | Fair Value | ||||||||||
Interest rate contracts | Receivable/Payable for variation margin on futures contracts | $ | 296,968 | * | ||||||||||
Total | $ | 296,968 | ||||||||||||
| * | Only variation margin receivable/payable at period end is reported within the statement of assets and liabilities. This amount reflects cumulative appreciation/(depreciation) of futures contracts as reported in the portfolio of investments. |
The effect of derivative instruments on the statement of operations for the six months ended February 28, 2011:
| Derivative Type | Location of Gain or (Loss) on Derivatives | Realized Gain or (Loss) on Derivatives | Change in Unrealized Appreciation or (Depreciation) | |||||||
Interest rate contracts | Net realized gain (loss) on futures contracts; Net change in unrealized appreciation/depreciation of futures contracts | $ | (17,044 | ) | $ | 392,269 | ||||
Total | $ | (17,044) | $ | 392,269 | ||||||
For the six months ended February 28, 2011, the average monthly original value of futures contracts was $324,626,193.
Intermediate | Asset Derivatives | Liability Derivatives | ||||||||||||
| Derivative Type | Statement of Assets and Liabilities Location | Fair Value | Statement of Assets and Liabilities Location | Fair Value | ||||||||||
Foreign exchange contracts | Unrealized appreciation of forward currency exchange contracts | $ | 79,980 |
| ||||||||||
Interest rate contracts | Unrealized appreciation on interest rate swap contracts | 317,550 | ||||||||||||
Total | $ | 397,530 | ||||||||||||
| ALLIANCEBERNSTEIN POOLING PORTFOLIOS • | 255 |
Notes to Financial Statements
The effect of derivative instruments on the statement of operations for the six months ended February 28, 2011:
| Derivative Type | Location of Gain or (Loss) on Derivatives | Realized Gain or (Loss) on Derivatives | Change in Unrealized Appreciation or (Depreciation) | |||||||
Foreign exchange contracts | Net realized gain (loss) on foreign currency transactions; Net change in unrealized appreciation/depreciation of foreign currency denominated assets and liabilities and other assets | $ | (257,101 | ) | $ | 79,980 | ||||
Interest rate contracts | Net realized gain (loss) on swap contracts; Net change in unrealized appreciation/depreciation of swap contracts | 55,509 | 317,550 | |||||||
Total | $ | (201,592) | $ | 397,530 | ||||||
For the six months ended February 28, 2011, the average monthly principal amount of foreign currency exchange contracts was $11,326,928 and average monthly notional amount of interest rate swaps was $43,645,714.
Bond Inflation | Asset Derivatives | Liability Derivatives | ||||||||||
| Derivative Type | Statement of Assets and Liabilities Location | Fair Value | Statement of Assets and Liabilities Location | Fair Value | ||||||||
Foreign exchange contracts | Unrealized appreciation of forward currency exchange contracts | $ | 486,187 |
| Unrealized depreciation of forward currency exchange contracts | $ | 2,547,940 |
| ||||
Interest rate contracts | Receivable/Payable for variation margin on futures contracts |
| 240,258 | * | ||||||||
Interest rate contracts | Unrealized appreciation on interest rate swap contracts |
| 162,187 |
| ||||||||
| 256 | • ALLIANCEBERNSTEIN POOLING PORTFOLIOS |
Notes to Financial Statements
Bond Inflation | Asset Derivatives | Liability Derivatives | ||||||||||
| Derivative Type | Statement of Assets and Liabilities Location | Fair Value | Statement of Assets and Liabilities Location | Fair Value | ||||||||
Credit contracts | Unrealized appreciation on credit default swap contracts | $ | 1,574,011 | |||||||||
Total | $ | 2,222,385 | $ | 2,788,198 | ||||||||
| * | Only variation margin receivable/payable at period end is reported within the statement of assets and liabilities. This amount reflects cumulative appreciation/(depreciation) of futures contracts as reported in the portfolio of investments. |
The effect of derivative instruments on the statement of operations for the six months ended February 28, 2011:
| Derivative Type | Location of Gain or (Loss) on Derivatives | Realized Gain or (Loss) on Derivatives | Change in Unrealized Appreciation or (Depreciation) | |||||||
Foreign exchange contracts | Net realized gain (loss) on foreign currency transactions; Net change in unrealized appreciation/depreciation of foreign currency denominated assets and liabilities | $ | 2,781,873 | $ (1,041,566) | ||||||
Interest rate contracts | Net realized gain (loss) on futures contracts; Net change in unrealized appreciation/depreciation of futures contracts | 456,537 | (105,738 | ) | ||||||
Interest rate contracts | Net realized gain (loss) on swap contracts; Net change in unrealized appreciation/depreciation of swap contracts | 37,021 | 162,187 | |||||||
Credit contracts | Net realized gain (loss) on swap contracts; Net change in unrealized appreciation/depreciation of swap contracts | 875,505 | 3,047,479 | |||||||
Total | $ | 4,150,936 | $ | 2,062,362 | ||||||
For the six months ended February 28, 2011, the average monthly principal amount of foreign currency exchange contracts was $157,756,287, average monthly original value of futures contracts was $78,358,732, average monthly
| ALLIANCEBERNSTEIN POOLING PORTFOLIOS • | 257 |
Notes to Financial Statements
notional amount of interest rate swaps was $29,108,571 and average monthly notional amount of credit default swaps was $80,402,857.
High-Yield | Asset Derivatives | Liability Derivatives | ||||||||||
| Derivative Type | Statement of Assets and Liabilities Location | Fair Value | Statement of Assets and Liabilities Location | Fair Value | ||||||||
Foreign exchange contracts | Unrealized appreciation of forward currency exchange contracts | $ | 2,771 |
| Unrealized depreciation of forward currency exchange contracts | $ | 1,043,788 |
| ||||
Interest rate contracts | Receivable/Payable for variation margin on futures contracts | 57,434 | * | |||||||||
Interest rate contracts | Unrealized appreciation on interest rate swap contracts |
| 221,779 |
| Unrealized depreciation on interest rate swap contracts |
| 287,393 |
| ||||
Credit contracts | Unrealized appreciation on credit default swap contracts | 75,303 | Unrealized depreciation on credit default swap contracts | 153,439 | ||||||||
Total | $ | 299,853 | $ | 1,542,054 | ||||||||
| * | Only variation margin receivable/payable at period end is reported within the statement of assets and liabilities. This amount reflects cumulative appreciation/(depreciation) of futures contracts as reported in the portfolio of investments. |
The effect of derivative instruments on the statement of operations for the six months ended February 28, 2011:
| Derivative Type | Location of Gain or (Loss) on Derivatives | Realized Gain or (Loss) on Derivatives | Change in Unrealized Appreciation or (Depreciation) | |||||||
Foreign exchange contracts | Net realized gain (loss) on foreign currency transactions; Net change in unrealized appreciation/depreciation of foreign currency denominated assets and liabilities | $ | 768,932 |
| $ | (1,028,613 | ) | |||
Interest rate contracts | Net realized gain (loss) on futures contracts; Net change in unrealized appreciation/depreciation of futures contracts | – 0 | – | (57,434 | ) | |||||
| 258 | • ALLIANCEBERNSTEIN POOLING PORTFOLIOS |
Notes to Financial Statements
| Derivative Type | Location of Gain or (Loss) on Derivatives | Realized Gain or (Loss) on Derivatives | Change in Unrealized Appreciation or (Depreciation) | |||||||
Interest rate contracts | Net realized gain (loss) on swap contracts; Net change in unrealized appreciation/depreciation of swap contracts | $ | 15,447 | $ | (65,614 | ) | ||||
Credit contracts | Net realized gain (loss) on swap contracts; Net change in unrealized appreciation/depreciation of swap contracts | (46,572 | ) | (43,182 | ) | |||||
Interest rate contracts | Net realized gain (loss) on investment transactions; Net change in unrealized appreciation/depreciation of investment transactions | – 0 | – | (83,509 | ) | |||||
Total | �� | $ | 737,807 | $ | (1,278,352 | ) | ||||
For the six months ended February 28, 2011, the average monthly principal amount of foreign currency exchange contracts was $29,009,100, average monthly original value of futures contracts was $15,943, average monthly notional amount of interest rate swaps was $64,485,714, average monthly notional amount of credit default swaps was $5,895,714, and average monthly cost of purchased options contracts was $40,500.
Multi-Asset | Asset Derivatives | Liability Derivatives | ||||||||||
| Derivative Type | Statement of Assets and Liabilities Location | Fair Value | Statement of Assets and Liabilities Location | Fair Value | ||||||||
Commodity contracts | Receivable/Payable for variation margin on futures contracts | $ | 675,601 | * | ||||||||
Equity contracts | Unrealized appreciation on total return swap contracts | $ | 8,971,256 | 27,359 | ||||||||
Total | $ | 8,971,256 | $ | 702,960 | ||||||||
| * | Only variation margin receivable/payable at period end is reported within the statement of assets and liabilities. This amount reflects cumulative appreciation/(depreciation) of futures contracts as reported in the portfolio of investments. |
| ** | Consolidated. |
| ALLIANCEBERNSTEIN POOLING PORTFOLIOS • | 259 |
Notes to Financial Statements
The effect of derivative instruments on the statement of operations for the six months ended February 28, 2011:
| Derivative Type | Location of Gain or (Loss) on Derivatives | Realized Gain or (Loss) on Derivatives | Change in Unrealized Appreciation or (Depreciation) | |||||||
Foreign exchange contracts | Net realized gain (loss) on foreign currency transactions; Net change in unrealized appreciation/depreciation of foreign currency denominated assets and liabilities | $ | 6,121,273 |
| $ | (3,693,496 | ) | |||
Commodity contracts | Net realized gain (loss) on futures contracts; Net change in unrealized appreciation/depreciation of futures contracts |
| (1,205,693 | ) |
| (675,601 | ) | |||
Equity contracts | Net realized gain (loss) on swap contracts; Net change in unrealized appreciation/depreciation of swap contracts | 7,916,431 | 8,943,897 | |||||||
Total | $ | 12,832,011 | $ | 4,574,800 | ||||||
For the six months ended February 28, 2011, the average monthly principal amount of foreign currency exchange contracts was $196,042,041, average monthly original value of futures contracts was $18,226,239 and average monthly notional amount of total return swaps was $103,140,387.
Volatility | Asset Derivatives | Liability Derivatives | ||||||||||
| Derivative Type | Statement of Assets and Liabilities Location | Fair Value | Statement of Assets and Liabilities Location | Fair Value | ||||||||
Foreign exchange contracts | Unrealized appreciation of forward currency exchange contracts | $ | 382,184 |
| Unrealized depreciation of forward currency exchange contracts | $ | 355,312 |
| ||||
Equity contracts | Receivable/Payable for variation margin on futures contracts | 13,566,082 | * | |||||||||
| 260 | • ALLIANCEBERNSTEIN POOLING PORTFOLIOS |
Notes to Financial Statements
Volatility | Asset Derivatives | Liability Derivatives | ||||||||||
| Derivative Type | Statement of Assets and Liabilities Location | Fair Value | Statement of Assets and Liabilities Location | Fair Value | ||||||||
Equity contracts | Unrealized appreciation on total return swap agreements | $ | 208,058 | |||||||||
Total | $ | 14,156,324 | $ | 355,312 | ||||||||
| * | Only variation margin receivable/payable at period end is reported within the statement of assets and liabilities. This amount reflects cumulative appreciation/(depreciation) of futures contracts as reported in the portfolio of investments. |
The effect of derivative instruments on the statement of operations for the six months ended February 28, 2011:
| Derivative Type | Location of Gain or (Loss) on Derivatives | Realized Gain or (Loss) on Derivatives | Change in Unrealized Appreciation or (Depreciation) | |||||||
Foreign exchange contracts | Net realized gain (loss) on foreign currency transactions; Net change in unrealized appreciation/depreciation of foreign currency denominated assets and liabilities | $ | – 0 | – | $ | 381,987 | ||||
Interest rate contracts | Net realized gain (loss) on futures contracts; Net change in unrealized appreciation/depreciation of futures contracts | 55,871 | – 0 | – | ||||||
Equity contracts | Net realized gain (loss) on futures contracts; Net change in unrealized appreciation/depreciation of futures contracts | 23,441,651 | 20,541,010 | |||||||
Equity contracts | Net realized gain (loss) on swap contracts; Net change in unrealized appreciation/depreciation of swap contracts | 5,421,686 | 563,173 | |||||||
Total | $ | 28,919,208 | $ | 21,486,170 | ||||||
| ALLIANCEBERNSTEIN POOLING PORTFOLIOS • | 261 |
Notes to Financial Statements
For the six months ended February 28, 2011, the average monthly principal amount of foreign currency exchange contracts was $21,768,843, average monthly original value of futures contracts was $174,852,790 and average monthly notional amount of total return swaps was $35,014,514.
2. Currency Transactions
The Portfolios may invest in non-U.S. Dollar securities on a currency hedged or unhedged basis. The Portfolio may seek investment opportunities by taking long or short positions in currencies through the use of currency-related derivatives, including forward currency exchange contracts, futures and options on futures, swaps, and other options. The Portfolios may enter into transactions for investment opportunities when it anticipates that a foreign currency will appreciate or depreciate in value but securities denominated in that currency are not held by the Portfolios and do not present attractive investment opportunities. Such transactions may also be used when the Adviser believes that it may be more efficient than a direct investment in a foreign currency-denominated security. The Portfolios may also conduct currency exchange contracts on a spot basis (i.e., for cash at the spot rate prevailing in the currency exchange market for buying or selling currencies).
3. Dollar Rolls
Certain Portfolios may enter into dollar rolls. Dollar rolls involve sales by the Portfolio of securities for delivery in the current month and the Portfolio’s simultaneously contracting to repurchase substantially similar (same type and coupon) securities on a specified future date. During the roll period, the Portfolio forgoes principal and interest paid on the securities. The Portfolio is compensated by the difference between the current sales price and the lower forward price for the future purchase (often referred to as the “drop”) as well as by the interest earned on the cash proceeds of the initial sale. Dollar rolls involve the risk that the market value of the securities the Portfolio is obligated to repurchase under the agreement may decline below the repurchase price. Dollar rolls are speculative techniques and may be considered to be borrowings by the Portfolio. For the six months ended February 28, 2011, the Intermediate Duration Bond Portfolio earned drop income of $179,232, which is included in interest income in the accompanying statement of operations.
4. Reverse Repurchase Agreements
Under a reverse repurchase agreement, the Portfolios sell securities and agree to repurchase them at a mutually agreed upon date and price. At the time the Portfolios enter into a reverse repurchase agreement, it will establish a segregated account with the custodian containing liquid assets having a value at least equal to the repurchase price. For the six months ended February 28, 2011, the average amount of reverse repurchase agreements outstanding for Bond Inflation Protection Portfolio was $260,984,415 and the daily weighted average interest rate was 0.24%.
| 262 | • ALLIANCEBERNSTEIN POOLING PORTFOLIOS |
Notes to Financial Statements
5. Term Asset-Backed Securities Loan Facility
Certain Portfolios participate in the TALF program. Under the TALF program eligible borrowers may obtain a non-recourse loan from the Federal Reserve Bank of New York (“FRBNY”) by posting certain asset-backed securities and commercial mortgage-backed securities (“Eligible Securities”) as collateral. The transfer of the collateral is not recorded as a sale on a Portfolio’s records. The Portfolio agrees to repay the non-recourse loan amount plus accrued interest under the terms of the loan, with the principal balance being due at loan maturity. According to the terms of the TALF program, a Portfolio is not required to pledge further collateral in the event the value of the Eligible Securities transferred as collateral fell below the loan amount. The loan is prepayable in whole or in part at any time at the Portfolio’s option. Prepayments of principal received on the collateral during the loan term must be used to immediately reduce proportionately the loan balance outstanding. At the time of loan approval, the Portfolio paid a one time administration fee based upon the amount borrowed to the FRBNY.
Borrowing under TALF, as with the extension of other types of credit, subjects a Portfolio to certain risks, including possible delays in recovery of securities posted as collateral or possible loss of rights in collateral should a Portfolio be unable to repay a loan. Additionally, there was the risk that the expense associated with the TALF loan, including interest expense, may be greater than the income earned from the investment of the proceeds and/or the interest earned on the collateral was used to pay interest expense associated with a loan. Should the interest earned exceed the interest expense on any given payment date, the remainder was applied to the principal balance. Conversely, should the interest earned on the collateral be in shortfall of the interest expense due at any given payment date, the Portfolio will be required to expend cash for the difference in order to meet its obligation. Interest on the TALF loan is measured based on a predetermined rate on the loan origination date and is reported on the statement of operations as interest expense.
For the six months ended February 28, 2011, the following Portfolios participated in the TALF program:
| Portfolio | Average Borrowing | Weighted Average Interest Rate | ||||||
Short Duration Bond | $ | 29,622,885 | 1.23 | % | ||||
Intermediate Duration Bond | 17,442,885 | 1.23 | ||||||
| ALLIANCEBERNSTEIN POOLING PORTFOLIOS • | 263 |
Notes to Financial Statements
NOTE D
Shares of Beneficial Interest
Transactions in shares of beneficial interest for each class were as follows:
| Shares | Amount | |||||||||||||||||||||||
| Six Months Ended February 28, 2011 (unaudited) | Year Ended August 31, 2010 | Six Months Ended February 28, 2011 (unaudited) | Year Ended August 31, 2010 | |||||||||||||||||||||
| U.S. Value | ||||||||||||||||||||||||
Shares sold | 3,294,483 | 10,261,746 | $ | 26,378,298 | $ | 78,204,655 | ||||||||||||||||||
Shares issued in reinvestment of dividends | 3,016,453 | 6,148,691 | 23,922,204 | 46,431,849 | ||||||||||||||||||||
Shares redeemed | (19,884,701 | ) | (36,098,186 | ) | (168,789,596 | ) | (288,019,021 | ) | ||||||||||||||||
Net decrease | (13,573,765 | ) | (19,687,749 | ) | $ | (118,489,094 | ) | $ | (163,382,517 | ) | ||||||||||||||
| Shares | Amount | |||||||||||||||||||||||
| Six Months Ended February 28, 2011 (unaudited) | Year Ended August 31, 2010 | Six Months Ended February 28, 2011 (unaudited) | Year Ended August 31, 2010 | |||||||||||||||||||||
| U.S. Large Cap Growth | ||||||||||||||||||||||||
Shares sold | 1,512,914 | 11,547,049 | $15,742,970 | $ | 112,180,236 | |||||||||||||||||||
Shares issued in reinvestment of dividends | 1,029,929 | 2,526,264 | 10,497,617 | 24,398,886 | ||||||||||||||||||||
Shares redeemed | (23,377,896 | ) | (23,551,495 | ) | (257,735,927 | ) | (239,722,756 | ) | ||||||||||||||||
Net decrease | (20,835,053 | ) | (9,478,182 | ) | $ | (231,495,340 | ) | $ | (103,143,634 | ) | ||||||||||||||
| Shares | Amount | |||||||||||||||||||||||
| Six Months Ended February 28, 2011 (unaudited) | Year Ended August 31, 2010 | Six Months Ended February 28, 2011 (unaudited) | Year Ended August 31, 2010 | |||||||||||||||||||||
| International Value | ||||||||||||||||||||||||
Shares sold | 1,864,480 | 12,826,634 | $ | 14,720,920 | $ | 95,760,071 | ||||||||||||||||||
Shares issued in reinvestment of dividends | 2,118,098 | 3,855,573 | 16,410,876 | 26,785,903 | ||||||||||||||||||||
Shares redeemed | (9,794,085 | ) | (20,777,335 | ) | (79,125,808 | ) | (161,792,062 | ) | ||||||||||||||||
Net decrease | (5,811,507 | ) | (4,095,128 | ) | $ | (47,994,012 | ) | $ | (39,246,088 | ) | ||||||||||||||
| 264 | • ALLIANCEBERNSTEIN POOLING PORTFOLIOS |
Notes to Financial Statements
| Shares | Amount | |||||||||||||||||||||||
| Six Months Ended February 28, 2011 (unaudited) | Year Ended August 31, 2010 | Six Months Ended February 28, 2011 (unaudited) | Year Ended August 31, 2010 | |||||||||||||||||||||
| International Growth | ||||||||||||||||||||||||
Shares sold | 3,836,765 | 7,698,526 | $ | 34,736,970 | $ | 65,826,788 | ||||||||||||||||||
Shares issued in reinvestment of dividends | 3,934,137 | 4,351,205 | 35,308,481 | 37,417,914 | ||||||||||||||||||||
Shares redeemed | (6,864,215 | ) | (18,009,127 | ) | (62,007,577 | ) | (157,640,024 | ) | ||||||||||||||||
Net increase (decrease) | 906,687 | (5,959,396 | ) | $ | 8,037,874 | $ | (54,395,322 | ) | ||||||||||||||||
| Shares | Amount | |||||||||||||||||||||||
| Six Months Ended February 28, 2011 (unaudited) | Year Ended August 31, 2010 | Six Months Ended February 28, 2011 (unaudited) | Year Ended 2010 | |||||||||||||||||||||
| Short Duration Bond | ||||||||||||||||||||||||
Shares sold | 11,853,167 | 14,272,730 | $ | 113,252,623 | $ | 133,941,334 | ||||||||||||||||||
Shares issued in reinvestment of dividends | 1,419,861 | 3,671,476 | 13,557,200 | 34,462,838 | ||||||||||||||||||||
Shares redeemed | (2,979,490 | ) | (10,140,430 | ) | (28,450,290 | ) | (96,120,934 | ) | ||||||||||||||||
Net increase | 10,293,538 | 7,803,776 | $ | 98,359,533 | $ | 72,283,238 | ||||||||||||||||||
| Shares | Amount | |||||||||||||||||||||||
| Six Months Ended February 28, 2011 (unaudited) | Year Ended August 31, 2010 | Six Months Ended February 28, 2011 (unaudited) | Year Ended August 31, 2010 | |||||||||||||||||||||
| Intermediate Duration Bond | ||||||||||||||||||||||||
Shares sold | 7,347,674 | 10,688,026 | $ | 77,630,282 | $ | 109,242,698 | ||||||||||||||||||
Shares issued in reinvestment of dividends and distributions | 3,101,440 | 5,800,749 | 32,995,389 | 59,461,645 | ||||||||||||||||||||
Shares redeemed | (2,890,881 | ) | (19,286,792 | ) | (30,687,758 | ) | (201,303,098 | ) | ||||||||||||||||
Net increase (decrease) | 7,558,233 | (2,798,017 | ) | $ | 79,937,913 | $ | (32,598,755 | ) | ||||||||||||||||
| ALLIANCEBERNSTEIN POOLING PORTFOLIOS • | 265 |
Notes to Financial Statements
| Shares | Amount | |||||||||||||||||||||||
| Six Months Ended February 28, 2011 (unaudited) | Year Ended August 31, 2010 | Six Months Ended February 28, 2011 (unaudited) | Year Ended August 31, 2010 | |||||||||||||||||||||
| Bond Inflation Protection | ||||||||||||||||||||||||
Shares sold | 4,926,485 | 7,721,772 | $ | 52,818,188 | $ | 79,305,813 | ||||||||||||||||||
Shares issued in reinvestment of dividends | 1,856,390 | 762,532 | 19,696,303 | 7,815,953 | ||||||||||||||||||||
Shares redeemed | (2,203,068 | ) | (5,191,920 | ) | (23,758,533 | ) | (54,239,296 | ) | ||||||||||||||||
Net increase | 4,579,807 | 3,292,384 | $ | 48,755,958 | $ | 32,882,470 | ||||||||||||||||||
| Shares | Amount | |||||||||||||||||||||||
| Six Months Ended February 28, 2011 (unaudited) | Year Ended August 31, 2010 | Six Months Ended February 28, 2011 (unaudited) | Year Ended 2010 | |||||||||||||||||||||
| High-Yield | ||||||||||||||||||||||||
Shares sold | 1,669,515 | 1,930,971 | $ | 16,844,880 | $ | 18,387,901 | ||||||||||||||||||
Shares issued in reinvestment of dividends | 2,633,187 | 4,884,045 | 26,412,437 | 45,864,332 | ||||||||||||||||||||
Shares redeemed | (2,108,685 | ) | (11,786,783 | ) | (21,294,865 | ) | (112,435,515 | ) | ||||||||||||||||
Net increase (decrease) | 2,194,017 | (4,971,767 | ) | $ | 21,962,452 | $ | (48,183,282 | ) | ||||||||||||||||
| Shares | Amount | |||||||||||||||||||||||
| Six Months Ended February 28, 2011 (unaudited) | Year Ended August 31, 2010 | Six Months Ended February 28, 2011 (unaudited) | Year Ended August 31, 2010 | |||||||||||||||||||||
| Small-Mid Cap Value | ||||||||||||||||||||||||
Shares sold | 310,329 | 1,530,725 | $ | 3,333,788 | $ | 13,981,268 | ||||||||||||||||||
Shares issued in reinvestment of dividends | 184,291 | 794,201 | 1,765,509 | 7,444,369 | ||||||||||||||||||||
Shares redeemed | (5,459,530 | ) | (15,445,924 | ) | (62,387,755 | ) | (151,976,566 | ) | ||||||||||||||||
Net decrease | (4,964,910 | ) | (13,120,998 | ) | $ | (57,288,458 | ) | $ | (130,550,929 | ) | ||||||||||||||
| 266 | • ALLIANCEBERNSTEIN POOLING PORTFOLIOS |
Notes to Financial Statements
| Shares | Amount | |||||||||||||||||||||||
| Six Months Ended February 28, 2011 (unaudited) | Year Ended August 31, 2010 | Six Months Ended February 28, 2011 (unaudited) | Year Ended 2010 | |||||||||||||||||||||
| Small-Mid Cap Growth | ||||||||||||||||||||||||
Shares sold | 147,970 | 1,228,281 | $ | 2,289,982 | $ | 13,488,899 | ||||||||||||||||||
Shares issued in reinvestment of dividends | 57,615 | 219,063 | 768,253 | 2,538,112 | ||||||||||||||||||||
Shares redeemed | (9,130,801 | ) | (11,079,524 | ) | (139,643,050 | ) | (132,864,128 | ) | ||||||||||||||||
Net decrease | (8,925,216 | ) | (9,632,180 | ) | $ | (136,584,815 | ) | $ | (116,837,117 | ) | ||||||||||||||
| Shares | Amount | |||||||||||||||||||||||
| Six Months Ended February 28, 2011 (unaudited)* | Year Ended 2010 | Six Months Ended February 28, 2011 (unaudited) | Year Ended 2010 | |||||||||||||||||||||
| Multi-Asset Real Return | ||||||||||||||||||||||||
Shares sold | 1,440,626 | 2,947,333 | $ | 13,258,858 | $ | 24,304,281 | ||||||||||||||||||
Shares issued in reinvestment of dividends | 8,546,303 | 3,285,660 | 76,523,004 | 26,734,353 | ||||||||||||||||||||
Shares redeemed | (9,608,476 | ) | (27,906,562 | ) | (89,960,226 | ) | (235,786,962 | ) | ||||||||||||||||
Net increase (decrease) | 378,453 | (21,673,569 | ) | $ | (178,364 | ) | $ | (184,748,328 | ) | |||||||||||||||
| * | Consolidated. |
| Shares | Amount | |||||||||||||||||||||||
| Six Months Ended February 28, 2011 (unaudited) | April 16, 2010(a) to August 31, 2010 | Six Months Ended February 28, 2011 (unaudited) | April 16, 2010(a) to August 31, 2010 | |||||||||||||||||||||
| Volatility Management | ||||||||||||||||||||||||
Shares sold | 1,162,096 | 33,067,103 | $ | 11,815,940 | $ | 321,847,149 | ||||||||||||||||||
Shares issued in reinvestment of dividends and distributions | 1,512,615 | – 0 | – | 15,428,671 | – 0 | – | ||||||||||||||||||
Shares redeemed | (3,117,362 | ) | (1,262,969 | ) | (32,714,536 | ) | (11,837,272 | ) | ||||||||||||||||
Net increase (decrease) | (442,651 | ) | 31,804,134 | $ | (5,469,925 | ) | $ | 310,009,877 | ||||||||||||||||
| (a) | Commencement of operations. |
| ALLIANCEBERNSTEIN POOLING PORTFOLIOS • | 267 |
Notes to Financial Statements
NOTE E
Basis for Consolidation
The Subsidiary was incorporated on October 18, 2010. The Multi-Asset Real Return Portfolio is the sole shareholder of the Subsidiary and it is intended that the Portfolio will remain the sole shareholder and will continue to control the Subsidiary. Under the Articles of Association of the Subsidiary, shares issued by the Subsidiary confer upon a shareholder the right to receive notice of, to attend and to vote at general meetings of the Subsidiary and shall confer upon the shareholder rights in a winding-up or repayment of capital and the right to participate in the profits or assets of the Subsidiary. As of February 28, 2011, net assets of the Portfolio were approximately $1,047,648,360, of which approximately $158,655,469, or approximately 15.1%, represented the Portfolio’s ownership of all issued shares and voting rights of the Subsidiary.
NOTE F
Risks Involved in Investing in the Portfolios
Interest Rate Risk and Credit Risk—Interest rate risk is the risk that changes in interest rates will affect the value of the Portfolios’ investments in fixed-income debt securities such as bonds or notes. Increases in interest rates may cause the value of the Portfolios’ investments to decline. Credit risk is the risk that the issuer or guarantor of a debt security, or the counterparty to a derivative contract, will be unable or unwilling to make timely principal and/or interest payments, or to otherwise honor its obligations. The degree of risk for a particular security may be reflected in its credit risk rating. Credit risk is greater for medium quality and lower-rated securities. Lower-rated debt securities and similar unrated securities (commonly known as “junk bonds”) have speculative elements or are predominantly speculative risks.
During the year ended August 31, 2009, the Intermediate Duration Bond Portfolio had swap counterparty exposure to Lehman Brothers Holdings Inc. (“Lehman Brothers”), as a guarantor for Lehman Brothers Special Financing Inc. (“LSBF”), which filed for bankruptcy on September 15, 2008. As a result, on September 15, 2008, the Portfolio terminated all outstanding swap contracts with LSBF prior to their scheduled maturity dates in accordance with the terms of the swap agreements. Upon the termination of the swap contracts, Lehman Brothers’ obligations to the Portfolio amounted to $2,015,576. The Portfolio’s claim to these obligations subject to the pending bankruptcy proceeding against the Lehman Brothers estate (the “Bankruptcy Claim”). As of February 28, 2011, the Bankruptcy Claim, based upon the estimated recovery value, was being valued at $798,168 (39.60% of the Bankruptcy Claim). The estimated recovery value may change over time. The Adviser has agreed to make the Portfolio whole in respect of the amount of the recovery that would be paid on the Bankruptcy Claim in the event the Bankruptcy Claim is not honored by the Lehman Brothers estate, or with respect to any diminution in value upon the sale of the Bankruptcy Claim, in either case resulting from the manner in which the Bankruptcy Claim was processed by the Adviser.
| 268 | • ALLIANCEBERNSTEIN POOLING PORTFOLIOS |
Notes to Financial Statements
Foreign Securities Risk—Investing in securities of foreign companies or foreign governments involve special risks which include changes in foreign currency exchange rates and the possibility of future political and economic developments which could adversely affect the value of such securities. Moreover, securities of many foreign companies or foreign governments and their markets may be less liquid and their prices more volatile than those of comparable U.S. companies or of the U.S. government.
Currency Risk—This is the risk that changes in foreign currency exchange rates may negatively affect the value of the Portfolios’ investments or reduce the returns of the Portfolio. For example, the value of the Portfolios’ investments in foreign currency-denominated securities or currencies may decrease if the U.S. Dollar is strong (i.e., gaining value relative to other currencies) and other currencies are weak (i.e., losing value relative to the U.S. Dollar). Currency markets are generally not as regulated as securities markets. Independent of the Portfolios’ investments denominated in foreign currencies, the Portfolios’ positions in various foreign currencies may cause the Portfolio to experience investment losses due to the changes in exchange rates and interest rates.
Derivatives Risk—The Portfolios may enter into derivative transactions such as forwards, options, futures and swaps. Derivatives may be illiquid, difficult to price, and leveraged so that small changes may produce disproportionate losses for the Portfolios, and subject to counterparty risk to a greater degree than more traditional investments. Derivatives may result in significant losses, including losses that are far greater than the value of the derivatives reflected in the statement of assets and liabilities.
Leverage Risk—When certain Portfolios borrows money or otherwise leverages its portfolios, it may be volatile because leverage tends to exaggerate the effect of any increase or decrease in the value of the Portfolio’s investments. The Portfolio may create leverage through the use of reverse repurchase arrangements, forward currency exchange contracts, forward commitments, dollar rolls or futures contracts or by borrowing money. The use of derivative instruments by the Portfolios, such as forwards, futures, options and swaps, may also result in a form of leverage. Leverage may result in higher returns to the Portfolios than if the Portfolios were not leveraged, but may also adversely affect returns, particularly if the market is declining.
Capitalization Risk—Investments in small- and mid-capitalization companies may be more volatile than investments in large-cap companies. Investments in small-cap companies may have additional risks because these companies have limited product lines, markets or financial resources.
Commodity Risk—Investments in commodities and commodity-linked derivative instruments by AllianceBernstein Multi-Asset Real Return, either directly or through its Subsidiary, may subject the Portfolio to greater volatility than
| ALLIANCEBERNSTEIN POOLING PORTFOLIOS • | 269 |
Notes to Financial Statements
investments in traditional securities. The value of commodity-linked derivative instruments may be affected by changes in overall market movements, commodity index volatility, changes in interest rates, or factors affecting a particular industry or commodity, such as drought, floods, weather, livestock disease, embargoes, tariffs and international economic, political and regulatory developments.
Indemnification Risk—In the ordinary course of business, the Portfolios enter into contracts that contain a variety of indemnifications. The Portfolio’s maximum exposure under these arrangements is unknown. However, the Portfolios have not had prior claims or losses pursuant to these indemnification provisions and expect the risk of loss thereunder to be remote. Therefore, the Portfolios have not accrued any liability in connection with these indemnification provisions.
NOTE G
Distributions to Shareholders
The tax character of distributions to be paid for the year ending August 31, 2011 will be determined at the end of the current fiscal year. The tax character of distributions paid during the fiscal years ended August 31, 2010 and August 31, 2009 were as follows:
| U.S. Value | 2010 | 2009 | ||||||
Distributions paid from: | ||||||||
Ordinary income | $ | 46,431,849 | $ | 64,468,391 | ||||
Long-term capital gains | – 0 | – | – 0 | – | ||||
Total distributions paid | $ | 46,431,849 | $ | 64,468,391 | ||||
| U.S. Large Cap Growth | 2010 | 2009 | ||||||
Distributions paid from: | ||||||||
Ordinary income | $ | 24,398,886 | $ | 23,934,284 | ||||
Long-term capital gains | – 0 | – | – 0 | – | ||||
Total distributions paid | $ | 24,398,886 | $ | 23,934,284 | ||||
| International Value | 2010 | 2009 | ||||||
Distributions paid from: | ||||||||
Ordinary income | $ | 26,785,904 | $ | 29,492,020 | ||||
Long-term capital gains | – 0 | – | 47,252,778 | |||||
Total distributions paid | $ | 26,785,904 | $ | 76,744,798 | ||||
| International Growth | 2010 | 2009 | ||||||
Distributions paid from: | ||||||||
Ordinary income | $ | 37,417,914 | $ | 33,227,507 | ||||
Long-term capital gains | – 0 | – | 154,989 | |||||
Total distributions paid | $ | 37,417,914 | $ | 33,382,496 | ||||
| 270 | • ALLIANCEBERNSTEIN POOLING PORTFOLIOS |
Notes to Financial Statements
| Short Duration Bond | 2010 | 2009 | ||||||
Distributions paid from: | ||||||||
Ordinary income | $ | 34,462,838 | $ | 44,230,027 | ||||
Long-term capital gains | – 0 | – | – 0 | – | ||||
Total distributions paid | $ | 34,462,838 | $ | 44,230,027 | ||||
| Intermediate Duration Bond | 2010 | 2009 | ||||||
Distributions paid from: | ||||||||
Ordinary income | $ | 59,461,645 | $ | 74,748,745 | ||||
Long-term capital gains | – 0 | – | – 0 | – | ||||
Total distributions paid | $ | 59,461,645 | $ | 74,748,745 | ||||
| Bond Inflation Protection | 2010 | 2009 | ||||||
Distributions paid from: | ||||||||
Ordinary income | $ | 7,815,952 | $ | 38,875,317 | ||||
Long-term capital gains | – 0 | – | – 0 | – | ||||
Total distributions paid | $ | 7,815,952 | $ | 38,875,317 | ||||
| High-Yield | 2010 | 2009 | ||||||
Distributions paid from: | ||||||||
Ordinary income | $ | 45,864,332 | $ | 45,605,929 | ||||
Long-term capital gains | – 0 | – | – 0 | – | ||||
Total distributions paid | $ | 45,864,332 | $ | 45,605,929 | ||||
| Small-Mid Cap Value | 2010 | 2009 | ||||||
Distributions paid from: | ||||||||
Ordinary income | $ | 7,444,369 | $ | 16,449,359 | ||||
Long-term capital gains | – 0 | – | 39,426,848 | |||||
Total distributions paid | $ | 7,444,369 | $ | 55,876,207 | ||||
| Small-Mid Cap Growth | 2010 | 2009 | ||||||
Distributions paid from: | ||||||||
Ordinary income | $ | 2,538,112 | $ | 2,218,697 | ||||
Long-term capital gains | – 0 | – | – 0 | – | ||||
Total distributions paid | $ | 2,538,112 | $ | 2,218,697 | ||||
| Multi-Asset Real Return | 2010 | 2009 | ||||||
Distributions paid from: | ||||||||
Ordinary income | $ | 26,734,353 | $ | 5,812,875 | ||||
Long-term capital gains | – 0 | – | – 0 | – | ||||
Total distributions paid | $ | 26,734,353 | $ | 5,812,875 | ||||
| ALLIANCEBERNSTEIN POOLING PORTFOLIOS • | 271 |
Notes to Financial Statements
As of August 31, 2010, the components of accumulated earnings/(deficit) on a tax basis were as follows:
| Portfolio | Undistributed Ordinary Income | Undistributed Long-Term Gains | Accumulated Capital and | Unrealized Appreciation/ | Total Accumulated Earnings/ (Deficit)(b) | |||||||||||||||
U.S. Value | $ | 8,634,242 | $ | – 0 | – | $ | (881,498,959 | ) | $ | (31,107,327 | ) | $ | (903,972,044 | ) | ||||||
U.S. Large Cap Growth | 1,809,906 | – 0 | – | (487,255,713 | ) | 48,854,330 | (436,591,477 | ) | ||||||||||||
International Value | 15,900,466 | – 0 | – | (404,213,262 | ) | (103,880,986 | ) | (492,193,782 | ) | |||||||||||
International Growth | 24,803,960 | – 0 | – | (410,715,498 | ) | 31,889,316 | (354,022,222 | ) | ||||||||||||
Short Duration Bond | 3,009,451 | – 0 | – | (48,017,681 | ) | (18,798,120 | ) | (63,806,350 | ) | |||||||||||
Intermediate Duration Bond | 5,861,230 | – 0 | – | (573,334 | ) | 61,948,992 | 67,236,888 | |||||||||||||
Bond Inflation Protection | 12,911,829 | – 0 | – | (851,375 | ) | 45,085,807 | 57,146,261 | |||||||||||||
High-Yield | 6,803,140 | – 0 | – | (64,074,930 | ) | 27,090,473 | (30,181,317 | ) | ||||||||||||
Small-Mid Cap Value | 1,364,157 | – 0 | – | (87,689,043 | ) | 6,412,758 | (79,912,128 | ) | ||||||||||||
Small-Mid Cap Growth | 508,684 | – 0 | – | (60,936,184 | ) | 59,468,481 | (959,019 | ) | ||||||||||||
Multi-Asset Real Return | 52,462,162 | – 0 | – | (437,810,241 | ) | 96,413,633 | (288,934,446 | ) | ||||||||||||
Volatility Management | 1,061,706 | – 0 | – | (11,549,351 | ) | (3,200,020 | ) | (13,687,665 | ) | |||||||||||
| (a) | The difference between book-basis and tax-basis unrealized appreciation/(depreciation) is attributable primarily to the tax deferral of losses on wash sales, mark to market on passive foreign investment companies, mark to market on forward contracts, futures contracts, partnership investments, interest writeoffs and accruals on defaulted securities, reclassification of distributions from investments in real estate investment trusts, and swap income (loss) accruals. |
| (b) | The difference between book-basis and tax-basis components of accumulated earnings (deficit) is attributable primarily to deferral of post October capital or currency losses. |
| (c) | Net capital loss, currency and PFIC losses incurred after October 31, and within the taxable year are deemed to arise on the first business day of the Portfolio’s next taxable year. U.S. Value, International Value, Short Duration Bond and High-Yield elect to defer $43,149,495, $25,354,319, $9,271,737, and $734,109 of capital losses that are deemed to arise in the next taxable year. Short Duration Bond Portfolio deferred $1,919,030 in straddle losses. Additionally, on August 31, 2010, the Portfolios had capital loss carryovers for federal income tax purposes. |
| 272 | • ALLIANCEBERNSTEIN POOLING PORTFOLIOS |
Notes to Financial Statements
On August 31, 2010, the following Portfolios had capital loss carryovers for federal income tax purposes which will expire in the years shown below. To the extent future gains are offset by capital loss carryforwards, such gains will not be distributed.
| Capital Losses Expiring in 2014 | Capital Losses Expiring in 2015 | Capital Losses Expiring in 2016 | Capital Losses Expiring in 2017 | Capital Losses Expiring in 2018 | Total Capital Losses | |||||||||||||||||||
U.S. Value | $ | – 0 | – | $ | – 0 | – | $ | – 0 | – | $ | 205,162,139 | $ | 633,187,325 | $ | 838,349,464 | |||||||||
U.S. Large Cap Growth | – 0 | – | – 0 | – | – 0 | – | 308,459,282 | 178,796,431 | 487,255,713 | |||||||||||||||
International Value | – 0 | – | – 0 | – | – 0 | – | 53,057,306 | 325,801,637 | 378,858,943 | |||||||||||||||
International Growth | – 0 | – | – 0 | – | – 0 | – | 107,784,754 | 302,930,744 | 410,715,498 | |||||||||||||||
Short Duration Bond | 529,195 | 3,562,331 | 1,756,801 | 19,308,695 | 11,669,892 | 36,826,914 | ||||||||||||||||||
Intermediate Duration Bond | – 0 | – | – 0 | – | – 0 | – | 573,334 | – 0 | – | 573,334 | ||||||||||||||
Bond Inflation Protection | – 0 | – | – 0 | – | – 0 | – | 851,375 | – 0 | – | 851,375 | ||||||||||||||
High-Yield | – 0 | – | 1,561,339 | 1,152,926 | 15,295,968 | 45,330,588 | 63,340,821 | |||||||||||||||||
Small-Mid Cap Value | – 0 | – | – 0 | – | – 0 | – | 25,737,293 | 61,951,750 | 87,689,043 | |||||||||||||||
Small-Mid Cap Growth | – 0 | – | – 0 | – | 1,225,905 | 56,608,394 | 3,101,885 | 60,936,184 | ||||||||||||||||
Multi-Asset Real Return | – 0 | – | – 0 | – | – 0 | – | 97,002,480 | 340,807,761 | 437,810,241 | |||||||||||||||
Volatility Management | – 0 | – | – 0 | – | – 0 | – | – 0 | – | 11,549,351 | 11,549,351 | ||||||||||||||
During the fiscal year ended August 31, 2010, Bond Inflation Protection Portfolio utilized $922,726 of capital loss carryforwards, and Intermediate Duration Bond Portfolio utilized $11,912,026 of capital loss carryforwards.
NOTE H
Subsequent Events
Management has evaluated subsequent events for possible recognition or disclosure in the financial statements through the date the financial statements are issued. Management has determined that there are no material events that would require disclosure in the Portfolios’ financial statements through this date.
| ALLIANCEBERNSTEIN POOLING PORTFOLIOS • | 273 |
Notes to Financial Statements
FINANCIAL HIGHLIGHTS
Selected Data For A Share Of Beneficial Interest Outstanding Throughout Each Period
| U.S. Value | ||||||||||||||||||||||||
| Six Months Ended February 28, 2011 (unaudited) | Year Ended August 31, | |||||||||||||||||||||||
| 2010 | 2009 | 2008 | 2007 | 2006 | ||||||||||||||||||||
Net asset value, beginning of period | $ 7.18 | $ 7.22 | $ 9.27 | $ 12.44 | $ 11.41 | $ 10.32 | ||||||||||||||||||
Income From Investment Operations | ||||||||||||||||||||||||
Net investment income(a) | .09 | .16 | .21 | .31 | .31 | .27 | ||||||||||||||||||
Net realized and unrealized gain (loss) on investment transactions | 1.92 | (.03 | ) | (2.03 | ) | (2.75 | ) | 1.22 | 1.11 | |||||||||||||||
Net increase (decrease) in net asset value from operations | 2.01 | .13 | (1.82 | ) | (2.44 | ) | 1.53 | 1.38 | ||||||||||||||||
Less: Dividends and Distributions | ||||||||||||||||||||||||
Dividends from net investment income | (.09 | ) | (.17 | ) | (.23 | ) | (.31 | ) | (.30 | ) | (.21 | ) | ||||||||||||
Distributions from net realized gain on investment transactions | – 0 | – | – 0 | – | (.00 | )(b) | (.42 | ) | (.20 | ) | (.08 | ) | ||||||||||||
Total dividends and distributions | (.09 | ) | (.17 | ) | (.23 | ) | (.73 | ) | (.50 | ) | (.29 | ) | ||||||||||||
Net asset value, end of period | $ 9.10 | $ 7.18 | $ 7.22 | $ 9.27 | $ 12.44 | $ 11.41 | ||||||||||||||||||
Total Return | ||||||||||||||||||||||||
Total investment return based on net asset value(c) | 28.17 | % | 1.64 | % | (19.36 | )% | (20.55 | )% | 13.55 | % | 13.60 | % | ||||||||||||
Ratios/Supplemental Data | ||||||||||||||||||||||||
Net assets, end of period (000,000’s omitted) | $2,334 | $1,938 | $2,091 | $2,521 | $2,573 | $1,822 | ||||||||||||||||||
Ratio to average net assets of: | ||||||||||||||||||||||||
Expenses | .01 | %(d)(e) | .01 | % | .02 | % | .02 | % | .02 | % | .04 | % | ||||||||||||
Net investment income | 2.12 | %(d)(e) | 2.09 | % | 3.23 | % | 2.93 | % | 2.49 | % | 2.48 | % | ||||||||||||
Portfolio turnover rate | 27 | % | 73 | % | 59 | % | 20 | % | 22 | % | 14 | % | ||||||||||||
| See | footnote summary on page 285. |
| 274 | • ALLIANCEBERNSTEIN POOLING PORTFOLIOS |
Financial Highlights
Selected Data For A Share Of Beneficial Interest Outstanding Throughout Each Period
| U.S. Large Cap Growth | ||||||||||||||||||||||||
| Six Months Ended February 28, 2011 (unaudited) | Year Ended August 31, | |||||||||||||||||||||||
| 2010 | 2009 | 2008 | 2007 | 2006 | ||||||||||||||||||||
Net asset value, | $ 8.94 | $ 9.25 | $ 11.08 | $ 12.47 | $ 11.09 | $ 10.73 | ||||||||||||||||||
Income From Investment Operations | ||||||||||||||||||||||||
Net investment income(a) | .06 | .11 | .11 | .10 | .10 | .07 | ||||||||||||||||||
Net realized and unrealized gain (loss) on investment and foreign currency transactions | 3.01 | (.31 | ) | (1.83 | ) | (1.04 | ) | 1.57 | .38 | |||||||||||||||
Net increase (decrease) in net asset value from operations | 3.07 | (.20 | ) | (1.72 | ) | (.94 | ) | 1.67 | .45 | |||||||||||||||
Less: Dividends and Distributions | ||||||||||||||||||||||||
Dividends from net investment income | (.05 | ) | (.11 | ) | (.11 | ) | (.10 | ) | (.09 | ) | (.06 | ) | ||||||||||||
Distributions from net realized gain on investment transactions | – 0 | – | – 0 | – | – 0 | – | (.35 | ) | (.20 | ) | (.03 | ) | ||||||||||||
Total dividends and distributions | (.05 | ) | (.11 | ) | (.11 | ) | (.45 | ) | (.29 | ) | (.09 | ) | ||||||||||||
Net asset value, end of period | $ 11.96 | $ 8.94 | $ 9.25 | $ 11.08 | $ 12.47 | $ 11.09 | ||||||||||||||||||
Total Return | ||||||||||||||||||||||||
Total investment return based on net asset value(c) | 34.44 | % | (2.23 | )%* | (15.41 | )% | (8.06 | )% | 15.23 | % | 4.10 | % | ||||||||||||
Ratios/Supplemental Data | ||||||||||||||||||||||||
Net assets, end of period (000,000’s omitted) | $2,324 | $1,924 | $2,078 | $2,532 | $2,608 | $1,775 | ||||||||||||||||||
Ratio to average net | ||||||||||||||||||||||||
Expenses | .02 | %(d)(e) | .01 | % | .02 | % | .02 | % | .02 | % | .04 | % | ||||||||||||
Net investment income | 1.12 | %(d)(e) | 1.13 | % | 1.40 | % | .86 | % | .80 | % | .64 | % | ||||||||||||
Portfolio turnover rate | 48 | % | 81 | % | 108 | % | 93 | % | 92 | % | 64 | % | ||||||||||||
See footnote summary on page 285.
| ALLIANCEBERNSTEIN POOLING PORTFOLIOS • | 275 |
Financial Highlights
Selected Data For A Share Of Beneficial Interest Outstanding Throughout Each Period
| International Value | ||||||||||||||||||||||||
| Six Months Ended February 28, 2011 (unaudited) | Year Ended August 31, | |||||||||||||||||||||||
| 2010 | 2009 | 2008 | 2007 | 2006 | ||||||||||||||||||||
Net asset value, beginning of period | $ 6.93 | $ 7.50 | $ 10.37 | $ 14.88 | $ 13.84 | $ 10.89 | ||||||||||||||||||
Income From Investment Operations | ||||||||||||||||||||||||
Net investment income(a) | .07 | .21 | .23 | .45 | .42 | .38 | ||||||||||||||||||
Net realized and unrealized gain (loss) on investment and foreign currency transactions | 1.75 | (.60 | ) | (2.55 | ) | (3.18 | ) | 2.29 | 3.04 | |||||||||||||||
Contributions from Adviser | – 0 | – | – 0 | – | .00 | (b) | – 0 | – | – 0 | – | – 0 | – | ||||||||||||
Net increase (decrease) in net asset value from operations | 1.82 | (.39 | ) | (2.32 | ) | (2.73 | ) | 2.71 | 3.42 | |||||||||||||||
Less: Dividends and Distributions | ||||||||||||||||||||||||
Dividends from net investment income | (.11 | ) | (.18 | ) | (.19 | ) | (.43 | ) | (.55 | ) | (.26 | ) | ||||||||||||
Distributions from net realized gain on investment transactions | – 0 | – | – 0 | – | (.36 | ) | (1.35 | ) | (1.12 | ) | (.21 | ) | ||||||||||||
Total dividends and distributions | (.11 | ) | (.18 | ) | (.55 | ) | (1.78 | ) | (1.67 | ) | (.47 | ) | ||||||||||||
Net asset value, end of period | $ 8.64 | $ 6.93 | $ 7.50 | $ 10.37 | $ 14.88 | $ 13.84 | ||||||||||||||||||
Total Return | ||||||||||||||||||||||||
Total investment return based on net asset value(c) | 26.51 | % | (5.15 | )% | (20.71 | )% | (20.92 | )% | 20.64 | % | 32.16 | % | ||||||||||||
Ratios/Supplemental Data | ||||||||||||||||||||||||
Net assets, end of period (000,000’s omitted) | $1,213 | $1,013 | $1,127 | $1,228 | $1,316 | $997 | ||||||||||||||||||
Ratio to average net assets of: | ||||||||||||||||||||||||
Expenses | .03 | %(d)(e) | .04 | % | .06 | % | .07 | % | .08 | % | .10 | % | ||||||||||||
Net investment income | 1.83 | %(d)(e) | 2.70 | % | 3.56 | % | 3.49 | % | 2.89 | % | 3.09 | % | ||||||||||||
Portfolio turnover rate | 30 | % | 60 | % | 56 | % | 31 | % | 31 | % | 27 | % | ||||||||||||
See footnote summary on page 285.
| 276 | • ALLIANCEBERNSTEIN POOLING PORTFOLIOS |
Financial Highlights
Selected Data For A Share Of Beneficial Interest Outstanding Throughout Each Period
| International Growth | ||||||||||||||||||||||||
Six Months (unaudited) | Year Ended August 31, | |||||||||||||||||||||||
| 2010 | 2009 | 2008 | 2007 | 2006 | ||||||||||||||||||||
Net asset value, beginning of period | $ 8.18 | $ 8.12 | $ 11.27 | $ 13.98 | $ 12.54 | $ 10.57 | ||||||||||||||||||
Income From Investment Operations | ||||||||||||||||||||||||
Net investment income(a) | .06 | .19 | .23 | .38 | .34 | .23 | ||||||||||||||||||
Net realized and unrealized gain (loss) on investment and foreign currency transactions | 1.09 | .16 | (3.11 | ) | (1.89 | ) | 1.86 | 1.95 | ||||||||||||||||
Contributions from Adviser | – 0 | – | .00 | (b) | .00 | (b) | .00 | (b) | .00 | (b) | – 0 | – | ||||||||||||
Net increase (decrease) in net asset value from operations | 1.15 | .35 | (2.88 | ) | (1.51 | ) | 2.20 | 2.18 | ||||||||||||||||
Less: Dividends and Distributions | ||||||||||||||||||||||||
Dividends from net investment income | (.29 | ) | (.29 | ) | (.27 | ) | (.38 | ) | (.27 | ) | (.19 | ) | ||||||||||||
Distributions from net realized gain on investment transactions | – 0 | – | – 0 | – | (.00 | )(b) | (.82 | ) | (.49 | ) | (.02 | ) | ||||||||||||
Total dividends and distributions | (.29 | ) | (.29 | ) | (.27 | ) | (1.20 | ) | (.76 | ) | (.21 | ) | ||||||||||||
Net asset value, end of period | $ 9.04 | $ 8.18 | $ 8.12 | $ 11.27 | $ 13.98 | $ 12.54 | ||||||||||||||||||
Total Return | ||||||||||||||||||||||||
Total investment return based on net asset value(c) | 14.04 | % | 4.20 | % | (25.32 | )% | (12.46 | )% | 18.08 | % | 20.88 | % | ||||||||||||
Ratios/Supplemental Data | ||||||||||||||||||||||||
Net assets, end of period (000,000’s omitted) | $1,155 | $1,037 | $1,078 | $1,246 | $1,329 | $886 | ||||||||||||||||||
Ratio to average net assets of: | ||||||||||||||||||||||||
Expenses | .04 | %(d)(e) | .03 | % | .05 | % | .06 | % | .07 | % | .11 | % | ||||||||||||
Net investment income | 1.28 | %(d)(e) | 2.27 | % | 3.19 | % | 2.81 | % | 2.50 | % | 1.96 | % | ||||||||||||
Portfolio turnover rate | 45 | % | 119 | % | 111 | % | 85 | % | 82 | % | 105 | % | ||||||||||||
| See | footnote summary on page 285. |
| ALLIANCEBERNSTEIN POOLING PORTFOLIOS • | 277 |
Financial Highlights
Selected Data For A Share Of Beneficial Interest Outstanding Throughout Each Period
| Short Duration Bond | ||||||||||||||||||||||||
| Six Months Ended February 28, 2011 (unaudited) | Year Ended August 31, | |||||||||||||||||||||||
| 2010 | 2009 | 2008 | 2007 | 2006 | ||||||||||||||||||||
Net asset value, beginning of period | $ 9.56 | $ 9.26 | $ 9.37 | $ 9.87 | $ 9.93 | $ 10.04 | ||||||||||||||||||
Income From Investment Operations | ||||||||||||||||||||||||
Net investment income(a) | .11 | .25 | .36 | .46 | .52 | .47 | ||||||||||||||||||
Net realized and unrealized gain (loss) on investment transactions | – 0 | – | .32 | (.08 | ) | (.49 | ) | (.08 | ) | (.14 | ) | |||||||||||||
Net increase (decrease) in net asset value from operations | .11 | .57 | .28 | (.03 | ) | .44 | .33 | |||||||||||||||||
Less: Dividends | ||||||||||||||||||||||||
Dividends from net investment income | (.10 | ) | (.27 | ) | (.39 | ) | (.47 | ) | (.50 | ) | (.44 | ) | ||||||||||||
Net asset value, end of period | $ 9.57 | $ 9.56 | $ 9.26 | $ 9.37 | $ 9.87 | $ 9.93 | ||||||||||||||||||
Total Return | ||||||||||||||||||||||||
Total investment return based on net asset value(c) | 1.20 | % | 6.26 | % | 3.14 | % | (.40 | )% | 4.51 | % | 3.39 | % | ||||||||||||
Ratios/Supplemental Data | ||||||||||||||||||||||||
Net assets, end of period (000,000’s omitted) | $1,318 | $1,218 | $1,108 | $1,299 | $1,272 | $960 | ||||||||||||||||||
Ratio to average net assets of: | ||||||||||||||||||||||||
Expenses | .05 | %(d)(e) | .12 | % | .04 | % | .03 | % | .02 | % | .05 | % | ||||||||||||
Expenses, excluding interest expense and TALF administration fee | .02 | %(d)(e) | .02 | % | .03 | % | .03 | % | .02 | % | .05 | % | ||||||||||||
Expenses, excluding interest expense | .02 | %(d)(e) | .03 | % | .04 | % | .03 | % | .02 | % | .05 | % | ||||||||||||
Net investment income | 2.38 | %(d)(e) | 2.64 | % | 4.06 | % | 4.75 | % | 5.23 | % | 4.69 | % | ||||||||||||
Portfolio turnover rate | 32 | % | 130 | % | 153 | % | 116 | % | 138 | % | 185 | % | ||||||||||||
See footnote summary on page 285.
| 278 | • ALLIANCEBERNSTEIN POOLING PORTFOLIOS |
Financial Highlights
Selected Data For A Share Of Beneficial Interest Outstanding Throughout Each Period
| Intermediate Duration Bond | ||||||||||||||||||||||||
Six Months (unaudited) | Year Ended August 31, | |||||||||||||||||||||||
| 2010 | 2009 | 2008 | 2007 | 2006 | ||||||||||||||||||||
Net asset value, beginning of period | $ 10.78 | $ 9.98 | $ 9.70 | $ 9.87 | $ 9.86 | $ 10.12 | ||||||||||||||||||
Income From Investment Operations | ||||||||||||||||||||||||
Net investment income(a) | .22 | .45 | .51 | .50 | .49 | .48 | ||||||||||||||||||
Net realized and unrealized gain (loss) on investment and foreign currency transactions | (.18 | ) | .80 | .33 | (.16 | ) | .00 | (b) | (.28 | ) | ||||||||||||||
Net increase in net asset value from operations | .04 | 1.25 | .84 | .34 | .49 | .20 | ||||||||||||||||||
Less: Dividends and Distributions | ||||||||||||||||||||||||
Dividends from net investment income | (.23 | ) | (.45 | ) | (.56 | ) | (.51 | ) | (.48 | ) | (.46 | ) | ||||||||||||
Distributions from net realized gain on investment transactions | (.03 | ) | – 0 | – | – 0 | – | – 0 | – | – 0 | – | – 0 | – | ||||||||||||
Total dividends and distributions | (.26 | ) | – 0 | – | – 0 | – | – 0 | – | – 0 | – | – 0 | – | ||||||||||||
Net asset value, end of period | $ 10.56 | $ 10.78 | $ 9.98 | $ 9.70 | $ 9.87 | $ 9.86 | ||||||||||||||||||
Total Return | ||||||||||||||||||||||||
Total investment return based on net asset value(c) | .36 | % | 12.84 | % | 9.26 | % | 3.51 | % | 5.03 | % | 2.13 | % | ||||||||||||
Ratios/Supplemental Data | ||||||||||||||||||||||||
Net assets, end of period (000,000’s omitted) | $1,405 | $1,353 | $1,281 | $1,654 | $1,600 | $1,076 | ||||||||||||||||||
Ratio to average net assets of: | ||||||||||||||||||||||||
Expenses | .04 | %(d)(e) | .13 | % | .04 | % | .03 | % | .04 | % | .06 | % | ||||||||||||
Expenses, excluding interest expense and TALF administration fee | .02 | %(d)(e) | .02 | % | .03 | % | .03 | % | .04 | % | .06 | % | ||||||||||||
Expenses, excluding interest expense | .02 | %(d)(e) | .03 | % | .04 | % | .03 | % | .04 | % | .06 | % | ||||||||||||
Net investment income | 4.10 | %(d)(e) | 4.38 | % | 5.47 | % | 5.01 | % | 5.01 | % | 4.89 | % | ||||||||||||
Portfolio turnover rate | 44 | % | 94 | % | 108 | % | 114 | % | 236 | % | 513 | % | ||||||||||||
See footnote summary on page 285.
| ALLIANCEBERNSTEIN POOLING PORTFOLIOS • | 279 |
Financial Highlights
Selected Data For A Share Of Beneficial Interest Outstanding Throughout Each Period
| Bond Inflation Protection | ||||||||||||||||||||||||
Six Months (unaudited) | Year Ended August 31, | |||||||||||||||||||||||
| 2010 | 2009 | 2008 | 2007 | 2006 | ||||||||||||||||||||
Net asset value, beginning of period | $ 10.70 | $ 9.91 | $ 10.74 | $ 9.99 | $ 9.91 | $ 10.01 | ||||||||||||||||||
Income From Investment Operations | ||||||||||||||||||||||||
Net investment income(a) | .21 | .34 | .04 | .69 | .49 | .57 | ||||||||||||||||||
Net realized and unrealized gain (loss) on investment and foreign currency transactions | .23 | .58 | (.19 | ) | .52 | (.06 | ) | (.36 | ) | |||||||||||||||
Contributions from Adviser | – 0 | – | .00 | (b) | – 0 | – | – 0 | – | .00 | (b) | – 0 | – | ||||||||||||
Net increase (decrease) in net asset value from operations | .44 | .92 | (.15 | ) | 1.21 | .43 | .21 | |||||||||||||||||
Less: Dividends and Distributions | ||||||||||||||||||||||||
Dividends from net investment income | (.32 | ) | (.13 | ) | (.68 | ) | (.46 | ) | (.35 | ) | (.30 | ) | ||||||||||||
Distributions from net realized gain on investment transactions | – 0 | – | – 0 | – | – 0 | – | – 0 | – | – 0 | – | (.01 | ) | ||||||||||||
Total dividends and distributions | (.32 | ) | (.13 | ) | (.68 | ) | (.46 | ) | (.35 | ) | (.31 | ) | ||||||||||||
Net asset value, end of period | $ 10.82 | $ 10.70 | $ 9.91 | $ 10.74 | $ 9.99 | $ 9.91 | ||||||||||||||||||
Total Return | ||||||||||||||||||||||||
Total investment return based on net asset value(c) | 4.12 | % | 9.31 | % | (.88 | )% | 12.45 | % | 4.44 | % | 2.11 | % | ||||||||||||
Ratios/Supplemental Data | ||||||||||||||||||||||||
Net assets, end of period (000’s omitted) | $724,957 | $667,764 | $586,321 | $688,918 | $643,549 | $447,210 | ||||||||||||||||||
Ratio to average net assets of: | ||||||||||||||||||||||||
Expenses | .13 | %(d)(e) | .07 | % | .04 | % | .04 | % | .04 | % | .07 | % | ||||||||||||
Expenses, excluding interest expense | .04 | %(d)(e) | .04 | % | .04 | % | .04 | % | .04 | % | .07 | % | ||||||||||||
Net investment income | 3.96 | %(d)(e) | 3.25 | % | .44 | % | 6.63 | % | 4.98 | % | 5.83 | % | ||||||||||||
Portfolio turnover rate | 8 | % | 21 | % | 20 | % | 9 | % | 12 | % | 13 | % | ||||||||||||
See footnote summary on page 285.
| 280 | • ALLIANCEBERNSTEIN POOLING PORTFOLIOS |
Financial Highlights
Selected Data For A Share Of Beneficial Interest Outstanding Throughout Each Period
| High-Yield | ||||||||||||||||||||||||
| Six Months Ended February 28, 2011 (unaudited) | Year Ended August 31, | |||||||||||||||||||||||
| 2010 | 2009 | 2008 | 2007 | 2006 | ||||||||||||||||||||
Net asset value, beginning of period | $ 9.85 | $ 8.51 | $ 8.87 | $ 9.89 | $ 9.99 | $ 10.35 | ||||||||||||||||||
Income From Investment Operations | ||||||||||||||||||||||||
Net investment income(a) | .44 | .89 | .81 | .78 | .77 | .75 | ||||||||||||||||||
Net realized and unrealized gain (loss) on investment and foreign currency transactions | .55 | 1.33 | (.38 | ) | (1.03 | ) | (.15 | ) | (.35 | ) | ||||||||||||||
Net increase (decrease) in net asset value from operations | .99 | 2.22 | .43 | (.25 | ) | .62 | .40 | |||||||||||||||||
Less: Dividends and Distributions | ||||||||||||||||||||||||
Dividends from net investment income | (.52 | ) | (.88 | ) | (.79 | ) | (.77 | ) | (.72 | ) | (.75 | ) | ||||||||||||
Distributions from net realized gain on investment transactions | – 0 | – | – 0 | – | – 0 | – | – 0 | – | – 0 | – | (.01 | ) | ||||||||||||
Total dividends and distributions | (.52 | ) | (.88 | ) | (.79 | ) | (.77 | ) | (.72 | ) | (.76 | ) | ||||||||||||
Net asset value, end of period | $ 10.32 | $ 9.85 | $ 8.51 | $ 8.87 | $ 9.89 | $ 9.99 | ||||||||||||||||||
Total Return | ||||||||||||||||||||||||
Total investment return based on net asset value(c) | 10.35 | % | 27.01 | % | 7.25 | % | (2.76 | )% | 6.22 | % | 4.06 | % | ||||||||||||
Ratios/Supplemental Data | ||||||||||||||||||||||||
Net assets, end of period (000’s omitted) | $533,577 | $487,751 | $463,400 | $526,850 | $495,833 | $325,931 | ||||||||||||||||||
Ratio to average net assets of: | ||||||||||||||||||||||||
Expenses | .05 | %(d)(e) | .05 | % | .06 | % | .05 | % | .06 | % | .09 | % | ||||||||||||
Net investment income | 8.80 | %(d)(e) | 9.29 | % | 11.13 | % | 8.19 | % | 7.50 | % | 7.47 | % | ||||||||||||
Portfolio turnover rate | 28 | % | 34 | % | 40 | % | 25 | % | 49 | % | 64 | % | ||||||||||||
See footnote summary on page 285.
| ALLIANCEBERNSTEIN POOLING PORTFOLIOS • | 281 |
Financial Highlights
Selected Data For A Share Of Beneficial Interest Outstanding Throughout Each Period
| Small-Mid Cap Value | ||||||||||||||||||||||||
| Six Months Ended February 28, 2011 (unaudited) | Year Ended August 31, | |||||||||||||||||||||||
| 2010 | 2009 | 2008 | 2007 | 2006 | ||||||||||||||||||||
Net asset value, beginning of period | $ 9.08 | $ 8.10 | $ 11.19 | $ 12.79 | $ 11.08 | $ 10.65 | ||||||||||||||||||
Income From Investment Operations | ||||||||||||||||||||||||
Net investment income(a) | .08 | .11 | .14 | .19 | .24 | .16 | ||||||||||||||||||
Net realized and unrealized gain (loss) on investment transactions | 3.18 | .99 | (2.34 | ) | (.96 | ) | 1.80 | .40 | ||||||||||||||||
Net increase (decrease) in net asset value from operations | 3.26 | 1.10 | (2.20 | ) | (.77 | ) | 2.04 | .56 | ||||||||||||||||
Less: Dividends and Distributions | ||||||||||||||||||||||||
Dividends from net investment income | (.03 | ) | (.12 | ) | (.14 | ) | (.18 | ) | (.23 | ) | (.13 | ) | ||||||||||||
Distributions from net realized gain on investment transactions | – 0 | – | – 0 | – | (.75 | ) | (.65 | ) | (.10 | ) | – 0 | – | ||||||||||||
Total dividends and distributions | (.03 | ) | (.12 | ) | (.89 | ) | (.83 | ) | (.33 | ) | (.13 | ) | ||||||||||||
Net asset value, end of period | $ 12.31 | $ 9.08 | $ 8.10 | $ 11.19 | $ 12.79 | $ 11.08 | ||||||||||||||||||
Total Return | ||||||||||||||||||||||||
Total investment return based on net asset value(c) | 36.03 | % | 13.56 | % | (16.76 | )% | (6.29 | )% | 18.64 | % | 5.24 | % | ||||||||||||
Ratios/Supplemental Data | ||||||||||||||||||||||||
Net assets, end of period (000’s omitted) | $617,816 | $500,525 | $553,145 | $685,788 | $648,401 | $444,250 | ||||||||||||||||||
Ratio to average net assets of: | ||||||||||||||||||||||||
Expenses | .03 | %(d)(e) | .04 | % | .04 | % | .04 | % | .04 | % | .07 | % | ||||||||||||
Net investment income | 1.47 | %(d)(e) | 1.20 | % | 2.00 | % | 1.67 | % | 1.93 | % | 1.45 | % | ||||||||||||
Portfolio turnover rate | 27 | % | 54 | % | 60 | % | 38 | % | 33 | % | 42 | % | ||||||||||||
See footnote summary on page 285.
| 282 | • ALLIANCEBERNSTEIN POOLING PORTFOLIOS |
Financial Highlights
Selected Data For A Share Of Beneficial Interest Outstanding Throughout Each Period
| Small-Mid Cap Growth | ||||||||||||||||||||||||
| Six Months Ended February 28, 2011 (unaudited) | Year Ended August 31, | |||||||||||||||||||||||
| 2010 | 2009 | 2008 | 2007 | 2006 | ||||||||||||||||||||
Net asset value, beginning of period | $ 11.77 | $ 10.18 | $ 12.62 | $ 14.79 | $ 11.84 | $ 10.99 | ||||||||||||||||||
Income From Investment Operations | ||||||||||||||||||||||||
Net investment income(a) | .04 | .05 | .04 | .05 | .06 | .04 | ||||||||||||||||||
Net realized and unrealized gain (loss) on investment transactions | 5.78 | 1.59 | (2.44 | ) | (.78 | ) | 3.16 | .84 | ||||||||||||||||
Contributions from Adviser | – 0 | – | – 0 | – | .00 | (b) | .01 | .00 | (b) | – 0 | – | |||||||||||||
Net increase (decrease) in net asset value from operations | 5.82 | 1.64 | (2.40 | ) | (.72 | ) | 3.22 | .88 | ||||||||||||||||
Less: Dividends and Distributions | ||||||||||||||||||||||||
Dividends from net investment income | (.02 | ) | (.05 | ) | (.04 | ) | (.06 | ) | (.04 | ) | (.03 | ) | ||||||||||||
Distributions from net realized gain on investment transactions | – 0 | – | – 0 | – | – 0 | – | (1.39 | ) | (.23 | ) | – 0 | – | ||||||||||||
Total dividends and distributions | (.02 | ) | (.05 | ) | (.04 | ) | (1.45 | ) | (.27 | ) | (.03 | ) | ||||||||||||
Net asset value, end of period | $ 17.57 | $ 11.77 | $ 10.18 | $ 12.62 | $ 14.79 | $ 11.84 | ||||||||||||||||||
Total Return | ||||||||||||||||||||||||
Total investment return based on net asset value(c) | 49.48 | %* | 16.13 | % | (18.97 | )% | (5.84 | )% | 27.50 | % | 8.00 | % | ||||||||||||
Ratios/Supplemental Data | ||||||||||||||||||||||||
Net assets, end of period (000’s omitted) | $620,238 | $520,593 | $548,279 | $686,291 | $668,771 | $429,431 | ||||||||||||||||||
Ratio to average net assets of: | ||||||||||||||||||||||||
Expenses | .04 | %(d)(e) | .04 | % | .05 | % | .04 | % | .05 | % | .07 | % | ||||||||||||
Net investment income | .47 | %(d)(e) | .46 | % | .49 | % | .39 | % | .45 | % | .33 | % | ||||||||||||
Portfolio turnover rate | 37 | % | 91 | % | 107 | % | 88 | % | 88 | % | 83 | % | ||||||||||||
See footnote summary on page 285.
| ALLIANCEBERNSTEIN POOLING PORTFOLIOS • | 283 |
Financial Highlights
Selected Data For A Share Of Beneficial Interest Outstanding Throughout Each Period
| Multi-Asset Real Return | ||||||||||||||||||||||||
| Six Months Ended February 28, 2011 (unaudited)** | Year Ended August 31, | |||||||||||||||||||||||
| 2010 | 2009 | 2008 | 2007 | 2006 | ||||||||||||||||||||
Net asset value, beginning of period | $ 8.57 | $ 7.68 | $ 9.56 | $ 13.90 | $ 13.14 | $ 10.74 | ||||||||||||||||||
Income From Investment Operations | ||||||||||||||||||||||||
Net investment income(a) | .11 | .28 | .28 | .36 | .27 | .36 | ||||||||||||||||||
Net realized and unrealized gain (loss) on investment and foreign currency transactions | 1.74 | .83 | (2.11 | ) | (2.32 | ) | 1.59 | 2.47 | ||||||||||||||||
Net increase (decrease) in net asset value from operations | 1.85 | 1.11 | (1.83 | ) | (1.96 | ) | 1.86 | 2.83 | ||||||||||||||||
Less: Dividends and Distributions | ||||||||||||||||||||||||
Dividends from net investment income | (.74 | ) | (.22 | ) | (.05 | ) | (1.33 | ) | (.58 | ) | (.37 | ) | ||||||||||||
Distributions from net realized gain on investment transactions | – 0 | – | – 0 | – | – 0 | – | (1.05 | ) | (.52 | ) | (.06 | ) | ||||||||||||
Total dividends and distributions | (.74 | ) | (.22 | ) | (.05 | ) | (2.38 | ) | (1.10 | ) | (.43 | ) | ||||||||||||
Net asset value, end of period | $ 9.68 | $ 8.57 | $ 7.68 | $ 9.56 | $ 13.90 | $ 13.14 | ||||||||||||||||||
Total Return | ||||||||||||||||||||||||
Total investment return based on net asset value(c) | 22.37 | % | 14.68 | % | (19.25 | )% | (17.38 | )% | 14.33 | % | 27.18 | % | ||||||||||||
Ratios/Supplemental Data | ||||||||||||||||||||||||
Net assets, end of period (000’s omitted) | $1,047,648 | $925,042 | $994,537 | $1,132,381 | $1,203,895 | $832,695 | ||||||||||||||||||
Ratio to average net assets of: | ||||||||||||||||||||||||
Expenses | .04 | %(d)(e) | .03 | % | .05 | % | .07 | % | .06 | % | .09 | % | ||||||||||||
Net investment income | 2.46 | %(d)(e) | 3.43 | % | 4.46 | % | 3.11 | % | 1.90 | % | 3.07 | % | ||||||||||||
Portfolio turnover rate | 107 | % | 57 | % | 76 | % | 46 | % | 49 | % | 46 | % | ||||||||||||
See footnote summary on page 285.
| 284 | • ALLIANCEBERNSTEIN POOLING PORTFOLIOS |
Financial Highlights
Selected Data For A Share Of Beneficial Interest Outstanding Throughout Each Period
| Volatility Management | ||||||||
| Six Months Ended February 28, 2011 (unaudited) | April 16, 2010(f) to August 31, 2010 | |||||||
Net asset value, beginning of period | $ 9.31 | $ 10.00 | ||||||
Income From Investment Operations | ||||||||
Net investment income(a)(g) | .04 | .04 | ||||||
Net realized and unrealized gain (loss) on investment and foreign currency transactions | 2.20 | (.73 | ) | |||||
Net increase (decrease) in net asset value from operations | 2.24 | (.69 | ) | |||||
Less: Dividends and Distributions | ||||||||
Dividends from net investment income | (.09 | ) | – 0 | – | ||||
Distributions from net realized gain on investment transactions | (.40 | ) | – 0 | – | ||||
Total dividends and distributions | (.49 | ) | – 0 | – | ||||
Net asset value, end of period | $ 11.06 | $ 9.31 | ||||||
Total Return | ||||||||
Total investment return based on net asset value(c) | 24.50 | % | (6.90 | )% | ||||
Ratios/Supplemental Data | ||||||||
Net assets, end of period (000’s omitted) | $346,800 | $296,252 | ||||||
Ratio to average net assets of: | ||||||||
Expenses, net of waivers/reimbursements(d)(e) | .15 | % | .15 | % | ||||
Expenses, before waivers/reimbursements(d)(e) | .17 | % | .21 | % | ||||
Net investment income(d)(e)(g) | .75 | % | 1.06 | % | ||||
Portfolio turnover rate | 33 | % | 51 | % | ||||
| (a) | Based on average shares outstanding. |
| (b) | Amount is less than $0.005. |
| (c) | Total investment return is calculated assuming an initial investment made at the net asset value at the beginning of the period, reinvestment of all dividends and distributions at net asset value during the period, and redemption on the last day of the period. Total return does not reflect the deduction of taxes that a shareholder would pay on fund distributions or the redemption of fund shares. Total investment return calculated for a period of less than one year is not annualized. |
| (d) | Annualized. |
| (e) | The ratio includes expenses attributable to costs of proxy solicitation. |
| (f) | Commencement of operations. |
| (g) | Net of fees and expenses waived/reimbursed by the Adviser. |
| * | Includes the impact of proceeds received and credited to the Portfolio resulting from the class action settlements, which enhanced the performance for the Small-Mid Cap Growth Portfolio for the six months ended February 28, 2011 by 0.01% and of the U.S. Large Cap Growth Portfolio for the year ended August 31, 2010 by 0.01%. |
| ** | Consolidated. |
See notes to financial statements.
| ALLIANCEBERNSTEIN POOLING PORTFOLIOS • | 285 |
Financial Highlights
RESULTS OF SHAREHOLDERS MEETING
(unaudited)
The Annual Meeting of Shareholders of The AllianceBernstein Pooling Portfolios (the “Fund”) was held on November 5, 2010. At the November 5, 2010 Meeting, with respect to the first item of business, the election of Trustees for the Fund, the second item of business, the amendment of the investment advisory agreement for each Portfolio, the third item of business, the amendment of the Fund’s Declaration of Trust, and the fourth item of business, the amendment or elimination of certain fundamental policies of the Portfolio, the required number of outstanding shares were voted in favor of the proposals, and all proposals were approved. A description of each proposal and number of shares voted at the Meeting are as follows (the proposal numbers shown below correspond to the proposal numbers in the Fund’s proxy statement):
| 1. | The election of the Trustees, each such Trustee to serve a term of an indefinite duration and until his or her successor is duly elected and qualifies. |
| Voted For | Withheld Authority | |||||||
John H. Dobkin | 1,366,062,011 | 0 | ||||||
Michael J. Downey | 1,366,062,011 | 0 | ||||||
William H. Foulk, Jr. | 1,366,062,011 | 0 | ||||||
D. James Guzy | 1,366,062,011 | 0 | ||||||
Nancy P. Jacklin | 1,366,062,011 | 0 | ||||||
Robert M. Keith | 1,366,062,011 | 0 | ||||||
Garry L. Moody | 1,366,062,011 | 0 | ||||||
Marshall C. Turner, Jr. | 1,366,062,011 | 0 | ||||||
Earl D. Weiner | 1,366,062,011 | 0 | ||||||
| 2. | Approve the amendment of each Portfolio’s Investment Advisory Agreement. |
| 2.B. | Approve the amendment to Investment Advisory Agreement regarding reimbursement of administrative expenses. |
Portfolio | Voted For | Voted Against | Abstained | |||||||||
AllianceBernstein U.S. Value Portfolio | 271,457,949 | 0 | 0 | |||||||||
AllianceBernstein U.S. Large Cap Growth Portfolio | 216,001,761 | 0 | 0 | |||||||||
AllianceBernstein Global Real Estate Investment Portfolio | 107,428,511 | 0 | 0 | |||||||||
AllianceBernstein International Value Portfolio | 146,822,104 | 0 | 0 | |||||||||
AllianceBernstein International Growth Portfolio | 126,978,192 | 0 | 0 | |||||||||
AllianceBernstein Short Duration Bond Portfolio | 127,805,294 | 0 | 0 | |||||||||
AllianceBernstein Intermediate Duration Bond Portfolio | 125,987,615 | 0 | 0 | |||||||||
| 286 | • ALLIANCEBERNSTEIN POOLING PORTFOLIOS |
Results of Shareholders Meeting
Portfolio | Voted For | Voted Against | Abstained | |||||||||
AllianceBernstein Bond Inflation Protection Portfolio | 62,390,695 | 0 | 0 | |||||||||
AllianceBernstein High-Yield Portfolio | 50,048,111 | 0 | 0 | |||||||||
AllianceBernstein Small-Mid Cap Value Portfolio | 55,354,700 | 0 | 0 | |||||||||
AllianceBernstein Small-Mid Cap Growth Portfolio | 44,009,585 | 0 | 0 | |||||||||
| 3. | Approve the amendment to the Fund’s Agreement and Declaration of Trust. |
| Voted For | Voted Against | Abstained | ||||||||||
The Fund | 1,366,062,011 | 0 | 0 | |||||||||
| 4. | Approve the amendment or elimination of certain fundamental policies of the Portfolio. |
| 4.A. | Approve the amendment of the Portfolio’s fundamental policy regarding diversification. |
Portfolio | Voted For | Voted Against | Abstained | |||||||||
AllianceBernstein U.S. Value Portfolio | 271,457,949 | 0 | 0 | |||||||||
AllianceBernstein U.S. Large Cap Growth Portfolio | 216,001,761 | 0 | 0 | |||||||||
AllianceBernstein Global Real Estate Investment Portfolio | 107,428,511 | 0 | 0 | |||||||||
AllianceBernstein International Value Portfolio | 146,822,104 | 0 | 0 | |||||||||
AllianceBernstein International Growth Portfolio | 126,978,192 | 0 | 0 | |||||||||
AllianceBernstein Short Duration Bond Portfolio | 127,805,294 | 0 | 0 | |||||||||
AllianceBernstein Intermediate Duration Bond Portfolio | 125,987,615 | 0 | 0 | |||||||||
AllianceBernstein Bond Inflation Protection Portfolio | 62,390,695 | 0 | 0 | |||||||||
AllianceBernstein High-Yield Portfolio | 50,048,111 | 0 | 0 | |||||||||
AllianceBernstein Small-Mid Cap Value Portfolio | 55,354,700 | 0 | 0 | |||||||||
AllianceBernstein Small-Mid Cap Growth Portfolio | 44,009,585 | 0 | 0 | |||||||||
AllianceBernstein Volatility Management Portfolio | 31,777,489 | 0 | 0 | |||||||||
| ALLIANCEBERNSTEIN POOLING PORTFOLIOS • | 287 |
Results of Shareholders Meeting
| 4.B. | Approve the amendment of the Portfolio’s fundamental policy regarding senior securities and borrowing money. |
Portfolio | Voted For | Voted Against | Abstained | |||||||||
AllianceBernstein U.S. Value Portfolio | 271,457,949 | 0 | 0 | |||||||||
AllianceBernstein U.S. Large Cap Growth Portfolio | 216,001,761 | 0 | 0 | |||||||||
AllianceBernstein Global Real Estate Investment Portfolio | 107,428,511 | 0 | 0 | |||||||||
AllianceBernstein International Value Portfolio | 146,822,104 | 0 | 0 | |||||||||
AllianceBernstein International Growth Portfolio | 126,978,192 | 0 | 0 | |||||||||
AllianceBernstein Short Duration Bond Portfolio | 127,805,294 | 0 | 0 | |||||||||
AllianceBernstein Intermediate Duration Bond Portfolio | 125,987,615 | 0 | 0 | |||||||||
AllianceBernstein Bond Inflation Protection Portfolio | 62,390,695 | 0 | 0 | |||||||||
AllianceBernstein High-Yield Portfolio | 50,048,111 | 0 | 0 | |||||||||
AllianceBernstein Small-Mid Cap Value Portfolio | 55,354,700 | 0 | 0 | |||||||||
AllianceBernstein Small-Mid Cap Growth Portfolio | 44,009,585 | 0 | 0 | |||||||||
AllianceBernstein Volatility Management Portfolio | 31,777,489 | 0 | 0 | |||||||||
| 4.C. | Approve the amendment of the Portfolio’s fundamental policy regarding underwriting securities. |
Portfolio | Voted For | Voted Against | Abstained | |||||||||
AllianceBernstein U.S. Value Portfolio | 271,457,949 | 0 | 0 | |||||||||
AllianceBernstein U.S. Large Cap Growth Portfolio | 216,001,761 | 0 | 0 | |||||||||
AllianceBernstein Global Real Estate Investment Portfolio | 107,428,511 | 0 | 0 | |||||||||
AllianceBernstein International Value Portfolio | 146,822,104 | 0 | 0 | |||||||||
AllianceBernstein International Growth Portfolio | 126,978,192 | 0 | 0 | |||||||||
AllianceBernstein Short Duration Bond Portfolio | 127,805,294 | 0 | 0 | |||||||||
AllianceBernstein Intermediate Duration Bond Portfolio | 125,987,615 | 0 | 0 | |||||||||
AllianceBernstein Bond Inflation Protection Portfolio | 62,390,695 | 0 | 0 | |||||||||
AllianceBernstein High-Yield Portfolio | 50,048,111 | 0 | 0 | |||||||||
AllianceBernstein Small-Mid Cap Value Portfolio | 55,354,700 | 0 | 0 | |||||||||
AllianceBernstein Small-Mid Cap Growth Portfolio | 44,009,585 | 0 | 0 | |||||||||
AllianceBernstein Volatility Management Portfolio | 31,777,489 | 0 | 0 | |||||||||
| 288 | • ALLIANCEBERNSTEIN POOLING PORTFOLIOS |
Results of Shareholders Meeting
| 4.D. | Approve the amendment of the Portfolio’s fundamental policy regarding concentration. |
Portfolio | Voted For | Voted Against | Abstained | |||||||||
AllianceBernstein U.S. Value Portfolio | 271,457,949 | 0 | 0 | |||||||||
AllianceBernstein U.S. Large Cap Growth Portfolio | 216,001,761 | 0 | 0 | |||||||||
AllianceBernstein Global Real Estate Investment Portfolio | 107,428,511 | 0 | 0 | |||||||||
AllianceBernstein International Value Portfolio | 146,822,104 | 0 | 0 | |||||||||
AllianceBernstein International Growth Portfolio | 126,978,192 | 0 | 0 | |||||||||
AllianceBernstein Short Duration Bond Portfolio | 127,805,294 | 0 | 0 | |||||||||
AllianceBernstein Intermediate Duration Bond Portfolio | 125,987,615 | 0 | 0 | |||||||||
AllianceBernstein Bond Inflation Protection Portfolio | 62,390,695 | 0 | 0 | |||||||||
AllianceBernstein High-Yield Portfolio | 50,048,111 | 0 | 0 | |||||||||
AllianceBernstein Small-Mid Cap Value Portfolio | 55,354,700 | 0 | 0 | |||||||||
AllianceBernstein Small-Mid Cap Growth Portfolio | 44,009,585 | 0 | 0 | |||||||||
AllianceBernstein Volatility Management Portfolio | 31,777,489 | 0 | 0 | |||||||||
| 4.E. | Approve the amendment of the Portfolio’s fundamental policy regarding investments in real estate. |
Portfolio | Voted For | Voted Against | Abstained | |||||||||
AllianceBernstein U.S. Value Portfolio | 271,457,949 | 0 | 0 | |||||||||
AllianceBernstein U.S. Large Cap Growth Portfolio | 216,001,761 | 0 | 0 | |||||||||
AllianceBernstein Global Real Estate Investment Portfolio | 107,428,511 | 0 | 0 | |||||||||
AllianceBernstein International Value Portfolio | 146,822,104 | 0 | 0 | |||||||||
AllianceBernstein International Growth Portfolio | 126,978,192 | 0 | 0 | |||||||||
AllianceBernstein Short Duration Bond Portfolio | 127,805,294 | 0 | 0 | |||||||||
AllianceBernstein Intermediate Duration Bond Portfolio | 125,987,615 | 0 | 0 | |||||||||
AllianceBernstein Bond Inflation Protection Portfolio | 62,390,695 | 0 | 0 | |||||||||
AllianceBernstein High-Yield Portfolio | 50,048,111 | 0 | 0 | |||||||||
AllianceBernstein Small-Mid Cap Value Portfolio | 55,354,700 | 0 | 0 | |||||||||
AllianceBernstein Small-Mid Cap Growth Portfolio | 44,009,585 | 0 | 0 | |||||||||
AllianceBernstein Volatility Management Portfolio | 31,777,489 | 0 | 0 | |||||||||
| ALLIANCEBERNSTEIN POOLING PORTFOLIOS • | 289 |
Results of Shareholders Meeting
| 4.F. | Approve the amendment of the Portfolio’s fundamental policy regarding commodities. |
Portfolio | Voted For | Voted Against | Abstained | |||||||||
AllianceBernstein U.S. Value Portfolio | 271,457,949 | 0 | 0 | |||||||||
AllianceBernstein U.S. Large Cap Growth Portfolio | 216,001,761 | 0 | 0 | |||||||||
AllianceBernstein Global Real Estate Investment Portfolio | 107,428,511 | 0 | 0 | |||||||||
AllianceBernstein International Value Portfolio | 146,822,104 | 0 | 0 | |||||||||
AllianceBernstein International Growth Portfolio | 126,978,192 | 0 | 0 | |||||||||
AllianceBernstein Short Duration Bond Portfolio | 127,805,294 | 0 | 0 | |||||||||
AllianceBernstein Intermediate Duration Bond Portfolio | 125,987,615 | 0 | 0 | |||||||||
AllianceBernstein Bond Inflation Protection Portfolio | 62,390,695 | 0 | 0 | |||||||||
AllianceBernstein High-Yield Portfolio | 50,048,111 | 0 | 0 | |||||||||
AllianceBernstein Small-Mid Cap Value Portfolio | 55,354,700 | 0 | 0 | |||||||||
AllianceBernstein Small-Mid Cap Growth Portfolio | 44,009,585 | 0 | 0 | |||||||||
AllianceBernstein Volatility Management Portfolio | 31,777,489 | 0 | 0 | |||||||||
| 4.G. | Approve the amendment of the Portfolio’s fundamental policy regarding loans. |
Portfolio | Voted For | Voted Against | Abstained | |||||||||
AllianceBernstein U.S. Value Portfolio | 271,457,949 | 0 | 0 | |||||||||
AllianceBernstein U.S. Large Cap Growth Portfolio | 216,001,761 | 0 | 0 | |||||||||
AllianceBernstein Global Real Estate Investment Portfolio | 107,428,511 | 0 | 0 | |||||||||
AllianceBernstein International Value Portfolio | 146,822,104 | 0 | 0 | |||||||||
AllianceBernstein International Growth Portfolio | 126,978,192 | 0 | 0 | |||||||||
AllianceBernstein Short Duration Bond Portfolio | 127,805,294 | 0 | 0 | |||||||||
AllianceBernstein Intermediate Duration Bond Portfolio | 125,987,615 | 0 | 0 | |||||||||
AllianceBernstein Bond Inflation Protection Portfolio | 62,390,695 | 0 | 0 | |||||||||
AllianceBernstein High-Yield Portfolio | 50,048,111 | 0 | 0 | |||||||||
AllianceBernstein Small-Mid Cap Value Portfolio | 55,354,700 | 0 | 0 | |||||||||
AllianceBernstein Small-Mid Cap Growth Portfolio | 44,009,585 | 0 | 0 | |||||||||
AllianceBernstein Volatility Management Portfolio | 31,777,489 | 0 | 0 | |||||||||
| 290 | • ALLIANCEBERNSTEIN POOLING PORTFOLIOS |
Results of Shareholders Meeting
| 4.H. | Approve the elimination of the Portfolio’s fundamental policy prohibiting pledging, hypothecating, mortgaging, or otherwise encumbering assets. |
Portfolio | Voted For | Voted Against | Abstained | |||||||||
AllianceBernstein U.S. Value Portfolio | 271,457,949 | 0 | 0 | |||||||||
AllianceBernstein U.S. Large Cap Growth Portfolio | 216,001,761 | 0 | 0 | |||||||||
AllianceBernstein Global Real Estate Investment Portfolio | 107,428,511 | 0 | 0 | |||||||||
AllianceBernstein International Value Portfolio | 146,822,104 | 0 | 0 | |||||||||
AllianceBernstein International Growth Portfolio | 126,978,192 | 0 | 0 | |||||||||
AllianceBernstein Short Duration Bond Portfolio | 127,805,294 | 0 | 0 | |||||||||
AllianceBernstein Intermediate Duration Bond Portfolio | 125,987,615 | 0 | 0 | |||||||||
AllianceBernstein Bond Inflation Protection Portfolio | 62,390,695 | 0 | 0 | |||||||||
AllianceBernstein High-Yield Portfolio | 50,048,111 | 0 | 0 | |||||||||
AllianceBernstein Small-Mid Cap Value Portfolio | 55,354,700 | 0 | 0 | |||||||||
AllianceBernstein Small-Mid Cap Growth Portfolio | 44,009,585 | 0 | 0 | |||||||||
AllianceBernstein Volatility Management Portfolio | 31,777,489 | 0 | 0 | |||||||||
| 4.I. | Approve the elimination of the Portfolio’s fundamental policy prohibiting investments for purpose of exercising control. |
Portfolio | Voted For | Voted Against | Abstained | |||||||||
AllianceBernstein U.S. Value Portfolio | 271,457,949 | 0 | 0 | |||||||||
AllianceBernstein U.S. Large Cap Growth Portfolio | 216,001,761 | 0 | 0 | |||||||||
AllianceBernstein Global Real Estate Investment Portfolio | 107,428,511 | 0 | 0 | |||||||||
AllianceBernstein International Value Portfolio | 146,822,104 | 0 | 0 | |||||||||
AllianceBernstein International Growth Portfolio | 126,978,192 | 0 | 0 | |||||||||
AllianceBernstein Short Duration Bond Portfolio | 127,805,294 | 0 | 0 | |||||||||
AllianceBernstein Intermediate Duration Bond Portfolio | 125,987,615 | 0 | 0 | |||||||||
AllianceBernstein Bond Inflation Protection Portfolio | 62,390,695 | 0 | 0 | |||||||||
AllianceBernstein High-Yield Portfolio | 50,048,111 | 0 | 0 | |||||||||
AllianceBernstein Small-Mid Cap Value Portfolio | 55,354,700 | 0 | 0 | |||||||||
AllianceBernstein Small-Mid Cap Growth Portfolio | 44,009,585 | 0 | 0 | |||||||||
AllianceBernstein Volatility Management Portfolio | 31,777,489 | 0 | 0 | |||||||||
| ALLIANCEBERNSTEIN POOLING PORTFOLIOS • | 291 |
Results of Shareholders Meeting
TRUSTEES
William H. Foulk, Jr.(1) , Chairman John H. Dobkin(1) Michael J. Downey(1) D. James Guzy(1) Nancy P. Jacklin(1) | Robert M. Keith, President and Chief Executive Officer Garry L. Moody(1) Marshall C. Turner, Jr.(1) Earl D. Weiner(1) | |
| OFFICERS(2) | ||
Philip L. Kirstein, Senior Vice President and Independent Compliance Officer Bruce K. Aronow, Vice President Stephen M. Beinhacker, Vice President Henry S. D’Auria, Vice President Sergey Davalchenko, Vice President Drew W. Demakis, Vice President Jon P. Denfeld, Vice President Paul J. DeNoon, Vice President Gershon M. Distenfeld, Vice President Joseph R. Elegante, Vice President Sharon E. Fay, Vice President Eric J. Franco, Vice President Gareth Jenkins, Vice President Shawn E. Keegan, Vice President N. Kumar Kirpalani, Vice President Samantha S. Lau, Vice President Jason P. Ley, Vice President Joshua B. Lisser, Vice President Daniel J. Loewy, Vice President James W. MacGregor, Vice President Alison M. Martier, Vice President Christopher W. Marx, Vice President | Teresa Marziano, Vice President Seth J. Masters, Vice President Joel J. McKoan, Vice President Joseph G. Paul, Vice President Douglas J. Peebles, Vice President John D. Phillips, Vice President David F. Randell, Vice President Jonathan E. Ruff, Vice President Laurent Saltiel, Vice President Kevin F. Simms, Vice President Christopher M. Toub, Vice President Wen-Tse Tseng, Vice President P. Scott Wallace, Vice President Andrew J. Weiner, Vice President Greg J. Wilensky, Vice President David Yuen, Vice President Vadim Zlotnikov, Vice President Emilie D. Wrapp, Secretary Joseph J. Mantineo, Treasurer and Chief Financial Officer Phyllis J. Clarke, Controller
| |
Custodian and Accounting Agent State Street Bank and Trust Company
Principal Underwriter AllianceBernstein Investments, Inc. |
Legal Counsel Seward & Kissel LLP | |
| 292 | • ALLIANCEBERNSTEIN POOLING PORTFOLIOS |
Trustees
Transfer Agent AllianceBernstein Investor
| Independent Registered Public Ernst & Young LLP |
| (1) | Member of the Audit Committee, the Governance and Nominating Committee, and the Independent Directors Committee. Mr. Foulk is the sole member of the Fair Value Pricing Committee. |
| (2) | The management of, and investment decisions for, the AllianceBernstein Multi-Asset Real Return Portfolio are made by the Real Asset Strategy Team. Mr. Drew W. Demakis, Mr. Joshua B. Lisser, Ms. Teresa Marziano, Mr. Jonathan E. Ruff and Mr. Greg J. Wilensky are the senior most members of the Investment Management Team. |
| The management of, and investment decisions for, the AllianceBernstein U.S. Value Portfolio are made by the U.S. Value Senior Investment Management Team. Mr. Joseph G. Paul, Mr. Christopher W. Marx, Mr. John D. Phillips and Mr. David Yuen are the senior most members of the Investment Management Team. |
| The management of, and investment decisions for, the AllianceBernstein Small-Mid Cap Value Portfolio are made by the Small-Mid Cap Value Senior Investment Management Team. Mr. Joseph G. Paul, Mr. James W. MacGregor and Mr. Andrew J. Weiner are the senior most members of the Investment Management Team. |
| The management of, and investment decisions for, the AllianceBernstein International Value Portfolio are made by the International Value Senior Investment Management Team. Ms. Sharon E. Fay, Mr. Kevin F. Simms, Mr. Henry S. D’Auria and Mr. Eric J. Franco are the senior most members of the Investment Management Team. |
| The management of, and investment decisions for, the AllianceBernstein U.S. Large Cap Growth Portfolio are made by the U.S. Large Cap Growth Team. Mr. Joseph R. Elegante, Mr. Jason P. Ley, Mr. David F. Randell, and Mr. P. Scott Wallace are the senior most members of the team. |
| The management of, and investment decisions for, the AllianceBernstein Small-Mid Cap Growth Portfolio are made by the Small Cap Growth Investment Team. Mr. Bruce K. Aronow, Mr. N. Kumar Kirpalani, Ms. Samantha S. Lau and Mr. Wen-Tse Tseng are the senior most members of the team. |
| The management of, and investment decisions for, the AllianceBernstein International Growth Portfolio are made by the International Large Cap Growth Team. Mr. Sergey Davalchenko, Mr. Gareth Jenkins and Mr. Laurent Saltiel, are the senior most members of the team. |
| The management of, and investment decisions for, the AllianceBernstein Short Duration Bond Portfolio are made by the U.S. Investment Grade: Liquid Markets/Structured Products Investment Team. Mr. Jon P. Denfeld, Mr. Paul J. DeNoon, Mr. Shawn E. Keegan, Ms. Alison M. Martier, Mr. Douglas J. Peebles and Mr. Greg J. Wilensky are the senior most members of the team. |
| The management of, and investment decisions for, the AllianceBernstein Intermediate Duration Bond Portfolio are made by the U.S. Investment Grade: Core Fixed Income Team. Mr. Paul J. DeNoon, Mr. Shawn E. Keegan, Ms. Alison M. Martier, Mr. Douglas J. Peebles and Mr. Greg J. Wilensky, are the senior most members of the team. |
| The management of, and investment decisions for, the AllianceBernstein High-Yield Portfolio are made by the Global Credit Investment Team. Mr. Gershon M. Distenfeld, Mr. Joel J. McKoan and Mr. Douglas J. Peebles are the senior most members of the team. |
| Mr. Greg J. Wilensky, Director of Stable Value Investments, is primarily responsible for the day-to-day management of the AllianceBernstein Bond Inflation Protection Portfolio. |
| The day-to-day management of, and investment decisions for, the AllianceBernstein Volatility Management Portfolio are made by the Adviser’s Dynamic Asset Allocation Team. Mr. Seth J. Masters and Mr. Daniel J. Loewy are primarily responsible for the day-to-day management of the Portfolio. |
| ALLIANCEBERNSTEIN POOLING PORTFOLIOS • | 293 |
Trustees
Information Regarding the Review and Approval of the Advisory Agreement in Respect of Each Portfolio
At a meeting held on November 2-4, 2010 the disinterested trustees (the “trustees”) of The AllianceBernstein Pooling Portfolios (the “Trust”) unanimously approved the continuance of the Advisory Agreement with the Adviser in respect of each of:
| • | AllianceBernstein Short Duration Bond Portfolio, |
| • | AllianceBernstein Intermediate Duration Bond Portfolio, |
| • | AllianceBernstein Bond Inflation Protection Portfolio (formerly AllianceBernstein Inflation Protected Securities Portfolio), and |
| • | AllianceBernstein High-Yield Portfolio (each, a “Portfolio” and collectively, the “Portfolios”).1 |
Prior to approval of the continuance of the Advisory Agreement in respect of each Portfolio, the trustees had requested from the Adviser, and received and evaluated, extensive materials. They reviewed the proposed continuance of the Advisory Agreement with the Adviser and with experienced counsel who are independent of the Adviser, who advised on the relevant legal standards. The trustees also reviewed an independent evaluation prepared by the Trust’s Senior Officer (who is also the Trust’s Independent Compliance Officer) of the reasonableness of the advisory fee in the Advisory Agreement in respect of each Portfolio wherein the Senior Officer concluded that the contractual fee (zero) for each Portfolio was reasonable. The trustees also discussed the proposed continuances in private sessions with counsel and the Trust’s Senior Officer.
The trustees noted that the Portfolios are designed as investment vehicles for certain AllianceBernstein institutional clients, including registered investment companies sponsored by the Adviser (the institutional clients, including the registered investment companies, are all referred to as the “Pooling Investors”). The trustees also noted that the Advisory Agreement provides for a fee rate of zero and does not include a reimbursement provision for certain administrative expenses included in the Adviser’s advisory agreements with most of the open-end AllianceBernstein Funds. The trustees further noted that the Trust acknowledges in the Advisory Agreement that the Adviser will receive compensation for its services to the Portfolios from third parties (e.g., the Pooling Investors that are shareholders of the Portfolios). The trustees noted that the current Pooling Investors in the Portfolios are certain registered investment companies sponsored by the Adviser and an unaffiliated institutional investor.
| 1 | This disclosure does not relate to AllianceBernstein U.S. Value Portfolio, AllianceBernstein U.S. Large Cap Growth Portfolio, AllianceBernstein Multi-Asset Real Return Portfolio (formerly AllianceBernstein Global Real Estate Investment Portfolio), AllianceBernstein International Value Portfolio, AllianceBernstein International Growth Portfolio, AllianceBernstein Small-Mid Cap Value Portfolio, AllianceBernstein Small-Mid Cap Growth Portfolio or AllianceBernstein Volatility Management Portfolio. |
| 294 | • ALLIANCEBERNSTEIN POOLING PORTFOLIOS |
The trustees considered their knowledge of the nature and quality of the services provided by the Adviser to the Portfolios gained from their experience as trustees or directors of most of the registered investment companies advised by the Adviser, their overall confidence in the Adviser’s integrity and competence they have gained from that experience, the Adviser’s initiative in identifying and raising potential issues with the trustees and its responsiveness, frankness and attention to concerns raised by the trustees in the past, including the Adviser’s willingness to consider and implement organizational and operational changes designed to improve investment results and the services provided to the AllianceBernstein Funds. The trustees noted that they have four regular meetings each year, at each of which they receive presentations from the Adviser on the investment results of the Portfolios and review extensive materials and information presented by the Adviser.
The trustees also considered all other factors they believed relevant, including the specific matters discussed below. In their deliberations, the trustees did not identify any particular information that was all-important or controlling, and different trustees may have attributed different weights to the various factors. The trustees determined that the selection of the Adviser to manage each Portfolio, and the overall arrangements between each Portfolio and the Adviser as provided in the Advisory Agreement, including the advisory fee, were fair and reasonable in light of the services performed, expenses incurred and such other matters as the trustees considered relevant in the exercise of their business judgment. The material factors and conclusions that formed the basis for the trustees’ determination included the following:
Nature, Extent and Quality of Services Provided
The trustees considered the scope and quality of services provided by the Adviser under the Advisory Agreement, including the quality of the investment research capabilities of the Adviser and the other resources it has dedicated to performing services for the Portfolios. They also noted the professional experience and qualifications of each Portfolio’s portfolio management team and other senior personnel of the Adviser. The quality of administrative and other services, including the Adviser’s role in coordinating the activities of each Portfolio’s other service providers, also were considered. The trustees concluded that, overall, they were satisfied with the nature, extent and quality of services provided to each of the Portfolios under the Advisory Agreement.
Costs of Services Provided and Profitability
The trustees reviewed a schedule of the revenues, expenses and related notes indicating the profitability of each Portfolio (which, as noted above, pays no advisory fee to the Adviser and does not reimburse expenses to the Adviser) to the Adviser for calendar years 2008 and 2009 that had been prepared with an expense allocation methodology arrived at in consultation with an independent consultant retained by the Trust’s Senior Officer. The trustees reviewed the
| ALLIANCEBERNSTEIN POOLING PORTFOLIOS • | 295 |
assumptions and methods of allocation used by the Adviser in preparing fund-specific profitability data and noted that there are a number of potentially acceptable allocation methodologies for information of this type. The trustees noted that the methodology took into account that the Adviser was indirectly compensated for its services to the Portfolios by the Pooling Investors. The trustees also noted that the profitability information reflected all revenues and expenses of the Adviser’s relationships with the Portfolios, including those relating to its subsidiaries which provide transfer agency, distribution and brokerage services to the Portfolios and that the profitability methodology attributed revenues and expenses to the Portfolios relating to the Pooling Investors. The trustees recognized that it is difficult to make comparisons of profitability between fund advisory contracts because comparative information is not generally publicly available and is affected by numerous factors. The trustees focused on the profitability of the Adviser’s relationships with the Portfolios before taxes and distribution expenses. The trustees concluded that they were satisfied that the Adviser’s level of profitability from its relationship with each Portfolio was not unreasonable. The trustees also considered that the Adviser bears certain costs in order to provide services to each Portfolio.
Fall-Out Benefits
The trustees considered the benefits to the Adviser and its affiliates from their relationships with the Portfolios other than the fees payable under the Advisory Agreement (none), including but not limited to benefits relating to soft dollar arrangements (whereby the Adviser receives brokerage and research services from many of the brokers that execute purchases and sales of securities on behalf of its clients (although not for the Portfolios) on an agency basis), 12b-1 fees and sales charges received by the Trust’s principal underwriter (which is a wholly owned subsidiary of the Adviser) in respect of certain classes of shares of the Pooling Investors that are registered investment companies, and brokerage commissions paid by the Portfolios to brokers affiliated with the Adviser. The trustees noted that while the Adviser’s affiliated transfer agent does not receive fees for providing services to the Portfolios (although it may be reimbursed for its out-of-pocket expenses), such affiliated transfer agent receives fees for providing services to the Pooling Investors. The trustees noted that the Adviser receives fees for advisory, distribution, recordkeeping and other services provided to the institutional Pooling Investor and is compensated by the other Pooling Investors for providing advisory services to them. The trustees recognized that the Adviser’s profitability would be somewhat lower without these benefits. The trustees also understood that the Adviser also might derive reputational and other benefits from its association with the Portfolios.
Investment Results
In addition to the information reviewed by the trustees in connection with the meeting, the trustees receive detailed comparative performance information for each Portfolio at each regular Board meeting during the year. At the November
| 296 | • ALLIANCEBERNSTEIN POOLING PORTFOLIOS |
2010 meeting, the trustees reviewed information prepared by Lipper showing the performance of each Portfolio as compared with that of a group of similar funds selected by Lipper (the “Performance Group”) and as compared with that of a broader array of funds selected by Lipper (the “Performance Universe”), and information prepared by the Adviser showing performance of each Portfolio as compared with an index, in each case for the 1-, 3- and 5-year periods ended July 31, 2010 and (in the case of comparisons with the index) the since inception period (May 2005 inception).
In reviewing the performance information the trustees noted that the Portfolios had a performance advantage in that the performance of virtually all of the Portfolios’ competitors was negatively affected by the fact they pay advisory fees whereas performance information for the Portfolios reflects their advisory fee of zero.
AllianceBernstein Short Duration Bond Portfolio
The trustees noted that the Portfolio was in the 3rd quintile of the Performance Group and 2nd quintile of the Performance Universe for the 1-year period, in the 4th quintile of the Performance Group and the Performance Universe for the 3-year period, and in the 4th quintile of the Performance Group and 5th quintile of the Performance Universe for the 5-year period. The Portfolio outperformed the BofA/Merrill Lynch 1-3 Year Treasury Index (the “Index”) in the 1-year period but lagged the Index in the 3- and 5-year and the since inception periods. Based on their review, the trustees concluded that the Portfolio’s relative performance was acceptable.
AllianceBernstein Intermediate Duration Bond Portfolio
The trustees noted that the Portfolio was in the 2nd quintile of the Performance Group and the Performance Universe for the 1-, 3- and 5-year periods, and that the Portfolio outperformed the Barclays Capital U.S. Aggregate Bond Index in all periods reviewed. Based on their review, the trustees concluded that the Portfolio’s relative performance over time had been satisfactory.
AllianceBernstein Bond Inflation Protection Portfolio
The trustees noted that the Portfolio was in the 4th quintile of the Performance Group and the Performance Universe for the 1-year period, in the 3rd quintile of the Performance Group and 2nd quintile of the Performance Universe for the 3-year period, and in the 2nd quintile of the Performance Group and the Performance Universe for the 5-year period. The Portfolio outperformed the Barclays Capital U.S. 1-10 Year TIPS Index in all periods reviewed. The trustees noted that at their February 2010 meetings they had approved modifications to the Portfolio’s investment guidelines and a name change to AllianceBernstein Bond Inflation Protection Portfolio effective March 2010. Based on their review, the trustees concluded that the Portfolio’s relative performance was satisfactory.
| ALLIANCEBERNSTEIN POOLING PORTFOLIOS • | 297 |
AllianceBernstein High-Yield Portfolio
The trustees noted that the Portfolio was in the 1st quintile of the Performance Group and the Performance Universe for the 1-, 3- and 5-year periods, and that the Portfolio outperformed the Barclays Capital U.S. High Yield 2% Issuer Cap Index in all periods reviewed. Based on their review, the trustees concluded that the Portfolio’s relative performance over time had been satisfactory.
Advisory Fees and Other Expenses
The trustees considered the advisory fee rate paid by each Portfolio to the Adviser (zero) and information prepared by Lipper concerning advisory fee rates paid by other funds in the same Lipper category as a Portfolio at a common asset level. The trustees also reviewed certain information showing the fees paid to the Adviser by the Pooling Investors. The trustees recognized that it is difficult to make comparisons of advisory fees because there are variations in the services that are included in the fees paid by other funds.
The trustees noted the unusual arrangements in the Advisory Agreement providing for no advisory fee but were cognizant that the Adviser is indirectly compensated by the Pooling Investors for its services to the Portfolios. While the fees paid by the Pooling Investors to the Adviser vary, the trustees acknowledged that a portion of those fees may reasonably be viewed as compensating the Adviser for advisory services it provides to each Portfolio (the “implied fee”) and that the Adviser had represented to the Securities and Exchange Commission staff and to the Trust’s former counsel that the implied fee rate is the same for all the institutional investors in the Portfolios (e.g., the Pooling Investors). The trustees also noted that the Adviser had undertaken to work with the trustees to develop procedures to enable the trustees to monitor the implied fee rates for the Portfolios and provided the trustees with information concerning the fees paid by the various Pooling Investors. Based on their review, the trustees concluded that the advisory arrangements for the Portfolios, including the zero fee aspect of the Advisory Agreement with the Adviser, were satisfactory.
The trustees also considered the fees the Adviser charges other clients with an investment style substantially similar to that of each of the Portfolios. For this purpose, the trustees reviewed the relevant fee information from the Adviser’s Form ADV and the evaluation from the Trust’s Senior Officer disclosing the institutional fee schedules for institutional products managed by the Adviser that have an investment style substantially similar to that of the Portfolios. The trustees noted that these comparisons were of limited utility in light of the Portfolios’ unusual fee arrangement. The trustees noted that the Adviser may, in some cases, agree to fee rates with large institutional clients that are lower than those on the schedules reviewed by the trustees and that they had previously discussed with the Adviser its policies in respect of such arrangements.
| 298 | • ALLIANCEBERNSTEIN POOLING PORTFOLIOS |
The trustees also reviewed information that indicated that, in the case of AllianceBernstein Intermediate Duration Bond Portfolio, the Adviser receives a fee for sub-advising a registered investment company with an investment style similar to that of the Portfolio. The trustees noted that these comparisons were of limited utility in light of the Portfolios’ unusual fee arrangement.
The Adviser reviewed with the trustees the significantly greater scope of the services it provides the Portfolios relative to institutional clients and sub-advised funds. The Adviser also noted that because mutual funds are constantly issuing and redeeming shares, they are more difficult to manage than an institutional account, where the assets tend to be relatively stable. In light of the substantial differences in services rendered by the Adviser to institutional clients as compared to funds such as the Portfolios, and the unusual fee structure for all the Portfolios, the trustees considered these fee comparisons inapt and did not place significant weight on them in their deliberations.
The trustees also considered the total non-advisory expense ratio of each Portfolio in comparison to the non-advisory expenses of funds within two comparison groups created by Lipper: an Expense Group and an Expense Universe. Lipper described an Expense Group as a representative sample of funds similar to a Portfolio and an Expense Universe as a broader group, consisting of all funds in a Portfolio’s investment classification/objective. The non-advisory expense ratio of each Portfolio was based on the Portfolio’s latest fiscal year. The trustees noted that it was likely that the non-advisory expense ratios of some funds in each Portfolio’s Lipper category were lowered by waivers or reimbursements by those funds’ investment advisers, which in some cases might be voluntary and temporary. The trustees view the non-advisory expense ratio information as relevant to their evaluation of the Adviser’s services because the Adviser is responsible for coordinating services provided to the Portfolios by others.
The trustees noted that each Portfolio’s total non-advisory expense ratio was lower than the Expense Group and the Expense Universe medians. The trustees concluded that each Portfolio’s non-advisory expense ratio was satisfactory.
Economies of Scale
Since the Advisory Agreement does not provide for any compensation to be paid to the Adviser by the Portfolios, the trustees did not consider the extent to which the fee levels in the Advisory Agreement reflect economies of scale. They did note, however, that the fee schedules for the Pooling Investors that are registered investment companies incorporate breakpoints.
| ALLIANCEBERNSTEIN POOLING PORTFOLIOS • | 299 |
THE FOLLOWING IS NOT PART OF THE SHAREHOLDER REPORT OR THE FINANCIAL STATEMENTS
SUMMARY OF SENIOR OFFICER’S EVALUATION OF INVESTMENT ADVISORY AGREEMENT1
The following is a summary of the evaluation of the Investment Advisory Agreement between AllianceBernstein L.P. (the “Adviser”) and AllianceBernstein Pooling Portfolios (the “Trust” or the “Pooling Portfolios”) in respect of the following Portfolios:2
– U.S. Value Portfolio
– U.S. Large Cap Growth Portfolio
– Global Real Estate Investment Portfolio
– International Value Portfolio
– International Growth Portfolio
– Small-Mid Cap Value Portfolio
– Small-Mid Cap Growth Portfolio
The Trust, which is designed to facilitate a “blended style” investment approach, represents a variety of asset classes and investment styles, and is available for investment only to institutional clients of the Adviser, including both registered investment companies and large managed separate accounts.
The evaluation of the Investment Advisory Agreement was prepared by Philip L. Kirstein, the Senior Officer, for the Trustees of the Trust, as required by a September 2004 agreement between the Adviser and the New York State Attorney General (the “NYAG”). The Senior Officer’s evaluation of the Investment Advisory Agreement is not meant to diminish the responsibility or authority of the Board of Trustees of the Trust to perform its duties pursuant to Section 15 of the Investment Company Act of 1940 (the “40 Act”) and applicable state law. The purpose of the summary is to provide shareholders with a synopsis of the independent evaluation of the reasonableness of the advisory fees proposed to be paid by the Portfolios which was provided to the Trustees in connection with their review of the proposed approval of the continuance of the Investment Advisory Agreement. The Senior Officer’s evaluation considered the following factors:
| 1. | Advisory fees charged to institutional and other clients of the Adviser for like services; |
| 1 | It should be noted that the information in the fee summary was completed on April 21, 2010 and presented to the Board of Trustees on May 4-6, 2010. |
| 2 | Future references to the Portfolios do not include “AllianceBernstein.” The Portfolios of the Trust that are not discussed in this evaluation are Volatility Management Portfolio and the fixed-income Pooling Portfolios: Short Duration Bond Portfolio, Intermediate Duration Bond Portfolio, Inflation Protected Securities Portfolio and High Yield Portfolio. The fixed-income Pooling Portfolios will be considered separately at the Board meeting schedules to be held on November 2-4, 2010. |
| 300 | • ALLIANCEBERNSTEIN POOLING PORTFOLIOS |
| 2. | Advisory fees charged by other mutual fund companies for like services; |
| 3. | Costs to the Adviser and its affiliates of supplying services pursuant to the advisory agreements, excluding any intra-corporate profit; |
| 4. | Profit margins of the Adviser and its affiliates from supplying such services; |
| 5. | Possible economies of scale as the Portfolios grow larger; and |
| 6. | Nature and quality of the Adviser’s services including the performance of the Portfolios. |
PORTFOLIO ADVISORY FEES, NET ASSETS, & EXPENSE RATIOS
Under the Investment Advisory Agreement, the Portfolios are not charged an advisory fee. The investment advisory contract also does not provide for the Adviser to be reimbursed for the cost of providing non-advisory services, which would include administration, distribution and transfer agent-related services, although the transfer agent of the Portfolios is reimbursed for out of pocket expenses. The Adviser is compensated by institutional clients of the Adviser (the “Institutional Clients”) that invest in the Pooling Portfolios. These clients include the AllianceBernstein Blended Style Series, Inc.—AllianceBernstein Retirement Strategies (“Retirement Strategies”),3 AllianceBernstein Blended Style Series, Inc.—U.S. Large Cap Portfolio (“U.S. Large Cap Portfolio”), The AllianceBernstein Portfolios—AllianceBernstein Wealth Strategies (“Wealth Strategies”),4 and the Rhode Island Higher Education Savings Trust (referred to herein as “CollegeBoundfund”). Collectively, these shareholders (the “Institutional Clients”) own 100 percent of the Pooling Portfolios’ total outstanding shares. Set forth below are the advisory fee schedules of the Institutional Clients that invests in the Pooling Portfolios.
| 3 | Includes AllianceBernstein 2000 Retirement Strategy, AllianceBernstein 2005 Retirement Strategy, AllianceBernstein 2010 Retirement Strategy, AllianceBernstein 2015 Retirement Strategy, AllianceBernstein 2020 Retirement Strategy, AllianceBernstein 2025 Retirement Strategy, AllianceBernstein 2030 Retirement Strategy, AllianceBernstein 2035 Retirement Strategy, AllianceBernstein 2040 Retirement Strategy, AllianceBernstein 2045 Retirement Strategy, AllianceBernstein 2050 Retirement Strategy and AllianceBernstein 2055 Retirement Strategy . Future references to the Retirement Strategies do not include “AllianceBernstein.” |
| 4 | Includes AllianceBernstein Balanced Wealth Strategy, AllianceBernstein Wealth Appreciation Strategy, AllianceBernstein Conservative Wealth Strategy. Future references to the Wealth Strategies do not include “AllianceBernstein.” |
| ALLIANCEBERNSTEIN POOLING PORTFOLIOS • | 301 |
AllianceBernstein Blended Style Series, Inc.—AllianceBernstein Retirement Strategies
Each of the Retirement Strategies pays an advisory fee correlated to the percentage of equity investments held by the Retirement Strategy. This fee is discounted by a certain percentage depending on the asset level of the Retirement Strategy as indicated below:
| % Invested in Equity Investments | Advisory Fee | |||
| Equal to or less than 60% | 0.55 | % | ||
| Greater than 60% and less than 80% | 0.60 | % | ||
| Equal to or greater than 80% | 0.65 | % | ||
| Net Asset Level | Discount | |||
| Assets equal to or less than $2.5 billion | n/a | |||
| Assets greater than $2.5 billion and less than $5 billion | 10 basis points | |||
| Assets greater than $5 billion | 15 basis points | |||
Accordingly, under the terms of the Investment Advisory Agreement, the Retirement Strategies will pay the Adviser at the following annual rates:
| Average Daily Net Assets | ||||||||||||
| Retirement Strategy | First $2.5 billion | Next $2.5 billion | In excess of $5 billion | |||||||||
Retirement Strategies: 2025, 2030, 2035, 2040, 2045, 2050, 2055 | 0.65 | % | 0.55 | % | 0.50 | % | ||||||
Retirement Strategies: 2015, 2020 | 0.60 | % | 0.50 | % | 0.45 | % | ||||||
Retirement Strategies: 2000, 2005, 2010 | 0.55 | % | 0.45 | % | 0.40 | % | ||||||
U.S. Large Cap Portfolio and the Wealth Strategies
Large Cap Portfolio and the Wealth Strategies are charged by the Adviser an advisory fee based on a percentage of each fund’s average daily net assets:
| Fund | Advisory Fee Based on % of Average Daily Net Assets | |||||
| U.S. Large Cap Portfolio | First $2.5 billion | 0.65 | % | |||
| Next $2.5 billion | 0.55 | % | ||||
| Excess of $5 billion | 0.50 | % | ||||
| Wealth Appreciation Strategy | First $2.5 billion | 0.65 | % | |||
| Next $2.5 billion | 0.55 | % | ||||
| Excess of $5 billion | 0.50 | % | ||||
| Balanced Wealth Strategy | First $2.5 billion | 0.55 | % | |||
| Next $2.5 billion | 0.45 | % | ||||
| Excess of $5 billion | 0.40 | % | ||||
| 302 | • ALLIANCEBERNSTEIN POOLING PORTFOLIOS |
| Fund | Advisory Fee Based on % of Average Daily Net Assets | |||||
| Conservative Wealth Strategy5 | First $2.5 billion | 0.55 | % | |||
| Next $2.5 billion | 0.45 | % | ||||
| Excess of $5 billion | 0.40 | % | ||||
CollegeBoundfund
The Adviser serves as the program manager of the CollegeBoundfund, a 529 college-savings plan. Services provided by the Adviser as program manager for CollegeBoundfund include managing the assets of each Education Strategy of the plan that may invest in a combination of the Pooling Portfolios (the “Underlying Portfolios”), performing administrative related functions, servicing shareholder accounts, providing customer service to participants, maintaining the program and developing/updating a website where participants can access their personal accounts. Note that shareholder servicing is provided by AllianceBernstein Investor Services (“ABIS”) and distribution by AllianceBernstein Investments, Inc. (“ABI”), both which are affiliates of the Adviser. As program manager, the Adviser is paid a program management fee equal to the total expense ratio (fixed) of each Education Strategy minus the weighted average of the expenses of the Underlying Portfolios in which the Strategy is invested. The weighted average of the expenses of the Underlying Portfolios may fluctuate over time, resulting in an increase or decrease in the program management fee since the total expense ratio is constant. Set forth below is a table showing the total expense ratios of the Education Strategies as of February 28, 2010.
| Portfolios | Total Expense Ratio6 | |||
| Age-Based Education Strategies | ||||
| Age-Based Aggressive 2008-2010 | 0.94 | % | ||
| Age-Based Aggressive 2005-2007 | 0.94 | % | ||
| Age-Based Aggressive 2002-2004 | 0.90 | % | ||
| Age-Based Aggressive 1999-2001 | 0.86 | % | ||
| Age-Based Aggressive 1996-1998 | 0.82 | % | ||
| Age-Based Aggressive 1993-1995 | 0.78 | % | ||
| Age-Based Aggressive 1990-1992 | 0.74 | % | ||
| Age-Based Aggressive 1987-1989 | 0.74 | % | ||
| Age-Based Aggressive 1984-1986 | 0.74 | % | ||
| Age-Based Aggressive Pre-1984 | 0.74 | % | ||
| Age-Based 2008-2010 | 0.92 | % | ||
| Age-Based 2005-2007 | 0.88 | % | ||
| Age-Based 2002-2004 | 0.84 | % | ||
| Age-Based 1999-2001 | 0.80 | % | ||
| Age-Based 1996-1998 | 0.78 | % | ||
| 5 | Effective December 31, 2009, AllianceBernstein Wealth Preservation Strategy changed its name to AllianceBernstein Conservative Wealth Strategy. |
| 6 | The total expense ratios do not include an annual distribution fee of 0.25% payable to AllianceBernstein Investments, Inc., the program distributor and an affiliate of the Adviser, which is applied only to certain accounts that are established with the involvement of a financial adviser (“FA”). This charge is to fund compensation payable in the same amount by ABI to the FA for the FA’s services after such account is open at least one year. |
| ALLIANCEBERNSTEIN POOLING PORTFOLIOS • | 303 |
| Portfolios | Total Expense Ratio | |||
| Age-Based 1993-1995 | 0.76 | % | ||
| Age-Based 1990-1992 | 0.72 | % | ||
| Age-Based 1987-1989 | 0.72 | % | ||
| Age-Based 1984-1986 | 0.72 | % | ||
| Age-Based Pre-1984 | 0.72 | % | ||
| Fixed Based Education Strategies | ||||
| Appreciation | 0.94 | % | ||
| Balanced | 0.80 | % | ||
| Conservative | 0.72 | % | ||
The Portfolios’ net assets as of March 31, 2010 are as follows:
| Portfolio | Net Assets ($MM) | |||
| U.S. Value Portfolio | $ | 2,312.0 | ||
| U.S. Large Cap Growth Portfolio | $ | 2,295.7 | ||
| Global Real Estate Investment Portfolio | $ | 1,061.0 | ||
| International Value Portfolio | $ | 1,192.1 | ||
| International Growth Portfolio | $ | 1,183.1 | ||
| Small-Mid Cap Value Portfolio | $ | 619.8 | ||
| Small-Mid Cap Growth Portfolio | $ | 614.1 | ||
Set forth below are the most recent fiscal year end total expense ratios of the Pooling Portfolios:
| Portfolio | Fiscal Year End | Total Expense Ratio | ||||
| U.S. Value Portfolio | August 31 | 0.02 | % | |||
| U.S. Large Cap Growth Portfolio | August 31 | 0.02 | % | |||
| Global Real Estate Investment Portfolio | August 31 | 0.05 | % | |||
| International Value Portfolio | August 31 | 0.06 | % | |||
| International Growth Portfolio | August 31 | 0.05 | % | |||
| Small-Mid Cap Value Portfolio | August 31 | 0.04 | % | |||
| Small-Mid Cap Growth Portfolio | August 31 | 0.04 | % | |||
| I. | ADVISORY FEES CHARGED TO INSTITUTIONAL AND OTHER CLIENTS |
Although the Portfolios are not charged an advisory fee, their shareholders, which include other investment companies and large institutional clients managed by the Adviser, pay the Adviser an investment advisory fee for managing their assets. In this regard, it is worth considering the advisory fees charged by the Adviser to institutional and other clients. The advisory fees charged to investment companies that the Adviser manages and sponsors are normally higher than those charged to similar sized institutional accounts, including pension plans and sub-advised investment companies. The fee differential reflects, among other things, different services provided to such clients and different liabilities assumed. Services provided by the Adviser to investment companies, including the Portfolios, that are not provided to non-investment company clients and sub-advised investment companies include providing office space and personnel to serve as Fund Officers, who among other responsibilities make the
| 304 | • ALLIANCEBERNSTEIN POOLING PORTFOLIOS |
certifications required under the Sarbanes–Oxley Act of 2002, and coordinating with and monitoring third party service providers such as Fund counsel, auditors, custodians, transfer agents and pricing services. The accounting, administrative, legal and compliance requirements for investment companies are more costly than those for institutional accounts due to the greater complexities and time required for investment companies, although a portion of the administrative expense of certain Institutional Clients that are investment companies are reimbursed by the Adviser to those Institutional Clients. It should be noted that those reimbursement agreements do not exist with respect to the Pooling Portfolios. In addition, managing the cash flow of an investment company may be more difficult than managing that of a stable pool of assets, such as an institutional account with little cash movement in either direction, particularly if the investment company experiences a net redemption and the Adviser is frequently forced to sell securities to raise cash for the redemption. However, managing an investment company with positive cash flow may be easier at times than managing a stable pool of assets. Finally, in recent years, investment advisers have been sued by institutional clients and have suffered reputational damage both by the attendant publicity and outcomes other than complete victories. Accordingly, the legal and reputational risks associated with institutional accounts are greater than previously thought, although still not equal to those related to the mutual fund industry.
Notwithstanding the Adviser’s view that managing an investment company is not comparable to managing other institutional accounts because the services provided are different, the Supreme Court has indicated consideration should be given to the advisory fees charged to institutional accounts that have a substantially similar investment style as the Portfolio.7 In addition to the AllianceBernstein Institutional fee schedule, set forth below are what would have been the effective advisory fees of the Portfolios had the AllianceBernstein Institutional fee schedules been applicable to the Portfolios based on March 31, 2010 net assets although it should be noted that the Portfolios are not charged an advisory fee by the Adviser.8
| 7 | The Supreme Court recently held the Gartenberg decision was correct in its basic formulation of what §36(b) requires: to face liability under §36(b), “an investment adviser must charge a fee that is so disproportionately large that it bears no reasonable relationship to the services rendered and could not have been the product of arms length bargaining.” Jones v. Harris Associates L.P., (No. 08-586), slip op. at 9, 559 U.S. 2010. In the Jones v. Harris decision, the Supreme Court stated the Gartenberg approach fully incorporates the correct understanding of fiduciary duty within the context of section 36(b) and noted with approval that “Gartenberg insists that all relevant circumstances be taken into account” and “uses the range of fees that might result from arms-length bargaining as the benchmark for reviewing challenged fees.” Jones v. Harris at 11. |
| 8 | The Adviser has indicated that with respect to institutional accounts with assets greater than $300 million, it will negotiate a fee schedule. Discounts that are negotiated vary based upon each client relationship. |
| ALLIANCEBERNSTEIN POOLING PORTFOLIOS • | 305 |
| Portfolio | Portfolio Net Assets ($MIL) | AllianceBernstein (AB) Fee Schedule | Effective Fee | |||||
| U.S. Value Portfolio | $2,312.0 | Diversified Value Schedule 65 bp on 1st $25 million 50 bp on next $25 million 40 bp on next $50 million 30 bp on next $100 million 25 bp on the balance Minimum Account Size: $25m | 0.262% | |||||
| U.S. Large Cap Growth Portfolio | $2,295.7 | U.S. Large Cap Growth Schedule 80 bp on 1st $25 million 50 bp on next $25 million 40 bp on next $50 million 30 bp on next $100 million 25 bp on the balance Minimum Account Size: $25m | 0.264% | |||||
| Global Real Estate Investment Portfolio9 | $1,061.0 | U.S. REIT Strategy 70 bp on 1st $25 million 60 bp on next $25 million 50 bp on next $25 million Negotiable on the balance Minimum Account Size: $25m | 0.507% | |||||
| International Value Portfolio | $1,192.1 | International Value Schedule 80 bp on 1st $25 million 60 bp on next $25 million 50 bp on next $50 million 40 bp on the balance Minimum Account Size: $25m | 0.417% | |||||
| International Growth Portfolio | $1,183.1 | International Large Cap 80 bp on 1st $25 million 60 bp on next $25 million 50 bp on next $50 million 40 bp on the balance Minimum Account Size: $25m | 0.417% | |||||
| Small-Mid Cap Value Portfolio | $618.8 | Small & Mid Cap Value Schedule 95 bp on 1st $25 million 75 bp on next $25 million 65 bp on next $50 million 55 bp on the balance Minimum Account Size: $25m | 0.582% | |||||
| 9 | It should be noted that the Portfolio’s investment guidelines are not as restrictive as that of the institutional strategy. The Portfolio may invest in equity securities of non-U.S. real estate investment trusts (“REITS”) and other non-U.S. real estate industry companies in contrast to the institutional strategy, which invests primarily in equities of U.S. REITS and other U.S. real estate industry companies. |
| 306 | • ALLIANCEBERNSTEIN POOLING PORTFOLIOS |
| Portfolio | Portfolio Net Assets ($MIL) | AllianceBernstein (AB) Fee Schedule | Effective Fee | |||||
| Small-Mid Cap Growth Portfolio | $614.1 | SMID Cap Growth Schedule 95 bp on 1st $25 million 75 bp on next $25 million 65 bp on next $50 million 55 bp on the balance Minimum Account Size: $25m | 0.583% | |||||
The Adviser manages the AllianceBernstein Mutual Funds (“ABMF”), which are open-end investment companies, and AllianceBernstein Variable Products Series Fund, Inc. (“AVPS”), which offers variable annuity and variable life contract policyholders the option to utilize certain AVPS portfolios as the investment option underlying their insurance contracts. The advisory schedules of these funds, implemented in January 2004 as a result of the Assurance of Discontinuance between the NYAG and the Adviser, contemplates eight categories with almost all of the AllianceBernstein funds in each category having the same advisory fee schedule. In addition to the fee schedules of the ABMF and AVPS funds, set forth below are what would have been the effective advisory fees of the Pooling Portfolios had the fee schedules of the ABMF/AVPS funds been applicable to the Portfolios based on the Portfolios March 31, 2010 net assets:
| Portfolio | ABMF/AVPS Portfolio | Fee Schedule | ABMF/ AVPS Effective Fee | |||||
| U.S. Value Portfolio | Value Fund AVPS Value Portfolio | 0.55% on first $2.5 billion 0.45% on next $2.5 billion 0.40% on the balance | 0.550 | % | ||||
| U.S. Large Cap Growth Portfolio | Large Cap Growth Fund, Inc. AVPS Large Cap Growth Portfolio | 0.75% on first $2.5 billion 0.65% on next $2.5 billion 0.60% on the balance | 0.750 | % | ||||
| Global Real Estate Investment Portfolio | Global Real Estate Fund, Inc. AVPS Real Estate Investment Portfolio | 0.55% on first $2.5 billion 0.45% on next $2.5 billion 0.40% on the balance | 0.550 | % | ||||
| International Value Portfolio | International Value Fund, Inc. AVPS International Value Portfolio | 0.75% on first $2.5 billion 0.65% on next $2.5 billion 0.60% on the balance | 0.750 | % | ||||
| International Growth Portfolio | International Growth Fund, Inc. AVPS International Growth Portfolio | 0.75% on first $2.5 billion 0.65% on next $2.5 billion 0.60% on the balance | 0.750 | % | ||||
| ALLIANCEBERNSTEIN POOLING PORTFOLIOS • | 307 |
| Portfolio | ABMF/AVPS Portfolio | Fee Schedule | ABMF/ AVPS Effective Fee | |||||
| Small-Mid Cap Value Portfolio | Small/Mid Cap Value Fund AVPS Small/Mid Cap Value Portfolio | 0.75% on first $2.5 billion 0.65% on next $2.5 billion 0.60% on the balance | 0.750 | % | ||||
| Small-Mid Cap Growth Portfolio | Small/Mid Cap Growth Fund | 0.75% on first $500 million 0.65% on next $500 million 0.55% on the balance | 0.731 | % | ||||
The Adviser also manages and sponsors retail mutual funds, which are organized in jurisdictions outside the United States, generally Luxembourg and Japan, and sold to non-United States resident investors. The Adviser charges the fees set forth below for the Luxembourg funds that have a somewhat similar investment style as the Portfolios. It should be noted that Class A shares of the funds are charged an “all-in” fee, which covers investment advisory services and distribution related services, unlike Class I shares, whose fee is for investment advisory services only.
| Portfolio | Luxembourg Fund | Fee | ||
| U.S. Large Cap Growth Portfolio | American Growth Portfolio Class A Class I | 1.50% 0.70% | ||
| Global Real Estate Investment Portfolio | Global Real Estate Securities Portfolio Class A Class I |
1.75% 0.95% |
The Alliance Capital Investment Trust Management mutual funds (“ITM”), which are offered to investors in Japan, have an “all-in” fee to compensate the Adviser for investment advisory as well as fund accounting and administrative related services. The fee schedules of the ITM mutual funds that have a somewhat similar investment style as certain of the Portfolios are as follows:
| Portfolio | ITM Mutual Fund | Fee10 | ||
| International Value Portfolio | Bernstein Kokusai Strategic Value11 | 0.95% on first ¥1 billion 0.85% on next ¥1.5 billion 0.70% on next ¥2.5 billion 0.60% on next ¥5 billion 0.50% on the balance |
| 10 | The Japanese Yen-U.S. dollar currency exchange rate quoted at 4 p.m. on March 1, 2010 by Reuters was ¥93.49 per $1. At that currency exchange rate, every ¥1 billion would be equivalent to approximately $10.3 million. |
| 11 | This ITM fund is privately placed or institutional |
| 308 | • ALLIANCEBERNSTEIN POOLING PORTFOLIOS |
The Adviser provides sub-advisory services to certain other investment companies managed by other fund families. The Adviser charges the fees set forth below for each of these sub-advisory relationships. Also shown are what would have been the effective advisory fees of the Portfolios had the fee schedules of the sub-advisory relationships been applicable to those Portfolios based on March 31, 2010 net assets:12
| Portfolio | Sub-advised Fund | Sub-advised Fund Fee Schedule | Sub-advised Fund Effective Mgmt. Fee (%) | |||||
| U.S. Value Portfolio | Client #1 | AB Sub-Advisory Fee Schedule: 0.25% on the first $500 million 0.20% on the balance | 0.211 | |||||
| Client #213,14 | AB Sub-Advisory Fee Schedule: 0.49% on the first $100 million 0.30% on the next $100 million 0.25% on the balance | 0.263 | ||||||
| Client #313 | AB Sub-Advisory Fee Schedule: 0.23% on 1st $300 million 0.20% on the balance | 0.204 | ||||||
| Client #413 | AB Sub-Advisory Fee Schedule: 0.23% on the first $300 million 0.20% on the balance | 0.204 | ||||||
| Client #5 | AB Sub-Advisory Fee Schedule: 0.15% on 1st $1 billion 0.14% on next $2 billion 0.12% on next $2 billion 0.10% on the balance +/- Performance Fee15 | 0.144 | 16 | |||||
| U.S. Large Cap Growth Portfolio | Client #6 | AB Sub-Advisory Fee Schedule: 0.60% on the first $1 billion 0.55% on the balance | 0.572 | |||||
| 12 | In considering this section, it should be noted that the Supreme Court cautioned against accepting mutual fund fee comparisons without careful scrutiny since “these comparisons are problematic because these fees, like those challenged, may not be the product of negotiations conducted at arms length.” Jones v. Harris at 14. |
| 13 | The fee schedule shown is for multiple sub-advised accounts of the same client and whose assets are aggregated for purposes of calculating the investment advisory fee. |
| 14 | The client is an affiliate of the Adviser. |
| 15 | The performance fee is calculated by multiplying the Base Fee during the period by an adjustment factor that considers the excess or under performance of the fund versus its benchmark. The performance adjustment factor can range from -50% to +50% of the base fee. |
| 16 | The sub-advised fund’s sub-advisory fee shown does not include any performance fee adjustment. |
| ALLIANCEBERNSTEIN POOLING PORTFOLIOS • | 309 |
| Portfolio | Sub-advised Fund | Sub-advised Fund Fee Schedule | Sub-advised Fund Effective Mgmt. Fee (%) | |||||
| U.S. Large Cap Growth Portfolio (continued) | Client #7 | AB Sub-Advisory Fee Schedule: 0.35% on the first $50 million 0.30% on the next $100 million 0.25% on the balance | 0.254 | |||||
| International Value Portfolio | Client #8 | AB Sub-Advisory Fee Schedule: 0.65% on the first $75 million 0.50% on the next $25 million 0.40% on the next $200 million 0.35% on the next $450 million 0.30% on the balance | 0.362 | |||||
| Client #9 13,14 | AB Sub-Advisory Fee Schedule: 0.60% on the first $1 billion 0.55% on the next $500 million 0.50% on the next $500 million 0.45% on the next $500 million 0.40% on the balance | 0.592 | ||||||
| Client #10 14 | AB Sub-Advisory Fee Schedule: 0.60% of average daily net assets | 0.600 | ||||||
| Client #11 | AB Sub-Advisory Fee Schedule: 0.765 % on 1st $10 million 0.675% on next $15 million 0.54% on next $25 million 0.45% on next $50 million 0.36% on the balance | 0.375 | ||||||
| Client #12 | AB Sub-Advisory Fee Schedule: 0.50% of average daily net assets | 0.500 | ||||||
| Client #13 | AB Sub-Advisory Fee Schedule: 0.22% on the first $1 billion 0.18% on the next $1.5 billion 0.16% on the balance +/- Performance Fee17 | 0.214 | 16 | |||||
| Client #14 | AB Sub-Advisory Fee Schedule: 0.60% on the first $50 million 0.40% on the next $50 million 0.30% on the next $300 million 0.25% on the balance | 0.284 | ||||||
| 17 | The performance fee is calculated by multiplying the Base Fee during the period by an adjustment factor that considers the excess or under performance of the fund versus its benchmark. The performance adjustment factor can range from -60% to +60% of the base fee. |
| 310 | • ALLIANCEBERNSTEIN POOLING PORTFOLIOS |
| Portfolio | Sub-advised Fund | Sub-advised Fund Fee Schedule | Sub-advised Fund Effective Mgmt. Fee (%) | |||||
| International Value Portfolio (continued) | Client #1513 | AB Sub-Advisory Fee Schedule: 0.50% on 1st $100 million 0.46% on next $300 million 0.41% on the balance | 0.430 | |||||
| Client #1613 | AB Sub-Advisory Fee Schedule: 0.72% on 1st $25 million 0.54% on next $25 million 0.45% on next $50 million 0.36% on the balance | 0.375 | ||||||
| Client #17 | AB Sub-Advisory Fee Schedule: 0.36% of average daily net assets | 0.360 | ||||||
| Client #18 | AB Sub-Advisory Fee Schedule: 0.35% on 1st $1 billion 0.30% on next $1 billion 0.25% on the balance | 0.342 | ||||||
| Client #19 | AB Sub-Advisory Fee Schedule: 0.35% on 1st $1 billion 0.325 % on the balance | 0.346 | ||||||
| Client #20 | AB Sub-Advisory Fee Schedule: 0.45% on the first $200 million 0.36% on the nest $300 million 0.32% thereafter | 0.352 | ||||||
| Small/Mid Cap Value Portfolio | Client #21 | AB Sub-Advisory Fee Schedule: 0.50% on the first $250 million 0.45 % on the balance | 0.470 | |||||
| Client #22 | AB Sub-Advisory Fee Schedule: 0.95% on the first $25 million 0.75% on the next $25 million 0.65% on the next $50 million 0.55% on the balance | 0.582 | ||||||
| Client #23 | AB Sub-Advisory Fee Schedule: 0.613% on the first $150 million 0.495% on the balance | 0.524 | ||||||
It is fair to note that the services the Adviser provides pursuant to sub-advisory agreements are generally confined to the services related to the investment process; in other words, they are not as comprehensive as the services provided to the Portfolios by the Adviser. In addition, to the extent that certain of these sub-advisory relationships are with affiliates of the Adviser, the fee schedules may not reflect arm’s-length bargaining or negotiations.
| ALLIANCEBERNSTEIN POOLING PORTFOLIOS • | 311 |
While it appears that certain sub-advisory relationships are paying a lower fee than the ABMF/AVPS Funds, it is difficult to evaluate the relevance of such lower fees due to differences in terms of the service provided, risks involved and other competitive factors between the ABMF/AVPS Funds and the sub-advisory relationships. There could be various business reasons why an investment adviser would be willing to provide a sub-advisory relationship investment related services at a different fee level than an investment company it is sponsoring where the investment adviser is providing all the services, not just investment management, generally required by a registered investment company.
| II. | MANAGEMENT FEES CHARGED BY OTHER MUTUAL FUNDS COMPANIES FOR LIKE SERVICES. |
The Trustees previously received the Senior Officer’s Evaluation of the Investment Advisory Agreement (the “Senior Officer Fee Evaluation”) for the Retirement Strategies, U.S. Large Cap Portfolio and the Wealth Strategies. In those Senior Officer Fee Evaluations, the Senior Officer concluded that the investment advisory agreements for those funds were reasonable and within range of what would have been negotiated at arm’s-length.
The Pooling Portfolios are not charged an advisory fee. However, as previously mentioned, the Institutional Clients that invest in the Pooling Portfolios do pay an advisory fee pursuant to their advisory agreements with the Adviser. The Adviser believes that the fee paid by the Institutional Clients includes a portion, referred by the Adviser as the “Implied Advisory Fee,” that may be reasonably viewed as compensation for services that the Adviser provides to the Pooling Portfolios. The Adviser further believes that the rate of the Implied Advisory Fee is the same for each Institutional Client invested in a series of the Pooling Portfolios.
Because of the Pooling Portfolios’ limited availability for investment, open only to certain institutional clients of the Adviser, the Pooling Portfolios have zero transfer agent (with the exception of certain transfer agent out of pocket expenses) and distribution fees, in addition to zero advisory fees. Such expense structure is rare in the industry. The UBS Relationship Funds, an open-end investment company managed by UBS Global Asset Management (Americas) Inc., was the only other fund family that was determined by the Adviser, the Senior Officer and Lipper, Inc. (“Lipper”) to have an expense structure comparable to the Pooling Portfolios.
Since there are not many funds of other fund families that have a similar expense structure as the Portfolios, Lipper, an analytical service not affiliated with the Adviser, compared the total expense ratios of the Portfolios to that of funds of a
| 312 | • ALLIANCEBERNSTEIN POOLING PORTFOLIOS |
similar investment classification/objective with institutional class shares;18 however, Lipper excluded management, transfer agent and distribution fees from the total expense ratios of the Portfolios’ peers.19 Lipper’s analysis included the Portfolios’ rankings20 relative to their respective Lipper Expense Group (“EG”) and Lipper Expense Universe (“EU”).21
Lipper describes an EG as a representative sample of comparable funds. Lipper’s standard methodology for screening funds to be included in an EG entails the consideration of several fund criteria, including fund type, investment classification/objective, load type and similar 12b-1/non-12b-1 service fees, asset (size) comparability, and expense components and attributes. An EG will typically consist of seven to twenty funds. An EU is a much broader group, consisting of all institutional classes of funds of the same investment classification/objective as the subject Portfolio.22
With respect to International Value Portfolio and International Growth Portfolio, each of those Portfolios’ original EGs had an insufficient number of comparable peers. Consequently, at the request of the Senior Officer and the Adviser, Lipper expanded each of those Portfolios’ EGs to include peers that have a similar but not the same Lipper investment classification/objective. However, because Lipper had expanded the EGs of those Portfolios, under Lipper’s standard guidelines, each of the Portfolios’ EUs was also expanded to include the universe of those peers that had a similar but not the same Lipper investment classification/objective.23
It should be noted that Lipper uses expense ratio data from financial statements of the most current fiscal year in their database. This has several implications: the total expense ratio of each fund that Lipper uses in their report is based on each
| 18 | In considering this section, the Trustees are cautioned to remember the Jones Court discussion of fund fee comparisons, “Courts should not rely too heavily on comparisons with fees charged to mutual funds by other advisers. These comparisons are problematic because those fees, like those challenged, may not be the product of negotiations conducted at arms length.” Jones v. Harris at 13. |
| 19 | Because the Portfolios are offered only to other investment companies and certain institutional clients managed by the Adviser, the Portfolios are not assessed a fee for transfer agent and distribution-related services although it should be noted that the transfer agent of the Portfolios is reimbursed for out of pocket expenses. |
| 20 | A ranking of “1” would mean that the Portfolio had the lowest total expense ratio in the Lipper peer group. |
| 21 | Note that there are limitations on expense category data because different funds categorize expenses differently. |
| 22 | Except for asset (size) comparability, Lipper uses the same criteria for selecting a Lipper EG when selecting a Lipper EU. Unlike the Lipper EG, the Lipper EU allows for the same adviser to be represented by more than just one fund. In addition, multiple institutional class shares for the Portfolios’ peers are included. |
| 23 | It should be noted that the expansion such Portfolios’ EUs was not requested by the Senior Officer or the Adviser. They requested that only the EGs be expanded. |
| ALLIANCEBERNSTEIN POOLING PORTFOLIOS • | 313 |
fund’s average net assets during its fiscal year. Since funds have different fiscal year ends, the total expense ratios of the funds may cover different twelve month periods, depending on the funds’ fiscal year ends. This is the process that Lipper always follows but given the volatile market conditions during 2008 and 2009, notably the last three months of 2008 through the first three months of 2009, when equity markets declined substantially, and conversely through the remainder of 2009, when equity markets rallied the effects on the funds’ total expense ratio caused by the differences in fiscal year ends may be more pronounced in 2008 and 2009 compared to other years under more normal market conditions.24
| Portfolio | Expense Ratio (%) | Lipper Exp. Group Median (%)25 | Lipper Group Rank | Lipper Exp. Median (%) | Lipper Rank | |||||||||||
| U.S. Value Portfolio | 0.019 | 0.054 | 1/12 | 0.114 | 1/37 | |||||||||||
| U.S. Large Cap Growth Portfolio | 0.019 | 0.040 | 2/18 | 0.076 | 3/131 | |||||||||||
| Global Real Estate Investment Portfolio | 0.049 | 0.117 | 1/8 | 0.151 | 1/17 | |||||||||||
| International Value Portfolio26 | 0.057 | 0.092 | 1/13 | 0.133 | 14/146 | |||||||||||
| International Growth Portfolio27 | 0.050 | 0.101 | 2/12 | 0.134 | 7/53 | |||||||||||
| Small-Mid Cap Value Portfolio | 0.043 | 0.115 | 3/19 | 0.088 | 7/45 | |||||||||||
| Small-Mid Cap Growth Portfolio | 0.050 | 0.073 | 3/17 | 0.096 | 13/74 | |||||||||||
Based on this analysis, the total expense ratios of the Portfolios are lower than their respective EG and EU medians.
| 24 | To cite an example, the average net assets and total expense ratio of a fund with a fiscal year end of March 31, 2008 will not be reflective of the market declines that occurred in the second half of 2008, in contrast to a fund with a fiscal year end of December 31, 2008. Likewise, the same fund’s net assets for fiscal year 2009 will not reflect the post March 2009 market rally. |
| 25 | With respect to the Portfolios’ peers, the total expense ratios of those funds are net of management, transfer agent and distribution fees. |
| 26 | The Portfolio’s EG includes the Portfolio, four other International Multi-Cap Value funds (“IMLV”), five International Large Cap Core funds (“ILCC”), two International Large Cap Value fund (“ILCV”), and one International Large Cap Growth fund (“ILCG”). The Portfolio’s EU includes the Portfolio and all other institutional funds of IMLV, ILCC, ILCV and ILCG, excluding outliers. |
| 27 | The Portfolio’s EG includes the Portfolio, eight other ILCG and three International Multi-Cap Growth funds (“IMLG”). The Portfolio’s EU includes the Portfolio and all other institutional funds of ILCG and IMLG, excluding outliers. |
| 314 | • ALLIANCEBERNSTEIN POOLING PORTFOLIOS |
| III. | COSTS TO THE ADVISER AND ITS AFFILIATES OF SUPPLYING SERVICES PURSUANT TO THE ADVISORY FEE ARRANGEMENT, EXCLUDING ANY INTRA-CORPORATE PROFIT. |
The Adviser utilizes two profitability reporting systems, which operate independently but are aligned with each other, to estimate the Adviser’s profitability in connection with investment advisory services provided to the Portfolios. The Senior Officer has retained a consultant to provide independent advice regarding the alignment of the two profitability systems as well as the methodologies and allocations utilized by both profitability systems. See Section IV for additional discussion.
| IV. | PROFIT MARGINS OF THE ADVISER AND ITS AFFILIATES FOR SUPPLYING SUCH SERVICES. |
The Pooling Portfolios’ profitability information, prepared by the Adviser for the Board of Trustees, was reviewed by the Senior Officer and the consultant. The Adviser used a weighted average of the Adviser’s profitability with respect to the Institutional Clients that are invested in the Pooling Portfolios, in addition to any Portfolio’s specific revenue or expense item, to calculate the Adviser’s profitability. The Adviser’s profitability from providing investment advisory services to each of the Pooling Portfolios decreased during calendar year 2009, relative to 2008.
The Portfolios may effect brokerage transactions in the future through the Adviser’s affiliate, Sanford C. Bernstein & Co. LLC, and/or its U.K. based affiliate, Sanford C. Bernstein Ltd., collectively “SCB”, and pay commissions during the Portfolios’ recent fiscal year. During the Portfolios’ most recently completed fiscal year, none of the Pooling Portfolios effected brokerage transactions with and paid commissions to SCB. In the ordinary course of business, SCB receives and pays liquidity rebates from electronic communications networks (“ECNs”) derived from trading for its clients, including the Portfolios. These credits and charges are not being passed on to any SCB client.
| V. | POSSIBLE ECONOMIES OF SCALE |
The Adviser has indicated that economies of scale are being shared with shareholders through fee structures,28 subsidies and enhancement to services. Based on some of the professional literature that has considered economies of scale in the mutual fund industry, it is thought that to the extent economies of scale exist, they may more often exist across a fund family as opposed to a specific fund. This is because the costs incurred by the Adviser, such as investment research or technology for trading or compliance systems can be spread across a greater asset base as the fund family increases in size. It is also possible that as the level of services required to operate a successful investment company has increased over time, and advisory firms make such investments in their business to provide services, there may be a sharing of economies of scale without a reduction in advisory fees.
| 28 | Fee structures include fee reductions, pricing at scale and breakpoints in advisory fee schedules. |
| ALLIANCEBERNSTEIN POOLING PORTFOLIOS • | 315 |
An independent consultant, retained by the Senior Officer, provided the Board of Trustees an update of the Deli29 study on advisory fees and various fund characteristics.30 The independent consultant first reiterated the results of his previous two dimensional comparison analysis (fund size and family size) with the Board of Trustees.31 The independent consultant then discussed the results of the regression model that was utilized to study the effects of various factors on advisory fees. The regression model output indicated that the bulk of the variation in fees predicted were explained by various factors, but substantially by fund AUM, family AUM, index fund indicator and investment style. The independent consultant also compared the advisory fees of the AllianceBernstein Mutual Funds to similar funds managed by 19 other large asset managers, regardless of the fund size and each Adviser’s proportion of mutual fund assets to non-mutual fund assets.
| VI. | NATURE AND QUALITY OF THE ADVISER’S SERVICES INCLUDING THE PERFORMANCE OF THE PORTFOLIOS. |
With assets under management of $501 billion as of March 31, 2010, the Adviser has the investment experience to manage and provide non-investment services to the Portfolios.
| 29 | The Deli study was originally published in 2002 based on 1997 data. |
| 30 | As mentioned previously, the Supreme Court cautioned against accepting mutual fund fee comparisons without careful scrutiny since the fees may not be the product of negotiations conducted at arms length. See Jones v. Harris at 14. |
| 31 | The two dimensional analysis showed patterns of lower advisory fees for funds with larger asset sizes and funds from larger family sizes compared to funds with smaller asset sizes and funds from smaller family sizes, which according to the independent consultant is indicative of a sharing of economies of scale and scope. However, in less liquid and active markets, such is not the case, as the empirical analysis showed potential for diseconomies of scale in those markets. The empirical analysis also showed diminishing economies of scale and scope as funds surpassed a certain high level of assets. |
| 316 | • ALLIANCEBERNSTEIN POOLING PORTFOLIOS |
The information in the table below shows the 1, 3 year and since inception32 gross performance returns and rankings of the Portfolios relative to their Lipper Performance Group (“PG”) and Lipper Performance Universe (“PU”)33 for the periods ended January 31, 2010.34
Portfolio Return (%) | PG Median (%) | PU Median (%) | PG Rank | PU Rank | ||||||||||||||||
| U.S. Value Portfolio | ||||||||||||||||||||
1 year | 34.99 | 35.87 | 38.04 | 7/12 | 39/63 | |||||||||||||||
3 year | -11.8 | -10.31 | -8.43 | 8/11 | 41/46 | |||||||||||||||
Since Inception | -2.28 | -1.25 | -0.25 | 7/10 | 27/32 | |||||||||||||||
| U.S. Large Cap Growth Portfolio | ||||||||||||||||||||
1 year | 33.08 | 34.10 | 36.00 | 12/18 | 118/170 | |||||||||||||||
3 year | -5.05 | -4.35 | -3.98 | 13/18 | 90/129 | |||||||||||||||
Since Inception | 0.65 | 1.82 | 1.08 | 12/15 | 65/103 | |||||||||||||||
| Global Real Estate Investment Portfolio | ||||||||||||||||||||
1 year | 48.56 | 47.47 | 48.60 | 4/8 | 14/24 | |||||||||||||||
3 year | -13.27 | -13.25 | -14.72 | 5/8 | 6/18 | |||||||||||||||
Since Inception | 1.95 | 2.26 | 0.45 | 3/3 | 3/7 | |||||||||||||||
| International Value Portfolio | ||||||||||||||||||||
1 year | 47.40 | 47.40 | 42.20 | 3/5 | 14/40 | |||||||||||||||
3 year | -12.17 | -7.68 | -8.01 | 5/5 | 23/24 | |||||||||||||||
Since Inception | 2.49 | 2.92 | 4.14 | 4/4 | 13/16 | |||||||||||||||
| International Growth Portfolio | ||||||||||||||||||||
1 year | 33.01 | 39.47 | 40.66 | 8/9 | 35/40 | |||||||||||||||
3 year | -9.22 | -5.82 | -5.32 | 8/9 | 27/29 | |||||||||||||||
Since Inception | 1.15 | 5.41 | 5.00 | 7/7 | 18/18 | |||||||||||||||
| Small-Mid Cap Value Portfolio | ||||||||||||||||||||
1 year | 57.39 | 47.40 | 44.41 | 2/19 | 4/53 | |||||||||||||||
3 year | -2.92 | -5.03 | -5.73 | 4/16 | 7/45 | |||||||||||||||
Since Inception | 3.25 | 3.11 | 2.90 | 5/11 | 13/31 | |||||||||||||||
| Small-Mid Cap Growth Portfolio | ||||||||||||||||||||
1 year | 42.27 | 45.04 | 42.59 | 10/17 | 52/97 | |||||||||||||||
3 year | -3.36 | -3.93 | -4.30 | 6/16 | 32/79 | |||||||||||||||
Since Inception | 4.45 | 2.89 | 2.53 | 6/13 | 14/62 | |||||||||||||||
| 32 | It should be noted that the period that Lipper uses to calculate inception date performance is from the nearest month end after inception date. Note that the since inception gross performance returns calculated by Lipper for U.S. Value Portfolio and U.S. Large Cap Growth Portfolio are less than the net performance returns provided by the Adviser. Normally, gross performance returns are higher than net performance returns. |
| 33 | A Portfolio’s PG and PU may not be identical to its respective EG and EU. The criteria for including and excluding a fund in a PG or PU is somewhat different from that of an EG or EU. |
| 34 | The performance returns of the Portfolios’ peers are also adjusted for expenses (gross up). |
| ALLIANCEBERNSTEIN POOLING PORTFOLIOS • | 317 |
Set forth below are the 1, 3 year and since inception net performance returns of the Portfolios (in bold) versus their benchmarks.35
| Periods Ending January 31, 2010 Annualized Performance | ||||||||||||
1 Year (%) | 3 Year (%) | Since Inception36 (%) | ||||||||||
| U.S. Value Portfolio | 34.97 | -11.82 | -2.21 | |||||||||
| Russell 1000 Value Index | 31.44 | -10.20 | -1.02 | |||||||||
| Inception Date: May 20, 2005 | ||||||||||||
| U.S. Large Cap Growth Portfolio | 33.06 | -5.06 | 0.91 | |||||||||
| Russell 1000 Growth Index | 37.85 | -4.15 | 1.08 | |||||||||
| Inception Date: May 20, 2005 | ||||||||||||
| Global Real Estate Investment Portfolio | 48.48 | -13.33 | 1.89 | |||||||||
| FTSE EPRA/NAREIT Developed RE Index | 49.57 | -15.43 | 0.86 | |||||||||
| Inception Date: May 20, 2005 | ||||||||||||
| International Value Portfolio | 47.32 | -12.23 | 2.35 | |||||||||
| MSCI EAFE Net Index | 39.68 | -7.65 | 3.35 | |||||||||
| Inception Date: May 20, 2005 | ||||||||||||
| International Growth Portfolio | 32.94 | -9.27 | 0.94 | |||||||||
| MSCI EAFE Net Index37 | 39.68 | -7.65 | 3.35 | |||||||||
| MSCI EAFE Growth Net Index | 35.51 | -6.39 | 3.52 | |||||||||
| Inception Date: May 20, 2005 | ||||||||||||
| Small-Mid Cap Value Portfolio | ||||||||||||
| Russell 2500 Value Index | 57.33 | -2.96 | 3.17 | |||||||||
| Inception Date: May 20, 2005 | 40.69 | -8.48 | 0.43 | |||||||||
| Small-Mid Cap Growth Portfolio | ||||||||||||
| Russell 2500 Growth Index | 42.20 | -3.41 | 4.45 | |||||||||
| Inception Date: May 20, 2005 | 44.51 | -5.47 | 1.99 | |||||||||
CONCLUSION:
Based on the factors discussed above the Senior Officer’s conclusion is that the proposed advisory fees for the Portfolios are reasonable and within the range of what would have been negotiated at arm’s-length in light of all the surrounding circumstances. This conclusion in respect of the Portfolios is based on an evaluation of all of these factors and no single factor was dispositive.
Dated: June 2, 2010
| 35 | The Adviser provided Portfolio and benchmark performance return information for periods through January 31, 2010. |
| 36 | Benchmark inception performance is as of the closest month end after fund inception |
| 37 | The Portfolio’s primary benchmark since November 2008. |
| 318 | • ALLIANCEBERNSTEIN POOLING PORTFOLIOS |
THE FOLLOWING IS NOT PART OF THE SHAREHOLDER REPORT OR THE FINANCIAL STATEMENTS
SUMMARY OF SENIOR OFFICER’S EVALUATION OF INVESTMENT ADVISORY AGREEMENT1
The following is a summary of the evaluation of the Investment Advisory Agreement between AllianceBernstein L.P. (the “Adviser”) and AllianceBernstein Pooling Portfolios (the “Trust” or the “Pooling Portfolios”) with respect to the following Portfolios:2
Short Duration Bond Portfolio
Intermediate Duration Bond Portfolio
Bond Inflation Protected Securities Portfolio3
High-Yield Portfolio
The Trust, which is designed to facilitate a “blended style” investment approach, represents a variety of asset classes and investment styles, and is available for investment only to institutional clients of the Adviser, including both registered investment companies and large managed separate accounts.
The evaluation of the Investment Advisory Agreement was prepared by Philip L. Kirstein, the Senior Officer of the Trust, for the Trustees of the Trust, as required by the September 1, 2004 Assurance of Discontinuance (“AoD”) between the Adviser and the New York State Attorney General (the “NYAG”). The Senior Officer’s evaluation of the Investment Advisory Agreement is not meant to diminish the responsibility or authority of the Board of Trustees of the Trust to perform its duties pursuant to Section 15 of the Investment Company Act of 1940 (the “40 Act”) and applicable state law. The purpose of the summary is to provide shareholders with a synopsis of the independent evaluation of the reasonableness of the advisory fees proposed to be paid by the Portfolios which was provided to the Trustees in connection with their review of the proposed approval of the continuance of the Investment Advisory Agreement. The Senior Officer’s evaluation considered the following factors:
| 1. | Advisory fees charged to institutional and other clients of the Adviser for like services; |
| 2. | Advisory fees charged by other mutual fund companies for like services; |
| 3. | Costs to the Adviser and its affiliates of supplying services pursuant to the advisory agreements, excluding any intra-corporate profit; |
| 1 | It should be noted that the Senior Officer’s fee evaluation was completed on October 21, 2010 and discussed with the Board of Directors on November 2-4, 2010. |
| 2 | Future references to the Portfolios do not include “AllianceBernstein.” |
| 3 | On or about April 2010, the Portfolio’s name was changed from Inflation Protected Securities Portfolio. At the same time, the Portfolio’s non-fundamental investment objective and certain investment policies changed. |
| ALLIANCEBERNSTEIN POOLING PORTFOLIOS • | 319 |
| 4. | Profit margins of the Adviser and its affiliates from supplying such services; |
| 5. | Possible economies of scale as the Portfolios grow larger; and |
| 6. | Nature and quality of the Adviser’s services including the performance of the Portfolios. |
These factors, with the exception of the first factor, are generally referred to as the “Gartenberg factors,” which were articulated by the United States Court of Appeals for the Second Circuit in 1982. The first factor is an additional factor required to be considered by the AoD. The Supreme Court recently held the Gartenberg decision was correct in its basic formulation of what Section 36(b) of the 40 Act requires: to face liability under Section 36(b), “an investment adviser must charge a fee that is so disproportionately large that it bears no reasonable relationship to the services rendered and could not have been the product of arms length bargaining.” Jones v. Harris Associates L.P., (No. 08-586), slip op. at 9, 559 U.S. 2010. In the Jones decision, the Court stated the Gartenberg approach fully incorporates the correct understanding of fiduciary duty within the context of Section 36(b) and noted with approval that “Gartenberg insists that all relevant circumstances be taken into account” and “uses the range of fees that might result from arms-length bargaining as the benchmark for reviewing challenged fees.”4
PORTFOLIO ADVISORY FEES, NET ASSETS, & EXPENSE RATIOS
Under the Investment Advisory Agreement, the Portfolios are not charged an advisory fee.5 The Adviser is compensated by institutional clients of the Adviser (the “Institutional Clients”) that invest in the Pooling Portfolios. These clients include the AllianceBernstein Blended Style Series, Inc.—AllianceBernstein Retirement Strategies (“Retirement Strategies”),6 certain series of The AllianceBernstein Portfolios—AllianceBernstein Wealth Strategies (“Wealth Strategies”),7 and the Rhode Island Higher Education Savings Trust (referred to herein as
| 4 | Jones v. Harris at 11. |
| 5 | It should be noted that in August 2010, the Trustees considered and approved the Adviser’s recommendation that the advisory agreement of the Trust with respect to each Portfolio be amended to include a provision to the Investment Advisory Agreement authorizing reimbursement to the Adviser of the administrative service expenses. A shareholder vote is required for approval because the amendment would result in a modest increase in the compensation paid to the Adviser under the Investment Advisory Agreement |
| 6 | Includes AllianceBernstein 2000 Retirement Strategy, AllianceBernstein 2005 Retirement Strategy, AllianceBernstein 2010 Retirement Strategy, AllianceBernstein 2015 Retirement Strategy, AllianceBernstein 2020 Retirement Strategy, AllianceBernstein 2025 Retirement Strategy, AllianceBernstein 2030 Retirement Strategy, AllianceBernstein 2035 Retirement Strategy, AllianceBernstein 2040 Retirement Strategy, AllianceBernstein 2045 Retirement Strategy, AllianceBernstein 2050 Retirement Strategy and AllianceBernstein 2055 Retirement Strategy . Future references to the Retirement Strategies do not include “AllianceBernstein.” |
| 7 | Includes AllianceBernstein Balanced Wealth Strategy and AllianceBernstein Wealth Preservation Strategy. Does not pertain to AllianceBernstein Wealth Appreciation Strategy since the fund is not invested in any of the fixed income Pooling Portfolios. Future references to the Wealth Strategies do not include “AllianceBernstein.” |
| 320 | • ALLIANCEBERNSTEIN POOLING PORTFOLIOS |
“CollegeBoundfund”). Collectively, these shareholders (the “Institutional Clients”) own 100 percent of the Pooling Portfolios’ total outstanding shares. Set forth below are the advisory fee schedules of the Institutional Clients that invests in the Pooling Portfolios.
AllianceBernstein Blended Style Series, Inc.—AllianceBernstein Retirement Strategies
Each of the Retirement Strategies pays an advisory fee correlated to the percentage of equity investments held by each Retirement Strategy and discounted by a certain percentage dependent on the asset level of the Retirement Strategy as indicated below:
| % Invested in Equity Investments | Advisory Fee | |||
| Equal to or less than 60% | 0.55 | % | ||
| Greater than 60% and less than 80% | 0.60 | % | ||
| Equal to or greater than 80% | 0.65 | % | ||
| Net Asset Level | Discount | |||
| Assets equal to or less than $2.5 billion | n/a | |||
| Assets greater than $2.5 billion and less than $5 billion | 10 basis points | |||
| Assets greater than $5 billion | 15 basis points | |||
Accordingly, under the terms of the Investment Advisory Agreement, the Strategies will pay the Adviser at the following annual rates:
| Average Daily Net Assets | ||||||||||||
| Retirement Strategy | First $2.5 billion | Next $2.5 billion | In excess of $5 billion | |||||||||
Retirement Strategies:8 | ||||||||||||
2025, 2030, 2035, 2040, 2045, 2050, 2055 | 0.65 | % | 0.55 | % | 0.50 | % | ||||||
Retirement Strategies: | ||||||||||||
2015, 2020 | 0.60 | % | 0.50 | % | 0.45 | % | ||||||
Retirement Strategies: | ||||||||||||
2000, 2005, 2010 | 0.55 | % | 0.45 | % | 0.40 | % | ||||||
| 8 | October 1, 2010, due to a shift to more fixed-income investments and less in equity investments, 2025 Retirement Strategy’s advisory fee decreased from 0.65% to 0.60% on the first $2.5 billion, 0.55% to 0.50% on the next $2.5 billion and 0.50% to 45% thereafter. |
| ALLIANCEBERNSTEIN POOLING PORTFOLIOS • | 321 |
The AllianceBernstein Portfolios—Balanced Wealth Strategy and Conservative Wealth Strategy
The Adviser charges Balanced Wealth Strategy and Conservative Wealth Strategy an advisory fee based on a percentage of each fund’s average daily net assets:
| Fund | Advisory Fee Based on % of Average Daily Net Assets | |||||
| Balanced Wealth Strategy | First $2.5 billion | 0.55 | % | |||
| Next $2.5 billion | 0.45 | % | ||||
| Excess of $5 billion | 0.40 | % | ||||
| Conservative Wealth Strategy | First $2.5 billion | 0.55 | % | |||
| Next $2.5 billion | 0.45 | % | ||||
| Excess of $5 billion | 0.40 | % | ||||
CollegeBoundfund
The Adviser serves as the program manager of the CollegeBoundfund, a 529 college-savings plan. Services provided by the Adviser as program manager for CollegeBoundfund include managing the assets of each Education Strategy of the plan that may invest in a combination of the Pooling Portfolios (the “Underlying Portfolios”), performing administrative related functions, servicing shareholder accounts, providing customer service to participants, maintaining the program and developing/updating a website where participants can access their personal accounts. It should be noted that shareholder servicing is provided by AllianceBernstein Investor Services (“ABIS”) and distribution by AllianceBernstein Investments, Inc. (“ABI”), both which are affiliates of the Adviser. As program manager, the Adviser is paid a program management fee equal to the total expense ratio (fixed) of each Education Strategy minus the weighted average of the expenses of the Underlying Portfolios in which the Strategy is invested. The weighted average of the expenses of the Underlying Portfolios may fluctuate over time, resulting in an increase or decrease in the program management fee since the total expense ratio is constant. Set forth below is a table showing the total expense ratios of the Education Strategies as of May 31, 2010:
| Portfolios | Total Expense Ratio9 | |||
| Age-Based Education Strategies10 | ||||
| Age-Based Aggressive 2008-2010 | 0.94 | % | ||
| Age-Based Aggressive 2005-2007 | 0.94 | % | ||
| Age-Based Aggressive 2002-2004 | 0.90 | % | ||
| Age-Based Aggressive 1999-2001 | 0.86 | % | ||
| 9 | The total expense ratios do not include an annual distribution fee of 0.25% payable to ABI, the program distributor, which is applied only to certain accounts that are established with the involvement of a financial adviser (“FA”). This charge is to fund compensation payable in the same amount by ABI to the FA for the FA’s services after such account is open at least one year. |
| 10 | Effective September 1, 2010, the total expense ratio, which includes the blended underlying expense ratio related to the Pooling Portfolios, for all Age-Based Education Strategies held only by Rhode Island resident accounts will be capped at 0.20%. |
| 322 | • ALLIANCEBERNSTEIN POOLING PORTFOLIOS |
| Portfolios | Total Expense Ratio | |||
| Age-Based Aggressive 1996-1998 | 0.82 | % | ||
| Age-Based Aggressive 1993-1995 | 0.78 | % | ||
| Age-Based Aggressive 1990-1992 | 0.74 | % | ||
| Age-Based Aggressive 1987-1989 | 0.74 | % | ||
| Age-Based Aggressive 1984-1986 | 0.74 | % | ||
| Age-Based Aggressive Pre-1984 | 0.74 | % | ||
| Age-Based 2008-2010 | 0.92 | % | ||
| Age-Based 2005-2007 | 0.88 | % | ||
| Age-Based 2002-2004 | 0.84 | % | ||
| Age-Based 1999-2001 | 0.80 | % | ||
| Age-Based 1996-1998 | 0.78 | % | ||
| Age-Based 1993-1995 | 0.76 | % | ||
| Age-Based 1990-1992 | 0.72 | % | ||
| Age-Based 1987-1989 | 0.72 | % | ||
| Age-Based 1984-1986 | 0.72 | % | ||
| Age-Based Pre-1984 | 0.72 | % | ||
| Fixed Based Education Strategies | ||||
| Appreciation | 0.94 | % | ||
| Balanced | 0.80 | % | ||
| Conservative | 0.72 | % | ||
The Portfolios’ net assets as of September 30, 2010 are set forth below:
| Portfolio | Net Assets ($MM) 9/30/2010 | |||
| Short Duration Bond Portfolio | $ | 1,227.3 | ||
| Intermediate Duration Bond Portfolio | $ | 1,365.3 | ||
| Bond Inflation Protected Securities Portfolio | $ | 678.3 | ||
| High-Yield Portfolio | $ | 503.6 | ||
Set forth below are the most recent semi-annual total expense ratios (as of February 28, 2010) of the Portfolios. It should be noted that the fiscal year end of the Portfolios is August 31.
| Portfolio | Total Expense Ratio (%) | |||
| Short Duration Bond Portfolio | 0.03 | % | ||
| Intermediate Duration Bond Portfolio | 0.02 | % | ||
| Bond Inflation Protected Securities Portfolio | 0.03 | % | ||
| High-Yield Portfolio | 0.05 | % | ||
| I. | ADVISORY FEES CHARGED TO INSTITUTIONAL AND OTHER CLIENTS |
Although the Portfolios are not charged an advisory fee, their shareholders, which include other investment companies and large institutional clients managed by the Adviser, pay the Adviser an investment advisory fee for managing their assets. In this regard, it is worth considering the advisory fees charged by
| ALLIANCEBERNSTEIN POOLING PORTFOLIOS • | 323 |
the Adviser to institutional and other clients. The advisory fees charged to investment companies that the Adviser manages and sponsors are normally higher than those charged to similar sized institutional accounts, including pension plans and sub-advised investment companies. The fee differential reflects, among other things, different services provided to such clients and different liabilities assumed. Services provided by the Adviser to investment companies, including the Portfolios, that are not provided to non-investment company clients and sub-advised investment companies include providing office space and personnel to serve as Fund Officers, who among other responsibilities make the certifications required under the Sarbanes–Oxley Act of 2002, and coordinating with and monitoring third party service providers such as Fund counsel, auditors, custodians, transfer agents and pricing services. The accounting, administrative, legal and compliance requirements for investment companies are more costly than those for institutional client accounts due to the greater complexities and time required for investment companies, the Adviser is reimbursed for providing such service with respect to certain Institutional Clients that are investment companies. It should be noted that those reimbursement agreements do not exist with respect to the Pooling Portfolios. In addition, managing the cash flow of an investment company may be more difficult than managing that of a stable pool of assets, such as an institutional account with little cash movement in either direction, particularly if the investment company experiences a net redemption and the Adviser is frequently forced to sell securities to raise cash for the redemption. However, managing an investment company with positive cash flow may be easier at times than managing a stable pool of assets. Finally, in recent years, investment advisers have been sued by institutional clients and have suffered reputational damage both by the attendant publicity and outcomes other than complete victories. Accordingly, the legal and reputational risks associated with institutional accounts are greater than previously thought, although arguably still not equal to those related to the mutual fund industry.
Notwithstanding the Adviser’s view that managing an investment company is not comparable to managing other institutional accounts because the services provided are different, the Supreme Court has indicated consideration should be given to the advisory fees charged to institutional accounts that have a substantially similar investment style the Portfolios.11 In addition to the AllianceBernstein Institutional fee schedule, set forth below are what would have been the effective advisory fees of the Portfolios had the AllianceBernstein Institutional fee schedule been applicable to the Portfolios based on September 30, 2010 net assets, although it should be noted that the Portfolios are not charged an advisory fee by the Adviser.
| 11 | It should be noted that the Supreme Court stated that “courts may give such comparisons the weight that they merit in light of the similarities and differences between the services that the clients in question require, but the courts must be wary of inapt comparisons.” Among the significant differences the Supreme Court noted that may exist between services provided to mutual funds and institutional accounts are “higher marketing costs.” Jones v. Harris at 13. |
| 324 | • ALLIANCEBERNSTEIN POOLING PORTFOLIOS |
| Portfolio | Portfolio Net Assets ($MIL) | AllianceBernstein (AB) Fee Schedule | Effective AB Inst. Advisory Fee | |||||
| Short Duration Bond Portfolio12 | $1,227.3 | Low Duration 30 bp on the first $20 million 20 bp on the next $80 million 15 bp on the next $150 million 12.5 bp on the next $250 million 10 bp on the balance Minimum Account Size: $25m | 0.121% | |||||
| Intermediate Duration Bond Portfolio13 | $1,365.3 | U.S. Strategic Core Plus 50 bp on the first $30 million 20 bp on the balance Minimum Account Size: $25m | 0.207% | |||||
| Bond Inflation Protected Securities Portfolio | $678.3 | U.S. Inflation-Linked Bonds 25 bp | 0.250% | |||||
| High-Yield Portfolio | $503.6 | High Yield 55 bp on the first $50 million 35 bp on the balance Minimum Account Size: $50m | 0.370% | |||||
The Adviser manages the AllianceBernstein Mutual Funds (“ABMF”), which are open-end investment companies, and AllianceBernstein Variable Products Series Fund, Inc. (“AVPS”), which offers variable annuity and variable life contract policyholders the option to utilize certain AVPS portfolios as the investment option underlying their insurance contracts. The advisory schedules of these funds, implemented in January 2004 as a result of the AoD between the NYAG and the Adviser, contemplates eight categories with almost all of the AllianceBernstein funds in each category having the same advisory fee schedule. In addition to the fee schedules of the ABMF and AVPS funds, set forth below are what
| 12 | Compared to the low duration institutional mandates, the Portfolio has a wider opportunity set and risk budget compared to that of the institutional mandates. |
| 13 | Intermediate Duration Bond Portfolio has a similar investment style as the institutional mandate. However, the Portfolio does not permit currency exposure and investing in below investment grade debt securities. The Portfolio may hold non-U.S. denominated securities, but the currency risk associated with these securities must be hedged. |
| 14 | Only offered to Collective Investment Trusts (“CIT”). |
| ALLIANCEBERNSTEIN POOLING PORTFOLIOS • | 325 |
would have been the effective advisory fees of the Pooling Portfolios had the fee schedules of the ABMF/AVPS funds been applicable to the Portfolios based on the Portfolios September 30, 2010 net assets:
| Portfolio | ABMF/AVPS Category | Fee Schedule | Effective ABMF/ Adv. Fee | |||||
| Short Duration Bond Portfolio | Low Risk Income | 0.45% on first $2.5 billion 0.40% on next $2.5 billion 0.35% on the balance | 0.450 | % | ||||
| Intermediate Duration Bond Portfolio15 | Low Risk Income | 0.45% on first $2.5 billion 0.40% on next $2.5 billion 0.35% on the balance | 0.450 | % | ||||
| Bond Inflation Protected Securities Portfolio | Low Risk Income | 0.45% on first $2.5 billion 0.40% on next $2.5 billion 0.35% on the balance | 0.500 | % | ||||
| High-Yield Portfolio | High Income | 0.50% on first $2.5 billion 0.45% on next $2.5 billion 0.40% on the balance | 0.500 | % | ||||
The Adviser manages Sanford C. Bernstein Fund, Inc. (“SCB Fund”), an open-end management investment company. Several portfolios of SCB Fund have a somewhat similar investment style to certain of the Portfolios and their advisory fee schedules are set forth below. Also presented are what would have been the effective advisory fees of the Portfolios had the SCB Fund fee schedules been applicable to the Portfolios based on September 30, 2010 net assets:
| Portfolio | SCB Fund Portfolio | Fee Schedule | SCB Fund Effective Fee | |||||
| Short Duration Bond Portfolio | Short Duration Plus Portfolio | 45 bp on 1st $750 million 40 bp thereafter | 0.431 | % | ||||
| Intermediate Duration Bond Portfolio15 | Intermediate Duration Portfolio | 50 bp on 1st $1 billion 45 bp on next $2 billion 40 bp on next $2 billion 35 bp on next $2 billion 30 bp thereafter | 0.487 | % | ||||
The AllianceBernstein Investment Trust Management mutual funds (“ITM”), which are offered to investors in Japan, have an “all-in” fee to compensate the
| 15 | The Adviser also manages Sanford C. Bernstein Fund II—Intermediate Duration Institutional Portfolio (“SCB II”), an open-end mutual fund that has a similar investment style as the Portfolio. SCB II is charged by the Adviser an advisory fee rate of 0.50% on the first $1 billion and 0.45% thereafter. SCB II has an expense cap of 0.45% which effectively reduces the advisory fee. |
| 326 | • ALLIANCEBERNSTEIN POOLING PORTFOLIOS |
Adviser for investment advisory as well as fund accounting and administrative related services. The fee schedule of the ITM mutual fund that has a somewhat similar investment style as High Yield Portfolio is set forth below:
| Portfolio | ITM Mutual Fund | ITM Fee | ||
| High-Yield Portfolio | High Yield Open Fund | 1.00% |
The Adviser provides sub-advisory services to certain other investment companies managed by other fund families. The Adviser charges the fee set forth below for the sub-advisory relationship that has a similar investment style as Intermediate Duration Bond Portfolio. Also shown is what would have been the advisory fee of the Portfolio had the sub-advisory fee schedule been applicable to the Portfolio based on September 30, 2010 net assets:
| Portfolio | Fee Schedule | Sub-advised Effective Fee | ||||||
| Intermediate Duration Bond Portfolio | Client #1 | 0.29% on first $100 million 0.20% thereafter | 0.207% | |||||
It is fair to note that the services the Adviser provides pursuant to sub-advisory agreements are generally confined to the services related to the investment process; in other words, they are not as comprehensive as the services provided to the Portfolios by the Adviser. In addition, to the extent that this is the only sub-advisory relationship and it is with an affiliate of the Adviser, the fee schedule may not reflect arm’s-length bargaining or negotiations.
While it appears the sub-advisory relationship is paying a lower fee than the ABMF/AVPS Funds, its is difficult to evaluate the relevance of such lower fees due to differences in terms of the service provided, risks involved and other competitive factors between the ABMF/AVPS Funds and the sub-advisory relationships. There could be various business reasons why an investment adviser would be willing to manage a sub-advisory relationship for a different fee level than an investment company it is sponsoring where the investment adviser is providing all the services, not just investment services generally required by a registered investment company
| II. | MANAGEMENT FEES CHARGED BY OTHER MUTUAL FUNDS COMPANIES FOR LIKE SERVICES. |
The Trustees previously received the Senior Officer’s Evaluation of the Investment Advisory Agreement (the “Senior Officer Fee Evaluation”) for the Retirement Strategies and the Wealth Strategies. In those Senior Officer Fee Evaluations, the Senior Officer concluded that the investment advisory agreements for those funds were reasonable and within range of what would have been negotiated at arm’s-length.
| ALLIANCEBERNSTEIN POOLING PORTFOLIOS • | 327 |
The Pooling Portfolios are not charged an advisory fee. However, as previously mentioned, the Institutional Clients that invest in the Pooling Portfolios do pay an advisory fee pursuant to their advisory agreements with the Adviser. The Adviser believes that the fee paid by the Institutional Clients includes a portion, referred by the Adviser as the “Implied Advisory Fee,” that may be reasonably viewed as compensation for services that the Adviser provides to the Pooling Portfolios. The Adviser further believes that the rate of the Implied Advisory Fee is the same for each Institutional Client invested in a series of the Pooling Portfolios.
Because of the Pooling Portfolios’ limited availability for investment, open only to certain institutional clients of the Adviser, the Pooling Portfolios have zero transfer agent (with the exception of certain transfer agent out of pocket expenses) and distribution fees, in addition to zero advisory fees. Such expense structure is rare in the industry. The UBS Relationship Funds, an open-end investment company managed by UBS Global Asset Management (Americas) Inc., was the only other fund family that was determined by the Adviser, the Senior Officer and Lipper, Inc. (“Lipper”) to have an expense structure comparable to the Pooling Portfolios.
Since there are not many funds of other fund families that have a similar expense structure as the Portfolios, Lipper, an analytical service not affiliated with the Adviser, compared the total expense ratios of the Portfolios to that of funds of a similar investment classification/objective with institutional class shares; however, Lipper excluded management, transfer agent and distribution fees from the total expense ratios of the Portfolios’ peers16,17 Lipper’s analysis included the Portfolios’ rankings18 relative to their respective Lipper Expense Group (“EG”) and Lipper Expense Universe (“EU”).19
Lipper describes an EG as a representative sample of comparable funds. Lipper’s standard methodology for screening funds to be included in an EG entails the consideration of several fund criteria, including fund type, investment classification/objective, load type and similar 12b-1/non-12b-1 service fees, asset (size) comparability, and expense components and attributes. An EG will
| 16 | Because the Portfolios are offered only to other investment companies and certain institutional clients managed by the Adviser, the Portfolios are not assessed a fee for transfer agent and distribution-related services although it should be noted that the transfer agent of the Portfolios is reimbursed for out of pocket expenses. |
| 17 | It should be noted that the Jones Court discussion of fund fee comparisons, “Courts should not rely too heavily on comparisons with fees charged to mutual funds by other advisers. These comparisons are problematic because those fees, like those challenged, may not be the product of negotiations conducted at arms length.” Jones v. Harris at 13. |
| 18 | A ranking of “1” would mean that the Portfolio had the lowest total expense ratio in the Lipper peer group. |
| 19 | Note that there are limitations on expense category data because different funds categorize expenses differently. |
| 328 | • ALLIANCEBERNSTEIN POOLING PORTFOLIOS |
typically consist of seven to twenty funds. An EU is a much broader group, consisting of all institutional classes of funds of the same classification/objective as the subject Portfolio.20 The result of Lipper’s analysis is set forth below:
| Portfolio | Expense Ratio (%)21 | Lipper Exp. Group Median (%)22 | Lipper Group Rank | Lipper Exp. Universe Median (%) | Lipper Universe Rank | |||||||||||
| Short Duration Bond Portfolio | 0.040 | 0.049 | 3/11 | 0.072 | 6/44 | |||||||||||
| Intermediate Duration Bond Portfolio | 0.040 | 0.058 | 4/15 | 0.068 | 10/107 | |||||||||||
| Bond Inflation Protected Securities Portfolio | 0.040 | 0.064 | 3/10 | 0.076 | 6/24 | |||||||||||
| High-Yield Portfolio | 0.060 | 0.066 | 6/15 | 0.088 | 32/97 | |||||||||||
| III. | COSTS TO THE ADVISER AND ITS AFFILIATES OF SUPPLYING SERVICES PURSUANT TO THE ADVISORY FEE ARRANGEMENT, EXCLUDING ANY INTRA-CORPORATE PROFIT. |
The Adviser utilizes two profitability reporting systems, which operate independently but are aligned with each other, to estimate the Adviser’s profitability in connection with investment advisory services provided to the Portfolios. The Senior Officer has retained a consultant to provide independent advice regarding the alignment of the two profitability systems as well as the methodologies and allocations utilized by both profitability systems. See Section IV for additional discussion.
| IV. | PROFIT MARGINS OF THE ADVISER AND ITS AFFILIATES FOR SUPPLYING SUCH SERVICES. |
The Pooling Portfolios’ profitability information, prepared by the Adviser for the Board of Trustees, was reviewed by the Senior Officer and the consultant. The Adviser used a weighted average of the Adviser’s profitability with respect to the Institutional Clients that are invested in the Pooling Portfolios, in addition to any Portfolio’s specific revenue or expense item, to calculate the Adviser’s profitability. With the exception of Intermediate Duration Bond Portfolio, the Adviser’s profitability from providing investment advisory services to the Pooling Portfolios increased during the calendar year 2009, relative to 2008.
| 20 | Except for asset (size) comparability, Lipper uses the same criteria for selecting an EG peer when selecting an EU peers. Unlike the EG, the EU allows for the same adviser to be represented by more than just one fund. |
| 21 | Most recently completed total expense ratio. |
| 22 | With respect to the Portfolios’ peers, the total expense ratios of those funds are net of management, transfer agent and distribution fees. |
| ALLIANCEBERNSTEIN POOLING PORTFOLIOS • | 329 |
| V. | POSSIBLE ECONOMIES OF SCALE |
The Adviser has indicated that economies of scale are being shared with shareholders through fee structures,23 subsidies and enhancement to services. Based on some of the professional literature that has considered economies of scale in the mutual fund industry, it is thought that to the extent economies of scale exist, they may more often exist across a fund family as opposed to a specific fund. This is because the costs incurred by the Adviser, such as investment research or technology for trading or compliance systems, can be spread across a greater asset base as the fund family increases in size. It is also possible that as the level of services required to operate a successful investment company has increased over time, and advisory firms have made such investments in their business to provide services, there may be a sharing of economies of scale without a reduction in advisory fees.
An independent consultant, retained by the Senior Officer, provided the Board of Trustees an update of the Deli24 study on advisory fees and various fund characteristics.25 The independent consultant first reiterated the results of his previous two dimensional comparison analysis (fund size and family size) with the Board of Trustees.26 The independent consultant then discussed the results of the regression model that was utilized to study the effects of various factors on advisory fees. The regression model output indicated that the bulk of the variation in fees predicted were explained by various factors, but substantially by fund assets under management (“AUM”), family AUM, index fund indicator and investment style. The independent consultant also compared the advisory fees of the AllianceBernstein Mutual Funds to similar funds managed by 19 other large asset managers, regardless of fund size and the large asset manager’s proportion of mutual fund assets to non-mutual fund assets.
| VI. | NATURE AND QUALITY OF THE ADVISER’S SERVICES INCLUDING THE PERFORMANCE OF THE PORTFOLIOS. |
With assets under management of $484 billion as of September 30, 2010, the Adviser has the investment experience to manage the portfolio assets of the Portfolios and provide non-investment services to the Portfolios
| 23 | Fee structures include fee reductions, pricing at scale and breakpoints in advisory fee schedules. |
| 24 | The Deli study was originally published in 2002 based on 1997 data. |
| 25 | As mentioned previously, the Supreme Court cautioned against accepting mutual fund fee comparisons without careful scrutiny since the fees may not be the product of negotiations conducted at arms length. See Jones V. Harris at 14. |
| 26 | The two dimensional analysis showed patterns of lower advisory fees for funds with larger asset sizes and funds from larger family sizes compared to funds with smaller asset sizes and funds from smaller family sizes, which according to the independent consultant is indicative of a sharing of economies of scale and scope. However, in less liquid and active markets, such is not the case, as the empirical analysis showed potential for diseconomies of scale in those markets. The empirical analysis also showed diminishing economies of scale and scope as funds surpassed a certain high level of assets. |
| 330 | • ALLIANCEBERNSTEIN POOLING PORTFOLIOS |
The information in the table below shows the 1, 3 and 5 year gross performance returns and rankings of the Portfolios relative to their Lipper Performance Group (“PG”) and Lipper Performance Universe (“PU”)27 for the periods ended July 31, 2010.28
| Pooling Portfolio | Portfolio Return (%) | PG Median (%) | PU Median (%) | PG Rank | PU Rank | |||||||||||||||
| Short Duration Bond Portfolio | ||||||||||||||||||||
1 year | 6.73 | 6.73 | 6.16 | 5/10 | 16/43 | |||||||||||||||
3 year | 2.84 | 3.38 | 4.20 | 5/7 | 28/35 | |||||||||||||||
5 year | 3.39 | 3.72 | 4.06 | 5/7 | 26/32 | |||||||||||||||
| Intermediate Duration Bond Portfolio | ||||||||||||||||||||
1 year | 12.70 | 10.93 | 11.70 | 6/15 | 41/106 | |||||||||||||||
3 year | 8.31 | 7.17 | 7.46 | 4/14 | 21/89 | |||||||||||||||
5 year | 6.41 | 5.69 | 5.87 | 3/13 | 15/73 | |||||||||||||||
| Bond Inflation Protected Securities Portfolio | ||||||||||||||||||||
1 year | 9.06 | 9.23 | 9.27 | 7/10 | 15/22 | |||||||||||||||
3 year | 6.79 | 6.60 | 6.45 | 5/10 | 7/20 | |||||||||||||||
5 year | 5.54 | 5.38 | 5.11 | 4/10 | 5/18 | |||||||||||||||
| High-Yield Portfolio | ||||||||||||||||||||
1 year | 31.08 | 20.93 | 21.66 | 1/15 | 4/95 | |||||||||||||||
3 year | 10.42 | 7.89 | 6.70 | 1/14 | 1/74 | |||||||||||||||
5 year | 7.96 | 7.20 | 6.43 | 2/11 | 6/58 | |||||||||||||||
| 27 | The Portfolios’ EG/EU are not identical to the Portfolios’ PG/PU as the criteria for including or excluding a fund from an EG/EU is different from a PG/PU. |
| 28 | The gross performance returns of the Portfolios were provided by Lipper. The performance returns of the Portfolios’ peers are also adjusted for expenses (gross up). |
| ALLIANCEBERNSTEIN POOLING PORTFOLIOS • | 331 |
Set forth below are the 1, 3 and 5 year and since inception net performance returns of the Portfolios (in bold) versus their benchmarks.29 Portfolio and benchmark volatility and reward-to-variability ratio (“Sharpe Ratio”) information are also shown.30
| Periods Ending July 31, 2010 Annualized Performance (%) | ||||||||||||||||||||||||||||
| 1 Year (%) | 3 Year (%) | 5 Year (%) | Since Inception (%) | Annualized | Risk Period (Year) | |||||||||||||||||||||||
| Volatility (%) | Sharpe Ratio (%) | |||||||||||||||||||||||||||
| Short Duration Bond Portfolio | 6.85 | 2.87 | 3.41 | 3.34 | 1.98 | 0.32 | 5 | |||||||||||||||||||||
| BofA Merrill Lynch 1-3 Yr. Treasury Index | 2.83 | 4.55 | 4.35 | 4.20 | 1.62 | 1.05 | 5 | |||||||||||||||||||||
| Inception Date: May 20, 2005 | ||||||||||||||||||||||||||||
| Intermediate Duration Bond Portfolio | 12.96 | 8.40 | 6.46 | 6.36 | 4.63 | 0.77 | 5 | |||||||||||||||||||||
| Barclays Capital U.S. Aggregate Bond Index | 8.91 | 7.63 | 5.96 | 5.78 | 3.63 | 0.85 | 5 | |||||||||||||||||||||
| Inception Date: May 20, 2005 | ||||||||||||||||||||||||||||
| Bond Inflation Protected Securities Portfolio | 9.06 | 6.79 | 5.54 | 5.16 | 6.06 | 0.48 | 5 | |||||||||||||||||||||
Barclays Capital 1-10 Yr. TIPS Index | 8.51 | 6.60 | 5.47 | 5.09 | 6.06 | 0.46 | 5 | |||||||||||||||||||||
| Inception Date: May 20, 2005 | ||||||||||||||||||||||||||||
| High-Yield Portfolio | 31.67 | 10.59 | 8.05 | 8.59 | 13.53 | 0.44 | 5 | |||||||||||||||||||||
| Barclays Capital U.S. High Yield 2% Issuer Cap Index | 23.69 | 9.40 | 7.63 | 8.41 | 13.25 | 0.41 | 5 | |||||||||||||||||||||
| Inception Date: May 20, 2005 | ||||||||||||||||||||||||||||
| 29 | The Adviser provided Portfolio and benchmark performance return information for periods through July 31, 2010. |
| 30 | Volatility and Sharpe Ratio information for the Portfolios’ benchmarks was obtained through Lipper LANA, a database maintained by Lipper. Portfolio volatility and Sharpe Ratio information was estimated by the Mutual Fund Senior Officer Group using standard Lipper methodology. Volatility is a statistical measure of the tendency of a market price or yield to vary over time. A Sharpe Ratio is a risk adjusted measure of return that divides a fund’s return in excess of the riskless return by the fund’s standard deviation. A fund with a greater volatility would be seen as more risky than a fund with equivalent performance but lower volatility; for that reason, a greater return would be demanded for the more risky fund. A fund with a higher Sharpe Ratio would be viewed as better performing than a fund with a lower Sharpe Ratio. |
| 332 | • ALLIANCEBERNSTEIN POOLING PORTFOLIOS |
CONCLUSION:
Based on the factors discussed above the Senior Officer’s conclusion is that the proposed advisory fees for the Portfolios are reasonable and within the range of what would have been negotiated at arm’s-length in light of all the surrounding circumstances. This conclusion in respect of the Portfolios is based on an evaluation of all of these factors and no single factor was dispositive.
Dated: November 22, 2010
| ALLIANCEBERNSTEIN POOLING PORTFOLIOS • | 333 |
THE FOLLOWING IS NOT PART OF THE SHAREHOLDER REPORT OR THE FINANCIAL STATEMENTS
SUMMARY OF SENIOR OFFICER’S EVALUATION OF INVESTMENT ADVISORY AGREEMENT1
The following is a summary of the evaluation of the Investment Advisory Agreement between AllianceBernstein L.P. (the “Adviser”) and the AllianceBernstein Pooling Portfolios (referred to herein as the “Trust” or the “Pooling Portfolios”) in respect of AllianceBernstein Volatility Management Portfolio (“Volatility Portfolio” or the “Portfolio”).2 The evaluation of the Investment Advisory Agreement was prepared by Philip L. Kirstein, the Senior Officer of the Fund, for the Trustees of the Fund, as required by the August 2004 agreement between the Adviser and the New York State Attorney General (the “NYAG”).
The Portfolio seeks to reduce the volatility of its Institutional Clients’ overall portfolios and the negative impact caused by such volatility without sacrificing long-term returns by reducing each Institutional Client’s overall equity exposure when the Adviser determines that the risks in the equity markets have risen to a level that is not compensated by the potential returns offered.3 The Portfolio will not pursue an asset class-pure, relative performance driven investment strategy. Instead, the Portfolio will invest opportunistically in a wide range of instruments, including both securities and derivatives, across a wide spectrum of asset classes, chosen for their potential to moderate the perceived increased equity market risk in the blended style investor’s overall portfolio. Therefore, at times when the Adviser determines equity market risk to be normal and/or the risk appropriate to the return potential presented, the Portfolio will be predominantly invested in equities. When the Adviser determines that the risks in the equity markets have risen to a level that is not compensated by the potential returns offered, the Portfolio will respond defensively by seeking exposure to bonds or other fixed-income investments, real estate-investments, commodity-linked securities or other instruments.
The Senior Officer’s evaluation of the Investment Advisory Agreement is not meant to diminish the responsibility or authority of the Board of Trustees of the Fund to perform its duties pursuant to Section 15 of the Investment Company Act of 1940 (the “40 Act”) and applicable state law. The purpose of the summary is to provide shareholders with a synopsis of the independent evaluation of the reasonableness of the advisory fees proposed to be paid by the Portfolio which was provided to the Trustees in connection with their review of the proposed approval of the continuance of the Investment Advisory Agreement.
| 1 | It should be noted that the information in the fee summary was completed on January 21, 2010. |
| 2 | Future references to the Portfolio do not include “AllianceBernstein. |
| 3 | Initially, only the AllianceBernstein Retirement Strategies (the “Retirement Strategies”) will invest in the Portfolio. |
| 334 | • ALLIANCEBERNSTEIN POOLING PORTFOLIOS |
The Senior Officer’s evaluation considered the following factors:
| 1. | Management fees charged to institutional and other clients of the Adviser for like services; |
| 2. | Management fees charged by other mutual fund companies for like services; |
| 3. | Costs to the Adviser and its affiliates of supplying services pursuant to the advisory agreement, excluding any intra-corporate profit; |
| 4. | Profit margins of the Adviser and its affiliates from supplying such services; |
| 5. | Possible economies of scale as the Portfolio grows larger; and |
| 6. | Nature and quality of the Adviser’s services including the performance of the Portfolio. |
INVESTMENT ADVISORY FEES, NET ASSETS, EXPENSE CAP & RATIO
Under the proposed Investment Advisory Agreement, the Portfolio is not charged an advisory fee. However, the Investment Advisory Agreement includes a provision for reimbursement to the Adviser of costs of providing administrative and accounting services. This provision is not included in the terms of the advisory agreement for other series (Pooling Portfolios) of the Trust. The Adviser is compensated by the Portfolio’s Institutional Clients. Set forth below is a discussion of the investment advisory fees charged by the Adviser to the Retirement Strategies, which will invest initially in the Portfolio:
Retirement Strategies
Each of the Retirement Strategies pays an advisory fee correlated to the percentage of equity investments held by each Retirement Strategy and discounted by a certain percentage dependent on the asset level of the Retirement Strategy as indicated below:
| % Invested in Equity Investments | Advisory Fee | |||
| Equal to or less than 60% | 0.55 | % | ||
| Greater than 60% and less than 80% | 0.60 | % | ||
| Equal to or greater than 80% | 0.65 | % | ||
| Net Asset Level | Discount | |||
| Assets equal to or less than $2.5 billion | n/a | |||
| Assets greater than $2.5 billion and less than $5 billion | 10 basis points | |||
| Assets greater than $5 billion | 15 basis points | |||
| ALLIANCEBERNSTEIN POOLING PORTFOLIOS • | 335 |
Accordingly, under the terms of the Investment Advisory Agreement, the Strategies will pay the Adviser at the following annual rates:
| Average Daily Net Assets | ||||||||||||
| Retirement Strategy | First $2.5 billion | Next $2.5 billion | In excess of $5 billion | |||||||||
Retirement Strategies: 2025, 2030, 2035, 2040, 2045, 2050, 2055 | 0.65 | % | 0.55 | % | 0.50 | % | ||||||
Retirement Strategies: 2010, 2015, 2020 | 0.60 | % | 0.50 | % | 0.45 | % | ||||||
Retirement Strategies: 2000, 2005 | 0.55 | % | 0.45 | % | 0.40 | % | ||||||
The Portfolio will be responsible for its direct operating expenses. The Adviser is proposing an expense cap of 0.15% for the Portfolio for an initial period ending December 31, 2011. The Portfolio’s total expense ratio is projected to be 0.09% based on an initial estimate of the Portfolio’s net assets at $300 million. The expense limitation agreement will terminate three years after the Portfolio commences operations. During the period between the expiration of the initial period and the termination of the agreement, under the expense limitation agreement, the Adviser may be able to recoup all or a portion of the Portfolio’s offering expenses, which will be paid initially by the Adviser, to the extent that the reimbursement does not cause the Portfolio’s expense ratio to exceed the expense cap.
| I. | MANAGEMENT FEES CHARGED TO INSTITUTIONAL AND OTHER CLIENTS |
Although the Portfolio is not charged an advisory fee, its shareholders, which include other investment companies and large institutional clients managed by the Adviser, pay the Adviser an investment advisory fee for managing their assets. In this regard, it is worth considering the advisory fees charged by the Adviser to institutional and other clients. The advisory fees charged to investment companies that the Adviser manages and sponsors are normally higher than those charged to similar sized institutional accounts, including pension plans and sub-advised investment companies. The fee differential reflects, among other things, different services provided to such clients and different liabilities assumed. Services provided by the Adviser to investment companies, including the Portfolio, that is not provided to non-investment company clients and sub-advised investment companies include providing office space and personnel to serve as Fund Officers, who among other responsibilities make the certifications required under the Sarbanes–Oxley Act of 2002, and coordinating with and monitoring third party service providers such as Fund counsel, auditors, custodians, transfer agents and pricing services. The accounting, administrative, legal and compliance requirements for investment companies are more costly
| 336 | • ALLIANCEBERNSTEIN POOLING PORTFOLIOS |
than those for institutional client accounts due to the greater complexities and time required for investment companies, although a portion of the Portfolio’s administrative expenses are reimbursed by the Adviser to the Portfolio. In addition, managing the cash flow of an investment company may be more difficult than managing that of a stable pool of assets, such as an institutional account with little cash movement in either direction, particularly if the investment company experiences a net redemption and the Adviser is frequently forced to sell securities to raise cash for the redemption. However, managing an investment company with positive cash flow may be easier at times than managing a stable pool of assets. Finally, in recent years, investment advisers have been sued by institutional clients and have suffered reputational damage both by the attendant publicity and outcomes other than complete victories. Accordingly, the legal and reputational risks associated with institutional accounts are greater than previously thought, although arguably still not equal to those related to the mutual fund industry.
Notwithstanding the Adviser’s view that managing an investment company is not comparable to managing other institutional accounts because the services provided are different and the legal and reputational risks are greater, it is worth considering information regarding the advisory fees charged to institutional accounts that have investment styles similar to those of the Portfolio.4 With respect to the Portfolio, the Adviser has represented that there is no category in the Form ADV for institutional products that have a substantially similar investment style as the Portfolio. However, the Adviser has represented that it does provide volatility reducing overlay services to certain existing institutional clients although the Adviser does not receive any additional fees for providing such services.
Although the Adviser represented that there in no category in the Form ADV for institutional products that have a substantially similar investment style as the Portfolio, the Portfolio will have the ability to invest a wide array of asset classes for which the Adviser does have institutional counterparts. It should be noted that in addition to investing in multiple asset classes as opposed to a single asset class, the Portfolio may employ with greater frequency the use of derivatives than its institutional counterparts. Set forth below are the institutional fee schedules of the various asset classes of which the Portfolio consist. Also shown below are what would have been the effective advisory fee of the Portfolio had the advisory
| 4 | The Adviser has indicated that with respect to institutional accounts with assets greater than $300 million ($75 million for U.S. REIT), it will negotiate a fee schedule but it should be noted that there were no such institutional accounts with similar investment styles as the Portfolio, which opened in the last 3 years ending September 30, 2009. Discounts that are negotiated vary based upon each client relationship. |
| ALLIANCEBERNSTEIN POOLING PORTFOLIOS • | 337 |
fee schedules of the institutional accounts been applicable to the Portfolio based on the initial estimate of the Portfolio’s net assets:
| AB Institutional Account Category | Initial ($MIL) | Fee Schedule | Effective AB Inst. Adv. Fee | |||||
| U.S. Style Blend | $300.0 | 80 bp on 1st $25 million 60 bp on next $25 million 50 bp on next $50 million 40 bp on next $100 million 30 bp on the balance Minimum Account Size: $50m | 0.433% | |||||
| International Style Blend | $300.0 | 80 bp on 1st $25 million 65 bp on next $25 million 55 bp on next $50 million 45 bp on next $100 million 40 bp on the balance Minimum Account Size: $50m | 0.496% | |||||
| Emerging Markets Style Blend | $300.0 | 100 bp on 1st $50 million 80 bp on the balance Minimum Account Size: $50m | 0.833% | |||||
| U.S. Strategic Core Plus | $300.0 | 50 bp on 1st $30 million 20 bp on the balance Minimum Account Size: $25m | 0.230% | |||||
| Global Plus Fixed Income | $300.0 | 50 bp on 1st $30 million 25 bp on the balance Minimum Account Size: $25m | 0.275% | |||||
| U.S. REITS | $300.0 | 70 bp on 1st $25 million 60 bp on next $25 million 50 bp on next $25 million Negotiable on the balance Minimum Account Size: $25m | 0.525% | |||||
| Currency Overlay | $300.0 | 25 bp on 1st $100 million 20 bp on the balance Minimum Account Size: $50m | 0.217% | |||||
| U.S. Inflation-Linked Bonds (TIPs) (for Collective Investment Trusts “CIT”) | $300.0 | 25 bp | 0.250% | |||||
| 338 | • ALLIANCEBERNSTEIN POOLING PORTFOLIOS |
The Adviser recently entered into an investment advisory contract with the Sanford C. Bernstein Fund, Inc, Overlay Portfolios (“Overlay Portfolios”). The Overlay Portfolios have a similar investment objective and, to a lesser degree, investment style as the Portfolio.5 The advisory fee schedule of the Overlay Portfolios is set forth in the table below:
| Overlay Portfolio | Advisory Fee6 | |
Overlay A Portfolio Tax-Aware Overlay A Portfolio | 0.90% of Average Daily Net Assets | |
Overlay B Portfolio Tax-Aware Overlay B Portfolio Tax-Aware Overlay C Portfolio Tax-Aware Overlay N Portfolio | 0.65% of Average Daily Net Assets |
The Adviser has represented that there are no offshore funds or sub-advisory relationships that the Adviser manages, which have a substantially similar investment style as any of the Portfolios.
| II. | MANAGEMENT FEES CHARGED BY OTHER MUTUAL FUND COMPANIES FOR LIKE SERVICES. |
The Trustees previously received the Senior Officer’s Evaluation of the Investment Advisory Agreement (the “Senior Officer Fee Evaluation”) for the Retirement Strategies. In those Senior Officer Fee Evaluations, the Senior Officer concluded that the investment advisory agreements for those funds were reasonable and within range of what would have been negotiated at arm’s-length.
The Pooling Portfolio will not be charged an advisory fee. However, as previously mentioned, the Institutional Clients that will invest in the Pooling Portfolio will pay an advisory fee pursuant to their advisory agreements with the Adviser. The Adviser believes that the fee will be paid by the Institutional Clients includes a portion, referred by the Adviser as the “Implied Advisory Fee,” that may be reasonably viewed as compensation for services that the Adviser provides to the Pooling Portfolio. The Adviser further believes that the rate of the Implied Advisory Fee is the same for each Institutional Client invested in a series of the Pooling Portfolio.
| 5 | The Overlay Portfolios are designed to be used only in conjunction with globally diversified portfolios of the Adviser’s Private Clients. When applied in a systematic way over time, the overlay strategies are designed to reduce portfolio volatility, reduce the probability of large losses and maintain returns over time. Overlay A Portfolio and Tax-Aware Overlay A Portfolio are intended for use in Private Client accounts that have a higher equity weighting (e.g. 80% equity and 20% fixed-income). The other Overlay Portfolios are intended for use in Private Client accounts that have a higher fixed income weighting (e.g. 70% fixed-income and 30% equity). Combinations of the Overlay Portfolios can be used to tailor the overlay service to suit a variety of Private Client account asset allocations. |
| 6 | The advisory fees of each Overlay Portfolio are based on the percentage of each Portfolio’s average daily net assets, not an aggregate of the assets in the Portfolios shown. |
| ALLIANCEBERNSTEIN POOLING PORTFOLIOS • | 339 |
Because of the Pooling Portfolio’s limited availability for investment, open only to certain institutional clients of the Adviser, the Pooling Portfolio has zero transfer agent (with the exception of certain transfer agent out of pocket expenses) and distribution fees, in addition to zero advisory fees. Such expense structure is rare in the industry.
Since there are not many funds of other fund families that have a similar expense structure as the Portfolio, Lipper, Inc. (“Lipper”), an analytical service not affiliated with the Adviser, compared the total expense ratios of the Portfolio to that of funds of a similar investment classification/objective with institutional class shares; however, Lipper excluded management, transfer agent and distribution fees from the total expense ratios of the Portfolio’s peers.7 Lipper’s analysis included the Portfolio’s rankings8 relative to its respective Lipper Expense Group (“EG”) and Lipper Expense Universe (“EU”).9
Lipper describes an EG as a representative sample of comparable funds. Lipper’s standard methodology for screening funds to be included in an EG entails the consideration of several fund criteria, including fund type, investment classification/objective, load type and similar 12b-1/non-12b-1 service fees, asset (size) comparability, and expense components and attributes. An EG will typically consist of seven to twenty funds. An EU is a much broader group, consisting of all institutional classes of funds of the same classification/objective as the subject Portfolio.10
| Portfolio | Expense Ratio (%)11 | Lipper Exp. Group | Lipper Group Rank | Lipper Exp. Universe Median (%) | Lipper Rank | |||||||||||
| Volatility Portfolio13 | 0.090 | 0.119 | 3/9 | 0.111 | 10/22 | |||||||||||
| 7 | Because the Portfolios are offered only to other investment companies and certain institutional clients managed by the Adviser, the Portfolios are not assessed a fee for transfer agent and distribution-related services although it should be noted that the transfer agent of the Portfolios is reimbursed for out of pocket expenses. |
| 8 | A ranking of “1” would mean that the Portfolio had the lowest total expense ratio in the Lipper peer group. |
| 9 | Note that there are limitations on expense category data because different funds categorize expenses differently. |
| 10 | Except for asset (size) comparability, Lipper uses the same criteria for selecting an EG peer when selecting an EU peers. Unlike the EG, the EU allows for the same adviser to be represented by more than just one fund. |
| 11 | The Portfolio’s total expense ratio is estimated based on an initial estimate of the Portfolio’s net assets of $300 million. |
| 12 | With respect to the Portfolio’s peers, the total expense ratios of those funds are net of management, transfer agent and distribution fees. |
| 13 | The Portfolio’s total expense ratio of 0.09% does not include offering expenses that the Adviser may recoup within the first three years after the Portfolio commences operations. See page 4 for additional information. |
| 340 | • ALLIANCEBERNSTEIN POOLING PORTFOLIOS |
Based on this analysis, the Portfolio’s total expense ratio is lower than the Portfolio’s EG and EU medians.
| III. | COSTS TO THE ADVISER AND ITS AFFILIATES OF SUPPLYING SERVICES PURSUANT TO THE ADVISORY AGREEMENT, EXCLUDING ANY INTRA-CORPORATE PROFIT. |
The Adviser utilizes two profitability reporting systems, which operate independently but are aligned with each other, to estimate the Adviser’s profitability in connection with investment advisory services provided to the Portfolio. The Senior Officer has retained a consultant to provide independent advice regarding the alignment of the two profitability systems as well as the methodologies and allocations utilized by both profitability systems. See Section IV for additional discussion.
| IV. | PROFIT MARGINS OF THE ADVISER AND ITS AFFILIATES FOR SUPPLYING SUCH SERVICES. |
There is no profitability information for the Portfolio since the Portfolio has not yet commenced operations. However, the Adviser’s profitability in respect of other series of the Trust and the Retirement Strategies were provided to the Board of Trustees.
The Portfolio may effect brokerage transactions through the Adviser’s affiliate, Sanford C. Bernstein & Co., LLC (“SCB & Co.”) and/or its U.K. affiliate, Sanford C. Bernstein Limited (“SCB Ltd.”), collectively “SCB,” and pay commissions for such transactions. The Adviser represented that SCB’s profitability from business conducted with the Portfolio will be comparable to the profitability of SCB’s dealings with other similar third party clients. In the ordinary course of business, SCB receives and pays liquidity rebates from electronic communications networks (“ECNs”) derived from trading for its clients, including the Portfolio. These credits and charges are not being passed onto any SCB client. The Adviser also receives certain soft dollar benefits from brokers that execute agency trades for the Portfolio and other clients. These soft dollar benefits reduce the Adviser’s cost of doing business and increase its profitability.
| V. | POSSIBLE ECONOMIES OF SCALE |
The Adviser has indicated that economies of scale are being shared with shareholders through fee structures,14 subsidies and enhancement to services. Based on some of the professional literature that has considered economies of scale in the mutual fund industry, it is thought that to the extent economies of scale exist, they may more often exist across a fund family as opposed to a specific fund. This is because the costs incurred by the Adviser, such as investment research or technology for trading or compliance systems can be spread across a
| 14 | Fee structures include fee reductions, pricing at scale and breakpoints in advisory fee schedules. |
| ALLIANCEBERNSTEIN POOLING PORTFOLIOS • | 341 |
greater asset base as the fund family increases in size. It is also possible that as the level of services required to operate a successful investment company has increased over time, and advisory firms make such investments in their business to provide services, there may be a sharing of economies of scale without a reduction in advisory fees.
An independent consultant, retained by the Senior Officer, provided the Board of Trustees an update of the Deli15 study on advisory fees and various fund characteristics. The independent consultant first reiterated the results of his previous two dimensional comparison analysis (fund size and family size) with the Board of Directors.16 The independent consultant then discussed the results of the regression model that was utilized to study the effects of various factors on advisory fees. The regression model output indicated that the bulk of the variation in fees predicted were explained by various factors, but substantially by fund AUM, family AUM, index fund indicator and investment style. The independent consultant also compared the advisory fees of the AllianceBernstein Mutual Funds to similar funds managed by 19 other large asset managers, regardless of the fund size and each Adviser’s proportion of mutual fund assets to non-mutual fund assets.
| VI. | NATURE AND QUALITY OF THE ADVISER’S SERVICES, INCLUDING THE PERFORMANCE OF THE PORTFOLIO |
With assets under management of approximately $496 billion as of December 31, 2009, the Adviser has the investment experience to manage and provide non-investment services (described in Section I) to the Portfolio.
There is no performance history since the Portfolio has not yet commenced operation. Because the volatility reducing overlay service is new, the Adviser does not have related portfolio performance information for accounts using such service. However, the Adviser represented that it has provided asset allocation services to clients such as managing overlays and dynamic multi-asset portfolios.
| 15 | The Deli study, which was based on 1997 SEC reported filings, was published in 2002 by Daniel N. Deli. The results of the study with respect to fund size and family size were consistent with economies of scale being shared with shareholders, suggesting a competitive environment. |
| 16 | The two dimensional analysis showed patterns of lower advisory fees for funds with larger asset sizes and funds from larger family sizes compared to funds with smaller asset sizes and funds from smaller family sizes, which according to the independent consultant is indicative of a sharing of economies of scale and scope. However, in less liquid and active markets, such is not the case, as the empirical analysis showed potential for diseconomies of scale in those markets. The empirical analysis also showed diminishing economies of scale and scope as funds surpassed a certain high level of assets. |
| 342 | • ALLIANCEBERNSTEIN POOLING PORTFOLIOS |
CONCLUSION:
Based on the factors discussed above the Senior Officer’s conclusion is that the proposed advisory fee for the Portfolio is reasonable and within the range of what would have been negotiated at arm’s-length in light of all the surrounding circumstances. In light of the Portfolio’s ability to invest in fixed-income investments, the Senior Officer suggested that the Board of Trustees consider discussing with the Adviser the Adviser’s view of the Portfolio as a pure equity vehicle and its impact on the advisory fees charged to the Retirement Strategies. This conclusion in respect of the Portfolio is based on an evaluation of all of these factors and no single factor was dispositive.
Dated: February 25, 2010
| ALLIANCEBERNSTEIN POOLING PORTFOLIOS • | 343 |
THIS PAGE IS NOT PART OF THE SHAREHOLDER REPORT OR THE FINANCIAL STATEMENTS
ALLIANCEBERNSTEIN FAMILY OF FUNDS
Wealth Strategies Funds
Balanced Wealth Strategy
Conservative Wealth Strategy
Wealth Appreciation Strategy
Tax-Managed Balanced Wealth Strategy
Tax-Managed Conservative Wealth Strategy
Tax-Managed Wealth Appreciation Strategy
Blended Style Funds
International Portfolio
Tax-Managed International Portfolio
U.S. Large Cap Portfolio
Growth Funds
Domestic
Growth Fund
Large Cap Growth Fund
Small Cap Growth Portfolio
Small/Mid Cap Growth Fund
U.S. Strategic Research Portfolio
Global & International
Global Growth Fund
Global Thematic Growth Fund
Greater China ’97 Fund
International Discovery Equity Portfolio
International Growth Fund
Value Funds
Domestic
Core Opportunities Fund
Equity Income Fund*
Growth & Income Fund
Small/Mid Cap Value Fund
Value Fund
Global & International
Global Real Estate Investment Fund
Global Value Fund
International Value Fund
Taxable Bond Funds
Bond Inflation Strategy
Global Bond Fund
High Income Fund
Intermediate Bond Portfolio
Short Duration Portfolio
Unconstrained Bond Fund*
Municipal Bond Funds
Arizona California High Income Massachusetts Michigan Minnesota Municipal Bond Inflation Strategy | National New Jersey New York Ohio Pennsylvania Virginia |
Intermediate Municipal Bond Funds
Intermediate California
Intermediate Diversified
Intermediate New York
Closed-End Funds
Alliance California Municipal Income Fund
Alliance New York Municipal Income Fund
AllianceBernstein Global High Income Fund
AllianceBernstein Income Fund
AllianceBernstein National Municipal Income Fund
The Ibero-America Fund
Alternatives
Market Neutral Strategy-Global
Market Neutral Strategy-U.S.
Real-Asset Strategy*
Balanced
Balanced Shares
Retirement Strategies Funds
2000 Retirement Strategy | 2020 Retirement Strategy | 2040 Retirement Strategy | ||
2005 Retirement Strategy | 2025 Retirement Strategy | 2045 Retirement Strategy | ||
2010 Retirement Strategy | 2030 Retirement Strategy | 2050 Retirement Strategy | ||
2015 Retirement Strategy | 2035 Retirement Strategy | 2055 Retirement Strategy |
We also offer Exchange Reserves,** which serves as the money market fund exchange vehicle for the AllianceBernstein mutual funds.
You should consider the investment objectives, risks, charges and expenses of any AllianceBernstein fund/portfolio carefully before investing. For free copies of our prospectuses, which contain this and other information, visit us online at www.alliancebernstein.com or contact your financial advisor. Please read the prospectus carefully before investing.
| * | Prior to August 31, 2010, Equity Income Fund was named Utility Income Fund. Prior to September 27, 2010, Real-Asset Strategy was named Multi-Asset Inflation Strategy. Prior to February 3, 2011, Unconstrained Bond Fund was named Diversified Yield Fund. |
| ** | An investment in the Fund is not a deposit in a bank and is not insured or guaranteed by the Federal Deposit Insurance Corporation or any other government agency. Although the Fund seeks to preserve the value of your investment at $1.00 per share, it is possible to lose money by investing in the Fund. |
| 344 | • ALLIANCEBERNSTEIN POOLING PORTFOLIOS |
AllianceBernstein Family of Funds
ALLIANCEBERNSTEIN POOLING PORTFOLIOS
1345 Avenue of the Americas
New York, NY 10105
800.221.5672
| POOL-0152-0211 |  | |
| ITEM 2. | CODE OF ETHICS. |
Not applicable when filing a semi-annual report to shareholders.
| ITEM 3. | AUDIT COMMITTEE FINANCIAL EXPERT. |
Not applicable when filing a semi-annual report to shareholders.
| ITEM 4. | PRINCIPAL ACCOUNTANT FEES AND SERVICES. |
Not applicable when filing a semi-annual report to shareholders.
| ITEM 5. | AUDIT COMMITTEE OF LISTED REGISTRANTS. |
Not applicable to the registrant.
| ITEM 6. | SCHEDULE OF INVESTMENTS. |
Please see Schedule of Investments contained in the Report to Shareholders included under Item 1 of this Form N-CSR.
| ITEM 7. | DISCLOSURE OF PROXY VOTING POLICIES AND PROCEDURES FOR CLOSED-END MANAGEMENT INVESTMENT COMPANIES. |
Not applicable to the registrant.
| ITEM 8. | PORTFOLIO MANAGERS OF CLOSED-END MANAGEMENT INVESTMENT COMPANIES. |
Not applicable to the registrant.
| ITEM 9. | PURCHASES OF EQUITY SECURITIES BY CLOSED-END MANAGEMENT INVESTMENT COMPANY AND AFFILIATED PURCHASERS. |
Not applicable to the registrant.
| ITEM 10. | SUBMISSION OF MATTERS TO A VOTE OF SECURITY HOLDERS. |
There have been no material changes to the procedures by which shareholders may recommend nominees to the Fund’s Board of Directors since the Fund last provided disclosure in response to this item.
3
| ITEM 11. | CONTROLS AND PROCEDURES. |
(a) The registrant’s principal executive officer and principal financial officer have concluded that the registrant’s disclosure controls and procedures (as defined in Rule 30a-2(c) under the Investment Company Act of 1940, as amended) are effective at the reasonable assurance level based on their evaluation of these controls and procedures as of a date within 90 days of the filing date of this document.
(b) There were no changes in the registrant’s internal controls over financial reporting that occurred during the second fiscal quarter of the period that has materially affected, or is reasonably likely to materially affect, the registrant’s internal control over financial reporting.
| ITEM 12. | EXHIBITS. |
The following exhibits are attached to this Form N-CSR:
EXHIBIT NO. | DESCRIPTION OF EXHIBIT | |||
12 (b) (1) | Certification of Principal Executive Officer Pursuant to Section 302 of the Sarbanes-Oxley Act of 2002 | |||
12 (b) (2) | Certification of Principal Financial Officer Pursuant to Section 302 of the Sarbanes-Oxley Act of 2002 | |||
12 (c) | Certification of Principal Executive Officer and Principal Financial Officer Pursuant to Section 906 of the Sarbanes-Oxley Act of 2002 | |||
4
SIGNATURES
Pursuant to the requirements of the Securities Exchange Act of 1934 and the Investment Company Act of 1940, the registrant has duly caused this report to be signed on its behalf by the undersigned, thereunto duly authorized.
(Registrant): The AllianceBernstein Pooling Portfolios
| By: | /s/ Robert M. Keith | |
Robert M. Keith President | ||
Date: April 25, 2011
Pursuant to the requirements of the Securities Exchange Act of 1934 and the Investment Company Act of 1940, this report has been signed below by the following persons on behalf of the registrant and in the capacities and on the dates indicated.
| By: | /s/ Robert M. Keith | |
Robert M. Keith President | ||
Date: April 25, 2011
| By: | /s/ Joseph J. Mantineo | |
Joseph J. Mantineo Treasurer and Chief Financial Officer | ||
Date: April 25, 2011
5