UNITED STATES
SECURITIES AND EXCHANGE COMMISSION
WASHINGTON, D.C. 20549
FORM N-CSR
CERTIFIED SHAREHOLDER REPORT OF REGISTERED
MANAGEMENT INVESTMENT COMPANIES
Investment Company Act file number: 811-21673
THE ALLIANCEBERNSTEIN POOLING PORTFOLIOS
(Exact name of registrant as specified in charter)
1345 Avenue of the Americas, New York, New York 10105
(Address of principal executive offices) (Zip code)
Joseph J. Mantineo
AllianceBernstein L.P.
1345 Avenue of the Americas
New York, New York 10105
(Name and address of agent for service)
Registrant’s telephone number, including area code: (800) 221-5672
Date of fiscal year end: August 31, 2010
Date of reporting period: February 28, 2010
| ITEM 1. | REPORTS TO STOCKHOLDERS. |
SEMI-ANNUAL REPORT
AllianceBernstein Pooling Portfolios
U.S. Value
U.S. Large Cap Growth
Global Real Estate Investment
International Value
International Growth
Small-Mid Cap Value
Small-Mid Cap Growth
Short Duration Bond
Intermediate Duration Bond
Inflation Protected Securities
High-Yield

February 28, 2010
Semi-Annual Report
Investment Products Offered
| • | Are Not FDIC Insured |
| • | May Lose Value |
| • | Are Not Bank Guaranteed |
The investment return and principal value of an investment in the Fund will fluctuate as the prices of the individual securities in which it invests fluctuate, so that your shares, when redeemed, may be worth more or less than their original cost. You should consider the investment objectives, risks, charges and expenses of the Fund carefully before investing. For a free copy of the Fund’s prospectus, which contains this and other information, visit our web site at www.alliancebernstein.com or call your financial advisor or AllianceBernstein® at (800) 227-4618. Please read the prospectus carefully before you invest.
You may obtain performance information current to the most recent month-end by visiting www.alliancebernstein.com.
This shareholder report must be preceded or accompanied by the Fund’s prospectus for individuals who are not current shareholders of the Fund.
You may obtain a description of the Fund’s proxy voting policies and procedures, and information regarding how the Fund voted proxies relating to portfolio securities during the most recent 12-month period ended June 30, without charge. Simply visit AllianceBernstein’s web site at www.alliancebernstein.com, or go to the Securities and Exchange Commission’s (the “Commission”) web site at www.sec.gov, or call AllianceBernstein at (800) 227-4618.
The Fund files its complete schedule of portfolio holdings with the Commission for the first and third quarters of each fiscal year on Form N-Q. The Fund’s Forms N-Q are available on the Commission’s web site at www.sec.gov. The Fund’s Forms N-Q may also be reviewed and copied at the Commission’s Public Reference Room in Washington, DC; information on the operation of the Public Reference Room may be obtained by calling (800) SEC-0330. AllianceBernstein publishes full portfolio holdings for the Fund monthly at www.alliancebernstein.com.
AllianceBernstein Investments, Inc. (ABI) is the distributor of the AllianceBernstein family of mutual funds. ABI is a member of FINRA and is an affiliate of AllianceBernstein L.P., the manager of the funds.
AllianceBernstein® and the AB Logo are registered trademarks and service marks used by permission of the owner, AllianceBernstein L.P.
April 23, 2010
Semi-Annual Report
This report provides management’s discussion of fund performance for the AllianceBernstein Pooling Portfolios (collectively, the “Portfolios”; individually, the “Portfolio”) for the semi-annual reporting period ended February 28, 2010.
The tables on pages 20-22 show each Portfolio’s performance for the six- and 12-month periods ended February 28, 2010, compared to their respective benchmarks. Additional performance can be found on pages 23-24. Each Portfolio’s benchmark is as follows: US Value Portfolio—Russell 1000 Value Index; US Large Cap Growth Portfolio—Russell 1000 Growth Index; Global Real Estate Investment Portfolio—Financial Times Stock Exchange (FTSE) European Public Real Estate Association (EPRA) National Association of Real Estate Investment Trusts (NAREIT) Developed Real Estate (RE) Index; International Value Portfolio—Morgan Stanley Capital International (MSCI) Europe, Australasia and Far East (EAFE) Index; International Growth Portfolio—MSCI EAFE Index and MSCI EAFE Growth Index; Small-Mid Cap Value Portfolio—Russell 2500 Value Index; Small-Mid Cap Growth Portfolio—Russell 2500 Growth Index; Short Duration Bond Portfolio—Bank of America Merrill Lynch (BofAML) 1-3 Year Treasury Index; Intermediate Duration Bond Portfolio—Barclays Capital US Aggregate Bond Index; Inflation Protected Securities Portfolio—Barclays Capital 1-10 Year Inflation Protected Securities (TIPS) Index; High-Yield Portfolio—Barclays Capital US High Yield 2% Issuer Cap Index.
Effective April 16, 2010, Inflation-Protected Securities Portfolio will be renamed the Bond Inflation Protection Portfolio and its investment objectives and certain investment policies will change. Please see the Portfolio’s Investment Objective and Policies section of this letter on pages 12 and 13 for greater detail.
US Value Portfolio
Investment Objective and Policies
The Portfolio seeks long-term growth of capital. The Portfolio invests primarily in a diversified portfolio of equity securities of US companies with relatively larger market capitalizations as compared to the overall US equity market. The Portfolio’s investment policies emphasize investment in companies that AllianceBernstein’s (the “Adviser’s”) Bernstein unit (“Bernstein”) determines to be undervalued. In selecting securities for the Portfolio, Bernstein uses its fundamental research to identify companies whose long-term earnings power and dividend-paying capability are not reflected in the current market price of their securities. Under normal circumstances, the Portfolio invests at least 80% of its net assets in equity securities issued by US companies.
Investment Results
For both the six- and 12-month periods ended February 28, 2010, the Portfolio outperformed the benchmark, the Russell 1000 Value Index. Strong sector selection boosted the Portfolio’s performance for the six-month period, while broad-based strength in stock selection contributed the lion’s share of the Portfolio’s
| ALLIANCEBERNSTEIN POOLING PORTFOLIOS • | 1 |
outperformance for the 12-month
period.
For the six-month period, underweights in the utilities and financials sectors added to relative performance. Stock selection was strongest in consumer growth, buoyed by the Portfolio’s media holdings. Stock selection in financials hurt relative performance.
For the 12-month period, stock selection was again strongest in consumer growth, where the Portfolio’s media holdings outperformed. The Portfolio’s underweight in financials offset positive stock selection in the sector.
Market Review and Investment Strategy
Following their surge off March 2009 lows, US equities, like equities globally, continued to gain amid gradually growing investor confidence that an economic and corporate-profit recovery was under way. Early signs of increased mergers & acquisitions activity also boosted investor sentiment. As hopes for a recovery rose, the stocks that had fared worst during the crisis outperformed.
In the aftermath of the global recession and credit crunch, companies face stiff challenges as they work to recover from severely depressed profit levels. Analysts remain unusually divided in their forecasts for earnings. These tensions are creating a fertile environment for the Portfolio’s research-driven value strategy. Valuation spreads between the cheapest and most expensive US stocks based
on price/book value are above long-term averages across the market.
US Large Cap Growth Portfolio
Investment Objective and Policies
The Portfolio seeks long-term growth of capital. The Portfolio invests primarily in equity securities of US companies with relatively larger market capitalizations as compared to the overall US equity market. The Portfolio focuses on a relatively small number of large, intensively researched US companies that the Adviser believes have strong management, superior industry positions, excellent balance sheets and superior earnings growth prospects.
Under normal circumstances, the Portfolio invests at least 80% of its net assets in equity securities issued by large-cap US companies. For these purposes, “large-cap US companies” are those that, at the time of investment, have market capitalizations within the range of market capitalizations of companies appearing in the Russell 1000 Growth Index. The Portfolio normally will invest in common stocks of companies with market capitalizations of at least $5 billion at the time of purchase. The Adviser looks for companies whose substantially above average prospective earnings growth is not fully reflected in current market valuations.
Investment Results
For the six-month period ended February 28, 2010, the Portfolio underperformed the benchmark, the Russell 1000 Growth Index. Both relative sector allocation and security
| 2 | • ALLIANCEBERNSTEIN POOLING PORTFOLIOS |
selection were negative for the reporting period. Underperformance was driven by stock selection in the financials, information technology, industrials and consumer discretionary sectors. The financials sector was the most notable detractor for the period as the Portfolio’s large overweight, paired with stock selection, hurt performance. The financials sector got particularly hard-hit in the fourth quarter of 2009 amid fears of potentially restrictive regulation. On the positive side, the health care, materials and consumer staples sectors all added to performance for the period due to stock selection.
For the 12-month period ended February 28, 2010, the Portfolio underperformed the benchmark. Underperformance was driven by stock selection, mainly in the health care, consumer discretionary and industrial sectors. The health care sector was the largest detractor, primarily due to investors moving away from perceived defensive sectors to increase cyclical exposure early in 2009. Concerns over the uncertainty of health care reform also battered the sector, rather than underlying fundamentals of specific companies. Benchmark securities not held hurt relative performance in the consumer discretionary and industrials sectors, while the Portfolio’s underweight in the technology sector also detracted from its relative return. The largest contributions to the Portfolio’s relative return came from stock selection in the energy and materials sectors. From a sector perspective, the Portfolio’s significant overweight in the
financials sector was able to offset stock selection and this sector added modestly to relative performance. Financial holdings were four of the top-ten individual contributors for the period. Other top performers were across sectors.
Market Review and Investment Strategy
2009 was a period of transition in the US stock market. Starting with the same negative tone that had marked 2008, the market abruptly reversed course in March 2009 as investors began seeing the so-called “green shoots,” or positive signs, of economic recovery. By the year’s close, the S&P 500 Stock Index had come through with an uncharacteristically strong gain. Several other transitions took place during the year. In terms of investment style, 2009 began and ended with the first and fourth quarters favoring growth, while value stocks rallied in the middle two periods. This pattern was very much in sync with wholesale shifts in investor attitudes toward risk across styles: first they shunned it altogether, then signs of economic recovery prompted them to embrace stocks previously branded as risky and whose prices had plunged most precipitously. By the fourth quarter, however, a more discriminating attitude toward risk was becoming evident.
During the first several months of 2009, the US Large Cap Growth Team (the “Team”) believed that global economic growth would exceed consensus expectations. Given the Team’s view that domestic and
| ALLIANCEBERNSTEIN POOLING PORTFOLIOS • | 3 |
international fiscal and monetary policy would ease concerns about the financial crisis, the Team shifted the Portfolio toward holdings with a higher degree of cyclical exposure: financials and industrials. The Team eliminated the Portfolio’s large overweight in the health care sector to fund these purchases. This positioning remains largely in place as the Team continues to see an improving economic environment and companies within the financial and industrials sectors with compelling valuations.
Global Real Estate Investment Portfolio
Investment Objective and Policies
The Portfolio seeks total return from a combination of income and long-term growth of capital. The Portfolio invests primarily in equity securities of real estate investment trusts, or REITs, and other real estate industry companies, such as real estate operating companies, or REOCs. Under normal circumstances, the Portfolio invests at least 80% of its net assets in these types of securities. The Portfolio’s investment policies emphasize investment in real estate companies Bernstein believes have strong property fundamentals and management teams. The Portfolio seeks to invest in real estate companies whose underlying portfolios are diversified geographically and by property type. The Portfolio may invest up to 20% of its total assets in mortgage-backed securities, which are securities that directly or indirectly represent participations in, or are collateralized by and payable from, mortgage loans secured by real property. The Portfolio has many of the same risks as direct ownership of real estate, including the risk that the value
of real estate could decline due to a variety of factors affecting the real estate market. In addition, REITs are dependent on the capability of their managers, may have limited diversification and could be significantly affected by changes in tax laws
Investment Results
For the six-month period ended February 28, 2010, the Portfolio outperformed the benchmark, the FTSE EPRA/NAREIT Developed RE Index. As global economies continued their fundamental recovery, the Portfolio’s cyclically exposed positions performed well and contributed to relative performance for the reporting period. Retail mall positions in the US, Canada and Brazil outperformed their peers. Many of the Portfolio’s lodging positions also performed ahead of the benchmark as a rebound in hotel bookings began. The main detractors from performance were some of the Portfolio’s Chinese residential developers and a Middle East Abu Dhabi investment—the latter reflects investor anxiety with regards to neighboring Dubai default and pending debt restructuring.
For the 12-month period ended February 28, 2010, the Portfolio underperformed the benchmark. Entering the second quarter of 2009, the Portfolio had an emphasis on resilient companies with reliable cash flow streams. This strategy underperformed during the April–June 2009 period, as those companies which had been regarded as less likely to survive after capital markets became unavailable late last year led the rally in real estate equities. Both stock and sector selection detracted from performance
| 4 | • ALLIANCEBERNSTEIN POOLING PORTFOLIOS |
during the period. Key detractors from the Portfolio’s performance were European and Canadian companies with moderate leverage and stable businesses. These companies were penalized as investors, expecting a robust recovery, sought companies with high financial and operational leverage. Some of the Portfolio’s positions in Japan also detracted as the local real estate markets continued to be impacted by liquidity availability. Key contributors during the period were the Portfolio’s Hong Kong companies with exposure to the residential market. Tight supply and strong demand for residential apartments added to mortgage competition among Hong Kong lenders to create a supportive environment for the apartments’ sale. Low mortgage costs lowered financing costs for residential buyers, increasing affordability and spurring an upswing in apartment volumes and pricing.
Market Review and Investment Strategy
For the six-month period ended February 28, 2010, the global real estate markets as represented by the FTSE EPRA/NAREIT Developed RE Index increased 7.11% as credit conditions improved and hopes of economic recovery continued to reduce risk premiums for real estate equity. For the 12-month period, the FTSE EPRA/NAREIT Developed RE Index posted a positive absolute return of 84.55%. As indicated earlier, real estate markets performed strongly beginning in April 2009, as concerns about the impact of the credit cycle on consumers, economic growth and real estate valuations begun to subside. For the
six-month period, global real estate returns moderated as the meaningful normalization of risk premiums that took place during the second and third quarters of 2009 was reflected in valuations.
While fundamentals vary by region of the world and by property type, in general, new commercial real estate construction in this cycle was subdued, partly due to high construction costs. As a result, commercial real estate entered the economic downturn with robust occupancy rates, a manageable supply of new space in the pipeline and in-place rents which, in many cases, are below prevailing market rents (thus giving some owners an opportunity to increase cash flows as leases expire and new rents are set). Given the collapse in new construction, exacerbated by lack of financing, fundamental supply is likely to remain in check facilitating a rebound in pricing power when demand begins to recover.
The REIT Senior Investment Management Team (the “Team”) believes the Portfolio is well positioned to benefit from the nascent economic recovery. The Portfolio’s stock selection emphasizes attractively valued companies with ample dividend coverage, reasonable leverage and high-quality tenants. The Portfolio’s global scope allows it to uncover new opportunities as it focuses on stocks unduly penalized by the market turmoil, attractively valued stocks in markets less affected by the credit crisis, and niche segments where demand dynamics are relatively more robust.
| ALLIANCEBERNSTEIN POOLING PORTFOLIOS • | 5 |
International Value Portfolio
Investment Objective and Policies
The Portfolio seeks long-term growth of capital. The Portfolio invests primarily in a diversified portfolio of equity securities of established companies selected from more than 40 industries and from more than 40 developed or emerging market countries. The Portfolio’s investment policies emphasize investment in companies that the Adviser determines to be undervalued. In selecting securities for the Portfolio, the Adviser uses its fundamental research to identify companies whose long-term earnings power is not reflected in the current market price of their securities.
Investment Results
For both the six- and 12-month periods ended February 28, 2010, the Portfolio outperformed the benchmark, the MSCI EAFE Index. The Portfolio’s outperformance was more muted for the six-month period, as strength from its capital equipment and technology holdings was offset by weakness from its energy and utilities holdings, as well as the Portfolio’s underweight of the outperforming consumer staples sector. Currency selection was a strong contributor to the Portfolio during the six-month period, as an overweight of the Australian dollar added meaningfully to its premium.
The Portfolio’s outperformance was more pronounced during the 12-month period, as strong stock selection in capital equipment, technology and financials drove the premium. Sector selection was also positive, buoyed by the Portfolio’s overweight of financials. The Portfo-
lio’s telecommunications holdings were the largest drag on relative performance for the 12-month period.
Market Review and Investment Strategy
Following their surge off March 2009 lows, international equities continued to gain amid gradually growing investor confidence that an economic and corporate-profit recovery was under way. Increased mergers & acquisitions activity also boosted investor sentiment. As hopes for a recovery rose, the stocks that had fared worst during the crisis outperformed. Consumer staples stocks led for the six-month period, while financial stocks lagged. For the 12-month period, the financial and industrial commodities sectors led, while utilities lagged.
The Portfolio’s International Value Senior Investment Management Team (the “Team”) continued to take advantage of attractive valuations across a wide range of sectors, while investing in companies with strong balance sheets and clearer earnings visibility. With the economy and banking system on a firmer footing, the Team increased the Portfolio’s exposure to economically sensitive companies that look undervalued relative to their earnings power under more normal business conditions. The Team’s research has also identified stocks that currently offer a favorable combination of attractive valuations and resilient cash flows
International Growth Portfolio
Investment Objective and Policies
The Portfolio seeks long-term growth of capital. The Portfolio invests
| 6 | • ALLIANCEBERNSTEIN POOLING PORTFOLIOS |
primarily in an international portfolio of equity securities of companies located in both developed and emerging market countries. The Portfolio’s investment process relies upon comprehensive fundamental company research produced by the Adviser’s large research team of analysts covering both developed and emerging markets around the globe. Research-driven stock selection is expected to be the primary driver of returns relative to the Portfolio’s benchmark and other decisions, such as country selection, are generally the result of the stock selection process. The Portfolio invests, under normal circumstances, in the equity securities of companies located in at least three countries (and normally substantially more) other than the United States.
For the six-month period ended February 28, 2010, the Portfolio outperformed both the primary benchmark, the MSCI EAFE Index, and the secondary benchmark, the MSCI EAFE Growth Index. For the 12-month period, the Portfolio underperformed both the MSCI EAFE Index and the MSCI EAFE Growth Index.
For the six-month period, both sector and security selection were strong, as the Portfolio’s materials, financials and consumer discretionary holdings drove outperformance. Stock selection in industrials was the largest drag on relative returns.
For the 12-month period, however, both sector and security selection were
negative, as the Portfolio’s industrials, financials and materials holdings, as well as its underweight of financials, dragged down relative returns. The Portfolio’s underweight of the utilities sector was the strongest contributor to relative performance.
The Portfolio utilized leverage for the reporting period.
Market Review and Investment Strategy
Following their surge off March 2009 lows, international equities continued to gain amid gradually growing investor confidence that an economic and corporate-profit recovery was under way. Increased mergers & acquisitions activity also boosted investor sentiment. As hopes for a recovery rose, the stocks that had fared worst during the crisis outperformed. Consumer staples stocks led for the six-month period, while financial stocks lagged. For the 12-month period, the financial and industrial commodities sectors led, while utilities lagged.
The Portfolio’s International Growth Team (the “Team’s”) “dynamic gap” investment process uses fundamental research to find disparities between the Group’s expectations for a company and the consensus views that are already reflected in the share price. The Group believes that there are an extraordinary number of these dynamic gap opportunities across the investment landscape as industries, companies and consumers recalibrate after the tumult of the last two years.
| ALLIANCEBERNSTEIN POOLING PORTFOLIOS • | 7 |
Small-Mid Cap Value Portfolio
Investment Objective and Policies
The Portfolio seeks long-term growth of capital. The Portfolio invests primarily in a diversified portfolio of equity securities of small- to mid-capitalization US companies. Under normal circumstances, the Portfolio invests at least 80% of its net assets in these types of securities. The Portfolio’s investment policies emphasize investment in companies that Bernstein determines to be undervalued. In selecting securities for the Portfolio, Bernstein uses its fundamental research to identify companies whose long-term earnings power is not reflected in the current market price of their securities. The Portfolio may also invest up to 20% of its total assets in equity securities issued by non-US companies.
Investment Results
For both the six- and 12-month periods ended February 28, 2010, the Portfolio outperformed the benchmark, the Russell 2500 Value Index. Broad-based strength in stock selection contributed the lion’s share of the Portfolio’s outperformance for both time periods. Sector selection was also positive during each period.
For the six-month period, the Portfolio’s financial, technology and consumer staples holdings drove the outperformance. The Portfolio’s utilities holdings lagged. For the 12-month period, stock selection was positive in all but three sectors. Technology was the strongest contributor, while consumer growth was the largest drag on relative performance. The Portfolio’s consumer staples, industrial resources, energy and financial holdings were also strong contributors.
The Portfolio utilized leverage for the reporting period.
Market Review and Investment Strategy
Following their surge off March 2009 lows, US small-cap equities, like equities globally, continued to gain amid gradually growing investor confidence that an economic and corporate-profit recovery was under way. As hopes for a recovery rose, the stocks that had fared worst during the crisis outperformed. Cyclical sectors led by extraordinarily wide margins, while financials and more defensive sectors such as utilities trailed. Stocks with higher balance-sheet leverage also outperformed as fears faded. The dispersion of returns for stocks within and across sectors was unusually wide.
Equities have surged from their panic-driven lows as investors, relieved that their darkest fears didn’t come to pass, began looking past current woes to future profits. But profitability remains deeply depressed and investor uncertainty about the path of the recovery remains high. While the valuation gap between the cheapest quintile of smaller-cap stocks and the smaller-cap universe has narrowed since the rally began, it remains above average. It is also unusually broad-based. As this phase of the recovery unfolds, the Team is using its deep quantitative and fundamental research to identify those companies whose earnings power and cash generation are being underpriced by the market.
Small-Mid Cap Growth Portfolio
Investment Objective and Policies
The Portfolio seeks long-term growth of capital. The Portfolio invests
| 8 | • ALLIANCEBERNSTEIN POOLING PORTFOLIOS |
primarily in a diversified portfolio of equity securities with relatively smaller market capitalizations as compared to the overall US equity market. Under normal circumstances, the Portfolio invests at least 80% of its net assets in small- and mid-cap companies. For these purposes, “small- and mid-cap companies” are those that, at the time of investment, have market capitalizations in the greater of the range of companies constituting the Russell 2500 Growth Index or between $1 and $6 billion. Because the Portfolio’s definition of small- to mid-cap companies is dynamic, the upper limit on market capitalization will change with the markets. Normally, the Portfolio invests in US companies that the Adviser believes have strong management, superior industry positions, excellent balance sheets and superior earnings growth prospects. The Adviser relies heavily on the fundamental analysis and research of its internal research staff to select the Portfolio’s investments. The Portfolio may also invest up to 20% of its total assets in equity securities issued by non-US companies.
Investment Results
For the six-month period ended February 28, 2010, the Portfolio underperformed the benchmark, the Russell 2500 Growth Index. Unfavorable stock selection accounted for the relative underperformance while sector selection was a partial offset. Stock selection was strongest in the consumer and industrial sectors, but was more than offset by negative stock selection within the financial, technology and health care sectors. In terms of sector exposure, the Portfolio’s underweight in the financial sector helped relative returns and its
overweight in the energy sector boosted both absolute and relative returns during the period.
For the 12-month period ended February 28, 2010, the Portfolio underperformed the benchmark. This period was marked by dramatic shifts in investor sentiment and the Portfolio performed well during periods when traditional growth factors added value—an important element of the Small Cap Growth Investment Team’s (the “Team’s”) investment discipline. During much of the period, however, the strongest performance accrued to lower-quality and more speculative shares which are not the focus of the Team’s investment process. Despite very strong absolute returns, the Portfolio’s underexposure to lower quality and more speculative stocks weighed on relative returns during the period.
Stock selection was a positive contributor to relative returns, with the strongest stock selection coming from picks in the industrial, technology, energy and consumer sectors. This was partially offset by weaker selection in the health care and financial sectors. Offsetting the period’s favorable stock selection was a negative contribution from sector allocation primarily related to the Portfolio’s cash holdings which, although modest, detracted from both relative and absolute returns given the market’s very strong absolute gains.
Market Review and Investment Strategy
2009 was transitional for capital markets as investors worked to assess the timing and pace of economic recovery. Market sentiment fluctuated wildly as investors flipped from fleeing risk at any
| ALLIANCEBERNSTEIN POOLING PORTFOLIOS • | 9 |
price to embracing stocks previously considered high-risk. 2009 started with a continuation of the negative tone that was pervasive throughout most of 2008, but then stocks rallied sharply as investors increasingly gained confidence that the worst of the crisis was past and economic recovery was under way.
Bolstered by a more than 80% surge off March 2009 lows, the Russell 2500 Growth Index finished the 12-month period ended February 28, 2010, up a strong 66.26%, nicely ahead of the S&P 500 Stock Index’s 53.62% advance. Consistent with prior early-recovery rallies, smaller cap stocks led performance. Also consistent with prior early-recovery rallies, the smaller, more speculative stocks within the Portfolio’s benchmark were the period’s strongest performers.
For the six- and 12-month periods, the Team’s bottom-up stock selection continued to emphasize investments in companies it believes are positioned to outperform the market’s expectations. Compared to earlier in calendar year 2009, when these opportunities were more evenly balanced between cyclically and more defensively oriented companies, the mix of companies shifted toward companies whose earnings prospects would disproportionately benefit from continued improvement in economic activity. As always, this was not a top-down decision, but rather a function of the Team’s bottom-up stock selection process. Relative to earlier in 2009, the Portfolio’s large overweight in consumer/commercial services was reduced to only modestly overweight
by the end of the reporting period. Underweights in the health care and industrials remain, but have been reduced markedly. At the end of the reporting period, the Portfolio’s underweight in the financial sector had widened.
Short Duration Bond Portfolio
Investment Objective and Policies
The Portfolio seeks a moderate rate of income that is subject to taxes. The Portfolio invests primarily in investment- grade, US Dollar-denominated fixed-income securities. Under normal circumstances, the Portfolio invests at least 80% of its net assets in fixed-income securities. The Portfolio seeks to maintain a relatively short duration of one to three years under normal market conditions. The Portfolio may invest in many types of fixed-income securities including corporate bonds, notes, US Government and agency securities, asset-backed securities (ABS), mortgage-related securities and inflation-protected securities, as well as other securities of US and non-US issuers.
Investment Results
For the six- and 12-month periods ended February 28, 2010, the Portfolio outperformed the benchmark, the Bank of America Merrill Lynch (BofAML) 1-3 Year Treasury Index. The Portfolio was positioned to capitalize on record wide yield spreads of non-government sectors and this benefited performance for both time periods. The following positions were positive: an underweight in Treasuries and overweights in asset- backed securities (ABS), investment-grade corporate bonds and commercial mortgage-backed securities (CMBS).
| 10 | • ALLIANCEBERNSTEIN POOLING PORTFOLIOS |
The Portfolio utilized leverage for the reporting period.
Market Review and Investment Strategy
The global economic recovery broadened in late 2009 and continued into early 2010 as evidence emerged that the US and euro-area economies had returned to positive growth, and many emerging economies in Asia posted near double-digit gains in economic growth. As the global economic rebound gained momentum and the corporate sector continued to strengthen, systemic risk in the markets dramatically receded. Risk assets extended their rally; nongovernment debt continued to outperform government bonds as spreads narrowed further.
The six-month period was marked by the continued strong recovery of investment-grade corporate bonds, which returned 5.20%. Spreads continued to tighten to end the reporting period at 173 basis points over Treasuries. Spreads on CMBS similarly continued to tighten as investor appetite for risk returned in the market. CMBS ended the period at 387 basis points over Treasuries. CMBS returned 12.34% for the six-month period. All data is according to Barclays Capital.
In the view of the US Investment Grade: Liquid Markets/Structured Products Investment Team (the “Team”), opportunities in the credit markets are still attractive. While spreads have tightened significantly and are returning to their long-term averages, the economic recovery con-
tinues to provide support for nongovernment debt. The Team is maintaining an overweight in corporate issues and the Portfolio’s positions remain diversified. The Team has also reduced exposure to CMBS as the sector has rallied.
Intermediate Duration Bond Portfolio
Investment Objective and Policies
The Portfolio seeks a moderate to high rate of income that is subject to taxes. The Portfolio invests primarily in investment-grade, US Dollar-denominated fixed-income securities. Under normal circumstances, the Portfolio invests at least 80% of its net assets in fixed-income securities. The Portfolio seeks to maintain a relatively longer duration of three to six years under normal market conditions. The Portfolio may invest in many types of debt securities including corporate bonds, notes, US Government and agency securities, asset-backed securities, mortgage-related securities and inflation-protected securities, as well as other securities of US and non-US issuers.
Investment Results
For both the six- and 12-month periods ended February 28, 2010, the Portfolio outperformed the benchmark, the Barclays Capital US Aggregate Bond Index. The Portfolio was positioned to capitalize on record wide yield spreads of credit, and this benefited performance for both time periods. The following positions were positive: an overweight in investment-grade corporates and CMBS, allocations to non-investment grade corporates and an underweight in Treasuries.
| ALLIANCEBERNSTEIN POOLING PORTFOLIOS • | 11 |
Market Review and Investment Strategy
The global economic recovery broadened in late 2009 and continued into early 2010 as evidence emerged that the US and euro-area economies had returned to positive growth, and many emerging economies in Asia posted near double-digit gains in economic growth. As the global economic rebound gained momentum and the corporate sector continued to strengthen, systemic risk in the markets dramatically receded. Risk assets extended their rally; nongovernment debt continued to outperform government bonds as spreads narrowed further.
The semi-annual period ended February 28, 2010, was marked by the continued strong recovery of investment-grade corporate bonds, which returned 5.20% during the six-month period. Spreads continued to tighten to end the period at 173 basis points over Treasuries. Spreads on CMBS similarly continued to tighten as investor appetite for risk returned in the market. CMBS ended the period at 387 basis points over Treasuries. CMBS returned 12.34% for the six-month period. All data is according to Barclays Capital.
In the view of the US Investment Grade: Core Fixed Income Team (the “Team”), opportunities in the credit markets are still attractive. While spreads have tightened significantly and are returning to their long-term averages, the economic recovery continues to provide support for corporates. The Team is maintaining the Portfolio’s overweight in more market-sensitive corporate issues, although they have tempered some of the most aggressive overweights. The Team has also reduced exposure to CMBS as the sector has rallied.
Inflation Protected Securities Portfolio
Investment Objective and Policies
Until April 16, 2010, the Portfolio seeks a total return that exceeds the rate of inflation over the long term with income that is subject to taxes. The Portfolio invests primarily in US Dollar-denominated inflation protected securities. Under normal circumstances, the Portfolio invests at least 80% of its net assets in inflation protected securities. The Portfolio’s investments in inflation protected securities include inflation protected debt securities of varying maturities issued by US or non-US governments, their agencies or instrumentalities and by corporations, and inflation derivatives. The Portfolio seeks to maintain a duration within three years (plus or minus) of the duration of the Barclays Capital 1-10 Year TIPS Index.
Assets not invested in inflation protected securities may be invested in other types of debt securities, including corporate bonds, notes, US Government and agency securities, asset-backed securities, and mortgage-related securities as well as other securities of US and non-US issuers.
Effective April 16, 2010, Inflation-Protected Securities Portfolio will be renamed the Bond Inflation Protection Portfolio. The Portfolio’s new non-fundamental investment objective will be “to maximize real return without assuming what the Adviser considers to be undue risk”. Consistent with the change in the Portfolio’s name, the Portfolio’s investment policy of investing at least 80% of its net assets in inflation-protected securities will be changed to a policy of investing at least 80% of its net assets in fixed-income securities. Changes to the Portfolio’s investment policies also include:
| 12 | • ALLIANCEBERNSTEIN POOLING PORTFOLIOS |
| • | the use of leverage through investments in reverse repurchase agreements; |
| • | expanded flexibility to invest in derivatives, such as total return swaps; |
| • | permitting the Portfolio to invest up to 15% of its total assets in below investment-grade fixed-income securities rated BB or B or the equivalent by at least one national ratings agency, or deemed by the Adviser to be of comparable quality; and |
| • | permitting the Portfolio to invest in fixed-income securities of any maturity and duration. |
There will be no change to the Portfolio’s benchmark, the Barclays Capital 1-10 Year Inflation Protected Securities (TIPS) Index.
Investment Results
For both the six- and 12-month periods ended February 28, 2010, the Portfolio outperformed the benchmark, the Barclays Capital 1-10 Year TIPS Index. For both periods the Portfolio’s longer duration relative to the benchmark contributed positively to performance.
Market Review and Investment Strategy
2009 was marked by a historic recovery in many fixed-income sectors following the extreme risk aversion that seized the markets after the bankruptcy of Lehman Brothers in September 2008. The positive trend in the credit markets continued into the first two months of 2010 despite a flare-up of concern of sovereign debt risk in the euro area. The global economic recovery broadened in late
2009 and continued into early 2010 as the US and euro-area economies returned to positive growth and many emerging economies in Asia posted near double-digit gains in economic growth. As the global economic rebound gained momentum and the corporate sector continued to strengthen, systemic risk in the markets dramatically receded. Risk assets extended their rally and nongovernment debt continued to outperform government bonds as spreads narrowed further.
Despite the unwinding of risk premiums, US Treasuries were in positive territory for the six-month period returning 1.44%. The Treasury yield curve continued to steepen with short-term rates declining modestly and longer term rates rising. For the six-month period, two-year yields declined 17 basis points to end the period at 0.81%, while 10-year yields rose 21 basis points to 3.61% and 30-year yields rose 38 basis points to end the period at 4.56%. TIPS (as represented by the Barclays Capital 1-10 Year TIPS Index) outperformed Treasuries posting an absolute return of 4.76% for the six-month period.
High-Yield Portfolio
Investment Objective and Policies
The Portfolio seeks a high total return by maximizing current income and, to the extent consistent with that objective, capital appreciation. The Portfolio invests primarily in high yield debt securities. Under normal circumstances, the Portfolio invests at least 80% of its net assets in these types of securities. The Portfolio invests in high yield, below-investment grade debt securities, commonly known as “junk bonds.” The Portfolio seeks to maximize current income by taking
| ALLIANCEBERNSTEIN POOLING PORTFOLIOS • | 13 |
advantage of market developments, yield disparities and variations in the creditworthiness of issuers.
Investment Results
For the six- and 12-month periods ended February 28, 2010, the Portfolio outperformed the benchmark, the Barclays Capital US High Yield 2% Issuer Cap Index. The Portfolio’s increased risk profile during a period of historically strong high-yield returns provided positive relative performance versus the benchmark. Overweight positions in the CCC-rated quality tier as well as overweights in Tier 1, hybrid and subordinated debt holdings—all of which increased the Portfolio’s overall risk profile—were positive contributors for both periods.
Market Review and Investment Strategy
2009 was marked by a historic recovery in many fixed-income sectors following the extreme risk aversion that seized the markets after the bankruptcy of Lehman Brothers in September 2008. The positive trend in the credit markets continued into the first two months of 2010. According to the Barclays Capital US High Yield 2% Issuer Cap Index, the high-yield market returned 13.86% for the six-month period under review and a historic 55.20% for the 12-month period ended February 28, 2010. For the calendar year 2009, the Portfolio outperformed the benchmark while the average high-yield fund underperformed the Barclays Capital index by more than 12%.
All industry classifications posted positive returns for the six-month reporting period. By industry sector, financial institutions returned 25.24%, and continued to lead along with insurance at 32.23% and banks at 23.19%. Other outperforming industries included consumer products at 28.69%, airlines at 18.72% and building materials at 17.42%. Underperforming industries included consumer non-cyclicals at 9.56%, utilities at 10.87%, energy at 11.65% and communications at 11.79%.
By quality tier, CCC-rated debt outperformed, returning 18.34%, with B-rated debt returning 10.46% and BB-rated debt returning 11.26%. For the six-month period, high-yield spreads continued to tighten an additional 195 basis to end the period at 656 basis points over duration-neutral Treasuries. High-yield spreads have tightened a dramatic 1,282 basis points since reaching their widest spreads in mid-December 2008.
In the view of the Portfolio’s Global Credit Investment Team (the “Team”), opportunities in the credit markets are still attractive. While spreads have tightened dramatically and are returning close to their long-term averages, the economic recovery continues to provide significant support. The Team is maintaining the Portfolio’s overweight in more market-sensitive issues, although it has tempered some of the Portfolio’s most aggressive overweights.
| 14 | • ALLIANCEBERNSTEIN POOLING PORTFOLIOS |
HISTORICAL PERFORMANCE
An Important Note About the Value of Historical Performance
The performance shown on the following pages represents past performance and does not guarantee future results. Current performance may be lower or higher than the performance information shown. The investment return and principal value of an investment in the Fund will fluctuate, so that your shares, when redeemed, may be worth more or less than their original cost.
Investors should consider the investment objectives, risks, charges and expenses of the Fund/Portfolio carefully before investing. For copies of our prospectus or summary prospectus, which contain this and other information, contact your AllianceBernstein Investments representative or call 800.227.4618. Please read the prospectus and/or summary prospectus carefully before investing.
Please note: Shares of the Portfolios are offered exclusively to mutual funds advised by, and certain institutional clients of, AllianceBernstein that seek a blend of asset classes for investment. These share classes are not currently offered for direct investment from the general public. The AllianceBernstein Pooling Portfolios can be purchased at the relevant net asset value (NAV) without a sales charge or other fee. However, there are sales charges in connection to purchases of other AllianceBernstein share classes invested in these Pooling Portfolios. For additional information regarding other retail share classes and their sales charges and fees, please visit www.alliancebernstein.com. All fees and expenses related to the operation of the Portfolios have been deducted. Performance assumes reinvestment of distributions and does not account for taxes.
Benchmark Disclosures
None of the indices listed below reflect fees and expenses associated with the active management of a mutual fund portfolio.
The unmanaged Russell 1000 Value Index contains those securities in the Russell 1000 Index with a less-than-average growth orientation. The unmanaged Russell 1000 Index is composed of 1000 of the largest capitalized companies that are traded in the United States.
The unmanaged Russell 1000 Growth Index contains those securities in the Russell 1000 Index with a greater-than-average growth orientation.
The unmanaged Russell 1000 Index is composed of 1000 of the largest capitalized companies that are traded in the US.
The unmanaged Financial Times Stock Exchange (FTSE) European Public Real Estate Association (EPRA)/National Association of Real Estate Investment Trust (NAREIT) Developed RE Index is a free-floating, market capitalization-weighted index structured in such a way that it can be considered to represent general trends in all eligible real estate stocks worldwide. The Index is designed to reflect the stock performance of companies engaged in specific aspects of the North American, European and Asian real estate markets.
The unmanaged Morgan Stanley Capital International (MSCI) Europe, Australasia and Far East (EAFE) Index is a market capitalization index that measures stock performance in 21 countries in Europe, Australasia and the Far East. Returns for this Index are net. In calculating net returns, the dividend is reinvested after deduction of withholding tax, applying the rate to non-resident individuals who do not benefit from double taxation treaties.
The unmanaged MSCI EAFE Growth Index is a subset of the MSCI EAFE Index and generally represents approximately 50% of the free float-adjusted market
(Historical Performance continued on next page)
| ALLIANCEBERNSTEIN POOLING PORTFOLIOS • | 15 |
Historical Performance
HISTORICAL PERFORMANCE
(continued from previous page)
capitalization of each appropriate Single Country Index and consists of those securities classified by MSCI as most representing the growth style.
The unmanaged Russell 2500 Value Index contains those securities in the Russell 2500 Index with a less-than-average growth orientation. The unmanaged Russell 2500 Index includes 2500 small- and mid-cap US stocks.
The unmanaged Russell 2500 Growth Index contains those securities in the Russell 2500 Index with a greater-than-average growth orientation. The unmanaged Russell 2500 Index includes 2500 small- and mid-cap US stocks.
The unmanaged Bank of America Merrill Lynch (BofAML) 1-3 Year Treasury Index is composed of US government securities, including agency securities, with remaining maturities of one to three years.
The unmanaged Barclays Capital US Aggregate Bond Index covers the US investment-grade fixed-rate bond market, including government and credit securities, agency mortgage pass through securities, asset-backed securities and commercial mortgage-backed securities.
The unmanaged Barclays Capital 1-10 Year TIPS Index is the 1-10 year maturity component of the unmanaged Barclays Capital US Treasury Inflation Notes Index and consists of inflation-protection securities issued by the US Treasury.
The unmanaged Barclays Capital US High Yield 2% Issuer Cap covers the universe of fixed-rate, non-investment grade debt. Pay-in-kind (PIK) bonds, Eurobonds, and debt issues from countries designated as emerging markets (e.g., Argentina, Brazil, Venezuela, etc.) are excluded, but Canadian and global bonds (SEC registered) of issuers in non-emerging market countries are included. Original issue zeroes, step-up coupon structures and 144-As are also included in the Index.
An investor cannot invest directly in an index, and its results are not indicative of the performance of any specific investment, including the Portfolio.
A Word About Risk
US Value Portfolio
Value investing does not guarantee a profit or eliminate risk. Not all companies whose stocks are considered to be value stocks are able to turn their business around or successfully employ corrective strategies which would result in stock prices that rise as initially expected.
US Large Cap Growth Portfolio
The Portfolio concentrates its investments in a limited number of issues and an investment in the Portfolio is therefore subject to greater risk and volatility than investments in a more diversified portfolio. Growth investing does not guarantee a profit or eliminate risk. The stocks of these companies can have relatively high valuations. Because of these high valuations, an investment in a growth stock can be more risky than an investment in a company with more modest growth expectations.
Global Real Estate Investment Portfolio
An investment in the Portfolio is subject to certain risks associated with the direct ownership of real estate and with the real estate industry in general, including declines in the value of real estate, general and local economic conditions and interest rates. The Portfolio concentrates its investments in real estate-related investments and may therefore be subject to greater risks and volatility than a fund with a more diversified Portfolio. The Portfolio’s assets may be invested in foreign securities, which may magnify these fluctuations due to changes in foreign exchange rates and the possibility of substantial volatility due to political and economic uncertainties in foreign countries. Investment in the Portfolio includes risks not associated with funds that
(Historical Performance continued on next page)
| 16 | • ALLIANCEBERNSTEIN POOLING PORTFOLIOS |
Historical Performance
HISTORICAL PERFORMANCE
(continued from previous page)
invest exclusively in US issues. Because the Portfolio will invest in foreign currency-denominated securities, these fluctuations may be magnified by changes in foreign exchange rates.
International Value Portfolio
Value investing does not guarantee a profit or eliminate risk. Not all companies whose stocks are considered to be value stocks are able to turn their business around or successfully employ corrective strategies which would result in stock prices that rise as initially expected. Substantially all of the Portfolio’s assets will be invested in foreign securities which may magnify fluctuations due to changes in foreign exchange rates and the possibility of substantial volatility due to political and economic uncertainties in foreign countries. Because the Portfolio may invest in emerging markets and in developing countries, an investment also has the risk that market changes or other factors affecting emerging markets and developing countries, including political instability and unpredictable economic conditions, may have a significant effect on the Portfolio’s net asset value.
International Growth Portfolio
Substantially all of the Portfolio’s assets will be invested in foreign securities which may magnify fluctuations due to changes in foreign exchange rates and the possibility of substantial volatility due to political and economic uncertainties in foreign countries. The Portfolio may invest in securities of emerging market nations. These investments have additional risks, such as illiquid or thinly traded markets, company management risk, heightened political instability and currency volatility. Accounting standards and market regulations in emerging market nations are not the same as those in the US.
Small-Mid Cap Value Portfolio
Value investing does not guarantee a profit or eliminate risk. Not all companies whose stocks are considered to be value stocks are able to turn their business around or successfully employ corrective strategies which would result in stock prices that rise as initially expected. The Portfolio concentrates its investments in the stocks of small- to mid-capitalization companies, which tend to be more volatile than large-cap companies. Small- and mid-cap stocks may have additional risks because these companies tend to have limited product lines, markets or financial resources. The Portfolio can invest in foreign securities which may magnify these fluctuations due to changes in foreign exchange rates and the possibility of substantial volatility due to political and economic uncertainties in foreign countries. Because the Portfolio may invest in emerging markets and in developing countries, an investment also has the risk that market changes or other factors affecting emerging markets and developing countries, including political instability and unpredictable economic conditions, may have a significant effect on the Portfolio’s net asset value.
Small-Mid Cap Growth Portfolio
The Portfolio concentrates its investments in the stocks of small- to mid-capitalization companies, which tend to be more volatile than large-cap companies. Small-cap stocks may have additional risks because these companies tend to have limited product lines, markets, financial resources or less liquidity (i.e., more difficulty when buying and selling more than the average daily trading volume of certain investment shares). The Portfolio can invest in foreign securities. Foreign markets can be more volatile than the US market due to increased risks of adverse issuer, political, regulatory, market or economic developments. In addition, because the Portfolio will invest in foreign currency-denominated securities, fluctuations in the value of the Portfolio’s investments may be magnified by changes in foreign exchange rates.
(Historical Performance continued on next page)
| ALLIANCEBERNSTEIN POOLING PORTFOLIOS • | 17 |
Historical Performance
HISTORICAL PERFORMANCE
(continued from previous page)
Short Duration Bond Portfolio
The Portfolio’s assets can be invested in foreign securities which may magnify asset value fluctuations due to changes in foreign exchange rates and the possibility of substantial volatility due to political and economic uncertainties in foreign countries. Because the Portfolio may invest in emerging markets and in developing countries, an investment also has the risk that market changes or other factors affecting emerging markets and developing countries, including political instability and unpredictable economic conditions, may have an impact on the Portfolio’s asset value. Price fluctuation in the Portfolio’s securities may be caused by changes in the general level of interest rates or changes in bond credit quality ratings. Please note, as interest rates rise, existing bond prices fall and can cause the value of an investment in the Portfolio to decline. Changes in interest rates have a greater effect on bonds with longer maturities than on those with shorter maturities. Investments in the Portfolio are not guaranteed because of fluctuation in the net asset value of the underlying fixed-income related investments. Similar to direct bond ownership, bond funds have the same interest rate, inflation and credit risks that are associated with the underlying bonds owned by the Portfolio. Portfolio purchasers should understand that, in contrast to owning individual bonds, there are ongoing fees and expenses associated with owning shares of bond funds. The Portfolio may also invest a portion of its assets in below investment-grade securities which are subject to greater risk than higher-rated securities.
Intermediate Duration Bond Portfolio
The Portfolio may invest in convertible debt securities, preferred stock and dividend paying stocks, US government obligations and foreign fixed-income securities. The Portfolio may invest in mortgage-related and other asset-backed securities which are subject to prepayment risk; the risk that early payments on principal on some mortgage-related securities may occur during periods of falling mortgage rates and expose the Portfolio to a lower rate of return upon reinvestment of principal. The Portfolio may invest a portion of its assets in foreign securities, which may magnify fluctuations. Price fluctuations may also be caused by changes in interest rates or bond quality ratings. These changes have a greater effect on bonds with longer maturities than on those with shorter maturities. Please note, as interest rates rise, existing bond prices fall and can cause the value of an investment in the Portfolio to decline. Investments in the Portfolio are not guaranteed because of fluctuation in the net asset value of the underlying fixed-income related investments. Similar to direct bond ownership, bond funds have the same interest rate, inflation and credit risks that are associated with the underlying bonds owned by the Portfolio. Portfolio purchasers should understand that, in contrast to owning individual bonds, there are ongoing fees and expenses associated with owning shares of bond funds. The Portfolio may invest in high-yield bonds, otherwise known as “junk bonds,” which involves a greater risk of default and price volatility than other bonds. Investing in below investment grade presents special risks, including credit risk. The Portfolio is also subject to leverage risk. When a fund borrows money or otherwise leverages its portfolio, it may be volatile because leverage tends to exaggerate the effect of any increase or decrease in the value of a fund’s investments. A fund may create leverage through the use of reverse repurchase agreements, forward contracts or dollar rolls or by borrowing money.
Inflation Protected Securities Portfolio
Among the principal risks of investing in the Portfolio are interest-rate risk, credit risk and market risk. Interest rate risk is the risk that changes in interest rates will affect the value of income-producing securities. Credit risk is the risk that a security issuer or the counterparty to certain derivatives will be unable or unwilling to make timely payments of income or principal. Market risk is the risk of losses from adverse changes
(Historical Performance continued on next page)
| 18 | • ALLIANCEBERNSTEIN POOLING PORTFOLIOS |
Historical Performance
HISTORICAL PERFORMANCE
(continued from previous page)
in the market. To the extent the Portfolio invests in securities of non-US issuers, it may have non-US issuer risk and currency risk.
High-Yield Portfolio
The Portfolio can invest in foreign securities, including emerging markets, which may magnify fluctuations due to changes in foreign exchange rates and the possibility of substantial volatility due to political and economic uncertainties in foreign countries. Price fluctuation in the Portfolio’s securities may be caused by changes in the general level of interest rates or changes in bond credit quality ratings. Please note, as interest rates rise, existing bond prices fall and can cause the value of an investment in the Portfolio to decline. Changes in interest rates have a greater effect on bonds with longer maturities than on those with shorter maturities. High-yield bonds, otherwise known as “junk bonds,” involve a greater risk of default and price volatility than other bonds. Investing in non-investment-grade securities presents special risks, including credit risk. Investments in the Portfolio are not guaranteed because of fluctuation in the net asset value of the underlying fixed-income related investments. Similar to direct bond ownership, bond funds have the same interest rate, inflation and credit risks that are associated with the underlying bonds owned by the Portfolio. Portfolio purchasers should understand that, in contrast to owning individual bonds, there are ongoing fees and expenses associated with owning shares of bond funds.
All Portfolios
While the equity Portfolios invest principally in common stocks and other equity securities and the fixed-income Portfolios invest principally in bonds and fixed-income securities, in order to achieve their investment objectives, the Portfolios may at times use certain types of investment derivatives, such as options, futures, forwards and swaps. These instruments involve risks different from, and in certain cases, greater than, the risks presented by more traditional investments. These risks are fully discussed in the Portfolios’ prospectus.
(Historical Performance continued on next page)
| ALLIANCEBERNSTEIN POOLING PORTFOLIOS • | 19 |
Historical Performance
HISTORICAL PERFORMANCE
(continued from previous page)
US VALUE PORTFOLIO
THE PORTFOLIO VS. ITS BENCHMARK PERIODS ENDED FEBRUARY 28, 2010 | Returns | |||||
| 6 Months | 12 Months | |||||
AllianceBernstein US Value Portfolio | 8.83% | 59.48% | ||||
Russell 1000 Value Index | 8.52% | 56.50% | ||||
US LARGE CAP GROWTH PORTFOLIO
THE PORTFOLIO VS. ITS BENCHMARK PERIODS ENDED FEBRUARY 28, 2010 | Returns | |||||
| 6 Months | 12 Months | |||||
AllianceBernstein US Large Cap Growth Portfolio | 8.09% | 48.66% | ||||
Russell 1000 Growth Index | 11.32% | 54.19% | ||||
GLOBAL REAL ESTATE INVESTMENT PORTFOLIO
THE PORTFOLIO VS. ITS BENCHMARK PERIODS ENDED FEBRUARY 28, 2010 | Returns | |||||
| 6 Months | 12 Months | |||||
AllianceBernstein Global Real Estate Investment Portfolio | 7.43% | 80.15% | ||||
FTSE EPRA/NAREIT Developed RE Index | 7.11% | 84.55% | ||||
Please keep in mind that high, double-digit returns are highly unusual and cannot be sustained. Investors should also be aware that these returns were primarily achieved during favorable market conditions.
See Historical Performance and Benchmark disclosures on pages 15-19.
(Historical Performance continued on next page)
| 20 | • ALLIANCEBERNSTEIN POOLING PORTFOLIOS |
Historical Performance
HISTORICAL PERFORMANCE
(continued from previous page)
INTERNATIONAL VALUE PORTFOLIO
THE PORTFOLIO VS. ITS BENCHMARK PERIODS ENDED FEBRUARY 28, 2010 | Returns | |||||
| 6 Months | 12 Months | |||||
AllianceBernstein International Value Portfolio | 1.02% | 63.95% | ||||
MSCI EAFE Index | 0.72% | 54.58% | ||||
INTERNATIONAL GROWTH PORTFOLIO
THE PORTFOLIO VS. ITS BENCHMARKS PERIODS ENDED FEBRUARY 28, 2010 | Returns | |||||
| 6 Months | 12 Months | |||||
AllianceBernstein International Growth Portfolio | 6.58% | 46.30% | ||||
MSCI EAFE Index | 0.72% | 54.58% | ||||
MSCI EAFE Growth Index | 3.89% | 49.44% | ||||
SMALL-MID CAP VALUE PORTFOLIO
THE PORTFOLIO VS. ITS BENCHMARK PERIODS ENDED FEBRUARY 28, 2010 | Returns | |||||
| 6 Months | 12 Months | |||||
AllianceBernstein Small-Mid Cap Value Portfolio | 19.11% | 88.87% | ||||
Russell 2500 Value Index | 12.31% | 69.33% | ||||
SMALL-MID CAP GROWTH PORTFOLIO
THE PORTFOLIO VS. ITS BENCHMARK PERIODS ENDED FEBRUARY 28, 2010 | Returns | |||||
| 6 Months | 12 Months | |||||
AllianceBernstein Small-Mid Cap Growth Portfolio | 12.69% | 65.89% | ||||
Russell 2500 Growth Index | 13.34% | 66.26% | ||||
Please keep in mind that high, double-digit returns are highly unusual and cannot be sustained. Investors should also be aware that these returns were primarily achieved during favorable market conditions.
See Historical Performance and Benchmark disclosures on pages 15-19.
(Historical Performance continued on next page)
| ALLIANCEBERNSTEIN POOLING PORTFOLIOS • | 21 |
Historical Performance
HISTORICAL PERFORMANCE
(continued from previous page)
SHORT DURATION BOND PORTFOLIO
THE PORTFOLIO VS. ITS BENCHMARK PERIODS ENDED FEBRUARY 28, 2010 | Returns | |||||
| 6 Months | 12 Months | |||||
AllianceBernstein Short Duration Bond Portfolio | 3.85% | 9.24% | ||||
BofAML 1-3 Year Treasury Index | 1.23% | 2.19% | ||||
INTERMEDIATE DURATION BOND PORTFOLIO
THE PORTFOLIO VS. ITS BENCHMARK PERIODS ENDED FEBRUARY 28, 2010 | Returns | |||||
| 6 Months | 12 Months | |||||
AllianceBernstein Intermediate Duration Bond Portfolio | 5.65% | 19.96% | ||||
Barclays Capital US Aggregate Bond Index | 3.19% | 9.32% | ||||
INFLATION PROTECTED SECURITIES PORTFOLIO
THE PORTFOLIO VS. ITS BENCHMARK PERIODS ENDED FEBRUARY 28, 2010 | Returns | |||||
| 6 Months | 12 Months | |||||
AllianceBernstein Inflation Protected Securities Portfolio | 5.22% | 12.12% | ||||
Barclays Capital 1-10 Year TIPS Index | 4.76% | 11.54% | ||||
HIGH-YIELD PORTFOLIO
THE PORTFOLIO VS. ITS BENCHMARK PERIODS ENDED FEBRUARY 28, 2010 | Returns | |||||
| 6 Months | 12 Months | |||||
AllianceBernstein High-Yield Portfolio | 18.63% | 64.52% | ||||
Barclays Capital US High Yield 2% Issuer Cap Index | 13.86% | 55.20% | ||||
Please keep in mind that high, double-digit returns are highly unusual and cannot be sustained. Investors should also be aware that these returns were primarily achieved during favorable market conditions.
See Historical Performance and Benchmark disclosures on pages 15-19.
(Historical Performance continued on next page)
| 22 | • ALLIANCEBERNSTEIN POOLING PORTFOLIOS |
Historical Performance
HISTORICAL PERFORMANCE
(continued from previous page)
| AVERAGE ANNUAL RETURNS AS OF FEBRUARY 28, 2010 | |||
| NAV/SEC Returns† | |||
| AllianceBernstein US Value Portfolio | |||
1 Year | 59.48 | % | |
Since Inception* | -1.47 | % | |
| AllianceBernstein US Large Cap Growth Portfolio | |||
1 Year | 48.66 | % | |
Since Inception* | 1.68 | % | |
| AllianceBernstein Global Real Estate Investment Portfolio | |||
1 Year | 80.15 | % | |
Since Inception* | 2.47 | % | |
| AllianceBernstein International Value Portfolio | |||
1 Year | 63.95 | % | |
Since Inception* | 2.17 | % | |
| AllianceBernstein International Growth Portfolio | |||
1 Year | 46.30 | % | |
Since Inception* | 1.10 | % | |
| AllianceBernstein Small-Mid Cap Value Portfolio | |||
1 Year | 88.87 | % | |
Since Inception* | 4.57 | % | |
| AllianceBernstein Small-Mid Cap Growth Portfolio | |||
1 Year | 65.89 | % | |
Since Inception* | 5.68 | % | |
| AllianceBernstein Short Duration Bond Portfolio | |||
1 Year | 9.24 | % | |
Since Inception* | 3.20 | % | |
| AllianceBernstein Intermediate Duration Bond Portfolio | |||
1 Year | 19.96 | % | |
Since Inception* | 5.76 | % | |
| AllianceBernstein Inflation Protected Securities Portfolio | |||
1 Year | 12.12 | % | |
Since Inception* | 5.00 | % | |
| AllianceBernstein High-Yield Portfolio | |||
1 Year | 64.52 | % | |
Since Inception* | 7.73 | % | |
| * | Inception date: 5/20/05 for all Portfolios. |
| † | These Portfolios are offered at net asset value (NAV) and their SEC returns and the same as their NAV returns. |
See Historical Performance and Benchmark disclosures on pages 15-19.
(Historical Performance continued on next page)
| ALLIANCEBERNSTEIN POOLING PORTFOLIOS • | 23 |
Historical Performance
HISTORICAL PERFORMANCE
(continued from previous page)
| SEC AVERAGE ANNUAL RETURNS AS OF THE MOST RECENT CALENDAR QUARTER-END (MARCH 31, 2010) | |||
| SEC Returns | |||
| AllianceBernstein US Value Portfolio | |||
1 Year | 54.54 | % | |
Since Inception* | -0.10 | % | |
| AllianceBernstein US Large Cap Growth Portfolio | |||
1 Year | 45.32 | % | |
Since Inception* | 2.86 | % | |
| AllianceBernstein Global Real Estate Investment Portfolio | |||
1 Year | 76.68 | % | |
Since Inception* | 3.74 | % | |
| AllianceBernstein International Value Portfolio | |||
1 Year | 62.38 | % | |
Since Inception* | 3.74 | % | |
| AllianceBernstein International Growth Portfolio | |||
1 Year | 48.07 | % | |
Since Inception* | 2.45 | % | |
| AllianceBernstein Small-Mid Cap Value Portfolio | |||
1 Year | 85.08 | % | |
Since Inception* | 6.35 | % | |
| AllianceBernstein Small-Mid Cap Growth Portfolio | |||
1 Year | 60.99 | % | |
Since Inception* | 7.24 | % | |
| AllianceBernstein Short Duration Bond Portfolio | |||
1 Year | 8.87 | % | |
Since Inception* | 3.17 | % | |
| AllianceBernstein Intermediate Duration Bond Portfolio | |||
1 Year | 17.88 | % | |
Since Inception* | 5.72 | % | |
| AllianceBernstein Inflation Protected Securities Portfolio | |||
1 Year | 6.96 | % | |
Since Inception* | 4.89 | % | |
| AllianceBernstein High-Yield Portfolio | |||
1 Year | 66.00 | % | |
Since Inception* | 8.45 | % | |
| * | Inception date: 5/20/05 for all Portfolios. |
See Historical Performance and Benchmark disclosures on pages 15-19.
(Historical Performance continued on next page)
| 24 | • ALLIANCEBERNSTEIN POOLING PORTFOLIOS |
Historical Performance
FUND EXPENSES
(unaudited)
As a shareholder of the Fund, you incur two types of costs: (1) transaction costs, including sales charges (loads) on purchase payments, contingent deferred sales charges on redemptions and (2) ongoing costs, including management fees; distribution (12b-1) fees; and other Fund expenses. This example is intended to help you understand your ongoing costs (in dollars) of investing in the Fund and to compare these costs with the ongoing costs of investing in other mutual funds.
The Example is based on an investment of $1,000 invested at the beginning of the period and held for the entire period as indicated below.
Actual Expenses
The first line of the table below provides information about actual account values and actual expenses. You may use the information in this line, together with the amount you invested, to estimate the expenses that you paid over the period. Simply divide your account value by $1,000 (for example, an $8,600 account value divided by $1,000 = 8.6), then multiply the result by the number in the first line under the heading entitled “Expenses Paid During Period” to estimate the expenses you paid on your account during this period.
Hypothetical Example for Comparison Purposes
The second line of the table below provides information about hypothetical account values and hypothetical expenses based on the Fund’s actual expense ratio and an assumed annual rate of return of 5% before expenses, which is not the Fund’s actual return. The hypothetical account values and expenses may not be used to estimate the actual ending account balance or expenses you paid for the period. You may use this information to compare the ongoing costs of investing in the Fund and other funds by comparing this 5% hypothetical example with the 5% hypothetical examples that appear in the shareholder reports of other funds.
Please note that the expenses shown in the table are meant to highlight your ongoing costs only and do not reflect any transactional costs, such as sales charges (loads), or contingent deferred sales charges on redemptions. Therefore, the second line of the table is useful in comparing ongoing costs only, and will not help you determine the relative total costs of owning different funds. In addition, if these transactional costs were included, your costs would have been higher.
| Beginning Account Value September 1, 2009 | Ending Account Value February 28, 2010 | Expenses Paid During Period* | Annualized Expense Ratio* | |||||||||
| U.S. Value Portfolio | ||||||||||||
Actual | $ | 1,000 | $ | 1,088.32 | $ | 0.05 | 0.01 | % | ||||
Hypothetical** | $ | 1,000 | $ | 1,024.74 | $ | 0.05 | 0.01 | % | ||||
| U.S. Large Cap Growth Portfolio | ||||||||||||
Actual | $ | 1,000 | $ | 1,080.88 | $ | 0.05 | 0.01 | % | ||||
Hypothetical** | $ | 1,000 | $ | 1,024.74 | $ | 0.05 | 0.01 | % | ||||
| Global Real Estate Investment Portfolio | ||||||||||||
Actual | $ | 1,000 | $ | 1,074.30 | $ | 0.21 | 0.04 | % | ||||
Hypothetical** | $ | 1,000 | $ | 1,024.60 | $ | 0.20 | 0.04 | % | ||||
| International Value Portfolio | ||||||||||||
Actual | $ | 1,000 | $ | 1,010.20 | $ | 0.15 | 0.03 | % | ||||
Hypothetical** | $ | 1,000 | $ | 1,024.65 | $ | 0.15 | 0.03 | % | ||||
| ALLIANCEBERNSTEIN POOLING PORTFOLIOS • | 25 |
Fund Expenses
FUND EXPENSES
(unaudited)
(continued from previous page)
| Beginning Account Value September 1, 2009 | Ending Account Value February 28, 2010 | Expenses Paid During Period* | Annualized Expense Ratio* | |||||||||
| International Growth Portfolio | ||||||||||||
Actual | $ | 1,000 | $ | 1,065.83 | $ | 0.15 | 0.03 | % | ||||
Hypothetical** | $ | 1,000 | $ | 1,024.65 | $ | 0.15 | 0.03 | % | ||||
| Small-Mid Cap Value Portfolio | ||||||||||||
Actual | $ | 1,000 | $ | 1,191.12 | $ | 0.22 | 0.04 | % | ||||
Hypothetical** | $ | 1,000 | $ | 1,024.60 | $ | 0.20 | 0.04 | % | ||||
| Small-Mid Cap Growth Portfolio | ||||||||||||
Actual | $ | 1,000 | $ | 1,126.92 | $ | 0.21 | 0.04 | % | ||||
Hypothetical** | $ | 1,000 | $ | 1,024.60 | $ | 0.20 | 0.04 | % | ||||
| Short Duration Bond Portfolio | ||||||||||||
Actual | $ | 1,000 | $ | 1,038.55 | $ | 0.91 | 0.18 | % | ||||
Hypothetical** | $ | 1,000 | $ | 1,023.90 | $ | 0.90 | 0.18 | % | ||||
| Intermediate Duration Bond Portfolio | ||||||||||||
Actual | $ | 1,000 | $ | 1,056.45 | $ | 1.12 | 0.22 | % | ||||
Hypothetical** | $ | 1,000 | $ | 1,023.70 | $ | 1.10 | 0.22 | % | ||||
| Inflation Protected Securities Portfolio | ||||||||||||
Actual | $ | 1,000 | $ | 1,052.23 | $ | 0.15 | 0.03 | % | ||||
Hypothetical** | $ | 1,000 | $ | 1,024.65 | $ | 0.15 | 0.03 | % | ||||
| High-Yield Portfolio | ||||||||||||
Actual | $ | 1,000 | $ | 1,186.31 | $ | 0.27 | 0.05 | % | ||||
Hypothetical** | $ | 1,000 | $ | 1,024.55 | $ | 0.25 | 0.05 | % | ||||
| * | Expenses are equal to each Class’ annualized expense ratio, multiplied by the average account value over the period, multiplied by the 181/365 (to reflect the one-half year period). |
| ** | Assumes 5% return before expenses. |
| 26 | • ALLIANCEBERNSTEIN POOLING PORTFOLIOS |
Fund Expenses
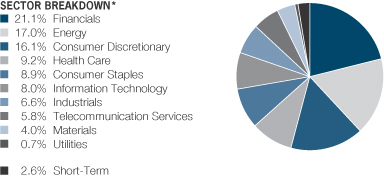
PORTFOLIO SUMMARY
February 28, 2010 (unaudited)
U.S. VALUE PORTFOLIO
U.S. LARGE CAP GROWTH PORTFOLIO
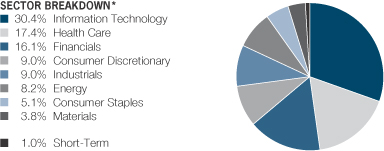
| * | All data are as of February 28, 2010. The Portfolio’s sector breakdown is expressed as a percentage of total investments and may vary over time. |
Please Note: The sector classifications presented herein are based on the Global Industry Classification Standard (GICS) which was developed by Morgan Stanley Capital International and Standard & Poor’s. The components are divided into sector, industry group, and industry sub-indices as classified by the GICS for each of the market capitalization indices in the Broad Market. These sector classifications are broadly defined. The “Portfolio of Investments” section of the report reflects more specific industry information and is consistent with the investment restrictions discussed in the Portfolio’s prospectus.
| ALLIANCEBERNSTEIN POOLING PORTFOLIOS • | 27 |
Portfolio Summary
PORTFOLIO SUMMARY
February 28, 2010 (unaudited)
GLOBAL REAL ESTATE INVESTMENT PORTFOLIO
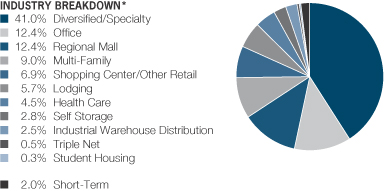
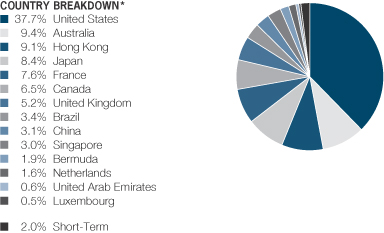
| * | All data are as of February 28, 2010. The Portfolio’s industry and country breakdowns are expressed as a percentage of total investments and may vary over time. |
Please Note: The industry classifications presented herein are based on industry categorization methodology of the Adviser. These industry classifications are broadly defined. The “Portfolio of Investments” section of the report reflects more specific sector information and is consistent with the investment restrictions discussed in the Portfolio’s prospectus.
| 28 | • ALLIANCEBERNSTEIN POOLING PORTFOLIOS |
Portfolio Summary
PORTFOLIO SUMMARY
February 28, 2010 (unaudited)
INTERNATIONAL VALUE PORTFOLIO
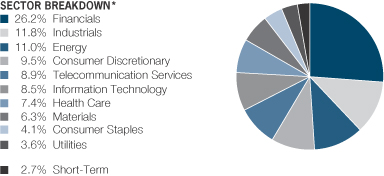
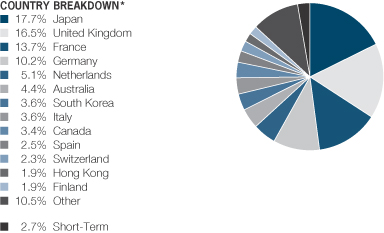
| * | All data are as of February 28, 2010. The Portfolio’s sector and country breakdowns are expressed as a percentage of total investments and may vary over time. ‘Other’ country weightings represent 1.9% or less in the following countries: Brazil, China, Denmark, India, Israel, Kazakhstan, New Zealand, Russia, South Africa, Taiwan and Turkey. |
Please Note: The sector classifications presented herein are based on the Global Industry Classification Standard (GICS) which was developed by Morgan Stanley Capital International and Standard & Poor’s. The components are divided into sector, industry group, and industry sub-indices as classified by the GICS for each of the market capitalization indices in the Broad Market. These sector classifications are broadly defined. The “Portfolio of Investments” section of the report reflects more specific industry information and is consistent with the investment restrictions discussed in the Portfolio’s prospectus.
| ALLIANCEBERNSTEIN POOLING PORTFOLIOS • | 29 |
Portfolio Summary
PORTFOLIO SUMMARY
February 28, 2010 (unaudited)
INTERNATIONAL GROWTH PORTFOLIO
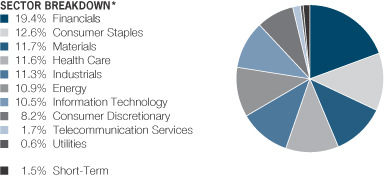
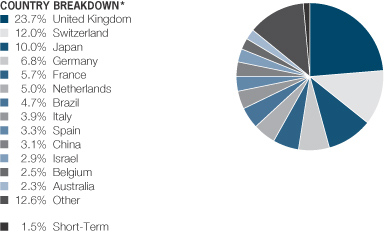
| * | All data are as of February 28, 2010. The Portfolio’s sector and country breakdowns are expressed as a percentage of total investments and may vary over time. ‘Other’ country weightings represent 2.3% or less into the following countries: Canada, Denmark, Hong Kong, India, Ireland, Norway, South Africa, South Korea, Sweden and Taiwan. |
Please Note: The sector classifications presented herein are based on the Global Industry Classification Standard (GICS) which was developed by Morgan Stanley Capital International and Standard & Poor’s. The components are divided into sector, industry group, and industry sub-indices as classified by the GICS for each of the market capitalization indices in the Broad Market. These sector classifications are broadly defined. The “Portfolio of Investments” section of the report reflects more specific industry information and is consistent with the investment restrictions discussed in the Portfolio’s prospectus.
| 30 | • ALLIANCEBERNSTEIN POOLING PORTFOLIOS |
Portfolio Summary
PORTFOLIO SUMMARY
February 28, 2010 (unaudited)
SMALL-MID CAP VALUE PORTFOLIO
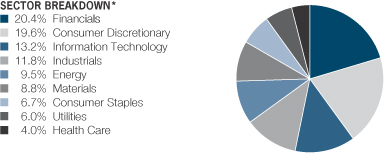
SMALL-MID CAP GROWTH PORTFOLIO
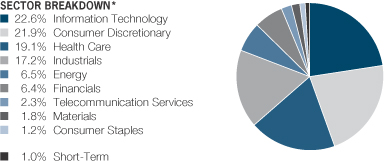
| * | All data are as of February 28, 2010. The Portfolio’s sector breakdown is expressed as a percentage of total investments and may vary over time. |
Please Note: The sector classifications presented herein are based on the Global Industry Classification Standard (GICS) which was developed by Morgan Stanley Capital International and Standard & Poor’s. The components are divided into sector, industry group, and industry sub-indices as classified by the GICS for each of the market capitalization indices in the Broad Market. These sector classifications are broadly defined. The “Portfolio of Investments” section of the report reflects more specific industry information and is consistent with the investment restrictions discussed in the Portfolio’s prospectus.
| ALLIANCEBERNSTEIN POOLING PORTFOLIOS • | 31 |
Portfolio Summary
PORTFOLIO SUMMARY
February 28, 2010 (unaudited)
SHORT DURATION BOND PORTFOLIO

INTERMEDIATE DURATION BOND PORTFOLIO
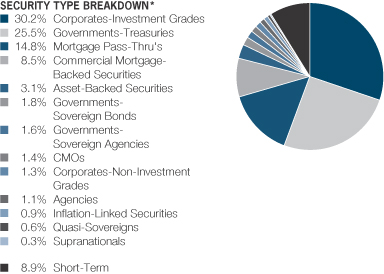
| * | All data are as of February 28, 2010. The Portfolio’s security type breakdown is expressed as a percentage of total investments and may vary over time. |
| 32 | • ALLIANCEBERNSTEIN POOLING PORTFOLIOS |
Portfolio Summary
PORTFOLIO SUMMARY
February 28, 2010 (unaudited)
INFLATION PROTECTED SECURITIES PORTFOLIO
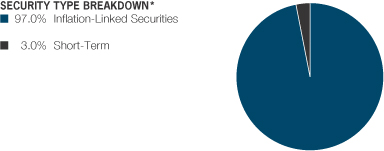
HIGH-YIELD PORTFOLIO
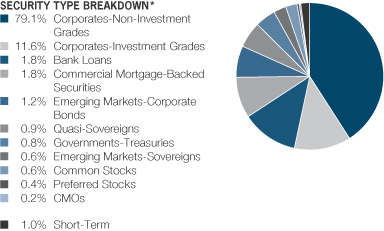
| * | All data are as of February 28, 2010. The Portfolio’s security type breakdown is expressed as a percentage of total investments and may vary over time. |
| ALLIANCEBERNSTEIN POOLING PORTFOLIOS • | 33 |
Portfolio Summary
U.S. VALUE PORTFOLIO
PORTFOLIO OF INVESTMENTS
February 28, 2010 (unaudited)
| Company | Shares | U.S. $ Value | |||
COMMON STOCKS – 97.2% | |||||
Financials – 21.1% | |||||
Capital Markets – 6.0% | |||||
Ameriprise Financial, Inc. | 552,700 | $ | 22,124,581 | ||
Deutsche Bank AG | 309,100 | 19,627,850 | |||
Goldman Sachs Group, Inc. (The) | 411,300 | 64,306,755 | |||
Morgan Stanley | 927,500 | 26,136,950 | |||
| 132,196,136 | |||||
Commercial Banks – 5.2% | |||||
BB&T Corp. | 757,400 | 21,608,622 | |||
US Bancorp | 921,900 | 22,687,959 | |||
Wells Fargo & Co. | 2,531,400 | 69,208,476 | |||
| 113,505,057 | |||||
Diversified Financial Services – 6.1% | |||||
Bank of America Corp. | 3,498,800 | 58,290,008 | |||
Citigroup, Inc.(a) | 3,631,500 | 12,347,100 | |||
JPMorgan Chase & Co. | 1,523,800 | 63,953,886 | |||
| 134,590,994 | |||||
Insurance – 3.8% | |||||
ACE Ltd.(a) | 181,400 | 9,068,186 | |||
Allstate Corp. (The) | 381,400 | 11,918,750 | |||
Everest Re Group Ltd. | 65,500 | 5,595,010 | |||
PartnerRe Ltd. | 66,100 | 5,262,221 | |||
Travelers Cos., Inc. (The) | 414,500 | 21,798,555 | |||
Unum Group | 555,100 | 11,551,631 | |||
XL Capital Ltd. – Class A | 951,600 | 17,385,732 | |||
| 82,580,085 | |||||
| 462,872,272 | |||||
Energy – 16.9% | |||||
Energy Equipment & Services – 1.7% | |||||
Ensco International PLC (Sponsored ADR) | 390,000 | 17,226,300 | |||
Noble Corp.(a) | 260,600 | 11,012,956 | |||
Rowan Cos., Inc.(a) | 386,318 | 10,051,994 | |||
| 38,291,250 | |||||
Oil, Gas & Consumable Fuels – 15.2% | |||||
Apache Corp. | 114,200 | 11,835,688 | |||
Chevron Corp. | 545,100 | 39,410,730 | |||
Cimarex Energy Co. | 398,100 | 23,790,456 | |||
ConocoPhillips | 1,272,300 | 61,070,400 | |||
Devon Energy Corp. | 552,500 | 38,045,150 | |||
Exxon Mobil Corp. | 1,076,000 | 69,940,000 | |||
Forest Oil Corp.(a) | 519,300 | 14,073,030 | |||
Newfield Exploration Co.(a) | 287,300 | 14,672,411 | |||
Nexen, Inc. | 1,013,600 | 22,806,000 | |||
| 34 | • ALLIANCEBERNSTEIN POOLING PORTFOLIOS |
U.S. Value Portfolio—Portfolio of Investments
| Company | Shares | U.S. $ Value | |||
Occidental Petroleum Corp. | 192,500 | $ | 15,371,125 | ||
Valero Energy Corp. | 1,308,500 | 22,924,920 | |||
| 333,939,910 | |||||
| 372,231,160 | |||||
Consumer Discretionary – 16.0% | |||||
Auto Components – 0.5% | |||||
TRW Automotive Holdings Corp.(a) | 382,500 | 10,277,775 | |||
Automobiles – 1.3% | |||||
Ford Motor Co.(a) | 2,532,800 | 29,735,072 | |||
Hotels, Restaurants & Leisure – 0.5% | |||||
Royal Caribbean Cruises Ltd.(a) | 408,500 | 11,548,295 | |||
Household Durables – 2.3% | |||||
DR Horton, Inc. | 686,400 | 8,483,904 | |||
Fortune Brands, Inc. | 41,500 | 1,818,945 | |||
Garmin Ltd. | 386,600 | 12,351,870 | |||
NVR, Inc.(a) | 24,000 | 16,999,200 | |||
Pulte Homes, Inc.(a) | 1,042,900 | 11,294,607 | |||
| 50,948,526 | |||||
Media – 6.2% | |||||
CBS Corp. – Class B | 1,544,900 | 20,068,251 | |||
News Corp. – Class A | 2,154,400 | 28,804,328 | |||
Time Warner Cable, Inc. – Class A | 752,600 | 35,138,894 | |||
Time Warner, Inc. | 1,086,100 | 31,540,344 | |||
Viacom, Inc. – Class B(a) | 699,500 | 20,740,175 | |||
| 136,291,992 | |||||
Multiline Retail – 1.0% | |||||
JC Penney Co., Inc. | 312,300 | 8,613,234 | |||
Macy’s, Inc. | 725,800 | 13,899,070 | |||
| 22,512,304 | |||||
Specialty Retail – 3.5% | |||||
Foot Locker, Inc. | 540,900 | 7,015,473 | |||
Home Depot, Inc. | 763,300 | 23,814,960 | |||
Limited Brands, Inc. | 477,800 | 10,564,158 | |||
Lowe’s Cos., Inc. | 486,000 | 11,523,060 | |||
Office Depot, Inc.(a) | 1,962,100 | 14,166,362 | |||
Ross Stores, Inc. | 190,200 | 9,302,682 | |||
| 76,386,695 | |||||
Textiles, Apparel & Luxury Goods – 0.7% | |||||
Jones Apparel Group, Inc. | 864,600 | 14,577,156 | |||
| 352,277,815 | |||||
| ALLIANCEBERNSTEIN POOLING PORTFOLIOS • | 35 |
U.S. Value Portfolio—Portfolio of Investments
| Company | Shares | U.S. $ Value | |||
Health Care – 9.2% | |||||
Health Care Providers & Services – 2.3% | |||||
Aetna, Inc. | 656,700 | $ | 19,694,433 | ||
UnitedHealth Group, Inc.(a) | 294,400 | 9,968,384 | |||
WellPoint, Inc.(a) | 339,200 | 20,986,304 | |||
| 50,649,121 | |||||
Pharmaceuticals – 6.9% | |||||
Merck & Co., Inc. | 1,592,700 | 58,738,776 | |||
Mylan, Inc.(a) | 646,000 | 13,785,640 | |||
Pfizer, Inc. | 4,445,400 | 78,016,770 | |||
| 150,541,186 | |||||
| 201,190,307 | |||||
Consumer Staples – 8.9% | |||||
Beverages – 1.2% | |||||
Coca-Cola Enterprises, Inc. | 596,200 | 15,232,910 | |||
Constellation Brands, Inc. – Class A(a) | 732,900 | 11,022,816 | |||
| 26,255,726 | |||||
Food & Staples Retailing – 0.7% | |||||
Supervalu, Inc. | 961,100 | 14,675,997 | |||
Food Products – 4.0% | |||||
Archer-Daniels-Midland Co. | 733,100 | 21,523,816 | |||
Bunge Ltd. | 228,000 | 13,586,520 | |||
Dean Foods Co.(a) | 593,200 | 8,654,788 | |||
Kraft Foods, Inc. – Class A | 663,400 | 18,860,462 | |||
Sara Lee Corp. | 953,700 | 12,932,172 | |||
Smithfield Foods, Inc.(a) | 330,700 | 5,691,347 | |||
Tyson Foods, Inc. – Class A | 426,100 | 7,260,744 | |||
| 88,509,849 | |||||
Household Products – 1.4% | |||||
Kimberly-Clark Corp. | 70,300 | 4,270,022 | |||
Procter & Gamble Co. (The) | 436,300 | 27,609,064 | |||
| 31,879,086 | |||||
Tobacco – 1.6% | |||||
Altria Group, Inc. | 840,600 | 16,912,872 | |||
Reynolds American, Inc. | 325,600 | 17,191,680 | |||
| 34,104,552 | |||||
| 195,425,210 | |||||
Information Technology – 8.0% | |||||
Communications Equipment – 3.4% | |||||
Ciena Corp.(a) | 35,325 | 506,561 | |||
JDS Uniphase Corp.(a) | 722,800 | 7,755,644 | |||
Motorola, Inc.(a) | 6,007,900 | 40,613,404 | |||
| 36 | • ALLIANCEBERNSTEIN POOLING PORTFOLIOS |
U.S. Value Portfolio—Portfolio of Investments
| Company | Shares | U.S. $ Value | |||
Nokia Oyj (Sponsored ADR) – Class A | 1,294,900 | $ | 17,442,303 | ||
Tellabs, Inc. | 1,150,200 | 7,947,882 | |||
| 74,265,794 | |||||
Computers & Peripherals – 1.4% | |||||
Dell, Inc.(a) | 1,168,000 | 15,452,640 | |||
Seagate Technology(a) | 610,000 | 12,145,100 | |||
Western Digital Corp.(a) | 72,800 | 2,812,264 | |||
| 30,410,004 | |||||
Electronic Equipment, Instruments & Components – 1.6% | |||||
Corning, Inc. | 680,800 | 12,002,504 | |||
Tyco Electronics Ltd. | 851,200 | 21,816,256 | |||
Vishay Intertechnology, Inc.(a) | 83,800 | 858,950 | |||
| 34,677,710 | |||||
Internet Software & Services – 0.1% | |||||
AOL, Inc.(a) | 114,236 | 2,830,768 | |||
IT Services – 0.5% | |||||
Accenture PLC | 267,400 | 10,687,978 | |||
Semiconductors & Semiconductor Equipment – 0.2% | |||||
Teradyne, Inc.(a) | 556,400 | 5,558,436 | |||
Software – 0.8% | |||||
Symantec Corp.(a) | 1,008,287 | 16,687,150 | |||
| 175,117,840 | |||||
Industrials – 6.6% | |||||
Aerospace & Defense – 1.1% | |||||
Northrop Grumman Corp. | 294,400 | 18,034,944 | |||
Raytheon Co. | 121,600 | 6,838,784 | |||
| 24,873,728 | |||||
Electrical Equipment – 0.3% | |||||
Cooper Industries PLC | 167,600 | 7,602,336 | |||
Industrial Conglomerates – 3.6% | |||||
General Electric Co. | 4,435,200 | 71,229,312 | |||
Textron, Inc. | 381,500 | 7,599,480 | |||
| 78,828,792 | |||||
Machinery – 1.3% | |||||
Ingersoll-Rand PLC | 666,400 | 21,264,824 | |||
SPX Corp. | 104,800 | 6,234,552 | |||
| 27,499,376 | |||||
| ALLIANCEBERNSTEIN POOLING PORTFOLIOS • | 37 |
U.S. Value Portfolio—Portfolio of Investments
| Company | Shares | U.S. $ Value | |||
Road & Rail – 0.3% | |||||
Hertz Global Holdings, Inc.(a) | 581,300 | $ | 5,464,220 | ||
| 144,268,452 | |||||
Telecommunication Services – 5.8% | |||||
Diversified Telecommunication | |||||
AT&T, Inc. | 2,800,362 | 69,476,981 | |||
Verizon Communications, Inc. | 780,700 | 22,585,651 | |||
| 92,062,632 | |||||
Wireless Telecommunication | |||||
Sprint Nextel Corp.(a) | 5,664,200 | 18,861,786 | |||
Vodafone Group PLC (Sponsored ADR) | 717,800 | 15,626,506 | |||
| 34,488,292 | |||||
| 126,550,924 | |||||
Materials – 4.0% | |||||
Chemicals – 1.4% | |||||
EI du Pont de Nemours & Co. | 733,900 | 24,747,108 | |||
Huntsman Corp. | 520,580 | 7,147,563 | |||
| 31,894,671 | |||||
Containers & Packaging – 0.3% | |||||
Sonoco Products Co. | 210,400 | 6,223,632 | |||
Metals & Mining – 2.3% | |||||
AK Steel Holding Corp. | 552,300 | 11,891,019 | |||
Freeport-McMoRan Copper & Gold, Inc. | 350,200 | 26,321,032 | |||
Steel Dynamics, Inc. | 721,000 | 11,773,930 | |||
| 49,985,981 | |||||
| 88,104,284 | |||||
Utilities – 0.7% | |||||
Electric Utilities – 0.2% | |||||
Edison International | 172,800 | 5,638,464 | |||
Independent Power Producers & Energy | |||||
RRI Energy, Inc.(a) | 982,400 | 4,175,200 | |||
Multi-Utilities – 0.3% | |||||
CMS Energy Corp. | 277,400 | 4,235,898 | |||
NiSource, Inc. | 164,300 | 2,467,786 | |||
| 6,703,684 | |||||
| 16,517,348 | |||||
Total Common Stocks | 2,134,555,612 | ||||
| 38 | • ALLIANCEBERNSTEIN POOLING PORTFOLIOS |
U.S. Value Portfolio—Portfolio of Investments
| Company | Shares | U.S. $ Value | |||
SHORT-TERM INVESTMENTS – 2.7% | |||||
Investment Companies – 2.7% | |||||
AllianceBernstein Fixed-Income Shares, Inc. – Government STIF Portfolio, 0.11%(b) | 57,915,741 | $ | 57,915,741 | ||
Total Investments – 99.9% | 2,192,471,353 | ||||
Other assets less liabilities – 0.1% | 2,975,360 | ||||
Net Assets – 100.0% | $ | 2,195,446,713 | |||
| (a) | Non-income producing security. |
| (b) | Investment in affiliated money market mutual fund. The rate shown represents the 7-day yield as of period end. |
Glossary:
ADR – American Depositary Receipt
See notes to financial statements.
| ALLIANCEBERNSTEIN POOLING PORTFOLIOS • | 39 |
U.S. Value Portfolio—Portfolio of Investments
U.S. LARGE CAP GROWTH PORTFOLIO
PORTFOLIO OF INVESTMENTS
February 28, 2010 (unaudited)
| Company | Shares | U.S. $ Value | |||
COMMON STOCKS – 98.8% | |||||
Information Technology – 30.3% | |||||
Communications Equipment – 3.6% | |||||
Cisco Systems, Inc.(a) | 1,633,500 | $ | 39,743,055 | ||
QUALCOMM, Inc. | 812,400 | 29,806,956 | |||
Research In Motion Ltd.(a) | 126,500 | 8,966,320 | |||
| 78,516,331 | |||||
Computers & Peripherals – 12.5% | |||||
Apple, Inc.(a) | 750,160 | 153,497,739 | |||
EMC Corp.(a) | 2,710,200 | 47,401,398 | |||
Hewlett-Packard Co. | 1,408,350 | 71,530,097 | |||
| 272,429,234 | |||||
Internet Software & Services – 6.0% | |||||
Google, Inc. – Class A(a) | 250,290 | 131,852,772 | |||
Semiconductors & Semiconductor | |||||
Broadcom Corp. – Class A | 824,400 | 25,820,208 | |||
Intel Corp. | 4,122,600 | 84,636,978 | |||
KLA-Tencor Corp. | 811,000 | 23,624,430 | |||
| 134,081,616 | |||||
Software – 2.1% | |||||
Microsoft Corp. | 1,606,100 | 46,030,826 | |||
| 662,910,779 | |||||
Health Care – 17.4% | |||||
Biotechnology – 6.1% | |||||
Celgene Corp.(a) | 276,800 | 16,475,136 | |||
Gilead Sciences, Inc.(a) | 2,049,950 | 97,598,119 | |||
Vertex Pharmaceuticals, Inc.(a) | 438,000 | 17,787,180 | |||
| 131,860,435 | |||||
Health Care Equipment & | |||||
Alcon, Inc. | 756,350 | 120,804,222 | |||
Baxter International, Inc. | 563,700 | 32,091,441 | |||
Covidien PLC | 594,800 | 29,216,576 | |||
| 182,112,239 | |||||
Health Care Providers & Services – 0.5% | |||||
Medco Health Solutions, Inc.(a) | 183,200 | 11,585,568 | |||
Pharmaceuticals – 2.5% | |||||
Teva Pharmaceutical Industries Ltd. (Sponsored ADR) | 915,100 | 54,915,151 | |||
| 380,473,393 | |||||
| 40 | • ALLIANCEBERNSTEIN POOLING PORTFOLIOS |
U.S. Large Cap Growth Portfolio—Portfolio of Investments
| Company | Shares | U.S. $ Value | |||
Financials – 16.0% | |||||
Capital Markets – 8.5% | |||||
Blackstone Group LP | 2,693,500 | $ | 37,655,130 | ||
Credit Suisse Group AG (Sponsored ADR) | 291,500 | 13,000,900 | |||
Franklin Resources, Inc. | 264,800 | 26,935,456 | |||
Goldman Sachs Group, Inc. (The) | 687,000 | 107,412,450 | |||
| 185,003,936 | |||||
Diversified Financial Services – 7.2% | |||||
Bank of America Corp. | 1,801,700 | 30,016,322 | |||
CME Group, Inc. – Class A | 54,775 | 16,525,070 | |||
JPMorgan Chase & Co. | 2,648,400 | 111,153,348 | |||
| 157,694,740 | |||||
Insurance – 0.3% | |||||
Principal Financial Group, Inc. | 332,900 | 7,726,609 | |||
| 350,425,285 | |||||
Consumer Discretionary – 9.0% | |||||
Auto Components – 1.6% | |||||
Johnson Controls, Inc. | 1,105,500 | 34,381,050 | |||
Automobiles – 1.2% | |||||
Ford Motor Co.(a) | 2,232,300 | 26,207,202 | |||
Hotels, Restaurants & Leisure – 0.5% | |||||
Hyatt Hotels Corp.(a) | 291,800 | 9,754,874 | |||
Media – 1.3% | |||||
Comcast Corp. – Class A | 1,165,400 | 19,159,176 | |||
Walt Disney Co. (The) | 324,300 | 10,131,132 | |||
| 29,290,308 | |||||
Multiline Retail – 4.2% | |||||
Kohl’s Corp.(a) | 943,600 | 50,784,552 | |||
Target Corp. | 807,300 | 41,592,096 | |||
| 92,376,648 | |||||
Specialty Retail – 0.2% | |||||
Home Depot, Inc. | 140,200 | 4,374,240 | |||
| 196,384,322 | |||||
Industrials – 9.0% | |||||
Air Freight & Logistics – 0.3% | |||||
FedEx Corp. | 81,400 | 6,899,464 | |||
Electrical Equipment – 2.3% | |||||
Cooper Industries PLC | 773,000 | 35,063,280 | |||
Vestas Wind Systems A/S (ADR)(a) | 822,800 | 13,576,200 | |||
| 48,639,480 | |||||
| ALLIANCEBERNSTEIN POOLING PORTFOLIOS • | 41 |
U.S. Large Cap Growth Portfolio—Portfolio of Investments
| Company | Shares | U.S. $ Value | |||
Machinery – 6.4% | |||||
Danaher Corp. | 682,600 | $ | 50,491,922 | ||
Dover Corp. | 633,300 | 28,663,158 | |||
Illinois Tool Works, Inc. | 1,340,000 | 60,996,800 | |||
| 140,151,880 | |||||
| 195,690,824 | |||||
Energy – 8.2% | |||||
Energy Equipment & Services – 5.2% | |||||
Cameron International Corp.(a) | 721,700 | 29,683,521 | |||
Schlumberger Ltd. | 1,371,935 | 83,825,228 | |||
| 113,508,749 | |||||
Oil, Gas & Consumable Fuels – 3.0% | |||||
EOG Resources, Inc. | 85,200 | 8,013,060 | |||
Noble Energy, Inc. | 483,500 | 35,121,440 | |||
Occidental Petroleum Corp. | 93,800 | 7,489,930 | |||
Suncor Energy, Inc. | 535,500 | 15,481,305 | |||
| 66,105,735 | |||||
| 179,614,484 | |||||
Consumer Staples – 5.1% | |||||
Beverages – 2.2% | |||||
Anheuser-Busch InBev NV (Sponsored ADR)(a) | 164,100 | 8,196,795 | |||
PepsiCo, Inc. | 652,300 | 40,749,181 | |||
| 48,945,976 | |||||
Food & Staples Retailing – 2.7% | |||||
Costco Wholesale Corp. | 750,900 | 45,782,373 | |||
CVS Caremark Corp. | 243,000 | 8,201,250 | |||
Wal-Mart Stores, Inc. | 80,050 | 4,328,304 | |||
| 58,311,927 | |||||
Tobacco – 0.2% | |||||
Philip Morris International, Inc. | 96,400 | 4,721,672 | |||
| 111,979,575 | |||||
Materials – 3.8% | |||||
Chemicals – 1.2% | |||||
Air Products & Chemicals, Inc. | 161,320 | 11,063,326 | |||
Dow Chemical Co. (The) | 537,500 | 15,216,625 | |||
| 26,279,951 | |||||
Metals & Mining – 2.6% | |||||
ArcelorMittal (New York) | 547,250 | 20,915,895 | |||
Freeport-McMoRan Copper & Gold, Inc. | 416,700 | 31,319,172 | |||
Vale SA (Sponsored ADR) – Class B | 133,600 | 3,722,096 | |||
| 55,957,163 | |||||
| 82,237,114 | |||||
Total Common Stocks | 2,159,715,776 | ||||
| 42 | • ALLIANCEBERNSTEIN POOLING PORTFOLIOS |
U.S. Large Cap Growth Portfolio—Portfolio of Investments
| Company | Shares | U.S. $ Value | |||
SHORT-TERM INVESTMENTS – 1.0% | |||||
Investment Companies – 1.0% | |||||
AllianceBernstein Fixed-Income Shares, Inc. – Government STIF Portfolio, 0.11%(b) | 21,820,040 | $ | 21,820,040 | ||
Total Investments – 99.8% | 2,181,535,816 | ||||
Other assets less liabilities – 0.2% | 3,481,577 | ||||
Net Assets – 100.0% | $ | 2,185,017,393 | |||
| (a) | Non-income producing security. |
| (b) | Investment in affiliated money market mutual fund. The rate shown represents the 7-day yield as of period end. |
Glossary:
ADR – American Depositary Receipt
LP – Limited Partnership
See notes to financial statements.
| ALLIANCEBERNSTEIN POOLING PORTFOLIOS • | 43 |
U.S. Large Cap Growth Portfolio—Portfolio of Investments
GLOBAL REAL ESTATE INVESTMENT PORTFOLIO
PORTFOLIO OF INVESTMENTS
February 28, 2010 (unaudited)
| Company | Shares | U.S. $ Value | |||
COMMON STOCKS – 96.3% | |||||
Equity: Other – 41.7% | |||||
Diversified/Specialty – 36.7% | |||||
Alexandria Real Estate Equities, Inc. | 79,306 | $ | 4,886,836 | ||
BioMed Realty Trust, Inc. | 621,945 | 9,609,050 | |||
British Land Co. PLC | 1,628,812 | 10,931,703 | |||
Canadian Real Estate Investment Trust | 314,162 | 8,404,923 | |||
CB Richard Ellis Group, Inc. – Class A(a) | 467,600 | 6,172,320 | |||
Crown Castle International Corp.(a) | 138,600 | 5,239,080 | |||
Dexus Property Group | 6,788,000 | 5,005,130 | |||
Digital Realty Trust, Inc. | 259,700 | 13,395,326 | |||
DuPont Fabros Technology, Inc.(a) | 274,659 | 5,383,316 | |||
Entertainment Properties Trust | 265,400 | 10,143,588 | |||
Fonciere Des Regions | 66,600 | 6,640,962 | |||
GPT Group | 20,552,000 | 10,553,975 | |||
H&R Real Estate Investment Trust | 335,100 | 5,222,999 | |||
Henderson Land Development Co., Ltd. | 1,739,000 | 11,746,862 | |||
Jones Lang LaSalle, Inc. | 77,600 | 4,942,344 | |||
Kerry Properties Ltd. | 2,432,191 | 11,523,412 | |||
Land Securities Group PLC | 701,209 | 6,765,718 | |||
Lend Lease Group | 1,932,655 | 16,789,735 | |||
Mitchells & Butlers PLC(a) | 1,649,700 | 7,139,033 | |||
Mitsubishi Estate Co., Ltd. | 489,000 | 7,667,101 | |||
Mitsui Fudosan Co., Ltd. | 2,381,000 | 40,231,343 | |||
Morguard Real Estate Investment Trust | 560,500 | 6,887,726 | |||
New World Development Ltd. | 9,754,157 | 17,815,157 | |||
Savills PLC | 1,384,400 | 6,575,847 | |||
Sumitomo Realty & Development Co., Ltd. | 674,000 | 11,949,153 | |||
Sun Hung Kai Properties Ltd. | 3,109,600 | 43,147,407 | |||
Swire Pacific Ltd. | 462,500 | 5,170,138 | |||
Telecity Group PLC(a) | 1,093,525 | 6,222,378 | |||
Unibail-Rodamco SE | 238,118 | 46,982,159 | |||
UOL Group Ltd. | 868,000 | 2,454,177 | |||
Vornado Realty Trust | 124,212 | 8,163,213 | |||
Wereldhave NV | 84,500 | 7,601,942 | |||
| 371,364,053 | |||||
Health Care – 4.5% | |||||
Chartwell Seniors Housing Real Estate Investment Trust | 873,000 | 6,330,536 | |||
HCP, Inc. | 240,915 | 6,933,534 | |||
Health Care REIT, Inc. | 236,900 | 10,035,084 | |||
Omega Healthcare Investors, Inc. | 394,051 | 7,475,147 | |||
Ventas, Inc. | 317,210 | 14,017,510 | |||
| 44,791,811 | |||||
| 44 | • ALLIANCEBERNSTEIN POOLING PORTFOLIOS |
Global Real Estate Investment Portfolio—Portfolio of Investments
| Company | Shares | U.S. $ Value | |||
Triple Net – 0.5% | |||||
National Retail Properties, Inc. | 245,300 | $ | 5,205,266 | ||
| 421,361,130 | |||||
Retail – 19.1% | |||||
Regional Mall – 12.3% | |||||
BR Malls Participacoes SA(a) | 330,200 | 4,293,888 | |||
CapitaMall Trust | 4,189,420 | 5,267,049 | |||
CBL & Associates Properties, Inc. | 690,737 | 8,212,863 | |||
Macerich Co. (The) | 90,400 | 3,221,856 | |||
Multiplan Empreendimentos Imobiliarios SA | 1,056,505 | 18,263,684 | |||
Simon Property Group, Inc. | 582,542 | 45,607,213 | |||
Taubman Centers, Inc. | 35,200 | 1,363,296 | |||
Westfield Group | 3,505,816 | 37,691,737 | |||
| 123,921,586 | |||||
Shopping Center/Other Retail – 6.8% | |||||
Corio NV | 143,500 | 8,875,217 | |||
Kimco Realty Corp. | 484,500 | 6,729,705 | |||
Klepierre(a) | 611,429 | 22,757,056 | |||
Macquarie CountryWide Trust | 3,711,064 | 1,892,669 | |||
Primaris Retail Real Estate Investment Trust | 398,199 | 6,482,749 | |||
RioCan Real Estate Investment Trust(b) | 132,100 | 2,391,660 | |||
RioCan Real Estate Investment Trust (Toronto) | 267,689 | 4,846,489 | |||
Tanger Factory Outlet Centers | 125,600 | 5,233,752 | |||
Weingarten Realty Investors | 482,296 | 9,930,475 | |||
| 69,139,772 | |||||
| 193,061,358 | |||||
Residential – 15.1% | |||||
Multi-Family – 12.1% | |||||
Agile Property Holdings Ltd. | 5,122,000 | 6,528,415 | |||
Camden Property Trust | 18,800 | 752,940 | |||
Equity Residential | 265,800 | 9,590,064 | |||
Essex Property Trust, Inc. | 67,600 | 5,806,840 | |||
GAGFAH SA | 528,800 | 4,847,967 | |||
Home Properties, Inc. | 124,700 | 5,711,260 | |||
KWG Property Holding Ltd. | 5,266,000 | 3,494,570 | |||
Mid-America Apartment Communities, Inc. | 199,400 | 10,356,836 | |||
MRV Engenharia e Participacoes SA | 1,512,500 | 10,964,087 | |||
NVR, Inc.(a) | 10,800 | 7,649,640 | |||
Shimao Property Holdings Ltd. | 2,125,000 | 3,537,276 | |||
Sino-Ocean Land Holdings Ltd. | 6,837,000 | 6,032,625 | |||
Stockland | 4,217,660 | 15,289,499 | |||
UDR, Inc. | 607,900 | 10,212,720 | |||
Wing Tai Holdings Ltd. | 8,420,000 | 10,061,214 | |||
Yanlord Land Group Ltd. | 8,803,000 | 11,199,073 | |||
| 122,035,026 | |||||
| ALLIANCEBERNSTEIN POOLING PORTFOLIOS • | 45 |
Global Real Estate Investment Portfolio—Portfolio of Investments
| Company | Shares | U.S. $ Value | |||
Self Storage – 2.7% | |||||
Extra Space Storage, Inc. | 664,067 | $ | 7,490,676 | ||
Public Storage | 247,500 | 20,342,025 | |||
| 27,832,701 | |||||
Student Housing – 0.3% | |||||
Education Realty Trust, Inc. | 553,100 | 3,014,395 | |||
| 152,882,122 | |||||
Office – 12.3% | |||||
Office – 12.3% | |||||
Allied Properties Real Estate Investment Trust | 326,200 | 5,921,327 | |||
Brandywine Realty Trust | 863,685 | 9,681,909 | |||
Brookfield Properties Corp. | 406,656 | 5,640,319 | |||
Cominar Real Estate Investment Trust | 431,589 | 7,822,089 | |||
Corporate Office Properties Trust | 268,926 | 9,904,545 | |||
Duke Realty Corp. | 998,650 | 11,085,015 | |||
Government Properties Income Trust | 296,400 | 6,980,220 | |||
Great Portland Estates PLC | 1,081,300 | 4,635,494 | |||
Hongkong Land Holdings Ltd. | 4,180,000 | 19,213,846 | |||
ING Office Fund | 13,448,600 | 7,252,350 | |||
Japan Real Estate Investment Corp. | 52 | 449,374 | |||
Kilroy Realty Corp. | 170,800 | 4,838,764 | |||
Mack-Cali Realty Corp. | 223,390 | 7,492,501 | |||
Nippon Building Fund, Inc. | 571 | 5,056,142 | |||
Nomura Real Estate Office Fund, Inc. | 1,263 | 7,411,785 | |||
NTT Urban Development Corp. | 7,434 | 5,916,037 | |||
Orix JREIT, Inc. | 1,076 | 5,167,386 | |||
| 124,469,103 | |||||
Lodging – 5.6% | |||||
Lodging – 5.6% | |||||
DiamondRock Hospitality Co.(a) | 702,033 | 6,276,175 | |||
Great Eagle Holdings Ltd. | 503,000 | 1,418,933 | |||
Host Hotels & Resorts, Inc.(a) | 459,774 | 5,383,954 | |||
Hyatt Hotels Corp.(a) | 170,986 | 5,716,062 | |||
InnVest Real Estate Investment Trust | 924,700 | 4,956,575 | |||
LaSalle Hotel Properties | 230,378 | 4,471,637 | |||
Sunstone Hotel Investors, Inc.(a) | 1,140,741 | 10,198,224 | |||
Whitbread PLC | 452,500 | 9,800,341 | |||
Wyndham Worldwide Corp. | 382,000 | 8,782,180 | |||
| 57,004,081 | |||||
Industrials – 2.5% | |||||
Industrial Warehouse Distribution – 2.5% | |||||
Ascendas Real Estate Investment Trust | 8,708,000 | 11,963,653 | |||
ProLogis | 1,007,057 | 12,980,965 | |||
| 24,944,618 | |||||
Total Common Stocks | 973,722,412 | ||||
| 46 | • ALLIANCEBERNSTEIN POOLING PORTFOLIOS |
Global Real Estate Investment Portfolio—Portfolio of Investments
| Company | Shares | U.S. $ Value | |||
WARRANTS – 0.6% | |||||
Equity: Other – 0.6% | |||||
Diversified/Specialty – 0.6% | |||||
Aldar Properties PJSC, expiring 10/22/12(a) | 1,685,300 | $ | 1,629,685 | ||
Aldar Properties PJSC, expiring 5/15/10(a) | 4,606,600 | 4,454,582 | |||
Fonciere Des Regions, expiring 12/31/10(a) | 66,600 | 44,527 | |||
Total Warrants | 6,128,794 | ||||
SHORT-TERM INVESTMENTS – 2.0% | |||||
Investment Companies – 2.0% | |||||
AllianceBernstein Fixed-Income Shares, Inc. – Government STIF Portfolio, 0.11%(c) | 20,192,200 | 20,192,200 | |||
Total Investments – 98.9% | 1,000,043,406 | ||||
Other assets less liabilities – 1.1% | 11,437,604 | ||||
Net Assets – 100.0% | $ | 1,011,481,010 | |||
FORWARD CURRENCY EXCHANGE CONTRACTS (see Note C)
| Contract Amount (000) | U.S. $ Value on Origination Date | U.S. $ Value at February 28, 2010 | Unrealized Appreciation/ (Depreciation) | |||||||||
Buy Contracts: | ||||||||||||
Australian Dollar settling 4/15/10 | 6,476 | $ | 5,585,939 | $ | 5,777,296 | $ | 191,357 | |||||
Australian Dollar settling 4/15/10 | 6,441 | 5,884,498 | 5,746,072 | (138,426 | ) | |||||||
Australian Dollar settling 4/15/10 | 33,298 | 30,644,149 | 29,705,433 | (938,716 | ) | |||||||
British Pound settling 4/15/10 | 16,812 | 27,091,866 | 25,627,139 | (1,464,727 | ) | |||||||
Japanese Yen settling 4/15/10 | 486,343 | 5,265,903 | 5,475,153 | 209,250 | ||||||||
Japanese Yen settling 4/15/10 | 976,720 | 10,924,058 | 10,995,720 | 71,662 | ||||||||
New Zealand Dollar settling 4/15/10 | 40,035 | 29,434,533 | 27,871,675 | (1,562,858 | ) | |||||||
Norwegian Krone settling 4/15/10 | 173,989 | 30,835,445 | 29,383,432 | (1,452,013 | ) | |||||||
Swedish Krona settling 4/15/10 | 140,937 | 20,082,217 | 19,768,895 | (313,322 | ) | |||||||
Sale Contracts: | ||||||||||||
Canadian Dollar settling 4/15/10 | 11,483 | 11,064,433 | 10,912,534 | 151,899 | ||||||||
Canadian Dollar settling 4/15/10 | 12,885 | 12,014,098 | 12,244,883 | (230,785 | ) | |||||||
Euro settling 4/15/10 | 30,451 | 44,170,698 | 41,461,073 | 2,709,625 | ||||||||
Euro settling 4/15/10 | 15,621 | 22,640,452 | 21,269,036 | 1,371,416 | ||||||||
Japanese Yen settling 4/15/10 | 486,343 | 5,350,014 | 5,475,153 | (125,139 | ) | |||||||
| ALLIANCEBERNSTEIN POOLING PORTFOLIOS • | 47 |
Global Real Estate Investment Portfolio—Portfolio of Investments
| (a) | Non-income producing security. |
| (b) | Security is exempt from registration under Rule 144A of the Securities Act of 1933. This security is considered liquid and may be resold in transactions exempt from registration, normally to qualified institutional buyers. At February 28, 2010, the market value of this security amounted to $2,391,660 or 0.2% of net assets. |
| (c) | Investment in affiliated money market mutual fund. The rate shown represents the 7-day yield as of period end. |
Glossary:
REIT – Real Estate Investment Trust
See notes to financial statements.
| 48 | • ALLIANCEBERNSTEIN POOLING PORTFOLIOS |
Global Real Estate Investment Portfolio—Portfolio of Investments
INTERNATIONAL VALUE PORTFOLIO
PORTFOLIO OF INVESTMENTS
February 28, 2010 (unaudited)
| Company | Shares | U.S. $ Value | |||
COMMON STOCKS – 96.0% | |||||
Financials – 25.9% | |||||
Capital Markets – 2.0% | |||||
Deutsche Bank AG | 249,600 | $ | 15,850,627 | ||
Macquarie Group Ltd. | 154,000 | 6,232,091 | |||
| 22,082,718 | |||||
Commercial Banks – 15.2% | |||||
Australia & New Zealand Banking Group Ltd. | 449,600 | 9,304,715 | |||
Banco do Brasil SA | 762,700 | 12,564,302 | |||
Banco Santander SA | 1,362,661 | 17,716,230 | |||
Barclays PLC | 2,544,200 | 12,158,410 | |||
BNP Paribas | 276,870 | 20,002,894 | |||
Credit Agricole SA | 816,582 | 12,124,016 | |||
Danske Bank A/S(a) | 272,300 | 6,190,656 | |||
KB Financial Group, Inc. | 306,062 | 12,842,236 | |||
National Australia Bank Ltd. | 651,400 | 14,842,398 | |||
National Bank of Canada | 90,400 | 5,176,392 | |||
Societe Generale | 309,070 | 16,986,573 | |||
Sumitomo Mitsui Financial Group, Inc. | 309,300 | 9,935,241 | |||
Turkiye Garanti Bankasi AS | 2,280,300 | 8,393,831 | |||
UniCredit SpA(a) | 4,084,800 | 10,323,500 | |||
| 168,561,394 | |||||
Consumer Finance – 1.2% | |||||
ORIX Corp. | 169,100 | 12,957,190 | |||
Insurance – 3.9% | |||||
Allianz SE | 157,100 | 18,125,265 | |||
Aviva PLC | 791,395 | 4,714,188 | |||
Muenchener Rueckversicherungs AG (MunichRe) | 73,000 | 11,290,277 | |||
Old Mutual PLC(a) | 3,571,900 | 6,179,607 | |||
Sun Life Financial, Inc. | 112,900 | 3,218,970 | |||
| 43,528,307 | |||||
Real Estate Investment Trusts | |||||
Klepierre | 132,700 | 4,939,022 | |||
Unibail-Rodamco SE | 34,400 | 6,787,334 | |||
| 11,726,356 | |||||
Real Estate Management & | |||||
Lend Lease Group | 453,200 | 3,937,127 | |||
Mitsui Fudosan Co., Ltd. | 728,000 | 12,300,889 | |||
New World Development Ltd. | 3,805,224 | 6,949,926 | |||
Sumitomo Realty & Development Co., Ltd. | 226,000 | 4,006,689 | |||
| 27,194,631 | |||||
| 286,050,596 | |||||
| ALLIANCEBERNSTEIN POOLING PORTFOLIOS • | 49 |
International Value Portfolio—Portfolio of Investments
| Company | Shares | U.S. $ Value | |||
Industrials – 11.6% | |||||
Aerospace & Defense – 2.2% | |||||
BAE Systems PLC | 2,110,300 | $ | 12,053,365 | ||
Rolls-Royce Group PLC(a) | 1,430,900 | 12,181,373 | |||
| 24,234,738 | |||||
Air Freight & Logistics – 0.7% | |||||
Deutsche Post AG | 506,100 | 8,230,725 | |||
Airlines – 0.6% | |||||
Qantas Airways Ltd. | 2,703,029 | 6,375,500 | |||
Building Products – 0.7% | |||||
Compagnie de St-Gobain | 166,300 | 7,805,826 | |||
Construction & Engineering – 0.5% | |||||
Bouygues SA | 112,500 | 5,162,385 | |||
Industrial Conglomerates – 0.8% | |||||
Bidvest Group Ltd. | 536,453 | 9,177,484 | |||
Machinery – 0.6% | |||||
Vallourec SA | 37,004 | 7,052,426 | |||
Professional Services – 1.3% | |||||
Adecco SA | 90,200 | 4,484,985 | |||
Randstad Holding NV(a) | 238,600 | 9,977,318 | |||
| 14,462,303 | |||||
Road & Rail – 0.4% | |||||
East Japan Railway Co. | 61,400 | 4,228,095 | |||
Trading Companies & | |||||
ITOCHU Corp. | 420,000 | 3,379,166 | |||
Mitsubishi Corp. | 548,400 | 13,679,254 | |||
Mitsui & Co., Ltd. | 710,200 | 11,007,159 | |||
Wolseley PLC(a) | 438,400 | 10,348,551 | |||
| 38,414,130 | |||||
Transportation Infrastructure – 0.3% | |||||
Intoll Group | 3,219,500 | 3,229,711 | |||
| 128,373,323 | |||||
Energy – 10.9% | |||||
Oil, Gas & Consumable Fuels – 10.9% | |||||
BP PLC | 2,310,500 | 20,357,445 | |||
ENI SpA | 621,800 | 14,033,416 | |||
Gazprom OAO (Sponsored ADR) | 320,900 | 7,136,816 | |||
KazMunaiGas Exploration Production (GDR)(b) | 192,600 | 4,649,364 | |||
| 50 | • ALLIANCEBERNSTEIN POOLING PORTFOLIOS |
International Value Portfolio—Portfolio of Investments
| Company | Shares | U.S. $ Value | |||
LUKOIL OAO (London) (Sponsored ADR) | 165,900 | $ | 8,709,750 | ||
Nexen, Inc. (Toronto) | 516,623 | 11,661,087 | |||
Nippon Mining Holdings, Inc. | 928,000 | 4,620,111 | |||
Penn West Energy Trust | 169,400 | 3,472,684 | |||
Royal Dutch Shell PLC (Euronext Amsterdam) – Class A | 1,152,052 | 31,472,123 | |||
Suncor Energy, Inc. (Toronto) | 327,548 | 9,466,579 | |||
Yanzhou Coal Mining Co., Ltd. – Class H | 2,130,000 | 4,535,661 | |||
| 120,115,036 | |||||
Consumer Discretionary – 9.4% | |||||
Automobiles – 2.3% | |||||
Bayerische Motoren Werke AG | 226,000 | 9,160,922 | |||
Nissan Motor Co., Ltd.(a) | 2,134,900 | 16,882,887 | |||
| 26,043,809 | |||||
Hotels, Restaurants & Leisure – 1.2% | |||||
TABCORP Holdings Ltd. | 712,900 | 4,315,901 | |||
Thomas Cook Group PLC | 974,200 | 3,503,297 | |||
TUI Travel PLC | 1,205,700 | 5,043,501 | |||
| 12,862,699 | |||||
Household Durables – 1.8% | |||||
Sharp Corp. | 744,000 | 8,609,152 | |||
Sony Corp. | 322,000 | 10,964,677 | |||
| 19,573,829 | |||||
Media – 2.5% | |||||
Lagardere SCA | 174,400 | 6,364,126 | |||
Vivendi SA | 471,330 | 11,859,232 | |||
WPP PLC | 991,100 | 9,097,936 | |||
| 27,321,294 | |||||
Multiline Retail – 0.4% | |||||
Marks & Spencer Group PLC | 936,000 | 4,713,564 | |||
Specialty Retail – 0.9% | |||||
Esprit Holdings Ltd. | 1,464,100 | 10,461,576 | |||
Textiles, Apparel & Luxury Goods – 0.3% | |||||
Yue Yuen Industrial Holdings Ltd. | 1,049,000 | 3,114,173 | |||
| 104,090,944 | |||||
Telecommunication Services – 8.8% | |||||
Diversified Telecommunication | |||||
Bezeq Israeli Telecommunication Corp. Ltd. | 1,443,100 | 3,752,278 | |||
France Telecom SA | 521,200 | 12,192,760 | |||
Nippon Telegraph & Telephone Corp. | 351,000 | 15,306,825 | |||
Telecom Corp. of New Zealand Ltd. | 2,404,100 | 3,807,556 | |||
Telecom Italia SpA (ordinary shares) | 6,603,400 | 9,406,165 | |||
| ALLIANCEBERNSTEIN POOLING PORTFOLIOS • | 51 |
International Value Portfolio—Portfolio of Investments
| Company | Shares | U.S. $ Value | |||
Telecom Italia SpA (savings shares) | 4,931,400 | $ | 5,233,903 | ||
Telefonica SA | 383,100 | 8,983,867 | |||
TELUS Corp. | 112,200 | 3,530,642 | |||
| 62,213,996 | |||||
Wireless Telecommunication | |||||
KDDI Corp. | 1,415 | 7,541,002 | |||
Vodafone Group PLC | 12,642,937 | 27,319,446 | |||
| 34,860,448 | |||||
| 97,074,444 | |||||
Information Technology – 8.4% | |||||
Communications Equipment – 1.9% | |||||
Nokia Oyj | 1,518,700 | 20,508,820 | |||
Computers & Peripherals – 1.9% | |||||
Compal Electronics, Inc. (GDR)(a)(b) | 1,314,800 | 9,428,825 | |||
Toshiba Corp.(a) | 2,253,000 | 11,269,746 | |||
| 20,698,571 | |||||
Electronic Equipment, Instruments & | |||||
AU Optronics Corp. | 10,533,790 | 10,878,160 | |||
Hitachi High-Technologies Corp. | 159,600 | 3,267,223 | |||
Murata Manufacturing Co., Ltd. | 201,000 | 10,658,199 | |||
| 24,803,582 | |||||
Semiconductors & Semiconductor | |||||
Hynix Semiconductor, Inc.(a) | 429,600 | 7,774,521 | |||
Samsung Electronics Co., Ltd. | 22,330 | 14,315,400 | |||
Samsung Electronics Co., Ltd. (Preference Shares) | 11,500 | 4,831,646 | |||
| 26,921,567 | |||||
| 92,932,540 | |||||
Health Care – 7.3% | |||||
Health Care Providers & Services – 0.3% | |||||
Celesio AG | 101,700 | 2,962,527 | |||
Pharmaceuticals – 7.0% | |||||
AstraZeneca PLC | 373,800 | 16,510,686 | |||
Bayer AG | 256,500 | 16,998,354 | |||
GlaxoSmithKline PLC | 150,300 | 2,778,741 | |||
Novartis AG | 375,110 | 20,784,536 | |||
Sanofi-Aventis SA | 283,319 | 20,677,256 | |||
| 77,749,573 | |||||
| 80,712,100 | |||||
| 52 | • ALLIANCEBERNSTEIN POOLING PORTFOLIOS |
International Value Portfolio—Portfolio of Investments
| Company | Shares | U.S. $ Value | |||
Materials – 6.2% | |||||
Chemicals – 1.2% | |||||
BASF SE | 130,400 | $ | 7,322,841 | ||
Koninklijke DSM NV | 148,100 | 6,185,357 | |||
| 13,508,198 | |||||
Metals & Mining – 5.0% | |||||
JFE Holdings, Inc. | 170,600 | 6,331,646 | |||
Kazakhmys PLC(a) | 282,900 | 5,786,853 | |||
MMC Norilsk Nickel (ADR)(a) | 203,370 | 3,068,853 | |||
Rio Tinto PLC | 310,500 | 16,034,386 | |||
Tata Steel Ltd. | 1,000,900 | 12,475,857 | |||
Xstrata PLC(a) | 730,040 | 11,474,984 | |||
| 55,172,579 | |||||
| 68,680,777 | |||||
Consumer Staples – 4.0% | |||||
Beverages – 1.4% | |||||
Asahi Breweries Ltd. | 261,300 | 5,008,298 | |||
Carlsberg A/S(a) | 135,300 | 10,456,422 | |||
| 15,464,720 | |||||
Food & Staples Retailing – 2.0% | |||||
Aeon Co., Ltd. | 685,700 | 7,054,031 | |||
Casino Guichard Perrachon SA | 91,600 | 7,359,499 | |||
Koninklijke Ahold NV | 615,640 | 7,529,201 | |||
Metro AG | 5,900 | 302,536 | |||
| 22,245,267 | |||||
Tobacco – 0.6% | |||||
Japan Tobacco, Inc. | 1,866 | 6,777,869 | |||
| 44,487,856 | |||||
Utilities – 3.5% | |||||
Electric Utilities – 2.7% | |||||
E.ON AG | 453,100 | 16,123,889 | |||
EDF SA | 208,700 | 10,459,090 | |||
Tokyo Electric Power Co., Inc. (The) | 141,700 | 3,890,960 | |||
| 30,473,939 | |||||
Gas Utilities – 0.3% | |||||
Tokyo Gas Co., Ltd. | 745,000 | 3,246,610 | |||
Multi-Utilities – 0.5% | |||||
RWE AG | 63,340 | 5,364,142 | |||
| 39,084,691 | |||||
Total Common Stocks | 1,061,602,307 | ||||
| ALLIANCEBERNSTEIN POOLING PORTFOLIOS • | 53 |
International Value Portfolio—Portfolio of Investments
| Company | Shares | U.S. $ Value | |||
SHORT-TERM INVESTMENTS – 2.7% | |||||
Investment Companies – 2.7% | |||||
AllianceBernstein Fixed-Income Shares, Inc. – Government STIF Portfolio, 0.11%(c) | 29,768,403 | $ | 29,768,403 | ||
Total Investments – 98.7% | 1,091,370,710 | ||||
Other assets less liabilities – 1.3% | 14,611,080 | ||||
Net Assets – 100.0% | $ | 1,105,981,790 | |||
FUTURES CONTRACTS (see Note C)
| Type | Number of Contracts | Expiration Month | Original Value | Value at February 28, 2010 | Unrealized Appreciation/ (Depreciation) | |||||||||
Purchased Contracts | ||||||||||||||
EURO STOXX 50 | 80 | March 2010 | $ | 3,063,311 | $ | 2,967,308 | $ | (96,003 | ) | |||||
FTSE 100 Index Futures | 70 | March 2010 | 5,507,696 | 5,695,964 | 188,268 | |||||||||
TOPIX Index Futures | 132 | March 2010 | 13,595,930 | 13,237,886 | (358,044 | ) | ||||||||
| $ | (265,779 | ) | ||||||||||||
FORWARD CURRENCY EXCHANGE CONTRACTS (see Note C)
| Contract Amount (000) | U.S. $ Value on Origination Date | U.S. $ Value at February 28, 2010 | Unrealized Appreciation/ (Depreciation) | |||||||||
Buy Contracts: | ||||||||||||
Australian Dollar settling 5/18/10 | 59,093 | $ | 51,224,767 | $ | 52,529,712 | $ | 1,304,945 | |||||
Japanese Yen settling 5/18/10 | 578,471 | 6,465,314 | 6,513,568 | 48,254 | ||||||||
New Zealand Dollar settling 5/18/10 | 72,523 | 49,980,676 | 50,375,867 | 395,191 | ||||||||
Norwegian Krone settling 5/18/10 | 284,987 | 47,877,663 | 48,052,034 | 174,371 | ||||||||
Swedish Krona settling 5/18/10 | 369,049 | 50,497,243 | 51,768,850 | 1,271,607 | ||||||||
Swedish Krona settling 5/18/10 | 33,648 | 4,735,240 | 4,720,019 | (15,221 | ) | |||||||
Sale Contracts: | ||||||||||||
Canadian Dollar settling 5/18/10 | 33,129 | 31,060,088 | 31,481,859 | (421,771 | ) | |||||||
Euro settling 5/18/10 | 86,028 | 118,157,737 | 117,127,570 | 1,030,167 | ||||||||
Euro settling 5/18/10 | 29,208 | 40,146,396 | 39,766,844 | 379,552 | ||||||||
| 54 | • ALLIANCEBERNSTEIN POOLING PORTFOLIOS |
International Value Portfolio—Portfolio of Investments
| (a) | Non-income producing security. |
| (b) | Security is exempt from registration under Rule 144A of the Securities Act of 1933. These securities are considered liquid and may be resold in transactions exempt from registration, normally to qualified institutional buyers. At February 28, 2010, the aggregate market value of these securities amounted to $14,078,189 or 1.3% of net assets. |
| (c) | Investment in affiliated money market mutual fund. The rate shown represents the 7-day yield as of period end. |
Glossary:
ADR – American Depositary Receipt
GDR – Global Depositary Receipt
REIT – Real Estate Investment Trust
See notes to financial statements.
| ALLIANCEBERNSTEIN POOLING PORTFOLIOS • | 55 |
International Value Portfolio—Portfolio of Investments
INTERNATIONAL GROWTH PORTFOLIO
PORTFOLIO OF INVESTMENTS
February 28, 2010 (unaudited)
| Company | Shares | U.S. $ Value | |||
COMMON STOCKS – 97.2% | |||||
Financials – 19.2% | |||||
Capital Markets – 6.3% | |||||
Credit Suisse Group AG | 609,106 | $ | 27,117,904 | ||
Julius Baer Group Ltd. | 398,019 | 12,382,402 | |||
Macquarie Group Ltd. | 481,700 | 19,493,495 | |||
Man Group PLC | 3,203,053 | 10,983,549 | |||
| 69,977,350 | |||||
Commercial Banks – 11.3% | |||||
Banco Santander SA | 1,526,579 | 19,847,360 | |||
BNP Paribas | 100,005 | 7,225,013 | |||
HDFC Bank Ltd. | 155,300 | 5,752,235 | |||
HSBC Holdings PLC | 2,114,800 | 23,297,420 | |||
Industrial & Commercial Bank of China Ltd. – Class H | 10,376,000 | 7,337,097 | |||
Itau Unibanco Holding SA (ADR) | 1,266,780 | 25,284,929 | |||
Standard Chartered PLC | 1,557,342 | 37,117,822 | |||
| 125,861,876 | |||||
Diversified Financial Services – 1.0% | |||||
Hong Kong Exchanges and Clearing Ltd. | 669,200 | 11,201,757 | |||
Insurance – 0.6% | |||||
QBE Insurance Group Ltd. | 305,302 | 5,845,612 | |||
| 212,886,595 | |||||
Consumer Staples – 12.5% | |||||
Beverages – 2.5% | |||||
Anheuser-Busch InBev NV | 551,577 | 27,544,202 | |||
Food & Staples Retailing – 2.2% | |||||
Tesco PLC | 3,750,180 | 24,013,506 | |||
Food Products – 4.8% | |||||
Nestle SA | 697,186 | 34,705,969 | |||
Unilever NV | 606,800 | 18,241,649 | |||
| 52,947,618 | |||||
Personal Products – 0.9% | |||||
L’Oreal SA | 98,856 | 10,225,694 | |||
Tobacco – 2.1% | |||||
British American Tobacco PLC | 704,860 | 23,965,712 | |||
| 138,696,732 | |||||
Materials – 11.5% | |||||
Chemicals – 2.0% | |||||
Syngenta AG | 41,228 | 10,682,970 | |||
Yara International ASA | 287,000 | 11,822,797 | |||
| 22,505,767 | |||||
| 56 | • ALLIANCEBERNSTEIN POOLING PORTFOLIOS |
International Growth Portfolio—Portfolio of Investments
| Company | Shares | U.S. $ Value | |||
Construction Materials – 0.7% | |||||
CRH PLC (London) | 354,300 | $ | 8,065,589 | ||
Metals & Mining – 8.8% | |||||
ArcelorMittal (Euronext Amsterdam) | 525,900 | 20,067,965 | |||
BHP Billiton PLC | 710,060 | 21,797,522 | |||
Impala Platinum Holdings Ltd. | 358,300 | 8,725,409 | |||
Rio Tinto PLC | 378,200 | 19,530,451 | |||
Vale SA (Sponsored ADR) – Class B | 609,300 | 16,975,098 | |||
Xstrata PLC(a) | 670,010 | 10,531,415 | |||
| 97,627,860 | |||||
| 128,199,216 | |||||
Health Care – 11.5% | |||||
Health Care Providers & Services – 1.0% | |||||
Fresenius Medical Care AG & Co. KGaA | 215,600 | 11,265,830 | |||
Pharmaceuticals – 10.5% | |||||
Bayer AG(a) | 258,613 | 17,138,384 | |||
Novartis AG | 40,410 | 2,239,085 | |||
Novo Nordisk A/S – Class B | 133,846 | 9,499,487 | |||
Roche Holding AG | 176,743 | 29,528,342 | |||
Sanofi-Aventis | 358,193 | 26,141,728 | |||
Teva Pharmaceutical Industries Ltd. (Sponsored ADR) | 531,800 | 31,913,318 | |||
| 116,460,344 | |||||
| 127,726,174 | |||||
Industrials – 11.1% | |||||
Aerospace & Defense – 1.4% | |||||
BAE Systems PLC | 2,725,425 | 15,566,765 | |||
Airlines – 0.3% | |||||
British Airways PLC(a) | 1,079,900 | 3,484,788 | |||
Electrical Equipment – 2.0% | |||||
ABB Ltd.(a) | 725,100 | 14,690,896 | |||
Vestas Wind Systems A/S(a) | 154,152 | 7,623,437 | |||
| 22,314,333 | |||||
Industrial Conglomerates – 2.1% | |||||
Siemens AG | 273,800 | 23,476,758 | |||
Machinery – 1.8% | |||||
Atlas Copco AB – Class A | 580,673 | 8,218,003 | |||
NGK Insulators Ltd. | 554,000 | 11,918,485 | |||
| 20,136,488 | |||||
| ALLIANCEBERNSTEIN POOLING PORTFOLIOS • | 57 |
International Growth Portfolio—Portfolio of Investments
| Company | Shares | U.S. $ Value | |||
Trading Companies & | |||||
Mitsubishi Corp. | 927,200 | $ | 23,128,016 | ||
Mitsui & Co., Ltd. | 991,200 | 15,362,287 | |||
| 38,490,303 | |||||
| 123,469,435 | |||||
Energy – 10.8% | |||||
Energy Equipment & Services – 4.4% | |||||
Saipem SpA(a) | 699,700 | 23,167,487 | |||
Technip SA | 78,400 | 5,577,445 | |||
Tenaris SA | 953,889 | 19,845,773 | |||
| 48,590,705 | |||||
Oil, Gas & Consumable Fuels – 6.4% | |||||
BG Group PLC | 1,459,824 | 25,515,363 | |||
China Coal Energy Co. – Class H | 4,211,000 | 6,687,956 | |||
CNOOC Ltd. | 3,455,000 | 5,408,043 | |||
Petroleo Brasileiro SA (ADR) | 223,900 | 9,549,335 | |||
Suncor Energy, Inc. (Toronto) | 479,100 | 13,846,636 | |||
Tullow Oil PLC | 562,690 | 10,212,807 | |||
| 71,220,140 | |||||
| 119,810,845 | |||||
Information Technology – 10.3% | |||||
Computers & Peripherals – 1.4% | |||||
Toshiba Corp.(a) | 3,205,000 | 16,031,751 | |||
Electronic Equipment, Instruments & Components – 3.8% | |||||
Hon Hai Precision Industry Co., Ltd. | 4,264,350 | 16,887,216 | |||
LG Display Co., Ltd. | 303,300 | 9,084,301 | |||
Nippon Electric Glass Co., Ltd. | 1,290,000 | 16,708,648 | |||
| 42,680,165 | |||||
Internet Software & Services – 0.8% | |||||
Tencent Holdings Ltd. | 472,800 | 9,248,342 | |||
IT Services – 0.8% | |||||
Infosys Technologies Ltd. | 156,160 | 8,825,954 | |||
Semiconductors & Semiconductor | |||||
ASML Holding NV | 528,700 | 16,266,742 | |||
Samsung Electronics Co., Ltd. | 22,260 | 14,270,524 | |||
| 30,537,266 | |||||
Software – 0.7% | |||||
SAP AG | 170,400 | 7,601,997 | |||
| 114,925,475 | |||||
| 58 | • ALLIANCEBERNSTEIN POOLING PORTFOLIOS |
International Growth Portfolio—Portfolio of Investments
| Company | Shares | U.S. $ Value | |||
Consumer Discretionary – 8.0% | |||||
Automobiles – 3.7% | |||||
Honda Motor Co., Ltd. | 509,100 | $ | 17,609,125 | ||
Suzuki Motor Corp. | 394,900 | 8,398,154 | |||
Volkswagen AG (Preference Shares) | 188,900 | 15,382,838 | |||
| 41,390,117 | |||||
Distributors – 0.3% | |||||
Li & Fung Ltd. | 870,000 | 4,042,454 | |||
Hotels, Restaurants & Leisure – 2.3% | |||||
Carnival PLC | 525,638 | 19,981,271 | |||
Ctrip.com International Ltd. (ADR)(a) | 136,600 | 5,222,218 | |||
| 25,203,489 | |||||
Media – 1.7% | |||||
British Sky Broadcasting Group PLC | 672,800 | 5,583,605 | |||
SES SA (FDR) | 544,618 | 13,180,223 | |||
| 18,763,828 | |||||
| 89,399,888 | |||||
Telecommunication Services – 1.7% | |||||
Diversified Telecommunication | |||||
Telefonica SA | 703,449 | 16,496,196 | |||
Wireless Telecommunication | |||||
Vodafone Group PLC | 1,024,400 | 2,213,571 | |||
| 18,709,767 | |||||
Utilities – 0.6% | |||||
Multi-Utilities – 0.6% | |||||
Centrica PLC | 1,474,251 | 6,292,974 | |||
Total Common Stocks | 1,080,117,101 | ||||
WARRANTS – 0.1% | |||||
Information Technology – 0.1% | |||||
Electronic Equipment, Instruments & Components – 0.1% | |||||
Hon Hai Precision, Credit Suisse(a) | 183,900 | 726,037 | |||
| ALLIANCEBERNSTEIN POOLING PORTFOLIOS • | 59 |
International Growth Portfolio—Portfolio of Investments
| Company | Shares | U.S. $ Value | |||
SHORT-TERM INVESTMENTS – 1.4% | |||||
Investment Companies – 1.4% | |||||
AllianceBernstein Fixed-Income Shares, Inc. – Government STIF Portfolio(b) | 15,900,281 | $ | 15,900,281 | ||
Total Investments – 98.7% | 1,096,743,419 | ||||
Other assets less liabilities – 1.3% | 14,776,860 | ||||
Net Assets – 100.0% | $ | 1,111,520,279 | |||
FORWARD CURRENCY EXCHANGE CONTRACTS (see Note C)
| Contract Amount (000) | U.S. $ Value on Origination Date | U.S. $ Value at February 28, 2010 | Unrealized Appreciation/ (Depreciation) | |||||||||
Buy Contracts: | ||||||||||||
Australian Dollar settling 3/15/10 | 119,045 | $ | 107,083,358 | $ | 106,545,019 | $ | (538,339 | ) | ||||
British Pound settling 3/15/10 | 33,298 | 53,238,840 | 50,768,191 | (2,470,649 | ) | |||||||
British Pound settling 3/15/10 | 12,791 | 20,841,783 | 19,501,950 | (1,339,833 | ) | |||||||
British Pound settling 3/15/10 | 27,986 | 45,412,882 | 42,669,187 | (2,743,695 | ) | |||||||
British Pound settling 3/15/10 | 4,360 | 7,032,767 | 6,647,526 | (385,241 | ) | |||||||
Canadian Dollar settling 3/15/10 | 3,645 | 3,437,479 | 3,464,096 | 26,617 | ||||||||
Canadian Dollar settling 3/15/10 | 7,450 | 7,034,607 | 7,080,251 | 45,644 | ||||||||
Euro settling 3/15/10 | 50,316 | 74,034,459 | 68,511,483 | (5,522,976 | ) | |||||||
Japanese Yen settling 3/15/10 | 692,708 | 7,854,812 | 7,797,233 | (57,579 | ) | |||||||
Japanese Yen settling 3/15/10 | 243,560 | 2,702,319 | 2,741,551 | 39,232 | ||||||||
Japanese Yen settling 3/15/10 | 2,803,395 | 31,103,905 | 31,555,464 | 451,559 | ||||||||
Japanese Yen settling 3/15/10 | 581,736 | 6,459,786 | 6,548,114 | 88,328 | ||||||||
Japanese Yen settling 6/17/10 | 3,071,039 | 34,330,546 | 34,586,415 | 255,869 | ||||||||
Japanese Yen settling 6/17/10 | 632,511 | 7,033,058 | 7,123,416 | 90,358 | ||||||||
New Zealand Dollar settling 3/15/10 | 24,299 | 17,121,561 | 16,951,951 | (169,610 | ) | |||||||
Norwegian Krone settling 3/15/10 | 273,279 | 47,160,733 | 46,218,559 | (942,174 | ) | |||||||
| 60 | • ALLIANCEBERNSTEIN POOLING PORTFOLIOS |
International Growth Portfolio—Portfolio of Investments
| Contract Amount (000) | U.S. $ Value on Origination Date | U.S. $ Value at February 28, 2010 | Unrealized Appreciation/ (Depreciation) | |||||||||
Norwegian Krone settling 3/15/10 | 33,944 | $ | 5,945,387 | $ | 5,740,810 | $ | (204,577 | ) | ||||
Swedish Krona settling 3/15/10 | 334,325 | 47,007,916 | 46,892,267 | (115,649 | ) | |||||||
Swedish Krona settling 3/15/10 | 50,774 | 7,140,707 | 7,121,537 | (19,170 | ) | |||||||
Sale Contracts: | ||||||||||||
Australian Dollar settling 3/15/10 | 6,518 | 5,946,371 | 5,833,596 | 112,775 | ||||||||
Australian Dollar settling 3/15/10 | 9,830 | 8,563,405 | 8,797,829 | (234,424 | ) | |||||||
British Pound settling 3/15/10 | 115,753 | 188,552,377 | 176,484,188 | 12,068,189 | ||||||||
British Pound settling 6/17/10 | 3,835 | 5,995,102 | 5,843,450 | 151,652 | ||||||||
British Pound settling 6/17/10 | 3,384 | 5,213,796 | 5,156,254 | 57,542 | ||||||||
Canadian Dollar settling 3/15/10 | 24,488 | 23,060,986 | 23,272,642 | (211,656 | ) | |||||||
Euro settling 3/15/10 | 2,618 | 3,833,485 | 3,564,732 | 268,753 | ||||||||
Euro settling 3/15/10 | 33,709 | 48,281,064 | 45,898,991 | 2,382,073 | ||||||||
Euro settling 3/15/10 | 11,796 | 17,068,812 | 16,061,719 | 1,007,093 | ||||||||
Euro settling 3/15/10 | 2,193 | 3,102,744 | 2,986,042 | 116,702 | ||||||||
Euro settling 3/15/10 | 41,865 | 59,232,277 | 57,004,398 | 2,227,879 | ||||||||
Euro settling 3/15/10 | 20,651 | 28,835,817 | 28,118,901 | 716,916 | ||||||||
Euro settling 6/17/10 | 12,212 | 16,800,781 | 16,625,338 | 175,443 | ||||||||
Euro settling 6/17/10 | 5,034 | 6,888,223 | 6,853,255 | 34,968 | ||||||||
Japanese Yen settling 3/15/10 | 474,897 | 5,471,416 | 5,345,517 | 125,899 | ||||||||
Japanese Yen settling 3/15/10 | 2,012,793 | 22,822,594 | 22,656,321 | 166,273 | ||||||||
Japanese Yen settling 3/15/10 | 1,008,413 | 11,041,663 | 11,350,859 | (309,196 | ) | |||||||
Norwegian Krone settling 3/15/10 | 15,700 | 2,648,368 | 2,655,277 | (6,909 | ) | |||||||
Swiss Franc settling 3/15/10 | 52,943 | 51,683,978 | 49,287,606 | 2,396,372 | ||||||||
Swiss Franc settling 3/15/10 | 5,118 | 4,962,284 | 4,764,633 | 197,651 | ||||||||
| (a) | Non-income producing security. |
| (b) | Investment in affiliated money market mutual fund. The rate shown represents the 7-day yield as of period end. |
Glossary:
ADR – American Depositary Receipt
FDR – Fiduciary Depositary Receipt
See notes to financial statements.
| ALLIANCEBERNSTEIN POOLING PORTFOLIOS • | 61 |
International Growth Portfolio—Portfolio of Investments
SMALL-MID CAP VALUE PORTFOLIO
PORTFOLIO OF INVESTMENTS
February 28, 2010 (unaudited)
| Company | Shares | U.S. $ Value | |||
COMMON STOCKS – 100.0% | |||||
Financials – 20.4% | |||||
Commercial Banks – 6.2% | |||||
Associated Banc-Corp | 536,200 | $ | 6,922,342 | ||
City National Corp. | 88,000 | 4,392,960 | |||
Comerica, Inc. | 194,000 | 6,999,520 | |||
Marshall & Ilsley Corp. | 532,400 | 3,769,392 | |||
Umpqua Holdings Corp. | 234,400 | 2,925,312 | |||
Umpqua Holdings Corp. (ADR) | 51,600 | 637,260 | |||
Webster Financial Corp. | 303,500 | 4,856,000 | |||
Whitney Holding Corp. | 444,900 | 5,716,965 | |||
| 36,219,751 | |||||
Insurance – 6.0% | |||||
Arch Capital Group Ltd.(a) | 50,100 | 3,706,398 | |||
Aspen Insurance Holdings Ltd. | 190,500 | 5,383,530 | |||
Endurance Specialty Holdings Ltd. | 151,900 | 5,842,074 | |||
Fidelity National Financial, Inc. – Class A | 305,000 | 4,346,250 | |||
Reinsurance Group of America, Inc. – Class A | 142,000 | 6,749,260 | |||
StanCorp Financial Group, Inc. | 87,500 | 3,760,750 | |||
Unum Group | 259,400 | 5,398,114 | |||
| 35,186,376 | |||||
Real Estate Investment Trusts (REITs) – 3.7% | |||||
Brandywine Realty Trust | 378,100 | 4,238,501 | |||
CBL & Associates Properties, Inc. | 391,300 | 4,652,557 | |||
Digital Realty Trust, Inc. | 73,700 | 3,801,446 | |||
Sunstone Hotel Investors, Inc.(a) | 431,401 | 3,856,725 | |||
Tanger Factory Outlet Centers | 121,600 | 5,067,072 | |||
| 21,616,301 | |||||
Real Estate Management & | |||||
CB Richard Ellis Group, Inc. – Class A(a) | 308,900 | 4,077,480 | |||
Jones Lang LaSalle, Inc. | 75,700 | 4,821,333 | |||
| 8,898,813 | |||||
Thrifts & Mortgage Finance – 3.0% | |||||
Astoria Financial Corp. | 299,642 | 3,976,249 | |||
First Niagara Financial Group, Inc. | 484,818 | 6,806,845 | |||
Washington Federal, Inc. | 354,250 | 6,904,332 | |||
| 17,687,426 | |||||
| 119,608,667 | |||||
Consumer Discretionary – 19.6% | |||||
Auto Components – 3.6% | |||||
Dana Holding Corp.(a) | 543,500 | 6,179,595 | |||
Federal Mogul Corp.(a) | 390,200 | 7,542,566 | |||
TRW Automotive Holdings Corp.(a) | 276,200 | 7,421,494 | |||
| 21,143,655 | |||||
| 62 | • ALLIANCEBERNSTEIN POOLING PORTFOLIOS |
Small-Mid Cap Value Portfolio—Portfolio of Investments
| Company | Shares | U.S. $ Value | |||
Hotels, Restaurants & Leisure – 3.6% | |||||
Boyd Gaming Corp.(a) | 416,300 | $ | 3,180,532 | ||
Darden Restaurants, Inc. | 162,800 | 6,601,540 | |||
Royal Caribbean Cruises Ltd.(a) | 188,600 | 5,331,722 | |||
Wyndham Worldwide Corp. | 261,500 | 6,011,885 | |||
| 21,125,679 | |||||
Household Durables – 2.0% | |||||
NVR, Inc.(a) | 5,475 | 3,877,942 | |||
Pulte Homes, Inc.(a) | 309,700 | 3,354,051 | |||
Whirlpool Corp. | 53,035 | 4,463,426 | |||
| 11,695,419 | |||||
Leisure Equipment & Products – 0.7% | |||||
Callaway Golf Co. | 501,800 | 3,979,274 | |||
Media – 0.6% | |||||
CBS Corp. – Class B | 258,500 | 3,357,915 | |||
Multiline Retail – 0.5% | |||||
JC Penney Co., Inc. | 117,500 | 3,240,650 | |||
Specialty Retail – 7.6% | |||||
AnnTaylor Stores Corp.(a) | 339,300 | 5,839,353 | |||
Dress Barn, Inc.(a) | 237,600 | 5,906,736 | |||
Foot Locker, Inc. | 544,400 | 7,060,868 | |||
Limited Brands, Inc. | 279,100 | 6,170,901 | |||
Men’s Wearhouse, Inc. (The) | 301,100 | 6,431,496 | |||
Office Depot, Inc.(a) | 854,200 | 6,167,324 | |||
Signet Jewelers Ltd.(a) | 241,924 | 6,969,831 | |||
| 44,546,509 | |||||
Textiles, Apparel & Luxury Goods – 1.0% | |||||
Jones Apparel Group, Inc. | 339,000 | 5,715,540 | |||
| 114,804,641 | |||||
Information Technology – 13.2% | |||||
Communications Equipment – 0.8% | |||||
CommScope, Inc.(a) | 195,100 | 4,973,099 | |||
Computers & Peripherals – 2.2% | |||||
NCR Corp.(a) | 330,700 | 4,173,434 | |||
SanDisk Corp.(a) | 131,200 | 3,821,856 | |||
Western Digital Corp.(a) | 134,500 | 5,195,735 | |||
| 13,191,025 | |||||
Electronic Equipment, Instruments & Components – 5.4% | |||||
Anixter International, Inc.(a) | 153,700 | 6,415,438 | |||
Arrow Electronics, Inc.(a) | 176,700 | 4,984,707 | |||
AU Optronics Corp. (Sponsored ADR) | 461,524 | 4,786,004 | |||
| ALLIANCEBERNSTEIN POOLING PORTFOLIOS • | 63 |
Small-Mid Cap Value Portfolio—Portfolio of Investments
| Company | Shares | U.S. $ Value | |||
Avnet, Inc.(a) | 186,000 | $ | 5,135,460 | ||
Flextronics International Ltd.(a) | 763,500 | 5,313,960 | |||
Insight Enterprises, Inc.(a) | 368,900 | 4,718,231 | |||
| 31,353,800 | |||||
IT Services – 1.9% | |||||
Amdocs Ltd.(a) | 117,400 | 3,413,992 | |||
Convergys Corp.(a) | 615,300 | 7,592,802 | |||
| 11,006,794 | |||||
Semiconductors & Semiconductor | |||||
Amkor Technology, Inc.(a) | 506,000 | 3,046,120 | |||
Lam Research Corp.(a) | 135,100 | 4,581,241 | |||
Siliconware Precision Industries Co. (Sponsored ADR) | 809,800 | 4,729,232 | |||
Teradyne, Inc.(a) | 437,600 | 4,371,624 | |||
| 16,728,217 | |||||
| 77,252,935 | |||||
Industrials – 11.8% | |||||
Airlines – 0.6% | |||||
Alaska Air Group, Inc.(a) | 111,700 | 3,909,500 | |||
Building Products – 0.6% | |||||
Masco Corp. | 254,600 | 3,404,002 | |||
Electrical Equipment – 3.5% | |||||
AO Smith Corp. | 106,000 | 4,801,800 | |||
EnerSys(a) | 225,500 | 5,139,145 | |||
General Cable Corp.(a) | 149,300 | 3,647,399 | |||
Thomas & Betts Corp.(a) | 191,550 | 6,914,955 | |||
| 20,503,299 | |||||
Machinery – 3.2% | |||||
Briggs & Stratton Corp. | 178,900 | 3,132,539 | |||
Gardner Denver, Inc. | 86,500 | 3,772,265 | |||
Mueller Industries, Inc. | 254,800 | 5,702,424 | |||
Terex Corp.(a) | 310,000 | 6,035,700 | |||
| 18,642,928 | |||||
Professional Services – 1.1% | |||||
Kelly Services, Inc. – Class A(a) | 403,200 | 6,342,336 | |||
Road & Rail – 1.7% | |||||
Con-way, Inc. | 175,200 | 5,692,248 | |||
Hertz Global Holdings, Inc.(a) | 442,900 | 4,163,260 | |||
| 9,855,508 | |||||
| 64 | • ALLIANCEBERNSTEIN POOLING PORTFOLIOS |
Small-Mid Cap Value Portfolio—Portfolio of Investments
| Company | Shares | U.S. $ Value | |||
Trading Companies & Distributors – 1.1% | |||||
WESCO International, Inc.(a) | 230,300 | $ | 6,653,367 | ||
| 69,310,940 | |||||
Energy – 9.5% | |||||
Energy Equipment & Services – 4.6% | |||||
Helix Energy Solutions Group, Inc.(a) | 619,700 | 7,132,747 | |||
Helmerich & Payne, Inc. | 119,700 | 4,850,244 | |||
Oil States International, Inc.(a) | 163,300 | 7,025,166 | |||
Rowan Cos., Inc.(a) | 304,500 | 7,923,090 | |||
| 26,931,247 | |||||
Oil, Gas & Consumable Fuels – 4.9% | |||||
Cimarex Energy Co. | 126,400 | 7,553,664 | |||
Forest Oil Corp.(a) | 267,700 | 7,254,670 | |||
Mariner Energy, Inc.(a) | 406,025 | 6,098,495 | |||
Patriot Coal Corp.(a) | 203,666 | 3,393,076 | |||
Whiting Petroleum Corp.(a) | 54,500 | 4,079,325 | |||
| 28,379,230 | |||||
| 55,310,477 | |||||
Materials – 8.8% | |||||
Chemicals – 4.1% | |||||
Arch Chemicals, Inc. | 167,600 | 5,173,812 | |||
Cytec Industries, Inc. | 144,900 | 6,182,883 | |||
Huntsman Corp. | 388,600 | 5,335,478 | |||
Rockwood Holdings, Inc.(a) | 291,100 | 6,983,489 | |||
| 23,675,662 | |||||
Containers & Packaging – 1.1% | |||||
Owens-Illinois, Inc.(a) | 123,200 | 3,651,648 | |||
Sonoco Products Co. | 99,500 | 2,943,210 | |||
| 6,594,858 | |||||
Metals & Mining – 3.6% | |||||
AK Steel Holding Corp. | 144,400 | 3,108,932 | |||
Commercial Metals Co. | 432,200 | 7,088,080 | |||
Reliance Steel & Aluminum Co. | 140,100 | 6,212,034 | |||
Steel Dynamics, Inc. | 284,900 | 4,652,417 | |||
| 21,061,463 | |||||
| 51,331,983 | |||||
Consumer Staples – 6.7% | |||||
Beverages – 1.1% | |||||
Constellation Brands, Inc. – Class A(a) | 419,494 | 6,309,190 | |||
Food & Staples Retailing – 0.8% | |||||
Supervalu, Inc. | 308,900 | 4,716,903 | |||
Food Products – 3.9% | |||||
Bunge Ltd. | 78,500 | 4,677,815 | |||
Dean Foods Co.(a) | 282,900 | 4,127,511 | |||
| ALLIANCEBERNSTEIN POOLING PORTFOLIOS • | 65 |
Small-Mid Cap Value Portfolio—Portfolio of Investments
| Company | Shares | U.S. $ Value | |||
Del Monte Foods Co. | 319,700 | $ | 3,746,884 | ||
Smithfield Foods, Inc.(a) | 369,900 | 6,365,979 | |||
Tyson Foods, Inc. – Class A | 246,600 | 4,202,064 | |||
| 23,120,253 | |||||
Tobacco – 0.9% | |||||
Universal Corp. | 99,200 | 5,262,560 | |||
| 39,408,906 | |||||
Utilities – 6.0% | |||||
Electric Utilities – 2.9% | |||||
Northeast Utilities | 138,600 | 3,548,160 | |||
Pepco Holdings, Inc. | 403,700 | 6,790,234 | |||
Portland General Electric Co. | 355,725 | 6,399,493 | |||
| 16,737,887 | |||||
Independent Power Producers & Energy Traders – 0.3% | |||||
RRI Energy, Inc.(a) | 456,000 | 1,938,000 | |||
Multi-Utilities – 2.8% | |||||
CMS Energy Corp. | 455,600 | 6,957,012 | |||
NiSource, Inc. | 347,000 | 5,211,940 | |||
Wisconsin Energy Corp. | 82,200 | 3,980,946 | |||
| 16,149,898 | |||||
| 34,825,785 | |||||
Health Care – 4.0% | |||||
Health Care Equipment & Supplies – 1.0% | |||||
Teleflex, Inc. | 96,400 | 5,874,616 | |||
Health Care Providers & Services – 3.0% | |||||
AMERIGROUP Corp.(a) | 138,800 | 3,647,664 | |||
Community Health Systems, Inc.(a) | 156,100 | 5,349,547 | |||
LifePoint Hospitals, Inc.(a) | 171,878 | 5,242,279 | |||
Molina Healthcare, Inc.(a) | 156,925 | 3,355,056 | |||
| 17,594,546 | |||||
| 23,469,162 | |||||
Total Investments – 100.0% | 585,323,496 | ||||
Other assets less liabilities – 0.0% | 46,969 | ||||
Net Assets – 100.0% | $ | 585,370,465 | |||
| (a) | Non-income producing security. |
Glossary:
ADR – American Depositary Receipt
REIT – Real Estate Investment Trust
See notes to financial statements.
| 66 | • ALLIANCEBERNSTEIN POOLING PORTFOLIOS |
Small-Mid Cap Value Portfolio—Portfolio of Investments
SMALL-MID CAP GROWTH PORTFOLIO
PORTFOLIO OF INVESTMENTS
February 28, 2010 (unaudited)
| Company | Shares | U.S. $ Value | |||
COMMON STOCKS – 99.3% | |||||
Information Technology – 22.6% | |||||
Communications Equipment – 4.3% | |||||
Blue Coat Systems, Inc.(a) | 321,600 | $ | 9,319,968 | ||
F5 Networks, Inc.(a) | 154,500 | 8,621,100 | |||
Riverbed Technology, Inc.(a) | 249,600 | 6,801,600 | |||
| 24,742,668 | |||||
Internet Software & Services – 1.8% | |||||
VistaPrint NV(a) | 185,300 | 10,695,516 | |||
IT Services – 2.7% | |||||
Alliance Data Systems Corp.(a) | 111,900 | 6,203,736 | |||
Cybersource Corp.(a) | 567,200 | 9,716,136 | |||
| 15,919,872 | |||||
Semiconductors & Semiconductor | |||||
Atheros Communications, Inc.(a) | 155,500 | 5,580,895 | |||
Fairchild Semiconductor International, Inc.(a) | 641,500 | 6,620,280 | |||
Hittite Microwave Corp.(a) | 123,400 | 5,150,716 | |||
ON Semiconductor Corp.(a) | 997,100 | 7,936,916 | |||
RF Micro Devices, Inc.(a) | 974,600 | 4,103,066 | |||
Skyworks Solutions, Inc.(a) | 439,800 | 6,715,746 | |||
Teradyne, Inc.(a) | 668,800 | 6,681,312 | |||
| 42,788,931 | |||||
Software – 6.5% | |||||
Concur Technologies, Inc.(a) | 82,900 | 3,261,286 | |||
Informatica Corp.(a) | 193,800 | 4,945,776 | |||
Red Hat, Inc.(a) | 270,300 | 7,581,915 | |||
SolarWinds, Inc.(a) | 311,000 | 5,849,910 | |||
Sybase, Inc.(a) | 177,900 | 7,896,981 | |||
TIBCO Software, Inc.(a) | 919,700 | 8,433,649 | |||
| 37,969,517 | |||||
| 132,116,504 | |||||
Consumer Discretionary – 22.0% | |||||
Distributors – 1.5% | |||||
LKQ Corp.(a) | 468,600 | 8,973,690 | |||
Diversified Consumer Services – 1.9% | |||||
Strayer Education, Inc. | 47,600 | 10,797,108 | |||
Hotels, Restaurants & Leisure – 4.2% | |||||
Chipotle Mexican Grill, Inc.(a) | 63,900 | 6,690,969 | |||
Orient-Express Hotels Ltd. – Class A(a) | 708,400 | 8,097,012 | |||
Panera Bread Co. – Class A(a) | 95,200 | 6,929,608 | |||
Wyndham Worldwide Corp. | 128,100 | 2,945,019 | |||
| 24,662,608 | |||||
| ALLIANCEBERNSTEIN POOLING PORTFOLIOS • | 67 |
Small-Mid Cap Growth Portfolio—Portfolio of Investments
| Company | Shares | U.S. $ Value | |||
Household Durables – 2.0% | |||||
Tempur-Pedic International, Inc.(a) | 417,600 | $ | 11,859,840 | ||
Internet & Catalog Retail – 1.6% | |||||
NetFlix, Inc.(a) | 142,200 | 9,392,310 | |||
Media – 2.9% | |||||
Lamar Advertising Co.(a) | 260,400 | 7,832,832 | |||
National CineMedia, Inc. | 571,300 | 9,192,217 | |||
| 17,025,049 | |||||
Multiline Retail – 2.1% | |||||
Dollar Tree, Inc.(a) | 221,500 | 12,346,410 | |||
Specialty Retail – 4.3% | |||||
CarMax, Inc.(a) | 328,200 | 6,626,358 | |||
Dick’s Sporting Goods, Inc.(a) | 375,100 | 9,126,183 | |||
J Crew Group, Inc.(a) | 173,400 | 7,296,672 | |||
Williams-Sonoma, Inc. | 89,800 | 1,927,108 | |||
| 24,976,321 | |||||
Textiles, Apparel & Luxury Goods – 1.5% | |||||
Carter’s, Inc.(a) | 294,000 | 8,426,040 | |||
| 128,459,376 | |||||
Health Care – 19.1% | |||||
Biotechnology – 8.1% | |||||
Alexion Pharmaceuticals, Inc.(a) | 140,500 | 6,957,560 | |||
Dendreon Corp.(a) | 171,500 | 5,355,945 | |||
Human Genome Sciences, Inc.(a) | 234,400 | 6,598,360 | |||
Ironwood Pharmaceuticals, Inc.(a) | 162,500 | 2,112,500 | |||
Medivation, Inc.(a) | 53,000 | 1,908,530 | |||
Onyx Pharmaceuticals, Inc.(a) | 152,100 | 4,222,296 | |||
OSI Pharmaceuticals, Inc.(a) | 97,800 | 3,620,556 | |||
Regeneron Pharmaceuticals, Inc.(a) | 141,200 | 3,453,752 | |||
Seattle Genetics, Inc.(a) | 158,200 | 1,613,640 | |||
United Therapeutics Corp.(a) | 115,800 | 6,648,078 | |||
Vertex Pharmaceuticals, Inc.(a) | 109,500 | 4,446,795 | |||
| 46,938,012 | |||||
Health Care Equipment & Supplies – 4.2% | |||||
Edwards Lifesciences Corp.(a) | 72,800 | 6,685,224 | |||
Masimo Corp.(a) | 202,900 | 5,618,301 | |||
NuVasive, Inc.(a) | 109,800 | 4,386,510 | |||
ResMed, Inc.(a) | 138,500 | 7,905,580 | |||
| 24,595,615 | |||||
Health Care Providers & Services – 4.3% | |||||
Emergency Medical Services Corp.(a) | 172,600 | 8,985,556 | |||
HMS Holdings Corp.(a) | 201,100 | 9,258,644 | |||
| 68 | • ALLIANCEBERNSTEIN POOLING PORTFOLIOS |
Small-Mid Cap Growth Portfolio—Portfolio of Investments
| Company | Shares | U.S. $ Value | |||
Magellan Health Services, Inc.(a) | 166,600 | $ | 6,983,872 | ||
| 25,228,072 | |||||
Health Care Technology – 0.1% | |||||
athenahealth, Inc.(a) | 21,600 | 795,744 | |||
Life Sciences Tools & Services – 1.3% | |||||
QIAGEN NV(a) | 353,900 | 7,718,559 | |||
Pharmaceuticals – 1.1% | |||||
Medicis Pharmaceutical Corp. | 287,900 | 6,477,750 | |||
| 111,753,752 | |||||
Industrials – 17.3% | |||||
Aerospace & Defense – 0.9% | |||||
Hexcel Corp.(a) | 498,000 | 5,487,960 | |||
Air Freight & Logistics – 1.1% | |||||
Expeditors International of Washington, Inc. | 170,400 | 6,214,488 | |||
Building Products – 0.8% | |||||
Simpson Manufacturing Co., Inc. | 184,800 | 4,542,384 | |||
Electrical Equipment – 2.9% | |||||
AMETEK, Inc. | 226,400 | 8,838,656 | |||
Baldor Electric Co. | 267,200 | 8,395,424 | |||
| 17,234,080 | |||||
Machinery – 7.6% | |||||
Actuant Corp. – Class A | 358,400 | 6,490,624 | |||
Bucyrus International, Inc. – Class A | 171,500 | 10,729,040 | |||
IDEX Corp. | 209,375 | 6,490,625 | |||
Joy Global, Inc. | 153,755 | 7,810,754 | |||
Lincoln Electric Holdings, Inc. | 158,900 | 7,579,530 | |||
Valmont Industries, Inc. | 70,400 | 5,012,480 | |||
| 44,113,053 | |||||
Marine – 0.8% | |||||
Kirby Corp.(a) | 137,600 | 4,542,176 | |||
Professional Services – 0.9% | |||||
Resources Connection, Inc.(a) | 301,700 | 5,140,968 | |||
Road & Rail – 2.3% | |||||
Genesee & Wyoming, Inc. – Class A(a) | 155,000 | 4,936,750 | |||
Knight Transportation, Inc. | 297,800 | 5,881,550 | |||
RailAmerica, Inc.(a) | 236,700 | 2,802,528 | |||
| 13,620,828 | |||||
| 100,895,937 | |||||
| ALLIANCEBERNSTEIN POOLING PORTFOLIOS • | 69 |
Small-Mid Cap Growth Portfolio—Portfolio of Investments
| Company | Shares | U.S. $ Value | |||
Energy – 6.5% | |||||
Energy Equipment & Services – 4.0% | |||||
Complete Production Services, Inc.(a) | 474,300 | $ | 6,621,228 | ||
FMC Technologies, Inc.(a) | 113,300 | 6,364,061 | |||
Oceaneering International, Inc.(a) | 79,700 | 4,817,865 | |||
Superior Energy Services, Inc.(a) | 259,500 | 5,363,865 | |||
| 23,167,019 | |||||
Oil, Gas & Consumable Fuels – 2.5% | |||||
Cabot Oil & Gas Corp. | 142,100 | 5,703,894 | |||
Concho Resources, Inc.(a) | 100,900 | 4,686,805 | |||
Newfield Exploration Co.(a) | 83,900 | 4,284,773 | |||
| 14,675,472 | |||||
| 37,842,491 | |||||
Financials – 6.4% | |||||
Capital Markets – 4.8% | |||||
Affiliated Managers Group, Inc.(a) | 99,050 | 7,045,426 | |||
Greenhill & Co., Inc. | 100,420 | 7,175,009 | |||
Lazard Ltd. – Class A | 194,100 | 6,974,013 | |||
Stifel Financial Corp.(a) | 126,600 | 6,925,020 | |||
| 28,119,468 | |||||
Commercial Banks – 0.5% | |||||
PrivateBancorp, Inc. | 228,800 | 2,974,400 | |||
Thrifts & Mortgage Finance – 1.1% | |||||
People’s United Financial, Inc. | 406,900 | 6,416,813 | |||
| 37,510,681 | |||||
Telecommunication Services – 2.3% | |||||
Diversified Telecommunication | |||||
tw telecom, Inc.(a) | 416,400 | 6,616,596 | |||
Wireless Telecommunication | |||||
SBA Communications Corp. – Class A(a) | 197,800 | 6,994,208 | |||
| 13,610,804 | |||||
Materials – 1.8% | |||||
Chemicals – 1.8% | |||||
Airgas, Inc. | 62,700 | 4,021,578 | |||
Solutia, Inc.(a) | 455,000 | 6,401,850 | |||
| 10,423,428 | |||||
Consumer Staples – 1.3% | |||||
Food Products – 1.3% | |||||
Green Mountain Coffee Roasters, Inc.(a) | 86,450 | 7,295,516 | |||
Total Common Stocks | 579,908,489 | ||||
| 70 | • ALLIANCEBERNSTEIN POOLING PORTFOLIOS |
Small-Mid Cap Growth Portfolio—Portfolio of Investments
| Company | Shares | U.S. $ Value | ||||
SHORT-TERM INVESTMENTS – 1.0% | ||||||
Investment Companies – 1.0% | ||||||
AllianceBernstein Fixed-Income Shares, Inc. – Government STIF Portfolio, 0.11%(b) | 5,761,846 | $ | 5,761,846 | |||
Total Investments – 100.3% | 585,670,335 | |||||
Other assets less liabilities – (0.3)% | (1,872,822 | ) | ||||
Net Assets – 100.0% | $ | 583,797,513 | ||||
| (a) | Non-income producing security. |
| (b) | Investment in affiliated money market mutual fund. The rate shown represents the 7-day yield as of period end. |
See notes to financial statements.
| ALLIANCEBERNSTEIN POOLING PORTFOLIOS • | 71 |
Small-Mid Cap Growth Portfolio—Portfolio of Investments
SHORT DURATION BOND PORTFOLIO
PORTFOLIO OF INVESTMENTS
February 28, 2010 (unaudited)
| Principal Amount (000) | U.S. $ Value | |||||
GOVERNMENTS - | ||||||
Treasuries – 28.3% | ||||||
United States – 28.3% | ||||||
U.S. Treasury Notes | $ | 101,920 | $ | 102,067,274 | ||
1.375%, 9/15/12 | 88,287 | 88,893,973 | ||||
1.75%, 8/15/12 | 76,037 | 77,343,924 | ||||
2.375%, 8/31/14 | 19,760 | 20,037,865 | ||||
2.75%, 7/31/10 | 8,000 | 8,086,248 | ||||
4.00%, 11/15/12 | 42,638 | 45,889,148 | ||||
Total Governments - Treasuries | 342,318,432 | |||||
CORPORATES - INVESTMENT | ||||||
Industrial – 14.7% | ||||||
Basic – 0.9% | ||||||
Ei Du Pont De Nemours & Co. | 4,719 | 4,763,094 | ||||
Praxair, Inc. | 5,520 | 5,578,772 | ||||
| 10,341,866 | ||||||
Capital Goods – 1.2% | ||||||
Boeing Capital Corp. | 5,932 | 6,032,809 | ||||
General Dynamics Corp. | 5,637 | 5,712,175 | ||||
John Deere Capital Corp. | 2,735 | 2,981,262 | ||||
| 14,726,246 | ||||||
Communications - | ||||||
AT&T, Inc. | 4,875 | 5,256,976 | ||||
New Cingular Wireless Services, Inc. | 5,160 | 5,840,754 | ||||
Verizon Global Funding Corp. | 2,142 | 2,436,745 | ||||
| 13,534,475 | ||||||
Consumer Cyclical - Automotive – 0.3% | ||||||
Daimler Finance North America LLC | 3,495 | 3,563,303 | ||||
| 72 | • ALLIANCEBERNSTEIN POOLING PORTFOLIOS |
Short Duration Bond Portfolio—Portfolio of Investments
| Principal Amount (000) | U.S. $ Value | |||||
Consumer Cyclical - | ||||||
The Walt Disney Co. | $ | 3,624 | $ | 3,940,814 | ||
Consumer Cyclical - | ||||||
McDonald’s Corp. | 3,595 | 3,858,639 | ||||
Consumer Cyclical - Retailers – 0.6% | ||||||
Costco Wholesale Corp. | 2,740 | 2,964,340 | ||||
Wal-Mart Stores, Inc. | 3,500 | 3,794,109 | ||||
| 6,758,449 | ||||||
Consumer Non-Cyclical – 5.0% | ||||||
Abbott Laboratories | 2,717 | 2,978,071 | ||||
Amgen, Inc. | 2,760 | 3,028,291 | ||||
Avon Products, Inc. | 2,450 | 2,710,822 | ||||
Baxter FinCo BV | 3,432 | 3,526,661 | ||||
Bottling Group LLC | 3,599 | 3,903,821 | ||||
6.95%, 3/15/14 | 3,290 | 3,835,972 | ||||
Campbell Soup Co. | 3,460 | 3,666,725 | ||||
Coca-Cola Enterprises, Inc. | 3,675 | 3,926,558 | ||||
Colgate-Palmolive Co. | 1,049 | 1,079,869 | ||||
Diageo Finance BV | 8,859 | 8,944,073 | ||||
Genentech, Inc. | 1,910 | 1,938,579 | ||||
Merck & Co., Inc. | 2,850 | 3,027,834 | ||||
Pepsico, Inc. | 2,802 | 3,029,223 | ||||
Procter & Gamble Co. | 11,035 | 11,366,547 | ||||
4.60%, 1/15/14 | 3,485 | 3,768,090 | ||||
| 60,731,136 | ||||||
| ALLIANCEBERNSTEIN POOLING PORTFOLIOS • | 73 |
Short Duration Bond Portfolio—Portfolio of Investments
| Principal Amount (000) | U.S. $ Value | |||||
Energy – 2.4% | ||||||
Apache Corp. | $ | 2,890 | $ | 3,138,011 | ||
Chevron Corp. | 3,665 | 3,889,067 | ||||
ConocoPhillips | 3,650 | 3,956,746 | ||||
Shell International Finance BV | 5,924 | 6,007,356 | ||||
Statoil ASA | 5,952 | 6,046,512 | ||||
Total Capital SA | 6,016 | 6,022,636 | ||||
| 29,060,328 | ||||||
Services – 0.4% | ||||||
The Western Union Co. | 4,980 | 5,316,304 | ||||
Technology – 2.2% | ||||||
Cisco Systems, Inc. | 1,765 | 1,797,695 | ||||
5.25%, 2/22/11 | 1,866 | 1,949,393 | ||||
Dell, Inc. | 2,134 | 2,223,359 | ||||
Hewlett-Packard Co. | 1,408 | 1,462,957 | ||||
International Business Machine | 12,055 | 12,167,931 | ||||
Oracle Corp. | 4,116 | 4,312,737 | ||||
5.00%, 1/15/11 | 2,062 | 2,140,610 | ||||
| 26,054,682 | ||||||
| 177,886,242 | ||||||
Financial Institutions – 8.0% | ||||||
Banking – 5.4% | ||||||
Bank of America Corp. | 3,805 | 3,860,119 | ||||
The Bank of New York Mellon Corp. | 1,785 | 1,897,260 | ||||
BB&T Corp. | 3,505 | 3,594,759 | ||||
Citigroup, Inc. | 2,864 | 3,039,557 | ||||
The Goldman Sachs Group, Inc. | 3,210 | 3,330,282 | ||||
4.75%, 7/15/13 | 2,844 | 3,003,156 | ||||
| 74 | • ALLIANCEBERNSTEIN POOLING PORTFOLIOS |
Short Duration Bond Portfolio—Portfolio of Investments
| Principal Amount (000) | U.S. $ Value | |||||
JP Morgan Chase & Co. | $ | 4,685 | $ | 4,775,730 | ||
Morgan Stanley | 5,650 | 6,111,176 | ||||
PNC Funding Corp. | 5,755 | 5,878,917 | ||||
Royal Bank of Canada | 4,960 | 5,304,105 | ||||
State Street Corp. | 3,015 | 3,171,129 | ||||
UnionBanCal Corp. | 5,212 | 5,615,185 | ||||
US Bancorp | 3,822 | 4,033,288 | ||||
Wells Fargo & Co. | 5,874 | 5,944,852 | ||||
Westpac Banking Corp. | 5,712 | 5,892,573 | ||||
| 65,452,088 | ||||||
Finance – 0.6% | ||||||
HSBC Finance Corp. | 4,905 | 4,926,714 | ||||
8.00%, 7/15/10 | 2,923 | 2,999,095 | ||||
| 7,925,809 | ||||||
Insurance – 1.7% | ||||||
Berkshire Hathaway, Inc. | 12,145 | 12,264,871 | ||||
Met Life Global Funding | 7,700 | 7,844,121 | ||||
| 20,108,992 | ||||||
Other Finance – 0.3% | ||||||
ORIX Corp. | 3,130 | 3,213,061 | ||||
| 96,699,950 | ||||||
Utility – 0.7% | ||||||
Electric – 0.7% | ||||||
National Rural Utilities Cooperative Finance Corp. | 5,790 | 5,979,953 | ||||
The Southern Co. | 2,001 | 2,111,905 | ||||
| 8,091,858 | ||||||
Total Corporates - Investment Grades | 282,678,050 | |||||
| ALLIANCEBERNSTEIN POOLING PORTFOLIOS • | 75 |
Short Duration Bond Portfolio—Portfolio of Investments
| Principal Amount (000) | U.S. $ Value | |||||
ASSET-BACKED SECURITIES – 18.9% | ||||||
Autos - Fixed Rate – 6.8% | ||||||
Bank of America Auto Trust | $ | 11,000 | $ | 11,250,815 | ||
Series 2009-2A, Class A4 | 8,610 | 8,878,658 | ||||
Series 2009-3A, Class A4 | 12,380 | 12,609,767 | ||||
BMW Vehicle Lease Trust | 8,144 | 8,306,145 | ||||
Chrysler Financial Auto Securitization Trust | 6,418 | 6,539,297 | ||||
Honda Auto Receivables Owner Trust | 3,420 | 3,481,950 | ||||
Mercedes-Benz Auto Receivables Trust | 7,560 | 7,648,745 | ||||
Nissan Auto Lease Trust | 6,335 | 6,548,151 | ||||
Series 2009-B, Class A3 | 5,515 | 5,592,281 | ||||
Series 2009-B, Class A4 | 10,555 | 10,801,156 | ||||
| 81,656,965 | ||||||
Credit Cards - Floating Rate – 3.8% | ||||||
Chase Issuance Trust | 4,825 | 4,815,685 | ||||
Citibank Omni Master Trust | 14,000 | 14,450,755 | ||||
Series 2009-A8, Class A8 | 8,400 | 8,482,611 | ||||
Discover Card Master Trust | 11,000 | 11,144,019 | ||||
Series 2010-A1, Class A1 | 7,206 | 7,172,822 | ||||
| 46,065,892 | ||||||
Other ABS - Fixed Rate – 2.0% | ||||||
DB Master Finance, LLC | 1,600 | 1,549,262 | ||||
| 76 | • ALLIANCEBERNSTEIN POOLING PORTFOLIOS |
Short Duration Bond Portfolio—Portfolio of Investments
| Principal Amount (000) | U.S. $ Value | |||||
John Deere Owner Trust | $ | 4,510 | $ | 4,585,381 | ||
Series 2009-A, Class A4 | 3,390 | 3,580,353 | ||||
Series 2009-B, Class A4 | 8,875 | 8,959,472 | ||||
Nissan Auto Lease Trust | 5,805 | 5,923,222 | ||||
| 24,597,690 | ||||||
Home Equity Loans - Floating | ||||||
ACE Securities Corp. | 18 | 12,737 | ||||
BNC Mortgage Loan Trust | 1,200 | 40,577 | ||||
Credit-Based Asset Servicing and Securitization LLC | 1,402 | 1,220,800 | ||||
First Franklin Mortgage Loan Trust | 61 | 39,964 | ||||
HFC Home Equity Loan Asset Backed Certificates | 1,340 | 1,094,789 | ||||
Home Equity Mortgage Trust | 27 | 26,265 | ||||
Household Home Equity Loan Trust | 2,800 | 2,572,405 | ||||
Indymac Residential Asset Backed Trust | 3,350 | 2,015,702 | ||||
Lehman ABS Mortgage Loan Trust | 3,660 | 1,333,038 | ||||
Lehman XS Trust | 5,000 | 105,848 | ||||
Series 2006-1, Class 1M1 | 4,000 | 59,106 | ||||
| ALLIANCEBERNSTEIN POOLING PORTFOLIOS • | 77 |
Short Duration Bond Portfolio—Portfolio of Investments
| Principal Amount (000) | U.S. $ Value | |||||
Merrill Lynch First Franklin Mortgage Loan Trust | $ | 895 | $ | 861,256 | ||
Nationstar Home Equity Loan Trust | 3,100 | 1,988,432 | ||||
Newcastle Mortgage Securities Trust | 2,377 | 1,682,054 | ||||
Novastar Home Loan Equity | 4,935 | 153,227 | ||||
Option One Mortgage Loan Trust | 2,491 | 1,669,108 | ||||
Security National Mortgage Loan Trust | 825 | 800,529 | ||||
Soundview Home Equity Loan Trust | 4,185 | 1,964,704 | ||||
Specialty Underwriting & Residential Finance | 2,000 | 575,378 | ||||
| 18,215,919 | ||||||
Autos - Floating Rate – 1.4% | ||||||
GE Dealer Floorplan Master Note Trust | 4,360 | 4,326,191 | ||||
Wheels SPV LLC | 12,201 | 12,364,481 | ||||
| 16,690,672 | ||||||
Credit Cards - Fixed Rate – 1.2% | ||||||
BA Credit Card Trust | 4,600 | 4,741,198 | ||||
Citibank Credit Card Issuance Trust | 9,625 | 9,720,407 | ||||
| 14,461,605 | ||||||
Other ABS - Floating Rate – 1.2% | ||||||
CNH Wholesale Master Note Trust | 14,000 | 14,341,677 | ||||
| 78 | • ALLIANCEBERNSTEIN POOLING PORTFOLIOS |
Short Duration Bond Portfolio—Portfolio of Investments
| Principal Amount (000) | U.S. $ Value | |||||
Petra CRE CDO Ltd. | $ | 1,865 | $ | 18,650 | ||
| 14,360,327 | ||||||
Home Equity Loans - Fixed Rate – 1.0% | ||||||
American General Mortgage Loan Trust | 2,767 | 2,467,779 | ||||
Citifinancial Mortgage Securities, Inc. | 6 | 5,716 | ||||
Countrywide Asset-Backed Certificates | 2,646 | 1,042,736 | ||||
Credit-Based Asset Servicing and Securitization LLC | 2,180 | 1,638,585 | ||||
Series 2005-CB4, Class AF2 | 708 | 682,681 | ||||
Series 2005-RP2, Class AF2 | 713 | 688,754 | ||||
Series 2007-CB4, Class A2A | 1,285 | 1,188,748 | ||||
Flagstar Home Equity Loan Trust | 3,384 | 3,034,862 | ||||
Home Equity Mortgage Trust | 2 | 2,401 | ||||
Series 2006-5, Class A1 | 2,395 | 289,330 | ||||
Nationstar NIM Trust | 35 | 0 | ||||
Structured Asset Securities Corp. | 9,431 | 1,493,363 | ||||
| 12,534,955 | ||||||
Total Asset-Backed Securities | 228,584,025 | |||||
MORTGAGE PASS-THRU’S – 17.8% | ||||||
Agency Fixed Rate 30-Year – 9.7% | ||||||
Federal Home Loan Mortgage Corp. Gold | 3,092 | 3,313,023 | ||||
6.50%, 12/01/33 | 8,197 | 8,983,785 | ||||
| ALLIANCEBERNSTEIN POOLING PORTFOLIOS • | 79 |
Short Duration Bond Portfolio—Portfolio of Investments
| Principal Amount (000) | U.S. $ Value | |||||
Federal National Mortgage Association | $ | 46,595 | $ | 49,873,567 | ||
Series 2008 6.00%, 8/01/38 | 13,358 | 14,185,322 | ||||
6.50%, 12/01/28-7/01/35 | 23,881 | 25,781,086 | ||||
Government National Mortgage Association | 14,673 | 15,773,144 | ||||
| 117,909,927 | ||||||
Agency ARMS – 7.5% | ||||||
Federal Home Loan Mortgage Corp. | 4,650 | 4,833,604 | ||||
Series 2007 | 6,420 | 6,769,120 | ||||
6.071%, 1/01/37(b) | 5,960 | 6,283,556 | ||||
Federal National Mortgage Association | 1,452 | 1,524,056 | ||||
Series 2005 | 7,623 | 7,832,822 | ||||
4.667%, 10/01/35(c) | 4,379 | 4,583,153 | ||||
5.333%, 1/01/36(c) | 3,198 | 3,335,291 | ||||
Series 2006 | 11,502 | 11,816,626 | ||||
5.49%, 5/01/36(b) | 6,131 | 6,349,830 | ||||
5.66%, 7/01/36(c) | 5,282 | 5,515,221 | ||||
5.81%, 11/01/36(b) | 9,364 | 9,873,564 | ||||
Series 2007 | 6,718 | 7,005,311 | ||||
5.533%, 2/01/37(b) | 6,721 | 7,086,057 | ||||
6.415%, 1/01/37(b) | 3,843 | 4,052,211 | ||||
Series 2009 | 3,545 | 3,710,726 | ||||
| 90,571,148 | ||||||
Agency Fixed Rate 15-Year – 0.6% | ||||||
Federal National Mortgage Association | 25 | 27,164 | ||||
Series 2001 | 128 | 137,540 | ||||
Series 2002 | 74 | 79,663 | ||||
Series 2005 | 245 | 263,238 | ||||
| 80 | • ALLIANCEBERNSTEIN POOLING PORTFOLIOS |
Short Duration Bond Portfolio—Portfolio of Investments
| Principal Amount (000) | U.S. $ Value | |||||
Series 2006 | $ | 4,628 | $ | 4,981,176 | ||
Series 2007 | 1,196 | 1,284,799 | ||||
| 6,773,580 | ||||||
Total Mortgage Pass-Thru’s | 215,254,655 | |||||
AGENCIES – 5.6% | ||||||
Agency Debentures – 5.6% | ||||||
Bank of America Corp. – FDIC Insured | 8,760 | 8,946,947 | ||||
Citigroup, Inc. – FDIC Insured | 18,659 | 18,947,020 | ||||
The Goldman Sachs Group, Inc. – FDIC Insured | 13,670 | 14,311,191 | ||||
JP Morgan Chase & Co. – FDIC Insured | 10,565 | 10,981,906 | ||||
Morgan Stanley – FDIC Insured | 6,000 | 6,138,144 | ||||
Wells Fargo & Co. – FDIC Insured | 7,493 | 7,771,635 | ||||
Total Agencies | 67,096,843 | |||||
COMMERCIAL MORTGAGE-BACKED SECURITIES – 3.9% | ||||||
Non-Agency Fixed Rate CMBS – 2.4% | ||||||
GE Capital Commercial Mortgage Corp. | 5,665 | 5,683,083 | ||||
GS Mortgage Securities Corp. II | 14,000 | 14,424,752 | ||||
JP Morgan Chase Commercial Mortgage Securities Corp. | 5,950 | 5,876,978 | ||||
LB Commercial Conduit Mortgage Trust | 10,000 | 2,681,905 | ||||
| 28,666,718 | ||||||
Non-Agency Floating Rate CMBS – 1.5% | ||||||
Banc of America Large Loan, Inc. | 2,500 | 2,005,567 | ||||
| ALLIANCEBERNSTEIN POOLING PORTFOLIOS • | 81 |
Short Duration Bond Portfolio—Portfolio of Investments
| Principal Amount (000) | U.S. $ Value | |||||
Commercial Mortgage Pass-Through Certificates | $ | 279 | $ | 279,392 | ||
Series 2005-FL11, Class D | 1,127 | 980,133 | ||||
Series 2007-FL14, Class C | 3,874 | 2,510,644 | ||||
Credit Suisse Mortgage Capital Certificates | 4,900 | 2,460,731 | ||||
Series 2007-TFLA, Class A2 | 8,000 | 6,529,405 | ||||
Lehman Brothers Floating Rate Commercial Mortgage Trust | 2,400 | 2,332,227 | ||||
Wachovia Bank Commercial Mortgage Trust | 2,600 | 905,971 | ||||
Series 2007-WHL8, Class E | 2,725 | 849,414 | ||||
| 18,853,484 | ||||||
Total Commercial Mortgage-Backed Securities | 47,520,202 | |||||
CMOS – 2.4% | ||||||
Non-Agency Floating Rate – 1.1% | ||||||
Adjustable Rate Mortgage Trust | 4,155 | 62,325 | ||||
American Home Mortgage Investment Trust | 79 | 38,561 | ||||
Countrywide Alternative Loan Trust | 2,030 | 874,295 | ||||
Countrywide Home Loan Mortgage Pass Through Trust | 130 | 33,794 | ||||
Deutsche ALT-A Securities, Inc. Alternate Loan Trust | 2,561 | 1,288,059 | ||||
| 82 | • ALLIANCEBERNSTEIN POOLING PORTFOLIOS |
Short Duration Bond Portfolio—Portfolio of Investments
| Principal Amount (000) | U.S. $ Value | |||||
Homebanc Mortgage Trust | $ | 3,206 | $ | 1,460,666 | ||
Lehman XS Trust | 3,602 | 9,803 | ||||
MLCC Mortgage Investors, Inc. | 95 | 80,089 | ||||
Mortgage Equity Conversion Asset Trust | 3,267 | 3,083,553 | ||||
Sequoia Mortgage Trust | 3,055 | 2,472,791 | ||||
Structured Adjustable Rate Mortgage Loan Trust | 137 | 111,840 | ||||
Structured Asset Mortgage Investment, Inc. | 656 | 556,473 | ||||
WaMu Mortgage Pass Through Certificates | 3,215 | 1,859,463 | ||||
Series 2006-AR4, Class 1A1B | 1,260 | 465,932 | ||||
Series 2006-AR9, Class 1AB2 | 3,449 | 1,125,635 | ||||
| 13,523,279 | ||||||
Non-Agency Fixed Rate – 0.5% | ||||||
Merrill Lynch Mortgage Investors, Inc. | 1,022 | 954,646 | ||||
Nomura Asset Acceptance Corp. | 5,054 | 4,892,789 | ||||
| 5,847,435 | ||||||
Agency Fixed Rate – 0.5% | ||||||
Fannie Mae REMICS | 2,380 | 2,408,350 | ||||
Series 2006-50, Class PA | 3,349 | 3,420,967 | ||||
| 5,829,317 | ||||||
| ALLIANCEBERNSTEIN POOLING PORTFOLIOS • | 83 |
Short Duration Bond Portfolio—Portfolio of Investments
| Principal Amount (000) | U.S. $ Value | ||||||
Agency Floating Rate – 0.2% | |||||||
Federal National Mortgage Association Series 2003-52, Class FV | $ | 1,283 | $ | 1,290,892 | |||
Series 2003-W13, Class AV2 | 268 | 232,974 | |||||
Freddie Mac Reference REMIC | 1,116 | 1,102,014 | |||||
| 2,625,880 | |||||||
Non-Agency ARMS – 0.1% | |||||||
Bear Stearns Alt-A Trust | 2,883 | 1,526,720 | |||||
Total CMOs | 29,352,631 | ||||||
| Shares | |||||||
SHORT-TERM INVESTMENTS – 4.8% | |||||||
Investment Companies – 2.1% | |||||||
AllianceBernstein Fixed-Income Shares, Inc. – Government STIF Portfolio, 0.11%(g) | 25,106,124 | 25,106,124 | |||||
| Principal Amount (000) | |||||||
Treasury Bills – 1.6% | |||||||
U.S. Treasury Bills | $ | 20,000 | 19,999,440 | ||||
Certificates of Deposit – 1.1% | |||||||
Royal Bank of Canada NY | 12,810 | 12,802,935 | |||||
Total Short-Term Investments | 57,908,499 | ||||||
Total Investments – 105.1% | 1,270,713,337 | ||||||
Other assets less liabilities – (5.1)% | (61,392,813 | ) | |||||
Net Assets – 100.0% | $ | 1,209,320,524 | |||||
| 84 | • ALLIANCEBERNSTEIN POOLING PORTFOLIOS |
Short Duration Bond Portfolio—Portfolio of Investments
FUTURES CONTRACTS (see Note C)
| Type | Number of Contracts | Expiration Month | Original Value | Value at February 28, 2010 | Unrealized Appreciation/ (Depreciation) | |||||||||
Purchased Contracts | ||||||||||||||
U.S. T-Note | 2,200 | June 2010 | $ | 477,067,053 | $ | 478,362,500 | $ | 1,295,447 | ||||||
Sold Contracts | ||||||||||||||
U.S. T-Note | 194 | June 2010 | 22,459,665 | 22,791,969 | (332,304 | ) | ||||||||
U.S. T-Note | 2,064 | June 2010 | 237,130,184 | 239,295,000 | (2,164,816 | ) | ||||||||
| $ | (1,201,673 | ) | ||||||||||||
| (a) | Security is exempt from registration under Rule 144A of the Securities Act of 1933. These securities are considered liquid and may be resold in transactions exempt from registration, normally to qualified institutional buyers. At February 28, 2010, the aggregate market value of these securities amounted to $121,078,380 or 10.0% of net assets. |
| (b) | Floating Rate Security. Stated interest rate was in effect at February 28, 2010. |
| (c) | Variable rate coupon, rate shown as of February 28, 2010. |
| (d) | Security is exempt from registration under Rule 144A of the Securities Act of 1933. This security, which represents 0.0% of net assets as of February 28, 2010, is considered illiquid and restricted. |
| Restricted Securities | Acquisition Date | Acquisition Cost | Market Value | Percentage of Net Assets | |||||||
Nationstar NIM Trust | 4/4/2007 | $ | 35,213 | $ | 0 | 0.0 | % | ||||
| (e) | Fair valued. |
| (f) | IO – Interest Only |
| (g) | Investment in affiliated money market mutual fund. The rate shown represents the 7-day yield as of period end. The fund currently owns investments collateralized by subprime mortgage loans. Subprime loans are offered to homeowners who do not have a history of debt or who have had problems meeting their debt obligations. Because repayment is less certain, subprime borrowers pay a higher rate of interest than prime borrowers. As of February 28, 2010, the fund’s total exposure to subprime investments was 3.94% of net assets. These investments are valued in accordance with the fund’s Valuation Policies (see Note A for additional details). |
| + | Position, or a portion thereof, has been segregrated to meet the collateral requirements of the Term Asset-Backed Securities Loan Facility (“TALF”) program administered by the Federal Reserve Bank of New York. The aggregate market value of these securities amounted to $66,725,684. |
Glossary:
ABS – Asset-Backed Securities
ARMS – Adjustable Rate Mortgages
CDO – Collateralized Debt Obligation
CMBS – Commercial Mortgage-Backed Securities
CMOs – Collateralized Mortgage Obligations
FDIC – Federal Deposit Insurance Corporation
REMIC – Real Estate Mortgage Investment Conduit
See notes to financial statements.
| ALLIANCEBERNSTEIN POOLING PORTFOLIOS • | 85 |
Short Duration Bond Portfolio—Portfolio of Investments
INTERMEDIATE DURATION BOND PORTFOLIO
PORTFOLIO OF INVESTMENTS
February 28, 2010 (unaudited)
| Principal Amount (000) | U.S. $ Value | |||||
CORPORATES - INVESTMENT GRADES – 33.2% | ||||||
Industrial – 16.1% | ||||||
Basic – 2.3% | ||||||
ArcelorMittal | $ | 3,570 | $ | 3,693,708 | ||
BHP Billiton Finance USA Ltd. | 3,132 | 3,674,491 | ||||
Celulosa Arauco Y Constitucion | 999 | 1,029,539 | ||||
The Dow Chemical Co. | 200 | 216,907 | ||||
8.55%, 5/15/19 | 4,115 | 4,974,677 | ||||
Eastman Chemical | 686 | 706,192 | ||||
EI Du Pont de Nemours & Co. | 1,539 | 1,725,967 | ||||
Freeport-McMoRan Copper & Gold, Inc. | 2,885 | 3,130,225 | ||||
International Paper Co. | 2,625 | 2,785,884 | ||||
7.50%, 8/15/21 | 797 | 902,742 | ||||
Packaging Corp. of America | 1,329 | 1,441,057 | ||||
PPG Industries, Inc. | 3,190 | 3,477,378 | ||||
Rio Tinto Finance USA Ltd. | 3,260 | 3,675,542 | ||||
| 31,434,309 | ||||||
Capital Goods – 1.0% | ||||||
Holcim US Finance Sarl & Cie SCS | 299 | 310,365 | ||||
John Deere Capital Corp. | 2,660 | 2,899,509 | ||||
Lafarge SA | 2,204 | 2,310,859 | ||||
Republic Services, Inc. | 1,213 | 1,226,336 | ||||
5.50%, 9/15/19(a) | 1,768 | 1,829,876 | ||||
Tyco International Finance SA | 1,250 | 1,391,885 | ||||
8.50%, 1/15/19 | 1,265 | 1,585,794 | ||||
United Technologies Corp. | 1,591 | 1,745,548 | ||||
| 13,300,172 | ||||||
| 86 | • ALLIANCEBERNSTEIN POOLING PORTFOLIOS |
Intermediate Duration Bond Portfolio—Portfolio of Investments
| Principal Amount (000) | U.S. $ Value | |||||
Communications - Media – 1.8% | ||||||
BSKYB Finance UK PLC | $ | 3,710 | $ | 4,082,269 | ||
Comcast Cable Communications Holdings, Inc. | 2,746 | 3,673,601 | ||||
Comcast Corp. | 2,767 | 2,890,685 | ||||
DirecTV Holdings LLC/DirecTV Financing Co., Inc. | 1,200 | 1,254,484 | ||||
News America Holdings, Inc. | 670 | 792,613 | ||||
News America, Inc. | 1,383 | 1,445,459 | ||||
Reed Elsevier Capital, Inc. | 1,345 | 1,682,951 | ||||
RR Donnelley & Sons Co. | 710 | 713,353 | ||||
Time Warner Cable, Inc. | 1,325 | 1,545,945 | ||||
Time Warner Entertainment Co. | 2,680 | 3,273,647 | ||||
WPP Finance UK | 376 | 398,266 | ||||
8.00%, 9/15/14 | 2,616 | 3,017,402 | ||||
| 24,770,675 | ||||||
Communications - Telecommunications – 2.7% | ||||||
AT&T Corp. | 295 | 360,673 | ||||
British Telecommunications PLC | 3,066 | 3,257,616 | ||||
Embarq Corp. | 3,780 | 4,166,834 | ||||
Pacific Bell Telephone Co. | 6,250 | 6,420,544 | ||||
Qwest Corp. | 3,270 | 3,482,550 | ||||
8.875%, 3/15/12(b) | 660 | 715,275 | ||||
Telecom Italia Capital SA | 2,510 | 2,734,201 | ||||
6.375%, 11/15/33 | 375 | 359,292 | ||||
US Cellular Corp. | 4,720 | 4,675,066 | ||||
| ALLIANCEBERNSTEIN POOLING PORTFOLIOS • | 87 |
Intermediate Duration Bond Portfolio—Portfolio of Investments
| Principal Amount (000) | U.S. $ Value | |||||
Verizon Communications, Inc. | $ | 2,540 | $ | 2,751,592 | ||
5.25%, 4/15/13 | 2,310 | 2,523,164 | ||||
Verizon New Jersey, Inc. | 2,259 | 2,416,161 | ||||
Vodafone Group PLC | 3,015 | 3,180,906 | ||||
| 37,043,874 | ||||||
Consumer Cyclical - Automotive – 0.5% | ||||||
Daimler Finance North America LLC | 1,105 | 1,170,959 | ||||
7.30%, 1/15/12 | 1,178 | 1,286,047 | ||||
7.75%, 1/18/11 | 437 | 462,349 | ||||
Harley-Davidson Funding Corp. | 1,440 | 1,498,169 | ||||
Nissan Motor Acceptance Corp. | 2,530 | 2,562,925 | ||||
| 6,980,449 | ||||||
Consumer Cyclical - Entertainment – 0.6% | ||||||
Time Warner, Inc. | 2,130 | 2,350,102 | ||||
7.625%, 4/15/31 | 2,810 | 3,273,984 | ||||
Viacom, Inc. | 2,895 | 3,061,642 | ||||
| 8,685,728 | ||||||
Consumer Cyclical - Other – 0.7% | ||||||
Marriott International, Inc. | 4,120 | 4,336,172 | ||||
MDC Holdings, Inc. | 4,540 | 4,716,475 | ||||
| 9,052,647 | ||||||
Consumer Non-Cyclical – 2.9% | ||||||
Altria Group, Inc. | 1,675 | 2,106,421 | ||||
Baxter FinCo BV | 2,678 | 2,751,865 | ||||
Bottling Group LLC | 2,315 | 2,699,172 | ||||
Bunge Ltd. Finance Corp. | 1,711 | 1,770,669 | ||||
5.875%, 5/15/13 | 2,720 | 2,892,598 | ||||
| 88 | • ALLIANCEBERNSTEIN POOLING PORTFOLIOS |
Intermediate Duration Bond Portfolio—Portfolio of Investments
| Principal Amount (000) | U.S. $ Value | |||||
Cadbury Schweppes US Finance LLC | $ | 3,480 | $ | 3,709,955 | ||
Campbell Soup Co. | 2,205 | 2,336,742 | ||||
ConAgra Foods, Inc. | 68 | 70,543 | ||||
Delhaize Group SA | 775 | 854,475 | ||||
Diageo Capital PLC | 2,340 | 2,755,553 | ||||
Fisher Scientific International, Inc. | 2,336 | 2,429,440 | ||||
Fortune Brands, Inc. | 2,016 | 2,108,998 | ||||
The Kroger Co. | 2,175 | 2,476,879 | ||||
Pepsico, Inc. | 2,505 | 2,708,138 | ||||
Pfizer, Inc. | 2,620 | 2,912,429 | ||||
The Procter & Gamble Co. | 2,607 | 2,705,388 | ||||
Safeway, Inc. | 453 | 477,431 | ||||
Wyeth | 2,212 | 2,461,109 | ||||
| 40,227,805 | ||||||
Energy – 1.9% | ||||||
Amerada Hess Corp. | 1,793 | 2,174,714 | ||||
Anadarko Petroleum Corp. | 3,050 | 3,334,827 | ||||
6.45%, 9/15/36 | 877 | 919,451 | ||||
Apache Corp. | 1,455 | 1,579,864 | ||||
Baker Hughes, Inc. | 1,300 | 1,499,346 | ||||
Canadian Natural Resources Ltd. | 1,220 | 1,313,371 | ||||
Marathon Oil Corp. | 995 | 1,159,569 | ||||
Nabors Industries, Inc. | 2,995 | 3,743,310 | ||||
Noble Energy, Inc. | 2,858 | 3,468,726 | ||||
The Premcor Refining Group, Inc. | 2,115 | 2,167,875 | ||||
| ALLIANCEBERNSTEIN POOLING PORTFOLIOS • | 89 |
Intermediate Duration Bond Portfolio—Portfolio of Investments
| Principal Amount (000) | U.S. $ Value | |||||
Valero Energy Corp | $ | 1,635 | $ | 1,645,698 | ||
Weatherford International Ltd. | 1,600 | 1,702,187 | ||||
9.625%, 3/01/19 | 1,540 | 1,962,026 | ||||
| 26,670,964 | ||||||
Other Industrial – 0.2% | ||||||
Noble Group Ltd. | 2,260 | 2,291,075 | ||||
Technology – 1.2% | ||||||
Cisco Systems, Inc. | 2,470 | 2,580,387 | ||||
Computer Sciences Corp. | 2,290 | 2,482,926 | ||||
Dell, Inc. | 1,645 | 1,821,752 | ||||
Electronic Data Systems Corp. | 3,850 | 4,316,847 | ||||
Motorola, Inc. | 1,800 | 1,760,700 | ||||
7.50%, 5/15/25 | 290 | 309,604 | ||||
7.625%, 11/15/10 | 146 | 151,741 | ||||
Oracle Corp. | 2,480 | 2,574,545 | ||||
Xerox Corp. | 310 | 365,128 | ||||
| 16,363,630 | ||||||
Transportation - Airlines – 0.2% | ||||||
Southwest Airlines Co. | 1,695 | 1,765,497 | ||||
5.75%, 12/15/16 | 1,115 | 1,149,037 | ||||
| 2,914,534 | ||||||
Transportation - Services – 0.1% | ||||||
Con-way, Inc. | 2,269 | 2,048,920 | ||||
| 221,784,782 | ||||||
Financial Institutions – 13.2% | ||||||
Banking – 7.6% | ||||||
American Express Co. | 1,900 | 2,166,044 | ||||
8.125%, 5/20/19 | 2,785 | 3,369,666 | ||||
ANZ National International Ltd. | 1,890 | 2,096,766 | ||||
| 90 | • ALLIANCEBERNSTEIN POOLING PORTFOLIOS |
Intermediate Duration Bond Portfolio—Portfolio of Investments
| Principal Amount (000) | U.S. $ Value | |||||
Bank of America Corp. | $ | 4,230 | $ | 4,439,305 | ||
7.625%, 6/01/19 | 1,700 | 1,922,452 | ||||
Series L | 1,400 | 1,396,486 | ||||
Bank of Tokyo-Mitsubishi UFJ Ltd./New York NY | 170 | 182,207 | ||||
Barclays Bank PLC | 961 | 936,975 | ||||
The Bear Stearns Co., Inc. | 5,410 | 5,618,442 | ||||
Citigroup, Inc. | 2,900 | 3,035,563 | ||||
6.50%, 8/19/13 | 2,770 | 2,979,534 | ||||
8.50%, 5/22/19 | 2,750 | 3,173,382 | ||||
Compass Bank | 4,989 | 4,696,465 | ||||
Countrywide Home Loans, Inc. | 1,151 | 1,185,521 | ||||
Credit Suisse USA, Inc. | 1,128 | 1,240,962 | ||||
Deutsche Bank AG London | 2,730 | 2,803,423 | ||||
The Goldman Sachs Group, Inc. | 2,806 | 2,963,029 | ||||
5.125%, 1/15/15 | 1,590 | 1,679,700 | ||||
6.00%, 5/01/14 | 1,675 | 1,838,321 | ||||
7.50%, 2/15/19 | 2,855 | 3,267,533 | ||||
JPMorgan Chase & Co. | 2,925 | 3,078,405 | ||||
JPMorgan Chase Capital XXV | 733 | 716,891 | ||||
Lloyds TSB Bank PLC | 3,820 | 3,756,187 | ||||
Marshall & Ilsley Bank | 3,700 | 3,054,072 | ||||
Merrill Lynch & Co., Inc. | 1,607 | 1,635,720 | ||||
Morgan Stanley | 1,615 | 1,645,695 | ||||
5.625%, 1/09/12 | 3,940 | 4,192,255 | ||||
6.60%, 4/01/12 | 2,565 | 2,790,266 | ||||
National Australia Bank Ltd. | 3,175 | 3,201,956 | ||||
| ALLIANCEBERNSTEIN POOLING PORTFOLIOS • | 91 |
Intermediate Duration Bond Portfolio—Portfolio of Investments
| Principal Amount (000) | U.S. $ Value | |||||
National City Bank of Cleveland Ohio | $ | 4,245 | $ | 4,422,292 | ||
Nationwide Building Society | 3,415 | 3,467,328 | ||||
Regions Financial Corp. | 975 | 966,840 | ||||
SouthTrust Corp. | 3,315 | 3,552,039 | ||||
Standard Chartered PLC | 4,800 | 4,109,323 | ||||
UBS Preferred Funding Trust I | 2,319 | 2,248,087 | ||||
UFJ Finance Aruba AEC | 1,913 | 2,148,586 | ||||
Union Bank of California | 1,005 | 1,062,419 | ||||
Union Planters Corp. | 2,817 | 2,835,747 | ||||
Wachovia Corp. | 4,155 | 4,488,206 | ||||
| 104,364,090 | ||||||
Finance – 0.9% | ||||||
General Electric Capital Corp. | 2,795 | 2,955,341 | ||||
Series A | 2,713 | 2,837,198 | ||||
HSBC Finance Corp. | 2,095 | 2,294,727 | ||||
SLM Corp. | 4,650 | 4,348,147 | ||||
| 12,435,413 | ||||||
Insurance – 3.3% | ||||||
Aetna, Inc. | 1,010 | 1,113,933 | ||||
Allied World Assurance Co. Holdings Ltd. | 1,820 | 1,979,223 | ||||
Assurant, Inc. | 1,028 | 1,071,505 | ||||
Berkshire Hathaway Finance Corp. | 1,656 | 1,702,860 | ||||
Coventry Health Care, Inc. | 665 | 630,061 | ||||
6.125%, 1/15/15 | 260 | 259,275 | ||||
6.30%, 8/15/14 | 2,060 | 2,100,617 | ||||
Genworth Financial, Inc. | 4,100 | 3,861,310 | ||||
| 92 | • ALLIANCEBERNSTEIN POOLING PORTFOLIOS |
Intermediate Duration Bond Portfolio—Portfolio of Investments
| Principal Amount (000) | U.S. $ Value | |||||
Guardian Life Insurance | $ | 1,605 | $ | 1,673,530 | ||
Humana, Inc. | 1,514 | 1,559,668 | ||||
6.45%, 6/01/16 | 285 | 301,397 | ||||
7.20%, 6/15/18 | 610 | 663,796 | ||||
Liberty Mutual Group, Inc. | 2,683 | 2,771,437 | ||||
Lincoln National Corp. | 791 | 953,728 | ||||
Massachusetts Mutual Life Insurance Co. | 1,510 | 1,864,539 | ||||
MetLife, Inc. | 1,159 | 1,347,621 | ||||
Nationwide Mutual Insurance Co. | 2,585 | 2,879,749 | ||||
Principal Financial Group, Inc. | 2,220 | 2,523,423 | ||||
Prudential Financial, Inc. | 2,545 | 2,709,565 | ||||
6.20%, 1/15/15 | 265 | 291,604 | ||||
Series D | 200 | 229,973 | ||||
Swiss Re Solutions Holding Corp. | 3,065 | 3,143,421 | ||||
UnitedHealth Group, Inc. | 4,300 | 4,462,579 | ||||
Wellpoint, Inc. | 270 | 293,542 | ||||
7.00%, 2/15/19 | 655 | 755,731 | ||||
XL Capital Ltd. | 4,520 | 4,673,364 | ||||
| 45,817,451 | ||||||
REITS – 1.4% | ||||||
ERP Operating LP | 4,570 | 4,823,923 | ||||
HCP, Inc. | 4,630 | 4,490,336 | ||||
Health Care REIT, Inc. | 3,980 | 4,033,085 | ||||
Healthcare Realty Trust, Inc. | 2,373 | 2,402,527 | ||||
Simon Property Group LP | 3,236 | 3,475,626 | ||||
| 19,225,497 | ||||||
| 181,842,451 | ||||||
| ALLIANCEBERNSTEIN POOLING PORTFOLIOS • | 93 |
Intermediate Duration Bond Portfolio—Portfolio of Investments
| Principal Amount (000) | U.S. $ Value | |||||
Utility – 2.7% | ||||||
Electric – 1.7% | ||||||
Allegheny Energy Supply Co. LLC | $ | 3,175 | $ | 3,199,720 | ||
Carolina Power & Light Co. | 2,595 | 2,872,066 | ||||
FirstEnergy Corp. | 58 | 61,972 | ||||
Series C | 2,291 | 2,477,272 | ||||
FPL Group Capital, Inc. | 2,855 | 3,032,073 | ||||
MidAmerican Energy Holdings Co. | 2,093 | 2,300,404 | ||||
Nisource Finance Corp. | 3,445 | 3,769,467 | ||||
Pacific Gas & Electric Co. | 1,700 | 1,848,231 | ||||
The Southern Co. | 999 | 1,070,213 | ||||
SPI Electricity & Gas Australia Holdings Pty Ltd. | 1,447 | 1,554,404 | ||||
Union Electric Co. | 315 | 354,485 | ||||
| 22,540,307 | ||||||
Natural Gas – 0.8% | ||||||
Duke Energy Field Services Corp. | 506 | 521,896 | ||||
Energy Transfer Partners LP | 972 | 1,066,689 | ||||
7.50%, 7/01/38 | 3,329 | 3,705,743 | ||||
Enterprise Products Operating LLC | 1,278 | 1,392,579 | ||||
Williams Partners LP | 4,178 | 4,245,362 | ||||
| 10,932,269 | ||||||
Other Utility – 0.2% | ||||||
Veolia Environnement | 2,785 | 2,994,401 | ||||
| 36,466,977 | ||||||
| 94 | • ALLIANCEBERNSTEIN POOLING PORTFOLIOS |
Intermediate Duration Bond Portfolio—Portfolio of Investments
| Principal Amount (000) | U.S. $ Value | |||||
Non Corporate Sectors – 1.2% | ||||||
Agencies - Not Government Guaranteed – 1.2% | ||||||
Gaz Capital SA | $ | 7,890 | $ | 7,899,863 | ||
Petrobras International Finance | 5,100 | 5,144,375 | ||||
TransCapitalInvest Ltd. for OJSC AK Transneft | 3,055 | 3,559,075 | ||||
| 16,603,313 | ||||||
Total Corporates - Investment Grades | 456,697,523 | |||||
GOVERNMENTS - TREASURIES – 28.1% | ||||||
Germany – 2.2% | ||||||
Bundesrepublik Deutschland | EUR | 20,300 | 29,700,515 | |||
New Zealand – 0.2% | ||||||
New Zealand Government | NZD | 3,929 | 2,900,622 | |||
United States – 25.7% | ||||||
U.S. Treasury Bonds | $ | 73,505 | 75,227,503 | |||
4.50%, 2/15/36 | 33,280 | 33,462,008 | ||||
U.S. Treasury Notes | 31,240 | 31,418,905 | ||||
1.75%, 11/15/11 | 18,785 | 19,137,219 | ||||
2.25%, 1/31/15 | 30,040 | 30,049,372 | ||||
2.375%, 8/31/14 | 50,785 | 51,499,139 | ||||
2.625%, 7/31/14 | 70,855 | 72,665,133 | ||||
3.375%, 11/15/19 | 41,255 | 40,536,255 | ||||
| 353,995,534 | ||||||
Total Governments - Treasuries | 386,596,671 | |||||
MORTGAGE PASS-THRU’S – 16.3% | ||||||
Agency Fixed Rate 30-Year – 14.7% | ||||||
Federal Home Loan Mortgage Corp. | 4,610 | 4,978,800 | ||||
Federal Home Loan Mortgage Corp. Gold | 3,073 | 3,129,871 | ||||
| ALLIANCEBERNSTEIN POOLING PORTFOLIOS • | 95 |
Intermediate Duration Bond Portfolio—Portfolio of Investments
| Principal Amount (000) | U.S. $ Value | |||||
Series 2006 | $ | 169 | $ | 171,655 | ||
Series 2007 | 4,327 | 4,594,635 | ||||
Series 2008 | 4,573 | 5,014,307 | ||||
Federal National Mortgage Association | 16,620 | 17,630,180 | ||||
Series 2003 | 12,918 | 13,461,792 | ||||
5.50%, 4/01/33-7/01/33 | 15,553 | 16,463,959 | ||||
Series 2004 | 12,268 | 12,977,646 | ||||
Series 2005 | 20,736 | 21,152,396 | ||||
5.50%, 2/01/35 | 2,994 | 3,169,962 | ||||
6.00%, 4/01/35 | 9,785 | 10,511,720 | ||||
Series 2006 | 16,212 | 16,861,101 | ||||
Series 2007 | 12,288 | 12,564,772 | ||||
5.50%, 8/01/37 | 22,008 | 23,297,597 | ||||
Series 2008 | 21,412 | 22,868,282 | ||||
6.50%, 1/01/39 | 3,296 | 3,522,382 | ||||
Government National Mortgage Association | 6,625 | 7,009,045 | ||||
6.00%, TBA | 2,950 | 3,146,821 | ||||
| 202,526,923 | ||||||
Agency ARMS – 1.6% | ||||||
Federal Home Loan Mortgage Corp. | 4,279 | 4,511,997 | ||||
Series 2009 | 6,522 | 6,805,055 | ||||
Federal National Mortgage Association | 2,015 | 2,114,849 | ||||
Series 2006 | 2,528 | 2,638,211 | ||||
6.153%, 3/01/36(c) | 1,773 | 1,856,943 | ||||
Series 2007 | 3,992 | 4,158,014 | ||||
| 22,085,069 | ||||||
Total Mortgage Pass-Thru’s | 224,611,992 | |||||
| 96 | • ALLIANCEBERNSTEIN POOLING PORTFOLIOS |
Intermediate Duration Bond Portfolio—Portfolio of Investments
| Principal Amount (000) | U.S. $ Value | |||||
COMMERCIAL MORTGAGE-BACKED | ||||||
Non-Agency Fixed Rate CMBS – 9.2% | ||||||
Bear Stearns Commercial Mortgage Securities, Inc. | $ | 6,455 | $ | 6,131,653 | ||
Citigroup Commercial Mortgage Trust | 8,585 | 8,302,313 | ||||
Commercial Mortgage Pass Through Certificates | 3,065 | 2,805,584 | ||||
Credit Suisse Mortgage Capital Certificates | 6,475 | 5,809,870 | ||||
Series 2006-C5, Class A3 | 4,500 | 3,958,295 | ||||
Greenwich Capital Commercial Funding Corp. | 1,470 | 1,398,489 | ||||
GS Mortgage Securities Corp. II | 14,000 | 14,424,752 | ||||
JP Morgan Chase Commercial Mortgage Securities Corp. | 14,000 | 14,435,737 | ||||
Series 2007-LD11, Class A4 | 855 | 783,261 | ||||
LB-UBS Commercial Mortgage Trust | 6,015 | 6,186,382 | ||||
Series 2006-C6, Class A4 | 8,090 | 8,159,352 | ||||
Series 2007-C1, Class A3 | 20,000 | 20,493,518 | ||||
Series 2007-C1, Class A4 | 5,725 | 5,299,005 | ||||
Merrill Lynch/Countrywide Commercial Mortgage Trust | 3,075 | 3,175,817 | ||||
Morgan Stanley Capital I | 8,155 | 6,949,722 | ||||
| ALLIANCEBERNSTEIN POOLING PORTFOLIOS • | 97 |
Intermediate Duration Bond Portfolio—Portfolio of Investments
| Principal Amount (000) | U.S. $ Value | |||||
Series 2007-IQ13, Class A4 | $ | 4,035 | $ | 3,691,946 | ||
Wachovia Bank Commercial Mortgage Trust | 8,565 | 8,414,714 | ||||
Series 2007-C32, Class A3 | 6,885 | 6,136,501 | ||||
| 126,556,911 | ||||||
Non-Agency Floating Rate CMBS – 0.1% | ||||||
GS Mortgage Securities Corp. II | 1,855 | 1,585,018 | ||||
Total Commercial Mortgage-Backed Securities | 128,141,929 | |||||
ASSET-BACKED SECURITIES – 3.4% | ||||||
Credit Cards - Floating Rate – 1.9% | ||||||
Citibank Omni Master Trust | 14,000 | 14,450,755 | ||||
Discover Card Master Trust | 11,000 | 11,144,019 | ||||
| 25,594,774 | ||||||
Autos - Floating Rate – 0.9% | ||||||
Wheels SPV LLC | 12,201 | 12,364,481 | ||||
Credit Cards - Fixed Rate – 0.3% | ||||||
Capital One Multi-Asset Execution Trust | 4,150 | 4,333,497 | ||||
Home Equity Loans - Floating Rate – 0.1% | ||||||
Citigroup Mortgage Loan Trust, Inc. | 3,715 | 163,887 | ||||
HFC Home Equity Loan Asset Backed Certificates | 872 | 764,132 | ||||
| 98 | • ALLIANCEBERNSTEIN POOLING PORTFOLIOS |
Intermediate Duration Bond Portfolio—Portfolio of Investments
| Principal Amount (000) | U.S. $ Value | |||||
Lehman XS Trust | $ | 4,865 | $ | 43,612 | ||
Merrill Lynch First Franklin Mortgage Loan Trust | 817 | 786,040 | ||||
Option One Mortgage Loan Trust | 1,785 | 9,487 | ||||
RAAC Series | 35 | 34,390 | ||||
| 1,801,548 | ||||||
Home Equity Loans - Fixed Rate – 0.1% | ||||||
Asset Backed Funding Certificates | 668 | 494,414 | ||||
Citifinancial Mortgage Securities, Inc. | 593 | 502,305 | ||||
Home Equity Mortgage Trust | 1 | 1,429 | ||||
| 998,148 | ||||||
Other ABS - Fixed Rate – 0.1% | ||||||
DB Master Finance, LLC | 1,000 | 968,289 | ||||
Other ABS - Floating Rate – 0.0% | ||||||
Petra CRE CDO Ltd. | 2,220 | 22,200 | ||||
SLM Student Loan Trust | 115 | 114,193 | ||||
| 136,393 | ||||||
Total Asset-Backed Securities | 46,197,130 | |||||
GOVERNMENTS - SOVEREIGN BONDS – 2.0% | ||||||
Brazil – 0.4% | ||||||
Republic of Brazil | 4,730 | 5,912,500 | ||||
| ALLIANCEBERNSTEIN POOLING PORTFOLIOS • | 99 |
Intermediate Duration Bond Portfolio—Portfolio of Investments
| Principal Amount (000) | U.S. $ Value | |||||
Croatia – 0.2% | ||||||
Republic of Croatia | $ | 3,365 | $ | 3,487,092 | ||
Lithuania – 0.3% | ||||||
Republic of Lithuania | 3,300 | 3,489,169 | ||||
Peru – 0.6% | ||||||
Republic of Peru | 1,995 | 2,428,912 | ||||
9.875%, 2/06/15 | 4,245 | 5,361,435 | ||||
| 7,790,347 | ||||||
Poland – 0.2% | ||||||
Poland Government International Bond | 2,570 | 2,778,813 | ||||
Russia – 0.3% | ||||||
Russian Federation | 3,493 | 3,957,964 | ||||
Total Governments - Sovereign Bonds | 27,415,885 | |||||
GOVERNMENTS - SOVEREIGN AGENCIES – 1.7% | ||||||
Germany – 0.4% | ||||||
Kreditanstalt fuer Wiederaufbau | 2,795 | 3,109,960 | ||||
Landwirtschaftliche Rentenbank | 2,695 | 2,971,432 | ||||
| 6,081,392 | ||||||
South Korea – 0.1% | ||||||
Korea Development Bank | 1,335 | 1,354,950 | ||||
United Kingdom – 1.2% | ||||||
The Royal Bank of Scotland PLC | 10,450 | 10,506,200 | ||||
2.625%, 5/11/12(a) | 6,000 | 6,137,436 | ||||
| 16,643,636 | ||||||
Total Governments - Sovereign Agencies | 24,079,978 | |||||
| 100 | • ALLIANCEBERNSTEIN POOLING PORTFOLIOS |
Intermediate Duration Bond Portfolio—Portfolio of Investments
| Principal Amount (000) | U.S. $ Value | |||||
CMOS – 1.5% | ||||||
Non-Agency ARMS – 0.7% | ||||||
Bear Stearns Alt-A Trust | $ | 3,066 | $ | 1,623,532 | ||
Series 2006-3, Class 22A1 | 1,379 | 668,261 | ||||
Series 2007-1, Class 21A1 | 2,071 | 1,148,578 | ||||
Citigroup Mortgage Loan Trust, Inc. | 2,964 | 2,552,163 | ||||
Series 2006-AR1, Class 3A1 | 3,527 | 2,285,920 | ||||
Indymac Index Mortgage Loan Trust | 1,775 | 986,657 | ||||
| 9,265,111 | ||||||
Agency Floating Rate – 0.6% | ||||||
Fannie Mae REMICS | 4,227 | 4,164,094 | ||||
Federal National Mortgage Association | 4,161 | 4,125,635 | ||||
| 8,289,729 | ||||||
Non-Agency Floating Rate – 0.2% | ||||||
Countrywide Alternative Loan Trust | 1,305 | 731,835 | ||||
Series 2006-OA14, Class 3A1 | 4,598 | 1,979,969 | ||||
Countrywide Home Loan Mortgage Pass Through Trust | 2,946 | 138,905 | ||||
| 2,850,709 | ||||||
Agency Fixed Rate – 0.0% | ||||||
Fannie Mae Grantor Trust | 392 | 364,252 | ||||
Total CMOs | 20,769,801 | |||||
| ALLIANCEBERNSTEIN POOLING PORTFOLIOS • | 101 |
Intermediate Duration Bond Portfolio—Portfolio of Investments
| Principal Amount (000) | U.S. $ Value | |||||
CORPORATES - NON-INVESTMENT GRADES – 1.4% | ||||||
Industrial – 1.2% | ||||||
Basic – 0.3% | ||||||
United States Steel Corp. | $ | 2,121 | $ | 2,151,854 | ||
7.00%, 2/01/18 | 1,260 | 1,189,603 | ||||
Westvaco Corp. | 670 | 738,044 | ||||
| 4,079,501 | ||||||
Capital Goods – 0.3% | ||||||
Masco Corp. | 4,795 | 4,480,079 | ||||
Consumer Cyclical - Other – 0.3% | ||||||
Wyndham Worldwide Corp. | 4,535 | 4,403,235 | ||||
Technology – 0.3% | ||||||
Xerox Capital Trust I | 4,410 | 4,354,875 | ||||
| 17,317,690 | ||||||
Financial Institutions – 0.2% | ||||||
Banking – 0.2% | ||||||
BankAmerica Capital II | 1,950 | 1,872,000 | ||||
RBS Capital Trust III | 562 | 320,340 | ||||
| 2,192,340 | ||||||
Finance – 0.0% | ||||||
International Lease Finance Corp. | 524 | 444,854 | ||||
| 2,637,194 | ||||||
Total Corporates - Non-Investment Grades | 19,954,884 | |||||
AGENCIES – 1.2% | ||||||
Agency Debentures – 1.2% | ||||||
Federal National Mortgage Association | 12,375 | 14,530,329 | ||||
6.625%, 11/15/30 | 1,710 | 2,096,693 | ||||
Total Agencies | 16,627,022 | |||||
| 102 | • ALLIANCEBERNSTEIN POOLING PORTFOLIOS |
Intermediate Duration Bond Portfolio—Portfolio of Investments
| Principal Amount (000) | U.S. $ Value | ||||||
INFLATION-LINKED SECURITIES – 1.0% | |||||||
United States – 1.0% | |||||||
U.S. Treasury Notes | $ | 12,696 | $ | 13,739,398 | |||
QUASI-SOVEREIGNS – 0.7% | |||||||
Quasi-Sovereign Bonds – 0.7% | |||||||
Malaysia – 0.3% | |||||||
Petronas Capital Ltd. | 3,390 | 3,442,087 | |||||
Russia – 0.4% | |||||||
RSHB Capital SA for OJSC Russian Agricultural Bank | 5,677 | 6,060,198 | |||||
Total Quasi-Sovereigns | 9,502,285 | ||||||
SUPRANATIONALS – 0.4% | |||||||
European Investment Bank | 1,970 | 1,959,894 | |||||
International Bank for Reconstruction & Development | 2,340 | 3,195,541 | |||||
Total Supranationals | 5,155,435 | ||||||
| Shares | |||||||
SHORT-TERM INVESTMENTS – 9.7% | |||||||
Investment Companies – 9.7% | |||||||
AllianceBernstein Fixed-Income Shares, Inc. – Government STIF Portfolio, 0.11%(f) | 134,117,320 | 134,117,320 | |||||
Total Investments – 109.9% | 1,513,607,253 | ||||||
Other assets less liabilities – (9.9)% | (136,568,017 | ) | |||||
Net Assets – 100.0% | $ | 1,377,039,236 | |||||
| ALLIANCEBERNSTEIN POOLING PORTFOLIOS • | 103 |
Intermediate Duration Bond Portfolio—Portfolio of Investments
INTEREST RATE SWAP TRANSACTIONS (see Note C)
| Swap Counterparty | Notional Amount (000) | Termination Date | Rate Type | Unrealized Appreciation/ (Depreciation) | |||||||||
| Payments made by the Portfolio | Payments received by the Portfolio | ||||||||||||
Morgan Stanley | $ | 11,500 | 9/17/13 | 3 Month LIBOR | 3.565 | % | $ | 820,957 | |||||
FORWARD CURRENCY EXCHANGE CONTRACTS (see Note C)
| Contract Amount (000) | U.S. $ Value on Origination Date | U.S. $ Value at February 28, 2010 | Unrealized Appreciation/ (Depreciation) | ||||||||
Sale Contracts: | |||||||||||
Euro settling 3/25/10 | 21,777 | $ | 29,658,133 | $ | 29,651,909 | $ | 6,224 | ||||
New Zealand Dollar settling 3/24/10 | 4,169 | 3,065,592 | 2,907,020 | 158,572 | |||||||
| (a) | Security is exempt from registration under Rule 144A of the Securities Act of 1933. These securities are considered liquid and may be resold in transactions exempt from registration, normally to qualified institutional buyers. At February 28, 2010, the aggregate market value of these securities amounted to $132,452,557 or 9.6% of net assets. |
| (b) | Coupon rate adjusts periodically based upon a predetermined schedule. Stated interest rate in effect at February 28, 2010. |
| (c) | Variable rate coupon, rate shown as of February 28, 2010. |
| (d) | When-Issued or delayed delivery security. |
| (e) | Floating Rate Security. Stated interest rate was in effect at February 28, 2010. |
| (f) | Investment in affiliated money market mutual fund. The rate shown represents the 7-day yield as of period end. |
| + | Position, or a portion thereof, has been segregated to meet the collateral requirements of the Term Asset-Backed Securities Loan Facility (“TALF”) program administered by the Federal Reserve Bank of New York. The aggregate market value of these securities amounted to $87,313,262. |
The fund currently owns investments collateralized by subprime mortgage loans. Subprime loans are offered to homeowners who do not have a history of debt or who have had problems meeting their debt obligations. Because repayment is less certain, subprime borrowers pay a higher rate of interest than prime borrowers. As of February 28, 2010, the fund’s total exposure to subprime investments was 0.90% of net assets. These investments are valued in accordance with the fund’s Valuation Policies (see Note A for additional details).
Currency Abbreviations:
EUR – Euro Dollar
NZD – New Zealand Dollar
Glossary:
ABS – Asset-Backed Securities
ARMS – Adjustable Rate Mortgages
CDO – Collateralized Debt Obligation
CMBS – Commercial Mortgage-Backed Securities
CMOs – Collateralized Mortgage Obligations
LIBOR – London Interbank Offered Rates
LP – Limited Partnership
OJSC – Open Joint Stock Company
REIT – Real Estate Investment Trust
REMIC – Real Estate Mortgage Investment Conduit
TBA – To Be Announced
TIPS – Treasury Inflation Protected Security
See notes to financial statements.
| 104 | • ALLIANCEBERNSTEIN POOLING PORTFOLIOS |
Intermediate Duration Bond Portfolio—Portfolio of Investments
INFLATION PROTECTED SECURITIES PORTFOLIO
PORTFOLIO OF INVESTMENTS
February 28, 2010 (unaudited)
Principal (000) | U.S. $ Value | |||||
INFLATION-LINKED SECURITIES – 96.7% | ||||||
United States – 96.7% | ||||||
U.S. Treasury Inflation Index | $ | 16,623 | $ | 16,495,928 | ||
1.625%, 1/15/15-1/15/18 (TIPS) | 169,287 | 176,751,158 | ||||
1.875%, 7/15/13-7/15/15 (TIPS) | 101,962 | 108,478,208 | ||||
2.00%, 7/15/14-1/15/16 (TIPS) | 89,875 | 96,117,586 | ||||
2.00%, 1/15/26 (TIPS) | 14,036 | 14,001,399 | ||||
2.125%, 1/15/19 (TIPS) | 32,641 | 34,724,203 | ||||
2.375%, 1/15/17 (TIPS) | 60,431 | 65,680,820 | ||||
3.00%, 7/15/12 (TIPS) | 61,101 | 66,123,292 | ||||
3.375%, 1/15/12 (TIPS) | 48,601 | 52,269,245 | ||||
Total Inflation-Linked Securities | 630,641,839 | |||||
| Shares | ||||||
SHORT-TERM INVESTMENTS – 3.1% | ||||||
Investment Companies – 3.1% | ||||||
AllianceBernstein Fixed-Income Shares, Inc. – Government STIF Portfolio, 0.11%(a) | 19,813,717 | 19,813,717 | ||||
Total Investments – 99.8% | 650,455,556 | |||||
Other assets less liabilities – 0.2% | 1,565,469 | |||||
Net Assets – 100.0% | $ | 652,021,025 | ||||
| (a) | Investment in affiliated money market mutual fund. The rate shown represents the 7-day yield as of period end. |
| Glossary: |
| TIPS | – Treasury Inflation Protected Security |
See notes to financial statements.
| ALLIANCEBERNSTEIN POOLING PORTFOLIOS • | 105 |
Inflation Protected Securities Portfolio—Portfolio of Investments
HIGH YIELD PORTFOLIO
PORTFOLIO OF INVESTMENTS
February 28, 2010 (unaudited)
Principal (000) | U.S. $ Value | |||||
CORPORATES - NON-INVESTMENT GRADES – 77.2% | ||||||
Industrial – 54.7% | ||||||
Basic – 7.6% | ||||||
Algoma Acquisition Corp. | $ | 1,050 | $ | 921,375 | ||
Appleton Papers, Inc. | 435 | 402,375 | ||||
Arch Western Finance LLC | 1,470 | 1,473,675 | ||||
Boise Paper Holdings LLC | 267 | 275,010 | ||||
Domtar Corp. | 2,500 | 2,506,250 | ||||
Evraz Group SA | 1,604 | 1,595,980 | ||||
8.875%, 4/24/13(a) | 200 | 206,500 | ||||
Georgia-Pacific LLC | 595 | 600,950 | ||||
8.25%, 5/01/16(a) | 375 | 395,625 | ||||
Hexion Finance Escrow LLC/Hexion Escrow Corp. | 486 | 464,130 | ||||
Hexion US Finance Corp./Hexion Nova Scotia Finance ULC | 525 | 446,250 | ||||
9.75%, 11/15/14 | 525 | 496,125 | ||||
Huntsman International LLC | 400 | 352,000 | ||||
7.875%, 11/15/14 | 1,330 | 1,290,100 | ||||
Ineos Group Holdings PLC | 2,400 | 1,560,000 | ||||
Jefferson Smurfit Corp. US | 630 | 519,750 | ||||
Kerling PLC | EUR | 885 | 1,223,136 | |||
Kronos International, Inc. | 1,275 | 1,406,244 | ||||
MacDermid, Inc. | $ | 675 | 675,000 | |||
Momentive Performance Materials, Inc. | 979 | 898,008 | ||||
NewMarket Corp. | 615 | 608,850 | ||||
NewPage Corp. | 1,647 | 947,025 | ||||
Norske Skogindustrier ASA | 761 | 525,090 | ||||
| 106 | • ALLIANCEBERNSTEIN POOLING PORTFOLIOS |
High Yield Portfolio—Portfolio of Investments
| Principal Amount (000) | U.S. $ Value | |||||
Novelis, Inc. | $ | 2,190 | $ | 2,031,225 | ||
Peabody Energy Corp. | 900 | 888,750 | ||||
7.375%, 11/01/16 | 545 | 576,338 | ||||
Series B | 415 | 420,187 | ||||
Rhodia SA | EUR | 980 | 1,241,008 | |||
Smurfit-Stone Container Enterprises, Inc. | $ | 650 | 534,625 | |||
Steel Capital SA for OAO Severstal | 1,438 | 1,533,268 | ||||
Steel Dynamics, Inc. | 2,230 | 2,218,850 | ||||
Teck Resources Ltd. | 1,850 | 2,183,000 | ||||
United States Steel Corp. | 1,825 | 1,723,035 | ||||
Vedanta Resources PLC | 1,400 | 1,477,000 | ||||
Verso Paper Holdings LLC/Verso Paper, Inc. | 900 | 677,250 | ||||
Weyerhaeuser Co. | 2,485 | 2,361,970 | ||||
| 37,655,954 | ||||||
Capital Goods – 5.1% | ||||||
Alion Science and Technology Corp. | 1,170 | 889,200 | ||||
AMH Holdings, Inc. | 1,635 | 1,618,650 | ||||
Berry Plastics Holding Corp. | 1,260 | 1,212,750 | ||||
Bombardier, Inc. | 1,515 | 1,556,663 | ||||
8.00%, 11/15/14(a) | 1,120 | 1,164,800 | ||||
Building Materials Corp. Of America | 689 | 689,000 | ||||
Case New Holland, Inc. | 1,490 | 1,490,000 | ||||
CNH America LLC | 935 | 932,663 | ||||
Crown Americas | 200 | 206,000 | ||||
Goodman Global Group, Inc. | 1,047 | 605,951 | ||||
| ALLIANCEBERNSTEIN POOLING PORTFOLIOS • | 107 |
High Yield Portfolio—Portfolio of Investments
| Principal Amount (000) | U.S. $ Value | |||||
Grohe Holding GMBH | EUR | 1,284 | $ | 1,503,589 | ||
Hanson Australia Funding Ltd. | $ | 824 | 824,096 | |||
Hanson Ltd. | 706 | 695,584 | ||||
L-3 Communications Corp. | 1,248 | 1,252,680 | ||||
Masco Corp. | 920 | 881,573 | ||||
Mohawk Industries, Inc. | 900 | 895,500 | ||||
Owens Brockway Glass Container, Inc. | 2,530 | 2,548,975 | ||||
Plastipak Holdings, Inc. | 1,180 | 1,180,000 | ||||
Pregis Corp. | EUR | 500 | 605,934 | |||
RSC Equipment Rental Inc/RSC Holdings III LLC | $ | 900 | 891,000 | |||
Sequa Corp. | 1,270 | 1,244,600 | ||||
Terex Corp. | 786 | 730,980 | ||||
United Rentals North America, Inc. | 1,575 | 1,468,687 | ||||
| 25,088,875 | ||||||
Communications - Media – 6.2% | ||||||
Allbritton Communications Co. | 1,771 | 1,755,504 | ||||
Cablevision Systems Corp. | 1,637 | 1,724,989 | ||||
Central European Media Enterprises Ltd. | EUR | 650 | 911,625 | |||
Charter Communications Operating LLC | $ | 800 | 828,000 | |||
Clear Channel Communications, Inc. | 4,809 | 2,861,355 | ||||
5.75%, 1/15/13 | 716 | 544,160 | ||||
Clear Channel Worldwide Holdings, Inc. | 175 | 179,550 | ||||
CSC Holdings, Inc. | 73 | 75,738 | ||||
7.625%, 7/15/18 | 535 | 549,713 | ||||
7.875%, 2/15/18 | 640 | 667,200 | ||||
| 108 | • ALLIANCEBERNSTEIN POOLING PORTFOLIOS |
High Yield Portfolio—Portfolio of Investments
| Principal Amount (000) | U.S. $ Value | |||||
Echostar DBS Corp. | $ | 970 | $ | 972,425 | ||
7.125%, 2/01/16 | 650 | 651,625 | ||||
Intelsat Bermuda Ltd. | 1,612 | 1,720,810 | ||||
11.50%, 2/04/17(d) | 797 | 778,945 | ||||
Intelsat Corp | 1,650 | 1,707,750 | ||||
Lamar Media Corp. | 2,190 | 2,091,450 | ||||
Liberty Media Corp. | 545 | 534,100 | ||||
LIN Television Corp. | 725 | 686,937 | ||||
Nielsen Finance LLC/Nielsen Finance Co. | 630 | 570,150 | ||||
Quebecor Media, Inc. | 2,455 | 2,461,137 | ||||
Rainbow National Services LLC | 1,224 | 1,248,480 | ||||
10.375%, 9/01/14(a) | 473 | 497,241 | ||||
RH Donnelley Corp. | 338 | 339,948 | ||||
Sinclair Television Group, Inc. | 160 | 166,000 | ||||
Sirius Satellite Radio, Inc. | 545 | 551,813 | ||||
Univision Communications, Inc. | 2,379 | 2,105,105 | ||||
Virgin Media Secured Finance PLC | 1,500 | 1,477,500 | ||||
WDAC Subsidiary Corp. | 982 | 61,375 | ||||
WMG Holdings Corp. | 2,096 | 2,096,000 | ||||
| 30,816,625 | ||||||
Communications - Telecommunications – 4.6% | ||||||
Cincinnati Bell, Inc. | 1,740 | 1,753,050 | ||||
Cricket Communications, Inc. | 800 | 813,000 | ||||
9.375%, 11/01/14 | 2,085 | 2,074,575 | ||||
Crown Castle International Corp. | 1,000 | 1,000,000 | ||||
| ALLIANCEBERNSTEIN POOLING PORTFOLIOS • | 109 |
High Yield Portfolio—Portfolio of Investments
| Principal Amount (000) | U.S. $ Value | |||||
Fairpoint Communications, Inc. | $ | 1,966 | $ | 255,592 | ||
Frontier Communications Corp. | 1,901 | 1,905,752 | ||||
9.00%, 8/15/31 | 1,145 | 1,110,650 | ||||
Level 3 Financing, Inc. | 2,360 | 2,100,400 | ||||
9.25%, 11/01/14 | 1,200 | 1,137,000 | ||||
Mobile Telesystems Finance SA | 1,558 | 1,645,560 | ||||
Qwest Capital Funding, Inc. | 1,529 | 1,593,982 | ||||
Qwest Communications International, Inc. | 350 | 353,500 | ||||
Sprint Capital Corp. | 1,315 | 996,113 | ||||
8.75%, 3/15/32 | 1,180 | 1,041,350 | ||||
Sprint Nextel Corp. | 1,000 | 865,000 | ||||
Time Warner Telecom Holdings, Inc. | 740 | 762,200 | ||||
VIP Finance (Vimpelcom) | 1,560 | 1,671,072 | ||||
Windstream Corp. | 675 | 659,813 | ||||
8.625%, 8/01/16 | 1,070 | 1,088,725 | ||||
| 22,827,334 | ||||||
Consumer Cyclical - Automotive – 3.6% | ||||||
Affinia Group, Inc. | 495 | 483,244 | ||||
Allison Transmission, Inc. | 560 | 581,000 | ||||
Ford Motor Credit Co. LLC | 2,785 | 2,610,937 | ||||
7.00%, 10/01/13 | 4,474 | 4,406,299 | ||||
8.00%, 12/15/16 | 2,665 | 2,676,028 | ||||
Goodyear Tire & Rubber Co./The | 550 | 570,625 | ||||
9.00%, 7/01/15 | 2,007 | 2,069,719 | ||||
Keystone Automotive Operations, Inc. | 1,436 | 617,480 | ||||
Navistar International Corp. | 1,010 | 1,025,150 | ||||
Tenneco, Inc. | 1,475 | 1,449,188 | ||||
| 110 | • ALLIANCEBERNSTEIN POOLING PORTFOLIOS |
High Yield Portfolio—Portfolio of Investments
| Principal Amount (000) | U.S. $ Value | |||||
Visteon Corp. | $ | 1,795 | $ | 1,238,550 | ||
| 17,728,220 | ||||||
Consumer Cyclical - Entertainment – 0.1% | ||||||
AMC Entertainment, Inc. | 520 | 557,700 | ||||
Consumer Cyclical - Other – 5.7% | ||||||
Beazer Homes USA, Inc. | 1,035 | 1,019,475 | ||||
12.00%, 10/15/17(a) | 425 | 473,875 | ||||
Boyd Gaming Corp. | 600 | 510,750 | ||||
7.75%, 12/15/12 | 737 | 735,158 | ||||
Broder Brothers Co. | 307 | 236,948 | ||||
Chukchansi Economic Development Authority | 540 | 437,400 | ||||
DR Horton, Inc. | 1,180 | 1,162,300 | ||||
Greektown Holdings LLC | 525 | 31,500 | ||||
Harrah’s Operating Co., Inc. | 514 | 250,575 | ||||
6.50%, 6/01/16 | 1,017 | 554,265 | ||||
10.75%, 2/01/16 | 1,766 | 1,359,820 | ||||
11.25%, 6/01/17 | 750 | 778,125 | ||||
Host Hotels & Resorts LP | 385 | 383,075 | ||||
Series Q | 935 | 920,975 | ||||
K Hovnanian Enterprises, Inc. | 1,355 | 962,050 | ||||
10.625%, 10/15/16 | 500 | 522,500 | ||||
KB Home | 125 | 127,187 | ||||
Levi Strauss & Co. | 742 | 769,825 | ||||
MGM Mirage | 1,222 | 965,380 | ||||
7.625%, 1/15/17 | 2,060 | 1,637,700 | ||||
8.375%, 2/01/11 | 1,024 | 998,400 | ||||
Mohegan Tribal Gaming Auth | 1,155 | 854,700 | ||||
NCL Corp. Ltd. | 1,000 | 1,037,500 | ||||
| ALLIANCEBERNSTEIN POOLING PORTFOLIOS • | 111 |
High Yield Portfolio—Portfolio of Investments
| Principal Amount (000) | U.S. $ Value | |||||
Pulte Homes, Inc. | $ | 590 | $ | 567,875 | ||
Quiksilver, Inc. | 650 | 554,125 | ||||
Royal Caribbean Cruises Ltd. | 2,385 | 2,367,112 | ||||
8.75%, 2/02/11 | 846 | 877,725 | ||||
Standard Pacific Corp. | 555 | 578,587 | ||||
Starwood Hotels & Resorts Worldwide, Inc. | 2,065 | 2,132,113 | ||||
7.875%, 5/01/12 | 539 | 578,078 | ||||
Station Casinos, Inc. | 3,610 | 18,772 | ||||
William Lyon Homes, Inc. | 1,597 | 1,285,585 | ||||
Wynn Las Vegas LLC/Corp. | 2,635 | 2,549,363 | ||||
| 28,238,818 | ||||||
Consumer Cyclical - Restaurants – 0.1% | ||||||
Sbarro, Inc. | 415 | 339,263 | ||||
Consumer Cyclical - Retailers – 2.9% | ||||||
Asbury Automotive Group, Inc. | 77 | 72,669 | ||||
8.00%, 3/15/14 | 550 | 549,313 | ||||
Autonation, Inc. | 175 | 165,375 | ||||
The Bon-Ton Dept Stores, Inc. | 1,195 | 1,072,513 | ||||
Burlington Coat Factory Warehouse Corp. | 700 | 712,250 | ||||
Couche-Tard US/Finance | 1,006 | 1,011,030 | ||||
Dollar General Corp. | 425 | 465,375 | ||||
GSC Holdings Corp. | 790 | 813,700 | ||||
Limited Brands, Inc. | 1,028 | 997,160 | ||||
6.90%, 7/15/17 | 1,645 | 1,595,650 | ||||
Macy’s Retail Holdings, Inc. | 960 | 962,400 | ||||
5.90%, 12/01/16 | 1,495 | 1,450,150 | ||||
| 112 | • ALLIANCEBERNSTEIN POOLING PORTFOLIOS |
High Yield Portfolio—Portfolio of Investments
| Principal Amount (000) | U.S. $ Value | |||||
Michaels Stores, Inc. | $ | 345 | $ | 350,175 | ||
11.375%, 11/01/16 | 565 | 567,825 | ||||
Neiman-Marcus Group, Inc. | 619 | 609,824 | ||||
Rite Aid Corp. | 2,080 | 1,783,600 | ||||
9.50%, 6/15/17 | 445 | 368,237 | ||||
Toys R US, Inc. | 900 | 846,000 | ||||
| 14,393,246 | ||||||
Consumer Non-Cyclical – 5.7% | ||||||
ACCO Brands Corp. | 1,000 | 917,500 | ||||
10.625%, 3/15/15(a) | 760 | 826,120 | ||||
Aramark Corp. | 1,710 | 1,727,100 | ||||
Bausch & Lomb, Inc. | 390 | 399,750 | ||||
Biomet, Inc. | 520 | 574,600 | ||||
Catalent Pharma Solutions, Inc. | 1,866 | 1,768,005 | ||||
Community Health Systems, Inc. | 891 | 922,185 | ||||
DaVita, Inc. | 950 | 952,375 | ||||
7.25%, 3/15/15 | 719 | 721,696 | ||||
Dean Foods Co. | 921 | 874,950 | ||||
Del Monte Corp. | 395 | 402,900 | ||||
DJO Finance LLC / DJO Finance Corp. | 520 | 556,400 | ||||
Hanger Orthopedic Group, Inc. | 670 | 710,200 | ||||
HCA, Inc. | 3,348 | 3,147,120 | ||||
6.50%, 2/15/16 | 1,520 | 1,417,400 | ||||
6.75%, 7/15/13 | 1,150 | 1,135,625 | ||||
9.625%, 11/15/16(d) | 2,803 | 2,999,210 | ||||
Healthsouth Corp. | 980 | 1,058,400 | ||||
IASIS Healthcare LLC/IASIS Capital Corp. | 424 | 428,240 | ||||
Jarden Corp. | 780 | 781,950 | ||||
| ALLIANCEBERNSTEIN POOLING PORTFOLIOS • | 113 |
High Yield Portfolio—Portfolio of Investments
| Principal Amount (000) | U.S. $ Value | |||||
New Albertsons, Inc. | $ | 1,220 | $ | 1,030,900 | ||
Select Medical Corp. | 1,015 | 954,100 | ||||
Stater Brothers Holdings | 594 | 596,970 | ||||
Sun Healthcare Group, Inc. | 750 | 761,250 | ||||
Universal Hospital Services, Inc. | 895 | 756,275 | ||||
Viant Holdings, Inc. | 567 | 552,825 | ||||
Visant Corp. | 883 | 887,415 | ||||
| 27,861,461 | ||||||
Energy – 5.8% | ||||||
Antero Resources Finance Corp. | 495 | 499,950 | ||||
Chaparral Energy, Inc. | 900 | 735,750 | ||||
Chesapeake Energy Corp. | 2,350 | 2,232,500 | ||||
6.625%, 1/15/16 | 2,995 | 2,890,175 | ||||
6.875%, 1/15/16 | 270 | 265,613 | ||||
7.50%, 9/15/13 | 805 | 817,075 | ||||
CIE Generale De Geophysique | 1,285 | 1,259,300 | ||||
7.75%, 5/15/17 | 195 | 191,100 | ||||
Complete Production Services, Inc. | 1,325 | 1,288,562 | ||||
Denbury Resources, Inc. | 95 | 98,325 | ||||
Energy XXI Gulf Coast, Inc. | 1,010 | 1,017,575 | ||||
Expro Finance Luxembourg SCA | 114 | 113,430 | ||||
Forest Oil Corp. | 1,915 | 1,876,700 | ||||
Hercules Offshore, Inc. | 915 | 910,425 | ||||
Hilcorp Energy I LP/Hilcorp Finance Co. | 1,425 | 1,385,812 | ||||
Mariner Energy, Inc. | 361 | 402,515 | ||||
Newfield Exploration Co. | 1,135 | 1,135,000 | ||||
| 114 | • ALLIANCEBERNSTEIN POOLING PORTFOLIOS |
High Yield Portfolio—Portfolio of Investments
| Principal Amount (000) | U.S. $ Value | |||||
OPTI Canada, Inc. | $ | 1,588 | $ | 1,413,320 | ||
PetroHawk Energy Corp. | 1,206 | 1,254,240 | ||||
Pioneer Natural Resources Co. | 995 | 953,270 | ||||
Plains Exploration & Production Co. | 2,015 | 2,032,631 | ||||
Pride International, Inc. | 634 | 651,435 | ||||
Range Resources Corp. | 940 | 961,150 | ||||
Sandridge Energy, Inc. | 525 | 514,500 | ||||
Southwestern Energy Co. | 1,025 | 1,081,375 | ||||
Tesoro Corp. | 680 | 675,750 | ||||
6.50%, 6/01/17 | 2,260 | 2,028,350 | ||||
| 28,685,828 | ||||||
Other Industrial – 0.6% | ||||||
Neenah Foundary Co. | 1,350 | 688,500 | ||||
RBS Global, Inc. and Rexnord Corp. | 455 | 460,688 | ||||
11.75%, 8/01/16 | 365 | 379,600 | ||||
Sensus Metering Systems, Inc. | 655 | 651,725 | ||||
Yioula Glassworks SA | EUR | 900 | 667,889 | |||
| 2,848,402 | ||||||
Services – 1.7% | ||||||
Realogy Corp. | $ | 895 | 747,325 | |||
12.375%, 4/15/15 | 1,605 | 1,099,425 | ||||
Service Corp. International | 2,000 | 1,960,000 | ||||
The ServiceMaster Co. | 1,760 | 1,804,000 | ||||
Ticketmaster Entertainment, Inc. | 940 | 1,034,000 | ||||
Travelport LLC | 1,135 | 1,160,537 | ||||
West Corp. | 750 | 744,375 | ||||
| 8,549,662 | ||||||
| ALLIANCEBERNSTEIN POOLING PORTFOLIOS • | 115 |
High Yield Portfolio—Portfolio of Investments
| Principal Amount (000) | U.S. $ Value | |||||
Technology – 3.6% | ||||||
Advanced Micro Devices, Inc. | $ | 202 | $ | 204,525 | ||
Amkor Technology, Inc. | 860 | 887,950 | ||||
Ceridian Corp. | 450 | 430,875 | ||||
First Data Corp. | 2,856 | 2,470,440 | ||||
11.25%, 3/31/16 | 1,100 | 902,000 | ||||
Flextronics International Ltd. | 418 | 427,405 | ||||
Freescale Semiconductor, Inc. | 2,380 | 2,112,250 | ||||
10.125%, 12/15/16 | 1,200 | 936,000 | ||||
Iron Mountain, Inc. | 1,360 | 1,339,600 | ||||
7.75%, 1/15/15 | 450 | 453,375 | ||||
Lucent Technologies, Inc. | 1,260 | 894,600 | ||||
NXP BV / NXP Funding LLC | 1,000 | 847,500 | ||||
9.50%, 10/15/15 | 920 | 800,400 | ||||
Sanmina Corp. | 500 | 492,500 | ||||
Seagate Technology HDD Holding | 1,753 | 1,805,590 | ||||
Serena Software, Inc. | 875 | 840,000 | ||||
Sungard Data Systems, Inc. | 1,012 | 1,036,035 | ||||
Telcordia Technologies, Inc. | 675 | 636,187 | ||||
| 17,517,232 | ||||||
Transportation - Airlines – 0.6% | ||||||
AMR Corp. | 1,570 | 1,342,350 | ||||
Continental Airlines, Inc. | 1,330 | 1,303,400 | ||||
Series RJO3 | ||||||
7.875%, 7/02/18 | 492 | 438,040 | ||||
| 3,083,790 | ||||||
Transportation - Railroads – 0.3% | ||||||
Trinity Industries, Inc. | 1,300 | 1,309,750 | ||||
| 116 | • ALLIANCEBERNSTEIN POOLING PORTFOLIOS |
High Yield Portfolio—Portfolio of Investments
| Principal Amount (000) | U.S. $ Value | |||||
Transportation - Services – 0.5% | ||||||
Avis Budget Car Rental | $ | 1,660 | $ | 1,498,150 | ||
Hertz Corp. | 1,145 | 1,162,175 | ||||
| 2,660,325 | ||||||
| 270,162,485 | ||||||
Financial Institutions – 12.0% | ||||||
Banking – 3.8% | ||||||
ABN Amro Bank NV | EUR | 1,805 | 1,523,823 | |||
BOI Capital Funding No. 3 | $ | 3,403 | 1,939,710 | |||
Dexia Credit Local | EUR | 2,250 | 1,700,361 | |||
HBOS Capital Funding LP | $ | 2,700 | 1,971,000 | |||
HT1 Funding GMBH | EUR | 825 | 716,143 | |||
LBG Capital No.1 PLC | $ | 3,125 | 2,437,500 | |||
Northern Rock PLC | GBP | 3,620 | 434,400 | |||
Royal Bank of Scotland Group PLC | $ | 2,715 | 1,791,900 | |||
Series U | ||||||
7.64%, 9/29/17(h) | 2,600 | 1,599,000 | ||||
Smurfit Kappa Acquisitions | EUR | 1,000 | 1,354,842 | |||
Swedbank | GBP | 1,350 | 1,523,274 | |||
UT2 Funding PLC | EUR | 1,284 | 1,188,884 | |||
Zions Bancorporation | $ | 665 | 569,388 | |||
6.00%, 9/15/15 | 220 | 190,134 | ||||
| 18,940,359 | ||||||
Brokerage – 0.8% | ||||||
E*Trade Financial Corp. | 1,925 | 1,828,750 | ||||
Lehman Brothers Holdings Inc | 5,500 | 1,258,125 | ||||
Nuveen Investments, Inc. | 900 | 814,500 | ||||
| 3,901,375 | ||||||
| ALLIANCEBERNSTEIN POOLING PORTFOLIOS • | 117 |
High Yield Portfolio—Portfolio of Investments
| Principal Amount (000) | U.S. $ Value | |||||
Finance – 3.9% | ||||||
American General Finance Corp. | $ | 1,930 | $ | 1,384,294 | ||
Capmark Financial Group, Inc. | 3,666 | 1,033,845 | ||||
CIT Group, Inc. | 3,465 | 0 | ||||
7.00%, 5/01/13-5/01/17 | 1,615 | 1,457,791 | ||||
Series . | ||||||
7.00%, 5/01/16 | 538 | 476,288 | ||||
GMAC, Inc. | 2,435 | 2,435,000 | ||||
8.00%, 11/01/31 | 1,332 | 1,228,770 | ||||
Series 8 | ||||||
6.75%, 12/01/14 | 1,657 | 1,582,435 | ||||
International Lease Finance Corp. | 2,465 | 2,171,064 | ||||
iStar Financial, Inc. | 1,500 | 1,432,500 | ||||
Series B | ||||||
5.125%, 4/01/11 | 2,325 | 1,883,250 | ||||
Residential Capital LLC | 1,625 | 1,568,125 | ||||
9.625%, 5/15/15 | 2,945 | 2,849,287 | ||||
| 19,502,649 | ||||||
Insurance – 2.9% | ||||||
AGFC Capital Trust I | 4,745 | 2,206,425 | ||||
American International Group, Inc. | 2,711 | 1,518,160 | ||||
8.175%, 5/15/58(h) | 2,325 | 1,569,375 | ||||
Crum & Forster Holdings Corp. | 760 | 748,600 | ||||
Genworth Financial, Inc. | 1,945 | 1,346,912 | ||||
ING Capital Funding Trust III | 1,294 | 1,171,070 | ||||
ING Groep NV | 1,291 | 1,006,597 | ||||
Liberty Mutual Group, Inc. | 1,645 | 1,406,475 | ||||
MBIA Insurance Corp. | 3,315 | 1,558,050 | ||||
XL Capital Ltd. | 2,100 | 1,645,980 | ||||
| 14,177,644 | ||||||
| 118 | • ALLIANCEBERNSTEIN POOLING PORTFOLIOS |
High Yield Portfolio—Portfolio of Investments
| Principal Amount (000) | U.S. $ Value | |||||
Other Finance – 0.6% | ||||||
Aiful Corp. | $ | 3,141 | $ | 2,359,676 | ||
iPayment, Inc. | 675 | 588,938 | ||||
| 2,948,614 | ||||||
| 59,470,641 | ||||||
Utility – 6.3% | ||||||
Electric – 5.1% | ||||||
The AES Corp. | 1,430 | 1,431,788 | ||||
8.00%, 10/15/17 | 1,240 | 1,232,250 | ||||
8.75%, 5/15/13(a) | 140 | 142,450 | ||||
CMS Energy Corp. | 1,000 | 978,803 | ||||
Dynegy Holdings, Inc. | 2,360 | 1,852,600 | ||||
8.375%, 5/01/16 | 980 | 857,500 | ||||
Dynegy Roseton/Danskammer Pass Through Trust | 44 | 43,870 | ||||
Series B | ||||||
7.67%, 11/08/16 | 1,222 | 1,179,230 | ||||
Edison Mission Energy | 3,840 | 2,812,800 | ||||
7.50%, 6/15/13 | 360 | 333,000 | ||||
7.75%, 6/15/16 | 1,695 | 1,356,000 | ||||
Energy Future Holdings Corp. | 1,545 | 1,170,338 | ||||
Mirant Americas Generation LLC | 2,325 | 2,173,875 | ||||
NRG Energy, Inc. | 420 | 423,150 | ||||
7.375%, 2/01/16-1/15/17 | 2,955 | 2,909,656 | ||||
RRI Energy, Inc. | 765 | 730,575 | ||||
7.875%, 6/15/17 | 840 | 785,400 | ||||
Texas Competitive Electric Holdings Co. LLC | 2,151 | 1,607,657 | ||||
TXU Corp. | 1,957 | 1,428,187 | ||||
Series Q | ||||||
6.50%, 11/15/24 | 3,106 | 1,559,004 | ||||
| 25,008,133 | ||||||
| ALLIANCEBERNSTEIN POOLING PORTFOLIOS • | 119 |
High Yield Portfolio—Portfolio of Investments
| Principal Amount (000) | U.S. $ Value | |||||
Natural Gas – 1.2% | ||||||
El Paso Corp. | $ | 745 | $ | 785,101 | ||
7.75%, 1/15/32 | 855 | 826,130 | ||||
Enterprise Products Operating LLC | 1,620 | 1,638,225 | ||||
Kinder Morgan Finance Co. | 1,765 | 1,716,462 | ||||
Regency Energy Partners | 1,089 | 1,118,948 | ||||
| 6,084,866 | ||||||
| 31,092,999 | ||||||
Credit Default Index Holdings – 4.2% | ||||||
DJ CDX.NA.HY100 – 4.2% | ||||||
CDX North America High Yield | 15,660 | 16,657,542 | ||||
Dow Jones CDX HY | 3,881 | 4,069,980 | ||||
| 20,727,522 | ||||||
Total Corporates - Non-Investment Grades | 381,453,647 | |||||
CORPORATES - INVESTMENT GRADES – 11.3% | ||||||
Financial Institutions – 5.1% | ||||||
Banking – 3.8% | ||||||
Allied Irish Banks PLC | EUR | 769 | 1,126,948 | |||
American Express Co. | $ | 900 | 846,000 | |||
Barclays Bank PLC | EUR | 520 | 458,609 | |||
5.926%, 12/15/16(a)(h) | $ | 1,300 | 1,066,000 | |||
BBVA International Preferred SA Unipersonal | EUR | 750 | 875,711 | |||
5.919%, 4/18/17 | $ | 640 | 512,240 | |||
The Bear Stearns Co., Inc. | 935 | 971,025 | ||||
Capital One Financial Corp. | 663 | 727,770 | ||||
Citigroup, Inc. | 400 | 418,698 | ||||
Countrywide Financial Corp. | 515 | 548,442 | ||||
6.25%, 5/15/16 | 1,221 | 1,246,280 | ||||
| 120 | • ALLIANCEBERNSTEIN POOLING PORTFOLIOS |
High Yield Portfolio—Portfolio of Investments
| Principal Amount (000) | U.S. $ Value | |||||
Countrywide Home Loans, Inc. | $ | 56 | $ | 57,679 | ||
Fifth Third Bancorp | 475 | 510,054 | ||||
Financial Security Assurance Holdings Ltd. | 1,400 | 966,000 | ||||
Merrill Lynch & Co., Inc. | 1,565 | 1,537,611 | ||||
National Capital Trust II | 647 | 566,643 | ||||
Societe Generale | EUR | 1,350 | 1,465,987 | |||
UBS AG/Jersey | 1,600 | 1,683,000 | ||||
Wachovia Bank | AUD | 2,050 | 1,589,474 | |||
Zions Bancorporation | $ | 1,480 | 1,423,477 | |||
| 18,597,648 | ||||||
Finance – 0.1% | ||||||
SLM Corp. | 255 | 248,999 | ||||
Series A | ||||||
5.00%, 10/01/13 | 400 | 374,644 | ||||
| 623,643 | ||||||
Insurance – 1.2% | ||||||
Assured Guaranty US Holdings, Inc. | 952 | 666,400 | ||||
Coventry Health Care, Inc. | 683 | 700,916 | ||||
5.95%, 3/15/17 | 60 | 56,847 | ||||
6.125%, 1/15/15 | 30 | 29,916 | ||||
6.30%, 8/15/14 | 185 | 188,648 | ||||
Liberty Mutual Group, Inc. | 450 | 464,833 | ||||
MetLife, Inc. | 695 | 856,432 | ||||
Nationwide Mutual Insurance Co. | 1,075 | 1,197,575 | ||||
Suncorp Metway Insurance Ltd. | AUD | 1,000 | 738,997 | |||
XL Capital Finance Europe PLC | $ | 1,000 | 1,058,810 | |||
| 5,959,374 | ||||||
| 25,180,665 | ||||||
| ALLIANCEBERNSTEIN POOLING PORTFOLIOS • | 121 |
High Yield Portfolio—Portfolio of Investments
| Principal Amount (000) | U.S. $ Value | |||||
Industrial – 4.7% | ||||||
Basic – 0.7% | ||||||
ArcelorMittal USA, Inc. | $ | 581 | $ | 632,377 | ||
Freeport-McMoRan Copper & Gold, Inc. | 1,235 | 1,339,975 | ||||
The Mosaic Co. | 1,375 | 1,501,238 | ||||
| 3,473,590 | ||||||
Capital Goods – 0.7% | ||||||
Allied Waste North America, Inc. | 553 | 597,240 | ||||
Owens Corning, Inc. | 710 | 729,870 | ||||
7.00%, 12/01/36 | 1,555 | 1,521,686 | ||||
Tyco International Finance SA | 700 | 877,514 | ||||
| 3,726,310 | ||||||
Communications - Media – 0.2% | ||||||
DirecTV Holdings LLC/DirecTV Financing Co., Inc. | 811 | 838,371 | ||||
Communications - Telecommunications – 0.7% | ||||||
Alltel Corp. | 450 | 541,651 | ||||
American Tower Corp. | 310 | 345,650 | ||||
Qwest Corp. | 770 | 774,812 | ||||
6.875%, 9/15/33 | 2,240 | 2,055,200 | ||||
| 3,717,313 | ||||||
Consumer Cyclical - Other – 0.3% | ||||||
Toll Brothers Finance Corp. | 1,443 | 1,384,983 | ||||
Consumer Cyclical - Retailers – 0.2% | ||||||
CVS Caremark Corp. | 1,000 | 915,000 | ||||
Consumer Non-Cyclical – 0.6% | ||||||
Cadbury Schweppes US Finance LLC | 580 | 618,326 | ||||
Reynolds American, Inc. | 1,245 | 1,368,926 | ||||
| 122 | • ALLIANCEBERNSTEIN POOLING PORTFOLIOS |
High Yield Portfolio—Portfolio of Investments
| Principal Amount (000) | U.S. $ Value | |||||
Ventas Realty LP/Ventas Capital Corp. | $ | 832 | $ | 832,000 | ||
| 2,819,252 | ||||||
Energy – 0.2% | ||||||
National Oilwell Varco, Inc. | 856 | 873,454 | ||||
TNK-BP Finance SA | 204 | 202,470 | ||||
| 1,075,924 | ||||||
Other Industrial – 0.3% | ||||||
Noble Group Ltd. | 1,400 | 1,457,407 | ||||
Services – 0.2% | ||||||
Expedia, Inc. | 1,070 | 1,171,650 | ||||
Technology – 0.6% | ||||||
Computer Sciences Corp. | 600 | 650,548 | ||||
Motorola, Inc. | 1,470 | 1,569,371 | ||||
Xerox Corp. | 535 | 591,358 | ||||
| 2,811,277 | ||||||
| 23,391,077 | ||||||
Utility – 1.2% | ||||||
Electric – 1.0% | ||||||
Allegheny Energy Supply Co. LLC | 830 | 923,822 | ||||
Aquila, Inc. | 596 | 696,125 | ||||
Oncor Electric Delivery Co. | 490 | 537,258 | ||||
6.80%, 9/01/18 | 640 | 719,268 | ||||
Sierra Pacific Power Co. | 440 | 482,982 | ||||
Teco Finance, Inc. | 500 | 531,715 | ||||
7.00%, 5/01/12 | 722 | 784,077 | ||||
| 4,675,247 | ||||||
Natural Gas – 0.2% | ||||||
Tennessee Gas Pipeline Co. | 570 | 608,130 | ||||
| ALLIANCEBERNSTEIN POOLING PORTFOLIOS • | 123 |
High Yield Portfolio—Portfolio of Investments
Principal (000) | U.S. $ Value | |||||
Williams Co., Inc. | $ | 470 | $ | 575,788 | ||
| 1,183,918 | ||||||
| 5,859,165 | ||||||
Non Corporate Sectors – 0.3% | ||||||
Agencies - Not Government Guaranteed – 0.3% | ||||||
TransCapitalInvest Ltd. for OJSC AK Transneft | 1,200 | 1,297,500 | ||||
Total Corporates - Investment Grades | 55,728,407 | |||||
BANK LOANS – 1.8% | ||||||
Industrial – 1.4% | ||||||
Basic – 0.3% | ||||||
Lyondell Chemical Company | 475 | 332,149 | ||||
3.98%, 12/22/14(b) | 289 | 202,071 | ||||
7.00%, 12/22/14(b) | 1,253 | 876,840 | ||||
| 1,411,060 | ||||||
Capital Goods – 0.2% | ||||||
Hawker Beechcraft Acquisition Co. LLC | 1,247 | 1,150,242 | ||||
Consumer Cyclical - Other – 0.4% | ||||||
Las Vegas Sands LLC | 2,444 | 2,140,091 | ||||
Energy – 0.5% | ||||||
Ashmore Energy International | 250 | 226,708 | ||||
3.25%, 3/30/14(b) | 2,123 | 1,928,103 | ||||
| 2,154,811 | ||||||
| 6,856,204 | ||||||
Financial Institutions – 0.4% | ||||||
Finance – 0.4% | ||||||
CIT Group, Inc. | 1,782 | 1,837,046 | ||||
Total Bank Loans | 8,693,250 | |||||
COMMERCIAL MORTGAGE-BACKED SECURITIES – 1.8% | ||||||
Non-Agency Fixed Rate CMBS – 1.8% | ||||||
Credit Suisse Mortgage Capital Certificates | 2,375 | 2,219,314 | ||||
| 124 | • ALLIANCEBERNSTEIN POOLING PORTFOLIOS |
High Yield Portfolio—Portfolio of Investments
Principal (000) | U.S. $ Value | |||||
JP Morgan Chase Commercial Mortgage Securities Corp. | $ | 1,100 | $ | 964,354 | ||
Series 2007-CB18, Class A4 | 1,875 | 1,761,203 | ||||
Series 2007-LD11, Class A4 | 2,000 | 1,832,189 | ||||
LB-UBS Commercial Mortgage Trust | 1,875 | 1,870,115 | ||||
Total Commercial Mortgage-Backed Securities | 8,647,175 | |||||
EMERGING MARKETS - CORPORATE BONDS – 1.1% | ||||||
Industrial – 1.1% | ||||||
Capital Goods – 0.0% | ||||||
Reynolds Group Escrow | 118 | 119,475 | ||||
Communications - Media – 0.2% | ||||||
Columbus International, Inc. | 1,128 | 1,195,680 | ||||
Consumer Cyclical - Retailers – 0.3% | ||||||
Edcon Holdings Proprietary Ltd. | EUR | 1,800 | 1,397,053 | |||
Consumer Non-Cyclical – 0.3% | ||||||
Foodcorp Ltd. | 1,128 | 1,537,862 | ||||
Other Industrial – 0.3% | ||||||
New Reclamation Group | 689 | 703,304 | ||||
Savcio Holdings Pty Ltd. | 450 | 594,360 | ||||
| 1,297,664 | ||||||
Total Emerging Markets - Corporate Bonds | 5,547,734 | |||||
| ALLIANCEBERNSTEIN POOLING PORTFOLIOS • | 125 |
High Yield Portfolio—Portfolio of Investments
Principal (000) | U.S. $ Value | |||||
QUASI-SOVEREIGNS – 0.9% | ||||||
Quasi-Sovereign Bonds – 0.9% | ||||||
Kazakhstan – 0.3% | ||||||
KazMunaiGaz Finance Sub BV | $ | 400 | $ | 438,000 | ||
9.125%, 7/02/18(a) | 950 | 1,078,250 | ||||
| 1,516,250 | ||||||
Russia – 0.3% | ||||||
RSHB Capital SA for OJSC Russian Agricultural Bank | 1,455 | 1,447,725 | ||||
Venezuela – 0.3% | ||||||
Petroleos de Venezuela SA | 2,250 | 1,366,875 | ||||
Total Quasi-Sovereigns | 4,330,850 | |||||
GOVERNMENTS - TREASURIES – 0.8% | ||||||
Brazil – 0.8% | ||||||
Republic of Brazil | BRL | 5,800 | 3,741,058 | |||
EMERGING MARKETS - SOVEREIGNS – 0.6% | ||||||
Argentina – 0.3% | ||||||
Argentina Bonos | $ | 2,100 | 1,517,950 | |||
Ukraine – 0.3% | ||||||
Government of Ukraine | 930 | 798,033 | ||||
6.875%, 3/04/11(a) | 700 | 687,750 | ||||
Total Emerging Markets - Sovereigns | 3,003,733 | |||||
| Shares | ||||||
COMMON STOCK – 0.6% | ||||||
Broder Brothers Co.(i)(j) | 28,873 | 0 | ||||
Charter Communications, Inc.(i) | 11,716 | 348,551 | ||||
CIT Group, Inc.(i) | 32,389 | 1,179,931 | ||||
Dex One Corp.(i) | 46,336 | 1,380,813 | ||||
Total Common Stock | 2,909,295 | |||||
| 126 | • ALLIANCEBERNSTEIN POOLING PORTFOLIOS |
High Yield Portfolio—Portfolio of Investments
Shares | U.S. $ Value | |||||
PREFERRED STOCKS – 0.4% | ||||||
Financial Institutions – 0.4% | ||||||
Finance – 0.2% | ||||||
GMAC, Inc. | 1,687 | $ | 1,194,027 | |||
REITS – 0.2% | ||||||
Sovereign REIT | 624 | 711,360 | ||||
| 1,905,387 | ||||||
Non Corporate Sectors – 0.0% | ||||||
Agencies - Government Sponsored – 0.0% | ||||||
Federal Home Loan Mortgage Corp. | 36,525 | 41,638 | ||||
Federal National Mortgage Association 8.25%(h) | 54,625 | 58,995 | ||||
| 100,633 | ||||||
Total Preferred Stocks | 2,006,020 | |||||
| Principal Amount (000) | ||||||
CMOS – 0.2% | ||||||
Non-Agency ARMS – 0.2% | ||||||
Morgan Stanley Mortgage Loan Trust Series 2007-15AR, Class 2A1 | $ | 1,797 | 1,166,382 | |||
| Shares | ||||||
WARRANTS – 0.0% | ||||||
Warrants – 0.0% | ||||||
Charter Communications, Inc., expiring 11/30/14(i) | 23,024 | 120,876 | ||||
SHORT-TERM INVESTMENTS – 0.9% | ||||||
Investment Companies – 0.9% | ||||||
AllianceBernstein Fixed-Income Shares, Inc. – Government STIF Portfolio, 0.11%(k) | 4,612,120 | 4,612,120 | ||||
Total Investments – 97.6% | 481,960,547 | |||||
Other assets less liabilities – 2.4% | 11,984,760 | |||||
Net Assets – 100.0% | $ | 493,945,307 | ||||
| ALLIANCEBERNSTEIN POOLING PORTFOLIOS • | 127 |
High Yield Portfolio—Portfolio of Investments
CREDIT DEFAULT SWAP CONTRACTS (see Notes C)
| Swap Counterparty & Referenced Obligation | Fixed Deal (Pay) Receive Rate | Implied Credit Spread at February 28, 2010 | Notional Amount (000) | Market Value | Upfront Premiums Paid (Received) | Unrealized Appreciation/ (Depreciation) | ||||||||||||||
Buy Contracts: | ||||||||||||||||||||
Morgan Stanley Capital Services Inc.: | ||||||||||||||||||||
Residential Capital, LLC | ||||||||||||||||||||
6.50%, 4/17/13, 6/30/10* | (5.00 | )% | 11.807 | % | $ | 1,625 | $ | 21,337 | $ | 135,229 | $ | (113,892 | ) | |||||||
XL Capital LTD | ||||||||||||||||||||
5.25%, 9/15/14, 3/20/12* | (5.00 | ) | 0.779 | 1,260 | (121,226 | ) | 86,777 | (208,003 | ) | |||||||||||
| * | Termination date. |
FORWARD CURRENCY EXCHANGE CONTRACTS (see Note C)
| Contract Amount (000) | U.S. $ Value on Origination Date | U.S. $ Value at February 28, 2010 | Unrealized Appreciation/ (Depreciation) | ||||||||
Sale Contracts: | |||||||||||
British Pound settling 3/17/10 | 575 | $ | 914,629 | $ | 876,370 | $ | 38,259 | ||||
Euro settling 3/25/10 | 11,081 | 15,599,539 | 15,088,082 | 511,457 | |||||||
Euro settling 3/25/10 | 404 | 568,289 | 549,645 | 18,644 | |||||||
Euro settling 3/25/10 | 281 | 387,323 | 383,104 | 4,219 | |||||||
| (a) | Security is exempt from registration under Rule 144A of the Securities Act of 1933. These securities are considered liquid and may be resold in transactions exempt from registration, normally to qualified institutional buyers. At February 28, 2010, the aggregate market value of these securities amounted to $105,586,184 or 21.4% of net assets. |
| (b) | Floating Rate Security. Stated interest rate was in effect at February 28, 2010. |
| (c) | Security is in default and is non-income producing. |
| (d) | Pay-In-Kind Payments (PIK). |
| (e) | Indicates a security that has a zero coupon that remains in effect until a predetermined date at which time the stated coupon rate becomes effective until final maturity. |
| (f) | Illiquid security. |
| (g) | Security is exempt from registration under Rule 144A of the Securities Act of 1933. These securities, which represent 0.2% of net assets as of February 28, 2010, are considered illiquid and restricted. |
| Restricted Securities | Acquisition Date | Cost | Market Value | Percentage of Net Assets | |||||||
Broder Brothers Co. | |||||||||||
12.00%, 10/15/13 | 8/5/2005 | $ | 587,252 | $ | 236,948 | 0.05 | % | ||||
Greektown Holdings LLC | |||||||||||
10.75%, 12/01/13 | 11/22/2005 | 499,357 | 31,500 | 0.01 | % | ||||||
Yioula Glassworks SA | |||||||||||
9.00%, 12/01/15 | 6/9/2009 | 525,447 | 667,890 | 0.14 | % | ||||||
| (h) | Variable rate coupon, rate shown as of February 28, 2010. |
| (i) | Non-income producing security. |
| (j) | Fair valued. |
| (k) | Investment in affiliated money market mutual fund. The rate represents the 7-day yield as of period end. |
| 128 | • ALLIANCEBERNSTEIN POOLING PORTFOLIOS |
High Yield Portfolio—Portfolio of Investments
Currency Abbreviations:
AUD – Australian Dollar
BRL – Brazilian Real
EUR – Euro Dollar
GBP – Great British Pound
Glossary:
ARMs – Adjustable Rate Mortgages
CMBS – Commercial Mortgage-Backed Securities
CMOs – Collateralized Mortgage Obligations
LP – Limited Partnership
OJSC – Open Joint Stock Company
REIT – Real Estate Investment Trust
See notes to financial statements.
| ALLIANCEBERNSTEIN POOLING PORTFOLIOS • | 129 |
High Yield Portfolio—Portfolio of Investments
STATEMENT OF ASSETS & LIABILITIES
February 28, 2010 (unaudited)
| U.S. Value | U.S. Large Cap Growth | Global Real Estate Investment | ||||||||||
| Assets | ||||||||||||
Investments in securities, at value | ||||||||||||
Unaffiliated issuers (cost $2,017,437,693, $1,779,371,020 and $824,971,275, respectively) | $ | 2,134,555,612 | $ | 2,159,715,776 | $ | 979,851,206 | ||||||
Affiliated issuers (cost $57,915,741, $21,820,040 and $20,192,200, respectively) | 57,915,741 | 21,820,040 | 20,192,200 | |||||||||
Foreign currencies, at value (cost $0, $0 and $6,747,464, respectively) | – 0 | – | – 0 | – | 6,760,657 | |||||||
Receivable for investment securities sold and foreign currency transactions | 5,609,523 | 21,385,786 | 12,945,143 | |||||||||
Dividends receivable | 4,983,052 | 2,428,361 | 1,089,106 | |||||||||
Receivable for shares of beneficial interest sold | 3,638 | 20,763 | – 0 | – | ||||||||
Unrealized appreciation of forward currency exchange contracts | – 0 | – | – 0 | – | 4,705,209 | |||||||
Total assets | 2,203,067,566 | 2,205,370,726 | 1,025,543,521 | |||||||||
| Liabilities | ||||||||||||
Payable for investment securities purchased and foreign currency transactions | 6,909,931 | 20,193,030 | 7,715,856 | |||||||||
Payable for shares of beneficial interest redeemed | 627,453 | 97,992 | 35,954 | |||||||||
Unrealized depreciation of forward currency exchange contracts | – 0 | – | – 0 | – | 6,225,986 | |||||||
Accrued expenses | 83,469 | 62,311 | 84,715 | |||||||||
Total liabilities | 7,620,853 | 20,353,333 | 14,062,511 | |||||||||
Net Assets | $ | 2,195,446,713 | $ | 2,185,017,393 | $ | 1,011,481,010 | ||||||
| Composition of Net Assets | ||||||||||||
Paid-in capital | $ | 2,953,145,061 | $ | 2,413,944,224 | $ | 1,352,754,054 | ||||||
Undistributed/(distributions in excess of) net investment income | 6,445,658 | 3,467,315 | (27,719,834 | ) | ||||||||
Accumulated net realized loss on investment and foreign currency transactions | (881,261,925 | ) | (612,738,902 | ) | (466,900,462 | ) | ||||||
Net unrealized appreciation on investments and foreign currency denominated assets and liabilities | 117,117,919 | 380,344,756 | 153,347,252 | |||||||||
Net Assets | $ | 2,195,446,713 | $ | 2,185,017,393 | $ | 1,011,481,010 | ||||||
Shares of beneficial interest outstanding—unlimited shares authorized, without par value | 283,031,673 | 219,742,192 | 123,947,372 | |||||||||
Net Asset Value | $ | 7.76 | $ | 9.94 | $ | 8.16 | ||||||
See notes to financial statements.
| 130 | • ALLIANCEBERNSTEIN POOLING PORTFOLIOS |
Statement of Assets & Liabilities
| International Value | International Growth | Small-Mid Cap Value | ||||||||||
| Assets | ||||||||||||
Investments in securities, at value | ||||||||||||
Unaffiliated issuers (cost $1,062,958,477, $965,603,968 and $512,638,947, respectively) | $ | 1,061,602,307 | $ | 1,080,843,138 | $ | 585,323,496 | ||||||
Affiliated issuers (cost $29,768,403, $15,900,281 and $0, respectively) | 29,768,403 | 15,900,281 | – 0 | – | ||||||||
Cash(a) | 953,828 | – 0 | – | – 0 | – | |||||||
Foreign currencies, at value (cost $10,794,335, $9,508,054 and $0, respectively) | 10,795,157 | 9,536,285 | – 0 | – | ||||||||
Receivable for investment securities sold and foreign currency transactions | 6,928,310 | 10,767 | 4,319,068 | |||||||||
Unrealized appreciation of forward currency exchange contracts | 4,604,087 | 23,203,787 | – 0 | – | ||||||||
Dividends receivable | 2,893,269 | 1,615,098 | 422,788 | |||||||||
Receivable for shares of beneficial interest sold | 969,281 | 576,090 | 2,206 | |||||||||
Receivable for variation margin on futures contracts | 103,232 | – 0 | – | – 0 | – | |||||||
Total assets | 1,118,617,874 | 1,131,685,446 | 590,067,558 | |||||||||
| Liabilities | ||||||||||||
Due to custodian | – 0 | – | – 0 | – | 3,377,377 | |||||||
Payable for investment securities purchased | 12,132,948 | 4,622,725 | 813,741 | |||||||||
Unrealized depreciation of forward currency exchange contracts | 436,992 | 15,271,677 | – 0 | – | ||||||||
Payable for shares of beneficial interest redeemed | – 0 | – | – 0 | – | 450,733 | |||||||
Accrued expenses and other liabilities | 66,144 | 270,765 | 55,242 | |||||||||
Total liabilities | 12,636,084 | 20,165,167 | 4,697,093 | |||||||||
Net Assets | $ | 1,105,981,790 | $ | 1,111,520,279 | $ | 585,370,465 | ||||||
| Composition of Net Assets | ||||||||||||
Paid-in capital | $ | 1,512,718,778 | $ | 1,434,196,129 | $ | 643,561,870 | ||||||
Undistributed/(distributions in excess of) net investment income | (5,409,083 | ) | (17,773,638 | ) | 3,543,171 | |||||||
Accumulated net realized loss on investment and foreign currency transactions | (403,862,830 | ) | (427,952,848 | ) | (134,419,125 | ) | ||||||
Net unrealized appreciation on investments and foreign currency denominated assets and liabilities | 2,534,925 | 123,050,636 | 72,684,549 | |||||||||
Net Assets | $ | 1,105,981,790 | $ | 1,111,520,279 | $ | 585,370,465 | ||||||
Shares of beneficial interest outstanding—unlimited shares authorized, without par value | 146,479,802 | 131,775,533 | 60,924,703 | |||||||||
Net Asset Value | $ | 7.55 | $ | 8.43 | $ | 9.61 | ||||||
| (a) | An amount of $953,828 has been segregated to collateralize margin requirements for open futures contracts outstanding at February 28, 2010 for the International Value Portfolio. |
See notes to financial statements.
| ALLIANCEBERNSTEIN POOLING PORTFOLIOS • | 131 |
Statement of Assets & Liabilities
| Small-Mid Cap Growth | Short Duration Bond | Intermediate Duration Bond | ||||||||||
| Assets | ||||||||||||
Investments in securities, at value | ||||||||||||
Unaffiliated issuers (cost $475,814,533, $1,291,836,633 and $1,361,447,867, respectively) | $ | 579,908,489 | $ | 1,245,607,213 | $ | 1,379,489,933 | ||||||
Affiliated issuers (cost $5,761,846, $25,106,124 and $134,117,320, respectively) | 5,761,846 | 25,106,124 | 134,117,320 | |||||||||
Cash(a) | – 0 | – | 1,610,211 | – 0 | – | |||||||
Receivable for investment securities sold | 6,332,058 | 13,061,730 | 9,979,817 | |||||||||
Dividends and interest receivable | 35,780 | 7,948,124 | 13,059,375 | |||||||||
Receivable for shares of beneficial interest sold | 8,436 | 5,598 | – 0 | – | ||||||||
Unrealized appreciation of forward currency exchange contracts | – 0 | – | – 0 | – | 164,796 | |||||||
Unrealized appreciation on interest rate swap contracts | – 0 | – | – 0 | – | 820,957 | |||||||
Other asset (see Note E) | – 0 | – | – 0 | – | 574,439 | |||||||
Total assets | 592,046,609 | 1,293,339,000 | 1,538,206,637 | |||||||||
| Liabilities | ||||||||||||
Payable for investment securities purchased | 7,780,527 | 24,521,271 | 85,680,044 | |||||||||
Payable for shares of beneficial interest redeemed | 412,518 | 1,106,958 | 1,793,334 | |||||||||
Payable for variation margin on futures contracts | – 0 | – | 308,221 | – 0 | – | |||||||
Interest expense payable | – 0 | – | 33,229 | 116,499 | ||||||||
TALF loan payable | – 0 | – | 57,985,899 | 73,495,103 | ||||||||
Accrued expenses | 56,051 | 62,898 | 82,421 | |||||||||
Total liabilities | 8,249,096 | 84,018,476 | 161,167,401 | |||||||||
Net Assets | $ | 583,797,513 | $ | 1,209,320,524 | $ | 1,377,039,236 | ||||||
| Composition of Net Assets | ||||||||||||
Paid-in capital | $ | 605,523,574 | $ | 1,284,630,566 | $ | 1,372,834,199 | ||||||
Undistributed net investment income | 830,746 | 3,676,434 | 3,516,813 | |||||||||
Accumulated net realized loss on investment and foreign currency transactions | (126,650,763 | ) | (31,555,383 | ) | (18,337,215 | ) | ||||||
Net unrealized appreciation/(depreciation) on investments and foreign currency denominated assets and liabilities | 104,093,956 | (47,431,093 | ) | 19,025,439 | ||||||||
Net Assets | $ | 583,797,513 | $ | 1,209,320,524 | $ | 1,377,039,236 | ||||||
Shares of beneficial interest outstanding—unlimited shares authorized, without par value | 50,936,181 | 127,665,068 | 133,689,941 | |||||||||
Net Asset Value | $ | 11.46 | $ | 9.47 | $ | 10.30 | ||||||
| (a) | An amount of $1,016,280 has been segregated to collateralize margin requirements for open futures contracts outstanding at February 28, 2010 for the Short Duration Bond Portfolio. |
See notes to financial statements.
| 132 | • ALLIANCEBERNSTEIN POOLING PORTFOLIOS |
Statement of Assets & Liabilities
| Inflation Protected Securities | High-Yield | |||||||
| Assets | ||||||||
Investments in securities, at value | ||||||||
Unaffiliated issuers (cost $595,481,316 and $455,321,623, respectively) | $ | 630,641,839 | $ | 477,348,427 | ||||
Affiliated issuers (cost $19,813,717 and $4,612,120, respectively) | 19,813,717 | 4,612,120 | ||||||
Cash | – 0 | – | 213 | |||||
Foreign currencies, at value (cost $0 and $207,558, respectively) | – 0 | – | 204,027 | |||||
Dividends and interest receivable | 1,563,179 | 9,900,051 | ||||||
Receivable for shares of beneficial interest sold | 118,974 | – 0 | – | |||||
Receivable for investment securities sold | – 0 | – | 1,666,152 | |||||
Unrealized appreciation of forward currency exchange contracts | – 0 | – | 572,579 | |||||
Premium paid on credit default swap contracts | – 0 | – | 222,006 | |||||
Total assets | 652,137,709 | 494,525,575 | ||||||
| Liabilities | ||||||||
Payable for shares of beneficial interest redeemed | 60,653 | 163,177 | ||||||
Audit fee payable | 22,729 | 23,488 | ||||||
Legal fee payable | 14,896 | 13,791 | ||||||
Custody fee payable | 7,453 | 7,502 | ||||||
Unrealized depreciation on credit default swap contracts | – 0 | – | 321,895 | |||||
Accrued expenses and other liabilities | 10,953 | 50,415 | (a) | |||||
Total liabilities | 116,684 | 580,268 | ||||||
Net Assets | $ | 652,021,025 | $ | 493,945,307 | ||||
| Composition of Net Assets | ||||||||
Paid-in capital | $ | 620,193,298 | $ | 535,935,177 | ||||
Undistributed net investment income | 1,133,342 | 4,401,539 | ||||||
Accumulated net realized loss on investment and foreign currency transactions | (4,466,138 | ) | (68,631,756 | ) | ||||
Net unrealized appreciation on investments and foreign currency denominated assets and liabilities | 35,160,523 | 22,240,347 | ||||||
Net Assets | $ | 652,021,025 | $ | 493,945,307 | ||||
Shares of beneficial interest outstanding—unlimited shares authorized, without par value | 63,308,708 | 51,320,472 | ||||||
Net Asset Value | $ | 10.30 | $ | 9.62 | ||||
| (a) | Includes an amount of $40,379 owed to Lehman Brothers resulting from the termination of credit default swap and interest rate swap contracts subsequent to its bankruptcy filing on September 15, 2008. |
See notes to financial statements.
| ALLIANCEBERNSTEIN POOLING PORTFOLIOS • | 133 |
Statement of Assets & Liabilities
STATEMENT OF OPERATIONS
Six Months Ended February 28, 2010 (unaudited)
| U.S. Value | U.S. Large Cap Growth | Global Real Estate Investment | ||||||||||
| Investment Income | ||||||||||||
Dividends | ||||||||||||
Unaffiliated issuers (net of foreign taxes withheld of $0, $150,664 and $1,201,452, respectively) | $ | 23,863,987 | $ | 11,969,602 | $ | 14,904,401 | ||||||
Affiliated issuers | 23,568 | 3,573 | 4,804 | |||||||||
Interest | – 0 | – | – 0 | – | 2,895 | |||||||
Total income | 23,887,555 | 11,973,175 | 14,912,100 | |||||||||
| Expenses | ||||||||||||
Custodian | 82,796 | 82,182 | 102,527 | |||||||||
Audit | 20,159 | 20,892 | 35,893 | |||||||||
Legal | 17,157 | 17,665 | 16,895 | |||||||||
Printing | 3,803 | 3,095 | 1,438 | |||||||||
Registration fees | 3,458 | 1,321 | 1,847 | |||||||||
Trustees’ fees | 2,224 | 2,172 | 2,332 | |||||||||
Miscellaneous | 23,552 | 16,154 | 33,095 | |||||||||
Total expenses | 153,149 | 143,481 | 194,027 | |||||||||
Net investment income | 23,734,406 | 11,829,694 | 14,718,073 | |||||||||
| Realized and Unrealized Gain (Loss) on Investment and Foreign Currency Transactions | ||||||||||||
Net realized gain (loss) on: | ||||||||||||
Investment transactions | (860,124 | ) | 54,956,073 | 1,234,742 | ||||||||
Foreign currency transactions | 437 | 182 | 7,985,059 | |||||||||
Net change in unrealized appreciation/depreciation of: | ||||||||||||
Investments | 160,237,481 | 102,409,959 | 53,750,053 | |||||||||
Foreign currency denominated assets and liabilities | – 0 | – | – 0 | – | (3,329,662 | ) | ||||||
Net gain on investment and foreign currency transactions | 159,377,794 | 157,366,214 | 59,640,192 | |||||||||
Net Increase in Net Assets from Operations | $ | 183,112,200 | $ | 169,195,908 | $ | 74,358,265 | ||||||
See notes to financial statements.
| 134 | • ALLIANCEBERNSTEIN POOLING PORTFOLIOS |
Statement of Operations
| International Value | International Growth | Small-Mid Cap Value | ||||||||||
| Investment Income | ||||||||||||
Dividends | ||||||||||||
Unaffiliated issuers (net of foreign taxes withheld of $642,959, $558,155 and $0, respectively) | $ | 10,014,011 | $ | 6,844,558 | $ | 3,417,823 | ||||||
Affiliated issuers | 9,219 | 7,681 | 2,740 | |||||||||
Interest | 2,455 | 1,889 | – 0 | – | ||||||||
Total income | 10,025,685 | 6,854,128 | 3,420,563 | |||||||||
| Expenses | ||||||||||||
Custodian | 125,393 | 108,942 | 54,083 | |||||||||
Audit | 24,609 | 25,440 | 20,139 | |||||||||
Legal | 16,466 | 15,042 | 16,427 | |||||||||
Registration fees | 4,450 | 6,255 | 4,072 | |||||||||
Trustees’ fees | 2,125 | 2,213 | 2,277 | |||||||||
Printing | 1,644 | 1,629 | 838 | |||||||||
Miscellaneous | 13,502 | 25,749 | 5,951 | |||||||||
Total expenses | 188,189 | 185,270 | 103,787 | |||||||||
Net investment income | 9,837,496 | 6,668,858 | 3,316,776 | |||||||||
| Realized and Unrealized Gain (Loss) on Investment and Foreign Currency Transactions | ||||||||||||
Net realized gain (loss) on: | ||||||||||||
Investment transactions | (26,742,255 | ) | 35,590,969 | (a) | 12,386,988 | |||||||
Futures contracts | 739,202 | – 0 | – | – 0 | – | |||||||
Foreign currency transactions | 11,079,952 | 19,803,325 | – 0 | – | ||||||||
Net change in unrealized appreciation/depreciation of: | ||||||||||||
Investments | 18,419,597 | 15,924,451 | (b) | 86,197,596 | ||||||||
Futures contracts | (910,411 | ) | – 0 | – | – 0 | – | ||||||
Foreign currency denominated assets and liabilities | 2,224,461 | (2,684,627 | ) | – 0 | – | |||||||
Net gain on investment and foreign currency transactions | 4,810,546 | 68,634,118 | 98,584,584 | |||||||||
Net Increase in Net Assets from Operations | $ | 14,648,042 | $ | 75,302,976 | $ | 101,901,360 | ||||||
| (a) | Net of foreign capital gains taxes of $151,050. |
| (b) | Net of increase in accrued foreign capital gains taxes of $150,352. |
See notes to financial statements.
| ALLIANCEBERNSTEIN POOLING PORTFOLIOS • | 135 |
Statement of Operations
| Small-Mid Cap Growth | Short Duration Bond | Intermediate Duration Bond | ||||||||||
| Investment Income | ||||||||||||
Dividends | ||||||||||||
Unaffiliated issuers | $ | 1,074,021 | $ | – 0 | – | $ | – 0 | – | ||||
Affiliated issuers | 3,036 | 14,426 | 55,435 | |||||||||
Interest | – 0 | – | 19,540,687 | 31,700,012 | ||||||||
Total income | 1,077,057 | 19,555,113 | 31,755,447 | |||||||||
| Expenses | ||||||||||||
Custodian | 55,564 | 91,352 | 102,316 | |||||||||
Audit | 19,364 | 22,813 | 22,679 | |||||||||
Legal | 17,058 | 18,693 | 24,412 | |||||||||
Trustees’ fees | 2,327 | 2,490 | 2,322 | |||||||||
Registration fees | 1,148 | 1,267 | 676 | |||||||||
Printing | 992 | 1,665 | 972 | |||||||||
Miscellaneous | 7,092 | 10,641 | 9,974 | |||||||||
Total expenses | 103,545 | 148,921 | 163,351 | |||||||||
TALF administrative fee | – 0 | – | 40,110 | 44,525 | ||||||||
Interest expense | – 0 | – | 881,369 | 1,264,136 | ||||||||
Net expenses | 103,545 | 1,070,400 | 1,472,012 | |||||||||
Net investment income | 973,512 | 18,484,713 | 30,283,435 | |||||||||
| Realized and Unrealized Gain (Loss) on Investment and Foreign Currency Transactions | ||||||||||||
Net realized gain (loss) on: | ||||||||||||
Investment transactions | 39,424,653 | 7,013,156 | 4,068,432 | |||||||||
Futures contracts | – 0 | – | (451,176 | ) | – 0 | – | ||||||
Swap contracts | – 0 | – | – 0 | – | 178,403 | |||||||
Foreign currency transactions | – 0 | – | – 0 | – | (274,936 | ) | ||||||
Net change in unrealized appreciation/depreciation of: | ||||||||||||
Investments | 28,578,640 | 20,327,080 | 38,798,179 | |||||||||
Futures contracts | – 0 | – | (700,400 | ) | – 0 | – | ||||||
Swap contracts | – 0 | – | – 0 | – | 141,011 | |||||||
Foreign currency denominated assets and liabilities | – 0 | – | – 0 | – | 563,299 | |||||||
Net gain on investment and foreign currency transactions | 68,003,293 | 26,188,660 | 43,474,388 | |||||||||
Net Increase in Net Assets from Operations | $ | 68,976,805 | $ | 44,673,373 | $ | 73,757,823 | ||||||
See notes to financial statements.
| 136 | • ALLIANCEBERNSTEIN POOLING PORTFOLIOS |
Statement of Operations
| Inflation Protected Securities | High-Yield | |||||||
| Investment Income | ||||||||
Interest | $ | 6,777,700 | $ | 23,635,353 | ||||
Dividends | ||||||||
Affiliated issuers | 5,924 | 1,322 | ||||||
Unaffiliated issuers | – 0 | – | 95,844 | |||||
Total income | 6,783,624 | 23,732,519 | ||||||
| Expenses | ||||||||
Custodian | 49,795 | 75,949 | ||||||
Audit | 21,629 | 24,484 | ||||||
Legal | 17,992 | 17,421 | ||||||
Trustees’ fees | 2,312 | 2,172 | ||||||
Printing | 1,362 | 481 | ||||||
Registration fees | 1,282 | 225 | ||||||
Miscellaneous | 6,381 | 7,328 | ||||||
Total expenses | 100,753 | 128,060 | ||||||
Net investment income | 6,682,871 | 23,604,459 | ||||||
| Realized and Unrealized Gain (Loss) on Investment and Foreign Currency Transactions | ||||||||
Net realized gain (loss) on: | ||||||||
Investment transactions | 389,556 | (2,663,668 | ) | |||||
Swap contracts | – 0 | – | (72,926 | ) | ||||
Foreign currency transactions | – 0 | – | 193,622 | |||||
Net change in unrealized appreciation/depreciation of: | ||||||||
Investments | 23,985,718 | 62,559,282 | ||||||
Swap contracts | – 0 | – | (124,103 | ) | ||||
Foreign currency denominated assets and liabilities | – 0 | – | 912,967 | |||||
Net gain on investment and foreign currency transactions | 24,375,274 | 60,805,174 | ||||||
Net Increase in Net Assets from Operations | $ | 31,058,145 | $ | 84,409,633 | ||||
See notes to financial statements.
| ALLIANCEBERNSTEIN POOLING PORTFOLIOS • | 137 |
Statement of Operations
STATEMENT OF CHANGES IN NET ASSETS
| U.S. Value | ||||||||
| Six Months Ended February 28, 2010 (unaudited) | Year Ended August 31, 2009 | |||||||
| Increase (Decrease) in Net Assets from Operations | ||||||||
Net investment income | $ | 23,734,406 | $ | 59,755,580 | ||||
Net realized loss on investment and foreign currency transactions | (859,687 | ) | (864,352,662 | ) | ||||
Net change in unrealized appreciation/depreciation of investments | 160,237,481 | 353,364,527 | ||||||
Net increase (decrease) in net assets from operations | 183,112,200 | (451,232,555 | ) | |||||
| Dividends and Distributions to Shareholders from | ||||||||
Net investment income | (27,091,719 | ) | (64,192,908 | ) | ||||
Net realized gain on investment transactions | – 0 | – | (275,483 | ) | ||||
| Transactions in Shares of Beneficial Interest | ||||||||
Net increase (decrease) | (52,037,459 | ) | 86,221,814 | |||||
Total increase (decrease) | 103,983,022 | (429,479,132 | ) | |||||
| Net Assets | ||||||||
Beginning of period | 2,091,463,691 | 2,520,942,823 | ||||||
End of period (including undistributed net investment income of $6,445,658 and $9,802,971, respectively) | $ | 2,195,446,713 | $ | 2,091,463,691 | ||||
See notes to financial statements.
| 138 | • ALLIANCEBERNSTEIN POOLING PORTFOLIOS |
Statement of Changes in Net Assets
| U.S. Large Cap Growth | ||||||||
| Six Months Ended February 28, 2010 (unaudited) | Year Ended August 31, 2009 | |||||||
| Increase (Decrease) in Net Assets from Operations | ||||||||
Net investment income | $ | 11,829,694 | $ | 25,891,772 | ||||
Net realized gain (loss) on investment and foreign currency transactions | 54,956,255 | (489,849,357 | ) | |||||
Net change in unrealized appreciation/depreciation of investments | 102,409,959 | 58,152,729 | ||||||
Net increase (decrease) in net assets from operations | 169,195,908 | (405,804,856 | ) | |||||
| Dividends to Shareholders from | ||||||||
Net investment income | (12,634,517 | ) | (23,934,284 | ) | ||||
| Transactions in Shares of Beneficial Interest | ||||||||
Net decrease | (49,411,411 | ) | (24,662,726 | ) | ||||
Total increase (decrease) | 107,149,980 | (454,401,866 | ) | |||||
| Net Assets | ||||||||
Beginning of period | 2,077,867,413 | 2,532,269,279 | ||||||
End of period (including undistributed net investment income of $3,467,315 and $4,272,138, respectively) | $ | 2,185,017,393 | $ | 2,077,867,413 | ||||
See notes to financial statements.
| ALLIANCEBERNSTEIN POOLING PORTFOLIOS • | 139 |
Statement of Changes in Net Assets
| Global Real Estate Investment | ||||||||
| Six Months Ended February 28, 2010 (unaudited) | Year Ended August 31, 2009 | |||||||
| Increase (Decrease) in Net Assets from Operations | ||||||||
Net investment income | $ | 14,718,073 | $ | 39,319,146 | ||||
Net realized gain (loss) on investment and foreign currency transactions | 9,219,801 | (415,710,175 | ) | |||||
Net change in unrealized appreciation/depreciation of investments and foreign currency denominated assets and liabilities | 50,420,391 | 205,328,781 | ||||||
Net increase (decrease) in net assets from operations | 74,358,265 | (171,062,248 | ) | |||||
| Dividends to Shareholders from | ||||||||
Net investment income | (11,443,247 | ) | (5,812,876 | ) | ||||
| Transactions in Shares of Beneficial Interest | ||||||||
Net increase (decrease) | (45,971,039 | ) | 39,031,083 | |||||
Total increase (decrease) | 16,943,979 | (137,844,041 | ) | |||||
| Net Assets | ||||||||
Beginning of period | 994,537,031 | 1,132,381,072 | ||||||
End of period (including distributions in excess of net investment income of ($27,719,834) and ($30,994,660), respectively) | $ | 1,011,481,010 | $ | 994,537,031 | ||||
See notes to financial statements.
| 140 | • ALLIANCEBERNSTEIN POOLING PORTFOLIOS |
Statement of Changes in Net Assets
| International Value | ||||||||
| Six Months Ended February 28, 2010 (unaudited) | Year Ended August 31, 2009 | |||||||
| Increase (Decrease) in Net Assets from Operations | ||||||||
Net investment income | $ | 9,837,496 | $ | 33,257,484 | ||||
Net realized loss on investment and foreign currency transactions | (14,923,101 | ) | (403,563,359 | ) | ||||
Net change in unrealized appreciation/depreciation of investments and foreign currency denominated assets and liabilities | 19,733,647 | 166,175,439 | ||||||
Contributions from Adviser (see Note B) | – 0 | – | 213,196 | |||||
Net increase (decrease) in net assets from operations | 14,648,042 | (203,917,240 | ) | |||||
| Dividends and Distributions to Shareholders from | ||||||||
Net investment income | (4,011,109 | ) | (29,331,747 | ) | ||||
Net realized gain on investment transactions | – 0 | – | (47,413,051 | ) | ||||
| Transactions in Shares of Beneficial Interest | ||||||||
Net increase (decrease) | (32,006,987 | ) | 179,537,135 | |||||
Total decrease | (21,370,054 | ) | (101,124,903 | ) | ||||
| Net Assets | ||||||||
Beginning of period | 1,127,351,844 | 1,228,476,747 | ||||||
End of period (including distributions in excess of net investment income of ($5,409,083) and ($11,235,470), respectively) | $ | 1,105,981,790 | $ | 1,127,351,844 | ||||
See notes to financial statements.
| ALLIANCEBERNSTEIN POOLING PORTFOLIOS • | 141 |
Statement of Changes in Net Assets
| International Growth | ||||||||
| Six Months Ended February 28, 2010 (unaudited) | Year Ended August 31, 2009 | |||||||
| Increase (Decrease) in Net Assets from Operations | ||||||||
Net investment income | $ | 6,668,858 | $ | 29,350,048 | ||||
Net realized gain (loss) on investment and foreign currency transactions | 55,394,294 | (463,979,673 | ) | |||||
Net change in unrealized appreciation/depreciation of investments and foreign currency denominated assets and liabilities | 13,239,824 | 134,594,068 | ||||||
Contributions from Adviser (see Note B) | – 0 | – | 57,294 | |||||
Net increase (decrease) in net assets from operations | 75,302,976 | (299,978,263 | ) | |||||
| Dividends and Distributions to Shareholders from | ||||||||
Net investment income | (30,093,357 | ) | (33,261,661 | ) | ||||
Net realized gain on investment transactions | – 0 | – | (120,835 | ) | ||||
| Transactions in Shares of Beneficial Interest | ||||||||
Net increase (decrease) | (11,470,562 | ) | 165,162,828 | |||||
Total increase (decrease) | 33,739,057 | (168,197,931 | ) | |||||
| Net Assets | ||||||||
Beginning of period | 1,077,781,222 | 1,245,979,153 | ||||||
End of period (including undistributed/(distributions in excess of) net investment income of ($17,773,638) and $5,650,861, respectively) | $ | 1,111,520,279 | $ | 1,077,781,222 | ||||
See notes to financial statements.
| 142 | • ALLIANCEBERNSTEIN POOLING PORTFOLIOS |
Statement of Changes in Net Assets
| Small-Mid Cap Value | ||||||||
| Six Months Ended February 28, 2010 (unaudited) | Year Ended August 31, 2009 | |||||||
| Increase (Decrease) in Net Assets from Operations | ||||||||
Net investment income | $ | 3,316,776 | $ | 9,670,916 | ||||
Net realized gain (loss) on investment transactions | 12,386,988 | (147,026,372 | ) | |||||
Net change in unrealized appreciation/depreciation of investments | 86,197,596 | 34,817,994 | ||||||
Net increase (decrease) in net assets from operations | 101,901,360 | (102,537,462 | ) | |||||
| Dividends and Distributions to Shareholders from | ||||||||
Net investment income | (2,249,173 | ) | (9,903,466 | ) | ||||
Net realized gain on investment transactions | – 0 | – | (45,972,741 | ) | ||||
| Transactions in Shares of Beneficial Interest | ||||||||
Net increase (decrease) | (67,426,242 | ) | 25,770,496 | |||||
Total increase (decrease) | 32,225,945 | (132,643,173 | ) | |||||
| Net Assets | ||||||||
Beginning of period | 553,144,520 | 685,787,693 | ||||||
End of period (including undistributed net investment income of $3,543,171 and $2,475,568, respectively) | $ | 585,370,465 | $ | 553,144,520 | ||||
See notes to financial statements.
| ALLIANCEBERNSTEIN POOLING PORTFOLIOS • | 143 |
Statement of Changes in Net Assets
| Small-Mid Cap Growth | ||||||||
| Six Months Ended February 28, 2010 (unaudited) | Year Ended August 31, 2009 | |||||||
| Increase (Decrease) in Net Assets from Operations | ||||||||
Net investment income | $ | 973,512 | $ | 2,330,437 | ||||
Net realized gain (loss) on investment transactions | 39,424,653 | (130,310,980 | ) | |||||
Net change in unrealized appreciation/depreciation of investments | 28,578,640 | (2,610,035 | ) | |||||
Contributions from Adviser (see Note B) | – 0 | – | 791 | |||||
Net increase (decrease) in net assets from operations | 68,976,805 | (130,589,787 | ) | |||||
| Dividends to Shareholders from | ||||||||
Net investment income | (591,916 | ) | (2,218,697 | ) | ||||
| Transactions in Shares of Beneficial Interest | ||||||||
Net decrease | (32,866,458 | ) | (5,203,248 | ) | ||||
Total increase (decrease) | 35,518,431 | (138,011,732 | ) | |||||
| Net Assets | ||||||||
Beginning of period | 548,279,082 | 686,290,814 | ||||||
End of period (including undistributed net investment income of $830,746 and $449,150, respectively) | $ | 583,797,513 | $ | 548,279,082 | ||||
See notes to financial statements.
| 144 | • ALLIANCEBERNSTEIN POOLING PORTFOLIOS |
Statement of Changes in Net Assets
| Short Duration Bond | ||||||||
| Six Months Ended February 28, 2010 (unaudited) | Year Ended August 31, 2009 | |||||||
| Increase (Decrease) in Net Assets from Operations | ||||||||
Net investment income | $ | 18,484,713 | $ | 42,190,796 | ||||
Net realized gain (loss) on investment transactions | 6,561,980 | (21,481,199 | ) | |||||
Net change in unrealized appreciation/depreciation of investments | 19,626,680 | 3,532,774 | ||||||
Net increase in net assets from operations | 44,673,373 | 24,242,371 | ||||||
| Dividends to Shareholders from | ||||||||
Net investment income | (17,943,826 | ) | (44,230,027 | ) | ||||
| Transactions in Shares of Beneficial Interest | ||||||||
Net increase (decrease) | 74,991,000 | (170,953,640 | ) | |||||
Total increase (decrease) | 101,720,547 | (190,941,296 | ) | |||||
| Net Assets | ||||||||
Beginning of period | 1,107,599,977 | 1,298,541,273 | ||||||
End of period (including undistributed net investment income of $3,676,434 and $3,135,547, respectively) | $ | 1,209,320,524 | $ | 1,107,599,977 | ||||
See notes to financial statements.
| ALLIANCEBERNSTEIN POOLING PORTFOLIOS • | 145 |
Statement of Changes in Net Assets
| Intermediate Duration Bond | ||||||||
| Six Months Ended February 28, 2010 (unaudited) | Year Ended August 31, 2009 | |||||||
| Increase (Decrease) in Net Assets from Operations | ||||||||
Net investment income | $ | 30,283,435 | $ | 67,823,944 | ||||
Net realized gain (loss) on investment and foreign currency transactions | 3,971,899 | (21,006,412 | ) | |||||
Net change in unrealized appreciation/depreciation of investments and foreign currency denominated assets and liabilities | 39,502,489 | 31,492,529 | ||||||
Net increase in net assets from operations | 73,757,823 | 78,310,061 | ||||||
| Dividends to Shareholders from | ||||||||
Net investment income | (31,354,683 | ) | (74,748,745 | ) | ||||
| Transactions in Shares of Beneficial Interest | ||||||||
Net increase (decrease) | 53,884,609 | (377,225,455 | ) | |||||
Total increase (decrease) | 96,287,749 | (373,664,139 | ) | |||||
| Net Assets | ||||||||
Beginning of period | 1,280,751,487 | 1,654,415,626 | ||||||
End of period (including undistributed net investment income of $3,516,813 and $4,588,061, respectively) | $ | 1,377,039,236 | $ | 1,280,751,487 | ||||
See notes to financial statements.
| 146 | • ALLIANCEBERNSTEIN POOLING PORTFOLIOS |
Statement of Changes in Net Assets
| Inflation Protected Securities | ||||||||
| Six Months Ended February 28, 2010 (unaudited) | Year Ended August 31, 2009 | |||||||
| Increase (Decrease) in Net Assets from Operations | ||||||||
Net investment income | $ | 6,682,871 | $ | 2,475,002 | ||||
Net realized gain (loss) on investment transactions | 389,556 | (3,417,167 | ) | |||||
Net change in unrealized appreciation/depreciation of investments | 23,985,718 | (14,610,443 | ) | |||||
Net increase (decrease) in net assets from operations | 31,058,145 | (15,552,608 | ) | |||||
| Dividends to Shareholders from | ||||||||
Net investment income | (7,815,952 | ) | (38,875,317 | ) | ||||
| Transactions in Shares of Beneficial Interest | ||||||||
Net increase (decrease) | 42,458,112 | (48,169,296 | ) | |||||
Total increase (decrease) | 65,700,305 | (102,597,221 | ) | |||||
| Net Assets | ||||||||
Beginning of period | 586,320,720 | 688,917,941 | ||||||
End of period (including undistributed net investment income of $1,133,342 and $2,266,423, respectively) | $ | 652,021,025 | $ | 586,320,720 | ||||
See notes to financial statements.
| ALLIANCEBERNSTEIN POOLING PORTFOLIOS • | 147 |
Statement of Changes in Net Assets
| High-Yield | ||||||||
| Six Months Ended February 28, 2010 (unaudited) | Year Ended August 31, 2009 | |||||||
| Increase (Decrease) in Net Assets from Operations | ||||||||
Net investment income | $ | 23,604,459 | $ | 46,809,322 | ||||
Net realized loss on investment and foreign currency transactions | (2,542,972 | ) | (52,091,777 | ) | ||||
Net change in unrealized appreciation/depreciation of investments and foreign currency denominated assets and liabilities | 63,348,146 | 23,218,238 | ||||||
Net increase in net assets from operations | 84,409,633 | 17,935,783 | ||||||
| Dividends to Shareholders from | ||||||||
Net investment income | (23,511,558 | ) | (45,605,929 | ) | ||||
| Transactions in Shares of Beneficial Interest | ||||||||
Net decrease | (30,352,306 | ) | (35,780,608 | ) | ||||
Total increase (decrease) | 30,545,769 | (63,450,754 | ) | |||||
| Net Assets | ||||||||
Beginning of period | 463,399,538 | 526,850,292 | ||||||
End of period (including undistributed net investment income of $4,401,539 and $4,308,638, respectively) | $ | 493,945,307 | $ | 463,399,538 | ||||
See notes to financial statements.
| 148 | • ALLIANCEBERNSTEIN POOLING PORTFOLIOS |
Statement of Changes in Net Assets
STATEMENT OF CASH FLOWS
Six Months Ended February 28, 2010 (unaudited)
| Short Duration Bond | ||||||||
| Increase (Decrease) in Cash from Operating Activities: | ||||||||
Interest and dividends received | $ | 21,885,802 | ||||||
Interest expense paid | (887,476 | ) | ||||||
Operating expenses paid | (182,044 | ) | ||||||
Net increase in cash from operating activities | $ | 20,816,282 | ||||||
| Investing Activities: | ||||||||
Purchases of long-term investments | (911,307,327 | ) | ||||||
Proceeds from disposition of long-term investments | 992,290,655 | |||||||
Purchase of short-term investments, net | (30,041,089 | ) | ||||||
Variation margin paid on futures contracts | (1,194,277 | ) | ||||||
Net increase in cash from investing activities | 49,747,962 | |||||||
| Financing Activities: | ||||||||
Redemptions of capital stock, net | 58,185,276 | |||||||
Decrease in loans payable | (12,274,101 | ) | ||||||
Decrease in reverse repurchase agreements | (116,143,568 | ) | ||||||
Net decrease in cash from financing activities | (70,232,393 | ) | ||||||
Net increase in cash | 331,851 | |||||||
Cash at beginning of period | 1,278,360 | |||||||
Cash at end of period | $ | 1,610,211 | ||||||
| Reconciliation of Net Increase in Net Assets from Operations to Net Increase in Cash from Operating Activities: | ||||||||
Net increase in net assets from operations | $ | 44,673,373 | ||||||
| Adjustments: | ||||||||
Increase in interest and dividends receivable | $ | (10,830 | ) | |||||
Net accretion of bond discount and amortization of bond premium | 2,350,797 | |||||||
Inflation Index Adjustment | (9,278 | ) | ||||||
Decrease in interest payable | (6,107 | ) | ||||||
Increase in accrued expenses | 6,987 | |||||||
Net realized gain on investment transactions | (6,561,980 | ) | ||||||
Net change in unrealized appreciation/depreciation of investments | (19,626,680 | ) | ||||||
Total adjustments | (23,857,091 | ) | ||||||
Net increase in cash from operating activities | $ | 20,816,282 | ||||||
See notes to financial statements.
| ALLIANCEBERNSTEIN POOLING PORTFOLIOS • | 149 |
Statement of Cash Flows
NOTES TO FINANCIAL STATEMENTS
February 28, 2010 (unaudited)
NOTE A
Significant Accounting Policies
The AllianceBernstein Pooling Portfolios (the “Trust”) was organized as a Massachusetts business trust on November 11, 2004 and is registered under the Investment Company Act of 1940 as a diversified, open-end management investment company. The Trust is currently comprised of eleven separate series: AllianceBernstein U.S. Value Portfolio, AllianceBernstein U.S. Large Cap Growth Portfolio, AllianceBernstein Global Real Estate Investment Portfolio, AllianceBernstein International Value Portfolio, AllianceBernstein International Growth Portfolio, AllianceBernstein Small-Mid Cap Value Portfolio, AllianceBernstein Small-Mid Cap Growth Portfolio, AllianceBernstein Short Duration Bond Portfolio, AllianceBernstein Intermediate Duration Bond Portfolio, AllianceBernstein Inflation Protected Securities Portfolio (effective April 16, 2010, the Portfolio’s new name is AllianceBernstein Bond Inflation Protection Portfolio) and AllianceBernstein High-Yield Portfolio (collectively, the “Portfolios”). Effective April 16, 2010, a new Portfolio will be offered by the Trust—AllianceBernstein Volatility Management Portfolio. The AllianceBernstein Global Value Portfolio and the AllianceBernstein Global Research Growth Portfolio, formerly series of the Trust, ceased operations on November 24, 2008. Each series is considered to be a separate entity for financial reporting and tax purposes. Shares of the Portfolios are offered exclusively to mutual funds advised by and certain other institutional clients of AllianceBernstein L.P. (the “Adviser”). A Portfolio’s shares may be purchased at the relevant net asset value without a sales charge or other fee. The financial statements have been prepared in conformity with U.S. generally accepted accounting principles (“U.S. GAAP”) which require management to make certain estimates and assumptions that affect the reported amounts of assets and liabilities in the financial statements and amounts of income and expenses during the reporting period. Actual results could differ from those estimates. The following is a summary of significant accounting policies followed by the Portfolios.
1. Security Valuation
Portfolio securities are valued at their current market value determined on the basis of market quotations or, if market quotations are not readily available or are deemed unreliable, at “fair value” as determined in accordance with procedures established by and under the general supervision of the Trust’s Board of Trustees.
In general, the market value of securities which are readily available and deemed reliable are determined as follows. Securities listed on a national securities exchange (other than securities listed on the NASDAQ Stock Market, Inc. (“NASDAQ”)) or on a foreign securities exchange are valued at the last sale price at the close of the exchange or foreign securities exchange. If there has been no sale on such day, the securities are valued at the mean of the closing bid and asked prices on such day. Securities listed on more than one exchange are
| 150 | • ALLIANCEBERNSTEIN POOLING PORTFOLIOS |
Notes to Financial Statements
valued by reference to the principal exchange on which the securities are traded; securities listed only on NASDAQ are valued in accordance with the NASDAQ Official Closing Price; listed put or call options are valued at the last sale price. If there has been no sale on that day, such securities will be valued at the closing bid prices on that day; open futures contracts and options thereon are valued using the closing settlement price or, in the absence of such a price, the most recent quoted bid price. If there are no quotations available for the day of valuation, the last available closing settlement price is used; securities traded in the over-the-counter market (“OTC”) are valued at the mean of the current bid and asked prices as reported by the National Quotation Bureau or other comparable sources; U.S. government securities and other debt instruments having 60 days or less remaining until maturity are valued at amortized cost if their original maturity was 60 days or less; or by amortizing their fair value as of the 61st day prior to maturity if their original term to maturity exceeded 60 days; fixed-income securities, including mortgage backed and asset backed securities, may be valued on the basis of prices provided by a pricing service or at a price obtained from one or more of the major broker/dealers. In cases where broker/dealer quotes are obtained, the Adviser may establish procedures whereby changes in market yields or spreads are used to adjust, on a daily basis, a recently obtained quoted price on a security; and OTC and other derivatives are valued on the basis of a quoted bid price or spread from a major broker/dealer in such security. Investments in money market funds are valued at their net asset value each day.
Securities for which market quotations are not readily available (including restricted securities) or are deemed unreliable are valued at fair value. Factors considered in making this determination may include, but are not limited to, information obtained by contacting the issuer, analysts, analysis of the issuer’s financial statements or other available documents. In addition, the Portfolios may use fair value pricing for securities primarily traded in non-U.S. markets because most foreign markets close well before the Portfolios value their securities at 4:00 p.m., Eastern Time (see Note A.2).
In valuing the Term Asset-Backed Securities Loan Facility (“TALF”) transactions, the Adviser, on an ongoing basis (i) requests dealer pricing indications, (ii) obtains inputs from third party valuation providers (where loans have traded in conjunction with recent asset sales) and (iii) considers prices at which loans are transferred between parties.
2. Fair Value Measurements
In accordance with U.S. GAAP regarding fair value measurements, fair value is defined as the price that the Portfolios would receive to sell an asset or pay to transfer a liability in an orderly transaction between market participants at the measurement date. The U.S. GAAP disclosure requirements establish a framework for measuring fair value, and a three-level hierarchy for fair value
| ALLIANCEBERNSTEIN POOLING PORTFOLIOS • | 151 |
Notes to Financial Statements
measurements based upon the transparency of inputs to the valuation of an asset or liability. Inputs may be observable or unobservable and refer broadly to the assumptions that market participants would use in pricing the asset or liability. Observable inputs reflect the assumptions market participants would use in pricing the asset or liability based on market data obtained from sources independent of the Portfolios. Unobservable inputs reflect the Portfolios’ own assumptions about the assumptions that market participants would use in pricing the asset or liability based on the best information available in the circumstances. Each investment is assigned a level based upon the observability of the inputs which are significant to the overall valuation. The three-tier hierarchy of inputs is summarized below.
| • | Level 1—quoted prices in active markets for identical investment |
| • | Level 2—other significant observable inputs (including quoted prices for similar investments, interest rates, prepayment speeds, credit risk, etc.) |
| • | Level 3—significant unobservable inputs (including the Portfolios’ own assumptions in determining the fair value of investments) |
The Short Duration Bond Portfolio and Intermediate Duration Bond Portfolio have elected the fair value option in valuing the TALF loan liability as permitted by U.S. GAAP regarding the fair value option for financial assets and financial liabilities. The fair value option permits a portfolio the opportunity to mitigate volatility in net assets caused by measuring related assets and liabilities differently. Consequently the Portfolios recorded the loan liability on the statement of assets and liabilities at fair value. The fair value option requires that the TALF loan be marked-to-market giving consideration to relevant market factors including changes in the market value of the collateral related to the TALF loan (see Note C.5). As of February 28, 2010, the Portfolios did not have a difference between the aggregate fair value and the aggregate unpaid principal balance of the TALF loans outstanding.
The following table summarizes the valuation of the Portfolios’ investments by the above fair value hierarchy levels as of February 28, 2010:
| U.S. Value Portfolio | ||||||||||||
| Investments in Securities | Level 1 | Level 2 | Level 3 | Total | ||||||||
Common Stocks | $ | 2,134,555,612 | $ | — | $ | — | $ | 2,134,555,612 | ||||
Short-Term Investments | 57,915,741 | — | — | 57,915,741 | ||||||||
Total Investments in Securities | 2,192,471,353 | — | — | 2,192,471,353 | ||||||||
Other Financial Instruments* | — | — | — | — | ||||||||
Total | $ | 2,192,471,353 | $ | — | $ | — | $ | 2,192,471,353 | ||||
| 152 | • ALLIANCEBERNSTEIN POOLING PORTFOLIOS |
Notes to Financial Statements
| U.S. Large Cap Growth Portfolio | |||||||||||||
| Investments in Securities | Level 1 | Level 2 | Level 3 | Total | |||||||||
Common Stocks | $ | 2,146,139,576 | $ | 13,576,200 | (a) | $ | — | $ | 2,159,715,776 | ||||
Short-Term Investments | 21,820,040 | — | — | 21,820,040 | |||||||||
Total Investments in Securities | 2,167,959,616 | 13,576,200 | — | 2,181,535,816 | |||||||||
Other Financial Instruments* | — | — | — | — | |||||||||
Total | $ | 2,167,959,616 | $ | 13,576,200 | $ | — | $ | 2,181,535,816 | |||||
| (a) | Represents one holding in the Industrial sector. |
| Global Real Estate Investment Portfolio | ||||||||||||||
| Investments in Securities | Level 1 | Level 2 | Level 3 | Total | ||||||||||
Assets: | ||||||||||||||
Common Stocks | ||||||||||||||
Equity: Other | $ | 138,447,798 | $ | 282,913,332 | $ | — | $ | 421,361,130 | ||||||
Retail | 116,577,630 | 76,483,728 | — | 193,061,358 | ||||||||||
Residential | 91,891,483 | 60,990,639 | — | 152,882,122 | ||||||||||
Office | 69,366,689 | 55,102,414 | — | 124,469,103 | ||||||||||
Lodging | 45,784,807 | 11,219,274 | — | 57,004,081 | ||||||||||
Industrials | 12,980,965 | 11,963,653 | — | 24,944,618 | ||||||||||
Warrants | 44,527 | — | 6,084,267 | 6,128,794 | ||||||||||
Short-Term Investments | 20,192,200 | — | — | 20,192,200 | ||||||||||
Total Investments in Securities | 495,286,099 | 498,673,040 | + | 6,084,267 | 1,000,043,406 | |||||||||
Other Financial Instruments*: | ||||||||||||||
Assets | — | 4,705,209 | — | 4,705,209 | ||||||||||
Liabilities | — | (6,225,986 | ) | — | (6,225,986 | ) | ||||||||
Total | $ | 495,286,099 | $ | 497,152,263 | $ | 6,084,267 | $ | 998,522,629 | ||||||
| ALLIANCEBERNSTEIN POOLING PORTFOLIOS • | 153 |
Notes to Financial Statements
| International Value Portfolio | |||||||||||||||
| Investments in Securities | Level 1 | Level 2 | Level 3 | Total | |||||||||||
Assets: | |||||||||||||||
Common Stocks | |||||||||||||||
Financials | $ | 20,959,664 | $ | 265,090,932 | $ | — | $ | 286,050,596 | |||||||
Industrials | — | 128,373,323 | — | 128,373,323 | |||||||||||
Energy | 29,249,714 | 90,865,322 | — | 120,115,036 | |||||||||||
Consumer Discretionary | — | 104,090,944 | — | 104,090,944 | |||||||||||
Telecommunication Services | 3,530,642 | 93,543,802 | — | 97,074,444 | |||||||||||
Information Technology | — | 92,932,540 | — | 92,932,540 | |||||||||||
Health Care | — | 80,712,100 | — | 80,712,100 | |||||||||||
Materials | — | 68,680,777 | — | 68,680,777 | |||||||||||
Consumer Staples | — | 44,487,856 | — | 44,487,856 | |||||||||||
Utilities | — | 39,084,691 | — | 39,084,691 | |||||||||||
Short-Term Investments | 29,768,403 | — | — | 29,768,403 | |||||||||||
Total Investments in Securities | 83,508,423 | 1,007,862,287 | + | — | 1,091,370,710 | ||||||||||
Other Financial Instruments*: | |||||||||||||||
Assets | 188,268 | 4,604,087 | — | 4,792,355 | |||||||||||
Liabilities | (454,047 | ) | (436,992 | ) | — | (891,039 | ) | ||||||||
Total | $ | 83,242,644 | $ | 1,012,029,382 | $ | — | $ | 1,095,272,026 | |||||||
| International Growth Portfolio | |||||||||||||||
| Investments in Securities | Level 1 | Level 2 | Level 3 | Total | |||||||||||
Assets: | |||||||||||||||
Common Stocks | |||||||||||||||
Financials | $ | 37,667,331 | $ | 175,219,264 | $ | — | $ | 212,886,595 | |||||||
Consumer Staples | — | 138,696,732 | — | 138,696,732 | |||||||||||
Materials | 16,975,098 | 111,224,118 | — | 128,199,216 | |||||||||||
Health Care | 31,913,318 | 95,812,856 | — | 127,726,174 | |||||||||||
Industrials | — | 123,469,435 | — | 123,469,435 | |||||||||||
Energy | 23,395,971 | 96,414,874 | — | 119,810,845 | |||||||||||
Information Technology | — | 114,925,475 | — | 114,925,475 | |||||||||||
Consumer Discretionary | 5,222,218 | 84,177,670 | — | 89,399,888 | |||||||||||
Telecommunication Services | — | 18,709,767 | — | 18,709,767 | |||||||||||
Utilities | — | 6,292,974 | — | 6,292,974 | |||||||||||
Warrants | — | — | 726,037 | 726,037 | |||||||||||
Short-Term Investments | 15,900,281 | — | — | 15,900,281 | |||||||||||
Total Investments in Securities | 131,074,217 | 964,943,165 | + | 726,037 | 1,096,743,419 | ||||||||||
Other Financial Instruments*: | |||||||||||||||
Assets | — | 23,203,787 | — | 23,203,787 | |||||||||||
Liabilities | — | (15,271,677 | ) | — | (15,271,677 | ) | |||||||||
Total | $ | 131,074,217 | $ | 972,875,275 | $ | 726,037 | $ | 1,104,675,529 | |||||||
| 154 | • ALLIANCEBERNSTEIN POOLING PORTFOLIOS |
Notes to Financial Statements
| Small-Mid Cap Value Portfolio | |||||||||||||||
| Investments in Securities | Level 1 | Level 2 | Level 3 | Total | |||||||||||
Common Stocks | $ | 585,323,496 | $ | — | $ | — | $ | 585,323,496 | |||||||
Total Investments in Securities | 585,323,496 | — | — | 585,323,496 | |||||||||||
Other Financial Instruments* | — | — | — | — | |||||||||||
Total | $ | 585,323,496 | $ | — | $ | — | $ | 585,323,496 | |||||||
| Small-Mid Cap Growth Portfolio | |||||||||||||||
| Investments in Securities | Level 1 | Level 2 | Level 3 | Total | |||||||||||
Common Stocks | $ | 579,908,489 | $ | — | $ | — | $ | 579,908,489 | |||||||
Short-Term Investments | 5,761,846 | — | — | 5,761,846 | |||||||||||
Total Investments in Securities | 585,670,335 | — | — | 585,670,335 | |||||||||||
Other Financial Instruments* | — | — | — | — | |||||||||||
Total | $ | 585,670,335 | $ | — | $ | — | $ | 585,670,335 | |||||||
| Short Duration Bond Portfolio | |||||||||||||||
| Investments in Securities | Level 1 | Level 2 | Level 3 | Total | |||||||||||
Assets: | |||||||||||||||
Governments – Treasuries | $ | — | $ | 342,318,432 | $ | — | $ | 342,318,432 | |||||||
Corporates – Investment Grades | — | 282,678,050 | — | 282,678,050 | |||||||||||
Asset-Backed Securities | — | 158,875,134 | 69,708,891 | 228,584,025 | |||||||||||
Mortgage Pass-Thru’s | — | 215,254,655 | — | 215,254,655 | |||||||||||
Agencies | — | 67,096,843 | — | 67,096,843 | |||||||||||
Commercial Mortgage-Backed Securities | — | 29,576,565 | 17,943,637 | 47,520,202 | |||||||||||
CMOs | — | 8,222,223 | 21,130,408 | 29,352,631 | |||||||||||
Short-Term Investments | |||||||||||||||
Investment Companies | 25,106,124 | — | — | 25,106,124 | |||||||||||
Treasury Bills | — | 19,999,440 | — | 19,999,440 | |||||||||||
Certificates of Deposit | — | 12,802,935 | — | 12,802,935 | |||||||||||
Total Investments in Securities | 25,106,124 | 1,136,824,277 | 108,782,936 | 1,270,713,337 | |||||||||||
Other Financial Instruments*: | |||||||||||||||
Assets | 1,295,447 | — | — | 1,295,447 | |||||||||||
Liabilities | (2,497,120 | ) | — | — | (2,497,120 | ) | |||||||||
TALF Loans | — | — | (57,985,899 | ) | (57,985,899 | ) | |||||||||
Total | $ | 23,904,451 | $ | 1,136,824,277 | $ | 50,797,037 | $ | 1,211,525,765 | |||||||
| ALLIANCEBERNSTEIN POOLING PORTFOLIOS • | 155 |
Notes to Financial Statements
| Intermediate Duration Bond Portfolio | ||||||||||||||
| Investments in Securities | Level 1 | Level 2 | Level 3 | Total | ||||||||||
Assets: | ||||||||||||||
Corporates – Investment Grades | $ | — | $ | 454,600,757 | $ | 2,096,766 | $ | 456,697,523 | ||||||
Governments – Treasuries | — | 386,596,671 | — | 386,596,671 | ||||||||||
Mortgage Pass-Thru’s | — | 224,611,992 | — | 224,611,992 | ||||||||||
Commercial Mortgage-Backed Securities | — | 106,778,042 | 21,363,887 | 128,141,929 | ||||||||||
Asset-Backed Securities | — | 42,292,752 | 3,904,378 | 46,197,130 | ||||||||||
Governments – Sovereign Bonds | — | 27,415,885 | — | 27,415,885 | ||||||||||
Governments – Sovereign Agencies | — | 24,079,978 | — | 24,079,978 | ||||||||||
CMOs | — | 8,653,981 | 12,115,820 | 20,769,801 | ||||||||||
Corporates – Non-Investment Grades | — | 19,954,884 | — | 19,954,884 | ||||||||||
Agencies | — | 16,627,022 | — | 16,627,022 | ||||||||||
Inflation-Linked Securities | — | 13,739,398 | — | 13,739,398 | ||||||||||
Quasi-Sovereigns | — | 9,502,285 | — | 9,502,285 | ||||||||||
Supranationals | — | 5,155,435 | — | 5,155,435 | ||||||||||
Short-Term Investments | 134,117,320 | — | — | 134,117,320 | ||||||||||
Total Investments in Securities | 134,117,320 | 1,340,009,082 | 39,480,851 | 1,513,607,253 | ||||||||||
Other Financial Instruments*: | ||||||||||||||
Assets | — | 985,753 | — | 985,753 | ||||||||||
Liabilities | — | — | — | — | ||||||||||
TALF Loans | — | — | (73,495,103 | ) | (73,495,103 | ) | ||||||||
Total | $ | 134,117,320 | $ | 1,340,994,835 | $ | (34,014,252 | ) | $ | 1,441,097,903 | |||||
| Inflation Protected Securities Portfolio | ||||||||||||||
| Investments in Securities | Level 1 | Level 2 | Level 3 | Total | ||||||||||
Inflation-Linked Securities | $ | — | $ | 630,641,839 | $ | — | $ | 630,641,839 | ||||||
Short-Term Investments | 19,813,717 | — | — | 19,813,717 | ||||||||||
Total Investments in Securities | 19,813,717 | 630,641,839 | — | 650,455,556 | ||||||||||
Other Financial Instruments* | — | — | — | — | ||||||||||
Total | $ | 19,813,717 | $ | 630,641,839 | $ | — | $ | 650,455,556 | ||||||
| 156 | • ALLIANCEBERNSTEIN POOLING PORTFOLIOS |
Notes to Financial Statements
| High-Yield Portfolio | ||||||||||||||
| Investments in Securities | Level 1 | Level 2 | Level 3 | Total | ||||||||||
Assets: | ||||||||||||||
Corporates – Non-Investment Grades | $ | — | $ | 359,156,094 | $ | 22,297,553 | $ | 381,453,647 | ||||||
Corporates – Investment Grades | — | 55,728,407 | — | 55,728,407 | ||||||||||
Bank Loans | — | — | 8,693,250 | 8,693,250 | ||||||||||
Commercial Mortgage-Backed Securities | — | 8,647,175 | — | 8,647,175 | ||||||||||
Emerging Markets – Corporate Bonds | — | 5,547,734 | — | 5,547,734 | ||||||||||
Quasi-Sovereigns | — | 4,330,850 | — | 4,330,850 | ||||||||||
Governments – Treasuries | — | 3,741,058 | — | 3,741,058 | ||||||||||
Emerging Markets – Sovereigns | — | 3,003,733 | — | 3,003,733 | ||||||||||
Common Stock | 2,909,295 | — | — | 2,909,295 | ||||||||||
Preferred Stocks | — | 2,006,020 | — | 2,006,020 | ||||||||||
CMOs | — | — | 1,166,382 | 1,166,382 | ||||||||||
Warrants | 120,876 | — | — | 120,876 | ||||||||||
Short-Term Investments | 4,612,120 | — | — | 4,612,120 | ||||||||||
Total Investments in Securities | 7,642,291 | 442,161,071 | 32,157,185 | 481,960,547 | ||||||||||
Other Financial Instruments*: | ||||||||||||||
Assets | — | 572,579 | — | 572,579 | ||||||||||
Liabilities | — | (321,895 | ) | — | (321,895 | ) | ||||||||
Total | $ | 7,642,291 | $ | 442,411,755 | $ | 32,157,185 | $ | 482,211,231 | ||||||
| * | Other financial instruments are derivative instruments, such as futures, forwards and swap contracts, which are valued at the unrealized appreciation/depreciation on the instrument. |
| + | The earlier close of the foreign markets gives rise to the possibility that significant events, including broad market moves, may have occurred between the close of the foreign markets and the time at which the Portfolio values its securities which may materially affect the value of securities trading in such markets. To account for this, the Portfolio may frequently value many of its foreign equity securities using fair value prices based on third party vendor modeling tools to the extent available. Accordingly, a significant portion of the Portfolio’s investments are categorized as Level 2 investments. |
| ALLIANCEBERNSTEIN POOLING PORTFOLIOS • | 157 |
Notes to Financial Statements
Following is a reconciliation of investments in which significant unobservable inputs (Level 3) were used in determining fair value:
Global Real Estate Investment Portfolio | Warrants | Total | ||||||
Balance as of 8/31/09 | $ | — | $ | — | ||||
Accrued discounts/premiums | — | — | ||||||
Realized gain (loss) | — | — | ||||||
Change in unrealized appreciation/depreciation | (4,246,984 | ) | (4,246,984 | ) | ||||
Net purchases (sales) | 10,331,251 | 10,331,251 | ||||||
Net transfers in and/or out of Level 3 | — | — | ||||||
Balance as of 2/28/10 | $ | 6,084,267 | $ | 6,084,267 | ||||
Net change in unrealized appreciation/depreciation from Investments held as of 2/28/10* | $ | (4,246,984 | ) | $ | (4,246,984 | ) | ||
International Growth Portfolio | Warrants | Total | ||||||
Balance as of 8/31/09 | $ | 7,224,324 | $ | 7,224,324 | ||||
Accrued discounts/premiums | — | — | ||||||
Realized gain (loss) | 2,353,031 | 2,353,031 | ||||||
Change in unrealized appreciation/depreciation | (1,958,713 | ) | (1,958,713 | ) | ||||
Net purchases (sales) | (6,892,605 | ) | (6,892,605 | ) | ||||
Net transfers in and/or out of Level 3 | — | — | ||||||
Balance as of 2/28/10 | $ | 726,037 | $ | 726,037 | ||||
Net change in unrealized appreciation/depreciation from Investments held as of 2/28/10* | $ | (52,863 | ) | $ | (52,863 | ) | ||
Short Duration Bond | Asset- Backed Securities | Commercial Mortgage- Backed Securities | CMOs | TALF Loans | |||||||||||
Balance as of 8/31/09 | $ | 61,249,235 | $ | 9,301,725 | $ | 20,934,198 | $ | (70,260,000 | ) | ||||||
Accrued discounts/premiums | 5,131 | 1,756 | (165 | ) | — | ||||||||||
Realized gain (loss) | 13,540 | — | (605,681 | ) | — | ||||||||||
Change in unrealized appreciation/depreciation | 5,859,468 | 4,880,620 | 4,285,517 | — | |||||||||||
Net purchases (sales) | 2,581,517 | (1,000,000 | ) | (3,483,461 | ) | 12,274,101 | |||||||||
Net transfers in and/or out of Level 3 | — | 4,759,536 | — | — | |||||||||||
Balance as of 2/28/10 | $ | 69,708,891 | $ | 17,943,637 | $ | 21,130,408 | $ | (57,985,899 | ) | ||||||
Net change in unrealized appreciation/depreciation from Investments held as of 2/28/10* | $ | 5,857,746 | $ | 4,753,245 | $ | 3,622,662 | $ | — | |||||||
| 158 | • ALLIANCEBERNSTEIN POOLING PORTFOLIOS |
Notes to Financial Statements
Short Duration Bond Portfolio | Total | |||
Balance as of 8/31/09 | $ | 21,225,158 | ||
Accrued discounts/premiums | 6,722 | |||
Realized gain (loss) | (592,141 | ) | ||
Change in unrealized appreciation/depreciation | 15,025,605 | |||
Net purchases (sales) | 10,372,157 | |||
Net transfers in and/or out of Level 3 | 4,759,536 | |||
Balance as of 2/28/10 | $ | 50,797,037 | ||
Net change in unrealized appreciation/depreciation from Investments held as of 2/28/10* | $ | 14,233,653 | ||
Intermediate | Corporates – Investment Grades | Commercial Mortgage- Backed Securities | Asset- Backed Securities | Governments – Sovereign Bonds | ||||||||||||
Balance as of 8/31/09 | $ | 14,820,320 | $ | 4,345,586 | $ | 5,131,079 | $ | 15,962,925 | ||||||||
Accrued discounts/premiums | 20,605 | 62,858 | 1,173 | (2,098 | ) | |||||||||||
Realized gain (loss) | — | (20,463 | ) | 5,336 | 803,995 | |||||||||||
Change in unrealized appreciation/ | 1,594,528 | 2,863,834 | 252,265 | (422,965 | ) | |||||||||||
Net purchases (sales) | — | (3,791,348 | ) | (1,485,475 | ) | (7,650,544 | ) | |||||||||
Net transfers in and/or out of Level 3 | (14,338,687 | ) | 17,903,420 | — | (8,691,313 | ) | ||||||||||
Balance as of 2/28/10 | $ | 2,096,766 | $ | 21,363,887 | $ | 3,904,378 | $ | — | ||||||||
Net change in unrealized appreciation/ | $ | 54,874 | $ | 2,507,540 | $ | 250,475 | $ | — | ||||||||
| ALLIANCEBERNSTEIN POOLING PORTFOLIOS • | 159 |
Notes to Financial Statements
Intermediate | CMOs | Corporates – Non- Investment Grades | Quasi- Sovereigns | TALF Loans | ||||||||||||
Balance as of 8/31/09 | $ | 13,082,041 | $ | 1,338,752 | $ | 16,817,375 | $ | (76,585,591 | ) | |||||||
Accrued discounts/premiums | 441 | 394 | 18,628 | — | ||||||||||||
Realized gain (loss) | 15,451 | (186,897 | ) | 729,825 | — | |||||||||||
Change in unrealized appreciation/ | 1,205,768 | 312,800 | 1,042,169 | — | ||||||||||||
Net purchases (sales) | (2,187,881 | ) | (1,465,049 | ) | (12,547,799 | ) | 3,090,488 | |||||||||
Net transfers in and/or out of Level 3 | — | — | (6,060,198 | ) | — | |||||||||||
Balance as of 2/28/10 | $ | 12,115,820 | $ | — | $ | — | $ | (73,495,103 | ) | |||||||
Net change in unrealized appreciation/ | $ | 1,193,710 | $ | — | $ | — | $ | — | ||||||||
| Total | ||||
Balance as of 8/31/09 | $ | (5,087,513 | ) | |
Accrued discounts/premiums | 102,001 | |||
Realized gain (loss) | 1,347,247 | |||
Change in unrealized appreciation/depreciation | 6,848,399 | |||
Net purchases (sales) | (26,037,608 | ) | ||
Net transfers in and/or out of Level 3 | (11,186,778 | ) | ||
Balance as of 2/28/10 | $ | (34,014,252 | ) | |
Net change in unrealized appreciation/depreciation from Investments held as of 2/28/10* | $ | 4,006,599 | ||
| 160 | • ALLIANCEBERNSTEIN POOLING PORTFOLIOS |
Notes to Financial Statements
High-Yield Portfolio | Corporates – Non- Investment Grades | Corporates – Investment Grades | Bank Loans | Quasi- Sovereigns | ||||||||||||
Balance as of 8/31/09 | $ | 32,354,954 | $ | 2,762,647 | $ | 7,424,856 | $ | 3,426,550 | ||||||||
Accrued discounts/premiums | 67,880 | (562 | ) | 500,088 | 27,504 | |||||||||||
Realized gain (loss) | 136,342 | 29,127 | 1,075,935 | 346,414 | ||||||||||||
Change in unrealized appreciation/depreciation | 1,759,970 | 162,013 | (466,835 | ) | (4,285 | ) | ||||||||||
Net purchases (sales) | (2,683,599 | ) | (458,150 | ) | 159,206 | (1,910,458 | ) | |||||||||
Net transfers in and/or out of Level 3 | (9,337,994 | ) | (2,495,075 | ) | — | (1,885,725 | ) | |||||||||
Balance as of 2/28/10 | $ | 22,297,553 | $ | — | $ | 8,693,250 | $ | — | ||||||||
Net change in unrealized appreciation/depreciation from Investments held as of 2/28/10* | $ | 1,227,173 | $ | — | $ | (466,835 | ) | $ | — | |||||||
| Emerging Markets – Sovereigns | Preferred Stocks | CMOs | Totals | |||||||||||||
Balance as of 8/31/09 | $ | 1,255,450 | $ | 561,600 | $ | 1,210,898 | $ | 48,996,955 | ||||||||
Accrued discounts/premiums | 43,821 | — | 12,499 | 651,230 | ||||||||||||
Realized gain (loss) | — | — | 48,849 | 1,636,667 | ||||||||||||
Change in unrealized appreciation/depreciation | 218,679 | — | 20,471 | 1,690,013 | ||||||||||||
Net purchases (sales) | — | — | (126,335 | ) | (5,019,336 | ) | ||||||||||
Net transfers in and/or out of Level 3 | (1,517,950 | ) | (561,600 | ) | — | (15,798,344 | ) | |||||||||
Balance as of 2/28/10 | $ | — | $ | — | $ | 1,166,382 | $ | 32,157,185 | ||||||||
Net change in unrealized appreciation/depreciation from Investments held as of 2/28/10* | $ | — | $ | — | $ | 20,471 | $ | 780,809 | ||||||||
| * | The unrealized appreciation/depreciation is included in net change in unrealized appreciation/depreciation of investments in the accompanying statement of operations. |
| ALLIANCEBERNSTEIN POOLING PORTFOLIOS • | 161 |
Notes to Financial Statements
3. Currency Translation
Assets and liabilities denominated in foreign currencies and commitments under forward currency exchange contracts are translated into U.S. dollars at the mean of the quoted bid and asked prices of such currencies against the U.S. dollar. Purchases and sales of portfolio securities are translated into U.S. dollars at the rates of exchange prevailing when such securities were acquired or sold. Income and expenses are translated into U.S. dollars at rates of exchange prevailing when accrued.
Net realized gain or loss on foreign currency transactions represents foreign exchange gains and losses from sales and maturities of foreign fixed income investments, foreign currency exchange contracts, holding of foreign currencies, currency gains or losses realized between the trade and settlement dates on foreign investment transactions, and the difference between the amounts of dividends, interest and foreign withholding taxes recorded on the Portfolios’ books and the U.S. dollar equivalent amounts actually received or paid. Net unrealized currency gains and losses from valuing foreign currency denominated assets and liabilities at period end exchange rates are reflected as a component of net unrealized appreciation or depreciation of investments and foreign currency denominated assets and liabilities.
4. Taxes
It is each Portfolios’ policy to meet the requirements of the Internal Revenue Code applicable to regulated investment companies and to distribute all of its investment company taxable income and net realized gains, if any, to shareholders. Therefore, no provisions for federal income or excise taxes are required. The Portfolios may be subject to taxes imposed by countries in which they invest. Such taxes are generally based on income and/or capital gains earned or repatriated. Taxes are accrued and applied to net investment income, net realized gains and net unrealized appreciation/depreciation as such income and/or gains are earned.
In accordance with U.S. GAAP requirements regarding accounting for uncertainties in income taxes, management has analyzed the Portfolios’ tax positions taken on federal and state income tax returns for all open tax years (the current and the prior three tax years) and has concluded that no provision for income tax is required in the Portfolios’ financial statements.
5. Investment Income and Investment Transactions
Dividend income is recorded on the ex-dividend date or as soon as the Portfolio is informed of the dividend. Interest income is accrued daily. Investment transactions are accounted for on the date the securities are purchased or sold. Investment gains or losses are determined on the identified cost basis. The Portfolios amortize premiums and accrete discounts as adjustments to interest income.
| 162 | • ALLIANCEBERNSTEIN POOLING PORTFOLIOS |
Notes to Financial Statements
6. Expenses
Expenses of the Trust are charged to each Portfolio in proportion to each Portfolio’s respective net assets.
7. Dividends and Distributions
Dividends and distributions to shareholders, if any, are recorded on the ex-dividend date. Income dividends and capital gains distributions are determined in accordance with federal tax regulations and may differ from those determined in accordance with U.S. GAAP. To the extent these differences are permanent, such amounts are reclassified within the capital accounts based on their federal tax basis treatment; temporary differences do not require such reclassification.
NOTE B
Advisory Fee and Other Transactions with Affiliates
The Trust has entered into an advisory agreement (the “Advisory Agreement”) with the Adviser. Under the terms of the Advisory Agreement, the Portfolios pay no advisory fees to the Adviser. The Adviser serves as investment manager and adviser of each of the Portfolios and continuously furnishes an investment program for each Portfolio and manages, supervises and conducts the affairs of each Portfolio, subject to the supervision of the Trust’s Board of Trustees. The Advisory Agreement provides that the Adviser or an affiliate will furnish, or pay the expenses of the Trust for, office space, facilities and equipment, services of executive and other personnel of the Trust and certain administrative services.
During the year ended August 31, 2009, the Adviser reimbursed the International Value Portfolio, International Growth Portfolio and Small-Mid Cap Growth Portfolio in the amounts of $213,196, $57,294 and $791, respectively, for trading losses incurred due to a trade entry error.
The Trust has entered into a distribution agreement (the “Distribution Agreement”) on behalf of each Portfolio with AllianceBernstein Investments, Inc., a wholly-owned subsidiary of the Adviser, the Portfolios’ principal underwriter (the “Underwriter”), to permit the Underwriter to distribute the Portfolios’ shares, which are sold at the net asset value without any sales charge.
Under the Distribution Agreement, the Trust is responsible for all expenses of the Portfolios, including, for example, certain administrative services, costs of printing Portfolio prospectuses and other reports to shareholders, any taxes levied against the Portfolios and brokerage fees and commissions in connection with the purchase and sale of portfolio securities, but not expenses incurred in promoting the sale of the Portfolios’ shares, which are borne by the Underwriter.
AllianceBernstein Investor Services, Inc. (“ABIS”), an indirect wholly-owned subsidiary of the Adviser, acts as the Portfolios’ registrar, transfer agent and dividend-disbursing agent.
| ALLIANCEBERNSTEIN POOLING PORTFOLIOS • | 163 |
Notes to Financial Statements
The Portfolios may invest in the AllianceBernstein Fixed-Income Shares, Inc.—Government STIF Portfolio, an open-end management investment company managed by the Adviser. The Government STIF Portfolio is offered as a cash management option to mutual funds and other institutional accounts of the Adviser, and is not available for direct purchase by members of the public. The Government STIF Portfolio pays no investment management fees but does bear its own expenses. A summary of the Portfolios’ transactions in shares of the Government STIF Portfolio for the six months ended February 28, 2010 is as follows:
| Portfolio | Market Value August 31, (000) | Purchases at Cost (000) | Sales Proceeds (000) | Market Value February 28, (000) | Dividend Income (000) | |||||||||||
U.S. Value | $ | 44,780 | $ | 490,685 | $ | 477,549 | $ | 57,916 | $ | 24 | ||||||
U.S. Large Cap Growth | 3,359 | 170,260 | 151,799 | 21,820 | 4 | |||||||||||
Global Real Estate Investment | 27,112 | 139,076 | 145,996 | 20,192 | 5 | |||||||||||
International Value | 1,858 | 170,950 | 143,040 | 29,768 | 9 | |||||||||||
International Growth | 13,999 | 158,803 | 156,902 | 15,900 | 8 | |||||||||||
Small-Mid Cap Value | 17,620 | 79,289 | 96,909 | – 0 | – | 3 | ||||||||||
Small-Mid Cap Growth | 3,783 | 86,530 | 84,551 | 5,762 | 3 | |||||||||||
Short Duration Bond | 27,867 | 362,937 | 365,698 | 25,106 | 14 | |||||||||||
Intermediate Duration Bond | 122,066 | 315,732 | 303,681 | 134,117 | 55 | |||||||||||
Inflation Protected Securities | 5,012 | 62,738 | 47,936 | 19,814 | 6 | |||||||||||
High-Yield | 4,608 | 40,903 | 40,899 | 4,612 | 1 | |||||||||||
Brokerage commissions paid on investment transactions and brokerage commissions paid to Sanford C. Bernstein & Co. LLC and Sanford C. Bernstein Limited, affiliates of the Adviser, for the six months ended February 28, 2010 were as follows:
| Portfolio | Total Commissions | Sanford C. Bernstein & Co. LLC | Sanford C. Bernstein Limited | |||||||||
U.S. Value | $ | 1,298,399 | $ | – 0 | – | $ | – 0 | – | ||||
U.S. Large Cap Growth | 1,160,997 | – 0 | – | – 0 | – | |||||||
Global Real Estate Investment | 594,882 | – 0 | – | – 0 | – | |||||||
International Value | 672,548 | – 0 | – | – 0 | – | |||||||
International Growth | 962,530 | – 0 | – | – 0 | – | |||||||
Small-Mid Cap Value | 410,236 | – 0 | – | – 0 | – | |||||||
Small-Mid Cap Growth | 620,118 | – 0 | – | – 0 | – | |||||||
Short Duration Bond | – 0 | – | – 0 | – | – 0 | – | ||||||
Intermediate Duration Bond | – 0 | – | – 0 | – | – 0 | – | ||||||
Inflation Protected Securities | – 0 | – | – 0 | – | – 0 | – | ||||||
High-Yield | 648 | – 0 | – | – 0 | – | |||||||
| 164 | • ALLIANCEBERNSTEIN POOLING PORTFOLIOS |
Notes to Financial Statements
NOTE C
Investment Transactions
Purchases and sales of investment securities (excluding U.S. government securities and short-term investments) for the six months ended February 28, 2010, were as follows:
| Portfolio | Purchases | Sales | ||||||
U.S. Value | $ | 621,084,161 | $ | 704,609,740 | ||||
U.S. Large Cap Growth | 917,518,907 | 989,384,842 | ||||||
Global Real Estate Investment | 268,377,570 | 317,224,202 | ||||||
International Value | 337,370,081 | 376,541,010 | ||||||
International Growth | 440,460,905 | 453,390,435 | ||||||
Small-Mid Cap Value | 152,906,005 | 206,908,829 | ||||||
Small-Mid Cap Growth | 286,840,314 | 317,287,097 | ||||||
Short Duration Bond | 282,858,446 | 303,010,206 | ||||||
Intermediate Duration Bond | 169,179,856 | 210,699,137 | ||||||
Inflation Protected Securities | – 0 | – | – 0 | – | ||||
High-Yield | 70,573,858 | 105,803,956 | ||||||
Purchases and sales of U.S. government securities for the six months ended February 28, 2010, were as follows:
| Portfolio | Purchases | Sales | ||||||
U.S. Value | $ | – 0 | – | $ | – 0 | – | ||
U.S. Large Cap Growth | – 0 | – | – 0 | – | ||||
Global Real Estate Investment | – 0 | – | – 0 | – | ||||
International Value | – 0 | – | – 0 | – | ||||
International Growth | – 0 | – | – 0 | – | ||||
Small-Mid Cap Value | – 0 | – | – 0 | – | ||||
Small-Mid Cap Growth | – 0 | – | – 0 | – | ||||
Short Duration Bond | 644,368,418 | 643,980,699 | ||||||
Intermediate Duration Bond | 440,352,909 | 288,035,661 | ||||||
Inflation Protected Securities | 40,985,982 | 14,864,410 | ||||||
High-Yield | – 0 | – | – 0 | – | ||||
The cost of investments for federal income tax purposes was substantially the same as the cost for financial reporting purposes. Accordingly, gross unrealized appreciation and unrealized depreciation (excluding futures, foreign currency and swap transactions) are as follows:
| Gross Unrealized | Net Unrealized Appreciation/ (Depreciation) | |||||||||
Portfolio | Appreciation | (Depreciation) | ||||||||
U.S. Value | $ | 267,486,216 | $ (150,368,297 | ) | $ | 117,117,919 | ||||
U.S. Large Cap Growth | 398,694,793 | (18,350,037 | ) | 380,344,756 | ||||||
Global Real Estate Investment | 187,070,802 | (32,190,871 | ) | 154,879,931 | ||||||
International Value | 99,700,074 | (101,056,244 | ) | (1,356,170 | ) | |||||
International Growth | 159,249,896 | (44,010,726 | ) | 115,239,170 | ||||||
Small-Mid Cap Value | 109,870,023 | (37,185,474 | ) | 72,684,549 | ||||||
Small-Mid Cap Growth | 117,467,879 | (13,373,923 | ) | 104,093,956 | ||||||
Short Duration Bond | 22,621,090 | (68,850,510 | ) | (46,229,420 | ) | |||||
Intermediate Duration Bond | 51,328,660 | (33,286,594 | ) | 18,042,066 | ||||||
Inflation Protected Securities | 35,347,261 | (186,738 | ) | 35,160,523 | ||||||
High-Yield | 54,384,425 | (32,357,621 | ) | 22,026,804 | ||||||
| ALLIANCEBERNSTEIN POOLING PORTFOLIOS • | 165 |
Notes to Financial Statements
1. Derivative Financial Instruments
Certain Portfolios may use derivatives to earn income and enhance returns, to hedge or adjust the risk profile of its portfolio, to replace more traditional direct investments, or to obtain exposure to otherwise inaccessible markets. The Portfolios may also use derivatives for non-hedging purposes as a means of making direct investment in foreign currencies, as described below under “Currency Transactions”.
The principal types of derivatives utilized by the Portfolios, as well as the methods in which they may be used are:
| • | Futures Contracts |
Certain Portfolios may buy or sell futures contracts for the purpose of hedging their Portfolios against adverse effects of anticipated movements in the market or for investment purposes. The Portfolio bears the market risk that arises from changes in the value of these instruments and the imperfect correlation between movements in the price of the futures contracts and movements in the price of the securities hedged or used for cover. The Portfolio may also purchase or sell futures contracts for foreign currencies or options thereon for non-hedging purposes as a means of making direct investment in foreign currencies, as described below under “Currency Transactions”.
At the time the Portfolio enters into a futures contract, the Portfolio deposits and maintains as collateral an initial margin with the broker, as required by the exchange on which the transaction is effected. Pursuant to the contract, the Portfolio agrees to receive from or pay to the broker an amount of cash equal to the daily fluctuation in the value of the contract. Such receipts or payments are known as variation margin and are recorded by the Portfolio as unrealized gains or losses. Risks may arise from the potential inability of a counterparty to meet the terms of the contract. The credit/counterparty risk for futures contracts is generally less than privately negotiated futures contracts, since the clearinghouse, which is the issuer or counterparty to each exchange-traded future, provides a guarantee of performance. This guarantee is supported by a daily payment system (i.e., margin requirements). When the contract is closed, the Portfolio records a realized gain or loss equal to the difference between the value of the contract at the time it was opened and the time it was closed.
Use of long futures contracts subjects the Portfolio to risk of loss in excess of the amounts shown on the statement of assets and liabilities, up to the notional value of the futures contracts. Use of short futures contracts subjects the Portfolio to unlimited risk of loss. Under some circumstances, futures exchanges may establish daily limits on the amount that the price of a futures contract can vary from the previous day’s settlement price, which could effectively prevent liquidation of unfavorable positions.
| 166 | • ALLIANCEBERNSTEIN POOLING PORTFOLIOS |
Notes to Financial Statements
| • | Forward Currency Exchange Contracts |
Certain Portfolios may enter into forward currency exchange contracts in order to hedge their exposure to changes in foreign currency exchange rates on their foreign portfolio holdings, to hedge certain firm purchase and sale commitments denominated in foreign currencies and for non-hedging purposes as a means of making direct investments in foreign currencies, as described below under “Currency Transactions”.
A forward currency exchange contract is a commitment to purchase or sell a foreign currency at a future date at a negotiated forward rate. The gain or loss arising from the difference between the original contract and the closing of such contract would be included in net realized gain or loss on foreign currency transactions. Fluctuations in the value of open forward currency exchange contracts are recorded for financial reporting purposes as unrealized appreciation and/or depreciation by the Portfolio. Risks may arise from the potential inability of a counterparty to meet the terms of a contract and from unanticipated movements in the value of a foreign currency relative to the U.S. dollar. The face or contract amount, in U.S. dollars reflects the total exposure the Portfolio has in that particular currency contract.
| • | Option Transactions |
For hedging and investment purposes, certain Portfolios may purchase and write (sell) put and call options on U.S. and foreign securities, including government securities, and foreign currencies that are traded on U.S. and foreign securities exchanges and over-the-counter markets. The Portfolio may also use options transactions for non-hedging purposes as a means of making direct investments in foreign currencies, as described below under “Currency Transactions”.
The risk associated with purchasing an option is that the Portfolio pays a premium whether or not the option is exercised. Additionally, the Portfolio bears the risk of loss of the premium and change in market value should the counterparty not perform under the contract. Put and call options purchased are accounted for in the same manner as portfolio securities. The cost of securities acquired through the exercise of call options is increased by premiums paid. The proceeds from securities sold through the exercise of put options are decreased by the premiums paid.
When the Portfolio writes an option, the premium received by the Portfolio is recorded as a liability and is subsequently adjusted to the current market value of the option written. Premiums received from written options which expire unexercised are recorded by the Portfolio on the expiration date as realized gains from options written. The difference between the premium received and the amount paid on effecting a closing purchase transaction, including brokerage commissions, is also treated as a realized gain, or if the premium received is less than the amount paid for
| ALLIANCEBERNSTEIN POOLING PORTFOLIOS • | 167 |
Notes to Financial Statements
the closing purchase transaction, as a realized loss. If a call option is exercised, the premium received is added to the proceeds from the sale of the underlying security or currency in determining whether the Portfolio has realized a gain or loss. If a put option is exercised, the premium received reduces the cost basis of the security or currency purchased by the Portfolio. In writing an option, the Portfolio bears the market risk of an unfavorable change in the price of the security or currency underlying the written option. Exercise of an option written by the Portfolio could result in the Portfolio selling or buying a security or currency at a price different from the current market value. For the six months ended February 28, 2010, the Portfolios had no transactions in written options.
| • | Swap Agreements |
Certain Portfolios may enter into swaps to hedge their exposure to interest rates, credit risk, or currencies. The Portfolio may also enter into swaps for non-hedging purposes as a means of making direct investments in foreign currencies, as described below under “Currency Transactions”. A swap is an agreement that obligates two parties to exchange a series of cash flows at specified intervals based upon or calculated by reference to changes in specified prices or rates for a specified amount of an underlying asset. The payment flows are usually netted against each other, with the difference being paid by one party to the other. In addition, collateral may be pledged or received by the Portfolio in accordance with the terms of the respective swap agreements to provide value and recourse to the Portfolio or its counterparties in the event of default, bankruptcy or insolvency by one of the parties to the swap agreement.
Interest Rate Swaps:
The Portfolio is subject to interest rate risk exposure in the normal course of pursuing its investment objectives. Because the Portfolio holds fixed rate bonds, the value of these bonds may decrease if interest rates rise. To help hedge against this risk and to maintain its ability to generate income at prevailing market rates, the Portfolio may enter into interest rate swap contracts. Interest rate swaps are agreements between two parties to exchange cash flows based on a notional amount. The Portfolio may elect to pay a fixed rate and receive a floating rate, or, receive a fixed rate and pay a floating rate on a notional amount.
A Portfolio may enter into interest rate swap transactions to reserve a return or spread on a particular investment or portion of its portfolio, or protecting against an increase in the price of securities the Portfolio anticipates purchasing at a later date. Interest rate swaps involve the exchange by a Portfolio with another party of their respective commitments to pay or receive interest (e.g., an exchange of floating rate payments for fixed rate payments) computed based on a contractually-based principal (or “notional”) amount. Interest rate swaps are entered
| 168 | • ALLIANCEBERNSTEIN POOLING PORTFOLIOS |
Notes to Financial Statements
into on a net basis (i.e., the two payment streams are netted out, with the Portfolio receiving or paying, as the case may be, only the net amount of the two payments).
Risks may arise as a result of the failure of the counterparty to the swap contract to comply with the terms of the swap contract. The loss incurred by the failure of a counterparty is generally limited to the net interim payment to be received by the Portfolio, and/or the termination value at the end of the contract. Therefore, the Portfolio considers the creditworthiness of each counterparty to a swap contract in evaluating potential counterparty risk. This risk is mitigated by having a netting arrangement between the Portfolio and the counterparty and by the posting of collateral by the counterparty to the Portfolio to cover the Portfolios exposure to the counterparty. Additionally, risks may arise from unanticipated movements in interest rates or in the value of the underlying securities. The Portfolio accrues for the interim payments on swap contracts on a daily basis, with the net amount recorded within unrealized appreciation/depreciation of swap contracts on the statement of assets and liabilities. Once the interim payments are settled in cash, the net amount is recorded as realized gain/(loss) on swaps on the statement of operations, in addition to any realized gain/(loss) recorded upon the termination of swap contracts. Fluctuations in the value of swap contracts are recorded as a component of net change in unrealized appreciation/depreciation of swap contracts on the statement of operations.
Credit Default Swaps:
The Portfolio may enter into credit default swaps to manage its exposure to the market or certain sectors of the market, to reduce its risk exposure to defaults by corporate and sovereign issuers held by the Portfolio, or to create exposure to corporate or sovereign issuers to which it is not otherwise exposed. The Portfolio may purchase credit protection (“Buy Contract”) or provide credit protection (“Sale Contract”) on the referenced obligation of the credit default swap. During the term of the swap agreement, the Portfolio receives/(pays) fixed payments from/(to) the respective counterparty, calculated at the agreed upon interest rate applied to the notional amount. The accrual for these interim payments is recorded within unrealized appreciation/depreciation of swap contracts on the statement of assets and liabilities. Upfront premiums paid or received in connection with credit default swap contracts are recognized as cost or proceeds on the statement of assets and liabilities and are amortized on a straight line basis over the life of the contract. Amortized upfront premiums are included in net realized gain/(loss) from swaps on the statement of operations. If the Portfolio is a buyer/(seller) of protection and a credit event occurs, as defined under the terms of the swap agreement, the Portfolio will either (i) receive from the seller/(pay to the buyer) of protection an amount equal to the notional amount of the swap
| ALLIANCEBERNSTEIN POOLING PORTFOLIOS • | 169 |
Notes to Financial Statements
contract (the “Maximum Payout Amount”) and deliver/(take delivery of) the referenced obligation or (ii) receive/(pay) a net settlement amount in the form of cash or securities equal to the notional amount of the swap less the recovery value of the referenced obligation.
Credit default swaps may involve greater risks than if a Portfolio had invested in the referenced obligation directly. Credit default swaps are subject to general market risk, liquidity risk, counterparty risk and credit risk. If the Portfolio is a buyer of protection and no credit event occurs, it will lose its investment. If the Portfolio is a seller of protection and a credit event occurs, the value of the referenced obligation received by the Portfolio coupled with the periodic payments previously received, may be less than the Maximum Payout Amount it pays to the buyer, resulting in a net loss to the Portfolio.
Implied credit spreads utilized in determining the market value of credit default swaps on issuers as of period end are disclosed in the portfolio of investments. The implied spreads serve as an indicator of the current status of the payment/ performance risk and typically reflect the likelihood of default by the issuer of the referenced obligation. The implied credit spread of a particular reference obligation also reflects the cost of buying/selling protection and may include upfront payments required to be made to enter into the agreement. Widening credit spreads and, with respect to buy contracts, increasing market values, in absolute terms when compared to the notional amount of the swap, typically represent a deterioration of the referenced obligation’s credit soundness and greater likelihood of default or other credit event occurring as defined under the terms of the agreement. A credit spread identified as “Defaulted” indicates a credit event has occurred for the referenced obligation.
In certain circumstances Maximum Payout Amounts may be partially offset by recovery values of the respective referenced obligations, upfront premium received upon entering into the agreement, or net amounts received from settlement of buy protection credit default swap agreements entered into by the Portfolio for the same reference obligation with the same counterparty.
Documentation governing the Portfolios’ swap transactions may contain provisions for early termination of a swap in the event the net assets of the Portfolio declines below specific levels set forth in the documentation (“net asset contingent features”). If these levels are triggered, the Portfolios’ counterparty has the right to terminate the swap and require the Portfolio to pay or receive a settlement amount in connection with the terminated swap transaction. As of February 28, 2010, the High-Yield Portfolio had credit default swap contracts in liability positions with net asset contingent features. The fair value of such contracts amounted to $321,895 at February 28, 2010.
| 170 | • ALLIANCEBERNSTEIN POOLING PORTFOLIOS |
Notes to Financial Statements
At February 28, 2010, the Portfolios have entered into the following derivatives:
Global Real Estate | Asset Derivatives | Liability Derivatives | ||||||||
| Derivatives Not Accounted for as Hedging Instruments | Statement of Assets and Liabilities Location | Fair Value | Statement of Assets and Liabilities Location | Fair Value | ||||||
Foreign exchange contracts | Unrealized appreciation of forward currency exchange contracts | $ | 4,705,209 | Unrealized depreciation of forward currency exchange contracts | $ | 6,225,986 | ||||
Total | $ | 4,705,209 | $ | 6,225,986 | ||||||
The effect of derivative instruments on the statement of operations for the six months ended February 28, 2010:
| Derivatives Not Accounted for as Hedging Instruments | Location of Gain or (Loss) on Derivatives | Realized Gain or (Loss) on Derivatives | Change in Unrealized Appreciation or (Depreciation) | |||||
Foreign exchange contracts | Net realized gain/(loss) on foreign currency transactions; Net change in unrealized appreciation/ depreciation of foreign currency denominated assets and liabilities | $ | 7,716,246 | $ (3,288,064 | ) | |||
Total | $ | 7,716,246 | $ (3,288,064 | ) | ||||
For the six months ended February 28, 2010, the average monthly principal amount of foreign currency exchange contracts was $247,512,596.
| ALLIANCEBERNSTEIN POOLING PORTFOLIOS • | 171 |
Notes to Financial Statements
International Value | Asset Derivatives | Liability Derivatives | |||||||||
| Derivatives Not Accounted for as Hedging Instruments | Statement of Assets and Liabilities Location | Fair Value | Statement of Assets and Liabilities Location | Fair Value | |||||||
Foreign exchange contracts | Unrealized | $ | 4,604,087 | Unrealized depreciation of forward currency exchange contracts | $ | 436,992 |
| ||||
Equity contracts | Payable for variation margin on futures contracts | 265,779 | * | ||||||||
Total | $ | 4,604,087 | $ | 702,771 | |||||||
| * | Only variation margin receivable/payable at period end is reported within the statement of assets and liabilities. Cumulative appreciation/(depreciation) of futures contracts is reported in the portfolio of investments. |
The effect of derivative instruments on the statement of operations for the six months ended February 28, 2010:
| Derivatives Not Accounted for as Hedging Instruments | Location of Gain or (Loss) on Derivatives | Realized Gain or (Loss) on Derivatives | Change in Unrealized Appreciation or (Depreciation) | ||||||
Foreign exchange contracts | Net realized gain/(loss) on foreign currency transactions; Net change in unrealized appreciation/ depreciation of foreign currency denominated assets and liabilities | $ | 11,557,744 | $ | 2,388,027 | ||||
Equity contracts | Net realized gain (loss) on futures contracts; Net change in unrealized appreciation/ depreciation of futures contracts | 739,202 | (910,411 | ) | |||||
Total | $ | 12,296,946 | $ | 1,477,616 | |||||
| 172 | • ALLIANCEBERNSTEIN POOLING PORTFOLIOS |
Notes to Financial Statements
For the six months ended February 28, 2010, the average monthly principal amount of foreign currency exchange contracts was $697,884,530 and average monthly original value of futures contracts was $14,480,672.
International | Asset Derivatives | Liability Derivatives | ||||||||
| Derivatives Not Accounted for as Hedging Instruments | Statement of Assets and Liabilities Location | Fair Value | Statement of Assets and Liabilities Location | Fair Value | ||||||
Foreign exchange contracts | Unrealized | $ | 23,203,787 | Unrealized | $ | 15,271,677 | ||||
Total | $ | 23,203,787 | $ | 15,271,677 | ||||||
The effect of derivative instruments on the statement of operations for the six months ended February 28, 2010:
| Derivatives Not Accounted for as Hedging Instruments | Location of Gain or (Loss) on Derivatives | Realized Gain or (Loss) on Derivatives | Change in Unrealized Appreciation or (Depreciation) | ||||||
Foreign exchange contracts | Net realized gain/(loss) on foreign currency transactions; Net change in unrealized appreciation/ depreciation of foreign currency denominated assets and liabilities | $ | 19,570,303 | $ | (2,827,834 | ) | |||
Total | $ | 19,570,303 | $ | (2,827,834 | ) | ||||
For the six months ended February 28, 2010, the average monthly principal amount of foreign currency exchange contracts was $791,164,101.
| ALLIANCEBERNSTEIN POOLING PORTFOLIOS • | 173 |
Notes to Financial Statements
Short Duration Bond Portfolio | Asset Derivatives | Liability Derivatives | ||||||||
| Derivatives Not Accounted for as Hedging Instruments | Statement of Assets and Liabilities Location | Fair Value | Statement of Assets and Liabilities Location | Fair Value | ||||||
Interest rate contracts | Payable for variation margin on futures contracts | $ | 1,201,673 | * | ||||||
Total | $ | 1,201,673 | ||||||||
| * | Only variation margin receivable/payable at period end is reported within the statement of assets and liabilities. Cumulative appreciation/(depreciation) of futures contracts is reported in the portfolio of investments. |
The effect of derivative instruments on the statement of operations for the six months ended February 28, 2010:
| Derivatives Not Accounted for as Hedging Instruments | Location of Gain or (Loss) on Derivatives | Realized Gain or (Loss) on Derivatives | Change in Unrealized Appreciation or (Depreciation) | |||||||
Interest rate contracts | Net realized gain (loss) on futures contracts; Net change in unrealized appreciation/ depreciation of futures contracts. | $ | (451,176 | ) | $ | (700,400 | ) | |||
Total | $ | (451,176 | ) | $ | (700,400 | ) | ||||
For the six months ended February 28, 2010, the average monthly original value of futures contracts was $332,527,156.
| 174 | • ALLIANCEBERNSTEIN POOLING PORTFOLIOS |
Notes to Financial Statements
Intermediate Duration | Asset Derivatives | Liability Derivatives | |||||||
| Derivatives Not Accounted for as Hedging Instruments | Statement of Assets and Liabilities Location | Fair Value | Statement of Assets and Liabilities Location | Fair Value | |||||
Foreign exchange contracts | Unrealized appreciation of forward currency exchange contracts | $ | 164,796 | ||||||
Interest rate contracts | Unrealized appreciation on interest rate swap contracts | 820,957 | |||||||
Total | $ | 985,753 | |||||||
The effect of derivative instruments on the statement of operations for the six months ended February 28, 2010:
| Derivatives Not Accounted for as Hedging Instruments | Location of Gain or (Loss) on Derivatives | Realized Gain or (Loss) on Derivatives | Change in Unrealized Appreciation or (Depreciation) | ||||||
Foreign exchange contracts | Net realized gain (loss) on foreign currency transactions; Net change in unrealized appreciation/ depreciation of foreign currency denominated assets and liabilities | $ | (1,250,408 | ) | $ | 580,555 | |||
Interest rate contracts | Net realized gain (loss) on swap contracts; Net change in unrealized appreciation/ depreciation of swap contracts | 178,403 | 141,011 | ||||||
Total | $ | (1,072,005 | ) | $ | 721,566 | ||||
For the six months ended February 28, 2010, the average monthly principal amount of foreign currency exchange contracts was $32,985,762 and average monthly notional amount of interest rate swaps was $11,500,000.
| ALLIANCEBERNSTEIN POOLING PORTFOLIOS • | 175 |
Notes to Financial Statements
High-Yield Portfolio | Asset Derivatives | Liability Derivatives | ||||||||
| Derivatives Not Accounted for as Hedging Instruments | Statement of Assets and Liabilities Location | Fair Value | Statement of Assets and Liabilities Location | Fair Value | ||||||
Foreign exchange contracts | Unrealized appreciation of forward currency exchange contracts | $ | 572,579 | |||||||
Credit contracts | Unrealized depreciation on credit default swap contracts | $ | 321,895 | |||||||
Total | $ | 572,579 | $ | 321,895 | ||||||
The effect of derivative instruments on the statement of operations for the six months ended February 28, 2010:
| Derivatives Not Accounted for as Hedging Instruments | Location of Gain (Loss) on Derivatives | Realized Gain or (Loss) on Derivatives | Change in Unrealized Appreciation or (Depreciation) | |||||||
Foreign exchange contracts | Net realized gain/(loss) on foreign currency transactions; Net change in unrealized appreciation/ depreciation of foreign currency denominated assets and liabilities | $ | (55,814 | ) | $ | 966,387 | ||||
Equity contracts | Net realized gain/(loss) on investments; Net change in unrealized appreciation/ depreciation of investments | (2,444,734 | ) | (510,170 | ) | |||||
| 176 | • ALLIANCEBERNSTEIN POOLING PORTFOLIOS |
Notes to Financial Statements
| Derivatives Not Accounted for as Hedging Instruments | Location of Gain (Loss) on Derivatives | Realized Gain or (Loss) on Derivatives | Change in Unrealized Appreciation or (Depreciation) | |||||||
Credit contracts | Net realized gain/(loss) on swap contracts; Net change in unrealized appreciation/ depreciation of swap contracts | (72,926 | ) | (124,103 | ) | |||||
Total | $ | (2,573,474 | ) | $ | 332,114 | |||||
For the six months ended February 28, 2010, the average monthly principal amount of foreign currency exchange contracts was $22,341,938, average monthly notional amount of options contracts was $776,496 and average monthly notional amount of credit default swaps was $2,885,000.
2. Currency Transactions
The Portfolio may invest in non-U.S. Dollar securities on a currency hedged or unhedged basis. The Portfolio may seek investment opportunities by taking long or short positions in currencies through the use of currency-related derivatives, including forward currency exchange contracts, futures and options on futures, swaps, and options. The Portfolio may enter into transactions for investment opportunities when it anticipates that a foreign currency will appreciate or depreciate in value but securities denominated in that currency are not held by the Portfolio and do not present attractive investment opportunities. Such transactions may also be used when the Adviser believes that it may be more efficient than a direct investment in a foreign currency-denominated security. The Portfolio may also conduct currency exchange contracts on a spot basis (i.e., for cash at the spot rate prevailing in the currency exchange market for buying or selling currencies).
3. Dollar Rolls
Certain Portfolios may enter into dollar rolls. Dollar rolls involve sales by the Portfolio of securities for delivery in the current month and the Portfolio’s simultaneously contracting to repurchase substantially similar (same type and coupon) securities on a specified future date. During the roll period, the Portfolio forgoes principal and interest paid on the securities. The Portfolio is compensated by the difference between the current sales price and the lower forward price for the future purchase (often referred to as the “drop”) as well as by the interest earned on the cash proceeds of the initial sale. Dollar rolls involve the risk that the market value of the securities the Portfolio is obligated to repurchase under the agreement may decline below the repurchase price. Dollar rolls are speculative techniques and may be considered to be borrowings by the Portfolio. For the six months ended February 28, 2010, the Intermediate
| ALLIANCEBERNSTEIN POOLING PORTFOLIOS • | 177 |
Notes to Financial Statements
Duration Bond Portfolio earned drop income of $302,672, which is included in interest income in the accompanying statement of operations.
4. Reverse Repurchase Agreements
Under a reverse repurchase agreement, the Portfolios sell securities and agree to repurchase them at a mutually agreed upon date and price. At the time the Portfolios enter into a reverse repurchase agreement, it will establish a segregated account with the custodian containing liquid assets having a value at least equal to the repurchase price.
For the six months ended February 28, 2010, the average amount of reverse repurchase agreements outstanding for Short Duration Bond Portfolio was $40,056,164 and the daily weighted average interest rate was 0.01%. During the period, the Portfolio received net interest payment from counterparties.
5. Term Asset-Backed Securities Loan Facility
Certain Portfolios participate in the TALF program. Under the TALF program eligible borrowers may obtain a non-recourse loan from the Federal Reserve Bank of New York (“FRBNY”) by posting certain asset-backed securities and commercial mortgage-backed securities (“Eligible Securities”) as collateral. The transfer of the collateral is not recorded as a sale on a Portfolio’s records. The Portfolio agrees to repay the non-recourse loan amount plus accrued interest under the terms of the loan, with the principal balance being due at loan maturity. According to the terms of the TALF program, a Portfolio is not required to pledge further collateral should the value of the Eligible Securities transferred as collateral fall below the loan amount. The loan is prepayable in whole or in part at any time at the Portfolio’s option. Prepayments of principal received on the collateral during the loan term must be used to immediately reduce proportionately the loan balance outstanding. At the time of loan approval, the Portfolio pays a one time administration fee based upon the amount borrowed to the FRBNY.
Borrowing under TALF, as with the extension of other types of credit, subjects a Portfolio to certain risks, including possible delays in recovery of securities posted as collateral or possible loss of rights in collateral should a Portfolio be unable to repay a loan. Additionally, there is the risk that the expense associated with the TALF loan, including interest expense, may be greater than the income earned from the investment of the proceeds and/or the interest earned on the collateral to which a Portfolio remains entitled. Under the TALF program, interest earned on collateral will be used to pay interest expense associated with a loan. Should the interest earned exceed the interest expense on any given payment date, the remainder may be applied to the principal balance. Conversely, should the interest earned on the collateral be in shortfall of the interest expense due at any given payment date, the Portfolio will be required to expend cash for the difference in order to meet its obligation. Interest on the TALF loan is
| 178 | • ALLIANCEBERNSTEIN POOLING PORTFOLIOS |
Notes to Financial Statements
measured based on a predetermined rate on the loan origination date and is reported on the statement of operations as interest expense.
For the six months ended February 28, 2010, the following Portfolios participated in the TALF program:
| Portfolio | Average Borrowing | Weighted Average Interest Rate | ||||
Short Duration Bond | $ | 90,513,598 | 1.91 | % | ||
Intermediate Duration Bond | 99,016,012 | 2.54 | ||||
NOTE D
Shares of Beneficial Interest
Transactions in shares of beneficial interest for each class were as follows:
| Shares | Amount | |||||||||||||||||
| Six Months Ended February 28, 2010 (unaudited) | Year Ended August 31, 2009 | Six Months Ended February 28, 2010 (unaudited) | Year Ended August 31, 2009 | |||||||||||||||
| Portfolio U.S. Value | ||||||||||||||||||
Shares sold | 3,792,962 | 38,234,423 | $ | 28,769,556 | $ | 225,115,627 | ||||||||||||
Shares issued in reinvestment of dividends and distributions | 3,615,829 | 9,917,433 | 27,091,719 | 64,468,390 | ||||||||||||||
Shares redeemed | (14,066,367 | ) | (30,310,530 | ) | (107,898,734 | ) | (203,362,203 | ) | ||||||||||
Net increase (decrease) | (6,657,576 | ) | 17,841,326 | $ | (52,037,459 | ) | $ | 86,221,814 | ||||||||||
| U.S. Large Cap Growth | ||||||||||||||||||
Shares sold | 4,390,699 | 23,973,439 | $ | 43,398,857 | $ | 190,235,878 | ||||||||||||
Shares issued in reinvestment of dividends | 1,294,168 | 2,996,008 | 12,634,516 | 23,934,284 | ||||||||||||||
Shares redeemed | (10,570,115 | ) | (30,787,155 | ) | (105,444,784 | ) | (238,832,888 | ) | ||||||||||
Net decrease | (4,885,248 | ) | (3,817,708 | ) | $ | (49,411,411 | ) | $ | (24,662,726 | ) | ||||||||
| Global Real Estate Investment | ||||||||||||||||||
Shares sold | 1,953,653 | 28,730,928 | $ | 15,935,090 | $ | 159,119,750 | ||||||||||||
Shares issued in reinvestment of dividends | 1,367,174 | 619,710 | 11,443,247 | 5,812,875 | ||||||||||||||
Shares redeemed | (8,926,356 | ) | (18,309,025 | ) | (73,349,376 | ) | (125,901,542 | ) | ||||||||||
Net increase (decrease) | (5,605,529 | ) | 11,041,613 | $ | (45,971,039 | ) | $ | 39,031,083 | ||||||||||
| ALLIANCEBERNSTEIN POOLING PORTFOLIOS • | 179 |
Notes to Financial Statements
| Shares | Amount | |||||||||||||||||
| Six Months Ended February 28, 2010 (unaudited) | Year Ended August 31, 2009 | Six Months Ended February 28, 2010 (unaudited) | Year Ended August 31, 2009 | |||||||||||||||
| International Value | ||||||||||||||||||
Shares sold | 5,238,315 | 35,481,511 | $ | 40,167,349 | $ | 214,726,719 | ||||||||||||
Shares issued in reinvestment of dividends and distributions | 521,601 | 13,140,207 | 4,011,109 | 76,744,799 | ||||||||||||||
Shares redeemed | (9,666,303 | ) | (16,688,918 | ) | (76,185,445 | ) | (111,934,383 | ) | ||||||||||
Net increase (decrease) | (3,906,387 | ) | 31,932,800 | $ | (32,006,987 | ) | $ | 179,537,135 | ||||||||||
| International Growth | ||||||||||||||||||
Shares sold | 3,928,693 | 20,795,752 | $ | 33,042,952 | $ | 152,752,270 | ||||||||||||
Shares issued in reinvestment of dividends and distributions | 3,386,178 | 4,462,455 | 30,093,357 | 33,382,496 | ||||||||||||||
Shares redeemed | (8,349,425 | ) | (3,051,503 | ) | (74,606,871 | ) | (20,971,938 | ) | ||||||||||
Net increase (decrease) | (1,034,554 | ) | 22,206,704 | $ | (11,470,562 | ) | $ | 165,162,828 | ||||||||||
| Small-Mid Cap Value | ||||||||||||||||||
Shares sold | 527,275 | 6,990,983 | $ | 4,536,956 | $ | 42,970,323 | ||||||||||||
Shares issued in reinvestment of dividends and distributions | 269,795 | 9,254,225 | 2,249,173 | 55,876,208 | ||||||||||||||
Shares redeemed | (8,144,058 | ) | (9,251,605 | ) | (74,212,371 | ) | (73,076,035 | ) | ||||||||||
Net increase (decrease) | (7,346,988 | ) | 6,993,603 | $ | (67,426,242 | ) | $ | 25,770,496 | ||||||||||
| Small-Mid Cap Growth | ||||||||||||||||||
Shares sold | 917,893 | 4,686,797 | $ | 9,728,776 | $ | 38,612,519 | ||||||||||||
Shares issued in reinvestment of dividends | 56,643 | 254,056 | 591,916 | 2,218,697 | ||||||||||||||
Shares redeemed | (3,890,380 | ) | (5,463,270 | ) | (43,187,150 | ) | (46,034,464 | ) | ||||||||||
Net decrease | (2,915,844 | ) | (522,417 | ) | $ | (32,866,458 | ) | $ | (5,203,248 | ) | ||||||||
| 180 | • ALLIANCEBERNSTEIN POOLING PORTFOLIOS |
Notes to Financial Statements
| Shares | Amount | |||||||||||||||||
| Six Months Ended February 28, 2010 (unaudited) | Year Ended August 31, 2009 | Six Months Ended February 28, 2010 (unaudited) | Year Ended August 31, 2009 | |||||||||||||||
| Short Duration Bond | ||||||||||||||||||
Shares sold | 8,892,396 | 17,436,541 | $ | 83,109,513 | $ | 159,135,598 | ||||||||||||
Shares issued in reinvestment of dividends | 1,923,785 | 4,885,703 | 17,943,826 | 44,230,027 | ||||||||||||||
Shares redeemed | (2,768,903 | ) | (41,237,256 | ) | (26,062,339 | ) | (374,319,265 | ) | ||||||||||
Net increase (decrease) | 8,047,278 | (18,915,012 | ) | $ | 74,991,000 | $ | (170,953,640 | ) | ||||||||||
| Intermediate Duration Bond | ||||||||||||||||||
Shares sold | 7,446,187 | 12,154,341 | $ | 75,666,251 | $ | 117,446,877 | ||||||||||||
Shares issued in reinvestment of dividends | 3,097,416 | 8,129,848 | 31,354,683 | 74,748,745 | ||||||||||||||
Shares redeemed | (5,186,859 | ) | (62,459,613 | ) | (53,136,325 | ) | (569,421,077 | ) | ||||||||||
Net increase (decrease) | 5,356,744 | (42,175,424 | ) | $ | 53,884,609 | $ | (377,225,455 | ) | ||||||||||
| Inflation Protected Securities | ||||||||||||||||||
Shares sold | 4,887,585 | 8,130,275 | $ | 49,941,174 | $ | 79,826,662 | ||||||||||||
Shares issued in reinvestment of dividends | 762,532 | 4,276,713 | 7,815,953 | 38,875,317 | ||||||||||||||
Shares redeemed | (1,485,515 | ) | (17,435,441 | ) | (15,299,015 | ) | (166,871,275 | ) | ||||||||||
Net increase (decrease) | 4,164,602 | (5,028,453 | ) | $ | 42,458,112 | $ | (48,169,296 | ) | ||||||||||
| High-Yield | ||||||||||||||||||
Shares sold | 1,142,458 | 2,778,264 | $ | 10,644,248 | $ | 19,994,772 | ||||||||||||
Shares issued in reinvestment of dividends | 2,596,842 | 6,535,590 | 23,511,559 | 45,605,929 | ||||||||||||||
Shares redeemed | (6,894,175 | ) | (14,234,189 | ) | (64,508,113 | ) | (101,381,309 | ) | ||||||||||
Net decrease | (3,154,875 | ) | (4,920,335 | ) | $ | (30,352,306 | ) | $ | (35,780,608 | ) | ||||||||
| ALLIANCEBERNSTEIN POOLING PORTFOLIOS • | 181 |
Notes to Financial Statements
Commencement of Offering
The Portfolios commenced offering on May 20, 2005 through the investments of cash and securities received in a tax free in-kind contributions from AllianceBernstein Wealth Appreciation Strategy, AllianceBernstein Balanced Wealth Strategy, AllianceBernstein Wealth Preservation Strategy and AllianceBernstein Blended Style Series—U.S. Large Cap Portfolio (“U.S. Large Cap Fund”). Prior to commencement of operations on May 20, 2005, the Trust had no operations other than the sale to the Adviser on April 15, 2005 of 10,000 shares for $10 each of the AllianceBernstein Small-Mid Cap Growth Portfolio.
NOTE E
Risks Involved in Investing in the Portfolios
Interest Rate Risk and Credit Risk—Interest rate risk is the risk that changes in interest rates will affect the value of the Portfolios’ investments in fixed-income debt securities such as bonds or notes. Increases in interest rates may cause the value of the Portfolios’ investments to decline. Credit risk is the risk that the issuer or guarantor of a debt security, or the counterparty to a derivative contract, will be unable or unwilling to make timely principal and/or interest payments, or to otherwise honor its obligations. The degree of risk for a particular security may be reflected in its credit risk rating. Credit risk is greater for medium quality and lower-rated securities. Lower-rated debt securities and similar unrated securities (commonly known as “junk bonds”) have speculative elements or are predominantly speculative risks.
During the year ended December 31, 2008, the Intermediate Duration Bond Portfolio had swap counterparty exposure to Lehman Brothers Holdings Inc. (“Lehman Brothers”), as a guarantor for Lehman Brothers Special Financing Inc. (“LSBF”), which filed for bankruptcy on September 15, 2008. As a result, on September 15, 2008, the Portfolio terminated all outstanding swap contracts with LSBF prior to their scheduled maturity dates in accordance with the terms of the swap agreements. Upon the termination of the swap contracts, Lehman Brothers’ obligations to the Portfolio amounted to $2,015,576. The Portfolio’s claim to these obligations subject to the pending bankruptcy proceeding against the Lehman Brothers estate (the “Bankruptcy Claim”). As of February 28, 2010, the Bankruptcy Claim, based upon the estimated recovery value, was being valued at $574,439 (28.50% of the Bankruptcy Claim). The estimated recovery value may change over time. The Adviser has agreed to make the Portfolio whole in respect of the amount of the recovery that would be paid on the Bankruptcy Claim in the event the Bankruptcy Claim is not honored by the Lehman Brothers estate, or with respect to any diminution in value upon the sale of the Bankruptcy Claim, in either case resulting from the manner in which the Bankruptcy Claim was processed by the Adviser.
Foreign Securities Risk—Investing in securities of foreign companies or foreign governments involves special risks which include changes in foreign currency exchange rates and the possibility of future political and economic developments
| 182 | • ALLIANCEBERNSTEIN POOLING PORTFOLIOS |
Notes to Financial Statements
which could adversely affect the value of such securities. Moreover, securities of many foreign companies or foreign governments and their markets may be less liquid and their prices more volatile than those of comparable U.S. companies or of the U.S. government.
Concentration of Risk—Although the Global Real Estate Investment Portfolio does not invest directly in real estate, it invests primarily in real estate equity securities and has a policy of concentration of its investments in the real estate industry. Therefore, an investment in the Portfolio is subject to certain risks associated with the direct ownership of real estate and with the real estate industry in general. To the extent that assets underlying the Portfolio’s investments are concentrated geographically, by property type or in certain other respects, the Portfolio may be subject to additional risks.
In addition, investing in Real Estate Investment Trusts (“REITs”) involves certain unique risks in addition to those risks associated with investing in the real estate industry in general. REITs are dependent upon management skills, are not diversified, and are subject to heavy cash flow dependency, default by borrowers and self-liquidation. REITs are also subject to the possibilities of failing to qualify for tax-free pass-through of income under the Code and failing to maintain their exemptions from registration under the 1940 Act. REITs (especially mortgage REITs) also are subject to interest rate risks.
Currency Risk—This is the risk that changes in foreign currency exchange rates may negatively affect the value of the Portfolios’ investments or reduce the returns of the Portfolio. For example, the value of the Portfolios’ investments in foreign currency-denominated securities or currencies may decrease if the U.S. Dollar is strong (i.e., gaining value relative to other currencies) and other currencies are weak (i.e., losing value relative to the U.S. Dollar). Currency markets are generally not as regulated as securities markets. Independent of the Portfolios’ investments denominated in foreign currencies, the Portfolios’ positions in various foreign currencies may cause the Portfolio to experience investment losses due to the changes in exchange rates and interest rates.
Derivatives Risk—The Portfolios may invest in derivatives such as forwards, options, futures and swaps. These investments may be illiquid, difficult to price, and leveraged so that small changes may produce disproportionate losses for the Portfolios, and subject to counterparty risk to a greater degree than more traditional investments.
Indemnification Risk—In the ordinary course of business, the Portfolios enter into contracts that contain a variety of indemnifications. The Portfolio’s maximum exposure under these arrangements is unknown. However, the Portfolios have not had prior claims or losses pursuant to these indemnification provisions and expect the risk of loss thereunder to be remote. As such, the Portfolios have not accrued any liability in connection with these indemnification provisions.
| ALLIANCEBERNSTEIN POOLING PORTFOLIOS • | 183 |
Notes to Financial Statements
NOTE F
Distributions to Shareholders
The tax character of distributions to be paid for the year ending August 31, 2010 will be determined at the end of the current fiscal year. The tax character of distributions paid during the fiscal years ended August 31, 2009 and August 31, 2008 were as follows:
| U.S. Value | 2009 | 2008 | |||||
Distributions paid from: | |||||||
Ordinary income | $ | 64,468,391 | $ | 98,553,381 | |||
Long-term capital gains | – 0 | – | 71,911,154 | ||||
Total distributions paid | $ | 64,468,391 | $ | 170,464,535 | |||
| U.S. Large Cap Growth | 2009 | 2008 | |||||
Distributions paid from: | |||||||
Ordinary income | $ | 23,934,284 | $ | 22,290,034 | |||
Long-term capital gains | – 0 | – | 72,783,508 | ||||
Total distributions paid | $ | 23,934,284 | $ | 95,073,542 | |||
| Global Real Estate Investment | 2009 | 2008 | |||||
Distributions paid from: | |||||||
Ordinary income | $ | 5,812,875 | $ | 135,605,856 | |||
Long-term capital gains | – 0 | – | 82,778,974 | ||||
Total distributions paid | $ | 5,812,875 | $ | 218,384,830 | |||
| International Value | 2009 | 2008 | |||||
Distributions paid from: | |||||||
Ordinary income | $ | 29,492,020 | $ | 54,038,034 | |||
Long-term capital gains | 47,252,778 | 116,678,554 | |||||
Total distributions paid | $ | 76,744,798 | $ | 170,716,588 | |||
| International Growth | 2009 | 2008 | |||||
Distributions paid from: | |||||||
Ordinary income | $ | 33,227,507 | $ | 38,160,575 | |||
Long-term capital gains | 154,989 | 77,521,675 | |||||
Total distributions paid | $ | 33,382,496 | $ | 115,682,250 | |||
| Small-Mid Cap Value | 2009 | 2008 | |||||
Distributions paid from: | |||||||
Ordinary income | $ | 16,449,359 | $ | 23,957,109 | |||
Long-term capital gains | 39,426,848 | 22,345,851 | |||||
Total distributions paid | $ | 55,876,207 | $ | 46,302,960 | |||
| 184 | • ALLIANCEBERNSTEIN POOLING PORTFOLIOS |
Notes to Financial Statements
| Small-Mid Cap Growth | 2009 | 2008 | ||||||
Distributions paid from: | ||||||||
Ordinary income | $ | 2,218,697 | $ | 5,216,643 | ||||
Long-term capital gains | – 0 | – | 62,756,744 | |||||
Total distributions paid | $ | 2,218,697 | $ | 67,973,387 | ||||
| Short Duration Bond | 2009 | 2008 | ||||||
Distributions paid from: | ||||||||
Ordinary income | $ | 44,230,027 | $ | 63,330,431 | ||||
Long-term capital gains | – 0 | – | – 0 | – | ||||
Total distributions paid | $ | 44,230,027 | $ | 63,330,431 | ||||
| Intermediate Duration Bond | 2009 | 2008 | ||||||
Distributions paid from: | ||||||||
Ordinary income | $ | 74,748,745 | $ | 85,510,435 | ||||
Long-term capital gains | – 0 | – | 2,300,936 | |||||
Total distributions paid | $ | 74,748,745 | $ | 87,811,371 | ||||
| Inflation Protected Securities | 2009 | 2008 | ||||||
Distributions paid from: | ||||||||
Ordinary income | $ | 38,875,317 | $ | 29,900,723 | ||||
Long-term capital gains | – 0 | – | – 0 | – | ||||
Total distributions paid | $ | 38,875,317 | $ | 29,900,723 | ||||
| High-Yield | 2009 | 2008 | ||||||
Distributions paid from: | ||||||||
Ordinary income | $ | 45,605,929 | $ | 42,186,325 | ||||
Long-term capital gains | – 0 | – | – 0 | – | ||||
Total distributions paid | $ | 45,605,929 | $ | 42,186,325 | ||||
| ALLIANCEBERNSTEIN POOLING PORTFOLIOS • | 185 |
Notes to Financial Statements
As of August 31, 2009, the components of accumulated earnings/(deficit) on a tax basis were as follows:
| Portfolio | Undistributed Ordinary Income | Undistributed Long-Term Gains | Accumulated Capital and Other Gains (Losses)(c) | Unrealized Appreciation/ (Depreciation)(a) | Total Accumulated Earnings/ (Deficit)(b) | |||||||||||||||
U.S. Value | $ | 9,802,969 | $ | – 0 | – | $ | (870,227,174 | ) | $ | (53,294,630 | ) | $ | (913,718,835 | ) | ||||||
U.S. Large Cap Growth | 4,272,140 | – 0 | – | (593,725,438 | ) | 203,965,076 | (385,488,222 | ) | ||||||||||||
Global Real Estate Investment | 28,033,736 | – 0 | – | (446,055,657 | ) | 13,833,859 | (404,188,062 | ) | ||||||||||||
International Value | – 0 | – | – 0 | – | (369,667,503 | ) | (47,706,418 | ) | (417,373,921 | ) | ||||||||||
International Growth | 16,410,803 | – 0 | – | (457,063,707 | ) | 72,767,431 | (367,885,473 | ) | ||||||||||||
Small-Mid Cap Value | 2,228,806 | – 0 | – | (145,663,389 | ) | (14,409,009 | ) | (157,843,592 | ) | |||||||||||
Small-Mid Cap Growth | 411,661 | – 0 | – | (149,310,603 | ) | 58,787,992 | (90,110,950 | ) | ||||||||||||
Short Duration Bond | 3,135,547 | – 0 | – | (38,233,894 | ) | (66,941,242 | ) | (102,039,589 | ) | |||||||||||
Intermediate Duration Bond | 4,821,094 | – 0 | – | (21,775,999 | ) | (21,243,196 | ) | (38,198,101 | ) | |||||||||||
Inflation Protected Securities | 8,501,629 | – 0 | – | (4,113,419 | ) | 4,197,324 | 8,585,534 | |||||||||||||
High-Yield | 5,889,284 | – 0 | – | (64,941,345 | ) | (43,439,774 | ) | (102,491,835 | ) | |||||||||||
| (a) | The difference between book-basis and tax-basis unrealized appreciation/(depreciation) is attributable primarily to the tax deferral of losses on wash sales, mark to market on passive foreign investment companies, mark to market on forward contracts, futures contracts, partnership investments, interest writeoffs and accruals on defaulted securities, straddle loss deferrals, deferral of losses based on deflationary adjustments in excess of cumulative earned income, bond premium amortization, reclassification of distributions from investments in real estate investment trusts, return of capital distributions, book to tax differences on writedowns of interest, swaps, and swap income (loss) accruals. |
| (b) | The difference between book-basis and tax-basis components of accumulated earnings (deficit) is attributable primarily to deferral of post October capital or currency losses. |
| (c) | On August 31, 2009, the U.S. Value, U.S. Large Cap Growth, International Value, International Growth, Small-Mid Cap Value, Small-Mid Cap Growth, Short Duration Bond, Intermediate Duration Bond, Inflation Protected Securities, High-Yield, and Global Real Estate Investment Trust Portfolios had a net capital loss carryforward of $205,162,139, $308,459,282, $53,057,306, $107,784,754, $25,737,293, $57,834,299, $25,157,022, $12,485,361, $1,774,101, $18,010,233, and $97,002,480 respectively, of which $205,162,139 expires in the year 2017 for the U.S. Value Portfolio, $308,459,282 expires in the year 2017 for the U.S. Large Cap Growth Portfolio, $53,057,306 expires in the year 2017 for International Value Portfolio, $107,784,754 expires in the year 2017 for International Growth Portfolio, $25,737,293 expires in the year 2017 for Small-Mid Cap Value, $1,225,905 expires in the year 2016 and $56,608,394 expires in the year 2017 for Small-Mid Cap Growth, $529,195 expires in the year 2014, $3,562,331 expires in the year 2015, $1,756,801 expires in the year 2016, $19,308,695 expires in the year 2017 for the Short Duration Portfolio, $12,485,361 expires in the year 2017 for Intermediate Duration Bond Portfolio, $98,445 expires in the year 2015 and $1,675,656 expires in the year 2017 for the Inflation Protected Securities Portfolio, $1,561,339 expires in the year 2015, $1,152,926 expires in the year 2016 and $15,295,968 expires in the year 2017 for the High-Yield Portfolio, $97,002,480 expires in the year 2017 for Global Real Estate |
| 186 | • ALLIANCEBERNSTEIN POOLING PORTFOLIOS |
Notes to Financial Statements
| Investment Trust. To the extent future gains are offset by capital loss carryforward, such gains will not be distributed. Net capital loss, currency and PFIC losses incurred after October 31, and within the taxable year are deemed arise on the first business day of the Portfolio’s next taxable year. U.S. Value, U.S. Large Cap Growth, International Value, International Growth, Small-Mid Cap Value, Small-Mid Cap Growth, Short Duration Bond, Intermediate Duration Bond, Inflation Protected Securities, High-Yield, and Global Real Estate Investment Trust elect to defer $665,065,035, $285,266,156, $309,567,121, $349,278,956, $119,926,096, $91,476,304, $13,076,872, $9,290,638, $2,339,318, and $349,053,179 of capital losses that are deemed to arise in the next taxable year. International Value also defers $7,043,076 of Currency losses. Intermediate Duration Bond Portfolio deferred $476,618 in straddle losses. |
NOTE G
Legal Proceedings
On October 2, 2003, a purported class action complaint entitled Hindo, et al. v. AllianceBernstein Growth & Income Fund, et al. (“Hindo Complaint”) was filed against the Adviser, Alliance Capital Management Holding L.P. (“Alliance Holding”), Alliance Capital Management Corporation, AXA Financial, Inc., the AllianceBernstein Funds, certain officers of the Adviser (“AllianceBernstein defendants”), and certain other unaffiliated defendants, as well as unnamed Doe defendants. The Hindo Complaint was filed in the United States District Court for the Southern District of New York by alleged shareholders of two of the AllianceBernstein Funds. The Hindo Complaint alleges that certain of the AllianceBernstein defendants failed to disclose that they improperly allowed certain hedge funds and other unidentified parties to engage in “late trading” and “market timing” of AllianceBernstein Fund securities, violating Sections 11 and 15 of the Securities Act, Sections 10(b) and 20(a) of the Exchange Act and Sections 206 and 215 of the Advisers Act. Plaintiffs seek an unspecified amount of compensatory damages and rescission of their contracts with the Adviser, including recovery of all fees paid to the Adviser pursuant to such contracts.
Following October 2, 2003, 43 additional lawsuits making factual allegations generally similar to those in the Hindo Complaint were filed in various federal and state courts against the Adviser and certain other defendants. On September 29, 2004, plaintiffs filed consolidated amended complaints with respect to four claim types: mutual fund shareholder claims; mutual fund derivative claims; derivative claims brought on behalf of Alliance Holding; and claims brought under ERISA by participants in the Profit Sharing Plan for Employees of the Adviser. All four complaints include substantially identical factual allegations, which appear to be based in large part on the Order of the SEC dated December 18, 2003 as amended and restated January 15, 2004 (“SEC Order”) and the New York State Attorney General Assurance of Discontinuance dated September 1, 2004 (“NYAG Order”).
On April 21, 2006, the Adviser and attorneys for the plaintiffs in the mutual fund shareholder claims, mutual fund derivative claims, and ERISA claims entered into a confidential memorandum of understanding containing their
| ALLIANCEBERNSTEIN POOLING PORTFOLIOS • | 187 |
Notes to Financial Statements
agreement to settle these claims. The agreement will be documented by a stipulation of settlement and will be submitted for court approval at a later date. The settlement amount ($30 million), which the Adviser previously accrued and disclosed, has been disbursed. The derivative claims brought on behalf of Alliance Holding, in which plaintiffs seek an unspecified amount of damages, remain pending.
It is possible that these matters and/or other developments resulting from these matters could result in increased redemptions of the AllianceBernstein Mutual Funds’ shares or other adverse consequences to the AllianceBernstein Mutual Funds. This may require the AllianceBernstein Mutual Funds to sell investments held by those funds to provide for sufficient liquidity and could also have an adverse effect on the investment performance of the AllianceBernstein Mutual Funds. However, the Adviser believes that these matters are not likely to have a material adverse effect on its ability to perform advisory services relating to the AllianceBernstein Mutual Funds.
NOTE H
Subsequent Events
Management has evaluated subsequent events for possible recognition or disclosure in the financial statements through the date the financial statements are issued. Management has determined that there are no material events that would require disclosure in the Portfolios’ financial statements through this date.
| 188 | • ALLIANCEBERNSTEIN POOLING PORTFOLIOS |
Notes to Financial Statements
FINANCIAL HIGHLIGHTS
Selected Data For A Share Of Beneficial Interest Outstanding Throughout Each Period
| U.S. Value | ||||||||||||||||||
Six Months (unaudited) | Year Ended August 31, | May 20, 2005 | ||||||||||||||||
| 2009 | 2008 | 2007 | 2006 | |||||||||||||||
Net asset value, beginning of period | $ 7.22 | $ 9.27 | $ 12.44 | $ 11.41 | $ 10.32 | $ 10.00 | ||||||||||||
Income From Investment Operations | ||||||||||||||||||
Net investment income(b) | .08 | .21 | .31 | .31 | .27 | .08 | ||||||||||||
Net realized and unrealized gain (loss) on investment and foreign currency transactions | .55 | (2.03 | ) | (2.75 | ) | 1.22 | 1.11 | .28 | ||||||||||
Net increase (decrease) in net asset value from operations | .63 | (1.82 | ) | (2.44 | ) | 1.53 | 1.38 | .36 | ||||||||||
Less: Dividends and Distributions | ||||||||||||||||||
Dividends from net investment income | (.09 | ) | (.23 | ) | (.31 | ) | (.30 | ) | (.21 | ) | (.04 | ) | ||||||
Distributions from net realized gain on investment transactions | – 0 | – | .00 | (c) | (.42 | ) | (.20 | ) | (.08 | ) | – 0 | – | ||||||
Total dividends and distributions | (.09 | ) | (.23 | ) | (.73 | ) | (.50 | ) | (.29 | ) | (.04 | ) | ||||||
Net asset value, end of period | $ 7.76 | $ 7.22 | $ 9.27 | $ 12.44 | $ 11.41 | $ 10.32 | ||||||||||||
Total Return | ||||||||||||||||||
Total investment return based on net asset value(d) | 8.83 | % | (19.36 | )% | (20.55 | )% | 13.55 | % | 13.6 | 0 % | 3.58 | % | ||||||
Ratios/Supplemental Data | ||||||||||||||||||
Net assets, end of period (000’s omitted) | $2,195,447 | $2,091,464 | $2,520,943 | $2,573,340 | $1,822,032 | $1,355,032 | ||||||||||||
Ratio to average net assets of: | ||||||||||||||||||
Expenses | .01 | %(e) | .02 | % | .02 | % | .02 | % | .04 | % | .07 | %(e) | ||||||
Net investment income | 2.18 | %(e) | 3.23 | % | 2.93 | % | 2.49 | % | 2.48 | % | 2.84 | %(e) | ||||||
Portfolio turnover rate | 29 | % | 59 | % | 20 | % | 22 | % | 14 | % | 21 | % | ||||||
See footnote summary on page 200.
| ALLIANCEBERNSTEIN POOLING PORTFOLIOS • | 189 |
Financial Highlights
Selected Data For A Share Of Beneficial Interest Outstanding Throughout Each Period
| U.S. Large Cap Growth | ||||||||||||||||||
Six Months (unaudited) | Year Ended August 31, | May 20, 2005 | ||||||||||||||||
| 2009 | 2008 | 2007 | 2006 | |||||||||||||||
Net asset value, beginning of period | $ 9.25 | $ 11.08 | $ 12.47 | $ 11.09 | $ 10.73 | $ 10.00 | ||||||||||||
Income From Investment Operations | ||||||||||||||||||
Net investment income(b) | .05 | .11 | .10 | .10 | .07 | .02 | ||||||||||||
Net realized and unrealized gain (loss) on investment and foreign currency transactions | .70 | (1.83 | ) | (1.04 | ) | 1.57 | .38 | .72 | ||||||||||
Net increase (decrease) in net asset value from operations | .75 | (1.72 | ) | (.94 | ) | 1.67 | .45 | .74 | ||||||||||
Less: Dividends | ||||||||||||||||||
Dividends from net investment income | (.06 | ) | (.11 | ) | (.10 | ) | (.09 | ) | (.06 | ) | (.01 | ) | ||||||
Distributions from | – 0 | – | – 0 | – | (.35 | ) | (.20 | ) | (.03 | ) | – 0 | – | ||||||
Total dividends | (.06 | ) | (.11 | ) | (.45 | ) | (.29 | ) | (.09 | ) | (.01 | ) | ||||||
Net asset value, | $ 9.94 | $ 9.25 | $ 11.08 | $ 12.47 | $ 11.09 | $ 10.73 | ||||||||||||
Total Return | ||||||||||||||||||
Total investment | 8.09 | % | (15.41 | )% | (8.06 | )% | 15.2 | 3 % | 4.10 | % | 7.38 | % | ||||||
Ratios/Supplemental Data | ||||||||||||||||||
Net assets, end of period (000’s omitted) | $2,185,017 | $2,077,867 | $2,532,269 | $2,608,154 | $1,775,474 | $1,397,037 | ||||||||||||
Ratio to average net assets of: | ||||||||||||||||||
Expenses | .01 | %(e) | .02 | % | .02 | % | .02 | % | .04 | % | .05 | %(e) | ||||||
Net investment income | 1.09 | %(e) | 1.40 | % | .86 | % | .80 | % | .64 | % | .62 | %(e) | ||||||
Portfolio turnover rate | 43 | % | 108 | % | 93 | % | 92 | % | 64 | % | 13 | % | ||||||
See footnote summary on page 200.
| 190 | • ALLIANCEBERNSTEIN POOLING PORTFOLIOS |
Financial Highlights
Selected Data For A Share Of Beneficial Interest Outstanding Throughout Each Period
| Global Real Estate Investment | ||||||||||||||||||
Six Months (unaudited) | Year Ended August 31, | May 20, 2005 | ||||||||||||||||
| 2009 | 2008 | 2007 | 2006 | |||||||||||||||
Net asset value, beginning of | $ 7.68 | $ 9.56 | $ 13.90 | $ 13.14 | $ 10.74 | $ 10.00 | ||||||||||||
Income From Investment Operations | ||||||||||||||||||
Net investment income(b) | .12 | .28 | .36 | .27 | .36 | .09 | (f) | |||||||||||
Net realized and unrealized gain (loss) on investment and foreign currency transactions | .45 | (2.11 | ) | (2.32 | ) | 1.59 | 2.47 | .69 | ||||||||||
Net increase (decrease) in net asset value from operations | .57 | (1.83 | ) | (1.96 | ) | 1.86 | 2.83 | .78 | ||||||||||
Less: Dividends and Distributions | ||||||||||||||||||
Dividends from net investment income | (.09 | ) | (.05 | ) | (1.33 | ) | (.58 | ) | (.37 | ) | (.04 | ) | ||||||
Distributions from net realized gain on investment transactions | – 0 | – | – 0 | – | (1.05 | ) | (.52 | ) | (.06 | ) | – 0 | – | ||||||
Total dividends and distributions | (.09 | ) | (.05 | ) | (2.38 | ) | (1.10 | ) | (.43 | ) | (.04 | ) | ||||||
Net asset value, end of period | $ 8.16 | $ 7.68 | $ 9.56 | $ 13.90 | $ 13.14 | $ 10.74 | ||||||||||||
Total Return | ||||||||||||||||||
Total investment return based on net asset value(d) | 7.43 | % | (19.25 | )% | (17.38 | )% | 14.33 | % | 27.18 | % | 7.80 | % | ||||||
Ratios/Supplemental Data | ||||||||||||||||||
Net assets, end of period (000’s omitted) | $1,011,481 | $994,537 | $1,132,381 | $1,203,895 | $832,695 | $508,737 | ||||||||||||
Ratio to average net assets of: | ||||||||||||||||||
Expenses, net of waivers/reimbursements | .04 | %(e) | .05 | % | .07 | % | .06 | % | .09 | % | .15 | %(e) | ||||||
Expenses, before waivers/reimbursements | .04 | %(e) | .05 | % | .07 | % | .06 | % | .09 | % | .16 | %(e) | ||||||
Net investment income | 2.91 | %(e) | 4.46 | % | 3.11 | % | 1.90 | % | 3.07 | % | 3.14 | %(e)(f) | ||||||
Portfolio turnover rate | 27 | % | 76 | % | 46 | % | 49 | % | 46 | % | 7 | % | ||||||
| See | footnote summary on page 200. |
| ALLIANCEBERNSTEIN POOLING PORTFOLIOS • | 191 |
Financial Highlights
Selected Data For A Share Of Beneficial Interest Outstanding Throughout Each Period
| International Value | ||||||||||||||||||
Six Months (unaudited) | Year Ended August 31, | May 20, 2005 | ||||||||||||||||
| 2009 | 2008 | 2007 | 2006 | |||||||||||||||
Net asset value, beginning of | $ 7.50 | $ 10.37 | $ 14.88 | $ 13.84 | $ 10.89 | $ 10.00 | ||||||||||||
Income From Investment Operations | ||||||||||||||||||
Net investment income(b) | .07 | .23 | .45 | .42 | .38 | .10 | (f) | |||||||||||
Net realized and unrealized gain (loss) on investment and foreign currency transactions | .01 | (2.55 | ) | (3.18 | ) | 2.29 | 3.04 | .87 | ||||||||||
Contributions from Adviser | – 0 | – | .00 | (c) | – 0 | – | – 0 | – | – 0 | – | – 0 | – | ||||||
Net increase (decrease) in net asset value from operations | .08 | (2.32 | ) | (2.73 | ) | 2.71 | 3.42 | .97 | ||||||||||
Less: Dividends and Distributions | ||||||||||||||||||
Dividends from net investment income | (.03 | ) | (.19 | ) | (.43 | ) | (.55 | ) | (.26 | ) | (.08 | ) | ||||||
Distributions from net realized gain on investment transactions | – 0 | – | (.36 | ) | (1.35 | ) | (1.12 | ) | (.21 | ) | – 0 | – | ||||||
Total dividends and distributions | (.03 | ) | (.55 | ) | (1.78 | ) | (1.67 | ) | (.47 | ) | (.08 | ) | ||||||
Net asset value, end of period | $ 7.55 | $ 7.50 | $ 10.37 | $ 14.88 | $ 13.84 | $ 10.89 | ||||||||||||
Total Return | ||||||||||||||||||
Total investment return based on net asset | 1.02 | % | (20.71 | )% | (20.92 | )% | 20.64 | % | 32.16 | % | 9.71 | % | ||||||
Ratios/Supplemental Data | ||||||||||||||||||
Net assets, end of period (000’s omitted) | $1,105,982 | $1,127,352 | $1,228,477 | $1,315,984 | $997,371 | $788,432 | ||||||||||||
Ratio to average net assets of: | ||||||||||||||||||
Expenses, net of waivers/reimbursements | .03 | %(e) | .06 | % | .07 | % | .08 | % | .10 | % | .15 | %(e) | ||||||
Expenses, before waivers/reimbursements | .03 | %(e) | .06 | % | .07 | % | .08 | % | .10 | % | .94 | %(e) | ||||||
Net investment income | 1.73 | %(e) | 3.56 | % | 3.49 | % | 2.89 | % | 3.09 | % | 3.56 | %(e)(f) | ||||||
Portfolio turnover rate | 31 | % | 56 | % | 31 | % | 31 | % | 27 | % | 23 | % | ||||||
See footnote summary on page 200.
| 192 | • ALLIANCEBERNSTEIN POOLING PORTFOLIOS |
Financial Highlights
Selected Data For A Share Of Beneficial Interest Outstanding Throughout Each Period
| International Growth | ||||||||||||||||||
Six Months (unaudited) | Year Ended August 31, | May 20, 2005 | ||||||||||||||||
| 2009 | 2008 | 2007 | 2006 | |||||||||||||||
Net asset value, beginning of | $ 8.12 | $ 11.27 | $ 13.98 | $ 12.54 | $ 10.57 | $ 10.00 | ||||||||||||
Income From Investment Operations | ||||||||||||||||||
Net investment income(b) | .05 | .23 | .38 | .34 | .23 | .05 | (f) | |||||||||||
Net realized and unrealized gain (loss) on investment and foreign currency transactions | .50 | (3.11 | ) | (1.89 | ) | 1.86 | 1.95 | .54 | ||||||||||
Contributions from Adviser | – 0 | – | .00 | (c) | .00 | (c) | .00 | (c) | – 0 | – | – 0 | – | ||||||
Net increase (decrease) in net asset value from operations | .55 | (2.88 | ) | (1.51 | ) | 2.20 | 2.18 | .59 | ||||||||||
Less: Dividends and Distributions | ||||||||||||||||||
Dividends from net investment income | (.24 | ) | (.27 | ) | (.38 | ) | (.27 | ) | (.19 | ) | (.02 | ) | ||||||
Distributions from net realized gain on investment transactions | – 0 | – | .00 | (c) | (.82 | ) | (.49 | ) | (.02 | ) | – 0 | – | ||||||
Total dividends and distributions | (.24 | ) | (.27 | ) | (1.20 | ) | (.76 | ) | (.21 | ) | (.02 | ) | ||||||
Net asset value, end of period | $ 8.43 | $ 8.12 | $ 11.27 | $ 13.98 | $ 12.54 | $ 10.57 | ||||||||||||
Total Return | ||||||||||||||||||
Total investment return based on net asset | 6.58 | % | (25.32 | )% | (12.46 | )% | 18.08 | % | 20.88 | % | 5.93 | % | ||||||
Ratios/Supplemental Data | ||||||||||||||||||
Net assets, end of period (000’s omitted) | $1,111,520 | $1,077,781 | $1,245,979 | $1,328,927 | $886,431 | $517,594 | ||||||||||||
Ratio to average net assets of: | ||||||||||||||||||
Expenses, net of waivers/reimbursements | .03 | %(e) | .05 | % | .06 | % | .07 | % | .11 | % | .15 | %(e) | ||||||
Expenses, before waivers/reimbursements | .03 | %(e) | .05 | % | .06 | % | .07 | % | .11 | % | .24 | %(e) | ||||||
Net investment income | 1.18 | %(e) | 3.19 | % | 2.81 | % | 2.50 | % | 1.96 | % | 1.78 | %(e)(f) | ||||||
Portfolio turnover rate | 40 | % | 111 | % | 85 | % | 82 | % | 105 | % | 19 | % | ||||||
See footnote summary on page 200.
| ALLIANCEBERNSTEIN POOLING PORTFOLIOS • | 193 |
Financial Highlights
Selected Data For A Share Of Beneficial Interest Outstanding Throughout Each Period
| Small-Mid Cap Value | ||||||||||||||||||
Six Months 2010 | Year Ended August 31, | May 20, 2005 | ||||||||||||||||
| 2009 | 2008 | 2007 | 2006 | |||||||||||||||
Net asset value, beginning of | $ 8.10 | $ 11.19 | $ 12.79 | $ 11.08 | $ 10.65 | $ 10.00 | ||||||||||||
Income From Investment Operations | ||||||||||||||||||
Net investment income(b) | .05 | .14 | .19 | .24 | .16 | .04 | (f) | |||||||||||
Net realized and unrealized gain (loss) on investment transactions | 1.49 | (2.34 | ) | (.96 | ) | 1.80 | .40 | .63 | ||||||||||
Net increase (decrease) in net asset value from operations | 1.54 | (2.20 | ) | (.77 | ) | 2.04 | .56 | .67 | ||||||||||
Less: Dividends and Distributions | ||||||||||||||||||
Dividends from net investment income | (.03 | ) | (.14 | ) | (.18 | ) | (.23 | ) | (.13 | ) | (.02 | ) | ||||||
Distributions from net realized gain on investment transactions | – 0 | – | (.75 | ) | (.65 | ) | (.10 | ) | – 0 | – | – 0 | – | ||||||
Total dividends and distributions | (.03 | ) | (.89 | ) | (.83 | ) | (.33 | ) | (.13 | ) | (.02 | ) | ||||||
Net asset value, end of period | $ 9.61 | $ 8.10 | $ 11.19 | $ 12.79 | $ 11.08 | $ 10.65 | ||||||||||||
Total Return | ||||||||||||||||||
Total investment return based on net asset | 19.11 | % | (16.76 | )% | (6.29 | )% | 18.64 | % | 5.24 | % | 6.72 | % | ||||||
Ratios/Supplemental Data | ||||||||||||||||||
Net assets, end of period (000’s omitted) | $585,370 | $553,145 | $685,788 | $648,401 | $444,250 | $320,038 | ||||||||||||
Ratio to average net assets of: | ||||||||||||||||||
Expenses, net of waivers/reimbursements | .04 | %(e) | .04 | % | .04 | % | .04 | % | .07 | % | .15 | %(e) | ||||||
Expenses, before waivers/reimbursements | .04 | %(e) | .04 | % | .04 | % | .04 | % | .07 | % | .34 | %(e) | ||||||
Net investment income | 1.15 | %(e) | 2.00 | % | 1.67 | % | 1.93 | % | 1.45 | % | 1.62 | %(e)(f) | ||||||
Portfolio turnover rate | 27 | % | 60 | % | 38 | % | 33 | % | 42 | % | 8 | % | ||||||
See footnote summary on page 200.
| 194 | • ALLIANCEBERNSTEIN POOLING PORTFOLIOS |
Financial Highlights
Selected Data For A Share Of Beneficial Interest Outstanding Throughout Each Period
| Small-Mid Cap Growth | ||||||||||||||||||
| Six Months Ended February 28, 2010 | Year Ended August 31, | May 20, 2005(a) to August 31, | ||||||||||||||||
| (unaudited) | 2009 | 2008 | 2007 | 2006 | 2005 | |||||||||||||
Net asset value, beginning of | $ 10.18 | $ 12.62 | $ 14.79 | $ 11.84 | $ 10.99 | $ 10.00 | ||||||||||||
Income From Investment Operations | ||||||||||||||||||
Net investment income(b) | .02 | .04 | .05 | .06 | .04 | .01 | (f) | |||||||||||
Net realized and unrealized gain (loss) on investment transactions | 1.27 | (2.44 | ) | (.78 | ) | 3.16 | .84 | .99 | ||||||||||
Contributions from Adviser | – 0 | – | .00 | (c) | .01 | .00 | (c) | – 0 | – | – 0 | – | |||||||
Net increase (decrease) in net asset value from operations | 1.29 | (2.40 | ) | (.72 | ) | 3.22 | .88 | 1.00 | ||||||||||
Less: Dividends and Distributions | ||||||||||||||||||
Dividends from net investment income | (.01 | ) | (.04 | ) | (.06 | ) | (.04 | ) | (.03 | ) | (.01 | ) | ||||||
Distributions from net realized gain on investment transactions | – 0 | – | – 0 | – | (1.39 | ) | (.23 | ) | – 0 | – | – 0 | – | ||||||
Total dividends and distributions | (.01 | ) | (.04 | ) | (1.45 | ) | (.27 | ) | (.03 | ) | (.01 | ) | ||||||
Net asset value, end of period | $ 11.46 | $ 10.18 | $ 12.62 | $ 14.79 | $ 11.84 | $ 10.99 | ||||||||||||
Total Return | ||||||||||||||||||
Total investment return based on net asset value(d) | 12.69 | % | (18.97 | )% | (5.84 | )% | 27.50 | % | 8.00 | % | 9.97 | % | ||||||
Ratios/Supplemental Data | ||||||||||||||||||
Net assets, end of period (000’s omitted) | $583,798 | $548,279 | $686,291 | $668,771 | $429,431 | $287,536 | ||||||||||||
Ratio to average net assets of: | ||||||||||||||||||
Expenses, net of waivers/reimbursements | .04 | %(e) | .05 | % | .04 | % | .05 | % | .07 | % | .15 | %(e) | ||||||
Expenses, before waivers/reimbursements | .04 | %(e) | .05 | % | .04 | % | .05 | % | .07 | % | .41 | %(e) | ||||||
Net investment income | .34 | %(e) | .49 | % | .39 | % | .45 | % | .33 | % | .37 | %(e)(f) | ||||||
Portfolio turnover rate | 51 | % | 107 | % | 88 | % | 88 | % | 83 | % | 21 | % | ||||||
See footnote summary on page 200.
| ALLIANCEBERNSTEIN POOLING PORTFOLIOS • | 195 |
Financial Highlights
Selected Data For A Share Of Beneficial Interest Outstanding Throughout Each Period
| Short Duration Bond | ||||||||||||||||||
Six Months (unaudited) | Year Ended August 31, | May 20, 2005 | ||||||||||||||||
| 2009 | 2008 | 2007 | 2006 | |||||||||||||||
Net asset value, beginning of | $ 9.26 | $ 9.37 | $ 9.87 | $ 9.93 | $ 10.04 | $ 10.00 | ||||||||||||
Income From Investment Operations | ||||||||||||||||||
Net investment income(b) | .15 | .36 | .46 | .52 | .47 | .09 | (f) | |||||||||||
Net realized and unrealized gain (loss) on investment transactions | .20 | (.08 | ) | (.49 | ) | (.08 | ) | (.14 | ) | (.01 | ) | |||||||
Net increase (decrease) in net asset value from operations | .35 | .28 | (.03 | ) | .44 | .33 | .08 | |||||||||||
Less: Dividends | ||||||||||||||||||
Dividends from net investment income | (.14 | ) | (.39 | ) | (.47 | ) | (.50 | ) | (.44 | ) | (.04 | ) | ||||||
Net asset value, end of period | $ 9.47 | $ 9.26 | $ 9.37 | $ 9.87 | $ 9.93 | $ 10.04 | ||||||||||||
Total Return | ||||||||||||||||||
Total investment return based on net asset value(d) | 3.85 | % | 3.14 | % | (.40 | )% | 4.51 | % | 3.39 | % | .82 | % | ||||||
Ratios/Supplemental Data | ||||||||||||||||||
Net assets, end of period (000’s omitted) | $1,209,321 | $1,107,600 | $1,298,541 | $1,272,076 | $960,111 | $652,505 | ||||||||||||
Ratio to average net assets of: | ||||||||||||||||||
Expenses, net of waivers/reimbursements | .18 | %(e) | .04 | % | .03 | % | .02 | % | .05 | % | .15 | %(e) | ||||||
Expenses, net of waivers/reimbursements excluding interest expense and TALF administration fee | .03 | %(e) | .03 | % | .03 | % | .02 | % | .05 | % | .15 | %(e) | ||||||
Expenses, before waivers/reimbursements | .18 | %(e) | .04 | % | .03 | % | .02 | % | .05 | % | .19 | %(e) | ||||||
Expenses, before waivers/reimbursements, excluding interest expense and TALF administration fee | .03 | %(e) | .03 | % | .03 | % | .02 | % | .05 | % | .19 | %(e) | ||||||
Net investment income | 3.18 | %(e) | 4.06 | % | 4.75 | % | 5.23 | % | 4.69 | % | 3.88 | %(e)(f) | ||||||
Portfolio turnover rate | 80 | % | 153 | % | 116 | % | 138 | % | 185 | % | 83 | % | ||||||
See footnote summary on page 200.
| 196 | • ALLIANCEBERNSTEIN POOLING PORTFOLIOS |
Financial Highlights
Selected Data For A Share Of Beneficial Interest Outstanding Throughout Each Period
| Intermediate Duration Bond | ||||||||||||||||||
Six Months (unaudited) | Year Ended August 31, | May 20, 2005 | ||||||||||||||||
| 2009 | 2008 | 2007 | 2006 | |||||||||||||||
Net asset value, beginning of period | $ 9.98 | $ 9.70 | $ 9.87 | $ 9.86 | $ 10.12 | $ 10.00 | ||||||||||||
Income From Investment Operations | ||||||||||||||||||
Net investment income(b) | .23 | .51 | .50 | .49 | .48 | .11 | ||||||||||||
Net realized and unrealized gain (loss) on investment and foreign currency transactions | .33 | .33 | (.16 | ) | .00 | (c) | (.28 | ) | .08 | |||||||||
Net increase in net asset value from operations | .56 | .84 | .34 | .49 | .20 | .19 | ||||||||||||
Less: Dividends | ||||||||||||||||||
Dividends from net investment income | (.24 | ) | (.56 | ) | (.51 | ) | (.48 | ) | (.46 | ) | (.07 | ) | ||||||
Net asset value, end of period | $ 10.30 | $ 9.98 | $ 9.70 | $ 9.87 | $ 9.86 | $ 10.12 | ||||||||||||
Total Return | ||||||||||||||||||
Total investment return based on net asset value(d) | 5.65 | % | 9.26 | % | 3.51 | % | 5.03 | % | 2.13 | % | 1.95 | % | ||||||
Ratios/Supplemental Data | ||||||||||||||||||
Net assets, end of period (000’s omitted) | $1,377,039 | $1,280,751 | $1,654,416 | $1,599,652 | $1,076,281 | $807,065 | ||||||||||||
Ratio to average net assets of: | ||||||||||||||||||
Expenses | .22 | %(e) | .04 | % | .03 | % | .04 | % | .06 | % | .10 | %(e) | ||||||
Expenses, excluding interest expense | .03 | %(e) | .04 | % | .03 | % | .04 | % | .06 | % | .10 | %(e) | ||||||
Expenses, excluding interest expense and TALF administration fee | .02 | %(e) | .03 | % | .03 | % | .04 | % | .06 | % | .10 | %(e) | ||||||
Net investment income | 4.52 | %(e) | 5.47 | % | 5.01 | % | 5.01 | % | 4.89 | % | 4.13 | %(e) | ||||||
Portfolio turnover rate | 39 | % | 108 | % | 114 | % | 236 | % | 513 | % | 206 | % | ||||||
See footnote summary on page 200.
| ALLIANCEBERNSTEIN POOLING PORTFOLIOS • | 197 |
Financial Highlights
Selected Data For A Share Of Beneficial Interest Outstanding Throughout Each Period
| Inflation Protected Securities | ||||||||||||||||||
Six Months (unaudited) | Year Ended August 31, | May 20, 2005 | ||||||||||||||||
| 2009 | 2008 | 2007 | 2006 | |||||||||||||||
Net asset value, beginning of period | $ 9.91 | $ 10.74 | $ 9.99 | $ 9.91 | $ 10.01 | $ 10.00 | ||||||||||||
Income From Investment Operations | ||||||||||||||||||
Net investment income(b) | .11 | .04 | .69 | .49 | .57 | .09 | (f) | |||||||||||
Net realized and unrealized gain (loss) on investment transactions | .41 | (.19 | ) | .52 | (.06 | ) | (.36 | ) | – 0 | – | ||||||||
Contributions from Adviser | – 0 | – | – 0 | – | – 0 | – | .00 | (c) | – 0 | – | – 0 | – | ||||||
Net increase (decrease) in net asset value from operations | .52 | (.15 | ) | 1.21 | .43 | .21 | .09 | |||||||||||
Less: Dividends and Distributions | ||||||||||||||||||
Dividends from net investment income | (.13 | ) | (.68 | ) | (.46 | ) | (.35 | ) | (.30 | ) | (.08 | ) | ||||||
Distributions from net realized gain on investment transactions | – 0 | – | – 0 | – | – 0 | – | – 0 | – | (.01 | ) | – 0 | – | ||||||
Total dividends and distributions | (.13 | ) | (.68 | ) | (.46 | ) | (.35 | ) | (.31 | ) | (.08 | ) | ||||||
Net asset value, end of period | $ 10.30 | $ 9.91 | $ 10.74 | $ 9.99 | $ 9.91 | $ 10.01 | ||||||||||||
Total Return | ||||||||||||||||||
Total investment return based on net asset value(d) | 5.22 | % | (.88 | )% | 12.45 | % | 4.44 | % | 2.11 | % | .92 | % | ||||||
Ratios/Supplemental Data | ||||||||||||||||||
Net assets, end of period (000’s omitted) | $652,021 | $586,321 | $688,918 | $643,549 | $447,210 | $263,128 | ||||||||||||
Ratio to average net assets of: | ||||||||||||||||||
Expenses, net of waivers/reimbursements | .03 | %(e) | .04 | % | .04 | % | .04 | % | .07 | % | .15 | %(e) | ||||||
Expenses, before waivers/reimbursements | .03 | %(e) | .04 | % | .04 | % | .04 | % | .07 | % | .52 | %(e) | ||||||
Net investment income | 2.14 | %(e) | .44 | % | 6.63 | % | 4.98 | % | 5.83 | % | 4.34 | %(e)(f) | ||||||
Portfolio turnover rate | 2 | % | 20 | % | 9 | % | 12 | % | 13 | % | 3 | % | ||||||
See footnote summary on page 200.
| 198 | • ALLIANCEBERNSTEIN POOLING PORTFOLIOS |
Financial Highlights
Selected Data For A Share Of Beneficial Interest Outstanding Throughout Each Period
| High-Yield | ||||||||||||||||||
Six Months unaudited) | Year Ended August 31, | May 20, 2005 | ||||||||||||||||
| 2009 | 2008 | 2007 | 2006 | |||||||||||||||
Net asset value, beginning of period | $ 8.51 | $ 8.87 | $ 9.89 | $ 9.99 | $ 10.35 | $ 10.00 | ||||||||||||
Income From Investment Operations | ||||||||||||||||||
Net investment income(b) | .44 | .81 | .78 | .77 | .75 | .20 | (f) | |||||||||||
Net realized and unrealized gain (loss) on investment and foreign currency transactions | 1.11 | (.38 | ) | (1.03 | ) | (.15 | ) | (.35 | ) | .24 | ||||||||
Net increase (decrease) in net asset value from operations | 1.55 | .43 | (.25 | ) | .62 | .40 | .44 | |||||||||||
Less: Dividends and Distributions | ||||||||||||||||||
Dividends from net investment income | (.44 | ) | (.79 | ) | (.77 | ) | (.72 | ) | (.75 | ) | (.09 | ) | ||||||
Distributions from net realized gain on investment transactions | – 0 | – | – 0 | – | – 0 | – | – 0 | – | (.01 | ) | – 0 | – | ||||||
Total dividends and distributions | (.44 | ) | (.79 | ) | (.77 | ) | (.72 | ) | (.76 | ) | (.09 | ) | ||||||
Net asset value, end of period | $ 9.62 | $ 8.51 | $ 8.87 | $ 9.89 | $ 9.99 | $ 10.35 | ||||||||||||
Total Return | ||||||||||||||||||
Total investment return based on net asset value(d) | 18.63 | % | 7.25 | % | (2.76 | )% | 6.22 | % | 4.06 | % | 4.38 | % | ||||||
Ratios/Supplemental Data | ||||||||||||||||||
Net assets, end of period (000’s omitted) | $493,945 | $463,400 | $526,850 | $495,833 | $325,931 | $258,236 | ||||||||||||
Ratio to average net assets of: | ||||||||||||||||||
Expenses, net of waivers/reimbursements | .05 | %(e) | .06 | % | .05 | % | .06 | % | .09 | % | .20 | %(e) | ||||||
Expenses, before waivers/reimbursements | .05 | %(e) | .06 | % | .05 | % | .06 | % | .09 | % | .45 | %(e) | ||||||
Net investment income | 9.59 | %(e) | 11.13 | % | 8.19 | % | 7.50 | % | 7.47 | % | 7.42 | %(e)(f) | ||||||
Portfolio turnover rate | 15 | % | 40 | % | 25 | % | 49 | % | 64 | % | 23 | % | ||||||
See footnote summary on page 200.
| ALLIANCEBERNSTEIN POOLING PORTFOLIOS • | 199 |
Financial Highlights
| (a) | Commencement of operations. |
| (b) | Based on average shares outstanding. |
| (c) | Amount is less than $.005. |
| (d) | Total investment return is calculated assuming an initial investment made at the net asset value at the beginning of the period, reinvestment of all dividends and distributions at net asset value during the period, and redemption on the last day of the period. Initial sales charges or contingent deferred sales charges are not reflected in the calculation of total investment return. Total return does not reflect the deduction of taxes that a shareholder would pay on fund distributions or the redemption of fund shares. Total investment return calculated for a period of less than one year is not annualized. |
| (e) | Annualized. |
| (f) | Net of fees and expenses waived/reimbursed by the Adviser. |
See notes to financial statements.
| 200 | • ALLIANCEBERNSTEIN POOLING PORTFOLIOS |
Financial Highlights
TRUSTEES
William H. Foulk, Jr.(1) , Chairman John H. Dobkin(1) Michael J. Downey(1) D. James Guzy(1) | Nancy P. Jacklin(1) Garry L. Moody(1) Marshall C. Turner, Jr.(1) Earl D. Weiner(1) | |
| OFFICERS(2) | ||
Robert M. Keith, President and Chief Executive Officer Philip L. Kirstein, Senior Vice President and Independent Compliance Officer Bruce K. Aronow, Vice President Stephen M. Beinhacker, Vice President Henry S. D’Auria, Vice President Jon P. Denfeld, Vice President Paul J. DeNoon, Vice President Gershon M. Distenfeld, Vice President Sharon E. Fay, Vice President Eric J. Franco, Vice President Shawn E. Keegan, Vice President N. Kumar Kirpalani, Vice President Samantha S. Lau, Vice President James W. MacGregor, Vice President Alison M. Martier, Vice President Christopher W. Marx, Vice President | Teresa Marziano, Vice President Joel J. McKoan, Vice President Joseph G. Paul, Vice President Douglas J. Peebles, Vice President John D. Phillips, Vice President James G. Reilly, Vice President Michael J. Reilly, Vice President Kevin F. Simms, Vice President Prashant Tewari, Vice President Christopher M. Toub, Vice President Wen-Tse Tseng, Vice President P. Scott Wallace, Vice President Andrew J. Weiner, Vice President Greg J. Wilensky, Vice President Diane Won, Vice President David Yuen, Vice President Vadim Zlotnikov, Vice President Emilie D. Wrapp, Secretary Joseph J. Mantineo, Treasurer and Chief Financial Officer Phyllis J. Clarke, Controller | |
Custodian and Accounting Agent State Street Bank and Trust Company
Principal Underwriter AllianceBernstein Investments, Inc. |
Legal Counsel Seward & Kissel LLP | |
| ALLIANCEBERNSTEIN POOLING PORTFOLIOS • | 201 |
Trustees
Transfer Agent AllianceBernstein Investor | Independent Registered Public KPMG LLP |
| (1) | Member of the Audit Committee, the Governance and Nominating Committee, and the Independent Directors Committee. Mr. Foulk is the sole member of the Fair Value Pricing Committee. |
| (2) | The management of, and investment decisions for, the AllianceBernstein Global Real Estate Investment Portfolio are made by the REIT Senior Investment Management Team. Ms. Teresa Marziano, Mr. Prashant Tewari and Ms. Diane Won are the senior most members of the Investment Management Team. |
| The management of, and investment decisions for, the AllianceBernstein U.S. Value Portfolio are made by the U.S. Value Senior Investment Management Team. Mr. Joseph G. Paul, Mr. Christopher W. Marx, Mr. John D. Phillips and Mr. David Yuen are the senior most members of the Investment Management Team. |
| The management of, and investment decisions for, the AllianceBernstein Small-Mid Cap Value Portfolio are made by the Small-Mid Cap Value Senior Investment Management Team. Mr. Joseph G. Paul, Mr. James W. MacGregor and Mr. Andrew J. Weiner are the senior most members of the Investment Management Team. |
| The management of, and investment decisions for, the AllianceBernstein International Value Portfolio are made by the International Value Senior Investment Management Team. Ms. Sharon E. Fay, Mr. Kevin F. Simms, Mr. Henry S. D’Auria and Mr. Eric J. Franco are the senior most members of the Investment Management Team. |
| The management of, and investment decisions for, the AllianceBernstein U.S. Large Cap Growth Portfolio are made by the U.S. Large Cap Growth Team. Mr. James G. Reilly, Mr. Michael J. Reilly and Mr. P. Scott Wallace are the senior most members of the team. |
| The management of, and investment decisions for, the AllianceBernstein Small-Mid Cap Growth Portfolio are made by the Small Cap Growth Investment Team. Mr. Bruce K. Aronow, Mr. N. Kumar Kirpalani, Ms. Samantha S. Lau and Mr. Wen-Tse Tseng are the senior most members of the team. |
| The management of, and investment decisions for, the AllianceBernstein International Growth Portfolio are made by the International Growth Team. Mr. Stephen M. Beinhacker, Mr. Christopher M. Toub and Mr. Vadim Zlotnikov are the senior most members of the team. |
| The management of, and investment decisions for, the AllianceBernstein Short Duration Bond Portfolio are made by the U.S. Investment Grade: Liquid Markets/Structured Products Investment Team. Mr. Jon P. Denfeld, Mr. Paul J. DeNoon, Mr. Shawn E. Keegan, Ms. Alison M. Martier, Mr. Douglas J. Peebles and Mr. Greg J. Wilensky are the senior most members of the team. |
| The management of, and investment decisions for, the AllianceBernstein Intermediate Duration Bond Portfolio are made by the U.S. Investment Grade: Core Fixed Income Team. Mr. Paul J. DeNoon, Mr. Shawn E. Keegan, Ms. Alison M. Martier, Mr. Douglas J. Peebles and Mr. Greg J. Wilensky, are the senior most members of the team. |
| The management of, and investment decisions for, the AllianceBernstein High-Yield Portfolio are made by the Global Credit Investment Team. Mr. Gershon M. Distenfeld, Mr. Joel J. McKoan and Mr. Douglas J. Peebles are the senior most members of the team. |
| Mr. Greg J. Wilensky, Director of Stable Value Investments, is primarily responsible for the day-to-day management of the AllianceBernstein Inflation-Protected Securities Portfolio. |
| 202 | • ALLIANCEBERNSTEIN POOLING PORTFOLIOS |
Trustees
THE FOLLOWING IS NOT PART OF THE SHAREHOLDER REPORT OR THE FINANCIAL STATEMENTS
SUMMARY OF SENIOR OFFICER’S EVALUATION OF INVESTMENT ADVISORY AGREEMENT1
The following is a summary of the evaluation of the Investment Advisory Agreement between AllianceBernstein L.P. (the “Adviser”) and AllianceBernstein Pooling Portfolios (the “Trust” or the “Pooling Portfolios”) in respect of the following Portfolios:2
U.S. Value Portfolio
U.S. Large Cap Growth Portfolio
Global Real Estate Investment Portfolio
International Value Portfolio
International Growth Portfolio
Small-Mid Cap Value Portfolio
Small-Mid Cap Growth Portfolio
The Trust, which is designed to facilitate a “blended style” investment approach, represents a variety of asset classes and investment styles, and is available for investment only to institutional clients of the Adviser, including both registered investment companies and large managed separate accounts.
The evaluation of the Investment Advisory Agreement was prepared by Philip L. Kirstein, the Senior Officer, for the Trustees of the Trust, as required by a September 2004 agreement between the Adviser and the New York State Attorney General (the “NYAG”). The Senior Officer’s evaluation of the Investment Advisory Agreement is not meant to diminish the responsibility or authority of the Board of Trustees of the Trust to perform its duties pursuant to Section 15 of the Investment Company Act of 1940 (the “40 Act”) and applicable state law. The purpose of the summary is to provide shareholders with a synopsis of the independent evaluation of the reasonableness of the advisory fees proposed to be paid by the Portfolios which was provided to the Trustees in connection
| 1 | It should be noted that the information in the fee summary was completed on April 23, 2009 and presented to the Board of Trustees on May 5-7, 2009. |
| 2 | Future references to the Portfolios do not include “AllianceBernstein.” The Portfolios of the Trust that are not discussed in this evaluation are Short Duration Bond Portfolio, Intermediate Duration Bond Portfolio, Inflation Protected Securities Portfolio and High Yield Portfolio. The fixed-income portfolios will be considered separately at the Board meeting schedules to be held on November 3-5, 2009. |
| ALLIANCEBERNSTEIN POOLING PORTFOLIOS • | 203 |
with their review of the proposed approval of the continuance of the Investment Advisory Agreement. The Senior Officer’s evaluation considered the following factors:
| 1. | Advisory fees charged to institutional and other clients of the Adviser for like services; |
| 2. | Advisory fees charged by other mutual fund companies for like services; |
| 3. | Costs to the Adviser and its affiliates of supplying services pursuant to the advisory agreements, excluding any intra-corporate profit; |
| 4. | Profit margins of the Adviser and its affiliates from supplying such services; |
| 5. | Possible economies of scale as the Portfolios grow larger; and |
| 6. | Nature and quality of the Adviser’s services including the performance of the Portfolios. |
PORTFOLIO ADVISORY FEES, NET ASSETS, & EXPENSE RATIOS
Under the Investment Advisory Agreement, the Portfolios are not charged an advisory fee. The investment advisory contract also does not provide for the Adviser to be reimbursed for the cost of providing non-advisory services, which would include administration, distribution and transfer agent-related services, although the transfer agent of the Portfolios is reimbursed for out of pocket expenses. The Adviser is compensated by institutional clients of the Adviser (the “Institutional Clients”) that invest in the Pooling Portfolios. These clients include the AllianceBernstein Blended Style Series, Inc.—AllianceBernstein Retirement Strategies (“Retirement Strategies”),3 AllianceBernstein Blended Style Series, Inc.—U.S. Large Cap Portfolio (“U.S. Large Cap Portfolio”), The AllianceBernstein Portfolios—AllianceBernstein Wealth Strategies (“Wealth Strategies”),4 the Rhode Island Higher Education Savings Trust (referred to herein as “CollegeBoundfund”), and Allstate ClearTarget Retirement Funds. Collectively, these shareholders (the “Institutional Clients”) own 100 percent of the Pooling Portfolios’ total outstanding shares. Set forth below are the advisory fee schedules of the Institutional Clients that invests in the Pooling Portfolios.
| 3 | Includes AllianceBernstein 2000 Retirement Strategy, AllianceBernstein 2005 Retirement Strategy, AllianceBernstein 2010 Retirement Strategy, AllianceBernstein 2015 Retirement Strategy, AllianceBernstein 2020 Retirement Strategy, AllianceBernstein 2025 Retirement Strategy, AllianceBernstein 2030 Retirement Strategy, AllianceBernstein 2035 Retirement Strategy, AllianceBernstein 2040 Retirement Strategy, AllianceBernstein 2045 Retirement Strategy, AllianceBernstein 2050 Retirement Strategy and AllianceBernstein 2055 Retirement Strategy . Future references to the Retirement Strategies do not include “AllianceBernstein.” |
| 4 | Includes AllianceBernstein Balanced Wealth Strategy, AllianceBernstein Wealth Appreciation Strategy, AllianceBernstein Wealth Preservation Strategy. Future references to the Wealth Strategies do not include “AllianceBernstein.” |
| 204 | • ALLIANCEBERNSTEIN POOLING PORTFOLIOS |
AllianceBernstein Blended Style Series, Inc.—AllianceBernstein Retirement Strategies and Allstate ClearTarget Retirement Funds
Each of the Retirement Strategies/Allstate Funds pays an advisory fee correlated to the percentage of equity investments held by the Retirement Strategy/Allstate Funds. This fee is discounted by a certain percentage depending on the asset level of the Retirement Strategy/Allstate Fund as indicated below:
| % Invested in Equity Investments | Advisory Fee | ||
Equal to or less than 60% Greater than 60% and less than 80% Equal to or greater than 80% | 0.55 0.60 0.65 | % % % |
| Net Asset Level | Discount | |
Assets equal to or less than $2.5 billion Assets greater than $2.5 billion and less than $5 billion Assets greater than $5 billion | n/a 10 basis points 15 basis points |
Accordingly, under the terms of the Investment Advisory Agreement, the Retirement Strategies will pay the Adviser at the following annual rates:
| Average Daily Net Assets | ||||||
| Retirement Strategy/Allstate Fund | First $2.5 billion | Next $2.5 billion | In excess of $5 billion | |||
Retirement Strategies: 2025, 2030, 2035, 2040,
Allstate Funds: 2030, 2040, 2050 | 0.65% | 0.55% | 0.50% | |||
Retirement Strategies: 2010, 2015, 2020
Allstate Funds: 2010, 2015, 2020 | 0.60% | 0.50% | 0.45% | |||
Retirement Strategies: 2000, 2005
Allstate Funds: 2005 | 0.55% | 0.45% | 0.40% | |||
U.S. Large Cap Portfolio and the Wealth Strategies
Large Cap Portfolio and the Wealth Strategies are charged by the Adviser an advisory fee based on a percentage of each fund’s average daily net assets:
| Fund | Advisory Fee Based on % of Average Daily Net Assets | ||||
| U.S. Large Cap Portfolio | First $2.5 billion Next $2.5 billion Excess of $5 billion | 0.65 0.55 0.50 | % % % | ||
| Wealth Appreciation Strategy | First $2.5 billion Next $2.5 billion Excess of $5 billion | 0.65 0.55 0.50 | % % % | ||
| ALLIANCEBERNSTEIN POOLING PORTFOLIOS • | 205 |
| Fund | Advisory Fee Based on % of Average Daily Net Assets | ||||
| Balanced Wealth Strategy | First $2.5 billion Next $2.5 billion Excess of $5 billion | 0.55 0.45 0.40 | % % % | ||
| Wealth Preservation Strategy | First $2.5 billion Next $2.5 billion Excess of $5 billion | 0.55 0.45 0.40 | % % % | ||
CollegeBoundfund
The Adviser serves as the program manager of the CollegeBoundfund, a 529 college-savings plan. Services provided by the Adviser as program manager for CollegeBoundfund include managing the assets of each Education Strategy of the plan that may invest in a combination of the Pooling Portfolios (the “Underlying Portfolios”), performing administrative related functions, servicing shareholder accounts, providing customer service to participants, maintaining the program and developing/updating a website where participants can access their personal accounts. Note that shareholder servicing is provided by AllianceBernstein Investor Services (“ABIS”) and distribution by AllianceBernstein Investments, Inc. (“ABI”), both which are affiliates of the Adviser. As program manager, the Adviser is paid a program management fee equal to the total expense ratio (fixed) of each Education Strategy minus the weighted average of the expenses of the Underlying Portfolios in which the Strategy is invested. The weighted average of the expenses of the Underlying Portfolios may fluctuate over time, resulting in an increase or decrease in the program management fee since the total expense ratio is constant. Set forth below is a table showing the total expense ratios of the Education Strategies as of February 28, 2009.
| Portfolios | Total Expense Ratio5 | ||
| Age-Based Education Strategies | |||
| Age-Based Aggressive 2008-2010 | 0.94 | % | |
| Age-Based Aggressive 2005-2007 | 0.94 | % | |
| Age-Based Aggressive 2002-2004 | 0.90 | % | |
| Age-Based Aggressive 1999-2001 | 0.86 | % | |
| Age-Based Aggressive 1996-1998 | 0.82 | % | |
| Age-Based Aggressive 1993-1995 | 0.78 | % | |
| Age-Based Aggressive 1990-1992 | 0.74 | % | |
| Age-Based Aggressive 1987-1989 | 0.74 | % | |
| Age-Based Aggressive 1984-1986 | 0.74 | % | |
| Age-Based Aggressive Pre-1984 | 0.74 | % | |
| Age-Based 2008-2010 | 0.92 | % | |
| Age-Based 2005-2007 | 0.88 | % | |
| Age-Based 2002-2004 | 0.84 | % |
| 5 | The total expense ratios do not include an annual distribution fee of 0.25% payable to AllianceBernstein Investments, Inc., the program distributor and an affiliate of the Adviser, which is applied only to certain accounts that are established with the involvement of a financial adviser (“FA”). This charge is to fund compensation payable in the same amount by ABI to the FA for the FA’s services after such account is open at least one year. |
| 206 | • ALLIANCEBERNSTEIN POOLING PORTFOLIOS |
| Portfolios | Total Expense Ratio5 | ||
| Age-Based 1999-2001 | 0.80 | % | |
| Age-Based 1996-1998 | 0.78 | % | |
| Age-Based 1993-1995 | 0.76 | % | |
| Age-Based 1990-1992 | 0.72 | % | |
| Age-Based 1987-1989 | 0.72 | % | |
| Age-Based 1984-1986 | 0.72 | % | |
| Age-Based Pre-1984 | 0.72 | % | |
| Fixed Based Education Strategies | |||
| Appreciation | 0.94 | % | |
| Balanced | 0.80 | % | |
| Preservation | 0.72 | % | |
The Portfolios’ net assets as of February 28, 2009 are as follows:
| Portfolio | Net Assets ($MM) | ||
| U.S. Value Portfolio | $ | 1,454.6 | |
| U.S. Large Cap Growth Portfolio | $ | 1,549.8 | |
| Global Real Estate Investment Portfolio | $ | 644.1 | |
| International Value Portfolio | $ | 741.4 | |
| International Growth Portfolio | $ | 766.8 | |
| Small-Mid Cap Value Portfolio | $ | 367.2 | |
| Small-Mid Cap Growth Portfolio | $ | 389.2 | |
Set forth below are the most recent fiscal year end total expense ratios of the Pooling Portfolios:
| Portfolio | Fiscal Year End | Total Expense Ratio | |||
| U.S. Value Portfolio | August 31 | 0.02 | % | ||
| U.S. Large Cap Growth Portfolio | August 31 | 0.02 | % | ||
| Global Real Estate Investment Portfolio | August 31 | 0.07 | % | ||
| International Value Portfolio | August 31 | 0.07 | % | ||
| International Growth Portfolio | August 31 | 0.06 | % | ||
| Small-Mid Cap Value Portfolio | August 31 | 0.04 | % | ||
| Small-Mid Cap Growth Portfolio | August 31 | 0.04 | % |
| I. | ADVISORY FEES CHARGED TO INSTITUTIONAL AND OTHER CLIENTS |
Although the Portfolios are not charged an advisory fee, their shareholders, which include other investment companies and large institutional clients managed by the Adviser, pay the Adviser an investment advisory fee for managing their assets. In this regard, it is worth considering the advisory fees charged by the Adviser to institutional and other clients. The advisory fees charged to investment companies that the Adviser manages and sponsors are normally
| 5 | The total expense ratios do not include an annual distribution fee of 0.25% payable to AllianceBernstein Investments, Inc., the program distributor and an affiliate of the Adviser, which is applied only to certain accounts that are established with the involvement of a financial adviser (“FA”). This charge is to fund compensation payable in the same amount by ABI to the FA for the FA’s services after such account is open at least one year. |
| ALLIANCEBERNSTEIN POOLING PORTFOLIOS • | 207 |
higher than those charged to similar sized institutional accounts, including pension plans and sub-advised investment companies. The fee differential reflects, among other things, different services provided to such clients and different liabilities assumed. Services provided by the Adviser to investment companies, including the Portfolios, that are not provided to non-investment company clients and sub-advised investment companies include providing office space and personnel to serve as Fund Officers, who among other responsibilities make the certifications required under the Sarbanes–Oxley Act of 2002, and coordinating with and monitoring third party service providers such as Fund counsel, auditors, custodians, transfer agents and pricing services. The accounting, administrative, legal and compliance requirements for investment companies are more costly than those for institutional accounts due to the greater complexities and time required for investment companies, although a portion of the administrative expense of certain Institutional Clients that are investment companies are reimbursed by the Adviser to those Institutional Clients. It should be noted that those reimbursement agreements do not exist with respect to the Pooling Portfolios. In addition, managing the cash flow of an investment company may be more difficult than managing that of a stable pool of assets, such as an institutional account with little cash movement in either direction, particularly if the investment company experiences a net redemption and the Adviser is frequently forced to sell securities to raise cash for the redemption. However, managing an investment company with positive cash flow may be easier at times than managing a stable pool of assets. Finally, in recent years, investment advisers have been sued by institutional clients and have suffered reputational damage both by the attendant publicity and outcomes other than complete victories. Accordingly, the legal and reputational risks associated with institutional accounts are greater than previously thought, although still not equal to those related to the mutual fund industry.
Notwithstanding the Adviser’s view that managing an investment company is not comparable to managing other institutional accounts because the services provided are different and legal and reputational risks are greater, it is worth considering information regarding the advisory fees charged to institutional accounts that have investment styles similar to those of the Portfolios.6 In addition to the AllianceBernstein Institutional fee schedule, set forth below are what would have been the effective advisory fees of the Portfolios had the AllianceBernstein Institutional fee schedule been applicable to those Portfolios based on February 28, 2009 net assets, although it should be noted that the Portfolios are not charged an advisory fee by the Adviser.
| 6 | The Adviser has indicated that with respect to institutional accounts with assets greater than $300 million, it will negotiate a fee schedule. Discounts that are negotiated vary based upon each client relationship. |
| 208 | • ALLIANCEBERNSTEIN POOLING PORTFOLIOS |
| Portfolio | Portfolio Net Assets ($MIL) | AllianceBernstein (AB) Fee Schedule | Effective Fee | |||
| U.S. Value Portfolio | $1,454.6 | Diversified Value Schedule 65 bp on 1st $25 million 50 bp on next $25 million 40 bp on next $50 million 30 bp on next $100 million 25 bp on the balance Minimum Account Size: $25 m | 0.270% | |||
| U.S. Large Cap Growth Portfolio | $1,549.8 | U.S. Large Cap Growth Schedule 80 bp on 1st $25 million 50 bp on next $25 million 40 bp on next $50 million 30 bp on next $100 million 25 bp on the balance Minimum Account Size: $25 m | 0.271% | |||
| Global Real Estate Investment Portfolio7 | $644.1 | U.S. REIT Strategy 70 bp on 1st $25 million 60 bp on next $25 million 50 bp on next $25 million Negotiable on the balance Minimum Account Size: $25 m | 0.512%8 | |||
| International Value Portfolio | $741.4 | International Strategic Value Schedule 90 bp on 1st $25 million 70 bp on next $25 million 60 bp on next $50 million 50 bp on the balance Minimum Account Size: $25 m | 0.527% | |||
| International Growth Portfolio | $766.8 | International Large Cap Growth Schedule 80 bp on 1st $25 million 60 bp on next $25 million 50 bp on next $50 million 40 bp on the balance Minimum Account Size: $25 m | 0.426% | |||
| 7 | It should be noted that the Portfolio’s investment guidelines are not as restrictive as that of the institutional strategy. The Portfolio may invest in equity securities of non-U.S. real estate investment trusts (“REITS”) and other non-U.S. real estate industry companies in contrast to the institutional strategy, which invests primarily in equities of U.S. REITS and other U.S. real estate industry companies. |
| 8 | Assumes 50 bp on the balance. |
| ALLIANCEBERNSTEIN POOLING PORTFOLIOS • | 209 |
| Portfolio | Portfolio ($MIL) | AllianceBernstein (AB) Fee Schedule | Effective Fee | |||
| Small-Mid Cap Value Portfolio | $367.2 | Small & Mid Cap Value Schedule 95 bp on 1st $25 million 75 bp on next $25 million 65 bp on next $50 million 55 bp on the balance Minimum Account Size: $25 m | 0.604% | |||
| Small-Mid Cap Growth Portfolio | $389.2 | SMID Cap Growth Schedule 95 bp on 1st $25 million 75 bp on next $25 million 65 bp on next $50 million 55 bp on the balance Minimum Account Size: $25 m | 0.601% |
The Adviser manages the AllianceBernstein Mutual Funds (“ABMF”), which are open-end investment companies, and AllianceBernstein Variable Products Series Fund, Inc. (“AVPS”), which offers variable annuity and variable life contract policyholders the option to utilize certain AVPS portfolios as the investment option underlying their insurance contracts. The advisory schedules of these funds, implemented in January 2004 as a result of the Assurance of Discontinuance between the New York State Attorney General and the Adviser, contemplates eight categories with almost all of the AllianceBernstein funds in each category having the same advisory fee schedule. In addition to the fee schedules of the ABMF and AVPS funds, set forth below are what would have been the effective advisory fees of the Pooling Portfolios had the fee schedules of the ABMF/AVPS funds been applicable to the Portfolios based on the Portfolios February 28, 2009 net assets:
| Portfolio | ABMF/AVPS Portfolio | Fee Schedule | Effective ABMF/ Adv. Fee | |||
| U.S. Value Portfolio | Value Fund
AVPS Value Portfolio | 0.55% on first $2.5 billion 0.45% on next $2.5 billion 0.40% on the balance | 0.550% | |||
| U.S. Large Cap Growth Portfolio | Large Cap Growth Fund, Inc.
AVPS Large Cap Growth Portfolio | 0.75% on first $2.5 billion 0.65% on next $2.5 billion 0.60% on the balance | 0.750% | |||
| Global Real Estate Investment Portfolio | Global Real Estate Fund, Inc.
AVPS Real Estate Investment Portfolio | 0.55% on first $2.5 billion 0.45% on next $2.5 billion 0.40% on the balance | 0.550% | |||
| 210 | • ALLIANCEBERNSTEIN POOLING PORTFOLIOS |
| Portfolio | ABMF/AVPS Portfolio | Fee Schedule | Effective ABMF/ Adv. Fee | |||
| International Value Portfolio | International Value Fund, Inc.
AVPS International Value Portfolio | 0.75% on first $2.5 billion 0.65% on next $2.5 billion 0.60% on the balance | 0.750% | |||
| International Growth Portfolio | International Growth Fund, Inc.
AVPS International Growth Portfolio | 0.75% on first $2.5 billion 0.65% on next $2.5 billion 0.60% on the balance | 0.750% | |||
| Small-Mid Cap Value Portfolio | Small/Mid Cap Value Fund
AVPS Small/Mid Cap Value Portfolio | 0.75% on first $2.5 billion 0.65% on next $2.5 billion 0.60% on the balance | 0.750% | |||
| Small-Mid Cap Growth Portfolio | Small/Mid Cap Growth Fund | 0.75% on first $2.5 billion 0.65% on next $2.5 billion 0.60% on the balance | 0.750% |
The Adviser also manages and sponsors retail mutual funds, which are organized in jurisdictions outside the United States, generally Luxembourg and Japan, and sold to non-United States resident investors. The Adviser charges the fees set forth below for the Luxembourg funds that have a somewhat similar investment style as the Portfolios. It should be noted that Class A shares of the funds are charged an “all-in” fee, which covers investment advisory services and distribution related services, unlike Class I shares, whose fee is for investment advisory services only.
| Portfolio | Luxembourg Fund | Fee | ||
| U.S. Large Cap Growth Portfolio | American Growth Portfolio Class A Class I | 0.70% | ||
| Global Real Estate Investment Portfolio | Global Real Estate Securities Portfolio Class A Class I | 0.95% |
The Alliance Capital Investment Trust Management mutual funds (“ITM”), which are offered to investors in Japan, have an “all-in” fee to compensate the Adviser for investment advisory as well as fund accounting and administrative
| ALLIANCEBERNSTEIN POOLING PORTFOLIOS • | 211 |
related services. The fee schedules of the ITM mutual funds that have a somewhat similar investment style as certain of the Portfolios are as follows:
| Portfolio | ITM Mutual Fund | Fee9 | ||
| U.S. Large Cap Growth Portfolio | AllianceBernstein U.S. Large Cap Growth Equity H (Hedged), N (Unhedged) | 0.95% | ||
| International Value Portfolio | Bernstein Kokusai Strategic Value10 | 0.95% on first ¥1 billion 0.85% on next ¥1.5 billion 0.70% on next ¥2.5 billion 0.60% on next ¥5 billion 0.50% on the balance |
The Adviser provides sub-advisory services to certain other investment companies managed by other fund families. The Adviser charges the fees set forth below for each of these sub-advisory relationships. Also shown are what would have been the effective advisory fees of the Portfolios had the fee schedules of the sub-advisory relationships been applicable to those Portfolios based on February 28, 2009 net assets:
| Portfolio | Fee Schedule | Effective Sub-Adv. Fee | ||||
| U.S. Value Portfolio | Client # 1 | 0.25% on 1st $500 million 0.20% on the balance | 0.217% | |||
| Client # 211, 12 | 0.49% on 1st $100 million 0.30% on next $100 million 0.20% on the balance | 0.270% | ||||
| Client # 311 | 0.23% on 1st $300 million 0.20% on the balance | 0.206% | ||||
| Client # 411 | 0.23% on 1st $300 million 0.20% on the balance | 0.206% |
| 9 | The Japanese Yen-U.S. dollar currency exchange rate quoted at 4 p.m. on April 8, 2009 by Reuters was ¥99.64 per $1. At that currency exchange rate, every ¥1 billion would be equivalent to approximately $10.3 million. |
| 10 | This ITM fund is privately placed or institutional |
| 11 | Assets are aggregated for purposes of calculating the investment advisory fee. |
| 12 | The Client is an affiliate of the Adviser. |
| 212 | • ALLIANCEBERNSTEIN POOLING PORTFOLIOS |
| Portfolio | Fee Schedule | Effective Sub-Adv. Fee | ||||
| Client # 5 | 0.15% on 1st $1 billion 0.14% on next $2 billion 0.12% on next $2 billion 0.10% thereafter +/- Performance Fee13 | 0.147%14 | ||||
| Client # 6 | 0.35% | 0.350% | ||||
| U.S. Large Cap Growth Portfolio | Client # 1 | 0.60% on 1st $1 billion 0.55% on the balance | 0.582% | |||
| Client # 2 | 0.35% on 1st $50 million 0.30% on next $100 million 0.25% on the balance | 0.256% | ||||
| Client # 311 | 0.40% on first $300 million 0.35% on next $300 million 0.25% thereafter | 0.289% | ||||
| Client # 4 | 0.35% | 0.350% | ||||
| International Value Portfolio | Client # 1 | 0.65% on 1st $75 million 0.50% on next $25 million 0.40% on next $200 million 0.35% on next $450 million 0.30% thereafter | 0.399% | |||
| Client # 211,12 | 0.60% on 1st $1 billion 0.55% on next $500 million 0.50% on next $500 million 0.45% on next $500 million 0.40% on the balance | 0.600% | ||||
| Client # 3 | 0.45% on 1st $200 million 0.36% on next $300 million 0.32% on the balance | 0.371% | ||||
| Client # 4 | 0.55% on 1st $150 million 0.50% on next $150 million 0.45% on the balance | 0.480% | ||||
| Client # 5 | 0.50% | 0.500% | ||||
| Client # 6 | 0.30% | 0.300% | ||||
| 13 | The performance fee is calculated by multiplying the Base Fee during the period by an adjustment factor that considers the excess or under performance of the fund versus its benchmark, over a cumulative 36-month period. The performance adjustment factor can range from -50% to +50% of the base fee. |
| 14 | The calculation excludes the performance fee. |
| ALLIANCEBERNSTEIN POOLING PORTFOLIOS • | 213 |
| Portfolio | Fee Schedule | Effective Sub-Adv. Fee | ||||
| Client #7 | 0.22% on 1st $1 billion 0.18% on next $1.5 billion 0.16% on the balance | 0.220%14 | ||||
| +/- Performance Fee15 | ||||||
| Client #8 | 0.60% on 1st $50 million 0.40% on next $50 million 0.30% on next $300 million 0.25% on the balance | 0.304% | ||||
| Client #911 | 0.50% on 1st $100 million 0.46% on next $300 million 0.41% on the balance | 0.442% | ||||
| Client #10 | 0.72% on 1st $25 million 0.54% on next $25 million 0.45% on the next $50 million 0.36% on the balance | 0.384% | ||||
| Client #11 | 0.35% on 1st $1 billion 0.30% on next $1 billion 0.25% on the balance | 0.350% | ||||
| Client #12 | 0.35% on 1st $1 billion 0.325% on the balance | 0.350% | ||||
| Small Cap-Mid Value Portfolio | Client #1 | 0.50% on 1st $250 million 0.40% on the balance | 0.484% | |||
| Client #2 | 0.72% on 1st $25 million 0.54% on next $225 million 0.50% on the balance | 0.539% | ||||
| Client #3 | 0.95% on 1st $25 million 0.75% on next $25 million 0.65% on 1st $50 million 0.55% on the balance | 0.604% | ||||
| Client #4 | 0.80% on 1st $25 million 0.60% on the balance | 0.614% | ||||
| Client #5 | 0.613% on 1st $150 million 0.495% on the balance | 0.543% |
| 14 | The calculation excludes the performance fee. |
| 15 | The performance fee is calculated by multiplying the Base Fee during the period by an adjustment factor that considers the excess or under performance of the fund versus its benchmark, over a 60 month rolling period. The performance adjustment factor can range from -60% to +60% of the base fee. |
| 214 | • ALLIANCEBERNSTEIN POOLING PORTFOLIOS |
It is fair to note that the services the Adviser provides pursuant to sub-advisory agreements are generally confined to the services related to the investment process; in other words, they are not as comprehensive as the services provided to the Portfolios by the Adviser. In addition, to the extent that certain of these sub-advisory relationships are with affiliates of the Adviser, the fee schedules may not reflect arm’s-length bargaining or negotiations.
| II. | MANAGEMENT FEES CHARGED BY OTHER MUTUAL FUNDS COMPANIES FOR LIKE SERVICES. |
The Trustees previously received the Senior Officer’s Evaluation of the Investment Advisory Agreement (the “Senior Officer Fee Evaluation”) for the Retirement Strategies, U.S. Large Cap Portfolio and the Wealth Strategies. In those Senior Officer Fee Evaluations, the Senior Officer concluded that the investment advisory agreements for those funds were reasonable and within range of what would have been negotiated at arm’s-length.
The Pooling Portfolios are not charged an advisory fee. However, as previously mentioned, the Institutional Clients that invest in the Pooling Portfolios do pay an advisory fee pursuant to their advisory agreements with the Adviser. The Adviser believes that the fee paid by the Institutional Clients includes a portion, referred by the Adviser as the “Implied Advisory Fee,” that may be reasonably viewed as compensation for services that the Adviser provides to the Pooling Portfolios. The Adviser further believes that the rate of the Implied Advisory Fee is the same for each Institutional Client invested in a series of the Pooling Portfolios.
Because of the Pooling Portfolios’ limited availability for investment, open only to certain institutional clients of the Adviser, the Pooling Portfolios have zero transfer agent (with the exception of certain transfer agent out of pocket expenses) and distribution fees, in addition to zero advisory fees. Such expense structure is rare in the industry. The UBS Relationship Funds, an open-end investment company managed by UBS Global Asset Management (Americas) Inc., was the only other fund family that was determined by the Adviser, the Senior Officer and Lipper, Inc. (“Lipper”) to have an expense structure comparable to the Pooling Portfolios.
Since there are not many funds of other fund families that have a similar expense structure as the Portfolios, Lipper, an analytical service not affiliated with the Adviser, compared the total expense ratios of the Portfolios to that of funds of a similar investment classification/objective with institutional class shares; however, Lipper excluded management, transfer agent and distribution fees from the
| ALLIANCEBERNSTEIN POOLING PORTFOLIOS • | 215 |
total expense ratios of the Portfolios’ peers.16 Lipper’s analysis included the Portfolios’ rankings17 relative to their respective Lipper Expense Group (“EG”) and Lipper Expense Universe (“EU”).18
Lipper describes an EG as a representative sample of comparable funds. Lipper’s standard methodology for screening funds to be included in an EG entails the consideration of several fund criteria, including fund type, investment classification/objective, load type and similar 12b-1/non-12b-1 service fees, asset (size) comparability, and expense components and attributes. 19 An EG will typically consist of seven to twenty funds. An EU is a much broader group, consisting of all institutional classes of funds of the same investment classification/objective as the subject Portfolio.20
With respect to International Value Portfolio and International Growth Portfolio, each of those Portfolios’ original EGs had an insufficient number of comparable peers. Consequently, at the request of the Senior Officer and the Adviser, Lipper expanded each of those Portfolios’ EGs to include peers that have a similar but not the same Lipper investment classification/objective. However, because Lipper had expanded the EGs of those Portfolios, under Lipper’s standard guidelines, each of the Portfolios’ EUs was also expanded to
| 16 | Because the Portfolios are offered only to other investment companies and certain institutional clients managed by the Adviser, the Portfolios are not assessed a fee for transfer agent and distribution-related services although it should be noted that the transfer agent of the Portfolios is reimbursed for out of pocket expenses. |
| 17 | A ranking of “1” would mean that the Portfolio had the lowest total expense ratio in the Lipper peer group. |
| 18 | Note that there are limitations on expense category data because different funds categorize expenses differently. |
| 19 | Lipper excluded institutional classes or funds that had a 12b-1 or non 12b-1 service fee for this evaluation in order for the Portfolios’ EUs to not include multiple classes of the same funds. As a result, the EUs in this evaluation are much smaller in size compared to the evaluation dated January 31, 2009. |
| 20 | Except for asset (size) comparability, Lipper uses the same criteria for selecting a Lipper EG when selecting a Lipper EU. Unlike the Lipper EG, the Lipper EU allows for the same adviser to be represented by more than just one fund. In addition, multiple institutional class shares for the Portfolios’ peers are included. |
| 216 | • ALLIANCEBERNSTEIN POOLING PORTFOLIOS |
include the universe of those peers that had a similar but not the same Lipper investment classification/objective.21 The result of Lipper’s analysis is set forth below:
| Portfolio | Expense Ratio | Lipper Exp. Group Median (%)22 | Lipper Group Rank | Lipper Exp. Median (%) | Lipper Rank | |||||
| U.S. Value Portfolio | 0.019 | 0.043 | 3/13 | 0.086 | 4/43 | |||||
| U.S. Large Cap Growth Portfolio | 0.019 | 0.041 | 1/18 | 0.068 | 6/128 | |||||
| Global Real Estate Investment Portfolio | 0.068 | 0.133 | 1/6 | 0.138 | 1/17 | |||||
| International Value Portfolio23 | 0.074 | 0.090 | 8/19 | 0.128 | 19/108 | |||||
| International Growth Portfolio24 | 0.063 | 0.086 | 7/19 | 0.087 | 11/48 | |||||
| Small-Mid Cap Value Portfolio | 0.040 | 0.050 | 7/17 | 0.066 | 16/57 | |||||
| Small-Mid Cap Growth Portfolio | 0.041 | 0.061 | 3/18 | 0.085 | 15/92 | |||||
Based on this analysis, the total expense ratios of the Portfolios are lower than their respective EG and EU medians.
| III. | COSTS TO THE ADVISER AND ITS AFFILIATES OF SUPPLYING SERVICES PURSUANT TO THE ADVISORY FEE ARRANGEMENT, EXCLUDING ANY INTRA-CORPORATE PROFIT. |
The Adviser utilizes two profitability reporting systems, which operate independently but are aligned with each other, to estimate the Adviser’s profitability in connection with investment advisory services provided to the Portfolios. The Senior Officer has retained a consultant to provide independent advice regarding the alignment of the two profitability systems as well as the methodologies and allocations utilized by both profitability systems. See Section IV for additional discussion.
| 21 | It should be noted that the expansion such Portfolios’ EUs was not requested by the Senior Officer or the Adviser. They requested that only the EGs be expanded. |
| 22 | With respect to the Portfolios’ peers, the total expense ratios of those funds are net of management, transfer agent and distribution fees. |
| 23 | The Portfolio’s EG includes the Portfolio, eight other International Multi-Cap Value funds (“IMLV”), four International Large-Cap Core funds (“ILCC”), five International Large-Cap Growth funds (“ILCG”) and one International Large-cap Value fund (“ILCV”). The Portfolio’s EU includes the Portfolio and all other institutional funds of IMLV, ILCC, ILCG, and ILCV, excluding outliers. |
| 24 | The Portfolio’s EG includes the Portfolio, seven other ILCG and 11 International Multi-Cap Growth funds (“IMLG”). The Portfolio’s EU includes the Portfolio and all other institutional funds of ILCG and IMLG, excluding outliers. |
| ALLIANCEBERNSTEIN POOLING PORTFOLIOS • | 217 |
| IV. | PROFIT MARGINS OF THE ADVISER AND ITS AFFILIATES FOR SUPPLYING SUCH SERVICES. |
The Pooling Portfolios’ profitability information, prepared by the Adviser for the Board of Trustees, was reviewed by the Senior Officer and the consultant. The Adviser used a weighted average of the Adviser’s profitability with respect to the Institutional Clients that are invested in the Pooling Portfolios, in addition to any Portfolio’s specific revenue or expense item, to calculate the Adviser’s profitability.
Certain of the Portfolios may effect brokerage transactions in the future through the Adviser’s affiliate, Sanford C. Bernstein & Co. LLC, and/or its U.K. based affiliate, Sanford C. Bernstein Ltd., collectively “SCB”, and pay commissions during the Portfolios’ recent fiscal year. During the Portfolios’ most recently completed fiscal year, only International Value Portfolio effected brokerage transactions with and paid commissions to SCB. The Adviser represents that SCB’s profitability from business conducted with the International Value Portfolio is comparable to the profitability of SCB’s dealings with other similar third-party clients. In the ordinary course of business, SCB receives and pays liquidity rebates from electronic communications networks (“ECNs”) derived from trading for its clients, including the Portfolios. These credits and charges are not being passed on to any SCB client.
| V. | POSSIBLE ECONOMIES OF SCALE |
The Adviser has indicated that economies of scale are being shared with shareholders through fee structures,25 subsidies and enhancement to services. Based on some of the professional literature that has considered economies of scale in the mutual fund industry, it is thought that to the extent economies of scale exist, they may more often exist across a fund family as opposed to a specific fund. This is because the costs incurred by the Adviser, such as investment research or technology for trading or compliance systems can be spread across a greater asset base as the fund family increases in size. It is also possible that as the level of services required to operate a successful investment company has increased over time, and advisory firms make such investments in their business to provide services, there may be a sharing of economies of scale without a reduction in advisory fees.
An independent consultant, retained by the Senior Officer, provided the Board of Directors an update of the Deli26 study on advisory fees and various fund characteristics. The independent consultant first reiterated the results of his previous two dimensional comparison analysis (fund size and family size) with the
| 25 | Fee structures include fee reductions, pricing at scale and breakpoints in advisory fee schedules. |
| 26 | The Deli study was originally published in 2002 based on 1997 data. |
| 218 | • ALLIANCEBERNSTEIN POOLING PORTFOLIOS |
Board of Directors.27 The independent consultant then discussed the results of the regression model that was utilized to study the effects of various factors on advisory fees. The regression model output indicated that the bulk of the variation in fees predicted were explained by various factors, but substantially by fund AUM, family AUM, index fund indicator and investment style. The independent consultant also compared the advisory fees of the AllianceBernstein Mutual Funds to similar funds managed by 19 other large asset managers, regardless of the fund size and each Adviser’s proportion of mutual fund assets to non-mutual fund assets.
| VI. | NATURE AND QUALITY OF THE ADVISER’S SERVICES INCLUDING THE PERFORMANCE OF THE PORTFOLIOS. |
With assets under management of $411 billion as of March 31, 2009, the Adviser has the investment experience to manage and provide non-investment services to the Portfolios.
The information in the table below shows the 1, 3 year and since inception28 gross performance returns and rankings of the Portfolios relative to their Lipper Performance Group (“PG”) and Lipper Performance Universe (“PU”)29 for the periods ended January 31, 2009.30
| Portfolio Return (%) | PG Median (%) | PU Median (%) | PG Rank | PU Rank | ||||||
U.S. Value Portfolio | ||||||||||
1 year | -45.23 | -40.97 | -41.61 | 11/13 | 50/63 | |||||
3 year | -15.35 | -13.75 | -13.13 | 9/12 | 32/50 | |||||
Since Inception | -10.53 | -8.73 | -8.22 | 9/11 | 31/40 |
| 27 | The two dimensional analysis showed patterns of lower advisory fees for funds with larger asset sizes and funds from larger family sizes compared to funds with smaller asset sizes and funds from smaller family sizes, which according to the independent consultant is indicative of a sharing of economies of scale and scope. However, in less liquid and active markets, such is not the case, as the empirical analysis showed potential for diseconomies of scale in those markets. The empirical analysis also showed diminishing economies of scale and scope as funds surpassed a certain high level of assets. |
| 28 | It should be noted that the period that Lipper uses to calculate inception date performance is from the nearest month end after inception date. In contrast to Lipper, the Adviser calculates the Portfolios’ performance using data from the actual inception date. Note that the since inception gross performance returns calculated by Lipper for U.S. Value Portfolio and U.S. Large Cap Growth Portfolio, Global Real Estate Investment Portfolio, Small/Mid Cap Value Portfolio and Small/Mid Cap Growth Portfolio are less than the net performance returns calculated by the Adviser. Normally, gross performance returns are higher than net performance returns. |
| 29 | A Portfolio’s PG and PU may not be identical to its respective EG and EU. The criteria for including and excluding a fund in a PG or PU is somewhat different from that of an EG or EU. |
| 30 | The performance returns of the Portfolios’ peers are also adjusted for expenses (gross up). |
| ALLIANCEBERNSTEIN POOLING PORTFOLIOS • | 219 |
Portfolio Return | PG Median (%) | PU Median (%) | PG Rank | PU Rank | ||||||
| U.S. Large Cap Growth Portfolio | ||||||||||
1 year | -35.87 | -37.98 | -36.75 | 7/18 | 64/163 | |||||
3 year | -14.20 | -13.18 | -11.85 | 12/17 | 104/130 | |||||
Since Inception | -6.74 | -6.90 | -7.20 | 7/14 | 49/144 | |||||
| Global Real Estate Investment Portfolio | ||||||||||
1 year | -49.89 | -50.31 | -50.10 | 3/6 | 10/22 | |||||
3 year | -14.82 | -14.82 | -16.09 | 2/3 | 3/9 | |||||
Since Inception | -8.00 | -7.51 | -9.67 | 2/2 | 2/7 | |||||
| International Value Portfolio | ||||||||||
1 year | -52.45 | -43.82 | -44.94 | 9/9 | 39/39 | |||||
3 year | -16.54 | -10.86 | -12.11 | 9/9 | 23/24 | |||||
Since Inception | -7.18 | -3.99 | -3.92 | 8/8 | 19/20 | |||||
| International Growth Portfolio | ||||||||||
1 year | -47.53 | -44.55 | -43.76 | 6/8 | 14/21 | |||||
3 year | -14.18 | -12.31 | -12.23 | 7/8 | 15/16 | |||||
Since Inception | -6.13 | -4.86 | -4.52 | 7/7 | 13/13 | |||||
| Small-Mid Cap Value Portfolio | ||||||||||
1 year | -40.37 | -41.00 | -39.26 | 8/16 | 39/68 | |||||
3 year | -13.29 | -11.92 | -12.82 | 10/14 | 32/54 | |||||
Since Inception | -7.97 | -6.34 | -6.70 | 10/13 | 28/43 | |||||
| Small-Mid Cap Growth Portfolio | ||||||||||
1 year | -38.82 | -40.09 | -41.44 | 7/18 | 35/112 | |||||
3 year | -12.21 | -12.79 | -13.20 | 7/16 | 30/90 | |||||
Since Inception | -3.99 | -6.31 | -6.50 | 4/14 | 15/79 |
| 220 | • ALLIANCEBERNSTEIN POOLING PORTFOLIOS |
Set forth below are the 1, 3 year and since inception net performance returns of the Portfolios (in bold) versus their benchmarks.31
| Periods Ending January 31, 2009 Annualized Performance (%) | ||||||
| 1 Year | 3 Year | Since Inception | ||||
| U.S. Value Portfolio | -45.24 | -15.37 | -10.36 | |||
| Russell 1000 Value Index | -41.48 | -13.09 | -8.19 | |||
| Inception Date: May 20, 2005 | ||||||
| U.S. Large Cap Growth Portfolio | -35.88 | -14.22 | -6.35 | |||
| Russell 1000 Growth Index | -36.44 | -11.11 | -6.99 | |||
| Inception Date: May 20, 2005 | ||||||
| Global Real Estate Investment Portfolio | -49.92 | -14.88 | -7.97 | |||
| FTSE EPRA NAREIT Global Index | -52.42 | -17.29 | -9.27 | |||
| Inception Date: May 20, 2005 | ||||||
| International Value Portfolio | -52.48 | -16.61 | -7.24 | |||
| MSCI EAFE Value Index | -43.74 | -12.25 | -4.65 | |||
| Inception Date: May 20, 2005 | ||||||
| International Growth Portfolio | -47.57 | -14.24 | -6.30 | |||
| MSCI EAFE Growth Index | -42.29 | -11.08 | -3.65 | |||
| Inception Date: May 20, 2005 | ||||||
| Small-Mid Cap Value Portfolio | -40.40 | -13.33 | -7.94 | |||
| Russell 2500 Value Index | -37.71 | -14.36 | -8.00 | |||
| Inception Date: May 20, 2005 | ||||||
| Small-Mid Cap Growth Portfolio | -38.85 | -12.25 | -3.90 | |||
| Russell 2500 Growth Index | -40.14 | -14.30 | -6.87 | |||
| Inception Date: May 20, 2005 | ||||||
CONCLUSION:
Based on the factors discussed above the Senior Officer’s conclusion is that the proposed advisory fees for the Portfolios are reasonable and within the range of what would have been negotiated at arm’s-length in light of all the surrounding circumstances. This conclusion in respect of the Portfolios is based on an evaluation of all of these factors and no single factor was dispositive.
Dated: May 29, 2009
| 31 | The Adviser provided Portfolio and benchmark performance return information for periods through January 31, 2009. |
| ALLIANCEBERNSTEIN POOLING PORTFOLIOS • | 221 |
THIS PAGE IS NOT PART OF THE SHAREHOLDER REPORT OR THE FINANCIAL STATEMENTS
ALLIANCEBERNSTEIN FAMILY OF FUNDS
Wealth Strategies Funds
Balanced Wealth Strategy
Wealth Appreciation Strategy
Conservative Wealth Strategy*
Tax-Managed Balanced Wealth Strategy
Tax-Managed Wealth Appreciation Strategy
Tax-Managed Conservative Wealth Strategy*
Blended Style Funds
U.S. Large Cap Portfolio
International Portfolio
Tax-Managed International Portfolio
Growth Funds
Domestic
Growth Fund
Large Cap Growth Fund
Small Cap Growth Portfolio
Small/Mid Cap Growth Fund
U.S. Strategic Research Portfolio*
Global & International
Global Growth Fund
Global Thematic Growth Fund
Greater China ‘97 Fund
International Growth Fund
Value Funds
Domestic
Balanced Shares
Core Opportunities Fund*
Growth & Income Fund
Small/Mid Cap Value Fund
Utility Income Fund
Value Fund
Global & International
Global Real Estate Investment Fund
Global Value Fund
International Value Fund
Taxable Bond Funds
Diversified Yield Fund
Global Bond Fund
High Income Fund
Intermediate Bond Portfolio
Short Duration Portfolio
Municipal Bond Funds
National Arizona California Massachusetts Michigan Minnesota | New Jersey New York Ohio Pennsylvania Virginia |
Intermediate Municipal Bond Funds
Intermediate California
Intermediate Diversified
Intermediate New York
Closed-End Funds
AllianceBernstein Global High Income Fund
AllianceBernstein Income Fund
AllianceBernstein National Municipal Income Fund
Alliance California Municipal Income Fund
Alliance New York Municipal Income Fund
The Ibero-America Fund*
Retirement Strategies Funds
2000 Retirement Strategy | 2020 Retirement Strategy | 2040 Retirement Strategy | ||
2005 Retirement Strategy | 2025 Retirement Strategy | 2045 Retirement Strategy | ||
2010 Retirement Strategy | 2030 Retirement Strategy | 2050 Retirement Strategy | ||
2015 Retirement Strategy | 2035 Retirement Strategy | 2055 Retirement Strategy |
We also offer Exchange Reserves,** which serves as the money market fund exchange vehicle for the AllianceBernstein mutual funds.
You should consider the investment objectives, risks, charges and expenses of any AllianceBernstein fund/portfolio carefully before investing. For free copies of our prospectuses, which contain this and other information, visit us online at www.alliancebernstein.com or contact your financial advisor. Please read the prospectus carefully before investing.
| * | Prior to December 31, 2009, Conservative Wealth Strategy was named Wealth Preservation Strategy, and Tax-Managed Conservative Wealth Strategy was named Tax-Managed Wealth Preservation Strategy. U.S. Strategic Research Portfolio was incepted on December 23, 2009. Prior to January 20, 2010, The Ibero-America Fund was named The Spain Fund. Prior to March 1, 2010, Core Opportunities Fund was named the Focused Growth & Income Fund. |
| ** | An investment in the Fund is not a deposit in a bank and is not insured or guaranteed by the Federal Deposit Insurance Corporation or any other government agency. Although the Fund seeks to preserve the value of your investment at $1.00 per share, it is possible to lose money by investing in the Fund. |
| 222 | • ALLIANCEBERNSTEIN POOLING PORTFOLIOS |
AllianceBernstein Family of Funds
NOTES
| ALLIANCEBERNSTEIN POOLING PORTFOLIOS • | 223 |
NOTES
| 224 | • ALLIANCEBERNSTEIN POOLING PORTFOLIOS |
ALLIANCEBERNSTEIN POOLING PORTFOLIOS
1345 Avenue of the Americas
New York, NY 10105
800.221.5672
| POOL-0152-0210 |  | |
| ITEM 2. | CODE OF ETHICS. |
Not applicable when filing a semi-annual report to shareholders.
| ITEM 3. | AUDIT COMMITTEE FINANCIAL EXPERT. |
Not applicable when filing a semi-annual report to shareholders.
| ITEM 4. | PRINCIPAL ACCOUNTANT FEES AND SERVICES. |
Not applicable when filing a semi-annual report to shareholders.
| ITEM 5. | AUDIT COMMITTEE OF LISTED REGISTRANTS. |
Not applicable to the registrant.
| ITEM 6. | SCHEDULE OF INVESTMENTS. |
Please see Schedule of Investments contained in the Report to Shareholders included under Item 1 of this Form N-CSR.
| ITEM 7. | DISCLOSURE OF PROXY VOTING POLICIES AND PROCEDURES FOR CLOSED-END MANAGEMENT INVESTMENT COMPANIES. |
Not applicable to the registrant.
| ITEM 8. | PORTFOLIO MANAGERS OF CLOSED-END MANAGEMENT INVESTMENT COMPANIES. |
Not applicable to the registrant.
| ITEM 9. | PURCHASES OF EQUITY SECURITIES BY CLOSED-END MANAGEMENT INVESTMENT COMPANY AND AFFILIATED PURCHASERS. |
Not applicable to the registrant.
| ITEM 10. | SUBMISSION OF MATTERS TO A VOTE OF SECURITY HOLDERS. |
There have been no material changes to the procedures by which shareholders may recommend nominees to the Fund’s Board of Directors since the Fund last provided disclosure in response to this item.
ITEM 11. CONTROLS AND PROCEDURES.
(a) The registrant’s principal executive officer and principal financial officer have concluded that the registrant’s disclosure controls and procedures (as defined in Rule 30a-2(c) under the Investment Company Act of 1940, as amended) are effective at the reasonable assurance level based on their evaluation of these controls and procedures as of a date within 90 days of the filing date of this document.
(b) There were no changes in the registrant’s internal controls over financial reporting that occurred during the second fiscal quarter of the period that has materially affected, or is reasonably likely to materially affect, the registrant’s internal control over financial reporting.
| ITEM 12. | EXHIBITS. |
The following exhibits are attached to this Form N-CSR:
EXHIBIT NO. | DESCRIPTION OF EXHIBIT | |
12 (b) (1) | Certification of Principal Executive Officer Pursuant to Section 302 of the Sarbanes-Oxley Act of 2002 | |
12 (b) (2) | Certification of Principal Financial Officer Pursuant to Section 302 of the Sarbanes-Oxley Act of 2002 | |
12 (c) | Certification of Principal Executive Officer and Principal Financial Officer Pursuant to Section 906 of the Sarbanes-Oxley Act of 2002 | |
SIGNATURES
Pursuant to the requirements of the Securities Exchange Act of 1934 and the Investment Company Act of 1940, the registrant has duly caused this report to be signed on its behalf by the undersigned, thereunto duly authorized.
| (Registrant): The AllianceBernstein Pooling Portfolios | ||
| By: | /s/ ROBERT M. KEITH | |
| Robert M. Keith | ||
| President | ||
Date: April 22, 2010
Pursuant to the requirements of the Securities Exchange Act of 1934 and the Investment Company Act of 1940, this report has been signed below by the following persons on behalf of the registrant and in the capacities and on the dates indicated.
| By: | /s/ ROBERT M. KEITH | |
| Robert M. Keith | ||
| President |
Date: April 22, 2010
| By: | /s/ JOSEPH J. MANTINEO | |
| Joseph J. Mantineo | ||
| Treasurer and Chief Financial Officer |
Date: April 22, 2010