UNITED STATES
SECURITIES AND EXCHANGE COMMISSION
WASHINGTON, D.C. 20549
FORM N-CSR
CERTIFIED SHAREHOLDER REPORT OF REGISTERED
MANAGEMENT INVESTMENT COMPANIES
Investment Company Act file number: 811-21673
THE ALLIANCEBERNSTEIN POOLING PORTFOLIOS
(Exact name of registrant as specified in charter)
1345 Avenue of the Americas, New York, New York 10105
(Address of principal executive offices) (Zip code)
Joseph J. Mantineo
AllianceBernstein L.P.
1345 Avenue of the Americas
New York, New York 10105
(Name and address of agent for service)
Registrant’s telephone number, including area code: (800) 221-5672
Date of fiscal year end: August 31, 2013
Date of reporting period: February 28, 2013
| ITEM 1. | REPORTS TO STOCKHOLDERS. |
SEMI-ANNUAL REPORT
AllianceBernstein Pooling Portfolios
U.S. Value
U.S. Large Cap Growth
International Value
International Growth
Short Duration Bond
Global Core Bond
Bond Inflation Protection
High-Yield
Small-Mid Cap Value
Small-Mid Cap Growth
Multi-Asset Real Return
Volatility Management
February 28, 2013
Semi-Annual Report

Investment Products Offered
•Are Not FDIC Insured •May Lose Value •Are Not Bank Guaranteed |
Investors should consider the investment objectives, risks, charges and expenses of the Fund carefully before investing. For copies of our prospectus or summary prospectus, which contain this and other information, visit us online at www.alliancebernstein.com or contact your AllianceBernstein Investments representative. Please read the prospectus and/or summary prospectus carefully before investing.
This shareholder report must be preceded or accompanied by the Fund’s prospectus for individuals who are not current shareholders of the Fund.
You may obtain a description of the Fund’s proxy voting policies and procedures, and information regarding how the Fund voted proxies relating to portfolio securities during the most recent 12-month period ended June 30, without charge. Simply visit AllianceBernstein’s website at www.alliancebernstein.com, or go to the Securities and Exchange Commission’s (the “Commission”) website at www.sec.gov, or call AllianceBernstein at (800) 227-4618.
The Fund files its complete schedule of portfolio holdings with the Commission for the first and third quarters of each fiscal year on Form N-Q. The Fund’s Forms N-Q are available on the Commission’s website at www.sec.gov. The Fund’s Forms N-Q may also be reviewed and copied at the Commission’s Public Reference Room in Washington, DC; information on the operation of the Public Reference Room may be obtained by calling (800) SEC-0330. AllianceBernstein publishes full portfolio holdings for the Fund monthly at www.alliancebernstein.com.
AllianceBernstein Investments, Inc. (ABI) is the distributor of the AllianceBernstein family of mutual funds. ABI is a member of FINRA and is an affiliate of AllianceBernstein L.P., the manager of the funds.
AllianceBernstein® and the AB Logo are registered trademarks and service marks used by permission of the owner, AllianceBernstein L.P.
April 23, 2013
Semi-Annual Report
This report provides management’s discussion of fund performance for the AllianceBernstein Pooling Portfolios (collectively, the “Portfolios”; individually, the “Portfolio”) for the semi-annual reporting period ended February 28, 2013.
The tables on pages 20-22 show each Portfolio’s performance for the six- and 12-month periods ended February 28, 2013, compared to their respective benchmarks. Additional performance can be found on pages 23-26. Each Portfolio’s benchmark is as follows: U.S. Value Portfolio—Russell 1000 Value Index; U.S. Large Cap Growth Portfolio—Russell 1000 Growth Index; International Value Portfolio—Morgan Stanley Capital International (“MSCI”) All Country World Index (“ACWI”) ex-U.S.; International Growth Portfolio—MSCI ACWI ex-U.S.; Short Duration Bond Portfolio—Bank of America Merrill Lynch (“BofA ML”) 1-3 Year U.S. Treasury Index; Global Core Bond Portfolio—Barclays Global Aggregate Bond Index (U.S. dollar hedged); Bond Inflation Protection Portfolio—Barclays 1-10 Year Treasury Inflation Protected Securities (“TIPS”) Index; High-Yield Portfolio—Barclays U.S. High Yield 2% Issuer Cap Index; Small-Mid Cap Value Portfolio—Russell 2500 Value Index; Small-Mid Cap Growth Portfolio—Russell 2500 Growth Index; Multi-Asset Real Return Portfolio—MSCI AC World Commodity Producers Index; Volatility Management Portfolio—MSCI ACWI.
Market Review
Global equity and bond markets advanced during the 12-month period ended February 28, 2013, largely driven by improved investor sentiment and the gradual return to riskier assets. Policy and political developments, rather than an acceleration of economic growth, were the main drivers. The willingness of political leaders to address the structural flaws of the euro zone—along with the continued global monetary easing cycle led by the U.S. Federal Reserve and the European Central Bank (“ECB”)—lifted investor confidence for much of the period.
In Europe, the threat of a worst-case outcome for the euro was reduced. The ECB’s Outright Monetary Transactions program and more support for Greece alleviated fears of a euro breakup. China’s slowdown appears to have bottomed. Housing starts, corporate bond issuance and a steady yuan should support 7%–8% growth. In Japan, equity markets gained as the yen weakened amid expectations of a monetary policy shift following the Liberal Democratic Party’s victory in the December elections. U.S. financial markets continued to rebound, approaching new highs for the equity market late in the reporting period, despite investors’ concerns about slowing corporate earnings growth and continued political dysfunction. While the American Taxpayer Relief Act of 2012, passed by the Senate and House of Representatives on January 1, 2013, averted the most feared outcomes of the “fiscal cliff”, it did not tackle spending or debt-reduction
| ALLIANCEBERNSTEIN POOLING PORTFOLIOS • | 1 |
issues which remain unresolved. Although risks remain, equity and bond markets around the world moved higher, helped by monetary policy actions and improving perceptions regarding the sovereign debt crisis in Europe.
U.S. Value Portfolio
Investment Objective and Policies
The Portfolio seeks long-term growth of capital. The Portfolio invests primarily in a diversified portfolio of equity securities of U.S. companies, emphasizing investments in companies that AllianceBernstein (the “Adviser”) believes are undervalued. The Portfolio uses the fundamental value approach of the Adviser’s Bernstein unit (“Bernstein”). This fundamental value approach seeks to identify investments that are considered to be undervalued because they are attractively priced relative to future earnings power and dividend-paying capability. The Adviser relies heavily on the fundamental analysis and research of Bernstein’s large internal research staff in making investment decisions for the Portfolio. Under normal circumstances, the Portfolio invests in at least 80% of its net assets in equity securities of U.S. companies.
The Portfolio may enter into derivatives transactions, such as options, futures contracts, forwards, and swaps. The Portfolio may use options strategies involving the purchase and/or writing of various combinations of call and/or put options, including on individual securities and stock indexes, futures contracts (including futures contracts on individual securities and stock indexes) or shares of exchange-traded funds
(“ETFs”). These transactions may be used, for example, in an effort to earn extra income, to adjust exposure to individual securities or markets, or to protect all or a portion of the Portfolio’s portfolio from a decline in value, sometimes within certain ranges. The Portfolio may, at times, invest in shares of ETFs in lieu of making direct investments in securities. ETFs may provide more efficient and economical exposure to the types of companies and geographic locations in which the Portfolio seeks to invest than direct investments.
Investment Results
The Portfolio rose in absolute terms and outperformed its benchmark, the Russell 1000 Value Index, during the six-month period ended February 28, 2013. Both sector and security selection were positive. Stock selection in the automotive, transportation and technology sectors was positive, but negative in the consumer growth, consumer staples and financials sectors. An underweight in the utilities sector, and an overweight in consumer growth added to returns, although an overweight in the technology sector and underweight in financials offset some of these gains.
For the 12-month period ended February 28, 2013, the Portfolio rose in absolute terms, but underperformed its benchmark. Security selection was the main source of underperformance, particularly in the financials, consumer growth and technology sectors. Sector selection was positive, which helped to offset some of these losses. An overweight in consumer growth and an underweight in industrial resources
| 2 | • ALLIANCEBERNSTEIN POOLING PORTFOLIOS |
were beneficial to returns. The Portfolio did not utilize derivatives during the six- or 12-month periods.
U.S. Large Cap Growth Portfolio
Investment Objective and Policies
The Portfolio seeks long-term growth of capital. The Portfolio invests primarily in the equity securities of a limited number of large, carefully selected, high-quality U.S. companies. The Portfolio invests primarily in the domestic equity securities of companies selected by the Portfolio’s Adviser for their growth potential within various market sectors. The Portfolio emphasizes investments in large, seasoned companies and normally invests in approximately 50-70 companies. Under normal circumstances, the Portfolio invests at least 80% of its net assets in equity securities of large-capitalization U.S. companies. For these purposes, “large capitalization U.S. companies” are those that, at the time of investment, have market capitalizations within the range of market capitalizations of companies appearing in the Russell 1000 Growth Index. The Adviser expects that normally the Portfolio’s portfolio will tend to emphasize investments in securities issued by U.S. companies, although it may invest in foreign securities.
The Portfolio may enter into derivatives transactions, such as options, futures contracts, forwards and swaps. The Portfolio may use options strategies involving the purchase and/or writing of various combinations of call and/or put options, including on individual securities and stock indexes, futures contracts (including futures contracts
on individual securities and stock indexes) or shares of ETFs. These transactions may be used, for example, in an effort to earn extra income, to adjust exposure to individual securities or markets, or to protect all or a portion of the Portfolio’s portfolio from a decline in value, sometimes within certain ranges.
The Portfolio may, at times, invest in shares of ETFs in lieu of making direct investments in securities. ETFs may provide more efficient and economical exposure to the types of companies and geographic locations in which the Portfolio seeks to invest than direct investments.
Investment Results
The Portfolio rose in absolute terms and outperformed its benchmark, the Russell 1000 Growth Index, for both the six- and 12-month periods ended February 28, 2013. The Portfolio benefited from an emphasis on high-growth stocks that did well in the market recovery. During both periods, equity valuations improved, as yet another round of aggressive monetary stimulus around the world, targeted at stabilizing continued global economic risk, positively impacted investor confidence.
For both periods, security selection accounted for the outperformance, particularly in the technology sector, where the Portfolio’s holdings benefited from better-than-expected earnings and strong growth in the Internet and cloud computing markets. Stock selection in the financials sector also benefited, as investors were drawn to attractive valuations in U.S. banks and
| ALLIANCEBERNSTEIN POOLING PORTFOLIOS • | 3 |
potential for higher profits in response to the U.S. Federal Reserve’s near-zero short-term interest rate policy. Stock selection in the energy and consumer discretionary sectors detracted for both periods. The Portfolio did not utilize derivatives during the six- or 12-month periods.
International Value Portfolio
Investment Objective and Policies
The Portfolio seeks long-term growth of capital. The Portfolio invests primarily in a diversified portfolio of equity securities of established companies selected from more than 40 industries and from more than 40 developed and emerging market countries. These countries currently include the developed nations in Europe and the Far East, Canada, Australia and emerging market countries worldwide. Under normal market conditions, the Portfolio invests significantly (at least 40%, unless market conditions are not deemed favorable by the Adviser) in securities of non-U.S. companies. In addition, the Portfolio invests, under normal market conditions, in companies in at least three countries other than the United States.
The Portfolio invests in companies that Bernstein determines are undervalued, using a fundamental value approach. In selecting securities for the Portfolio, the Bernstein uses its fundamental and quantitative research to identify companies whose stocks are priced low in relation to their perceived long-term earnings power.
Currencies can have a dramatic impact on equity returns, significantly adding
to returns in some years and greatly diminishing them in others. The Adviser evaluates currency and equity positions separately and may seek to hedge the currency exposure resulting from securities positions when it finds the currency positions unattractive. To hedge a portion of its currency risk, the Portfolio may from time to time invest in currency-related derivatives, including forward currency exchange contracts, futures and options on futures, swaps and options. The Adviser may also seek investment opportunities by taking long or short positions in currencies through the use of currency-related derivatives.
The Portfolio may invest in depositary receipts, instruments of supranational entities denominated in the currency of any country, securities of multi-national companies and “semi-governmental securities”, and enter into forward commitments. The Portfolio may enter into derivatives transactions, such as options, futures contracts, forwards and swaps. The Portfolio may use options strategies involving the purchase and/or writing of various combinations of call and/or put options, including on individual securities and stock indexes, futures contracts (including futures contracts on individual securities and stock indexes) or shares of ETFs. These transactions may be used, for example, in an effort to earn extra income, to adjust exposure to individual securities or markets, or to protect all or a portion of the Portfolio’s portfolio from a decline in value, sometimes within certain ranges.
| 4 | • ALLIANCEBERNSTEIN POOLING PORTFOLIOS |
The Portfolio may, at times, invest in shares of ETFs in lieu of making direct investments in securities. ETFs may provide more efficient and economical exposure to the types of companies and geographic locations in which the Portfolio seeks to invest than direct investments.
Investment Results
The Portfolio rose in absolute terms and outperformed its benchmark, the MSCI ACWI ex-U.S, for the six-month period ended February 28, 2013. Security selection was the main source of outperformance, particularly in the capital equipment, financials and industrial commodities sectors. Sector selection, however, was slightly negative, owing to an overweight in the energy sector and underweight in the construction and housing sectors.
For the 12-month period ended February 28, 2013, the Portfolio rose in absolute terms, but underperformed its benchmark. Both security selection and sector selection were negative. Stock selection in the technology and consumer cyclicals sectors hurt performance, as did an overweight in the energy sector and an underweight in the consumer staples sector. Currency selection was positive for both periods. The Portfolio utilized derivatives including futures for investment purposes, which had an immaterial impact on performance, and currencies for hedging and investment purposes, which also had an immaterial impact on performance.
International Growth Portfolio
Investment Objective and Policies
The Portfolio’s investment objective is long-term growth of capital. The
Portfolio invests primarily in an international portfolio of companies selected by the Adviser whose growth potential appears likely to outpace market expectations. The Adviser’s growth analysts use proprietary research to seek to identify companies that grow while creating a significant amount of “economic value”. These companies typically exhibit solid, durable growth; strong, sustainable competitive advantages; high return on invested capital and robust free cash flow.
The Portfolio invests, under normal circumstances, in the equity securities of companies located in at least three countries (and normally substantially more) other than the United States. The Portfolio invests in securities of companies in both developed and emerging market countries. Geographic distribution of the Portfolio’s investments among countries or regions also will be a product of the stock selection process rather than a predetermined allocation. The Portfolio may also invest in synthetic foreign equity securities, which are types of warrants used internationally that entitle a holder to buy or sell underlying securities. The Adviser expects that normally the Portfolio will tend to emphasize investments in larger-capitalization companies.
Currencies can have a dramatic impact on equity returns, significantly adding to returns in some years and greatly diminishing them in others. Currency and equity positions are evaluated separately. The Adviser may seek to hedge the currency exposure resulting from securities positions when it finds
| ALLIANCEBERNSTEIN POOLING PORTFOLIOS • | 5 |
the currency exposure unattractive. To hedge a portion of its currency risk, the Portfolio may from time to time invest in currency-related derivatives, including forward currency exchange contracts, futures, options on futures, swaps and options. The Adviser may also seek investment opportunities by taking long or short positions in currencies through the use of currency-related derivatives.
The Portfolio may enter into derivatives transactions, such as options, futures contracts, forwards and swaps. The Portfolio may use options strategies involving the purchase and/or writing of various combinations of call and/or put options, including on individual securities and stock indexes, futures contracts (including futures contracts on individual securities and stock indexes) or shares of ETFs. These transactions may be used, for example, in an effort to earn extra income, to adjust exposure to individual securities or markets, or to protect all or a portion of the Portfolio’s portfolio from a decline in value, sometimes within certain ranges.
The Portfolio may, at times, invest in shares of ETFs in lieu of making direct investments in securities. ETFs may provide more efficient and economical exposure to the types of companies and geographic locations in which the Portfolio seeks to invest than direct investments.
Investment Results
The Portfolio rose in absolute terms, but underperformed its benchmark, the MSCI ACWI ex-U.S. during the six- and 12-month periods ended
February 28, 2013. During the six-month period, security selection drove the deficit; sector positioning and net currency exposure were positive. Stocks selection in the financials and industrials sectors undercut relative performance. Underweight exposure to both the telecom and energy sectors boosted relative performance mitigated some of the losses.
During the 12-month period, stock selection was responsible for most of the deficit. Sector positioning was positive and net currency exposure was negative. Stock selection in consumer-related sectors detracted from relative performance. Underweight exposure to the materials sector tempered underperformance, as did stock selection in the industrials sector. The Portfolio utilized derivatives including currencies for hedging and investment purposes and purchased options for hedging purposes, which detracted from returns during both periods and written options for hedging purposes, which contributed positively for both periods.
Short Duration Bond Portfolio
Investment Objective and Policies
The Portfolio seeks a moderate rate of income that is subject to taxes. The Portfolio may invest in many types of fixed-income securities, including corporate bonds, notes, U.S. government and agency securities, asset-backed securities, mortgage-related securities and inflation-protected securities, as well as other securities of U.S. and non-U.S. issuers. Under normal circumstances, the Portfolio invests at least 80% of its net assets in fixed-income securities. The Portfolio may
| 6 | • ALLIANCEBERNSTEIN POOLING PORTFOLIOS |
also invest up to 20% of its total assets in debt securities denominated in currencies other than the U.S. dollar. The Portfolio may also invest up to 20% of its assets in hybrid instruments, which have characteristics of futures, options, currencies and securities. The Portfolio seeks to maintain a relatively short duration of one to three years under normal market conditions. The Adviser may use interest-rate forecasting to determine the best level of interest rate risk at a given time. The Adviser may moderately shorten the average duration of the Portfolio when it expects interest rates to rise and modestly lengthen the average duration when it anticipates that rates will fall.
The Portfolio may invest in investment grade quality securities rated A or Baa (including Baa1, Baa2 and Baa3) by Moody’s Investor Service (“Moody’s”), or A or BBB (including BBB+ and BBB-) by S&P or Fitch. The Portfolio may invest in variable, floating, and inverse floating rate investments. The Portfolio may also invest in zero-coupon and interest-only or principal-only securities. The Portfolio may enter into derivatives transactions, such as options, futures contracts, forwards and swaps.
Investment Results
The Portfolio rose in absolute terms and outperformed its benchmark, the BofA ML 1-3 Year U.S. Treasury Index, for the six- and 12-month periods ended February 28, 2013. During both periods, exposure to spread product, specifically agency mortgage pass-throughs, commercial mortgage-backed securities (“CMBS”), asset backed securities and investment-grade corporates,
contributed positively as non-government sectors outperformed. Yield curve positioning was positive for the 12-month period, while it was negative for the six-month period due to a continued overweight position in intermediate maturities. During both periods, the Portfolio utilized derivative instruments, including Treasury futures and interest rate swaps, in order to manage duration and yield curve positioning. Currency forwards were also utilized for hedging purposes, which had an immaterial impact on performance.
Global Core Bond Portfolio
Investment Objective and Policies
The Portfolio seeks a moderate to high rate of income that is subject to taxes. The Portfolio invests, under normal circumstances, at least 80% of its net assets in fixed-income securities. Fixed-income securities include, among other things, bonds. Under normal market conditions, the Portfolio invests at least 40% of its assets in fixed-income securities of non-U.S. issuers. In addition, the Portfolio invests, under normal circumstances, in the fixed-income securities of issuers located in at least three countries.
The Portfolio may invest in medium-quality securities rated A or Baa (including Baa1, Baa2 and Baa3) by Moody’s, or A or BBB (including BBB+ and BBB-) by S&P or Fitch. The Portfolio may invest in mortgage-related and other asset-backed securities, loan participations, inflation-protected securities, structured securities, variable, floating, and inverse floating rate instruments and preferred stock, and may use other investment techniques.
| ALLIANCEBERNSTEIN POOLING PORTFOLIOS • | 7 |
To reduce volatility, the Adviser may hedge a significant portion of the currency exposure resulting from securities positions when it finds the currency exposure unattractive. To hedge its currency exposure, the Portfolio intends to use currency-related derivatives, including forward currency exchange contracts and futures. The Adviser may also seek investment opportunities by taking long or short positions in currencies through the use of currency-related derivatives. The Portfolio may also invest in other derivatives, including, without limitation, credit default swaps and interest rate swaps. The Portfolio may, among other things, enter into transactions such as reverse repurchase agreements and dollar rolls.
Investment Results
The Portfolio rose in absolute terms and outperformed its benchmark, the Barclays Global Aggregate Bond Index (U.S. dollar hedged) for the six- and 12-month periods ended February 28, 2013. For both periods sector allocation was a positive contributor. An overweight in U.S. corporates and underweight in U.S. Treasuries were solid contributors, while an underweight to agency mortgage pass-throughs and an overweight allocation to CMBS also helped. U.S. corporate security selection, with a focus on financials, was also a notable contributor for both periods. An underweight to peripheral European government exposure detracted for both periods, as the ECB began to take a more proactive role in addressing the sovereign debt crisis. An overweight exposure to U.S. interest rates during the six-month period detracted, as U.S. yields began to rise from historic lows. Conversely,
an underweight to Japan and an overweight to South Africa contributed positively for the 12-month period.
During both periods, the Portfolio utilized derivative instruments, including Treasury futures, in order to manage duration and yield curve positioning. Overall yield curve positioning was positive for both periods. The Portfolio also utilized currency forwards for hedging purposes, resulting in minimal currency impact.
Bond Inflation Protection Portfolio
Investment Objective and Policies
The Portfolio’s investment objective is to maximize real return without assuming what the Adviser considers to be undue risk. Real return equals total return less the estimated effect of inflation. The Portfolio pursues its objective by investing principally in treasury inflation-protected securities (“TIPS”) directly or by gaining indirect exposure to TIPS through derivatives transactions such as total return swaps linked to TIPS. The Portfolio may invest in other fixed-income investments such as U.S. and non-U.S. government securities, corporate fixed-income securities and mortgage-related securities, as well as derivatives linked to such securities. Under normal circumstances, the Portfolio invests at least of 80% of its net assets in fixed-income securities. While the Portfolio invests principally in investment-grade securities, it may invest up to 15% of its total assets in fixed-income securities rated BB or B, or the equivalent by at least one national ratings agency (or deemed by the Adviser to be of comparable credit quality) which are not investment-grade (“junk bonds”).
| 8 | • ALLIANCEBERNSTEIN POOLING PORTFOLIOS |
The Portfolio may also invest in other inflation-indexed securities, issued by both U.S. and non-U.S. issuers, and in derivative instruments linked to these securities, such as options, futures, forwards or swap agreements. The Portfolio intends to use leverage for investment purposes. The Portfolio may also invest in loan participations, structured securities, asset-backed securities, variable, floating, and inverse floating rate instruments, and preferred stock, and may use other investment techniques. The Portfolio may invest in fixed-income securities of any maturity and duration.
Investment Results
The Portfolio rose in absolute terms and outperformed its benchmark, the Barclays 1-10 Year TIPS Index, for the six- and 12-month periods ended February 28, 2013. During both periods, exposure to investment-grade corporates was the primary positive driver to relative outperformance. As part of the Portfolio’s credit positioning, credit default swaps were utilized, which had a modestly positive impact on performance. Specific security selection of TIPS holdings across the 1- to 10-year maturity spectrum also contributed positively. Exposure to agency mortgage pass-throughs modestly detracted for the six-month period, while CMBS contributed for the 12-month period.
Overall currency positioning contributed positively for both periods, helped by a short position in the Japanese yen. Currency forwards were utilized for both establishing currency positions and for hedging purposes.
During both periods, Treasury futures and interest rate swaps were utilized in order to manage duration and yield curve positioning. As interest rates rose during the six-month period, the Portfolio’s longer-duration positioning detracted, as did an overweight to the intermediate part of the curve. The Portfolio also utilized leverage through reverse repurchase agreements.
High-Yield Portfolio
Investment Objective and Policies
The Portfolio invests, under normal circumstances, at least 80% of its net assets in high-yield debt securities. The Portfolio invests in a diversified mix of high yield, below investment grade debt securities, known as “junk bonds.” The Portfolio may invest in debt securities with a range of maturities from short- to long-term. The Portfolio may invest in U.S. dollar-denominated and non-U.S. dollar-denominated foreign fixed-income securities. The Portfolio also may invest in mortgage-related and other asset-backed securities, loan participations, inflation-protected securities, structured securities and preferred stocks. The Portfolio may use leverage for investment purposes by entering into transactions such as reverse repurchase agreements and dollar rolls.
The Portfolio may invest in variable, floating, and inverse floating rate investments. The Portfolio may also invest in zero-coupon and interest-only or principal-only securities. The Portfolio may enter into derivatives transactions, such as options, futures contracts, forwards, and swaps.
| ALLIANCEBERNSTEIN POOLING PORTFOLIOS • | 9 |
Investment Results
The Portfolio rose in absolute terms and outperformed its benchmark, the Barclays U.S. High Yield 2% Issuer Cap Index, for the six- and 12-month periods ended February 28, 2013. For both periods, overall security selection was the primary positive driver. For the six-month period, selection within the consumer non-cyclicals, bank, brokerage, automotive and technology sectors contributed positively. For the 12-month period, security selection in the consumer non-cyclical, technology, media, electric, brokerage and basic industries sectors all contributed positively. An allocation to non-agency mortgages, CMBS and asset-backed securities contributed positively for both periods, while an allocation to U.S. treasuries detracted for the six-month period. Security selection in natural gas, finance and energy positions detracted for both periods.
Within the Portfolio’s derivative positions, credit default swaps were utilized for hedging and investment purposes, which contributed positively for both periods. The Portfolio also utilized currency forwards for hedging and investment purposes, resulting in no currency impact. Written options were utilized for hedging purposes, interest rate derivatives were utilized to manage yield curve positioning and equity derivatives were employed for hedging purposes, all with no material impact on performance.
Small-Mid Cap Value Portfolio
Investment Objective and Policies
The Portfolio seeks long-term growth of capital. The Portfolio invests primarily in a diversified portfolio of equity
securities of small- to mid-capitalization U.S. companies, generally representing 60-125 companies. Under normal circumstances, the Portfolio invests at least 80% of its net assets in small- to mid-cap companies. For purposes of this policy, small- to mid-capitalization companies are those that, at the time of investment, fall within the capitalization range between the smallest company appearing in the Russell 2500 Value Index and the greater of $5 billion or the market capitalization of the largest company in the Russell 2500 Value Index. The Portfolio may invest in securities issued by non-U.S. companies and enter into forward commitments.
The Portfolio may enter into derivatives transactions, such as options, futures contracts, forwards and swaps. The Portfolio may use options strategies involving the purchase and/or writing of various combinations of call and/or put options, including on individual securities and stock indexes, futures contracts (including futures contracts on individual securities and stock indexes) or shares of ETFs. These transactions may be used, for example, in an effort to earn extra income, to adjust exposure to individual securities or markets, or to protect all or a portion of the Portfolio’s portfolio from a decline in value, sometimes within certain ranges.
The Portfolio may, at times, invest in shares of ETFs in lieu of making direct investments in securities. ETFs may provide more efficient and economical exposure to the types of companies and geographic locations in which the Portfolio seeks to invest than direct investments.
| 10 | • ALLIANCEBERNSTEIN POOLING PORTFOLIOS |
Investment Results
During the six-month period ended February 28, 2013, the Portfolio rose in absolute terms and outperformed its benchmark, the Russell 2500 Value Index, as well as the broad market, as represented by the Russell 2500 Index. Holdings in the consumer growth, capital equipment and technology sectors were key drivers of the outperformance. Holdings in the consumer cyclicals sector, an overweight in the technology sector and an underweight in the consumer growth sector detracted. For the 12-month period ended February 28, 2013, the Portfolio rose in absolute terms yet underperformed its benchmark, while it outperformed the broad market. Holdings in the consumer cyclicals sector and overweights in the technology and industrial resources sectors were significant drivers of the shortfall; stock selection, particularly in the energy, consumer staples, and utilities sectors, was positive and helped performance. The Portfolio did not utilize derivatives during the six- or 12-month periods.
Small-Mid Cap Growth Portfolio
Investment Objective and Policies
The Portfolio seeks long-term growth of capital. The Portfolio invests primarily in a diversified portfolio of equity securities with relatively smaller capitalizations as compared to the overall market. Under normal circumstances, the Portfolio invests at least 80% of its net assets in the equity securities of small- and mid-capitalization U.S. companies. For these purposes, “small- and mid-capitalization companies” are generally those companies that, at the time of investment, fall within the lowest 25% of the total U.S. equity
market capitalization (excluding, for purposes of this calculation, companies with market capitalizations of less than $10 million). In the future, the Portfolio may define small- and mid-capitalization companies using a different classification system.
The Portfolio may invest in any company and industry and in any type of equity security with potential for capital appreciation. It invests in well-known and established companies and in new and less-seasoned companies. The Portfolio’s investment policies emphasize investments in companies that are demonstrating improving financial results and a favorable earnings outlook. The Portfolio may invest in foreign securities. The Portfolio invests principally in equity securities but may also invest in other types of securities, such as preferred stocks. The Portfolio may also invest up to 20% of its total assets in rights and warrants.
The Portfolio may enter into derivatives transactions, such as options, futures contracts, forwards and swaps. The Portfolio may use options strategies involving the purchase and/or writing of various combinations of call and/or put options, including on individual securities and stock indexes, futures contracts (including futures contracts on individual securities and stock indexes) or shares of ETFs. These transactions may be used, for example, in an effort to earn extra income, to adjust exposure to individual securities or markets, or to protect all or a portion of the Portfolio’s portfolio from a decline in value, sometimes within certain ranges.
| ALLIANCEBERNSTEIN POOLING PORTFOLIOS • | 11 |
The Portfolio may, at times, invest in shares of ETFs in lieu of making direct investments in securities. ETFs may provide more efficient and economical exposure to the types of companies and geographic locations in which the Portfolio seeks to invest than direct investments.
Investment Results
The Portfolio rose in absolute returns but underperformed its benchmark, the Russell 2500 Growth Index, for the six- and 12-month periods ended February 28, 2013. During the six-month period, stock selection in the consumer/commercial services, healthcare and technology sectors and an overweight in technology detracted from performance. Stock selection in the industrials and financials sectors was positive and helped offset relative underperformance. For the 12-month period, the largest detractors from performance were an underweight and stock selection in the financials sector, as well as an overweight and stock selection in the technology sector. Favorable stock selection in the industrials and energy sectors contributed positively to relative performance. At the end of the reporting period, the largest overweight was in the technology sector, while the largest underweight was in the financials sector. The Portfolio did not utilize derivatives during the six- or 12-month periods.
Multi-Asset Real Return Portfolio
Investment Objective and Policies
The Portfolio seeks to maximize real return over inflation. Real return is the rate of total return (including income and capital appreciation) after adjusting for inflation. The Portfolio pursues
an aggressive investment strategy involving a variety of asset classes. The Portfolio invests primarily in instruments that the Adviser expects to outperform broad equity indices during periods of rising inflation. Under normal circumstances, the Portfolio expects to invest its assets principally in the following instruments that, in the judgment of the Adviser, are affected directly or indirectly by the level and change in rate of inflation: inflation-protected fixed-income securities, such as TIPS and similar bonds issued by governments outside of the United States, commodities, equity securities, such as commodity-related stocks, real estate securities, utility securities, infra-structure related securities, securities and derivatives linked to the price of other assets (such as commodities, stock indices and real estate), and currencies. The Portfolio expects its investments in fixed-income securities to have a broad range of any maturity and quality level.
The Portfolio may invest in derivatives, such as options, futures, forwards, swap agreements or structured notes. The Portfolio intends to use leverage for investment purposes through the use of cash made available by derivatives transactions to make other investments in accordance with its investment policies. The Portfolio is non-diversified, which means that it may concentrate its assets in a smaller number of issuers than a diversified fund.
Investment Results
For the six-month period ended February 28, 2013, the Portfolio rose in absolute terms but underperformed its
| 12 | • ALLIANCEBERNSTEIN POOLING PORTFOLIOS |
benchmark, the MSCI AC World Commodity Producers Index. Underperformance was driven primarily by the Portfolio’s strategic exposure to commodity futures, which contributed negatively to relative performance. Within the Portfolio’s natural resources equities allocation, active management contributed positively to performance. The Portfolio also benefited from active security and sector selection decisions within the real estate allocation. Within the commodity futures allocation, negative contributions from security selection were offset by positive returns from curve management and sector selection decisions. Positive contributions from top-down collateral management strategies were offset by asset allocation and risk management decisions, resulting in a negative contribution to relative performance from top-down active management over the six-month period.
For the 12-month period ended February 28, 2013, the Portfolio rose in absolute terms and outperformed its benchmark. Relative performance was driven primarily by the Portfolio’s strategic allocations to real estate equities and commodity futures. Active management within both the natural resource equities and real estate allocations also contributed positively to performance, while security selection decisions within commodity futures detracted modestly from performance. Within the commodity futures allocation, value was added by the Portfolio’s curve positioning and sector selection decisions (exposure to commodity futures was obtained via commodity index swaps, commodity futures, and options on commodity futures). The
Portfolio’s “top-down” active decisions, including asset allocation and risk management strategies, detracted from performance over the 12-month period.
The Portfolio utilized derivatives including interest rate swaps for investment purposes, which had an immaterial impact on performance during both periods; inflation swaps for investment purposes, which had an immaterial impact for both periods; purchased and written options for hedging purposes, which detracted for both periods; futures for hedging and investment purposes, which detracted for both periods; forwards for hedging and investment purposes, as part of its currency management strategies, which detracted for both periods, and total return swaps for investment purposes, which detracted for both periods.
Volatility Management Portfolio Investment Objective and Policies
The Portfolio’s investment objective is long-term growth of capital and income. The Portfolio is designed to reduce the overall portfolio volatility and the effects of adverse equity market conditions for a blended style investor (an “investing Fund”). The Portfolio will not pursue its investment objective of long-term growth of capital and income in isolation, but always with the goal of reducing an investing Fund’s overall equity exposure when appropriate to mitigate equity risk. In other words, in making investment decisions for the Portfolio, the Adviser will consider the blended investing style of the investing Fund and not necessarily the goal of achieving the Portfolio’s investment objective.
| ALLIANCEBERNSTEIN POOLING PORTFOLIOS • | 13 |
The Portfolio will have the ability to invest in a wide array of asset classes, including U.S., non-U.S. and emerging market equity and fixed-income securities, commodities, REITs and other real estate-related securities, currencies, and inflation-protected securities. The Portfolio will invest directly in equity securities, but it will also be able to invest without limit in derivative instruments, including futures, forwards, options, swaps and other financially-linked investments.
To effectuate the Portfolio’s dynamic, opportunistic asset allocation approach, the Adviser may invest in derivatives or ETFs rather than investing directly in equity securities. The Portfolio may use index futures or ETFs, for example, to gain broad exposure to a particular segment of the market, while buying representative equity securities to achieve exposure to another. The Adviser will choose investments, in each case, based on concerns of cost and efficiency of access. The Portfolio’s holdings may be frequently adjusted to reflect the Adviser’s assessment of changing risks. The Adviser believes that these adjustments can also frequently be made efficiently and economically through the use of derivatives strategies and/or ETFs. Similarly, when the Adviser decides to reduce (or eliminate) the Portfolio’s exposure to the equity markets, the Adviser may choose to gain this alternative exposure directly through securities purchases or indirectly through derivatives transactions and/or ETFs. The asset classes selected may or may not be represented by the holdings of
other of the Pooling Portfolios, because investment decisions for the Portfolio will be driven by risk mitigation concerns that may be best facilitated through exposure to asset classes not represented elsewhere in the investing Fund’s overall exposure.
The Portfolio has the risk that it may not accomplish its purpose if the Adviser does not correctly assess the risk in equity markets and, consequently, its performance could be affected adversely.
Investment Results
The Portfolio rose in absolute terms but underperformed its benchmark, the MSCI ACWI, for the six- and 12-month periods ended February 28, 2013. The Portfolio’s long-term objective is to reduce overall portfolio volatility and the effects of adverse equity market conditions by reducing equity exposure during periods of high equity market volatility, or when the compensation for equity risk is poor. At such times, the Portfolio will move to underweight stocks relative to the primary benchmark and will seek to diversify across asset classes which are not represented in the benchmark including fixed income securities and real estate. In both the six- and 12-month time periods, equities performed strongly and a lower allocation relative to the benchmark drove underperformance. Strategy decisions to diversify away from stocks had mixed results in both periods. Exposure to real estate contributed to relative performance in the 12-month period and was a modest detractor in the six-month period. Exposure to
| 14 | • ALLIANCEBERNSTEIN POOLING PORTFOLIOS |
cash detracted in both periods. The Portfolio has held a portion of the account in cash instead of bonds since a bond’s ability to hedge equity risk is limited. As 10-year U.S. Treasury rates are currently below 2% (at the time of this letter), the Dynamic Asset Allocation Team (the “Team”) feels that there is little room for interest rates to fall, capping their return potential. On the other hand bond yields can rise substantially, creating the potential for significant losses on bond positions. Within stocks, a decision to overweight non-U.S. stocks based on their more attractive valuations helped relative performance in the last six months, but was a detractor over the 12-month period.
During both periods, the Portfolio met the objective of reducing overall portfolio volatility.
Positive returns in equity markets during the 12-month period ended February 28, 2013 mask very wide swings in investor sentiment and share prices. The Portfolio was positioned defensively at the beginning of 2012 and during July and August of that year, when the Team was concerned about severe downside risks emanating from Europe. While equities were attractively priced, they were not cheap enough given the Team’s assessment of the potential risks, hence the Portfolio held an underweight position. This underweight cost relative performance when policy makers took significant action to avert a bank funding crisis and euro breakup. Typically, when volatility builds in the
market, it tends to persist for a while and markets struggle. However, during the 12-month period, the bursts of volatility were followed rather quickly by sharp recoveries, so the decisions to de-risk the Portfolio were not as effective. From a fundamental perspective, the period provided evidence that at
times when equity valuations are very attractive, decisive moves by policy makers can have a very positive impact on market prices and investor risk taking, even though in some cases, it is short-lived.
As European policy makers took forceful action to support the euro and the U.S. Federal Reserve engaged in additional monetary stimulus to support growth, financial conditions improved, perceived tail risks fell, and markets staged a sharp rally. While recognizing that the potential for near-term volatility remained due to uncertainties surrounding fiscal policy in the U.S., the Portfolio gradually increased the Portfolio’s equity exposure across all regions and capitalization sizes and reduced the cash allocation. More recently, risks of major downturns (“tail risks”) from Europe have moderated slightly, the U.S. economic recovery appears to be on firmer ground, equity valuations have remained attractive, and the risk-reward outlook appears more favorable. The Team expects the low levels of yields to persist as a result of Central Bank accommodations, which should stimulate economic activity. Recent economic data—particularly in the U.S.—has been supportive of this point of view. The 12-month period ended with the Portfolio positioned with close to a full exposure to risk assets. In the Team’s view, higher growth, attractive corporate fundamentals and reasonable equity valuations are likely to reward investors.
Derivatives utilized included currencies and purchased options, for hedging and investment purposes, which detracted from performance during both periods; and futures, total return swaps and written options, for hedging and investment purposes, which added to performance during both periods.
| ALLIANCEBERNSTEIN POOLING PORTFOLIOS • | 15 |
DISCLOSURES AND RISKS
Benchmark Disclosures
None of the indices listed below reflect fees and expenses associated with the active management of a mutual fund portfolio. The unmanaged Russell 1000® Value Index represents the performance of 1,000 large-cap value companies within the U.S. The unmanaged Russell 1000® Growth Index represents the performance of 1,000 large-cap growth companies within the U.S. The unmanaged MSCI ACWI ex-U.S. (free float-adjusted, market capitalization weighted) represents the equity market performance of developed and emerging markets, excluding the United States. The unmanaged BofA ML® 1-3 Year U.S. Treasury Index represents the performance of U.S. dollar-denominated sovereign debt publicly issued by the U.S. government in its domestic market with a remaining term to final maturity of 1-3 years. The unmanaged Barclays Global Aggregate Bond Index (U.S. dollar hedged) represents the performance of the global investment-grade developed fixed-income markets. The unmanaged Barclays U.S. Aggregate Bond Index represents the performance of securities within the U.S. investment-grade fixed-rate bond market, with index components for government and corporate securities, mortgage pass-through securities, asset-backed securities, and commercial mortgage-backed securities. The unmanaged Barclays 1-10 Year TIPS Index represents the performance of inflation-protected securities issued by the U.S. Treasury. The unmanaged Barclays U.S. High Yield 2% Issuer Cap Index is the 2% issuer cap component of the U.S. Corporate High Yield Index, which represents the performance of fixed-income securities having a maximum quality rating of Ba1, a minimum amount outstanding of $150 million, and at least one year to maturity. The unmanaged Russell 2500™ Value Index represents the performance of 2,500 small- to mid-cap value companies within the U.S. The unmanaged Russell 2500™ Growth Index represents the performance of 2,500 small- to mid-cap growth companies within the U.S. The unmanaged MSCI AC World Commodity Producers Index is an equity-based index designed to reflect the performance related to commodity producers stocks. The index is free float-adjusted, market capitalization-weighted and comprised of commodity producer companies based on the Global Industry Classification Standard (“GICS”). The unmanaged MSCI ACWI (free float-adjusted, market capitalization weighted) represents the equity market performance of developed and emerging markets. MSCI makes no express or implied warranties or representations, and shall have no liability whatsoever with respect to any MSCI data contained herein. The MSCI data may not be further redistributed or used as a basis for other indices, any securities or financial products. This report is not approved, reviewed or produced by MSCI. An investor cannot invest directly in an index, and its results are not indicative of the performance for any specific investment, including the Portfolios.
A Word About Risk
All Portfolios
While the equity Portfolios invest principally in common stocks and other equity securities and the fixed-income Portfolios invest principally in bonds and fixed-income securities, in order to achieve their investment objectives, the Portfolios may at times use certain types of investment derivatives, such as options, futures, forwards and swaps. These instruments involve risks different from, and in certain cases, greater than, the risks presented by more traditional investments. These risks are fully discussed in the Portfolios’ prospectus.
Market Risk: The value of the Portfolio’s assets will fluctuate as the stock or bond market fluctuates. The value of its investments may decline, sometimes rapidly and unpredictably, simply because of economic changes or other events that affect large portions of the market. It includes the risk that a particular style of investing, such as the Portfolio’s value approach, may be underperforming the market generally.
(Disclosures, Risks and Notes about Historical Performance continued on next page)
| 16 | • ALLIANCEBERNSTEIN POOLING PORTFOLIOS |
Disclosures and Risks
DISCLOSURES AND RISKS
(continued from previous page)
Derivatives Risk: Investments in derivatives may be illiquid, difficult to price, and leveraged so that small changes may produce disproportionate losses for the Portfolio, and may be subject to counterparty risk to a greater degree than more traditional investments.
Management Risk: The Portfolio is subject to management risk because it is an actively managed investment fund. The Adviser will apply its investment techniques and risk analyses in making investment decisions for the Portfolio, but there is no guarantee that its techniques will produce the intended results.
U.S. Large Cap Growth Portfolio, International Value Portfolio, International Growth Portfolio, Short Duration Bond Portfolio, Global Core Bond Portfolio, Bond Inflation Protection Portfolio, High-Yield Portfolio, Small-Mid Cap Value Portfolio, Small-Mid Cap Growth Portfolio, Multi-Asset Real Return Portfolio, Volatility Management Portfolio
Foreign (Non-U.S.) Risk: Investments in securities on non-U.S. issuers may involve more risk than those of U.S. issuers. These securities may fluctuate more widely in price and may be less liquid due to adverse market, economic, political, regulatory or other factors.
U.S. Large Cap Growth Portfolio
Focused Portfolio Risk: This is the risk that investments in a limited number of companies may have more risk because changes in the value of a single security may have a more significant effect, either negative or positive, on the Portfolio’s net asset value (“NAV”).
International Value Portfolio, International Growth Portfolio, Short Duration Bond Portfolio, Global Core Bond Portfolio, Bond Inflation Protection Portfolio, High-Yield Portfolio, Small-Mid Cap Value Portfolio, Multi-Asset Real Return Portfolio, Volatility Management Portfolio
Currency Risk: Fluctuations in currency exchange rates may negatively affect the value of the Portfolio’s investments or reduce its returns.
International Value Portfolio, International Growth Portfolio, Global Core Bond Portfolio, Volatility Management Portfolio
Emerging Market Risk: Investments in emerging market countries may have more risk because the markets are less developed and less liquid, as well as being subject to increased economic, political, regulatory or other uncertainties.
Short Duration Bond Portfolio, Global Core Bond Portfolio, Bond Inflation Protection Portfolio, High-Yield Portfolio, Multi-Asset Real Return Portfolio, Volatility Management Portfolio
Interest Rate Risk: Changes in interest rates will affect the value of investments in fixed-income securities. When interest rates rise, the value of investments in fixed-income securities tends to fall and this decrease in value may not be offset by higher income from new investments. Interest rate risk is generally greater for fixed-income securities with longer maturities or durations.
Credit Risk: An issuer or guarantor of a fixed-income security, or the counterparty to a derivatives or other contract, may be unable or unwilling to make timely payments of interest or principal, or to otherwise honor its obligations. The issuer or guarantor may default, causing a loss of the full principal amount of a security. The degree of risk for a particular security may be reflected in its credit rating. There is the possibility that the credit rating of a fixed-income security may be downgraded after purchase, which may adversely affect the value of the security. Investments in fixed-income securities with lower ratings tend to have a higher probability that an issuer will default or fail to meet its payment obligations.
(Disclosures, Risks and Notes about Historical Performance continued on next page)
| ALLIANCEBERNSTEIN POOLING PORTFOLIOS • | 17 |
Disclosures and Risks
DISCLOSURES AND RISKS
(continued from previous page)
Short Duration Bond Portfolio, Global Core Bond Portfolio, Bond Inflation Protection Portfolio, High-Yield Portfolio, Volatility Management Portfolio
Inflation Risk: This is the risk that the value of assets or income from investments will be less in the future as inflation decreases the value of money. As inflation increases, the value of each Portfolio’s assets can decline as can the value of the Portfolio’s distributions. This risk is significantly greater for fixed-income securities with longer maturities.
Global Core Bond Portfolio, Bond Inflation Protection Portfolio, High-Yield Portfolio, Multi-Asset Real Return Portfolio
Leverage Risk: To the extent the Portfolio uses leveraging techniques, its NAV may be more volatile because leverage tends to exaggerate the effect of changes in interest rates and any increase or decrease in the value of the Portfolio’s investments.
Bond Inflation Protection Portfolio, Multi-Asset Real Return Portfolio
Liquidity Risk: Liquidity risk exists when particular investments are difficult to purchase or sell, possibly preventing the Portfolio from selling out of these illiquid securities at an advantageous price. Derivatives and securities involving substantial market and credit risk tend to involve greater liquidity risk.
High-Yield Portfolio
Below Investment Grade Securities Risk: Investments in fixed-income securities with lower ratings (commonly known as “junk bonds”) tend to have a higher probability that an issuer will default or fail to meet its payment obligations. These securities may be subject to greater price volatility due to such factors as specific corporate developments, interest rate sensitivity, negative performance of the junk bond market generally and less secondary market liquidity.
Small-Mid Cap Value Portfolio, Small-Mid Cap Growth Portfolio
Capitalization Risk: Investments in small- and mid-capitalization companies may be more volatile than investments in large-capitalization companies. Investments in small-capitalization companies may have additional risks because these companies have limited product lines, markets or financial resources.
Multi-Asset Real Return Portfolio, Volatility Management Portfolio
Commodity Risk: Investments in commodities and commodity-linked derivative instruments may subject the Portfolio to greater volatility than investments in traditional securities. The value of these investments may be affected by changes in overall market movements, commodity index volatility, changes in interest rates, or factors affecting a particular industry or commodity, such as drought, floods, weather, livestock disease, embargoes, tariffs and international economic, political and regulatory developments.
Multi-Asset Real Return Portfolio
Subsidiary Risk: By investing in the Subsidiary, the Portfolio is indirectly exposed to the risks associated with the Subsidiary’s investments, including its investments in commodities. There is no guarantee that the investment objective of the Subsidiary will be achieved.
Real Estate Risk: The Portfolio’s investments in real estate securities have many of the same risks as direct ownership of real estate, including the risk that the value of real estate could decline due to a variety of factors that affect the real estate market generally. Investments in REITs may have additional risks. REITs are dependent on the capability of their managers, may have limited diversification, and could be significantly affected by changes in taxes.
(Disclosures, Risks and Notes about Historical Performance continued on next page)
| 18 | • ALLIANCEBERNSTEIN POOLING PORTFOLIOS |
Disclosures and Risks
DISCLOSURES AND RISKS
(continued from previous page)
Diversification Risk: The Portfolio may have more risk because it is “non-diversified”, meaning that it can invest more of its assets in a smaller number of issuers and that adverse changes in the value of one security could have a more significant effect on the Portfolio’s NAV.
An Important Note About Historical Performance
The investment return and principal value of an investment in the Portfolios will fluctuate, so that shares, when redeemed, may be worth more or less than their original cost. Performance shown on the following pages represents past performance and does not guarantee future results. Current performance may be lower or higher than the performance information shown. You may obtain performance information current to the most recent month-end by visiting www.alliancebernstein.com.
Please note: Shares of the Portfolios are offered exclusively to mutual funds advised by, and certain institutional clients of, AllianceBernstein that seek a blend of asset classes for investment. These share classes are not currently offered for direct investment from the general public. The Pooling Portfolios can be purchased at the relevant NAV without a sales charge or other fee. However, there are sales charges in connection to purchases of other AllianceBernstein share classes invested in these Portfolios. For additional information regarding other retail share classes and their sales charges and fees, please visit www.alliancebernstein.com. All fees and expenses related to the operation of the Portfolios have been deducted. Performance assumes reinvestment of distributions and does not account for taxes.
| ALLIANCEBERNSTEIN POOLING PORTFOLIOS • | 19 |
Disclosures and Risks
HISTORICAL PERFORMANCE
THE PORTFOLIOS VS. THEIR BENCHMARKS PERIODS ENDED FEBRUARY 28, 2013
| Returns | ||||||||||
| U.S. VALUE PORTFOLIO | 6 Months | 12 Months | ||||||||
AllianceBernstein U.S. Value Portfolio* | 14.46% | 14.79% | ||||||||
| ||||||||||
Russell 1000 Value Index | 13.15% | 17.63% | ||||||||
| ||||||||||
* Includes the impact of proceeds received and credited to the Portfolio resulting from class action settlements, which enhanced the performance of all share classes of the Portfolio for the 12-month period ended February 28, 2013 by 0.01%. | ||||||||||
| Returns | ||||||||||
| U.S. LARGE CAP GROWTH PORTFOLIO | 6 Months | 12 Months | ||||||||
AllianceBernstein U.S. Large Cap Growth Portfolio* | 8.03% | 9.81% | ||||||||
|
|
|
|
|
| |||||
Russell 1000 Growth Index | 6.23% | 9.60% | ||||||||
| ||||||||||
* Includes the impact of proceeds received and credited to the Portfolio resulting from class action settlements, which enhanced the performance of all share classes of the Portfolio for the 12-month period ended February 28, 2013 by 0.02%. | ||||||||||
| Returns | ||||||||||
| INTERNATIONAL VALUE PORTFOLIO | 6 Months | 12 Months | ||||||||
AllianceBernstein International Value Portfolio | 15.64% | 2.35% | ||||||||
|
|
|
|
|
| |||||
MSCI All Country World Index ex-U.S. | 13.06% | 6.66% | ||||||||
| ||||||||||
| Returns | ||||||||||
| INTERNATIONAL GROWTH PORTFOLIO | 6 Months | 12 Months | ||||||||
AllianceBernstein International Growth Portfolio | 9.86% | 3.19% | ||||||||
| ||||||||||
MSCI All Country World Index ex-U.S. | 13.06% | 6.66% | ||||||||
| ||||||||||
| Please keep in mind that high, double-digit returns are highly unusual and cannot be sustained. Investors should also be aware that these returns were primarily achieved during favorable market conditions. |
See Disclosures, Risks and Note about Historical Performance on pages 16-19.
(Historical Performance continued on next page)
| 20 | • ALLIANCEBERNSTEIN POOLING PORTFOLIOS |
Historical Performance
HISTORICAL PERFORMANCE
(continued from previous page)
THE PORTFOLIOS VS. THEIR BENCHMARKS PERIODS ENDED FEBRUARY 28, 2013
| Returns | ||||||||||
| SHORT DURATION BOND PORTFOLIO | 6 Months | 12 Months | ||||||||
AllianceBernstein Short Duration Bond Portfolio* | 0.34% | 1.20% | ||||||||
| ||||||||||
BofA ML 1-3 Year U.S. Treasury Index | 0.17% | 0.56% | ||||||||
| ||||||||||
* Includes the impact of proceeds received and credited to the Portfolio resulting from class action settlements, which enhanced the performance of all share classes of the Portfolio for the 12-month period ended February 28, 2013 by 0.02%. | ||||||||||
| Returns | ||||||||||
| GLOBAL CORE BOND PORTFOLIO | 6 Months | 12 Months | ||||||||
AllianceBernstein Global Core Bond Portfolio* | 1.42% | 5.58% | ||||||||
| ||||||||||
Barclays Global Aggregate Bond Index (U.S. dollar hedged) | 1.35% | 4.36% | ||||||||
| ||||||||||
* Includes the impact of proceeds received and credited to the Portfolio resulting from class action settlements, which enhanced the performance of all share classes of the Portfolio for the 12-month period ended February 28, 2013 by 0.01%. | ||||||||||
| Returns | ||||||||||
| BOND INFLATION PROTECTION PORTFOLIO | 6 Months | 12 Months | ||||||||
AllianceBernstein Bond Inflation Protection Portfolio | 2.37% | 5.57% | ||||||||
| ||||||||||
Barclays 1-10 Year TIPS Index | 0.88% | 3.07% | ||||||||
| ||||||||||
| Returns | ||||||||||
| HIGH-YIELD PORTFOLIO | 6 Months | 12 Months | ||||||||
AllianceBernstein High-Yield Portfolio | 7.38% | 13.53% | ||||||||
| ||||||||||
Barclays U.S. High Yield 2% Issuer Cap Index | 6.67% | 11.79% | ||||||||
| ||||||||||
| Please keep in mind that high, double-digit returns are highly unusual and cannot be sustained. Investors should also be aware that these returns were primarily achieved during favorable market conditions. |
See Disclosures, Risks and Note about Historical Performance on pages 16-19.
(Historical Performance continued on next page)
| ALLIANCEBERNSTEIN POOLING PORTFOLIOS • | 21 |
Historical Performance
HISTORICAL PERFORMANCE
(continued from previous page)
THE PORTFOLIOS VS. THEIR BENCHMARKS PERIODS ENDED FEBRUARY 28, 2013
| Returns | ||||||||||
| SMALL-MID CAP VALUE PORTFOLIO | 6 Months | 12 Months | ||||||||
AllianceBernstein Small-Mid Cap Value Portfolio | 17.78% | 18.07% | ||||||||
| ||||||||||
Russell 2500 Value Index | 16.17% | 18.92% | ||||||||
| ||||||||||
| Returns | ||||||||||
| SMALL-MID CAP GROWTH PORTFOLIO | 6 Months | 12 Months | ||||||||
AllianceBernstein Small-Mid Cap Growth Portfolio* | 10.57% | 9.74% | ||||||||
| ||||||||||
Russell 2500 Growth Index | 11.98% | 10.84% | ||||||||
| ||||||||||
* Includes the impact of proceeds received and credited to the Portfolio resulting from class action settlements, which enhanced the performance of all share classes of the Portfolio for the six- and 12-month periods ended February 28, 2013 by 0.04% and 0.05%, respectively. | ||||||||||
| Returns | ||||||||||
| MULTI-ASSET REAL RETURN PORTFOLIO | 6 Months | 12 Months | ||||||||
AllianceBernstein Multi-Asset Real Return Portfolio* | 2.95% | 0.63% | ||||||||
| ||||||||||
MSCI All Country World Commodity Producers Index | 3.73% | -9.25% | ||||||||
| ||||||||||
* Includes the impact of proceeds received and credited to the Portfolio resulting from class action settlements, which enhanced the performance of all share classes of the Portfolio for the 12-month period ended February 28, 2013 by 0.01%. | ||||||||||
| Returns | ||||||||||
| VOLATILITY MANAGEMENT PORTFOLIO | 6 Months | 12 Months | ||||||||
AllianceBernstein Volatility Management Portfolio | 7.76% | 4.79% | ||||||||
| ||||||||||
MSCI All Country World Index | 10.99% | 9.29% | ||||||||
| ||||||||||
| Please keep in mind that high, double-digit returns are highly unusual and cannot be sustained. Investors should also be aware that these returns were primarily achieved during favorable market conditions. |
See Disclosures, Risks and Note about Historical Performance on pages 16-19.
(Historical Performance continued on next page)
| 22 | • ALLIANCEBERNSTEIN POOLING PORTFOLIOS |
Historical Performance
HISTORICAL PERFORMANCE
(continued from previous page)
| AVERAGE ANNUAL RETURNS AS OF FEBRUARY 28, 2013 | ||||
| NAV/SEC Returns† | ||||
| AllianceBernstein U.S. Value Portfolio | ||||
1 Year | 14.79 | % | ||
5 Years | 1.91 | % | ||
Since Inception* | 3.13 | % | ||
| AllianceBernstein U.S. Large Cap Growth Portfolio | ||||
1 Year | 9.81 | % | ||
5 Years | 4.52 | % | ||
Since Inception* | 5.26 | % | ||
| AllianceBernstein International Value Portfolio | ||||
1 Year | 2.35 | % | ||
5 Years | -5.65 | % | ||
Since Inception* | 2.11 | % | ||
| AllianceBernstein International Growth Portfolio | ||||
1 Year | 3.19 | % | ||
5 Years | -6.06 | % | ||
Since Inception* | 1.28 | % | ||
| AllianceBernstein Short Duration Bond Portfolio | ||||
1 Year | 1.20 | % | ||
5 Years | 2.23 | % | ||
Since Inception* | 2.77 | % | ||
| AllianceBernstein Global Core Bond Portfolio | ||||
1 Year | 5.58 | % | ||
5 Years | 6.94 | % | ||
Since Inception* | 6.19 | % | ||
| AllianceBernstein Bond Inflation Protection Portfolio | ||||
1 Year | 5.57 | % | ||
5 Years | 5.59 | % | ||
Since Inception* | 6.04 | % | ||
| AllianceBernstein High-Yield Portfolio | ||||
1 Year | 13.53 | % | ||
5 Years | 12.30 | % | ||
Since Inception* | 9.47 | % | ||
| AllianceBernstein Small-Mid Cap Value Portfolio | ||||
1 Year | 18.07 | % | ||
5 Years | 8.56 | % | ||
Since Inception* | 8.15 | % | ||
| † | These Portfolios are offered at NAV and their SEC returns are the same as their NAV returns. |
| * | Inception date: 5/20/05. |
See Disclosures, Risks and Note about Historical Performance on pages 16-19.
(Historical Performance continued on next page)
| ALLIANCEBERNSTEIN POOLING PORTFOLIOS • | 23 |
Historical Performance
HISTORICAL PERFORMANCE
(continued from previous page)
| AVERAGE ANNUAL RETURNS AS OF FEBRUARY 28, 2013 | ||||
| NAV/SEC Returns† | ||||
| AllianceBernstein Small-Mid Cap Growth Portfolio | ||||
1 Year | 9.74 | % | ||
5 Years | 12.35 | % | ||
Since Inception* | 11.91 | % | ||
| AllianceBernstein Multi-Asset Real Return Portfolio | ||||
1 Year | 0.63 | % | ||
5 Years | 0.08 | % | ||
Since Inception* | 4.60 | % | ||
| AllianceBernstein Volatility Management Portfolio | ||||
1 Year | 4.79 | % | ||
Since Inception** | 6.43 | % | ||
| † | These Portfolios are offered at NAV and their SEC returns are the same as their NAV returns. |
| * | Inception date: 5/20/05. |
| ** | Inception date: 4/16/10. |
See Disclosures, Risks and Note about Historical Performance on pages 16-19.
(Historical Performance continued on next page)
| 24 | • ALLIANCEBERNSTEIN POOLING PORTFOLIOS |
Historical Performance
HISTORICAL PERFORMANCE
(continued from previous page)
| SEC AVERAGE ANNUAL RETURNS AS OF THE MOST RECENT CALENDAR QUARTER-END (MARCH 31, 2013) | ||||
| SEC Returns† | ||||
| AllianceBernstein U.S. Value Portfolio | ||||
1 Year | 16.18 | % | ||
5 Years | 3.07 | % | ||
Since Inception* | 3.70 | % | ||
| AllianceBernstein U.S. Large Cap Growth Portfolio | ||||
1 Year | 8.70 | % | ||
5 Years | 5.27 | % | ||
Since Inception* | 5.58 | % | ||
| AllianceBernstein International Value Portfolio | ||||
1 Year | 4.80 | % | ||
5 Years | -5.74 | % | ||
Since Inception* | 2.14 | % | ||
| AllianceBernstein International Growth Portfolio | ||||
1 Year | 4.68 | % | ||
5 Years | -5.30 | % | ||
Since Inception* | 1.41 | % | ||
| AllianceBernstein Short Duration Bond Portfolio | ||||
1 Year | 1.19 | % | ||
5 Years | 2.52 | % | ||
Since Inception* | 2.74 | % | ||
| AllianceBernstein Global Core Bond Portfolio | ||||
1 Year | 6.48 | % | ||
5 Years | 7.05 | % | ||
Since Inception* | 6.19 | % | ||
| AllianceBernstein Bond Inflation Protection Portfolio | ||||
1 Year | 6.35 | % | ||
5 Years | 5.59 | % | ||
Since Inception* | 6.02 | % | ||
| AllianceBernstein High-Yield Portfolio | ||||
1 Year | 15.00 | % | ||
5 Years | 12.63 | % | ||
Since Inception* | 9.52 | % | ||
| AllianceBernstein Small-Mid Cap Value Portfolio | ||||
1 Year | 19.93 | % | ||
5 Years | 9.34 | % | ||
Since Inception* | 8.70 | % | ||
| † | These Portfolios are offered at NAV and their SEC returns are the same as their NAV returns. |
| * | Inception date: 5/20/05. |
See Disclosures, Risks and Note about Historical Performance on pages 16-19.
(Historical Performance continued on next page)
| ALLIANCEBERNSTEIN POOLING PORTFOLIOS • | 25 |
Historical Performance
HISTORICAL PERFORMANCE
(continued from previous page)
| SEC AVERAGE ANNUAL RETURNS AS OF THE MOST RECENT CALENDAR QUARTER-END (MARCH 31, 2013) | ||||
| SEC Returns† | ||||
| AllianceBernstein Small-Mid Cap Growth Portfolio | ||||
1 Year | 12.02 | % | ||
5 Years | 13.19 | % | ||
Since Inception* | 12.23 | % | ||
| AllianceBernstein Multi-Asset Real Return Portfolio | ||||
1 Year | 3.55 | % | ||
5 Years | -0.25 | % | ||
Since Inception* | 4.63 | % | ||
| AllianceBernstein Volatility Management Portfolio | ||||
1 Year | 5.60 | % | ||
Since Inception** | 6.99 | % | ||
| † | These Portfolios are offered at NAV and their SEC returns are the same as their NAV returns. |
| * | Inception date: 5/20/05. |
| ** | Inception date: 4/16/10. |
See Disclosures, Risks and Note about Historical Performance on pages 16-19.
| 26 | • ALLIANCEBERNSTEIN POOLING PORTFOLIOS |
Historical Performance
FUND EXPENSES
(unaudited)
As a shareholder of the Fund, you incur two types of costs: (1) transaction costs, including sales charges (loads) on purchase payments, contingent deferred sales charges on redemptions and (2) ongoing costs, including management fees; distribution (12b-1) fees; and other Fund expenses. This example is intended to help you understand your ongoing costs (in dollars) of investing in the Fund and to compare these costs with the ongoing costs of investing in other mutual funds.
The Example is based on an investment of $1,000 invested at the beginning of the period and held for the entire period as indicated below.
Actual Expenses
The table below provides information about actual account values and actual expenses. You may use the information in this line, together with the amount you invested, to estimate the expenses that you paid over the period. Simply divide your account value by $1,000 (for example, an $8,600 account value divided by $1,000 = 8.6), then multiply the result by the number in the first line under the heading entitled “Expenses Paid During Period” to estimate the expenses you paid on your account during this period.
Hypothetical Example for Comparison Purposes
The table below provides information about hypothetical account values and hypothetical expenses based on the Fund’s actual expense ratio and an assumed annual rate of return of 5% before expenses, which is not the Fund’s actual return. The hypothetical account values and expenses may not be used to estimate the actual ending account balance or expenses you paid for the period. You may use this information to compare the ongoing costs of investing in the Fund and other funds by comparing this 5% hypothetical example with the 5% hypothetical examples that appear in the shareholder reports of other funds.
Please note that the expenses shown in the table are meant to highlight your ongoing costs only and do not reflect any transactional costs, such as sales charges (loads), or contingent deferred sales charges on redemptions. Therefore, the second line of the table is useful in comparing ongoing costs only, and will not help you determine the relative total costs of owning different funds. In addition, if these transactional costs were included, your costs would have been higher.
| Beginning Account Value September 1, 2012 | Ending Account Value February 28, 2013 | Expenses Paid During Period* | Annualized Expense Ratio* | |||||||||||||
| U.S. Value | ||||||||||||||||
Actual | $ | 1,000 | $ | 1,144.60 | $ | 0.11 | 0.02 | % | ||||||||
Hypothetical** | $ | 1,000 | $ | 1,024.70 | $ | 0.10 | 0.02 | % | ||||||||
| U.S. Large Cap Growth | ||||||||||||||||
Actual | $ | 1,000 | $ | 1,080.30 | $ | 0.10 | 0.02 | % | ||||||||
Hypothetical** | $ | 1,000 | $ | 1,024.70 | $ | 0.10 | 0.02 | % | ||||||||
| International Value | ||||||||||||||||
Actual | $ | 1,000 | $ | 1,156.40 | $ | 0.27 | 0.05 | % | ||||||||
Hypothetical** | $ | 1,000 | $ | 1,024.55 | $ | 0.25 | 0.05 | % | ||||||||
| International Growth | ||||||||||||||||
Actual | $ | 1,000 | $ | 1,098.60 | $ | 0.21 | 0.04 | % | ||||||||
Hypothetical** | $ | 1,000 | $ | 1,024.60 | $ | 0.20 | 0.04 | % | ||||||||
| Short Duration Bond | ||||||||||||||||
Actual | $ | 1,000 | $ | 1,003.40 | $ | 0.15 | 0.03 | % | ||||||||
Hypothetical** | $ | 1,000 | $ | 1,024.65 | $ | 0.15 | 0.03 | % | ||||||||
| ALLIANCEBERNSTEIN POOLING PORTFOLIOS • | 27 |
Fund Expenses
FUND EXPENSES
(unaudited)
(continued from previous page)
| Beginning Account Value September 1, 2012 | Ending Account Value February 28, 2013 | Expenses Paid During Period* | Annualized Expense Ratio* | |||||||||||||
| Global Core Bond | ||||||||||||||||
Actual | $ | 1,000 | $ | 1,014.20 | $ | 0.15 | 0.03 | % | ||||||||
Hypothetical** | $ | 1,000 | $ | 1,024.65 | $ | 0.15 | 0.03 | % | ||||||||
| Bond Inflation Protection | ||||||||||||||||
Actual | $ | 1,000 | $ | 1,023.70 | $ | 0.75 | 0.15 | % | ||||||||
Hypothetical** | $ | 1,000 | $ | 1,024.05 | $ | 0.75 | 0.15 | % | ||||||||
| High-Yield | ||||||||||||||||
Actual | $ | 1,000 | $ | 1,073.80 | $ | 0.41 | 0.08 | % | ||||||||
Hypothetical** | $ | 1,000 | $ | 1,024.40 | $ | 0.40 | 0.08 | % | ||||||||
| Small-Mid Cap Value | ||||||||||||||||
Actual | $ | 1,000 | $ | 1,177.80 | $ | 0.32 | 0.06 | % | ||||||||
Hypothetical** | $ | 1,000 | $ | 1,024.50 | $ | 0.30 | 0.06 | % | ||||||||
| Small-Mid Cap Growth | ||||||||||||||||
Actual | $ | 1,000 | $ | 1,105.70 | $ | 0.37 | 0.07 | % | ||||||||
Hypothetical** | $ | 1,000 | $ | 1,024.45 | $ | 0.35 | 0.07 | % | ||||||||
| Multi-Asset Real Return*** | ||||||||||||||||
Actual | $ | 1,000 | $ | 1,029.50 | $ | 0.25 | 0.05 | % | ||||||||
Hypothetical** | $ | 1,000 | $ | 1,024.55 | $ | 0.25 | 0.05 | % | ||||||||
| Volatility Management | ||||||||||||||||
Actual | $ | 1,000 | $ | 1,077.60 | $ | 0.15 | 0.03 | % | ||||||||
Hypothetical** | $ | 1,000 | $ | 1,024.65 | $ | 0.15 | 0.03 | % | ||||||||
| * | Expenses are equal to the classes’ annualized expense ratios multiplied by the average account value over the period, multiplied by 181/365 (to reflect the one-half year period). |
| ** | Assumes 5% return before expenses. |
| *** | Consolidated (See Note A). |
| 28 | • ALLIANCEBERNSTEIN POOLING PORTFOLIOS |
Fund Expenses
U.S. VALUE PORTFOLIO
PORTFOLIO SUMMARY
February 28, 2013 (unaudited)
PORTFOLIO STATISTICS
Net Assets ($mil): $1,165.8
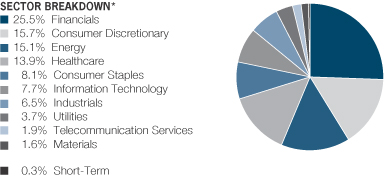
| * | All data are as of February 28, 2013. The Portfolio’s sector breakdown is expressed as a percentage of total investments (excluding security lending collateral) and may vary over time. |
Please note: The sector classifications presented herein are based on the Global Industry Classification Standard (GICS) which was developed by Morgan Stanley Capital International and Standard & Poor’s. The components are divided into sector, industry group, and industry sub-indices as classified by the GICS for each of the market capitalization indices in the broad market. These sector classifications are broadly defined. The “Portfolio of Investments” section of the report reflects more specific industry information and is consistent with the investment restrictions discussed in the Portfolio’s prospectus.
| ALLIANCEBERNSTEIN POOLING PORTFOLIOS • | 29 |
Portfolio Summary
U.S. LARGE CAP GROWTH PORTFOLIO
PORTFOLIO SUMMARY
February 28, 2013 (unaudited)
PORTFOLIO STATISTICS
Net Assets ($mil): $1,162.7
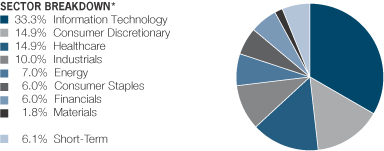
| * | All data are as of February 28, 2013. The Portfolio’s sector breakdown is expressed as a percentage of total investments (excluding security lending collateral) and may vary over time. |
Please note: The sector classifications presented herein are based on the Global Industry Classification Standard (GICS) which was developed by Morgan Stanley Capital International and Standard & Poor’s. The components are divided into sector, industry group, and industry sub-indices as classified by the GICS for each of the market capitalization indices in the broad market. These sector classifications are broadly defined. The “Portfolio of Investments” section of the report reflects more specific industry information and is consistent with the investment restrictions discussed in the Portfolio’s prospectus.
| 30 | • ALLIANCEBERNSTEIN POOLING PORTFOLIOS |
Portfolio Summary
INTERNATIONAL VALUE PORTFOLIO
PORTFOLIO SUMMARY
February 28, 2013 (unaudited)
PORTFOLIO STATISTICS
Net Assets ($mil): $980.6
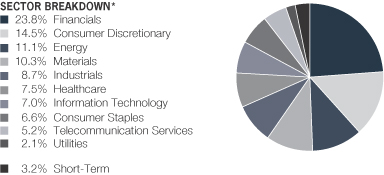
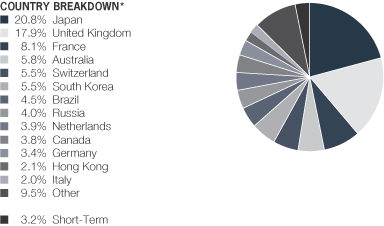
| * | All data are as of February 28, 2013. The Portfolio’s sector and country breakdowns are expressed as a percentage of total investments (excluding security lending collateral) and may vary over time. The Portfolio also enters into derivative transactions, which may be used for hedging or investment purposes (see “Portfolio of Investments” section of the report for additional details). “Other” country weightings represent 1.9% or less in the following countries: China, Czech Republic, Denmark, Mexico, Norway, Poland, Portugal, South Africa, Sweden, Taiwan and Thailand. |
Please note: The sector classifications presented herein are based on the Global Industry Classification Standard (GICS) which was developed by Morgan Stanley Capital International and Standard & Poor’s. The components are divided into sector, industry group, and industry sub-indices as classified by the GICS for each of the market capitalization indices in the broad market. These sector classifications are broadly defined. The “Portfolio of Investments” section of the report reflects more specific industry information and is consistent with the investment restrictions discussed in the Portfolio’s prospectus.
| ALLIANCEBERNSTEIN POOLING PORTFOLIOS • | 31 |
Portfolio Summary
INTERNATIONAL GROWTH PORTFOLIO
PORTFOLIO SUMMARY
February 28, 2013 (unaudited)
PORTFOLIO STATISTICS
Net Assets ($mil): $977.4
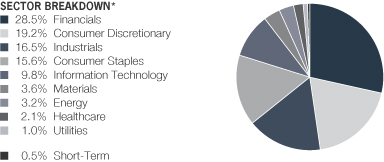
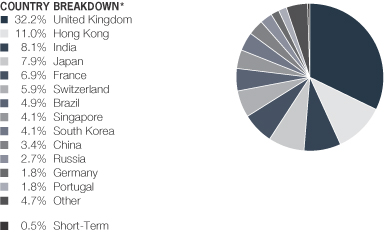
| * | All data are as of February 28, 2013. The Portfolio’s sector and country breakdowns are expressed as a percentage of total investments (excluding security lending collateral) and may vary over time. The Portfolio also enters into derivative transactions, which may be used for hedging or investment purposes (see “Portfolio of Investments” section of the report for additional details). “Other” country weightings represent 0.9% or less in the following countries: Argentina, Belgium, Cyprus, Finland, Indonesia, Italy, Luxembourg, South Africa and Sri Lanka. |
Please note: The sector classifications presented herein are based on the Global Industry Classification Standard (GICS) which was developed by Morgan Stanley Capital International and Standard & Poor’s. The components are divided into sector, industry group, and industry sub-indices as classified by the GICS for each of the market capitalization indices in the broad market. These sector classifications are broadly defined. The “Portfolio of Investments” section of the report reflects more specific industry information and is consistent with the investment restrictions discussed in the Portfolio’s prospectus.
| 32 | • ALLIANCEBERNSTEIN POOLING PORTFOLIOS |
Portfolio Summary
SHORT DURATION BOND PORTFOLIO
PORTFOLIO SUMMARY
February 28, 2013 (unaudited)
PORTFOLIO STATISTICS
Net Assets ($mil): $945.8
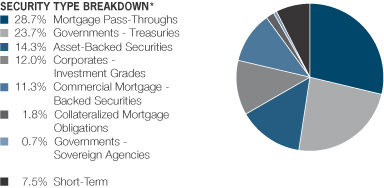
| * | All data are as of February 28, 2013. The Portfolio’s security type breakdown is expressed as a percentage of total investments and may vary over time. The Portfolio also enters into derivative transactions, which may be used for hedging or investment purposes (see “Portfolio of Investments” section of the report for additional details). |
| ALLIANCEBERNSTEIN POOLING PORTFOLIOS • | 33 |
Portfolio Summary
GLOBAL CORE BOND PORTFOLIO
PORTFOLIO SUMMARY
February 28, 2013 (unaudited)
PORTFOLIO STATISTICS
Net Assets ($mil): $1,083.7
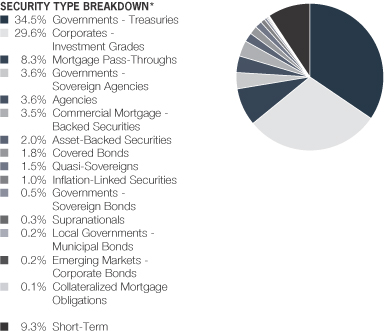
| * | All data are as of February 28, 2013. The Portfolio’s security type breakdown is expressed as a percentage of total investments and may vary over time. The Portfolio also enters into derivative transactions, which may be used for hedging or investment purposes (see “Portfolio of Investments” section of the report for additional details). |
| 34 | • ALLIANCEBERNSTEIN POOLING PORTFOLIOS |
Portfolio Summary
GLOBAL CORE BOND PORTFOLIO
PORTFOLIO SUMMARY
February 28, 2013 (unaudited)
PORTFOLIO STATISTICS
Net Assets ($mil): $1,083.7
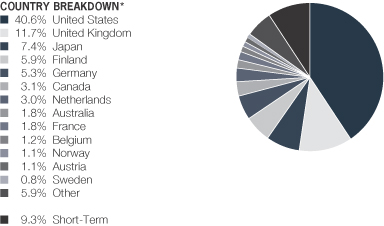
| * | All data are as of February 28, 2013. The Portfolio’s country breakdown is expressed as a percentage of total investments and may vary over time. The Portfolio also enters into derivative transactions, which may be used for hedging or investment purposes (see “Portfolio of Investments” section of the report for additional details). “Other” country weightings represent 0.7% or less in the following countries: Brazil, China, India, Ireland, Israel, Italy, Kazakhstan, Malaysia, Mexico, New Zealand, Peru, Qatar, Russia, South Africa, South Korea, Spain, Supranational, Turkey and United Arab Emirates. |
| ALLIANCEBERNSTEIN POOLING PORTFOLIOS • | 35 |
Portfolio Summary
BOND INFLATION PROTECTION PORTFOLIO
PORTFOLIO SUMMARY
February 28, 2013 (unaudited)
PORTFOLIO STATISTICS
Net Assets ($mil): $778.0
Total Investments ($mil): $1,089.3
| INFLATION PROTECTION BREAKDOWN* | ||||
U.S. Inflation-Protected Exposure | 97.3 | % | ||
Non-U.S. | — | |||
Non-Inflation Exposure | 2.7 | % | ||
|
| |||
| 100.0 | % | |||
| SECTOR BREAKDOWN OF NET PORTFOLIO ASSETS, EXCLUDING TREASURY SECURITIES, TIPS, INTEREST RATE DERIVATIVES AND NET CASH EQUIVALENTS* | ||||
Corporates – Investment Grades | 20.4 | % | ||
Asset-Backed Securities | 9.8 | % | ||
Commercial Mortgage-Backed Securities | 6.1 | % | ||
Mortgage Pass-Throughs | 2.7 | % | ||
Corporates – Non-Investment Grades | 1.7 | % | ||
Quasi-Sovereigns | 1.1 | % | ||
Agencies | 1.1 | % | ||
Governments – Sovereign Bonds | 0.2 | % | ||
| SECTOR BREAKDOWN OF TOTAL PORTFOLIO INVESTMENTS, EXCLUDING DERIVATIVES** | ||||
Inflation-Linked Securities | 69.5 | % | ||
Corporates – Investment Grades | 14.2 | % | ||
Asset-Backed Securities | 7.0 | % | ||
Commercial Mortgage-Backed Securities | 4.4 | % | ||
Mortgage Pass-Throughs | 2.0 | % | ||
Corporates – Non-Investment Grades | 1.2 | % | ||
Quasi-Sovereigns | 0.8 | % | ||
Agencies | 0.8 | % | ||
Governments – Sovereign Bonds | 0.1 | % | ||
| * | All data are as of February 28, 2013. The Portfolio’s sector and inflation protection exposure breakdowns are expressed as an approximate percentage of the Portfolio’s total net assets (and may vary over time) inclusive of derivative exposure except as noted, based on the Adviser’s internal classification. |
| ** | The Portfolio’s sector breakdown is expressed, based on the Adviser’s internal classification, as a percentage of total investments and may vary over time. The Portfolio also enters into derivative transactions (not reflected in the table), which may be used for hedging or investment purposes or to adjust the risk profile or exposures of the Portfolio (see “Portfolio of Investments” section of the report for additional details). Derivative transactions may result in a form of leverage for the Portfolio. The Portfolio uses leverage for investment purposes by entering into reverse repurchase agreements. As a result, the Portfolio’s total investments will generally exceed its net assets. |
| 36 | • ALLIANCEBERNSTEIN POOLING PORTFOLIOS |
Portfolio Summary
HIGH-YIELD PORTFOLIO
PORTFOLIO SUMMARY
February 28, 2013 (unaudited)
PORTFOLIO STATISTICS
Net Assets ($mil): $385.4
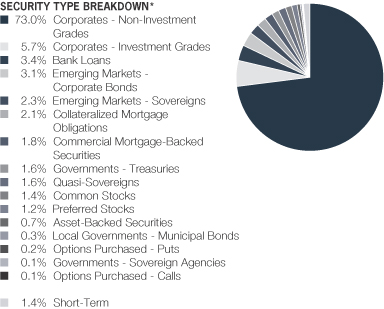
| * | All data are as of February 28, 2013. The Portfolio’s security type breakdown is expressed as a percentage of total investments and may vary over time. The Portfolio also enters into derivative transactions, which may be used for hedging or investment purposes (see “Portfolio of Investments” section of the report for additional details). |
| ALLIANCEBERNSTEIN POOLING PORTFOLIOS • | 37 |
Portfolio Summary
SMALL-MID CAP VALUE PORTFOLIO
PORTFOLIO SUMMARY
February 28, 2013 (unaudited)
PORTFOLIO STATISTICS
Net Assets ($mil): $326.7
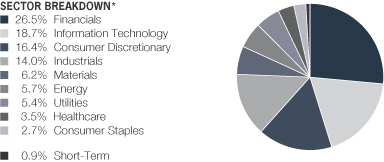
| * | All data are as of February 28, 2013. The Portfolio’s sector breakdown is expressed as a percentage of total investments (excluding security lending collateral) and may vary over time. |
Please note: The sector classifications presented herein are based on the Global Industry Classification Standard (GICS) which was developed by Morgan Stanley Capital International and Standard & Poor’s. The components are divided into sector, industry group, and industry sub-indices as classified by the GICS for each of the market capitalization indices in the broad market. These sector classifications are broadly defined. The “Portfolio of Investments” section of the report reflects more specific industry information and is consistent with the investment restrictions discussed in the Portfolio’s prospectus.
| 38 | • ALLIANCEBERNSTEIN POOLING PORTFOLIOS |
Portfolio Summary
SMALL-MID CAP GROWTH PORTFOLIO
PORTFOLIO SUMMARY
February 28, 2013 (unaudited)
PORTFOLIO STATISTICS
Net Assets ($mil): $327.8

| * | All data are as of February 28, 2013. The Portfolio’s sector breakdown is expressed as a percentage of total investments(excluding security lending collateral) and may vary over time. |
| * | Please note: The sector classifications presented herein are based on the Global Industry Classification Standard (GICS) which was developed by Morgan Stanley Capital International and Standard & Poor’s. The components are divided into sector, industry group, and industry sub-indices as classified by the GICS for each of the market capitalization indices in the broad market. These sector classifications are broadly defined. The “Portfolio of Investments” section of the report reflects more specific industry information and is consistent with the investment restrictions discussed in the Portfolio’s prospectus. |
| ALLIANCEBERNSTEIN POOLING PORTFOLIOS • | 39 |
Portfolio Summary
MULTI-ASSET REAL RETURN PORTFOLIO
PORTFOLIO SUMMARY
February 28, 2013 (unaudited)
PORTFOLIO STATISTICS
Net Assets ($mil): $1,144.4
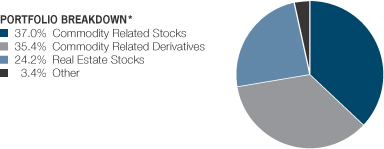
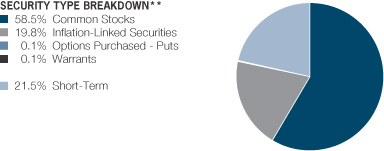
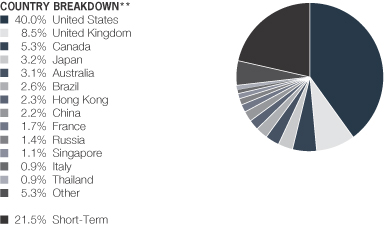
| * | All data are as of February 28, 2013. The Portfolio’s portfolio type breakdown is expressed as an approximate percentage of the Portfolio’s net assets inclusive of derivative exposure, based on the Adviser’s internal classification guidelines. |
| ** | The Portfolio’s security type and country breakdowns are expressed as a percentage of total investments (excluding security lending collateral) and may vary over time . The Portfolio also enters into derivative transactions, which may be used for hedging or investment purposes (see “Portfolio of Investments” section of the report for additional details). “Other” country weightings represent 0.8% or less in the following countries: Austria, Belgium, Finland, Germany, India, Indonesia, Israel, Jersey (Channel Islands), Malaysia, Mexico, Netherlands, New Zealand, Norway, Peru, Philippines, Poland, Portugal, South Africa, South Korea, Spain, Sweden, Switzerland, Turkey, Ukraine and United Arab Emirates. |
| 40 | • ALLIANCEBERNSTEIN POOLING PORTFOLIOS |
Portfolio Summary
VOLATILITY MANAGEMENT PORTFOLIO
PORTFOLIO SUMMARY
February 28, 2013 (unaudited)
PORTFOLIO STATISTICS
Net Assets ($mil): $1,669.3
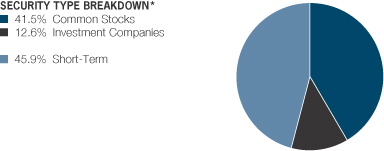
TEN LARGEST HOLDINGS** February 28, 2013 (unaudited) | ||||||||
| Company | U.S. $ Value | Percent of Net Assets | ||||||
iShares MSCI Emerging Markets Index Fund | $ | 208,548,744 | 12.5 | % | ||||
Apple, Inc. | 11,414,604 | 0.7 | ||||||
Exxon Mobil Corp. | 11,391,656 | 0.7 | ||||||
General Electric Co. | 6,752,376 | 0.4 | ||||||
Chevron Corp. | 6,337,815 | 0.4 | ||||||
International Business Machines Corp. | 5,944,568 | 0.4 | ||||||
Google, Inc. – Class A | 5,888,820 | 0.4 | ||||||
Johnson & Johnson | 5,784,360 | 0.3 | ||||||
Procter & Gamble Co. (The) | 5,782,062 | 0.3 | ||||||
Microsoft Corp. | 5,776,840 | 0.3 | ||||||
| $ | 273,621,845 | 16.4 | % | |||||
| * | All data are as of February 28, 2013. The Portfolio’s security type breakdown is expressed as a percentage of total investments (excluding security lending collateral) and may vary over time. The Portfolio also enters into derivative transactions, which may be used for hedging or investment purposes (see “Portfolio of Investments” section of the report for additional details). |
| ** | Long-term investments. |
| ALLIANCEBERNSTEIN POOLING PORTFOLIOS • | 41 |
Portfolio Summary
U.S. VALUE PORTFOLIO
PORTFOLIO OF INVESTMENTS
February 28, 2013 (unaudited)
| Company | Shares | U.S. $ Value | ||||||
| ||||||||
COMMON STOCKS – 97.9% | ||||||||
Financials – 25.0% | ||||||||
Capital Markets – 0.6% | ||||||||
State Street Corp. | 122,700 | $ | 6,943,593 | |||||
|
| |||||||
Commercial Banks – 8.5% | ||||||||
BB&T Corp. | 416,200 | 12,635,832 | ||||||
CIT Group, Inc.(a) | 466,200 | 19,515,132 | ||||||
Fifth Third Bancorp | 143,200 | 2,268,288 | ||||||
KeyCorp | 182,300 | 1,711,797 | ||||||
Regions Financial Corp. | 403,000 | 3,082,950 | ||||||
SunTrust Banks, Inc. | 84,800 | 2,339,632 | ||||||
US Bancorp | 471,600 | 16,024,968 | ||||||
Wells Fargo & Co. | 1,177,500 | 41,306,700 | ||||||
|
| |||||||
| 98,885,299 | ||||||||
|
| |||||||
Consumer Finance – 1.2% | ||||||||
Discover Financial Services | 362,800 | 13,978,684 | ||||||
|
| |||||||
Diversified Financial Services – 7.9% | ||||||||
Bank of America Corp. | 2,550,200 | 28,638,746 | ||||||
Citigroup, Inc. | 868,300 | 36,442,551 | ||||||
JPMorgan Chase & Co. | 559,800 | 27,385,416 | ||||||
|
| |||||||
| 92,466,713 | ||||||||
|
| |||||||
Insurance – 6.8% | ||||||||
Berkshire Hathaway, Inc.(a) | 93,100 | 9,511,096 | ||||||
Chubb Corp. (The) | 144,500 | 12,142,335 | ||||||
Everest Re Group Ltd. | 80,600 | 10,043,566 | ||||||
Fidelity National Financial, Inc. – Class A | 325,000 | 8,105,500 | ||||||
MetLife, Inc. | 134,100 | 4,752,504 | ||||||
PartnerRe Ltd. | 120,800 | 10,780,192 | ||||||
Reinsurance Group of America, Inc. – Class A | 130,900 | 7,526,750 | ||||||
Torchmark Corp. | 129,500 | 7,276,605 | ||||||
Travelers Cos., Inc. (The) | 74,500 | 5,991,290 | ||||||
Validus Holdings Ltd. | 101,800 | 3,627,134 | ||||||
|
| |||||||
| 79,756,972 | ||||||||
|
| |||||||
| 292,031,261 | ||||||||
|
| |||||||
Consumer Discretionary – 15.4% | ||||||||
Auto Components – 2.2% | ||||||||
Lear Corp. | 240,900 | 12,868,878 | ||||||
Magna International, Inc. (New York) – Class A | 58,100 | 3,092,082 | ||||||
TRW Automotive Holdings Corp.(a) | 160,100 | 9,396,269 | ||||||
|
| |||||||
| 25,357,229 | ||||||||
|
| |||||||
Automobiles – 1.5% | ||||||||
Ford Motor Co. | 1,421,100 | 17,920,071 | ||||||
|
| |||||||
| 42 | • ALLIANCEBERNSTEIN POOLING PORTFOLIOS |
U.S. Value Portfolio—Portfolio of Investments
| Company | Shares | U.S. $ Value | ||||||
| ||||||||
Hotels, Restaurants & Leisure – 0.8% | ||||||||
MGM Resorts International(a) | 727,600 | $ | 9,087,724 | |||||
|
| |||||||
Household Durables – 1.1% | ||||||||
PulteGroup, Inc.(a) | 665,000 | 12,754,700 | ||||||
|
| |||||||
Media – 5.9% | ||||||||
Comcast Corp. – Class A | 549,500 | 21,864,605 | ||||||
Gannett Co., Inc. | 435,400 | 8,738,478 | ||||||
News Corp. – Class A | 404,900 | 11,661,120 | ||||||
Time Warner Cable, Inc. – Class A | 138,800 | 11,990,932 | ||||||
Viacom, Inc. – Class B | 245,700 | 14,363,622 | ||||||
|
| |||||||
| 68,618,757 | ||||||||
|
| |||||||
Multiline Retail – 1.0% | ||||||||
Macy’s, Inc. | 298,400 | 12,264,240 | ||||||
|
| |||||||
Specialty Retail – 2.9% | ||||||||
GameStop Corp. – Class A(b) | 407,100 | 10,201,926 | ||||||
Home Depot, Inc. (The) | 21,300 | 1,459,050 | ||||||
Lowe’s Cos., Inc. | 246,600 | 9,407,790 | ||||||
TJX Cos., Inc. | 284,900 | 12,811,953 | ||||||
|
| |||||||
| 33,880,719 | ||||||||
|
| |||||||
| 179,883,440 | ||||||||
|
| |||||||
Energy – 14.8% | ||||||||
Energy Equipment & Services – 2.6% | ||||||||
Diamond Offshore Drilling, Inc.(b) | 142,200 | 9,908,496 | ||||||
Halliburton Co. | 232,900 | 9,667,679 | ||||||
Helix Energy Solutions Group, Inc.(a) | 233,900 | 5,475,599 | ||||||
Helmerich & Payne, Inc. | 31,100 | 2,060,686 | ||||||
Nabors Industries Ltd.(a) | 195,600 | 3,278,256 | ||||||
|
| |||||||
| 30,390,716 | ||||||||
|
| |||||||
Oil, Gas & Consumable Fuels – 12.2% | ||||||||
BP PLC (Sponsored ADR) | 204,400 | 8,257,760 | ||||||
Chevron Corp. | 268,500 | 31,454,775 | ||||||
Exxon Mobil Corp. | 749,400 | 67,108,770 | ||||||
HollyFrontier Corp. | 30,100 | 1,691,620 | ||||||
Marathon Petroleum Corp. | 159,200 | 13,194,496 | ||||||
Royal Dutch Shell PLC (ADR) | 127,300 | 8,357,245 | ||||||
Valero Energy Corp. | 265,700 | 12,113,263 | ||||||
|
| |||||||
| 142,177,929 | ||||||||
|
| |||||||
| 172,568,645 | ||||||||
|
| |||||||
Health Care – 13.7% | ||||||||
Biotechnology – 0.5% | ||||||||
Vertex Pharmaceuticals, Inc.(a) | 129,300 | 6,053,826 | ||||||
|
| |||||||
| ALLIANCEBERNSTEIN POOLING PORTFOLIOS • | 43 |
U.S. Value Portfolio—Portfolio of Investments
| Company | Shares | U.S. $ Value | ||||||
| ||||||||
Health Care Equipment & Supplies – 1.1% | ||||||||
Medtronic, Inc. | 287,700 | $ | 12,934,992 | |||||
|
| |||||||
Health Care Providers & Services – 3.0% | ||||||||
Aetna, Inc. | 195,700 | 9,235,083 | ||||||
Health Net, Inc./CA(a) | 230,800 | 5,940,792 | ||||||
WellPoint, Inc. | 308,900 | 19,207,402 | ||||||
|
| |||||||
| 34,383,277 | ||||||||
|
| |||||||
Pharmaceuticals – 9.1% | ||||||||
AstraZeneca PLC (Sponsored ADR) | 184,000 | 8,360,960 | ||||||
Johnson & Johnson | 249,300 | 18,974,223 | ||||||
Merck & Co., Inc. | 484,300 | 20,694,139 | ||||||
Pfizer, Inc. | 1,812,400 | 49,605,388 | ||||||
Roche Holding AG (Sponsored ADR) | 145,000 | 8,318,650 | ||||||
|
| |||||||
| 105,953,360 | ||||||||
|
| |||||||
| 159,325,455 | ||||||||
|
| |||||||
Consumer Staples – 8.0% | ||||||||
Beverages – 0.2% | ||||||||
Coca-Cola Enterprises, Inc. | 43,900 | 1,570,742 | ||||||
|
| |||||||
Food & Staples Retailing – 2.5% | ||||||||
CVS Caremark Corp. | 187,400 | 9,579,888 | ||||||
Kroger Co. (The) | 660,600 | 19,296,126 | ||||||
|
| |||||||
| 28,876,014 | ||||||||
|
| |||||||
Food Products – 1.9% | ||||||||
Bunge Ltd. | 67,500 | 5,002,425 | ||||||
Smithfield Foods, Inc.(a) | 108,100 | 2,404,144 | ||||||
Tyson Foods, Inc. – Class A | 661,100 | 14,987,137 | ||||||
|
| |||||||
| 22,393,706 | ||||||||
|
| |||||||
Household Products – 0.9% | ||||||||
Procter & Gamble Co. (The) | 143,000 | 10,893,740 | ||||||
|
| |||||||
Tobacco – 2.5% | ||||||||
Altria Group, Inc. | 475,100 | 15,939,605 | ||||||
Lorillard, Inc. | 277,500 | 10,694,850 | ||||||
Philip Morris International, Inc. | 27,700 | 2,541,475 | ||||||
|
| |||||||
| 29,175,930 | ||||||||
|
| |||||||
| 92,910,132 | ||||||||
|
| |||||||
Information Technology – 7.6% | ||||||||
Communications Equipment – 1.9% | ||||||||
Cisco Systems, Inc. | 775,000 | 16,158,750 | ||||||
Harris Corp. | 127,500 | 6,128,925 | ||||||
|
| |||||||
| 22,287,675 | ||||||||
|
| |||||||
| 44 | • ALLIANCEBERNSTEIN POOLING PORTFOLIOS |
U.S. Value Portfolio—Portfolio of Investments
| Company | Shares | U.S. $ Value | ||||||
| ||||||||
Computers & Peripherals – 2.3% | ||||||||
Hewlett-Packard Co. | 1,309,650 | $ | 26,376,351 | |||||
|
| |||||||
Semiconductors & | ||||||||
Applied Materials, Inc. | 1,013,900 | 13,890,430 | ||||||
Micron Technology, Inc.(a) | 1,294,100 | 10,857,499 | ||||||
|
| |||||||
| 24,747,929 | ||||||||
|
| |||||||
Software – 1.3% | ||||||||
CA, Inc. | 47,600 | 1,165,724 | ||||||
Electronic Arts, Inc.(a) | 220,000 | 3,856,600 | ||||||
Symantec Corp.(a) | 418,000 | 9,797,920 | ||||||
|
| |||||||
| 14,820,244 | ||||||||
|
| |||||||
| 88,232,199 | ||||||||
|
| |||||||
Industrials – 6.4% | ||||||||
Aerospace & Defense – 0.3% | ||||||||
Northrop Grumman Corp. | 47,900 | 3,146,072 | ||||||
|
| |||||||
Airlines – 0.8% | ||||||||
Delta Air Lines, Inc.(a) | 656,400 | 9,366,828 | ||||||
|
| |||||||
Industrial Conglomerates – 3.8% | ||||||||
General Electric Co. | 1,913,000 | 44,419,860 | ||||||
|
| |||||||
Machinery – 1.5% | ||||||||
Cummins, Inc. | 50,300 | 5,828,261 | ||||||
Flowserve Corp. | 19,300 | 3,097,650 | ||||||
Parker Hannifin Corp. | 14,000 | 1,322,720 | ||||||
Timken Co. | 135,300 | 7,349,496 | ||||||
|
| |||||||
| 17,598,127 | ||||||||
|
| |||||||
| 74,530,887 | ||||||||
|
| |||||||
Utilities – 3.6% | ||||||||
Electric Utilities – 2.5% | ||||||||
Edison International | 168,400 | 8,088,252 | ||||||
Great Plains Energy, Inc. | 340,100 | 7,424,383 | ||||||
NV Energy, Inc. | 668,000 | 13,199,680 | ||||||
|
| |||||||
| 28,712,315 | ||||||||
|
| |||||||
Gas Utilities – 0.7% | ||||||||
Atmos Energy Corp. | 223,400 | 8,527,178 | ||||||
|
| |||||||
Multi-Utilities – 0.4% | ||||||||
DTE Energy Co. | 28,400 | 1,897,120 | ||||||
Sempra Energy | 36,800 | 2,861,568 | ||||||
|
| |||||||
| 4,758,688 | ||||||||
|
| |||||||
| 41,998,181 | ||||||||
|
| |||||||
| ALLIANCEBERNSTEIN POOLING PORTFOLIOS • | 45 |
U.S. Value Portfolio—Portfolio of Investments
| Company | Shares | U.S. $ Value | ||||||
| ||||||||
Telecommunication Services – 1.9% | ||||||||
Diversified Telecommunication | ||||||||
AT&T, Inc. | 618,400 | $ | 22,206,744 | |||||
|
| |||||||
Materials – 1.5% | ||||||||
Chemicals – 1.5% | ||||||||
CF Industries Holdings, Inc. | 8,100 | 1,626,723 | ||||||
LyondellBasell Industries NV | 276,100 | 16,184,982 | ||||||
|
| |||||||
| 17,811,705 | ||||||||
|
| |||||||
Total Common Stocks | 1,141,498,649 | |||||||
|
| |||||||
SHORT-TERM INVESTMENTS – 0.4% | ||||||||
Investment Companies – 0.4% | ||||||||
AllianceBernstein Fixed-Income Shares, Inc. – Government STIF Portfolio, 0.12%(c) | 4,025,699 | 4,025,699 | ||||||
|
| |||||||
Total Investments Before Security Lending Collateral for Securities Loaned – 98.3% | 1,145,524,348 | |||||||
|
| |||||||
INVESTMENTS OF CASH COLLATERAL FOR SECURITIES LOANED – 1.1% | ||||||||
Investment Companies – 1.1% | ||||||||
AllianceBernstein Exchange Reserves – | 13,342,427 | 13,342,427 | ||||||
|
| |||||||
Total Investments – 99.4% | 1,158,866,775 | |||||||
Other assets less liabilities – 0.6% | 6,934,585 | |||||||
|
| |||||||
Net Assets – 100.0% | $ | 1,165,801,360 | ||||||
|
| |||||||
| (a) | Non-income producing security. |
| (b) | Represents entire or partial securities out on loan. See Note D for securities lending information. |
| (c) | Investment in affiliated money market mutual fund. The rate shown represents the 7-day yield as of period end. |
Glossary:
| ADR | – American Depositary Receipt |
See notes to financial statements.
| 46 | • ALLIANCEBERNSTEIN POOLING PORTFOLIOS |
U.S. Value Portfolio—Portfolio of Investments
U.S. LARGE CAP GROWTH PORTFOLIO
PORTFOLIO OF INVESTMENTS
February 28, 2013 (unaudited)
| Company | Shares | U.S. $ Value | ||||||
| ||||||||
COMMON STOCKS – 93.2% | ||||||||
Information Technology – 33.1% | ||||||||
Communications Equipment – 3.7% | ||||||||
F5 Networks, Inc.(a) | 177,370 | $ | 16,749,049 | |||||
QUALCOMM, Inc. | 397,310 | 26,075,455 | ||||||
|
| |||||||
| 42,824,504 | ||||||||
|
| |||||||
Computers & Peripherals – 5.1% | ||||||||
Apple, Inc. | 120,790 | 53,316,706 | ||||||
EMC Corp./MA(a) | 266,737 | 6,137,618 | ||||||
|
| |||||||
| 59,454,324 | ||||||||
|
| |||||||
Electronic Equipment, Instruments & Components – 1.1% | ||||||||
Amphenol Corp. – Class A | 64,310 | 4,557,007 | ||||||
Trimble Navigation Ltd.(a) | 140,730 | 8,363,584 | ||||||
|
| |||||||
| 12,920,591 | ||||||||
|
| |||||||
Internet Software & Services – 9.1% | ||||||||
Akamai Technologies, Inc.(a) | 215,430 | 7,962,293 | ||||||
eBay, Inc.(a) | 520,763 | 28,475,321 | ||||||
Facebook, Inc.(a) | 281,050 | 7,658,612 | ||||||
Google, Inc. – Class A(a) | 53,255 | 42,667,906 | ||||||
LinkedIn Corp.(a) | 115,360 | 19,401,245 | ||||||
|
| |||||||
| 106,165,377 | ||||||||
|
| |||||||
IT Services – 5.8% | ||||||||
Cognizant Technology Solutions Corp. – | 577,080 | 44,302,432 | ||||||
Visa, Inc. – Class A | 141,970 | 22,522,121 | ||||||
|
| |||||||
| 66,824,553 | ||||||||
|
| |||||||
Semiconductors & Semiconductor | ||||||||
Broadcom Corp. – Class A | 210,196 | 7,169,786 | ||||||
Mellanox Technologies Ltd.(a)(b) | 50,263 | 2,650,368 | ||||||
|
| |||||||
| 9,820,154 | ||||||||
|
| |||||||
Software – 7.5% | ||||||||
ANSYS, Inc.(a) | 242,220 | 18,360,276 | ||||||
Citrix Systems, Inc.(a) | 434,170 | 30,782,653 | ||||||
Intuit, Inc. | 262,260 | 16,910,525 | ||||||
Red Hat, Inc.(a) | 193,970 | 9,855,616 | ||||||
SolarWinds, Inc.(a) | 84,822 | 4,789,050 | ||||||
TIBCO Software, Inc.(a) | 286,857 | 6,153,082 | ||||||
| 86,851,202 | ||||||||
|
| |||||||
| 384,860,705 | ||||||||
|
| |||||||
Consumer Discretionary – 14.8% | ||||||||
Automobiles – 0.9% | ||||||||
Harley-Davidson, Inc. | 197,097 | 10,373,215 | ||||||
|
| |||||||
| ALLIANCEBERNSTEIN POOLING PORTFOLIOS • | 47 |
U.S. Large Cap Growth Portfolio—Portfolio of Investments
| Company | Shares | U.S. $ Value | ||||||
| ||||||||
Hotels, Restaurants & Leisure – 2.7% | ||||||||
Chipotle Mexican Grill, Inc. – Class A(a) | 25,210 | $ | 7,986,276 | |||||
Starbucks Corp. | 415,690 | 22,788,126 | ||||||
|
| |||||||
| 30,774,402 | ||||||||
|
| |||||||
Internet & Catalog Retail – 3.2% | ||||||||
Amazon.com, Inc.(a) | 80,670 | 21,318,661 | ||||||
priceline.com, Inc.(a) | 23,500 | 16,158,130 | ||||||
|
| |||||||
| 37,476,791 | ||||||||
|
| |||||||
Media – 4.4% | ||||||||
Comcast Corp. – Class A | 580,040 | 23,079,792 | ||||||
Walt Disney Co. (The) | 518,680 | 28,314,741 | ||||||
|
| |||||||
| 51,394,533 | ||||||||
|
| |||||||
Multiline Retail – 0.6% | ||||||||
Dollar General Corp.(a) | 148,634 | 6,887,699 | ||||||
|
| |||||||
Specialty Retail – 1.6% | ||||||||
O’Reilly Automotive, Inc.(a) | 100,190 | 10,193,330 | ||||||
Ulta Salon Cosmetics & Fragrance, Inc. | 93,962 | 8,321,275 | ||||||
|
| |||||||
| 18,514,605 | ||||||||
|
| |||||||
Textiles, Apparel & Luxury Goods – 1.4% | ||||||||
Coach, Inc. | 143,680 | 6,944,055 | ||||||
VF Corp. | 59,770 | 9,638,510 | ||||||
|
| |||||||
| 16,582,565 | ||||||||
|
| |||||||
| 172,003,810 | ||||||||
|
| |||||||
Health Care – 14.7% | ||||||||
Biotechnology – 6.1% | ||||||||
Biogen Idec, Inc.(a) | 243,087 | 40,435,092 | ||||||
Celgene Corp.(a) | 193,350 | 19,949,853 | ||||||
Gilead Sciences, Inc.(a) | 241,440 | 10,311,902 | ||||||
|
| |||||||
| 70,696,847 | ||||||||
|
| |||||||
Health Care Equipment & Supplies – 4.0% | ||||||||
IDEXX Laboratories, Inc.(a) | 234,810 | 21,630,697 | ||||||
Intuitive Surgical, Inc.(a) | 49,080 | 25,025,401 | ||||||
|
| |||||||
| 46,656,098 | ||||||||
|
| |||||||
Health Care Providers & Services – 2.3% | ||||||||
McKesson Corp. | 89,060 | 9,451,938 | ||||||
UnitedHealth Group, Inc. | 326,235 | 17,437,261 | ||||||
|
| |||||||
| 26,889,199 | ||||||||
|
| |||||||
Life Sciences Tools & Services – 0.6% | ||||||||
Illumina, Inc.(a) | 132,700 | 6,652,251 | ||||||
|
| |||||||
Pharmaceuticals – 1.7% | ||||||||
Allergan, Inc./United States | 189,820 | 20,580,284 | ||||||
|
| |||||||
| 171,474,679 | ||||||||
|
| |||||||
| 48 | • ALLIANCEBERNSTEIN POOLING PORTFOLIOS |
U.S. Large Cap Growth Portfolio—Portfolio of Investments
| Company | Shares | U.S. $ Value | ||||||
| ||||||||
Industrials – 10.0% | ||||||||
Aerospace & Defense – 4.7% | ||||||||
Boeing Co. (The) | 188,520 | $ | 14,497,188 | |||||
Precision Castparts Corp. | 214,300 | 39,986,237 | ||||||
|
| |||||||
| 54,483,425 | ||||||||
|
| |||||||
Commercial Services & Supplies – 0.6% | ||||||||
Stericycle, Inc.(a) | 70,570 | 6,769,074 | ||||||
|
| |||||||
Electrical Equipment – 1.8% | ||||||||
AMETEK, Inc. | 261,227 | 10,927,126 | ||||||
Roper Industries, Inc. | 82,700 | 10,305,247 | ||||||
|
| |||||||
| 21,232,373 | ||||||||
|
| |||||||
Industrial Conglomerates – 2.0% | ||||||||
Danaher Corp. | 373,559 | 23,011,234 | ||||||
|
| |||||||
Machinery – 0.9% | ||||||||
Flowserve Corp. | 63,814 | 10,242,147 | ||||||
|
| |||||||
| 115,738,253 | ||||||||
|
| |||||||
Energy – 7.0% | ||||||||
Energy Equipment & Services – 4.2% | ||||||||
National Oilwell Varco, Inc. | 137,420 | 9,362,425 | ||||||
Oceaneering International, Inc. | 153,370 | 9,752,798 | ||||||
Schlumberger Ltd. | 372,623 | 29,008,701 | ||||||
|
| |||||||
| 48,123,924 | ||||||||
|
| |||||||
Oil, Gas & Consumable Fuels – 2.8% | ||||||||
Concho Resources, Inc.(a) | 49,030 | 4,410,739 | ||||||
EOG Resources, Inc. | 92,631 | 11,644,643 | ||||||
Noble Energy, Inc. | 150,587 | 16,689,557 | ||||||
|
| |||||||
| 32,744,939 | ||||||||
|
| |||||||
| 80,868,863 | ||||||||
|
| |||||||
Consumer Staples – 5.9% | ||||||||
Food Products – 1.7% | ||||||||
Hershey Co. (The) | 234,510 | 19,544,063 | ||||||
|
| |||||||
Personal Products – 1.4% | ||||||||
Estee Lauder Cos., Inc. (The) – Class A | 254,820 | 16,333,962 | ||||||
|
| |||||||
Tobacco – 2.8% | ||||||||
Philip Morris International, Inc. | 362,165 | 33,228,639 | ||||||
|
| |||||||
| 69,106,664 | ||||||||
|
| |||||||
Financials – 5.9% | ||||||||
Capital Markets – 2.5% | ||||||||
Affiliated Managers Group, Inc.(a) | 126,900 | 18,556,587 | ||||||
BlackRock, Inc. – Class A | 43,900 | 10,525,025 | ||||||
|
| |||||||
| 29,081,612 | ||||||||
|
| |||||||
| ALLIANCEBERNSTEIN POOLING PORTFOLIOS • | 49 |
U.S. Large Cap Growth Portfolio—Portfolio of Investments
| Company | Shares | U.S. $ Value | ||||||
| ||||||||
Diversified Financial Services – 3.4% | ||||||||
IntercontinentalExchange, Inc.(a) | 256,011 | $ | 39,635,623 | |||||
|
| |||||||
| 68,717,235 | ||||||||
|
| |||||||
Materials – 1.8% | ||||||||
Chemicals – 1.8% | ||||||||
Monsanto Co. | 206,445 | 20,857,138 | ||||||
|
| |||||||
Total Common Stocks | 1,083,627,347 | |||||||
|
| |||||||
SHORT-TERM INVESTMENTS – 6.1% | ||||||||
Investment Companies – 6.1% | ||||||||
AllianceBernstein Fixed-Income Shares, Inc. – Government STIF Portfolio, 0.12%(c) | 70,261,258 | 70,261,258 | ||||||
|
| |||||||
Total Investments Before Security Lending Collateral for Securities Loaned – 99.3% (cost $919,166,145) | 1,153,888,605 | |||||||
|
| |||||||
INVESTMENTS OF CASH COLLATERAL | ||||||||
Investment Companies – 0.2% | ||||||||
AllianceBernstein Exchange Reserves – | 2,651,373 | 2,651,373 | ||||||
|
| |||||||
Total Investments – 99.5% | 1,156,539,978 | |||||||
Other assets less liabilities – 0.5% | 6,165,933 | |||||||
|
| |||||||
Net Assets – 100.0% | $ | 1,162,705,911 | ||||||
|
| |||||||
| (a) | Non-income producing security. |
| (b) | Represents entire or partial securities out on loan. See Note D for securities lending information. |
| (c) | Investment in affiliated money market mutual fund. The rate shown represents the 7-day yield as of period end. |
See notes to financial statements.
| 50 | • ALLIANCEBERNSTEIN POOLING PORTFOLIOS |
U.S. Large Cap Growth Portfolio—Portfolio of Investments
INTERNATIONAL VALUE PORTFOLIO
PORTFOLIO OF INVESTMENTS
February 28, 2013 (unaudited)
| Company | Shares | U.S. $ Value | ||||||
| ||||||||
COMMON STOCKS – 97.4% | ||||||||
Financials – 23.9% | ||||||||
Capital Markets – 3.3% | ||||||||
Credit Suisse Group AG(a) | 380,170 | $ | 10,134,476 | |||||
Deutsche Bank AG (REG) | 174,500 | 7,966,727 | ||||||
Macquarie Group Ltd. | 364,210 | 13,991,839 | ||||||
|
| |||||||
| 32,093,042 | ||||||||
|
| |||||||
Commercial Banks – 14.1% | ||||||||
Banco do Brasil SA | 938,300 | 12,486,017 | ||||||
Banco Santander Brasil SA/Brazil (ADR) | 315,700 | 2,307,767 | ||||||
Bank of Montreal | 126,890 | 7,900,710 | ||||||
Barclays PLC | 1,455,330 | 6,752,609 | ||||||
HSBC Holdings PLC | 1,196,790 | 13,255,244 | ||||||
KB Financial Group, Inc. | 421,052 | 15,244,999 | ||||||
Komercni Banka AS | 12,440 | 2,528,501 | ||||||
Lloyds Banking Group PLC(a) | 9,141,360 | 7,514,239 | ||||||
Mitsubishi UFJ Financial Group, Inc. | 2,577,200 | 14,283,939 | ||||||
National Australia Bank Ltd. | 518,110 | 15,944,805 | ||||||
Sberbank of Russia (Sponsored ADR) | 700,310 | 9,657,275 | ||||||
Societe Generale SA(a) | 383,634 | 14,623,578 | ||||||
Sumitomo Mitsui Financial Group, Inc. | 271,600 | 10,839,300 | ||||||
Unione di Banche Italiane SCPA | 1,013,562 | 4,610,391 | ||||||
|
| |||||||
| 137,949,374 | ||||||||
|
| |||||||
Diversified Financial Services – 1.9% | ||||||||
ING Groep NV(a) | 1,440,230 | 11,530,215 | ||||||
ORIX Corp. | 64,760 | 7,215,266 | ||||||
|
| |||||||
| 18,745,481 | ||||||||
|
| |||||||
Insurance – 2.8% | ||||||||
Aegon NV | 1,058,061 | 6,298,266 | ||||||
Allianz SE | 30,040 | 4,095,535 | ||||||
Aviva PLC | 982,260 | 5,286,691 | ||||||
Muenchener Rueckversicherungs AG | 27,300 | 4,897,022 | ||||||
Suncorp Group Ltd. | 620,780 | 7,120,971 | ||||||
|
| |||||||
| 27,698,485 | ||||||||
|
| |||||||
Real Estate Investment | ||||||||
Stockland | 1,885,742 | 7,242,858 | ||||||
|
| |||||||
Real Estate Management & | ||||||||
Evergrande Real Estate Group Ltd.(b) | 13,182,000 | 6,436,630 | ||||||
New World Development Co., Ltd. | 2,357,836 | 4,308,894 | ||||||
|
| |||||||
| 10,745,524 | ||||||||
|
| |||||||
| 234,474,764 | ||||||||
|
| |||||||
| ALLIANCEBERNSTEIN POOLING PORTFOLIOS • | 51 |
International Value Portfolio—Portfolio of Investments
| Company | Shares | U.S. $ Value | ||||||
| ||||||||
Consumer Discretionary – 14.6% | ||||||||
Auto Components – 3.8% | ||||||||
Cie Generale des Etablissements | 92,902 | $ | 8,274,739 | |||||
GKN PLC | 1,850,540 | 7,631,808 | ||||||
Magna International, Inc. (Toronto) – Class A(b) | 154,250 | 8,204,230 | ||||||
NGK Spark Plug Co., Ltd. | 209,000 | 3,174,296 | ||||||
Valeo SA | 173,830 | 9,805,179 | ||||||
|
| |||||||
| 37,090,252 | ||||||||
|
| |||||||
Automobiles – 5.9% | ||||||||
Bayerische Motoren Werke AG | 67,710 | 6,225,318 | ||||||
Honda Motor Co., Ltd. | 284,000 | 10,621,196 | ||||||
Kia Motors Corp. | 49,140 | 2,521,796 | ||||||
Mazda Motor Corp.(a) | 3,447,000 | 10,393,867 | ||||||
Nissan Motor Co., Ltd. | 1,053,700 | 10,675,368 | ||||||
Renault SA | 102,630 | 6,482,730 | ||||||
Volkswagen AG (Preference Shares) | 48,930 | 10,642,865 | ||||||
|
| |||||||
| 57,563,140 | ||||||||
|
| |||||||
Distributors – 0.4% | ||||||||
Imperial Holdings Ltd. | 162,480 | 3,725,152 | ||||||
|
| |||||||
Hotels, Restaurants & Leisure – 0.5% | ||||||||
Melco Crown Entertainment Ltd. (ADR)(a) | 284,140 | 5,458,329 | ||||||
|
| |||||||
Household Durables – 0.5% | ||||||||
Sony Corp. | 377,000 | 5,498,755 | ||||||
|
| |||||||
Leisure Equipment & Products – 0.3% | ||||||||
Namco Bandai Holdings, Inc. | 197,500 | 3,141,052 | ||||||
|
| |||||||
Media – 0.5% | ||||||||
Fairfax Media Ltd.(b) | 3,170,950 | 1,854,008 | ||||||
Informa PLC | 418,700 | 3,176,715 | ||||||
|
| |||||||
| 5,030,723 | ||||||||
|
| |||||||
Multiline Retail – 0.3% | ||||||||
Myer Holdings Ltd.(b) | 1,011,198 | 2,874,581 | ||||||
|
| |||||||
Specialty Retail – 2.0% | ||||||||
Mr. Price Group Ltd. | 449,700 | 5,767,609 | ||||||
Shimamura Co., Ltd. | 35,100 | 3,584,967 | ||||||
Yamada Denki Co., Ltd.(b) | 275,780 | 10,007,249 | ||||||
|
| |||||||
| 19,359,825 | ||||||||
|
| |||||||
Textiles, Apparel & Luxury Goods – 0.4% | ||||||||
Yue Yuen Industrial Holdings Ltd. | 1,049,000 | 3,544,066 | ||||||
|
| |||||||
| 143,285,875 | ||||||||
|
| |||||||
| 52 | • ALLIANCEBERNSTEIN POOLING PORTFOLIOS |
International Value Portfolio—Portfolio of Investments
| Company | Shares | U.S. $ Value | ||||||
| ||||||||
Energy – 11.2% | ||||||||
Energy Equipment & Services – 1.3% | ||||||||
Seadrill Ltd. | 345,280 | $ | 12,590,779 | |||||
|
| |||||||
Oil, Gas & Consumable Fuels – 9.9% | ||||||||
Banpu PCL | 180,050 | 2,366,371 | ||||||
BP PLC | 2,832,080 | 18,990,589 | ||||||
Cameco Corp. | 222,800 | 4,753,067 | ||||||
China Petroleum & Chemical Corp. – Class H | 7,110,000 | 8,073,255 | ||||||
ENI SpA | 664,050 | 15,113,623 | ||||||
Gazprom OAO (Sponsored ADR) | 1,035,890 | 9,198,703 | ||||||
JX Holdings, Inc. | 262,300 | 1,598,530 | ||||||
LUKOIL OAO (London) (Sponsored ADR) | 110,230 | 7,109,835 | ||||||
Petroleo Brasileiro SA (Sponsored ADR) | 885,130 | 14,808,225 | ||||||
Royal Dutch Shell PLC (Euronext | 453,682 | 14,900,993 | ||||||
|
| |||||||
| 96,913,191 | ||||||||
|
| |||||||
| 109,503,970 | ||||||||
|
| |||||||
Materials – 10.4% | ||||||||
Chemicals – 3.0% | ||||||||
Agrium, Inc. (Toronto) | 47,771 | 4,946,876 | ||||||
Arkema SA | 32,060 | 3,250,361 | ||||||
DIC Corp. | 1,557,000 | 3,118,491 | ||||||
Koninklijke DSM NV | 168,799 | 9,858,917 | ||||||
OCI Co., Ltd.(b) | 28,970 | 4,619,234 | ||||||
Teijin Ltd. | 1,473,000 | 3,414,969 | ||||||
|
| |||||||
| 29,208,848 | ||||||||
|
| |||||||
Construction Materials – 0.2% | ||||||||
China Shanshui Cement Group Ltd. | 3,239,000 | 2,317,977 | ||||||
|
| |||||||
Metals & Mining – 7.2% | ||||||||
Anglo American PLC | 313,870 | 9,094,933 | ||||||
Dowa Holdings Co., Ltd. | 274,000 | 2,015,011 | ||||||
Goldcorp, Inc. | 129,860 | 4,238,630 | ||||||
KGHM Polska Miedz SA | 184,720 | 10,473,256 | ||||||
Kinross Gold Corp. | 686,250 | 5,223,818 | ||||||
MMC Norilsk Nickel OJSC (ADR) | 751,630 | 13,303,851 | ||||||
Rio Tinto PLC | 205,700 | 10,999,260 | ||||||
Vale SA (Sponsored ADR) (Local Preference Shares) | 805,730 | 14,801,260 | ||||||
|
| |||||||
| 70,150,019 | ||||||||
|
| |||||||
| 101,676,844 | ||||||||
|
| |||||||
Industrials – 8.7% | ||||||||
Aerospace & Defense – 2.9% | ||||||||
European Aeronautic Defence and Space Co. NV | 252,508 | 12,871,752 | ||||||
Saab AB | 206,600 | 4,532,624 | ||||||
| ALLIANCEBERNSTEIN POOLING PORTFOLIOS • | 53 |
International Value Portfolio—Portfolio of Investments
| Company | Shares | U.S. $ Value | ||||||
| ||||||||
Safran SA | 235,059 | $ | 10,742,299 | |||||
|
| |||||||
| 28,146,675 | ||||||||
|
| |||||||
Airlines – 1.3% | ||||||||
Japan Airlines Co., Ltd.(a) | 147,600 | 7,002,419 | ||||||
Qantas Airways Ltd.(a) | 3,251,798 | 5,440,487 | ||||||
|
| |||||||
| 12,442,906 | ||||||||
|
| |||||||
Building Products – 0.9% | ||||||||
Asahi Glass Co., Ltd. | 1,331,000 | 9,021,702 | ||||||
|
| |||||||
Commercial Services & Supplies – 0.3% | ||||||||
Downer EDI Ltd.(a) | 486,658 | 2,735,087 | ||||||
|
| |||||||
Electrical Equipment – 1.3% | ||||||||
Sumitomo Electric Industries Ltd. | 1,135,900 | 13,224,057 | ||||||
|
| |||||||
Industrial Conglomerates – 0.8% | ||||||||
Jardine Matheson Holdings Ltd. | 82,000 | 5,191,939 | ||||||
Jardine Strategic Holdings Ltd. | 64,500 | 2,474,645 | ||||||
|
| |||||||
| 7,666,584 | ||||||||
|
| |||||||
Machinery – 0.2% | ||||||||
IHI Corp. | 573,000 | 1,606,963 | ||||||
|
| |||||||
Road & Rail – 0.4% | ||||||||
Tokyu Corp. | 718,000 | 4,299,535 | ||||||
|
| |||||||
Trading Companies & Distributors – 0.6% | ||||||||
Mitsubishi Corp. | 326,500 | 6,468,157 | ||||||
|
| |||||||
| 85,611,666 | ||||||||
|
| |||||||
Health Care – 7.6% | ||||||||
Biotechnology – 1.1% | ||||||||
Actelion Ltd.(a) | 204,670 | 10,534,141 | ||||||
|
| |||||||
Pharmaceuticals – 6.5% | ||||||||
AstraZeneca PLC | 286,070 | 12,971,880 | ||||||
GlaxoSmithKline PLC | 750,780 | 16,544,743 | ||||||
Novartis AG | 135,180 | 9,154,131 | ||||||
Roche Holding AG | 109,290 | 25,006,445 | ||||||
|
| |||||||
| 63,677,199 | ||||||||
|
| |||||||
| 74,211,340 | ||||||||
|
| |||||||
Information Technology – 7.1% | ||||||||
Computers & Peripherals – 1.4% | ||||||||
Fujitsu Ltd. | 2,052,000 | 9,425,092 | ||||||
Wistron Corp. | 3,809,400 | 4,266,418 | ||||||
|
| |||||||
| 13,691,510 | ||||||||
|
| |||||||
| 54 | • ALLIANCEBERNSTEIN POOLING PORTFOLIOS |
International Value Portfolio—Portfolio of Investments
| Company | Shares | U.S. $ Value | ||||||
| ||||||||
Electronic Equipment, Instruments & | ||||||||
Hon Hai Precision Industry Co., Ltd. | 1,705,000 | $ | 4,756,955 | |||||
LG Display Co., Ltd.(a) | 511,980 | 14,328,233 | ||||||
|
| |||||||
| 19,085,188 | ||||||||
|
| |||||||
Semiconductors & Semiconductor | ||||||||
Advanced Semiconductor Engineering, Inc. | 8,931,579 | 7,500,168 | ||||||
Samsung Electronics Co., Ltd. | 3,420 | 4,844,017 | ||||||
SK Hynix, Inc.(a) | 414,340 | 10,083,539 | ||||||
Sumco Corp.(a) | 487,800 | 4,877,809 | ||||||
Tokyo Electron Ltd. | 129,400 | 6,005,896 | ||||||
|
| |||||||
| 33,311,429 | ||||||||
|
| |||||||
Software – 0.3% | ||||||||
Nintendo Co., Ltd. | 32,000 | 3,095,611 | ||||||
|
| |||||||
| 69,183,738 | ||||||||
|
| |||||||
Consumer Staples – 6.6% | ||||||||
Beverages – 0.8% | ||||||||
Asahi Group Holdings Ltd. | 301,500 | 7,612,209 | ||||||
|
| |||||||
Food & Staples Retailing – 2.0% | ||||||||
George Weston Ltd. | 27,430 | 1,982,940 | ||||||
Koninklijke Ahold NV | 771,330 | 11,068,508 | ||||||
WM Morrison Supermarkets PLC | 1,696,480 | 6,670,165 | ||||||
|
| |||||||
| 19,721,613 | ||||||||
|
| |||||||
Tobacco – 3.8% | ||||||||
British American Tobacco PLC | 196,200 | 10,206,985 | ||||||
Imperial Tobacco Group PLC | 315,820 | 11,432,315 | ||||||
Japan Tobacco, Inc. | 433,100 | 13,674,727 | ||||||
KT&G Corp. | 31,590 | 2,252,209 | ||||||
|
| |||||||
| 37,566,236 | ||||||||
|
| |||||||
| 64,900,058 | ||||||||
|
| |||||||
| Telecommunication Services – 5.2% | ||||||||
Diversified Telecommunication | ||||||||
Nippon Telegraph & Telephone Corp. | 421,800 | 19,273,163 | ||||||
TDC A/S | 355,950 | 2,677,498 | ||||||
Vivendi SA | 320,067 | 6,713,883 | ||||||
|
| |||||||
| 28,664,544 | ||||||||
|
| |||||||
Wireless Telecommunication | ||||||||
America Movil SAB de CV Series L (ADR) | 289,640 | 6,050,579 | ||||||
China Mobile Ltd. | 214,500 | 2,355,398 | ||||||
Vodafone Group PLC | 5,666,607 | 14,212,956 | ||||||
|
| |||||||
| 22,618,933 | ||||||||
|
| |||||||
| 51,283,477 | ||||||||
|
| |||||||
| ALLIANCEBERNSTEIN POOLING PORTFOLIOS • | 55 |
International Value Portfolio—Portfolio of Investments
| Company | Shares | U.S. $ Value | ||||||
| ||||||||
| Utilities – 2.1% | ||||||||
Electric Utilities – 1.4% | ||||||||
EDP – Energias de Portugal SA | 2,499,930 | $ | 7,476,986 | |||||
Electricite de France SA | 361,110 | 6,813,736 | ||||||
|
| |||||||
| 14,290,722 | ||||||||
|
| |||||||
Multi-Utilities – 0.7% | ||||||||
National Grid PLC | 599,710 | 6,625,762 | ||||||
|
| |||||||
| 20,916,484 | ||||||||
|
| |||||||
Total Common Stocks | 955,048,216 | |||||||
|
| |||||||
SHORT-TERM INVESTMENTS – 3.2% | ||||||||
Investment Companies – 3.2% | ||||||||
AllianceBernstein Fixed-Income Shares, Inc. – Government STIF Portfolio, 0.12%(c) | 31,678,901 | 31,678,901 | ||||||
|
| |||||||
Total Investments Before Security Lending Collateral for Securities Loaned – 100.6% (cost $917,267,835) | 986,727,117 | |||||||
|
| |||||||
INVESTMENTS OF CASH COLLATERAL FOR SECURITIES LOANED – 2.8% | ||||||||
Investment Companies – 2.8% | ||||||||
AllianceBernstein Exchange Reserves – | 27,331,840 | 27,331,840 | ||||||
|
| |||||||
Total Investments – 103.4% | 1,014,058,957 | |||||||
Other assets less liabilities – (3.4)% | (33,413,834 | ) | ||||||
|
| |||||||
Net Assets – 100.0% | $ | 980,645,123 | ||||||
|
| |||||||
FUTURES CONTRACTS (see Note C)
| Type | Number of Contracts | Expiration Month | Original Value | Value at February 28, 2013 | Unrealized Appreciation/ (Depreciation) | |||||||||||||||
Purchased Contracts | ||||||||||||||||||||
Euro STOXX50 Index Futures | 277 | March 2013 | $ | 9,606,246 | $ | 9,529,140 | $ | (77,106 | ) | |||||||||||
| 56 | • ALLIANCEBERNSTEIN POOLING PORTFOLIOS |
International Value Portfolio—Portfolio of Investments
FORWARD CURRENCY EXCHANGE CONTRACTS (see Note C)
| Counterparty | Contracts to Deliver (000) | In Exchange For (000) | Settlement Date | Unrealized Appreciation/ (Depreciation) | ||||||||||||||||||||
Barclays Bank PLC Wholesale | GBP | 18,101 | USD | 28,981 | 5/15/13 | $ | 1,531,200 | |||||||||||||||||
Barclays Bank PLC Wholesale | JPY | 11,384,316 | USD | 122,149 | 5/15/13 | (733,559 | ) | |||||||||||||||||
Barclays Bank PLC Wholesale | USD | 25,008 | CHF | 23,336 | 5/15/13 | (90,077 | ) | |||||||||||||||||
Barclays Bank PLC Wholesale | USD | 42,938 | NOK | 238,052 | 5/15/13 | (1,585,007 | ) | |||||||||||||||||
BNP Paribas SA | USD | 44,923 | JPY | 4,197,606 | 5/15/13 | 385,642 | ||||||||||||||||||
Citibank, NA | AUD | 5,295 | USD | 5,400 | 5/15/13 | 20,476 | ||||||||||||||||||
Citibank, NA | GBP | 35,690 | USD | 56,011 | 5/15/13 | 1,887,359 | ||||||||||||||||||
Citibank, NA | USD | 19,550 | AUD | 19,064 | 5/15/13 | (183,014 | ) | |||||||||||||||||
Credit Suisse International | USD | 50,697 | SEK | 326,157 | 5/15/13 | (345,359 | ) | |||||||||||||||||
Deutsche Bank AG London | NOK | 158,082 | USD | 27,512 | 5/15/13 | 50,731 | ||||||||||||||||||
Deutsche Bank AG London | NZD | 13,288 | USD | 11,103 | 5/15/13 | 169,828 | ||||||||||||||||||
Goldman Sachs Capital Markets LP | AUD | 24,033 | USD | 24,690 | 5/15/13 | 274,072 | ||||||||||||||||||
Goldman Sachs Capital Markets LP | CHF | 31,758 | USD | 34,684 | 5/15/13 | 773,701 | ||||||||||||||||||
Goldman Sachs Capital Markets LP | JPY | 1,786,495 | USD | 19,932 | 5/15/13 | 648,266 | ||||||||||||||||||
Goldman Sachs Capital Markets LP | USD | 41,842 | GBP | 27,590 | 5/15/13 | (2,125 | ) | |||||||||||||||||
Goldman Sachs Capital Markets LP | USD | 27,307 | JPY | 2,520,909 | 5/15/13 | (96,502 | ) | |||||||||||||||||
HSBC Bank USA | CAD | 33,171 | USD | 33,199 | 5/15/13 | 1,086,053 | ||||||||||||||||||
HSBC Bank USA | HKD | 26,928 | USD | 3,473 | 5/15/13 | 92 | ||||||||||||||||||
HSBC Bank USA | USD | 38,899 | NZD | 46,866 | 5/15/13 | (337,931 | ) | |||||||||||||||||
Morgan Stanley and Co., Inc. | EUR | 49,570 | USD | 64,876 | 5/15/13 | 124,783 | ||||||||||||||||||
Morgan Stanley and Co., Inc. | USD | 2,768 | CHF | 2,541 | 5/15/13 | (54,593 | ) | |||||||||||||||||
Royal Bank of Scotland PLC | USD | 12,544 | CAD | 12,917 | 5/15/13 | (38,684 | ) | |||||||||||||||||
Royal Bank of Scotland PLC | USD | 43,431 | EUR | 32,513 | 5/15/13 | (961,094 | ) | |||||||||||||||||
UBS AG | CAD | 2,912 | USD | 2,948 | 5/15/13 | 129,009 | ||||||||||||||||||
UBS AG | USD | 10,721 | AUD | 10,264 | 5/15/13 | (293,396 | ) | |||||||||||||||||
UBS AG | USD | 44,379 | EUR | 33,122 | 5/15/13 | (1,112,711 | ) | |||||||||||||||||
Westpac Banking Corp. | NZD | 20,857 | USD | 17,236 | 5/15/13 | 74,743 | ||||||||||||||||||
|
| |||||||||||||||||||||||
| $ | 1,321,903 | |||||||||||||||||||||||
|
| |||||||||||||||||||||||
| (a) | Non-income producing security. |
| (b) | Represents entire or partial securities out on loan. See Note D for securities lending information. |
| (c) | Investment in affiliated money market mutual fund. The rate shown represents the 7-day yield as of period end. |
Currency Abbreviations:
| AUD | – Australian Dollar |
| CAD | – Canadian Dollar |
| CHF | – Swiss Franc |
| EUR | – Euro |
| GBP | – Great British Pound |
| HKD | – Hong Kong Dollar |
| JPY | – Japanese Yen |
| NOK | – Norwegian Krone |
| NZD | – New Zealand Dollar |
| SEK | – Swedish Krona |
| USD | – United States Dollar |
Glossary:
| ADR | – American Depositary Receipt |
| OJSC | – Open Joint Stock Company |
| REG | – Registered Shares |
See notes to financial statements.
| ALLIANCEBERNSTEIN POOLING PORTFOLIOS • | 57 |
International Value Portfolio—Portfolio of Investments
INTERNATIONAL GROWTH PORTFOLIO
PORTFOLIO OF INVESTMENTS
February 28, 2013 (unaudited)
| Company | Shares | U.S. $ Value | ||||||
| ||||||||
COMMON STOCKS – 97.8% | ||||||||
Financials – 28.2% | ||||||||
Capital Markets – 3.3% | ||||||||
UBS AG(a) | 2,005,393 | $ | 31,685,815 | |||||
|
| |||||||
Commercial Banks – 4.9% | ||||||||
HDFC Bank Ltd. | 630,130 | 7,324,122 | ||||||
HSBC Holdings PLC | 2,194,150 | 24,301,669 | ||||||
Sberbank of Russia (Sponsored ADR) | 1,173,826 | 16,187,061 | ||||||
|
| |||||||
| 47,812,852 | ||||||||
|
| |||||||
Consumer Finance – 1.8% | ||||||||
Muthoot Finance Ltd. | 508,417 | 1,953,114 | ||||||
Shriram Transport Finance Co., Ltd. | 1,255,510 | 15,709,743 | ||||||
|
| |||||||
| 17,662,857 | ||||||||
|
| |||||||
Diversified Financial Services – 2.1% | ||||||||
BM&FBovespa SA | 708,000 | 4,796,545 | ||||||
IG Group Holdings PLC | 2,122,220 | 15,848,045 | ||||||
|
| |||||||
| 20,644,590 | ||||||||
|
| |||||||
Insurance – 10.0% | ||||||||
Admiral Group PLC | 1,178,441 | 22,308,644 | ||||||
AIA Group Ltd. | 6,196,600 | 26,957,101 | ||||||
Lancashire Holdings Ltd. | 1,416,922 | 19,513,228 | ||||||
Prudential PLC | 1,948,480 | 28,920,802 | ||||||
|
| |||||||
| 97,699,775 | ||||||||
|
| |||||||
Real Estate Management & | ||||||||
Global Logistic Properties Ltd. | 6,216,000 | 12,748,738 | ||||||
Hang Lung Properties Ltd. | 6,838,000 | 26,371,807 | ||||||
Mitsubishi Estate Co., Ltd. | 239,000 | 5,958,075 | ||||||
|
| |||||||
| 45,078,620 | ||||||||
|
| |||||||
Thrifts & Mortgage Finance – 1.5% | ||||||||
Housing Development Finance Corp. | 1,066,230 | 15,018,510 | ||||||
|
| |||||||
| 275,603,019 | ||||||||
|
| |||||||
Consumer Discretionary – 19.0% | ||||||||
Auto Components – 0.5% | ||||||||
Nokian Renkaat OYJ | 103,930 | 4,707,129 | ||||||
|
| |||||||
Automobiles – 2.0% | ||||||||
Toyota Motor Corp. | 384,900 | 19,768,288 | ||||||
|
| |||||||
Distributors – 2.1% | ||||||||
Li & Fung Ltd. | 14,934,000 | 19,970,501 | ||||||
|
| |||||||
Diversified Consumer Services – 2.8% | ||||||||
Anhanguera Educacional Participacoes SA | 643,800 | 13,335,253 | ||||||
Estacio Participacoes SA | 583,800 | 14,304,486 | ||||||
|
| |||||||
| 27,639,739 | ||||||||
|
| |||||||
| 58 | • ALLIANCEBERNSTEIN POOLING PORTFOLIOS |
International Growth Portfolio—Portfolio of Investments
| Company | Shares | U.S. $ Value | ||||||
| ||||||||
Hotels, Restaurants & Leisure – 4.6% | ||||||||
Ajisen China Holdings Ltd.(b) | 8,133,800 | $ | 5,868,278 | |||||
Sands China Ltd. | 4,124,800 | 19,536,325 | ||||||
Sodexo | 188,286 | 17,418,217 | ||||||
Whitbread PLC | 62,230 | 2,375,178 | ||||||
|
| |||||||
| 45,197,998 | ||||||||
|
| |||||||
Household Durables – 1.0% | ||||||||
MRV Engenharia e Participacoes SA | 1,546,900 | 9,925,043 | ||||||
|
| |||||||
Media – 0.5% | ||||||||
Naspers Ltd. | 78,930 | 5,096,767 | ||||||
|
| |||||||
Multiline Retail – 0.8% | ||||||||
Don Quijote Co., Ltd. | 39,000 | 1,537,154 | ||||||
Golden Eagle Retail Group Ltd.(b) | 3,113,000 | 6,374,127 | ||||||
|
| |||||||
| 7,911,281 | ||||||||
|
| |||||||
Specialty Retail – 2.8% | ||||||||
Belle International Holdings Ltd. | 6,821,000 | 12,494,183 | ||||||
Indomobil Sukses Internasional TBK PT | 3,242,000 | 1,808,591 | ||||||
L’Occitane International SA | 2,223,250 | 6,674,311 | ||||||
Nitori Holdings Co., Ltd. | 83,750 | 6,236,334 | ||||||
|
| |||||||
| 27,213,419 | ||||||||
|
| |||||||
Textiles, Apparel & Luxury Goods – 1.9% | ||||||||
Burberry Group PLC | 156,470 | 3,258,195 | ||||||
Cie Financiere Richemont SA | 147,620 | 11,840,435 | ||||||
LVMH Moet Hennessy Louis Vuitton SA | 15,480 | 2,656,397 | ||||||
Samsonite International SA | 372,800 | 880,202 | ||||||
|
| |||||||
| 18,635,229 | ||||||||
|
| |||||||
| 186,065,394 | ||||||||
|
| |||||||
Industrials – 16.1% | ||||||||
Commercial Services & Supplies – 0.9% | ||||||||
Aggreko PLC | 141,540 | 3,628,250 | ||||||
Edenred | 142,641 | 4,927,508 | ||||||
|
| |||||||
| 8,555,758 | ||||||||
|
| |||||||
Construction & Engineering – 1.3% | ||||||||
Larsen & Toubro Ltd. | 424,138 | 10,664,361 | ||||||
Samsung Engineering Co., Ltd. | 14,500 | 2,054,057 | ||||||
|
| |||||||
| 12,718,418 | ||||||||
|
| |||||||
Machinery – 1.8% | ||||||||
FANUC Corp. | 63,700 | 9,822,403 | ||||||
Komatsu Ltd. | 297,600 | 7,494,244 | ||||||
|
| |||||||
| 17,316,647 | ||||||||
|
| |||||||
Professional Services – 11.5% | ||||||||
Bureau Veritas SA | 192,250 | 24,755,890 | ||||||
Capita PLC | 2,862,727 | 35,689,217 | ||||||
| ALLIANCEBERNSTEIN POOLING PORTFOLIOS • | 59 |
International Growth Portfolio—Portfolio of Investments
| Company | Shares | U.S. $ Value | ||||||
| ||||||||
Intertek Group PLC | 758,989 | $ | 38,354,826 | |||||
Qualicorp SA(a) | 257,000 | 2,873,300 | ||||||
SGS SA | 4,369 | 11,080,263 | ||||||
|
| |||||||
| 112,753,496 | ||||||||
|
| |||||||
Road & Rail – 0.6% | ||||||||
Globaltrans Investment PLC | 391,070 | 6,253,209 | ||||||
|
| |||||||
| 157,597,528 | ||||||||
|
| |||||||
Consumer Staples – 14.9% | ||||||||
Beverages – 0.8% | ||||||||
Anheuser-Busch InBev NV | 87,950 | 8,242,217 | ||||||
|
| |||||||
Food & Staples Retailing – 4.2% | ||||||||
Jeronimo Martins SGPS SA | 850,650 | 16,954,718 | ||||||
Olam International Ltd. | 16,044,370 | 21,432,138 | ||||||
Tsuruha Holdings, Inc. | 31,100 | 2,694,481 | ||||||
|
| |||||||
| 41,081,337 | ||||||||
|
| |||||||
Food Products – 1.0% | ||||||||
Unilever PLC | 246,363 | 9,811,048 | ||||||
|
| |||||||
Household Products – 2.4% | ||||||||
Henkel AG & Co. KGaA | 174,443 | 12,888,053 | ||||||
Reckitt Benckiser Group PLC | 152,693 | 10,239,429 | ||||||
|
| |||||||
| 23,127,482 | ||||||||
|
| |||||||
Tobacco – 6.5% | ||||||||
British American Tobacco PLC | 775,024 | 40,319,359 | ||||||
Japan Tobacco, Inc. | 729,200 | 23,023,807 | ||||||
|
| |||||||
| 63,343,166 | ||||||||
|
| |||||||
| 145,605,250 | ||||||||
|
| |||||||
Information Technology – 9.7% | ||||||||
Internet Software & Services – 3.4% | ||||||||
Baidu, Inc. (Sponsored ADR)(a) | 205,363 | 18,638,746 | ||||||
MercadoLibre, Inc.(b) | 28,920 | 2,475,841 | ||||||
Telecity Group PLC | 663,809 | 9,394,390 | ||||||
Tencent Holdings Ltd. | 69,700 | 2,401,847 | ||||||
|
| |||||||
| 32,910,824 | ||||||||
|
| |||||||
IT Services – 2.0% | ||||||||
Tata Consultancy Services Ltd. | 703,408 | 19,661,783 | ||||||
|
| |||||||
Semiconductors & Semiconductor | ||||||||
Samsung Electronics Co., Ltd. | 46,743 | 37,795,117 | ||||||
|
| |||||||
Software – 0.5% | ||||||||
SAP AG | 59,690 | 4,661,207 | ||||||
|
| |||||||
| 95,028,931 | ||||||||
|
| |||||||
| 60 | • ALLIANCEBERNSTEIN POOLING PORTFOLIOS |
International Growth Portfolio—Portfolio of Investments
| Company | Shares | U.S. $ Value | ||||||
| ||||||||
Materials – 3.6% | ||||||||
Chemicals – 1.2% | ||||||||
Filtrona PLC | 1,242,017 | $ | 12,005,521 | |||||
|
| |||||||
Construction Materials – 0.6% | ||||||||
Semen Indonesia Persero Tbk PT | 2,896,500 | 5,196,584 | ||||||
|
| |||||||
Metals & Mining – 1.8% | ||||||||
BHP Billiton PLC | 562,940 | 17,764,053 | ||||||
|
| |||||||
| 34,966,158 | ||||||||
|
| |||||||
Energy – 3.2% | ||||||||
Energy Equipment & Services – 1.7% | ||||||||
AMEC PLC | 277,821 | 4,387,158 | ||||||
Saipem SpA | 101,460 | 2,709,091 | ||||||
Technip SA | 88,990 | 9,616,002 | ||||||
|
| |||||||
| 16,712,251 | ||||||||
|
| |||||||
Oil, Gas & Consumable Fuels – 1.5% | ||||||||
Afren PLC(a) | 1,974,044 | 4,245,341 | ||||||
NovaTek OAO | 86,620 | 10,037,597 | ||||||
|
| |||||||
| 14,282,938 | ||||||||
|
| |||||||
| 30,995,189 | ||||||||
|
| |||||||
Health Care – 2.1% | ||||||||
Health Care Providers & Services – 0.3% | ||||||||
Odontoprev SA | 490,900 | 2,271,720 | ||||||
|
| |||||||
Life Sciences Tools & Services – 0.7% | ||||||||
Eurofins Scientific | 35,756 | 7,078,654 | ||||||
|
| |||||||
Pharmaceuticals – 1.1% | ||||||||
Lupin Ltd. | 248,500 | 2,680,306 | ||||||
Roche Holding AG | 11,130 | 2,546,635 | ||||||
Sun Pharmaceutical Industries Ltd. | 382,140 | 5,596,659 | ||||||
|
| |||||||
| 10,823,600 | ||||||||
|
| |||||||
| 20,173,974 | ||||||||
|
| |||||||
Utilities – 1.0% | ||||||||
Independent Power Producers & Energy | ||||||||
APR Energy PLC | 874,781 | 9,396,116 | ||||||
|
| |||||||
Total Common Stocks | 955,431,559 | |||||||
|
| |||||||
| ALLIANCEBERNSTEIN POOLING PORTFOLIOS • | 61 |
International Growth Portfolio—Portfolio of Investments
Principal Amount (000) | U.S. $ Value | |||||||
| ||||||||
CORPORATES - NON-INVESTMENT | ||||||||
Industrial – 0.5% | ||||||||
Consumer Non-Cyclical – 0.5% | ||||||||
Olam International Ltd. | $ | 5,221 | $ | 4,978,248 | ||||
|
| |||||||
| Shares | ||||||||
WARRANTS – 0.3% | ||||||||
Industrials – 0.2% | ||||||||
Industrial Conglomerates – 0.2% | ||||||||
John Keells Holdings PLC, Deutsche Bank AG London, | 1,414,604 | 2,595,232 | ||||||
|
| |||||||
Consumer Staples – 0.1% | ||||||||
Food & Staples Retailing – 0.1% | ||||||||
Olam International Ltd., | 2,702,057 | 797,107 | ||||||
|
| |||||||
Total Warrants | 3,392,339 | |||||||
|
| |||||||
SHORT-TERM INVESTMENTS – 0.5% | ||||||||
Investment Companies – 0.5% | ||||||||
AllianceBernstein Fixed-Income Shares, Inc. – Government STIF Portfolio, 0.12%(d) | 4,991,776 | 4,991,776 | ||||||
|
| |||||||
Total Investments Before Security Lending Collateral for Securities Loaned – 99.1% | 968,793,922 | |||||||
|
| |||||||
INVESTMENTS OF CASH COLLATERAL FOR |
| |||||||
Investment Companies – 1.1% | ||||||||
AllianceBernstein Exchange Reserves – | 10,882,706 | 10,882,706 | ||||||
|
| |||||||
Total Investments – 100.2% | 979,676,628 | |||||||
Other assets less liabilities – (0.2)% | (2,267,551 | ) | ||||||
|
| |||||||
Net Assets – 100.0% | $ | 977,409,077 | ||||||
|
| |||||||
| 62 | • ALLIANCEBERNSTEIN POOLING PORTFOLIOS |
International Growth Portfolio—Portfolio of Investments
FORWARD CURRENCY EXCHANGE CONTRACTS (see Note C)
| Counterparty | Contracts to Deliver (000) | In Exchange (000) | Settlement Date | Unrealized Appreciation/ (Depreciation) | ||||||||||||||||||||
Bank of America, NA | EUR | 21,824 | USD | 28,255 | 3/15/13 | $ | (239,767 | ) | ||||||||||||||||
Barclays Bank PLC Wholesale | GBP | 61,537 | USD | 98,965 | 3/15/13 | 5,616,306 | ||||||||||||||||||
Barclays Bank PLC Wholesale | HKD | 399,738 | USD | 51,583 | 3/15/13 | 38,769 | ||||||||||||||||||
Barclays Bank PLC Wholesale | USD | 6,412 | NOK | 36,863 | 3/15/13 | 6,951 | ||||||||||||||||||
BNP Paribas SA | BRL | 15,193 | USD | 7,691 | 3/04/13 | 15,542 | ||||||||||||||||||
BNP Paribas SA | USD | 7,410 | BRL | 15,193 | 3/04/13 | 265,062 | ||||||||||||||||||
BNP Paribas SA | JPY | 1,951,256 | USD | 21,899 | 3/15/13 | 845,786 | ||||||||||||||||||
Citibank, NA | USD | 6,792 | CAD | 6,744 | 3/15/13 | (254,094 | ) | |||||||||||||||||
Citibank, NA | USD | 21,714 | SEK | 139,715 | 6/13/13 | (157,891 | ) | |||||||||||||||||
Deutsche Bank AG London | USD | 20,073 | SGD | 24,510 | 3/15/13 | (280,958 | ) | |||||||||||||||||
Goldman Sachs Capital Markets LP | BRL | 15,193 | USD | 7,080 | 3/04/13 | (595,875 | ) | |||||||||||||||||
Goldman Sachs Capital Markets LP | USD | 7,691 | BRL | 15,193 | 3/04/13 | (15,542 | ) | |||||||||||||||||
Goldman Sachs Capital Markets LP | HKD | 59,758 | USD | 7,711 | 3/15/13 | 5,333 | ||||||||||||||||||
Goldman Sachs Capital Markets LP | JPY | 362,840 | USD | 4,402 | 3/15/13 | 487,291 | ||||||||||||||||||
HSBC BankUSA | USD | 10,376 | HKD | 80,411 | 3/15/13 | (7,109 | ) | |||||||||||||||||
Royal Bank of Canada | USD | 71,307 | CAD | 70,605 | 3/15/13 | (2,862,339 | ) | |||||||||||||||||
Royal Bank of Scotland PLC | JPY | 980,117 | USD | 11,914 | 3/15/13 | 1,339,273 | ||||||||||||||||||
Royal Bank of Scotland PLC | GBP | 4,944 | USD | 7,810 | 6/13/13 | 313,435 | ||||||||||||||||||
Standard Chartered Bank | USD | 8,943 | HKD | 69,349 | 3/15/13 | (956 | ) | |||||||||||||||||
Standard Chartered Bank | USD | 6,299 | SGD | 7,795 | 6/13/13 | (4,463 | ) | |||||||||||||||||
State Street Bank & Trust Co. | EUR | 5,205 | USD | 6,964 | 3/15/13 | 168,265 | ||||||||||||||||||
State Street Bank & Trust Co. | USD | 12,583 | AUD | 12,294 | 6/13/13 | (119,904 | ) | |||||||||||||||||
UBS AG | USD | 36,056 | EUR | 27,029 | 3/15/13 | (765,126 | ) | |||||||||||||||||
Westpac Banking Corp. | USD | 48,843 | AUD | 46,665 | 3/15/13 | (1,216,610 | ) | |||||||||||||||||
|
| |||||||||||||||||||||||
| $ | 2,581,379 | |||||||||||||||||||||||
|
| |||||||||||||||||||||||
| (a) | Non-income producing security. |
| (b) | Represents entire or partial securities out on loan. See Note D for securities lending information. |
| (c) | Security is exempt from registration under Rule 144A of the Securities Act of 1933. These securities are considered liquid and may be resold in transactions exempt from registration, normally to qualified institutional buyers. At February 28, 2013, the aggregate market value of these securities amounted to $21,269,054 or 2.2% of net assets. |
| (d) | Investment in affiliated money market mutual fund. The rate shown represents the 7-day yield as of period end. |
Currency Abbreviations:
| AUD | – Australian Dollar |
| BRL | – Brazilian Real |
| CAD | – Canadian Dollar |
| EUR | – Euro |
| GBP | – Great British Pound |
| HKD | – Hong Kong Dollar |
| JPY | – Japanese Yen |
| NOK | – Norwegian Krone |
| SEK | – Swedish Krona |
| SGD | – Singapore Dollar |
| USD | – United States Dollar |
Glossary:
| ADR | – American Depositary Receipt |
| GDR | – Global Depositary Receipt |
See notes to financial statements.
| ALLIANCEBERNSTEIN POOLING PORTFOLIOS • | 63 |
International Growth Portfolio—Portfolio of Investments
SHORT DURATION BOND PORTFOLIO
PORTFOLIO OF INVESTMENTS
February 28, 2013 (unaudited)
| Principal Amount (000) | U.S. $ Value | |||||||||
|
|
| ||||||||
MORTGAGE PASS-THROUGHS – 29.7% | ||||||||||
Agency ARMs – 13.0% | ||||||||||
Federal Home Loan Mortgage Corp. | U.S.$ | 9,053 | $ | 9,393,009 | ||||||
2.484%, 7/01/42(a) | 11,552 | 11,960,926 | ||||||||
3.023%, 6/01/37(a) | 8,712 | 9,339,840 | ||||||||
Series 2005 | 2,892 | 3,087,503 | ||||||||
Federal National Mortgage Association | 7,515 | 7,796,135 | ||||||||
2.252%, 8/01/42(a) | 6,157 | 6,403,896 | ||||||||
2.381%, 6/01/42(a) | 5,446 | 5,668,010 | ||||||||
2.414%, 1/01/36(a) | 1,524 | 1,627,083 | ||||||||
2.441%, 5/01/42(a) | 8,912 | 9,280,258 | ||||||||
2.503%, 6/01/42(b) | 8,976 | 9,351,156 | ||||||||
2.666%, 8/01/42(a) | 11,647 | 12,188,510 | ||||||||
2.67%, 8/01/42(a) | 11,111 | 11,627,770 | ||||||||
2.733%, 6/01/42(a) | 12,659 | 13,253,797 | ||||||||
Series 2003 | 747 | 799,041 | ||||||||
Series 2005 | 3,823 | 4,088,516 | ||||||||
3.083%, 10/01/35(a) | 2,369 | 2,527,129 | ||||||||
Series 2006 | 1,768 | 1,886,239 | ||||||||
Series 2007 | 1,005 | 1,056,371 | ||||||||
Series 2009 | 1,643 | 1,762,039 | ||||||||
|
| |||||||||
| 123,097,228 | ||||||||||
|
| |||||||||
Agency Fixed Rate 15-Year – 12.7% | ||||||||||
Federal Home Loan Mortgage Corp. Gold | 8,247 | 8,797,249 | ||||||||
4.50%, 6/01/25 | 6,354 | 6,770,074 | ||||||||
5.00%, 7/01/25 | 2,907 | 3,111,423 | ||||||||
Series 2011 | 8,407 | 8,890,948 | ||||||||
Federal National Mortgage Association | 14,055 | 14,792,888 | ||||||||
3.50%, 3/01/26-1/01/27 | 42,188 | 44,855,901 | ||||||||
Series 1998 | 1 | 1,010 | ||||||||
Series 2001 | 44 | 46,778 | ||||||||
Series 2002 | 44 | 47,873 | ||||||||
| 64 | • ALLIANCEBERNSTEIN POOLING PORTFOLIOS |
Short Duration Bond Portfolio—Portfolio of Investments
| Principal Amount (000) | U.S. $ Value | |||||||||
|
|
| ||||||||
Series 2005 | U.S.$ | 67 | $ | 69,174 | ||||||
Series 2006 | 1,516 | 1,660,405 | ||||||||
Series 2007 | 408 | 450,720 | ||||||||
Series 2010 | 16,107 | 17,159,308 | ||||||||
Series 2012 | 12,652 | 13,395,505 | ||||||||
|
| |||||||||
| 120,049,256 | ||||||||||
|
| |||||||||
Agency Fixed Rate 30-Year – 4.0% | ||||||||||
Federal Home Loan Mortgage Corp. Gold | 1,075 | 1,176,595 | ||||||||
Series 2009 | 4,101 | 4,458,958 | ||||||||
Federal National Mortgage Association | 8,409 | 9,161,868 | ||||||||
4.50%, 8/01/39-4/01/41 | 7,328 | 8,064,458 | ||||||||
6.00%, 2/01/37-10/01/38 | 11,791 | 12,951,756 | ||||||||
Series 2010 | 1,577 | 1,730,409 | ||||||||
|
| |||||||||
| 37,544,044 | ||||||||||
|
| |||||||||
Total Mortgage Pass-Throughs | 280,690,528 | |||||||||
|
| |||||||||
GOVERNMENTS - TREASURIES – 24.5% | ||||||||||
United States – 24.5% | ||||||||||
U.S. Treasury Notes | 180,785 | 180,865,815 | ||||||||
0.625%, 4/30/13 | 33,270 | 33,298,579 | ||||||||
0.75%, 10/31/17 | 5,715 | 5,728,842 | ||||||||
1.00%, 10/31/16 | 11,337 | 11,549,569 | ||||||||
|
| |||||||||
Total Governments - Treasuries | 231,442,805 | |||||||||
|
| |||||||||
ASSET-BACKED SECURITIES – 14.8% | ||||||||||
Autos - Fixed Rate – 7.0% | ||||||||||
Ally Auto Receivables Trust | 5,740 | 5,871,027 | ||||||||
Series 2012-A, Class C | 2,415 | 2,505,541 | ||||||||
| ALLIANCEBERNSTEIN POOLING PORTFOLIOS • | 65 |
Short Duration Bond Portfolio—Portfolio of Investments
| Principal Amount (000) | U.S. $ Value | |||||||||
|
|
| ||||||||
Ally Master Owner Trust | U.S.$ | 945 | $ | 944,794 | ||||||
AmeriCredit Automobile Receivables Trust | 3,560 | 3,586,365 | ||||||||
Series 2013-1, Class A2 | 2,075 | 2,075,848 | ||||||||
Avis Budget Rental Car Funding AESOP LLC | 1,730 | 1,768,105 | ||||||||
Bank of America Auto Trust | 1,071 | 1,073,564 | ||||||||
Series 2012-1, Class A4 | 1,650 | 1,665,898 | ||||||||
Series 2012-1, Class C | 2,960 | 3,043,072 | ||||||||
Capital Auto Receivables Asset Trust | 1,785 | 1,784,481 | ||||||||
CarMax Auto Owner Trust | 1,870 | 1,870,224 | ||||||||
Ford Auto Securitization Trust | CAD | 2,111 | 2,046,657 | |||||||
Ford Credit Auto Lease Trust | U.S.$ | 2,626 | 2,627,517 | |||||||
Ford Credit Floorplan Master Owner Trust | 5,265 | 5,280,206 | ||||||||
Series 2013-1, Class A1 | 2,222 | 2,220,831 | ||||||||
Hertz Vehicle Financing LLC | 3,405 | 3,404,017 | ||||||||
Hyundai Auto Lease Securitization Trust | 2,509 | 2,508,748 | ||||||||
Mercedes-Benz Auto Lease Trust | 698 | 698,141 | ||||||||
Mercedes-Benz Auto Receivables Trust | 6,740 | 6,746,874 | ||||||||
| 66 | • ALLIANCEBERNSTEIN POOLING PORTFOLIOS |
Short Duration Bond Portfolio—Portfolio of Investments
| Principal Amount (000) | U.S. $ Value | |||||||||
|
|
| ||||||||
Mercedes-Benz Master Owner Trust | U.S.$ | 2,534 | $ | 2,536,795 | ||||||
Navistar Financial Corp. Owner Trust | 2,873 | 2,877,947 | ||||||||
Nissan Auto Lease Trust | 1,761 | 1,764,100 | ||||||||
Nissan Auto Receivables Owner Trust | 1,020 | 1,021,488 | ||||||||
Porsche Innovative Lease Owner Trust | 403 | 403,389 | ||||||||
Santander Drive Auto Receivables Trust | 1,870 | 1,870,152 | ||||||||
SMART Trust/Australia | 1,550 | 1,551,312 | ||||||||
World Omni Automobile Lease Securitization Trust | 2,852 | 2,870,929 | ||||||||
|
| |||||||||
| 66,618,022 | ||||||||||
|
| |||||||||
Credit Cards - Fixed Rate – 3.3% | ||||||||||
American Express Credit Account Master Trust | 4,975 | 4,994,908 | ||||||||
Chase Issuance Trust | 3,310 | 3,308,540 | ||||||||
Citibank Credit Card Issuance Trust | 4,015 | 4,503,280 | ||||||||
Discover Card Master Trust | 1,322 | 1,331,115 | ||||||||
Series 2012-A3, Class A3 | 1,621 | 1,631,285 | ||||||||
Dryrock Issuance Trust | 2,715 | 2,713,662 | ||||||||
| ALLIANCEBERNSTEIN POOLING PORTFOLIOS • | 67 |
Short Duration Bond Portfolio—Portfolio of Investments
| Principal Amount (000) | U.S. $ Value | |||||||||
|
|
| ||||||||
GE Capital Credit Card Master Note Trust | ||||||||||
1.03%, 1/15/18 | U.S.$ | 5,170 | $ | 5,222,781 | ||||||
Series 2012-6, Class A | 2,510 | 2,540,604 | ||||||||
Series 2012-7, Class A | 2,170 | 2,158,077 | ||||||||
World Financial Network Credit Card Master Trust | 1,540 | 1,568,341 | ||||||||
Series 2013-A, Class A | 950 | 949,986 | ||||||||
|
| |||||||||
| 30,922,579 | ||||||||||
|
| |||||||||
Credit Cards - Floating Rate – 2.0% | ||||||||||
Capital One Multi-Asset Execution Trust | 6,000 | 5,998,536 | ||||||||
Discover Card Master Trust | 7,206 | 7,207,592 | ||||||||
Gracechurch Card Funding PLC | EUR | 2,140 | 2,827,235 | |||||||
Penarth Master Issuer PLC | U.S.$ | 2,796 | 2,803,904 | |||||||
|
| |||||||||
| 18,837,267 | ||||||||||
|
| |||||||||
Autos - Floating Rate – 1.6% | ||||||||||
Ally Master Owner Trust | 4,590 | 4,622,213 | ||||||||
BMW Floorplan Master Owner Trust | 3,598 | 3,593,112 | ||||||||
Ford Credit Floorplan Master Owner Trust | 3,025 | 3,106,094 | ||||||||
GE Dealer Floorplan Master Note Trust | 3,880 | 3,893,557 | ||||||||
|
| |||||||||
| 15,214,976 | ||||||||||
|
| |||||||||
Other ABS - Fixed Rate – 0.7% | ||||||||||
CIT Canada Equipment Receivables Trust | CAD | 277 | 268,820 | |||||||
| 68 | • ALLIANCEBERNSTEIN POOLING PORTFOLIOS |
Short Duration Bond Portfolio—Portfolio of Investments
| Principal Amount (000) | U.S. $ Value | |||||||||
|
|
| ||||||||
CNH Equipment Trust | U.S.$ | 1,104 | $ | 1,107,121 | ||||||
GE Equipment Transportation LLC | 4,980 | 5,008,142 | ||||||||
|
| |||||||||
| 6,384,083 | ||||||||||
|
| |||||||||
Home Equity Loans - Fixed Rate – 0.1% | ||||||||||
Credit-Based Asset Servicing and | 823 | 814,987 | ||||||||
Nationstar NIM Trust | 35 | – 0 | – | |||||||
|
| |||||||||
| 814,987 | ||||||||||
|
| |||||||||
Home Equity Loans - Floating | ||||||||||
HSBC Home Equity Loan Trust | 815 | 784,028 | ||||||||
|
| |||||||||
Total Asset-Backed Securities | 139,575,942 | |||||||||
|
| |||||||||
CORPORATES - INVESTMENT | ||||||||||
Industrial – 7.1% | ||||||||||
Capital Goods – 0.8% | ||||||||||
Caterpillar Financial Services Corp. | 4,990 | 5,049,306 | ||||||||
Eaton Corp. | 2,469 | 2,470,227 | ||||||||
|
| |||||||||
| 7,519,533 | ||||||||||
|
| |||||||||
Communications - | ||||||||||
AT&T, Inc. | 2,365 | 2,366,502 | ||||||||
1.40%, 12/01/17 | 3,320 | 3,312,105 | ||||||||
Cellco Partnership/Verizon Wireless | 4,375 | 4,561,769 | ||||||||
Verizon Communications, Inc. | 1,685 | 1,705,371 | ||||||||
1.95%, 3/28/14 | 3,130 | 3,179,501 | ||||||||
Vodafone Group PLC | 3,310 | 3,290,756 | ||||||||
|
| |||||||||
| 18,416,004 | ||||||||||
|
| |||||||||
| ALLIANCEBERNSTEIN POOLING PORTFOLIOS • | 69 |
Short Duration Bond Portfolio—Portfolio of Investments
| Principal Amount (000) | U.S. $ Value | |||||||||
|
|
| ||||||||
Consumer Cyclical - Automotive – 1.0% | ||||||||||
American Honda Finance Corp. | U.S.$ | 4,534 | $ | 4,537,296 | ||||||
Daimler Finance North America LLC | 4,430 | 4,440,136 | ||||||||
|
| |||||||||
| 8,977,432 | ||||||||||
|
| |||||||||
Consumer Non-Cyclical – 2.4% | ||||||||||
AbbVie, Inc. | 3,280 | 3,327,196 | ||||||||
Baxter International, Inc. | 1,051 | 1,051,422 | ||||||||
Eli Lilly & Co. | 2,845 | 2,950,695 | ||||||||
Gilead Sciences, Inc. | 3,085 | 3,310,844 | ||||||||
GlaxoSmithKline Capital, Inc. | 2,109 | 2,127,677 | ||||||||
McKesson Corp. | 1,298 | 1,301,937 | ||||||||
Novartis Capital Corp. | 2,855 | 2,952,829 | ||||||||
PepsiCo, Inc. | 3,315 | 3,316,170 | ||||||||
Sanofi | 2,445 | 2,478,741 | ||||||||
|
| |||||||||
| 22,817,511 | ||||||||||
|
| |||||||||
Energy – 0.8% | ||||||||||
BP Capital Markets PLC | 3,290 | 3,285,829 | ||||||||
Chevron Corp. | 3,305 | 3,312,800 | ||||||||
ConocoPhillips | 723 | 750,810 | ||||||||
|
| |||||||||
| 7,349,439 | ||||||||||
|
| |||||||||
Technology – 0.2% | ||||||||||
Oracle Corp. | 2,140 | 2,150,946 | ||||||||
|
| |||||||||
| 67,230,865 | ||||||||||
|
| |||||||||
Financial Institutions – 4.9% | ||||||||||
Banking – 3.2% | ||||||||||
Australia & New Zealand Banking Group Ltd. | 3,300 | 3,310,702 | ||||||||
Bank of America Corp. | 3,220 | 3,210,295 | ||||||||
Citigroup, Inc. | 3,335 | 3,325,839 | ||||||||
| 70 | • ALLIANCEBERNSTEIN POOLING PORTFOLIOS |
Short Duration Bond Portfolio—Portfolio of Investments
| Principal Amount (000) | U.S. $ Value | |||||||||
|
|
| ||||||||
Goldman Sachs Group, Inc. (The) | U.S.$ | 3,080 | $ | 3,274,795 | ||||||
ING Bank NV | 3,310 | 3,310,000 | ||||||||
JPMorgan Chase & Co. | 3,290 | 3,301,163 | ||||||||
KeyBank NA/Cleveland OH | 1,847 | 1,866,000 | ||||||||
Morgan Stanley | 1,988 | 1,996,733 | ||||||||
PNC Funding Corp. | 3,130 | 3,306,131 | ||||||||
UnionBanCal Corp. | 3,867 | 4,007,697 | ||||||||
|
| |||||||||
| 30,909,355 | ||||||||||
|
| |||||||||
Finance – 0.5% | ||||||||||
General Electric Capital Corp. | 4,680 | 4,684,390 | ||||||||
|
| |||||||||
Insurance – 1.2% | ||||||||||
Berkshire Hathaway, Inc. | 3,315 | 3,358,973 | ||||||||
MetLife Institutional Funding II | 4,500 | 4,505,026 | ||||||||
New York Life Global Funding | 3,315 | 3,315,146 | ||||||||
|
| |||||||||
| 11,179,145 | ||||||||||
|
| |||||||||
| 46,772,890 | ||||||||||
|
| |||||||||
Utility – 0.4% | ||||||||||
Natural Gas – 0.4% | ||||||||||
TransCanada PipeLines Ltd. | 3,290 | 3,288,322 | ||||||||
|
| |||||||||
Total Corporates - Investment Grades | 117,292,077 | |||||||||
|
| |||||||||
COMMERCIAL MORTGAGE-BACKED SECURITIES – 11.7% | ||||||||||
Non-Agency Fixed Rate CMBS – 9.8% | ||||||||||
Commercial Mortgage Pass Through Certificates | 6,329 | 6,652,488 | ||||||||
Series 2012-CR3, Class A1 | 3,492 | 3,489,983 | ||||||||
Series 2012-CR4, Class A1 | 3,648 | 3,647,746 | ||||||||
| ALLIANCEBERNSTEIN POOLING PORTFOLIOS • | 71 |
Short Duration Bond Portfolio—Portfolio of Investments
| Principal Amount (000) | U.S. $ Value | |||||||||
|
|
| ||||||||
Series 2012-CR5, Class A1 | U.S.$ | 2,739 | $ | 2,735,938 | ||||||
Series 2013-CR6, Class A1 | 4,613 | 4,612,610 | ||||||||
Series 2013-LC6, Class A1 | 2,227 | 2,226,087 | ||||||||
GS Mortgage Securities Corp. II | 4,201 | 4,196,388 | ||||||||
Series 2013-GC10, Class A1 | 2,717 | 2,719,333 | ||||||||
JP Morgan Chase Commercial Mortgage | 2,595 | 2,625,308 | ||||||||
Series 2010-C1, Class A1 | 4,309 | 4,561,862 | ||||||||
Series 2010-C2, Class A1 | 1,870 | 1,950,880 | ||||||||
Series 2011-C3, Class A1 | 4,578 | 4,644,863 | ||||||||
Series 2011-C4, Class A1 | 2,002 | 2,023,707 | ||||||||
Series 2012-CBX, Class A1 | 4,037 | 4,044,801 | ||||||||
Series 2012-LC9, Class A1 | 1,249 | 1,245,715 | ||||||||
Merrill Lynch Mortgage Trust | 1,816 | 1,844,048 | ||||||||
Morgan Stanley Bank of America | 4,426 | 4,415,264 | ||||||||
Series 2013-C8, Class A1 | 4,456 | 4,461,504 | ||||||||
Morgan Stanley Capital I, Inc. | 4,430 | 4,545,539 | ||||||||
UBS-Barclays Commercial Mortgage Trust | 3,076 | 3,073,318 | ||||||||
Series 2013-C5, Class A1 | 4,715 | 4,719,728 | ||||||||
Wells Fargo Commercial Mortgage Trust | 4,506 | 4,503,276 | ||||||||
| 72 | • ALLIANCEBERNSTEIN POOLING PORTFOLIOS |
Short Duration Bond Portfolio—Portfolio of Investments
| Principal Amount (000) | U.S. $ Value | |||||||||
|
|
| ||||||||
WF-RBS Commercial Mortgage Trust | U.S.$ | 1,981 | $ | 2,025,896 | ||||||
Series 2012-C10, Class A1 | 5,441 | 5,443,175 | ||||||||
Series 2012-C9, Class A1 | 4,463 | 4,458,255 | ||||||||
Series 2013-C11, Class A1 | 2,267 | 2,271,659 | ||||||||
|
| |||||||||
| 93,139,371 | ||||||||||
|
| |||||||||
Non-Agency Floating Rate CMBS – 1.4% | ||||||||||
Commercial Mortgage Pass Through Certificates | 669 | 621,971 | ||||||||
Series 2007-FL14, Class C | 2,839 | 2,639,324 | ||||||||
Credit Suisse Mortgage Capital Certificates | 4,900 | 4,782,821 | ||||||||
Series 2007-TFLA, Class A2 | 2,226 | 2,177,931 | ||||||||
Wachovia Bank Commercial Mortgage Trust | 3,037 | 2,989,161 | ||||||||
|
| |||||||||
| 13,211,208 | ||||||||||
|
| |||||||||
Agency CMBS – 0.5% | ||||||||||
NCUA Guaranteed Notes | 4,372 | 4,457,666 | ||||||||
|
| |||||||||
Total Commercial Mortgage-Backed Securities | 110,808,245 | |||||||||
|
| |||||||||
COLLATERALIZED MORTGAGE OBLIGATIONS – 1.8% | ||||||||||
Agency Fixed Rate – 1.5% | ||||||||||
Federal Home Loan Mortgage Corp. | 7,136 | 7,348,537 | ||||||||
Federal National Mortgage Association | 3,589 | 3,727,844 | ||||||||
Series 2011-39, Class DA | 3,505 | 3,599,927 | ||||||||
|
| |||||||||
| 14,676,308 | ||||||||||
|
| |||||||||
| ALLIANCEBERNSTEIN POOLING PORTFOLIOS • | 73 |
Short Duration Bond Portfolio—Portfolio of Investments
| Principal Amount (000) | U.S. $ Value | |||||||||
|
|
| ||||||||
Non-Agency Floating Rate – 0.3% | ||||||||||
Mortgage Equity Conversion Asset Trust | U.S.$ | 2,888 | $ | 2,422,707 | ||||||
|
| |||||||||
Non-Agency Fixed Rate – 0.0% | ||||||||||
Merrill Lynch Mortgage Investors, Inc. | 254 | 256,167 | ||||||||
|
| |||||||||
Agency Floating Rate – 0.0% | ||||||||||
Fannie Mae Whole Loan | 108 | 107,633 | ||||||||
Freddie Mac Reference REMICs | 53 | 53,066 | ||||||||
|
| |||||||||
| 160,699 | ||||||||||
|
| |||||||||
Total Collateralized Mortgage Obligations | 17,515,881 | |||||||||
|
| |||||||||
GOVERNMENTS - SOVEREIGN | ||||||||||
Netherlands – 0.7% | ||||||||||
Achmea Hypotheekbank NV | 6,456 | 6,455,923 | ||||||||
|
| |||||||||
| Shares | ||||||||||
SHORT-TERM INVESTMENTS – 7.7% | ||||||||||
Investment Companies – 7.7% | ||||||||||
AllianceBerstein Fixed-Income Shares Inc. - Government STIF Portfolio, 0.12%(f) | 72,993,769 | 72,993,769 | ||||||||
|
| |||||||||
Total Investments – 103.3% | 976,775,170 | |||||||||
Other assets less liabilities – (3.3)% | (31,007,250 | ) | ||||||||
|
| |||||||||
Net Assets – 100.0% | $ | 945,767,920 | ||||||||
|
| |||||||||
| 74 | • ALLIANCEBERNSTEIN POOLING PORTFOLIOS |
Short Duration Bond Portfolio—Portfolio of Investments
FUTURES CONTRACTS (see Note C)
| Type | Number of Contracts | Expiration Month | Original Value | Value at February 28, 2013 | Unrealized Appreciation/ (Depreciation) | |||||||||||||||
Purchased Contracts |
| |||||||||||||||||||
U.S. T-Note 2 Yr Futures | 666 | June 2013 | $ | 146,832,283 | $ | 146,832,188 | $ | (95 | ) | |||||||||||
Sold Contracts |
| |||||||||||||||||||
U.S. T-Note 5 Yr Futures | 288 | June 2013 | 35,690,695 | 35,707,500 | (16,805 | ) | ||||||||||||||
U.S. T-Note 10 Yr Futures | 310 | June 2013 | 40,479,203 | 40,779,531 | (300,328 | ) | ||||||||||||||
|
| |||||||||||||||||||
| $ | (317,228 | ) | ||||||||||||||||||
|
| |||||||||||||||||||
FORWARD CURRENCY EXCHANGE CONTRACTS (see Note C)
| Counterparty | Contracts to (000) | In Exchange For (000) | Settlement Date | Unrealized Appreciation/ (Depreciation) | ||||||||||||
BNP Paribas SA | USD 27,483 | CAD 28,210 | 3/14/13 | $ | (135,872 | ) | ||||||||||
Citibank, NA | CAD 30,661 | USD 30,500 | 3/14/13 | 777,410 | ||||||||||||
| Counterparty | Contracts to | In Exchange (000) | Settlement Date | Unrealized Appreciation/ (Depreciation) | ||||||||||||||||||||
State Street Bank & Trust Co. | USD | 140 | CAD | 139 | 3/14/13 | $ | (4,438 | ) | ||||||||||||||||
|
| |||||||||||||||||||||||
| $ | 637,100 | |||||||||||||||||||||||
|
| |||||||||||||||||||||||
CROSS CURRENCY SWAP CONTRACTS (see Note C)
| Counterparty | Expiration Date | Pay Currency | Pay Rate | Receive Currency | Receive Rate | Unrealized Appreciation/ (Depreciation) | ||||||||||||||
Barclays Bank PLC | 2/15/15 | EUR | 1 Month EURIBOR Plus a Specified Spread | USD | 1 Month LIBOR Plus a Specified Spread | $ | 52,575 | |||||||||||||
| (a) | Variable rate coupon, rate shown as of February 28, 2013. |
| (b) | Floating Rate Security. Stated interest rate was in effect at February 28, 2013. |
| (c) | Security is exempt from registration under Rule 144A of the Securities Act of 1933. These securities are considered liquid and may be resold in transactions exempt from registration, normally to qualified institutional buyers. At February 28, 2013, the aggregate market value of these securities amounted to $106,912,969 or 11.3% of net assets. |
| (d) | Security is exempt from registration under Rule 144A of the Securities Act of 1933. These securities, which represent 0.00% of net assets as of February 28, 2013, are considered illiquid and restricted. |
| ALLIANCEBERNSTEIN POOLING PORTFOLIOS • | 75 |
Short Duration Bond Portfolio—Portfolio of Investments
| Restricted Securities | Acquisition Date | Cost | Market Value | Percentage of Net Assets | ||||||||||||
Nationstar NIM Trust Series 2007-A, Class A 9.79%, 3/25/37 | 4/04/07 | $ | 35,213 | $ | – 0 | – | 0.00 | % | ||||||||
| (e) | Fair valued by the Adviser. |
| (f) | Investment in affiliated money market mutual fund. The rate shown represents the 7-day yield as of period end. |
Currency Abbreviations:
CAD – Canadian Dollar
EUR – Euro
USD – United States Dollar
Glossary:
| ABS | – Asset-Backed Securities |
| ARMs | – Adjustable Rate Mortgages |
| CMBS | – Commercial Mortgage-Backed Securities |
| EURIBOR | – Euro Interbank Offered Rate |
| LIBOR | – London Interbank Offered Rates |
| NCUA | – National Credit Union Administration |
| REMICs | – Real Estate Mortgage Investment Conduits |
| TBA | – To Be Announced |
See notes to financial statements.
| 76 | • ALLIANCEBERNSTEIN POOLING PORTFOLIOS |
Short Duration Bond Portfolio—Portfolio of Investments
GLOBAL CORE BOND PORTFOLIO
PORTFOLIO OF INVESTMENTS
February 28, 2013 (unaudited)
| Principal Amount (000) | U.S. $ Value | |||||||||
|
|
| ||||||||
GOVERNMENTS - TREASURIES – 36.5% | ||||||||||
Australia – 1.3% | ||||||||||
Australia Government Bond | AUD | 12,775 | $ | 14,572,373 | ||||||
|
| |||||||||
Austria – 1.1% | ||||||||||
Austria Government Bond | EUR | 9,070 | 12,452,513 | |||||||
|
| |||||||||
Belgium – 1.3% | ||||||||||
Belgium Government Bond | 9,635 | 13,783,028 | ||||||||
|
| |||||||||
Finland – 6.3% | ||||||||||
Finland Government Bond | 45,300 | 67,823,881 | ||||||||
|
| |||||||||
Germany – 3.0% | ||||||||||
Bundesrepublik Deutschland | 15,636 | 23,406,202 | ||||||||
Series 2007 | 4,903 | 8,918,172 | ||||||||
|
| |||||||||
| 32,324,374 | ||||||||||
|
| |||||||||
Japan – 7.0% | ||||||||||
Japan Government Forty Year Bond | JPY | 548,600 | 5,976,550 | |||||||
Japan Government Ten Year Bond | 2,306,350 | 26,681,013 | ||||||||
Series 327 | 1,015,850 | 11,102,301 | ||||||||
Japan Government Thirty Year Bond | 560,250 | 6,288,895 | ||||||||
Japan Government Twenty Year Bond | 2,053,350 | 24,610,870 | ||||||||
Series 48 | 103,700 | 1,296,963 | ||||||||
|
| |||||||||
| 75,956,592 | ||||||||||
|
| |||||||||
Mexico – 0.5% | ||||||||||
Mexican Bonos | MXN | 60,165 | 5,323,595 | |||||||
|
| |||||||||
Netherlands – 2.2% | ||||||||||
Netherlands Government Bond | EUR | 15,612 | 23,757,986 | |||||||
|
| |||||||||
| ALLIANCEBERNSTEIN POOLING PORTFOLIOS • | 77 |
Global Core Bond Portfolio—Portfolio of Investments
| Principal Amount (000) | U.S. $ Value | |||||||||
|
|
| ||||||||
New Zealand – 0.1% | ||||||||||
New Zealand Government Bond | NZD | 1,307 | $ | 1,238,055 | ||||||
|
| |||||||||
Norway – 0.9% | ||||||||||
Norway Government Bond | NOK | 51,245 | 9,951,565 | |||||||
|
| |||||||||
United Kingdom – 9.4% | ||||||||||
United Kingdom Gilt | GBP | 6,835 | 10,466,195 | |||||||
1.75%, 1/22/17-9/07/22 | 21,720 | 33,671,439 | ||||||||
2.00%, 1/22/16 | 5,808 | 9,218,713 | ||||||||
3.75%, 9/07/19 | 6,245 | 10,938,750 | ||||||||
4.50%, 12/07/42 | 2,978 | 5,568,294 | ||||||||
4.75%, 12/07/30 | 16,349 | 31,528,127 | ||||||||
|
| |||||||||
| 101,391,518 | ||||||||||
|
| |||||||||
United States – 3.4% | ||||||||||
U.S. Treasury Bonds | U.S.$ | 18,561 | 24,296,976 | |||||||
U.S. Treasury Notes | ||||||||||
1.625%, 8/15/22 | 11,340 | 11,155,725 | ||||||||
4.50%, 5/15/17 | 1,405 | 1,633,094 | ||||||||
|
| |||||||||
| 37,085,795 | ||||||||||
|
| |||||||||
Total Governments - Treasuries | 395,661,275 | |||||||||
|
| |||||||||
CORPORATES - INVESTMENT | ||||||||||
Financial Institutions – 15.0% | ||||||||||
Banking – 9.9% | ||||||||||
Bank of America Corp. | 2,896 | 3,521,417 | ||||||||
7.625%, 6/01/19 | 1,700 | 2,168,459 | ||||||||
Series L | 4,350 | 5,049,450 | ||||||||
Barclays Bank PLC | EUR | 1,800 | 2,725,024 | |||||||
Bear Stearns Cos. LLC (The) | U.S.$ | 2,866 | 3,266,793 | |||||||
BNP Paribas SA | 2,966 | 3,381,240 | ||||||||
Capital One Financial Corp. | 2,470 | 2,811,354 | ||||||||
| 78 | • ALLIANCEBERNSTEIN POOLING PORTFOLIOS |
Global Core Bond Portfolio—Portfolio of Investments
| Principal Amount (000) | U.S. $ Value | |||||||||
|
|
| ||||||||
Citigroup, Inc. | U.S.$ | 2,760 | $ | 3,047,744 | ||||||
4.50%, 1/14/22 | 3,160 | 3,516,344 | ||||||||
8.50%, 5/22/19 | 790 | 1,058,921 | ||||||||
Compass Bank | 4,989 | 5,139,453 | ||||||||
Cooperatieve Centrale Raiffeisen-Boerenleenbank BA/Netherlands | 1,742 | 1,850,805 | ||||||||
3.95%, 11/09/22 | 1,486 | 1,510,115 | ||||||||
DNB Bank ASA | EUR | 1,675 | 2,533,857 | |||||||
Goldman Sachs Group, Inc. (The) | U.S.$ | 2,700 | 3,220,463 | |||||||
Series G | 2,855 | 3,609,711 | ||||||||
HSBC Holdings PLC | 5,990 | 6,448,630 | ||||||||
ING Bank NV | 3,020 | 3,237,229 | ||||||||
Intesa Sanpaolo SpA | 1,792 | 1,757,909 | ||||||||
JPMorgan Chase & Co. | 1,335 | 1,491,785 | ||||||||
4.625%, 5/10/21 | 857 | 968,071 | ||||||||
Lloyds TSB Bank PLC | 3,575 | 3,938,184 | ||||||||
Macquarie Bank Ltd. | 651 | 715,873 | ||||||||
Macquarie Group Ltd. | 647 | 698,047 | ||||||||
Morgan Stanley | 1,615 | 1,807,930 | ||||||||
5.50%, 7/24/20 | 2,455 | 2,815,384 | ||||||||
Murray Street Investment Trust I | 272 | 297,835 | ||||||||
Nationwide Building Society | 3,415 | 4,019,387 | ||||||||
Nordea Bank AB | 2,990 | 3,172,339 | ||||||||
PNC Funding Corp. | 3,020 | 3,119,663 | ||||||||
Santander US Debt SAU | 3,400 | 3,420,842 | ||||||||
Societe Generale SA | 1,670 | 1,689,038 | ||||||||
| ALLIANCEBERNSTEIN POOLING PORTFOLIOS • | 79 |
Global Core Bond Portfolio—Portfolio of Investments
| Principal Amount (000) | U.S. $ Value | |||||||||
|
|
| ||||||||
5.20%, 4/15/21(a) | U.S.$ | 1,355 | $ | 1,535,879 | ||||||
SouthTrust Corp. | 3,315 | 3,527,975 | ||||||||
Standard Chartered PLC | 2,214 | 2,279,313 | ||||||||
Sumitomo Mitsui Banking Corp. | �� | 1,377 | 1,371,372 | |||||||
Svenska Handelsbanken AB | 3,000 | 3,183,234 | ||||||||
Turkiye Halk Bankasi AS | 1,624 | 1,612,804 | ||||||||
UFJ Finance Aruba AEC | 1,913 | 1,956,827 | ||||||||
Unicredit Luxembourg Finance SA | 1,386 | 1,405,371 | ||||||||
Vesey Street Investment Trust I | 696 | 752,896 | ||||||||
Wachovia Corp. | 1,225 | 1,234,861 | ||||||||
|
| |||||||||
| 106,869,828 | ||||||||||
|
| |||||||||
Finance – 0.6% | ||||||||||
General Electric Capital Corp. | 4,200 | 4,351,309 | ||||||||
SLM Corp. | 2,085 | 2,176,321 | ||||||||
|
| |||||||||
| 6,527,630 | ||||||||||
|
| |||||||||
Insurance – 3.6% | ||||||||||
Allied World Assurance Co., Ltd. | 1,820 | 2,144,750 | ||||||||
Berkshire Hathaway, Inc. | 2,800 | 2,943,256 | ||||||||
Coventry Health Care, Inc. | 665 | 774,233 | ||||||||
6.125%, 1/15/15 | 260 | 282,078 | ||||||||
6.30%, 8/15/14 | 2,060 | 2,211,278 | ||||||||
Guardian Life Insurance Co. of America | 1,305 | 1,767,947 | ||||||||
Hartford Financial Services Group, Inc. | 685 | 721,514 | ||||||||
5.125%, 4/15/22 | 600 | 691,252 | ||||||||
5.50%, 3/30/20 | 1,727 | 2,017,155 | ||||||||
Humana, Inc. | 369 | 434,330 | ||||||||
6.45%, 6/01/16 | 285 | 326,815 | ||||||||
7.20%, 6/15/18 | 610 | 746,773 | ||||||||
| 80 | • ALLIANCEBERNSTEIN POOLING PORTFOLIOS |
Global Core Bond Portfolio—Portfolio of Investments
| Principal Amount (000) | U.S. $ Value | |||||||||
|
|
| ||||||||
Lincoln National Corp. | U.S.$ | 791 | $ | 1,070,012 | ||||||
Markel Corp. | 1,105 | 1,365,119 | ||||||||
Massachusetts Mutual Life Insurance Co. | 815 | 1,264,084 | ||||||||
MetLife, Inc. | 1,085 | 1,242,048 | ||||||||
7.717%, 2/15/19 | 1,159 | 1,513,298 | ||||||||
Muenchener Rueckversicherungs AG | EUR | 1,400 | 2,146,869 | |||||||
Nationwide Mutual Insurance Co. | U.S.$ | 2,585 | 3,753,495 | |||||||
Prudential Financial, Inc. | 2,045 | 2,126,800 | ||||||||
Swiss Re Solutions Holding Corp. | 3,065 | 3,980,405 | ||||||||
UnitedHealth Group, Inc. | 3,020 | 3,053,009 | ||||||||
XL Group PLC | 1,920 | 2,031,700 | ||||||||
|
| |||||||||
| 38,608,220 | ||||||||||
|
| |||||||||
Other Finance – 0.2% | ||||||||||
ORIX Corp. | 2,467 | 2,642,238 | ||||||||
|
| |||||||||
REITS – 0.7% | ||||||||||
ERP Operating LP | 2,600 | 2,779,124 | ||||||||
HCP, Inc. | 2,195 | 2,545,221 | ||||||||
Healthcare Realty Trust, Inc. | 2,373 | 2,468,326 | ||||||||
|
| |||||||||
| 7,792,671 | ||||||||||
|
| |||||||||
| 162,440,587 | ||||||||||
|
| |||||||||
Industrial – 13.3% | ||||||||||
Basic – 1.2% | ||||||||||
Air Products & Chemicals, Inc. | 2,067 | 2,105,161 | ||||||||
AngloGold Ashanti Holdings PLC | 2,110 | 2,229,152 | ||||||||
Dow Chemical Co. (The) | 1,640 | 2,213,644 | ||||||||
Freeport-mcmoran Copper & Gold | 1,581 | 1,580,842 | ||||||||
International Paper Co. | 2,625 | 2,836,830 | ||||||||
| ALLIANCEBERNSTEIN POOLING PORTFOLIOS • | 81 |
Global Core Bond Portfolio—Portfolio of Investments
| Principal Amount (000) | U.S. $ Value | |||||||||
|
|
| ||||||||
Vale Overseas Ltd. | U.S.$ | 2,353 | $ | 2,448,748 | ||||||
|
| |||||||||
| 13,414,377 | ||||||||||
|
| |||||||||
Capital Goods – 0.6% | ||||||||||
John Deere Capital Corp. | 2,870 | 2,905,209 | ||||||||
Republic Services, Inc. | 85 | 93,606 | ||||||||
5.25%, 11/15/21 | 1,213 | 1,411,577 | ||||||||
5.50%, 9/15/19 | 1,768 | 2,102,963 | ||||||||
|
| |||||||||
| 6,513,355 | ||||||||||
|
| |||||||||
Communications - Media – 2.3% | ||||||||||
CBS Corp. | 1,410 | 1,662,594 | ||||||||
Comcast Cable Communications | 1,906 | 2,891,160 | ||||||||
Comcast Corp. | 965 | 978,187 | ||||||||
DirecTV Holdings LLC/DirecTV Financing Co., Inc. | 1,870 | 2,006,459 | ||||||||
4.75%, 10/01/14 | 1,200 | 1,271,995 | ||||||||
Globo Comunicacao e Participacoes SA | 681 | 735,480 | ||||||||
News America, Inc. | 890 | 1,010,110 | ||||||||
6.55%, 3/15/33 | 1,383 | 1,650,677 | ||||||||
Omnicom Group, Inc. | 1,008 | 1,026,638 | ||||||||
Reed Elsevier Capital, Inc. | 2,894 | 3,771,510 | ||||||||
Time Warner Entertainment Co. LP | 2,680 | 3,678,748 | ||||||||
Virgin Media Secured Finance PLC | 1,080 | 1,129,577 | ||||||||
WPP Finance 2010 | 417 | 448,751 | ||||||||
WPP Finance UK | 2,616 | 2,881,194 | ||||||||
|
| |||||||||
| 25,143,080 | ||||||||||
|
| |||||||||
Communications - | ||||||||||
American Tower Corp. | 2,750 | 3,065,466 | ||||||||
AT&T, Inc. | 463 | 436,421 | ||||||||
| 82 | • ALLIANCEBERNSTEIN POOLING PORTFOLIOS |
Global Core Bond Portfolio—Portfolio of Investments
| Principal Amount (000) | U.S. $ Value | |||||||||
|
|
| ||||||||
4.45%, 5/15/21 | U.S.$ | 1,694 | $ | 1,914,818 | ||||||
British Telecommunications PLC | 1,215 | 1,245,650 | ||||||||
Deutsche Telekom International Finance | 2,586 | 2,633,326 | ||||||||
Telecom Italia Capital SA | 1,450 | 1,651,512 | ||||||||
United States Cellular Corp. | 1,550 | 1,651,314 | ||||||||
|
| |||||||||
| 12,598,507 | ||||||||||
|
| |||||||||
Consumer Cyclical - | ||||||||||
Harley-Davidson Funding Corp. | 2,465 | 2,672,684 | ||||||||
Toyota Motor Credit Corp. | 3,270 | 3,461,056 | ||||||||
|
| |||||||||
| 6,133,740 | ||||||||||
|
| |||||||||
Consumer Cyclical - | ||||||||||
Time Warner, Inc. | 1,460 | 1,639,355 | ||||||||
7.625%, 4/15/31 | 2,810 | 3,813,853 | ||||||||
|
| |||||||||
| 5,453,208 | ||||||||||
|
| |||||||||
Consumer Cyclical - Other – 0.2% | ||||||||||
Wyndham Worldwide Corp. | 1,620 | 1,629,550 | ||||||||
|
| |||||||||
Consumer Cyclical - Retailers – 0.1% | ||||||||||
Macy’s Retail Holdings, Inc. | 1,304 | 1,362,990 | ||||||||
|
| |||||||||
Consumer Non-Cyclical – 2.0% | ||||||||||
Actavis, Inc. | 999 | 1,007,185 | ||||||||
Ahold Finance USA LLC | 3,105 | 4,012,877 | ||||||||
Baxter International, Inc. | 2,810 | 2,742,872 | ||||||||
Bunge Ltd. Finance Corp. | 481 | 523,028 | ||||||||
5.875%, 5/15/13 | 2,720 | 2,743,784 | ||||||||
Cadbury Schweppes US Finance LLC | 3,480 | 3,559,692 | ||||||||
Kroger Co. (The) | 242 | 248,382 | ||||||||
Mckesson Corp. | 1,201 | 1,192,992 | ||||||||
| ALLIANCEBERNSTEIN POOLING PORTFOLIOS • | 83 |
Global Core Bond Portfolio—Portfolio of Investments
Principal (000) | U.S. $ Value | |||||||||
|
|
| ||||||||
Pepsico, Inc. | U.S.$ | 2,972 | $ | 2,967,943 | ||||||
Reynolds American, Inc. | 1,269 | 1,261,885 | ||||||||
Teva Pharmaceutical Finance IV LLC | 1,912 | 1,927,170 | ||||||||
|
| |||||||||
| 22,187,810 | ||||||||||
|
| |||||||||
Energy – 2.5% | ||||||||||
Anadarko Petroleum Corp. | 735 | 845,113 | ||||||||
6.45%, 9/15/36 | 877 | 1,075,716 | ||||||||
Apache Corp. | 2,730 | 2,650,311 | ||||||||
ConocoPhillips Co. | 2,700 | 2,693,471 | ||||||||
Nabors Industries, Inc. | 2,393 | 3,043,138 | ||||||||
Noble Energy, Inc. | 2,858 | 3,738,558 | ||||||||
Noble Holding International Ltd. | 251 | 278,964 | ||||||||
Occidental Petroleum Corp. | 2,558 | 2,589,041 | ||||||||
Phillips 66 | 3,940 | 4,341,470 | ||||||||
Reliance Holdings USA, Inc. | 2,345 | 2,628,522 | ||||||||
Southwestern Energy Co. | 823 | 869,555 | ||||||||
Weatherford International Ltd./Bermuda | 1,540 | 2,021,090 | ||||||||
|
| |||||||||
| 26,774,949 | ||||||||||
|
| |||||||||
Technology – 1.2% | ||||||||||
Agilent Technologies, Inc. | 505 | 570,608 | ||||||||
Baidu, Inc. | 627 | 635,396 | ||||||||
Hewlett-Packard Co. | 1,498 | 1,537,168 | ||||||||
Microsoft Corp. | 2,775 | 2,700,361 | ||||||||
Motorola Solutions, Inc. | 1,506 | 1,482,508 | ||||||||
7.50%, 5/15/25 | 290 | 366,613 | ||||||||
Oracle Corp. | 2,800 | 2,799,742 | ||||||||
| 84 | • ALLIANCEBERNSTEIN POOLING PORTFOLIOS |
Global Core Bond Portfolio—Portfolio of Investments
Principal (000) | U.S. $ Value | |||||||||
|
|
| ||||||||
Telefonaktiebolaget LM Ericsson | U.S.$ | 2,995 | $ | 3,093,781 | ||||||
|
| |||||||||
| 13,186,177 | ||||||||||
|
| |||||||||
Transportation - Airlines – 0.3% | ||||||||||
Southwest Airlines Co. | 1,695 | 1,800,542 | ||||||||
5.75%, 12/15/16 | 1,115 | 1,254,760 | ||||||||
|
| |||||||||
| 3,055,302 | ||||||||||
|
| |||||||||
Transportation - Services – 0.6% | ||||||||||
Asciano Finance Ltd. | 3,375 | 3,475,886 | ||||||||
Con-way, Inc. | 1,179 | 1,242,381 | ||||||||
Ryder System, Inc. | 930 | 1,064,498 | ||||||||
7.20%, 9/01/15 | 908 | 1,033,064 | ||||||||
|
| |||||||||
| 6,815,829 | ||||||||||
|
| |||||||||
| 144,268,874 | ||||||||||
|
| |||||||||
Utility – 2.4% | ||||||||||
Electric – 1.0% | ||||||||||
Constellation Energy Group, Inc. | 504 | 573,913 | ||||||||
FirstEnergy Corp. | 2,291 | 2,720,267 | ||||||||
Nisource Finance Corp. | 3,445 | 4,213,735 | ||||||||
SPI Electricity & Gas Australia Holdings Pty Ltd. | 1,447 | 1,486,445 | ||||||||
TECO Finance, Inc. | 745 | 802,500 | ||||||||
5.15%, 3/15/20 | 915 | 1,058,380 | ||||||||
Union Electric Co. | 315 | 394,320 | ||||||||
|
| |||||||||
| 11,249,560 | ||||||||||
|
| |||||||||
Natural Gas – 1.4% | ||||||||||
Energy Transfer Partners LP | 972 | 1,173,030 | ||||||||
7.50%, 7/01/38 | 2,264 | 2,868,352 | ||||||||
GDF Suez | 975 | 978,141 | ||||||||
Kinder Morgan Energy Partners LP | 698 | 707,145 | ||||||||
3.95%, 9/01/22 | 495 | 524,993 | ||||||||
4.15%, 3/01/22 | 863 | 923,955 | ||||||||
| ALLIANCEBERNSTEIN POOLING PORTFOLIOS • | 85 |
Global Core Bond Portfolio—Portfolio of Investments
Principal (000) | U.S. $ Value | |||||||||||
|
|
| ||||||||||
Talent Yield Investments Ltd. | U.S.$ | 2,400 | $ | 2,629,903 | ||||||||
Williams Cos., Inc. (The) | 2,460 | 2,450,165 | ||||||||||
Williams Partners LP | 2,198 | 2,511,046 | ||||||||||
|
| |||||||||||
| 14,766,730 | ||||||||||||
|
| |||||||||||
| 26,016,290 | ||||||||||||
|
| |||||||||||
Non Corporate Sectors – 0.7% | ||||||||||||
Agencies - Not Government Guaranteed – 0.7% | ||||||||||||
Abu Dhabi National Energy Co. | ||||||||||||
3.625%, 1/12/23(a) | 819 | 831,559 | ||||||||||
4.125%, 3/13/17(a) | 757 | 815,594 | ||||||||||
Electricite de France SA | 2,143 | 2,105,497 | ||||||||||
Petrobras International Finance Co. – Pifco | 2,500 | 2,729,220 | ||||||||||
Qtel International Finance Ltd. | 647 | 640,530 | ||||||||||
|
| |||||||||||
| 7,122,400 | ||||||||||||
|
| |||||||||||
Total Corporates - Investment Grades | 339,848,151 | |||||||||||
|
| |||||||||||
MORTGAGE PASS-THROUGHS – 8.8% | ||||||||||||
Agency Fixed Rate 30-Year – 7.2% | ||||||||||||
Federal Home Loan Mortgage Corp. Gold Series 2006 | ||||||||||||
4.50%, 5/01/36 | 52 | 56,052 | ||||||||||
Series 2007 | ||||||||||||
5.50%, 7/01/35 | 1,720 | 1,882,955 | ||||||||||
Federal National Mortgage Association | ||||||||||||
3.00%, TBA | 12,090 | 12,516,928 | ||||||||||
3.50%, TBA | 12,635 | 13,359,539 | ||||||||||
4.00%, TBA | 20,340 | 21,674,812 | ||||||||||
6.00%, 5/01/31-3/01/38 | 3,092 | 3,395,850 | ||||||||||
Series 2003 | ||||||||||||
5.50%, 4/01/33 | 1,402 | 1,542,219 | ||||||||||
Series 2004 | ||||||||||||
5.50%, 4/01/34-11/01/34 | 4,410 | 4,857,656 | ||||||||||
Series 2005 | ||||||||||||
5.50%, 2/01/35 | 1,093 | 1,202,270 | ||||||||||
6.00%, 4/01/35 | 4,010 | 4,514,865 | ||||||||||
Series 2006 | ||||||||||||
5.00%, 1/01/36 | 3 | 3,793 | ||||||||||
Series 2007 | ||||||||||||
4.50%, 8/01/37 | 344 | 370,457 | ||||||||||
Series 2008 | ||||||||||||
6.00%, 3/01/37-5/01/38 | 11,227 | 12,381,104 | ||||||||||
|
| |||||||||||
| 77,758,500 | ||||||||||||
|
| |||||||||||
| 86 | • ALLIANCEBERNSTEIN POOLING PORTFOLIOS |
Global Core Bond Portfolio—Portfolio of Investments
Principal (000) | U.S. $ Value | |||||||||||
|
|
| ||||||||||
Agency Fixed Rate 15-Year – 1.1% | ||||||||||||
Federal National Mortgage Association | U.S.$ | 11,145 | $ | 11,987,405 | ||||||||
|
| |||||||||||
Agency ARMs – 0.5% | ||||||||||||
Federal Home Loan Mortgage Corp. | 2,029 | 2,183,072 | ||||||||||
Federal National Mortgage Association | 1,037 | 1,108,786 | ||||||||||
Series 2007 | 1,995 | 2,127,518 | ||||||||||
|
| |||||||||||
| 5,419,376 | ||||||||||||
|
| |||||||||||
Total Mortgage Pass-Throughs | 95,165,281 | |||||||||||
|
| |||||||||||
GOVERNMENTS - SOVEREIGN | ||||||||||||
Canada – 2.7% | ||||||||||||
Canada Housing Trust No 1 | CAD | 27,715 | 29,339,872 | |||||||||
|
| |||||||||||
Germany – 1.1% | ||||||||||||
KFW | EUR | 7,865 | 12,122,204 | |||||||||
|
| |||||||||||
Total Governments - Sovereign Agencies | 41,462,076 | |||||||||||
|
| |||||||||||
AGENCIES – 3.8% | ||||||||||||
Agency Debentures – 3.8% | ||||||||||||
Federal Home Loan Mortgage Corp. | U.S.$ | 12,000 | 12,376,116 | |||||||||
Residual Funding Corp. Principal Strip | 32,305 | 28,525,670 | ||||||||||
|
| |||||||||||
Total Agencies | 40,901,786 | |||||||||||
|
| |||||||||||
COMMERCIAL MORTGAGE-BACKED | ||||||||||||
Non-Agency Fixed Rate CMBS – 3.1% | ||||||||||||
Commercial Mortgage Pass Through Certificates | ||||||||||||
Series 2006-C8, Class A4 | ||||||||||||
5.306%, 12/10/46 | 3,065 | 3,463,910 | ||||||||||
Series 2013-CR6, Class A2 | ||||||||||||
2.122%, 3/10/46 | 5,420 | 5,582,510 | ||||||||||
| ALLIANCEBERNSTEIN POOLING PORTFOLIOS • | 87 |
Global Core Bond Portfolio—Portfolio of Investments
Principal (000) | U.S. $ Value | |||||||||||
|
|
| ||||||||||
Credit Suisse Mortgage Capital Certificates | U.S.$ | 6,475 | $ | 7,297,565 | ||||||||
JP Morgan Chase Commercial Mortgage Securities Corp. | 2,697 | 3,098,376 | ||||||||||
LB-UBS Commercial Mortgage Trust | 6,015 | 6,337,055 | ||||||||||
ML-CFC Commercial Mortgage Trust | 6,885 | 7,800,547 | ||||||||||
|
| |||||||||||
| 33,579,963 | ||||||||||||
|
| |||||||||||
Agency CMBS – 0.5% | ||||||||||||
FHLMC Multifamily Structured Pass | 4,653 | 5,146,143 | ||||||||||
|
| |||||||||||
Non-Agency Floating Rate | ||||||||||||
GS Mortgage Securities Corp. II | 1,855 | 1,865,889 | ||||||||||
|
| |||||||||||
Total Commercial Mortgage-Backed Securities | 40,591,995 | |||||||||||
|
| |||||||||||
ASSET-BACKED SECURITIES – 2.1% | ||||||||||||
Credit Cards - Floating Rate – 1.0% | ||||||||||||
Capital One Multi-Asset Execution Trust | 5,500 | 5,498,658 | ||||||||||
Chase Issuance Trust | 5,500 | 5,518,210 | ||||||||||
|
| |||||||||||
| 11,016,868 | ||||||||||||
|
| |||||||||||
Autos - Fixed Rate – 0.8% | ||||||||||||
AmeriCredit Automobile Receivables Trust | ||||||||||||
Series 2011-3, Class A2 | 493 | 492,838 | ||||||||||
Series 2011-4, Class A2 | 652 | 652,929 | ||||||||||
Series 2011-5, Class A2 | 677 | 679,137 | ||||||||||
| 88 | • ALLIANCEBERNSTEIN POOLING PORTFOLIOS |
Global Core Bond Portfolio—Portfolio of Investments
Principal (000) | U.S. $ Value | |||||||||||
|
|
| ||||||||||
Ford Auto Securitization Trust | CAD | 3,671 | $ | 3,570,944 | ||||||||
Ford Credit Auto Lease Trust | U.S.$ | 851 | 851,530 | |||||||||
Huntington Auto Trust | 2,315 | 2,325,774 | ||||||||||
World Omni Automobile Lease | 102 | 102,507 | ||||||||||
|
| |||||||||||
| 8,675,659 | ||||||||||||
|
| |||||||||||
Other ABS - Fixed Rate – 0.2% | ||||||||||||
CNH Equipment Trust | 610 | 611,463 | ||||||||||
GE Equipment Midticket LLC | 1,408 | 1,412,613 | ||||||||||
|
| |||||||||||
| 2,024,076 | ||||||||||||
|
| |||||||||||
Home Equity Loans - Floating | ||||||||||||
Asset Backed Funding Certificates | 398 | 385,388 | ||||||||||
HSBC Home Equity Loan Trust | 552 | 546,749 | ||||||||||
|
| |||||||||||
| 932,137 | ||||||||||||
|
| |||||||||||
Home Equity Loans - Fixed Rate – 0.0% | ||||||||||||
Citifinancial Mortgage Securities, Inc. | 387 | 397,438 | ||||||||||
|
| |||||||||||
Total Asset-Backed Securities | 23,046,178 | |||||||||||
|
| |||||||||||
COVERED BONDS – 1.9% | ||||||||||||
Aib Mortgage Bank | EUR | 665 | 931,863 | |||||||||
Banco Santander SA | 1,300 | 1,792,574 | ||||||||||
Bank of Ireland Mortgage Bank | 580 | 773,441 | ||||||||||
| ALLIANCEBERNSTEIN POOLING PORTFOLIOS • | 89 |
Global Core Bond Portfolio—Portfolio of Investments
Principal (000) | U.S. $ Value | |||||||||
|
|
| ||||||||
Bank of Nova Scotia | U.S.$ | 2,900 | $ | 2,995,990 | ||||||
BPCE SFH SA | ||||||||||
2.75%, 2/16/17 | EUR | 1,800 | 2,508,496 | |||||||
3.625%, 5/12/16(a) | 400 | 567,842 | ||||||||
Caisse Francaise de Financement Local | 883 | 1,253,036 | ||||||||
Cie de Financement Foncier SA | 3,457 | 4,844,885 | ||||||||
Nationwide Building Society | 2,610 | 3,692,708 | ||||||||
Societe Generale SFH | 900 | 1,268,078 | ||||||||
|
| |||||||||
Total Covered Bonds | 20,628,913 | |||||||||
|
| |||||||||
QUASI-SOVEREIGNS – 1.6% | ||||||||||
Quasi-Sovereign Bonds – 1.6% | ||||||||||
Kazakhstan – 0.2% | ||||||||||
KazMunaiGaz Finance Sub BV | U.S.$ | 1,990 | 2,412,875 | |||||||
|
| |||||||||
Malaysia – 0.4% | ||||||||||
Petronas Capital Ltd. | 3,390 | 3,984,603 | ||||||||
|
| |||||||||
Peru – 0.1% | ||||||||||
El Fondo Mivivienda SA | 613 | 597,675 | ||||||||
|
| |||||||||
Russia – 0.3% | ||||||||||
Russian Agricultural Bank OJSC Via | 2,782 | 3,275,805 | ||||||||
|
| |||||||||
South Korea – 0.3% | ||||||||||
Korea National Oil Corp. | 2,995 | 3,156,128 | ||||||||
|
| |||||||||
United Arab Emirates – 0.3% | ||||||||||
IPIC GMTN Ltd. | 3,300 | 3,522,750 | ||||||||
|
| |||||||||
Total Quasi-Sovereigns | 16,949,836 | |||||||||
|
| |||||||||
| 90 | • ALLIANCEBERNSTEIN POOLING PORTFOLIOS |
Global Core Bond Portfolio—Portfolio of Investments
Principal (000) | U.S. $ Value | |||||||||
|
|
| ||||||||
INFLATION-LINKED | ||||||||||
Germany – 1.0% | ||||||||||
Bundesrepublik Deutschland Bundesobligation Inflation Linked Bond | EUR | 8,547 | $ | 11,101,251 | ||||||
|
| |||||||||
GOVERNMENTS - SOVEREIGN | ||||||||||
Qatar – 0.3% | ||||||||||
State of Qatar | U.S.$ | 2,944 | 3,311,558 | |||||||
|
| |||||||||
Russia – 0.2% | ||||||||||
Russian Foreign Bond – Eurobond | 1,892 | 2,355,468 | ||||||||
|
| |||||||||
Total Governments - Sovereign Bonds | 5,667,026 | |||||||||
|
| |||||||||
SUPRANATIONALS – 0.3% | ||||||||||
International Bank for Reconstruction & Development | 2,340 | 3,167,550 | ||||||||
|
| |||||||||
LOCAL GOVERNMENTS - MUNICIPAL BONDS – 0.3% | ||||||||||
United States – 0.3% | ||||||||||
California GO | 1,985 | 2,895,520 | ||||||||
|
| |||||||||
EMERGING MARKETS - CORPORATE BONDS – 0.2% | ||||||||||
Industrial – 0.2% | ||||||||||
Consumer Non-Cyclical – 0.2% | ||||||||||
Raizen Energy Finance Ltd. | 1,885 | 2,143,245 | ||||||||
|
| |||||||||
COLLATERALIZED MORTGAGE OBLIGATIONS – 0.2% | ||||||||||
Non-Agency Fixed Rate – 0.1% | ||||||||||
Citigroup Mortgage Loan Trust, Inc. | 1,424 | 1,374,764 | ||||||||
|
| |||||||||
| ALLIANCEBERNSTEIN POOLING PORTFOLIOS • | 91 |
Global Core Bond Portfolio—Portfolio of Investments
Principal (000) | U.S. $ Value | |||||||||
|
|
| ||||||||
Agency Fixed Rate – 0.1% | ||||||||||
Fannie Mae Grantor Trust | U.S.$ | 392 | $ | 338,735 | ||||||
|
| |||||||||
Total Collateralized Mortgage Obligations | 1,713,499 | |||||||||
|
| |||||||||
| Shares | ||||||||||
SHORT-TERM INVESTMENTS – 9.9% | ||||||||||
Investment Companies – 5.7% | ||||||||||
AllianceBerstein Fixed-Income Shares, Inc. – Government STIF Portfolio, 0.12%(e) | 61,548,897 | 61,548,897 | ||||||||
|
| |||||||||
| Principal Amount (000) | ||||||||||
U.S. Treasury Bill – 4.2% | ||||||||||
U.S. Treasury Bill | U.S.$ | 45,815 | 45,813,454 | |||||||
|
| |||||||||
Total Short-Term Investments | 107,362,351 | |||||||||
|
| |||||||||
Total Investments – 106.0% | 1,148,305,933 | |||||||||
Other assets less liabilities – (6.0)% | (64,584,497 | ) | ||||||||
|
| |||||||||
Net Assets – 100.0% | $ | 1,083,721,436 | ||||||||
|
| |||||||||
FUTURES CONTRACTS (see Note C)
| Type | Number of Contracts | Expiration Month | Original Value | Value at February 28, 2013 | Unrealized Appreciation/ (Depreciation) | |||||||||||||||
Sold Contracts |
| |||||||||||||||||||
U.S. T-Bond 30 Yr Futures | 205 | June 2013 | $ | 29,299,711 | $ | 29,475,156 | $ | (175,445 | ) | |||||||||||
U.S. T-Note 2 Yr Futures | 76 | June 2013 | 16,755,440 | 16,755,625 | (185 | ) | ||||||||||||||
|
| |||||||||||||||||||
| $ | (175,630 | ) | ||||||||||||||||||
|
| |||||||||||||||||||
| 92 | • ALLIANCEBERNSTEIN POOLING PORTFOLIOS |
Global Core Bond Portfolio—Portfolio of Investments
FORWARD CURRENCY EXCHANGE CONTRACTS (see Note C)
| Counterparty | Contracts to (000) | In Exchange (000) | Settlement Date | Unrealized Appreciation/ (Depreciation) | ||||||||||||||||||||
Barclays Bank PLC Wholesale | NOK | 59,533 | USD | 10,685 | 3/07/13 | $ | 315,267 | |||||||||||||||||
Barclays Bank PLC Wholesale | SGD | 13,871 | USD | 11,319 | 3/15/13 | 118,303 | ||||||||||||||||||
BNP Paribas SA | NZD | 10,298 | USD | 8,630 | 3/08/13 | 118,324 | ||||||||||||||||||
Citibank, NA | USD | 7,270 | NZD | 8,672 | 3/08/13 | (102,036 | ) | |||||||||||||||||
Goldman Sachs Capital Markets LP | AUD | 14,318 | USD | 15,038 | 3/08/13 | 417,246 | ||||||||||||||||||
Goldman Sachs Capital Markets LP | USD | 11,119 | SGD | 13,740 | 3/15/13 | (24,095 | ) | |||||||||||||||||
Goldman Sachs Capital Markets LP | EUR | 154,212 | USD | 201,620 | 4/11/13 | 233,402 | ||||||||||||||||||
Royal Bank of Canada | CAD | 33,668 | USD | 33,484 | 3/14/13 | 845,511 | ||||||||||||||||||
Royal Bank of Scotland PLC | MXN | 66,372 | USD | 5,131 | 4/12/13 | (48,645 | ) | |||||||||||||||||
State Street Bank & Trust Co. | USD | 254 | CAD | 260 | 3/14/13 | (1,447 | ) | |||||||||||||||||
State Street Bank & Trust Co. | GBP | 59,227 | USD | 89,710 | 4/11/13 | (121,961 | ) | |||||||||||||||||
State Street Bank & Trust Co. | JPY | 1,022,672 | USD | 10,990 | 4/12/13 | (46,287 | ) | |||||||||||||||||
UBS AG | JPY | 5,791,678 | USD | 61,951 | 4/12/13 | (549,399 | ) | |||||||||||||||||
|
| |||||||||||||||||||||||
| $ | 1,154,183 | |||||||||||||||||||||||
|
| |||||||||||||||||||||||
| (a) | Security is exempt from registration under Rule 144A of the Securities Act of 1933. These securities are considered liquid and may be resold in transactions exempt from registration, normally to qualified institutional buyers. At February 28, 2013, the aggregate market value of these securities amounted to $171,785,623 or 15.9% of net assets. |
| (b) | Coupon rate adjusts periodically based upon a predetermined schedule. Stated interest rate in effect at February 28, 2013. |
| (c) | Variable rate coupon, rate shown as of February 28, 2013. |
| (d) | Floating Rate Security. Stated interest rate was in effect at February 28, 2013. |
| (e) | Investment in affiliated money market mutual fund. The rate shown represents the 7-day yield as of period end. |
Currency Abbreviations:
| AUD | – Australian Dollar |
| CAD | – Canadian Dollar |
| EUR | – Euro |
| GBP | – Great British Pound |
| JPY | – Japanese Yen |
| MXN | – Mexican Peso |
| NOK | – Norwegian Krone |
| NZD | – New Zealand Dollar |
| SGD | – Singapore Dollar |
| USD | – United States Dollar |
| Glossary: |
| ABS | – Asset-Backed Securities |
| ARMs | – Adjustable Rate Mortgages |
| CMBS | – Commercial Mortgage-Backed |
| FHLMC | – Federal Home Loan Mortgage Corporation |
| GO | – General Obligation |
| OJSC | – Open Joint Stock Company |
| REIT | – Real Estate Investment |
| TBA | – To Be Announced |
See notes to financial statements.
| ALLIANCEBERNSTEIN POOLING PORTFOLIOS • | 93 |
Global Core Bond Portfolio—Portfolio of Investments
BOND INFLATION PROTECTION PORTFOLIO
PORTFOLIO OF INVESTMENTS
February 28, 2013 (unaudited)
Principal Amount (000) | U.S. $ Value | |||||||||
| ||||||||||
INFLATION-LINKED SECURITIES – 97.3% | ||||||||||
United States – 97.3% | ||||||||||
U.S. Treasury Inflation Index | U.S.$ | 90,592 | $ | 98,069,659 | ||||||
0.125%, 1/15/22 (TIPS) | 16,081 | 17,487,176 | ||||||||
0.625%, 7/15/21 (TIPS)(a) | 87,658 | 100,019,651 | ||||||||
1.125%, 1/15/21 (TIPS)(a) | 13,814 | 16,263,736 | ||||||||
1.25%, 7/15/20 (TIPS)(a)(b) | 63,564 | 75,795,323 | ||||||||
1.375%, 7/15/18-1/15/20 (TIPS) | 57,346 | 68,006,323 | ||||||||
1.625%, 1/15/15 (TIPS)(a) | 75,623 | 80,869,330 | ||||||||
1.625%, 1/15/18 (TIPS) | 17,641 | 20,619,583 | ||||||||
1.875%, 7/15/15-7/15/19 (TIPS)(a) | 83,817 | 97,644,121 | ||||||||
2.00%, 7/15/14 (TIPS)(a) | 91,479 | 97,175,273 | ||||||||
2.00%, 1/15/16 (TIPS) | 13,877 | 15,488,321 | ||||||||
2.125%, 1/15/19 (TIPS) | 22,267 | 27,207,733 | ||||||||
2.375%, 1/15/25 (TIPS) | 5,774 | 7,744,610 | ||||||||
2.50%, 7/15/16 (TIPS) | 16,043 | 18,580,207 | ||||||||
2.625%, 7/15/17 (TIPS) | 13,267 | 15,989,217 | ||||||||
|
| |||||||||
Total Inflation-Linked Securities | 756,960,263 | |||||||||
|
| |||||||||
CORPORATES - INVESTMENT | ||||||||||
Industrial – 10.4% | ||||||||||
Basic – 1.0% | ||||||||||
Alcoa, Inc. | 1,205 | 1,266,421 | ||||||||
AngloGold Ashanti Holdings PLC | 980 | 1,035,341 | ||||||||
Dow Chemical Co. (The) | ||||||||||
5.25%, 11/15/41 | 945 | 1,016,695 | ||||||||
8.55%, 5/15/19 | 637 | 859,812 | ||||||||
International Paper Co. | 1,710 | 1,918,362 | ||||||||
Vale SA | 1,980 | 2,054,923 | ||||||||
|
| |||||||||
| 8,151,554 | ||||||||||
|
| |||||||||
Capital Goods – 0.5% | ||||||||||
CRH Finance BV | EUR | 1,100 | 1,549,528 | |||||||
Embraer SA | U.S.$ | 550 | 603,075 | |||||||
Odebrecht Finance Ltd. | 730 | 777,450 | ||||||||
Republic Services, Inc. | 660 | 768,047 | ||||||||
|
| |||||||||
| 3,698,100 | ||||||||||
|
| |||||||||
| 94 | • ALLIANCEBERNSTEIN POOLING PORTFOLIOS |
Bond Inflation Protection Portfolio—Portfolio of Investments
| Principal Amount (000) | U.S. $ Value | |||||||||
|
|
| ||||||||
Communications - Media – 1.9% | ||||||||||
CBS Corp. | U.S.$ | 1,625 | $ | 1,916,110 | ||||||
Comcast Corp. | 1,745 | 2,059,691 | ||||||||
DirecTV Holdings LLC/DirecTV Financing Co., Inc. | ||||||||||
3.80%, 3/15/22 | 1,330 | 1,335,243 | ||||||||
4.60%, 2/15/21 | 660 | 708,162 | ||||||||
Globo Comunicacao e Participacoes SA | 606 | 654,480 | ||||||||
News America, Inc. | 1,584 | 1,911,591 | ||||||||
Omnicom Group, Inc. | 703 | 715,998 | ||||||||
Reed Elsevier Capital, Inc. | 1,340 | 1,746,311 | ||||||||
Time Warner Cable, Inc. | 1,435 | 1,537,947 | ||||||||
WPP Finance 2010 | 1,737 | 1,869,257 | ||||||||
|
| |||||||||
| 14,454,790 | ||||||||||
|
| |||||||||
Communications - Telecommunications – 1.3% | ||||||||||
American Tower Corp. | 1,355 | 1,510,439 | ||||||||
AT&T, Inc. | 1,397 | 1,529,908 | ||||||||
British Telecommunications PLC | ||||||||||
2.00%, 6/22/15 | 739 | 757,642 | ||||||||
5.95%, 1/15/18 | 253 | 302,017 | ||||||||
Deutsche Telekom International Finance BV | 1,777 | 1,809,521 | ||||||||
Rogers Communications, Inc. | CAD | 150 | 152,842 | |||||||
Telefonica Emisiones SAU | U.S.$ | 835 | 880,277 | |||||||
United States Cellular Corp. | 835 | 889,579 | ||||||||
Verizon Communications, Inc. | 780 | 1,087,572 | ||||||||
Vodafone Group PLC | 870 | 1,049,146 | ||||||||
|
| |||||||||
| 9,968,943 | ||||||||||
|
| |||||||||
Consumer Cyclical - Automotive – 0.5% | ||||||||||
Ford Motor Credit Co. LLC | 1,595 | 1,760,070 | ||||||||
| ALLIANCEBERNSTEIN POOLING PORTFOLIOS • | 95 |
Bond Inflation Protection Portfolio—Portfolio of Investments
| Principal Amount (000) | U.S. $ Value | |||||||||
|
|
| ||||||||
Harley-Davidson Funding Corp. | U.S.$ | 1,640 | $ | 1,778,175 | ||||||
|
| |||||||||
| 3,538,245 | ||||||||||
|
| |||||||||
Consumer Cyclical - Other – 0.3% | ||||||||||
Carnival PLC | EUR | 1,225 | 1,637,595 | |||||||
Host Hotels & Resorts LP | U.S.$ | 830 | 921,433 | |||||||
|
| |||||||||
| 2,559,028 | ||||||||||
|
| |||||||||
Consumer Cyclical - Retailers – 0.3% | ||||||||||
Macy’s Retail Holdings, Inc. | 2,025 | 2,116,607 | ||||||||
|
| |||||||||
Consumer Non-Cyclical – 1.0% | ||||||||||
Actavis, Inc. | 707 | 712,793 | ||||||||
Bunge Ltd. Finance Corp. | 1,610 | 1,750,677 | ||||||||
ConAgra Foods, Inc. | 591 | 589,596 | ||||||||
Kroger Co. (The) | 1,395 | 1,431,790 | ||||||||
Reynolds American, Inc. | 899 | 893,959 | ||||||||
Tyson Foods, Inc. | 1,985 | 2,153,818 | ||||||||
|
| |||||||||
| 7,532,633 | ||||||||||
|
| |||||||||
Energy – 2.0% | ||||||||||
Encana Corp. | 2,060 | 2,173,743 | ||||||||
Marathon Petroleum Corp. | ||||||||||
3.50%, 3/01/16 | 230 | 245,569 | ||||||||
5.125%, 3/01/21 | 590 | 686,759 | ||||||||
Nabors Industries, Inc. | 1,064 | 1,353,071 | ||||||||
Noble Energy, Inc. | 1,370 | 1,792,101 | ||||||||
Phillips 66 | 2,775 | 3,057,761 | ||||||||
Reliance Holdings USA, Inc. | 2,065 | 2,314,669 | ||||||||
Transocean, Inc. | 874 | 884,962 | ||||||||
Valero Energy Corp. | 998 | 1,209,341 | ||||||||
| 96 | • ALLIANCEBERNSTEIN POOLING PORTFOLIOS |
Bond Inflation Protection Portfolio—Portfolio of Investments
| Principal Amount (000) | U.S. $ Value | |||||||||
|
|
| ||||||||
Weatherford International Ltd./Bermuda | U.S.$ | 1,860 | $ | 2,008,889 | ||||||
|
| |||||||||
| 15,726,865 | ||||||||||
|
| |||||||||
Technology – 0.9% | ||||||||||
Agilent Technologies, Inc. | 249 | 281,349 | ||||||||
Baidu, Inc. | 480 | 486,427 | ||||||||
Hewlett-Packard Co. | 778 | 798,343 | ||||||||
Intel Corp. | 1,130 | 1,205,364 | ||||||||
Motorola Solutions, Inc. | 1,540 | 1,946,843 | ||||||||
Telefonaktiebolaget LM Ericsson | 2,095 | 2,164,097 | ||||||||
|
| |||||||||
| 6,882,423 | ||||||||||
|
| |||||||||
Transportation - Airlines – 0.2% | ||||||||||
Southwest Airlines Co. | 1,615 | 1,817,432 | ||||||||
|
| |||||||||
Transportation - Railroads – 0.1% | ||||||||||
CSX Corp. | 1,085 | 1,128,784 | ||||||||
|
| |||||||||
Transportation - Services – 0.4% | ||||||||||
Asciano Finance Ltd. | 950 | 1,039,873 | ||||||||
Ryder System, Inc. | ||||||||||
3.15%, 3/02/15 | 1,105 | 1,148,436 | ||||||||
5.85%, 11/01/16 | 630 | 721,112 | ||||||||
|
| |||||||||
| 2,909,421 | ||||||||||
|
| |||||||||
| 80,484,825 | ||||||||||
|
| |||||||||
Financial Institutions – 6.2% | ||||||||||
Banking – 3.6% | ||||||||||
Bank of America Corp. | ||||||||||
5.00%, 5/13/21 | 960 | 1,082,985 | ||||||||
5.625%, 7/01/20 | 705 | 824,905 | ||||||||
Barclays Bank PLC | ||||||||||
6.625%, 3/30/22(c) | EUR | 1,245 | 1,884,808 | |||||||
7.625%, 11/21/22 | U.S.$ | 1,213 | 1,209,968 | |||||||
Citigroup, Inc. | 496 | 582,268 | ||||||||
Cooperatieve Centrale Raiffeisen-Boerenleenbank BA/Netherlands | 896 | 910,540 | ||||||||
DNB Bank ASA | 2,070 | 2,202,128 | ||||||||
| ALLIANCEBERNSTEIN POOLING PORTFOLIOS • | 97 |
Bond Inflation Protection Portfolio—Portfolio of Investments
| Principal Amount (000) | U.S. $ Value | |||||||||
|
|
| ||||||||
Fifth Third Bancorp | U.S.$ | 797 | $ | 831,375 | ||||||
Goldman Sachs Group, Inc. (The) | ||||||||||
5.75%, 1/24/22 | 545 | 639,389 | ||||||||
6.00%, 6/15/20 | 685 | 817,043 | ||||||||
HSBC Holdings PLC | ||||||||||
4.00%, 3/30/22 | 810 | 872,018 | ||||||||
5.10%, 4/05/21 | 1,130 | 1,316,107 | ||||||||
ING Bank NV | 1,995 | 2,032,925 | ||||||||
JPMorgan Chase & Co. | ||||||||||
4.40%, 7/22/20 | 715 | 798,971 | ||||||||
4.50%, 1/24/22 | 1,120 | 1,246,650 | ||||||||
Series 1 | ||||||||||
7.90%, 4/30/18 | 1,084 | 1,250,229 | ||||||||
Macquarie Group Ltd. | 720 | 871,757 | ||||||||
Morgan Stanley Series G | 2,413 | 2,768,704 | ||||||||
Murray Street Investment Trust I | 184 | 201,477 | ||||||||
National Capital Trust II | 1,090 | 1,106,584 | ||||||||
Royal Bank of Scotland PLC (The) | 319 | 376,420 | ||||||||
Standard Chartered PLC | 1,900 | 1,956,050 | ||||||||
UBS AG/Stamford CT | 655 | 733,279 | ||||||||
7.625%, 8/17/22 | 929 | 1,036,788 | ||||||||
Vesey Street Investment Trust I | 493 | 533,301 | ||||||||
|
| |||||||||
| 28,086,669 | ||||||||||
|
| |||||||||
Finance – 0.1% | ||||||||||
SLM Corp. | 1,075 | 1,184,112 | ||||||||
|
| |||||||||
Insurance – 1.9% | ||||||||||
Allstate Corp. (The) | 1,145 | 1,215,189 | ||||||||
American International Group, Inc. | 1,660 | 2,064,743 | ||||||||
Hartford Financial Services Group, Inc. | 1,330 | 1,532,274 | ||||||||
6.10%, 10/01/41 | 760 | 921,116 | ||||||||
Humana, Inc. | 1,520 | 1,860,811 | ||||||||
| 98 | • ALLIANCEBERNSTEIN POOLING PORTFOLIOS |
Bond Inflation Protection Portfolio—Portfolio of Investments
| Principal Amount (000) | U.S. $ Value | |||||||||
|
|
| ||||||||
Lincoln National Corp. | U.S.$ | 550 | $ | 744,003 | ||||||
Nationwide Mutual Insurance Co. | 805 | 1,168,883 | ||||||||
Prudential Financial, Inc. | 940 | 977,600 | ||||||||
Swiss Re Capital I LP | 1,815 | 1,919,363 | ||||||||
WellPoint, Inc. | 703 | 711,293 | ||||||||
XL Group PLC | 1,590 | 1,682,502 | ||||||||
|
| |||||||||
| 14,797,777 | ||||||||||
|
| |||||||||
REITS – 0.6% | ||||||||||
HCP, Inc. | 1,877 | 2,187,473 | ||||||||
Health Care REIT, Inc. | 1,945 | 2,180,590 | ||||||||
|
| |||||||||
| 4,368,063 | ||||||||||
|
| |||||||||
| 48,436,621 | ||||||||||
|
| |||||||||
Utility – 2.9% | ||||||||||
Electric – 0.8% | ||||||||||
Allegheny Energy Supply Co. LLC | 1,355 | 1,576,727 | ||||||||
Constellation Energy Group, Inc. | 263 | 299,482 | ||||||||
MidAmerican Energy Holdings Co. | 960 | 1,205,247 | ||||||||
Nisource Finance Corp. | 695 | 695,000 | ||||||||
Pacific Gas & Electric Co. | 800 | 856,834 | ||||||||
TECO Finance, Inc. | 1,680 | 1,809,664 | ||||||||
|
| |||||||||
| 6,442,954 | ||||||||||
|
| |||||||||
Natural Gas – 2.1% | ||||||||||
DCP Midstream LLC | 1,290 | 1,703,934 | ||||||||
Energy Transfer Partners LP | 1,645 | 1,900,982 | ||||||||
Enterprise Products Operating LLC | 720 | 845,143 | ||||||||
Kinder Morgan Energy Partners LP | 1,439 | 1,526,190 | ||||||||
4.15%, 3/01/22 | 625 | 669,144 | ||||||||
| ALLIANCEBERNSTEIN POOLING PORTFOLIOS • | 99 |
Bond Inflation Protection Portfolio—Portfolio of Investments
| Principal Amount (000) | U.S. $ Value | |||||||||
|
|
| ||||||||
ONEOK, Inc. | U.S.$ | 2,025 | $ | 2,158,172 | ||||||
Spectra Energy Capital LLC | 1,395 | 1,833,343 | ||||||||
Talent Yield Investments Ltd. | 2,090 | 2,290,207 | ||||||||
Williams Cos., Inc. (The) | 1,758 | 1,750,972 | ||||||||
Williams Partners LP | 1,660 | 1,751,322 | ||||||||
|
| |||||||||
| 16,429,409 | ||||||||||
|
| |||||||||
| 22,872,363 | ||||||||||
|
| |||||||||
Non Corporate Sectors – 0.4% | ||||||||||
Agencies - Not Government | ||||||||||
Gazprom OAO Via Gaz Capital SA | 1,292 | 1,437,996 | ||||||||
Petrobras International Finance Co. – Pifco | 1,570 | 1,713,950 | ||||||||
|
| |||||||||
| 3,151,946 | ||||||||||
|
| |||||||||
Total Corporates - Investment Grades | 154,945,755 | |||||||||
|
| |||||||||
ASSET-BACKED SECURITIES – 9.9% | ||||||||||
Autos - Fixed Rate – 5.8% | ||||||||||
Ally Master Owner Trust | 3,150 | 3,197,395 | ||||||||
Series 2013-1, Class A2 | 1,555 | 1,554,660 | ||||||||
AmeriCredit Automobile Receivables Trust | 260 | 259,948 | ||||||||
Series 2011-4, Class A2 | 348 | 348,229 | ||||||||
Series 2012-3, Class A3 | 2,415 | 2,430,422 | ||||||||
Series 2012-4, Class A2 | 2,925 | 2,926,029 | ||||||||
Series 2013-1, Class A2 | 1,707 | 1,707,697 | ||||||||
Avis Budget Rental Car Funding AESOP LLC | 1,475 | 1,507,488 | ||||||||
Bank of America Auto Trust | 1,335 | 1,347,863 | ||||||||
| 100 | • ALLIANCEBERNSTEIN POOLING PORTFOLIOS |
Bond Inflation Protection Portfolio—Portfolio of Investments
| Principal Amount (000) | U.S. $ Value | |||||||||
|
|
| ||||||||
Capital Auto Receivables Asset Trust | U.S.$ | 1,469 | $ | 1,468,573 | ||||||
Exeter Automobile Receivables Trust | 840 | 844,602 | ||||||||
Series 2012-2A, Class A | 1,552 | 1,560,774 | ||||||||
Ford Auto Securitization Trust | CAD | 1,271 | 1,231,622 | |||||||
Ford Credit Auto Owner Trust | U.S.$ | 1,487 | 1,496,531 | |||||||
Series 2012-D, Class B | 645 | 643,319 | ||||||||
Ford Credit Floorplan Master Owner Trust | 4,475 | 4,487,925 | ||||||||
Series 2013-1, Class A2 | 2,082 | 2,081,999 | ||||||||
Huntington Auto Trust | 1,240 | 1,245,771 | ||||||||
Hyundai Auto Lease Securitization Trust | 2,063 | 2,062,793 | ||||||||
Hyundai Auto Receivables Trust | 585 | 596,165 | ||||||||
Mercedes-Benz Auto Lease Trust | 509 | 509,208 | ||||||||
Mercedes-Benz Master Owner Trust | 2,116 | 2,118,334 | ||||||||
Navistar Financial Corp. Owner Trust | 2,448 | 2,452,216 | ||||||||
Nissan Auto Lease Trust | 1,528 | 1,530,796 | ||||||||
Porsche Innovative Lease Owner Trust | 2,190 | 2,196,671 | ||||||||
| ALLIANCEBERNSTEIN POOLING PORTFOLIOS • | 101 |
Bond Inflation Protection Portfolio—Portfolio of Investments
| Principal Amount (000) | U.S. $ Value | |||||||||
|
|
| ||||||||
Santander Drive Auto Receivables Trust | U.S.$ | 1,990 | $ | 1,990,162 | ||||||
SMART Trust/Australia | 1,320 | 1,321,117 | ||||||||
|
| |||||||||
| 45,118,309 | ||||||||||
|
| |||||||||
Credit Cards - Fixed Rate – 2.2% | ||||||||||
American Express Credit Account | 2,310 | 2,310,589 | ||||||||
CABMT 2013 1 A /GB/AB64809 | 1,905 | 1,903,744 | ||||||||
Chase Issuance Trust | 2,720 | 2,718,800 | ||||||||
Citibank Credit Card Issuance Trust | 1,300 | 1,458,098 | ||||||||
Dryrock Issuance Trust | 2,290 | 2,288,871 | ||||||||
GE Capital Credit Card Master Note Trust | 2,125 | 2,150,910 | ||||||||
Series 2012-7, Class A | 1,835 | 1,824,918 | ||||||||
World Financial Network Credit Card | 1,310 | 1,334,108 | ||||||||
Series 2013-A, Class A | 809 | 808,988 | ||||||||
|
| |||||||||
| 16,799,026 | ||||||||||
|
| |||||||||
Autos - Floating Rate – 0.8% | ||||||||||
BMW Floorplan Master Owner Trust | 3,034 | 3,029,878 | ||||||||
GE Dealer Floorplan Master Note Trust | 3,340 | 3,351,670 | ||||||||
|
| |||||||||
| 6,381,548 | ||||||||||
|
| |||||||||
Credit Cards - Floating Rate – 0.6% | ||||||||||
Discover Card Master Trust | 1,825 | 1,837,355 | ||||||||
| 102 | • ALLIANCEBERNSTEIN POOLING PORTFOLIOS |
Bond Inflation Protection Portfolio—Portfolio of Investments
Principal Amount (000) | U.S. $ Value | |||||||||
| ||||||||||
Penarth Master Issuer PLC | U.S.$ | 2,401 | $ | 2,407,788 | ||||||
|
| |||||||||
| 4,245,143 | ||||||||||
|
| |||||||||
Other ABS - Fixed Rate – 0.5% | ||||||||||
CIT Canada Equipment Receivables Trust | CAD | 236 | 228,439 | |||||||
CIT Equipment Collateral | U.S.$ | 1,192 | 1,195,121 | |||||||
CNH Equipment Trust | 308 | 308,758 | ||||||||
Series 2012-A, Class A3 | 1,605 | 1,614,708 | ||||||||
GE Equipment Midticket LLC | 707 | 709,544 | ||||||||
|
| |||||||||
| 4,056,570 | ||||||||||
|
| |||||||||
Total Asset-Backed Securities | 76,600,596 | |||||||||
|
| |||||||||
COMMERCIAL MORTGAGE-BACKED SECURITIES – 6.1% | ||||||||||
Non-Agency Fixed Rate CMBS – 5.3% |
| |||||||||
Banc of America Merrill Lynch Commercial Mortgage, Inc. | 618 | 692,246 | ||||||||
Bear Stearns Commercial Mortgage | 805 | 767,500 | ||||||||
Commercial Mortgage Pass Through | 3,350 | 3,786,003 | ||||||||
Commercial Mortgage Pass-Through | 770 | 756,719 | ||||||||
CW Capital Cobalt Ltd. | 3,835 | 4,457,010 | ||||||||
| ALLIANCEBERNSTEIN POOLING PORTFOLIOS • | 103 |
Bond Inflation Protection Portfolio—Portfolio of Investments
Principal Amount (000) | U.S. $ Value | |||||||||
| ||||||||||
Extended Stay America Trust | U.S.$ | 1,320 | $ | 1,318,247 | ||||||
Greenwich Capital Commercial Funding Corp. | 3,780 | 4,306,762 | ||||||||
Series 2007-GG9, Class AM | 710 | 779,628 | ||||||||
GS Mortgage Securities Corp. II | 4,045 | 4,296,635 | ||||||||
GS Mortgage Securities Trust | 2,100 | 2,172,870 | ||||||||
JP Morgan Chase Commercial Mortgage | 2,255 | 2,534,951 | ||||||||
Series 2007-CB19, Class AM | 700 | 777,697 | ||||||||
Series 2007-LD11, Class A4 | 1,091 | 1,253,722 | ||||||||
Series 2007-LD12, Class AM | 598 | 676,413 | ||||||||
Series 2010-C2, Class A1 | 1,610 | 1,679,158 | ||||||||
Merrill Lynch Mortgage Trust | 1,265 | 1,284,651 | ||||||||
ML-CFC Commercial Mortgage Trust | 3,265 | 3,699,170 | ||||||||
Motel 6 Trust | 1,518 | 1,519,198 | ||||||||
UBS-Barclays Commercial Mortgage Trust | 3,276 | 3,385,778 | ||||||||
WF-RBS Commercial Mortgage Trust | 1,272 | 1,284,687 | ||||||||
|
| |||||||||
| 41,429,045 | ||||||||||
|
| |||||||||
Agency CMBS – 0.4% | ||||||||||
FHLMC Multifamily Structured Pass | 2,992 | 3,178,842 | ||||||||
|
| |||||||||
| 104 | • ALLIANCEBERNSTEIN POOLING PORTFOLIOS |
Bond Inflation Protection Portfolio—Portfolio of Investments
Principal Amount (000) | U.S. $ Value | |||||||||
| ||||||||||
Non-Agency Floating Rate CMBS – 0.4% |
| |||||||||
Extended Stay America Trust | U.S.$ | 1,010 | $ | 1,011,247 | ||||||
GS Mortgage Securities Corp. II | 2,035 | 2,039,715 | ||||||||
|
| |||||||||
| 3,050,962 | ||||||||||
|
| |||||||||
Total Commercial Mortgage-Backed Securities | 47,658,849 | |||||||||
|
| |||||||||
MORTGAGE PASS-THROUGHS – 2.7% |
| |||||||||
Agency Fixed Rate 30-Year – 2.3% | ||||||||||
Federal National Mortgage Association | 16,448 | 18,054,181 | ||||||||
|
| |||||||||
Agency ARMs – 0.4% | ||||||||||
Federal Home Loan Mortgage Corp. | 2,047 | 2,180,610 | ||||||||
2.84%, 5/01/38(f) | 1,047 | 1,126,747 | ||||||||
|
| |||||||||
| 3,307,357 | ||||||||||
|
| |||||||||
Total Mortgage Pass-Throughs | 21,361,538 | |||||||||
|
| |||||||||
CORPORATES - NON-INVESTMENT | ||||||||||
Industrial – 1.0% | ||||||||||
Basic – 0.3% | ||||||||||
Basell Finance Co. BV | 590 | 778,800 | ||||||||
Eagle Spinco, Inc. | 157 | 159,551 | ||||||||
LyondellBasell Industries NV | 1,087 | 1,263,638 | ||||||||
|
| |||||||||
| 2,201,989 | ||||||||||
|
| |||||||||
Capital Goods – 0.3% | ||||||||||
B/E Aerospace, Inc. | 1,245 | 1,291,688 | ||||||||
Ball Corp. | 1,250 | 1,303,125 | ||||||||
|
| |||||||||
| 2,594,813 | ||||||||||
|
| |||||||||
Communications - | ||||||||||
VimpelCom Holdings BV | 497 | 504,076 | ||||||||
|
| |||||||||
| ALLIANCEBERNSTEIN POOLING PORTFOLIOS • | 105 |
Bond Inflation Protection Portfolio—Portfolio of Investments
Principal Amount (000) | U.S. $ Value | |||||||||
| ||||||||||
Consumer Cyclical - Other – 0.2% | ||||||||||
Wynn Las Vegas LLC/Wynn Las Vegas | U.S.$ | 1,245 | $ | 1,308,806 | ||||||
|
| |||||||||
Consumer Cyclical - Retailers – 0.0% | ||||||||||
Dollar General Corp. | 336 | 355,320 | ||||||||
|
| |||||||||
Energy – 0.1% | ||||||||||
Cimarex Energy Co. | 596 | 636,230 | ||||||||
|
| |||||||||
| 7,601,234 | ||||||||||
|
| |||||||||
Financial Institutions – 0.6% | ||||||||||
Banking – 0.6% | ||||||||||
Citigroup, Inc. | 1,935 | 1,971,281 | ||||||||
Danske Bank A/S | GBP | 772 | 1,112,605 | |||||||
LBG Capital No.2 PLC | EUR | 1,015 | 1,881,688 | |||||||
|
| |||||||||
| 4,965,574 | ||||||||||
|
| |||||||||
Utility – 0.1% | ||||||||||
Electric – 0.1% | ||||||||||
CMS Energy Corp. | U.S.$ | 669 | 752,835 | |||||||
|
| |||||||||
Total Corporates - Non-Investment Grades | 13,319,643 | |||||||||
|
| |||||||||
QUASI-SOVEREIGNS – 1.1% | ||||||||||
Quasi-Sovereign Bonds – 1.1% | ||||||||||
Indonesia – 0.2% | ||||||||||
Perusahaan Listrik Negara PT | 1,083 | 1,191,300 | ||||||||
|
| |||||||||
Kazakhstan – 0.2% | ||||||||||
KazMunaiGaz Finance Sub BV | 1,328 | 1,610,200 | ||||||||
|
| |||||||||
Malaysia – 0.2% | ||||||||||
Petronas Capital Ltd. | 1,500 | 1,763,099 | ||||||||
|
| |||||||||
South Korea – 0.3% | ||||||||||
Korea National Oil Corp. | 2,070 | 2,181,364 | ||||||||
|
| |||||||||
| 106 | • ALLIANCEBERNSTEIN POOLING PORTFOLIOS |
Bond Inflation Protection Portfolio—Portfolio of Investments
Principal Amount (000) | U.S. $ Value | |||||||||
|
|
| ||||||||
United Arab Emirates – 0.2% | ||||||||||
IPIC GMTN Ltd. | U.S.$ | 1,695 | $ | 1,809,412 | ||||||
|
| |||||||||
Total Quasi-Sovereigns | 8,555,375 | |||||||||
|
| |||||||||
AGENCIES – 1.1% | ||||||||||
Agency Debentures – 1.1% | ||||||||||
Federal Home Loan Mortgage Corp. | 7,932 | 8,239,341 | ||||||||
|
| |||||||||
GOVERNMENTS - SOVEREIGN | ||||||||||
Qatar – 0.2% | ||||||||||
State of Qatar | 1,445 | 1,625,408 | ||||||||
|
| |||||||||
Total Investments – 140.0% | 1,089,266,768 | |||||||||
Other assets less liabilities – (40.0)% | (311,248,605 | ) | ||||||||
|
| |||||||||
Net Assets – 100.0% | $ | 778,018,163 | ||||||||
|
| |||||||||
FUTURES CONTRACTS (see Note C)
| Type | Number of Contracts | Expiration Month | Original Value | Value at February 28, 2013 | Unrealized Appreciation/ (Depreciation) | |||||||||||||||
Sold Contracts | ||||||||||||||||||||
U.S. T-Bond 30 Yr Futures | 102 | June 2013 | $ | 14,578,393 | $ | 14,665,688 | $ | (87,295 | ) | |||||||||||
U.S. T-Note 5 Yr Futures | 423 | June 2013 | 52,420,709 | 52,445,391 | (24,682 | ) | ||||||||||||||
U.S. T-Note 10 Yr Futures | 75 | June 2013 | 9,793,356 | 9,866,016 | (72,660 | ) | ||||||||||||||
|
| |||||||||||||||||||
| $ | (184,637 | ) | ||||||||||||||||||
|
| |||||||||||||||||||
FORWARD CURRENCY EXCHANGE CONTRACTS (see Note C)
| Counterparty | Contracts to | In Exchange | Settlement Date | Unrealized Appreciation/ (Depreciation) | ||||||||||||||||||||
BNP Paribas SA | CAD | 3,911 | USD | 3,898 | 3/14/13 | $ | 107,003 | |||||||||||||||||
Deutsche Bank AG London | JPY | 1,045,799 | USD | 11,168 | 4/12/13 | (117,362 | ) | |||||||||||||||||
Goldman Sachs Capital Markets LP | EUR | 5,572 | USD | 7,285 | 4/11/13 | 8,433 | ||||||||||||||||||
HSBC Bank USA | GBP | 5,632 | USD | 8,525 | 4/11/13 | (17,032 | ) | |||||||||||||||||
Royal Bank of Canada | CAD | 1,746 | USD | 1,736 | 3/14/13 | 43,840 | ||||||||||||||||||
Royal Bank of Scotland PLC | USD | 8,007 | MXN | 103,576 | 4/12/13 | 75,913 | ||||||||||||||||||
State Street Bank & Trust Co. | USD | 113 | CAD | 116 | 3/14/13 | (537 | ) | |||||||||||||||||
|
| |||||||||||||||||||||||
| $ | 100,258 | |||||||||||||||||||||||
|
| |||||||||||||||||||||||
| ALLIANCEBERNSTEIN POOLING PORTFOLIOS • | 107 |
Bond Inflation Protection Portfolio—Portfolio of Investments
INTEREST RATE SWAP CONTRACTS (see Note C)
| Rate Type | ||||||||||||||||||||
| Swap Counterparty | Notional Amount (000) | Termination Date | Payments made by the Fund | Payments received by the Fund | Unrealized Appreciation/ (Depreciation) | |||||||||||||||
Barclays Bank PLC | $ | 33,270 | 6/7/13 | 0.627 | % | 3 Month LIBOR | $ | (55,434 | ) | |||||||||||
Barclays Bank PLC | 50,940 | 11/17/13 | 1.059 | % | 3 Month LIBOR | (426,689 | ) | |||||||||||||
Barclays Bank PLC | 7,590 | 1/17/22 | 2.05 | % | 3 Month LIBOR | (184,844 | ) | |||||||||||||
JPMorgan Chase Bank, NA | 8,040 | 5/17/21 | 3.268 | % | 3 Month LIBOR | (1,094,297 | ) | |||||||||||||
Morgan Stanley Capital Services Inc. | 46,600 | 3/12/14 | 0.563 | % | 3 Month LIBOR | (209,022 | ) | |||||||||||||
Morgan Stanley Capital Services Inc. | 5,480 | 2/21/42 | 2.813 | % | 3 Month LIBOR | 142,678 | ||||||||||||||
Morgan Stanley Capital Services Inc. | 3,990 | 3/6/42 | 2.804 | % | 3 Month LIBOR | 62,556 | ||||||||||||||
|
| |||||||||||||||||||
| $ | (1,765,052 | ) | ||||||||||||||||||
|
| |||||||||||||||||||
CREDIT DEFAULT SWAP CONTRACTS (see Note C)
| Swap Counterparty & Referenced Obligation | Fixed Rate (Pay) Receive | Implied Credit Spread at February 28, 2013 | Notional | Market Value | Upfront Premiums Paid (Received) | Unrealized Appreciation/ (Depreciation) | ||||||||||||||||||
Sale Contracts | ||||||||||||||||||||||||
Bank of America, NA: | ||||||||||||||||||||||||
Societe General., | 3.00 | % | 1.64 | % | EUR | 1,400 | $ | 123,640 | $ | 81,776 | $ | 41,864 | ||||||||||||
Credit Suisse International: | ||||||||||||||||||||||||
Anadarko Petroleum Corp., 5.95% 9/15/16, 9/20/17* | 1.00 | 1.20 | $ | 2,140 | (16,411 | ) | (68,631 | ) | 52,220 | |||||||||||||||
|
|
|
|
|
| |||||||||||||||||||
| $ | 107,229 | $ | 13,145 | $ | 94,084 | |||||||||||||||||||
|
|
|
|
|
| |||||||||||||||||||
| * | Termination date |
REVERSE REPURCHASE AGREEMENTS (see Note C)
| Broker | Interest Rate | Maturity | U.S. $ Value at February 28, 2013 | |||||||||
Bank of America+ | 0.15 | % | — | $ | 70,850,846 | |||||||
Barclays+ | 0.13 | % | — | 48,426,898 | ||||||||
Barclays | 0.21 | % | 3/19/13 | 18,070,664 | ||||||||
Barclays | 0.22 | % | 4/24/13 | 32,145,231 | ||||||||
Barclays | 0.23 | % | 3/04/13 | 65,435,248 | ||||||||
Morgan Stanley | 0.21 | % | 5/09/13 | 34,651,617 | ||||||||
Morgan Stanley | 0.21 | % | 5/21/13 | 45,807,052 | ||||||||
|
| |||||||||||
| $ | 315,387,556 | |||||||||||
|
| |||||||||||
| + | The reverse repurchase agreement matures on demand. Interest rate resets daily and the rate shown is the rate in effect on February 28, 2013. |
| (a) | Position, or a portion thereof, has been segregated to collateralize reverse repurchase agreements. The market value of the collateral amounted to $318,959,696. |
| 108 | • ALLIANCEBERNSTEIN POOLING PORTFOLIOS |
Bond Inflation Protection Portfolio—Portfolio of Investments
| (b) | Position, or a portion thereof, has been segregated to collateralize OTC derivatives outstanding. The aggregate market value of these securities amounted to $1,757,540. |
| (c) | Security is exempt from registration under Rule 144A of the Securities Act of 1933. These securities are considered liquid and may be resold in transactions exempt from registration, normally to qualified institutional buyers. At February 28, 2013, the aggregate market value of these securities amounted to $72,856,300 or 9.4% of net assets. |
| (d) | Coupon rate adjusts periodically based upon a predetermined schedule. Stated interest rate in effect at February 28, 2013. |
| (e) | Floating Rate Security. Stated interest rate was in effect at February 28, 2013. |
| (f) | Variable rate coupon, rate shown as of February 28, 2013. |
Currency Abbreviations:
| CAD | – Canadian Dollar |
| EUR | – Euro |
| GBP | – Great British Pound |
| JPY | – Japanese Yen |
| MXN | – Mexican Peso |
| USD | – United States Dollar |
Glossary:
| ABS | – Asset-Backed Securities |
| ARMs | – Adjustable Rate Mortgages |
| CMBS | – Commercial Mortgage-Backed Securities |
| FHLMC | – Federal Home Loan Mortgage Corporation |
| LIBOR | – London Interbank Offered Rates |
| REIT | – Real Estate Investment Trust |
| TIPS | – Treasury Inflation Protected Security |
See notes to financial statements.
| ALLIANCEBERNSTEIN POOLING PORTFOLIOS • | 109 |
Bond Inflation Protection Portfolio—Portfolio of Investments
HIGH-YIELD PORTFOLIO
PORTFOLIO OF INVESTMENTS
February 28, 2013 (unaudited)
| Principal Amount (000) | U.S. $ Value | |||||||||
|
|
| ||||||||
CORPORATES - NON-INVESTMENT GRADES – 74.6% | ||||||||||
Industrial – 64.4% | ||||||||||
Basic – 6.3% | ||||||||||
AK Steel Corp. | U.S.$ | 355 | $ | 386,950 | ||||||
Aleris International, Inc. | 935 | 988,762 | ||||||||
7.875%, 11/01/20 | 466 | 493,960 | ||||||||
ArcelorMittal | 1,330 | 1,434,136 | ||||||||
6.75%, 2/25/22(a) | 865 | 952,458 | ||||||||
7.50%, 10/15/39 | 338 | 350,392 | ||||||||
Arch Coal, Inc. | 594 | 507,870 | ||||||||
Axiall Corp. | 242 | 245,630 | ||||||||
Basell Finance Co. BV | 1,004 | 1,325,280 | ||||||||
Calcipar SA | 479 | 504,746 | ||||||||
Celanese US Holdings LLC | 492 | 493,845 | ||||||||
Commercial Metals Co. | 1,366 | 1,485,525 | ||||||||
Consol Energy, Inc. | 1,485 | 1,637,212 | ||||||||
Eagle Spinco, Inc. | 174 | 176,828 | ||||||||
Huntsman International LLC | 400 | 400,000 | ||||||||
8.625%, 3/15/21 | 496 | 560,480 | ||||||||
Ineos Finance PLC | 376 | 405,140 | ||||||||
8.375%, 2/15/19(b) | 425 | 465,375 | ||||||||
JMC Steel Group, Inc. | 736 | 782,000 | ||||||||
LyondellBasell Industries NV | 1,075 | 1,249,687 | ||||||||
6.00%, 11/15/21 | 339 | 398,325 | ||||||||
Momentive Performance Materials, Inc. | 310 | 318,138 | ||||||||
NOVA Chemicals Corp. | 501 | 568,635 | ||||||||
Novelis, Inc./GA | 1,976 | 2,213,120 | ||||||||
| 110 | • ALLIANCEBERNSTEIN POOLING PORTFOLIOS |
High-Yield Portfolio—Portfolio of Investments
| Principal Amount (000) | U.S. $ Value | |||||||||
|
|
| ||||||||
Peabody Energy Corp. | U.S.$ | 275 | $ | 292,188 | ||||||
6.25%, 11/15/21 | 659 | 685,360 | ||||||||
Rain CII Carbon LLC/CII Carbon Corp. | 501 | 531,060 | ||||||||
Ryerson, Inc./Joseph T Ryerson & Son, Inc. | 400 | 438,000 | ||||||||
Smurfit Kappa Acquisitions | EUR | 500 | 716,420 | |||||||
Steel Dynamics, Inc. | U.S.$ | 515 | 551,050 | |||||||
6.375%, 8/15/22(b) | 487 | 521,090 | ||||||||
TPC Group, Inc. | 495 | 501,188 | ||||||||
US Coatings Acquisition, Inc./Flash Dutch 2 BV | EUR | 280 | 372,865 | |||||||
7.375%, 5/01/21(a)(b) | U.S.$ | 535 | 553,725 | |||||||
Weyerhaeuser Co. | 685 | 853,287 | ||||||||
|
| |||||||||
| 24,360,727 | ||||||||||
|
| |||||||||
Capital Goods – 8.4% | ||||||||||
Ardagh Packaging Finance PLC | 620 | 675,800 | ||||||||
Ardagh Packaging Finance PLC/Ardagh MP Holdings USA, Inc. | 242 | 238,370 | ||||||||
5.00%, 11/15/22(b) | EUR | 328 | 425,009 | |||||||
7.375%, 10/15/17(b) | 650 | 916,496 | ||||||||
B/E Aerospace, Inc. | U.S.$ | 698 | 724,175 | |||||||
BC Mountain LLC/BC Mountain Finance, Inc. | 403 | 415,090 | ||||||||
Berry Plastics Corp. | 1,205 | 1,391,775 | ||||||||
Bombardier, Inc. | 967 | 991,175 | ||||||||
Cemex Espana Luxembourg | 335 | 382,738 | ||||||||
Cemex Finance LLC | 200 | 232,888 | ||||||||
9.50%, 12/14/16(b) | 277 | 300,545 | ||||||||
CNH America LLC | 935 | 1,047,200 | ||||||||
CNH Capital LLC | 262 | 289,510 | ||||||||
Franz Haniel & Cie GmbH | EUR | 760 | 1,109,041 | |||||||
| ALLIANCEBERNSTEIN POOLING PORTFOLIOS • | 111 |
High-Yield Portfolio—Portfolio of Investments
| Principal Amount (000) | U.S. $ Value | |||||||||
|
|
| ||||||||
Graphic Packaging International, Inc. | U.S.$ | 500 | $ | 550,000 | ||||||
HD Supply, Inc. | ||||||||||
7.50%, 7/15/20(a)(b) | 400 | 400,500 | ||||||||
8.125%, 4/15/19(b) | 300 | 337,875 | ||||||||
10.50%, 1/15/21(b) | 935 | 965,387 | ||||||||
HeidelbergCement Finance Luxembourg SA | EUR | 765 | 1,203,488 | |||||||
Interline Brands, Inc. | U.S.$ | 590 | 648,631 | |||||||
KUKA AG | EUR | 361 | 530,216 | |||||||
Lafarge SA | 840 | 1,151,495 | ||||||||
Manitowoc Co., Inc. (The) | U.S.$ | 922 | 1,040,707 | |||||||
Masco Corp. | ||||||||||
5.95%, 3/15/22 | 1,170 | 1,302,975 | ||||||||
7.125%, 3/15/20 | 900 | 1,053,842 | ||||||||
Polymer Group, Inc. | 1,300 | 1,407,250 | ||||||||
Reynolds Group Issuer, Inc./Reynolds Group Issuer LLC/Reynolds Group Issuer Lu | 712 | 764,510 | ||||||||
7.875%, 8/15/19 | 1,190 | 1,314,950 | ||||||||
8.25%, 2/15/21(e) | 2,714 | 2,802,205 | ||||||||
9.00%, 4/15/19 | 638 | 676,280 | ||||||||
RSI Home Products, Inc. | 1,012 | 1,022,120 | ||||||||
Sealed Air Corp. | 1,320 | 1,204,500 | ||||||||
8.125%, 9/15/19(b) | 551 | 618,498 | ||||||||
8.375%, 9/15/21(b) | 241 | 274,740 | ||||||||
Silver II Borrower/Silver II US Holdings LLC | 908 | 944,320 | ||||||||
TransDigm, Inc. | 1,200 | 1,317,000 | ||||||||
United Rentals North America, Inc. | 750 | 850,313 | ||||||||
8.375%, 9/15/20(a) | 267 | 293,700 | ||||||||
9.25%, 12/15/19 | 650 | 741,000 | ||||||||
|
| |||||||||
| 32,556,314 | ||||||||||
|
| |||||||||
Communications - Media – 8.7% | ||||||||||
Allbritton Communications Co. | 510 | 553,988 | ||||||||
Arqiva Broadcast Finance PLC | GBP | 555 | 869,327 | |||||||
| 112 | • ALLIANCEBERNSTEIN POOLING PORTFOLIOS |
High-Yield Portfolio—Portfolio of Investments
| Principal Amount (000) | U.S. $ Value | |||||||||
|
|
| ||||||||
Cablevision Systems Corp. | U.S.$ | 785 | $ | 871,350 | ||||||
CCO Holdings LLC/CCO Holdings Capital Corp. | 580 | 627,850 | ||||||||
7.00%, 1/15/19 | 2,250 | 2,424,375 | ||||||||
7.375%, 6/01/20 | 750 | 829,687 | ||||||||
7.875%, 4/30/18 | 664 | 708,820 | ||||||||
8.125%, 4/30/20 | 219 | 243,911 | ||||||||
Cequel Communications Holdings I LLC/Cequel Capital Corp. | 490 | 506,538 | ||||||||
8.625%, 11/15/17(b) | 405 | 433,350 | ||||||||
Clear Channel Communications, Inc. | 1,260 | 1,171,800 | ||||||||
Clear Channel Worldwide Holdings, Inc. | 2,000 | 2,101,062 | ||||||||
Series A | 100 | 102,500 | ||||||||
Crown Media Holdings, Inc. | 470 | 529,925 | ||||||||
CSC Holdings LLC | 535 | 615,250 | ||||||||
DigitalGlobe, Inc. | 232 | 230,260 | ||||||||
DISH DBS Corp. | 350 | 389,375 | ||||||||
Griffey Intermediate, Inc./Griffey Finance Sub LLC | 566 | 574,490 | ||||||||
Hughes Satellite Systems Corp. | 965 | 1,100,100 | ||||||||
Intelsat Jackson Holdings SA | 1,900 | 2,037,750 | ||||||||
Intelsat Luxembourg SA | 1,725 | 1,832,812 | ||||||||
11.50%, 2/04/17(d) | 1,023 | 1,088,362 | ||||||||
Kabel Deutschland Holding AG | EUR | 640 | 904,485 | |||||||
Lamar Media Corp. | U.S.$ | 459 | 498,015 | |||||||
Lynx II Corp. | ||||||||||
6.375%, 4/15/23(b) | 545 | 564,756 | ||||||||
7.00%, 4/15/23(b) | GBP | 257 | 402,066 | |||||||
Quebecor Media, Inc. | U.S.$ | 1,178 | 1,198,615 | |||||||
| ALLIANCEBERNSTEIN POOLING PORTFOLIOS • | 113 |
High-Yield Portfolio—Portfolio of Investments
| Principal Amount (000) | U.S. $ Value | |||||||||
|
|
| ||||||||
RR Donnelley & Sons Co. | U.S.$ | 824 | $ | 861,080 | ||||||
Sinclair Television Group, Inc. | 576 | 614,880 | ||||||||
8.375%, 10/15/18(a) | 600 | 669,000 | ||||||||
Starz LLC / Starz Finance Corp. | 425 | 434,563 | ||||||||
Townsquare Radio LLC/Townsquare Radio, Inc. | 332 | 363,540 | ||||||||
Unitymedia Hessen GmbH & Co. KG/Unitymedia NRW GmbH | 580 | 585,800 | ||||||||
7.50%, 3/15/19(b) | 402 | 436,299 | ||||||||
Univision Communications, Inc. | 645 | 696,600 | ||||||||
6.875%, 5/15/19(b) | 1,000 | 1,070,000 | ||||||||
8.50%, 5/15/21(b) | 950 | 1,036,687 | ||||||||
UPCB Finance III Ltd. | 550 | 589,875 | ||||||||
UPCB Finance V Ltd. | 665 | 731,500 | ||||||||
XM Satellite Radio, Inc. | 975 | 1,072,500 | ||||||||
Ziggo Bond Co. BV | ||||||||||
8.00%, 5/15/18(b) | EUR | 745 | 1,050,445 | |||||||
|
| |||||||||
| 33,623,588 | ||||||||||
|
| |||||||||
Communications - | ||||||||||
CenturyLink, Inc. | ||||||||||
5.80%, 3/15/22 | U.S.$ | 565 | 574,592 | |||||||
Series U | ||||||||||
7.65%, 3/15/42 | 680 | 663,896 | ||||||||
Clearwire Communications LLC/Clearwire Finance, Inc. | 1,050 | 1,136,625 | ||||||||
Crown Castle International Corp. | 1,000 | 1,095,000 | ||||||||
Fairpoint Communications, Inc./Old | 1,966 | 19,661 | ||||||||
Frontier Communications Corp. | 545 | 561,350 | ||||||||
Level 3 Communications, Inc. | 743 | 858,165 | ||||||||
Level 3 Financing, Inc. | ||||||||||
7.00%, 6/01/20(b) | 800 | 840,000 | ||||||||
9.375%, 4/01/19 | 550 | 616,688 | ||||||||
| 114 | • ALLIANCEBERNSTEIN POOLING PORTFOLIOS |
High-Yield Portfolio—Portfolio of Investments
| Principal Amount (000) | U.S. $ Value | |||||||||
|
|
| ||||||||
PAETEC Holding Corp. | U.S.$ | 495 | $ | 566,775 | ||||||
Phones4u Finance PLC | GBP | 345 | 540,392 | |||||||
Portugal Telecom International Finance BV | EUR | 725 | 989,117 | |||||||
Sprint Capital Corp. | ||||||||||
6.875%, 11/15/28 | U.S.$ | 2,590 | 2,615,900 | |||||||
8.75%, 3/15/32 | 1,180 | 1,386,500 | ||||||||
Sprint Nextel Corp. | ||||||||||
6.00%, 11/15/22 | 785 | 792,850 | ||||||||
9.00%, 11/15/18(b) | 945 | 1,171,800 | ||||||||
Sunrise Communications Holdings SA | EUR | 350 | 499,438 | |||||||
Telenet Finance III Luxembourg SCA | 420 | 571,635 | ||||||||
tw telecom holdings, Inc. | U.S.$ | 1,039 | 1,129,912 | |||||||
Wind Acquisition Finance SA | ||||||||||
7.25%, 2/15/18(b) | 880 | 906,400 | ||||||||
11.75%, 7/15/17(b) | 985 | 1,036,712 | ||||||||
Windstream Corp. | ||||||||||
7.50%, 4/01/23 | 1,465 | 1,530,925 | ||||||||
7.875%, 11/01/17 | 675 | 764,437 | ||||||||
8.125%, 9/01/18 | 900 | 985,500 | ||||||||
|
| |||||||||
| 21,854,270 | ||||||||||
|
| |||||||||
Consumer Cyclical - Automotive – 2.0% | ||||||||||
Affinia Group, Inc. | 380 | 380,954 | ||||||||
Allison Transmission, Inc. | 975 | 1,038,375 | ||||||||
American Axle & Manufacturing, Inc. | 463 | 467,051 | ||||||||
Commercial Vehicle Group, Inc. | 427 | 430,736 | ||||||||
Continental Rubber of America Corp. | 799 | 812,983 | ||||||||
Delphi Corp. | 1,015 | 1,056,869 | ||||||||
General Motors Financial Co., Inc. | 760 | 874,000 | ||||||||
Goodyear Tire & Rubber Co. (The) | 857 | 970,552 | ||||||||
Meritor, Inc. | 92 | 97,175 | ||||||||
Navistar International Corp. | 1,224 | 1,181,160 | ||||||||
| ALLIANCEBERNSTEIN POOLING PORTFOLIOS • | 115 |
High-Yield Portfolio—Portfolio of Investments
| Principal Amount (000) | U.S. $ Value | |||||||||
|
|
| ||||||||
UCI International, Inc. | U.S.$ | 402 | $ | 411,045 | ||||||
|
| |||||||||
| 7,720,900 | ||||||||||
|
| |||||||||
Consumer Cyclical - Entertainment – 0.8% | ||||||||||
AMC Entertainment, Inc. | 425 | 489,812 | ||||||||
ClubCorp Club Operations, Inc. | 385 | 432,644 | ||||||||
Greektown Holdings LLC | 525 | – 0 | – | |||||||
NAI Entertainment Holdings LLC | 837 | 912,330 | ||||||||
Regal Entertainment Group | 1,020 | 1,144,950 | ||||||||
|
| |||||||||
| 2,979,736 | ||||||||||
|
| |||||||||
Consumer Cyclical - Other – 4.3% | ||||||||||
Broder Brothers Co. | 354 | 350,917 | ||||||||
Caesars Entertainment Operating Co., Inc. | 825 | 544,500 | ||||||||
Chester Downs & Marina LLC | 456 | 440,040 | ||||||||
CityCenter Holdings LLC/CityCenter Finance Corp. | 1,111 | 1,195,714 | ||||||||
DR Horton, Inc. | 1,180 | 1,306,850 | ||||||||
Felcor Lodging LP | 522 | 525,263 | ||||||||
Isle of Capri Casinos, Inc. | 545 | 591,325 | ||||||||
Lennar Corp. | 1,260 | 1,387,575 | ||||||||
M/I Homes, Inc. | 790 | 870,975 | ||||||||
Marina District Finance Co., Inc. | 370 | 380,175 | ||||||||
MGM Resorts International | ||||||||||
6.625%, 7/15/15 | 1,222 | 1,319,760 | ||||||||
7.75%, 3/15/22 | 315 | 346,106 | ||||||||
NCL Corp., Ltd. | ||||||||||
9.50%, 11/15/18 | 190 | 211,850 | ||||||||
11.75%, 11/15/16 | 260 | 295,750 | ||||||||
Royal Caribbean Cruises Ltd. | 1,885 | 1,913,275 | ||||||||
Ryland Group, Inc. (The) | 335 | 368,500 | ||||||||
| 116 | • ALLIANCEBERNSTEIN POOLING PORTFOLIOS |
High-Yield Portfolio—Portfolio of Investments
| Principal Amount (000) | U.S. $ Value | |||||||||
|
|
| ||||||||
Shea Homes LP/Shea Homes Funding Corp. | U.S.$ | 703 | $ | 780,330 | ||||||
Standard Pacific Corp. | 500 | 588,750 | ||||||||
Toll Brothers Finance Corp. | 525 | 585,779 | ||||||||
Wolverine World Wide, Inc. | 251 | 263,550 | ||||||||
Wynn Las Vegas LLC/Wynn Las Vegas Capital Corp. | 1,900 | 2,123,250 | ||||||||
|
| |||||||||
| 16,390,234 | ||||||||||
|
| |||||||||
Consumer Cyclical - Restaurants – 0.2% | ||||||||||
CKE Restaurants, Inc. | 675 | 786,375 | ||||||||
|
| |||||||||
Consumer Cyclical - Retailers – 2.4% | ||||||||||
Asbury Automotive Group, Inc. | 357 | 398,055 | ||||||||
Burlington Coat Factory Warehouse Corp. | 960 | 1,058,400 | ||||||||
Dollar General Corp. | 486 | 513,945 | ||||||||
J Crew Group, Inc. | 1,040 | 1,115,400 | ||||||||
Limited Brands, Inc. | ||||||||||
5.625%, 2/15/22 | 503 | 531,923 | ||||||||
6.625%, 4/01/21 | 400 | 451,000 | ||||||||
6.90%, 7/15/17 | 1,063 | 1,219,792 | ||||||||
Michaels Stores, Inc. | 500 | 545,625 | ||||||||
Rite Aid Corp. | ||||||||||
8.00%, 8/15/20 | 1,000 | 1,135,000 | ||||||||
10.25%, 10/15/19 | 648 | 750,060 | ||||||||
Sally Holdings LLC/Sally Capital, Inc. | 606 | 640,087 | ||||||||
Toys R US – Delaware, Inc. | 805 | 817,075 | ||||||||
|
| |||||||||
| 9,176,362 | ||||||||||
|
| |||||||||
Consumer Non-Cyclical – 10.9% | ||||||||||
Air Medical Group Holdings, Inc. | 1,169 | 1,293,206 | ||||||||
Alere, Inc. | 800 | 840,000 | ||||||||
ARAMARK Corp. | ||||||||||
5.75%, 3/15/20(b) | 244 | 248,880 | ||||||||
8.50%, 2/01/15(a) | 1,710 | 1,718,567 | ||||||||
| ALLIANCEBERNSTEIN POOLING PORTFOLIOS • | 117 |
High-Yield Portfolio—Portfolio of Investments
| Principal Amount (000) | U.S. $ Value | |||||||||
|
|
| ||||||||
Biomet, Inc. | U.S.$ | 925 | $ | 952,750 | ||||||
Capsugel FinanceCo SCA | EUR | 740 | 1,086,870 | |||||||
Care UK Health & Social Care PLC | GBP | 510 | 779,498 | |||||||
Catalent Pharma Solutions, Inc. | U.S.$ | 175 | 175,737 | |||||||
Cerba European Lab | EUR | 850 | 1,115,266 | |||||||
Chiquita Brands International, Inc./Chiquita Brands LLC | U.S.$ | 319 | 324,583 | |||||||
CHS/Community Health Systems, Inc. | ||||||||||
7.125%, 7/15/20 | 401 | 432,077 | ||||||||
8.00%, 11/15/19 | 396 | 437,085 | ||||||||
Constellation Brands, Inc. | 1,107 | 1,209,397 | ||||||||
ConvaTec Healthcare E SA | 386 | 427,977 | ||||||||
Del Monte Corp. | 595 | 617,312 | ||||||||
Dole Food Co., Inc. | 500 | 521,875 | ||||||||
Elizabeth Arden, Inc. | 445 | 493,950 | ||||||||
Emergency Medical Services Corp. | 1,123 | 1,225,474 | ||||||||
Endo Health Solutions, Inc. | 255 | 277,313 | ||||||||
FAGE Dairy Industry SA/FAGE USA Dairy Industry, Inc. | 582 | 632,925 | ||||||||
Fresenius Medical Care US Finance, Inc. | 385 | 435,050 | ||||||||
Grifols, Inc. | 700 | 768,250 | ||||||||
HCA, Inc. | ||||||||||
6.375%, 1/15/15 | 1,698 | 1,821,105 | ||||||||
6.50%, 2/15/20 | 3,125 | 3,500,000 | ||||||||
IASIS Healthcare LLC/IASIS Capital Corp. | 600 | 618,000 | ||||||||
Jaguar Holding Co. II/Jaguar Merger Sub, Inc. | 995 | 1,141,762 | ||||||||
Jarden Corp. | 280 | 305,900 | ||||||||
| 118 | • ALLIANCEBERNSTEIN POOLING PORTFOLIOS |
High-Yield Portfolio—Portfolio of Investments
| Principal Amount (000) | U.S. $ Value | |||||||||
|
|
| ||||||||
JBS USA LLC/JBS USA Finance, Inc. | ||||||||||
7.25%, 6/01/21(b) | U.S.$ | 215 | $ | 222,525 | ||||||
8.25%, 2/01/20(b) | 764 | 819,390 | ||||||||
Kinetic Concepts, Inc./KCI USA, Inc. | 1,015 | 1,093,662 | ||||||||
Minerva Luxembourg SA | 925 | 993,219 | ||||||||
New Albertsons, Inc. | 1,870 | 1,346,400 | ||||||||
Party City Holdings, Inc. | 640 | 696,000 | ||||||||
Pinnacle Foods Finance LLC/Pinnacle Foods Finance Corp. | 825 | 882,750 | ||||||||
Post Holdings, Inc. | 398 | 429,840 | ||||||||
Priory Group No 3 PLC | GBP | 665 | 1,041,626 | |||||||
R&R Ice Cream PLC | EUR | 600 | 849,521 | |||||||
Select Medical Holdings Corp. | U.S.$ | 500 | 500,000 | |||||||
Serta Simmons Holdings LLC | 343 | 350,289 | ||||||||
Spectrum Brands Escrow Corp. | 48 | 51,060 | ||||||||
6.625%, 11/15/22(b) | 84 | 90,510 | ||||||||
Spectrum Brands, Inc. | 900 | 969,750 | ||||||||
Stater Bros Holdings, Inc. | 390 | 419,006 | ||||||||
STHI Holding Corp. | 175 | 191,188 | ||||||||
Tenet Healthcare Corp. | 900 | 1,017,000 | ||||||||
United Surgical Partners International, Inc. | 382 | 429,750 | ||||||||
Universal Hospital Services, Inc. | 895 | 890,525 | ||||||||
Valeant Pharmaceuticals International | 825 | 896,156 | ||||||||
7.00%, 10/01/20(b) | 1,215 | 1,325,869 | ||||||||
7.25%, 7/15/22(b) | 210 | 231,788 | ||||||||
Vanguard Health Holding Co. II LLC/Vanguard Holding Co. II, Inc. | 727 | 778,799 | ||||||||
8.00%, 2/01/18 | 170 | 181,050 | ||||||||
| ALLIANCEBERNSTEIN POOLING PORTFOLIOS • | 119 |
High-Yield Portfolio—Portfolio of Investments
| Principal Amount (000) | U.S. $ Value | |||||||||
|
|
| ||||||||
Voyage Care Bondco PLC | GBP | 600 | $ | 926,159 | ||||||
VPI Escrow Corp. | U.S.$ | 800 | 861,000 | |||||||
|
| |||||||||
| 41,885,641 | ||||||||||
|
| |||||||||
Energy – 7.0% | ||||||||||
Antero Resources Finance Corp. | 384 | 411,840 | ||||||||
9.375%, 12/01/17 | 495 | 539,550 | ||||||||
ATP Oil & Gas Corp./United States | 410 | 18,963 | ||||||||
Basic Energy Services, Inc. | 500 | 510,000 | ||||||||
Bill Barrett Corp. | 400 | 422,000 | ||||||||
Bristow Group, Inc. | 222 | 238,650 | ||||||||
Chaparral Energy, Inc. | 835 | 905,975 | ||||||||
CHC Helicopter SA | 609 | 642,495 | ||||||||
Chesapeake Energy Corp. | 1,225 | 1,168,344 | ||||||||
Cie Generale de Geophysique – Veritas | 800 | 832,000 | ||||||||
Continental Resources, Inc./OK | 814 | 875,050 | ||||||||
Denbury Resources, Inc. | 1,202 | 1,313,185 | ||||||||
Energy XXI Gulf Coast, Inc. | 489 | 524,452 | ||||||||
9.25%, 12/15/17 | 800 | 904,000 | ||||||||
EP Energy LLC/Everest Acquisition | 823 | 897,070 | ||||||||
Forest Oil Corp. | 739 | 744,542 | ||||||||
Hornbeck Offshore Services, Inc. | 543 | 570,150 | ||||||||
Key Energy Services, Inc. | 435 | 441,525 | ||||||||
6.75%, 3/01/21 | 466 | 475,320 | ||||||||
Laredo Petroleum, Inc. | 369 | 400,365 | ||||||||
Linn Energy LLC/Linn Energy Finance Corp. | 369 | 376,380 | ||||||||
| 120 | • ALLIANCEBERNSTEIN POOLING PORTFOLIOS |
High-Yield Portfolio—Portfolio of Investments
| Principal Amount (000) | U.S. $ Value | |||||||||
|
|
| ||||||||
Newfield Exploration Co. | U.S.$ | 1,135 | $ | 1,181,819 | ||||||
Offshore Group Investment Ltd. | 483 | 498,094 | ||||||||
11.50%, 8/01/15 | 642 | 699,780 | ||||||||
Oil States International, Inc. | 722 | 772,540 | ||||||||
Petroleum Geo-Services ASA | 348 | 382,800 | ||||||||
PHI, Inc. | 400 | 435,000 | ||||||||
Pioneer Energy Services Corp. | 716 | 782,230 | ||||||||
Plains Exploration & Production Co. | 344 | 384,420 | ||||||||
6.625%, 5/01/21 | 500 | 556,875 | ||||||||
6.75%, 2/01/22 | 1,485 | 1,685,475 | ||||||||
Precision Drilling Corp. | 299 | 316,940 | ||||||||
QEP Resources, Inc. | 1,100 | 1,152,250 | ||||||||
Range Resources Corp. | 1,060 | 1,128,900 | ||||||||
SandRidge Energy, Inc. | 641 | 670,545 | ||||||||
8.125%, 10/15/22 | 435 | 468,169 | ||||||||
8.75%, 1/15/20 | 775 | 833,125 | ||||||||
SESI LLC | 563 | 623,522 | ||||||||
Tervita Corp. | 754 | 776,620 | ||||||||
W&T Offshore, Inc. | 550 | 588,500 | ||||||||
|
| |||||||||
| 27,149,460 | ||||||||||
|
| |||||||||
Other Industrial – 1.4% | ||||||||||
A123 Systems, Inc. | 270 | 195,750 | ||||||||
Brightstar Corp. | 883 | 944,810 | ||||||||
General Cable Corp. | 387 | 396,675 | ||||||||
Hologic, Inc. | 291 | 307,005 | ||||||||
Interline Brands, Inc./NJ | 704 | 762,080 | ||||||||
Laureate Education, Inc. | 889 | 966,788 | ||||||||
| ALLIANCEBERNSTEIN POOLING PORTFOLIOS • | 121 |
High-Yield Portfolio—Portfolio of Investments
| Principal Amount (000) | U.S. $ Value | |||||||||
|
|
| ||||||||
Neenah Foundry Co. | U.S.$ | 347 | $ | 319,501 | ||||||
New Enterprise Stone & Lime Co., Inc. | 950 | 741,000 | ||||||||
Rexel SA | 645 | 677,250 | ||||||||
|
| |||||||||
| 5,310,859 | ||||||||||
|
| |||||||||
Services – 1.5% | ||||||||||
Cerved Technologies SpA | EUR | 241 | 313,064 | |||||||
8.00%, 1/15/21(b) | 270 | 342,805 | ||||||||
Live Nation Entertainment, Inc. | U.S.$ | 284 | 304,590 | |||||||
Lottomatica Group SpA | EUR | 730 | 969,730 | |||||||
Mobile Mini, Inc. | U.S.$ | 309 | 343,762 | |||||||
Realogy Group LLC | 449 | 506,247 | ||||||||
Sabre, Inc. | 847 | 923,230 | ||||||||
ServiceMaster Co./TN | 319 | 324,583 | ||||||||
8.00%, 2/15/20 | 342 | 362,520 | ||||||||
Travelport LLC/Travelport, Inc. | 566 | 517,890 | ||||||||
West Corp. | 880 | 919,600 | ||||||||
|
| |||||||||
| 5,828,021 | ||||||||||
|
| |||||||||
Technology – 4.2% | ||||||||||
Avaya, Inc. | 102 | 97,410 | ||||||||
9.75%, 11/01/15 | 972 | 956,205 | ||||||||
CDW LLC/CDW Finance Corp. | 671 | 743,133 | ||||||||
8.50%, 4/01/19 | 1,049 | 1,156,522 | ||||||||
Ceridian Corp. | 821 | 925,677 | ||||||||
CommScope, Inc. | 760 | 824,600 | ||||||||
CPI International, Inc. | 704 | 726,880 | ||||||||
First Data Corp. | 652 | 668,300 | ||||||||
7.375%, 6/15/19(b) | 3,600 | 3,780,000 | ||||||||
| 122 | • ALLIANCEBERNSTEIN POOLING PORTFOLIOS |
High-Yield Portfolio—Portfolio of Investments
| Principal Amount (000) | U.S. $ Value | |||||||||
|
|
| ||||||||
Freescale Semiconductor, Inc. | U.S.$ | 152 | $ | 153,520 | ||||||
10.125%, 12/15/16 | 212 | 218,095 | ||||||||
Infor US, Inc. | 318 | 356,955 | ||||||||
10.00%, 4/01/19 | EUR | 251 | 360,462 | |||||||
Iron Mountain, Inc. | U.S.$ | 533 | 531,668 | |||||||
MMI International Ltd. | 475 | 491,625 | ||||||||
NCR Corp. | 241 | 239,795 | ||||||||
Sanmina Corp. | 603 | 622,598 | ||||||||
Seagate HDD Cayman | 769 | 834,365 | ||||||||
Sensata Technologies BV | 800 | 860,000 | ||||||||
Serena Software, Inc. | 702 | 714,285 | ||||||||
SunGard Data Systems, Inc. | 800 | 866,000 | ||||||||
|
| |||||||||
| 16,128,095 | ||||||||||
|
| |||||||||
Transportation - Airlines – 0.1% | ||||||||||
TAM Capital 3, Inc. | 465 | 518,475 | ||||||||
|
| |||||||||
Transportation - Services – 0.5% | ||||||||||
HDTFS, Inc. | 360 | 374,400 | ||||||||
6.25%, 10/15/22(b) | 145 | 155,875 | ||||||||
Hertz Corp. (The) | 1,236 | 1,331,790 | ||||||||
|
| |||||||||
| 1,862,065 | ||||||||||
|
| |||||||||
| 248,131,122 | ||||||||||
|
| |||||||||
Utility – 5.2% | ||||||||||
Electric – 4.2% | ||||||||||
AES Corp./VA | 489 | 552,570 | ||||||||
7.75%, 3/01/14 | 630 | 666,225 | ||||||||
8.00%, 10/15/17 | 1,240 | 1,432,200 | ||||||||
Calpine Corp. | 1,250 | 1,329,687 | ||||||||
7.875%, 1/15/23(b) | 450 | 498,375 | ||||||||
CMS Energy Corp. | 1,000 | 1,185,010 | ||||||||
| ALLIANCEBERNSTEIN POOLING PORTFOLIOS • | 123 |
High-Yield Portfolio—Portfolio of Investments
| Principal Amount (000) | U.S. $ Value | |||||||||||
|
|
| ||||||||||
DPL, Inc. | U.S.$ | 463 | $ | 496,568 | ||||||||
EDP Finance BV | EUR | 430 | 592,307 | |||||||||
6.00%, 2/02/18(b) | U.S.$ | 705 | 736,725 | |||||||||
Energy Future Intermediate Holding Co. LLC/EFIH Finance, Inc. | 994 | 1,048,670 | ||||||||||
10.00%, 12/01/20 | 792 | 898,920 | ||||||||||
10.00%, 12/01/20(b) | 694 | 782,485 | ||||||||||
11.25%, 12/01/18(b)(d) | 373 | 357,148 | ||||||||||
GenOn Americas Generation LLC | 725 | 851,875 | ||||||||||
GenOn Energy, Inc. | 840 | 932,400 | ||||||||||
NRG Energy, Inc. | 901 | 1,011,372 | ||||||||||
8.25%, 9/01/20 | 825 | 933,281 | ||||||||||
PPL Capital Funding, Inc. | 375 | 398,438 | ||||||||||
Techem Energy Metering Service GmbH & | EUR | 300 | 419,081 | |||||||||
Techem GmbH | 300 | 416,144 | ||||||||||
Texas Competitive Electric Holdings Co. LLC/TCEH Finance, Inc. | U.S.$ | 761 | 570,750 | |||||||||
|
| |||||||||||
| 16,110,231 | ||||||||||||
|
| |||||||||||
Natural Gas – 1.0% | ||||||||||||
Access Midstream Partners LP/ACMP | 556 | 550,440 | ||||||||||
Kinder Morgan Finance Co. ULC | 1,765 | 1,921,127 | ||||||||||
MarkWest Energy Partners LP/MarkWest Energy Finance Corp. | 1,040 | 1,123,200 | ||||||||||
Targa Resources Partners LP/Targa Resources Partners Finance Corp. | 330 | 359,700 | ||||||||||
|
| |||||||||||
| 3,954,467 | ||||||||||||
|
| |||||||||||
| 20,064,698 | ||||||||||||
|
| |||||||||||
| 124 | • ALLIANCEBERNSTEIN POOLING PORTFOLIOS |
High-Yield Portfolio—Portfolio of Investments
| Principal Amount (000) | U.S. $ Value | |||||||||
|
|
| ||||||||
Financial Institutions – 5.0% | ||||||||||
Banking – 1.6% | ||||||||||
ABN Amro Bank NV | EUR | 980 | $ | 1,106,714 | ||||||
Ally Financial, Inc. | U.S.$ | 501 | 626,250 | |||||||
BBVA International Preferred SAU | 363 | 304,920 | ||||||||
HBOS Capital Funding No2 LP | 665 | 578,550 | ||||||||
HT1 Funding GmbH | EUR | 825 | 931,673 | |||||||
LBG Capital No.1 PLC | U.S.$ | 370 | 394,926 | |||||||
Regions Financing Trust II | 650 | 650,000 | ||||||||
Swedbank AB | GBP | 340 | 531,941 | |||||||
UBS AG/Jersey | EUR | 820 | 1,049,140 | |||||||
|
| |||||||||
| 6,174,114 | ||||||||||
|
| |||||||||
Brokerage – 0.6% | ||||||||||
E*Trade Financial Corp. | U.S.$ | 513 | 534,802 | |||||||
6.75%, 6/01/16 | 329 | 351,208 | ||||||||
Lehman Brothers Holdings, Inc. | 5,500 | 1,430,000 | ||||||||
|
| |||||||||
| 2,316,010 | ||||||||||
|
| |||||||||
Finance – 1.3% | ||||||||||
Air Lease Corp. | 294 | 311,640 | ||||||||
Capmark Financial Group, Inc. | 1,666 | – 0 | – | |||||||
CIT Group, Inc. | 1,400 | 1,505,000 | ||||||||
International Lease Finance Corp. | 2,200 | 2,363,759 | ||||||||
Residential Capital LLC | 375 | 409,688 | ||||||||
Speedy Group Holdings Corp. | 519 | 529,380 | ||||||||
|
| |||||||||
| 5,119,467 | ||||||||||
|
| |||||||||
Insurance – 0.3% | ||||||||||
Genworth Financial, Inc. | 295 | 258,863 | ||||||||
| ALLIANCEBERNSTEIN POOLING PORTFOLIOS • | 125 |
High-Yield Portfolio—Portfolio of Investments
| Principal Amount (000) | U.S. $ Value | |||||||||
|
|
| ||||||||
Liberty Mutual Group, Inc. | U.S.$ | 410 | $ | 472,525 | ||||||
XL Group PLC Series E | 420 | 409,500 | ||||||||
|
| |||||||||
| 1,140,888 | ||||||||||
|
| |||||||||
Other Finance – 1.2% | ||||||||||
CNG Holdings, Inc./OH | 732 | 721,935 | ||||||||
FTI Consulting, Inc. | 500 | 531,250 | ||||||||
Icahn Enterprises LP/Icahn Enterprises | 1,481 | 1,586,521 | ||||||||
iPayment Holdings, Inc. | 304 | 230,515 | ||||||||
iPayment, Inc. | 860 | 795,500 | ||||||||
Speedy Cash Intermediate Holdings Corp. | 599 | 640,930 | ||||||||
|
| |||||||||
| 4,506,651 | ||||||||||
|
| |||||||||
| 19,257,130 | ||||||||||
|
| |||||||||
Total Corporates – Non-Investment Grades | 287,452,950 | |||||||||
|
| |||||||||
CORPORATES – INVESTMENT GRADES – 5.8% | ||||||||||
Financial Institutions – 3.2% | ||||||||||
Banking – 1.5% | ||||||||||
Banco de Bogota SA | 240 | 247,948 | ||||||||
Barclays Bank PLC | 775 | 773,062 | ||||||||
BNP Paribas SA | EUR | 650 | 863,458 | |||||||
Cooperatieve Centrale Raiffeisen-Boerenleenbank BA/Netherlands | U.S.$ | 410 | 441,775 | |||||||
HSBC Capital Funding LP/Jersey | 544 | 761,381 | ||||||||
Lloyds TSB Bank PLC | EUR | 580 | 944,818 | |||||||
Sovereign Bank/Wilmington DE | U.S.$ | 360 | 433,384 | |||||||
Turkiye Garanti Bankasi AS | 672 | 706,106 | ||||||||
Turkiye Vakiflar Bankasi Tao | 425 | 463,365 | ||||||||
|
| |||||||||
| 5,635,297 | ||||||||||
|
| |||||||||
| 126 | • ALLIANCEBERNSTEIN POOLING PORTFOLIOS |
High-Yield Portfolio—Portfolio of Investments
| Principal Amount (000) | U.S. $ Value | |||||||||
|
|
| ||||||||
Finance – 0.5% | ||||||||||
General Electric Capital Corp. | U.S.$ | 800 | $ | 923,857 | ||||||
SLM Corp. | 335 | 369,002 | ||||||||
8.00%, 3/25/20 | 580 | 671,350 | ||||||||
|
| |||||||||
| 1,964,209 | ||||||||||
|
| |||||||||
Insurance – 0.8% | ||||||||||
MetLife Capital Trust IV | 750 | 926,250 | ||||||||
Mitsui Sumitomo Insurance Co., Ltd. | 489 | 547,658 | ||||||||
Nationwide Mutual Insurance Co. | 575 | 834,917 | ||||||||
Swiss Re Capital I LP | 580 | 613,350 | ||||||||
Swiss Reinsurance Co. via ELM BV | EUR | 100 | 130,489 | |||||||
|
| |||||||||
| 3,052,664 | ||||||||||
|
| |||||||||
REITS – 0.4% | ||||||||||
EPR Properties | U.S.$ | 842 | 1,000,871 | |||||||
Senior Housing Properties Trust | 600 | 693,823 | ||||||||
|
| |||||||||
| 1,694,694 | ||||||||||
|
| |||||||||
| 12,346,864 | ||||||||||
|
| |||||||||
Industrial – 2.3% | ||||||||||
Capital Goods – 0.5% | ||||||||||
Mohawk Industries, Inc. | 627 | 706,942 | ||||||||
Mondi Consumer Packaging International AG | EUR | 517 | 766,090 | |||||||
Tyco International Finance SA | U.S.$ | 375 | 487,728 | |||||||
|
| |||||||||
| 1,960,760 | ||||||||||
|
| |||||||||
Communications - Media – 0.4% | ||||||||||
Virgin Media Secured Finance PLC | 1,500 | 1,601,250 | ||||||||
|
| |||||||||
Communications - Telecommunications – 0.2% | ||||||||||
Qwest Corp. | 720 | 718,200 | ||||||||
|
| |||||||||
| ALLIANCEBERNSTEIN POOLING PORTFOLIOS • | 127 |
High-Yield Portfolio—Portfolio of Investments
| Principal Amount (000) | U.S. $ Value | |||||||||
|
|
| ||||||||
Consumer Cyclical - Other – 0.4% | ||||||||||
Host Hotels & Resorts LP | U.S.$ | 643 | $ | 659,075 | ||||||
Seminole Indian Tribe of Florida | 94 | 102,917 | ||||||||
7.75%, 10/01/17(b) | 631 | 683,846 | ||||||||
|
| |||||||||
| 1,445,838 | ||||||||||
|
| |||||||||
Consumer Cyclical - Retailers – 0.1% | ||||||||||
Macy’s Retail Holdings, Inc. | 402 | 469,296 | ||||||||
|
| |||||||||
Energy – 0.7% | ||||||||||
National Oilwell Varco, Inc. | 856 | 862,188 | ||||||||
Petrohawk Energy Corp. | 450 | 504,252 | ||||||||
Pioneer Natural Resources Co. | 995 | 1,124,970 | ||||||||
|
| |||||||||
| 2,491,410 | ||||||||||
|
| |||||||||
| 8,686,754 | ||||||||||
|
| |||||||||
Non Corporate Sectors – 0.2% | ||||||||||
Agencies - Not Government Guaranteed – 0.2% | ||||||||||
Petrobras International Finance Co. - Pifco | 850 | 927,935 | ||||||||
|
| |||||||||
Utility – 0.1% | ||||||||||
Natural Gas – 0.1% | ||||||||||
Enterprise Products Operating LLC | 420 | 479,850 | ||||||||
Total Corporates - Investment Grades | 22,441,403 | |||||||||
|
| |||||||||
BANK LOANS – 3.5% | ||||||||||
Industrial – 3.4% | ||||||||||
Basic – 0.3% | ||||||||||
FMG Resources (August 2006) Pty LTD (FMG America Finance, Inc.) | 603 | 610,717 | ||||||||
Patriot Coal Corporation | 250 | 251,095 | ||||||||
Unifrax Holding Co. | EUR | 250 | 326,388 | |||||||
|
| |||||||||
| 1,188,200 | ||||||||||
|
| |||||||||
| 128 | • ALLIANCEBERNSTEIN POOLING PORTFOLIOS |
High-Yield Portfolio—Portfolio of Investments
| Principal Amount (000) | U.S. $ Value | |||||||||
|
|
| ||||||||
Capital Goods – 0.1% | ||||||||||
Serta Simmons Holdings LLC | U.S.$ | 500 | $ | 505,400 | ||||||
|
| |||||||||
Communications - Telecommunications – 0.2% | ||||||||||
Alcatel-Lucent USA, Inc. | 600 | 606,600 | ||||||||
|
| |||||||||
Consumer Cyclical - Automotive – 0.3% | ||||||||||
Schaeffler AG | 448 | 447,435 | ||||||||
TI Group Automotive Systems, LLC | 794 | 797,970 | ||||||||
|
| |||||||||
| 1,245,405 | ||||||||||
|
| |||||||||
Consumer Cyclical - Entertainment – 0.5% | ||||||||||
ClubCorp Club Operations, Inc. | 539 | 547,759 | ||||||||
Harrah’s Las Vegas Propco, LLC | 1,500 | 1,380,000 | ||||||||
|
| |||||||||
| 1,927,759 | ||||||||||
|
| |||||||||
Consumer Cyclical - Other – 0.5% | ||||||||||
Las Vegas Sands, LLC | 1,337 | 1,341,316 | ||||||||
Station Casinos LLC | 375 | 371,250 | ||||||||
|
| |||||||||
| 1,712,566 | ||||||||||
|
| |||||||||
Consumer Cyclical - Retailers – 0.3% | ||||||||||
Harbor Freight Tools USA, Inc./Central Puchasing LLC | 498 | 502,475 | ||||||||
Supervalu Inc. | 550 | 556,188 | ||||||||
|
| |||||||||
| 1,058,663 | ||||||||||
|
| |||||||||
Consumer Non-Cyclical – 0.4% | ||||||||||
BJ’s Wholesale Club, Inc. | 400 | 413,252 | ||||||||
Immucor, Inc. (fka IVD Acquisition Corporation) | 593 | 591,782 | ||||||||
Kinetic Concepts, Inc. | 396 | 400,886 | ||||||||
Par Pharmaceutical Companies, Inc. (Par Pharmaceutical, Inc.) | 299 | 298,876 | ||||||||
|
| |||||||||
| 1,704,796 | ||||||||||
|
| |||||||||
| ALLIANCEBERNSTEIN POOLING PORTFOLIOS • | 129 |
High-Yield Portfolio—Portfolio of Investments
| Principal Amount (000) | U.S. $ Value | |||||||||
|
|
| ||||||||
Other Industrial – 0.3% | ||||||||||
Asurion, LLC (fka Asurion Corporation) | U.S.$ | 300 | $ | 300,876 | ||||||
Navistar, Inc. | 599 | 605,083 | ||||||||
Silver II Borrower S.C.A (Silver II US Holdings, LLC) | 275 | 275,000 | ||||||||
|
| |||||||||
| 1,180,959 | ||||||||||
|
| |||||||||
Technology – 0.5% | ||||||||||
Avaya, Inc. | 258 | 256,204 | ||||||||
Blackboard, Inc. | 1,100 | 1,074,700 | ||||||||
Eastman Kodak Company | 70 | 70,116 | ||||||||
Smart Modular Technologies (Global), Inc. | 683 | 591,216 | ||||||||
|
| |||||||||
| 1,992,236 | ||||||||||
|
| |||||||||
| 13,122,584 | ||||||||||
|
| |||||||||
Financial Institutions – 0.1% | ||||||||||
REITS – 0.1% | ||||||||||
iStar Financial, Inc. | 202 | 203,907 | ||||||||
|
| |||||||||
Total Bank Loans | 13,326,491 | |||||||||
|
| |||||||||
EMERGING MARKETS - | ||||||||||
Industrial – 2.6% | ||||||||||
Basic – 0.5% | ||||||||||
Severstal OAO Via Steel Capital SA | 293 | 299,970 | ||||||||
9.25%, 4/19/14(b) | 508 | 548,081 | ||||||||
Vedanta Resources PLC | 900 | 943,920 | ||||||||
|
| |||||||||
| 1,791,971 | ||||||||||
|
| |||||||||
Communications - Media – 0.2% | ||||||||||
Columbus International, Inc. | 698 | 782,632 | ||||||||
|
| |||||||||
Consumer Cyclical - Other – 0.3% | ||||||||||
Studio City Finance Ltd. | 1,025 | 1,126,219 | ||||||||
|
| |||||||||
| 130 | • ALLIANCEBERNSTEIN POOLING PORTFOLIOS |
High-Yield Portfolio—Portfolio of Investments
| Principal Amount (000) | U.S. $ Value | |||||||||
|
|
| ||||||||
Consumer Non - Cyclical – 1.3% | ||||||||||
Agrokor DD | EUR | 630 | $ | 912,971 | ||||||
Corp. Azucarera del Peru SA | U.S.$ | 562 | 605,761 | |||||||
Foodcorp Pty Ltd. | EUR | 642 | 919,884 | |||||||
Tonon Bioenergia SA | U.S.$ | 775 | 780,238 | |||||||
USJ Acucar e Alcool SA | 850 | 945,625 | ||||||||
Virgolino de Oliveira Finance Ltd. | 930 | 979,988 | ||||||||
|
| |||||||||
| 5,144,467 | ||||||||||
|
| |||||||||
Energy – 0.1% | ||||||||||
Golden Close Maritime Corp,. Ltd | 400 | 427,968 | ||||||||
|
| |||||||||
Other Industrial – 0.2% | ||||||||||
Marfrig Holding Europe BV | 997 | 972,075 | ||||||||
|
| |||||||||
| 10,245,332 | ||||||||||
|
| |||||||||
Financial Institutions – 0.5% | ||||||||||
Banking – 0.2% | ||||||||||
Banco de Reservas de LA Republica Dominicana | 875 | 870,625 | ||||||||
|
| |||||||||
Finance – 0.3% | ||||||||||
Sistema International Funding SA | 850 | 920,687 | ||||||||
|
| |||||||||
| 1,791,312 | ||||||||||
|
| |||||||||
Total Emerging Markets - Corporate Bonds | 12,036,644 | |||||||||
|
| |||||||||
EMERGING MARKETS - SOVEREIGNS – 2.4% | ||||||||||
Argentina – 0.5% | ||||||||||
Argentina Boden Bonds | 2,100 | 1,717,683 | ||||||||
|
| |||||||||
Croatia – 0.3% | ||||||||||
Croatia Government International Bond | 1,060 | 1,142,097 | ||||||||
|
| |||||||||
Hungary – 0.3% | ||||||||||
Hungary Government International Bond | 1,130 | 1,218,705 | ||||||||
|
| |||||||||
| ALLIANCEBERNSTEIN POOLING PORTFOLIOS • | 131 |
High-Yield Portfolio—Portfolio of Investments
| Principal Amount (000) | U.S. $ Value | |||||||||
|
|
| ||||||||
Serbia – 0.2% | ||||||||||
Republic of Serbia | U.S.$ | 578 | $ | 566,685 | ||||||
|
| |||||||||
Turkey – 0.3% | ||||||||||
Turkey Government International Bond | 1,051 | 1,274,338 | ||||||||
|
| |||||||||
Ukraine – 0.2% | ||||||||||
Ukraine Government International Bond | 930 | 941,625 | ||||||||
|
| |||||||||
Venezuela – 0.6% | ||||||||||
Venezuela Government International Bond | 2,675 | 2,224,262 | ||||||||
|
| |||||||||
Total Emerging Markets - Sovereigns | 9,085,395 | |||||||||
|
| |||||||||
COLLATERALIZED MORTGAGE | ||||||||||
Non-Agency Floating Rate – 1.2% | ||||||||||
Greenpoint Mortgage Funding Trust | 608 | 437,175 | ||||||||
HarborView Mortgage Loan Trust | 930 | 737,308 | ||||||||
Lehman XS Trust | 296 | 231,287 | ||||||||
Residential Accredit Loans, Inc. | ||||||||||
3.799%, 9/25/35(c) | 1,697 | 1,370,226 | ||||||||
Series 2007-QH6, Class A1 | ||||||||||
0.392%, 7/25/37(c) | 1,673 | 1,284,079 | ||||||||
Structured Asset Mortgage Investments, Inc. | 657 | 519,616 | ||||||||
|
| |||||||||
| 4,579,691 | ||||||||||
|
| |||||||||
Non-Agency Fixed Rate – 0.9% | ||||||||||
CSMC Mortgage-Backed Trust | 471 | 419,387 | ||||||||
Indymac Index Mortgage Loan Trust | 1,384 | 1,257,922 | ||||||||
| 132 | • ALLIANCEBERNSTEIN POOLING PORTFOLIOS |
High-Yield Portfolio—Portfolio of Investments
| Principal Amount (000) | U.S. $ Value | |||||||||
|
|
| ||||||||
Residential Accredit Loans, Inc. | U.S.$ | 1,138 | $ | 952,445 | ||||||
Series 2006-QS2, Class 1A9 | 1,151 | 932,068 | ||||||||
|
| |||||||||
| 3,561,822 | ||||||||||
|
| |||||||||
Total Collateralized Mortgage Obligations | 8,141,513 | |||||||||
|
| |||||||||
COMMERCIAL MORTGAGE - | ||||||||||
Non-Agency Fixed Rate CMBS – 1.8% | ||||||||||
Bear Stearns Commercial Mortgage Securities Trust | 167 | 165,895 | ||||||||
Bear Stearns Commercial Mortgage Securities, Inc | 1,000 | 953,416 | ||||||||
GS Mortgage Securities Corp. II | 1,000 | 982,838 | ||||||||
LB-UBS Commercial Mortgage Trust | 1,565 | 1,538,116 | ||||||||
ML-CFC Commercial Mortgage Trust | 315 | 289,942 | ||||||||
Morgan Stanley Capital I Trust | 970 | 967,237 | ||||||||
Wachovia Bank Commercial Mortgage Trust | 1,000 | 884,961 | ||||||||
WFDB Commercial Mortgage Trust | 1,300 | 1,337,185 | ||||||||
|
| |||||||||
Total Commercial Mortgage-Backed Securities | 7,119,590 | |||||||||
|
| |||||||||
GOVERNMENTS - TREASURIES – 1.7% | ||||||||||
Canada – 0.4% | ||||||||||
Canadian Government Bond | CAD | 550 | 547,520 | |||||||
3.25%, 6/01/21 | 925 | 1,000,704 | ||||||||
|
| |||||||||
| 1,548,224 | ||||||||||
|
| |||||||||
| ALLIANCEBERNSTEIN POOLING PORTFOLIOS • | 133 |
High-Yield Portfolio—Portfolio of Investments
| Principal Amount (000) | U.S. $ Value | |||||||||
|
|
| ||||||||
United Kingdom – 0.7% | ||||||||||
United Kingdom Gilt | GBP | 1,725 | $ | 2,737,996 | ||||||
|
| |||||||||
United States – 0.6% | ||||||||||
U.S. Treasury Bonds | U.S.$ | 2,192 | 2,215,840 | |||||||
|
| |||||||||
Total Governments - Treasuries | 6,502,060 | |||||||||
|
| |||||||||
QUASI-SOVEREIGNS – 1.6% | ||||||||||
Quasi-Sovereign Bonds – 1.6% | ||||||||||
Kazakhstan – 0.7% | ||||||||||
Kazatomprom Natsionalnaya Atomnaya Kompaniya AO | 875 | 938,437 | ||||||||
KazMunayGas National Co. | 400 | 408,200 | ||||||||
9.125%, 7/02/18(b) | 950 | 1,215,677 | ||||||||
|
| |||||||||
| 2,562,314 | ||||||||||
|
| |||||||||
Russia – 0.3% | ||||||||||
Russian Agricultural Bank OJSC Via | 955 | 1,048,113 | ||||||||
|
| |||||||||
Trinidad & Tobago – 0.2% | ||||||||||
Petroleum Co. of Trinidad & Tobago Ltd. | 750 | 995,625 | ||||||||
|
| |||||||||
United States – 0.2% | ||||||||||
Citgo Petroleum Corp. | 891 | 1,015,740 | ||||||||
|
| |||||||||
Venezuela – 0.2% | ||||||||||
Petroleos de Venezuela SA | 800 | 708,000 | ||||||||
|
| |||||||||
Total Quasi-Sovereigns | 6,329,792 | |||||||||
|
| |||||||||
| Shares | ||||||||||
COMMON STOCKS – 1.5% | ||||||||||
Beazer Homes USA, Inc.(i) | 22,502 | 350,356 | ||||||||
Crown Castle International Corp.(i) | 9,194 | 641,741 | ||||||||
Greektown Superholdings, Inc.(g)(h)(i) | 397 | 23,820 | ||||||||
Isle of Capri Casinos, Inc.(i) | 59,535 | 394,717 | ||||||||
Keystone Automotive Operations, Inc.(g)(h) | 61,065 | 605,152 | ||||||||
Las Vegas Sands Corp. | 8,388 | 431,898 | ||||||||
LifePoint Hospitals, Inc.(i) | 13,469 | 593,848 | ||||||||
| 134 | • ALLIANCEBERNSTEIN POOLING PORTFOLIOS |
High-Yield Portfolio—Portfolio of Investments
| Company | Shares | U.S. $ Value | ||||||||
|
|
| ||||||||
LyondellBasell Industries NV | 6,076 | $ | 356,175 | |||||||
Meritor, Inc.(i) | 40,824 | 179,626 | ||||||||
Neenah Enterprises, Inc.(g)(h)(i) | 58,199 | 378,294 | ||||||||
SBA Communications Corp. - Class A(i) | 9,819 | 698,328 | ||||||||
Seagate Technology PLC | 12,533 | 403,061 | ||||||||
Vanguard Health Systems, Inc.(i) | 39,452 | 586,651 | ||||||||
Voyager Learning Exchange(g)(h)(i) | 982,000 | 1 | ||||||||
|
| |||||||||
Total Common Stocks | 5,643,668 | |||||||||
|
| |||||||||
PREFERRED STOCKS – 1.2% | ||||||||||
Financial Institutions – 1.1% | ||||||||||
Banking – 0.8% | ||||||||||
Citigroup Capital XIII | 5,000 | 141,719 | ||||||||
Royal Bank of Scotland Group PLC | 60,000 | 1,387,800 | ||||||||
US Bancorp | 35,000 | 1,013,250 | ||||||||
Zions Bancorporation | 27,300 | 705,705 | ||||||||
|
| |||||||||
| 3,248,474 | ||||||||||
|
| |||||||||
REITS – 0.3% | ||||||||||
Health Care REIT, Inc. | 13,825 | 376,303 | ||||||||
Sovereign Real Estate Investment Trust | 624 | 813,818 | ||||||||
|
| |||||||||
| 1,190,121 | ||||||||||
|
| |||||||||
| 4,438,595 | ||||||||||
|
| |||||||||
Industrial – 0.1% | ||||||||||
Basic – 0.1% | ||||||||||
ArcelorMittal | 9,350 | 218,790 | ||||||||
|
| |||||||||
Non Corporate Sectors – 0.0% | ||||||||||
Agencies - Government Sponsored – 0.0% | ||||||||||
Federal Home Loan Mortgage Corp. | 36,525 | 80,355 | ||||||||
|
| |||||||||
Total Preferred Stocks | 4,737,740 | |||||||||
|
| |||||||||
| Principal Amount (000) | ||||||||||
ASSET-BACKED SECURITIES – 0.7% | ||||||||||
Home Equity Loans - Fixed Rate – 0.5% | ||||||||||
Countrywide Asset-Backed Certificates | U.S.$ | 737 | 526,696 | |||||||
| ALLIANCEBERNSTEIN POOLING PORTFOLIOS • | 135 |
High-Yield Portfolio—Portfolio of Investments
| Principal Amount (000) | U.S. $ Value | |||||||||
|
|
| ||||||||
Lehman XS Trust | U.S.$ | 1,353 | $ | 1,171,047 | ||||||
|
| |||||||||
| 1,697,743 | ||||||||||
|
| |||||||||
Home Equity Loans - Floating | ||||||||||
GSAA Home Equity Trust | 1,398 | 875,522 | ||||||||
|
| |||||||||
Total Asset-Backed Securities | 2,573,265 | |||||||||
|
| |||||||||
LOCAL GOVERNMENTS - MUNICIPAL BONDS – 0.4% | ||||||||||
United States – 0.4% | ||||||||||
California GO | 325 | 479,723 | ||||||||
7.95%, 3/01/36 | 700 | 877,114 | ||||||||
|
| |||||||||
Total Local Governments - Municipal Bonds | 1,356,837 | |||||||||
|
| |||||||||
| Contracts | |||||||||
OPTIONS PURCHASED – PUTS – 0.2% | ||||||||||
Options on Forward Contracts – 0.1% | ||||||||||
JPY/USD | 375,710,000 | 567,209 | ||||||||
EUR/USD | 1,920,000 | 3 | ||||||||
|
| |||||||||
| 567,212 | ||||||||||
|
| |||||||||
Options on Equities – 0.1% | ||||||||||
American Axle & MFG Holdings | 387 | 36,765 | ||||||||
Boyd Gaming Corp. | 2,925 | 182,812 | ||||||||
|
| |||||||||
| 219,577 | ||||||||||
|
| |||||||||
Options on Funds and Investment Trusts – 0.0% | ||||||||||
SPDR S&P 500 ETF Trust | 74,800 | 11,220 | ||||||||
Expiration: Apr 2014, | 18,500 | 36,260 | ||||||||
|
| |||||||||
| 47,480 | ||||||||||
|
| |||||||||
| 136 | • ALLIANCEBERNSTEIN POOLING PORTFOLIOS |
High-Yield Portfolio—Portfolio of Investments
| Company | Contracts | U.S. $ Value | ||||||||
|
|
| ||||||||
Total Options Purchased – Puts | $ | 834,269 | ||||||||
|
| |||||||||
| Principal Amount (000) | ||||||||||
GOVERNMENTS – SOVEREIGN AGENCIES – 0.1% | ||||||||||
Norway – 0.1% | ||||||||||
Eksportfinans ASA | U.S.$ | 539 | 513,936 | |||||||
|
| |||||||||
| Contracts | ||||||||||
OPTIONS PURCHASED – CALLS – 0.1% | ||||||||||
Options on Equities – 0.1% | ||||||||||
Beazer Homes USA, Inc. | 1,115 | 248,087 | ||||||||
|
| |||||||||
| Shares | ||||||||||
WARRANTS – 0.0% | ||||||||||
Fairpoint Communications, Inc., | 12,643 | – 0 | – | |||||||
iPayment Holdings, Inc., | 272 | – 0 | – | |||||||
Talon Equity Co. NV, expiring 11/24/15(g)(h)(i) | 671 | – 0 | – | |||||||
|
| |||||||||
Total Warrants | – 0 | – | ||||||||
|
| |||||||||
SHORT-TERM INVESTMENTS – 1.4% | ||||||||||
Investment Companies – 1.4% | ||||||||||
AllianceBerstein Fixed-Income Shares Inc.—Government STIF Portfolio, 0.12%(n) | 5,524,468 | 5,524,468 | ||||||||
|
| |||||||||
Total Investments – 102.2% | 393,868,108 | |||||||||
Other assets less liabilities – (2.2)% | (8,436,656 | ) | ||||||||
|
| |||||||||
Net Assets – 100.0% | $ | 385,431,452 | ||||||||
|
| |||||||||
FUTURES CONTRACTS (see Note C)
| Type | Number of Contracts | Expiration Month | Original Value | Value at February 28, 2013 | Unrealized Appreciation/ (Depreciation) | |||||||||||||||
Purchased Contracts |
| |||||||||||||||||||
Russell 2000 Mini Index Futures | 37 | March 2013 | $ | 3,352,968 | $ | 3,367,740 | $ | 14,772 | ||||||||||||
| ALLIANCEBERNSTEIN POOLING PORTFOLIOS • | 137 |
High-Yield Portfolio—Portfolio of Investments
| Type | Number of Contracts | Expiration Month | Original Value | Value at February 28, 2013 | Unrealized Appreciation/ (Depreciation) | |||||||||||||||
U.S. T-Note 2 Yr Futures | 206 | June 2013 | $ | 45,410,221 | $ | 45,416,562 | $ | 6,341 | ||||||||||||
U.S. T-Note 5 Yr Futures | 522 | June 2013 | 64,655,177 | 64,719,844 | 64,667 | |||||||||||||||
Ultra Long U.S. | 22 | June 2013 | 3,434,391 | 3,476,000 | 41,609 | |||||||||||||||
Sold Contracts | ||||||||||||||||||||
U.S. T-Note 10 Yr Futures | 133 | June 2013 | 17,389,526 | 17,495,734 | (106,208 | ) | ||||||||||||||
|
| |||||||||||||||||||
| $ | 21,181 | |||||||||||||||||||
|
| |||||||||||||||||||
FORWARD CURRENCY EXCHANGE CONTRACTS (see Note C)
| Counterparty | Contracts to Deliver (000) | In Exchange For (000) | Settlement Date | Unrealized Appreciation/ (Depreciation) | ||||||||||||||||||||
Bank of America, NA | EUR | 22,460 | USD | 29,356 | 4/11/13 | $ | 25,122 | |||||||||||||||||
Barclays Bank PLC Wholesale | JPY | 163,596 | USD | 1,747 | 4/12/13 | (18,182 | ) | |||||||||||||||||
Citibank, NA | GBP | 5,873 | USD | 8,892 | 4/11/13 | (15,946 | ) | |||||||||||||||||
Royal Bank of Canada | CAD | 1,735 | USD | 1,726 | 3/14/13 | 43,574 | ||||||||||||||||||
Royal Bank of Scotland PLC | USD | 1,919 | NOK | 10,615 | 3/07/13 | (70,515 | ) | |||||||||||||||||
Royal Bank of Scotland PLC | USD | 1,878 | MXN | 24,293 | 4/12/13 | 17,805 | ||||||||||||||||||
State Street Bank & Trust Co. | GBP | 555 | USD | 840 | 4/11/13 | (1,942 | ) | |||||||||||||||||
|
| |||||||||||||||||||||||
| $ | (20,084 | ) | ||||||||||||||||||||||
|
| |||||||||||||||||||||||
CALL OPTIONS WRITTEN (see Note C)
| Description | Contracts | Exercise Price | Expiration Month | Premiums Received | U.S. $ Value | |||||||||||||||
Beazer Homes | 1,115 | $ | 25.00 | January 2014 | $ | 116,480 | $ | (58,538 | ) | |||||||||||
PUT OPTIONS WRITTEN (see Note C)
| Description | Contracts | Exercise Price | Expiration Month | Premiums Received | U.S. $ Value | |||||||||||||||
Boyd Gaming Corp.(m) | 2,925 | $ | 7.00 | January 2014 | $ | 473,729 | $ | (475,312 | ) | |||||||||||
CURRENCY OPTIONS WRITTEN (see Note C)
| Description | Exercise Price | Expiration Date | Contracts (000) | Premiums Received | U.S. $ Value | |||||||||||||||
Put - JPY vs. USD(l) | JPY | 81.27 | 3/14/13 | JPY | 375,710 | $ | 156,950 | $ | (567,209 | ) | ||||||||||
CREDIT DEFAULT SWAPTIONS WRITTEN (see Note C)
| Description | Counter- party | Buy/Sell Protection | Strike Rate | Expiration Date | Notional Amount (000) | Premiums Received | Market Value | |||||||||||||||||||
CDX-NAHY Series 19 5 Year Index | Barclays Bank PLC | Sell | 98.00 | % | 3/20/13 | $ | 5,360 | $ | 119,528 | $ | (2,111 | ) | ||||||||||||||
CDX-NAHY Series 19 5 Year Index | Bank of America, NA | Sell | 98.00 | 3/20/13 | 9,650 | 223,880 | (3,801 | ) | ||||||||||||||||||
| 138 | • ALLIANCEBERNSTEIN POOLING PORTFOLIOS |
High-Yield Portfolio—Portfolio of Investments
| Description | Counter- party | Buy/Sell Protection | Strike Rate | Expiration Date | Notional Amount (000) | Premiums Received | Market Value | |||||||||||||||||||
CDX-NAHY Series 19 5 Year Index | JPMorgan Chase Bank, NA | Sell | 102.00 | % | 4/17/13 | $ | 3,900 | $ | 56,550 | $ | (38,677 | ) | ||||||||||||||
|
|
|
| |||||||||||||||||||||||
| $ | 399,958 | $ | (44,589 | ) | ||||||||||||||||||||||
|
|
|
| |||||||||||||||||||||||
INTEREST RATE SWAP CONTRACTS (see Note C)
| Rate Type | ||||||||||||||||||||
| Swap Counterparty | Notional Amount (000) | Termination Date | Payments made by the Fund | Payments received by the Fund | Unrealized Appreciation/ (Depreciation) | |||||||||||||||
Bank of America, NA | $ | 7,600 | 9/11/22 | 1.774 | % | 3 Month LIBOR | $ | 27,194 | ||||||||||||
Citibank, NA | 20,280 | 9/14/17 | 0.836 | % | 3 Month LIBOR | (83,897 | ) | |||||||||||||
Credit Suisse International | 50,000 | 10/29/14 | 0.410 | % | 3 Month LIBOR | (101,555 | ) | |||||||||||||
Credit Suisse International | 12,000 | 1/31/15 | 0.435 | % | 3 Month LIBOR | (14,766 | ) | |||||||||||||
Deutsche Bank AG | GBP | 9,320 | 10/4/22 | 1.860 | % | 6 Month LIBOR | 75,727 | |||||||||||||
Deutsche Bank AG | 3,930 | 10/4/42 | 6 Month LIBOR | 2.968 | % | (147,497 | ) | |||||||||||||
Deutsche Bank AG | GBP | 250 | 2/22/43 | 6 Month LIBOR | 3.213 | % | 6,398 | |||||||||||||
Goldman Sachs International | $ | 20,420 | 9/18/17 | 0.853 | % | 3 Month LIBOR | (97,642 | ) | ||||||||||||
Goldman Sachs International | 20,700 | 11/13/17 | 0.779 | % | 3 Month LIBOR | 28,221 | ||||||||||||||
|
| |||||||||||||||||||
| $ | (307,817 | ) | ||||||||||||||||||
|
| |||||||||||||||||||
CREDIT DEFAULT SWAP CONTRACTS (see Note C)
| Swap Counterparty & Referenced Obligation | Fixed Rate (Pay) Receive | Implied Credit Spread at February 28, 2013 | Notional Amount (000) | Market Value | Upfront Premiums Paid (Received) | Unrealized Appreciation/ (Depreciation) | ||||||||||||||||||
Buy Contracts | ||||||||||||||||||||||||
Barclays Bank PLC: | ||||||||||||||||||||||||
Alcatel-Lucent USA, Inc., 6.50% 1/15/28 3/20/17* | (5.00 | )% | 7.05 | % | $ | 200 | $ | 12,170 | $ | 15,703 | $ | (3,533 | ) | |||||||||||
Bolivarian Republic of Venezuela, 9.25%, 9/15/27, 6/20/16* | (5.00 | ) | 6.26 | 2,800 | 73,153 | 368,418 | (295,265 | ) | ||||||||||||||||
Fifth & Pacific Companies, Inc., 5.00% 7/08/13, 12/20/13* | (5.00 | ) | 0.29 | 180 | (8,668 | ) | 1,143 | (9,811 | ) | |||||||||||||||
Nokia OYJ, 6.75% 2/04/19, 9/20/14* | (5.00 | ) | 1.93 | 1,420 | (74,191 | ) | 88,959 | (163,150 | ) | |||||||||||||||
The McClatchy Co., 5.75% 9/01/17, 12/20/13* | (5.00 | ) | 0.91 | 180 | (7,558 | ) | 2,143 | (9,701 | ) | |||||||||||||||
| ALLIANCEBERNSTEIN POOLING PORTFOLIOS • | 139 |
High-Yield Portfolio—Portfolio of Investments
| Swap Counterparty & Referenced Obligation | Fixed Rate (Pay) Receive | Implied Credit Spread at February 28, 2013 | Notional Amount (000) | Market Value | Upfront Premiums Paid (Received) | Unrealized Appreciation/ (Depreciation) | ||||||||||||||||||
Citibank, NA: | ||||||||||||||||||||||||
CDX-NAHY Series 17 5 Year Index, 12/20/16* | (5.00 | )% | 3.68 | % | $ | 2,880 | $ | (158,000 | ) | $ | 64,950 | $ | (222,950 | ) | ||||||||||
CDX-NAHY Series 18 5 Year Index, 6/20/17* | (5.00 | ) | 4.05 | 3,960 | (180,125 | ) | (62,609 | ) | (117,516 | ) | ||||||||||||||
CDX-NAHY Series 18 5 Year Index, 6/20/17* | (5.00 | ) | 4.05 | 3,960 | (180,125 | ) | (24,582 | ) | (155,543 | ) | ||||||||||||||
CDX-NAHY Series 19 5 Year index, 12/20/17* | (5.00 | ) | 4.40 | 375 | (12,821 | ) | (2,351 | ) | (10,470 | ) | ||||||||||||||
Deutsche Bank AG: | ||||||||||||||||||||||||
CDX-NAHY Series 19 5 Year index, 12/20/17* | (5.00 | ) | 4.40 | 378 | (12,941 | ) | (5,086 | ) | (7,855 | ) | ||||||||||||||
CDX-NAHY Series 19 5 Year index, 12/20/17* | (5.00 | ) | 4.40 | 379 | (12,975 | ) | (4,876 | ) | (8,099 | ) | ||||||||||||||
CDX-NAHY Series 19 5 Year index, 12/20/17* | (5.00 | ) | 4.40 | 746 | (25,539 | ) | (6,952 | ) | (18,587 | ) | ||||||||||||||
Goldman Sachs Bank USA: | ||||||||||||||||||||||||
CDX-NAHY Series 11 5 Year Index, 12/20/13* | (1.00 | ) | — | 464 | 154,076 | 81,996 | 72,080 | |||||||||||||||||
CDX-NAHY Series 18 5 Year Index, 6/20/17* | (5.00 | ) | 4.05 | 7,940 | (361,150 | ) | 171,014 | (532,164 | ) | |||||||||||||||
CDX-NAIG Series 18 5 Year Index, 6/20/17* | (1.00 | ) | 0.76 | 16,500 | (199,269 | ) | 84,989 | (284,258 | ) | |||||||||||||||
Goldman Sachs International: | ||||||||||||||||||||||||
CDX-NAHY Series 19 5 Year index, 12/20/17* | (5.00 | ) | 4.40 | 373 | (12,772 | ) | (3,257 | ) | (9,515 | ) | ||||||||||||||
CDX-NAHYS Series 19 5 Year index, 12/20/17* | (5.00 | ) | 4.40 | 749 | (25,643 | ) | (3,357 | ) | (22,286 | ) | ||||||||||||||
JPMorgan Chase Bank, NA: | ||||||||||||||||||||||||
Beazer Homes | (5.00 | ) | 5.68 | 810 | 18,512 | 82,175 | (63,663 | ) | ||||||||||||||||
| 140 | • ALLIANCEBERNSTEIN POOLING PORTFOLIOS |
High-Yield Portfolio—Portfolio of Investments
| Swap Counterparty & Referenced Obligation | Fixed Rate (Pay) Receive | Implied Credit Spread at February 28, 2013 | Notional Amount (000) | Market Value | Upfront Premiums Paid (Received) | Unrealized Appreciation/ (Depreciation) | ||||||||||||||||||
CDX-NAIG Series 17 5 Year Index, 12/20/16* | (1.00 | )% | 0.66 | % | $ | 8,300 | $ | (122,870 | ) | $ | 118,997 | $ | (241,867 | ) | ||||||||||
MBIA, Inc., 6.625% 10/01/28, 12/20/13* | (5.00 | ) | 8.54 | 370 | 7,150 | 12,361 | (5,211 | ) | ||||||||||||||||
Morgan Stanley Capital Services Inc.: | ||||||||||||||||||||||||
CDX-EM Series 17 5 Year Index, 6/20/17* | (5.00 | ) | 2.42 | 9,800 | (1,097,219 | ) | (1,044,720 | ) | (52,499 | ) | ||||||||||||||
CDX-NAHY Series 18 5 Year Index, 6/20/17* | (5.00 | ) | 4.05 | 3,960 | (180,125 | ) | 216,852 | (396,977 | ) | |||||||||||||||
Fiat SpA, 6.625% 2/15/13, 12/20/17* | (5.00 | ) | 5.54 | EUR | 165 | 2,968 | 11,583 | (8,615 | ) | |||||||||||||||
Fiat SpA, 6.625% 2/15/13, 12/20/17* | (5.00 | ) | 5.54 | 235 | 4,228 | 16,814 | (12,586 | ) | ||||||||||||||||
Sale Contracts |
| |||||||||||||||||||||||
Bank of | ||||||||||||||||||||||||
Amkor Technology, Inc., 7.375% 5/01/18, 6/20/17* | 5.00 | 5.18 | 640 | 692 | (20,358 | ) | 21,050 | |||||||||||||||||
Boyd Gaming Corp., 6.75% 4/15/14, 3/20/16* | 5.00 | 6.49 | 860 | (26,874 | ) | (35,120 | ) | 8,246 | ||||||||||||||||
CDX-NAIG Series 19 5 Year Index, 12/20/17* | 1.00 | — | 917 | (132,263 | ) | (156,226 | ) | 23,963 | ||||||||||||||||
CDX-NAIG Series 19 5 Year Index, 12/20/17* | 1.00 | — | 459 | (66,131 | ) | (77,942 | ) | 11,811 | ||||||||||||||||
| ALLIANCEBERNSTEIN POOLING PORTFOLIOS • | 141 |
High-Yield Portfolio—Portfolio of Investments
| Swap Counterparty & Referenced Obligation | Fixed Rate (Pay) Receive | Implied Credit Spread at February 28, 2013 | Notional Amount (000) | Market Value | Upfront Premiums Paid (Received) | Unrealized Appreciation/ (Depreciation) | ||||||||||||||||||
Sanmina Corp., 8.125% 3/01/16, 6/20/17* | 5.00 | % | 3.81 | % | $ | 640 | $ | 35,172 | $ | (31,323 | ) | $ | 66,495 | |||||||||||
Barclays Bank PLC: | ||||||||||||||||||||||||
Advanced Micro Devices, Inc., 7.750% 8/01/20, 3/20/16* | 5.00 | 7.79 | 350 | (22,295 | ) | (30,032 | ) | 7,737 | ||||||||||||||||
Advanced Micro Devices, Inc., 7.750% 8/01/20, 3/20/16* | 5.00 | 7.79 | 710 | (45,229 | ) | (50,170 | ) | 4,941 | ||||||||||||||||
CDX- NAIG Series 15 5 Year Index, 12/20/15* | 1.00 | — | 500 | (17,378 | ) | (41,531 | ) | 24,153 | ||||||||||||||||
Clear Channel Communications, Inc., 6.875% 6/15/18, 12/20/14* | 5.00 | 7.18 | 440 | (16,808 | ) | (39,158 | ) | 22,350 | ||||||||||||||||
Clear Channel Communications, Inc., | 5.00 | 15.95 | 200 | (50,444 | ) | (51,782 | ) | 1,338 | ||||||||||||||||
Community Health Systems, Inc., | 5.00 | 1.86 | 800 | 86,891 | (16,560 | ) | 103,451 | |||||||||||||||||
Freescale Semiconductor, Inc., | 5.00 | 3.70 | 1,850 | 86,863 | (33,503 | ) | 120,366 | |||||||||||||||||
Health Management Associates, Inc., 6.125% 4/15/16, 6/20/17* | 5.00 | 2.69 | 640 | 64,904 | (3,307 | ) | 68,211 | |||||||||||||||||
MGM Resorts International, | 5.00 | 4.00 | 470 | 21,741 | (22,585 | ) | 44,326 | |||||||||||||||||
Nokia OYJ, | 5.00 | 5.28 | 890 | (3,012 | ) | (147,167 | ) | 144,155 | ||||||||||||||||
NXP BV, | 5.00 | 2.20 | 550 | 51,205 | 19,798 | 31,407 | ||||||||||||||||||
Owens-Illinois, Inc., | 5.00 | 1.97 | 430 | 57,270 | 26,289 | 30,981 | ||||||||||||||||||
Univision Communications, Inc., | 5.00 | 2.83 | 550 | 41,415 | (11,208 | ) | 52,623 | |||||||||||||||||
Virgin Media Finance PLC, | 5.00 | 3.49 | 650 | 44,086 | 16,223 | 27,863 | ||||||||||||||||||
Credit Suisse International: CDX- NAHY | 5.00 | — | 2,800 | 221,953 | (170,137 | ) | 392,090 | |||||||||||||||||
| 142 | • ALLIANCEBERNSTEIN POOLING PORTFOLIOS |
High-Yield Portfolio—Portfolio of Investments
| Swap Counterparty & Referenced Obligation | Fixed Rate (Pay) Receive | Implied Credit Spread at February 28, 2013 | Notional Amount (000) | Market Value | Upfront Premiums Paid (Received) | Unrealized Appreciation/ (Depreciation) | ||||||||||||||||||
CDX- NAHY | 5.00 | % | — | % | $ | 2,500 | $ | 198,173 | $ | (153,099 | ) | $ | 351,272 | |||||||||||
MGM Resorts International, | 5.00 | 2.44 | 1,700 | 146,425 | (33,245 | ) | 179,670 | |||||||||||||||||
MGM Resorts International, | 5.00 | 0.29 | 800 | 19,708 | 2,782 | 16,926 | ||||||||||||||||||
United States Steel Corp., 6.65% 6/01/37, 12/20/17* | 5.00 | 6.20 | 440 | (18,259 | ) | (36,928 | ) | 18,669 | ||||||||||||||||
Wind Acquisition Finance S.A., | 5.00 | 5.19 | 1,320 | 3,415 | 39,435 | (36,020 | ) | |||||||||||||||||
Deutsche Bank AG: CDX-NAIG | 1.00 | — | 459 | (66,185 | ) | (84,505 | ) | 18,320 | ||||||||||||||||
Goldman Sachs Bank USA: CDX-NAHY | 5.00 | — | 4,451 | 1,295 | (319,886 | ) | 321,181 | |||||||||||||||||
CDX-NAIG | 1.00 | — | 900 | (31,281 | ) | (75,733 | ) | 44,452 | ||||||||||||||||
Chesapeake Energy Corp., | 5.00 | 3.28 | 1,250 | 95,973 | (76,061 | ) | 172,034 | |||||||||||||||||
ConvaTec Healthcare E S.A., | 5.00 | 5.79 | EUR | 590 | (16,604 | ) | (102,711 | ) | 86,107 | |||||||||||||||
Mediacom LLC, | 5.00 | 2.01 | $ | 1,070 | 106,094 | (27,587 | ) | 133,681 | ||||||||||||||||
United States Steel Corp., | 5.00 | 5.93 | 230 | (6,963 | ) | (17,216 | ) | 10,253 | ||||||||||||||||
United States Steel Corp., | 5.00 | 5.93 | 225 | (6,812 | ) | (16,596 | ) | 9,784 | ||||||||||||||||
| ALLIANCEBERNSTEIN POOLING PORTFOLIOS • | 143 |
High-Yield Portfolio—Portfolio of Investments
| Swap Counterparty & Referenced Obligation | Fixed Rate (Pay) Receive | Implied Credit Spread at February 28, 2013 | Notional Amount (000) | Market Value | Upfront Premiums Paid (Received) | Unrealized Appreciation/ (Depreciation) | ||||||||||||||||||
Goldman Sachs International: |
| |||||||||||||||||||||||
CDX-NAIG Series 19 5 Year Index, 12/20/17* | 1.00 | % | — | % | $ | 917 | $ | (132,264 | ) | $ | (169,879 | ) | $ | 37,615 | ||||||||||
CDX-NAIG | 1.00 | — | 459 | (66,131 | ) | (79,213 | ) | 13,082 | ||||||||||||||||
JPMorgan Chase Bank, NA: | ||||||||||||||||||||||||
Sabre Holdings Corp., | 5.00 | 3.33 | 277 | 16,691 | (19,914 | ) | 36,605 | |||||||||||||||||
Morgan Stanley Capital Services Inc.: |
| |||||||||||||||||||||||
AK Steel Holding Corp., | 5.00 | 8.94 | 550 | (50,073 | ) | 5,411 | (55,484 | ) | ||||||||||||||||
CDX-NAIG Series 19 5 Year Index, 12/20/17* | 1.00 | — | 459 | (66,130 | ) | (79,544 | ) | 13,414 | ||||||||||||||||
NXP BV, | 5.00 | 3.06 | EUR | 230 | 25,765 | (12,745 | ) | 38,510 | ||||||||||||||||
NXP BV, 8.625%, 10/15/13, 9/20/17* | 5.00 | 3.22 | 330 | 35,402 | (20,387 | ) | 55,789 | |||||||||||||||||
UBS AG: |
| |||||||||||||||||||||||
Goodyear Tire & Rubber Co., | 5.00 | 4.54 | $ | 1,050 | 26,524 | (76,701 | ) | 103,225 | ||||||||||||||||
HCA Inc., 6.375%, 1/15/15, 6/20/17* | 5.00 | 2.57 | 1,720 | 183,458 | (2,970 | ) | 186,428 | |||||||||||||||||
Levi Strauss & Co., | 5.00 | 3.17 | 850 | 68,877 | (44,093 | ) | 112,970 | |||||||||||||||||
|
|
|
|
|
| |||||||||||||||||||
| $ | (1,600,878 | ) | $ | (2,096,877 | ) | $ | 495,999 | |||||||||||||||||
|
|
|
|
|
| |||||||||||||||||||
DIVIDEND SWAP CONTRACTS (see Note C)
| Dividend Yield On | Counterparty | Strike Rate | Termination Date | Unrealized Appreciation/ (Depreciation) | ||||||||||
Euro Stoxx 50 Index Dividend Futures | Credit Suisse International | 91.8 | % | 12/19/14 | $ | 24,127 | ||||||||
Euro Stoxx 50 Index Dividend Futures | UBS AG | 90.2 | % | 12/18/15 | $ | 16,297 | ||||||||
|
| |||||||||||||
| $ | 40,424 | |||||||||||||
|
| |||||||||||||
| 144 | • ALLIANCEBERNSTEIN POOLING PORTFOLIOS |
High-Yield Portfolio—Portfolio of Investments
TOTAL RETURN SWAP CONTRACTS (see Note C)
| Receive/Pay Total Return on Reference Equity | Equity | # of Shares or Units | Rate Received by the Fund | Notional Amount (000) | Maturity Date | Counterparty | Unrealized Appreciation/ (Depreciation) | |||||||||||||||||||
Total Return on Reference Equity | ||||||||||||||||||||||||||
Pay | Burger King Worldwide, Inc. | 23,000 | 0.29 | % | $ | 391 | 8/15/14 | Citibank, NA | $ | (28,552 | ) | |||||||||||||||
REVERSE REPURCHASE AGREEMENTS (see Note C)
| Broker | Interest Rate | Maturity | U.S. $ Value at 2013 | |||||||||
Credit Suisse Securities (USA) LLC† | (4.00 | )%* | — | $ | 268,994 | |||||||
Credit Suisse Securities (USA) LLC† | (2.50 | )%* | — | 1,046,857 | ||||||||
Credit Suisse Securities (USA) LLC† | (1.50 | )%* | — | 302,713 | ||||||||
Credit Suisse Securities (USA) LLC† | (1.00 | )%* | — | 2,951,298 | ||||||||
Credit Suisse Securities (USA) LLC† | (0.50 | )%* | — | 410,015 | ||||||||
Credit Suisse Securities (USA) LLC | (0.25 | )%* | 3/01/13 | 976,254 | ||||||||
Credit Suisse Securities (USA) LLC† | (0.25 | )%* | — | 3,185,431 | ||||||||
Credit Suisse Securities (USA) LLC† | (0.05 | )%* | — | 1,039,572 | ||||||||
Credit Suisse Securities (USA) LLC† | 0.00 | % | — | 7,793,906 | ||||||||
Credit Suisse Securities (USA) LLC† | 0.15 | % | — | 1,839,245 | ||||||||
Deutsche Bank Securities, Inc.† | 0.00 | % | — | 1,260,000 | ||||||||
HSBC | 0.45 | % | 3/01/13 | 3,713,820 | ||||||||
ING† | (1.13 | )%* | — | 367,293 | ||||||||
|
| |||||||||||
| $ | 25,155,398 | |||||||||||
|
| |||||||||||
| ALLIANCEBERNSTEIN POOLING PORTFOLIOS • | 145 |
High-Yield Portfolio—Portfolio of Investments
| † | The reverse repurchase agreement matures on demand. Interest rate resets daily and the rate shown is the rate in effect on February 28, 2013 |
| * | Interest payment due from counterparty. |
| (a) | Position, or a portion thereof, has been segregated to collateralize reverse repurchase agreements. The market value of the collateral amounted to $21,207,331. |
| (b) | Security is exempt from registration under Rule 144A of the Securities Act of 1933. These securities are considered liquid and may be resold in transactions exempt from registration, normally to qualified institutional buyers. At February 28, 2013, the aggregate market value of these securities amounted to $129,254,318 or 33.5% of net assets. |
| (c) | Floating Rate Security. Stated interest rate was in effect at February 28, 2013. |
| (d) | Pay-In-Kind Payments (PIK). |
| (e) | Variable rate coupon, rate shown as of February 28, 2013. |
| (f) | Security is in default and is non-income producing. |
| (g) | Fair valued by the Adviser. |
| (h) | Illiquid security. |
| (i) | Non-income producing security. |
| (j) | This position or a portion of this position represents an unsettled loan purchase. At February 28, 2013, the market value and unrealized gain of these unsettled loan purchases amounted to $2,116,630 and $11,015, respectively. The coupon rate will be determined at the time of settlement and will be based upon the London-Interbank Offered Rate (“LIBOR”) plus a premium which was determined at the time of purchase. |
| (k) | Position, or a portion thereof, has been segregated to collateralize OTC derivatives outstanding. The aggregate market value of these securities amounted to $1,789,287. |
| (l) | One contract relates to 1 share. |
| (m) | One contract relates to 100 shares. |
| (n) | Investment in affiliated money market mutual fund. The rate shown represents the 7-day yield as of period end. |
Currency Abbreviations:
| AUD | – Australian Dollar |
| CAD | – Canadian Dollar |
| EUR | – Euro |
| GBP | – Great British Pound |
| JPY | – Japanese Yen |
| MXN | – Mexican Peso |
| NOK | – Norwegian Krone |
| USD | – United States Dollar |
Glossary:
| CDX-EM | – Emerging Market Credit Default Swap Index |
| CDX-NAHY | – North American High Yield Credit Default Swap Index |
| CDX-NAIG | – North American Investment Grade Credit Default Swap Index |
| CMBS | – Commercial Mortgage-Backed Securities |
| GO | – General Obligation |
| LIBOR | – London Interbank Offered Rates |
| OJSC | – Open Joint Stock Company |
| REIT | – Real Estate Investment Trust |
See notes to financial statements.
| 146 | • ALLIANCEBERNSTEIN POOLING PORTFOLIOS |
High-Yield Portfolio—Portfolio of Investments
SMALL-MID CAP VALUE PORTFOLIO
PORTFOLIO OF INVESTMENTS
February 28, 2013 (unaudited)
| Company | Shares | U.S. $ Value | ||||||
| ||||||||
COMMON STOCKS – 98.5% | ||||||||
Financials – 26.4% | ||||||||
Capital Markets – 1.7% | ||||||||
E*Trade Financial Corp.(a) | 237,820 | $ | 2,547,052 | |||||
Legg Mason, Inc. | 101,750 | 2,899,875 | ||||||
|
| |||||||
| 5,446,927 | ||||||||
|
| |||||||
Commercial Banks – 10.6% | ||||||||
Associated Banc-Corp | 233,320 | 3,357,475 | ||||||
CapitalSource, Inc. | 457,090 | 4,113,810 | ||||||
Comerica, Inc. | 120,990 | 4,159,636 | ||||||
First Niagara Financial Group, Inc. | 424,568 | 3,472,966 | ||||||
Huntington Bancshares, Inc./OH | 640,750 | 4,504,473 | ||||||
Popular, Inc.(a) | 169,167 | 4,723,143 | ||||||
Susquehanna Bancshares, Inc. | 296,403 | 3,447,167 | ||||||
Webster Financial Corp. | 80,360 | 1,769,527 | ||||||
Zions Bancorporation | 206,260 | 4,979,116 | ||||||
|
| |||||||
| 34,527,313 | ||||||||
|
| |||||||
Insurance – 8.4% | ||||||||
Aspen Insurance Holdings Ltd. | 128,390 | 4,604,066 | ||||||
Fidelity National Financial, Inc. – Class A | 189,280 | 4,720,643 | ||||||
Platinum Underwriters Holdings Ltd. | 79,090 | 4,182,279 | ||||||
Reinsurance Group of America, Inc. – Class A | 50,870 | 2,925,025 | ||||||
Torchmark Corp. | 68,700 | 3,860,253 | ||||||
Unum Group | 140,430 | 3,436,322 | ||||||
Validus Holdings Ltd. | 105,970 | 3,775,711 | ||||||
|
| |||||||
| 27,504,299 | ||||||||
|
| |||||||
Real Estate Investment Trusts (REITs) – 5.7% | ||||||||
BioMed Realty Trust, Inc. | 178,510 | 3,770,131 | ||||||
Camden Property Trust | 32,150 | 2,222,851 | ||||||
Glimcher Realty Trust | 174,840 | 1,968,698 | ||||||
Mid-America Apartment Communities, Inc. | 32,460 | 2,254,023 | ||||||
Plum Creek Timber Co., Inc. | 79,870 | 3,873,695 | ||||||
RLJ Lodging Trust | 212,690 | 4,549,439 | ||||||
|
| |||||||
| 18,638,837 | ||||||||
|
| |||||||
| 86,117,376 | ||||||||
|
| |||||||
Information Technology – 18.5% | ||||||||
Communications Equipment – 0.8% | ||||||||
Harris Corp. | 52,060 | 2,502,524 | ||||||
|
| |||||||
Electronic Equipment, Instruments & Components – 9.8% | ||||||||
Anixter International, Inc. | 46,820 | 3,226,834 | ||||||
Arrow Electronics, Inc.(a) | 91,060 | 3,656,059 | ||||||
AU Optronics Corp. (Sponsored ADR)(a) | 564,434 | 2,449,644 | ||||||
Avnet, Inc.(a) | 104,510 | 3,690,248 | ||||||
| ALLIANCEBERNSTEIN POOLING PORTFOLIOS • | 147 |
Small-Mid Cap Value Portfolio—Portfolio of Investments
| Company | Shares | U.S. $ Value | ||||||
| ||||||||
Flextronics International Ltd.(a) | 312,250 | $ | 2,076,463 | |||||
Ingram Micro, Inc. – Class A(a) | 131,600 | 2,481,976 | ||||||
Insight Enterprises, Inc.(a) | 185,593 | 3,567,097 | ||||||
Jabil Circuit, Inc. | 192,640 | 3,608,147 | ||||||
TTM Technologies, Inc.(a) | 292,918 | 2,401,928 | ||||||
Vishay Intertechnology, Inc.(a) | 380,980 | 5,025,126 | ||||||
|
| |||||||
| 32,183,522 | ||||||||
|
| |||||||
IT Services – 2.1% | ||||||||
Amdocs Ltd. | 109,350 | 3,987,995 | ||||||
Convergys Corp. | 180,110 | 2,988,025 | ||||||
|
| |||||||
| 6,976,020 | ||||||||
|
| |||||||
Semiconductors & Semiconductor | ||||||||
Amkor Technology, Inc.(a)(b) | 349,040 | 1,413,612 | ||||||
Entegris, Inc.(a) | 401,640 | 3,819,596 | ||||||
Lam Research Corp.(a) | 96,430 | 4,078,989 | ||||||
MEMC Electronic Materials, Inc.(a) | 557,240 | 2,758,338 | ||||||
Micron Technology, Inc.(a) | 511,200 | 4,288,968 | ||||||
MKS Instruments, Inc. | 95,684 | 2,596,864 | ||||||
|
| |||||||
| 18,956,367 | ||||||||
|
| |||||||
| 60,618,433 | ||||||||
|
| |||||||
Consumer Discretionary – 16.3% | ||||||||
Auto Components – 3.8% | ||||||||
Dana Holding Corp. | 232,890 | 3,896,250 | ||||||
Lear Corp. | 72,660 | 3,881,497 | ||||||
TRW Automotive Holdings Corp.(a) | 79,940 | 4,691,679 | ||||||
|
| |||||||
| 12,469,426 | ||||||||
|
| |||||||
Hotels, Restaurants & Leisure – 2.4% | ||||||||
MGM Resorts International(a) | 324,212 | 4,049,408 | ||||||
Royal Caribbean Cruises Ltd. | 105,320 | 3,672,508 | ||||||
|
| |||||||
| 7,721,916 | ||||||||
|
| |||||||
Household Durables – 4.1% | ||||||||
Meritage Homes Corp.(a) | 94,620 | 3,831,164 | ||||||
Newell Rubbermaid, Inc. | 81,700 | 1,906,878 | ||||||
NVR, Inc.(a) | 3,750 | 3,784,500 | ||||||
PulteGroup, Inc.(a) | 194,970 | 3,739,524 | ||||||
|
| |||||||
| 13,262,066 | ||||||||
|
| |||||||
Media – 1.9% | ||||||||
Gannett Co., Inc. | 146,780 | 2,945,875 | ||||||
Regal Entertainment Group—Class A(b) | 197,770 | 3,099,056 | ||||||
|
| |||||||
| 6,044,931 | ||||||||
|
| |||||||
Specialty Retail – 3.0% | ||||||||
GameStop Corp.—Class A(b) | 95,280 | 2,387,717 | ||||||
| 148 | • ALLIANCEBERNSTEIN POOLING PORTFOLIOS |
Small-Mid Cap Value Portfolio—Portfolio of Investments
| Company | Shares | U.S. $ Value | ||||||
| ||||||||
Men’s Wearhouse, Inc. (The) | 139,180 | $ | 3,913,741 | |||||
Office Depot, Inc.(a) | 905,430 | 3,648,883 | ||||||
|
| |||||||
| 9,950,341 | ||||||||
|
| |||||||
Textiles, Apparel & Luxury Goods – 1.1% | ||||||||
Jones Group, Inc. (The) | 324,780 | 3,747,961 | ||||||
|
| |||||||
| 53,196,641 | ||||||||
|
| |||||||
Industrials – 13.9% | ||||||||
Building Products – 1.5% | ||||||||
Fortune Brands Home & Security, Inc.(a) | 139,833 | 4,831,230 | ||||||
|
| |||||||
Commercial Services & Supplies – 1.6% | ||||||||
Avery Dennison Corp. | 67,760 | 2,767,996 | ||||||
Steelcase, Inc. | 181,320 | 2,565,678 | ||||||
|
| |||||||
| 5,333,674 | ||||||||
|
| |||||||
Construction & Engineering – 1.0% | ||||||||
Tutor Perini Corp.(a) | 198,580 | 3,377,846 | ||||||
|
| |||||||
Electrical Equipment – 2.4% | ||||||||
EnerSys, Inc.(a) | 88,280 | 3,608,886 | ||||||
General Cable Corp.(a) | 126,760 | 4,175,475 | ||||||
|
| |||||||
| 7,784,361 | ||||||||
|
| |||||||
Machinery – 3.9% | ||||||||
Kennametal, Inc. | 83,380 | 3,375,222 | ||||||
Terex Corp.(a) | 137,670 | 4,516,953 | ||||||
Timken Co. | 89,290 | 4,850,233 | ||||||
|
| |||||||
| 12,742,408 | ||||||||
|
| |||||||
Road & Rail – 2.4% | ||||||||
Avis Budget Group, Inc.(a) | 148,440 | 3,469,043 | ||||||
Con-way, Inc. | 123,530 | 4,342,079 | ||||||
|
| |||||||
| 7,811,122 | ||||||||
|
| |||||||
Trading Companies & Distributors – 1.1% | ||||||||
Aircastle Ltd. | 265,380 | 3,574,668 | ||||||
|
| |||||||
| 45,455,309 | ||||||||
|
| |||||||
Materials – 6.2% | ||||||||
Chemicals – 1.9% | ||||||||
Chemtura Corp.(a) | 173,560 | 3,492,027 | ||||||
Huntsman Corp. | 156,150 | 2,690,465 | ||||||
|
| |||||||
| 6,182,492 | ||||||||
|
| |||||||
Metals & Mining – 4.3% | ||||||||
Cliffs Natural Resources, Inc.(b) | 69,250 | 1,763,105 | ||||||
Commercial Metals Co. | 270,090 | 4,405,168 | ||||||
Reliance Steel & Aluminum Co. | 56,440 | 3,758,339 | ||||||
Steel Dynamics, Inc. | 275,330 | 4,204,289 | ||||||
|
| |||||||
| 14,130,901 | ||||||||
|
| |||||||
| 20,313,393 | ||||||||
|
| |||||||
| ALLIANCEBERNSTEIN POOLING PORTFOLIOS • | 149 |
Small-Mid Cap Value Portfolio—Portfolio of Investments
| Company | Shares | U.S. $ Value | ||||||
| ||||||||
Energy – 5.6% | ||||||||
Energy Equipment & Services – 3.1% | ||||||||
Bristow Group, Inc. | 69,050 | $ | 4,022,853 | |||||
Helix Energy Solutions Group, Inc.(a) | 92,805 | 2,172,565 | ||||||
Helmerich & Payne, Inc. | 59,530 | 3,944,458 | ||||||
|
| |||||||
| 10,139,876 | ||||||||
|
| |||||||
Oil, Gas & Consumable Fuels – 2.5% | ||||||||
Cimarex Energy Co. | 67,450 | 4,540,059 | ||||||
Stone Energy Corp.(a) | 98,930 | 2,023,119 | ||||||
Teekay Corp. | 50,350 | 1,747,145 | ||||||
|
| |||||||
| 8,310,323 | ||||||||
|
| |||||||
| 18,450,199 | ||||||||
|
| |||||||
Utilities – 5.4% | ||||||||
Electric Utilities – 3.3% | ||||||||
Great Plains Energy, Inc. | 152,780 | 3,335,188 | ||||||
NV Energy, Inc. | 192,430 | 3,802,417 | ||||||
PNM Resources, Inc. | 163,970 | 3,682,766 | ||||||
|
| |||||||
| 10,820,371 | ||||||||
|
| |||||||
Gas Utilities – 2.1% | ||||||||
Atmos Energy Corp. | 82,020 | 3,130,703 | ||||||
UGI Corp. | 99,090 | 3,549,404 | ||||||
|
| |||||||
| 6,680,107 | ||||||||
|
| |||||||
| 17,500,478 | ||||||||
|
| |||||||
Health Care – 3.5% | ||||||||
Health Care Providers & Services – 3.5% | ||||||||
Health Net, Inc./CA(a) | 137,540 | 3,540,280 | ||||||
LifePoint Hospitals, Inc.(a) | 69,428 | 3,061,081 | ||||||
Universal Health Services, Inc. – Class B | 84,950 | 4,917,755 | ||||||
|
| |||||||
| 11,519,116 | ||||||||
|
| |||||||
Consumer Staples – 2.7% | ||||||||
Beverages – 0.5% | ||||||||
Constellation Brands, Inc. – Class A(a) | 39,014 | 1,725,979 | ||||||
|
| |||||||
Food Products – 2.2% | ||||||||
Dole Food Co., Inc.(a) | 258,830 | 2,898,896 | ||||||
Tyson Foods, Inc. – Class A | 179,500 | 4,069,265 | ||||||
|
| |||||||
| 6,968,161 | ||||||||
|
| |||||||
| 8,694,140 | ||||||||
|
| |||||||
Total Common Stocks | 321,865,085 | |||||||
|
| |||||||
SHORT-TERM INVESTMENTS – 0.9% | ||||||||
Investment Companies – 0.9% | ||||||||
AllianceBernstein Fixed-Income Shares, Inc. – Government STIF Portfolio, 0.12%(c) | 2,817,260 | 2,817,260 | ||||||
|
| |||||||
| 150 | • ALLIANCEBERNSTEIN POOLING PORTFOLIOS |
Small-Mid Cap Value Portfolio—Portfolio of Investments
| Company | Shares | U.S. $ Value | ||||||
| ||||||||
Total Investments Before Security Lending Collateral for Securities Loaned – 99.4% | $ | 324,682,345 | ||||||
|
| |||||||
INVESTMENTS OF CASH COLLATERAL FOR SECURITIES LOANED – 2.7% | ||||||||
Investment Companies – 2.7% | ||||||||
AllianceBernstein Exchange Reserves – Class I, 0.10%(c) (cost $8,851,935) | 8,851,935 | 8,851,935 | ||||||
|
| |||||||
Total Investments – 102.1% | 333,534,280 | |||||||
Other assets less liabilities – (2.1)% | (6,818,884 | ) | ||||||
|
| |||||||
Net Assets – 100.0% | $ | 326,715,396 | ||||||
|
| |||||||
| (a) | Non-income producing security. |
| (b) | Represents entire or partial securities out on loan. See Note D for securities lending information. |
| (c) | Investment in affiliated money market mutual fund. The rate shown represents the 7-day yield as of period end. |
Glossary:
| ADR | – American Depositary Receipt |
See notes to financial statements.
| ALLIANCEBERNSTEIN POOLING PORTFOLIOS • | 151 |
Small-Mid Cap Value Portfolio—Portfolio of Investments
SMALL-MID CAP GROWTH PORTFOLIO
PORTFOLIO OF INVESTMENTS
February 28, 2013 (unaudited)
| Company | Shares | U.S. $ Value | ||||||
| ||||||||
COMMON STOCKS – 97.8% | ||||||||
Industrials – 26.0% | ||||||||
Aerospace & Defense – 3.0% | ||||||||
Hexcel Corp.(a) | 191,719 | $ | 5,224,343 | |||||
TransDigm Group, Inc. | 31,220 | 4,443,855 | ||||||
|
| |||||||
| 9,668,198 | ||||||||
|
| |||||||
Air Freight & Logistics – 1.0% | ||||||||
Expeditors International of Washington, Inc. | 87,490 | 3,398,986 | ||||||
|
| |||||||
Building Products – 0.4% | ||||||||
Simpson Manufacturing Co., Inc. | �� | 40,781 | 1,186,727 | |||||
|
| |||||||
Electrical Equipment – 1.3% | ||||||||
AMETEK, Inc. | 101,231 | 4,234,493 | ||||||
|
| |||||||
Industrial Conglomerates – 1.3% | ||||||||
Carlisle Cos., Inc. | 64,840 | 4,400,691 | ||||||
|
| |||||||
Machinery – 9.5% | ||||||||
Actuant Corp. – Class A | 120,832 | 3,674,501 | ||||||
Chart Industries, Inc.(a) | 48,590 | 3,525,690 | ||||||
IDEX Corp. | 80,145 | 4,081,785 | ||||||
Joy Global, Inc. | 66,840 | 4,233,646 | ||||||
Lincoln Electric Holdings, Inc. | 101,680 | 5,699,164 | ||||||
Middleby Corp.(a) | 30,420 | 4,542,010 | ||||||
Valmont Industries, Inc. | 34,761 | 5,476,596 | ||||||
|
| |||||||
| 31,233,392 | ||||||||
|
| |||||||
Marine – 1.8% | ||||||||
Kirby Corp.(a) | 78,728 | 5,981,753 | ||||||
|
| |||||||
Professional Services – 3.1% | ||||||||
Advisory Board Co. (The)(a) | 83,071 | 4,220,838 | ||||||
Robert Half International, Inc. | 162,810 | 5,787,895 | ||||||
|
| |||||||
| 10,008,733 | ||||||||
|
| |||||||
Road & Rail – 1.7% | ||||||||
Genesee & Wyoming, Inc. – Class A(a) | 61,585 | 5,513,089 | ||||||
|
| |||||||
Trading Companies & Distributors – 2.9% | ||||||||
MSC Industrial Direct Co., Inc. – Class A | 42,440 | 3,620,981 | ||||||
United Rentals, Inc.(a) | 109,990 | 5,874,566 | ||||||
|
| |||||||
| 9,495,547 | ||||||||
|
| |||||||
| 85,121,609 | ||||||||
|
| |||||||
Consumer Discretionary – 22.2% | ||||||||
Distributors – 1.6% | ||||||||
LKQ Corp.(a) | 245,068 | 5,192,991 | ||||||
|
| |||||||
Diversified Consumer Services – 1.3% | ||||||||
K12, Inc.(a) (b) | 197,230 | 4,112,246 | ||||||
|
| |||||||
| 152 | • ALLIANCEBERNSTEIN POOLING PORTFOLIOS |
Small-Mid Cap Growth Portfolio—Portfolio of Investments
| Company | Shares | U.S. $ Value | ||||||
| ||||||||
Hotels, Restaurants & Leisure – 3.6% | ||||||||
Norwegian Cruise Line Holdings Ltd.(a) | 148,797 | $ | 4,609,731 | |||||
Orient-Express Hotels Ltd. – Class A(a) | 288,085 | 2,975,918 | ||||||
Panera Bread Co. – Class A(a) | 27,250 | 4,385,888 | ||||||
|
| |||||||
| 11,971,537 | ||||||||
|
| |||||||
Internet & Catalog Retail – 0.7% | ||||||||
NetFlix, Inc.(a) (b) | 11,455 | 2,154,456 | ||||||
|
| |||||||
Media – 2.0% | ||||||||
National CineMedia, Inc. | 243,354 | 3,711,149 | ||||||
Pandora Media, Inc.(a)(b) | 241,010 | 2,940,322 | ||||||
|
| |||||||
| 6,651,471 | ||||||||
|
| |||||||
Specialty Retail – 10.3% | ||||||||
CarMax, Inc.(a) | 112,457 | 4,319,473 | ||||||
Dick’s Sporting Goods, Inc. | 102,220 | 5,111,000 | ||||||
Five Below, Inc.(a) (b) | 81,014 | 3,224,357 | ||||||
Francesca’s Holdings Corp.(a) | 155,982 | 3,969,742 | ||||||
Lumber Liquidators Holdings, Inc.(a) | 85,420 | 5,056,010 | ||||||
Select Comfort Corp.(a) | 21,209 | 435,421 | ||||||
Tractor Supply Co. | 33,915 | 3,526,821 | ||||||
Ulta Salon Cosmetics & Fragrance, Inc. | 49,490 | 4,382,834 | ||||||
Vitamin Shoppe, Inc.(a) | 71,356 | 3,749,758 | ||||||
|
| |||||||
| 33,775,416 | ||||||||
|
| |||||||
Textiles, Apparel & Luxury Goods – 2.7% | ||||||||
PVH Corp. | 40,354 | 4,917,135 | ||||||
Tumi Holdings, Inc.(a) (b) | 168,207 | 3,976,413 | ||||||
|
| |||||||
| 8,893,548 | ||||||||
|
| |||||||
| 72,751,665 | ||||||||
|
| |||||||
Information Technology – 18.8% | ||||||||
Communications Equipment – 3.9% | ||||||||
Acme Packet, Inc.(a) | 76,860 | 2,242,775 | ||||||
Aruba Networks, Inc.(a) | 160,380 | 3,996,669 | ||||||
Ciena Corp.(a) | 187,880 | 2,863,291 | ||||||
JDS Uniphase Corp.(a) | 272,060 | 3,852,370 | ||||||
|
| |||||||
| 12,955,105 | ||||||||
|
| |||||||
Internet Software & Services – 1.8% | ||||||||
CoStar Group, Inc.(a) | 57,167 | 5,759,003 | ||||||
|
| |||||||
IT Services – 1.0% | ||||||||
MAXIMUS, Inc. | 43,520 | 3,167,386 | ||||||
|
| |||||||
Semiconductors & Semiconductor Equipment – 4.9% | ||||||||
Cavium, Inc.(a) | 73,330 | 2,707,344 | ||||||
Cree, Inc.(a)(b) | 75,874 | 3,431,781 | ||||||
| ALLIANCEBERNSTEIN POOLING PORTFOLIOS • | 153 |
Small-Mid Cap Growth Portfolio—Portfolio of Investments
| Company | Shares | U.S. $ Value | ||||||
| ||||||||
Fairchild Semiconductor International, Inc.(a) | 280,086 | $ | 3,994,026 | |||||
Teradyne, Inc.(a) | 173,910 | 2,914,732 | ||||||
Veeco Instruments, Inc.(a) | 98,706 | 3,149,708 | ||||||
|
| |||||||
| 16,197,591 | ||||||||
|
| |||||||
Software – 7.2% | ||||||||
ANSYS, Inc.(a) | 39,921 | 3,026,012 | ||||||
Aspen Technology, Inc.(a) | 126,086 | 3,878,405 | ||||||
Cadence Design Systems, Inc.(a) | 406,155 | 5,751,155 | ||||||
Fortinet, Inc.(a) | 73,830 | 1,785,210 | ||||||
ServiceNow, Inc.(a) (b) | 120,183 | 3,902,342 | ||||||
SolarWinds, Inc.(a) | 74,509 | 4,206,778 | ||||||
Workday, Inc.(a) (b) | 17,859 | 987,424 | ||||||
|
| |||||||
| 23,537,326 | ||||||||
|
| |||||||
| 61,616,411 | ||||||||
|
| |||||||
Health Care – 14.2% | ||||||||
Biotechnology – 3.2% | ||||||||
Ariad Pharmaceuticals, Inc.(a) | 56,529 | 1,188,805 | ||||||
BioMarin Pharmaceutical, Inc.(a) | 55,120 | 3,195,307 | ||||||
Cubist Pharmaceuticals, Inc.(a) | 54,865 | 2,327,922 | ||||||
Onyx Pharmaceuticals, Inc.(a) | 51,530 | 3,880,724 | ||||||
|
| |||||||
| 10,592,758 | ||||||||
|
| |||||||
Health Care Equipment & Supplies – 3.0% | ||||||||
Align Technology, Inc.(a) | 17,830 | 560,575 | ||||||
HeartWare International, Inc.(a) (b) | 35,580 | 3,039,244 | ||||||
Sirona Dental Systems, Inc.(a) | 60,526 | 4,298,556 | ||||||
Volcano Corp.(a) | 87,828 | 1,900,598 | ||||||
|
| |||||||
| 9,798,973 | ||||||||
|
| |||||||
Health Care Providers & Services – 5.0% | ||||||||
Acadia Healthcare Co., Inc.(a) | 143,419 | 3,903,865 | ||||||
Catamaran Corp.(a) | 108,688 | 5,837,633 | ||||||
Mednax, Inc.(a) | 49,647 | 4,250,776 | ||||||
WellCare Health Plans, Inc.(a) | 38,880 | 2,223,547 | ||||||
|
| |||||||
| 16,215,821 | ||||||||
|
| |||||||
Life Sciences Tools & Services – 1.1% | ||||||||
ICON PLC(a) | 118,327 | 3,687,069 | ||||||
|
| |||||||
Pharmaceuticals – 1.9% | ||||||||
Akorn, Inc.(a) | 216,204 | 2,983,615 | ||||||
Impax Laboratories, Inc.(a) | 13,100 | 259,773 | ||||||
Jazz Pharmaceuticals PLC(a) | 51,750 | 3,010,815 | ||||||
|
| |||||||
| 6,254,203 | ||||||||
|
| |||||||
| 46,548,824 | ||||||||
|
| |||||||
Financials – 8.4% | ||||||||
Capital Markets – 4.1% | ||||||||
Affiliated Managers Group, Inc.(a) | 37,610 | 5,499,710 | ||||||
| 154 | • ALLIANCEBERNSTEIN POOLING PORTFOLIOS |
Small-Mid Cap Growth Portfolio—Portfolio of Investments
| Company | Shares | U.S. $ Value | ||||||
| ||||||||
Lazard Ltd. – Class A | 121,090 | $ | 4,347,131 | |||||
Stifel Financial Corp.(a) | 99,481 | 3,436,074 | ||||||
|
| |||||||
| 13,282,915 | ||||||||
|
| |||||||
Commercial Banks – 3.6% | ||||||||
Iberiabank Corp. | 77,472 | 3,889,094 | ||||||
Signature Bank/New York NY(a) | 58,320 | 4,331,427 | ||||||
SVB Financial Group(a) | 54,790 | 3,674,217 | ||||||
|
| |||||||
| 11,894,738 | ||||||||
|
| |||||||
Real Estate Management & | ||||||||
Realogy Holdings Corp.(a) | 53,102 | 2,381,625 | ||||||
|
| |||||||
| 27,559,278 | ||||||||
|
| |||||||
Energy – 5.8% | ||||||||
Energy Equipment & Services – 3.2% | ||||||||
FMC Technologies, Inc.(a) | 52,340 | 2,716,969 | ||||||
Oceaneering International, Inc. | 66,430 | 4,224,284 | ||||||
Oil States International, Inc.(a) | 45,899 | 3,495,209 | ||||||
|
| |||||||
| 10,436,462 | ||||||||
|
| |||||||
Oil, Gas & Consumable Fuels – 2.6% | ||||||||
Cabot Oil & Gas Corp. | 47,590 | 2,949,152 | ||||||
Concho Resources, Inc.(a) | 28,103 | 2,528,146 | ||||||
SM Energy Co. | 53,373 | 3,089,229 | ||||||
|
| |||||||
| 8,566,527 | ||||||||
|
| |||||||
| 19,002,989 | ||||||||
|
| |||||||
Consumer Staples – 1.0% | ||||||||
Food Products – 1.0% | ||||||||
Green Mountain Coffee Roasters, Inc.(a)(b) | 65,420 | 3,124,459 | ||||||
|
| |||||||
Materials – 0.7% | ||||||||
Chemicals – 0.7% | ||||||||
PolyOne Corp. | 107,400 | 2,447,646 | ||||||
|
| |||||||
Telecommunication Services – 0.7% | ||||||||
Diversified Telecommunication | ||||||||
tw telecom, Inc.(a) | 90,317 | 2,286,826 | ||||||
|
| |||||||
Total Common Stocks | 320,459,707 | |||||||
|
| |||||||
SHORT-TERM INVESTMENTS – 0.9% | ||||||||
Investment Companies – 0.9% | ||||||||
AllianceBernstein Fixed-Income Shares, Inc. – Government STIF Portfolio, 0.12%(c) | 3,001,099 | 3,001,099 | ||||||
|
| |||||||
| ALLIANCEBERNSTEIN POOLING PORTFOLIOS • | 155 |
Small-Mid Cap Growth Portfolio—Portfolio of Investments
| Company | Shares | U.S. $ Value | ||||||
| ||||||||
Total Investments Before Security Lending Collateral for | $ | 323,460,806 | ||||||
|
| |||||||
INVESTMENTS OF CASH COLLATERAL FOR SECURITIES LOANED – 7.5% | ||||||||
Investment Companies – 7.5% | ||||||||
AllianceBernstein Exchange Reserves – Class I, 0.10%(c) | 24,809,497 | 24,809,497 | ||||||
|
| |||||||
Total Investments – 106.2% | 348,270,303 | |||||||
Other assets less liabilities – (6.2)% | (20,463,759 | ) | ||||||
|
| |||||||
Net Assets – 100.0% | $ | 327,806,544 | ||||||
|
| |||||||
| (a) | Non-income producing security. |
| (b) | Represents entire or partial securities out on loan. See Note D for securities lending information. |
| (c) | Investment in affiliated money market mutual fund. The rate shown represents the 7-day yield as of period end. |
See notes to financial statements.
| 156 | • ALLIANCEBERNSTEIN POOLING PORTFOLIOS |
Small-Mid Cap Growth Portfolio—Portfolio of Investments
MULTI-ASSET REAL RETURN PORTFOLIO
CONSOLIDATED PORTFOLIO OF INVESTMENTS
February 28, 2013 (unaudited)
| Company | Shares | U.S. $ Value | ||||||
| ||||||||
COMMON STOCKS – 61.1% | ||||||||
Energy – 24.0% | ||||||||
Coal & Consumable Fuels – 0.7% | ||||||||
Adaro Energy Tbk PT | 1,436,800 | $ | 232,987 | |||||
Banpu PCL | 189,700 | 2,493,200 | ||||||
Cameco Corp. | 107,260 | 2,288,213 | ||||||
China Coal Energy Co., Ltd. – Class H | 206,700 | 203,866 | ||||||
China Shenhua Energy Co., Ltd. – Class H | 167,870 | 634,870 | ||||||
Coal India Ltd. | 31,010 | 178,226 | ||||||
Consol Energy, Inc. | 9,980 | 320,857 | ||||||
Exxaro Resources Ltd.(a) | 65,430 | 1,243,434 | ||||||
Indo Tambangraya Megah Tbk PT | 49,900 | 207,473 | ||||||
Peabody Energy Corp. | 12,290 | 264,972 | ||||||
Tambang Batubara Bukit Asam Persero | 182,000 | 284,257 | ||||||
|
| |||||||
| 8,352,355 | ||||||||
|
| |||||||
Integrated Oil & Gas – 17.1% | ||||||||
BG Group PLC | 530,590 | 9,356,166 | ||||||
BP PLC | 2,645,910 | 17,742,221 | ||||||
Cenovus Energy, Inc. | 33,900 | 1,097,620 | ||||||
Chevron Corp. | 188,910 | 22,130,807 | ||||||
China Petroleum & Chemical Corp. – Class H | 4,660,100 | 5,291,445 | ||||||
ENI SpA | 416,020 | 9,468,518 | ||||||
Exxon Mobil Corp. | 520,330 | 46,595,552 | ||||||
Galp Energia SGPS SA | 69,067 | 1,064,007 | ||||||
Gazprom OAO (Sponsored ADR) | 933,320 | 8,287,881 | ||||||
Hess Corp. | 59,000 | 3,923,500 | ||||||
Husky Energy, Inc.(a) | 43,400 | 1,334,511 | ||||||
Imperial Oil Ltd. | 27,500 | 1,143,467 | ||||||
LUKOIL OAO (London) (Sponsored ADR) | 26,980 | 1,740,210 | ||||||
Murphy Oil Corp. | 23,580 | 1,435,550 | ||||||
Origin Energy Ltd. | 99,400 | 1,231,083 | ||||||
PetroChina Co., Ltd. – Class H | 947,800 | 1,298,980 | ||||||
Petroleo Brasileiro SA | 133,700 | 978,738 | ||||||
Petroleo Brasileiro SA (ADR) | 279,200 | 4,095,864 | ||||||
Petroleo Brasileiro SA (Preference Shares) | 188,700 | 1,583,463 | ||||||
Petroleo Brasileiro SA (Sponsored ADR) | 125,668 | 2,102,426 | ||||||
PTT PCL | 284,100 | 3,342,353 | ||||||
Repsol SA | 43,700 | 929,553 | ||||||
Rosneft OAO (GDR)(b) | 92,630 | 735,019 | ||||||
Royal Dutch Shell PLC (Euronext Amsterdam) –Class A | 351,143 | 11,533,143 | ||||||
Royal Dutch Shell PLC – Class A | 199,015 | 6,536,562 | ||||||
Royal Dutch Shell PLC – Class B | 255,950 | 8,612,902 | ||||||
Sasol Ltd. | 24,600 | 1,046,286 | ||||||
Statoil ASA | 118,450 | 2,940,484 | ||||||
Suncor Energy, Inc. (Toronto) | 269,550 | 8,168,182 | ||||||
Surgutneftegas OAO (Sponsored ADR)(a) | 90,460 | 854,847 | ||||||
Total SA | 169,370 | 8,455,911 | ||||||
|
| |||||||
| 195,057,251 | ||||||||
|
| |||||||
| ALLIANCEBERNSTEIN POOLING PORTFOLIOS • | 157 |
Multi-Asset Real Return Portfolio—Consolidated Portfolio of Investments
| Company | Shares | U.S. $ Value | ||||||
| ||||||||
Oil & Gas Drilling – 0.4% | ||||||||
Diamond Offshore Drilling, Inc. | 20,790 | $ | 1,448,647 | |||||
Helmerich & Payne, Inc. | 20,210 | 1,339,114 | ||||||
Seadrill Ltd.(a) | 61,110 | 2,240,904 | ||||||
|
| |||||||
| 5,028,665 | ||||||||
|
| |||||||
Oil & Gas Equipment & Services – 0.7% | ||||||||
Aker Solutions ASA | 69,170 | 1,355,777 | ||||||
Halliburton Co. | 56,280 | 2,336,183 | ||||||
Schlumberger Ltd. | 48,730 | 3,793,631 | ||||||
|
| |||||||
| 7,485,591 | ||||||||
|
| |||||||
Oil & Gas Exploration & Production – 5.0% | ||||||||
Anadarko Petroleum Corp. | 79,530 | 6,328,998 | ||||||
Apache Corp. | 20,900 | 1,552,243 | ||||||
ARC Resources Ltd.(a) | 13,100 | 330,279 | ||||||
Athabasca Oil Corp.(c) | 35,900 | 352,995 | ||||||
Baytex Energy Corp.(a) | 14,500 | 605,590 | ||||||
Cabot Oil & Gas Corp. | 32,510 | 2,014,644 | ||||||
Cairn India Ltd. | 44,800 | 246,711 | ||||||
Canadian Natural Resources Ltd. | 58,600 | 1,791,100 | ||||||
Canadian Oil Sands Ltd. | 21,800 | 446,253 | ||||||
Chesapeake Energy Corp.(a) | 29,900 | 602,784 | ||||||
Cimarex Energy Co. | 2,600 | 175,006 | ||||||
CNOOC Ltd. | 956,200 | 1,871,264 | ||||||
Cobalt International Energy, Inc.(c) | 10,500 | 259,035 | ||||||
Concho Resources, Inc.(c) | 4,400 | 395,824 | ||||||
ConocoPhillips | 61,800 | 3,581,310 | ||||||
Continental Resources, Inc./OK(c) | 3,600 | 316,800 | ||||||
Crescent Point Energy Corp.(a) | 15,600 | 593,746 | ||||||
Denbury Resources, Inc.(c) | 40,200 | 728,424 | ||||||
Devon Energy Corp. | 17,300 | 938,698 | ||||||
EnCana Corp. | 33,100 | 595,399 | ||||||
EOG Resources, Inc. | 42,290 | 5,316,276 | ||||||
EQT Corp. | 6,700 | 422,703 | ||||||
Inpex Corp. | 99 | 525,515 | ||||||
Kunlun Energy Co., Ltd. | 144,000 | 299,004 | ||||||
Lundin Petroleum AB(c) | 83,650 | 1,893,789 | ||||||
Marathon Oil Corp. | 31,690 | 1,061,615 | ||||||
MEG Energy Corp.(c) | 11,900 | 384,262 | ||||||
Newfield Exploration Co.(c) | 8,850 | 204,612 | ||||||
Nexen, Inc. (Toronto)(d)(e) | 23,803 | 652,981 | ||||||
Noble Energy, Inc. | 24,720 | 2,739,717 | ||||||
NovaTek OAO (Sponsored GDR)(b) | 4,100 | 475,600 | ||||||
Occidental Petroleum Corp. | 116,780 | 9,614,497 | ||||||
OGX Petroleo e Gas Participacoes SA(c) | 172,600 | 274,674 | ||||||
Oil & Natural Gas Corp. Ltd. | 54,600 | 314,106 | ||||||
Pacific Rubiales Energy Corp. | 13,200 | 323,200 | ||||||
Penn West Petroleum Ltd.(a) | 57,100 | 554,804 | ||||||
| 158 | • ALLIANCEBERNSTEIN POOLING PORTFOLIOS |
Multi-Asset Real Return Portfolio—Consolidated Portfolio of Investments
| Company | Shares | U.S. $ Value | ||||||
| ||||||||
Pioneer Natural Resources Co. | 5,300 | $ | 666,793 | |||||
Plains Exploration & Production Co.(c) | 14,400 | 653,328 | ||||||
PTT Exploration & Production PCL | 91,089 | 483,767 | ||||||
QEP Resources, Inc. | 22,000 | 670,120 | ||||||
Range Resources Corp. | 7,300 | 560,640 | ||||||
Santos Ltd.(a) | 42,900 | 585,047 | ||||||
Southwestern Energy Co.(c) | 15,700 | 538,039 | ||||||
Talisman Energy, Inc. | 46,400 | 582,672 | ||||||
Tatneft OAO (Sponsored ADR) | 12,230 | 508,768 | ||||||
Tourmaline Oil Corp.(c) | 24,400 | 869,764 | ||||||
Tullow Oil PLC | 40,800 | 749,441 | ||||||
Vermilion Energy, Inc.(a) | 3,200 | 165,609 | ||||||
Whiting Petroleum Corp.(c) | 7,197 | 350,494 | ||||||
Woodside Petroleum Ltd. | 29,600 | 1,129,390 | ||||||
|
| |||||||
| 57,298,330 | ||||||||
|
| |||||||
Oil & Gas Refining & Marketing – 0.1% | ||||||||
Valero Energy Corp. | 25,140 | 1,146,133 | ||||||
|
| |||||||
| 274,368,325 | ||||||||
|
| |||||||
Materials – 12.7% | ||||||||
Aluminum – 0.1% | ||||||||
Alcoa, Inc. | 50,900 | 433,668 | ||||||
Alumina Ltd.(a)(c) | 202,500 | 252,764 | ||||||
Aluminum Corp. of China Ltd.(a)(c) | 634,200 | 273,543 | ||||||
Hindalco Industries Ltd. | 77,300 | 140,695 | ||||||
Norsk Hydro ASA | 35,000 | 154,171 | ||||||
|
| |||||||
| 1,254,841 | ||||||||
|
| |||||||
Diversified Chemicals – 0.2% | ||||||||
BASF SE | 30,500 | 2,864,457 | ||||||
|
| |||||||
Diversified Metals & Mining – 5.4% | ||||||||
Anglo American PLC | 220,820 | 6,398,645 | ||||||
Antofagasta PLC | 18,200 | 300,066 | ||||||
Assore Ltd.(a) | 8,600 | 321,985 | ||||||
BHP Billiton Ltd. | 358,080 | 13,405,857 | ||||||
BHP Billiton PLC | 118,710 | 3,745,995 | ||||||
Eurasian Natural Resources Corp. PLC | 143,200 | 729,832 | ||||||
First Quantum Minerals Ltd. | 26,800 | 499,227 | ||||||
Freeport-McMoRan Copper & Gold, Inc. | 151,860 | 4,847,371 | ||||||
Glencore International PLC(a) | 214,000 | 1,253,730 | ||||||
Grupo Mexico SAB de CV | 182,300 | 714,801 | ||||||
Inmet Mining Corp. | 5,300 | 348,965 | ||||||
KGHM Polska Miedz SA | 6,400 | 362,867 | ||||||
Korea Zinc Co., Ltd.(c) | 1,900 | 655,912 | ||||||
Minera Frisco SAB de CV(c) | 61,600 | 259,487 | ||||||
MMC Norilsk Nickel OJSC (ADR) | 177,510 | 3,141,927 | ||||||
Rio Tinto Ltd.(a) | 24,500 | 1,667,327 | ||||||
Rio Tinto PLC | 273,190 | 14,608,108 | ||||||
| ALLIANCEBERNSTEIN POOLING PORTFOLIOS • | 159 |
Multi-Asset Real Return Portfolio—Consolidated Portfolio of Investments
| Company | Shares | U.S. $ Value | ||||||
| ||||||||
Southern Copper Corp. | 7,100 | $ | 268,309 | |||||
Sterlite Industries India Ltd. | 128,200 | 224,440 | ||||||
Sumitomo Metal Mining Co., Ltd. | 27,000 | 425,078 | ||||||
Teck Resources Ltd. | 119,690 | 3,705,893 | ||||||
Turquoise Hill Resources Ltd.(c) | 28,400 | 181,485 | ||||||
Xstrata PLC | 181,590 | 3,187,170 | ||||||
|
| |||||||
| 61,254,477 | ||||||||
|
| |||||||
Fertilizers & Agricultural | ||||||||
Agrium, Inc. | 27,405 | 2,837,896 | ||||||
CF Industries Holdings, Inc. | 2,100 | 421,743 | ||||||
Incitec Pivot Ltd. | 64,400 | 211,688 | ||||||
Israel Chemicals Ltd. | 18,300 | 235,904 | ||||||
Israel Corp. Ltd. (The) | 209 | 149,696 | ||||||
K&S AG | 13,500 | 632,997 | ||||||
Monsanto Co. | 69,540 | 7,025,626 | ||||||
Mosaic Co. (The) | 10,200 | 597,108 | ||||||
Potash Corp. of Saskatchewan, Inc. | 34,200 | 1,372,311 | ||||||
Syngenta AG | 3,700 | 1,570,227 | ||||||
Uralkali OJSC (Sponsored GDR)(b) | 10,850 | 411,758 | ||||||
Yara International ASA | 12,300 | 586,454 | ||||||
|
| |||||||
| 16,053,408 | ||||||||
|
| |||||||
Forest Products – 0.0% | ||||||||
Duratex SA | 12,600 | 105,350 | ||||||
|
| |||||||
Gold – 2.1% | ||||||||
Agnico-Eagle Mines Ltd. | 38,740 | 1,553,732 | ||||||
Anglogold Ashanti Ltd. | 18,000 | 436,894 | ||||||
Barrick Gold Corp.(a) | 47,700 | 1,446,380 | ||||||
Cia de Minas Buenaventura SA (ADR) – | 23,200 | 594,384 | ||||||
Eldorado Gold Corp. | 68,100 | 672,250 | ||||||
Franco-Nevada Corp. | 4,400 | 212,821 | ||||||
Gold Fields Ltd. | 70,600 | 578,660 | ||||||
Goldcorp, Inc. | 199,830 | 6,522,452 | ||||||
Harmony Gold Mining Co., Ltd. | 49,500 | 310,248 | ||||||
IAMGOLD Corp. | 32,500 | 219,030 | ||||||
Kinross Gold Corp. | 400,580 | 3,049,263 | ||||||
Koza Altin Isletmeleri AS | 62,350 | 1,474,845 | ||||||
New Gold, Inc.(c) | 123,050 | 1,097,755 | ||||||
Newcrest Mining Ltd. | 36,500 | 836,764 | ||||||
Newmont Mining Corp. | 23,600 | 950,844 | ||||||
Osisko Mining Corp.(c) | 48,600 | 281,350 | ||||||
Randgold Resources Ltd. | 2,700 | 223,497 | ||||||
Real Gold Mining Ltd.(a)(c)(d)(e) | 686,500 | 123,923 | ||||||
Yamana Gold, Inc. | 174,850 | 2,573,792 | ||||||
Zijin Mining Group Co., Ltd.(a) | 1,064,800 | 364,552 | ||||||
|
| |||||||
| 23,523,436 | ||||||||
|
| |||||||
| 160 | • ALLIANCEBERNSTEIN POOLING PORTFOLIOS |
Multi-Asset Real Return Portfolio—Consolidated Portfolio of Investments
| Company | Shares | U.S. $ Value | ||||||
| ||||||||
Paper Products – 0.4% | ||||||||
Fibria Celulose SA(c) | 19,600 | $ | 222,102 | |||||
International Paper Co. | 16,500 | 726,165 | ||||||
MeadWestvaco Corp. | 5,100 | 182,121 | ||||||
Mondi PLC | 154,820 | 1,976,124 | ||||||
Nine Dragons Paper Holdings Ltd. | 302,500 | 287,380 | ||||||
OJI Holdings Corp. | 150,000 | 570,541 | ||||||
Stora Enso Oyj | 24,600 | 164,679 | ||||||
UPM-Kymmene Oyj | 13,500 | 157,248 | ||||||
|
| |||||||
| 4,286,360 | ||||||||
|
| |||||||
Precious Metals & Minerals – 0.4% | ||||||||
Anglo American Platinum Ltd.(a) | 3,400 | 160,077 | ||||||
Fresnillo PLC | 20,700 | 484,406 | ||||||
Harry Winston Diamond Corp.(c) | 80,600 | 1,258,166 | ||||||
Impala Platinum Holdings Ltd. | 25,600 | 393,692 | ||||||
Industrias Penoles SAB de CV | 4,300 | 198,747 | ||||||
Kazakhmys PLC | 31,200 | 291,076 | ||||||
North American Palladium Ltd.(a)(c) | 555,710 | 822,451 | ||||||
Northam Platinum Ltd. | 45,753 | 199,087 | ||||||
Pan American Silver Corp. | 12,200 | 202,180 | ||||||
Silver Wheaton Corp. | 16,900 | 535,884 | ||||||
|
| |||||||
| 4,545,766 | ||||||||
|
| |||||||
Specialty Chemicals – 0.3% | ||||||||
Johnson Matthey PLC | 30,400 | 1,056,320 | ||||||
Koninklijke DSM NV | 47,656 | 2,783,408 | ||||||
|
| |||||||
| 3,839,728 | ||||||||
|
| |||||||
Steel – 2.4% | ||||||||
Allegheny Technologies, Inc. | 5,000 | 152,350 | ||||||
ArcelorMittal (Euronext Amsterdam) | 44,600 | 667,736 | ||||||
Arrium Ltd. | 591,757 | 720,452 | ||||||
Bradespar SA | 19,800 | 290,588 | ||||||
Cia Siderurgica Nacional SA | 59,800 | 302,112 | ||||||
Cliffs Natural Resources, Inc.(a) | 4,400 | 112,024 | ||||||
Commercial Metals Co. | 131,540 | 2,145,417 | ||||||
Eregli Demir ve Celik Fabrikalari TAS | 132,100 | 170,353 | ||||||
Evraz PLC | 41,100 | 169,045 | ||||||
Fortescue Metals Group Ltd.(a) | 78,800 | 376,479 | ||||||
Fosun International | 472,600 | 306,815 | ||||||
Gerdau SA | 48,300 | 401,402 | ||||||
Hitachi Metals Ltd. | 14,000 | 130,941 | ||||||
Hyundai Hysco Co., Ltd. | 3,500 | 116,472 | ||||||
Hyundai Steel Co. | 6,100 | 476,025 | ||||||
JFE Holdings, Inc. | 146,300 | 3,132,395 | ||||||
Jindal Steel & Power Ltd. | 39,400 | 259,569 | ||||||
JSW Steel Ltd. | 20,300 | 276,835 | ||||||
Kobe Steel Ltd.(c) | 252,000 | 339,734 | ||||||
| ALLIANCEBERNSTEIN POOLING PORTFOLIOS • | 161 |
Multi-Asset Real Return Portfolio—Consolidated Portfolio of Investments
| Company | Shares | U.S. $ Value | ||||||
| ||||||||
Kumba Iron Ore Ltd.(a) | 2,500 | $ | 157,059 | |||||
Metalurgica Gerdau SA (Preference Shares) | 13,300 | 140,767 | ||||||
Nippon Steel & Sumitomo Metal Corp. | 427,000 | 1,155,983 | ||||||
Novolipetsk Steel OJSC (GDR)(b) | 14,700 | 282,093 | ||||||
Nucor Corp. | 15,100 | 680,255 | ||||||
POSCO | 3,700 | 1,205,047 | ||||||
Severstal OAO (GDR)(b) | 24,460 | 274,197 | ||||||
Tata Steel Ltd. | 55,500 | 351,415 | ||||||
ThyssenKrupp AG(c) | 18,400 | 413,448 | ||||||
United States Steel Corp.(a) | 43,460 | 905,707 | ||||||
Vale SA | 73,600 | 1,405,517 | ||||||
Vale SA (Preference Shares) | 112,600 | 2,079,180 | ||||||
Vale SA (Sponsored ADR) (Local Preference Shares) | 420,910 | 7,732,117 | ||||||
Voestalpine AG | 9,100 | 306,184 | ||||||
|
| |||||||
| 27,635,713 | ||||||||
|
| |||||||
| 145,363,536 | ||||||||
|
| |||||||
Equity:Other – 8.8% | ||||||||
Diversified/Specialty – 7.4% | ||||||||
Agung Podomoro Land Tbk PT | 3,388,700 | 159,339 | ||||||
Alam Sutera Realty Tbk PT | 1,811,500 | 173,982 | ||||||
Amata Corp. PCL | 121,100 | 103,800 | ||||||
Anant Raj Ltd. | 21,700 | 24,676 | ||||||
ANF Immobilier | 1,400 | 40,485 | ||||||
Asian Property Development PCL | 128,900 | 44,628 | ||||||
Ayala Land, Inc. | 1,766,700 | 1,388,741 | ||||||
Azrieli Group | 1,900 | 50,882 | ||||||
Bakrieland Development Tbk PT(c) | 3,490,300 | 21,256 | ||||||
Beijing North Star Co., Ltd. | 567,100 | 153,326 | ||||||
Beni Stabili SpA | 79,900 | 50,503 | ||||||
British Land Co. PLC | 330,965 | 2,841,673 | ||||||
Bumi Serpong Damai PT | 876,100 | 144,818 | ||||||
Buzzi Unicem SpA | 82,710 | 1,295,524 | ||||||
C C Land Holdings Ltd. | 245,300 | 80,469 | ||||||
CA Immobilien Anlagen AG(c) | 4,800 | 68,955 | ||||||
Capital Property Fund | 804,550 | 960,347 | ||||||
CapitaLand Ltd. | 345,000 | 1,083,835 | ||||||
Central Pattana PCL | 95,400 | 307,845 | ||||||
Ciputra Development Tbk PT | 1,392,200 | 159,889 | ||||||
Ciputra Property Tbk PT | 246,600 | 24,221 | ||||||
Ciputra Surya Tbk PT | 62,000 | 18,104 | ||||||
City Developments Ltd. | 24,000 | 215,633 | ||||||
Country Garden Holdings Co., Ltd.(c) | 3,693,400 | 1,901,721 | ||||||
CyrusOne, Inc.(c) | 92,246 | 1,965,762 | ||||||
Dexus Property Group | 276,200 | 307,603 | ||||||
DLF Ltd. | 74,700 | 379,427 | ||||||
Duke Realty Corp. | 136,420 | 2,204,547 | ||||||
| 162 | • ALLIANCEBERNSTEIN POOLING PORTFOLIOS |
Multi-Asset Real Return Portfolio—Consolidated Portfolio of Investments
| Company | Shares | U.S. $ Value | ||||||
| ||||||||
Dundee Real Estate Investment Trust | 38,816 | $ | 1,385,896 | |||||
Eastern & Oriental Bhd | 129,350 | 66,129 | ||||||
Emira Property Fund | 62,100 | 102,164 | ||||||
Even Construtora e Incorporadora SA | 28,600 | 144,488 | ||||||
Evergrande Real Estate Group Ltd.(a) | 3,529,000 | 1,723,173 | ||||||
F&C Commercial Property Trust Ltd. | 24,500 | 38,171 | ||||||
Fastighets AB Balder(c) | 10,900 | 80,196 | ||||||
Fibra Uno Administracion SA de CV | 368,320 | 1,141,789 | ||||||
Filinvest Land, Inc. | 766,800 | 37,114 | ||||||
Fonciere Des Regions | 1,500 | 123,914 | ||||||
Franshion Properties China Ltd. | 599,100 | 213,084 | ||||||
Gecina SA | 800 | 90,638 | ||||||
Globe Trade Centre SA(c) | 23,300 | 59,622 | ||||||
Glomac Bhd | 200,700 | 56,499 | ||||||
GPT Group | 63,320 | 253,711 | ||||||
Growthpoint Properties Ltd. | 591,100 | 1,794,508 | ||||||
Guangzhou R&F Properties Co., Ltd. | 168,046 | 284,089 | ||||||
Hang Lung Properties Ltd. | 227,000 | 875,460 | ||||||
Helbor Empreendimentos SA | 22,300 | 130,686 | ||||||
Helical Bar PLC | 5,950 | 20,716 | ||||||
Henderson Land Development Co., Ltd. | 138,000 | 965,351 | ||||||
Hopson Development Holdings Ltd.(c) | 44,450 | 76,588 | ||||||
Hysan Development Co., Ltd. | 45,000 | 231,653 | ||||||
ICADE | 17,570 | 1,575,873 | ||||||
IGB Corp. Bhd | 140,200 | 101,838 | ||||||
IJM Land Bhd | 85,500 | 60,311 | ||||||
IMMOFINANZ AG(c) | 37,500 | 156,628 | ||||||
Intiland Development Tbk PT | 623,500 | 32,865 | ||||||
Is Gayrimenkul Yatirim Ortakligi AS | 73,200 | 60,195 | ||||||
Kawasan Industri Jababeka Tbk PT(c) | 1,589,200 | 42,655 | ||||||
Keppel Land Ltd. | 28,000 | 93,750 | ||||||
Kerry Properties Ltd. | 41,500 | 212,593 | ||||||
Kiwi Income Property Trust | 59,450 | 56,765 | ||||||
KLCC Property Holdings Bhd | 71,150 | 150,565 | ||||||
Kungsleden AB | 12,200 | 78,315 | ||||||
Land Securities Group PLC | 90,559 | 1,137,365 | ||||||
LC Corp. SA(c) | 39,100 | 12,903 | ||||||
Lippo Karawaci Tbk PT | 2,527,300 | 295,533 | ||||||
Londonmetric Property PLC | 19,550 | 32,159 | ||||||
Longfor Properties Co., Ltd.(a) | 49,500 | 88,140 | ||||||
LPN Development PCL | 1,730,000 | 1,453,782 | ||||||
Macquarie Mexico Real Estate Management SA de CV(c) | 865,580 | 1,963,135 | ||||||
Mah Sing Group Bhd | 95,000 | 64,555 | ||||||
Mapletree Commercial Trust | 1,439,300 | 1,560,207 | ||||||
Megaworld Corp. | 1,751,350 | 169,091 | ||||||
Mitsubishi Estate Co., Ltd. | 256,000 | 6,381,871 | ||||||
Mitsui Fudosan Co., Ltd. | 244,000 | 6,206,347 | ||||||
Mobimo Holding AG(c) | 300 | 68,303 | ||||||
| ALLIANCEBERNSTEIN POOLING PORTFOLIOS • | 163 |
Multi-Asset Real Return Portfolio—Consolidated Portfolio of Investments
| Company | Shares | U.S. $ Value | ||||||
| ||||||||
New World Development Co., Ltd. | 1,822,000 | $ | 3,329,665 | |||||
Nieuwe Steen Investments NV | 5,500 | 39,480 | ||||||
Nomura Real Estate Holdings, Inc. | 2,700 | 48,422 | ||||||
Pakuwon Jati Tbk PT | 5,656,000 | 210,523 | ||||||
Poly Property Group Co., Ltd.(c) | 275,400 | 195,935 | ||||||
Premier Investment Corp. | 50 | 224,313 | ||||||
Prestige Estates Projects Ltd. | 17,750 | 55,423 | ||||||
Pruksa Real Estate PCL | 100,850 | 101,697 | ||||||
Quality Houses PCL | 559,700 | 74,501 | ||||||
Quintain Estates & Development PLC(c) | 24,250 | 25,476 | ||||||
Redefine Properties Ltd. | 403,900 | 440,444 | ||||||
Regal Real Estate Investment Trust | 697,600 | 199,747 | ||||||
Resilient Property Income Fund Ltd. | 35,700 | 201,175 | ||||||
Robinsons Land Corp. | 206,200 | 115,350 | ||||||
SA Corporate Real Estate Fund Nominees | 519,600 | 231,717 | ||||||
Sansiri PCL | 394,700 | 66,336 | ||||||
SC Asset Corp. PCL | 40,000 | 45,714 | ||||||
Sentul City Tbk PT(c) | 3,587,650 | 109,428 | ||||||
Sino Land Co., Ltd. | 106,000 | 192,592 | ||||||
Sinpas Gayrimenkul Yatirim Ortakligi AS | 21,500 | 16,635 | ||||||
SM Development Corp. | 970,900 | 204,639 | ||||||
SP Setia Bhd | 75,200 | 76,648 | ||||||
Spirit Realty Capital, Inc. | 131,049 | 2,610,496 | ||||||
Sponda Oyj | 18,900 | 92,864 | ||||||
Sumitomo Realty & Development Co., Ltd. | 99,000 | 3,346,943 | ||||||
Summarecon Agung Tbk PT | 824,250 | 198,222 | ||||||
Sun Hung Kai Properties Ltd. | 388,305 | 5,999,015 | ||||||
Suntec Real Estate Investment Trust(a) | 80,000 | 115,994 | ||||||
Supalai PCL | 1,732,050 | 1,263,378 | ||||||
Swire Properties Ltd. | 616,300 | 2,310,825 | ||||||
TAG Immobilien AG | 6,900 | 81,669 | ||||||
Tebrau Teguh Bhd(c) | 280,000 | 81,993 | ||||||
Tecnisa SA | 34,900 | 154,100 | ||||||
Telecity Group PLC | 87,795 | 1,242,497 | ||||||
Ticon Industrial Connection PCL | 65,500 | 47,776 | ||||||
Tokyu Land Corp. | 14,000 | 105,564 | ||||||
Tokyu REIT, Inc.(a) | 50 | 281,545 | ||||||
Torunlar Gayrimenkul Yatirim Ortakligi AS | 39,800 | 70,603 | ||||||
Unite Group PLC | 10,200 | 44,775 | ||||||
Unitech Ltd.(c) | 298,950 | 150,055 | ||||||
United Urban Investment Corp.(a) | 100 | 131,336 | ||||||
UOL Group Ltd. | 373,602 | 1,960,056 | ||||||
Vornado Realty Trust | 8,000 | 641,680 | ||||||
Wallenstam AB | 5,800 | 76,512 | ||||||
Wereldhave Belgium NV | 700 | 74,692 | ||||||
West Fraser Timber Co., Ltd. | 31,000 | 2,555,152 | ||||||
Wharf Holdings Ltd. | 505,000 | 4,420,367 | ||||||
Wheelock & Co., Ltd. | 318,000 | 1,720,877 | ||||||
| 164 | • ALLIANCEBERNSTEIN POOLING PORTFOLIOS |
Multi-Asset Real Return Portfolio—Consolidated Portfolio of Investments
| Company | Shares | U.S. $ Value | ||||||
| ||||||||
Wihlborgs Fastigheter AB | 4,400 | $ | 72,813 | |||||
YTL Land & Development BHD(c) | 134,500 | 37,374 | ||||||
Yuexiu Property Co., Ltd. | 1,057,555 | 366,457 | ||||||
|
| |||||||
| 84,584,864 | ||||||||
|
| |||||||
Health Care – 1.4% | ||||||||
Chartwell Retirement Residences | 144,920 | 1,544,408 | ||||||
HCP, Inc. | 63,750 | 3,116,100 | ||||||
Health Care REIT, Inc. | 32,500 | 2,084,550 | ||||||
LTC Properties, Inc. | 70,730 | 2,728,056 | ||||||
Omega Healthcare Investors, Inc. | 69,610 | 1,948,384 | ||||||
Sabra Health Care REIT, Inc. | 21,990 | 581,196 | ||||||
Senior Housing Properties Trust | 82,310 | 2,065,158 | ||||||
Ventas, Inc. | 24,020 | 1,700,135 | ||||||
|
| |||||||
| 15,767,987 | ||||||||
|
| |||||||
| 100,352,851 | ||||||||
|
| |||||||
Retail – 5.4% | ||||||||
Regional Mall – 2.2% | ||||||||
BR Malls Participacoes SA | 163,160 | 2,110,183 | ||||||
CapitaMall Trust | 383,000 | 663,734 | ||||||
CFS Retail Property Trust Group(a) | 120,800 | 257,499 | ||||||
General Growth Properties, Inc. | 96,060 | 1,838,588 | ||||||
Glimcher Realty Trust | 182,728 | 2,057,517 | ||||||
Multiplan Empreendimentos Imobiliarios SA | 39,650 | 1,134,774 | ||||||
Pennsylvania Real Estate Investment Trust | 133,440 | 2,408,592 | ||||||
Simon Property Group, Inc. | 53,311 | 8,468,986 | ||||||
Westfield Group | 538,237 | 6,150,722 | ||||||
|
| |||||||
| 25,090,595 | ||||||||
|
| |||||||
Shopping Center/Other Retail – 3.2% | ||||||||
Aeon Mall Co., Ltd. | 72,100 | 1,788,248 | ||||||
Akmerkez Gayrimenkul Yatirim Ortakligi AS | 4,250 | 51,607 | ||||||
Aliansce Shopping Centers SA | 49,700 | 615,161 | ||||||
Atrium European Real Estate Ltd. | 12,000 | 71,957 | ||||||
Capital & Counties Properties PLC | 27,000 | 108,355 | ||||||
CapitaMalls Asia Ltd. | 55,650 | 93,164 | ||||||
Citycon Oyj(a) | 249,306 | 809,111 | ||||||
Corio NV | 42,378 | 1,951,307 | ||||||
DDR Corp.(a) | 209,460 | 3,617,374 | ||||||
Deutsche Euroshop AG | 1,950 | 80,585 | ||||||
Development Securities PLC | 8,350 | 20,711 | ||||||
Eurocommercial Properties NV | 39,700 | 1,517,450 | ||||||
Federation Centres | 81,500 | 203,958 | ||||||
Fortune Real Estate Investment Trust | 843,000 | 730,690 | ||||||
Fountainhead Property Trust | 244,400 | 236,040 | ||||||
Fukuoka REIT Co.(a) | 158 | 1,310,091 | ||||||
Hammerson PLC | 25,350 | 189,602 | ||||||
Hyprop Investments Ltd. | 111,300 | 891,620 | ||||||
| ALLIANCEBERNSTEIN POOLING PORTFOLIOS • | 165 |
Multi-Asset Real Return Portfolio—Consolidated Portfolio of Investments
| Company | Shares | U.S. $ Value | ||||||
| ||||||||
Iguatemi Empresa de Shopping Centers SA | 9,700 | $ | 133,391 | |||||
Intu Properties PLC | 23,350 | 117,534 | ||||||
Japan Retail Fund Investment Corp. | 335 | 655,115 | ||||||
Kite Realty Group Trust | 300,024 | 1,977,158 | ||||||
Klepierre | 51,542 | 2,114,482 | ||||||
Link REIT (The) | 298,378 | 1,595,110 | ||||||
Mercialys SA | 60,600 | 1,280,434 | ||||||
Pavilion Real Estate Investment Trust | 137,100 | 69,204 | ||||||
Ramco-Gershenson Properties Trust | 160,710 | 2,539,218 | ||||||
RioCan Real Estate Investment Trust (Toronto) | 19,831 | 535,557 | ||||||
Shaftesbury PLC | 8,950 | 79,055 | ||||||
SM Prime Holdings, Inc. | 1,058,800 | 494,248 | ||||||
Sonae Sierra Brasil SA | 4,850 | 69,832 | ||||||
Tanger Factory Outlet Centers | 18,500 | 652,865 | ||||||
Unibail-Rodamco SE | 28,907 | 6,672,347 | ||||||
Westfield Retail Trust | 1,117,100 | 3,624,594 | ||||||
|
| |||||||
| 36,897,175 | ||||||||
|
| |||||||
| 61,987,770 | ||||||||
|
| |||||||
Residential – 4.5% | ||||||||
Multi-Family – 3.8% | ||||||||
Advance Residence Investment Corp. | 50 | 106,210 | ||||||
Associated Estates Realty Corp. | 150,060 | 2,623,049 | ||||||
AvalonBay Communities, Inc. | 10,020 | 1,250,797 | ||||||
Berkeley Group Holdings PLC(c) | 42,140 | 1,216,535 | ||||||
BRE Properties, Inc. | 8,260 | 401,519 | ||||||
Brookfield Incorporacoes SA | 594,495 | 946,074 | ||||||
Brookfield Residential Properties, Inc.(c) | 119,130 | 2,639,921 | ||||||
China Overseas Land & Investment Ltd. | 1,966,000 | 5,970,176 | ||||||
China Resources Land Ltd. | 391,500 | 1,145,269 | ||||||
China Vanke Co., Ltd. – Class B(c) | 813,104 | 1,651,802 | ||||||
Consorcio ARA SAB de CV(c) | 99,660 | 38,726 | ||||||
Corp. GEO SAB de CV(c) | 108,590 | 91,452 | ||||||
Cyrela Brazil Realty SA Empreendimentos e Participacoes | 47,620 | 418,606 | ||||||
Desarrolladora Homex SAB de CV(a)(c) | 38,370 | 76,352 | ||||||
Deutsche Wohnen AG | 5,250 | 96,229 | ||||||
Emlak Konut Gayrimenkul Yatirim Ortakligi AS | 109,500 | 177,814 | ||||||
Equity Residential | 29,900 | 1,645,696 | ||||||
Essex Property Trust, Inc. | 7,244 | 1,079,284 | ||||||
Ez Tec Empreendimentos e Participacoes SA | 8,950 | 124,117 | ||||||
Gafisa SA(c) | 62,700 | 135,574 | ||||||
GAGFAH SA(c) | 3,800 | 41,807 | ||||||
Grainger PLC | 14,850 | 30,649 | ||||||
GSW Immobilien AG | 1,820 | 72,467 | ||||||
| 166 | • ALLIANCEBERNSTEIN POOLING PORTFOLIOS |
Multi-Asset Real Return Portfolio—Consolidated Portfolio of Investments
| Company | Shares | U.S. $ Value | ||||||
| ||||||||
JHSF Participacoes SA | 29,000 | $ | 124,533 | |||||
KWG Property Holding Ltd. | 1,554,000 | 1,064,616 | ||||||
Land and Houses PCL | 458,250 | 184,463 | ||||||
LEG Immobilien AG(c) | 42,421 | 2,435,178 | ||||||
Meritage Homes Corp.(c) | 14,390 | 582,651 | ||||||
Mid-America Apartment Communities, Inc. | 25,480 | 1,769,331 | ||||||
Mirvac Group | 567,249 | 949,108 | ||||||
MRV Engenharia e Participacoes SA | 203,660 | 1,306,700 | ||||||
NVR, Inc.(c) | 1,740 | 1,756,008 | ||||||
Patrizia Immobilien AG(c) | 5,800 | 49,280 | ||||||
PDG Realty SA Empreendimentos e Participacoes | 195,630 | 317,254 | ||||||
Persimmon PLC | 87,530 | 1,210,635 | ||||||
Property Perfect PCL | 859,450 | 53,156 | ||||||
PulteGroup, Inc.(c) | 120,400 | 2,309,272 | ||||||
Rodobens Negocios Imobiliarios SA | 6,900 | 48,350 | ||||||
Rossi Residencial SA | 491,721 | 871,952 | ||||||
Sare Holding SAB de CV(a)(c) | 564,000 | 36,673 | ||||||
Shenzhen Investment Ltd. | 414,350 | 180,302 | ||||||
Shimao Property Holdings Ltd. | 389,100 | 782,097 | ||||||
Sino-Ocean Land Holdings Ltd. | 673,100 | 464,813 | ||||||
Stockland | 845,220 | 3,246,365 | ||||||
Toll Brothers, Inc.(c) | 48,150 | 1,642,878 | ||||||
Urbi Desarrollos Urbanos SAB de CV(c) | 52,560 | 18,324 | ||||||
Vista Land & Lifescapes, Inc. | 782,750 | 105,442 | ||||||
Wing Tai Holdings Ltd. | 55,600 | 87,037 | ||||||
Yanlord Land Group Ltd.(a)(c) | 52,900 | 65,318 | ||||||
|
| |||||||
| 43,641,861 | ||||||||
|
| |||||||
Self Storage – 0.3% | ||||||||
Big Yellow Group PLC | 7,900 | 44,751 | ||||||
Extra Space Storage, Inc. | 80,737 | 3,022,793 | ||||||
Public Storage | 1,600 | 241,936 | ||||||
Safestore Holdings PLC | 12,500 | 23,894 | ||||||
|
| |||||||
| 3,333,374 | ||||||||
|
| |||||||
Single Family – 0.4% | ||||||||
Fortune Brands Home & Security, Inc.(c) | 69,740 | 2,409,517 | ||||||
Masco Corp. | 28,870 | 556,036 | ||||||
Realogy Holdings Corp.(c) | 51,300 | 2,300,805 | ||||||
|
| |||||||
| 5,266,358 | ||||||||
|
| |||||||
| 52,241,593 | ||||||||
|
| |||||||
Office – 3.0% | ||||||||
Office – 3.0% | ||||||||
Allied Properties Real Estate Investment Trust | 33,804 | 1,124,342 | ||||||
Allreal Holding AG(c) | 500 | 73,562 | ||||||
Alstria Office REIT – AG | 3,650 | 42,692 | ||||||
| ALLIANCEBERNSTEIN POOLING PORTFOLIOS • | 167 |
Multi-Asset Real Return Portfolio—Consolidated Portfolio of Investments
| Company | Shares | U.S. $ Value | ||||||
| ||||||||
Befimmo SCA Sicafi | 1,300 | $ | 85,623 | |||||
Boston Properties, Inc. | 14,413 | 1,497,222 | ||||||
Brandywine Realty Trust | 60,860 | 836,825 | ||||||
CapitaCommercial Trust | 1,333,000 | 1,785,672 | ||||||
Castellum AB | 87,564 | 1,313,604 | ||||||
Champion REIT(a) | 182,900 | 93,580 | ||||||
Cominar Real Estate Investment Trust | 36,303 | 794,882 | ||||||
Commonwealth Property Office Fund | 1,478,034 | 1,679,901 | ||||||
CommonWealth REIT | 71,350 | 1,801,587 | ||||||
Corporate Office Properties Trust | 61,880 | 1,600,836 | ||||||
Derwent London PLC | 3,650 | 121,660 | ||||||
Douglas Emmett, Inc. | 69,748 | 1,709,523 | ||||||
Great Portland Estates PLC | 12,300 | 91,623 | ||||||
Hongkong Land Holdings Ltd. | 253,000 | 1,951,237 | ||||||
Hufvudstaden AB – Class A | 124,142 | 1,707,177 | ||||||
Investa Office Fund | 487,490 | 1,515,147 | ||||||
Japan Excellent, Inc.(a) | 205 | 1,239,800 | ||||||
Japan Prime Realty Investment Corp. | 30 | 88,277 | ||||||
Japan Real Estate Investment Corp. | 138 | 1,513,123 | ||||||
Kenedix Realty Investment Corp. – Class A | 391 | 1,611,289 | ||||||
Liberty Property Trust | 23,790 | 922,814 | ||||||
Mack-Cali Realty Corp. | 62,080 | 1,761,830 | ||||||
Nippon Building Fund, Inc. | 261 | 2,918,751 | ||||||
Nomura Real Estate Office Fund, Inc. | 11 | 67,505 | ||||||
Norwegian Property ASA | 37,550 | 58,869 | ||||||
NTT Urban Development Corp. | 64 | 65,098 | ||||||
Orix JREIT, Inc. | 1,370 | 1,611,870 | ||||||
Parkway Properties, Inc./MD | 147,298 | 2,490,809 | ||||||
PSP Swiss Property AG(c) | 1,650 | 149,674 | ||||||
Societe Immobiliere de Location pour l’Industrie et le Commerce(c) | 800 | 86,874 | ||||||
Swiss Prime Site AG(c) | 2,150 | 172,610 | ||||||
Tokyo Tatemono Co., Ltd. | 12,000 | 66,869 | ||||||
Workspace Group PLC | 9,300 | 48,308 | ||||||
|
| |||||||
| 34,701,065 | ||||||||
|
| |||||||
Lodging – 1.3% | ||||||||
Lodging – 1.3% | ||||||||
Ashford Hospitality Trust, Inc. | 205,840 | 2,422,737 | ||||||
Far East Hospitality Trust | 1,434,000 | 1,273,700 | ||||||
Great Eagle Holdings Ltd. | 293,000 | 1,165,781 | ||||||
Host Hotels & Resorts, Inc. | 71,670 | 1,194,739 | ||||||
InterContinental Hotels Group PLC | 60,941 | 1,767,035 | ||||||
Pebblebrook Hotel Trust | 53,330 | 1,275,120 | ||||||
RLJ Lodging Trust | 135,980 | 2,908,612 | ||||||
Strategic Hotels & Resorts, Inc.(c) | 371,200 | 2,702,336 | ||||||
|
| |||||||
| 14,710,060 | ||||||||
|
| |||||||
| 168 | • ALLIANCEBERNSTEIN POOLING PORTFOLIOS |
Multi-Asset Real Return Portfolio—Consolidated Portfolio of Investments
| Company | Shares | U.S. $ Value | ||||||
| ||||||||
Industrials – 1.0% | ||||||||
Industrial Warehouse Distribution – 0.9% | ||||||||
Ascendas Real Estate Investment Trust | 80,000 | $ | 165,536 | |||||
Daiwa House REIT Investment Corp. | 187 | 1,351,710 | ||||||
Global Logistic Properties Ltd. | 803,350 | 1,647,635 | ||||||
Granite Real Estate Investment(c) | 40,850 | 1,572,317 | ||||||
Hansteen Holdings PLC | 32,500 | 40,642 | ||||||
Mapletree Industrial Trust | 70,100 | 79,247 | ||||||
Mapletree Logistics Trust | 2,304,200 | 2,268,212 | ||||||
Nippon Prologis REIT, Inc.(c) | 161 | 1,261,042 | ||||||
ProLogis, Inc. | 28,036 | 1,091,722 | ||||||
Segro PLC | 26,570 | 102,856 | ||||||
STAG Industrial, Inc. | 72,100 | 1,529,241 | ||||||
|
| |||||||
| 11,110,160 | ||||||||
|
| |||||||
Mixed Office Industrial – 0.1% | ||||||||
BR Properties SA | 45,270 | 562,616 | ||||||
Goodman Group | 57,510 | 272,799 | ||||||
|
| |||||||
| 835,415 | ||||||||
|
| |||||||
| 11,945,575 | ||||||||
|
| |||||||
Food Beverage & Tobacco – 0.4% | ||||||||
Agricultural Products – 0.4% | ||||||||
Archer-Daniels-Midland Co. | 26,200 | 834,732 | ||||||
Bunge Ltd. | 27,840 | 2,063,223 | ||||||
Charoen Pokphand Indonesia Tbk PT | 742,400 | 337,222 | ||||||
Felda Global Ventures Holdings Bhd | 171,300 | 248,871 | ||||||
Golden Agri-Resources Ltd. | 262,000 | 137,062 | ||||||
IOI Corp. Bhd | 89,600 | 142,061 | ||||||
Kuala Lumpur Kepong Bhd | 19,800 | 132,876 | ||||||
Wilmar International Ltd. | 59,000 | 168,617 | ||||||
|
| |||||||
| 4,064,664 | ||||||||
|
| |||||||
Packaged Foods & Meats – 0.0% | ||||||||
MHP SA (GDR)(b)(c) | 7,346 | 134,065 | ||||||
|
| |||||||
| 4,198,729 | ||||||||
|
| |||||||
Total Common Stocks | 699,869,504 | |||||||
|
| |||||||
| Principal Amount (000) | ||||||||
INFLATION-LINKED SECURITIES – 20.6% | ||||||||
United States – 20.6% | ||||||||
U.S. Treasury Inflation Index | ||||||||
0.625%, 7/15/21 (TIPS) | $ | 5,642 | 6,437,806 | |||||
1.875%, 7/15/15 (TIPS)(f)(g) | 208,938 | 229,684,778 | ||||||
|
| |||||||
Total Inflation-Linked Securities | 236,122,584 | |||||||
|
| |||||||
| ALLIANCEBERNSTEIN POOLING PORTFOLIOS • | 169 |
Multi-Asset Real Return Portfolio—Consolidated Portfolio of Investments
| Company | Contracts | U.S. $ Value | ||||||
| ||||||||
OPTIONS PURCHASED - PUTS – 0.1% | ||||||||
Options on Equity Indices – 0.1% | ||||||||
Dow Jones-UBS Commodity Index Expiration: Mar 2013, Exercise | 240,600 | $ | 122,706 | |||||
S&P 500 Index Expiration: Apr 2013, | 580 | 759,800 | ||||||
|
| |||||||
Total Options Purchased – Puts | 882,506 | |||||||
|
| |||||||
| Shares | ||||||||
WARRANTS – 0.1% | ||||||||
Equity:Other – 0.1% | ||||||||
Diversified/Specialty – 0.1% | ||||||||
Emaar Properties PJSC, Merril Lynch, expiring 10/01/15(c) | 528,766 | 763,009 | ||||||
|
| |||||||
INVESTMENT COMPANIES – 0.0% | ||||||||
Funds and Investment Trust – 0.0% | ||||||||
CPN Retail Growth Leasehold Property Fund | 187,000 | 125,609 | ||||||
|
| |||||||
RIGHTS – 0.0% | ||||||||
Retail – 0.0% | ||||||||
Shopping Center/Other Retail – 0.0% | ||||||||
Citycon Oyj, expiring 3/07/13(c) | 236,840 | 64,934 | ||||||
|
| |||||||
Equity:Other – 0.0% | ||||||||
Diversified/Specialty – 0.0% | ||||||||
Mah Sing Group Bhd, expiring 3/12/13(c) | 31,667 | 6,865 | ||||||
|
| |||||||
Total Rights | 71,799 | |||||||
|
| |||||||
SHORT-TERM INVESTMENTS – 22.5% | ||||||||
Investment Companies – 7.9% | ||||||||
AllianceBernstein Fixed-Income Shares, Inc. – Government STIF Portfolio, 0.12%(j) | 90,546,731 | 90,546,731 | ||||||
|
| |||||||
| Principal Amount (000) | ||||||||
U.S. Treasury Bill – 8.8% | ||||||||
U.S. Treasury Bill Zero Coupon, 4/18/13(g) | $ | 101,000 | 100,986,871 | |||||
|
| |||||||
Treasury Bill – 5.8% | ||||||||
Germany Treasury Bills Zero Coupon, 4/10/13 | EUR50,490 | 65,920,311 | ||||||
|
| |||||||
| 170 | • ALLIANCEBERNSTEIN POOLING PORTFOLIOS |
Multi-Asset Real Return Portfolio—Consolidated Portfolio of Investments
| Principal Amount (000) | U.S. $ Value | |||||||
| ||||||||
Total Short-Term Investments | $ | 257,453,913 | ||||||
|
| |||||||
Total Investments Before Security Lending Collateral for Securities Loaned – 104.4% | 1,195,288,924 | |||||||
|
| |||||||
| Shares | ||||||||
INVESTMENTS OF CASH COLLATERAL FOR SECURITIES LOANED – 2.0% | ||||||||
Investment Companies – 2.0% | ||||||||
AllianceBernstein Exchange Reserves—Class I, 0.10%(j) | 22,386,798 | 22,386,798 | ||||||
Total Investments – 106.4% | 1,217,675,722 | |||||||
Other assets less liabilities – (6.4)% | (73,230,374 | ) | ||||||
|
| |||||||
Net Assets – 100.0% | $ | 1,144,445,348 | ||||||
|
| |||||||
FUTURES CONTRACTS (see Note C)
| Type | Number of Contracts | Expiration Month | Original Value | Value at February 28, 2013 | Unrealized Appreciation/ (Depreciation) | |||||||||||||||
Purchased Contracts |
| |||||||||||||||||||
Brent Crude Oil Futures | 68 | June 2013 | $ | 7,528,701 | $ | 7,449,400 | $ | (79,301 | ) | |||||||||||
Cocoa Futures | 185 | March 2013 | 4,364,349 | 3,954,419 | (409,930 | ) | ||||||||||||||
Copper London Metal Exchange Futures | 2 | March 2013 | 404,903 | 389,613 | (15,290 | ) | ||||||||||||||
Lead Futures | 28 | March 2013 | 1,628,947 | 1,590,050 | (38,897 | ) | ||||||||||||||
Lean Hogs Futures | 219 | April 2013 | 7,664,559 | 7,095,600 | (568,959 | ) | ||||||||||||||
Natural Gas Futures | 36 | April 2013 | 1,203,209 | 1,254,960 | 51,751 | |||||||||||||||
Nickel Futures | 27 | March 2013 | 2,863,656 | 2,680,776 | (182,880 | ) | ||||||||||||||
Platinum Futures | 180 | April 2013 | 14,721,995 | 14,251,500 | (470,495 | ) | ||||||||||||||
Soybean Futures | 14 | July 2013 | 1,021,386 | 1,004,675 | (16,711 | ) | ||||||||||||||
Soybean Meal Futures | 69 | July 2013 | 2,956,320 | 2,964,240 | 7,920 | |||||||||||||||
| Type | Number of Contracts | Expiration Month | Original Value | Value at February 28, 2013 | Unrealized Appreciation/ (Depreciation) | |||||||||||||||
Sold Contracts |
| |||||||||||||||||||
Cattle Feeder Futures | 45 | March 2013 | $ | 3,428,336 | $ | 3,195,000 | $ | 233,336 | ||||||||||||
Cattle Feeder Futures | 22 | May 2013 | 1,629,322 | 1,628,550 | 772 | |||||||||||||||
Copper London Metal Exchange Futures | 23 | March 2013 | 4,641,707 | 4,480,544 | 161,163 | |||||||||||||||
Cotton No. 2 Futures | 38 | July 2013 | 1,585,656 | 1,632,860 | (47,204 | ) | ||||||||||||||
| ALLIANCEBERNSTEIN POOLING PORTFOLIOS • | 171 |
Multi-Asset Real Return Portfolio—Consolidated Portfolio of Investments
| Type | Number of Contracts | Expiration Month | Original Value | Value at February 28, 2013 | Unrealized Appreciation/ (Depreciation) | |||||||||||||||
Gold 100 OZ Futures | 62 | April 2013 | $ | 10,340,680 | $ | 9,784,220 | $ | 556,460 | ||||||||||||
Heating Oil Futures | 67 | May 2013 | 9,140,690 | 8,540,490 | 600,200 | |||||||||||||||
Live Cattle Futures | 101 | April 2013 | 5,443,889 | 5,245,940 | 197,949 | |||||||||||||||
Silver Futures | 16 | May 2013 | 2,353,960 | 2,274,560 | 79,400 | |||||||||||||||
Sugar 11 Futures | 90 | July 2013 | 1,860,661 | 1,860,768 | (107 | ) | ||||||||||||||
Wheat Futures | 20 | July 2013 | 823,297 | 759,500 | 63,797 | |||||||||||||||
|
| |||||||||||||||||||
| $ | 122,974 | |||||||||||||||||||
|
| |||||||||||||||||||
FORWARD CURRENCY EXCHANGE CONTRACTS (see Note C)
| Counterparty | Contracts to Deliver (000) | In Exchange For (000) | Settlement Date | Unrealized Appreciation/ (Depreciation) | ||||||||||||||||||||
Bank of America, NA | EUR | 5,196 | USD | 6,796 | 3/15/13 | $ | 12,261 | |||||||||||||||||
Bank of America, NA | USD | 5,636 | JPY | 498,906 | 3/15/13 | (253,150 | ) | |||||||||||||||||
Barclays Bank PLC Wholesale | GBP | 16,658 | USD | 26,647 | 3/15/13 | 1,377,436 | ||||||||||||||||||
Barclays Bank PLC Wholesale | USD | 3,290 | HKD | 25,496 | 3/15/13 | (2,473 | ) | |||||||||||||||||
Barclays Bank PLC Wholesale | JPY | 874,195 | USD | 9,489 | 6/13/13 | 50,473 | ||||||||||||||||||
BNP Paribas SA | CAD | 3,747 | USD | 3,790 | 3/15/13 | 157,734 | ||||||||||||||||||
BNP Paribas SA | EUR | 50,490 | USD | 66,154 | 4/10/13 | 219,455 | ||||||||||||||||||
Brown Brothers Harriman & Co. | EUR | 14,919 | USD | 19,300 | 3/15/13 | (179,213 | ) | |||||||||||||||||
Citibank, NA | CAD | 2,796 | USD | 2,825 | 3/15/13 | 114,386 | ||||||||||||||||||
Citibank, NA | JPY | 862,016 | USD | 9,197 | 3/15/13 | (103,862 | ) | |||||||||||||||||
Citibank, NA | JPY | 671,201 | USD | 7,166 | 6/13/13 | (80,838 | ) | |||||||||||||||||
Deutsche Bank AG London | CAD | 4,728 | USD | 4,769 | 3/15/13 | 185,779 | ||||||||||||||||||
Deutsche Bank AG London | GBP | 4,520 | USD | 7,293 | 3/15/13 | 436,312 | ||||||||||||||||||
Deutsche Bank AG London | USD | 3,480 | SGD | 4,305 | 6/13/13 | (3,480 | ) | |||||||||||||||||
Goldman Sachs Capital Markets LP | EUR | 6,696 | USD | 8,870 | 3/15/13 | 127,744 | ||||||||||||||||||
HSBC Bank USA | NOK | 11,550 | USD | 2,029 | 3/15/13 | 18,028 | ||||||||||||||||||
HSBC Bank USA | USD | 3,559 | JPY | 309,916 | 3/15/13 | (215,480 | ) | |||||||||||||||||
HSBC Bank USA | USD | 709 | SGD | 866 | 3/15/13 | (9,840 | ) | |||||||||||||||||
JPMorgan Chase Bank, NA | EUR | 2,604 | USD | 3,369 | 3/15/13 | (30,864 | ) | |||||||||||||||||
JPMorgan Chase Bank, NA | USD | 461 | ZAR | 4,054 | 3/15/13 | (12,080 | ) | |||||||||||||||||
Royal Bank of Canada | CAD | 7,559 | USD | 7,638 | 3/15/13 | 310,347 | ||||||||||||||||||
Standard Chartered Bank | USD | 1,278 | CHF | 1,191 | 3/15/13 | (7,031 | ) | |||||||||||||||||
Standard Chartered Bank | USD | 7,750 | HKD | 60,070 | 3/15/13 | (3,826 | ) | |||||||||||||||||
Standard Chartered Bank | USD | 651 | JPY | 53,194 | 3/15/13 | (77,254 | ) | |||||||||||||||||
State Street Bank & Trust Co. | BRL | 16,333 | USD | 8,188 | 3/04/13 | (63,292 | ) | |||||||||||||||||
State Street Bank & Trust Co. | USD | 8,287 | BRL | 16,333 | 3/04/13 | (35,166 | ) | |||||||||||||||||
State Street Bank & Trust Co. | AUD | 2,430 | USD | 2,547 | 3/15/13 | 66,961 | ||||||||||||||||||
State Street Bank & Trust Co. | RUB | 81,007 | USD | 2,577 | 3/15/13 | (62,723 | ) | |||||||||||||||||
State Street Bank & Trust Co. | THB | 167,945 | USD | 5,543 | 3/15/13 | (98,401 | ) | |||||||||||||||||
| 172 | • ALLIANCEBERNSTEIN POOLING PORTFOLIOS |
Multi-Asset Real Return Portfolio—Consolidated Portfolio of Investments
| Counterparty | Contracts to Deliver (000) | In Exchange For (000) | Settlement Date | Unrealized Appreciation/ (Depreciation) | ||||||||||||||||||||
State Street Bank & Trust Co. | USD | 1,989 | CHF | 1,822 | 3/15/13 | $ (45,248 | ) | |||||||||||||||||
State Street Bank & Trust Co. | USD | 38,081 | CNY | 238,306 | 3/15/13 | 104,195 | ||||||||||||||||||
State Street Bank & Trust Co. | USD | 4,717 | GBP | 2,941 | 3/15/13 | (255,756 | ) | |||||||||||||||||
State Street Bank & Trust Co. | USD | 2,114 | IDR | 20,453,303 | 3/15/13 | 2,205 | ||||||||||||||||||
State Street Bank & Trust Co. | USD | 331 | MXN | 4,272 | 3/15/13 | 3,175 | ||||||||||||||||||
State Street Bank & Trust Co. | USD | 616 | MYR | 1,893 | 3/15/13 | (3,914 | ) | |||||||||||||||||
State Street Bank & Trust Co. | USD | 82 | SEK | 551 | 3/15/13 | 3,045 | ||||||||||||||||||
State Street Bank & Trust Co. | BRL | 16,333 | USD | 8,231 | 5/03/13 | 37,325 | ||||||||||||||||||
UBS AG | USD | 15,679 | AUD | 14,916 | 3/15/13 | (455,475 | ) | |||||||||||||||||
Westpac Banking Corp. | AUD | 5,098 | USD | 5,313 | 3/15/13 | 109,944 | ||||||||||||||||||
Westpac Banking Corp. | USD | 3,858 | AUD | 3,670 | 3/15/13 | (112,030 | ) | |||||||||||||||||
|
| |||||||||||||||||||||||
| $ | 1,225,409 | |||||||||||||||||||||||
|
| |||||||||||||||||||||||
PUT OPTIONS WRITTEN (see Note C)
| Description | Contracts | Exercise Price | Expiration Month | Premiums Received | U.S. $ Value | |||||||||||||||
S&P 500 Index (i) | 580 | $ | 1,350.00 | April 2013 | $ | 404,238 | $ | (229,100 | ) | |||||||||||
INFLATION (CPI) SWAP CONTRACTS (see Note C)
| Rate Type | ||||||||||||||||||||
| Swap Counterparty | Notional Amount (000) | Termination Date | Payments made by the Fund | Payments received by the Fund | Unrealized Appreciation/ (Depreciation) | |||||||||||||||
Citibank, NA | $ | 1,500 | 3/27/18 | 2.450 | % | CPI | # | $ | (10,541 | ) | ||||||||||
| # | Variable interest rate based on the rate of inflation as determined by the Consumer Price Index (CPI). |
INTEREST RATE SWAP CONTRACTS (see Note C)
| Rate Type | ||||||||||||||||||||
| Swap Counterparty | Notional Amount (000) | Termination Date | Payments made by the Fund | Payments received by the Fund | Unrealized Appreciation/ (Depreciation) | |||||||||||||||
Bank of America, NA | $ | 6,040 | 3/30/22 | 2.263 | % | 3 Month LIBOR | $ | (285,719 | ) | |||||||||||
| ALLIANCEBERNSTEIN POOLING PORTFOLIOS • | 173 |
Multi-Asset Real Return Portfolio—Consolidated Portfolio of Investments
TOTAL RETURN SWAP CONTRACTS (see Note C)
| Receive/ Pay Total Return on Reference Index | Index | # of Shares or Units | Rate Paid by the Fund | Notional Amount (000) | Maturity Date | Counterparty | Unrealized Appreciation/ (Depreciation) | |||||||||||||||
Receive Total Return on Reference Index | ||||||||||||||||||||||
Receive | Dow Jones-UBS Commodity Index 2 Month Forward | 10,178 | 0.15% | $ | 3,016 | 3/15/13 | Credit Suisse International | $ | (61,151 | ) | ||||||||||||
Receive | Dow Jones-UBS Commodity Index 2 Month Forward | 270,000 | 0.15% | 80,015 | 3/15/13 | Credit Suisse International | (1,622,193 | ) | ||||||||||||||
Receive | Dow Jones-UBS Commodity Index 2 Month Forward | 301,244 | 0.15% | 89,274 | 3/15/13 | Credit Suisse International | (1,809,911 | ) | ||||||||||||||
Receive | Dow Jones-UBS Commodity ex-Precious Metals Index | 172,642 | 0.11% | 23,292 | 3/15/13 | Deutsche Bank AG | (408,140 | ) | ||||||||||||||
Receive | Dow Jones-UBS Commodity Index 2 Month Forward | 17,935 | 0.16% | 5,315 | 3/15/13 | JPMorgan Chase Bank, NA | (107,778 | ) | ||||||||||||||
Receive | Dow Jones-UBS Commodity Index 2 Month Forward | 212,940 | 0.16% | 63,105 | 3/15/13 | JPMorgan Chase Bank, NA | (1,279,298 | ) | ||||||||||||||
Receive | Dow Jones-UBS Commodity Index 2 Month Forward | 219,023 | 0.16% | 64,908 | 3/15/13 | JPMorgan Chase Bank, NA | (1,316,187 | ) | ||||||||||||||
Receive | Dow Jones-UBS Commodity Index 2 Month Forward | 274,406 | 0.16% | 81,321 | 3/15/13 | JPMorgan Chase Bank, NA | (1,649,003 | ) | ||||||||||||||
|
| |||||||||||||||||||||
| $ | (8,253,661 | ) | ||||||||||||||||||||
|
| |||||||||||||||||||||
| 174 | • ALLIANCEBERNSTEIN POOLING PORTFOLIOS |
Multi-Asset Real Return Portfolio—Consolidated Portfolio of Investments
| (a) | Represents entire or partial securities out on loan. See Note D for securities lending information. |
| (b) | Security is exempt from registration under Rule 144A of the Securities Act of 1933. These securities are considered liquid and may be resold in transactions exempt from registration, normally to qualified institutional buyers. At February 28, 2013, the aggregate market value of these securities amounted to $2,312,732 or 0.2% of net assets. |
| (c) | Non-income producing security. |
| (d) | Fair valued by the Adviser. |
| (e) | Illiquid security. |
| (f) | Position, or a portion thereof, has been segregated to collateralize margin requirements for open futures contracts. The market value of the collateral amounted to $3,924,372. |
| (g) | Position, or a portion thereof, has been segregated to collateralize OTC derivatives outstanding. The aggregate market value of these securities amounted to $ 36,811,872. |
| (h) | One contract relates to 1 share. |
| (i) | One contract relates to 100 shares. |
| (j) | Investment in affiliated money market mutual fund. The rate shown represents the 7-day yield as of period end. |
Currency Abbreviations:
AUD – Australian Dollar
BRL – Brazilian Real
CAD – Canadian Dollar
CHF – Swiss Franc
CNY – Chinese Yuan Renminbi
EUR – Euro
GBP – Great British Pound
HKD – Hong Kong Dollar
IDR – Indonesian Rupiah
JPY – Japanese Yen
MXN – Mexican Peso
MYR – Malaysian Ringgit
NOK – Norwegian Krone
RUB – Russian Ruble
SEK – Swedish Krona
SGD – Singapore Dollar
THB – Thailand Baht
USD – United States Dollar
ZAR – South African Rand
Glossary:
ADR – American Depositary Receipt
GDR – Global Depositary Receipt
LIBOR – London Interbank Offered Rates
OJSC – Open Joint Stock Company
REIT – Real Estate Investment Trust
TIPS – Treasury Inflation Protected Security
See notes to financial statements.
| ALLIANCEBERNSTEIN POOLING PORTFOLIOS • | 175 |
Multi-Asset Real Return Portfolio—Consolidated Portfolio of Investments
VOLATILITY MANAGEMENT PORTFOLIO
PORTFOLIO OF INVESTMENTS
February 28, 2013 (unaudited)
| Company | Shares | U.S. $ Value | ||||||
| ||||||||
COMMON STOCKS – 40.9% | ||||||||
Financials – 7.6% | ||||||||
Capital Markets – 0.8% | ||||||||
3i Group PLC | 22,408 | $ | 108,580 | |||||
Aberdeen Asset Management PLC | 21,155 | 137,624 | ||||||
Ameriprise Financial, Inc. | 5,800 | 398,054 | ||||||
Bank of New York Mellon Corp. (The) | 32,500 | 882,050 | ||||||
BlackRock, Inc. Class A | 3,540 | 848,715 | ||||||
Charles Schwab Corp. (The) | 30,100 | 488,824 | ||||||
Credit Suisse Group AG(a) | 30,770 | 820,259 | ||||||
Daiwa Securities Group, Inc. | 40,000 | 247,195 | ||||||
Deutsche Bank AG (REG) | 22,855 | 1,043,436 | ||||||
E*Trade Financial Corp.(a) | 7,000 | 74,970 | ||||||
Franklin Resources, Inc. | 3,800 | 536,750 | ||||||
Goldman Sachs Group, Inc. (The) | 12,400 | 1,857,024 | ||||||
Hargreaves Lansdown PLC | 5,819 | 76,331 | ||||||
ICAP PLC | 12,443 | 62,633 | ||||||
Invesco Ltd. | 12,200 | 326,838 | ||||||
Investec PLC | 13,241 | 95,997 | ||||||
Julius Baer Group Ltd.(a) | 5,317 | 200,628 | ||||||
Legg Mason, Inc. | 3,300 | 94,050 | ||||||
Macquarie Group Ltd. | 7,926 | 304,493 | ||||||
Mediobanca SpA | 12,704 | 76,809 | ||||||
Morgan Stanley | 38,000 | 856,900 | ||||||
Nomura Holdings, Inc. | 89,000 | 510,585 | ||||||
Northern Trust Corp. | 6,000 | 319,020 | ||||||
Partners Group Holding AG | 426 | 98,352 | ||||||
Ratos AB | 4,711 | 48,261 | ||||||
SBI Holdings, Inc./Japan | 5,508 | 43,761 | ||||||
Schroders PLC | 2,779 | 83,720 | ||||||
State Street Corp. | 13,200 | 746,988 | ||||||
T Rowe Price Group, Inc. | 7,000 | 498,330 | ||||||
UBS AG(a) | 89,535 | 1,414,680 | ||||||
|
| |||||||
| 13,301,857 | ||||||||
|
| |||||||
Commercial Banks – 2.8% | ||||||||
Aozora Bank Ltd. | 14,000 | 42,404 | ||||||
Australia & New Zealand Banking Group Ltd. | 66,639 | 1,948,805 | ||||||
Banca Monte dei Paschi di Siena SpA(a) | 139,084 | 38,021 | ||||||
Banco Bilbao Vizcaya Argentaria SA | 133,690 | 1,295,097 | ||||||
Banco de Sabadell SA(a)(b) | 67,219 | 145,966 | ||||||
Banco Espirito Santo SA(a) | 44,620 | 53,330 | ||||||
Banco Popolare SC(a) | 40,005 | 67,007 | ||||||
Banco Popular Espanol SA(a) | 130,606 | 112,889 | ||||||
Banco Santander SA | 253,234 | 1,917,451 | ||||||
Bank Hapoalim BM(a) | 24,757 | 109,568 | ||||||
Bank Leumi Le-Israel BM(a) | 29,314 | 104,222 | ||||||
Bank of East Asia Ltd. | 33,400 | 135,508 | ||||||
| 176 | • ALLIANCEBERNSTEIN POOLING PORTFOLIOS |
Volatility Management Portfolio—Portfolio of Investments
| Company | Shares | U.S. $ Value | ||||||
| ||||||||
Bank of Kyoto Ltd. (The) | 8,000 | $ | 69,909 | |||||
Bank of Yokohama Ltd. (The) | 29,000 | 149,163 | ||||||
Bankia SA(a)(b) | 18,796 | 7,949 | ||||||
Banque Cantonale Vaudoise(a) | 74 | 42,138 | ||||||
Barclays PLC | 284,478 | 1,319,954 | ||||||
BB&T Corp. | 19,200 | 582,912 | ||||||
Bendigo and Adelaide Bank Ltd. | 9,752 | 98,674 | ||||||
BNP Paribas SA | 24,609 | 1,376,483 | ||||||
BOC Hong Kong Holdings Ltd. | 90,500 | 304,250 | ||||||
CaixaBank | 18,761 | 76,799 | ||||||
Chiba Bank Ltd. (The) | 18,000 | 114,726 | ||||||
Chugoku Bank Ltd. (The) | 4,000 | 58,626 | ||||||
Comerica, Inc. | 5,300 | 182,214 | ||||||
Commerzbank AG(a) | 92,969 | 170,634 | ||||||
Commonwealth Bank of Australia | 39,065 | 2,677,736 | ||||||
Credit Agricole SA(a) | 24,569 | 229,228 | ||||||
Danske Bank A/S(a) | 16,037 | 298,324 | ||||||
DBS Group Holdings Ltd. | 45,000 | 547,215 | ||||||
DnB ASA | 24,029 | 357,134 | ||||||
Erste Group Bank AG(a) | 5,336 | 171,277 | ||||||
Fifth Third Bancorp | 25,300 | 400,752 | ||||||
First Horizon National Corp. | 6,800 | 72,284 | ||||||
Fukuoka Financial Group, Inc. | 18,000 | 81,781 | ||||||
Gunma Bank Ltd. (The) | 9,000 | 48,907 | ||||||
Hachijuni Bank Ltd. (The) | 10,000 | 53,499 | ||||||
Hang Seng Bank Ltd. | 18,800 | 302,581 | ||||||
Hiroshima Bank Ltd. (The) | 12,000 | 50,364 | ||||||
HSBC Holdings PLC | 449,269 | 4,975,953 | ||||||
Huntington Bancshares, Inc./OH | 23,600 | 165,908 | ||||||
Intesa Sanpaolo SpA | 244,816 | 394,176 | ||||||
Intesa Sanpaolo SpA – RSP | 19,298 | 26,537 | ||||||
Iyo Bank Ltd. (The) | 6,000 | 51,137 | ||||||
Joyo Bank Ltd. (The) | 15,000 | 74,907 | ||||||
KBC Groep NV | 3,961 | 146,303 | ||||||
KeyCorp | 25,900 | 243,201 | ||||||
Lloyds Banking Group PLC(a) | 1,030,964 | 847,457 | ||||||
M&T Bank Corp.(b) | 3,300 | 336,897 | ||||||
Mitsubishi UFJ Financial Group, Inc. | 312,600 | 1,732,562 | ||||||
Mizrahi Tefahot Bank Ltd.(a) | 3,047 | 31,960 | ||||||
Mizuho Financial Group, Inc. | 560,600 | 1,232,995 | ||||||
National Australia Bank Ltd. | 55,773 | 1,716,411 | ||||||
Natixis | 21,180 | 87,640 | ||||||
Nishi-Nippon City Bank Ltd. (The) | 16,000 | 41,914 | ||||||
Nordea Bank AB | 64,727 | 746,712 | ||||||
Oversea-Chinese Banking Corp., Ltd. | 63,000 | 512,392 | ||||||
PNC Financial Services Group, Inc. | 14,600 | 910,894 | ||||||
Raiffeisen Bank International AG | 1,202 | 45,310 | ||||||
| ALLIANCEBERNSTEIN POOLING PORTFOLIOS • | 177 |
Volatility Management Portfolio—Portfolio of Investments
| Company | Shares | U.S. $ Value | ||||||
| ||||||||
Regions Financial Corp. | 38,900 | $ | 297,585 | |||||
Resona Holdings, Inc. | 46,200 | 211,717 | ||||||
Royal Bank of Scotland Group PLC(a) | 51,251 | 251,056 | ||||||
Seven Bank Ltd. | 13,149 | 34,595 | ||||||
Shinsei Bank Ltd. | 37,000 | 81,404 | ||||||
Shizuoka Bank Ltd. (The) | 13,000 | 129,205 | ||||||
Skandinaviska Enskilda Banken AB | 34,682 | 360,198 | ||||||
Societe Generale SA(a) | 17,311 | 659,870 | ||||||
Standard Chartered PLC | 58,812 | 1,596,428 | ||||||
Sumitomo Mitsui Financial Group, Inc. | 33,000 | 1,316,999 | ||||||
Sumitomo Mitsui Trust Holdings, Inc. | 76,000 | 295,014 | ||||||
SunTrust Banks, Inc. | 14,800 | 408,332 | ||||||
Suruga Bank Ltd. | 5,000 | 73,448 | ||||||
Svenska Handelsbanken AB | 12,279 | 532,240 | ||||||
Swedbank AB | 19,659 | 471,611 | ||||||
UniCredit SpA(a) | 98,560 | 497,138 | ||||||
Unione di Banche Italiane SCPA | 19,809 | 90,105 | ||||||
United Overseas Bank Ltd.(b) | 31,000 | 476,143 | ||||||
US Bancorp | 52,200 | 1,773,756 | ||||||
Wells Fargo & Co. | 135,300 | 4,746,324 | ||||||
Westpac Banking Corp. | 75,572 | 2,370,784 | ||||||
Wing Hang Bank Ltd. | 4,500 | 49,685 | ||||||
Yamaguchi Financial Group, Inc. | 5,000 | 46,724 | ||||||
Zions Bancorporation | 5,000 | 120,700 | ||||||
|
| |||||||
| 47,028,108 | ||||||||
|
| |||||||
Consumer Finance – 0.2% | ||||||||
Acom Co., Ltd.(a) | 980 | 24,255 | ||||||
Aeon Credit Service Co., Ltd.(b) | 1,600 | 37,254 | ||||||
American Express Co. | 27,200 | 1,690,480 | ||||||
Capital One Financial Corp. | 15,985 | 815,715 | ||||||
Credit Saison Co., Ltd. | 3,900 | 83,020 | ||||||
Discover Financial Services | 14,200 | 547,126 | ||||||
SLM Corp. | 12,900 | 244,713 | ||||||
|
| |||||||
| 3,442,563 | ||||||||
|
| |||||||
Diversified Financial Services – 1.0% | ||||||||
ASX Ltd. | 4,306 | 160,131 | ||||||
Bank of America Corp. | 296,802 | 3,333,086 | ||||||
Citigroup, Inc. | 80,700 | 3,386,979 | ||||||
CME Group, Inc./IL – Class A | 8,400 | 502,488 | ||||||
Deutsche Boerse AG | 4,745 | 293,626 | ||||||
Eurazeo | 734 | 39,876 | ||||||
Exor SpA | 1,576 | 43,973 | ||||||
First Pacific Co., Ltd./Hong Kong | 47,000 | 61,719 | ||||||
Groupe Bruxelles Lambert SA | 1,984 | 158,356 | ||||||
Hong Kong Exchanges and Clearing Ltd.(b) | 25,200 | 453,118 | ||||||
Industrivarden AB | 2,895 | 51,490 | ||||||
ING Groep NV(a) | 94,178 | 753,972 | ||||||
| 178 | • ALLIANCEBERNSTEIN POOLING PORTFOLIOS |
Volatility Management Portfolio—Portfolio of Investments
| Company | Shares | U.S. $ Value | ||||||
| ||||||||
IntercontinentalExchange, Inc.(a) | 2,000 | $ | 309,640 | |||||
Investment AB Kinnevik | 5,057 | 115,132 | ||||||
Investor AB | 11,199 | 327,258 | ||||||
JPMorgan Chase & Co. | 104,600 | 5,117,032 | ||||||
Leucadia National Corp.(b) | 5,400 | 145,260 | ||||||
London Stock Exchange Group PLC | 4,333 | 87,467 | ||||||
McGraw-Hill Cos., Inc. (The) | 7,700 | 358,435 | ||||||
Mitsubishi UFJ Lease & Finance Co., Ltd. | 1,430 | 66,077 | ||||||
Moody’s Corp. | 5,300 | 254,718 | ||||||
NASDAQ OMX Group, Inc. (The) | 3,200 | 101,312 | ||||||
NYSE Euronext | 6,700 | 249,776 | ||||||
ORIX Corp. | 2,570 | 286,338 | ||||||
Pargesa Holding SA | 664 | 47,327 | ||||||
Pohjola Bank PLC | 3,407 | 53,667 | ||||||
Resolution Ltd. | 32,923 | 129,925 | ||||||
Singapore Exchange Ltd. | 21,000 | 128,484 | ||||||
Wendel SA | 808 | 88,843 | ||||||
|
| |||||||
| 17,105,505 | ||||||||
|
| |||||||
Insurance – 1.8% | ||||||||
ACE Ltd. | 9,300 | 794,127 | ||||||
Admiral Group PLC | 5,003 | 94,710 | ||||||
Aegon NV | 42,259 | 251,553 | ||||||
Aflac, Inc. | 12,900 | 644,355 | ||||||
Ageas | 5,742 | 195,081 | ||||||
AIA Group Ltd. | 265,900 | 1,156,746 | ||||||
Allianz SE | 11,195 | 1,526,282 | ||||||
Allstate Corp. (The) | 13,300 | 612,066 | ||||||
American International Group, Inc.(a) | 40,840 | 1,552,328 | ||||||
AMP Ltd. | 70,162 | 391,584 | ||||||
AON PLC | 8,900 | 543,701 | ||||||
Assicurazioni Generali SpA | 28,710 | 463,215 | ||||||
Assurant, Inc. | 2,200 | 92,378 | ||||||
Aviva PLC | 71,746 | 386,149 | ||||||
AXA SA | 43,471 | 752,028 | ||||||
Baloise Holding AG | 1,168 | 104,608 | ||||||
Berkshire Hathaway, Inc.(a) | 50,500 | 5,159,080 | ||||||
Chubb Corp. (The) | 7,300 | 613,419 | ||||||
Cincinnati Financial Corp. | 4,000 | 180,040 | ||||||
CNP Assurances | 3,993 | 59,344 | ||||||
Dai-ichi Life Insurance Co., Ltd. (The) | 209 | 292,514 | ||||||
Delta Lloyd NV | 3,409 | 60,083 | ||||||
Genworth Financial, Inc. – Class A(a) | 13,500 | 115,290 | ||||||
Gjensidige Forsikring ASA | 4,918 | 78,356 | ||||||
Hannover Rueckversicherung AG | 1,483 | 115,801 | ||||||
Hartford Financial Services Group, Inc. | 12,000 | 283,320 | ||||||
Insurance Australia Group Ltd. | 50,098 | 290,686 | ||||||
Legal & General Group PLC | 144,425 | 349,643 | ||||||
| ALLIANCEBERNSTEIN POOLING PORTFOLIOS • | 179 |
Volatility Management Portfolio—Portfolio of Investments
| Company | Shares | U.S. $ Value | ||||||
| ||||||||
Lincoln National Corp. | 7,600 | $ | 224,504 | |||||
Loews Corp. | 8,600 | 370,746 | ||||||
Mapfre SA | 17,150 | 55,642 | ||||||
Marsh & McLennan Cos., Inc. | 14,900 | 553,386 | ||||||
MetLife, Inc. | 29,200 | 1,034,848 | ||||||
MS&AD Insurance Group Holdings | 12,500 | 258,503 | ||||||
Muenchener Rueckversicherungs AG | 4,410 | 791,057 | ||||||
NKSJ Holdings, Inc. | 9,000 | 190,341 | ||||||
Old Mutual PLC | 119,669 | 366,261 | ||||||
Principal Financial Group, Inc. | 7,600 | 240,236 | ||||||
Progressive Corp. (The) | 15,400 | 375,144 | ||||||
Prudential Financial, Inc. | 12,800 | 711,296 | ||||||
Prudential PLC | 62,742 | 931,264 | ||||||
QBE Insurance Group Ltd.(b) | 29,055 | 395,681 | ||||||
RSA Insurance Group PLC | 84,718 | 154,622 | ||||||
Sampo Oyj | 10,305 | 379,960 | ||||||
SCOR SE | 4,014 | 113,363 | ||||||
Sony Financial Holdings, Inc. | 4,269 | 67,308 | ||||||
Standard Life PLC | 57,007 | 303,803 | ||||||
Suncorp Group Ltd. | 31,635 | 362,885 | ||||||
Swiss Life Holding AG(a) | 749 | 122,485 | ||||||
Swiss Re AG | 8,659 | 692,603 | ||||||
T&D Holdings, Inc. | 14,200 | 168,258 | ||||||
Tokio Marine Holdings, Inc. | 17,000 | 479,242 | ||||||
Torchmark Corp. | 2,600 | 146,094 | ||||||
Travelers Cos., Inc. (The) | 10,600 | 852,452 | ||||||
Tryg A/S | 603 | 48,612 | ||||||
Unum Group | 7,700 | 188,419 | ||||||
Vienna Insurance Group AG Wiener Versicherung Gruppe | 944 | 47,729 | ||||||
XL Group PLC | 8,400 | 240,576 | ||||||
Zurich Insurance Group AG(a) | 3,623 | 989,166 | ||||||
|
| |||||||
| 29,014,973 | ||||||||
|
| |||||||
Real Estate Investment Trusts | ||||||||
American Tower Corp. | 10,900 | 845,840 | ||||||
Ascendas Real Estate Investment Trust | 115,000 | 237,958 | ||||||
British Land Co. PLC | 48,165 | 413,546 | ||||||
CapitaMall Trust | 137,550 | 238,372 | ||||||
CFS Retail Property Trust Group | 111,937 | 238,606 | ||||||
Corio NV | 3,942 | 181,511 | ||||||
EPR Properties | 1,460 | 71,233 | ||||||
Gecina SA | 1,099 | 124,515 | ||||||
GPT Group | 88,568 | 354,875 | ||||||
Hammerson PLC | 39,453 | 295,083 | ||||||
ICADE | 1,225 | 109,871 | ||||||
Japan Real Estate Investment Corp. | 33 | 361,834 | ||||||
Klepierre | 5,452 | 223,665 | ||||||
| 180 | • ALLIANCEBERNSTEIN POOLING PORTFOLIOS |
Volatility Management Portfolio—Portfolio of Investments
| Company | Shares | U.S. $ Value | ||||||
| ||||||||
Land Securities Group PLC | 43,279 | $ | 543,558 | |||||
Link REIT (The) | 126,900 | 678,399 | ||||||
Mirvac Group | 189,898 | 317,733 | ||||||
Nippon Building Fund, Inc. | 35 | 391,403 | ||||||
Plum Creek Timber Co., Inc. | 4,400 | 213,400 | ||||||
Unibail-Rodamco SE | 5,117 | 1,181,112 | ||||||
Westfield Group | 124,067 | 1,417,780 | ||||||
Westfield Retail Trust | 164,377 | 533,345 | ||||||
|
| |||||||
| 8,973,639 | ||||||||
|
| |||||||
Real Estate Management & | ||||||||
Aeon Mall Co., Ltd. | 4,620 | 114,587 | ||||||
CapitaLand Ltd. | 160,050 | 502,805 | ||||||
CapitaMalls Asia Ltd. | 78,446 | 131,326 | ||||||
CBRE Group, Inc.(a) | 8,300 | 200,611 | ||||||
City Developments Ltd. | 33,200 | 298,291 | ||||||
Daito Trust Construction Co., Ltd. | 1,800 | 161,070 | ||||||
Daiwa House Industry Co., Ltd. | 13,000 | 238,936 | ||||||
Henderson Land Development Co., Ltd. | 60,400 | 422,516 | ||||||
Hulic Co., Ltd. | 5,895 | 44,221 | ||||||
IMMOFINANZ AG(a) | 22,877 | 95,551 | ||||||
Keppel Land Ltd. | 41,450 | 138,783 | ||||||
Kerry Properties Ltd. | 39,400 | 201,836 | ||||||
Mitsui Fudosan Co., Ltd. | 48,090 | 1,223,210 | ||||||
Nomura Real Estate Holdings, Inc. | 4,780 | 85,725 | ||||||
NTT Urban Development Corp. | 70 | 71,201 | ||||||
Sino Land Co., Ltd. | 162,360 | 294,993 | ||||||
Sumitomo Realty & Development Co., Ltd. | 23,590 | 797,519 | ||||||
Sun Hung Kai Properties Ltd. | 100,100 | 1,546,468 | ||||||
Wharf Holdings Ltd. | 84,350 | �� | 738,332 | |||||
|
| |||||||
| 7,307,981 | ||||||||
|
| |||||||
Thrifts & Mortgage Finance – 0.0% | ||||||||
Hudson City Bancorp, Inc. | 13,000 | 110,760 | ||||||
People’s United Financial, Inc. | 9,600 | 125,760 | ||||||
|
| |||||||
| 236,520 | ||||||||
|
| |||||||
| 126,411,146 | ||||||||
|
| |||||||
Information Technology – 4.8% | ||||||||
Communications Equipment – 0.5% | ||||||||
Cisco Systems, Inc. | 145,700 | 3,037,845 | ||||||
F5 Networks, Inc.(a) | 2,200 | 207,746 | ||||||
Harris Corp. | 3,100 | 149,017 | ||||||
JDS Uniphase Corp.(a) | 6,300 | 89,208 | ||||||
Juniper Networks, Inc.(a) | 14,500 | 299,860 | ||||||
Motorola Solutions, Inc. | 7,900 | 491,459 | ||||||
Nokia Oyj(b) | 90,560 | 329,083 | ||||||
QUALCOMM, Inc. | 46,900 | 3,078,047 | ||||||
Telefonaktiebolaget LM Ericsson – Class B | 74,668 | 907,708 | ||||||
|
| |||||||
| 8,589,973 | ||||||||
|
| |||||||
| ALLIANCEBERNSTEIN POOLING PORTFOLIOS • | 181 |
Volatility Management Portfolio—Portfolio of Investments
| Company | Shares | U.S. $ Value | ||||||
| ||||||||
Computers & Peripherals – 1.0% | ||||||||
Apple, Inc.(c) | 25,860 | $ | 11,414,604 | |||||
Dell, Inc. | 40,100 | 559,395 | ||||||
EMC Corp./MA(a) | 57,800 | 1,329,978 | ||||||
Fujitsu Ltd. | 45,000 | 206,691 | ||||||
Gemalto NV | 1,948 | 177,015 | ||||||
Hewlett-Packard Co. | 54,100 | 1,089,574 | ||||||
NEC Corp.(a) | 63,000 | 155,742 | ||||||
NetApp, Inc.(a) | 10,000 | 338,300 | ||||||
SanDisk Corp.(a) | 6,600 | 332,574 | ||||||
Seagate Technology PLC | 9,680 | 311,309 | ||||||
Toshiba Corp. | 98,000 | 451,027 | ||||||
Western Digital Corp. | 6,100 | 287,676 | ||||||
|
| |||||||
| 16,653,885 | ||||||||
|
| |||||||
Electronic Equipment, Instruments & Components – 0.3% | ||||||||
Amphenol Corp. – Class A | 4,400 | 311,784 | ||||||
Citizen Holdings Co., Ltd. | 6,400 | 34,721 | ||||||
Corning, Inc. | 41,000 | 517,010 | ||||||
FLIR Systems, Inc. | 4,100 | 107,994 | ||||||
Fujifilm Holdings Corp. | 11,400 | 218,849 | ||||||
Hamamatsu Photonics KK | 1,800 | 71,421 | ||||||
Hexagon AB | 5,822 | 165,357 | ||||||
Hirose Electric Co., Ltd. | 800 | 96,615 | ||||||
Hitachi High-Technologies Corp. | 1,600 | 33,043 | ||||||
Hitachi Ltd. | 113,000 | 633,361 | ||||||
Hoya Corp. | 10,700 | 204,875 | ||||||
Ibiden Co., Ltd. | 3,000 | 46,968 | ||||||
Jabil Circuit, Inc. | 5,100 | 95,523 | ||||||
Keyence Corp. | 1,200 | 337,842 | ||||||
Kyocera Corp. | 3,800 | 330,560 | ||||||
Molex, Inc. | 3,700 | 102,527 | ||||||
Murata Manufacturing Co., Ltd. | 5,000 | 322,019 | ||||||
Nippon Electric Glass Co., Ltd. | 9,000 | 44,200 | ||||||
Omron Corp. | 5,000 | 121,105 | ||||||
Shimadzu Corp. | 6,000 | 37,975 | ||||||
TDK Corp.(b) | 3,100 | 106,886 | ||||||
TE Connectivity Ltd. | 11,700 | 469,521 | ||||||
Yaskawa Electric Corp. | 5,000 | 45,020 | ||||||
Yokogawa Electric Corp. | 4,900 | 49,180 | ||||||
|
| |||||||
| 4,504,356 | ||||||||
|
| |||||||
Internet Software & Services – 0.5% | ||||||||
Akamai Technologies, Inc.(a) | 4,900 | 181,104 | ||||||
Dena Co., Ltd.(b) | 2,590 | 72,626 | ||||||
eBay, Inc.(a) | 31,900 | 1,744,292 | ||||||
Google, Inc. – Class A(a) | 7,350 | 5,888,820 | ||||||
United Internet AG | 2,379 | 55,995 | ||||||
| 182 | • ALLIANCEBERNSTEIN POOLING PORTFOLIOS |
Volatility Management Portfolio—Portfolio of Investments
| Company | Shares | U.S. $ Value | ||||||
| ||||||||
VeriSign, Inc.(a) | 4,300 | $ | 196,940 | |||||
Yahoo! Japan Corp. | 357 | 150,880 | ||||||
Yahoo!, Inc.(a) | 28,700 | 611,597 | ||||||
|
| |||||||
| 8,902,254 | ||||||||
|
| |||||||
IT Services – 0.9% | ||||||||
Accenture PLC | 17,500 | 1,301,300 | ||||||
Amadeus IT Holding SA | 7,704 | 196,694 | ||||||
AtoS | 1,407 | 104,255 | ||||||
Automatic Data Processing, Inc. | 13,300 | 816,088 | ||||||
Cap Gemini SA | 3,639 | 178,520 | ||||||
Cognizant Technology Solutions Corp. – | 8,200 | 629,514 | ||||||
Computer Sciences Corp. | 4,200 | 201,726 | ||||||
Computershare Ltd. | 10,930 | 113,440 | ||||||
Fidelity National Information Services, Inc. | 6,800 | 256,020 | ||||||
Fiserv, Inc.(a) | 3,700 | 303,807 | ||||||
International Business Machines Corp. | 29,600 | 5,944,568 | ||||||
Itochu Techno-Solutions Corp. | 700 | 30,549 | ||||||
Mastercard, Inc. – Class A | 2,980 | 1,543,104 | ||||||
Nomura Research Institute Ltd. | 2,500 | 56,712 | ||||||
NTT Data Corp. | 31 | 98,450 | ||||||
Otsuka Corp. | 400 | 40,576 | ||||||
Paychex, Inc. | 8,800 | 291,280 | ||||||
SAIC, Inc. | 7,800 | 92,196 | ||||||
Teradata Corp.(a) | 4,700 | 272,882 | ||||||
Total System Services, Inc. | 4,400 | 104,544 | ||||||
Visa, Inc. – Class A | 14,400 | 2,284,416 | ||||||
Western Union Co. (The) – Class W | 16,500 | 231,495 | ||||||
|
| |||||||
| 15,092,136 | ||||||||
|
| |||||||
Office Electronics – 0.1% | ||||||||
Brother Industries Ltd. | 5,800 | 60,640 | ||||||
Canon, Inc. | 27,900 | 1,009,683 | ||||||
Konica Minolta Holdings, Inc. | 11,500 | 87,915 | ||||||
Ricoh Co., Ltd. | 16,000 | 171,679 | ||||||
Xerox Corp. | 36,000 | 291,960 | ||||||
|
| |||||||
| 1,621,877 | ||||||||
|
| |||||||
Semiconductors & Semiconductor Equipment – 0.6% | ||||||||
Advanced Micro Devices, Inc.(a)(b) | 16,500 | 41,085 | ||||||
Advantest Corp. | 3,700 | 53,111 | ||||||
Altera Corp. | 8,800 | 311,696 | ||||||
Analog Devices, Inc. | 8,200 | 370,804 | ||||||
Applied Materials, Inc. | 34,000 | 465,800 | ||||||
ARM Holdings PLC | 33,857 | 490,164 | ||||||
ASM Pacific Technology Ltd.(b) | 4,900 | 64,732 | ||||||
ASML Holding NV | 7,726 | 548,362 | ||||||
| ALLIANCEBERNSTEIN POOLING PORTFOLIOS • | 183 |
Volatility Management Portfolio—Portfolio of Investments
| Company | Shares | U.S. $ Value | ||||||
| ||||||||
Broadcom Corp. – Class A | 14,100 | $ | 480,951 | |||||
Infineon Technologies AG(b) | 26,721 | 227,979 | ||||||
Intel Corp. | 137,800 | 2,873,130 | ||||||
KLA-Tencor Corp. | 4,600 | 251,896 | ||||||
Lam Research Corp.(a) | 4,988 | 210,992 | ||||||
Linear Technology Corp. | 6,300 | 240,912 | ||||||
LSI Corp.(a) | 15,300 | 106,488 | ||||||
Mellanox Technologies Ltd.(a) | 879 | 45,317 | ||||||
Microchip Technology, Inc. | 5,300 | 193,291 | ||||||
Micron Technology, Inc.(a) | 28,000 | 234,920 | ||||||
NVIDIA Corp. | 17,000 | 215,220 | ||||||
Rohm Co., Ltd. | 2,400 | 85,138 | ||||||
STMicroelectronics NV | 15,672 | 124,793 | ||||||
Sumco Corp.(a) | 2,800 | 27,999 | ||||||
Teradyne, Inc.(a) | 5,100 | 85,476 | ||||||
Texas Instruments, Inc. | 31,300 | 1,075,781 | ||||||
Tokyo Electron Ltd. | 4,200 | 194,936 | ||||||
Xilinx, Inc. | 7,200 | 268,344 | ||||||
|
| |||||||
| 9,289,317 | ||||||||
|
| |||||||
Software – 0.9% | ||||||||
Adobe Systems, Inc.(a) | 13,500 | 530,550 | ||||||
Autodesk, Inc.(a) | 6,200 | 227,664 | ||||||
BMC Software, Inc.(a) | 4,000 | 160,280 | ||||||
CA, Inc. | 9,400 | 230,206 | ||||||
Citrix Systems, Inc.(a) | 5,200 | 368,680 | ||||||
Dassault Systemes SA | 1,567 | 177,513 | ||||||
Electronic Arts, Inc.(a) | 8,700 | 152,511 | ||||||
Intuit, Inc. | 7,600 | 490,048 | ||||||
Konami Corp. | 2,500 | 48,570 | ||||||
Microsoft Corp. | 207,800 | 5,776,840 | ||||||
Nexon Co., Ltd. | 2,659 | 24,072 | ||||||
NICE Systems Ltd.(a) | 1,458 | 51,393 | ||||||
Nintendo Co., Ltd. | 2,700 | 261,192 | ||||||
Oracle Corp. | 104,900 | 3,593,874 | ||||||
Oracle Corp. Japan | 1,000 | 42,057 | ||||||
Red Hat, Inc.(a) | 5,300 | 269,293 | ||||||
Sage Group PLC (The) | 30,171 | 155,447 | ||||||
Salesforce.com, Inc.(a) | 3,600 | 609,192 | ||||||
SAP AG | 22,647 | 1,768,510 | ||||||
Square Enix Holdings Co., Ltd.(b) | 1,600 | 18,374 | ||||||
Symantec Corp.(a) | 19,300 | 452,392 | ||||||
Trend Micro, Inc./Japan | 2,600 | 73,541 | ||||||
|
| |||||||
| 15,482,199 | ||||||||
|
| |||||||
| 80,135,997 | ||||||||
|
| |||||||
| 184 | • ALLIANCEBERNSTEIN POOLING PORTFOLIOS |
Volatility Management Portfolio—Portfolio of Investments
| Company | Shares | U.S. $ Value | ||||||
| ||||||||
Industrials – 4.5% | ||||||||
Aerospace & Defense – 0.7% | ||||||||
BAE Systems PLC | 78,921 | $ | 423,978 | |||||
Boeing Co. (The) | 18,600 | 1,430,340 | ||||||
Cobham PLC | 25,045 | 87,686 | ||||||
European Aeronautic Defence and Space Co. NV | 10,138 | 516,791 | ||||||
Finmeccanica SpA(a) | 9,951 | 48,696 | ||||||
General Dynamics Corp. | 9,100 | 618,527 | ||||||
Honeywell International, Inc. | 21,500 | 1,507,150 | ||||||
L-3 Communications Holdings, Inc. | 2,700 | 205,929 | ||||||
Lockheed Martin Corp. | 7,400 | 651,200 | ||||||
Meggitt PLC | 19,234 | 132,194 | ||||||
Northrop Grumman Corp. | 6,800 | 446,624 | ||||||
Precision Castparts Corp. | 4,000 | 746,360 | ||||||
Raytheon Co. | 9,100 | 496,587 | ||||||
Rockwell Collins, Inc. | 3,900 | 234,429 | ||||||
Rolls-Royce Holdings PLC(a) | 46,035 | 716,131 | ||||||
Safran SA | 5,640 | 257,750 | ||||||
Singapore Technologies Engineering Ltd. | 37,000 | 126,704 | ||||||
Textron, Inc. | 7,700 | 222,145 | ||||||
Thales SA | 2,239 | 78,690 | ||||||
United Technologies Corp. | 23,100 | 2,091,705 | ||||||
Zodiac Aerospace | 839 | 94,218 | ||||||
|
| |||||||
| 11,133,834 | ||||||||
|
| |||||||
Air Freight & Logistics – 0.2% | ||||||||
CH Robinson Worldwide, Inc. | 4,400 | 250,888 | ||||||
Deutsche Post AG | 22,248 | 498,043 | ||||||
Expeditors International of Washington, Inc. | 5,800 | 225,330 | ||||||
FedEx Corp. | 8,100 | 853,983 | ||||||
Kuehne & Nagel International AG | 1,328 | 152,216 | ||||||
TNT Express NV | 8,015 | 60,598 | ||||||
Toll Holdings Ltd. | 16,083 | 101,133 | ||||||
United Parcel Service, Inc. – Class B | 19,800 | 1,636,470 | ||||||
Yamato Holdings Co., Ltd. | 9,200 | 153,882 | ||||||
|
| |||||||
| 3,932,543 | ||||||||
|
| |||||||
Airlines – 0.1% | ||||||||
All Nippon Airways Co., Ltd. | 28,000 | 57,380 | ||||||
Cathay Pacific Airways Ltd. | 28,000 | 52,342 | ||||||
Deutsche Lufthansa AG (REG) | 5,630 | 113,349 | ||||||
International Consolidated Airlines Group SA(a) | 20,991 | 75,936 | ||||||
Japan Airlines Co., Ltd.(a) | 1,469 | 69,692 | ||||||
Qantas Airways Ltd.(a) | 23,671 | 39,603 | ||||||
Singapore Airlines Ltd. | 13,000 | 114,222 | ||||||
Southwest Airlines Co. | 20,400 | 238,680 | ||||||
|
| |||||||
| 761,204 | ||||||||
|
| |||||||
| ALLIANCEBERNSTEIN POOLING PORTFOLIOS • | 185 |
Volatility Management Portfolio—Portfolio of Investments
| Company | Shares | U.S. $ Value | ||||||
| ||||||||
Building Products – 0.1% | ||||||||
Asahi Glass Co., Ltd. | 25,000 | $ | 169,453 | |||||
Assa Abloy AB | 8,292 | 327,766 | ||||||
Cie de St-Gobain | 9,825 | 390,378 | ||||||
Daikin Industries Ltd. | 5,800 | 215,180 | ||||||
Geberit AG(a) | 905 | 218,404 | ||||||
LIXIL Group Corp. | 6,600 | 135,265 | ||||||
Masco Corp. | 9,800 | 188,748 | ||||||
TOTO Ltd. | 7,000 | 63,295 | ||||||
|
| |||||||
| 1,708,489 | ||||||||
|
| |||||||
Commercial Services & Supplies – 0.2% | ||||||||
ADT Corp. (The) | 6,350 | 304,102 | ||||||
Aggreko PLC | 6,595 | 169,057 | ||||||
Avery Dennison Corp. | 2,700 | 110,295 | ||||||
Babcock International Group PLC | 8,831 | 143,564 | ||||||
Brambles Ltd. | 38,220 | 341,020 | ||||||
Cintas Corp. | 2,900 | 127,310 | ||||||
Dai Nippon Printing Co., Ltd. | 14,000 | 123,043 | ||||||
Edenred | 4,166 | 143,914 | ||||||
G4S PLC | 33,439 | 147,029 | ||||||
Park24 Co., Ltd. | 2,400 | 43,860 | ||||||
Pitney Bowes, Inc.(b) | 5,500 | 72,050 | ||||||
Republic Services, Inc. – Class A | 8,200 | 257,808 | ||||||
Secom Co., Ltd. | 5,200 | 266,951 | ||||||
Securitas AB | 7,699 | 71,511 | ||||||
Serco Group PLC | 12,250 | 105,804 | ||||||
Societe BIC SA | 704 | 82,061 | ||||||
Stericycle, Inc.(a) | 2,400 | 230,208 | ||||||
Toppan Printing Co., Ltd. | 13,000 | 87,461 | ||||||
Tyco International Ltd. | 12,700 | 406,527 | ||||||
Waste Management, Inc. | 12,000 | 447,840 | ||||||
|
| |||||||
| 3,681,415 | ||||||||
|
| |||||||
Construction & Engineering – 0.1% | ||||||||
ACS Actividades de Construccion y Servicios SA | 3,482 | 82,606 | ||||||
Balfour Beatty PLC | 15,687 | 67,751 | ||||||
Bouygues SA | 4,645 | 130,912 | ||||||
Chiyoda Corp. | 4,000 | 49,949 | ||||||
Ferrovial SA | 9,920 | 155,270 | ||||||
Fluor Corp. | 4,600 | 284,740 | ||||||
Hochtief AG(a) | 757 | 50,786 | ||||||
Jacobs Engineering Group, Inc.(a) | 3,500 | 170,940 | ||||||
JGC Corp. | 5,000 | 137,988 | ||||||
Kajima Corp. | 20,000 | 59,156 | ||||||
Kinden Corp. | 3,000 | 19,921 | ||||||
Koninklijke Boskalis Westminster NV | 1,899 | 81,167 | ||||||
Leighton Holdings Ltd.(b) | 3,730 | 89,440 | ||||||
| 186 | • ALLIANCEBERNSTEIN POOLING PORTFOLIOS |
Volatility Management Portfolio—Portfolio of Investments
| Company | Shares | U.S. $ Value | ||||||
| ||||||||
Obayashi Corp. | 15,000 | $ | 77,266 | |||||
Quanta Services, Inc.(a) | 5,800 | 164,720 | ||||||
Shimizu Corp. | 14,000 | 45,031 | ||||||
Skanska AB | 9,342 | 165,452 | ||||||
Taisei Corp. | 25,000 | 73,891 | ||||||
Vinci SA | 11,313 | 521,514 | ||||||
|
| |||||||
| 2,428,500 | ||||||||
|
| |||||||
Electrical Equipment – 0.4% | ||||||||
ABB Ltd. (REG)(a) | 54,069 | 1,230,099 | ||||||
Alstom SA | 5,069 | 222,796 | ||||||
Eaton Corp. PLC | 12,709 | 787,577 | ||||||
Emerson Electric Co. | 20,000 | 1,134,000 | ||||||
First Solar, Inc.(a)(b) | 1,600 | 41,360 | ||||||
Fuji Electric Co., Ltd. | 13,000 | 37,123 | ||||||
Furukawa Electric Co., Ltd.(a) | 15,000 | 33,928 | ||||||
GS Yuasa Corp.(b) | 8,000 | 34,661 | ||||||
Legrand SA | 5,829 | 267,124 | ||||||
Mabuchi Motor Co., Ltd. | 600 | 29,482 | ||||||
Mitsubishi Electric Corp. | 47,000 | 382,258 | ||||||
Nidec Corp.(b) | 2,700 | 158,849 | ||||||
Prysmian SpA | 5,009 | 108,716 | ||||||
Rockwell Automation, Inc. | 3,900 | 352,326 | ||||||
Roper Industries, Inc. | 2,700 | 336,447 | ||||||
Schneider Electric SA | 12,895 | 987,665 | ||||||
Sumitomo Electric Industries Ltd. | 18,500 | 215,376 | ||||||
Ushio, Inc. | 2,600 | 28,537 | ||||||
|
| |||||||
| 6,388,324 | ||||||||
|
| |||||||
Industrial Conglomerates – 0.8% | ||||||||
3M Co. | 17,500 | 1,820,000 | ||||||
Danaher Corp. | 16,100 | 991,760 | ||||||
Fraser and Neave Ltd.(d)(e) | 23,000 | 175,323 | ||||||
General Electric Co. | 290,800 | 6,752,376 | ||||||
Hutchison Whampoa Ltd. | 52,000 | 559,694 | ||||||
Keppel Corp., Ltd. | 35,000 | 327,946 | ||||||
Koninklijke Philips Electronics NV | 25,559 | 722,077 | ||||||
NWS Holdings Ltd. | 35,000 | 66,675 | ||||||
Orkla ASA | 18,975 | 155,332 | ||||||
SembCorp Industries Ltd. | 24,000 | 102,171 | ||||||
Siemens AG | 20,231 | 2,099,795 | ||||||
Smiths Group PLC | 9,655 | 184,118 | ||||||
|
| |||||||
| 13,957,267 | ||||||||
|
| |||||||
Industrial Warehouse Distribution – 0.1% | ||||||||
DCT Industrial Trust, Inc.(b) | 8,260 | 59,968 | ||||||
EastGroup Properties, Inc. | 930 | 52,833 | ||||||
First Industrial Realty Trust, Inc.(a) | 3,050 | 48,403 | ||||||
Global Logistic Properties Ltd. | 119,815 | 245,735 | ||||||
| ALLIANCEBERNSTEIN POOLING PORTFOLIOS • | 187 |
Volatility Management Portfolio—Portfolio of Investments
| Company | Shares | U.S. $ Value | ||||||
| ||||||||
Hansteen Holdings PLC | 19,813 | $ | 24,777 | |||||
Hopewell Holdings Ltd. | 13,500 | 59,286 | ||||||
Industrial & Infrastructure Fund Investment Corp. | 4 | 35,896 | ||||||
Mapletree Industrial Trust | 37,812 | 42,746 | ||||||
Mapletree Logistics Trust | 56,355 | 55,475 | ||||||
ProLogis, Inc. | 26,835 | 1,044,955 | ||||||
Segro PLC | 39,921 | 154,540 | ||||||
STAG Industrial, Inc. | 1,300 | 27,573 | ||||||
Warehouses De Pauw SCA | 340 | 22,079 | ||||||
|
| |||||||
| 1,874,266 | ||||||||
|
| |||||||
Machinery – 0.9% | ||||||||
Alfa Laval AB | 8,251 | 191,391 | ||||||
Amada Co., Ltd. | 8,000 | 52,146 | ||||||
Andritz AG | 1,790 | 126,217 | ||||||
Atlas Copco AB | 9,595 | 247,454 | ||||||
Atlas Copco AB – Class A | 16,511 | 478,582 | ||||||
Caterpillar, Inc. | 18,000 | 1,662,660 | ||||||
Cummins, Inc. | 4,900 | 567,763 | ||||||
Deere & Co. | 10,800 | 948,564 | ||||||
Dover Corp. | 5,000 | 366,750 | ||||||
FANUC Corp. | 4,700 | 724,730 | ||||||
Fiat Industrial SpA | 21,042 | 255,056 | ||||||
Flowserve Corp. | 1,400 | 224,700 | ||||||
GEA Group AG | 4,293 | 152,442 | ||||||
Hino Motors Ltd. | 6,000 | 63,380 | ||||||
Hitachi Construction Machinery Co., Ltd. | 2,700 | 61,982 | ||||||
IHI Corp. | 32,000 | 89,743 | ||||||
Illinois Tool Works, Inc. | 11,900 | 731,850 | ||||||
IMI PLC | 7,895 | 145,969 | ||||||
Ingersoll-Rand PLC | 7,900 | 415,935 | ||||||
Invensys PLC | 19,984 | 108,205 | ||||||
Japan Steel Works Ltd. (The) | 7,000 | 40,898 | ||||||
Joy Global, Inc. | 2,900 | 183,686 | ||||||
JTEKT Corp. | 5,500 | 54,834 | ||||||
Kawasaki Heavy Industries Ltd. | 34,000 | 108,114 | ||||||
Komatsu Ltd. | 22,900 | 576,674 | ||||||
Kone Oyj(b) | 3,828 | 308,846 | ||||||
Kubota Corp. | 27,000 | 325,644 | ||||||
Kurita Water Industries Ltd. | 2,800 | 55,900 | ||||||
Makita Corp. | 2,800 | 126,774 | ||||||
MAN SE | 1,040 | 119,343 | ||||||
Melrose Industries PLC | 28,170 | 110,274 | ||||||
Metso Oyj | 3,142 | 134,359 | ||||||
Mitsubishi Heavy Industries Ltd. | 74,000 | 410,417 | ||||||
Nabtesco Corp. | 3,000 | 55,316 | ||||||
NGK Insulators Ltd. | 7,000 | 75,410 | ||||||
| 188 | • ALLIANCEBERNSTEIN POOLING PORTFOLIOS |
Volatility Management Portfolio—Portfolio of Investments
| Company | Shares | U.S. $ Value | ||||||
| ||||||||
NSK Ltd. | 11,000 | $ | 85,817 | |||||
PACCAR, Inc. | 9,700 | 460,071 | ||||||
Pall Corp. | 3,200 | 218,176 | ||||||
Parker Hannifin Corp. | 4,100 | 387,368 | ||||||
Pentair Ltd. | 5,784 | 308,114 | ||||||
Sandvik AB | 24,674 | 399,380 | ||||||
Scania AB | 7,868 | 163,215 | ||||||
Schindler Holding AG | 1,195 | 184,806 | ||||||
Schindler Holding AG (REG) | 529 | 79,470 | ||||||
SembCorp Marine Ltd.(b) | 20,000 | 72,142 | ||||||
SKF AB | 9,638 | 236,400 | ||||||
SMC Corp./Japan | 1,400 | 242,674 | ||||||
Snap-On, Inc. | 1,600 | 128,432 | ||||||
Stanley Black & Decker, Inc. | 4,600 | 362,020 | ||||||
Sulzer AG | 590 | 102,869 | ||||||
Sumitomo Heavy Industries Ltd. | 13,000 | 57,351 | ||||||
THK Co., Ltd. | 3,000 | 55,899 | ||||||
Vallourec SA | 2,538 | 134,865 | ||||||
Volvo AB – Class B | 34,219 | 511,606 | ||||||
Wartsila Oyj Abp(b) | 4,122 | 189,862 | ||||||
Weir Group PLC (The) | 5,225 | 185,337 | ||||||
Xylem, Inc./NY | 5,100 | 140,250 | ||||||
Yangzijiang Shipbuilding Holdings Ltd.(b) | 40,600 | 31,518 | ||||||
Zardoya Otis SA | 3,789 | 53,424 | ||||||
|
| |||||||
| 15,093,074 | ||||||||
|
| |||||||
Marine – 0.0% | ||||||||
AP Moeller – Maersk A/S | 33 | 263,423 | ||||||
AP Moeller – Maersk A/S – Class A | 14 | 107,569 | ||||||
Mitsui OSK Lines Ltd. | 26,000 | 90,945 | ||||||
Nippon Yusen KK | 39,000 | 97,882 | ||||||
Orient Overseas International Ltd. | 5,500 | 38,650 | ||||||
|
| |||||||
| 598,469 | ||||||||
|
| |||||||
Mixed Office Industrial – 0.0% | ||||||||
Goodman Group | 87,808 | 416,517 | ||||||
|
| |||||||
Professional Services – 0.1% | ||||||||
Adecco SA(a) | 3,258 | 184,850 | ||||||
ALS Ltd/Queensland | 8,299 | 98,972 | ||||||
Bureau Veritas SA | 1,359 | 174,997 | ||||||
Capita PLC | 16,078 | 200,442 | ||||||
Dun & Bradstreet Corp. (The)(b) | 1,200 | 96,720 | ||||||
Equifax, Inc. | 3,300 | 181,896 | ||||||
Experian PLC | 24,809 | 410,440 | ||||||
Intertek Group PLC | 3,953 | 199,761 | ||||||
Randstad Holding NV | 2,962 | 125,628 | ||||||
Robert Half International, Inc. | 3,900 | 138,645 | ||||||
SGS SA | 135 | 342,375 | ||||||
|
| |||||||
| 2,154,726 | ||||||||
|
| |||||||
| ALLIANCEBERNSTEIN POOLING PORTFOLIOS • | 189 |
Volatility Management Portfolio—Portfolio of Investments
| Company | Shares | U.S. $ Value | ||||||
| ||||||||
Road & Rail – 0.4% | ||||||||
Asciano Ltd. | 22,875 | $ | 129,872 | |||||
Aurizon Holdings Ltd. | 41,996 | 172,482 | ||||||
Central Japan Railway Co. | 3,538 | 343,820 | ||||||
ComfortDelGro Corp. Ltd. | 46,000 | 71,194 | ||||||
CSX Corp. | 28,600 | 656,084 | ||||||
DSV A/S | 4,672 | 114,643 | ||||||
East Japan Railway Co. | 8,400 | 619,546 | ||||||
Hankyu Hanshin Holdings, Inc. | 28,000 | 153,608 | ||||||
Keikyu Corp. | 11,000 | 97,157 | ||||||
Keio Corp. | 14,000 | 111,876 | ||||||
Keisei Electric Railway Co., Ltd. | 7,000 | 66,839 | ||||||
Kintetsu Corp.(b) | 39,000 | 163,998 | ||||||
MTR Corp., Ltd | 35,000 | 144,731 | ||||||
Nippon Express Co., Ltd. | 20,000 | 87,845 | ||||||
Norfolk Southern Corp. | 8,800 | 642,840 | ||||||
Odakyu Electric Railway Co., Ltd. | 15,000 | 158,245 | ||||||
Ryder System, Inc. | 1,400 | 78,680 | ||||||
Tobu Railway Co., Ltd. | 25,000 | 137,236 | ||||||
Tokyu Corp. | 28,000 | 167,670 | ||||||
Union Pacific Corp. | 13,100 | 1,796,141 | ||||||
West Japan Railway Co. | 4,171 | 184,219 | ||||||
|
| |||||||
| 6,098,726 | ||||||||
|
| |||||||
Trading Companies & Distributors – 0.3% | ||||||||
Brenntag AG | 1,266 | 180,108 | ||||||
Bunzl PLC | 8,145 | 155,454 | ||||||
Fastenal Co. | 7,400 | 382,062 | ||||||
ITOCHU Corp. | 37,000 | 426,932 | ||||||
Marubeni Corp. | 40,000 | 291,754 | ||||||
Mitsubishi Corp. | 34,500 | 683,465 | ||||||
Mitsui & Co., Ltd. | 42,700 | 632,110 | ||||||
Noble Group Ltd. | 95,000 | 90,505 | ||||||
Rexel SA | 2,644 | 61,196 | ||||||
Sojitz Corp. | 30,700 | 47,024 | ||||||
Sumitomo Corp. | 27,600 | 337,056 | ||||||
Toyota Tsusho Corp. | 5,200 | 132,534 | ||||||
Wolseley PLC | 6,712 | 315,216 | ||||||
WW Grainger, Inc. | 1,700 | 384,982 | ||||||
|
| |||||||
| 4,120,398 | ||||||||
|
| |||||||
Transportation Infrastructure – 0.1% | ||||||||
Abertis Infraestructuras SA | 9,015 | 158,089 | ||||||
Aeroports de Paris | 730 | 61,580 | ||||||
Atlantia SpA | 8,137 | 140,421 | ||||||
Auckland International Airport Ltd. | 20,500 | 47,993 | ||||||
Fraport AG Frankfurt Airport Services Worldwide | 904 | 53,621 | ||||||
Groupe Eurotunnel SA | 13,783 | 116,442 | ||||||
| 190 | • ALLIANCEBERNSTEIN POOLING PORTFOLIOS |
Volatility Management Portfolio—Portfolio of Investments
| Company | Shares | U.S. $ Value | ||||||
| ||||||||
Hutchison Port Holdings Trust | 122,000 | $ | 98,652 | |||||
Kamigumi Co., Ltd. | 6,000 | 51,952 | ||||||
Koninklijke Vopak NV | 1,729 | 124,213 | ||||||
Mitsubishi Logistics Corp. | 3,000 | 48,786 | ||||||
Sydney Airport | 4,566 | 14,761 | ||||||
Transurban Group | 32,272 | 202,572 | ||||||
|
| |||||||
| 1,119,082 | ||||||||
|
| |||||||
| 75,466,834 | ||||||||
|
| |||||||
Consumer Staples – 4.4% | ||||||||
Beverages – 1.0% | ||||||||
Anheuser-Busch InBev NV | 19,746 | 1,850,493 | ||||||
Asahi Group Holdings Ltd. | 9,500 | 239,854 | ||||||
Beam, Inc. | 4,400 | 268,532 | ||||||
Brown-Forman Corp. – Class B | 4,150 | 272,323 | ||||||
Carlsberg A/S | 2,630 | 270,287 | ||||||
Coca Cola Hellenic Bottling Co. SA(a) | 4,957 | 135,202 | ||||||
Coca-Cola Amatil Ltd. | 14,040 | 207,630 | ||||||
Coca-Cola Co. (The) | 106,600 | 4,127,552 | ||||||
Coca-Cola Enterprises, Inc. | 7,600 | 271,928 | ||||||
Coca-Cola West Co., Ltd. | 1,500 | 25,681 | ||||||
Constellation Brands, Inc. – Class A(a) | 4,000 | 176,960 | ||||||
Crimson Wine Group Ltd.(a) | 540 | 4,347 | ||||||
Diageo PLC | 61,601 | 1,847,178 | ||||||
Dr Pepper Snapple Group, Inc. | 5,800 | 252,996 | ||||||
Heineken Holding NV | 2,479 | 155,180 | ||||||
Heineken NV | 5,665 | 422,145 | ||||||
Kirin Holdings Co., Ltd. | 21,000 | 304,962 | ||||||
Molson Coors Brewing Co. – Class B | 4,300 | 190,103 | ||||||
Monster Beverage Corp.(a) | 4,210 | 212,310 | ||||||
PepsiCo, Inc. | 42,900 | 3,250,533 | ||||||
Pernod-Ricard SA | 5,207 | 674,376 | ||||||
Remy Cointreau SA | 549 | 69,381 | ||||||
SABMiller PLC | 23,494 | 1,165,585 | ||||||
Treasury Wine Estates Ltd. | 15,880 | 85,746 | ||||||
|
| |||||||
| 16,481,284 | ||||||||
|
| |||||||
Food & Staples Retailing – 0.9% | ||||||||
Aeon Co., Ltd.(b) | 14,700 | 165,295 | ||||||
Carrefour SA | 14,791 | 402,284 | ||||||
Casino Guichard Perrachon SA | 1,416 | 142,128 | ||||||
Colruyt SA | 1,865 | 91,770 | ||||||
Costco Wholesale Corp. | 11,900 | 1,205,351 | ||||||
CVS Caremark Corp. | 35,000 | 1,789,200 | ||||||
Delhaize Group SA | 2,505 | 121,070 | ||||||
Distribuidora Internacional de Alimentacion SA | 15,033 | 117,290 | ||||||
FamilyMart Co., Ltd. | 1,500 | 63,230 | ||||||
J Sainsbury PLC | 30,110 | 157,563 | ||||||
| ALLIANCEBERNSTEIN POOLING PORTFOLIOS • | 191 |
Volatility Management Portfolio—Portfolio of Investments
| Company | Shares | U.S. $ Value | ||||||
| ||||||||
Jeronimo Martins SGPS SA | 5,416 | $ | 107,949 | |||||
Kesko Oyj | 1,563 | 48,730 | ||||||
Koninklijke Ahold NV | 24,730 | 354,873 | ||||||
Kroger Co. (The) | 15,000 | 438,150 | ||||||
Lawson, Inc.(b) | 1,500 | 111,566 | ||||||
Metcash Ltd.(b) | 21,249 | 88,417 | ||||||
Metro AG | 3,188 | 98,402 | ||||||
Olam International Ltd. | 38,000 | 50,761 | ||||||
Safeway, Inc.(b) | 6,500 | 155,090 | ||||||
Seven & I Holdings Co., Ltd.(b) | 18,500 | 539,979 | ||||||
Sysco Corp. | 16,100 | 517,776 | ||||||
Tesco PLC | 196,723 | 1,101,301 | ||||||
Wal-Mart Stores, Inc. | 46,300 | 3,277,114 | ||||||
Walgreen Co. | 23,600 | 966,184 | ||||||
Wesfarmers Ltd. | 24,748 | 1,035,622 | ||||||
Whole Foods Market, Inc. | 4,700 | 402,414 | ||||||
WM Morrison Supermarkets PLC | 56,330 | 221,476 | ||||||
Woolworths Ltd. | 30,259 | 1,079,736 | ||||||
|
| |||||||
| 14,850,721 | ||||||||
|
| |||||||
Food Products – 1.1% | ||||||||
Ajinomoto Co., Inc. | 16,000 | 212,138 | ||||||
Archer-Daniels-Midland Co. | 18,100 | 576,666 | ||||||
Aryzta AG(a) | 2,145 | 123,036 | ||||||
Associated British Foods PLC | 8,760 | 245,803 | ||||||
Barry Callebaut AG(a) | 49 | 47,713 | ||||||
Calbee, Inc.(b) | 401 | 34,166 | ||||||
Campbell Soup Co. | 4,900 | 201,684 | ||||||
ConAgra Foods, Inc. | 11,100 | 378,621 | ||||||
Danone SA | 14,233 | 985,983 | ||||||
DE Master Blenders 1753 NV(a) | 14,546 | 175,301 | ||||||
Dean Foods Co.(a) | 5,000 | 83,000 | ||||||
General Mills, Inc. | 17,800 | 823,250 | ||||||
Golden Agri-Resources Ltd. | 173,000 | 90,503 | ||||||
Hershey Co. (The) | 4,200 | 350,028 | ||||||
HJ Heinz Co. | 8,800 | 637,384 | ||||||
Hormel Foods Corp. | 3,600 | 134,676 | ||||||
JM Smucker Co. (The) | 3,000 | 285,900 | ||||||
Kellogg Co. | 6,800 | 411,400 | ||||||
Kerry Group PLC | 3,671 | 205,893 | ||||||
Kikkoman Corp. | 4,000 | 62,221 | ||||||
Kraft Foods Group, Inc. | 16,300 | 790,061 | ||||||
Lindt & Spruengli AG(a) | 22 | 79,312 | ||||||
Lindt & Spruengli AG (REG)(a) | 3 | 128,033 | ||||||
McCormick & Co., Inc./MD | 3,700 | 248,899 | ||||||
Mead Johnson Nutrition Co. | 5,600 | 419,496 | ||||||
MEIJI Holdings Co., Ltd. | 1,500 | 64,544 | ||||||
Mondelez International, Inc. | 48,900 | 1,352,085 | ||||||
| 192 | • ALLIANCEBERNSTEIN POOLING PORTFOLIOS |
Volatility Management Portfolio—Portfolio of Investments
| Company | Shares | U.S. $ Value | ||||||
| ||||||||
Nestle SA | 79,122 | $ | 5,523,547 | |||||
Nippon Meat Packers, Inc. | 4,000 | 62,535 | ||||||
Nisshin Seifun Group, Inc. | 4,500 | 59,057 | ||||||
Nissin Foods Holdings Co., Ltd. | 1,500 | 59,605 | ||||||
Suedzucker AG | 2,002 | 87,582 | ||||||
Tate & Lyle PLC | 11,456 | 140,953 | ||||||
Toyo Suisan Kaisha Ltd. | 3,000 | 87,871 | ||||||
Tyson Foods, Inc. – Class A | 7,900 | 179,093 | ||||||
Unilever NV | 40,054 | 1,553,349 | ||||||
Unilever PLC | 31,558 | 1,256,751 | ||||||
Wilmar International Ltd. | 47,000 | 134,322 | ||||||
Yakult Honsha Co., Ltd.(b) | 2,400 | 89,199 | ||||||
Yamazaki Baking Co., Ltd. | 3,000 | 37,879 | ||||||
|
| |||||||
| 18,419,539 | ||||||||
|
| |||||||
Household Products – 0.6% | ||||||||
Clorox Co. (The) | 3,600 | 302,436 | ||||||
Colgate-Palmolive Co. | 12,300 | 1,407,489 | ||||||
Henkel AG & Co. KGaA | 3,194 | 235,976 | ||||||
Henkel AG & Co. KGaA (Preference Shares) | 4,381 | 385,344 | ||||||
Kimberly-Clark Corp. | 10,900 | 1,027,652 | ||||||
Procter & Gamble Co. (The) | 75,900 | 5,782,062 | ||||||
Reckitt Benckiser Group PLC | 15,998 | 1,072,809 | ||||||
Svenska Cellulosa AB – Class B | 14,235 | 347,376 | ||||||
Unicharm Corp.(b) | 2,800 | 162,292 | ||||||
|
| |||||||
| 10,723,436 | ||||||||
|
| |||||||
Personal Products – 0.1% | ||||||||
Avon Products, Inc. | 11,900 | 232,645 | ||||||
Beiersdorf AG | 2,478 | 215,670 | ||||||
Estee Lauder Cos., Inc. (The) – Class A | 6,600 | 423,060 | ||||||
Kao Corp. | 12,900 | 412,799 | ||||||
L’Oreal SA | 5,930 | 884,626 | ||||||
Shiseido Co., Ltd. | 8,800 | 116,682 | ||||||
|
| |||||||
| 2,285,482 | ||||||||
|
| |||||||
Tobacco – 0.7% | ||||||||
Altria Group, Inc. | 56,000 | 1,878,800 | ||||||
British American Tobacco PLC | 47,682 | 2,480,578 | ||||||
Imperial Tobacco Group PLC | 24,332 | 880,790 | ||||||
Japan Tobacco, Inc. | 22,082 | 697,219 | ||||||
Lorillard, Inc. | 10,800 | 416,232 | ||||||
Philip Morris International, Inc. | 46,500 | 4,266,375 | ||||||
Reynolds American, Inc. | 9,000 | 393,120 | ||||||
Swedish Match AB | 5,065 | 165,708 | ||||||
|
| |||||||
| 11,178,822 | ||||||||
|
| |||||||
| 73,939,284 | ||||||||
|
| |||||||
| ALLIANCEBERNSTEIN POOLING PORTFOLIOS • | 193 |
Volatility Management Portfolio—Portfolio of Investments
| Company | Shares | U.S. $ Value | ||||||
| ||||||||
Health Care – 4.4% | ||||||||
Biotechnology – 0.5% | ||||||||
Actelion Ltd.(a) | 2,727 | $ | 140,356 | |||||
Alexion Pharmaceuticals, Inc.(a) | 5,340 | 463,192 | ||||||
Amgen, Inc. | 21,200 | 1,937,892 | ||||||
Biogen Idec, Inc.(a) | 6,500 | 1,081,210 | ||||||
Celgene Corp.(a) | 11,900 | 1,227,842 | ||||||
CSL Ltd. | 12,405 | 760,193 | ||||||
Elan Corp. PLC(a) | 12,367 | 139,081 | ||||||
Gilead Sciences, Inc.(a) | 41,600 | 1,776,736 | ||||||
Grifols SA(a) | 3,667 | 130,446 | ||||||
|
| |||||||
| 7,656,948 | ||||||||
|
| |||||||
Health Care Equipment & Supplies – 0.6% | ||||||||
Abbott Laboratories | 43,200 | 1,459,728 | ||||||
Baxter International, Inc. | 15,100 | 1,020,760 | ||||||
Becton Dickinson and Co. | 5,500 | 484,330 | ||||||
Boston Scientific Corp.(a) | 39,000 | 288,210 | ||||||
CareFusion Corp.(a) | 6,100 | 199,714 | ||||||
Cie Generale d’Optique Essilor International SA | 4,995 | 514,184 | ||||||
Cochlear Ltd. | 1,400 | 101,253 | ||||||
Coloplast A/S | 2,800 | 146,032 | ||||||
Covidien PLC | 13,200 | 839,124 | ||||||
CR Bard, Inc. | 2,200 | 217,470 | ||||||
DENTSPLY International, Inc. | 3,900 | 161,538 | ||||||
Edwards Lifesciences Corp.(a) | 3,200 | 274,976 | ||||||
Elekta AB | 9,022 | 135,115 | ||||||
Fresenius SE & Co. KGaA | 3,090 | 379,159 | ||||||
Getinge AB | 4,921 | 148,064 | ||||||
Intuitive Surgical, Inc.(a) | 1,130 | 576,176 | ||||||
Medtronic, Inc. | 28,100 | 1,263,376 | ||||||
Olympus Corp.(a) | 5,300 | 116,244 | ||||||
Smith & Nephew PLC | 22,047 | 236,166 | ||||||
Sonova Holding AG(a) | 1,208 | 144,509 | ||||||
St Jude Medical, Inc. | 8,600 | 352,600 | ||||||
Stryker Corp. | 8,000 | 511,040 | ||||||
Sysmex Corp. | 1,800 | 94,315 | ||||||
Terumo Corp. | 3,800 | 166,634 | ||||||
Varian Medical Systems, Inc.(a) | 3,000 | 211,890 | ||||||
William Demant Holding A/S(a) | 646 | 51,657 | ||||||
Zimmer Holdings, Inc. | 4,800 | 359,808 | ||||||
|
| |||||||
| 10,454,072 | ||||||||
|
| |||||||
Health Care Providers & Services – 0.5% | ||||||||
Aetna, Inc. | 9,200 | 434,148 | ||||||
Alfresa Holdings Corp. | 1,000 | 49,202 | ||||||
AmerisourceBergen Corp. – Class A | 6,900 | 325,680 | ||||||
Cardinal Health, Inc. | 9,400 | 434,374 | ||||||
Celesio AG | 2,091 | 37,750 | ||||||
| 194 | • ALLIANCEBERNSTEIN POOLING PORTFOLIOS |
Volatility Management Portfolio—Portfolio of Investments
| Company | Shares | U.S. $ Value | ||||||
| ||||||||
CIGNA Corp. | 7,900 | $ | 461,834 | |||||
Coventry Health Care, Inc. | 3,700 | 167,832 | ||||||
DaVita HealthCare Partners, Inc.(a) | 2,400 | 287,088 | ||||||
Express Scripts Holding Co.(a) | 22,283 | 1,268,126 | ||||||
Fresenius Medical Care AG & Co. KGaA | 5,240 | 359,122 | ||||||
Humana, Inc. | 4,500 | 307,170 | ||||||
Laboratory Corp. of America Holdings(a) | 2,700 | 239,220 | ||||||
McKesson Corp. | 6,500 | 689,845 | ||||||
Medipal Holdings Corp. | 3,600 | 46,530 | ||||||
Miraca Holdings, Inc. | 1,400 | 67,537 | ||||||
Patterson Cos., Inc. | 2,300 | 83,582 | ||||||
Quest Diagnostics, Inc. | 4,400 | 247,148 | ||||||
Ramsay Health Care Ltd. | 3,230 | 105,934 | ||||||
Sonic Healthcare Ltd. | 9,133 | 125,423 | ||||||
Suzuken Co., Ltd./Aichi Japan | 1,800 | 62,558 | ||||||
Tenet Healthcare Corp.(a) | 2,850 | 112,034 | ||||||
UnitedHealth Group, Inc. | 28,400 | 1,517,980 | ||||||
WellPoint, Inc. | 9,000 | 559,620 | ||||||
|
| |||||||
| 7,989,737 | ||||||||
|
| |||||||
Health Care Technology – 0.0% | ||||||||
Cerner Corp.(a) | 4,000 | 349,840 | ||||||
M3, Inc. | 16 | 27,503 | ||||||
|
| |||||||
| 377,343 | ||||||||
|
| |||||||
Life Sciences Tools & Services – 0.1% | ||||||||
Agilent Technologies, Inc. | 9,600 | 398,208 | ||||||
Life Technologies Corp.(a) | 4,800 | 279,024 | ||||||
Lonza Group AG(a) | 1,301 | 81,134 | ||||||
PerkinElmer, Inc. | 3,100 | 105,927 | ||||||
QIAGEN NV(a) | 5,791 | 122,766 | ||||||
Thermo Fisher Scientific, Inc. | 10,100 | 745,380 | ||||||
Waters Corp.(a) | 2,400 | 222,528 | ||||||
|
| |||||||
| 1,954,967 | ||||||||
|
| |||||||
Pharmaceuticals – 2.7% | ||||||||
AbbVie, Inc. | 43,200 | 1,594,944 | ||||||
Actavis, Inc.(a) | 3,500 | 298,060 | ||||||
Allergan, Inc./United States | 8,500 | 921,570 | ||||||
Astellas Pharma, Inc. | 10,900 | 588,793 | ||||||
AstraZeneca PLC | 30,596 | 1,387,379 | ||||||
Bayer AG | 20,333 | 2,008,081 | ||||||
Bristol-Myers Squibb Co. | 46,200 | 1,708,014 | ||||||
Chugai Pharmaceutical Co., Ltd. | 5,500 | 118,934 | ||||||
Daiichi Sankyo Co., Ltd. | 16,500 | 295,106 | ||||||
Dainippon Sumitomo Pharma Co., Ltd. | 3,900 | 56,415 | ||||||
Eisai Co., Ltd.(b) | 6,200 | 276,102 | ||||||
Eli Lilly & Co. | 28,100 | 1,535,946 | ||||||
Forest Laboratories, Inc.(a) | 6,400 | 235,520 | ||||||
| ALLIANCEBERNSTEIN POOLING PORTFOLIOS • | 195 |
Volatility Management Portfolio—Portfolio of Investments
| Company | Shares | U.S. $ Value | ||||||
| ||||||||
GlaxoSmithKline PLC | 122,034 | $ | 2,689,232 | |||||
Hisamitsu Pharmaceutical Co., Inc.(b) | 1,600 | 92,570 | ||||||
Hospira, Inc.(a) | 4,500 | 132,435 | ||||||
Johnson & Johnson | 76,000 | 5,784,360 | ||||||
Kyowa Hakko Kirin Co., Ltd. | 6,000 | 62,843 | ||||||
Merck & Co., Inc. | 83,900 | 3,585,047 | ||||||
Merck KGaA | 1,589 | 223,730 | ||||||
Mitsubishi Tanabe Pharma Corp. | 6,000 | 85,050 | ||||||
Mylan, Inc./PA(a) | 11,100 | 328,671 | ||||||
Novartis AG | 56,438 | 3,821,873 | ||||||
Novo Nordisk A/S – Class B | 10,014 | 1,750,789 | ||||||
Ono Pharmaceutical Co., Ltd. | 2,100 | 111,445 | ||||||
Orion Oyj | 2,374 | 70,263 | ||||||
Otsuka Holdings Co., Ltd.(b) | 8,915 | 285,579 | ||||||
Perrigo Co. | 2,400 | 271,608 | ||||||
Pfizer, Inc. | 205,700 | 5,630,009 | ||||||
Roche Holding AG | 17,238 | 3,944,195 | ||||||
Sanofi | 29,288 | 2,765,892 | ||||||
Santen Pharmaceutical Co., Ltd. | 1,900 | 85,312 | ||||||
Shionogi & Co., Ltd. | 7,300 | 148,732 | ||||||
Shire PLC | 13,832 | 432,778 | ||||||
Taisho Pharmaceutical Holdings Co., Ltd. | 887 | 61,092 | ||||||
Takeda Pharmaceutical Co., Ltd. | 19,400 | 1,002,709 | ||||||
Teva Pharmaceutical Industries Ltd. | 23,182 | 868,013 | ||||||
Tsumura & Co. | 1,500 | 52,478 | ||||||
UCB SA | 2,705 | 156,213 | ||||||
|
| |||||||
| 45,467,782 | ||||||||
|
| |||||||
| 73,900,849 | ||||||||
|
| |||||||
Consumer Discretionary – 4.4% | ||||||||
Auto Components – 0.2% | ||||||||
Aisin Seiki Co., Ltd. | 4,700 | 170,101 | ||||||
BorgWarner, Inc.(a) | 3,200 | 238,112 | ||||||
Bridgestone Corp. | 16,000 | 491,030 | ||||||
Cie Generale des Etablissements Michelin – Class B | 4,480 | 399,032 | ||||||
Continental AG | 2,699 | 315,994 | ||||||
Delphi Automotive PLC(a) | 7,821 | 327,309 | ||||||
Denso Corp. | 12,000 | 504,000 | ||||||
GKN PLC | 39,964 | 164,815 | ||||||
Goodyear Tire & Rubber Co. (The)(a) | 6,700 | 86,966 | ||||||
Johnson Controls, Inc. | 18,800 | 591,636 | ||||||
Koito Manufacturing Co., Ltd. | 3,000 | 48,871 | ||||||
NGK Spark Plug Co., Ltd. | 5,000 | 75,940 | ||||||
NHK Spring Co., Ltd. | 4,000 | 34,814 | ||||||
NOK Corp. | 2,600 | 35,825 | ||||||
Nokian Renkaat OYJ | 2,756 | 124,823 | ||||||
Pirelli & C. SpA(b) | 5,849 | 67,722 | ||||||
Stanley Electric Co., Ltd. | 3,500 | 60,918 | ||||||
| 196 | • ALLIANCEBERNSTEIN POOLING PORTFOLIOS |
Volatility Management Portfolio—Portfolio of Investments
| Company | Shares | U.S. $ Value | ||||||
| ||||||||
Sumitomo Rubber Industries Ltd. | 4,200 | $ | 65,417 | |||||
Toyoda Gosei Co., Ltd. | 1,600 | 36,941 | ||||||
Toyota Boshoku Corp.(b) | 1,600 | 21,814 | ||||||
Toyota Industries Corp. | 4,000 | 142,798 | ||||||
|
| |||||||
| 4,004,878 | ||||||||
|
| |||||||
Automobiles – 0.7% | ||||||||
Bayerische Motoren Werke AG | 8,141 | 748,491 | ||||||
Bayerische Motoren Werke AG (Preference Shares) | 1,283 | 83,220 | ||||||
Daihatsu Motor Co., Ltd. | 5,000 | 101,516 | ||||||
Daimler AG | 22,288 | 1,323,931 | ||||||
Fiat SpA(a)(b) | 20,438 | 109,080 | ||||||
Ford Motor Co. | 105,000 | 1,324,050 | ||||||
Fuji Heavy Industries Ltd. | 14,000 | 209,622 | ||||||
Harley-Davidson, Inc. | 6,300 | 331,569 | ||||||
Honda Motor Co., Ltd. | 40,000 | 1,495,943 | ||||||
Isuzu Motors Ltd. | 29,000 | 178,230 | ||||||
Mazda Motor Corp.(a) | 66,000 | 199,012 | ||||||
Mitsubishi Motors Corp.(a) | 95,000 | 104,556 | ||||||
Nissan Motor Co., Ltd. | 61,000 | 618,010 | ||||||
Peugeot SA(a) | 5,671 | 42,703 | ||||||
Porsche Automobil Holding SE (Preference Shares) | 3,765 | 297,375 | ||||||
Renault SA | 4,726 | 298,523 | ||||||
Suzuki Motor Corp. | 9,000 | 215,173 | ||||||
Toyota Motor Corp. | 67,700 | 3,477,041 | ||||||
Volkswagen AG | 725 | 148,939 | ||||||
Volkswagen AG (Preference Shares) | 3,556 | 773,473 | ||||||
Yamaha Motor Co., Ltd. | 6,900 | 82,512 | ||||||
|
| |||||||
| 12,162,969 | ||||||||
|
| |||||||
Distributors – 0.0% | ||||||||
Genuine Parts Co. | 4,300 | 305,429 | ||||||
Jardine Cycle & Carriage Ltd. | 3,000 | 124,679 | ||||||
Li & Fung Ltd. | 142,000 | 189,890 | ||||||
|
| |||||||
| 619,998 | ||||||||
|
| |||||||
Diversified Consumer Services – 0.0% | ||||||||
Apollo Group, Inc. – Class A(a) | 2,700 | 45,549 | ||||||
Benesse Holdings, Inc. | 1,700 | 70,513 | ||||||
Gree, Inc.(b) | 2,291 | 27,856 | ||||||
H&R Block, Inc. | 7,400 | 183,964 | ||||||
|
| |||||||
| 327,882 | ||||||||
|
| |||||||
Hotels, Restaurants & Leisure – 0.6% | ||||||||
Accor SA | 3,632 | 130,707 | ||||||
Carnival Corp. | 12,300 | 439,971 | ||||||
Carnival PLC | 4,579 | 171,767 | ||||||
Chipotle Mexican Grill, Inc. – Class A(a) | 900 | 285,111 | ||||||
| ALLIANCEBERNSTEIN POOLING PORTFOLIOS • | 197 |
Volatility Management Portfolio—Portfolio of Investments
| Company | Shares | U.S. $ Value | ||||||
| ||||||||
Compass Group PLC | 45,669 | $ | 553,306 | |||||
Crown Ltd. | 9,850 | 120,695 | ||||||
Darden Restaurants, Inc. | 3,500 | 161,945 | ||||||
Echo Entertainment Group Ltd. | 16,915 | 64,994 | ||||||
Flight Centre Ltd.(b) | 1,351 | 44,684 | ||||||
Galaxy Entertainment Group Ltd.(a) | 51,400 | 215,356 | ||||||
Genting Singapore PLC(b) | 149,000 | 189,212 | ||||||
International Game Technology | 7,300 | 116,362 | ||||||
Marriott International, Inc./DE – Class A | 6,900 | 272,205 | ||||||
McDonald’s Corp. | 27,800 | 2,666,020 | ||||||
McDonald’s Holdings Co. Japan Ltd.(b) | 1,700 | 42,584 | ||||||
MGM China Holdings Ltd. | 20,600 | 49,789 | ||||||
OPAP SA | 5,491 | 46,660 | ||||||
Oriental Land Co., Ltd./Japan | 1,300 | 191,936 | ||||||
Sands China Ltd. | 58,200 | 275,653 | ||||||
Shangri-La Asia Ltd. | 38,000 | 88,451 | ||||||
SJM Holdings Ltd. | 45,500 | 113,079 | ||||||
SKYCITY Entertainment Group Ltd. | 12,550 | 44,052 | ||||||
Sodexo | 2,318 | 214,437 | ||||||
Starbucks Corp. | 20,900 | 1,145,738 | ||||||
Starwood Hotels & Resorts Worldwide, Inc. | 5,400 | 325,782 | ||||||
TABCORP Holdings Ltd. | 16,263 | 52,741 | ||||||
Tatts Group Ltd.(b) | 31,902 | 103,710 | ||||||
TUI Travel PLC | 9,841 | 47,208 | ||||||
Whitbread PLC | 4,375 | 166,984 | ||||||
Wynn Macau Ltd.(a) | 36,500 | 96,524 | ||||||
Wynn Resorts Ltd. | 2,200 | 257,180 | ||||||
Yum! Brands, Inc. | 12,600 | 825,048 | ||||||
|
| |||||||
| 9,519,891 | ||||||||
|
| |||||||
Household Durables – 0.2% | ||||||||
Casio Computer Co., Ltd.(b) | 5,500 | 43,588 | ||||||
DR Horton, Inc. | 7,600 | 169,480 | ||||||
Electrolux AB | 5,915 | 150,531 | ||||||
Garmin Ltd.(b) | 3,030 | 104,050 | ||||||
Harman International Industries, Inc. | 1,800 | 76,410 | ||||||
Husqvarna AB | 9,926 | 61,088 | ||||||
Leggett & Platt, Inc. | 3,800 | 116,204 | ||||||
Lennar Corp. – Class A(b) | 4,400 | 169,796 | ||||||
Newell Rubbermaid, Inc. | 7,900 | 184,386 | ||||||
Panasonic Corp. | 54,100 | 389,220 | ||||||
PulteGroup, Inc.(a) | 9,300 | 178,374 | ||||||
Rinnai Corp. | 800 | 57,394 | ||||||
Sekisui Chemical Co., Ltd. | 10,000 | 96,986 | ||||||
Sekisui House Ltd. | 13,000 | 150,521 | ||||||
Sharp Corp./Japan(b) | 24,000 | 76,101 | ||||||
Sony Corp. | 24,700 | 360,263 | ||||||
Whirlpool Corp. | 2,100 | 237,195 | ||||||
|
| |||||||
| 2,621,587 | ||||||||
|
| |||||||
| 198 | • ALLIANCEBERNSTEIN POOLING PORTFOLIOS |
Volatility Management Portfolio—Portfolio of Investments
| Company | Shares | U.S. $ Value | ||||||
| ||||||||
Internet & Catalog Retail – 0.3% | ||||||||
Amazon.com, Inc.(a) | 10,000 | $ | 2,642,700 | |||||
Expedia, Inc. | 2,600 | 165,984 | ||||||
NetFlix, Inc.(a) | 1,500 | 282,120 | ||||||
priceline.com, Inc.(a) | 1,460 | 1,003,867 | ||||||
Rakuten, Inc. | 17,814 | 153,981 | ||||||
TripAdvisor, Inc.(a) | 3,000 | 136,380 | ||||||
|
| |||||||
| 4,385,032 | ||||||||
|
| |||||||
Leisure Equipment & Products – 0.1% | ||||||||
Hasbro, Inc.(b) | 3,200 | 128,064 | ||||||
Mattel, Inc. | 9,400 | 383,050 | ||||||
Namco Bandai Holdings, Inc. | 4,400 | 69,978 | ||||||
Nikon Corp. | 8,400 | 188,715 | ||||||
Sankyo Co., Ltd. | 1,200 | 50,572 | ||||||
Sega Sammy Holdings, Inc. | 4,900 | 90,501 | ||||||
Shimano, Inc. | 1,900 | 136,377 | ||||||
Yamaha Corp. | 3,900 | 38,796 | ||||||
|
| |||||||
| 1,086,053 | ||||||||
|
| |||||||
Media – 1.0% | ||||||||
Axel Springer AG | 973 | 45,785 | ||||||
British Sky Broadcasting Group PLC | 26,498 | 340,987 | ||||||
Cablevision Systems Corp. | 5,900 | 82,541 | ||||||
CBS Corp. – Class B | 16,400 | 711,596 | ||||||
Comcast Corp. – Class A | 73,700 | 2,932,523 | ||||||
Dentsu, Inc. | 4,500 | 140,154 | ||||||
DIRECTV(a) | 17,300 | 833,341 | ||||||
Discovery Communications, Inc. – Class A(a) | 6,800 | 498,644 | ||||||
Eutelsat Communications SA | 3,247 | 116,759 | ||||||
Gannett Co., Inc. | 6,300 | 126,441 | ||||||
Hakuhodo DY Holdings, Inc. | 580 | 44,032 | ||||||
Interpublic Group of Cos., Inc. (The) | 12,000 | 153,360 | ||||||
ITV PLC | 90,909 | 170,740 | ||||||
JCDecaux SA | 1,637 | 44,293 | ||||||
Jupiter Telecommunications Co., Ltd. | 52 | 69,004 | ||||||
Kabel Deutschland Holding AG | 2,177 | 188,484 | ||||||
Lagardere SCA | 2,902 | 103,384 | ||||||
News Corp. – Class A | 56,000 | 1,612,800 | ||||||
Omnicom Group, Inc. | 7,300 | 419,969 | ||||||
Pearson PLC | 20,064 | 351,051 | ||||||
ProSiebenSat.1 Media AG (Preference Shares) | 2,152 | 74,063 | ||||||
Publicis Groupe SA | 4,356 | 287,231 | ||||||
Reed Elsevier NV | 16,915 | 256,654 | ||||||
Reed Elsevier PLC | 29,937 | 321,013 | ||||||
Scripps Networks Interactive, Inc. – Class A | 2,400 | 151,320 | ||||||
SES SA | 7,471 | 229,744 | ||||||
Singapore Press Holdings Ltd.(b) | 39,000 | 131,531 | ||||||
Time Warner Cable, Inc. – Class A | 8,500 | 734,315 | ||||||
| ALLIANCEBERNSTEIN POOLING PORTFOLIOS • | 199 |
Volatility Management Portfolio—Portfolio of Investments
| Company | Shares | U.S. $ Value | ||||||
| ||||||||
Time Warner, Inc. | 26,100 | $ | 1,387,737 | |||||
Toho Co., Ltd./Tokyo | 2,800 | 53,865 | ||||||
Viacom, Inc. – Class B | 13,000 | 759,980 | ||||||
Walt Disney Co. (The) | 49,400 | 2,696,746 | ||||||
Washington Post Co. (The) – Class B(b) | 200 | 79,708 | ||||||
Wolters Kluwer NV | 7,423 | 147,566 | ||||||
WPP PLC | 30,988 | 493,760 | ||||||
|
| |||||||
| 16,791,121 | ||||||||
|
| |||||||
Multiline Retail – 0.3% | ||||||||
Dollar General Corp.(a) | 7,360 | 341,062 | ||||||
Dollar Tree, Inc.(a) | 6,300 | 284,666 | ||||||
Don Quijote Co., Ltd. | 1,400 | 55,180 | ||||||
Family Dollar Stores, Inc. | 2,700 | 155,385 | ||||||
Harvey Norman Holdings Ltd.(b) | 10,380 | 26,334 | ||||||
Isetan Mitsukoshi Holdings Ltd. | 8,700 | 96,280 | ||||||
J Front Retailing Co., Ltd. | 11,000 | 65,058 | ||||||
JC Penney Co., Inc.(b) | 3,900 | 68,523 | ||||||
Kohl’s Corp. | 5,900 | 271,990 | ||||||
Macy’s, Inc. | 11,100 | 456,210 | ||||||
Marks & Spencer Group PLC | 39,510 | 221,824 | ||||||
Marui Group Co., Ltd. | 5,500 | 46,938 | ||||||
Next PLC | 4,071 | 258,904 | ||||||
Nordstrom, Inc. | 4,200 | 227,724 | ||||||
PPR | 1,858 | 415,360 | ||||||
Takashimaya Co., Ltd. | 6,392 | 50,071 | ||||||
Target Corp. | 18,000 | 1,133,280 | ||||||
|
| |||||||
| 4,174,789 | ||||||||
|
| |||||||
Specialty Retail – 0.6% | ||||||||
ABC-Mart, Inc.(b) | 700 | 24,421 | ||||||
Abercrombie & Fitch Co. – Class A | 2,200 | 102,586 | ||||||
AutoNation, Inc.(a) | 1,000 | 43,770 | ||||||
AutoZone, Inc.(a) | 1,060 | 402,959 | ||||||
Bed Bath & Beyond, Inc.(a) | 6,400 | 363,200 | ||||||
Best Buy Co., Inc. | 7,300 | 119,793 | ||||||
CarMax, Inc.(a) | 6,200 | 238,142 | ||||||
Fast Retailing Co., Ltd.(b) | 1,300 | 356,864 | ||||||
GameStop Corp. – Class A(b) | 3,400 | 85,204 | ||||||
Gap, Inc. (The) | 8,200 | 269,944 | ||||||
Hennes & Mauritz AB – Class B | 23,345 | 836,002 | ||||||
Home Depot, Inc. (The) | 41,500 | 2,842,750 | ||||||
Inditex SA | 5,364 | 717,083 | ||||||
Kingfisher PLC | 57,131 | 239,331 | ||||||
Limited Brands, Inc. | 6,600 | 300,432 | ||||||
Lowe’s Cos., Inc. | 31,400 | 1,197,910 | ||||||
Nitori Holdings Co., Ltd. | 850 | 63,294 | ||||||
O’Reilly Automotive, Inc.(a) | 3,300 | 335,742 | ||||||
PetSmart, Inc. | 2,990 | 194,679 | ||||||
| 200 | • ALLIANCEBERNSTEIN POOLING PORTFOLIOS |
Volatility Management Portfolio—Portfolio of Investments
| Company | Shares | U.S. $ Value | ||||||
| ||||||||
Ross Stores, Inc. | 6,200 | $ | 359,352 | |||||
Sanrio Co., Ltd.(b) | 1,100 | 43,452 | ||||||
Shimamura Co., Ltd. | 600 | 61,282 | ||||||
Staples, Inc. | 18,700 | 246,466 | ||||||
Tiffany & Co. | 3,300 | 221,628 | ||||||
TJX Cos., Inc. | 20,300 | 912,891 | ||||||
Urban Outfitters, Inc.(a) | 3,000 | 121,560 | ||||||
USS Co., Ltd. | 540 | 59,269 | ||||||
Yamada Denki Co., Ltd.(b) | 2,140 | 77,654 | ||||||
|
| |||||||
| 10,837,660 | ||||||||
|
| |||||||
Textiles, Apparel & Luxury Goods – 0.4% | ||||||||
Adidas AG | 5,144 | 467,545 | ||||||
Asics Corp. | 4,000 | 62,749 | ||||||
Burberry Group PLC | 10,788 | 224,640 | ||||||
Christian Dior SA | 1,340 | 223,111 | ||||||
Cie Financiere Richemont SA | 12,835 | 1,029,481 | ||||||
Coach, Inc. | 7,800 | 376,974 | ||||||
Fossil, Inc.(a) | 1,529 | 157,135 | ||||||
Hugo Boss AG | 606 | 70,122 | ||||||
Luxottica Group SpA | 4,040 | 188,464 | ||||||
LVMH Moet Hennessy Louis Vuitton SA | 6,246 | 1,071,825 | ||||||
NIKE, Inc. – Class B | 20,200 | 1,100,092 | ||||||
PVH Corp. | 2,211 | 269,411 | ||||||
Ralph Lauren Corp. | 1,700 | 294,899 | ||||||
Swatch Group AG (The) | 758 | 430,488 | ||||||
Swatch Group AG (The) (REG) | 1,068 | 108,411 | ||||||
VF Corp. | 2,500 | 403,150 | ||||||
Yue Yuen Industrial Holdings Ltd. | 18,000 | 60,813 | ||||||
|
| |||||||
| 6,539,310 | ||||||||
|
| |||||||
| 73,071,170 | ||||||||
|
| |||||||
Energy – 3.7% | ||||||||
Energy Equipment & Services – 0.6% | ||||||||
Aker Solutions ASA | 4,042 | 79,226 | ||||||
AMEC PLC | 7,625 | 120,409 | ||||||
Baker Hughes, Inc. | 12,100 | 542,322 | ||||||
Cameron International Corp.(a) | 6,800 | 433,296 | ||||||
Cie Generale de Geophysique-Veritas(a) | 3,901 | 96,522 | ||||||
Diamond Offshore Drilling, Inc. | 1,900 | 132,392 | ||||||
Ensco PLC | 6,400 | 384,896 | ||||||
FMC Technologies, Inc.(a) | 6,500 | 337,415 | ||||||
Fugro NV | 1,701 | 80,832 | ||||||
Halliburton Co. | 25,500 | 1,058,505 | ||||||
Helmerich & Payne, Inc. | 2,900 | 192,154 | ||||||
Nabors Industries Ltd.(a) | 7,900 | 132,404 | ||||||
National Oilwell Varco, Inc. | 11,800 | 803,934 | ||||||
Noble Corp. | 6,900 | 247,158 | ||||||
| ALLIANCEBERNSTEIN POOLING PORTFOLIOS • | 201 |
Volatility Management Portfolio—Portfolio of Investments
| Company | Shares | U.S. $ Value | ||||||
| ||||||||
Petrofac Ltd. | 6,378 | $ | 140,227 | |||||
Rowan Cos. PLC(a) | 3,400 | 117,606 | ||||||
Saipem SpA | 6,510 | 173,824 | ||||||
Schlumberger Ltd. | 36,600 | 2,849,310 | ||||||
Seadrill Ltd. | 8,653 | 315,535 | ||||||
Subsea 7 SA | 6,920 | 163,421 | ||||||
Technip SA | 2,500 | 270,143 | ||||||
Tenaris SA | 11,611 | 238,155 | ||||||
Transocean Ltd. | 8,818 | 464,837 | ||||||
WorleyParsons Ltd. | 5,061 | 137,064 | ||||||
|
| |||||||
| 9,511,587 | ||||||||
|
| |||||||
Oil, Gas & Consumable Fuels – 3.1% | ||||||||
Anadarko Petroleum Corp. | 13,800 | 1,098,204 | ||||||
Apache Corp. | 10,800 | 802,116 | ||||||
BG Group PLC | 83,522 | 1,472,786 | ||||||
BP PLC | 467,107 | 3,132,199 | ||||||
Cabot Oil & Gas Corp. | 5,800 | 359,426 | ||||||
Caltex Australia Ltd. | 3,319 | 67,413 | ||||||
Chesapeake Energy Corp.(b) | 14,200 | 286,272 | ||||||
Chevron Corp. | 54,100 | 6,337,815 | ||||||
ConocoPhillips | 33,500 | 1,941,325 | ||||||
Consol Energy, Inc. | 6,200 | 199,330 | ||||||
Cosmo Oil Co., Ltd.(b) | 13,000 | 30,505 | ||||||
Delek Group Ltd. | 112 | 29,526 | ||||||
Denbury Resources, Inc.(a) | 10,700 | 193,884 | ||||||
Devon Energy Corp. | 10,400 | 564,304 | ||||||
ENI SpA | 62,550 | 1,423,623 | ||||||
EOG Resources, Inc. | 7,500 | 942,825 | ||||||
EQT Corp. | 4,100 | 258,669 | ||||||
Exxon Mobil Corp. | 127,210 | 11,391,656 | ||||||
Galp Energia SGPS SA | 6,623 | 102,030 | ||||||
Hess Corp. | 8,200 | 545,300 | ||||||
Idemitsu Kosan Co., Ltd. | 600 | 54,510 | ||||||
Inpex Corp. | 54 | 286,644 | ||||||
Japan Petroleum Exploration Co. | 700 | 26,527 | ||||||
JX Holdings, Inc. | 55,000 | 335,185 | ||||||
Kinder Morgan, Inc./Delaware | 15,635 | 579,589 | ||||||
Lundin Petroleum AB(a) | 5,472 | 123,883 | ||||||
Marathon Oil Corp. | 19,400 | 649,900 | ||||||
Marathon Petroleum Corp. | 9,300 | 770,784 | ||||||
Murphy Oil Corp. | 5,100 | 310,488 | ||||||
Neste Oil Oyj(b) | 3,152 | 47,259 | ||||||
Newfield Exploration Co.(a) | 3,700 | 85,544 | ||||||
Noble Energy, Inc. | 4,900 | 543,067 | ||||||
Occidental Petroleum Corp. | 22,300 | 1,835,959 | ||||||
OMV AG | 3,621 | 157,278 | ||||||
Origin Energy Ltd. | 26,789 | 331,786 | ||||||
| 202 | • ALLIANCEBERNSTEIN POOLING PORTFOLIOS |
Volatility Management Portfolio—Portfolio of Investments
| Company | Shares | U.S. $ Value | ||||||
| ||||||||
Peabody Energy Corp. | 7,300 | $ | 157,388 | |||||
Phillips 66 | 17,300 | 1,089,208 | ||||||
Pioneer Natural Resources Co. | 3,400 | 427,754 | ||||||
QEP Resources, Inc. | 4,800 | 146,208 | ||||||
Range Resources Corp. | 4,500 | 345,600 | ||||||
Repsol SA | 20,077 | 427,063 | ||||||
Royal Dutch Shell PLC – Class A | 91,169 | 2,994,406 | ||||||
Royal Dutch Shell PLC – Class B | 64,545 | 2,171,986 | ||||||
Santos Ltd.(b) | 23,480 | 320,208 | ||||||
Showa Shell Sekiyu KK | 4,600 | 33,223 | ||||||
Southwestern Energy Co.(a) | 9,500 | 325,565 | ||||||
Spectra Energy Corp. | 17,900 | 519,816 | ||||||
Statoil ASA | 27,441 | 681,214 | ||||||
Tesoro Corp. | 3,800 | 213,712 | ||||||
TonenGeneral Sekiyu KK | 7,000 | 69,440 | ||||||
Total SA | 52,308 | 2,611,512 | ||||||
Tullow Oil PLC | 22,290 | 409,437 | ||||||
Valero Energy Corp. | 15,100 | 688,409 | ||||||
Whitehaven Coal Ltd.(b) | 9,628 | 27,345 | ||||||
Williams Cos., Inc. (The) | 17,200 | 597,012 | ||||||
Woodside Petroleum Ltd. | 16,207 | 618,379 | ||||||
WPX Energy, Inc.(a) | 5,400 | 76,626 | ||||||
|
| |||||||
| 52,269,122 | ||||||||
|
| |||||||
| 61,780,709 | ||||||||
|
| |||||||
Materials – 2.3% | ||||||||
Chemicals – 1.1% | ||||||||
Air Liquide SA | 7,679 | 931,951 | ||||||
Air Products & Chemicals, Inc. | 5,800 | 500,772 | ||||||
Air Water, Inc. | 4,000 | 54,138 | ||||||
Airgas, Inc. | 1,900 | 190,532 | ||||||
Akzo Nobel NV | 5,857 | 372,796 | ||||||
Arkema SA | 1,534 | 155,523 | ||||||
Asahi Kasei Corp. | 31,000 | 183,120 | ||||||
BASF SE | 22,584 | 2,121,013 | ||||||
CF Industries Holdings, Inc. | 1,800 | 361,494 | ||||||
Croda International PLC | 3,327 | 130,441 | ||||||
Daicel Corp. | 7,000 | 53,854 | ||||||
Denki Kagaku Kogyo KK | 11,000 | 41,826 | ||||||
Dow Chemical Co. (The) | 33,000 | 1,046,760 | ||||||
Eastman Chemical Co. | 4,200 | 292,866 | ||||||
Ecolab, Inc. | 7,300 | 558,815 | ||||||
EI du Pont de Nemours & Co. | 25,600 | 1,226,240 | ||||||
EMS-Chemie Holding AG | 201 | 56,556 | ||||||
FMC Corp. | 3,800 | 228,988 | ||||||
Givaudan SA(a) | 204 | 243,175 | ||||||
Hitachi Chemical Co., Ltd. | 2,600 | 35,580 | ||||||
Incitec Pivot Ltd. | 38,543 | 126,694 | ||||||
| ALLIANCEBERNSTEIN POOLING PORTFOLIOS • | 203 |
Volatility Management Portfolio—Portfolio of Investments
| Company | Shares | U.S. $ Value | ||||||
| ||||||||
International Flavors & Fragrances, Inc. | 2,200 | $ | 160,556 | |||||
Israel Chemicals Ltd. | 10,949 | 141,143 | ||||||
Israel Corp. Ltd. (The) | 57 | 40,826 | ||||||
Johnson Matthey PLC | 5,039 | 175,092 | ||||||
JSR Corp. | 4,400 | 89,640 | ||||||
K&S AG | 4,236 | 198,621 | ||||||
Kaneka Corp. | 6,000 | 33,177 | ||||||
Kansai Paint Co., Ltd. | 5,000 | 52,969 | ||||||
Koninklijke DSM NV | 3,792 | 221,476 | ||||||
Kuraray Co., Ltd. | 8,500 | 115,569 | ||||||
Lanxess AG | 2,046 | 172,673 | ||||||
Linde AG | 4,549 | 823,421 | ||||||
LyondellBasell Industries NV | 9,310 | 545,752 | ||||||
Mitsubishi Chemical Holdings Corp. | 33,000 | 154,739 | ||||||
Mitsubishi Gas Chemical Co., Inc. | 9,000 | 63,647 | ||||||
Mitsui Chemicals, Inc. | 21,000 | 49,751 | ||||||
Monsanto Co. | 14,700 | 1,485,141 | ||||||
Mosaic Co. (The) | 7,600 | 444,904 | ||||||
Nitto Denko Corp. | 4,100 | 240,551 | ||||||
Novozymes A/S(b) | 6,003 | 209,377 | ||||||
Orica Ltd. | 8,975 | 249,990 | ||||||
PPG Industries, Inc. | 4,200 | 565,572 | ||||||
Praxair, Inc. | 8,200 | 927,010 | ||||||
Sherwin-Williams Co. (The) | 2,400 | 387,816 | ||||||
Shin-Etsu Chemical Co., Ltd. | 10,100 | 620,930 | ||||||
Showa Denko KK(b) | 34,000 | 52,753 | ||||||
Sigma-Aldrich Corp. | 3,300 | 254,298 | ||||||
Sika AG | 53 | 131,136 | ||||||
Solvay SA | 1,458 | 207,675 | ||||||
Sumitomo Chemical Co., Ltd. | 36,000 | 106,270 | ||||||
Syngenta AG | 2,285 | 969,721 | ||||||
Taiyo Nippon Sanso Corp.(b) | 6,000 | 42,068 | ||||||
Teijin Ltd. | 22,000 | 51,004 | ||||||
Toray Industries, Inc. | 36,000 | 221,467 | ||||||
Ube Industries Ltd./Japan | 24,000 | 50,687 | ||||||
Umicore SA | 2,803 | 139,689 | ||||||
Yara International ASA | 4,597 | 219,181 | ||||||
|
| |||||||
| 19,529,426 | ||||||||
|
| |||||||
Construction Materials – 0.1% | ||||||||
Boral Ltd. | 17,467 | 91,904 | ||||||
CRH PLC | 17,756 | 386,051 | ||||||
Fletcher Building Ltd. | 16,790 | 126,782 | ||||||
HeidelbergCement AG | 3,458 | 237,622 | ||||||
Holcim Ltd.(a) | 5,630 | 453,269 | ||||||
Imerys SA | 829 | 55,681 | ||||||
James Hardie Industries PLC | 10,751 | 107,372 | ||||||
Lafarge SA | 4,591 | 308,210 | ||||||
| 204 | • ALLIANCEBERNSTEIN POOLING PORTFOLIOS |
Volatility Management Portfolio—Portfolio of Investments
| Company | Shares | U.S. $ Value | ||||||
| ||||||||
Taiheiyo Cement Corp. | 27,000 | $ | 66,713 | |||||
Vulcan Materials Co. | 3,500 | 178,255 | ||||||
|
| |||||||
| 2,011,859 | ||||||||
|
| |||||||
Containers & Packaging – 0.1% | ||||||||
Amcor Ltd./Australia | 29,670 | 278,183 | ||||||
Ball Corp. | 4,200 | 186,522 | ||||||
Bemis Co., Inc. | 2,800 | 104,552 | ||||||
Owens-Illinois, Inc.(a) | 4,500 | 114,750 | ||||||
Rexam PLC | 19,413 | 151,267 | ||||||
Sealed Air Corp. | 4,800 | 106,608 | ||||||
Toyo Seikan Kaisha Ltd. | 3,700 | 53,833 | ||||||
|
| |||||||
| 995,715 | ||||||||
|
| |||||||
Metals & Mining – 0.9% | ||||||||
Alcoa, Inc. | 29,300 | 249,636 | ||||||
Allegheny Technologies, Inc. | 2,900 | 88,363 | ||||||
Alumina Ltd. | 54,842 | 68,455 | ||||||
Anglo American PLC | 34,179 | 990,396 | ||||||
Antofagasta PLC | 9,696 | 159,859 | ||||||
ArcelorMittal (Euronext Amsterdam) | 23,028 | 344,767 | ||||||
BHP Billiton Ltd. | 79,114 | 2,961,883 | ||||||
BHP Billiton PLC | 51,932 | 1,638,759 | ||||||
Boliden AB | 6,725 | 113,580 | ||||||
Cliffs Natural Resources, Inc.(b) | 3,900 | 99,294 | ||||||
Daido Steel Co., Ltd. | 6,000 | 31,872 | ||||||
Eurasian Natural Resources Corp. PLC | 5,173 | 26,365 | ||||||
Evraz PLC | 6,891 | 28,343 | ||||||
Fortescue Metals Group Ltd.(b) | 33,177 | 158,508 | ||||||
Freeport-McMoRan Copper & Gold, Inc. | 26,100 | 833,112 | ||||||
Fresnillo PLC | 4,409 | 103,176 | ||||||
Glencore International PLC(b) | 92,714 | 543,170 | ||||||
Hitachi Metals Ltd. | 4,000 | 37,412 | ||||||
Iluka Resources Ltd.(b) | 10,295 | 110,046 | ||||||
JFE Holdings, Inc. | 12,100 | 259,070 | ||||||
Kazakhmys PLC | 5,151 | 48,056 | ||||||
Kobe Steel Ltd.(a) | 61,000 | 82,237 | ||||||
Maruichi Steel Tube Ltd. | 1,200 | 29,307 | ||||||
Mitsubishi Materials Corp. | 27,000 | 82,137 | ||||||
Newcrest Mining Ltd. | 18,810 | 431,220 | ||||||
Newmont Mining Corp. | 13,700 | 551,973 | ||||||
Nippon Steel & Sumitomo Metal Corp. | 186,000 | 503,543 | ||||||
Norsk Hydro ASA | 21,853 | 96,260 | ||||||
Nucor Corp. | 8,700 | 391,935 | ||||||
OZ Minerals Ltd. | 7,581 | 48,990 | ||||||
Randgold Resources Ltd. | 2,144 | 177,473 | ||||||
Rio Tinto Ltd. | 10,714 | 729,133 | ||||||
Rio Tinto PLC | 32,958 | 1,762,341 | ||||||
Salzgitter AG | 960 | 45,624 | ||||||
| ALLIANCEBERNSTEIN POOLING PORTFOLIOS • | 205 |
Volatility Management Portfolio—Portfolio of Investments
| Company | Shares | U.S. $ Value | ||||||
| ||||||||
Sims Metal Management Ltd.(b) | 4,035 | $ | 44,724 | |||||
Sumitomo Metal Mining Co., Ltd. | 13,000 | 204,667 | ||||||
ThyssenKrupp AG(a) | 9,488 | 213,196 | ||||||
United States Steel Corp.(b) | 3,900 | 81,276 | ||||||
Vedanta Resources PLC | 2,614 | 46,273 | ||||||
Voestalpine AG | 2,702 | 90,913 | ||||||
Xstrata PLC | 51,681 | 907,077 | ||||||
Yamato Kogyo Co., Ltd.(b) | 1,100 | 31,450 | ||||||
|
| |||||||
| 15,445,871 | ||||||||
|
| |||||||
Paper & Forest Products – 0.1% | ||||||||
International Paper Co. | 12,000 | 528,120 | ||||||
MeadWestvaco Corp. | 4,700 | 167,837 | ||||||
Nippon Paper Group, Inc.(b) | 2,400 | 41,729 | ||||||
OJI Holdings Corp.(b) | 19,000 | 72,269 | ||||||
Stora Enso Oyj | 13,552 | 90,721 | ||||||
UPM-Kymmene Oyj | 12,928 | 150,586 | ||||||
|
| |||||||
| 1,051,262 | ||||||||
|
| |||||||
| 39,034,133 | ||||||||
|
| |||||||
Telecommunication Services – 1.4% | ||||||||
Diversified Telecommunication | ||||||||
AT&T, Inc. | 158,900 | 5,706,099 | ||||||
Belgacom SA | 3,740 | 104,349 | ||||||
Bezeq The Israeli Telecommunication Corp., Ltd. | 42,709 | 54,650 | ||||||
BT Group PLC | 191,929 | 778,987 | ||||||
CenturyLink, Inc. | 17,100 | 592,857 | ||||||
Deutsche Telekom AG | 69,064 | 740,123 | ||||||
Elisa Oyj | 3,485 | 73,360 | ||||||
France Telecom SA | 45,592 | 439,732 | ||||||
Frontier Communications Corp.(b) | 27,500 | 113,850 | ||||||
HKT Trust/HKT Ltd. | 55,100 | 54,648 | ||||||
Iliad SA | 561 | 107,215 | ||||||
Inmarsat PLC | 11,021 | 108,535 | ||||||
Koninklijke KPN NV(b) | 24,639 | 83,661 | ||||||
Nippon Telegraph & Telephone Corp. | 10,800 | 493,481 | ||||||
PCCW Ltd. | 98,000 | 46,954 | ||||||
Portugal Telecom SGPS SA | 14,326 | 72,368 | ||||||
Singapore Telecommunications Ltd. | 195,000 | 537,428 | ||||||
Swisscom AG | 573 | 260,594 | ||||||
TDC A/S | 12,171 | 91,552 | ||||||
Telecom Corp. of New Zealand Ltd. | 43,956 | 87,965 | ||||||
Telecom Italia SpA (ordinary shares) | 225,457 | 165,800 | ||||||
Telecom Italia SpA (savings shares) | 141,900 | 91,763 | ||||||
Telefonica SA | 100,495 | 1,311,696 | ||||||
Telekom Austria AG | 5,446 | 35,984 | ||||||
| 206 | • ALLIANCEBERNSTEIN POOLING PORTFOLIOS |
Volatility Management Portfolio—Portfolio of Investments
| Company | Shares | U.S. $ Value | ||||||
| ||||||||
Telenet Group Holding NV | 1,395 | $ | 71,387 | |||||
Telenor ASA | 17,224 | 370,329 | ||||||
TeliaSonera AB | 53,234 | 364,457 | ||||||
Telstra Corp., Ltd. | 105,980 | 496,051 | ||||||
Verizon Communications, Inc. | 78,500 | 3,652,605 | ||||||
Vivendi SA | 31,924 | 669,653 | ||||||
Windstream Corp.(b) | 16,100 | 138,299 | ||||||
Ziggo NV | 2,945 | 99,404 | ||||||
|
| |||||||
| 18,015,836 | ||||||||
|
| |||||||
Wireless Telecommunication | ||||||||
KDDI Corp. | 6,603 | 495,923 | ||||||
MetroPCS Communications, Inc.(a) | 8,700 | 85,260 | ||||||
Millicom International Cellular SA | 1,556 | 121,904 | ||||||
NTT DoCoMo, Inc. | 375 | 579,745 | ||||||
Softbank Corp. | 21,800 | 807,442 | ||||||
Sprint Nextel Corp.(a) | 82,600 | 479,080 | ||||||
StarHub Ltd. | 14,000 | 47,296 | ||||||
Tele2 AB – Class B | 7,814 | 124,454 | ||||||
Vodafone Group PLC | 1,206,497 | 3,026,130 | ||||||
|
| |||||||
| 5,767,234 | ||||||||
|
| |||||||
| 23,783,070 | ||||||||
|
| |||||||
Utilities – 1.4% | ||||||||
Electric Utilities – 0.7% | ||||||||
Acciona SA | 633 | 38,781 | ||||||
American Electric Power Co., Inc. | 13,300 | 622,307 | ||||||
Cheung Kong Infrastructure Holdings Ltd. | 12,000 | 78,569 | ||||||
Chubu Electric Power Co., Inc. | 15,800 | 198,107 | ||||||
Chugoku Electric Power Co., Inc. (The) | 7,300 | 91,757 | ||||||
CLP Holdings Ltd. | 44,500 | 382,979 | ||||||
Contact Energy Ltd.(a) | 7,917 | 35,257 | ||||||
Duke Energy Corp. | 19,358 | 1,340,541 | ||||||
Edison International | 9,000 | 432,270 | ||||||
EDP – Energias de Portugal SA | 44,990 | 134,560 | ||||||
Electricite de France SA | 5,910 | 111,515 | ||||||
Enel SpA | 160,544 | 579,436 | ||||||
Entergy Corp. | 4,900 | 305,074 | ||||||
Exelon Corp. | 23,482 | 727,707 | ||||||
FirstEnergy Corp. | 11,500 | 454,020 | ||||||
Fortum Oyj | 10,922 | 207,861 | ||||||
Hokkaido Electric Power Co., Inc. | 4,500 | 39,868 | ||||||
Hokuriku Electric Power Co. | 4,100 | 47,143 | ||||||
Iberdrola SA | 97,903 | 483,099 | ||||||
Kansai Electric Power Co., Inc. (The) | 18,400 | 158,881 | ||||||
Kyushu Electric Power Co., Inc. | 10,500 | 100,764 | ||||||
NextEra Energy, Inc. | 11,600 | 833,692 | ||||||
| ALLIANCEBERNSTEIN POOLING PORTFOLIOS • | 207 |
Volatility Management Portfolio—Portfolio of Investments
| Company | Shares | U.S. $ Value | ||||||
| ||||||||
Northeast Utilities | 8,600 | $ | 356,986 | |||||
Pepco Holdings, Inc. | 6,300 | 127,827 | ||||||
Pinnacle West Capital Corp. | 3,000 | 167,820 | ||||||
Power Assets Holdings Ltd. | 34,000 | 303,470 | ||||||
PPL Corp. | 15,900 | 490,038 | ||||||
Red Electrica Corp. SA | 2,661 | 147,086 | ||||||
Shikoku Electric Power Co., Inc. | 4,100 | 50,206 | ||||||
Southern Co. (The) | 24,100 | 1,084,741 | ||||||
SP AusNet | 40,947 | 49,803 | ||||||
SSE PLC | 23,229 | 508,759 | ||||||
Terna Rete Elettrica Nazionale SpA | 30,818 | 128,694 | ||||||
Tohoku Electric Power Co., Inc.(a) | 11,100 | 85,865 | ||||||
Tokyo Electric Power Co., Inc.(a) | 35,400 | 80,164 | ||||||
Verbund AG | 1,674 | 34,779 | ||||||
Xcel Energy, Inc. | 13,400 | 384,580 | ||||||
|
| |||||||
| 11,405,006 | ||||||||
|
| |||||||
Gas Utilities – 0.1% | ||||||||
AGL Resources, Inc. | 3,200 | 127,872 | ||||||
APA Group | 20,299 | 127,480 | ||||||
Enagas SA | 4,686 | 111,994 | ||||||
Gas Natural SDG SA | 8,534 | 168,906 | ||||||
Hong Kong & China Gas Co., Ltd. | 127,000 | 355,236 | ||||||
ONEOK, Inc. | 5,600 | 251,944 | ||||||
Osaka Gas Co., Ltd. | 46,000 | 178,533 | ||||||
Snam SpA | 40,445 | 191,511 | ||||||
Toho Gas Co., Ltd. | 10,000 | 55,224 | ||||||
Tokyo Gas Co., Ltd. | 60,000 | 289,772 | ||||||
|
| |||||||
| 1,858,472 | ||||||||
|
| |||||||
Independent Power Producers & | ||||||||
AES Corp./VA | 17,100 | 198,702 | ||||||
Electric Power Development Co., Ltd. | 2,900 | 74,460 | ||||||
Enel Green Power SpA | 40,111 | 73,994 | ||||||
NRG Energy, Inc. | 6,200 | 148,800 | ||||||
|
| |||||||
| 495,956 | ||||||||
|
| |||||||
Multi-Utilities – 0.5% | ||||||||
AGL Energy Ltd. | 13,328 | 216,670 | ||||||
Ameren Corp. | 6,600 | 223,014 | ||||||
CenterPoint Energy, Inc. | 11,700 | 250,731 | ||||||
Centrica PLC | 127,468 | 679,801 | ||||||
CMS Energy Corp. | 7,200 | 191,592 | ||||||
Consolidated Edison, Inc. | 8,100 | 477,900 | ||||||
Dominion Resources, Inc./VA | 15,800 | 884,800 | ||||||
DTE Energy Co. | 4,700 | 313,960 | ||||||
E.ON SE | 44,281 | 737,727 | ||||||
GDF Suez | 31,397 | 592,655 | ||||||
| 208 | • ALLIANCEBERNSTEIN POOLING PORTFOLIOS |
Volatility Management Portfolio—Portfolio of Investments
| Company | Shares | U.S. $ Value | ||||||
| ||||||||
Integrys Energy Group, Inc. | 2,100 | $ | 118,797 | |||||
National Grid PLC | 89,259 | 986,158 | ||||||
NiSource, Inc. | 7,800 | 216,060 | ||||||
PG&E Corp. | 11,700 | 498,888 | ||||||
Public Service Enterprise Group, Inc. | 13,900 | 453,001 | ||||||
RWE AG | 12,033 | 441,099 | ||||||
RWE AG (Preference Shares) | 959 | 34,328 | ||||||
SCANA Corp. | 3,600 | 175,824 | ||||||
Sempra Energy | 6,200 | 482,112 | ||||||
Suez Environnement Co. | 6,900 | 91,809 | ||||||
TECO Energy, Inc. | 5,600 | 96,600 | ||||||
United Utilities Group PLC | 16,764 | 187,205 | ||||||
Veolia Environnement SA | 8,305 | 104,318 | ||||||
Wisconsin Energy Corp. | 6,300 | 260,190 | ||||||
|
| |||||||
| 8,715,239 | ||||||||
|
| |||||||
Water Utilities – 0.0% | ||||||||
Severn Trent PLC | 5,857 | 143,656 | ||||||
|
| |||||||
| 22,618,329 | ||||||||
|
| |||||||
Equity:Other – 0.8% | ||||||||
Diversified/Specialty – 0.6% | ||||||||
Activia Properties, Inc. | 6 | 45,571 | ||||||
Alexandria Real Estate Equities, Inc. | 1,960 | 139,434 | ||||||
American Assets Trust, Inc. | 1,200 | 36,276 | ||||||
ANF Immobilier | 750 | 21,688 | ||||||
Artis Real Estate Investment Trust | 3,400 | 52,916 | ||||||
Azrieli Group | 1,150 | 30,797 | ||||||
Beni Stabili SpA | 29,700 | 18,772 | ||||||
BioMed Realty Trust, Inc. | 4,750 | 100,320 | ||||||
CA Immobilien Anlagen AG(a) | 2,719 | 39,060 | ||||||
Campus Crest Communities, Inc. | 1,300 | 16,302 | ||||||
Canadian Real Estate Investment Trust | 2,100 | 95,729 | ||||||
CapLease, Inc. | 4,700 | 28,106 | ||||||
Cheung Kong Holdings Ltd. | 34,000 | 527,924 | ||||||
Cofinimmo | 470 | 55,654 | ||||||
Conwert Immobilien Invest SE | 2,544 | 32,248 | ||||||
Country Garden Holdings Co., Ltd.(a) | 112,949 | 58,157 | ||||||
Cousins Properties, Inc. | 3,214 | 31,240 | ||||||
Crown Castle International Corp.(a) | 8,090 | 564,682 | ||||||
Daejan Holdings PLC | 355 | 18,526 | ||||||
Dexus Property Group | 258,260 | 287,624 | ||||||
Digital Realty Trust, Inc.(b) | 3,810 | 255,194 | ||||||
Duke Realty Corp. | 9,760 | 157,722 | ||||||
Dundee Real Estate Investment Trust | 3,000 | 107,113 | ||||||
DuPont Fabros Technology, Inc.(b) | 1,940 | 44,930 | ||||||
F&C Commercial Property Trust Ltd. | 17,183 | 26,771 | ||||||
Fastighets AB Balder(a) | 3,500 | 25,751 | ||||||
Fonciere Des Regions | 1,561 | 128,952 | ||||||
| ALLIANCEBERNSTEIN POOLING PORTFOLIOS • | 209 |
Volatility Management Portfolio—Portfolio of Investments
| Company | Shares | U.S. $ Value | ||||||
| ||||||||
Forest City Enterprises, Inc.(a) | 4,660 | $ | 74,746 | |||||
Granite Real Estate Investment Trust | 1,450 | 55,877 | ||||||
H&R Real Estate Investment Trust | 6,000 | 134,982 | ||||||
Hamborner REIT AG | 1,600 | 15,646 | ||||||
Hang Lung Properties Ltd. | 123,150 | 474,947 | ||||||
Hysan Development Co., Ltd. | 39,800 | 204,885 | ||||||
Investors Real Estate Trust | 2,860 | 27,199 | ||||||
Iron Mountain, Inc. | 4,464 | 154,008 | ||||||
Kiwi Income Property Trust | 30,650 | 29,266 | ||||||
Klovern AB | 3,890 | 17,297 | ||||||
Kungsleden AB | 4,250 | 27,282 | ||||||
Lend Lease Group | 13,380 | 145,336 | ||||||
Lexington Realty Trust | 5,480 | 62,801 | ||||||
Londonmetric Property PLC | 22,427 | 36,892 | ||||||
Mapletree Commercial Trust | 43,250 | 46,883 | ||||||
Mitsubishi Estate Co., Ltd. | 63,240 | 1,576,522 | ||||||
Mobimo Holding AG(a) | 200 | 45,535 | ||||||
Morguard Real Estate Investment Trust | 1,400 | 25,536 | ||||||
New World China Land Ltd. | 80,300 | 37,030 | ||||||
New World Development Co., Ltd. | 231,550 | 423,153 | ||||||
Nieuwe Steen Investments NV | 2,074 | 14,887 | ||||||
Premier Investment Corp. | 6 | 26,918 | ||||||
Quintain Estates & Development PLC(a) | 16,562 | 17,399 | ||||||
Schroder Real Estate Investment Trust Ltd. | 25,413 | 15,313 | ||||||
Shui On Land Ltd. | 92,450 | 42,864 | ||||||
Soho China Ltd. | 63,500 | 49,309 | ||||||
Spirit Realty Capital, Inc. | 1,050 | 20,916 | ||||||
Sponda Oyj | 8,760 | 43,042 | ||||||
ST Modwen Properties PLC | 4,673 | 17,814 | ||||||
Suntec Real Estate Investment Trust(b) | 69,050 | 100,118 | ||||||
Swire Pacific Ltd. | 16,500 | 213,480 | ||||||
Swire Properties Ltd. | 64,950 | 243,531 | ||||||
TAG Immobilien AG | 4,020 | 47,581 | ||||||
Tokyu Land Corp. | 22,820 | 172,070 | ||||||
Tokyu REIT, Inc. | 4 | 22,524 | ||||||
Top REIT, Inc. | 5 | 23,386 | ||||||
Unite Group PLC | 4,923 | 21,611 | ||||||
United Urban Investment Corp.(b) | 65 | 85,368 | ||||||
UOL Group Ltd. | 28,700 | 150,571 | ||||||
Vornado Realty Trust | 10,470 | 839,799 | ||||||
Wallenstam AB | 3,600 | 47,490 | ||||||
Washington Real Estate Investment Trust | 2,040 | 56,488 | ||||||
Wereldhave Belgium NV | 200 | 21,340 | ||||||
Wereldhave NV | 670 | 46,879 | ||||||
Weyerhaeuser Co. | 14,800 | 435,268 | ||||||
Wheelock & Co., Ltd. | 22,000 | 119,054 | ||||||
Wihlborgs Fastigheter AB | 2,370 | 39,220 | ||||||
Winthrop Realty Trust | 1,750 | 21,962 | ||||||
|
| |||||||
| 9,519,484 | ||||||||
|
| |||||||
| 210 | • ALLIANCEBERNSTEIN POOLING PORTFOLIOS |
Volatility Management Portfolio—Portfolio of Investments
| Company | Shares | U.S. $ Value | ||||||
| ||||||||
Health Care – 0.2% | ||||||||
Chartwell Retirement Residences | 5,250 | $ | 55,949 | |||||
Extendicare Inc./US(b) | 2,650 | 20,686 | ||||||
HCP, Inc. | 25,810 | 1,261,593 | ||||||
Health Care REIT, Inc. | 14,320 | 918,485 | ||||||
Healthcare Realty Trust, Inc. | 2,700 | 71,820 | ||||||
LTC Properties, Inc. | 950 | 36,641 | ||||||
Medical Properties Trust, Inc. | 4,180 | 60,694 | ||||||
National Health Investors, Inc. | 850 | 55,080 | ||||||
Omega Healthcare Investors, Inc. | 3,490 | 97,685 | ||||||
Sabra Health Care REIT, Inc. | 1,150 | 30,395 | ||||||
Senior Housing Properties Trust | 5,480 | 137,493 | ||||||
Universal Health Realty Income Trust | 410 | 23,415 | ||||||
Ventas, Inc. | 17,240 | 1,220,247 | ||||||
|
| |||||||
| 3,990,183 | ||||||||
|
| |||||||
Triple Net – 0.0% | ||||||||
Agree Realty Corp. | 800 | 22,456 | ||||||
Getty Realty Corp.(b) | 850 | 16,898 | ||||||
National Retail Properties, Inc. | 3,400 | 117,130 | ||||||
Realty Income Corp.(b) | 5,517 | 251,851 | ||||||
|
| |||||||
| 408,335 | ||||||||
|
| |||||||
| 13,918,002 | ||||||||
|
| |||||||
Retail – 0.4% | ||||||||
Regional Mall – 0.2% | ||||||||
Alexander’s, Inc. | 40 | 12,980 | ||||||
CBL & Associates Properties, Inc. | 4,990 | 113,473 | ||||||
General Growth Properties, Inc. | 14,550 | 278,487 | ||||||
Glimcher Realty Trust | 4,380 | 49,319 | ||||||
Macerich Co. (The) | 4,220 | 253,664 | ||||||
Pennsylvania Real Estate Investment Trust | 1,710 | 30,865 | ||||||
Simon Property Group, Inc. | 17,920 | 2,846,771 | ||||||
Taubman Centers, Inc. | 1,900 | 145,768 | ||||||
|
| |||||||
| 3,731,327 | ||||||||
|
| |||||||
Shopping Center/Other Retail – 0.2% | ||||||||
Acadia Realty Trust | 1,560 | 41,995 | ||||||
BWP Trust | 16,260 | 39,114 | ||||||
Calloway Real Estate Investment Trust | 3,300 | 93,408 | ||||||
Capital & Counties Properties PLC | 23,315 | 93,567 | ||||||
Capital Shopping Centres Group PLC | 34,001 | 171,146 | ||||||
Charter Hall Retail REIT | 10,176 | 40,999 | ||||||
Citycon OYJ(b) | 7,580 | 24,601 | ||||||
Crombie Real Estate Investment Trust | 1,550 | 22,140 | ||||||
DDR Corp.(b) | 9,620 | 166,137 | ||||||
Deutsche Euroshop AG | 1,665 | 68,807 | ||||||
Development Securities PLC | 8,713 | 21,612 | ||||||
Equity One, Inc. | 1,830 | 43,023 | ||||||
| ALLIANCEBERNSTEIN POOLING PORTFOLIOS • | 211 |
Volatility Management Portfolio—Portfolio of Investments
| Company | Shares | U.S. $ Value | ||||||
| ||||||||
Eurocommercial Properties NV | 1,240 | $ | 47,396 | |||||
Excel Trust, Inc.(b) | 1,400 | 17,654 | ||||||
Federal Realty Investment Trust | 1,980 | 210,296 | ||||||
Federation Centres | 75,518 | 188,988 | ||||||
First Capital Realty, Inc. | 2,530 | 46,540 | ||||||
Frontier Real Estate Investment Corp. | 7 | 67,294 | ||||||
Inland Real Estate Corp. | 2,750 | 26,565 | ||||||
Japan Retail Fund Investment Corp. | 115 | 224,890 | ||||||
Kimco Realty Corp. | 23,780 | 517,691 | ||||||
Kite Realty Group Trust | 2,750 | 18,122 | ||||||
Mercialys SA | 1,440 | 30,426 | ||||||
Primaris Retail Real Estate Investment Trust | 3,050 | 80,860 | ||||||
Ramco-Gershenson Properties Trust | 1,480 | 23,384 | ||||||
Regency Centers Corp. | 2,770 | 143,708 | ||||||
Retail Opportunity Investments Corp.(b) | 1,650 | 21,301 | ||||||
RioCan Real Estate Investment Trust (Toronto) | 9,200 | 248,456 | ||||||
Saul Centers, Inc. | 440 | 19,254 | ||||||
Shaftesbury PLC | 7,733 | 68,306 | ||||||
Tanger Factory Outlet Centers | 2,890 | 101,988 | ||||||
Urstadt Biddle Properties, Inc.(b) | 800 | 16,904 | ||||||
Vastned Retail NV | 610 | 25,765 | ||||||
Weingarten Realty Investors | 3,720 | 114,018 | ||||||
|
| |||||||
| 3,086,355 | ||||||||
|
| |||||||
| 6,817,682 | ||||||||
|
| |||||||
Residential – 0.4% | ||||||||
Multi-Family – 0.3% | ||||||||
Advance Residence Investment Corp. | 26 | 55,229 | ||||||
Agile Property Holdings Ltd. | 43,050 | 55,301 | ||||||
Apartment Investment & Management Co. – Class A | 8,490 | 251,474 | ||||||
Associated Estates Realty Corp. | 1,550 | 27,094 | ||||||
AvalonBay Communities, Inc. | 6,250 | 780,187 | ||||||
Boardwalk Real Estate Investment Trust | 1,500 | 94,022 | ||||||
BRE Properties, Inc. | 2,370 | 115,206 | ||||||
Camden Property Trust | 2,600 | 179,764 | ||||||
Canadian Apartment Properties REIT | 3,150 | 77,555 | ||||||
Colonial Properties Trust | 2,750 | 59,290 | ||||||
Daiwahouse Residential Investment Corp. | 10 | 41,991 | ||||||
Deutsche Wohnen AG | 4,550 | 83,398 | ||||||
Equity Lifestyle Properties, Inc. | 1,290 | 95,060 | ||||||
Equity Residential | 18,350 | 1,009,984 | ||||||
Essex Property Trust, Inc. | 1,130 | 168,359 | ||||||
GAGFAH SA(a) | 2,400 | 26,404 | ||||||
Grainger PLC | 12,865 | 26,552 | ||||||
GSW Immobilien AG | 1,550 | 61,717 | ||||||
Home Properties, Inc. | 1,600 | 99,872 | ||||||
Killam Properties, Inc.(b) | 1,650 | 20,640 | ||||||
Mid-America Apartment Communities, Inc. | 1,330 | 92,355 | ||||||
| 212 | • ALLIANCEBERNSTEIN POOLING PORTFOLIOS |
Volatility Management Portfolio—Portfolio of Investments
| Company | Shares | U.S. $ Value | ||||||
| ||||||||
Nippon Accommodations Fund, Inc.(b) | 5 | $ | 36,684 | |||||
Northern Property Real Estate Investment Trust | 1,000 | 30,885 | ||||||
Patrizia Immobilien AG(a) | 2,010 | 17,078 | ||||||
Post Properties, Inc. | 1,700 | 81,158 | ||||||
Shimao Property Holdings Ltd. | 42,950 | 86,330 | ||||||
Stockland | 122,167 | 469,225 | ||||||
Sun Communities, Inc. | 940 | 43,738 | ||||||
UDR, Inc. | 7,730 | 184,438 | ||||||
Wing Tai Holdings Ltd. | 18,125 | 28,373 | ||||||
Yanlord Land Group Ltd.(a)(b) | 18,088 | 22,334 | ||||||
|
| |||||||
| 4,421,697 | ||||||||
|
| |||||||
Self Storage – 0.1% | ||||||||
Big Yellow Group PLC | 4,054 | 22,965 | ||||||
CubeSmart | 4,030 | 59,402 | ||||||
Extra Space Storage, Inc. | 3,400 | 127,296 | ||||||
Public Storage | 7,970 | 1,205,144 | ||||||
Sovran Self Storage, Inc. | 930 | 56,581 | ||||||
|
| |||||||
| 1,471,388 | ||||||||
|
| |||||||
Student Housing – 0.0% | ||||||||
American Campus Communities, Inc. | 3,220 | 145,544 | ||||||
Education Realty Trust, Inc. | 3,480 | 37,967 | ||||||
| 183,511 | ||||||||
|
| |||||||
| 6,076,596 | ||||||||
|
| |||||||
Office – 0.3% | ||||||||
Office – 0.3% | ||||||||
Allied Properties Real Estate Investment Trust | 1,850 | 61,532 | ||||||
Allreal Holding AG(a) | 230 | 33,839 | ||||||
Alstria Office REIT-AG | 2,420 | 28,305 | ||||||
Befimmo SCA Sicafi | 570 | 37,542 | ||||||
Boston Properties, Inc. | 8,850 | 919,338 | ||||||
Brandywine Realty Trust | 4,400 | 60,500 | ||||||
Brookfield Office Properties, Inc.(b) | 11,650 | 194,308 | ||||||
CapitaCommercial Trust | 113,350 | 151,842 | ||||||
Castellum AB | 5,060 | 75,908 | ||||||
Champion REIT(b) | 87,850 | 44,948 | ||||||
Cominar Real Estate Investment Trust | 3,805 | 83,313 | ||||||
Commonwealth Property Office Fund | 73,790 | 83,868 | ||||||
CommonWealth REIT | 2,580 | 65,145 | ||||||
Corporate Office Properties Trust | 2,500 | 64,675 | ||||||
Derwent London PLC | 3,170 | 105,661 | ||||||
Douglas Emmett, Inc. | 3,240 | 79,412 | ||||||
Dundee International Real Estate Investment Trust | 2,150 | 22,621 | ||||||
Fabege AB | 5,040 | 55,618 | ||||||
First Potomac Realty Trust | 1,600 | 22,608 | ||||||
Franklin Street Properties Corp. | 2,570 | 35,338 | ||||||
| ALLIANCEBERNSTEIN POOLING PORTFOLIOS • | 213 |
Volatility Management Portfolio—Portfolio of Investments
| Company | Shares | U.S. $ Value | ||||||
| ||||||||
Government Properties Income Trust(b) | 1,270 | $ | 33,604 | |||||
Great Portland Estates PLC | 10,631 | 79,191 | ||||||
Highwoods Properties, Inc. | 2,430 | 88,695 | ||||||
Hongkong Land Holdings Ltd. | 54,200 | 418,012 | ||||||
Hudson Pacific Properties, Inc. | 1,100 | 24,827 | ||||||
Hufvudstaden AB – Class A | 4,580 | 62,983 | ||||||
Investa Office Fund | 19,033 | 59,156 | ||||||
IVG Immobilien AG(a) | 5,000 | 14,972 | ||||||
Japan Excellent, Inc. | 6 | 36,287 | ||||||
Japan Prime Realty Investment Corp. | 46 | 135,358 | ||||||
Kenedix Realty Investment Corp. – Class A | 9 | 37,088 | ||||||
Kilroy Realty Corp. | 2,320 | 122,403 | ||||||
Liberty Property Trust | 3,630 | 140,808 | ||||||
Mack-Cali Realty Corp. | 2,720 | 77,194 | ||||||
Mori Hills REIT Investment Corp.(b) | 7 | 40,041 | ||||||
Mori Trust Sogo Reit, Inc.(b) | 6 | 57,370 | ||||||
Nomura Real Estate Office Fund, Inc. | 16 | 98,188 | ||||||
Norwegian Property ASA | 17,000 | 26,652 | ||||||
Orix JREIT, Inc. | 35 | 41,179 | ||||||
Parkway Properties, Inc./MD | 1,250 | 21,138 | ||||||
Piedmont Office Realty Trust, Inc. | 5,250 | 103,215 | ||||||
Prime Office REIT-AG | 2,750 | 13,176 | ||||||
PS Business Parks, Inc. | 540 | 39,955 | ||||||
PSP Swiss Property AG(a) | 1,430 | 129,718 | ||||||
SL Green Realty Corp. | 2,780 | 226,904 | ||||||
Societe Immobiliere de Location pour l’Industrie et le Commerce | 390 | 42,351 | ||||||
Swiss Prime Site AG(a) | 3,151 | 252,974 | ||||||
Tokyo Tatemono Co., Ltd. | 10,460 | 58,287 | ||||||
Workspace Group PLC | 4,497 | 23,359 | ||||||
|
| |||||||
| 4,731,406 | ||||||||
|
| |||||||
Lodging – 0.1% | ||||||||
Lodging – 0.1% | ||||||||
Ashford Hospitality Trust, Inc. | 2,110 | 24,835 | ||||||
CDL Hospitality Trusts(b) | 22,488 | 37,524 | ||||||
Chesapeake Lodging Trust | 1,250 | 26,913 | ||||||
DiamondRock Hospitality Co. | 6,070 | 54,266 | ||||||
FelCor Lodging Trust, Inc.(a) | 3,840 | 19,277 | ||||||
Hersha Hospitality Trust(b) | 6,140 | 34,445 | ||||||
Hospitality Properties Trust | 3,810 | 101,727 | ||||||
Host Hotels & Resorts, Inc. | 42,160 | 702,807 | ||||||
InnVest Real Estate Investment Trust | 6,650 | 28,825 | ||||||
InterContinental Hotels Group PLC | 6,687 | 193,895 | ||||||
LaSalle Hotel Properties | 2,950 | 74,900 | ||||||
Pebblebrook Hotel Trust | 1,900 | 45,429 | ||||||
RLJ Lodging Trust | 3,300 | 70,587 | ||||||
| 214 | • ALLIANCEBERNSTEIN POOLING PORTFOLIOS |
Volatility Management Portfolio—Portfolio of Investments
| Company | Shares | U.S. $ Value | ||||||
| ||||||||
Strategic Hotels & Resorts, Inc.(a) | 6,350 | $ | 46,228 | |||||
Sunstone Hotel Investors, Inc.(a) | 4,180 | 47,359 | ||||||
Wyndham Worldwide Corp. | 3,900 | 234,936 | ||||||
|
| |||||||
| 1,743,953 | ||||||||
|
| |||||||
Total Common Stocks | 683,429,160 | |||||||
|
| |||||||
INVESTMENT COMPANIES – 12.5% | ||||||||
Funds and Investment Trusts – 12.5% | ||||||||
IRP Property Investments Ltd. | 7,860 | 7,675 | ||||||
iShares MSCI Emerging Markets Index Fund | 4,826,400 | 208,548,744 | ||||||
Picton Property Income Ltd. | 24,584 | 14,918 | ||||||
Standard Life Investment Property Income Trust PLC | 9,750 | 8,690 | ||||||
UK Commercial Property Trust Ltd./fund | 15,049 | 15,924 | ||||||
|
| |||||||
Total Investment Companies | 208,595,951 | |||||||
|
| |||||||
RIGHTS – 0.0% | ||||||||
Retail – 0.0% | ||||||||
Shopping Center/Other Retail – 0.0% | ||||||||
Citycon Oyj, expiring 3/07/13(a) | 7,201 | 1,974 | ||||||
|
| |||||||
WARRANTS – 0.0% | ||||||||
Nieuwe Steen Investments NV, | 250 | – 0 | – | |||||
|
| |||||||
SHORT-TERM INVESTMENTS – 45.3% | ||||||||
Investment Companies – 45.0% | ||||||||
AllianceBernstein Fixed-Income Shares, Inc. – Government STIF Portfolio, 0.12%(f) | 751,605,011 | 751,605,011 | ||||||
|
| |||||||
| Principal Amount (000) | ||||||||
U.S. Treasury Bill – 0.3% | ||||||||
U.S. Treasury Bill | $ | 4,500 | 4,498,857 | |||||
|
| |||||||
Total Short-Term Investments | 756,103,868 | |||||||
|
| |||||||
| ALLIANCEBERNSTEIN POOLING PORTFOLIOS • | 215 |
Volatility Management Portfolio—Portfolio of Investments
| Company | Shares | U.S. $ Value | ||||||
| ||||||||
Total Investments Before Security Lending Collateral – 98.7% | $ | 1,648,130,953 | ||||||
|
| |||||||
| Shares | ||||||||
INVESTMENTS OF CASH COLLATERAL | ||||||||
Investment Companies – 0.7% | ||||||||
AllianceBernstein Exchange Reserves – | 10,823,132 | 10,823,132 | ||||||
Total Investments – 99.4% | 1,658,954,085 | |||||||
Other assets less liabilities – 0.6% | 10,325,854 | |||||||
|
| |||||||
Net Assets – 100.0% | $ | 1,669,279,939 | ||||||
|
| |||||||
FUTURES CONTRACTS (see Note C)
| Type | Number of Contracts | Expiration Month | Original Value | Value at February 28, 2013 | Unrealized Appreciation/ | |||||||||||||||
Purchased Contracts | ||||||||||||||||||||
ASX SPI 200 Index Futures | 167 | March 2013 | $ | 19,608,870 | $ | 21,685,266 | $ | 2,076,396 | ||||||||||||
Euro STOXX 50 Index Futures | 4,175 | March 2013 | 143,510,797 | 143,625,132 | 114,335 | |||||||||||||||
FTSE 100 Index Futures | 1,106 | March 2013 | 98,206,741 | 106,686,565 | 8,479,824 | |||||||||||||||
Hang Seng Index Futures | 61 | March 2013 | 8,873,182 | 9,034,066 | 160,884 | |||||||||||||||
MSCI EAFE Mini Index Futures | 10 | March 2013 | 818,286 | 829,450 | 11,164 | |||||||||||||||
S&P 500 E Mini Index Futures | 1,233 | March 2013 | 88,851,811 | 93,294,945 | 4,443,134 | |||||||||||||||
S&P Mid Cap 400 E Mini Index Futures | 1,177 | March 2013 | 118,771,451 | 129,670,090 | 10,898,639 | |||||||||||||||
S&P TSE 60 Index Futures | 246 | March 2013 | 33,612,751 | 35,194,996 | 1,582,245 | |||||||||||||||
Topix Index Futures | 482 | March 2013 | 44,090,238 | 50,493,257 | 6,403,019 | |||||||||||||||
|
| |||||||||||||||||||
| $ | 34,169,640 | |||||||||||||||||||
|
| |||||||||||||||||||
FORWARD CURRENCY EXCHANGE CONTRACTS (see Note C)
| Counterparty | Contracts to Deliver | In For | Settlement Date | Unrealized Appreciation/ (Depreciation) | ||||||||||||||||||||
Bank of America, NA | USD | 44,464 | EUR | 34,344 | 3/15/13 | $ | 377,317 | |||||||||||||||||
Barclays Bank PLC Wholesale | CAD | 1,651 | USD | 1,674 | 3/15/13 | 73,505 | ||||||||||||||||||
Barclays Bank PLC Wholesale | JPY | 3,457,367 | USD | 41,113 | 3/15/13 | 3,809,978 | ||||||||||||||||||
Barclays Bank PLC Wholesale | USD | 16,077 | EUR | 11,957 | 3/15/13 | (465,625 | ) | |||||||||||||||||
Barclays Bank PLC Wholesale | USD | 39,492 | GBP | 24,556 | 3/15/13 | (2,241,156 | ) | |||||||||||||||||
| 216 | • ALLIANCEBERNSTEIN POOLING PORTFOLIOS |
Volatility Management Portfolio—Portfolio of Investments
| Counterparty | Contracts to Deliver | In Exchange For | Settlement Date | Unrealized Appreciation/ (Depreciation) | ||||||||||||||||||||
Citibank, NA | CHF | 4,818 | USD | 5,279 | 3/15/13 | $ | 138,039 | |||||||||||||||||
Citibank, NA | GBP | 1,592 | USD | 2,564 | 3/15/13 | 148,609 | ||||||||||||||||||
Citibank, NA | USD | 41,603 | EUR | 31,840 | 3/15/13 | (31,161 | ) | |||||||||||||||||
Citibank, NA | USD | 5,999 | GBP | 3,964 | 6/13/13 | 12,141 | ||||||||||||||||||
Credit Suisse International | USD | 33,462 | JPY | 2,749,862 | 3/15/13 | (3,792,508 | ) | |||||||||||||||||
Deutsche Bank AG London | USD | 2,477 | AUD | 2,395 | 3/15/13 | (32,457 | ) | |||||||||||||||||
Deutsche Bank AG London | USD | 2,160 | JPY | 180,297 | 3/15/13 | (214,208 | ) | |||||||||||||||||
Goldman Sachs Capital Markets LP | JPY | 512,486 | USD | 5,570 | 3/15/13 | 41,025 | ||||||||||||||||||
Goldman Sachs Capital Markets LP | USD | 62,549 | GBP | 38,888 | 3/15/13 | (3,557,558 | ) | |||||||||||||||||
Goldman Sachs Capital Markets LP | USD | 33,509 | JPY | 2,753,437 | 3/15/13 | (3,801,516 | ) | |||||||||||||||||
HSBC BankUSA | EUR | 11,108 | USD | 14,690 | 3/15/13 | 186,588 | ||||||||||||||||||
Morgan Stanley & Co., Inc. | CAD | 15,242 | USD | 15,091 | 3/15/13 | 315,562 | ||||||||||||||||||
Morgan Stanley & Co., Inc. | EUR | 2,563 | USD | 3,356 | 3/15/13 | 9,836 | ||||||||||||||||||
Royal Bank of Canada | EUR | 1,981 | USD | 2,579 | 3/15/13 | (7,899 | ) | |||||||||||||||||
Royal Bank of Canada | USD | 51,037 | CAD | 50,509 | 3/15/13 | (2,073,726 | ) | |||||||||||||||||
Royal Bank of Scotland PLC | USD | 12,824 | CHF | 11,852 | 3/15/13 | (177,840 | ) | |||||||||||||||||
Royal Bank of Scotland PLC | USD | 4,216 | GBP | 2,683 | 3/15/13 | (145,848 | ) | |||||||||||||||||
State Street Bank & Trust Co. | USD | 5,744 | CHF | 5,323 | 3/15/13 | (63,776 | ) | |||||||||||||||||
State Street Bank & Trust Co. | USD | 2,795 | EUR | 2,121 | 3/15/13 | (25,744 | ) | |||||||||||||||||
State Street Bank & Trust Co. | USD | 3,010 | JPY | 262,044 | 3/15/13 | (182,801 | ) | |||||||||||||||||
UBS AG | USD | 16,570 | CHF | 15,442 | 3/15/13 | (92,990 | ) | |||||||||||||||||
UBS AG | USD | 23,475 | JPY | 2,129,390 | 3/15/13 | (500,385 | ) | |||||||||||||||||
Westpac Banking Corp. | USD | 14,658 | AUD | 14,065 | 3/15/13 | (303,326 | ) | |||||||||||||||||
|
| |||||||||||||||||||||||
| $ | (12,597,924 | ) | ||||||||||||||||||||||
|
| |||||||||||||||||||||||
TOTAL RETURN SWAP CONTRACTS (see Note C)
| Receive/ Pay Total Return on Reference Index | Index | # of Shares or Units | Rate Paid/ Received by the Fund | Notional Amount (000) | Maturity Date | Counterparty | Unrealized Appreciation/ (Depreciation) | |||||||||||||||||
Receive Total Return on Reference Index |
| |||||||||||||||||||||||
| Receive | Russell 2000 Total Return Index | 5,111 | 0.21 | % | $ | 21,699 | 10/15/13 | Bank of America, NA | $ | (271,023 | ) | |||||||||||||
| Receive | Russell 2000 Total Return Index | 10,376 | 0.21 | % | 44,053 | 12/16/13 | Bank of America, NA | (552,171 | ) | |||||||||||||||
| Receive | Russell 2000 Total Return Index | 25 | 0.21 | % | 106 | 3/15/13 | Deutsche Bank AG | (1,329 | ) | |||||||||||||||
| Receive | Russell 2000 Total Return Index | 3,533 | 0.21 | % | 15,000 | 3/15/13 | JPMorgan Chase Bank, NA | (187,846 | ) | |||||||||||||||
| Receive | Russell 2000 Total Return Index | 244 | 0.21 | % | 1,036 | 6/17/13 | Morgan Stanley Capital Services LLC | (12,943 | ) | |||||||||||||||
| Receive | MSCI Emerging Markets Index | 162,739 | 0.66 | % | 69,412 | 12/23/13 | UBS AG | (754,231 | ) | |||||||||||||||
| Receive | Russell 2000 Total Return Index | 1,097 | 0.21 | % | 4,657 | 9/16/13 | UBS AG | (58,182 | ) | |||||||||||||||
| Receive | Russell 2000 Total Return Index | 1,085 | 0.21 | % | 4,607 | 9/16/13 | UBS AG | (57,555 | ) | |||||||||||||||
| ALLIANCEBERNSTEIN POOLING PORTFOLIOS • | 217 |
Volatility Management Portfolio—Portfolio of Investments
| Receive/ Pay Total Return on Reference Index | Index | # of Shares or Units | Rate Paid/ Received by the Fund | Notional Amount (000) | Maturity Date | Counterparty | Unrealized Appreciation/ (Depreciation) | |||||||||||||||||||
Receive | Russell 2000 Total Return Index | 1,012 | 0.21 | % | $ | 4,297 | 10/15/13 | UBS AG | $ | (53,702 | ) | |||||||||||||||
Receive | Russell 2000 Total Return Index | 883 | 0.21 | % | 3,749 | 10/15/13 | UBS AG | (46,965 | ) | |||||||||||||||||
Receive | Russell 2000 Total Return Index | 528 | 0.21 | % | 2,242 | 10/15/13 | UBS AG | (28,123 | ) | |||||||||||||||||
Receive | Russell 2000 Total Return Index | 5,797 | 0.20 | % | 24,612 | 2/18/14 | UBS AG | (308,506 | ) | |||||||||||||||||
|
| |||||||||||||||||||||||||
| $ | (2,332,576 | ) | ||||||||||||||||||||||||
|
| |||||||||||||||||||||||||
| (a) | Non-income producing security. |
| (b) | Represents entire or partial securities out on loan. See Note D for securities lending information. |
| (c) | Position, or a portion thereof, has been segregated to collateralize OTC derivatives outstanding. The aggregate market value of these securities amounted to $6,580,447. |
| (d) | Fair valued by the Adviser. |
| (e) | Illiquid security. |
| (f) | Investment in affiliated money market mutual fund. The rate shown represents the 7-day yield as of period end. |
Currency Abbreviations:
AUD – Australian Dollar
CAD – Canadian Dollar
CHF – Swiss Franc
EUR – Euro
GBP – Great British Pound
JPY – Japanese Yen
USD – United States Dollar
Glossary:
FTSE – Financial Times Stock Exchange
REG – Registered Shares
REIT – Real Estate Investment Trust
See notes to financial statements.
| 218 | • ALLIANCEBERNSTEIN POOLING PORTFOLIOS |
Volatility Management Portfolio—Portfolio of Investments
STATEMENT OF ASSETS & LIABILITIES
February 28, 2013 (unaudited)
| U.S. Value | U.S. Large Cap Growth | International Value | ||||||||||
| Assets | ||||||||||||
Investments in securities, at value | ||||||||||||
Unaffiliated issuers (cost $951,840,711, $848,904,887 and $885,588,934, respectively)(a) | $ | 1,141,498,649 | $ | 1,083,627,347 | $ | 955,048,216 | ||||||
Affiliated issuers (cost $17,368,126, $72,912,631 and $59,010,741, – including investment of cash collateral for securities loaned of $13,342,427, $2,651,373 and $27,331,840, respectively) | 17,368,126 | 72,912,631 | 59,010,741 | |||||||||
Cash(b) | – 0 | – | – 0 | – | 868,685 | |||||||
Foreign currencies, at value (cost $0, $0 and $2,154,218, respectively) | – 0 | – | – 0 | – | 2,133,593 | |||||||
Receivable for investment securities sold | 21,067,868 | 9,888,307 | 2,832,338 | |||||||||
Dividends and interest receivable | 4,309,276 | 539,592 | 3,744,404 | |||||||||
Receivable for shares of beneficial interest sold | 4,012 | 22,902 | 18,501 | |||||||||
Unrealized appreciation of forward currency exchange contracts | – 0 | – | – 0 | – | 7,262,939 | |||||||
Receivable for variation margin on futures contracts | – 0 | – | – 0 | – | 84,189 | |||||||
|
|
|
|
|
| |||||||
Total assets | 1,184,247,931 | 1,166,990,779 | 1,031,003,606 | |||||||||
|
|
|
|
|
| |||||||
| Liabilities | ||||||||||||
Payable for collateral received on securities loaned | 13,342,427 | 2,651,373 | 27,331,840 | |||||||||
Payable for investment securities purchased and foreign currency transactions | 3,370,831 | 555,930 | 16,981,196 | |||||||||
Payable for shares of beneficial interest redeemed | 1,658,739 | 1,013,887 | 29,156 | |||||||||
Unrealized depreciation of forward currency exchange contracts | – 0 | – | – 0 | – | 5,941,036 | |||||||
Accrued expenses and other liabilities | 74,574 | 63,678 | 75,255 | |||||||||
|
|
|
|
|
| |||||||
Total liabilities | 18,446,571 | 4,284,868 | 50,358,483 | |||||||||
|
|
|
|
|
| |||||||
Net Assets | $ | 1,165,801,360 | $ | 1,162,705,911 | $ | 980,645,123 | ||||||
|
|
|
|
|
| |||||||
| ALLIANCEBERNSTEIN POOLING PORTFOLIOS • | 219 |
Statement of Assets & Liabilities
| U.S. Value | U.S. Large Cap Growth | International Value | ||||||||||
| Composition of Net Assets | ||||||||||||
Paid-in capital | $ | 1,565,770,615 | $ | 919,421,435 | $ | 1,412,523,303 | ||||||
Undistributed net investment income | 5,725,119 | 2,333,059 | 9,247,374 | |||||||||
Accumulated net realized gain (loss) on investment and foreign currency transactions | (595,352,312 | ) | 6,228,957 | (511,773,359 | ) | |||||||
Net unrealized appreciation on investments and foreign currency denominated assets and liabilities | 189,657,938 | 234,722,460 | 70,647,805 | |||||||||
|
|
|
|
|
| |||||||
Net Assets | $ | 1,165,801,360 | $ | 1,162,705,911 | $ | 980,645,123 | ||||||
|
|
|
|
|
| |||||||
Shares of beneficial interest outstanding—unlimited shares authorized, without par value | 118,312,939 | 87,896,301 | 135,403,519 | |||||||||
|
|
|
|
|
| |||||||
Net Asset Value | $ | 9.85 | $ | 13.23 | $ | 7.24 | ||||||
|
|
|
|
|
| |||||||
| (a) | Includes securities on loan with a value of $12,938,051, $2,650,368 and $26,036,635, respectively (see Note D). |
| (b) | An amount of $711,351 has been segregated to collateralize margin requirements for open futures contracts outstanding at February 28, 2013 for the International Value Portfolio. |
See notes to financial statements.
| 220 | • ALLIANCEBERNSTEIN POOLING PORTFOLIOS |
Statement of Assets & Liabilities
| International Growth | Short Duration Bond | Global Core Bond | ||||||||||
| Assets | ||||||||||||
Investments in securities, at value | ||||||||||||
Unaffiliated issuers (cost $874,950,918, $901,610,362 and $1,050,229,089, respectively)(a) | $ | 963,802,146 | $ | 903,781,401 | $ | 1,086,757,036 | ||||||
Affiliated issuers (cost $15,874,482, $72,993,769 and $61,548,897, – including investment of cash collateral for securities loaned of $10,882,706, $0 and $0, respectively) | 15,874,482 | 72,993,769 | 61,548,897 | |||||||||
Cash(b) | – 0 | – | 390,124 | 529,600 | ||||||||
Foreign currencies, at value (cost $1,272,690, $0 and $95,804, respectively) | 1,279,188 | – 0 | – | 95,672 | ||||||||
Unrealized appreciation of forward currency exchange contracts | 9,102,013 | 777,410 | 2,048,053 | |||||||||
Receivable for investment securities sold | 2,368,723 | 504,766 | 943,589 | |||||||||
Dividends and interest receivable | 2,269,050 | 1,824,422 | 10,626,538 | |||||||||
Receivable for shares of beneficial interest sold | 242,639 | 94,006 | 410,929 | |||||||||
Unrealized appreciation on cross currency swap contracts | – 0 | – | 52,575 | – 0 | – | |||||||
|
|
|
|
|
| |||||||
Total assets | 994,938,241 | 980,418,473 | 1,162,960,314 | |||||||||
|
|
|
|
|
| |||||||
| Liabilities | ||||||||||||
Due to custodian | – 0 | – | 1,861 | – 0 | – | |||||||
Payable for collateral received on securities loaned | 10,882,706 | – 0 | – | – 0 | – | |||||||
Unrealized depreciation of forward currency exchange contracts | 6,520,634 | 140,310 | 893,870 | |||||||||
Payable for investment securities purchased | 72,516 | 34,338,392 | 78,032,967 | |||||||||
Premium received on cross currency swap contracts | – 0 | – | 1,712 | – 0 | – | |||||||
Payable for shares of beneficial interest redeemed | 453 | 59,255 | 216,052 | |||||||||
Payable for variation margin on futures contracts | – 0 | – | 44,492 | 26,812 | ||||||||
Accrued expenses and other liabilities | 52,855 | 64,531 | 69,177 | |||||||||
|
|
|
|
|
| |||||||
Total liabilities | 17,529,164 | 34,650,553 | 79,238,878 | |||||||||
|
|
|
|
|
| |||||||
Net Assets | $ | 977,409,077 | $ | 945,767,920 | $ | 1,083,721,436 | ||||||
|
|
|
|
|
| |||||||
| ALLIANCEBERNSTEIN POOLING PORTFOLIOS • | 221 |
Statement of Assets & Liabilities
| International Growth | Short Duration Bond | Global Core Bond | ||||||||||
| Composition of Net Assets | ||||||||||||
Paid-in capital | $ | 1,318,119,444 | $ | 1,014,672,607 | $ | 1,034,467,628 | ||||||
Undistributed/(distributions in excess of) net investment income | 7,189,677 | (2,210,528 | ) | 8,615,812 | ||||||||
Accumulated net realized gain (loss) on investment and foreign currency transactions | (439,415,189 | ) | (69,237,623 | ) | 3,179,858 | |||||||
Net unrealized appreciation on investments and foreign currency denominated assets and liabilities | 91,515,145 | 2,543,464 | 37,458,138 | |||||||||
|
|
|
|
|
| |||||||
Net Assets | $ | 977,409,077 | $ | 945,767,920 | $ | 1,083,721,436 | ||||||
|
|
|
|
|
| |||||||
Shares of beneficial interest outstanding—unlimited shares authorized, without par value | 118,901,352 | 99,539,460 | 102,519,872 | |||||||||
|
|
|
|
|
| |||||||
Net Asset Value | $ | 8.22 | $ | 9.50 | $ | 10.57 | ||||||
|
|
|
|
|
| |||||||
| (a) | Includes securities on loan with a value of $10,442,667 for the International Growth Portfolio (see Note D). |
| (b) | Amounts of $390,124 and $529,600 have been segregated to collateralize margin requirements for open futures contracts outstanding at February 28, 2013 for the Short Duration Bond Portfolio and Global Core Bond Portfolio, respectively. |
See notes to financial statements.
| 222 | • ALLIANCEBERNSTEIN POOLING PORTFOLIOS |
Statement of Assets & Liabilities
| Bond Inflation Protection | High-Yield | Small-Mid Cap Value | ||||||||||
| Assets | ||||||||||||
Investments in securities, at value | ||||||||||||
Unaffiliated issuers (cost $1,023,016,723, $361,649,219 and $261,800,413, respectively)(a) | $ | 1,089,266,768 | $ | 388,343,640 | $ | 321,865,085 | ||||||
Affiliated issuers (cost $0, $5,524,468 and $11,669,195, – including investment of cash collateral for securities loaned of $0, $0 and $8,851,935, respectively) | – 0 | – | 5,524,468 | 11,669,195 | ||||||||
Cash(b)(c) | 5,841,085 | 9,826,903 | – 0 | – | ||||||||
Foreign currencies, at value (cost $0, $325,203 and $0, respectively) | – 0 | – | 324,755 | – 0 | – | |||||||
Dividends and interest receivable | 3,973,410 | 6,372,259 | 385,948 | |||||||||
Receivable for investment securities sold | 440,841 | 9,013,033 | 2,677,909 | |||||||||
Unrealized appreciation of forward currency exchange contracts | 235,189 | 86,501 | – 0 | – | ||||||||
Unrealized appreciation on interest rate swap contracts | 205,234 | 137,540 | – 0 | – | ||||||||
Unrealized appreciation on credit default swap contracts | 94,084 | 3,239,624 | – 0 | – | ||||||||
Premium paid on credit default swap contracts | 81,776 | 1,448,035 | – 0 | – | ||||||||
Receivable for shares of beneficial interest sold | 24,601 | 166,618 | 37,060 | |||||||||
Unrealized appreciation on dividend swap contracts | – 0 | – | 40,424 | – 0 | – | |||||||
Receivable for variation margin on futures contracts | – 0 | – | 29,492 | – 0 | – | |||||||
|
|
|
|
|
| |||||||
Total assets | 1,100,162,988 | 424,553,292 | 336,635,197 | |||||||||
|
|
|
|
|
| |||||||
| ALLIANCEBERNSTEIN POOLING PORTFOLIOS • | 223 |
Statement of Assets & Liabilities
| Bond Inflation Protection | High-Yield | Small-Mid Cap Value | ||||||||||
| Liabilities | ||||||||||||
Payable reverse repurchase agreements | $ | 315,387,556 | $ | 25,155,398 | $ | – 0 | – | |||||
Payable for investment securities purchased | 4,268,110 | 5,870,503 | 957,540 | |||||||||
Unrealized depreciation on interest rate swap contracts | 1,970,286 | 445,357 | – 0 | – | ||||||||
Payable for shares of beneficial interest redeemed | 215,492 | 22,721 | 62,631 | |||||||||
Unrealized depreciation of forward currency exchange contracts | 134,931 | 106,585 | – 0 | – | ||||||||
Premium received on credit default swap contracts | 68,631 | 3,544,912 | – 0 | – | ||||||||
Payable for variation margin on futures contracts | 47,391 | – 0 | – | – 0 | – | |||||||
Unrealized depreciation on credit default swap contracts | – 0 | – | 2,743,625 | – 0 | – | |||||||
Options written, at value (premiums received $0, $747,159 and $0, respectively) | – 0 | – | 1,101,059 | – 0 | – | |||||||
Swaptions written, at value (premiums received $0, $399,958 and $0, respectively) | – 0 | – | 44,589 | – 0 | – | |||||||
Unrealized depreciation on total return swap contracts | – 0 | – | 28,552 | – 0 | – | |||||||
Payable for collateral received on securities loaned | – 0 | – | – 0 | – | 8,851,935 | |||||||
Accrued expenses | 52,428 | 58,539 | 47,695 | |||||||||
|
|
|
|
|
| |||||||
Total liabilities | 322,144,825 | 39,121,840 | 9,919,801 | |||||||||
|
|
|
|
|
| |||||||
Net Assets | $ | 778,018,163 | $ | 385,431,452 | $ | 326,715,396 | ||||||
|
|
|
|
|
| |||||||
| 224 | • ALLIANCEBERNSTEIN POOLING PORTFOLIOS |
Statement of Assets & Liabilities
| Bond Inflation Protection | High-Yield | Small-Mid Cap Value | ||||||||||
Composition of Net Assets | ||||||||||||
Paid-in capital | $ | 706,039,902 | $ | 389,183,778 | $ | 264,108,419 | ||||||
Undistributed/(distributions in excess of) net investment income | (7,537,705 | ) | 4,429,847 | 607,372 | ||||||||
Accumulated net realized gain (loss) on investment and foreign currency transactions | 15,019,130 | (35,088,624 | ) | 1,934,933 | ||||||||
Net unrealized appreciation on investments and foreign currency denominated assets and liabilities | 64,496,836 | 26,906,451 | 60,064,672 | |||||||||
|
|
|
|
|
| |||||||
Net Assets | $ | 778,018,163 | $ | 385,431,452 | $ | 326,715,396 | ||||||
|
|
|
|
|
| |||||||
Shares of beneficial interest outstanding—unlimited shares authorized, without par value | 72,112,343 | 36,508,110 | 27,387,850 | |||||||||
|
|
|
|
|
| |||||||
Net Asset Value | $ | 10.79 | $ | 10.56 | $ | 11.93 | ||||||
|
|
|
|
|
| |||||||
| (a) | Includes securities on loan with a value of $8,582,458 for the Small-Mid Cap Value Portfolio (see Note D). |
| (b) | Amounts of $570,150 and $463,190 have been segregated to collateralize margin requirements for open futures contracts outstanding at February 28, 2013 for the Bond Inflation Protection Portfolio and High-Yield Portfolio, respectively. |
| (c) | An amount of $8,363,000 has been segregated to collateralize OTC derivatives outstanding at February 28, 2013 for the High-Yield Portfolio. |
See notes to financial statements.
| ALLIANCEBERNSTEIN POOLING PORTFOLIOS • | 225 |
Statement of Assets & Liabilities
| Small-Mid Cap Growth | Multi-Asset Real Return* | Volatility Management | ||||||||||
| Assets | ||||||||||||
Investments in securities, at value | ||||||||||||
Unaffiliated issuers (cost $230,607,582, $1,071,972,156 and $822,608,977, respectively)(a) | $ | 320,459,707 | $ | 1,104,742,193 | $ | 896,525,942 | ||||||
Affiliated issuers (cost $27,810,596, $112,933,529 and $762,428,143, – including investment of cash collateral for securities loaned of $24,809,497, $22,386,798 and $10,823,132, respectively) | 27,810,596 | 112,933,529 | 762,428,143 | |||||||||
Cash(b)(c) | – 0 | – | 20,559,762 | 11,206,209 | ||||||||
Foreign currencies, at value (cost $0, $1,826,405 and $22,867,428, respectively)(d) | – 0 | – | 1,804,334 | 22,584,012 | ||||||||
Receivable for investment securities sold | 6,481,170 | 4,239,944 | 263 | |||||||||
Dividends and interest receivable | 81,481 | 2,549,670 | 1,847,730 | |||||||||
Other asset | 79,945 | – 0 | – | – 0 | – | |||||||
Receivable for shares of beneficial interest sold | 9,421 | 186,388 | 234,397 | |||||||||
Unrealized appreciation of forward currency exchange contracts | – 0 | – | 3,384,161 | 5,112,600 | ||||||||
Receivable for variation margin on futures contracts | – 0 | – | 32,243 | 345,506 | ||||||||
Receivable for terminated total return swap contracts | – 0 | – | – 0 | – | 125,814 | |||||||
|
|
|
|
|
| |||||||
Total assets | 354,922,320 | 1,250,432,224 | 1,700,410,616 | |||||||||
|
|
|
|
|
| |||||||
| 226 | • ALLIANCEBERNSTEIN POOLING PORTFOLIOS |
Statement of Assets & Liabilities
| Small-Mid Cap Growth | Multi-Asset Real Return* | Volatility Management | ||||||||||
| Liabilities | ||||||||||||
Payable for collateral received on securities loaned | $ | 24,809,497 | $ | 22,386,798 | $ | 10,823,132 | ||||||
Payable for investment securities purchased and foreign currency transactions | 1,890,424 | 72,436,326 | – 0 | – | ||||||||
Payable for shares of beneficial interest redeemed | 366,924 | – 0 | – | 177,714 | ||||||||
Unrealized depreciation on total return swap contracts | – 0 | – | 8,253,661 | 2,332,576 | ||||||||
Unrealized depreciation of forward currency exchange contracts | – 0 | – | 2,158,752 | 17,710,524 | ||||||||
Unrealized depreciation on interest rate swap contracts | – 0 | – | 285,719 | – 0 | – | |||||||
Options written, at value (premiums received $0, $404,238 and $0, respectively) | – 0 | – | 229,100 | – 0 | – | |||||||
Unrealized depreciation on inflation swap contracts | – 0 | – | 10,541 | – 0 | – | |||||||
Transfer Agent fee payable | – 0 | – | 8,968 | – 0 | – | |||||||
Administrative fee payable | – 0 | – | – 0 | – | 28,125 | |||||||
Accrued expenses and other liabilities | 48,931 | 217,011 | 58,606 | |||||||||
|
|
|
|
|
| |||||||
Total liabilities | 27,115,776 | 105,986,876 | 31,130,677 | |||||||||
|
|
|
|
|
| |||||||
Net Assets | $ | 327,806,544 | $ | 1,144,445,348 | $ | 1,669,279,939 | ||||||
|
|
|
|
|
| |||||||
| ALLIANCEBERNSTEIN POOLING PORTFOLIOS • | 227 |
Statement of Assets & Liabilities
| Small-Mid Cap Growth | Multi-Asset Real Return* | Volatility Management | ||||||||||
| Composition of Net Assets | ||||||||||||
Paid-in capital | $ | 227,934,032 | $ | 1,396,881,208 | $ | 1,549,803,160 | ||||||
Distributions in excess of net investment income | (103,082 | ) | (4,916,976 | ) | (8,313,746 | ) | ||||||
Accumulated net realized gain (loss) on investment and foreign currency transactions | 10,123,469 | (273,284,752 | ) | 34,931,009 | ||||||||
Net unrealized appreciation on investments and foreign currency denominated | 89,852,125 | 25,765,868 | 92,859,516 | |||||||||
|
|
|
|
|
| |||||||
Net Assets | $ | 327,806,544 | $ | 1,144,445,348 | $ | 1,669,279,939 | ||||||
|
|
|
|
|
| |||||||
Shares of beneficial interest outstanding—unlimited shares authorized, without par value | 28,300,643 | 132,416,658 | 153,042,015 | |||||||||
|
|
|
|
|
| |||||||
Net Asset Value | $ | 11.58 | $ | 8.64 | $ | 10.91 | ||||||
|
|
|
|
|
| |||||||
| * | Consolidated (see Note A). |
| (a) | Includes securities on loan with a value of $24,157,884, $21,295,083 and $10,329,524, respectively (see Note D). |
| (b) | An amount of $1,500,000 has been segregated to collateralize OTC derivatives outstanding at February 28, 2013 for the Volatility Management Portfolio. |
| (c) | An amount of $9,706,209 has been segregated to collateralize margin requirements for open futures contracts outstanding at February 28, 2013 for the Volatility Management Portfolio. |
| (d) | An amount equivalent to $22,363,043 has been segregated to collateralize margin requirements for open futures contracts outstanding at February 28, 2013 for the Volatility Management Portfolio. |
See notes to financial statements.
| 228 | • ALLIANCEBERNSTEIN POOLING PORTFOLIOS |
Statement of Assets & Liabilities
STATEMENT OF OPERATIONS
Six Months Ended February 28, 2013 (unaudited)
| U.S. Value | U.S. Large Cap Growth | International Value | ||||||||||
| Investment Income | ||||||||||||
Dividends | ||||||||||||
Unaffiliated issuers (net of foreign taxes withheld of $182,263, $0 and $1,339,718, respectively) | $ | 15,958,891 | $ | 5,828,358 | $ | 10,882,521 | ||||||
Affiliated issuers | 15,647 | 30,484 | 28,342 | |||||||||
Interest | – 0 | – | 108 | 2,336 | ||||||||
Securities lending income | 100,795 | 61,157 | 548,113 | |||||||||
|
|
|
|
|
| |||||||
Total income | 16,075,333 | 5,920,107 | 11,461,312 | |||||||||
|
|
|
|
|
| |||||||
| Expenses | ||||||||||||
Custodian | 86,525 | 86,624 | 131,841 | |||||||||
Audit | 18,778 | 18,774 | 20,540 | |||||||||
Legal | 16,402 | 16,880 | 17,172 | |||||||||
Trustees’ fees | 2,349 | 2,353 | 2,352 | |||||||||
Printing | 2,082 | 2,242 | 2,204 | |||||||||
Registration fees | – 0 | – | 531 | 393 | ||||||||
Miscellaneous | 18,489 | 11,081 | 78,256 | |||||||||
|
|
|
|
|
| |||||||
Total expenses | 144,625 | 138,485 | 252,758 | |||||||||
|
|
|
|
|
| |||||||
Net investment income | 15,930,708 | 5,781,622 | 11,208,554 | |||||||||
|
|
|
|
|
| |||||||
| Realized and Unrealized Gain (Loss) on Investment and Foreign Currency Transactions | ||||||||||||
Net realized gain (loss) on: | ||||||||||||
Investment transactions | 46,760,716 | 55,016,370 | (44,045,282 | )(a) | ||||||||
Futures contracts | – 0 | – | – 0 | – | 1,198,397 | |||||||
Foreign currency transactions | – 0 | – | – 0 | – | 21,818,737 | |||||||
Net change in unrealized appreciation/depreciation of: | ||||||||||||
Investments | 96,186,353 | 29,171,061 | 152,859,979 | (b) | ||||||||
Futures contracts | – 0 | – | – 0 | – | (751,756 | ) | ||||||
Foreign currency denominated assets and liabilities | – 0 | – | – 0 | – | 2,410,674 | |||||||
|
|
|
|
|
| |||||||
Net gain on investment and foreign currency transactions | 142,947,069 | 84,187,431 | 133,490,749 | |||||||||
|
|
|
|
|
| |||||||
Net Increase in Net Assets from Operations | $ | 158,877,777 | $ | 89,969,053 | $ | 144,699,303 | ||||||
|
|
|
|
|
| |||||||
| (a) | Net of foreign capital gains taxes of $241,033. |
| (b) | Net of decrease in accrued foreign capital gains taxes of $22,581. |
See notes to financial statements.
| ALLIANCEBERNSTEIN POOLING PORTFOLIOS • | 229 |
Statement of Operations
| International Growth | Short Duration Bond | Global Core Bond | ||||||||||
| Investment Income | ||||||||||||
Dividends | ||||||||||||
Unaffiliated issuers (net of foreign taxes withheld of $322,074, $0 and $0, respectively) | $ | 8,397,336 | $ | – 0 | – | $ | – 0 | – | ||||
Affiliated issuers | 43,243 | 29,482 | 20,041 | |||||||||
Interest | 37,787 | 4,664,453 | 15,401,584 | |||||||||
Securities lending income | 436,399 | – 0 | – | – 0 | – | |||||||
|
|
|
|
|
| |||||||
Total income | 8,914,765 | 4,693,935 | 15,421,625 | |||||||||
|
|
|
|
|
| |||||||
| Expenses | ||||||||||||
Custodian | 125,710 | 86,310 | 118,236 | |||||||||
Audit | 20,535 | 21,649 | 21,649 | |||||||||
Legal | 17,347 | 17,005 | 20,466 | |||||||||
Trustees’ fees | 2,357 | 2,353 | 2,353 | |||||||||
Printing | 2,296 | 835 | 1,950 | |||||||||
Registration fees | – 0 | – | – 0 | – | 69 | |||||||
Miscellaneous | 19,604 | 10,414 | 13,655 | |||||||||
|
|
|
|
|
| |||||||
Total expenses | 187,849 | 138,566 | 178,378 | |||||||||
|
|
|
|
|
| |||||||
Net investment income | 8,726,916 | 4,555,369 | 15,243,247 | |||||||||
|
|
|
|
|
| |||||||
| Realized and Unrealized Gain (Loss) on Investment and Foreign Currency Transactions | ||||||||||||
Net realized gain (loss) on: | ||||||||||||
Investment transactions | (22,284,879 | ) | 1,607,236 | 3,555,240 | ||||||||
Futures contracts | – 0 | – | (397,923 | ) | 809,294 | |||||||
Options written | 2,768,429 | – 0 | – | – 0 | – | |||||||
Swap contracts | – 0 | – | 6,634 | – 0 | – | |||||||
Foreign currency transactions | (6,566,615 | ) | (637,598 | ) | 5,253,808 | |||||||
Net change in unrealized appreciation/depreciation of: | ||||||||||||
Investments | 110,540,915 | (2,488,850 | ) | (16,935,821 | ) | |||||||
Futures contracts | – 0 | – | (348,837 | ) | 178,742 | |||||||
Options written | (2,449,013 | ) | – 0 | – | – 0 | – | ||||||
Swap contracts | – 0 | – | (122,581 | ) | – 0 | – | ||||||
Foreign currency denominated assets and liabilities | 3,617,464 | 741,794 | 7,897,924 | |||||||||
|
|
|
|
|
| |||||||
Net gain (loss) on investment and foreign currency transactions | 85,626,301 | (1,640,125 | ) | 759,187 | ||||||||
|
|
|
|
|
| |||||||
Net Increase in Net Assets from Operations | $ | 94,353,217 | $ | 2,915,244 | $ | 16,002,434 | ||||||
|
|
|
|
|
| |||||||
See notes to financial statements.
| 230 | • ALLIANCEBERNSTEIN POOLING PORTFOLIOS |
Statement of Operations
| Bond Inflation Protection | High-Yield | Small-Mid Cap Value | ||||||||||
| Investment Income | ||||||||||||
Interest | $ | 7,098,575 | $ | 14,084,774 | $ | – 0 | – | |||||
Dividends | ||||||||||||
Unaffiliated issuers (net of foreign taxes withheld of $0, $365 and $0, respectively) | – 0 | – | 591,836 | 3,030,717 | ||||||||
Affiliated issuers | 5,096 | 2,658 | 7,023 | |||||||||
Securities lending income | – 0 | – | – 0 | – | 51,749 | |||||||
|
|
|
|
|
| |||||||
Total income | 7,103,671 | 14,679,268 | 3,089,489 | |||||||||
|
|
|
|
|
| |||||||
| Expenses | ||||||||||||
Custodian | 84,277 | 104,572 | 47,131 | |||||||||
Audit | 23,571 | 28,375 | 18,894 | |||||||||
Legal | 17,184 | 17,001 | 17,184 | |||||||||
Trustees’ fees | 2,353 | 2,353 | 2,352 | |||||||||
Printing | 1,585 | 1,586 | 2,134 | |||||||||
Registration fees | – 0 | – | 364 | – 0 | – | |||||||
Miscellaneous | 10,097 | 3,095 | 4,854 | |||||||||
|
|
|
|
|
| |||||||
Total expenses before interest expense | 139,067 | 157,346 | 92,549 | |||||||||
Interest expense | 426,496 | – 0 | – | – 0 | – | |||||||
|
|
|
|
|
| |||||||
Total expenses | 565,563 | 157,346 | 92,549 | |||||||||
|
|
|
|
|
| |||||||
Net investment income | 6,538,108 | 14,521,922 | 2,996,940 | |||||||||
|
|
|
|
|
| |||||||
| Realized and Unrealized Gain (Loss) on Investment and Foreign Currency Transactions | ||||||||||||
Net realized gain (loss) on: | ||||||||||||
Investment transactions | 15,845,140 | 3,222,374 | 11,780,880 | |||||||||
Futures contracts | 195,922 | (3,867 | ) | – 0 | – | |||||||
Options written | – 0 | – | (60,331 | ) | – 0 | – | ||||||
Swaptions written | – 0 | – | 1,290,288 | – 0 | – | |||||||
Swap contracts | (361,642 | ) | 431,267 | – 0 | – | |||||||
Foreign currency transactions | 1,137,238 | (440,708 | ) | – 0 | – | |||||||
Net change in unrealized appreciation/depreciation of: | ||||||||||||
Investments | (7,233,661 | ) | 8,116,113 | 38,915,571 | ||||||||
Futures contracts | 356,410 | 21,181 | – 0 | – | ||||||||
Options written | – 0 | – | (353,900 | ) | – 0 | – | ||||||
Swaptions written | – 0 | – | (532,231 | ) | – 0 | – | ||||||
Swap contracts | 1,549,697 | 1,053,073 | – 0 | – | ||||||||
Foreign currency denominated assets and liabilities | 386,537 | 581,519 | – 0 | – | ||||||||
|
|
|
|
|
| |||||||
Net gain on investment and foreign currency transactions | 11,875,641 | 13,324,778 | 50,696,451 | |||||||||
|
|
|
|
|
| |||||||
Net Increase in Net Assets from Operations | $ | 18,413,749 | $ | 27,846,700 | $ | 53,693,391 | ||||||
|
|
|
|
|
| |||||||
See notes to financial statements.
| ALLIANCEBERNSTEIN POOLING PORTFOLIOS • | 231 |
Statement of Operations
| Small-Mid Cap Growth | Multi-Asset Real Return* | Volatility Management | ||||||||||
| Investment Income | ||||||||||||
Dividends | ||||||||||||
Unaffiliated issuers (net of foreign taxes withheld of $0, $430,771 and $141,929, respectively) | $ | 1,151,602 | $ | 6,014,045 | $ | 10,328,414 | ||||||
Affiliated issuers | 17,553 | 54,587 | 590,936 | |||||||||
Interest | – 0 | – | (1,647,076 | ) | 25,478 | |||||||
Securities lending income | 134,538 | 143,043 | 55,126 | |||||||||
|
|
|
|
|
| |||||||
Total income | 1,303,693 | 4,564,599 | 10,999,954 | |||||||||
|
|
|
|
|
| |||||||
| Expenses | ||||||||||||
Transfer agency—Class A | – 0 | – | 5,728 | – 0 | – | |||||||
Custodian | 55,024 | 142,597 | 166,324 | |||||||||
Legal | 24,856 | 22,128 | 17,253 | |||||||||
Audit | 19,308 | 26,378 | 24,566 | |||||||||
Trustees’ fees | 2,353 | 2,353 | 2,307 | |||||||||
Printing | 2,022 | 2,021 | 2,062 | |||||||||
Registration fees | 362 | – 0 | – | 131 | ||||||||
Administrative | – 0 | – | – 0 | – | 24,822 | |||||||
Miscellaneous | 4,431 | 7,047 | 31,290 | |||||||||
|
|
|
|
|
| |||||||
Total expenses | 108,356 | 208,252 | 268,755 | |||||||||
|
|
|
|
|
| |||||||
Net investment income | 1,195,337 | 4,356,347 | 10,731,199 | |||||||||
|
|
|
|
|
| |||||||
| Realized and Unrealized Gain (Loss) on Investment and Foreign Currency Transactions | ||||||||||||
Net realized gain (loss) on: | ||||||||||||
Investment transactions | 20,409,174 | 10,425,222 | (a) | 13,630,293 | ||||||||
Futures contracts | – 0 | – | (1,180,388 | ) | 31,105,891 | |||||||
Options written | – 0 | – | 1,246,492 | 661,437 | ||||||||
Swap contracts | – 0 | – | (2,832,195 | ) | 16,473,008 | |||||||
Foreign currency transactions | – 0 | – | (1,258,876 | ) | 2,935,052 | |||||||
Net change in unrealized appreciation/depreciation of: | ||||||||||||
Investments | 11,201,566 | 18,306,993 | (b) | 53,997,076 | ||||||||
Futures contracts | – 0 | – | (1,424,569 | ) | 16,263,575 | |||||||
Options written | – 0 | – | (184,728 | ) | – 0 | – | ||||||
Swap contracts | – 0 | – | (12,375,641 | ) | (2,964,480 | ) | ||||||
Foreign currency denominated assets and liabilities | – 0 | – | 2,458,975 | (17,134,546 | ) | |||||||
|
|
|
|
|
| |||||||
Net gain on investment and foreign currency transactions | 31,610,740 | 13,181,285 | 114,967,306 | |||||||||
|
|
|
|
|
| |||||||
Net Increase in Net Assets from Operations | $ | 32,806,077 | $ | 17,537,632 | $ | 125,698,505 | ||||||
|
|
|
|
|
| |||||||
| * | Consolidated (see Note A). |
| (a) | Net of foreign capital gains taxes of $13,875. |
| (b) | Net of increase in accrued foreign capital gains taxes of $135,480. |
See notes to financial statements.
| 232 | • ALLIANCEBERNSTEIN POOLING PORTFOLIOS |
Statement of Operations
STATEMENT OF CHANGES IN NET ASSETS
| U.S. Value | ||||||||
| Six Months Ended February 28, 2013 (unaudited) | Year Ended August 31, 2012 | |||||||
| Increase in Net Assets from Operations | ||||||||
Net investment income | $ | 15,930,708 | $ | 37,591,315 | ||||
Net realized gain on investment transactions | 46,760,716 | 55,791,826 | ||||||
Net change in unrealized appreciation/depreciation of investments | 96,186,353 | 74,952,806 | ||||||
|
|
|
| |||||
Net increase in net assets from operations | 158,877,777 | 168,335,947 | ||||||
| Dividends to Shareholders from | ||||||||
Net investment income | (16,746,389 | ) | (42,821,254 | ) | ||||
| Transactions in Shares of Beneficial Interest | ||||||||
Net decrease | (149,566,502 | ) | (895,071,723 | ) | ||||
|
|
|
| |||||
Total decrease | (7,435,114 | ) | (769,557,030 | ) | ||||
| Net Assets | ||||||||
Beginning of period | 1,173,236,474 | 1,942,793,504 | ||||||
|
|
|
| |||||
End of period (including undistributed net investment income of $5,725,119 and $6,540,800, respectively) | $ | 1,165,801,360 | $ | 1,173,236,474 | ||||
|
|
|
| |||||
See notes to financial statements.
| ALLIANCEBERNSTEIN POOLING PORTFOLIOS • | 233 |
Statement of Changes in Net Assets
| U.S. Large Cap Growth | ||||||||
| Six Months Ended February 28, 2013 (unaudited) | Year Ended August 31, 2012 | |||||||
| Increase in Net Assets from Operations | ||||||||
Net investment income | $ | 5,781,622 | $ | 15,024,694 | ||||
Net realized gain on investment and foreign currency transactions | 55,016,370 | 209,772,710 | ||||||
Net change in unrealized appreciation/depreciation of investments | 29,171,061 | 1,425,472 | ||||||
|
|
|
| |||||
Net increase in net assets from operations | 89,969,053 | 226,222,876 | ||||||
| Dividends to Shareholders from | ||||||||
Net investment income | (5,111,580 | ) | (20,454,820 | ) | ||||
| Transactions in Shares of Beneficial Interest | ||||||||
Net decrease | (94,986,933 | ) | (985,778,939 | ) | ||||
|
|
|
| |||||
Total decrease | (10,129,460 | ) | (780,010,883 | ) | ||||
| Net Assets | ||||||||
Beginning of period | 1,172,835,371 | 1,952,846,254 | ||||||
|
|
|
| |||||
End of period (including undistributed net investment income of $2,333,059 and $1,663,017, respectively) | $ | 1,162,705,911 | $ | 1,172,835,371 | ||||
|
|
|
| |||||
See notes to financial statements.
| 234 | • ALLIANCEBERNSTEIN POOLING PORTFOLIOS |
Statement of Changes in Net Assets
| International Value | ||||||||
| Six Months Ended February 28, 2013 (unaudited) | Year Ended August 31, 2012 | |||||||
| Increase (Decrease) in Net Assets from Operations | ||||||||
Net investment income | $ | 11,208,554 | $ | 35,688,125 | ||||
Net realized loss on investment and foreign currency transactions | (21,028,148 | ) | (87,968,915 | ) | ||||
Net change in unrealized appreciation/depreciation of investments and foreign currency denominated assets and liabilities | 154,518,897 | (10,320,329 | ) | |||||
|
|
|
| |||||
Net increase (decrease) in net assets from operations | 144,699,303 | (62,601,119 | ) | |||||
| Dividends to Shareholders from | ||||||||
Net investment income | (20,003,192 | ) | (18,401,328 | ) | ||||
| Transactions in Shares of Beneficial Interest | ||||||||
Net increase (decrease) | (129,696,034 | ) | 82,828,281 | |||||
|
|
|
| |||||
Total increase (decrease) | (4,999,923 | ) | 1,825,834 | |||||
| Net Assets | ||||||||
Beginning of period | 985,645,046 | 983,819,212 | ||||||
|
|
|
| |||||
End of period (including undistributed net investment income of $9,247,374 and $18,042,012, respectively) | $ | 980,645,123 | $ | 985,645,046 | ||||
|
|
|
| |||||
See notes to financial statements.
| ALLIANCEBERNSTEIN POOLING PORTFOLIOS • | 235 |
Statement of Changes in Net Assets
| International Growth | ||||||||
| Six Months Ended February 28, 2013 (unaudited) | Year Ended August 31, 2012 | |||||||
| Increase (Decrease) in Net Assets from Operations | ||||||||
Net investment income | $ | 8,726,916 | $ | 23,700,412 | ||||
Net realized loss on investment and foreign currency transactions | (26,083,065 | ) | (72,753,927 | ) | ||||
Net change in unrealized appreciation/depreciation of investments and foreign currency denominated assets and liabilities | 111,709,366 | (21,975,724 | ) | |||||
|
|
|
| |||||
Net increase (decrease) in net assets from operations | 94,353,217 | (71,029,239 | ) | |||||
| Dividends to Shareholders from | ||||||||
Net investment income | (7,559,047 | ) | (17,085,762 | ) | ||||
| Transactions in Shares of Beneficial Interest | ||||||||
Net increase (decrease) | (108,126,991 | ) | 64,880,967 | |||||
|
|
|
| |||||
Total decrease | (21,332,821 | ) | (23,234,034 | ) | ||||
| Net Assets | ||||||||
Beginning of period | 998,741,898 | 1,021,975,932 | ||||||
|
|
|
| |||||
End of period (including undistributed net investment income of $7,189,677 and $6,021,808, respectively) | $ | 977,409,077 | $ | 998,741,898 | ||||
|
|
|
| |||||
See notes to financial statements.
| 236 | • ALLIANCEBERNSTEIN POOLING PORTFOLIOS |
Statement of Changes in Net Assets
| Short Duration Bond | ||||||||
| Six Months Ended February 28, 2013 (unaudited) | Year Ended August 31, 2012 | |||||||
| Increase (Decrease) in Net Assets from Operations | ||||||||
Net investment income | $ | 4,555,369 | $ | 12,197,222 | ||||
Net realized gain (loss) on investment transactions | 578,349 | (1,832,248 | ) | |||||
Net change in unrealized appreciation/depreciation of investments and foreign currency denominated assets and liabilities | (2,218,474 | ) | 989,198 | |||||
|
|
|
| |||||
Net increase in net assets from operations | 2,915,244 | 11,354,172 | ||||||
| Dividends to Shareholders from | ||||||||
Net investment income | (9,027,312 | ) | (15,303,830 | ) | ||||
| Transactions in Shares of Beneficial Interest | ||||||||
Net increase (decrease) | 19,091,782 | (349,000,650 | ) | |||||
|
|
|
| |||||
Total increase (decrease) | 12,979,714 | (352,950,308 | ) | |||||
| Net Assets | ||||||||
Beginning of period | 932,788,206 | 1,285,738,514 | ||||||
|
|
|
| |||||
End of period (including distributions in excess of net investment income of ($2,210,528) and undistributed net investment income of $2,261,415, respectively) | $ | 945,767,920 | $ | 932,788,206 | ||||
|
|
|
| |||||
See notes to financial statements.
| ALLIANCEBERNSTEIN POOLING PORTFOLIOS • | 237 |
Statement of Changes in Net Assets
| Global Core Bond | ||||||||
| Six Months Ended February 28, 2013 (unaudited) | Year Ended August 31, 2012 | |||||||
| Increase (Decrease) in Net Assets from Operations | ||||||||
Net investment income | $ | 15,243,247 | $ | 37,203,021 | ||||
Net realized gain on investment and foreign currency transactions | 9,618,342 | 55,294,127 | ||||||
Net change in unrealized appreciation/depreciation of investments and foreign currency denominated assets and liabilities | (8,859,155 | ) | (10,684,386 | ) | ||||
|
|
|
| |||||
Net increase in net assets from operations | 16,002,434 | 81,812,762 | ||||||
| Dividends and Distributions to Shareholders from | ||||||||
Net investment income | (23,030,864 | ) | (39,383,515 | ) | ||||
Net realized gain on investment transactions | (35,073,150 | ) | (32,616,025 | ) | ||||
| Transactions in Shares of Beneficial Interest | ||||||||
Net increase (decrease) | 1,616,175 | (192,868,890 | ) | |||||
|
|
|
| |||||
Total decrease | (40,485,405 | ) | (183,055,668 | ) | ||||
| Net Assets | ||||||||
Beginning of period | 1,124,206,841 | 1,307,262,509 | ||||||
|
|
|
| |||||
End of period (including undistributed net investment income of $8,615,812 and $16,403,429, respectively) | $ | 1,083,721,436 | $ | 1,124,206,841 | ||||
|
|
|
| |||||
See notes to financial statements.
| 238 | • ALLIANCEBERNSTEIN POOLING PORTFOLIOS |
Statement of Changes in Net Assets
| Bond Inflation Protection | ||||||||
| Six Months Ended February 28, 2013 (unaudited) | Year Ended August 31, 2012 | |||||||
| Increase (Decrease) in Net Assets from Operations | ||||||||
Net investment income | $ | 6,538,108 | $ | 26,396,898 | ||||
Net realized gain on investment and foreign currency transactions | 16,816,658 | 18,586,980 | ||||||
Net change in unrealized appreciation/depreciation of investments and foreign currency denominated assets and liabilities | (4,941,017 | ) | 3,860,862 | |||||
|
|
|
| |||||
Net increase in net assets from operations | 18,413,749 | 48,844,740 | ||||||
| Dividends and Distributions to Shareholders from | ||||||||
Net investment income | (35,403,908 | ) | (43,265,419 | ) | ||||
Net realized gain on investment transactions | (12,050,946 | ) | (12,914,162 | ) | ||||
| Transactions in Shares of Beneficial Interest | ||||||||
Net increase | 14,337,817 | 87,325,784 | ||||||
|
|
|
| |||||
Total increase (decrease) | (14,703,288 | ) | 79,990,943 | |||||
| Net Assets | ||||||||
Beginning of period | 792,721,451 | 712,730,508 | ||||||
|
|
|
| |||||
End of period (including distributions in excess of net investment income of ($7,537,705) and undistributed net investment income of $21,328,095, respectively) | $ | 778,018,163 | $ | 792,721,451 | ||||
|
|
|
| |||||
See notes to financial statements.
| ALLIANCEBERNSTEIN POOLING PORTFOLIOS • | 239 |
Statement of Changes in Net Assets
| High-Yield | ||||||||
| Six Months Ended February 28, 2013 (unaudited) | Year Ended August 31, 2012 | |||||||
| Increase in Net Assets from Operations | ||||||||
Net investment income | $ | 14,521,922 | $ | 32,806,023 | ||||
Net realized gain on investment and foreign currency transactions | 4,439,023 | 9,559,448 | ||||||
Net change in unrealized appreciation/depreciation of investments and foreign currency denominated assets and liabilities | 8,885,755 | 11,489,306 | ||||||
|
|
|
| |||||
Net increase in net assets from operations | 27,846,700 | 53,854,777 | ||||||
| Dividends to Shareholders from | ||||||||
Net investment income | (18,403,170 | ) | (29,996,780 | ) | ||||
| Transactions in Shares of Beneficial Interest | ||||||||
Net decrease | (21,220,003 | ) | (109,072,726 | ) | ||||
|
|
|
| |||||
Total decrease | (11,776,473 | ) | (85,214,729 | ) | ||||
| Net Assets | ||||||||
Beginning of period | 397,207,925 | 482,422,654 | ||||||
|
|
|
| |||||
End of period (including undistributed net investment income of $4,429,847 and $8,311,095, respectively) | $ | 385,431,452 | $ | 397,207,925 | ||||
|
|
|
| |||||
See notes to financial statements.
| 240 | • ALLIANCEBERNSTEIN POOLING PORTFOLIOS |
Statement of Changes in Net Assets
| Small-Mid Cap Value | ||||||||
| Six Months Ended February 28, 2013 (unaudited) | Year Ended August 31, 2012 | |||||||
| Increase in Net Assets from Operations | ||||||||
Net investment income | $ | 2,996,940 | $ | 5,604,192 | ||||
Net realized gain on investment transactions | 11,780,880 | 35,803,404 | ||||||
Net change in unrealized appreciation/depreciation of investments | 38,915,571 | 13,884,317 | ||||||
|
|
|
| |||||
Net increase in net assets from operations | 53,693,391 | 55,291,913 | ||||||
| Dividends and Distributions to Shareholders from | ||||||||
Net investment income | (5,106,288 | ) | (4,570,365 | ) | ||||
Net realized gain on investment transactions | (39,201,880 | ) | – 0 | – | ||||
| Transactions in Shares of Beneficial Interest | ||||||||
Net decrease | (11,419,296 | ) | (219,021,030 | ) | ||||
|
|
|
| |||||
Total decrease | (2,034,073 | ) | (168,299,482 | ) | ||||
| Net Assets | ||||||||
Beginning of period | 328,749,469 | 497,048,951 | ||||||
|
|
|
| |||||
End of period (including undistributed net investment income of $607,372 and $2,716,720, respectively) | $ | 326,715,396 | $ | 328,749,469 | ||||
|
|
|
| |||||
See notes to financial statements.
| ALLIANCEBERNSTEIN POOLING PORTFOLIOS • | 241 |
Statement of Changes in Net Assets
| Small-Mid Cap Growth | ||||||||
| Six Months Ended February 28, 2013 (unaudited) | Year Ended August 31, 2012 | |||||||
| Increase (Decrease) in Net Assets from Operations | ||||||||
Net investment income | $ | 1,195,337 | $ | 2,118,737 | ||||
Net realized gain on investment transactions | 20,409,174 | 76,734,106 | ||||||
Net change in unrealized appreciation/depreciation of investments | 11,201,566 | (9,471,749 | ) | |||||
|
|
|
| |||||
Net increase in net assets from operations | 32,806,077 | 69,381,094 | ||||||
| Dividends and Distributions to Shareholders from | ||||||||
Net investment income | (1,738,071 | ) | (2,298,494 | ) | ||||
Net realized gain on investment transactions | (64,602,314 | ) | (124,716,703 | ) | ||||
| Transactions in Shares of Beneficial Interest | ||||||||
Net increase (decrease) | 32,706,591 | (118,667,468 | ) | |||||
|
|
|
| |||||
Total decrease | (827,717 | ) | (176,301,571 | ) | ||||
| Net Assets | ||||||||
Beginning of period | 328,634,261 | 504,935,832 | ||||||
|
|
|
| |||||
End of period (including distributions in excess of net investment income of ($103,082) and undistributed net investment income of $439,652, respectively) | $ | 327,806,544 | $ | 328,634,261 | ||||
|
|
|
| |||||
See notes to financial statements.
| 242 | • ALLIANCEBERNSTEIN POOLING PORTFOLIOS |
Statement of Changes in Net Assets
| Multi-Asset Real Return* | ||||||||
| Six Months Ended February 28, 2013 (unaudited) | Year Ended August 31, 2012 | |||||||
| Increase (Decrease) in Net Assets from Operations | ||||||||
Net investment income | $ | 4,356,347 | $ | 13,667,157 | ||||
Net realized gain (loss) on investment and foreign currency transactions | 6,400,255 | (13,874,152 | ) | |||||
Net change in unrealized appreciation/depreciation of investments and foreign currency denominated assets and liabilities | 6,781,030 | (9,795,624 | ) | |||||
|
|
|
| |||||
Net increase (decrease) in net assets from operations | 17,537,632 | (10,002,619 | ) | |||||
| Dividends to Shareholders from | ||||||||
Net investment income | (23,613,602 | ) | (34,377,414 | ) | ||||
| Transactions in Shares of Beneficial Interest | ||||||||
Net increase (decrease) | 602,592,639 | (344,972,619 | ) | |||||
|
|
|
| |||||
Total increase (decrease) | 596,516,669 | (389,352,652 | ) | |||||
| Net Assets | ||||||||
Beginning of period | 547,928,679 | 937,281,331 | ||||||
|
|
|
| |||||
End of period (including distributions in excess of net investment income of ($4,916,976) and undistributed net investment income of $14,340,279, respectively) | $ | 1,144,445,348 | $ | 547,928,679 | ||||
|
|
|
| |||||
| * | Consolidated (see Note A). |
See notes to financial statements.
| ALLIANCEBERNSTEIN POOLING PORTFOLIOS • | 243 |
Statement of Changes in Net Assets
| Volatility Management | ||||||||
| Six Months Ended February 28, 2013 (unaudited) | Year Ended August 31, 2012 | |||||||
| Increase (Decrease) in Net Assets from Operations | ||||||||
Net investment income | $ | 10,731,199 | $ | 9,403,203 | ||||
Net realized gain (loss) on investment and foreign currency transactions | 64,805,681 | (27,859,000 | ) | |||||
Net change in unrealized appreciation/depreciation of investments and foreign currency denominated assets and liabilities | 50,161,625 | 42,501,308 | ||||||
|
|
|
| |||||
Net increase in net assets from operations | 125,698,505 | 24,045,511 | ||||||
| Dividends and Distributions to Shareholders from | ||||||||
Net investment income | (18,808,069 | ) | (5,546,626 | ) | ||||
Net realized gain on investment transactions | – 0 | – | (24,959,819 | ) | ||||
| Transactions in Shares of Beneficial Interest | ||||||||
Net increase (decrease) | (125,892,337 | ) | 1,410,360,256 | |||||
|
|
|
| |||||
Total increase (decrease) | (19,001,901 | ) | 1,403,899,322 | |||||
| Net Assets | ||||||||
Beginning of period | 1,688,281,840 | 284,382,518 | ||||||
|
|
|
| |||||
End of period (including distributions in excess of net investment income of ($8,313,746) and ($236,876), respectively) | $ | 1,669,279,939 | $ | 1,688,281,840 | ||||
|
|
|
| |||||
See notes to financial statements.
| 244 | • ALLIANCEBERNSTEIN POOLING PORTFOLIOS |
Statement of Changes in Net Assets
STATEMENT OF CASH FLOWS
Six Months Ended February 28, 2013 (unaudited)
| Bond Inflation Protection* | ||||||||
| Increase (Decrease) in Cash from | ||||||||
| Operating Activities: | ||||||||
Interest and dividends received | $ | 10,974,768 | ||||||
Interest expense paid | (426,496 | ) | ||||||
Operating expenses paid | (166,829 | ) | ||||||
Purchases of long-term investments | (270,984,573 | ) | ||||||
Proceeds from disposition of long-term investments | 308,076,030 | |||||||
Proceeds from disposition of short-term investments, net | 3,510,917 | |||||||
Payments on swap contracts, net | (543,444 | ) | ||||||
Variation margin paid on futures contracts | 284,176 | |||||||
|
| |||||||
Net increase in cash from operating activities | $ | 50,724,549 | ||||||
| Financing Activities: | ||||||||
Subscriptions of beneficial interest, net | (33,015,906 | ) | ||||||
Increase in reverse repurchase agreements | (13,958,163 | ) | ||||||
|
| |||||||
Net decrease in cash from financing activities | (46,974,069 | ) | ||||||
Effect of exchange rate on cash | 1,189,008 | |||||||
|
| |||||||
Net increase in cash | 4,939,488 | |||||||
Cash at beginning of period | 901,597 | |||||||
|
| |||||||
Cash at end of period | $ | 5,841,085 | ||||||
|
| |||||||
| Reconciliation of Net Increase in Net Assets from Operations to Net Increase in Cash from Operating Activities: | ||||||||
Net increase in net assets from operations | $ | 18,413,749 | ||||||
| Adjustments: | ||||||||
Increase in interest and dividends receivable | $ | 279,941 | ||||||
Net accretion of bond discount and amortization of bond premium | 4,188,646 | |||||||
Inflation Index Income | (597,490 | ) | ||||||
Decrease in accrued expenses | (27,762 | ) | ||||||
Purchases of long-term investments | (270,984,573) | |||||||
Proceeds from disposition of long-term investments | 308,076,030 | |||||||
Proceeds from disposition of short-term investments, net | 3,510,917 | |||||||
Payments on swap contracts, net | (543,444 | ) | ||||||
Variation margin paid on futures contracts | 284,176 | |||||||
Net realized gain on investment and foreign currency transactions | (16,816,658 | ) | ||||||
Net change in unrealized appreciation/depreciation of investments and foreign currency denominated assets and liabilities | 4,941,017 | |||||||
|
| |||||||
Total adjustments | 32,310,800 | |||||||
|
| |||||||
Net increase in cash from operating activities | $ | 50,724,549 | ||||||
|
| |||||||
| * | In accordance with U.S. GAAP, the Portfolio has included a Statement of Cash Flows as a result of its substantial investments in reverse purchase agreements throughout the period. |
See notes to financial statements.
| ALLIANCEBERNSTEIN POOLING PORTFOLIOS • | 245 |
Statement of Cash Flows
NOTES TO FINANCIAL STATEMENTS
February 28, 2013 (unaudited)
NOTE A
Significant Accounting Policies
The AllianceBernstein Pooling Portfolios (the “Trust”) was organized as a Massachusetts business trust on November 11, 2004 and is registered under the Investment Company Act of 1940 as a diversified, open-end management investment company. The Trust is currently comprised of twelve separate series: AllianceBernstein U.S. Value Portfolio, AllianceBernstein U.S. Large Cap Growth Portfolio, AllianceBernstein International Value Portfolio, AllianceBernstein International Growth Portfolio, AllianceBernstein Short Duration Bond Portfolio, AllianceBernstein Global Core Bond Portfolio, AllianceBernstein Bond Inflation Protection Portfolio, AllianceBernstein High-Yield Portfolio, AllianceBernstein Small-Mid Cap Value Portfolio, AllianceBernstein Small-Mid Cap Growth Portfolio, AllianceBernstein Multi-Asset Real Return Portfolio and AllianceBernstein Volatility Management Portfolio (collectively, the “Portfolios”). As part of AllianceBernstein Multi-Asset Real Return Portfolio’s investment strategy, the Portfolio seeks to gain exposure to commodities and commodities-related instruments and derivatives primarily through investments in AllianceBernstein Cayman Inflation Pooling Subsidiary, Ltd., a wholly-owned subsidiary of the Portfolio organized under the laws of the Cayman Islands (the “Subsidiary”). The Subsidiary was incorporated and commenced operations on October 18, 2010. The Multi-Asset Real Return Portfolio is the sole shareholder of the Subsidiary and it is intended that the Portfolio will remain the sole shareholder and will continue to control the Subsidiary. Under the Articles of Association of the Subsidiary, shares issued by the Subsidiary confer upon a shareholder the right to receive notice of, to attend and to vote at general meetings of the Subsidiary and shall confer upon the shareholder rights in a winding-up or repayment of capital and the right to participate in the profits or assets of the Subsidiary. As of February 28, 2013, net assets of the Multi-Asset Real Return Portfolio were $1,144,445,348, of which $233,461,463, or approximately 20.40%, represented the Portfolio’s ownership of all issued shares and voting rights of the Subsidiary. This report presents the consolidated financial statements and portfolio of investments of AllianceBernstein Multi-Asset Real Return Portfolio and the Subsidiary. All intercompany transactions and balances have been eliminated in consolidation. Each Portfolio is considered to be a separate entity for financial reporting and tax purposes. Shares of the Portfolios are offered exclusively to mutual funds advised by and certain other institutional clients of AllianceBernstein L.P. (the “Adviser”). A Portfolio’s shares may be purchased at the relevant net asset value without a sales charge or other fee. The financial statements have been prepared in conformity with U.S. generally accepted accounting principles (“U.S. GAAP”) which require management to make certain estimates and assumptions that affect the reported amounts of assets and liabilities in the financial statements and amounts of income and expenses during the reporting period. Actual results could differ from those estimates. The following is a summary of significant accounting policies followed by the Portfolios.
| 246 | • ALLIANCEBERNSTEIN POOLING PORTFOLIOS |
Notes to Financial Statements
1. Security Valuation
Portfolio securities are valued at their current market value determined on the basis of market quotations or, if market quotations are not readily available or are deemed unreliable, at “fair value” as determined in accordance with procedures established by and under the general supervision of the Trust’s Board of Trustees (the “Board”).
In general, the market value of securities which are readily available and deemed reliable are determined as follows: Securities listed on a national securities exchange (other than securities listed on the NASDAQ Stock Market, Inc. (“NASDAQ”)) or on a foreign securities exchange are valued at the last sale price at the close of the exchange or foreign securities exchange. If there has been no sale on such day, the securities are valued at the last traded price from the previous day. Securities listed on more than one exchange are valued by reference to the principal exchange on which the securities are traded; securities listed only on NASDAQ are valued in accordance with the NASDAQ Official Closing Price; listed or over the counter (“OTC”) market put or call options are valued at the mid level between the current bid and ask prices. If either a current bid or current ask price is unavailable, the Adviser will have discretion to determine the best valuation (e.g. last trade price in the case of listed options); open futures contracts are valued using the closing settlement price or, in the absence of such a price, the most recent quoted bid price. If there are no quotations available for the day of valuation, the last available closing settlement price is used; U.S. government securities and other debt instruments having 60 days or less remaining until maturity are valued at amortized cost if their original maturity was 60 days or less; or by amortizing their fair value as of the 61st day prior to maturity if their original term to maturity exceeded 60 days; fixed-income securities, including mortgage backed and asset backed securities, may be valued on the basis of prices provided by a pricing service or at a price obtained from one or more of the major broker/dealers. In cases where broker/dealer quotes are obtained, the Adviser may establish procedures whereby changes in market yields or spreads are used to adjust, on a daily basis, a recently obtained quoted price on a security. Swaps and other derivatives are valued daily, primarily using independent pricing services, independent pricing models using market inputs, as well as third party broker-dealers or counterparties. Investments in money market funds are valued at their net asset value each day.
Securities for which market quotations are not readily available (including restricted securities) or are deemed unreliable are valued at fair value. Factors considered in making this determination may include, but are not limited to, information obtained by contacting the issuer, analysts, analysis of the issuer’s financial statements or other available documents. In addition, the Portfolios may use fair value pricing for securities primarily traded in non-U.S. markets because most foreign markets close well before the Portfolios value their securities at 4:00 p.m., Eastern Time. The earlier close of foreign markets gives rise
| ALLIANCEBERNSTEIN POOLING PORTFOLIOS • | 247 |
Notes to Financial Statements
to the possibility that significant events, including broad market moves, may have occurred between the close of the foreign markets and the time at which the Portfolios value their securities which may materially affect the value of securities trading in such markets.
2. Fair Value Measurements
In accordance with U.S. GAAP regarding fair value measurements, fair value is defined as the price that the Portfolios would receive to sell an asset or pay to transfer a liability in an orderly transaction between market participants at the measurement date. U.S. GAAP establishes a framework for measuring fair value, and a three-level hierarchy for fair value measurements based upon the transparency of inputs to the valuation of an asset (including those valued based on their market values as described in Note 1 above) or liability. Inputs may be observable or unobservable and refer broadly to the assumptions that market participants would use in pricing the asset or liability. Observable inputs reflect the assumptions market participants would use in pricing the asset or liability based on market data obtained from sources independent of the Portfolios. Unobservable inputs reflect the Portfolios’ own assumptions about the assumptions that market participants would use in pricing the asset or liability based on the best information available in the circumstances. Each investment is assigned a level based upon the observability of the inputs which are significant to the overall valuation. The three-tier hierarchy of inputs is summarized below.
| • | Level 1—quoted prices in active markets for identical investment |
| • | Level 2—other significant observable inputs (including quoted prices for similar investments, interest rates, prepayment speeds, credit risk, etc.) |
| • | Level 3—significant unobservable inputs (including the Portfolios’ own assumptions in determining the fair value of investments) |
The fair value of debt instruments, such as bonds, and over-the-counter derivatives is generally based on market price quotations, recently executed market transactions (where observable) or industry recognized modeling techniques and are generally classified as Level 2. Pricing vendor inputs to Level 2 valuations may include quoted prices for similar investments in active markets, interest rate curves, coupon rates, currency rates, yield curves, option adjusted spreads, default rates, credit spreads and other unique security features in order to estimate the relevant cash flows which is then discounted to calculate fair values. If these inputs are unobservable and significant to the fair value, these investments will be classified as Level 3.
Where readily available market prices or relevant bid prices are not available for certain equity investments, such investments may be valued based on similar publicly traded investments, movements in relevant indices since last available prices or based upon underlying company fundamentals and comparable company data (such as multiples to earnings or other multiples to equity). Where an investment is valued using an observable input, such as another publicly traded
| 248 | • ALLIANCEBERNSTEIN POOLING PORTFOLIOS |
Notes to Financial Statements
security, the investment will be classified as Level 2. If management determines that an adjustment is appropriate based on restrictions on resale, illiquidity or uncertainty, and such adjustment is a significant component of the valuation, the investment will be classified as Level 3. An investment will also be classified as Level 3 where management uses company fundamentals and other significant inputs to determine the valuation.
Options and warrants are valued using market-based inputs to models, broker or dealer quotations, or alternative pricing sources with reasonable levels of price transparency, where such inputs and models are available. Alternatively the values may be obtained through unobservable management determined inputs and/or management’s proprietary models. Where models are used, the selection of a particular model to value an option or a warrant depends upon the contractual terms of, and specific risks inherent in, the option or warrant as well as the availability of pricing information in the market. Valuation models require a variety of inputs, including contractual terms, market prices, measures of volatility and correlations of such inputs. Exchange traded options will be classified as Level 2. For options or warrants that do not trade on exchange but trade in liquid markets, inputs can generally be verified and model selection does not involve significant management judgment. Options and warrants are classified within Level 2 on the fair value hierarchy when all of the significant inputs can be corroborated to market evidence. Otherwise such instruments are classified as Level 3.
Valuations of mortgage-backed or other asset backed securities, by pricing vendors, are based on both proprietary and industry recognized models and discounted cash flow techniques. Significant inputs to the valuation of these instruments are value of the collateral, the rates and timing of delinquencies, the rates and timing of prepayments, and default and loss expectations, which are driven in part by housing prices for residential mortgages. Significant inputs are determined based on relative value analyses, which incorporate comparisons to instruments with similar collateral and risk profiles, including relevant indices. Mortgage and asset backed securities for which management has collected current observable data through pricing services are generally categorized within Level 2. Those investments for which current observable data has not been provided are classified as Level 3.
Bank loan prices are provided by third party pricing services and consist of a composite of the quotes received by the vendor into a consensus price. Bank loans are classified as Level 3, as significant input used in the fair value measurement of these instruments is the market quotes that are received by the vendor and these inputs are not observable.
Other fixed income investments, including non-U.S. government and corporate debt, are generally valued using quoted market prices, if available, which are
| ALLIANCEBERNSTEIN POOLING PORTFOLIOS • | 249 |
Notes to Financial Statements
typically impacted by current interest rates, maturity dates and any perceived credit risk of the issuer. Additionally, in the absence of quoted market prices, these inputs are used by pricing vendors to derive a valuation based upon industry or proprietary models which incorporate issuer specific data with relevant yield/spread comparisons with more widely quoted bonds with similar key characteristics. Those investments for which there are observable inputs are classified as Level 2. Where the inputs are not observable, the investments are classified as Level 3.
The following table summarizes the valuation of the Portfolios’ investments by the above fair value hierarchy levels as of February 28, 2013:
| U.S. Value Portfolio | ||||||||||||||||
| Investments in Securities: | Level 1 | Level 2 | Level 3 | Total | ||||||||||||
Assets: | ||||||||||||||||
Common Stocks* | $ | 1,141,498,649 | $ | – 0 | – | $ | – 0 | – | $ | 1,141,498,649 | ||||||
Short-Term Investments | 4,025,699 | – 0 | – | – 0 | – | 4,025,699 | ||||||||||
Investments of Cash Collateral for Securities Loaned in Affiliated Money Market Fund | 13,342,427 | – 0 | – | –0 | – | 13,342,427 | ||||||||||
|
|
|
|
|
|
|
| |||||||||
Total Investments in Securities | 1,158,866,775 | – 0 | – | – 0 | – | 1,158,866,775 | ||||||||||
Other Financial Instruments** | – 0 | – | – 0 | – | – 0 | – | – 0 | – | ||||||||
|
|
|
|
|
|
|
| |||||||||
Total++ | $ | 1,158,866,775 | $ | – 0 | – | $ | – 0 | – | $ | 1,158,866,775 | ||||||
|
|
|
|
|
|
|
| |||||||||
| U.S. Large Cap Growth Portfolio | ||||||||||||||||
| Investments in Securities: | Level 1 | Level 2 | Level 3 | Total | ||||||||||||
Assets: | ||||||||||||||||
Common Stocks* | $ | 1,083,627,347 | $ | – 0 | – | $ | – 0 | – | $ | 1,083,627,347 | ||||||
Short-Term Investments | 70,261,258 | – 0 | – | – 0 | – | 70,261,258 | ||||||||||
Investments of Cash Collateral for Securities Loaned in Affiliated Money Market Fund | 2,651,373 | – 0 | – | – 0 | – | 2,651,373 | ||||||||||
|
|
|
|
|
|
|
| |||||||||
Total Investments in Securities | 1,156,539,978 | – 0 | – | – 0 | – | 1,156,539,978 | ||||||||||
Other Financial Instruments** | – 0 | – | – 0 | – | – 0 | – | – 0 | – | ||||||||
|
|
|
|
|
|
|
| |||||||||
Total++ | $ | 1,156,539,978 | $ | – 0 | – | $ | – 0 | – | $ | 1,156,539,978 | ||||||
|
|
|
|
|
|
|
| |||||||||
| 250 | • ALLIANCEBERNSTEIN POOLING PORTFOLIOS |
Notes to Financial Statements
| International Value Portfolio | ||||||||||||||||
| Investments in Securities: | Level 1 | Level 2 | Level 3 | Total | ||||||||||||
Assets: | ||||||||||||||||
Common Stocks: | ||||||||||||||||
Financials | $ | 32,351,769 | $ | 202,122,995 | – 0 | – | $ | 234,474,764 | ||||||||
Consumer Discretionary | 13,662,559 | 129,623,316 | – 0 | – | 143,285,875 | |||||||||||
Energy | 35,869,830 | 73,634,140 | – 0 | – | 109,503,970 | |||||||||||
Materials | 42,514,435 | 59,162,409 | – 0 | – | 101,676,844 | |||||||||||
Industrials | – 0 | – | 85,611,666 | – 0 | – | 85,611,666 | ||||||||||
Health Care | – 0 | – | 74,211,340 | – 0 | – | 74,211,340 | ||||||||||
Information Technology | – 0 | – | 69,183,738 | – 0 | – | 69,183,738 | ||||||||||
Consumer Staples | 4,235,149 | 60,664,909 | – 0 | – | 64,900,058 | |||||||||||
Telecommunication Services | 6,050,579 | 45,232,898 | – 0 | – | 51,283,477 | |||||||||||
Utilities | – 0 | – | 20,916,484 | – 0 | – | 20,916,484 | ||||||||||
Short-Term Investments | 31,678,901 | – 0 | – | – 0 | – | 31,678,901 | ||||||||||
Investments of Cash Collateral for Securities Loaned in Affiliated Money Market Fund | 27,331,840 | – 0 | – | – 0 | – | 27,331,840 | ||||||||||
|
|
|
|
|
|
|
| |||||||||
Total Investments in Securities | 193,695,062 | 820,363,895+ | – 0 | – | 1,014,058,957 | |||||||||||
Other Financial Instruments** : | ||||||||||||||||
Assets: | ||||||||||||||||
Forward Currency Exchange Contracts | – 0 | – | 7,262,939 | – 0 | – | 7,262,939 | ||||||||||
Liabilities: | ||||||||||||||||
Futures Contracts | – 0 | – | (77,106 | ) | – 0 | – | (77,106 | ) # | ||||||||
Forward Currency Exchange Contracts | – 0 | – | (5,941,036 | ) | – 0 | – | (5,941,036 | ) | ||||||||
|
|
|
|
|
|
|
| |||||||||
Total++ | $ | 193,695,062 | $ | 821,608,692 | $ | – 0 | – | $ | 1,015,303,754 | |||||||
|
|
|
|
|
|
|
| |||||||||
| ALLIANCEBERNSTEIN POOLING PORTFOLIOS • | 251 |
Notes to Financial Statements
| International Growth Portfolio | ||||||||||||||||
| Investments in Securities: | Level 1 | Level 2 | Level 3 | Total | ||||||||||||
Assets: | ||||||||||||||||
Common Stocks: | ||||||||||||||||
Financials | $ | 22,936,720 | $ | 252,666,299 | $ | – 0 | – | $ | 275,603,019 | |||||||
Consumer Discretionary | 37,564,782 | 148,500,612 | – 0 | – | 186,065,394 | |||||||||||
Industrials | 9,126,509 | 148,471,019 | – 0 | – | 157,597,528 | |||||||||||
Consumer Staples | – 0 | – | 145,605,250 | – 0 | – | 145,605,250 | ||||||||||
Information Technology | 21,114,587 | 73,914,344 | – 0 | – | 95,028,931 | |||||||||||
Materials | – 0 | – | 34,966,158 | – 0 | – | 34,966,158 | ||||||||||
Energy | 2,843,856 | 28,151,333 | – 0 | – | 30,995,189 | |||||||||||
Health Care | 2,271,720 | 17,902,254 | – 0 | – | 20,173,974 | |||||||||||
Utilities | – 0 | – | 9,396,116 | – 0 | – | 9,396,116 | ||||||||||
Corporates – Non-Investment Grades | – 0 | – | – 0 | – | 4,978,248 | 4,978,248 | ||||||||||
Warrants | 797,107 | – 0 | – | 2,595,232 | 3,392,339 | |||||||||||
Short-Term Investments | 4,991,776 | – 0 | – | – 0 | – | 4,991,776 | ||||||||||
Investments of Cash Collateral for Securities Loaned in Affiliated Money Market Fund | 10,882,706 | – 0 | – | – 0 | – | 10,882,706 | ||||||||||
|
|
|
|
|
|
|
| |||||||||
Total Investments in Securities | 112,529,763 | 859,573,385 | + | 7,573,480 | 979,676,628 | |||||||||||
Other Financial Instruments** : | ||||||||||||||||
Assets: | ||||||||||||||||
Forward Currency Exchange Contracts | – 0 | – | 9,102,013 | – 0 | – | 9,102,013 | ||||||||||
Liabilities: | ||||||||||||||||
Forward Currency Exchange Contracts | – 0 | – | (6,520,634 | ) | – 0 | – | (6,520,634 | ) | ||||||||
|
|
|
|
|
|
|
| |||||||||
Total(a) | $ | 112,529,763 | $ | 862,154,764 | $ | 7,573,480 | $ | 982,258,007 | ||||||||
|
|
|
|
|
|
|
| |||||||||
| 252 | • ALLIANCEBERNSTEIN POOLING PORTFOLIOS |
Notes to Financial Statements
| Short Duration Bond Portfolio | ||||||||||||||||
| Investments in Securities: | Level 1 | Level 2 | Level 3 | Total | ||||||||||||
Assets: | ||||||||||||||||
Mortgage Pass-Throughs | $ | – 0 | – | $ | 280,690,528 | $ | – 0 | – | $ | 280,690,528 | ||||||
Governments – Treasuries | – 0 | – | 231,442,805 | – 0 | – | 231,442,805 | ||||||||||
Asset-Backed Securities | 2,508,748 | 129,084,096 | 7,983,098 | 139,575,942 | ||||||||||||
Corporates – Investment Grades | 3,310,000 | 113,982,077 | – 0 | – | 117,292,077 | |||||||||||
Commercial Mortgage-Backed Securities | 4,612,610 | 92,102,731 | 14,092,904 | 110,808,245 | ||||||||||||
Collateralized Mortgage Obligations | – 0 | – | 14,729,374 | 2,786,507 | 17,515,881 | |||||||||||
Governments – Sovereign Agencies | – 0 | – | 6,455,923 | – 0 | – | 6,455,923 | ||||||||||
Short-Term Investments | 72,993,769 | – 0 | – | – 0 | – | 72,993,769 | ||||||||||
|
|
|
|
|
|
|
| |||||||||
Total Investments in Securities | 83,425,127 | 868,487,534 | 24,862,509 | 976,775,170 | ||||||||||||
Other Financial Instruments** : | ||||||||||||||||
Assets: | ||||||||||||||||
Forward Currency Exchange Contracts | – 0 | – | 777,410 | – 0 | – | 777,410 | ||||||||||
Cross Currency Swap Contracts | – 0 | – | – 0 | – | 52,575 | 52,575 | ||||||||||
Liabilities: | ||||||||||||||||
Futures Contracts | (317,228 | ) | – 0 | – | – 0 | – | (317,228 | ) # | ||||||||
Forward Currency Exchange Contracts | – 0 | – | (140,310 | ) | – 0 | – | (140,310 | ) | ||||||||
|
|
|
|
|
|
|
| |||||||||
Total++ | $ | 83,107,899 | $ | 869,124,634 | $ | 24,915,084 | $ | 977,147,617 | ||||||||
|
|
|
|
|
|
|
| |||||||||
| ALLIANCEBERNSTEIN POOLING PORTFOLIOS • | 253 |
Notes to Financial Statements
| Global Core Bond Portfolio | ||||||||||||||||
Investments in Securities: | Level 1 | Level 2 | Level 3 | Total | ||||||||||||
Assets: | ||||||||||||||||
Governments – Treasuries | $ | – 0 | – | $ | 395,661,275 | $ | – 0 | – | $ | 395,661,275 | ||||||
Corporates – Investment Grades | – 0 | – | 339,848,151 | – 0 | – | 339,848,151 | ||||||||||
Mortgage Pass-Throughs | – 0 | – | 95,165,281 | – 0 | – | 95,165,281 | ||||||||||
Governments – Sovereign Agencies | – 0 | – | 41,462,076 | – 0 | – | 41,462,076 | ||||||||||
Agencies | – 0 | – | 40,901,786 | – 0 | – | 40,901,786 | ||||||||||
Commercial Mortgage-Backed Securities | 5,582,510 | 30,045,220 | 4,964,265 | 40,591,995 | ||||||||||||
Asset-Backed Securities | – 0 | – | 19,692,527 | 3,353,651 | 23,046,178 | |||||||||||
Covered Bonds | – 0 | – | 20,628,913 | – 0 | – | 20,628,913 | ||||||||||
Quasi-Sovereigns | – 0 | – | 16,949,836 | – 0 | – | 16,949,836 | ||||||||||
Inflation-Linked Securities | – 0 | – | 11,101,251 | – 0 | – | 11,101,251 | ||||||||||
Governments – Sovereign Bonds | – 0 | – | 5,667,026 | – 0 | – | 5,667,026 | ||||||||||
Supranationals | – 0 | – | 3,167,550 | – 0 | – | 3,167,550 | ||||||||||
Local Governments – Municipal Bonds | – 0 | – | 2,895,520 | – 0 | – | 2,895,520 | ||||||||||
Emerging Markets – Corporate Bonds | – 0 | – | 2,143,245 | – 0 | – | 2,143,245 | ||||||||||
Collateralized Mortgage Obligations | – 0 | – | 338,735 | 1,374,764 | 1,713,499 | |||||||||||
Short-Term Investments: | ||||||||||||||||
Investment Companies | 61,548,897 | – 0 | – | – 0 | – | 61,548,897 | ||||||||||
U.S. Treasury Bill | – 0 | – | 45,813,454 | – 0 | – | 45,813,454 | ||||||||||
|
|
|
|
|
|
|
| |||||||||
Total Investments in Securities | 67,131,407 | 1,071,481,846 | 9,692,680 | 1,148,305,933 | ||||||||||||
Other Financial |
| |||||||||||||||
Assets: | ||||||||||||||||
Forward Currency Exchange Contracts | – 0 | – | 2,048,053 | – 0 | – | 2,048,053 | ||||||||||
Liabilities: | ||||||||||||||||
Futures Contracts | (175,630 | ) | – 0 | – | – 0 | – | (175,630 | ) # | ||||||||
Forward Currency Exchange Contracts | – 0 | – | (893,870 | ) | – 0 | – | (893,870 | ) | ||||||||
|
|
|
|
|
|
|
| |||||||||
Total++ | $ | 66,955,777 | $ | 1,072,636,029 | $ | 9,692,680 | $ | 1,149,284,486 | ||||||||
|
|
|
|
|
|
|
| |||||||||
| 254 | • ALLIANCEBERNSTEIN POOLING PORTFOLIOS |
Notes to Financial Statements
| Bond Inflation Protection Portfolio | ||||||||||||||||
| Investments in Securities: | Level 1 | Level 2 | Level 3 | Total | ||||||||||||
Assets: | ||||||||||||||||
Inflation-Linked Securities | $ | – 0 | – | $ | 756,960,263 | $ | – 0 | – | $ | 756,960,263 | ||||||
Corporates – Investment Grades | – 0 | – | 154,945,755 | – 0 | – | 154,945,755 | ||||||||||
Asset-Backed Securities | 3,966,537 | 68,577,489 | 4,056,570 | 76,600,596 | ||||||||||||
Commercial Mortgage-Backed Securities | – 0 | – | 41,954,924 | 5,703,925 | 47,658,849 | |||||||||||
Mortgage Pass-Throughs | – 0 | – | 21,361,538 | – 0 | – | 21,361,538 | ||||||||||
Corporates – Non-Investment Grades | – 0 | – | 13,319,643 | – 0 | – | 13,319,643 | ||||||||||
Quasi-Sovereigns | – 0 | – | 8,555,375 | – 0 | – | 8,555,375 | ||||||||||
Agencies | – 0 | – | 8,239,341 | – 0 | – | 8,239,341 | ||||||||||
Governments – Sovereign Bonds | – 0 | – | 1,625,408 | – 0 | – | 1,625,408 | ||||||||||
|
|
|
|
|
|
|
| |||||||||
Total Investments in Securities | 3,966,537 | 1,075,539,736 | 9,760,495 | 1,089,266,768 | ||||||||||||
Other Financial Instruments** : | ||||||||||||||||
Assets: | ||||||||||||||||
Forward Currency Exchange Contracts | – 0 | – | 235,189 | – 0 | – | 235,189 | ||||||||||
Interest Rate Swap Contracts | – 0 | – | 205,234 | – 0 | – | 205,234 | ||||||||||
Credit Default Swap Contracts | – 0 | – | 94,084 | – 0 | – | 94,084 | ||||||||||
Liabilities: | ||||||||||||||||
Futures Contracts | (184,637 | ) | – 0 | – | – 0 | – | (184,637 | ) # | ||||||||
Forward Currency Exchange Contracts | – 0 | – | (134,931 | ) | – 0 | – | (134,931 | ) | ||||||||
Interest Rate Swap Contracts | – 0 | – | (1,970,286 | ) | – 0 | – | (1,970,286 | ) | ||||||||
|
|
|
|
|
|
|
| |||||||||
Total++ | $ | 3,781,900 | $ | 1,073,969,026 | $ | 9,760,495 | $ | 1,087,511,421 | ||||||||
|
|
|
|
|
|
|
| |||||||||
| ALLIANCEBERNSTEIN POOLING PORTFOLIOS • | 255 |
Notes to Financial Statements
| High-Yield Portfolio | ||||||||||||||||
| Investments in Securities: | Level 1 | Level 2 | Level 3 | Total | ||||||||||||
Assets: | ||||||||||||||||
Corporates—Non-Investment Grades | $ | – 0 | – | $ | 286,236,518 | $ | 1,216,432 | ^ | $ | 287,452,950 | ||||||
Corporates—Investment Grades | – 0 | – | 22,441,403 | – 0 | – | 22,441,403 | ||||||||||
Bank Loans | 371,250 | – 0 | – | 12,955,241 | 13,326,491 | |||||||||||
Emerging Markets—Corporate Bonds | – 0 | – | 11,608,676 | 427,968 | 12,036,644 | |||||||||||
Emerging Markets—Sovereigns | – 0 | – | 9,085,395 | – 0 | – | 9,085,395 | ||||||||||
Collateralized Mortgage Obligations | – 0 | – | – 0 | – | 8,141,513 | 8,141,513 | ||||||||||
Commercial Mortgage-Backed Securities | – 0 | – | – 0 | – | 7,119,590 | 7,119,590 | ||||||||||
Governments—Treasuries | – 0 | – | 6,502,060 | – 0 | – | 6,502,060 | ||||||||||
Quasi-Sovereigns | – 0 | – | 6,329,792 | – 0 | – | 6,329,792 | ||||||||||
Common Stocks | 4,636,401 | – 0 | – | 1,007,267 | 5,643,668 | |||||||||||
Preferred Stocks | 3,843,567 | 894,173 | – 0 | – | 4,737,740 | |||||||||||
Asset-Backed Securities | – 0 | – | – 0 | – | 2,573,265 | 2,573,265 | ||||||||||
Local Governments—Municipal Bonds | – 0 | – | 1,356,837 | – 0 | – | 1,356,837 | ||||||||||
Options Purchased—Puts | – 0 | – | 834,269 | – 0 | – | 834,269 | ||||||||||
Governments—Sovereign Agencies | – 0 | – | 513,936 | – 0 | – | 513,936 | ||||||||||
Options Purchased—Calls | – 0 | – | 248,087 | – 0 | – | 248,087 | ||||||||||
Warrants | – 0 | – | – 0 | – | – 0 | –^ | – 0 | – | ||||||||
Short-Term Investments | 5,524,468 | – 0 | – | – 0 | – | 5,524,468 | ||||||||||
|
|
|
|
|
|
|
| |||||||||
Total Investments in Securities | 14,375,686 | 346,051,146 | 33,441,276 | 393,868,108 | ||||||||||||
Other Financial Instruments** : | ||||||||||||||||
Assets: | ||||||||||||||||
Futures Contracts | 127,389 | – 0 | – | – 0 | – | 127,389 | # | |||||||||
Forward Currency Exchange Contracts | – 0 | – | 86,501 | – 0 | – | 86,501 | ||||||||||
Interest Rate Swap Contracts | – 0 | – | 137,540 | – 0 | – | 137,540 | ||||||||||
Credit Default Swap Contracts | – 0 | – | 3,239,624 | – 0 | – | 3,239,624 | ||||||||||
Dividend Swap Contracts | – 0 | – | 40,424 | – 0 | – | 40,424 | ||||||||||
| 256 | • ALLIANCEBERNSTEIN POOLING PORTFOLIOS |
Notes to Financial Statements
| High-Yield Portfolio | ||||||||||||||||
| Investments in Securities: | Level 1 | Level 2 | Level 3 | Total | ||||||||||||
Liabilities: | ||||||||||||||||
Futures Contracts | $ | (106,208 | ) | $ | – 0 | – | $ | – 0 | – | $ | (106,208 | ) # | ||||
Forward Currency Exchange Contracts | – 0 | – | (106,585 | ) | – 0 | – | (106,585 | ) | ||||||||
Call Options Written | – 0 | – | (58,538 | ) | – 0 | – | (58,538 | ) | ||||||||
Put Options Written | – 0 | – | (475,312 | ) | – 0 | – | (475,312 | ) | ||||||||
Currency Options Written | – 0 | – | (567,209 | ) | – 0 | – | (567,209 | ) | ||||||||
Credit Default Swaptions Written | – 0 | – | (44,589 | ) | – 0 | – | (44,589 | ) | ||||||||
Interest Rate Swap Contracts | – 0 | – | (445,357 | ) | – 0 | – | (445,357 | ) | ||||||||
Credit Default Swap Contracts | – 0 | – | (2,743,625 | ) | – 0 | – | (2,743,625 | ) | ||||||||
Total Return Swap Contracts | – 0 | – | (28,552 | ) | – 0 | – | (28,552 | ) | ||||||||
|
|
|
|
|
|
|
| |||||||||
Total++ | $ | 14,396,867 | $ | 345,085,468 | $ | 33,441,276 | $ | 392,923,611 | ||||||||
|
|
|
|
|
|
|
| |||||||||
| Small-Mid Cap Value Portfolio | ||||||||||||||||
| Investments in Securities: | Level 1 | Level 2 | Level 3 | Total | ||||||||||||
Assets: | ||||||||||||||||
Common Stocks* | $ | 321,865,085 | $ | – 0 | – | $ | – 0 | – | $ | 321,865,085 | ||||||
Short-Term Investments | 2,817,260 | – 0 | – | – 0 | – | 2,817,260 | ||||||||||
Investments of Cash Collateral for Securities Loaned in Affiliated Money Market Fund | 8,851,935 | – 0 | – | – 0 | – | 8,851,935 | ||||||||||
|
|
|
|
|
|
|
| |||||||||
Total Investments in Securities | 333,534,280 | – 0 | – | – 0 | – | 333,534,280 | ||||||||||
Other Financial Instruments** | – 0 | – | – 0 | – | – 0 | – | – 0 | – | ||||||||
|
|
|
|
|
|
|
| |||||||||
Total++ | $ | 333,534,280 | $ | – 0 | – | $ | – 0 | – | $ | 333,534,280 | ||||||
|
|
|
|
|
|
|
| |||||||||
| ALLIANCEBERNSTEIN POOLING PORTFOLIOS • | 257 |
Notes to Financial Statements
| Small-Mid Cap Growth Portfolio | ||||||||||||||||
| Investments in Securities: | Level 1 | Level 2 | Level 3 | Total | ||||||||||||
Assets: | ||||||||||||||||
Common Stocks* | $ | 320,459,707 | $ | – 0 | – | $ | – 0 | – | $ | 320,459,707 | ||||||
Short-Term Investments | 3,001,099 | – 0 | – | – 0 | – | 3,001,099 | ||||||||||
Investments of Cash Collateral for Securities Loaned in Affiliated Money Market Fund | 24,809,497 | – 0 | – | – 0 | – | 24,809,497 | ||||||||||
Total Investments in Securities | 348,270,303 | – 0 | – | – 0 | – | 348,270,303 | ||||||||||
Other Financial Instruments** | – 0 | – | – 0 | – | – 0 | – | – 0 | – | ||||||||
|
|
|
|
|
|
|
| |||||||||
Total++ | $ | 348,270,303 | $ | – 0 | – | $ | – 0 | – | $ | 348,270,303 | ||||||
|
|
|
|
|
|
|
| |||||||||
| Multi-Asset Real Return Portfolio*** | ||||||||||||||||
| Investments in Securities: | Level 1 | Level 2 | Level 3 | Total | ||||||||||||
Assets: | ||||||||||||||||
Common Stocks: | ||||||||||||||||
Energy | $ | 170,586,587 | $ | 103,781,738 | $ | – 0 | – | $ | 274,368,325 | |||||||
Materials | 67,720,505 | 77,519,108 | 123,923 | 145,363,536 | ||||||||||||
Equity:Other | 33,465,280 | 66,887,571 | – 0 | – | 100,352,851 | |||||||||||
Retail | 28,525,026 | 33,462,744 | – 0 | – | 61,987,770 | |||||||||||
Residential | 33,290,003 | 18,951,590 | – 0 | – | 52,241,593 | |||||||||||
Office | 14,936,711 | 19,764,354 | – 0 | – | 34,701,065 | |||||||||||
Lodging | 10,503,544 | 4,206,516 | – 0 | – | 14,710,060 | |||||||||||
Industrials | 7,447,895 | 4,497,680 | – 0 | – | 11,945,575 | |||||||||||
Food Beverage & Tobacco | 3,555,828 | 642,901 | – 0 | – | 4,198,729 | |||||||||||
Inflation-Linked Securities | – 0 | – | 236,122,584 | – 0 | – | 236,122,584 | ||||||||||
Options Purchased - Puts | – 0 | – | 882,506 | – 0 | – | 882,506 | ||||||||||
Warrants | – 0 | – | 763,009 | – 0 | – | 763,009 | ||||||||||
Investment Companies | – 0 | – | 125,609 | – 0 | – | 125,609 | ||||||||||
Rights | 71,799 | – 0 | – | – 0 | – | 71,799 | ||||||||||
Short-Term Investments: | ||||||||||||||||
Investment Companies | 90,546,731 | – 0 | – | 90,546,731 | ||||||||||||
U.S. Treasury Bills | – 0 | – | 100,986,871 | – 0 | – | 100,986,871 | ||||||||||
Treasury Bills | – 0 | – | 65,920,311 | – 0 | – | 65,920,311 | ||||||||||
Investments of Cash Collateral for Securities Loaned in Affiliated Money Market Fund | 22,386,798 | – 0 | – | – 0 | – | 22,386,798 | ||||||||||
|
|
|
|
|
|
|
| |||||||||
Total Investments in Securities | 483,036,707 | 734,515,092 | + | 123,923 | 1,217,675,722 | |||||||||||
| 258 | • ALLIANCEBERNSTEIN POOLING PORTFOLIOS |
Notes to Financial Statements
| Multi-Asset Real Return Portfolio*** | ||||||||||||||||
| Investments in Securities: | Level 1 | Level 2 | Level 3 | Total | ||||||||||||
Other Financial Instruments** : | ||||||||||||||||
Assets: | ||||||||||||||||
Futures Contracts | $ | 1,952,748 | $ | – 0 | – | $ | – 0 | – | $ | 1,952,748 | # | |||||
Forward Currency Exchange Contracts | – 0 | – | 3,384,161 | – 0 | – | 3,384,161 | ||||||||||
Liabilities: | ||||||||||||||||
Futures Contracts | (1,829,774 | ) | – 0 | – | – 0 | – | (1,829,774 | ) # | ||||||||
Forward Currency Exchange Contracts | – 0 | – | (2,158,752 | ) | – 0 | – | (2,158,752 | ) | ||||||||
Put Options Written | – 0 | – | (229,100 | ) | – 0 | – | (229,100 | ) | ||||||||
Inflation (CPI) Swap Contracts | – 0 | – | (10,541 | ) | – 0 | – | (10,541 | ) | ||||||||
Interest Rate Swap Contracts | (285,719 | ) | – 0 | – | (285,719 | ) | ||||||||||
Total Return Swap Contracts | – 0 | – | (8,253,661 | ) | – 0 | – | (8,253,661 | ) | ||||||||
|
|
|
|
|
|
|
| |||||||||
Total## | $ | 483,159,681 | $ | 726,961,480 | $ | 123,923 | $ | 1,210,245,084 | ||||||||
|
| �� |
|
|
|
|
| |||||||||
| ALLIANCEBERNSTEIN POOLING PORTFOLIOS • | 259 |
Notes to Financial Statements
| Volatility Management Portfolio | ||||||||||||||||
| Investments in Securities: | Level 1 | Level 2 | Level 3 | Total | ||||||||||||
Assets: | ||||||||||||||||
Common Stocks: | ||||||||||||||||
Financials | $ | 52,322,441 | $ | 74,088,705 | $ | – 0 | – | $ | 126,411,146 | |||||||
Information Technology | 68,096,920 | 12,039,077 | – 0 | – | 80,135,997 | |||||||||||
Industrials | 39,600,427 | 35,691,084 | 175,323 | 75,466,834 | ||||||||||||
Consumer Staples | 41,352,622 | 32,586,662 | – 0 | – | 73,939,284 | |||||||||||
Health Care | 45,970,384 | 27,930,465 | – 0 | – | 73,900,849 | |||||||||||
Consumer Discretionary | 43,057,540 | 30,013,630 | – 0 | – | 73,071,170 | |||||||||||
Energy | 41,515,147 | 20,265,562 | – 0 | – | 61,780,709 | |||||||||||
Materials | 12,859,749 | 26,174,384 | – 0 | – | 39,034,133 | |||||||||||
Telecommunication Services | 10,768,050 | 13,015,020 | – 0 | – | 23,783,070 | |||||||||||
Utilities | 12,698,390 | 9,919,939 | – 0 | – | 22,618,329 | |||||||||||
Equity:Other | 8,210,699 | 5,707,303 | – 0 | – | 13,918,002 | |||||||||||
Retail | 5,915,371 | 902,311 | – 0 | – | 6,817,682 | |||||||||||
Residential | 5,065,980 | 1,010,616 | – 0 | – | 6,076,596 | |||||||||||
Office | 2,865,838 | 1,865,568 | – 0 | – | 4,731,406 | |||||||||||
Lodging | 1,512,534 | 231,419 | – 0 | – | 1,743,953 | |||||||||||
Investment Companies | 208,548,744 | 47,207 | – 0 | – | 208,595,951 | |||||||||||
Rights | 1,974 | – 0 | – | – 0 | – | 1,974 | ||||||||||
Warrants | – 0 | – | – 0 | – | – 0 | –^ | – 0 | – | ||||||||
Short-Term Investments: | ||||||||||||||||
Investment Companies | 751,605,011 | – 0 | – | – 0 | – | 751,605,011 | ||||||||||
U.S. Treasury Bills | – 0 | – | 4,498,857 | – 0 | – | 4,498,857 | ||||||||||
Investments of Cash Collateral for Securities Loaned in Affiliated Money Market Fund | 10,823,132 | – 0 | – | – 0 | – | 10,823,132 | ||||||||||
|
|
|
|
|
|
|
| |||||||||
Total Investments in Securities | 1,362,790,953 | 295,987,809 | + | 175,323 | 1,658,954,085 | |||||||||||
Other Financial Instruments** : | ||||||||||||||||
Assets: | ||||||||||||||||
Futures Contracts | 16,935,182 | 17,234,458 | – 0 | – | 34,169,640 | # | ||||||||||
Forward Currency Exchange Contracts | – 0 | – | 5,112,600 | – 0 | – | 5,112,600 | ||||||||||
| 260 | • ALLIANCEBERNSTEIN POOLING PORTFOLIOS |
Notes to Financial Statements
| Volatility Management Portfolio | ||||||||||||||||
| Investments in Securities: | Level 1 | Level 2 | Level 3 | Total | ||||||||||||
Liabilities: | ||||||||||||||||
Forward Currency Exchange Contracts | $ | – 0 | – | $ | (17,710,524 | ) | $ | – 0 | – | $ | (17,710,524 | ) | ||||
Total Return Swap Contracts | – 0 | – | (2,332,576 | ) | – 0 | – | (2,332,576 | ) | ||||||||
|
|
|
|
|
|
|
| |||||||||
Total## | $ | 1,379,726,135 | $ | 298,291,767 | $ | 175,323 | $ | 1,678,193,225 | ||||||||
|
|
|
|
|
|
|
| |||||||||
| ^ | The Portfolio held securities with zero market value at period end. |
| * | See Portfolio of Investments for sector classifications. |
| ** | Other financial instruments are derivative instruments, such as futures, forwards and swap contracts, which are valued at the unrealized appreciation/depreciation on the instrument. Other financial instruments may also include options written which are valued at market value. |
| *** | Consolidated (see Note A). |
| + | A significant portion of the Portfolio’s foreign equity investments are categorized as Level 2 investments since they are valued using fair value prices based on third party vendor modeling tools to the extent available, see Note A.1. |
| ++ | There were no transfers between Level 1 and Level 2 during the reporting period. |
| # | Only variation margin receivable/payable at period end is reported within the statement of assets and liabilities. This amount reflects cumulative appreciation/(depreciation) of futures contracts as reported in the portfolio of investments. |
| ## | There were de minimis transfers under 1% of net assets between Level 1 and Level 2 during the reporting period. |
| (a) | An amount of $12,239,160 was transferred from Level 1 to Level 2 due to insufficient observable inputs during the reporting period. |
The Portfolios recognize all transfers between levels of the fair value hierarchy assuming the financial instruments were transferred at the beginning of the reporting period.
The following is a reconciliation of investments in which significant unobservable inputs (Level 3) were used in determining fair value.
International Growth | Corporates - Non-Investment Grades | Warrants | Total | |||||||||
Balance as of 8/31/12 | $ | – 0 | – | $ | 1,379,326 | $ | 1,379,326 | |||||
Accrued discounts/(premiums) | 3,725 | – 0 | – | 3,725 | ||||||||
Realized gain (loss) | – 0 | – | – 0 | – | – 0 | – | ||||||
Change in unrealized appreciation/depreciation | 14,913 | 359,588 | 374,501 | |||||||||
Purchases | 4,959,610 | 856,318 | 5,815,928 | |||||||||
Sales | – 0 | – | – 0 | – | – 0 | – | ||||||
Transfers in to Level 3 | – 0 | – | – 0 | – | – 0 | – | ||||||
Transfers out of Level 3 | – 0 | – | – 0 | – | – 0 | – | ||||||
|
|
|
|
|
| |||||||
Balance as of 2/28/13 | $ | 4,978,248 | $ | 2,595,232 | $ | 7,573,480 | ||||||
|
|
|
|
|
| |||||||
Net change in unrealized appreciation/depreciation from Investments held as of 2/28/13* | $ | 14,913 | $ | 359,588 | $ | 374,501 | ||||||
|
|
|
|
|
| |||||||
| ALLIANCEBERNSTEIN POOLING PORTFOLIOS • | 261 |
Notes to Financial Statements
Short Duration Bond | Asset-Backed Securities | Commercial Mortgage-Backed Securities | Collateralized Mortgage Obligations | |||||||||
Balance as of 8/31/12 | $ | 16,382,420 | $ | 14,711,880 | $ | 2,921,216 | ||||||
Accrued discounts/(premiums) | 416 | (331 | ) | 22 | ||||||||
Realized gain (loss) | 20,265 | (2,936 | ) | 454 | ||||||||
Change in unrealized appreciation/ | 33,340 | 266,666 | 74,636 | |||||||||
Purchases | – 0 | – | – 0 | – | – 0 | – | ||||||
Sales | (4,553,609 | ) | (882,375 | ) | (209,821 | ) | ||||||
Settlements | – 0 | – | – 0 | – | – 0 | – | ||||||
Transfers in to Level 3 | – 0 | – | – 0 | – | – 0 | – | ||||||
Transfers out of Level 3 | (3,899,734 | ) | – 0 | – | – 0 | – | ||||||
|
|
|
|
|
| |||||||
Balance as of 2/28/13+ | $ | 7,983,098 | $ | 14,092,904 | $ | 2,786,507 | ||||||
|
|
|
|
|
| |||||||
Net change in unrealized appreciation/depreciation from Investments held as of 2/28/13* | $ | 33,736 | $ | 266,666 | $ | 74,636 | ||||||
|
|
|
|
|
| |||||||
| Cross Currency Swap Contracts | Total | |||||||||||
Balance as of 8/31/12 | $ | 175,156 | $ | 34,190,672 | ||||||||
Accrued discounts/(premiums) | – 0 | – | 107 | |||||||||
Realized gain (loss) | 6,661 | 24,444 | ||||||||||
Change in unrealized appreciation/ | (122,581 | ) | 252,061 | |||||||||
Purchases | – 0 | – | – 0 | – | ||||||||
Sales | – 0 | – | (5,645,805 | ) | ||||||||
Settlements | (6,661 | ) | (6,661 | ) | ||||||||
Transfers in to Level 3 | – 0 | – | – 0 | – | ||||||||
Transfers out of Level 3 | – 0 | – | (3,899,734 | ) | ||||||||
|
|
|
| |||||||||
Balance as of 2/28/13 | $ | 52,575 | $ | 24,915,084 | ||||||||
|
|
|
| |||||||||
Net change in unrealized appreciation/depreciation | ||||||||||||
from Investments held as of 2/28/13* | $ | (122,581 | ) | $ | 252,457 | |||||||
|
|
|
| |||||||||
| 262 | • ALLIANCEBERNSTEIN POOLING PORTFOLIOS |
Notes to Financial Statements
Global Core Bond | Commercial Mortgage-Backed Securities | Asset-Backed Securities | Collateralized Mortgage Obligations | |||||||||
Balance as of 8/31/12 | $ | 12,492,233 | $ | 5,411,002 | $ | 2,357,797 | ||||||
Accrued discounts/(premiums) | (37,928 | ) | 183 | 320 | ||||||||
Realized gain (loss) | 711,139 | (4,736,216 | ) | (2,949,662 | ) | |||||||
Change in unrealized appreciation/depreciation | (506,186 | ) | 4,900,390 | 3,109,727 | ||||||||
Purchases | – 0 | – | – 0 | – | – 0 | – | ||||||
Sales | (7,694,993 | ) | (2,221,708 | ) | (805,386 | ) | ||||||
Transfers in to Level 3 | – 0 | – | – 0 | – | – 0 | – | ||||||
Transfers out of Level 3 | – 0 | – | – 0 | – | (338,032 | ) | ||||||
|
|
|
|
|
| |||||||
Balance as of 2/28/13+ | $ | 4,964,265 | $ | 3,353,651 | $ | 1,374,764 | ||||||
|
|
|
|
|
| |||||||
Net change in unrealized appreciation/depreciation from Investments held as of 2/28/13* | $ | (506,186 | ) | $ | 102,763 | $ | 67,548 | |||||
|
|
|
|
|
| |||||||
| Total | ||||||||||||
Balance as of 8/31/12 | $ | 20,261,032 | ||||||||||
Accrued discounts/(premiums) | (37,425 | ) | ||||||||||
Realized gain (loss) | (6,974,739 | ) | ||||||||||
Change in unrealized appreciation/ | 7,503,931 | |||||||||||
Purchases | – 0 | – | ||||||||||
Sales | (10,722,087 | ) | ||||||||||
Transfers in to Level 3 | – 0 | – | ||||||||||
Transfers out of Level 3 | (338,032 | ) | ||||||||||
|
| |||||||||||
Balance as of 2/28/13 | $ | 9,692,680 | ||||||||||
|
| |||||||||||
Net change in unrealized appreciation/depreciation from Investments held as of 2/28/13* | $ | (335,875 | ) | |||||||||
|
| |||||||||||
| ALLIANCEBERNSTEIN POOLING PORTFOLIOS • | 263 |
Notes to Financial Statements
Bond Inflation | Asset-Backed Securities | Commercial Mortgage-Backed Securities | Bank Loans | |||||||||
Balance as of 8/31/12 | $ | 8,646,219 | $ | 4,328,766 | $ | 1,108,530 | ||||||
Accrued discounts/(premiums) | 26 | (35,952 | ) | 131 | ||||||||
Realized gain (loss) | 16,221 | 185,293 | 15,610 | |||||||||
Change in unrealized appreciation/ | (37,412 | ) | (99,868 | ) | (21,535 | ) | ||||||
Purchases | – 0 | – | 4,457,610 | – 0 | – | |||||||
Sales | (1,211,497 | ) | (3,131,924 | ) | (1,102,736 | ) | ||||||
Transfers in to Level 3 | – 0 | – | – 0 | – | – 0 | – | ||||||
Transfers out of Level 3 | (3,356,987 | ) | – 0 | – | – 0 | – | ||||||
|
|
|
|
|
| |||||||
Balance as of 2/28/13+ | $ | 4,056,570 | $ | 5,703,925 | $ | – 0 | – | |||||
|
|
|
|
|
| |||||||
Net change in unrealized appreciation/depreciation from Investments held as of 2/28/13* | $ | (37,412 | ) | $ | (99,868 | ) | $ | – 0 | – | |||
|
|
|
|
|
| |||||||
| Total | ||||||||||||
Balance as of 8/31/12 | $ | 14,083,515 | ||||||||||
Accrued discounts/(premiums) | (35,795 | ) | ||||||||||
Realized gain (loss) | 217,124 | |||||||||||
Change in unrealized appreciation/ | (158,815 | ) | ||||||||||
Purchases | 4,457,610 | |||||||||||
Sales | (5,446,157 | ) | ||||||||||
Transfers in to Level 3 | – 0 | – | ||||||||||
Transfers out of Level 3 | (3,356,987 | ) | ||||||||||
|
| |||||||||||
Balance as of 2/28/13 | $ | 9,760,495 | ||||||||||
|
| |||||||||||
Net change in unrealized appreciation/depreciation from Investments held as of 2/28/13* | $ | (137,280 | ) | |||||||||
|
| |||||||||||
| 264 | • ALLIANCEBERNSTEIN POOLING PORTFOLIOS |
Notes to Financial Statements
High-Yield Portfolio | Corporates - Non-Investment Grades^ | Corporates - Investment Grades | Bank Loans | |||||||||
Balance as of 8/31/12 | $ | 1,233,762 | $ | 759,615 | $ | 10,958,957 | ||||||
Accrued discounts/(premiums) | (46,223 | ) | – 0 | – | 101,308 | |||||||
Realized gain (loss) | 101,462 | – 0 | – | (2,884,051 | ) | |||||||
Change in unrealized appreciation/ | 157,700 | – 0 | – | 3,241,894 | ||||||||
Purchases | 294,000 | – 0 | – | 6,853,927 | ||||||||
Sales | (630,869 | ) | – 0 | – | (5,316,794 | ) | ||||||
Transfers in to Level 3 | 106,600 | – 0 | – | – 0 | – | |||||||
Transfers out of Level 3 | – 0 | – | (759,615 | ) | – 0 | – | ||||||
|
|
|
|
|
| |||||||
Balance as of 2/28/13+ | $ | 1,216,432 | $ | – 0 | – | $ | 12,955,241 | |||||
|
|
|
|
|
| |||||||
Net change in unrealized appreciation/depreciation from Investments held as of 2/28/13* | $ | 157,137 | $ | – 0 | – | $ | 365,555 | |||||
|
|
|
|
|
| |||||||
| Emerging Markets - Corporate Bonds | Collateralized Mortgage Obligations | Commercial Mortgage-Backed Securities | ||||||||||
Balance as of 8/31/12 | $ | 428,143 | $ | 3,181,707 | $ | 6,982,910 | ||||||
Accrued discounts/(premiums) | (478 | ) | 21,407 | 30,894 | ||||||||
Realized gain (loss) | – 0 | – | 124,237 | 530,872 | ||||||||
Change in unrealized appreciation/depreciation | 303 | 353,558 | (217,434 | ) | ||||||||
Purchases | – 0 | – | 4,982,938 | 4,247,382 | ||||||||
Sales | – 0 | – | (522,334 | ) | (4,455,034 | ) | ||||||
Transfers in to Level 3 | – 0 | – | – 0 | – | – 0 | – | ||||||
Transfers out of Level 3 | – 0 | – | – 0 | – | – 0 | – | ||||||
|
|
|
|
|
| |||||||
Balance as of 2/28/13 | $ | 427,968 | $ | 8,141,513 | $ | 7,119,590 | ||||||
|
|
|
|
|
| |||||||
Net change in unrealized appreciation/depreciation from Investments held as of 2/28/13* | $ | 303 | $ | 353,558 | $ | 107,543 | ||||||
|
|
|
|
|
| |||||||
| ALLIANCEBERNSTEIN POOLING PORTFOLIOS • | 265 |
Notes to Financial Statements
| Common Stocks | Asset-Backed Securities | Warrants^ | ||||||||||
Balance as of 8/31/12 | $ | 1,134,891 | $ | 4,611,998 | $ | –0 | – | |||||
Accrued discounts/(premiums) | – 0 | – | 41,036 | – 0 | – | |||||||
Realized gain (loss) | – 0 | – | 422,786 | – 0 | – | |||||||
Change in unrealized appreciation/depreciation | (127,624 | ) | 235,574 | – 0 | – | |||||||
Purchases | – 0 | – | – 0 | – | – 0 | – | ||||||
Sales | – 0 | – | (2,738,129 | ) | – 0 | – | ||||||
Transfers in to Level 3 | – 0 | – | – 0 | – | – 0 | – | ||||||
Transfers out of Level 3 | – 0 | – | – 0 | – | – 0 | – | ||||||
|
|
|
|
|
| |||||||
Balance as of 2/28/13 | $ | 1,007,267 | $ | 2,573,265 | $ | – 0 | – | |||||
|
|
|
|
|
| |||||||
Net change in unrealized appreciation/depreciation from Investments held as of 2/28/13* | $ | (127,624 | ) | $ | 117,564 | $ | – 0 | – | ||||
|
|
|
|
|
| |||||||
| Unfunded Loan Commitments | Total | |||||||||||
Balance as of 8/31/12 | $ | (105,188 | ) | $ | 29,186,795 | |||||||
Accrued discounts/(premiums) | – 0 | – | 147,944 | |||||||||
Realized gain (loss) | 74,858 | (1,629,836 | ) | |||||||||
Change in unrealized appreciation/depreciation | – 0 | – | 3,643,971 | |||||||||
Purchases | – 0 | – | 16,378,247 | |||||||||
Sales | 30,330 | (13,632,830 | ) | |||||||||
Transfers in to Level 3 | – 0 | – | 106,600 | |||||||||
Transfers out of Level 3 | – 0 | – | (759,615 | ) | ||||||||
|
|
|
| |||||||||
Balance as of 2/28/13 | $ | – 0 | – | $ | 33,441,276 | |||||||
|
|
|
| |||||||||
Net change in unrealized appreciation/depreciation from Investments held as of 2/28/13* | $ | – 0 | – | $ | 974,036 | |||||||
|
|
|
| |||||||||
Multi-Asset Real Return Portfolio | Materials | Total | ||||||||||
Balance as of 8/31/12 | $ | 123,918 | $ | 123,918 | ||||||||
Accrued discounts/(premiums) | – 0 | – | – 0 | – | ||||||||
Realized gain (loss) | – 0 | – | – 0 | – | ||||||||
Change in unrealized appreciation/depreciation | 5 | 5 | ||||||||||
Purchases | – 0 | – | – 0 | – | ||||||||
Sales | – 0 | – | – 0 | – | ||||||||
Transfers in to Level 3 | – 0 | – | – 0 | – | ||||||||
Transfers out of Level 3 | – 0 | – | – 0 | – | ||||||||
|
|
|
| |||||||||
Balance as of 2/28/13 | $ | 123,923 | $ | 123,923 | ||||||||
|
|
|
| |||||||||
Net change in unrealized appreciation/depreciation from Investments held as of 2/28/13* | $ | 5 | $ | 5 | ||||||||
|
|
|
| |||||||||
| 266 | • ALLIANCEBERNSTEIN POOLING PORTFOLIOS |
Notes to Financial Statements
Volatility Management Portfolio | Industrials | Rights | Warrants^ | |||||||
Balance as of 8/31/12 | $ – 0 – | $ | 7,638 | $ | – 0 | – | ||||
Accrued discounts/(premiums) | – 0 – | – 0 | – | – 0 | – | |||||
Realized gain (loss) | – 0 – | – 0 | – | – 0 | – | |||||
Change in unrealized appreciation/depreciation | 9,302 | (7,638 | ) | – 0 | – | |||||
Purchases | 166,021 | – 0 | – | – 0 | – | |||||
Sales | – 0 – | – 0 | – | – 0 | – | |||||
Transfers in to Level 3 | – 0 – | – 0 | – | – 0 | – | |||||
Transfers out of Level 3 | – 0 – | – 0 | – | – 0 | – | |||||
|
|
|
|
| ||||||
Balance as of 2/28/13 | $ 175,323 | $ | – 0 | – | $ | – 0 | – | |||
|
|
|
|
| ||||||
Net change in unrealized appreciation/depreciationfrom Investments held as of 2/28/13* | $ 9,302 | $ | – 0 | – | $ | – 0 | – | |||
|
|
|
|
| ||||||
Total | ||||||||||
Balance as of 8/31/12 | $ 7,638 | |||||||||
Accrued discounts/(premiums) | – 0 – | |||||||||
Realized gain (loss) | – 0 – | |||||||||
Change in unrealized appreciation/depreciation | 1,664 | |||||||||
Purchases | 166,021 | |||||||||
Sales | – 0 – | |||||||||
Transfers in to Level 3 | – 0 – | |||||||||
Transfers out of Level 3 | – 0 – | |||||||||
| ||||||||||
Balance as of 2/28/13 | $ 175,323 | |||||||||
| ||||||||||
Net change in unrealized appreciation/depreciationfrom Investments held as of 2/28/13* | $ 9,302 | |||||||||
| ||||||||||
| ^ | The Portfolio held securities with zero market value at period end. |
| * | The unrealized appreciation/depreciation is included in net change in unrealized appreciation/depreciation of investments in the accompanying statement of operations. |
| + | There were de minimis transfers under 1% of net assets during the reporting period. |
| ALLIANCEBERNSTEIN POOLING PORTFOLIOS • | 267 |
Notes to Financial Statements
The following presents information about significant unobservable inputs related to the Portfolio’s Level 3 investments February 28, 2013:
Short Duration Bond Portfolio
Quantitative Information about Level 3 Fair Value Measurements
| Fair Value at 2/28/2013 | Valuation Technique | Unobservable Input | Range | |||||||||
Asset-Backed Securities | $ | 7,983,098 | Third Party | Evaluated | $ | 96.15-$100.02 | ||||||
| Vendor | Quotes | |||||||||||
Asset-Backed Securities | $ | – 0 | – | Qualitative | $ | 0.00 | ||||||
| Assessment | ||||||||||||
Collateralized Mortgage Obligations | $ | 2,786,507 | Third Party | Evaluated | $ | 83.88-$100.99 | ||||||
| Vendor | Quotes | |||||||||||
Commercial Mortgage-Backed Securities | $ | 14,092,904 | Third Party | Evaluated | $ | 92.97-$102.28 | ||||||
| Vendor | Quotes | |||||||||||
Cross Currency Swap Contracts | $ | 52,575 | Bloomberg | Bloomberg | N/A | |||||||
| Vendor Model | Currency Swap | |||||||||||
| Curves | ||||||||||||
Bond Inflation Protection Portfolio Quantitative Information about Level 3 Fair Value Measurements |
| |||||||||||
| Fair Value at 2/28/2013 | Valuation Technique | Unobservable Input | Range | |||||||||
Asset-Backed Securities | $ | 4,056,570 | Third Party | Evaluated | $ | 110.02-$100.61 | ||||||
| Vendor | Quotes | |||||||||||
Commercial Mortgage-Backed Securities | $ | 5,703,925 | Third Party | Evaluated | $ | 95.34-$114.90 | ||||||
| Vendor | Quotes | |||||||||||
High-Yield Portfolio Quantitative Information about Level 3 Fair Value Measurements |
| |||||||||||
| Fair Value at 2/28/2013 | Valuation Technique | Unobservable Input | Range | |||||||||
Corporates – Non-Investment Grades | $ | 1,216,432 | Third Party | Evaluated | $ | 1.00-$106.00 | ||||||
| Vendor | Quotes | |||||||||||
Bank Loans | $12,955,241 | Third Party | Evaluated | $ | 86.63-$103.31 | |||||||
| Vendor | Quotes | |||||||||||
Emerging Markets –Corporate Bonds |
| $427,968 |
| Third Party | Evaluated | $ | 107.00 |
| ||||
| Vendor | Quotes | |||||||||||
| 268 | • ALLIANCEBERNSTEIN POOLING PORTFOLIOS |
Notes to Financial Statements
| Fair Value at 2/28/2013 | Valuation Technique | Unobservable Input | Range | |||||||||
Collateralized Mortgage Obligations | $ | 6,857,434 | Third Party | Evaluated | $ | 71.90-$90.89 | ||||||
| Vendor | Quotes | |||||||||||
| $ | 1,284,079 | Indicative Market Quotations | $ | 77.13 | ||||||||
Commercial Mortgage-Backed Securities | $ | 5,251,791 | Third Party | Evaluated | $ | 92.05-$103.27 | ||||||
| Vendor | Quotes | |||||||||||
| $ | 1,867,799 | Indicative Market Quotations | $ | 90.00-$99.53 | ||||||||
Common Stocks | $ | 1,007,267 | Modeling | $ | 60.00 | |||||||
| Tool | ||||||||||||
| $ | 0 | Qualitative Assessment | $ | 0.00 | ||||||||
Asset-Backed Securities | $ | 2,573,265 | Third Party | Evaluated | $ | 62.63-$86.56 | ||||||
| Vendor | Quotes | |||||||||||
Warrants | $ | 0 | Qualitative | $ | 0.00 | |||||||
| Assessment | ||||||||||||
The Adviser has established a Valuation Committee (the “Committee”) which is responsible for overseeing the pricing and valuation of all securities held in the Portfolio. The Committee operates under pricing and valuation policies and procedures established by the Adviser and approved by the Board, including pricing policies which set forth the mechanisms and processes to be employed on a daily basis to implement these policies and procedures. In particular, the pricing policies describe how to determine market quotations for securities and other instruments. The Committee’s responsibilities include: 1) fair value and liquidity determinations (and oversight of any third parties to whom any responsibility for fair value and liquidity determinations is delegated), and 2) regular monitoring of the Adviser’s pricing and valuation policies and procedures and modification or enhancement of these policies and procedures (or recommendation of the modification of these policies and procedures) as the Committee believes appropriate.
The Committee is also responsible for monitoring the implementation of the pricing policies by the Adviser’s Pricing Group (the “Pricing Group”) and a third party which performs certain pricing functions in accordance with the pricing policies. The Pricing Group is responsible for the oversight of the third party on a day-to-day basis. The Committee and the Pricing Group perform a series of activities to provide reasonable assurance of the accuracy of prices including: 1) periodic vendor due diligence meetings, review of methodologies, new developments and process at vendors, 2) daily compare of security valuation versus prior day for all securities that exceeded established thresholds, and 3) daily review of unpriced, stale, and variance reports with exceptions reviewed by senior management and the Committee.
| ALLIANCEBERNSTEIN POOLING PORTFOLIOS • | 269 |
Notes to Financial Statements
In addition, several processes outside of the pricing process are used to monitor valuation issues including: 1) performance and performance attribution reports are monitored for anomalous impacts based upon benchmark performance, and 2) portfolio managers review all portfolios for performance and analytics (which are generated using the Adviser’s prices).
3. Currency Translation
Assets and liabilities denominated in foreign currencies and commitments under forward currency exchange contracts are translated into U.S. dollars at the mean of the quoted bid and ask prices of such currencies against the U.S. dollar. Purchases and sales of portfolio securities are translated into U.S. dollars at the rates of exchange prevailing when such securities were acquired or sold. Income and expenses are translated into U.S. dollars at rates of exchange prevailing when accrued.
Net realized gain or loss on foreign currency transactions represents foreign exchange gains and losses from sales and maturities of foreign fixed income investments, foreign currency exchange contracts, holding of foreign currencies, currency gains or losses realized between the trade and settlement dates on foreign investment transactions, and the difference between the amounts of dividends, interest and foreign withholding taxes recorded on the Portfolios’ books and the U.S. dollar equivalent amounts actually received or paid. Net unrealized currency gains and losses from valuing foreign currency denominated assets and liabilities at period end exchange rates are reflected as a component of net unrealized appreciation or depreciation of foreign currency denominated assets and liabilities.
4. Taxes
It is each Portfolios’ policy to meet the requirements of the Internal Revenue Code applicable to regulated investment companies and to distribute all of its investment company taxable income and net realized gains, if any, to shareholders. Therefore, no provisions for federal income or excise taxes are required. The Portfolios may be subject to taxes imposed by countries in which they invest. Such taxes are generally based on income and/or capital gains earned or repatriated. Taxes are accrued and applied to net investment income, net realized gains and net unrealized appreciation/depreciation as such income and/or gains are earned.
If, during a taxable year, the Subsidiary’s taxable losses (and other deductible items) exceed its income and gains, the net loss will not pass through to the Multi-Asset Real Return Portfolio as a deductible amount for Federal income tax purposes. Note that the loss from the Subsidiary contemplated activities also cannot be carried forward to reduce future Subsidiary’s income in subsequent years. However, if the Subsidiary’s taxable gains exceed its losses and other deductible items during a taxable year, the net gain will pass through to the Portfolio as income for Federal income tax purposes.
| 270 | • ALLIANCEBERNSTEIN POOLING PORTFOLIOS |
Notes to Financial Statements
In accordance with U.S. GAAP requirements regarding accounting for uncertainties in income taxes, management has analyzed the Portfolios’ tax positions taken or expected to be taken on federal and state income tax returns for all open tax years (the current and the prior three tax years, as applicable) and has concluded that no provision for income tax is required in the Portfolios’ financial statements.
5. Investment Income and Investment Transactions
Dividend income is recorded on the ex-dividend date or as soon as a Portfolio is informed of the dividend. Interest income is accrued daily. Investment transactions are accounted for on the date the securities are purchased or sold. Investment gains or losses are determined on the identified cost basis. The Portfolios amortize premiums and accrete discounts as adjustments to interest income.
6. Expenses
Certain expenses of the Trust are charged to each Portfolio in proportion to each Portfolio’s respective net assets, while other expenses of the Trust are distributed equally among the Portfolios.
7. Dividends and Distributions
Dividends and distributions to shareholders, if any, are recorded on the ex-dividend date. Income dividends and capital gains distributions are determined in accordance with federal tax regulations and may differ from those determined in accordance with U.S. GAAP. To the extent these differences are permanent, such amounts are reclassified within the capital accounts based on their federal tax basis treatment; temporary differences do not require such reclassification.
NOTE B
Advisory Fee and Other Transactions with Affiliates
The Trust has entered into an advisory agreement (the “Advisory Agreement”) with the Adviser. Under the terms of the Advisory Agreement, the Portfolios pay no advisory fees to the Adviser. The Adviser serves as investment manager and adviser of each of the Portfolios and continuously furnishes an investment program for each Portfolio and manages, supervises and conducts the affairs of each Portfolio, subject to the supervision of the Trust’s Board of Trustees. The Advisory Agreement provides that the Adviser or an affiliate will furnish, or pay the expenses of the Trust for, office space, facilities and equipment, services of executive and other personnel of the Trust and certain administrative services. The Adviser has agreed to bear certain expenses to the extent necessary to limit the total portfolio operating expenses to .15% of average daily net assets for the Volatility Management Portfolio. For the six months ended February 28, 2013, there was no such reimbursement.
The Subsidiary has entered into a separate agreement with the Adviser for the management of the Subsidiary’s portfolio. The Adviser receives no compensation from the Subsidiary for its services under the agreement.
| ALLIANCEBERNSTEIN POOLING PORTFOLIOS • | 271 |
Notes to Financial Statements
The Trust has entered into a distribution agreement (the “Distribution Agreement”) on behalf of each Portfolio with AllianceBernstein Investments, Inc., a wholly-owned subsidiary of the Adviser, the Portfolios’ principal underwriter (the “Underwriter”), to permit the Underwriter to distribute the Portfolios’ shares, which are sold at the net asset value without any sales charge.
Under the Distribution Agreement, the Trust is responsible for all expenses of the Portfolios, including, for example, certain administrative services, costs of printing Portfolio prospectuses and other reports to shareholders, any taxes levied against the Portfolios and brokerage fees and commissions in connection with the purchase and sale of portfolio securities, but not expenses incurred in promoting the sale of the Portfolios’ shares, which are borne by the Underwriter.
AllianceBernstein Investor Services, Inc. (“ABIS”), a wholly-owned subsidiary of the Adviser, acts as the Portfolios’ registrar, transfer agent and dividend-disbursing agent.
The Portfolios may invest in the AllianceBernstein Fixed-Income Shares, Inc. – Government STIF Portfolio (“Government STIF Portfolio”), an open-end management investment company managed by the Adviser. The Government STIF Portfolio is offered as a cash management option to mutual funds and other institutional accounts of the Adviser, and is not available for direct purchase by members of the public. The Government STIF Portfolio pays no investment management fees but does bear its own expenses. A summary of the Portfolios’ transactions in shares of the Government STIF Portfolio for the six months ended February 28, 2013 is as follows:
| Portfolio | Market Value August 31, (000) | Purchases at Cost (000) | Sales Proceeds (000) | Market Value February 28, (000) | Dividend Income (000) | |||||||||||||||
| U.S. Value | $ | 12,231 | $ | 201,824 | $ | 210,029 | $ | 4,026 | $ | 7 | ||||||||||
| U.S. Large Cap Growth | 36,691 | 252,044 | 218,474 | 70,261 | 25 | |||||||||||||||
| International Value | 11,297 | 131,484 | 111,102 | 31,679 | 6 | |||||||||||||||
| International Growth | 2,419 | 136,307 | 133,734 | 4,992 | 4 | |||||||||||||||
| Short Duration Bond | 6,761 | 292,211 | 225,978 | 72,994 | 29 | |||||||||||||||
| Global Core Bond | 23,524 | 246,386 | 208,361 | 61,549 | 20 | |||||||||||||||
| Bond Inflation Protection | 3,511 | 165,269 | 168,780 | – 0 | – | 5 | ||||||||||||||
| High-Yield | 5,561 | 84,945 | 84,982 | 5,524 | 3 | |||||||||||||||
| Small-Mid Cap Value | 5,856 | 60,991 | 64,030 | 2,817 | 2 | |||||||||||||||
| 272 | • ALLIANCEBERNSTEIN POOLING PORTFOLIOS |
Notes to Financial Statements
| Portfolio | Market Value August 31, (000) | Purchases at Cost (000) | Sales Proceeds (000) | Market Value February 28, (000) | Dividend Income (000) | |||||||||||||||
| Small-Mid Cap Growth | $ | 1,570 | $ | 50,420 | $ | 48,989 | $ | 3,001 | $ | 4 | ||||||||||
| Multi-Asset Real Return | 42,969 | 543,632 | 496,054 | 90,547 | 45 | |||||||||||||||
| Volatility Management | 1,149,608 | 550,876 | 948,879 | 751,605 | 585 | |||||||||||||||
Brokerage commissions paid on investment transactions and brokerage commissions paid to Sanford C. Bernstein & Co. LLC and Sanford C. Bernstein Limited, affiliates of the Adviser, for the six months ended February 28, 2013 were as follows:
Portfolio | Total Commissions | Sanford C. Bernstein & Co. LLC | Sanford C. Bernstein Limited | |||||||||
U.S. Value | $ 695,814 | $ | – 0 | – | $ | – 0 | – | |||||
U.S. Large Cap Growth | 404,519 | – 0 | – | – 0 | – | |||||||
International Value | 582,108 | – 0 | – | 3,077 | ||||||||
International Growth | 834,678 | – 0 | – | 5,640 | ||||||||
Short Duration Bond | 12,738 | – 0 | – | – 0 | – | |||||||
Global Core Bond | 2,297 | – 0 | – | – 0 | – | |||||||
Bond Inflation Protection | 5,250 | – 0 | – | – 0 | – | |||||||
High-Yield | 63,179 | – 0 | – | – 0 | – | |||||||
Small-Mid Cap Value | 265,901 | – 0 | – | – 0 | – | |||||||
Small-Mid Cap Growth | 250,757 | 179 | – 0 | – | ||||||||
Multi-Asset Real Return | 514,889 | – 0 | – | 51 | ||||||||
Volatility Management | 438,676 | – 0 | – | – 0 | – | |||||||
Prior to September 15, 2008, the Global Core Bond Portfolio had swap counterparty exposure to Lehman Brothers Holdings Inc. (“Lehman Brothers”), as a guarantor for Lehman Brothers Special Financing Inc. (“LBSF”), which filed for bankruptcy on September 15, 2008. As a result, on September 15, 2008, the Portfolio terminated all outstanding swap contracts with LBSF prior to their scheduled maturity dates in accordance with the terms of the swap agreements. Upon the termination of the swap contracts, Lehman Brothers’ obligations to the Portfolio amounted to $2,015,576. The Portfolio’s claim to these obligations is subject to the pending bankruptcy proceeding against the Lehman Brothers estate (the “Bankruptcy Claim”). In accordance with its error correction policy, the Adviser has agreed to make the Portfolio whole in respect of the amount of the recovery that would be paid on the Bankruptcy Claim in the event the Bankruptcy Claim is not honored by the Lehman Brothers estate, or with respect to any diminution in value upon the sale of the Bankruptcy Claim, in either case resulting from the manner in which the Bankruptcy Claim was processed by the Adviser. On April 9, 2012, the portfolio management team determined to dispose of the position held by the Portfolio that reflects the Bankruptcy Claim (thereby realizing upon the corresponding undertaking of the Adviser to make payment in respect of
| ALLIANCEBERNSTEIN POOLING PORTFOLIOS • | 273 |
Notes to Financial Statements
said Claim to make the Portfolio whole). On that date, the Bankruptcy Claim was being valued at $1,002,749 (49.75% of the Bankruptcy Claim), based upon the estimated recovery value. Accordingly, on April 13, 2012, the Adviser reimbursed the Portfolio in an amount equal to $1,002,749.
NOTE C
Investment Transactions
Purchases and sales of investment securities (excluding U.S. government securities and short-term investments) for the six months ended February 28, 2013, were as follows:
| Portfolio | Purchases | Sales | ||||||
U.S. Value | $ | 275,855,289 | $ | 436,359,585 | ||||
U.S. Large Cap Growth | 317,335,593 | 458,160,036 | ||||||
International Value | 188,177,880 | 312,220,284 | ||||||
International Growth | 270,282,654 | 387,489,779 | ||||||
Short Duration Bond | 242,175,984 | 124,610,516 | ||||||
Global Core Bond | 265,103,459 | 289,822,595 | ||||||
Bond Inflation Protection | 99,421,954 | 74,527,080 | ||||||
High-Yield | 100,911,502 | 104,953,572 | ||||||
Small-Mid Cap Value | 77,927,318 | 131,344,032 | ||||||
Small-Mid Cap Growth | 105,118,342 | 142,237,352 | ||||||
Multi-Asset Real Return | 579,502,387 | 260,670,082 | ||||||
Volatility Management | 782,281,079 | 470,419,975 | ||||||
Purchases and sales of U.S. government securities for the six months ended February 28, 2013, were as follows:
| Portfolio | Purchases | Sales | ||||||
U.S. Value | $ | – 0 | – | $ | – 0 | – | ||
U.S. Large Cap Growth | – 0 | – | – 0 | – | ||||
International Value | – 0 | – | – 0 | – | ||||
International Growth | – 0 | – | – 0 | – | ||||
Short Duration Bond | 436,809,253 | 521,770,296 | ||||||
Global Core Bond | 262,643,428 | 259,813,194 | ||||||
Bond Inflation Protection | 145,373,015 | 185,922,538 | ||||||
High-Yield | 5,105,003 | 14,762,779 | ||||||
Small-Mid Cap Value | – 0 | – | – 0 | – | ||||
Small-Mid Cap Growth | – 0 | – | – 0 | – | ||||
Multi-Asset Real Return | 166,322,700 | 7,388,870 | ||||||
Volatility Management | – 0 | – | – 0 | – | ||||
The cost of investments for federal income tax purposes was substantially the same as the cost for financial reporting purposes. Accordingly, gross unrealized appreciation and unrealized depreciation (excluding futures, foreign currency, written options and swap transactions) are as follows:
| Gross Unrealized | Net Unrealized Appreciation | |||||||||||
Portfolio | Appreciation | (Depreciation) | ||||||||||
U.S. Value | $ | 204,361,651 | $ | (14,703,713 | ) | $ | 189,657,938 | |||||
U.S. Large Cap Growth | 243,901,502 | (9,179,042 | ) | 234,722,460 | ||||||||
| 274 | • ALLIANCEBERNSTEIN POOLING PORTFOLIOS |
Notes to Financial Statements
| Gross Unrealized | Net Unrealized Appreciation | |||||||||||
Portfolio | Appreciation | (Depreciation) | ||||||||||
International Value | $ | 124,650,776 | $ | (55,191,494 | ) | $ | 69,459,282 | |||||
International Growth | 140,382,433 | (51,531,205 | ) | 88,851,228 | ||||||||
Short Duration Bond | 3,808,524 | (1,637,485 | ) | 2,171,039 | ||||||||
Global Core Bond | 53,710,729 | (17,182,782 | ) | 36,527,947 | ||||||||
Bond Inflation Protection | 66,792,557 | (542,512 | ) | 66,250,045 | ||||||||
High-Yield | 31,022,263 | (4,327,842 | ) | 26,694,421 | ||||||||
Small-Mid Cap Value | 66,936,889 | (6,872,217 | ) | 60,064,672 | ||||||||
Small-Mid Cap Growth | 91,392,520 | (1,540,395 | ) | 89,852,125 | ||||||||
Multi-Asset Real Return | 55,367,172 | (22,597,135 | ) | 32,770,037 | ||||||||
Volatility Management | 87,238,261 | (13,321,296 | ) | 73,916,965 | ||||||||
1. Derivative Financial Instruments
Certain Portfolios may use derivatives in an effort to earn income and enhance returns, to replace more traditional direct investments, to obtain exposure to otherwise inaccessible markets (collectively, “investment purposes”) or to hedge or adjust the risk profile of its portfolio.
The principal types of derivatives utilized by the Portfolios, as well as the methods in which they may be used are:
| • | Futures Contracts |
Certain Portfolios may buy or sell futures contracts for investment purposes or for the purpose of hedging their Portfolios against adverse effects of potential movements in the market or for investment purposes. The Portfolio bears the market risk that arises from changes in the value of these instruments and the imperfect correlation between movements in the price of the futures contracts and movements in the price of the assets, reference rates or indices which they are designed to track. Among other things, the Portfolio may purchase or sell futures contracts for foreign currencies or options thereon for non-hedging purposes as a means of making direct investment in foreign currencies, as described below under “Currency Transactions”.
At the time the Portfolio enters into a futures contract, the Portfolio deposits and maintains as collateral an initial margin with the broker, as required by the exchange on which the transaction is effected. Pursuant to the contract, the Portfolio agrees to receive from or pay to the broker an amount of cash equal to the daily fluctuation in the value of the contract. Such receipts or payments are known as variation margin and are recorded by the Portfolio as unrealized gains or losses. Risks may arise from the potential inability of a counterparty to meet the terms of the contract. The credit/counterparty risk for exchange-traded futures contracts is generally less than privately negotiated futures contracts, since the clearinghouse, which is the issuer or counterparty to each exchange-traded future, provides a guarantee of performance. This guarantee is supported by a daily payment system (i.e., margin requirements). When the contract is
| ALLIANCEBERNSTEIN POOLING PORTFOLIOS • | 275 |
Notes to Financial Statements
closed, the Portfolio records a realized gain or loss equal to the difference between the value of the contract at the time it was opened and the time it was closed.
Use of long futures contracts subjects the Portfolio to risk of loss in excess of the amounts shown on the statement of assets and liabilities, up to the notional value of the futures contracts. Use of short futures contracts subjects the Portfolio to unlimited risk of loss. Under some circumstances, futures exchanges may establish daily limits on the amount that the price of a futures contract can vary from the previous day’s settlement price, which could effectively prevent liquidation of unfavorable positions.
During the six months ended February 28, 2013, the High-Yield Portfolio held futures contracts for hedging purposes and the International Value Portfolio for non-hedging purposes. Short Duration Bond Portfolio, Global Core Bond Portfolio, Bond Inflation Protection Portfolio, Multi-Asset Real Return Portfolio and Volatility Management Portfolio held futures contracts for hedging and non-hedging purposes.
| • | Forward Currency Exchange Contracts |
Certain Portfolios may enter into forward currency exchange contracts in order to hedge their exposure to changes in foreign currency exchange rates on their foreign portfolio holdings, to hedge certain firm purchase and sale commitments denominated in foreign currencies and for non-hedging purposes as a means of making direct investments in foreign currencies, as described below under “Currency Transactions”.
A forward currency exchange contract is a commitment to purchase or sell a foreign currency at a future date at a negotiated forward rate. The gain or loss arising from the difference between the original contract and the closing of such contract would be included in net realized gain or loss on foreign currency transactions. Fluctuations in the value of open forward currency exchange contracts are recorded for financial reporting purposes as unrealized appreciation and/or depreciation by the Portfolio. Risks may arise from the potential inability of a counterparty to meet the terms of a contract and from unanticipated movements in the value of a foreign currency relative to the U.S. dollar.
During the six months ended February 28, 2013, the International Value Portfolio, International Growth Portfolio, Bond Inflation Protection Portfolio, High-Yield Portfolio, Multi-Asset Real Return Portfolio and Volatility Management Portfolio held forward currency exchange contracts for hedging and non-hedging purposes. Short Duration Bond Portfolio and Global Core Bond Portfolio held forward currency exchange contracts for hedging purposes.
| • | Option Transactions |
For hedging and investment purposes, certain Portfolios may purchase and write (sell) put and call options on U.S. and foreign securities, including
| 276 | • ALLIANCEBERNSTEIN POOLING PORTFOLIOS |
Notes to Financial Statements
government securities, and foreign currencies that are traded on U.S. and foreign securities exchanges and over-the-counter markets. Among other things, the Portfolio may use options transactions for non-hedging purposes as a means of making direct investments in foreign currencies, as described below under “Currency Transactions” and may use options strategies involving the purchase and/or writing of various combinations of call and/or put options, for hedging and investment purposes.
The risk associated with purchasing an option is that the Portfolio pays a premium whether or not the option is exercised. Additionally, the Portfolio bears the risk of loss of the premium and change in market value should the counterparty not perform under the contract. Put and call options purchased are accounted for in the same manner as portfolio securities. The cost of securities acquired through the exercise of call options is increased by premiums paid. The proceeds from securities sold through the exercise of put options are decreased by the premiums paid.
When the Portfolio writes an option, the premium received by the Portfolio is recorded as a liability and is subsequently adjusted to the current market value of the option written. Premiums received from written options which expire unexercised are recorded by the Portfolio on the expiration date as realized gains from options written. The difference between the premium received and the amount paid on effecting a closing purchase transaction, including brokerage commissions, is also treated as a realized gain, or if the premium received is less than the amount paid for the closing purchase transaction, as a realized loss. If a call option is exercised, the premium received is added to the proceeds from the sale of the underlying security or currency in determining whether the Portfolio has realized a gain or loss. If a put option is exercised, the premium received reduces the cost basis of the security or currency purchased by the Portfolio. In writing an option, the Portfolio bears the market risk of an unfavorable change in the price of the security or currency underlying the written option. Exercise of an option written by the Portfolio could result in the Portfolio selling or buying a security or currency at a price different from the current market value.
A Portfolio may also invest in options on swap agreements, also called “swaptions”. A swaption is an option that gives the buyer the right, but not the obligation, to enter into a swap on a future date in exchange for paying a market-based “premium”. A receiver swaption gives the owner the right to receive the total return of a specified asset, reference rate, or index. A payer swaption gives the owner the right to pay the total return on a specified asset, reference rate, or index. Swaptions also include options that allow an existing swap to be terminated or extended by one of the counterparties.
During the six months ended February 28, 2013, the International Growth Portfolio and Multi-Asset Real Return Portfolio held purchased options and written options for hedging purposes. The High-Yield Portfolio held purchased options, written options and swaptions for hedging purposes. Volatility Management Portfolio held purchase options and written options for hedging and non-hedging purposes.
| ALLIANCEBERNSTEIN POOLING PORTFOLIOS • | 277 |
Notes to Financial Statements
For the six months ended February 28, 2013, the International Growth Portfolio, High-Yield Portfolio, Multi-Asset Real Return Portfolio and Volatility Management Portfolio had the following transactions in written options and swaptions:
| International Growth Portfolio | Number of Contracts | Premiums Received | ||||||
Options written outstanding as of 8/31/12 | 350,000 | $ | 2,625,105 | |||||
Options written | – 0 | – | – 0 | – | ||||
Options expired | (350,000 | ) | (2,625,105 | ) | ||||
Options bought back | – 0 | – | – 0 | – | ||||
Options exercised | – 0 | – | – 0 | – | ||||
|
|
|
| |||||
Options written outstanding as of 2/28/13 | – 0 | – | $ | – 0 | – | |||
|
|
|
| |||||
| High-Yield Portfolio | Number of Contracts | Premiums Received | ||||||
Options written outstanding as of 8/31/12 | – 0 | – | $ | – 0 | – | |||
Options written | 378,764,627 | 1,466,344 | ||||||
Options expired | (3,050,140 | ) | (21,864 | ) | ||||
Options bought back | (447 | ) | (697,321 | ) | ||||
Options exercised | – 0 | – | – 0 | – | ||||
|
|
|
| |||||
Options written outstanding as of 2/28/13 | 375,714,040 | $ | 747,159 | |||||
|
|
|
| |||||
| Notional Amount | Premiums Received | |||||||
Swaptions written outstanding as of 8/31/12 | 30,050,000 | $ | 997,131 | |||||
Swaptions written | 44,810,000 | 693,115 | ||||||
Swaptions expired | (55,950,000 | ) | (1,290,288 | ) | ||||
Swaptions bought back | – 0 | – | – 0 | – | ||||
Swaptions exercised | – 0 | – | – 0 | – | ||||
|
|
|
| |||||
Swaptions written outstanding as of 2/28/13 | 18,910,000 | $ | 399,958 | |||||
|
|
|
| |||||
| Multi-Asset Real Return Portfolio* | Number of Contracts | Premiums Received | ||||||
Options written outstanding as of 8/31/12 | 2,416 | $ | 901,681 | |||||
Options written | 2,852 | 974,321 | ||||||
Options expired | (2,246 | ) | (209,681 | ) | ||||
Options bought back | (2,442 | ) | (1,262,083 | ) | ||||
Options exercised | – 0 | – | – 0 | – | ||||
|
|
|
| |||||
Options written outstanding as of 2/28/13 | 580 | $ | 404,238 | |||||
|
|
|
| |||||
| * | Consolidated (see Note A). |
| Volatility Management Portfolio | Number of Contracts | Premiums Received | ||||||
Options written outstanding as of 8/31/12 | – 0 | – | $ | – 0 | – | |||
Options written | 5,851 | 1,415,759 | ||||||
Options expired | – 0 | – | – 0 | – | ||||
Options bought back | (5,851 | ) | (1,415,759 | ) | ||||
Options exercised | – 0 | – | – 0 | – | ||||
|
|
|
| |||||
Options written outstanding as of 2/28/13 | – 0 | – | $ | – 0 | – | |||
|
|
|
| |||||
| 278 | • ALLIANCEBERNSTEIN POOLING PORTFOLIOS |
Notes to Financial Statements
| • | Swap Agreements |
Certain Portfolios may enter into swaps to hedge their exposure to interest rates, credit risk, equity markets, currencies or other underlying asset classes. The Portfolio may also enter into swaps for non-hedging purposes as a means of gaining market exposures, including by making direct investments in foreign currencies, as described below under “Currency Transactions” or in order to take a “long” or “short” position with respect to an underlying referenced asset described below under “Total Return Swaps”. A swap is an agreement that obligates two parties to exchange a series of cash flows at specified intervals based upon or calculated by reference to changes in specified prices or rates for a specified amount of an underlying asset. The payment flows are usually netted against each other, with the difference being paid by one party to the other. In addition, collateral may be pledged or received by the Portfolio in accordance with the terms of the respective swap agreements to provide value and recourse to the Portfolio or its counterparties in the event of default, bankruptcy or insolvency by one of the parties to the swap agreement.
Risks may arise as a result of the failure of the counterparty to the swap contract to comply with the terms of the swap contract. The loss incurred by the failure of a counterparty is generally limited to the net interim payment to be received by the Portfolio, and/or the termination value at the end of the contract. Therefore, the Portfolio considers the creditworthiness of each counterparty to a swap contract in evaluating potential counterparty risk. This risk is mitigated by having a netting arrangement between the Portfolio and the counterparty and by the posting of collateral by the counterparty to the Portfolio to cover the Portfolio’s exposure to the counterparty. Additionally, risks may arise from unanticipated movements in interest rates or in the value of the underlying securities. The Portfolio accrues for the interim payments on swap contracts on a daily basis, with the net amount recorded within unrealized appreciation/depreciation of swap contracts on the statement of assets and liabilities, where applicable. Once the interim payments are settled in cash, the net amount is recorded as realized gain/(loss) on swaps on the statement of operations, in addition to any realized gain/(loss) recorded upon the termination of swap contracts. Upfront premiums paid or received are recognized as cost or proceeds on the statement of assets and liabilities and are amortized on a straight line basis over the life of the contract. Amortized upfront premiums are included in net realized gain/(loss) from swaps on the statement of operations. Fluctuations in the value of swap contracts are recorded as a component of net change in unrealized appreciation/depreciation of swap contracts on the statement of operations.
Interest Rate Swaps:
The Portfolio is subject to interest rate risk exposure in the normal course of pursuing its investment objectives. Because the Portfolio holds fixed rate bonds, the value of these bonds may decrease if interest rates rise. To help
��
| ALLIANCEBERNSTEIN POOLING PORTFOLIOS • | 279 |
Notes to Financial Statements
hedge against this risk and to maintain its ability to generate income at prevailing market rates, the Portfolio may enter into interest rate swap contracts. Interest rate swaps are agreements between two parties to exchange cash flows based on a notional amount. The Portfolio may elect to pay a fixed rate and receive a floating rate, or, receive a fixed rate and pay a floating rate on a notional amount.
In addition, a Portfolio may also enter into interest rate swap transactions to preserve a return or spread on a particular investment or portion of its portfolio, or protecting against an increase in the price of securities the Portfolio anticipates purchasing at a later date. Interest rate swaps involve the exchange by a Portfolio with another party of their respective commitments to pay or receive interest (e.g., an exchange of floating rate payments for fixed rate payments) computed based on a contractually-based principal (or “notional”) amount. Interest rate swaps are entered into on a net basis (i.e., the two payment streams are netted out, with the Portfolio receiving or paying, as the case may be, only the net amount of the two payments).
During the six months ended February 28, 2013, the Bond Inflation Protection Portfolio held interest rate swaps for hedging and non-hedging purposes and High-Yield Portfolio for hedging purposes and Multi-Asset Real Return Portfolio for non-hedging purposes.
Inflation (CPI) Swaps:
Inflation swap agreements are contracts in which one party agrees to pay the cumulative percentage increase in a price index (the Consumer Price Index with respect to CPI swaps) over the term of the swap (with some lag on the inflation index), and the other pays a compounded fixed rate. Inflation swap agreements may be used to protect the net asset value, or NAV, of a Strategy against an unexpected change in the rate of inflation measured by an inflation index since the value of these agreements is expected to increase if unexpected inflation increases.
During the six months ended February 28, 2013, the Multi-Asset Real Return Portfolio held inflation (CPI) swaps for non-hedging purposes.
Currency Swaps:
The Portfolio may invest in currency swaps for hedging purposes to protect against adverse changes in exchange rates between the U.S. Dollar and other currencies or for non-hedging purposes as a means of making direct investments in foreign currencies, as described below under “Currency Transactions”. Currency swaps involve the individually negotiated exchange by a Portfolio with another party of a series of payments in specified currencies. Actual principal amounts of currencies may be exchanged by the counterparties at the initiation, and again upon the termination, of the transaction. Therefore, the entire principal value of a currency swap is subject to the risk that the swap counterparty will default on its contractual delivery obligations.
| 280 | • ALLIANCEBERNSTEIN POOLING PORTFOLIOS |
Notes to Financial Statements
During the six months ended February 28, 2013, the Short Duration Bond Portfolio held currency swaps for hedging purposes.
Credit Default Swaps:
The Portfolio may enter into credit default swaps, including to manage its exposure to the market or certain sectors of the market, to reduce its risk exposure to defaults by corporate and sovereign issuers held by the Portfolio, or to create exposure to corporate or sovereign issuers to which it is not otherwise exposed. The Portfolio may purchase credit protection (“Buy Contract”) or provide credit protection (“Sale Contract”) on the referenced obligation of the credit default swap. During the term of the swap agreement, the Portfolio receives/(pays) fixed payments from/(to) the respective counterparty, calculated at the agreed upon rate applied to the notional amount. If the Portfolio is a buyer/(seller) of protection and a credit event occurs, as defined under the terms of the swap agreement, the Portfolio will either (i) receive from the seller/(pay to the buyer) of protection an amount equal to the notional amount of the swap contract (the “Maximum Payout Amount”) and deliver/(take delivery of) the referenced obligation or (ii) receive/(pay) a net settlement amount in the form of cash or securities equal to the notional amount of the swap less the recovery value of the referenced obligation.
Credit default swaps may involve greater risks than if a Portfolio had invested in the referenced obligation directly. Credit default swaps are subject to general market risk, liquidity risk, counterparty risk and credit risk. If the Portfolio is a buyer of protection and no credit event occurs, it will lose the payments it made to its counterparty. If the Portfolio is a seller of protection and a credit event occurs, the value of the referenced obligation received by the Portfolio coupled with the periodic payments previously received, may be less than the Maximum Payout Amount it pays to the buyer, resulting in a net loss to the Portfolio.
During the six months ended February 28, 2013, the Bond Inflation Protection Portfolio held credit default swaps for non-hedging purposes and High-Yield Portfolio for hedging and non-hedging purposes.
Implied credit spreads utilized in determining the market value of credit default swaps on issuers as of period end are disclosed in the portfolio of investments. The implied spreads serve as an indicator of the current status of the payment/ performance risk and typically reflect the likelihood of default by the issuer of the referenced obligation. The implied credit spread of a particular reference obligation also reflects the cost of buying/selling protection and may reflect upfront payments required to be made to enter into the agreement. Widening credit spreads typically represent a deterioration of the referenced obligation’s credit soundness and greater likelihood of default or other credit event occurring as defined under the terms of the agreement. A credit spread identified as “Defaulted” indicates a credit event has occurred for the referenced obligation.
| ALLIANCEBERNSTEIN POOLING PORTFOLIOS • | 281 |
Notes to Financial Statements
At February 28, 2013, the Bond Inflation Protection Portfolio and High-Yield Portfolio had Sale Contracts outstanding with Maximum Payout Amounts aggregating $3,967,769 and $38,373,551, with net unrealized appreciation/depreciation of $94,084 and $3,076,040, respectively, and terms of less than 5 years, as reflected in the portfolio of investments.
In certain circumstances Maximum Payout Amounts may be partially offset by recovery values of the respective referenced obligations, upfront premium received upon entering into the agreement, or net amounts received from settlement of buy protection credit default swap agreements entered into by the Portfolio for the same reference obligation with the same counterparty.
Total Return Swaps:
The Portfolio may enter into total return swaps in order to take a “long” or “short” position with respect to an underlying referenced asset. The Portfolio is subject to market price volatility of the underlying referenced asset. A total return swap involves commitments to pay interest in exchange for a market linked return based on a notional amount. To the extent that the total return of the security, group of securities or index underlying the transaction exceeds or falls short of the offsetting interest obligation, the Portfolio will receive a payment from or make a payment to the counterparty.
During the six months ended February 28, 2013, the High-Yield Portfolio held total return swaps for hedging purposes and Multi-Asset Real Return Portfolio for non-hedging purposes and Volatility Management Portfolio for hedging and non-hedging purposes.
Dividend Swaps:
Dividend swap agreements involve an exchange by the parties of their respective commitments to pay or right to receive the changes in a dividend index point. The Portfolio may gain exposure by either paying or receiving an amount in respect of an increase or decrease in the change of the relevant dividend index point based on a notional amount.
During the six months ended February 28, 2013, the High-Yield Portfolio held dividend swaps for hedging purposes.
Documentation governing the Portfolios’ OTC derivatives may contain provisions for early termination of such transaction in the event the net assets of the Portfolio decline below specific levels set forth in the documentation (“net asset contingent features”). If these levels are triggered, the Portfolios’ counterparty has the right to terminate such transaction and require the Portfolio to pay or receive a settlement amount in connection with the terminated transaction. As of February 28, 2013, the U.S Value Portfolio, U.S. Large Cap Portfolio, Small-Mid Cap Value Portfolio and Small-Mid Cap Growth Portfolio did not have OTC derivatives with contingent features in net liability positions. As of February 28, 2013, the following Portfolios had OTC derivatives with contingent features in net liability positions:
| 282 | • ALLIANCEBERNSTEIN POOLING PORTFOLIOS |
Notes to Financial Statements
Portfolio | Total Market Value of OTC Derivatives | Market Value of Collateral Pledged | Uncollateralized Amount | |||||||||
International Value | $ | (3,499,678 | ) | $ | – 0 | – | $ | (3,499,678 | ) | |||
International Growth | (3,038,658 | ) | – 0 | – | (3,038,658 | ) | ||||||
Short Duration Bond | (135,872 | ) | – 0 | – | (135,872 | ) | ||||||
Global Core Bond | (700,080 | ) | – 0 | – | (700,080 | ) | ||||||
Bond Inflation Protection | (1,898,825 | ) | 1,757,540 | (269,460 | ) | |||||||
High-Yield | (3,008,849 | ) | 10,152,287 | (1,238,122 | ) | |||||||
Multi-Asset Real Return | (9,220,813 | ) | 36,811,872 | (860,871 | ) | |||||||
Volatility Management | (14,519,927 | ) | 8,080,447 | (11,737,571 | ) | |||||||
If a trigger event had occurred at February 28, 2013, for those derivatives in a net liability position, the uncollateralized amount would be required to be posted by the Portfolios.
At February 28, 2013, the Portfolios had entered into the following derivatives:
International Value Portfolio | Asset Derivatives | Liability Derivatives | ||||||||||
| Derivative Type | Statement of Assets and Liabilities Location | Fair Value | Statement of Assets and Liabilities Location | Fair Value | ||||||||
Foreign exchange contracts | Unrealized appreciation of forward currency exchange contracts | $ | 7,262,939 | Unrealized depreciation of forward currency exchange contracts | $ | 5,941,036 | ||||||
Equity contracts | Receivable/ Payable for variation margin on futures contracts | 77,106 | * | |||||||||
|
|
|
| |||||||||
Total | $ | 7,262,939 | $ | 6,018,142 | ||||||||
|
|
|
| |||||||||
| * | Only variation margin receivable/payable at period end is reported within the statement of assets and liabilities. This amount reflects cumulative appreciation/(depreciation) of futures contracts as reported in the portfolio of investments. |
| ALLIANCEBERNSTEIN POOLING PORTFOLIOS • | 283 |
Notes to Financial Statements
The effect of derivative instruments on the statement of operations for the six months ended February 28, 2013:
Derivative Type | Location of | Realized Gain or (Loss) on Derivatives | Change in Unrealized Appreciation or (Depreciation) | |||||||
Foreign exchange contracts | Net realized gain (loss) on foreign currency transactions; Net change in unrealized appreciation/depreciation of foreign currency denominated assets and liabilities | $ | 22,254,068 | $ | 2,465,313 | |||||
Equity contracts | Net realized gain (loss) on futures contracts; Net change in unrealized appreciation/depreciation of futures contracts | 1,198,397 | (751,756 | ) | ||||||
|
|
|
| |||||||
Total | $ | 23,452,465 | $ | 1,713,557 | ||||||
|
|
|
| |||||||
International Growth Portfolio | Asset Derivatives | Liability Derivatives | ||||||||||
| Derivative Type | Statement of Assets and Liabilities Location | Fair Value | Statement of Assets and Liabilities Location | Fair Value | ||||||||
Foreign exchange contracts | Unrealized appreciation of forward currency exchange contracts | $ | 9,102,013 | Unrealized depreciation of forward currency exchange contracts | $ | 6,520,634 | ||||||
|
|
|
| |||||||||
Total | $ | 9,102,013 | $ | 6,520,634 | ||||||||
|
|
|
| |||||||||
The effect of derivative instruments on the statement of operations for the six months ended February 28, 2013:
Derivative Type | Location of Gain or (Loss) on Derivatives | Realized Gain or (Loss) on Derivatives | Change in Unrealized Appreciation or (Depreciation) | |||||||
Foreign exchange contracts | Net realized gain (loss) on foreign currency transactions; Net change in unrealized appreciation/depreciation of foreign currency denominated assets and liabilities | $ | (7,153,225 | ) | $ | 3,632,767 | ||||
| 284 | • ALLIANCEBERNSTEIN POOLING PORTFOLIOS |
Notes to Financial Statements
Derivative Type | Location of Gain or (Loss) on Derivatives | Realized Gain or (Loss) on Derivatives | Change in Unrealized Appreciation or (Depreciation) | |||||||
Equity contracts | Net realized gain (loss) on investment transactions; Net change in unrealized appreciation/depreciation of investments | $ | (7,788,513 | ) | $ | 5,932,536 | ||||
Equity contracts | Net realized gain (loss) on options written; Net change in unrealized appreciation/depreciation of options written | 2,768,429 | (2,449,013 | ) | ||||||
|
|
|
| |||||||
Total | $ | (12,173,309 | ) | $ | 7,116,290 | |||||
|
|
|
| |||||||
Short Duration Bond Portfolio | Asset Derivatives | Liability Derivatives | ||||||||||
Derivative Type | Statement of Assets and Liabilities Location | Fair Value | Statement of Assets and Liabilities Location | Fair Value | ||||||||
Foreign exchange contracts | Unrealized appreciation of forward currency exchange contracts | $ | 777,410 | Unrealized depreciation of forward currency exchange contracts | $ | 140,310 | ||||||
Foreign exchange contracts | Unrealized appreciation of currency swap contracts | 52,575 | ||||||||||
Interest rate contracts | Receivable/ Payable for variation margin on futures contracts | 317,228 | * | |||||||||
|
|
|
| |||||||||
Total | $ | 829,985 | $ | 457,538 | ||||||||
|
|
|
| |||||||||
| * | Only variation margin receivable/payable at period end is reported within the statement of assets and liabilities. This amount reflects cumulative appreciation/(depreciation) of futures contracts as reported in the portfolio of investments. |
| ALLIANCEBERNSTEIN POOLING PORTFOLIOS • | 285 |
Notes to Financial Statements
The effect of derivative instruments on the statement of operations for the six months ended February 28, 2013:
Derivative Type | Location of Gain or (Loss) on Derivatives | Realized Gain or (Loss) on Derivatives | Change in Unrealized Appreciation or (Depreciation) | |||||||
Foreign exchange contracts | Net realized gain (loss) on foreign currency transactions; Net change in unrealized appreciation/depreciation of foreign currency denominated assets and liabilities | $ | (201,516 | ) | $ | 742,346 | ||||
Foreign exchange contracts | Net realized gain (loss) on swap contracts; Net change in unrealized appreciation/depreciation of swap contracts | 6,634 | (122,581 | ) | ||||||
Interest rate contracts | Net realized gain (loss) on futures contracts; Net change in unrealized appreciation/depreciation of futures contracts | (397,923 | ) | (348,837 | ) | |||||
|
|
|
| |||||||
Total | $ | (592,805 | ) | $ | 270,928 | |||||
|
|
|
| |||||||
Global Core Bond Portfolio | Asset Derivatives | Liability Derivatives | ||||||||||
| Derivative Type | Statement of Assets and Liabilities Location | Fair Value | Statement of Assets and Liabilities Location | Fair Value | ||||||||
Foreign exchange contracts | Unrealized appreciation of forward currency exchange contracts | $ | 2,048,053 |
| Unrealized depreciation of forward currency exchange contracts | $ | 893,870 |
| ||||
Interest rate contracts | Receivable/Payable for variation margin on futures contracts |
| 175,630 | * | ||||||||
|
|
|
| |||||||||
Total | $ | 2,048,053 | $ | 1,069,500 | ||||||||
|
|
|
| |||||||||
| * | Only variation margin receivable/payable at period end is reported within the statement of assets and liabilities. This amount reflects cumulative appreciation/(depreciation) of futures contracts as reported in the portfolio of investments. |
| 286 | • ALLIANCEBERNSTEIN POOLING PORTFOLIOS |
Notes to Financial Statements
The effect of derivative instruments on the statement of operations for the six months ended February 28, 2013:
Derivative Type | Location of | Realized Gain or (Loss) on Derivatives | Change in Unrealized Appreciation or (Depreciation) | |||||||
Foreign exchange contracts | Net realized gain (loss) on foreign currency transactions; Net change in unrealized appreciation/depreciation of foreign currency denominated assets and liabilities | $ | 479,904 |
| $ | 7,985,026 |
| |||
Interest rate contracts | Net realized gain (loss) on futures contracts; Net change in unrealized appreciation/depreciation of futures contracts | 809,294 | 178,742 | |||||||
|
|
|
| |||||||
Total | $ | 1,289,198 | $ | 8,163,768 | ||||||
|
|
|
| |||||||
Bond Inflation | Asset Derivatives | Liability Derivatives | ||||||||||
| Derivative Type | Statement of Assets and Liabilities Location | Fair Value | Statement of Assets and Liabilities Location | Fair Value | ||||||||
Foreign exchange contracts | Unrealized appreciation of forward currency exchange contracts | $ | 235,189 |
| Unrealized depreciation of forward currency exchange contracts | $ | 134,931 |
| ||||
Interest rate contracts | Receivable/Payable for variation margin on futures contracts |
| 184,637 | * | ||||||||
Interest rate contracts | Unrealized appreciation on interest rate swap contracts |
| 205,234 |
| Unrealized depreciation on interest rate swap contracts |
| 1,970,286 |
| ||||
Credit contracts | Unrealized appreciation on credit default swap contracts | 94,084 | ||||||||||
|
|
|
| |||||||||
Total | $ | 534,507 | $ | 2,289,854 | ||||||||
|
|
|
| |||||||||
| * | Only variation margin receivable/payable at period end is reported within the statement of assets and liabilities. This amount reflects cumulative appreciation/(depreciation) of futures contracts as reported in the portfolio of investments. |
| ALLIANCEBERNSTEIN POOLING PORTFOLIOS • | 287 |
Notes to Financial Statements
The effect of derivative instruments on the statement of operations for the six months ended February 28, 2013:
Derivative Type | Location of | Realized Gain or (Loss) on Derivatives | Change in Unrealized Appreciation or (Depreciation) | |||||||
Foreign exchange contracts | Net realized gain (loss) on foreign currency transactions; Net change in unrealized appreciation/depreciation of foreign currency denominated assets and liabilities | $ | (1,674 | ) | $ | 382,950 |
| |||
Interest rate contracts | Net realized gain (loss) on futures contracts; Net change in unrealized appreciation/depreciation of futures contracts | 195,922 | 356,410 | |||||||
Interest rate contracts | Net realized gain (loss) on swap contracts; Net change in unrealized appreciation/depreciation of swap contracts | (482,690 | ) | 1,467,912 | ||||||
Credit contracts | Net realized gain (loss) on swap contracts; Net change in unrealized appreciation/depreciation of swap contracts | 121,048 | 81,785 | |||||||
|
|
|
| |||||||
Total | $ | (167,394 | ) | $ | 2,289,057 | |||||
|
|
|
| |||||||
High-Yield Portfolio | Asset Derivatives | Liability Derivatives | ||||||||||
| Derivative Type | Statement of Assets and Liabilities Location | Fair Value | Statement of Assets and Liabilities Location | Fair Value | ||||||||
Foreign exchange contracts | Unrealized appreciation of forward currency exchange contracts | $ | 86,501 |
| Unrealized depreciation of forward currency exchange contracts | $ | 106,585 |
| ||||
Foreign exchange contracts | Options written, at value |
| 567,209 |
| ||||||||
Foreign exchange contracts | Investments in securities, at value |
| 567,212 |
| ||||||||
| 288 | • ALLIANCEBERNSTEIN POOLING PORTFOLIOS |
Notes to Financial Statements
Asset Derivatives | Liability Derivatives | |||||||||||
| Derivative Type | Statement of Assets and Liabilities Location | Fair Value | Statement of Assets and Liabilities Location | Fair Value | ||||||||
Interest rate contracts | Receivable/Payable for variation margin on futures contracts | $ | 112,617 | * | Receivable/Payable for variation margin on futures contracts | $ | 106,208 | * | ||||
Interest rate contracts | Unrealized appreciation on interest rate swap contracts |
| 137,540 |
| Unrealized depreciation on interest rate swap contracts | | 445,357 | | ||||
Credit contracts | Unrealized appreciation on credit default swap contracts | 3,239,624 | Unrealized depreciation on credit default swap contracts | 2,743,625 | ||||||||
Equity contracts | Receivable/Payable for variation margin on futures contracts | 14,772 | * | |||||||||
Equity contracts | Unrealized depreciation on total return swap contracts | 28,552 | ||||||||||
Equity contracts | Unrealized appreciation on dividend swap contracts | 40,424 | ||||||||||
Equity contracts | Investments in securities, at value | 515,144 | ||||||||||
Equity contracts | Options written, at value | 533,850 | ||||||||||
Credit contracts | Swaptions written, at value | 44,589 | ||||||||||
|
|
|
| |||||||||
Total | $ | 4,713,834 | $ | 4,575,975 | ||||||||
|
|
|
| |||||||||
| * | Only variation margin receivable/payable at period end is reported within the statement of assets and liabilities. This amount reflects cumulative appreciation/(depreciation) of futures contracts as reported in the portfolio of investments. |
| ALLIANCEBERNSTEIN POOLING PORTFOLIOS • | 289 |
Notes to Financial Statements
The effect of derivative instruments on the statement of operations for the six months ended February 28, 2013:
Derivative Type | Location of | Realized Gain or (Loss) on Derivatives | Change in Unrealized Appreciation or (Depreciation) | |||||||
Foreign exchange contracts | Net realized gain (loss) on foreign currency transactions; Net change in unrealized appreciation/depreciation of foreign currency denominated assets and liabilities | $ | 36,180 |
| $ | 574,921 |
| |||
Interest rate contracts | Net realized gain (loss) on swap contracts; Net change in unrealized appreciation/depreciation of swap contracts | (336,896 | ) | 49,367 | ||||||
Interest rate contracts | Net realized gain (loss) on futures contracts; Net change in unrealized appreciation/depreciation of futures contracts | (3,867 | ) | 6,409 | ||||||
Credit contracts | Net realized gain (loss) on swap contracts; Net change in unrealized appreciation/depreciation of swap contracts | 759,285 | 991,834 | |||||||
Equity contracts | Net realized gain (loss) on futures contracts; Net change in unrealized appreciation/depreciation of futures contracts | – 0 | – | 14,772 | ||||||
Equity contracts | Net realized gain (loss) on swap contracts; Net change in unrealized appreciation/depreciation of swap contracts | 8,878 | 40,424 | |||||||
Equity contracts | Net realized gain (loss) on swap contracts; Net change in unrealized appreciation/depreciation of swap contracts | – 0 | – | (28,552 | ) | |||||
| 290 | • ALLIANCEBERNSTEIN POOLING PORTFOLIOS |
Notes to Financial Statements
Derivative Type | Location of | Realized Gain or (Loss) on Derivatives | Change in Unrealized Appreciation or (Depreciation) | |||||||
Equity contracts | Net realized gain (loss) on investment transactions; Net change in unrealized appreciation/depreciation of investments | $ | (1,392,028 | ) | $ | 363,945 | ||||
Equity contracts | Net realized gain (loss) on options written; Net change in unrealized appreciation/depreciation of options written | (61,702 | ) | (353,900 | ) | |||||
Credit contracts | Net realized gain (loss) on options written; Net change in unrealized appreciation/depreciation of swaptions written | 1,290,288 | (532,231 | ) | ||||||
Foreign exchange contracts | Net realized gain (loss) on options written; Net change in unrealized appreciation/depreciation of options written |
| 1,371 |
|
| – 0 | – | |||
Foreign exchange contracts | Net realized gain (loss) on investment transactions; Net change in unrealized appreciation/depreciation of investments |
| (94,611 | ) |
| 532,664 |
| |||
|
|
|
| |||||||
Total | $ | 206,898 | $ | 1,659,653 | ||||||
|
|
|
| |||||||
Multi-Asset Real | Asset Derivatives | Liability Derivatives | ||||||||||
| Derivative Type | Statement of Assets and Liabilities Location | Fair Value | Statement of Assets and Liabilities Location | Fair Value | ||||||||
Foreign exchange contracts | Unrealized appreciation of forward currency exchange contracts | $ | 3,384,161 |
| Unrealized depreciation of forward currency exchange contracts | $ | 2,158,752 |
| ||||
| ALLIANCEBERNSTEIN POOLING PORTFOLIOS • | 291 |
Notes to Financial Statements
Asset Derivatives | Liability Derivatives | |||||||||||
| Derivative Type | Statement of Assets and Liabilities Location | Fair Value | Statement of Assets and Liabilities Location | Fair Value | ||||||||
Commodity contracts | Receivable/Payable for variation margin on futures contracts | $ | 1,952,748 | * | Receivable/Payable for variation margin on futures contracts | $ | 1,829,774 | * | ||||
Interest rate contracts | Unrealized depreciation on interest rate swap contracts |
| 285,719 |
| ||||||||
Interest rate contracts | Unrealized depreciation on inflation rate swap contracts |
| 10,541 |
| ||||||||
Equity contracts | Unrealized depreciation on total return swap agreements | 8,253,661 | ||||||||||
Equity contracts | Investments in securities, at value | 882,506 | ||||||||||
Equity contracts | Options written, at value | 229,100 | ||||||||||
|
|
|
| |||||||||
Total | $ | 6,219,415 | $ | 12,767,547 | ||||||||
|
|
|
| |||||||||
| * | Only variation margin receivable/payable at period end is reported within the statement of assets and liabilities. This amount reflects cumulative appreciation/(depreciation) of futures contracts as reported in the portfolio of investments. |
| ** | Consolidated (see Note A). |
The effect of derivative instruments on the statement of operations for the six months ended February 28, 2013:
Derivative Type | Location of | Realized Gain or (Loss) on Derivatives | Change in Unrealized Appreciation or (Depreciation) | |||||||
Foreign exchange contracts | Net realized gain (loss) on foreign currency transactions; Net change in unrealized appreciation/depreciation of foreign currency denominated assets and liabilities | $ | (1,247,915 | ) | $ | 2,299,729 | ||||
Commodity contracts | Net realized gain (loss) on futures contracts; Net change in unrealized appreciation/depreciation of futures contracts | (140,161 | ) | (1,405,380 | ) | |||||
| 292 | • ALLIANCEBERNSTEIN POOLING PORTFOLIOS |
Notes to Financial Statements
Derivative Type | Location of | Realized Gain or (Loss) on Derivatives | Change in Unrealized Appreciation or (Depreciation) | |||||||
Interest rate contracts | Net realized gain (loss) on swap contracts; Net change in unrealized appreciation/depreciation of swap contracts | $ | 49,924 | $ | 129,139 | |||||
Interest rate contracts | Net realized gain (loss) on swap contracts; Net change in unrealized appreciation/depreciation of swap contracts | – 0 | – | 14,114 | ||||||
Equity contracts | Net realized gain (loss) on futures contracts; Net change in unrealized appreciation/depreciation of futures contracts | (1,040,227 | ) | (19,189 | ) | |||||
Equity contracts | Net realized gain (loss) on swap contracts; Net change in unrealized appreciation/depreciation of swap contracts | (2,882,119 | ) | (12,518,894 | ) | |||||
Equity contracts | Net realized gain (loss) on investment transactions; Net change in unrealized appreciation/depreciation of investments | (3,043,141 | ) | (94,044 | ) | |||||
Equity contracts | Net realized gain (loss) on options written; Net change in unrealized appreciation/depreciation of options written | 1,246,492 | (184,728 | ) | ||||||
|
|
|
| |||||||
Total | $ | (7,057,147 | ) | $ | (11,779,253 | ) | ||||
|
|
|
| |||||||
Volatility | Asset Derivatives | Liability Derivatives | ||||||||||
| Derivative Type | Statement of Assets and Liabilities Location | Fair Value | Statement of Assets and Liabilities Location | Fair Value | ||||||||
Foreign exchange contracts | Unrealized appreciation of forward currency exchange contracts | $ | 5,112,600 |
| Unrealized depreciation of forward currency exchange contracts | $ | 17,710,524 |
| ||||
| ALLIANCEBERNSTEIN POOLING PORTFOLIOS • | 293 |
Notes to Financial Statements
Asset Derivatives | Liability Derivatives | |||||||||||
| Derivative Type | Statement of Assets and Liabilities Location | Fair Value | Statement of Assets and Liabilities Location | Fair Value | ||||||||
Equity contracts | Receivable/Payable for variation margin on futures contracts | $ | 34,169,640 | * | ||||||||
Equity contracts | Unrealized depreciation on total return swap agreements | $ | 2,332,576 |
| ||||||||
|
|
|
| |||||||||
Total | $ | 39,282,240 | $ | 20,043,100 | ||||||||
|
|
|
| |||||||||
| * | Only variation margin receivable/payable at period end is reported within the statement of assets and liabilities. This amount reflects cumulative appreciation/(depreciation) of futures contracts as reported in the portfolio of investments. |
The effect of derivative instruments on the statement of operations for the six months ended February 28, 2013:
Derivative Type | Location of | Realized Gain or (Loss) on Derivatives | Change in Unrealized Appreciation or (Depreciation) | |||||||
Foreign exchange contracts | Net realized gain (loss) on foreign currency transactions; Net change in unrealized appreciation/depreciation of foreign currency denominated assets and liabilities | $ | 4,129,572 | $ | (16,851,813 | ) | ||||
Equity contracts | Net realized gain (loss) on futures contracts; Net change in unrealized appreciation/depreciation of futures contracts | 31,105,891 | 16,263,575 | |||||||
Equity contracts | Net realized gain (loss) on swap contracts; Net change in unrealized appreciation/depreciation of swap contracts | 16,473,008 | (2,964,480 | ) | ||||||
| 294 | • ALLIANCEBERNSTEIN POOLING PORTFOLIOS |
Notes to Financial Statements
Derivative Type | Location of | Realized Gain or (Loss) on Derivatives | Change in Unrealized Appreciation or (Depreciation) | |||||||
Equity contracts | Net realized gain (loss) on investment transactions; Net change in unrealized appreciation/depreciation of investments | $ | (2,206,910 | ) | $ | – 0 | – | |||
Equity contracts | Net realized gain (loss) on options written; Net change in unrealized appreciation/depreciation of options written | 661,437 | – 0 | – | ||||||
|
|
|
| |||||||
Total | $ | 50,162,998 | $ | (3,552,718 | ) | |||||
|
|
|
| |||||||
The following tables represent the volume of the Portfolios’ derivative transactions during the six months ended February 28, 2013:
| International Value Portfolio | ||||
Forward Currency Exchange Contracts: | ||||
Average principal amount of buy contracts | $ | 282,594,101 | ||
Average principal amount of sale contracts | $ | 325,925,135 | ||
Futures Contracts: | ||||
Average original value of buy contracts | $ | 7,413,909 | ||
| International Growth Portfolio | ||||
Forward Currency Exchange Contracts: | ||||
Average principal amount of buy contracts | $ | 235,622,219 | ||
Average principal amount of sale contracts | $ | 284,357,378 | ||
Purchased Options: | ||||
Average monthly cost | $ | 7,385,295 | (a) | |
(a) Positions were open for three months during the period. | ||||
| Short Duration Bond Portfolio | ||||
Forward Currency Exchange Contracts: | ||||
Average principal amount of buy contracts | $ | 11,831,123 | (a) | |
Average principal amount of sale contracts | $ | 17,737,986 | ||
Cross Currency Swap Contracts: | ||||
Average notional amount | $ | 2,837,640 | ||
Futures Contracts: | ||||
Average original value of buy contracts | $ | 223,741,876 | ||
Average original value of sale contracts | $ | 32,433,387 | ||
(a) Positions were open for four months during the period. | ||||
| Global Core Bond Portfolio | ||||
Forward Currency Exchange Contracts: | ||||
Average principal amount of buy contracts | $ | 11,319,103 | ||
Average principal amount of sale contracts | $ | 467,767,453 | ||
| ALLIANCEBERNSTEIN POOLING PORTFOLIOS • | 295 |
Notes to Financial Statements
Futures Contracts: | ||||
Average original value of sale contracts | $ | 50,249,983 | ||
| Bond Inflation Protection Portfolio | ||||
Forward Currency Exchange Contracts: | ||||
Average principal amount of buy contracts | $ | 6,626,870 | ||
Average principal amount of sale contracts | $ | 28,050,915 | ||
Futures Contracts: | ||||
Average original value of buy contracts | $ | 5,372,899 | (a) | |
Average original value of sale contracts | $ | 80,951,912 | ||
Interest Rate Swap Contracts: | ||||
Average notional amount | $ | 157,108,744 | ||
Credit Default Swap Contracts: | ||||
Average notional amount of sale contracts | $ | 4,587,429 | ||
(a) Positions were open for one month during the period. | ||||
| High-Yield Portfolio | ||||
Forward Currency Exchange Contracts: | ||||
Average principal amount of buy contracts | $ | 2,265,557 | ||
Average principal amount of sale contracts | $ | 36,251,069 | ||
Futures Contracts: | ||||
Average original value of buy contracts | $ | 102,812,752 | ||
Average original value of sale contracts | $ | 17,389,527 | (a) | |
Interest Rate Swap Contracts: | ||||
Average notional amount | $ | 111,582,343 | ||
Credit Default Swap Contracts: | ||||
Average notional amount of buy contracts | $ | 66,951,016 | ||
Average notional amount of sale contracts | $ | 41,627,534 | ||
Total Return Swap Contracts: | ||||
Average notional amount | $ | 391,230 | (a) | |
Dividend Swap Contracts: | ||||
Average notional amount | $ | 448,663 | (b) | |
Purchased Options: | ||||
Average monthly cost | $ | 989,048 | ||
(a) Positions were open for one month during the period. |
| |||
(b) Positions were open for five months during the period. |
| |||
| Multi-Asset Real Return Portfolio* | ||||
Forward Currency Exchange Contracts: | ||||
Average principal amount of buy contracts | $ | 69,760,482 | ||
Average principal amount of sale contracts | $ | 107,303,546 | ||
Futures Contracts: | ||||
Average original value of buy contracts | $ | 41,224,547 | ||
Average original value of sale contracts | $ | 49,664,636 | ||
| 296 | • ALLIANCEBERNSTEIN POOLING PORTFOLIOS |
Notes to Financial Statements
Interest Rate Swap Contracts: | ||||
Average notional amount | $ | 6,040,000 | ||
Total Return Swap Contracts: | ||||
Average notional amount | $ | 258,220,879 | ||
Inflation Swap Contracts: | ||||
Average notional amount | $ | 1,500,000 | ||
Purchased Options: | ||||
Average monthly cost | $ | 1,883,780 | ||
* Consolidated (see Note A). | ||||
| Volatility Management Portfolio | ||||
Forward Currency Exchange Contracts: | ||||
Average principal amount of buy contracts | $ | 388,889,308 | ||
Average principal amount of sale contracts | $ | 109,869,833 | ||
Futures Contracts: | ||||
Average original value of buy contracts | $ | 719,622,267 | ||
Total Return Swap Contracts: | ||||
Average notional amount | $ | 128,930,835 | ||
Purchased Options: | ||||
Average monthly cost | $ | 6,362,563 | (a) | |
(a) Positions were open for four months during the period. | ||||
2. Currency Transactions
The Portfolios may invest in non-U.S. Dollar securities on a currency hedged or unhedged basis. The Portfolio may seek investment opportunities by taking long or short positions in currencies through the use of currency-related derivatives, including forward currency exchange contracts, futures and options on futures, swaps, and other options. The Portfolios may enter into transactions for investment opportunities when it anticipates that a foreign currency will appreciate or depreciate in value but securities denominated in that currency are not held by the Portfolios and do not present attractive investment opportunities. Such transactions may also be used when the Adviser believes that it may be more efficient than a direct investment in a foreign currency-denominated security. The Portfolios may also conduct currency exchange contracts on a spot basis (i.e., for cash at the spot rate prevailing in the currency exchange market for buying or selling currencies).
3. Dollar Rolls
Certain Portfolios may enter into dollar rolls. Dollar rolls involve sales by the Portfolio of securities for delivery in the current month and the Portfolio’s simultaneously contracting to repurchase substantially similar (same type and coupon) securities on a specified future date. During the roll period, the Portfolio forgoes principal and interest paid on the securities. The Portfolio is compensated by the difference between the current sales price and the lower forward price for the future purchase (often referred to as the “drop”) as well as by the interest earned on the cash proceeds of the initial sale. Dollar rolls involve the
| ALLIANCEBERNSTEIN POOLING PORTFOLIOS • | 297 |
Notes to Financial Statements
risk that the market value of the securities the Portfolio is obligated to repurchase under the agreement may decline below the repurchase price. Dollar rolls are speculative techniques and may be considered to be borrowings by the Portfolio. For the six months ended February 28, 2013, the Global Core Bond Portfolio earned drop income of $147,781, which is included in interest income in the accompanying statement of operations.
4. Reverse Repurchase Agreements
Under a reverse repurchase agreement, the Portfolios sell securities and agree to repurchase them at a mutually agreed upon date and price. At the time the Portfolios enter into a reverse repurchase agreement, it will establish a segregated account with the custodian containing liquid assets having a value at least equal to the repurchase price. For the six months ended February 28, 2013, the average amount of reverse repurchase agreements outstanding for Bond Inflation Protection Portfolio and High-Yield Portfolio were $323,648,582 and $9,697,041, respectively, and the daily weighted average interest rates were 0.26% and (1.06)%, respectively. During the period, the High-Yield Portfolio received net interest payment from counterparties.
5. Loan Participations and Assignments
Certain Portfolios may invest in direct debt instruments which are interests in amounts owed to lenders or lending syndicates by corporate, governmental, or other borrowers, either in the form of participations at the time the loan is originated (“Participations”) or by buying an interest in the loan in the secondary market from a financial institution or institutional investor (“Assignments”). A loan is often administered by a bank or other financial institution (the “Lender”) that acts as agent for all holders. The agent administers the term of the loan as specified in the loan agreement. When investing in Participations, the Portfolio generally has no right to enforce compliance with the terms of the loan agreement with the borrower. In addition, when investing in Participations, the Portfolio has the right to receive payments of principal, interest and any fees to which it is entitled only from the Lender and only upon receipt of payments by the Lender from the borrower. As a result, the Portfolio may be subject to the credit risk of both the borrower and the Lender. When the Portfolio purchases Assignments from Lenders, it will typically acquire direct rights against the borrower on the loan. These loans may include participations in “bridge loans”, which are loans taken out by borrowers for a short period (typically less than six months) pending arrangement of more permanent financing through, for example, the issuance of bonds, frequently high-yield bonds issued for the purpose of acquisitions. The Portfolio may also participate in unfunded loan commitments, which are contractual obligations for investing in future Participations, and receive a commitment fee based on the amount of the commitment. Under these arrangements, the Portfolio will receive a fixed rate commitment fee and, if and to the extent the borrower borrows under the facility, the Portfolio may receive an additional funding fee.
| 298 | • ALLIANCEBERNSTEIN POOLING PORTFOLIOS |
Notes to Financial Statements
Unfunded loan commitments and funded loans are marked to market daily.
The High-Yield Portfolio had the following bridge loan commitments outstanding:
| Loan | Unfunded Loan Participation Commitments | Funded | ||||||
Nielsen Holdings | $ | 1,000,000 | $ | – 0 – | ||||
During the six months ended February 28, 2013, the High-Yield Portfolio received commitment fees or additional funding fees during the period in the amount of $52,069.
NOTE D
Securities Lending
Certain Portfolio’s may enter into securities lending transactions. Under the Portfolio’s securities lending program, all loans of securities will be collateralized continually by cash. The Portfolio will be compensated for the loan from a portion of the net return from the income earned on cash collateral after a rebate is paid to the borrower (in some cases, this rebate may be a “negative rebate” or fee paid by the borrower to the Portfolio in connection with the loan), and payments are made for fees of the securities lending agent and for certain other administrative expenses. It is the policy of the Portfolio to receive collateral consisting of cash in an amount exceeding the value of the securities loaned. The Portfolio will have the right to call a loan and obtain the securities loaned at any time on notice to the borrower within the normal and customary settlement time for the securities. While the securities are on loan, the borrower is obligated to pay the Portfolio amounts equal to any income or other distributions from the securities. The Portfolio will not have the right to vote any securities during the existence of a loan, but will have the right to regain ownership of loaned securities in order to exercise voting or other ownership rights. The lending agent has agreed to indemnify the Portfolio in the case of default of any securities borrower. Collateral received and securities loaned are marked to market daily to ensure that the securities loaned are secured by collateral. The lending agent will invest the cash collateral received in AllianceBernstein Exchange Reserves, an eligible money market vehicle, in accordance with the investment restrictions of the Portfolio, and as approved by the Trust’s Board of Trustees. The collateral received on securities loaned is recorded as an asset as well as a corresponding liability in the statement of assets and liabilities. When the Portfolio lends securities, its investment performance will continue to reflect changes in the value of the securities loaned. As of February 28, 2013, the value of securities on loan and cash collateral received which has been invested into AllianceBernstein Exchange Reserves are as follows:
| Portfolio | Market Value of Securities on Loan | Market Value of Cash Collateral | ||||||
U.S. Value | $ | 12,938,051 | $ | 13,342,427 | ||||
U.S. Large Cap Growth | 2,650,368 | 2,651,373 | ||||||
| ALLIANCEBERNSTEIN POOLING PORTFOLIOS • | 299 |
Notes to Financial Statements
| Portfolio | Market Value of Securities on Loan | Market Value of Cash Collateral | ||||||
International Value | $ | 26,036,635 | $ | 27,331,840 | ||||
International Growth | 10,442,667 | 10,882,706 | ||||||
Small-Mid Cap Value | 8,582,458 | 8,851,935 | ||||||
Small-Mid Cap Growth | 24,157,884 | 24,809,497 | ||||||
Multi-Asset Real Return | 21,295,083 | 22,386,798 | ||||||
Volatility Management | 10,329,524 | 10,823,132 | ||||||
The cash collateral will be adjusted on the next business day to maintain the required collateral amount. The securities lending income earned for the six months ended February 28, 2013 from the borrowers and AllianceBernstein Exchange Reserves are as follows:
| Portfolio | Borrowers | AllianceBernstein Exchange Reserves | ||||||
U.S. Value | $ | 100,795 | $ | 8,412 | ||||
U.S. Large Cap Growth | 61,157 | 4,770 | ||||||
International Value | 548,113 | 22,592 | ||||||
International Growth | 436,399 | 39,327 | ||||||
Small-Mid Cap Value | 51,749 | 4,799 | ||||||
Small-Mid Cap Growth | 134,538 | 13,881 | ||||||
Multi-Asset Real Return | 143,043 | 9,398 | ||||||
Volatility Management | 55,126 | 5,547 | ||||||
These amounts are reflected in the statement of operations. A principal risk of lending portfolio securities is that the borrower will fail to return the loaned securities upon termination of the loan and that the collateral will not be sufficient to replace the loaned securities. A summary of the Portfolios’ transactions in shares of AllianceBernstein Exchange Reserves for the six months ended February 28, 2013 are as follows:
| Portfolio | Market Value August 31, (000) | Purchases at Cost (000) | Sales Proceeds (000) | Market Value February 28, (000) | Dividend Income (000) | |||||||||||||||
U.S. Value | $ | 19,132 | $ | 113,748 | $ | 119,538 | $ | 13,342 | $ | 9 | ||||||||||
U.S. Large Cap Growth | 6,844 | 41,227 | 45,419 | 2,652 | 5 | |||||||||||||||
International Value | 26,420 | 317,452 | 316,540 | 27,332 | 22 | |||||||||||||||
International Growth | 100,018 | 147,653 | 236,789 | 10,882 | 39 | |||||||||||||||
Small-Mid Cap Value | 8,083 | 29,406 | 28,637 | 8,852 | 5 | |||||||||||||||
Small-Mid Cap Growth | 22,659 | 70,965 | 68,814 | 24,810 | 14 | |||||||||||||||
Multi-Asset Real Return | 16,101 | 153,182 | 146,896 | 22,387 | 10 | |||||||||||||||
Volatility Management | 8,167 | 54,818 | 52,162 | 10,823 | 6 | |||||||||||||||
| 300 | • ALLIANCEBERNSTEIN POOLING PORTFOLIOS |
Notes to Financial Statements
NOTE E
Shares of Beneficial Interest
Transactions in shares of beneficial interest for each class were as follows:
| U.S. Value | ||||||||||||||||||||
| Shares | Amount | |||||||||||||||||||
| Six Months Ended February 28, 2013 (unaudited) | Year Ended August 31, 2012 | Six Months Ended February 28, 2013 (unaudited) | Year Ended August 31, 2012 | |||||||||||||||||
|
| |||||||||||||||||||
Shares sold | 744,748 | 3,695,918 | $ | 6,769,911 | $ | 30,433,233 | ||||||||||||||
| ||||||||||||||||||||
Shares issued in reinvestment of dividends | 1,866,880 | 5,350,789 | 16,746,388 | 42,821,254 | ||||||||||||||||
| ||||||||||||||||||||
Shares redeemed | (18,678,023 | ) | (118,348,241 | ) | (173,082,801 | ) | (968,326,210 | ) | ||||||||||||
| ||||||||||||||||||||
Net decrease | (16,066,395 | ) | (109,301,534 | ) | $ | (149,566,502 | ) | $ | (895,071,723 | ) | ||||||||||
| ||||||||||||||||||||
| U.S. Large Cap Growth | ||||||||||||||||||||
| Shares | Amount | |||||||||||||||||||
| Six Months Ended February 28, 2013 (unaudited) | Year Ended August 31, 2012 | Six Months Ended February 28, 2013 (unaudited) | Year Ended August 31, 2012 | |||||||||||||||||
|
|
|
|
|
|
|
|
| ||||||||||||
Shares sold | 1,330,080 | 2,580,355 | $ | 16,531,761 | $ | 28,925,274 | ||||||||||||||
| ||||||||||||||||||||
Shares issued in reinvestment of dividends | 410,417 | 1,878,101 | 5,111,581 | 20,454,819 | ||||||||||||||||
| ||||||||||||||||||||
Shares redeemed | (9,165,017 | ) | (92,406,449 | ) | (116,630,275 | ) | (1,035,159,032 | ) | ||||||||||||
| ||||||||||||||||||||
Net decrease | (7,424,520 | ) | (87,947,993 | ) | $ | (94,986,933 | ) | $ | (985,778,939 | ) | ||||||||||
| ||||||||||||||||||||
| International Value | ||||||||||||||||||||
| Shares | Amount | |||||||||||||||||||
| Six Months Ended February 28, 2013 (unaudited) | Year Ended August 31, 2012 | Six Months Ended February 28, 2013 (unaudited) | Year Ended August 31, 2012 | |||||||||||||||||
|
| |||||||||||||||||||
Shares sold | 1,080,356 | 35,379,800 | $ | 7,571,256 | $ | 233,087,270 | ||||||||||||||
| ||||||||||||||||||||
Shares issued in reinvestment of dividends | 2,950,323 | 2,831,358 | 20,003,192 | 18,401,328 | ||||||||||||||||
| ||||||||||||||||||||
Shares redeemed | (22,774,239 | ) | (25,009,969 | ) | (157,270,482 | ) | (168,660,317 | ) | ||||||||||||
| ||||||||||||||||||||
Net increase (decrease) | (18,743,560 | ) | 13,201,189 | $ | (129,696,034 | ) | $ | 82,828,281 | ||||||||||||
| ||||||||||||||||||||
| ALLIANCEBERNSTEIN POOLING PORTFOLIOS • | 301 |
Notes to Financial Statements
| International Growth | ||||||||||||||||||||
| Shares | Amount | |||||||||||||||||||
| Six Months Ended February 28, 2013 (unaudited) | Year Ended August 31, 2012 | Six Months Ended February 28, 2013 (unaudited) | Year Ended August 31, 2012 | |||||||||||||||||
|
| |||||||||||||||||||
Shares sold | 1,268,932 | 27,003,355 | $ | 10,272,008 | $ | 205,019,615 | ||||||||||||||
| ||||||||||||||||||||
Shares issued in reinvestment of dividends | 950,824 | 2,317,471 | 7,559,047 | 17,085,762 | ||||||||||||||||
| ||||||||||||||||||||
Shares redeemed | (15,821,031 | ) | (20,372,504 | ) | (125,958,046 | ) | (157,224,410 | ) | ||||||||||||
| ||||||||||||||||||||
Net increase (decrease) | (13,601,275 | ) | 8,948,322 | $ | (108,126,991 | ) | $ | 64,880,967 | ||||||||||||
| ||||||||||||||||||||
| Short Duration Bond | ||||||||||||||||||||
| Shares | Amount | |||||||||||||||||||
| Six Months Ended February 28, 2013 (unaudited) | Year Ended August 31, 2012 | Six Months Ended February 28, 2013 (unaudited) | Year Ended August 31, 2012 | |||||||||||||||||
|
| |||||||||||||||||||
Shares sold | 5,119,983 | 6,968,816 | $ | 48,765,763 | $ | 66,501,972 | ||||||||||||||
| ||||||||||||||||||||
Shares issued in reinvestment of dividends | 948,375 | 1,603,894 | 9,027,312 | 15,303,830 | ||||||||||||||||
| ||||||||||||||||||||
Shares redeemed | (4,061,226 | ) | (45,042,013 | ) | (38,701,293 | ) | (430,806,452 | ) | ||||||||||||
| ||||||||||||||||||||
Net increase (decrease) | 2,007,132 | (36,469,303 | ) | $ | 19,091,782 | $ | (349,000,650 | ) | ||||||||||||
| ||||||||||||||||||||
| Global Core Bond | ||||||||||||||||||||
| Shares | Amount | |||||||||||||||||||
| Six Months Ended February 28, 2013 (unaudited) | Year Ended August 31, 2012 | Six Months Ended February 28, 2013 (unaudited) | Year Ended August 31, 2012 | |||||||||||||||||
|
|
|
|
|
|
|
|
| ||||||||||||
Shares sold | 2,803,679 | 13,741,327 | $ | 29,975,612 | $ | 148,684,200 | ||||||||||||||
| ||||||||||||||||||||
Shares issued in reinvestment of dividends and distributions | 5,452,002 | 6,756,698 | 58,104,015 | 71,999,541 | ||||||||||||||||
| ||||||||||||||||||||
Shares redeemed | (7,950,290 | ) | (38,412,095 | ) | (86,463,452 | ) | (413,552,631 | ) | ||||||||||||
| ||||||||||||||||||||
Net increase (decrease) | 305,391 | (17,914,070 | ) | $ | 1,616,175 | $ | (192,868,890 | ) | ||||||||||||
| ||||||||||||||||||||
| 302 | • ALLIANCEBERNSTEIN POOLING PORTFOLIOS |
Notes to Financial Statements
| Bond Inflation Protection | ||||||||||||||||||||
| Shares | Amount | |||||||||||||||||||
| Six Months Ended February 28, 2013 (unaudited) | Year Ended August 31, 2012 | Six Months Ended February 28, 2013 (unaudited) | Year Ended August 31, | |||||||||||||||||
|
| |||||||||||||||||||
Shares sold | 1,747,378 | 18,087,254 | $ | 19,105,761 | $ | 197,706,676 | ||||||||||||||
| ||||||||||||||||||||
Shares issued in reinvestment of dividends and distributions | 4,389,903 | 5,280,036 | 47,454,854 | 56,179,581 | ||||||||||||||||
| ||||||||||||||||||||
Shares redeemed | (4,675,074 | ) | (14,908,838 | ) | (52,222,798 | ) | (166,560,473 | ) | ||||||||||||
| ||||||||||||||||||||
Net increase | 1,462,207 | 8,458,452 | $ | 14,337,817 | $ | 87,325,784 | ||||||||||||||
| ||||||||||||||||||||
| High-Yield | ||||||||||||||||||||
| Shares | Amount | |||||||||||||||||||
| Six Months Ended February 28, 2013 (unaudited) | Year Ended August 31, 2012 | Six Months Ended February 28, 2013 (unaudited) | Year Ended August 31, 2012 | |||||||||||||||||
|
| |||||||||||||||||||
Shares sold | 431,303 | 4,933,929 | $ | 4,528,633 | $ | 47,515,247 | ||||||||||||||
| ||||||||||||||||||||
Shares issued in reinvestment of dividends | 1,768,061 | 3,071,979 | 18,403,170 | 29,996,780 | ||||||||||||||||
| ||||||||||||||||||||
Shares redeemed | (4,223,324 | ) | (19,149,937 | ) | (44,151,806 | ) | (186,584,753 | ) | ||||||||||||
| ||||||||||||||||||||
Net decrease | (2,023,960 | ) | (11,144,029 | ) | $ | (21,220,003 | ) | $ | (109,072,726 | ) | ||||||||||
| ||||||||||||||||||||
| Small-Mid Cap Value | ||||||||||||||||||||
| Shares | Amount | |||||||||||||||||||
| Six Months Ended February 28, 2013 (unaudited) | Year Ended August 31, 2012 | Six Months Ended February 28, 2013 (unaudited) | Year Ended August 31, 2012 | |||||||||||||||||
|
| |||||||||||||||||||
Shares sold | 126,812 | 665,147 | $ | 1,451,497 | $ | 7,254,818 | ||||||||||||||
| ||||||||||||||||||||
Shares issued in reinvestment of dividends and distributions | 4,127,126 | 432,694 | 44,308,168 | 4,570,365 | ||||||||||||||||
| ||||||||||||||||||||
Shares redeemed | (4,907,192 | ) | (20,952,658 | ) | (57,178,961 | ) | (230,846,213 | ) | ||||||||||||
| ||||||||||||||||||||
Net decrease | (653,254 | ) | (19,854,817 | ) | $ | (11,419,296 | ) | $ | (219,021,030 | ) | ||||||||||
| ||||||||||||||||||||
| ALLIANCEBERNSTEIN POOLING PORTFOLIOS • | 303 |
Notes to Financial Statements
| Small-Mid Cap Growth | ||||||||||||||||||||
| Shares | Amount | |||||||||||||||||||
| Six Months Ended February 28, 2013 (unaudited) | Year Ended August 31, 2012 | Six Months Ended February 28, 2013 (unaudited) | Year Ended August 31, 2012 | |||||||||||||||||
|
| |||||||||||||||||||
Shares sold | 185,566 | 390,483 | $ | 2,233,721 | $ | 5,111,187 | ||||||||||||||
| ||||||||||||||||||||
Shares issued in reinvestment of dividends and distributions | �� | 6,315,457 | 10,757,449 | 66,340,385 | 127,015,197 | |||||||||||||||
| ||||||||||||||||||||
Shares redeemed | (3,038,750 | ) | (17,688,160 | ) | (35,867,515 | ) | (250,793,852 | ) | ||||||||||||
| ||||||||||||||||||||
Net increase (decrease) | 3,462,273 | (6,540,228 | ) | $ | 32,706,591 | $ | (118,667,468 | ) | ||||||||||||
| ||||||||||||||||||||
| Multi-Asset Real Return* | ||||||||||||||||||||
| Shares | Amount | |||||||||||||||||||
| Six Months Ended February 28, 2013 (unaudited) | Year Ended August 31, 2012 | Six Months Ended February 28, 2013 (unaudited) | Year Ended August 31, 2012 | |||||||||||||||||
|
|
|
|
|
|
|
| |||||||||||||
Shares sold | 71,799,422 | 2,282,689 | $ | 625,541,373 | $ | 19,059,123 | ||||||||||||||
| ||||||||||||||||||||
Shares issued in reinvestment of dividends | 2,761,825 | 4,253,554 | 23,613,602 | 34,377,414 | ||||||||||||||||
|
|
| ||||||||||||||||||
Shares redeemed | (5,316,735 | ) | (46,031,776 | ) | (46,562,336 | ) | (398,409,156 | ) | ||||||||||||
|
|
| ||||||||||||||||||
Net increase (decrease) | 69,244,512 | (39,495,533 | ) | $ | 602,592,639 | $ | (344,972,619 | ) | ||||||||||||
| ||||||||||||||||||||
| * | Consolidated (see Note A). |
| Volatility Management | ||||||||||||||||||||
| Shares | Amount | |||||||||||||||||||
| Six Months Ended February 28, 2013 (unaudited) | Year Ended August 31, 2012 | Six Months Ended February 28, 2013 (unaudited) | Year Ended August 31, 2012 | |||||||||||||||||
|
| |||||||||||||||||||
Shares sold | 3,089,698 | 155,932,553 | $ | 32,333,171 | $ | 1,602,855,376 | ||||||||||||||
| ||||||||||||||||||||
Shares issued in reinvestment of dividends and distributions | 1,827,801 | 3,047,597 | 18,808,069 | 30,506,445 | ||||||||||||||||
| ||||||||||||||||||||
Shares redeemed | (16,817,918 | ) | (21,727,365 | ) | (177,033,577 | ) | (223,001,565 | ) | ||||||||||||
| ||||||||||||||||||||
Net increase (decrease) | (11,900,419 | ) | 137,252,785 | $ | (125,892,337 | ) | $ | 1,410,360,256 | ||||||||||||
| ||||||||||||||||||||
| 304 | • ALLIANCEBERNSTEIN POOLING PORTFOLIOS |
Notes to Financial Statements
NOTE F
Risks Involved in Investing in the Portfolios
Interest Rate Risk and Credit Risk—Interest rate risk is the risk that changes in interest rates will affect the value of the Portfolios’ investments in fixed-income debt securities such as bonds or notes. Increases in interest rates may cause the value of the Portfolios’ investments to decline. Credit risk is the risk that the issuer or guarantor of a debt security, or the counterparty to a derivative contract, will be unable or unwilling to make timely principal and/or interest payments, or to otherwise honor its obligations. The degree of risk for a particular security may be reflected in its credit risk rating. Credit risk is greater for medium quality and lower-rated securities. Lower-rated debt securities and similar unrated securities (commonly known as “junk bonds”) have speculative elements or are predominantly speculative risks.
Foreign Securities Risk—Investing in securities of foreign companies or foreign governments involves special risks which include changes in foreign currency exchange rates and the possibility of future political and economic developments which could adversely affect the value of such securities. Moreover, securities of many foreign companies or foreign governments and their markets may be less liquid and their prices more volatile than those of comparable U.S. companies or of the U.S. government.
Currency Risk—This is the risk that changes in foreign currency exchange rates may negatively affect the value of the Portfolios’ investments or reduce the returns of the Portfolio. For example, the value of the Portfolios’ investments in foreign currency-denominated securities or currencies may decrease if the U.S. Dollar is strong (i.e., gaining value relative to other currencies) and other currencies are weak (i.e., losing value relative to the U.S. Dollar). Currency markets are generally not as regulated as securities markets. Independent of the Portfolios’ investments denominated in foreign currencies, the Portfolios’ positions in various foreign currencies may cause the Portfolio to experience investment losses due to the changes in exchange rates and interest rates.
Derivatives Risk—The Portfolios may enter into derivative transactions such as forwards, options, futures and swaps. Derivatives may be illiquid, difficult to price, and leveraged so that small changes may produce disproportionate losses for the Portfolios, and subject to counterparty risk to a greater degree than more traditional investments. Derivatives may result in significant losses, including losses that are far greater than the value of the derivatives reflected in the statement of assets and liabilities.
Leverage Risk—When certain Portfolios borrow money or otherwise leverages its portfolios, it may be volatile because leverage tends to exaggerate the effect of any increase or decrease in the value of the Portfolio’s investments. The Portfolio may create leverage through the use of reverse repurchase arrangements, forward currency exchange contracts, forward commitments, dollar
| ALLIANCEBERNSTEIN POOLING PORTFOLIOS • | 305 |
Notes to Financial Statements
rolls or futures contracts or by borrowing money. The use of derivative instruments by the Portfolios, such as forwards, futures, options and swaps, may also result in a form of leverage. Leverage may result in higher returns to the Portfolios than if the Portfolios were not leveraged, but may also adversely affect returns, particularly if the market is declining.
Capitalization Risk—Investments in small- and mid-capitalization companies may be more volatile than investments in large-capitalization companies. Investments in small-capitalization companies may have additional risks because these companies have limited product lines, markets or financial resources.
Commodity Risk—Investments in commodities and commodity-linked derivative instruments by AllianceBernstein Multi-Asset Real Return, either directly or through its Subsidiary, may subject the Portfolio to greater volatility than investments in traditional securities. The value of commodity-linked derivative instruments may be affected by changes in overall market movements, commodity index volatility, changes in interest rates, or factors affecting a particular industry or commodity, such as drought, floods, weather, livestock disease, embargoes, tariffs and international economic, political and regulatory developments.
Indemnification Risk—In the ordinary course of business, the Portfolios enter into contracts that contain a variety of indemnifications. The Portfolio’s maximum exposure under these arrangements is unknown. However, the Portfolios have not had prior claims or losses pursuant to these indemnification provisions and expect the risk of loss thereunder to be remote. Therefore, the Portfolios have not accrued any liability in connection with these indemnification provisions.
NOTE G
Distributions to Shareholders
The tax character of distributions to be paid for the year ending August 31, 2013 will be determined at the end of the current fiscal year. The tax character of distributions paid during the fiscal years ended August 31, 2012 and August 31, 2011 were as follows:
| U.S. Value | 2012 | 2011 | ||||||
Distributions paid from: | ||||||||
Ordinary income | $ | 42,821,254 | $ | 42,781,375 | ||||
|
|
|
| |||||
Total distributions paid | $ | 42,821,254 | $ | 42,781,375 | ||||
|
|
|
| |||||
| U.S. Large Cap Growth | 2012 | 2011 | ||||||
Distributions paid from: | ||||||||
Ordinary income | $ | 20,454,820 | $ | 20,138,612 | ||||
|
|
|
| |||||
Total distributions paid | $ | 20,454,820 | $ | 20,138,612 | ||||
|
|
|
| |||||
| 306 | • ALLIANCEBERNSTEIN POOLING PORTFOLIOS |
Notes to Financial Statements
| International Value | 2012 | 2011 | ||||||
Distributions paid from: | ||||||||
Ordinary income | $ | 18,401,328 | $ | 45,343,296 | ||||
|
|
|
| |||||
Total distributions paid | $ | 18,401,328 | $ | 45,343,296 | ||||
|
|
|
| |||||
| International Growth | 2012 | 2011 | ||||||
Distributions paid from: | ||||||||
Ordinary income | $ | 17,085,762 | $ | 44,303,767 | ||||
|
|
|
| |||||
Total distributions paid | $ | 17,085,762 | $ | 44,303,767 | ||||
|
|
|
| |||||
| Short Duration Bond | 2012 | 2011 | ||||||
Distributions paid from: | ||||||||
Ordinary income | $ | 15,303,830 | $ | 25,915,259 | ||||
|
|
|
| |||||
Total distributions paid | $ | 15,303,830 | $ | 25,915,259 | ||||
|
|
|
| |||||
| Global Core Bond | 2012 | 2011 | ||||||
Distributions paid from: | ||||||||
Ordinary income | $ | 50,664,246 | $ | 56,723,779 | ||||
Long-term capital gains | 21,335,294 | 2,813,418 | ||||||
|
|
|
| |||||
Total distributions paid | $ | 71,999,540 | $ | 59,537,197 | ||||
|
|
|
| |||||
| Bond Inflation Protection | 2012 | 2011 | ||||||
Distributions paid from: | ||||||||
Ordinary income | $ | 43,265,419 | $ | 19,696,303 | ||||
Long-term capital gains | 12,914,162 | 0 | ||||||
|
|
|
| |||||
Total distributions paid | $ | 56,179,581 | $ | 19,696,303 | ||||
|
|
|
| |||||
| High-Yield | 2012 | 2011 | ||||||
Distributions paid from: | ||||||||
Ordinary income | $ | 29,996,780 | $ | 47,357,542 | ||||
|
|
|
| |||||
Total distributions paid | $ | 29,996,780 | $ | 47,357,542 | ||||
|
|
|
| |||||
| Small-Mid Cap Value | 2012 | 2011 | ||||||
Distributions paid from: | ||||||||
Ordinary income | $ | 4,570,365 | $ | 7,671,358 | ||||
|
|
|
| |||||
Total distributions paid | $ | 4,570,365 | $ | 7,671,358 | ||||
|
|
|
| |||||
| Small-Mid Cap Growth | 2012 | 2011 | ||||||
Distributions paid from: | ||||||||
Ordinary income | $ | 2,298,494 | $ | 2,621,006 | ||||
Long-term capital gains | 124,716,703 | – 0 | – | |||||
|
|
|
| |||||
Total distributions paid | $ | 127,015,197 | $ | 2,621,006 | ||||
|
|
|
| |||||
| Multi-Asset Real Return | 2012 | 2011 | ||||||
Distributions paid from: | ||||||||
Ordinary income | $ | 34,377,414 | $ | 76,523,004 | ||||
|
|
|
| |||||
Total distributions paid | $ | 34,377,414 | $ | 76,523,004 | ||||
|
|
|
| |||||
| ALLIANCEBERNSTEIN POOLING PORTFOLIOS • | 307 |
Notes to Financial Statements
| Volatility Management | 2012 | 2011 | ||||||
Distributions paid from: | ||||||||
Ordinary income | $ | 9,572,404 | $ | 9,131,254 | ||||
Long-term capital gains | 20,934,041 | 6,297,416 | ||||||
|
|
|
| |||||
Total distributions paid | $ | 30,506,445 | $ | 15,428,670 | ||||
|
|
|
| |||||
As of August 31, 2012, the components of accumulated earnings/(deficit) on a tax basis were as follows:
| Portfolio | Undistributed Ordinary Income | Undistributed Long-Term Gains | Accumulated Capital and | Unrealized Appreciation/ | Total Accumulated Earnings/ (Deficit)(c) | |||||||||||||||
U.S. Value | $ | 6,540,798 | $ | – 0 | – | $ | (634,338,852 | ) | $ | 85,697,405 | $ | (542,100,649 | ) | |||||||
U.S. Large Cap Growth | – 0 | – | – 0 | – | (37,256,692 | ) | 195,683,699 | 158,427,007 | ||||||||||||
International Value | 19,794,179 | – 0 | – | (480,854,005 | ) | (95,514,468 | ) | (556,574,294 | ) | |||||||||||
International Growth | 4,823,133 | – 0 | – | (406,741,464 | ) | (25,586,212 | ) | (427,504,543 | ) | |||||||||||
Short Duration Bond | 2,160,042 | – 0 | – | (69,784,358 | ) | 4,831,700 | (62,792,616 | ) | ||||||||||||
Global Core Bond | 21,917,732 | 21,170,234 | (4,263,641 | ) | 52,531,066 | 91,355,391 | ||||||||||||||
Bond Inflation Protection | 20,755,543 | 10,139,275 | – 0 | – | 70,124,550 | 101,019,368 | ||||||||||||||
High-Yield | 7,704,243 | – 0 | – | (39,465,231 | ) | 19,072,015 | (12,688,973 | ) | ||||||||||||
Small-Mid Cap Value | 2,698,080 | 34,320,708 | – 0 | – | 16,202,968 | 53,221,756 | ||||||||||||||
Small-Mid Cap Growth | 754,727 | 60,178,644 | – 0 | – | 72,473,442 | 133,406,813 | ||||||||||||||
Multi-Asset Real Return | 17,276,433 | – 0 | – | (256,298,644 | ) | (28,878,943 | ) | (267,901,154 | ) | |||||||||||
Volatility Management | 7,359,877 | – 0 | – | (22,328,792 | ) | 27,604,966 | 12,636,051 | |||||||||||||
| (a) | During the fiscal year ended August 31, 2012, U.S. Value Portfolio, U.S. Large Cap Growth Portfolio, High Yield Portfolio, Small-Mid Cap Value Portfolio, and Multi-Asset Real Return Portfolio utilized capital loss carryforwards of $67,510,687, $191,806,276,$6,232,115, $4,495,616, and $3,151,081, respectively, to offset current year net realized gains. At August 31, 2012, Short Duration Bond Portfolio deferred $958,424 in straddles losses, Global Core Bond Portfolio deferred $4,263,641 in straddle losses and High Yield Portfolio deferred $11,198 in straddle losses. Net capital losses incurred after October 31 and within the taxable year are deemed to arise on the first business day of the Portfolio’s next taxable year. In this regard, U.S. Value Portfolio, Multi-Asset Real Return Portfolio, and Volatility Management Portfolio elected to defer $4,355,637, $2,099,460, and $22,328,792, respectively, of post-October short-term capital losses that are deemed to arise on September 1, 2012. Additionally, as of August 31, 2012 certain Portfolios had capital loss carryforwards for federal income tax purposes. |
| (b) | The differences between book-basis and tax-basis unrealized appreciation/(depreciation) are attributable primarily to the tax deferral of losses on wash sales, the tax treatment of swaps and passive foreign investment companies (PFICs), the realization for tax purposes of gains/losses on certain derivative instruments, the tax treatment of partnership investments and Treasury inflation-protected securities, return of capital distributions received from underlying securities, and the tax treatment of earnings from a wholly owned subsidiary. |
| 308 | • ALLIANCEBERNSTEIN POOLING PORTFOLIOS |
Notes to Financial Statements
| (c) | The differences between book-basis and tax-basis components of accumulated earnings/(deficit) are attributable primarily to the amortization of offering costs and the tax treatment of earnings from a wholly-owned subsidiary. |
For tax purposes, net capital losses may be carried over to offset future capital gains, if any. Under the Regulated Investment Company Modernization Act of 2010, funds are permitted to carry forward capital losses incurred in taxable years beginning after December 22, 2010 for an indefinite period. These post-enactment capital losses must be utilized prior to the pre-enactment capital losses, which are subject to expiration. Post-enactment capital loss carryforwards will retain their character as either short-term or long-term capital losses rather than being considered short-term as under previous regulation.
As of August 31, 2012, the Pooling Portfolios had net capital loss carryforwards of which will expire as follows:
Portfolio | Short-Term Amount | Long-Term Amount | Expiration | |||||||
U.S. Value | $ | 629,983,215 | n/a | 2018 | ||||||
U.S. Large Cap Growth | 37,256,692 | n/a | 2018 | |||||||
International Value | 51,400,581 | n/a | 2017 | |||||||
International Value | 325,801,637 | n/a | 2018 | |||||||
International Value | 31,763,421 | 71,888,366 | No expiration | |||||||
International Growth | 45,345,293 | n/a | 2017 | |||||||
International Growth | 302,930,744 | n/a | 2018 | |||||||
International Growth | 55,233,569 | 3,231,858 | No expiration | |||||||
Short Duration Bond | 529,195 | n/a | 2014 | |||||||
Short Duration Bond | 3,562,331 | n/a | 2015 | |||||||
Short Duration Bond | 1,756,801 | n/a | 2016 | |||||||
Short Duration Bond | 19,308,695 | n/a | 2017 | |||||||
Short Duration Bond | 11,669,892 | n/a | 2018 | |||||||
Short Duration Bond | 8,417,896 | n/a | 2019 | |||||||
Short Duration Bond | 67,681 | 23,513,443 | No expiration | |||||||
Global Core Bond | – 0 | – | – 0 | – | n/a | |||||
Bond Inflation Protection | – 0 | – | – 0 | – | n/a | |||||
High Yield | 39,454,033 | n/a | 2018 | |||||||
Small-Mid Cap Value | – 0 | – | – 0 | – | n/a | |||||
Small-Mid Cap Growth | – 0 | – | – 0 | – | n/a | |||||
Multi-Asset Real Return | 254,199,184 | n/a | 2018 | |||||||
Volatility Management | – 0 | – | – 0 | – | n/a | |||||
NOTE H
Recent Accounting Pronouncements
In December 2011, the Financial Accounting Standards Board (“FASB”) issued an Accounting Standards Update (“ASU”) related to disclosures about offsetting assets and liabilities in financial statements. The amendments in this update require an entity to disclose both gross and net information for derivatives and other financial instruments that are either offset in the statement of assets and liabilities or subject to an enforceable master netting arrangement or similar agreement. In January 2013, the FASB issued an ASU to clarify the
| ALLIANCEBERNSTEIN POOLING PORTFOLIOS • | 309 |
Notes to Financial Statements
scope of disclosures about offsetting assets and liabilities. The ASU limits the scope of the new balance sheet offsetting disclosures to derivatives, repurchase agreements and securities lending transactions. The ASU is effective during interim or annual reporting periods beginning on or after January 1, 2013. At this time, management is evaluating the implication of this ASU and its impact on the financial statements has not been determined.
NOTE I
Subsequent Events
Management has evaluated subsequent events for possible recognition or disclosure in the financial statements through the date the financial statements are issued. Management has determined that there are no material events that would require disclosure in the Portfolios’ financial statements through this date.
| 310 | • ALLIANCEBERNSTEIN POOLING PORTFOLIOS |
Notes to Financial Statements
FINANCIAL HIGHLIGHTS
Selected Data For A Share Of Beneficial Interest Outstanding Throughout Each Period
| U.S. Value | ||||||||||||||||||||||||
Six Months (unaudited) | Year Ended August 31, | |||||||||||||||||||||||
| 2012 | 2011 | 2010 | 2009 | 2008 | ||||||||||||||||||||
|
|
|
|
|
|
|
|
|
|
|
| |||||||||||||
Net asset value, beginning | $ 8.73 | $ 7.97 | $ 7.18 | $ 7.22 | $ 9.27 | $ 12.44 | ||||||||||||||||||
|
|
|
|
|
|
|
|
|
|
|
| |||||||||||||
Income From Investment Operations | ||||||||||||||||||||||||
Net investment income(a) | .13 | .23 | .18 | .16 | .21 | .31 | ||||||||||||||||||
Net realized and unrealized gain (loss) on investment transactions | 1.12 | .76 | .77 | (.03 | ) | (2.03 | ) | (2.75 | ) | |||||||||||||||
|
|
|
|
|
|
|
|
|
|
|
| |||||||||||||
Net increase (decrease) in net asset value from operations | 1.25 | .99 | .95 | .13 | (1.82 | ) | (2.44 | ) | ||||||||||||||||
|
|
|
|
|
|
|
|
|
|
|
| |||||||||||||
Less: Dividends and Distributions | ||||||||||||||||||||||||
Dividends from net investment income | (.13 | ) | (.23 | ) | (.16 | ) | (.17 | ) | (.23 | ) | (.31 | ) | ||||||||||||
Distributions from net realized gain on investment transactions | – 0 | – | – 0 | – | – 0 | – | – 0 | – | (.00 | )(b) | (.42 | ) | ||||||||||||
|
|
|
|
|
|
|
|
|
|
|
| |||||||||||||
Total dividends and distributions | (.13 | ) | (.23 | ) | (.16 | ) | (.17 | ) | (.23 | ) | (.73 | ) | ||||||||||||
|
|
|
|
|
|
|
|
|
|
|
| |||||||||||||
Net asset value, end of period | $9.85 | $8.73 | $7.97 | $7.18 | $7.22 | $9.27 | ||||||||||||||||||
|
| |||||||||||||||||||||||
Total Return | ||||||||||||||||||||||||
Total investment return based on net asset value(c) | 14.46 | % | 12.75 | %* | 13.21 | % | 1.64 | % | (19.36 | )% | (20.55 | )% | ||||||||||||
Ratios/Supplemental Data | ||||||||||||||||||||||||
Net assets, end of period (000,000’s omitted) | $1,166 | $1,173 | $1,943 | $1,938 | $2,091 | $2,521 | ||||||||||||||||||
Ratio to average net assets of: | ||||||||||||||||||||||||
Expenses | .02 | %(d) | .02 | % | .01 | %(e) | .01 | % | .02 | % | .02 | % | ||||||||||||
Net investment income | 2.75 | %(d) | 2.75 | % | 2.14 | %(e) | 2.09 | % | 3.23 | % | 2.93 | % | ||||||||||||
Portfolio turnover rate | 24 | % | 40 | % | 65 | % | 73 | % | 59 | % | 20 | % | ||||||||||||
See footnote summary on page 323.
| ALLIANCEBERNSTEIN POOLING PORTFOLIOS • | 311 |
Financial Highlights
Selected Data For A Share Of Beneficial Interest Outstanding Throughout Each Period
| U.S. Large Cap Growth | ||||||||||||||||||||||||
Six Months (unaudited) | Year Ended August 31, | |||||||||||||||||||||||
| 2012 | 2011 | 2010 | 2009 | 2008 | ||||||||||||||||||||
|
|
|
|
|
|
|
|
|
|
|
| |||||||||||||
Net asset value, beginning of period | $ 12.30 | $ 10.66 | $ 8.94 | $ 9.25 | $ 11.08 | $ 12.47 | ||||||||||||||||||
|
|
|
|
|
|
|
|
|
|
|
| |||||||||||||
Income From Investment Operations | ||||||||||||||||||||||||
Net investment income(a) | .06 | .12 | .12 | .11 | .11 | .10 | ||||||||||||||||||
Net realized and unrealized gain (loss) on investment and foreign currency transactions | .92 | 1.67 | 1.70 | (.31 | ) | (1.83 | ) | (1.04 | ) | |||||||||||||||
|
|
|
|
|
|
|
|
|
|
|
| |||||||||||||
Net increase (decrease) in net asset value from operations | .98 | 1.79 | 1.82 | (.20 | ) | (1.72 | ) | (.94 | ) | |||||||||||||||
|
|
|
|
|
|
|
|
|
|
|
| |||||||||||||
Less: Dividends and Distributions | ||||||||||||||||||||||||
Dividends from net investment income | (.05 | ) | (.15 | ) | (.10 | ) | (.11 | ) | (.11 | ) | (.10 | ) | ||||||||||||
Distributions from net realized gain on investment transactions | – 0 | – | – 0 | – | – 0 | – | – 0 | – | – 0 | – | (.35 | ) | ||||||||||||
|
|
|
|
|
|
|
|
|
|
|
| |||||||||||||
Total dividends and distributions | (.05 | ) | (.15 | ) | (.10 | ) | (.11 | ) | (.11 | ) | (.45 | ) | ||||||||||||
|
|
|
|
|
|
|
|
|
|
|
| |||||||||||||
Net asset value, end of period | $13.23 | $12.30 | $10.66 | $8.94 | $9.25 | $11.08 | ||||||||||||||||||
|
| |||||||||||||||||||||||
Total Return | ||||||||||||||||||||||||
Total investment return based on net asset value(c) | 8.03 | % | 16.99 | % * | 20.35 | % * | (2.23 | )% * | (15.41 | )% | (8.06 | )% | ||||||||||||
Ratios/Supplemental Data | ||||||||||||||||||||||||
Net assets, end of period (000,000’s omitted) | $1,163 | $1,173 | $1,953 | $1,924 | $2,078 | $2,532 | ||||||||||||||||||
Ratio to average net assets of: | ||||||||||||||||||||||||
Expenses | .02 | %(d) | .02 | % | .02 | %(e) | .01 | % | .02 | % | .02 | % | ||||||||||||
Net investment income | 1.01 | %(d) | 1.10 | % | 1.09 | %(e) | 1.13 | % | 1.40 | % | .86 | % | ||||||||||||
Portfolio turnover rate | 29 | % | 85 | % | 91 | % | 81 | % | 108 | % | 93 | % | ||||||||||||
See footnote summary on page 323.
| 312 | • ALLIANCEBERNSTEIN POOLING PORTFOLIOS |
Financial Highlights
Selected Data For A Share Of Beneficial Interest Outstanding Throughout Each Period
| International Value | ||||||||||||||||||||||||
Six Months (unaudited) | Year Ended August 31, | |||||||||||||||||||||||
| 2012 | 2011 | 2010 | 2009 | 2008 | ||||||||||||||||||||
|
|
|
|
|
|
|
|
|
|
|
| |||||||||||||
Net asset value, beginning of period | $ 6.39 | $ 6.98 | $ 6.93 | $ 7.50 | $ 10.37 | $ 14.88 | ||||||||||||||||||
|
|
|
|
|
|
|
|
|
|
|
| |||||||||||||
Income From Investment Operations | ||||||||||||||||||||||||
Net investment income(a) | .08 | .23 | .24 | .21 | .23 | .45 | ||||||||||||||||||
Net realized and unrealized gain (loss) on investment and foreign currency transactions | .91 | (.70 | ) | .13 | (.60 | ) | (2.55 | ) | (3.18 | ) | ||||||||||||||
Contributions from Adviser | – 0 | – | – 0 | – | – 0 | – | – 0 | – | .00 | (b) | – 0 | – | ||||||||||||
|
|
|
|
|
|
|
|
|
|
|
| |||||||||||||
Net increase (decrease) in net asset value from operations | .99 | (.47 | ) | .37 | (.39 | ) | (2.32 | ) | (2.73 | ) | ||||||||||||||
|
|
|
|
|
|
|
|
|
|
|
| |||||||||||||
Less: Dividends and Distributions | ||||||||||||||||||||||||
Dividends from net investment income | (.14 | ) | (.12 | ) | (.32 | ) | (.18 | ) | (.19 | ) | (.43 | ) | ||||||||||||
Distributions from net realized gain on investment transactions | – 0 | – | – 0 | – | – 0 | – | – 0 | – | (.36 | ) | (1.35 | ) | ||||||||||||
|
|
|
|
|
|
|
|
|
|
|
| |||||||||||||
Total dividends and distributions | (.14 | ) | (.12 | ) | (.32 | ) | (.18 | ) | (.55 | ) | (1.78 | ) | ||||||||||||
|
|
|
|
|
|
|
|
|
|
|
| |||||||||||||
Net asset value, end of period | $7.24 | $6.39 | $6.98 | $6.93 | $7.50 | $10.37 | ||||||||||||||||||
|
| |||||||||||||||||||||||
Total Return | ||||||||||||||||||||||||
Total investment return based on net asset value(c) | 15.64 | % | (6.69 | )% | 4.82 | % | (5.15 | )% | (20.71 | )% | (20.92 | )% | ||||||||||||
Ratios/Supplemental Data | ||||||||||||||||||||||||
Net assets, end of period (000,000’s omitted) | $981 | $986 | $984 | $1,013 | $1,127 | $1,228 | ||||||||||||||||||
Ratio to average net assets of: | ||||||||||||||||||||||||
Expenses | .05 | %(d) | .04 | % | .04 | %(e) | .04 | % | .06 | % | .07 | % | ||||||||||||
Net investment income | 2.27 | %(d) | 3.56 | % | 3.00 | %(e) | 2.70 | % | 3.56 | % | 3.49 | % | ||||||||||||
Portfolio turnover rate | 19 | % | 61 | % | 58 | % | 60 | % | 56 | % | 31 | % | ||||||||||||
See footnote summary on page 323.
| ALLIANCEBERNSTEIN POOLING PORTFOLIOS • | 313 |
Financial Highlights
Selected Data For A Share Of Beneficial Interest Outstanding Throughout Each Period
| International Growth | ||||||||||||||||||||||||
Six Months (unaudited) | Year Ended August 31, | |||||||||||||||||||||||
| 2012 | 2011 | 2010 | 2009 | 2008 | ||||||||||||||||||||
|
| |||||||||||||||||||||||
Net asset value, beginning of period | $ 7.54 | $ 8.27 | $ 8.18 | $ 8.12 | $ 11.27 | $ 13.98 | ||||||||||||||||||
|
| |||||||||||||||||||||||
Income From Investment Operations | ||||||||||||||||||||||||
Net investment income(a) | .07 | .18 | .19 | .19 | .23 | .38 | ||||||||||||||||||
Net realized and unrealized gain (loss) on investment and foreign currency transactions | .67 | (.78 | ) | .26 | .16 | (3.11 | ) | (1.89 | ) | |||||||||||||||
Contributions from Adviser | – 0 | – | – 0 | – | – 0 | – | .00 | (b) | .00 | (b) | .00 | (b) | ||||||||||||
|
| |||||||||||||||||||||||
Net increase (decrease) in net asset value from operations | .74 | (.60 | ) | .45 | .35 | (2.88 | ) | (1.51 | ) | |||||||||||||||
|
| |||||||||||||||||||||||
Less: Dividends and Distributions | ||||||||||||||||||||||||
Dividends from net investment income | (.06 | ) | (.13 | ) | (.36 | ) | (.29 | ) | (.27 | ) | (.38 | ) | ||||||||||||
Distributions from net realized gain on investment transactions | – 0 | – | – 0 | – | – 0 | – | – 0 | – | (.00 | )(b) | (.82 | ) | ||||||||||||
|
| |||||||||||||||||||||||
Total dividends and distributions | (.06 | ) | (.13 | ) | (.36 | ) | (.29 | ) | (.27 | ) | (1.20 | ) | ||||||||||||
|
| |||||||||||||||||||||||
Net asset value, end of period | $ 8.22 | $ 7.54 | $ 8.27 | $ 8.18 | $ 8.12 | $ 11.27 | ||||||||||||||||||
|
| |||||||||||||||||||||||
Total Return | ||||||||||||||||||||||||
Total investment return based on net asset value(C) | 9.86 | % | (7.19 | )% | 5.15 | % | 4.20 | % | (25.32 | )% | (12.46 | )% | ||||||||||||
Ratios/Supplemental Data | ||||||||||||||||||||||||
Net assets, end of period | $977 | $999 | $1,022 | $1,037 | $1,078 | $1,246 | ||||||||||||||||||
Ratio to average net assets of: | ||||||||||||||||||||||||
Expenses | .04 | %(d) | .04 | % | .04 | %(e) | .03 | % | .05 | % | .06 | % | ||||||||||||
Net investment income | 1.77 | %(d) | 2.36 | % | 2.15 | %(e) | 2.27 | % | 3.19 | % | 2.81 | % | ||||||||||||
Portfolio turnover rate | 28 | % | 93 | % | 73 | % | 119 | % | 111 | % | 85 | % | ||||||||||||
See footnote summary on page 323.
| 314 | • ALLIANCEBERNSTEIN POOLING PORTFOLIOS |
Financial Highlights
Selected Data For A Share Of Beneficial Interest Outstanding Throughout Each Period
| Short Duration Bond | ||||||||||||||||||||||||
Six Months (unaudited) | Year Ended August 31, | |||||||||||||||||||||||
| 2012 | 2011 | 2010 | 2009 | 2008 | ||||||||||||||||||||
|
|
|
|
|
|
|
|
|
|
|
| |||||||||||||
Net asset value, beginning of period | $ 9.56 | $ 9.59 | $ 9.56 | $ 9.26 | $ 9.37 | $ 9.87 | ||||||||||||||||||
|
| |||||||||||||||||||||||
Income From Investment Operations | ||||||||||||||||||||||||
Net investment income(a) | .05 | .12 | .17 | .25 | .36 | .46 | ||||||||||||||||||
Net realized and unrealized gain (loss) on investment transactions | (.02 | ) | – 0 | – | .05 | .32 | (.08 | ) | (.49 | ) | ||||||||||||||
|
| |||||||||||||||||||||||
Net increase (decrease) in net asset value from operations | .03 | .12 | .22 | .57 | .28 | (.03 | ) | |||||||||||||||||
|
| |||||||||||||||||||||||
Less: Dividends | ||||||||||||||||||||||||
Dividends from net investment income | (.09 | ) | (.15 | ) | (.19 | ) | (.27 | ) | (.39 | ) | (.47 | ) | ||||||||||||
|
| |||||||||||||||||||||||
Net asset value, end of period | $ 9.50 | $ 9.56 | $ 9.59 | $ 9.56 | $ 9.26 | $ 9.37 | ||||||||||||||||||
|
| |||||||||||||||||||||||
Total Return | ||||||||||||||||||||||||
Total investment return based on net asset value(c) | .34 | %* | 1.24 | % | 2.36 | % | 6.26 | % | 3.14 | % | (.40 | )% | ||||||||||||
Ratios/Supplemental Data | ||||||||||||||||||||||||
Net assets, end of period | $946 | $933 | $1,286 | $1,218 | $1,108 | $1,299 | ||||||||||||||||||
Ratio to average net assets of: | ||||||||||||||||||||||||
Expenses | .03 | %(d) | .03 | % | .05 | %(e) | .12 | % | .04 | % | .03 | % | ||||||||||||
Expenses, excluding interest expense and TALF administration fee | .03 | %(d) | .03 | % | .03 | %(e) | .02 | % | .03 | % | .03 | % | ||||||||||||
Expenses, excluding interest expense | .03 | %(d) | .03 | % | .03 | %(e) | .03 | % | .04 | % | .03 | % | ||||||||||||
Net investment income | .98 | %(d) | 1.26 | % | 1.75 | %(e) | 2.64 | % | 4.06 | % | 4.75 | % | ||||||||||||
Portfolio turnover rate | 70 | % | 129 | % | 88 | % | 130 | % | 153 | % | 116 | % | ||||||||||||
See footnote summary on page 323.
| ALLIANCEBERNSTEIN POOLING PORTFOLIOS • | 315 |
Financial Highlights
Selected Data For A Share Of Beneficial Interest Outstanding Throughout Each Period
| Global Core Bond | ||||||||||||||||||||||||
Six Months (unaudited) | Year Ended August 31, | |||||||||||||||||||||||
| 2012 | 2011 | 2010 | 2009 | 2008 | ||||||||||||||||||||
|
|
|
|
|
|
|
|
|
|
|
| |||||||||||||
Net asset value, beginning of period | $ 11.00 | $ 10.88 | $ 10.78 | $ 9.98 | $ 9.70 | $ 9.87 | ||||||||||||||||||
|
| |||||||||||||||||||||||
Income From Investment Operations | ||||||||||||||||||||||||
Net investment income(a) | .15 | .33 | .41 | .45 | .51 | .50 | ||||||||||||||||||
Net realized and unrealized gain (loss) on investment and foreign currency transactions | .01 | .40 | .15 | .80 | .33 | (.16 | ) | |||||||||||||||||
|
| |||||||||||||||||||||||
Net increase in net asset value from operations | .16 | .73 | .56 | 1.25 | .84 | .34 | ||||||||||||||||||
|
| |||||||||||||||||||||||
Less: Dividends and Distributions | ||||||||||||||||||||||||
Dividends from net investment income | (.23 | ) | (.34 | ) | (.43 | ) | (.45 | ) | (.56 | ) | (.51 | ) | ||||||||||||
Distributions from net realized gain on investment transactions | (.36 | ) | (.27 | ) | (.03 | ) | – 0 | – | – 0 | – | – 0 | – | ||||||||||||
|
| |||||||||||||||||||||||
Total dividends and distributions | (.59 | ) | (.61 | ) | (.46 | ) | (.45 | ) | (.56 | ) | (.51 | ) | ||||||||||||
|
| |||||||||||||||||||||||
Net asset value, end of period | $ 10.57 | $ 11.00 | $ 10.88 | $ 10.78 | $ 9.98 | $ 9.70 | ||||||||||||||||||
|
| |||||||||||||||||||||||
Total Return | ||||||||||||||||||||||||
Total investment return based on net asset value(c) | 1.42 | %* | 6.98 | %† | 5.38 | % | 12.84 | % | 9.26 | % | 3.51 | % | ||||||||||||
Ratios/Supplemental Data | ||||||||||||||||||||||||
Net assets, end of period | $1,084 | $1,124 | $1,307 | $1,353 | $1,281 | $1,654 | ||||||||||||||||||
Ratio to average net assets of: | ||||||||||||||||||||||||
Expenses | .03 | %(d) | .03 | % | .03 | %(e) | .13 | % | .04 | % | .03 | % | ||||||||||||
Expenses, excluding interest expense and TALF administration fee | .03 | %(d) | .03 | % | .02 | %(e) | .02 | % | .03 | % | .03 | % | ||||||||||||
Expenses, excluding interest expense | .03 | %(d) | .03 | % | .02 | %(e) | .03 | % | .04 | % | .03 | % | ||||||||||||
Net investment income | 2.80 | %(d) | 2.99 | % | 3.87 | %(e) | 4.38 | % | 5.47 | % | 5.01 | % | ||||||||||||
Portfolio turnover rate | 49 | % | 163 | % | 114 | % | 94 | % | 108 | % | 114 | % | ||||||||||||
| See | footnote summary on page 323. |
| 316 | • ALLIANCEBERNSTEIN POOLING PORTFOLIOS |
Financial Highlights
Selected Data For A Share Of Beneficial Interest Outstanding Throughout Each Period
| Bond Inflation Protection | ||||||||||||||||||||||||
Six Months (unaudited) | Year Ended August 31, | |||||||||||||||||||||||
| 2012 | 2011 | 2010 | 2009 | 2008 | ||||||||||||||||||||
|
| |||||||||||||||||||||||
Net asset value, beginning of period | $ 11.22 | $ 11.46 | $ 10.70 | $ 9.91 | $ 10.74 | $ 9.99 | ||||||||||||||||||
|
|
|
|
|
|
|
|
|
|
|
| |||||||||||||
Income From Investment Operations | ||||||||||||||||||||||||
Net investment income(a) | .09 | .38 | .68 | .34 | .04 | .69 | ||||||||||||||||||
Net realized and unrealized gain (loss) on investment and foreign currency transactions | .18 | .32 | .40 | .58 | (.19 | ) | .52 | |||||||||||||||||
Contributions from Adviser | – 0 | – | – 0 | – | – 0 | – | .00 | (b) | – 0 | – | – 0 | – | ||||||||||||
|
|
|
|
|
|
|
|
|
|
|
| |||||||||||||
Net increase (decrease) in net asset value from operations | .27 | .70 | 1.08 | .92 | (.15 | ) | 1.21 | |||||||||||||||||
|
|
|
|
|
|
|
|
|
|
|
| |||||||||||||
Less: Dividends and Distributions | ||||||||||||||||||||||||
Dividends from net investment income | (.52 | ) | (.72 | ) | (.32 | ) | (.13 | ) | (.68 | ) | (.46 | ) | ||||||||||||
Distributions from net realized gain on investment transactions | (.18 | ) | (.22 | ) | – 0 | – | – 0 | – | – 0 | – | – 0 | – | ||||||||||||
|
|
|
|
|
|
|
|
|
|
|
| |||||||||||||
Total dividends and distributions | (.70 | ) | (.94 | ) | (.32 | ) | (.13 | ) | (.68 | ) | (.46 | ) | ||||||||||||
|
|
|
|
|
|
|
|
|
|
|
| |||||||||||||
Net asset value, end of period | $ 10.79 | $ 11.22 | $ 11.46 | $ 10.70 | $ 9.91 | $ 10.74 | ||||||||||||||||||
|
| |||||||||||||||||||||||
Total Return | ||||||||||||||||||||||||
Total investment return based on net asset value(c) | 2.37 | % | 6.59 | % | 10.28 | % | 9.31 | % | (.88 | )% | 12.45 | % | ||||||||||||
Ratios/Supplemental Data | ||||||||||||||||||||||||
Net assets, end of period | $778,018 | $792,721 | $712,731 | $667,764 | $586,321 | $688,918 | ||||||||||||||||||
Ratio to average net assets of: | ||||||||||||||||||||||||
Expenses | .15 | %(d) | .11 | % | .12 | %(e) | .07 | % | .04 | % | .04 | % | ||||||||||||
Expenses, excluding interest expense | .04 | %(d) | .04 | % | .04 | %(e) | .04 | % | .04 | % | .04 | % | ||||||||||||
Net investment income | 1.68 | %(d) | 3.44 | % | 6.21 | %(e) | 3.25 | % | .44 | % | 6.63 | % | ||||||||||||
Portfolio turnover rate | 22 | % | 52 | % | 39 | % | 21 | % | 20 | % | 9 | % | ||||||||||||
See footnote summary on page 323.
| ALLIANCEBERNSTEIN POOLING PORTFOLIOS • | 317 |
Financial Highlights
Selected Data For A Share Of Beneficial Interest Outstanding Throughout Each Period
| High-Yield | ||||||||||||||||||||||||
Six Months (unaudited) | Year Ended August 31, | |||||||||||||||||||||||
| 2012 | 2011 | 2010 | 2009 | 2008 | ||||||||||||||||||||
|
|
|
|
|
|
|
|
|
|
|
| |||||||||||||
Net asset value, beginning of period | $ 10.31 | $ 9.71 | $ 9.85 | $ 8.51 | $ 8.87 | $ 9.89 | ||||||||||||||||||
|
| |||||||||||||||||||||||
Income From Investment Operations | ||||||||||||||||||||||||
Net investment income(a) | .39 | .76 | .87 | .89 | .81 | .78 | ||||||||||||||||||
Net realized and unrealized gain (loss) on investment and foreign currency transactions | .36 | .53 | (.08 | ) | 1.33 | (.38 | ) | (1.03 | ) | |||||||||||||||
Contributions from Adviser | – 0 | – | – 0 | – | .00 | (b) | – 0 | – | – 0 | – | – 0 | – | ||||||||||||
|
|
|
|
|
|
|
|
|
|
|
| |||||||||||||
Net increase (decrease) in net asset value from operations | .75 | 1.29 | .79 | 2.22 | .43 | (.25 | ) | |||||||||||||||||
|
|
|
|
|
|
|
|
|
|
|
| |||||||||||||
Less: Dividends | ||||||||||||||||||||||||
Dividends from net investment income | (.50 | ) | (.69 | ) | (.93 | ) | (.88 | ) | (.79 | ) | (.77 | ) | ||||||||||||
|
|
|
|
|
|
|
|
|
|
|
| |||||||||||||
Net asset value, end of period | $ 10.56 | $ 10.31 | $ 9.71 | $ 9.85 | $ 8.51 | $ 8.87 | ||||||||||||||||||
|
| |||||||||||||||||||||||
Total Return | ||||||||||||||||||||||||
Total investment return based on net asset value(c) | 7.38 | % | 13.95 | % | 8.07 | % | 27.01 | % | 7.25 | % | (2.76 | )% | ||||||||||||
Ratios/Supplemental Data | ||||||||||||||||||||||||
Net assets, end of period | $385,431 | $397,208 | $482,423 | $487,751 | $463,400 | $526,850 | ||||||||||||||||||
Ratio to average net assets of: | ||||||||||||||||||||||||
Expenses | .08 | %(d) | .07 | % | .07 | %(e) | .05 | % | .06 | % | .05 | % | ||||||||||||
Net investment income | 7.48 | %(d) | 7.87 | % | 8.53 | %(e) | 9.29 | % | 11.13 | % | 8.19 | % | ||||||||||||
Portfolio turnover rate | 27 | % | 57 | % | 55 | % | 34 | % | 40 | % | 25 | % | ||||||||||||
See footnote summary on page 323.
| 318 | • ALLIANCEBERNSTEIN POOLING PORTFOLIOS |
Financial Highlights
Selected Data For A Share Of Beneficial Interest Outstanding Throughout Each Period
| Small-Mid Cap Value | ||||||||||||||||||||||||
Six Months (unaudited) | Year Ended August 31, | |||||||||||||||||||||||
| 2012 | 2011 | 2010 | 2009 | 2008 | ||||||||||||||||||||
|
|
|
|
|
|
|
|
|
|
|
| |||||||||||||
Net asset value, beginning of period | $ 11.72 | $ 10.38 | $ 9.08 | $ 8.10 | $ 11.19 | $ 12.79 | ||||||||||||||||||
|
| |||||||||||||||||||||||
Income From Investment Operations | ||||||||||||||||||||||||
Net investment income(a) | .11 | .16 | .15 | .11 | .14 | .19 | ||||||||||||||||||
Net realized and unrealized gain (loss) on investment transactions | 1.78 | 1.30 | 1.30 | .99 | (2.34 | ) | (.96 | ) | ||||||||||||||||
|
| |||||||||||||||||||||||
Net increase (decrease) in net asset value from operations | 1.89 | 1.46 | 1.45 | 1.10 | (2.20 | ) | (.77 | ) | ||||||||||||||||
|
| |||||||||||||||||||||||
Less: Dividends and Distributions | ||||||||||||||||||||||||
Dividends from net investment income | (.19 | ) | (.12 | ) | (.15 | ) | (.12 | ) | (.14 | ) | (.18 | ) | ||||||||||||
Distributions from net realized gain on investment transactions | (1.49 | ) | – 0 | – | – 0 | – | – 0 | – | (.75 | ) | (.65 | ) | ||||||||||||
|
| |||||||||||||||||||||||
Total dividends and distributions | (1.68 | ) | (.12 | ) | (.15 | ) | (.12 | ) | (.89 | ) | (.83 | ) | ||||||||||||
|
| |||||||||||||||||||||||
Net asset value, end of period | $ 11.93 | $ 11.72 | $ 10.38 | $ 9.08 | $ 8.10 | $ 11.19 | ||||||||||||||||||
|
| |||||||||||||||||||||||
Total Return | ||||||||||||||||||||||||
Total investment return based on net asset value(c) | 17.78 | % | 14.21 | % | 15.84 | % | 13.56 | % | (16.76 | )% | (6.29 | )% | ||||||||||||
Ratios/Supplemental Data | ||||||||||||||||||||||||
Net assets, end of period | $326,715 | $328,749 | $497,049 | $500,525 | $553,145 | $685,788 | ||||||||||||||||||
Ratio to average net assets of: | ||||||||||||||||||||||||
Expenses | .06 | %(d) | .05 | % | .04 | %(e) | .04 | % | .04 | % | .04 | % | ||||||||||||
Net investment income | 1.85 | %(d) | 1.47 | % | 1.36 | %(e) | 1.20 | % | 2.00 | % | 1.67 | % | ||||||||||||
Portfolio turnover rate | 24 | % | 52 | % | 65 | % | 54 | % | 60 | % | 38 | % | ||||||||||||
See footnote summary on page 323.
| ALLIANCEBERNSTEIN POOLING PORTFOLIOS • | 319 |
Financial Highlights
Selected Data For A Share Of Beneficial Interest Outstanding Throughout Each Period
| Small-Mid Cap Growth | ||||||||||||||||||||||||
Six Months (unaudited) | Year Ended August 31, | |||||||||||||||||||||||
| 2012 | 2011 | 2010 | 2009 | 2008 | ||||||||||||||||||||
|
| |||||||||||||||||||||||
Net asset value, beginning of period | $ 13.23 | $ 16.09 | $ 11.77 | $ 10.18 | $ 12.62 | $ 14.79 | ||||||||||||||||||
|
| |||||||||||||||||||||||
Income From Investment Operations | ||||||||||||||||||||||||
Net investment income(a) | .05 | .08 | .07 | .05 | .04 | .05 | ||||||||||||||||||
Net realized and unrealized gain (loss) on investment transactions | 1.06 | 2.15 | 4.32 | 1.59 | (2.44 | ) | (.78 | ) | ||||||||||||||||
Contributions from Adviser | – 0 | – | – 0 | – | – 0 | – | – 0 | – | .00 | (b) | .01 | |||||||||||||
|
| |||||||||||||||||||||||
Net increase (decrease) in net asset value from operations | 1.11 | 2.23 | 4.39 | 1.64 | (2.40 | ) | (.72 | ) | ||||||||||||||||
|
| |||||||||||||||||||||||
Less: Dividends and Distributions | ||||||||||||||||||||||||
Dividends from net investment income | (.07 | ) | (.09 | ) | (.07 | ) | (.05 | ) | (.04 | ) | (.06 | ) | ||||||||||||
Distributions from net realized gain on investment transactions | (2.69 | ) | (5.00 | ) | – 0 | – | – 0 | – | – 0 | – | (1.39 | ) | ||||||||||||
|
| |||||||||||||||||||||||
Total dividends and distributions | (2.76 | ) | (5.09 | ) | (.07 | ) | (.05 | ) | (.04 | ) | (1.45 | ) | ||||||||||||
|
| |||||||||||||||||||||||
Net asset value, end of period | $ 11.58 | $ 13.23 | $ 16.09 | $ 11.77 | $ 10.18 | $ 12.62 | ||||||||||||||||||
|
| |||||||||||||||||||||||
Total Return | ||||||||||||||||||||||||
Total investment return based on net asset value(c) | 10.57 | %* | 17.77 | %* | 37.31 | %* | 16.13 | % | (18.97 | )% | (5.84 | )% | ||||||||||||
Ratios/Supplemental Data | ||||||||||||||||||||||||
Net assets, end of period | $327,807 | $328,634 | $504,936 | $520,593 | $548,279 | $686,291 | ||||||||||||||||||
Ratio to average net assets of: | ||||||||||||||||||||||||
Expenses | .07 | %(d) | .06 | % | .04 | %(e) | .04 | % | .05 | % | .04 | % | ||||||||||||
Net investment income | .74 | %(d) | .55 | % | .43 | %(e) | .46 | % | .49 | % | .39 | % | ||||||||||||
Portfolio turnover rate | 33 | % | 68 | % | 75 | % | 91 | % | 107 | % | 88 | % | ||||||||||||
See footnote summary on page 323.
| 320 | • ALLIANCEBERNSTEIN POOLING PORTFOLIOS |
Financial Highlights
Selected Data For A Share Of Beneficial Interest Outstanding Throughout Each Period
| Multi-Asset Real Return | ||||||||||||||||||||||||
Six Months (unaudited) | Year Ended August 31, | |||||||||||||||||||||||
| 2012** | 2011** | 2010 | 2009 | 2008 | ||||||||||||||||||||
|
| |||||||||||||||||||||||
Net asset value, beginning of period | $ 8.67 | $ 9.13 | $ 8.57 | $ 7.68 | $ 9.56 | $ 13.90 | ||||||||||||||||||
|
| |||||||||||||||||||||||
Income From Investment Operations | ||||||||||||||||||||||||
Net investment income(a) | .05 | .18 | .24 | .28 | .28 | .36 | ||||||||||||||||||
Net realized and unrealized gain (loss) on investment and foreign currency transactions | .20 | (.25 | ) | 1.06 | .83 | (2.11 | ) | (2.32 | ) | |||||||||||||||
|
| |||||||||||||||||||||||
Net increase (decrease) in net asset value from operations | .25 | (.07 | ) | 1.30 | 1.11 | (1.83 | ) | (1.96 | ) | |||||||||||||||
|
| |||||||||||||||||||||||
Less: Dividends and Distributions | ||||||||||||||||||||||||
Dividends from net investment income | (.28 | ) | (.39 | ) | (.74 | ) | (.22 | ) | (.05 | ) | (1.33 | ) | ||||||||||||
Distributions from net realized gain on investment transactions | – 0 | – | – 0 | – | – 0 | – | – 0 | – | – 0 | – | (1.05 | ) | ||||||||||||
|
| |||||||||||||||||||||||
Total dividends and distributions | (.28 | ) | (.39 | ) | (.74 | ) | (.22 | ) | (.05 | ) | (2.38 | ) | ||||||||||||
|
| |||||||||||||||||||||||
Net asset value, end of period | $ 8.64 | $ 8.67 | $ 9.13 | $ 8.57 | $ 7.68 | $ 9.56 | ||||||||||||||||||
|
| |||||||||||||||||||||||
Total Return | ||||||||||||||||||||||||
Total investment return based on net asset value(c) | 2.95 | % | (.45 | )%* | 15.42 | % | 14.68 | % | (19.25 | )% | (17.38 | )% | ||||||||||||
Ratios/Supplemental Data | ||||||||||||||||||||||||
Net assets, end of period (000’s omitted) | $1,144,445 | $547,929 | $937,281 | $925,042 | $994,537 | $1,132,381 | ||||||||||||||||||
Ratio to average net assets of: | ||||||||||||||||||||||||
Expenses | .05 | %(d) | .06 | % | .05 | %(e) | .03 | % | .05 | % | .07 | % | ||||||||||||
Net investment income | 1.14 | %(d) | 2.11 | % | 2.52 | %(e) | 3.43 | % | 4.46 | % | 3.11 | % | ||||||||||||
Portfolio turnover rate | 38 | % | 110 | % | 156 | % | 57 | % | 76 | % | 46 | % | ||||||||||||
See footnote summary on page 323.
| ALLIANCEBERNSTEIN POOLING PORTFOLIOS • | 321 |
Financial Highlights
Selected Data For A Share Of Beneficial Interest Outstanding Throughout Each Period
| Volatility Management | ||||||||||||||||
Six Months (unaudited) | Year Ended August 31, | April 16, 2010(f) to August 31, | ||||||||||||||
| 2012 | 2011 | 2010 | ||||||||||||||
|
| |||||||||||||||
Net asset value, beginning of period | $ 10.24 | $ 10.27 | $ 9.31 | $ 10.00 | ||||||||||||
|
| |||||||||||||||
Income From Investment Operations | ||||||||||||||||
Net investment income(a) | .07 | .07 | .09 | (g) | .04 | (g) | ||||||||||
Net realized and unrealized gain (loss) on investment and foreign currency transactions | .72 | .24 | 1.36 | (.73 | ) | |||||||||||
|
| |||||||||||||||
Net increase (decrease) in net asset value from operations | .79 | .31 | 1.45 | (.69 | ) | |||||||||||
|
| |||||||||||||||
Less: Dividends and Distributions | ||||||||||||||||
Dividends from net investment income | (.12 | ) | (.06 | ) | (.08 | ) | – 0 | – | ||||||||
Distributions from net realized gain on investment transactions | – 0 | – | (.28 | ) | (.41 | ) | – 0 | – | ||||||||
|
| |||||||||||||||
Total dividends and distributions | (.12 | ) | (.34 | ) | (.49 | ) | – 0 | – | ||||||||
|
| |||||||||||||||
Net asset value, end of period | $ 10.91 | $ 10.24 | $ 10.27 | $ 9.31 | ||||||||||||
|
| |||||||||||||||
Total Return | ||||||||||||||||
Total investment return based on net asset value(c) | 7.76 | % | 3.10 | % | 15.61 | % | (6.90 | )% | ||||||||
Ratios/Supplemental Data | ||||||||||||||||
Net assets, end of period | $1,669 | $1,688 | $284 | $296 | ||||||||||||
Ratio to average net assets of: | ||||||||||||||||
Expenses, net of waivers/reimbursements | .03 | %(d) | .04 | % | .15 | %(e) | .15 | %(d)(e) | ||||||||
Expenses, before waivers/reimbursements | .03 | %(d) | .04 | % | .16 | %(e) | .21 | %(d)(e) | ||||||||
Net investment income | 1.29 | %(d) | .68 | % | .88 | %(e)(g) | 1.06 | %(d)(e)(g) | ||||||||
Portfolio turnover rate | 60 | % | 130 | % | 81 | % | 51 | % | ||||||||
See footnote summary on page 323.
| 322 | • ALLIANCEBERNSTEIN POOLING PORTFOLIOS |
Financial Highlights
| (a) | Based on average shares outstanding. |
| (b) | Amount is less than $0.005. |
| (c) | Total investment return is calculated assuming an initial investment made at the net asset value at the beginning of the period, reinvestment of all dividends and distributions at net asset value during the period, and redemption on the last day of the period. Total return does not reflect the deduction of taxes that a shareholder would pay on fund distributions or the redemption of fund shares. Total investment return calculated for a period of less than one year is not annualized. |
| (d) | Annualized. |
| (e) | The ratio includes expenses attributable to costs of proxy solicitation. |
| (f) | Commencement of operations. |
| (g) | Net of fees and expenses waived/reimbursed by the Adviser. |
| * | Includes the impact of proceeds received and credited to the Portfolio resulting from the class action settlements, which enhanced the performance for the U.S. Value Portfolio for the year ended August 31, 2012 by 0.01%, U.S. Large Cap Growth Portfolio for the years ended August 31, 2012, August 31, 2011 and August 31, 2010 by 0.02%, 0.01% and 0.01%, respectively, Short Duration Bond Portfolio for the six months ended February 28, 2013 by 0.02%, Global Core Bond Portfolio for the six months ended by 0.01%, Small-Mid Cap Growth Portfolio for the six months ended February 28, 2013 and years ended August 31, 2012 and August 31, 2011 by 0.04%, 0.01% and 0.01%, respectively and Multi-Asset Real Return Portfolio for the year ended August 31, 2012 by 0.01% . |
| ** | Consolidated (see Note A). |
| † | Includes the Adviser’s reimbursement in respect of the Lehman Bankruptcy Claim which contributed to the Portfolio’s performance by 0.09% for the year ended August 31, 2012, (see Note B). |
See notes to financial statements.
| ALLIANCEBERNSTEIN POOLING PORTFOLIOS • | 323 |
Financial Highlights
TRUSTEES
William H. Foulk, Jr.(1) , Chairman John H. Dobkin(1) Michael J. Downey(1) D. James Guzy(1) Nancy P. Jacklin(1) | Robert M. Keith, President and Chief Executive Officer Garry L. Moody(1) Marshall C. Turner, Jr.(1) Earl D. Weiner(1) | |
| OFFICERS(2) | ||
Philip L. Kirstein, Senior Vice President and Independent Compliance Officer Bruce K. Aronow, Vice President Takeo Aso, Vice President Frank V. Caruso, Vice President Vincent L. Childers, Vice President Sergey Davalchenko, Vice President Paul J. DeNoon, Vice President Jon P. Denfeld, Vice President Scott A. DiMaggio, Vice President Gershon M. Distenfeld, Vice President Vincent C. DuPont, Vice President Sharon E. Fay, Vice President John H. Fogarty, Vice President Rajen B. Jadav, Vice President Shawn E. Keegan, Vice President N. Kumar Kirpalani, Vice President Samantha S. Lau, Vice President Avi Lavi, Vice President Daniel J. Loewy, Vice President James W. MacGregor, Vice President | Alison M. Martier, Vice President Christopher W. Marx, Vice President Seth J. Masters, Vice President Michael L. Mon, Vice President Joseph G. Paul, Vice President Douglas J. Peebles, Vice President Gregory L. Powell, Vice President Jonathan E. Ruff, Vice President Laurent Saltiel, Vice President Ashish C. Shah, Vice President Matthew S. Sheridan, Vice President Kevin F. Simms, Vice President Wen-Tse Tseng, Vice President Jean-Francois Van de Walle, Vice President Andrew J. Weiner, Vice President Greg J. Wilensky, Vice President Emilie D. Wrapp, Secretary Joseph J. Mantineo, Treasurer and Chief Financial Officer Phyllis J. Clarke, Controller | |
Custodian and Accounting Agent State Street Bank and Trust Company
Principal Underwriter AllianceBernstein Investments, Inc.
Transfer Agent AllianceBernstein Investor |
Legal Counsel Seward & Kissel LLP
Independent Registered Public Ernst & Young LLP | |
| (1) | Member of the Audit Committee, the Governance and Nominating Committee and the Independent Directors Committee. Mr. Foulk is the sole member of the Fair Value Pricing Committee. |
| 324 | • ALLIANCEBERNSTEIN POOLING PORTFOLIOS |
Trustees
| (2) | The management of, and investment decisions for, the AllianceBernstein Multi-Asset Real Return Portfolio are made by the Real Asset Strategy Team. Mr. Vincent L. Childers and Mr. Jonathan E. Ruff are the senior most members of the Investment Management Team. |
| The management of, and investment decisions for, the AllianceBernstein U.S. Value Portfolio are made by the U.S. Value Senior Investment Management Team. Mr. Joseph G. Paul, Mr. Christopher W. Marx and Mr. Gregory L. Powell are the senior most members of the Investment Management Team. |
| The management of, and investment decisions for, the AllianceBernstein Small-Mid Cap Value Portfolio are made by the Small-Mid Cap Value Senior Investment Management Team. Mr. Joseph G. Paul, Mr. James W. MacGregor and Mr. Andrew J. Weiner are the senior most members of the Investment Management Team. |
| The management of, and investment decisions for, the AllianceBernstein International Value Portfolio are made by the International Value Senior Investment Management Team. Mr. Takeo Aso, Ms. Sharon E. Fay, Mr. Avi Lavi and Mr. Kevin F. Simms are the senior most members of the Investment Management Team. |
| The management of, and investment decisions for, the AllianceBernstein U.S. Large Cap Growth Portfolio are made by the U.S. Large Cap Growth Team. Mr. Frank V. Caruso, Mr. Vincent C. DuPont and Mr. John H. Fogarty are the senior most members of the team. |
| The management of, and investment decisions for, the AllianceBernstein Small-Mid Cap Growth Portfolio are made by the Small/Mid Cap Growth Investment Team. Mr. Bruce K. Aronow, Mr. N. Kumar Kirpalani, Ms. Samantha S. Lau and Mr. Wen-Tse Tseng are the senior most members of the team. |
| The management of, and investment decisions for, the AllianceBernstein International Growth Portfolio are made by the International Growth Team. Mr. Sergey Davalchenko, Mr. Laurent Saltiel and Mr. Jean-Francois Van de Walle are the senior most members of the team. |
| The management of, and investment decisions for, the AllianceBernstein Short Duration Bond Portfolio are made by the U.S. Multi Sector Fixed Income Team. Mr. Jon P. Denfeld, Mr. Paul J. DeNoon, Mr. Shawn E. Keegan, Ms. Alison M. Martier, Mr. Douglas J. Peebles and Mr. Greg J. Wilensky are the senior most members of the team. |
| The management of, and investment decisions for, the AllianceBernstein Global Core Bond Portfolio are made by the U.S. Global Fixed Income Investment Team. Mr. Paul J. DeNoon, Mr. Scott A. DiMaggio, Mr. Michael L. Mon, Mr. Douglas J. Peebles and Mr. Matthew S. Sheridan are the senior most members of the team. |
| The management of, and investment decisions for, the AllianceBernstein High-Yield Portfolio are made by the Global Credit Investment Team. Mr. Gershon M. Distenfeld, Mr. Douglas J. Peebles and Mr. Ashish C. Shah are the senior most members of the team. |
| Mr. Greg J. Wilensky, Director of Stable Value Investments, Mr. Rajen B. Jadav and Mr. Shawn E. Keegan are primarily responsible for the day-to-day management of the AllianceBernstein Bond Inflation Protection Portfolio. |
| The day-to-day management of, and investment decisions for, the AllianceBernstein Volatility Management Portfolio are made by the Adviser’s Dynamic Asset Allocation Team. Mr. Seth J. Masters and Mr. Daniel J. Loewy are primarily responsible for the day-to-day management of the Portfolio. |
| ALLIANCEBERNSTEIN POOLING PORTFOLIOS • | 325 |
Trustees
Information Regarding the Review and Approval of the Advisory Agreement in Respect of Each Portfolio
The disinterested trustees (the “trustees”) of The AllianceBernstein Pooling Portfolios (the “Trust”) unanimously approved the continuance of the Trust’s Advisory Agreement with the Adviser in respect of each of the fixed-income portfolios listed below (each, a “Portfolio” and collectively, the “Portfolios”) at a meeting held on November 6-8, 2012:
| • | AllianceBernstein Short Duration Bond Portfolio |
| • | AllianceBernstein Global Core Bond Portfolio (formerly named AllianceBernstein Intermediate Duration Bond Portfolio) |
| • | AllianceBernstein Bond Inflation Protection Portfolio (formerly named AllianceBernstein Inflation Protected Securities Portfolio) |
| • | AllianceBernstein High-Yield Portfolio |
Prior to approval of the continuance of the Advisory Agreement in respect of each Portfolio, the trustees had requested from the Adviser, and received and evaluated, extensive materials. They reviewed the proposed continuance of the Advisory Agreement with the Adviser and with experienced counsel who are independent of the Adviser, who advised on the relevant legal standards. The trustees also reviewed an independent evaluation prepared by the Trust’s Senior Officer (who is also the Trust’s Independent Compliance Officer) of the reasonableness of the advisory fee in respect of each Portfolio, in which the Senior Officer concluded that the contractual fee (zero) for each Portfolio was reasonable. The trustees also discussed the proposed continuances in private sessions with counsel and the Trust’s Senior Officer.
The trustees noted that the Portfolios are designed as investment vehicles for certain AllianceBernstein institutional clients, including registered investment companies sponsored by the Adviser (the institutional clients, including the registered investment companies, are all referred to as the “Pooling Investors”). The trustees also noted that no advisory fee is payable by any of the Portfolios, although the Advisory Agreement provides that the Portfolios will reimburse the Adviser for the cost of certain clerical, accounting, administrative and other services provided to the Portfolios by employees of the Adviser or its affiliates, and that a similar reimbursement provision is included in the Adviser’s advisory agreements with most of the open-end AllianceBernstein Funds. The trustees further noted that the Trust acknowledges in the Advisory Agreement that the Adviser will receive compensation for its services to the Portfolios from third parties (e.g., the Pooling Investors). The trustees noted that the current Pooling Investors in the Portfolios are certain registered investment companies sponsored by the Adviser and an unaffiliated institutional investor.
The trustees considered their knowledge of the nature and quality of the services provided by the Adviser to the Portfolios gained from their experience as trustees
| 326 | • ALLIANCEBERNSTEIN POOLING PORTFOLIOS |
or directors of most of the registered investment companies advised by the Adviser, their overall confidence in the Adviser’s integrity and competence they have gained from that experience, the Adviser’s initiative in identifying and raising potential issues with the trustees and its responsiveness, frankness and attention to concerns raised by the trustees in the past, including the Adviser’s willingness to consider and implement organizational and operational changes designed to improve investment results and the services provided to the AllianceBernstein Funds. The trustees noted that they have four regular meetings each year, at each of which they receive presentations from the Adviser on the investment results of the Portfolios and review extensive materials and information presented by the Adviser.
The trustees also considered all other factors they believed relevant, including the specific matters discussed below. In their deliberations, the trustees did not identify any particular information that was all-important or controlling, and different trustees may have attributed different weights to the various factors. The trustees determined that the selection of the Adviser to manage each Portfolio, and the overall arrangements between each Portfolio and the Adviser as provided in the Advisory Agreement, including the advisory fee, were fair and reasonable in light of the services performed, expenses incurred and such other matters as the trustees considered relevant in the exercise of their business judgment. The material factors and conclusions that formed the basis for the trustees’ determination included the following:
Nature, Extent and Quality of Services Provided
The trustees considered the scope and quality of services provided by the Adviser under the Advisory Agreement, including the quality of the investment research capabilities of the Adviser and the other resources it has dedicated to performing services for the Portfolios. They also noted the professional experience and qualifications of each Portfolio’s portfolio management team and other senior personnel of the Adviser. The trustees also considered that the Advisory Agreement provides that each Portfolio will reimburse the Adviser for the cost to it of providing certain clerical, accounting, administrative and other services provided to such Portfolio by employees of the Adviser or its affiliates. Requests for these reimbursements are made on a quarterly basis and subject to approval by the trustees and, to the extent requested and paid, result in some compensation from such Portfolio to the Adviser. The trustees noted that the methodology used to determine the reimbursement amounts had been reviewed by an independent consultant retained by the Trust’s Senior Officer. The trustees noted that to date the Adviser had not asked them to approve reimbursements from any of the Portfolios. The quality of administrative and other services, including the Adviser’s role in coordinating the activities of each Portfolio’s other service providers, also were considered. The trustees concluded that, overall, they were satisfied with the nature, extent and quality of services provided to each of the Portfolios under the Advisory Agreement.
| ALLIANCEBERNSTEIN POOLING PORTFOLIOS • | 327 |
Costs of Services Provided and Profitability
The trustees reviewed a schedule of the revenues, expenses and related notes indicating the profitability of each Portfolio (which, as noted above, pays no advisory fee to the Adviser but may reimburse expenses to the Adviser) to the Adviser for calendar years 2010 and 2011 that had been prepared with an expense allocation methodology arrived at in consultation with an independent consultant retained by the Trust’s Senior Officer. The trustees reviewed the assumptions and methods of allocation used by the Adviser in preparing fund-specific profitability data and noted that there are a number of potentially acceptable allocation methodologies for information of this type. The trustees noted that the methodology took into account that the Adviser was indirectly compensated for its services to the Portfolios by the Pooling Investors. The trustees also noted that the profitability information reflected all revenues and expenses of the Adviser’s relationships with the Portfolios, including those relating to its subsidiaries that provide transfer agency, distribution and brokerage services to the Portfolios, and that the profitability methodology attributed revenues and expenses to the Portfolios relating to the Pooling Investors. The trustees recognized that it is difficult to make comparisons of the profitability of the Advisory Agreement with the profitability of advisory contracts for unaffiliated funds because comparative information is not generally publicly available and is affected by numerous factors. The trustees focused on the profitability of the Adviser’s relationships with the Portfolios before taxes and distribution expenses. The trustees concluded that they were satisfied that the Adviser’s level of profitability from its relationship with each Portfolio was not unreasonable.
Fall-Out Benefits
The trustees considered the other benefits to the Adviser and its affiliates from their relationships with the Portfolios, including but not limited to benefits relating to 12b-1 fees and sales charges received by the Trust’s principal underwriter (which is a wholly owned subsidiary of the Adviser) in respect of certain classes of shares of the Pooling Investors that are registered investment companies. The trustees noted that while the Adviser’s affiliated transfer agent does not receive fees for providing services to the Portfolios (although it may be reimbursed for its out-of-pocket expenses), such affiliated transfer agent receives fees for providing services to the Pooling Investors. The trustees noted that the Adviser receives fees for advisory, distribution, recordkeeping and other services provided to the institutional Pooling Investor and is compensated by the other Pooling Investors for providing advisory services to them. The trustees recognized that the Adviser’s profitability would be lower without these benefits. The trustees also understood that the Adviser also might derive reputational and other benefits from its association with the Portfolios.
Investment Results
In addition to the information reviewed by the trustees in connection with the meeting, the trustees receive detailed comparative performance information for
| 328 | • ALLIANCEBERNSTEIN POOLING PORTFOLIOS |
each Portfolio at each regular Board meeting during the year. At the November 2012 meeting, the trustees reviewed information prepared by Lipper showing the performance of each Portfolio as compared with that of a group of similar funds selected by Lipper (the “Performance Group”) and as compared with that of a broader array of funds selected by Lipper (the “Performance Universe”), and information prepared by the Adviser showing performance of each Portfolio as compared with one or more indices, in each case for the 1-, 3- and 5-year periods ended July 31, 2012 and (in the case of comparisons with the indices) the period since inception (May 2005 inception).
In reviewing the performance information the trustees noted that the Portfolios had a performance advantage in that the performance of virtually all of the Portfolios’ competitors was negatively affected by the fact they pay advisory fees whereas the Portfolios do not.
AllianceBernstein Short Duration Bond Portfolio
The trustees noted that the Portfolio was in the 5th quintile of the Performance Group and the Performance Universe for the 1- and 5-year periods, and in the 5th quintile of the Performance Group and 4th quintile of the Performance Universe for the 3-year period. The Portfolio outperformed the Bank of America Merrill Lynch 1-3 Year Treasury Index in the 1- and 3-year periods but lagged it in the 5-year period and the period since inception. Based on their review and their discussion with the Adviser of the reasons for the Portfolio’s performance, the trustees retained confidence in the Adviser’s ability to advise the Portfolio.
AllianceBernstein Global Core Bond Portfolio (formerly named AllianceBernstein Intermediate Duration Bond Portfolio)
The trustees noted that the Portfolio was in the 2nd quintile of the Performance Group and 1st quintile of the Performance Universe for the 1-year period, and in the 2nd quintile of the Performance Group and 3rd quintile of the Performance Universe for the 3- and 5-year periods. The Portfolio outperformed the Barclays Capital Global Aggregate Bond Index (USD hedged) and the Barclays Capital U.S. Aggregate Bond Index in all periods. The trustees noted the Adviser’s changes to the investment policies and restrictions of the Portfolio, and the related changes to the Portfolio’s name (to AllianceBernstein Global Core Bond Portfolio) and its benchmark (to the Barclays Capital Global Aggregate Bond Index, hedged to U.S. dollars) effective December 2011. Based on their review, the trustees concluded that the Portfolio’s performance was satisfactory.
AllianceBernstein Bond Inflation Protection Portfolio
The trustees noted that, although the Portfolio outperformed the Barclays Capital U.S. 1-10 Year Treasury Inflation Protected Securities (TIPS) Index in all periods, the Portfolio fell in the 4th quintile of the Performance Group and 5th quintile of the Performance Universe for the 1-year period, and in the 5th quintile of the Performance Group and the Performance Universe for the 3- and
| ALLIANCEBERNSTEIN POOLING PORTFOLIOS • | 329 |
5-year periods. The trustees noted that in 2010 they had approved modifications to the Portfolio’s investment guidelines and a name change to AllianceBernstein Bond Inflation Protection Portfolio from AllianceBernstein Inflation Protected Securities Portfolio. Based on their review and their discussion with the Adviser of the reasons for the Portfolio’s performance relative to its peers, the trustees concluded that the Portfolio’s performance was acceptable.
AllianceBernstein High-Yield Portfolio
The trustees noted that the Portfolio was in the 2nd quintile of the Performance Group and 3rd quintile of the Performance Universe for the 1-year period, and in the 1st quintile of the Performance Group and the Performance Universe for the 3- and 5-year periods. The Portfolio lagged the Barclays Capital U.S. High Yield 2% Issuer Capped Index in the 1-year period, was essentially even with the Index in the period since inception, and outperformed the Index in the 3- and 5-year periods. Based on their review, the trustees concluded that the Portfolio’s relative performance over time had been satisfactory.
Advisory Fees and Other Expenses
The trustees considered the advisory fee rate paid by each Portfolio to the Adviser (zero) and information prepared by Lipper concerning advisory fee rates paid by other funds in the same Lipper category as such Portfolio at a common asset level. The trustees also reviewed certain information showing the fees paid to the Adviser by the Pooling Investors. The trustees recognized that it is difficult to make comparisons of advisory fees because there are variations in the services that are included in the fees paid by other funds.
The trustees noted the unusual arrangements in the Advisory Agreement providing for no advisory fee but were cognizant that the Adviser is indirectly compensated by the Pooling Investors for its services to the Portfolios. While the fees paid by the Pooling Investors to the Adviser vary, the trustees acknowledged that a portion of those fees may reasonably be viewed as compensating the Adviser for advisory services it provides to each Portfolio (the “implied fee”) and that the Adviser had represented to the Securities and Exchange Commission’s staff and to the Trust’s former counsel that the implied fee rate is the same for all the Pooling Investors. The trustees also noted that the Adviser had undertaken to work with the trustees to develop procedures to enable the trustees to monitor the implied fee rates for the Portfolios and had provided the trustees with information concerning the fees paid by the various Pooling Investors. Based on their review, the trustees concluded that the advisory arrangements for the Portfolios, including the zero fee aspect of the Advisory Agreement with the Adviser, were satisfactory.
The trustees also considered the advisory fees the Adviser charges non-fund clients pursuing a similar investment style. For this purpose, the trustees reviewed the relevant advisory fee information from the Adviser’s Form ADV and the
| 330 | • ALLIANCEBERNSTEIN POOLING PORTFOLIOS |
evaluation from the Trust’s Senior Officer. The trustees recognized that this information was of limited utility in light of the Portfolios’ unusual fee arrangements. The trustees noted that the Adviser may, in some cases, agree to fee rates with large institutional clients that are lower than those on the schedules reviewed by the trustees and that they had previously discussed with the Adviser its policies in respect of such arrangements.
The Adviser reviewed with the trustees the significantly greater scope of the services it provides the Portfolios relative to institutional clients. The Adviser also noted that because mutual funds are constantly issuing and redeeming shares, they are more difficult to manage than an institutional account, where the assets tend to be relatively stable. In light of the substantial differences in services rendered by the Adviser to institutional clients as compared to funds such as the Portfolios, and the unusual fee structure for all the Portfolios, the trustees considered these fee comparisons inapt and did not place significant weight on them in their deliberations.
The trustees also considered the total non-advisory expense ratio of each Portfolio in comparison to the non-advisory expenses of funds within two comparison groups created by Lipper: an Expense Group and an Expense Universe. Lipper described an Expense Group as a representative sample of funds similar to a Portfolio and an Expense Universe as a broader group, consisting of all funds in a Portfolio’s investment classification/objective. The non-advisory expense ratio of each Portfolio was based on the Portfolio’s latest fiscal year. The trustees noted that it was likely that the non-advisory expense ratios of some of the other funds in each Portfolio’s Lipper category were lowered by waivers or reimbursements by those funds’ investment advisers, which in some cases might be voluntary or temporary. The trustees view the non-advisory expense ratio information as relevant to their evaluation of the Adviser’s services because the Adviser is responsible for coordinating services provided to the Portfolios by others.
The trustees noted that each Portfolio’s total non-advisory expense ratio was lower than the Expense Group and the Expense Universe medians. The trustees concluded that each Portfolio’s non-advisory expense ratio was satisfactory.
Economies of Scale
Since the Advisory Agreement does not provide for any compensation to be paid to the Adviser by the Portfolios, the trustees did not consider the extent to which the fee levels in the Advisory Agreement reflect economies of scale. They did note, however, that the fee schedules for the Pooling Investors that are registered investment companies incorporate breakpoints.
| ALLIANCEBERNSTEIN POOLING PORTFOLIOS • | 331 |
THE FOLLOWING IS NOT PART OF THE SHAREHOLDER REPORT OR THE FINANCIAL STATEMENTS
SUMMARY OF SENIOR OFFICER’S EVALUATION OF INVESTMENT ADVISORY AGREEMENT1
The following is a summary of the evaluation of the Investment Advisory Agreement between AllianceBernstein L.P. (the “Adviser”) and AllianceBernstein Pooling Portfolios (the “Trust” or the “Pooling Portfolios”) in respect of the following Portfolios:2
U.S. Value Portfolio
U.S. Large Cap Growth Portfolio
Multi-Asset Real Return Portfolio3
International Value Portfolio
International Growth Portfolio
Small-Mid Cap Value Portfolio
Small-Mid Cap Growth Portfolio
Volatility Management Portfolio
The Trust, which is designed to facilitate a “blended style” investment approach, represents a variety of asset classes and investment styles, and is available for investment only to institutional clients of the Adviser, including both registered investment companies and large managed separate accounts.
The evaluation of the Investment Advisory Agreement was prepared by Philip L. Kirstein, the Senior Officer, for the Trustees of the Trust, as required by a September 2004 agreement between the Adviser and the New York State Attorney General (the “NYAG”). The Senior Officer’s evaluation of the Investment Advisory Agreement is not meant to diminish the responsibility or authority of the Board of Trustees of the Trust to perform its duties pursuant to Section 15 of the Investment Company Act of 1940 (the “40 Act”) and applicable state law. The purpose of the summary is to provide shareholders with a synopsis of the independent evaluation of the reasonableness of the advisory fees proposed to be paid by the Portfolios which was provided to the Trustees in connection with their
| 1 | The information in the fee summary was completed on April 19, 2012 and discussed with the Board of Trustees on May 1-3, 2012. |
| 2 | Future references to the Portfolios do not include “AllianceBernstein.” The Portfolios of the Trust that are not discussed in this evaluation are the fixed-income Pooling Portfolios: Short Duration Bond Portfolio, Global Core Bond (formerly Intermediate Duration Bond Portfolio), Bond Inflation Protected Securities Portfolio (formerly Inflation Protected Securities Portfolio) and High Yield Portfolio. . |
| 3 | Effective December 31, 2010, the Portfolio changed its name from Global Real Estate Investment Portfolio and eliminated its policy of investing at least 80% of its net assets in real estate related investments. Also at this time, the Portfolio’s management team changed. |
| 332 | • ALLIANCEBERNSTEIN POOLING PORTFOLIOS |
review of the proposed approval of the continuance of the Investment Advisory Agreement. The Senior Officer’s evaluation considered the following factors:
| 1. | Advisory fees charged to institutional and other clients of the Adviser for like services; |
| 2. | Advisory fees charged by other mutual fund companies for like services; |
| 3. | Costs to the Adviser and its affiliates of supplying services pursuant to the advisory agreements, excluding any intra-corporate profit; |
| 4. | Profit margins of the Adviser and its affiliates from supplying such services; |
| 5. | Possible economies of scale as the Portfolios grow larger; and |
| 6. | Nature and quality of the Adviser’s services including the performance of the Portfolios. |
These factors, with the exception of the first factor, are generally referred to as the “Gartenberg factors,” which were articulated by the United States Court of Appeals for the Second Circuit in 1982. Gartenberg v. Merrill Lynch Asset Management, Inc., 694 F. 2d 923 (2d Cir. 1982). The first factor is an additional factor required to be considered by the AoD. On March 30, 2010, the Supreme Court held the Gartenberg decision was correct in its basic formulation of what §36(b) requires: to face liability under §36(b), “an investment adviser must charge a fee that is so disproportionately large that it bears no reasonable relationship to the services rendered and could not have been the product of arm’s length bargaining.” Jones v. Harris Associates L.P., 130 S. Ct. 1418 (2010). In the Jones decision, the Court stated the Gartenberg approach fully incorporates the correct understanding of fiduciary duty within the context of section 36(b) and noted with approval that “Gartenberg insists that all relevant circumstances be taken into account” and “uses the range of fees that might result from arm’s-length bargaining as the benchmark for reviewing challenged fees.”4
PORTFOLIO ADVISORY FEES, NET ASSETS, & EXPENSE RATIOS
Under the Investment Advisory Agreement, the Portfolios are not charged an advisory fee. The investment advisory contract also does not provide for the Adviser to be reimbursed for the cost of providing non-advisory services, which would include administration, distribution and transfer agent-related services, although the transfer agent of the Portfolios is reimbursed for out of pocket expenses. The Adviser is compensated by institutional clients of the Adviser (the “Institutional Clients”) that invest in the Pooling Portfolios. These clients include the AllianceBernstein Blended Style Series, Inc. – AllianceBernstein
| 4 | Jones v. Harris at 1427. |
| ALLIANCEBERNSTEIN POOLING PORTFOLIOS • | 333 |
Retirement Strategies (“Retirement Strategies”),5 The AllianceBernstein Portfolios – AllianceBernstein Wealth Strategies (“Wealth Strategies”),6 and the Rhode Island Higher Education Savings Trust (referred to herein as “CollegeBoundfund”). Collectively, these shareholders (the “Institutional Clients”) own 100 percent of the Pooling Portfolios’ total outstanding shares. Set forth below are the advisory fee schedules of the Institutional Clients that invests in the Pooling Portfolios.
AllianceBernstein Blended Style Series, Inc. – AllianceBernstein Retirement Strategies
Each of the Retirement Strategies pays an advisory fee correlated to the percentage of equity investments held by the Retirement Strategy. This fee is discounted by a certain percentage depending on the asset level of the Retirement Strategy as indicated below:
| % Invested in Equity Investments | Advisory Fee | |||
Equal to or less than 60% Greater than 60% and less than 80% Equal to or greater than 80% |
| 0.55 0.60 0.65 | % % % | |
| Net Asset Level | Discount | |
| Assets equal to or less than $2.5 billion | n/a | |
| Assets greater than $2.5 billion and less than $5 billion | 10 basis points | |
| Assets greater than $5 billion | 15 basis points |
Accordingly, under the terms of the Investment Advisory Agreement, the Retirement Strategies will pay the Adviser at the following annual rates:
| Average Daily Net Assets | ||||||||||||
| Retirement Strategy | First $2.5 billion | Next $2.5 billion | In excess of $5 billion | |||||||||
Retirement Strategies: 2030, 2035, 2040, 2045, 2050, 2055 | 0.65 | % | 0.55 | % | 0.50 | % | ||||||
Retirement Strategies: 2015, 2020, 2025 | 0.60 | % | 0.50 | % | 0.45 | % | ||||||
Retirement Strategies: 2000, 2005, 2010 | 0.55 | % | 0.45 | % | 0.40 | % | ||||||
| 5 | Includes AllianceBernstein 2000 Retirement Strategy, AllianceBernstein 2005 Retirement Strategy, AllianceBernstein 2010 Retirement Strategy, AllianceBernstein 2015 Retirement Strategy, AllianceBernstein 2020 Retirement Strategy, AllianceBernstein 2025 Retirement Strategy, AllianceBernstein 2030 Retirement Strategy, AllianceBernstein 2035 Retirement Strategy, AllianceBernstein 2040 Retirement Strategy, AllianceBernstein 2045 Retirement Strategy, AllianceBernstein 2050 Retirement Strategy and AllianceBernstein 2055 Retirement Strategy. Future references to the Retirement Strategies do not include “AllianceBernstein.” |
| 6 | Includes AllianceBernstein Balanced Wealth Strategy, AllianceBernstein Wealth Appreciation Strategy, AllianceBernstein Conservative Wealth Strategy. Future references to the Wealth Strategies do not include “AllianceBernstein.” |
| 334 | • ALLIANCEBERNSTEIN POOLING PORTFOLIOS |
AllianceBernstein Portfolios — Balanced Wealth Strategy, Wealth Appreciation Strategy and Conservative Wealth Strategies
The Wealth Strategies are charged by the Adviser an advisory fee based on a percentage of each fund’s average daily net assets:
| Fund | Advisory Fee Based on % of Average Daily Net Assets | |||||
| Wealth Appreciation Strategy | First $2.5 billion | 0.65 | % | |||
| Next $2.5 billion | 0.55 | % | ||||
| Excess of $5 billion | 0.50 | % | ||||
| Balanced Wealth Strategy | First $2.5 billion | 0.55 | % | |||
| Next $2.5 billion | 0.45 | % | ||||
| Excess of $5 billion | 0.40 | % | ||||
| Conservative Wealth Strategy7 | First $2.5 billion | 0.55 | % | |||
| Next $2.5 billion | 0.45 | % | ||||
| Excess of $5 billion | 0.40 | % | ||||
CollegeBoundfund
The Adviser serves as the program manager of the CollegeBoundfund, a 529 college-savings plan. Services provided by the Adviser as program manager for CollegeBoundfund include managing the assets of each Education Strategy of the plan that may invest in a combination of the Pooling Portfolios (the “Underlying Portfolios”), performing administrative related functions, servicing shareholder accounts, providing customer service to participants, maintaining the program and developing/updating a website where participants can access their personal accounts. Note that shareholder servicing is provided by AllianceBernstein Investor Services (“ABIS”) and distribution by AllianceBernstein Investments, Inc. (“ABI”), both which are affiliates of the Adviser. As program manager, the Adviser is paid a program management fee equal to the total expense ratio (fixed) of each Education Strategy minus the weighted average of the expenses of the Underlying Portfolios in which the Strategy is invested. The weighted average of the expenses of the Underlying Portfolios may fluctuate over time, resulting in an increase or decrease in the program management fee since the total expense ratio is constant. Set forth below is a table showing the total expense ratios of the Education Strategies as of December 31, 2011.
| Portfolios | Total Expense Ratio8 | |||
| Age-Based Education Strategies | ||||
| Age-Based Aggressive Growth 2011-2013 | 0.94 | % | ||
| Age-Based Aggressive Growth 2008-2010 | 0.94 | % | ||
| Age-Based Aggressive Growth 2005-2007 | 0.90 | % | ||
| Age-Based Aggressive Growth 2002-2004 | 0.86 | % | ||
| Age-Based Aggressive Growth 1999-2001 | 0.82 | % | ||
| Age-Based Aggressive Growth 1996-1998 | 0.78 | % | ||
| 7 | Effective December 31, 2009, AllianceBernstein Wealth Preservation Strategy changed its name to AllianceBernstein Conservative Wealth Strategy. |
| 8 | The total expense ratios do not include an annual distribution fee of up to 1.00% payable to AllianceBernstein Investments, Inc., the program distributor and an affiliate of the Adviser, which is applied only to certain accounts that are established with the involvement of a financial adviser (“FA”). |
| ALLIANCEBERNSTEIN POOLING PORTFOLIOS • | 335 |
| Portfolios | Total Expense Ratio8 | |||
| Age-Based Aggressive Growth 1993-1995 | 0.74 | % | ||
| Age-Based Aggressive Growth 1990-1992 | 0.74 | % | ||
| Age-Based Aggressive Growth 1987-1989 | 0.74 | % | ||
| Age-Based Aggressive Growth 1984-1986 | 0.74 | % | ||
| Age-Based Aggressive Growth Pre-1984 | 0.74 | % | ||
| Age-Based Moderate Growth 2011-2013 | 0.92 | % | ||
| Age-Based Moderate Growth 2008-2010 | 0.88 | % | ||
| Age-Based Moderate Growth 2005-2007 | 0.84 | % | ||
| Age-Based Moderate Growth 2002-2004 | 0.80 | % | ||
| Age-Based Moderate Growth 1999-2001 | 0.78 | % | ||
| Age-Based Moderate Growth 1996-1998 | 0.76 | % | ||
| Age-Based Moderate Growth 1993-1995 | 0.72 | % | ||
| Age-Based Moderate Growth 1990-1992 | 0.72 | % | ||
| Age-Based Moderate Growth 1987-1989 | 0.72 | % | ||
| Age-Based Moderate Growth 1984-1986 | 0.72 | % | ||
| Age-Based Moderate Growth Pre-1984 | 0.72 | % | ||
| Age-Based Conservative Growth 2011-2013 | 0.82 | % | ||
| Age-Based Conservative Growth 2008-2010 | 0.82 | % | ||
| Age-Based Conservative Growth 2005-2007 | 0.79 | % | ||
| Age-Based Conservative Growth 2002-2004 | 0.78 | % | ||
| Age-Based Conservative Growth 1999-2001 | 0.76 | % | ||
| Age-Based Conservative Growth 1996-1998 | 0.72 | % | ||
| Age-Based Conservative Growth Pre-19969 | 0.72 | % | ||
Fixed Based Education Strategies | ||||
| Appreciation | 0.94 | % | ||
| Balanced | 0.80 | % | ||
| Conservative | 0.72 | % | ||
The Portfolios’ net assets as of March 31, 2012 are as follows:
| Portfolio | Net Assets 3/31/12 ($MM) | |
| U.S. Value Portfolio | $1,323.6 | |
| U.S. Large Cap Growth Portfolio | $1,323.1 | |
| Multi-Asset Real Return Portfolio | $ 599.4 | |
| International Value Portfolio | $1,098.8 | |
| International Growth Portfolio | $1,105.8 | |
| Small-Mid Cap Value Portfolio | $ 371.9 | |
| Small-Mid Cap Growth Portfolio | $ 369.5 | |
| Volatility Management Portfolio | $1,858.8 |
| 8 | The total expense ratios do not include an annual distribution fee of up to 1.00% payable to AllianceBernstein Investments, Inc., the program distributor and an affiliate of the Adviser, which is applied only to certain accounts that are established with the involvement of a financial adviser (“FA”). |
| 9 | The Education Strategy commenced operations on September 16, 2011. |
| 336 | • ALLIANCEBERNSTEIN POOLING PORTFOLIOS |
Set forth below are the most recently completed fiscal year total expense ratios of the Pooling Portfolios that do not have an Expense Limitation Undertaking:
| Portfolio | Fiscal Year End | Total Expense Ratio | ||||
| U.S. Value Portfolio | August 31 | 0.01 | % | |||
| U.S. Large Cap Growth Portfolio | August 31 | 0.02 | % | |||
| Multi-Asset Real Return Portfolio | August 31 | 0.05 | % | |||
| International Value Portfolio | August 31 | 0.04 | % | |||
| International Growth Portfolio | August 31 | 0.04 | % | |||
| Small-Mid Cap Value Portfolio | August 31 | 0.04 | % | |||
| Small-Mid Cap Growth Portfolio | August 31 | 0.04 | % | |||
With respect to Volatility Management Portfolio, the Adviser agreed to waive that portion of its management fees and/or reimburse the Portfolio for that portion of the Portfolio’s total operating expenses to the degree necessary to limit the Portfolio’s expense ratio to the amount set forth below for the Portfolio’s current fiscal year. The waiver is terminable by the Adviser at the end of the Portfolio’s fiscal year upon at least 60 days’ written notice. Also set forth below is the Portfolio’s gross expense ratio:
| Fund | Expense Cap Pursuant to Expense Limitation Undertaking | Gross Expense Ratio | Fiscal Year End | |||||||
| Volatility Management Portfolio | 0.15% | 0.16 | % | August 31 | ||||||
Indicated below is the reimbursement amount which the Adviser received from Volatility Management Portfolio during the Portfolio’s most recently completed fiscal year, expressed in dollars and as a percentage of average daily net assets:
| Fund | Amount | As a % of Average Daily Net Assets | ||||||
| Volatility Management Portfolio | $ | 44,167 | 0.01 | % | ||||
| I. | ADVISORY FEES CHARGED TO INSTITUTIONAL AND OTHER CLIENTS |
Although the Portfolios are not charged an advisory fee, their shareholders, which include other investment companies and large institutional clients managed by the Adviser, pay the Adviser an investment advisory fee for managing their assets. In this regard, it is worth considering the advisory fees charged by the Adviser to institutional and other clients. The advisory fees charged to investment companies that the Adviser manages and sponsors are normally higher than those charged to similar sized institutional accounts, including pension plans and sub-advised investment companies. The fee differential reflects, among other things, different services provided to such clients and different liabilities assumed. Services provided by the Adviser to investment companies, including the Portfolios, that are not provided to non-investment company clients and sub-advised investment companies include providing office space and
| ALLIANCEBERNSTEIN POOLING PORTFOLIOS • | 337 |
personnel to serve as Fund Officers, who among other responsibilities make the certifications required under the Sarbanes–Oxley Act of 2002, and coordinating with and monitoring third party service providers such as Fund counsel, auditors, custodians, transfer agents and pricing services. The accounting, administrative, legal and compliance requirements for investment companies are more costly than those for institutional accounts due to the greater complexities and time required for investment companies, although, as previously mentioned, with respect to Volatility Management Portfolio, the Adviser is reimbursed for providing such services. In addition, managing the cash flow of an investment company may be more difficult than managing that of a stable pool of assets, such as an institutional account with little cash movement in either direction, particularly if the investment company experiences a net redemption and the Adviser is frequently forced to sell securities to raise cash for the redemption. However, managing an investment company with positive cash flow may be easier at times than managing a stable pool of assets. Finally, in recent years, investment advisers have been sued by institutional clients and have suffered reputational damage both by the attendant publicity and outcomes other than complete victories. Accordingly, the legal and reputational risks associated with institutional accounts are greater than previously thought, although still not equal to those related to the mutual fund industry.
Notwithstanding the Adviser’s view that managing an investment company is not comparable to managing other institutional accounts because the services provided are different, the Supreme Court has indicated consideration should be given to the advisory fees charged to institutional accounts that have a substantially similar investment style as the Portfolio.10 In addition to the AllianceBernstein Institutional fee schedule, set forth below are what would have been the effective advisory fees of the Portfolios had the AllianceBernstein Institutional fee schedules been applicable to the Portfolios based on March 31, 2012 net assets, although the Portfolios are not charged an advisory fee by the Adviser.11
| 10 | The Supreme Court stated that “courts may give such comparisons the weights that they merit in light of the similarities and differences between the services that the clients in question require, but the courts must be wary of inapt comparisons.” Among the significant differences the Supreme Court noted that may exist between services provided to mutual funds and institutional accounts are “higher marketing costs.” Jones v. Harris at 1428. |
| 11 | The Adviser has indicated that with respect to institutional accounts with assets greater than $300 million, it will negotiate a fee schedule. Discounts that are negotiated vary based upon each client relationship. |
| 338 | • ALLIANCEBERNSTEIN POOLING PORTFOLIOS |
| Portfolio | Portfolio Net Assets ($MIL) | AllianceBernstein Fee Schedule | Effective Fee (%) | |||||
| U.S. Value Portfolio | $1,323.6 | Diversified Value 65 bp on 1st $25 million 50 bp on next $25 million 40 bp on next $50 million 30 bp on next $100 million 25 bp on the balance Minimum Account Size: $25 m | 0.272% | |||||
| U.S. Large Cap Growth Portfolio | $1,323.1 | U.S. Large Cap Growth 80 bp on 1st $25 million 50 bp on next $25 million 40 bp on next $50 million 30 bp on next $100 million 25 bp on the balance Minimum Account Size: $25m | 0.275% | |||||
| Multi-Asset Real Return Portfolio | $599.4 | Real Asset Strategy 75 bp on 1st $150 million 60 bp on next $150 million 50 bp on the balance Minimum Account Size: $75m | 0.588% | |||||
| International Value Portfolio | $1,098.8 | International Value 80 bp on 1st $25 million 60 bp on next $25 million 50 bp on next $50 million 40 bp on the balance Minimum Account Size: $25m | 0.418% | |||||
| International Growth Portfolio | $1,105.8 | International Research Growth AC 85 bp on 1st $25 million 65 bp on next $25 million 55 bp on next $50 million 45 bp on the balance Minimum Account Size: $25 m | 0.468% | |||||
| Small-Mid Cap Value Portfolio | $371.9 | Small & Mid Cap Value 95 bp on 1st $25 million 75 bp on next $25 million 65 bp on next $50 million 55 bp on the balance Minimum Account Size: $25m | 0.604% | |||||
| Small-Mid Cap Growth Portfolio | $369.5 | U.S. SMID Cap Growth 95 bp on 1st $25 million 75 bp on next $25 million 65 bp on next $50 million 55 bp on the balance Minimum Account Size: $25m | 0.604% | |||||
| Volatility Management Portfolio | $1,858.8 | Volatility Management12 25 bp | 0.250 | |||||
| 12 | For use only with Customized Retirement Strategies or custom target date funds. |
| ALLIANCEBERNSTEIN POOLING PORTFOLIOS • | 339 |
The Adviser manages the AllianceBernstein Mutual Funds (“ABMF”), which are open-end investment companies, and AllianceBernstein Variable Products Series Fund, Inc. (“AVPS”), which offers variable annuity and variable life contract policyholders the option to utilize certain AVPS portfolios as the investment option underlying their insurance contracts. The advisory schedules of almost all of the ABMF and AVPS funds, implemented in January 2004 as a result of the Assurance of Discontinuance between the NYAG and the Adviser, contemplates eight categories with almost all of the AllianceBernstein funds in each category having the same advisory fee schedule. In addition to the fee schedules of the ABMF and AVPS funds, set forth below are what would have been the effective advisory fees of the Pooling Portfolios had the fee schedules of the ABMF/AVPS funds been applicable to the Portfolios based on the Portfolios March 31, 2012 net assets:
| Portfolio | ABMF / AVPS Portfolio | Fee Schedule | ABMF / AVPS Effective Fee (%) | |||||
| U.S. Value Portfolio | Value Fund AVPS Value Portfolio | 0.55% on first $2.5 billion 0.45% on next $2.5 billion 0.40% on the balance | 0.550% | |||||
| U.S. Large Cap Growth Portfolio | Large Cap Growth Fund, Inc. AVPS Large Cap Growth Portfolio | 0.75% on first $2.5 billion 0.65% on next $2.5 billion 0.60% on the balance | 0.750% | |||||
| Multi-Asset Real Return Portfolio | Bond Fund, Inc. – Real Asset Strategy | 0.75% (flat fee) | 0.750% | |||||
| International Value Portfolio | International Value Fund, Inc. AVPS International Value Portfolio | 0.75% on first $2.5 billion 0.65% on next $2.5 billion 0.60% on the balance | 0.750% | |||||
| International Growth Portfolio | International Growth Fund, Inc. AVPS International Growth Portfolio | 0.75% on first $2.5 billion 0.65% on next $2.5 billion 0.60% on the balance | 0.750% | |||||
| Small-Mid Cap Value Portfolio | Small/Mid Cap Value Fund AVPS Small/Mid Cap Value Portfolio | 0.75% on first $2.5 billion 0.65% on next $2.5 billion 0.60% on the balance | 0.750% | |||||
| Small-Mid Cap Growth Portfolio | Small/Mid Cap Growth Fund | 0.75% on first $500 million 0.65% on next $500 million 0.55% on the balance | 0.750% | |||||
The Adviser also manages and sponsors retail mutual funds, which are organized in jurisdictions outside the United States, generally Luxembourg and Japan, and sold to non-United States resident investors. The Adviser charges the fees set forth below for the Luxembourg fund that has a somewhat similar investment style as U.S. Large Cap Portfolio and Multi-Asset Real Return Portfolio.
| 340 | • ALLIANCEBERNSTEIN POOLING PORTFOLIOS |
| Portfolio | Luxembourg Fund | Fee13 | ||
| U.S. Large Cap Growth Portfolio | American Growth Portfolio Class A Class I | 1.50% 0.70% | ||
| Multi-Asset Real Return Portfolio | Real Asset Portfolio Class A Class I | 1.55% 0.75% |
The Adviser provides sub-advisory investment services to certain other investment companies managed by other fund families. The Adviser charges the fees set Forth below for the following sub-advisory relationships that have a somewhat similar investment style as the Portfolios. In the table below are the advisory fee schedules of the sub-advised funds and the effective management fees of the sub-advisory relationships based on the Portfolios’ March 31, 2012 net assets.14
| Portfolio | Sub-advised Fund | Sub-advised Fund Fee Schedule | Sub-advised Fund Eff. Mgmt. Fee (%) | |||
| U.S. Value Portfolio | Client #1 | 0.49% on the first $100 million 0.30% on the next $100 million 0.25% on the balance | 0.272% | |||
| Client #2 | 0.30% of average daily net assets | 0.300% | ||||
| Client #3 | 0.15% on first $1 billion 0.14% on next $2 billion 0.12% on next $2 billion 0.10% on the balance +/- Performance Fee (v. R1000V) | 0.148%15 | ||||
| U.S. Large Cap Growth Portfolio | Client #4 | 0.35% on the first $50 million 0.30% on the next $100 million 0.25% on the balance | 0.258% | |||
| International Value Portfolio | Client #5 | 0.60% of average daily net assets | 0.600% | |||
| Client #6 | 0.75% on the first $50 million 0.60% on the next $15 million 0.50% on the next $70 million 0.40% on the balance | 0.425% | ||||
| Client #7 | 0.35% on the first $1 billion 0.325 % on the balance | 0.348% |
| 13 | Class A shares of the Luxembourg funds are charged an “all-in” fee, which includes investment advisory services and distribution related services, unlike Class I shares, whose fee is for investment advisory services only. |
| 14 | The Supreme Court cautioned against accepting mutual fund fee comparisons without careful scrutiny since “these comparisons are problematic because these fees, like those challenged, may not be the product of negotiations conducted at arm’s-length.” Jones v. Harris at 1429. |
| 15 | The sub-advised fund’s sub-advisory fee shown does not include any performance fee adjustment. |
| ALLIANCEBERNSTEIN POOLING PORTFOLIOS • | 341 |
| Portfolio | Sub-advised Fund | Sub-advised Fund Fee Schedule | Sub-advised Fund Eff. Mgmt. Fee (%) | |||
| Client #8 | 0.22% on the first $1 billion 0.18% on the next $1.5 billion 0.16% on the balance +/- Performance Fee (v. ACWI ex U.S.) | 0.216%15 | ||||
| Small/Mid Cap Value Portfolio | Client #9 | 0.50% on the first $250 million 0.40 % on the balance | 0.484% | |||
| Client #10 | 0.95% on the first $25 million 0.75% on the next $25 million 0.65% on the next $50 million 0.55% on the balance | 0.604% | ||||
| Client #11 | 0.61% on the first $150 million 0.50 % on the balance | 0.544% |
It is fair to note that the services the Adviser provides pursuant to sub-advisory agreements are generally confined to the services related to the investment process; in other words, they are not as comprehensive as the services provided to the Portfolios by the Adviser. In addition, to the extent that certain of these sub-advisory relationships are with affiliates of the Adviser, the fee schedules may not reflect arm’s-length bargaining or negotiations.
While it appears that certain sub-advisory relationships are paying a lower fee than the ABMF/AVPS Funds, it is difficult to evaluate the relevance of such lower fees due to differences in terms of the service provided, risks involved and other competitive factors between the ABMF/AVPS Funds and the sub-advisory relationships. There could be various business reasons why an investment adviser would be willing to provide a sub-advisory relationship investment related services at a different fee level than an investment company it is sponsoring where the investment adviser is providing all the services, not just investment management, generally required by a registered investment company.
| II. | MANAGEMENT FEES CHARGED BY OTHER MUTUAL FUNDS COMPANIES FOR LIKE SERVICES. |
The Trustees previously received the Senior Officer’s Evaluation of the Investment Advisory Agreement (the “Senior Officer Fee Evaluation”) for the Retirement Strategies and the Wealth Strategies. In those Senior Officer Fee Evaluations, the Senior Officer concluded that the investment advisory agreements for those funds were reasonable and within range of what would have been negotiated at arm’s-length.
The Pooling Portfolios are not charged an advisory fee. However, as previously mentioned, the Institutional Clients that invest in the Pooling Portfolios do pay an advisory fee pursuant to their advisory agreements with the Adviser. The
| 15 | The sub-advised fund’s sub-advisory fee shown does not include any performance fee adjustment. |
| 342 | • ALLIANCEBERNSTEIN POOLING PORTFOLIOS |
Adviser believes that the fee paid by the Institutional Clients includes a portion, referred by the Adviser as the “Implied Advisory Fee,” that may be reasonably viewed as compensation for services that the Adviser provides to the Pooling Portfolios. The Adviser further believes that the rate of the Implied Advisory Fee is the same for each Institutional Client invested in a series of the Pooling Portfolios.
Because of the Pooling Portfolios’ limited availability for investment, open only to certain institutional clients of the Adviser, the Pooling Portfolios have zero transfer agent (with the exception of certain transfer agent out of pocket expenses) and distribution fees, in addition to zero advisory fees. Such expense structure is rare in the industry. The UBS Relationship Funds, an open-end investment company managed by UBS Global Asset Management (Americas) Inc., was the only other fund family that was determined by the Adviser, the Senior Officer and Lipper, Inc. (“Lipper”) to have an expense structure comparable to the Pooling Portfolios.
Since there are not many funds of other fund families that have a similar expense structure as the Portfolios, Lipper, an analytical service not affiliated with the Adviser, compared the total expense ratios of the Portfolios to that of funds of a similar investment classification/objective with institutional class shares; 16 however, Lipper excluded management, transfer agent and distribution fees from the total expense ratios of the Portfolios’ peers.17 Lipper’s analysis included the Portfolios’ rankings18 relative to their respective Lipper Expense Group (“EG”) and Lipper Expense Universe (“EU”).19
Lipper describes an EG as a representative sample of comparable funds. Lipper’s standard methodology for screening funds to be included in an EG entails the consideration of several fund criteria, including fund type, investment classification/objective, load type and similar 12b-1/non-12b-1 service fees, asset (size) comparability, and expense components and attributes. An EG will typically consist of seven to twenty funds. An EU is a much broader group, consisting of all
| 16 | As stated previously, comparisons with fees charged to mutual funds by other advisers may be “problematic” as the fees charged by other advisers may not be the product of negotiations conducted at arm’s-length. Jones v. Harris at 1429. |
| 17 | As described on page 19, because the Portfolios are offered only to other investment companies and certain institutional clients managed by the Adviser, the Portfolios are not assessed a fee for transfer agent and distribution-related services although the transfer agent of the Portfolios is reimbursed for out of pocket expenses. |
| 18 | A ranking of “1” would mean that the Portfolio had the lowest total expense ratio in the Lipper peer group. |
| 19 | Note that there are limitations on expense category data because different funds categorize expenses differently. |
| ALLIANCEBERNSTEIN POOLING PORTFOLIOS • | 343 |
institutional classes of funds of the same investment classification/objective as the subject Portfolio.20 The result of Lipper’s analysis is set forth in the table below:
| Portfolio | Expense Ratio (%) | Lipper Exp. Group Median (%) | Lipper Group Rank | Lipper Exp. Median (%) | Lipper Rank | |||||||||||
| U.S. Value Portfolio | 0.014 | % | 0.040 | % | 1/10 | 0.073 | % | 3/48 | ||||||||
| U.S. Large Cap Growth Portfolio | 0.017 | % | 0.034 | % | 1/15 | 0.074 | % | 6/133 | ||||||||
| Multi-Asset Real Return Portfolio | 0.054 | % | 0.077 | % | 2/11 | 0.100 | % | 9/41 | ||||||||
| International Value Portfolio | 0.039 | % | 0.071 | % | 2/10 | 0.133 | % | 2/26 | ||||||||
| International Growth Portfolio | 0.041 | % | 0.043 | % | 3/7 | 0.127 | % | 7/38 | ||||||||
| Small-Mid Cap Value Portfolio | 0.040 | % | 0.089 | % | 2/16 | 0.095 | % | 8/40 | ||||||||
| Small-Mid Cap Growth Portfolio | 0.040 | % | 0.064 | % | 3/20 | 0.082 | % | 13/79 | ||||||||
| Volatility Management Portfolio | 0.150 | % | 0.129 | % | 9/14 | 0.112 | % | 29/41 | ||||||||
Based on this analysis, except for Volatility Management Portfolio, the total expense ratios of the Portfolios are lower than their respective EG and EU medians.
| III. | COSTS TO THE ADVISER AND ITS AFFILIATES OF SUPPLYING SERVICES PURSUANT TO THE ADVISORY FEE ARRANGEMENT, EXCLUDING ANY INTRA-CORPORATE PROFIT. |
The Adviser utilizes two profitability reporting systems, which operate independently but are aligned with each other, to estimate the Adviser’s profitability in connection with investment advisory services provided to the Portfolios. The Senior Officer has retained a consultant to provide independent advice regarding the alignment of the two profitability systems as well as the methodologies and allocations utilized by both profitability systems. See Section IV for additional discussion.
| IV. | PROFIT MARGINS OF THE ADVISER AND ITS AFFILIATES FOR SUPPLYING SUCH SERVICES. |
The Pooling Portfolios’ profitability information, prepared by the Adviser for the Board of Trustees, was reviewed by the Senior Officer and the consultant. The Adviser used a weighted average of the Adviser’s profitability with respect to the Institutional Clients that are invested in the Pooling Portfolios, in addition to any Portfolio’s specific revenue or expense item, to calculate the Adviser’s profitability. The Adviser’s profitability from providing investment advisory services to each of the Pooling Portfolios decreased with the exception of U.S. Value Portfolio, U.S. Large Cap Portfolio, International Value Portfolio and International Growth Portfolio during calendar year 2011, relative to 2010.
| 20 | Except for asset (size) comparability, Lipper uses the same criteria for selecting a Lipper EG when selecting a Lipper EU. Unlike the Lipper EG, the Lipper EU allows for the same adviser to be represented by more than just one fund. In addition, multiple institutional class shares for the Portfolios’ peers are included. |
| 344 | • ALLIANCEBERNSTEIN POOLING PORTFOLIOS |
Multi-Asset Real Return, International Value Portfolio, International Growth Portfolio and Small-Mid Cap Growth Portfolio effected brokerage transactions and paid commissions to the Adviser’s affiliate, Sanford C. Bernstein & Co. LLC, and/or its U.K. based affiliate, Sanford C. Bernstein Ltd., collectively “SCB”, during the Portfolios’ most recently completed fiscal year. The Adviser represented that SCB’s profitability from business conducted with the Portfolios is comparable to the profitability of SCB’s dealings with other similar third party clients. In the ordinary course of business, SCB receives and pays liquidity rebates from electronic communications networks (“ECNs”) derived from trading for its clients, including the Portfolios. These credits and charges are not being passed on to any SCB client.
| V. | POSSIBLE ECONOMIES OF SCALE |
The Adviser has indicated that economies of scale are being shared with shareholders through fee structures,21 subsidies and enhancement to services. Based on some of the professional literature that has considered economies of scale in the mutual fund industry, it is thought that to the extent economies of scale exist, they may more often exist across a fund family as opposed to a specific fund. This is because the costs incurred by the Adviser, such as investment research or technology for trading or compliance systems can be spread across a greater asset base as the fund family increases in size. It is also possible that as the level of services required to operate a successful investment company has increased over time, and advisory firms make such investments in their business to provide services, there may be a sharing of economies of scale without a reduction in advisory fees.
An independent consultant, retained by the Senior Officer, provided the Board of Directors information on the Adviser’s firm-wide average costs from 2005 through 2011 and potential economies of scale. The independent consultant noted that from 2005 through 2007 the Adviser experienced significant growth in assets under management (“AUM”). During this period, operating expenses increased, in part to keep up with growth, and in part reflecting market returns. However, from 2008 through the first quarter of 2009, AUM rapidly and significantly decreased. Some operating expenses, including base compensation and office space, adjusted more slowly during this period, resulting in an increase in average costs. Since 2009, AUM has moved within a range of $400 to $500 million ending 2011 with an average of $411 million in the fourth quarter. The independent consultant noted that changes in operating expenses reflect changes in business composition and business practices in response to changes in financial markets. Finally, the independent consultant concluded that the increase in average cost and the decline in net operating margin across the company since 2008 are inconsistent with the view that there are currently “economies of scale” to be shared with clients through lower fees.
| 21 | Fee structures include fee reductions, pricing at scale and breakpoints in advisory fee schedules. |
| ALLIANCEBERNSTEIN POOLING PORTFOLIOS • | 345 |
In February 2008, the independent consultant provided the Board of Directors an update of the Deli22 study on advisory fees and various fund characteristics.23 The independent consultant first reiterated the results of his previous two dimensional comparison analysis (fund size and family size) with the Board of Directors.24 The independent consultant then discussed the results of the regression model that was utilized to study the effects of various factors on advisory fees. The regression model output indicated that the bulk of the variation in fees predicted were explained by various factors, but substantially by fund AUM, family AUM, index fund indicator and investment style. The independent consultant also compared the advisory fees of the AllianceBernstein Mutual Funds to similar funds managed by 19 other large asset managers, regardless of the fund size and each Adviser’s proportion of mutual fund assets to non-mutual fund assets.
| VI. | NATURE AND QUALITY OF THE ADVISER’S SERVICES INCLUDING THE PERFORMANCE OF THE PORTFOLIOS. |
With assets under management of $419 billion as of March 31, 2012, the Adviser has the investment experience to manage and provide non-investment services to the Portfolios.
| 22 | The Deli study, originally published in 2002 based on 1997 data and updated for the February 2008 Presentation, may be of diminished value due to the age of the data used in the presentation and the changes experienced in the industry over the last four years. |
| 23 | As mentioned previously, the Supreme Court cautioned against accepting mutual fund fee comparisons without careful scrutiny since the fees may not be the product of negotiations conducted at arm’s length. See Jones V. Harris at 1429. |
| 24 | The two dimensional analysis showed patterns of lower advisory fees for funds with larger asset sizes and funds from larger family sizes compared to funds with smaller asset sizes and funds from smaller family sizes, which according to the independent consultant is indicative of a sharing of economies of scale and scope. However, in less liquid and active markets, such is not the case, as the empirical analysis showed potential for diseconomies of scale in those markets. The empirical analysis also showed diminishing economies of scale and scope as funds surpassed a certain high level of assets. |
| 346 | • ALLIANCEBERNSTEIN POOLING PORTFOLIOS |
The information in the table below shows the 1, 3 and 5 year (with respect to Volatility Management Portfolio, 1 year) gross performance returns and rankings of the Portfolios25 relative to their Lipper Performance Group (“PG”) and Lipper Performance Universe (“PU”)26 for the periods ended February 29, 2012.27,28
| Portfolio | PG Median | PU Median | PG Rank | PU Rank | ||||||||||||||
| U.S. Value Portfolio | ||||||||||||||||||
1 year | -0.69 | -0.73 | 0.00 | 5/11 | 28/48 | |||||||||||||
3 year | 23.78 | 26.38 | 26.38 | 9/11 | 34/43 | |||||||||||||
5 year | -3.04 | -0.54 | 0.65 | 10/11 | 36/37 | |||||||||||||
| U.S. Large Cap Growth Portfolio | ||||||||||||||||||
1 year | 3.05 | 4.46 | 6.14 | 12/15 | 107/131 | |||||||||||||
3 year | 23.06 | 25.29 | 26.20 | 11/14 | 94/112 | |||||||||||||
5 year | 2.66 | 5.20 | 4.38 | 11/13 | 80/99 | |||||||||||||
| Multi-Asset Real Return Portfolio29 | ||||||||||||||||||
1 year | -3.89 | 1.76 | 1.82 | 11/11 | 34/40 | |||||||||||||
3 year | 31.30 | 21.48 | 21.29 | 1/9 | 3/25 | |||||||||||||
5 year | -3.58 | 3.34 | 3.34 | 7/7 | 17/17 | |||||||||||||
| International Value Portfolio | ||||||||||||||||||
1 year | -12.63 | -11.06 | -7.36 | 9/10 | 25/26 | |||||||||||||
3 year | 19.43 | 19.73 | 20.64 | 6/10 | 18/25 | |||||||||||||
5 year | -6.90 | -4.11 | -2.80 | 6/6 | 18/18 | |||||||||||||
| International Growth Portfolio | ||||||||||||||||||
1 year | -8.84 | -0.85 | -3.54 | 7/7 | 33/37 | |||||||||||||
3 year | 14.17 | 24.58 | 23.56 | 6/6 | 29/29 | |||||||||||||
5 year | -5.24 | -0.83 | -0.45 | 6/6 | 19/19 | |||||||||||||
| Small-Mid Cap Value Portfolio | ||||||||||||||||||
1 year | -2.94 | 1.48 | 0.84 | 15/16 | 36/40 | |||||||||||||
3 year | 33.50 | 30.02 | 29.69 | 1/14 | 7/36 | |||||||||||||
5 year | 3.88 | 1.93 | 2.11 | 2/11 | 9/32 | |||||||||||||
| Small-Mid Cap Growth Portfolio | ||||||||||||||||||
1 year | 9.05 | 3.56 | 3.06 | 4/20 | 11/78 | |||||||||||||
3 year | 40.76 | 30.63 | 31.01 | 1/19 | 3/66 | |||||||||||||
5 year | 10.17 | 7.57 | 6.03 | 2/14 | 4/53 | |||||||||||||
| Volatility Management Portfolio | ||||||||||||||||||
1 year | -1.40 | 1.32 | 1.78 | 10/14 | 29/40 | |||||||||||||
| 25 | The performance returns of the Portfolios shown were provided by Lipper. |
| 26 | A Portfolio’s PG/PU may not be identical to its respective EG/EU as the criteria for including/excluding a fund in a PG/PU is somewhat different from that of an EG/EU. |
| 27 | The performance returns of the Portfolios’ peers are also adjusted for expenses (gross up). |
| 28 | The Lipper investment classification/objective dictates the PG/PU throughout the life of each Portfolio even if a Portfolio had a different investment classification/objective at a different point in time. |
| 29 | The Portfolio’s Lipper classification changed in 2011 from Global Real Estates to Global Flexible Funds as a result of changes to the Portfolio’s strategy. |
| ALLIANCEBERNSTEIN POOLING PORTFOLIOS • | 347 |
Set forth below are the 1, 3, 5 year and since inception net performance returns of the Portfolios (in bold) versus their benchmarks.30 Portfolio and benchmark volatility and reward-to-variability ratio (“Sharpe Ratio”) information is also shown.31
| Periods Ended February 29, 2012 Annualized Performance | ||||||||||||||||||||||||||||
1 Year (%) | 3 Year (%) | 5 Year (%) | Since Inception32 | Annualized | Risk Period (Year) | |||||||||||||||||||||||
Volatility (%) | Sharpe Ratio | |||||||||||||||||||||||||||
| U.S. Value Portfolio | -0.70 | 23.76 | -3.05 | 1.51 | 20.98 | -0.10 | 5 | |||||||||||||||||||||
| Russell 1000 Value Index | 2.18 | 25.01 | -1.08 | 3.12 | 20.05 | -0.02 | 5 | |||||||||||||||||||||
| Inception Date: May 20, 2005 | ||||||||||||||||||||||||||||
| U.S. Large Cap Growth Portfolio | 3.03 | 23.04 | 2.64 | 4.60 | 20.23 | 0.17 | 5 | |||||||||||||||||||||
| Russell 1000 Growth Index | 7.62 | 27.51 | 4.54 | 5.78 | 19.13 | 0.26 | 5 | |||||||||||||||||||||
| Inception Date: May 20, 2005 | ||||||||||||||||||||||||||||
| Multi-Asset Real Return Portfolio | -3.94 | 31.24 | -3.63 | 5.20 | 26.21 | -0.05 | 5 | |||||||||||||||||||||
| MSCI AC World Commodity Producers Index | -8.25 | 22.07 | 4.77 | 10.51 | 27.10 | 0.26 | 5 | |||||||||||||||||||||
| FTSE EPRA/NAREIT Developed RE Index | 0.76 | 33.95 | -4.22 | 5.06 | N/A | N/A | N/A | |||||||||||||||||||||
| Inception Date: May 20, 2005 | ||||||||||||||||||||||||||||
| International Value Portfolio33 | -12.66 | 19.37 | -6.95 | 2.08 | 26.45 | -0.18 | 5 | |||||||||||||||||||||
| MSCI AC World Index ex U.S. | -6.10 | 22.79 | -0.75 | 5.85 | 23.78 | 0.04 | 5 | |||||||||||||||||||||
| MSCI EAFE Net Index | -7.45 | 19.74 | -2.93 | N/A | N/A | N/A | N/A | |||||||||||||||||||||
| Inception Date: May 20, 2005 | ||||||||||||||||||||||||||||
| 30 | The Adviser provided Portfolio and benchmark performance return information for periods through February 29, 2012. |
| 31 | Portfolio and benchmark volatility and Sharpe Ratio information was obtained through Lipper LANA, a database maintained by Lipper. Volatility is a statistical measure of the tendency of a market price or yield to vary over time. A Sharpe Ratio is a risk adjusted measure of return that divides a portfolio’s return in excess of the riskless return by the portfolio’s standard deviation. A portfolio with a greater volatility would be regarded as more risky than a portfolio with equivalent performance but lower volatility; for that reason, a greater return would be demanded for the more risky portfolio. A portfolio with a higher Sharpe Ratio would be regarded as better performing than a portfolio with a lower Sharpe Ratio. |
| 32 | Benchmark inception performance is from the exact inception date. |
| 33 | The Portfolio’s benchmark changed from MSCI EAFE Net Index to MSCI AC World Index ex U.S. on January 1, 2012. |
| 348 | • ALLIANCEBERNSTEIN POOLING PORTFOLIOS |
| Periods Ended February 29, 2012 Annualized Performance | ||||||||||||||||||||||||||||
1 Year (%) | 3 Year (%) | 5 Year (%) | Since Inception | Annualized | Risk Period (Year) | |||||||||||||||||||||||
Volatility (%) | Sharpe Ratio | |||||||||||||||||||||||||||
| International Growth Portfolio33 | -8.88 | 14.12 | -5.29 | 1.01 | 23.54 | -0.16 | 5 | |||||||||||||||||||||
| MSCI AC World Index ex U.S. | -6.10 | 22.79 | -0.75 | 5.85 | 23.78 | 0.04 | 5 | |||||||||||||||||||||
| MSCI AC World Index ex U.S. Growth | -5.18 | -22.00 | -0.02 | 6.06 | N/A | N/A | N/A | |||||||||||||||||||||
| MSCI EAFE Net Index | -7.45 | 19.74 | -2.93 | N/A | N/A | N/A | N/A | |||||||||||||||||||||
| Inception Date: May 20, 2005 | ||||||||||||||||||||||||||||
| Small-Mid Cap Value Portfolio | -2.98 | 33.45 | 3.84 | 6.76 | 26.09 | 0.23 | 5 | |||||||||||||||||||||
| Russell 2500 Value Index | -0.80 | 29.59 | 0.70 | 4.98 | 23.59 | 0.09 | 5 | |||||||||||||||||||||
| Inception Date: May 20, 2005 | ||||||||||||||||||||||||||||
| Small-Mid Cap Growth Portfolio | 9.00 | 40.70 | 10.12 | 12.23 | 24.91 | 0.46 | 5 | |||||||||||||||||||||
| Russell 2500 Growth Index | 3.95 | 33.10 | 4.72 | 7.68 | 24.1 | 0.26 | 5 | |||||||||||||||||||||
| Inception Date: May 20, 2005 | ||||||||||||||||||||||||||||
| Volatility Management Portfolio34 | -1.64 | N/A | N/A | 7.26 | 7.86 | -0.18 | 1 | |||||||||||||||||||||
| MSCI AC World Index | -1.49 | N/A | N/A | 5.40 | 18.76 | 18.92 | 1 | |||||||||||||||||||||
| S&P 500 Index | 5.12 | N/A | N/A | N/A | N/A | N/A | N/A | |||||||||||||||||||||
| Inception Date: April 16, 2010 | ||||||||||||||||||||||||||||
CONCLUSION:
Based on the factors discussed above the Senior Officer’s conclusion is that the proposed advisory fees for the Portfolios are reasonable and within the range of what would have been negotiated at arm’s-length in light of all the surrounding circumstances. This conclusion in respect of the Portfolios is based on an evaluation of all of these factors and no single factor was dispositive.
Dated: May 25, 2012
| 33 | The Portfolio’s benchmark changed from MSCI EAFE Net Index to MSCI AC World Index ex U.S. on January 1, 2012. |
| 34 | The Portfolio’s benchmark changed from S&P 500 Index to MSCI AC World Index on January 1, 2012. |
| ALLIANCEBERNSTEIN POOLING PORTFOLIOS • | 349 |
THIS PAGE IS NOT PART OF THE SHAREHOLDER REPORT OR THE FINANCIAL STATEMENTS
ALLIANCEBERNSTEIN FAMILY OF FUNDS
Wealth Strategies
Balanced Wealth Strategy
Conservative Wealth Strategy
Wealth Appreciation Strategy
Tax-Managed Balanced Wealth Strategy
Tax-Managed Conservative Wealth Strategy
Tax-Managed Wealth Appreciation Strategy
Asset Allocation/Multi-Asset Funds
Emerging Markets Multi-Asset Portfolio
International Portfolio
Tax-Managed International Portfolio
Growth Funds
Domestic
Discovery Growth Fund**
Growth Fund
Large Cap Growth Fund
Select US Equity Portfolio
Small Cap Growth Portfolio
U.S. Strategic Research Portfolio
Global & International
Global Thematic Growth Fund
International Discovery Equity Portfolio
International Focus 40 Portfolio
International Growth Fund
Value Funds
Domestic
Core Opportunities Fund
Discovery Value Fund**
Equity Income Fund
Growth & Income Fund
Value Fund
Global & International
Emerging Markets Equity Portfolio
Global Real Estate Investment Fund
Global Value Fund
International Value Fund
Taxable Bond Funds
Bond Inflation Strategy
Global Bond Fund
High Income Fund
Intermediate Bond Portfolio
Limited Duration High Income Portfolio
Short Duration Portfolio
Municipal Bond Funds
Arizona Portfolio California Portfolio High Income Portfolio Massachusetts Portfolio Michigan Portfolio Minnesota Portfolio Municipal Bond Inflation Strategy | National Portfolio New Jersey Portfolio New York Portfolio Ohio Portfolio Pennsylvania Portfolio Virginia Portfolio |
Intermediate Municipal Bond Funds
Intermediate California Portfolio
Intermediate Diversified Portfolio
Intermediate New York Portfolio
Closed-End Funds
Alliance California Municipal Income Fund
Alliance New York Municipal Income Fund
AllianceBernstein Global High Income Fund
AllianceBernstein Income Fund
AllianceBernstein National Municipal Income Fund
Alternatives
Dynamic All Market Fund
Global Risk Allocation Fund**
Market Neutral Strategy-Global
Market Neutral Strategy-U.S.
Real Asset Strategy
Select US Long/Short Portfolio
Unconstrained Bond Fund
Retirement Strategies
2000 Retirement Strategy | 2020 Retirement Strategy | 2040 Retirement Strategy | ||
2005 Retirement Strategy | 2025 Retirement Strategy | 2045 Retirement Strategy | ||
2010 Retirement Strategy | 2030 Retirement Strategy | 2050 Retirement Strategy | ||
2015 Retirement Strategy | 2035 Retirement Strategy | 2055 Retirement Strategy |
We also offer Exchange Reserves,* which serves as the money market fund exchange vehicle for the AllianceBernstein mutual funds.
Investors should consider the investment objectives, risks, charges and expenses of the Fund carefully before investing. For copies of our prospectus or summary prospectus, which contain this and other information, visit us online at www.alliancebernstein.com or contact your AllianceBernstein investments representative. Please read the prospectus and/or summary prospectus carefully before investing.
| * | An investment in Exchange Reserves is not a deposit in a bank and is not insured or guaranteed by the Federal Deposit Insurance Corporation or any other government agency. Although the Fund seeks to preserve the value of your investment at $1.00 per share, it is possible to lose money by investing in the Fund. |
| ** | Prior to October 8, 2012, Global Risk Allocation Fund was named Balanced Shares. Prior to November 1, 2012, Discovery Growth Fund was named Small/Mid Cap Growth Fund and Discovery Value Fund was named Small/Mid Cap Value Fund. |
| 350 | • ALLIANCEBERNSTEIN POOLING PORTFOLIOS |
AllianceBernstein Family of Funds
NOTES
| ALLIANCEBERNSTEIN POOLING PORTFOLIOS • | 351 |
NOTES
| 352 | • ALLIANCEBERNSTEIN POOLING PORTFOLIOS |
ALLIANCEBERNSTEIN POOLING PORTFOLIOS
1345 Avenue of the Americas
New York, NY 10105
800.221.5672
| POOL-0152-0213 |  | |
| ITEM 2. | CODE OF ETHICS. |
Not applicable when filing a semi-annual report to shareholders.
| ITEM 3. | AUDIT COMMITTEE FINANCIAL EXPERT. |
Not applicable when filing a semi-annual report to shareholders.
| ITEM 4. | PRINCIPAL ACCOUNTANT FEES AND SERVICES. |
Not applicable when filing a semi-annual report to shareholders.
| ITEM 5. | AUDIT COMMITTEE OF LISTED REGISTRANTS. |
Not applicable to the registrant.
| ITEM 6. | SCHEDULE OF INVESTMENTS. |
Please see Schedule of Investments contained in the Report to Shareholders included under Item 1 of this Form N-CSR.
| ITEM 7. | DISCLOSURE OF PROXY VOTING POLICIES AND PROCEDURES FOR CLOSED-END MANAGEMENT INVESTMENT COMPANIES. |
Not applicable to the registrant.
| ITEM 8. | PORTFOLIO MANAGERS OF CLOSED-END MANAGEMENT INVESTMENT COMPANIES. |
Not applicable to the registrant.
| ITEM 9. | PURCHASES OF EQUITY SECURITIES BY CLOSED-END MANAGEMENT INVESTMENT COMPANY AND AFFILIATED PURCHASERS. |
Not applicable to the registrant.
| ITEM 10. | SUBMISSION OF MATTERS TO A VOTE OF SECURITY HOLDERS. |
There have been no material changes to the procedures by which shareholders may recommend nominees to the Fund’s Board of Directors since the Fund last provided disclosure in response to this item.
ITEM 11. CONTROLS AND PROCEDURES.
(a) The registrant’s principal executive officer and principal financial officer have concluded that the registrant’s disclosure controls and procedures (as defined in Rule 30a-2(c) under the Investment Company Act of 1940, as amended) are effective at the reasonable assurance level based on their evaluation of these controls and procedures as of a date within 90 days of the filing date of this document.
(b) There were no changes in the registrant’s internal controls over financial reporting that occurred during the second fiscal quarter of the period that has materially affected, or is reasonably likely to materially affect, the registrant’s internal control over financial reporting.
| ITEM 12. | EXHIBITS. |
The following exhibits are attached to this Form N-CSR:
EXHIBIT NO. | DESCRIPTION OF EXHIBIT | |
| 12 (b) (1) | Certification of Principal Executive Officer Pursuant to Section 302 of the Sarbanes-Oxley Act of 2002 | |
| 12 (b) (2) | Certification of Principal Financial Officer Pursuant to Section 302 of the Sarbanes-Oxley Act of 2002 | |
| 12 (c) | Certification of Principal Executive Officer and Principal Financial Officer Pursuant to Section 906 of the Sarbanes-Oxley Act of 2002 | |
SIGNATURES
Pursuant to the requirements of the Securities Exchange Act of 1934 and the Investment Company Act of 1940, the registrant has duly caused this report to be signed on its behalf by the undersigned, thereunto duly authorized.
(Registrant): The AllianceBernstein Pooling Portfolios
| By: | /s/ Robert M. Keith | |
Robert M. Keith President |
Date: April 23, 2013
Pursuant to the requirements of the Securities Exchange Act of 1934 and the Investment Company Act of 1940, this report has been signed below by the following persons on behalf of the registrant and in the capacities and on the dates indicated.
| By: | /s/ Robert M. Keith | |
Robert M. Keith President |
Date: April 23, 2013
| By: | /s/ Joseph J. Mantineo | |
Joseph J. Mantineo Treasurer and Chief Financial Officer |
Date: April 23, 2013