united states
securities and exchange commission
washington, d.c. 20549
form n-csr
certified shareholder report of registered management
investment companies
Investment Company Act file number 811-21720
Northern Lights Fund Trust
(Exact name of registrant as specified in charter)
225 Pictoria Drive, Suite 450 Cincinnati, OH 45246
(Address of principal executive offices) (Zip code)
The Corporation Trust Company
1209 Orange Street Wilmington, DE 19801
(Name and address of agent for service)
Registrant's telephone number, including area code: 631-490-4300
Date of fiscal year end: 9/30
Date of reporting period: 9/30/23
Item 1. Reports to Stockholders.
Grant Park Multi Alternative Strategies Fund
| Class A shares: GPAAX | Class C shares: GPACX | Class I shares: GPAIX |
| Class N shares: GPANX |
Annual Report
September 30, 2023
Distributed by Northern Lights Distributors, LLC
Member FINRA/SIPC
This report is authorized for distribution only to shareholders and to others who have received a copy of the Prospectus.
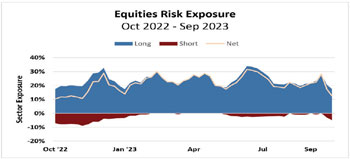
Performance Review for the Grant Park Multi Alternative Strategies Fund
October 1, 2022 – September 30, 2023
Grant Park Multi Alternative Strategies Fund (Ticker: GPAIX)
Oct 1, 2022 - Sep 30, 2023
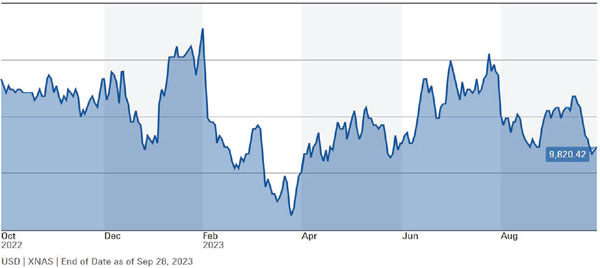
Past performance does not guarantee future results. Source: Morningstar
Fund performance of -1.99% was largely driven by a lack of directional price movement across the sectors in which the Fund trades. The Fund’s active management is primarily driven by a quantitative analysis of price movement and volatility within its investment universe. The systems are designed to reduce market exposure during periods of price uncertainty in an attempt to limit losses.
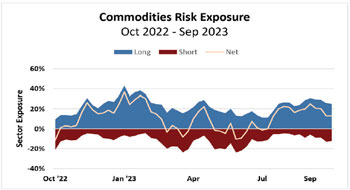
Recession fears, “higher for longer” interest rates, and international turmoil drove market prices and Fund performance. Multiple sharp price reversals created a difficult trading environment across global fixed income markets, which drove a large portion of the Fund’s losses for the reporting period. Equities and commodities contributed positive returns and helped offset losses.
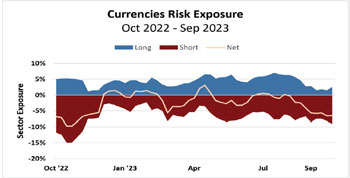
| Commodities | Currencies | |||||||||
| Q4 ’22 | Q1 ’23 | Q2 ’23 | Q3 ’23 | Q4 ’22 | Q1 ’23 | Q2 ’23 | Q3 ’23 | |||
| Return | -0.14% | -0.05% | +0.05% | +0.31% | Return | -0.96% | -0.17% | +0.20% | 0.00% | |
 |  |
| Fixed Income | Equities | |||||||||
| Q4 ’22 | Q1 ’23 | Q2 ’23 | Q3 ’23 | Q4 ’22 | Q1 ’23 | Q2 ’23 | Q3 ’23 | |||
| Return | -1.10% | -1.93% | -0.25% | -1.49% | Return | +0.20% | +0.34% | +2.37% | -1.54% | |
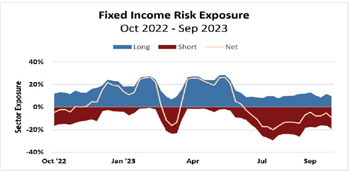 |  |
Sector performance will differ from Fund performance due to gains or losses in the cash management portfolio and fund expenses.
1
Distributions
Fund Dividend & Capital Gains Distributions Record Date: December 13, 2022 Ex-Dividend/Reinvestment NAV Date: December 14, 2022 Payable Date: December 15, 2022 | |||||
| Share Class | Re-Investment | Dividend | Short-Term Capital Gain | Long-Term Capital Gain | Distribution |
| A (GPAAX) | $10.43 | $0.2544 | $0.0000 | $0.0000 | $0.2544 |
| C (GPACX) | $10.03 | $0.1818 | $0.0000 | $0.0000 | $0.1818 |
| I (GPAIX) | $10.57 | $0.2811 | $0.0000 | $0.0000 | $0.2811 |
| N (GPANX) | $10.45 | $0.2572 | $0.0000 | $0.0000 | $0.2572 |
| Past distributions are no guarantee of future distributions or performance results. | |||||
The one-year performance for the Fund for the fiscal year ended September 30, 2023 as compared to its benchmarks was:
| As of September 30, 2023 | 1-Year Return |
| GPAAX | -2.27% |
| GPAAX (with load) | -7.89% |
| GPACX | -2.98% |
| GPAIX | -1.99% |
| GPANX | -2.15% |
| Bloomberg 1-3 Year U.S. Treasury Bond Index | 2.44% |
| Bloomberg U.S. Government/Corporate Long Bond Index | -3.27% |
Investment Outlook
Uncertainty about central bank interest rate policies, recession fears, and escalating global turmoil and tensions increased risks across markets during the past 12 months. Moving forward, we believe they will continue to be key factors that will drive market performance.
Global equity markets rallied during the first half of 2023 and experienced unusually low volatility. However, concerns that persistent inflation may result in further tightening negatively affected markets throughout the second half of the year. Equity markets may continue to see a challenging environment as fears of a severe global recession grow.
Fixed income portfolios continued to suffer losses due to aggressive central bank tightening. A “higher for longer” interest rate environment led to higher-than-normal volatility and sharp reversals throughout the year. Going forward, we believe bond volatility will remain elevated and will provide fewer diversification benefits in a traditional portfolio.
These challenges will continue to produce investment opportunities across financial and commodities markets. The foundation of our investment approach is to create a multi-asset portfolio that has the potential to profit as prices rise or fall. We believe aggressive risk management and active trading will continue to be the keys to pursuing investment opportunities.
We appreciate your support and commitment to the Fund.
3526-NLD-10/31/2023
2
Grant Park Multi Alternative Strategies Fund
PORTFOLIO REVIEW (Unaudited)
September 30, 2023
The Fund’s performance figures* for the periods ended September 30, 2023, as compared to its benchmarks:
| Inception - | |||
| Annualized | September 30, 2023 ** | ||
| One Year | Five Year | (Annualized) | |
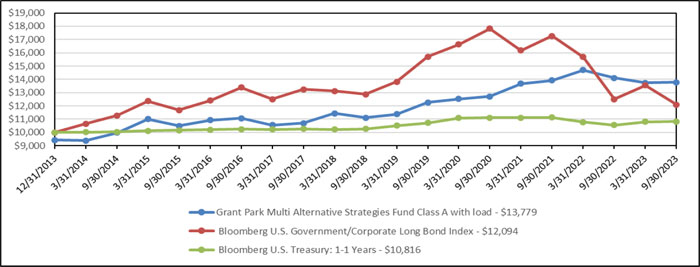
| Grant Park Multi Alternative Strategies Fund - Class A | (2.27)% | 4.40% | 3.97% |
| Grant Park Multi Alternative Strategies Fund - Class A with load | (7.89)% | 3.18% | 3.34% |
| Grant Park Multi Alternative Strategies Fund - Class C | (2.98)% | 3.63% | 3.21% |
| Grant Park Multi Alternative Strategies Fund - Class I | (1.99)% | 4.67% | 4.25% |
| Grant Park Multi Alternative Strategies Fund - Class N | (2.15)% | 4.41% | 4.00% |
| Bloomberg 1-3 Year U.S. Treasury Bond Index *** | 2.44% | 1.03% | 0.81% |
| Bloomberg U.S. Government/Corporate Long Bond Index **** | (3.27)% | (1.23)% | 1.97% |
| * | The performance data quoted here represents past performance. The performance comparison includes reinvestment of all dividends and capital gains and has been adjusted for the Class A maximum applicable sales charge of 5.75%. Current performance may be lower or higher than the performance data quoted above. Past performance is no guarantee of future results. The investment return and principal value of an investment will fluctuate so that an investor’s shares, when redeemed, may be worth more or less than their original cost. The returns shown do not reflect the deduction of taxes that a shareholder would pay on Fund distributions or on the redemption of Fund shares. Performance figures for periods greater than one year are annualized. The Fund’s total annual operating expenses are 1.71% for Class A shares, 2.46% for Class C shares, 1.46% for Class I shares, and 1.71% for Class N shares per the Fund’s Prospectus dated January 30, 2023. Class A Shares are subject to a maximum deferred sales charge of 1.00%. Redemptions made within 60 days of purchase of any share class may be assessed a redemption fee of 1.00%. The Fund’s advisor has agreed to waive and/or reimburse certain expenses of the Fund. Absent this agreement, the performance shown would have been lower. For performance information current to the most recent month-end, please call toll-free 1-855-501-4758. |
| ** | Inception date is December 31, 2013. |
| *** | The Bloomberg 1-3 Year U.S. Treasury Bond Index measures the performance of U.S. Treasury securities that have a remaining maturity of at least one year and less than three years. Investors can not invest directly in an index. |
| **** | The Bloomberg U.S. Government/Corporate Long Bond Index measures the performance of all medium and larger public issues of U.S. Treasury, agency, investment-grade corporate bonds with maturities longer than 10 years. Investors can not invest directly in an index. |
Comparison of the Change in Value of a $10,000 Investment
3
Grant Park Multi Alternative Strategies Fund
PORTFOLIO REVIEW (Unaudited)(Continued)
September 30, 2023
Portfolio Composition as of September 30, 2023
| Holdings by type of investment | % of Net Assets at Value | |||
| Short-Term Investment | 35.0 | % | ||
| Bonds & Notes | 29.4 | % | ||
| U.S. Government & Agencies | 25.9 | % | ||
| Exchange-Traded Funds | 4.4 | % | ||
| Other Assets Less Liabilities - Net | 5.3 | % | ||
| 100.0 | % | |||
Please refer to the Consolidated Schedule of Investments in this annual report for a detailed listing of the Fund’s holdings.
Derivative exposure is included in Other Assets Less Liabilities - Net.
4
| GRANT PARK MULTI ALTERNATIVE STRATEGIES FUND |
| CONSOLIDATED SCHEDULE OF INVESTMENTS |
| September 30, 2023 |
| Shares | Fair Value | |||||||||||
| EXCHANGE-TRADED FUNDS — 4.4% | ||||||||||||
| EQUITY - 4.0% | ||||||||||||
| 6,491 | iShares Core S&P 500 ETF USD Class | $ | 2,787,430 | |||||||||
| 18,721 | iShares MSCI ACWI ETF | 1,729,259 | ||||||||||
| 36,385 | iShares MSCI ACWI ex US ETF | 1,710,459 | ||||||||||
| 24,854 | iShares MSCI EAFE ETF | 1,712,938 | ||||||||||
| 30,088 | iShares MSCI EAFE Small-Cap ETF | 1,699,069 | ||||||||||
| 44,988 | iShares MSCI Emerging Markets ETF | 1,707,294 | ||||||||||
| 11,825 | iShares Russell 1000 ETF | 2,777,811 | ||||||||||
| 15,116 | iShares Russell 2000 ETF | 2,671,602 | ||||||||||
| 39,671 | iShares Russell Mid-Cap ETF | 2,747,217 | ||||||||||
| 33,710 | iShares U.S. Real Estate ETF | 2,634,099 | ||||||||||
| 22,177,178 | ||||||||||||
| FIXED INCOME - 0.4% | ||||||||||||
| 30,000 | Vanguard Short-Term Corporate Bond ETF | 2,254,500 | ||||||||||
| TOTAL EXCHANGE-TRADED FUNDS (Cost $21,191,377) | 24,431,678 | |||||||||||
| Principal | Coupon Rate | |||||||||||
| Amount ($) | (%) | Maturity | Fair Value | |||||||||
| BONDS & NOTES — 29.4% | ||||||||||||
| OIL & GAS PRODUCERS — 0.9% | ||||||||||||
| 5,000,000 | Shell International Finance BV | 2.0000 | 11/07/24 | 4,816,934 | ||||||||
| SOFTWARE — 0.9% | ||||||||||||
| 5,000,000 | Microsoft Corporation | 3.1250 | 11/03/25 | 4,792,201 | ||||||||
| U.S. GOVERNMENT & AGENCY OBLIGATIONS — 27.6% | ||||||||||||
| 10,000,000 | Federal Farm Credit Banks Funding Corporation | 0.2000 | 02/16/24 | 9,801,323 | ||||||||
| 10,000,000 | Federal Farm Credit Banks Funding Corporation | 0.3200 | 12/23/24 | 9,388,987 | ||||||||
| 9,000,000 | Federal Home Loan Banks | 0.2600 | 12/22/23 | 8,897,333 | ||||||||
| 7,180,000 | Federal Home Loan Banks | 0.3750 | 06/24/24 | 6,913,477 | ||||||||
| 10,000,000 | Federal Home Loan Banks(a) | 1.0000 | 06/30/26 | 9,124,619 | ||||||||
| 14,000,000 | Federal Home Loan Banks(a) | 1.0000 | 07/21/26 | 12,666,714 | ||||||||
| 4,250,000 | Federal Home Loan Banks(a) | 0.5000 | 05/27/27 | 3,870,684 | ||||||||
| 10,000,000 | Federal Home Loan Banks(a) | 1.0000 | 06/30/27 | 8,806,066 | ||||||||
See accompanying notes to consolidated financial statements.
5
| GRANT PARK MULTI ALTERNATIVE STRATEGIES FUND |
| CONSOLIDATED SCHEDULE OF INVESTMENTS (Continued) |
| September 30, 2023 |
| Principal | Coupon Rate | |||||||||||
| Amount ($) | (%) | Maturity | Fair Value | |||||||||
| BONDS & NOTES — 29.4% (Continued) | ||||||||||||
| U.S. GOVERNMENT & AGENCY OBLIGATIONS — 27.6% (Continued) | ||||||||||||
| 10,000,000 | Federal Home Loan Banks(a) | 0.7500 | 01/28/28 | $ | 8,724,119 | |||||||
| 10,000,000 | Federal Home Loan Banks(a) | 0.4000 | 02/24/28 | 8,728,983 | ||||||||
| 14,750,000 | Federal Home Loan Banks(a) | 0.3000 | 02/25/28 | 12,819,745 | ||||||||
| 10,000,000 | Federal Home Loan Banks(a) | 1.2500 | 08/16/28 | 8,611,876 | ||||||||
| 9,900,000 | Federal Home Loan Banks(a) | 1.0000 | 08/24/28 | 8,640,002 | ||||||||
| 3,500,000 | Federal Home Loan Mortgage Corporation | 5.0000 | 12/16/24 | 3,470,278 | ||||||||
| 10,000,000 | Federal Home Loan Mortgage Corporation | 0.7000 | 08/19/26 | 8,828,256 | ||||||||
| 6,000,000 | Federal National Mortgage Association | 0.5500 | 08/25/25 | 5,492,368 | ||||||||
| 5,000,000 | Federal National Mortgage Association | 0.7500 | 01/20/26 | 4,516,859 | ||||||||
| 13,000,000 | Federal National Mortgage Association | 0.8500 | 06/30/26 | 11,584,192 | ||||||||
| 2,335,559 | Government National Mortgage Association | 2.5000 | 12/20/49 | 2,003,576 | ||||||||
| 152,889,457 | ||||||||||||
| TOTAL BONDS & NOTES (Cost $179,204,719) | 162,498,592 | |||||||||||
| Principal | ||||||||||||
| Amount ($) | Yield Rate (%) | Maturity | Fair Value | |||||||||
| U.S. GOVERNMENT & AGENCIES — 25.9% | ||||||||||||
| U.S. TREASURY BILLS — 24.2% | ||||||||||||
| 20,000,000 | United States Treasury Bill(b) | 3.2000 | 10/05/23 | 19,991,231 | ||||||||
| 25,000,000 | United States Treasury Bill(b) | 5.1400 | 11/14/23 | 24,842,632 | ||||||||
| 15,000,000 | United States Treasury Bill(b) | 5.2100 | 11/21/23 | 14,889,514 | ||||||||
| 20,000,000 | United States Treasury Bill(b) | 5.2100 | 11/24/23 | 19,844,165 | ||||||||
| 30,000,000 | United States Treasury Bill(b) | 5.2600 | 11/30/23 | 29,738,433 | ||||||||
| 10,000,000 | United States Treasury Bill(b) | 5.2800 | 12/12/23 | 9,895,407 | ||||||||
| 15,000,000 | United States Treasury Bill(b) | 5.3500 | 01/18/24 | 14,761,838 | ||||||||
| 133,963,220 | ||||||||||||
| Coupon Rate | ||||||||||||
| (%) | ||||||||||||
| U.S. TREASURY NOTES — 1.7% | ||||||||||||
| 10,000,000 | United States Treasury Note | 1.1250 | 01/15/25 | 9,482,031 | ||||||||
| TOTAL U.S. GOVERNMENT & AGENCIES (Cost $143,572,779) | 143,445,251 | |||||||||||
See accompanying notes to consolidated financial statements.
6
| GRANT PARK MULTI ALTERNATIVE STRATEGIES FUND |
| CONSOLIDATED SCHEDULE OF INVESTMENTS (Continued) |
| September 30, 2023 |
| Shares | Fair Value | |||||||||||
| SHORT-TERM INVESTMENT - 35.0% | ||||||||||||
| MONEY MARKET FUND - 35.0% | ||||||||||||
| 193,461,693 | Morgan Stanley Institutional Liquidity Funds - Government Portfolio Institutional Class, 5.27%(c) (e) (Cost $193,461,693) | $ | 193,461,693 | |||||||||
| TOTAL INVESTMENTS - 94.7% (Cost $537,430,568) | $ | 523,837,214 | ||||||||||
| OTHER ASSETS IN EXCESS OF LIABILITIES - 5.3% | 29,171,091 | |||||||||||
| NET ASSETS - 100.0% | $ | 553,008,305 | ||||||||||
| OPEN FUTURES CONTRACTS | ||||||||||||
| Number of Contracts | Open Long Futures Contracts | Expiration | Notional Amount(d) | Value and Unrealized Appreciation (Depreciation) | ||||||||
| 192 | CBOT 10 Year US Treasury Note | 12/19/2023 | $20,748,000 | $ | (361,023 | ) | ||||||
| 143 | CBOT 5 Year US Treasury Note | 12/29/2023 | 15,066,391 | (111,179 | ) | |||||||
| 8 | CBOT Rough Rice Future(e) | 01/12/2024 | 259,600 | 480 | ||||||||
| 325 | CBOT US Treasure Bond Futures | 12/19/2023 | 36,978,906 | (2,048,485 | ) | |||||||
| 22 | CME E-Mini NASDAQ 100 Index Future | 12/15/2023 | 6,541,260 | (265,371 | ) | |||||||
| 42 | CME E-Mini Standard & Poor’s 500 Index Future | 12/15/2023 | 9,083,550 | (369,350 | ) | |||||||
| 54 | CME E-Mini Standard & Poor’s MidCap 400 Index | 12/15/2023 | 13,610,160 | (440,720 | ) | |||||||
| 24 | CME Feeder Cattle Future(e) | 11/16/2023 | 3,058,800 | (90,450 | ) | |||||||
| 2 | CME Lean Hogs Future(e) | 12/14/2023 | 57,420 | (1,020 | ) | |||||||
| 54 | CME Live Cattle Future(e) | 12/29/2023 | 4,059,180 | (52,740 | ) | |||||||
| 239 | CME Mexican Peso Currency Future | 12/18/2023 | 6,778,040 | 86,395 | ||||||||
| 116 | COMEX Gold 100 Troy Ounces Future(e) | 12/27/2023 | 21,646,760 | (1,192,030 | ) | |||||||
| 254 | FTSE 100 Index Future | 12/15/2023 | 23,771,247 | (55,272 | ) | |||||||
| 66 | ICE Brent Crude Oil Future(e) | 12/31/2023 | 6,085,200 | (71,260 | ) | |||||||
| 145 | ICE Gas Oil Future(e) | 11/10/2023 | 14,010,625 | 385,375 | ||||||||
| 38 | LME Copper Future(e) | 12/18/2023 | 7,856,500 | (188,963 | ) | |||||||
| 27 | LME Nickel Future(e) | 12/18/2023 | 3,023,082 | (363,102 | ) | |||||||
| 209 | LME Primary Aluminum Future(e) | 12/18/2023 | 12,291,813 | 478,750 | ||||||||
| 156 | LME Zinc Future(e) | 12/18/2023 | 10,345,725 | 624,375 | ||||||||
| 88 | NYBOT CSC Cocoa Future(e) | 12/13/2023 | 3,007,840 | (227,920 | ) | |||||||
| 571 | NYBOT CSC Number 11 World Sugar Future(e) | 03/29/2024 | 16,934,490 | (261,150 | ) | |||||||
| 30 | NYBOT CTN Frozen Concentrated Orange Juice A(e) | 11/09/2023 | 1,573,875 | 150,465 | ||||||||
| 557 | NYBOT CTN Number 2 Cotton Future(e) | 12/06/2023 | 24,271,275 | (371,655 | ) | |||||||
| 269 | NYBOT FINEX United States Dollar Index Future | 12/18/2023 | 28,464,235 | 56,895 | ||||||||
| 98 | NYMEX Light Sweet Crude Oil Future(e) | 11/20/2023 | 8,897,420 | 247,330 | ||||||||
| 39 | NYMEX NY Harbor ULSD Futures(e) | 11/30/2023 | 5,406,383 | (53,785 | ) | |||||||
| 18 | NYMEX Reformulated Gasoline Blendstock for Oxygen(e) | 11/30/2023 | 1,814,022 | (196,338 | ) | |||||||
| 361 | SGX Asiaclear TSI Iron Ore CFR China 62% FE Fines(e) | 11/30/2023 | 4,229,837 | 179,647 | ||||||||
| 328 | SGX Nikkei 225 Stock Index Future | 12/07/2023 | 35,123,025 | (727,465 | ) | |||||||
See accompanying notes to consolidated financial statements.
7
| GRANT PARK MULTI ALTERNATIVE STRATEGIES FUND |
| CONSOLIDATED SCHEDULE OF INVESTMENTS (Continued) |
| September 30, 2023 |
| OPEN FUTURES CONTRACTS (Continued) | ||||||||||||||
| Number of Contracts | Open Long Futures Contracts | Expiration | Notional Amount(d) | Value and Unrealized Appreciation (Depreciation) | ||||||||||
| 498 | Three Month SONIA Index Futures | 06/16/2025 | $ | 144,988,745 | $ | (226,928 | ) | |||||||
| NET UNREALIZED DEPRECIATION FROM OPEN LONG FUTURES CONTRACTS | $ | (5,466,494 | ) | |||||||||||
| OPEN FUTURES CONTRACTS | ||||||||||||||
| Number of Contracts | Open Short Futures Contracts | Expiration | Notional Amount(d) | Value and Unrealized Appreciation (Depreciation) | ||||||||||
| 1,286 | 3 Month Euro Euribor Future | 06/16/2025 | $ | 329,300,428 | $ | 268,945 | ||||||||
| 369 | CBOT 2 Year US Treasury Note Future | 12/29/2023 | 74,800,336 | 151,156 | ||||||||||
| 1,259 | CBOT 30 Day Federal Funds Future | 12/29/2023 | 496,269,302 | (98,471 | ) | |||||||||
| 664 | CBOT Corn Future(e) | 12/14/2023 | 15,828,100 | 5,600 | ||||||||||
| 10 | CBOT Oats Future(e) | 12/14/2023 | 216,250 | (4,887 | ) | |||||||||
| 7 | CBOT Soybean Future(e) | 11/14/2023 | 446,250 | 6,850 | ||||||||||
| 108 | CBOT Soybean Meal Future(e) | 12/14/2023 | 4,116,960 | 36,780 | ||||||||||
| 10 | CBOT Soybean Oil Future(e) | 12/14/2023 | 334,980 | 7,914 | ||||||||||
| 252 | CBOT Wheat Future(e) | 12/14/2023 | 6,822,900 | 558,287 | ||||||||||
| 268 | CME Australian Dollar Currency Future | 12/18/2023 | 17,299,400 | (149,583 | ) | |||||||||
| 158 | CME British Pound Currency Future | 12/18/2023 | 12,057,375 | 59,044 | ||||||||||
| 335 | CME Canadian Dollar Currency Future | 12/19/2023 | 24,734,725 | (125,536 | ) | |||||||||
| 146 | CME Euro Foreign Exchange Currency Future | 12/18/2023 | 19,367,813 | 32,806 | ||||||||||
| 407 | CME Japanese Yen Currency Future | 12/18/2023 | 34,480,531 | 627,481 | ||||||||||
| 196 | CME New Zealand Dollar Currency Future | 12/18/2023 | 11,762,940 | (156,085 | ) | |||||||||
| 102 | CME Swiss Franc Currency Future | 12/18/2023 | 14,045,400 | 138,588 | ||||||||||
| 26 | COMEX Copper Future(e) | 12/27/2023 | 2,429,375 | (9,775 | ) | |||||||||
| 12 | COMEX Silver Future(e) | 12/27/2023 | 1,347,000 | 18,375 | ||||||||||
| 94 | Eurex 10 Year Euro BUND Future | 12/07/2023 | 12,783,762 | 268,267 | ||||||||||
| 775 | Eurex 2 Year Euro SCHATZ Future | 12/07/2023 | 86,020,986 | 11,041 | ||||||||||
| 4 | Eurex 30 Year Euro BUXL Future | 12/07/2023 | 517,433 | 32,263 | ||||||||||
| 277 | Eurex 5 Year Euro BOBL Future | 12/07/2023 | 33,896,554 | 247,380 | ||||||||||
| 22 | Eurex DAX Index Future | 12/15/2023 | 9,027,698 | 286,683 | ||||||||||
| 98 | Euro-BTP Italian Bond Futures | 12/07/2023 | 11,368,580 | 130,870 | ||||||||||
| 59 | French Government Bond Futures | 12/07/2023 | 7,684,533 | 183,886 | ||||||||||
| 132 | HKG Hang Seng Index Future | 10/30/2023 | 15,077,426 | (260,485 | ) | |||||||||
| 26 | ICE US MSCI Emerging Markets EM Index Futures | 12/15/2023 | 1,242,150 | 5,065 | ||||||||||
| 38 | LME Copper Future(e) | 12/18/2023 | 7,856,500 | 63,000 | ||||||||||
| 64 | LME Nickel Future(e) | 12/18/2023 | 7,165,824 | 634,656 | ||||||||||
| 178 | LME Primary Aluminum Future(e) | 12/18/2023 | 10,468,625 | (736,262 | ) | |||||||||
| 149 | LME Zinc Future(e) | 12/18/2023 | 9,881,494 | (1,030,844 | ) | |||||||||
| 167 | Long Gilt Future | 12/27/2023 | 19,184,442 | 83,957 | ||||||||||
| 59 | NYBOT CSC C Coffee Future(e) | 12/18/2023 | 3,233,569 | 124,931 | ||||||||||
| 132 | NYMEX Henry Hub Natural Gas Futures(e) | 11/27/2023 | 3,866,280 | 2,340 | ||||||||||
| 4 | NYMEX Palladium Future(e) | 12/27/2023 | 502,400 | (23,150 | ) | |||||||||
| 96 | NYMEX Platinum Future(e) | 01/29/2024 | 4,396,320 | 33,910 | ||||||||||
| 1,165 | Three-Month SOFR Futures | 06/16/2025 | 279,265,063 | 840,300 | ||||||||||
| 33 | TSE Japanese 10 Year Bond Futures | 12/13/2023 | 32,010,492 | 9,533 | ||||||||||
See accompanying notes to consolidated financial statements.
8
| GRANT PARK MULTI ALTERNATIVE STRATEGIES FUND |
| CONSOLIDATED SCHEDULE OF INVESTMENTS (Continued) |
| September 30, 2023 |
| OPEN FUTURES CONTRACTS (Continued) | ||||||||||||||
| Number of Contracts | Open Short Futures Contracts | Expiration | Notional Amount(d) | Value and Unrealized Appreciation (Depreciation) | ||||||||||
| 80 | WCE Canola Future(e) | 11/14/2023 | $ | 832,843 | $ | (6,975 | ) | |||||||
| NET UNREALIZED APPRECIATION FROM OPEN SHORT FUTURES CONTRACTS | $ | 2,267,855 | ||||||||||||
| TOTAL NET UNREALIZED DEPRECIATION FROM OPEN FUTURES CONTRACTS | $ | (3,198,639 | ) | |||||||||||
| EAFE | - Europe, Australasia and Far East |
| ETF | - Exchange-Traded Fund |
| MSCI | - Morgan Stanley Capital International |
| (a) | Step bond. Coupon rate is fixed rate that changes on a specified date. The rate shown is the current rate at September 30, 2023. |
| (b) | Zero coupon bond. |
| (c) | Rate disclosed is the seven day effective yield as of September 30, 2023. |
| (d) | The amounts shown are the underlying reference notional amounts to stock exchange indices and equities upon which the fair value of the futures contracts held by the Fund are based. Notional values do not represent the current fair value of, and are not necessarily indicative of the future cash flows of the Fund’s futures contracts. Further, the underlying price changes in relation to the variables specified by the notional values affects the fair value of these derivative financial instruments. The notional values as set forth within this schedule do not purport to represent economic value at risk to the Fund. |
| (e) | All or a portion of this investment is a holding of the GPMAS Fund Limited. |
See accompanying notes to consolidated financial statements.
9
| Grant Park Multi Alternative Strategies Fund |
| CONSOLIDATED STATEMENT OF ASSETS AND LIABILITIES |
| September 30, 2023 |
| Assets | ||||
| Investment securities: | ||||
| Securities at cost | $ | 537,430,568 | ||
| Securities at fair value | $ | 523,837,214 | ||
| Deposit at Broker for futures contracts | 32,298,738 | |||
| Net unrealized appreciation from open futures contracts | 7,079,620 | |||
| Dividend and interest receivable | 1,331,622 | |||
| Receivable for Fund shares sold | 426,885 | |||
| Prepaid expenses and other assets | 57,041 | |||
| Total Assets | 565,031,120 | |||
| Liabilities | ||||
| Net unrealized depreciation from open futures contracts | 10,278,259 | |||
| Payable for Fund shares redeemed | 871,741 | |||
| Investment advisory fees payable | 549,261 | |||
| Payable to related parties | 168,666 | |||
| Distribution (12b-1) fees payable | 22,294 | |||
| Accrued expenses and other liabilities | 132,594 | |||
| Total Liabilities | 12,022,815 | |||
| NET ASSETS | $ | 553,008,305 | ||
| Net Assets Consist of: | ||||
| Paid in capital ($0 par value, unlimited shares authorized) | $ | 607,739,074 | ||
| Accumulated deficit | (54,730,769 | ) | ||
| NET ASSETS | $ | 553,008,305 |
See accompanying notes to consolidated financial statements.
10
| Grant Park Multi Alternative Strategies Fund |
| CONSOLIDATED STATEMENT OF ASSETS AND LIABILITIES (Continued) |
| September 30, 2023 |
| Net Asset Value Per Share: | ||||
| Class A Shares | ||||
| Net Assets | $ | 13,947,905 | ||
| Shares of beneficial interest outstanding | 1,371,171 | |||
| Net asset value (Net Assets ÷ Shares Outstanding) and redemption price per share (a) | $ | 10.17 | ||
| Maximum offering price per share (net asset value plus maximum sales charge of 5.75%) (b) | $ | 10.79 | ||
| Class C Shares | ||||
| Net Assets | $ | 14,161,784 | ||
| Shares of beneficial interest outstanding | 1,457,080 | |||
| Net asset value (Net Assets ÷ Shares Outstanding), offering price and redemption price per share (a) | $ | 9.72 | ||
| Class I Shares | ||||
| Net Assets | $ | 489,685,929 | ||
| Shares of beneficial interest outstanding | 47,434,567 | |||
| Net asset value (Net Assets ÷ Shares Outstanding), offering price and redemption price per share (a) | $ | 10.32 | ||
| Class N Shares | ||||
| Net Assets | $ | 35,212,687 | ||
| Shares of beneficial interest outstanding | 3,456,140 | |||
| Net asset value (Net Assets ÷ Shares Outstanding), offering price and redemption price per share (a) | $ | 10.19 |
| (a) | Redemptions made within 60 days of purchase may be assessed a redemption fee of 1.00%. |
| (b) | On investments of $25,000 or more, the offering price is reduced. |
See accompanying notes to consolidated financial statements.
11
| Grant Park Multi Alternative Strategies Fund |
| CONSOLIDATED STATEMENT OF OPERATIONS |
| For The Year Ended September 30, 2023 |
| Investment Income | ||||
| Dividends | $ | 634,520 | ||
| Interest | 20,056,796 | |||
| Total Investment Income | 20,691,316 | |||
| Expenses | ||||
| Investment advisory fees | 8,227,183 | |||
| Distribution (12b-1) fees: | ||||
| Class A | 43,719 | |||
| Class C | 153,344 | |||
| Class N | 112,974 | |||
| Administrative services fees | 564,558 | |||
| Third party administrative servicing fees | 426,211 | |||
| Transfer agent fees | 361,125 | |||
| Accounting services fees | 116,180 | |||
| Registration fees | 107,869 | |||
| Printing and postage expenses | 92,653 | |||
| Custodian fees | 78,400 | |||
| Compliance officer fees | 49,560 | |||
| Legal fees | 30,164 | |||
| Audit and tax fees | 24,014 | |||
| Trustees fees and expenses | 23,528 | |||
| Insurance expense | 9,001 | |||
| Other expenses | 49,082 | |||
| Total Expenses | 10,469,565 | |||
| Net Investment Income | 10,221,751 | |||
| Realized and Unrealized Gain (Loss) | ||||
| Net realized loss from: | ||||
| Investments | (613,350 | ) | ||
| Foreign currency transactions | (123,870 | ) | ||
| Futures contracts | (30,076,565 | ) | ||
| (30,813,785 | ) | |||
| Net change in unrealized appreciation (depreciation) of: | ||||
| Investments | 9,433,755 | |||
| Foreign currency translations | (37,661 | ) | ||
| Futures contracts | (2,916,969 | ) | ||
| 6,479,125 | ||||
| Net Realized and Unrealized Loss | (24,334,660 | ) | ||
| Net Decrease in Net Assets Resulting From Operations | $ | (14,112,909 | ) |
See accompanying notes to consolidated financial statements.
12
| Grant Park Multi Alternative Strategies Fund |
| CONSOLIDATED STATEMENTS OF CHANGES IN NET ASSETS |
| For the | For the | |||||||
| Year Ended | Year Ended | |||||||
| September 30, 2023 | September 30, 2022 | |||||||
| From Operations | ||||||||
| Net investment income (loss) | $ | 10,221,751 | $ | (3,979,821 | ) | |||
| Net realized gain (loss) from investment, foreign currency transactions and futures contracts | (30,813,785 | ) | 37,279,772 | |||||
| Distributions of capital gains from underlying investments | — | 10,926 | ||||||
| Net change in unrealized appreciation (depreciation) of investments, foreign currency translations, and futures contracts | 6,479,125 | (35,498,479 | ) | |||||
| Net decrease in net assets resulting from operations | (14,112,909 | ) | (2,187,602 | ) | ||||
| DISTRIBUTIONS TO SHAREHOLDERS | ||||||||
| Total distributions paid | ||||||||
| Class A | (513,005 | ) | (1,911,026 | ) | ||||
| Class C | (280,768 | ) | (1,330,911 | ) | ||||
| Class I | (18,439,669 | ) | (44,220,009 | ) | ||||
| Class N | (1,192,175 | ) | (2,540,394 | ) | ||||
| Total distributions to shareholders | (20,425,617 | ) | (50,002,340 | ) | ||||
| Capital Transactions | ||||||||
| Class A: | ||||||||
| Proceeds from shares sold | 1,873,610 | 8,942,407 | ||||||
| Net asset value of shares issued in reinvestment of distributions | 444,839 | 1,658,807 | ||||||
| Redemption fee proceeds | 785 | 1,973 | ||||||
| Payments for shares redeemed | (8,892,712 | ) | (5,834,096 | ) | ||||
| Net increase (decrease) from capital transactions | (6,573,478 | ) | 4,769,091 | |||||
| Class C: | ||||||||
| Proceeds from shares sold | 1,068,452 | 5,261,577 | ||||||
| Net asset value of shares issued in reinvestment of distributions | 262,682 | 1,234,258 | ||||||
| Redemption fee proceeds | 701 | 1,391 | ||||||
| Payments for shares redeemed | (2,570,676 | ) | (2,544,568 | ) | ||||
| Net increase (decrease) from capital transactions | (1,238,841 | ) | 3,952,658 | |||||
| Class I: | ||||||||
| Proceeds from shares sold | 148,151,446 | 473,633,518 | ||||||
| Net asset value of shares issued in reinvestment of distributions | 16,244,948 | 39,495,029 | ||||||
| Redemption fee proceeds | 28,349 | 52,171 | ||||||
| Payments for shares redeemed | (357,220,587 | ) | (159,753,906 | ) | ||||
| Net increase (decrease) from capital transactions | (192,795,844 | ) | 353,426,812 | |||||
See accompanying notes to consolidated financial statements.
13
| Grant Park Multi Alternative Strategies Fund |
| CONSOLIDATED STATEMENTS OF CHANGES IN NET ASSETS (Continued) |
| For the | For the | |||||||
| Year Ended | Year Ended | |||||||
| September 30, 2023 | September 30, 2022 | |||||||
| Capital Transactions (Continued) | ||||||||
| Class N: | ||||||||
| Proceeds from shares sold | $ | 13,525,553 | $ | 47,372,466 | ||||
| Net asset value of shares issued in reinvestment of distributions | 1,006,600 | 2,493,821 | ||||||
| Redemption fee proceeds | 2,094 | 3,455 | ||||||
| Payments for shares redeemed | (34,148,953 | ) | (12,894,828 | ) | ||||
| Net increase (decrease) from capital transactions | (19,614,706 | ) | 36,974,914 | |||||
| Total Increase (Decrease) in Net Assets From Capital Transactions | (220,222,869 | ) | 399,123,475 | |||||
| Net Assets | ||||||||
| Beginning of Year | 807,769,700 | 460,836,167 | ||||||
| End of Year | $ | 553,008,305 | $ | 807,769,700 | ||||
| SHARE ACTIVITY | ||||||||
| Class A: | ||||||||
| Shares Sold | 180,659 | 806,991 | ||||||
| Shares Reinvested | 42,650 | 154,164 | ||||||
| Shares Redeemed | (864,548 | ) | (529,979 | ) | ||||
| Net increase (decrease) in shares of beneficial interest outstanding | (641,239 | ) | 431,176 | |||||
| Class C: | ||||||||
| Shares Sold | 107,067 | 497,162 | ||||||
| Shares Reinvested | 26,190 | 119,252 | ||||||
| Shares Redeemed | (258,662 | ) | (241,286 | ) | ||||
| Net increase (decrease) in shares of beneficial interest outstanding | (125,405 | ) | 375,128 | |||||
| Class I: | ||||||||
| Shares Sold | 14,020,998 | 42,457,559 | ||||||
| Shares Reinvested | 1,536,892 | 3,626,724 | ||||||
| Shares Redeemed | (34,100,593 | ) | (14,375,525 | ) | ||||
| Net increase (decrease) in shares of beneficial interest outstanding | (18,542,703 | ) | 31,708,758 | |||||
| Class N: | ||||||||
| Shares Sold | 1,309,043 | 4,286,178 | ||||||
| Shares Reinvested | 96,325 | 231,553 | ||||||
| Shares Redeemed | (3,283,177 | ) | (1,175,731 | ) | ||||
| Net increase (decrease) in shares of beneficial interest outstanding | (1,877,809 | ) | 3,342,000 | |||||
See accompanying notes to consolidated financial statements.
14
| Grant Park Multi Alternative Strategies Fund |
| CONSOLIDATED FINANCIAL HIGHLIGHTS |
Per Share Data and Ratios for a Share of Beneficial Interest Outstanding Throughout Each Year Presented
| Class A | ||||||||||||||||||||
| Year Ended | Year Ended | Year Ended | Year Ended | Year Ended | ||||||||||||||||
| September 30, | September 30, | September 30, | September 30, | September 30, | ||||||||||||||||
| 2023 | 2022 | 2021 | 2020 | 2019 | ||||||||||||||||
| Net asset value, beginning of year | $ | 10.66 | $ | 11.68 | $ | 10.85 | $ | 11.84 | $ | 10.89 | ||||||||||
| Activity from investment operations: | ||||||||||||||||||||
| Net investment income (loss) (1) | 0.13 | (0.10 | ) | (0.13 | ) | (0.03 | ) | (0.01 | ) | |||||||||||
| Net realized and unrealized gain (loss) | (0.37 | ) | 0.26 | 1.13 | 0.42 | 1.12 | ||||||||||||||
| Total from investment operations | (0.24 | ) | 0.16 | 1.00 | 0.39 | 1.11 | ||||||||||||||
| Less distributions from: | ||||||||||||||||||||
| Net investment income | (0.25 | ) | (0.50 | ) | (0.04 | ) | (1.19 | ) | — | |||||||||||
| Net realized gains | — | (0.68 | ) | (0.13 | ) | (0.19 | ) | (0.16 | ) | |||||||||||
| Total distributions | (0.25 | ) | (1.18 | ) | (0.17 | ) | (1.38 | ) | (0.16 | ) | ||||||||||
| Paid-in-capital from redemption fees (2) | 0.00 | 0.00 | 0.00 | 0.00 | 0.00 | |||||||||||||||
| Net asset value, end of year | $ | 10.17 | $ | 10.66 | $ | 11.68 | $ | 10.85 | $ | 11.84 | ||||||||||
| Total return (3) | (2.27 | )% | 1.31 | % | 9.39 | % | 3.72 | % | 10.40 | % | ||||||||||
| Net assets, at end of year (000s) | $ | 13,948 | $ | 21,446 | $ | 18,474 | $ | 11,465 | $ | 9,371 | ||||||||||
| Ratios/Supplemental Data: | ||||||||||||||||||||
| Ratio of gross expenses to average net assets, including interest expense (4) | 1.71 | % | 1.68 | % | 1.74 | % | 1.78 | % (6) | 1.84 | % | ||||||||||
| Ratio of net expenses to average net assets, including interest expense | 1.71 | % | 1.68 | % | 1.74 | % | 1.79 | % (5) | 1.83 | % | ||||||||||
| Ratio of net investment income (loss) to average net assets | 1.25 | % | (0.88 | )% | (1.11 | )% | (0.31 | )% | (0.12 | )% | ||||||||||
| Portfolio Turnover Rate | 1 | % | 9 | % | 39 | % | 49 | % | 41 | % | ||||||||||
| (1) | Per share amounts calculated using the average shares method, which more appropriately presents the per share data for the period. |
| (2) | Less than $0.005 per share. |
| (3) | Total returns are historical in nature and assume changes in share price, reinvestment of dividends and capital gain distributions, if any. Had the advisor not absorbed a portion of Fund expenses for the year ended September 30, 2019, total returns would have been lower. |
| (4) | Represents the ratio of expenses to average net assets absent fee waivers or expense recapture by the advisor. Interest expense is not included in the waiver. |
| (5) | Represents the ratio of expenses to average net assets after advisor recapture of waived/reimbursement fees from prior periods. |
| (6) | Represents the ratio of expenses to average net assets before advisor recapture of waived/reimbursement fees from prior periods. |
See accompanying notes to consolidated financial statements.
15
| Grant Park Multi Alternative Strategies Fund |
| CONSOLIDATED FINANCIAL HIGHLIGHTS |
Per Share Data and Ratios for a Share of Beneficial Interest Outstanding Throughout Each Year Presented
| Class C | ||||||||||||||||||||
| Year Ended | Year Ended | Year Ended | Year Ended | Year Ended | ||||||||||||||||
| September 30, | September 30, | September 30, | September 30, | September 30, | ||||||||||||||||
| 2023 | 2022 | 2021 | 2020 | 2019 | ||||||||||||||||
| Net asset value, beginning of year | $ | 10.20 | $ | 11.23 | $ | 10.47 | $ | 11.47 | $ | 10.63 | ||||||||||
| Activity from investment operations: | ||||||||||||||||||||
| Net investment income (loss) (1) | 0.05 | (0.17 | ) | (0.20 | ) | (0.11 | ) | (0.11 | ) | |||||||||||
| Net realized and unrealized gain (loss) | (0.35 | ) | 0.24 | 1.09 | 0.41 | 1.11 | ||||||||||||||
| Total from investment operations | (0.30 | ) | 0.07 | 0.89 | 0.30 | 1.00 | ||||||||||||||
| Less distributions from: | ||||||||||||||||||||
| Net investment income | (0.18 | ) | (0.42 | ) | — | (1.11 | ) | — | ||||||||||||
| Net realized gains | — | (0.68 | ) | (0.13 | ) | (0.19 | ) | (0.16 | ) | |||||||||||
| Total distributions | (0.18 | ) | (1.10 | ) | (0.13 | ) | (1.30 | ) | (0.16 | ) | ||||||||||
| Paid-in-capital from redemption fees (2) | 0.00 | 0.00 | 0.00 | 0.00 | 0.00 | |||||||||||||||
| Net asset value, end of year | $ | 9.72 | $ | 10.20 | $ | 11.23 | $ | 10.47 | $ | 11.47 | ||||||||||
| Total return (3) | (2.98 | )% | 0.50 | % | 8.60 | % | 2.96 | % | 9.61 | % | ||||||||||
| Net assets, at end of year (000s) | $ | 14,162 | $ | 16,135 | $ | 13,553 | $ | 11,109 | $ | 13,008 | ||||||||||
| Ratios/Supplemental Data: | ||||||||||||||||||||
| Ratio of gross expenses to average net assets, including interest expense (4) | 2.46 | % | 2.43 | % | 2.49 | % | 2.52 | % (6) | 2.59 | % | ||||||||||
| Ratio of net expenses to average net assets, including interest expense | 2.46 | % | 2.43 | % | 2.49 | % | 2.53 | % (5) | 2.58 | % | ||||||||||
| Ratio of net investment income (loss) to average net assets | 0.55 | % | (1.62 | )% | (1.86 | )% | (1.04 | )% | (1.03 | )% | ||||||||||
| Portfolio Turnover Rate | 1 | % | 9 | % | 39 | % | 49 | % | 41 | % | ||||||||||
| (1) | Per share amounts calculated using the average shares method, which more appropriately presents the per share data for the period. |
| (2) | Less than $0.005 per share. |
| (3) | Total returns are historical in nature and assume changes in share price, reinvestment of dividends and capital gain distributions, if any. Had the advisor not absorbed a portion of Fund expenses for the year ended September 30, 2019, total returns would have been lower. |
| (4) | Represents the ratio of expenses to average net assets absent fee waivers or expense recapture by the advisor. Interest expense is not included in the waiver. |
| (5) | Represents the ratio of expenses to average net assets after advisor recapture of waived/reimbursement fees from prior periods. |
| (6) | Represents the ratio of expenses to average net assets before advisor recapture of waived/reimbursement fees from prior periods. |
See accompanying notes to consolidated financial statements.
16
| Grant Park Multi Alternative Strategies Fund |
| CONSOLIDATED FINANCIAL HIGHLIGHTS |
Per Share Data and Ratios for a Share of Beneficial Interest Outstanding Throughout Each Year Presented
| Class I | ||||||||||||||||||||
| Year Ended | Year Ended | Year Ended | Year Ended | Year Ended | ||||||||||||||||
| September 30, | September 30, | September 30, | September 30, | September 30, | ||||||||||||||||
| 2023 | 2022 | 2021 | 2020 | 2019 | ||||||||||||||||
| Net asset value, beginning of year | $ | 10.81 | $ | 11.83 | $ | 10.99 | $ | 11.97 | $ | 10.98 | ||||||||||
| Activity from investment operations: | ||||||||||||||||||||
| Net investment income (loss) (1) | 0.16 | (0.07 | ) | (0.10 | ) | (0.01 | ) | 0.08 | ||||||||||||
| Net realized and unrealized gain (loss) | (0.37 | ) | 0.26 | 1.14 | 0.45 | 1.07 | ||||||||||||||
| Total from investment operations | (0.21 | ) | 0.19 | 1.04 | 0.44 | 1.15 | ||||||||||||||
| Less distributions from: | ||||||||||||||||||||
| Net investment income | (0.28 | ) | (0.53 | ) | (0.07 | ) | (1.23 | ) | — | |||||||||||
| Net realized gains | — | (0.68 | ) | (0.13 | ) | (0.19 | ) | (0.16 | ) | |||||||||||
| Total distributions | (0.28 | ) | (1.21 | ) | (0.20 | ) | (1.42 | ) | (0.16 | ) | ||||||||||
| Paid-in-capital from redemption fees (2) | 0.00 | 0.00 | 0.00 | 0.00 | 0.00 | |||||||||||||||
| Net asset value, end of year | $ | 10.32 | $ | 10.81 | $ | 11.83 | $ | 10.99 | $ | 11.97 | ||||||||||
| Total return (3) | (1.99 | )% | 1.53 | % | 9.59 | % | 4.12 | % | 10.68 | % | ||||||||||
| Net assets, at end of year (000s) | $ | 489,686 | $ | 713,252 | $ | 405,503 | $ | 277,842 | $ | 167,041 | ||||||||||
| Ratios/Supplemental Data: | ||||||||||||||||||||
| Ratio of gross expenses to average net assets, including interest expense (4) | 1.46 | % | 1.43 | % | 1.49 | % | 1.52 | % (6) | 1.59 | % | ||||||||||
| Ratio of net expenses to average net assets, including interest expense | 1.46 | % | 1.43 | % | 1.49 | % | 1.53 | % (5) | 1.58 | % | ||||||||||
| Ratio of net investment income (loss) to average net assets | 1.51 | % | (0.59 | )% | (0.86 | )% | (0.11 | )% | 0.75 | % | ||||||||||
| Portfolio Turnover Rate | 1 | % | 9 | % | 39 | % | 49 | % | 41 | % | ||||||||||
| (1) | Per share amounts calculated using the average shares method, which more appropriately presents the per share data for the period. |
| (2) | Less than $0.005 per share. |
| (3) | Total returns are historical in nature and assume changes in share price, reinvestment of dividends and capital gain distributions, if any. Had the advisor not absorbed a portion of Fund expenses for the year ended September 30, 2019, total returns would have been lower. |
| (4) | Represents the ratio of expenses to average net assets absent fee waivers or expense recapture by the advisor. Interest expense is not included in the waiver. |
| (5) | Represents the ratio of expenses to average net assets after advisor recapture of waived/reimbursement fees from prior periods. |
| (6) | Represents the ratio of expenses to average net assets before advisor recapture of waived/reimbursement fees from prior periods. |
See accompanying notes to consolidated financial statements.
17
| Grant Park Multi Alternative Strategies Fund |
| CONSOLIDATED FINANCIAL HIGHLIGHTS |
Per Share Data and Ratios for a Share of Beneficial Interest Outstanding Throughout Each Year Presented
| Class N | ||||||||||||||||||||
| Year Ended | Year Ended | Year Ended | Year Ended | Year Ended | ||||||||||||||||
| September 30, | September 30, | September 30, | September 30, | September 30, | ||||||||||||||||
| 2023 | 2022 | 2021 | 2020 | �� | 2019 | |||||||||||||||
| Net asset value, beginning of year | $ | 10.67 | $ | 11.70 | $ | 10.87 | $ | 11.86 | $ | 10.90 | ||||||||||
| Activity from investment operations: | ||||||||||||||||||||
| Net investment income (loss) (1) | 0.13 | (0.09 | ) | (0.13 | ) | (0.04 | ) | 0.23 | ||||||||||||
| Net realized and unrealized gain (loss) | (0.35 | ) | 0.24 | 1.13 | 0.44 | 0.89 | ||||||||||||||
| Total from investment operations | (0.22 | ) | 0.15 | 1.00 | 0.40 | 1.12 | ||||||||||||||
| Less distributions from: | ||||||||||||||||||||
| Net investment income | (0.26 | ) | (0.50 | ) | (0.04 | ) | (1.20 | ) | — | |||||||||||
| Net realized gains | — | (0.68 | ) | (0.13 | ) | (0.19 | ) | (0.16 | ) | |||||||||||
| Total distributions | (0.26 | ) | (1.18 | ) | (0.17 | ) | (1.39 | ) | (0.16 | ) | ||||||||||
| Paid-in-capital from redemption fees (2) | 0.00 | 0.00 | 0.00 | 0.00 | 0.00 | |||||||||||||||
| Net asset value, end of year | $ | 10.19 | $ | 10.67 | $ | 11.70 | $ | 10.87 | $ | 11.86 | ||||||||||
| Total return (3) | (2.15 | )% | 1.22 | % | 9.37 | % | 3.79 | % | 10.38 | % | ||||||||||
| Net assets, at end of year (000s) | $ | 35,213 | $ | 56,938 | $ | 23,306 | $ | 16,112 | $ | 10,771 | ||||||||||
| Ratios/Supplemental Data: | ||||||||||||||||||||
| Ratio of gross expenses to average net assets, including interest expense (4) | 1.71 | % | 1.68 | % | 1.74 | % | 1.77 | % (6) | 1.84 | % | ||||||||||
| Ratio of net expenses to average net assets, including interest expense | 1.71 | % | 1.68 | % | 1.74 | % | 1.78 | % (5) | 1.83 | % | ||||||||||
| Ratio of net investment income (loss) to average net assets | 1.26 | % | (0.78 | )% | (1.11 | )% | (0.33 | )% | 2.11 | % | ||||||||||
| Portfolio Turnover Rate | 1 | % | 9 | % | 39 | % | 49 | % | 41 | % | ||||||||||
| (1) | Per share amounts calculated using the average shares method, which more appropriately presents the per share data for the period. |
| (2) | Less than $0.005 per share. |
| (3) | Total returns are historical in nature and assume changes in share price, reinvestment of dividends and capital gain distributions, if any. Had the advisor not absorbed a portion of Fund expenses for the year ended September 30, 2019, total returns would have been lower. |
| (4) | Represents the ratio of expenses to average net assets absent fee waivers or expense recapture by the advisor. Interest expense is not included in the waiver. |
| (5) | Represents the ratio of expenses to average net assets after advisor recapture of waived/reimbursement fees from prior periods. |
| (6) | Represents the ratio of expenses to average net assets before advisor recapture of waived/reimbursement fees from prior periods. |
See accompanying notes to consolidated financial statements.
18
Grant Park Multi Alternative Strategies Fund
NOTES TO CONSOLIDATED FINANCIAL STATEMENTS
September 30, 2023
| 1. | ORGANIZATION |
The Grant Park Multi Alternative Strategies Fund (the “Fund”) is a diversified series of shares of beneficial interest of Northern Lights Fund Trust (the “Trust”), a statutory trust organized under the laws of the State of Delaware on January 19, 2005, and registered under the Investment Company Act of 1940, as amended (the “1940 Act”), as an open-end management investment company. The Fund’s investment objective is to provide positive absolute returns.
The Fund offers four classes of shares Class A, Class C, Class I, and Class N. Class C, I, and N shares are offered at net asset value. Class A shares are offered at net asset value plus a maximum sales charge of 5.75%. Each class represents an interest in the same assets of the Fund and classes are identical except for differences in their sales charge structures and ongoing service and distribution charges. All classes of shares have equal voting privileges except that each class has exclusive voting rights with respect to its service and/or distribution plans. The Fund’s income, expenses (other than class specific distribution fees) and realized and unrealized gains and losses are allocated proportionately each day based upon the relative net assets of each class.
| 2. | SIGNIFICANT ACCOUNTING POLICIES |
The following is a summary of significant accounting policies followed by the Fund in preparation of its consolidated financial statements. The policies are in conformity with accounting principles generally accepted in the United States of America (“GAAP”). The preparation of the consolidated financial statements requires management to make estimates and assumptions that affect the reported amounts of assets and liabilities and disclosure of contingent assets and liabilities at the date of the consolidated financial statements and the reported amounts of income and expenses for the period. Actual results could differ from those estimates. The Fund is an investment company and accordingly follows the investment company accounting and reporting guidance of the Financial Accounting Standards Board (“FASB”) Accounting Standard Codification Topic 946 “Financial Services – Investment Companies” including FASB Accounting Standard Update ASU 2013-08. Fund level income and expenses and realized and unrealized capital gains and losses are allocated to each class of shares based on their relative assets within the Fund. Class specific expenses are allocated to that share class.
Security Valuation – Securities listed on an exchange are valued at the last reported sale price at the close of the regular trading session of the primary exchange on the business day the value is being determined, or in the case of securities listed on NASDAQ at the NASDAQ Official Closing Price. In the absence of a sale such securities shall be valued at the mean between the current bid and ask prices on the day of valuation. Futures and future options are valued at the final settled price or, in the absence of a settled price, at the last sale price on the day of valuation. Options contracts listed on a securities exchange or board of trade for which market quotations are readily available shall be valued at the last quoted sales price or, in the absence of a sale, at the mean between the current bid and ask prices on the primary exchange on the day of valuation. Option contracts not listed on a securities exchange or board of trade for which over-the-counter market quotations are readily available shall be valued at the mean between the current bid and ask prices on the day of valuation. Index options shall be valued at the mean between the current bid and ask prices on the day of valuation. Debt securities (other than short term obligations) are valued each day by an independent pricing service approved by the Trust’s Board of Trustees (“Board”) based on methods which include consideration of: yields or prices of securities of comparable quality, coupon, maturity and type, indications as to values from dealers, and general market conditions or market quotations from a major market maker in the securities. Investments valued in currencies other than the U.S. dollar are converted to U.S. dollars using exchange rates obtained from pricing services. Fair value may also be used by the Board if extraordinary events occur after the close of the relevant world market but prior to the NYSE close. The independent pricing service does not distinguish between smaller-sized bond positions known as “odd lots” and larger institutional-sized bond positions known as “round lots”. The Fund may fair value a particular bond if the Advisor does not believe that the round lot value provided by the independent pricing service reflects fair value of the Fund’s holding. Short-term debt obligations having 60 days or less remaining until maturity, at time of purchase, may be valued at amortized cost. Investments in open-end and closed-end investment companies are valued at net asset value.
The Fund may hold securities, such as private investments, interests in commodity pools, other non-traded securities or temporarily illiquid securities, for which market quotations are not readily available or are determined to be unreliable. These securities will be valued using the “fair value” procedures approved by the Board. The Board has delegated execution of these procedures to the Advisor as its valuation designee (the “Valuation Designee”). The Board may also enlist third party consultants such as a valuation specialist at a public accounting firm, valuation consultant or financial officer of a security issuer on an as-needed basis to assist the Valuation Designee in determining a security-specific fair value. The Board is responsible for reviewing and approving fair value methodologies utilized by the Valuation Designee, which approval shall be based upon whether the Valuation Designee followed the valuation procedures established by the Board.
Fair Valuation Process – The applicable investments are valued by the Valuation Designee pursuant to valuation procedures established by the Board. For example, fair value determinations are required for the following securities: (i) securities for which market quotations are insufficient or not readily available on a particular business day (including securities for which there is a short and temporary lapse in the provision of a price by the regular pricing source); (ii) securities for which, in the judgment of the Valuation Designee, the prices or values available do not represent the fair value of the instrument; factors which may cause the Valuation Designee to make such a judgment
19
Grant Park Multi Alternative Strategies Fund
NOTES TO CONSOLIDATED FINANCIAL STATEMENTS (Continued)
September 30, 2023
include, but are not limited to, the following: only a bid price or an ask price is available; the spread between bid and ask prices is substantial; the frequency of sales; the thinness of the market; the size of reported trades; and actions of the securities markets, such as the suspension or limitation of trading; (iii) securities determined to be illiquid; and (iv) securities with respect to which an event that will affect the value thereof has occurred (a “significant event”) since the closing prices were established on the principal exchange on which they are traded, but prior to a Fund’s calculation of its net asset value. Specifically, interests in commodity pools or managed futures pools are valued on a daily basis by reference to the closing market prices of each futures contract or other asset held by a pool, as adjusted for pool expenses. Restricted or illiquid securities, such as private investments or non-traded securities are valued based upon the current bid for the security from two or more independent dealers or other parties reasonably familiar with the facts and circumstances of the security (who should take into consideration all relevant factors as may be appropriate under the circumstances). If a current bid from such independent dealers or other independent parties is unavailable, the Valuation Designee shall determine, the fair value of such security using the following factors: (i) the type of security; (ii) the cost at date of purchase; (iii) the size and nature of the Fund’s holdings; (iv) the discount from market value of unrestricted securities of the same class at the time of purchase and subsequent thereto; (v) information as to any transactions or offers with respect to the security; (vi) the nature and duration of restrictions on disposition of the security and the existence of any registration rights; (vii) how the yield of the security compares to similar securities of companies of similar or equal creditworthiness; (viii) the level of recent trades of similar or comparable securities; (ix) the liquidity characteristics of the security; (x) current market conditions; and (xi) the market value of any securities into which the security is convertible or exchangeable.
The Fund utilizes various methods to measure the fair value of all of its investments on a recurring basis. GAAP establishes a fair value hierarchy that prioritizes inputs to valuation methods. The three levels of the hierarchy are:
Level 1 – Unadjusted quoted prices in active markets for identical assets and liabilities that a Fund has the ability to access.
Level 2 – Observable inputs other than quoted prices included in Level 1 that are observable for the asset or liability, either directly or indirectly. These inputs may include quoted prices for the identical instrument in an inactive market, prices for similar instruments, interest rates, prepayment speeds, credit risk, yield curves, default rates and similar data.
Level 3 – Unobservable inputs for the asset or liability, to the extent relevant observable inputs are not available, representing a Fund’s own assumptions about the assumptions a market participant would use in valuing the asset or liability, and would be based on the best information available.
The availability of observable inputs can vary from security to security and is affected by a wide variety of factors, including, for example, the type of security, whether the security is new and not yet established in the marketplace, the liquidity of markets, and other characteristics particular to the security. To the extent that valuation is based on models or inputs that are less observable or unobservable in the market, the determination of fair value requires more judgment. Accordingly, the degree of judgment exercised in determining fair value is greatest for instruments categorized in Level 3.
The inputs used to measure fair value may fall into different levels of the fair value hierarchy. In such cases, for disclosure purposes, the level in the fair value hierarchy within which the fair value measurement falls in its entirety, is determined based on the lowest level input that is significant to the fair value measurement in its entirety.
The inputs or methodology used for valuing securities are not necessarily an indication of the risk associated with investing in those securities. The following tables summarize the inputs used as of September 30, 2023 for the Fund’s investments measured at fair value:
| Assets * | Level 1 | Level 2 | Level 3 | Total | ||||||||||||
| Exchange-Traded Funds | $ | 24,431,678 | $ | — | $ | — | $ | 24,431,678 | ||||||||
| Bonds & Notes | — | 162,498,592 | — | 162,498,592 | ||||||||||||
| U.S. Government & Agencies | — | 143,445,251 | — | 143,445,251 | ||||||||||||
| Short-Term Investment | 193,461,693 | — | — | 193,461,693 | ||||||||||||
| Net unrealized appreciation from open futures | 7,079,620 | — | — | 7,079,620 | ||||||||||||
| Total | $ | 224,972,991 | $ | 305,943,843 | $ | — | $ | 530,916,834 | ||||||||
| Liabilities * | Level 1 | Level 2 | Level 3 | Total | ||||||||||||
| Net unrealized depreciation from open futures | $ | 10,278,259 | $ | — | $ | — | $ | 10,278,259 | ||||||||
| Total | $ | 10,278,259 | $ | — | $ | — | $ | 10,278,259 | ||||||||
The Fund did not hold any Level 3 securities during the year.
| * | Refer to the Consolidated Schedule of Investments for security classifications. |
20
Grant Park Multi Alternative Strategies Fund
NOTES TO CONSOLIDATED FINANCIAL STATEMENTS (Continued)
September 30, 2023
Offsetting of Financial Assets and Derivative Assets
The Fund’s policy is to present assets and liabilities on a gross basis equal to the unrealized appreciation (depreciation) for futures contracts. The following table presents financial instruments that are subject to enforceable netting arrangements or other similar agreements as of September 30, 2023:
| Gross and Net Amounts of | ||||||||||||||||||
| Assets: | Counterparty | Recognized Assets | Financial Instruments | Cash Collateral Pledged (1) | Net Amount | |||||||||||||
| ADM Investor Services, Inc. | $ | 2,551,681 | $ | (2,551,681 | ) | $ | — | $ | — | |||||||||
| RJ O’Brien | 4,527,939 | (4,527,939 | ) | — | — | |||||||||||||
| Total | $ | 7,079,620 | $ | (7,079,620 | ) | $ | — | $ | — | |||||||||
| Gross and Net Amounts of | Cash Collateral | |||||||||||||||||
| Liabilities: | Recognized Liabilities | Financial Instruments | Pledged/(Received)(1) | Net Amount | ||||||||||||||
| ADM Investor Services, Inc. | $ | (4,274,900 | ) | $ | 2,551,681 | $ | 1,723,219 | $ | — | |||||||||
| RJ O’Brien | (6,003,359 | ) | 4,527,939 | 1,475,420 | — | |||||||||||||
| Total | $ | (10,278,259 | ) | $ | 7,079,620 | $ | 3,198,639 | $ | — | |||||||||
| (1) | Over-collateralization of total financial instruments or cash is not shown. |
Impact of Derivatives on the Consolidated Statement of Assets and Liabilities
The following is a summary of the location of derivative investments on the Fund’s Consolidated Statement of Assets and Liabilities for the year ended September 30, 2023:
| Derivative Investment Type | Asset/Liability Derivatives |
| Equity/Currency/Commodity/Interest Rate Contracts | Net unrealized appreciation from open futures contracts |
| Net unrealized depreciation from open futures contracts |
The following table sets forth the fair value of the Fund’s derivative contracts by primary risk exposure for the year ended September 30, 2023:
| Asset Derivatives Investment Fair Value | ||||||||||||||||||||
| Commodity | Interest Rate | Total for the year ended | ||||||||||||||||||
| Derivative Investment Type | Equity Risk | Currency Risk | Risk | Risk | September 30, 2023 | |||||||||||||||
| Futures | $ | 291,748 | $ | 1,001,209 | $ | 3,559,065 | $ | 2,227,598 | $ | 7,079,620 | ||||||||||
| Liability Derivatives Investment Fair Value | ||||||||||||||||||||
| Commodity | Interest Rate | Total for the year ended | ||||||||||||||||||
| Derivative Investment Type | Equity Risk | Currency Risk | Risk | Risk | September 30, 2023 | |||||||||||||||
| Futures | $ | (2,118,663 | ) | $ | (431,204 | ) | $ | (4,882,306 | ) | $ | (2,846,086 | ) | $ | (10,278,259 | ) | |||||
Impact of Derivatives on the Consolidated Statement of Operations
The following is a summary of the location of derivative investments on the Fund’s Consolidated Statement of Operations for the year ended September 30, 2023:
| Derivative Investment Type | Location of Gain (Loss) on Derivatives |
| Equity/Currency/Commodity/Interest Rate Contracts | Net realized gain (loss) from futures contracts |
| Net change in unrealized appreciation (depreciation) on futures contracts |
21
Grant Park Multi Alternative Strategies Fund
NOTES TO CONSOLIDATED FINANCIAL STATEMENTS (Continued)
September 30, 2023
The following is a summary of the Fund’s net realized gain (loss) and change in unrealized appreciation (depreciation) on derivative investments recognized in the Consolidated Statement of Operations categorized by primary risk exposure for the year ended September 30, 2023:
Net realized gain (loss) on derivatives recognized in the Consolidated Statement of Operations
| Commodity | Interest Rate | Total for the year ended | ||||||||||||||||||
| Derivative Investment Type | Equity Risk | Currency Risk | Risk | Risk | September 30, 2023 | |||||||||||||||
| Futures | $ | 4,090,606 | $ | (4,058,269 | ) | $ | 1,791,697 | $ | (31,900,599 | ) | $ | (30,076,565 | ) | |||||||
Net change in net unrealized appreciation (depreciation) on derivatives recognized in the Consolidated Statement of Operations
| Commodity | Interest Rate | Total for the year ended | ||||||||||||||||||
| Derivative Investment Type | Equity Risk | Currency Risk | Risk | Risk | September 30, 2023 | |||||||||||||||
| Futures | $ | 2,346,775 | $ | (3,373,604 | ) | $ | (460,094 | ) | $ | (1,430,046 | ) | $ | (2,916,969 | ) | ||||||
Consolidation of Subsidiary – The consolidated financial statements of the Fund include GPMAS Fund Limited (“GPMAS”), a wholly-owned and controlled subsidiary. All inter-company accounts and transactions have been eliminated in consolidation.
The Fund may invest up to 25% of its total assets in a controlled foreign corporation, which acts as an investment vehicle in order to effect certain investments consistent with the Fund’s investment objectives and policies. GPMAS commenced operations on December 31, 2013.
A summary of the Fund’s investments in GPMAS is as follows:
| GPMAS Fund Limited (GPMAS) September 30, 2023 | |||||
| Fair Value of GPMAS | $ | 25,869,173 | |||
| Other Assets | $ | — | |||
| Total Net Assets | $ | 25,869,173 | |||
| Percentage of the Fund’s Total Net Assets | 4.7% | ||||
For tax purposes, GPMAS is an exempted Cayman investment company. GPMAS received an undertaking from the Government of the Cayman Islands exempting it from all local income, profits and capital gains taxes. No such taxes are levied in the Cayman Islands at the present time. For U.S. income tax purposes, GPMAS is a controlled foreign corporation which generates and is allocated no income which is considered effectively connected with U.S. trade of business and as such is not subject to U.S. income tax. However, as a wholly-owned controlled foreign corporation, GPMAS’s net income and capital gain, to the extent of its earnings and profits, will be included each year in the Fund’s investment company taxable income.
Exchange Traded Funds – The Fund may invest in exchange traded funds (“ETFs”). ETFs are a type of fund bought and sold on a securities exchange. An ETF trades like common stock and represents a fixed portfolio of securities. The risks of owning an ETF generally reflect the risks of owning the underlying securities they are designed to track, although the lack of liquidity on an ETF could result in it being more volatile. Additionally, ETFs have fees and expenses that reduce their value.
Futures Contracts – The Fund is subject to equity price risk, interest rate risk, commodity price risk and foreign currency exchange rate risk in the normal course of pursuing its investment objectives. The Fund may purchase or sell futures contracts to hedge against market risk and to reduce return volatility. Initial margin deposits required upon entering into futures contracts as presented in deposit at broker for futures contracts in the Consolidated Statement of Assets and Liabilities are satisfied by the segregation of specific securities or cash as collateral for the account of the broker (the Fund’s agent in acquiring the futures position). During the period the futures contracts are open, changes in the value of the contracts are recognized as unrealized gains or losses by “marking to market” on a daily basis to reflect the market value of the contracts at the end of each day’s trading. Variation margin payments are received or made depending upon whether unrealized gains or losses are incurred. When the contracts are closed, the Fund recognizes a realized gain or loss equal to the difference between the proceeds from, or cost of, the closing transaction and the Fund’s basis in the contract. If the Fund was unable to liquidate a futures contract and/or enter into an offsetting closing transaction, the Fund would continue to be subject to market risk with respect to the value of the contracts and continue to be required to maintain the margin deposits on the futures contracts. The Fund segregates liquid securities having a value at least equal to the amount of the current obligation under any open futures contract. Risks may exceed amounts recognized in the Consolidated Statement of Assets and Liabilities. With futures, there is minimal counterparty credit risk to the Fund because futures are exchange traded and the exchange’s clearinghouse, as counterparty to all exchange traded futures, guarantees the futures against default.
22
Grant Park Multi Alternative Strategies Fund
NOTES TO CONSOLIDATED FINANCIAL STATEMENTS (Continued)
September 30, 2023
The derivative instruments outstanding as of September 30, 2023 as disclosed in the Consolidated Schedule of Investments and the amounts of net realized gain and losses and changes in unrealized appreciation and depreciation on derivative instruments during the period as disclosed in the Consolidated Statement of Operations serve as indicators of the volume of derivative activity for the Fund.
Foreign Currency Translations – The accounting records of the Fund are maintained in U.S. dollars. Investment securities and other assets and liabilities denominated in a foreign currency, and income receipts and expense payments are translated into U.S. dollars using the prevailing exchange rate at the London market close. Purchases and sales of securities are translated into U.S. dollars at the contractual currency rates established at the approximate time of the trade.Net realized gains and losses on foreign currency transactions represent net gains and losses from currency realized between the trade and settlement dates on securities transactions and the difference between income accrued versus income received. The effects of changes in foreign currency exchange rates on investments in securities are included with the net realized and unrealized gain or loss on investments.
Security Transactions and Related Income – Security transactions are accounted for on the trade date. Interest income is recognized on an accrual basis. Discounts are accreted and premiums are amortized on securities purchased to the earlier of the call date or the maturity of the respective securities. Dividend income is recorded on the ex-dividend date. Realized gains or losses from sales of securities are determined by comparing the identified cost of the security lot sold with the net sales proceeds. The difference between the cost and fair value of open investments is reflected as unrealized appreciation (depreciation) on investments and any change in that amount from the prior period is reflected in the accompanying Consolidated Statement of Operations.
Dividends and Distributions to Shareholders – Dividends from net investment income, if any, are declared and paid at least annually for the Fund. Distributable net realized capital gains, if any, are declared and distributed annually. Dividends from net investment income and distributions from net realized gains are determined in accordance with federal income tax regulations, which may differ from GAAP. These “book/tax” differences are considered either temporary (i.e., deferred losses, capital loss carry forwards) or permanent in nature. To the extent these differences are permanent in nature, such amounts are reclassified within the composition of net assets based on their federal tax-basis treatment; temporary differences do not require reclassification. Dividends and distributions to shareholders are recorded on the ex-dividend date.
Federal Income Taxes – The Fund intends to continue to comply with the requirements of the Internal Revenue Code applicable to regulated investment companies and to distribute all of its taxable income to its shareholders. Therefore, no provision for Federal income tax is required. The Fund recognizes the tax benefits of uncertain tax positions only where the position is “more likely than not” to be sustained assuming examination by tax authorities. Management has reviewed the tax positions taken by the Fund on returns filed for open tax years 2020 to 2022 or expected to be taken in the Fund’s September 30, 2023 year-end tax return. The Fund identifies its major tax jurisdictions as U.S. Federal, Ohio and foreign jurisdictions where the Fund makes significant investments; however the Fund is not aware of any tax positions for which it is reasonably possible that the total amounts of unrecognized tax benefits will change materially in the next twelve months. The Fund recognizes interest and penalties, if any, related to unrecognized tax benefits as income tax expense in the Consolidated Statement of Operations. During the period, the Fund did not incur any interest or penalties. Generally, tax authorities can examine tax returns filed for the last three years.
Expenses – Expenses of the Trust that are directly identifiable to a specific fund are charged to that fund. Expenses, which are not readily identifiable to a specific fund, are allocated in such a manner as deemed equitable (as determined by the Board), taking into consideration the nature and type of expense and the relative sizes of the funds in the Trust.
Indemnification – The Trust indemnifies its officers and Trustees for certain liabilities that may arise from the performance of their duties to the Trust. Additionally, in the normal course of business, the Fund enters into contracts that contain a variety of representations and warranties and which provide general indemnities. The Fund’s maximum exposure under these arrangements is unknown, as this would involve future claims that may be made against the Fund that have not yet occurred. However, based on experience, the risk of loss due to these warranties and indemnities appears to be remote.
| 3. | PRINCIPAL INVESTMENT RISKS |
Management Risk – The Advisor’s judgements regarding the attractiveness of investing in certain securities and derivatives may prove incorrect and may result in significant losses to the Fund.
Market and Geopolitical Risk – The increasing interconnectivity between global economies and financial markets increases the likelihood that events or conditions in one region or financial market may adversely impact issuers in a different country, region or financial market. Securities in the Fund may underperform due to inflation (or expectations for inflation), interest rates, global demand for particular products or resources, natural disasters, climate-change or climate related events, pandemics, epidemics, terrorism, regulatory events and governmental or quasi-governmental actions. The occurrence of global events similar to those in recent years, such as terrorist attacks around the world, natural disasters, social and political discord or debt crises and downgrades, among others, may result in market volatility and may have long term effects on both the U.S. and global financial markets. It is difficult to predict when similar events affecting the U.S.
23
Grant Park Multi Alternative Strategies Fund
NOTES TO CONSOLIDATED FINANCIAL STATEMENTS (Continued)
September 30, 2023
or global financial markets may occur, the effects that such events may have and the duration of those effects. Any such event(s) could have a significant adverse impact on the value and risk profile of the Fund. It is not known how long such impacts, or any future impacts of other significant events described above, will or would last, but there could be a prolonged period of global economic slowdown, which may impact your investment. Therefore, the Fund could lose money over short periods due to short-term market movements and over longer periods during more prolonged market downturns. During a general market downturn, multiple asset classes may be negatively affected. Changes in market conditions and interest rates can have the same impact on all types of securities and instruments. In times of severe market disruptions you could lose your entire investment.
Credit Risk – Credit risk relates to the ability of the issuer to meet interest and principal payments, or both, as they come due. In general, lower-grade, higher-yield bonds are subject to credit risk to a greater extent than lower-yield, higher-quality bonds.
Counterparty Risk – Counterparty risk is the risk that the counterparty to a financial instrument will cause a financial loss for the Fund by failing to discharge an obligation. A concentration of counterparty risk exists in that the part of a Fund’s cash is held at the broker. The Fund could be unable to recover assets held at the prime broker, including assets directly traceable to the Fund, in the event of the broker’s bankruptcy. The Fund does not anticipate any material losses as a result of this concentration.
| 4. | INVESTMENT TRANSACTIONS |
For the year ended September 30, 2023, the cost of purchases and proceeds from the sale and/or maturity of securities, other than short-term securities and U.S. Government securities, amounted to $2,772,955, and $62,769,671 respectively.
| 5. | INVESTMENT ADVISORY AGREEMENT AND TRANSACTIONS WITH RELATED PARTIES |
Dearborn Capital Management, LLC, serves as the Fund’s investment advisor (the “Advisor”). EMC Capital Advisors, LLC serves as the sub-advisor for the Fund and is paid by the Advisor, not the Fund.
Pursuant to an investment advisory agreement with the Trust, on behalf of the Fund, the Advisor, under the oversight of the Board, directs the daily operations of the Fund and supervises the performance of administrative and professional services provided by others. As compensation for its services and the related expenses borne by the Advisor, the Fund pays the Advisor a management fee, computed and accrued daily and paid monthly, at an annual rate of 1.18%, of the applicable Fund’s average daily net assets.
Pursuant to an operating expenses limitation agreement with the Trust, on behalf of the Fund, effective January 28, 2016 the Advisor has agreed, at least until January 31, 2024, to waive a portion of its advisory fee and has agreed to reimburse the Fund for other expenses to the extent necessary so that the total expenses incurred by the Fund (excluding any front-end or contingent deferred loads, brokerage fees and commissions, acquired fund fees and expenses associated with investments in other collective investment vehicles or derivative instruments (including for example options and swap fees and expenses), borrowing costs (such as interest and dividend expense on securities sold short), taxes, and extraordinary expenses, such as litigation expenses (which may include indemnification of Fund officers and Trustees and contractual indemnification of Fund service providers, other than the Advisor)) do not exceed 1.83%, 2.58%, 1.58%, and 1.83% per annum of the Fund’s average daily net assets for Class A, Class C, Class I, and Class N shares, respectively (the “Expense Limitation”). For the year ended September 30, 2023, the Advisor earned $8,227,183 in management fees for the Fund.
With respect to the Fund, if the Advisor waives any applicable fees or reimburses any expense pursuant to the operating expenses limitation agreement, and the Fund’s operating expenses are subsequently less than the Expense Limitation, the Advisor shall be entitled to reimbursement by the Fund for such waived fees or reimbursed expenses. These fee waivers and expense reimbursements are subject to possible recoupment from the Fund in future years on a rolling three-year basis (within the three years after the end of the fiscal year during which the fees were waived or reimbursed) if such recoupment can be achieved within the lesser of the foregoing expense limits at the time of waiver or reimbursement or the then-current expense limits at the time of recoupment. For the year ended September 30, 2023, the Advisor recaptured $0 of previously waived expenses and there are none available for recoupment.
The Trust, with respect to the Fund, has adopted the Trust’s Master Distribution and Shareholder Servicing Plans for Class A, Class C and Class N shares of the Fund (the “Plan”). The Plan provides that a monthly service fee is calculated at an annual rate of 0.25%, 1.00% and 0.25% of the average daily net assets attributable to the Class A, Class C and Class N shares, of the Fund, respectively. Pursuant to the Plan, the Fund may compensate the securities dealers or other financial intermediaries, financial institutions, investment advisors, and others for activities primarily intended to result in the sale of the Fund’s shares and for maintenance and personal service provided to existing shareholders. The Plan further provides for periodic payments to brokers, dealers and other financial intermediaries, including insurance companies, for providing shareholder services and for promotional and other sales-related costs. During the year ended September 30, 2023, the Fund incurred $310,037 in fees, pursuant to the Plan.
24
Grant Park Multi Alternative Strategies Fund
NOTES TO CONSOLIDATED FINANCIAL STATEMENTS (Continued)
September 30, 2023
Northern Lights Distributors, LLC (the “Distributor”) acts as the Fund’s principal underwriter in a continuous public offering of the Fund’s Class A, Class C, Class I and Class N shares. On sales of Class A shares for the year ended September 30, 2023, the Distributor received $20,947 from front-end sales charges of which $3,173 was retained by the principal underwriter or other affiliated broker-dealer.
In addition, certain affiliates of the Distributor provide services to the Fund as follows:
Ultimus Fund Solutions, LLC (“UFS”)
UFS, an affiliate of the Distributor, provides administration, fund accounting, and transfer agent services to the Trust. Pursuant to separate servicing agreements with UFS, the Fund pays UFS customary fees for providing administration, fund accounting and transfer agency services to the Fund. Certain officers of the Trust are also officers of UFS, and are not paid any fees directly by the Fund for serving in such capacities.
Northern Lights Compliance Services, LLC (“NLCS”)
NLCS, an affiliate of UFS and the Distributor, provides a Chief Compliance Officer to the Trust, as well as related compliance services, pursuant to a consulting agreement between NLCS and the Trust. Under the terms of such agreement, NLCS receives customary fees from the Fund.
Blu Giant, LLC (“Blu Giant”)
Blu Giant, an affiliate of UFS and the Distributor, provides EDGAR conversion and filing services as well as print management services for the Fund on an ad-hoc basis. For the provision of these services, Blu Giant receives customary fees from the Fund.
| 6. | REDEMPTION FEE PROCEEDS |
The Fund may assess a short-term redemption fee of 1.00% of the total redemption amount if a shareholder sells its shares after holding them for less than 60 days. The redemption fee is paid directly to the Fund. For the year ended September 30, 2023, the redemption fees assessed for the Fund was $31,929.
| 7. | UNDERLYING INVESTMENT IN OTHER INVESTMENT COMPANIES |
The Fund seeks to achieve its investment objectives by investing a portion of their assets in the Morgan Stanley Institutional Liquidity Funds-Government Portfolio Institutional Class (the “Portfolio”), ticker MVRXX, a registered open-end fund. The Fund may redeem its investment from the Portfolio at any time if the Advisor determines that it is in the best interest of the Fund and its shareholders to do so. The performance of the Fund will be directly affected by the performance of the Portfolio. The annual report of the Portfolio, along with the report of the independent registered public accounting firm is available at www.sec.gov. As of September 30, 2023, the percentage of the Fund’s net assets invested in the Portfolio was 35.0%.
| 8. | CONTROL OWNERSHIP |
The beneficial ownership, either directly or indirectly, of more than 25% of the voting securities of a portfolio creates presumption of the control of the portfolio, under section 2(a)(9) of the 1940 Act. As of September 30, 2023, Charles Schwab & Co. held 34.61% of the voting securities of the Fund and may be deemed to control the Fund.
| 9. | TAX COMPONENTS OF CAPITAL |
The tax character of distributions paid during the fiscal years ended September 30, 2023 and September 30, 2022 was as follows:
| Fiscal Year Ended | Fiscal Year Ended | |||||||
| September 30, 2023 | September 30, 2022 | |||||||
| Ordinary Income | $ | 20,425,285 | $ | 35,254,692 | ||||
| Long-Term Capital Gain | 332 | 14,747,648 | ||||||
| Return of Capital | — | — | ||||||
| $ | 20,425,617 | $ | 50,002,340 | |||||
25
Grant Park Multi Alternative Strategies Fund
NOTES TO CONSOLIDATED FINANCIAL STATEMENTS (Continued)
September 30, 2023
As of September 30, 2023, the components of accumulated earnings/ (deficit) on a tax basis were as follows:
| Undistributed | Undistributed | Post October Loss | Capital Loss | Other | Unrealized | Total | ||||||||||||||||||||
| Ordinary | Long-Term | and | Carry | Book/Tax | Appreciation/ | Distributable Earnings/ | ||||||||||||||||||||
| Income | Gains | Late Year Loss | Forwards | Differences | (Depreciation) | (Accumulated Deficit) | ||||||||||||||||||||
| $ | 5,797,183 | $ | — | $ | (35,959,060 | ) | $ | (9,487,382 | ) | $ | — | $ | (15,081,510 | ) | $ | (54,730,769 | ) | |||||||||
The difference between book basis and tax basis accumulated net investment income, accumulated net realized gain, and unrealized appreciation from investments is primarily attributable to the tax deferral of losses on wash sales, foreign tax passthrough basis adjustments, and the mark-to-market on futures contracts. The unrealized appreciation (depreciation) in the table above includes unrealized foreign currency gains of $1,347.
Capital losses incurred after October 30 within the fiscal year are deemed to arise on the first business day of the following fiscal year for tax purposes. The Fund incurred and elected to defer such capital losses of $36,045,485.
At September 30, 2023, the Fund had capital loss carry forwards for federal income tax purposes available to offset future capital gains as follows:
| Short-Term | Long-Term | Total | CLCF Utilized | |||||||||||
| $ | 2,573,546 | $ | 6,913,836 | $ | 9,487,382 | $ | — | |||||||
| 10. | AGGREGATE TAX UNREALIZED APPRECIATION AND DEPRECIATION |
At September 30, 2023 the aggregate cost for federal tax purposes, which differs from fair value by net unrealized appreciation (depreciation) of securities, are as follows:
| Cost for Federal | Unrealized | Unrealized | Tax Net Unrealized | |||||||||||
| Tax purposes | Appreciation | Depreciation | Depreciation | |||||||||||
| $ | 535,721,432 | $ | 3,997,761 | $ | (19,080,618 | ) | $ | (15,082,857 | ) | |||||
| 11. | RECENT REGULATORY UPDATE |
On January 24, 2023, the SEC adopted rule and form amendments to require mutual funds and ETFs to transmit concise and visually engaging streamlined annual and semiannual reports to shareholders that highlight key information. Other information, including financial statements, will not appear in a streamlined shareholder report but must be available online, delivered free of charge upon request, and filed on a semiannual basis on Form N-CSR. The rule and form amendments have a compliance date of July 24, 2024. At this time, management is evaluating the impact of these amendments on the shareholder reports for the Funds.
| 12. | SUBSEQUENT EVENTS |
Subsequent events after the date of the Statement of Assets and Liabilities have been evaluated through the date the financial statements were issued. Management has determined that no events or transactions occurred requiring adjustment or disclosure in the financial statements.
26

REPORT OF INDEPENDENT REGISTERED PUBLIC ACCOUNTING FIRM
To the Shareholders of Grant Park Multi Alternative Strategies Fund and
Board of Trustees of Northern Lights Fund Trust
Opinion on the Financial Statements
We have audited the accompanying consolidated statement of assets and liabilities, including the consolidated schedule of investments, of Grant Park Multi Alternative Strategies Fund (the “Fund”), a series of Northern Lights Fund Trust, as of September 30, 2023, the related consolidated statement of operations for the year then ended, the consolidated statements of changes in net assets for each of the years in the two-year period then ended, the related notes, and the consolidated financial highlights for each of the years in the two-year period then ended collectively referred to as the “financial statements”). In our opinion, the financial statements present fairly, in all material respects, the financial position of the Fund as of September 30, 2023, the results of its operations for the year then ended, the changes in net assets, and the financial highlights for each of the years in the two-year period then ended, in conformity with accounting principles generally accepted in the United States of America.
The Fund’s consolidated financial statements and financial highlights for the years ended September 30, 2021, and prior, were audited by other auditors whose report dated November 29, 2021, expressed an unqualified opinion on those financial statements and financial highlights.
Basis for Opinion
These financial statements are the responsibility of the Fund’s management. Our responsibility is to express an opinion on the Fund’s financial statements based on our audits. We are a public accounting firm registered with the Public Company Accounting Oversight Board (United States) (“PCAOB”) and are required to be independent with respect to the Fund in accordance with the U.S. federal securities laws and the applicable rules and regulations of the Securities and Exchange Commission and the PCAOB.
We conducted our audits in accordance with the standards of the PCAOB. Those standards require that we plan and perform the audit to obtain reasonable assurance about whether the financial statements are free of material misstatement whether due to error or fraud.
Our audits included performing procedures to assess the risks of material misstatement of the financial statements, whether due to error or fraud, and performing procedures that respond to those risks. Such procedures included examining, on a test basis, evidence regarding the amounts and disclosures in the financial statements. Our procedures included confirmation of securities owned as of September 30, 2023, by correspondence with the custodian and brokers. Our audits also included evaluating the accounting principles used and significant estimates made by management, as well as evaluating the overall presentation of the financial statements. We believe that our audits provide a reasonable basis for our opinion.
We have served as the Fund’s auditor since 2021.

COHEN & COMPANY, LTD.
Philadelphia, Pennsylvania
November 29, 2023
COHEN & COMPANY, LTD.
800.229.1099 | 866.818.4538 fax | cohencpa.com
Registered with the Public Company Accounting Oversight Board
27
| Grant Park Multi Alternative Strategies Fund |
| EXPENSE EXAMPLES (Unaudited) |
| September 30, 2023 |
As a shareholder of the Fund, you incur two types of costs: (1) transaction costs, including sales charges (loads) on purchases of Class A shares and deferred sales charges on certain sales of class A shares; (2) ongoing costs, including management fees; distribution and/or service (12b-1) fees; and other Fund expenses. This example is intended to help you understand your ongoing costs (in dollars) of investing in the Fund and to compare these costs with the ongoing costs of investing in other mutual funds.
Actual Expenses
The “Actual” columns in the table below provides information about actual account values and actual expenses. You may use the information below, together with the amount you invested, to estimate the expenses that you paid over the period. Simply divide your account value by $1,000 (for example, an $8,600 account value divided by $1,000 = 8.6), then multiply the result by the number in the table under the heading entitled “Expenses Paid During Period” to estimate the expenses you paid on your account during this period.
Hypothetical Example for Comparison Purposes
The “Hypothetical” columns in the table below provides information about hypothetical account values and hypothetical expenses based on the Fund’s actual expense ratio and an assumed rate of return of 5% per year before expenses, which is not the Fund’s actual return. The hypothetical account values and expenses may not be used to estimate the actual ending account balances or expenses you paid for the period. You may use this information to compare this 5% hypothetical example with the 5% hypothetical examples that appear in the shareholder reports of other funds.
Please note that the expenses shown in the tables are meant to highlight your ongoing costs only and do not reflect any transactional costs, such as sales charges (loads), or redemption fees. Therefore, the tables are useful in comparing ongoing costs only, and will not help you determine the relative total costs of owning different funds. In addition, if these transactional costs were included, your costs would have been higher.
| Hypothetical | ||||||||||||
| Actual | (5% return before expenses) | |||||||||||
| Consolidated | ||||||||||||
| Expenses | Ending | Expenses | ||||||||||
| Fund’s | Beginning | Ending | Paid During | Account | Paid During | |||||||
| Annualized | Account Value | Account Value | Period * | Value | Period * | |||||||
| Expense Ratio | 4/1/23 | 9/30/23 | 4/1/23 – 9/30/23 | 9/30/23 | 4/1/23 – 9/30/23 | |||||||
| Grant Park Multi Alternative Strategies Fund: | ||||||||||||
| Class A | 1.71% | $ 1,000.00 | $ 1,003.00 | $ 8.59 | $ 1,016.50 | $ 8.64 | ||||||
| Class C | 2.46% | $ 1,000.00 | $ 999.00 | $ 12.33 | $ 1,012.73 | $ 12.41 | ||||||
| Class I | 1.49% | $ 1,000.00 | $ 1,003.90 | $ 7.48 | $ 1,017.61 | $ 7.53 | ||||||
| Class N | 1.74% | $ 1,000.00 | $ 1,003.00 | $ 8.72 | $ 1,016.36 | $ 8.78 | ||||||
| * | Expenses are equal to the average account value over the period, multiplied by the Fund’s annualized expense ratio, multiplied by the number of days in the period (182) divided by the number of days in the fiscal year (365). |
28
| Grant Park Multi Alternative Strategies Fund |
| SUPPLEMENTAL INFORMATION (Unaudited) |
| September 30, 2023 |
The Trustees and the executive officers of the Trust are listed below with their present positions with the Trust and principal occupations over at least the last five years. The business address of each Trustee and Officer is 225 Pictoria Drive, Suite 450, Cincinnati, OH 45246. All correspondence to the Trustees and Officers should be directed to c/o Ultimus Fund Solutions, LLC, P.O. Box 541150, Omaha, Nebraska 68154.
Independent Trustees
| Name, Address and Year of Birth | Position/Term of Office* | Principal Occupation During the Past Five Years | Number of Portfolios in Fund Complex** Overseen by Trustee | Other Directorships held by Trustee During the Past Five Years |
| Mark Garbin Born in 1951 | Trustee Since 2013 | Managing Principal, Coherent Capital Management LLC (since 2007). | 1 | Northern Lights Fund Trust (for series not affiliated with the Funds since 2013); Two Roads Shared Trust (since 2012); Forethought Variable Insurance Trust (since 2013); Northern Lights Variable Trust (since 2013); OHA Mortgage Strategies Fund (offshore), Ltd. (2014 - 2017); and Altegris KKR Commitments Master Fund (since 2014); Carlyle Tactical Private Credit Fund (since March 2018) and Independent Director OHA CLO Enhanced Equity II Genpar LLP (since June 2021). |
| Mark D. Gersten Born in 1950 | Trustee Since 2013 | Independent Consultant (since 2012). | 1 | Northern Lights Fund Trust (for series not affiliated with the Funds since 2013); Northern Lights Variable Trust (since 2013); Two Roads Shared Trust (since 2012); Altegris KKR Commitments Master Fund (since 2014); previously, Ramius Archview Credit and Distressed Fund (2015-2017); and Schroder Global Series Trust (2012 to 2017). |
| Anthony J. Hertl Born in 1950 | Trustee Since 2005; Chairman of the Board since 2013 | Retired, previously held several positions in a major Wall Street firm including Capital Markets Controller, Director of Global Taxation, and CFO of the Specialty Finance Group. | 1 | Northern Lights Fund Trust (for series not affiliated with the Funds since 2005); Northern Lights Variable Trust (since 2006); Alternative Strategies Fund (since 2010); Satuit Capital Management Trust (2007-2019). |
| Gary W. Lanzen Born in 1954 | Trustee Since 2005 | Retired (since 2012). Formerly, Founder, President, and Chief Investment Officer, Orizon Investment Counsel, Inc. (2000-2012). | 1 | Northern Lights Fund Trust (for series not affiliated with the Funds since 2005) Northern Lights Variable Trust (since 2006); AdvisorOne Funds (since 2003); Alternative Strategies Fund (since 2010); and previously, CLA Strategic Allocation Fund (2014-2015). |
| John V. Palancia Born in 1954 | Trustee Since 2011 | Retired (since 2011). Formerly, Director of Futures Operations, Merrill Lynch, Pierce, Fenner & Smith Inc. (1975-2011). | 1 | Northern Lights Fund Trust (for series not affiliated with the Funds since 2011); Northern Lights Fund Trust III (since February 2012); Alternative Strategies Fund (since 2012) and Northern Lights Variable Trust (since 2011). |
| Mark H. Taylor Born in 1964 | Trustee Since 2007; Chairman of the Audit Committee since 2013 | PhD (Accounting), CPA; Professor and Director, Lynn Pippenger School of Accountancy, Muma College of Business, University of South Florida (2019 – present); Professor and Department of Accountancy Chair, Case Western Reserve University (2009-2019); President, American Accounting Association (AAA) commencing August 2022 (President-Elect 2022-2023, President 2023-2024; Past President 2024- 2025). AAA Vice President-Finance (2017-2020); President, Auditing Section of the AAA; Member, AICPA Auditing Standards Board (2009-2012); Academic Fellow, Office of the Chief Accountant, United States Securities Exchange Commission (2005-2006); Center for Audit Quality research grants (2014, 2012). | 1 | Northern Lights Fund Trust (for series not affiliated with the Funds since 2007); Alternative Strategies Fund (since 2010); Northern Lights Fund Trust III (since 2012); and Northern Lights Variable Trust (since 2007). |
9/30/23 – NLFT_v1
29
| Grant Park Multi Alternative Strategies Fund |
| SUPPLEMENTAL INFORMATION (Unaudited) (Continued) |
| September 30, 2023 |
Officers
| Name, Address and Year of Birth | Position/Term of Office* | Principal Occupation During the Past Five Years | Number of Portfolios in Fund Complex** Overseen by Trustee | Other Directorships held by Trustee During the Past Five Years |
| Kevin E. Wolf Born in 1969 | President, Principal Executive Officer Since June 2017 | Executive Vice President, Head of Fund Administration, and Product; Ultimus Fund Solutions, LLC (since 2020); Vice President of The Ultimus Group, LLC (since 2019); Executive Vice President, Gemini Fund Services, LLC (2019-2020); President, Gemini Fund Services, LLC (2012-2019); Treasurer of the Trust (2006-June 2017). | N/A | N/A |
| James Colantino Born in 1969 | Treasurer, Principal Accounting Officer Since June 2017 | Senior Vice President Fund Administration, Ultimus Fund Solutions (since 2020); Senior Vice President Fund Administration, Gemini Fund Services, LLC (2012-2020); Assistant Treasurer of the Trust (2006-June 2017). | N/A | N/A |
| Stephanie Shearer Born in 1979 | Secretary Since February 2017 | Assistant Secretary of the Trust (2012-February 2017); Associate Director, Ultimus Fund Solutions (since 2022); Manager of Legal Administration, Ultimus Fund Solutions (2020-2022); Manager of Legal Administration, Gemini Fund Services, LLC (2018-2020); Senior Paralegal, Gemini Fund Services, LLC (2013 - 2018). | N/A | N/A |
| Michael J. Nanosky Born in 1966 | Chief Compliance Officer Since January 2021 | Chief Compliance Officer, of the Trust (since January 2021); Vice President-Senior Compliance Officer, Ultimus Fund Solutions (since 2020); Vice President, Chief Compliance Officer for Williamsburg Investment Trust (2020-current); Senior Vice President- Chief Compliance Officer, PNC Funds (2014-2019). | N/A | N/A |
| * | The term of office for each Trustee and officer listed above will continue indefinitely until the individual resigns or is removed. |
| ** | As of September 30, 2023, the Trust was comprised of 66 active portfolios managed by unaffiliated investment advisers. The term “Fund Complex” applies only to the Funds in the Trust advised by the Fund’s Adviser. The Funds do not hold themselves out as related to any other series within the Trust that is not advised by the Fund’s Adviser. |
The Funds’ SAI includes additional information about the Trustees and is available free of charge, upon request, by calling toll-free at 1-855-501-4758.
9/30/23 – NLFT_v1
30
| Grant Park Multi Alternative Strategies Fund |
| Additional Information (Unaudited) |
| September 30, 2023 |
LIQUIDITY RISK MANAGEMENT PROGRAM
The Fund has adopted and implemented a written liquidity risk management program as required by Rule 22e-4 (the “Liquidity Rule”) under the Investment Company Act. The program is reasonably designed to assess and manage the Fund’s liquidity risk, taking into consideration, among other factors, the Fund’s investment strategy and the liquidity of its portfolio investments during normal and reasonably foreseeable stressed conditions; its short and long-term cash flow projections; and its cash holdings and access to other funding sources.
During the year ended September 30, 2023, the Trust’s Liquidity Risk Management Program Committee (the “Committee”) reviewed the Fund’s investments and determined that the Fund held adequate levels of cash and highly liquid investments to meet shareholder redemption activities in accordance with applicable requirements. Accordingly, the Committee concluded that (i) the Fund’s liquidity risk management program is reasonably designed to prevent violations of the Liquidity Rule and (ii) the Fund’s liquidity risk management program has been effectively implemented.
31
PRIVACY NOTICE
Northern Lights Fund Trust
Rev. February 2014
| FACTS | WHAT DOES NORTHERN LIGHTS FUND TRUST DO WITH YOUR PERSONAL INFORMATION? |
| Why? | Financial companies choose how they share your personal information. Federal law gives consumers the right to limit some, but not all sharing. Federal law also requires us to tell you how we collect, share, and protect your personal information. Please read this notice carefully to understand what we do. |
| What? | The types of personal information we collect and share depends on the product or service that you have with us. This information can include:
● Social Security number and wire transfer instructions
● account transactions and transaction history
● investment experience and purchase history
When you are no longer our customer, we continue to share your information as described in this notice. |
| How? | All financial companies need to share customers’ personal information to run their everyday business. In the section below, we list the reasons financial companies can share their customers’ personal information; the reasons Northern Lights Fund Trust chooses to share; and whether you can limit this sharing. |
| Reasons we can share your personal information: | Does Northern Lights Fund Trust share information? | Can you limit this sharing? |
For our everyday business purposes - such as to process your transactions, maintain your account(s), respond to court orders and legal investigations, or report to credit bureaus. | YES | NO |
For our marketing purposes - to offer our products and services to you. | NO | We don’t share |
| For joint marketing with other financial companies. | NO | We don’t share |
For our affiliates’ everyday business purposes - information about your transactions and records. | NO | We don’t share |
For our affiliates’ everyday business purposes - information about your credit worthiness. | NO | We don’t share |
| For nonaffiliates to market to you | NO | We don’t share |
| QUESTIONS? | Call 1-402-493-4603 |
32
PRIVACY NOTICE
Northern Lights Fund Trust
| Page 2 |
| What we do: | |
| How does Northern Lights Fund Trust protect my personal information? | To protect your personal information from unauthorized access and use, we use security measures that comply with federal law. These measures include computer safeguards and secured files and buildings.
Our service providers are held accountable for adhering to strict policies and procedures to prevent any misuse of your nonpublic personal information. |
| How does Northern Lights Fund Trust collect my personal information? | We collect your personal information, for example, when you
● open an account or deposit money
● direct us to buy securities or direct us to sell your securities
● seek advice about your investments
We also collect your personal information from others, such as credit bureaus, affiliates, or other companies. |
| Why can’t I limit all sharing? | Federal law gives you the right to limit only:
● sharing for affiliates’ everyday business purposes – information about your creditworthiness.
● affiliates from using your information to market to you.
● sharing for nonaffiliates to market to you.
State laws and individual companies may give you additional rights to limit sharing. |
| Definitions | |
| Affiliates | Companies related by common ownership or control. They can be financial and nonfinancial companies.
● Northern Lights Fund Trust does not share with its affiliates. |
| Nonaffiliates | Companies not related by common ownership or control. They can be financial and nonfinancial companies.
● Northern Lights Fund Trust does not share with nonaffiliates so they can market to you. |
| Joint marketing | A formal agreement between nonaffiliated financial companies that together market financial products or services to you.
● Northern Lights Fund Trust doesn’t jointly market. |
33
PROXY VOTING POLICY
Information regarding how the Fund voted proxies relating to portfolio securities for the most recent twelve month period ended June 30, as well as a description of the policies and procedures that the Fund uses to determine how to vote proxies is available without charge, upon request, by calling 1-855 -501-4758 or by referring to the Securities and Exchange Commission’s (“SEC”) website at http://www.sec.gov.
PORTFOLIO HOLDINGS
Funds file a complete schedule of portfolio holdings with the Securities and Exchange Commission (the “SEC”) for the first and third quarters of each fiscal year as an exhibit to its reports on Form N-PORT, within sixty days after the end of the period. Form N-PORT reports are available at the SEC’s website at www.sec.gov.
| INVESTMENT ADVISOR |
| Dearborn Capital Management, LLC |
| 566 W Adams St., Suite 300 |
| Chicago, IL 60661 |
| ADMINISTRATOR |
| Ultimus Fund Solutions, LLC |
| 225 Pictoria Drive, Suite 450 |
| Cincinnati, OH 45246 |
| GRANTPARK-A23 |
Item 2. Code of Ethics.
(a) As of the end of the period covered by this report, the registrant has adopted a code of ethics that applies to the registrant's principal executive officer, principal financial officer, principal accounting officer or controller, or persons performing similar functions, regardless of whether these individuals are employed by the registrant or a third party.
(b) For purposes of this item, “code of ethics” means written standards that are reasonably designed to deter wrongdoing and to promote:
| (1) | Honest and ethical conduct, including the ethical handling of actual or apparent conflicts of interest between personal and professional relationships; |
| (2) | Full, fair, accurate, timely, and understandable disclosure in reports and documents that a registrant files with, or submits to, the Commission and in other public communications made by the registrant; |
(3) Compliance with applicable governmental laws, rules, and regulations;
| (4) | The prompt internal reporting of violations of the code to an appropriate person or persons identified in the code; and |
(5) Accountability for adherence to the code.
(c) Amendments: During the period covered by the report, there have not been any amendments to the provisions of the code of ethics.
(d) Waivers: During the period covered by the report, the registrant has not granted any express or implicit waivers from the provisions of the code of ethics.
(e) The Code of Ethics is not posted on Registrant’ website.
(f) A copy of the Code of Ethics is attached as an exhibit.
Item 3. Audit Committee Financial Expert.
(a) The Registrant’s board of trustees has determined that Mark Gersten, Anthony J. Hertl, and Mark H. Taylor are audit committee financial experts, as defined in Item 3 of Form N-CSR. Mr. Gersten, Mr. Hertl and Mr. Taylor are independent for purposes of this Item 3
Item 4. Principal Accountant Fees and Services.
| (a) | Audit Fees |
2023 - $19,000
2022 - $19,000
| (b) | Audit-Related Fees |
2023 - None
2022 - None
| (c) | Tax Fees |
2023 - $5,000
2022 - $5,000
Preparation of Federal & State income tax returns, assistance with calculation of required income, capital gain and excise distributions and preparation of Federal excise tax returns.
| (d) | All Other Fees |
2023 - None
2022 – None
| (e) | (1) Audit Committee’s Pre-Approval Policies |
The registrant’s Audit Committee is required to pre-approve all audit services and, when appropriate, any non-audit services (including audit-related, tax and all other services) to the registrant. The registrant’s Audit Committee also is required to pre-approve, when appropriate, any non-audit services (including audit-related, tax and all other services) to its adviser, or any entity controlling, controlled by or under common control with the adviser that provides ongoing services to the registrant, to the extent that the services may be determined to have an impact on the operations or financial reporting of the registrant. Services are reviewed on an engagement by engagement basis by the Audit Committee.
| (2) | Percentages of Services Approved by the Audit Committee |
2023 2022
Audit-Related Fees: 0.00% 0.00%
Tax Fees: 0.00% 0.00%
All Other Fees: 0.00% 0.00%
| (f) | During the audit of registrant's financial statements for the most recent fiscal year, less than 50 percent of the hours expended on the principal accountant's engagement were attributed to work performed by persons other than the principal accountant's full-time, permanent employees. |
| (g) | The aggregate non-audit fees billed by the registrant's accountant for services rendered to the registrant, and rendered to the registrant's investment adviser (not including any sub-adviser whose role is primarily portfolio management and is subcontracted with or overseen by another investment adviser), and any entity controlling, controlled by, or under common control with the adviser that provides ongoing services to the registrant: |
2023 - $5,000
2022 - $5,000
(h) The registrant's audit committee has considered whether the provision of non-audit services to the registrant's investment adviser (not including any sub-adviser whose role is primarily portfolio management and is subcontracted with or overseen by another investment adviser), and any entity controlling, controlled by, or under common control with the investment adviser that provides ongoing services to the registrant, that were not pre-approved pursuant to paragraph (c)(7)(ii) of Rule 2-01 of Regulation S-X, is compatible with maintaining the principal accountant's independence.
(i) Not applicable.
(j) Not applicable.
Item 5. Audit Committee of Listed Companies. Not applicable to open-end investment companies.
Item 6. Schedule of Investments. Schedule of investments in securities of unaffiliated issuers is included under Item 1.
Item 7. Disclosure of Proxy Voting Policies and Procedures for Closed-End Funds. Not applicable to open-end investment companies.
Item 8. Portfolio Managers of Closed-End Management Investment Companies. Not applicable to open-end investment companies.
Item 9. Purchases of Equity Securities by Closed-End Funds. Not applicable to open-end investment companies.
Item 10. Submission of Matters to a Vote of Security Holders. None
Item 11. Controls and Procedures.
(a) Based on an evaluation of the Registrant’s disclosure controls and procedures as of a date within 90 days of filing date of this Form N-CSR, the principal executive officer and principal financial officer of the Registrant have concluded that the disclosure controls and procedures of the Registrant are reasonably designed to ensure that the information required in filings on Form N-CSR is recorded, processed, summarized, and reported by the filing date, including that information required to be disclosed is accumulated and communicated to the Registrant’s management, including the Registrant’s
principal executive officer and principal financial officer, as appropriate to allow timely decisions regarding required disclosure.
(b) There were no significant changes in the Registrant’s internal control over financial reporting that occurred during the Registrant’s last fiscal half-year that have materially affected, or are reasonably likely to materially affect, the Registrant’s internal control over financial reporting.
Item 12. Disclosure of Securities Lending Activities for Closed-End Management Investment Companies. Not applicable.
Item 13. Exhibits.
(a)(1) Code of Ethics filed herewith.
(a)(3) Not applicable for open-end investment companies.
SIGNATURES
Pursuant to the requirements of the Securities Exchange Act of 1934 and the Investment Company Act of 1940, the registrant has duly caused this report to be signed on its behalf by the undersigned, thereunto duly authorized.
(Registrant) Northern Lights Fund Trust
By (Signature and Title)
/s/ Kevin E. Wolf
Kevin E. Wolf, Principal Executive Officer/President
Date 12/8/2023
Pursuant to the requirements of the Securities Exchange Act of 1934 and the Investment Company Act of 1940, this report has been signed below by the following persons on behalf of the registrant and in the capacities and on the dates indicated.
By (Signature and Title)
/s/ Kevin E. Wolf
Kevin E. Wolf, Principal Executive Officer/President
Date 12/8/2023
By (Signature and Title)
/s/ James Colantino
James Colantino, Principal Financial Officer/Treasurer
Date 12/8/2023