united states
securities and exchange commission
washington, d.c. 20549
form n-csr
certified shareholder report of registered management
investment companies
Investment Company Act file number 811-21720
Northern Lights Fund Trust
(Exact name of registrant as specified in charter)
225 Pictoria Drive, Suite 450 Cincinnati, OH 45246
(Address of principal executive offices) (Zip code)
The Corporation Trust Company
1209 Orange Street Wilmington, DE 19801
(Name and address of agent for service)
Registrant's telephone number, including area code: 631-490-4300
Date of fiscal year end: 9/30
Date of reporting period: 9/30/23
Item 1. Reports to Stockholders.
Deer Park Total Return Credit Fund
Class A Shares: DPFAX
Class C Shares: DPFCX
Class I Shares: DPFNX
Annual Report
September 30, 2023
www.deerparkfund.com
1-888-868-9501
Distributed by Northern Lights Distributors, LLC
Member FINRA/SIPC

November 30, 2023
Dear Investor,
The Deer Park Total Return Credit Fund (the “Fund”) is an open-end mutual fund that invests primarily in legacy non-agency mortgage backed securities (“RMBS”) and legacy asset backed securities (“ABS”) which we believe have an attractive fundamental backdrop. The Fund seeks to target a distribution yield of 3-6% and a mid-to-high single-digit total return with little correlation to both investment grade and high yield bonds, though actual distributions and performance will vary, and the Fund may have periods of negative performance (please see important disclosures below regarding the Fund’s distribution yield and performance).
Market Performance for the Fiscal Year Ended September 30, 2023
The Fund’s Class I Shares returned -2.37% over the fiscal year ended September 30, 2023 (the “Investment Period”), and 3.45% annualized since the Fund’s inception on October 16, 2015. In aggregate, the Fund’s Class I Shares distributed approximately $0.59/share over the fiscal year based on a specified distribution policy of $0.045/ share during the first two months of the Investment Period and $0.05/share per month in the remaining ten. This may have included a portion of return of capital.
The Fund’s distribution policy is to make monthly distributions to shareholders. The level of monthly distributions (including return of capital) is not fixed. However, this distribution policy is subject to change. Shareholders should not assume that the source of a distribution from the Fund is net profit. A portion of the distributions consist of a return of capital based on the character of the distributions received from the underlying holdings. The final determination of the source and tax characteristics of all distributions will be made after the end of the year. Shareholders should note that return of capital will reduce the tax basis of their shares and potentially increase the taxable gain, if any, upon disposition of their shares. There is no assurance that the Fund will continue to declare distributions or that they will continue at these rates.
| As of September 30, 2023 | Q4 2022 | Q1 2023 | Q2 2023 | Q3 2023 | One Year | Three Year | Since Inception* |
| DPFNX Class I (NAV) | -2.35% | -0.68% | 0.57% | 0.10% | -2.37% | -0.78% | 3.45% |
| DPFAX Class A (NAV) | -2.42% | -0.74% | 0.51% | -0.08% | -2.73% | -1.06% | 3.17% |
| DPFAX Class A (Max Load) | -8.03% | -6.46% | -5.32% | -5.83% | -8.32% | -2.99% | 2.41% |
| DPFCX Class C (NAV) | -2.61% | -0.93% | 0.31% | -0.27% | -3.47% | -1.82% | 0.86% |
| Bloomberg US Aggregate Bond Index | 1.87% | 2.96% | -0.84% | -3.23% | 0.64% | -5.21% | 0.50% |
| HFRX Fixed Income – Credit | 2.51% | 1.68% | 1.30% | -0.11% | 5.48% | -0.94% | 1.49% |
| * | Inception date for the I and A share classes is October 16, 2015. Inception date the C share class is April 6, 2017. Total returns are calculated with the traded NAV on September 29, 2023.Performance for periods longer than one year is annualized. |
The performance data quoted here represents past performance. Current performance may be lower or higher than the performance data quoted above. Investment return and principal value will fluctuate so that shares, when redeemed, may be worth more or less than their original cost. Past performance is no guarantee of future results. For performance information current to the most recent month-end, please call toll-free (888) 868-9501.
The Fund’s total annual operating expenses are 2.44%, 3.19%, and 2.19% for the Class A, C, and I shares, respectively. The Fund’s investment advisor has contractually agreed to waive management fees and to make payments to limit Fund expenses until at least January 31, 2024. After this fee waiver, the expense ratios are 2.04%, 2.79%, and 1.79% for the Class A, C, and I shares, respectively. These fee waivers and expense reimbursements are subject to possible recoupment from the Fund in future years. The maximum sales load for the Class A shares is 5.75%. A fund’s performance, especially for very short periods of time, should not be the sole factor in making your investment decisions.
1
Performance Statistics
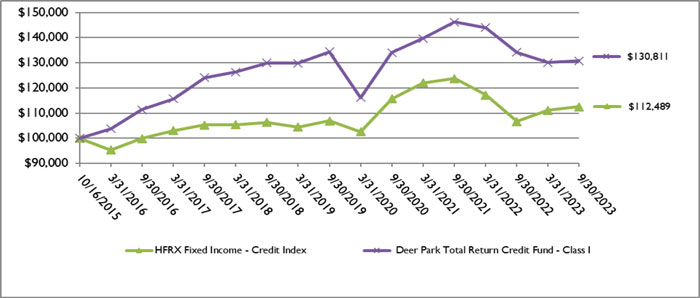
The chart below shows performance statistics of the Fund relative to the Bloomberg Barclays U.S. Aggregate Bond Index and the HFRX Fixed Income – Credit Index from November 2015 (the first full month of Fund performance) through September 2023.
| Nov. 2015 - Sep. 2023 | Deer Park Total Return Credit I | Bloomberg Barclays US Aggregate Bond Index | HFRX Fixed Income - Credit Index |
| Annualized Return | 3.38% | 0.56% | 1.43% |
| Cumulative Return | 30.06% | 4.51% | 11.87% |
| Standard Deviation | 6.84% | 4.72% | 5.10% |
| Gain Deviation | 3.51% | 3.26% | 3.43% |
| Loss Deviation | 5.92% | 3.39% | 3.77% |
| Sharpe Ratio | 0.29 | -0.18 | 0.00 |
| Max Drawdown | -15.80% | -17.18% | -14.26% |
| Deer Park Fund Correlation to: | 1.00 | 0.24 | 0.66 |
Past performance is not indicative of future results. Investors cannot directly invest in an index and unmanaged index returns do not reflect any fees, expenses or sales charges.
Please see additional information in the Important Risk Disclosures section at the end of this letter regarding the terms used in this table.
Since inception of the Fund on October 16, 2015 through September 30, 2023, the Fund’s performance was positive or flat 81% of the trading days and negative only 19% of the trading days. This compares favorably to the Bloomberg Barclays US Aggregate Bond Index shown below.
| Daily Statistics | Deer Park Total Return Credit I | Bloomberg Barclays US Aggregate Bond Index |
| Positive/Flat Days | 1614 | 1056 |
| Negative Days | 387 | 945 |
| % Positive/Flat Days | 81% | 53% |
| % Negative Days | 19% | 47% |
Past performance is not indicative of future results. Investors cannot directly invest in an index and unmanaged index returns do not reflect any fees, expenses or sales charges.
Market & Portfolio Update:
The financial markets were exceptionally volatile in the 12 months ended September 30, 2023 with investor sentiment whipsawed by push-pull expectations for the Fed’s tightening efforts, a rising AI narrative, slowing economic growth, and some market participants hoping for a Fed pivot to pause rate hikes and return to QE. The extent of uncertainty remains high as the narrative around outcomes continues to evolve.
2
The Fed has raised the Fed Funds rate 525 basis points since March 2022 (through September 30, 2023), the largest increase since 1980. We believe that the general market consensus is that, after that 525 bps of interest rate increases since March 2022, we are nearing ‘peak rates.’ As often stated by the Federal Reserve (the “Fed”), interest rate increases operate on a long and variable lag with timing and effects that are difficult to predict. This is especially the case with the recent increase in longer-dated Treasury rates (e.g., 10-year Treasury yield above 4.50% at the end of September 2023) and the anticipated further economic slowing this increase may have on the economy.
While the markets are taking solace from the hopes that interest rate increases may be done, the Fed’s message of keeping interest rates ‘higher for longer’ appears to have changed mid-term expectations. Fed Chairman Powell has clearly messaged that they do not want to make the mistake the Fed made in the 1970’s and ease interest rates before fully extinguishing inflationary pressures. Historically, there has been a lag between when the Fed hikes interest rates and when the resulting effects are observed in credit markets. Often, this delay has several quarters or even over a year from the time that interest rates increase to the point that they result in higher corporate interest costs and the potential onset of an economic recession. Notably, given the effect of the pandemic relief stimulus and the significant refinancing wave that occurred as a result of years of near-zero interest rates, we may see an even more prolonged lag effect from the Fed’s current rate increases.
Credit spreads have widened across the majority of credit products beginning in 2022 and continuing into 2023, including in the Non-Agency RMBS space. In our view, given the price decline and spread widening, RMBS offers historically attractive default-adjusted return opportunities, especially relative to investment grade and high-yield corporate bonds. The current spread levels in RMBS would historically indicate credit stress and an impending default cycle. However, in our view, the fundamentals in RMBS remain sound, and technical market factors (forced selling, low liquidity, slower prepayment assumptions) are not representative of underlying collateral performance characteristics. We believe that the price/yield levels across most investment grade and high yield corporate bonds do not reflect the potential risk associated with a potential recessionary environment. We feel the current price levels offer an attractive relative value entry point for mortgage credit and especially for RMBS which possess additional upside optionality associated with positive convexity, forbearance recoveries, increased prepayments, and excess spread recoveries.
3
Performance Attribution
Please see the below Performance Attribution for the Investment Period. The performance of these sectors reflected the impact of the broader credit market spread widening effect.
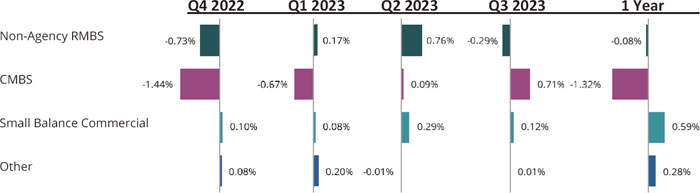
The attribution data will not match the performance results of the Fund as it is an estimate and does not include Fund expenses, the results of residual cash balances and other timing considerations. Past performance is not indicative of future results. Investors cannot directly invest in an index and unmanaged index returns do not reflect any fees, expenses or sales charges.
Legacy RMBS
Legacy Non-Agency RMBS remains the largest holding in the Fund’s portfolio, and these positions were roughly flat (-0.08% contribution to return) over the Investment Period. As mentioned earlier, recent market volatility has resulted in increased spread levels across the Legacy Non-Agency RMBS bonds. Deer Park is hoping to utilize their position as one of the largest and most knowledgeable investors in the Legacy RMBS sector and selectively purchase bonds at what they believe are attractive prices.
CMBS
The Fund’s CMBS positions contributed negatively to performance in the first half of the Investment Period, but contributed positively during the second half of the Investment Period. Uncertainty in the CMBS market has contributed to many investors’ broad-brush dismissal of the entire commercial real estate sector. However, about 70% of conduit CMBS loans have been refinancing before or within three months of their scheduled maturity date. We believe that the market’s expectation that the majority of commercial real estate assets will be unable to refinance and default seems too draconian. This creates the opportunity to analyze bonds to select those with high-quality assets and the highest probability of repayment.
Other Investment Notes
The Fund did not have exposure to derivatives during the Investment Period. We believe the Fund invested in a manner consistent with the objectives or investment strategy detailed in the fund’s prospectus throughout the Investment Period.
4
Market Outlook
We continue to have a very positive outlook on the portfolio and believe that positive performance trends continue to support the long-term return potential for these positions. In our view, traditional fixed-income investors have largely overlooked the RMBS space. Trading activity in this sector has been impacted by liquidity-driven technical factors that have created what we believe is a compelling investment opportunity; (1) technical price impact of forced selling; (2) stable-to-improved collateral performance characteristics due to years of home price appreciation and deleveraging of risk; (3) further long-term return potential from unique facets within the RMBS sector. The RMBS space is trading at levels we have not seen in years and offering what we believe are attractive Default-Adjusted Yields with what we believe is diminishing credit risk. Current market conditions are seeing a dearth of bid activity, offering liquidity providers an opportune time to actively select RMBS bonds with attractive return potential.
5
Important Risk Disclosures:
Investors should carefully consider the investment objectives, risks, charges and expenses of the Deer Park Total Return Credit Fund. This and other important information about the Fund is contained in the Prospectus, which can be obtained by contacting your financial advisor, or by calling (888) 868-9501. The Prospectus should be read carefully before investing. The Deer Park Total Return Credit Fund is distributed by Northern Lights Distributors, LLC member FINRA/SIPC. Princeton Fund Advisors, LLC, and Northern Lights Distributors are not affiliated. Mutual Funds involve risk including the possible loss of principal.
ABS, RMBS and CMBS are subject to credit risk because underlying loan borrowers may default. Additionally, these securities are subject to prepayment risk because the underlying loans held by the issuers may be paid off prior to maturity. The value of these securities may go down as a result of changes in prepayment rates on the underlying mortgages or loans. During periods of declining interest rates, prepayment rates usually increase and the Fund may have to reinvest prepayment proceeds at a lower interest rate. CMBS are less susceptible to this risk because underlying loans may have prepayment penalties or prepayment lock out periods. There is a risk that issuers and counterparties will not make payments on securities and other investments held by the Fund, resulting in losses to the Fund. In addition, the credit quality of securities held by the Fund may be lowered if an issuer’s financial condition changes.
Standard Deviation measures the average deviations of a return series from its mean. Gain Deviation is the Standard Deviation of all positive returns. Loss Deviation is the Standard Deviation of all negative returns. Sharpe Ratio is a statistical measure that uses standard deviation and excess return over a risk-free rate of return to determine reward per unit of risk. A higher Sharpe ratio implies a better historical risk-adjusted performance. The Sharpe ratio has been calculated using the Citi 3-month Treasury Bill Index for the risk-free rate of return. Correlation is a statistic that measures the degree to which two return series move in relation to each other. Loan-to-Value is calculated by dividing the amount borrowed (mortgage amount) by the appraised value of the property, expressed as a percentage. The House Price Index (HPI) is a broad measure of the movement of single-family property prices in the United States.
The Bloomberg Barclays U.S. Aggregate Bond Index provides a measure of the performance of the U.S. investment grades bond market. The value of the Fund’s investments in fixed income securities will fluctuate with changes in interest rates. Typically, a rise in interest rates causes a decline in the value of fixed income securities. HFRX Fixed Income - Credit Index includes strategies with exposure to credit across a broad continuum of credit sub-strategies, including Corporate, Sovereign, and Asset Backed. Investment thesis across all strategies is predicated on realization of a valuation discrepancy between the related credit instruments.
Foreign investing involves risks not typically associated with U.S. investments, including adverse fluctuations in foreign currency values, adverse political, social and economic developments, less liquidity, greater volatility, less developed or less efficient trading markets, political instability and differing auditing and legal standards. Investing in emerging markets imposes risks different from, or greater than, risks of investing in foreign developed countries.
Lower-quality fixed income securities, known as “high yield” or “junk” bonds, present greater risk than bonds of higher quality, including an increased risk of default. An economic downturn or period of rising interest rates could adversely affect the market for these bonds and reduce the Fund’s ability to sell its bonds. The lack of a liquid market for these bonds could decrease the Fund’s share price.
Repayment of defaulted securities and obligations of distressed issuers (including insolvent issuers or issuers in payment or covenant default, in workout or restructuring or in bankruptcy or in solvency proceedings) is subject to significant uncertainties. Investments in defaulted securities and obligations of distressed issuers are considered speculative as are junk bonds in general.
The value of a specific security can be more volatile than the market as a whole and can perform differently from the value of the market as a whole. The value of securities of smaller issuers can be more volatile than those of larger issuers. The value of certain types of securities can be more volatile due to increased sensitivity to adverse issuer, political, regulatory, market, or economic developments. Liquidity risk exists when particular investments of the Fund would be difficult to purchase or sell, possibly preventing the Fund from selling such illiquid securities at an advantageous time or price, or possibly requiring the Fund to dispose of other investments at unfavorable times or prices in order to satisfy its obligations.
The advisor’s and sub-advisor’s judgments about the attractiveness, value and potential appreciation of particular asset classes and securities in which the Fund invests (long or short) may prove to be incorrect and may not produce the desired results. Additionally, the advisor’s judgments about the potential performance of the sub-advisor may also prove incorrect and may not produce the desired results. Overall equity and fixed income securities and derivatives market risks may affect the value of individual instruments in which the Fund invests. Factors such as domestic and foreign economic growth and market conditions, interest rate levels, and political events affect the securities and derivatives markets. When the value of the Fund’s investments goes down, your investment in the Fund decreases in value and you could lose money.
Smaller companies may have limited product lines, markets or financial resources, and they may be dependent on a limited management group. Securities of smaller companies may be subject to more abrupt or erratic market movements than those of larger, more established companies or the market averages in general. Underlying funds are subject to investment advisory and other expenses, which will be indirectly paid by the Fund. As a result, the cost of investing in the Fund will be higher than the cost of investing directly in an underlying fund and may be higher than other mutual funds that invest directly in stocks and bonds. Underlying funds are subject to specific risks, depending on the nature of the fund.
7975-NLD 11/20/2023
6
| Deer Park Total Return Credit Fund |
| PORTFOLIO REVIEW (Unaudited) |
| September 30, 2023 |
The Fund’s performance figures* for the period ended September 30, 2023, compared to its benchmarks:
| Annualized | Annualized | ||||
| Annualized | Annualized | Inception** - | Inception*** - | ||
| One Year | Three Year | Five Year | September 30, 2023 | September 30, 2023 | |
| Class A Shares | (2.73)% | (1.06)% | (0.12)% | 3.17% | — |
| Class A Shares with load | (8.32)% | (2.99)% | (1.30)% | 2.41% | — |
| Class C Shares | (3.47)% | (1.82)% | (0.87)% | — | 0.86% |
| Class I Shares | (2.37)% | (0.78)% | 0.15% | 3.45% | — |
| Bloomberg Capital U.S. Aggregate Bond Index | 0.64% | (5.21)% | 0.10% | 0.50% | 0.19% |
| HFRX Fixed Income - Credit Index | 5.47% | (0.94)% | 1.12% | 1.49% | 1.37% |
| * | The performance data quoted here represents past performance. The performance comparison includes reinvestment of all dividends and distributions and has been adjusted for the Class A maximum applicable sales charge of 5.75%. Current performance may be lower or higher than the performance data quoted above. Past performance is no guarantee of future results. The investment return and principal value of an investment will fluctuate so that investors’ shares, when redeemed, may be worth more or less than the original cost. Total returns are calculated with the traded NAV on September 29, 2023. The returns shown do not reflect the deduction of taxes that a shareholder would have to pay on Fund distributions or on the redemption of Fund shares. The Fund’s total annual operating expenses, including underlying funds, before fee waivers and/or expense reimbursements are 2.44%, 3.19% and 2.19%, respectively, for Class A, Class C and Class I shares per the January 30, 2023 prospectus. The Fund’s total annual operating expenses, including underlying funds, after fee waivers and/or expense reimbursements are 2.04%, 2.79% and 1.79%, respectively, for Class A, Class C and Class I shares per the January 30, 2023 prospectus. Class A shares are subject to a maximum sales charge of 5.75% imposed on purchases. For certain of the periods shown, the Fund’s adviser waived and/or reimbursed certain expenses of the Fund. Absent this arrangement, the Fund’s performance would have been lower. For performance information current to the most recent month-end, please call toll free (888) 868-9501. |
| ** | Commencement of operations is October 16, 2015. |
| *** | Commencement of operations is April 6, 2017. |
The Bloomberg Capital U.S. Aggregate Bond Index is commonly used as a benchmark by both passive and active investors to measure portfolio performance relative to the U.S. dollar-denominated investment grade fixed-rate taxable bond market. It is also an informational measure of broad market returns commonly applied to fixed income instruments. The index contains approximately 8,200 fixed income issues and is valued at around $15 trillion, representing 43% of the total U.S. bond market. Investors cannot invest directly in the index.
HFRX Fixed Income - Credit Index includes strategies with exposure to credit across a broad continuum of credit sub-strategies, including Corporate, Sovereign, Distressed, Convertible, Asset Backed, Capital Structure Arbitrage, Multi-Strategy and other Relative Value and Event Driven sub-strategies. Investment thesis across all strategies is predicated on realization of a valuation discrepancy between the related credit instruments. Strategies may also include and utilize equity securities, credit derivatives, government fixed income, commodities, currencies or other hybrid securities. Investors cannot invest directly in the index.
Comparison of the Change in Value of a $100,000 Investment
7
| Deer Park Total Return Credit Fund |
| PORTFOLIO REVIEW (Unaudited)(Continued) |
| September 30, 2023 |
The Fund’s top asset classes and industry sectors as of September 30, 2023, are as follows:
| Percent of Net | ||||
| Portfolio Composition: | Assets | |||
| Agency Asset Backed Securities | ||||
| Collateralized Mortgage Obligations | 0.6 | % | ||
| Agency CMBS | 0.6 | % | ||
| Non Agency Asset Backed Securities | ||||
| Collateralized Mortgage Obligations | 31.8 | % | ||
| Residential Mortgage | 27.5 | % | ||
| Non Agency CMBS | 25.3 | % | ||
| Home Equity | 16.0 | % | ||
| Manufactured Housing | 2.4 | % | ||
| Other ABS | 0.7 | % | ||
| Whole Business | 0.1 | % | ||
| Short-Term Investment | 0.7 | % | ||
| Liabilities In Excess Of Other Assets + | (5.7 | )% | ||
| 100.0 | % | |||
| + | Includes Reverse Repurchase Agreements |
Please refer to the Schedule of Investments in this Annual Report for a detailed listing of the Fund’s holdings.
8
| DEER PARK TOTAL RETURN CREDIT FUND |
| SCHEDULE OF INVESTMENTS |
| September 30, 2023 |
| Principal | Coupon | |||||||||||||
| Amount ($) | Spread | Rate (%) | Maturity | Fair Value | ||||||||||
| AGENCY ASSET BACKED SECURITIES — 1.2% | ||||||||||||||
| AGENCY CMBS — 0.6% | ||||||||||||||
| 2,553,595 | Freddie Mac Military Housing Bonds Series 2015-R1 C3(b),(d) | 5.9280 | 11/25/52 | $ | 2,118,884 | |||||||||
| 2,925,944 | Government National Mortgage Association Series 2007-15 IO(a),(b) | 1.5960 | 03/16/47 | 30,895 | ||||||||||
| 4,325,182 | Government National Mortgage Association Series 2015-6 IO(a),(b) | 0.4750 | 02/16/51 | 45,751 | ||||||||||
| 2,619,044 | Government National Mortgage Association Series 2013-15 IO(a),(b) | 0.5620 | 08/16/51 | 54,642 | ||||||||||
| 828,765 | Government National Mortgage Association Series 2012-72 IO(a),(b) | 0.5610 | 11/16/52 | 6,322 | ||||||||||
| 253,231 | Government National Mortgage Association Series 2015-122 IO(a),(b) | 0.5840 | 05/16/57 | 320 | ||||||||||
| 2,256,814 | ||||||||||||||
| COLLATERALIZED MORTGAGE OBLIGATIONS — 0.6% | ||||||||||||||
| 1,050,666 | Fannie Mae REMICS Series 2012-90 SA(a),(c) | SOFR30A + 5.936% | 0.6210 | 08/25/42 | 70,222 | |||||||||
| 4,501,794 | Fannie Mae REMICS Series 2012-144 SH(a),(c) | SOFR30A + 5.986% | 0.6710 | 01/25/43 | 388,463 | |||||||||
| 3,871,149 | Fannie Mae REMICS Series 2017-16 CS(a),(c) | SOFR30A + 5.936% | 0.6210 | 03/25/47 | 318,683 | |||||||||
| 2,484,576 | Fannie Mae REMICS Series 2017-14 DS(a),(c) | SOFR30A + 5.936% | 0.6210 | 03/25/47 | 207,343 | |||||||||
| 2,450,151 | Fannie Mae REMICS Series 2017-68 SN(a),(c) | SOFR30A + 6.036% | 0.7210 | 09/25/47 | 237,209 | |||||||||
| 1,882,089 | Fannie Mae REMICS Series 2018-64 SE(a),(c) | SOFR30A + 6.086% | 0.7710 | 09/25/48 | 156,565 | |||||||||
| 635,082 | Freddie Mac REMICS Series 4238 NS(a),(c) | SOFR30A + 6.586% | 1.2720 | 02/15/42 | 52,412 | |||||||||
| 3,454,100 | Freddie Mac REMICS Series 4416 DS(a),(c) | SOFR30A + 5.986% | 0.6720 | 12/15/44 | 269,476 | |||||||||
| 201,443 | Freddie Mac REMICS Series 4583 ST(a),(c) | SOFR30A + 5.886% | 0.5720 | 05/15/46 | 15,203 | |||||||||
| 1,793,058 | Freddie Mac REMICS Series 4685 SA(a),(c) | SOFR30A + 5.986% | 0.6720 | 05/15/47 | 165,696 | |||||||||
| 3,844,444 | Freddie Mac REMICS Series 4718 SC(a),(c) | SOFR30A + 6.036% | 0.7220 | 09/15/47 | 359,143 | |||||||||
| 1,254,530 | Freddie Mac REMICS Series 4796 AS(a),(c) | SOFR30A + 6.086% | 0.7720 | 05/15/48 | 110,631 | |||||||||
| 10,518,089 | Government National Mortgage Association Series 2019-111 SK(a),(c) | TSFR1M + 3.316% | 0.0001 | 09/20/49 | 74,524 | |||||||||
| 2,425,570 | ||||||||||||||
| TOTAL AGENCY ASSET BACKED SECURITIES (Cost $18,513,107) | 4,682,384 | |||||||||||||
| NON-AGENCY ASSET BACKED SECURITIES — 103.8% | ||||||||||||||
| COLLATERALIZED MORTGAGE OBLIGATIONS — 31.8% | ||||||||||||||
| 36,767 | Adjustable Rate Mortgage Trust 2005-4 Series 2005-4 3A1(b) | 4.8040 | 08/25/35 | 35,657 | ||||||||||
| 1,680,494 | Adjustable Rate Mortgage Trust 2007-1 Series 2007-1 5A1(c) | TSFR1M + 0.414% | 5.7340 | 03/25/37 | 1,893,124 | |||||||||
| 139,155 | Alternative Loan Trust 2003-4CB Series 2003-4CB B1(b) | 6.1280 | 04/25/33 | 71,693 | ||||||||||
| 93,111 | Alternative Loan Trust 2003-J2 Series 2003-J2 B1 | 6.0000 | 10/25/33 | 67,971 | ||||||||||
| 720,053 | Alternative Loan Trust 2004-8CB Series 2004-8CB M3(c) | TSFR1M + 2.964% | 8.2840 | 06/25/34 | 823,505 | |||||||||
| 339,569 | Alternative Loan Trust 2005-22T1 Series 2005-22T1 A2(a),(c) | TSFR1M + 4.956% | 0.0001 | 06/25/35 | 11,661 | |||||||||
See accompanying notes to financial statements.
9
| DEER PARK TOTAL RETURN CREDIT FUND |
| SCHEDULE OF INVESTMENTS (Continued) |
| September 30, 2023 |
| Principal | Coupon | |||||||||||||
| Amount ($) | Spread | Rate (%) | Maturity | Fair Value | ||||||||||
| NON-AGENCY ASSET BACKED SECURITIES — 103.8% (Continued) | ||||||||||||||
| COLLATERALIZED MORTGAGE OBLIGATIONS — 31.8% (Continued) | ||||||||||||||
| 568,918 | Alternative Loan Trust 2005-45 Series 2005-45 2A1(c) | 12MTA + 2.050% | 6.6760 | 10/20/35 | $ | 400,826 | ||||||||
| 1,129,553 | Alternative Loan Trust 2005-50CB Series 2005-50CB 3A1 | 6.0000 | 11/25/35 | 433,329 | ||||||||||
| 335,034 | Alternative Loan Trust 2005-56 Series 2005-56 5A1(c) | TSFR1M + 0.754% | 6.0740 | 11/25/35 | 264,473 | |||||||||
| 599,783 | Alternative Loan Trust 2005-65CB Series 2005-65CB 2A4 | 5.5000 | 12/25/35 | 416,883 | ||||||||||
| 413,992 | Alternative Loan Trust 2005-65CB Series 2005-65CB 1A5(c) | TSFR1M + 0.864% | 5.5000 | 01/25/36 | 258,887 | |||||||||
| 1,630,196 | Alternative Loan Trust 2006-32CB Series 2006-32CB A8(a),(c) | TSFR1M + 5.156% | 0.0001 | 11/25/36 | 71,393 | |||||||||
| 465,743 | Alternative Loan Trust 2006-36T2 Series 2006-36T2 1A9(c) | TSFR1M + 1.014% | 6.3340 | 12/25/36 | 153,265 | |||||||||
| 163,966 | Alternative Loan Trust 2006-HY10 Series 2006-HY10 2A1(b) | 4.3380 | 05/25/36 | 142,435 | ||||||||||
| 294,588 | Alternative Loan Trust 2006-J3 Series 2006-J3 2A1 | 4.7500 | 12/29/23 | 201,571 | ||||||||||
| 159,122 | Alternative Loan Trust 2006-J5 Series 2006-J5 1A4 | 6.5000 | 09/25/36 | 84,343 | ||||||||||
| 21,915,571 | Alternative Loan Trust 2006-OA10 Series 2006-OA10 XBI(a),(e) (i) | 0.0001 | 08/25/46 | 5,746 | ||||||||||
| 5,276,636 | Alternative Loan Trust 2006-OA10 Series 2006-OA10 XAD(a),(e) (i) | 0.0001 | 08/25/46 | 491 | ||||||||||
| 1,065,567 | Alternative Loan Trust 2006-OA11 Series 2006-OA11 A1B(c) | TSFR1M + 0.494% | 5.8140 | 09/25/46 | 983,367 | |||||||||
| 13,499,933 | Alternative Loan Trust 2006-OA14 Series 2006-OA14 X2(a),(b) (i) | 0.0001 | 11/25/46 | 68 | ||||||||||
| 5,579,674 | Alternative Loan Trust 2006-OA17 Series 2006-OA17 2X(a),(b) | 0.9710 | 12/20/46 | 375,163 | ||||||||||
| 225,289 | Alternative Loan Trust 2006-OA19 Series 2006-OA19 A1(c) | TSFR1M + 0.294% | 5.6190 | 02/20/47 | 171,771 | |||||||||
| 36,910,986 | Alternative Loan Trust 2006-OA2 Series 2006-OA2 X1P(a),(b) (i) | 0.0490 | 05/20/46 | 273,444 | ||||||||||
| 1,985,720 | Alternative Loan Trust 2006-OA7 Series 2006-OA7 2A1(c) | 12MTA + 0.940% | 5.3700 | 06/25/46 | 1,647,182 | |||||||||
| 78 | Alternative Loan Trust 2006-OC6 Series 2006-OC6 2A2A(c) (i) | TSFR1M + 0.434% | 5.7540 | 07/25/36 | 4,718 | |||||||||
| 149,687 | Alternative Loan Trust Resecuritization 2006-22R Series 2006-22R 2A2 | 6.2500 | 05/25/36 | 83,119 | ||||||||||
| 1,190,767 | American Home Mortgage Assets Trust 2005-1 Series 2005-1 3A22(c) | TSFR1M + 0.774% | 6.0940 | 11/25/35 | 938,286 | |||||||||
| 456,728 | American Home Mortgage Assets Trust 2006-1 Series 2006-1 1A2(c) | TSFR1M + 0.304% | 5.6240 | 05/25/46 | 379,297 | |||||||||
| 187,869 | American Home Mortgage Assets Trust 2006-2 Series 2006-2 1A1(c) | 12MTA + 0.960% | 5.5860 | 09/25/46 | 161,384 | |||||||||
| 144,327 | American Home Mortgage Assets Trust 2007-5 Series 2007-5 A1(c) | TSFR1M + 0.494% | 5.8140 | 06/25/47 | 124,805 | |||||||||
| 2,862,497 | American Home Mortgage Investment Trust 2005-4 Series 2005-4 1A2(c) | TSFR1M + 0.874% | 6.1940 | 11/25/45 | 2,819,820 | |||||||||
| 498,954 | American Home Mortgage Investment Trust 2006-3 Series 2006-3 11A2(c) | TSFR1M + 0.574% | 5.8940 | 12/25/46 | 479,512 | |||||||||
| 4,197,727 | American Home Mortgage Investment Trust 2007-2 Series 2007-2 12A1(c) | TSFR1M + 0.654% | 5.9740 | 03/25/37 | 1,537,161 | |||||||||
| 859,814 | Banc of America Alternative Loan Trust 2006-5 Series 2006-5 CBIO(a) | 6.0000 | 06/25/46 | 153,090 | ||||||||||
| 1,425,048 | Banc of America Alternative Loan Trust 2006-6 Series 2006-6 CBIO(a) | 6.0000 | 07/25/46 | 179,223 | ||||||||||
| 172,767 | Banc of America Alternative Loan Trust 2006-8 Series 2006-8 1A5(a),(c) | TSFR1M + 772.262% | 6.0000 | 11/25/36 | 31,539 | |||||||||
| 343,009 | Banc of America Alternative Loan Trust 2006-8 Series 2006-8 XIO(a) | 6.0000 | 11/25/46 | 69,862 | ||||||||||
| 2,917,708 | Banc of America Funding 2005-C Trust Series 2005-C M2(c) | TSFR1M + 0.764% | 6.0890 | 05/20/35 | 2,087,690 | |||||||||
| 61,589 | Banc of America Funding 2005-F Trust Series 2005-F 1A1(c) | TSFR1M + 0.734% | 6.0590 | 09/20/35 | 43,434 | |||||||||
| 1,383,564 | Banc of America Funding 2006-D Trust Series 2006-D 1A2(c) | TSFR1M + 0.674% | 5.9990 | 05/20/36 | 411,909 | |||||||||
See accompanying notes to financial statements.
10
| DEER PARK TOTAL RETURN CREDIT FUND |
| SCHEDULE OF INVESTMENTS (Continued) |
| September 30, 2023 |
| Principal | Coupon | |||||||||||||
| Amount ($) | Spread | Rate (%) | Maturity | Fair Value | ||||||||||
| NON-AGENCY ASSET BACKED SECURITIES — 103.8% (Continued) | ||||||||||||||
| COLLATERALIZED MORTGAGE OBLIGATIONS — 31.8% (Continued) | ||||||||||||||
| 471,426 | Banc of America Mortgage 2007-1 Trust Series 2007-1 2IO(a) | 6.0000 | 01/25/37 | $ | 69,147 | |||||||||
| 567,712 | BCAP, LLC 2008-RR3 Trust Series 2008-RR3 A1B(b),(d) | 6.6940 | 10/25/36 | 172,860 | ||||||||||
| 1,703,688 | BCAP, LLC 2009-RR4 Trust Series 2009-RR4 1A2(b),(d) | 52.0660 | 06/26/37 | 449,790 | ||||||||||
| 81,450 | Bear Stearns ALT-A Trust Series 2004-7 1A1(b) (i) | 2.6250 | 10/25/34 | 55,783 | ||||||||||
| 732,774 | Bear Stearns ALT-A Trust 2003-5 Series 2003-5 M(b) | 4.7380 | 12/25/33 | 668,652 | ||||||||||
| 262,905 | Bear Stearns ALT-A Trust 2003-6 Series 2003-6 B1(b) | 4.6160 | 01/25/34 | 153,472 | ||||||||||
| 1,524,666 | Bear Stearns ALT-A Trust 2005-10 Series 2005-10 11A1(c) | TSFR1M + 0.614% | 5.9340 | 01/25/36 | 1,465,957 | |||||||||
| 1,001,322 | Bear Stearns ALT-A Trust 2005-3 Series 2005-3 1A1(b) | 3.8720 | 04/25/35 | 862,919 | ||||||||||
| 227,937 | Bear Stearns ALT-A Trust 2005-7 Series 2005-7 25A1(b) | 4.6810 | 09/25/35 | 93,132 | ||||||||||
| 1,280,070 | Bear Stearns ALT-A Trust 2006-4 Series 2006-4 23A4(b) | 4.0170 | 08/25/36 | 856,719 | ||||||||||
| 386,341 | Bear Stearns ALT-A Trust 2007-2 Series 2007-2 1A1(c) | TSFR1M + 0.454% | 5.7740 | 04/25/37 | 333,712 | |||||||||
| 180,157 | Bear Stearns ARM Trust 2004-6 Series 2004-6 2A2(b) | 3.8350 | 09/25/34 | 132,583 | ||||||||||
| 310,020 | Bear Stearns ARM Trust 2005-12 Series 2005-12 23A1(b) | 4.6410 | 02/25/36 | 277,410 | ||||||||||
| 70,764 | Bear Stearns ARM Trust 2007-4 Series 2007-4 22A1(b) | 4.0680 | 06/25/47 | 63,059 | ||||||||||
| 30,678 | Bear Stearns Asset Backed Securities I Trust Series 2004-AC5 A2(c) | TSFR1M + 0.514% | 5.8340 | 10/25/34 | 26,168 | |||||||||
| 216,991 | Bear Stearns Asset Backed Securities Trust Series 2003-AC4 M1(e) | 5.6580 | 09/25/33 | 152,207 | ||||||||||
| 44,451 | Bear Stearns Asset Backed Securities Trust Series 2003-AC5 B(c) | TSFR1M + 4.989% | 10.3090 | 10/25/33 | 55,397 | |||||||||
| 36,106 | Bear Stearns Asset Backed Securities Trust Series 2003-AC6 M2(c) | TSFR1M + 2.764% | 8.0840 | 11/25/33 | 25,213 | |||||||||
| 1,580,001 | Bear Stearns Mortgage Funding Trust 2006-AR1 Series 2006-AR1 2A2(c) | TSFR1M + 0.634% | 5.9540 | 08/25/36 | 1,946,997 | |||||||||
| 318,883 | Bear Stearns Mortgage Funding Trust 2006-AR5 Series 2006-AR5 1A1(c) | TSFR1M + 0.274% | 5.5940 | 12/25/46 | 260,807 | |||||||||
| 2,670,405 | Bear Stearns Mortgage Funding Trust 2006-AR5 Series 2006-AR5 1A2(c) | TSFR1M + 0.324% | 5.6440 | 12/25/46 | 2,688,729 | |||||||||
| 2,504,110 | Bear Stearns Mortgage Funding Trust 2007-AR1 Series 2007-AR1 1A2(c) | TSFR1M + 0.324% | 5.6440 | 01/25/37 | 2,409,905 | |||||||||
| 148,656 | Bear Stearns Mortgage Funding Trust 2007-AR3 Series 2007-AR3 1A1(c) | TSFR1M + 0.254% | 5.5740 | 03/25/37 | 125,115 | |||||||||
| 1,950,440 | Bear Stearns Mortgage Funding Trust 2007-AR3 Series 2007-AR3 1A2(c) | TSFR1M + 0.294% | 5.6140 | 03/25/37 | 2,012,050 | |||||||||
| 1,659,605 | Bear Stearns Mortgage Funding Trust 2007-AR3 Series 2007-AR3 21A2(c) | TSFR1M + 0.494% | 5.8140 | 04/25/37 | 1,635,829 | |||||||||
| 22,127 | Bear Stearns Mortgage Funding Trust 2007-SL1 Series 2007-SL1 1A(c) | TSFR1M + 0.434% | 5.7540 | 03/25/37 | 22,602 | |||||||||
| 392,367 | Chase Mortgage Finance Trust Series 2005-S3 Series 2005-S3 A10 | 5.5000 | 11/25/35 | 283,665 | ||||||||||
| 23,060 | Chase Mortgage Finance Trust Series 2007-A1 Series 2007-A1 5A2(b) | 5.3060 | 02/25/37 | 20,978 | ||||||||||
| 43,077 | Chase Mortgage Finance Trust Series 2007-A1 Series 2007-A1 7A1(b) | 5.4630 | 02/25/37 | 42,385 | ||||||||||
| 570,406 | ChaseFlex Trust Multi-Class Mortgage Pass-Through Series 2007-M1 2AV2(c) | TSFR1M + 0.344% | 4.0530 | 08/25/37 | 444,337 | |||||||||
| 669,489 | Chevy Chase Funding, LLC Mortgage-Backed Series 2003-4A B1(b),(d) | 5.7400 | 10/25/34 | 605,894 | ||||||||||
| 37,077 | Chevy Chase Funding, LLC Mortgage-Backed Series 2004-2A A2(c),(d) | TSFR1M + 0.434% | 5.7540 | 05/25/35 | 35,019 | |||||||||
| 525,469 | Chevy Chase Funding, LLC Mortgage-Backed Series 2004-4A B1(b),(d) | 4.6640 | 10/25/35 | 385,504 | ||||||||||
| 437,602 | Chevy Chase Funding, LLC Mortgage-Backed Series 2007-2A A2(c),(d) | TSFR1M + 0.294% | 5.6140 | 05/25/48 | 272,076 | |||||||||
See accompanying notes to financial statements.
11
| DEER PARK TOTAL RETURN CREDIT FUND |
| SCHEDULE OF INVESTMENTS (Continued) |
| September 30, 2023 |
| Principal | Coupon | |||||||||||||
| Amount ($) | Spread | Rate (%) | Maturity | Fair Value | ||||||||||
| NON-AGENCY ASSET BACKED SECURITIES — 103.8% (Continued) | ||||||||||||||
| COLLATERALIZED MORTGAGE OBLIGATIONS — 31.8% (Continued) | ||||||||||||||
| 484,506 | CHL Mortgage Pass-Through Trust 2003-48 Series 2003-48 B1(b) | 5.3380 | 10/25/33 | $ | 27,635 | |||||||||
| 240,070 | CHL Mortgage Pass-Through Trust 2003-58 Series 2003-58 M(b) | 4.6990 | 02/19/34 | 213,242 | ||||||||||
| 27,043 | CHL Mortgage Pass-Through Trust 2004-25 Series 2004-25 1A2(c) | TSFR1M + 0.894% | 6.2140 | 02/25/35 | 21,278 | |||||||||
| 5,289,552 | CHL Mortgage Pass-Through Trust 2004-29 Series 2004-29 2X(a),(b) (i) | 0.001 | 02/25/35 | 53 | ||||||||||
| 40,103 | CHL Mortgage Pass-Through Trust 2005-11 Series 2005-11 3A3(b) | 3.5620 | 04/25/35 | 28,873 | ||||||||||
| 20,491 | CHL Mortgage Pass-Through Trust 2005-11 Series 2005-11 4A1(c) | TSFR1M + 0.384% | 5.7040 | 04/25/35 | 18,537 | |||||||||
| 253,116 | CHL Mortgage Pass-Through Trust 2005-11 Series 2005-11 4A2(c) | TSFR1M + 0.434% | 5.7540 | 04/25/35 | 141,330 | |||||||||
| 211,897 | CHL Mortgage Pass-Through Trust 2005-14 Series 2005-14 A3 | 5.5000 | 07/25/35 | 77,458 | ||||||||||
| 286,538 | CHL Mortgage Pass-Through Trust 2005-2 Series 2005-2 2A3(c) | TSFR1M + 0.794% | 6.1140 | 03/25/35 | 259,090 | |||||||||
| 76,989 | CHL Mortgage Pass-Through Trust 2006-HYB3 Series 2006-HYB3 2A1A(b) | 3.9380 | 05/20/36 | 70,939 | ||||||||||
| 101,074 | CHL Mortgage Pass-Through Trust 2007-HYB2 Series 2007-HYB2 3A1(b) | 3.7280 | 02/25/47 | 86,931 | ||||||||||
| 258,967 | CHL Mortgage Pass-Through Trust 2007-J3 Series 2007-J3 A9 | 6.0000 | 07/25/37 | 108,880 | ||||||||||
| 64,598 | Citicorp Mortgage Securities Trust Series 2006-4 Series 2006-4 1A12 | 6.0000 | 08/25/36 | 39,683 | ||||||||||
| 34,027 | Citicorp Mortgage Securities Trust Series 2007-7 Series 2007-7 APO(f) | 0.0001 | 08/25/37 | 23,385 | ||||||||||
| 39,089 | Citigroup Mortgage Loan Trust 2004-HYB2 Series 2004-HYB2 1A(b) | 5.3240 | 03/25/34 | 36,437 | ||||||||||
| 134,173 | Citigroup Mortgage Loan Trust 2005-3 Series 2005-3 2A2B(b) | 5.2130 | 08/25/35 | 109,936 | ||||||||||
| 67,027 | Citigroup Mortgage Loan Trust 2006-AR1 Series 2006-AR1 2A1(c) | H15T1Y + 2.400% | 6.3800 | 03/25/36 | 61,242 | |||||||||
| 66,691 | Citigroup Mortgage Loan Trust 2007-10 Series 2007-10 22AA(b) | 4.3800 | 09/25/37 | 58,734 | ||||||||||
| 40,334 | Citigroup Mortgage Loan Trust 2007-AR8 Series 2007-AR8 2A1A(b) | 4.3890 | 07/25/37 | 34,941 | ||||||||||
| 25,553 | Citigroup Mortgage Loan Trust, Inc. Series 2004-HYB1 A31(b) | 4.1830 | 02/25/34 | 25,539 | ||||||||||
| 433,860 | Citigroup Mortgage Loan Trust, Inc. Series 2005-9 1A1(c) | TSFR1M + 0.374% | 5.6940 | 11/25/35 | 363,204 | |||||||||
| 61,757 | CitiMortgage Alternative Loan Trust Series 2007-A1 Series 2007-A1 1A1 | 6.0000 | 01/25/37 | 53,793 | ||||||||||
| 1,103,610 | CitiMortgage Alternative Loan Trust Series 2007-A4 Series 2007-A4 1A7 | 5.7500 | 04/25/37 | 968,085 | ||||||||||
| 2,924,354 | CitiMortgage Alternative Loan Trust Series 2007-A6 Series 2007-A6 1A2(a),(c) | TSFR1M + 5.286% | 0.0001 | 06/25/37 | 70,876 | |||||||||
| 95,714 | Countrywide Asset-Backed Certificates Series 2005-IM3 A3(c) | TSFR1M + 0.614% | 5.9340 | 03/25/36 | 93,856 | |||||||||
| 264,542 | Credit Suisse First Boston Mortgage Securities Series 2002-AR21 CB1(b) | 3.9010 | 06/25/32 | 251,861 | ||||||||||
| 1,056,762 | Credit Suisse First Boston Mortgage Securities Series 2003-1 DB2(b) | 6.6550 | 02/25/33 | 787,523 | ||||||||||
| 87,188 | Credit Suisse First Boston Mortgage Securities Series 2003-AR9 CB1(b) | 4.2570 | 03/25/33 | 82,690 | ||||||||||
| 690,681 | Credit Suisse First Boston Mortgage Securities Series 2004-AR1 6M2(c) | TSFR1M + 2.214% | 7.5340 | 02/25/34 | 709,305 | |||||||||
| 941,414 | Credit Suisse First Boston Mortgage Securities Series 2004-AR7 CB1(c) | TSFR1M + 1.264% | 6.5840 | 11/25/34 | 879,599 | |||||||||
| 568,329 | Credit Suisse First Boston Mortgage Securities Series 2005-1 1A4 | 5.5000 | 02/25/35 | 494,062 | ||||||||||
| 544,792 | CSFB Mortgage-Backed Trust Series 2004-7 Series 2004-7 DB1(b) | 5.9880 | 11/25/34 | 278,595 | ||||||||||
| 66,540 | Deutsche Alt-A Securities Inc Mortgage Loan Trust Series 2005-5 1A3(b) | 5.5000 | 11/25/35 | 96,315 | ||||||||||
| 660,393 | Deutsche Alt-A Securities Mortgage Loan Trust Series 2006-AR5 23A | 6.0000 | 10/25/23 | 344,642 | ||||||||||
See accompanying notes to financial statements.
12
| DEER PARK TOTAL RETURN CREDIT FUND |
| SCHEDULE OF INVESTMENTS (Continued) |
| September 30, 2023 |
| Principal | Coupon | |||||||||||||
| Amount ($) | Spread | Rate (%) | Maturity | Fair Value | ||||||||||
| NON-AGENCY ASSET BACKED SECURITIES — 103.8% (Continued) | ||||||||||||||
| COLLATERALIZED MORTGAGE OBLIGATIONS — 31.8% (Continued) | ||||||||||||||
| 1,096,989 | Deutsche Alt-A Securities Mortgage Loan Trust Series 2007-OA5 A3(c) | TSFR1M + 0.514% | 5.8340 | 08/25/47 | $ | 804,541 | ||||||||
| 1,003,227 | Deutsche Mortgage Securities Inc REMIC Trust Series 2008-RS1 4A2(c),(d) | US0001M + 0.250% | 5.6830 | 05/28/37 | 479,625 | |||||||||
| 12,088 | DSLA Mortgage Loan Trust 2004-AR3 Series 2004-AR3 B2(c) | TSFR1M + 1.764% | 7.0920 | 08/25/35 | 10,547 | |||||||||
| 244,551 | DSLA Mortgage Loan Trust 2004-AR3 Series 2004-AR3 B3(c) | TSFR1M + 1.989% | 7.3170 | 07/19/44 | 132,189 | |||||||||
| 3,201,247 | DSLA Mortgage Loan Trust 2007-AR1 Series 2007-AR1 2A1B(c) (h) | TSFR1M + 0.294% | 5.6220 | 04/19/47 | 3,234,947 | |||||||||
| 122,963 | Fannie Mae REMIC Trust 2003-W1 Series 2003-W1 M(b) | 2.4880 | 12/25/42 | 96,879 | ||||||||||
| 1,150,197 | Global Mortgage Securitization Ltd. Series 2005-A B1(d) | 5.2500 | 04/25/32 | 1,118,340 | ||||||||||
| 1,502 | GreenPoint Mortgage Funding Trust 2006-AR3 Series 2006-AR3 3A1(c) | TSFR1M + 0.574% | 5.8940 | 04/25/36 | 3,533 | |||||||||
| 1,560,768 | GreenPoint Mortgage Funding Trust Series 2006-AR6 Series 2006-AR6 A4(c) | TSFR1M + 0.794% | 6.1140 | 10/25/46 | 1,065,584 | |||||||||
| 330,639 | GreenPoint Mortgage Loan Trust 2004-1 Series 2004-1 A(c) | TSFR1M + 1.264% | 6.5840 | 10/25/34 | 258,982 | |||||||||
| 1,310,297 | GSMPS Mortgage Loan Trust 2003-3 Series 2003-3 B1(b),(d) | 7.0320 | 06/25/43 | 88,555 | ||||||||||
| 199,915 | GSR Mortgage Loan Trust 2003-1 Series 2003-1 A11(c) | H15T1Y + 1.750% | 6.7800 | 03/25/33 | 191,087 | |||||||||
| 155,788 | GSR Mortgage Loan Trust 2003-2F Series 2003-2F 2A5 | 4.7500 | 03/25/32 | 142,175 | ||||||||||
| 13,271 | GSR Mortgage Loan Trust 2004-7 Series 2004-7 1A2(b) | 4.2310 | 06/25/34 | 12,847 | ||||||||||
| 1,978,257 | GSR Mortgage Loan Trust 2006-4F Series 2006-4F 4A1(c) | TSFR1M + 0.464% | 5.7840 | 05/25/36 | 345,726 | |||||||||
| 1,043,814 | GSR Mortgage Loan Trust 2006-9F Series 2006-9F 6A1(c) | TSFR1M + 0.464% | 5.7840 | 10/25/36 | 92,975 | |||||||||
| 16,745 | GSR Mortgage Loan Trust 2006-AR2 Series 2006-AR2 1B2(c) | TSFR1M + 0.894% | 6.2140 | 12/25/35 | 5,374 | |||||||||
| 98,845 | GSR Mortgage Loan Trust 2006-AR2 Series 2006-AR2 2A1(b) | 3.5740 | 04/25/36 | 66,281 | ||||||||||
| 1,210,322 | GSR Mortgage Loan Trust 2006-OA1 Series 2006-OA1 2A2(c) | TSFR1M + 0.634% | 5.9540 | 08/25/46 | 301,502 | |||||||||
| 458,875 | HarborView Mortgage Loan Trust 2005-12 Series 2005-12 1A1A(c) | 12MTA + 2.000% | 6.6260 | 10/19/35 | 248,327 | |||||||||
| 3,407,862 | HarborView Mortgage Loan Trust 2005-13 Series 2005-13 2A11(c) | TSFR1M + 0.674% | 6.0020 | 02/19/36 | 1,618,209 | |||||||||
| 116,072 | HarborView Mortgage Loan Trust 2005-6 Series 2005-6 A1B(c) | US0006M + 0.760% | 6.3880 | 07/19/45 | 92,556 | |||||||||
| 1,293,804 | HarborView Mortgage Loan Trust 2005-6 Series 2005-6 B1(c) | US0006M + 0.825% | 6.4530 | 07/19/45 | 946,134 | |||||||||
| 15,009,905 | HarborView Mortgage Loan Trust 2005-8 Series 2005-8 1X(a),(b) | 0.0001 | 09/19/35 | 150 | ||||||||||
| 11,400,008 | HarborView Mortgage Loan Trust 2006-1 Series 2006-1 X1(a),(b) | 0.0001 | 03/19/36 | 114 | ||||||||||
| 3,849,028 | HarborView Mortgage Loan Trust 2006-10 Series 2006-10 2A1B(c) (h) | TSFR1M + 0.354% | 5.6820 | 11/19/36 | 3,397,565 | |||||||||
| 1,344,682 | HarborView Mortgage Loan Trust 2006-12 Series 2006-12 2A13(c) | TSFR1M + 0.594% | 5.9220 | 12/19/36 | 1,224,619 | |||||||||
| 1,013,165 | HarborView Mortgage Loan Trust 2006-14 Series 2006-14 2A1B(c) | TSFR1M + 0.514% | 5.8420 | 02/19/37 | 1,442,784 | |||||||||
| 105,748 | HarborView Mortgage Loan Trust 2006-7 Series 2006-7 2A1A(c) | TSFR1M + 0.514% | 5.8420 | 09/19/46 | 93,655 | |||||||||
| 2,061,657 | HarborView Mortgage Loan Trust 2007-1 Series 2007-1 2A1B(c) | TSFR1M + 0.474% | 5.8020 | 03/19/37 | 2,930,440 | |||||||||
| 1,620,520 | HarborView Mortgage Loan Trust 2007-3 Series 2007-3 2A1B(c) | TSFR1M + 0.574% | 5.9020 | 05/19/47 | 1,337,215 | |||||||||
| 4,230,605 | HarborView Mortgage Loan Trust 2007-7 Series 2007-7 2A1B(c) | TSFR1M + 2.114% | 6.4340 | 10/25/37 | 3,413,423 | |||||||||
| 85,010 | HomeBanc Mortgage Trust 2004-2 Series 2004-2 M1(c) | TSFR1M + 1.089% | 6.4090 | 12/25/34 | 78,716 | |||||||||
| 336,455 | HomeBanc Mortgage Trust 2005-1 Series 2005-1 B1(c) | TSFR1M + 1.989% | 2.1580 | 03/25/35 | 218,065 | |||||||||
See accompanying notes to financial statements.
13
| DEER PARK TOTAL RETURN CREDIT FUND |
| SCHEDULE OF INVESTMENTS (Continued) |
| September 30, 2023 |
| Principal | Coupon | |||||||||||||
| Amount ($) | Spread | Rate (%) | Maturity | Fair Value | ||||||||||
| NON-AGENCY ASSET BACKED SECURITIES — 103.8% (Continued) | ||||||||||||||
| COLLATERALIZED MORTGAGE OBLIGATIONS — 31.8% (Continued) | ||||||||||||||
| 43,910 | HomeBanc Mortgage Trust 2005-1 Series 2005-1 B2(c) | TSFR1M + 2.064% | 2.1580 | 03/25/35 | $ | 28,434 | ||||||||
| 305,615 | Impac CMB Trust Series 2004-11 Series 2004-11 2A2(c) | TSFR1M + 0.854% | 6.1740 | 03/25/35 | 271,326 | |||||||||
| 28,142 | Impac CMB Trust Series 2004-4 Series 2004-4 1M6(c) | TSFR1M + 2.364% | 7.6840 | 09/25/34 | 27,627 | |||||||||
| 220,881 | Impac CMB Trust Series 2005-2 Series 2005-2 1M1(c) | TSFR1M + 0.759% | 6.0790 | 04/25/35 | 201,511 | |||||||||
| 377,654 | Impac CMB Trust Series 2005-2 Series 2005-2 1M3(c) | TSFR1M + 0.879% | 6.1990 | 04/25/35 | 340,656 | |||||||||
| 54,112 | Impac CMB Trust Series 2005-2 Series 2005-2 2M2(c) | TSFR1M + 1.239% | 6.5590 | 04/25/35 | 48,903 | |||||||||
| 36,075 | Impac CMB Trust Series 2005-2 Series 2005-2 2B(c) | TSFR1M + 2.589% | 7.9090 | 04/25/35 | 34,260 | |||||||||
| 3,238 | Impac CMB Trust Series 2005-6 Series 2005-6 2B2(c) | TSFR1M + 3.489% | 8.8090 | 10/25/35 | 3,149 | |||||||||
| 210,943 | Impac Secured Assets CMN Owner Trust Series 2002-2 M1 | 6.5000 | 04/25/33 | 117,803 | ||||||||||
| 900,165 | Impac Secured Assets CMN Owner Trust Series 2004-1 M2(e) | 5.5260 | 03/25/34 | 729,360 | ||||||||||
| 1,555,800 | IndyMac IMJA Mortgage Loan Trust 2007-A1 Series 2007-A1 A4 | 6.0000 | 08/25/37 | 608,882 | ||||||||||
| 1,475,253 | IndyMac IMJA Mortgage Loan Trust 2007-A3 Series 2007-A3 A1 | 6.2500 | 11/25/37 | 652,790 | ||||||||||
| 4,431,683 | IndyMac IMSC Mortgage Loan Trust 2007-HOA1 Series 2007-HOA1 A22(c) | TSFR1M + 0.474% | 5.7940 | 07/25/47 | 3,179,263 | |||||||||
| 75,103 | IndyMac INDA Mortgage Loan Trust 2006-AR3 Series 2006-AR3 1A1(b) | 3.7330 | 12/25/36 | 64,079 | ||||||||||
| 961,289 | IndyMac INDX Mortgage Loan Trust 2004-AR13 Series 2004-AR13 B1(b) | 3.4340 | 01/25/35 | 721,617 | ||||||||||
| 1,391,918 | IndyMac INDX Mortgage Loan Trust 2004-AR14 Series 2004-AR14 2A1A(c) | TSFR1M + 0.834% | 6.1540 | 01/25/35 | 981,414 | |||||||||
| 95,538 | IndyMac INDX Mortgage Loan Trust 2004-AR5 Series 2004-AR5 2A1B(c) | TSFR1M + 0.914% | 6.2340 | 08/25/34 | 82,217 | |||||||||
| 738,076 | IndyMac INDX Mortgage Loan Trust 2004-AR6 Series 2004-AR6 2A(b) | 4.4720 | 10/25/34 | 695,091 | ||||||||||
| 901,829 | IndyMac INDX Mortgage Loan Trust 2004-AR9 Series 2004-AR9 5M2(c) | TSFR1M + 1.914% | 7.2340 | 11/25/34 | 653,765 | |||||||||
| 195,708 | IndyMac INDX Mortgage Loan Trust 2005-AR2 Series 2005-AR2 2A1B(c) | TSFR1M + 0.894% | 6.2140 | 02/25/35 | 138,615 | |||||||||
| 279,128 | IndyMac INDX Mortgage Loan Trust 2005-AR23 Series 2005-AR23 2A1(b) | 3.9380 | 11/25/35 | 224,210 | ||||||||||
| 299,688 | IndyMac INDX Mortgage Loan Trust 2005-AR4 Series 2005-AR4 2A1A(c) | TSFR1M + 0.674% | 5.9940 | 03/25/35 | 293,803 | |||||||||
| 226,023 | IndyMac INDX Mortgage Loan Trust 2006-AR21 Series 2006-AR21 A1(c) | TSFR1M + 0.354% | 5.6740 | 08/25/36 | 206,780 | |||||||||
| 486,076 | IndyMac INDX Mortgage Loan Trust 2006-AR29 Series 2006-AR29 A2(c) | TSFR1M + 0.274% | 5.5940 | 11/25/36 | 470,782 | |||||||||
| 595,578 | IndyMac INDX Mortgage Loan Trust 2006-AR29 Series 2006-AR29 A3(c) | TSFR1M + 0.454% | 5.7740 | 11/25/36 | 579,401 | |||||||||
| 38,293 | IndyMac INDX Mortgage Loan Trust 2006-AR5 Series 2006-AR5 2A1(b) | 3.4250 | 05/25/36 | 34,959 | ||||||||||
| 71,791 | IndyMac INDX Mortgage Loan Trust 2006-AR6 Series 2006-AR6 2A1A(c) | TSFR1M + 0.514% | 5.8340 | 06/25/46 | 55,494 | |||||||||
| 137,056 | IndyMac INDX Mortgage Loan Trust 2006-AR8 Series 2006-AR8 A3A(c) | TSFR1M + 0.574% | 5.8940 | 07/25/46 | 169,492 | |||||||||
| 1,362,658 | IndyMac INDX Mortgage Loan Trust 2007-FLX3 Series 2007-FLX3 A2(c) | TSFR1M + 0.654% | 5.9740 | 06/25/37 | 1,462,142 | |||||||||
| 356,466 | JP Morgan Alternative Loan Trust Series 2006-A2 5A1(b) | 3.9770 | 05/25/36 | 201,596 | ||||||||||
| 957,411 | JP Morgan Mortgage Trust 2005-A1 Series 2005-A1 IB2(b) | 4.6660 | 02/25/35 | 847,949 | ||||||||||
| 57,172 | JP Morgan Mortgage Trust 2006-A6 Series 2006-A6 3A2(b) | 4.3800 | 10/25/36 | 41,401 | ||||||||||
| 136,870 | JP Morgan Mortgage Trust 2006-A7 Series 2006-A7 2A2(b) | 3.9010 | 01/25/37 | 111,165 | ||||||||||
| 129,528 | JP Morgan Mortgage Trust 2006-S3 Series 2006-S3 1A12 | 6.5000 | 08/25/36 | 43,264 | ||||||||||
See accompanying notes to financial statements.
14
| DEER PARK TOTAL RETURN CREDIT FUND |
| SCHEDULE OF INVESTMENTS (Continued) |
| September 30, 2023 |
| Principal | Coupon | |||||||||||||
| Amount ($) | Spread | Rate (%) | Maturity | Fair Value | ||||||||||
| NON-AGENCY ASSET BACKED SECURITIES — 103.8% (Continued) | ||||||||||||||
| COLLATERALIZED MORTGAGE OBLIGATIONS — 31.8% (Continued) | ||||||||||||||
| 1,683,356 | Lehman Mortgage Trust 2005-3 Series 2005-3 1A5 | 5.5000 | 01/25/36 | $ | 831,072 | |||||||||
| 38,765 | Lehman Mortgage Trust 2005-3 Series 2005-3 2A7 | 6.0000 | 01/25/36 | 31,221 | ||||||||||
| 1,304,347 | Lehman XS Trust Series 2005-5N Series 2005-5N 3A3C(c) | TSFR1M + 0.614% | 5.9340 | 11/25/35 | 780,160 | |||||||||
| 1,631,292 | Lehman XS Trust Series 2006-18N Series 2006-18N A4(c) | TSFR1M + 0.494% | 5.8140 | 12/25/36 | 1,316,249 | |||||||||
| 643,209 | Lehman XS Trust Series 2007-12N Series 2007-12N 1A3A(c) | TSFR1M + 0.514% | 5.8340 | 07/25/47 | 611,955 | |||||||||
| 124,121 | Lehman XS Trust Series 2007-16N Series 2007-16N 2A2(c) | TSFR1M + 1.814% | 7.1340 | 09/25/47 | 106,359 | |||||||||
| 793,536 | Lehman XS Trust Series 2007-7N Series 2007-7N 1A2(c) | TSFR1M + 0.594% | 5.9140 | 06/25/47 | 696,105 | |||||||||
| 436,304 | MASTR Alternative Loan Trust 2006-2 Series 2006-2 2A3(c) | TSFR1M + 0.464% | 5.7840 | 03/25/36 | 46,837 | |||||||||
| 283,598 | MASTR Alternative Loan Trust 2006-2 Series 2006-2 2A1(c) | TSFR1M + 0.514% | 5.8340 | 03/25/36 | 30,790 | |||||||||
| 361,026 | MASTR Asset Securitization Trust 2004-1 Series 2004-1 B1(b) | 5.4920 | 02/25/34 | 289,048 | ||||||||||
| 42,361 | MASTR Asset Securitization Trust 2004-3 Series 2004-3 4A11 | 5.5000 | 03/25/34 | 1,825 | ||||||||||
| 561,319 | Mellon Residential Funding Cor Mor Pas Thr Tr Series 1999-TBC3 A2(b) | 5.8930 | 10/20/29 | 565,082 | ||||||||||
| 581,509 | Merrill Lynch Alternative Note Asset Trust Series 2007-OAR4 A1(c) | TSFR1M + 0.614% | 5.9340 | 08/25/37 | 495,430 | |||||||||
| 50,863 | Merrill Lynch Mortgage Investors Trust MLMI Series 2003-A1 M2(b) | 4.5120 | 12/25/32 | 48,001 | ||||||||||
| 3,520,737 | Merrill Lynch Mortgage Investors Trust Series 2005-A6 M2(c) | TSFR1M + 1.089% | 6.4090 | 08/25/35 | 3,118,088 | |||||||||
| 3,558,158 | Merrill Lynch Mortgage Investors Trust Series MLCC Series 2003-G XA2(a),(b) | 0.1730 | 01/25/29 | 11,522 | ||||||||||
| 287,904 | Merrill Lynch Mortgage Investors Trust Series MLCC Series 2007-3 M1(b) | 3.4270 | 09/25/37 | 66,827 | ||||||||||
| 29,727 | Merrill Lynch Mortgage Investors Trust Series MLMI Series 2004-A1 M1(b) | 4.1690 | 02/25/34 | 21,305 | ||||||||||
| 414,839 | Morgan Stanley Mortgage Loan Trust 2004-11AR Series 2004-11AR 1B1(c) | TSFR1M + 0.714% | 6.0340 | 01/25/35 | 331,781 | |||||||||
| 67,027 | MortgageIT Trust 2005-2 Series 2005-2 1M2(c) | TSFR1M + 0.924% | 6.2440 | 05/25/35 | 64,426 | |||||||||
| 21,824 | MortgageIT Trust 2005-2 Series 2005-2 2M2(c) | TSFR1M + 1.764% | 7.0940 | 05/25/35 | 19,802 | |||||||||
| 123,485 | Nomura Asset Acceptance Corp Alternative Loan Series 2004-AR1 5M1(c) | TSFR1M + 1.214% | 6.5340 | 08/25/34 | 133,512 | |||||||||
| 221,815 | Nomura Asset Acceptance Corp Alternative Loan Series 2006-AF1 2A(b) | 5.0230 | 06/25/36 | 161,869 | ||||||||||
| 249,829 | NovaStar Mortgage Funding Trust Series 2006-MTA1 Series 2006-MTA1 2A1A(c) | TSFR1M + 0.494% | 0.4760 | 09/25/46 | 225,884 | |||||||||
| 4,230,027 | OPTONE 68402SAC3 DEL TR 2016-1 Series 2016-1A SAC3(a),(b),(d) | 4.9340 | 02/26/38 | 2,388,019 | ||||||||||
| 695,000 | Prime Mortgage Trust 2006-CL1 Series 2006-CL1 M3(c) | TSFR1M + 0.834% | 6.1540 | 02/25/35 | 560,732 | |||||||||
| 325,067 | RAAC Series 2004-SP3 Trust Series 2004-SP3 MII4(c) | TSFR1M + 2.889% | 8.2090 | 09/25/34 | 218,756 | |||||||||
| 3,888 | RALI Series 2003-QS9 Trust Series 2003-QS9 A2(c) | TSFR1M + 0.564% | 5.8840 | 05/25/30 | 3,314 | |||||||||
| 3,357,902 | RALI Series 2005-QO1 Trust Series 2005-QO1 A3(c) | TSFR1M + 0.494% | 5.8140 | 08/25/35 | 1,177,139 | |||||||||
| 190,749 | RALI Series 2005-QS7 Trust Series 2005-QS7 CB | 5.5000 | 06/25/35 | 165,717 | ||||||||||
| 1,596,537 | RALI Series 2006-QA8 Trust Series 2006-QA8 A1(c) | TSFR1M + 0.494% | 5.8140 | 09/25/36 | 1,421,681 | |||||||||
| 1,558,766 | RALI Series 2006-QO7 Trust Series 2006-QO7 1A1(c) | 12MTA + 0.800% | 5.2300 | 09/25/46 | 1,331,015 | |||||||||
| 316,096 | RALI Series 2006-QO8 Trust Series 2006-QO8 1A3A(c) | TSFR1M + 0.514% | 5.8340 | 10/25/46 | 292,111 | |||||||||
| 33,159,251 | RALI Series 2006-QS12 Trust Series 2006-QS12 AV(a),(b) (i) | 0.4650 | 09/25/36 | 404,732 | ||||||||||
See accompanying notes to financial statements.
15
| DEER PARK TOTAL RETURN CREDIT FUND |
| SCHEDULE OF INVESTMENTS (Continued) |
| September 30, 2023 |
| Principal | Coupon | |||||||||||||
| Amount ($) | Spread | Rate (%) | Maturity | Fair Value | ||||||||||
| NON-AGENCY ASSET BACKED SECURITIES — 103.8% (Continued) | ||||||||||||||
| COLLATERALIZED MORTGAGE OBLIGATIONS — 31.8% (Continued) | ||||||||||||||
| 266,755 | RALI Series 2006-QS16 Trust Series 2006-QS16 A10 | 6.0000 | 11/25/36 | $ | 194,715 | |||||||||
| 140,905 | RALI Series 2006-QS7 Trust Series 2006-QS7 A4(c) | TSFR1M + 0.514% | 5.8340 | 06/25/36 | 100,056 | |||||||||
| 1,724,683 | RALI Series 2007-QH3 Trust Series 2007-QH3 A2(c) | TSFR1M + 0.534% | 5.8540 | 04/25/37 | 3,548,509 | |||||||||
| 467,053 | RALI Series 2007-QH5 Trust Series 2007-QH5 AI2(c) | TSFR1M + 0.614% | 5.9340 | 06/25/37 | 267,057 | |||||||||
| 599,609 | RALI Series 2007-QH7 Trust Series 2007-QH7 1A2(c) | TSFR1M + 0.654% | 5.9740 | 08/25/37 | 351,246 | |||||||||
| 6,258 | RAMP Series 2004-SL1 Trust Series 2004-SL1 MI6(c) | TSFR1M + 2.014% | 8.2840 | 10/25/31 | 5,719 | |||||||||
| 8,685,502 | Reperforming Loan REMIC Trust 2005-R1 Series 2005-R1 1AS(a),(b),(d) | 0.8200 | 03/25/35 | 287,176 | ||||||||||
| 8,435,495 | Reperforming Loan REMIC Trust 2005-R2 Series 2005-R2 1AS(a),(b),(d) | 0.4190 | 06/25/35 | 209,824 | ||||||||||
| 9,380,122 | Reperforming Loan REMIC Trust 2006-R1 Series 2006-R1 AS(a),(b) | 0.3350 | 01/25/36 | 257,218 | ||||||||||
| 863,804 | Residential Asset Securitization Trust 2003-A4 Series 2003-A4 B1 | 5.7500 | 05/25/33 | 591,252 | ||||||||||
| 14,940,778 | Residential Asset Securitization Trust 2005-A11CB Series 2005-A11 1AX(a),(b) | 0.3660 | 10/25/35 | 171,224 | ||||||||||
| 265,324 | Residential Asset Securitization Trust 2005-A16 Series 2005-A16 A3 | 6.0000 | 02/25/36 | 118,260 | ||||||||||
| 2,125,529 | Residential Asset Securitization Trust 2007-A9 Series 2007-A9 AX(a),(b) | 7.0000 | 09/25/37 | 630,937 | ||||||||||
| 1,120,940 | RFMSI Series 2007-S6 Trust Series 2007-S6 2A5(c) | TSFR1M + 0.614% | 5.9340 | 06/25/37 | 703,762 | |||||||||
| 159,614 | SACO I, Inc. Series 1999-3 1B1(b),(d) (i) | 4.9850 | 04/25/39 | 147,240 | ||||||||||
| 79,056 | Sequoia Mortgage Trust 9 Series 9 B1(c) | TSFR1M + 1.239% | 6.5640 | 09/20/32 | 67,493 | |||||||||
| 2,896,444 | Structured Adjustable Rate Mortgage Loan Trust Series 2005-10 M1(c) | TSFR1M + 0.789% | 6.1090 | 06/25/35 | 2,846,733 | |||||||||
| 1,072,675 | Structured Adjustable Rate Mortgage Loan Trust Series 2005-18 4A1(b) | 3.8310 | 09/25/35 | 698,796 | ||||||||||
| 2,019,410 | Structured Asset Mortgage Investments II Trust Series 2005-AR5 X2(a),(b) | 0.4660 | 07/19/35 | 27,352 | ||||||||||
| 180,897 | Structured Asset Mortgage Investments II Trust Series 2006-AR3 11A1(c) | TSFR1M + 0.534% | 5.8540 | 04/25/36 | 157,482 | |||||||||
| 2,997,026 | Structured Asset Mortgage Investments II Trust Series 2006-AR3 12A3(c) | TSFR1M + 0.654% | 5.9740 | 05/25/36 | 2,253,704 | |||||||||
| 35,511,364 | Structured Asset Mortgage Investments II Trust Series 2006-AR7 X(a) | 0.9000 | 08/25/36 | 832,244 | ||||||||||
| 10,380 | Structured Asset Mortgage Investments II Trust Series AR7 A10(c) (i) | TSFR1M + 0.514% | 5.8340 | 08/25/36 | 11,739 | |||||||||
| 1,790,375 | Structured Asset Mortgage Investments II Trust Series 2005-AR2 1A1(c) | TSFR1M + 0.574% | 5.8940 | 05/25/45 | 1,609,660 | |||||||||
| 926,207 | Structured Asset Mortgage Investments II Trust Series 2007-AR7 2A1(b) | 3.6050 | 05/25/47 | 746,670 | ||||||||||
| 32,657,454 | Structured Asset Mortgage Investments II Trust Series 2007-AR6 X2(a) | 0.5000 | 08/25/47 | 583,919 | ||||||||||
| 2,462,798 | Structured Asset Mortgage Investments II Trust Series AR6 A2(c) | 12MTA + 1.730% | 6.1600 | 08/25/47 | 2,620,611 | |||||||||
| 389,268 | Structured Asset Securities Corp Assistance Loan Series 2003-AL1 B1(d) | 3.3560 | 04/25/31 | 385,168 | ||||||||||
| 189,524 | Structured Asset Securities Corp Mortgage Series 2003-9A B1II(b) | 6.0100 | 03/25/33 | 172,957 | ||||||||||
| 451,613 | Structured Asset Securities Corporation Series 2005-RF4 B1(b),(d) | 4.3910 | 07/25/35 | 320,406 | ||||||||||
| 447,860 | SunTrust Alternative Loan Trust 2006-1F Series 2006-1F 1A4 | 6.0000 | 04/25/36 | 190,147 | ||||||||||
| 24,169,714 | WaMu Mortgage Pass-Through Certificates Series 2005-AR15 X(a),(b) | 0.0001 | 11/25/45 | 15,457 | ||||||||||
| 439,404 | WaMu Mortgage Pass-Through Certificates Series 2006-AR4 2A1A(c) | COF 11 + 1.500% | 4.5820 | 05/25/46 | 363,989 | |||||||||
| 380,105 | Washington Mutual Mortgage Pass-Through Series 2006-5 1A2 | 6.0000 | 07/25/36 | 284,444 | ||||||||||
See accompanying notes to financial statements.
16
| DEER PARK TOTAL RETURN CREDIT FUND |
| SCHEDULE OF INVESTMENTS (Continued) |
| September 30, 2023 |
| Principal | Coupon | |||||||||||||
| Amount ($) | Spread | Rate (%) | Maturity | Fair Value | ||||||||||
| NON-AGENCY ASSET BACKED SECURITIES — 103.8% (Continued) | ||||||||||||||
| COLLATERALIZED MORTGAGE OBLIGATIONS — 31.8% (Continued) | ||||||||||||||
| 1,100,114 | Washington Mutual Mortgage Pass-Through Series 2007-1 1A3(c) | TSFR1M + 0.484% | 5.8040 | 02/25/37 | $ | 725,796 | ||||||||
| 324,700 | Washington Mutual Mortgage Pass-Through Series 2007-OA1 1A(c) | 12MTA + 0.710% | 5.1400 | 12/25/46 | 265,586 | |||||||||
| 124,867,493 | ||||||||||||||
| HOME EQUITY — 16.0% | ||||||||||||||
| 176,034 | ABFC 2004-OPT1 Trust Series 2004-OPT1 M6(c) | TSFR1M + 5.364% | 10.6840 | 12/25/32 | 166,399 | |||||||||
| 340,586 | ABFC 2004-OPT3 Trust Series 2004-OPT3 M1(c) | TSFR1M + 0.864% | 6.1840 | 09/25/33 | 341,363 | |||||||||
| 481,733 | ABFC 2004-OPT4 Trust Series 2004-OPT4 M3(c) | TSFR1M + 2.289% | 7.6090 | 08/25/33 | 436,840 | |||||||||
| 562,272 | Accredited Mortgage Loan Trust 2005-3 Series 2005-3 M6(c) | TSFR1M + 1.164% | 6.4840 | 09/25/35 | 364,156 | |||||||||
| 114,000 | Accredited Mortgage Loan Trust 2005-4 Series 2005-4 M3(c) | TSFR1M + 0.574% | 5.8940 | 12/25/35 | 81,550 | |||||||||
| 338,700 | ACE Securities Corp Home Equity Loan Trust Series Series 2003-FM1 M6(c) | TSFR1M + 5.364% | 10.6840 | 11/25/32 | 272,885 | |||||||||
| 141,259 | ACE Securities Corp Home Equity Loan Trust Series Series 2003-NC1 M4(c) | TSFR1M + 5.364% | 10.6840 | 07/25/33 | 113,773 | |||||||||
| 464,823 | ACE Securities Corp Home Equity Loan Trust Series Series 2003-HE1 M5(c) | TSFR1M + 5.364% | 10.6840 | 11/25/33 | 435,777 | |||||||||
| 33,875 | ACE Securities Corp Home Equity Loan Trust Series Series 2004-OP1 M2(c) | TSFR1M + 1.689% | 7.0090 | 04/25/34 | 32,023 | |||||||||
| 80,583 | ACE Securities Corp Home Equity Loan Trust Series Series 2004-OP1 M4(c) | TSFR1M + 3.114% | 8.4340 | 04/25/34 | 73,067 | |||||||||
| 245,351 | ACE Securities Corp Home Equity Loan Trust Series Series 2004-OP1 M5(c) | TSFR1M + 3.489% | 8.8090 | 04/25/34 | 193,627 | |||||||||
| 1,418,184 | ACE Securities Corp Home Equity Loan Trust Series Series 2004-RM2 M5(c) | TSFR1M + 1.509% | 6.8290 | 01/25/35 | 1,006,213 | |||||||||
| 372,476 | Aegis Asset Backed Securities Trust Mortgage Series 2004-1 M3(c) | TSFR1M + 2.444% | 7.7640 | 04/25/34 | 175,900 | |||||||||
| 192,973 | Aegis Asset Backed Securities Trust Mortgage Series 2004-1 B1(c) | TSFR1M + 2.894% | 8.2140 | 04/25/34 | 14,784 | |||||||||
| 623,163 | AFC Home Equity Loan Trust Series 1999-2 1A(c) | TSFR1M + 0.924% | 6.2440 | 06/25/29 | 367,773 | |||||||||
| 3,157,162 | Ameriquest Mortgage Securities Asset-Backed Series 2002-3 M4(c) | TSFR1M + 3.339% | 8.6590 | 08/25/32 | 2,714,869 | |||||||||
| 297,741 | Argent Securities Inc Asset-Backed Pass-Through Series 2003-W10 M3(c) | TSFR1M + 2.889% | 3.4330 | 01/25/34 | 233,745 | |||||||||
| 285,921 | Argent Securities Inc Asset-Backed Pass-Through Series 2006-M2 A2C(c) | TSFR1M + 0.264% | 5.5840 | 09/25/36 | 92,741 | |||||||||
| 102,868 | Asset Backed Securities Corp Home Equity Loan Series 2004-HE3 M6(c) | TSFR1M + 4.239% | 9.5590 | 06/25/34 | 93,177 | |||||||||
| 328,556 | Asset Backed Securities Corp Home Equity Loan Series 2004-HE9 M2(c) | TSFR1M + 1.914% | 7.2340 | 12/25/34 | 235,770 | |||||||||
| 199,370 | Asset Backed Securities Corp Home Equity Loan Series 2005-HE2 M4(c) | TSFR1M + 1.344% | 6.2540 | 02/25/35 | 192,455 | |||||||||
| 790,274 | Asset Backed Securities Corp Home Equity Loan Series 2005-HE2 M5(c) | TSFR1M + 1.989% | 6.6840 | 02/25/35 | 759,682 | |||||||||
| 57,666 | Bayview Financial Acquisition Trust Series 2006-D 1A4(e) | 6.5960 | 12/28/36 | 57,664 | ||||||||||
| 2,430,000 | Bayview Financial Mortgage Pass-Through Trust Series 2005-C B2(c) | TSFR1M + 2.139% | 6.7830 | 06/28/44 | 2,140,356 | |||||||||
| 4,756,909 | Bayview Financial Mortgage Pass-Through Trust Series 2004-D B2(c) | TSFR1M + 5.364% | 10.6850 | 08/28/44 | 5,289,762 | |||||||||
| 293,321 | Bear Stearns Asset Backed Securities I Trust Series 2004-FR2 M6(c) | TSFR1M + 2.964% | 5.0570 | 06/25/34 | 261,286 | |||||||||
| 112,763 | Bear Stearns Asset Backed Securities I Trust Series 2004-HE6 M5(c) | TSFR1M + 4.239% | 5.2440 | 08/25/34 | 100,116 | |||||||||
| 182,516 | Bear Stearns Asset Backed Securities I Trust Series 2004-HE7 M6(c) | TSFR1M + 5.739% | 11.0590 | 08/25/34 | 168,103 | |||||||||
| 912,695 | Bear Stearns Asset Backed Securities I Trust Series 2004-FR3 M5(c) | TSFR1M + 2.964% | 5.2630 | 09/25/34 | 797,600 | |||||||||
| 542,598 | Bear Stearns Asset Backed Securities I Trust Series 2004-FR3 M4(c) | TSFR1M + 2.814% | 5.2630 | 09/25/34 | 485,401 | |||||||||
See accompanying notes to financial statements.
17
| DEER PARK TOTAL RETURN CREDIT FUND |
| SCHEDULE OF INVESTMENTS (Continued) |
| September 30, 2023 |
| Principal | Coupon | |||||||||||||
| Amount ($) | Spread | Rate (%) | Maturity | Fair Value | ||||||||||
| NON-AGENCY ASSET BACKED SECURITIES — 103.8% (Continued) | ||||||||||||||
| HOME EQUITY — 16.0% (Continued) | ||||||||||||||
| 454,479 | Bear Stearns Asset Backed Securities I Trust Series 2004-HE8 M3(c) | TSFR1M + 2.214% | 7.5340 | 09/25/34 | $ | 434,131 | ||||||||
| 618,958 | Bear Stearns Asset Backed Securities I Trust Series 2004-HE8 M4(c) | TSFR1M + 2.739% | 8.0590 | 09/25/34 | 623,566 | |||||||||
| 708,000 | Bear Stearns Asset Backed Securities I Trust Series 2004-BO1 M9B(c) | TSFR1M + 6.114% | 11.4340 | 10/25/34 | 708,621 | |||||||||
| 376,533 | Bear Stearns Asset Backed Securities I Trust Series 2004-HE9 M4(c) | TSFR1M + 2.739% | 5.3710 | 11/25/34 | 363,593 | |||||||||
| 188,378 | Bear Stearns Asset Backed Securities I Trust Series 2004-HE10 M5(c) | TSFR1M + 2.814% | 5.6280 | 12/25/34 | 196,729 | |||||||||
| 731,384 | Bear Stearns Asset Backed Securities I Trust Series 2006-HE10 23A(c) | TSFR1M + 0.254% | 4.7170 | 12/25/36 | 897,345 | |||||||||
| 158,089 | Bear Stearns Asset Backed Securities Trust Series 1999-2 MF1(e) | 8.2200 | 10/25/29 | 207,092 | ||||||||||
| 38,451 | Bear Stearns Asset Backed Securities Trust Series 1999-2 AF2(e) | 8.4100 | 10/25/29 | 38,273 | ||||||||||
| 73,148 | Bear Stearns Asset Backed Securities Trust Series 2003-HE1 M5(c) | TSFR1M + 3.489% | 5.5550 | 01/25/34 | 78,958 | |||||||||
| 86,246 | Bear Stearns Asset Backed Securities Trust Series 2003-HE1 M4(c) | TSFR1M + 2.964% | 5.5550 | 01/25/34 | 80,144 | |||||||||
| 112,358 | Bear Stearns Asset Backed Securities Trust Series 2004-HE1 M6(c) | TSFR1M + 6.114% | 5.7270 | 02/25/34 | 119,647 | |||||||||
| 514,705 | Bear Stearns Asset Backed Securities Trust Series 2004-HE2 M6(c) | TSFR1M + 4.989% | 5.2980 | 03/25/34 | 497,671 | |||||||||
| 9,927 | Bear Stearns Asset Backed Securities Trust Series 2004-HE2 M4(c) | TSFR1M + 2.739% | 5.2980 | 03/25/34 | 9,628 | |||||||||
| 73,228 | Bear Stearns Asset Backed Securities Trust Series 2004-HE5 M2(c) | TSFR1M + 1.989% | 7.3090 | 07/25/34 | 62,410 | |||||||||
| 51,739 | Bear Stearns Asset Backed Securities Trust Series 2004-HE5 M6(c) | TSFR1M + 5.739% | 11.0590 | 07/25/34 | 41,084 | |||||||||
| 923,475 | CDC Mortgage Capital Trust 2003-HE2 Series 2003-HE2 M2(c) | TSFR1M + 2.964% | 8.2840 | 10/25/33 | 906,403 | |||||||||
| 602,930 | CDC Mortgage Capital Trust 2004-HE1 Series 2004-HE1 M1(c) | TSFR1M + 0.969% | 6.2890 | 06/25/34 | 695,125 | |||||||||
| 581,470 | CDC Mortgage Capital Trust 2004-HE1 Series 2004-HE1 M2(c) | TSFR1M + 1.914% | 7.2340 | 06/25/34 | 576,150 | |||||||||
| 358,357 | CDC Mortgage Capital Trust 2004-HE3 Series 2004-HE3 M2(c) | TSFR1M + 1.914% | 6.2200 | 11/25/34 | 338,459 | |||||||||
| 277,929 | Centex Home Equity Loan Trust 2001-b Series 2001-B A5(e) | 7.3300 | 07/25/32 | 209,192 | ||||||||||
| 48,684 | Centex Home Equity Loan Trust 2003-A Series 2003-A M2(c) | TSFR1M + 1.844% | 7.1640 | 03/25/33 | 45,097 | |||||||||
| 658,373 | Centex Home Equity Loan Trust 2004-B Series 2004-B M5(c) | TSFR1M + 1.689% | 7.0090 | 03/25/34 | 607,682 | |||||||||
| 83,580 | Centex Home Equity Loan Trust 2004-D Series 2004-D MV2(c) | TSFR1M + 1.149% | 6.4690 | 09/25/34 | 80,573 | |||||||||
| 182,009 | Citigroup Global Markets Mortgage Securities VII, Series 2002-WMC1 M1(c) | TSFR1M + 1.464% | 6.7840 | 01/25/32 | 190,937 | |||||||||
| 77,450 | Citigroup Mortgage Loan Trust 2007-AMC2 Series 2007-AMC2 A3A(c) | TSFR1M + 0.194% | 5.5140 | 01/25/37 | 53,581 | |||||||||
| 323,859 | Citigroup Mortgage Loan Trust 2007-OPX1 Series 2007-OPX1 A4B(e) | 6.3330 | 01/25/37 | 115,483 | ||||||||||
| 4,418,377 | Citigroup Mortgage Loan Trust, Inc. Series 2005-HE4 M5(c) | TSFR1M + 1.089% | 6.4090 | 10/25/35 | 2,311,054 | |||||||||
| 116,328 | Conseco Finance Corporation/Old Series 2002-A B1(c) | TSFR1M + 5.364% | 10.6970 | 04/15/32 | 116,720 | |||||||||
| 180,382 | Conseco Finance Home Equity Loan Trust 2002-B Series 2002-B B1(c) | TSFR1M + 5.364% | 10.6970 | 05/15/33 | 181,014 | |||||||||
| 78,867 | Credit Suisse First Boston Mortgage Securities Series 2002-HE16 M2(c) | TSFR1M + 2.114% | 7.4340 | 10/25/32 | 76,979 | |||||||||
| 114,483 | Credit Suisse First Boston Mortgage Securities Series 2004-FRE1 B3(c) | TSFR1M + 3.364% | 3.9100 | 04/25/34 | 101,950 | |||||||||
| 488,289 | CWHEQ Revolving Home Equity Loan Trust Series Series 2005-B 2A(c),(d) | TSFR1M + 0.294% | 5.6270 | 05/15/35 | 482,424 | |||||||||
| 122,024 | Delta Funding Home Equity Loan Trust 1999-3 Series 1999-3 M1(e) | 8.1000 | 01/15/30 | 80,355 | ||||||||||
| 778,987 | EMC Mortgage Loan Trust 2002-A Series 2002-AA M2(c),(d) | TSFR1M + 2.664% | 7.9840 | 05/25/39 | 776,510 | |||||||||
See accompanying notes to financial statements.
18
| DEER PARK TOTAL RETURN CREDIT FUND |
| SCHEDULE OF INVESTMENTS (Continued) |
| September 30, 2023 |
| Principal | Coupon | |||||||||||||
| Amount ($) | Spread | Rate (%) | Maturity | Fair Value | ||||||||||
| NON-AGENCY ASSET BACKED SECURITIES — 103.8% (Continued) | ||||||||||||||
| HOME EQUITY — 16.0% (Continued) | ||||||||||||||
| 441,101 | EquiFirst Mortgage Loan Trust 2004-3 Series 2004-3 M9(c) | TSFR1M + 4.014% | 9.3340 | 12/25/34 | $ | 374,692 | ||||||||
| 3,910,253 | First NLC Trust 2005-1 Series 2005-1 M2(c) | TSFR1M + 0.759% | 2.6290 | 05/25/35 | 2,880,687 | |||||||||
| 305,240 | GE Capital Mortgage Funding Corp 1999-HE3 Trust Series 1999-HE3 M(b) | 7.7750 | 10/25/29 | 298,949 | ||||||||||
| 54,313 | GE Capital Mortgage Services Inc 1999-HE2 Trust Series 1999-HE2 B1(b) | 7.9050 | 07/25/29 | 28,461 | ||||||||||
| 51,718 | GSAA Home Equity Trust 2006-3 Series 2006-3 A1(c) | TSFR1M + 0.274% | 5.5940 | 03/25/36 | 18,460 | |||||||||
| 229,987 | Home Equity Asset Trust Series 2002-4 M2(c) | TSFR1M + 2.664% | 7.9840 | 03/25/33 | 214,424 | |||||||||
| 135,035 | Home Equity Asset Trust Series 2003-8 M3(c) | TSFR1M + 2.464% | 7.7840 | 04/25/34 | 129,268 | |||||||||
| 296,287 | Home Equity Asset Trust Series 2003-8 B1(c) | TSFR1M + 2.614% | 7.9340 | 04/25/34 | 279,876 | |||||||||
| 202,168 | Home Equity Asset Trust Series 2004-3 B1(c) | TSFR1M + 2.714% | 8.0340 | 08/25/34 | 605,324 | |||||||||
| 770,660 | Home Equity Asset Trust Series 2004-8 M4(c) | TSFR1M + 1.614% | 6.9340 | 03/25/35 | 703,314 | |||||||||
| 177,370 | Home Equity Asset Trust 2002-2 Series 2002-2 M2(c) | TSFR1M + 1.964% | 7.2790 | 06/25/32 | 159,381 | |||||||||
| 215,407 | Home Equity Asset Trust 2004-6 Series 2004-6 M5(c) | TSFR1M + 1.764% | 7.0840 | 12/25/34 | 205,750 | |||||||||
| 1,143,915 | Home Equity Asset Trust 2005-4 Series 2005-4 M7(c) | TSFR1M + 1.794% | 4.4540 | 10/25/35 | 1,150,605 | |||||||||
| 464,290 | Home Equity Mortgage Loan Asset-Backed Trust Series 2001-C M2(c) | TSFR1M + 2.289% | 7.6090 | 12/25/32 | 464,411 | |||||||||
| 105,693 | Home Equity Mortgage Loan Asset-Backed Trust Series 2003-A MF1(e) | 4.9790 | 04/25/33 | 152,785 | ||||||||||
| 156,564 | Home Equity Mortgage Loan Asset-Backed Trust Series 2004-C M4(c) | TSFR1M + 1.539% | 4.2480 | 03/25/35 | 134,947 | |||||||||
| 344,441 | Home Equity Mortgage Loan Asset-Backed Trust Series 2004-C M5(c) | TSFR1M + 1.689% | 4.2480 | 03/25/35 | 292,537 | |||||||||
| 293,558 | Home Equity Mortgage Loan Asset-Backed Trust Series 2004-C M6(c) | TSFR1M + 1.989% | 4.2480 | 03/25/35 | 245,930 | |||||||||
| 453,975 | IMC Home Equity Loan Trust 1998-1 Series 1998-1 M1(e) | 7.5300 | 06/20/29 | 423,208 | ||||||||||
| 612 | IMC Home Equity Loan Trust 1998-5 Series 1998-5 A6(e) | 6.5600 | 03/15/37 | 605 | ||||||||||
| 133,609 | Mastr Asset Backed Securities Trust 2004-FRE1 Series 2004-FRE1 M6(c) | TSFR1M + 2.214% | 6.8340 | 07/25/34 | 109,348 | |||||||||
| 97,560 | Mastr Asset Backed Securities Trust 2004-HE1 Series 2004-HE1 M8(c) | TSFR1M + 3.864% | 9.1840 | 09/25/34 | 78,540 | |||||||||
| 24,381 | Mastr Asset Backed Securities Trust 2004-OPT2 Series 2004-OPT2 M4(c) | TSFR1M + 1.614% | 6.9340 | 09/25/34 | 24,324 | |||||||||
| 662,362 | Mastr Asset Backed Securities Trust 2004-OPT2 Series 2004-OPT2 M8(c) | TSFR1M + 2.964% | 8.2840 | 09/25/34 | 481,717 | |||||||||
| 52,367 | Mastr Asset Backed Securities Trust 2005-NC1 Series 2005-NC1 M5(c) | TSFR1M + 1.314% | 6.6340 | 12/25/34 | 51,205 | |||||||||
| 1,088,197 | Merrill Lynch Mortgage Investors Trust Series Series 2003-HE1 M2(c) | TSFR1M + 2.589% | 7.9090 | 07/25/34 | 1,041,844 | |||||||||
| 701,486 | Merrill Lynch Mortgage Investors Trust Series Series 2004-HE2 B3(c) | TSFR1M + 5.364% | 10.6840 | 08/25/35 | 648,743 | |||||||||
| 122,683 | Merrill Lynch Mortgage Investors Trust Series Series 2005-NC1 B2(c) | TSFR1M + 2.064% | 7.3840 | 10/25/35 | 114,619 | |||||||||
| 732,187 | Morgan Stanley A.B.S Capital I Inc Trust 2003-NC10 Series 2003-NC10 B2(c) | TSFR1M + 5.739% | 11.0590 | 10/25/33 | 778,486 | |||||||||
| 420,215 | Morgan Stanley A.B.S Capital I Inc Trust 2003-NC8 Series 2003-NC8 B1(c) | TSFR1M + 5.514% | 10.8340 | 09/25/33 | 401,663 | |||||||||
| 568,546 | Morgan Stanley A.B.S Capital I Inc Trust 2003-NC8 Series 2003-NC8 B2(c) | TSFR1M + 5.739% | 11.0590 | 09/25/33 | 510,168 | |||||||||
| 492,840 | Morgan Stanley A.B.S Capital I Inc Trust 2005-HE2 Series 2005-HE2 M5(c) | TSFR1M + 1.134% | 6.4540 | 01/25/35 | 406,705 | |||||||||
| 1,100,106 | Morgan Stanley A.B.S Capital I Inc Trust 2005-NC1 Series 2005-NC1 M5(c) | TSFR1M + 1.209% | 6.5290 | 01/25/35 | 984,510 | |||||||||
| 263,916 | Morgan Stanley A.B.S Capital I Inc Trust 2007-HE3 Series 2007-HE3 A2A(c) | TSFR1M + 0.174% | 5.4940 | 12/25/36 | 128,964 | |||||||||
See accompanying notes to financial statements.
19
| DEER PARK TOTAL RETURN CREDIT FUND |
| SCHEDULE OF INVESTMENTS (Continued) |
| September 30, 2023 |
| Principal | Coupon | |||||||||||||
| Amount ($) | Spread | Rate (%) | Maturity | Fair Value | ||||||||||
| NON-AGENCY ASSET BACKED SECURITIES — 103.8% (Continued) | ||||||||||||||
| HOME EQUITY — 16.0% (Continued) | ||||||||||||||
| 20,949,213 | Morgan Stanley Mortgage Loan Trust 2007-7AX Series 2007-7AX 2A4(c) | TSFR1M + 0.754% | 6.0740 | 04/25/37 | $ | 774,656 | ||||||||
| 5,261,451 | Morgan Stanley Mortgage Loan Trust 2007-7AX Series 2007-7AX 2A6(c) | TSFR1M + 0.754% | 6.0740 | 04/25/37 | 194,557 | |||||||||
| 781,492 | New Century Home Equity Loan Trust 2003-6 Series 2003-6 M4(c) | TSFR1M + 4.877% | 10.1970 | 01/25/34 | 787,050 | |||||||||
| 2,262 | New Century Home Equity Loan Trust 2004-1 Series 2004-1 M2(c) | TSFR1M + 2.139% | 7.4590 | 05/25/34 | 2,518 | |||||||||
| 368,373 | New Century Home Equity Loan Trust 2004-4 Series 4 M4(c) | TSFR1M + 1.389% | 6.7090 | 02/25/35 | 358,118 | |||||||||
| 930,689 | New Century Home Equity Loan Trust Series 2003-2 Series 2003-2 M2(c) | TSFR1M + 3.114% | 8.4340 | 01/25/33 | 770,482 | |||||||||
| 174,454 | New Century Home Equity Loan Trust Series 2003-3 Series 2003-3 M6(c) | TSFR1M + 5.739% | 11.0590 | 07/25/33 | 186,795 | |||||||||
| 1,579,466 | New Century Home Equity Loan Trust Series 2003-5 Series 2003-5 B(d),(e) | 4.7980 | 11/25/33 | 1,582,246 | ||||||||||
| 29,202 | New Century Home Equity Loan Trust Series 2003-5 Series 2003-5 M5(e) | 4.7980 | 11/25/33 | 23,088 | ||||||||||
| 1,281,027 | NovaStar Mortgage Funding Trust Series 2004-1 Series 2004-1 B1(c) | TSFR1M + 2.664% | 7.9840 | 06/25/34 | 1,251,575 | |||||||||
| 329,739 | NovaStar Mortgage Funding Trust Series 2004-3 Series 2004-3 B1(c) | TSFR1M + 2.889% | 8.2090 | 12/25/34 | 237,855 | |||||||||
| 224,579 | Option One Mortgage Loan Trust 2004-1 Series 2004-1 M3(c) | TSFR1M + 2.139% | 7.4590 | 01/25/34 | 184,565 | |||||||||
| 298,286 | Option One Mortgage Loan Trust 2004-1 Series 2004-1 M4(c) | TSFR1M + 2.589% | 7.9090 | 01/25/34 | 240,954 | |||||||||
| 42,837 | Option One Mortgage Loan Trust 2004-2 Series 2004-2 M2(c) | TSFR1M + 1.689% | 7.0090 | 05/25/34 | 42,478 | |||||||||
| 554,493 | Option One Mortgage Loan Trust 2004-2 Series 2004-2 M4(c) | TSFR1M + 2.814% | 8.1340 | 05/25/34 | 471,925 | |||||||||
| 404,000 | Provident Bank Home Equity Loan Trust 1998-4 Series 1998-4 A9(c) | TSFR1M + 3.614% | 8.9340 | 01/25/30 | 376,462 | |||||||||
| 469,006 | Provident Bank Home Equity Loan Trust 1999-3 Series 1999-3 A3(c) | TSFR1M + 0.894% | 6.2090 | 01/25/31 | 388,436 | |||||||||
| 163,820 | Provident Bank Home Equity Loan Trust 1999-3 Series 1999-3 A2(c) | TSFR1M + 0.954% | 6.2690 | 01/25/31 | 135,111 | |||||||||
| 1,000,000 | RAMP Series 2005-EFC4 Trust Series 2005-EFC4 M5(c) | TSFR1M + 0.744% | 6.3790 | 09/25/35 | 945,617 | |||||||||
| 336,186 | RASC Series 2003-KS4 Trust Series 2003-KS4 AIII(c) | TSFR1M + 0.404% | 5.7240 | 06/25/33 | 329,558 | |||||||||
| 1,272,870 | RASC Series 2005-KS12 Trust Series 2005-KS12 M5(c) | TSFR1M + 0.784% | 6.4390 | 01/25/36 | 1,062,145 | |||||||||
| 361,307 | Renaissance Home Equity Loan Trust 2002-3 Series 2002-3 B(c) | TSFR1M + 5.364% | 10.6840 | 12/25/32 | 232,058 | |||||||||
| 350,719 | Renaissance Home Equity Loan Trust 2003-2 Series 2003-2 M2A(c) | TSFR1M + 3.114% | 3.9250 | 08/25/33 | 290,426 | |||||||||
| 719,805 | SASCO Mortgage Loan Trust 2004-GEL2 Series 2004-GEL2 M4(e) | 5.5000 | 05/25/34 | 608,193 | ||||||||||
| 618,856 | SASCO Mortgage Loan Trust 2004-GEL2 Series 2004-GEL2 M3(e) | 5.5000 | 07/19/44 | 556,999 | ||||||||||
| 30,746 | Securitized Asset Backed Receivables, LLC Trust Series 2004-NC1 B2(c) | TSFR1M + 3.114% | 8.4340 | 02/25/34 | 30,735 | |||||||||
| 18,418 | Securitized Asset Backed Receivables, LLC Trust Series 2004-OP2 M3(c) | TSFR1M + 2.139% | 7.4590 | 08/25/34 | 17,808 | |||||||||
| 1,752,558 | Soundview Home Loan Trust 2006-2 Series 2006-2 M4(c) | TSFR1M + 0.819% | 6.1390 | 03/25/36 | 1,521,242 | |||||||||
| 242,906 | Soundview Home Loan Trust 2007-OPT2 Series 2007-OPT2 2A3(c) | TSFR1M + 0.294% | 5.6140 | 07/25/37 | 205,737 | |||||||||
| 516,718 | Specialty Underwriting & Residential Finance Trust Series 2004-BC1 B1(c) | TSFR1M + 2.664% | 7.9840 | 02/25/35 | 514,849 | |||||||||
| 17,952 | Structured Asset Securities Corp Mortgage Pass Series 2001-SB1 A5 | 3.3750 | 08/25/31 | 16,123 | ||||||||||
| 46,863 | Structured Asset Securities Corp Pass-Through Series 2002-AL1 A2 | 3.4500 | 02/25/32 | 41,166 | ||||||||||
| 32,170 | Terwin Mortgage Trust Series 2004-7HE M1(c),(d) | TSFR1M + 1.389% | 6.7090 | 07/25/34 | 30,047 | |||||||||
| 53,731 | Terwin Mortgage Trust 2003-7SL Series 2003-7SL B3(b),(d) | 8.0000 | 12/25/33 | 52,247 | ||||||||||
See accompanying notes to financial statements.
20
| DEER PARK TOTAL RETURN CREDIT FUND |
| SCHEDULE OF INVESTMENTS (Continued) |
| September 30, 2023 |
| Principal | Coupon | |||||||||||||
| Amount ($) | Spread | Rate (%) | Maturity | Fair Value | ||||||||||
| NON-AGENCY ASSET BACKED SECURITIES — 103.8% (Continued) | ||||||||||||||
| HOME EQUITY — 16.0% (Continued) | ||||||||||||||
| 540,366 | Terwin Mortgage Trust 2004-18SL Series 2004-18SL 1B4(b),(d) | 8.0000 | 10/25/34 | $ | 490,725 | |||||||||
| 102,346 | Terwin Mortgage Trust 2006-HF-1 Series 2006-HF1 M1(b),(d) (i) | 4.5600 | 02/25/37 | 231,788 | ||||||||||
| 177,562 | Terwin Mortgage Trust Series TMTS 2003-2HE Series 2003-2HE B(b) | 6.0000 | 07/25/34 | 174,873 | ||||||||||
| 11,741 | Terwin Mortgage Trust Series TMTS 2003-5SL Series 2003-5SL B3(b),(d) | 8.0000 | 10/25/34 | 11,413 | ||||||||||
| 746,435 | Truman Capital Mortgage Loan Trust Series 2004-1 M3(c),(d) | TSFR1M + 4.239% | 9.5590 | 01/25/34 | 743,073 | |||||||||
| 1,423,387 | UCFC Home Equity Loan Trust 1998-D Series 1998-D MF2(b) | 7.7500 | 04/15/30 | 1,301,460 | ||||||||||
| 178,327 | Wells Fargo Home Equity Asset-Backed Securities Series 2004-2 M6(c) | TSFR1M + 2.934% | 8.2540 | 10/25/34 | 173,696 | |||||||||
| 430,628 | Wells Fargo Home Equity Asset-Backed Securities Series 2005-1 M10(c) | TSFR1M + 3.864% | 9.1840 | 04/25/35 | 442,080 | |||||||||
| 186,591 | Yale Mortgage Loan Trust 2007-1 Series 2007-1 A(c),(d) | TSFR1M + 0.514% | 5.8340 | 06/25/37 | 60,454 | |||||||||
| 62,621,270 | ||||||||||||||
| MANUFACTURED HOUSING — 2.4% | ||||||||||||||
| 1,877,843 | Conseco Finance Corporation Series 1996-8 B1(b) | 7.9500 | 11/15/26 | 1,741,683 | ||||||||||
| 125,230 | Conseco Finance Corporation Series 1997-2 M1(b) | 7.5400 | 06/15/28 | 122,851 | ||||||||||
| 2,255,263 | Conseco Finance Corporation Series 1998-4 M1(b) | 6.8300 | 04/01/30 | 2,094,357 | ||||||||||
| 2,959,756 | Conseco Finance Securitizations Corporation Series 2002-1 M2(b) | 9.5460 | 12/01/33 | 2,862,459 | ||||||||||
| 730,099 | Conseco Finance Securitizations Corporation Series 2002-1 B1(b) | 9.7900 | 12/01/33 | 30,684 | ||||||||||
| 776,220 | MERIT Securities Corporation Series 1-Dec 1M2(e) | 8.3500 | 07/28/33 | 699,532 | ||||||||||
| 1,890,501 | Oakwood Mortgage Investors, Inc. Series 2002-A M1(b) | 7.7600 | 03/15/32 | 1,720,655 | ||||||||||
| 9,272,221 | ||||||||||||||
| NON AGENCY CMBS — 25.3% | ||||||||||||||
| 18,729,314 | BANK 2017-BNK6 Series 2017-BNK6 XG(a),(b),(d) | 1.5000 | 07/15/60 | 773,077 | ||||||||||
| 64,228 | Bayview Commercial Asset Trust 2003-2 Series 2003-2 M2(c),(d) | TSFR1M + 3.339% | 8.6590 | 12/25/33 | 64,454 | |||||||||
| 399,828 | Bayview Commercial Asset Trust 2005-2 Series 2005-2A M4(c),(d) | TSFR1M + 1.029% | 6.3490 | 08/25/35 | 369,175 | |||||||||
| 495,103 | Bayview Commercial Asset Trust 2005-3 Series 2005-3A M1(c),(d) | TSFR1M + 0.774% | 5.8740 | 11/25/35 | 451,371 | |||||||||
| 701,022 | Bayview Commercial Asset Trust 2005-3 Series 2005-3A B1(c),(d) | TSFR1M + 1.764% | 6.5340 | 11/25/35 | 660,141 | |||||||||
| 256,388 | Bayview Commercial Asset Trust 2005-4 Series 2005-4A M3(c),(d) | TSFR1M + 0.864% | 6.1840 | 01/25/36 | 234,779 | |||||||||
| 131,319 | Bayview Commercial Asset Trust 2005-4 Series 2005-4A M4(c),(d) | TSFR1M + 1.029% | 6.3490 | 01/25/36 | 121,132 | |||||||||
| 18,723 | Bayview Commercial Asset Trust 2006-1 Series 2006-1A M1(c),(d) | TSFR1M + 0.684% | 6.0040 | 04/25/36 | 16,918 | |||||||||
| 19,782 | Bayview Commercial Asset Trust 2006-1 Series 2006-1A M2(c),(d) | TSFR1M + 0.714% | 6.0340 | 04/25/36 | 17,877 | |||||||||
| 9,645 | Bayview Commercial Asset Trust 2006-1 Series 2006-1A M4(c),(d) | TSFR1M + 0.894% | 6.2140 | 04/25/36 | 8,577 | |||||||||
| 9,361 | Bayview Commercial Asset Trust 2006-1 Series 2006-1A M5(c),(d) | TSFR1M + 0.954% | 6.2740 | 04/25/36 | 8,254 | |||||||||
| 125,155 | Bayview Commercial Asset Trust 2006-2 Series 2006-2A M1(c),(d) | TSFR1M + 0.579% | 5.8990 | 07/25/36 | 114,281 | |||||||||
| 36,471 | Bayview Commercial Asset Trust 2006-2 Series 2006-2A M3(c),(d) | TSFR1M + 0.639% | 5.9590 | 07/25/36 | 33,200 | |||||||||
| 791,043 | Bayview Commercial Asset Trust 2006-4 Series 2006-4A M1(c),(d) | TSFR1M + 0.549% | 5.8690 | 12/25/36 | 727,938 | |||||||||
See accompanying notes to financial statements.
21
| DEER PARK TOTAL RETURN CREDIT FUND |
| SCHEDULE OF INVESTMENTS (Continued) |
| September 30, 2023 |
| Principal | Coupon | |||||||||||||
| Amount ($) | Spread | Rate (%) | Maturity | Fair Value | ||||||||||
| NON-AGENCY ASSET BACKED SECURITIES — 103.8% (Continued) | ||||||||||||||
| NON AGENCY CMBS — 25.3% (Continued) | ||||||||||||||
| 4,000,000 | Bayview Commercial Asset Trust 2006-SP1 Series 2006-SP1 B2(c),(d) | TSFR1M + 3.489% | 8.8090 | 04/25/36 | $ | 3,552,984 | ||||||||
| 781,441 | Bayview Commercial Asset Trust 2006-SP2 Series 2006-SP2 M1(c),(d) | TSFR1M + 0.609% | 5.9290 | 01/25/37 | 717,901 | |||||||||
| 1,199,824 | Bayview Commercial Asset Trust 2006-SP2 Series 2006-SP2 M4(c),(d) | TSFR1M + 0.819% | 6.1390 | 01/25/37 | 1,197,008 | |||||||||
| 372,377 | Bayview Commercial Asset Trust 2006-SP2 Series 2006-SP2 M5(c),(d) | TSFR1M + 0.849% | 6.1690 | 01/25/37 | 347,805 | |||||||||
| 400,036 | Bayview Commercial Asset Trust 2006-SP2 Series 2006-SP2 M6(c),(d) | TSFR1M + 0.954% | 6.2740 | 01/25/37 | 375,542 | |||||||||
| 922,976 | Bayview Commercial Asset Trust 2006-SP2 Series 2006-SP2 B1(c),(d) | TSFR1M + 1.914% | 7.2340 | 01/25/37 | 1,619,338 | |||||||||
| 270,348 | Bayview Commercial Asset Trust 2007-1 Series 2007-1 M2(c),(d) | TSFR1M + 0.549% | 5.8690 | 03/25/37 | 245,162 | |||||||||
| 207,267 | Bayview Commercial Asset Trust 2007-1 Series 2007-1 M3(c),(d) | TSFR1M + 0.594% | 5.9140 | 03/25/37 | 187,708 | |||||||||
| 1,088,956 | Bayview Commercial Asset Trust 2007-2 Series 2007-2A A2(c),(d) | TSFR1M + 0.434% | 5.7540 | 07/25/37 | �� | 949,936 | ||||||||
| 10,933,258 | Bayview Commercial Asset Trust 2007-5 Series 2007-5A A4(c),(d) | TSFR1M + 1.614% | 6.9340 | 10/25/37 | 6,876,176 | |||||||||
| 627,190 | CBA Commercial Small Balance Commercial Mortgage Series 2006-2A A(d),(e) | 6.0400 | 01/25/39 | 596,406 | ||||||||||
| 2,500,000 | CFCRE Commercial Mortgage Trust 2016-C6 Series 2016-C6 D(b),(d) | 4.3170 | 11/10/49 | 1,872,650 | ||||||||||
| 3,050,000 | CFCRE Commercial Mortgage Trust 2016-C7 Series 2016-C7 D(b),(d) | 4.5140 | 12/10/54 | 2,162,664 | ||||||||||
| 3,500,000 | Citigroup Commercial Mortgage Trust 2014-GC21 Series 2014-GC21 E(b),(d) | 3.5880 | 05/10/47 | 2,269,764 | ||||||||||
| 19,454,114 | Citigroup Commercial Mortgage Trust 2015-GC27 Series 2015-GC27 XH(a),(b),(d) (i) | 1.5660 | 02/10/48 | 266,924 | ||||||||||
| 3,150,000 | Citigroup Commercial Mortgage Trust 2015-GC35 Series 2015-GC35 D | 3.2360 | 11/10/48 | 1,998,842 | ||||||||||
| 918,000 | COMM 2013-CCRE7 Mortgage Trust Series 2013-CR7 E(b),(d) | 4.3980 | 03/10/46 | 679,480 | ||||||||||
| 1,300,000 | COMM 2014-LC17 Mortgage Trust Series 2014-LC17 E(d) | 3.1140 | 10/10/47 | 1,060,640 | ||||||||||
| 1,000,000 | Csail 2015-C2 Commercial Mortgage Trust Series 2015-C2 D(b) | 4.3140 | 06/15/57 | 655,140 | ||||||||||
| 1,250,000 | GS Mortgage Securities Corp Trust 2018-3PCK Series 2018-3PCK D(c),(d) | TSFR1M + 4.614% | 9.9460 | 09/15/31 | 1,174,651 | |||||||||
| 6,278,131 | GS Mortgage Securities Corporation II Series 2018-SRP5 A(c),(d) | TSFR1M + 1.914% | 7.2470 | 09/15/31 | 5,276,034 | |||||||||
| 994,862 | GS Mortgage Securities Trust 2007-GG10 Series 2007-GG10 AJ(b) | 5.8180 | 08/10/45 | 216,383 | ||||||||||
| 3,500,000 | GS Mortgage Securities Trust 2014-GC22 Series 2014-GC22 D(b),(d) | 4.8420 | 06/10/47 | 2,435,787 | ||||||||||
| 3,790,000 | GS Mortgage Securities Trust 2014-GC26 Series 2014-GC26 D(b),(d) | 4.6620 | 11/10/47 | 2,548,544 | ||||||||||
| 3,000,000 | GS Mortgage Securities Trust 2016-GS4 Series 2016-GS4 D(b),(d) | 3.2330 | 11/10/49 | 2,070,744 | ||||||||||
| 8,113,000 | HMH Trust Series 2017-NSS E(d) | 6.2920 | 07/05/31 | 5,614,780 | ||||||||||
| 850,000 | HMH Trust 2017-NSS Series 2017-NSS A(d) | 3.0620 | 07/05/31 | 790,798 | ||||||||||
| 4,000,000 | HMH Trust 2017-NSS Series 2017-NSS F(d) | 8.4800 | 07/05/31 | 1,745,848 | ||||||||||
| 1,846,000 | Hudsons Bay Simon JV Trust 2015-HBS Series 2015-HB10 A10(d) | 4.1540 | 08/05/34 | 1,594,968 | ||||||||||
| 525,987 | Hudsons Bay Simon JV Trust 2015-HBS Series 2015-HBFL BFL(c),(d) | TSFR1M + 2.514% | 7.8420 | 08/05/34 | 506,309 | |||||||||
| 64,000 | JP Morgan Chase Commercial Mortgage Securities Series 2018-PTC C(c),(d) | TSFR1M + 2.597% | 7.9300 | 04/15/31 | 39,360 | |||||||||
| 27,000 | JP Morgan Chase Commercial Mortgage Securities Series 2018-PTC D(c),(d) | TSFR1M + 3.417% | 8.7500 | 04/15/31 | 15,255 | |||||||||
See accompanying notes to financial statements.
22
| DEER PARK TOTAL RETURN CREDIT FUND |
| SCHEDULE OF INVESTMENTS (Continued) |
| September 30, 2023 |
| Principal | Coupon | |||||||||||||
| Amount ($) | Spread | Rate (%) | Maturity | Fair Value | ||||||||||
| NON-AGENCY ASSET BACKED SECURITIES — 103.8% (Continued) | ||||||||||||||
| NON AGENCY CMBS — 25.3% (Continued) | ||||||||||||||
| 1,821,000 | JP Morgan Chase Commercial Mortgage Securities Series 2013-LC11 D(b) | 4.2610 | 04/15/46 | $ | 1,195,346 | |||||||||
| 861,663 | JP Morgan Chase Commercial Mortgage Securities Series 2006-LDP9 AMS | 5.3370 | 05/15/47 | 808,570 | ||||||||||
| 3,081,631 | JP Morgan Chase Commercial Mortgage Securities Trust Series 2012-WLDN A(d) | 3.9100 | 05/05/30 | 2,382,773 | ||||||||||
| 1,000,000 | JPMBB Commercial Mortgage Securities Trust Series 2015-C28 E(b),(d) | 3.7730 | 10/15/48 | 719,825 | ||||||||||
| 3,302,000 | JPMBB Commercial Mortgage Securities Trust 2016-C1 Series 2016-C1 E(b),(d) | 4.8590 | 03/15/49 | 2,302,399 | ||||||||||
| 2,500,000 | JPMDB Commercial Mortgage Securities Trust 2016-C2 Series 2016-C2 D(b),(d) | 3.4810 | 06/15/49 | 1,333,775 | ||||||||||
| 5,000,000 | Lehman Brothers Small Balance Commercial Mortgage Series 2007-2A M2(c),(d) | TSFR1M + 0.714% | 6.0340 | 06/25/37 | 3,970,425 | |||||||||
| 2,667,000 | Morgan Stanley Bank of America Merrill Lynch Trust Series 2013-C7 D(b),(d) | 4.3080 | 02/15/46 | 1,910,761 | ||||||||||
| 100,000 | Morgan Stanley Bank of America Merrill Lynch Trust Series 2013-C10 C(b) | 4.0950 | 07/15/46 | 80,611 | ||||||||||
| 1,666,666 | Morgan Stanley Bank of America Merrill Lynch Trust Series 2016-C29 E(d) | 2.8770 | 05/15/49 | 1,075,940 | ||||||||||
| 3,976,000 | Morgan Stanley Bank of America Merrill Lynch Trust Series 2016-C30 E(b),(d) | 3.0000 | 09/15/49 | 1,740,383 | ||||||||||
| 4,566,000 | Morgan Stanley Bank of America Merrill Lynch Trust Series 2016-C31 D(b),(d) | 3.0000 | 11/15/49 | 2,689,926 | ||||||||||
| 750,000 | Morgan Stanley Capital I Trust 2019-BPR Series 2019-BPR D(c),(d) | TSFR1M + 4.592% | 9.9220 | 05/15/36 | 703,735 | |||||||||
| 109,000 | Morgan Stanley Capital I Trust 2019-MEAD Series 2019-MEAD B(b),(d) | 3.2830 | 11/10/36 | 96,997 | ||||||||||
| 4,387,000 | Palisades Center Trust Series 2016-PLSD A(d) | 2.7130 | 04/13/33 | 2,496,453 | ||||||||||
| 4,727,952 | Starwood Retail Property Trust Series 2014-STAR A(c),(d) | US0001M + 1.470% | 8.5000 | 11/15/27 | 3,611,375 | |||||||||
| 939,641 | Velocity Commercial Capital Loan Trust 2017-2 Series 2017-2 M5(b),(d) | 6.4200 | 11/25/47 | 734,269 | ||||||||||
| 256,761 | Velocity Commercial Capital Loan Trust 2017-2 Series 2017-2 M6(b),(d) | 7.7500 | 11/25/47 | 181,325 | ||||||||||
| 1,035,000 | Wells Fargo Commercial Mortgage Trust Series 2013-LC12 C(b) | 4.1310 | 07/15/46 | 682,863 | ||||||||||
| 4,892,000 | Wells Fargo Commercial Mortgage Trust 2013-LC12 Series 2013-LC12 D(b),(d) | 4.1310 | 07/15/46 | 1,834,290 | ||||||||||
| 1,666,666 | Wells Fargo Commercial Mortgage Trust 2015-C27 Series 2015-C27 E(d) | 2.8690 | 02/15/48 | 751,845 | ||||||||||
| 1,631,000 | Wells Fargo Commercial Mortgage Trust 2015-C27 Series 2015-C27 D(d) | 3.7680 | 02/15/48 | 1,242,781 | ||||||||||
| 2,500,000 | Wells Fargo Commercial Mortgage Trust 2015-C31 Series 2015-C31 D | 3.8520 | 11/15/48 | 1,923,503 | ||||||||||
| 15,153,000 | Wells Fargo Commercial Mortgage Trust 2016-C34 Series 2016-C34 XFG(a),(b),(d) | 2.2290 | 06/15/49 | 649,101 | ||||||||||
| 967,758 | Wells Fargo Commercial Mortgage Trust 2016-C34 Series 2016-C34 C(b) | 5.2290 | 06/15/49 | 759,771 | ||||||||||
| 2,500,000 | Wells Fargo Commercial Mortgage Trust 2016-C36 Series 2016-C36 D(d) | 2.9420 | 11/15/59 | 1,541,825 | ||||||||||
| 2,000,000 | Wells Fargo Commercial Mortgage Trust 2017-C40 Series 2017-C40 D(d) | 2.7000 | 10/15/50 | 1,364,416 | ||||||||||
| 1,600,000 | WFRBS Commercial Mortgage Trust Series 2013-C14 D(b),(d) | 3.9640 | 06/15/46 | 924,773 | ||||||||||
| 2,971,000 | WFRBS Commercial Mortgage Trust 2012-C9 Series 2012-C9 E(b),(d) | 4.8760 | 11/15/45 | 2,505,117 | ||||||||||
| 3,000,000 | WFRBS Commercial Mortgage Trust 2013-C14 Series 2013-C14 E(d) | 3.2500 | 06/15/46 | 1,657,128 | ||||||||||
| 99,135,006 | ||||||||||||||
See accompanying notes to financial statements.
23
| DEER PARK TOTAL RETURN CREDIT FUND |
| SCHEDULE OF INVESTMENTS (Continued) |
| September 30, 2023 |
| Principal | Coupon | |||||||||||||
| Amount ($) | Spread | Rate (%) | Maturity | Fair Value | ||||||||||
| OTHER ABS — 0.7% | ||||||||||||||
| 1,340,727 | Bayview Commercial Asset Trust 2007-4 Series 2007-4A A2(c),(d) | TSFR1M + 0.939% | 6.2590 | 09/25/37 | $ | 1,808,522 | ||||||||
| 272,042 | BCMSC Trust 2001-A Series 2001-A M2(b) | 8.2650 | 12/15/30 | 117,192 | ||||||||||
| 950,603 | Conseco Finance Securitizations Corporation Series 2001-2 M1(b) | 7.6900 | 03/01/31 | 877,237 | ||||||||||
| 163,696 | Origen Manufactured Housing Contract Trust 2001-A Series 2001-A M1(b) | 7.8200 | 03/15/32 | 155,911 | ||||||||||
| 2,958,862 | ||||||||||||||
| RESIDENTIAL MORTGAGE — 27.5% | ||||||||||||||
| 3,609,240 | Ameriquest Mortgage Securities Inc Asset Backed Series 2005-R11 M6(c) | TSFR1M + 1.269% | 6.5890 | 01/25/36 | 3,404,167 | |||||||||
| 164,050 | Amortizing Residential Collateral Trust Series 2001-BC5 M1(c) | TSFR1M + 0.939% | 6.2590 | 08/25/31 | 166,973 | |||||||||
| 1,171,717 | Amortizing Residential Collateral Trust 2001-BC6 Series 2001-BC6 M1(c) | TSFR1M + 1.314% | 6.6340 | 10/25/31 | 1,102,679 | |||||||||
| 256,724 | Amortizing Residential Collateral Trust 2001-BC6 Series 2001-BC6 M2(c) | TSFR1M + 2.139% | 7.4590 | 10/25/31 | 209,255 | |||||||||
| 121,968 | Amortizing Residential Collateral Trust 2002-BC5 Series 2002-BC5 M2(c) | TSFR1M + 1.914% | 7.2340 | 07/25/32 | 121,298 | |||||||||
| 37,632 | Bear Stearns Asset Backed Securities Trust Series 2004-SD1 M3(e) | 6.0000 | 12/25/42 | 10,111 | ||||||||||
| 1,016,463 | Bear Stearns Asset Backed Securities Trust Series 2005-SD2 2B(c) | TSFR1M + 3.864% | 9.1840 | 12/25/44 | 1,074,147 | |||||||||
| 74,068 | Bear Stearns Asset Backed Securities Trust Series 2007-SD2 1A2A | 6.0000 | 09/25/46 | 68,063 | ||||||||||
| 5,222,069 | Carrington Mortgage Loan Trust Series 2005-FRE1 Series 2005-FRE1 M4(c) | TSFR1M + 1.044% | 6.3640 | 12/25/35 | 3,578,700 | |||||||||
| 807,282 | C-BASS 2007-CB1 TRUST Series 2007-CB1 AF2(e) | 5.7210 | 01/25/37 | 252,804 | ||||||||||
| 2,210,814 | C-BASS 2007-CB1 TRUST Series 2007-CB1 AF6(e) | 5.8350 | 01/25/37 | 692,130 | ||||||||||
| 137,392 | Chase Funding Trust Series 2003-1 Series 2003-1 2A2(c) | TSFR1M + 0.774% | 6.0940 | 11/25/32 | 135,398 | |||||||||
| 109,783 | Chase Funding Trust Series 2003-3 Series 2003-3 1M2 | 4.8850 | 05/25/32 | 75,694 | ||||||||||
| 4,056,187 | Citicorp Residential Mortgage Trust Series 2006-1 Series 2006-1 M3(e) | 4.6350 | 07/25/36 | 2,441,139 | ||||||||||
| 1,328,652 | Citicorp Residential Mortgage Trust Series 2006-2 Series 2006-2 M3(e) | 5.9960 | 09/25/36 | 554,650 | ||||||||||
| 147,303 | Citigroup Global Markets Mortgage Securities VII, Series 1997-LB6 B2 | 7.0000 | 12/25/27 | 73,454 | ||||||||||
| 222,945 | Citigroup Mortgage Loan Trust 2007-AHL3 Series 2007-AHL3 A1(c),(d) | TSFR1M + 0.284% | 5.6040 | 05/25/37 | 189,350 | |||||||||
| 55,704 | Citigroup Mortgage Loan Trust, Inc. Series 2005-OPT1 M5(c) | TSFR1M + 1.209% | 6.5290 | 02/25/35 | 51,386 | |||||||||
| 1,323,058 | Citigroup Mortgage Loan Trust, Inc. Series 2005-WF2 MV6(c) | TSFR1M + 1.989% | 7.3090 | 08/25/35 | 1,483,608 | |||||||||
| 1,084,194 | Countrywide Asset-Backed Certificates Series 2002-BC3 M1(c) | TSFR1M + 1.014% | 6.3340 | 05/25/32 | 1,058,236 | |||||||||
| 525,220 | Countrywide Asset-Backed Certificates Series 2002-4 M2(c) | TSFR1M + 2.364% | 7.6840 | 11/25/32 | 511,439 | |||||||||
| 39,746 | Countrywide Asset-Backed Certificates Series 2003-BC5 M4(c) | TSFR1M + 2.664% | 7.9840 | 04/25/33 | 40,050 | |||||||||
| 543,629 | Countrywide Asset-Backed Certificates Series 2003-4 M1(c) | TSFR1M + 1.134% | 6.4540 | 09/25/33 | 478,882 | |||||||||
| 200,272 | Countrywide Asset-Backed Certificates Series 2004-BC3 M5(c) | TSFR1M + 1.989% | 7.3090 | 04/25/34 | 182,518 | |||||||||
| 506,367 | Countrywide Asset-Backed Certificates Series 2004-8 M4(c) | TSFR1M + 1.989% | 7.3090 | 10/25/34 | 376,263 | |||||||||
| 3,285,155 | Countrywide Asset-Backed Certificates Series 2006-BC1 M4(c) | TSFR1M + 1.089% | 6.4090 | 04/25/36 | 2,402,477 | |||||||||
| 1,829,536 | Countrywide Asset-Backed Certificates Series 2006-1 MV2(c) | TSFR1M + 0.729% | 4.0240 | 07/25/36 | 1,660,476 | |||||||||
| 357,591 | Countrywide Asset-Backed Certificates Series 2006-12 1A(c) | TSFR1M + 0.374% | 5.6940 | 12/25/36 | 311,051 | |||||||||
| 110,215 | Countrywide Asset-Backed Certificates Series 2006-23 1A(c) | TSFR1M + 0.394% | 5.7140 | 05/25/37 | 100,196 | |||||||||
See accompanying notes to financial statements.
24
| DEER PARK TOTAL RETURN CREDIT FUND |
| SCHEDULE OF INVESTMENTS (Continued) |
| September 30, 2023 |
| Principal | Coupon | |||||||||||||
| Amount ($) | Spread | Rate (%) | Maturity | Fair Value | ||||||||||
| NON-AGENCY ASSET BACKED SECURITIES — 103.8% (Continued) | ||||||||||||||
| RESIDENTIAL MORTGAGE — 27.5% (Continued) | ||||||||||||||
| 228,218 | Countrywide Asset-Backed Certificates Series 2006-21 M1(c) | TSFR1M + 0.459% | 5.7790 | 05/25/37 | $ | 141,831 | ||||||||
| 834,001 | Countrywide Asset-Backed Certificates Series 2007-SD1 A1(c),(d) | TSFR1M + 1.014% | 6.3340 | 03/25/47 | 623,388 | |||||||||
| 928,113 | Credit-Based Asset Servicing and Securitization, Series 2002-CB2 M2(c) | TSFR1M + 2.064% | 7.3840 | 04/25/32 | 917,369 | |||||||||
| 479,578 | Credit-Based Asset Servicing and Securitization, Series 2002-CB5 M2(c) | TSFR1M + 3.114% | 4.6470 | 05/25/32 | 492,420 | |||||||||
| 74,015 | Credit-Based Asset Servicing and Securitization, Series 2003-CB1 M1(c) | TSFR1M + 1.539% | 4.9170 | 01/25/33 | 72,422 | |||||||||
| 221,578 | Credit-Based Asset Servicing and Securitization, Series 2004-CB3 B4(c),(d) | TSFR1M + 3.864% | 3.3400 | 03/25/34 | 235,094 | |||||||||
| 145,075 | Credit-Based Asset Servicing and Securitization, Series 2004-CB3 B3(c) | TSFR1M + 4.989% | 3.3400 | 03/25/34 | 213,542 | |||||||||
| 108,178 | Credit-Based Asset Servicing and Securitization, Series 2004-CB3 B2(c) | TSFR1M + 3.114% | 3.3400 | 03/25/34 | 111,411 | |||||||||
| 81,048 | Credit-Based Asset Servicing and Securitization, Series 2004-CB6 B1(c) | TSFR1M + 2.814% | 4.6940 | 07/25/35 | 66,374 | |||||||||
| 19,216 | Credit-Based Asset Servicing and Securitization, Series 2004-CB8 M1(c) | TSFR1M + 0.909% | 3.4860 | 12/25/35 | 18,722 | |||||||||
| 849,082 | Credit-Based Asset Servicing and Securitization, Series 2006-RP2 M1(c),(d) | TSFR1M + 1.164% | 6.4840 | 07/25/36 | 834,628 | |||||||||
| 445,000 | Credit-Based Asset Servicing and Securitization, Series 2007-CB4 A2C(e) | 6.1140 | 04/25/37 | 248,393 | ||||||||||
| 132,574 | CWABS Asset-Backed Certificates Trust 2005-1 Series 2005-1 MF4(b) | 5.6540 | 07/25/35 | 88,371 | ||||||||||
| 1,883,000 | CWABS Asset-Backed Certificates Trust 2005-4 Series 2005-4 MF3(b) | 5.2360 | 07/25/35 | 1,366,806 | ||||||||||
| 20,038 | CWABS Inc Asset-Backed Certificates Trust 2004-5 Series 2004-5 M1(c) | TSFR1M + 0.969% | 6.2890 | 08/25/34 | 19,939 | |||||||||
| 2,937,953 | Equifirst Loan Securitization Trust 2007-1 Series 2007-1 M1(c) | TSFR1M + 0.394% | 5.7140 | 04/25/37 | 3,118,893 | |||||||||
| 457,005 | Equity One Mortgage Pass-Through Trust 2004-3 Series 2004-3 M3(e) | 3.8850 | 07/25/34 | 340,442 | ||||||||||
| 403,874 | Finance America Mortgage Loan Trust 2004-1 Series 2004-1 M6(c) | TSFR1M + 2.289% | 7.6090 | 06/25/34 | 342,539 | |||||||||
| 207,363 | Finance America Mortgage Loan Trust 2004-2 Series 2004-2 M2(c) | TSFR1M + 1.014% | 6.3340 | 08/25/34 | 192,770 | |||||||||
| 640,958 | First Franklin Mortgage Loan Trust 2002-FF4 Series 2002-FF4 M1(c) | TSFR1M + 1.689% | 7.0090 | 02/25/33 | 529,759 | |||||||||
| 274,373 | First Franklin Mortgage Loan Trust 2003-FF4 Series 2003-FF4 M2(c) | TSFR1M + 2.589% | 7.9090 | 10/25/33 | 228,236 | |||||||||
| 883,103 | First Franklin Mortgage Loan Trust 2003-FFH1 Series 2003-FFH1 M2(c) | TSFR1M + 2.739% | 8.0590 | 09/25/33 | 769,781 | |||||||||
| 2,832,085 | First Franklin Mortgage Loan Trust 2003-FFH2 Series 2003-FFH2 M2(c) | TSFR1M + 2.484% | 7.8040 | 02/25/34 | 2,642,724 | |||||||||
| 2,605,375 | First Franklin Mortgage Loan Trust 2004-FF10 Series 2004-FF10 M2(c) | TSFR1M + 2.439% | 7.7590 | 05/25/34 | 1,966,560 | |||||||||
| 362,577 | First Franklin Mortgage Loan Trust 2004-FF5 Series 2004-FF5 M6(c) | TSFR1M + 2.514% | 7.8340 | 08/25/34 | 326,550 | |||||||||
| 1,042,205 | First Franklin Mortgage Loan Trust 2004-FF7 Series 2004-FF7 B(e) | 5.5000 | 09/25/34 | 936,939 | ||||||||||
| 1,148,388 | First Franklin Mortgage Loan Trust 2004-FF7 Series 2004-FF7 M5(c) | TSFR1M + 2.289% | 7.6090 | 09/25/34 | 1,304,204 | |||||||||
| 4,957,273 | First Franklin Mortgage Loan Trust 2005-FF9 Series 2005-FF9 M1(c) (h) | TSFR1M + 0.924% | 6.2440 | 10/25/35 | 5,115,593 | |||||||||
| 4,626,819 | First Franklin Mortgage Loan Trust 2006-FF10 Series 2006-FF10 M1(c) | TSFR1M + 0.384% | 5.7040 | 07/25/36 | 5,502,876 | |||||||||
| 4,363,281 | First Franklin Mortgage Loan Trust 2006-FF11 Series 2006-FF11 M1(c) (h) | TSFR1M + 0.489% | 5.8090 | 08/25/36 | 3,897,584 | |||||||||
| 54,487 | Fremont Home Loan Trust 2004-B Series 2004-B M6(c) | TSFR1M + 2.439% | 7.7590 | 05/25/34 | 37,652 | |||||||||
| 325 | Fremont Home Loan Trust 2004-C Series 2004-C M3(c) | TSFR1M + 1.839% | 7.1590 | 08/25/34 | 258 | |||||||||
| 166,297 | GSAMP Trust 2004-OPT Series 2004-OPT B2(c) | TSFR1M + 2.664% | 3.4220 | 11/25/34 | 116,906 | |||||||||
| 89,597 | GSAMP Trust 2004-WF Series 2004-WF B1(c) | TSFR1M + 2.589% | 7.9090 | 10/25/34 | 89,351 | |||||||||
See accompanying notes to financial statements.
25
| DEER PARK TOTAL RETURN CREDIT FUND |
| SCHEDULE OF INVESTMENTS (Continued) |
| September 30, 2023 |
| Principal | Coupon | |||||||||||||
| Amount ($) | Spread | Rate (%) | Maturity | Fair Value | ||||||||||
| NON-AGENCY ASSET BACKED SECURITIES — 103.8% (Continued) | ||||||||||||||
| RESIDENTIAL MORTGAGE — 27.5% (Continued) | ||||||||||||||
| 750,439 | GSAMP Trust 2006-NC1 Series 2006-NC1 M2(c) | TSFR1M + 0.684% | 6.0040 | 02/25/36 | $ | 729,959 | ||||||||
| 2,000,000 | GSAMP Trust 2007-SEA1 Series 2007-SEA1 M1(d),(e) | 5.5000 | 12/25/36 | 1,901,094 | ||||||||||
| 9,272,225 | Home Equity Loan Trust Series 2007-FRE1 M1(c) (h) | TSFR1M + 0.614% | 5.9340 | 04/25/37 | 8,725,971 | |||||||||
| 137,000 | Home Equity Mortgage Loan Asset-Backed Trust Series 2005-D M1(c) | TSFR1M + 0.774% | 6.0940 | 03/25/36 | 121,887 | |||||||||
| 159,421 | Home Equity Mortgage Loan Asset-Backed Trust Series 2006-E 2A2(c) | TSFR1M + 0.234% | 5.5540 | 04/25/37 | 109,698 | |||||||||
| 5,053,504 | HSI Asset Securitization Corp Trust 2007-WF1 Series 2007-WF1 M2(c) (h) | TSFR1M + 0.519% | 5.8390 | 05/25/37 | 5,336,586 | |||||||||
| 138,334 | Lehman XS Trust 2007-1 Series 2007-1 1A4(c) | TSFR1M + 0.574% | 5.8940 | 02/25/37 | 100,142 | |||||||||
| 882,696 | Lehman XS Trust 2007-6 Series 2007-6 2A1(c) | TSFR1M + 0.534% | 5.8540 | 05/25/37 | 733,324 | |||||||||
| 332,556 | Mastr Specialized Loan Trust Series 2005-2 B(d),(e) | 6.2500 | 07/25/35 | 294,079 | ||||||||||
| 70,723 | Merrill Lynch Mortgage Investors Trust Series Series 2005-WMC1 M2(c) | TSFR1M + 0.909% | 6.2290 | 09/25/35 | 70,073 | |||||||||
| 1,092,952 | Merrill Lynch Mortgage Investors Trust Series Series 2005-WMC1 B5(c),(d) | TSFR1M + 5.739% | 11.0590 | 09/25/35 | 895,482 | |||||||||
| 21,288 | Morgan Stanley A.B.S Capital I Inc Trust 2004-NC7 Series 2004-NC7 M4(c) | TSFR1M + 1.839% | 7.1590 | 07/25/34 | 21,139 | |||||||||
| 182,858 | Morgan Stanley A.B.S Capital I Inc Trust 2005-WMC4 Series 2005-WMC4 M6(c) | TSFR1M + 1.164% | 6.4840 | 04/25/35 | 171,274 | |||||||||
| 2,040,322 | Morgan Stanley IXIS Real Estate Capital Trust Series 2006-2 A3(c) | TSFR1M + 0.264% | 5.5840 | 11/25/36 | 715,726 | |||||||||
| 1,018,004 | Newcastle Mortgage Securities Trust 2007-1 Series 2007-1 M2(c) | TSFR1M + 0.764% | 6.0840 | 04/25/37 | 1,662,573 | |||||||||
| 931,166 | Ownit Mortgage Loan Trust Series 2004-1 Series 2004-1 B2(c) | TSFR1M + 2.889% | 8.2090 | 07/25/35 | 1,141,921 | |||||||||
| 2,298,378 | Ownit Mortgage Loan Trust Series 2006-3 Series 2006-3 M1(c) | TSFR1M + 0.609% | 5.9290 | 03/25/37 | 2,004,254 | |||||||||
| 1,331,069 | Park Place Securities Inc Asset-Backed Series 2004-WHQ1 M7(c) | TSFR1M + 2.889% | 8.2090 | 09/25/34 | 1,150,946 | |||||||||
| 3,282,237 | Park Place Securities Inc Asset-Backed Series 2005-WCW1 M5(c) | TSFR1M + 1.104% | 6.4240 | 09/25/35 | 2,781,269 | |||||||||
| 189,648 | People’s Choice Home Loan Securities Trust Series Series 2004-2 M3(c) | TSFR1M + 1.839% | 7.1590 | 10/25/34 | 164,174 | |||||||||
| 1,325,384 | People’s Choice Home Loan Securities Trust Series Series 2004-2 M5(c) | TSFR1M + 2.814% | 8.1340 | 10/25/34 | 831,891 | |||||||||
| 14,946 | Popular A.B.S Mortgage Pass-Through Trust 2005-5 Series 2005-5 AF4(e) | 3.4500 | 11/25/35 | 14,662 | ||||||||||
| 2,376,214 | Popular A.B.S Mortgage Pass-Through Trust 2006-C Series 2006-C M2(c) (h) | TSFR1M + 0.759% | 6.0790 | 07/25/36 | 2,265,414 | |||||||||
| 1,340,102 | Quest Trust Series 2003-X4A M2(c),(d) | TSFR1M + 5.364% | 3.7580 | 12/25/33 | 1,103,026 | |||||||||
| 1,104,117 | Quest Trust Series 2004-X2 M3(c),(d) | TSFR1M + 3.339% | 8.6590 | 06/25/34 | 981,625 | |||||||||
| 439,812 | RAAC Series 2005-SP2 Trust Series 2005-SP2 2A(c) | TSFR1M + 0.714% | 6.0340 | 06/25/44 | 365,593 | |||||||||
| 200,749 | RAAC Series 2006-SP1 Trust Series 2006-SP1 M2(c) | TSFR1M + 0.939% | 6.2590 | 09/25/45 | 140,181 | |||||||||
| 412,504 | RAAC Series 2007-RP4 Trust Series 2007-RP4 A(c),(d) | TSFR1M + 0.464% | 6.1340 | 11/25/46 | 383,802 | |||||||||
| 358,780 | RAMP Series 2003-RS7 Trust Series 2003-RS7 MII3(c) | TSFR1M + 3.714% | 4.8540 | 08/25/33 | 293,013 | |||||||||
| 386,390 | RAMP Series 2003-RS9 Trust Series 2003-RS9 MII2(c) | TSFR1M + 1.914% | 5.0050 | 10/25/33 | 365,986 | |||||||||
| 230,841 | RAMP Series 2005-RS8 Trust Series 2005-RS8 M2(c) | TSFR1M + 0.614% | 6.1840 | 09/25/35 | 224,666 | |||||||||
| 889,570 | RAMP Series 2006-RS1 Trust Series 2006-RS1 M1(c) | TSFR1M + 0.524% | 6.0490 | 01/25/36 | 689,626 | |||||||||
| 2,403,310 | RAMP Series 2006-RZ2 Trust Series 2006-RZ2 M2(c) | TSFR1M + 0.454% | 5.9440 | 05/25/36 | 2,696,517 | |||||||||
| 209,838 | RAMP Series 2007-RS2 Trust Series 2007-RS2 A3(c) | TSFR1M + 0.854% | 6.1740 | 05/25/37 | 185,376 | |||||||||
See accompanying notes to financial statements.
26
| DEER PARK TOTAL RETURN CREDIT FUND |
| SCHEDULE OF INVESTMENTS (Continued) |
| September 30, 2023 |
| Principal | Coupon | |||||||||||||
| Amount ($) | Spread | Rate (%) | Maturity | Fair Value | ||||||||||
| NON-AGENCY ASSET BACKED SECURITIES — 103.8% (Continued) | ||||||||||||||
| RESIDENTIAL MORTGAGE — 27.5% (Continued) | ||||||||||||||
| 122,505 | SACO I Trust 2006-3 Series 2006-3 A1(c) | TSFR1M + 0.474% | 5.7940 | 04/25/36 | $ | 198,667 | ||||||||
| 34,461 | SACO I Trust 2006-6 Series 2006-6 A(c) | TSFR1M + 0.374% | 5.6940 | 06/25/36 | 52,384 | |||||||||
| 52,691 | Saxon Asset Securities Trust 2004-2 Series 2004-2 MV3(c) | TSFR1M + 2.019% | 3.9830 | 08/25/35 | 48,626 | |||||||||
| 948,250 | Saxon Asset Securities Trust 2005-1 Series 2005-1 B3(c) | TSFR1M + 3.639% | 1.9240 | 05/25/35 | 83,428 | |||||||||
| 4,500,000 | Saxon Asset Securities Trust 2007-4 Series 2007-4 M1(c),(d) | TSFR1M + 3.114% | 8.4340 | 12/25/37 | 2,601,401 | |||||||||
| 142,039 | Securitized Asset Backed Receivables, LLC Trust Series 2004-NC3 M2(c) | TSFR1M + 1.794% | 7.1140 | 09/25/34 | 131,985 | |||||||||
| 113,314 | SG Mortgage Securities Trust 2006-OPT2 Series 2006-OPT2 A3C(c) | TSFR1M + 0.264% | 5.5840 | 10/25/36 | 102,003 | |||||||||
| 36,644 | Soundview Home Loan Trust 2004-WMC1 Series 2004-WMC1 M4(c) | TSFR1M + 1.314% | 6.6340 | 01/25/35 | 30,983 | |||||||||
| 166,394 | Specialty Underwriting & Residential Finance Trust Series 2003-BC2 B1(c) | TSFR1M + 4.614% | 9.9340 | 06/25/34 | 166,787 | |||||||||
| 473,390 | Structured Asset Investment Loan Trust 2003-BC10 Series 2003-BC10 B(c) | TSFR1M + 4.614% | 9.9340 | 10/25/33 | 523,760 | |||||||||
| 60,828 | Structured Asset Investment Loan Trust 2003-BC2 Series 2003-BC2 A2(c) | TSFR1M + 0.834% | 6.1540 | 04/25/33 | 59,695 | |||||||||
| 260,149 | Structured Asset Investment Loan Trust 2003-BC2 Series 2003-BC2 M1(c) | TSFR1M + 1.494% | 6.8140 | 04/25/33 | 252,710 | |||||||||
| 145,759 | Structured Asset Investment Loan Trust 2003-BC4 Series 2003-BC4 M4(c) | TSFR1M + 4.989% | 10.3090 | 06/25/33 | 161,993 | |||||||||
| 68,262 | Structured Asset Investment Loan Trust 2003-BC8 Series 2003-BC8 M2(c) | TSFR1M + 2.739% | 8.0590 | 08/25/33 | 61,659 | |||||||||
| 508,601 | Structured Asset Investment Loan Trust 2004-5 Series 2004-5 M7(c) | TSFR1M + 3.114% | 8.4340 | 05/25/34 | 413,959 | |||||||||
| 71,562 | Structured Asset Investment Loan Trust 2004-9 Series 2004-9 M6(c) | TSFR1M + 2.889% | 8.2090 | 10/25/34 | 71,066 | |||||||||
| 512,216 | Structured Asset Investment Loan Trust 2004-BNC2 Series 2004-BNC2 M1(c) | TSFR1M + 1.389% | 6.7090 | 12/25/34 | 486,200 | |||||||||
| 3,724,574 | Structured Asset Investment Loan Trust 2005-9 Series 2005-9 M2(c) (h) | TSFR1M + 0.789% | 6.1090 | 11/25/35 | 3,170,890 | |||||||||
| 239,793 | Structured Asset Securities Corp Mortgage Series 2003-36XS M1(e) | 5.2920 | 11/25/33 | 186,090 | ||||||||||
| 273,448 | Structured Asset Securities Corp Mortgage Series 2004-6XS M1(e) | 5.6700 | 03/25/34 | 255,524 | ||||||||||
| 3,618,249 | Structured Asset Securities Corp Mortgage Loan Series 2006-BC6 M1(c) (h) | TSFR1M + 0.384% | 5.7040 | 01/25/37 | 3,240,909 | |||||||||
| 1,884,172 | Washington Mutual Asset-Backed Certificates WMABS Series 2006-HE5 2A1(c) | TSFR1M + 0.234% | 4.0140 | 10/25/36 | 681,373 | |||||||||
| 33,588 | Wilshire Mortgage Loan Trust Series 1997-2 A7(b) | 6.8350 | 03/25/28 | 33,413 | ||||||||||
| 38,752 | Wilshire Mortgage Loan Trust Series 1997-2 M2(b) | 7.4250 | 05/25/28 | 38,566 | ||||||||||
| 108,143,941 | ||||||||||||||
| WHOLE BUSINESS — 0.1% | ||||||||||||||
| 416,144 | Business Loan Express Business Loan Trust 2007-A Series 2007-AA B(c),(d) | US0001M + 1.100% | 6.5390 | 10/20/40 | 346,096 | |||||||||
| TOTAL NON-AGENCY ASSET BACKED SECURITIES (Cost $441,763,838) | 407,344,889 | |||||||||||||
See accompanying notes to financial statements.
27
| DEER PARK TOTAL RETURN CREDIT FUND |
| SCHEDULE OF INVESTMENTS (Continued) |
| September 30, 2023 |
| Shares | Fair Value | |||||||
| SHORT-TERM INVESTMENT — 0.7% | ||||||||
| MONEY MARKET FUND - 0.7% | ||||||||
| 2,570,624 | First American Government Obligations Fund Class X, 5.25% (Cost $2,570,624)(g) | $ | 2,570,624 | |||||
| TOTAL INVESTMENTS - 105.7% (Cost $462,847,569) | $ | 414,597,897 | ||||||
| REVERSE REPURCHASE AGREEMENTS - (5.8)% | (22,557,000 | ) | ||||||
| OTHER ASSETS LESS LIABILITIES - 0.1% | 312,507 | |||||||
| NET ASSETS - 100.0% | $ | 392,353,404 | ||||||
| ABS | - Asset Backed Securities |
| CMBS | - Commercial Mortgage Backed Securities |
| LLC | - Limited Liability Company |
| LTD | - Limited Company |
| REMIC | - Real Estate Mortgage Investment Conduit |
| 12MTA | - 12-Month Treasury Average |
| COF 11 | - Cost of Funds for the 11th District of San Francisco |
| H15T1Y | - US Treasury Yield Curve Rate T Note Constant Maturity 1 Year |
| SOFR30A | - United States Secured Overnight Financing Rate (SOFR) Over A Rolling 30-Day Period |
| TSFR1M | - Term Secured Overnight Financing Rate (SOFR) 1 month |
| US0001M | - Intercontinental Exchange London Interbank Offered Rate (ICE LIBOR) USD 1 Month |
| US0006M | - Intercontinental Exchange London Interbank Offered Rate (ICE LIBOR) USD 6 Month |
| (a) | Interest only securities. |
| (b) | Variable rate security; the rate shown represents the rate on September 30, 2023. |
| (c) | Floating rate security, the interest rate of which adjusts periodically based on changes in current interest rates and prepayments on the underlying pool of assets. |
| (d) | Security exempt from registration under Rule 144A or Section 4(2) of the Securities Act of 1933. The security may be resold in transactions exempt from registration, normally to qualified institutional buyers. As of September 30, 2023 the total market value of 144A securities is $116,936,871 or 29.8% of net assets. |
| (e) | Step bond. Coupon rate is fixed rate that changes on a specified date. The rate shown is the current rate at September 30, 2023. |
| (f) | Zero coupon bond. |
| (g) | Rate disclosed is the seven day effective yield as of September 30, 2023. |
| (h) | All or a portion of the security is pledged as collateral for open reverse repurchase agreements. See Note 5. |
| (i) | Illiquid security. Total illiquid securities represent 0.4% of net assets as of September 30, 2023. |
See accompanying notes to financial statements.
28
| Deer Park Total Return Credit Fund |
| STATEMENT OF ASSETS AND LIABILITIES |
| September 30, 2023 |
| ASSETS | ||||
| Investments (cost $462,847,569), at fair value | $ | 414,597,897 | ||
| Collateral held at broker | 406,604 | |||
| Interest & dividend receivable | 1,462,471 | |||
| Receivable for fund shares sold | 183,011 | |||
| Prepaid expenses and other assets | 55,109 | |||
| TOTAL ASSETS | 416,705,092 | |||
| LIABILITIES | ||||
| Payable for reverse repurchase agreements | 22,557,000 | |||
| Payable for fund shares redeemed | 714,381 | |||
| Investment advisory fees payable | 688,478 | |||
| Payable to related parties | 126,814 | |||
| Interest payable for reverse repurchase agreements | 105,309 | |||
| Distribution (12b-1) fees payable | 21,568 | |||
| Accrued expenses and other liabilities | 138,138 | |||
| TOTAL LIABILITIES | 24,351,688 | |||
| NET ASSETS | $ | 392,353,404 | ||
| Net Assets Consist Of: | ||||
| Paid in capital | $ | 520,158,490 | ||
| Accumulated loss | (127,805,086 | ) | ||
| NET ASSETS | $ | 392,353,404 | ||
| Net Asset Value Per Share: | ||||
| Class A Shares: | ||||
| Net Assets | $ | 89,663,949 | ||
| Shares of beneficial interest outstanding ($0 par value, unlimited shares authorized) | 10,509,988 | |||
| Net asset value (Net Assets ÷ Shares Outstanding) and redemption price per share | $ | 8.53 | ||
| Maximum offering price per share (maximum sales charge of 5.75%) (a) | $ | 9.05 | ||
| Class C Shares: | ||||
| Net Assets | $ | 3,195,618 | ||
| Shares of beneficial interest outstanding ($0 par value, unlimited shares authorized) | 375,923 | |||
| Net asset value (Net Assets ÷ Shares Outstanding) and redemption price per share | $ | 8.50 | ||
| Class I Shares: | ||||
| Net Assets | $ | 299,493,837 | ||
| Shares of beneficial interest outstanding ($0 par value, unlimited shares authorized) | 35,059,363 | |||
| Net asset value (Net Assets ÷ Shares Outstanding) and redemption price per share | $ | 8.54 | (b) | |
| (a) | On investments of $1 million or more, the maximum sales charge will not apply. |
| (b) | The NAV and offering price shown above differs from the traded NAV on September 29, 2023 due to financial statement rounding and/or financial statement adjustments. |
See accompanying notes to financial statements.
29
| Deer Park Total Return Credit Fund |
| STATEMENT OF OPERATIONS |
| For the Year Ended September 30, 2023 |
| INVESTMENT INCOME | ||||
| Interest income | $ | 30,446,979 | ||
| TOTAL INVESTMENT INCOME | 30,446,979 | |||
| EXPENSES | ||||
| Investment advisory fees | 8,731,985 | |||
| Distribution (12b-1) Fees: | ||||
| Class A | 266,723 | |||
| Class C | 42,167 | |||
| Interest expense for reverse repurchase agreements | 1,012,015 | |||
| Administrative services fees | 528,104 | |||
| Professional fees | 282,813 | |||
| Third party administrative servicing fees | 216,850 | |||
| Printing and postage expenses | 127,217 | |||
| Transfer agent fees | 121,257 | |||
| Accounting services fees | 93,013 | |||
| Registration fees | 72,227 | |||
| Custodian fees | 53,466 | |||
| Compliance officer fees | 34,521 | |||
| Trustees fees and expenses | 19,766 | |||
| Insurance expense | 5,729 | |||
| Line of credit interest expense | 166 | |||
| Other expenses | 27,567 | |||
| TOTAL EXPENSES | 11,635,586 | |||
| Less: Fees waived by the Adviser | (1,794,509 | ) | ||
| NET EXPENSES | 9,841,077 | |||
| NET INVESTMENT INCOME | 20,605,902 | |||
| REALIZED AND UNREALIZED LOSS ON INVESTMENTS | ||||
| Net realized loss from security transactions | (4,657,074 | ) | ||
| Net change in unrealized depreciation on investments | (30,128,322 | ) | ||
| NET REALIZED AND UNREALIZED LOSS ON INVESTMENTS | (34,785,396 | ) | ||
| NET DECREASE IN NET ASSETS RESULTING FROM OPERATIONS | $ | (14,179,494 | ) | |
See accompanying notes to financial statements.
30
| Deer Park Total Return Credit Fund |
| STATEMENTS OF CHANGES IN NET ASSETS |
| Year Ended | Year Ended | |||||||
| September 30, 2023 | September 30, 2022 | |||||||
| FROM OPERATIONS | ||||||||
| Net investment income | $ | 20,605,902 | $ | 22,477,023 | ||||
| Net realized gain (loss) from security transactions | (4,657,074 | ) | 1,501,498 | |||||
| Net change in unrealized depreciation of investments | (30,128,322 | ) | (80,247,046 | ) | ||||
| Net decrease in net assets resulting from operations | (14,179,494 | ) | (56,268,525 | ) | ||||
| DISTRIBUTIONS TO SHAREHOLDERS | ||||||||
| From return of capital: | ||||||||
| Class A | (1,480,543 | ) | (2,229,541 | ) | ||||
| Class C | (47,000 | ) | (81,599 | ) | ||||
| Class I | (5,217,925 | ) | (9,121,841 | ) | ||||
| Total distributions paid: | ||||||||
| Class A | (5,234,371 | ) | (3,943,295 | ) | ||||
| Class C | (185,572 | ) | (180,577 | ) | ||||
| Class I | (18,343,608 | ) | (22,110,570 | ) | ||||
| Net decrease in net assets resulting from distributions to shareholders | (30,509,019 | ) | (37,667,423 | ) | ||||
| FROM SHARES OF BENEFICIAL INTEREST | ||||||||
| Proceeds from shares sold: | ||||||||
| Class A | 16,454,845 | 59,768,477 | ||||||
| Class C | 187,350 | 389,696 | ||||||
| Class I | 90,180,521 | 220,855,881 | ||||||
| Net asset value of shares issued in reinvestment of distributions: | ||||||||
| Class A | 6,672,637 | 6,124,639 | ||||||
| Class C | 196,353 | 239,906 | ||||||
| Class I | 21,603,813 | 28,469,373 | ||||||
| Payments for shares redeemed: | ||||||||
| Class A | (46,576,403 | ) | (41,445,096 | ) | ||||
| Class C | (1,909,048 | ) | (2,958,837 | ) | ||||
| Class I | (241,334,126 | ) | (411,513,841 | ) | ||||
| Net decrease in net assets resulting from shares of beneficial interest | (154,524,058 | ) | (140,069,802 | ) | ||||
| TOTAL DECREASE IN NET ASSETS | (199,212,571 | ) | (234,005,750 | ) | ||||
| NET ASSETS | ||||||||
| Beginning of Year | 591,565,975 | 825,571,725 | ||||||
| End of Year | $ | 392,353,404 | $ | 591,565,975 | ||||
See accompanying notes to financial statements.
31
| Deer Park Total Return Credit Fund |
| STATEMENTS OF CHANGES IN NET ASSETS (Continued) |
| Year Ended | Year Ended | |||||||
| September 30, 2023 | September 30, 2022 | |||||||
| SHARE ACTIVITY | ||||||||
| Class A: | ||||||||
| Shares sold | 1,817,727 | 5,855,720 | ||||||
| Shares reinvested | 754,681 | 605,223 | ||||||
| Shares redeemed | (5,219,744 | ) | (4,061,742 | ) | ||||
| Net increase (decrease) in shares of beneficial interest outstanding | (2,647,336 | ) | 2,399,201 | |||||
| Class C: | ||||||||
| Shares sold | 21,078 | 38,498 | ||||||
| Shares reinvested | 22,251 | 23,595 | ||||||
| Shares redeemed | (216,750 | ) | (281,602 | ) | ||||
| Net decrease in shares of beneficial interest outstanding | (173,421 | ) | (219,509 | ) | ||||
| Class I: | ||||||||
| Shares sold | 10,051,593 | 21,018,084 | ||||||
| Shares reinvested | 2,439,589 | 2,786,388 | ||||||
| Shares redeemed | (26,939,475 | ) | (39,534,174 | ) | ||||
| Net decrease in shares of beneficial interest outstanding | (14,448,293 | ) | (15,729,702 | ) | ||||
See accompanying notes to financial statements.
32
| Deer Park Total Return Credit Fund |
| FINANCIAL HIGHLIGHTS |
| Per Share Data and Ratios for a Share of Beneficial Interest Outstanding Throughout Each Year |
| Year Ended | Year Ended | Year Ended | Year Ended | Year Ended | ||||||||||||||||
| Class A | September 30, 2023 | September 30, 2022 | September 30, 2021 | September 30, 2020 | September 30, 2019 | |||||||||||||||
| Net asset value, beginning of year | $ | 9.35 | $ | 10.75 | $ | 10.37 | $ | 10.98 | $ | 11.26 | ||||||||||
| Activity from investment operations: | ||||||||||||||||||||
| Net investment income (1) | 0.37 | 0.33 | 0.29 | 0.22 | 0.19 | |||||||||||||||
| Net realized and unrealized gain (loss) on investments | (0.62 | ) | (1.22 | ) | 0.60 | (0.31 | ) | 0.14 | ||||||||||||
| Total from investment operations | (0.25 | ) | (0.89 | ) | 0.89 | (0.09 | ) | 0.33 | ||||||||||||
| Less distributions from: | ||||||||||||||||||||
| Net investment income | (0.43 | ) | (0.34 | ) | (0.39 | ) | (0.51 | ) | (0.40 | ) | ||||||||||
| Return of capital | (0.14 | ) | (0.17 | ) | (0.12 | ) | (0.01 | ) | (0.21 | ) | ||||||||||
| Total distributions | (0.57 | ) | (0.51 | ) | (0.51 | ) | (0.52 | ) | (0.61 | ) | ||||||||||
| Net asset value, end of year | $ | 8.53 | $ | 9.35 | $ | 10.75 | $ | 10.37 | $ | 10.98 | ||||||||||
| Total return (2) | (2.73 | )% | (8.51 | )% | 8.82 | % | (0.50 | )% | 3.16 | % | ||||||||||
| Net assets, at end of year (000s) | $ | 89,664 | $ | 123,018 | $ | 115,606 | $ | 112,937 | $ | 135,705 | ||||||||||
| Ratio of gross expenses to average net assets (3) | 2.64 | % (8) | 2.43 | % (7) | 2.39 | % (6) | 2.40 | % (5) | 2.35 | % (4) | ||||||||||
| Ratio of net expenses to average net assets | 2.26 | % (8) | 2.11 | % (7) | 2.15 | % (6) | 2.20 | % (5) | 2.25 | % (4) | ||||||||||
| Ratio of net investment income to average net assets | 4.17 | % | 3.26 | % | 2.72 | % | 2.15 | % | 1.73 | % | ||||||||||
| Portfolio Turnover Rate | 1 | % | 17 | % | 17 | % | 11 | % | 29 | % | ||||||||||
| (1) | Per share amounts calculated using the average shares method, which more appropriately presents the per share data for the period. |
| (2) | Total returns shown are historical in nature and assume changes in share price, reinvestment of dividends and distributions, if any, and exclude the effect of applicable sales charges and redemption fees. Had the Adviser not waived fees or absorbed a portion of Fund expenses, total returns would have been lower. |
| (3) | Represents the ratio of expenses to average net assets absent fee waivers and/or expense reimbursements by the Adviser. |
| (4) | Includes 0.01% for the year ended September 30, 2019 attributed to broker margin interest expense on options, which is not subject to waiver by the Adviser. |
| (5) | Includes 0.03% for the year ended September 30, 2020 attributed to broker margin interest expense, interest on reverse repurchase agreements and line of credit expense which are not subject to waiver by the Adviser. |
| (6) | Includes 0.01% for the year ended September 30, 2021 attributed to broker margin interest expense, which is not subject to waiver by the Adviser. |
| (7) | Includes 0.03% for the year ended September 30, 2022 attributed to broker margin interest expense, interest on reverse repurchase agreements and line of credit expense which are not subject to waiver by the Adviser. |
| (8) | Includes 0.26% for the year ended September 30, 2023 attributed to interest on reverse repurchase agreements, line of credit expense and extraordinary expenses which are not subject to waiver by the Adviser. |
See accompanying notes to financial statements.
33
| Deer Park Total Return Credit Fund |
| FINANCIAL HIGHLIGHTS |
| Per Share Data and Ratios for a Share of Beneficial Interest Outstanding Throughout Each Year |
| Year Ended | Year Ended | Year Ended | Year Ended | Year Ended | ||||||||||||||||
| Class C | September 30, 2023 | September 30, 2022 | September 30, 2021 | September 30, 2020 | September 30, 2019 | |||||||||||||||
| Net asset value, beginning of year | $ | 9.32 | $ | 10.71 | $ | 10.34 | $ | 10.94 | $ | 11.23 | ||||||||||
| Activity from investment operations: | ||||||||||||||||||||
| Net investment income (1) | 0.30 | 0.22 | 0.21 | 0.15 | 0.10 | |||||||||||||||
| Net realized and unrealized gain (loss) on investments | (0.62 | ) | (1.17 | ) | 0.59 | (0.30 | ) | 0.15 | ||||||||||||
| Total from investment operations | (0.32 | ) | (0.95 | ) | 0.80 | (0.15 | ) | 0.25 | ||||||||||||
| Less distributions from: | ||||||||||||||||||||
| Net investment income | (0.38 | ) | (0.29) | (0.33) | (0.44) | (0.35) | ||||||||||||||
| Return of capital | (0.12 | ) | (0.15) | (0.10) | (0.01) | (0.19) | ||||||||||||||
| Total distributions | (0.50 | ) | (0.44 | ) | (0.43 | ) | (0.45 | ) | (0.54 | ) | ||||||||||
| Net asset value, end of year | $ | 8.50 | $ | 9.32 | $ | 10.71 | $ | 10.34 | $ | 10.94 | ||||||||||
| Total return (2) | (3.47 | )% | (9.14 | )% | 7.92 | % | (1.15 | )% | 2.30 | % | ||||||||||
| Net assets, at end of year (000s) | $ | 3,196 | $ | 5,119 | $ | 8,234 | $ | 10,637 | $ | 9,046 | ||||||||||
| Ratio of gross expenses to average net assets (3) | 3.39 | % (8) | 3.18 | % (7) | 3.14 | % (6) | 3.15 | % (5) | 3.10 | % (4) | ||||||||||
| Ratio of net expenses to average net assets | 3.01 | % (8) | 2.87 | % (7) | 2.90 | % (6) | 2.95 | % (5) | 3.00 | % (4) | ||||||||||
| Ratio of net investment income to average net assets | 3.37 | % | 2.16 | % | 1.97 | % | 1.39 | % | 0.95 | % | ||||||||||
| Portfolio Turnover Rate | 1 | % | 17 | % | 17 | % | 11 | % | 29 | % | ||||||||||
| (1) | Per share amounts calculated using the average shares method, which more appropriately presents the per share data for the period. |
| (2) | Total returns shown are historical in nature and assume changes in share price, reinvestment of dividends and distributions, if any, and exclude the effect of applicable sales charges and redemption fees. Had the Adviser not waived fees or absorbed a portion of Fund expenses, total returns would have been lower. |
| (3) | Represents the ratio of expenses to average net assets absent fee waivers and/or expense reimbursements by the Adviser. |
| (4) | Includes 0.01% for the year ended September 30, 2019 attributed to broker margin interest expense on options, which is not subject to waiver by the Adviser. |
| (5) | Includes 0.03% for the year ended September 30, 2020 attributed to broker margin interest expense, interest on reverse repurchase agreements and line of credit expense which are not subject to waiver by the Adviser. |
| (6) | Includes 0.01% for the year ended September 30, 2021 attributed to broker margin interest expense, which is not subject to waiver by the Adviser. |
| (7) | Includes 0.03% for the year ended September 30, 2022 attributed to broker margin interest expense, interest on reverse repurchase agreements and line of credit expense which are not subject to waiver by the Adviser. |
| (8) | Includes 0.26% for the year ended September 30, 2023 attributed to interest on reverse repurchase agreements, line of credit expense and extraordinary expenses which are not subject to waiver by the Adviser. |
See accompanying notes to financial statements.
34
| Deer Park Total Return Credit Fund |
| FINANCIAL HIGHLIGHTS |
| Per Share Data and Ratios for a Share of Beneficial Interest Outstanding Throughout Each Year |
| Year Ended | Year Ended | Year Ended | Year Ended | Year Ended | ||||||||||||||||
| Class I | September 30, 2023 | September 30, 2022 | September 30, 2021 | September 30, 2020 | September 30, 2019 | |||||||||||||||
| Net asset value, beginning of year | $ | 9.36 | $ | 10.76 | $ | 10.38 | $ | 10.99 | $ | 11.26 | ||||||||||
| Activity from investment operations: | ||||||||||||||||||||
| Net investment income (1) | 0.39 | 0.32 | 0.31 | 0.25 | 0.23 | |||||||||||||||
| Net realized and unrealized gain (loss) on investments | (0.62 | ) | (1.18 | ) | 0.61 | (0.31 | ) | 0.14 | ||||||||||||
| Total from investment operations | (0.23 | ) | (0.86 | ) | 0.92 | (0.06 | ) | 0.37 | ||||||||||||
| Less distributions from: | ||||||||||||||||||||
| Net investment income | (0.45 | ) | (0.36) | (0.42) | (0.54) | (0.42) | ||||||||||||||
| Return of capital | (0.14 | ) | (0.18) | (0.12) | (0.01) | (0.22) | ||||||||||||||
| Total distributions | (0.59 | ) | (0.54 | ) | (0.54 | ) | (0.55 | ) | (0.64 | ) | ||||||||||
| Net asset value, end of year | $ | 8.54 | $ | 9.36 | $ | 10.76 | $ | 10.38 | $ | 10.99 | ||||||||||
| Total return (2) | (2.48 | )% | (8.27 | )% | 9.09 | % | (0.24 | )% | 3.40 | % | ||||||||||
| Net assets, at end of year (000s) | $ | 299,494 | $ | 463,430 | $ | 701,732 | $ | 583,566 | $ | 591,022 | ||||||||||
| Ratio of gross expenses to average net assets (3) | 2.39 | % (8) | 2.18 | % (7) | 2.14 | % (6) | 2.15 | % (5) | 2.10 | % (4) | ||||||||||
| Ratio of net expenses to average net assets | 2.01 | % (8) | 1.87 | % (7) | 1.90 | % (6) | 1.95 | % (5) | 2.00 | % (4) | ||||||||||
| Ratio of net investment income to average net assets | 4.41 | % | 3.05 | % | 2.97 | % | 2.43 | % | 2.04 | % | ||||||||||
| Portfolio Turnover Rate | 1 | % | 17 | % | 17 | % | 11 | % | 29 | % | ||||||||||
| (1) | Per share amounts calculated using the average shares method, which more appropriately presents the per share data for the period. |
| (2) | Total returns shown are historical in nature and assume changes in share price, reinvestment of dividends and distributions, if any, and exclude the effect of applicable sales charges and redemption fees. Had the Adviser not waived fees or absorbed a portion of Fund expenses, total returns would have been lower. |
| (3) | Represents the ratio of expenses to average net assets absent fee waivers and/or expense reimbursements by the Adviser. |
| (4) | Includes 0.01% for the year ended September 30, 2019 attributed to broker margin interest expense on options, which is not subject to waiver by the Adviser. |
| (5) | Includes 0.03% for the year ended September 30, 2020 attributed to broker margin interest expense, interest on reverse repurchase agreements and line of credit expense which are not subject to waiver by the Adviser. |
| (6) | Includes 0.01% for the year ended September 30, 2021 attributed to broker margin interest expense, which is not subject to waiver by the Adviser. |
| (7) | Includes 0.03% for the year ended September 30, 2022 attributed to broker margin interest expense, interest on reverse repurchase agreements and line of credit expense which are not subject to waiver by the Adviser. |
| (8) | Includes 0.26% for the year ended September 30, 2023 attributed to interest on reverse repurchase agreements, line of credit expense and extraordinary expenses which are not subject to waiver by the Adviser. |
See accompanying notes to financial statements.
35
| Deer Park Total Return Credit Fund |
| NOTES TO FINANCIAL STATEMENTS |
| September 30, 2023 |
| 1. | ORGANIZATION |
The Deer Park Total Return Credit Fund (the “Fund”) is a non-diversified series of shares of beneficial interest of Northern Lights Fund Trust (the “Trust”), a statutory trust organized under the laws of the State of Delaware on January 19, 2005, and registered under the Investment Company Act of 1940, as amended (the “1940 Act”), as an open-end management investment company. The Fund’s investment objective is to seek income and capital appreciation. The Fund commenced operations on October 16, 2015.
The Fund currently offers Class A shares, Class C shares and Class I shares. Class C and Class I shares are offered at net asset value (“NAV”). Class A shares are offered at NAV plus a maximum sales charge of 5.75%, which can be waived by the Adviser. Each class represents an interest in the same assets of the Fund and classes are identical except for differences in their sales charge structures and ongoing service and distribution charges. All classes of shares have equal voting privileges except that each class has exclusive voting rights with respect to its service and/or distribution plans. The Fund’s income, expenses (other than class specific distribution fees), and realized and unrealized gains and losses are allocated proportionately each day based upon the relative net assets of each class.
| 2. | SIGNIFICANT ACCOUNTING POLICIES |
The following is a summary of significant accounting policies followed by the Trust in preparation of the Fund’s financial statements. These policies are in conformity with accounting principles generally accepted in the United States of America (“GAAP”). The preparation of financial statements requires management to make estimates and assumptions that affect the reported amounts of assets and liabilities and disclosure of contingent assets and liabilities at the date of the financial statements and the reported amounts of income and expenses for the period. Actual results could differ from those estimates. The Fund is an investment company and accordingly follows the investment company accounting and reporting guidance of the Financial Accounting Standards Board (“FASB”) Accounting Standards Codification Topic 946 “Financial Services – Investment Companies” including FASB Accounting Standards Update (“ASU”) 2013-08.
Securities Valuation – Securities listed on an exchange are valued at the last reported sale price at the close of the regular trading session of the primary exchange on the business day the value is being determined, or in the case of securities listed on NASDAQ at the NASDAQ Official Closing Price (“NOCP”). In the absence of a sale, such securities shall be valued at the mean between the current bid and ask prices on the day of valuation. Debt securities (other than short-term obligations) are valued each day by an independent pricing service approved by the Trust’s Board of Trustees (the “Board”) based on methods which include consideration of: yields or prices of securities of comparable quality, coupon, maturity and type, indications as to values from dealers, and general market conditions or market quotations from a major market maker in the securities. Investments valued in currencies other than the U.S. dollar are converted to U.S. dollars using exchange rates obtained from pricing services. The independent pricing service does not distinguish between smaller-sized bond positions known as “odd lots” and larger institutional-sized bond positions known as “round lots”. The Fund may fair value a particular bond if the Adviser does not believe that the round lot value provided by the
36
| Deer Park Total Return Credit Fund |
| NOTES TO FINANCIAL STATEMENTS (Continued) |
| September 30, 2023 |
independent pricing service reflects fair value of the Fund’s holding. Short-term debt obligations having 60 days or less remaining until maturity, at time of purchase, may be valued at amortized cost. Investments in open-end investment companies may be valued at NAV.
The Fund may hold securities, such as private investments, interests in commodity pools, other non-traded securities or temporarily illiquid securities, for which market quotations are not readily available or are determined to be unreliable. These securities will be valued using the “fair value” procedures approved by the Board. The Board has delegated execution of these procedures to the Adviser as its valuation designee (the “Valuation Designee”) . The Board may also enlist third party consultants such as a valuation specialist at a public accounting firm, valuation consultant or financial officer of a security issuer on an as-needed basis to assist the Valuation Designee in determining a security-specific fair value. The Board is responsible for reviewing and approving fair value methodologies utilized by the Valuation Designee, which approval shall be based upon whether the Valuation Designee followed the valuation procedures established by the Board.
Fair Valuation Process – The applicable investments are valued by the Valuation Designee pursuant to valuation procedures established by the Board. For example, fair value determinations are required for the following securities: (i) securities for which market quotations are insufficient or not readily available on a particular business day (including securities for which there is a short and temporary lapse in the provision of a price by the regular pricing source); (ii) securities for which, in the judgment of the Valuation Designee, the prices or values available do not represent the fair value of the instrument; factors which may cause the Valuation Designee to make such a judgment include, but are not limited to, the following: only a bid price or an ask price is available; the spread between bid and ask prices is substantial; the frequency of sales; the thinness of the market; the size of reported trades; and actions of the securities markets, such as the suspension or limitation of trading; (iii) securities determined to be illiquid; and (iv) securities with respect to which an event that will affect the value thereof has occurred (a “significant event”) since the closing prices were established on the principal exchange on which they are traded, but prior to a Fund’s calculation of its NAV. Specifically, interests in commodity pools or managed futures pools are valued on a daily basis by reference to the closing market prices of each futures contract or other asset held by a pool, as adjusted for pool expenses. Restricted or illiquid securities, such as private investments or non-traded securities are valued based upon the current bid for the security from two or more independent dealers or other parties reasonably familiar with the facts and circumstances of the security (who should take into consideration all relevant factors as may be appropriate under the circumstances). If a current bid from such independent dealers or other independent parties is unavailable, the Valuation Designee shall determine, the fair value of such security using the following factors: (i) the type of security; (ii) the cost at date of purchase; (iii) the size and nature of the Fund’s holdings; (iv) the discount from market value of unrestricted securities of the same class at the time of purchase and subsequent thereto; (v) information as to any transactions or offers with respect to the security; (vi) the nature and duration of restrictions on disposition of the security and the existence of any registration rights; (vii) how the yield of the security compares to similar securities of companies of similar or equal creditworthiness; (viii) the level of recent trades of similar or comparable securities; (ix) the liquidity characteristics of the security; (x) current market conditions; and (xi) the market value of any securities into which the security is convertible or exchangeable.
37
| Deer Park Total Return Credit Fund |
| NOTES TO FINANCIAL STATEMENTS (Continued) |
| September 30, 2023 |
The Fund utilizes various methods to measure the fair value of all of its investments on a recurring basis. GAAP establishes a hierarchy that prioritizes inputs to valuation methods. The three levels of input are:
Level 1 – Unadjusted quoted prices in active markets for identical assets and liabilities that the Fund has the ability to access.
Level 2 – Observable inputs other than quoted prices included in Level 1 that are observable for the asset or liability, either directly or indirectly. These inputs may include quoted prices for the identical instrument in an inactive market, prices for similar instruments, interest rates, prepayment speeds, credit risk, yield curves, default rates and similar data.
Level 3 – Unobservable inputs for the asset or liability, to the extent relevant observable inputs are not available, representing the Fund’s own assumptions about the assumptions a market participant would use in valuing the asset or liability, and would be based on the best information available.
The availability of observable inputs can vary from security to security and is affected by a wide variety of factors, including, for example, the type of security, whether the security is new and not yet established in the marketplace, the liquidity of markets, and other characteristics particular to the security. To the extent that valuation is based on models or inputs that are less observable or unobservable in the market, the determination of fair value requires more judgment. Accordingly, the degree of judgment exercised in determining fair value is greatest for instruments categorized in Level 3.
The inputs used to measure fair value may fall into different levels of the fair value hierarchy. In such cases, for disclosure purposes, the level in the fair value hierarchy within which the fair value measurement falls in its entirety, is determined based on the lowest level input that is significant to the fair value measurement in its entirety.
The inputs or methodology used for valuing securities are not necessarily an indication of the risk associated with investing in those securities. The following tables summarize the inputs used as of September 30, 2023 for the Fund’s assets and liabilities measured at fair value:
| Assets* | Level 1 | Level 2 | Level 3 | Total | ||||||||||||
| Agency Asset Backed Securities | $ | — | $ | 4,682,384 | $ | — | $ | 4,682,384 | ||||||||
| Non-Agency Asset Backed Securities | — | 407,344,889 | — | 407,344,889 | ||||||||||||
| Short-Term Investment | 2,570,624 | — | — | 2,570,624 | ||||||||||||
| Total | $ | 2,570,624 | $ | 412,027,273 | $ | — | $ | 414,597,897 | ||||||||
The Fund did not hold any Level 3 securities during the year.
| * | See Schedule of Investments for industry classification. |
38
| Deer Park Total Return Credit Fund |
| NOTES TO FINANCIAL STATEMENTS (Continued) |
| September 30, 2023 |
Interest Only Securities – The Fund may invest in stripped mortgage-backed securities, which receive differing proportions of the interest and principal payments from the underlying assets, including interest-only (“IO”) and principal-only (“PO”) securities. Stripped securities are created when the issuer separates the interest and principal components of an instrument and sells them as separate securities. In general, one security is entitled to receive the interest payments on underlying assets (the interest only or “IO” security) and the other to receive the principal payments (the principal only or “PO” security). Some stripped securities may receive a combination of interest and principal payments. The yields to maturity on IOs and POs are sensitive to the expected or anticipated rate of principal payments (including prepayments) on the related underlying assets, and principal payments may have a material effect on yield to maturity. If the underlying assets experience greater than anticipated prepayments of principal, the Fund may not fully recoup its initial investment in IOs. Conversely, if the underlying assets experience less than anticipated prepayments of principal, the yield on POs could be adversely affected. Stripped securities may be highly sensitive to changes in interest rates and rates of prepayment. IO and PO mortgage-backed securities may be illiquid. The market value of such securities generally is more sensitive to changes in prepayment and interest rates than is the case with securities traditional mortgage-backed securities, and in some cases such market value may be extremely volatile.
Security Transactions and Related Income – Security transactions are accounted for on the trade date. Interest income is recognized on an accrual basis. Discounts are accreted and premiums are amortized to the call date. Dividend income is recorded on the ex-dividend date. Realized gains or losses from sales of securities are determined by comparing the identified cost of the security lot sold with the net sales proceeds.
Option Transactions – The Fund is subject to equity price and interest rate risk in the normal course of pursuing its investment objective and may purchase or sell options to help hedge against risk. When the Fund writes put and call options, an amount equal to the premium received is included in the Statements of Assets and Liabilities as a liability. The amount of the liability is subsequently marked-to-market to reflect the current market value of the option. If an option expires on its stipulated expiration date or if the Fund enters into a closing purchase transaction, a gain or loss is realized. If a written call option is exercised, a gain or loss is realized for the sale of the underlying security and the proceeds from the sale are increased by the premium originally received. As writer of an option, the Fund has no control over whether the option will be exercised and, as a result, retains the market risk of an unfavorable change in the price of the security underlying the written option.
The Fund may purchase put and call options. Put options are purchased to hedge against a decline in the value of securities held in the Fund’s portfolios or to gain inverse exposure to market index. If such a decline occurs, the put options will permit the Fund to sell the securities underlying such options at the exercise price, or to close out the options at a profit. Call options are purchased to allow the Fund to enter a futures contract or purchase an exchange-traded note at a specified price. The premium paid for a put or call option plus any transaction costs will reduce the benefit, if any, realized by the Fund upon exercise of the option, and, unless the price of the underlying security, index, or future rises or declines sufficiently, the option may expire worthless to the Fund. In addition, in the event that the price of the security, index, or future in connection with which an option was
39
| Deer Park Total Return Credit Fund |
| NOTES TO FINANCIAL STATEMENTS (Continued) |
| September 30, 2023 |
purchased moves in a direction favorable to the Fund, the benefits realized by the Fund as a result of such favorable movement will be reduced by the amount of the premium paid for the option and related transaction costs. Written and purchased options are non-income producing securities. With purchased options, there is minimal counterparty risk to the Fund since these options are exchange traded and the exchange’s clearinghouse, as counterparty to all exchange traded options, guarantees against a possible default.
Cash – Cash includes cash and overnight investments in interest-bearing demand deposits with a financial institution with original maturities of three months or less. The assets of the Fund may be placed in deposit accounts at U.S. banks and such deposits generally exceed Federal Deposit Insurance Corporation (FDIC) insurance limits. The FDIC insures deposit accounts up to $250,000 for each accountholder. The counterparty is generally a single bank or other financial institution, rather than a group of financial institutions; thus there may be a greater counterparty credit risk. The Fund places deposits only with those counterparties which are believed to be creditworthy.
Dividends and Distributions to Shareholders – Dividends from net investment income, if any, are declared and paid at least annually. Distributable net realized capital gains, if any, are declared and distributed annually. Dividends from net investment income and distributions from net realized gains are determined in accordance with federal income tax regulations, which may differ from GAAP. These “book/tax” differences are considered either temporary (e.g., deferred losses) or permanent in nature. To the extent these differences are permanent in nature, such amounts are reclassified within the composition of net assets based on their federal tax-basis treatment; temporary differences do not require reclassification. Dividends and distributions to shareholders are recorded on the ex-dividend date.
Expenses – Expenses of the Trust that are directly identifiable to a specific fund are charged to that fund. Expenses, which are not readily identifiable to a specific fund, are allocated in such a manner as deemed equitable (as determined by the Board), taking into consideration the nature and type of expense and the relative sizes of the funds in the Trust.
Credit Facility – Effective August 2, 2022, the Fund entered into a revolving, uncommitted $170,000,000 line of credit with U.S. Bank National Association (the “Revolving Credit Agreement”) which expired on July 31, 2023. Effective August 1, 2023, the Fund entered into an amended and restated agreement, dated August 1, 2023, with a $160,000,000 line credit with U.S. Bank National Association (the “Amended and Restated Revolving Credit Agreement”) set to expire on July 29, 2024. Borrowings under the Amended and Restated Revolving Credit Agreement bear interest at Prime Rate minus 1% per month. There are no fees charged on the unused portion of the line of credit. For the year ended September 30, 2022 through September 30, 2023, amounts outstanding to the Fund under the credit facility at no time were permitted to exceed $160,000,000.
40
| Deer Park Total Return Credit Fund |
| NOTES TO FINANCIAL STATEMENTS (Continued) |
| September 30, 2023 |
For the year ended September 30, 2023, the interest expense was $166 for the Fund. There was an outstanding balance of $0 as of September 30, 2023. The average borrowings for the Fund for the period the line was drawn, September 30, 2022 through September 30, 2023, was $332,667 at an average borrowing rate of 6.0%. At September 30, 2023, the maximum borrowing interest rate was 6.0%.
Federal Income Taxes – The Fund complies with the requirements of the Internal Revenue Code applicable to regulated investment companies and to distribute all of its taxable income to its shareholders. Therefore, no provision for federal income tax is required. The Fund recognizes the tax benefits of uncertain tax positions only where the position is “more likely than not” to be sustained assuming examination by tax authorities. Management has analyzed the Fund’s tax positions and has concluded that no liability for unrecognized tax benefits should be recorded related to uncertain tax positions taken on tax returns filed for the open September 30, 2020 through September 30, 2022 tax years, or expected to be taken in the Fund’s September 30, 2023 tax returns. The Fund identifies its major tax jurisdictions as U.S. federal, Ohio and foreign jurisdictions where the Fund makes significant investments; however, the Fund is not aware of any tax positions for which it is reasonably possible that the total amounts of unrecognized tax benefits will change materially in the next twelve months. The Fund recognizes interest and penalties, if any, related to unrecognized tax benefits as income tax expense in the Statement of Operations. During the period, the Fund did not incur any interest or penalties. Generally, tax authorities can examine tax returns filed for the last three years.
Market and Geopolitical Risk – The increasing interconnectivity between global economies and financial markets increases the likelihood that events or conditions in one region or financial market may adversely impact issuers in a different country, region or financial market. Securities in the Fund may underperform due to inflation (or expectations for inflation), interest rates, global demand for particular products or resources, natural disasters, climate-change or climate-related events, pandemics, epidemics, terrorism, regulatory events and governmental or quasi-governmental actions. The occurrence of global events similar to those in recent years, such as terrorist attacks around the world, natural disasters, social and political discord or debt crises and downgrades, among others, may result in market volatility and may have long term effects on both the U.S. and global financial markets. It is difficult to predict when similar events affecting the U.S. or global financial markets may occur, the effects that such events may have and the duration of those effects. Any such event(s) could have a significant adverse impact on the value and risk profile of the Fund. It is not known how long such impacts, or any future impacts of other significant events described above, will or would last, but there could be a prolonged period of global economic slowdown, which may impact your investment. Therefore, the Fund could lose money over short periods due to short-term market movements and over longer periods during more prolonged market downturns. During a general market downturn, multiple asset classes may be negatively affected. Changes in market conditions and interest rates can have the same impact on all types of securities and instruments. In times of severe market disruptions you could lose your entire investment.
41
| Deer Park Total Return Credit Fund |
| NOTES TO FINANCIAL STATEMENTS (Continued) |
| September 30, 2023 |
Credit Risk – Credit risk relates to the ability of the issuer to meet interest and principal payments, or both, as they come due. In general, lower-grade, higher-yield bonds are subject to credit risk to a greater extent than lower-yield, higher-quality bonds.
Counterparty Risk – Counterparty risk is the risk that the counterparty to a financial instrument will cause a financial loss for the Fund by failing to discharge an obligation. A concentration of counterparty risk would exist if that part of the Fund’s cash were held at the broker. The Fund could be unable to recover assets held at the prime broker, including assets directly traceable to the Fund, in the event of the broker’s bankruptcy. The Fund does not anticipate any material losses as a result of this concentration.
Mortgage-Backed and Asset Backed Securities Risk – The default rate on underlying mortgage loans or asset loans may be higher than anticipated, potentially reducing payments to the Fund. Default rates are sensitive to overall economic conditions such as unemployment, wage levels and economic growth rates. Mortgage-backed securities are susceptible to maturity risk because issuers of securities held by the Fund are able to prepay principal due on these securities, particularly during periods of declining interest rates.
Volatility Risk – The Fund may have investments that appreciate or decrease significantly in value over short periods of time. This may cause the Fund’s NAV per share to experience significant increases or declines in value over short periods of time.
Indemnification – The Trust indemnifies its officers and trustees for certain liabilities that may arise from the performance of their duties to the Trust. Additionally, in the normal course of business, the Fund enters into contracts that contain a variety of representations and warranties and which provide general indemnities. The Fund’s maximum exposure under these arrangements is unknown, as this would involve future claims that may be made against the Fund that have not yet occurred. However, based on experience, the risk of loss due to these warranties and indemnities appears to be remote.
| 3. | INVESTMENT TRANSACTIONS |
For the year ended September 30, 2023, cost of purchases and proceeds from sales of portfolio securities, other than short sales, short-term investments and U.S. Government securities, amounted to $3,916,939 and $89,959,674, respectively.
| 4. | INVESTMENT ADVISORY AGREEMENT AND TRANSACTIONS WITH RELATED PARTIES |
Princeton Fund Advisors, LLC, serves as the Fund’s investment Adviser (the “Adviser”). The Adviser has engaged Deer Park Road Management Company, LP, Inc. as the sub-adviser (the “Sub-Adviser”) to the Fund. The Adviser compensates the Sub-Adviser for its services from the management fees received from the Fund.
42
| Deer Park Total Return Credit Fund |
| NOTES TO FINANCIAL STATEMENTS (Continued) |
| September 30, 2023 |
Pursuant to an Investment Advisory Agreement with the Trust, on behalf of the Fund, the Adviser, under the oversight of the Board, directs the daily operations of the Fund and supervises the performance of administrative and professional services provided by others. As compensation for its services and the related expenses borne by the Adviser, the Fund pays the Adviser a management fee, computed and accrued daily and paid monthly, at an annual rate of 1.84% of the Fund’s average daily net assets. For the year ended September 30, 2023, the Fund incurred $8,731,985 in advisory fees of which $688,478 is payable as of September 30, 2023 and included in the Statement of Assets and Liabilities under the Liabilities section.
Pursuant to a written contract (the “Waiver Agreement”), the Adviser had agreed, at least until January 31, 2024, to waive a portion of its advisory fee and has agreed to reimburse the Fund for other expenses to the extent necessary to ensure that the total expenses incurred by the Fund (excluding front-end or contingent deferred loads, brokerage fees and commissions, acquired fund fees and expenses, borrowing costs (such as interest and dividend expenses on securities sold short), taxes, or extraordinary expenses, such as litigation expenses (which may include indemnification of Fund officers and Trustees or contractual indemnification of Fund service providers (other than the Adviser)), not incurred in the ordinary course of the Fund’s business) do not exceed 2.00% per annum of Class A average daily net assets, 2.75% per annum of Class C average daily net assets, and 1.75% per annum of Class I average daily net assets (the “expense limitation”).
If the Adviser waives any fee or reimburses any expense pursuant to the Waiver Agreement, and the Fund’s operating expenses are subsequently less than the expense limitation, the Adviser shall be entitled to reimbursement by the Fund for such waived fees or reimbursed expenses provided that such reimbursement does not cause the Fund’s expenses to exceed the expense limitation. If the operating expenses subsequently exceed the expense limitation, the reimbursements shall be suspended. The Adviser may seek reimbursement only for expenses waived or paid by it during the three fiscal years prior to such reimbursement; provided, however, that such expenses may only be reimbursed to the extent they were waived or paid after the effective date of the Waiver Agreement (or any similar agreement). The Board may terminate the Waiver Agreement at any time.
For the year ended September 30, 2023, the Adviser waived fees of $1,794,509 pursuant to the Waiver Agreement.
The following amounts previously waived or reimbursed by the Adviser are subject to recapture by the following dates:
| 9/30/2024 | 9/30/2025 | 9/30/2026 |
| $1,735,405 | $2,269,245 | $1,794,509 |
Distributor – The Trust, with respect to the Fund, has adopted the Trust’s Master Distribution and Shareholder Servicing Plans pursuant to Rule 12b-1 under the 1940 Act for each of its Class A and Class C shares (the “Plans”). The Plans provide that a monthly service and/or distribution fee is calculated by the Fund at annual rates of 0.25% and 1.00% of the average daily net assets attributable to Class A shares and Class C shares, respectively, and is paid to Northern Lights Distributors, LLC
43
| Deer Park Total Return Credit Fund |
| NOTES TO FINANCIAL STATEMENTS (Continued) |
| September 30, 2023 |
(“NLD” or the “Distributor”), to provide compensation for ongoing distribution-related activities or services and/or maintenance of the Fund’s shareholder accounts, not otherwise required to be provided by the Adviser. Class I shares do not incur a 12b-1 fee. The Plans are compensation plans, which mean that compensation is provided regardless of 12b-1 expenses incurred. For the year ended September 30, 2023, the Fund paid $266,723 and $42,167 to the Distributor for Class A and Class C shares, respectively.
The Distributor acts as the Fund’s principal underwriter in a continuous public offering of the Fund’s shares. On sales of Class A shares for the year ended September 30, 2023, the Distributor received $7,668 from front-end sales charges of which $1,183 was retained by the principal underwriter or other affiliated broker-dealers.
In addition, certain affiliates of the Distributor provide ancillary services to the Fund as follows:
Ultimus Fund Solutions, LLC (“UFS”) – UFS, an affiliate of the Distributor, provides administration, fund accounting, and transfer agent services to the Trust. Pursuant to separate servicing agreements with UFS, the Fund pays UFS customary fees for providing administration, fund accounting and transfer agency services to the Fund. Certain officers of the Trust are also officers of UFS, and are not paid any fees directly by the Fund for serving in such capacities.
Northern Lights Compliance Services, LLC (“NLCS”) – NLCS, an affiliate of UFS and the Distributor, provides a Chief Compliance Officer to the Trust, as well as related compliance services, pursuant to a consulting agreement between NLCS and the Trust. Under the terms of such agreement, NLCS receives customary fees from the Fund.
Blu Giant, LLC (“Blu Giant”) – Blu Giant, an affiliate of UFS and the Distributor, provides EDGAR conversion and filing services as well as print management services for the Fund on an ad-hoc basis. For the provision of these services, Blu Giant receives customary fees from the Fund.
| 5. | REVERSE REPURCHASE AGREEMENTS |
The Fund is subject to ASC 860, Transfers and Servicing, which requires that all involvements of a transferor with the transferred financial asset be considered in analyzing whether the transferor has surrendered control over the transferred financial asset.
Transactions involving securities repurchase agreements are treated as collateralized borrowings and are recorded at their contracted amounts which approximate fair value. In addition, interest is included in interest payable. As of September 30, 2023, the fund held reverse repurchase agreements with Société Générale and Mizuho as the counterparty. The carrying amount of the Fund’s payable for reverse repurchase agreements as reported on the Statement of Assets and Liabilities approximates its fair value.
44
| Deer Park Total Return Credit Fund |
| NOTES TO FINANCIAL STATEMENTS (Continued) |
| September 30, 2023 |
Further, as of September 30, 2023, securities with approximately $127,005,469 of fair market value are pledged to collateralize reverse repurchase agreements. Of this, 100.0% are Asset Backed Securities.
For the year ended September 30, 2023, the Fund entered into several repurchase financing transactions contemporaneously with the initial purchase of securities from Société Générale and Mizuho counterparty’s, which are considered to be secured borrowings. The following table summarizes the Fund’s borrowings classified as reverse repurchase agreements.
| As of September 30, 2023 | ||||||||||||||||
| Less than 1 | 1 to 2 | 2 Months or | ||||||||||||||
| Month | Months | Greater | Total | |||||||||||||
| Reverse Repurchase Agreements | ||||||||||||||||
| Non-Agency Asset Backed Securities | $ | — | $ | — | $ | 22,557,000 | $ | 22,557,000 | ||||||||
| Total | $ | — | $ | — | $ | 22,557,000 | $ | 22,557,000 | ||||||||
| 6. | OFFSETTING ASSETS AND LIABILITIES |
The Fund is subject to various Master Netting Arrangements, which govern the terms of certain transactions with select counterparties. The Master Netting Arrangements allows the Fund to close out and net its total exposure to a counterparty in the event of a default with respect to all the transactions governed under a single agreement with a counterparty. The Master Netting Arrangements also specify collateral posting arrangements at pre-arranged exposure levels. Under the Master Netting Arrangements, collateral is routinely transferred if the total net exposure to certain transactions (net of existing collateral already in place) governed under the relevant Master Netting Arrangement with a counterparty in a given account exceeds a specified threshold depending on the counterparty and the type of Master Netting Arrangement.
As of September 30, 2023, the Fund held the following instruments that were subject to offsetting on the Statement of Assets and Liabilities:
| Liabilities: | ||||||||||||||||||||||||||
| Gross Amounts not offset in the | ||||||||||||||||||||||||||
| Gross Amounts | Net Amounts | Statement of Assets and Liabilities | ||||||||||||||||||||||||
| Gross | Offset in the | presented in the | ||||||||||||||||||||||||
| Amounts of | Statement of | Statement of | Cash | |||||||||||||||||||||||
| Recognized | Assets and | Assets and | Financial | Collateral | Net | |||||||||||||||||||||
| Description | Counterparty | Liabilities | Liabilities | Liabilities | Instruments | Pledged | Amount | |||||||||||||||||||
| Reverse Repurchase Agreements | Société Générale | $ | (8,311,000 | ) | $ | — | $ | (8,311,000 | ) | $ | 8,311,000 | $ | 406,000 | $ | — | |||||||||||
| Reverse Repurchase Agreements | Mizuho | (14,246,000 | ) | — | (14,246,000 | ) | 14,246,000 | — | — | |||||||||||||||||
| Total Reverse Repurchase Agreements | $ | (22,557,000 | ) | $ | — | $ | (22,557,000 | ) | $ | 22,557,000 | $ | 406,000 | $ | — | ||||||||||||
45
| Deer Park Total Return Credit Fund |
| NOTES TO FINANCIAL STATEMENTS (Continued) |
| September 30, 2023 |
| 7. | CONTROL OWNERSHIP |
The beneficial ownership, either directly or indirectly, of more than 25% of the voting securities of a portfolio creates presumption of the control of the portfolio, under section 2(a)(9) of the 1940 Act. As of September 30, 2023, Charles Schwab held 53.1% of the voting securities of the Fund and may be deemed to control the Fund.
| 8. | DISTRIBUTIONS TO SHAREHOLDERS AND TAX COMPONENTS OF CAPITAL |
The tax character of distributions paid during the fiscal years ended September 30, 2023, and September 30, 2022, was as follows:
| Fiscal Year Ended | Fiscal Year Ended | |||||||
| September 30, 2023 | September 30, 2022 | |||||||
| Ordinary Income | $ | 23,763,550 | $ | 26,234,442 | ||||
| Long-Term Capital Gain | — | — | ||||||
| Return of Capital | 6,745,469 | 11,432,981 | ||||||
| $ | 30,509,019 | $ | 37,667,423 | |||||
As of September 30, 2023, the components of accumulated earnings/(deficit) on a tax basis were as follows:
| Undistributed | Undistributed | Post October Loss | Capital Loss | Other | Unrealized | Total | ||||||||||||||||||||
| Ordinary | Long-Term | and | Carry | Book/Tax | Appreciation/ | Distributable Earnings/ | ||||||||||||||||||||
| Income | Gains | Late Year Loss | Forwards | Differences | (Depreciation) | (Accumulated Deficit) | ||||||||||||||||||||
| $ | — | $ | — | $ | (7,759,817 | ) | $ | (46,293,355 | ) | $ | — | $ | (48,249,672 | ) | $ | (102,302,844 | ) | |||||||||
Capital losses incurred after October 31 within the fiscal year are deemed to arise on the first business day of the following fiscal year for tax purposes. The Fund incurred and elected to defer such capital losses of $7,759,817.
At September 30, 2023, the Fund had capital loss carry forwards for federal income tax purposes available to offset future capital gains, as follows:
| Short-Term | Long-Term | Total | CLCF Utilized | |||||||||||
| $ | 35,470,488 | $ | 10,822,867 | $ | 46,293,355 | $ | — | |||||||
As a result of the acquisition of another Fund, $8,281,778 and $17,220,464 of short-term and long-term capital loss carryover, respectively, remains to be recognized in future years. This amount is subject to an annual limitation of $112,216 under tax rules.
46
| Deer Park Total Return Credit Fund |
| NOTES TO FINANCIAL STATEMENTS (Continued) |
| September 30, 2023 |
Permanent book and tax differences, primarily attributable to distributions in excess resulted in reclassifications for the Fund for the year ended September 30, 2023, as follows:
| Paid In Capital | Accumulated Deficit | |||||
| $ | — | $ | — | |||
| 9. | AGGREGATE UNREALIZED APPRECIATION AND DEPRECIATION – TAX BASIS |
| Gross | Tax Net | |||||||||||||
| Cost for Federal | Gross Unrealized | Unrealized | Unrealized | |||||||||||
| Tax purposes | Appreciation | Depreciation | Depreciation | |||||||||||
| $ | 440,290,569 | $ | 29,679,443 | $ | (77,929,115 | ) | $ | (48,249,672 | ) | |||||
| 10. | RECENT REGULATORY UPDATE |
On January 24, 2023, the SEC adopted rule and form amendments to require mutual funds and ETFs to transmit concise and visually engaging streamlined annual and semiannual reports to shareholders that highlight key information. Other information, including financial statements, will not appear in a streamlined shareholder report but must be available online, delivered free of charge upon request, and filed on a semiannual basis on Form N-CSR. The rule and form amendments have a compliance date of July 24, 2024. At this time, management is evaluating the impact of these amendments on the shareholder reports for the Funds.
| 11. | SUBSEQUENT EVENTS |
Subsequent events after the date of the Statement of Assets and Liabilities have been evaluated through the date the financial statements were issued.
Management has determined that no events or transactions occurred requiring adjustment or disclosure in the financial statements, other than the following:
On October 30, 2023, the board of trustees approved and declared the following distributions:
| Distributions Per Share | Record Date | Payable Date | ||||
| Class A | 0.0483 | 10/27/2023 | 10/31/2023 | |||
| Class C | 0.0430 | 10/27/2023 | 10/31/2023 | |||
| Class I | 0.0500 | 10/27/2023 | 10/31/2023 |
47
Report of Independent Registered Public Accounting Firm
To the Board of Trustees of Northern Lights Fund Trust
and Shareholders of Deer Park Total Return Credit Fund
Opinion on the Financial Statements
We have audited the accompanying statement of assets and liabilities of Deer Park Total Return Credit Fund (the Fund), a series of the Northern Lights Fund Trust, including the schedule of investments, as of September 30, 2023, the related statements of operations for the year then ended, the statements of changes in net assets for each of the two years in the period then ended, and the related notes to the financial statements (collectively, the financial statements), and the financial highlights for each of the five years in the period then ended. In our opinion, the financial statements and financial highlights present fairly, in all material respects, the financial position of the Fund as of September 30, 2023, the results of its operations for the year then ended, the changes in net assets for each of the two years in the period then ended, and the financial highlights for each of the five years in the period then ended, in conformity with accounting principles generally accepted in the United States of America.
Basis for Opinion
These financial statements are the responsibility of the Fund’s management. Our responsibility is to express an opinion on the Fund’s financial statements and financial highlights based on our audits. We are a public accounting firm registered with the Public Company Accounting Oversight Board (United States) (PCAOB) and are required to be independent with respect to the Fund in accordance with U.S. federal securities laws and the applicable rules and regulations of the Securities and Exchange Commission and the PCAOB.
We conducted our audits in accordance with the standards of the PCAOB. Those standards require that we plan and perform the audit to obtain reasonable assurance about whether the financial statements are free of material misstatement, whether due to error or fraud. The Fund is not required to have, nor were we engaged to perform, an audit of its internal control over financial reporting. As part of our audits, we are required to obtain an understanding of internal control over financial reporting but not for the purpose of expressing an opinion on the effectiveness of the Fund’s internal control over financial reporting. Accordingly, we express no such opinion.
Our audits included performing procedures to assess the risks of material misstatement of the financial statements, whether due to error or fraud, and performing procedures that respond to those risks. Such procedures included examining, on a test basis, evidence regarding the amounts and disclosures in the financial statements. Our procedures included confirmation of investments owned as of September 30, 2023, by correspondence with the custodian. Our audits also included evaluating the accounting principles used and significant estimates made by management, as well as evaluating the overall presentation of the financial statements. We believe that our audits provide a reasonable basis for our opinion.
/s/ RSM US LLP
We have served as the auditor of one or more Princeton Fund Advisors, LLC advised investment companies since 2010.
Denver, Colorado
November 29, 2023
48
| Deer Park Total Return Credit Fund |
| EXPENSE EXAMPLES (Unaudited) |
| September 30, 2023 |
As a shareholder of the Deer Park Total Return Credit Fund, you incur two types of costs: (1) transaction costs, including sales charges (loads) on purchases of Class A shares; (2) ongoing costs, including management fees; distribution and/or service (12b-1) fees; and other Fund expenses. This example is intended to help you understand your ongoing costs (in dollars) of investing in the Fund and to compare these costs with the ongoing costs of investing in other mutual funds.
The example is based on an investment of $1,000 invested at the beginning of the period and held for the entire period from April 1, 2023 through September 30, 2023.
Actual Expenses
The “Actual” Expenses in the table below provides information about actual account values and actual expenses. You may use the information below; together with the amount you invested, to estimate the expenses that you paid over the period. Simply divide your account value by $1,000 (for example, an $8,600 account value divided by $1,000 = 8.6), then multiply the result by the number in the table under the heading entitled “Expenses Paid During Period” to estimate the expenses you paid on your account during this period.
Hypothetical Example for Comparison Purposes
The “Hypothetical Expenses” in the table below provides information about hypothetical account values and hypothetical expenses based on the Deer Park Total Return Credit Fund’s actual expense ratio and an assumed rate of return of 5% per year before expenses, which is not the Fund’s actual return. The hypothetical account values and expenses may not be used to estimate the actual ending account balances or expenses you paid for the period. You may use this information to compare this 5% hypothetical example with the 5% hypothetical examples that appear in the shareholder reports of other funds.
Please note that the expenses shown in the table are meant to highlight your ongoing costs only and do not reflect any transactional costs, such as sales charges (loads), or redemption fees. Therefore, the table is useful in comparing ongoing costs only, and will not help you determine the relative total costs of owning different funds. In addition, if these transactional costs were included, your costs would have been higher.
| Beginning | Ending | Expenses Paid | Expense Ratio | |||||
| Account Value | Account Value | During Period* | During Period** | |||||
| Actual | 4/1/2023 | 9/30/2023 | 4/1/2023 - 9/30/2023 | 4/1/2023 - 9/30/2023 | ||||
| Class A | $1,000.00 | $1,004.30 | $12.27 | 2.44% | ||||
| Class C | 1,000.00 | 1,000.50 | 15.99 | 3.19% | ||||
| Class I | 1,000.00 | 1,006.70 | 11.04 | 2.19% | ||||
| Beginning | Ending | Expenses Paid | Expense Ratio | |||||
| Hypothetical | Account Value | Account Value | During Period* | During Period** | ||||
| (5% return before expenses) | 4/1/2023 | 9/30/2023 | 4/1/2023 - 9/30/2023 | 4/1/2023 - 9/30/2023 | ||||
| Class A | $1,000.00 | $1,012.83 | $12.32 | 2.44% | ||||
| Class C | 1,000.00 | 1,009.08 | 16.06 | 3.19% | ||||
| Class I | 1,000.00 | 1,014.07 | 11.08 | 2.19% | ||||
| * | Expenses are equal to the average account value over the period, multiplied by each Fund’s annualized expense ratio, multiplied by the number of days in the period (183) divided by the number of days in the fiscal year (365). |
| ** | Annualized. |
49
| Deer Park Total Return Credit Fund |
| SUPPLEMENTAL INFORMATION (Unaudited) |
| September 30, 2023 |
Princeton Fund Advisors, LLC
Adviser to Deer Park Total Return Credit Fund*
In connection with the regular meeting held on September 20-21, 2023 of the Board of Trustees (the “Trustees” or the “Board”) of the Northern Lights Fund Trust (the “Trust”), including a majority of the Trustees who are not “interested persons,” as that term is defined in the Investment Company Act of 1940, as amended, discussed the re-approval of an investment advisory agreement (the “Advisory Agreement”) between Princeton Fund Advisors, LLC (“PFA” or the “Adviser”) and the Trust, with respect to the Deer Park Total Return Credit Fund (“Deer Park Total” or the “Fund”). In considering the re-approval of the Advisory Agreement, the Board received materials specifically relating to the Advisory Agreement.
The Trustees were assisted by independent legal counsel throughout the Advisory Agreement review process. The Trustees relied upon the advice of independent legal counsel and their own business judgment in determining the material factors to be considered in evaluating the Advisory Agreement and the weight to be given to each such factor. The conclusions reached by the Trustees were based on a comprehensive evaluation of all of the information provided and were not the result of any one factor. Moreover, each Trustee may have afforded different weight to the various factors in reaching his conclusions with respect to the Advisory Agreement.
Nature, Extent, and Quality of Services. The Board noted that PFA was founded in 2011 and it and its affiliates had approximately $2.9 billion in assets under management with affiliates as of June 30, 2023. The Board reviewed the background information on the key investment personnel who were responsible for servicing the Fund, considering their education and noting the investment team’s diverse financial industry experience, which included managing hedge funds and alternative products. The Board noted that, with respect to Deer Park Total, PFA conducted ongoing due diligence and oversight of the sub-adviser and works with the sub-adviser to monitor compliance with investment and compliance limits, and closely oversees trading activities. The Board noted that PFA reported no material compliance or litigation issues since the last renewal of the Advisory Agreement and discussed the results of the firm’s last regulatory examination. The Board further noted that PFA dedicated sufficient resources to support the sophisticated trading strategies of the Fund. Based on the information provided, the Board concluded that PFA could be expected to continue to provide quality service to the Fund and its respective shareholders.
Performance. The Board observed that the Fund had a one-star Morningstar rating and that the Fund underperformed its benchmark, category, and peers over the prior year. The Board acknowledged that use of “high yield” as a peer group was not ideal because the Fund invested in asset backed securities with a focus on mortgage-backed securities. With that in mind, they discussed the Fund’s long-term performance, noting that since inception the Fund had outperformed the aggregate bond index, and delivered the strategy as intended by the prospectus. The Board concluded that returns were not unreasonable.
50
| Deer Park Total Return Credit Fund |
| SUPPLEMENTAL INFORMATION (Unaudited)(Continued) |
| September 30, 2023 |
Fees and Expenses. The Board considered PFA’s advisory fee, noting that it was higher than the peer group and Morningstar category medians and averages, representing the highest fee in the category. The Board discussed the Fund’s net expense ratio, noting that it was higher than the peer group and Morningstar category medians and averages. The Board discussed PFA’s justification for its higher fee, noting that PFA believed that the fees were reasonable because of the resources of the advisory and sub-advisory teams, uniqueness and complexity of the Fund’s strategy, and consistent performance relative to its peers. The Board acknowledged that the Fund had an expense limitation agreement in place. They considered the advisory fee relative to the sub-advisory fee and the reasonableness of such allocation in light of the duties of the Adviser and sub-adviser. The Board concluded the advisory fee was not unreasonable.
Profitability. The Board reviewed PFA’s profitability analysis, including the impact of sub-advisory fees for Deer Park Total, noting that the Adviser was earning a profit on each relationship. The Board acknowledged the effort required to maintain and manage the Fund’s investment program, considered the Adviser’s observations on the reasonableness of the profits, and determined PFA’s profits were not excessive with respect to the Fund.
Economies of Scale. The Board considered whether PFA had achieved economies of scale with respect to the Fund. The Board noted PFA’s belief that the Fund had capacity constraints at certain asset levels. The Board agreed that the expense limitation agreement had provided benefits to shareholders. The Board reviewed the Fund’s current asset levels and associated fee waivers and concluded that the Fund had not attained an asset level at which PFA had achieved meaningful economies of scale in managing the Fund, despite the breakpoints in the Deer Park Total sub-advisory fee and determined to revisit the matter if circumstances were to change.
Conclusion. Having requested and received such information from PFA as the Board believed to be reasonably necessary to evaluate the terms of the Advisory Agreement, and as assisted by the advice of counsel, the Board concluded that renewal of the Advisory Agreement with PFA was in the best interests of the Fund and its respective shareholders.
| * | Due to the timing of the contract renewal schedule, these deliberations may or may not relate to the current performance results of the Fund. |
51
| Deer Park Total Return Credit Fund |
| SUPPLEMENTAL INFORMATION (Unaudited)(Continued) |
| September 30, 2023 |
Deer Park Road Management, LP
Sub-Adviser to Deer Park Total Return Credit Fund*
In connection with the regular meeting held on September 20-21, 2023 of the Board, including a majority of the Trustees who are not “interested persons,” as that term is defined in the Investment Company Act of 1940, as amended, discussed the renewal of the sub-advisory agreement (the “Sub-Advisory Agreement”) between Princeton Fund Advisers, LLC (“PFA”) and Deer Park Road Management Company, L.P. (“Sub-Adviser”), with respect to the Deer Park Total Return Credit Fund (the “Fund”). In considering the renewal of the Sub-Advisory Agreement, the Board received materials specifically relating to the Sub-Advisory Agreement.
The Trustees were assisted by independent legal counsel throughout the Sub-Advisory Agreement review process. The Board relied upon the advice of independent legal counsel and their own business judgment in determining the material factors to be considered in evaluating the Sub-Advisory Agreement and the weight to be given to each such factor. The conclusions reached by the Trustees were based on a comprehensive evaluation of all of the information provided and were not the result of any one factor. Moreover, each Trustee may have afforded different weight to the various factors in reaching his conclusions with respect to the Sub-Advisory Agreement.
Nature, Extent, and Quality of Services. The Board noted that the Sub-Adviser was founded in 2003 and had approximately $3.4 billion in assets under management, and that the Sub-Adviser specialized in structured credit analysis and providing portfolio management to individual and institutional investors. The Board reviewed the background information of the key investment personnel who were responsible for providing sub-advisory services to the Fund, taking into consideration their education and experience, and changes to personnel since the last renewal. The Board acknowledged that the Sub-Adviser’s strategy used fundamental research to identify and select mortgage-backed and asset-backed securities that the Sub-Adviser believed were undervalued to exploit the disparity between intrinsic value and market value. The Board noted that the Sub-Adviser used modeling software to monitor the Fund’s portfolio and adhere to the Fund’s investment limitations. The Board further noted that the Sub-Adviser selected broker-dealers based on its evaluation of the broker’s ability to meet certain best execution standards including reasonable trading costs and other quality of service factors. The Board commented that the Sub-Adviser provided deep research and sufficient resources to support the investment process and the Fund. The Board concluded that the Sub-Adviser was expected to continue to provide quality service to PFA, the Fund, and its shareholders. Based on the information provided, including PFA’s satisfaction with the services of the Sub-Adviser, the Board concluded that the nature, extent and quality of the service provided were acceptable.
Performance. The Board observed that the Fund had a one-star Morningstar rating and that the Fund underperformed its benchmark, category and peers over the prior year. The Board acknowledged that performance had been challenging, but the Fund’s since inception returns exceeded the peer group and the index. The Board agreed that the Sub-Adviser’s performance was acceptable.
52
| Deer Park Total Return Credit Fund |
| SUPPLEMENTAL INFORMATION (Unaudited)(Continued) |
| September 30, 2023 |
Fees and Expenses. The Board noted that the Sub-Adviser received a sub-advisory fee based on net advisory fees after the payment of certain expenses, with breakpoints at various asset levels, which was paid by PFA out of its advisory fee. The Board noted that the Sub- Adviser compared the Fund’s sub-advisory fee to the fees paid to the Sub-Adviser for managing private funds, and that the fees charged for managing the private funds generally included a 1% management fee as well as incentive fees. After discussion, the Board concluded the sub-advisory fee was not unreasonable.
Profitability. The Board reviewed the profitability analysis provided by the Sub-Adviser, acknowledging that the Sub-Adviser received a solid profit in terms of actual dollars and percentage of revenue earned. The Board acknowledged the Sub-Adviser’s assertion that the profits were reasonable based on the amount of research and intensive analysis required to select the Fund’s investments. After further discussion, the Board concluded that the Sub-Adviser’s profitability was not excessive.
Economies of Scale. The Board considered whether the Sub-Adviser had realized economies of scale with respect to the sub-advisory services provided to the Fund. The Board agreed that this was primarily an adviser level issue and had been considered with respect to the overall advisory agreement and current fee waivers, taking into consideration the impact of the sub-advisory expense and the breakpoints in the sub-advisory fee.
Conclusion. Having requested and received such information from the Sub-Adviser as the Board believed to be reasonably necessary to evaluate the terms of the Sub-Advisory Agreement, and as assisted by the advice of counsel, the Board concluded that renewal of the Sub-Advisory Agreement with the Fund was in the best interests of the Fund and its shareholders.
| * | Due to the timing of the contract renewal schedule, these deliberations may or may not relate to the current performance results of the Fund. |
53
| Deer Park Total Return Credit Fund |
| SUPPLEMENTAL INFORMATION (Unaudited) |
| September 30, 2023 |
LIQUIDITY RISK MANAGEMENT PROGRAM
The Fund has adopted and implemented a written liquidity risk management program as required by Rule 22e-4 (the “Liquidity Rule”) under the Investment Company Act. The program is reasonably designed to assess and manage the Fund’s liquidity risk, taking into consideration, among other factors, the Fund’s investment strategy and the liquidity of its portfolio investments during normal and reasonably foreseeable stressed conditions; its short and long-term cash flow projections; and its cash holdings and access to other funding sources.
During the fiscal year ended September 30, 2023, the Trust’s Liquidity Risk Management Program Committee (the “Committee”) reviewed the Fund’s investments and determined that the Fund held adequate levels of cash and highly liquid investments to meet shareholder redemption activities in accordance with applicable requirements. Accordingly, the Committee concluded that (i) the Fund’s liquidity risk management program is reasonably designed to prevent violations of the Liquidity Rule and (ii) the Fund’s liquidity risk management program has been effectively implemented.
54
| Deer Park Total Return Credit Fund |
| SUPPLEMENTAL INFORMATION (Unaudited) |
| September 30, 2023 |
The Trustees and the executive officers of the Trust are listed below with their present positions with the Trust and principal occupations over at least the last five years. The business address of each Trustee and Officer is 225 Pictoria Drive, Suite 450, Cincinnati, OH 45246. All correspondence to the Trustees and Officers should be directed to c/o Ultimus Fund Solutions, LLC, P.O. Box 541150, Omaha, Nebraska 68154.
Independent Trustees
| Name, Address and Year of Birth | Position/Term of Office* | Principal Occupation During the Past Five Years | Number of Portfolios in Fund Complex** Overseen by Trustee | Other Directorships held by Trustee During the Past Five Years |
| Mark Garbin Born in 1951 | Trustee Since 2013 | Managing Principal, Coherent Capital Management LLC (since 2007). | 5 | Northern Lights Fund Trust (for series not affiliated with the Funds since 2013); Two Roads Shared Trust (since 2012); Forethought Variable Insurance Trust (since 2013); Northern Lights Variable Trust (since 2013); OHA Mortgage Strategies Fund (offshore), Ltd. (2014 - 2017); and Altegris KKR Commitments Master Fund (since 2014); Carlyle Tactical Private Credit Fund (since March 2018) and Independent Director OHA CLO Enhanced Equity II Genpar LLP (since June 2021). |
| Mark D. Gersten Born in 1950 | Trustee Since 2013 | Independent Consultant (since 2012). | 5 | Northern Lights Fund Trust (for series not affiliated with the Funds since 2013); Northern Lights Variable Trust (since 2013); Two Roads Shared Trust (since 2012); Altegris KKR Commitments Master Fund (since 2014); previously, Ramius Archview Credit and Distressed Fund (2015-2017); and Schroder Global Series Trust (2012 to 2017). |
| Anthony J. Hertl Born in 1950 | Trustee Since 2005; Chairman of the Board since 2013 | Retired, previously held several positions in a major Wall Street firm including Capital Markets Controller, Director of Global Taxation, and CFO of the Specialty Finance Group. | 5 | Northern Lights Fund Trust (for series not affiliated with the Funds since 2005); Northern Lights Variable Trust (since 2006); Alternative Strategies Fund (since 2010); Satuit Capital Management Trust (2007-2019). |
| Gary W. Lanzen Born in 1954 | Trustee Since 2005 | Retired (since 2012). Formerly, Founder, President, and Chief Investment Officer, Orizon Investment Counsel, Inc. (2000-2012). | 5 | Northern Lights Fund Trust (for series not affiliated with the Funds since 2005) Northern Lights Variable Trust (since 2006); AdvisorOne Funds (since 2003); Alternative Strategies Fund (since 2010); and previously, CLA Strategic Allocation Fund (2014-2015). |
| John V. Palancia Born in 1954 | Trustee Since 2011 | Retired (since 2011). Formerly, Director of Futures Operations, Merrill Lynch, Pierce, Fenner & Smith Inc. (1975-2011). | 5 | Northern Lights Fund Trust (for series not affiliated with the Funds since 2011); Northern Lights Fund Trust III (since February 2012); Alternative Strategies Fund (since 2012) and Northern Lights Variable Trust (since 2011). |
| Mark H. Taylor Born in 1964 | Trustee Since 2007; Chairman of the Audit Committee since 2013 | PhD (Accounting), CPA; Professor and Director, Lynn Pippenger School of Accountancy, Muma College of Business, University of South Florida (2019 – present); Professor and Department of Accountancy Chair, Case Western Reserve University (2009-2019); President, American Accounting Association (AAA) commencing August 2022 (President-Elect 2022-2023, President 2023-2024; Past President 2024- 2025). AAA Vice President-Finance (2017-2020); President, Auditing Section of the AAA; Member, AICPA Auditing Standards Board (2009-2012); Academic Fellow, Office of the Chief Accountant, United States Securities Exchange Commission (2005-2006); Center for Audit Quality research grants (2014, 2012). | 5 | Northern Lights Fund Trust (for series not affiliated with the Funds since 2007); Alternative Strategies Fund (since 2010); Northern Lights Fund Trust III (since 2012); and Northern Lights Variable Trust (since 2007). |
9/30/23 – NLFT_v1
55
| Deer Park Total Return Credit Fund |
| SUPPLEMENTAL INFORMATION (Unaudited)(Continued) |
| September 30, 2023 |
Officers
| Name, Address and Year of Birth | Position/Term of Office* | Principal Occupation During the Past Five Years | Number of Portfolios in Fund Complex** Overseen by Trustee | Other Directorships held by Trustee During the Past Five Years |
| Kevin E. Wolf Born in 1969 | President, Principal Executive Officer Since June 2017 | Executive Vice President, Head of Fund Administration, and Product; Ultimus Fund Solutions, LLC (since 2020); Vice President of The Ultimus Group, LLC (since 2019); Executive Vice President, Gemini Fund Services, LLC (2019-2020); President, Gemini Fund Services, LLC (2012-2019); Treasurer of the Trust (2006-June 2017). | N/A | N/A |
| James Colantino Born in 1969 | Treasurer, Principal Accounting Officer Since June 2017 | Senior Vice President Fund Administration, Ultimus Fund Solutions (since 2020); Senior Vice President Fund Administration, Gemini Fund Services, LLC (2012-2020); Assistant Treasurer of the Trust (2006-June 2017). | N/A | N/A |
| Stephanie Shearer Born in 1979 | Secretary Since February 2017 | Assistant Secretary of the Trust (2012-February 2017); Associate Director, Ultimus Fund Solutions (since 2022); Manager of Legal Administration, Ultimus Fund Solutions (2020-2022); Manager of Legal Administration, Gemini Fund Services, LLC (2018-2020); Senior Paralegal, Gemini Fund Services, LLC (2013 - 2018). | N/A | N/A |
| Michael J. Nanosky Born in 1966 | Chief Compliance Officer Since January 2021 | Chief Compliance Officer, of the Trust (since January 2021); Vice President-Senior Compliance Officer, Ultimus Fund Solutions (since 2020); Vice President, Chief Compliance Officer for Williamsburg Investment Trust (2020-current); Senior Vice President- Chief Compliance Officer, PNC Funds (2014-2019). | N/A | N/A |
| * | The term of office for each Trustee and officer listed above will continue indefinitely until the individual resigns or is removed. |
| ** | As of September 30, 2023, the Trust was comprised of 66 active portfolios managed by unaffiliated investment advisers. The term “Fund Complex” applies only to the Funds in the Trust advised by the Fund’s Adviser. The Funds do not hold themselves out as related to any other series within the Trust that is not advised by the Fund’s Adviser. |
The Funds’ SAI includes additional information about the Trustees and is available free of charge, upon request, by calling toll-free at 1-888-868-9501.
9/30/23 – NLFT_v1
56
PRIVACY NOTICE
Northern Lights Fund Trust
Rev. February 2014
| FACTS | WHAT DOES NORTHERN LIGHTS FUND TRUST DO WITH YOUR PERSONAL INFORMATION? |
| Why? | Financial companies choose how they share your personal information. Federal law gives consumers the right to limit some, but not all sharing. Federal law also requires us to tell you how we collect, share, and protect your personal information. Please read this notice carefully to understand what we do. |
| What? | The types of personal information we collect and share depends on the product or service that you have with us. This information can include:
● Social Security number and wire transfer instructions
● account transactions and transaction history
● investment experience and purchase history
When you are no longer our customer, we continue to share your information as described in this notice. |
| How? | All financial companies need to share customers’ personal information to run their everyday business. In the section below, we list the reasons financial companies can share their customers’ personal information; the reasons Northern Lights Fund Trust chooses to share; and whether you can limit this sharing. |
| Reasons we can share your personal information: | Does Northern Lights Fund Trust share information? | Can you limit this sharing? |
For our everyday business purposes - such as to process your transactions, maintain your account(s), respond to court orders and legal investigations, or report to credit bureaus. | YES | NO |
For our marketing purposes - to offer our products and services to you. | NO | We don’t share |
| For joint marketing with other financial companies. | NO | We don’t share |
For our affiliates’ everyday business purposes - information about your transactions and records. | NO | We don’t share |
For our affiliates’ everyday business purposes - information about your credit worthiness. | NO | We don’t share |
| For nonaffiliates to market to you | NO | We don’t share |
| QUESTIONS? | Call 1-402-493-4603 |
57
PRIVACY NOTICE
Northern Lights Fund Trust
| Page 2 |
| What we do: | |
| How does Northern Lights Fund Trust protect my personal information? | To protect your personal information from unauthorized access and use, we use security measures that comply with federal law. These measures include computer safeguards and secured files and buildings.
Our service providers are held accountable for adhering to strict policies and procedures to prevent any misuse of your nonpublic personal information. |
| How does Northern Lights Fund Trust collect my personal information? | We collect your personal information, for example, when you
● open an account or deposit money
● direct us to buy securities or direct us to sell your securities
● seek advice about your investments
We also collect your personal information from others, such as credit bureaus, affiliates, or other companies. |
| Why can’t I limit all sharing? | Federal law gives you the right to limit only:
● sharing for affiliates’ everyday business purposes – information about your creditworthiness.
● affiliates from using your information to market to you.
● sharing for nonaffiliates to market to you.
State laws and individual companies may give you additional rights to limit sharing. |
| Definitions | |
| Affiliates | Companies related by common ownership or control. They can be financial and nonfinancial companies.
● Northern Lights Fund Trust does not share with its affiliates. |
| Nonaffiliates | Companies not related by common ownership or control. They can be financial and nonfinancial companies.
● Northern Lights Fund Trust does not share with nonaffiliates so they can market to you. |
| Joint marketing | A formal agreement between nonaffiliated financial companies that together market financial products or services to you.
● Northern Lights Fund Trust doesn’t jointly market. |
58
PROXY VOTING POLICY
Information regarding how the Fund voted proxies relating to portfolio securities for the most recent twelve month period ended June 30 as well as a description of the policies and procedures that the Fund uses to determine how to vote proxies is available without charge, upon request, by calling 1-888 -868-9501 or by referring to the Securities and Exchange Commission’s (“SEC”) website at http://www.sec.gov.
PORTFOLIO HOLDINGS
Funds file a complete schedule of portfolio holdings with the Securities and Exchange Commission (the “SEC”) for the first and third quarters of each fiscal year as an exhibit to its reports on Form N-PORT, within sixty days after the end of the period. Form N-PORT reports are available at the SEC’s website at www.sec.gov.
| INVESTMENT ADVISER |
| Princeton Fund Advisors, LLC |
| 1580 Lincoln Street, Suite 680 |
| Denver, CO 80203 |
| INVESTMENT SUB-ADVISER |
| Deer Park Road Management Company, LP |
| 1195 Bangtail Way |
| Steamboat Springs, CO 80487 |
| ADMINISTRATOR |
| Ultimus Fund Solutions, LLC |
| 225 Pictoria Drive, Suite 450 |
| Cincinnati, OH 45246 |
| DEERPARK-AR23 |
Item 2. Code of Ethics.
(a) As of the end of the period covered by this report, the registrant has adopted a code of ethics that applies to the registrant's principal executive officer, principal financial officer, principal accounting officer or controller, or persons performing similar functions, regardless of whether these individuals are employed by the registrant or a third party.
(b) For purposes of this item, “code of ethics” means written standards that are reasonably designed to deter wrongdoing and to promote:
| (1) | Honest and ethical conduct, including the ethical handling of actual or apparent conflicts of interest between personal and professional relationships; |
| (2) | Full, fair, accurate, timely, and understandable disclosure in reports and documents that a registrant files with, or submits to, the Commission and in other public communications made by the registrant; |
(3) Compliance with applicable governmental laws, rules, and regulations;
| (4) | The prompt internal reporting of violations of the code to an appropriate person or persons identified in the code; and |
(5) Accountability for adherence to the code.
(c) Amendments: During the period covered by the report, there have not been any amendments to the provisions of the code of ethics.
(d) Waivers: During the period covered by the report, the registrant has not granted any express or implicit waivers from the provisions of the code of ethics.
(e) The Code of Ethics is not posted on Registrant’ website.
(f) A copy of the Code of Ethics is attached as an exhibit.
Item 3. Audit Committee Financial Expert.
(a)(1)ii The Registrant’s board of trustees has determined that Anthony J. Hertl, Mark H. Taylor and Mark Gersten are audit committee financial experts, as defined in Item 3 of Form N-CSR. Mr. Hertl, Mr. Taylor and Mr. Gersten are independent for purposes of this Item 3.
(a)(2) Not applicable.
(a)(3) In this regard, no member of the audit committee was identified as having all of the required technical attributes identified in instruction 2 (b) to item 3 of Form N-CSR to qualify as an “audit committee financial expert,” whether through the type of specialized education or experience required by that instruction. At this time, the board believes the experience provided by each member of the audit committee collectively offers the fund adequate oversight by its audit committee given the fund’s level of financial complexity. The board will from time to time reexamine such belief.
Item 4. Principal Accountant Fees and Services.
| (a) | Audit Fees |
2023 - $42,500
2022 - $37,000
| (b) | Audit-Related Fees |
2023– None
2022– None
| (c) | Tax Fees |
2023 - $3,900
2022- $3,900
Preparation of Federal & State income tax returns, assistance with calculation of required income, capital gain and excise distributions and preparation of Federal excise tax returns.
| (d) | All Other Fees |
2023 – None
2022 - None
| (e) | (1) Audit Committee’s Pre-Approval Policies |
The registrant’s Audit Committee is required to pre-approve all audit services and, when appropriate, any non-audit services (including audit-related, tax and all other services) to the registrant. The registrant’s Audit Committee also is required to pre-approve, when
appropriate, any non-audit services (including audit-related, tax and all other services) to its adviser, or any entity controlling, controlled by or under common control with the adviser that provides ongoing services to the registrant, to the extent that the services may be determined to have an impact on the operations or financial reporting of the registrant. Services are reviewed on an engagement by engagement basis by the Audit Committee.
| (2) | Percentages of Services Approved by the Audit Committee |
2023 2022
Audit-Related Fees: 0.00% 0.00%
Tax Fees: 0.00% 0.00%
All Other Fees: 0.00% 0.00%
| (f) | During the audit of registrant's financial statements for the most recent fiscal year, less than 50 percent of the hours expended on the principal accountant's engagement were attributed to work performed by persons other than the principal accountant's full-time, permanent employees. |
| (g) | The aggregate non-audit fees billed by the registrant's accountant for services rendered to the registrant, and rendered to the registrant's investment adviser (not including any sub-adviser whose role is primarily portfolio management and is subcontracted with or overseen by another investment adviser), and any entity controlling, controlled by, or under common control with the adviser that provides ongoing services to the registrant: |
2023 - $3,900
2022 - $3,900
(h) The registrant's audit committee has considered whether the provision of non-audit services to the registrant's investment adviser (not including any sub-adviser whose role is primarily portfolio management and is subcontracted with or overseen by another investment adviser), and any entity controlling, controlled by, or under common control with the investment adviser that provides ongoing services to the registrant, that were not pre-approved pursuant to paragraph (c)(7)(ii) of Rule 2-01 of Regulation S-X, is compatible with maintaining the principal accountant's independence.
(i) Not applicable.
(j) Not applicable.
Item 5. Audit Committee of Listed Companies. Not applicable to open-end investment companies.
Item 6. Schedule of Investments. Schedule of investments in securities of unaffiliated issuers is included under Item 1.
Item 7. Disclosure of Proxy Voting Policies and Procedures for Closed-End Funds. Not applicable to open-end investment companies.
Item 8. Portfolio Managers of Closed-End Management Investment Companies. Not applicable to open-end investment companies.
Item 9. Purchases of Equity Securities by Closed-End Funds. Not applicable to open-end investment companies.
Item 10. Submission of Matters to a Vote of Security Holders. None
Item 11. Controls and Procedures.
(a) Based on an evaluation of the Registrant’s disclosure controls and procedures as of a date within 90 days of filing date of this Form N-CSR, the principal executive officer and principal financial officer of the Registrant have concluded that the disclosure controls and procedures of the Registrant are reasonably designed to ensure that the information required in filings on Form N-CSR is recorded, processed, summarized, and reported by the filing date, including that information required to be disclosed is accumulated and communicated to the Registrant’s management, including the Registrant’s principal executive officer and principal financial officer, as appropriate to allow timely decisions regarding required disclosure.
(b) There were no significant changes in the Registrant’s internal control over financial reporting that occurred during the Registrant’s last fiscal half-year that have materially affected, or are reasonably likely to materially affect, the Registrant’s internal control over financial reporting.
Item 12. Disclosure of Securities Lending Activities for Closed-End Management Investment Companies. Not applicable to open-end investment companies.
Item 13. Exhibits.
(a)(1) Code of Ethics filed herewith.
(a)(3) Not applicable for open-end investment companies.
SIGNATURES
Pursuant to the requirements of the Securities Exchange Act of 1934 and the Investment Company Act of 1940, the registrant has duly caused this report to be signed on its behalf by the undersigned, thereunto duly authorized.
(Registrant) Northern Lights Fund Trust
By (Signature and Title)
/s/ Kevin E. Wolf
Kevin E. Wolf, Principal Executive Officer/President
Date 12/08/23
Pursuant to the requirements of the Securities Exchange Act of 1934 and the Investment Company Act of 1940, this report has been signed below by the following persons on behalf of the registrant and in the capacities and on the dates indicated.
By (Signature and Title)
/s/ Kevin E. Wolf
Kevin E. Wolf, Principal Executive Officer/President
Date 12/08/23
By (Signature and Title)
/s/ Jim Colantino
Jim Colantino, Principal Financial Officer/Treasurer
Date 12/08/23