united states
securities and exchange commission
washington, d.c. 20549
form n-csr
certified shareholder report of registered management
investment companies
Investment Company Act file number 811-21720
Northern Lights Fund Trust
(Exact name of registrant as specified in charter)
225 Pictoria Drive, Suite 450, Cincinnati, OH 45246
(Address of principal executive offices) (Zip code)
The Corporation Trust Company
1209 Orange Street Wilmington, DE 19801
(Name and address of agent for service)
Registrant's telephone number, including area code: 631-490-4300
Date of fiscal year end: 9/30
Date of reporting period: 9/30/23
Item 1. Reports to Stockholders.

SIERRA TACTICAL ALL ASSET FUND
SIERRA TACTICAL CORE INCOME FUND
SIERRA TACTICAL MUNICIPAL FUND
SIERRA TACTICAL BOND FUND
SIERRA TACTICAL RISK SPECTRUM 50 FUND
SIERRA TACTICAL RISK SPECTRUM 30 FUND
SIERRA TACTICAL RISK SPECTRUM 70 FUND
Annual Report
September 30, 2023
1-866-738-4363
www.sierramutualfunds.com
Distributed by Northern Lights Distributors, LLC
Member FINRA/SIPC
Letter to Shareholders, November 2023 (Unaudited)
Dear Shareholders:
This letter covers the 12-month period ended September 30, 2023, the fiscal year for the Sierra Mutual Funds (“Sierra”, or, the “Funds”).
We are very pleased to report that two new Sierra Funds were launched since the prior fiscal year. The Sierra Tactical Risk Spectrum 30 Fund was launched on September 30, 2022 and the Sierra Tactical Risk Spectrum 70 Fund was launched at the end of March 2023. These new funds expand the suite of Sierra asset allocation mutual funds.
The Federal Reserve has been a large factor in financial markets during the period as it raised the Federal Funds rate from 3.75% to 5.25% during the 12-month period. This is the highest Federal Funds rate since the 2008 financial crisis.
The Federal Reserve Bank of St. Louis has developed a recession model based on spreads between three-month and ten-year Treasury yields. The model’s forecast in September 2023, based on nominal 10-year Treasury rates versus three-month yields is that the probability of recession in the next twelve months is 65%.
But there is also a lot of “good news” about the economy and financial markets. U.S. inflation, as measured by Personal Consumption Expenditures, was 6.6% as of September 2022 but fell almost in half to 3.4% by the end of the period. Employment grew steadily during the period as more than 3 million additional jobs were added to the job market. And companies were looking for even more workers. Data from the U.S Chamber of Commerce at the end of September show that companies in many industries are having a hard time finding enough workers. More than half of job openings in the financial and professional and business service sectors are currently unfilled.
Core fixed income returns varied during the period as 10-year U.S. Treasury rates started at 3.83% and ended at 4.59%. The Bloomberg US Aggregate Bond Index (the “Agg”), a widely used benchmark for core fixed income, had a modest gain of 0.64% during the twelve month period. The Agg gained 4.9% during the first half of the period. But gave back most of this in the second half of the period. high yield corporate bonds (“HYCB”) gained 10.3% during the period, municipal bonds gained 2.7%, but preferred stocks declined during the period.
Equities had strong gains during the period with the S&P 500 Index and MSCI EAFE returning 21.6% and 22.3%, respectively. Emerging markets stocks and small-cap U.S. stocks also had positive returns during the period but lagged behind MSCI EAFE and the S&P 500 Index, respectively.
Regardless of market noise, explanations, and numerous forecasts from ‘experts,’ we continue to abide by our long time-tested processes, including broad diversification in the Funds, as well as our quantitative, rules-based defensive disciplines.
1
Sierra Tactical All Asset Fund
The Sierra Tactical All Asset Fund (the “All Asset Fund”) has been in existence for more than 15 years, a period that includes the unprecedented 2008-2009 global financial crisis as well as the recent global pandemic crisis and the accompanying deep global recession. The stock market crashes that occurred in 2007-2009 and in early 2020 constitute especially important periods of time for the All Asset Fund. These periods help demonstrate Wright Fund Management’s capabilities in helping reduce left-tail risk to mitigate severe drawdowns, while also having the opportunistic potential in participating in the trampoline-like rebound that characterized the final nine months of 2009 and from mid-2020 through 2021.
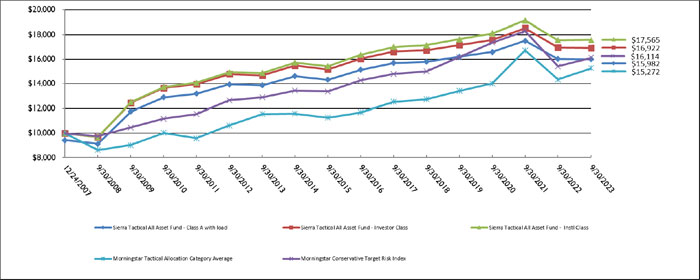
Long-term performance continues to be a focus of our Portfolio Management team. We are pleased to report the performance, as compared to its benchmark, that the Sierra Tactical All Asset Fund Instl Shares delivered, a cumulative return of 75.52%, or 3.64% annualized since inception on December 25, 2007 through September 30, 2023. This performance slightly exceeded that of the Morningstar Conservative Target Risk Index, the All Asset Fund’s benchmark, which earned an average annualized return of 3.04% over the same period.
For the twelve -month period ended September 30, 2023, the Sierra Tactical All Asset Fund Instl Shares gained 0.03% but trailed the Morningstar Conservative Target Risk Index, which gained 4.55% during the period. While underperforming compared to the benchmark, the All Asset Fund was able to meet its investment objective of limiting volatility and downside risk, whereas the All Asset Fund had lower standard deviation than the index for both the past 12 months and since inception periods. The All Asset Fund underperformed its benchmark over both the past five- and ten-year periods.
The All Asset Fund began the period almost wholly in cash due to previous sell signals. The All Asset Fund found new buy signals in the fourth quarter in both U.S. and International Equities as well as fixed income asset classes including municipal bonds, high grade U.S. bonds, and intermediate-term bonds. But the All Asset Fund finished the year with almost 30% in cash.
Markets picked up in early 2023 and the All Asset Fund was almost fully invested at the end of January. Volatility continued throughout the rest of the fiscal year and the All Asset Fund ended the fiscal year with 27% in equities and significant fixed income positions in high yield corporate bonds, floating rate funds, and multisector bond funds, with 24% in cash.
The largest positive contributors to the All Asset Fund during the period were U.S. equities, foreign equities, floating rate notes, and municipal bonds. The largest detractors to performance during the period were intermediate-term bonds and high grade U.S. bonds.
Regardless of the investment environment the investment team continues to follow its long-standing tactical approach and act with discipline in both up and down markets.
The performance data quoted here represents past performance for the Instl Shares (symbol SIRRX) and are net of the total annual operating expenses of the Instl Shares. For performance numbers current to the most recent month end, please call toll-free 866-738-4363 or visit our website, SierraMutualFunds.com. Current performance may be lower or higher than the performance data quoted above. Past performance is no guarantee of future results. The investment return and principal value of an investment in the All Asset Fund will fluctuate, so that investors’ shares, when redeemed, may be worth more or less than their original cost.
2
The All Asset Fund’s net annual operating expenses, excluding expenses of the underlying funds, estimated at 0.78%, are 1.69% for Class A and Investor shares, 1.84% for Class A1 and I1 shares, 2.44% for Class C shares and 1.44% for Instl Shares. Please review the All Asset Fund’s prospectus for more information regarding the All Asset Fund’s fees and expenses.
Sierra Tactical Core Income Fund
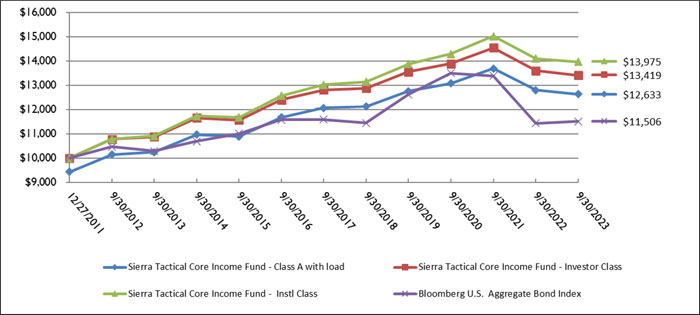
From inception on December 27, 2011 to September 30, 2023, the Sierra Tactical Core Income Fund (the “Core Income Fund) Instl Shares achieved a cumulative performance of 39.54%. The annualized return of 2.88% outpaced the benchmark, the Bloomberg US Aggregate Bond Index, which delivered an average annualized gain of 1.15% over the same period. This outperformance is attributable to our proprietary buy and sell disciplines that we apply to a broad range of income-oriented asset classes, including all categories of bonds and income, preferred stock, REITs, and master limited partnerships, some of which are not included in the benchmark.
For the twelve-month period ended September 30, 2023, the Core Income Fund Instl Shares underperformed the benchmark, falling 0.89% versus a gain of 0.64% for the Bloomberg US Aggregate Bond Index. The Core Income Fund outperformed its benchmark over both the past five- and ten-year periods.
The Core Income Fund started the period almost fully in cash due to previous sell Signals. New buy Signals were seen in November in municipal bonds, high grade U.S. bonds, and other fixed income categories. The Core Income Fund became almost fully invested at the end of January 2023. But market volatility remained high in 2023 and the Core Income Fund had cash holdings most months. The Core Income Fund ended the period with 26% in cash.
The largest positive contributors to the Core Income Fund during the period were floating rate notes, municipal bonds and emerging market bonds. The largest detractors to performance during the period were intermediate-term bonds and high grade U.S. bonds.
The performance data quoted here represents past performance for the Instl Shares (symbol SSIRX) and are net of the total annual operating expenses of the Instl Shares. For performance numbers current to the most recent month end, please call toll-free 866-738-4363 or visit our website, SierraMutualFunds.com. Current performance may be lower or higher than the performance data quoted above. Past performance is no guarantee of future results. The investment return and principal value of an investment in the Core Income Fund will fluctuate, so that investors’ shares, when redeemed, may be worth more or less than their original cost.
The Core Income Fund’s net annual operating expenses, excluding expenses of the underlying funds, estimated at 0.73%, are 1.34% for Class A and Investor Shares, 1.94% for Class C shares, and 0.95% for Instl Shares. Please review the Core Income Fund’s prospectus for more information regarding the Core Income Fund’s fees and expenses.
Sierra Tactical Municipal Fund
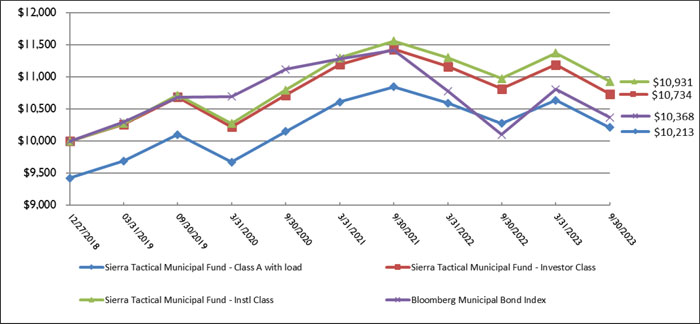
The Sierra Tactical Municipal Fund (the “Municipal Fund”) was launched on December 27, 2018. From inception to September 30, 2023, the Municipal Fund’s Instl Shares achieved a cumulative
3
performance of 9.31% or 1.89% annualized. This performance exceeded the benchmark, the Bloomberg Municipal Bond Index, which gained 0.75% annualized over the same time period. The outperformance over the relatively short period of time in large part can be largely attributed to the Municipal Fund’s investment objective to limit volatility and downside risk, which was especially important in 2022. For the twelve-month period ended September 30, 2023, the Municipal Fund Instl Shares fell 0.40%, trailing its benchmark, which gained 2.66%.
The Municipal Fund started the period almost fully in cash due to previous sell signals. The Municipal Fund had new buy signals in November and finished the month of November fully invested. Market volatility increased in December 2022 and the Municipal Fund ended 2022 with 30% in Cash.
Municipal markets were volatile in 2023 and the Municipal Fund had several episodes of buy signals followed closely by sell signals. As a result, the Municipal Fund ended the period with more than 75% in cash. We believe that high market volatility held back the Municipal Fund’s performance during the period.
The performance data quoted here represents past performance for the Instl Shares (symbol STMEX) and are net of the total annual operating expenses of the Instl Shares. For performance numbers current to the most recent month end, please call toll-free 866-738-4363 or visit our website, SierraMutualFunds.com. Current performance may be lower or higher than the performance data quoted above. Past performance is no guarantee of future results. The investment return and principal value of an investment in the Fund will fluctuate, so that investors’ shares, when redeemed, may be worth more or less than their original cost.
The Municipal Fund’s net annual operating expenses, excluding expenses of the underlying funds, estimated at 0.64%, are 1.23% for Class A Shares, 1.98% for Class C Shares, 0.92% for Special shares, 1.38% for Investor Shares, and 1.02% for Instl Shares. Please review the Municipal Fund’s prospectus for more information regarding the Municipal Fund’s fees and expenses.
Sierra Tactical Bond Fund
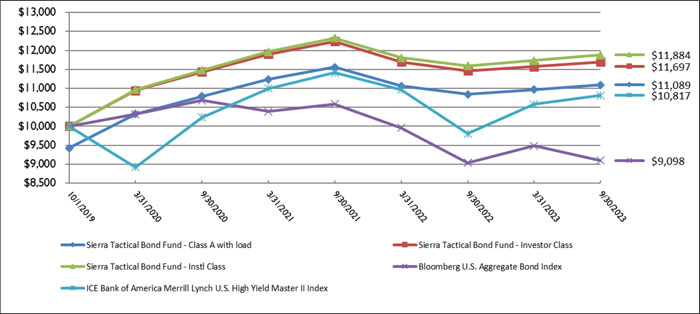
From inception on October 1, 2019 to September 30, 2023, the Sierra Tactical Bond Fund (the “Tactical Bond Fund”) Instl Shares achieved a cumulative performance of 18.32% or 4.39% annualized. The Tactical Bond Fund’s performance outpaced the annualized performance of its primary benchmark, the Bloomberg US Aggregate Bond Index, which fell 2.42%. and its secondary benchmark, the ICE BofA US High Yield Index, which gained 1.92%.
The outperformance of the Tactical Bond Fund since inception helps illustrate core principles of the Tactical Bond Fund’s strategy, which holds HYCB Funds whenever they are in an uptrend and moves to long-duration Treasury bonds, if they have a buy signal, when the HYCB sector declines.
For the twelve-month period ended September 30, 2023, the Tactical Bond Fund Instl Shares gained 2.47%, outperforming the primary benchmark, the Bloomberg US Aggregate Bond Index, which gained 0.64%. The Tactical Bond Fund materially trailed the secondary index, the ICE BofA US High Yield Index, which gained 10.19%.
The Tactical Bond Fund started the 12-month period fully invested in cash due to prior sell signals. New buy signals were seen in the fourth quarter and the Fund was almost fully invested at the end of
4
November. The Fund had sell signals again in the first quarter of 2023 but was almost fully invested in HYCBs from April through the end of the period.
The performance data quoted here represents past performance for the Instl Shares (symbol STBJX) and are net of the total annual operating expenses of the Instl Shares. For performance numbers current to the most recent month end, please call toll-free 866-738-4363 or visit our website, SierraMutualFunds.com. Current performance may be lower or higher than the performance data quoted above. Past performance is no guarantee of future results. The investment return and principal value of an investment in the Fund will fluctuate, so that investors’ shares, when redeemed, may be worth more or less than their original cost.
The Fund’s net annual operating expenses, excluding expenses of the underlying funds, estimated at 0.69%, are 1.48% for Class A shares, 2.23% for Class C shares, 1.23% for Instl Shares, 1.63% for Investor Shares. Please review the Tactical Bond Fund’s prospectus for more information regarding the Tactical Bond Fund’s fees and expenses.
Sierra Tactical Risk Spectrum 30 Fund
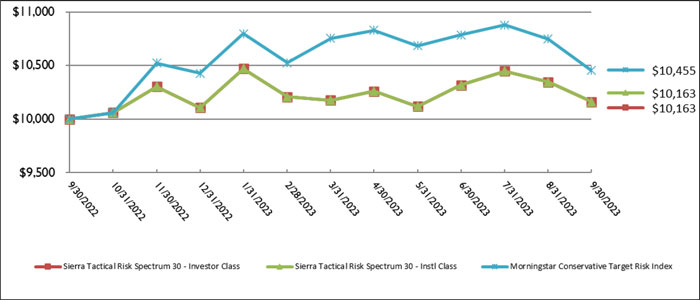
The Sierra Tactical Risk Spectrum 30 Fund (the “Risk Spectrum 30 Fund”) completed its first year during the period. The Risk Spectrum 30 Fund is designed to target average equity exposure of between 15% and 30% over trailing three-year periods. The Risk Spectrum 30 Fund uses the same risk mitigation strategies as all other Sierra Funds, including an investment objective of limiting volatility and downside risk.
From inception to September 30, 2023 the Risk Spectrum 30 Fund Instl Shares gained 1.63% while the Morningstar Conservative Target Risk Index gained 4.55%. The Risk Spectrum 30 Fund thus underperformed its benchmark during the period.
The Risk Spectrum 30 Fund started the period 100% in cash since it was launched at the beginning of the fiscal year. The Risk Spectrum 30 Fund often had significant cash holdings during the period. Both U.S. and international equities were held throughout the period.
The largest positive contributors to the Risk Spectrum 30 Fund during the period were domestic equities, foreign equities, floating rate notes, and municipal bonds. The largest detractors to performance during the period were intermediate-term bonds and high grade U.S. bonds.
The performance data quoted here represents past performance for the Instl Shares (symbol SRTJX) and are net of the total annual operating expenses of the Instl Shares. For performance numbers current to the most recent month end, please call toll-free 866-738-4363 or visit our website, SierraMutualFunds.com. Current performance may be lower or higher than the performance data quoted above. Past performance is no guarantee of future results. The investment return and principal value of an investment in the Risk Spectrum 50 Fund will fluctuate, so that investors’ shares, when redeemed, may be worth more or less than their original cost.
The Risk Spectrum 30 Fund’s net annual operating expenses, excluding expenses of the underlying funds, estimated at 0.68%, are 1.56% for Class A shares, 2.31% for Class C shares, 1.71% for Investor Shares, and 1.31% for Instl Shares. Please review the Risk Spectrum 50 Fund’s prospectus for more information regarding the Risk Spectrum 50 Fund’s fees and expenses.
5
Sierra Tactical Risk Spectrum 50 Fund
The Sierra Tactical Risk Spectrum 50 Fund (the “Risk Spectrum 50 Fund”) completed its second full year during the period. The Risk Spectrum 50 Fund is designed to target average equity exposure of between 30% and 50% over trailing three-year periods.
Markets have been volatile and negative much of the time since the Fund’s inception on May 26, 2021. However, we believe this period was a good test of our tactical approach to risk mitigation. From inception to September 30, 2023 the Risk Spectrum 50 Fund Instl Shares fell 8.50%, or -3.73% annualized, while the Morningstar Moderately Conservative Target Risk Index lost 4.20% annualized. The Risk Spectrum 50 Fund thus outperformed its index, the Morningstar Moderately Conservative Target Risk Index.
For the twelve-month period ended September 30, 2023, the Risk Spectrum 50 Fund Instl Shares rose 3.60%, underperforming its index, the Morningstar Moderately Conservative Target Risk Index, which gained 8.22%.
The Risk Spectrum 50 Fund started the period almost wholly in cash due to previous sell signals. The Fund became almost fully invested at the end of 2022. Market volatility in 2023 led to both new sell signals and new buy signals. As a result, the Fund often had cash holdings during 2023.
The largest positive contributors to the Risk Spectrum 50 Fund’s performance during the period were U.S. equities and floating rate notes. The largest detractors to performance during the period were intermediate-term Bonds, high grade U.S. bonds, and international equities.
Sierra Tactical Risk Spectrum 70 Fund
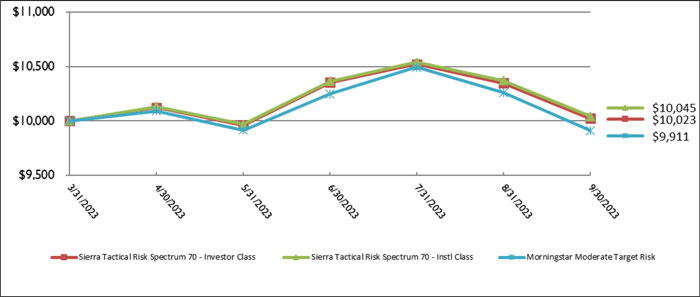
The Sierra Tactical Risk Spectrum 70 Fund (the “Risk Spectrum 70 Fund”) was launched mid-way through the fiscal year on March 31, 2023. The Fund is designed to target average equity exposure of between 50% and 70% over trailing three-year periods. The Risk Spectrum 70 Fund uses the same risk mitigation strategies as all other Sierra Funds, including an investment objective of limiting volatility and downside risk.
From inception to September 30, 2023 the Risk Spectrum 70 Fund Instl Shares gained 0.45% while the Morningstar Moderate Target Risk Index lost 0.89%. The Risk Spectrum 70 Fund therefore outperformed its index since its inception, which we attribute to our tactical approach to risk mitigation.
The new Risk Spectrum 70 Fund started wholly in cash at the end of the first quarter of 2023. The Risk Spectrum 70 Fund was almost fully invested by the end of April. The largest holdings at the end of April were 72% in U.S. and international equities, 9% in intermediate term bonds, and 6% in high grade U.S. bonds.
The Risk Spectrum 70 Fund ended the period with 10% in Cash, over 60% in equities, and with significant fixed income positions. The largest contributor to performance during the period was floating rate notes while the largest detractors were U.S. and international equities.
The performance data quoted here represents past performance for the Instl Shares (symbol SRSJX) and are net of the total annual operating expenses of the Instl Shares. For performance numbers
6
current to the most recent month end, please call toll-free 866-738-4363 or visit our website, SierraMutualFunds.com. Current performance may be lower or higher than the performance data quoted above. Past performance is no guarantee of future results. The investment return and principal value of an investment in the Risk Spectrum 70 Fund will fluctuate, so that investors’ shares, when redeemed, may be worth more or less than their original cost.
The Risk Spectrum 70 Fund’s net annual operating expenses, excluding expenses of the underlying funds, estimated at 0.43%, are 1.56% for Class A shares, 2.31% for Class C shares, 1.71% for Investor Shares, and 1.31% for Instl Shares. Please review the Risk Spectrum 70 Fund’s prospectus for more information regarding the Risk Spectrum 70 Fund’s fees and expenses.
We at Sierra appreciate your confidence in our firm and Portfolio Management team. And we thank you for your support throughout the years for the Sierra mutual funds.
Sincerely,
Kenneth L. Sleeper, MBA, PhD
Ryan A. Harder, CFA
Douglas A. Loeffler, CFA, CAIA
Marshall Quan
Portfolio Managers
7
For more detailed Commentary see the “News and Media” link on our website, www.sierramutualfunds.com.
Cumulative performance from inception is the total increase in value of an investment in the Instl Shares assuming reinvestment of dividends and capital gains.
Bloomberg US Aggregate Bond Index is a broad-based index maintained by Bloomberg L.P. Capital that is often used to represent investment-grade bonds traded in the United States.
The S&P 500 Index is maintained by S&P Dow Jones Indices, a joint venture majority-owned by S&P Global, and its components are selected by a committee.
The MSCI EAFE Index is a free-float adjusted, market capitalization- weighted index designed to measure equity performance of developed markets, excluding the United States and Canada.
The MSCI Emerging Markets Index (net of foreign withholding taxes) is a free float-adjusted market capitalization-weighted index measuring emerging market equity performance.
The Bloomberg Municipal Bond Index is a market-value-weighted index for the long-term tax-exempt bond market.
The ICE BofA US High Yield Index tracks the performance of U.S. dollar-denominated below investment grade corporate debt publicly issued in the U.S. domestic market.
The Morningstar Conservative Target Risk Index: The Morningstar Target Risk Index family is designed to meet the needs of investors who would like to maintain a target level of equity exposure through a portfolio diversified across equities, bonds, and inflation-hedged instruments. The Morningstar Conservative Target Risk Index seeks approximately 20% exposure to global equity markets. This Index does not incorporate Environmental, Social, or Governance (ESG) criteria.
The Morningstar Moderately Conservative Target Allocation Index: The Morningstar Target Allocation Index family consists of indexes that offer a diversified mix of stocks and bonds created for local investors to benchmark their allocation funds. Morningstar’s Category classification system defines the level of equity and bond exposure for each index. The Morningstar US Moderately Conservative Target Allocation Index seeks 40% exposure to global equity markets.
The Morningstar Moderate Target Allocation Index: The Morningstar Target Allocation Index family consists of indexes that offer a diversified mix of stocks and bonds created for local investors to benchmark their allocation funds. Morningstar’s Category classification system defines the level of equity and bond exposure for each index. The Morningstar US Moderate Target Allocation Index seeks 60% exposure to global equity markets.
Investors cannot directly invest in an index, and unmanaged index returns do not reflect any fees, expenses, or sales charges.
8
Past performance is not an indication of future results and there is no guarantee that any investment strategy will achieve its objectives, generate profits, or avoid losses. A Fund may differ significantly from the securities included in the index.
Investors should carefully consider the investment objectives, risks, charges and expenses of the Sierra Mutual Funds. This and other information about the Funds is contained in their prospectuses and should be read carefully before investing. The prospectuses can be obtained by visiting sierramutualfunds.com or by calling toll free 1-866-738-4363 (1-866-RETI-FND).
The Funds are managed by Wright Fund Management, LLC (“Wright Fund a registered investment adviser (“RIA”) regulated by the U.S. Securities and Exchange Commission (“SEC”). The use of the term “registered” does not imply any particular level of skill or training and does not imply any approval by the SEC. For information pertaining to the registration status of Wright Fund, please call 1-844-727-1813 or refer to the Investment Adviser Public Disclosure website (www.adviserinfo.sec.gov).
The Sierra Mutual Funds are distributed by Northern Lights Distributors, LLC, member FINRA/SIPC. Wright Fund is not affiliated entities with Northern Lights.
8218-NLD-11282023
9
SIERRA TACTICAL ALL ASSET FUND
PORTFOLIO REVIEW (Unaudited)
September 30, 2023
The Fund’s performance figures* for the periods ended September 30, 2023, compared to its benchmarks:
| Annualized | Annualized | Annualized | |||||
| Annualized | Annualized | Annualized | Inception**- | Inception***- | Inception****- | ||
| One Year | Three Year | Five Year | Ten Year | September 30, 2023 | September 30, 2023 | September 30, 2023 | |
| Sierra Tactical All Asset Fund – Class A | (0.23)% | (1.24)% | 0.24% | 1.43% | 3.41% | — | — |
| Sierra Tactical All Asset Fund – Class A with load | (3.95)% | (3.17)% | (0.94)% | 0.83% | 3.02% | — | — |
| Sierra Tactical All Asset Fund – Class C | (0.94)% | (1.98)% | (0.51)% | 0.67% | — | 1.28% | — |
| Sierra Tactical All Asset Fund – Investor Class | (0.23)% | (1.23)% | 0.24% | 1.42% | 3.39% | — | — |
| Sierra Tactical All Asset Fund – Instl Class | 0.03% | (1.00)% | 0.49% | 1.67% | 3.64% | — | — |
| Sierra Tactical All Asset Fund – Class A1 | (0.38)% | (1.39)% | 0.09% | 1.27% | — | — | 1.30% |
| Sierra Tactical All Asset Fund – Class A1 with load | (4.10)% | (3.31)% | (1.08)% | 0.68% | — | — | 0.77% |
| Sierra Tactical All Asset Fund – Class I1 | (0.38)% | (1.41)% | 0.09% | 1.27% | — | — | 1.30% |
| Morningstar Tactical Allocation Category Average | 6.60% | 2.91% | 2.57% | 4.02% | 2.72% | 4.14% | 3.79% |
| Morningstar Conservative Target Risk Index | 4.55% | (2.45)% | 1.43% | 2.25% | 3.07% | 3.14% | 2.49% |
| * | The performance data quoted here represents past performance. The performance comparison includes reinvestment of all dividends and capital gain distributions and has been adjusted for the Class A and Class A1 maximum applicable sales charge of 3.75%. Current performance may be lower or higher than the performance data quoted above. Past performance is no guarantee of future results. The investment return and principal value of an investment will fluctuate so that an investor’s shares, when redeemed, may be worth more or less than their original cost. Total returns are calculated with the traded NAV on September 29, 2023. The returns shown do not reflect the deduction of taxes that a shareholder would pay on Fund distributions or on the redemption of Fund shares. Performance figures for periods greater than 1 year are annualized. The Fund’s total annual operating expenses are 2.26% for Class A and Investor Class, 2.01% for Instl Class, 3.01% for Class C shares, 2.41% for Class A1 and Class I1 shares per the January 30, 2023 prospectus. Class A and Class A1 are subject to a maximum deferred sales charge of 1.00%. For performance information current to the most recent month-end, please call toll-free 1-866-738-4363 (1-866-RETI-FND). |
| ** | Inception date is December 24, 2007 for Class A, Investor and Institutional Class shares. |
| *** | Inception date is February 5, 2010 for Class C shares. |
| **** | Inception date is June 7, 2012 for Class A1 and Class I1 shares. |
The Morningstar Tactical Allocation Category Average is comprised of mutual funds that seek to provide both capital appreciation and income by shifting exposure across stocks, bonds and cash. One cannot invest directly in an index.
The Morningstar Conservative Target Risk Index: The Morningstar Target Risk Index family is designed to meet the needs of investors who would like to maintain a target level of equity exposure through a portfolio diversified across equities, bonds, and inflation-hedged instruments. The Morningstar Conservative Target Risk Index seeks approximately 20% exposure to global equity markets. This Index does not incorporate Environmental, Social, or Governance (ESG) criteria. One cannot invest directly in an index.
Sierra Tactical All Asset Fund (the “Fund”) is not sponsored, endorsed, sold or promoted by Morningstar, Inc. or any of its affiliates (all such entities, collectively, “Morningstar Entities”). The Morningstar Entities make no representation or warranty, express or implied, to individuals who invest in the Fund or any member of the public regarding the advisability of investing in equity securities generally or in the Fund in particular or the ability of the Fund to track the Morningstar Indices or general equity market performance. THE MORNINGSTAR ENTITIES DO NOT GUARANTEE THE ACCURACY AND/OR THE COMPLETENESS OF THE FUND OR ANY DATA INCLUDED THEREIN AND MORNINGSTAR ENTITIES SHALL HAVE NO LIABILITY FOR ANY ERRORS, OMISSIONS, OR INTERRUPTIONS THEREIN. One cannot invest directly in an index.
10
SIERRA TACTICAL ALL ASSET FUND
PORTFOLIO REVIEW (Unaudited)(Continued)
September 30, 2023
Comparison of the Change in Value of a $10,000 Investment
The Fund’s asset classes as of September 30, 2023, are as follows:
| Asset Class | % of Net Assets | |||
| Exchange-Traded Funds | ||||
| Fixed Income | 25.8 | % | ||
| Equity | 21.4 | % | ||
| Open End Funds | ||||
| Fixed Income | 21.0 | % | ||
| Alternative | 4.9 | % | ||
| Equity | 3.3 | % | ||
| Mixed Allocation | 0.0 | %* | ||
| Short-Term Investment | ||||
| Money Market Fund | 20.4 | % | ||
| Other Assets Less Liabilities | 3.2 | % | ||
| 100.0 | % | |||
| * | Percentage rounds to less than 0.1%. |
Please refer to the Schedule of Investments in this Annual Report for a detailed listing of the Fund’s holdings.
11
SIERRA TACTICAL CORE INCOME FUND
PORTFOLIO REVIEW (Unaudited)
September 30, 2023
The Fund’s performance figures* for the periods ended September 30, 2023, compared to its benchmark:
| Annualized | |||||
| Annualized | Annualized | Annualized | Inception**- | ||
| One Year | Three Year | Five Year | Ten Year | September 30, 2023 | |
| Sierra Tactical Core Income Fund – Class A | (1.33)% | (1.15)% | 0.82% | 2.12% | 2.52% |
| Sierra Tactical Core Income Fund – Class A with load | (5.04)% | (3.08)% | (0.37)% | 1.52% | 2.01% |
| Sierra Tactical Core Income Fund – Class C | (1.88)% | (1.74)% | 0.22% | 1.51% | 1.91% |
| Sierra Tactical Core Income Fund – Investor Class | (1.33)% | (1.16)% | 0.82% | 2.12% | 2.53% |
| Sierra Tactical Core Income Fund – Instl Class | (0.89)% | (0.74)% | 1.22% | 2.51% | 2.89% |
| Bloomberg U.S. Aggregate Bond Index | 0.64% | (5.21)% | 0.10% | 1.13% | 1.20% |
| * | The performance data quoted here represents past performance. The performance comparison includes reinvestment of all dividends and capital gain distributions and has been adjusted for the Class A maximum applicable sales charge of 3.75%. Current performance may be lower or higher than the performance data quoted above. Past performance is no guarantee of future results. The investment return and principal value of an investment will fluctuate so that an investor’s shares, when redeemed, may be worth more or less than their original cost. Total returns are calculated with the traded NAV on September 29, 2023. The returns shown do not reflect the deduction of taxes that a shareholder would pay on Fund distributions or on the redemption of Fund shares. The Fund’s returns would have been lower had the adviser not waived its fees or reimbursed a portion of the Fund’s expenses. The Fund’s total annual operating expenses are 1.82% for each of Class A and Investor Class, 1.41% for Instl Class and 2.42% for Class C shares per the January 30, 2023 prospectus. Class A shares are subject to a maximum deferred sales charge of 1.00%. For performance information current to the most recent month-end, please call toll-free 1-866-738-4363 (1-866-RETI-FND). |
| ** | The Fund’s inception date is December 27, 2011. |
The Bloomberg U.S. Aggregate Bond Index is commonly used as a benchmark by both passive and active investors to measure portfolio performance relative to the U.S. dollar-denominated investment grade fixed-rate taxable bond market. It is also an informational measure of broad market returns commonly applied to fixed income instruments. The index contains approximately 10,100 fixed income issues and is valued at around $20 trillion, representing 43% of the total U.S. bond market. The index does not take into account charges, fees and other expenses, and investors cannot invest directly in an index.
12
SIERRA TACTICAL CORE INCOME FUND
PORTFOLIO REVIEW (Unaudited)(Continued)
September 30, 2023
Comparison of the Change in Value of a $10,000 Investment
The Fund’s asset classes as of September 30, 2023, are as follows:
| Asset Class | % of Net Assets | |||
| Exchange-Traded Funds | ||||
| Fixed Income | 39.0 | % | ||
| Equity | 2.1 | % | ||
| Open End Funds | ||||
| Fixed Income | 33.4 | % | ||
| Alternative | 0.0 | %* | ||
| Short-Term Investment | ||||
| Money Market Fund | 19.2 | % | ||
| Other Assets Less Liabilities | 6.3 | % | ||
| 100.0 | % | |||
| * | Percentage rounds to less than 0.1%. |
Please refer to the Schedule of Investments in this Annual Report for a detailed listing of the Fund’s holdings.
13
SIERRA TACTICAL MUNICIPAL FUND
PORTFOLIO REVIEW (Unaudited)
September 30, 2023
The Fund’s performance figures* for the periods ended September 30, 2023, compared to its benchmark:
| One Year | Annualized Three Year | Annualized Inception**- September 30, 2023 | Annualized Inception***- September 30, 2023 | |
| Sierra Tactical Municipal Fund – Class A | (0.61)% | 0.21% | 1.71% | — |
| Sierra Tactical Municipal Fund – Class A with load | (4.35)% | (1.75)% | 0.44% | — |
| Sierra Tactical Municipal Fund – Class C | (1.32)% | (0.53)% | — | (0.55)% |
| Sierra Tactical Municipal Fund – Investor Class | (0.76)% | 0.05% | 1.50% | — |
| Sierra Tactical Municipal Fund – Instl Class | (0.40)% | 0.42% | 1.89% | — |
| Sierra Tactical Municipal Fund – Special Shares | (0.31)% | 0.52% | 2.00% | — |
| Bloomberg Municipal Bond Index | 2.66% | (2.30)% | 0.76% | (0.82)% |
| * | The performance data quoted here represents past performance. The performance comparison includes reinvestment of all dividends and capital gain distributions and has been adjusted for the Class A maximum applicable sales charge of 3.75%. Current performance may be lower or higher than the performance data quoted above. Past performance is no guarantee of future results. The investment return and principal value of an investment will fluctuate so that an investor’s shares, when redeemed, may be worth more or less than their original cost. Total returns are calculated using the traded NAV on September 29, 2023. The returns shown do not reflect the deduction of taxes that a shareholder would pay on Fund distributions or on the redemption of Fund shares. The Fund’s returns would have been lower had the adviser not waived its fees or reimbursed a portion of the Fund’s expenses. The Fund’s total annual operating expenses before waiver are 1.69% for Class A shares, 2.44% for Class C shares, 1.84% for Investor Class, 1.44% for Instl Class and 1.37% for Special Class shares per the January 30, 2023 prospectus. After fee waivers and reimbursements, the Fund’s total annual operating expenses are 1.66% for Class A shares, 2.41% for Class C shares, 1.81% for Investor Class, 1.44% for Instl Class and 1.35% for Special Class shares per the January 30, 2023 prospectus. Class A shares are subject to a maximum deferred sales charge of 1.00%. For performance information current to the most recent month-end, please call toll-free 1-866-738-4363 (1-866-RETI-FND). |
| ** | The Sierra Tactical Municipal Fund Class A, Investor, Institutional and Special Class shares inception date is December 27, 2018. |
| *** | The Sierra Tactical Municipal Fund Class C inception date is September 10, 2019. |
The Bloomberg Municipal Bond Index is a market-value-weighted index for the long-term tax-exempt bond market. To be included in the index, bonds must have a minimum credit rating of Baa. They must have an outstanding par value of at least $7 million and be issued as part of a transaction of at least $75 million. The bonds must be fixed rate, have a dated-date after December 31, 1990, and must be at least one year from their maturity date. The index does not take into account charges, fees and other expenses, and investors cannot invest directly in an index.
14
SIERRA TACTICAL MUNICIPAL FUND
PORTFOLIO REVIEW (Unaudited)(Continued)
September 30, 2023
Comparison of the Change in Value of a $10,000 Investment
The Fund’s asset classes as of September 30, 2023, are as follows:
| Asset Class | % of Net Assets | |||
| Open End Funds | ||||
| Fixed Income | 23.4 | % | ||
| Short-Term Investments | ||||
| Money Market Funds | 69.5 | % | ||
| Other Assets Less Liabilities | 7.1 | % | ||
| 100.0 | % | |||
Please refer to the Schedule of Investments in this Annual Report for a detailed listing of the Fund’s holdings.
15
SIERRA TACTICAL BOND FUND
PORTFOLIO REVIEW (Unaudited)
September 30, 2023
The Fund’s performance figures* for the periods ended September 30, 2023, compared to its benchmarks:
| One Year | Annualized Three Year | Annualized Inception**- September 30, 2023 | |
| Sierra Tactical Bond Fund – Class A | 2.24% | 0.92% | 4.15% |
| Sierra Tactical Bond Fund – Class A with load | (1.60)% | (1.06)% | 2.62% |
| Sierra Tactical Bond Fund – Class C | 1.42% | 0.15% | 3.44% |
| Sierra Tactical Bond Fund – Investor Class | 2.03% | 0.76% | 4.00% |
| Sierra Tactical Bond Fund – Instl Class | 2.47% | 1.16% | 4.41% |
| Bloomberg U.S. Aggregate Bond Index | 0.64% | (5.21)% | (2.34)% |
| ICE Bank of America Merrill Lynch U.S. High Yield Master II Index | 10.28% | 1.85% | 1.98% |
| * | The performance data quoted here represents past performance. The performance comparison includes reinvestment of all dividends and capital gain distributions and has been adjusted for the Class A maximum applicable sales charge of 3.75%. Current performance may be lower or higher than the performance data quoted above. Past performance is no guarantee of future results. The investment return and principal value of an investment will fluctuate so that an investor’s shares, when redeemed, may be worth more or less than their original cost. Total returns are calculated with the traded NAV on September 29, 2023. The returns shown do not reflect the deduction of taxes that a shareholder would pay on Fund distributions or on the redemption of Fund shares. The Fund’s total annual operating expenses are 1.84% for Class A shares, 2.59% for Class C shares, 1.99% for Investor Class, and 1.59% for Instl Class shares per the January 30, 2023 prospectus. Class A shares are subject to a maximum deferred sales charge of 1.00%. For performance information current to the most recent month-end, please call toll-free 1-866-738-4363 (1-866-RETI-FND). |
| ** | The Sierra Tactical Bond Fund Class A, Class C, Investor, and Institutional Class shares inception date is October 1, 2019. |
The Bloomberg U.S. Aggregate Bond Index is commonly used as a benchmark by both passive and active investors to measure portfolio performance relative to the U.S. dollar-denominated investment grade fixed-rate taxable bond market. It is also an informational measure of broad market returns commonly applied to fixed income instruments. The index contains approximately 10,100 fixed income issues and is valued at around $20 trillion, representing 43% of the total U.S. bond market. The index does not take into account charges, fees and other expenses, and investors cannot invest directly in an index.
The ICE Bank of America Merrill Lynch U.S. High Yield Master II Index tracks the performance of US dollar denominated below investment grade corporate debt publicly issued in the US domestic market. Qualifying securities must have a below investment grade rating (based on an average of Moody’s, S&P and Fitch), at least 18 months to final maturity at the time of issuance, at least one-year remaining term to final maturity as of the rebalancing date, a fixed coupon schedule and a minimum amount outstanding of $100 million. In addition, qualifying securities must have risk exposure to countries that are members of the FX-G10, Western Europe or territories of the US and Western Europe. The index does not take into account charges, fees and other expenses, and investors cannot invest directly in an index.
16
SIERRA TACTICAL BOND FUND
PORTFOLIO REVIEW (Unaudited)(Continued)
September 30, 2023
Comparison of the Change in Value of a $10,000 Investment
The Fund’s asset classes as of September 30, 2023, are as follows:
| Asset Class | % of Net Assets | |||
| Exchange-Traded Funds | ||||
| Fixed Income | 50.4 | % | ||
| Open End Funds | ||||
| Fixed Income | 50.0 | % | ||
| Short-Term Investment | ||||
| Money Market Fund | 0.1 | % | ||
| Liabilities in Excess of Other Assets | (0.5 | )% | ||
| 100.0 | % | |||
Please refer to the Schedule of Investments in this Annual Report for a detailed listing of the Fund’s holdings.
17
SIERRA TACTICAL RISK SPECTRUM 50 FUND
PORTFOLIO REVIEW (Unaudited)
September 30, 2023
The Fund’s performance figures* for the periods ended September 30, 2023, compared to its benchmark:
| Annualized | ||
| Inception**- | ||
| One Year | September 30, 2023 | |
| Sierra Tactical Risk Spectrum 50 Fund – Class A | 3.33% | (3.84)% |
| Sierra Tactical Risk Spectrum 50 Fund – Class A with load | (0.56)% | (6.24)% |
| Sierra Tactical Risk Spectrum 50 Fund – Class C | 2.58% | (4.54)% |
| Sierra Tactical Risk Spectrum 50 Fund – Investor Class | 3.16% | (3.99)% |
| Sierra Tactical Risk Spectrum 50 Fund – Instl Class | 3.60% | (3.60)% |
| Morningstar Moderately Conservative Target Risk Index | 8.22% | (4.10)% |
| * | The performance data quoted here represents past performance. The performance comparison includes reinvestment of all dividends and capital gain distributions and has been adjusted for the Class A maximum applicable sales charge of 3.75%. Current performance may be lower or higher than the performance data quoted above. Past performance is no guarantee of future results. The investment return and principal value of an investment will fluctuate so that an investor’s shares, when redeemed, may be worth more or less than their original cost. Total returns are calculated with the traded NAV on September 29, 2023. The returns shown do not reflect the deduction of taxes that a shareholder would pay on Fund distributions or on the redemption of Fund shares. The Fund’s total annual operating expenses before waiver are 2.15% for Class A shares, 2.90% for Class C shares, 2.30% for Investor Class, and 1.90% for Instl Class shares per the January 30, 2023 prospectus. After fee waivers and reimbursements, the Fund’s total annual operating expenses are 2.07% for Class A shares, 2.82% for Class C shares, 2.22% for Investor Class, and 1.82% for Instl Class shares per the January 30, 2023 prospectus. Class A shares are subject to a maximum deferred sales charge of 1.00%. For performance information current to the most recent month-end, please call toll-free 1-866-738-4363 (1-866-RETI-FND). |
| ** | The Sierra Tactical Risk Spectrum 50 Fund Class A, Class C, Investor, and Institutional Class shares inception date is May 26, 2021. |
The Morningstar Moderately Conservative Target Risk Index: The Morningstar Target Allocation Index family consists of indexes that offer a diversified mix of stocks and bonds created for local investors to benchmark their allocation funds. Morningstar’s Category classification system defines the level of equity and bond exposure for each index. The Morningstar US Moderately Conservative Target Allocation Index seeks 40% exposure to global equity markets. One cannot invest directly in an index.
Sierra Tactical Risk Spectrum 50 Fund (the “Fund”) are not sponsored, endorsed, sold or promoted by Morningstar, Inc. or any of its affiliates (all such entities, collectively, “Morningstar Entities”). The Morningstar Entities make no representation or warranty, express or implied, to individuals who invest in the Fund or any member of the public regarding the advisability of investing in equity securities generally or in the Fund’s in particular or the ability of the Fund to track the Morningstar Indices or general equity market performance. THE MORNINGSTAR ENTITIES DO NOT GUARANTEE THE ACCURACY AND/OR THE COMPLETENESS OF THE FUND OR ANY DATA INCLUDED THEREIN AND MORNINGSTAR ENTITIES SHALL HAVE NO LIABILITY FOR ANY ERRORS, OMISSIONS, OR INTERRUPTIONS THEREIN. One cannot invest directly in an index.
18
SIERRA TACTICAL RISK SPECTRUM 50 FUND
PORTFOLIO REVIEW (Unaudited)(Continued)
September 30, 2023
Comparison of the Change in Value of a $10,000 Investment

The Fund’s asset classes as of September 30, 2023, are as follows:
| Asset Class | % of Net Assets | |||
| Exchange-Traded Funds | ||||
| Equity | 38.6 | % | ||
| Fixed Income | 16.4 | % | ||
| Open End Funds | ||||
| Fixed Income | 21.4 | % | ||
| Equity | 9.3 | % | ||
| Alternative | 1.7 | % | ||
| Short-Term Investment | ||||
| Money Market Fund | 10.4 | % | ||
| Other Assets Less Liabilities | 2.2 | % | ||
| 100.0 | % | |||
Please refer to the Schedule of Investments in this Annual Report for a detailed listing of the Fund’s holdings.
19
SIERRA TACTICAL RISK SPECTRUM 30 FUND
PORTFOLIO REVIEW (Unaudited)
September 30, 2023
The Fund’s performance figures* for the periods ended September 30, 2023, compared to its benchmark:
| Annualized | |
| Inception**- | |
| September 30, 2023 | |
| Sierra Tactical Risk Spectrum 30 Fund – Investor Class | 1.63% |
| Sierra Tactical Risk Spectrum 30 Fund – Instl Class | 1.63% |
| Morningstar Conservative Target Risk Index | 7.53% |
| * | The performance data quoted here represents past performance. The performance comparison includes reinvestment of all dividends and capital gain distributions. Current performance may be lower or higher than the performance data quoted above. Past performance is no guarantee of future results. The investment return and principal value of an investment will fluctuate so that an investor’s shares, when redeemed, may be worth more or less than their original cost. Total returns are calculated with the traded NAV on September 29, 2023. The returns shown do not reflect the deduction of taxes that a shareholder would pay on Fund distributions or on the redemption of Fund shares. The Fund’s total annual operating expenses before waiver are 2.12% for Class A shares, 2.87% for Class C shares, 2.27% for Investor Class and 1.87% for Instl Class shares per the January 30, 2023 prospectus. After fee waivers and reimbursements, the Fund’s total annual operating expenses are 2.04% for Class A shares, 2.79% for Class C shares, 2.19% for Investor Class and 1.79% for Instl Class shares per the January 30, 2023 prospectus. For performance information current to the most recent month-end, please call toll-free 1-866-738-4363 (1-866-RETI-FND). Class A and Class C shares of the Fund are not currently for sale. |
| ** | The Sierra Tactical Risk Spectrum 30 Fund Investor and Institutional Class shares inception date is September 30, 2022. |
The Morningstar Conservative Target Risk Index: The Morningstar Target Risk Index family is designed to meet the needs of investors who would like to maintain a target level of equity exposure through a portfolio diversified across equities, bonds, and inflation-hedged instruments. The Morningstar Conservative Target Risk Index seeks approximately 20% exposure to global equity markets. This Index does not incorporate Environmental, Social, or Governance (ESG) criteria. One cannot invest directly in an index.
Sierra Tactical Risk Spectrum 30 Fund (the “Fund”) are not sponsored, endorsed, sold or promoted by Morningstar, Inc. or any of its affiliates (all such entities, collectively, “Morningstar Entities”). The Morningstar Entities make no representation or warranty, express or implied, to individuals who invest in the Fund or any member of the public regarding the advisability of investing in equity securities generally or in the Fund’s in particular or the ability of the Fund to track the Morningstar Indices or general equity market performance. THE MORNINGSTAR ENTITIES DO NOT GUARANTEE THE ACCURACY AND/OR THE COMPLETENESS OF THE FUND OR ANY DATA INCLUDED THEREIN AND MORNINGSTAR ENTITIES SHALL HAVE NO LIABILITY FOR ANY ERRORS, OMISSIONS, OR INTERRUPTIONS THEREIN. One cannot invest directly in an index.
20
SIERRA TACTICAL RISK SPECTRUM 30 FUND
PORTFOLIO REVIEW (Unaudited)(Continued)
September 30, 2023
Comparison of the Change in Value of a $10,000 Investment
The Fund’s asset classes as of September 30, 2023, are as follows:
| Asset Class | % of Net Assets | |||
| Exchange-Traded Funds | ||||
| Equity | 24.4 | % | ||
| Fixed Income | 24.3 | % | ||
| Open End Funds | ||||
| Fixed Income | 29.5 | % | ||
| Equity | 4.5 | % | ||
| Alternative | 4.3 | % | ||
| Short-Term Investment | ||||
| Money Market Fund | 10.1 | % | ||
| Other Assets Less Liabilities | 2.9 | % | ||
| 100.0 | % | |||
Please refer to the Schedule of Investments in this Annual Report for a detailed listing of the Fund’s holdings.
21
SIERRA TACTICAL RISK SPECTRUM 70 FUND
PORTFOLIO REVIEW (Unaudited)
September 30, 2023
The Fund’s performance figures* for the period ended September 30, 2023, compared to its benchmark:
| Annualized | |
| Inception**- | |
| September 30, 2023 | |
| Sierra Tactical Risk Spectrum 70 Fund – Investor Class | 0.23% |
| Sierra Tactical Risk Spectrum 70 Fund – Instl Class | 0.45% |
| Morningstar Moderate Target Risk Index | (0.89)% |
| * | The performance data quoted here represents past performance. The performance comparison includes reinvestment of all dividends and capital gain distributions. Current performance may be lower or higher than the performance data quoted above. Past performance is no guarantee of future results. The investment return and principal value of an investment will fluctuate so that an investor’s shares, when redeemed, may be worth more or less than their original cost. Total returns are calculated with the traded NAV on September 29, 2023. The returns shown do not reflect the deduction of taxes that a shareholder would pay on Fund distributions or on the redemption of Fund shares. The Fund’s total annual operating expenses before waiver are 2.07% for Class A shares, 2.82% for Class C shares, 2.22% for Investor Class and 1.82% for Instl Class shares per the March 31, 2023 prospectus. After fee waivers and reimbursements, the Fund’s total annual operating expenses are 1.99% for Class A shares, 2.74% for Class C shares, 2.14% for Investor Class and 1.74% for Instl Class shares per the March 31, 2023 prospectus. For performance information current to the most recent month-end, please call toll-free 1-866-738-4363 (1-866-RETI-FND). Class A and Class C shares of the Fund are not currently for sale. |
| ** | The Sierra Tactical Risk Spectrum 70 Fund Investor and Institutional Class shares inception date is March 31, 2023. |
The Morningstar Moderate Target Risk Index: The Morningstar Target Risk Index family is designed to meet the needs of investors who would like to maintain a target level of equity exposure through a portfolio diversified across equities, bonds and inflation-hedged instruments. The Morningstar Moderate Target Risk Index seeks approximately 60% exposure to global equity markets. This Index does not incorporate Environmental, Social, or Governance (ESG) criteria. One cannot invest directly in an index.
Sierra Tactical Risk Spectrum 70 Fund (the “Fund”) are not sponsored, endorsed, sold or promoted by Morningstar, Inc. or any of its affiliates (all such entities, collectively, “Morningstar Entities”). The Morningstar Entities make no representation or warranty, express or implied, to individuals who invest in the Fund or any member of the public regarding the advisability of investing in equity securities generally or in the Fund’s in particular or the ability of the Fund to track the Morningstar Indices or general equity market performance. THE MORNINGSTAR ENTITIES DO NOT GUARANTEE THE ACCURACY AND/OR THE COMPLETENESS OF THE FUND OR ANY DATA INCLUDED THEREIN AND MORNINGSTAR ENTITIES SHALL HAVE NO LIABILITY FOR ANY ERRORS, OMISSIONS, OR INTERRUPTIONS THEREIN. One cannot invest directly in an index.
22
SIERRA TACTICAL RISK SPECTRUM 70 FUND
PORTFOLIO REVIEW (Unaudited)(Continued)
September 30, 2023
Comparison of the Change in Value of a $10,000 Investment
The Fund’s asset classes as of September 30, 2023, are as follows:
| Asset Class | % of Net Assets | |||
| Exchange-Traded Funds | ||||
| Equity | 57.6 | % | ||
| Fixed Income | 13.1 | % | ||
| Commodity | 1.0 | % | ||
| Open End Funds | ||||
| Equity | 9.2 | % | ||
| Fixed Income | 7.3 | % | ||
| Alternative | 2.0 | % | ||
| Short-Term Investment | ||||
| Money Market Fund | 7.7 | % | ||
| Other Assets Less Liabilities | 2.1 | % | ||
| 100.0 | % | |||
Please refer to the Schedule of Investments in this Annual Report for a detailed listing of the Fund’s holdings.
23
| SIERRA TACTICAL ALL ASSET FUND |
| SCHEDULE OF INVESTMENTS |
| September 30, 2023 |
| Shares | Fair Value | |||||||
| EXCHANGE-TRADED FUNDS — 47.2% | ||||||||
| EQUITY - 21.4% | ||||||||
| 59,400 | Communication Services Select Sector SPDR Fund | $ | 3,894,858 | |||||
| 52,100 | Energy Select Sector SPDR Fund | 4,709,319 | ||||||
| 101,700 | Financial Select Sector SPDR Fund | 3,373,389 | ||||||
| 22,100 | Invesco QQQ Trust Series 1 | 7,917,767 | ||||||
| 29,900 | iShares Core S&P Mid-Cap ETF | 7,455,565 | ||||||
| 99,900 | iShares MSCI EAFE Min Vol Factor ETF | 6,515,478 | ||||||
| 60,100 | iShares MSCI Japan ETF | 3,623,429 | ||||||
| 67,300 | iShares MSCI USA Min Vol Factor ETF | 4,871,174 | ||||||
| 28,000 | iShares MSCI USA Quality Factor ETF | 3,690,120 | ||||||
| 163,900 | JPMorgan Equity Premium Income ETF | 8,778,484 | ||||||
| 79,900 | JPMorgan Nasdaq Equity Premium Income ETF | 3,749,707 | ||||||
| 44,300 | SPDR Dow Jones Industrial Average ETF Trust | 14,838,285 | ||||||
| 28,300 | Vanguard Growth ETF | 7,706,373 | ||||||
| 148,600 | Vanguard S&P 500 ETF | 58,355,220 | ||||||
| 97,800 | Vanguard Value ETF | 13,489,554 | ||||||
| 101,200 | WisdomTree India Earnings Fund | 3,720,112 | ||||||
| 156,688,834 | ||||||||
| FIXED INCOME - 25.8% | ||||||||
| 1,590,500 | Invesco Senior Loan ETF | 33,384,595 | ||||||
| 307,400 | iShares 0-5 Year High Yield Corporate Bond ETF | 12,612,622 | ||||||
| 357,400 | iShares Broad USD High Yield Corporate Bond ETF | 12,405,354 | ||||||
| 240,600 | iShares Fallen Angels USD Bond ETF | 5,966,880 | ||||||
| 613,000 | iShares iBoxx High Yield Corporate Bond ETF | 45,190,360 | ||||||
| 774,200 | SPDR Blackstone Senior Loan ETF | 32,462,206 | ||||||
| 123,900 | SPDR Bloomberg Investment Grade Floating Rate ETF | 3,806,208 | ||||||
| 339,600 | SPDR Bloomberg High Yield Bond ETF | 30,699,840 | ||||||
| 516,200 | SPDR Bloomberg Short Term High Yield Bond ETF | 12,626,252 | ||||||
| 189,154,317 | ||||||||
| TOTAL EXCHANGE-TRADED FUNDS (Cost $339,660,836) | 345,843,151 | |||||||
See accompanying notes to financial statements.
24
| SIERRA TACTICAL ALL ASSET FUND |
| SCHEDULE OF INVESTMENTS (Continued) |
| September 30, 2023 |
| Shares | Fair Value | |||||||
| OPEN END FUNDS — 29.2% | ||||||||
| ALTERNATIVE - 4.9% | ||||||||
| 306,099 | Abbey Capital Futures Strategy Fund, Class I | $ | 3,651,759 | |||||
| 1,053,120 | DoubleLine Flexible Income Fund, Class I | 8,814,613 | ||||||
| 478,556 | JPMorgan Hedged Equity 3 Fund, Class I | 7,417,596 | ||||||
| 1 | JPMorgan Hedged Equity Fund, Class I | 27 | ||||||
| 740,525 | LoCorr Long/Short Commodities Strategy Fund, Class I | 7,508,926 | ||||||
| 769,759 | Neuberger Berman US Equity Index PutWrite Strategy, Class I | 8,090,170 | ||||||
| 35,483,091 | ||||||||
| EQUITY - 3.3% | ||||||||
| 185,267 | BlackRock Equity Dividend Fund, Institutional Class | 3,381,130 | ||||||
| 367,570 | Dodge & Cox International Stock Fund, Class I | 17,312,560 | ||||||
| 1 | JPMorgan Emerging Markets Equity Fund, Class I | 29 | ||||||
| 257,460 | Lazard Global Listed Infrastructure Portfolio, Institutional Class | 3,614,743 | ||||||
| 1 | Virtus KAR Small-Cap Core Fund, Class I | 51 | ||||||
| 1 | Virtus KAR Small-Cap Growth Fund, Class I | 49 | ||||||
| 24,308,562 | ||||||||
| FIXED INCOME - 21.0% | ||||||||
| 519,142 | American Century High Income Fund, Class I | 4,236,196 | ||||||
| 783,855 | BlackRock Floating Rate Income Portfolio, Institutional Class | 7,556,364 | ||||||
| 1,124,087 | BlackRock High Yield Bond Portfolio, Institutional Class | 7,542,627 | ||||||
| 6 | BlackRock High Yield Municipal Fund, Institutional Class | 46 | ||||||
| 6,334 | BlackRock National Municipal Fund, Institutional Class | 61,564 | ||||||
| 2,738 | BlackRock Strategic Municipal Opportunities Fund, Institutional Class | 27,049 | ||||||
| 9,591 | Cohen & Steers Preferred Securities and Income, Class I | 107,228 | ||||||
| 1,549 | Columbia Intermediate Duration Municipal Bond Fund, Institutional Class | 14,208 | ||||||
| 5,733 | Goldman Sachs High Yield Floating Rate Fund, Institutional Class | 50,738 | ||||||
| 1 | Goldman Sachs Investment Grade Credit Fund, Institutional Class | 11 | ||||||
| 18 | Invesco High Yield Municipal Fund, Class Y | 143 | ||||||
| 4,473 | Invesco International Bond Fund, Class Y | 18,653 | ||||||
| 9,935 | Invesco Rochester Municipal Opportunities Fund, Class Y | 63,184 | ||||||
| 5,465 | Invesco Senior Floating Rate Fund, Class Y | 36,614 | ||||||
| 1 | JPMorgan Emerging Markets Debt Fund, Class I | 6 | ||||||
| 3,480 | JPMorgan Income Fund, Class I | 28,046 | ||||||
| 5,418 | Lord Abbett Floating Rate Fund, Class I | 43,883 | ||||||
| 126,842 | MassMutual Global Floating Rate Fund, Class Y | 1,116,214 | ||||||
See accompanying notes to financial statements.
25
| SIERRA TACTICAL ALL ASSET FUND |
| SCHEDULE OF INVESTMENTS (Continued) |
| September 30, 2023 |
| Shares | Fair Value | |||||||
| OPEN END FUNDS — 29.2% (Continued) | ||||||||
| FIXED INCOME - 21.0% (Continued) | ||||||||
| 5 | Metropolitan West High Yield Bond Fund, Class I | $ | 46 | |||||
| 8,607 | Metropolitan West Total Return Bond Fund, Class I | 74,449 | ||||||
| 2,165 | MFS Corporate Bond Fund, Class I | 25,117 | ||||||
| 2,973 | Neuberger Berman Strategic Income Fund, Class I | 27,711 | ||||||
| 1,863 | Nuveen All-American Municipal Bond Fund, Class I | 18,068 | ||||||
| 2,128 | Nuveen California Municipal Bond Fund, Class I | 20,425 | ||||||
| 4,991 | Nuveen High Yield Municipal Bond Fund, Class I | 68,732 | ||||||
| 585,103 | Nuveen Preferred Securities Fund, Class I | 8,384,523 | ||||||
| 3,438 | Nuveen Short Duration High Yield Municipal Bond, Class I | 31,562 | ||||||
| 3,232 | Nuveen Strategic Income Fund, Class I | 30,155 | ||||||
| 712,748 | PIMCO Diversified Income Fund, Institutional Class | 6,400,476 | ||||||
| 779,929 | PIMCO Emerging Markets Bond Fund, Institutional Class | 6,036,652 | ||||||
| 3,978 | PIMCO Emerging Markets Local Currency and Bond, Institutional Class | 22,118 | ||||||
| 0 | (c) | PIMCO High Yield Fund, Institutional Class | 0 | (d) | ||||
| 22 | PIMCO High Yield Municipal Bond Fund, Institutional Class | 176 | ||||||
| 3,811,636 | PIMCO Income Fund Institutional Class | 38,840,576 | ||||||
| 3,248,925 | PIMCO International Bond Fund U.S. Dollar-Hedged, Institutional Class | 30,507,406 | ||||||
| 7,257 | PIMCO Investment Grade Credit Bond Fund, Institutional Class | 61,104 | ||||||
| 7 | PIMCO Long-Term Credit Bond Fund, Institutional Class | 60 | ||||||
| 935,881 | PIMCO Preferred and Capital Security Fund, Institutional Class | 7,795,892 | ||||||
| 1,253 | PIMCO Real Return Fund, Institutional Class | 12,115 | ||||||
| 13,810 | PIMCO Total Return Fund, Institutional Class | 112,825 | ||||||
| 7 | Pioneer Strategic Income Fund, Class Y | 60 | ||||||
| 1,424,387 | Principal Spectrum Preferred and Capital Securities Income Fund, Institutional Class | 12,107,288 | ||||||
| 2,667 | Putnam Ultra Short Duration Income Fund, Class Y | 26,800 | ||||||
| 1,863,010 | TCW Emerging Markets Income Fund, Institutional Class | 11,010,392 | ||||||
| 6,878 | TIAA-Cref Bond Index Fund, Institutional Class | 62,933 | ||||||
| 1,250,628 | Voya Securitized Credit Fund, Class I | 11,268,155 | ||||||
| 15,920 | Western Asset Core Plus Bond Fund, Class I | 141,047 | ||||||
| 153,989,637 | ||||||||
See accompanying notes to financial statements.
26
| SIERRA TACTICAL ALL ASSET FUND |
| SCHEDULE OF INVESTMENTS (Continued) |
| September 30, 2023 |
| Shares | Fair Value | |||||||
| OPEN END FUNDS — 29.2% (Continued) | ||||||||
| MIXED ALLOCATION - 0.0%(a) | ||||||||
| 1,498 | Nuveen Real Asset Income Fund, Class I | $ | 28,743 | |||||
| TOTAL OPEN END FUNDS (Cost $216,615,619) | 213,810,033 | |||||||
| SHORT-TERM INVESTMENT — 20.4% | ||||||||
| MONEY MARKET FUND - 20.4% | ||||||||
| 149,561,329 | First American Government Obligations Fund Class X, 5.26% (Cost $149,561,329)(b) | 149,561,329 | ||||||
| TOTAL INVESTMENTS - 96.8% (Cost $705,837,784) | $ | 709,214,513 | ||||||
| OTHER ASSETS IN EXCESS OF LIABILITIES - 3.2% | 23,586,667 | |||||||
| NET ASSETS - 100.0% | $ | 732,801,180 | ||||||
| EAFE | - Europe, Australasia and Far East |
| ETF | - Exchange-Traded Fund |
| MSCI | - Morgan Stanley Capital International |
| SPDR | - Standard & Poor’s Depositary Receipt |
| (a) | Percentage rounds to less than 0.1%. |
| (b) | Rate disclosed is the seven day effective yield as of September 30, 2023. |
| (c) | Amount represents less than 1 share |
| (d) | Amount represents less than $1 |
See accompanying notes to financial statements.
27
| SIERRA TACTICAL CORE INCOME FUND |
| SCHEDULE OF INVESTMENTS |
| September 30, 2023 |
| Shares | Fair Value | |||||||
| EXCHANGE-TRADED FUNDS — 41.1% | ||||||||
| EQUITY - 2.1% | ||||||||
| 885,200 | Alerian MLP ETF | $ | 37,355,440 | |||||
| FIXED INCOME - 39.0% | ||||||||
| 70,600 | BNY Mellon High Yield Beta ETF | 3,212,300 | ||||||
| 123,900 | First Trust ETF IV First Trust Tactical High Yield | 4,860,597 | ||||||
| 592,000 | First Trust Preferred Securities and Income ETF | 9,454,240 | ||||||
| 249,700 | First Trust Senior Loan ETF | 11,421,278 | ||||||
| 61,400 | Franklin Liberty Senior Loan ETF | 1,476,670 | ||||||
| 209,800 | Invesco BulletShares 2024 High Yield Corporate | 4,717,122 | ||||||
| 550,700 | Invesco BulletShares 2025 High Yield Corporate Bond ETF | 12,379,736 | ||||||
| 6,333,000 | Invesco Senior Loan ETF | 132,929,670 | ||||||
| 84,100 | Invesco Variable Rate Preferred ETF | 1,881,317 | ||||||
| 1,045,000 | iShares 0-5 Year High Yield Corporate Bond ETF | 42,876,350 | ||||||
| 681,600 | iShares Broad USD High Yield Corporate Bond ETF | 23,658,336 | ||||||
| 740,900 | iShares Fallen Angels USD Bond ETF | 18,374,320 | ||||||
| 93,800 | iShares Floating Rate Bond ETF | 4,773,482 | ||||||
| 169,900 | iShares iBonds 2024 Term High Yield and Income ETF | 3,941,680 | ||||||
| 1,918,200 | iShares iBoxx High Yield Corporate Bond ETF | 141,409,704 | ||||||
| 581,500 | Janus Henderson AAA CLO ETF | 29,266,895 | ||||||
| 26,400 | Janus Henderson B-BBB CLO ETF | 1,254,000 | ||||||
| 80,000 | JPMorgan High Yield Research Enhanced ETF | 3,510,400 | ||||||
| 75,000 | PGIM Active High Yield Bond ETF | 2,505,765 | ||||||
| 45,100 | Pimco Senior Loan Active ETF | 2,268,530 | ||||||
| 834,600 | SPDR Blackstone Senior Loan ETF | 34,994,778 | ||||||
| 305,100 | SPDR Bloomberg Investment Grade Floating Rate ETF | 9,372,672 | ||||||
| 1,072,800 | SPDR Bloomberg High Yield Bond ETF | 96,981,120 | ||||||
| 1,754,600 | SPDR Bloomberg Short Term High Yield Bond ETF | 42,917,516 | ||||||
| 1,255,900 | SPDR Portfolio High Yield Bond ETF | 28,157,278 | ||||||
| 25,200 | Vaneck CLO ETF | 1,314,432 | ||||||
| 1,017,700 | VanEck Fallen Angel High Yield Bond ETF | 27,538,962 | ||||||
| 392,400 | VanEck Vectors Investment Grade Floating Rate ETF | 9,923,796 | ||||||
| 707,372,946 | ||||||||
| TOTAL EXCHANGE-TRADED FUNDS (Cost $750,024,336) | 744,728,386 | |||||||
See accompanying notes to financial statements.
28
| SIERRA TACTICAL CORE INCOME FUND |
| SCHEDULE OF INVESTMENTS (Continued) |
| September 30, 2023 |
| Shares | Fair Value | |||||||
| OPEN END FUNDS — 33.4% | ||||||||
| ALTERNATIVE - 0.0%(a) | ||||||||
| 10,145 | Metropolitan West Unconstrained Bond Fund, Class I | $ | 101,857 | |||||
| 56,997 | Victory Market Neutral Income Fund, Class I | 488,468 | ||||||
| 590,325 | ||||||||
| FIXED INCOME - 33.4% | ||||||||
| 9,390 | Allspring Municipal Bond Fund, Institutional Class | 87,425 | ||||||
| 1,327,436 | American Century High Income Fund, Class I | 10,831,879 | ||||||
| 10,370 | Angel Oak Multi-Strategy Income Fund, Institutional Class | 86,589 | ||||||
| 1,654,656 | Aristotle Floating Rate Income Fund, Class I | 15,653,045 | ||||||
| 5,137,950 | BlackRock Floating Rate Income Portfolio, Institutional Class | 49,529,843 | ||||||
| 4,149,041 | BlackRock High Yield Bond Portfolio, Institutional Class | 27,840,063 | ||||||
| 49 | BlackRock High Yield Municipal Fund, Institutional Class | 402 | ||||||
| 18,075 | BlackRock National Municipal Fund, Institutional Class | 175,688 | ||||||
| 2,789 | BlackRock New York Municipal Opportunities Fund, Institutional Class | 27,726 | ||||||
| 7,714 | BlackRock Strategic Municipal Opportunities Fund, Institutional Class | 76,212 | ||||||
| 35,848 | Cohen & Steers Preferred Securities and Income, Class I | 400,780 | ||||||
| 4,395 | Columbia Intermediate Duration Municipal Bond Fund, Institutional Class | 40,306 | ||||||
| 1,551 | Columbia Total Return Bond Fund, Institutional Class | 44,580 | ||||||
| 4,661,043 | Credit Suisse Floating Rate High Income Fund, Institutional Class | 29,644,235 | ||||||
| 636 | Fidelity Capital & Income Fund | 5,860 | ||||||
| 12,213 | Goldman Sachs High Yield Floating Rate Fund, Institutional Class | 108,084 | ||||||
| 6,002 | Goldman Sachs High Yield Municipal Fund, Institutional Class | 51,013 | ||||||
| 1,213,774 | Holbrook Income Fund, Class I | 11,858,570 | ||||||
| 13,310 | Invesco Floating Rate ESG Fund, Class Y | 90,909 | ||||||
| 17,917 | Invesco High Yield Municipal Fund, Class Y | 142,616 | ||||||
| 24,319 | Invesco International Bond Fund, Class Y | 101,410 | ||||||
| 82,751 | Invesco Rochester Municipal Opportunities Fund, Class Y | 526,293 | ||||||
| 15,516 | Invesco Senior Floating Rate Fund, Class Y | 103,959 | ||||||
| 1 | JPMorgan Emerging Markets Debt Fund, Class I | 6 | ||||||
See accompanying notes to financial statements.
29
| SIERRA TACTICAL CORE INCOME FUND |
| SCHEDULE OF INVESTMENTS (Continued) |
| September 30, 2023 |
| Shares | Fair Value | |||||||
| OPEN END FUNDS — 33.4% (Continued) | ||||||||
| FIXED INCOME - 33.4% (Continued) | ||||||||
| 11,209 | JPMorgan Income Fund, Class I | $ | 90,345 | |||||
| 334,576 | Leader Capital High Quality Income Fund, Institutional Class | 3,697,067 | ||||||
| 1,133 | Medalist Partners MBS Total Return Fund, Institutional Class | 9,010 | ||||||
| 19,560 | Metropolitan West Total Return Bond Fund, Class I | 169,195 | ||||||
| 4,066 | MFS California Municipal Bond Fund, Class I | 34,598 | ||||||
| 9,701 | MFS Corporate Bond Fund, Class I | 112,531 | ||||||
| 13,921 | MFS Emerging Markets Debt Fund, Class I | 154,660 | ||||||
| 6,578 | MFS Emerging Markets Debt Local Currency Fund, Class I | 35,063 | ||||||
| 469,540 | Neuberger Berman Floating Rate Income Fund, Class I | 4,380,813 | ||||||
| 9,271 | Neuberger Berman Strategic Income Fund, Class I | 86,404 | ||||||
| 9,191 | Nuveen All-American Municipal Bond Fund, Class I | 89,148 | ||||||
| 15,915 | Nuveen High Yield Municipal Bond Fund, Class I | 219,155 | ||||||
| 1,841 | Nuveen Intermediate Duration Municipal Bond Fund, Class I | 15,560 | ||||||
| 1,468,145 | Nuveen Preferred Securities Fund, Class I | 21,038,517 | ||||||
| 9,700 | Nuveen Short Duration High Yield Municipal Bond, Class I | 89,049 | ||||||
| 30 | Nuveen Strategic Income Fund, Class I | 280 | ||||||
| 839,084 | Palmer Square Income Plus Fund | 8,231,418 | ||||||
| 1,150,866 | PGIM Floating Rate Income Fund, Class Z | 10,357,796 | ||||||
| 2,206,832 | PIMCO Diversified Income Fund, Institutional Class | 19,817,354 | ||||||
| 3,245,138 | PIMCO Dynamic Bond Fund, Institutional Class | 30,926,167 | ||||||
| 1,922,967 | PIMCO Emerging Markets Bond Fund, Institutional Class | 14,883,767 | ||||||
| 0 | (c) | PIMCO Emerging Markets Full Spectrum Bond Fund, Institutional Class | 0 | (d) | ||||
| 6,513 | PIMCO Emerging Markets Local Currency and Bond, Institutional Class | 36,210 | ||||||
| 15,171 | PIMCO High Yield Municipal Bond Fund, Institutional Class | 120,305 | ||||||
| 15,382,197 | PIMCO Income Fund Institutional Class | 156,744,591 | ||||||
| 8,763,020 | PIMCO International Bond Fund U.S. Dollar-Hedged, Institutional Class | 82,284,755 | ||||||
| 469 | PIMCO International Bond Fund Unhedged, Institutional Class | 3,347 | ||||||
| 22,154 | PIMCO Investment Grade Credit Bond Fund, Institutional Class | 186,533 | ||||||
| 32 | PIMCO Long-Term Credit Bond Fund, Institutional Class | 264 | ||||||
| 5,430,460 | PIMCO Low Duration Income Fund, Institutional Class | 42,086,064 | ||||||
| 3,818 | PIMCO Real Return Fund, Institutional Class | 36,919 | ||||||
| 43,505 | PIMCO Total Return Fund Institutional Class | 355,437 | ||||||
| 23 | Pioneer Strategic Income Fund, Class Y | 205 | ||||||
| 4,223,887 | Principal Spectrum Preferred and Capital Securities Income Fund, Institutional Class | 35,903,040 | ||||||
See accompanying notes to financial statements.
30
| SIERRA TACTICAL CORE INCOME FUND |
| SCHEDULE OF INVESTMENTS (Continued) |
| September 30, 2023 |
| Shares | Fair Value | |||||||
| OPEN END FUNDS — 33.4% (Continued) | ||||||||
| FIXED INCOME - 33.4% (Continued) | ||||||||
| 5,874 | Putnam Ultra Short Duration Income Fund, Class Y | $ | 59,032 | |||||
| 3,280,341 | TCW Emerging Markets Income Fund, Institutional Class | 19,386,812 | ||||||
| 485,006 | Thornburg Strategic Income Fund, Class I | 5,335,069 | ||||||
| 21,975 | TIAA-Cref Bond Index Fund, Institutional Class | 201,069 | ||||||
| 45,546 | Western Asset Core Plus Bond Fund, Class I | 403,533 | ||||||
| 605,008,575 | ||||||||
| TOTAL OPEN END FUNDS (Cost $612,877,394) | 605,598,900 | |||||||
| SHORT-TERM INVESTMENT — 19.2% | ||||||||
| MONEY MARKET FUND - 19.2% | ||||||||
| 348,236,451 | First American Government Obligations Fund Class X, 5.26% (Cost $348,236,451)(b) | 348,236,451 | ||||||
| TOTAL INVESTMENTS - 93.7% (Cost $1,711,138,181) | $ | 1,698,563,737 | ||||||
| OTHER ASSETS IN EXCESS OF LIABILITIES - 6.3% | 113,463,375 | |||||||
| NET ASSETS - 100.0% | $ | 1,812,027,112 | ||||||
| CLO | - Collateralized Loan Obligation |
| ETF | - Exchange-Traded Fund |
| MLP | - Master Limited Partnership |
| SPDR | - Standard & Poor’s Depositary Receipt |
| (a) | Percentage rounds to less than 0.1%. |
| (b) | Rate disclosed is the seven day effective yield as of September 30, 2023. |
| (c) | Amount represents less than one share |
| (d) | Amount represents less than $1 |
See accompanying notes to financial statements.
31
| SIERRA TACTICAL MUNICIPAL FUND |
| SCHEDULE OF INVESTMENTS |
| September 30, 2023 |
| Shares | Fair Value | |||||||
| OPEN END FUNDS — 23.4% | ||||||||
| FIXED INCOME - 23.4% | ||||||||
| 1,897 | American Century High-Yield Municipal Fund, Class I | $ | 15,591 | |||||
| 5,484 | BlackRock High Yield Municipal Fund, Institutional Class | 44,750 | ||||||
| 8,561 | BlackRock National Municipal Fund, Institutional Class | 83,212 | ||||||
| 2,314 | BlackRock Strategic Municipal Opportunities Fund, Institutional Class | 22,862 | ||||||
| 3,516 | City National Rochdale Municipal High Income Fund, Service Class | 30,487 | ||||||
| 1,729 | Columbia High Yield Municipal Fund, Institutional Class | 14,314 | ||||||
| 3,765 | Columbia Tax Exempt Fund, Class I | 41,530 | ||||||
| 7,420 | Franklin High Yield Tax-Free Income Fund, Class A1 | 61,437 | ||||||
| 4,757 | Goldman Sachs High Yield Municipal Fund, Institutional Class | 40,438 | ||||||
| 10,829 | Invesco High Yield Municipal Fund, Class Y | 86,201 | ||||||
| 22,183 | Invesco Rochester Municipal Opportunities Fund, Class Y | 141,081 | ||||||
| 3,656 | MainStay MacKay High Yield Municipal Bond Fund, Class I | 39,737 | ||||||
| 4,286 | Northern Intermediate Tax-Exempt Fund | 40,335 | ||||||
| 4,136 | Nuveen All-American Municipal Bond Fund, Class I | 40,119 | ||||||
| 1,049 | Nuveen California High Yield Municipal Bond Fund, Class I | 7,562 | ||||||
| 2,114 | Nuveen California Municipal Bond Fund, Class I | 20,290 | ||||||
| 13,091 | Nuveen High Yield Municipal Bond Fund, Class I | 180,264 | ||||||
| 2,476,688 | Nuveen Limited Term Municipal Bond Fund, Class I | 26,104,294 | ||||||
| 4,714,332 | Nuveen Short Duration High Yield Municipal Bond, Class I | 43,277,571 | ||||||
| 10,670 | PIMCO High Yield Municipal Bond Fund, Institutional Class | 84,611 | ||||||
| 928 | Putnam Strategic Intermediate Municipal Fund, Class Y | 12,411 | ||||||
| TOTAL OPEN END FUNDS (Cost $72,981,351) | 70,389,097 | |||||||
See accompanying notes to financial statements.
32
| SIERRA TACTICAL MUNICIPAL FUND |
| SCHEDULE OF INVESTMENTS (Continued) |
| September 30, 2023 |
| Shares | Fair Value | |||||||
| SHORT-TERM INVESTMENTS — 69.5% | ||||||||
| MONEY MARKET FUNDS - 69.5% | ||||||||
| 208,067,220 | BlackRock Liquidity Funds MuniCash, Institutional Class, 4.03%(a)(b) | $ | 208,067,220 | |||||
| 401,184 | First American Government Obligations Fund Class X, 5.26%(a) | 401,184 | ||||||
| TOTAL MONEY MARKET FUNDS (Cost $208,469,554) | 208,468,404 | |||||||
| TOTAL INVESTMENTS - 92.9% (Cost $281,450,905) | $ | 278,857,501 | ||||||
| OTHER ASSETS IN EXCESS OF LIABILITIES - 7.1% | 21,347,263 | |||||||
| NET ASSETS - 100.0% | $ | 300,204,764 | ||||||
| (a) | Rate disclosed is the seven day effective yield as of September 30, 2023. |
| (b) | Floating Net Asset Value |
See accompanying notes to financial statements.
33
| SIERRA TACTICAL BOND FUND |
| SCHEDULE OF INVESTMENTS |
| September 30, 2023 |
| Shares | Fair Value | |||||||
| EXCHANGE-TRADED FUNDS — 50.4% | ||||||||
| FIXED INCOME - 50.4% | ||||||||
| 297,900 | FlexShrs High Yield Value-Scored Bond Index Fund | $ | 11,844,504 | |||||
| 1,471,200 | iShares 0-5 Year High Yield Corporate Bond ETF | 60,363,336 | ||||||
| 2,092,400 | iShares Broad USD High Yield Corporate Bond ETF | 72,627,204 | ||||||
| 3,962,300 | iShares iBoxx High Yield Corporate Bond ETF | 292,100,756 | ||||||
| 75,000 | PGIM Active High Yield Bond ETF | 2,505,765 | ||||||
| 71,300 | PIMCO 0-5 Year High Yield Corporate Bond Index ETF | 6,438,390 | ||||||
| 3,265,700 | SPDR Bloomberg High Yield Bond ETF | 295,219,280 | ||||||
| 3,252,800 | SPDR Bloomberg Short Term High Yield Bond ETF | 79,563,488 | ||||||
| 2,143,600 | Xtrackers USD High Yield Corporate Bond ETF | 72,668,040 | ||||||
| TOTAL EXCHANGE-TRADED FUNDS (Cost $906,278,004) | 893,330,763 | |||||||
| OPEN END FUNDS — 50.0% | ||||||||
| FIXED INCOME - 50.0% | ||||||||
| 3,795,681 | Allspring Short-Term High Yield Bond Fund, Institutional Class | 29,378,568 | ||||||
| 67,034,293 | BlackRock High Yield Bond Portfolio, Institutional Class | 449,800,107 | ||||||
| 3,707,097 | City National Rochdale Fixed Income Opportunities, Class N | 70,323,625 | ||||||
| 17,250 | Fidelity Capital & Income Fund | 159,042 | ||||||
| 45,351 | Fidelity High Income Fund | 331,062 | ||||||
| 28,274 | Goldman Sachs High Yield Fund, Institutional Class | 151,268 | ||||||
| 46,751 | John Hancock High Yield Fund, Class I | 136,047 | ||||||
| 30,894 | Lord Abbett High Yield Fund, Class I | 186,911 | ||||||
| 541,881 | MassMutual High Yield Fund, Class I | 4,080,363 | ||||||
| 11 | Metropolitan West High Yield Bond Fund, Class I | 100 | ||||||
| 0 | (b) | Neuberger Berman High Income Bond Fund, Institutional Class | 1 | |||||
| 5 | Nuveen High Yield Income Fund, Class I | 91 | ||||||
| 11,018,975 | Osterweis Strategic Income Fund | 116,470,567 | ||||||
| 41,465,233 | PGIM High Yield Fund, Class Z | 188,252,156 | ||||||
| 21,474 | PGIM Short Duration High Yield, Class Z | 173,083 | ||||||
| 94 | PIMCO High Yield Fund, Institutional Class | 711 | ||||||
| 0 | (b) | PIMCO High Yield Spectrum Fund, Institutional Class | 0 | (c) | ||||
| 92 | Principal Funds Inc - High Income Fund, Institutional Class | 584 | ||||||
See accompanying notes to financial statements.
34
| SIERRA TACTICAL BOND FUND |
| SCHEDULE OF INVESTMENTS (Continued) |
| September 30, 2023 |
| Shares | Fair Value | |||||||
| OPEN END FUNDS — 50.0% (Continued) | ||||||||
| FIXED INCOME - 50.0% (Continued) | ||||||||
| 2,090,988 | Putnam High Yield Fund, Class Y | $ | 11,312,245 | |||||
| 3,914 | TIAA-CREF High Yield Fund, Institutional Class | 32,214 | ||||||
| 1,313,019 | Wells Fargo High Yield Bond Fund, Institutional Class | 3,794,626 | ||||||
| 2,454,459 | Western Asset Short Duration High Income Fund, Class I | 11,585,048 | ||||||
| TOTAL OPEN END FUNDS (Cost $894,031,830) | 886,168,419 | |||||||
| SHORT-TERM INVESTMENT — 0.1% | ||||||||
| MONEY MARKET FUND - 0.1% | ||||||||
| 1,574,243 | First American Government Obligations Fund Class X, 5.26% (Cost $1,574,243)(a) | 1,574,243 | ||||||
| TOTAL INVESTMENTS - 100.5% (Cost $1,801,884,077) | $ | 1,781,073,425 | ||||||
| LIABILITIES IN EXCESS OF OTHER ASSETS - (0.5)% | (9,291,263 | ) | ||||||
| NET ASSETS - 100.0% | $ | 1,771,782,162 | ||||||
| ETF | - Exchange-Traded Fund |
| SPDR | - Standard & Poor’s Depositary Receipt |
| (a) | Rate disclosed is the seven day effective yield as of September 30, 2023. |
| (b) | Amount represents less than one share |
| (c) | Amount represents less than $1 |
See accompanying notes to financial statements.
35
| SIERRA TACTICAL RISK SPECTRUM 50 FUND |
| SCHEDULE OF INVESTMENTS |
| September 30, 2023 |
| Shares | Fair Value | |||||||
| EXCHANGE-TRADED FUNDS — 55.0% | ||||||||
| EQUITY - 38.6% | ||||||||
| 83,400 | Communication Services Select Sector SPDR Fund | $ | 5,468,538 | |||||
| 72,700 | Energy Select Sector SPDR Fund | 6,571,353 | ||||||
| 65,300 | Financial Select Sector SPDR Fund | 2,166,001 | ||||||
| 30,700 | Invesco QQQ Trust Series 1 | 10,998,889 | ||||||
| 42,300 | iShares Core S&P Mid-Cap ETF | 10,547,505 | ||||||
| 115,100 | iShares MSCI EAFE Min Vol Factor ETF | 7,506,822 | ||||||
| 106,700 | iShares MSCI USA Min Vol Factor ETF | 7,722,946 | ||||||
| 31,200 | iShares MSCI USA Quality Factor ETF | 4,111,848 | ||||||
| 171,200 | JPMorgan Equity Premium Income ETF | 9,169,472 | ||||||
| 89,200 | JPMorgan Nasdaq Equity Premium Income ETF | 4,186,156 | ||||||
| 14,300 | SPDR Dow Jones Industrial Average ETF Trust | 4,789,785 | ||||||
| 39,300 | Vanguard Growth ETF | 10,701,783 | ||||||
| 152,600 | Vanguard S&P 500 ETF | 59,926,020 | ||||||
| 101,300 | Vanguard Value ETF | 13,972,309 | ||||||
| 157,839,427 | ||||||||
| FIXED INCOME - 16.4% | ||||||||
| 40,500 | Franklin Liberty Senior Loan ETF | 974,025 | ||||||
| 513,800 | Invesco Senior Loan ETF | 10,784,662 | ||||||
| 116,200 | iShares 0-5 Year High Yield Corporate Bond ETF | 4,767,686 | ||||||
| 126,700 | iShares Broad USD High Yield Corporate Bond ETF | 4,397,757 | ||||||
| 219,700 | iShares iBoxx High Yield Corporate Bond ETF | 16,196,284 | ||||||
| 9,000 | Pacer Pacific Asset Floating Rate High Income ETF | 420,165 | ||||||
| 29,700 | Pimco Senior Loan Active ETF | 1,493,910 | ||||||
| 91,900 | SPDR Blackstone Senior Loan ETF | 3,853,367 | ||||||
| 69,100 | SPDR Bloomberg Investment Grade Floating Rate ETF | 2,122,752 | ||||||
| 101,200 | SPDR Bloomberg High Yield Bond ETF | 9,148,480 | ||||||
| 367,100 | SPDR Bloomberg Short Term High Yield Bond ETF | 8,979,266 | ||||||
| 186,500 | SPDR Portfolio High Yield Bond ETF | 4,181,330 | ||||||
| 67,319,684 | ||||||||
| TOTAL EXCHANGE-TRADED FUNDS (Cost $220,447,791) | 225,159,111 | |||||||
See accompanying notes to financial statements.
36
| SIERRA TACTICAL RISK SPECTRUM 50 FUND |
| SCHEDULE OF INVESTMENTS (Continued) |
| September 30, 2023 |
| Shares | Fair Value | |||||||
| OPEN END FUNDS — 32.4% | ||||||||
| ALTERNATIVE - 1.7% | ||||||||
| 322,001 | DoubleLine Flexible Income Fund, Class I | $ | 2,695,148 | |||||
| 1 | JPMorgan Hedged Equity Fund, Class I | 27 | ||||||
| 413,528 | LoCorr Long/Short Commodities Strategy Fund, Class I | 4,193,176 | ||||||
| 6,888,351 | ||||||||
| EQUITY - 9.3% | ||||||||
| 262,333 | BlackRock Equity Dividend Fund, Institutional Class | 4,787,572 | ||||||
| 482,514 | Causeway International Value Fund, Class I | 8,902,382 | ||||||
| 520,842 | Dodge & Cox International Stock Fund, Class I | 24,531,646 | ||||||
| 38,221,600 | ||||||||
| FIXED INCOME - 21.4% | ||||||||
| 502 | Allspring California Tax-Free Fund, Institutional Class | 5,055 | ||||||
| 1,604 | Ashmore Emerging Markets Total Return Fund, Institutional Class | 7,316 | ||||||
| 998,243 | BlackRock Floating Rate Income Portfolio, Institutional Class | 9,623,065 | ||||||
| 469,927 | BlackRock High Yield Bond Portfolio, Institutional Class | 3,153,209 | ||||||
| 1,085 | BlackRock National Municipal Fund, Institutional Class | 10,544 | ||||||
| 342 | BlackRock Strategic Municipal Opportunities Fund, Institutional Class | 3,376 | ||||||
| 1,743 | Cohen & Steers Preferred Securities and Income, Class I | 19,490 | ||||||
| 261 | Columbia Intermediate Duration Municipal Bond Fund, Institutional Class | 2,396 | ||||||
| 513,070 | Crossingbridge Low Duration High Yield Fund, Institutional Class | 4,956,225 | ||||||
| 318,099 | DoubleLine Low Duration Emerging Markets Fixed, Class I | 2,888,342 | ||||||
| 123,068 | First Trust Preferred Securities and Income Fund, Class I | 2,210,297 | ||||||
| 18 | Invesco High Yield Municipal Fund, Class Y | 142 | ||||||
| 11,108 | Invesco Rochester Municipal Opportunities Fund, Class Y | 70,645 | ||||||
| 2,258 | Invesco Senior Floating Rate Fund, Class Y | 15,132 | ||||||
| 1,219 | JPMorgan Income Fund, Class I | 9,825 | ||||||
| 1,077,078 | JPMorgan Unconstrained Debt Fund, Class I | 10,006,060 | ||||||
| 78,096 | MassMutual Global Floating Rate Fund, Class Y | 687,245 | ||||||
| 1,084 | Neuberger Berman Strategic Income Fund, Class I | 10,106 | ||||||
| 102,712 | North Square Preferred and Income Securities Fund, Class I | 1,885,788 | ||||||
| 612 | Nuveen All-American Municipal Bond Fund, Class I | 5,938 | ||||||
| 1,733 | Nuveen High Yield Municipal Bond Fund, Class I | 23,866 | ||||||
| 337,529 | Nuveen Preferred Securities Fund, Class I | 4,836,796 | ||||||
| 431 | Nuveen Short Duration High Yield Municipal Bond, Class I | 3,961 | ||||||
| 655 | Nuveen Strategic Income Fund, Class I | 6,113 | ||||||
See accompanying notes to financial statements.
37
| SIERRA TACTICAL RISK SPECTRUM 50 FUND |
| SCHEDULE OF INVESTMENTS (Continued) |
| September 30, 2023 |
| Shares | Fair Value | |||||||
| OPEN END FUNDS — 32.4% (Continued) | ||||||||
| FIXED INCOME - 21.4% (Continued) | ||||||||
| 262,271 | PIMCO Diversified Income Fund, Institutional Class | $ | 2,355,192 | |||||
| 305,277 | PIMCO Emerging Markets Bond Fund, Institutional Class | 2,362,846 | ||||||
| 1,658 | PIMCO Emerging Markets Full Spectrum Bond Fund, Institutional Class | 9,598 | ||||||
| 1,385,988 | PIMCO Income Fund Institutional Class | 14,123,216 | ||||||
| 958,201 | PIMCO International Bond Fund U.S. Dollar-Hedged, Institutional Class | 8,997,505 | ||||||
| 2,579 | PIMCO Investment Grade Credit Bond Fund, Institutional Class | 21,715 | ||||||
| 1 | PIMCO Long-Term Credit Bond Fund, Institutional Class | 11 | ||||||
| 314,869 | PIMCO Low Duration Income Fund, Institutional Class | 2,440,235 | ||||||
| 265,035 | PIMCO Preferred and Capital Security Fund, Institutional Class | 2,207,741 | ||||||
| 422 | PIMCO Real Return Fund, Institutional Class | 4,078 | ||||||
| 7,402 | PIMCO Total Return Fund, Institutional Class | 60,475 | ||||||
| 538,026 | Principal Spectrum Preferred and Capital Securities Income Fund, Institutional Class | 4,573,222 | ||||||
| 439,110 | Putnam Floating Rate Income Fund, Class Y | 3,486,530 | ||||||
| 290,079 | RiverPark Strategic Income Fund, Institutional Class | 2,477,256 | ||||||
| 630,177 | TCW Emerging Markets Income Fund, Institutional Class | 3,724,347 | ||||||
| 2,398 | TIAA-Cref Bond Index Fund, Institutional Class | 21,940 | ||||||
| 2,073 | Western Asset Core Plus Bond Fund, Class I | 18,369 | ||||||
| 87,325,208 | ||||||||
| TOTAL OPEN END FUNDS (Cost $132,889,911) | 132,435,159 | |||||||
| SHORT-TERM INVESTMENT — 10.4% | ||||||||
| MONEY MARKET FUND - 10.4% | ||||||||
| 42,535,501 | First American Government Obligations Fund Class X, 5.26% (Cost $42,535,501)(a) | 42,535,501 | ||||||
| TOTAL INVESTMENTS - 97.8% (Cost $395,873,203) | $ | 400,129,771 | ||||||
| OTHER ASSETS IN EXCESS OF LIABILITIES - 2.2% | 8,802,371 | |||||||
| NET ASSETS - 100.0% | $ | 408,932,142 | ||||||
| EAFE | - Europe, Australasia and Far East |
| ETF | - Exchange-Traded Fund |
| MSCI | - Morgan Stanley Capital International |
| SPDR | - Standard & Poor’s Depositary Receipt |
| (a) | Rate disclosed is the seven day effective yield as of September 30, 2023. |
See accompanying notes to financial statements.
38
| SIERRA TACTICAL RISK SPECTRUM 30 FUND |
| SCHEDULE OF INVESTMENTS |
| September 30, 2023 |
| Shares | Fair Value | |||||||
| EXCHANGE-TRADED FUNDS — 48.7% | ||||||||
| EQUITY - 24.4% | ||||||||
| 4,400 | Communication Services Select Sector SPDR Fund | $ | 288,508 | |||||
| 4,000 | Energy Select Sector SPDR Fund | 361,560 | ||||||
| 7,600 | Financial Select Sector SPDR Fund | 252,092 | ||||||
| 1,600 | Invesco QQQ Trust Series 1 | 573,232 | ||||||
| 2,300 | iShares Core S&P Mid-Cap ETF | 573,505 | ||||||
| 6,200 | iShares MSCI EAFE Min Vol Factor ETF | 404,364 | ||||||
| 6,900 | iShares MSCI USA Min Vol Factor ETF | 499,422 | ||||||
| 1,400 | iShares MSCI USA Quality Factor ETF | 184,506 | ||||||
| 10,000 | JPMorgan Equity Premium Income ETF | 535,600 | ||||||
| 4,100 | JPMorgan Nasdaq Equity Premium Income ETF | 192,413 | ||||||
| 2,000 | SPDR Dow Jones Industrial Average ETF Trust | 669,900 | ||||||
| 2,100 | Vanguard Growth ETF | 571,851 | ||||||
| 8,400 | Vanguard S&P 500 ETF | 3,298,680 | ||||||
| 6,000 | Vanguard Value ETF | 827,580 | ||||||
| 9,233,213 | ||||||||
| FIXED INCOME - 24.3% | ||||||||
| 6,900 | Blackrock AAA CLO ETF | 353,970 | ||||||
| 79,800 | Invesco Senior Loan ETF | 1,675,002 | ||||||
| 16,000 | iShares Broad USD High Yield Corporate Bond ETF | 555,360 | ||||||
| 27,000 | iShares iBoxx High Yield Corporate Bond ETF | 1,990,440 | ||||||
| 8,400 | Pacer Pacific Asset Floating Rate High Income ETF | 392,154 | ||||||
| 31,200 | Simplify Enhanced Income ETF | 776,256 | ||||||
| 29,800 | SPDR Blackstone Senior Loan ETF | 1,249,514 | ||||||
| 13,700 | SPDR Bloomberg High Yield Bond ETF | 1,238,480 | ||||||
| 23,800 | SPDR Bloomberg Short Term High Yield Bond ETF | 582,148 | ||||||
| 17,200 | SPDR Portfolio High Yield Bond ETF | 385,624 | ||||||
| 9,198,948 | ||||||||
| TOTAL EXCHANGE-TRADED FUNDS (Cost $17,954,552) | 18,432,161 | |||||||
See accompanying notes to financial statements.
39
| SIERRA TACTICAL RISK SPECTRUM 30 FUND |
| SCHEDULE OF INVESTMENTS (Continued) |
| September 30, 2023 |
| Shares | Fair Value | |||||||
| OPEN END FUNDS — 38.3% | ||||||||
| ALTERNATIVE - 4.3% | ||||||||
| 75,173 | DoubleLine Flexible Income Fund, Class I | $ | 629,199 | |||||
| 62,708 | iMGP High Income Fund, Institutional Class | 588,832 | ||||||
| 38,083 | LoCorr Long/Short Commodities Strategy Fund, Class I | 386,160 | ||||||
| 1,604,191 | ||||||||
| EQUITY - 4.5% | ||||||||
| 36,269 | Dodge & Cox International Stock Fund, Class I | 1,708,255 | ||||||
| FIXED INCOME - 29.5% | ||||||||
| 25,885 | American Century High Income Fund, Class I | 211,220 | ||||||
| 217,938 | American Century High-Yield Fund, Investor Class | 1,048,283 | ||||||
| 73,830 | Aristotle Strategic Income Fund, Class I-2 | 738,299 | ||||||
| 611 | Ashmore Emerging Markets Corporate Income Fund, Institutional Class | 3,222 | ||||||
| 470 | Ashmore Emerging Markets Total Return Fund, Institutional Class | 2,142 | ||||||
| 160 | BlackRock Strategic Municipal Opportunities Fund, Institutional Class | 1,584 | ||||||
| 79 | Columbia Intermediate Duration Municipal Bond Fund, Institutional Class | 722 | ||||||
| 62,613 | Crossingbridge Low Duration High Yield Fund, Institutional Class | 604,842 | ||||||
| 50,422 | DoubleLine Low Duration Emerging Markets Fixed, Class I | 457,829 | ||||||
| 556 | Franklin High Yield Tax-Free Income Fund, Class A1 | 4,605 | ||||||
| 40,282 | Holbrook Structured Income Fund, Class I | 394,361 | ||||||
| 191,262 | Medalist Partners MBS Total Return Fund, Institutional Class | 1,520,537 | ||||||
| 217 | Nuveen High Yield Municipal Bond Fund, Class I | 2,982 | ||||||
| 29,349 | Nuveen Preferred Securities Fund, Class I | 420,566 | ||||||
| 153 | Nuveen Short Duration High Yield Municipal Bond, Class I | 1,400 | ||||||
| 163 | Nuveen Strategic Income Fund, Class I | 1,524 | ||||||
| 168,895 | PIMCO Income Fund Institutional Class | 1,721,042 | ||||||
| 265,467 | PIMCO International Bond Fund U.S. Dollar-Hedged, Institutional Class | 2,492,730 | ||||||
| 322 | PIMCO Investment Grade Credit Bond Fund, Institutional Class | 2,708 | ||||||
| 616 | PIMCO Total Return Fund Institutional Class | 5,033 | ||||||
| 72,493 | Principal Spectrum Preferred and Capital Securities Income Fund, Institutional Class | 616,187 | ||||||
| 55,066 | Putnam Floating Rate Income Fund, Class Y | 437,222 | ||||||
| 35,491 | RiverPark Strategic Income Fund, Institutional Class | 303,094 | ||||||
| 28,548 | TCW Emerging Markets Income Fund, Institutional Class | 168,720 | ||||||
| 1 | TCW Emerging Markets Local Currency Income Fund, Class I | 7 | ||||||
| 1 | TCW Total Return Bond Fund, Class I | 8 | ||||||
See accompanying notes to financial statements.
40
| SIERRA TACTICAL RISK SPECTRUM 30 FUND |
| SCHEDULE OF INVESTMENTS (Continued) |
| September 30, 2023 |
| Shares | Fair Value | |||||||
| OPEN END FUNDS — 38.3% (Continued) | ||||||||
| FIXED INCOME - 29.5% (Continued) | ||||||||
| 296 | TIAA-Cref Bond Index Fund, Institutional Class | $ | 2,705 | |||||
| 740 | Western Asset Core Plus Bond Fund, Class I | 6,552 | ||||||
| 11,170,126 | ||||||||
| TOTAL OPEN END FUNDS (Cost $14,609,941) | 14,482,572 | |||||||
| SHORT-TERM INVESTMENT — 10.1% | ||||||||
| MONEY MARKET FUND - 10.1% | ||||||||
| 3,832,377 | First American Government Obligations Fund Class X, 5.26% (Cost $3,832,377)(a) | 3,832,377 | ||||||
| TOTAL INVESTMENTS - 97.1% (Cost $36,396,870) | $ | 36,747,110 | ||||||
| OTHER ASSETS IN EXCESS OF LIABILITIES - 2.9% | 1,091,310 | |||||||
| NET ASSETS - 100.0% | $ | 37,838,420 | ||||||
| CLO | - Collateralized Loan Obligation |
| EAFE | - Europe, Australasia and Far East |
| ETF | - Exchange-Traded Fund |
| MBS | - Mortgage Backed Securities |
| MSCI | - Morgan Stanley Capital International |
| SPDR | - Standard & Poor’s Depositary Receipt |
| (a) | Rate disclosed is the seven day effective yield as of September 30, 2023. |
See accompanying notes to financial statements.
41
| SIERRA TACTICAL RISK SPECTRUM 70 FUND |
| SCHEDULE OF INVESTMENTS |
| September 30, 2023 |
| Shares | Fair Value | |||||||
| EXCHANGE-TRADED FUNDS — 71.7% | ||||||||
| COMMODITY - 1.0% | ||||||||
| 15,525 | Invesco Optimum Yield Diversified Commodity | $ | 232,099 | |||||
| EQUITY - 57.6% | ||||||||
| 4,857 | Communication Services Select Sector SPDR Fund | 318,473 | ||||||
| 5,356 | Energy Select Sector SPDR Fund | 484,129 | ||||||
| 8,608 | Financial Select Sector SPDR Fund | 285,527 | ||||||
| 2,689 | Invesco QQQ Trust Series 1 | 963,388 | ||||||
| 2,922 | iShares Core S&P Mid-Cap ETF | 728,601 | ||||||
| 14,635 | iShares MSCI EAFE Min Vol Factor ETF | 954,495 | ||||||
| 7,707 | iShares MSCI USA Min Vol Factor ETF | 557,833 | ||||||
| 3,386 | iShares MSCI USA Quality Factor ETF | 446,241 | ||||||
| 9,982 | JPMorgan Equity Premium Income ETF | 534,636 | ||||||
| 9,670 | JPMorgan Nasdaq Equity Premium Income ETF | 453,813 | ||||||
| 1,838 | SPDR Dow Jones Industrial Average ETF Trust | 615,638 | ||||||
| 4,708 | Vanguard Growth ETF | 1,282,035 | ||||||
| 12,243 | Vanguard S&P 500 ETF | 4,807,826 | ||||||
| 5,944 | Vanguard Value ETF | 819,856 | ||||||
| 3,109 | WisdomTree India Earnings Fund | 114,287 | ||||||
| 13,366,778 | ||||||||
| FIXED INCOME - 13.1% | ||||||||
| 23,284 | Angel Oak Income ETF | 468,011 | ||||||
| 23,861 | Invesco Senior Loan ETF | 500,842 | ||||||
| 4,359 | iShares 0-5 Year High Yield Corporate Bond ETF | 178,850 | ||||||
| 3,917 | iShares Broad USD High Yield Corporate Bond ETF | 135,959 | ||||||
| 7,904 | iShares iBoxx High Yield Corporate Bond ETF | 582,684 | ||||||
| 4,936 | Pacer Pacific Asset Floating Rate High Income ETF | 230,437 | ||||||
| 8,952 | Panagram BBB-B CLO ETF | 234,005 | ||||||
| 2,999 | SPDR Blackstone Senior Loan ETF | 125,748 | ||||||
| 3,606 | SPDR Bloomberg High Yield Bond ETF | 325,982 | ||||||
| 10,892 | SPDR Bloomberg Short Term High Yield Bond ETF | 266,418 | ||||||
| 3,048,936 | ||||||||
| TOTAL EXCHANGE-TRADED FUNDS (Cost $17,035,075) | 16,647,813 | |||||||
See accompanying notes to financial statements.
42
| SIERRA TACTICAL RISK SPECTRUM 70 FUND |
| SCHEDULE OF INVESTMENTS (Continued) |
| September 30, 2023 |
| Shares | Fair Value | |||||||
| OPEN END FUNDS — 18.5% | ||||||||
| ALTERNATIVE - 2.0% | ||||||||
| 24,824 | iMGP High Income Fund, Institutional Class | $ | 233,101 | |||||
| 23,292 | LoCorr Long/Short Commodities Strategy Fund, Class I | 236,179 | ||||||
| 469,280 | ||||||||
| EQUITY - 9.2% | ||||||||
| 32,473 | Ashmore Emerging Markets Frontier Equity Fund, Institutional Class | 329,928 | ||||||
| 20,017 | Brandes Institutional International Equity Fund, Class I | 366,705 | ||||||
| 30,374 | Dodge & Cox International Stock Fund, Class I | 1,430,600 | ||||||
| 2,127,233 | ||||||||
| FIXED INCOME - 7.3% | ||||||||
| 12,562 | American Century High Income Fund, Class I | 102,506 | ||||||
| 21,352 | Aristotle Strategic Income Fund, Class I-2 | 213,517 | ||||||
| 37 | Columbia Intermediate Duration Municipal Bond Fund, Institutional Class | 336 | ||||||
| 75,560 | Medalist Partners MBS Total Return Fund, Institutional Class | 600,699 | ||||||
| 14,452 | Nuveen Preferred Securities Fund, Class I | 207,104 | ||||||
| 76 | PIMCO Investment Grade Credit Bond Fund, Institutional Class | 637 | ||||||
| 40,205 | Principal Spectrum Preferred and Capital Securities Income Fund, Institutional Class | 341,739 | ||||||
| 25,532 | Putnam Floating Rate Income Fund, Class Y | 202,726 | ||||||
| 2,519 | TCW Emerging Markets Income Fund, Institutional Class | 14,885 | ||||||
| 1,684,149 | ||||||||
| TOTAL OPEN END FUNDS (Cost $4,326,421) | 4,280,662 | |||||||
| SHORT-TERM INVESTMENT — 7.7% | ||||||||
| MONEY MARKET FUND - 7.7% | ||||||||
| 1,783,534 | First American Government Obligations Fund Class X, 5.26% (Cost $1,783,534)(a) | 1,783,534 | ||||||
| TOTAL INVESTMENTS - 97.9% (Cost $23,145,030) | $ | 22,712,009 | ||||||
| OTHER ASSETS IN EXCESS OF LIABILITIES - 2.1% | 479,747 | |||||||
| NET ASSETS - 100.0% | $ | 23,191,756 | ||||||
| CLO | - Collateralized Loan Obligation |
| EAFE | - Europe, Australasia and Far East |
| ETF | - Exchange-Traded Fund |
| MSCI | - Morgan Stanley Capital International |
| SPDR | - Standard & Poor’s Depositary Receipt |
| (a) | Rate disclosed is the seven day effective yield as of September 30, 2023. |
See accompanying notes to financial statements.
43
| THE SIERRA FUNDS |
| STATEMENTS OF ASSETS AND LIABILITIES |
| September 30, 2023 |
| Sierra Tactical All | Sierra Tactical Core | Sierra Tactical | Sierra Tactical | |||||||||||||
| Asset Fund | Income Fund | Municipal Fund | Bond Fund | |||||||||||||
| ASSETS | ||||||||||||||||
| Investment securities: | ||||||||||||||||
| At cost | $ | 705,837,784 | $ | 1,711,138,181 | $ | 281,450,905 | $ | 1,801,884,077 | ||||||||
| At value | $ | 709,214,513 | $ | 1,698,563,737 | $ | 278,857,501 | $ | 1,781,073,425 | ||||||||
| Receivable for securities sold | 24,637,003 | 116,353,584 | 24,976,832 | — | ||||||||||||
| Dividends and interest receivable | 862,409 | 1,250,254 | 263,691 | 363,815 | ||||||||||||
| Receivable for Fund shares sold | 361,556 | 1,090,746 | 166,970 | 1,604,598 | ||||||||||||
| Prepaid expenses and other assets | 29,879 | 68,089 | 41,615 | 121,348 | ||||||||||||
| TOTAL ASSETS | 735,105,360 | 1,817,326,410 | 304,306,609 | 1,783,163,186 | ||||||||||||
| LIABILITIES | ||||||||||||||||
| Payable for Fund shares repurchased | 1,357,802 | 3,613,420 | 3,872,256 | 9,342,578 | ||||||||||||
| Investment advisory fees payable | 773,696 | 1,147,988 | 192,235 | 1,556,701 | ||||||||||||
| Distribution (12b-1) fees payable | 35,126 | 152,343 | 4,255 | 25,282 | ||||||||||||
| Payable to related parties | 32,058 | 121,485 | 18,221 | 58,812 | ||||||||||||
| Accrued expenses and other liabilities | 105,498 | 264,062 | 14,878 | 397,651 | ||||||||||||
| TOTAL LIABILITIES | 2,304,180 | 5,299,298 | 4,101,845 | 11,381,024 | ||||||||||||
| NET ASSETS | $ | 732,801,180 | $ | 1,812,027,112 | $ | 300,204,764 | $ | 1,771,782,162 | ||||||||
| Net Assets Consist Of: | ||||||||||||||||
| Paid in capital | $ | 812,264,097 | $ | 2,000,735,381 | $ | 326,557,199 | $ | 1,887,895,239 | ||||||||
| Accumulated Deficit | (79,462,917 | ) | (188,708,269 | ) | (26,352,435 | ) | (116,113,077 | ) | ||||||||
| NET ASSETS | $ | 732,801,180 | $ | 1,812,027,112 | $ | 300,204,764 | $ | 1,771,782,162 | ||||||||
See accompanying notes to financial statements.
44
| THE SIERRA FUNDS | ||||||||||||
| STATEMENTS OF ASSETS AND LIABILITIES (Continued) | ||||||||||||
| September 30, 2023 | ||||||||||||
| Sierra Tactical All | Sierra Tactical Core | Sierra Tactical | Sierra Tactical | |||||||||||||
| Asset Fund | Income Fund | Municipal Fund | Bond Fund | |||||||||||||
| Net Asset Value Per Share: | ||||||||||||||||
| Class A: | ||||||||||||||||
| Net Assets | $ | 18,736,988 | $ | 40,787,677 | $ | 4,265,754 | $ | 7,054,778 | ||||||||
| Shares of beneficial interest outstanding ($0 par value, unlimited shares authorized) | 892,470 | 2,110,118 | 176,743 | 278,800 | ||||||||||||
| Net asset value (Net Assets ÷ Shares Outstanding) and redemption price per share | $ | 20.99 | $ | 19.33 | $ | 24.14 | (b) | $ | 25.30 | |||||||
| Maximum offering price per share (maximum sales charge of 3.75%) (a) | $ | 21.81 | $ | 20.08 | $ | 25.08 | $ | 26.29 | ||||||||
| Class C: | ||||||||||||||||
| Net Assets | $ | 31,465,159 | $ | 112,911,121 | $ | 2,579,159 | $ | 23,088,397 | ||||||||
| Shares of beneficial interest outstanding ($0 par value, unlimited shares authorized) | 1,491,808 | 5,871,677 | 108,011 | 919,533 | ||||||||||||
| Net asset value (Net Assets ÷ Shares Outstanding), offering price and redemption price per share | $ | 21.09 | $ | 19.23 | $ | 23.88 | $ | 25.11 | (b) | |||||||
| Investor Class: | ||||||||||||||||
| Net Assets | $ | 7,682,996 | $ | 56,841,843 | $ | 4,109,810 | $ | 13,226,517 | ||||||||
| Shares of beneficial interest outstanding ($0 par value, unlimited shares authorized) | 366,649 | 2,935,447 | 170,488 | 523,068 | ||||||||||||
| Net asset value (Net Assets ÷ Shares Outstanding), offering price and redemption price per share | $ | 20.95 | $ | 19.36 | $ | 24.11 | (b) | $ | 25.29 | (b) | ||||||
| Instl Class: | ||||||||||||||||
| Net Assets | $ | 665,473,127 | $ | 1,601,486,471 | $ | 288,960,360 | $ | 1,728,412,470 | ||||||||
| Shares of beneficial interest outstanding ($0 par value, unlimited shares authorized) | 31,983,386 | 83,234,480 | 12,007,312 | 68,178,602 | ||||||||||||
| Net asset value (Net Assets ÷ Shares Outstanding), offering price and redemption price per share | $ | 20.81 | (b) | $ | 19.24 | $ | 24.07 | (b) | $ | 25.35 | ||||||
| Special Shares: | ||||||||||||||||
| Net Assets | $ | 289,681 | ||||||||||||||
| Shares of beneficial interest outstanding ($0 par value, unlimited shares authorized) | 11,982 | |||||||||||||||
| Net asset value (Net Assets ÷ Shares Outstanding), offering price and redemption price per share | $ | 24.18 | (b) | |||||||||||||
| Class A1: | ||||||||||||||||
| Net Assets | $ | 3,138,625 | ||||||||||||||
| Shares of beneficial interest outstanding ($0 par value, unlimited shares authorized) | 147,902 | |||||||||||||||
| Net asset value (Net Assets ÷ Shares Outstanding) and redemption price per share | $ | 21.22 | ||||||||||||||
| Maximum offering price per share (maximum sales charge of 3.75%) (a) | $ | 22.05 | ||||||||||||||
| Class I1: | ||||||||||||||||
| Net Assets | $ | 6,304,285 | ||||||||||||||
| Shares of beneficial interest outstanding ($0 par value, unlimited shares authorized) | 298,430 | |||||||||||||||
| Net asset value (Net Assets ÷ Shares Outstanding), offering price and redemption price per share | $ | 21.12 | ||||||||||||||
| (a) | On investments of $1 million or more, the maximum sales charge will not apply. Instead, the investment may be subject to a 1.00% contingent deferred sales charge on redemptions within 18 months of purchase. |
| (b) | The Net Asset Value (“NAV”) and offering price shown above differs from the traded NAV on September 29, 2023 due to financial statement rounding and/or financial statement adjustments. |
See accompanying notes to financial statements.
45
| THE SIERRA FUNDS |
| STATEMENTS OF ASSETS AND LIABILITIES |
| September 30, 2023 |
| Sierra Tactical Risk | Sierra Tactical Risk | Sierra Tactical Risk | ||||||||||
| Spectrum 50 Fund | Spectrum 30 Fund | Spectrum 70 Fund | ||||||||||
| ASSETS | ||||||||||||
| Investment securities: | ||||||||||||
| At cost | $ | 395,873,203 | $ | 36,396,870 | $ | 23,145,030 | ||||||
| At value | $ | 400,129,771 | $ | 36,747,110 | $ | 22,712,009 | ||||||
| Receivable for securities sold | 9,148,299 | 1,120,297 | 524,061 | |||||||||
| Dividends and interest receivable | 500,151 | 40,617 | 36,658 | |||||||||
| Receivable for Fund shares sold | 335,650 | 8,915 | 1,366 | |||||||||
| Prepaid expenses and other assets | 48,081 | 36,404 | 39,190 | |||||||||
| TOTAL ASSETS | 410,161,952 | 37,953,343 | 23,313,284 | |||||||||
| LIABILITIES | ||||||||||||
| Payable for Fund shares repurchased | 790,645 | 66,286 | 105,147 | |||||||||
| Investment advisory fees payable | 358,373 | 23,180 | 10,836 | |||||||||
| Payable to related parties | 17,085 | 172 | 480 | |||||||||
| Distribution (12b-1) fees payable | 2,006 | — | 6 | |||||||||
| Accrued expenses and other liabilities | 61,701 | 25,285 | 5,059 | |||||||||
| TOTAL LIABILITIES | 1,229,810 | 114,923 | 121,528 | |||||||||
| NET ASSETS | $ | 408,932,142 | $ | 37,838,420 | $ | 23,191,756 | ||||||
| Net Assets Consist Of: | ||||||||||||
| Paid in capital | $ | 440,818,447 | $ | 38,201,865 | $ | 23,699,477 | ||||||
| Accumulated Deficit | (31,886,305 | ) | (363,445 | ) | (507,721 | ) | ||||||
| NET ASSETS | $ | 408,932,142 | $ | 37,838,420 | $ | 23,191,756 | ||||||
See accompanying notes to financial statements.
46
| THE SIERRA FUNDS |
| STATEMENTS OF ASSETS AND LIABILITIES (Continued) |
| September 30, 2023 |
| Sierra Tactical Risk | Sierra Tactical Risk | Sierra Tactical Risk | ||||||||||
| Spectrum 50 Fund | Spectrum 30 Fund | Spectrum 70 Fund | ||||||||||
| Net Asset Value Per Share: | ||||||||||||
| Class A: | ||||||||||||
| Net Assets | $ | 203,089 | ||||||||||
| Shares of beneficial interest outstanding ($0 par value, unlimited shares authorized) | 9,243 | |||||||||||
| Net asset value (Net Assets ÷ Shares Outstanding) and redemption price per share | $ | 21.97 | ||||||||||
| Maximum offering price per share (maximum sales charge of 3.75%) (a) | $ | 22.83 | ||||||||||
| Class C: | ||||||||||||
| Net Assets | $ | 588,857 | ||||||||||
| Shares of beneficial interest outstanding ($0 par value, unlimited shares authorized) | 26,944 | |||||||||||
| Net asset value (Net Assets ÷ Shares Outstanding), offering price and redemption price per share | $ | 21.85 | ||||||||||
| Investor Class: | ||||||||||||
| Net Assets | $ | 4,699,569 | $ | 25 | $ | 18,326 | ||||||
| Shares of beneficial interest outstanding ($0 par value, unlimited shares authorized) | 214,047 | 1 | 734 | |||||||||
| Net asset value (Net Assets ÷ Shares Outstanding), offering price and redemption price per share | $ | 21.96 | (b) | $ | 24.69 | (b)(c) | $ | 24.97 | (b) | |||
| Instl Class: | ||||||||||||
| Net Assets | $ | 403,440,627 | $ | 37,838,395 | $ | 23,173,430 | ||||||
| Shares of beneficial interest outstanding ($0 par value, unlimited shares authorized) | 18,363,965 | 1,532,632 | 927,967 | |||||||||
| Net asset value (Net Assets ÷ Shares Outstanding), offering price and redemption price per share | $ | 21.97 | $ | 24.69 | (b) | $ | 24.97 | |||||
| (a) | On investments of $1 million or more, the maximum sales charge will not apply. Instead, the investment may be subject to a 1.00% contingent deferred sales charge on redemptions within 18 months of purchase. |
| (b) | The Net Asset Value (“NAV”) and offering price shown above differs from the traded NAV on September 29, 2023 due to financial statement rounding and/or financial statement adjustments. |
| (c) | The NAV shown above does not recompute due to rounding of shares. |
See accompanying notes to financial statements.
47
| THE SIERRA FUNDS |
| STATEMENTS OF OPERATIONS |
| For the Year Ended September 30, 2023 |
| Sierra Tactical All | Sierra Tactical | Sierra Tactical | Sierra Tactical | |||||||||||||
| Asset Fund | Core Income Fund | Municipal Fund | Bond Fund | |||||||||||||
| INVESTMENT INCOME | ||||||||||||||||
| Dividends | $ | 29,020,844 | $ | 65,310,477 | $ | 8,779,076 | $ | 97,318,843 | ||||||||
| Interest | 8,188,892 | 26,128,045 | 2,428,847 | 17,773,719 | ||||||||||||
| TOTAL INVESTMENT INCOME | 37,209,736 | 91,438,522 | 11,207,923 | 115,092,562 | ||||||||||||
| EXPENSES | ||||||||||||||||
| Investment advisory fees | 10,391,175 | 15,171,850 | 2,526,425 | 20,459,050 | ||||||||||||
| Distribution (12b-1) fees: | ||||||||||||||||
| Class A | 52,453 | 184,980 | 12,553 | 40,464 | ||||||||||||
| Class C | 354,831 | 1,342,038 | 26,506 | 233,457 | ||||||||||||
| Investor Class | 23,754 | 267,252 | 17,366 | 61,191 | ||||||||||||
| Class A1 | 13,757 | — | — | — | ||||||||||||
| Class I1 | 30,011 | — | — | — | ||||||||||||
| Third party administrative servicing fee | 748,165 | 1,648,329 | 302,901 | 1,433,644 | ||||||||||||
| Administrative services fees | 309,597 | 751,216 | 140,628 | 726,061 | ||||||||||||
| Registration fees | 150,000 | 160,001 | 120,001 | 169,999 | ||||||||||||
| Accounting services fees | 104,611 | 266,283 | 40,946 | 229,201 | ||||||||||||
| Transfer agent fees | 85,056 | 551,459 | 92,604 | 226,140 | ||||||||||||
| Custodian fees | 76,711 | 169,447 | 34,466 | 436,817 | ||||||||||||
| Printing and postage expenses | 75,580 | 149,119 | 72,793 | 109,950 | ||||||||||||
| Professional fees | 30,941 | 29,759 | 30,797 | 31,879 | ||||||||||||
| Compliance officer fees | 28,245 | 48,001 | 19,623 | 46,937 | ||||||||||||
| Trustees fees and expenses | 15,735 | 15,842 | 15,842 | 15,949 | ||||||||||||
| Insurance expense | 11,001 | 20,998 | 5,500 | 21,998 | ||||||||||||
| Interest expense | 2,821 | 655 | 15,573 | 106,423 | ||||||||||||
| Other expenses | 20,318 | 27,664 | 11,651 | 43,473 | ||||||||||||
| TOTAL EXPENSES | 12,524,762 | 20,804,893 | 3,486,175 | 24,392,633 | ||||||||||||
| Plus: Recapture of fees waived by the Adviser | — | 6,113 | — | — | ||||||||||||
| Less: Fees waived by the Adviser | — | — | (4,158 | ) | — | |||||||||||
| NET EXPENSES | 12,524,762 | 20,811,006 | 3,482,017 | 24,392,633 | ||||||||||||
| NET INVESTMENT INCOME | 24,684,974 | 70,627,516 | 7,725,906 | 90,699,929 | ||||||||||||
| REALIZED AND UNREALIZED GAIN (LOSS) ON INVESTMENTS | ||||||||||||||||
| Net realized loss from security transactions | (24,972,391 | ) | (81,324,110 | ) | (6,853,547 | ) | (12,150,618 | ) | ||||||||
| Distributions of capital gains from underlying investment companies | 56,179 | 46,984 | 141,703 | 1,194 | ||||||||||||
| (24,916,212 | ) | (81,277,126 | ) | (6,711,844 | ) | (12,149,424 | ) | |||||||||
| Net change in unrealized appreciation (depreciation) of investments | 1,721,615 | (12,152,874 | ) | (2,505,141 | ) | (20,587,355 | ) | |||||||||
| NET REALIZED AND UNREALIZED LOSS ON INVESTMENTS | (23,194,597 | ) | (93,430,000 | ) | (9,216,985 | ) | (32,736,779 | ) | ||||||||
| NET INCREASE (DECREASE) IN NET ASSETS RESULTING FROM OPERATIONS | $ | 1,490,377 | $ | (22,802,484 | ) | $ | (1,491,079 | ) | $ | 57,963,150 | ||||||
See accompanying notes to financial statements.
48
| THE SIERRA FUNDS |
| STATEMENTS OF OPERATIONS (Continued) |
| For the Year and Period Ended September 30, 2023 |
| Sierra Tactical Risk | Sierra Tactical Risk | Sierra Tactical Risk | ||||||||||
| Spectrum 50 Fund | Spectrum 30 Fund | Spectrum 70 Fund * | ||||||||||
| INVESTMENT INCOME | ||||||||||||
| Dividends | $ | 10,140,610 | $ | 1,397,994 | $ | 141,907 | ||||||
| Interest | 2,349,300 | 374,422 | 33,527 | |||||||||
| TOTAL INVESTMENT INCOME | 12,489,910 | 1,772,416 | 175,434 | |||||||||
| EXPENSES | ||||||||||||
| Investment advisory fees | 3,801,546 | 437,147 | 61,872 | |||||||||
| Distribution (12b-1) fees: | ||||||||||||
| Class A | 521 | — | — | |||||||||
| Class C | 1,673 | — | — | |||||||||
| Investor Class | 15,954 | — | 25 | |||||||||
| Third party administrative servicing fee | 343,664 | 31,486 | 4,674 | |||||||||
| Administrative services fees | 148,887 | 27,358 | 6,136 | |||||||||
| Registration fees | 68,534 | 66,109 | 27,116 | |||||||||
| Printing and postage expenses | 66,603 | 14,923 | 9,083 | |||||||||
| Transfer agent fees | 54,336 | 9,321 | 5,936 | |||||||||
| Accounting services fees | 40,034 | 5,239 | 589 | |||||||||
| Custodian fees | 39,803 | 7,014 | 2,135 | |||||||||
| Professional fees | 29,764 | 35,958 | 22,260 | |||||||||
| Compliance officer fees | 19,633 | 14,510 | 6,674 | |||||||||
| Trustees fees and expenses | 15,949 | 12,008 | 4,027 | |||||||||
| Interest expense | 5,873 | — | — | |||||||||
| Insurance expense | 3,563 | 2,931 | 1,546 | |||||||||
| Other expenses | 10,045 | 10,579 | 2,664 | |||||||||
| TOTAL EXPENSES | 4,666,382 | 674,583 | 154,737 | |||||||||
| Plus: Recapture of fees waived by the Adviser | 109,335 | — | — | |||||||||
| Less: Fees waived by the Adviser and expenses reimbursed | — | (127,829 | ) | (76,683 | ) | |||||||
| NET EXPENSES | 4,775,717 | 546,754 | 78,054 | |||||||||
| NET INVESTMENT INCOME | 7,714,193 | 1,225,662 | 97,380 | |||||||||
| REALIZED AND UNREALIZED GAIN (LOSS) ON INVESTMENTS | ||||||||||||
| Net realized loss from security transactions | (14,284,227 | ) | (780,946 | ) | (104,972 | ) | ||||||
| Distributions of capital gains from underlying investment companies | 70,025 | 11,527 | — | |||||||||
| (14,214,202 | ) | (769,419 | ) | (104,972 | ) | |||||||
| Net change in unrealized appreciation (depreciation) of investments | 4,318,980 | 350,240 | (433,021 | ) | ||||||||
| NET REALIZED AND UNREALIZED LOSS ON INVESTMENTS | (9,895,222 | ) | (419,179 | ) | (537,993 | ) | ||||||
| NET INCREASE (DECREASE) IN NET ASSETS RESULTING FROM OPERATIONS | $ | (2,181,029 | ) | $ | 806,483 | $ | (440,613 | ) | ||||
| * | Sierra Tactical Risk Spectrum 70 Fund commenced operations on March 31, 2023. |
See accompanying notes to financial statements.
49
| SIERRA TACTICAL ALL ASSET FUND |
| STATEMENTS OF CHANGES IN NET ASSETS |
| Year Ended | Year Ended | |||||||
| September 30, | September 30, | |||||||
| 2023 | 2022 | |||||||
| FROM OPERATIONS | ||||||||
| Net investment income | $ | 24,684,974 | $ | 7,407,793 | ||||
| Net realized loss from security transactions | (24,972,391 | ) | (58,994,023 | ) | ||||
| Distributions of capital gains from underlying investment companies | 56,179 | 522,997 | ||||||
| Net change in unrealized appreciation (depreciation) of investments | 1,721,615 | (23,854,743 | ) | |||||
| Net increase (decrease) in net assets resulting from operations | 1,490,377 | (74,917,976 | ) | |||||
| DISTRIBUTIONS TO SHAREHOLDERS | ||||||||
| From return of capital: | ||||||||
| Class A | (315 | ) | (25,115 | ) | ||||
| Class C | (387 | ) | (7,703 | ) | ||||
| Investor Class | (129 | ) | (13,169 | ) | ||||
| Instl Class | (12,297 | ) | (1,383,537 | ) | ||||
| Class AI | (50 | ) | (2,271 | ) | ||||
| Class I1 | (99 | ) | (5,211 | ) | ||||
| From distributable earnings: | ||||||||
| Class A | (576,241 | ) | (260,437 | ) | ||||
| Class C | (708,879 | ) | (281,740 | ) | ||||
| Investor Class | (253,145 | ) | (132,651 | ) | ||||
| Instl Class | (22,832,354 | ) | (8,721,092 | ) | ||||
| Class A1 | (88,213 | ) | (31,145 | ) | ||||
| Class I1 | (192,650 | ) | (76,273 | ) | ||||
| Net decrease in net assets resulting from distributions to shareholders | (24,664,759 | ) | (10,940,344 | ) | ||||
| FROM SHARES OF BENEFICIAL INTEREST | ||||||||
| Proceeds from shares sold: | ||||||||
| Class A | 558,131 | 908,318 | ||||||
| Class C | 1,930,652 | 4,107,347 | ||||||
| Investor Class | 781,730 | 729,357 | ||||||
| Instl Class | 191,910,005 | 327,840,054 | ||||||
| Class A1 | 463,002 | 711,010 | ||||||
| Class I1 | 1,826,797 | 2,510,290 | ||||||
| Net asset value of shares issued in reinvestment of distributions: | ||||||||
| Class A | 565,004 | 276,712 | ||||||
| Class C | 689,629 | 279,492 | ||||||
| Investor Class | 241,604 | 138,366 | ||||||
| Instl Class | 22,645,091 | 10,041,915 | ||||||
| Class A1 | 72,553 | 28,911 | ||||||
| Class I1 | 189,022 | 78,681 | ||||||
| Payments for shares redeemed: | ||||||||
| Class A | (4,426,165 | ) | (5,044,773 | ) | ||||
| Class C | (8,300,868 | ) | (9,109,597 | ) | ||||
| Investor Class | (4,389,234 | ) | (3,982,416 | ) | ||||
| Instl Class | (311,308,830 | ) | (243,543,150 | ) | ||||
| Class A1 | (598,333 | ) | (512,145 | ) | ||||
| Class I1 | (3,158,556 | ) | (3,299,452 | ) | ||||
| Net increase (decrease) in net assets resulting from shares of beneficial interest | (110,308,766 | ) | 82,158,920 | |||||
| TOTAL DECREASE IN NET ASSETS | (133,483,148 | ) | (3,699,400 | ) | ||||
| NET ASSETS | ||||||||
| Beginning of Year | 866,284,328 | 869,983,728 | ||||||
| End of Year | $ | 732,801,180 | $ | 866,284,328 | ||||
See accompanying notes to financial statements.
50
| SIERRA TACTICAL ALL ASSET FUND |
| STATEMENTS OF CHANGES IN NET ASSETS (Continued) |
| Year Ended | Year Ended | |||||||
| September 30, | September 30, | |||||||
| 2023 | 2022 | |||||||
| SHARE ACTIVITY | ||||||||
| Class A: | ||||||||
| Shares Sold | 25,861 | 39,219 | ||||||
| Shares Reinvested | 26,396 | 11,893 | ||||||
| Shares Redeemed | (204,517 | ) | (217,431 | ) | ||||
| Net decrease in shares of beneficial interest outstanding | (152,260 | ) | (166,319 | ) | ||||
| Class C: | ||||||||
| Shares Sold | 88,934 | 175,779 | ||||||
| Shares Reinvested | 32,062 | 11,862 | ||||||
| Shares Redeemed | (382,045 | ) | (394,936 | ) | ||||
| Net decrease in shares of beneficial interest outstanding | (261,049 | ) | (207,295 | ) | ||||
| Investor Class: | ||||||||
| Shares Sold | 36,194 | 31,671 | ||||||
| Shares Reinvested | 11,304 | 5,960 | ||||||
| Shares Redeemed | (202,417 | ) | (171,868 | ) | ||||
| Net decrease in shares of beneficial interest outstanding | (154,919 | ) | (134,237 | ) | ||||
| Instl Class: | ||||||||
| Shares Sold | 8,916,605 | 14,434,915 | ||||||
| Shares Reinvested | 1,067,249 | 437,406 | ||||||
| Shares Redeemed | (14,506,606 | ) | (10,697,324 | ) | ||||
| Net increase (decrease) in shares of beneficial interest outstanding | (4,522,752 | ) | 4,174,997 | |||||
| Class A1 | ||||||||
| Shares Sold | 20,954 | 31,083 | ||||||
| Shares Reinvested | 3,353 | 1,227 | ||||||
| Shares Redeemed | (27,423 | ) | (22,055 | ) | ||||
| Net increase (decrease) in shares of beneficial interest outstanding | (3,116 | ) | 10,255 | |||||
| Class I1 | ||||||||
| Shares Sold | 83,394 | 108,976 | ||||||
| Shares Reinvested | 8,774 | 3,352 | ||||||
| Shares Redeemed | (145,356 | ) | (142,033 | ) | ||||
| Net decrease in shares of beneficial interest outstanding | (53,188 | ) | (29,705 | ) | ||||
See accompanying notes to financial statements.
51
| SIERRA TACTICAL CORE INCOME FUND |
| STATEMENTS OF CHANGES IN NET ASSETS |
| Year Ended | Year Ended | |||||||
| September 30, | September 30, | |||||||
| 2023 | 2022 | |||||||
| FROM OPERATIONS | ||||||||
| Net investment income | $ | 70,627,516 | $ | 26,855,719 | ||||
| Net realized loss from security transactions | (81,324,110 | ) | (96,729,950 | ) | ||||
| Distributions of capital gains from underlying investment companies | 46,984 | 1,604,914 | ||||||
| Net change in unrealized depreciation of investments | (12,152,874 | ) | (56,053,673 | ) | ||||
| Net decrease in net assets resulting from operations | (22,802,484 | ) | (124,322,990 | ) | ||||
| DISTRIBUTIONS TO SHAREHOLDERS | ||||||||
| From return of capital: | ||||||||
| Class A | (6,390 | ) | (82,347 | ) | ||||
| Class C | (15,366 | ) | (146,283 | ) | ||||
| Investor Class | (8,825 | ) | (110,408 | ) | ||||
| Instl Class | (273,213 | ) | (3,522,428 | ) | ||||
| From distributable earnings: | ||||||||
| Class A | (1,471,985 | ) | (598,504 | ) | ||||
| Class C | (3,477,726 | ) | (1,256,301 | ) | ||||
| Investor Class | (2,116,272 | ) | (800,723 | ) | ||||
| Instl Class | (64,185,805 | ) | (22,424,866 | ) | ||||
| Net decrease in net assets resulting from distributions to shareholders | (71,555,582 | ) | (28,941,860 | ) | ||||
| FROM SHARES OF BENEFICIAL INTEREST | ||||||||
| Proceeds from shares sold: | ||||||||
| Class A | 5,299,388 | 6,387,218 | ||||||
| Class C | 19,053,944 | 37,458,854 | ||||||
| Investor Class | 20,289,178 | 21,628,566 | ||||||
| Instl Class | 797,758,155 | 750,787,836 | ||||||
| Net asset value of shares issued in reinvestment of distributions: | ||||||||
| Class A | 1,400,867 | 636,258 | ||||||
| Class C | 3,294,131 | 1,315,994 | ||||||
| Investor Class | 2,010,660 | 859,907 | ||||||
| Instl Class | 58,245,919 | 24,842,398 | ||||||
| Payments for shares redeemed: | ||||||||
| Class A | (13,752,731 | ) | (14,595,504 | ) | ||||
| Class C | (53,085,717 | ) | (52,469,255 | ) | ||||
| Investor Class | (29,896,358 | ) | (29,571,151 | ) | ||||
| Instl Class | (845,835,755 | ) | (543,194,427 | ) | ||||
| Net increase (decrease) in net assets resulting from shares of beneficial interest | (35,218,319 | ) | 204,086,694 | |||||
| TOTAL INCREASE (DECREASE) IN NET ASSETS | (129,576,385 | ) | 50,821,844 | |||||
| NET ASSETS | ||||||||
| Beginning of Year | 1,941,603,497 | 1,890,781,653 | ||||||
| End of Year | $ | 1,812,027,112 | $ | 1,941,603,497 | ||||
See accompanying notes to financial statements.
52
| SIERRA TACTICAL CORE INCOME FUND |
| STATEMENTS OF CHANGES IN NET ASSETS (Continued) |
| Year Ended | Year Ended | |||||||
| September 30, | September 30, | |||||||
| 2023 | 2022 | |||||||
| SHARE ACTIVITY | ||||||||
| Class A: | ||||||||
| Shares Sold | 262,637 | 301,662 | ||||||
| Shares Reinvested | 70,455 | 30,028 | ||||||
| Shares Redeemed | (687,682 | ) | (689,044 | ) | ||||
| Net decrease in shares of beneficial interest outstanding | (354,590 | ) | (357,354 | ) | ||||
| Class C: | ||||||||
| Shares Sold | 951,692 | 1,765,996 | ||||||
| Shares Reinvested | 166,542 | 62,125 | ||||||
| Shares Redeemed | (2,668,496 | ) | (2,501,112 | ) | ||||
| Net decrease in shares of beneficial interest outstanding | (1,550,262 | ) | (672,991 | ) | ||||
| Investor Class: | ||||||||
| Shares Sold | 1,005,813 | 1,030,664 | ||||||
| Shares Reinvested | 100,998 | 40,524 | ||||||
| Shares Redeemed | (1,499,060 | ) | (1,408,835 | ) | ||||
| Net decrease in shares of beneficial interest outstanding | (392,249 | ) | (337,647 | ) | ||||
| Instl Class: | ||||||||
| Shares Sold | 39,596,908 | 35,847,677 | ||||||
| Shares Reinvested | 3,139,643 | 1,183,283 | ||||||
| Shares Redeemed | (42,635,790 | ) | (25,950,915 | ) | ||||
| Net increase in shares of beneficial interest outstanding | 100,761 | 11,080,045 | ||||||
See accompanying notes to financial statements.
53
| SIERRA TACTICAL MUNICIPAL FUND |
| STATEMENTS OF CHANGES IN NET ASSETS |
| Year Ended | Year Ended | |||||||
| September 30, | September 30, | |||||||
| 2023 | 2022 | |||||||
| FROM OPERATIONS | ||||||||
| Net investment income | $ | 7,725,906 | $ | 2,903,776 | ||||
| Net realized loss from security transactions | (6,853,547 | ) | (16,254,860 | ) | ||||
| Distributions of capital gains from underlying investment companies | 141,703 | — | ||||||
| Net change in unrealized depreciation of investments | (2,505,141 | ) | (2,586,669 | ) | ||||
| Net decrease in net assets resulting from operations | (1,491,079 | ) | (15,937,753 | ) | ||||
| DISTRIBUTIONS TO SHAREHOLDERS | ||||||||
| From return of capital: | ||||||||
| Class A | (54 | ) | — | |||||
| Class C | (22 | ) | — | |||||
| Investor Class | (49 | ) | — | |||||
| Instl Class | (4,100 | ) | — | |||||
| Special Shares | (4 | ) | — | |||||
| From distributable earnings: | ||||||||
| Class A | (103,218 | ) | (134,018 | ) | ||||
| Class C | (38,599 | ) | (44,386 | ) | ||||
| Investor Class | (84,176 | ) | (154,050 | ) | ||||
| Instl Class | (7,561,985 | ) | (11,403,110 | ) | ||||
| Special Shares | (7,234 | ) | (15,589 | ) | ||||
| Net decrease in net assets resulting from distributions to shareholders | (7,799,441 | ) | (11,751,153 | ) | ||||
| FROM SHARES OF BENEFICIAL INTEREST | ||||||||
| Proceeds from shares sold: | ||||||||
| Class A | 1,759,310 | 1,661,106 | ||||||
| Class C | 2,611,682 | 494,000 | ||||||
| Investor Class | 1,437,263 | 892,059 | ||||||
| Instl Class | 130,585,862 | 149,594,996 | ||||||
| Special Shares | 1,173 | 2,762 | ||||||
| Net asset value of shares issued in reinvestment of distributions: | ||||||||
| Class A | 103,264 | 133,861 | ||||||
| Class C | 38,621 | 44,386 | ||||||
| Investor Class | 84,038 | 153,678 | ||||||
| Instl Class | 7,274,486 | 10,905,850 | ||||||
| Special Shares | 7,238 | 15,588 | ||||||
| Payments for shares redeemed: | ||||||||
| Class A | (2,030,652 | ) | (248,674 | ) | ||||
| Class C | (1,477,704 | ) | (136,256 | ) | ||||
| Investor Class | (1,410,566 | ) | (907,701 | ) | ||||
| Instl Class | (142,971,949 | ) | (112,487,708 | ) | ||||
| Special Shares | (5,743 | ) | (129,189 | ) | ||||
| Net increase (decrease) in net assets resulting from shares of beneficial interest | (3,993,677 | ) | 49,988,758 | |||||
| TOTAL INCREASE (DECREASE) IN NET ASSETS | (13,284,197 | ) | 22,299,852 | |||||
| NET ASSETS | ||||||||
| Beginning of Year | 313,488,961 | 291,189,109 | ||||||
| End of Year | $ | 300,204,764 | $ | 313,488,961 | ||||
See accompanying notes to financial statements.
54
| SIERRA TACTICAL MUNICIPAL FUND |
| STATEMENTS OF CHANGES IN NET ASSETS (Continued) |
| Year Ended | Year Ended | |||||||
| September 30, | September 30, | |||||||
| 2023 | 2022 | |||||||
| SHARE ACTIVITY | ||||||||
| Class A: | ||||||||
| Shares Sold | 69,377 | 64,587 | ||||||
| Shares Reinvested | 4,123 | 5,106 | ||||||
| Shares Redeemed | (81,543 | ) | (9,514 | ) | ||||
| Net increase (decrease) in shares of beneficial interest outstanding | (8,043 | ) | 60,179 | |||||
| Class C: | ||||||||
| Shares Sold | 103,512 | 19,459 | ||||||
| Shares Reinvested | 1,558 | 1,701 | ||||||
| Shares Redeemed | (59,351 | ) | (5,233 | ) | ||||
| Net increase in shares of beneficial interest outstanding | 45,719 | 15,927 | ||||||
| Investor Class: | ||||||||
| Shares Sold | 56,612 | 34,936 | ||||||
| Shares Reinvested | 3,360 | 5,854 | ||||||
| Shares Redeemed | (56,222 | ) | (35,318 | ) | ||||
| Net increase in shares of beneficial interest outstanding | 3,750 | 5,472 | ||||||
| Instl Class: | ||||||||
| Shares Sold | 5,181,291 | 5,815,175 | ||||||
| Shares Reinvested | 291,174 | 417,241 | ||||||
| Shares Redeemed | (5,714,829 | ) | (4,390,890 | ) | ||||
| Net increase (decrease) in shares of beneficial interest outstanding | (242,364 | ) | 1,841,526 | |||||
| Special Shares: | ||||||||
| Shares Sold | 45 | 105 | ||||||
| Shares Reinvested | 289 | 593 | ||||||
| Shares Redeemed | (228 | ) | (5,159 | ) | ||||
| Net increase (decrease) in shares of beneficial interest outstanding | 106 | (4,461 | ) | |||||
See accompanying notes to financial statements.
55
| SIERRA TACTICAL BOND FUND |
| STATEMENTS OF CHANGES IN NET ASSETS |
| Year Ended | Year Ended | |||||||
| September 30, | September 30, | |||||||
| 2023 | 2022 | |||||||
| FROM OPERATIONS | ||||||||
| Net investment income | $ | 90,699,929 | $ | 12,838,410 | ||||
| Net realized loss from security transactions | (12,150,618 | ) | (82,158,261 | ) | ||||
| Distributions of capital gains from underlying investment companies | 1,194 | 21,305 | ||||||
| Net change in unrealized depreciation of investments | (20,587,355 | ) | (50,987,714 | ) | ||||
| Net increase (decrease) in net assets resulting from operations | 57,963,150 | (120,286,260 | ) | |||||
| DISTRIBUTIONS TO SHAREHOLDERS | ||||||||
| From return of capital: | ||||||||
| Class A | (827 | ) | — | |||||
| Class C | (2,412 | ) | — | |||||
| Investor Class | (1,508 | ) | — | |||||
| Instl Class | (209,837 | ) | — | |||||
| From distributable earnings: | ||||||||
| Class A | (679,670 | ) | (76,940 | ) | ||||
| Class C | (899,706 | ) | (61,880 | ) | ||||
| Investor Class | (654,908 | ) | (83,103 | ) | ||||
| Instl Class | (88,947,420 | ) | (12,134,712 | ) | ||||
| Net decrease in net assets resulting from distributions to shareholders | (91,396,288 | ) | (12,356,635 | ) | ||||
| FROM SHARES OF BENEFICIAL INTEREST | ||||||||
| Proceeds from shares sold: | ||||||||
| Class A | 1,556,818 | 16,839,209 | ||||||
| Class C | 8,795,937 | 9,093,521 | ||||||
| Investor Class | 7,782,701 | 10,686,917 | ||||||
| Instl Class | 762,874,058 | 1,040,458,590 | ||||||
| Net asset value of shares issued in reinvestment of distributions: | ||||||||
| Class A | 677,677 | 76,323 | ||||||
| Class C | 894,422 | 61,562 | ||||||
| Investor Class | 629,001 | 73,716 | ||||||
| Instl Class | 87,867,469 | 11,885,671 | ||||||
| Payments for shares redeemed: | ||||||||
| Class A | (17,007,372 | ) | (5,863,460 | ) | ||||
| Class C | (7,550,850 | ) | (8,797,668 | ) | ||||
| Investor Class | (12,540,636 | ) | (10,925,097 | ) | ||||
| Instl Class | (1,141,757,821 | ) | (712,754,359 | ) | ||||
| Net increase (decrease) in net assets resulting from shares of beneficial interest | (307,778,596 | ) | 350,834,925 | |||||
| TOTAL INCREASE (DECREASE) IN NET ASSETS | (341,211,734 | ) | 218,192,030 | |||||
| NET ASSETS | ||||||||
| Beginning of Year | 2,112,993,896 | 1,894,801,866 | ||||||
| End of Year | $ | 1,771,782,162 | $ | 2,112,993,896 | ||||
See accompanying notes to financial statements.
56
| SIERRA TACTICAL BOND FUND |
| STATEMENTS OF CHANGES IN NET ASSETS (Continued) |
| Year Ended | Year Ended | |||||||
| September 30, | September 30, | |||||||
| 2023 | 2022 | |||||||
| SHARE ACTIVITY | ||||||||
| Class A: | ||||||||
| Shares Sold | 60,272 | 633,823 | ||||||
| Shares Reinvested | 26,476 | 2,836 | ||||||
| Shares Redeemed | (660,269 | ) | (220,755 | ) | ||||
| Net increase (decrease) in shares of beneficial interest outstanding | (573,521 | ) | 415,904 | |||||
| Class C: | ||||||||
| Shares Sold | 342,816 | 337,966 | ||||||
| Shares Reinvested | 35,239 | 2,265 | ||||||
| Shares Redeemed | (295,357 | ) | (333,412 | ) | ||||
| Net increase in shares of beneficial interest outstanding | 82,698 | 6,819 | ||||||
| Investor Class: | ||||||||
| Shares Sold | 301,431 | 402,299 | ||||||
| Shares Reinvested | 24,600 | 2,721 | ||||||
| Shares Redeemed | (482,621 | ) | (412,889 | ) | ||||
| Net decrease in shares of beneficial interest outstanding | (156,590 | ) | (7,869 | ) | ||||
| Instl Class: | ||||||||
| Shares Sold | 29,486,527 | 39,137,604 | ||||||
| Shares Reinvested | 3,426,628 | 440,707 | ||||||
| Shares Redeemed | (43,786,306 | ) | (26,831,999 | ) | ||||
| Net increase (decrease) in shares of beneficial interest outstanding | (10,873,151 | ) | 12,746,312 | |||||
See accompanying notes to financial statements.
57
| SIERRA TACTICAL RISK SPECTRUM 50 FUND |
| STATEMENTS OF CHANGES IN NET ASSETS |
| Year Ended | Year Ended | |||||||
| September 30, | September 30, | |||||||
| 2023 | 2022 | |||||||
| FROM OPERATIONS | ||||||||
| Net investment income | $ | 7,714,193 | $ | 1,807,459 | ||||
| Net realized loss from security transactions | (14,284,227 | ) | (21,863,431 | ) | ||||
| Distributions of capital gains from underlying investment companies | 70,025 | 86,664 | ||||||
| Net change in unrealized appreciation of investments | 4,318,980 | 2,358,303 | ||||||
| Net decrease in net assets resulting from operations | (2,181,029 | ) | (17,611,005 | ) | ||||
| DISTRIBUTIONS TO SHAREHOLDERS | ||||||||
| From return of capital: | ||||||||
| Class A | — | (211 | ) | |||||
| Class C | — | (5 | ) | |||||
| Investor Class | — | (412 | ) | |||||
| Instl Class | — | (73,365 | ) | |||||
| From distributable earnings: | ||||||||
| Class A | (4,026 | ) | (4,998 | ) | ||||
| Class C | (3,292 | ) | (105 | ) | ||||
| Investor Class | (63,839 | ) | (12,162 | ) | ||||
| Instl Class | (7,240,223 | ) | (1,795,214 | ) | ||||
| Net decrease in net assets resulting from distributions to shareholders | (7,311,380 | ) | (1,886,472 | ) | ||||
| FROM SHARES OF BENEFICIAL INTEREST | ||||||||
| Proceeds from shares sold: | ||||||||
| Class A | — | 968,862 | ||||||
| Class C | 556,268 | 17,000 | ||||||
| Investor Class | 5,743,031 | 395,750 | ||||||
| Instl Class | 427,525,979 | 88,203,858 | ||||||
| Net asset value of shares issued in reinvestment of distributions: | ||||||||
| Class A | 4,026 | 5,209 | ||||||
| Class C | 3,292 | 110 | ||||||
| Investor Class | 56,835 | 12,568 | ||||||
| Instl Class | 7,159,043 | 1,862,705 | ||||||
| Payments for shares redeemed: | ||||||||
| Class A | (417,114 | ) | (615,174 | ) | ||||
| Investor Class | (2,441,199 | ) | (225,332 | ) | ||||
| Instl Class | (185,036,630 | ) | (41,819,050 | ) | ||||
| Net increase in net assets resulting from shares of beneficial interest | 253,153,531 | 48,806,506 | ||||||
| TOTAL INCREASE IN NET ASSETS | 243,661,122 | 29,309,029 | ||||||
| NET ASSETS | ||||||||
| Beginning of Year | 165,271,020 | 135,961,991 | ||||||
| End of Year | $ | 408,932,142 | $ | 165,271,020 | ||||
See accompanying notes to financial statements.
58
| SIERRA TACTICAL RISK SPECTRUM 50 FUND |
| STATEMENTS OF CHANGES IN NET ASSETS (Continued) |
| Year Ended | Year Ended | |||||||
| September 30, | September 30, | |||||||
| 2023 | 2022 | |||||||
| SHARE ACTIVITY | ||||||||
| Class A: | ||||||||
| Shares Sold | — | 41,140 | ||||||
| Shares Reinvested | 183 | 224 | ||||||
| Shares Redeemed | (19,222 | ) | (26,859 | ) | ||||
| Net increase (decrease) in shares of beneficial interest outstanding | (19,039 | ) | 14,505 | |||||
| Class C: | ||||||||
| Shares Sold | 24,860 | 763 | ||||||
| Shares Reinvested | 150 | 5 | ||||||
| Net increase in shares of beneficial interest outstanding | 25,010 | 768 | ||||||
| Investor Class: | ||||||||
| Shares Sold | 253,369 | 16,913 | ||||||
| Shares Reinvested | 2,576 | 534 | ||||||
| Shares Redeemed | (109,230 | ) | (9,344 | ) | ||||
| Net increase in shares of beneficial interest outstanding | 146,715 | 8,103 | ||||||
| Instl Class: | ||||||||
| Shares Sold | 18,801,899 | 3,768,440 | ||||||
| Shares Reinvested | 324,182 | 79,918 | ||||||
| Shares Redeemed | (8,283,726 | ) | (1,777,418 | ) | ||||
| Net increase in shares of beneficial interest outstanding | 10,842,355 | 2,070,940 | ||||||
See accompanying notes to financial statements.
59
| SIERRA TACTICAL RISK SPECTRUM 30 FUND |
| STATEMENT OF CHANGES IN NET ASSETS |
| Year Ended | ||||
| September 30, | ||||
| 2023* | ||||
| FROM OPERATIONS | ||||
| Net investment income | $ | 1,225,662 | ||
| Net realized loss from security transactions | (780,946 | ) | ||
| Distributions of capital gains from underlying investment companies | 11,527 | |||
| Net change in unrealized appreciation of investments | 350,240 | |||
| Net increase in net assets resulting from operations | 806,483 | |||
| DISTRIBUTIONS TO SHAREHOLDERS | ||||
| From distributable earnings: | ||||
| Investor Class | (0 | ) + | ||
| Instl Class | (1,191,647 | ) | ||
| Net decrease in net assets resulting from distributions to shareholders | (1,191,647 | ) | ||
| FROM SHARES OF BENEFICIAL INTEREST | ||||
| Proceeds from shares sold: | ||||
| Investor Class | 25 | |||
| Instl Class | 47,071,265 | |||
| Net asset value of shares issued in reinvestment of distributions: | ||||
| Investor Class | 0 | + | ||
| Instl Class | 1,191,647 | |||
| Payments for shares redeemed: | ||||
| Instl Class | (10,039,353 | ) | ||
| Net increase in net assets resulting from shares of beneficial interest | 38,223,584 | |||
| TOTAL INCREASE IN NET ASSETS | 37,838,420 | |||
| NET ASSETS | ||||
| Beginning of Year | — | |||
| End of Year | $ | 37,838,420 | ||
| SHARE ACTIVITY | ||||
| Investor Class: | ||||
| Shares Sold | 1 | |||
| Shares Reinvested | 0 | ++ | ||
| Net increase in shares of beneficial interest outstanding | 1 | |||
| Instl Class: | ||||
| Shares Sold | 1,882,187 | |||
| Shares Reinvested | 47,778 | |||
| Shares Redeemed | (397,333 | ) | ||
| Net increase in shares of beneficial interest outstanding | 1,532,632 | |||
| * | Sierra Tactical Risk Spectrum 30 Fund commenced operations on September 30, 2022. |
| + | Amount represented is less than $0.50. |
| ++ | Less than 1 Share |
See accompanying notes to financial statements.
60
| SIERRA TACTICAL RISK SPECTRUM 70 FUND |
| STATEMENT OF CHANGES IN NET ASSETS |
| Period Ended | ||||
| September 30, | ||||
| 2023* | ||||
| FROM OPERATIONS | ||||
| Net investment income | $ | 97,380 | ||
| Net realized loss from security transactions | (104,972 | ) | ||
| Net change in unrealized depreciation of investments | (433,021 | ) | ||
| Net decrease in net assets resulting from operations | (440,613 | ) | ||
| DISTRIBUTIONS TO SHAREHOLDERS | ||||
| From distributable earnings: | ||||
| Investor Class | (58 | ) | ||
| Instl Class | (76,702 | ) | ||
| Net decrease in net assets resulting from distributions to shareholders | (76,760 | ) | ||
| FROM SHARES OF BENEFICIAL INTEREST | ||||
| Proceeds from shares sold: | ||||
| Investor Class | 18,821 | |||
| Instl Class | 25,523,519 | |||
| Net asset value of shares issued in reinvestment of distributions: | ||||
| Investor Class | 2 | |||
| Instl Class | 69,204 | |||
| Payments for shares redeemed: | ||||
| Instl Class | (1,902,417 | ) | ||
| Net increase in net assets resulting from shares of beneficial interest | 23,709,129 | |||
| TOTAL INCREASE IN NET ASSETS | 23,191,756 | |||
| NET ASSETS | ||||
| Beginning of Period | — | |||
| End of Period | $ | 23,191,756 | ||
| SHARE ACTIVITY | ||||
| Investor Class: | ||||
| Shares Sold | 734 | |||
| Shares Reinvested | 0 | + | ||
| Net increase in shares of beneficial interest outstanding | 734 | |||
| Instl Class: | ||||
| Shares Sold | 1,000,318 | |||
| Shares Reinvested | 2,760 | |||
| Shares Redeemed | (75,111 | ) | ||
| Net increase in shares of beneficial interest outstanding | 927,967 | |||
| * | Sierra Tactical Risk Spectrum 70 Fund commenced operations on March 31, 2023. |
| + | Less than 1 Share |
See accompanying notes to financial statements.
61
| SIERRA TACTICAL ALL ASSET FUND |
| FINANCIAL HIGHLIGHTS |
| Per Share Data and Ratios for a Share of Beneficial Interest Outstanding Throughout Each Year |
| Year Ended | Year Ended | Year Ended | Year Ended | Year Ended | ||||||||||||||||
| September 30, | September 30, | September 30, | September 30, | September 30, | ||||||||||||||||
| Class A Shares | 2023 | 2022 | 2021 | 2020 | 2019 | |||||||||||||||
| Net asset value, beginning of year | $ | 21.64 | $ | 23.90 | $ | 23.28 | $ | 23.11 | $ | 22.95 | ||||||||||
| Activity from investment operations: | ||||||||||||||||||||
| Net investment income (1) | 0.61 | 0.16 | 0.64 | 0.34 | 0.42 | |||||||||||||||
| Net realized and unrealized gain (loss) on investments | (0.65 | ) | (2.16 | ) | 0.62 | 0.22 | 0.16 | |||||||||||||
| Total from investment operations | (0.04 | ) | (2.00 | ) | 1.26 | 0.56 | 0.58 | |||||||||||||
| Less distributions from: | ||||||||||||||||||||
| Net investment income | (0.61 | ) | (0.16 | ) | (0.64 | ) | (0.35 | ) | (0.42 | ) | ||||||||||
| Net realized gains | — | (0.08 | ) | — | (0.04 | ) | — | |||||||||||||
| Return of capital | (0.00 | ) (6) | (0.02 | ) | — | (0.00 | ) (6) | — | ||||||||||||
| Total distributions | (0.61 | ) | (0.26 | ) | (0.64 | ) | (0.39 | ) | (0.42 | ) | ||||||||||
| Net asset value, end of year | $ | 20.99 | $ | 21.64 | $ | 23.90 | $ | 23.28 | $ | 23.11 | ||||||||||
| Total return (2) | (0.23 | )% | (8.45 | )% | 5.46 | % | 2.41 | % | 2.59 | % | ||||||||||
| Net assets, at end of year (000s) | $ | 18,737 | $ | 22,613 | $ | 28,943 | $ | 31,880 | $ | 34,599 | ||||||||||
| Ratio of gross expenses to average net assets (3)(4) | 1.70 | % | 1.70 | % | 1.69 | % | 1.70 | % | 1.74 | % | ||||||||||
| Ratio of net expenses to average net assets (4) | 1.70 | % | 1.70 | % | 1.69 | % | 1.70 | % | 1.74 | % | ||||||||||
| Ratio of net investment income to average net assets (4)(5) | 2.77 | % | 0.70 | % | 2.66 | % | 1.48 | % | 1.83 | % | ||||||||||
| Portfolio Turnover Rate | 267 | % | 292 | % | 159 | % | 310 | % | 320 | % | ||||||||||
| (1) | Per share amounts calculated using the average shares method, which more appropriately presents the per share data for the year. |
| (2) | Total returns shown exclude the effect of applicable sales charges, and assume changes in share price and reinvestment of dividends and capital gain distributions. |
| (3) | Represents the ratio of expenses to average net assets absent fee waivers and/or expense reimbursements by the adviser. |
| (4) | Does not include the expenses of other investment companies in which the Fund invests. |
| (5) | Recognition of net investment income by the Fund is affected by the timing of declaration of dividends by the underlying investment companies in which the Fund invests. |
| (6) | Less than $0.01. |
See accompanying notes to financial statements.
62
| SIERRA TACTICAL ALL ASSET FUND |
| FINANCIAL HIGHLIGHTS |
| Per Share Data and Ratios for a Share of Beneficial Interest Outstanding Throughout Each Year |
| Year Ended | Year Ended | Year Ended | Year Ended | Year Ended | ||||||||||||||||
| September 30, | September 30, | September 30, | September 30, | September 30, | ||||||||||||||||
| Class C Shares | 2023 | 2022 | 2021 | 2020 | 2019 | |||||||||||||||
| Net asset value, beginning of year | $ | 21.74 | $ | 24.07 | $ | 23.44 | $ | 23.30 | $ | 23.13 | ||||||||||
| Activity from investment operations: | ||||||||||||||||||||
| Net investment income (loss) (1) | 0.43 | (0.01 | ) | 0.47 | 0.17 | 0.25 | ||||||||||||||
| Net realized and unrealized gain (loss) on investments | (0.64 | ) | (2.16 | ) | 0.62 | 0.21 | 0.17 | |||||||||||||
| Total from investment operations | (0.21 | ) | (2.17 | ) | 1.09 | 0.38 | 0.42 | |||||||||||||
| Less distributions from: | ||||||||||||||||||||
| Net investment income | (0.44 | ) | (0.07 | ) | (0.46 | ) | (0.20 | ) | (0.25 | ) | ||||||||||
| Net realized gains | — | (0.08 | ) | — | (0.04 | ) | — | |||||||||||||
| Return of capital | (0.00 | ) (6) | (0.01 | ) | — | (0.00 | ) (6) | — | ||||||||||||
| Total distributions | (0.44 | ) | (0.16 | ) | (0.46 | ) | (0.24 | ) | (0.25 | ) | ||||||||||
| Net asset value, end of year | $ | 21.09 | $ | 21.74 | $ | 24.07 | $ | 23.44 | $ | 23.30 | ||||||||||
| Total return (2) | (0.99 | )% | (9.10 | )% | 4.63 | % | 1.66 | % | 1.83 | % | ||||||||||
| Net assets, at end of year (000s) | $ | 31,465 | $ | 38,104 | $ | 47,185 | $ | 48,432 | $ | 52,649 | ||||||||||
| Ratio of gross expenses to average net assets (3)(4) | 2.45 | % | 2.45 | % | 2.44 | % | 2.45 | % | 2.49 | % | ||||||||||
| Ratio of net expenses to average net assets (4) | 2.45 | % | 2.45 | % | 2.44 | % | 2.45 | % | 2.49 | % | ||||||||||
| Ratio of net investment income (loss) to average net assets (4)(5) | 2.02 | % | (0.05 | )% | 1.92 | % | 0.74 | % | 1.07 | % | ||||||||||
| Portfolio Turnover Rate | 267 | % | 292 | % | 159 | % | 310 | % | 320 | % | ||||||||||
| (1) | Per share amounts calculated using the average shares method, which more appropriately presents the per share data for the year. |
| (2) | Total returns shown assume changes in share price and reinvestment of dividends and capital gain distributions. |
| (3) | Represents the ratio of expenses to average net assets absent fee waivers and/or expense reimbursements by the adviser. |
| (4) | Does not include the expenses of other investment companies in which the Fund invests. |
| (5) | Recognition of net investment income (loss) by the Fund is affected by the timing of declaration of dividends by the underlying investment companies in which the Fund invests. |
| (6) | Less than $0.01. |
See accompanying notes to financial statements.
63
| SIERRA TACTICAL ALL ASSET FUND |
| FINANCIAL HIGHLIGHTS |
| Per Share Data and Ratios for a Share of Beneficial Interest Outstanding Throughout Each Year |
| Year Ended | Year Ended | Year Ended | Year Ended | Year Ended | ||||||||||||||||
| September 30, | September 30, | September 30, | September 30, | September 30, | ||||||||||||||||
| Investor Class | 2023 | 2022 | 2021 | 2020 | 2019 | |||||||||||||||
| Net asset value, beginning of year | $ | 21.60 | $ | 23.85 | $ | 23.22 | $ | 23.08 | $ | 22.91 | ||||||||||
| Activity from investment operations: | ||||||||||||||||||||
| Net investment income (1) | 0.59 | 0.16 | 0.64 | 0.33 | 0.41 | |||||||||||||||
| Net realized and unrealized gain (loss) on investments | (0.64 | ) | (2.15 | ) | 0.63 | 0.20 | 0.18 | |||||||||||||
| Total from investment operations | (0.05 | ) | (1.99 | ) | 1.27 | 0.53 | 0.59 | |||||||||||||
| Less distributions from: | ||||||||||||||||||||
| Net investment income | (0.60 | ) | (0.16 | ) | (0.64 | ) | (0.35 | ) | (0.42 | ) | ||||||||||
| Net realized gains | — | (0.08 | ) | — | (0.04 | ) | — | |||||||||||||
| Return of capital | (0.00 | ) (6) | (0.02 | ) | — | (0.00 | ) (6) | — | ||||||||||||
| Total distributions | (0.60 | ) | (0.26 | ) | (0.64 | ) | (0.39 | ) | (0.42 | ) | ||||||||||
| Net asset value, end of year | $ | 20.95 | $ | 21.60 | $ | 23.85 | $ | 23.22 | $ | 23.08 | ||||||||||
| Total return (2) | (0.23 | )% | (8.43 | )% | 5.47 | % | 2.33 | % | 2.63 | % | ||||||||||
| Net assets, at end of year (000s) | $ | 7,683 | $ | 11,267 | $ | 15,643 | $ | 16,479 | $ | 15,425 | ||||||||||
| Ratio of gross expenses to average net assets (3)(4) | 1.70 | % | 1.70 | % | 1.69 | % | 1.70 | % | 1.74 | % | ||||||||||
| Ratio of net expenses to average net assets (4) | 1.70 | % | 1.70 | % | 1.69 | % | 1.70 | % | 1.74 | % | ||||||||||
| Ratio of net investment income to average net assets (4)(5) | 2.74 | % | 0.69 | % | 2.68 | % | 1.44 | % | 1.83 | % | ||||||||||
| Portfolio Turnover Rate | 267 | % | 292 | % | 159 | % | 310 | % | 320 | % | ||||||||||
| (1) | Per share amounts calculated using the average shares method, which more appropriately presents the per share data for the year. |
| (2) | Total returns shown assume changes in share price and reinvestment of dividends and capital gain distributions. |
| (3) | Represents the ratio of expenses to average net assets absent fee waivers and/or expense reimbursements by the adviser. |
| (4) | Does not include the expenses of other investment companies in which the Fund invests. |
| (5) | Recognition of net investment income by the Fund is affected by the timing of declaration of dividends by the underlying investment companies in which the Fund invests. |
| (6) | Less than $0.01. |
See accompanying notes to financial statements.
64
| SIERRA TACTICAL ALL ASSET FUND |
| FINANCIAL HIGHLIGHTS |
| Per Share Data and Ratios for a Share of Beneficial Interest Outstanding Throughout Each Year |
| Year Ended | Year Ended | Year Ended | Year Ended | Year Ended | ||||||||||||||||
| September 30, | September 30, | September 30, | September 30, | September 30, | ||||||||||||||||
| Instl Class | 2023 | 2022 | 2021 | 2020 | 2019 | |||||||||||||||
| Net asset value, beginning of year | $ | 21.46 | $ | 23.68 | $ | 23.08 | $ | 22.91 | $ | 22.75 | ||||||||||
| Activity from investment operations: | ||||||||||||||||||||
| Net investment income (1) | 0.65 | 0.21 | 0.70 | 0.38 | 0.47 | |||||||||||||||
| Net realized and unrealized gain (loss) on investments | (0.64 | ) | (2.13 | ) | 0.60 | 0.24 | 0.17 | |||||||||||||
| Total from investment operations | 0.01 | (1.92 | ) | 1.30 | 0.62 | 0.64 | ||||||||||||||
| Less distributions from: | ||||||||||||||||||||
| Net investment income | (0.66 | ) | (0.18 | ) | (0.70 | ) | (0.41 | ) | (0.48 | ) | ||||||||||
| Net realized gains | — | (0.08 | ) | — | (0.04 | ) | — | |||||||||||||
| Return of capital | (0.00 | ) (6) | (0.04 | ) | — | (0.00 | ) (6) | — | ||||||||||||
| Total distributions | (0.66 | ) | (0.30 | ) | (0.70 | ) | (0.45 | ) | (0.48 | ) | ||||||||||
| Net asset value, end of year | $ | 20.81 | $ | 21.46 | $ | 23.68 | $ | 23.08 | $ | 22.91 | ||||||||||
| Total return (2) | 0.03 | % | (8.18 | )% | 5.64 | % | 2.73 | % | 2.87 | % | ||||||||||
| Net assets, at end of year (000s) | $ | 665,473 | $ | 783,341 | $ | 765,643 | $ | 595,260 | $ | 486,871 | ||||||||||
| Ratio of gross expenses to average net assets (3)(4) | 1.45 | % | 1.45 | % | 1.44 | % | 1.45 | % | 1.49 | % | ||||||||||
| Ratio of net expenses to average net assets (4) | 1.45 | % | 1.45 | % | 1.44 | % | 1.45 | % | 1.49 | % | ||||||||||
| Ratio of net investment income to average net assets (4)(5) | 3.02 | % | 0.92 | % | 2.95 | % | 1.67 | % | 2.08 | % | ||||||||||
| Portfolio Turnover Rate | 267 | % | 292 | % | 159 | % | 310 | % | 320 | % | ||||||||||
| (1) | Per share amounts calculated using the average shares method, which more appropriately presents the per share data for the year. |
| (2) | Total returns shown assume changes in share price and reinvestment of dividends and capital gain distributions. |
| (3) | Represents the ratio of expenses to average net assets absent fee waivers and/or expense reimbursements by the adviser. |
| (4) | Does not include the expenses of other investment companies in which the Fund invests. |
| (5) | Recognition of net investment income by the Fund is affected by the timing of declaration of dividends by the underlying investment companies in which the Fund invests. |
| (6) | Less than $0.01. |
See accompanying notes to financial statements.
65
| SIERRA TACTICAL ALL ASSET FUND |
| FINANCIAL HIGHLIGHTS |
| Per Share Data and Ratios for a Share of Beneficial Interest Outstanding Throughout Each Year |
| Year Ended | Year Ended | Year Ended | Year Ended | Year Ended | ||||||||||||||||
| September 30, | September 30, | September 30, | September 30, | September 30, | ||||||||||||||||
| Class A1 Shares | 2023 | 2022 | 2021 | 2020 | 2019 | |||||||||||||||
| Net asset value, beginning of year | $ | 21.87 | $ | 24.15 | $ | 23.52 | $ | 23.35 | $ | 23.18 | ||||||||||
| Activity from investment operations: | ||||||||||||||||||||
| Net investment income (1) | 0.56 | 0.13 | 0.60 | 0.31 | 0.38 | |||||||||||||||
| Net realized and unrealized gain (loss) on investments | (0.64 | ) | (2.17 | ) | 0.63 | 0.21 | 0.18 | |||||||||||||
| Total from investment operations | (0.08 | ) | (2.04 | ) | 1.23 | 0.52 | 0.56 | |||||||||||||
| Less distributions from: | ||||||||||||||||||||
| Net investment income | (0.57 | ) | (0.14 | ) | (0.60 | ) | (0.31 | ) | (0.39 | ) | ||||||||||
| Net realized gains | — | (0.08 | ) | — | (0.04 | ) | — | |||||||||||||
| Return of capital | (0.00 | ) (6) | (0.02 | ) | — | (0.00 | ) (6) | — | ||||||||||||
| Total distributions | (0.57 | ) | (0.24 | ) | (0.60 | ) | (0.35 | ) | (0.39 | ) | ||||||||||
| Net asset value, end of year | $ | 21.22 | $ | 21.87 | $ | 24.15 | $ | 23.52 | $ | 23.35 | ||||||||||
| Total return (2) | (0.38 | )% | (8.54 | )% | 5.25 | % | 2.26 | % | 2.45 | % | ||||||||||
| Net assets, at end of year (000s) | $ | 3,139 | $ | 3,303 | $ | 3,400 | $ | 3,246 | $ | 3,506 | ||||||||||
| Ratio of gross expenses to average net assets (3)(4) | 1.85 | % | 1.85 | % | 1.84 | % | 1.85 | % | 1.89 | % | ||||||||||
| Ratio of net expenses to average net assets (4) | 1.85 | % | 1.85 | % | 1.84 | % | 1.85 | % | 1.89 | % | ||||||||||
| Ratio of net investment income to average net assets (4)(5) | 2.57 | % | 0.54 | % | 2.48 | % | 1.36 | % | 1.67 | % | ||||||||||
| Portfolio Turnover Rate | 267 | % | 292 | % | 159 | % | 310 | % | 320 | % | ||||||||||
| (1) | Per share amounts calculated using the average shares method, which more appropriately presents the per share data for the year. |
| (2) | Total returns shown exclude the effect of applicable sales charges (Class A1) and assume changes in share price and reinvestment of dividends and capital gain distributions, if any. |
| (3) | Represents the ratio of expenses to average net assets absent fee waivers and/or expense reimbursements by the adviser. |
| (4) | Does not include the expenses of other investment companies in which the Fund invests. |
| (5) | Recognition of net investment income by the Fund is affected by the timing of declaration of dividends by the underlying investment companies in which the Fund invests. |
| (6) | Less than $0.01. |
See accompanying notes to financial statements.
66
| SIERRA TACTICAL ALL ASSET FUND |
| FINANCIAL HIGHLIGHTS |
| Per Share Data and Ratios for a Share of Beneficial Interest Outstanding Throughout Each Year |
| Year Ended | Year Ended | Year Ended | Year Ended | Year Ended | ||||||||||||||||
| September 30, | September 30, | September 30, | September 30, | September 30, | ||||||||||||||||
| Class I1 Shares | 2023 | 2022 | 2021 | 2020 | 2019 | |||||||||||||||
| Net asset value, beginning of year | $ | 21.77 | $ | 24.05 | $ | 23.43 | $ | 23.26 | $ | 23.08 | ||||||||||
| Activity from investment operations: | ||||||||||||||||||||
| Net investment income (1) | 0.57 | 0.13 | 0.60 | 0.31 | 0.38 | |||||||||||||||
| Net realized and unrealized gain (loss) on investments | (0.65 | ) | (2.18 | ) | 0.63 | 0.21 | 0.19 | |||||||||||||
| Total from investment operations | (0.08 | ) | (2.05 | ) | 1.23 | 0.52 | 0.57 | |||||||||||||
| Less distributions from: | ||||||||||||||||||||
| Net investment income | (0.57 | ) | (0.13 | ) | (0.61 | ) | (0.31 | ) | (0.39 | ) | ||||||||||
| Net realized gains | — | (0.08 | ) | — | (0.04 | ) | — | |||||||||||||
| Return of capital | (0.00 | ) (6) | (0.02 | ) | — | (0.00 | ) (6) | — | ||||||||||||
| Total distributions | (0.57 | ) | (0.23 | ) | (0.61 | ) | (0.35 | ) | (0.39 | ) | ||||||||||
| Net asset value, end of year | $ | 21.12 | $ | 21.77 | $ | 24.05 | $ | 23.43 | $ | 23.26 | ||||||||||
| Total return (2) | (0.38 | )% | (8.59 | )% | 5.24 | % | 2.27 | % | 2.50 | % | ||||||||||
| Net assets, at end of year (000s) | $ | 6,304 | $ | 7,656 | $ | 9,170 | $ | 3,172 | $ | 3,950 | ||||||||||
| Ratio of gross expenses to average net assets (3)(4) | 1.85 | % | 1.85 | % | 1.84 | % | 1.85 | % | 1.89 | % | ||||||||||
| Ratio of net expenses to average net assets (4) | 1.85 | % | 1.85 | % | 1.84 | % | 1.85 | % | 1.89 | % | ||||||||||
| Ratio of net investment income to average net assets (4)(5) | 2.60 | % | 0.54 | % | 2.45 | % | 1.32 | % | 1.68 | % | ||||||||||
| Portfolio Turnover Rate | 267 | % | 292 | % | 159 | % | 310 | % | 320 | % | ||||||||||
| (1) | Per share amounts calculated using the average shares method, which more appropriately presents the per share data for the year. |
| (2) | Total returns shown assume changes in share price and reinvestment of dividends and capital gain distributions, if any. |
| (3) | Represents the ratio of expenses to average net assets absent fee waivers and/or expense reimbursements by the adviser. |
| (4) | Does not include the expenses of other investment companies in which the Fund invests. |
| (5) | Recognition of net investment income by the Fund is affected by the timing of declaration of dividends by the underlying investment companies in which the Fund invests. |
| (6) | Less than $0.01. |
See accompanying notes to financial statements.
67
| SIERRA TACTICAL CORE INCOME FUND |
| FINANCIAL HIGHLIGHTS |
| Per Share Data and Ratios for a Share of Beneficial Interest Outstanding Throughout Each Year |
| Year Ended | Year Ended | Year Ended | Year Ended | Year Ended | ||||||||||||||||
| September 30, | September 30, | September 30, | September 30, | September 30, | ||||||||||||||||
| Class A Shares | 2023 | 2022 | 2021 | 2020 | 2019 | |||||||||||||||
| Net asset value, beginning of year | $ | 20.24 | $ | 21.91 | $ | 21.50 | $ | 21.51 | $ | 20.96 | ||||||||||
| Activity from investment operations: | ||||||||||||||||||||
| Net investment income (1) | 0.63 | 0.24 | 0.58 | 0.53 | 0.51 | |||||||||||||||
| Net realized and unrealized gain (loss) on investments | (0.89 | ) | (1.65 | ) | 0.43 | 0.00 | (6) | 0.56 | ||||||||||||
| Total from investment operations | (0.26 | ) | (1.41 | ) | 1.01 | 0.53 | 1.07 | |||||||||||||
| Less distributions from: | ||||||||||||||||||||
| Net investment income | (0.65 | ) | (0.23 | ) | (0.60 | ) | (0.54 | ) | (0.52 | ) | ||||||||||
| Net realized gains | — | — | — | (0.00 | ) (6) | — | ||||||||||||||
| Return of capital | (0.00 | ) (6) | (0.03 | ) | — | — | — | |||||||||||||
| Total distributions | (0.65 | ) | (0.26 | ) | (0.60 | ) | (0.54 | ) | (0.52 | ) | ||||||||||
| Net asset value, end of year | $ | 19.33 | $ | 20.24 | $ | 21.91 | $ | 21.50 | $ | 21.51 | ||||||||||
| Total return (2) | (1.33 | )% | (6.50 | )% | 4.71 | % | 2.48 | % | 5.21 | % | ||||||||||
| Net assets, at end of year (000s) | $ | 40,788 | $ | 49,885 | $ | 61,843 | $ | 69,753 | $ | 64,244 | ||||||||||
| Ratio of gross expenses to average net assets (3)(4) | 1.34 | % (8) | 1.34 | % (8) | 1.34 | % | 1.36 | % | 1.36 | % | ||||||||||
| Ratio of net expenses to average net assets (4) | 1.35 | % (7) | 1.35 | % (7) | 1.34 | % | 1.35 | % | 1.35 | % | ||||||||||
| Ratio of net investment income to average net assets (4)(5) | 3.17 | % | 1.16 | % | 2.65 | % | 2.47 | % | 2.45 | % | ||||||||||
| Portfolio Turnover Rate | 373 | % | 281 | % | 117 | % | 294 | % | 221 | % | ||||||||||
| (1) | Per share amounts calculated using the average shares method, which more appropriately presents the per share data for the year. |
| (2) | Total returns shown exclude the effect of applicable sales charges and assume changes in share price and reinvestment of dividends and capital gain distributions. |
| (3) | Represents the ratio of expenses to average net assets absent fee waivers and/or expense reimbursements by the adviser. |
| (4) | Does not include the expenses of other investment companies in which the Fund invests. |
| (5) | Recognition of net investment income by the Fund is affected by the timing of declaration of dividends by the underlying investment companies in which the Fund invests. |
| (6) | Less than $0.01. |
| (7) | Represents the ratio of expenses to average net assets after adviser recapture of waived fees from the prior period. |
| (8) | Represents the ratio of expenses to average net assets before adviser recapture of waived/reimbursed fees from the prior period. |
See accompanying notes to financial statements.
68
| SIERRA TACTICAL CORE INCOME FUND |
| FINANCIAL HIGHLIGHTS |
| Per Share Data and Ratios for a Share of Beneficial Interest Outstanding Throughout Each Year |
| Year Ended | Year Ended | Year Ended | Year Ended | Year Ended | ||||||||||||||||
| September 30, | September 30, | September 30, | September 30, | September 30, | ||||||||||||||||
| Class C Shares | 2023 | 2022 | 2021 | 2020 | 2019 | |||||||||||||||
| Net asset value, beginning of year | $ | 20.14 | $ | 21.85 | $ | 21.44 | $ | 21.45 | $ | 20.91 | ||||||||||
| Activity from investment operations: | ||||||||||||||||||||
| Net investment income (1) | 0.51 | 0.12 | 0.44 | 0.40 | 0.39 | |||||||||||||||
| Net realized and unrealized gain (loss) on investments | (0.89 | ) | (1.66 | ) | 0.44 | 0.00 | (6) | 0.55 | ||||||||||||
| Total from investment operations | (0.38 | ) | (1.54 | ) | 0.88 | 0.40 | 0.94 | |||||||||||||
| Less distributions from: | ||||||||||||||||||||
| Net investment income | (0.53 | ) | (0.15 | ) | (0.47 | ) | (0.41 | ) | (0.40 | ) | ||||||||||
| Net realized gains | — | — | — | (0.00 | ) (6) | — | ||||||||||||||
| Return of capital | (0.00 | ) (6) | (0.02 | ) | — | — | — | |||||||||||||
| Total distributions | (0.53 | ) | (0.17 | ) | (0.47 | ) | (0.41 | ) | (0.40 | ) | ||||||||||
| Net asset value, end of year | $ | 19.23 | $ | 20.14 | $ | 21.85 | $ | 21.44 | $ | 21.45 | ||||||||||
| Total return (2) | (1.93 | )% | (7.07 | )% | 4.12 | % | 1.90 | % | 4.56 | % | ||||||||||
| Net assets, at end of year (000s) | $ | 112,911 | $ | 149,452 | $ | 176,858 | $ | 142,722 | $ | 130,746 | ||||||||||
| Ratio of gross expenses to average net assets (3)(4) | 1.94 | % (8) | 1.94 | % (8) | 1.94 | % | 1.96 | % | 1.96 | % | ||||||||||
| Ratio of net expenses to average net assets (4) | 1.94 | % (7) | 1.95 | % (7) | 1.94 | % | 1.95 | % | 1.95 | % | ||||||||||
| Ratio of net investment income to average net assets (4)(5) | 2.58 | % | 0.54 | % | 2.00 | % | 1.87 | % | 1.84 | % | ||||||||||
| Portfolio Turnover Rate | 373 | % | 281 | % | 117 | % | 294 | % | 221 | % | ||||||||||
| (1) | Per share amounts calculated using the average shares method, which more appropriately presents the per share data for the year. |
| (2) | Total returns shown assume changes in share price and reinvestment of dividends and capital gain distributions. |
| (3) | Represents the ratio of expenses to average net assets absent fee waivers and/or expense reimbursements by the adviser. |
| (4) | Does not include the expenses of other investment companies in which the Fund invests. |
| (5) | Recognition of net investment income by the Fund is affected by the timing of declaration of dividends by the underlying investment companies in which the Fund invests. |
| (6) | Less than $0.01. |
| (7) | Represents the ratio of expenses to average net assets after adviser recapture of waived fees from the prior period. |
| (8) | Represents the ratio of expenses to average net assets before adviser recapture of waived/reimbursed fees from the prior period. |
See accompanying notes to financial statements.
69
| SIERRA TACTICAL CORE INCOME FUND |
| FINANCIAL HIGHLIGHTS |
| Per Share Data and Ratios for a Share of Beneficial Interest Outstanding Throughout Each Year |
| Year Ended | Year Ended | Year Ended | Year Ended | Year Ended | ||||||||||||||||
| September 30, | September 30, | September 30, | September 30, | September 30, | ||||||||||||||||
| Investor Class | 2023 | 2022 | 2021 | 2020 | 2019 | |||||||||||||||
| Net asset value, beginning of year | $ | 20.27 | $ | 21.95 | $ | 21.54 | $ | 21.54 | $ | 20.99 | ||||||||||
| Activity from investment operations: | ||||||||||||||||||||
| Net investment income (1) | 0.64 | 0.24 | 0.58 | 0.53 | 0.51 | |||||||||||||||
| Net realized and unrealized gain (loss) on investments | (0.90 | ) | (1.66 | ) | 0.43 | 0.01 | 0.56 | |||||||||||||
| Total from investment operations | (0.26 | ) | (1.42 | ) | 1.01 | 0.54 | 1.07 | |||||||||||||
| Less distributions from: | ||||||||||||||||||||
| Net investment income | (0.65 | ) | (0.23 | ) | (0.60 | ) | (0.54 | ) | (0.52 | ) | ||||||||||
| Net realized gains | — | — | — | (0.00 | ) (6) | — | ||||||||||||||
| Return of capital | (0.00 | ) (6) | (0.03 | ) | — | — | — | |||||||||||||
| Total distributions | (0.65 | ) | (0.26 | ) | (0.60 | ) | (0.54 | ) | (0.52 | ) | ||||||||||
| Net asset value, end of year | $ | 19.36 | $ | 20.27 | $ | 21.95 | $ | 21.54 | $ | 21.54 | ||||||||||
| Total return (2) | (1.33 | )% | (6.53 | )% | 4.70 | % | 2.53 | % | 5.19 | % | ||||||||||
| Net assets, at end of year (000s) | $ | 56,842 | $ | 67,463 | $ | 80,457 | $ | 77,540 | $ | 68,005 | ||||||||||
| Ratio of gross expenses to average net assets (3)(4) | 1.34 | % (8) | 1.34 | % (8) | 1.34 | % | 1.36 | % | 1.36 | % | ||||||||||
| Ratio of net expenses to average net assets (4) | 1.34 | % (7) | 1.35 | % (7) | 1.34 | % | 1.35 | % | 1.35 | % | ||||||||||
| Ratio of net investment income to average net assets (4)(5) | 3.17 | % | 1.13 | % | 2.64 | % | 2.48 | % | 2.44 | % | ||||||||||
| Portfolio Turnover Rate | 373 | % | 281 | % | 117 | % | 294 | % | 221 | % | ||||||||||
| (1) | Per share amounts calculated using the average shares method, which more appropriately presents the per share data for the year. |
| (2) | Total returns shown assume changes in share price and reinvestment of dividends and capital gain distributions. |
| (3) | Represents the ratio of expenses to average net assets absent fee waivers and/or expense reimbursements by the adviser. |
| (4) | Does not include the expenses of other investment companies in which the Fund invests. |
| (5) | Recognition of net investment income by the Fund is affected by the timing of declaration of dividends by the underlying investment companies in which the Fund invests. |
| (6) | Less than $0.01. |
| (7) | Represents the ratio of expenses to average net assets after adviser recapture of waived fees from the prior period. |
| (8) | Represents the ratio of expenses to average net assets before adviser recapture of waived/reimbursed fees from the prior period. |
See accompanying notes to financial statements.
70
| SIERRA TACTICAL CORE INCOME FUND |
| FINANCIAL HIGHLIGHTS |
| Per Share Data and Ratios for a Share of Beneficial Interest Outstanding Throughout Each Year |
| Year Ended | Year Ended | Year Ended | Year Ended | Year Ended | ||||||||||||||||
| September 30, | September 30, | September 30, | September 30, | September 30, | ||||||||||||||||
| Instl Class | 2023 | 2022 | 2021 | 2020 | 2019 | |||||||||||||||
| Net asset value, beginning of year | $ | 20.15 | $ | 21.81 | $ | 21.40 | $ | 21.41 | $ | 20.87 | ||||||||||
| Activity from investment operations: | ||||||||||||||||||||
| Net investment income (1) | 0.71 | 0.32 | 0.66 | 0.60 | 0.59 | |||||||||||||||
| Net realized and unrealized gain (loss) on investments | (0.89 | ) | (1.64 | ) | 0.43 | 0.01 | 0.56 | |||||||||||||
| Total from investment operations | (0.18 | ) | (1.32 | ) | 1.09 | 0.61 | 1.15 | |||||||||||||
| Less distributions from: | ||||||||||||||||||||
| Net investment income | (0.73 | ) | (0.30 | ) | (0.68 | ) | (0.62 | ) | (0.61 | ) | ||||||||||
| Net realized gains | — | — | — | (0.00 | ) (6) | — | ||||||||||||||
| Return of capital | (0.00 | ) (6) | (0.04 | ) | — | — | — | |||||||||||||
| Total distributions | (0.73 | ) | (0.34 | ) | (0.68 | ) | (0.62 | ) | (0.61 | ) | ||||||||||
| Net asset value, end of year | $ | 19.24 | $ | 20.15 | $ | 21.81 | $ | 21.40 | $ | 21.41 | ||||||||||
| Total return (2) | (0.94 | )% | (6.12 | )% | 5.15 | % | 2.90 | % | 5.61 | % | ||||||||||
| Net assets, at end of year (000s) | $ | 1,601,486 | $ | 1,674,803 | $ | 1,571,623 | $ | 1,345,504 | $ | 1,018,078 | ||||||||||
| Ratio of gross expenses to average net assets (3)(4) | 0.94 | % | 0.94 | % | 0.94 | % | 0.96 | % | 0.96 | % | ||||||||||
| Ratio of net expenses to average net assets (4) | 0.94 | % | 0.94 | % | 0.94 | % | 0.96 | % | 0.96 | % | ||||||||||
| Ratio of net investment income to average net assets (4)(5) | 3.58 | % | 1.51 | % | 3.01 | % | 2.82 | % | 2.83 | % | ||||||||||
| Portfolio Turnover Rate | 373 | % | 281 | % | 117 | % | 294 | % | 221 | % | ||||||||||
| (1) | Per share amounts calculated using the average shares method, which more appropriately presents the per share data for the year. |
| (2) | Total returns shown assume changes in share price and reinvestment of dividends and capital gain distributions. |
| (3) | Represents the ratio of expenses to average net assets absent fee waivers and/or expense reimbursements by the adviser. |
| (4) | Does not include the expenses of other investment companies in which the Fund invests. |
| (5) | Recognition of net investment income by the Fund is affected by the timing of declaration of dividends by the underlying investment companies in which the Fund invests. |
| (6) | Less than $0.01. |
See accompanying notes to financial statements.
71
| SIERRA TACTICAL MUNICIPAL FUND |
| FINANCIAL HIGHLIGHTS |
| Per Share Data and Ratios for a Share of Beneficial Interest Outstanding Throughout Each Period |
| Year Ended | Year Ended | Year Ended | Year Ended | Period Ended | ||||||||||||||||
| September 30, | September 30, | September 30, | September 30, | September 30, | ||||||||||||||||
| Class A Shares | 2023 | 2022 | 2021 | 2020 | 2019 (1) | |||||||||||||||
| Net asset value, beginning of period | $ | 24.79 | $ | 27.16 | $ | 25.93 | $ | 26.42 | $ | 25.00 | ||||||||||
| Activity from investment operations: | ||||||||||||||||||||
| Net investment income (2) | 0.53 | 0.20 | 0.55 | 0.58 | 0.48 | |||||||||||||||
| Net realized and unrealized gain (loss) on investments | (0.66 | ) | (1.58 | ) | 1.21 | (0.45 | ) | 1.31 | ||||||||||||
| Total from investment operations | (0.13 | ) | (1.38 | ) | 1.76 | 0.13 | 1.79 | |||||||||||||
| Less distributions from: | ||||||||||||||||||||
| Net investment income | (0.52 | ) | (0.22 | ) | (0.53 | ) | (0.59 | ) | (0.37 | ) | ||||||||||
| Net realized gains | — | (0.77 | ) | — | (0.03 | ) | — | |||||||||||||
| Return of capital | (0.00 | ) (10) | — | — | — | — | ||||||||||||||
| Total distributions | (0.52 | ) | (0.99 | ) | (0.53 | ) | (0.62 | ) | (0.37 | ) | ||||||||||
| Net asset value, end of period | $ | 24.14 | $ | 24.79 | $ | 27.16 | $ | 25.93 | $ | 26.42 | ||||||||||
| Total return (3) | (0.57 | )% | (5.27 | )% | 6.88 | % | 0.46 | % | 7.20 | % (8) | ||||||||||
| Net assets, at end of period (000s) | $ | 4,266 | $ | 4,582 | $ | 3,384 | $ | 2,659 | $ | 1,616 | ||||||||||
| Ratio of gross expenses to average net assets (4)(5)(7) | 1.26 | % (9) | 1.26 | % | 1.29 | % | 1.35 | % | 1.47 | % | ||||||||||
| Ratio of net expenses to average net assets (5)(7) | 1.23 | % (9) | 1.23 | % | 1.23 | % | 1.23 | % | 1.23 | % | ||||||||||
| Ratio of net investment income to average net assets (5)(6)(7) | 2.08 | % | 0.78 | % | 2.04 | % | 2.23 | % | 2.42 | % | ||||||||||
| Portfolio Turnover Rate | 407 | % | 360 | % | 121 | % | 186 | % | 26 | % (8) | ||||||||||
| (1) | The Sierra Tactical Municipal Fund Class A shares commenced operations on December 27, 2018. |
| (2) | Per share amounts calculated using the average shares method, which more appropriately presents the per share data for the period. |
| (3) | Total returns shown exclude the effect of applicable sales charges and assume changes in share price and reinvestment of dividends and capital gain distributions. |
| (4) | Represents the ratio of expenses to average net assets absent fee waivers and/or expense reimbursements by the adviser. |
| (5) | Does not include the expenses of other investment companies in which the Fund invests. |
| (6) | Recognition of net investment income by the Fund is affected by the timing of declaration of dividends by the underlying investment companies in which the Fund invests. |
| (7) | Annualized for periods less than one year. |
| (8) | Not annualized. |
| (9) | Includes 0.00% for the year ended September 30, 2023 attributed to line of credit expense which are not subject to waiver by the Adviser. |
| (10) | Less than $0.01. |
See accompanying notes to financial statements.
72
| SIERRA TACTICAL MUNICIPAL FUND |
| FINANCIAL HIGHLIGHTS |
| Per Share Data and Ratios for a Share of Beneficial Interest Outstanding Throughout Each Period |
| Year Ended | Year Ended | Year Ended | Year Ended | Period Ended | ||||||||||||||||
| September 30, | September 30, | September 30, | September 30, | September 30, | ||||||||||||||||
| Class C Shares | 2023 | 2022 | 2021 | 2020 | 2019 (1) | |||||||||||||||
| Net asset value, beginning of period | $ | 24.55 | $ | 26.99 | $ | 25.80 | $ | 26.33 | $ | 26.44 | ||||||||||
| Activity from investment operations: | ||||||||||||||||||||
| Net investment income (2) | 0.34 | 0.01 | 0.32 | 0.35 | 0.02 | |||||||||||||||
| Net realized and unrealized gain (loss) on investments | (0.66 | ) | (1.56 | ) | 1.22 | (0.39 | ) | (0.13 | ) | |||||||||||
| Total from investment operations | (0.32 | ) | (1.55 | ) | 1.54 | (0.04 | ) | (0.11 | ) | |||||||||||
| Less distributions from: | ||||||||||||||||||||
| Net investment income | (0.35 | ) | (0.12 | ) | (0.35 | ) | (0.46 | ) | — | |||||||||||
| Net realized gains | — | (0.77 | ) | — | (0.03 | ) | — | |||||||||||||
| Return of capital | (0.00 | ) (11) | — | — | — | — | ||||||||||||||
| Total distributions | (0.35 | ) | (0.89 | ) | (0.35 | ) | (0.49 | ) | — | |||||||||||
| Net asset value, end of period | $ | 23.88 | $ | 24.55 | $ | 26.99 | $ | 25.80 | $ | 26.33 | ||||||||||
| Total return (3) | (1.36 | )% | (5.92 | )% | 6.05 | % | (0.21 | )% | (0.42 | )% (9) | ||||||||||
| Net assets, at end of period (000s) | $ | 2,579 | $ | 1,529 | $ | 1,252 | $ | 386 | $ | 26 | (7) | |||||||||
| Ratio of gross expenses to average net assets (4)(5)(8) | 2.02 | % (10) | 2.01 | % | 2.04 | % | 2.10 | % | 2.22 | % | ||||||||||
| Ratio of net expenses to average net assets (5)(8) | 1.99 | % (10) | 1.98 | % | 1.98 | % | 1.98 | % | 1.98 | % | ||||||||||
| Ratio of net investment income to average net assets (5)(6)(8) | 1.36 | % | 0.04 | % | 1.19 | % | 1.36 | % | 1.37 | % | ||||||||||
| Portfolio Turnover Rate | 407 | % | 360 | % | 121 | % | 186 | % | 26 | % (9) | ||||||||||
| (1) | The Sierra Tactical Municipal Fund Class C shares commenced operations on September 10, 2019. |
| (2) | Per share amounts calculated using the average shares method, which more appropriately presents the per share data for the period. |
| (3) | Total returns shown assume changes in share price and reinvestment of dividends and capital gain distributions. |
| (4) | Represents the ratio of expenses to average net assets absent fee waivers and/or expense reimbursements by the adviser. |
| (5) | Does not include the expenses of other investment companies in which the Fund invests. |
| (6) | Recognition of net investment income by the Fund is affected by the timing of declaration of dividends by the underlying investment companies in which the Fund invests. |
| (7) | Not truncated. |
| (8) | Annualized for periods less than one year. |
| (9) | Not annualized. |
| (10) | Includes 0.01% for the year ended September 30, 2023 attributed to line of credit expense which are not subject to waiver by the Adviser. |
| (11) | Less than $0.01. |
See accompanying notes to financial statements.
73
| SIERRA TACTICAL MUNICIPAL FUND |
| FINANCIAL HIGHLIGHTS |
| Per Share Data and Ratios for a Share of Beneficial Interest Outstanding Throughout Each Period |
| Year Ended | Year Ended | Year Ended | Year Ended | Period Ended | ||||||||||||||||
| September 30, | September 30, | September 30, | September 30, | September 30, | ||||||||||||||||
| Investor Class Shares | 2023 | 2022 | 2021 | 2020 | 2019 (1) | |||||||||||||||
| Net asset value, beginning of period | $ | 24.76 | $ | 27.14 | $ | 25.92 | $ | 26.33 | $ | 25.00 | ||||||||||
| Activity from investment operations: | ||||||||||||||||||||
| Net investment income (2) | 0.49 | 0.15 | 0.51 | 0.48 | 0.42 | |||||||||||||||
| Net realized and unrealized gain (loss) on investments | (0.66 | ) | (1.57 | ) | 1.21 | (0.40 | ) | 1.28 | ||||||||||||
| Total from investment operations | (0.17 | ) | (1.42 | ) | 1.72 | 0.08 | 1.70 | |||||||||||||
| Less distributions from: | ||||||||||||||||||||
| Net investment income | (0.48 | ) | (0.19 | ) | (0.50 | ) | (0.46 | ) | (0.37 | ) | ||||||||||
| Net realized gains | — | (0.77 | ) | — | (0.03 | ) | — | |||||||||||||
| Return of capital | (0.00 | ) (10) | — | — | — | — | ||||||||||||||
| Total distributions | (0.48 | ) | (0.96 | ) | (0.50 | ) | (0.49 | ) | (0.37 | ) | ||||||||||
| Net asset value, end of period | $ | 24.11 | $ | 24.76 | $ | 27.14 | $ | 25.92 | $ | 26.33 | ||||||||||
| Total return (3) | (0.72 | )% | (5.38 | )% | 6.66 | % | 0.30 | % | 6.85 | % (8) | ||||||||||
| Net assets, at end of period (000s) | $ | 4,110 | $ | 4,129 | $ | 4,377 | $ | 2,465 | $ | 94 | ||||||||||
| Ratio of gross expenses to average net assets (4)(5)(7) | 1.41 | % (9) | 1.41 | % | 1.44 | % | 1.50 | % | 1.62 | % | ||||||||||
| Ratio of net expenses to average net assets (5)(7) | 1.38 | % (9) | 1.38 | % | 1.38 | % | 1.38 | % | 1.38 | % | ||||||||||
| Ratio of net investment income to average net assets (5)(6)(7) | 1.95 | % | 0.59 | % | 1.89 | % | 1.86 | % | 2.17 | % | ||||||||||
| Portfolio Turnover Rate | 407 | % | 360 | % | 121 | % | 186 | % | 26 | % (8) | ||||||||||
| (1) | The Sierra Tactical Municipal Fund Investor Class shares commenced operations on December 27, 2018. |
| (2) | Per share amounts calculated using the average shares method, which more appropriately presents the per share data for the period. |
| (3) | Total returns shown assume changes in share price and reinvestment of dividends and capital gain distributions. |
| (4) | Represents the ratio of expenses to average net assets absent fee waivers and/or expense reimbursements by the adviser. |
| (5) | Does not include the expenses of other investment companies in which the Fund invests. |
| (6) | Recognition of net investment income by the Fund is affected by the timing of declaration of dividends by the underlying investment companies in which the Fund invests. |
| (7) | Annualized for periods less than one year. |
| (8) | Not annualized. |
| (9) | Includes 0.00% for the year ended September 30, 2023 attributed to line of credit expense which are not subject to waiver by the Adviser. |
| (10) | Less than $0.01. |
See accompanying notes to financial statements.
74
| SIERRA TACTICAL MUNICIPAL FUND |
| FINANCIAL HIGHLIGHTS |
| Per Share Data and Ratios for a Share of Beneficial Interest Outstanding Throughout Each Period |
| Year Ended | Year Ended | Year Ended | Year Ended | Period Ended | ||||||||||||||||
| September 30, | September 30, | September 30, | September 30, | September 30, | ||||||||||||||||
| Instl Class Shares | 2023 | 2022 | 2021 | 2020 | 2019 (1) | |||||||||||||||
| Net asset value, beginning of period | $ | 24.73 | $ | 27.07 | $ | 25.85 | $ | 26.35 | $ | 25.00 | ||||||||||
| Activity from investment operations: | ||||||||||||||||||||
| Net investment income (2) | 0.58 | 0.25 | 0.60 | 0.64 | 0.49 | |||||||||||||||
| Net realized and unrealized gain (loss) on investments | (0.65 | ) | (1.57 | ) | 1.22 | (0.45 | ) | 1.30 | ||||||||||||
| Total from investment operations | (0.07 | ) | (1.32 | ) | 1.82 | 0.19 | 1.79 | |||||||||||||
| Less distributions from: | ||||||||||||||||||||
| Net investment income | (0.59 | ) | (0.25 | ) | (0.60 | ) | (0.66 | ) | (0.44 | ) | ||||||||||
| Net realized gains | — | (0.77 | ) | — | (0.03 | ) | — | |||||||||||||
| Return of capital | (0.00 | ) (10) | — | — | — | — | ||||||||||||||
| Total distributions | (0.59 | ) | (1.02 | ) | (0.60 | ) | (0.69 | ) | (0.44 | ) | ||||||||||
| Net asset value, end of period | $ | 24.07 | $ | 24.73 | $ | 27.07 | $ | 25.85 | $ | 26.35 | ||||||||||
| Total return (3) | (0.36 | )% | (5.04 | )% | 7.06 | % | 0.71 | % | 7.20 | % (8) | ||||||||||
| Net assets, at end of period (000s) | $ | 288,960 | $ | 302,954 | $ | 281,733 | $ | 196,579 | $ | 120,105 | ||||||||||
| Ratio of gross expenses to average net assets (4)(5)(7) | 1.02 | % (9) | 1.01 | % | 1.04 | % | 1.10 | % | 1.22 | % | ||||||||||
| Ratio of net expenses to average net assets (5)(7) | 1.02 | % (9) | 1.01 | % | 1.02 | % | 0.98 | % | 0.98 | % | ||||||||||
| Ratio of net investment income to average net assets (5)(6)(7) | 2.31 | % | 0.96 | % | 2.23 | % | 2.47 | % | 2.52 | % | ||||||||||
| Portfolio Turnover Rate | 407 | % | 360 | % | 121 | % | 186 | % | 26 | % (8) | ||||||||||
| (1) | The Sierra Tactical Municipal Fund Instl Class shares commenced operations on December 27, 2018. |
| (2) | Per share amounts calculated using the average shares method, which more appropriately presents the per share data for the period. |
| (3) | Total returns shown assume changes in share price and reinvestment of dividends and capital gain distributions. |
| (4) | Represents the ratio of expenses to average net assets absent fee waivers and/or expense reimbursements by the adviser. |
| (5) | Does not include the expenses of other investment companies in which the Fund invests. |
| (6) | Recognition of net investment income by the Fund is affected by the timing of declaration of dividends by the underlying investment companies in which the Fund invests. |
| (7) | Annualized for periods less than one year. |
| (8) | Not annualized. |
| (9) | Includes 0.00% for the year ended September 30, 2023 attributed to line of credit expense which are not subject to waiver by the Adviser. |
| (10) | Less than $0.01. |
See accompanying notes to financial statements.
75
| SIERRA TACTICAL MUNICIPAL FUND |
| FINANCIAL HIGHLIGHTS |
| Per Share Data and Ratios for a Share of Beneficial Interest Outstanding Throughout Each Period |
| Year Ended | Year Ended | Year Ended | Year Ended | Period Ended | ||||||||||||||||
| September 30, | September 30, | September 30, | September 30, | September 30, | ||||||||||||||||
| Special Class Shares | 2023 | 2022 | 2021 | 2020 | 2019 (1) | |||||||||||||||
| Net asset value, beginning of period | $ | 24.84 | $ | 27.11 | $ | 25.88 | $ | 26.37 | $ | 25.00 | ||||||||||
| Activity from investment operations: | ||||||||||||||||||||
| Net investment income (2) | 0.61 | 0.27 | 0.64 | 0.71 | 0.53 | |||||||||||||||
| Net realized and unrealized gain (loss) on investments | (0.66 | ) | (1.57 | ) | 1.21 | (0.50 | ) | 1.29 | ||||||||||||
| Total from investment operations | (0.05 | ) | (1.30 | ) | 1.85 | 0.21 | 1.82 | |||||||||||||
| Less distributions from: | ||||||||||||||||||||
| Net investment income | (0.61 | ) | (0.20 | ) | (0.62 | ) | (0.67 | ) | (0.45 | ) | ||||||||||
| Net realized gains | — | (0.77 | ) | — | (0.03 | ) | — | |||||||||||||
| Return of capital | (0.00 | ) (10) | — | — | — | — | ||||||||||||||
| Total distributions | (0.61 | ) | (0.97 | ) | (0.62 | ) | (0.70 | ) | (0.45 | ) | ||||||||||
| Net asset value, end of period | $ | 24.18 | $ | 24.84 | $ | 27.11 | $ | 25.88 | $ | 26.37 | ||||||||||
| Total return (3) | (0.27 | )% | (4.96 | )% | 7.19 | % | 0.81 | % | 7.33 | % (8) | ||||||||||
| Net assets, at end of period (000s) | $ | 290 | $ | 295 | $ | 443 | $ | 339 | $ | 382 | ||||||||||
| Ratio of gross expenses to average net assets (4)(5)(7) | 0.93 | % (9) | 0.94 | % | 0.94 | % | 1.04 | % | 1.16 | % | ||||||||||
| Ratio of net expenses to average net assets (5)(7) | 0.92 | % (9) | 0.92 | % | 0.92 | % | 0.92 | % | 0.92 | % | ||||||||||
| Ratio of net investment income to average net assets (5)(6)(7) | 2.40 | % | 1.04 | % | 2.36 | % | 2.73 | % | 2.68 | % | ||||||||||
| Portfolio Turnover Rate | 407 | % | 360 | % | 121 | % | 186 | % | 26 | % (8) | ||||||||||
| (1) | The Sierra Tactical Municipal Fund Special shares commenced operations on December 27, 2018. |
| (2) | Per share amounts calculated using the average shares method, which more appropriately presents the per share data for the period. |
| (3) | Total returns shown assume changes in share price and reinvestment of dividends and capital gain distributions. |
| (4) | Represents the ratio of expenses to average net assets absent fee waivers and/or expense reimbursements by the adviser. |
| (5) | Does not include the expenses of other investment companies in which the Fund invests. |
| (6) | Recognition of net investment income by the Fund is affected by the timing of declaration of dividends by the underlying investment companies in which the Fund invests. |
| (7) | Annualized for periods less than one year. |
| (8) | Not annualized. |
| (9) | Includes 0.00% for the year ended September 30, 2023 attributed to line of credit expense which are not subject to waiver by the Adviser. |
| (10) | Less than $0.01. |
See accompanying notes to financial statements.
76
| SIERRA TACTICAL BOND FUND |
| FINANCIAL HIGHLIGHTS |
| Per Share Data and Ratios for a Share of Beneficial Interest Outstanding Throughout Each Period |
| Year Ended | Year Ended | Year Ended | Period Ended | |||||||||||||
| September 30, | September 30, | September 30, | September 30, | |||||||||||||
| Class A Shares | 2023 | 2022 | 2021 | 2020 (1) | ||||||||||||
| Net asset value, beginning of period | $ | 25.90 | $ | 27.74 | $ | 27.83 | $ | 25.00 | ||||||||
| Activity from investment operations: | ||||||||||||||||
| Net investment income (2) | 1.10 | 0.11 | 0.84 | 0.76 | ||||||||||||
| Net realized and unrealized gain (loss) on investments | (0.54 | ) | (1.81 | ) | 1.09 | 2.82 | ||||||||||
| Total from investment operations | 0.56 | (1.70 | ) | 1.93 | 3.58 | |||||||||||
| Less distributions from: | ||||||||||||||||
| Net investment income | (1.16 | ) | (0.14 | ) | (0.78 | ) | (0.75 | ) | ||||||||
| Net realized gains | — | — | (1.24 | ) | — | |||||||||||
| Return of capital | (0.00 | ) (9) | — | — | — | |||||||||||
| Total distributions | (1.16 | ) | (0.14 | ) | (2.02 | ) | (0.75 | ) | ||||||||
| Net asset value, end of period | $ | 25.30 | $ | 25.90 | $ | 27.74 | $ | 27.83 | ||||||||
| Total return (3) | 2.20 | % | (6.15 | )% | 7.15 | % | 14.50 | % (8) | ||||||||
| Net assets, at end of period (000s) | $ | 7,055 | $ | 22,076 | $ | 12,105 | $ | 4,721 | ||||||||
| Ratio of gross expenses to average net assets (4)(5)(7) | 1.48 | % | 1.48 | % | 1.48 | % | 1.49 | % | ||||||||
| Ratio of net expenses to average net assets (5)(7) | 1.48 | % | 1.48 | % | 1.48 | % | 1.49 | % | ||||||||
| Ratio of net investment income to average net assets (5)(6)(7) | 4.25 | % | 0.40 | % | 3.02 | % | 2.72 | % | ||||||||
| Portfolio Turnover Rate | 198 | % | 514 | % | 57 | % | 956 | % (8) | ||||||||
| (1) | The Sierra Tactical Bond Fund Class A shares commenced operations on October 1, 2019. |
| (2) | Per share amounts calculated using the average shares method, which more appropriately presents the per share data for the period. |
| (3) | Total returns shown exclude the effect of applicable sales charges and assume changes in share price and reinvestment of dividends and capital gain distributions. |
| (4) | Represents the ratio of expenses to average net assets absent fee waivers and/or expense reimbursements by the adviser. |
| (5) | Does not include the expenses of other investment companies in which the Fund invests. |
| (6) | Recognition of net investment income by the Fund is affected by the timing of declaration of dividends by the underlying investment companies in which the Fund invests. |
| (7) | Annualized for periods less than one year. |
| (8) | Not annualized. |
| (9) | Less than $0.01. |
See accompanying notes to financial statements.
77
| SIERRA TACTICAL BOND FUND |
| FINANCIAL HIGHLIGHTS |
| Per Share Data and Ratios for a Share of Beneficial Interest Outstanding Throughout Each Period |
| Year Ended | Year Ended | Year Ended | Period Ended | |||||||||||||
| September 30, | September 30, | September 30, | September 30, | |||||||||||||
| Class C Shares | 2023 | 2022 | 2021 | 2020 (1) | ||||||||||||
| Net asset value, beginning of period | $ | 25.72 | $ | 27.68 | $ | 27.81 | $ | 25.00 | ||||||||
| Activity from investment operations: | ||||||||||||||||
| Net investment income (loss) (2) | 0.93 | (0.09 | ) | 0.63 | 0.53 | |||||||||||
| Net realized and unrealized gain (loss) on investments | (0.56 | ) | (1.80 | ) | 1.09 | 2.92 | ||||||||||
| Total from investment operations | 0.37 | (1.89 | ) | 1.72 | 3.45 | |||||||||||
| Less distributions from: | ||||||||||||||||
| Net investment income | (0.98 | ) | (0.07 | ) | (0.61 | ) | (0.64 | ) | ||||||||
| Net realized gains | — | — | (1.24 | ) | — | |||||||||||
| Return of capital | (0.00 | ) (9) | — | — | — | |||||||||||
| Total distributions | (0.98 | ) | (0.07 | ) | (1.85 | ) | (0.64 | ) | ||||||||
| Net asset value, end of period | $ | 25.11 | $ | 25.72 | $ | 27.68 | $ | 27.81 | ||||||||
| Total return (3) | 1.46 | % | (6.85 | )% | 6.33 | % | 13.97 | % (8) | ||||||||
| Net assets, at end of period (000s) | $ | 23,088 | $ | 21,528 | $ | 22,977 | $ | 2,517 | ||||||||
| Ratio of gross expenses to average net assets (4)(5)(7) | 2.24 | % | 2.23 | % | 2.23 | % | 2.24 | % | ||||||||
| Ratio of net expenses to average net assets (5)(7) | 2.24 | % | 2.23 | % | 2.23 | % | 2.24 | % | ||||||||
| Ratio of net investment income (loss) to average net assets (5)(6)(7) | 3.63 | % | (0.36 | )% | 2.27 | % | 1.91 | % | ||||||||
| Portfolio Turnover Rate | 198 | % | 514 | % | 57 | % | 956 | % (8) | ||||||||
| (1) | The Sierra Tactical Bond Fund Class C shares commenced operations on October 1, 2019. |
| (2) | Per share amounts calculated using the average shares method, which more appropriately presents the per share data for the period. |
| (3) | Total returns shown assume changes in share price and reinvestment of dividends and capital gain distributions. |
| (4) | Represents the ratio of expenses to average net assets absent fee waivers and/or expense reimbursements by the adviser. |
| (5) | Does not include the expenses of other investment companies in which the Fund invests. |
| (6) | Recognition of net investment income (loss) by the Fund is affected by the timing of declaration of dividends by the underlying investment companies in which the Fund invests. |
| (7) | Annualized for periods less than one year. |
| (8) | Not annualized. |
| (9) | Less than $0.01. |
See accompanying notes to financial statements.
78
| SIERRA TACTICAL BOND FUND |
| FINANCIAL HIGHLIGHTS |
| Per Share Data and Ratios for a Share of Beneficial Interest Outstanding Throughout Each Period |
| Year Ended | Year Ended | Year Ended | Period Ended | |||||||||||||
| September 30, | September 30, | September 30, | September 30, | |||||||||||||
| Investor Class Shares | 2023 | 2022 | 2021 | 2020 (1) | ||||||||||||
| Net asset value, beginning of period | $ | 25.89 | $ | 27.75 | $ | 27.84 | $ | 25.00 | ||||||||
| Activity from investment operations: | ||||||||||||||||
| Net investment income (2) | 1.10 | 0.07 | 0.79 | 0.75 | ||||||||||||
| Net realized and unrealized gain (loss) on investments | (0.57 | ) | (1.81 | ) | 1.10 | 2.79 | ||||||||||
| Total from investment operations | 0.53 | (1.74 | ) | 1.89 | 3.54 | |||||||||||
| Less distributions from: | ||||||||||||||||
| Net investment income | (1.13 | ) | (0.12 | ) | (0.74 | ) | (0.70 | ) | ||||||||
| Net realized gains | — | — | (1.24 | ) | — | |||||||||||
| Return of capital | (0.00 | ) (9) | — | — | — | |||||||||||
| Total distributions | (1.13 | ) | (0.12 | ) | (1.98 | ) | (0.70 | ) | ||||||||
| Net asset value, end of period | $ | 25.29 | $ | 25.89 | $ | 27.75 | $ | 27.84 | ||||||||
| Total return (3) | 2.07 | % | (6.29 | )% | 6.99 | % | 14.36 | % (8) | ||||||||
| Net assets, at end of period (000s) | $ | 13,227 | $ | 17,598 | $ | 19,077 | $ | 11,594 | ||||||||
| Ratio of gross expenses to average net assets (4)(5)(7) | 1.64 | % | 1.63 | % | 1.63 | % | 1.64 | % | ||||||||
| Ratio of net expenses to average net assets (5)(7) | 1.64 | % | 1.63 | % | 1.63 | % | 1.64 | % | ||||||||
| Ratio of net investment income to average net assets (5)(6)(7) | 4.28 | % | 0.27 | % | 2.83 | % | 2.74 | % | ||||||||
| Portfolio Turnover Rate | 198 | % | 514 | % | 57 | % | 956 | % (8) | ||||||||
| (1) | The Sierra Tactical Bond Fund Investor Class shares commenced operations on October 1, 2019. |
| (2) | Per share amounts calculated using the average shares method, which more appropriately presents the per share data for the period. |
| (3) | Total returns shown assume changes in share price and reinvestment of dividends and capital gain distributions. |
| (4) | Represents the ratio of expenses to average net assets absent fee waivers and/or expense reimbursements by the adviser. |
| (5) | Does not include the expenses of other investment companies in which the Fund invests. |
| (6) | Recognition of net investment income by the Fund is affected by the timing of declaration of dividends by the underlying investment companies in which the Fund invests. |
| (7) | Annualized for periods less than one year. |
| (8) | Not annualized. |
| (9) | Less than $0.01. |
See accompanying notes to financial statements.
79
| SIERRA TACTICAL BOND FUND |
| FINANCIAL HIGHLIGHTS |
| Per Share Data and Ratios for a Share of Beneficial Interest Outstanding Throughout Each Period |
| Year Ended | Year Ended | Year Ended | Period Ended | |||||||||||||
| September 30, | September 30, | September 30, | September 30, | |||||||||||||
| Instl Class Shares | 2023 | 2022 | 2021 | 2020 (1) | ||||||||||||
| Net asset value, beginning of period | $ | 25.96 | $ | 27.76 | $ | 27.85 | $ | 25.00 | ||||||||
| Activity from investment operations: | ||||||||||||||||
| Net investment income (2) | 1.20 | 0.18 | 0.91 | 0.83 | ||||||||||||
| Net realized and unrealized gain (loss) on investments | (0.58 | ) | (1.81 | ) | 1.09 | 2.81 | ||||||||||
| Total from investment operations | 0.62 | (1.63 | ) | 2.00 | 3.64 | |||||||||||
| Less distributions from: | ||||||||||||||||
| Net investment income | (1.23 | ) | (0.17 | ) | (0.85 | ) | (0.79 | ) | ||||||||
| Net realized gains | — | — | (1.24 | ) | — | |||||||||||
| Return of capital | (0.00 | ) (9) | — | — | — | |||||||||||
| Total distributions | (1.23 | ) | (0.17 | ) | (2.09 | ) | (0.79 | ) | ||||||||
| Net asset value, end of period | $ | 25.35 | $ | 25.96 | $ | 27.76 | $ | 27.85 | ||||||||
| Total return (3) | 2.43 | % | (5.89 | )% | 7.40 | % | 14.78 | % (8) | ||||||||
| Net assets, at end of period (000s) | $ | 1,728,412 | $ | 2,051,793 | $ | 1,840,643 | $ | 1,027,880 | ||||||||
| Ratio of gross expenses to average net assets (4)(5)(7) | 1.24 | % | 1.23 | % | 1.23 | % | 1.24 | % | ||||||||
| Ratio of net expenses to average net assets (5)(7) | 1.24 | % | 1.23 | % | 1.23 | % | 1.24 | % | ||||||||
| Ratio of net investment income to average net assets (5)(6)(7) | 4.68 | % | 0.66 | % | 3.26 | % | 3.05 | % | ||||||||
| Portfolio Turnover Rate | 198 | % | 514 | % | 57 | % | 956 | % (8) | ||||||||
| (1) | The Sierra Tactical Bond Fund Instl Class shares commenced operations on October 1, 2019. |
| (2) | Per share amounts calculated using the average shares method, which more appropriately presents the per share data for the period. |
| (3) | Total returns shown assume changes in share price and reinvestment of dividends and capital gain distributions. |
| (4) | Represents the ratio of expenses to average net assets absent fee waivers and/or expense reimbursements by the adviser. |
| (5) | Does not include the expenses of other investment companies in which the Fund invests. |
| (6) | Recognition of net investment income by the Fund is affected by the timing of declaration of dividends by the underlying investment companies in which the Fund invests. |
| (7) | Annualized for periods less than one year. |
| (8) | Not annualized. |
| (9) | Less than $0.01. |
See accompanying notes to financial statements.
80
| SIERRA TACTICAL RISK SPECTRUM 50 FUND |
| FINANCIAL HIGHLIGHTS |
| Per Share Data and Ratios for a Share of Beneficial Interest Outstanding Throughout each Period |
| Year Ended | Year Ended | Period Ended | ||||||||||
| September 30, | September 30, | September 30, | ||||||||||
| Class A Shares | 2023 | 2022 | 2021 (1) | |||||||||
| Net asset value, beginning of period | $ | 21.69 | $ | 24.61 | $ | 25.00 | ||||||
| Activity from investment operations: | ||||||||||||
| Net investment income (2) | 0.47 | 0.20 | 0.24 | |||||||||
| Net realized and unrealized gain (loss) on investments | 0.25 | (11) | (2.89 | ) | (0.44 | ) | ||||||
| Total from investment operations | 0.72 | (2.69 | ) | (0.20 | ) | |||||||
| Less distributions from: | ||||||||||||
| Net investment income | (0.44 | ) | (0.22 | ) | (0.19 | ) | ||||||
| Return of capital | — | (0.01 | ) | — | ||||||||
| Total distributions | (0.44 | ) | (0.23 | ) | (0.19 | ) | ||||||
| Net asset value, end of period | $ | 21.97 | $ | 21.69 | $ | 24.61 | ||||||
| Total return (3) | 3.33 | % | (10.99 | )% | (0.82 | )% (8) | ||||||
| Net assets, at end of period (000s) | $ | 203 | $ | 614 | $ | 339 | ||||||
| Ratio of gross expenses to average net assets (4)(5)(7) | 1.53 | % (10) | 1.64 | % | 1.72 | % | ||||||
| Ratio of net expenses to average net assets (5)(7) | 1.56 | % (9) | 1.56 | % | 1.56 | % | ||||||
| Ratio of net investment income to average net assets (5)(6)(7) | 2.11 | % | 0.85 | % | 2.72 | % | ||||||
| Portfolio Turnover Rate | 207 | % | 345 | % | 39 | % (8) | ||||||
| (1) | The Sierra Tactical Risk Spectrum 50 Fund Class A shares commenced operations on May 26, 2021. |
| (2) | Per share amounts calculated using the average shares method, which more appropriately presents the per share data for the period. |
| (3) | Total returns shown exclude the effect of applicable sales charges and assume changes in share price and reinvestment of dividends and capital gain distributions. |
| (4) | Represents the ratio of expenses to average net assets absent fee waivers and/or expense reimbursements by the adviser. |
| (5) | Does not include the expenses of other investment companies in which the Fund invests. |
| (6) | Recognition of net investment income by the Fund is affected by the timing of declaration of dividends by the underlying investment companies in which the Fund invests. |
| (7) | Annualized for periods less than one year. |
| (8) | Not annualized. |
| (9) | Represents the ratio of expenses to average net assets after adviser recapture of waived fees from the prior period. |
| (10) | Represents the ratio of expenses to average net assets before adviser recapture of waived/reimbursed fees from the prior period. |
| (11) | Net realized and unrealized gain (loss) per share are balancing amounts necessary to reconcile the change in net asset value per share for the period, and may anot accord with the aggregate gains and losses in the Statement of Operations due to share transactions for the period. |
See accompanying notes to financial statements.
81
| SIERRA TACTICAL RISK SPECTRUM 50 FUND |
| FINANCIAL HIGHLIGHTS |
| Per Share Data and Ratios for a Share of Beneficial Interest Outstanding Throughout each Period |
| Year Ended | Year Ended | Period Ended | ||||||||||
| September 30, | September 30, | September 30, | ||||||||||
| Class C Shares | 2023 | 2022 | 2021 (1) | |||||||||
| Net asset value, beginning of period | $ | 21.63 | $ | 24.55 | $ | 25.00 | ||||||
| Activity from investment operations: | ||||||||||||
| Net investment income (2) | 0.28 | 0.05 | 0.14 | |||||||||
| Net realized and unrealized gain (loss) on investments | 0.27 | (12) | (2.89 | ) | (0.41 | ) | ||||||
| Total from investment operations | 0.55 | (2.84 | ) | (0.27 | ) | |||||||
| Less distributions from: | ||||||||||||
| Net investment income | (0.33 | ) | (0.08 | ) | (0.18 | ) | ||||||
| Return of capital | — | (0.00 | ) (9) | — | ||||||||
| Total distributions | (0.33 | ) | (0.08 | ) | (0.18 | ) | ||||||
| Net asset value, end of period | $ | 21.85 | $ | 21.63 | $ | 24.55 | ||||||
| Total return (3) | 2.53 | % | (11.58 | )% | (1.09 | )% (8) | ||||||
| Net assets, at end of period (000s) | $ | 589 | $ | 42 | $ | 29 | ||||||
| Ratio of gross expenses to average net assets (4)(5)(7) | 2.28 | % (11) | 2.39 | % | 2.47 | % | ||||||
| Ratio of net expenses to average net assets (5)(7) | 2.31 | % (10) | 2.31 | % | 2.31 | % | ||||||
| Ratio of net investment income to average net assets (5)(6)(7) | 1.26 | % | 0.22 | % | 1.63 | % | ||||||
| Portfolio Turnover Rate | 207 | % | 345 | % | 39 | % (8) | ||||||
| (1) | The Sierra Tactical Risk Spectrum 50 Fund Class C shares commenced operations on May 26, 2021. |
| (2) | Per share amounts calculated using the average shares method, which more appropriately presents the per share data for the period. |
| (3) | Total returns shown assume changes in share price and reinvestment of dividends and capital gain distributions. |
| (4) | Represents the ratio of expenses to average net assets absent fee waivers and/or expense reimbursements by the adviser. |
| (5) | Does not include the expenses of other investment companies in which the Fund invests. |
| (6) | Recognition of net investment income by the Fund is affected by the timing of declaration of dividends by the underlying investment companies in which the Fund invests. |
| (7) | Annualized for periods less than one year. |
| (8) | Not annualized. |
| (9) | Less than $0.01. |
| (10) | Represents the ratio of expenses to average net assets after adviser recapture of waived fees from the prior period. |
| (11) | Represents the ratio of expenses to average net assets before adviser recapture of waived/reimbursed fees from the prior period. |
| (12) | Net realized and unrealized gain (loss) per share are balancing amounts necessary to reconcile the change in net asset value per share for the period, and may anot accord with the aggregate gains and losses in the Statement of Operations due to share transactions for the period. |
See accompanying notes to financial statements.
82
| SIERRA TACTICAL RISK SPECTRUM 50 FUND |
| FINANCIAL HIGHLIGHTS |
| Per Share Data and Ratios for a Share of Beneficial Interest Outstanding Throughout each Period |
| Year Ended | Year Ended | Period Ended | ||||||||||
| September 30, | September 30, | September 30, | ||||||||||
| Investor Class Shares | 2023 | 2022 | 2021 (1) | |||||||||
| Net asset value, beginning of period | $ | 21.69 | $ | 24.61 | $ | 25.00 | ||||||
| Activity from investment operations: | ||||||||||||
| Net investment income (2) | 0.38 | 0.19 | 0.18 | |||||||||
| Net realized and unrealized gain (loss) on investments | 0.30 | (11) | (2.91 | ) | (0.39 | ) | ||||||
| Total from investment operations | 0.68 | (2.72 | ) | (0.21 | ) | |||||||
| Less distributions from: | ||||||||||||
| Net investment income | (0.41 | ) | (0.19 | ) | (0.18 | ) | ||||||
| Return of capital | — | (0.01 | ) | — | ||||||||
| Total distributions | (0.41 | ) | (0.20 | ) | (0.18 | ) | ||||||
| Net asset value, end of period | $ | 21.96 | $ | 21.69 | $ | 24.61 | ||||||
| Total return (3) | 3.16 | % | (11.07 | )% | (0.84 | )% (8) | ||||||
| Net assets, at end of period (000s) | $ | 4,700 | $ | 1,460 | $ | 1,457 | ||||||
| Ratio of gross expenses to average net assets (4)(5)(7) | 1.68 | % (10) | 1.79 | % | 1.87 | % | ||||||
| Ratio of net expenses to average net assets (5)(7) | 1.71 | % (9) | 1.71 | % | 1.71 | % | ||||||
| Ratio of net investment income to average net assets (5)(6)(7) | 1.68 | % | 0.82 | % | 2.03 | % | ||||||
| Portfolio Turnover Rate | 207 | % | 345 | % | 39 | % (8) | ||||||
| (1) | The Sierra Tactical Risk Spectrum 50 Fund Investor Class shares commenced operations on May 26, 2021. |
| (2) | Per share amounts calculated using the average shares method, which more appropriately presents the per share data for the period. |
| (3) | Total returns shown assume changes in share price and reinvestment of dividends and capital gain distributions. |
| (4) | Represents the ratio of expenses to average net assets absent fee waivers and/or expense reimbursements by the adviser. |
| (5) | Does not include the expenses of other investment companies in which the Fund invests. |
| (6) | Recognition of net investment income by the Fund is affected by the timing of declaration of dividends by the underlying investment companies in which the Fund invests. |
| (7) | Annualized for periods less than one year. |
| (8) | Not annualized. |
| (9) | Represents the ratio of expenses to average net assets after adviser recapture of waived fees from the prior period. |
| (10) | Represents the ratio of expenses to average net assets before adviser recapture of waived/reimbursed fees from the prior period. |
| (11) | Net realized and unrealized gain (loss) per share are balancing amounts necessary to reconcile the change in net asset value per share for the period, and may anot accord with the aggregate gains and losses in the Statement of Operations due to share transactions for the period. |
See accompanying notes to financial statements.
83
| SIERRA TACTICAL RISK SPECTRUM 50 FUND |
| FINANCIAL HIGHLIGHTS |
| Per Share Data and Ratios for a Share of Beneficial Interest Outstanding Throughout each Period |
| Year Ended | Year Ended | Period Ended | ||||||||||
| September 30, | September 30, | September 30, | ||||||||||
| Instl Class Shares | 2023 | 2022 | 2021 (1) | |||||||||
| Net asset value, beginning of period | $ | 21.69 | $ | 24.61 | $ | 25.00 | ||||||
| Activity from investment operations: | ||||||||||||
| Net investment income (2) | 0.48 | 0.29 | 0.21 | |||||||||
| Net realized and unrealized gain (loss) on investments | 0.30 | (11) | (2.92 | ) | (0.40 | ) | ||||||
| Total from investment operations | 0.78 | (2.63 | ) | (0.19 | ) | |||||||
| Less distributions from: | ||||||||||||
| Net investment income | (0.50 | ) | (0.28 | ) | (0.20 | ) | ||||||
| Return of capital | — | (0.01 | ) | — | ||||||||
| Total distributions | (0.50 | ) | (0.29 | ) | (0.20 | ) | ||||||
| Net asset value, end of period | $ | 21.97 | $ | 21.69 | $ | 24.61 | ||||||
| Total return (3) | 3.60 | % | (10.75 | )% | (0.76 | )% (8) | ||||||
| Net assets, at end of period (000s) | $ | 403,441 | $ | 163,155 | $ | 134,137 | ||||||
| Ratio of gross expenses to average net assets (4)(5)(7) | 1.28 | % (10) | 1.39 | % | 1.47 | % | ||||||
| Ratio of net expenses to average net assets (5)(7) | 1.31 | % (9) | 1.31 | % | 1.31 | % | ||||||
| Ratio of net investment income to average net assets (5)(6)(7) | 2.13 | % | 1.21 | % | 2.32 | % | ||||||
| Portfolio Turnover Rate | 207 | % | 345 | % | 39 | % (8) | ||||||
| (1) | The Sierra Tactical Risk Spectrum 50 Fund Instl Class shares commenced operations on May 26, 2021. |
| (2) | Per share amounts calculated using the average shares method, which more appropriately presents the per share data for the period. |
| (3) | Total returns shown assume changes in share price and reinvestment of dividends and capital gain distributions. |
| (4) | Represents the ratio of expenses to average net assets absent fee waivers and/or expense reimbursements by the adviser. |
| (5) | Does not include the expenses of other investment companies in which the Fund invests. |
| (6) | Recognition of net investment income by the Fund is affected by the timing of declaration of dividends by the underlying investment companies in which the Fund invests. |
| (7) | Annualized for periods less than one year. |
| (8) | Not annualized. |
| (9) | Represents the ratio of expenses to average net assets after adviser recapture of waived fees from the prior period. |
| (10) | Represents the ratio of expenses to average net assets before adviser recapture of waived/reimbursed fees from the prior period. |
| (11) | Net realized and unrealized gain (loss) per share are balancing amounts necessary to reconcile the change in net asset value per share for the period, and may anot accord with the aggregate gains and losses in the Statement of Operations due to share transactions for the period. |
See accompanying notes to financial statements.
84
| SIERRA TACTICAL RISK SPECTRUM 30 FUND |
| FINANCIAL HIGHLIGHTS |
| Per Share Data and Ratios for a Share of Beneficial Interest Outstanding Throughout each Period |
| Period Ended September 30, 2023 (1) | Investor Class Shares | Instl Class Shares | ||||||
| Net asset value, beginning of period | $ | 25.00 | $ | 25.00 | ||||
| Activity from investment operations: | ||||||||
| Net investment income (2) | 0.74 | 0.74 | ||||||
| Net realized and unrealized loss on investments | (0.32 | ) | (0.32 | ) | ||||
| Total from investment operations | 0.42 | 0.42 | ||||||
| Less distributions from: | ||||||||
| Net investment income | (0.73 | ) | (0.73 | ) | ||||
| Total distributions | (0.73 | ) | (0.73 | ) | ||||
| Net asset value, end of period | $ | 24.69 | $ | 24.69 | ||||
| Total return (3)(8) | 1.68 | % | 1.68 | % | ||||
| Net assets, at end of period (000s) | $ | 25 | (9) | $ | 37,838 | |||
| Ratio of gross expenses to average net assets (4)(5)(7) | 2.02 | % | 1.62 | % | ||||
| Ratio of net expenses to average net assets (5)(7) | 1.71 | % | 1.31 | % | ||||
| Ratio of net investment income to average net assets (5)(6)(7) | 2.94 | % | 2.94 | % | ||||
| Portfolio Turnover Rate (8) | 232 | % | 232 | % | ||||
| (1) | The Sierra Tactical Risk Spectrum 30 Fund Investor Class shares and Instl Class shares commenced operations on September 30, 2022 |
| (2) | Per share amounts calculated using the average shares method, which more appropriately presents the per share data for the period. |
| (3) | Total returns shown assume changes in share price and reinvestment of dividends and capital gain distributions. |
| (4) | Represents the ratio of expenses to average net assets absent fee waivers and/or expense reimbursements by the adviser. |
| (5) | Does not include the expenses of other investment companies in which the Fund invests. |
| (6) | Recognition of net investment income by the Fund is affected by the timing of declaration of dividends by the underlying investment companies in which the Fund invests. |
| (7) | Annualized for periods less than one year. |
| (8) | Not annualized. |
| (9) | Actual net assets, not truncated. |
See accompanying notes to financial statements.
85
| SIERRA TACTICAL RISK SPECTRUM 70 FUND |
| FINANCIAL HIGHLIGHTS |
| Per Share Data and Ratios for a Share of Beneficial Interest Outstanding Throughout each Period |
| Period Ended September 30, 2023 (1) | Investor Class Shares | Instl Class Shares | ||||||
| Net asset value, beginning of period | $ | 25.00 | $ | 25.00 | ||||
| Activity from investment operations: | ||||||||
| Net investment income (2) | 0.17 | 0.21 | ||||||
| Net realized and unrealized loss on investments | (0.10 | ) | (0.10 | ) | ||||
| Total from investment operations | 0.07 | 0.11 | ||||||
| Less distributions from: | ||||||||
| Net investment income | (0.10 | ) | (0.14 | ) | ||||
| Total distributions | (0.10 | ) | (0.14 | ) | ||||
| Net asset value, end of period | $ | 24.97 | $ | 24.97 | ||||
| Total return (3)(8) | 0.28 | % | 0.45 | % | ||||
| Net assets, at end of period (000s) | $ | 18 | $ | 23,173 | ||||
| Ratio of gross expenses to average net assets (4)(5)(7) | 2.99 | % | 2.59 | % | ||||
| Ratio of net expenses to average net assets (5)(7) | 1.71 | % | 1.31 | % | ||||
| Ratio of net investment income to average net assets (5)(6)(7) | 1.30 | % | 1.64 | % | ||||
| Portfolio Turnover Rate (8) | 99 | % | 99 | % | ||||
| (1) | The Sierra Tactical Risk Spectrum 70 Fund Investor Class shares and Instl Class shares commenced operations on March 31, 2023. |
| (2) | Per share amounts calculated using the average shares method, which more appropriately presents the per share data for the period. |
| (3) | Total returns shown assume changes in share price and reinvestment of dividends and capital gain distributions. |
| (4) | Represents the ratio of expenses to average net assets absent fee waivers and/or expense reimbursements by the adviser. |
| (5) | Does not include the expenses of other investment companies in which the Fund invests. |
| (6) | Recognition of net investment income by the Fund is affected by the timing of declaration of dividends by the underlying investment companies in which the Fund invests. |
| (7) | Annualized for periods less than one year. |
| (8) | Not annualized. |
See accompanying notes to financial statements.
86
| THE SIERRA FUNDS |
| NOTES TO FINANCIAL STATEMENTS |
| September 30, 2023 |
| 1. | ORGANIZATION |
The Sierra Tactical All Asset Fund (“STAAF”), Sierra Tactical Core Income Fund (“STCIF”), Sierra Tactical Municipal Fund (“STMF”), Sierra Tactical Bond Fund (“STBF”), Sierra Tactical Risk Spectrum 50 Fund (“STRSFF”), Sierra Tactical Risk Spectrum 30 Fund (“STRSTF”) and Sierra Tactical Risk Spectrum 70 Fund (“STRSSF”) (each a “Fund” and collectively the “Funds”), are each a diversified series of shares of beneficial interest of Northern Lights Fund Trust (the “Trust”), a statutory trust organized under the laws of the State of Delaware on January 19, 2005, and registered under the Investment Company Act of 1940, as amended (the “1940 Act”), as an open-ended management investment company. STAAF’s two investment objectives are to provide long-term total return (the combination of yield and net price gains from underlying funds) and to limit volatility and downside risk. STCIF’s two investment objectives are to provide total return (with income contributing a significant part) and to limit volatility and downside risk. STMF’s investment objective is to seek total return, including tax- free income from the dividends of underlying municipal bond funds, while seeking to limit downside risk. STBF’s two investment objectives are to provide total return (with income contributing a significant part) and to limit volatility and downside risk. STRSFF’s two investment objectives are to provide total return (the combination of yield and net price gains from the underlying funds) and to limit volatility and downside risk. STRSTF’s two investment objectives are to provide total investment return and to limit volatility and downside risk. STRSSF’s two investment objectives are to provide total return (the combination of yield and net price gains from the underlying funds) and to limit volatility and downside risk. The Funds pursue their investment objectives by investing in a broadly diversified portfolio consisting of open-end and/or closed-end investment companies, including mutual funds and exchange-traded funds (“ETFs”). The Funds are “fund of funds”, in that they will generally invest in other investment companies.
STAAF, STCIF, STMF, STBF and STRSFF currently offer Class A, Class C, Investor Class, and Instl Class with STAAF also offering Class A1 and Class I1, and STMF also offering Special Class Shares. STRSTF and STRSSF currently offer Investor Class and Instl Class Shares. Class C, Investor Class, Instl Class, Special Shares and Class I1 shares are offered at net asset value (“NAV”). The Trust suspended the sale of Class Y shares for STAAF. Effective July 26, 2019, the Trust suspended the sale of Class Y shares and existing Class Y shares have been converted into Instl Class shares for STCIF. Effective July 7, 2023, STMF suspended purchase orders from any investors for the Special Shares Class. Class A and Class A1 shares are offered at NAV plus a maximum sales charge of 3.75%. Each class represents an interest in the same assets of the respective Fund and classes are identical except for differences in their sales charge structures, minimum investment amounts and ongoing service and distribution charges. All classes of shares have equal voting privileges except that each class has exclusive voting rights with respect to its service and/or distribution plans. The Funds’ income, expenses (other than class specific distribution fees) and realized and unrealized gains and losses are allocated proportionately each day based upon the relative net assets of each class.
| 2. | SIGNIFICANT ACCOUNTING POLICIES |
The following is a summary of significant accounting policies followed by the Funds in preparation of their financial statements. These policies are in conformity with accounting principles generally
87
| THE SIERRA FUNDS |
| NOTES TO FINANCIAL STATEMENTS (Continued) |
| September 30, 2023 |
accepted in the United States of America (“GAAP”). The preparation of financial statements requires management to make estimates and assumptions that affect the reported amounts of assets and liabilities and disclosure of contingent assets and liabilities at the date of the financial statements and the reported amounts of income and expenses for the period. Actual results could differ from those estimates. Each Fund is an investment company and accordingly follows the investment company accounting and reporting guidance of the Financial Accounting Standards Board (“FASB”) Accounting Standards Codification Topic 946 “Financial Services – Investment Companies” including FASB Accounting Standards Update (“ASU”) 2013-08.
Securities Valuation – Securities listed on an exchange are valued at the last reported sale price at the close of the regular trading session of the primary exchange on the business day the value is being determined, or in the case of securities listed on NASDAQ at the NASDAQ Official Closing Price (“NOCP”). In the absence of a sale, such securities shall be valued at the mean between the current bid and ask prices on the day of valuation. Debt securities (other than short-term obligations) are valued each day by an independent pricing service approved by the Trust’s Board of Trustees (the “Board”) based on methods which include consideration of: yields or prices of securities of comparable quality, coupon, maturity and type, indications as to values from dealers, and general market conditions or market quotations from a major market maker in the securities. Investments valued in currencies other than the U.S. dollar are converted to U.S. dollars using exchange rates obtained from pricing services. The independent pricing service does not distinguish between smaller-sized bond positions known as “odd lots” and larger institutional-sized bond positions known as “round lots”. A Fund may fair value a particular bond if the adviser does not believe that the round lot value provided by the independent pricing service reflects fair value of the Fund’s holding. Short-term debt obligations having 60 days or less remaining until maturity, at time of purchase, may be valued at amortized cost.
Valuation of Fund of Funds – The Funds may invest in portfolios of open-end or closed-end investment companies (the “underlying funds”). Underlying open-end investment companies are valued at their respective NAV as reported by such investment companies. The underlying funds value securities in their portfolios for which market quotations are readily available at their market values (generally the last reported sale price) and all other securities and assets at their fair value by the methods established by the boards of the underlying funds. The shares of many closed-end investment companies, after their initial public offering, frequently trade at a price per share, which is different than the NAV per share. The difference represents a market premium or market discount of such shares. There can be no assurances that the market discount or market premium on shares of any closed-end investment company purchased by a Fund will not change.
Exchange-Traded Funds – The Funds may invest in exchange-traded funds (“ETFs”). ETFs are a type of fund bought and sold on a securities exchange. An ETF trades like common stock and represents a fixed portfolio of securities. The risks of owning an ETF generally reflect the risks of owning the underlying securities they are designed to track, although the lack of liquidity on an ETF could result in it being more volatile. Additionally, ETFs have fees and expenses that reduce their value.
88
| THE SIERRA FUNDS |
| NOTES TO FINANCIAL STATEMENTS (Continued) |
| September 30, 2023 |
The Fund may hold securities, such as private investments, interests in commodity pools, other non-traded securities or temporarily illiquid securities, for which market quotations are not readily available or are determined to be unreliable. These securities will be valued using the “fair value” procedures approved by the Board. The Board has delegated execution of these procedures to the Adviser as its valuation designee (the “Valuation Designee”). The Board may also enlist third party consultants such as a valuation specialist at a public accounting firm, valuation consultant or financial officer of a security issuer on an as-needed basis to assist the Valuation Designee in determining a security-specific fair value. The Board is responsible for reviewing and approving fair value methodologies utilized by the Valuation Designee, which approval shall be based upon whether the Valuation Designee followed the valuation procedures established by the Board.
Fair Valuation Process – The applicable investments are valued by the Valuation Designee pursuant to valuation procedures established by the Board. For example, fair value determinations are required for the following securities: (i) securities for which market quotations are insufficient or not readily available on a particular business day (including securities for which there is a short and temporary lapse in the provision of a price by the regular pricing source); (ii) securities for which, in the judgment of the Valuation Designee, the prices or values available do not represent the fair value of the instrument; factors which may cause the Valuation Designee to make such a judgment include, but are not limited to, the following: only a bid price or an ask price is available; the spread between bid and ask prices is substantial; the frequency of sales; the thinness of the market; the size of reported trades; and actions of the securities markets, such as the suspension or limitation of trading; (iii) securities determined to be illiquid; and (iv) securities with respect to which an event that will affect the value thereof has occurred (a “significant event”) since the closing prices were established on the principal exchange on which they are traded, but prior to a Fund’s calculation of its net asset value. Specifically, interests in commodity pools or managed futures pools are valued on a daily basis by reference to the closing market prices of each futures contract or other asset held by a pool, as adjusted for pool expenses. Restricted or illiquid securities, such as private investments or non-traded securities are valued based upon the current bid for the security from two or more independent dealers or other parties reasonably familiar with the facts and circumstances of the security (who should take into consideration all relevant factors as may be appropriate under the circumstances). If a current bid from such independent dealers or other independent parties is unavailable, the Valuation Designee shall determine, the fair value of such security using the following factors: (i) the type of security; (ii) the cost at date of purchase; (iii) the size and nature of the Fund’s holdings; (iv) the discount from market value of unrestricted securities of the same class at the time of purchase and subsequent thereto; (v) information as to any transactions or offers with respect to the security; (vi) the nature and duration of restrictions on disposition of the security and the existence of any registration rights; (vii) how the yield of the security compares to similar securities of companies of similar or equal creditworthiness; (viii) the level of recent trades of similar or comparable securities; (ix) the liquidity characteristics of the security; (x) current market conditions; and (xi) the market value of any securities into which the security is convertible or exchangeable.
89
| THE SIERRA FUNDS |
| NOTES TO FINANCIAL STATEMENTS (Continued) |
| September 30, 2023 |
The Funds utilize various methods to measure the fair value of all of their investments on a recurring basis. GAAP establishes a hierarchy that prioritizes inputs to valuation methods. The three levels of input are:
Level 1 – Unadjusted quoted prices in active markets for identical assets and liabilities that the Funds have the ability to access.
Level 2 – Observable inputs other than quoted prices included in Level 1 that are observable for the asset or liability, either directly or indirectly. These inputs may include quoted prices for the identical instrument in an inactive market, prices for similar instruments, interest rates, prepayment speeds, credit risk, yield curves, default rates and similar data.
Level 3 – Unobservable inputs for the asset or liability, to the extent relevant observable inputs are not available, representing the Funds’ own assumptions about the assumptions a market participant would use in valuing the asset or liability, and would be based on the best information available.
The availability of observable inputs can vary from security to security and is affected by a wide variety of factors, including, for example, the type of security, whether the security is new and not yet established in the marketplace, the liquidity of markets, and other characteristics particular to the security. To the extent that valuation is based on models or inputs that are less observable or unobservable in the market, the determination of fair value requires more judgment. Accordingly, the degree of judgment exercised in determining fair value is greatest for instruments categorized in Level 3.
The inputs used to measure fair value may fall into different levels of the fair value hierarchy. In such cases, for disclosure purposes, the level in the fair value hierarchy within which the fair value measurement falls in its entirety, is determined based on the lowest level input that is significant to the fair value measurement in its entirety.
The inputs or methodology used for valuing securities are not necessarily an indication of the risk associated with investing in those securities. The following tables summarize the inputs used as of September 30, 2023 for the Funds’ assets measured at fair value:
| Sierra Tactical All Asset Fund | ||||||||||||||||
| Assets* | Level 1 | Level 2 | Level 3 | Total | ||||||||||||
| Exchange-Traded Funds | $ | 345,843,151 | $ | — | $ | — | $ | 345,843,151 | ||||||||
| Open End Funds | 213,810,033 | — | — | 213,810,033 | ||||||||||||
| Short-Term Investment | 149,561,329 | — | — | 149,561,329 | ||||||||||||
| Total | $ | 709,214,513 | $ | — | $ | — | $ | 709,214,513 | ||||||||
90
| THE SIERRA FUNDS |
| NOTES TO FINANCIAL STATEMENTS (Continued) |
| September 30, 2023 |
| Sierra Tactical Core Income Fund | ||||||||||||||||
| Assets* | Level 1 | Level 2 | Level 3 | Total | ||||||||||||
| Exchange Traded Funds | $ | 744,728,386 | $ | — | $ | — | $ | 744,728,386 | ||||||||
| Open End Funds | 605,598,900 | — | — | 605,598,900 | ||||||||||||
| Short-Term Investment | 348,236,451 | — | — | 348,236,451 | ||||||||||||
| Total | $ | 1,698,563,737 | $ | — | $ | — | $ | 1,698,563,737 | ||||||||
| Sierra Tactical Municipal Fund | ||||||||||||||||
| Assets* | Level 1 | Level 2 | Level 3 | Total | ||||||||||||
| Open End Funds | $ | 70,389,097 | $ | — | $ | — | $ | 70,389,097 | ||||||||
| Short-Term Investments | 208,468,404 | — | — | 208,468,404 | ||||||||||||
| Total | $ | 278,857,501 | $ | — | $ | — | $ | 278,857,501 | ||||||||
| Sierra Tactical Bond Fund | ||||||||||||||||
| Assets* | Level 1 | Level 2 | Level 3 | Total | ||||||||||||
| Exchange Traded Funds | $ | 893,330,763 | $ | — | $ | — | $ | 893,330,763 | ||||||||
| Open End Funds | 886,168,419 | — | — | 886,168,419 | ||||||||||||
| Short-Term Investment | 1,574,243 | — | — | 1,574,243 | ||||||||||||
| Total | $ | 1,781,073,425 | $ | — | $ | — | $ | 1,781,073,425 | ||||||||
| Sierra Tactical Risk Spectrum 50 Fund | ||||||||||||||||
| Assets* | Level 1 | Level 2 | Level 3 | Total | ||||||||||||
| Exchange-Traded Funds | $ | 225,159,111 | $ | — | $ | — | $ | 225,159,111 | ||||||||
| Open End Funds | 132,435,159 | — | — | 132,435,159 | ||||||||||||
| Short-Term Investment | 42,535,501 | — | — | 42,535,501 | ||||||||||||
| Total | $ | 400,129,771 | $ | — | $ | — | $ | 400,129,771 | ||||||||
| Sierra Tactical Risk Spectrum 30 Fund | ||||||||||||||||
| Assets* | Level 1 | Level 2 | Level 3 | Total | ||||||||||||
| Exchange-Traded Funds | $ | 18,432,161 | $ | — | $ | — | $ | 18,432,161 | ||||||||
| Open End Funds | 14,482,572 | — | — | 14,482,572 | ||||||||||||
| Short-Term Investment | 3,832,377 | — | — | 3,832,377 | ||||||||||||
| Total | $ | 36,747,110 | $ | — | $ | — | $ | 36,747,110 | ||||||||
91
| THE SIERRA FUNDS |
| NOTES TO FINANCIAL STATEMENTS (Continued) |
| September 30, 2023 |
| Sierra Tactical Risk Spectrum 70 Fund | ||||||||||||||||
| Assets* | Level 1 | Level 2 | Level 3 | Total | ||||||||||||
| Exchange-Traded Funds | $ | 16,647,813 | $ | — | $ | — | $ | 16,647,813 | ||||||||
| Open End Funds | 4,280,662 | — | — | 4,280,662 | ||||||||||||
| Short-Term Investment | 1,783,534 | — | — | 1,783,534 | ||||||||||||
| Total | $ | 22,712,009 | $ | — | $ | — | $ | 22,712,009 | ||||||||
The Funds did not hold any Level 2 or 3 securities during the year.
| * | See Schedule of Investments for classification. |
Security Transactions and Related Income – Security transactions are accounted for on the trade date. Interest income is recognized on an accrual basis. Discounts are accreted and premiums are amortized on securities purchased over the lives of the respective securities. Dividend income is recorded on the ex-dividend date. Realized gains or losses from sales of securities are determined by comparing the identified cost of the security lot sold with the net sales proceeds.
Dividends and Distributions to Shareholders – Dividends from net investment income, if any, are declared and paid monthly for STCIF, STMF and STBF and quarterly for STAAF, STRSFF, STRSTF and STRSSF. Distributable net realized capital gains, if any, are declared and distributed annually. Dividends from net investment income and distributions from net realized gains are determined in accordance with federal income tax regulations, which may differ from GAAP. These “book/tax” differences are considered either temporary (e.g., deferred losses) or permanent in nature. To the extent these differences are permanent in nature, such amounts are reclassified within the composition of net assets based on their federal tax-basis treatment; temporary differences do not require reclassification. Dividends and distributions to shareholders are recorded on the ex-dividend date.
Federal Income Taxes – The Funds comply with the requirements of the Internal Revenue Code applicable to regulated investment companies and distribute all of their taxable income to their shareholders. Therefore, no provision for federal income tax is required. The Funds recognize the tax benefits of uncertain tax positions only where the position is “more likely than not” to be sustained assuming examination by tax authorities. Management has analyzed the Funds’ tax positions, and has concluded that no liability for unrecognized tax benefits should be recorded related to uncertain tax positions taken on returns filed for open tax years ended September 30, 2020 to September 30, 2022, or expected to be taken in the Funds’ September 30, 2023 tax returns. The Funds have identified their major tax jurisdictions as U.S. federal, Ohio and foreign jurisdictions where the Funds make significant investments. The Funds are not aware of any tax positions for which it is reasonably possible that the total amounts of unrecognized tax benefits will change materially in the next twelve months.
Expenses – Expenses of the Trust that are directly identifiable to a specific fund are charged to that fund. Expenses, which are not readily identifiable to a specific fund, are allocated in such a manner as deemed equitable (as determined by the Board), taking into consideration the nature and type of expense and the relative sizes of the funds in the Trust.
92
| THE SIERRA FUNDS |
| NOTES TO FINANCIAL STATEMENTS (Continued) |
| September 30, 2023 |
Indemnification – The Trust indemnifies its officers and Trustees for certain liabilities that may arise from the performance of their duties to the Trust. Additionally, in the normal course of business, the Funds enter into contracts that contain a variety of representations and warranties and which provide general indemnities. The Funds’ maximum exposure under these arrangements is unknown, as this would involve future claims that may be made against the Funds that have not yet occurred. However, based on experience, the risk of loss due to these warranties and indemnities appears to be remote.
| 3. | PRINCIPAL INVESTMENT RISKS |
Market and Geopolitical Risk - The increasing interconnectivity between global economies and financial markets increases the likelihood that events or conditions in one region or financial market may adversely impact issuers in a different country, region or financial market. Securities in a Fund’s portfolio may underperform due to inflation (or expectations for inflation), interest rates, global demand for particular products or resources, natural disasters, climate change or climate-related events, pandemics, epidemics, terrorism, regulatory events and governmental or quasi-governmental actions. The occurrence of global events similar to those in recent years may result in market volatility and may have long term effects on both the U.S. and global financial markets. It is not known how long such impacts, or any future impacts of other significant events described above, will or would last, but there could be a prolonged period of global economic slowdown, which may impact your investment.
| 4. | INVESTMENT TRANSACTIONS |
For the year ended September 30, 2023, cost of purchases and proceeds from sales of portfolio securities, other than short-term investments, were as follows:
| FUND | PURCHASES | SALES | ||||||
| STAAF | $ | 2,093,324,843 | $ | 1,568,642,671 | ||||
| STCIF | $ | 5,963,026,072 | $ | 4,523,666,044 | ||||
| STMF | $ | 911,941,602 | $ | 832,957,357 | ||||
| STBF | $ | 4,571,576,097 | $ | 2,762,021,586 | ||||
| STRSFF | $ | 953,537,202 | $ | 593,916,117 | ||||
| STRSTF | $ | 103,785,489 | $ | 70,440,021 | ||||
| STRSSF | $ | 31,454,705 | $ | 9,988,238 | ||||
93
| THE SIERRA FUNDS |
| NOTES TO FINANCIAL STATEMENTS (Continued) |
| September 30, 2023 |
| 5. | INVESTMENT ADVISORY AGREEMENT AND TRANSACTIONS WITH RELATED PARTIES |
Wright Fund Management, LLC serves as the Funds’ investment adviser (the “Adviser”). Pursuant to an advisory agreement with the Trust, on behalf of the Funds, the Adviser, under the oversight of the Board, directs the daily operations of the Funds and supervises the performance of administrative and professional services provided by others. As compensation for its services and the related expenses borne by the Adviser, the Funds pay the Adviser a management fee, computed and accrued daily and paid monthly, at an annual rate of each Fund’s average daily net assets as indicated below. For the year ended September 30, 2023, each Fund incurred the following in advisory fees:
| TOTAL | ||||||
| FUND | ANNUAL RATE | ADVISORY FEE | ||||
| STAAF | 1.25% | $ | 10,391,175 | |||
| STCIF | 0.75% | $ | 15,171,850 | |||
| STMF | 0.75% | $ | 2,526,425 | |||
| STBF | 1.05% | $ | 20,459,050 | |||
| STRSFF | 1.05% | $ | 3,801,546 | |||
| STRSTF | 1.05% | $ | 437,147 | |||
| STRSSF | 1.05% | $ | 61,872 | |||
Pursuant to a written contract (the “Expense Limitation Agreement”), the Adviser has agreed, at least until January 31, 2024 for STAAF, STCIF, STMF, STBF, STRSFF, STRSTF, and until January 31, 2025 for STRSSF to waive a portion of its advisory fee and has agreed to reimburse the Funds for other expenses to the extent necessary so that the total expenses incurred by the Funds (excluding front-end or contingent deferred loads, brokerage fees and commissions, acquired fund fees and expenses, borrowing costs (such as interest and dividend expenses on securities sold short), fees and expenses associated with investments in other collective investment vehicles or derivative instruments (including, for example, option and swap fees and expenses), taxes or extraordinary expenses, such as litigation expenses)) do not exceed the following amounts per annum of the average daily net assets of each class of shares:
| Investor | ||||||||||||||
| Class A | Class C | Class | Instl Class | Class A1 | Class I1 | Special Shares | ||||||||
| STAAF | 1.75% | 2.50% | 1.75% | 1.50% | 1.90% | 1.90% | N/A | |||||||
| STCIF | 1.35% | 1.95% | 1.35% | 1.00% | N/A | N/A | N/A | |||||||
| STMF | 1.23% | 1.98% | 1.38% | 1.05% | N/A | N/A | 0.92% | |||||||
| STBF | 1.54% | 2.29% | 1.69% | 1.29% | N/A | N/A | N/A | |||||||
| STRSFF | 1.56% | 2.31% | 1.71% | 1.31% | N/A | N/A | N/A | |||||||
| STRSTF | N/A | N/A | 1.71% | 1.31% | N/A | N/A | N/A | |||||||
| STRSSF | N/A | N/A | 1.71% | 1.31% | N/A | N/A | N/A |
If the Adviser waives any fees or reimburses any expenses pursuant to the Expense Limitation Agreement, and a Fund’s operating expenses are subsequently lower than its respective expense limitation, the Adviser shall be entitled to reimbursement by the respective Fund provided that such reimbursement does not cause that Fund’s operating expenses to exceed its respective expense limitation. If a Fund’s operating expenses subsequently exceed the respective expense limitation, the reimbursements for such Fund shall be suspended. The Adviser may seek reimbursement only for expenses waived or paid by it during the three years prior to such reimbursement; provided, however, that such expenses may only be reimbursed to the extent they were waived or paid after the date of the Expense Limitation Agreement (or any similar agreement). The Board may terminate this expense reimbursement arrangement at any time. For the year ended September 30, 2023, the Adviser waived $0 with respect to STAAF, STCIF, STBF, and STRSFF, and $4,158, $127,829, and $76,683 to STMF, STRSTF, and STRSSF, respectively, under each Fund’s Expense Limitation Agreement. For the year ended September 30, 2023, the Adviser recaptured fees in the amount of $6,113 and $109,335 for STCIF and STRSFF with respect to the Funds.
94
| THE SIERRA FUNDS |
| NOTES TO FINANCIAL STATEMENTS (Continued) |
| September 30, 2023 |
The following amounts are subject to recapture by the Adviser by the following dates:
| 9/30/2024 | 9/30/2025 | 9/30/2026 | ||||||||||
| STMF | $ | 53,674 | $ | 3,054 | $ | 4,158 | ||||||
| STRSFF | $ | 4,064 | $ | 11,432 | $ | — | ||||||
| STRSTF | $ | — | $ | — | $ | 127,829 | ||||||
| STRSSF | $ | — | $ | — | $ | 76,683 | ||||||
Distributor – The Trust, with respect to the Funds, has adopted the Trust’s Master Distribution and Shareholder Servicing Plans (the “Plans”) pursuant to Rule 12b-1 under the 1940 Act. The Plans provide that a monthly service and/or distribution fee is calculated by the Funds at annual rates of the average daily net assets attributable to the following Funds and Classes, respectively, and is paid to Northern Lights Distributors, LLC (the “Distributor”), to provide compensation for ongoing distribution-related activities or services and/or maintenance of the Funds’ shareholder accounts, not otherwise required to be provided by the Adviser. The Plans are compensation plans, which means that compensation is provided regardless of 12b-1 expenses incurred. For the year ended September 30, 2023, the 12b-1 annual rates of the average daily net assets of each class of shares for the Funds were as follows:
| Investor | ||||||||||
| Class A | Class C | Class | Class A1 | Class I1 | ||||||
| STAAF | 0.25% | 1.00% | 0.25% | 0.40% | 0.40% | |||||
| STCIF | 0.40% | 1.00% | 0.40% | N/A | N/A | |||||
| STMF | 0.25% | 1.00% | 0.40% | N/A | N/A | |||||
| STBF | 0.25% | 1.00% | 0.40% | N/A | N/A | |||||
| STRSFF | 0.25% | 1.00% | 0.40% | N/A | N/A | |||||
| STRSTF | N/A | N/A | 0.40% | N/A | N/A | |||||
| STRSSF | N/A | N/A | 0.40% | N/A | N/A |
The Distributor acts as the Funds’ principal underwriter in a continuous public offering of the Funds’ shares. For the year ended September 30, 2023, the amounts listed below were received by the Distributor and retained by the principal underwriter or other affiliated broker-dealers for each fund respectively:
| Front End Sale | Amounts retained by | |||||||||||
| Share | charges received by | the Principal | ||||||||||
| Fund | Class | the Distributor | Underwriter | |||||||||
| STAAF | Class A1 | $ | 2,500 | $ | — | |||||||
| Class A | $ | 13,486 | $ | 1,011 | ||||||||
| STCIF | Class A | $ | 121,882 | $ | 7,958 | |||||||
| STMF | Class A | $ | 48,429 | $ | 4,418 | |||||||
| STBF | Class A | $ | 34,356 | $ | 2,312 | |||||||
| STRSFF | Class A | $ | — | $ | — | |||||||
| STRSTF | Class A | $ | — | $ | — | |||||||
| STRSSF | Class A | $ | — | $ | — | |||||||
95
| THE SIERRA FUNDS |
| NOTES TO FINANCIAL STATEMENTS (Continued) |
| September 30, 2023 |
In addition, certain affiliates of the Distributor provide services to the Funds as follows:
Ultimus Fund Solutions, LLC (“UFS”) – UFS, an affiliate of the Distributor, provides administration, fund accounting, and transfer agent services to the Trust. Pursuant to separate servicing agreements with UFS, the Funds pay UFS customary fees for providing administration, fund accounting and transfer agency services to the Funds. Certain officers of the Trust are also officers of UFS, and are not paid any fees directly by the Funds for serving in such capacities.
Northern Lights Compliance Services, LLC (“NLCS”) – NLCS, an affiliate of UFS and the Distributor, provides a Chief Compliance Officer to the Trust, as well as related compliance services, pursuant to a consulting agreement between NLCS and the Trust. Under the terms of such agreement, NLCS receives customary fees from the Funds.
Blu Giant LLC (“Blu Giant”) – Blu Giant, an affiliate of UFS and the Distributor, provides EDGAR conversion and filing services as well as print management services for the Funds on an ad-hoc basis. For the provision of these services, Blu Giant receives customary fees from the Funds.
| 6. | CREDIT FACILITY |
Effective July 31, 2023, the Fund entered into an amended and restated loan agreement, dated July 31, 2023, with a $150,000,000 line credit with U.S. Bank National Association (the “Amended and Restated Revolving Credit Agreement”). Borrowings under the Amended and Restated Revolving Credit Agreement bear interest at Prime Rate per month. There are no fees charged on the unused portion of the line of credit. For the year ended September 30, 2023, amounts outstanding to the Funds under the credit facility at no time were permitted to exceed $150,000,000.
During the year ended September 30, 2023, STAAF, STMF, STBF, and STRSFF drew on the line of credit as follows:
| Maximum | ||||||||||||||||||
| Outstanding Balance as | Average Borrowings | Borrowing Interest | ||||||||||||||||
| FUND | Interest Expense | of September 30, 2023 | Average Borrowings | Rate | Rate | |||||||||||||
| STAAF | $ | 2,821 | $ | — | $ | 1,529,000 | 8.50% | 8.50% | ||||||||||
| STMF | $ | 15,573 | $ | — | $ | 2,272,767 | 8.23% | 8.50% | ||||||||||
| STBF | $ | 106,423 | $ | — | $ | 11,103,273 | 8.13% | 8.50% | ||||||||||
| STRSFF | $ | 5,873 | $ | — | $ | 1,499,250 | 8.03% | 8.50% | ||||||||||
| 7. | CONTROL OWNERSHIP |
The beneficial ownership, either directly or indirectly, of more than 25% of the voting securities of a Fund creates presumption of control of the Fund, under Section 2(a)(9) of the 1940 Act. As of September 30, 2023, Charles Schwab held approximately 65.8%, 38.7%, 56.7%, 61.4%, 67.3%, 99.2%, and 50.4% of the voting securities of STAAF, STCIF, STMF, STBF, STRSFF, STRSTF, and STRSSF, respectively. The Trust has no knowledge as to whether all or any portion of the shares owned of record by Charles Schwab are also owned beneficially.
96
| THE SIERRA FUNDS |
| NOTES TO FINANCIAL STATEMENTS (Continued) |
| September 30, 2023 |
| 8. | UNDERLYING INVESTMENT IN OTHER INVESTMENT COMPANIES |
STMF currently invests a portion of their assets in the BlackRock Liquidity Funds MuniCash, - Institutional Class (“BlackRock”). BlackRock is registered under the 1940 Act as open-end management investment companies. STMF may redeem its investments in BlackRock at any time if the Adviser determines that it is in the best interest of STMF, and their shareholders to do so. The performance of STMF will be directly affected by the performance of BlackRock. The financial statements of BlackRock, including its portfolios of investments, can be found at the Securities and Exchange Commission’s website, www.sec.gov, and should be read in conjunction with STMF’s financial statements. As of September 30, 2023, the percentage of STMF’s net assets invested in BlackRock Liquidity Funds MuniCash, - Institutional Class was 69.3%.
STBF currently invests a portion of their assets in the BlackRock High Yield Bond Portfolio, - Institutional Class (“BlackRock”). BlackRock is registered under the 1940 Act as open-end management investment companies. STBF may redeem its investments in BlackRock at any time if the Adviser determines that it is in the best interest of STBF, and their shareholders to do so. The performance of STBF will be directly affected by the performance of BlackRock. The financial statements of BlackRock, including its portfolios of investments, can be found at the Securities and Exchange Commission’s website, www.sec.gov, and should be read in conjunction with STBF’s financial statements. As of September 30, 2023, the percentage of STBF’s net assets invested in BlackRock High Yield Bond Portfolio, - Institutional Class was 25.4%.
| 9. | DISTRIBUTIONS TO SHAREHOLDERS AND TAX COMPONENTS OF CAPITAL |
The tax character of distributions utilized during the periods ended September 30, 2023, and September 30, 2022 was as follows:
| For the period ended September 30, 2023: | ||||||||||||||||||||
| Ordinary | Long-Term | Return | Tax Exempt | |||||||||||||||||
| Portfolio | Income | Capital Gains | of Capital | Income | Total | |||||||||||||||
| Sierra Tactical All Asset Fund | $ | 23,300,546 | $ | — | $ | 13,277 | $ | 1,350,936 | $ | 24,664,759 | ||||||||||
| Sierra Tactical Core Income Fund | 66,096,025 | — | 303,794 | 5,155,763 | 71,555,582 | |||||||||||||||
| Sierra Tactical Municipal Fund | 2,106,433 | — | 4,229 | 5,688,779 | 7,799,441 | |||||||||||||||
| Sierra Tactical Bond Fund | 91,181,704 | — | 214,584 | — | 91,396,288 | |||||||||||||||
| Sierra Tactical Risk Spectrum 50 Fund | 7,098,958 | — | — | 212,422 | 7,311,380 | |||||||||||||||
| Sierra Tactical Risk Spectrum 30 Fund | 1,134,820 | — | — | 56,827 | 1,191,647 | |||||||||||||||
| Sierra Tactical Risk Spectrum 70 Fund | 76,760 | — | — | — | 76,760 | |||||||||||||||
| For the period ended September 30, 2022: | ||||||||||||||||||||
| Ordinary | Long-Term | Return | Tax Exempt | |||||||||||||||||
| Portfolio | Income | Capital Gains | of Capital | Income | Total | |||||||||||||||
| Sierra Tactical All Asset Fund | $ | 6,082,745 | $ | 2,830,529 | $ | 1,437,006 | $ | 590,064 | $ | 10,940,344 | ||||||||||
| Sierra Tactical Core Income Fund | 21,456,669 | — | 3,861,466 | 3,623,725 | 28,941,860 | |||||||||||||||
| Sierra Tactical Municipal Fund | 8,769,849 | 592,443 | — | 2,388,861 | 11,751,153 | |||||||||||||||
| Sierra Tactical Bond Fund | 12,356,635 | — | — | — | 12,356,635 | |||||||||||||||
| Sierra Tactical Risk Spectrum 50 Fund | 1,599,419 | — | 73,993 | 213,060 | 1,886,472 | |||||||||||||||
| Sierra Tactical Risk Spectrum 30 Fund | — | — | — | — | — | |||||||||||||||
| Sierra Tactical Risk Spectrum 70 Fund | — | — | — | — | — | |||||||||||||||
97
| THE SIERRA FUNDS |
| NOTES TO FINANCIAL STATEMENTS (Continued) |
| September 30, 2023 |
As of September 30, 2023, the components of accumulated earnings/(deficit) on a tax basis were as follows:
| Undistributed | Undistributed | Post October Loss | Capital Loss | Other | Unrealized | Total | ||||||||||||||||||||||
| Ordinary | Long-Term | and | Carry | Book/Tax | Appreciation/ | Accumulated | ||||||||||||||||||||||
| Portfolio | Income | Capital Gains | Late Year Loss | Forwards | Differences | (Depreciation) | Earnings/(Deficits) | |||||||||||||||||||||
| Sierra Tactical All Asset Fund | $ | — | $ | — | $ | (24,397,345 | ) | $ | (57,335,521 | ) | $ | — | $ | 2,269,949 | $ | (79,462,917 | ) | |||||||||||
| Sierra Tactical Core Income Fund | — | — | (80,501,837 | ) | (94,110,663 | ) | — | (14,095,769 | ) | (188,708,269 | ) | |||||||||||||||||
| Sierra Tactical Municipal Fund | — | — | (6,711,064 | ) | (17,021,694 | ) | — | (2,619,677 | ) | (26,352,435 | ) | |||||||||||||||||
| Sierra Tactical Bond Fund | — | — | (10,226,086 | ) | (82,829,850 | ) | — | (23,057,141 | ) | (116,113,077 | ) | |||||||||||||||||
| Sierra Tactical Risk Spectrum 50 Fund | 387,326 | — | (13,618,198 | ) | (22,127,354 | ) | — | 3,471,921 | (31,886,305 | ) | ||||||||||||||||||
| Sierra Tactical Risk Spectrum 30 Fund | 45,759 | — | (695,373 | ) | (2 | ) | — | 286,171 | (363,445 | ) | ||||||||||||||||||
| Sierra Tactical Risk Spectrum 70 Fund | 30,272 | — | (76,634 | ) | — | — | (461,359 | ) | (507,721 | ) | ||||||||||||||||||
The difference between the book basis and tax basis for unrealized appreciation and undistributed net realized gains from security transactions is primarily attributable to the tax deferral of losses on wash sales and adjustments for C-Corps.
Capital losses incurred after October 31 within the fiscal year are deemed to arise on the first business day of the following fiscal year for tax purposes. The Funds incurred and elected to defer such capital losses as follows:
| Post October | ||||
| Portfolio | Losses | |||
| Sierra Tactical All Asset Fund | $ | 24,397,345 | ||
| Sierra Tactical Core Income Fund | 80,501,837 | |||
| Sierra Tactical Municipal Fund | 6,711,064 | |||
| Sierra Tactical Bond Fund | 10,226,086 | |||
| Sierra Tactical Risk Spectrum 50 Fund | 13,618,198 | |||
| Sierra Tactical Risk Spectrum 30 Fund | 695,373 | |||
| Sierra Tactical Risk Spectrum 70 Fund | 76,634 | |||
At September 30, 2023, the Funds had capital loss carry forwards for federal income tax purposes available to offset future capital gains, along with capital loss carryforwards utilized as follows:
| Non-Expiring | ||||||||||||||||
| Portfolio | Short-Term | Long-Term | Total | CLCF Utilized | ||||||||||||
| Sierra Tactical All Asset Fund | $ | 57,335,521 | $ | — | $ | 57,335,521 | $ | — | ||||||||
| Sierra Tactical Core Income Fund | 94,110,663 | — | 94,110,663 | — | ||||||||||||
| Sierra Tactical Municipal Fund | 17,021,694 | — | 17,021,694 | — | ||||||||||||
| Sierra Tactical Bond Fund | 82,829,850 | — | 82,829,850 | — | ||||||||||||
| Sierra Tactical Risk Spectrum 50 Fund | 22,127,354 | — | 22,127,354 | — | ||||||||||||
| Sierra Tactical Risk Spectrum 30 Fund | 2 | — | 2 | — | ||||||||||||
| Sierra Tactical Risk Spectrum 70 Fund | — | — | — | |||||||||||||
98
| THE SIERRA FUNDS |
| NOTES TO FINANCIAL STATEMENTS (Continued) |
| September 30, 2023 |
Permanent book and tax differences, primarily attributable to the book/tax basis treatment of non-deductible expenses and adjustments for prior year tax returns, resulted in reclassifications for the Funds for the fiscal year ended September 30, 2023 as follows:
| Paid | ||||||||
| In | Accumulated | |||||||
| Portfolio | Capital | Earnings (Losses) | ||||||
| Sierra Tactical All Asset Fund | $ | (53,764 | ) | $ | 53,764 | |||
| Sierra Tactical Core Income Fund | (374,106 | ) | 374,106 | |||||
| Sierra Tactical Municipal Fund | — | — | ||||||
| Sierra Tactical Bond Fund | — | — | ||||||
| Sierra Tactical Risk Spectrum 50 Fund | (32,665 | ) | 32,665 | |||||
| Sierra Tactical Risk Spectrum 30 Fund | (21,719 | ) | 21,719 | |||||
| Sierra Tactical Risk Spectrum 70 Fund | (9,652 | ) | 9,652 | |||||
| 10. | FOREIGN TAX CREDIT (Unaudited) |
The following funds intend to elect to pass through to shareholders the income tax credit for taxes paid to foreign countries. Foreign source income and foreign tax expense per outstanding share as of fiscal year ended September 30, 2023, and September 30, 2022 were as follows:
| For fiscal year ended | ||||||||
| 9/30/2023 | Foreign Taxes Paid | Foreign Source Income | ||||||
| Sierra Tactical All Asset Fund | $ | 0.0054 | $ | 0.0731 | ||||
| Sierra Tactical Risk Spectrum 50 Fund | $ | 0.0038 | $ | 0.0426 | ||||
| Sierra Tactical Risk Spectrum 30 Fund | $ | 0.0024 | $ | 0.0421 | ||||
| For fiscal year ended | ||||||||
| 9/30/2022 | Foreign Taxes Paid | Foreign Source Income | ||||||
| Sierra Tactical Risk Spectrum 50 Fund | $ | 0.0019 | $ | 0.0163 | ||||
| 11. | AGGREGATE UNREALIZED APPRECIATION AND DEPRECIATION – TAX BASIS |
| Cost for | Tax Net | |||||||||||||||
| Federal Tax | Unrealized | Unrealized | Unrealized | |||||||||||||
| Portfolio | purposes | Appreciation | Depreciation | App/Dep | ||||||||||||
| Sierra Tactical All Asset Fund | $ | 706,944,564 | $ | 9,876,696 | $ | (7,606,747 | ) | $ | 2,269,949 | |||||||
| Sierra Tactical Core Income Fund | 1,712,659,506 | 3,365,370 | (17,461,139 | ) | (14,095,769 | ) | ||||||||||
| Sierra Tactical Municipal Fund | 281,477,178 | — | (2,619,677 | ) | (2,619,677 | ) | ||||||||||
| Sierra Tactical Bond Fund | 1,804,130,566 | 2,647,395 | (25,704,536 | ) | (23,057,141 | ) | ||||||||||
| Sierra Tactical Risk Spectrum 50 Fund | 396,657,850 | 8,173,593 | (4,701,672 | ) | 3,471,921 | |||||||||||
| Sierra Tactical Risk Spectrum 30 Fund | 36,460,939 | 672,853 | (386,682 | ) | 286,171 | |||||||||||
| Sierra Tactical Risk Spectrum 70 Fund | 23,173,368 | 44,561 | (505,920 | ) | (461,359 | ) | ||||||||||
99
| THE SIERRA FUNDS |
| NOTES TO FINANCIAL STATEMENTS (Continued) |
| September 30, 2023 |
| 12. | RECENT REGULATORY UPDATE |
On January 24, 2023, the SEC adopted rule and form amendments to require mutual funds and ETFs to transmit concise and visually engaging streamlined annual and semiannual reports to shareholders that highlight key information. Other information, including financial statements, will not appear in a streamlined shareholder report but must be available online, delivered free of charge upon request, and filed on a semiannual basis on Form N-CSR. The rule and form amendments have a compliance date of July 24, 2024. At this time, management is evaluating the impact of these amendments on the shareholder reports for the Funds.
| 13. | SUBSEQUENT EVENTS |
Subsequent events after the date of the Statement of Assets and Liabilities have been evaluated through the date the financial statements were issued.
Management has determined that no events or transactions occurred requiring adjustment or disclosure in the financial statements, other than the following:
Dividends: The Board declared the following monthly dividends:
| Fund | Dividend Per Share | Record Date | Payable Date | |||||
| Sierra Tactical Core Income Fund | Class A | 0.0873 | 10/27/2023 | 10/31/2023 | ||||
| Sierra Tactical Core Income Fund | Class C | 0.0787 | 10/27/2023 | 10/31/2023 | ||||
| Sierra Tactical Core Income Fund | Investor Class | 0.0869 | 10/27/2023 | 10/31/2023 | ||||
| Sierra Tactical Core Income Fund | Instl Class | 0.0930 | 10/27/2023 | 10/31/2023 | ||||
| Fund | Dividend Per Share | Record Date | Payable Date | |||||
| Sierra Tactical Municipal Fund | Class A | 0.0392 | 10/27/2023 | 10/31/2023 | ||||
| Sierra Tactical Municipal Fund | Class C | 0.0252 | 10/27/2023 | 10/31/2023 | ||||
| Sierra Tactical Municipal Fund | Investor Class | 0.0361 | 10/27/2023 | 10/31/2023 | ||||
| Sierra Tactical Municipal Fund | Instl Class | 0.0435 | 10/27/2023 | 10/31/2023 | ||||
| Sierra Tactical Municipal Fund | Special Class | 0.0452 | 10/27/2023 | 10/31/2023 | ||||
| Fund | Dividend Per Share | Record Date | Payable Date | |||||
| Sierra Tactical Bond Fund | Class A | 0.1351 | 10/27/2023 | 10/31/2023 | ||||
| Sierra Tactical Bond Fund | Class C | 0.1209 | 10/27/2023 | 10/31/2023 | ||||
| Sierra Tactical Bond Fund | Investor Class | 0.1316 | 10/27/2023 | 10/31/2023 | ||||
| Sierra Tactical Bond Fund | Instl Class | 0.1397 | 10/27/2023 | 10/31/2023 |
100

REPORT OF INDEPENDENT REGISTERED PUBLIC ACCOUNTING FIRM
To the Shareholders of Sierra Tactical Funds and
Board of Trustees of Northern Lights Fund Trust
Opinion on the Financial Statements
We have audited the accompanying statements of assets and liabilities, including the schedules of investments, of The Sierra Tactical Funds, comprising the funds listed below (the “Funds”), each a series of the Northern Lights Fund Trust, as of September 30, 2023, the related statements of operations and changes in net assets, the related notes, and the financial highlights for each of the periods indicated below (collectively referred to as the “financial statements”). In our opinion, the financial statements present fairly, in all material respects, the financial position of the Funds as of September 30, 2023, the results of their operations, the changes in net assets, and financial highlights for each of the periods indicated below, in conformity with accounting principles generally accepted in the United States of America.
| Statement(s) of | |||
| Statements of | Changes in Net | Financial | |
| Fund Name | Operation | Assets | Highlights |
| Sierra Tactical All Asset Fund, Sierra Tactical Core Income Fund, Sierra Tactical Municipal Fund, Sierra Tactical Bond Fund, Sierra Tactical Risk Spectrum 50 Fund, Sierra Tactical Risk Spectrum 30 Fund | For the year ended September 30, 2023 | ||
| Sierra Tactical Risk Spectrum 70 Fund | For the period from March 31, 2023 (commencement of operations) through September 30, 2023 | ||
The Funds’ financial statements and financial highlights for the years or periods ended September 30, 2022, and prior, were audited by other auditors whose report dated November 28, 2022, expressed an unqualified opinion on those financial statements and financial highlights.
Basis for Opinion
These financial statements are the responsibility of the Funds’ management. Our responsibility is to express an opinion on the Funds’ financial statements based on our audits. We are a public accounting firm registered with the Public Company Accounting Oversight Board (United States) (“PCAOB”) and are required to be independent with respect to the Funds in accordance with the U.S. federal securities laws and the applicable rules and regulations of the Securities and Exchange Commission and the PCAOB.
We conducted our audits in accordance with the standards of the PCAOB. Those standards require that we plan and perform the audits to obtain reasonable assurance about whether the financial statements are free of material misstatement whether due to error or fraud.
COHEN & COMPANY, LTD.
800.229.1099 | 866.818.4538 fax | cohencpa.com
Registered with the Public Company Accounting Oversight Board
101
Our audits included performing procedures to assess the risks of material misstatement of the financial statements, whether due to error or fraud, and performing procedures that respond to those risks. Such procedures included examining, on a test basis, evidence regarding the amounts and disclosures in the financial statements. Our procedures included confirmation of securities owned as of September 30, 2023, by correspondence with the custodian and brokers. Our audits also included evaluating the accounting principles used and significant estimates made by management, as well as evaluating the overall presentation of the financial statements. We believe that our audits provide a reasonable basis for our opinion.
We have served as the Funds’ auditor since 2023.

COHEN & COMPANY, LTD.
Philadelphia, Pennsylvania
November 29, 2023
102
| THE SIERRA FUNDS |
| EXPENSE EXAMPLES (Unaudited) |
| September 30, 2023 |
As a shareholder of the Sierra Funds, you incur two types of costs: (1) transaction costs, including sales charges (loads) on purchases of Class A and Class A1 shares and; (2) ongoing costs, including management fees, distribution and/or service (12b-1) fees; and other Fund expenses. This example is intended to help you understand your ongoing costs (in dollars) of investing in the Sierra Funds and to compare these costs with the ongoing costs of investing in other mutual funds.
The example is based on an investment of $1,000 invested at the beginning of the period and held for the entire period from April 1, 2023 through September 30, 2023.
Actual Expenses
The “Actual” table below provides information about actual account values and actual expenses. You may use the information below, together with the amount you invested, to estimate the expenses that you paid over the period. Simply divide your account value by $1,000 (for example, an $8,600 account value divided by $1,000 = 8.6), then multiply the result by the number in the table under the heading entitled “Expenses Paid During Period” to estimate the expenses you paid on your account during this period.
Hypothetical Example for Comparison Purposes
The “Hypothetical” table below provides information about hypothetical account values and hypothetical expenses based on the Sierra Funds’ actual expense ratios and an assumed rate of return of 5% per year before expenses, which is not the Funds’ actual return. The hypothetical account values and expenses may not be used to estimate the actual ending account balances or expenses you paid for the period. You may use this information to compare this 5% hypothetical example with the 5% hypothetical examples that appear in the shareholder reports of other funds.
Please note that the expenses shown in the table are meant to highlight your ongoing costs only and do not reflect any transactional costs, such as sales charges (loads). Therefore, the table is useful in comparing ongoing costs only, and will not help you determine the relative total costs of owning different funds. In addition, if these transactional costs were included, your costs would have been higher.
| Beginning Account | Ending Account | Expenses Paid | Expense Ratio | |||||
| Value | Value | During Period* | During Period** | |||||
| Actual | 4/1/2023 | 9/30/2023 | 4/1/2023 - 9/30/2023 | 4/1/2023 - 9/30/2023 | ||||
| Sierra Tactical All Asset Class A | $1,000.00 | $987.20 | $8.45 | 1.70% | ||||
| Sierra Tactical All Asset Class C | 1,000.00 | 983.40 | 12.16 | 2.45% | ||||
| Sierra Tactical All Asset Investor Class | 1,000.00 | 987.10 | 8.45 | 1.70% | ||||
| Sierra Tactical All Asset Instl Class | 1,000.00 | 988.30 | 7.21 | 1.45% | ||||
| Sierra Tactical All Asset Class A1 | 1,000.00 | 986.50 | 9.20 | 1.85% | ||||
| Sierra Tactical All Asset Class I1 | 1,000.00 | 986.40 | 9.19 | 1.85% | ||||
| Sierra Tactical Core Income Class A | 1,000.00 | 984.20 | 6.66 | 1.34% | ||||
| Sierra Tactical Core Income Class C | 1,000.00 | 981.20 | 9.64 | 1.94% | ||||
| Sierra Tactical Core Income Investor Class | 1,000.00 | 983.70 | 6.68 | 1.34% | ||||
| Sierra Tactical Core Income Instl Class | 1,000.00 | 986.20 | 4.68 | 0.94% | ||||
| Sierra Tactical Municipal Fund Class A | 1,000.00 | 960.10 | 6.06 | 1.23% | ||||
| Sierra Tactical Municipal Fund Class C | 1,000.00 | 956.80 | 9.74 | 1.98% | ||||
| Sierra Tactical Municipal Fund Investor Class | 1,000.00 | 959.40 | 6.80 | 1.38% | ||||
| Sierra Tactical Municipal Fund Instl Class | 1,000.00 | 961.20 | 5.01 | 1.02% | ||||
| Sierra Tactical Municipal Fund Special Shares | 1,000.00 | 961.40 | 4.60 | 0.93% | ||||
| Sierra Tactical Bond Fund Class A | 1,000.00 | 1,011.40 | 7.48 | 1.47% | ||||
| Sierra Tactical Bond Fund Class C | 1,000.00 | 1,007.10 | 11.25 | 2.23% | ||||
| Sierra Tactical Bond Fund Investor Class | 1,000.00 | 1,010.50 | 8.24 | 1.63% | ||||
| Sierra Tactical Bond Fund Instl Class | 1,000.00 | 1,012.50 | 6.23 | 1.23% | ||||
| Sierra Tactical Risk Spectrum 50 Fund Class A | 1,000.00 | 1,002.90 | 7.82 | 1.56% | ||||
| Sierra Tactical Risk Spectrum 50 Fund Class C | 1,000.00 | 998.90 | 11.57 | 2.31% | ||||
| Sierra Tactical Risk Spectrum 50 Fund Investor Class | 1,000.00 | 1,002.00 | 8.59 | 1.71% | ||||
| Sierra Tactical Risk Spectrum 50 Fund Instl Class | 1,000.00 | 1,004.10 | 6.59 | 1.31% | ||||
| Sierra Tactical Risk Spectrum 30 Fund Investor Class | 1,000.00 | 998.80 | 8.53 | 1.71% | ||||
| Sierra Tactical Risk Spectrum 30 Fund Instl Class | 1,000.00 | 998.80 | 6.54 | 1.31% | ||||
| Sierra Tactical Risk Spectrum 70 Fund Investor Class | 1,000.00 | 1,002.30 | 8.49 | 1.71% | ||||
| Sierra Tactical Risk Spectrum 70 Fund Instl Class | 1,000.00 | 1,004.50 | 6.51 | 1.31% |
103
| THE SIERRA FUNDS |
| EXPENSE EXAMPLES (Unaudited)(Continued) |
| September 30, 2023 |
| Beginning Account | Ending | Expenses Paid | Expense Ratio | |||||
| Hypothetical | Value | Account Value | During Period* | During Period** | ||||
| (5% return before expenses) | 4/1/2023 | 9/30/2023 | 4/1/2023 - 9/30/2023 | 4/1/2023 - 9/30/2023 | ||||
| Sierra Tactical All Asset Class A | $1,000.00 | $1,016.57 | $8.57 | 1.70% | ||||
| Sierra Tactical All Asset Class C | 1,000.00 | 1,012.80 | 12.34 | 2.45% | ||||
| Sierra Tactical All Asset Investor Class | 1,000.00 | 1,016.57 | 8.57 | 1.70% | ||||
| Sierra Tactical All Asset Instl Class | 1,000.00 | 1,017.82 | 7.31 | 1.45% | ||||
| Sierra Tactical All Asset Class A1 | 1,000.00 | 1,015.81 | 9.33 | 1.85% | ||||
| Sierra Tactical All Asset Class I1 | 1,000.00 | 1,015.81 | 9.33 | 1.85% | ||||
| Sierra Tactical Core Income Class A | 1,000.00 | 1,018.35 | 6.78 | 1.34% | ||||
| Sierra Tactical Core Income Class C | 1,000.00 | 1,015.33 | 9.81 | 1.94% | ||||
| Sierra Tactical Core Income Investor Class | 1,000.00 | 1,018.33 | 6.80 | 1.34% | ||||
| Sierra Tactical Core Income Instl Class | 1,000.00 | 1,020.36 | 4.76 | 0.94% | ||||
| Sierra Tactical Municipal Fund Class A | 1,000.00 | 1,018.88 | 6.25 | 1.23% | ||||
| Sierra Tactical Municipal Fund Class C | 1,000.00 | 1,015.12 | 10.03 | 1.98% | ||||
| Sierra Tactical Municipal Fund Investor Class | 1,000.00 | 1,018.13 | 7.01 | 1.38% | ||||
| Sierra Tactical Municipal Fund Instl Class | 1,000.00 | 1,019.96 | 5.16 | 1.02% | ||||
| Sierra Tactical Municipal Fund Special Shares | 1,000.00 | 1,020.38 | 4.73 | 0.93% | ||||
| Sierra Tactical Bond Fund Class A | 1,000.00 | 1,017.63 | 7.50 | 1.47% | ||||
| Sierra Tactical Bond Fund Class C | 1,000.00 | 1,013.86 | 11.29 | 2.23% | ||||
| Sierra Tactical Bond Fund Investor Class | 1,000.00 | 1,016.87 | 8.27 | 1.63% | ||||
| Sierra Tactical Bond Fund Instl Class | 1,000.00 | 1,018.88 | 6.25 | 1.23% | ||||
| Sierra Tactical Risk Spectrum 50 Fund Class A | 1,000.00 | 1,017.26 | 7.88 | 1.56% | ||||
| Sierra Tactical Risk Spectrum 50 Fund Class C | 1,000.00 | 1,013.49 | 11.66 | 2.31% | ||||
| Sierra Tactical Risk Spectrum 50 Fund Investor Class | 1,000.00 | 1,016.49 | 8.65 | 1.71% | ||||
| Sierra Tactical Risk Spectrum 50 Fund Instl Class | 1,000.00 | 1,018.49 | 6.64 | 1.31% | ||||
| Sierra Tactical Risk Spectrum 30 Fund Investor Class | 1,000.00 | 1,016.40 | 8.61 | 1.71% | ||||
| Sierra Tactical Risk Spectrum 30 Fund Instl Class | 1,000.00 | 1,018.39 | 6.60 | 1.31% | ||||
| Sierra Tactical Risk Spectrum 70 Fund Investor Class | 1,000.00 | 1,016.32 | 8.55 | 1.71% | ||||
| Sierra Tactical Risk Spectrum 70 Fund Instl Class | 1,000.00 | 1,018.30 | 6.56 | 1.31% |
| * | Expenses are equal to the average account value over the period, multiplied by each Fund’s annualized expense ratio, multiplied by the number of days in the period (183) divided by the number of days in the fiscal year (365). |
| ** | Annualized. |
104
| THE SIERRA FUNDS |
| SUPPLEMENTAL INFORMATION (Unaudited) |
| September 30, 2023 |
Wright Fund Management, LLC
Adviser to Sierra Tactical All Asset Fund (“Sierra Tactical”), Sierra Tactical Bond Fund “(Sierra Bond”), Sierra Tactical Core Income Fund (“Sierra Tactical Core”), Sierra Tactical Municipal Fund (“Sierra Municipal”), Sierra Tactical Risk Spectrum 30 Fund (“Sierra Tactical 30”) and Sierra Tactical Risk Spectrum 50 Fund (“Sierra Tactical 50”)*
In connection with the regular meeting held on September 20-21, 2023 of the Board of Trustees (the “Trustees” or the “Board”) of the Northern Lights Fund Trust (the “Trust”), including a majority of the Trustees who are not “interested persons,” as that term is defined in the Investment Company Act of 1940, as amended, discussed the re-approval of the investment advisory agreements (each “Advisory Agreement”) between Wright Fund Management, LLC (“the Adviser”) and the Trust, with respect to the Sierra Tactical, Sierra Bond, Sierra Tactical Core, Sierra Municipal, Sierra Tactical 30 and Sierra Tactical 50 (collectively referred to as the “Funds”). In considering the re-approval of each Advisory Agreement, the Board received materials specifically relating to each Advisory Agreement.
The Trustees were assisted by independent legal counsel throughout the advisory agreement review process. The Trustees relied upon the advice of independent legal counsel and their own business judgment in determining the material factors to be considered in evaluating each Advisory Agreement and the weight to be given to each such factor. The conclusions reached by the Trustees were based on a comprehensive evaluation of all of the information provided and were not the result of any one factor. Moreover, each Trustee may have afforded different weight to the various factors in reaching his conclusions with respect to each Advisory Agreement.
Nature, Extent, and Quality of Services. The Board noted that the Adviser was founded in 1987, has approximately $5.5 billion in assets under management, and was part of the Sierra Investment Management group of companies (the “Sierra Group”). The Board noted that the Adviser offered a suite of tactically managed investment strategies with a focus on risk management designed to meet the needs of retirees and other conservative investors. The Board reviewed the background information of the key investment personnel who were responsible for servicing the Funds, considering their education and the high level of financial industry experience from the veteran team. The Board discussed that the Adviser used a proprietary mathematical tactical discipline that determined when to buy and sell investments, constructing diversified portfolios consisting of mutual funds and ETFs that represented different components of the asset allocation. They considered that the Adviser built risk-mitigation processes into the strategies through the selection of mutual funds and ETFs that were diversified, had a low to modest correlation to each other, low volatility, and used trailing stop-loss orders under each position to help mitigate risk and limit declines, temporarily moving the Funds to cash or cash equivalents when markets became volatile or unstable. They observed that the Adviser managed investment limitations using a pre-trade process that assessed each underlying fund for its portfolio composition, size, capacity, and impact it may have on each Fund. The Board observed that the Adviser used a custodian bank to execute mutual fund transactions and selected broker dealers on their ability to execute ETF trades and provide post-trade analyses. The Board further noted
105
| THE SIERRA FUNDS |
| SUPPLEMENTAL INFORMATION (Unaudited)(Continued) |
| September 30, 2023 |
that the Adviser reported no material compliance or litigation issues since the prior renewal of each Advisory Agreement. The Board concluded that the Adviser was expected to continue to provide a high level of quality service to the Funds and their respective shareholders.
Performance.
Sierra Tactical All Asset Fund. The Board noted that the Fund had underperformed its peers and categories over the prior one-year, three-year, and five-year periods but was still a high performing portfolio as a longer-term vehicle. The Board acknowledged the Adviser’s explanation that performance was hampered by the stop loss discipline, and recent performance negatively impacted the three- year and five-year results. They considered the initiatives contemplated by the Adviser to enhance shareholder value. The Board concluded the Adviser was achieving the Fund’s objective.
Sierra Tactical Bond Fund. The Board noted that the Fund outperformed its peer group and the aggregate bond index over the prior one-year, three-year and since inception periods. They considered that the Fund’s standard deviation was reasonable, and risk adjusted returns were solid. The Board concluded the Adviser was managing the Fund consistent with the prospectus.
Sierra Tactical Core Income Fund. The Board observed the performance of the Fund, noting that it had outperformed its benchmark over each of the one-year, three-year, five-year, and since-inception periods. The Board noted that while the Fund had underperformed its peers over most periods, the since inception results demonstrated that over time, performance was stronger. The Board considered that volatility statistics confirmed the Adviser’s attention to volatility and downside protection. The Board concluded that the Fund’s performance was reasonable.
Sierra Tactical Municipal Fund. The Board observed the performance of the Fund, noting that it outperformed peer and category medians over the prior one-year and three-year periods. The Board further observed that the Fund’s standard deviation was excellent, beating the index, and was in the top percentile of its category and peer group over the prior three years. The Board concluded the Adviser was achieving the Fund’s objective.
Sierra Tactical Risk Spectrum 30 Fund. The Board observed the Fund was launched September 30, 2022, and the period of review was short, and difficult to evaluate performance. They noted the Fund’s returns were positive, and the Board would continue to monitor performance.
Sierra Tactical Risk Spectrum 50 Fund. The Board observed that the Fund had underperformed its peers and category since inception. The Board discussed that the Fund had outperformed its benchmark index over the prior one-year and since inception period. The Board acknowledged that the Fund was still relatively new and without a meaningful period to evaluate full cycle performance. The Board concluded that the Adviser was managing the Fund according to the prospectus and performance was acceptable.
106
| THE SIERRA FUNDS |
| SUPPLEMENTAL INFORMATION (Unaudited)(Continued) |
| September 30, 2023 |
Fees and Expenses.
Sierra Tactical All Asset Fund. The Board reviewed the advisory fee, which was the highest fee among the funds in the peer group and Morningstar category. The Board further noted the Fund’s net expense ratio was higher than the Morningstar average and median, but below the category high. The Board further noted that the Adviser attributed the higher fee to extensive daily involvement of senior personnel who conduct extensive quantitative and global macro top-down fundamental analysis, uniquely broad diversification, and emphasis on risk mitigation. The Board acknowledged the additional analytical work involved in selecting and allocating assets among a wider range of mutual funds and ETFs.
Sierra Tactical Bond Fund. The Board reviewed the advisory fee, which was higher than its Morningstar category median and averages but lower than the peer group median and average fee. The Board further noted the Fund’s net expense ratio was higher than the Morningstar average and median but lower than the peer group median and average fee. The Board noted the Fund’s unique strategy and management style when compared to its peers, which were not all actively managed.
Sierra Tactical Core Income Fund. The Board reviewed the advisory fee, which was substantially the same as the Morningstar category average and above the mean but lower than the peer group median and average fee. The Board observed that the Fund’s net expense ratio was marginally higher than the Morningstar category average and above the median but lower than the peer group median and average fee.
Sierra Tactical Municipal Fund. The Board reviewed the advisory fee, which was higher than the Morningstar category and peer group averages and medians. The Board acknowledged that the advisory fee was not the category high. The Board noted that the Fund’s expense ratio was significantly above the Morningstar category average and median. The Board discussed the Adviser’s explanation for the Fund’s higher fees, acknowledging that the Adviser attributed the higher fees and expenses to the costs of extensive daily involvement of senior personnel, uniquely broad diversification, and its emphasis on risk mitigation.
Sierra Tactical Risk Spectrum 30 Fund. The Board reviewed the advisory fee, which was higher than the Morningstar category and peer group averages and medians. The Board acknowledged that the advisory fee was not the category or peer group high. The Board noted that the Fund’s expense ratio was significantly above the Morningstar category average and median. The Board discussed the Adviser’s explanation that the higher fees were attributable to the costs of extensive daily involvement of senior personnel, additional resources required to analyze a wider variety of asset classes than its peers, and extremely unique risk mitigation strategy with a downside goal limit.
Sierra Tactical Risk Spectrum 50 Fund. The Board noted that the advisory fee was much higher than the peer group and Morningstar category medians and averages. The Board acknowledged that the advisory fee was the category high. The Board further noted that the Fund’s net expense ratio was higher than the peer group and Morningstar category medians and
107
| THE SIERRA FUNDS |
| SUPPLEMENTAL INFORMATION (Unaudited)(Continued) |
| September 30, 2023 |
averages. The Board discussed the Adviser’s explanation that the higher fees were attributable to the costs of extensive daily involvement of senior personnel, additional resources required to analyze a wider variety of asset classes than its peers, and extremely unique risk mitigation strategy with a downside goal limit.
The Board discussed the fees charged by the Adviser’s affiliate for managing separately managed accounts. After evaluating each Sierra Fund’s fees, the total expense ratios, the strategies employed, and the comparative fees, the Board agreed that the advisory fee with respect to each Fund were not unreasonable.
Profitability. The Board reviewed the profitability analysis provided by the Adviser with respect to each Fund individually. The Board acknowledged the Adviser demonstrated a degree of profitability that was not insignificant for each Fund. The Board further noted that when considering the amount of fees waived by the Adviser and its affiliates for the separately managed accounts invested in the Funds, the profitability calculations for each Fund decreased. The Board recognized that the Adviser was an efficiently managed enterprise with minimal overhead and expenses. After further discussion, the Board determined that the level of profitability for each Fund was not excessive.
Economies of Scale. The Board considered whether economies of scale had been realized in connection with the advisory services provided to the Funds. The Board noted that the Adviser had agreed to a 0.25% breakpoint for Sierra Tactical on assets over $ 1 billion. The Board acknowledged the Adviser’s general concerns regarding capacity constraints. The Board agreed to continue to monitor each Fund’s asset levels and discuss breakpoints with the Adviser at a future meeting.
Conclusion. Having requested and received such information from the Adviser as the Board believed to be reasonably necessary to evaluate the terms of each Advisory Agreement, and as assisted by the advice of counsel, the Board concluded that the advisory fees were not unreasonable and that renewal of each Advisory Agreement with the Adviser was in the best interests of the Funds and each Fund’s respective shareholders.
| * | Due to the timing of the contract renewal schedule, these deliberations may or may not relate to the current performance results of the Funds. |
108
| THE SIERRA FUNDS |
| SUPPLEMENTAL INFORMATION (Unaudited)(Continued) |
| September 30, 2023 |
Wright Fund Management, LLC Adviser to Sierra Tactical Risk Spectrum 70 Fund (“Sierra Tactical 70”)*
In connection with the regular meeting held on March 29-30, 2023 of the Board of Trustees (the “Trustees” or the “Board”) of the Northern Lights Fund Trust (the “Trust”), including a majority of the Trustees who are not “interested persons,” as that term is defined in the Investment Company Act of 1940, as amended, discussed the re-approval of the investment advisory agreement (“Advisory Agreement”) between Wright Fund Management, LLC (the “Adviser”) and the Trust, with respect to the Sierra Tactical 70 (referred to as the “Fund”). In considering the re-approval of the Advisory Agreement, the Board received materials specifically relating to the Advisory Agreement.
The Trustees were assisted by independent legal counsel throughout the Advisory Agreement review process. The Trustees relied upon the advice of independent legal counsel and their own business judgment in determining the material factors to be considered in evaluating the Advisory Agreement and the weight to be given to each such factor. The conclusions reached by the Trustees were based on a comprehensive evaluation of all of the information provided and were not the result of any one factor. Moreover, each Trustee may have afforded different weight to the various factors in reaching his conclusions with respect to the Advisory Agreement.
Nature, Extent, and Quality of Services. The Board recalled that the Advisory Agreement had been approved in March 2021, but the Fund had not yet launched, and therefore the Board was considering the re-approval of the Advisory Agreement while considering any new facts or circumstances relevant to their prior deliberations. The Board observed that the Adviser was founded in 1987 and was part of the Sierra Group of companies managing or advising over $5.2 billion in assets, with approximately $1.6 billion in total assets under management. The Board acknowledged the extensive background and experience of the Adviser’s personnel. The Board noted the proprietary strategies to be used by the Fund and noted the Adviser’s focus on risk mitigation. The Board made note of the Adviser’s commitment to hedging and stop-loss orders. It further noted that the Adviser planned to contract an outside firm to assist with cyber security. the Board considered that, based on the Board’s experience with the Adviser advising other Sierra Funds, the Adviser had demonstrated a high level of competence in managing mutual funds. The Board concluded that the Adviser would provide effective and quality services to Sierra Tactical 70 and its shareholders.
Performance. The Board considered the Fund’s objective and noted the lack of past performance. The Board noted the Adviser’s success with similar funds. The Board considered the performance of the Sierra Tactical, noting that for the period of December 24, 2007 to December 31, 2022, Sierra Tactical’s institutional class rate of return was 3.88% annually, outperforming the corresponding Morningstar index and category averages. The Board reviewed the performance of the Sierra Bond, noting that since October 1, 2019, Sierra Bond institutional class had an annual rate of return of 4.61%, outperforming the Bloomberg AGG Index and the BofA High Yield Index. The Board further noted that Sierra Bond also outperformed the Bloomberg AGG Index and BofA High Yield Index over the past twelve months. The Board
109
| THE SIERRA FUNDS |
| SUPPLEMENTAL INFORMATION (Unaudited)(Continued) |
| September 30, 2023 |
considered that Sierra Tactical Core outperformed the Bloomberg AGG Index over the past one, five, and ten-year periods. The Board reviewed the performance of the Sierra Tactical 50, noting that it had outperformed both the Morningstar Conservative Target Risk Index and the Morningstar Allocation 30 – 50% Equity Index. Given this record of performance, the Board concluded that the Adviser’s historical performance was satisfactory.
Fees and Expenses. The Board evaluated the Fund’s proposed advisory fee, noting that the advisory fee of 1.05% was higher than its peer group median, but within the range of fees of the peer group, and well above the Morningstar category average and median. The Board observed that the Fund’s net expense ratio of 1.31% was generally in line with the Fund’s peer group, while significantly higher than that of its Morningstar category. The Board discussed the average size of the funds in the Morningstar category, the impact of those economies on fees and expenses. The Board concluded that the advisory fee for Sierra Tactical 70 was not unreasonable.
Economies of Scale. The Board considered whether economies of scale would be achieved by the Adviser with respect to the management of the Fund. The Board considered the Adviser’s representations that Sierra Tactical 70 would likely not achieve scale in the near term, and therefore the issue would be reconsidered if the Fund realized meaningful growth in assets.
Profitability. The Board considered the Adviser’s representations that its estimated profits related to the Fund would likely be well below the estimates presented to the Board at the March 2021 Board meeting due to the Adviser’s current expectations for attracting investors. Acknowledging the Adviser’s optimism for profitability over the long term, the Board concluded that the Adviser’s profitability with respect to the Fund would not be excessive during the initial term of the Advisory Agreement.
Conclusion. Having requested and received such information from the Adviser as the Board believed to be reasonably necessary to evaluate the terms of the Advisory Agreement, and as assisted by the advice of independent counsel, the Board concluded that re-approval of the Advisory Agreement was in the best interests of the shareholders of Sierra Tactical 70 Fund.
| * | Due to the timing of the contract renewal schedule, these deliberations may or may not relate to the current performance results of the Fund. |
110
| THE SIERRA FUNDS |
| Additional Information (Unaudited) |
| September 30, 2023 |
Change in Independent Registered Public Accounting Firm
On March 12, 2023, BBD LLP (“BBD”) ceased to serve as the independent registered public accounting firm of Sierra Tactical All Asset Fund, Sierra Tactical Core Income Fund, Sierra Tactical Municipal Fund, Sierra Tactical Bond Fund and Sierra Tactical Risk Spectrum 50 Fund (The “Funds”), a series of Northern Lights Fund Trust. The Audit Committee of the Board of Directors approved the replacement of BBD as a result of Cohen & Company, Ltd.’s (“Cohen”) acquisition of BBD’s investment management group.
The reports of BBD on the financial statements of the Funds as of and for the fiscal years ended September 30, 2022 and September 30, 2021 did not contain an adverse opinion or a disclaimer of opinion, and were not qualified or modified as to uncertainties, audit scope or accounting principles. During the fiscal years ended September 30, 2022 and September 30, 2021, and during the subsequent interim period through March 12, 2023: (i) there were no disagreements between the registrant and BBD on any matter of accounting principles or practices, financial statement disclosure, or auditing scope or procedure, which disagreements, if not resolved to the satisfaction of BBD, would have caused it to make reference to the subject matter of the disagreements in its report on the financial statements of the Fund for such years or interim period; and (ii) there were no “reportable events,” as defined in Item 304(a)(1)(v) of Regulation S-K under the Securities Exchange Act of 1934, as amended.
On June 21, 2023, the Audit Committee of the Board of Directors also recommended and approved the appointment of Cohen as the Fund’s independent registered public accounting firm for the fiscal year ending September 30, 2023.
During the fiscal year ended September 30, 2022, and during the subsequent interim period through June 21, 2023, neither the registrant, nor anyone acting on its behalf, consulted with Cohen on behalf of the Funds regarding the application of accounting principles to a specified transaction (either completed or proposed), the type of audit opinion that might be rendered on the Funds’ financial statements, or any matter that was either: (i) the subject of a “disagreement,” as defined in Item 304(a)(1)(iv) of Regulation S-K and the instructions thereto; or (ii) “reportable events,” as defined in Item 304(a)(1)(v) of Regulation S-K.
111
| THE SIERRA FUNDS |
| SUPPLEMENTAL INFORMATION (Unaudited) |
| September 30, 2023 |
The Trustees and the executive officers of the Trust are listed below with their present positions with the Trust and principal occupations over at least the last five years. The business address of each Trustee and Officer is 225 Pictoria Drive, Suite 450, Cincinnati, OH 45246. All correspondence to the Trustees and Officers should be directed to c/o Ultimus Fund Solutions, LLC, P.O. Box 541150, Omaha, Nebraska 68154.
Independent Trustees
| Name, Address and Year of Birth | Position/Term of Office* | Principal Occupation During the Past Five Years | Number of Portfolios in Fund Complex** Overseen by Trustee | Other Directorships held by Trustee During the Past Five Years |
| Mark Garbin Born in 1951 | Trustee Since 2013 | Managing Principal, Coherent Capital Management LLC (since 2007). | 7 | Northern Lights Fund Trust (for series not affiliated with the Funds since 2013); Two Roads Shared Trust (since 2012); Forethought Variable Insurance Trust (since 2013); Northern Lights Variable Trust (since 2013); OHA Mortgage Strategies Fund (offshore), Ltd. (2014 - 2017); and Altegris KKR Commitments Master Fund (since 2014); Carlyle Tactical Private Credit Fund (since March 2018) and Independent Director OHA CLO Enhanced Equity II Genpar LLP (since June 2021). |
| Mark D. Gersten Born in 1950 | Trustee Since 2013 | Independent Consultant (since 2012). | 7 | Northern Lights Fund Trust (for series not affiliated with the Funds since 2013); Northern Lights Variable Trust (since 2013); Two Roads Shared Trust (since 2012); Altegris KKR Commitments Master Fund (since 2014); previously, Ramius Archview Credit and Distressed Fund (2015-2017); and Schroder Global Series Trust (2012 to 2017). |
| Anthony J. Hertl Born in 1950 | Trustee Since 2005; Chairman of the Board since 2013 | Retired, previously held several positions in a major Wall Street firm including Capital Markets Controller, Director of Global Taxation, and CFO of the Specialty Finance Group. | 7 | Northern Lights Fund Trust (for series not affiliated with the Funds since 2005); Northern Lights Variable Trust (since 2006); Alternative Strategies Fund (since 2010); Satuit Capital Management Trust (2007-2019). |
| Gary W. Lanzen Born in 1954 | Trustee Since 2005 | Retired (since 2012). Formerly, Founder, President, and Chief Investment Officer, Orizon Investment Counsel, Inc. (2000-2012). | 7 | Northern Lights Fund Trust (for series not affiliated with the Funds since 2005) Northern Lights Variable Trust (since 2006); AdvisorOne Funds (since 2003); Alternative Strategies Fund (since 2010); and previously, CLA Strategic Allocation Fund (2014-2015). |
| John V. Palancia Born in 1954 | Trustee Since 2011 | Retired (since 2011). Formerly, Director of Futures Operations, Merrill Lynch, Pierce, Fenner & Smith Inc. (1975-2011). | 7 | Northern Lights Fund Trust (for series not affiliated with the Funds since 2011); Northern Lights Fund Trust III (since February 2012); Alternative Strategies Fund (since 2012) and Northern Lights Variable Trust (since 2011). |
| Mark H. Taylor Born in 1964 | Trustee Since 2007; Chairman of the Audit Committee since 2013 | PhD (Accounting), CPA; Professor and Director, Lynn Pippenger School of Accountancy, Muma College of Business, University of South Florida (2019 – present); Professor and Department of Accountancy Chair, Case Western Reserve University (2009-2019); President, American Accounting Association (AAA) commencing August 2022 (President-Elect 2022-2023, President 2023-2024; Past President 2024- 2025). AAA Vice President-Finance (2017-2020); President, Auditing Section of the AAA; Member, AICPA Auditing Standards Board (2009-2012); Academic Fellow, Office of the Chief Accountant, United States Securities Exchange Commission (2005-2006); Center for Audit Quality research grants (2014, 2012). | 7 | Northern Lights Fund Trust (for series not affiliated with the Funds since 2007); Alternative Strategies Fund (since 2010); Northern Lights Fund Trust III (since 2012); and Northern Lights Variable Trust (since 2007). |
9/30/23 – NLFT_v1
112
| THE SIERRA FUNDS |
| SUPPLEMENTAL INFORMATION (Unaudited)(Continued) |
| September 30, 2023 |
Officers
| Name, Address and Year of Birth | Position/Term of Office* | Principal Occupation During the Past Five Years | Number of Portfolios in Fund Complex** Overseen by Trustee | Other Directorships held by Trustee During the Past Five Years |
| Kevin E. Wolf Born in 1969 | President, Principal Executive Officer Since June 2017 | Executive Vice President, Head of Fund Administration, and Product; Ultimus Fund Solutions, LLC (since 2020); Vice President of The Ultimus Group, LLC (since 2019); Executive Vice President, Gemini Fund Services, LLC (2019-2020); President, Gemini Fund Services, LLC (2012-2019); Treasurer of the Trust (2006-June 2017). | N/A | N/A |
| James Colantino Born in 1969 | Treasurer, Principal Accounting Officer Since June 2017 | Senior Vice President Fund Administration, Ultimus Fund Solutions (since 2020); Senior Vice President Fund Administration, Gemini Fund Services, LLC (2012-2020); Assistant Treasurer of the Trust (2006-June 2017). | N/A | N/A |
| Stephanie Shearer Born in 1979 | Secretary Since February 2017 | Assistant Secretary of the Trust (2012-February 2017); Associate Director, Ultimus Fund Solutions (since 2022); Manager of Legal Administration, Ultimus Fund Solutions (2020-2022); Manager of Legal Administration, Gemini Fund Services, LLC (2018-2020); Senior Paralegal, Gemini Fund Services, LLC (2013 - 2018). | N/A | N/A |
| Michael J. Nanosky Born in 1966 | Chief Compliance Officer Since January 2021 | Chief Compliance Officer, of the Trust (since January 2021); Vice President-Senior Compliance Officer, Ultimus Fund Solutions (since 2020); Vice President, Chief Compliance Officer for Williamsburg Investment Trust (2020-current); Senior Vice President- Chief Compliance Officer, PNC Funds (2014-2019). | N/A | N/A |
| * | The term of office for each Trustee and officer listed above will continue indefinitely until the individual resigns or is removed. |
| ** | As of September 30, 2023, the Trust was comprised of 66 active portfolios managed by unaffiliated investment advisers. The term “Fund Complex” applies only to the Funds in the Trust advised by the Fund’s Adviser. The Funds do not hold themselves out as related to any other series within the Trust that is not advised by the Fund’s Adviser. |
The Funds’ SAI includes additional information about the Trustees and is available free of charge, upon request, by calling toll-free at 1-866-738-4363.
9/30/23 – NLFT_v1
113
| THE SIERRA FUNDS |
| Additional Information (Unaudited) |
| September 30, 2023 |
LIQUIDITY RISK MANAGEMENT PROGRAM
The Funds have adopted and implemented a written liquidity risk management program as required by Rule 22e-4 (the “Liquidity Rule”) under the Investment Company Act. The program is reasonably designed to assess and manage the Funds’ liquidity risk, taking into consideration, among other factors, each Fund’s investment strategies and the liquidity of its portfolio investments during normal and reasonably foreseeable stressed conditions; its short and long-term cash flow projections; and its cash holdings and access to other funding sources.
During the year ended September 30, 2023, the Board and the Trust’s Liquidity Risk Management Program Committee (the “Committee”) reviewed the Funds’ investments and they determined that each Fund held adequate levels of cash and highly liquid investments to meet shareholder redemption activities in accordance with applicable requirements. Accordingly, the Board and Committee concluded that (i) the Funds’ liquidity risk management program is reasonably designed to prevent violations of the Liquidity Rule and (ii) the Funds’ liquidity risk management program has been effectively implemented.
114
PRIVACY NOTICE
Northern Lights Fund Trust
Rev. February 2014
| FACTS | WHAT DOES NORTHERN LIGHTS FUND TRUST DO WITH YOUR PERSONAL INFORMATION? |
| Why? | Financial companies choose how they share your personal information. Federal law gives consumers the right to limit some, but not all sharing. Federal law also requires us to tell you how we collect, share, and protect your personal information. Please read this notice carefully to understand what we do. |
| What? | The types of personal information we collect and share depends on the product or service that you have with us. This information can include:
● Social Security number and wire transfer instructions
● account transactions and transaction history
● investment experience and purchase history
When you are no longer our customer, we continue to share your information as described in this notice. |
| How? | All financial companies need to share customers’ personal information to run their everyday business. In the section below, we list the reasons financial companies can share their customers’ personal information; the reasons Northern Lights Fund Trust chooses to share; and whether you can limit this sharing. |
| Reasons we can share your personal information: | Does Northern Lights Fund Trust share information? | Can you limit this sharing? |
For our everyday business purposes - such as to process your transactions, maintain your account(s), respond to court orders and legal investigations, or report to credit bureaus. | YES | NO |
For our marketing purposes - to offer our products and services to you. | NO | We don’t share |
| For joint marketing with other financial companies. | NO | We don’t share |
For our affiliates’ everyday business purposes - information about your transactions and records. | NO | We don’t share |
For our affiliates’ everyday business purposes - information about your credit worthiness. | NO | We don’t share |
| For nonaffiliates to market to you | NO | We don’t share |
| QUESTIONS? | Call 1-402-493-4603 |
115
PRIVACY NOTICE
Northern Lights Fund Trust
| Page 2 |
| What we do: | |
| How does Northern Lights Fund Trust protect my personal information? | To protect your personal information from unauthorized access and use, we use security measures that comply with federal law. These measures include computer safeguards and secured files and buildings.
Our service providers are held accountable for adhering to strict policies and procedures to prevent any misuse of your nonpublic personal information. |
| How does Northern Lights Fund Trust collect my personal information? | We collect your personal information, for example, when you
● open an account or deposit money
● direct us to buy securities or direct us to sell your securities
● seek advice about your investments
We also collect your personal information from others, such as credit bureaus, affiliates, or other companies. |
| Why can’t I limit all sharing? | Federal law gives you the right to limit only:
● sharing for affiliates’ everyday business purposes – information about your creditworthiness.
● affiliates from using your information to market to you.
● sharing for nonaffiliates to market to you.
State laws and individual companies may give you additional rights to limit sharing. |
| Definitions | |
| Affiliates | Companies related by common ownership or control. They can be financial and nonfinancial companies.
● Northern Lights Fund Trust does not share with our affiliates. |
| Nonaffiliates | Companies not related by common ownership or control. They can be financial and nonfinancial companies.
● Northern Lights Fund Trust does not share with nonaffiliates so they can market to you. |
| Joint marketing | A formal agreement between nonaffiliated financial companies that together market financial products or services to you.
● Northern Lights Fund Trust doesn’t jointly market. |
116
PROXY VOTING POLICY
Information regarding how the Funds voted proxies relating to portfolio securities for the most recent 12 month period ended June 30 as well as a description of the policies and procedures that the Funds use to determine how to vote proxies is available without charge, upon request, by calling 1-866-738-4363 or by referring to the Securities and Exchange Commission’s (“SEC”) website at http://www.sec.gov.
PORTFOLIO HOLDINGS
Funds file a complete schedule of portfolio holdings with the Securities and Exchange Commission (the “SEC”) for the first and third quarters of each fiscal year as an exhibit to their reports on Form N-PORT, within sixty days after the end of the period. Form N-PORT reports are available at the SEC’s website at www.sec.gov.
| INVESTMENT ADVISER |
| Wright Fund Management, LLC |
| 3420 Ocean Park Blvd., Suite 3060 |
| Santa Monica, CA 90405 |
| ADMINISTRATOR |
| Ultimus Fund Solutions, LLC |
| 225 Pictoria Drive, Suite 450 |
| Cincinnati, OH 45246 |
| SIERRA-AR23 |
Item 2. Code of Ethics.
(a) As of the end of the period covered by this report, the registrant has adopted a code of ethics that applies to the registrant's principal executive officer, principal financial officer, principal accounting officer or controller, or persons performing similar functions, regardless of whether these individuals are employed by the registrant or a third party.
(b) For purposes of this item, “code of ethics” means written standards that are reasonably designed to deter wrongdoing and to promote:
| (1) | Honest and ethical conduct, including the ethical handling of actual or apparent conflicts of interest between personal and professional relationships; |
| (2) | Full, fair, accurate, timely, and understandable disclosure in reports and documents that a registrant files with, or submits to, the Commission and in other public communications made by the registrant; |
(3) Compliance with applicable governmental laws, rules, and regulations;
| (4) | The prompt internal reporting of violations of the code to an appropriate person or persons identified in the code; and |
(5) Accountability for adherence to the code.
(c) Amendments: During the period covered by the report, there have not been any amendments to the provisions of the code of ethics.
(d) Waivers: During the period covered by the report, the registrant has not granted any express or implicit waivers from the provisions of the code of ethics.
(e) The Code of Ethics is not posted on Registrant’ website.
(f) A copy of the Code of Ethics is attached as an exhibit.
Item 3. Audit Committee Financial Expert.
(a)(1)ii The Registrant’s board of trustees has determined that Anthony J. Hertl, Mark H. Taylor and Mark Gersten are audit committee financial experts, as defined in Item 3 of Form N-CSR. Mr. Hertl, Mr. Taylor and Mr. Gersten are independent for purposes of this Item 3.
(a)(2) Not applicable.
(a)(3) In this regard, no member of the audit committee was identified as having all of the required technical attributes identified in instruction 2 (b) to item 3 of Form N-CSR to qualify as an “audit committee financial expert,” whether through the type of specialized education or experience required by that instruction. At this time, the board believes the experience provided by each member of the audit committee collectively offers the fund adequate oversight by its audit committee given the fund’s level of financial complexity. The board will from time to time reexamine such belief.
Item 4. Principal Accountant Fees and Services.
| (a) | Audit Fees |
2023 - $ 99,480
2022 - $ 75,800
| (b) | Audit-Related Fees |
2023 – None
2022 – None
| (c) | Tax Fees |
2023 – $ 21,000
2022 – $ 12,500
Preparation of Federal & State income tax returns, assistance with calculation of required income, capital gain and excise distributions and preparation of Federal excise tax returns.
| (d) | All Other Fees |
2023 - None
2022 - None
| (e) | (1) Audit Committee’s Pre-Approval Policies |
The registrant’s Audit Committee is required to pre-approve all audit services and, when appropriate, any non-audit services (including audit-related, tax and all other services) to
the registrant. The registrant’s Audit Committee also is required to pre-approve, when appropriate, any non-audit services (including audit-related, tax and all other services) to its adviser, or any entity controlling, controlled by or under common control with the adviser that provides ongoing services to the registrant, to the extent that the services may be determined to have an impact on the operations or financial reporting of the registrant. Services are reviewed on an engagement by engagement basis by the Audit Committee.
| (2) | Percentages of Services Approved by the Audit Committee |
2023 2022
Audit-Related Fees: 0.00% 0.00%
Tax Fees: 0.00% 0.00%
All Other Fees: 0.00% 0.00%
| (f) | During the audit of registrant's financial statements for the most recent fiscal year, less than 50 percent of the hours expended on the principal accountant's engagement were attributed to work performed by persons other than the principal accountant's full-time, permanent employees. |
| (g) | The aggregate non-audit fees billed by the registrant's accountant for services rendered to the registrant, and rendered to the registrant's investment adviser (not including any sub-adviser whose role is primarily portfolio management and is subcontracted with or overseen by another investment adviser), and any entity controlling, controlled by, or under common control with the adviser that provides ongoing services to the registrant: |
2023 - $ 21,000
2022 - $ 12,500
(h) The registrant's audit committee has considered whether the provision of non-audit services to the registrant's investment adviser (not including any sub-adviser whose role is primarily portfolio management and is subcontracted with or overseen by another investment adviser), and any entity controlling, controlled by, or under common control with the investment adviser that provides ongoing services to the registrant, that were not pre-approved pursuant to paragraph (c)(7)(ii) of Rule 2-01 of Regulation S-X, is compatible with maintaining the principal accountant's independence.
(i) Not applicable.
(j) Not applicable.
Item 5. Audit Committee of Listed Companies. Not applicable to open-end investment companies.
Item 6. Schedule of Investments. See Item 1.
Item 7. Disclosure of Proxy Voting Policies and Procedures for Closed-End Funds. Not applicable to open-end investment companies.
Item 8. Portfolio Managers of Closed-End Management Investment Companies. Not applicable to open-end investment companies.
Item 9. Purchases of Equity Securities by Closed-End Funds. Not applicable to open-end investment companies.
Item 10. Submission of Matters to a Vote of Security Holders. None
Item 11. Controls and Procedures.
(a) Based on an evaluation of the Registrant’s disclosure controls and procedures as of a date within 90 days of filing date of this Form N-CSR, the principal executive officer and principal financial officer of the Registrant have concluded that the disclosure controls and procedures of the Registrant are reasonably designed to ensure that the information required in filings on Form N-CSR is recorded, processed, summarized, and reported by the filing date, including that information required to be disclosed is accumulated and communicated to the Registrant’s management, including the Registrant’s principal executive officer and principal financial officer, as appropriate to allow timely decisions regarding required disclosure.
(b) There were no significant changes in the Registrant’s internal control over financial reporting that occurred during the Registrant’s last fiscal half-year that have materially affected, or are reasonably likely to materially affect, the Registrant’s internal control over financial reporting.
Item 12. Disclosure of Securities Lending Activities for Closed-End Management Investment Companies. Not applicable to open-end investment companies.
Item 13. Exhibits.
(a)(1) Code of Ethics herewith.
(a)(3) Not applicable for open-end investment companies.
SIGNATURES
Pursuant to the requirements of the Securities Exchange Act of 1934 and the Investment Company Act of 1940, the registrant has duly caused this report to be signed on its behalf by the undersigned, thereunto duly authorized.
(Registrant) Northern Lights Fund Trust
By (Signature and Title)
/s/ Kevin E. Wolf
Kevin E. Wolf, Principal Executive Officer/President
Date 12/08/23
Pursuant to the requirements of the Securities Exchange Act of 1934 and the Investment Company Act of 1940, this report has been signed below by the following persons on behalf of the registrant and in the capacities and on the dates indicated.
By (Signature and Title)
/s/ Kevin E. Wolf
Kevin E. Wolf, Principal Executive Officer/President
Date 12/08/23
By (Signature and Title)
/s/ Jim Colantino
Jim Colantino, Principal Financial Officer/ Treasurer
Date 12/08/23