UNITED STATES
SECURITIES AND EXCHANGE COMMISSION
Washington, D.C. 20549
FORM N-CSR
CERTIFIED SHAREHOLDER REPORT OF REGISTERED MANAGEMENT INVESTMENT COMPANIES
Investment Company Act File Number 811-21726
360 Funds
(Exact name of registrant as specified in charter)
| 4520 Main Street, Suite 1425 Kansas City, MO | 64111 |
| (Address of principal executive offices) | (Zip code) |
Matrix 360 Administration, LLC
4520 Main Street
Suite 1425
Kansas City, MO 64111
(Name and address of agent for service)
Registrant's telephone number, including area code: 877-244-6235
Date of fiscal year end: 12/31/2014
Date of reporting period: 12/31/2014
| ITEM 1. | REPORTS TO SHAREHOLDERS |
The Annual report to Shareholders of the Foundry Partners, LLC Funds, series of the 360 Funds (the “registrant”) for the period ended December 31, 2014 pursuant to Rule 30e-1 under the Investment Company Act of 1940 (the “1940 Act”), as amended (17 CFR 270.30e-1) is filed herewith.
FOUNDRY PARTNERS, LLC FUNDS
Foundry Micro Cap Value Fund
Class I Shares (Ticker Symbol: FMCIX)
Foundry Small Cap Value Fund
Class I Shares (Ticker Symbol: FSVIX)
Series of the
360 Funds
ANNUAL REPORT
December 31, 2014
Investment Adviser:
Foundry Partners, LLC
510 First Avenue North,
Suite 409
Minneapolis, MN 55403
TABLE OF CONTENTS
| LETTER TO SHAREHOLDERS | 1 |
| INVESTMENT HIGHLIGHTS | 3 |
| SCHEDULES OF INVESTMENTS | 7 |
| STATEMENTS OF ASSETS AND LIABILITIES | 14 |
| STATEMENTS OF OPERATIONS | 16 |
| STATEMENTS OF CHANGES IN NET ASSETS | 18 |
| FINANCIAL HIGHLIGHTS | 20 |
| NOTES TO FINANCIAL STATEMENTS | 22 |
| REPORT OF INDEPENDENT REGISTERED PUBLIC ACCOUNTING FIRM | 29 |
| ADDITIONAL INFORMATION | 30 |
| EXPENSE EXAMPLES | 34 |
| Foundry Partners, LLC Funds | ANNUAL REPORT |
Foundry Micro Cap Value Fund
MANAGEMENT’S DISCUSSION AND ANALYSIS
December 31, 2014 (Unaudited)
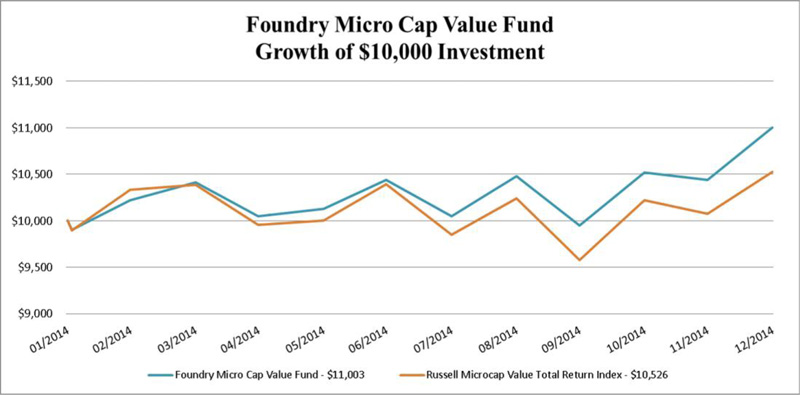
Portfolio performance – The Foundry Micro Cap Value Fund (the “Fund”) outperformed the Russell Microcap® Value Total Return Index(a) from its 1/30/14 inception through year end. The Fund returned 10.03%(b) compared to 5.26% for the benchmark.
Global Macro environment – The U.S. equity markets faced significant volatility in 2014, as the year was filled with a seemingly unrelenting series of geopolitical and exogenous events: unrest in Ukraine, Russian annexation of Crimea, the rise of ISIS, pro-democracy protests in Hong Kong, and an outbreak of Ebola. The global economic environment provided no source of relief for investors as worsening economic conditions (Europe, Japan, China), major quantitative easing programs (Japan, Europe), and the end of quantitative easing in the U.S. created another year of macro related uncertainty. By the end of the year, the economic sanctions against Russia restricting access to capital markets, combined with the crash in oil prices, instigated a crisis with the Ruble while Europe began to contemplate its own U.S.-styled bond buying program.
U.S. Economic environment – U.S. consumer confidence rose to a seven year high on the heels of falling gasoline prices and continued job growth. The Federal Reserve officially ended asset purchases bringing quantitative easing to a close; its balance sheet more than doubling to $4.48 trillion since November 2008. For the first time, the Fed’s governing board did not describe the slack in the economy as “significant”. In fact, the U.S. economy expanded at the fastest pace in more than a decade during the third quarter coming in at 5.0%.
Benchmark Observations – Despite high valuations, Real Estate Investment Trusts ("REITs") and Utilities generated the strongest performance within the benchmark (Russell Microcap Value Total Return Index) in 2014 as the rate on U.S. 10-year Treasury Notes reversed the 2013 uptick by declining to 2.2% from 3.0%. Significant quantitative easing by foreign central banks and improving fiscal deficits in the U.S. lead to a decline in the issuance of U.S. Treasuries which served to drive rates lower. Investors reacted by bidding up interest rate sensitive and high yield groups in the equity market such as REITs and Utilities. In other segments of the Financial Sector, valuations improved in response to three fundamental factors: higher acquisition activity among Banks and Thrifts, accelerating loan growth throughout the year, and abating credit issues. On the negative side of the index, oil price driven volatility contributed to the -34% decline in the Energy sector - one of the largest deviations from the benchmark by any individual sector over the past ten years.
| Foundry Micro Cap Value Fund | |
Holdings Data As Of 12/31/2014 (as a percentage of market value) | |
| Sector | Portfolio Weight |
| Consumer Discretionary | 14.81 |
| Consumer Staples | 2.91 |
| Energy | 3.87 |
| Financials | 33.23 |
| Health Care | 3.95 |
| Industrials | 19.76 |
| Information Technology | 13.60 |
| Materials | 1.00 |
| Telecommunication Services | 1.34 |
| Cash | 5.53 |
Foundry Micro Cap Value Fund – Our bottom up process consists of identifying companies poised to benefit from turnarounds, new management or restructurings, or stocks that are simply priced attractively compared to their normalized earnings power. The blend of our company specific research and our top-down analysis produces our sector weights. The Funds underweight towards REITs and Utilities stemmed from our value discipline and stock selection process. Despite the drag on relative performance from underweighting these groups, stock selection clearly carried the Fund as 9 out of 10 sectors were positive contributors. Stock selection among Trucking companies, an acquisition in Business Services, and other solid performers within Industrials drove performance. Specialty Retailers, Luxury Goods, Durables, and Restaurants delivered exceptional returns as stronger than expected consumer spending helped to leverage margin enhancement initiatives among our Consumer Discretionary holdings. Energy, Technology, Materials, and Consumer Staples also generated sizable contributions to relative performance. Entering 2015, the Micro Cap Value Fund is overweight in Consumer Discretionary, Energy, and Industrials while underweight Financials, Healthcare, Materials, and Utilities.
| Foundry Partners, LLC Funds | ANNUAL REPORT |
Foundry Micro Cap Value Fund
MANAGEMENT’S DISCUSSION AND ANALYSIS
December 31, 2014 (Unaudited)
(a) | The Russell Microcap® Value Total Return Index measures the performance of the microcap value segment of the U.S. equity market. It includes those Russell Microcap® Index companies with lower price-to-book ratios and lower forecasted growth values. Please note that indices do not take into account any fees and expenses of investing in the individual securities that they track and individuals cannot invest directly in any index. |
(b) | The performance information quoted assumes the reinvestment of all dividend and capital gain distributions, if any, and represents past performance, which is not a guarantee of future results. The returns shown do not reflect taxes that a shareholder would pay on Fund distributions or on the redemption of Fund shares. The investment return and principal value of an investment will fluctuate and, therefore, an investor’s shares, when redeemed, may be worth more or less than their original cost. Updated performance data current to the most recent month-end can be obtained by calling 1-877-244-6235. Investors should consider the investment objectives, risks, charges and expenses carefully before investing or sending money. This and other important information about the Fund can be found in the Fund’s prospectus. Please read it carefully before investing. |
| Foundry Partners, LLC Funds | ANNUAL REPORT |
Foundry Small Cap Value Fund
MANAGEMENT’S DISCUSSION AND ANALYSIS
December 31, 2014 (Unaudited)
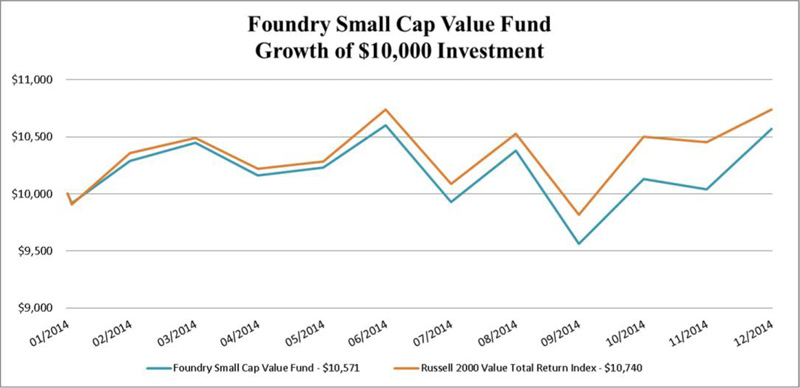
Portfolio performance – The Foundry Small Cap Value Fund underperformed the Russell 2000® Value Total Return Index(a) from its 1/30/14 inception through year end. The Fund returned 5.71%(b) compared to 7.40% for the benchmark.
Global Macro environment – The U.S. equity markets faced significant volatility in 2014, as the year was filled with a seemingly unrelenting series of geopolitical and exogenous events: unrest in Ukraine, Russian annexation of Crimea, the rise of ISIS, pro-democracy protests in Hong Kong, and an outbreak of Ebola. The global economic environment provided no source of relief for investors as worsening economic conditions (Europe, Japan, China), major quantitative easing programs (Japan, Europe), and the end of quantitative easing in the U.S. created another year of macro related uncertainty. By the end of the year, the economic sanctions against Russia restricting access to capital markets, combined with the crash in oil prices, instigated a crisis with the Ruble while Europe began to contemplate its own U.S.-styled bond buying program.
U.S. Economic environment – U.S. consumer confidence rose to a seven year high on the heels of falling gasoline prices and continued job growth. The Federal Reserve officially ended asset purchases bringing quantitative easing to a close; its balance sheet more than doubling to $4.48 trillion since November 2008. For the first time, the Fed’s governing board did not describe the slack in the economy as “significant”. In fact, the U.S. economy expanded at the fastest pace in more than a decade during the third quarter coming in at 5.0%.
Benchmark Observations – Despite high valuations, REITs and Utilities generated the strongest performance within the benchmark (Russell 2000 Value Index) in 2014 as the rate on U.S. 10-year Treasury Notes reversed the 2013 uptick by declining to 2.2% from 3.0%. Significant quantitative easing by foreign central banks and improving fiscal deficits in the U.S. lead to a decline in the issuance of U.S. Treasuries which served to drive rates lower. Investors reacted by bidding up interest rate sensitive and high yield groups in the equity market such as REITs and Utilities. The Fund was significantly underweight to both groups as our value discipline and stock selection process prevented us from taking larger positions. Volatility also reared its ugly head in 2014 - in one of the largest deviations from the index by any individual sector over the past ten years, Energy tumbled -35% managing to drag the index down by 2.4%.
| Foundry Small Cap Value Fund |
Holdings Data As Of 12/31/2014 (as a percentage of market value) | |
Sector | Portfolio Weight |
| Consumer Discretionary | 15.67 |
| Consumer Staples | 2.95 |
| Energy | | 4.91 |
| Financials | 30.58 |
| Health Care | 3.44 |
| Industrials | 16.02 |
| Information Technology | 12.39 |
| Materials | 5.64 |
| Telecommunication Services | 0.90 |
| Utilities | | 2.50 |
| Cash | | 5.00 |
Portfolio performance – Our bottom up process consists of identifying companies poised to benefit from turnarounds, new management or restructurings, or stocks that are simply priced attractively compared to their normalized earnings power. The blend of our company specific research and our top-down analysis produces our sector weights. Much of the underperformance can be traced to the underweight in REITs and Utilities; however, stock selection in general largely added to our relative performance. Although the Fund was overweight to Energy during the year, good stock selection and early-in-the-year sales enabled us to outperform in this difficult sector. Our consumer holdings in Specialty Retailers, Luxury Goods, Durables and Restaurants delivered exceptional performance as stronger than expected consumer spending allowed our companies’ restructuring efforts to return to normalized earnings faster than market expectations. Acquisition activity in the Banking industry benefited the Fund as our holdings initiated value-enhancing deals and one of our banks was bought out as well. Entering the year, the Foundry Small Cap Value Fund was overweight in Consumer Discretionary, Energy, Industrials, Technology, and Materials while underweight Financials, Healthcare, and Utilities.
| Foundry Partners, LLC Funds | ANNUAL REPORT |
Foundry Small Cap Value Fund
MANAGEMENT’S DISCUSSION AND ANALYSIS
December 31, 2014 (Unaudited)
(a) | The Russell 2000® Value Total Return Index measures the performance of those Russell 2000 companies with lower price-to-book ratios and lower forecasted growth values. Please note that indices do not take into account any fees and expenses of investing in the individual securities that they track and individuals cannot invest directly in any index. |
(b) | The performance information quoted assumes the reinvestment of all dividend and capital gain distributions, if any, and represents past performance, which is not a guarantee of future results. The returns shown do not reflect taxes that a shareholder would pay on Fund distributions or on the redemption of Fund shares. The investment return and principal value of an investment will fluctuate and, therefore, an investor’s shares, when redeemed, may be worth more or less than their original cost. Updated performance data current to the most recent month-end can be obtained by calling 1-877-244-6235. Investors should consider the investment objectives, risks, charges and expenses carefully before investing or sending money. This and other important information about the Fund can be found in the Fund’s prospectus. Please read it carefully before investing. |
| Foundry Partners, LLC Funds | ANNUAL REPORT |
Foundry Micro Cap Value Fund
INVESTMENT HIGHLIGHTS
December 31, 2014 (Unaudited)
The investment objective of the Foundry Micro Cap Value Fund (the “Micro Cap Fund”) is capital appreciation. To meet the investment objective of this Fund, the Fund will invest at least 80% of its assets in equity securities of micro-cap companies. Micro-cap companies are those companies contained within the Russell Microcap® Value Total Return Index, or companies with similar size characteristics. Equity securities consist of common stock and securities convertible into common stock.
As of December 31, 2014, the median market capitalization of companies included in the Russell Microcap® Value Total Return Index was approximately $231 million; the average market capitalization for companies contained within the Russell Microcap® Value Total Return Index was approximately $492 million; and the largest stock in the index had a market capitalization of $3.867 billion.
The Micro Cap Fund seeks to provide broad exposure to micro-cap domestic equity securities and seeks to outperform the Russell Microcap® Value Total Return Index after fees over a long-term investment horizon. Foundry Partners, LLC (the "Adviser") seeks to invest in companies that it considers to be “statistically cheap” (based on factors which may include, for example, low ratio of price to earnings, price to cash flow, price to book value, and price to sales). The Adviser also looks for companies that it believes are undervalued relative to their earning power and long term earnings growth prospects, adjusted for risk. The Adviser may filter less attractive companies by analyzing cash flows, evaluating financial strength, performing earnings analysis and reviewing purchase and sale activity in company shares by company executives, and through fundamental analysis, which may include a review of assets, earnings, sales, products, markets, and management, among other indicators. Ideally, after filtering out companies that do not meet the Adviser’s criteria above, the Adviser looks for companies that have a positive catalyst, (e.g., new products, management changes, acquisition, etc.).
The Adviser also utilizes a sell discipline and may consider selling a security when: it becomes fully valued in the Adviser’s opinion or less attractive to the Adviser; one of the Fund’s holdings has performed well and reached or approached the Adviser’s price target; a company fails to pass the Adviser’s investment screens; or there is deterioration in a company’s fundamentals, management or financial reporting.
The Adviser will look to manage risk through several strategies, which typically include: maintaining minimum and maximum sector weightings relative to the Russell Microcap® Value Total Return Index; monitoring risk statistics relative to the Russell Microcap® Value Total Return Index; and, monitoring trade volume.
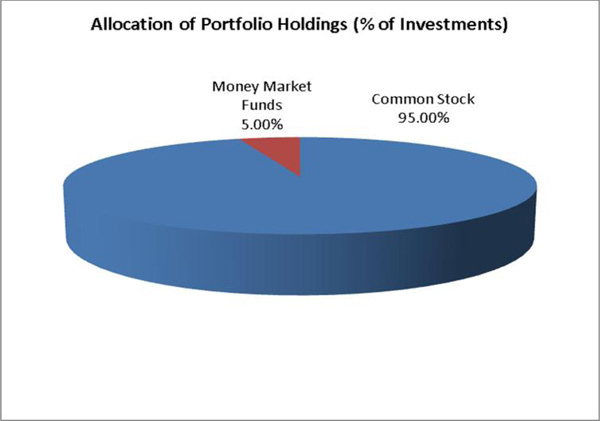
The percentages in the above graph are based on the portfolio holdings of the Fund as of December 31, 2014 and are subject to change. For a detailed break-out of holdings by industry, please refer to the Schedules of Investments.
| Foundry Partners, LLC Funds | ANNUAL REPORT |
Foundry Micro Cap Value Fund
INVESTMENT HIGHLIGHTS
December 31, 2014 (Unaudited)
| Returns as of December 31, 2014 | Since Inception from January 30, 2014 through December 31, 2014 (1) |
| | |
| Foundry Micro Cap Value Fund Institutional Class shares | 10.03% |
| Russell Microcap® Value Total Return Index | 5.26% |
The performance information quoted in this annual report assumes the reinvestment of all dividend and capital gain distributions, if any, and represents past performance, which is not a guarantee of future results. The returns shown do not reflect taxes that a shareholder would pay on Fund distributions or on the redemption of Fund shares. The investment return and principal value of an investment will fluctuate and, therefore, an investor’s shares, when redeemed, may be worth more or less than their original cost. Updated performance data current to the most recent month-end can be obtained by calling 1-877-244-6235.
The above graph depicts the performance of the Foundry Micro Cap Value Fund versus the Russell Microcap® Value Total Return Index. The Russell Microcap® Value Total Return Index measures the performance of the microcap value segment of the U.S. equity market. It includes those Russell Microcap® Index companies with lower price-to-book ratios and lower forecasted growth values. Please note that indices do not take into account any fees and expenses of investing in the individual securities that they track and individuals cannot invest directly in any index.
As with any fund, save an index fund, that commonly compares its performance to the Russell Microcap® Value Total Return Index, such a comparison may be said to be inappropriate because of the dissimilarity between the Fund’s investments and the securities comprising the index; so too with the Foundry Micro Cap Value Fund, which will generally not invest in all the securities comprising the index.
| Foundry Partners, LLC Funds | ANNUAL REPORT |
Foundry Small Cap Value Fund
INVESTMENT HIGHLIGHTS
December 31, 2014 (Unaudited)
The investment objective of the Foundry Small Cap Value Fund (the “Small Cap Fund”) is capital appreciation. The Fund plans to meet its investment objective by investing at least 80% of its assets in the equity securities of small cap companies. Small cap companies are defined as those companies included in the Russell 2000® Value Total Return Index and companies with similar market capitalizations. Market capitalization, a common measure of the size of a company, is the market price of a share of a company’s stock multiplied by the number of shares that are outstanding. Equity securities consist of common stock and securities convertible into common stock.
As of December 31, 2014, the median market capitalization of companies included in the Russell 2000® Value Total Return Index was approximately $639 million; the average market capitalization for companies contained within the Russell 2000® Value Total Return Index was approximately $1.727 billion; and the largest stock in the index had a market capitalization of $4.914 billion.
The Small Cap Fund seeks to outperform the Russell 2000® Value Total Return Index after fees over a long-term investment horizon. The Adviser seeks to invest in companies that it considers to be “statistically cheap” (based on factors which may include, for example, low ratio of price to earnings, price to cash flow, price to book value, and price to sales). The Adviser also looks for companies that it believes are undervalued relative to their earning power and long term earnings growth prospects, adjusted for risk. The Adviser may filter less attractive companies by analyzing cash flows, evaluating financial strength, performing earnings analysis and reviewing purchase and sale activity in company shares by company executives, and through fundamental analysis. Ideally, attractive companies will have a positive catalyst (e.g., new products, management changes, acquisition, etc.).
The Adviser also utilizes a sell discipline and may consider selling a security when: it becomes fully valued in the Adviser’s opinion or less attractive to the Adviser; one of the Fund’s holdings has performed well and reached or approached the Adviser’s price target; a company fails to pass the Adviser’s investment screens; or there is a deterioration in a company’s fundamentals, management or financial reporting.
The Adviser will look to manage risk through several strategies, which typically include maintaining minimum and maximum sector weightings relative to the Russell 2000® Value Total Return Index and monitoring risk statistics relative to the Russell 2000® Value Total Return Index.
The percentages in the above graph are based on the portfolio holdings of the Fund as of December 31, 2014 and are subject to change. For a detailed break-out of holdings by industry, please refer to the Schedules of Investments.
| Foundry Partners, LLC Funds | ANNUAL REPORT |
Foundry Small Cap Value Fund
INVESTMENT HIGHLIGHTS
December 31, 2014 (Unaudited)
| Returns as of December 31, 2014 | Since Inception from January 30, 2014 through December 31, 2014 (1) |
| | |
| Foundry Small Cap Value Fund Institutional Class shares | 5.71% |
| Russell 2000® Value Total Return Index | 7.40% |
The performance information quoted in this annual report assumes the reinvestment of all dividend and capital gain distributions, if any, and represents past performance, which is not a guarantee of future results. The returns shown do not reflect taxes that a shareholder would pay on Fund distributions or on the redemption of Fund shares. The investment return and principal value of an investment will fluctuate and, therefore, an investor’s shares, when redeemed, may be worth more or less than their original cost. Updated performance data current to the most recent month-end can be obtained by calling 1-877-244-6235.
The above graph depicts the performance of the Foundry Small Cap Value Fund versus the Russell 2000® Value Total Return Index. The Russell 2000® Value Total Return Index measures the performance of those Russell 2000 companies with lower price-to-book ratios and lower forecasted growth values. Please note that indices do not take into account any fees and expenses of investing in the individual securities that they track and individuals cannot invest directly in any index.
As with any fund, save an index fund, that commonly compares its performance to the Russell 2000® Value Total Return Index, such a comparison may be said to be inappropriate because of the dissimilarity between the Fund’s investments and the securities comprising the index; so too with the Foundry Small Cap Value Fund, which will generally not invest in all the securities comprising the index.
FOUNDRY PARTNERS, LLC FUNDS
FOUNDRY MICRO CAP VALUE FUND
SCHEDULE OF INVESTMENTS
| December 31, 2014 | ANNUAL REPORT |
| COMMON STOCKS - 96.41% | | SHARES | | | FAIR VALUE | |
| | | | | | | |
| Aerospace & Defense - 1.16% | | | | | | |
Ducommun, Inc. (a) | | | 685 | | | $ | 17,317 | |
| | | | | | | | | |
| Apparel - 0.79% | | | | | | | | |
Perry Ellis International, Inc. (a) | | | 450 | | | | 11,668 | |
| | | | | | | | | |
| Auto Parts & Equipment - 1.36% | | | | | | | | |
| Spartan Motors, Inc. | | | 3,850 | | | | 20,251 | |
| | | | | | | | | |
| Banks - 15.59% | | | | | | | | |
| Bank of Commerce Holdings | | | 1,310 | | | | 7,821 | |
| Bar Harbor Bankshares | | | 450 | | | | 14,400 | |
| Capital City Bank Group, Inc. | | | 1,075 | | | | 16,706 | |
| Financial Institutions, Inc. | | | 580 | | | | 14,587 | |
| First Financial Corp. | | | 510 | | | | 18,166 | |
| First Internet Bancorp | | | 880 | | | | 14,731 | |
First NBC Bank Holding Co. (a) | | | 500 | | | | 17,600 | |
| Hanmi Financial Corp. | | | 800 | | | | 17,448 | |
| Independent Bank Corp. MI | | | 1,075 | | | | 14,029 | |
| MainSource Financial Group, Inc. | | | 1,065 | | | | 22,280 | |
| Monarch Financial Holdings, Inc. | | | 1,375 | | | | 18,906 | |
| Northrim BanCorp, Inc. | | | 340 | | | | 8,922 | |
| Simmons First National Corp. | | | 350 | | | | 14,227 | |
| Towne Bank - Portsmouth, VA | | | 950 | | | | 14,364 | |
| Washington Trust Bancorp, Inc. | | | 435 | | | | 17,478 | |
| | | | | | | | 231,665 | |
| Biotechnology - 0.62% | | | | | | | | |
Cambrex Corp. (a) | | | 425 | | | | 9,189 | |
| | | | | | | | | |
| Building Materials - 1.19% | | | | | | | | |
Gibraltar Industries, Inc. (a) | | | 1,085 | | | | 17,642 | |
| | | | | | | | | |
| Commercial Services - 6.14% | | | | | | | | |
CBIZ, Inc. (a) | | | 1,675 | | | | 14,338 | |
CRA International, Inc. (a) | | | 225 | | | | 6,822 | |
Cross Country Healthcare, Inc. (a) | | | 1,300 | | | | 16,224 | |
Global Cash Access Holdings, Inc. (a) | | | 2,350 | | | | 16,803 | |
Great Lakes Dredge & Dock Corp. (a) | | | 2,280 | | | | 19,517 | |
Hill International, Inc. (a) | | | 4,560 | | | | 17,510 | |
| | | | | | | | 91,214 | |
| Computers - 0.99% | | | | | | | | |
| Computer Task Group, Inc. | | | 1,550 | | | | 14,771 | |
FOUNDRY PARTNERS, LLC FUNDS
FOUNDRY MICRO CAP VALUE FUND
SCHEDULE OF INVESTMENTS
| December 31, 2014 | ANNUAL REPORT |
| COMMON STOCKS - 96.41% (Continued) | | SHARES | | | FAIR VALUE | |
| | | | | | | |
| Diversified Financial Services - 2.70% | | | | | | |
Consumer Portfolio Services, Inc. (a) | | | 1,925 | | | $ | 14,168 | |
| Federal Agricultural Mortgage Corp. | | | 345 | | | | 10,467 | |
| Gain Capital Holdings, Inc. | | | 1,720 | | | | 15,514 | |
| | | | | | | | 40,149 | |
| Electrical Components - 1.06% | | | | | | | | |
| Powell Industries, Inc. | | | 320 | | | | 15,702 | |
| | | | | | | | | |
| Electronics - 1.90% | | | | | | | | |
| Electro Scientific Industries, Inc. | | | 1,750 | | | | 13,580 | |
ZAGG, Inc. (a) | | | 2,165 | | | | 14,700 | |
| | | | | | | | 28,280 | |
| Engineering & Construction - 3.49% | | | | | | | | |
| Comfort Systems USA, Inc. | | | 990 | | | | 16,949 | |
Orion Marine Group, Inc. (a) | | | 1,660 | | | | 18,343 | |
Sterling Construction Co., Inc. (a) | | | 2,600 | | | | 16,614 | |
| | | | | | | | 51,906 | |
| Environmental Control - 1.20% | | | | | | | | |
| Ceco Environmental Corp. | | | 1,150 | | | | 17,871 | |
| | | | | | | | | |
| Food - 1.99% | | | | | | | | |
| SpartanNash Co. | | | 1,130 | | | | 29,538 | |
| | | | | | | | | |
| Hand & Machine Tools - 1.13% | | | | | | | | |
| Hardinge, Inc. | | | 1,415 | | | | 16,867 | |
| | | | | | | | | |
| Healthcare - Products - 0.89% | | | | | | | | |
Synergetics USA, Inc. (a) | | | 3,035 | | | | 13,202 | |
| | | | | | | | | |
| Healthcare - Services - 0.67% | | | | | | | | |
Almost Family, Inc. (a) | | | 345 | | | | 9,988 | |
| | | | | | | | | |
| Home Builders - 1.26% | | | | | | | | |
WCI Communities, Inc. (a) | | | 955 | | | | 18,699 | |
| | | | | | | | | |
| Home Furnishings - 2.12% | | | | | | | | |
| Daktronics, Inc. | | | 1,200 | | | | 15,012 | |
| Hooker Furniture Corp. | | | 965 | | | | 16,569 | |
| | | | | | | | 31,581 | |
| Household Products & Wares - 0.98% | | | | | | | | |
Central Garden and Pet Co. (a) | | | 1,525 | | | | 14,564 | |
| | | | | | | | | |
| Insurance - 1.47% | | | | | | | | |
| Meadowbrook Insurance Group, Inc. | | | 2,590 | | | | 21,911 | |
| | | | | | | | | |
| Internet - 1.32% | | | | | | | | |
1-800-Flowers.com, Inc. (a) | | | 900 | | | | 7,416 | |
Safeguard Scientifics, Inc. (a) | | | 615 | | | | 12,189 | |
| | | | | | | | 19,605 | |
FOUNDRY PARTNERS, LLC FUNDS
FOUNDRY MICRO CAP VALUE FUND
SCHEDULE OF INVESTMENTS
| December 31, 2014 | ANNUAL REPORT |
| COMMON STOCKS - 96.41% (Continued) | | SHARES | | | FAIR VALUE | |
| | | | | | | |
| Investment Companies - 1.38% | | | | | | |
| Gladstone Capital Corp. | | | 770 | | | $ | 6,368 | |
| MVC Capital, Inc. | | | 595 | | | | 5,849 | |
| Saratoga Investment Corp. | | | 560 | | | | 8,316 | |
| | | | | | | | 20,533 | |
| Iron & Steel - 1.02% | | | | | | | | |
Universal Stainless & Alloy Products, Inc. (a) | | | 605 | | | | 15,216 | |
| | | | | | | | | |
| Leisure Time - 0.70% | | | | | | | | |
| Callaway Golf Co. | | | 1,350 | | | | 10,395 | |
| | | | | | | | | |
| Lodging - 0.97% | | | | | | | | |
Century Casinos, Inc. (a) | | | 2,840 | | | | 14,342 | |
| | | | | | | | | |
| Machinery - Diversified - 1.07% | | | | | | | | |
| Global Power Equipment Group, Inc. | | | 1,150 | | | | 15,882 | |
| | | | | | | | | |
| Metal Fabricate & Hardware - 0.65% | | | | | | | | |
Northwest Pipe Co. (a) | | | 320 | | | | 9,638 | |
| | | | | | | | | |
| Miscellaneous Manufacturing - 0.93% | | | | | | | | |
| FreightCar America, Inc. | | | 525 | | | | 13,813 | |
| | | | | | | | | |
| Office & Business - 1.15% | | | | | | | | |
| Barrett Business Services, Inc. | | | 625 | | | | 17,125 | |
| | | | | | | | | |
| Oil & Gas - 0.71% | | | | | | | | |
PetroQuest Energy, Inc. (a) | | | 2,830 | | | | 10,584 | |
| | | | | | | | | |
| Oil & Gas Services - 1.80% | | | | | | | | |
| Gulf Island Fabrication, Inc. | | | 530 | | | | 10,277 | |
| North American Energy Partners, Inc. | | | 1,895 | | | | 5,950 | |
| Tesco Corp. | | | 820 | | | | 10,512 | |
| | | | | | | | 26,739 | |
| Pharmaceuticals - 0.76% | | | | | | | | |
BioScrip. Inc. (a) | | | 1,625 | | | | 11,359 | |
| | | | | | | | | |
| Real Estate Investment Trusts - 2.66% | | | | | | | | |
| Gladstone Commercial Corp. | | | 460 | | | | 7,898 | |
| Independence Realty Trust, Inc. | | | 2,090 | | | | 19,458 | |
| Monmouth Real Estate Investment Corp. | | | 1,105 | | | | 12,232 | |
| | | | | | | | 39,588 | |
| Retail - 7.44% | | | | | | | | |
Christopher & Banks Corp. (a) | | | 916 | | | | 5,230 | |
Destination XL Group, Inc. (a) | | | 2,750 | | | | 15,015 | |
Kirkland's, Inc. (a) | | | 720 | | | | 17,021 | |
Ruby Tuesday, Inc. (a) | | | 2,280 | | | | 15,595 | |
| Stein Mart, Inc. | | | 1,345 | | | | 19,664 | |
TravelCenters of America LLC (a) | | | 1,550 | | | | 19,561 | |
West Marine, Inc. (a) | | | 1,430 | | | | 18,476 | |
| | | | | | | | 110,562 | |
FOUNDRY PARTNERS, LLC FUNDS
FOUNDRY MICRO CAP VALUE FUND
SCHEDULE OF INVESTMENTS
| December 31, 2014 | ANNUAL REPORT |
| COMMON STOCKS - 96.41% (Continued) | | SHARES | | | FAIR VALUE | |
| | | | | | | |
| Savings & Loans - 9.28% | | | | | | |
| Banc of California, Inc. | | | 1,575 | | | $ | 18,065 | |
| Berkshire Hills Bancorp, Inc. | | | 600 | | | | 15,996 | |
| Dime Community Bancshares, Inc. | | | 1,100 | | | | 17,908 | |
| ESSA Bancorp, Inc. | | | 1,180 | | | | 14,160 | |
HomeTrust Bancshares, Inc. (a) | | | 621 | | | | 10,346 | |
| Meta Financial Group, Inc. | | | 500 | | | | 17,520 | |
| SI Financial Group, Inc. | | | 1,415 | | | | 15,763 | |
| Territorial Bancorp, Inc. | | | 800 | | | | 17,240 | |
| United Community Financial Corp./OH | | | 2,050 | | | | 11,008 | |
| | | | | | | | 138,006 | |
| Semiconductors - 5.12% | | | | | | | | |
Alpha & Omega Semiconductor Ltd. (a) | | | 1,600 | | | | 14,160 | |
| IXYS Corp. | | | 1,345 | | | | 16,947 | |
Pericom Semiconductor Corp. (a) | | | 1,205 | | | | 16,316 | |
Photronics, Inc. (a) | | | 1,665 | | | | 13,836 | |
Rudolph Technologies, Inc. (a) | | | 1,450 | | | | 14,834 | |
| | | | | | | | 76,093 | |
| Software - 2.31% | | | | | | | | |
| American Software, Inc./Georgia | | | 1,500 | | | | 13,665 | |
| Concurrent Computer Corp. | | | 1,800 | | | | 12,762 | |
| Wayside Technology Group, Inc. | | | 460 | | | | 7,917 | |
| | | | | | | | 34,344 | |
| Telecommunications - 3.78% | | | | | | | | |
| Black Box Corp. | | | 640 | | | | 15,296 | |
EXFO, Inc. (a) | | | 3,110 | | | | 10,730 | |
Premiere Global Services, Inc. (a) | | | 1,075 | | | | 11,417 | |
| Spok Holdings, Inc. | | | 515 | | | | 8,940 | |
Westell Technologies, Inc. (a) | | | 6,500 | | | | 9,750 | |
| | | | | | | | 56,133 | |
| Transportation - 4.66% | | | | | | | | |
| Aegean Marine Petroleum Network, Inc. | | | 1,530 | | | | 21,451 | |
| Celadon Group, Inc. | | | 855 | | | | 19,400 | |
Covenant Transportation Group, Inc. (a) | | | 505 | | | | 13,691 | |
| Marten Transport Ltd. | | | 670 | | | | 14,646 | |
| | | | | | | | 69,188 | |
| Total Common Stocks (Cost $1,369,699) | | | | | | | 1,433,120 | |
| | | | | | | | | |
| MONEY MARKET FUND - 5.65% | | | | | | | | |
First American Prime Obligations Fund Class Z, 0.02% (b) (Cost $83,941) | | | 83,941 | | | | 83,941 | |
| | | | | | | | | |
| Total Investments at Fair Value - 102.06% (Cost $1,453,640) | | | | | | | 1,517,061 | |
| | | | | | | | | |
| Liabilities in Excess of Other Assets, Net - (2.06)% | | | | | | | (30,609 | ) |
| | | | | | | | | |
| Net Assets - 100.00% | | | | | | $ | 1,486,452 | |
(a) Non-income producing security.
(b) Rate shown represents the 7-day yield at December 31, 2014, is subject to change and resets daily.
The accompanying notes are an integral part of these financial statements.
FOUNDRY PARTNERS, LLC FUNDS
FOUNDRY SMALL CAP VALUE FUND
SCHEDULE OF INVESTMENTS
| December 31, 2014 | ANNUAL REPORT |
| COMMON STOCKS - 98.35% | | SHARES | | | FAIR VALUE | |
| | | | | | | |
| Banks - 16.30% | | | | | | |
| Banner Corp. | | | 465 | | | $ | 20,004 | |
| Financial Institutions, Inc. | | | 620 | | | | 15,593 | |
| First Financial Corp. IN | | | 550 | | | | 19,591 | |
First NBC Bank Holding Co. (a) | | | 537 | | | | 18,902 | |
| Hanmi Financial Corp. | | | 835 | | | | 18,211 | |
| Independent Bank Corp./Rockland MA | | | 460 | | | | 19,693 | |
| MainSource Financial Group, Inc. | | | 1,085 | | | | 22,698 | |
| Old National Bancorp IN | | | 1,190 | | | | 17,707 | |
| Susquehanna Bancshares Inc | | | 800 | | | | 10,744 | |
| Towne Bank - Portsmouth, VA | | | 1,225 | | | | 18,522 | |
| | | | | | | | 181,665 | |
| Building Materials - 1.83% | | | | | | | | |
Gibraltar Industries, Inc. (a) | | | 1,255 | | | | 20,406 | |
| | | | | | | | | |
| Commercial Services - 3.58% | | | | �� | | | | |
| Aaron's, Inc. | | | 650 | | | | 19,870 | |
Great Lakes Dredge & Dock Corp. (a) | | | 2,340 | | | | 20,030 | |
| | | | | | | | 39,900 | |
| Computers - 2.50% | | | | | | | | |
| Mentor Graphics Corp. | | | 725 | | | | 15,892 | |
Synaptics, Inc. (a) | | | 175 | | | | 12,047 | |
| | | | | | | | 27,939 | |
| Diversified Financial Services - 1.25% | | | | | | | | |
| FXCM, Inc. | | | 845 | | | | 14,002 | |
| | | | | | | | | |
| Electric - 1.67% | | | | | | | | |
| Portland General Electric Co. | | | 492 | | | | 18,612 | |
| | | | | | | | | |
| Electrical Components & Equipment - 3.05% | | | | | | | | |
| Encore Wire Corp. | | | 450 | | | | 16,799 | |
| Powell Industries, Inc. | | | 350 | | | | 17,175 | |
| | | | | | | | 33,974 | |
| Electronics - 2.36% | | | | | | | | |
| AVX Corp. | | | 920 | | | | 12,880 | |
Plexus Corp. (a) | | | 325 | | | | 13,393 | |
| | | | | | | | 26,273 | |
| Engineering & Construction - 2.11% | | | | | | | | |
| Comfort Systems USA, Inc. | | | 1,375 | | | | 23,540 | |
| | | | | | | | | |
| Environmental Control - 1.63% | | | | | | | | |
| Ceco Environmental Corp. | | | 1,168 | | | | 18,151 | |
| | | | | | | | | |
| Food - 1.75% | | | | | | | | |
| SpartanNash Co. | | | 745 | | | | 19,474 | |
| | | | | | | | | |
| Forest Products & Paper - 3.07% | | | | | | | | |
| Deltic Timber Corp. | | | 270 | | | | 18,468 | |
| PH Glatfelter Co. | | | 615 | | | | 15,726 | |
| | | | | | | | 34,194 | |
FOUNDRY PARTNERS, LLC FUNDS
FOUNDRY SMALL CAP VALUE FUND
SCHEDULE OF INVESTMENTS
| December 31, 2014 | ANNUAL REPORT |
| COMMON STOCKS - 98.35% (Continued) | | SHARES | | | FAIR VALUE | |
| | | | | | | |
| Gas - 0.92% | | | | | | |
| ONE Gas, Inc. | | | 250 | | | $ | 10,305 | |
| | | | | | | | | |
| Home Builders - 1.71% | | | | | | | | |
WCI Communities, Inc. (a) | | | 975 | | | | 19,090 | |
| | | | | | | | | |
| Home Furnishings - 4.80% | | | | | | | | |
| Daktronics, Inc. | | | 1,125 | | | | 14,074 | |
| Ethan Allen Interiors, Inc. | | | 580 | | | | 17,963 | |
| La-Z-Boy, Inc. | | | 800 | | | | 21,472 | |
| | | | | | | | 53,509 | |
| Household Products & Wares - 1.31% | | | | | | | | |
Central Garden and Pet Co. (a) | | | 1,525 | | | | 14,564 | |
| | | | | | | | | |
| Insurance - 2.05% | | | | | | | | |
| Meadowbrook Insurance Group, Inc. | | | 2,700 | | | | 22,842 | |
| | | | | | | | | |
| Iron & Steel - 1.61% | | | | | | | | |
| Carpenter Technology Corp. | | | 365 | | | | 17,976 | |
| | | | | | | | | |
| Machinery - Diversified - 1.36% | | | | | | | | |
| Global Power Equipment Group, Inc. | | | 1,100 | | | | 15,191 | |
| | | | | | | | | |
| Miscellaneous Manufacturing - 2.65% | | | | | | | | |
| FreightCar America, Inc. | | | 631 | | | | 16,602 | |
LSB Industries, Inc. (a) | | | 410 | | | | 12,890 | |
| | | | | | | | 29,492 | |
| Oil & Gas - 1.12% | | | | | | | | |
Goodrich Petroleum Corp. (a) | | | 650 | | | | 2,886 | |
PetroQuest Energy, Inc. (a) | | | 2,570 | | | | 9,612 | |
| | | | | | | | 12,498 | |
| Oil & Gas Services - 2.18% | | | | | | | | |
Helix Energy Solutions Group, Inc. (a) | | | 375 | | | | 8,137 | |
Matrix Service Co. (a) | | | 450 | | | | 10,044 | |
| North American Energy Partners, Inc. | | | 1,940 | | | | 6,092 | |
| | | | | | | | 24,273 | |
| Pharmaceuticals - 2.24% | | | | | | | | |
BioScrip. Inc. (a) | | | 1,649 | | | | 11,527 | |
Impax Laboratories, Inc. (a) | | | 425 | | | | 13,464 | |
| | | | | | | | 24,991 | |
| Real Estate - 1.10% | | | | | | | | |
Forestar Group, Inc. (a) | | | 800 | | | | 12,320 | |
| | | | | | | | | |
| Real Estate Investment Trusts - 5.22% | | | | | | | | |
| Brandywine Realty Trust | | | 817 | | | | 13,056 | |
| Hersha Hospitality Trust | | | 2,092 | | | | 14,707 | |
| LaSalle Hotel Properties | | | 405 | | | | 16,390 | |
| Lexington Realty Trust | | | 1,275 | | | | 14,000 | |
| | | | | | | | 58,153 | |
FOUNDRY PARTNERS, LLC FUNDS
FOUNDRY SMALL CAP VALUE FUND
SCHEDULE OF INVESTMENTS
| December 31, 2014 | ANNUAL REPORT |
| COMMON STOCKS - 98.35% (Continued) | | SHARES | | | FAIR VALUE | |
| | | | | | | |
| Retail - 9.19% | | | | | | |
| Big Lots, Inc. | | | 260 | | | $ | 10,405 | |
Bloomin' Brands, Inc. (a) | | | 775 | | | | 19,189 | |
Kirkland's, Inc. (a) | | | 775 | | | | 18,321 | |
Ruby Tuesday, Inc. (a) | | | 2,300 | | | | 15,732 | |
| Stein Mart, Inc. | | | 1,400 | | | | 20,468 | |
| TravelCenters of America LLC | | | 1,450 | | | | 18,299 | |
| | | | | | | | 102,414 | |
| Savings & Loans - 5.74% | | | | | | | | |
| Banc of California, Inc. | | | 1,655 | | | | 18,983 | |
| Berkshire Hills Bancorp, Inc. | | | 680 | | | | 18,129 | |
BofI Holding, Inc. (a) | | | 225 | | | | 17,507 | |
HomeTrust Bancshares, Inc. (a) | | | 562 | | | | 9,363 | |
| | | | | | | | 63,982 | |
| Semiconductors - 4.45% | | | | | | | | |
Entegris, Inc. (a) | | | 875 | | | | 11,559 | |
Photronics, Inc. (a) | | | 1,525 | | | | 12,673 | |
QLogic Corp. (a) | | | 900 | | | | 11,988 | |
Rudolph Technologies, Inc. (a) | | | 1,311 | | | | 13,412 | |
| | | | | | | | 49,632 | |
| Software - 1.32% | | | | | | | | |
Allscripts Healthcare Solutions,. Inc. (a) | | | 1,150 | | | | 14,686 | |
| | | | | | | | | |
| Telecommunications - 3.18% | | | | | | | | |
| Black Box Corp. | | | 550 | | | | 13,145 | |
| Plantronics, Inc. | | | 225 | | | | 11,929 | |
Premiere Global Services, Inc. (a) | | | 975 | | | | 10,354 | |
| | | | | | | | 35,428 | |
| Transportation - 5.10% | | | | | | | | |
| Aegean Marine Petroleum Network, Inc. | | | 1,420 | | | | 19,908 | |
| Celadon Group, Inc. | | | 834 | | | | 18,923 | |
| Marten Transport Ltd. | | | 825 | | | | 18,035 | |
| | | | | | | | 56,866 | |
| Total Common Stocks (Cost $1,026,190) | | | | | | | 1,096,342 | |
| | | | | | | | | |
| MONEY MARKET FUND - 5.18% | | | | | | | | |
First American Prime Obligations Fund Class Z, 0.02% (b) (Cost $57,761) | | | 57,761 | | | | 57,761 | |
| | | | | | | | | |
| Total Investments at Fair Value - 103.53% (Cost $1,083,951) | | | | | | | 1,154,103 | |
| | | | | | | | | |
| Liabilities in Excess of other Assets, Net - (3.53%) | | | | | | | (39,369 | ) |
| | | | | | | | | |
| Net Assets - 100.00% | | | | | | $ | 1,114,734 | |
(a) Non-income producing security.
(b) Rate shown represents the 7-day yield at December 31, 2014, is subject to change and resets daily.
The accompanying notes are an integral part of these financial statements.
FOUNDRY PARTNERS, LLC FUNDS
FOUNDRY MICRO CAP VALUE FUND
STATEMENT OF ASSETS AND LIABILITIES
| December 31, 2014 | ANNUAL REPORT |
| Assets: | | | |
| Investments, at value (identified cost $1,453,640) | | $ | 1,517,061 | |
| Due from advisor | | | 6,455 | |
| Receivables: | | | | |
| Interest | | | 1 | |
| Dividends | | | 1,354 | |
| Investment securities sold | | | 8,511 | |
| Prepaid expenses | | | 929 | |
| Total assets | | | 1,534,311 | |
| | | | | |
| Liabilities: | | | | |
| Payables: | | | | |
| Investment securities purchased | | | 21,826 | |
| Due to administrator | | | 2,780 | |
| Due to trustees | | | 1,791 | |
| Accrued expenses | | | 21,462 | |
| Total liabilities | | | 47,859 | |
| Net Assets | | $ | 1,486,452 | |
| | | | | |
| Sources of Net Assets: | | | | |
| Paid-in capital | | $ | 1,384,401 | |
| Accumulated net realized gain on investments | | | 38,630 | |
| Net unrealized appreciation on investments | | | 63,421 | |
| Total Net Assets (Unlimited shares of beneficial interest authorized) | | $ | 1,486,452 | |
| | | | | |
| | | | | |
| Institutional Class Shares: | | | | |
| Net assets applicable to 137,876 shares outstanding | | $ | 1,486,452 | |
| Net Asset Value and Offering Price Per Share | | $ | 10.78 | |
| Minimum Redemption Price Per Share (a) | | $ | 10.56 | |
(a) A 2.00% redemption fee is assessed on redemption transactions of shares that are held for 90 days or less.
The accompanying notes are an integral part of these financial statements.
FOUNDRY PARTNERS, LLC FUNDS
FOUNDRY SMALL CAP VALUE FUND
STATEMENT OF ASSETS AND LIABILITIES
| December 31, 2014 | ANNUAL REPORT |
| Assets: | | | |
| Investments, at value (identified cost $1,083,951) | | $ | 1,154,103 | |
| Due from advisor | | | 3,049 | |
| Receivables: | | | | |
| Dividends | | | 1,691 | |
| Investment securities sold | | | 6,507 | |
| Prepaid expenses | | | 929 | |
| Total assets | | | 1,166,279 | |
| | | | | |
| Liabilities: | | | | |
| Payables: | | | | |
| Investment securities purchased | | | 27,145 | |
| Due to administrator | | | 2,680 | |
| Due to trustees | | | 1,792 | |
| Accrued expenses | | | 19,928 | |
| Total liabilities | | | 51,545 | |
| Net Assets | | $ | 1,114,734 | |
| | | | | |
| Sources of Net Assets: | | | | |
| Paid-in capital | | $ | 1,065,413 | |
| Accumulated net realized loss on investments | | | (20,831 | ) |
| Net unrealized appreciation on investments | | | 70,152 | |
| Total Net Assets (Unlimited shares of beneficial interest authorized) | | $ | 1,114,734 | |
| Institutional Class Shares: | | | | |
| Net assets applicable to 107,731 shares outstanding | | $ | 1,114,734 | |
| Net Asset Value and Offering Price Per Share | | $ | 10.35 | |
Minimum Redemption Price Per Share (a) | | $ | 10.14 | |
(a) A 2.00% redemption fee is assessed on redemption transactions of shares that are held for 90 days or less.
The accompanying notes are an integral part of these financial statements.
FOUNDRY PARTNERS, LLC FUNDS
FOUNDRY MICRO CAP VALUE FUND
STATEMENT OF OPERATIONS
| December 31, 2014 | ANNUAL REPORT |
| | | For the | |
| | | Period Ended | |
| | | December 31, 2014 (a) | |
| | | | |
| Investment income: | | | |
| Dividends (net of foreign withholding taxes of $32) | | $ | 11,046 | |
| Interest | | | 8 | |
| Total investment income | | | 11,054 | |
| | | | | |
| Expenses: | | | | |
| Management fees (Note 5) | | | 8,281 | |
| Accounting and transfer agent fees and expenses | | | 28,967 | |
| Audit fees | | | 15,750 | |
| Legal fees | | | 11,682 | |
| Custodian fees | | | 11,586 | |
| Miscellaneous | | | 8,925 | |
| Trustee fees and expenses | | | 8,820 | |
| Pricing fees | | | 7,732 | |
| Insurance fees | | | 987 | |
| Reports to shareholders | | | 500 | |
| Registration and filing fees | | | 364 | |
| Total expenses | | | 103,594 | |
| Less: fees waived and expenses absorbed | | | (89,103 | ) |
| Net expenses | | | 14,491 | |
| | | | | |
| Net investment loss | | | (3,437 | ) |
| | | | | |
| Realized and unrealized gain (loss): | | | | |
| Net realized gain on: | | | | |
| Investments | | | 71,586 | |
| Net realized gain on investments | | | 71,586 | |
| | | | | |
| Net change in unrealized appreciation on: | | | | |
| Investments | | | 63,421 | |
| Net change in unrealized appreciation | | | 63,421 | |
| | | | | |
| Net gain on investments | | | 135,007 | |
| | | | | |
| Net increase in net assets resulting from operations | | $ | 131,570 | |
(a) The Foundry Micro Cap Value Fund commenced operations on January 30, 2014.
The accompanying notes are an integral part of these financial statements.
FOUNDRY PARTNERS, LLC FUNDS
FOUNDRY SMALL CAP VALUE FUND
STATEMENT OF OPERATIONS
| December 31, 2014 | ANNUAL REPORT |
| | | For the | |
| | | Period Ended | |
| | | December 31, 2014 (a) | |
| | | | |
| Investment income: | | | |
| Dividends (net of foreign withholding taxes of $21) | | $ | 11,016 | |
| Interest | | | 5 | |
| Total investment income | | | 11,021 | |
| | | | | |
| Expenses: | | | | |
| Management fees (Note 5) | | | 6,770 | |
| Accounting and transfer agent fees and expenses | | | 28,999 | |
| Audit fees | | | 15,750 | |
| Legal fees | | | 11,682 | |
| Miscellaneous | | | 8,925 | |
| Trustee fees and expenses | | | 8,820 | |
| Custodian fees | | | 7,590 | |
| Pricing fees | | | 5,537 | |
| Insurance fees | | | 987 | |
| Reports to shareholders | | | 500 | |
| Registration and filing fees | | | 364 | |
| Total expenses | | | 95,924 | |
| Less: fees waived and expenses absorbed | | | (83,230 | ) |
| Net expenses | | | 12,694 | |
| | | | | |
| Net investment loss | | | (1,673 | ) |
| | | | | |
| Realized and unrealized gain (loss): | | | | |
| Net realized gain on: | | | | |
| Investments | | | 3,599 | |
| Net realized gain on investments | | | 3,599 | |
| | | | | |
| Net change in unrealized appreciation (depreciation) on: | | | | |
| Investments | | | 70,152 | |
| Net change in unrealized appreciation | | | 70,152 | |
| | | | | |
| Net gain on investments | | | 73,751 | |
| | | | | |
| Net increase in net assets resulting from operations | | $ | 72,078 | |
(a) The Foundry Small Cap Value Fund commenced operations on January 30, 2014.
The accompanying notes are an integral part of these financial statements.
FOUNDRY PARTNERS, LLC FUNDS
FOUNDRY MICRO CAP VALUE FUND
STATEMENT OF CHANGES IN NET ASSETS
| December 31, 2014 | ANNUAL REPORT |
| | | | |
| Increase (decrease) in net assets from: | | | |
| Operations: | | | |
| Net investment loss | | $ | (3,437 | ) |
| Net realized gain on investments | | | 71,586 | |
| Net unrealized appreciation on investments | | | 63,421 | |
| Net increase in net assets resulting from operations | | | 131,570 | |
| | | | | |
| Distributions to shareholders from: | | | | |
| Net realized capital gains | | | (29,519 | ) |
| Decrease in net assets resulting from distributions | | | (29,519 | ) |
| | | | | |
| Capital share transactions (Note 3): | | | | |
| Increase in net assets from capital share transactions | | | 1,384,401 | |
| | | | | |
| Increase in net assets | | | 1,486,452 | |
| | | | | |
| Net Assets: | | | | |
| Beginning of period | | | - | |
| | | | | |
| End of period | | $ | 1,486,452 | |
| Undistributed net investment income | | $ | - | |
(a) The Foundry Micro Cap Value Fund commenced operations on January 30, 2014.
The accompanying notes are an integral part of these financial statements.
FOUNDRY PARTNERS, LLC FUNDS
FOUNDRY SMALL CAP VALUE FUND
STATEMENT OF CHANGES IN NET ASSETS
| December 31, 2014 | ANNUAL REPORT |
| | | For the | |
| | | Period Ended | |
| | | December 31, 2014 (a) | |
| | | | |
| Increase (decrease) in net assets from: | | | |
| Operations: | | | |
| Net investment loss | | $ | (1,673 | ) |
| Net realized gain on investments | | | 3,599 | |
| Net unrealized appreciation on investments | | | 70,152 | |
| Net increase in net assets resulting from operations | | | 72,078 | |
| | | | | |
| Distributions to shareholders from: | | | | |
| Net realized capital gains | | | (22,757 | ) |
| Decrease in net assets resulting from distributions | | | (22,757 | ) |
| | | | | |
| Capital share transactions (Note 3): | | | | |
| Increase in net assets from capital share transactions | | | 1,065,413 | |
| | | | | |
| Increase in net assets | | | 1,114,734 | |
| | | | | |
| Net Assets: | | | | |
| Beginning of period | | | - | |
| | | | | |
| End of period | | $ | 1,114,734 | |
| Undistributed net investment income | | $ | - | |
(a) The Foundry Small Cap Value Fund commenced operations on January 30, 2014.
The accompanying notes are an integral part of these financial statements.
FOUNDRY PARTNERS, LLC FUNDS
FOUNDRY MICRO CAP VALUE FUND
FINANCIAL HIGHLIGHTS
| December 31, 2014 | | ANNUAL REPORT |
The following tables set forth the per share operating performance data for a share of capital stock outstanding, total return ratios to average net assets and other supplemental data for the period indicated.
| | | FOUNDRY MICRO CAP VALUE FUND | | |
| | | For the | | |
| | | Period Ended | | |
| | | December 31, 2014 (a) | | |
| | | | | |
| | | | | |
| Net Asset Value, Beginning of Period | | $ | 10.00 | | |
| | | | | | |
| Investment Operations: | | | | | |
| Net investment loss | | | (0.02 | ) | |
| Net realized and unrealized gain on investments | | | 1.02 | | |
| Total from investment operations | | | 1.00 | | |
| | | | | | |
| Distributions: | | | | | |
| From net realized capital gains | | | (0.22 | ) | |
| Total distributions | | | (0.22 | ) | |
| | | | | | |
| Net Asset Value, End of Year/Period | | $ | 10.78 | | |
| | | | | | |
Total Return (b) | | | 10.03 | % | (c)(d) |
| | | | | | |
| Ratios/Supplemental Data | | | | | |
| Net assets, end of period (in 000's) | | $ | 1,486 | | |
| | | | | | |
Ratio of expenses to average net assets (e): | | | | | |
| Before fees waived and expenses absorbed | | | 12.51 | % | (f) |
| After fees waived and expenses absorbed | | | 1.75 | % | (f) |
| | | | | | |
Ratio of net investment income (loss) (e): | | | | | |
| Before fees waived and expenses absorbed | | | (11.18 | )% | (f) |
| After fees waived and expenses absorbed | | | (0.42 | )% | (f) |
| | | | | | |
| Portfolio turnover rate | | | 58 | % | (c) |
(a) | The Foundry Micro Cap Value Fund commenced operations on January 30, 2014. |
(b) | Total Return represents the rate that the investor would have earned or lost on an investment in the Fund, assuming reinvestment of dividends. |
(d) | Total Return is for the period from January 30, 2014, the date of initial portfolio trades, through December 31, 2014. |
(e) | Ratios are for the period from January 30, 2014, the date of initial expense accruals, through December 31, 2014. |
The accompanying notes are an integral part of these financial statements.
FOUNDRY PARTNERS, LLC FUNDS
FOUNDRY SMALL CAP VALUE FUND
FINANCIAL HIGHLIGHTS
| December 31, 2014 | ANNUAL REPORT |
The following tables set forth the per share operating performance data for a share of capital stock outstanding, total return ratios to average net assets and other supplemental data for the period indicated.
| | | FOUNDRY SMALL CAP VALUE FUND | | |
| | | For the | | |
| | | Period Ended | | |
| | | December 31, 2014 (a) | | |
| | | | | |
| | | | | |
| Net Asset Value, Beginning of Period | | $ | 10.00 | | |
| | | | | | |
| Investment Operations: | | | | | |
| Net investment loss | | | (0.02 | ) | |
| Net realized and unrealized gain on investments | | | 0.59 | | |
| Total from investment operations | | | 0.57 | | |
| | | | | | |
| Distributions: | | | | | |
| From net realized capital gains | | | (0.22 | ) | |
| Total distributions | | | (0.22 | ) | |
| | | | | | |
| Net Asset Value, End of Year/Period | | $ | 10.35 | | |
| | | | | | |
Total Return (b) | | | 5.71 | % | (c)(d) |
| | | | | | |
| Ratios/Supplemental Data | | | | | |
| Net assets, end of period (in 000's) | | $ | 1,115 | | |
| | | | | | |
Ratio of expenses to average net assets (e): | | | | | |
| Before fees waived and expenses absorbed | | | 11.34 | % | (f) |
| After fees waived and expenses absorbed | | | 1.50 | % | (f) |
| | | | | | |
Ratio of net investment income (loss) (e): | | | | | |
| Before fees waived and expenses absorbed | | | (10.03 | )% | (f) |
| After fees waived and expenses absorbed | | | (0.19 | )% | (f) |
| | | | | | |
| Portfolio turnover rate | | | 75 | % | (c) |
(a) | The Foundry Small Cap Value Fund commenced operations on January 30, 2014. |
(b) | Total Return represents the rate that the investor would have earned or lost on an investment in the Fund, assuming reinvestment of dividends. |
(d) | Total Return is for the period from January 30, 2014, the date of initial portfolio trades, through December 31, 2014. |
(e) | Ratios are for the period from January 30, 2014, the date of initial expense accruals, through December 31, 2014. |
The accompanying notes are an integral part of these financial statements.
| Foundry Partners, LLC Funds | ANNUAL REPORT |
NOTES TO THE FINANCIAL STATEMENTS
December 31, 2014
| 1. | ORGANIZATION AND SIGNIFICANT ACCOUNTING POLICIES |
The Foundry Partners, LLC Funds (the “Funds”) are series of 360 Funds (the “Trust”). The Trust was organized on February 24, 2005, as a Delaware statutory trust. The Trust is registered as an open-end management investment company under the Investment Company Act of 1940 (the “1940 Act”). The following series of funds advised by Foundry Partners, LLC: (i) Foundry Micro Cap Value Fund (“Micro Cap Value Fund”), and (ii) Foundry Small Cap Value Fund (“Small Cap Value Fund”), (each a “Fund” and collectively, the “Funds”) are each an open end management investment company and separate series of the Trust. The investment objective of the Foundry Micro Cap Value Fund is capital appreciation. The investment objective of the Foundry Small Cap Value Fund is capital appreciation. The Funds are diversified Funds. The Funds’ investment adviser is Foundry Partners, LLC (the “Adviser”). The Funds each have one class of shares, Institutional Class Shares. The Institutional Class Shares commenced operations on January 30, 2014.
a) Security Valuation – All investments in securities are recorded at their estimated fair value, as described in note 2.
b) Exchange Traded Funds – The Funds may invest in Exchange Traded Funds (“ETFs”). ETFs are registered investment companies and incur fees and expenses such as operating expenses, licensing fees, registration fees, trustees fees, and marketing expenses, and ETF shareholders, such as a Fund, pay their proportionate share of these expenses. Your cost of investing in a Fund will generally be higher than the cost of investing directly in ETFs. By investing in a Fund, you will indirectly bear fees and expenses charged by the underlying ETFs in which a Fund invests in addition to a Fund's direct fees and expenses.
c) Federal Income Taxes – The Funds intend to qualify as regulated investment companies under Subchapter M of the Internal Revenue Code of 1986, as amended (the “Code”). It is the policy of the Funds to comply with the requirements of the Code applicable to regulated investment companies and to distribute substantially all of their net investment company taxable income and net capital gains. Therefore, no provision for federal income taxes is required.
As of December 31, 2014 and during the period since inception from January 30, 2014 through December 31, 2014, the Funds did not have a liability for any unrecognized tax expenses. The Funds recognize interest and penalties, if any, related to unrecognized tax liability as income tax expense in the statement of operations. During the period since inception from January 30, 2014 through December 31, 2014, the Funds did not incur any interest or penalties. The Funds identify their major tax jurisdictions as U.S. Federal and Delaware state.
d) Distributions to Shareholders – Dividends from net investment income and distributions of net realized capital gains, if any, will be declared and paid at least annually. Income and capital gain distributions, which are determined in accordance with income tax regulations, are recorded on the ex-dividend date. Accounting principles generally accepted in the United States of America ("GAAP") requires that permanent financial reporting differences relating to shareholder distributions be reclassified to paid-in capital or net realized gains. As of December 31, 2014, the Funds recorded reclassifications to increase (decrease) the capital accounts as follows:
| Fund | | Net Investment Loss | | | Paid-in Capital | | | Net Realized Capital Gains | |
| Micro Cap Value Fund: | | $ | 3,437 | | | $ | - | | | $ | (3,437 | ) |
| Small Cap Value Fund | | | 1,673 | | | | - | | | | (1,673 | ) |
e) Use of Estimates – The preparation of financial statements in conformity with GAAP requires management to make estimates and assumptions that affect the reported amounts of assets and liabilities and disclosure of contingent assets and liabilities at the date of the financial statements and the reported amounts of revenues and expenses during the reporting period. Actual results could differ from those estimates.
f) Other – Investment and shareholder transactions are recorded on trade date. The Funds determine the gain or loss realized from the investment transactions by comparing the original cost of the security lot sold with the net sales proceeds. Dividend income is recognized on the ex-dividend date or as soon as information is available to the Funds and interest income is recognized on an accrual basis. Withholding taxes on foreign dividends have been provided for in accordance with the Funds' understanding of the applicable country’s tax rules and rates.
| Foundry Partners, LLC Funds | ANNUAL REPORT |
NOTES TO THE FINANCIAL STATEMENTS
December 31, 2014
| 1. | ORGANIZATION AND SIGNIFICANT ACCOUNTING POLICIES (continued) |
g) Investments in Small-Cap Companies and Micro-Cap Companies – A Fund may invest a significant portion of its assets in securities of companies with small market capitalizations or micro market capitalizations. Certain small-cap companies and micro-cap companies may offer greater potential for capital appreciation than larger companies. However, investors should note that this potential for greater capital appreciation is accompanied by a substantial risk of loss and that, by their very nature, investments in small-cap companies and micro-cap companies tend to be very volatile and speculative. Small-cap companies and micro-cap companies may have a small share of the market for their products or services, their businesses may be limited to regional markets, or they may provide goods and services for a limited market. For example, they may be developing or marketing new products or services for markets that are not yet established or may never become established. In addition, small-cap companies and micro-cap companies may have or will develop only a regional market for products or services and thus be affected by local or regional market conditions. In addition, small-cap companies and micro-cap companies may lack depth of management or they may be unable to generate funds necessary for growth or potential development, either internally or through external financing on favorable terms. Such companies may also be insignificant in their industries and be subject to or become subject to intense competition from larger companies. Due to these and other factors, a Fund’s investments in small-cap companies and micro-cap companies may suffer significant losses. Further, there is typically a smaller market for the securities of a small-cap company or micro-cap company than for securities of a large company. Therefore, investments in small-cap companies and micro-cap companies may be less liquid and subject to significant price declines that result in losses for a Fund.
h) Redemption fees - Shareholders that redeem shares within 90 days of purchase will be assessed a redemption fee of 2.00% of the amount redeemed. The redemption fee is paid directly to and retained by the Funds, and is designed to deter excessive short-term trading and to offset brokerage commissions, market impact and other costs that may be associated with short-term money movement in and out of the Funds. No redemption fees were paid to the Funds during the period since inception from January 30, 2014 through December 31, 2014.
Processes and Structure
The Funds' Board of Trustees has adopted guidelines for valuing securities and other derivative instruments including in circumstances in which market quotes are not readily available, and has delegated authority to the Adviser to apply those guidelines in determining fair value prices, subject to review by the Board of Trustees.
Hierarchy of Fair Value Inputs
The Funds utilize various methods to measure the fair value of most of its investments on a recurring basis. GAAP establishes a hierarchy that prioritizes inputs to valuation techniques used to measure fair value. The three levels of inputs are as follows:
| • | Level 1 – Unadjusted quoted prices in active markets for identical assets or liabilities that the Funds have the ability to access. |
| • | Level 2 – Observable inputs other than quoted prices included in Level 1 that are observable for the asset or liability either directly or indirectly. These inputs may include quoted prices for the identical instrument on an inactive market, prices for similar instruments, interest rates, prepayment speeds, credit risk, yield curves, default rates, and similar data. |
| • | Level 3 – Unobservable inputs for the asset or liability to the extent that relevant observable inputs are not available, representing the Funds' own assumptions about the assumptions that a market participant would use in valuing the asset or liability, and that would be based on the best information available. |
| Foundry Partners, LLC Funds | ANNUAL REPORT |
NOTES TO THE FINANCIAL STATEMENTS
December 31, 2014
| 2. | SECURITIES VALUATIONS (continued) |
The availability of observable inputs can vary from security to security and is affected by a wide variety of factors, including, for example, the type of security, whether the security is new and not yet established in the marketplace, the liquidity of markets, and other characteristics particular to the security. To the extent that valuation is based on models or inputs that are less observable or unobservable in the market, the determination of fair value requires more judgment. Accordingly, the degree of judgment exercised in determining fair value is greatest for instruments categorized in Level 3.
The inputs used to measure fair value may fall into different levels of the fair value hierarchy. In such cases, for disclosure purposes, the level in the fair value hierarchy within which the fair value measurement falls in its entirety is determined based on the lowest level input that is significant to the fair value measurement in its entirety.
Fair Value Measurements
A description of the valuation techniques applied to the Funds' major categories of assets and liabilities measured at fair value on a recurring basis follows.
Equity securities (common stock and ETFs) – Securities traded on a national securities exchange (or reported on the NASDAQ national market) are stated at the last reported sales price on the day of valuation. To the extent these securities are actively traded, and valuation adjustments are not applied, they are categorized in Level 1 of the fair value hierarchy. Certain foreign securities may be fair valued using a pricing service that considers the correlation of the trading patterns of the foreign security to the intraday trading in the U.S. markets for investments such as American Depositary Receipts, financial futures, Exchange Traded Funds, and the movement of certain indexes of securities based on a statistical analysis of the historical relationship and are categorized in Level 2. Preferred stock and other equities traded on inactive markets or valued by reference to similar instruments are also categorized in Level 2.
Money market funds – Money market funds are valued at their net asset value of $1.00 per share and are categorized as Level 1.
The following table summarizes the inputs used to value the Funds' assets and liabilities measured at fair value as of December 31, 2014:
Categories (a) | | Level 1 | | | Level 2 | | | Level 3 | | | Total | |
Micro Cap Value Fund: | | | | | | | | | | | | |
Common Stock (b) | | $ | 1,433,120 | | | | - | | | | - | | | $ | 1,433,120 | |
| Money market funds | | | 83,941 | | | | - | | | | - | | | | 83,941 | |
| Total Investments in Securities | | $ | 1,517,061 | | | | - | | | | - | | | $ | 1,517,061 | |
| Small Cap Value Fund: | | | | | | | | | | | | | | | | |
Common Stock (b) | | $ | 1,096,342 | | | | - | | | | - | | | $ | 1,096,342 | |
| Money market funds | | | 57,761 | | | | - | | | | - | | | | 57,761 | |
| Total Investments in Securities | | $ | 1,154,103 | | | | - | | | | - | | | $ | 1,154,103 | |
(a) As of December 31, 2014 and during the period since inception from January 30, 2014 through December 31, 2014, the Funds held no securities that were considered to be “Level 3” securities (those valued using significant unobservable inputs). Therefore, a reconciliation of assets in which significant unobservable inputs (Level 3) were used in determining fair value is not applicable.
(b) All common stock held in the Funds are Level 1 securities. For a detailed break-out of common stock by industry, please refer to the Schedules of Investments.
The Funds recognize transfers, if any, between fair value hierarchy levels at the reporting period end. There were no transfers between levels as of December 31, 2014, from the valuation input levels used on January 30, 2014 (inception date).
During the period since inception from January 30, 2014 through December 31, 2014, no securities were fair valued.
| Foundry Partners, LLC Funds | | ANNUAL REPORT |
NOTES TO THE FINANCIAL STATEMENTS
December 31, 2014
| 3. | CAPITAL SHARE TRANSACTIONS |
Transactions in shares of capital stock for the Funds for the period since inception from January 30, 2014 through December 31, 2014 were as follows:
| MicroCap Value Fund: | | Sold | | | Redeemed | | | Reinvested | | | Net Increase | |
| Institutional Class Shares | | | | | | | | | | | | |
| Shares | | | 140,143 | | | | (5,062 | ) | | | 2,795 | | | | 137,876 | |
| Value | | $ | 1,406,000 | | | $ | (51,118 | ) | | $ | 29,519 | | | $ | 1,384,401 | |
| Small Cap Value Fund: | | Sold | | | Redeemed | | | Reinvested | | | Net Increase | |
| Institutional Class Shares | | | | | | | | | | | | |
| Shares | | | 110,625 | | | | (5,143 | ) | | | 2,249 | | | | 107,731 | |
| Value | | $ | 1,094,642 | | | $ | (51,986 | ) | | $ | 22,757 | | | $ | 1,065,413 | |
| 4. | INVESTMENT TRANSACTIONS |
For the period since inception from January 30, 2014 through December 31, 2014, aggregate purchases and sales of investment securities (excluding short-term investments) were as follows:
| Fund | | Purchases | | | Sales | |
| Micro Cap Value Fund | | $ | 1,789,004 | | | $ | 489,547 | |
| Small Cap Value Fund | | | 1,671,694 | | | | 648,307 | |
There were no government securities purchased or sold during the period.
| 5. | ADVISORY FEES AND OTHER RELATED PARTY TRANSACTIONS |
The Funds have entered into an Investment Advisory Agreement (the “Advisory Agreement”) with the Adviser. Pursuant to the Advisory Agreement, the Adviser manages the operations of the Funds and manages the Funds' investments in accordance with the stated policies of the Funds. As compensation for the investment advisory services provided to the Funds, the Adviser will receive a monthly management fee equal to an annual rate of each Fund’s net assets for Institutional Class shares as follows:
Fund | | Management Fee Rate | | | Incurred | |
| Micro Cap Value Fund: | | | 1.00 | % | | $ | 8,281 | |
| Small Cap Value Fund | | | 0.80 | % | | | 6,770 | |
The Adviser and the Funds have entered into an Expense Limitation Agreement (“Expense Agreements”) under which the Adviser has agreed to waive or reduce its fees and to assume other expenses of each Fund, if necessary, in an amount that limits annual operating expenses (exclusive of interest, taxes, brokerage fees and commissions, acquired fund fees and expenses, shareholder servicing fees, extraordinary expenses, dividend and interest expenses in connection with securities sold short and payments, if any, under the Rule 12b-1 Plan) to not more than the following percentages of average daily net assets of each of the Funds through April 30, 2016:
Fund | | Expense Limitation | | | Management Fees Waived | | | Expenses Reimbursed | |
| Micro Cap Value Fund: | | | 1.75 | % | | $ | 8,281 | | | $ | 80,822 | |
| Small Cap Value Fund | | | 1.50 | % | | | 6,770 | | | | 76,460 | |
| Foundry Partners, LLC Funds | ANNUAL REPORT |
NOTES TO THE FINANCIAL STATEMENTS
December 31, 2014
| 5. | ADVISORY FEES AND OTHER RELATED PARTY TRANSACTIONS (continued) |
If, at any time, the annualized expenses of Funds were less than the annualized expense ratios, the Funds would reimburse the Adviser for any fees previously waived and/or expenses previously assumed; provided, however, that repayment would be payable only to the extent that it (a) can be made during the three (3) years following the time at which the Adviser waived fees or assumed expenses for the Funds, and (b) can be repaid without causing the expenses of Funds to exceed the annualized expense ratios.
At December 31, 2014, the cumulative unreimbursed amounts paid and/or waived by the Adviser on behalf of the Funds that may be recouped no later than the dates stated below are as follows:
| Fund | | December 31, 2017 | | | Totals | |
| Micro Cap Value Fund: | | $ | 89,103 | | | $ | 89,103 | |
| Small Cap Value Fund | | | 83,230 | | | | 83,230 | |
The Funds have entered into an Investment Company Services Agreement (“Services Agreement”) with Matrix 360 Administration, LLC (“M3Sixty”). Under the Services Agreement, M3Sixty is responsible for a wide variety of functions, including but not limited to: (a) Fund accounting services; (b) financial statement preparation; (c) valuation of the Funds’ portfolio securities; (d) pricing the Funds’ shares; (e) assistance in preparing tax returns; (f) preparation and filing of required regulatory reports; (g) communications with shareholders; (h) coordination of Board and shareholder meetings; (i) monitoring the Funds’ legal compliance; (j) maintaining shareholder account records.
For the period since inception from January 30, 2014 through December 31, 2014, the Funds incurred fees pursuant to the Services Agreement as follows:
| Fund | | Service Fees | |
| Micro Cap Value Fund: | | $ | 28,967 | |
| Small Cap Value Fund | | | 28,999 | |
Certain officers and a Trustee of the Funds are also employees of M3Sixty.
The Funds have entered into a Distribution Agreement with Matrix Capital Group, Inc. (the “Distributor”). Pursuant to the Distribution Agreement, the Distributor will provide distribution services to the Funds. The Distributor serves as underwriter/distributor of the Funds. Fees incurred pursuant to the Distribution Agreement are paid by the Funds' Adviser, not the Funds, therefore, there were no payments made to the Distributor by the Funds during the period since inception from January 30, 2014 through December 31, 2014.
The Distributor is not affiliated with the Adviser. The Distributor is an affiliate of M3Sixty.
For U.S. Federal income tax purposes, the cost of securities owned, gross appreciation, gross depreciation, and net unrealized appreciation/(depreciation) of investments at December 31, 2014 were as follows:
Fund | | Tax Cost | | | Gross Unrealized Appreciation | | | Gross Unrealized Depreciation | | | Net Unrealized Appreciation | |
| Micro Cap Value Fund: | | $ | 1,456,054 | | | $ | 129,211 | | | $ | (68,204 | ) | | $ | 61,007 | |
| Small Cap Value Fund | | | 1,085,221 | | | | 109,245 | | | | (40,363 | ) | | | 68,882 | |
The difference between book basis unrealized appreciation and tax-basis unrealized appreciation for the Funds is attributable primarily to the tax deferral of losses on wash sales.
| Foundry Partners, LLC Funds | ANNUAL REPORT |
NOTES TO THE FINANCIAL STATEMENTSDecember 31, 2014
| 6. | TAX MATTERS (continued) |
The Funds’ tax basis distributable earnings are determined only at the end of each fiscal year. The tax character of distributable earnings (deficit) at December 31, 2014, the Funds’ most recent fiscal year end, was as follows:
Fund | | Unrealized Appreciation (Depreciation) | | | Undistributed Ordinary Income | | | Undistributed Capital Gains | | | Post-October Losses | | | Total Distributable Earnings | |
| Micro Cap Value Fund: | | $ | 61,007 | | | $ | 40,686 | | | $ | 358 | | | $ | - | | | $ | 102,051 | |
| Small Cap Value Fund | | | 68,882 | | | | 285 | | | | 75 | | | | (19,921 | ) | | | 49,321 | |
The undistributed ordinary income and capital gains shown above differ from corresponding accumulated net investment income and accumulated net realized gain (loss) figures reported in the statements of assets and liabilities due to differing book/tax treatment of short-term capital gains, and certain temporary book/tax differences due to the tax deferral of losses on wash sales.
Under current tax law, net capital losses realized after October 31st may be deferred and treated as occurring on the first day of the following fiscal year. The Funds’ post-October losses are determined only at the end of each fiscal year. As of December 31, 2014, the Funds elected to defer net ordinary losses as indicated in the chart below.
| | | Post-October Losses | | | Post-December Losses | |
| Fund | | Deferred | | | Utilized | | | Deferred | | | Utilized | |
| Micro Cap Value Fund: | | $ | - | | | $ | - | | | $ | - | | | $ | - | |
| Small Cap Value Fund | | | 19,921 | | | | - | | | | - | | | | - | |
Under the Regulated Investment Company Modernization Act of 2010 (the Act), net capital losses recognized after December 31, 2010, may be carried forward indefinitely, and their character is retained as short-term and/or long-term. As of December 31, 2014, the Funds had no capital loss carryforwards for federal income tax purposes.
The tax character of distributions paid during the period since inception from January 30, 2014 through December 31, 2014 by the Funds were as follows.
| Fund | | Long-term Capital Gain | | | Ordinary Income | |
| Micro Cap Value Fund: | | $ | 20 | | | $ | 29,499 | |
| Small Cap Value Fund | | | 11 | | | | 22,746 | |
The beneficial ownership, either directly or indirectly, of more than 25% of the voting securities of a fund creates a presumption of control of the fund, under Section 2(a)(9) of the Investment Company Act of 1940. As of December 31, 2014, Reliance Trust Co. held 47% and 74% of the Micro Cap Value Fund’s Institutional Class Shares and Small Cap Value Fund’s Institutional Class Shares outstanding, respectively.
| 8. | COMMITMENTS AND CONTINGENCIES |
In the normal course of business, the Trust may enter into contracts that may contain a variety of representations and warranties and provide general indemnifications. The Funds' maximum exposure under these arrangements is dependent on future claims that may be made against the Funds and, therefore, cannot be estimated; however, management considers the risk of loss from such claims to be remote.
In accordance with GAAP, Management has evaluated the impact of all subsequent events of the Funds through the date the financial statements were issued, and has determined that there were no other subsequent events requiring recognition or disclosure in the financial statements.
| Foundry Partners, LLC Funds | ANNUAL REPORT |
NOTES TO THE FINANCIAL STATEMENTS
December 31, 2014
| 10. | RECENT ACCOUNTING PRONOUNCEMENTS |
In June 2014, the Financial Accounting Standards Board (“FASB”) issued Accounting Standards Update (“ASU”) No. 2014-11 Repurchase-to-Maturity Transactions, Repurchase Financings, and Disclosures. The amendments in this ASU require an entity to modify accounting for repurchase-to maturity transactions and repurchase financing arrangements, as well as modify required disclosures for repurchase agreements, securities lending transactions, and repurchase-to-maturity transactions that are accounted for as secured borrowings. The guidance is effective for fiscal years beginning on or after December 15, 2014, and for interim periods within those fiscal years. Management is currently evaluating the impact, if any, these changes will have on the Funds’ financial statement disclosures.
REPORT OF INDEPENDENT REGISTERED PUBLIC ACCOUNTING FIRM
To the Shareholders of Foundry Partners, LLC Funds and
Board of Trustees of 360 Funds
We have audited the accompanying statements of assets and liabilities, including the schedules of investments, of Foundry Partners, LLC Funds comprising Foundry Micro Cap Value Fund and Foundry Small Cap Value Fund (the “Funds”), each a series of the 360 Funds, as of December 31, 2014, and the related statements of operations and changes in net assets, and the financial highlights for the period January 30, 2014 (commencement of operations) through December 31, 2014. These financial statements and financial highlights are the responsibility of the Funds’ management. Our responsibility is to express an opinion on these financial statements and financial highlights based on our audit.
We conducted our audit in accordance with the standards of the Public Company Accounting Oversight Board (United States). Those standards require that we plan and perform the audit to obtain reasonable assurance about whether the financial statements and financial highlights are free of material misstatement. An audit includes examining, on a test basis, evidence supporting the amounts and disclosures in the financial statements. Our procedures included confirmation of securities owned as of December 31, 2014, by correspondence with the custodian and brokers or by other appropriate auditing procedures where replies from brokers were not received. An audit also includes assessing the accounting principles used and significant estimates made by management, as well as evaluating the overall financial statement presentation. We believe that our audit provides a reasonable basis for our opinion.
In our opinion, the financial statements and financial highlights referred to above present fairly, in all material respects, the financial position of each of the Funds constituting Foundry Partners, LLC Funds as of December 31, 2014, the results of their operations, the changes in their net assets, and the financial highlights for the period January 30, 2014 (commencement of operations) through December 31, 2014, in conformity with accounting principles generally accepted in the United States of America.
COHEN FUND AUDIT SERVICES, LTD.
Cleveland, Ohio
February 25, 2015
| Foundry Partners, LLC Funds | ANNUAL REPORT |
ADDITIONAL INFORMATION (Unaudited)
December 31, 2014
The Funds file their complete schedule of portfolio holdings with the Securities and Exchange Commission (the “Commission”) for the first and third quarters of each fiscal year on Form N-Q. The Funds’ Forms N-Q are available on the Commission’s website at http://www.sec.gov. The Funds’ Forms N-Q may be reviewed and copied at the Commission’s Public Reference Room in Washington, DC. Information on the operation of the Commission’s Public Reference Room may be obtained by calling 1-800-SEC-0330.
A description of the policies and procedures that the Funds use to determine how to vote proxies relating to portfolio securities is available without charge, upon request, by calling 1-877-244-6235; and on the Commission’s website at http://www.sec.gov.
Information regarding how the Funds voted proxies relating to portfolio securities during the most recent 12-month period ended June 30th is available without charge, upon request, by calling 1-877-244-6235; and on the Commission’s website at http://www.sec.gov.
For the fiscal year ended December 31, 2014, certain distributions paid by the Funds may be subject to a maximum tax rate of 20%. The Foundry Micro Cap Value Fund and the Foundry Small Cap Value Fund intend to designate up to a maximum amount of $29,519, and $22,757, respectively, as taxed at a maximum rate of 20%. Complete information will be computed and reported in conjunction with your 2014 Form 1099-DIV.
Shareholders should refer to their Form 1099-DIV or other tax information which will be mailed in 2015 to determine the calendar year amounts to be included on their 2014 tax returns. Shareholders should consult their own tax advisors.
| Foundry Partners, LLC Funds | ANNUAL REPORT |
ADDITIONAL INFORMATION
December 31, 2014
TRUSTEES AND OFFICERS INFORMATION (Unaudited)
Trustees and Officers. Following are the Trustees and Officers of the Trust, their age and address, their present position with the Trust or the Funds, and their principal occupation during the past five years. As described above under “Description of the Trust”, each of the Trustees of the Trust will generally hold office indefinitely. The Officers of the Trust will hold office indefinitely, except that: (1) any Officer may resign or retire and (2) any Officer may be removed any time by written instrument signed by at least two-thirds of the number of Trustees prior to such removal. In case a vacancy or an anticipated vacancy on the Board of Trustees shall for any reason exist, the vacancy shall be filled by the affirmative vote of a majority of the remaining Trustees, subject to certain restrictions under the 1940 Act. Those Trustees who are “interested persons” (as defined in the 1940 Act) by virtue of their affiliation with either the Trust or the Adviser, are indicated in the table.
| Name, Address and Age | Position(s) Held with Trust | Length of Service | Principal Occupation(s) During Past 5 Years | Number of Series Overseen | Other Directorships During Past 5 Years |
| Independent Trustees |
Art Falk 4520 Main Street Suite 1425 Kansas City, Missouri 64111 Year of Birth: 1937 | Trustee and Independent Chairman | Since June 2011 | Mr. Falk has retired from Murray Hill Financial Marketing, a financial marketing consulting firm. He was President of the Company from 1990 to 2012. | Thirteen | None |
Thomas Krausz 4520 Main Street Suite 1425 Kansas City, Missouri 64111 Year of Birth: 1944 | Trustee | Since June 2011 | Mr. Krausz has been an independent management consultant to private enterprises since 2007. | Thirteen | None |
| Tom M. Wirtshafter 4520 Main Street Suite 1425 Kansas City, Missouri 64111 Year of Birth: 1954 | Trustee | Since June 2011 | Mr. Wirtshafter has been the Senior Vice President of each of American Portfolios Financial Services, a broker-dealer, and American Portfolios Advisors, an investment adviser, since 2009. | Thirteen | None |
Gary DiCenzo 4520 Main Street Suite 1425 Kansas City, Missouri 64111 Year of Birth: 1962 | Trustee | Since September, 2014 | Gary DiCenzo is President and CEO of IMC Group, LLC. IMC Group provides strategic planning and consulting for asset managers firms. Prior to IMC Group, he was a board director for Scout Investment Advisors, CEO of Scout Distributors & president of Scout Family of Funds (2003-2010). | Thirteen | None |
| Interested Trustee* | | | | | |
Randall K. Linscott 4520 Main Street Suite 1425 Kansas City, Missouri 64111 Year of Birth: 1971 | President | Since July, 2013 | Mr. Linscott has been the Chief Operating Officer for M3Sixty Administration LLC since 2011. Prior to 2011, Mr. Linscott served as a Division Vice President at Boston Financial Data Services from 2005 until 2011. | Thirteen | None |
| Foundry Partners, LLC Funds | ANNUAL REPORT |
ADDITIONAL INFORMATION
December 31, 2014
TRUSTEES AND OFFICERS INFORMATION (Unaudited) (continued)
| Name, Address and Age | Position(s) Held with Trust | Length of Service | Principal Occupation(s) During Past 5 Years | Number of Series Overseen | Other Directorships During Past 5 Years |
| Officers |
Robert S. Driessen 4520 Main Street Suite 1425 Kansas City, Missouri 64111 Year of Birth: 1947 | Chief Compliance Officer and Secretary | Since July, 2013 | Prior to 2013, Mr. Driessen served as the Senior Vice President and Chief Compliance Officer for Aquila Distributors, Inc., and Vice President and Chief Compliance Officer of its advisory affiliate, Aquila Investment Management LLC from November 2009 until December 2012. | N/A | N/A |
Brandon Byrd 4520 Main Street Suite 1425 Kansas City, Missouri 64111 Year of Birth: 1981 | Assistant Secretary | Since July, 2013 | Mr. Byrd has been the Director of Operations at M3Sixty Administration LLC since 2012. Prior to 2012, Mr. Byrd served as a Division Manager – Client Service Officer for Boston Financial Data Services from 2010 until 2012, and as a Group Manager for Boston Financial Data Services from 2007 until 2010. | N/A | N/A |
Larry Beaver 4520 Main Street Suite 1425 Kansas City, Missouri 64111 Year of Birth: 1969 | Treasurer | Since March, 2007 | Mr. Beaver has been the Director of Fund Accounting & Administration for M3Sixty Administration LLC since February 2005. | N/A | N/A |
Jeremiah Hierseman 4520 Main Street Suite 1425 Kansas City, Missouri 64111 Year of Birth: 1975 | Assistant Treasurer | Since September, 2014 | Mr. Hierseman has been a member of the Fund Accounting Team at Matrix 360 Administration, LLC since September 2014. Mr. Hierseman was a Fund Manager at State Street Bank – Insurance Services Division from 2003 to 2014. | N/A | N/A |
Remuneration Paid to Trustees and Officers - Officers of the Trust and Trustees who are “interested persons” of the Trust or the Adviser will receive no salary or fees from the Trust. Officers of the Trust and interested Trustees do receive compensation directly from certain service providers to the Trust. Each Trustee who is not an “interested person” receives a fee of $1,000 each year plus $125 per Board or committee meeting attended in person and $100 per meeting attended by telephone. The Trust reimburses each Trustee and officer for his or her travel and other expenses relating to attendance at such meetings.
| Foundry Partners, LLC Funds | ANNUAL REPORT |
ADDITIONAL INFORMATION
December 31, 2014
TRUSTEES AND OFFICERS INFORMATION (Unaudited) (continued)
Remuneration Paid to Trustees and Officers (continued)
Name of Trustee1 | Aggregate Compensation From Each Foundry Fund2 | Pension or Retirement Benefits Accrued As Part of Portfolio Expenses | Estimated Annual Benefits Upon Retirement | Total Compensation From the Foundry Funds Paid to Trustees2 |
| Independent Trustees |
| Art Falk | $1,625 | None | None | $3,250 |
| Thomas Krausz | $1,625 | None | None | $3,250 |
| Tom M. Wirtshafter | $1,625 | None | None | $3,250 |
| Gary DiCenzo | $ 750 | None | None | $1,500 |
| Interested Trustees |
| Randall K. Linscott | None | None | None | None |
1 | Each of the Trustees serves as a Trustee to each Series of the Trust. The Trust currently offers thirteen (13) series of shares. |
2 | Figures are for the period since inception from January 30, 2014 through December 31, 2014. |
| Foundry Partners, LLC Funds | ANNUAL REPORT |
Information About Your Fund’s Expenses - (Unaudited)
As a shareholder of the Fund, you incur two types of costs: (1) transaction costs, such as the sales charge (load) imposed on certain subscriptions and the contingent deferred sales charge (“CDSC”) imposed on certain short-term redemptions; and (2) ongoing costs, including management fees, distribution and/or service (12b-1) fees; and other Fund expenses. The example below is intended to help you understand your ongoing costs (in dollars) of investing in the Fund and to compare these costs with the ongoing costs of investing in other mutual funds.
The example is based on an investment of $1,000 invested at the beginning of the period and held for the entire period as indicated below.
Actual Expenses – The first section of the table provides information about actual account values and actual expenses (relating to the example $1,000 investment made at the beginning of the period). You may use the information in this section, together with the amount you invested, to estimate the expenses that you paid over the period. Simply divide your account value by $1,000 (for example, an $8,600 account value divided by $1,000 = 8.6), then multiply the result by the number in the first section under the heading entitled “Expenses Paid During Period” to estimate the expenses you paid on your account during this period.
Hypothetical Example for Comparison Purposes – The second section of the table provides information about the hypothetical account values and hypothetical expenses based on the Fund’s actual expense ratio and an assumed rate of return of 5% per year before expenses, which is not the Fund’s actual return. The hypothetical account values and expenses may not be used to estimate the actual ending account balance or expenses you paid for the period. You may use this information to compare the ongoing costs of investing in the Fund to other funds. To do so, compare this 5% hypothetical example with the 5% hypothetical examples that appear in the shareholder reports of the other funds.
Please note that the expenses shown in the table are meant to highlight your ongoing costs only and do not reflect any transactional costs, such as sales charges (loads), CDSC fees, or exchange fees. Therefore, the second section of the table is useful in comparing ongoing costs only, and will not help you determine the relative total costs of owning different funds. In addition, if these transactional costs were included, your costs would have been higher. For more information on transactional costs, please refer to the Fund’s prospectus.
Expenses and Value of a $1,000 Investment for the period since inception from 06/30/14 through 12/31/14
Micro Cap Value Fund: | Beginning Account
Value (06/30/2014) | Annualized Expense
Ratio for the Period | Ending Account
Value (12/31/2014) | Expenses Paid
During Period |
| Actual Fund Return (in parentheses) | | | |
| Institutional Class Shares (+5.39%) | $1,000.00 | 1.75% | $1,053.90 | $9.06(a) |
| Hypothetical 5% Fund Return | | | |
| Institutional Class Shares | $1,000.00 | 1.75% | $1,016.40 | $8.89(a) |
Small Cap Value Fund: | | | | |
| Actual Fund Return (in parentheses) | | | |
| Institutional Class Shares (-0.28%) | $1,000.00 | 1.50% | $ 997.20 | $7.55(a) |
| Hypothetical 5% Fund Return | | | |
| Institutional Class Shares | $1,000.00 | 1.50% | $1,017.60 | $7.63(a) |
| (a) | Expenses are equal to the Funds’ annualized expense ratios, multiplied by the average account value over the period, multiplied by 184/365 to reflect the one-half year period. |
For more information on Fund expenses, please refer to the Fund’s prospectus, which can be obtained from your investment representative or by calling 1-877-244-6235. Please read it carefully before you invest or send money.
| Foundry Partners, LLC Funds | ANNUAL REPORT |
Information About Your Fund’s Expenses - (Unaudited)(continued)
Total Fund operating expense ratios as stated in the current Fund prospectus dated January 29, 2014 for the Funds were as follows: |
| Foundry Micro Cap Value Fund Institutional Class Shares | 1.62% |
| Foundry Small Cap Value Fund Institutional Class Shares | 1.42% |
Foundry Partners, LLC (the “Adviser”) has entered into an Expense Limitation Agreement with the Funds under which it has agreed to waive or reduce its fees and to assume other expenses of the Fund, if necessary, in an amount that limits the Fund’s annual operating expenses (exclusive of interest, taxes, brokerage fees and commissions, acquired funds fees and expenses, extraordinary expenses, dividend and interest expenses related to short investments) to not more than 1.75% and 1.50%, of the Foundry Micro Cap Value Fund and the Foundry Small Cap Value Fund, respectively, through at least December 31, 2014. Subject to approval by the Fund’s Board, any waiver under the Expense Limitation Agreement is subject to repayment by the Fund within the three fiscal years following the year in which such waiver occurred, if the Fund is able to make the payment without exceeding the expense limitation. The current contractual agreement cannot be terminated prior to at least one year after the effective date without the Board of Trustees’ approval. Total Gross Operating Expenses (Annualized) during the period from January 30, 2014, the day of initial expense accruals, through December 31, 2014 were 12.51% and 11.34% for the Foundry Micro Cap Value Fund Institutional Class shares and the Foundry Small Cap Value Institutional Class shares, respectively. Please see the Information About Your Fund’s Expenses, the Financial Highlights and Notes to Financial Statements (Note 5) sections of this report for expense related disclosures during the period since inception from January 30, 2014 through December 31, 2014. |
360 FUNDS
4520 Main Street
Suite 1425
Kansas City, MO 64111
INVESTMENT ADVISER
Foundry Partners, LLC
510 First Avenue North,
Suite 409
Minneapolis, MN 55403
ADMINISTRATOR & TRANSFER AGENT
Matrix 360 Administration, LLC
4520 Main Street
Suite 1425
Kansas City, MO 64111
DISTRIBUTOR
Matrix Capital Group, Inc.
242 East 72nd Street
New York, NY 10021
INDEPENDENT REGISTERED PUBLIC ACCOUNTING FIRM
Cohen Fund Audit Services, Ltd.
1350 Euclid Ave., Suite 800
Cleveland, OH 44115
LEGAL COUNSEL
Graydon Head & Ritchey LLP
1900 Fifth Third Center
511 Walnut Street
Cincinnati, OH 45202
CUSTODIAN BANK
U.S. Bank, N.A
425 Walnut Street
Cincinnati, OH 45202
| (a) | The registrant has, as of the end of the period covered by this report, adopted a code of ethics that applies to the registrant's principal executive officer, principal financial officer, and principal accounting officer or controller, or persons performing similar functions, regardless of whether these individuals are employed by the registrant or a third party. |
| (b) | During the period covered by this report, there were no amendments to any provision of the code of ethics. |
| (c) | During the period covered by this report, there were no waivers or implicit waivers of a provision of the code of ethics. |
| (d) | The registrant’s Code of Ethics is filed herewith. |
| ITEM 3. | AUDIT COMMITTEE FINANCIAL EXPERT. |
The registrant’s Board of Trustees has determined that it does not have an audit committee financial expert serving on its audit committee. At this time, the registrant believes that the experience provided by each member of the audit committee together offer the registrant adequate oversight for the registrant’s level of financial complexity.
| ITEM 4. | PRINCIPAL ACCOUNTANT FEES AND SERVICES. |
| (a) | Audit Fees. The aggregate fees billed for professional services rendered by the principal accountant for the audit of the registrant’s annual financial statements or for services that are normally provided by the accountant in connection with statutory and regulatory filings or engagements were $26,000 with respect to the registrant’s fiscal year ended December 31, 2014, the first fiscal year of operations for the Foundry Partners, LLC Funds. |
| (b) | Audit-Related Fees. There were no fees billed during the fiscal year for assurances and related services by the principal accountant that are reasonably related to the performance of the audit of the registrant’s financial statements and are not reported under paragraph (a) of this item. |
| (c) | Tax Fees. The aggregate fees billed in the last fiscal year for professional services rendered by the principal accountant for tax compliance, tax advice and tax planning were $5,000 with respect to the registrant’s fiscal year ended December 31, 2014, the first fiscal year of operations for the Foundry Partners, LLC Funds. The services comprising these fees are the preparation of the registrant’s federal income and excise tax returns. |
| (d) | All Other Fees. The aggregate fees billed in last fiscal year for products and services provided by the registrant’s principal accountant, other than the services reported in paragraphs (a) through (c) of this item were $1,425 for the fiscal year ended December 31, 2014, the first fiscal year of operations for the Foundry Partners, LLC Funds, and were for the auditor's consent on the registration statement and the review of the semi-annual financial report. |
| (e)(1) | The audit committee does not have pre-approval policies and procedures. Instead, the audit committee or audit committee chairman approves on a case-by-case basis each audit or non-audit service before the principal accountant is engaged by the registrant. |
| (e)(2) | There were no services described in each of paragraphs (b) through (d) of this Item that were approved by the audit committee pursuant to paragraph (c)(7)(i)(C) of Rule 2-01 of Regulation S-X |
| (f) | Not applicable. The percentage of hours expended on the principal accountant's engagement to audit the registrant's financial statements for the most recent fiscal year that were attributed to work performed by persons other than the principal accountant's full-time, permanent employees was zero percent (0%). |
| (g) | All non-audit fees billed by the registrant's principal accountant for services rendered to the registrant for the fiscal year ended December 31, 2014, the first fiscal year of operations for the Foundry Partners, LLC Funds, are disclosed in (b)-(d) above. There were no audit or non-audit services performed by the registrant's principal accountant for the registrant's adviser. |
| (h) | There were no non-audit services rendered to the registrant’s investment adviser. |
| ITEM 5. | AUDIT COMMITTEE OF LISTED REGISTRANTS. |
Not applicable
| ITEM 6. | SCHEDULES OF INVESTMENTS |
Included in annual report to shareholders filed under item 1 of this form.
| ITEM 7. | DISCLOSURE OF PROXY VOTING POLICIES AND PROCEDURES FOR CLOSED-END MANAGEMENT INVESTMENT COMPANIES. |
Not applicable Fund is an open-end management investment company
| ITEM 8. | PORTFOLIO MANAGERS OF CLOSED-END MANAGEMENT INVESTMENT COMPANIES |
Not applicable Fund is an open-end management investment company
| ITEM 9. | PURCHASES OF EQUITY SECURITIES BY CLOSED-END MANAGEMENT INVESTMENT COMPANY AND AFFILIATED PURCHASERS. |
Not applicable Fund is an open-end management investment company
| ITEM 10. | SUBMISSION OF MATTERS TO A VOTE OF SECURITY HOLDERS. |
Not applicable at this time.
| ITEM 11. | CONTROLS AND PROCEDURES. |
| (a) | The registrant's principal executive and principal financial officers, or persons performing similar functions, have concluded that the registrant's disclosure controls and procedures (as defined in Rule 30a-3(c) under the 1940 Act, are effective, as of a date within 90 days of the filing date of this report, based on the evaluation of these controls and procedures required by Rule 30a-3(b) under the 1940 Act and Rule 15d-15(b) under the Securities Exchange Act of 1934, as amended. |
| (b) | There were no changes in the registrant's internal control over financial reporting (as defined in Rule 30a-3(d) under the 1940 Act) that occurred during the period covered by this report that have materially affected, or are reasonably likely to materially affect, the registrant's internal control over financial reporting. |
| (1) | Code of Ethics for Principal Executive and Senior Financial Officers is attached hereto. |
| (2) | Certifications pursuant to Section 302 of the Sarbanes-Oxley Act of 2002 are filed herewith. |
| (3) | Certifications pursuant to Section 906 of the Sarbanes-Oxley Act of 2002 are filed herewith. |
SIGNATURES
Pursuant to the requirements of the Securities Exchange Act of 1934 and the Investment Company Act of 1940, the registrant has duly caused this report to be signed on its behalf by the undersigned, thereunto duly authorized.
360 Funds
| By: Randy Linscott | /s/ Randy Linscott | |
| President, | |
| Date: March 3, 2015 | | |
Pursuant to the requirements of the Securities Exchange Act of 1934 and the Investment Company Act of 1940, this report has been signed below by the following person on behalf of the registrant and in the capacities and on the date indicated.
| By Randy Linscott | /s/ Randy Linscott | |
| President | |
| Date: March 3, 2015 | | |
Pursuant to the requirements of the Securities Exchange Act of 1934 and the Investment Company Act of 1940, this report has been signed below by the following person on behalf of the registrant and in the capacities and on the date indicated.
| By Larry E. Beaver, Jr. | /s/ Larry E. Beaver, Jr. | |
| Treasurer | |
| Date: March 3, 2015 | | |