| |
| UNITED STATES |
| SECURITIES AND EXCHANGE COMMISSION |
| Washington, D. C. 20549 |
| |
| FORM N-CSR |
| |
| CERTIFIED SHAREHOLDER REPORT OF REGISTERED |
| MANAGEMENT INVESTMENT COMPANIES |
| |
| Investment Company Act file number 811-21777 |
| |
| John Hancock Funds III |
| (Exact name of registrant as specified in charter) |
| |
| 601 Congress Street, Boston, Massachusetts 02210 |
| (Address of principal executive offices) (Zip code) |
| |
| Gordon M. Shone |
| Treasurer |
| |
| 601 Congress Street |
| Boston, Massachusetts 02210 |
| |
| (Name and address of agent for service) |
| |
| Registrant's telephone number, including area code: 617-663-3000 |
| | |
| Date of fiscal year end: | February 29 |
| |
| |
| Date of reporting period: | February 29, 2008 |
ITEM 1. REPORT TO SHAREHOLDERS.

Discussion of Fund performance
By Grantham, Mayo, Van Otterloo & Co. LLC (GMO)
U.S. stocks went on a wild ride during the 12-month period, highlighted both by record highs for broad market indexes and conditions deemed poor enough to warrant numerous interventions by the Federal Reserve. For the period in full the S&P 500 Index returned –3.60%, a modest move that belied its frequent violent gyrations. Growth stocks outpaced value stocks during the period. Financials and consumer discretionary were the worst-performing sectors in the Russell 1000 Value Index, while energy stocks performed the best.
"U.S. stocks went on a wild ride
during the 12-month review
period…"
For the year ended February, 29, 2008, John Hancock Intrinsic Value Fund’s Class A, Class B, Class C, Class I, Class R1 and Class 1 shares returned –12.52%, –13.13%, –13.13%, –12.18%, –12.60% and –12.13%, respectively, at net asset value while the Russell 1000 Value Index returned –7.91% and the average large value fund monitored by Morningstar, Inc. returned –6.64% .
Sector selection added to relative returns while stock selection detracted. Sector weightings adding to relative returns included an underweight in financials, while sector weightings detracting from relative returns included an overweight in consumer discretionary. Stock selections in information technology added to relative returns, while picks in consumer discretionary and financials detracted. Individual names adding to returns versus the benchmark included overweight positions in Exxon Mobil Corp., Wal-Mart Stores, Inc. and Merck & Company, Inc., while overweight positions detracting from relative returns included Citigroup, Inc., Fannie Mae and Home Depot, Inc.
This commentary reflects the views of the portfolio management team through the end of the Fund’s period discussed in this report. The team’s statements reflect their own opinions. As such, they are in no way guarantees of future events and are not intended to be used as investment advice or a recommendation regarding any specific security. They are also subject to change at any time as market and other conditions warrant.
Intrinsic Value Fund | Annual report
6
A look at performance
For the periods ended February 29, 2008
| | | | | | | | | | | |
| | | | Average annual returns | | | | Cumulative total returns | | |
| | | | with maximum sales charge (POP) | | | with maximum sales charge (POP) | | |
| | |
| |
|
| | Inception | | | | | Since | | | | | Since |
| Class | date | | 1-year | 5-year | 10-year | inception | | 1-year | 5-year | 10-year | inception |
|
| A | 6-12-06 | | –16.88% | — | — | –2.50% | | –16.88% | — | — | –4.26% |
|
| B | 6-12-06 | | –17.14 | — | — | –2.38 | | –17.14 | — | — | –4.07 |
|
| C | 6-12-06 | | –13.93 | — | — | –0.25 | | –13.93 | — | — | –0.44 |
|
| I 1 | 6-12-06 | | –12.18 | — | — | 0.83 | | –12.18 | — | — | 1.44 |
|
| R11 | 6-12-06 | | –12.60 | — | — | 0.24 | | –12.60 | — | — | 0.41 |
|
| 1 1 | 6-12-06 | | –12.13 | — | — | 0.88 | | –12.13 | — | — | 1.52 |
|
Performance figures assume all distributions are reinvested. Public offering price (POP) figures reflect maximum sales charge on Class A shares of 5%, and the applicable contingent deferred sales charge (CDSC) on Class B and Class C shares. The Class B shares’ CDSC declines annually between years 1 to 6 according to the following schedule: 5, 4, 3, 3, 2, 1%. No sales charge will be assessed after the sixth year. Class C shares held for less than one year are subject to a 1% CDSC. Sales charge is not applicable for Class I, Class R1 and Class 1 shares.
The expense ratios of the Fund, both net (including any fee waivers or expense limitations) and gross (excluding any fee waivers or expense limitations), are set forth according to the most recent publicly available prospectuses for the Fund and may differ from the expense ratios disclosed in the Financial Highlights tables in this report. The waivers and expense limitations are contractual at least until 6-30-08. The net expenses are as follows: Class A — 1.34%, Class B — 2.04%, Class C — 2.04%, Class I — 0.95%, Class R1 — 1.69%, Class 1 — 0.90% . Had the fee waivers and expense limitations not been in place, the gross expenses would be as follows: Class A — 1.94%, Class B — 9.00%, Class C — 10.08%, Class I —17.60%, Class R1 — 20.85%, Class 1 — 1.44% .
The returns reflect past results and should not be considered indicative of future performance. The return and principal value of an investment will fluctuate so that shares, when redeemed, may be worth more or less than their original cost. Due to market volatility, the Fund’s current performance may be higher or lower than the performance shown. For performance data current to the most recent month end, please call 1-800-225-5291 or visit the Fund’s Web site at www.jhfunds.com.
The performance table above and the chart on the next page do not reflect the deduction of taxes that a shareholder would pay on fund distributions or the redemption of fund shares.
The Fund’s performance results reflect any applicable expense reductions, without which the expenses increase and results would have been less favorable.
Performance is calculated with an opening price (prior day’s close) on the inception date.
1 For certain types of investors as described in the Fund’s Class I, Class R1 and Class 1 share prospectuses.
Annual report | Intrinsic Value Fund
7
A look at performance
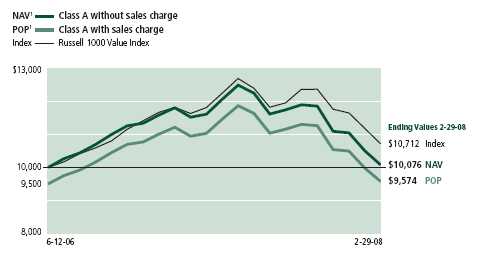
Growth of $10,000
This chart shows what happened to a hypothetical $10,000 investment in Intrinsic Value Fund Class A shares for the period indicated. For comparison, we’ve shown the same investment in the Russell 1000 Value Index.
| | | | |
| | | | With maximum | |
| Class | Period beginning | Without sales charge | sales charge | Index |
|
| B | 6-12-06 | $9,957 | $9,593 | $10,712 |
|
| C 2 | 6-12-06 | 9,956 | 9,956 | 10,712 |
|
| I 3 | 6-12-06 | 10,144 | 10,144 | 10,712 |
|
| R13 | 6-12-06 | 10,041 | 10,041 | 10,712 |
|
| 1 3 | 6-12-06 | 10,152 | 10,152 | 10,712 |
|
Assuming all distributions were reinvested for the period indicated, the table above shows the value of a $10,000 investment in the Fund’s Class B, Class C, Class I, Class R1 and Class 1 shares, respectively, as of February 29, 2008. Performance of the classes will vary based on the difference in sales charges paid by shareholders investing in the different classes and the fee structure of those classes.
Russell 1000 Value Index is an unmanaged index containing those securities in the Russell 1000 Index with a less-than-average growth orientation.
It is not possible to invest directly in an index. Index figures do not reflect sales charges, which would have resulted in lower values if they did.
1 NAV represents net asset value and POP represents public offering price.
2 No contingent deferred sales charge applicable.
3 For certain types of investors as described in the Fund’s Class I, Class R1 and Class 1 share prospectuses.
Intrinsic Value Fund | Annual report
8
Your expenses
These examples are intended to help you understand your ongoing operating expenses.
Understanding fund expenses
As a shareholder of the Fund, you incur two types of costs:
■ Transaction costs which include sales charges (loads) on purchases or redemptions (varies by share class), minimum account fee charge, etc.
■ Ongoing operating expenses including management fees, distribution and service fees (if applicable), and other fund expenses.
We are going to present only your ongoing operating expenses here.
Actual expenses/actual returns
This example is intended to provide information about your fund’s actual ongoing operating expenses, and is based on your fund’s actual return. It assumes an account value of $1,000.00 on September 1, 2007, with the same investment held until February 29, 2008.
| | | |
| | Account value | Ending value | Expenses paid during |
| | on 9-1-07 | on 2-29-08 | period on 2-29-081 |
|
| Class A | $1,000.00 | $858.12 | $6.24 |
|
| Class B | 1,000.00 | 854.75 | 9.45 |
|
| Class C | 1,000.00 | 854.74 | 9.50 |
|
| Class I | 1,000.00 | 859.68 | 4.39 |
|
| Class R1 | 1,000.00 | 858.80 | 5.45 |
|
| Class 1 | 1,000.00 | 859.77 | 4.16 |
|
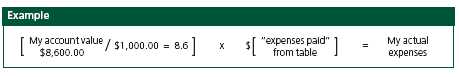
Together with the value of your account, you may use this information to estimate the operating expenses that you paid over the period. Simply divide your account value at February 29, 2008, by $1,000.00, then multiply it by the “expenses paid” for your share class from the table above. For example, for an account value of $8,600.00, the operating expenses should be calculated as follows:
Annual report | Intrinsic Value Fund
9
Your expenses
Hypothetical example for comparison purposes
This table allows you to compare your fund’s ongoing operating expenses with those of any other fund. It provides an example of the Fund’s hypothetical account values and hypothetical expenses based on each class’s actual expense ratio and an assumed 5% annualized return before expenses (which is not your fund’s actual return). It assumes an account value of $1,000.00 on September 1, 2007, with the same investment held until February 29, 2008. Look in any other fund shareholder report to find its hypothetical example and you will be able to compare these expenses.
| | | |
| | Account value on | Ending value on | Expenses paid during |
| | 9-1-07 | 2-29-08 | period on 2-29-081 |
|
| Class A | $1,000.00 | $1,018.15 | $6.77 |
|
| Class B | 1,000.00 | 1,014.67 | 10.27 |
|
| Class C | 1,000.00 | 1,014.62 | 10.32 |
|
| Class I | 1,000.00 | 1,020.14 | 4.77 |
|
| Class R1 | 1,000.00 | 1,019.00 | 5.92 |
|
| Class 1 | 1,000.00 | 1,020.39 | 4.52 |
|
Remember, these examples do not include any transaction costs, such as sales charges; therefore, these examples will not help you to determine the relative total costs of owning different funds. If transaction costs were included, your expenses would have been higher. See the prospectus for details regarding transaction costs.
1 Expenses are equal to the Fund’s annualized expense ratio of 1.35%, 2.05%, 2.06%, 0.95%, 1.18% and 0.90% for Class A, Class B, Class C, Class I, Class R1 and Class 1, respectively, multiplied by the average account value over the period, multiplied by the number of days in most recent fiscal half year/366 (to reflect the one-half year period).
Intrinsic Value Fund | Annual report
10
Portfolio summary
| | | | |
| Top 10 holdings1 | | | | |
|
| Exxon Mobil Corp. | 7.9% | | Citigroup, Inc. | 2.8% |
| |
|
| Chevron Corp. | 5.7% | | Home Depot, Inc. | 2.4% |
| |
|
| ConocoPhillips | 3.4% | | UnitedHealth Group, Inc. | 2.2% |
| |
|
| Wal-Mart Stores, Inc. | 3.4% | | The Coca-Cola Company | 2.0% |
| |
|
| Pfizer, Inc. | 2.9% | | Merck & Company, Inc. | 2.0% |
| |
|
| |
| Sector distribution1 | | | | |
|
| Consumer non-cyclical | 23% | | Technology | 6% |
| |
|
| Energy | 22% | | Communications | 6% |
| |
|
| Financial | 15% | | Basic materials | 2% |
| |
|
| Consumer cyclical | 14% | | Utilities | 2% |
| |
|
| Industrial | 7% | | Other | 3% |
| |
|
1 As a percentage of net assets on February 29, 2008.
Annual report | Intrinsic Value Fund
11
F I N A N C I A L S T A T E M E N T S
Fund’s investments
Securities owned by the Fund on 2-29-08
This schedule is divided into three main categories: common stocks, short-term investments and repurchase agreements. Common stocks are further broken down by industry group. Repurchase agreements, which represent the Fund’s cash position, are listed last.
| | |
| Issuer | Shares | Value |
| |
| Common stocks 96.51% | | $17,953,838 |
|
| (Cost $19,713,761) | | |
| | | |
| Aerospace 0.83% | | 154,226 |
|
| Alliant Techsystems, Inc. * | 100 | 10,494 |
|
| General Dynamics Corp. | 500 | 40,925 |
|
| Goodrich Corp. | 200 | 11,846 |
|
| Northrop Grumman Corp. | 200 | 15,722 |
|
| Rockwell Collins, Inc. | 200 | 11,780 |
|
| United Technologies Corp. | 900 | 63,459 |
| | | |
| Aluminum 0.36% | | 66,852 |
|
| Alcoa, Inc. | 1,800 | 66,852 |
| | | |
| Apparel & Textiles 0.71% | | 132,976 |
|
| Coach, Inc. * | 1,100 | 33,352 |
|
| Jones Apparel Group, Inc. | 800 | 11,288 |
|
| Liz Claiborne, Inc. | 1,100 | 19,558 |
|
| Mohawk Industries, Inc. * | 200 | 14,282 |
|
| NIKE, Inc. , Class B | 400 | 24,080 |
|
| VF Corp. | 400 | 30,416 |
| | | |
| Auto Parts 0.79% | | 147,016 |
|
| Autoliv, Inc. | 100 | 4,990 |
|
| AutoZone, Inc. * | 200 | 23,016 |
|
| BorgWarner, Inc. | 400 | 17,244 |
|
| Johnson Controls, Inc. | 2,500 | 82,150 |
|
| O’Reilly Automotive, Inc. * | 400 | 10,784 |
|
| TRW Automotive Holdings Corp. * | 400 | 8,832 |
| | | |
| Auto Services 0.24% | | 45,343 |
|
| AutoNation, Inc. * | 1,700 | 24,769 |
|
| Avis Budget Group, Inc. * | 1,800 | 20,574 |
| | | |
| Automobiles 0.97% | | 180,604 |
|
| Ford Motor Company * | 11,300 | 73,789 |
|
| General Motors Corp. | 1,700 | 39,576 |
|
| PACCAR, Inc. | 1,550 | 67,239 |
See notes to financial statements
Intrinsic Value Fund | Annual report
12
F I N A N C I A L S T A T E M E N T S
| | |
| Issuer | Shares | Value |
| | | |
| Banking 3.11% | | $578,854 |
|
| Bank of America Corp. | 8,100 | 321,894 |
|
| BB&T Corp. | 1,400 | 43,582 |
|
| Comerica, Inc. | 1,100 | 39,864 |
|
| Fifth Third Bancorp | 600 | 13,740 |
|
| First Horizon National Corp. | 800 | 12,992 |
|
| National City Corp. | 3,400 | 53,924 |
|
| U. S. Bancorp | 2,900 | 92,858 |
| | | |
| Biotechnology 0.58% | | 107,166 |
|
| Amgen, Inc. * | 700 | 31,864 |
|
| Biogen Idec, Inc. * | 800 | 46,688 |
|
| Charles River Laboratories International, Inc. * | 200 | 11,716 |
|
| Invitrogen Corp. * | 200 | 16,898 |
| | | |
| Broadcasting 0.18% | | 33,850 |
|
| Discovery Holding Company * | 1,000 | 22,570 |
|
| Liberty Global, Inc. , Class A * | 300 | 11,280 |
| | | |
| Building Materials & Construction 0.16% | | 29,982 |
|
| Lennox International, Inc. | 300 | 11,292 |
|
| Masco Corp. | 1,000 | 18,690 |
| | | |
| Business Services 0.67% | | 125,305 |
|
| Affiliated Computer Services, Inc. , Class A * | 500 | 25,375 |
|
| Cadence Design Systems, Inc. * | 700 | 7,434 |
|
| FactSet Research Systems, Inc. | 200 | 10,528 |
|
| Fiserv, Inc. * | 900 | 47,358 |
|
| NCR Corp. * | 700 | 15,512 |
|
| R. R. Donnelley & Sons Company | 600 | 19,098 |
| | | |
| Cellular Communications 0.05% | | 9,380 |
|
| Telephone & Data Systems, Inc. | 200 | 9,380 |
| | | |
| Chemicals 0.55% | | 102,268 |
|
| Air Products & Chemicals, Inc. | 200 | 18,266 |
|
| Celanese Corp. , Series A | 300 | 11,670 |
|
| Dow Chemical Company | 1,000 | 37,690 |
|
| FMC Corp. | 200 | 11,322 |
|
| Lubrizol Corp. | 400 | 23,320 |
| | | |
| Colleges & Universities 0.06% | | 11,880 |
|
| Career Education Corp. * | 800 | 11,880 |
| | | |
| Commercial Services 0.07% | | 12,876 |
|
| Shaw Group, Inc. * | 200 | 12,876 |
| | | |
| Computers & Business Equipment 3.89% | | 722,770 |
|
| Cisco Systems, Inc. * | 9,200 | 224,204 |
|
| Dell, Inc. * | 5,600 | 111,160 |
|
| EMC Corp. * | 5,700 | 88,578 |
|
| Foundry Networks, Inc. * | 600 | 7,122 |
|
| Hewlett-Packard Company | 1,000 | 47,770 |
See notes to financial statements
Annual report | Intrinsic Value Fund
13
F I N A N C I A L S T A T E M E N T S
| | |
| Issuer | Shares | Value |
| | | |
| Computers & Business Equipment (continued) | | |
|
| Ingram Micro, Inc. , Class A * | 1,000 | $15,270 |
|
| International Business Machines Corp. | 1,300 | 148,018 |
|
| Juniper Networks, Inc. * | 600 | 16,092 |
|
| Lexmark International, Inc. * | 500 | 16,515 |
|
| Tech Data Corp. * | 700 | 23,345 |
|
| Western Digital Corp. * | 800 | 24,696 |
| | | |
| Construction & Mining Equipment 0.07% | | 12,093 |
|
| Rowan Companies, Inc. | 300 | 12,093 |
| | | |
| Construction Materials 0.10% | | 18,020 |
|
| Trane, Inc. | 400 | 18,020 |
| | | |
| Cosmetics & Toiletries 0.94% | | 174,641 |
|
| Colgate-Palmolive Company | 300 | 22,827 |
|
| Kimberly-Clark Corp. | 400 | 26,072 |
|
| Procter & Gamble Company | 1,900 | 125,742 |
| | | |
| Crude Petroleum & Natural Gas 2.77% | | 515,272 |
|
| Apache Corp. | 1,000 | 114,710 |
|
| Cimarex Energy Company | 300 | 15,810 |
|
| Devon Energy Corp. | 500 | 51,360 |
|
| Forest Oil Corp. * | 200 | 9,866 |
|
| Hess Corp. | 400 | 37,272 |
|
| Occidental Petroleum Corp. | 3,200 | 247,584 |
|
| Patterson-UTI Energy, Inc. | 600 | 14,238 |
|
| Sunoco, Inc. | 400 | 24,432 |
| | | |
| Drugs & Health Care 0.26% | | 47,982 |
|
| Wyeth | 1,100 | 47,982 |
| | | |
| Educational Services 0.22% | | 41,118 |
|
| Apollo Group, Inc. , Class A * | 400 | 24,552 |
|
| ITT Educational Services, Inc. * | 300 | 16,566 |
| | | |
| Electrical Utilities 1.46% | | 271,731 |
|
| American Electric Power Company, Inc. | 800 | 32,736 |
|
| Constellation Energy Group, Inc. | 400 | 35,340 |
|
| Edison International | 800 | 39,520 |
|
| Entergy Corp. | 300 | 30,822 |
|
| FPL Group, Inc. | 500 | 30,145 |
|
| Mirant Corp. * | 300 | 11,100 |
|
| PPL Corp. | 200 | 9,076 |
|
| Public Service Enterprise Group, Inc. | 1,200 | 52,920 |
|
| Quanta Services, Inc. * | 400 | 9,552 |
|
| Reliant Energy, Inc. * | 900 | 20,520 |
| | | |
| Electronics 0.62% | | 115,612 |
|
| Arrow Electronics, Inc. * | 400 | 13,044 |
|
| Avnet, Inc. * | 600 | 20,226 |
|
| L-3 Communications Holdings, Inc. | 600 | 63,774 |
|
| Synopsys, Inc. * | 800 | 18,568 |
See notes to financial statements
Intrinsic Value Fund | Annual report
14
F I N A N C I A L S T A T E M E N T S
| | |
| Issuer | Shares | Value |
| | | |
| Energy 0.09% | | $16,508 |
|
| NRG Energy, Inc. * | 400 | 16,508 |
| | | |
| Financial Services 4.30% | | 799,169 |
|
| Citigroup, Inc. | 21,900 | 519,249 |
|
| Countrywide Financial Corp. (a) | 1,400 | 8,834 |
|
| Federal Home Loan Mortgage Corp. | 300 | 7,554 |
|
| Federal National Mortgage Association | 7,200 | 199,080 |
|
| Janus Capital Group, Inc. | 400 | 9,688 |
|
| Leucadia National Corp. | 300 | 13,578 |
|
| T. Rowe Price Group, Inc. (c) | 200 | 10,106 |
|
| Washington Mutual, Inc. | 2,100 | 31,080 |
| | | |
| Food & Beverages 3.55% | | 659,767 |
|
| Coca-Cola Enterprises, Inc. | 400 | 9,772 |
|
| Kraft Foods, Inc. , Class A | 1,222 | 38,090 |
|
| PepsiAmericas, Inc. | 500 | 12,650 |
|
| PepsiCo, Inc. | 2,700 | 187,812 |
|
| Pilgrim’s Pride Corp. (a) | 300 | 7,038 |
|
| The Coca-Cola Company | 6,400 | 374,144 |
|
| Tyson Foods, Inc. , Class A | 2,100 | 30,261 |
| | | |
| Forest Products 0.16% | | 30,600 |
|
| Weyerhaeuser Company | 500 | 30,600 |
| | | |
| Healthcare Products 3.27% | | 608,596 |
|
| Johnson & Johnson | 5,400 | 334,584 |
|
| Medtronic, Inc. | 1,100 | 54,296 |
|
| Patterson Companies, Inc. * | 600 | 21,120 |
|
| Stryker Corp. | 1,200 | 78,132 |
|
| Zimmer Holdings, Inc. * | 1,600 | 120,464 |
| | | |
| Healthcare Services 5.55% | | 1,032,455 |
|
| Cardinal Health, Inc. | 1,400 | 82,796 |
|
| Coventry Health Care, Inc. * | 900 | 46,683 |
|
| Express Scripts, Inc. * | 1,100 | 65,010 |
|
| McKesson Corp. | 3,000 | 176,280 |
|
| Medco Health Solutions, Inc. * | 2,000 | 88,620 |
|
| Quest Diagnostics, Inc. | 600 | 28,602 |
|
| UnitedHealth Group, Inc. | 9,000 | 418,320 |
|
| WellPoint, Inc. * | 1,800 | 126,144 |
| | | |
| Holdings Companies/Conglomerates 1.71% | | 318,144 |
|
| General Electric Company | 9,600 | 318,144 |
| | | |
| Homebuilders 0.45% | | 84,043 |
|
| Centex Corp. | 600 | 13,314 |
|
| D. R. Horton, Inc. | 1,500 | 21,045 |
|
| KB Home (a) | 300 | 7,179 |
|
| Lennar Corp. , Class A (a) | 700 | 13,027 |
|
| M. D. C. Holdings, Inc. | 400 | 16,752 |
|
| Toll Brothers, Inc. * | 600 | 12,726 |
See notes to financial statements
Annual report | Intrinsic Value Fund
15
F I N A N C I A L S T A T E M E N T S
| | |
| Issuer | Shares | Value |
| | | |
| Hotels & Restaurants 0.58% | | $108,220 |
|
| McDonald’s Corp. | 2,000 | 108,220 |
| | | |
| Household Products 0.10% | | 18,566 |
|
| Energizer Holdings, Inc. * | 200 | 18,566 |
| | | |
| Industrial Machinery 1.51% | | 280,648 |
|
| AGCO Corp. * | 200 | 12,972 |
|
| Cummins, Inc. | 400 | 20,152 |
|
| Deere & Company | 1,600 | 136,336 |
|
| Ingersoll-Rand Company, Ltd. , Class A | 600 | 25,116 |
|
| ITT Corp. | 300 | 16,872 |
|
| Kennametal, Inc. | 400 | 12,148 |
|
| Pall Corp. | 300 | 11,811 |
|
| Parker-Hannifin Corp. | 700 | 45,241 |
| | | |
| Insurance 7.87% | | 1,464,450 |
|
| ACE, Ltd. | 1,100 | 61,864 |
|
| Aetna, Inc. | 1,500 | 74,400 |
|
| AFLAC, Inc. | 1,300 | 81,133 |
|
| Allstate Corp. | 5,100 | 243,423 |
|
| Ambac Financial Group, Inc. (a) | 800 | 8,912 |
|
| American International Group, Inc. | 6,200 | 290,532 |
|
| Aon Corp. | 800 | 33,288 |
|
| Chubb Corp. | 1,200 | 61,080 |
|
| CIGNA Corp. | 800 | 35,664 |
|
| Commerce Group, Inc. | 400 | 14,496 |
|
| Everest Re Group, Ltd. | 100 | 9,688 |
|
| First American Corp. | 700 | 24,381 |
|
| Hartford Financial Services Group, Inc. | 500 | 34,950 |
|
| HCC Insurance Holdings, Inc. | 400 | 9,624 |
|
| MBIA, Inc. (a) | 800 | 10,376 |
|
| MGIC Investment Corp. (a) | 800 | 11,848 |
|
| Nationwide Financial Services, Inc. , Class A | 400 | 16,500 |
|
| Old Republic International Corp. | 1,600 | 21,952 |
|
| Progressive Corp. * | 2,600 | 47,658 |
|
| Protective Life Corp. | 400 | 15,436 |
|
| Prudential Financial, Inc. | 900 | 65,673 |
|
| SAFECO Corp. | 500 | 23,130 |
|
| The Travelers Companies, Inc. | 3,300 | 153,153 |
|
| Torchmark Corp. | 700 | 42,182 |
|
| Transatlantic Holdings, Inc. | 200 | 13,480 |
|
| UnumProvident Corp. | 2,100 | 48,111 |
|
| W. R. Berkley Corp. | 400 | 11,516 |
See notes to financial statements
Intrinsic Value Fund | Annual report
16
F I N A N C I A L S T A T E M E N T S
| | |
| Issuer | Shares | Value |
| | | |
| International Oil 17.68% | | $3,288,176 |
|
| Anadarko Petroleum Corp. | 1,100 | 70,114 |
|
| Chevron Corp. | 12,200 | 1,057,252 |
|
| ConocoPhillips | 7,700 | 636,867 |
|
| Exxon Mobil Corp. | 16,900 | 1,470,469 |
|
| Murphy Oil Corp. | 200 | 16,076 |
|
| Noble Corp. | 200 | 9,830 |
|
| Weatherford International, Ltd. * | 400 | 27,568 |
| | | |
| Internet Content 0.25% | | 47,118 |
|
| Google, Inc. , Class A * | 100 | 47,118 |
| | | |
| Internet Retail 0.44% | | 82,637 |
|
| eBay, Inc. * | 2,700 | 71,172 |
|
| Expedia, Inc. * | 500 | 11,465 |
| | | |
| Internet Software 0.22% | | 41,301 |
|
| McAfee, Inc. * | 300 | 9,981 |
|
| VeriSign, Inc. * | 900 | 31,320 |
| | | |
| Leisure Time 0.03% | | 4,887 |
|
| Brunswick Corp. | 300 | 4,887 |
| | | |
| Life Sciences 0.05% | | 9,928 |
|
| PerkinElmer, Inc. | 400 | 9,928 |
| | | |
| Liquor 0.13% | | 23,545 |
|
| Anheuser-Busch Companies, Inc. | 500 | 23,545 |
| | | |
| Manufacturing 1.87% | | 348,626 |
|
| 3M Company | 1,600 | 125,440 |
|
| Danaher Corp. | 700 | 51,905 |
|
| Eaton Corp. | 200 | 16,126 |
|
| Harley-Davidson, Inc. | 800 | 29,728 |
|
| Honeywell International, Inc. | 1,000 | 57,540 |
|
| Illinois Tool Works, Inc. | 200 | 9,814 |
|
| Pentair, Inc. | 300 | 9,786 |
|
| SPX Corp. | 100 | 10,230 |
|
| Tyco International, Ltd. | 950 | 38,057 |
| | | |
| Metal & Metal Products 0.09% | | 16,638 |
|
| Reliance Steel & Aluminum Company | 300 | 16,638 |
| | | |
| Office Furnishings & Supplies 0.04% | | 7,959 |
|
| Office Depot, Inc. * | 700 | 7,959 |
| | | |
| Paper 0.06% | | 11,491 |
|
| Smurfit-Stone Container Corp. * | 1,100 | 8,745 |
|
| Temple-Inland, Inc. | 200 | 2,746 |
| | | |
| Petroleum Services 1.10% | | 203,766 |
|
| Helmerich & Payne, Inc. | 300 | 13,449 |
|
| Tidewater, Inc. | 200 | 11,230 |
|
| Valero Energy Corp. | 3,100 | 179,087 |
See notes to financial statements
Annual report | Intrinsic Value Fund
17
F I N A N C I A L S T A T E M E N T S
| | |
| Issuer | Shares | Value |
| | | |
| Pharmaceuticals 6.73% | | $1,252,532 |
|
| Abbott Laboratories | 1,400 | 74,970 |
|
| AmerisourceBergen Corp. | 1,700 | 70,924 |
|
| Bristol-Myers Squibb Company | 900 | 20,349 |
|
| Eli Lilly & Company | 1,200 | 60,024 |
|
| Forest Laboratories, Inc. * | 1,300 | 51,701 |
|
| Gilead Sciences, Inc. * | 600 | 28,392 |
|
| King Pharmaceuticals, Inc. * | 1,400 | 14,840 |
|
| Merck & Company, Inc. | 8,400 | 372,120 |
|
| Pfizer, Inc. | 24,600 | 548,088 |
|
| Watson Pharmaceuticals, Inc. * | 400 | 11,124 |
| | | |
| Publishing 0.43% | | 79,687 |
|
| Gannett Company, Inc. | 2,100 | 63,315 |
|
| McGraw-Hill Companies, Inc. | 400 | 16,372 |
| | | |
| Railroads & Equipment 0.27% | | 49,904 |
|
| Union Pacific Corp. | 400 | 49,904 |
| | | |
| Real Estate 0.15% | | 27,810 |
|
| Annaly Capital Management, Inc. , REIT | 1,000 | 20,690 |
|
| Thornburg Mortgage, Inc. , REIT | 800 | 7,120 |
| | | |
| Retail Grocery 0.34% | | 62,825 |
|
| SUPERVALU, Inc. | 1,100 | 28,875 |
|
| The Kroger Company | 1,400 | 33,950 |
| | | |
| Retail Trade 9.84% | | 1,830,925 |
|
| Abercrombie & Fitch Company, Class A | 400 | 31,012 |
|
| Advance Auto Parts, Inc. | 300 | 10,062 |
|
| American Eagle Outfitters, Inc. | 600 | 12,822 |
|
| Bed Bath & Beyond, Inc. * | 1,100 | 31,174 |
|
| Best Buy Company, Inc. | 200 | 8,602 |
|
| BJ’s Wholesale Club, Inc. * | 600 | 18,936 |
|
| Costco Wholesale Corp. | 200 | 12,384 |
|
| CVS Caremark Corp. | 900 | 36,342 |
|
| Dollar Tree Stores, Inc. * | 1,300 | 34,879 |
|
| Family Dollar Stores, Inc. | 700 | 13,405 |
|
| Home Depot, Inc. | 16,800 | 446,040 |
|
| Kohl’s Corp. * | 1,100 | 48,884 |
|
| Lowe’s Companies, Inc. | 10,600 | 254,082 |
|
| Staples, Inc. | 2,100 | 46,725 |
|
| Target Corp. | 2,300 | 121,003 |
|
| Tiffany & Company | 400 | 15,056 |
|
| Walgreen Company | 1,500 | 54,765 |
|
| Wal-Mart Stores, Inc. | 12,800 | 634,752 |
| | | |
| Semiconductors 0.42% | | 78,718 |
|
| Cypress Semiconductor Corp. * | 400 | 8,696 |
|
| Intel Corp. | 1,600 | 31,920 |
See notes to financial statements
Intrinsic Value Fund | Annual report
18
F I N A N C I A L S T A T E M E N T S
| | |
| Issuer | Shares | Value |
| | | |
| Semiconductors (continued) | | |
|
| Intersil Corp. , Class A | 400 | $9,308 |
|
| KLA-Tencor Corp. | 400 | 16,804 |
|
| Teradyne, Inc. * | 1,000 | 11,990 |
| | | |
| Software 2.57% | | 478,487 |
|
| CA, Inc. | 800 | 18,304 |
|
| Compuware Corp. * | 1,700 | 13,532 |
|
| Intuit, Inc. * | 400 | 10,624 |
|
| Microsoft Corp. | 12,100 | 329,362 |
|
| Novell, Inc. * | 1,700 | 12,665 |
|
| Oracle Corp. * | 5,000 | 94,000 |
| | | |
| Telecommunications Equipment & Services 2.33% | | 432,684 |
|
| ADC Telecommunications, Inc. * | 700 | 9,569 |
|
| QUALCOMM, Inc. | 3,900 | 165,243 |
|
| Verizon Communications, Inc. | 7,100 | 257,872 |
| | | |
| Telephone 0.62% | | 115,312 |
|
| AT&T, Inc. | 3,127 | 108,913 |
|
| Sprint Nextel Corp. | 900 | 6,399 |
| | | |
| Tobacco 1.38% | | 255,990 |
|
| Altria Group, Inc. | 3,500 | 255,990 |
| | | |
| Toys, Amusements & Sporting Goods 0.23% | | 42,513 |
|
| Hasbro, Inc. | 900 | 23,193 |
|
| Mattel, Inc. | 1,000 | 19,320 |
| | | |
| Transportation 0.07% | | 12,544 |
|
| Overseas Shipholding Group, Inc. | 200 | 12,544 |
| | | |
| Trucking & Freight 0.37% | | 68,852 |
|
| FedEx Corp. | 400 | 35,252 |
|
| United Parcel Service, Inc. , Class B | 400 | 28,096 |
|
| YRC Worldwide, Inc. * | 400 | 5,504 |
See notes to financial statements
Annual report | Intrinsic Value Fund
19
F I N A N C I A L S T A T E M E N T S
| | |
| | Principal | |
| Issuer, description, maturity date | amount | Value |
| |
| Short-term investments 0.36% | | $66,544 |
|
| (Cost $66,544) | | |
|
| John Hancock Cash Investment Trust, 3.5681% (c)(f) | $66,544 | $66,544 |
| |
| Repurchase agreements 3.30% | | $614,000 |
|
| (Cost $614,000) | | |
|
| Repurchase Agreement with State Street Corp. dated 2-29-08 at | | |
| 2.35% to be repurchased at $614,120 on 3-3-08, | | |
| collateralized by $635,000 Federal National Mortgage | | |
| Association, 5.57%, due 7-14-28 (valued at $627,856, | | |
| including interest) | $614,000 | $614,000 |
| |
| Total investments (cost $20,394,305)† 100.17% | | $18,634,382 |
|
| |
| Liabilities in excess of other assets (0.17%) | | (31,753) |
|
| |
| Total net assets 100.00% | | $18,602,629 |
|
Percentages are stated as a percent of net assets.
REIT Real Estate Investment Trust
* Non-income producing.
(a) All or a portion of this security was out on loan.
(c) Investment is an affiliate of the Trust’s adviser or subadviser.
(f) John Hancock Cash Investment Trust is managed by MFC Global Investment Management (U.S.), LLC. The rate shown is the seven-day effective yield at period end.
† At February 29, 2008, the aggregate cost of investment securities for federal income tax purposes was $20,445,250. Net unrealized depreciation aggregated $1,810,868, of which $821,067 related to appreciated investment securities and $2,631,935 related to depreciated investment securities.
See notes to financial statements
Intrinsic Value Fund | Annual report
20
F I N A N C I A L S T A T E M E N T S
Financial statements
Statement of assets and liabilities 2-29-08
This Statement of Assets and Liabilities is the Fund’s balance sheet. It shows the value of what the Fund owns, is due and owes. You’ll also find the net asset value and the maximum public offering price per share.
| |
| Assets | |
|
| Investments in unaffiliated issuers, at value (cost $19,713,761) including | |
| $65,239 of securities loaned (Note 2) | $17,953,838 |
| Repurchase agreement, at value (cost $614,000) (Note 2) | 614,000 |
| Investments in affiliated issuers, at value (cost $66,544) (Note 2) | 66,544 |
| | |
| Total investments, at value (cost $20,394,305) | 18,634,382 |
| Cash | 795 |
| Cash collateral at broker for futures contracts | 45,360 |
| Receivable for fund shares sold | 14,248 |
| Dividends and interest receivable (net of tax) | 41,399 |
| Receivable due from adviser | 3,880 |
| Other assets | 96 |
| | |
| Total assets | 18,740,160 |
| |
| Liabilities | |
|
| Payable for fund shares repurchased | 8,899 |
| Payable upon return of securities loaned (Note 2) | 66,544 |
| Payable for futures variation margin | 10,350 |
| Payable to affiliates | |
| Fund administration fees | 193 |
| Transfer agent fees | 2,816 |
| Distribution and service fees | 195 |
| Trustees’ fees | 73 |
| Other payables and accrued expenses | 48,461 |
| | |
| Total liabilities | 137,531 |
| |
| Net assets | |
|
| Capital paid-in | $20,812,480 |
| Undistributed net investment income | 26,236 |
| Accumulated undistributed net realized gain (loss) on investments and futures contracts | (464,411) |
| Net unrealized appreciation (depreciation) on investments and futures contracts | (1,771,676) |
| | |
| Net assets | $18,602,629 |
See notes to financial statements
Annual report | Intrinsic Value Fund
21
F I N A N C I A L S T A T E M E N T S
Statement of assets and liabilities (continued)
| |
| Net asset value per share | |
|
| The Funds have an unlimited number of shares authorized with no par value. | |
| Net asset value is calculated by dividing the net assets of each class of shares | |
| by the number of outstanding shares in the class. | |
| | |
| Class A | |
| Net assets | $17,554,568 |
| Shares outstanding | 964,495 |
| Net asset value and redemption price per share | $18.20 |
| | |
| Class B1 | |
| Net assets | $289,866 |
| Shares outstanding | 15,942 |
| Net asset value and offering price per share | $18.18 |
| | |
| Class C1 | |
| Net assets | $413,575 |
| Shares outstanding | 22,744 |
| Net asset value and offering price per share | $18.18 |
| | |
| Class I | |
| Net assets | $134,704 |
| Shares outstanding | 7,396 |
| Net asset value, offering price and redemption price per share | $18.21 |
| | |
| Class R1 | |
| Net assets | $108,385 |
| Shares outstanding | 5,968 |
| Net asset value, offering price and redemption price per share | $18.16 |
| | |
| Class 1 | |
| Net assets | $101,531 |
| Shares outstanding | 5,575 |
| Net asset value, offering price and redemption price per share | $18.21 |
| |
| Maximum public offering price per share | |
|
| Class A (net asset value per share ÷ 95%)2 | $19.16 |
1 Redemption price per share is equal to the net asset value less any applicable contingent deferred sales charge.
2 On single retail sales of less than $50,000. On sales of $50,000 or more and on group sales the offering price is reduced.
See notes to financial statements
Intrinsic Value Fund | Annual report
22
F I N A N C I A L S T A T E M E N T S
Statement of operations For the year ended 2-29-08
This Statement of Operations summarizes the Fund’s investment income earned and expenses incurred in operating the Fund. It also shows net gains (losses) for the period stated.
| |
| Investment income | |
|
| Dividends | $470,439 |
| Interest | 32,387 |
| Securities lending | 849 |
| Income from affiliated issuers | 205 |
| | |
| Total investment income | 503,880 |
| |
| Expenses | |
|
| Investment management fees (Note 3) | 163,557 |
| Distribution and service fees (Note 3) | 68,124 |
| Transfer agent fees (Note 3) | 18,272 |
| Fund administration fees (Note 3) | 9,581 |
| Blue sky fees (Note 3) | 76,510 |
| Audit and legal fees | 66,930 |
| Printing and postage fees (Note 3) | 7,298 |
| Custodian fees | 27,821 |
| Trustees’ fees (Note 3) | 1,535 |
| Registration and filing fees | 24,473 |
| Miscellaneous | 295 |
| | |
| Total expenses | 464,396 |
| Less expense reductions (Note 3) | (176,615) |
| | |
| Net expenses | 287,781 |
| | |
| Net investment income | 216,099 |
| |
| Realized and unrealized gain (loss) | |
|
| Net realized gain (loss) on | |
| Investments in unaffiliated issuers | 628,405 |
| Futures contracts | (11,356) |
| | 617,049 |
| Change in net unrealized appreciation (depreciation) of | |
| Investments in unaffiliated issuers | (3,482,374) |
| Futures contracts | (8,396) |
| | (3,490,770) |
| | |
| Net realized and unrealized gain (loss) | (2,873,721) |
| | |
| Increase (decrease) in net assets from operations | ($2,657,622) |
See notes to financial statements
Annual report | Intrinsic Value Fund
23
F I N A N C I A L S T A T E M E N T S
Statement of changes in net assets
These Statements of Changes in Net Assets show how the value of the Fund’s net assets has changed during the last two periods. The difference reflects earnings less expenses, any investment gains and losses, distributions, if any, paid to shareholders and the net of Fund share transactions.
| | |
| | Year | Year |
| | ended | ended |
| | 2-28-071 | 2-29-08 |
| |
| Increase (decrease) in net assets | | |
|
| From operations | | |
| Net investment income | $143,510 | $216,099 |
| Net realized gain (loss) | 526,061 | 617,049 |
| Change in net unrealized appreciation (depreciation) | 1,719,094 | (3,490,770) |
| | | |
| Increase (decrease) in net assets resulting from operations | 2,388,665 | (2,657,622) |
| | | |
| Distributions to shareholders | | |
| From net investment income | | |
| Class A | (108,035) | (224,181) |
| Class B | (1,017) | (1,449) |
| Class C | (762) | (2,335) |
| Class I | (985) | (2,359) |
| Class R1 | (620) | (1,273) |
| Class 1 | (914) | (1,843) |
| From net realized gain | | |
| Class A | (179,361) | (1,330,407) |
| Class B | (3,802) | (23,393) |
| Class C | (2,850) | (37,862) |
| Class I | (1,241) | (10,289) |
| Class R1 | (1,118) | (8,307) |
| Class 1 | (1,118) | (7,782) |
| | | |
| Total distributions | (301,823) | (1,651,480) |
| | | |
| From Fund share transactions (Note 6) | 18,224,388 | 2,600,501 |
| | | |
| Total increase (decrease) | 20,311,230 | (1,708,601) |
| |
| Net assets | | |
|
| Beginning of year | — | 20,311,230 |
| | | |
| End of year | $20,311,230 | $18,602,629 |
| | | |
| Undistributed net investment income | $43,586 | $26,236 |
1 Period from 6-12-06 (commencement of operations) to 2-28-07.
See notes to financial statements
Intrinsic Value Fund | Annual report
24
F I N A N C I A L S T A T E M E N T S
Financial highlights
The Financial Highlights show how the Fund’s net asset value for a share has changed since the end of the previous period.
CLASS A SHARES
| | |
| Period ended | 2-28-07 1 | 2-29-08 |
| |
| Per share operating performance | | |
|
| Net asset value, beginning of period | $20.00 | $22.68 |
| Net investment income (loss)2 | 0.18 | 0.24 |
| Net realized and unrealized gain | | |
| (loss) on investments | 2.85 | (2.93) |
| Total from investment operations | 3.03 | (2.69) |
| Less distributions | | |
| From net investment income | (0.13) | (0.26) |
| From net realized gain | (0.22) | (1.53) |
| | (0.35) | (1.79) |
| Net asset value, end of period | $22.68 | $18.20 |
| Total return3,4 (%) | 15.19 5 | (12.52) |
| |
| Ratios and supplemental data | | |
|
| Net assets, end of period (in millions) | $19 | $18 |
| Ratios (as a percentage of average net assets): | | |
| Expenses before reductions | 1.94 6 | 1.89 |
| Expenses net of fee waivers, if any | 1.34 6 | 1.35 |
| Expenses net of all fee waivers and credits | 1.34 6 | 1.35 |
| Net investment income (loss) | 1.13 6 | 1.05 |
| Portfolio turnover (%) | 32 5 | 72 |
1 Class A shares began operations on 6-12-06.
2 Based on the average of the shares outstanding.
3 Total returns would have been lower had certain expenses not been reduced during the periods shown.
4 Assumes dividend reinvestment.
5 Not annualized.
6 Annualized.
See notes to financial statements
Annual report | Intrinsic Value Fund
25
F I N A N C I A L S T A T E M E N T S
Financial highlights
CLASS B SHARES
| | |
| Period ended | 2-28-07 1 | 2-29-08 |
| |
| Per share operating performance | | |
|
| Net asset value, beginning of period | $20.00 | $22.64 |
| Net investment income (loss)2 | 0.07 | 0.08 |
| Net realized and unrealized gain | | |
| (loss) on investments | 2.85 | (2.92) |
| Total from investment operations | 2.92 | (2.84) |
| Less distributions | | |
| From net investment income | (0.06) | (0.09) |
| From net realized gain | (0.22) | (1.53) |
| | (0.28) | (1.62) |
| Net asset value, end of period | $22.64 | $18.18 |
| Total return3,4 (%) | 14.61 5 | (13.13) |
| |
| Ratios and supplemental data | | |
|
| Net assets, end of period (in millions) | — 6 | — 6 |
| Ratios (as a percentage of average net assets): | | |
| Expenses before reductions | 9.00 7 | 6.13 |
| Expenses net of fee waivers, if any | 2.04 7 | 2.06 |
| Expenses net of all fee waivers and credits | 2.04 7 | 2.05 |
| Net investment income (loss) | 0.42 7 | 0.35 |
| Portfolio turnover (%) | 32 5 | 72 |
1 Class B shares began operations on 6-12-06.
2 Based on the average of the shares outstanding.
3 Total returns would have been lower had certain expenses not been reduced during the periods shown.
4 Assumes dividend reinvestment.
5 Not annualized.
6 Less than $500,000.
7 Annualized.
See notes to financial statements
Intrinsic Value Fund | Annual report
26
F I N A N C I A L S T A T E M E N T S
Financial highlights
CLASS C SHARES
| | |
| Period ended | 2-28-07 1 | 2-29-08 |
| |
| Per share operating performance | | |
|
| Net asset value, beginning of period | $20.00 | $22.64 |
| Net investment income (loss)2 | 0.06 | 0.08 |
| Net realized and unrealized gain | | |
| (loss) on investments | 2.86 | (2.92) |
| Total from investment operations | 2.92 | (2.84) |
| Less distributions | | |
| From net investment income | (0.06) | (0.09) |
| From net realized gain | (0.22) | (1.53) |
| | (0.28) | (1.62) |
| Net asset value, end of period | $22.64 | $18.18 |
| Total return3,4 (%) | 14.61 5 | (13.13) |
| |
| Ratios and supplemental data | | |
|
| Net assets, end of period (in millions) | — 6 | — 6 |
| Ratios (as a percentage of average net assets): | | |
| Expenses before reductions | 10.08 7 | 6.21 |
| Expenses net of fee waivers, if any | 2.04 7 | 2.06 |
| Expenses net of all fee waivers and credits | 2.04 7 | 2.05 |
| Net investment income (loss) | 0.37 7 | 0.36 |
| Portfolio turnover (%) | 32 5 | 72 |
1 Class C shares began operations on 6-12-06.
2 Based on the average of the shares outstanding.
3 Total returns would have been lower had certain expenses not been reduced during the periods shown.
4 Assumes dividend reinvestment.
5 Not annualized.
6 Less than $500,000.
7 Annualized.
See notes to financial statements
Annual report | Intrinsic Value Fund
27
F I N A N C I A L S T A T E M E N T S
Financial highlights
CLASS I SHARES
| | |
| Period ended | 2-28-07 1 | 2-29-08 |
| |
| Per share operating performance | | |
|
| Net asset value, beginning of period | $20.00 | $22.70 |
| Net investment income (loss)2 | 0.24 | 0.32 |
| Net realized and unrealized gain | | |
| (loss) on investments | 2.86 | (2.93) |
| Total from investment operations | 3.10 | (2.61) |
| Less distributions | | |
| From net investment income | (0.18) | (0.35) |
| From net realized gain | (0.22) | (1.53) |
| | (0.40) | (1.88) |
| Net asset value, end of period | $22.70 | $18.21 |
| Total return3,4 (%) | 15.50 5 | (12.18) |
| |
| Ratios and supplemental data | | |
|
| Net assets, end of period (in millions) | — 6 | — 6 |
| Ratios (as a percentage of average net assets): | | |
| Expenses before reductions | 17.60 7 | 13.79 |
| Expenses net of fee waivers, if any | 0.95 7 | 0.95 |
| Expenses net of all fee waivers and credits | 0.95 7 | 0.95 |
| Net investment income (loss) | 1.53 7 | 1.45 |
| Portfolio turnover (%) | 32 5 | 72 |
1 Class I shares began operations on 6-12-06.
2 Based on the average of the shares outstanding.
3 Total returns would have been lower had certain expenses not been reduced during the periods shown.
4 Assumes dividend reinvestment.
5 Not annualized.
6 Less than $500,000.
7 Annualized.
See notes to financial statements
Intrinsic Value Fund | Annual report
28
F I N A N C I A L S T A T E M E N T S
Financial highlights
CLASS R1 SHARES
| | |
| Period ended | 2-28-07 1 | 2-29-08 |
| |
| Per share operating performance | | |
|
| Net asset value, beginning of period | $20.00 | $22.63 |
| Net investment income (loss)2 | 0.12 | 0.21 |
| Net realized and unrealized gain | | |
| (loss) on investments | 2.85 | (2.92) |
| Total from investment operations | 2.97 | (2.71) |
| Less distributions | | |
| From net investment income | (0.12) | (0.23) |
| From net realized gain | (0.22) | (1.53) |
| | (0.34) | (1.76) |
| Net asset value, end of period | $22.63 | $18.16 |
| Total return3,4 (%) | 14.88 5 | (12.60) |
| |
| Ratios and supplemental data | | |
|
| Net assets, end of period (in millions) | — 6 | — 6 |
| Ratios (as a percentage of average net assets): | | |
| Expenses before reductions | 20.85 7 | 15.27 |
| Expenses net of fee waivers, if any | 1.69 7 | 1.45 |
| Expenses net of all fee waivers and credits | 1.69 7 | 1.45 |
| Net investment income (loss) | 0.78 7 | 0.95 |
| Portfolio turnover (%) | 32 5 | 72 |
1 Class R1 shares began operations on 6-12-06.
2 Based on the average of the shares outstanding.
3 Total returns would have been lower had certain expenses not been reduced during the periods shown.
4 Assumes dividend reinvestment.
5 Not annualized.
6 Less than $500,000.
7 Annualized.
See notes to financial statements
Annual report | Intrinsic Value Fund
29
F I N A N C I A L S T A T E M E N T S
Financial highlights
CLASS 1 SHARES
| | |
| Period ended | 2-28-07 1 | 2-29-08 |
| |
| Per share operating performance | | |
|
| Net asset value, beginning of period | $20.00 | $22.70 |
| Net investment income (loss)2 | 0.25 | 0.34 |
| Net realized and unrealized gain | | |
| (loss) on investments | 2.85 | (2.94) |
| Total from investment operations | 3.10 | (2.60) |
| Less distributions | | |
| From net investment income | (0.18) | (0.36) |
| From net realized gain | (0.22) | (1.53) |
| | (0.40) | (1.89) |
| Net asset value, end of period | $22.70 | $18.21 |
| Total return3,4 (%) | 15.53 5 | (12.13) |
| |
| Ratios and supplemental data | | |
|
| Net assets, end of period (in millions) | — 6 | — 6 |
| Ratios (as a percentage of average net assets): | | |
| Expenses before reductions | 1.44 7 | 1.47 |
| Expenses net of fee waivers, if any | 0.90 7 | 0.90 |
| Expenses net of all fee waivers and credits | 0.90 7 | 0.90 |
| Net investment income (loss) | 1.58 7 | 1.50 |
| Portfolio turnover (%) | 32 5 | 72 |
1 Class 1 shares began operations on 6-12-06.
2 Based on the average of the shares outstanding.
3 Total returns would have been lower had certain expenses not been reduced during the periods shown.
4 Assumes dividend reinvestment.
5 Not annualized.
6 Less than $500,000.
7 Annualized
See notes to financial statements
Intrinsic Value Fund | Annual report
30
Notes to financial statements
1. Organization
John Hancock Intrinsic Value Fund (the Fund) is a non-diversified series of John Hancock Funds III (the Trust). The Trust was established as a Massachusetts business trust on June 9, 2005. The Trust is registered under the Investment Company Act of 1940, as amended (the 1940 Act), as an open-end investment management company. The investment objective of the Fund is to seek long-term capital growth.
John Hancock Life Insurance Company of New York (John Hancock New York) is a wholly owned subsidiary of John Hancock Life Insurance Company (U.S.A.) (John Hancock USA). John Hancock USA and John Hancock New York are indirect wholly owned subsidiaries of The Manufacturers Life Insurance Company (Manulife), which in turn is a wholly owned subsidiary of Manulife Financial Corporation (MFC), a publicly traded company. MFC and its subsidiaries are known collectively as “Manulife Financial.”
John Hancock Investment Management Services, LLC (the Adviser), a Delaware limited liability company controlled by John Hancock USA, serves as investment adviser for the Trust and John Hancock Funds, LLC (the Distributor), a Delaware limited liability company, an affiliate of the Adviser, serves as principal underwriter.
The Board of Trustees have authorized the issuance of multiple classes of shares of the Fund, including classes designated as Class A, Class B, Class C, Class I, Class R1 and Class 1 shares. Class A, Class B and Class C shares are open to all retail investors. Class I shares are offered without any sales charge to various institutional and certain individual investors. Class R1 shares are available only to certain retirement plans. Class 1 shares are sold only to certain exempt separate accounts of John Hancock USA and John Hancock New York. The shares of each class represent an interest in the same portfolio of investments of the Fund, and have equal rights as to voting, redemptions, dividends and liquidation, except that certain expenses, subject to the approval of the Board of Trustees, may be applied differently to each class of shares in accordance with current regulations of the Securities and Exchange Commission (SEC) and the Interna l Revenue Service. Shareholders of a class that bear distribution and service expenses under the terms of a distribution plan have exclusive voting rights to that distribution plan. Class B shares will convert to Class A shares eight years after purchase.
The Adviser and other affiliates of John Hancock USA owned 802,790, 5,571, 5,529 and 5,575 shares of beneficial interest of Class A, Class I, Class R1 and Class 1, respectively, on February 29, 2008.
2. Significant accounting policies
In the preparation of the financial statements, the Fund follows the policies described below. The preparation of financial statements in conformity with accounting principles generally accepted in the United States of America requires management to make estimates and assumptions that affect the reported amounts of assets and liabilities at the date of the financial statements and the reported amounts of income and expenses during the reporting period. Actual results may differ from these estimates.
Security valuation
The net asset value of the shares of the Fund is determined daily as of the close of the New York Stock Exchange (NYSE), normally at 4:00 P.M., Eastern Time. Short-term debt investments that have a remaining maturity of 60 days or less are valued at amortized cost, and thereafter assume a constant amortization to maturity of any discount or premium, which approximates market value. Investments in John Hancock Cash Investment Trust (JHCIT),
Annual report | Intrinsic Value Fund
31
an affiliate of the John Hancock Advisers, LLC (JHA), a wholly owned subsidiary of John Hancock Financial Services, Inc., a subsidiary of MFC, are valued at their net asset value each business day. All other securities held by the Fund are valued at the last sale price or official closing price (closing bid price or last evaluated quote if no sale has occurred) as of the close of business on the principal securities exchange (domestic or foreign) on which they trade or, lacking any sales, at the closing bid price. Securities traded only in the over-the-counter market are valued at the last bid price quoted by brokers making markets in the securities at the close of trading. Securities for which there are no such quotations, principally debt securities, are valued based on the evaluated prices provided by an independent pricing service, which utilizes both dealer-supplied and electronic data processing techniques, which take into account factors such as institutional-size trading in similar groups of securities, yield, quality, coupon rate, maturity, type of issue, trading characteristics and other market data.
Other assets and securities for which no such quotations are readily available are valued at fair value as determined in good faith under consistently applied procedures established by and under the general supervision of the Board of Trustees. Generally, trading in non-U.S. securities is substantially completed each day at various times prior to the close of trading on the NYSE. The values of such securities used in computing the net asset value of a Fund’s shares are generally determined as of such times. Occasionally, significant events that affect the values of such securities may occur between the times at which such values are generally determined and the close of the NYSE. Upon such an occurrence, these securities will be valued at fair value as determined in good faith under consistently applied procedures established by and under the general supervision of the Board of Trustees.
In deciding whether to make a fair value adjustment to the price of a security, the Board of Trustees or their designee may review a variety of factors, including developments in foreign markets, the performance of U.S. securities markets and the performance of instruments trading in U.S. markets that represent foreign securities and baskets of foreign securities. The Fund may also fair value securities in other situations, for example, when a particular foreign market is closed, but the Fund is calculating the net asset value. In view of these factors, it is likely that Funds investing significant amounts of assets in securities in foreign markets will be fair valued more frequently than Funds investing significant amounts of assets in frequently traded, U.S. exchange listed securities of large-capitalization U.S. issuers.
For purposes of determining when fair value adjustments may be appropriate with respect to Funds that invest in securities in foreign markets that close prior to the NYSE, the Funds will, on an ongoing basis, monitor for “significant market events.” A significant market event may be a certain percentage change in the value of an index or of certain Exchange Traded Funds that track foreign markets in which Funds have significant investments. If a significant market event occurs due to a change in the value of the index or of Exchange Traded Funds, the pricing for the Fund will promptly be reviewed and potential adjustments to the net asset value of the Fund will be recommended to the Trust’s Pricing Committee when applicable.
Fair value pricing of securities is intended to help ensure that the net asset value of the Fund’s shares reflects the value of the Fund’s securities as of the close of the NYSE (as opposed to a value which is no longer accurate as of such close), thus limiting the opportunity for aggressive traders to purchase shares of the Fund at deflated prices, reflecting stale security valuations, and to promptly sell such shares at a gain. However, a security’s valuation may differ depending on the method used for determining value and no assurance can be given that fair value pricing of securities will successfully eliminate all potential opportunities for such trading gains.
New accounting pronouncements
In September 2006, Financial Accounting Standards Board (FASB) Standard No. 157, Fair Value Measurements (FAS 157), was issued and is effective for fiscal years beginning after
Intrinsic Value Fund | Annual report
32
November 15, 2007. FAS 157 defines fair value, establishes a framework for measuring fair value and expands disclosure about fair value measurements. As of February 29, 2008, management does not believe the adoption of FAS 157 will impact the amounts reported in the financial statements; however, additional disclosures regarding pricing sources will be required about the inputs used to develop the measurements of fair value and the related realized and unrealized gain/loss for certain securities valued by significant unobservable market inputs.
In March 2008, FASB No. 161 (FAS 161), Disclosures about Derivative Instruments and Hedging Activities , an amendment of FASB Statement No. 133 (FAS 133), was issued and is effective for fiscal years beginning after November 15, 2008. FAS 161 amends and expands the disclosure requirements of FAS 133 in order to provide financial statement users an understanding of a company’s use of derivative instruments, how derivative instruments are accounted for under FAS 133 and related interpretations and how these instruments affect a company’s financial position, performance, and cash flows. FAS 161 requires companies to disclose information detailing the objectives and strategies for using derivative instruments, the level of derivative activity entered into by the company, and any credit risk-related contingent features of the agreements. Management is currently evaluating the adoption of FAS 161 on the Fund’s financial statement disclosures.
Guarantees and indemnifications
Under the Trust’s organizational documents, its Officers and Trustees are indemnified against certain liability arising out of the performance of their duties to the Trust. Additionally, in the normal course of business, the Trust enters into contracts with service providers that contain general indemnification clauses. The Trust’s maximum exposure under these arrangements is unknown, as this would involve future claims that may be made against the Trust that have not yet occurred.
Repurchase agreements
The Fund may enter into repurchase agreements. When the Fund enters into a repurchase agreement through its custodian, it receives delivery of securities, the amount of which at the time of purchase and each subsequent business day is required to be maintained at such a level that the market value is generally at least 102% of the repurchase amount. The Fund will take constructive receipt of all securities underlying the repurchase agreements it has entered into until such agreements expire. If the seller defaults, the Fund would suffer a loss to the extent that proceeds from the sale of underlying securities were less than the repurchase amount. The Fund may enter into repurchase agreements maturing within seven days with domestic dealers, banks or other financial institutions deemed to be creditworthy by the Adviser. Collateral for certain tri-party repurchase agreements is held at the custodian bank in a segregated account for the benefi t of the Fund and the counterparty.
Security transactions and related investment income
Investment security transactions are accounted for on a trade date plus one basis for daily net asset value calculations. However, for financial reporting purposes, investment transactions are reported on trade date. Interest income is accrued as earned. Dividend income and distributions to shareholders are recorded on the ex-dividend date. Foreign dividends are recorded on the ex-date or when the Fund becomes aware of the dividends from cash collections. Discounts/premiums are accreted/ amortized for financial reporting purposes. Non-cash dividends are recorded at the fair market value of the securities received. Debt obligations may be placed in a non-accrual status and related interest income may be reduced by ceasing current accruals and writing off interest receivables when the collection of all or a portion of interest has become doubtful, based upon consistently applied procedures.
From time to time, the Fund may invest in Real Estate Investment Trusts (REITs) and, as a result, will estimate the components of distributions from these securities. Distributions from REITs received in excess of income are recorded as a reduction of cost of investments and/or as a realized gain.
Annual report | Intrinsic Value Fund
33
The Fund uses the specific identification method for determining realized gain or loss on investments for both financial statement and federal income tax reporting purposes.
Allocations of income and expenses
All income, expenses (except class-specific expenses), and realized and unrealized gain/ loss are allocated to each class of shares based upon the relative net assets of each class. Dividends to shareholders from net investment income are determined at a class level and distributions from capital gains are determined at a Fund level.
Expenses not directly attributable to the Fund or share classes are allocated based on the relative share of net assets of the Fund or share class at the time the expense was incurred. Class-specific expenses, as detailed in Note 3, are accrued daily and charged directly to the respective share classes.
Securities lending
The Fund may lend portfolio securities from time to time in order to earn additional income. The Fund retains beneficial ownership of the securities it has loaned and continues to receive interest and dividends paid by the issuer of securities and to participate in any changes in their value. On the settlement date of the loan, the Fund receives collateral against the loaned securities and maintain collateral in an amount not less than 100% of the market value of the loaned securities during the period of the loan. The market value of the loaned securities is determined at the close of business of the Fund and any additional required collateral is delivered to the Fund on the next business day. Any cash collateral received is invested in the JHCIT. If the borrower defaults on its obligation to return the securities loaned because of insolvency or other reasons, a fund could experience delays and costs in recovering the securities loaned or in gaining access to the collat eral. The Fund receives compensation for lending its securities either in the form of fees, guarantees, and/or by retaining a portion of interest on the investment of any cash received as collateral.
The Fund has entered into an agreement with Morgan Stanley & Co. Incorporated and MS Securities Services Inc. (collectively, Morgan Stanley), which permits the Fund to lend securities to Morgan Stanley on a principal basis. Morgan Stanley is the primary borrower of fund securities of the Fund. The risk of having one primary borrower of securities (as opposed to several borrowers in an agency relationship) is that should Morgan Stanley fail financially, all securities lent will be affected by the failure and by any delays in recovery of the securities (or in the rare event, loss of rights in the collateral).
Prior to May 8, 2007, cash collateral was invested in the State Street Navigator Securities Lending Portfolio. At February 29, 2008, the Fund loaned securities having a market value of $65,239 collateralized by securities in the amount of $66,544.
Futures
The Fund may purchase and sell financial futures contracts and options on those contracts. The Fund invests in contracts based on financial instruments, such as U.S. Treasury Bonds or Notes, or on securities indices such as the Standard & Poor’s 500 Index, in order to hedge against a decline in the value of securities owned by the Fund.
Initial margin deposits required upon entering into futures contracts are satisfied by the delivery of specific securities or cash as collateral to the broker (the Fund’s agent in acquiring the futures position). If the position is closed out by taking an opposite position prior to the settlement date of the futures contract, a final determination of variation margin is made, cash is required to be paid to or released by the broker and the Fund realizes a gain or loss.
When the Fund sells a futures contract based on a financial instrument, the Fund becomes obligated to deliver that kind of instrument at an agreed upon date for a specified price. The Fund realizes a gain or loss depending on whether the price of an offsetting purchase is less or more than the price of the initial sale or on whether the price of an offsetting sale is more or less than the price of the initial purchase. The Fund could be exposed to risks if it could not close out futures positions because of an illiquid secondary market or the inability
Intrinsic Value Fund | Annual report
34
of counterparties to meet the terms of their contracts. Futures contracts are valued at the quoted daily settlement prices established by the exchange on which they trade.
The following is a summary of open futures contracts on February 29, 2008:
| | | | | |
| | | | | | UNREALIZED |
| | NUMBER OF | | EXPIRATION | NOTIONAL | APPRECIATION |
| OPEN CONTRACTS | CONTRACTS | POSITION | DATE | AMOUNT | (DEPRECIATION) |
|
| S&P Mini 500 Index Futures | 6 | Long | Mar 2008 | $399,390 | ($11,753) |
Federal income taxes
The Fund qualifies as a regulated investment company by complying with the applicable provisions of the Internal Revenue Code and will not be subject to federal income tax on taxable income that is distributed to shareholders. Therefore, no federal income tax provision is required. Net capital losses of $425,219 that are attributable to security transactions incurred after October 31, 2007, are treated as arising on March 1, 2008, the first day of the Fund’s next taxable year.
The Fund has adopted the provisions of FASB Interpretation No. 48, Accounting for Uncertainty in Income Taxes , an interpretation of FASB Statement 109 (FIN 48), at the beginning of the Fund’s fiscal year. FIN 48 prescribes a minimum threshold for financial statement recognition of the benefit of a tax position taken or expected to be taken in a tax return. The implementation of FIN 48 did not have a material impact on the Fund’s financial statements. Each of the Fund’s federal tax returns for the prior fiscal years remains subject to examination by the Internal Revenue Service.
Distribution of income and gains
The Fund records distributions to shareholders from net investment income and net realized gains, if any, on the ex-dividend date. During the year ended February 28, 2007, the tax character of distributions paid was as follows: ordinary income $270,360 and long-term capital gain $31,463. During the year ended February 29, 2008, the tax character of distributions paid was as follows: ordinary income $1,019,233 and long-term capital gain $632,247. Distributions paid by the Fund with respect to each class of shares are calculated in the same manner, at the same time and are in the same amount, except for the effect of expenses that may be applied differently to each class.
As of February 29, 2008, the components of distributable earnings on a tax basis included $26,236 of undistributed ordinary income.
Such distributions and distributable earnings, on a tax basis, are determined in conformity with income tax regulations, which may differ from accounting principles generally accepted in the United States of America. Distributions in excess of tax basis earnings and profits, if any, are reported in the Fund’s financial statements as a return of capital.
Capital accounts within financial statements are adjusted for permanent book/tax differences. These adjustments have no impact on net assets or the results of operations. Temporary book/tax differences will reverse in a subsequent period. Permanent book/tax differences are primarily attributable to derivative transactions.
3. Investment advisory and
other agreements
The Trust has entered into an Investment Advisory Agreement with the Adviser. The Adviser is responsible for managing the corporate and business affairs of the Trust and for selecting and compensating subadvisers to handle the investment of the assets of the Fund, subject to the supervision of the Trust’s Board of Trustees. As compensation for its services, the Adviser receives an advisory fee from the Trust. Under the Advisory Agreement, the Fund pays a monthly management fee to the Adviser equivalent, on an annual basis, to the sum of: (a) 0.78% of the first $500,000,000 of the Fund’s aggregate daily net assets; (b) 0.76% of the next $500,000,000 of the Fund’s aggregate daily net assets; (c) 0.75% of the Fund’s next $1,500,000,000 of the Fund’s aggregate daily net assets; and (d) 0.74% of the Fund’s aggregate daily net assets in excess of $2,500,000,000. Aggregate net assets include
Annual report | Intrinsic Value Fund
35
the net assets of the Fund and Intrinsic Value Trust, a series of John Hancock Trust and Intrinsic Value Fund, a series of John Hancock Funds II. The Adviser has a subadvisory agreement with Grantham, Mayo, Van Otterloo & Co. LLC. The Fund is not responsible for payment of the subadvisory fees.
The investment management fees incurred for the year ended February 29, 2008, were equivalent to an annual effective rate of 0.78% of the Fund’s average daily net assets.
Expense reimbursements
The Adviser has contractually agreed to reimburse or limit certain Fund level expenses to 0.08% of the Fund’s average annual net assets which are allocated pro rata to all share classes. This agreement excludes taxes, portfolio brokerage commissions, interest, advisory fees, Rule 12b-1 fees, transfer agency fees, blue sky fees, printing and postage and litigation and indemnification expenses and other extraordinary expenses not incurred in the ordinary course of the Fund’s business. In addition, fees incurred under any agreement or plans of the Fund dealing with services for the shareholders and others with beneficial interest in shares of the Fund, are excluded.
In addition, the Adviser has agreed to reimburse or limit certain expenses for each share class. This agreement excludes taxes, portfolio brokerage commissions, interest and litigation and indemnification expenses and other extraordinary expenses not incurred in the ordinary course of the Fund’s business. In addition, fees incurred under any agreement or plans of the Fund dealing with services for the shareholders and others with beneficial interest in shares of the Fund, are excluded. The reimbursements and limits are such that these expenses will not exceed 1.35% for Class A shares, 2.05% for Class B, 2.05% for Class C, 0.95% for Class I, 1.45% for Class R1 and 0.90% for Class 1. Accordingly, the expense reductions or reimbursements related to this agreement were $107,537, $16,704, $16,870, $18,453, $16,037 and $664 for Class A, Class B, Class C, Class I, Class R1 and Class 1, respectively for the year ended February 29, 2008. The expense reimbursements and limits will continue in effect until June 30, 2008 and thereafter until terminated by the Adviser on notice to the Trust.
Fund administration fees
Pursuant to the Advisory Agreement, the Fund reimburses the Adviser for all expenses associated with providing the administrative, financial, legal, accounting and recordkeeping services of the Fund, including the preparation of all tax returns, annual, semiannual and periodic reports to shareholders and the preparation of all regulatory reports. These expenses are allocated based on the relative share of net assets of each class at the time the expense was incurred.
The fund administration fees incurred for the year ended February 29, 2008, were $9,581 with an annual effective rate of 0.05% of the Fund’s average daily net assets.
Distribution and shareholder servicing fees
The Trust has a Distribution Agreement with the Distributor. The Fund has adopted Distribution Plans with respect to Class A, Class B, Class C, Class R1 and Class 1, pursuant to Rule 12b-1 under the 1940 Act, to pay the Distributor for the services it provides as distributor of shares of the Fund. Accordingly, the Fund makes monthly payments to the Distributor at an annual rate not to exceed 0.30%, 1.00%, 1.00%, 0.50% and 0.05% of average daily net asset value of Class A, Class B, Class C, Class R1 and Class 1, respectively. A maximum of 0.25% of such payments may be service fees, as defined by the Conduct Rules of Financial Industry Regulatory Authority (formerly the National Association of Securities Dealers). Under the Conduct Rules, curtailment of a portion of the Fund’s 12b-1 payments could occur under certain circumstances.
In addition, the Fund has also adopted a Service Plan for Class R1 shares. Under the Service Plan, the Fund may pay up to 0.25% of Class R1 average daily net asset value for certain other services. There were no Service Plan fees incurred for the year ended February 29, 2008.
Sales charges
Class A shares are assessed up-front sales charges of up to 5.00% of net asset value of such shares. During the year ended
Intrinsic Value Fund | Annual report
36
February 29, 2008, the Fund was informed that the Distributor received net up-front sales charges of $22,389 with regard to sales of Class A shares. Of this amount, $3,598 was retained and used for printing prospectuses, advertising, sales literature and other purposes; $18,738 was paid as sales commissions to unrelated broker-dealers; and $53 was paid as sales commissions to sales personnel of Signator Investors, Inc. (Signator Investors), a related broker-dealer, an indirect subsidiary of MFC.
Class B shares that are redeemed within six years of purchase are subject to a contingent deferred sales charge (CDSC) at declining rates, beginning at 5.00% of the lesser of the current market value at the time of redemption or the original purchase cost of the shares being redeemed. Class C shares that are redeemed within one year of purchase are subject to a CDSC at a rate of 1.00% of the lesser of the current market value at the time of redemption or the original purchase cost of the shares being redeemed. Proceeds from the CDSCs are paid to the Distributor and are used, in whole or in part, to defray its expenses for providing distribution-related services to the Fund in connection with the sale of Class B and Class C shares. During the year ended February 29, 2008, CDSCs received by Distributor amounted to $216 for Class B shares and $664 for Class C shares.
Transfer agent fees
The Fund has a Transfer Agency Agreement with John Hancock Signature Services, Inc. (Signature Services), an indirect subsidiary of MFC. For Class A, Class B, Class C, Class I and Class R1 shares, the Fund pays a monthly transfer agent fee at an annual rate of 0.05% of each class’ average daily net assets, plus a fee based on the number of shareholder accounts and reimbursement for certain out-of-pocket expenses. Expenses not directly attributable to a particular class of shares are aggregated and allocated to each class on the basis of its relative net asset value. The Fund pays a monthly fee which is based on an annual rate of $15.00 for each Class A shareholder account, $17.50 for each Class B shareholder account, $16.50 for each Class C shareholder account and $15.00 for each Class R1 shareholder account.
Signature Services has agreed to limit the transfer agent fees so that such fees do not exceed 0.20% annually of Class A, Class B, Class C, Class I and Class R1 share average daily net assets. This agreement is effective until December 31, 2008. Signature Services reserves the right to terminate this limitation in the future. There were no transfer agent fee reductions for Class A, Class B, Class C, Class I and Class R1 shares, respectively, during the year ended February 29, 2008.
In addition, Signature Services has voluntarily agreed to further limit transfer agent fees for Class R1 shares so that such fees do not exceed 0.05% annually of each class’s average daily net assets. For the year ended February 29, 2008, the transfer agent fees reductions for Class R1 were $179.
In May 2007, the Fund began receiving earnings credits from its transfer agent as a result of uninvested cash balances. These credits are used to reduce a portion of the Fund’s transfer agent fees and out-of-pocket expenses. During the year ended February 29, 2008, the Fund’s transfer agent fees and out-of-pocket expenses were reduced by $171 for transfer agent credits earned.
Annual report | Intrinsic Value Fund
37
Class level expenses for the year ended February 29, 2008, were as follows:
| | | | |
| | Distribution and | Transfer | | Printing and |
| Share class | service fees | agent fees | Blue sky fees | postage fees |
|
| Class A | $59,322 | $16,276 | $14,643 | $6,887 |
| Class B | 4,098 | 844 | 14,450 | — |
| Class C | 4,059 | 837 | 14,312 | 321 |
| Class I | — | 75 | 17,658 | 60 |
| Class R1 | 587 | 240 | 15,447 | 3 |
| Class 1 | 58 | — | — | 27 |
| Total | $68,124 | $18,272 | $76,510 | $7,298 |
4. Trustees’ fees
The Trust compensates each Trustee who is not an employee of the Adviser or its affiliates. Total Trustees’ expenses are allocated to the Fund based on its average daily net asset value.
5. Line of credit
The Fund has entered into an agreement which enables them to participate in a $100 million unsecured committed line of credit with State Street Corporation. Borrowings will be made solely to temporarily finance the repurchase of capital shares. Interest is charged to the Fund based on its borrowings at a rate per annum equal to the Federal Funds rate plus 0.50%. In addition, a commitment fee of 0.05% per annum, payable at the end of each calendar quarter, based on the average daily-unused portion of the line of credit, is charged to the Fund on a prorated basis based on average net assets. Effective October 15, 2007, the commitment fee was changed from 0.07% to 0.05%. For the year ended February 29, 2008, there were no borrowings under the line of credit.
Intrinsic Value Fund | Annual report
38
6. Fund share transactions
Share activities for the Fund for the years ended February 28, 2007, and February 29, 2008, were as follows:
| | | | |
| | | Year ended 2-28-071 | Year ended 2-29-08 |
| | Shares | Amount | Shares | Amount |
| Class A shares | | | | |
|
| Sold | 838,725 | $17,032,947 | 133,987 | $2,940,726 |
| Distributions reinvested | 12,374 | 281,144 | 76,470 | 1,516,395 |
| Repurchased | (4,497) | (101,945) | (92,564) | (2,053,477) |
| Net increase (decrease) | 846,602 | $17,212,146 | 117,893 | $2,403,644 |
| |
| Class B shares | | | | |
|
| Sold | 25,686 | $554,475 | 5,662 | $132,547 |
| Distributions reinvested | 201 | 4,563 | 1,131 | 22,436 |
| Repurchased | (5,219) | (119,072) | (11,519) | (264,243) |
| Net increase (decrease) | 20,668 | $439,966 | (4,726) | ($109,260) |
| |
| Class C shares | | | | |
|
| Sold | 23,486 | $503,103 | 16,074 | $359,010 |
| Distributions reinvested | 135 | 3,064 | 1,822 | 36,151 |
| Repurchased | (10,948) | (251,638) | (7,825) | (155,541) |
| Net increase (decrease) | 12,673 | $254,529 | 10,071 | $239,620 |
| |
| Class I shares | | | | |
|
| Sold | 5,547 | $111,000 | 1,135 | $26,925 |
| Distributions reinvested | 98 | 2,226 | 638 | 12,648 |
| Repurchased | — | — | (22) | (500) |
| Net increase (decrease) | 5,645 | $113,226 | 1,751 | $39,073 |
| |
| Class R1 shares | | | | |
|
| Sold | 5,033 | $100,750 | 407 | $8,923 |
| Distributions reinvested | 76 | 1,738 | 484 | 9,580 |
| Repurchased | — | — | (32) | (704) |
| Net increase (decrease) | 5,109 | $102,488 | 859 | $17,799 |
| |
| Class 1 shares | | | | |
|
| Sold | 5,000 | $100,000 | — | — |
| Distributions reinvested | 90 | 2,033 | 485 | 9,625 |
| Net increase (decrease) | 5,090 | $102,033 | 485 | $9,625 |
| |
| Net increase (decrease) | 895,787 | $18,224,388 | 126,333 | $2,600,501 |
|
1Period from 6-12-06 (commencement of operations) to 2-28-07.
7. Purchases and sales of securities
Purchases and proceeds from sales or maturities of securities, other than short-term securities and obligations of the U.S. government, during the year ended February 29, 2008, aggregated $15,745,342 and $14,402,123, respectively.
Annual report | Intrinsic Value Fund
39
Auditors’ report
Report of Independent Registered Public Accounting Firm
To the Board of Trustees of John Hancock Funds III and Shareholders of John Hancock Intrinsic Value Fund,
In our opinion, the accompanying statement of assets and liabilities, including the schedule of investments, and the related statements of operations and of changes in net assets and the financial highlights present fairly, in all material respects, the financial position of John Hancock Intrinsic Value Fund (the Fund) at February 29, 2008, and the results of its operations, the changes in its net assets and the financial highlights for each of the periods indicated, in conformity with accounting principles generally accepted in the United States of America. These financial statements and financial highlights (hereafter referred to as “financial statements”) are the responsibility of the Fund’s management. Our responsibility is to express an opinion on these financial statements based on our audits. We conducted our audits of these financial statements in accordance with the standards of the Public Company Accounting Oversight Board (United States). Those standards require that we plan and perform the audits to obtain reasonable assurance about whether the financial statements are free of material misstatement. An audit includes examining, on a test basis, evidence supporting the amounts and disclosures in the financial statements, assessing the accounting principles used and significant estimates made by management, and evaluating the overall financial statement presentation. We believe that our audits, which included confirmation of investments at February 29, 2008 by correspondence with the custodian and brokers, provide a reasonable basis for our opinion.
PricewaterhouseCoopers LLP
Boston, Massachusetts
April 18, 2008
Intrinsic Value Fund | Annual report
40
Tax information
Unaudited
For federal income tax purposes, the following information is furnished with respect to the distributions of the Fund, if any, paid during its taxable year ended February 29, 2008.
The Fund has designated distributions to shareholders of $632,247 as a long-term capital gain dividend. With respect to the ordinary dividends paid by the Fund for the fiscal year ended February 29, 2008, 69.12% of the dividends qualifies for the corporate dividends-received deduction.
The Fund hereby designates the maximum amount allowable of its net taxable income as qualified dividend income as provided in the Jobs and Growth Tax Relief Reconciliation Act of 2003. This amount will be reflected on Form 1099-DIV for the calendar year 2008.
Shareholders will be mailed a 2008 U.S. Treasury Department Form 1099-DIV in January 2009. This will reflect the total of all distributions that are taxable for calendar year 2008.
Annual report | Intrinsic Value Fund
41
Trustees and Officers
This chart provides information about the Trustees and Officers who oversee your John Hancock fund. Officers elected by the Trustees manage the day-to-day operations of the Fund and execute policies formulated by the Trustees.
Independent Trustees
| | |
| Name, Year of Birth | | Number of |
| Position(s) held with Fund | Trustee | John Hancock |
| Principal occupation(s) and other | of Fund | Funds overseen |
| directorships during past 5 years | since 1 | by Trustee |
| |
| James F. Carlin, Born: 1940 | 2006 | 55 |
|
| Chairman (since December 2007); Director and Treasurer, Alpha Analytical Laboratories, Inc. (chemical |
| analysis) (since 1985); Part Owner and Treasurer, Lawrence Carlin Insurance Agency, Inc. (since 1995); |
| Part Owner and Vice President, Mone Lawrence Carlin Insurance Agency, Inc. (until 2005); Chairman |
| and Chief Executive Officer, Carlin Consolidated, Inc. (management/investments) (since 1987); Trustee, |
| Massachusetts Health and Education Tax Exempt Trust (1993–2003) . | | |
|
| |
| William H. Cunningham, Born: 1944 | 2006 | 55 |
|
| Professor, University of Texas at Austin (since 1971); former Chancellor, University of Texas System and |
| former President, University of Texas at Austin (until 2001); Chairman and Chief Executive Officer, IBT |
| Technologies (until 2001); Director of the following: Hicks Acquisition Company I, Inc. (since 2007); |
| Hire.com (until 2004), STC Broadcasting, Inc. and Sunrise Television Corp. (until 2001), Symtx, Inc. |
| (electronic manufacturing) (since 2001), Adorno/Rogers Technology, Inc. (until 2004), Pinnacle |
| Foods Corporation (until 2003), rateGenius (until 2003), Lincoln National Corporation (insurance) |
| (since 2006), Jefferson-Pilot Corporation (diversified life insurance company) (until 2006), New |
| Century Equity Holdings (formerly Billing Concepts) (until 2001), eCertain (until 2001), ClassMap.com |
| (until 2001), Agile Ventures (until 2001), AskRed.com (until 2001), Southwest Airlines (since 2000), |
| Introgen (manufacturer of biopharmaceuticals) (since 2000) and Viasystems Group, Inc. (electronic |
| manufacturer) (until 2003); Advisory Director, Interactive Bridge, Inc. (college fundraising) (until 2001); |
| Advisory Director, Q Investments (until 2003); Advisory Director, JPMorgan Chase Bank (formerly Texas |
| Commerce Bank–Austin), LIN Television (until 2008), WilTel Communications (until 2003) and Hayes |
| Lemmerz International, Inc. (diversified automotive parts supply company) (since 2003) . | |
|
| |
| Charles L. Ladner,2 Born: 1938 | 2006 | 55 |
|
| Chairman and Trustee, Dunwoody Village, Inc. (retirement services) (until 2003); Senior Vice President |
| and Chief Financial Officer, UGI Corporation (public utility holding company) (retired 1998); Vice |
| President and Director, AmeriGas, Inc. (retired 1998); Director, AmeriGas Partners, L. P. (gas distribution) |
| (until 1997); Director, EnergyNorth, Inc. (until 1997); Director, Parks and History Association (until 2005) . |
|
| |
| John A. Moore, 2 Born: 1939 | 2006 | 55 |
|
| President and Chief Executive Officer, Institute for Evaluating Health Risks (nonprofit institution) |
| (until 2001); Senior Scientist, Sciences International (health research) (until 2003); Former Assistant |
| Administrator and Deputy Administrator, Environmental Protection Agency; Principal, Hollyhouse |
| (consulting) (since 2000); Director, CIIT Center for Health Science Research (nonprofit research) |
| (until 2007) . | | |
Intrinsic Value Fund | Annual report
42
Independent Trustees (continued)
| | |
| Name, Year of Birth | | Number of |
| Position(s) held with Fund | Trustee | John Hancock |
| Principal occupation(s) and other | of Fund | Funds overseen |
| directorships during past 5 years | since 1 | by Trustee |
| |
| Patti McGill Peterson,2 Born: 1943 | 2006 | 55 |
|
| Senior Associate, Institute for Higher Education Policy (since 2007); Executive Director, Council for |
| International Exchange of Scholars and Vice President, Institute of International Education (until 2007); |
| Senior Fellow, Cornell Institute of Public Affairs, Cornell University, Ithaca, NY (until 1998); Former |
| President, Wells College, Aurora, NY, and St. Lawrence University, Canton, NY; Director, Niagara |
| Mohawk Power Corporation (until 2003); Director, Ford Foundation, International Fellowships Program |
| (since 2002); Director, Lois Roth Endowment (since 2002); Director, Council for International Educational |
| Exchange (since 2003) . | | |
|
| |
| Steven R. Pruchansky, Born: 1944 | 2006 | 55 |
|
| Chairman and Chief Executive Officer, Greenscapes of Southwest Florida, Inc. (since 2000); Director and |
| President, Greenscapes of Southwest Florida, Inc. (until 2000); Managing Director, JonJames, LLC (real |
| estate) (since 2000); Director, First Signature Bank & Trust Company (until 1991); Director, Mast Realty |
| Trust (until 1994); President, Maxwell Building Corp. (until 1991) . | | |
Non-Independent Trustees 3
| | |
| Name, Year of Birth | | Number of |
| Position(s) held with Fund | Trustee | John Hancock |
| Principal occupation(s) and other | of Fund | Funds overseen |
| directorships during past 5 years | since 1 | by Trustee |
| |
| James R. Boyle, Born: 1959 | 2006 | 265 |
|
| Executive Vice President, Manulife Financial Corporation (since 1999); President, John Hancock Variable |
| Life Insurance Company (since March 2007); Executive Vice President, John Hancock Life Insurance |
| Company (since 2004); Chairman and Director, John Hancock Advisers, LLC (the Adviser), John Hancock |
| Funds, LLC and The Berkeley Financial Group, LLC (The Berkeley Group) (holding company) (since 2005); |
| Senior Vice President, The Manufacturers Life Insurance Company (U. S. A. ) (until 2004) . | |
Annual report | Intrinsic Value Fund
43
Principal officers who are not Trustees
| |
| Name, Year of Birth | |
| Position(s) held with Fund | Officer |
| Principal occupation(s) and other | of Fund |
| directorships during past 5 years | since |
| |
| Keith F. Hartstein, Born: 1956 | 2006 |
|
| President and Chief Executive Officer | |
| Senior Vice President, Manulife Financial Corporation (since 2004); Director, President and Chief | |
| Executive Officer, the Adviser, The Berkeley Group and John Hancock Funds, LLC (since 2005); Director, |
| MFC Global Investment Management (U. S. ), LLC (MFC Global (U. S. )) (since 2005); Director, John | |
| Hancock Signature Services, Inc. (since 2005); President and Chief Executive Officer, John Hancock |
| Investment Management Services, LLC (since 2006); President and Chief Executive Officer, John Hancock |
| Funds, John Hancock Funds II, John Hancock Funds III and John Hancock Trust (since 2005); Director, |
| Chairman and President, NM Capital Management, Inc. (since 2005); Member, Investment Company |
| Institute Sales Force Marketing Committee (since 2003); President and Chief Executive Officer, MFC |
| Global (U.S. ) (2005–2006); Executive Vice President, John Hancock Funds, LLC (until 2005) . | |
|
| |
| Thomas M. Kinzler, Born: 1955 | 2006 |
|
| Secretary and Chief Legal Officer | |
| Vice President and Counsel, John Hancock Life Insurance Company (U. S. A. ) (since 2006); Secretary and |
| Chief Legal Officer, John Hancock Funds and John Hancock Funds II (since 2006); Chief Legal Officer |
| and Assistant Secretary, John Hancock Trust (since 2006); Vice President and Associate General Counsel, |
| Massachusetts Mutual Life Insurance Company (1999–2006); Secretary and Chief Legal Counsel, MML |
| Series Investment Fund (2000–2006); Secretary and Chief Legal Counsel, MassMutual Institutional Funds |
| (2000–2004); Secretary and Chief Legal Counsel, MassMutual Select Funds and MassMutual Premier |
| Funds (2004–2006) . | |
|
| |
| Francis V. Knox, Jr. , Born: 1947 | 2006 |
|
| Chief Compliance Officer | |
| Vice President and Chief Compliance Officer, John Hancock Investment Management Services, LLC, |
| the Adviser and MFC Global (U. S. ) (since 2005); Vice President and Chief Compliance Officer, John |
| Hancock Funds, John Hancock Funds II, John Hancock Funds III and John Hancock Trust (since 2005); |
| Vice President and Assistant Treasurer, Fidelity Group of Funds (until 2004); Vice President and Ethics & |
| Compliance Officer, Fidelity Investments (until 2001) . | |
|
| |
| Charles A. Rizzo, Born: 1957 | 2007 |
|
| Chief Financial Officer | |
| Chief Financial Officer, John Hancock Funds, John Hancock Funds II, John Hancock Funds III and John |
| Hancock Trust (since June 2007); Assistant Treasurer, Goldman Sachs Mutual Fund Complex (regis- |
| tered investment companies) (2005–June 2007); Vice President, Goldman Sachs (2005–June 2007); |
| Managing Director and Treasurer of Scudder Funds, Deutsche Asset Management (2003–2005); | |
| Director, Tax and Financial Reporting, Deutsche Asset Management (2002–2003); Vice President and |
| Treasurer, Deutsche Global Fund Services (Deutsche Registered Investment Companies) (1999–2002) . |
|
| |
| Gordon M. Shone, Born: 1956 | 2006 |
|
| Treasurer | |
| Senior Vice President, John Hancock Life Insurance Company (U.S. A. ) (since 2001); Treasurer, John |
| Hancock Funds (since 2006), John Hancock Funds II, John Hancock Funds III and John Hancock Trust |
| (since 2005); Vice President and Chief Financial Officer, John Hancock Trust (2003–2005); Vice President, |
| John Hancock Investment Management Services, Inc., John Hancock Advisers, LLC (since 2006) and The |
| Manufacturers Life Insurance Company (U. S. A. ) (1998–2000) . | |
Intrinsic Value Fund | Annual report
44
Principal officers who are not Trustees (continued)
| |
| Name, Year of Birth | |
| Position(s) held with Fund | Officer |
| Principal occupation(s) and other | of Fund |
| directorships during past 5 years | since |
| |
| John G. Vrysen, Born: 1955 | 2006 |
|
| Chief Operating Officer | |
| Senior Vice President, Manulife Financial Corporation (since 2006); Director, Executive Vice President |
| and Chief Operating Officer, the Adviser, The Berkeley Group and John Hancock Funds, LLC (since | |
| June 2007); Executive Vice President and Chief Operating Officer, John Hancock Investment | |
| Management Services, LLC (since December 2007); Chief Operating Officer, John Hancock Funds, |
| John Hancock Funds II, John Hancock Funds III and John Hancock Trust (since June 2007); Director, |
| Executive Vice President and Chief Financial Officer, the Adviser, The Berkeley Group and John Hancock |
| Funds, LLC (2005–2007); Executive Vice President and Chief Financial Officer, John Hancock Investment |
| Management Services, LLC (2005–2007); Executive Vice President and Chief Financial Officer, MFC |
| Global (U. S. ) (2005 until August 2007); Director, John Hancock Signature Services, Inc. (since 2005); |
| Chief Financial Officer, John Hancock Funds, John Hancock Funds II, John Hancock Funds III and John |
| Hancock Trust (2005 until June 2007); Vice President and General Manager, John Hancock Fixed | |
| Annuities, U.S. Wealth Management (2004–2005); Vice President, Operations, Manulife Wood Logan |
| (2000–2004) . | |
The business address for all Trustees and Officers is 601 Congress Street, Boston, Massachusetts 02210-2805.
The Statement of Additional Information of the Fund includes additional information about members of the Board of Trustees of the Fund and is available without charge, upon request, by calling 1-800-225-5291.
1 Each Trustee serves until resignation, retirement age or until his or her successor is elected.
2 Member of Audit and Compliance Committee.
3 Non-Independent Trustee holds positions with the Fund’s investment adviser, underwriter and certain other affiliates.
Annual report | Intrinsic Value Fund
45
For more information
The Fund’s proxy voting policies, procedures and records are available without charge, upon request:
| | |
| By phone | On the Fund’s Web site | On the SEC’s Web site |
| 1-800-225-5291 | www. jhfunds. com/proxy | www. sec. gov |
|
| |
| Investment adviser | Custodian | Legal counsel |
| John Hancock Investment | State Street Bank & Trust Co. | Kirkpatrick & Lockhart |
| Management Services, LLC | 2 Avenue de Lafayette | Preston Gates Ellis LLP |
| 601 Congress Street | Boston, MA 02111 | One Lincoln Street |
| Boston, MA 02210-2805 | | Boston, MA 02111-2950 |
| Transfer agent | |
| Subadviser | John Hancock Signature | Independent registered |
| Grantham, Mayo, Van | Services, Inc. | public accounting firm |
| Otterloo & Co. LLC | P. O. Box 9510 | PricewaterhouseCoopers LLP |
| 40 Rowes Wharf | Portsmouth, NH 03802-9510 | 125 High Street |
| Boston, MA 02110 | | Boston, MA 02110 |
| | | |
| Principal distributor | | |
| John Hancock Funds, LLC | | |
| 601 Congress Street | | |
| Boston, MA 02210-2805 | | |
| | |
| How to contact us | |
|
| |
| Internet | www. jhfunds.com | |
|
| |
| Mail | Regular mail: | Express mail: |
| | John Hancock Signature | John Hancock Signature |
| | Services, Inc. | Services, Inc. |
| | P. O. Box 9510 | Mutual Fund Image Operations |
| | Portsmouth, NH 03802-9510 | 164 Corporate Drive |
| | | Portsmouth, NH 03801 |
|
| |
| Phone | Customer service representatives | 1-800-225-5291 |
| | EASI-Line | 1-800-338-8080 |
| | TDD line | 1-800-554-6713 |
|
A listing of month-end portfolio holdings is available on our Web site, www.jhfunds.com. A more detailed portfolio holdings summary is available on a quarterly basis 60 days after the fiscal quarter on our Web site or upon request by calling 1-800-225-5291, or on the SEC’s Web site, www.sec.gov.
Intrinsic Value Fund | Annual report
46

1-800-225-5291
1-800-554-6713 TDD
1-800-338-8080 EASI-Line
www. jhfunds.com
Now available: electronic delivery
www. jhfunds.com/edelivery
| | |
| This report is for the information of the shareholders of John Hancock Intrinsic Value Fund. | 5100A | 2/08 |
| It is not authorized for distribution to prospective investors unless preceded or accompanied by a prospectus. | | 4/08 |

Discussion of Fund performance
By Grantham, Mayo, Van Otterloo & Co. LLC (GMO)
U.S. stocks went on a wild ride during the 12-month period highlighted both by record highs for broad market indexes and conditions deemed poor enough to warrant numerous interventions by the Federal Reserve. For the period in full the S&P 500 Index finished down 3.60%, a modest move which belied its frequent violent gyrations. Growth stocks outpaced value stocks during the period. Financials and consumer discretionary were the worst-performing sectors in the Russell 2500 Value Index, while energy stocks performed the best.
“U.S. stocks went on a wild ride
during the 12-month review
period…”
For the 12 months ended February, 29, 2008, John Hancock Value Opportunities Fund’s Class A, Class B, Class C, Class I, Class R1 and Class 1 shares returned –19.45%, –20.08%, –20.03%, –19.16%, –19.57% and –19.12%, respectively, at net asset value while the Russell 2500 Value Index returned –15.50% . Sector selection detracted from relative returns, while stock selection added. Sector weightings adding to relative returns included an overweight in consumer staples, while sector weightings detracting from relative returns included an overweight in consumer discretionary. Stock selections in consumer discretionary added to relative returns, while picks in industrials detracted. Individual names adding to returns versus the benchmark included overweight positions in Commerce Group, Inc., Annaly Capital Management, Inc. and CDW Corp., while overweight positions detracting from relative returns included Liz Claiborne, Inc., PMI Group Inc., and First Horizon National Corp.
This commentary reflects the views of the portfolio management team through the end of the Fund’s period discussed in this report. The team’s statements reflect their own opinions. As such, they are in no way guarantees of future events and are not intended to be used as investment advice or a recommendation regarding any specific security. They are also subject to change at any time as market and other conditions warrant.
Value Opportunities Fund | Annual report
6
A look at performance
For the periods ended February 29, 2008
| | | | | | | | | | | |
| | | | Average annual returns | | | | Cumulative total returns | | |
| | | | with maximum sales charge (POP) | | | with maximum sales charge (POP) | | |
| | Inception | | | | | Since | | | | | Since |
| Class | date | | 1-year | 5-year | 10-year | inception | | 1-year | 5-year | 10-year | inception |
|
| A | 6-12-06 | | –23.49% | — | — | –8.06% | | –23.49% | — | — | –13.48% |
|
| B | 6-12-06 | | –23.87 | — | — | –8.04 | | –23.87 | — | — | –13.45 |
|
| C | 6-12-06 | | –20.79 | — | — | –5.93 | | –20.79 | — | — | –10.01 |
|
| I 1 | 6-12-06 | | –19.16 | — | — | –4.91 | | –19.16 | — | — | –8.31 |
|
| R1 1 | 6-12-06 | | –19.57 | — | — | –5.49 | | –19.57 | — | — | –9.27 |
|
| 1 1 | 6-12-06 | | –19.12 | — | — | –4.87 | | –19.12 | — | — | –8.24 |
|
Performance figures assume all distributions are reinvested. Public offering price (POP) figures reflect maximum sales charge on Class A shares of 5%, and the applicable contingent deferred sales charge (CDSC) on Class B and Class C shares. The Class B shares’ CDSC declines annually between years 1 to 6 according to the following schedule: 5, 4, 3, 3, 2, 1%. No sales charge will be assessed after the sixth year. Class C shares held for less than one year are subject to a 1% CDSC. Sales charge is not applicable for Class I, Class R1 and Class 1 shares.
The expense ratios of the Fund, both net (including any fee waivers or expense limitations) and gross (excluding any fee waivers or expense limitations), are set forth according to the most recent publicly available prospectuses for the Fund and may differ from the expense ratios disclosed in the Financial Highlights tables in this report. The waivers and expense limitations are contractual at least until 06-30-08. The net expenses are as follows: Class A — 1.41%, Class B — 2.11%, Class C — 2.11%, Class I — 1.02%, Class R1 — 1.76%, Class 1 — 0.97% . Had the fee waivers and expense limitations not been in place, the gross expenses would be as follows: Class A — 2.16%, Class B — 11.34%, Class C — 5.12%, Class I — 12.66%, Class R1 — 21.72%, Class 1 — 1.70% .
The returns reflect past results and should not be considered indicative of future performance. The return and principal value of an investment will fluctuate so that shares, when redeemed, may be worth more or less than their original cost. Due to market volatility, the Fund’s current performance may be higher or lower than the performance shown. For performance data current to the most recent month end, please call 1-800-225-5291 or visit the Fund’s Web site at www.jhfunds.com.
The performance table above and the chart on the next page do not reflect the deduction of taxes that a shareholder would pay on fund distributions or the redemption of fund shares.
The Fund’s performance results reflect any applicable expense reductions, without which the expenses increase and results would have been less favorable.
Performance is calculated with an opening price (prior day’s close) on the inception date.
1 For certain types of investors as described in the Fund’s Class I, Class R1 and Class 1 share prospectuses.
Annual report | Value Opportunities Fund
7
A look at performance
Growth of $10,000
This chart shows what happened to a hypothetical $10,000 investment in Value Opportunities Fund Class A shares for the period indicated. For comparison, we’ve shown the same investment in the Russell 2500 Value Index.
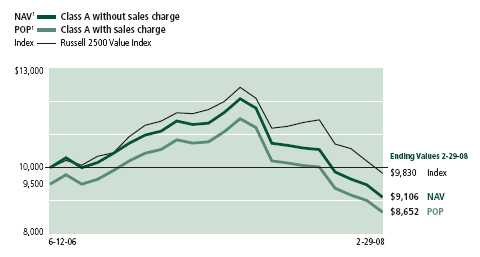
| | | | | |
| | | | With maximum | |
| Class | Period beginning | Without sales charge | sales charge | Index |
|
| B | 6-12-06 | $8,994 | $8,655 | $9,830 |
|
| C 2 | 6-12-06 | 8,999 | 8,999 | 9,830 |
|
| I 3 | 6-12-06 | 9,169 | 9,169 | 9,830 |
|
| R1 3 | 6-12-06 | 9,073 | 9,073 | 9,830 |
|
| 1 3 | 6-12-06 | 9,176 | 9,176 | 9,830 |
|
Assuming all distributions were reinvested for the period indicated, the table above shows the value of a $10,000 investment in the Fund’s Class B, Class C, Class I, Class R1 and Class 1 shares, respectively, as of February 29, 2008. Performance of the classes will vary based on the difference in sales charges paid by shareholders investing in the different classes and the fee structure of those classes.
Russell 2500 Value Index is an unmanaged index containing those securities in the Russell 2500 Index with a less-than-average growth orientation.
It is not possible to invest directly in an index. Index figures do not reflect sales charges, which would have resulted in lower values if they did.
1 NAV represents net asset value and POP represents public offering price.
2 No contingent deferred sales charge applicable.
3 For certain types of investors as described in the Fund’s Class I, Class R1 and Class 1 share prospectuses.
Value Opportunities Fund | Annual report
8
Your expenses
These examples are intended to help you understand your ongoing operating expenses.
Understanding fund expenses
As a shareholder of the Fund, you incur two types of costs:
■ Transaction costs which include sales charges (loads) on purchases or redemptions (varies by share class), minimum account fee charge, etc.
■ Ongoing operating expenses including management fees, distribution and service fees (if applicable), and other fund expenses.
We are going to present only your ongoing operating expenses here.
Actual expenses/actual returns
This example is intended to provide information about your fund’s actual ongoing operating expenses, and is based on your fund’s actual return. It assumes an account value of $1,000.00 on September 1, 2007, with the same investment held until February 29, 2008.
| | | |
| | Account value | Ending value | Expenses paid during |
| | on 9-1-07 | on 2-29-08 | period on 2-29-081 |
|
| Class A | $1,000.00 | $853.17 | $6.36 |
|
| Class B | 1,000.00 | 849.83 | 9.66 |
|
| Class C | 1,000.00 | 849.93 | 9.61 |
|
| Class I | 1,000.00 | 855.00 | 4.57 |
|
| Class R1 | 1,000.00 | 853.68 | 5.62 |
|
| Class 1 | 1,000.00 | 855.03 | 4.34 |
|
Together with the value of your account, you may use this information to estimate the operating expenses that you paid over the period. Simply divide your account value at February 29, 2008, by $1,000.00, then multiply it by the “expenses paid” for your share class from the table above. For example, for an account value of $8,600.00, the operating expenses should be calculated as follows:
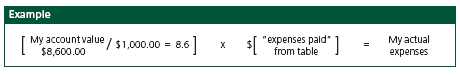
Annual report | Value Opportunities Fund
9
Your expenses
Hypothetical example for comparison purposes
This table allows you to compare your fund’s ongoing operating expenses with those of any other fund. It provides an example of the Fund’s hypothetical account values and hypothetical expenses based on each class’s actual expense ratio and an assumed 5% annualized return before expenses (which is not your fund’s actual return). It assumes an account value of $1,000.00 on September 1, 2007, with the same investment held until February 29, 2008. Look in any other fund shareholder report to find its hypothetical example and you will be able to compare these expenses.
| | | | |
| | Account value | Ending value | Expenses paid during |
| | on 9-1-07 | on 2-29-08 | period on 2-29-081 |
|
| Class A | $1,000.00 | $1,018.00 | $6.92 |
|
| Class B | 1,000.00 | 1,014.42 | 10.52 |
|
| Class C | 1,000.00 | 1,014.47 | 10.47 |
|
| Class I | 1,000.00 | 1,019.94 | 4.97 |
|
| Class R1 | 1,000.00 | 1,018.80 | 6.12 |
|
| Class 1 | 1,000.00 | 1,020.19 | 4.72 |
|
Remember, these examples do not include any transaction costs, such as sales charges; therefore, these examples will not help you to determine the relative total costs of owning different funds. If transaction costs were included, your expenses would have been higher. See the prospectus for details regarding transaction costs.
1 Expenses are equal to the Fund’s annualized expense ratio of 1.38%, 2.10%, 2.09%, 0.99%, 1.22% and 0.94% for Class A, Class B, Class C, Class I, Class R1 and Class 1, respectively, multiplied by the average account value over the period, multiplied by the number of days in most recent fiscal half year/366 (to reflect the one-half year period).
Value Opportunities Fund | Annual report
10
Portfolio summary
| | | | |
| Top 10 holdings 1 | | | | |
|
| Western Digital Corp. | 1.4% | | BorgWarner, Inc. | 1.0% |
| |
|
| Annaly Capital Management,. Inc., REIT | 1.2% | | Energizer Holdings, Inc. | 1.0% |
| |
|
| Commerce Group, Inc. | 1.2% | | First American Corp. | 1.0% |
| |
|
| AutoNation, Inc. | 1.2% | | Transatlantic Holdings, Inc. | 0.9% |
| |
|
| Reinsurance Group of America, Inc. | 1.1% | | Tech Data Corp. | 0.9% |
| |
|
| |
| Sector distribution 1 | | | | |
|
| Financial | 25% | | Basic materials | 5% |
| |
|
| Consumer, cyclical | 21% | | Energy | 4% |
| |
|
| Consumer, non-cyclical | 18% | | Communications | 3% |
| |
|
| Industrial | 12% | | Utilities | 1% |
| |
|
| Technology | 5% | | Others | 6% |
| |
|
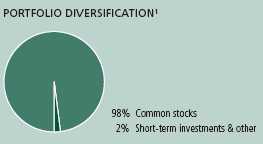
1 As a percentage of net assets on February 29, 2008.
Annual report | Value Opportunities Fund
11
F I N A N C I A L S T A T E M E N T S
Fund’s investments
Securities owned by the Fund on 2-29-08
This schedule is divided into three main categories: common stocks, short-term investments and repurchase agreements. Common stocks are further broken down by industry group. Repurchase agreements, which represent the Fund’s cash position, are listed last.
| | |
| Issuer | Shares | Value |
| |
| Common stocks 97.64% | | $17,759,402 |
|
| (Cost $20,057,523) | | |
| | | |
| Aerospace 0.86% | | 156,029 |
|
| Alliant Techsystems, Inc. * | 1,000 | 104,940 |
|
| Curtiss-Wright Corp. | 500 | 21,030 |
|
| Ducommun, Inc. * | 500 | 13,865 |
|
| Esterline Technologies Corp. * | 200 | 10,480 |
|
| Woodward Governor Company | 200 | 5,714 |
| | | |
| Agriculture 0.37% | | 66,420 |
|
| Fresh Del Monte Produce, Inc. * | 2,000 | 66,420 |
| | | |
| Air Freight 0.01% | | 1,701 |
|
| ExpressJet Holdings, Inc. * | 700 | 1,701 |
| | | |
| Air Travel 0.15% | | 26,544 |
|
| SkyWest, Inc. | 1,200 | 26,544 |
| | | |
| Apparel & Textiles 1.68% | | 304,637 |
|
| Columbia Sportswear Company (a) | 1,500 | 61,995 |
|
| Jones Apparel Group, Inc. | 4,000 | 56,440 |
|
| K-Swiss, Inc. , Class A | 1,200 | 17,412 |
|
| Liz Claiborne, Inc. | 7,100 | 126,238 |
|
| Oxford Industries, Inc. | 500 | 10,570 |
|
| Timberland Company, Class A * | 1,600 | 24,032 |
|
| Wolverine World Wide, Inc. | 300 | 7,950 |
| | | |
| Auto Parts 3.57% | | 650,192 |
|
| Aftermarket Technology Corp. * | 200 | 3,750 |
|
| American Axle & Manufacturing Holdings, Inc. | 1,500 | 29,520 |
|
| ArvinMeritor, Inc. | 4,600 | 51,934 |
|
| Autoliv, Inc. | 2,200 | 109,780 |
|
| BorgWarner, Inc. | 4,200 | 181,062 |
|
| CSK Auto Corp. * | 2,700 | 24,489 |
|
| Lear Corp. * | 2,200 | 60,676 |
|
| O’Reilly Automotive, Inc. * | 2,500 | 67,400 |
|
| Pep Boys — Manny, Moe & Jack | 1,500 | 17,160 |
|
| Tenneco, Inc. * | 900 | 22,725 |
|
| TRW Automotive Holdings Corp. * | 3,700 | 81,696 |
See notes to financial statements
Value Opportunities Fund | Annual report
12
F I N A N C I A L S T A T E M E N T S
| | |
| Issuer | Shares | Value |
| | | |
| Auto Services 1.92% | | $348,996 |
|
| AutoNation, Inc. * | 14,500 | 211,265 |
|
| Avis Budget Group, Inc. * | 4,500 | 51,435 |
|
| Copart, Inc. * | 1,800 | 74,988 |
|
| Lithia Motors, Inc. , Class A | 1,100 | 11,308 |
| | | |
| Automobiles 1.22% | | 222,420 |
|
| Asbury Automotive Group, Inc. | 3,500 | 49,070 |
|
| Group 1 Automotive, Inc. | 2,100 | 51,450 |
|
| Penske Auto Group, Inc. | 6,100 | 110,044 |
|
| Rush Enterprises, Inc. , Class A * | 800 | 11,856 |
| | | |
| Banking 8.58% | | 1,561,169 |
|
| AMCORE Financial, Inc. | 800 | 15,536 |
|
| Anchor BanCorp Wisconsin, Inc. | 1,700 | 32,181 |
|
| Associated Banc-Corp. | 4,700 | 117,124 |
|
| Astoria Financial Corp. | 1,600 | 41,872 |
|
| BancorpSouth, Inc. | 2,200 | 49,456 |
|
| Bank of Hawaii Corp. | 800 | 38,416 |
|
| Cathay General Bancorp, Inc. (a) | 1,200 | 26,304 |
|
| Central Pacific Financial Corp. | 600 | 11,094 |
|
| Chemical Financial Corp. (a) | 1,200 | 26,664 |
|
| Citizens Banking Corp. | 300 | 3,339 |
|
| City National Corp. | 2,300 | 117,875 |
|
| Colonial Bancgroup, Inc. | 800 | 9,664 |
|
| Commerce Bancshares, Inc. | 1,664 | 69,306 |
|
| Community Bank Systems, Inc. | 1,300 | 28,730 |
|
| Dime Community Bancorp, Inc. | 800 | 12,176 |
|
| Downey Financial Corp. (a) | 1,800 | 47,142 |
|
| F. N. B. Corp. (a) | 600 | 8,226 |
|
| First BanCorp Puerto Rico (a) | 3,200 | 28,928 |
|
| First Horizon National Corp. (a) | 3,600 | 58,464 |
|
| FirstMerit Corp. | 3,400 | 63,818 |
|
| Flagstar Bancorp, Inc. (a) | 2,400 | 17,184 |
|
| Hanmi Financial Corp. | 1,200 | 9,156 |
|
| Imperial Capital Bancorp, Inc. | 500 | 11,180 |
|
| International Bancshares Corp. | 2,540 | 55,067 |
|
| New York Community Bancorp, Inc. | 400 | 6,532 |
|
| Old National Bancorp | 1,500 | 23,280 |
|
| Oriental Financial Group, Inc. | 900 | 18,738 |
|
| Pacific Capital Bancorp | 2,100 | 43,995 |
|
| Park National Corp. | 300 | 18,150 |
|
| Popular, Inc. (a) | 10,500 | 115,920 |
|
| S & T Bancorp, Inc. | 400 | 11,340 |
|
| SVB Financial Group * | 700 | 31,710 |
|
| TCF Financial Corp. | 7,200 | 133,992 |
|
| The South Financial Group, Inc. | 600 | 8,658 |
See notes to financial statements
Annual report | Value Opportunities Fund
13
F I N A N C I A L S T A T E M E N T S
| | |
| Issuer | Shares | Value |
| | | |
| Banking (continued) | | |
|
| TrustCo Bank Corp. , NY (a) | 1,100 | $9,515 |
|
| Trustmark Corp. (a) | 2,400 | 47,424 |
|
| United Bankshares, Inc. | 800 | 21,016 |
|
| Washington Federal, Inc. | 2,000 | 45,400 |
|
| Webster Financial Corp. | 1,000 | 27,970 |
|
| WestAmerica Bancorp (a) | 1,100 | 52,063 |
|
| Whitney Holding Corp. | 400 | 9,604 |
|
| Wilmington Trust Corp. | 1,200 | 36,960 |
| | | |
| Biotechnology 1.32% | | 240,704 |
|
| Bio-Rad Laboratories, Inc. , Class A * | 200 | 18,888 |
|
| Charles River Laboratories International, Inc. * | 900 | 52,722 |
|
| Immucor, Inc. * | 400 | 11,920 |
|
| Invitrogen Corp. * | 1,400 | 118,286 |
|
| Pharmanet Development Group, Inc. * | 400 | 11,532 |
|
| Techne Corp. * | 400 | 27,356 |
| | | |
| Broadcasting 0.51% | | 92,496 |
|
| Belo Corp. , Class A | 2,700 | 31,779 |
|
| Discovery Holding Company * | 2,400 | 54,168 |
|
| Westwood One, Inc. | 3,700 | 6,549 |
| | | |
| Building Materials & Construction 0.29% | | 52,633 |
|
| Dycom Industries, Inc. * | 1,100 | 12,584 |
|
| EMCOR Group, Inc. * | 100 | 2,409 |
|
| Lennox International, Inc. | 1,000 | 37,640 |
| | | |
| Business Services 3.85% | | 701,041 |
|
| ABM Industries, Inc. | 1,600 | 31,776 |
|
| Affiliated Computer Services, Inc. , Class A * | 1,100 | 55,825 |
|
| CDI Corp. | 500 | 11,375 |
|
| Convergys Corp. * | 1,100 | 15,884 |
|
| Deluxe Corp. | 5,700 | 118,731 |
|
| FactSet Research Systems, Inc. | 900 | 47,376 |
|
| FTI Consulting, Inc. * | 100 | 6,350 |
|
| Global Payments, Inc. | 700 | 27,769 |
|
| Insight Enterprises, Inc. * | 2,500 | 43,825 |
|
| Kelly Services, Inc. , Class A | 2,800 | 53,788 |
|
| Manpower, Inc. | 700 | 39,690 |
|
| MAXIMUS, Inc. | 700 | 25,424 |
|
| Pre-Paid Legal Services, Inc. * | 400 | 19,060 |
|
| R. H. Donnelley Corp. * | 400 | 2,836 |
|
| Resources Connection, Inc. * | 900 | 14,490 |
|
| ScanSource, Inc. * | 600 | 20,382 |
|
| SYNNEX Corp. * | 1,600 | 33,296 |
|
| Total Systems Services, Inc. | 3,100 | 68,913 |
|
| URS Corp. * | 1,200 | 48,336 |
|
| Watson Wyatt Worldwide, Inc. , Class A | 300 | 15,915 |
See notes to financial statements
Value Opportunities Fund | Annual report
14
F I N A N C I A L S T A T E M E N T S
| | |
| Issuer | Shares | Value |
| | | |
| Cellular Communications 0.31% | | $56,280 |
|
| Telephone & Data Systems, Inc. | 1,200 | 56,280 |
| | | |
| Chemicals 3.56% | | 647,881 |
|
| Albemarle Corp. | 100 | 3,794 |
|
| Cabot Corp. | 500 | 13,700 |
|
| Celanese Corp. , Series A | 1,700 | 66,130 |
|
| Cytec Industries, Inc. | 400 | 22,912 |
|
| Eastman Chemical Company | 400 | 26,324 |
|
| FMC Corp. | 1,900 | 107,559 |
|
| Lubrizol Corp. | 2,700 | 157,410 |
|
| Olin Corp. | 2,000 | 38,440 |
|
| PolyOne Corp. * | 400 | 2,600 |
|
| Rockwood Holdings, Inc. * | 600 | 18,414 |
|
| Sensient Technologies Corp. | 1,900 | 51,186 |
|
| Sigma-Aldrich Corp. | 2,100 | 115,542 |
|
| Stepan Company | 700 | 23,870 |
| | | |
| Colleges & Universities 0.41% | | 74,610 |
| | |
|
| Career Education Corp. * | 3,900 | 57,915 |
|
| Corinthian Colleges, Inc. * | 2,100 | 16,695 |
| | | |
| Computers & Business Equipment 3.95% | | 718,533 |
|
| CACI International, Inc. , Class A * | 600 | 26,196 |
|
| Diebold, Inc. | 200 | 4,824 |
|
| Foundry Networks, Inc. * | 800 | 9,496 |
|
| Ingram Micro, Inc. , Class A * | 10,700 | 163,389 |
|
| Lexmark International, Inc. * | 2,400 | 79,272 |
|
| Plexus Corp. * | 500 | 12,385 |
|
| Tech Data Corp. * | 5,000 | 166,750 |
|
| Western Digital Corp. * | 8,300 | 256,221 |
| | | |
| Construction & Mining Equipment 0.12% | | 21,693 |
|
| Kaman Corp. , Class A | 400 | 9,600 |
|
| Rowan Companies, Inc. | 300 | 12,093 |
| | | |
| Construction Materials 0.38% | | 68,587 |
|
| Applied Industrial Technologies, Inc. | 100 | 2,764 |
|
| Louisiana-Pacific Corp. | 100 | 1,088 |
|
| Simpson Manufacturing Company, Inc. (a) | 2,000 | 47,920 |
|
| Standex International Corp. | 300 | 5,703 |
|
| Universal Forest Products, Inc. | 400 | 11,112 |
| | | |
| Containers & Glass 0.41% | | 74,292 |
|
| Bemis Company, Inc. | 700 | 17,374 |
|
| Owens-Illinois, Inc. * | 700 | 39,515 |
|
| Sealed Air Corp. | 100 | 2,421 |
|
| Silgan Holdings, Inc. | 200 | 9,348 |
|
| Sonoco Products Company | 200 | 5,634 |
See notes to financial statements
Annual report | Value Opportunities Fund
15
F I N A N C I A L S T A T E M E N T S
| | |
| Issuer | Shares | Value |
| | | |
| Cosmetics & Toiletries 0.77% | | $139,380 |
|
| Alberto-Culver Company | 2,400 | 64,320 |
|
| Chattem, Inc. * | 300 | 23,370 |
|
| Elizabeth Arden, Inc. * | 500 | 9,110 |
|
| Estee Lauder Companies, Inc. , Class A | 1,000 | 42,580 |
| | | |
| Crude Petroleum & Natural Gas 1.96% | | 356,742 |
|
| Cimarex Energy Company | 1,800 | 94,860 |
|
| Forest Oil Corp. * | 500 | 24,665 |
|
| Patterson-UTI Energy, Inc. | 4,600 | 109,158 |
|
| Unit Corp. * | 2,100 | 115,815 |
|
| Whiting Petroleum Corp. * | 200 | 12,244 |
| | | |
| Domestic Oil 1.04% | | 188,427 |
|
| Berry Petroleum Company, Class A | 700 | 28,777 |
|
| Encore Acquisition Company * | 300 | 11,040 |
|
| Helix Energy Solutions Group, Inc. * | 300 | 10,566 |
|
| Holly Corp. | 800 | 42,712 |
|
| Oil States International, Inc. * | 1,900 | 80,104 |
|
| Stone Energy Corp. * | 300 | 15,228 |
| | | |
| Drugs & Health Care 0.43% | | 78,174 |
|
| Invacare Corp. | 1,300 | 32,448 |
|
| Molina Healthcare, Inc. * (a) | 600 | 18,990 |
|
| Perrigo Company | 800 | 26,736 |
| | | |
| Educational Services 0.42% | | 76,312 |
|
| ITT Educational Services, Inc. * | 1,100 | 60,742 |
|
| Strayer Education, Inc. | 100 | 15,570 |
| | | |
| Electrical Equipment 0.47% | | 86,213 |
|
| A. O. Smith Corp. | 300 | 10,929 |
|
| Anixter International, Inc. * | 500 | 32,695 |
|
| Hubbell, Inc. , Class B | 700 | 31,759 |
|
| Varian, Inc. * | 200 | 10,830 |
| | | |
| Electrical Utilities 0.06% | | 10,486 |
|
| Teco Energy, Inc. | 700 | 10,486 |
| | | |
| Electronics 1.74% | | 316,348 |
|
| Arrow Electronics, Inc. * | 2,600 | 84,786 |
|
| Avnet, Inc. * | 2,900 | 97,759 |
|
| Checkpoint Systems, Inc. * | 900 | 21,780 |
|
| Synopsys, Inc. * | 100 | 2,321 |
|
| Teleflex, Inc. | 1,600 | 90,480 |
|
| Zoran Corp. * | 1,400 | 19,222 |
| | | |
| Energy 0.67% | | 122,157 |
|
| Energen Corp. | 1,200 | 72,000 |
|
| Energy East Corp. | 1,100 | 29,315 |
|
| Headwaters, Inc. * (a) | 1,700 | 20,842 |
See notes to financial statements
Value Opportunities Fund | Annual report
16
F I N A N C I A L S T A T E M E N T S
| | |
| Issuer | Shares | Value |
| | | |
| Financial Services 1.20% | | $218,398 |
|
| AmeriCredit Corp. * | 100 | 1,438 |
|
| City Holding Company | 300 | 11,172 |
|
| Federal Agricultural Mortgage Corp. , Class C | 600 | 14,424 |
|
| Fulton Financial Corp. | 3,800 | 44,194 |
|
| Interactive Data Corp. | 1,700 | 49,742 |
|
| Nelnet, Inc. , Class A (a) | 1,500 | 16,350 |
|
| SEI Investments Company | 2,800 | 70,028 |
|
| Student Loan Corp. | 100 | 11,050 |
| | | |
| Food & Beverages 3.73% | | 677,644 |
|
| Chiquita Brands International, Inc. * | 1,600 | 32,752 |
|
| Corn Products International, Inc. | 200 | 7,342 |
|
| Dean Foods Company * | 3,900 | 83,928 |
|
| Del Monte Foods Company | 1,400 | 12,572 |
|
| Flowers Foods, Inc. | 1,500 | 33,990 |
|
| Hormel Foods Corp. | 600 | 24,516 |
|
| J. M. Smucker Company | 1,500 | 76,785 |
|
| PepsiAmericas, Inc. | 2,700 | 68,310 |
|
| Performance Food Group Company * | 3,400 | 110,500 |
|
| Pilgrim’s Pride Corp. (a) | 1,200 | 28,152 |
|
| Ralcorp Holdings, Inc. * | 100 | 5,545 |
|
| Sanderson Farms, Inc. (a) | 1,200 | 41,832 |
|
| Seaboard Corp. | 13 | 20,670 |
|
| Smithfield Foods, Inc. * | 300 | 8,265 |
|
| Tyson Foods, Inc. , Class A | 8,500 | 122,485 |
| | | |
| Funeral Services 0.13% | | 23,022 |
|
| Service Corporation International | 1,800 | 19,440 |
|
| Stewart Enterprises, Inc. , Class A | 600 | 3,582 |
| | | |
| Furniture & Fixtures 0.84% | | 152,441 |
|
| American Woodmark Corp. (a) | 100 | 1,898 |
|
| Ethan Allen Interiors, Inc. (a) | 2,000 | 54,480 |
|
| Furniture Brands International, Inc. (a) | 2,700 | 35,100 |
|
| La-Z-Boy, Inc. | 100 | 843 |
|
| Leggett & Platt, Inc. | 3,600 | 60,120 |
| | | |
| Gas & Pipeline Utilities 0.20% | | 35,609 |
|
| Equitable Resources, Inc. | 200 | 12,324 |
|
| ONEOK, Inc. | 500 | 23,285 |
| | | |
| Healthcare Products 1.90% | | 344,856 |
|
| CONMED Corp. * | 1,400 | 37,744 |
|
| IDEXX Laboratories, Inc. * | 1,000 | 55,470 |
|
| Kinetic Concepts, Inc. * | 400 | 20,556 |
|
| Owens & Minor, Inc. | 2,200 | 94,534 |
|
| Patterson Companies, Inc. * | 2,200 | 77,440 |
|
| Respironics, Inc. * | 900 | 59,112 |
See notes to financial statements
Annual report | Value Opportunities Fund
17
F I N A N C I A L S T A T E M E N T S
| | |
| Issuer | Shares | Value |
| | | |
| Healthcare Services 1.75% | | $318,777 |
|
| AMERIGROUP Corp. * | 700 | 25,200 |
|
| Apria Healthcare Group, Inc. * | 3,900 | 84,669 |
|
| Covance, Inc. * | 400 | 33,764 |
|
| Lincare Holdings, Inc. * | 1,900 | 61,750 |
|
| Omnicare, Inc. | 1,000 | 20,980 |
|
| Pediatrix Medical Group, Inc. * | 1,400 | 92,414 |
| | | |
| Homebuilders 1.27% | | 230,874 |
|
| D. R. Horton, Inc. | 100 | 1,403 |
|
| Lennar Corp. , Class A | 100 | 1,861 |
|
| M. D. C. Holdings, Inc. | 2,700 | 113,076 |
|
| Toll Brothers, Inc. * | 5,400 | 114,534 |
| | | |
| Hotels & Restaurants 1.00% | | 182,293 |
|
| Brinker International, Inc. | 2,300 | 42,412 |
|
| CBRL Group, Inc. | 1,500 | 54,630 |
|
| CEC Entertainment, Inc. * | 1,500 | 40,245 |
|
| Jack in the Box, Inc. * | 1,000 | 26,270 |
|
| O’Charley’s, Inc. | 400 | 4,516 |
|
| Ruby Tuesday, Inc. | 2,000 | 14,220 |
| | | |
| Household Products 2.06% | | 375,259 |
|
| Blyth, Inc. | 3,800 | 75,354 |
|
| Church & Dwight, Inc. | 400 | 21,384 |
|
| Energizer Holdings, Inc. * | 1,900 | 176,377 |
|
| Tupperware Brands Corp. | 2,800 | 102,144 |
| | | |
| Industrial Machinery 1.23% | | 223,835 |
|
| AGCO Corp. * | 700 | 45,402 |
|
| Albany International Corp. , Class A | 300 | 10,299 |
|
| Crane Company | 1,400 | 57,722 |
|
| EnPro Industries, Inc. * | 400 | 11,812 |
|
| Gardner Denver, Inc. * | 300 | 11,073 |
|
| Kennametal, Inc. | 1,300 | 39,481 |
|
| Middleby Corp. * | 200 | 13,600 |
|
| Pall Corp. | 600 | 23,622 |
|
| Tennant Company | 300 | 10,824 |
| | | |
| Insurance 15.31% | | 2,784,144 |
|
| Alfa Corp. | 700 | 15,239 |
|
| Alleghany Corp. * | 100 | 36,100 |
|
| American Financial Group, Inc. | 3,700 | 95,719 |
|
| American National Insurance Company | 200 | 22,690 |
|
| Arch Capital Group, Ltd. * | 1,300 | 89,024 |
|
| Aspen Insurance Holdings, Ltd. | 400 | 11,576 |
|
| Axis Capital Holdings, Ltd. | 2,200 | 81,114 |
|
| Brown & Brown, Inc. | 2,000 | 35,660 |
|
| Commerce Group, Inc. | 6,000 | 217,440 |
|
| Conseco, Inc. * | 1,600 | 18,768 |
See notes to financial statements
Value Opportunities Fund | Annual report
18
F I N A N C I A L S T A T E M E N T S
| | |
| Issuer | Shares | Value |
| | | |
| Insurance (continued) | | |
|
| Donegal Group, Inc. | 400 | $6,528 |
|
| Endurance Specialty Holdings, Ltd. | 900 | 35,370 |
|
| Erie Indemnity Company, Class A | 1,400 | 69,090 |
|
| FBL Financial Group, Inc. , Class A | 600 | 17,646 |
|
| First American Corp. | 5,000 | 174,150 |
|
| Harleysville Group, Inc. | 600 | 20,148 |
|
| HCC Insurance Holdings, Inc. | 4,600 | 110,676 |
|
| Horace Mann Educators Corp. | 3,300 | 57,354 |
|
| Kansas City Life Insurance Company | 200 | 8,266 |
|
| Markel Corp. * | 200 | 92,950 |
|
| Max Re Capital, Ltd. | 400 | 11,096 |
|
| MBIA, Inc. | 100 | 1,297 |
|
| Mercury General Corp. | 2,400 | 109,440 |
|
| MGIC Investment Corp. | 100 | 1,481 |
|
| National Western Life Insurance Company, Class A | 200 | 35,630 |
|
| Nationwide Financial Services, Inc. , Class A | 2,500 | 103,125 |
|
| Navigators Group, Inc. * | 200 | 10,946 |
|
| Odyssey Re Holdings Corp. | 800 | 28,944 |
|
| Old Republic International Corp. | 8,700 | 119,364 |
|
| PartnerRe, Ltd. | 800 | 61,512 |
|
| Philadelphia Consolidated Holding Corp. * | 4,400 | 149,248 |
|
| Platinum Underwriters Holdings, Ltd. | 300 | 10,350 |
|
| PMI Group, Inc. | 100 | 727 |
|
| Presidential Life Corp. | 500 | 8,380 |
|
| Protective Life Corp. | 2,100 | 81,039 |
|
| Reinsurance Group of America, Inc. | 3,600 | 196,956 |
|
| RenaissanceRe Holdings, Ltd. | 600 | 32,940 |
|
| RLI Corp. | 1,200 | 62,676 |
|
| Safety Insurance Group, Inc. | 1,300 | 48,217 |
|
| Selective Insurance Group, Inc. | 2,000 | 47,520 |
|
| Stancorp Financial Group, Inc. | 1,800 | 88,362 |
|
| State Auto Financial Corp. | 400 | 10,856 |
|
| Stewart Information Services Corp. | 2,100 | 62,517 |
|
| Transatlantic Holdings, Inc. | 2,500 | 168,500 |
|
| United Fire & Casualty Company | 700 | 24,045 |
|
| Unitrin, Inc. | 900 | 32,040 |
|
| Universal American Financial Corp. * | 600 | 10,308 |
|
| Zenith National Insurance Corp. | 1,500 | 51,120 |
| | | |
| Internet Content 0.06% | | 11,209 |
|
| InfoSpace, Inc. * | 1,100 | 11,209 |
| | | |
| Internet Service Provider 0.13% | | 23,859 |
|
| Earthlink, Inc. * | 3,300 | 23,859 |
See notes to financial statements
Annual report | Value Opportunities Fund
19
F I N A N C I A L S T A T E M E N T S
| | |
| Issuer | Shares | Value |
| | | |
| Leisure Time 0.70% | | $128,004 |
|
| Brunswick Corp. | 5,000 | 81,450 |
|
| Callaway Golf Company | 800 | 12,192 |
|
| Polaris Industries, Inc. (a) | 900 | 34,362 |
| | | |
| Life Sciences 0.77% | | 140,799 |
|
| PerkinElmer, Inc. | 2,000 | 49,640 |
|
| Pharmaceutical Product Development, Inc. | 700 | 31,549 |
|
| Waters Corp. * | 1,000 | 59,610 |
| | | |
| Liquor 0.42% | | 77,012 |
|
| Constellation Brands, Inc. , Class A * | 1,200 | 23,052 |
|
| Molson Coors Brewing Company, Class B | 1,000 | 53,960 |
| | | |
| Manufacturing 2.24% | | 407,994 |
|
| AptarGroup, Inc. | 1,700 | 63,716 |
|
| Blout International, Inc. * | 1,000 | 11,930 |
|
| Ceradyne, Inc. * | 1,100 | 34,221 |
|
| Mine Safety Appliances Company | 500 | 20,055 |
|
| Pentair, Inc. | 1,700 | 55,454 |
|
| Snap-on, Inc. | 500 | 24,960 |
|
| SPX Corp. | 1,600 | 163,680 |
|
| Stanley Works | 700 | 33,978 |
| | | |
| Medical-Hospitals 0.43% | | 77,555 |
|
| Centene Corp. * | 500 | 8,960 |
|
| Health Management Associates, Inc. , Class A * | 5,400 | 28,890 |
|
| LifePoint Hospitals, Inc. * | 1,200 | 30,072 |
|
| VCA Antech, Inc. * | 300 | 9,633 |
| | | |
| Metal & Metal Products 2.22% | | 403,990 |
|
| Commercial Metals Company | 1,200 | 36,552 |
|
| Lawson Products, Inc. | 300 | 7,620 |
|
| Matthews International Corp. , Class A | 600 | 26,916 |
|
| Mueller Industries, Inc. | 1,100 | 31,603 |
|
| Quanex Corp. | 2,400 | 123,480 |
|
| Reliance Steel & Aluminum Company | 2,500 | 138,650 |
|
| Timken Company | 1,300 | 39,169 |
| | | |
| Mobile Homes 0.34% | | 60,960 |
|
| Thor Industries, Inc. | 2,000 | 60,960 |
| | | |
| Newspapers 0.19% | | 34,409 |
|
| AH Belo Corp. * | 540 | 6,572 |
|
| Lee Enterprises, Inc. (a) | 2,700 | 27,837 |
| | | |
| Office Furnishings & Supplies 0.61% | | 110,812 |
|
| Office Depot, Inc. * | 2,800 | 31,836 |
|
| United Stationers, Inc. * | 1,600 | 78,976 |
| | | |
| Paper 0.21% | | 37,452 |
|
| Rock-Tenn Company, Class A | 200 | 5,366 |
|
| Smurfit-Stone Container Corp. * | 1,100 | 8,745 |
|
| Temple-Inland, Inc. | 1,700 | 23,341 |
See notes to financial statements
Value Opportunities Fund | Annual report
20
F I N A N C I A L S T A T E M E N T S
| | |
| Issuer | Shares | Value |
| | | |
| Petroleum Services 1.01% | | $184,551 |
|
| Helmerich & Payne, Inc. | 2,000 | 89,660 |
|
| Tidewater, Inc. | 1,300 | 72,995 |
|
| World Fuel Services Corp. | 700 | 21,896 |
| | | |
| Pharmaceuticals 1.40% | | 255,280 |
|
| Endo Pharmaceutical Holdings, Inc. * | 1,400 | 36,764 |
|
| King Pharmaceuticals, Inc. * | 14,700 | 155,820 |
|
| Par Pharmaceutical Companies, Inc. * | 400 | 7,076 |
|
| Watson Pharmaceuticals, Inc. * | 2,000 | 55,620 |
| | | |
| Publishing 0.63% | | 113,890 |
|
| Scholastic Corp. * | 100 | 3,487 |
|
| The New York Times Company, Class A (a) | 4,300 | 80,109 |
|
| Valassis Communications, Inc. * | 2,700 | 30,294 |
| | | |
| Real Estate 1.54% | | 280,509 |
|
| Annaly Capital Management, Inc. , REIT | 10,900 | 225,520 |
|
| Anthracite Capital, Inc. , REIT (a) | 2,500 | 15,975 |
|
| Anworth Mortgage Asset Corp. , REIT | 2,600 | 24,674 |
|
| MFA Mortgage Investments, Inc. , REIT | 1,500 | 14,340 |
| | | |
| Retail Grocery 0.99% | | 180,096 |
|
| Ingles Markets, Inc. | 1,900 | 45,619 |
|
| Nash Finch Company | 2,100 | 73,647 |
|
| SUPERVALU, Inc. | 1,700 | 44,625 |
|
| Weis Markets, Inc. | 500 | 16,205 |
| | | |
| Retail Trade 6.78% | | 1,234,104 |
|
| Advance Auto Parts, Inc. | 2,700 | 90,558 |
|
| Aeropostale, Inc. * | 900 | 24,174 |
|
| American Eagle Outfitters, Inc. | 2,900 | 61,973 |
|
| Big Lots, Inc. * | 700 | 11,795 |
|
| BJ’s Wholesale Club, Inc. * | 4,700 | 148,332 |
|
| Borders Group, Inc. | 1,200 | 11,112 |
|
| Chico’s FAS, Inc. * | 3,200 | 29,792 |
|
| Dollar Tree Stores, Inc. * | 5,600 | 150,248 |
|
| Family Dollar Stores, Inc. | 4,600 | 88,090 |
|
| Foot Locker, Inc. | 2,800 | 34,440 |
|
| Fossil, Inc. * | 1,100 | 35,398 |
|
| Longs Drug Stores Corp. | 800 | 38,424 |
|
| NBTY, Inc. * | 1,600 | 45,696 |
|
| RadioShack Corp. | 3,800 | 66,310 |
|
| Regis Corp. | 2,500 | 62,625 |
|
| Rent-A-Center, Inc. * | 3,600 | 61,740 |
|
| Ross Stores, Inc. | 2,500 | 69,625 |
|
| Sonic Automotive, Inc. | 2,800 | 49,784 |
|
| The Men’s Wearhouse, Inc. | 1,100 | 25,344 |
|
| Tiffany & Company | 400 | 15,056 |
|
| Tuesday Morning Corp. | 3,400 | 18,326 |
See notes to financial statements
Annual report | Value Opportunities Fund
21
F I N A N C I A L S T A T E M E N T S
| | |
| Issuer | Shares | Value |
| | | |
| Retail Trade (continued) | | |
|
| Tween Brands, Inc. * | 700 | $20,720 |
|
| United Rentals, Inc. * | 700 | 14,070 |
|
| Williams-Sonoma, Inc. (a) | 1,100 | 25,696 |
|
| Zale Corp. * | 1,800 | 34,776 |
| | | |
| Semiconductors 0.72% | | 131,031 |
|
| Cabot Microelectronics Corp. * | 700 | 23,443 |
|
| Intersil Corp. , Class A | 3,200 | 74,464 |
|
| Semtech Corp. * | 2,600 | 33,124 |
| | | |
| Software 0.54% | | 98,049 |
|
| Compuware Corp. * | 4,400 | 35,024 |
|
| Novell, Inc. * | 3,100 | 23,095 |
|
| Sybase, Inc. * | 1,500 | 39,930 |
| | | |
| Steel 0.46% | | 84,488 |
|
| Carpenter Technology Corp. | 200 | 12,566 |
|
| Schnitzer Steel Industries, Inc. | 400 | 26,188 |
|
| Worthington Industries, Inc. | 2,600 | 45,734 |
| | | |
| Telecommunications Equipment & Services 0.92% | | 167,598 |
|
| ADC Telecommunications, Inc. * | 2,400 | 32,808 |
|
| ADTRAN, Inc. | 1,200 | 22,104 |
|
| J2 Global Communications, Inc. * | 900 | 19,368 |
|
| Plantronics, Inc. | 3,000 | 56,580 |
|
| Telecommunications Equipment & Premiere Global Services, Inc. * | 2,600 | 36,738 |
| | | |
| Telephone 0.60% | | 108,570 |
|
| CenturyTel, Inc. | 3,000 | 108,570 |
| | | |
| Tires & Rubber 0.24% | | 44,271 |
|
| Cooper Tire & Rubber Company | 2,300 | 41,561 |
|
| Goodyear Tire & Rubber Company * | 100 | 2,710 |
| | | |
| Tobacco 0.28% | | 51,219 |
|
| Universal Corp. | 900 | 51,219 |
| | | |
| Toys, Amusements & Sporting Goods 0.29% | | 52,630 |
|
| Hasbro, Inc. | 1,500 | 38,655 |
|
| Jakks Pacific, Inc. * | 500 | 13,975 |
| | | |
| Transportation 0.68% | | 124,072 |
|
| Bristow Group, Inc. * | 200 | 10,552 |
|
| Golar LNG, Ltd. (a) | 1,000 | 19,090 |
|
| Overseas Shipholding Group, Inc. | 1,300 | 81,536 |
|
| Teekay Shipping Corp. | 300 | 12,894 |
| | | |
| Trucking & Freight 0.59% | | 106,740 |
|
| Arkansas Best Corp. (a) | 1,600 | 42,736 |
|
| Werner Enterprises, Inc. | 1,200 | 21,348 |
|
| YRC Worldwide, Inc. * | 3,100 | 42,656 |
See notes to financial statements
Value Opportunities Fund | Annual report
22
F I N A N C I A L S T A T E M E N T S
| | |
| Issuer | Shares | Value |
| |
| Short-term investments 5.42% | | $986,503 |
|
| (Cost $986,503) | | |
|
| John Hancock Cash Investment Trust, 3.5681% (c)(f) | 986,503 | 986,503 |
|
| |
| | Principal | |
| | amount | |
|
| Repurchase agreements 2.35% | | $427,790 |
|
| (Cost $427,790) | | |
|
| Repurchase Agreement with State Street Corp. dated 2-29-08 at | | |
| 2.35% to be repurchased at $427,874 on 3-3-08, | | |
| collateralized by $445,000 Federal National Mortgage | | |
| Association, 5.57%, due 7-14-08 (valued at $439,994, | | |
| including interest) | $427,790 | 427,790 |
| |
| Total investments (Cost $21,471,816) † 105.41% | | $19,173,695 |
|
| |
| Liabilities in excess of other assets (5.41%) | | ($984,185) |
|
| |
| Total net assets 100.00% | | $18,189,510 |
|
Percentages are stated as a percent of net assets.
REIT Real Estate Investment Trust
* Non-income producing.
(a) All or a portion of this security was out on loan.
(c) Investment is an affiliate of the Trust’s adviser or subadviser.
(f) John Hancock Cash Investment Trust is managed by MFC Global Investment Management (U.S.), LLC. The rate shown is the seven-day effective yield at period end.
† At February 29, 2008, the aggregate cost of investment securities for federal income tax purposes was $21,495,776. Net unrealized depreciation aggregated $2,322,081, of which $886,964 related to appreciated investment securities and $3,209,045 related to depreciated investment securities.
See notes to financial statements
Annual report | Value Opportunities Fund
23
F I N A N C I A L S T A T E M E N T S
Financial statements
Statement of assets and liabilities 2-29-08
This Statement of Assets and Liabilities is the Fund’s balance sheet. It shows the value of what the Fund owns, is due and owes. You’ll also find the net asset value and the maximum public offering price per share.
| |
| Assets | |
|
| Investments in unaffiliated issuers, at value (cost $20,057,523) including | |
| $967,160 of securities loaned (Note 2) | $17,759,402 |
| Repurchase agreement, at value (cost $427,790) (Note 2) | 427,790 |
| Investments in affiliated issuers, at value (cost $986,503) (Note 2) | 986,503 |
| | |
| Total investments, at value (cost $21,471,816) | 19,173,695 |
| Cash collateral at broker for futures contracts | 41,280 |
| Receivable for fund shares sold | 7,634 |
| Dividends and interest receivable (net of tax) | 21,245 |
| Receivable for security lending income | 819 |
| Other assets | 69 |
| | |
| Total assets | 19,244,742 |
| |
| Liabilities | |
|
| Payable upon return of securities loaned (Note 2) | 986,503 |
| Payable for futures variation margin | 6,255 |
| Distributions payable | 20 |
| Payable to affiliates | |
| Fund administration fees | 228 |
| Transfer agent fees | 3,081 |
| Distribution and service fees | 173 |
| Investment management fees | 1,202 |
| Trustees’ fees | 79 |
| Other payables and accrued expenses | 57,691 |
| | |
| Total liabilities | 1,055,232 |
| |
| Net assets | |
|
| Capital paid-in | $21,829,848 |
| Undistributed net investment income | 7,711 |
| Accumulated undistributed net realized gain (loss) | |
| on investments and futures contracts | (1,343,353) |
| Net unrealized appreciation (depreciation) on investments and futures contracts | (2,304,696) |
| | |
| Net assets | $18,189,510 |
See notes to financial statements
Value Opportunities Fund | Annual report
24
F I N A N C I A L S T A T E M E N T S
Statement of assets and liabilities continued
| |
| Net asset value per share | |
|
| The Fund has an unlimited number of shares authorized with no par value. | |
| Net asset value is calculated by dividing the net assets of each class of | |
| shares by the number of outstanding shares in the class. | |
| | |
| Class A | |
| Net assets | $16,079,031 |
| Shares outstanding | 945,981 |
| Net asset value and redemption price per share | $17.00 |
| | |
| Class B 1 | |
| Net assets | $300,831 |
| Shares outstanding | 17,756 |
| Net asset value and offering price per share | $16.94 |
| | |
| Class C 1 | |
| Net assets | $1,019,170 |
| Shares outstanding | 60,137 |
| Net asset value and offering price per share | $16.95 |
| | |
| Class I | |
| Net assets | $99,946 |
| Shares outstanding | 5,873 |
| Net asset value, offering price and redemption price per share | $17.02 |
| | |
| Class R1 | |
| Net assets | $109,547 |
| Shares outstanding | 6,460 |
| Net asset value, offering price and redemption price per share | $16.96 |
| | |
| Class 1 | |
| Net assets | $580,985 |
| Shares outstanding | 34,140 |
| Net asset value, offering price and redemption price per share | $17.02 |
| |
| Maximum public offering price per share | |
|
| Class A (net asset value per share + 95%) 2 | $17.89 |
1 Redemption price per share is equal to the net asset value less any applicable contingent deferred sales charge.
2 On single retail sales of less than $50,000. On sales of $50,000 or more and on group sales the offering price is reduced.
See notes to financial statements
Annual report | Value Opportunities Fund
25
F I N A N C I A L S T A T E M E N T S
Statement of operations For the year ended 2-29-08
This Statement of Operations summarizes the Fund’s investment income earned and expenses incurred in operating the Fund. It also shows net gains (losses) for the period stated.
| |
| Investment income | |
|
| Dividends | $368,621 |
| Interest | 36,084 |
| Securities lending | 18,372 |
| Income from affiliated issuers | 5,051 |
| Less foreign taxes withheld | (288) |
| | |
| Total investment income | 427,840 |
| |
| Expenses | |
|
| Investment management fees (Note 3) | 175,481 |
| Distribution and service fees (Note 3) | 76,754 |
| Transfer agent fees (Note 3) | 19,927 |
| Fund administration fees (Note 3) | 10,054 |
| Blue sky fees (Note 3) | 80,141 |
| Audit and legal fees | 67,086 |
| Printing and postage fees (Note 3) | 6,768 |
| Custodian fees | 56,683 |
| Trustees’ fees (Note 4) | 1,579 |
| Registration and filing fees | 27,323 |
| Miscellaneous | 310 |
| | |
| Total expenses | 522,106 |
| Less: expense reductions (Note 3) | (207,891) |
| | |
| Net expenses | 314,215 |
| | |
| Net investment income | 113,625 |
| |
| Realized and unrealized gain (loss) | |
|
| Net realized gain (loss) on | |
| Investments in unaffiliated issuers | (598,344) |
| Futures contracts | (39,015) |
| | (637,359) |
| Change in net unrealized appreciation (depreciation) of | |
| Investments in unaffiliated issuers | (4,115,974) |
| Futures contracts | (3,615) |
| | |
| | (4,119,589) |
| | |
| Net realized and unrealized gain (loss) | (4,756,948) |
| | |
| Increase (decrease) in net assets from operations | ($4,643,323) |
See notes to financial statements
Value Opportunities Fund | Annual report
26
F I N A N C I A L S T A T E M E N T S
Statement of changes in net assets
These Statements of Changes in Net Assets show how the value of the Fund’s net assets has changed during the last two periods. The difference reflects earnings less expenses, any investment gains and losses, distributions, if any, paid to shareholders and the net of Fund share transactions.
| | |
| | Year | Year |
| | ended | ended |
| | 2-28-071 | 2-29-08 |
|
| Increase (decrease) in net assets | | |
|
| From operations | | |
| Net investment income | 60,627 | $113,625 |
| Net realized gain (loss) | 437,545 | (637,359) |
| Change in net unrealized appreciation (depreciation) | 1,814,893 | (4,119,589) |
| | | |
| Increase (decrease) in net assets resulting from operations | 2,313,065 | (4,643,323) |
| | | |
| Distributions to shareholders | | |
| From net investment income | | |
| Class A | (70,959) | (98,667) |
| Class B | (135) | — |
| Class C | (747) | — |
| Class I | (1,369) | (1,006) |
| Class R1 | (372) | (547) |
| Class 1 | (880) | (4,886) |
| From net realized gain | | |
| Class A | (135,189) | (875,720) |
| Class B | (1,747) | (16,516) |
| Class C | (9,633) | (64,954) |
| Class I | (1,755) | (5,327) |
| Class R1 | (807) | (5,854) |
| Class 1 | (1,083) | (24,644) |
| | | |
| Total distributions | (224,676) | (1,098,121) |
| | | |
| From Fund share transactions (Note 6) | 20,103,746 | 1,738,819 |
| | | |
| Total increase (decrease) | 22,192,135 | (4,002,625) |
| |
| Net assets | | |
|
| Beginning of year | — | 22,192,135 |
| | | |
| End of year | $22,192,135 | $18,189,510 |
| | | |
| Undistributed net investment income | — | $7,711 |
1 Period from 6-12-06 (commencement of operations) to 2-28-07.
See notes to financial statements
Annual report | Value Opportunities Fund
27
F I N A N C I A L S T A T E M E N T S
Financial highlights
The Financial Highlights show how the Fund’s net asset value for a share has changed since the end of the previous period.
CLASS A SHARES
| | |
| Period ended | 2-28-07 1 | 2-29-08 |
| |
| Per share operating performance | | |
|
| Net asset value, beginning of period | $20.00 | $22.36 |
| Net investment income (loss) 2 | 0.07 3 | 0.12 |
| Net realized and unrealized gain | | |
| (loss) on investments | 2.53 | (4.41) |
| Total from investment operations | 2.60 | (4.29) |
| Less distributions | | |
| From net investment income | (0.08) | (0.11) |
| From net realized gain | (0.16) | (0.96) |
| | (0.24) | (1.07) |
| Net asset value, end of period | $22.36 | $17.00 |
| Total return 4,5 (%) | 13.06 6 | (19.45) |
| |
| Ratios and supplemental data | | |
|
| Net assets, end of period (in millions) | $20 | $16 |
| Ratios (as a percentage of average net assets): | | |
| Expenses before reductions | 2.13 7 | 2.04 |
| Expenses net of fee waivers, if any | 1.38 7 | 1.39 |
| Expenses net of all fee waivers and credits | 1.38 7 | 1.39 |
| Net investment income (loss) | 0.47 3,7 | 0.56 |
| Portfolio turnover (%) | 30 6 | 68 |
1 Class A shares began operations on 6-12-06.
2 Based on the average of the shares outstanding.
3 Net investment income per share and ratio of net investment income to average net assets reflects a special dividend received by the Fund which amounted to $0.02 per share and 0.09% of average net assets.
4 Total returns would have been lower had certain expenses not been reduced during the periods shown.
5 Assumes dividend reinvestment.
6 Not annualized.
7 Annualized.
See notes to financial statements
Value Opportunities Fund | Annual report
28
F I N A N C I A L S T A T E M E N T S
Financial highlights
CLASS B SHARES
| | |
| Period ended | 2-28-07 1 | 2-29-08 |
| |
| Per share operating performance | | |
|
| Net asset value, beginning of period | $20.00 | $22.33 |
| Net investment income (loss) 2 | (0.01) 3 | (0.03) |
| Net realized and unrealized gain | | |
| (loss) on investments | 2.51 | (4.40) |
| Total from investment operations | 2.50 | (4.43) |
| Less distributions | | |
| From net investment income | (0.01) | — |
| From net realized gain | (0.16) | (0.96) |
| | (0.17) | (0.96) |
| Net asset value, end of period | $22.33 | $16.94 |
| Total return 4,5 (%) | 12.54 6 | (20.08) |
| |
| Ratios and supplemental data | | |
|
| Net assets, end of period (in millions) | — 7 | — 7 |
| Ratios (as a percentage of average net assets): | | |
| Expenses before reductions | 11.31 8 | 6.82 |
| Expenses net of fee waivers, if any | 2.08 8 | 2.10 |
| Expenses net of all fee waivers and credits | 2.08 8 | 2.09 |
| Net investment income (loss) | (0.07) 3,8 | (0.14) |
| Portfolio turnover (%) | 30 6 | 68 |
1 Class B shares began operations on 6-12-06.
2 Based on the average of the shares outstanding.
3 Net investment loss per share and ratio of net investment loss to average net assets reflects a special dividend received by the Fund which amounted to $0.02 per share and 0.10% of average net assets.
4 Total returns would have been lower had certain expenses not been reduced during the periods shown.
5 Assumes dividend reinvestment.
6 Not annualized.
7 Less than $500,0000.
8 Annualized.
See notes to financial statements
Annual report | Value Opportunities Fund
29
F I N A N C I A L S T A T E M E N T S
Financial highlights
CLASS C SHARES
| | |
| Period ended | 2-28-07 1 | 2-29-08 |
| |
| Per share operating performance | | |
|
| Net asset value, beginning of period | $20.00 | $22.33 |
| Net investment income (loss) 2 | (0.01) 3 | (0.03) |
| Net realized and unrealized gain | | |
| (loss) on investments | 2.51 | (4.39) |
| Total from investment operations | 2.50 | (4.42) |
| Less distributions | | |
| From net investment income | (0.01) | — |
| From net realized gain | (0.16) | (0.96) |
| | (0.17) | (0.96) |
| Net asset value, end of period | $22.33 | $16.95 |
| Total return 4,5 (%) | 12.54 6 | (20.03) |
| |
| Ratios and supplemental data | | |
|
| Net assets, end of period (in millions) | $1 | $1 |
| Ratios (as a percentage of average net assets): | | |
| Expenses before reductions | 5.09 7 | 3.88 |
| Expenses net of fee waivers, if any | 2.08 7 | 2.10 |
| Expenses net of all fee waivers and credits | 2.08 7 | 2.09 |
| Net investment income (loss) | (0.07) 3,7 | (0.14) |
| Portfolio turnover (%) | 30 6 | 68 |
1 Class C shares began operations on 6-12-06.
2 Based on the average of the shares outstanding.
3 Net investment loss per share and ratio of net investment loss to average net assets reflects a special dividend received by the Fund which amounted to $0.02 per share and 0.10% of average net assets.
4 Total returns would have been lower had certain expenses not been reduced during the periods shown.
5 Assumes dividend reinvestment.
6 Not annualized.
7 Annualized.
See notes to financial statements
Value Opportunities Fund | Annual report
30
F I N A N C I A L S T A T E M E N T S
Financial highlights
CLASS I SHARES
| | |
| Period ended | 2-28-07 1 | 2-29-08 |
| |
| Per share operating performance | | |
|
| Net asset value, beginning of period | $20.00 | $22.39 |
| Net investment income (loss) 2 | 0.15 3 | 0.18 |
| Net realized and unrealized gain | | |
| (loss) on investments | 2.53 | (4.41) |
| Total from investment operations | 2.68 | (4.23) |
| Less distributions | | |
| From net investment income | (0.13) | (0.18) |
| From net realized gain | (0.16) | (0.96) |
| | (0.29) | (1.14) |
| Net asset value, end of period | $22.39 | $17.02 |
| Total return 4,5 (%) | 13.42 6 | (19.16) |
| |
| Ratios and supplemental data | | |
|
| Net assets, end of period (in millions) | — 7 | — 7 |
| Ratios (as a percentage of average net assets): | | |
| Expenses before reductions | 12.63 8 | 8.80 |
| Expenses net of fee waivers, if any | 0.99 8 | 0.99 |
| Expenses net of all fee waivers and credits | 0.99 8 | 0.99 |
| Net investment income (loss) | 0.96 3,8 | 0.86 |
| Portfolio turnover (%) | 30 6 | 68 |
1 Class I shares began operations on 6-12-06.
2 Based on the average of the shares outstanding.
3 Net investment income per share and ratio of net investment income to average net assets reflects a special dividend received by the Fund which amounted to $0.02 per share and 0.10% of average net assets.
4 Total returns would have been lower had certain expenses not been reduced during the periods shown.
5 Assumes dividend reinvestment.
6 Not annualized.
7 Less than $500,0000.
8 Annualized.
See notes to financial statements
Annual report | Value Opportunities Fund
31
F I N A N C I A L S T A T E M E N T S
Financial highlights
CLASS R1 SHARES
| | |
| Period ended | 2-28-07 1 | 2-29-08 |
| |
| Per share operating performance | | |
|
| Net asset value, beginning of period | $20.00 | $22.32 |
| Net investment income (loss) 2 | 0.02 3 | 0.10 |
| Net realized and unrealized gain | | |
| (loss) on investments | 2.53 | (4.41) |
| Total from investment operations | 2.55 | (4.31) |
| Less distributions | | |
| From net investment income | (0.07) | (0.09) |
| From net realized gain | (0.16) | (0.96) |
| | (0.23) | (1.05) |
| Net asset value, end of period | $22.32 | $16.96 |
| Total return 4,5 (%) | 12.80 6 | (19.57) |
| |
| Ratios and supplemental data | | |
|
| Net assets, end of period (in millions) | — 7 | — 7 |
| Ratios (as a percentage of average net assets): | | |
| Expenses before reductions | 21.69 8 | 15.22 |
| Expenses net of fee waivers, if any | 1.73 8 | 1.49 |
| Expenses net of all fee waivers and credits | 1.73 8 | 1.49 |
| Net investment income (loss) | 0.12 3,8 | 0.48 |
| Portfolio turnover (%) | 30 6 | 68 |
1 Class R1 shares began operations on 6-12-06.
2 Based on the average of the shares outstanding.
3 Net investment income per share and ratio of net investment income to average net assets reflects a special dividend received by the Fund which amounted to $0.02 per share and 0.09% of average net assets.
4 Total returns would have been lower had certain expenses not been reduced during the periods shown.
5 Assumes dividend reinvestment.
6 Not annualized.
7 Less than $500,0000.
8 Annualized.
See notes to financial statements
Value Opportunities Fund | Annual report
32
F I N A N C I A L S T A T E M E N T S
Financial highlights
CLASS 1 SHARES
| | |
| Period ended | 2-28-07 1 | 2-29-08 |
| |
| Per share operating performance | | |
|
| Net asset value, beginning of period | $20.00 | $22.39 |
| Net investment income (loss) 2 | 0.14 3 | 0.23 |
| Net realized and unrealized gain | | |
| (loss) on investments | 2.54 | (4.45) |
| Total from investment operations | 2.68 | (4.22) |
| Less distributions | | |
| From net investment income | (0.13) | (0.19) |
| From net realized gain | (0.16) | (0.96) |
| | (0.29) | (1.15) |
| Net asset value, end of period | $22.39 | $17.02 |
| Total return 4,5 (%) | 13.44 6 | (19.12) |
| |
| Ratios and supplemental data | | |
|
| Net assets, end of period (in millions) | — 7 | $1 |
| Ratios (as a percentage of average net assets): | | |
| Expenses before reductions | 1.67 8 | 1.62 |
| Expenses net of fee waivers, if any | 0.94 8 | 0.94 |
| Expenses net of all fee waivers and credits | 0.94 8 | 0.94 |
| Net investment income (loss) | 0.89 3,8 | 1.14 |
| Portfolio turnover (%) | 30 6 | 68 |
1 Class 1 shares began operations on 6-12-06.
2 Based on the average of the shares outstanding.
3 Net investment income per share and ratio of net investment income to average net assets reflects a special dividend received by the Fund which amounted to $0.02 per share and 0.09% of average net assets.
4 Total returns would have been lower had certain expenses not been reduced during the periods shown.
5 Assumes dividend reinvestment.
6 Not annualized.
7 Less than $500,0000.
8 Annualized.
See notes to financial statements
Annual report | Value Opportunities Fund
33
Notes to financial statements
1. Organization
John Hancock Value Opportunities Fund (the Fund) is a diversified series of John Hancock Funds III (the Trust). The Trust was established as a Massachusetts business trust on June 9, 2005. The Trust is registered under the Investment Company Act of 1940, as amended (the 1940 Act), as an open-end investment management company. The investment objective of the Fund is to seek long-term capital growth.
John Hancock Life Insurance Company of New York (John Hancock New York) is a wholly owned subsidiary of John Hancock Life Insurance Company (U.S.A.) (John Hancock USA). John Hancock USA and John Hancock New York are indirect wholly owned subsidiaries of The Manufacturers Life Insurance Company (Manulife), which in turn is a wholly owned subsidiary of Manulife Financial Corporation (MFC), a publicly traded company. MFC and its subsidiaries are known collectively as “Manulife Financial.”
John Hancock Investment Management Services, LLC (the Adviser), a Delaware limited liability company controlled by John Hancock USA, serves as investment adviser for the Trust and John Hancock Funds, LLC (the Distributor), a Delaware limited liability company, an affiliate of the Adviser, serves as principal underwriter.
The Board of Trustees have authorized the issuance of multiple classes of shares of the Fund, including classes designated as Class A, Class B, Class C, Class I, Class R1 and Class 1 shares. Class A, Class B and Class C shares are open to all retail investors. Class I shares are offered without any sales charge to various institutional and certain individual investors. Class R1 shares are available only to certain retirement plans. Class 1 shares are sold only to certain exempt separate accounts of John Hancock USA and John Hancock New York.
The shares of each class represent an interest in the same portfolio of investments of the Fund, and have equal rights as to voting, redemptions, dividends and liquidation, except that certain expenses, subject to the approval of the Board of Trustees, may be applied differently to each class of shares in accordance with current regulations of the Securities and Exchange Commission (SEC) and the Internal Revenue Service. Shareholders of a class that bear distribution and service expenses under the terms of a distribution plan have exclusive voting rights to that distribution plan. Class B shares will convert to Class A shares eight years after purchase.
The Adviser and other affiliates of John Hancock USA owned 776,719 and 5,350 shares of beneficial interest of Class A and Class R1, respectively, on February 29, 2008.
2. Significant accounting policies
In the preparation of the financial statements, the Fund follows the policies described below. The preparation of financial statements in conformity with accounting principles generally accepted in the United States of America requires management to make estimates and assumptions that affect the reported amounts of assets and liabilities at the date of the financial statements and the reported amounts of income and expenses during the reporting period. Actual results may differ from these estimates.
Security valuation
The net asset value of the shares of the Fund is determined daily as of the close of the New York Stock Exchange (NYSE), normally at 4:00 p.m., Eastern Time. Short-term debt investments that have a remaining maturity of 60 days or less are valued at amortized cost, and thereafter assume a constant amortization to maturity of any discount or premium, which approximates market value. Investments in John Hancock Cash Investment Trust (JHCIT),
Value Opportunities Fund | Annual report
34
an affiliate of the John Hancock Advisers, LLC (JHA), a wholly owned subsidiary of John Hancock Financial Services, Inc., a subsidiary of MFC, are valued at their net asset value each business day. All other securities held by the Fund are valued at the last sale price or official closing price (closing bid price or last evaluated quote if no sale has occurred) as of the close of business on the principal securities exchange (domestic or foreign) on which they trade or, lacking any sales, at the closing bid price. Securities traded only in the over-the-counter market are valued at the last bid price quoted by brokers making markets in the securities at the close of trading. Securities for which there are no such quotations, principally debt securities, are valued based on the evaluated prices provided by an independent pricing service, which utilizes both dealer-supplied and electronic data processing techniques, which take into account factors such as institutional-size trading in similar groups of securities, yield, quality, coupon rate, maturity, type of issue, trading characteristics and other market data.
Other assets and securities for which no such quotations are readily available are valued at fair value as determined in good faith under consistently applied procedures established by and under the general supervision of the Board of Trustees. Generally, trading in non-U.S. securities is substantially completed each day at various times prior to the close of trading on the NYSE. The values of such securities used in computing the net asset value of a Fund’s shares are generally determined as of such times. Occasionally, significant events that affect the values of such securities may occur between the times at which such values are generally determined and the close of the NYSE. Upon such an occurrence, these securities will be valued at fair value as determined in good faith under consistently applied procedures established by and under the general supervision of the Board of Trustees.
In deciding whether to make a fair value adjustment to the price of a security, the Board of Trustees or their designee may review a variety of factors, including developments in foreign markets, the performance of U.S. securities markets and the performance of instruments trading in U.S. markets that represent foreign securities and baskets of foreign securities. The Fund may also fair value securities in other situations, for example, when a particular foreign market is closed, but the Fund is calculating the net asset value. In view of these factors, it is likely that Funds investing significant amounts of assets in securities in foreign markets will be fair valued more frequently than Funds investing significant amounts of assets in frequently traded, U.S. exchange listed securities of large-capitalization U.S. issuers.
For purposes of determining when fair value adjustments may be appropriate with respect to Funds that invest in securities in foreign markets that close prior to the NYSE, the Fund will, on an ongoing basis, monitor for “significant market events.” A significant market event may be a certain percentage change in the value of an index or of certain Exchange Traded Funds that track foreign markets in which Funds have significant investments. If a significant market event occurs due to a change in the value of the index or of Exchange Traded Funds, the pricing for the Fund will promptly be reviewed and potential adjustments to the net asset value of the Fund will be recommended to the Trust’s Pricing Committee when applicable.
Fair value pricing of securities is intended to help ensure that the net asset value of the Fund’s shares reflects the value of the Fund’s securities as of the close of the NYSE (as opposed to a value which is no longer accurate as of such close), thus limiting the opportunity for aggressive traders to purchase shares of the Fund at deflated prices, reflecting stale security valuations, and to promptly sell such shares at a gain. However, a security’s valuation may differ depending on the method used for determining value and no assurance can be given that fair value pricing of securities will successfully eliminate all potential opportunities for such trading gains.
New accounting pronouncements
In September 2006, Financial Accounting Standards Board (FASB) Standard No. 157, Fair Value Measurements (FAS 157), was issued
Annual report | Value Opportunities Fund
35
and is effective for fiscal years beginning after November 15, 2007. FAS 157 defines fair value, establishes a framework for measuring fair value and expands disclosure about fair value measurements. As of February 29, 2008, management does not believe the adoption of FAS 157 will impact the amounts reported in the financial statements; however, additional disclosures regarding pricing sources will be required about the inputs used to develop the measurements of fair value and the related realized and unrealized gain/loss for certain securities valued by significant unobservable market inputs.
In March 2008, FASB No. 161 (FAS 161), Disclosures about Derivative Instruments and Hedging Activities, an amendment of FASB Statement No. 133 (FAS 133), was issued and is effective for fiscal years beginning after November 15, 2008. FAS 161 amends and expands the disclosure requirements of FAS 133 in order to provide financial statement users an understanding of a company’s use of derivative instruments, how derivative instruments are accounted for under FAS 133 and related interpretations and how these instruments affect a company’s financial position, performance, and cash flows. FAS 161 requires companies to disclose information detailing the objectives and strategies for using derivative instruments, the level of derivative activity entered into by the company, and any credit risk-related contingent features of the agreements. Management is currently evaluating the adoption of FAS 161 on the Fund’s financial statement disclosures.
Guarantees and indemnifications
Under the Trust’s organizational documents, its Officers and Trustees are indemnified against certain liability arising out of the performance of their duties to the Trust. Additionally, in the normal course of business, the Trust enters into contracts with service providers that contain general indemnification clauses. The Trust’s maximum exposure under these arrangements is unknown, as this would involve future claims that may be made against the Trust that have not yet occurred.
Repurchase agreements
The Fund may enter into repurchase agreements. When the Fund enters into a repurchase agreement through its custodian, it receives delivery of securities, the amount of which at the time of purchase and each subsequent business day is required to be maintained at such a level that the market value is generally at least 102% of the repurchase amount. The Fund will take constructive receipt of all securities underlying the repurchase agreements it has entered into until such agreements expire. If the seller defaults, the Fund would suffer a loss to the extent that proceeds from the sale of underlying securities were less than the repurchase amount. The Fund may enter into repurchase agreements maturing within seven days with domestic dealers, banks or other financial institutions deemed to be creditworthy by the Adviser. Collateral for certain tri-party repurchase agreements is held at the custodian bank in a segregated account for the benefit of the Fund and the counterpa rty.
Security transactions and related investment income
Investment security transactions are accounted for on a trade date plus one basis for daily net asset value calculations. However, for financial reporting purposes, investment transactions are reported on trade date. Interest income is accrued as earned. Dividend income and distributions to shareholders are recorded on the ex-dividend date. Foreign dividends are recorded on the ex-date or when the Fund becomes aware of the dividends from cash collections. Discounts/premiums are accreted/ amortized for financial reporting purposes. Non-cash dividends are recorded at the fair market value of the securities received. Debt obligations may be placed in a non-accrual status and related interest income may be reduced by ceasing current accruals and writing off interest receivables when the collection of all or a portion of interest has become doubtful, based upon consistently applied procedures.
From time to time, the Fund may invest in Real Estate Investment Trusts (REITs) and, as a result, will estimate the components of distributions from these securities. Distributions from REITs
Value Opportunities Fund | Annual report
36
received in excess of income are recorded as a reduction of cost of investments and/or as a realized gain.
The Fund uses the specific identification method for determining realized gain or loss on investments for both financial statement and federal income tax reporting purposes.
Allocations of income and expenses
All income, expenses (except class-specific expenses), and realized and unrealized gain/ loss are allocated to each class of shares based upon the relative net assets of each class. Dividends to shareholders from net investment income are determined at a class level and distributions from capital gains are determined at a Fund level.
Expenses not directly attributable to the Fund or share classes are allocated based on the relative share of net assets of the Fund or share class at the time the expense was incurred. Class-specific expenses, as detailed in Note 3, are accrued daily and charged directly to the respective share classes.
Securities lending
The Fund may lend portfolio securities from time to time in order to earn additional income. The Fund retains beneficial ownership of the securities it has loaned and continues to receive interest and dividends paid by the issuer of securities and to participate in any changes in their value. On the settlement date of the loan, the Fund receives collateral against the loaned securities and maintain collateral in an amount not less than 100% of the market value of the loaned securities during the period of the loan. The market value of the loaned securities is determined at the close of business of the Fund and any additional required collateral is delivered to the Fund on the next business day. Any cash collateral received is invested in the JHCIT. If the borrower defaults on its obligation to return the securities loaned because of insolvency or other reasons, a fund could experience delays and costs in recovering the securities loaned or in gaining access to the collat eral. The Fund receives compensation for lending its securities either in the form of fees, guarantees, and/or by retaining a portion of interest on the investment of any cash received as collateral.
The Fund has entered into an agreement with Morgan Stanley & Co. Incorporated and MS Securities Services Inc. (collectively, Morgan Stanley), which permits the Fund to lend securities to Morgan Stanley on a principal basis. Morgan Stanley is the primary borrower of securities of the Fund. The risk of having one primary borrower of Fund securities (as opposed to several borrowers in an agency relationship) is that should Morgan Stanley fail financially, all securities lent will be affected by the failure and by any delays in recovery of the securities (or in the rare event, loss of rights in the collateral).
Prior to May 8, 2007, cash collateral was invested in the State Street Navigator Securities Lending Portfolio. At February 29, 2008, the Fund loaned securities having a market value of $967,180 collateralized by securities in the amount of $986,503.
Futures
The Fund may purchase and sell financial futures contracts and options on those contracts. The Fund invests in contracts based on financial instruments, such as U.S. Treasury Bonds or Notes, or on securities indices such as the Standard & Poor’s 500 Index, in order to hedge against a decline in the value of securities owned by the Fund.
Initial margin deposits required upon entering into futures contracts are satisfied by the delivery of specific securities or cash as collateral to the broker (the Fund’s agent in acquiring the futures position). If the position is closed out by taking an opposite position prior to the settlement date of the futures contract, a final determination of variation margin is made, cash is required to be paid to or released by the broker and the Fund realizes a gain or loss.
When the Fund sells a futures contract based on a financial instrument, the Fund becomes obligated to deliver that kind of instrument at an agreed upon date for a specified price. The Fund realizes a gain or loss depending on whether the price of an offsetting purchase is less or more than the price of the initial sale
Annual report | Value Opportunities Fund
37
or on whether the price of an offsetting sale is more or less than the price of the initial purchase. The Fund could be exposed to risks if it could not close out futures positions because of an illiquid secondary market or the inability of counterparties to meet the terms of their contracts. Futures contracts are valued at the quoted daily settlement prices established by the exchange on which they trade.
The following is a summary of open futures contracts at February 29, 2008:
| | | | | |
| | | | | | UNREALIZED |
| OPEN | NUMBER OF | | EXPIRATION | NOTIONAL | APPRECIATION |
| CONTRACTS | CONTRACTS | POSITION | DATE | VALUE | (DEPRECIATION) |
|
| Russell 2000 Mini Index | | | | | |
| Futures | 1 | Long | Mar 2008 | $68,680 | ($6,913) |
| S&P Mid 400 E-mini | | | | | |
| Index Futures | 1 | Long | Mar 2008 | 78,940 | 338 |
|
| | | | | | ($6,575) |
Federal income taxes
The Fund qualifies as a regulated investment company by complying with the applicable provisions of the Internal Revenue Code and will not be subject to federal income tax on taxable income that is distributed to shareholders. Therefore, no federal income tax provision is required. Net capital losses of $1,325,968 that are attributable to security transactions incurred after October 31, 2007, are treated as arising on March 1, 2008, the first day of the Fund’s next taxable year.
The Fund has adopted the provisions of FASB Interpretation No. 48, Accounting for Uncertainty in Income Taxes, an interpretation of FASB Statement 109 (FIN 48), at the beginning of the Fund’s fiscal year. FIN 48 prescribes a minimum threshold for financial statement recognition of the benefit of a tax position taken or expected to be taken in a tax return. The implementation of FIN 48 did not have a material impact on the Fund’s financial statements. Each of the Fund’s federal tax returns for the prior fiscal years remains subject to examination by the Internal Revenue Service.
Distribution of income and gains
The Fund records distributions to shareholders from net investment income and net realized gains, if any, on the ex-dividend date. During the year ended February 28, 2007, the tax character of distributions paid was as follows: ordinary income $164,683 and long term capital gain $59,993. During the year ended February 29, 2008, the tax character of distributions paid was as follows: ordinary income $760,204 and long-term capital gain $337,917. Distributions paid by the Fund with respect to each class of shares are calculated in the same manner, at the same time and are in the same amount, except for the effect of expenses that may be applied differently to each class.
As of February 29, 2008, the components of distributable earnings on a tax basis included $7,711 of undistributed ordinary income.
Such distributions and distributable earnings, on a tax basis, are determined in conformity with income tax regulations, which may differ from accounting principles generally accepted in the United States of America. Distributions in excess of tax basis earnings and profits, if any, are reported in the Fund’s financial statements as a return of capital.
Capital accounts within financial statements are adjusted for permanent book/tax differences. These adjustments have no impact on net assets or the results of operations. Temporary book/tax differences will reverse in a subsequent period. Permanent book/tax differences are primarily attributable to derivative transactions.
3. Investment advisory and
other agreements
The Trust has entered into an Investment Advisory Agreement with the Adviser. The Adviser is responsible for managing the corporate and business affairs of the Trust and
Value Opportunities Fund | Annual report
38
for selecting and compensating subadvisers to handle the investment of the assets of the Fund, subject to the supervision of the Trust’s Board of Trustees. As compensation for its services, the Adviser receives an advisory fee from the Trust. Under the Advisory Agreement, the Fund pays a monthly management fee to the Adviser equivalent, on an annual basis, to the sum of: (a) 0.80% of the first $500,000,000 of the Fund’s aggregate daily net assets; (b) 0.78% of the next $500,000,000 of the Fund’s aggregate daily net assets; (c) 0.77% of the next $1,500,000,000 of the Fund’s aggregate daily net assets; and (d) 0.76% of the Fund’s aggregate daily net assets in excess of $2,500,000,000. Aggregate net assets include the net assets of the Fund and Value Opportunities Trust, a series of John Hancock Trust and Value Opportunities Fund, a series of John Hancock Funds II. The Adviser has a subadvisory agreement with Grantham, Mayo, Van Otterloo & Co. L LC. The Fund is not responsible for payment of the subadvisory fees.
The investment management fees incurred for the year ended February 29, 2008, were equivalent to an annual effective rate of 0.80% of the Fund’s average daily net assets.
Expense reimbursements
The Adviser has contractually agreed to reimburse or limit certain Fund level expenses to 0.09% of the Fund’s average annual net assets which are allocated pro rata to all share classes. This agreement excludes taxes, portfolio brokerage commissions, interest, advisory fees, Rule 12b-1 fees, transfer agency fees, blue sky fees, printing and postage and litigation and indemnification expenses and other extraordinary expenses not incurred in the ordinary course of the Fund’s business. In addition, fees incurred under any agreement or plans of the Fund dealing with services for the shareholders and others with beneficial interest in shares of the Fund, are excluded.
In addition, the Adviser has agreed to reimburse or limit certain expenses for each share class. This agreement excludes taxes, portfolio brokerage commissions, interest and litigation and indemnification expenses and other extraordinary expenses not incurred in the ordinary course of the Fund’s business. In addition, fees incurred under any agreement or plans of the Fund dealing with services for the shareholders and others with beneficial interest in shares of the Fund, are excluded. The reimbursements and limits are such that these expenses will not exceed 1.39% for Class A shares, 2.09% for Class B, 2.09% for Class C, 0.99% for Class I, 1.49% for Class R1 and 0.94% for Class 1. Accordingly, the expense reductions or reimbursements related to this agreement were $126,318, $17,010, $25,489, $19,345, $16,517 and $2,798 for Class A, Class B, Class C, Class I, Class R1 and Class 1, respectively for the year ended February 29, 2008. The expense reimbursements and limits will continue in effect until June 30, 2008 and thereafter until terminated by the Adviser on notice to the Trust.
Fund administration fees
Pursuant to the Advisory Agreement, the Fund reimburses the Adviser for all expenses associated with providing the administrative, financial, legal, accounting and recordkeeping services of the Fund, including the preparation of all tax returns, annual, semiannual and periodic reports to shareholders and the preparation of all regulatory reports. These expenses are allocated based on the relative share of net assets of each class at the time the expense was incurred.
The fund administration fees incurred for the year ended February 29, 2008, were $10,054 with an annual effective rate of 0.05% of the Fund’s average daily net assets.
Distribution and shareholder servicing fees
The Trust has a Distribution Agreement with the Distributor. The Fund has adopted Distribution Plans with respect to Class A, Class B, Class C, Class R1 and Class 1, pursuant to Rule 12b-1 under the 1940 Act, to pay the Distributor for the services it provides as distributor of shares of the Fund. Accordingly, the Fund makes monthly payments to the Distributor at an annual rate not to exceed 0.30%, 1.00%, 1.00%, 0.50% and 0.05% of average daily net asset value of Class A, Class B, Class C, Class R1 and Class 1, respectively. A maximum of 0.25% of such payments may be service fees, as defined by the Conduct Rules of Financial Industry
Annual report | Value Opportunities Fund
39
Regulatory Authority (formerly the National Association of Securities Dealers). Under the Conduct Rules, curtailment of a portion of the Fund’s 12b-1 payments could occur under certain circumstances.
In addition, the Fund has also adopted a Service Plan for Class R1 shares. Under the Service Plan, the Fund may pay up to 0.25% of Class R1 average daily net asset value for certain other services. There were no Service Plan fees incurred for the year ended February 29, 2008.
Sales charges
Class A shares are assessed up-front sales charges of up to 5.00% of net asset value of such shares. During the year ended February 29, 2008, the Fund was informed that the Distributor received net up-front sales charges of $16,704 with regard to sales of Class A shares. Of this amount, $2,707 was retained and used for printing prospectuses, advertising, sales literature and other purposes; $13,952 was paid as sales commissions to unrelated broker-dealers; and $45 was paid as sales commissions to sales personnel of Signator Investors, Inc. (Signator Investors), a related broker-dealer, an indirect subsidiary of MFC.
Class B shares that are redeemed within six years of purchase are subject to a contingent deferred sales charge (CDSC) at declining rates, beginning at 5.00% of the lesser of the current market value at the time of redemption or the original purchase cost of the shares being redeemed. Class C shares that are redeemed within one year of purchase are subject to a CDSC at a rate of 1.00% of the lesser of the current market value at the time of redemption or the original purchase cost of the shares being redeemed. Proceeds from the CDSCs are paid to the Distributor and are used, in whole or in part, to defray its expenses for providing distribution-related services to the Fund in connection with the sale of Class B and Class C shares. During the year ended February 29, 2008, CDSCs received by Distributor amounted to $1,318 for Class B shares and $1,163 for Class C shares.
Transfer agent fees
The Fund has a Transfer Agency Agreement with John Hancock Signature Services, Inc. (Signature Services), an indirect subsidiary of MFC. For Class A, Class B, Class C, Class I and Class R1 shares, the Fund pays a monthly transfer agent fee at an annual rate of 0.05% of each class’ average daily net assets, plus a fee based on the number of shareholder accounts and reimbursement for certain out-of-pocket expenses. Expenses not directly attributable to a particular class of shares are aggregated and allocated to each class on the basis of its relative net asset value. The Fund pays a monthly fee which is based on an annual rate of $15.00 for each Class A shareholder account, $17.50 for each Class B shareholder account, $16.50 for each Class C shareholder account and $15.00 for each Class R1 shareholder account.
Signature Services has agreed to limit the transfer agent fees so that such fees do not exceed 0.20% annually of Class A, Class B, Class C, Class I and Class R1 share average daily net assets. This agreement is effective until December 31, 2008. Signature Services reserves the right to terminate this limitation in the future. There were no transfer agent fee reductions for Class A, Class B, Class C, Class I and Class R1 shares, respectively, during the year ended February 29, 2008.
In addition, Signature Services has voluntarily agreed to further limit transfer agent fees for Class R1 shares so that such fees do not exceed 0.05% annually of each class’s average daily net assets. For the year ended February 29, 2008, the transfer agent fees reductions for Class R1 were $187.
In May 2007, the Fund began receiving earnings credits from its transfer agent as a result of uninvested cash balances. These credits are used to reduce a portion of the Fund’s transfer agent fees and out-of-pocket expenses. During the year ended February 29, 2008, the Fund’s transfer agent fees and out-of-pocket expenses were reduced by $227 for transfer agent credits earned.
Value Opportunities Fund | Annual report
40
Class level expenses for the year ended February 29, 2008, were as follows:
| | | | |
| | Distribution and | Transfer | Blue sky | Printing and |
| Share class | service fees | agent fees | fees | postage fees |
|
| |
| Class A | $58,094 | $15,871 | $16,909 | $5,645 |
| Class B | 3,599 | 745 | 14,620 | 6 |
| Class C | 14,246 | 2,928 | 15,177 | 921 |
| Class I | — | 133 | 17,659 | 160 |
| Class R1 | 608 | 250 | 15,776 | 3 |
| Class 1 | 207 | — | — | 33 |
| Total | $76,754 | $19,927 | $80,141 | $6,768 |
4. Trustees’ fees
The Trust compensates each Trustee who is not an employee of the Adviser or its affiliates. Total Trustees’ expenses are allocated to the Fund based on its average daily net asset value.
5. Line of credit
The Fund has entered into an agreement which enables them to participate in a $100 million unsecured committed line of credit with State Street Corporation. Borrowings will be made solely to temporarily finance the repurchase of capital shares. Interest is charged to the Fund based on its borrowings at a rate per annum equal to the Federal Funds rate plus 0.50% . In addition, a commitment fee of 0.05% per annum, payable at the end of each calendar quarter, based on the average daily-unused portion of the line of credit, is charged to the Fund on a prorated basis based on average net assets. Effective October 15, 2007, the commitment fee was changed from 0.07% to 0.05% . For the year ended February 29, 2008, there were no borrowings under the line of credit.
Annual report | Value Opportunities Fund
41
6. Fund share transactions
Share activities for the Fund for the years ended February 28, 2007, and February 29, 2008, were as follows:
| | | | |
| | | Year ended 2-28-07 1 | Year ended 2-29-08 |
| | Shares | Amount | Shares | Amount |
| Class A shares | | | | |
|
| Sold | 941,272 | $19,088,419 | 83,981 | $1,839,886 |
| Distributions reinvested | 9,278 | 203,273 | 53,292 | 958,716 |
| Repurchased | (60,859) | (1,306,606) | (80,983) | (1,597,867) |
| Net increase (decrease) | 889,691 | $17,985,086 | 56,290 | $1,200,735 |
| | | | | |
| Class B shares | | | | |
|
| Sold | 21,277 | $445,406 | 7,022 | $153,171 |
| Distributions reinvested | 78 | 1,721 | 795 | 14,285 |
| Repurchased | (7,339) | (162,632) | (4,077) | (80,691) |
| Net increase (decrease) | 14,016 | $284,495 | 3,740 | $86,765 |
| | | | | |
| Class C shares | | | | |
|
| Sold | 69,790 | $1,449,685 | 21,502 | $466,603 |
| Distributions reinvested | 414 | 9,061 | 3,408 | 61,199 |
| Repurchased | (7,105) | (155,548) | (27,872) | (538,229) |
| Net increase (decrease) | 63,099 | $1,303,198 | (2,962) | ($10,427) |
| | | | | |
| Class I shares | | | | |
|
| Sold | 11,800 | $245,442 | 5,764 | $129,736 |
| Distributions reinvested | 117 | 2,570 | 288 | 5,191 |
| Repurchased | — | — | (12,096) | (243,103) |
| Net increase (decrease) | 11,917 | $248,012 | (6,044) | ($108,176) |
| | | | | |
| Class R1 shares | | | | |
|
| Sold | 5,000 | $100,000 | 1,049 | $24,953 |
| Distributions reinvested | 54 | 1,179 | 357 | 6,401 |
| Net increase (decrease) | 5,054 | $101,179 | 1,406 | $31,354 |
| | | | | |
| Class 1 shares | | | | |
|
| Sold | 8,549 | $179,825 | 37,501 | $765,929 |
| Distributions reinvested | 90 | 1,963 | 1,640 | 29,511 |
| Repurchased | (1) | (12) | (13,639) | (256,872) |
| Net increase (decrease) | 8,638 | $181,776 | 25,502 | $538,568 |
| | | | | |
| Net increase (decrease) | 992,415 | $20,103,746 | 77,932 | $1,738,819 |
|
1Period from 6-12-06 (commencement of operations) to 2-28-07 for Class A, Class B, Class C, Class I and Class R1.
7. Purchases and sales of securities
Purchases and proceeds from sales or maturities of securities, other than short-term securities and obligations of the U.S. government, during the year ended February 29, 2008, aggregated $15,397,292 and $14,239,084, respectively.
Value Opportunities Fund | Annual report
42
Auditors’ report
Report of Independent Registered Public Accounting Firm
To the Board of Trustees of John Hancock Funds III and Shareholders of John Hancock Value Opportunities Fund,
In our opinion, the accompanying statement of assets and liabilities, including the schedule of investments, and the related statements of operations and of changes in net assets and the financial highlights present fairly, in all material respects, the financial position of John Hancock Value Opportunities Fund (the Fund) at February 29, 2008, and the results of its operations, the changes in its net assets and the financial highlights for each of the periods indicated, in conformity with accounting principles generally accepted in the United States of America. These financial statements and financial highlights (hereafter referred to as “financial statements”) are the responsibility of the Fund’s management. Our responsibility is to express an opinion on these financial statements based on our audits. We conducted our audits of these financial statements in accordance with the standards of the Public Company Accounting Oversight Board (United States). Those standards require that we plan and perform the audits to obtain reasonable assurance about whether the financial statements are free of material misstatement. An audit includes examining, on a test basis, evidence supporting the amounts and disclosures in the financial statements, assessing the accounting principles used and significant estimates made by management, and evaluating the overall financial statement presentation. We believe that our audits, which included confirmation of investments at February 29, 2008 by correspondence with the custodian, provide a reasonable basis for our opinion.
PricewaterhouseCoopers LLP
Boston, Massachusetts
April 18, 2008
Annual report | Value Opportunities Fund
43
Tax information
Unaudited
For federal income tax purposes, the following information is furnished with respect to the distributions of the Fund, if any, paid during its taxable year ended February 29, 2008.
The Fund has designated distributions to shareholders of $337,917 as a long-term capital gain dividend. With respect to the ordinary dividends paid by the Fund for the fiscal year ended February 29, 2008, 100.00% of the dividends qualifies for the corporate dividends-received deduction.
The Fund hereby designates the maximum amount allowable of its net taxable income as qualified dividend income as provided in the Jobs and Growth Tax Relief Reconciliation Act of 2003. This amount will be reflected on Form 1099-DIV for the calendar year 2008.
Shareholders will be mailed a 2008 U.S. Treasury Department Form 1099-DIV in January 2009. This will reflect the total of all distributions that are taxable for calendar year 2008.
Value Opportunities Fund | Annual report
44
Trustees and Officers
This chart provides information about the Trustees and Officers who oversee your John Hancock fund. Officers elected by the Trustees manage the day-to-day operations of the Fund and execute policies formulated by the Trustees.
Independent Trustees
| | |
| Name, Year of Birth | | Number of |
| Position(s) held with Fund | Trustee | John Hancock |
| Principal occupation(s) and other | of Fund | funds overseen |
| directorships during past 5 years | since1 | by Trustee |
| |
| James F. Carlin, Born: 1940 | 2006 | 55 |
|
| Chairman (since December 2007); Director and Treasurer, Alpha Analytical Laboratories, Inc. (chemical |
| analysis) (since 1985); Part Owner and Treasurer, Lawrence Carlin Insurance Agency, Inc. (since 1995); |
| Part Owner and Vice President, Mone Lawrence Carlin Insurance Agency, Inc. (until 2005); Chairman |
| and Chief Executive Officer, Carlin Consolidated, Inc. (management/investments) (since 1987); Trustee, |
| Massachusetts Health and Education Tax Exempt Trust (1993–2003) . | | |
| |
| |
| William H. Cunningham, Born: 1944 | 2006 | 55 |
|
| Professor, University of Texas at Austin (since 1971); former Chancellor, University of Texas System and |
| former President, University of Texas at Austin (until 2001); Chairman and Chief Executive Officer, IBT |
| Technologies (until 2001); Director of the following: Hicks Acquisition Company I, Inc. (since 2007); |
| Hire.com (until 2004), STC Broadcasting, Inc. and Sunrise Television Corp. (until 2001), Symtx, Inc. |
| (electronic manufacturing) (since 2001), Adorno/Rogers Technology, Inc. (until 2004), Pinnacle |
| Foods Corporation (until 2003), rateGenius (until 2003), Lincoln National Corporation (insurance) |
| (since 2006), Jefferson-Pilot Corporation (diversified life insurance company) (until 2006), New |
| Century Equity Holdings (formerly Billing Concepts) (until 2001), eCertain (until 2001), ClassMap.com |
| (until 2001), Agile Ventures (until 2001), AskRed.com (until 2001), Southwest Airlines (since 2000), |
| Introgen (manufacturer of biopharmaceuticals) (since 2000) and Viasystems Group, Inc. (electronic |
| manufacturer) (until 2003); Advisory Director, Interactive Bridge, Inc. (college fundraising) (until 2001); |
| Advisory Director, Q Investments (until 2003); Advisory Director, JPMorgan Chase Bank (formerly Texas |
| Commerce Bank–Austin), LIN Television (until 2008), WilTel Communications (until 2003) and Hayes |
| Lemmerz International, Inc. (diversified automotive parts supply company) (since 2003) . | |
|
| |
| Charles L. Ladner, 2 Born: 1938 | 2006 | 55 |
|
| Chairman and Trustee, Dunwoody Village, Inc. (retirement services) (until 2003); Senior Vice President |
| and Chief Financial Officer, UGI Corporation (public utility holding company) (retired 1998); Vice |
| President and Director, AmeriGas, Inc. (retired 1998); Director, AmeriGas Partners, L. P. (gas distribution) |
| (until 1997); Director, EnergyNorth, Inc. (until 1997); Director, Parks and History Association (until 2005) . |
|
| |
| John A. Moore, 2 Born: 1939 | 2006 | 55 |
|
| President and Chief Executive Officer, Institute for Evaluating Health Risks (nonprofit institution) |
| (until 2001); Senior Scientist, Sciences International (health research) (until 2003); Former Assistant |
| Administrator and Deputy Administrator, Environmental Protection Agency; Principal, Hollyhouse |
| (consulting) (since 2000); Director, CIIT Center for Health Science Research (nonprofit research) |
| (until 2007) . | | |
Annual report | Value Opportunities Fund
45
Independent Trustees (continued)
| | |
| Name, Year of Birth | | Number of |
| Position(s) held with Fund | Trustee | John Hancock |
| Principal occupation(s) and other | of Fund | funds overseen |
| directorships during past 5 years | since1 | by Trustee |
| |
| Patti McGill Peterson,2 Born: 1943 | 2006 | 55 |
|
| Senior Associate, Institute for Higher Education Policy (since 2007); Executive Director, Council for |
| International Exchange of Scholars and Vice President, Institute of International Education (until 2007); |
| Senior Fellow, Cornell Institute of Public Affairs, Cornell University, Ithaca, NY (until 1998); Former |
| President, Wells College, Aurora, NY, and St. Lawrence University, Canton, NY; Director, Niagara |
| Mohawk Power Corporation (until 2003); Director, Ford Foundation, International Fellowships Program |
| (since 2002); Director, Lois Roth Endowment (since 2002); Director, Council for International Educational |
| Exchange (since 2003) . | | |
|
| |
| Steven R. Pruchansky, Born: 1944 | 2006 | 55 |
|
| Chairman and Chief Executive Officer, Greenscapes of Southwest Florida, Inc. (since 2000); Director and |
| President, Greenscapes of Southwest Florida, Inc. (until 2000); Managing Director, JonJames, LLC (real |
| estate) (since 2000); Director, First Signature Bank & Trust Company (until 1991); Director, Mast Realty |
| Trust (until 1994); President, Maxwell Building Corp. (until 1991) . | | |
Non-Independent Trustees 3
| | |
| Name, Year of Birth | | Number of |
| Position(s) held with Fund | Trustee | John Hancock |
| Principal occupation(s) and other | of Fund | funds overseen |
| directorships during past 5 years | since1 | by Trustee |
| |
| James R. Boyle, Born: 1959 | 2006 | 265 |
|
| Executive Vice President, Manulife Financial Corporation (since 1999); President, John Hancock Variable |
| Life Insurance Company (since March 2007); Executive Vice President, John Hancock Life Insurance |
| Company (since 2004); Chairman and Director, John Hancock Advisers, LLC (the Adviser), John Hancock |
| Funds, LLC and The Berkeley Financial Group, LLC (The Berkeley Group) (holding company) (since 2005); |
| Senior Vice President, The Manufacturers Life Insurance Company (U.S. A. ) (until 2004) . | |
Value Opportunities Fund | Annual report
46
Principal officers who are not Trustees
| |
| Name, Year of Birth | |
| Position(s) held with Fund | Officer |
| Principal occupation(s) and other | of Fund |
| directorships during past 5 years | since |
| |
| Keith F. Hartstein, Born: 1956 | 2006 |
|
| President and Chief Executive Officer | |
| Senior Vice President, Manulife Financial Corporation (since 2004); Director, President and Chief | |
| Executive Officer, the Adviser, The Berkeley Group and John Hancock Funds, LLC (since 2005); Director, |
| MFC Global Investment Management (U.S. ), LLC (MFC Global (U.S. )) (since 2005); Director, John | |
| Hancock Signature Services, Inc. (since 2005); President and Chief Executive Officer, John Hancock |
| Investment Management Services, LLC (since 2006); President and Chief Executive Officer, John Hancock |
| Funds, John Hancock Funds II, John Hancock Funds III and John Hancock Trust (since 2005); Director, |
| Chairman and President, NM Capital Management, Inc. (since 2005); Member, Investment Company |
| Institute Sales Force Marketing Committee (since 2003); President and Chief Executive Officer, MFC |
| Global (U.S. ) (2005–2006); Executive Vice President, John Hancock Funds, LLC (until 2005) . | |
|
| |
| Thomas M. Kinzler, Born: 1955 | 2006 |
|
| Secretary and Chief Legal Officer | |
| Vice President and Counsel, John Hancock Life Insurance Company (U.S. A. ) (since 2006); Secretary and |
| Chief Legal Officer, John Hancock Funds and John Hancock Funds II (since 2006); Chief Legal Officer |
| and Assistant Secretary, John Hancock Trust (since 2006); Vice President and Associate General Counsel, |
| Massachusetts Mutual Life Insurance Company (1999–2006); Secretary and Chief Legal Counsel, MML |
| Series Investment Fund (2000–2006); Secretary and Chief Legal Counsel, MassMutual Institutional Funds |
| (2000–2004); Secretary and Chief Legal Counsel, MassMutual Select Funds and MassMutual Premier |
| Funds (2004–2006) . | |
|
| |
| Francis V. Knox, Jr. , Born: 1947 | 2006 |
|
| Chief Compliance Officer | |
| Vice President and Chief Compliance Officer, John Hancock Investment Management Services, LLC, |
| the Adviser and MFC Global (U.S. ) (since 2005); Vice President and Chief Compliance Officer, John |
| Hancock Funds, John Hancock Funds II, John Hancock Funds III and John Hancock Trust (since 2005); |
| Vice President and Assistant Treasurer, Fidelity Group of Funds (until 2004); Vice President and Ethics & |
| Compliance Officer, Fidelity Investments (until 2001) . | |
|
| |
| Charles A. Rizzo, Born: 1957 | 2007 |
|
| Chief Financial Officer | |
| Chief Financial Officer, John Hancock Funds, John Hancock Funds II, John Hancock Funds III and John |
| Hancock Trust (since June 2007); Assistant Treasurer, Goldman Sachs Mutual Fund Complex (regis- |
| tered investment companies) (2005–June 2007); Vice President, Goldman Sachs (2005–June 2007); |
| Managing Director and Treasurer of Scudder Funds, Deutsche Asset Management (2003–2005); | |
| Director, Tax and Financial Reporting, Deutsche Asset Management (2002–2003); Vice President and |
| Treasurer, Deutsche Global Fund Services (Deutsche Registered Investment Companies) (1999–2002) . |
|
| |
| Gordon M. Shone, Born: 1956 | 2006 |
|
| Treasurer | |
| Senior Vice President, John Hancock Life Insurance Company (U.S. A. ) (since 2001); Treasurer, John |
| Hancock Funds (since 2006), John Hancock Funds II, John Hancock Funds III and John Hancock Trust |
| (since 2005); Vice President and Chief Financial Officer, John Hancock Trust (2003–2005); Vice President, |
| John Hancock Investment Management Services, Inc., John Hancock Advisers, LLC (since 2006) and The |
| Manufacturers Life Insurance Company (U.S. A. ) (1998–2000) . | |
Annual report | Value Opportunities Fund
47
Principal officers who are not Trustees (continued)
| |
| Name, Year of Birth | |
| Position(s) held with Fund | Officer |
| Principal occupation(s) and other | of Fund |
| directorships during past 5 years | since |
| |
| John G. Vrysen, Born: 1955 | 2006 |
|
| Chief Operating Officer | |
| Senior Vice President, Manulife Financial Corporation (since 2006); Director, Executive Vice President |
| and Chief Operating Officer, the Adviser, The Berkeley Group and John Hancock Funds, LLC (since | |
| June 2007); Executive Vice President and Chief Operating Officer, John Hancock Investment | |
| Management Services, LLC (since December 2007); Chief Operating Officer, John Hancock Funds, |
| John Hancock Funds II, John Hancock Funds III and John Hancock Trust (since June 2007); Director, |
| Executive Vice President and Chief Financial Officer, the Adviser, The Berkeley Group and John Hancock |
| Funds, LLC (2005–2007); Executive Vice President and Chief Financial Officer, John Hancock Investment |
| Management Services, LLC (2005–2007); Executive Vice President and Chief Financial Officer, MFC |
| Global (U.S. ) (2005 until August 2007); Director, John Hancock Signature Services, Inc. (since 2005); |
| Chief Financial Officer, John Hancock Funds, John Hancock Funds II, John Hancock Funds III and John |
| Hancock Trust (2005 until June 2007); Vice President and General Manager, John Hancock Fixed | |
| Annuities, U.S. Wealth Management (2004–2005); Vice President, Operations, Manulife Wood Logan |
| (2000–2004) . | |
The business address for all Trustees and Officers is 601 Congress Street, Boston, Massachusetts 02210-2805.
The Statement of Additional Information of the Fund includes additional information about members of the Board of Trustees of the Fund and is available without charge, upon request, by calling 1-800-225-5291.
1 Each Trustee serves until resignation, retirement age or until his or her successor is elected.
2 Member of Audit and Compliance Committee.
3 Non-Independent Trustee holds positions with the Fund’s investment adviser, underwriter and certain other affiliates
Value Opportunities Fund | Annual report
48
For more information
The Fund’s proxy voting policies, procedures and records are available without charge, upon request:
| | |
| By phone | On the Fund’s Web site | On the SEC’s Web site |
| 1-800-225-5291 | www. jhfunds. com/proxy | www. sec. gov |
|
| Investment adviser | Custodian | Legal counsel |
| John Hancock Investment | State Street Bank & Trust Co. | Kirkpatrick & Lockhart |
| Management Services, LLC | 2 Avenue de Lafayette | Preston Gates Ellis LLP |
| 601 Congress Street | Boston, MA 02111 | One Lincoln Street |
| Boston, MA 02210-2805 | | Boston, MA 02111-2950 |
| | Transfer agent | |
| Subadviser | John Hancock Signature | Independent registered |
| Grantham, Mayo, Van | Services, Inc. | public accounting firm |
| Otterloo & Co. LLC | P. O. Box 9510 | PricewaterhouseCoopers LLP |
| 40 Rowes Wharf | Portsmouth, NH 03802-9510 | 125 High Street |
| Boston, MA 02110 | | Boston, MA 02110 |
| | | |
| Principal distributor | | |
| John Hancock Funds, LLC | | |
| 601 Congress Street | | |
| Boston, MA 02210-2805 | | |
| | |
| How to contact us | |
|
| |
| Internet | www. jhfunds.com | |
|
| |
| Mail | Regular mail: | Express mail: |
| | John Hancock Signature | John Hancock Signature |
| | Services, Inc. | Services, Inc. |
| | P. O. Box 9510 | Mutual Fund Image Operations |
| | Portsmouth, NH 03802-9510 | 164 Corporate Drive |
| | | Portsmouth, NH 03801 |
|
| |
| Phone | Customer service representatives | 1-800-225-5291 |
| | EASI-Line | 1-800-338-8080 |
| | TDD line | 1-800-554-6713 |
|
A listing of month-end portfolio holdings is available on our Web site, www.jhfunds.com. A more detailed portfolio holdings summary is available on a quarterly basis 60 days after the fiscal quarter on our Web site or upon request by calling 1-800-225-5291, or on the SEC’s Web site, www.sec.gov.
Annual report | Value Opportunities Fund
49

1-800-225-5291
1-800-554-6713 (TDD)
1-800-338-8080 EASI-Line
www. jhfunds.com
Now available: electronic delivery
www. jhfunds.com/edelivery
| | |
| This report is for the information of the shareholders of John Hancock Value Opportunities Fund. | 6300A | 2/08 |
| It is not authorized for distribution to prospective investors unless preceded or accompanied by a prospectus. | | 4/08 |

Discussion of Fund performance
By Grantham, Mayo, Van Otterloo & Co. LLC (GMO)
U.S. stocks went on a wild ride during the 12-month period, highlighted both by record highs for broad market indexes and conditions deemed poor enough to warrant numerous interventions by the Federal Reserve. For the period in full, the Standard & Poor’s 500 Index returned –3.60%, a modest move which belied its frequent violent gyrations. Growth stocks outpaced value stocks during the period. Financials and consumer discretionary were the worst-performing sectors in the S&P 500, while energy stocks performed the best.
“U.S. stocks went on a wild ride
during the 12-month review
period…”
For the 12 months ended February 29, 2008, John Hancock U.S. Core Fund’s Class A, Class B, Class C, Class I and Class R1 shares returned –8.16%, –8.84%, –8.84%, –7.82% and –8.32%, respectively, at net asset value, while the S&P 500 returned –3.60% . Sector selection added to relative returns, while stock selection detracted. Sector weightings adding to relative returns included an underweight in financials, while sector weightings detracting from relative returns included an overweight in consumer discretionary. Stock selections in telecommunication services added to relative returns, while picks in consumer discretionary and financials detracted. Individual names adding to returns versus the benchmark included overweight positions in Exxon Mobil Corp., Merck & Company, Inc. and Wal-Mart Stores, Inc., while overweight positions detracting from relative returns included Home Depot, Inc., Citigroup, Inc. and Lowe’s Companies, Inc.
This commentary reflects the views of the portfolio management team through the end of the Fund’s period discussed in this report. The team’s statements reflect their own opinions. As such, they are in no way guarantees of future events and are not intended to be used as investment advice or a recommendation regarding any specific security. They are also subject to change at any time as market and other conditions warrant.
U.S. Core Fund | Annual report
6
A look at performance
For the periods ended February 29, 2008
| | | | | | | | | | | |
| | | | Average annual returns | | | | Cumulative total returns | | |
| | | | with maximum sales charge (POP) | | | with maximum sales charge (POP) | | |
| | | |
| |
|
| | Inception | | | | | Since | | | | | Since |
| Class | date | | 1-year | 5-year | 10-year | inception | | 1-year | 5-year | 10-year | inception |
|
| A | 6-12-06 | | –12.75% | — | — | –1.00% | | –12.75% | — | — | –1.71% |
|
| B | 6-12-06 | | –13.21 | — | — | –1.00 | | –13.21 | — | — | –1.72 |
|
| C | 6-12-06 | | –9.71 | — | — | 1.28 | | –9.71 | — | — | 2.21 |
|
| I1 | 6-12-06 | | –7.82 | — | — | 2.37 | | –7.82 | — | — | 4.12 |
|
| R11 | 6-12-06 | | –8.32 | — | — | 1.75 | | –8.32 | — | — | 3.04 |
|
Performance figures assume all distributions are reinvested. Public offering price (POP) figures reflect maximum sales charge on Class A shares of 5%, and the applicable contingent deferred sales charge (CDSC) on Class B and Class C shares. The Class B shares’ CDSC declines annually between years 1 to 6 according to the following schedule: 5, 4, 3, 3, 2, 1%. No sales charge will be assessed after the sixth year. Class C shares held for less than one year are subject to a 1% CDSC. Sales charge is not applicable for Class I and Class R1 shares.
The expense ratios of the Fund, both net (including any fee waivers or expense limitations) and gross (excluding any fee waivers or expense limitations), are set forth according to the most recent publicly available prospectuses for the Fund and may differ from the expense ratios disclosed in the Financial Highlights tables in this report. The waivers and expense limitations are contractual at least until 6-30-08. The net expenses are as follows: Class A — 1.34%, Class B — 2.04%, Class C — 2.04%, Class I — 0.95%, Class R1 — 1.69% . Had the fee waivers and expense limitations not been in place, the gross expenses would be as follows: Class A — 1.93%, Class B — 13.58%, Class C — 3.82%, Class I — 17.83%, Class R1 — 21.12% .
The returns reflect past results and should not be considered indicative of future performance. The return and principal value of an investment will fluctuate so that shares, when redeemed, may be worth more or less than their original cost. Due to market volatility, the Fund’s current performance may be higher or lower than the performance shown. For performance data current to the most recent month end, please call 1-800-225-5291 or visit the Fund’s Web site at www.jhfunds.com.
The performance table above and the chart on the next page do not reflect the deduction of taxes that a shareholder would pay on fund distributions or the redemption of fund shares.
The Fund’s performance results reflect any applicable expense reductions, without which the expenses would increase and results would have been less favorable.
Performance is calculated with an opening price (prior day’s close) on the inception date.
1 For certain types of investors as described in the Fund’s Class I and Class R1 share prospectuses.
Annual report | U.S. Core Fund
7
A look at performance
Growth of $10,000
This chart shows what happened to a hypothetical $10,000 investment in U.S. Core Fund Class A shares for the period indicated. For comparison, we’ve shown the same investment in the Standard & Poor’s 500 Index.
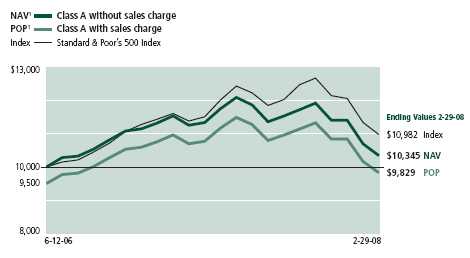
| | | | |
| | | | With maximum | |
| Class | Period beginning | Without sales charge | sales charge | Index |
|
| B | 6-12-06 | $10,216 | $9,828 | $10,982 |
|
| C2 | 6-12-06 | 10,221 | 10,221 | 10,982 |
|
| I3 | 6-12-06 | 10,412 | 10,412 | 10,982 |
|
| R13 | 6-12-06 | 10,304 | 10,304 | 10,982 |
|
Assuming all distributions were reinvested for the period indicated, the table above shows the value of a $10,000 investment in the Fund’s Class B, Class C, Class I and Class R1 shares, respectively, as of February 29, 2008. Performance of the classes will vary based on the difference in sales charges paid by shareholders investing in the different classes and the fee structure of those classes.
Standard & Poor’s 500 Index is an unmanaged index that includes 500 widely traded common stocks.
It is not possible to invest directly in an index. Index figures do not reflect sales charges, which would have resulted in lower values if they did.
1 NAV represents net asset value and POP represents public offering price.
2 No contingent deferred sales charge applicable.
3 For certain types of investors as described in the Fund’s Class I and Class R1 share prospectuses.
U.S. Core Fund | Annual report
8
Your expenses
These examples are intended to help you understand your ongoing operating expenses.
Understanding fund expenses
As a shareholder of the Fund, you incur two types of costs:
■ Transaction costs which include sales charges (loads) on purchases or redemptions (varies by share class), minimum account fee charge, etc.
■ Ongoing operating expenses including management fees, distribution and service fees (if applicable), and other fund expenses.
We are going to present only your ongoing operating expenses here.
Actual expenses/actual returns
This example is intended to provide information about your fund’s actual ongoing operating expenses, and is based on your fund’s actual return. It assumes an account value of $1,000.00 on September 1, 2007, with the same investment held until February 29, 2008.
| | | |
| | Account value | Ending value | Expenses paid during |
| | on 9-1-07 | on 2-29-08 | period on 2-29-081 |
|
| Class A | $1,000.00 | $896.23 | $6.22 |
|
| Class B | 1,000.00 | 892.68 | 9.65 |
|
| Class C | 1,000.00 | 893.15 | 9.65 |
|
| Class I | 1,000.00 | 897.98 | 4.48 |
|
| Class R1 | 1,000.00 | 896.62 | 5.56 |
|
Together with the value of your account, you may use this information to estimate the operating expenses that you paid over the period. Simply divide your account value at February 29, 2008, by $1,000.00, then multiply it by the “expenses paid” for your share class from the table above. For example, for an account value of $8,600.00, the operating expenses should be calculated as follows:
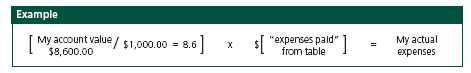
Annual report | U.S. Core Fund
9
Your expenses
Hypothetical example for comparison purposes
This table allows you to compare your fund’s ongoing operating expenses with those of any other fund. It provides an example of the Fund’s hypothetical account values and hypothetical expenses based on each class’s actual expense ratio and an assumed 5% annualized return before expenses (which is not your fund’s actual return). It assumes an account value of $1,000.00 on September 1, 2007, with the same investment held until February 29, 2008. Look in any other fund shareholder report to find its hypothetical example and you will be able to compare these expenses.
| | | |
| | Account value | Ending value | Expenses paid during |
| | on 9-1-07 | on 2-29-08 | period on 2-29-081 |
|
| Class A | $1,000.00 | $1,018.30 | $6.62 |
|
| Class B | 1,000.00 | 1,014.67 | 10.27 |
|
| Class C | 1,000.00 | 1,014.67 | 10.27 |
|
| Class I | 1,000.00 | 1,020.14 | 4.77 |
|
| Class R1 | 1,000.00 | 1,019.00 | 5.92 |
|
Remember, these examples do not include any transaction costs, such as sales charges; therefore, these examples will not help you to determine the relative total costs of owning different funds. If transaction costs were included, your expenses would have been higher. See the prospectus for details regarding transaction costs.
1 Expenses are equal to the Fund’s annualized expense ratio of 1.32%, 2.05%, 2.05%, 0.95% and 1.18% for Class A, Class B, Class C, Class I and Class R1, respectively, multiplied by the average account value over the period, multiplied by the number of days in most recent fiscal half year/ 366 (to reflect the one-half year period).
U.S. Core Fund | Annual report
10
Portfolio summary
| | | | |
| Top 10 holdings1 | | | | |
|
| Exxon Mobil Corp. | 5.8% | | Johnson & Johnson | 3.1% |
| |
|
| Wal-Mart Stores, Inc. | 3.9% | | UnitedHealth Group, Inc. | 3.0% |
| |
|
| Pfizer, Inc. | 3.8% | | Microsoft Corp. | 2.7% |
| |
|
| Chevron Corp. | 3.7% | | Merck & Company, Inc. | 2.6% |
| |
|
| The Coca-Cola Company | 3.3% | | QUALCOMM, Inc. | 2.0% |
| |
|
| |
| Sector distribution1 | | | | |
|
| Consumer non-cyclical | 32% | | Industrial | 7% |
| |
|
| Energy | 17% | | Financial | 6% |
| |
|
| Consumer, cyclical | 12% | | Basic materials | 3% |
| |
|
| Technology | 10% | | Utilities | 1% |
| |
|
| Communications | 9% | | Other | 3% |
| |
|
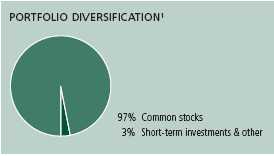
1 As a percentage of net assets on February 29, 2008.
Annual report | U.S. Core Fund
11
F I N A N C I A L S T A T E M E N T S
Fund’s investments
Securities owned by the Fund on 2-29-08
This schedule is divided into three main categories: common stocks, short-term investments and repurchase agreements. Common stocks are further broken down by industry group. Repurchase agreements, which represent the Fund’s cash position, are listed last.
| | |
| Issuer | Shares | Value |
| |
| Common stocks 96.62% | | $20,636,960 |
|
| (Cost $21,725,664) | | |
| | | |
| Aerospace 0.77% | | 164,658 |
|
| General Dynamics Corp. | 200 | 16,370 |
|
| Goodrich Corp. | 400 | 23,692 |
|
| Rockwell Collins, Inc. | 200 | 11,780 |
|
| United Technologies Corp. | 1,600 | 112,816 |
| | | |
| Agriculture 1.08% | | 231,360 |
|
| Monsanto Company | 2,000 | 231,360 |
| | | |
| Aluminum 0.17% | | 37,140 |
|
| Alcoa, Inc. | 1,000 | 37,140 |
| | | |
| Apparel & Textiles 0.84% | | 178,590 |
|
| Coach, Inc. * | 2,100 | 63,672 |
|
| Liz Claiborne, Inc. | 400 | 7,112 |
|
| NIKE, Inc., Class B | 700 | 42,140 |
|
| Polo Ralph Lauren Corp., Class A | 200 | 12,438 |
|
| VF Corp. | 700 | 53,228 |
| | | |
| Auto Parts 0.51% | | 108,988 |
|
| Autoliv, Inc. | 200 | 9,980 |
|
| AutoZone, Inc. * | 300 | 34,524 |
|
| BorgWarner, Inc. | 200 | 8,622 |
|
| Johnson Controls, Inc. | 1,700 | 55,862 |
| | | |
| Auto Services 0.05% | | 11,656 |
|
| AutoNation, Inc. * | 800 | 11,656 |
| | | |
| Automobiles 0.58% | | 123,998 |
|
| Ford Motor Company * | 5,200 | 33,956 |
|
| General Motors Corp. | 700 | 16,296 |
|
| PACCAR, Inc. | 1,700 | 73,746 |
| | | |
| Banking 1.27% | | 270,901 |
|
| Bank of America Corp. | 4,800 | 190,752 |
|
| BB&T Corp. | 500 | 15,565 |
|
| Comerica, Inc. | 200 | 7,248 |
|
| National City Corp. | 2,000 | 31,720 |
|
| U.S. Bancorp | 800 | 25,616 |
See notes to financial statements
U.S. Core Fund | Annual report
12
F I N A N C I A L S T A T E M E N T S
| | |
| Issuer | Shares | Value |
| |
| Biotechnology 0.51% | | $109,132 |
|
| Amgen, Inc. * | 1,500 | 68,280 |
|
| Biogen Idec, Inc. * | 700 | 40,852 |
| | | |
| Broadcasting 0.19% | | 40,947 |
|
| Discovery Holding Company * | 800 | 18,056 |
|
| Liberty Global, Inc., Class A * | 300 | 11,280 |
|
| Liberty Media Corp., Capital, Series A * | 100 | 11,611 |
| | | |
| Building Materials & Construction 0.02% | | 3,738 |
|
| Masco Corp. | 200 | 3,738 |
| | | |
| Business Services 1.07% | | 228,886 |
|
| Affiliated Computer Services, Inc., Class A * | 700 | 35,525 |
|
| Fiserv, Inc. * | 1,600 | 84,192 |
|
| Fluor Corp. | 400 | 55,700 |
|
| Jacobs Engineering Group, Inc. * | 500 | 40,145 |
|
| NCR Corp. * | 200 | 4,432 |
|
| Total Systems Services, Inc. | 400 | 8,892 |
| | | |
| Chemicals 0.49% | | 104,713 |
|
| Air Products & Chemicals, Inc. | 200 | 18,266 |
|
| Celanese Corp., Series A | 600 | 23,340 |
|
| Dow Chemical Company | 300 | 11,307 |
|
| Lubrizol Corp. | 200 | 11,660 |
|
| Praxair, Inc. | 500 | 40,140 |
| | | |
| Computers & Business Equipment 6.70% | | 1,430,100 |
|
| Apple, Inc. * | 2,400 | 300,048 |
|
| Cisco Systems, Inc. * | 14,900 | 363,113 |
|
| Dell, Inc. * | 10,800 | 214,380 |
|
| EMC Corp. * | 10,100 | 156,954 |
|
| Hewlett-Packard Company | 900 | 42,993 |
|
| International Business Machines Corp. | 2,800 | 318,808 |
|
| Juniper Networks, Inc. * | 800 | 21,456 |
|
| Western Digital Corp. * | 400 | 12,348 |
| | | |
| Construction Materials 0.14% | | 28,780 |
|
| Martin Marietta Materials, Inc. | 100 | 10,760 |
|
| Trane, Inc. | 400 | 18,020 |
| | | |
| Containers & Glass 0.19% | | 39,515 |
|
| Owens-Illinois, Inc. * | 700 | 39,515 |
| | | |
| Cosmetics & Toiletries 1.83% | | 391,107 |
|
| Avon Products, Inc. | 400 | 15,224 |
|
| Colgate-Palmolive Company | 700 | 53,263 |
|
| Estee Lauder Companies, Inc., Class A | 300 | 12,774 |
|
| Kimberly-Clark Corp. | 1,200 | 78,216 |
|
| Procter & Gamble Company | 3,500 | 231,630 |
See notes to financial statements
Annual report | U.S. Core Fund
13
F I N A N C I A L S T A T E M E N T S | | |
| Issuer | Shares | Value |
| |
| Crude Petroleum & Natural Gas 1.75% | | $374,779 |
|
| Apache Corp. | 800 | 91,768 |
|
| Devon Energy Corp. | 500 | 51,360 |
|
| Hess Corp. | 200 | 18,636 |
|
| Marathon Oil Corp. | 200 | 10,632 |
|
| Occidental Petroleum Corp. | 2,300 | 177,951 |
|
| Sunoco, Inc. | 400 | 24,432 |
| | | |
| Drugs & Health Care 0.43% | | 91,602 |
|
| Wyeth | 2,100 | 91,602 |
| | | |
| Educational Services 0.82% | | 174,306 |
|
| Apollo Group, Inc., Class A * | 2,300 | 141,174 |
|
| ITT Educational Services, Inc. * | 600 | 33,132 |
| | | |
| | | |
| Electrical Equipment 0.05% | | 10,192 |
|
| Emerson Electric Company | 200 | 10,192 |
| | | |
| Electrical Utilities 0.68% | | 146,217 |
|
| American Electric Power Company, Inc. | 200 | 8,184 |
|
| Constellation Energy Group, Inc. | 300 | 26,505 |
|
| Edison International | 400 | 19,760 |
|
| Entergy Corp. | 100 | 10,274 |
|
| FPL Group, Inc. | 200 | 12,058 |
|
| Mirant Corp. * | 300 | 11,100 |
|
| PPL Corp. | 200 | 9,076 |
|
| Public Service Enterprise Group, Inc. | 600 | 26,460 |
|
| Reliant Energy, Inc. * | 1,000 | 22,800 |
| | | |
| Electronics 0.39% | | 83,670 |
|
| Arrow Electronics, Inc. * | 300 | 9,783 |
|
| Avnet, Inc. * | 300 | 10,113 |
|
| L-3 Communications Holdings, Inc. | 600 | 63,774 |
| | | |
| Energy 0.32% | | 68,452 |
|
| Duke Energy Corp. | 1,300 | 22,802 |
|
| McDermott International, Inc. * | 400 | 20,888 |
|
| NRG Energy, Inc. * | 600 | 24,762 |
| | | |
| Financial Services 1.81% | | 386,349 |
|
| Charles Schwab Corp. | 500 | 9,805 |
|
| Citigroup, Inc. | 12,300 | 291,633 |
|
| Eaton Vance Corp. | 300 | 9,555 |
|
| Franklin Resources, Inc. | 200 | 18,874 |
|
| Leucadia National Corp. | 300 | 13,578 |
|
| Morgan Stanley | 500 | 21,060 |
|
| SEI Investments Company | 400 | 10,004 |
|
| Washington Mutual, Inc. | 800 | 11,840 |
| | | |
| Food & Beverages 5.62% | | 1,201,315 |
|
| Coca-Cola Enterprises, Inc. | 500 | 12,215 |
|
| Kraft Foods, Inc., Class A | 1,522 | 47,441 |
See notes to financial statements
U.S. Core Fund | Annual report
14
F I N A N C I A L S T A T E M E N T S
| | |
| Issuer | Shares | Value |
| |
| Food & Beverages (continued) | | |
|
| PepsiCo, Inc. | 5,800 | $403,448 |
|
| The Coca-Cola Company | 12,000 | 701,520 |
|
| Tyson Foods, Inc., Class A | 1,300 | 18,733 |
|
| William Wrigley Jr. Company | 300 | 17,958 |
| | | |
| Forest Products 0.06% | | 12,240 |
|
| Weyerhaeuser Company | 200 | 12,240 |
| | | |
| Gas & Pipeline Utilities 0.64% | | 137,559 |
|
| Transocean, Inc. * | 979 | 137,559 |
| | | |
| Healthcare Products 6.16% | | 1,316,179 |
|
| Baxter International, Inc. | 100 | 5,902 |
|
| Intuitive Surgical, Inc. * | 200 | 56,384 |
|
| Johnson & Johnson | 10,800 | 669,168 |
|
| Medtronic, Inc. | 2,400 | 118,464 |
|
| Patterson Companies, Inc. * | 900 | 31,680 |
|
| St. Jude Medical, Inc. * | 600 | 25,788 |
|
| Stryker Corp. | 2,000 | 130,220 |
|
| Zimmer Holdings, Inc. * | 3,700 | 278,573 |
| | | |
| Healthcare Services 6.25% | | 1,334,838 |
|
| Cardinal Health, Inc. | 900 | 53,226 |
|
| Cerner Corp. * | 200 | 8,690 |
|
| Coventry Health Care, Inc. * | 1,400 | 72,618 |
|
| Express Scripts, Inc. * | 3,300 | 195,030 |
|
| McKesson Corp. | 1,500 | 88,140 |
|
| Medco Health Solutions, Inc. * | 2,100 | 93,051 |
|
| Quest Diagnostics, Inc. | 500 | 23,835 |
|
| UnitedHealth Group, Inc. | 13,900 | 646,072 |
|
| WellPoint, Inc. * | 2,200 | 154,176 |
| | | |
| Holdings Companies/Conglomerates 0.15% | | 32,502 |
|
| Textron, Inc. | 600 | 32,502 |
| | | |
| Homebuilders 0.03% | | 6,363 |
|
| Toll Brothers, Inc. * | 300 | 6,363 |
| | | |
| Hotels & Restaurants 0.49% | | 105,333 |
|
| McDonald’s Corp. | 1,600 | 86,576 |
|
| Starbucks Corp. * | 100 | 1,797 |
|
| Wynn Resorts, Ltd. * | 100 | 10,070 |
|
| Yum! Brands, Inc. | 200 | 6,890 |
| | | |
| Household Products 0.26% | | 55,698 |
|
| Energizer Holdings, Inc. * | 600 | 55,698 |
| | | |
| Industrial Machinery 1.50% | | 320,244 |
|
| Cameron International Corp. * | 700 | 29,736 |
|
| Caterpillar, Inc. | 1,000 | 72,330 |
|
| Deere & Company | 1,400 | 119,294 |
|
| FMC Technologies, Inc. * | 200 | 11,332 |
See notes to financial statements
Annual report | U.S. Core Fund
15
F I N A N C I A L S T A T E M E N T S
| | |
| Issuer | Shares | Value |
| | | |
| Industrial Machinery (continued) | | |
|
| Ingersoll-Rand Company, Ltd., Class A | 500 | $20,930 |
|
| ITT Corp. | 400 | 22,496 |
|
| Pall Corp. | 300 | 11,811 |
|
| Parker-Hannifin Corp. | 500 | 32,315 |
| | | |
| Industrials 0.06% | | 12,198 |
|
| Fastenal Company | 300 | 12,198 |
| | | |
| Insurance 3.22% | | 686,790 |
|
| ACE, Ltd. | 400 | 22,496 |
|
| Aetna, Inc. | 800 | 39,680 |
|
| AFLAC, Inc. | 900 | 56,169 |
|
| Allstate Corp. | 2,400 | 114,552 |
|
| American International Group, Inc. | 3,300 | 154,638 |
|
| Aon Corp. | 600 | 24,966 |
|
| Brown & Brown, Inc. | 400 | 7,132 |
|
| Chubb Corp. | 600 | 30,540 |
|
| CIGNA Corp. | 800 | 35,664 |
|
| CNA Financial Corp. | 300 | 7,995 |
|
| First American Corp. | 200 | 6,966 |
|
| Hartford Financial Services Group, Inc. | 200 | 13,980 |
|
| Old Republic International Corp. | 300 | 4,116 |
|
| Progressive Corp. | 1,200 | 21,996 |
|
| Prudential Financial, Inc. | 300 | 21,891 |
|
| SAFECO Corp. | 100 | 4,626 |
|
| The Travelers Companies, Inc. | 1,300 | 60,333 |
|
| Torchmark Corp. | 300 | 18,078 |
|
| Transatlantic Holdings, Inc. | 200 | 13,480 |
|
| UnumProvident Corp. | 1,200 | 27,492 |
| | | |
| International Oil 11.53% | | 2,463,122 |
|
| Anadarko Petroleum Corp. | 700 | 44,618 |
|
| Chevron Corp. | 9,200 | 797,272 |
|
| ConocoPhillips | 3,600 | 297,756 |
|
| Exxon Mobil Corp. | 14,200 | 1,235,542 |
|
| Murphy Oil Corp. | 200 | 16,076 |
|
| Noble Corp. | 200 | 9,830 |
|
| Weatherford International, Ltd. * | 900 | 62,028 |
| | | |
| Internet Content 1.10% | | 235,590 |
|
| Google, Inc., Class A * | 500 | 235,590 |
| | | |
| Internet Retail 1.46% | | 312,120 |
|
| Amazon.com, Inc. * | 1,700 | 109,599 |
|
| eBay, Inc. * | 6,900 | 181,884 |
|
| Expedia, Inc. * | 900 | 20,637 |
| | | |
| Internet Software 0.14% | | 30,708 |
|
| McAfee, Inc. * | 400 | 13,308 |
|
| VeriSign, Inc. * | 500 | 17,400 |
See notes to financial statements
U.S. Core Fund | Annual report
16
F I N A N C I A L S T A T E M E N T S
| | |
| Issuer | Shares | Value |
| | | |
| Leisure Time 0.20% | | $43,154 |
|
| Carnival Corp. | 300 | 11,805 |
|
| MGM MIRAGE * (a) | 509 | 31,349 |
| | | |
| Liquor 0.29% | | 61,217 |
|
| Anheuser-Busch Companies, Inc. | 1,300 | 61,217 |
| | | |
| Manufacturing 2.60% | | 555,216 |
|
| 3M Company | 3,600 | 282,240 |
|
| Danaher Corp. | 1,300 | 96,395 |
|
| Eaton Corp. | 200 | 16,126 |
|
| Harley-Davidson, Inc. | 800 | 29,728 |
|
| Honeywell International, Inc. | 1,800 | 103,572 |
|
| Illinois Tool Works, Inc. | 100 | 4,907 |
|
| SPX Corp. | 100 | 10,230 |
|
| Tyco International, Ltd. | 300 | 12,018 |
| | | |
| Metal & Metal Products 0.26% | | 55,195 |
|
| Precision Castparts Corp. | 500 | 55,195 |
| | | |
| Mining 0.14% | | 30,258 |
|
| Freeport-McMoRan Copper & Gold, Inc., Class B | 300 | 30,258 |
| | | |
| Office Furnishings & Supplies 0.17% | | 36,384 |
|
| Office Depot, Inc. * | 3,200 | 36,384 |
| | | |
| Paper 0.02% | | 4,119 |
|
| Temple-Inland, Inc. | 300 | 4,119 |
| | | |
| Petroleum Services 2.43% | | 518,028 |
|
| Baker Hughes, Inc. | 200 | 13,458 |
|
| Diamond Offshore Drilling, Inc. | 300 | 36,249 |
|
| Halliburton Company | 700 | 26,810 |
|
| Schlumberger, Ltd. | 3,400 | 293,930 |
|
| Smith International, Inc. | 600 | 37,818 |
|
| Valero Energy Corp. | 1,900 | 109,763 |
| Pharmaceuticals 8.50% | | 1,815,711 |
|
| Abbott Laboratories | 2,500 | 133,875 |
|
| AmerisourceBergen Corp. | 900 | 37,548 |
|
| Bristol-Myers Squibb Company | 600 | 13,566 |
|
| Eli Lilly & Company | 2,200 | 110,044 |
|
| Forest Laboratories, Inc. * | 1,800 | 71,586 |
|
| Gilead Sciences, Inc. * | 400 | 18,928 |
|
| Merck & Company, Inc. | 12,600 | 558,180 |
|
| Pfizer, Inc. | 36,800 | 819,904 |
|
| Schering-Plough Corp. | 2,400 | 52,080 |
| | | |
| Publishing 0.19% | | 40,273 |
|
| Gannett Company, Inc. | 1,200 | 36,180 |
|
| McGraw-Hill Companies, Inc. | 100 | 4,093 |
See notes to financial statements
Annual report | U.S. Core Fund
17
F I N A N C I A L S T A T E M E N T S
| | |
| Issuer | Shares | Value |
| | | |
| Railroads & Equipment 0.14% | | $29,804 |
|
| CSX Corp. | 100 | 4,852 |
|
| Union Pacific Corp. | 200 | 24,952 |
| | | |
| Retail Grocery 0.33% | | 71,365 |
|
| Safeway, Inc. | 1,000 | 28,740 |
|
| SUPERVALU, Inc. | 700 | 18,375 |
|
| The Kroger Company | 1,000 | 24,250 |
| | | |
| Retail Trade 8.97% | | 1,915,966 |
|
| Abercrombie & Fitch Company, Class A | 400 | 31,012 |
|
| American Eagle Outfitters, Inc. | 1,450 | 30,987 |
|
| Bed Bath & Beyond, Inc. * | 1,200 | 34,008 |
|
| Best Buy Company, Inc. | 200 | 8,602 |
|
| Costco Wholesale Corp. | 200 | 12,384 |
|
| CVS Caremark Corp. | 300 | 12,114 |
|
| Family Dollar Stores, Inc. | 700 | 13,405 |
|
| GameStop Corp., Class A * | 400 | 16,944 |
|
| Home Depot, Inc. | 15,300 | 406,215 |
|
| Kohl’s Corp. * | 1,200 | 53,328 |
|
| Lowe’s Companies, Inc. | 8,400 | 201,348 |
|
| Nordstrom, Inc. | 100 | 3,703 |
|
| RadioShack Corp. | 300 | 5,235 |
|
| Staples, Inc. | 1,900 | 42,275 |
|
| Target Corp. | 1,700 | 89,437 |
|
| Tiffany & Company | 300 | 11,292 |
|
| Walgreen Company | 3,300 | 120,483 |
|
| Wal-Mart Stores, Inc. | 16,600 | 823,194 |
| | | |
| Semiconductors 0.71% | | 151,963 |
|
| Analog Devices, Inc. | 100 | 2,692 |
|
| Intel Corp. | 5,900 | 117,705 |
|
| KLA-Tencor Corp. | 200 | 8,402 |
|
| Texas Instruments, Inc. | 400 | 11,984 |
|
| Xilinx, Inc. | 500 | 11,180 |
| | | |
| Software 3.82% | | 814,857 |
|
| Autodesk, Inc. * | 300 | 9,327 |
|
| CA, Inc. | 500 | 11,440 |
|
| Citrix Systems, Inc. * | 600 | 19,758 |
|
| Intuit, Inc. * | 200 | 5,312 |
|
| Microsoft Corp. | 21,000 | 571,620 |
|
| Oracle Corp. * | 10,500 | 197,400 |
| | | |
| Telecommunications Equipment & Services 3.70% | | 789,352 |
|
| Corning, Inc. | 1,200 | 27,876 |
|
| QUALCOMM, Inc. | 10,000 | 423,700 |
|
| Verizon Communications, Inc. | 9,300 | 337,776 |
| | | |
| Telephone 0.60% | | 128,000 |
|
| AT&T, Inc. | 3,675 | 128,000 |
See notes to financial statements
U.S. Core Fund | Annual report
18
F I N A N C I A L S T A T E M E N T S
| | |
| Issuer | Shares | Value |
| | | |
| Tires & Rubber 0.08% | | $16,260 |
|
| Goodyear Tire & Rubber Company * | 600 | 16,260 |
| | | |
| Tobacco 1.78% | | 380,102 |
|
| Altria Group, Inc. | 4,900 | 358,386 |
|
| UST, Inc. | 400 | 21,716 |
| | | |
| Toys, Amusements & Sporting Goods 0.08% | | 17,391 |
|
| Hasbro, Inc. | 300 | 7,731 |
|
| Mattel, Inc. | 500 | 9,660 |
| | | |
| Trucking & Freight 0.28% | | 59,770 |
|
| FedEx Corp. | 200 | 17,626 |
|
| United Parcel Service, Inc., Class B | 600 | 42,144 |
| |
| | Principal | |
| Issuer, description, maturity date | amount | Value |
| |
| Short-term investments 0.13% | | $26,879 |
|
| (Cost $26,879) | | |
| |
| John Hancock Cash Investment Trust, 3.5681% (c) (f) | $26,879 | 26,879 |
| |
| Repurchase agreements 3.27% | | $699,000 |
|
| (Cost $699,000) | | |
|
| Repurchase Agreement with State Street Corp. dated | | |
| 2-29-08 at 2.35% to be repurchased at $699,137 | | |
| on 3-3-08, collateralized by $615,000 Federal | | |
| National Mortgage Association, 6.25%, due | | |
| 5-15-29 (valued at $713,400, including interest) | $699,000 | 699,000 |
| |
| Total investments (Cost $22,451,543)† 100.02% | | $21,362,839 |
|
| Liabilities in excess of other assets (0.02%) | | ($3,696) |
|
| Total net assets 100.00% | | $21,359,143 |
|
Percentages are stated as a percent of net assets.
* Non-income producing.
(a) All or a portion of this security was out on loan.
(c) Investment is an affiliate of the Trust’s adviser or subadviser.
(f) John Hancock Cash Investment Trust is managed by MFC Global Investment Management (U.S.), LLC. The rate shown is the seven-day effective yield at period end.
† At February 29, 2008, the aggregate cost of investment securities for federal income tax purposes was $22,520,999. Net unrealized depreciation aggregated $1,158,160, of which $884,751 related to appreciated investment securities and $2,042,911 related to depreciated investment securities.
See notes to financial statements
Annual report | U.S. Core Fund
19
F I N A N C I A L S T A T E M E N T S
Financial statements
Statement of assets and liabilities 2-29-08
This Statement of Assets and Liabilities is the Fund’s balance sheet. It shows the value of what the Fund owns, is due and owes. You’ll also find the net asset value and the maximum public offering price per share.
| |
| Assets | |
|
| Investments in unaffiliated issuers, at value (cost $21,725,664) including | |
| $26,352 of securities loaned (Note 2) | $20,636,960 |
| Repurchase agreement, at value (cost $699,000) (Note 2) | 699,000 |
| Investments in affiliated issuers, at value (cost $26,879) (Note 2) | 26,879 |
| Total investments, at value (cost $22,451,543) | 21,362,839 |
| Cash | 34 |
| Cash collateral at broker for futures contracts | 41,580 |
| Receivable for investments sold | 6,080 |
| Dividends and interest receivable (net of tax) | 45,575 |
| Receivable due from adviser | 6,112 |
| Other assets | 103 |
| | |
| Total assets | 21,462,323 |
| |
| Liabilities | |
|
| Payable for fund shares repurchased | 9,004 |
| Payable upon return of securities loaned (Note 2) | 26,879 |
| Payable for futures variation margin | 12,075 |
| Payable to affiliates | |
| Fund administration fees | 212 |
| Transfer agent fees | 1,834 |
| Distribution and service fees | 193 |
| Trustees’ fees | 86 |
| Other payables and accrued expenses | 52,897 |
| | |
| Total liabilities | 103,180 |
| |
| Net assets | |
|
| Capital paid-in | $22,732,737 |
| Undistributed net investment income | 19,301 |
| Accumulated undistributed net realized gain (loss) on investments and futures contracts | (278,773) |
| Net unrealized appreciation (depreciation) on investments and futures contracts | (1,114,122) |
| | |
| Net assets | $21,359,143 |
See notes to financial statements
U.S. Core Fund | Annual report
20
F I N A N C I A L S T A T E M E N T S
Statement of assets and liabilities (continued)
| |
| Net asset value per share | |
|
| The Funds have an unlimited number of shares authorized with no par | |
| value. Net asset value is calculated by dividing the net assets of each class | |
| of shares by the number of outstanding shares in the class. | |
| | |
| Class A | |
| Net assets | $17,582,212 |
| Shares outstanding | 905,575 |
| Net asset value and redemption price per share | $19.42 |
| | |
| Class B1 | |
| Net assets | $337,116 |
| Shares outstanding | 17,392 |
| Net asset value and offering price per share | $19.38 |
| | |
| Class C1 | |
| Net assets | $3,159,503 |
| Shares outstanding | 162,981 |
| Net asset value and offering price per share | $19.39 |
| | |
| Class I | |
| Net assets | $177,266 |
| Shares outstanding | 9,123 |
| Net asset value, offering price and redemption price per share | $19.43 |
| | |
| Class R1 | |
| Net assets | $103,046 |
| Shares outstanding | 5,319 |
| Net asset value, offering price and redemption price per share | $19.37 |
| |
| Maximum public offering price per share | |
|
| Class A (net asset value per share ÷ 95%)2 | $20.44 |
1 Redemption price per share is equal to the net asset value less any applicable contingent deferred sales charge.
2 On single retail sales of less than $50,000. On sales of $50,000 or more and on group sales the offering price is reduced.
See notes to financial statements
Annual report | U.S. Core Fund
21
F I N A N C I A L S T A T E M E N T S
Statement of operations For the year ended 2-29-08
This Statement of Operations summarizes the Fund’s investment income earned and expenses incurred in operating the Fund. It also shows net gains (losses) for the period stated.
| |
| Investment income | |
|
| Dividends | $459,865 |
| Interest | 36,863 |
| Securities lending | 109 |
| Income from affiliated issuers | 36 |
| | |
| Total investment income | 496,873 |
| |
| Expenses | |
|
| Investment management fees (Note 3) | 185,232 |
| Distribution and service fees (Note 3) | 100,628 |
| Transfer agent fees (Note 3) | 18,857 |
| Fund administration fees (Note 3) | 10,610 |
| Blue sky fees (Note 3) | 78,355 |
| Audit and legal fees | 78,038 |
| Printing and postage fees (Note 3) | 7,602 |
| Custodian fees | 35,646 |
| Trustees’ fees (Note 3) | 1,733 |
| Registration and filing fees | 25,734 |
| Miscellaneous | 342 |
| | |
| Total expenses | 542,777 |
| Less expense reductions (Note 3) | (189,284) |
| | |
| Net expenses | 353,493 |
| | |
| Net investment income | 143,380 |
| |
| Realized and unrealized gain (loss) | |
|
| Net realized gain (loss) on | |
| Investments in unaffiliated issuers | 393,570 |
| Futures contracts | (16,845) |
| | 376,725 |
| Change in net unrealized appreciation (depreciation) of | |
| Investments in unaffiliated issuers | (2,499,212) |
| Futures contracts | (19,868) |
| | (2,519,080) |
| Net realized and unrealized gain (loss) | (2,142,355) |
| | |
| Increase (decrease) in net assets from operations | ($1,998,975) |
See notes to financial statements
U.S. Core Fund | Annual report
22
F I N A N C I A L S T A T E M E N T S
Statement of changes in net assets
These Statements of Changes in Net Assets show how the value of the Fund’s net assets has changed during the last two periods. The difference reflects earnings less expenses, any investment gains and losses, distributions, if any, paid to shareholders and the net of Fund share transactions.
| | |
| | Period | Year |
| | ended | ended |
| | 2-28-071 | 2-29-08 |
|
| Increase (decrease) in net assets | | |
| From operations | | |
| Net investment income | $98,228 | $143,380 |
| Net realized gain (loss) | 531,494 | 376,725 |
| Change in net unrealized appreciation (depreciation) | 1,404,958 | (2,519,080) |
| | | |
| Increase (decrease) in net assets resulting from operations | 2,034,680 | (1,998,975) |
| | | |
| Distributions to shareholders | | |
| From net investment income | | |
| Class A | (75,450) | (147,501) |
| Class B | (174) | (184) |
| Class C | (2,087) | (2,027) |
| Class I | (737) | (5,265) |
| Class R1 | (400) | (756) |
| From net realized gain | | |
| Class A | (165,121) | (797,028) |
| Class B | (2,107) | (14,341) |
| Class C | (25,345) | (157,675) |
| Class I | (1,098) | (18,582) |
| Class R1 | (990) | (4,722) |
| | | |
| Total distributions | (273,509) | (1,148,081) |
| | | |
| From Fund share transactions (Note 6) | 21,350,742 | 1,394,286 |
| | | |
| Total increase (decrease) | 23,111,913 | (1,752,770) |
| |
| Net assets | | |
|
| Beginning of year | — | 23,111,913 |
| | | |
| End of year | $23,111,913 | $21,359,143 |
| | | |
| Undistributed net investment income | $31,671 | $19,301 |
1 Period from 6-12-06 (commencement of operations) to 2-28-07.
See notes to financial statements
Annual report | U.S. Core Fund
23
F I N A N C I A L S T A T E M E N T S
Financial highlights
The Financial Highlights show how the Fund’s net asset value for a share has changed since the end of the previous period.
| | |
| CLASS A SHARES | | |
| |
| Period ended | 2-28-071 | 2-29-08 |
| |
| Per share operating performance | | |
|
| Net asset value, beginning of period | $20.00 | $22.24 |
| Net investment income (loss)2 | 0.12 | 0.16 |
| Net realized and unrealized | | |
| gain (loss) on investments | 2.41 | (1.88) |
| Total from investment operations | 2.53 | (1.72) |
| Less distributions | | |
| From net investment income | (0.09) | (0.17) |
| From net realized gain | (0.20) | (0.93) |
| | (0.29) | (1.10) |
| Net asset value, end of period | $22.24 | $19.42 |
| Total return3,4 (%) | 12.645 | (8.16) |
| |
| Ratios and supplemental data | | |
|
| Net assets, end of period (in millions) | $19 | $18 |
| Ratios (as a percentage of average net assets): | | |
| Expenses before reductions | 1.936 | 1.86 |
| Expenses net of fee waivers, if any | 1.346 | 1.34 |
| Expenses net of all fee waivers and credits | 1.346 | 1.34 |
| Net investment income (loss) | 0.766 | 0.70 |
| Portfolio turnover (%) | 365 | 81 |
1 Class A shares began operations on 6-12-06.
2 Based on the average of the shares outstanding.
3 Total returns would have been lower had certain expenses not been reduced during the periods shown.
4 Assumes dividend reinvestment.
5 Not annualized.
6 Annualized.
See notes to financial statements
U.S. Core Fund | Annual report
24
F I N A N C I A L S T A T E M E N T S
Financial highlights
| | |
| CLASS B SHARES | | |
| |
| Period ended | 2-28-071 | 2-29-08 |
| |
| Per share operating performance | | |
|
| Net asset value, beginning of period | $20.00 | $22.20 |
| Net investment income (loss)2 | 0.02 | —3 |
| Net realized and unrealized | | |
| gain (loss) on investments | 2.40 | (1.88) |
| Total from investment operations | 2.42 | (1.88) |
| Less distributions | | |
| From net investment income | (0.02) | (0.01) |
| From net realized gain | (0.20) | (0.93) |
| | (0.22) | (0.94) |
| Net asset value, end of period | $22.20 | $19.38 |
| Total return4,5 (%) | 12.076 | (8.84) |
| |
| Ratios and supplemental data | | |
|
| Net assets, end of period (in millions) | —7 | —7 |
| Ratios (as a percentage of average net assets): | | |
| Expenses before reductions | 13.588 | 6.98 |
| Expenses net of fee waivers, if any | 2.048 | 2.05 |
| Expenses net of all fee waivers and credits | 2.048 | 2.05 |
| Net investment income (loss) | 0.128 | —9 |
| Portfolio turnover (%) | 366 | 81 |
1 Class B shares began operations on 6-12-06.
2 Based on the average of the shares outstanding.
3 Less than $0.01 per share.
4 Total returns would have been lower had certain expenses not been reduced during the periods shown.
5 Assumes dividend reinvestment.
6 Not annualized.
7 Less than $500,000.
8 Annualized.
9 Less than 0.01% .
See notes to financial statements
Annual report | U.S. Core Fund
25
F I N A N C I A L S T A T E M E N T S
Financial highlights
| | |
| CLASS C SHARES | | |
| |
| Period ended | 2-28-071 | 2-29-08 |
| |
| Per share operating performance | | |
|
| Net asset value, beginning of period | $20.00 | $22.21 |
| Net investment income (loss)2 | 0.03 | —3 |
| Net realized and unrealized | | |
| gain (loss) on investments | 2.40 | (1.88) |
| Total from investment operations | 2.43 | (1.88) |
| Less distributions | | |
| From net investment income | (0.02) | (0.01) |
| From net realized gain | (0.20) | (0.93) |
| | (0.22) | (0.94) |
| Net asset value, end of period | $22.21 | $19.39 |
| Total return4,5 (%) | 12.126 | (8.84) |
| |
| Ratios and supplemental data | | |
|
| Net assets, end of period (in millions) | $3 | $3 |
| Ratios (as a percentage of average net assets): | | |
| Expenses before reductions | 3.827 | 2.94 |
| Expenses net of fee waivers, if any | 2.047 | 2.05 |
| Expenses net of all fee waivers and credits | 2.047 | 2.05 |
| Net investment income (loss) | 0.167 | (0.01) |
| Portfolio turnover (%) | 366 | 81 |
1 Class C shares began operations on 6-12-06.
2 Based on the average of the shares outstanding.
3 Less than $0.01 per share.
4 Total returns would have been lower had certain expenses not been reduced during the periods shown.
5 Assumes dividend reinvestment.
6 Not annualized.
7 Annualized.
See notes to financial statements
U.S. Core Fund | Annual report
26
F I N A N C I A L S T A T E M E N T S
Financial highlights
| | |
| CLASS I SHARES | | |
| |
| Period ended | 2-28-071 | 2-29-08 |
| |
| Per share operating performance | | |
|
| Net asset value, beginning of period | $20.00 | $22.26 |
| Net investment income (loss)2 | 0.18 | 0.25 |
| Net realized and unrealized | | |
| gain (loss) on investments | 2.41 | (1.89) |
| Total from investment operations | 2.59 | (1.64) |
| Less distributions | | |
| From net investment income | (0.13) | (0.26) |
| From net realized gain | (0.20) | (0.93) |
| | (0.33) | (1.19) |
| Net asset value, end of period | $22.26 | $19.43 |
| Total return3,4 (%) | 12.955 | (7.82) |
| |
| Ratios and supplemental data | | |
|
| Net assets, end of period (in millions) | —6 | —6 |
| Ratios (as a percentage of average net assets): | | |
| Expenses before reductions | 17.837 | 12.79 |
| Expenses net of fee waivers, if any | 0.957 | 0.95 |
| Expenses net of all fee waivers and credits | 0.957 | 0.95 |
| Net investment income (loss) | 1.167 | 1.10 |
| Portfolio turnover (%) | 365 | 81 |
1 Class I shares began operations on 6-12-06.
2 Based on the average of the shares outstanding.
3 Total returns would have been lower had certain expenses not been reduced during the periods shown.
4 Assumes dividend reinvestment.
5 Not annualized.
6 Less than $500,000.
7 Annualized.
See notes to financial statements
Annual report | U.S. Core Fund
27
F I N A N C I A L S T A T E M E N T S
Financial highlights
| | |
| CLASS R1 SHARES | | |
| |
| Period ended | 2-28-071 | 2-29-08 |
| |
| Per share operating performance | | |
|
| Net asset value, beginning of period | $20.00 | $22.20 |
| Net investment income (loss)2 | 0.06 | 0.13 |
| Net realized and unrealized | | |
| gain (loss) on investments | 2.42 | (1.88) |
| Total from investment operations | 2.48 | (1.75) |
| Less distributions | | |
| From net investment income | (0.08) | (0.15) |
| From net realized gain | (0.20) | (0.93) |
| | (0.28) | (1.08) |
| Net asset value, end of period | $22.20 | $19.37 |
| Total return3,4 (%) | 12.385 | (8.32) |
| |
| Ratios and supplemental data | | |
|
| Net assets, end of period (in millions) | —6 | —6 |
| Ratios (as a percentage of average net assets): | | |
| Expenses before reductions | 21.127 | 15.98 |
| Expenses net of fee waivers, if any | 1.697 | 1.45 |
| Expenses net of all fee waivers and credits | 1.697 | 1.45 |
| Net investment income (loss) | 0.417 | 0.59 |
| Portfolio turnover (%) | 365 | 81 |
1 Class R1 shares began operations on 6-12-06.
2 Based on the average of the shares outstanding.
3 Total returns would have been lower had certain expenses not been reduced during the periods shown.
4 Assumes dividend reinvestment.
5 Not annualized.
6 Less than $500,000.
7 Annualized.
See notes to financial statements
U.S. Core Fund | Annual report
28
Notes to financial statements
1. Organization
John Hancock U.S. Core Fund (the Fund) is a diversified series of John Hancock Funds III (the Trust). The Trust was established as a Massachusetts business trust on June 9, 2005. The Trust is registered under the Investment Company Act of 1940, as amended (the 1940 Act), as an open-end investment management company. The investment objective of the Fund is to seek high total return.
John Hancock Life Insurance Company of New York (John Hancock New York) is a wholly owned subsidiary of John Hancock Life Insurance Company (U.S.A.) (John Hancock USA). John Hancock USA and John Hancock New York are indirect wholly owned subsidiaries of The Manufacturers Life Insurance Company (Manulife), which in turn is a wholly owned subsidiary of Manulife Financial Corporation (MFC), a publicly traded company. MFC and its subsidiaries are known collectively as “Manulife Financial.”
John Hancock Investment Management Services, LLC (the Adviser), a Delaware limited liability company controlled by John Hancock USA, serves as investment adviser for the Trust and John Hancock Funds, LLC (the Distributor), a Delaware limited liability company, an affiliate of the Adviser, serves as principal underwriter.
The Board of Trustees have authorized the issuance of multiple classes of shares of the Fund, including classes designated as Class A, Class B, Class C, Class I and Class R1 shares. Class A, Class B and Class C shares are open to all retail investors. Class I shares are offered without any sales charge to various institutional and certain individual investors. Class R1 shares are available only to certain retirement plans. The shares of each class represent an interest in the same portfolio of investments of the Fund, and have equal rights as to voting, redemptions, dividends and liquidation, except that certain expenses, subject to the approval of the Board of Trustees, may be applied differently to each class of shares in accordance with current regulations of the Securities and Exchange Commission (SEC) and the Internal Revenue Service. Shareholders of a class that bear distribution and service expenses under the terms of a distribution plan have exclusive voting rights to that distribution plan. Class B shares will convert to Class A shares eight years after purchase.
The Adviser and other subsidiaries of John Hancock USA owned 777,709, 5,271, 5,359 and 5,319 shares of beneficial interest of Class A, Class B, Class I and Class R1, respectively, of the Fund on February 29, 2008.
2. Significant accounting policies
In the preparation of the financial statements, the Fund follows the policies described below. The preparation of financial statements in conformity with accounting principles generally accepted in the United States of America requires management to make estimates and assumptions that affect the reported amounts of assets and liabilities at the date of the financial statements and the reported amounts of income and expenses during the reporting period. Actual results may differ from these estimates.
Security valuation
The net asset value of the shares of the Fund is determined daily as of the close of the New York Stock Exchange (NYSE), normally at 4:00 P.M., Eastern Time. Short-term debt investments that have a remaining maturity of 60 days or less are valued at amortized cost, and thereafter assume a constant amortization to maturity of any discount or premium, which approximates market value. Investments in John Hancock Cash Investment Trust (JHCIT), an affiliate of the John Hancock Advisers, LLC (JHA), a wholly owned subsidiary of John Hancock Financial Services, Inc., a subsidiary
Annual report | U.S. Core Fund
29
of MFC, are valued at their net asset value each business day. All other securities held by the Fund are valued at the last sale price or official closing price (closing bid price or last evaluated quote if no sale has occurred) as of the close of business on the principal securities exchange (domestic or foreign) on which they trade or, lacking any sales, at the closing bid price. Securities traded only in the over-the-counter market are valued at the last bid price quoted by brokers making markets in the securities at the close of trading. Securities for which there are no such quotations, principally debt securities, are valued based on the evaluated prices provided by an independent pricing service, which utilizes both dealer-supplied and electronic data processing techniques, which take into account factors such as institutional-size trading in similar groups of securities, yield, quality, coupon rate, maturity, type of issue, trading characteristics and other marke t data.
Other assets and securities for which no such quotations are readily available are valued at fair value as determined in good faith under consistently applied procedures established by and under the general supervision of the Board of Trustees. Generally, trading in non-U.S. securities is substantially completed each day at various times prior to the close of trading on the NYSE. The values of such securities used in computing the net asset value of a Fund’s shares are generally determined as of such times. Occasionally, significant events that affect the values of such securities may occur between the times at which such values are generally determined and the close of the NYSE. Upon such an occurrence, these securities will be valued at fair value as determined in good faith under consistently applied procedures established by and under the general supervision of the Board of Trustees.
In deciding whether to make a fair value adjustment to the price of a security, the Board of Trustees or their designee may review a variety of factors, including developments in foreign markets, the performance of U.S. securities markets and the performance of instruments trading in U.S. markets that represent foreign securities and baskets of foreign securities. The Fund may also fair value securities in other situations, for example, when a particular foreign market is closed, but the Fund is calculating the net asset value. In view of these factors, it is likely that Funds investing significant amounts of assets in securities in foreign markets will be fair valued more frequently than Funds investing signifi-cant amounts of assets in frequently traded, U.S. exchange-listed securities of large-capitalization U.S. issuers.
For purposes of determining when fair value adjustments may be appropriate with respect to Funds that invest in securities in foreign markets that close prior to the NYSE, the Funds will, on an ongoing basis, monitor for “significant market events.” A significant market event may be a certain percentage change in the value of an index or of certain Exchange Traded Funds that track foreign markets in which Funds have significant investments. If a significant market event occurs due to a change in the value of the index or of Exchange Traded Funds, the pricing for the Fund will promptly be reviewed and potential adjustments to the net asset value of the Fund will be recommended to the Trust’s Pricing Committee when applicable.
Fair value pricing of securities is intended to help ensure that the net asset value of the Fund’s shares reflects the value of the Fund’s securities as of the close of the NYSE (as opposed to a value which is no longer accurate as of such close), thus limiting the opportunity for aggressive traders to purchase shares of the Fund at deflated prices, reflecting stale security valuations, and to promptly sell such shares at a gain. However, a security’s valuation may differ depending on the method used for determining value and no assurance can be given that fair value pricing of securities will successfully eliminate all potential opportunities for such trading gains.
New accounting pronouncements
In September 2006, Financial Accounting Standards Board (FASB) Standard No. 157, Fair Value Measurements (FAS 157), was issued and is effective for fiscal years beginning after November 15, 2007. FAS 157 defines fair value, establishes a framework for measuring fair value and expands disclosure about fair
U.S. Core Fund | Annual report
30
value measurements. As of February 29, 2008, management does not believe the adoption of FAS 157 will impact the amounts reported in the financial statements; however, additional disclosures regarding pricing sources will be required about the inputs used to develop the measurements of fair value and the related realized and unrealized gain/loss for certain securities valued by significant unobservable market inputs.
In March 2008, FASB No. 161 (FAS 161), Disclosures about Derivative Instruments and Hedging Activities, an amendment of FASB Statement No. 133 (FAS 133), was issued and is effective for fiscal years beginning after November 15, 2008. FAS 161 amends and expands the disclosure requirements of FAS 133 in order to provide financial statement users an understanding of a company’s use of derivative instruments, how derivative instruments are accounted for under FAS 133 and related interpretations and how these instruments affect a company’s financial position, performance, and cash flows. FAS 161 requires companies to disclose information detailing the objectives and strategies for using derivative instruments, the level of derivative activity entered into by the company, and any credit risk-related contingent features of the agreements. Management is currently evaluating the adoption of FAS 161 on the Fund’s financial statement disclosures.
Guarantees and indemnifications
Under the Trust’s organizational documents, its Officers and Trustees are indemnified against certain liability arising out of the performance of their duties to the Trust. Additionally, in the normal course of business, the Trust enters into contracts with service providers that contain general indemnification clauses. The Trust’s maximum exposure under these arrangements is unknown, as this would involve future claims that may be made against the Trust that have not yet occurred.
Repurchase agreements
The Fund may enter into repurchase agreements. When the Fund enters into a repurchase agreement through its custodian, it receives delivery of securities, the amount of which at the time of purchase and each subsequent business day is required to be maintained at such a level that the market value is generally at least 102% of the repurchase amount. The Fund will take constructive receipt of all securities underlying the repurchase agreements it has entered into until such agreements expire. If the seller defaults, the Fund would suffer a loss to the extent that proceeds from the sale of underlying securities were less than the repurchase amount. The Fund may enter into repurchase agreements maturing within seven days with domestic dealers, banks or other financial institutions deemed to be creditworthy by the Adviser. Collateral for certain tri-party repurchase agreements is held at the custodian bank in a segregated account for the benefi t of the Fund and the counterparty.
Security transactions and related investment income
Investment security transactions are accounted for on a trade date plus one basis for daily net asset value calculations. However, for financial reporting purposes, investment transactions are reported on trade date. Interest income is accrued as earned. Dividend income and distributions to shareholders are recorded on the ex-dividend date. Foreign dividends are recorded on the ex-date or when the Fund becomes aware of the dividends from cash collections. Discounts/premiums are accreted/ amortized for financial reporting purposes. Non-cash dividends are recorded at the fair market value of the securities received. Debt obligations may be placed in a non-accrual status and related interest income may be reduced by ceasing current accruals and writing off interest receivables when the collection of all or a portion of interest has become doubtful, based upon consistently applied procedures.
From time to time, the Fund may invest in Real Estate Investment Trusts (REITs) and, as a result, will estimate the components of distributions from these securities. Distributions from REITs received in excess of income are recorded as a reduction of cost of investments and/or as a realized gain.
The Fund uses the specific identification method for determining realized gain or loss on investments for both financial statement and federal income tax reporting purposes.
Annual report | U.S. Core Fund
31
Allocations of income and expenses
All income, expenses (except class-specific expenses), and realized and unrealized gain/ loss are allocated to each class of shares based upon the relative net assets of each class. Dividends to shareholders from net investment income are determined at a class level and distributions from capital gains are determined at a Fund level.
Expenses not directly attributable to the Fund or share classes are allocated based on the relative share of net assets of the Fund or share class at the time the expense was incurred. Class-specific expenses, as detailed in Note 3, are accrued daily and charged directly to the respective share classes.
Securities lending
The Fund may lend portfolio securities from time to time in order to earn additional income. The Fund retains beneficial ownership of the securities it has loaned and continues to receive interest and dividends paid by the issuer of securities and to participate in any changes in their value. On the settlement date of the loan, the Fund receives collateral against the loaned securities and maintain collateral in an amount not less than 100% of the market value of the loaned securities during the period of the loan. The market value of the loaned securities is determined at the close of business of the Fund and any additional required collateral is delivered to the Fund on the next business day. Any cash collateral received is invested in the JHCIT. If the borrower defaults on its obligation to return the securities loaned because of insolvency or other reasons, a fund could experience delays and costs in recovering the securities loaned or in gaining access to the collat eral. The Fund receives compensation for lending its securities either in the form of fees, guarantees, and/or by retaining a portion of interest on the investment of any cash received as collateral.
The Fund has entered into an agreement with Morgan Stanley & Co. Incorporated and MS Securities Services Inc. (collectively, Morgan Stanley) which permits the Fund to lend securities to Morgan Stanley on a principal basis. Morgan Stanley is the primary borrower of fund securities of the Fund. The risk of having one primary borrower of securities (as opposed to several borrowers in an agency relationship) is that should Morgan Stanley fail financially, all securities lent will be affected by the failure and by any delays in recovery of the securities (or in the rare event, loss of rights in the collateral).
Prior to May 8, 2007, cash collateral was invested in the State Street Navigator Securities Lending Portfolio. At February 29, 2008, the Fund loaned securities having a market value of $26,352 collateralized by securities in the amount of $26,879.
Futures
The Fund may purchase and sell financial futures contracts and options on those contracts. The Fund invests in contracts based on finan-cial instruments, such as U.S. Treasury Bonds or Notes, or on securities indices such as the Standard & Poor’s 500 Index, in order to hedge against a decline in the value of securities owned by the Fund.
Initial margin deposits required upon entering into futures contracts are satisfied by the delivery of specific securities or cash as collateral to the broker (the Fund’s agent in acquiring the futures position). If the position is closed out by taking an opposite position prior to the settlement date of the futures contract, a final determination of variation margin is made, cash is required to be paid to or released by the broker and the Fund realizes a gain or loss.
When the Fund sells a futures contract based on a financial instrument, the Fund becomes obligated to deliver that kind of instrument at an agreed upon date for a specified price. The Fund realizes a gain or loss depending on whether the price of an offsetting purchase is less or more than the price of the initial sale or on whether the price of an offsetting sale is more or less than the price of the initial purchase. The Fund could be exposed to risks if it could not close out futures positions because of an illiquid secondary market or the inability of counterparties to meet the terms of their contracts. Futures contracts are valued at the quoted daily settlement prices established by the exchange on which they trade.
U.S. Core Fund | Annual report
32
The following is a summary of open futures contracts at February 29, 2008:
| | | | | |
| | | | | | UNREALIZED |
| | NUMBER OF | | EXPIRATION | NOTIONAL | APPRECIATION |
| OPEN CONTRACTS | CONTRACTS | POSITION | DATE | VALUE | (DEPRECIATION) |
|
| S&P Mini 500 | | | | | |
| Index Futures | 7 | Long | Mar 2008 | $465,955 | ($25,418) |
Federal income taxes
The Fund qualifies as a regulated investment company by complying with the applicable provisions of the Internal Revenue Code and will not be subject to federal income tax on taxable income that is distributed to shareholders. Therefore, no federal income tax provision is required. Net capital losses of $234,735 that are attributable to security transactions incurred after October 31, 2007, are treated as arising on March 1, 2008, the first day of the Fund’s next taxable year.
The Fund has adopted the provisions of FASB Interpretation No. 48, Accounting for Uncertainty in Income Taxes, an interpretation of FASB Statement 109 (FIN 48), at the beginning of the Fund’s fiscal year. FIN 48 prescribes a minimum threshold for financial statement recognition of the benefit of a tax position taken or expected to be taken in a tax return. The implementation of FIN 48 did not have a material impact on the Fund’s financial statements. Each of the Fund’s federal tax returns for the prior fiscal years remains subject to examination by the Internal Revenue Service.
Distribution of income and gains
The Fund records distributions to shareholders from net investment income and net realized gains, if any, on the ex-dividend date. During the year ended February 28, 2007, the tax character of distributions paid was as follows: ordinary income $244,036 and long-term capital gain $29,472. During the year ended February 29, 2008, the tax character of distributions paid was as follows: ordinary income $761,252 and long-term capital gain $386,829. Distributions paid by the Fund with respect to each class of shares are calculated in the same manner, at the same time and are in the same amount, except for the effect of expenses that may be applied differently to each class.
As of February 29, 2008, the components of distributable earnings on a tax basis included $19,302 of undistributed ordinary income.
Such distributions and distributable earnings, on a tax basis, are determined in conformity with income tax regulations, which may differ from accounting principles generally accepted in the United States of America. Distributions in excess of tax basis earnings and profits, if any, are reported in the Fund’s financial statements as a return of capital.
Capital accounts within financial statements are adjusted for permanent book/tax differences. These adjustments have no impact on net assets or the results of operations. Temporary book/tax differences will reverse in a subsequent period.
3. Investment advisory and other agreements
The Trust has entered into an Investment Advisory Agreement with the Adviser. The Adviser is responsible for managing the corporate and business affairs of the Trust and for selecting and compensating subadvisers to handle the investment of the assets of the Fund, subject to the supervision of the Trust’s Board of Trustees. As compensation for its services, the Adviser receives an advisory fee from the Trust. Under the Advisory Agreement, the Fund pays a monthly management fee to the Adviser equivalent, on an annual basis, to the sum of: (a) 0.78% of the first $500,000,000 of the Fund’s aggregate daily net assets; (b) 0.76% of the next $500,000,000 of the Fund’s aggregate daily net assets; (c) 0.75% of the next $1,500,000,000 of the Fund’s aggregate daily net assets; and (d) 0.74% of the Fund’s aggregate daily net assets in excess of $2,500,000,000. Aggregate net assets include the net assets of the Fund, U.S. Core Trust, Growth and Income Trust, and a portion of the net assets of the Managed Trust Series of John Hancock Trust, the U.S. Core Fund, a series of John Hancock
Annual report | U.S. Core Fund
33
Funds II, that are subadvised by Grantham, Mayo, Van Otterloo & Co. LLC. The Fund is not responsible for payment of the subadvisory fees.
The investment management fees incurred for the year ended February 29, 2008, were equivalent to an annual effective rate of 0.76% of the Fund’s average daily net assets.
Expense reimbursements
The Adviser has contractually agreed to reimburse or limit certain Fund level expenses to 0.10% of the Fund’s average annual net assets which are allocated pro rata to all share classes. This agreement excludes taxes, portfolio brokerage commissions, interest, advisory fees, Rule 12b-1 fees, transfer agency fees, blue sky fees, printing and postage and litigation and indemnification expenses and other extraordinary expenses not incurred in the ordinary course of the Fund’s business. In addition, fees incurred under any agreement or plans of the Fund dealing with services for the shareholders and others with beneficial interest in shares of the Fund, are excluded.
In addition, the Adviser has agreed to reimburse or limit certain expenses for each share class. This agreement excludes taxes, portfolio brokerage commissions, interest and litigation and indemnification expenses and other extraordinary expenses not incurred in the ordinary course of the Fund’s business. In addition, fees incurred under any agreement or plans of the Fund dealing with services for the shareholders and others with beneficial interest in shares of the Fund, are excluded. The reimbursements and limits are such that these expenses will not exceed 1.35% for Class A shares, 2.05% for Class B, 2.05% for Class C, 0.95% for Class I and 1.45% for Class R1. Accordingly, the expense reductions or reimbursements related to this agreement were $105,283, $16,541, $32,283, $18,472 and $16,429 for Class A, Class B, Class C, Class I and Class R1, respectively for the year ended February 29, 2008. The expense reimbursements and limits will continue in effect until Jun e 30, 2008 and thereafter until terminated by the Adviser on notice to the Trust.
Fund administration fees
Pursuant to the Advisory Agreement, the Fund reimburses the Adviser for all expenses associated with providing the administrative, financial, legal, accounting and recordkeeping services of the Fund, including the preparation of all tax returns, annual, semiannual and periodic reports to shareholders and the preparation of all regulatory reports. These expenses are allocated based on the relative share of net assets of each class at the time the expense was incurred.
The fund administration fees incurred for the year ended February 29, 2008, were $10,610 with an annual effective rate of 0.04% of the Fund’s average daily net assets.
Distribution and shareholder servicing fees
The Trust has a Distribution Agreement with the Distributor. The Fund has adopted Distribution Plans with respect to Class A, Class B, Class C and Class R1, pursuant to Rule 12b-1 under the 1940 Act, to pay the Distributor for the services it provides as distributor of shares of the Fund. Accordingly, the Fund makes monthly payments to the Distributor at an annual rate not to exceed 0.30%, 1.00%, 1.00% and 0.50% of average daily net asset value of Class A, Class B, Class C and Class R1, respectively. A maximum of 0.25% of such payments may be service fees, as defined by the Conduct Rules of Financial Industry Regulatory Authority (formerly the National Association of Securities Dealers). Under the Conduct Rules, curtailment of a portion of the Fund’s 12b-1 payments could occur under certain circumstances.
In addition, the Fund has also adopted a Service Plan for Class R1 shares. Under the Service Plan, the Fund may pay up to 0.25% of Class R1 average daily net asset value for certain other services. There were no Service Plan fees incurred for the year ended February 29, 2008.
Sales charges
Class A shares are assessed up-front sales charges of up to 5.00% of net asset value of such shares. During the year ended February 29, 2008, the Fund was informed that the Distributor received net up-front sales charges of $56,437 with regard to sales
U.S. Core Fund | Annual report
34
of Class A shares. Of this amount, $9,186 was retained and used for printing prospectuses, advertising, sales literature and other purposes; $47,209 was paid as sales commissions to unrelated broker-dealers; and $42 was paid as sales commissions to sales personnel of Signator Investors, Inc. (Signator Investors), a related broker-dealer, an indirect subsidiary of MFC.
Class B shares that are redeemed within six years of purchase are subject to a contingent deferred sales charge (CDSC) at declining rates, beginning at 5.00% of the lesser of the current market value at the time of redemption or the original purchase cost of the shares being redeemed. Class C shares that are redeemed within one year of purchase are subject to a CDSC at a rate of 1.00% of the lesser of the current market value at the time of redemption or the original purchase cost of the shares being redeemed. Proceeds from the CDSCs are paid to the Distributor and are used, in whole or in part, to defray its expenses for providing distribution-related services to the Fund in connection with the sale of Class B and Class C shares. During the year ended February 29, 2008, CDSCs received by Distributor amounted to $1,352 for Class B shares and $611 for Class C shares.
Transfer agent fees
The Fund has a Transfer Agency Agreement with John Hancock Signature Services, Inc. (Signature Services), an indirect subsidiary of MFC. For Class A, Class B, Class C, Class I and Class R1 shares, the Fund pays a monthly transfer agent fee at an annual rate of 0.05% of each class’ average daily net assets, plus a fee based on the number of shareholder accounts and reimbursement for certain out-of-pocket expenses. Expenses not directly attributable to a particular class of shares are aggregated and allocated to each class on the basis of its relative net asset value. The Fund pays a monthly fee which is based on an annual rate of $15.00 for each Class A shareholder account, $17.50 for each Class B shareholder account, $16.50 for each Class C shareholder account and $15.00 for each Class R1 shareholder account.
Signature Services has agreed to limit the transfer agent fees so that such fees do not exceed 0.20% annually of Class A, Class B, Class C, Class I and Class R1 share average daily net assets. This agreement is effective until December 31, 2008. Signature Services reserves the right to terminate this limitation in the future. There were no transfer agent fee reductions for Class A, Class B, Class C, Class I and Class R1 shares, respectively, during the year ended February 29, 2008.
In addition, Signature Services has voluntarily agreed to further limit transfer agent fees for Class R1 shares so that such fees do not exceed 0.05% annually of each class’s average daily net assets. For the year ended February 29, 2008, the transfer agent fees reductions for Class R1 were $175.
In May 2007, the Fund began receiving earnings credits from its transfer agent as a result of uninvested cash balances. These credits are used to reduce a portion of the Fund’s transfer agent fees and out-of-pocket expenses. During the year ended February 29, 2008, the Fund’s transfer agent fees and out-of-pocket expenses were reduced by $101 for transfer agent credits earned.
Class level expenses for the year ended February 29, 2008, were as follows:
| | | | |
| | Distribution and | Transfer | Blue | Printing and |
| Share class | service fees | agent fees | sky fees | postage fees |
|
| Class A | $60,215 | $14,155 | $15,342 | $6,099 |
| Class B | 3,359 | 683 | 14,720 | 3 |
| Class C | 36,483 | 3,706 | 14,719 | 1,438 |
| Class I | — | 80 | 17,698 | 59 |
| Class R1 | 571 | 233 | 15,876 | 3 |
| Total | $100,628 | $18,857 | $78,355 | $7,602 |
Annual report | U.S. Core Fund
35
4. Trustees’ fees
The Trust compensates each Trustee who is not an employee of the Adviser or its affiliates. Total Trustees’ expenses are allocated to the Fund based on its average daily net asset value.
5. Line of credit
The Fund has entered into an agreement which enables them to participate in a $100 million unsecured committed line of credit with State Street Corporation. Borrowings will be made solely to temporarily finance the repurchase of capital shares. Interest is charged to the Fund based on its borrowings at a rate per annum equal to the Federal Funds rate plus 0.50% .
In addition, a commitment fee of 0.05% per annum, payable at the end of each calendar quarter, based on the average daily-unused portion of the line of credit, is charged to the Fund on a prorated basis based on average net assets. Effective October 15, 2007, the commitment fee was changed from 0.07% to 0.05% . For the year ended February 29, 2008, there were no borrowings under the line of credit.
6. Fund share transactions
Share activities for the Fund for the period ended February 28, 2007, and the year ended February 29, 2008, were as follows:
| | | | |
| | Period ended 2-28-071 | Year ended 2-29-08 |
| | Shares | Amount | Shares | Amount |
| Class A shares | | | | |
|
| Sold | 864,514 | $17,543,185 | 106,396 | $2,395,336 |
| Distributions reinvested | 10,725 | 239,263 | 43,986 | 939,554 |
| Repurchased | (2,906) | (65,923) | (117,140) | (2,611,267) |
| Net increase (decrease) | 872,333 | $17,716,525 | 33,242 | $723,623 |
| |
| Class B shares | | | | |
|
| Sold | 13,046 | $278,326 | 5,003 | $110,340 |
| Distributions reinvested | 94 | 2,087 | 640 | 13,671 |
| Repurchased | (292) | (6,586) | (1,099) | (25,142) |
| Net increase (decrease) | 12,848 | $273,827 | 4,544 | $98,869 |
| |
| Class C shares | | | | |
|
| Sold | 147,710 | $3,240,381 | 31,279 | $715,779 |
| Distributions reinvested | 1,205 | 26,878 | 7,433 | 158,760 |
| Repurchased | (5,402) | (121,094) | (19,244) | (404,858) |
| Net increase (decrease) | 143,513 | $3,146,165 | 19,468 | $469,681 |
| |
| Class I shares | | | | |
|
| Sold | 5,545 | $111,000 | 14,516 | $326,350 |
| Distributions reinvested | 82 | 1,835 | 1,116 | 23,848 |
| Repurchased | — | — | (12,136) | (253,563) |
| Net increase (decrease) | 5,627 | $112,835 | 3,496 | $96,635 |
| |
| Class R1 shares | | | | |
|
| Sold | 5,000 | $100,000 | — | — |
| Distributions reinvested | 62 | 1,390 | 257 | 5,478 |
| Net increase (decrease) | 5,062 | $101,390 | 257 | $5,478 |
| |
| Net increase (decrease) | 1,039,383 | $21,350,742 | 61,007 | $1,394,286 |
|
1Period from 6-12-06 (commencement of operations) to 2-28-07.
7. Purchases and sales of securities and obligations of the U.S. government, during Purchases and proceeds from sales or maturities the year ended February 29, 2008, aggregated of securities, other than short-term securities $19,186,533 and $18,750,220, respectively.
U.S. Core Fund | Annual report
36
Auditors’ report
Report of Independent Registered Public Accounting Firm
To the Board of Trustees of John Hancock Funds III and Shareholders of John Hancock U.S. Core Fund,
In our opinion, the accompanying statement of assets and liabilities, including the schedule of investments, and the related statements of operations and of changes in net assets and the financial highlights present fairly, in all material respects, the financial position of John Hancock U.S. Core Fund (the Fund) at February 29, 2008, and the results of its operations, the changes in its net assets and the financial highlights for each of the periods indicated, in conformity with accounting principles generally accepted in the United States of America. These financial statements and financial highlights (hereafter referred to as “financial statements”) are the responsibility of the Fund’s management. Our responsibility is to express an opinion on these financial statements based on our audits. We conducted our audits of these financial statements in accordance with the standards of the Public Company Accounting Oversight Board (United States). Those standa rds require that we plan and perform the audits to obtain reasonable assurance about whether the financial statements are free of material misstatement. An audit includes examining, on a test basis, evidence supporting the amounts and disclosures in the financial statements, assessing the accounting principles used and significant estimates made by management, and evaluating the overall financial statement presentation. We believe that our audits, which included confirmation of investments at February 29, 2008 by correspondence with the custodian, provide a reasonable basis for our opinion.
PricewaterhouseCoopers LLP
Boston, Massachusetts
April 18, 2008
Annual report | U.S. Core Fund
37
Tax information
Unaudited
For federal income tax purposes, the following information is furnished with respect to the distributions of the Fund, if any, paid during its taxable year ended February 29, 2008.
The Fund has designated distributions to shareholders of $386,839 as a long-term capital gain dividend. With respect to the ordinary dividends paid by the Fund for the fiscal year ended February 29, 2008, 100.00% of the dividends qualifies for the corporate dividends-received deduction.
The Fund hereby designates the maximum amount allowable of its net taxable income as qualified dividend income as provided in the Jobs and Growth Tax Relief Reconciliation Act of 2003. This amount will be reflected on Form 1099-DIV for the calendar year 2008.
Shareholders will be mailed a 2008 U.S. Treasury Department Form 1099-DIV in January 2009. This will reflect the total of all distributions that are taxable for calendar year 2008.
U.S. Core Fund | Annual report
38
Trustees and Officers
This chart provides information about the Trustees and Officers who oversee your John Hancock fund. Officers elected by the Trustees manage the day-to-day operations of the Fund and execute policies formulated by the Trustees.
| | |
| Independent Trustees | | |
| |
| Name, Year of Birth | | Number of |
| Position(s) held with Fund | Trustee | John Hancock |
| Principal occupation(s) and other | of Fund | funds overseen |
| directorships during past 5 years | since1 | by Trustee |
| |
| James F. Carlin, Born: 1940 | 2006 | 55 |
|
| Chairman (since December 2007); Director and Treasurer, Alpha Analytical Laboratories, Inc. (chemical |
| analysis) (since 1985); Part Owner and Treasurer, Lawrence Carlin Insurance Agency, Inc. (since 1995); |
| Part Owner and Vice President, Mone Lawrence Carlin Insurance Agency, Inc. (until 2005); Chairman |
| and Chief Executive Officer, Carlin Consolidated, Inc. (management/investments) (since 1987); Trustee, |
| Massachusetts Health and Education Tax Exempt Trust (1993–2003). | | |
| |
| |
| William H. Cunningham, Born: 1944 | 2006 | 55 |
|
| Professor, University of Texas at Austin (since 1971); former Chancellor, University of Texas System and |
| former President, University of Texas at Austin (until 2001); Chairman and Chief Executive Officer, IBT |
| Technologies (until 2001); Director of the following: Hicks Acquisition Company I, Inc. (since 2007); |
| Hire.com (until 2004), STC Broadcasting, Inc. and Sunrise Television Corp. (until 2001), Symtx, Inc. |
| (electronic manufacturing) (since 2001), Adorno/Rogers Technology, Inc. (until 2004), Pinnacle |
| Foods Corporation (until 2003), rateGenius (until 2003), Lincoln National Corporation (insurance) |
| (since 2006), Jefferson-Pilot Corporation (diversified life insurance company) (until 2006), New |
| Century Equity Holdings (formerly Billing Concepts) (until 2001), eCertain (until 2001), ClassMap.com |
| (until 2001), Agile Ventures (until 2001), AskRed.com (until 2001), Southwest Airlines (since 2000), |
| Introgen (manufacturer of biopharmaceuticals) (since 2000) and Viasystems Group, Inc. (electronic |
| manufacturer) (until 2003); Advisory Director, Interactive Bridge, Inc. (college fundraising) (until 2001); |
| Advisory Director, Q Investments (until 2003); Advisory Director, JPMorgan Chase Bank (formerly Texas |
| Commerce Bank–Austin), LIN Television (until 2008), WilTel Communications (until 2003) and Hayes |
| Lemmerz International, Inc. (diversified automotive parts supply company) (since 2003). | |
|
| |
| Charles L. Ladner,2 Born: 1938 | 2006 | 55 |
|
| Chairman and Trustee, Dunwoody Village, Inc. (retirement services) (until 2003); Senior Vice President |
| and Chief Financial Officer, UGI Corporation (public utility holding company) (retired 1998); Vice |
| President and Director, AmeriGas, Inc. (retired 1998); Director, AmeriGas Partners, L.P. (gas distribution) |
| (until 1997); Director, EnergyNorth, Inc. (until 1997); Director, Parks and History Association (until 2005). |
|
| |
| John A. Moore,2 Born: 1939 | 2006 | 55 |
|
| President and Chief Executive Officer, Institute for Evaluating Health Risks (nonprofit institution) |
| (until 2001); Senior Scientist, Sciences International (health research) (until 2003); Former Assistant |
| Administrator and Deputy Administrator, Environmental Protection Agency; Principal, Hollyhouse |
| (consulting) (since 2000); Director, CIIT Center for Health Science Research (nonprofit research) |
| (until 2007). | | |
Annual report | U.S. Core Fund
39
| | |
| Independent Trustees (continued) | | |
| |
| Name, Year of Birth | | Number of |
| Position(s) held with Fund | Trustee | John Hancock |
| Principal occupation(s) and other | of Fund | funds overseen |
| directorships during past 5 years | since1 | by Trustee |
| |
| Patti McGill Peterson,2 Born: 1943 | 2006 | 55 |
|
| Senior Associate, Institute for Higher Education Policy (since 2007); Executive Director, Council for |
| International Exchange of Scholars and Vice President, Institute of International Education (until 2007); |
| Senior Fellow, Cornell Institute of Public Affairs, Cornell University, Ithaca, NY (until 1998); Former |
| President, Wells College, Aurora, NY, and St. Lawrence University, Canton, NY; Director, Niagara |
| Mohawk Power Corporation (until 2003); Director, Ford Foundation, International Fellowships Program |
| (since 2002); Director, Lois Roth Endowment (since 2002); Director, Council for International Educational |
| Exchange (since 2003). | | |
|
| |
| Steven R. Pruchansky, Born: 1944 | 2006 | 55 |
|
| Chairman and Chief Executive Officer, Greenscapes of Southwest Florida, Inc. (since 2000); Director and |
| President, Greenscapes of Southwest Florida, Inc. (until 2000); Managing Director, JonJames, LLC (real |
| estate) (since 2000); Director, First Signature Bank & Trust Company (until 1991); Director, Mast Realty |
| Trust (until 1994); President, Maxwell Building Corp. (until 1991). | | |
| |
| Non-Independent Trustees3 | | |
| |
| Name, Year of Birth | | Number of |
| Position(s) held with Fund | Trustee | John Hancock |
| Principal occupation(s) and other | of Fund | funds overseen |
| directorships during past 5 years | since1 | by Trustee |
| |
| James R. Boyle, Born: 1959 | 2006 | 265 |
|
| Executive Vice President, Manulife Financial Corporation (since 1999); President, John Hancock Variable |
| Life Insurance Company (since March 2007); Executive Vice President, John Hancock Life Insurance |
| Company (since 2004); Chairman and Director, John Hancock Advisers, LLC (the Adviser), John Hancock |
| Funds, LLC and The Berkeley Financial Group, LLC (The Berkeley Group) (holding company) (since 2005); |
| Senior Vice President, The Manufacturers Life Insurance Company (U.S.A.) (until 2004). | |
U.S. Core Fund | Annual report
40
| |
| Principal officers who are not Trustees | |
| |
| Name, Year of Birth | |
| Position(s) held with Fund | Officer |
| Principal occupation(s) and other | of Fund |
| directorships during past 5 years | since |
| |
| Keith F. Hartstein, Born: 1956 | 2006 |
|
| President and Chief Executive Officer | |
| Senior Vice President, Manulife Financial Corporation (since 2004); Director, President and Chief | |
| Executive Officer, the Adviser, The Berkeley Group and John Hancock Funds, LLC (since 2005); Director, |
| MFC Global Investment Management (U.S.), LLC (MFC Global (U.S.)) (since 2005); Director, John | |
| Hancock Signature Services, Inc. (since 2005); President and Chief Executive Officer, John Hancock |
| Investment Management Services, LLC (since 2006); President and Chief Executive Officer, John Hancock |
| Funds, John Hancock Funds II, John Hancock Funds III and John Hancock Trust (since 2005); Director, |
| Chairman and President, NM Capital Management, Inc. (since 2005); Member, Investment Company |
| Institute Sales Force Marketing Committee (since 2003); President and Chief Executive Officer, MFC |
| Global (U.S.) (2005–2006); Executive Vice President, John Hancock Funds, LLC (until 2005). | |
|
| |
| Thomas M. Kinzler, Born: 1955 | 2006 |
|
| Secretary and Chief Legal Officer | |
| Vice President and Counsel, John Hancock Life Insurance Company (U.S.A.) (since 2006); Secretary and |
| Chief Legal Officer, John Hancock Funds and John Hancock Funds II (since 2006); Chief Legal Officer |
| and Assistant Secretary, John Hancock Trust (since 2006); Vice President and Associate General Counsel, |
| Massachusetts Mutual Life Insurance Company (1999–2006); Secretary and Chief Legal Counsel, MML |
| Series Investment Fund (2000–2006); Secretary and Chief Legal Counsel, MassMutual Institutional Funds |
| (2000–2004); Secretary and Chief Legal Counsel, MassMutual Select Funds and MassMutual Premier |
| Funds (2004–2006). | |
|
| |
| Francis V. Knox, Jr., Born: 1947 | 2006 |
|
| Chief Compliance Officer | |
| Vice President and Chief Compliance Officer, John Hancock Investment Management Services, LLC, |
| the Adviser and MFC Global (U.S.) (since 2005); Vice President and Chief Compliance Officer, John |
| Hancock Funds, John Hancock Funds II, John Hancock Funds III and John Hancock Trust (since 2005); |
| Vice President and Assistant Treasurer, Fidelity Group of Funds (until 2004); Vice President and Ethics & |
| Compliance Officer, Fidelity Investments (until 2001). | |
| |
| |
| Charles A. Rizzo, Born: 1957 | 2007 |
|
| Chief Financial Officer | |
| Chief Financial Officer, John Hancock Funds, John Hancock Funds II, John Hancock Funds III and John |
| Hancock Trust (since June 2007); Assistant Treasurer, Goldman Sachs Mutual Fund Complex (regis- |
| tered investment companies) (2005–June 2007); Vice President, Goldman Sachs (2005–June 2007); |
| Managing Director and Treasurer of Scudder Funds, Deutsche Asset Management (2003–2005); | |
| Director, Tax and Financial Reporting, Deutsche Asset Management (2002–2003); Vice President and |
| Treasurer, Deutsche Global Fund Services (Deutsche Registered Investment Companies) (1999–2002). |
|
| |
| Gordon M. Shone, Born: 1956 | 2006 |
|
| Treasurer | |
| Senior Vice President, John Hancock Life Insurance Company (U.S.A.) (since 2001); Treasurer, John |
| Hancock Funds (since 2006), John Hancock Funds II, John Hancock Funds III and John Hancock Trust |
| (since 2005); Vice President and Chief Financial Officer, John Hancock Trust (2003–2005); Vice President, |
| John Hancock Investment Management Services, Inc., John Hancock Advisers, LLC (since 2006) and The |
| Manufacturers Life Insurance Company (U.S.A.) (1998–2000). | |
Annual report | U.S. Core Fund
41
Principal officers who are not Trustees (continued)
| |
| Name, Year of Birth | |
| Position(s) held with Fund | Officer |
| Principal occupation(s) and other | of Fund |
| directorships during past 5 years | since |
| |
| John G. Vrysen, Born: 1955 | 2006 |
|
| Chief Operating Officer | |
| Senior Vice President, Manulife Financial Corporation (since 2006); Director, Executive Vice President |
| and Chief Operating Officer, the Adviser, The Berkeley Group and John Hancock Funds, LLC (since | |
| June 2007); Executive Vice President and Chief Operating Officer, John Hancock Investment | |
| Management Services, LLC (since December 2007); Chief Operating Officer, John Hancock Funds, |
| John Hancock Funds II, John Hancock Funds III and John Hancock Trust (since June 2007); Director, |
| Executive Vice President and Chief Financial Officer, the Adviser, The Berkeley Group and John Hancock |
| Funds, LLC (2005–2007); Executive Vice President and Chief Financial Officer, John Hancock Investment |
| Management Services, LLC (2005–2007); Executive Vice President and Chief Financial Officer, MFC |
| Global (U.S.) (2005 until August 2007); Director, John Hancock Signature Services, Inc. (since 2005); |
| Chief Financial Officer, John Hancock Funds, John Hancock Funds II, John Hancock Funds III and John |
| Hancock Trust (2005 until June 2007); Vice President and General Manager, John Hancock Fixed | |
| Annuities, U.S. Wealth Management (2004–2005); Vice President, Operations, Manulife Wood Logan |
| (2000–2004). | |
The business address for all Trustees and Officers is 601 Congress Street, Boston, Massachusetts 02210-2805.
The Statement of Additional Information of the Fund includes additional information about members of the Board of Trustees of the Fund and is available without charge, upon request, by calling 1-800-225-5291.
1 Each Trustee serves until resignation, retirement age or until his or her successor is elected.
2 Member of Audit and Compliance Committee.
3 Non-Independent Trustee holds positions with the Fund’s investment adviser, underwriter and certain other affiliates.
U.S. Core Fund | Annual report
42
For more information
The Fund’s proxy voting policies, procedures and records are available without charge, upon request:
| | |
| By phone | On the Fund’s Web site | On the SEC’s Web site |
| 1-800-225-5291 | www.jhfunds.com/proxy | www.sec.gov |
|
| |
| Investment adviser | Custodian | Legal counsel |
| John Hancock Advisers, LLC | State Street Bank & Trust Co. | Kirkpatrick & Lockhart |
| 601 Congress Street | 2 Avenue de Lafayette | Preston Gates Ellis LLP |
| Boston, MA 02210-2805 | Boston, MA 02111 | One Lincoln Street |
| | Boston, MA 02111-2950 |
| Subadviser | Transfer agent | |
| Grantham, Mayo, | John Hancock Signature | Independent registered |
| Van Otterloo & Co. LLC | Services, Inc. | public accounting firm |
| 40 Rowes Wharf | P.O. Box 9510 | PricewaterhouseCoopers LLP |
| Boston, MA 02110 | Portsmouth, NH 03802-9510 | 125 High Street |
| | | Boston, MA 02110 |
| Principal distributor | | |
| John Hancock Funds, LLC | | |
| 601 Congress Street | | |
| Boston, MA 02210-2805 | | |
| | |
| How to contact us | |
|
| |
| Internet | www.jhfunds.com | |
|
| |
| Mail | Regular mail: | Express mail: |
| | John Hancock Signature | John Hancock Signature |
| | Services, Inc. | Services, Inc. |
| | P.O. Box 9510 | Mutual Fund Image Operations |
| | Portsmouth, NH 03802-9510 | 164 Corporate Drive |
| | | Portsmouth, NH 03801 |
|
| |
| Phone | Customer service representatives | 1-800-225-5291 |
| | EASI-Line | 1-800-338-8080 |
| | TDD line | 1-800-554-6713 |
A listing of month-end portfolio holdings is available on our Web site, www.jhfunds.com. A more detailed portfolio holdings summary is available on a quarterly basis 60 days after the fiscal quarter on our Web site or upon request by calling 1-800-225-5291, or on the SEC’s Web site, www.sec.gov.
Annual report | U.S. Core Fund
43

1-800-225-5291
1-800-554-6713 TDD
1-800-338-8080 EASI-Line
www.jhfunds.com
Now available: electronic delivery www.jhfunds. com/edelivery
| | |
| This report is for the information of the shareholders of John Hancock U.S. Core Fund. | 6500A | 2/08 |
| It is not authorized for distribution to prospective investors unless preceded or accompanied by a prospectus. | | 4/08 |

Discussion of Fund performance
By Grantham, Mayo, Van Otterloo & Co. LLC (GMO)
The year ended February 29, 2008, was a challenging one for international markets. While foreign stocks continued to outperform U.S. equities, share prices weakened notably in the final four months of the period, as a slew of unfavorable economic and corporate earnings data built a convincing case that a serious U.S.-centered slowdown was, in fact, occurring, and that the fallout from the subprime mortgage crisis was by no means as contained as investors had previously hoped. Against this backdrop, the MSCI EAFE Net Total Return Index returned 0.84%, while the average foreign large value fund monitored by Morningstar Inc. gained –1.23% .
“The year ended February 29,
2008, was a challenging one for
international markets. “
During the past year, John Hancock International Core Fund’s Class A, Class B, Class C, Class I, Class R1, Class 1 and Class NAV shares returned –0.76%, –1.48%, –1.48%, –0.33%, –0.82%, –0.25% and –0.20%, respectively, at net asset value. During this period, the Fund’s momentum criteria worked better than its valuation parameters.
Among countries, the Fund received its biggest boosts from Canada, Italy and Japan. The largest Canada-based contributor was fertilizer maker Potash Corp. of Saskatchewan, Inc. Another Canadian standout was Research In Motion, Ltd. (RIM), maker of the popular BlackBerry handheld messaging device. Other contributors included U.K.-based Rio Tinto PLC, a mining company, and Dutch bank ABM AMRO Holding N.V. Not owning benchmark component UBS AG, a Swiss bank hurt by the subprime mortgage crisis, was beneficial as well. Conversely, the Fund’s two largest detractors were U.K. holdings: Royal Bank of Scotland Group PLC and drug stock GlaxoSmithKline PLC. Another drug holding, France-based Sanofi-Aventis SA, struggled despite what we considered an attractive valuation. Underweighting strong-performing Australian mining stock BHP Billiton, Ltd. and overweighting Japanese automaker Honda Motor Company, Ltd. further hurt performance.
This commentary reflects the views of the portfolio management team through the end of the Fund’s period discussed in this report. The team’s statements reflect their own opinions. As such, they are in no way guarantees of future events and are not intended to be used as investment advice or a recommendation regarding any specific security. They are also subject to change at any time as market and other conditions warrant.
International Core Fund | Annual report
6
A look at performance
For the periods ended February 29, 2008
| | | | | | | | | | | |
| | | | Average annual returns | | | | Cumulative total returns | | |
| | | | with maximum sales charge (POP) | | | with maximum sales charge (POP) | | |
| | |
| |
|
| | Inception | | | | | Since | | | | | Since |
| Class | date | | 1-year | 5-year | 10-year | inception | | 1-year | 5-year | 10-year | inception |
|
| A1,2 | 9-16-05 | | –5.72% | — | — | 10.00% | | –5.72% | — | — | 26.33% |
|
| B | 6-12-06 | | –5.99 | — | — | 8.57 | | –5.99 | — | — | 15.22 |
|
| C | 6-12-06 | | –2.38 | — | — | 10.75 | | –2.38 | — | — | 19.25 |
|
| I3 | 6-12-06 | | –0.33 | — | — | 12.01 | | –0.33 | — | — | 21.58 |
|
| R13 | 6-12-06 | | –0.82 | — | — | 11.33 | | –0.82 | — | — | 20.32 |
|
| 13 | 11-6-06 | | –0.25 | — | — | 5.91 | | –0.25 | — | — | 7.84 |
|
| NAV3 | 8-29-06 | | –0.20 | — | — | 7.63 | | –0.20 | — | — | 11.68 |
|
Performance figures assume all distributions are reinvested. Public offering price (POP) figures reflect maximum sales charge on Class A shares of 5%, and the applicable contingent deferred sales charge (CDSC) on Class B and Class C shares. The Class B shares’ CDSC declines annually between years 1 to 6 according to the following schedule: 5, 4, 3, 3, 2, 1%. No sales charge will be assessed after the sixth year. Class C shares held for less than one year are subject to a 1% CDSC. Sales charge is not applicable for Class I, Class R1, Class 1 and Class NAV shares.
The expense ratios of the Fund, both net (including any fee waivers or expense limitations) and gross (excluding any fee waivers or expense limitations), are set forth according to the most recent publicly available prospectuses for the Fund and may differ from the expense ratios disclosed in the Financial Highlights tables in this report. The waivers and expense limitations are contractual at least until 6-30-08. The net expenses are as follows: Class A — 1.61%, Class B — 2.39%, Class C — 2.39%, Class I — 1.20%, Class R1 — 1.94%, Class 1 — 1.14% . Had the fee waivers and expense limitations not been in place, the gross expenses would be as follows: Class A — 2.23%, Class B — 6.83%, Class C — 3.72%, Class I — 12.52%, Class R1 — ; 20.40%, Class 1 — 1.23% . For Class NAV, the net expense equals the gross expense and is 1.08% .
The returns reflect past results and should not be considered indicative of future performance. The return and principal value of an investment will fluctuate so that shares, when redeemed, may be worth more or less than their original cost. Due to market volatility, the Fund’s current performance may be higher or lower than the performance shown. For performance data current to the most recent month end, please call 1-800-225-5291 or visit the Fund’s Web site at www.jhfunds.com.
The performance table above and the chart on the next page do not reflect the deduction of taxes that a shareholder would pay on fund distributions or the redemption of fund shares.
The Fund’s performance results reflect any applicable expense reductions, without which the expenses increase and results would have been less favorable.
Performance is calculated with an opening price (prior day’s close) on the inception date.
1 Effective June 12, 2006, shareholders of the former GMO International Disciplined Equity Fund (the Predecessor Fund) became owners of that number of full and fractional shares of John Hancock International Core Fund Class A. Additionally, the accounting and performance history of the former GMO International Disciplined Equity Fund was redesignated as that of John Hancock International Core Fund Class A.
2 Class A performance linked back to the Predecessor Fund.
3 For certain types of investors as described in the Fund’s Class I, Class R1, Class 1 and Class NAV share prospectuses.
Annual report | International Core Fund
7
A look at performance
Growth of $10,000
This chart shows what happened to a hypothetical $10,000 investment in International Core Fund Class A1 shares for the period indicated. For comparison, we’ve shown the same investment in the MSCI EAFE Net Total Return Index.
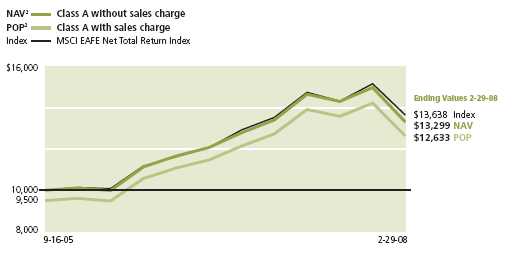
| | | | |
| | | | With maximum | |
| Class | Period beginning | Without sales charge | sales charge | Index |
|
| B | 6-12-06 | $11,922 | $11,522 | $12,254 |
|
| C3 | 6-12-06 | 11,925 | 11,925 | 12,254 |
|
| I4 | 6-12-06 | 12,158 | 12,158 | 12,254 |
|
| R14 | 6-12-06 | 12,032 | 12,032 | 12,254 |
|
| 14 | 11-6-06 | 10,784 | 10,784 | 10,893 |
|
| NAV4 | 8-29-06 | 11,168 | 11,168 | 11,399 |
|
Assuming all distributions were reinvested for the period indicated, the table above shows the value of a $10,000 investment in the Fund’s Class B, Class C, Class I, Class R1, Class 1 and Class NAV shares, respectively, as of February 29, 2008. Performance of the classes will vary based on the difference in sales charges paid by shareholders investing in the different classes and the fee structure of those classes.
MSCI EAFE Net Total Return Index (Europe, Australasia, Far East) is a free float-adjusted market capitalization index is designed to measure developed market equity performance, excluding the U.S. and Canada. As of June 2006, the MSCI EAFE Index consisted of the following 21 developed market country indexes: Australia, Austria, Belgium, Denmark, Finland, France, Germany, Greece, Hong Kong, Ireland, Italy, Japan, Netherlands, New Zealand, Norway, Portugal, Singapore, Spain, Sweden, Switzerland and United Kingdom. Returns are calculated and presented net of withholding tax.
It is not possible to invest directly in an index. Index figures do not reflect sales charges, which would have resulted in lower values if they did.
1 Class A performance linked back to the Predecessor Fund.
2 NAV represents net asset value and POP represents public offering price.
3 No contingent deferred sales charge applicable.
4 For certain types of investors as described in the Fund’s Class I, Class R1, Class 1 and Class NAV share prospectuses.
International Core Fund | Annual report
8
Your expenses
These examples are intended to help you understand your ongoing operating expenses.
Understanding fund expenses
As a shareholder of the Fund, you incur two types of costs:
■ Transaction costs which include sales charges (loads) on purchases or redemptions (varies by share class), minimum account fee charge, etc.
■ Ongoing operating expenses including management fees, distribution and service fees (if applicable), and other fund expenses.
We are going to present only your ongoing operating expenses here.
Actual expenses/actual returns
This example is intended to provide information about your fund’s actual ongoing operating expenses, and is based on your fund’s actual return. It assumes an account value of $1,000.00 on September 1, 2007, with the same investment held until February 29, 2008.
| | | |
| | Account value | Ending value | Expenses paid during period |
| | on 9-1-07 | on 2-29-08 | on 2-29-081 |
|
| Class A | $1,000.00 | $930.10 | $7.87 |
|
| Class B | 1,000.00 | 926.66 | 11.54 |
|
| Class C | 1,000.00 | 926.90 | 11.50 |
|
| Class I | 1,000.00 | 932.30 | 5.67 |
|
| Class R1 | 1,000.00 | 931.03 | 7.06 |
|
| Class 1 | 1,000.00 | 932.47 | 5.48 |
|
| Class NAV | 1,000.00 | 932.87 | 5.19 |
|
Together with the value of your account, you may use this information to estimate the operating expenses that you paid over the period. Simply divide your account value at February 29, 2008, by $1,000.00, then multiply it by the “expenses paid” for your share class from the table above. For example, for an account value of $8,600.00, the operating expenses should be calculated as follows:
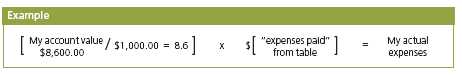
Annual report | International Core Fund
9
Your expenses
Hypothetical example for comparison purposes
This table allows you to compare your fund’s ongoing operating expenses with those of any other fund. It provides an example of the Fund’s hypothetical account values and hypothetical expenses based on each class’s actual expense ratio and an assumed 5% annualized return before expenses (which is not your fund’s actual return). It assumes an account value of $1,000.00 on September 1, 2007, with the same investment held until February 29, 2008. Look in any other fund shareholder report to find its hypothetical example and you will be able to compare these expenses.
| | | |
| | Account value | Ending value | Expenses paid during period |
| | on 9-1-07 | on 2-29-08 | on 2-29-081 |
|
| Class A | $1,000.00 | $1,016.71 | $8.22 |
|
| Class B | 1,000.00 | 1,012.88 | 12.06 |
|
| Class C | 1,000.00 | 1,012.93 | 12.01 |
|
| Class I | 1,000.00 | 1,019.00 | 5.92 |
|
| Class R1 | 1,000.00 | 1,017.55 | 7.37 |
|
| Class 1 | 1,000.00 | 1,019.19 | 5.72 |
|
| Class NAV | 1,000.00 | 1,019.49 | 5.42 |
|
Remember, these examples do not include any transaction costs, such as sales charges; therefore, these examples will not help you to determine the relative total costs of owning different funds. If transaction costs were included, your expenses would have been higher. See the prospectus for details regarding transaction costs.
1 Expenses are equal to the Fund’s annualized expense ratio of 1.64%, 2.41%, 2.40%, 1.18%, 1.47%, 1.14% and 1.08% for Class A, Class B, Class C, Class I, Class R1, Class 1 and Class NAV, respectively, multiplied by the average account value over the period, multiplied by the number of days in most recent fiscal half year/366 (to reflect the one-half year period).
International Core Fund | Annual report
10
Portfolio summary
| | | | |
| Top 10 holdings1 | | | | |
|
| GlaxoSmithKline PLC | 3.6% | | Eni SpA | 2.6% |
| |
|
| Vodafone Group PLC | 3.4% | | Novartis AG | 2.3% |
| |
|
| Total SA | 3.2% | | Rio Tinto PLC | 1.7% |
| |
|
| Nokia AB Oyj | 3.0% | | Royal Bank of Scotland Group PLC | 1.6% |
| |
|
| Sanofi-Aventis SA | 2.8% | | ING Groep NV | 1.4% |
| |
|
| |
| Sector distribution1 | | | | |
|
| Consumer non-cyclical | 16% | | Basic materials | 9% |
| |
|
| Financial | 14% | | Industrial | 8% |
| |
|
| Consumer cyclical | 12% | | Utilities | 4% |
| |
|
| Energy | 11% | | Technology | 2% |
| |
|
| Communications | 10% | | Other | 14% |
| |
|

1As a percentage of net assets on February 29, 2008.
Annual report | International Core Fund
11
F I N A N C I A L S T A T E M E N T S
Fund’s investments
Securities owned by the Fund on 2-29-08
This schedule is divided into four main categories: common stocks, preferred stocks, short-term investments and repurchase agreements. Common stocks and preferred stocks are further broken down by country. Repurchase agreements, which represent the Fund’s cash position, are listed last.
| | |
| Issuer | Shares | Value |
| |
| Common stocks 94.10% | | $1,558,995,008 |
|
| (Cost $1,499,281,583) | | |
| | | |
| Australia 4.85% | | 80,272,886 |
|
| Australia and New Zealand Banking Group, Ltd. (a) | 237,471 | 4,792,014 |
|
| Australian Stock Exchange, Ltd. | 24,466 | 940,659 |
|
| BHP Billiton, Ltd. | 322,683 | 11,675,552 |
|
| Bluescope Steel, Ltd. (a) | 321,766 | 3,218,669 |
|
| CSL, Ltd. (a) | 127,523 | 4,277,047 |
|
| Fortescue Metals Group, Ltd. * | 150,679 | 1,068,151 |
|
| Foster’s Group, Ltd. (a) | 346,465 | 1,706,984 |
|
| Incitec Pivot, Ltd. | 6,922 | 940,161 |
|
| Leighton Holdings, Ltd. (a) | 56,306 | 2,360,403 |
|
| Macquarie Group, Ltd. (a) | 21,259 | 1,061,683 |
|
| Mirvac Group, Ltd. | 596,676 | 2,115,061 |
|
| Newcrest Mining, Ltd. | 76,164 | 2,647,957 |
|
| Qantas Airways, Ltd. (a) | 300,772 | 1,169,781 |
|
| QBE Insurance Group, Ltd. | 40,666 | 841,125 |
|
| Stockland Company, Ltd. (a) | 750,276 | 4,855,452 |
|
| Suncorp-Metway, Ltd. (a) | 439,159 | 5,633,631 |
|
| TABCORP Holdings, Ltd. (a) | 226,226 | 3,189,167 |
|
| Telstra Corp., Ltd. (a) | 1,313,330 | 5,903,919 |
|
| Westpac Banking Corp., Ltd. (a) | 284,859 | 6,092,743 |
|
| Woodside Petroleum, Ltd. (a) | 191,463 | 10,011,878 |
|
| Woolworths, Ltd. | 153,635 | 4,103,146 |
|
| Zinifex, Ltd. | 165,755 | 1,667,703 |
| | | |
| Austria 0.12% | | 2,011,145 |
|
| OMV AG | 27,834 | 2,011,145 |
| | | |
| Belgium 1.16% | | 19,159,339 |
|
| Belgacom SA | 24,874 | 1,191,266 |
|
| Colruyt SA | 3,066 | 749,170 |
|
| Delhaize Group | 10,889 | 824,651 |
|
| Dexia (a) | 271,408 | 6,380,839 |
|
| Fortis Group SA | 340,709 | 7,527,067 |
|
| Solvay SA (a) | 8,778 | 1,103,141 |
|
| UCB SA | 29,180 | 1,383,205 |
See notes to financial statements
International Core Fund | Annual report
12
F I N A N C I A L S T A T E M E N T S
| | |
| Issuer | Shares | Value |
| | | |
| Canada 3.05% | | $50,612,527 |
|
| Barrick Gold Corp. | 33,100 | 1,721,839 |
|
| BCE, Inc. | 50,388 | 1,826,101 |
|
| Canadian Imperial Bank of Commerce | 50,470 | 3,424,832 |
|
| Canadian Natural Resources, Ltd. | 45,537 | 3,412,557 |
|
| Canadian Pacific Railway, Ltd. | 11,500 | 835,875 |
|
| EnCana Corp. | 83,497 | 6,365,029 |
|
| Magna International, Inc. | 30,600 | 2,244,052 |
|
| National Bank of Canada (a) | 83,465 | 4,119,614 |
|
| Potash Corp. of Saskatchewan, Inc. | 86,100 | 13,688,522 |
|
| Research In Motion, Ltd. * | 99,300 | 10,344,149 |
|
| Sun Life Financial, Inc. | 54,900 | 2,629,957 |
| | | |
| Denmark 0.49% | | 8,117,656 |
|
| A P Moller Maersk AS, Series A | 87 | 897,996 |
|
| FLS Industries AS, B Shares | 29,550 | 2,758,987 |
|
| Novo Nordisk AS | 32,900 | 2,250,635 |
|
| Vestas Wind Systems AS * | 21,800 | 2,210,038 |
| | | |
| Finland 4.20% | | 69,583,976 |
|
| Fortum Corp. Oyj | 95,228 | 3,976,022 |
|
| Metra Oyj, B Shares | 19,800 | 1,353,458 |
|
| Neste Oil Oyj (a) | 82,084 | 2,872,050 |
|
| Nokia AB Oyj | 1,358,607 | 48,811,467 |
|
| Outokumpu Oyj (a) | 91,904 | 3,485,826 |
|
| Rautaruukki Oyj (a) | 81,209 | 3,540,742 |
|
| Sampo Oyj, A Shares | 204,287 | 5,544,411 |
| | | |
| France 10.01% | | 165,911,053 |
|
| Air Liquide | 11,615 | 1,643,792 |
|
| Alstom | 37,500 | 7,880,981 |
|
| BNP Paribas SA | 114,165 | 10,206,345 |
|
| Bouygues SA | 35,943 | 2,454,913 |
|
| Casino Guich-Perrachon SA | 34,335 | 3,883,537 |
|
| Compagnie de Saint-Gobain SA | 34,715 | 2,713,826 |
|
| Compagnie Generale des Etablissements Michelin, Class B | 15,410 | 1,517,736 |
|
| Credit Agricole SA | 33,770 | 916,006 |
|
| Electricite de France | 20,271 | 1,890,676 |
|
| Essilor International SA | 21,430 | 1,272,466 |
|
| France Telecom SA | 266,145 | 8,934,247 |
|
| Hermes International SA | 11,601 | 1,357,711 |
|
| L’Oreal SA | 21,622 | 2,565,922 |
|
| Pernod-Ricard SA | 14 | 1,481 |
|
| PSA Peugeot Citroen SA | 114,059 | 8,670,677 |
|
| Renault Regie Nationale SA | 48,565 | 5,188,999 |
|
| Sanofi-Aventis SA | 624,670 | 46,170,980 |
|
| Societe Generale NV — New Shares* | 10,582 | 1,162,790 |
|
| Societe Generale | 42,330 | 4,529,280 |
|
| Total SA | 703,132 | 52,948,688 |
See notes to financial statements
Annual report | International Core Fund
13
F I N A N C I A L S T A T E M E N T S
| | |
| Issuer | Shares | Value |
| |
| Germany 8.16% | | $135,115,941 |
|
| Adidas-Salomon AG | 48,679 | 3,088,967 |
|
| Allianz AG | 21,271 | 3,682,646 |
|
| BASF AG | 95,384 | 12,136,584 |
|
| Bayer AG | 74,877 | 5,765,891 |
|
| Bayerische Motoren Werke (BMW) AG | 89,416 | 4,901,199 |
|
| DaimlerChrysler AG (a) | 161,050 | 13,517,845 |
|
| Deutsche Bank AG | 23,480 | 2,622,216 |
|
| Deutsche Boerse AG | 43,796 | 6,941,903 |
|
| Deutsche Post AG | 33,698 | 1,121,080 |
|
| E.ON AG | 69,370 | 13,037,597 |
|
| K&S AG | 14,071 | 4,094,299 |
|
| Linde AG | 14,299 | 1,902,475 |
|
| MAN AG | 35,314 | 4,648,369 |
|
| Muenchener Rueckversicherungs-Gesellschaft AG | 45,388 | 7,999,051 |
|
| Q-Cells AG * (a) | 34,896 | 2,803,785 |
|
| RWE AG | 36,306 | 4,391,000 |
|
| Salzgitter AG | 33,438 | 5,900,353 |
|
| SAP AG | 138,410 | 6,622,290 |
|
| Siemens AG | 72,334 | 9,313,734 |
|
| Suedzucker AG (a) | 49,851 | 1,095,980 |
|
| Thyssen Krupp AG | 99,321 | 5,713,189 |
|
| Volkswagen AG | 50,084 | 11,384,133 |
|
| Wacker Chemie AG | 11,397 | 2,431,355 |
| | | |
| Greece 0.13% | | 2,126,037 |
|
| National Bank of Greece SA | 39,238 | 2,126,037 |
| | | |
| Hong Kong 1.91% | | 31,677,154 |
|
| CLP Holdings, Ltd. (a) | 1,140,199 | 8,913,084 |
|
| Esprit Holdings, Ltd. | 179,000 | 2,233,782 |
|
| Hang Seng Bank, Ltd. | 59,700 | 1,131,516 |
|
| Henderson Land Development Company, Ltd. | 133,000 | 1,032,584 |
|
| Hong Kong & China Gas Company, Ltd. | 334,000 | 964,165 |
|
| Hong Kong Electric Holdings, Ltd. (a) | 873,854 | 4,915,395 |
|
| Hong Kong Exchange & Clearing, Ltd. | 346,500 | 6,586,829 |
|
| Noble Group, Ltd. (a) | 518,361 | 811,245 |
|
| Sun Hung Kai Properties, Ltd. | 230,000 | 4,022,502 |
|
| Yue Yuen Industrial Holdings, Ltd. (a) | 360,218 | 1,066,052 |
| | | |
| Ireland 0.49% | | 8,111,452 |
|
| Bank of Ireland | 113,392 | 1,595,113 |
|
| CRH PLC | 146,326 | 5,438,291 |
|
| Kerry Group PLC | 34,358 | 1,078,048 |
See notes to financial statements
International Core Fund | Annual report
14
F I N A N C I A L S T A T E M E N T S
| | |
| Issuer | Shares | Value |
| | | |
| Italy 3.09% | | $51,214,190 |
|
| Enel SpA | 310,819 | 3,353,848 |
|
| Eni SpA | 1,254,342 | 43,313,919 |
|
| Fiat SpA, RNC | 39,512 | 660,327 |
|
| Fondiaria-Sai SpA | 20,600 | 626,974 |
|
| Italcementi SpA, RNC | 36,738 | 558,724 |
|
| Luxottica Group SpA (a) | 46,514 | 1,281,405 |
|
| Mediaset SpA | 157,127 | 1,418,993 |
| | | |
| Japan 19.90% | | 329,764,519 |
|
| Acom Company, Ltd. | 41,180 | 1,191,122 |
|
| Aisin Seiki Company (a) | 24,000 | 955,976 |
|
| Alps Electric Company, Ltd. (a) | 46 | 538 |
|
| Asahi Breweries, Ltd. | 53,200 | 994,414 |
|
| Astellas Pharmaceuticals, Inc. | 62,400 | 2,727,239 |
|
| Cosmo Oil Company, Ltd. (a) | 421,000 | 1,391,180 |
|
| Daiichi Sankyo Company, Ltd. | 201,053 | 6,239,374 |
|
| Daikin Industries, Ltd. | 101,000 | 4,544,745 |
|
| Dena Company, Ltd. * | 165 | 1,069,140 |
|
| Denso Corp. | 42,800 | 1,597,789 |
|
| Eisai Company, Ltd. | 56,280 | 2,029,705 |
|
| Fanuc, Ltd. | 26,100 | 2,433,272 |
|
| Fast Retailing Company, Ltd. (a) | 31,100 | 2,297,431 |
|
| Fuji Heavy Industries, Ltd. | 340,116 | 1,483,747 |
|
| Haseko Corp. * (a) | 130,847 | 197,350 |
|
| Hitachi, Ltd. | 384,000 | 2,782,394 |
|
| Hokkaido Electric Power Company, Inc. | 88,699 | 1,986,261 |
|
| Honda Motor Company, Ltd. | 633,812 | 19,347,316 |
|
| Hoya Corp. | 122,700 | 3,113,259 |
|
| Ibiden Company, Ltd. | 44,500 | 2,124,910 |
|
| Inpex Holdings, Inc. | 145 | 1,629,150 |
|
| Isuzu Motors, Ltd. | 141,542 | 644,545 |
|
| Itochu Corp. | 1,053,047 | 11,088,953 |
|
| Japan Real Estate Investment Corp., REIT (a) | 126 | 1,402,139 |
|
| JFE Holdings, Inc. | 90,800 | 4,045,846 |
|
| Kao Corp. (a) | 150,050 | 4,619,710 |
|
| Kawasaki Kisen Kaisha, Ltd. (a) | 593,000 | 6,015,400 |
|
| Keyence Corp. | 9,100 | 2,123,311 |
|
| Komatsu, Ltd. | 215,100 | 5,464,503 |
|
| Konami Corp. (a) | 51,323 | 1,699,449 |
|
| Konica Minolta Holdings, Inc. | 177,500 | 2,514,669 |
|
| Kyushu Electric Power Company, Inc. | 87,580 | 2,206,647 |
|
| Marubeni Corp. | 992,824 | 7,516,767 |
|
| Matsushita Electric Industrial Company, Ltd. | 111,000 | 2,337,814 |
|
| Mitsubishi Corp. | 519,095 | 15,837,829 |
|
| Mitsubishi Electric Corp. | 255,000 | 2,335,661 |
See notes to financial statements
Annual report | International Core Fund
15
F I N A N C I A L S T A T E M E N T S
| | |
| Issuer | Shares | Value |
| | | |
| Japan (continued) | | |
|
| Mitsubishi Estate Company, Ltd. | 81,404 | $1,983,854 |
|
| Mitsui & Company, Ltd. | 523,560 | 11,386,084 |
|
| Mitsui O.S.K. Lines, Ltd. | 399,000 | 5,182,162 |
|
| Mitsui Trust Holdings, Inc. | 675,553 | 4,656,880 |
|
| Mitsumi Electric Company, Ltd. (a) | 32,300 | 1,003,774 |
|
| Murata Manufacturing Company, Ltd. | 23,500 | 1,275,062 |
|
| NGK INSULATORS, LTD. (a) | 109,000 | 2,475,162 |
|
| Nidec Corp. | 15,600 | 1,033,739 |
|
| Nikon Corp. (a) | 119,000 | 3,333,191 |
|
| Nintendo Company, Ltd. | 32,900 | 16,380,754 |
|
| Nippon Building Fund, Inc., REIT | 137 | 1,685,509 |
|
| Nippon Mining Holdings, Inc. | 535,000 | 3,168,724 |
|
| Nippon Oil Corp. | 812,000 | 5,539,199 |
|
| Nippon Steel Corp. | 546,000 | 2,872,614 |
|
| Nippon Telegraph & Telephone Corp. | 1,565 | 6,824,548 |
|
| Nippon Yusen Kabushiki Kaisha (a) | 503,000 | 4,647,932 |
|
| Nissan Motor Company, Ltd. | 1,261,500 | 11,344,634 |
|
| Nitto Denko Corp. | 19,100 | 929,943 |
|
| Nomura Research Institute, Ltd. (a) | 40,700 | 1,159,180 |
|
| NTT DoCoMo, Inc. | 5,794 | 8,488,613 |
|
| Olympus Optical Company, Ltd. (a) | 48,000 | 1,405,518 |
|
| Osaka Gas Company, Ltd. | 1,740,120 | 6,981,967 |
|
| Resona Holdings, Inc. (a) | 4,188 | 6,774,150 |
|
| Ricoh Company, Ltd. | 257,000 | 4,127,452 |
|
| Rohm Company, Ltd. | 12,700 | 926,281 |
|
| SBI Holdings, Inc. (a) | 7,172 | 1,756,482 |
|
| Secom Company, Ltd. (a) | 22,100 | 1,114,481 |
|
| SEGA SAMMY HOLDINGS, INC. (a) | 208,300 | 2,298,201 |
|
| Seven & I Holdings Company, Ltd. (a) | 388,700 | 9,665,126 |
|
| Shin-Etsu Chemical Company, Ltd. | 153,800 | 8,300,022 |
|
| Shinko Securities Company, Ltd. | 196,000 | 672,668 |
|
| Shiseido Company, Ltd. | 41,000 | 934,345 |
|
| Showa Shell Sekiyu K.K. (a) | 158,800 | 1,611,063 |
|
| Sojitz Holdings Corp. | 1,326,000 | 4,970,544 |
|
| Sony Corp. | 69,000 | 3,259,780 |
|
| Sumco Corp. | 124,700 | 2,757,567 |
|
| Sumitomo Chemical Company, Ltd. | 182,000 | 1,259,863 |
|
| Sumitomo Corp. | 328,596 | 4,725,601 |
|
| Sumitomo Electric Industries, Ltd. | 68,200 | 1,009,225 |
|
| Taisho Pharmaceuticals Company, Ltd. | 44,790 | 912,747 |
|
| Takeda Pharmaceutical Company, Ltd. | 256,189 | 14,295,090 |
|
| Takefuji Corp. (a) | 118,290 | 2,987,773 |
|
| TDK Corp. | 51,600 | 3,667,867 |
|
| Terumo Corp. | 50,200 | 2,725,726 |
|
| The Japan Steel Works, Ltd. (a) | 166,000 | 2,697,637 |
See notes to financial statements
International Core Fund | Annual report
16
F I N A N C I A L S T A T E M E N T S
| | |
| Issuer | Shares | Value |
| | | |
| Japan (continued) | | |
|
| The Tokyo Electric Power Company, Ltd. | 79,439 | $2,040,951 |
|
| Tokyo Gas Company, Ltd. | 469,397 | 2,105,610 |
|
| Tokyu Land Corp. | 164,000 | 1,105,371 |
|
| TonenGeneral Sekiyu K.K. (a) | 121,133 | 1,149,972 |
|
| Toshiba Corp. | 408,000 | 3,060,298 |
|
| Yahoo Japan Corp. | 3,260 | 1,449,407 |
|
| Yamada Denki Company, Ltd. | 18,920 | 1,654,621 |
| | | |
| Luxembourg 0.69% | | 11,386,156 |
|
| ArcelorMittal | 149,959 | 11,386,156 |
| | | |
| Netherlands 3.78% | | 62,638,592 |
|
| Aegon NV | 665,325 | 9,936,252 |
|
| DSM NV | 59,695 | 2,626,963 |
|
| Heineken Holding NV | 28,268 | 1,437,191 |
|
| Heineken NV | 138,273 | 7,798,665 |
|
| ING Groep NV | 672,195 | 22,338,189 |
|
| Reed Elsevier NV | 219,299 | 4,074,150 |
|
| Royal Dutch Shell PLC, A Shares EUR | 327,014 | 11,693,875 |
|
| TNT Post Group NV | 37,942 | 1,494,249 |
|
| TomTom NV * (a) | 26,440 | 1,239,058 |
| | | |
| Norway 0.59% | | 9,794,032 |
|
| Den Norske Bank ASA | 97,700 | 1,429,116 |
|
| Statoil ASA | 274,518 | 8,364,916 |
| | | |
| Singapore 2.04% | | 33,724,663 |
|
| Capitaland, Ltd. * | 280,000 | 1,237,052 |
|
| City Developments, Ltd. | 72,000 | 604,278 |
|
| Cosco Corp. Singapore, Ltd. | 908,600 | 2,577,690 |
|
| K-REIT Asia * | 46,908 | 55,148 |
|
| Neptune Orient Lines, Ltd. (a) | 577,488 | 1,262,014 |
|
| Oversea-Chinese Banking Corp., Ltd. | 643,000 | 3,468,687 |
|
| SembCorp Industries, Ltd. | 396,802 | 1,334,181 |
|
| SembCorp Marine, Ltd. (a) | 1,157,573 | 2,964,554 |
|
| Singapore Exchange, Ltd. (a) | 437,000 | 2,542,745 |
|
| Singapore Press Holdings, Ltd. (a) | 769,000 | 2,396,267 |
|
| Singapore Telecommunications, Ltd. | 4,146,350 | 11,218,964 |
|
| United Overseas Bank, Ltd. | 193,000 | 2,447,118 |
|
| Wilmar International, Ltd. (a) | 522,000 | 1,615,965 |
| | | |
| Spain 1.92% | | 31,785,689 |
|
| Gas Natural SDG SA | 39,851 | 2,414,716 |
|
| Iberdrola SA | 246,931 | 3,566,379 |
|
| Industria de Diseno Textil SA | 55,517 | 2,862,103 |
|
| Repsol YPF SA | 259,557 | 8,953,851 |
|
| Telefonica SA | 483,424 | 13,988,640 |
See notes to financial statements
Annual report | International Core Fund
17
F I N A N C I A L S T A T E M E N T S
| | |
| Issuer | Shares | Value |
| | | |
| Sweden 1.26% | | $20,952,916 |
|
| Hennes & Mauritz AB, B shares (a) | 98,450 | 5,521,877 |
|
| Investor AB, B shares (a) | 287,600 | 6,083,440 |
|
| Scania AB, Series B * | 120,100 | 2,897,454 |
|
| SKF AB, B Shares * (a) | 115,600 | 2,126,084 |
|
| Svenska Handelsbanken AB, Series A (a) | 67,100 | 1,869,327 |
|
| Swedbank AB, A shares (a) | 51,400 | 1,389,231 |
|
| Tele2 AB, Series B | 60,620 | 1,065,503 |
| | | |
| Switzerland 5.92% | | 98,002,005 |
|
| ABB, Ltd. (a) | 418,546 | 10,427,777 |
|
| Compagnie Financiere Richemont AG, Series A * | 57,283 | 3,316,037 |
|
| Nestle SA | 39,327 | 18,770,316 |
|
| Novartis AG (a) | 768,587 | 37,962,657 |
|
| Roche Holdings AG — Genusschein | 38,903 | 7,629,204 |
|
| Swatch Group AG, BR shares | 8,824 | 2,590,062 |
|
| Swiss Re | 66,385 | 5,320,983 |
|
| Syngenta AG * | 8,817 | 2,534,970 |
|
| Synthes AG (a) | 7,112 | 996,686 |
|
| Zurich Financial Services AG | 27,041 | 8,453,313 |
| | | |
| United Kingdom 20.34% | | 337,033,080 |
|
| 3i Group PLC | 393,174 | 6,354,379 |
|
| Alliance & Leicester PLC | 95,433 | 1,058,410 |
|
| AMEC PLC | 179,435 | 2,737,169 |
|
| Antofagasta PLC | 110,784 | 1,765,708 |
|
| Associated British Foods PLC | 61,455 | 1,029,743 |
|
| AstraZeneca Group PLC | 509,680 | 19,050,494 |
|
| Aviva PLC | 315,781 | 3,806,239 |
|
| Barclays PLC | 700,199 | 6,562,476 |
|
| BG Group PLC | 587,891 | 13,857,180 |
|
| BHP Billiton PLC | 357,187 | 11,426,454 |
|
| Biffa PLC | 111 | 762 |
|
| British American Tobacco PLC | 93,057 | 3,489,332 |
|
| Cadbury Schweppes PLC | 162,871 | 1,812,945 |
|
| Capita Group PLC * | 179,156 | 2,321,384 |
|
| Centrica PLC | 70,541 | 450,384 |
|
| Diageo PLC | 188,305 | 3,847,987 |
|
| GlaxoSmithKline PLC | 2,749,055 | 60,008,031 |
|
| HBOS PLC | 654,888 | 7,782,025 |
|
| Home Retail Group | 553,425 | 2,826,932 |
|
| ICAP PLC | 78,176 | 973,407 |
|
| Imperial Tobacco Group PLC | 151,536 | 7,014,950 |
|
| International Power PLC | 330,279 | 2,481,328 |
|
| Kingfisher PLC | 512,023 | 1,321,736 |
|
| Ladbrokes PLC | 311,943 | 1,873,179 |
|
| London Stock Exchange Group PLC | 31,494 | 844,562 |
See notes to financial statements
International Core Fund | Annual report
18
F I N A N C I A L S T A T E M E N T S
| | |
| Issuer | Shares | Value |
| | | |
| United Kingdom (continued) | | |
|
| Next Group PLC | 102,537 | $2,600,527 |
|
| Old Mutual PLC | 1,139,012 | 2,813,439 |
|
| Reckitt Benckiser PLC | 76,953 | 4,150,931 |
|
| Reed Elsevier PLC * (a) | 146,035 | 1,837,981 |
|
| Reuters Group PLC | 215,756 | 2,548,080 |
|
| Rio Tinto PLC | 252,295 | 28,385,070 |
|
| Royal Bank of Scotland Group PLC | 3,419,466 | 25,852,923 |
|
| Royal Dutch Shell PLC, A Shares, GBP | 440,387 | 15,746,641 |
|
| Royal Dutch Shell PLC, B Shares, GBP | 162,810 | 5,711,679 |
|
| SABMiller PLC | 68,926 | 1,431,984 |
|
| Scottish & Southern Energy PLC | 121,440 | 3,550,987 |
|
| Smith & Nephew PLC | 106,314 | 1,381,351 |
|
| Taylor Woodrow PLC | 890,383 | 3,012,914 |
|
| Tesco PLC | 417,399 | 3,298,446 |
|
| The Sage Group PLC | 192,857 | 751,838 |
|
| Tullow Oil PLC | 84,957 | 1,053,155 |
|
| Unilever PLC | 154,381 | 4,863,964 |
|
| United Utilities PLC | 149,177 | 2,042,710 |
|
| Vedanta Resources PLC | 40,711 | 1,751,436 |
|
| Vodafone Group PLC | 17,589,501 | 56,628,722 |
|
| Wolseley PLC | 238,710 | 2,921,106 |
| |
| Preferred stocks 0.51% | | $8,385,319 |
|
| (Cost $5,866,028) | | |
| | | |
| Germany 0.51% | | 8,385,319 |
|
| Bayerische Motoren Werke (BMW) AG | 10,400 | 481,090 |
|
| Porsche Automobil Holding SE | 2,297 | 3,937,016 |
|
| Volkswagen AG | 28,509 | 3,967,213 |
| | | |
| | Principal | |
| | amount | |
| |
| Short-term investments 12.17% | | $201,621,129 |
|
| (Cost $201,621,129) | | |
|
| John Hancock Cash Investment Trust, 3.5681% (c)(f) | $201,621,129 | 201,621,129 |
See notes to financial statements
Annual report | International Core Fund
19
F I N A N C I A L S T A T E M E N T S
| | |
| | Principal | |
| Issuer | amount | Value |
| |
| Repurchase agreements 4.11% | | $68,140,000 |
|
| (Cost $68,140,000) | | |
|
| Repurchase Agreement with State Street Corp. dated 2-29-08 | | |
| at 2.35% to be repurchased at $68,153,344 on 3-3-08, | | |
| collateralized by $69,245,000 Federal National Mortgage | | |
| Association, 6.30%, due 12-21-26 (valued at $69,504,669, | | |
| including interest) | $68,140,000 | 68,140,000 |
| |
| Total investments (Cost $1,774,908,740)† 110.89% | | $1,837,141,456 |
|
| Liabilities in excess of other assets (10.89%) | | ($180,483,109) |
|
| Total net assets 100.00% | | $1,656,658,347 |
|
Percentages are stated as a percent of net assets.
The portfolio had the following five top industry concentrations as of February 29, 2008 (as a percentage of total net assets):
| | | |
| Telecommunications equipment & services | 9.44% | | |
| International oil | 9.02% | | |
| Pharmaceuticals | 8.46% | | |
| Banking | 6.31% | | |
| Automobiles | 5.34% | | |
ADR American Depositary Receipt
PLC Public Limited Company
REIT Real Estate Investment Trust
SBI Shares Beneficial Interest
* Non-income producing.
(a) All or a portion of this security was out on loan.
(c) Investment is an affiliate of the Trust’s adviser or subadviser.
(f) John Hancock Cash Investment Trust is managed by MFC Global Investment Management (U.S.), LLC. The rate shown is the seven-day effective yield at period end.
† At February 29, 2008, the aggregate cost of investment securities for federal income tax purposes was $1,777,068,135. Net unrealized appreciation aggregated $60,073,321, of which $183,406,564 related to appreciated investment securities and $123,333,243 related to depreciated investment securities.
See notes to financial statements
International Core Fund | Annual report
20
F I N A N C I A L S T A T E M E N T S
Financial statements
Statement of assets and liabilities 2-29-08
This Statement of Assets and Liabilities is the Fund’s balance sheet. It shows the value of what the Fund owns, is due and owes. You’ll also find the net asset value and the maximum public offering price per share.
| |
| Assets | |
|
| Investments in unaffiliated issuers, at value (cost $1,505,147,611) | |
| including $192,020,123 of securities loaned (Note 2) | $1,567,380,327 |
| Repurchase agreement, at value (cost $68,140,000) (Note 2) | 68,140,000 |
| Investments in affiliated issuers, at value (cost $201,621,129) (Note 2) | 201,621,129 |
| | |
| Total investments, at value (cost $1,774,908,740) | 1,837,141,456 |
| Cash | 738 |
| Foreign currency, at value (cost $521,164) | 532,556 |
| Cash collateral at broker for futures contracts | 20,700,000 |
| Receivable for forward foreign currency exchange contracts (Note 2) | 11,555,061 |
| Receivable for fund shares sold | 227,456 |
| Dividends and interest receivable (net of tax) | 4,369,698 |
| Receivable for security lending income | 88,934 |
| Receivable due from adviser | 109,253 |
| Other assets | 14,208 |
| | |
| Total assets | 1,874,739,360 |
| |
| Liabilities | |
|
| Payable for investments purchased | 763,518 |
| Payable for forward foreign currency exchange contracts (Note 2) | 6,277,161 |
| Payable for fund shares repurchased | 6,904,658 |
| Payable upon return of securities loaned (Note 2) | 201,621,129 |
| Payable for futures variation margin | 1,468,547 |
| Payable to affiliates | |
| Fund administration fees | 30,899 |
| Transfer agent fees | 88,686 |
| Distribution and service fees | 50,184 |
| Trustees’ fees | 4,530 |
| Other payables and accrued expenses | 871,701 |
| | |
| Total liabilities | 218,081,013 |
| |
| Net assets | |
|
| Capital paid-in | $1,556,886,295 |
| Undistributed net investment income | 14,685,496 |
| Accumulated undistributed net realized gain (loss) on investments, | |
| futures contracts and foreign currency transactions | 30,809,644 |
| Net unrealized appreciation (depreciation) on investments, | |
| futures contracts, and translation of assets and liabilities in foreign currencies | 54,276,912 |
| | |
| Net assets | $1,656,658,347 |
See notes to financial statements
Annual report | International Core Fund
21
F I N A N C I A L S T A T E M E N T S
Statement of assets and liabilities (continued)
| |
| Net asset value per share | |
|
| The Fund has an unlimited number of shares authorized with no par value. | |
| Net asset value is calculated by dividing the net assets of each class of | |
| shares by the number of outstanding shares in the class. | |
| | |
| Class A | |
|
| Net assets | $130,075,228 |
| Shares outstanding | 3,329,870 |
| Net asset value and redemption price per share | $39.06 |
| | |
| Class B1 | |
|
| Net assets | $19,563,497 |
| Shares outstanding | 504,201 |
| Net asset value and offering price per share | $38.80 |
| | |
| Class C1 | |
|
| Net assets | $15,386,093 |
| Shares outstanding | 396,486 |
| Net asset value and offering price per share | $38.81 |
| | |
| Class I | |
|
| Net assets | $2,874,926 |
| Shares outstanding | 73,349 |
| Net asset value, offering price and redemption price per share | $39.20 |
| | |
| Class R1 | |
|
| Net assets | $164,876 |
| Shares outstanding | 4,235 |
| Net asset value, offering price and redemption price per share | $38.942 |
| | |
| Class 1 | |
|
| Net assets | $73,862,085 |
| Shares outstanding | 1,883,471 |
| Net asset value, offering price and redemption price per share | $39.22 |
| | |
| Class NAV | |
|
| Net assets | $1,414,731,642 |
| Shares outstanding | 36,084,644 |
| Net asset value, offering price and redemption price per share | $39.21 |
| |
| Maximum public offering price per share | |
|
| Class A (net asset value per share ÷ 95%)3 | $41.12 |
1 Redemption price per share is equal to the net asset value less any applicable contingent deferred sales charge.
2 Net assets and shares outstanding have been rounded for presentation purposes. The net asset value is as reported on February 29, 2008.
3 On single retail sales of less than $50,000. On sales of $50,000 or more and on group sales the offering price is reduced.
See notes to financial statements
International Core Fund | Annual report
22
F I N A N C I A L S T A T E M E N T S
Statement of operations For the year ended 2-29-08
This Statement of Operations summarizes the Fund’s investment income earned and expenses incurred in operating the Fund. It also shows net gains (losses) for the period stated.
| |
| Investment income | |
|
| Dividends | $50,922,611 |
| Interest | 2,624,326 |
| Securities lending | 1,325,527 |
| Income from affiliated issuers | 221,730 |
| Less foreign taxes withheld | (4,674,751) |
| Total investment income | 50,419,443 |
| |
| Expenses | |
|
| Investment management fees (Note 3) | 14,353,461 |
| Distribution and service fees (Note 3) | 676,146 |
| Transfer agent fees (Note 3) | 270,229 |
| Fund administration fees (Note 3) | 546,691 |
| Blue sky fees (Note 3) | 91,680 |
| Audit and legal fees | 691,228 |
| Printing and postage fees (Note 3) | 47,455 |
| Custodian fees | 2,033,568 |
| Trustees’ fees (Note 4) | 102,117 |
| Registration and filing fees | 212,176 |
| Miscellaneous | 19,247 |
| Total expenses | 19,043,998 |
| Less expense reductions (Note 3) | (422,236) |
| | |
| Net expenses | 18,621,762 |
| | |
| Net investment income | 31,797,681 |
| |
| Realized and unrealized gain (loss) | |
|
| Net realized gain (loss) on | |
| Investments in unaffiliated issuers | 140,187,611 |
| Futures contracts | 11,013,631 |
| Foreign currency transactions | 8,665,323 |
| | 159,866,565 |
| Change in net unrealized appreciation (depreciation) of | |
|
| Investments in unaffiliated issuers | (201,319,466) |
| Futures contracts | (13,608,559) |
| Translation of assets and liabilities in foreign currencies | 3,955,638 |
| | (210,972,387) |
| Net realized and unrealized gain (loss) | (51,105,822) |
| | |
| Increase (decrease) in net assets from operations | ($19,308,141) |
See notes to financial statements
Annual report | International Core Fund
23
F I N A N C I A L S T A T E M E N T S
Statement of changes in net assets
These Statements of Changes in Net Assets show how the value of the Fund’s net assets has changed during the last two periods. The difference reflects earnings less expenses, any investment gains and losses, distributions, if any, paid to shareholders and the net of Fund share transactions.
| | |
| | Year | Year |
| | ended | ended |
| | 2-28-07 | 2-29-08 |
| |
| Increase (decrease) in net assets | | |
|
| From operations | | |
| Net investment income | $2,484,546 | $31,797,681 |
| Net realized gain (loss) | 36,328,435 | 159,866,565 |
| Change in net unrealized appreciation (depreciation) | 101,813,528 | (210,972,387) |
| | | |
| Increase (decrease) in net assets resulting from operations | 140,626,509 | (19,308,141) |
| | | |
| Distributions to shareholders | | |
| From net investment income | | |
| Class A | — | (1,428,621) |
| Class B | — | (84,722) |
| Class C | — | (64,270) |
| Class I | — | (34,527) |
| Class R1 | — | (1,255) |
| Class 1 | (56,793) | (1,180,905) |
| Class NAV | (986,755) | (20,701,580) |
| From net realized gain | | |
| Class A | (73,495) | (12,052,892) |
| Class B | (6,331) | (1,960,810) |
| Class C | (22,267) | (1,487,649) |
| Class I | (1,930) | (206,228) |
| Class R1 | (1,056) | (10,954) |
| Class 1 | (731,024) | (6,868,892) |
| Class NAV | (10,547,441) | (116,609,468) |
| | | |
| Total distributions | (12,427,092) | (162,692,773) |
| | | |
| From Fund share transactions (Note 6) | 1,198,322,023 | 495,364,086 |
| | | |
| Total increase (decrease) | 1,326,521,440 | 313,363,172 |
| |
| Net assets | | |
|
| Beginning of year | 16,773,735 | 1,343,295,175 |
| | | |
| End of year | $1,343,295,175 | $1,656,658,347 |
| | | |
| Undistributed net investment income (loss) | ($4,292,153) | $14,685,496 |
See notes to financial statements
International Core Fund | Annual report
24
F I N A N C I A L S T A T E M E N T S
Financial highlights
The Financial Highlights show how the Fund’s net asset value for a share has changed since the end of the previous period.
| | | |
| CLASS A SHARES | | | |
| |
| Period ended | 2-28-061 | 2-28-072 | 2-29-08 |
| |
| Per share operating performance | | | |
|
| Net asset value, beginning of period | $32.60 | $36.26 | $43.30 |
| Net investment income (loss)3 | 0.19 | 0.63 | 0.35 |
| Net realized and unrealized gain | | | |
| (loss) on investments | 3.47 | 6.79 | (0.35) |
| Total from investment operations | 3.66 | 7.42 | — |
| Less distributions | | | |
| From net investment income | — | — | (0.45) |
| From net realized gain | — | (0.38) | (3.79) |
| | — | (0.38) | (4.24) |
| Net asset value, end of period | $36.26 | $43.30 | $39.06 |
| Total return4 (%) | 11.235,6 | 20.486,7 | (0.76)6 |
| |
| Ratios and supplemental data | | | |
|
| Net assets, end of period (in millions) | $17 | $12 | $130 |
| Ratios (as a percentage of average net assets): | | | |
| Expenses before reductions | 2.228 | 2.23 | 1.68 |
| Expenses net of fee waivers, if any | 0.558 | 1.40 | 1.65 |
| Expenses net of all fee waivers and credits | 0.558 | 1.40 | 1.65 |
| Net investment income (loss) | 1.238 | 1.58 | 0.78 |
| Portfolio turnover (%) | 225 | 37 | 509 |
1 Class A shares began operations on 9-16-05.
2 Effective June 12, 2006, shareholders of the former GMO International Disciplined Equity Fund (the Predecessor Fund) became owners of an equal number of full and fractional Class A shares of the John Hancock International Core Fund. Additionally, the accounting and performance history of the former GMO International Disciplined Equity Fund was redesignated as that of John Hancock International Core Fund Class A.
3 Based on the average of the shares outstanding.
4 Total returns would have been lower had certain expenses not been reduced during the periods shown.
5 Not annualized.
6 Assumes dividend reinvestment.
7 Class A returns linked back to the Predecessor Fund.
8 Annualized.
9 Excludes merger activity.
See notes to financial statements
Annual report | International Core Fund
25
F I N A N C I A L S T A T E M E N T S
Financial highlights
| | |
| CLASS B SHARES | | |
| |
| Period ended | 2-28-071 | 2-29-08 |
| |
| Per share operating performance | | |
|
| Net asset value, beginning of period | $35.92 | $43.08 |
| Net investment income (loss)2 | (0.25) | — 3 |
| Net realized and unrealized gain | | |
| (loss) on investments | 7.79 | (0.33) |
| Total from investment operations | 7.54 | (0.33) |
| Less distributions | | |
| From net investment income | — | (0.16) |
| From net realized gain | (0.38) | (3.79) |
| | (0.38) | (3.95) |
| Net asset value, end of period | $43.08 | $38.80 |
| Total return4,5 (%) | 21.016 | (1.48) |
| |
| Ratios and supplemental data | | |
|
| Net assets, end of period (in millions) | $1 | $20 |
| Ratios (as a percentage of average net assets): | | |
| Expenses before reductions | 6.837 | 2.48 |
| Expenses net of fee waivers, if any | 2.397 | 2.41 |
| Expenses net of all fee waivers and credits | 2.397 | 2.40 |
| Net investment income (loss) | (0.84)7 | — 8 |
| Portfolio turnover (%) | 376 | 509 |
1 Class B shares began operations on 6-12-06.
2 Based on the average of the shares outstanding.
3 Less than $0.01 per share.
4 Total returns would have been lower had certain expenses not been reduced during the periods shown.
5 Assumes dividend reinvestment.
6 Not annualized.
7 Annualized.
8 Less than 0.01% .
9 Excludes merger activity.
See notes to financial statements
International Core Fund | Annual report
26
F I N A N C I A L S T A T E M E N T S
Financial highlights
| | |
| CLASS C SHARES | | |
| |
| Period ended | 2-28-071 | 2-29-08 |
| |
| Per share operating performance | | |
|
| Net asset value, beginning of period | $35.92 | $43.09 |
| Net investment income (loss)2 | (0.24) | 0.13 |
| Net realized and unrealized gain | | |
| (loss) on investments | 7.79 | (0.46) |
| Total from investment operations | 7.55 | (0.33) |
| Less distributions | | |
| From net investment income | — | (0.16) |
| From net realized gain | (0.38) | (3.79) |
| | (0.38) | (3.95) |
| Net asset value, end of period | $43.09 | $38.81 |
| Total return3,4 (%) | 21.045 | (1.48) |
| |
| Ratios and supplemental data | | |
|
| Net assets, end of period (in millions) | $4 | $15 |
| Ratios (as a percentage of average net assets): | | |
| Expenses before reductions | 3.726 | 2.49 |
| Expenses net of fee waivers, if any | 2.396 | 2.40 |
| Expenses net of all fee waivers and credits | 2.396 | 2.40 |
| Net investment income (loss) | (0.79)6 | 0.28 |
| Portfolio turnover (%) | 375 | 507 |
1 Class C shares began operations on 6-12-06.
2 Based on the average of the shares outstanding.
3 Total returns would have been lower had certain expenses not been reduced during the periods shown.
4 Assumes dividend reinvestment.
5 Not annualized.
6 Annualized.
7 Excludes merger activity.
See notes to financial statements
Annual report | International Core Fund
27
F I N A N C I A L S T A T E M E N T S
Financial highlights
| | |
| CLASS I SHARES | | |
| |
| Period ended | 2-28-071 | 2-29-08 |
| |
| Per share operating performance | | |
|
| Net asset value, beginning of period | $35.92 | $43.43 |
| Net investment income (loss)2 | 0.16 | 0.55 |
| Net realized and unrealized gain | | |
| (loss) on investments | 7.73 | (0.35) |
| Total from investment operations | 7.89 | 0.20 |
| Less distributions | | |
| From net investment income | — | (0.64) |
| From net realized gain | (0.38) | (3.79) |
| | (0.38) | (4.43) |
| Net asset value, end of period | $43.43 | $39.20 |
| Total return3,4 (%) | 21.995 | (0.33) |
| |
| Ratios and supplemental data | | |
|
| Net assets, end of period (in millions) | — 6 | $3 |
| Ratios (as a percentage of average net assets): | | |
| Expenses before reductions | 12.527 | 2.34 |
| Expenses net of fee waivers, if any | 1.207 | 1.18 |
| Expenses net of all fee waivers and credits | 1.207 | 1.18 |
| Net investment income (loss) | 0.567 | 1.24 |
| Portfolio turnover (%) | 375 | 508 |
1 Class I shares began operations on 6-12-06.
2 Based on the average of the shares outstanding.
3 Total returns would have been lower had certain expenses not been reduced during the periods shown.
4 Assumes dividend reinvestment.
5 Not annualized.
6 Less than $500,000.
7 Annualized.
8 Excludes merger activity.
See notes to financial statements
International Core Fund | Annual report
28
F I N A N C I A L S T A T E M E N T S
Financial highlights
| | |
| CLASS R1 SHARES | | |
| |
| Period ended | 2-28-071 | 2-29-08 |
| |
| Per share operating performance | | |
|
| Net asset value, beginning of period | $35.92 | $43.19 |
| Net investment income (loss)2 | (0.03) | 0.66 |
| Net realized and unrealized gain | | |
| (loss) on investments | 7.68 | (0.69) |
| Total from investment operations | 7.65 | (0.03) |
| Less distributions | | |
| From net investment income | — | (0.43) |
| From net realized gain | (0.38) | (3.79) |
| | (0.38) | (4.22) |
| Net asset value, end of period | $43.19 | $38.94 |
| Total return3,4 (%) | 21.325 | (0.82) |
| |
| Ratios and supplemental data | | |
|
| Net assets, end of period (in millions) | — 6 | — 6 |
| Ratios (as a percentage of average net assets): | | |
| Expenses before reductions | 20.407 | 13.85 |
| Expenses net of fee waivers, if any | 1.947 | 1.70 |
| Expenses net of all fee waivers and credits | 1.947 | 1.70 |
| Net investment income (loss) | (0.10)7 | 1.48 |
| Portfolio turnover (%) | 375 | 508 |
1 Class R1 shares began operations on 6-12-06.
2 Based on the average of the shares outstanding.
3 Total returns would have been lower had certain expenses not been reduced during the periods shown.
4 Assumes dividend reinvestment.
5 Not annualized.
6 Less than $500,000.
7 Annualized.
8 Excludes merger activity.
See notes to financial statements
Annual report | International Core Fund
29
F I N A N C I A L S T A T E M E N T S
Financial highlights
| | |
| CLASS 1 SHARES | | |
| |
| Period ended | 2-28-071 | 2-29-08 |
| |
| Per share operating performance | | |
|
| Net asset value, beginning of period | $40.56 | $43.43 |
| Net investment income (loss)2 | 0.02 | 0.95 |
| Net realized and unrealized gain | | |
| (loss) on investments | 3.26 | (0.72) |
| Total from investment operations | 3.28 | 0.23 |
| Less distributions | | |
| From net investment income | (0.03) | (0.65) |
| From net realized gain | (0.38) | (3.79) |
| | (0.41) | (4.44) |
| Net asset value, end of period | $43.43 | $39.22 |
| Total return3,4 (%) | 8.115 | (0.25) |
| |
| Ratios and supplemental data | | |
|
| Net assets, end of period (in millions) | $82 | $74 |
| Ratios (as a percentage of average net assets): | | |
| Expenses before reductions | 1.236 | 1.16 |
| Expenses net of fee waivers, if any | 1.176 | 1.14 |
| Expenses net of all fee waivers and credits | 1.176 | 1.14 |
| Net investment income (loss) | 0.166 | 2.09 |
| Portfolio turnover (%) | 375 | 507 |
1 Class 1 shares began operations on 11-6-06.
2 Based on the average of the shares outstanding.
3 Total returns would have been lower had certain expenses not been reduced during the periods shown.
4 Assumes dividend reinvestment.
5 Not annualized.
6 Annualized.
7 Excludes merger activity.
See notes to financial statements
International Core Fund | Annual report
30
F I N A N C I A L S T A T E M E N T S
Financial highlights
| | |
| CLASS NAV SHARES | | |
| |
| Period ended | 2-28-071 | 2-29-08 |
| |
| Per share operating performance | | |
|
| Net asset value, beginning of period | $39.18 | $43.42 |
| Net investment income (loss)2 | 0.08 | 0.95 |
| Net realized and unrealized gain | | |
| (loss) on investments | 4.58 | (0.70) |
| Total from investment operations | 4.66 | 0.25 |
| Less distributions | | |
| From net investment income | (0.04) | (0.67) |
| From net realized gain | (0.38) | (3.79) |
| | (0.42) | (4.46) |
| Net asset value, end of period | $43.42 | $39.21 |
| Total return3 (%) | 11.904 | (0.20)5 |
| |
| Ratios and supplemental data | | |
|
| Net assets, end of period (in millions) | $1,244 | $1,415 |
| Ratios (as a percentage of average net assets): | | |
| Expenses before reductions | 1.086 | 1.11 |
| Expenses net of fee waivers, if any | 1.086 | 1.08 |
| Expenses net of all fee waivers and credits | 1.086 | 1.08 |
| Net investment income (loss) | 0.386 | 2.09 |
| Portfolio turnover (%) | 374 | 507 |
1 Class NAV shares began operations on 8-29-06.
2 Based on the average of the shares outstanding.
3 Assumes dividend reinvestment.
4 Not annualized.
5 Total returns would have been lower had certain expenses not been reduced during the periods shown.
6 Annualized.
7 Excludes merger activity.
See notes to financial statements
Annual report | International Core Fund
31
Notes to financial statements
1. Organization
John Hancock International Core Fund (the Fund) is a diversified series of John Hancock Funds III (the Trust). The Trust was established as a Massachusetts business trust on June 9, 2005. The Trust is registered under the Investment Company Act of 1940, as amended (the 1940 Act), as an open-end investment management company. The investment objective of the Fund is to seek high total return.
John Hancock Life Insurance Company of New York (John Hancock New York) is a wholly owned subsidiary of John Hancock Life Insurance Company (U.S.A.) (John Hancock USA). John Hancock USA and John Hancock New York are indirect wholly owned subsidiaries of The Manufacturers Life Insurance Company (Manulife), which in turn is a wholly owned subsidiary of Manulife Financial Corporation (MFC), a publicly traded company. MFC and its subsidiaries are known collectively as “Manulife Financial.”
John Hancock Investment Management Services, LLC (the Adviser), a Delaware limited liability company controlled by John Hancock USA, serves as investment adviser for the Trust and John Hancock Funds, LLC (the Distributor), a Delaware limited liability company, an affiliate of the Adviser, serves as principal underwriter.
The Board of Trustees have authorized the issuance of multiple classes of shares of the Fund, including classes designated as Class A, Class B, Class C, Class I, Class R1, Class 1 and Class NAV shares. Class A, Class B and Class C shares are open to all retail investors. Class I shares are offered without any sales charge to various institutional and certain individual investors. Class R1 shares are available only to certain retirement plans. Class 1 shares are sold only to certain exempt separate accounts of John Hancock USA and John Hancock New York.
Class NAV shares are sold to affiliated funds of funds, which are funds of funds within the John Hancock funds complex. The shares of each class represent an interest in the same portfolio of investments of the Fund, and have equal rights as to voting, redemptions, dividends and liquidation, except that certain expenses, subject to the approval of the Board of Trustees, may be applied differently to each class of shares in accordance with current regulations of the Securities and Exchange Commission (SEC) and the Internal Revenue Service. Shareholders of a class that bear distribution and service expenses under the terms of a distribution plan have exclusive voting rights to that distribution plan. Class B shares will convert to Class A shares eight years after purchase.
The Adviser and other affiliates of John Hancock USA owned 3,090 shares of beneficial interest of Class R1 on February 29, 2008.
The Fund is the accounting and performance successor to the GMO International Disciplined Equity Fund (the Predecessor Fund), a diver-sified open-end investment management company organized as a Massachusetts corporation on September 16, 2005. On June 12, 2006, the Fund acquired substantially all the assets and assumed the liabilities of the Predecessor Fund pursuant to an agreement and plan of reorganization, in exchange for Class A shares of the Fund.
2. Significant accounting policies
In the preparation of the financial statements, the Fund follows the policies described below. The preparation of financial statements in conformity with accounting principles generally accepted in the United States of America requires management to make estimates and assumptions that affect the reported amounts of assets and liabilities at the date of the financial statements and the reported amounts of income and expenses during
International Core Fund | Annual report
32
the reporting period. Actual results may differ from these estimates.
Security valuation
The net asset value of the shares of the Fund is determined daily as of the close of the New York Stock Exchange (NYSE), normally at 4:00 P.M., Eastern Time. Short-term debt investments that have a remaining maturity of 60 days or less are valued at amortized cost, and thereafter assume a constant amortization to maturity of any discount or premium, which approximates market value. Investments in John Hancock Cash Investment Trust (JHCIT), an affiliate of the John Hancock Advisers, LLC (JHA), a wholly owned subsidiary of John Hancock Financial Services, Inc., a subsidiary of MFC, are valued at their net asset value each business day. All other securities held by the Fund are valued at the last sale price or official closing price (closing bid price or last evaluated quote if no sale has occurred) as of the close of business on the principal securiti es exchange (domestic or foreign) on which they trade or, lacking any sales, at the closing bid price. Securities traded only in the over-the-counter market are valued at the last bid price quoted by brokers making markets in the securities at the close of trading. Securities for which there are no such quotations, principally debt securities, are valued based on the evaluated prices provided by an independent pricing service, which utilizes both dealer-supplied and electronic data processing techniques, which take into account factors such as institutional-size trading in similar groups of securities, yield, quality, coupon rate, maturity, type of issue, trading characteristics and other market data.
Other assets and securities for which no such quotations are readily available are valued at fair value as determined in good faith under consistently applied procedures established by and under the general supervision of the Board of Trustees. Generally, trading in non-U.S. securities is substantially completed each day at various times prior to the close of trading on the NYSE. The values of such securities used in computing the net asset value of a Fund’s shares are generally determined as of such times. Occasionally, significant events that affect the values of such securities may occur between the times at which such values are generally determined and the close of the NYSE. Upon such an occurrence, these securities will be valued at fair value as determined in good faith under consistently applied procedures established by and under the general supervision of the Board of Trustees.
In deciding whether to make a fair value adjustment to the price of a security, the Board of Trustees or their designee may review a variety of factors, including developments in foreign markets, the performance of U.S. securities markets and the performance of instruments trading in U.S. markets that represent foreign securities and baskets of foreign securities. The Fund may also fair value securities in other situations, for example, when a particular foreign market is closed, but the Fund is calculating the net asset value. In view of these factors, it is likely that Funds investing significant amounts of assets in securities in foreign markets will be fair valued more frequently than Funds investing significant amounts of assets in frequently traded, U.S. exchange listed securities of large-capitalization U.S. issuers.
For purposes of determining when fair value adjustments may be appropriate with respect to Funds that invest in securities in foreign markets that close prior to the NYSE, the Funds will, on an ongoing basis, monitor for “significant market events.” A significant market event may be a certain percentage change in the value of an index or of certain Exchange Traded Funds that track foreign markets in which Funds have significant investments. If a significant market event occurs due to a change in the value of the index or of Exchange Traded Funds, the pricing for the Fund will promptly be reviewed and potential adjustments to the net asset value of the Fund will be recommended to the Trust’s Pricing Committee when applicable.
Fair value pricing of securities is intended to help ensure that the net asset value of the Fund’s shares reflects the value of the Fund’s securities as of the close of the NYSE (as opposed to a value which is no longer accurate as of such close), thus limiting the opportunity for aggressive traders to purchase shares of the
Annual report | International Core Fund
33
Fund at deflated prices, reflecting stale security valuations, and to promptly sell such shares at a gain. However, a security’s valuation may differ depending on the method used for determining value and no assurance can be given that fair value pricing of securities will successfully eliminate all potential opportunities for such trading gains.
New accounting pronouncements
In September 2006, Financial Accounting Standards Board (FASB) Standard No. 157, Fair Value Measurements (FAS 157), was issued and is effective for fiscal years beginning after November 15, 2007. FAS 157 defines fair value, establishes a framework for measuring fair value and expands disclosure about fair value measurements. As of February 29, 2008, management does not believe the adoption of FAS 157 will impact the amounts reported in the financial statements; however, additional disclosures regarding pricing sources will be required about the inputs used to develop the measurements of fair value and the related realized and unrealized gain/loss for certain securities valued by significant unobservable market inputs.
In March 2008, FASB No. 161 (FAS 161), Disclosures about Derivative Instruments and Hedging Activities, an amendment of FASB Statement No. 133 (FAS 133), was issued and is effective for fiscal years beginning after November 15, 2008. FAS 161 amends and expands the disclosure requirements of FAS 133 in order to provide financial statement users an understanding of a company’s use of derivative instruments, how derivative instruments are accounted for under FAS 133 and related interpretations and how these instruments affect a company’s financial position, performance, and cash flows. FAS 161 requires companies to disclose information detailing the objectives and strategies for using derivative instruments, the level of derivative activity entered into by the company, and any credit risk-related contingent features of the agreements. Management is currently evaluating the adoption of FAS 1 61 on the Fund’s financial statement disclosures.
Guarantees and indemnifications
Under the Trust’s organizational documents, its Officers and Trustees are indemnified against certain liability arising out of the performance of their duties to the Trust. Additionally, in the normal course of business, the Trust enters into contracts with service providers that contain general indemnification clauses. The Trust’s maximum exposure under these arrangements is unknown, as this would involve future claims that may be made against the Trust that have not yet occurred.
Repurchase agreements
The Fund may enter into repurchase agreements. When the Fund enters into a repurchase agreement through its custodian, it receives delivery of securities, the amount of which at the time of purchase and each subsequent business day is required to be maintained at such a level that the market value is generally at least 102% of the repurchase amount. The Fund will take constructive receipt of all securities underlying the repurchase agreements it has entered into until such agreements expire. If the seller defaults, the Fund would suffer a loss to the extent that proceeds from the sale of underlying securities were less than the repurchase amount. The Fund may enter into repurchase agreements maturing within seven days with domestic dealers, banks or other financial institutions deemed to be creditworthy by the Adviser. Collateral for certain tri-party repurchase agreements is held at the custodian bank in a segregated account for the benefit of the Fund and the counterpa rty.
Foreign currency transactions
The books and records of the Fund are maintained in U.S. dollars. Investment securities and other assets and liabilities denominated in a foreign currency are translated into U.S. dollars at the prevailing exchange rates at period end. Purchases and sales of investment securities, income and expenses are translated into U.S. dollars at the prevailing exchange rates on the respective dates of the transactions.
Net realized and unrealized gains and losses on foreign currency transactions represent net gains and losses between trade and settlement dates on securities transactions,
International Core Fund | Annual report
34
the disposition of forward foreign currency exchange contracts and foreign currencies, and the difference between the amount of net investment income accrued and the U.S. dollar amount actually received. That portion of both realized and unrealized gains and losses on investments that results from fluctuations in foreign currency exchange rates is not separately disclosed but is included with net realized and unrealized gain/appreciation and loss/depreciation on investments.
The Fund may be subject to capital gains and repatriation taxes imposed by certain countries in which it invests. Such taxes are generally based upon income and/or capital gains earned or repatriated. Taxes are accrued based upon net investment income, net realized gains and net unrealized appreciation.
The Fund may invest in securities of issuers based in countries with emerging markets or economies and may, therefore, be subject to greater market risk than Funds that invest principally in securities of issuers in more developed countries. Emerging markets securities may be more volatile and less liquid than securities of issuers in developed countries and may be subject to substantial currency fluctuations and affected by sudden economic, social and political developments in the emerging market country. The securities markets of emerging countries may have less government regulation and may be subject to less extensive accounting and financial reporting requirements than the securities markets of more developed countries. Emerging market countries may have currency controls or restrictions which may prevent or delay the Fund from taking money out of the country or may impose additional taxes on money removed from the country.
Security transactions and related investment income
Investment security transactions are accounted for on a trade date plus one basis for daily net asset value calculations. However, for financial reporting purposes, investment transactions are reported on trade date. Interest income is accrued as earned. Dividend income and distributions to shareholders are recorded on the ex-dividend date. Foreign dividends are recorded on the ex-date or when the Fund becomes aware of the dividends from cash collections. Discounts/premiums are accreted/ amortized for financial reporting purposes. Non-cash dividends are recorded at the fair market value of the securities received. Debt obligations may be placed in a non-accrual status and related interest income may be reduced by ceasing current accruals and writing off interest receivables when the collection of all or a portion of interest has become doubtful, based upon consistently applied procedures.
From time to time, the Fund may invest in Real Estate Investment Trusts (REITs) and, as a result, will estimate the components of distributions from these securities. Distributions from REITs received in excess of income are recorded as a reduction of cost of investments and/or as a realized gain.
The Fund uses the specific identification method or determining realized gain or loss on investments for both financial statement and federal income tax reporting purposes.
Allocations of income and expenses
All income, expenses (except class-specific expenses), and realized and unrealized gain/ loss are allocated to each class of shares based upon the relative net assets of each class. Dividends to shareholders from net investment income are determined at a class level and distributions from capital gains are determined at a Fund level.
Expenses not directly attributable to the Fund or share classes are allocated based on the relative share of net assets of the Fund or share class at the time the expense was incurred. Class-specific expenses, as detailed in Note 3, are accrued daily and charged directly to the respective share classes.
Securities lending
The Fund may lend portfolio securities from time to time in order to earn additional income. The Fund retains beneficial ownership of the securities it has loaned and continues to receive interest and dividends paid by the issuer of securities and to participate in any changes in their value. On the settlement date of the loan, the Fund
Annual report | International Core Fund
35
receives collateral against the loaned securities and maintain collateral in an amount not less than 100% of the market value of the loaned securities during the period of the loan. The market value of the loaned securities is determined at the close of business of the Fund and any additional required collateral is delivered to the Fund on the next business day. Any cash collateral received is invested in the JHCIT. If the borrower defaults on its obligation to return the securities loaned because of insolvency or other reasons, a fund could experience delays and costs in recovering the securities loaned or in gaining access to the collateral. The Fund receives compensation for lending its securities either in the form of fees, guarantees, and/or by retaining a portion of interest on the investment of any cash received as collateral.
The Fund has entered into an agreement with Morgan Stanley & Co. Incorporated and MS Securities Services Inc. (collectively, Morgan Stanley), which permits the Fund to lend securities to Morgan Stanley on a principal basis. Morgan Stanley is the primary borrower of securities of the Fund. The risk of having one primary borrower of Fund securities (as opposed to several borrowers in an agency relationship) is that should Morgan Stanley fail financially, all securities lent will be affected by the failure and by any delays in recovery of the securities (or in the rare event, loss of rights in the collateral).
Prior to May 8, 2007, cash collateral was invested in the State Street Navigator Securities Lending Portfolio. At February 29, 2008 the Fund loaned securities having a market value of $192,020,123 collateralized by securities in the amount of $201,621,129.
Futures
The Fund may purchase and sell financial futures contracts and options on those contracts. The Fund invests in contracts based on finan-cial instruments, such as U.S. Treasury Bonds or Notes, or on securities indices such as the Standard & Poor’s 500 Index, in order to hedge against a decline in the value of securities owned by the Fund.
Initial margin deposits required upon entering into futures contracts are satisfied by the delivery of specific securities or cash as collateral to the broker (the Fund’s agent in acquiring the futures position). If the position is closed out by taking an opposite position prior to the settlement date of the futures contract, a final determination of variation margin is made, cash is required to be paid to or released by the broker and the Fund realizes a gain or loss.
When the Fund sells a futures contract based on a financial instrument, the Fund becomes obligated to deliver that kind of instrument at an agreed upon date for a specified price. The Fund realizes a gain or loss depending on whether the price of an offsetting purchase is less or more than the price of the initial sale or on whether the price of an offsetting sale is more or less than the price of the initial purchase. The Fund could be exposed to risks if it could not close out futures positions because of an illiquid secondary market or the inability of counterparties to meet the terms of their contracts. Futures contracts are valued at the quoted daily settlement prices established by the exchange on which they trade.
International Core Fund | Annual report
36
The following is a summary of open futures contracts at February 29, 2008:
| | | | | | | | | | |
| | | | | | | | | |
| | | | | | | | | | | UNREALIZED |
| | | NUMBER OF | | | | EXPIRATION | | | | APPRECIATION |
| OPEN CONTRACTS | | CONTRACTS | | POSITION | | DATE | | NOTIONAL VALUE | | (DEPRECIATION) |
|
| CAC 40 10 Euro | | | | | | | | | |
| Index Futures | | 243 | | Long | | Mar 2008 | | $17,698,491 | ($73,130) |
| DAX Index Futures | | 361 | | Long | | Mar 2008 | | 92,463,310 | (13,316,567) |
| EOE Dutch Stock | | 12 | | Long | | Mar 2008 | | 1,630,494 | 21,012 |
| Index Futures | | | | | | | | | |
| FTSE 100 Index Futures | | 64 | | Long | | Mar 2008 | | 7,416,618 | (24,294) |
| Hang Seng Stock | | 4 | | Long | | Mar 2008 | | 622,261 | 17,331 |
| Index Futures | | | | | | | | | |
| MSCI Singapore Stock | | 16 | | Long | | Mar 2008 | | 854,542 | (24,197) |
| Index Futures | | | | | | | | | |
| OMX 30 Stock | | 60 | | Long | | Mar 2008 | | 941,924 | 8,291 |
| Index Futures | | | | | | | | | |
| S&P/MIB Index Futures | | 7 | | Long | | Mar 2008 | | 1,788,906 | (8,653) |
| Share Price 200 | | 13 | | Long | | Mar 2008 | | 1,684,521 | (21,251) |
| Index Futures | | | | | | | | | |
| Topix Index Futures | | 68 | | Long | | Mar 2008 | | 8,643,180 | 58,626 |
| IBEX 35 Index Futures | | 123 | | Short | | Mar 2008 | | 24,658,036 | 38,531 |
| S&P/TSE 60 | | 224 | | Short | | Mar 2008 | | 36,235,997 | (391,322) |
| Index Futures | | | | | | | | | |
| | | | | | | | | | ($13,715,623) |
Forward foreign currency contracts
The Fund may purchase and sell forward foreign currency contracts in order to hedge a specific transaction or Fund position. Forward foreign currency contracts are valued at forward foreign currency exchange rates and marked to market daily. Net realized gains (losses) on foreign currency and forward foreign currency contracts shown in the Statements of Operations include net gains or losses realized by the Fund on contracts that have matured.
The net U.S. dollar value of foreign currency underlying all contractual commitments held at the end of the period, the resulting net unrealized appreciation (depreciation) and related net receivable or payable amount are determined using forward foreign currency exchange rates supplied by a quotation service. The Fund could be exposed to risks in excess of amounts recognized on the Statements of Assets and Liabilities if the counterparties to the contracts are unable to meet the terms of their contracts or if the value of the forward foreign currency contract changes unfavorably.
At February 29, 2008, the Fund entered into forward foreign currency contracts, which contractually obligate the Fund to deliver currencies at future dates.
Annual report | International Core Fund
37
Open forward foreign currency contracts as of February 29, 2008, were as follows:
| | | | | | |
| | | | | |
| | | | | | | UNREALIZED |
| | | PRINCIPAL AMOUNT | | SETTLEMENT | | APPRECIATION |
| CURRENCY | | COVERED BY CONTRACT | | DATE | | (DEPRECIATION) |
|
| Buys | | | | | |
| Australian Dollar | | 5,379,000 | | 5/23/08 | $185,298 |
| Euro | | 4,868,000 | | 5/23/08 | 323,605 |
| Euro | | 10,619,000 | | 5/23/08 | 565,409 |
| Japanese Yen | | 2,437,234,042 | | 5/23/08 | 772,398 |
| Japanese Yen | | 1,847,022,042 | | 5/23/08 | 580,178 |
| Japanese Yen | | 1,847,022,042 | | 5/23/08 | 620,039 |
| Japanese Yen | | 1,847,022,042 | | 5/23/08 | 629,791 |
| Japanese Yen | | 615,788,000 | | 5/23/08 | 150,015 |
| New Zealand Dollar | | 7,389,165 | | 5/23/08 | 907 |
| New Zealand Dollar | | 7,389,165 | | 5/23/08 | 1,867 |
| New Zealand Dollar | | 7,613,079 | | 5/23/08 | 858 |
| Norwegian Krone | | 20,731,000 | | 5/23/08 | 219,004 |
| Pound Sterling | | 2,055,000 | | 5/23/08 | 79,379 |
| Swedish Krona | | 123,365,733 | | 5/23/08 | 469,371 |
| Swedish Krona | | 29,654,000 | | 5/23/08 | 204,315 |
| Swedish Krona | | 123,365,733 | | 5/23/08 | 503,969 |
| Swedish Krona | | 7,620,000 | | 5/23/08 | 61,112 |
| Swedish Krona | | 127,104,089 | | 5/23/08 | 492,457 |
| Swiss Franc | | 20,715,718 | | 5/23/08 | 924,718 |
| Swiss Franc | | 20,715,718 | | 5/23/08 | 959,400 |
| Swiss Franc | | 19,497,147 | | 5/23/08 | 895,154 |
| Swiss Franc | | 20,715,718 | | 5/23/08 | 917,415 |
| Swiss Franc | | 19,497,147 | | 5/23/08 | 912,365 |
| Swiss Franc | | 23,403,718 | | 5/23/08 | 1,086,037 |
| | | | | | $11,555,061 |
| Sells | | | | | |
| Australian Dollar | | 10,695,777 | | 5/23/08 | (131,071) |
| Australian Dollar | | 10,695,824 | | 5/23/08 | (131,025) |
| Australian Dollar | | 10,709,105 | | 5/23/08 | (117,744) |
| Australian Dollar | | 10,689,478 | | 5/23/08 | (137,371) |
| Canadian Dollar | | 8,891,555 | | 5/23/08 | (279,491) |
| Canadian Dollar | | 9,198,449 | | 5/23/08 | (250,508) |
| Canadian Dollar | | 8,891,030 | | 5/23/08 | (280,016) |
| Danish Kroner | | 2,053,866 | | 5/23/08 | (63,004) |
| Danish Kroner | | 2,053,422 | | 5/23/08 | (63,448) |
| Danish Kroner | | 2,115,170 | | 5/23/08 | (65,847) |
| Euro | | 18,548,956 | | 5/23/08 | (559,721) |
| Euro | | 18,552,062 | | 5/23/08 | (556,616) |
| Euro | | 19,104,867 | | 5/23/08 | (582,861) |
| Norwegian Krone | | 3,412,823 | | 5/23/08 | (81,326) |
| Norwegian Krone | | 3,513,342 | | 5/23/08 | (86,690) |
| Norwegian Krone | | 3,406,087 | | 5/23/08 | (88,062) |
| Pound Sterling | | 10,209,493 | | 5/23/08 | (128,166) |
| Pound Sterling | | 17,466,788 | | 5/23/08 | (320,793) |
| Pound Sterling | | 17,455,657 | | 5/23/08 | (331,924) |
| Pound Sterling | | 17,989,479 | | 5/23/08 | (337,120) |
| Swiss Franc | | 30,686,082 | | 5/23/08 | (1,684,357) |
| | | | | | ($6,277,161) |
International Core Fund | Annual report
38
Federal income taxes
The Fund qualifies as a regulated investment company by complying with the applicable provisions of the Internal Revenue Code and will not be subject to federal income tax on taxable income that is distributed to shareholders. Therefore, no federal income tax provision is required. For federal income tax purposes, the Fund had $5,573,841 of a capital loss carryforward available, to the extent provided by regulations, to offset future net realized capital gains. To the extent that such carryforward is used by the Fund, no capital gain distributions will be made. The loss carryforward expires as follows: February 28, 2009 — $2,640,620 and February 28, 2010 — $2,933,221. Availability of a certain amount of the loss carryforwards, which were acquired on May 25, 2007, in a merger with John Hancock International Fund, may be limited in a given year.
The Fund has adopted the provisions of FASB Interpretation No. 48, Accounting for Uncertainty in Income Taxes, an interpretation of FASB Statement 109 (FIN 48), at the beginning of the Fund’s fiscal year. FIN 48 prescribes a minimum threshold for financial statement recognition of the benefit of a tax position taken or expected to be taken in a tax return. The implementation of FIN 48 did not have a material impact on the Fund’s financial statements. Each of the Fund’s federal tax returns for the prior fiscal years remains subject to examination by the Internal Revenue Service.
Distribution of income and gains
The Fund records distributions to shareholders from net investment income and net realized gains, if any, on the ex-dividend date. During the year ended February 28, 2007, the tax character of distributions paid was as follows: ordinary income $12,427,092. During the year ended February 29, 2008, the tax character of distributions paid was as follows: ordinary income $61,419,948 and long-term capital gain $101,272,825. Distributions paid by the Fund with respect to each class of shares are calculated in the same manner, at the same time and are in the same amount, except for the effect of expenses that may be applied differently to each class.
As of February 29, 2008, the components of distributable earnings on a tax basis included $20,684,100 of undistributed ordinary income and $37,525,761 of undistributed long-term gain.
Such distributions and distributable earnings, on a tax basis, are determined in conformity with income tax regulations, which may differ from accounting principles generally accepted in the United States of America. Distributions in excess of tax basis earnings and profits, if any, are reported in the Fund’s financial statements as a return of capital.
Capital accounts within financial statements are adjusted for permanent book/tax differences. These adjustments have no impact on net assets or the results of operations. Temporary book/tax differences will reverse in a subsequent period. Permanent book/tax differences are primarily attributable to foreign currency transactions, derivative transactions, expiration of capital loss carryforwards, merger related transactions and investments in passive foreign investment companies.
3. Investment advisory and other agreements
The Trust has entered into an Investment Advisory Agreement with the Adviser. The Adviser is responsible for managing the corporate and business affairs of the Trust and for selecting and compensating subadvisers to handle the investment of the assets of the Fund, subject to the supervision of the Trust’s Board of Trustees. As compensation for its services, the Adviser receives an advisory fee from the Trust. Under the Advisory Agreement, the Fund pays a monthly management fee to the Adviser equivalent, on an annual basis, to the sum of: (a) 0.92% of the first $100,000,000 of the Fund’s aggregate daily net assets; (b) 0.895% of the next $900,000,000 of the Fund’s aggregate daily net assets; and (c) 0.880% of the Fund’s aggregate daily net assets in excess of $1,000,000,000. Aggregate net assets include the net assets of the Fund and International Core Trust, a series of John Hancock Trust and International Core Fund, a series of John Hancock Funds II. The Adviser has a subadvisory agreement with Grantham, Mayo, Van Otterloo & Co. LLC. The Fund is not responsible for payment of the subadvisory fees.
Annual report | International Core Fund
39
The investment management fees incurred for the year ended February 29, 2008, were equivalent to an annual effective rate of 0.89% of the Fund’s average daily net assets.
Expense reimbursements
The Adviser has contractually agreed to reimburse or limit certain Fund level expenses to 0.20% of the Fund’s average annual net assets which are allocated pro rata to all share classes. This agreement excludes taxes, portfolio brokerage commissions, interest, advisory fees, Rule 12b-1 fees, transfer agency fees, blue sky fees, printing and postage and litigation and indem-nification expenses and other extraordinary expenses not incurred in the ordinary course of the Fund’s business. In addition, fees incurred under any agreement or plans of the Fund dealing with services for the shareholders and others with beneficial interest in shares of the Fund, are excluded.
In addition, the Adviser has agreed to reimburse or limit certain expenses for each share class. This agreement excludes taxes, portfolio brokerage commissions, interest and litigation and indemnification expenses and other extraordinary expenses not incurred in the ordinary course of the Fund’s business. In addition, fees incurred under any agreement or plans of the Fund dealing with services for the shareholders and others with beneficial interest in shares of the Fund, are excluded. The reimbursements and limits are such that these expenses will not exceed 1.70% for Class A shares, 2.40% for Class B, 2.40% for Class C, 1.18% for Class I, 1.70% for Class R1, 1.15% for Class 1 and 1.10% for Class NAV. Prior to September 28, 2007, the expense limitation for Class I was 1.20% . Accordingly, the expense reductions or reimbursements related to this agreement were $29,716, $12,954, $12,332, $18,253, $16,151, $17,392 and $307,069 for Class A, Class B, Class C, Class I, C lass R1, Class 1 and Class NAV, respectively for the year ended February 29, 2008. The expense reimbursements and limits will continue in effect until June 30, 2008 and thereafter until terminated by the Adviser on notice to the Trust.
Fund administration fees
Pursuant to the Advisory Agreement, the Fund reimburses the Adviser for all expenses associated with providing the administrative, financial, legal, accounting and recordkeeping services of the Fund, including the preparation of all tax returns, annual, semiannual and periodic reports to shareholders and the preparation of all regulatory reports. These expenses are allocated based on the relative share of net assets of each class at the time the expense was incurred.
The fund administration fees incurred for the year ended February 29, 2008, were $546,691 with an annual effective rate of 0.03% of the Fund’s average daily net assets.
Distribution and shareholder servicing fees
The Trust has a Distribution Agreement with the Distributor. The Fund has adopted Distribution Plans with respect to Class A, Class B, Class C, Class R1 and Class 1, pursuant to Rule 12b-1 under the 1940 Act, to pay the Distributor for the services it provides as distributor of shares of the Fund. Accordingly, the Fund makes monthly payments to the Distributor at an annual rate not to exceed 0.30%, 1.00%, 1.00%, 0.50% and 0.05% of average daily net asset value of Class A, Class B, Class C, Class R1 and Class 1, respectively. A maximum of 0.25% of such payments may be service fees, as defined by the Conduct Rules of Financial Industry Regulatory Authority (formerly the National Association of Securities Dealers). Under the Conduct Rules, curtailment of a portion of the Fund’s 12b-1 payments could occur under certain circumstances.
In addition, the Fund has also adopted a Service Plan for Class R1 shares. Under the Service Plan, the Fund may pay up to 0.25% of Class R1 average daily net asset value for certain other services. There were no Service Plan fees incurred for the year ended February 29, 2008.
Sales charges
Class A shares are assessed up-front sales charges of up to 5.00% of net asset value of such shares. During the year ended February 29, 2008, the Fund was informed that the Distributor received net up-front sales charges of $241,978 with regard to sales of Class A shares. Of this amount, $34,728 was retained and used for printing prospectuses, advertising, sales literature and other purposes;
International Core Fund | Annual report
40
$194,404 was paid as sales commissions to unrelated broker-dealers; and $12,846 was paid as sales commissions to sales personnel of Signator Investors, Inc. (Signator Investors), a related broker-dealer, an indirect subsidiary of MFC.
Class B shares that are redeemed within six years of purchase are subject to a contingent deferred sales charge (CDSC) at declining rates, beginning at 5.00% of the lesser of the current market value at the time of redemption or the original purchase cost of the shares being redeemed. Class C shares that are redeemed within one year of purchase are subject to a CDSC at a rate of 1.00% of the lesser of the current market value at the time of redemption or the original purchase cost of the shares being redeemed. Proceeds from the CDSCs are paid to the Distributor and are used, in whole or in part, to defray its expenses for providing distribution-related services to the Fund in connection with the sale of Class B and Class C shares. During the year ended February 29, 2008, CDSCs received by Distributor amounted to $18,406 for Class B shares and $5,004 for Class C shares.
Transfer agent fees
The Fund has a Transfer Agency Agreement with John Hancock Signature Services, Inc. (Signature Services), an indirect subsidiary of MFC. For Class A, Class B, Class C, Class I and Class R1 shares, the Fund pays a monthly transfer agent fee at an annual rate of 0.05% of each class’ average daily net assets, plus a fee based on the number of shareholder accounts and reimbursement for certain out-of-pocket expenses. Expenses not directly attributable to a particular class of shares are aggregated and allocated to each class on the basis of its relative net asset value. The Fund pays a monthly fee which is based on an annual rate of $15.00 for each Class A shareholder account, $17.50 for each Class B shareholder account, $16.50 for each Class C shareholder account and $15.00 for each Class R1 shareholder account.
Signature Services has agreed to limit the transfer agent fees so that such fees do not exceed 0.30% annually of Class A, Class B, Class C, Class I and Class R1 share average daily net assets. This agreement is effective until December 31, 2008. Signature Services reserves the right to terminate this limitation in the future. There were no transfer agent fee reductions for Class A, Class B, Class C, Class I and Class R1 shares, respectively, during the year ended February 29, 2008.
In addition, Signature Services has voluntarily agreed to further limit transfer agent fees for Class R1 shares so that such fees do not exceed 0.05% annually of each class’s average daily net assets. For the year ended February 29, 2008, the transfer agent fees reductions for Class R1 were $335.
In May 2007, the Fund began receiving earnings credits from its transfer agent as a result of uninvested cash balances. These credits are used to reduce a portion of the Fund’s transfer agent fees and out-of-pocket expenses. During the year ended February 29, 2008, the Fund’s transfer agent fees and out-of-pocket expenses were reduced by $8,034 for transfer agent credits earned.
Class level expenses for the year ended February 29, 2008, were as follows:
| | | | |
| | Distribution and | Transfer | Blue sky | Printing and |
| Share class | service fees | agent fees | fees | postage fees |
|
| Class A | $313,112 | $200,121 | $22,791 | $33,051 |
| Class B | 184,814 | 41,816 | 16,005 | 5,295 |
| Class C | 134,786 | 27,083 | 19,019 | 3,916 |
| Class I | — | 804 | 17,658 | 557 |
| Class R1 | 678 | 405 | 16,207 | 3 |
| Class 1 | 42,756 | — | — | 4,633 |
| Total | $676,146 | $270,229 | $91,680 | $47,455 |
Annual report | International Core Fund
41
4. Trustees’ fees
The Trust compensates each Trustee who is not an employee of the Adviser or its affiliates. Total Trustees’ expenses are allocated to the Fund based on its average daily net asset value.
5. Line of credit
The Fund has entered into an agreement which enables them to participate in a $100 million unsecured committed line of credit with State Street Corporation. Borrowings will be made solely to temporarily finance the repurchase of capital shares. Interest is charged to the Fund based on its borrowings at a rate per annum equal to the Federal Funds rate plus 0.50% . In addition, a commitment fee of 0.05% per annum, payable at the end of each calendar quarter, based on the average daily-unused portion of the line of credit, is charged to the Fund on a prorated basis based on average net assets. Effective October 15, 2007, the commitment fee was changed from 0.07% to 0.05% . For the year ended February 29, 2008, there were no borrowings under the line of credit.
6. Fund share transactions
Share activities for the Fund for the years ended February 28, 2007, and February 29, 2008, were as follows:
| | | | |
| | Year ended 2-28-07 | Year ended 2-29-08 |
| | Shares | Amount | Shares | Amount |
| Class A shares | | | | |
|
| Sold | 284,321 | $11,617,841 | 1,465,538 | $65,700,113 |
| Issued in reorganization | — | — | 2,188,767 | 102,289,840 |
| Distributions reinvested | 1,655 | 70,124 | 298,965 | 12,673,075 |
| Repurchased | (468,712) | (19,816,280) | (903,245) | (38,268,180) |
| Net increase (decrease) | (182,736) | ($8,128,315) | 3,050,025 | $142,394,848 |
| |
| Class B shares | | | | |
|
| Sold | 27,188 | $1,088,930 | 111,794 | $5,054,286 |
| Issued in reorganization | — | — | 519,204 | 24,096,952 |
| Distributions reinvested | 145 | 6,146 | 45,949 | 1,937,144 |
| Repurchased | (4,739) | (194,969) | (195,340) | (8,566,851) |
| Net increase (decrease) | 22,594 | $900,1071 | 481,607 | $22,521,531 |
| |
| Class C shares | | | | |
|
| Sold | 108,359 | $4,434,998 | 239,764 | $11,103,560 |
| Issued in reorganization | — | — | 123,192 | 5,718,520 |
| Distributions reinvested | 478 | 20,196 | 34,387 | 1,450,443 |
| Repurchased | (4,754) | (197,095) | (104,940) | (4,451,373) |
| Net increase (decrease) | 104,083 | $4,258,0991 | 292,403 | $13,821,150 |
| |
| Class I shares | | | | |
|
| Sold | 5,134 | $189,482 | 66,404 | $3,070,600 |
| Issued in reorganization | — | — | 3,865 | 181,228 |
| Distributions reinvested | 45 | 1,930 | 4,834 | 205,394 |
| Repurchased | (46) | (2,038) | (6,887) | (323,804) |
| Net increase (decrease) | 5,133 | $189,3741 | 68,216 | $3,133,418 |
| |
| Class R1 shares | | | | |
|
| Sold | 2,820 | $101,500 | 1,245 | $48,556 |
| Distributions reinvested | 25 | 1,056 | 289 | 12,209 |
| Repurchased | — | — | (144) | (5,493) |
| Net increase (decrease) | 2,845 | $102,5561 | 1,390 | $55,272 |
International Core Fund | Annual report
42
| | | | |
| | Year ended 2-28-07 | Year ended 2-29-08 |
| | Shares | Amount | Shares | Amount |
| Class 1 shares | | | | |
|
| Sold | 48,304 | $2,043,017 | 188,611 | $8,598,212 |
| Issued in reorganization | 1,953,542 | 79,235,655 | — | — |
| Distributions reinvested | 18,537 | 787,817 | 189,362 | 8,049,797 |
| Repurchased | (138,020) | (5,874,002) | (376,865) | (16,502,541) |
| Net increase (decrease) | 1,882,363 | $76,192,4872 | 1,108 | $145,468 |
| |
| Class NAV shares | | | | |
|
| Sold | 3,063,357 | $123,822,093 | 6,108,534 | $264,764,263 |
| Issued in reorganization | 26,094,263 | 1,022,391,188 | — | — |
| Distributions reinvested | 271,456 | 11,534,195 | 3,230,848 | 137,311,048 |
| Repurchased | (788,527) | (32,939,761) | (1,895,287) | (88,782,912) |
| Net increase (decrease) | 28,640,549 | $1,124,807,7153 | 7,444,095 | $313,292,399 |
| |
| Net increase (decrease) | 30,474,831 | $1,198,322,023 | 11,338,844 | $495,364,086 |
|
1Period from 6-12-06 (commencement of operations) to 2-28-07.
2Period from 11-6-06 (commencement of operations) to 2-28-07.
3Period from 8-29-06 (commencement of operations) to 2-28-07.
7. Purchases and sales of securities
Purchases and proceeds from sales or maturities of securities, other than short-term securities and obligations of the U.S. government, during the year ended February 29, 2008, aggregated $981,929,752 and $772,055,325, respectively.
8. Reorganization
On June 12, 2006, the Fund acquired substantially all of the assets and liabilities of the Predecessor Fund in exchange solely for Class A shares of the Fund. The acquisition was accounted for as a tax-free exchange of 462,581 Class A shares of the Fund for the net assets of the Predecessor Fund, which amounted to $16,617,195, including $884,271 of unrealized appreciation, after the close of business on June 9, 2006. Accounting and performance history of the Predecessor Fund was redesignated as that of Class A of the Fund.
On August 29, 2006, the Board of Trustees of John Hancock Funds II International Stock Fund (the International Stock Fund) approved an Agreement and Plan of Reorganization, which provided for the transfer of substantially all of the assets and liabilities of the International Stock Fund Class NAV in exchange for the Class NAV of the Fund. The acquisition was accounted for as a tax-free exchange of 26,094,263 of the Class NAV shares of the Fund for the net assets of the International Stock Fund Class NAV, which amounted to $1,022,391,188, including the total of $122,941,561 of unrealized appreciation, after the close of business on August 29, 2006.
In addition, on August 29, 2006, the Board of Trustees of International Stock Fund approved an agreement and Plan of Reorganization, which provided for the transfer of substantially all of the assets and liabilities of the International Stock Fund Class 1 in exchange for the Class 1 of the Fund. The acquisition was accounted for as a taxfree exchange of 1,953,542 of the Class 1 shares of the Fund for the net assets of the International Stock Fund Class 1, which amounted to $79,235,655, including the total of $14,608,110 of unrealized appreciation, after the close of business on November 6, 2006.
On April 18, 2007, the shareholders of John Hancock International Fund (International Fund) approved an Agreement and Plan of Reorganization, which provided for the transfer of substantially all of the assets and liabilities of the International Fund in exchange for Class A, Class B, Class C and Class I shares of the Fund. The acquisition was accounted for as a tax-free exchange of 2,188,767 Class A shares, 519,204 Class B shares, 123,192 Class C shares and 3,865 Class I shares of the Fund for the net assets of the International Fund, which amounted to $102,289,840,
Annual report | International Core Fund
43
$24,096,952, $5,718,520 and $181,228 for Class A, Class B, Class C and Class I shares of the International Fund, respectively, including the total of $24,329,893 of unrealized appreciation, after the close of business on May 25, 2007.
International Core Fund | Annual report
44
Auditors’ report
Report of Independent Registered Public Accounting Firm
To the Board of Trustees of John Hancock Funds III and Shareholders of John Hancock International Core Fund,
In our opinion, the accompanying statement of assets and liabilities, including the schedule of investments, and the related statements of operations and of changes in net assets and the financial highlights present fairly, in all material respects, the financial position of John Hancock International Core Fund (the Fund) at February 29, 2008, and the results of its operations, the changes in its net assets and the financial highlights for each of the periods indicated, in conformity with accounting principles generally accepted in the United States of America. These financial statements and financial highlights (hereafter referred to as “financial statements”) are the responsibility of the Fund’s management. Our responsibility is to express an opinion on these financial statements based on our audits. We conducted our audits of these financial statements in accordance with the standards of the Public Company Accounting Oversight Board (United States). Those standards require that we plan and perform the audits to obtain reasonable assurance about whether the financial statements are free of material misstatement. An audit includes examining, on a test basis, evidence supporting the amounts and disclosures in the financial statements, assessing the accounting principles used and significant estimates made by management, and evaluating the overall financial statement presentation. We believe that our audits, which included confirmation of investments at February 29, 2008 by correspondence with the custodian and brokers, provide a reasonable basis for our opinion.
PricewaterhouseCoopers LLP
Boston, Massachusetts
April 18, 2008
Annual report | International Core Fund
45
Tax information
Unaudited
For federal income tax purposes, the following information is furnished with respect to the distributions of the Fund, if any, paid during its taxable year ended February 29, 2008.
The Fund has designated distributions to shareholders of $101,272,825 as a long-term capital gain dividend. As of February 29, 2008, the Fund designates the following as a foreign tax credit, which represents taxes paid on income derived from sources within foreign countries or possessions of the United States: $2,656,930.
The Fund hereby designates the maximum amount allowable of its net taxable income as qualified dividend income as provided in the Jobs and Growth Tax Relief Reconciliation Act of 2003. This amount will be reflected on Form 1099-DIV for the calendar year 2008.
Shareholders will be mailed a 2008 U.S. Treasury Department Form 1099-DIV in January 2009. This will reflect the total of all distributions that are taxable for calendar year 2008.
International Core Fund | Annual report
46
Trustees and Officers
This chart provides information about the Trustees and Officers who oversee your John Hancock fund. Officers elected by the Trustees manage the day-to-day operations of the Fund and execute policies formulated by the Trustees.
| | |
| Independent Trustees | | |
| |
| Name, Year of Birth | | Number of |
| Position(s) held with Fund | Trustee | John Hancock |
| Principal occupation(s) and other | of Fund | funds overseen |
| directorships during past 5 years | since1 | by Trustee |
| |
| James F. Carlin, Born: 1940 | 2006 | 55 |
|
| Chairman (since December 2007); Director and Treasurer, Alpha Analytical Laboratories, Inc. (chemical |
| analysis) (since 1985); Part Owner and Treasurer, Lawrence Carlin Insurance Agency, Inc. (since 1995); |
| Part Owner and Vice President, Mone Lawrence Carlin Insurance Agency, Inc. (until 2005); Chairman |
| and Chief Executive Officer, Carlin Consolidated, Inc. (management/investments) (since 1987); Trustee, |
| Massachusetts Health and Education Tax Exempt Trust (1993–2003). | | |
| |
| |
| William H. Cunningham, Born: 1944 | 2006 | 55 |
|
| Professor, University of Texas at Austin (since 1971); former Chancellor, University of Texas System and |
| former President, University of Texas at Austin (until 2001); Chairman and Chief Executive Officer, IBT |
| Technologies (until 2001); Director of the following: Hicks Acquisition Company I, Inc. (since 2007); |
| Hire.com (until 2004), STC Broadcasting, Inc. and Sunrise Television Corp. (until 2001), Symtx, Inc. |
| (electronic manufacturing) (since 2001), Adorno/Rogers Technology, Inc. (until 2004), Pinnacle |
| Foods Corporation (until 2003), rateGenius (until 2003), Lincoln National Corporation (insurance) |
| (since 2006), Jefferson-Pilot Corporation (diversified life insurance company) (until 2006), New |
| Century Equity Holdings (formerly Billing Concepts) (until 2001), eCertain (until 2001), ClassMap.com |
| (until 2001), Agile Ventures (until 2001), AskRed.com (until 2001), Southwest Airlines (since 2000), |
| Introgen (manufacturer of biopharmaceuticals) (since 2000) and Viasystems Group, Inc. (electronic |
| manufacturer) (until 2003); Advisory Director, Interactive Bridge, Inc. (college fundraising) (until 2001); |
| Advisory Director, Q Investments (until 2003); Advisory Director, JPMorgan Chase Bank (formerly Texas |
| Commerce Bank–Austin), LIN Television (until 2008), WilTel Communications (until 2003) and Hayes |
| Lemmerz International, Inc. (diversified automotive parts supply company) (since 2003). | |
| |
| |
| Charles L. Ladner,2 Born: 1938 | 2006 | 55 |
|
| Chairman and Trustee, Dunwoody Village, Inc. (retirement services) (until 2003); Senior Vice President |
| and Chief Financial Officer, UGI Corporation (public utility holding company) (retired 1998); Vice |
| President and Director, AmeriGas, Inc. (retired 1998); Director, AmeriGas Partners, L.P. (gas distribution) |
| (until 1997); Director, EnergyNorth, Inc. (until 1997); Director, Parks and History Association (until 2005). |
| |
| |
| John A. Moore,2 Born: 1939 | 2006 | 55 |
|
| President and Chief Executive Officer, Institute for Evaluating Health Risks (nonprofit institution) |
| (until 2001); Senior Scientist, Sciences International (health research) (until 2003); Former Assistant |
| Administrator and Deputy Administrator, Environmental Protection Agency; Principal, Hollyhouse |
| (consulting) (since 2000); Director, CIIT Center for Health Science Research (nonprofit research) |
| (until 2007). | | |
Annual report | International Core Fund
47
| | |
| Independent Trustees (continued) | | |
| |
| Name, Year of Birth | | Number of |
| Position(s) held with Fund | Trustee | John Hancock |
| Principal occupation(s) and other | of Fund | funds overseen |
| directorships during past 5 years | since1 | by Trustee |
| |
| Patti McGill Peterson,2 Born: 1943 | 2006 | 55 |
|
| Senior Associate, Institute for Higher Education Policy (since 2007); Executive Director, Council for |
| International Exchange of Scholars and Vice President, Institute of International Education (until 2007); |
| Senior Fellow, Cornell Institute of Public Affairs, Cornell University, Ithaca, NY (until 1998); Former |
| President, Wells College, Aurora, NY, and St. Lawrence University, Canton, NY; Director, Niagara |
| Mohawk Power Corporation (until 2003); Director, Ford Foundation, International Fellowships Program |
| (since 2002); Director, Lois Roth Endowment (since 2002); Director, Council for International Educational |
| Exchange (since 2003). | | |
| |
| |
| Steven R. Pruchansky, Born: 1944 | 2006 | 55 |
|
| Chairman and Chief Executive Officer, Greenscapes of Southwest Florida, Inc. (since 2000); Director and |
| President, Greenscapes of Southwest Florida, Inc. (until 2000); Managing Director, JonJames, LLC (real |
| estate) (since 2000); Director, First Signature Bank & Trust Company (until 1991); Director, Mast Realty |
| Trust (until 1994); President, Maxwell Building Corp. (until 1991). | | |
| |
| Non-Independent Trustees3 | | |
| |
| Name, Year of Birth | | Number of |
| Position(s) held with Fund | Trustee | John Hancock |
| Principal occupation(s) and other | of Fund | funds overseen |
| directorships during past 5 years | since1 | by Trustee |
| |
| James R. Boyle, Born: 1959 | 2006 | 265 |
|
| Executive Vice President, Manulife Financial Corporation (since 1999); President, John Hancock Variable |
| Life Insurance Company (since March 2007); Executive Vice President, John Hancock Life Insurance |
| Company (since 2004); Chairman and Director, John Hancock Advisers, LLC (the Adviser), John Hancock |
| Funds, LLC and The Berkeley Financial Group, LLC (The Berkeley Group) (holding company) (since 2005); |
| Senior Vice President, The Manufacturers Life Insurance Company (U.S.A.) (until 2004). | |
International Core Fund | Annual report
48
| |
| Principal officers who are not Trustees | |
| |
| Name, Year of Birth | |
| Position(s) held with Fund | Officer |
| Principal occupation(s) and other | of Fund |
| directorships during past 5 years | since |
| |
| Keith F. Hartstein, Born: 1956 | 2006 |
|
| President and Chief Executive Officer | |
| Senior Vice President, Manulife Financial Corporation (since 2004); Director, President and Chief | |
| Executive Officer, the Adviser, The Berkeley Group and John Hancock Funds, LLC (since 2005); Director, |
| MFC Global Investment Management (U.S.), LLC (MFC Global (U.S.)) (since 2005); Director, John | |
| Hancock Signature Services, Inc. (since 2005); President and Chief Executive Officer, John Hancock |
| Investment Management Services, LLC (since 2006); President and Chief Executive Officer, John Hancock |
| Funds, John Hancock Funds II, John Hancock Funds III and John Hancock Trust (since 2005); Director, |
| Chairman and President, NM Capital Management, Inc. (since 2005); Member, Investment Company |
| Institute Sales Force Marketing Committee (since 2003); President and Chief Executive Officer, MFC |
| Global (U.S.) (2005–2006); Executive Vice President, John Hancock Funds, LLC (until 2005). | |
| |
| |
| Thomas M. Kinzler, Born: 1955 | 2006 |
|
| Secretary and Chief Legal Officer | |
| Vice President and Counsel, John Hancock Life Insurance Company (U.S.A.) (since 2006); Secretary and |
| Chief Legal Officer, John Hancock Funds and John Hancock Funds II (since 2006); Chief Legal Officer |
| and Assistant Secretary, John Hancock Trust (since 2006); Vice President and Associate General Counsel, |
| Massachusetts Mutual Life Insurance Company (1999–2006); Secretary and Chief Legal Counsel, MML |
| Series Investment Fund (2000–2006); Secretary and Chief Legal Counsel, MassMutual Institutional Funds |
| (2000–2004); Secretary and Chief Legal Counsel, MassMutual Select Funds and MassMutual Premier |
| Funds (2004–2006). | |
| |
| |
| Francis V. Knox, Jr., Born: 1947 | 2006 |
|
| Chief Compliance Officer | |
| Vice President and Chief Compliance Officer, John Hancock Investment Management Services, LLC, |
| the Adviser and MFC Global (U.S.) (since 2005); Vice President and Chief Compliance Officer, John |
| Hancock Funds, John Hancock Funds II, John Hancock Funds III and John Hancock Trust (since 2005); |
| Vice President and Assistant Treasurer, Fidelity Group of Funds (until 2004); Vice President and Ethics & |
| Compliance Officer, Fidelity Investments (until 2001). | |
| |
| |
| Charles A. Rizzo, Born: 1957 | 2007 |
|
| Chief Financial Officer | |
| Chief Financial Officer, John Hancock Funds, John Hancock Funds II, John Hancock Funds III and John |
| Hancock Trust (since June 2007); Assistant Treasurer, Goldman Sachs Mutual Fund Complex (regis- |
| tered investment companies) (2005–June 2007); Vice President, Goldman Sachs (2005–June 2007); |
| Managing Director and Treasurer of Scudder Funds, Deutsche Asset Management (2003–2005); | |
| Director, Tax and Financial Reporting, Deutsche Asset Management (2002–2003); Vice President and |
| Treasurer, Deutsche Global Fund Services (Deutsche Registered Investment Companies) (1999–2002). |
| |
| |
| Gordon M. Shone, Born: 1956 | 2006 |
|
| Treasurer | |
| Senior Vice President, John Hancock Life Insurance Company (U.S.A.) (since 2001); Treasurer, John |
| Hancock Funds (since 2006), John Hancock Funds II, John Hancock Funds III and John Hancock Trust |
| (since 2005); Vice President and Chief Financial Officer, John Hancock Trust (2003–2005); Vice President, |
| John Hancock Investment Management Services, Inc., John Hancock Advisers, LLC (since 2006) and The |
| Manufacturers Life Insurance Company (U.S.A.) (1998–2000). | |
Annual report | International Core Fund
49
| |
| Principal officers who are not Trustees (continued) | |
| |
| Name, Year of Birth | |
| Position(s) held with Fund | Officer |
| Principal occupation(s) and other | of Fund |
| directorships during past 5 years | since |
| |
| John G. Vrysen, Born: 1955 | 2006 |
|
| Chief Operating Officer | |
| Senior Vice President, Manulife Financial Corporation (since 2006); Director, Executive Vice President |
| and Chief Operating Officer, the Adviser, The Berkeley Group and John Hancock Funds, LLC (since | |
| June 2007); Executive Vice President and Chief Operating Officer, John Hancock Investment | |
| Management Services, LLC (since December 2007); Chief Operating Officer, John Hancock Funds, |
| John Hancock Funds II, John Hancock Funds III and John Hancock Trust (since June 2007); Director, |
| Executive Vice President and Chief Financial Officer, the Adviser, The Berkeley Group and John Hancock |
| Funds, LLC (2005–2007); Executive Vice President and Chief Financial Officer, John Hancock Investment |
| Management Services, LLC (2005–2007); Executive Vice President and Chief Financial Officer, MFC |
| Global (U.S.) (2005 until August 2007); Director, John Hancock Signature Services, Inc. (since 2005); |
| Chief Financial Officer, John Hancock Funds, John Hancock Funds II, John Hancock Funds III and John |
| Hancock Trust (2005 until June 2007); Vice President and General Manager, John Hancock Fixed | |
| Annuities, U.S. Wealth Management (2004–2005); Vice President, Operations, Manulife Wood Logan |
| (2000–2004). | |
The business address for all Trustees and Officers is 601 Congress Street, Boston, Massachusetts 02210-2805.
The Statement of Additional Information of the Fund includes additional information about members of the Board of Trustees of the Fund and is available without charge, upon request, by calling 1-800-225-5291.
1 Each Trustee serves until resignation, retirement age or until his or her successor is elected.
2 Member of Audit and Compliance Committee.
3 Non-Independent Trustee holds positions with the Fund’s investment adviser, underwriter and certain other affiliates.
International Core Fund | Annual report
50
For more information
The Fund’s proxy voting policies, procedures and records are available without charge, upon request:
| | |
| By phone | On the Fund’s Web site | On the SEC’s Web site |
| 1-800-225-5291 | www.jhfunds.com/proxy | www.sec.gov |
|
| |
| Investment adviser | Custodian | Legal counsel |
| John Hancock Advisers, LLC | State Street Bank & Trust Co. | Kirkpatrick & Lockhart |
| 601 Congress Street | 2 Avenue de Lafayette | Preston Gates Ellis LLP |
| Boston, MA 02210-2805 | Boston, MA 02111 | One Lincoln Street |
| | Boston, MA 02111-2950 |
| Subadviser | Transfer agent | |
| Grantham, Mayo, | John Hancock Signature | Independent registered |
| Van Otterloo & Co. LLC | Services, Inc. | public accounting firm |
| 40 Rowes Wharf | P.O. Box 9510 | PricewaterhouseCoopers LLP |
| Boston, MA 02110 | Portsmouth, NH 03802-9510 | 125 High Street |
| | | Boston, MA 02110 |
| Principal distributor | | |
| John Hancock Funds, LLC | | |
| 601 Congress Street | | |
| Boston, MA 02210-2805 | | |
| | |
| How to contact us | |
|
| |
| Internet | www.jhfunds.com | |
|
| Mail | Regular mail: | Express mail: |
| | John Hancock Signature | John Hancock Signature |
| | Services, Inc. | Services, Inc. |
| | P.O. Box 9510 | Mutual Fund Image Operations |
| | Portsmouth, NH 03802-9510 | 164 Corporate Drive |
| | | Portsmouth, NH 03801 |
|
| Phone | Customer service representatives | 1-800-225-5291 |
| | EASI-Line | 1-800-338-8080 |
| | TDD line | 1-800-554-6713 |
A listing of month-end portfolio holdings is available on our Web site, www.jhfunds.com. A more detailed portfolio holdings summary is available on a quarterly basis 60 days after the fiscal quarter on our Web site or upon request by calling 1-800-225-5291, or on the SEC’s Web site, www.sec.gov.
Annual report | International Core Fund
51

1-800-225-5291
1-800-554-6713 TDD
1-800-338-8080 EASI-Line
www.jhfunds.com
Now available: electronic delivery
www.jhfunds.com/edelivery
| | |
| This report is for the information of the shareholders of John Hancock International Core Fund. | 6600A | 2/08 |
| It is not authorized for distribution to prospective investors unless preceded or accompanied by a prospectus. | | 4/08 |

Discussion of Fund performance
By Grantham, Mayo, Van Otterloo & Co. LLC (GMO)
U.S. stocks went on a wild ride during the 12-month period highlighted both by record highs for broad market indexes and conditions deemed poor enough to warrant numerous interventions by the Federal Reserve. For the period in full the S&P 500 Index returned –3.60%, a modest move which belied its frequent violent gyrations. Growth stocks outpaced value stocks during the period. Telecommunication services and consumer discretionary were the worst performing sectors in the Russell 2500 Growth Index while energy stocks performed the best.
”U.S. stocks went on a wild
ride during the 12-month period…”
For the year ended February, 29, 2008, John Hancock Growth Opportunities Fund’s Class A, Class B, Class C, Class I, Class R1, and Class 1 shares returned –14.69%, –15.29%, –15.25%, –14.36%, –14.77% and –14.31%, respectively, at net asset value, while the Russell 2500 Growth Index returned –4.27% and the average mid cap growth fund monitored by Morningstar, Inc. returned –0.09% . Sector and stock selection both detracted from relative returns. Sector weightings adding to relative returns included an overweight in materials, while sector weightings detracting from relative returns included an overweight in consumer discretionary. Stock selections in materials added to relative returns, while picks in consumer discretionary detracted. Individual names adding to returns versus the benchmark included overweight positions in Priceline. com, CF Industries Holdings and Cleveland-Cliffs, while overweight positions detracting from relat ive returns included ITT Education Services, Inc., The First Marblehead Corp. and American Eagle Outfitters, Inc.
This commentary reflects the views of the portfolio management team through the end of the Fund’s period discussed in this report. The team’s statements reflect their own opinions. As such, they are in no way guarantees of future events and are not intended to be used as investment advice or a recommendation regarding any specific security. They are also subject to change at any time as market and other conditions warrant.
Growth Opportunities Fund | Annual report
6
A look at performance
For the periods ended February 29, 2008
| | | | | | | | | |
| | | Average annual returns | | | Cumulative total returns | | |
| | | with maximum sales charge (POP) | | with maximum sales charge (POP) | | |
| |
| |
| |
| | Inception | | | | Since | | | | Since |
| Class | date | 1-year | 5-year | 10-year | inception | 1-year | 5-year | 10-year | inception |
|
| A1,2 | 9-16-05 | –18.95% | — | — | –2.70% | –18.95% | — | — | –6.49% |
|
| B | 6-12-06 | –19.53 | — | — | –6.04 | –19.53 | — | — | –10.18 |
|
| C | 6-12-06 | –16.10 | — | — | –3.79 | –16.10 | — | — | –6.44 |
|
| I3 | 6-12-06 | –14.36 | — | — | –2.79 | –14.36 | — | — | –4.76 |
|
| R13 | 6-12-06 | –14.77 | — | — | –3.38 | –14.77 | — | — | –5.76 |
|
| 13 | 6-12-06 | –14.31 | — | — | –2.73 | –14.31 | — | — | –4.67 |
| |
Performance figures assume all distributions are reinvested. Public offering price (POP) figures reflect maximum sales charge on Class A shares of 5%, and the applicable contingent deferred sales charge (CDSC) on Class B and Class C shares. The Class B shares’ CDSC declines annually between years 1 to 6 according to the following schedule: 5, 4, 3, 3, 2, 1%. No sales charge will be assessed after the sixth year. Class C shares held for less than one year are subject to a 1% CDSC. Sales charge is not applicable for Class I, Class R1 and Class 1 shares.
The expense ratios of the Fund, both net (including any fee waivers or expense limitations) and gross (excluding any fee waivers or expense limitations), are set forth according to the most recent publicly available prospectuses for the Fund and may differ from the expense ratios disclosed in the Financial Highlights tables in this report. The waivers and expense limitations are contractual at least until 6-30-08. The net expenses are as follows: Class A — 1.54%, Class B — 2.23%, Class C — 2.23%, Class I — 1.14%, Class R1 — 1.89%, Class 1 — 1.10% . Had the fee waivers and expense limitations not been in place, the gross expenses would be as follows: Class A — 5. 60%, Class B — 14.63%, Class C — 10.44%, Class I — 16.26%, Class R1 — 24.21%, Class 1 — 3.82% .
The returns reflect past results and should not be considered indicative of future performance. The return and principal value of an investment will fluctuate so that shares, when redeemed, may be worth more or less than their original cost. Due to market volatility, the Fund’s current performance may be higher or lower than the performance shown. For performance data current to the most recent month end, please call 1-800-225-5291 or visit the Fund’s Web site at www.jhfunds.com.
The performance table above and the chart on the next page do not reflect the deduction of taxes that a shareholder would pay on fund distributions or the redemption of fund shares.
The Fund’s performance results reflect any applicable expense reductions, without which the expenses would increase and results would have been less favorable.
Performance is calculated with an opening price (prior day’s close) on the inception date.
1 Effective June 12, 2006, shareholders of the former GMO Small/Mid Cap Growth Fund (the Predecessor Fund) became owners of that number of full and fractional shares of John Hancock Growth Opportunities Fund. Additionally, the accounting and performance history of the former GMO Small/Mid Cap Growth Fund was redesignated as that of Class A of John Hancock Growth Opportunities Fund.
2 Performance linked to the Predecessor Fund.
3 For certain types of investors as described in the Fund’s Class I, Class R1 and Class 1 share prospectuses.
Annual report | Growth Opportunities Fund
7
A look at performance
Growth of $10,000
This chart shows what happened to a hypothetical $10,000 investment in Growth Opportunities Fund Class A shares1 for the period indicated. For comparison, we’ve shown the same investment in the Russell 2500 Growth Index.
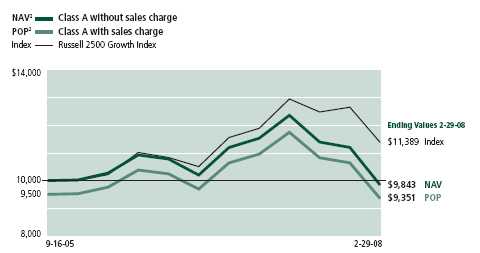
| | | | |
| | | | With maximum | |
| Class | Period beginning | Without sales charge | sales charge | Index |
|
| B | 6-12-06 | $9,352 | $8,982 | $10,850 |
|
| C3 | 6-12-06 | 9,356 | 9,356 | 10,850 |
|
| I4 | 6-12-06 | 9,524 | 9,524 | 10,850 |
|
| R14 | 6-12-06 | 9,424 | 9,424 | 10,850 |
|
| 14 | 6-12-06 | 9,533 | 9,533 | 10,850 |
|
Assuming all distributions were reinvested for the period indicated, the table above shows the value of a $10,000 investment in the Fund’s Class B, Class C, Class I, Class R1 and Class 1 shares, respectively, as of February 29, 2008. Performance of the classes will vary based on the difference in sales charges paid by shareholders investing in the different classes and the fee structure of those classes.
Russell 2500 Growth Index is an unmanaged index containing those securities in the Russell 2500 Index with a greater-than-average growth orientation.
It is not possible to invest directly in an index. Index figures do not reflect sales charges, which would have resulted in lower values if they did.
1 Performance linked to the Predecessor Fund.
2 NAV represents net asset value and POP represents public offering price.
3 No contingent deferred sales charge applicable.
4 For certain types of investors as described in the Fund’s Class I, Class R1 and Class 1 share prospectuses.
Growth Opportunities Fund | Annual report
8
Your expenses
These examples are intended to help you understand your ongoing operating expenses.
Understanding fund expenses
As a shareholder of the Fund, you incur two types of costs:
■ Transaction costs which include sales charges (loads) on purchases or redemptions (varies by share class), minimum account fee charge, etc.
■ Ongoing operating expenses including management fees, distribution and service fees (if applicable), and other fund expenses.
We are going to present only your ongoing operating expenses here.
Actual expenses/actual returns
This example is intended to provide information about your fund’s actual ongoing operating expenses, and is based on your fund’s actual return. It assumes an account value of $1,000.00 on September 1, 2007, with the same investment held until February 29, 2008.
| | | |
| | Account value | Ending value | Expenses paid during |
| | on 9-1-07 | on 2-29-08 | period on 2-29-081 |
|
| Class A | $1,000.00 | $863.38 | $7.23 |
|
| Class B | 1,000.00 | 860.20 | 10.41 |
|
| Class C | 1,000.00 | 860.26 | 10.45 |
|
| Class I | 1,000.00 | 864.17 | 5.28 |
|
| Class R1 | 1,000.00 | 863.65 | 6.72 |
|
| Class 1 | 1,000.00 | 865.00 | 5.38 |
|
Together with the value of your account, you may use this information to estimate the operating expenses that you paid over the period. Simply divide your account value at February 29, 2008, by $1,000.00, then multiply it by the “expenses paid” for your share class from the table above. For example, for an account value of $8,600.00, the operating expenses should be calculated as follows:
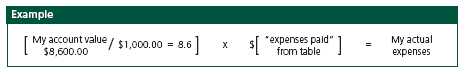
Annual report | Growth Opportunities Fund
9
Your expenses
Hypothetical example for comparison purposes
This table allows you to compare your fund’s ongoing operating expenses with those of any other fund. It provides an example of the Fund’s hypothetical account values and hypothetical expenses based on each class’s actual expense ratio and an assumed 5% annualized return before expenses (which is not your fund’s actual return). It assumes an account value of $1,000.00 on September 1, 2007, with the same investment held until February 29, 2008. Look in any other fund shareholder report to find its hypothetical example and you will be able to compare these expenses.
| | | |
| | Account value | Ending value | Expenses paid during |
| | on 9-1-07 | on 2-29-08 | period on 2-29-081 |
|
| Class A | $1,000.00 | $1,017.11 | $7.82 |
|
| Class B | 1,000.00 | 1,013.67 | 11.27 |
|
| Class C | 1,000.00 | 1,013.63 | 11.31 |
|
| Class I | 1,000.00 | 1,019.19 | 5.72 |
|
| Class R1 | 1,000.00 | 1,017.65 | 7.27 |
|
| Class 1 | 1,000.00 | 1,019.10 | 5.82 |
|
Remember, these examples do not include any transaction costs, such as sales charges; therefore, these examples will not help you to determine the relative total costs of owning different funds. If transaction costs were included, your expenses would have been higher. See the prospectus for details regarding transaction costs.
1 Expenses are equal to the Fund’s annualized expense ratio of 1.56%, 2.25%, 2.26%, 1.14%, 1.45% and 1.16% for Class A, Class B, Class C, Class I, Class R1 and Class 1, respectively, multiplied by the average account value over the period, multiplied by the number of days in most recent fiscal half year/366 (to reflect the one-half year period).
Growth Opportunities Fund | Annual report
10
Portfolio summary
| | | | |
| Top 10 holdings1 | | | | |
|
| Jacobs Engineering Group, Inc. | 2.0% | | Mettler-Toldeo International, Inc. | 1.5% |
| |
|
| Intuitive Surgical, Inc. | 1.9% | | Priceline.com, Inc. | 1.4% |
| |
|
| FLIR Systems, Inc. | 1.6% | | Energizer Holdings, Inc. | 1.3% |
| |
|
| FMC Technologies, Inc. | 1.6% | | Waters Corp. | 1.3% |
| |
|
|
| CF Industries Holdings, Inc. | 1.5% | | Covance, Inc. | 1.2% |
| |
|
| Sector distribution1 | | | | |
|
| Consumer non-cyclical | 27% | | Basic materials | 5% |
| |
|
| Industrial | 21% | | Financial | 5% |
| |
|
| Consumer cyclical | 12% | | Communications | 5% |
| |
|
| Technology | 10% | | Utilities | 1% |
| |
|
| Energy | 6% | | Other | 8% |
| |
|
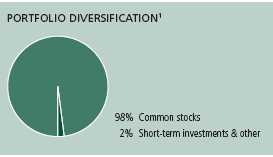
1 As a percentage of net assets on February 29, 2008.
Annual report | Growth Opportunities Fund
11
F I N A N C I A L S T A T E M E N T SFund’s investments
Securities owned by the Fund on 2-29-08
This schedule is divided into three main categories: common stocks, short-term investments and repurchase agreements. Common stocks are further broken down by industry group. Repurchase agreements, which represent the Fund’s cash position, are listed last.
| | |
| Issuer | Shares | Value |
| |
| Common stocks 97.82% | | $85,604,551 |
|
| (Cost $91,216,394) | | |
| | | |
| Advertising 0.06% | | 51,456 |
|
| Getty Images, Inc. * | 1,600 | 51,456 |
| | | |
| Aerospace 1.19% | | 1,041,061 |
|
| Alliant Techsystems, Inc. * | 3,400 | 356,796 |
|
| BE Aerospace, Inc. * | 2,700 | 92,610 |
|
| HEICO Corp. (a) | 500 | 21,900 |
|
| Innovative Solutions & Support, Inc. * (a) | 1,800 | 16,290 |
|
| Orbital Sciences Corp., Class A * | 900 | 19,485 |
|
| Spirit Aerosystems Holdings, Inc., Class A * | 2,100 | 56,742 |
|
| Teledyne Technologies, Inc. * | 4,700 | 208,680 |
|
| Woodward Governor Company | 9,400 | 268,558 |
| | | |
| Agriculture 0.16% | | 139,482 |
|
| Fresh Del Monte Produce, Inc. * | 4,200 | 139,482 |
| | | |
| Air Travel 0.06% | | 50,554 |
|
| Copa Holdings SA, Class A | 1,400 | 50,554 |
| | | |
| Apparel & Textiles 2.23% | | 1,951,523 |
|
| Bebe Stores, Inc. | 4,000 | 48,840 |
|
| Crocs, Inc. * (a) | 11,800 | 286,976 |
|
| Deckers Outdoor Corp. * | 6,300 | 697,032 |
|
| Guess?, Inc. | 21,200 | 871,956 |
|
| Maidenform Brands, Inc. * | 900 | 11,133 |
|
| Volcom, Inc. * | 1,800 | 35,586 |
| | | |
| Auto Parts 1.36% | | 1,189,055 |
|
| Amerigon, Inc. * | 1,200 | 21,792 |
|
| BorgWarner, Inc. | 5,300 | 228,483 |
|
| Gentex Corp. | 23,400 | 377,208 |
|
| LKQ Corp. * | 10,700 | 227,268 |
|
| O’Reilly Automotive, Inc. * | 12,400 | 334,304 |
| | | |
| Auto Services 0.79% | | 691,556 |
|
| Copart, Inc. * | 16,600 | 691,556 |
| | | |
| Banking 0.31% | | 275,077 |
|
| Bank of Hawaii Corp. | 600 | 28,812 |
See notes to financial statements
Growth Opportunities Fund | Annual report
12
F I N A N C I A L S T A T E M E N T S
| | |
| Issuer | Shares | Value |
| | | |
| Banking (continued) | | |
|
| Frontier Financial Corp. (a) | 1,400 | $20,972 |
|
| Greenhill & Company, Inc. (a) | 300 | 19,503 |
|
| S & T Bancorp, Inc. | 900 | 25,515 |
|
| SVB Financial Group * | 2,100 | 95,130 |
|
| TrustCo Bank Corp., NY (a) | 2,800 | 24,220 |
|
| Valley National Bancorp (a) | 1,500 | 28,020 |
|
| WestAmerica Bancorp (a) | 500 | 23,665 |
|
| Wilmington Trust Corp. | 300 | 9,240 |
| | | |
| Biotechnology 2.87% | | 2,513,724 |
|
| Applera Corp. | 3,100 | 104,501 |
|
| Bio-Rad Laboratories, Inc., Class A * | 1,400 | 132,216 |
|
| Charles River Laboratories International, Inc. * | 5,600 | 328,048 |
|
| Illumina, Inc. * | 300 | 21,723 |
|
| Immucor, Inc. * | 21,200 | 631,760 |
|
| Invitrogen Corp. * | 10,800 | 912,492 |
|
| Techne Corp. * | 5,600 | 382,984 |
| | | |
| Broadcasting 0.41% | | 361,120 |
|
| Discovery Holding Company * | 16,000 | 361,120 |
| | | |
| Building Materials & Construction 0.17% | | 149,853 |
|
| EMCOR Group, Inc. * | 2,900 | 69,861 |
|
| KBR, Inc. * | 2,400 | 79,992 |
| | | |
| Business Services 7.78% | | 6,810,202 |
|
| ABM Industries, Inc. | 6,100 | 121,146 |
|
| Affiliated Computer Services, Inc., Class A * | 400 | 20,300 |
|
| Alliance Data Systems Corp. * | 1,100 | 55,693 |
|
| DST Systems, Inc. * | 1,400 | 98,364 |
|
| Dun & Bradstreet Corp. | 8,200 | 716,188 |
|
| Equifax, Inc. | 9,900 | 338,778 |
|
| FactSet Research Systems, Inc. | 19,400 | 1,021,216 |
|
| Fair Isaac Corp. | 900 | 20,880 |
|
| FTI Consulting, Inc. * | 9,200 | 584,200 |
|
| Gartner Group, Inc., Class A * | 1,700 | 32,147 |
|
| Global Payments, Inc. | 11,100 | 440,337 |
|
| Global Sources, Ltd. * (a) | 2,440 | 29,768 |
|
| Healthcare Services Group, Inc. | 9,500 | 187,910 |
|
| Informatica Corp. * | 3,000 | 52,380 |
|
| Jacobs Engineering Group, Inc. * | 21,800 | 1,750,322 |
|
| Pre-Paid Legal Services, Inc. * | 2,400 | 114,360 |
|
| Resources Connection, Inc. * | 5,200 | 83,720 |
|
| ScanSource, Inc. * | 700 | 23,779 |
|
| SRA International, Inc., Class A * | 600 | 14,400 |
|
| Stanley, Inc. * | 600 | 16,614 |
|
| Syntel, Inc. | 10,800 | 294,084 |
|
| TeleTech Holdings, Inc. * | 4,900 | 110,593 |
See notes to financial statements
Annual report | Growth Opportunities Fund
13
F I N A N C I A L S T A T E M E N T S
| | |
| Issuer | Shares | Value |
| | | |
| Business Services (continued) | | |
|
| Total Systems Services, Inc. | 17,600 | $391,248 |
|
| Watson Wyatt Worldwide, Inc., Class A | 5,500 | 291,775 |
| | | |
| Cellular Communications 0.03% | | 22,218 |
|
| Novatel Wireless, Inc. * | 2,100 | 22,218 |
| | | |
| Chemicals 4.04% | | 3,535,721 |
|
| Albemarle Corp. | 11,200 | 424,928 |
|
| Celanese Corp., Series A | 10,100 | 392,890 |
|
| CF Industries Holdings, Inc. | 10,900 | 1,330,672 |
|
| ShengdaTech, Inc. * (a) | 1,400 | 14,812 |
|
| Sigma-Aldrich Corp. | 16,200 | 891,324 |
|
| Terra Industries, Inc. * | 10,000 | 452,100 |
|
| Valhi, Inc. (a) | 1,500 | 28,995 |
| | | |
| Coal 0.19% | | 170,268 |
|
| Alpha Natural Resources, Inc. * | 4,200 | 170,268 |
| | | |
| Colleges & Universities 0.21% | | 179,685 |
|
| Career Education Corp. * (a) | 12,100 | 179,685 |
| | | |
| Commercial Services 0.55% | | 484,193 |
|
| Chemed Corp. | 6,200 | 295,802 |
|
| Shaw Group, Inc. * | 2,500 | 160,950 |
|
| Team, Inc. * | 900 | 27,441 |
| | | |
| Computers & Business Equipment 1.75% | | 1,534,827 |
|
| Blue Coat Systems, Inc. * | 3,000 | 70,440 |
|
| CACI International, Inc., Class A * | 600 | 26,196 |
|
| Cogent, Inc. * | 4,900 | 49,000 |
|
| Foundry Networks, Inc. * | 8,100 | 96,147 |
|
| IHS, Inc., Class A * | 400 | 24,660 |
|
| Immersion Corp. * | 2,300 | 19,389 |
|
| Jack Henry & Associates, Inc. | 7,900 | 185,887 |
|
| MICROS Systems, Inc. * | 11,800 | 378,072 |
|
| National Instruments Corp. | 1,500 | 38,790 |
|
| NETGEAR, Inc. * | 1,700 | 37,094 |
|
| Radiant Systems, Inc. * | 1,300 | 18,564 |
|
| Stratasys, Inc. * (a) | 7,100 | 133,196 |
|
| Synaptics, Inc. * | 2,900 | 77,691 |
|
| Western Digital Corp. * | 12,300 | 379,701 |
| | | |
| Construction & Mining Equipment 0.07% | | 58,422 |
|
| Bucyrus International, Inc., Class A | 400 | 39,952 |
|
| Carbo Ceramics, Inc. (a) | 500 | 18,470 |
| | | |
| Construction Materials 0.85% | | 745,900 |
|
| Clarcor, Inc. | 1,900 | 68,020 |
|
| Martin Marietta Materials, Inc. (a) | 6,300 | 677,880 |
See notes to financial statements
Growth Opportunities Fund | Annual report
14
F I N A N C I A L S T A T E M E N T S
| | |
| Issuer | Shares | Value |
| | | |
| Containers & Glass 0.27% | | $234,355 |
|
| Packaging Corp. of America | 2,900 | 66,091 |
|
| Silgan Holdings, Inc. | 3,600 | 168,264 |
| | | |
| Correctional Facilities 0.06% | | 53,720 |
|
| Corrections Corp. of America * | 2,000 | 53,720 |
| | | |
| Cosmetics & Toiletries 1.24% | | 1,085,656 |
|
| Alberto-Culver Company | 6,200 | 166,160 |
|
| Bare Escentuals, Inc. * | 1,200 | 32,856 |
|
| Chattem, Inc. * (a) | 5,300 | 412,870 |
|
| Estee Lauder Companies, Inc., Class A | 1,200 | 51,096 |
|
| International Flavors & Fragrances, Inc. | 9,800 | 422,674 |
| | | |
| Crude Petroleum & Natural Gas 0.62% | | 542,663 |
|
| Cabot Oil & Gas Corp. | 1,500 | 74,625 |
|
| Cimarex Energy Company | 1,400 | 73,780 |
|
| Contango Oil & Gas Company * | 600 | 38,580 |
|
| Patterson-UTI Energy, Inc. | 2,300 | 54,579 |
|
| Unit Corp. * | 3,500 | 193,025 |
|
| VAALCO Energy, Inc. * | 1,900 | 8,474 |
|
| Western Refining, Inc. (a) | 5,000 | 99,600 |
| | | |
| Domestic Oil 2.51% | | 2,192,644 |
|
| Atlas America, Inc. | 1,000 | 60,470 |
|
| Berry Petroleum Company, Class A | 1,900 | 78,109 |
|
| Continental Resources, Inc. * | 800 | 22,464 |
|
| Denbury Resources, Inc. * | 20,200 | 644,178 |
|
| Frontier Oil Corp. | 19,600 | 699,916 |
|
| Holly Corp. | 8,300 | 443,137 |
|
| Oil States International, Inc. * | 4,200 | 177,072 |
|
| Range Resources Corp. | 1,100 | 67,298 |
| | | |
| Drugs & Health Care 0.62% | | 543,250 |
|
| CV Therapeutics, Inc. * (a) | 5,000 | 29,200 |
|
| Meridian Bioscience, Inc. | 15,000 | 514,050 |
| | | |
| Educational Services 2.24% | | 1,958,038 |
|
| Capella Education Company * | 600�� | 31,626 |
|
| DeVry, Inc. | 6,800 | 298,792 |
|
| ITT Educational Services, Inc. * | 18,000 | 993,960 |
|
| Renaissance Learning, Inc. (a) | 2,000 | 26,320 |
|
| Strayer Education, Inc. | 3,700 | 576,090 |
|
| Universal Technical Institute, Inc. * | 2,500 | 31,250 |
| | | |
| Electrical Equipment 2.51% | | 2,198,634 |
|
| AMETEK, Inc. | 8,300 | 353,497 |
|
| Baldor Electric Company | 1,300 | 37,271 |
|
| FLIR Systems, Inc. * | 48,800 | 1,388,848 |
|
| General Cable Corp. * | 1,400 | 86,408 |
|
| Hubbell, Inc., Class B | 3,000 | 136,110 |
See notes to financial statements
Annual report | Growth Opportunities Fund
15
F I N A N C I A L S T A T E M E N T S
| | |
| Issuer | Shares | Value |
| | | |
| Electrical Equipment (continued) | | |
|
| Universal Electronics, Inc. * | 1,500 | $34,050 |
|
| Varian, Inc. * | 3,000 | 162,450 |
| | | |
| Electrical Utilities 0.35% | | 310,164 |
|
| Quanta Services, Inc. * | 4,300 | 102,684 |
|
| Reliant Energy, Inc. * | 9,100 | 207,480 |
| | | |
| Electronics 1.82% | | 1,589,887 |
|
| Amphenol Corp., Class A | 10,100 | 373,397 |
|
| AVX Corp. | 1,400 | 17,556 |
|
| Cynosure, Inc. * | 1,200 | 28,716 |
|
| II-VI, Inc. * | 7,700 | 252,098 |
|
| Itron, Inc. * | 500 | 47,665 |
|
| Multi-Fineline Electronix, Inc. * | 2,000 | 42,540 |
|
| Synopsys, Inc. * | 3,100 | 71,951 |
|
| Teleflex, Inc. | 2,200 | 124,410 |
|
| Trimble Navigation, Ltd. * | 23,100 | 631,554 |
| | | |
| Energy 1.78% | | 1,561,009 |
|
| Alon USA Energy, Inc. | 4,100 | 64,329 |
|
| Energen Corp. | 9,000 | 540,000 |
|
| First Solar, Inc. * | 2,100 | 430,920 |
|
| SunPower Corp., Class A. * (a) | 8,000 | 525,760 |
| | | |
| Financial Services 4.51% | | 3,945,456 |
|
| Bankrate, Inc. * | 2,300 | 97,198 |
|
| Broadridge Financial Solutions, Inc. | 2,800 | 53,620 |
|
| Cohen & Steers, Inc. (a) | 5,000 | 125,900 |
|
| Eaton Vance Corp. | 30,400 | 968,240 |
|
| FCStone Group, Inc. * | 500 | 23,320 |
|
| Federated Investors, Inc., Class B | 10,800 | 438,264 |
|
| Interactive Data Corp. | 10,900 | 318,934 |
|
| IntercontinentalExchange, Inc. * | 2,400 | 312,720 |
|
| Janus Capital Group, Inc. | 11,000 | 266,420 |
|
| Nasdaq Stock Market, Inc. * | 600 | 24,906 |
|
| Portfolio Recovery Associates, Inc. * (a) | 800 | 29,216 |
|
| SEI Investments Company | 39,900 | 997,899 |
|
| Stifel Financial Corp. * (a) | 1,000 | 43,590 |
|
| The First Marblehead Corp. (a) | 4,100 | 49,323 |
|
| Waddell & Reed Financial, Inc., Class A | 4,700 | 147,298 |
|
| World Acceptance Corp. * | 1,600 | 48,608 |
| | | |
| Food & Beverages 2.42% | | 2,118,244 |
|
| Coca-Cola Bottling Company | 300 | 16,407 |
|
| Flowers Foods, Inc. | 11,600 | 262,856 |
|
| Green Mountain Coffee Roasters, Inc. * (a) | 5,700 | 173,907 |
|
| Hansen Natural Corp. * | 15,400 | 639,100 |
|
| Hormel Foods Corp. | 10,000 | 408,600 |
|
| J.M. Smucker Company | 2,300 | 117,737 |
See notes to financial statements
Growth Opportunities Fund | Annual report
16
F I N A N C I A L S T A T E M E N T S
| | |
| Issuer | Shares | Value |
| | | |
| Food & Beverages (continued) | | |
|
| M & F Worldwide Corp. * | 3,400 | $125,902 |
|
| McCormick & Company, Inc. | 9,400 | 323,830 |
|
| Ralcorp Holdings, Inc. * | 900 | 49,905 |
| | | |
| Funeral Services 0.16% | | 139,320 |
|
| Service Corporation International | 12,900 | 139,320 |
| | | |
| Gas & Pipeline Utilities 0.14% | | 121,658 |
|
| Equitable Resources, Inc. | 600 | 36,972 |
|
| Global Industries, Ltd. * | 4,600 | 84,686 |
| | | |
| Healthcare Products 8.58% | | 7,507,573 |
|
| ArthroCare Corp. * | 3,900 | 156,585 |
|
| DENTSPLY International, Inc. | 25,100 | 979,904 |
|
| Edwards Lifesciences Corp. * | 3,900 | 170,079 |
|
| Gen-Probe, Inc. * | 7,100 | 339,451 |
|
| Haemonetics Corp. * | 300 | 17,430 |
|
| Henry Schein, Inc. * | 11,100 | 664,002 |
|
| Herbalife, Ltd. | 2,200 | 92,026 |
|
| IDEXX Laboratories, Inc. * | 17,000 | 942,990 |
|
| Intuitive Surgical, Inc. * | 6,000 | 1,691,520 |
|
| Kinetic Concepts, Inc. * | 10,600 | 544,734 |
|
| LifeCell Corp. * | 4,300 | 173,505 |
|
| Patterson Companies, Inc. * | 16,100 | 566,720 |
|
| ResMed, Inc. * | 3,900 | 157,911 |
|
| Respironics, Inc. * | 11,900 | 781,592 |
|
| USANA Health Sciences, Inc. * (a) | 2,000 | 62,360 |
|
| Varian Medical Systems, Inc. * | 2,800 | 146,860 |
|
| Zoll Medical Corp. * | 800 | 19,904 |
| | | |
| Healthcare Services 3.04% | | 2,661,864 |
|
| Cerner Corp. * | 4,900 | 212,905 |
|
| Covance, Inc. * | 12,400 | 1,046,684 |
|
| Emergency Medical Services Corp., Class A * (a) | 3,600 | 89,028 |
|
| Health Net, Inc. * | 3,000 | 131,820 |
|
| Lincare Holdings, Inc. * | 6,800 | 221,000 |
|
| Obagi Medical Products, Inc. * | 1,300 | 20,228 |
|
| Pediatrix Medical Group, Inc. * | 9,900 | 653,499 |
|
| Weight Watchers International, Inc. | 6,100 | 286,700 |
| | | |
| Hotels & Restaurants 1.02% | | 896,283 |
|
| Brinker International, Inc. | 2,400 | 44,256 |
|
| Buffalo Wild Wings, Inc. * | 2,800 | 64,876 |
|
| Chipotle Mexican Grill, Inc., Class A * (a) | 1,600 | 158,880 |
|
| Choice Hotels International, Inc. | 9,200 | 298,540 |
|
| Jack in the Box, Inc. * | 11,900 | 312,613 |
|
| P.F. Chang’s China Bistro, Inc. * | 600 | 17,118 |
| | | |
| Household Appliances 0.29% | | 255,354 |
|
| The Toro Company | 5,300 | 255,354 |
See notes to financial statements
Annual report | Growth Opportunities Fund
17
F I N A N C I A L S T A T E M E N T S
| | |
| Issuer | Shares | Value |
| | | |
| Household Products 2.59% | | $2,265,579 |
|
| Church & Dwight, Inc. | 12,100 | 646,866 |
|
| Energizer Holdings, Inc. * | 12,700 | 1,178,941 |
|
| Tempur-Pedic International, Inc. (a) | 7,600 | 132,392 |
|
| Tupperware Brands Corp. | 8,000 | 291,840 |
|
| WD-40 Company | 500 | 15,540 |
| | | |
| Industrial Machinery 6.04% | | 5,281,727 |
|
| Dionex Corp. * | 3,500 | 258,370 |
|
| Donaldson Company, Inc. | 6,900 | 290,904 |
|
| Dresser-Rand Group, Inc. * | 10,400 | 354,328 |
|
| Flowserve Corp. | 2,700 | 294,030 |
|
| FMC Technologies, Inc. * | 24,400 | 1,382,504 |
|
| Graco, Inc. | 6,300 | 218,673 |
|
| IDEX Corp. | 5,500 | 165,880 |
|
| Middleby Corp. * (a) | 5,000 | 340,000 |
|
| Pall Corp. | 18,800 | 740,156 |
|
| The Manitowoc Company, Inc. | 23,300 | 949,242 |
|
| Valmont Industries, Inc. | 3,600 | 287,640 |
| | | |
| Industrials 0.48% | | 421,811 |
|
| Fastenal Company (a) | 4,400 | 178,904 |
|
| Harsco Corp. | 4,300 | 242,907 |
| | | |
| Insurance 1.76% | | 1,542,405 |
|
| Alleghany Corp. * | 200 | 72,200 |
|
| Amtrust Financial Services, Inc. | 2,200 | 36,740 |
|
| Brown & Brown, Inc. | 16,600 | 295,978 |
|
| Erie Indemnity Company, Class A | 5,300 | 261,555 |
|
| HCC Insurance Holdings, Inc. | 3,000 | 72,180 |
|
| Markel Corp. * | 600 | 278,850 |
|
| Odyssey Re Holdings Corp. | 2,700 | 97,686 |
|
| Philadelphia Consolidated Holding Corp. * | 11,800 | 400,256 |
|
| Transatlantic Holdings, Inc. | 400 | 26,960 |
| | | |
| International Oil 0.09% | | 76,258 |
|
| Cheniere Energy, Inc. * | 2,600 | 76,258 |
| | | |
| Internet Content 0.40% | | 346,722 |
|
| Sohu.com, Inc. * (a) | 7,400 | 333,592 |
|
| Travelzoo, Inc. * (a) | 1,300 | 13,130 |
| | | |
| Internet Retail 1.75% | | 1,533,692 |
|
| Blue Nile, Inc. * (a) | 5,500 | 242,880 |
|
| PetMed Express, Inc. * | 2,200 | 25,190 |
|
| Priceline.com, Inc. * (a) | 11,100 | 1,265,622 |
| | | |
| Internet Software 0.98% | | 854,002 |
|
| eResearch Technology, Inc. * | 3,700 | 44,252 |
|
| Interwoven, Inc. * | 700 | 9,485 |
|
| McAfee, Inc. * | 20,100 | 668,727 |
See notes to financial statements
Growth Opportunities Fund | Annual report
18
F I N A N C I A L S T A T E M E N T S
| | |
| Issuer | Shares | Value |
| | | |
| Internet Software (continued) | | |
|
| S1 Corp. * | 2,800 | $19,824 |
|
| Sapient Corp. * | 1,200 | 8,856 |
|
| VASCO Data Security International, Inc. * | 9,300 | 102,858 |
| | | |
| Leisure Time 0.19% | | 163,606 |
|
| Bally Technologies, Inc. * | 400 | 15,164 |
|
| Polaris Industries, Inc. (a) | 3,600 | 137,448 |
|
| Premier Exhibitions, Inc. * | 2,300 | 10,994 |
| | | |
| Life Sciences 2.26% | | 1,976,863 |
|
| Dawson Geophysical Company * | 300 | 19,761 |
|
| PerkinElmer, Inc. | 4,400 | 109,208 |
|
| Pharmaceutical Product Development, Inc. | 16,400 | 739,148 |
|
| Waters Corp. * | 18,600 | 1,108,746 |
| | | |
| Liquor 0.47% | | 411,206 |
|
| Boston Beer Company, Inc. * | 3,700 | 131,942 |
|
| Central European Distribution Corp. * | 4,800 | 279,264 |
| | | |
| Manufacturing 2.81% | | 2,455,629 |
|
| AptarGroup, Inc. | 8,900 | 333,572 |
|
| Ceradyne, Inc. * | 3,300 | 102,663 |
|
| Kaydon Corp. | 500 | 21,355 |
|
| Mettler-Toledo International, Inc. * | 13,100 | 1,279,870 |
|
| Mine Safety Appliances Company | 3,400 | 136,374 |
|
| Raven Industries, Inc. (a) | 5,500 | 161,040 |
|
| Roper Industries, Inc. | 6,700 | 377,880 |
|
| Spartan Motors, Inc. (a) | 2,650 | 21,545 |
|
| Sturm Ruger & Company, Inc. * | 2,700 | 21,330 |
| | | |
| Medical-Hospitals 0.36% | | 317,689 |
|
| Sunrise Senior Living, Inc. * | 1,400 | 38,332 |
|
| VCA Antech, Inc. * | 8,700 | 279,357 |
| | | |
| Metal & Metal Products 0.38% | | 336,335 |
|
| Dynamic Materials Corp. | 3,100 | 176,669 |
|
| Kaiser Aluminum Corp. | 600 | 44,010 |
|
| Matthews International Corp., Class A | 1,900 | 85,234 |
|
| Sun Hydraulics, Inc. | 1,400 | 30,422 |
| | | |
| Mining 0.75% | | 654,518 |
|
| Cleveland-Cliffs, Inc. | 5,300 | 633,138 |
|
| General Moly, Inc. * (a) | 2,000 | 21,380 |
| | | |
| Mobile Homes 0.18% | | 161,544 |
|
| Thor Industries, Inc. | 5,300 | 161,544 |
| | | |
| Office Furnishings & Supplies 0.04% | | 38,779 |
|
| Herman Miller, Inc. | 1,300 | 38,779 |
See notes to financial statements
Annual report | Growth Opportunities Fund
19
F I N A N C I A L S T A T E M E N T S
| | |
| Issuer | Shares | Value |
| | | |
| Petroleum Services 2.06% | | $1,799,310 |
|
| Atwood Oceanics, Inc. * | 3,400 | 316,506 |
|
| Bolt Technology Corp. * | 900 | 15,651 |
|
| Delek US Holdings, Inc. | 1,700 | 26,826 |
|
| Flotek Industries, Inc. * (a) | 2,500 | 56,825 |
|
| GulfMark Offshore, Inc. * | 500 | 25,330 |
|
| Helmerich & Payne, Inc. | 3,600 | 161,388 |
|
| Oceaneering International, Inc. * | 12,300 | 738,000 |
|
| Tesoro Corp. | 1,700 | 63,138 |
|
| Tidewater, Inc. | 4,900 | 275,135 |
|
| W-H Energy Services, Inc. * | 500 | 31,435 |
|
| Willbros Group, Inc. * | 2,600 | 89,076 |
| | | |
| Pharmaceuticals 0.73% | | 638,992 |
|
| Barr Pharmaceuticals, Inc. * | 2,400 | 113,160 |
|
| Endo Pharmaceutical Holdings, Inc. * | 11,250 | 295,425 |
|
| Hi-Tech Pharmacal Company, Inc. * | 1,400 | 15,596 |
|
| Onyx Pharmaceuticals, Inc. * | 4,100 | 112,012 |
|
| United Therapeutics Corp. * | 600 | 50,502 |
|
| Warner Chilcott, Ltd., Class A * | 3,100 | 52,297 |
| | | |
| Publishing 0.17% | | 149,568 |
|
| John Wiley & Sons, Inc., Class A | 4,100 | 149,568 |
| | | |
| Real Estate 0.21% | | 185,096 |
|
| Alexander’s, Inc., REIT * | 100 | 30,245 |
|
| Entertainment Properties Trust, REIT | 2,000 | 93,739 |
|
| Jones Lang LaSalle, Inc. | 800 | 61,112 |
| | | |
| Retail Trade 6.44% | | 5,639,705 |
|
| Abercrombie & Fitch Company, Class A | 1,700 | 131,801 |
|
| Advance Auto Parts, Inc. | 7,550 | 253,227 |
|
| Aeropostale, Inc. * | 16,800 | 451,248 |
|
| American Eagle Outfitters, Inc. | 12,100 | 258,577 |
|
| Chico’s FAS, Inc. * | 9,900 | 92,169 |
|
| Dick’s Sporting Goods, Inc. * | 1,500 | 41,370 |
|
| Dollar Tree Stores, Inc. * | 12,600 | 338,058 |
|
| Family Dollar Stores, Inc. | 1,000 | 19,150 |
|
| First Cash Financial Services, Inc. * | 1,000 | 9,350 |
|
| Fossil, Inc. * | 13,200 | 424,776 |
|
| GameStop Corp., Class A * | 20,100 | 851,436 |
|
| Hibbett Sports, Inc. * | 1,700 | 26,860 |
|
| J. Crew Group, Inc. * | 2,000 | 80,100 |
|
| MSC Industrial Direct Company, Inc., Class A | 11,900 | 482,902 |
|
| PetSmart, Inc. | 3,800 | 81,814 |
|
| Ross Stores, Inc. | 3,700 | 103,045 |
|
| The Buckle, Inc. | 4,350 | 197,490 |
See notes to financial statements
Growth Opportunities Fund | Annual report
20
F I N A N C I A L S T A T E M E N T S
| | |
| Issuer | Shares | Value |
| | | |
| Retail Trade (continued) | | |
|
| The Men’s Wearhouse, Inc. | 4,600 | $105,984 |
|
| Tiffany & Company | 23,000 | 865,720 |
|
| Tractor Supply Company * | 700 | 26,208 |
|
| Urban Outfitters, Inc. * | 26,200 | 754,036 |
|
| Williams-Sonoma, Inc. (a) | 1,900 | 44,384 |
| | | |
| Sanitary Services 1.16% | | 1,011,790 |
|
| Darling International, Inc. * | 3,300 | 45,870 |
|
| Nalco Holding Company | 4,800 | 103,680 |
|
| Stericycle, Inc. * | 16,000 | 862,240 |
| | | |
| Semiconductors 1.75% | | 1,528,708 |
|
| Advanced Analogic Technologies, Inc. * | 5,200 | 33,800 |
|
| Cree, Inc. * (a) | 8,800 | 271,920 |
|
| Cypress Semiconductor Corp. * | 1,200 | 26,088 |
|
| Intersil Corp., Class A | 8,000 | 186,160 |
|
| Microsemi Corp. * | 900 | 19,575 |
|
| Netlogic Microsystems, Inc. * | 800 | 18,880 |
|
| ON Semiconductor Corp. * | 25,600 | 153,600 |
|
| Power Integrations, Inc. * | 1,600 | 42,080 |
|
| QLogic Corp. * | 1,900 | 30,115 |
|
| Semtech Corp. * | 9,500 | 121,030 |
|
| Silicon Laboratories, Inc. * | 2,200 | 68,090 |
|
| Varian Semiconductor Equipment Associates, Inc. * | 16,500 | 557,370 |
| | | |
| Software 2.16% | | 1,891,483 |
|
| Activision, Inc. * | 2,500 | 68,125 |
|
| Ansoft Corp. * | 6,200 | 150,784 |
|
| ANSYS, Inc. * | 13,100 | 489,547 |
|
| BMC Software, Inc. * | 6,700 | 216,276 |
|
| Citrix Systems, Inc. * | 3,900 | 128,427 |
|
| Concur Technologies, Inc. * | 4,700 | 137,428 |
|
| EPIQ Systems, Inc. * | 1,500 | 20,400 |
|
| FARO Technologies, Inc. * | 1,100 | 36,025 |
|
| Macrovision Corp. * | 1,000 | 15,290 |
|
| Manhattan Associates, Inc. * | 2,900 | 63,974 |
|
| NAVTEQ Corp. * | 3,600 | 269,820 |
|
| Nuance Communications, Inc. * | 2,400 | 39,480 |
|
| Omniture, Inc. * | 2,500 | 57,450 |
|
| Red Hat, Inc. * | 900 | 16,047 |
|
| Riverbed Technology, Inc. * | 2,500 | 50,150 |
|
| Solera Holdings, Inc. * | 800 | 18,984 |
|
| SPSS, Inc. * | 1,000 | 38,030 |
|
| Synchronoss Technologies, Inc. * | 2,500 | 40,200 |
|
| Websense, Inc. * | 1,800 | 35,046 |
See notes to financial statements
Annual report | Growth Opportunities Fund
21
F I N A N C I A L S T A T E M E N T S
| | |
| Issuer | Shares | Value |
| | | |
| Steel 0.28% | | $242,052 |
|
| AK Steel Holding Corp. * | 4,600 | 242,052 |
| Telecommunications Equipment & Services 0.82% | | 714,251 |
|
| ADTRAN, Inc. | 5,900 | 108,678 |
|
| Atheros Communications, Inc. * | 700 | 17,024 |
|
| CommScope, Inc. * | 4,200 | 175,896 |
|
| Comtech Telecommunications Corp. * | 1,500 | 65,070 |
|
| J2 Global Communications, Inc. * | 2,500 | 53,800 |
|
| NTELOS Holdings Corp. | 1,100 | 23,463 |
|
| Polycom, Inc. * | 12,400 | 270,320 |
| | | |
| Toys, Amusements & Sporting Goods 0.91% | | 793,449 |
|
| Hasbro, Inc. | 18,200 | 469,014 |
|
| Marvel Entertainment, Inc. * | 12,900 | 324,435 |
| | | |
| Transportation 0.18% | | 155,463 |
|
| Genco Shipping & Trading, Ltd. (a) | 400 | 23,308 |
|
| Horizon Lines, Inc. (a) | 2,300 | 46,391 |
|
| Kirby Corp. * | 1,100 | 49,588 |
|
| Ship Finance International, Ltd. (a) | 1,400 | 36,176 |
| | | |
| Trucking & Freight 0.16% | | 144,650 |
|
| Forward Air Corp. | 700 | 20,545 |
|
| J.B. Hunt Transport Services, Inc. | 2,200 | 60,214 |
|
| Landstar Systems, Inc. | 600 | 27,828 |
|
| Oshkosh Truck Corp. | 900 | 36,063 |
| |
| | Principal | |
| Issuer, description, maturity date | amount | Value |
|
| Short-term investments 7.52% | | $6,584,591 |
|
| (Cost $6,584,591) | | |
|
| John Hancock Cash Investment Trust, 3.5681% (c) (f) | $6,584,591 | 6,584,591 |
| |
| Repurchase agreements 2.25% | | $1,966,000 |
|
| (Cost $1,966,000) | | |
|
| Repurchase Agreement with State Street Corp. dated 2-29-08 | | |
| at 2.35% to be repurchased at $1,966,385 on 3-3-08, collateralized | | |
| by $2,030,000 Federal National Mortgage Association, 5.57%, due | | |
| 7-14-28 (valued at $2,007,163, including interest) | $1,966,000 | 1,966,000 |
|
| Total investments (Cost $99,766,985)† 107.59% | | $94,155,142 |
|
| Liabilities in excess of other assets (7.59%) | | (6,645,432) |
|
| Total net assets 100.00% | | $87,509,710 |
|
See notes to financial statements
Growth Opportunities Fund | Annual report
22
F I N A N C I A L S T A T E M E N T S
Notes to Schedule of Investments
Percentages are stated as a percent of net assets.
REIT Real Estate Investment Trust
* Non-income producing.
(a) All or a portion of this security was out on loan.
(c) Investment is an affiliate of the Trust’s adviser or subadviser.
(f) John Hancock Cash Investment Trust is managed by MFC Global Investment Management (U.S.), LLC. The rate shown is the seven-day effective yield at period end.
† At February 29, 2008, the aggregate cost of investment securities for federal income tax purposes was $100,252,463. Net unrealized depreciation aggregated $6,097,321, of which $4,185,905 related to appreciated investment securities and $10,283,226 related to depreciated investment securities.
See notes to financial statements
Annual report | Growth Opportunities Fund
23
F I N A N C I A L S T A T E M E N T S
Financial statements
Statement of assets and liabilities 2-29-08
This Statement of Assets and Liabilities is the Fund’s balance sheet. It shows the value of what the Fund owns, is due and owes. You’ll also find the net asset value and the maximum public offering price per share.
| |
| Assets | |
|
| Investments in unaffiliated issuers, at value (cost $91,216,394) including | |
| $6,455,481 of securities loaned (Note 2) | $85,604,551 |
| Repurchase agreement, at value (cost $1,966,000) (Note 2) | 1,966,000 |
| Investments in affiliated issuers, at value (cost $6,584,591) (Note 2) | 6,584,591 |
| | |
| Total investments, at value (cost $99,766,985) | 94,155,142 |
| Cash | 720 |
| Cash collateral at broker for futures contracts | 124,320 |
| Receivable for fund shares sold | 21,730 |
| Dividends and interest receivable (net of tax) | 26,476 |
| Receivable for security lending income | 246 |
| Receivable due from adviser | 91,291 |
| Other assets | 460 |
| | |
| Total assets | 94,420,385 |
| |
| Liabilities | |
|
| Payable for fund shares repurchased | 116,353 |
| Payable upon return of securities loaned (Note 2) | 6,584,591 |
| Payable for futures variation margin | 22,538 |
| Payable to affiliates | |
| Fund administration fees | 1,643 |
| Transfer agent fees | 35,724 |
| Distribution and service fees | 43,886 |
| Trustees’ fees | 584 |
| Other payables and accrued expenses | 105,356 |
| | |
| Total liabilities | 6,910,675 |
| |
| Net assets | |
|
| Capital paid-in | $140,762,116 |
| Accumulated undistributed net realized gain (loss) on investments | |
| and futures contracts | (47,614,138) |
| Net unrealized appreciation (depreciation) on investments and futures contracts | (5,638,268) |
| | |
| Net assets | $87,509,710 |
See notes to financial statements
Growth Opportunities Fund | Annual report
24
F I N A N C I A L S T A T E M E N T S
Statement of assets and liabilities (continued)
| |
| Net asset value per share | |
|
| The Funds have an unlimited number of shares authorized with no par | |
| value. Net asset value is calculated by dividing the net assets of each class | |
| of shares by the number of outstanding shares in the class. | |
| | |
| Class A | |
| Net assets | $71,748,117 |
| Shares outstanding | 3,456,827 |
| Net asset value and redemption price per share | $20.76 |
| | |
| Class B1 | |
| Net assets | $12,609,287 |
| Shares outstanding | 614,447 |
| Net asset value and offering price per share | $20.52 |
| | |
| Class C1 | |
| Net assets | $2,512,411 |
| Shares outstanding | 122,386 |
| Net asset value and offering price per share | $20.53 |
| | |
| Class I | |
| Net assets | $12,619 |
| Shares outstanding | 604 |
| Net asset value, offering price and redemption price per share | $20.902 |
| | |
| Class R1 | |
| Net assets | $119,592 |
| Shares outstanding | 5,784 |
| Net asset value, offering price and redemption price per share | $20.68 |
| | |
| Class 1 | |
| Net assets | $507,684 |
| Shares outstanding | 24,269 |
| Net asset value, offering price and redemption price per share | $20.92 |
| |
| Maximum public offering price per share | |
|
| Class A (net asset value per share ÷ 95%)3 | $21.85 |
1 Redemption price per share is equal to the net asset value less any applicable contingent deferred sales charge.
2 Net assets and shares outstanding have been rounded for presentation purposes. The net asset value is as reported on February 29, 2008.
3 On single retail sales of less than $50,000. On sales of $50,000 or more and on group sales the offering price is reduced.
See notes to financial statements
Annual report | Growth Opportunities Fund
25
F I N A N C I A L S T A T E M E N T S
Statement of operations For the year ended 2-29-08
This Statement of Operations summarizes the Fund’s investment income earned and expenses incurred in operating the Fund. It also shows net gains (losses) for the period stated.
| Investment income | |
|
| Dividends | $532,740 |
| Securities lending | 133,929 |
| Interest | 71,699 |
| Income from affiliated issuers | 32,201 |
| | |
| Total investment income | 770,569 |
| |
| Expenses | |
|
| Investment management fees (Note 3) | 685,750 |
| Distribution and service fees (Note 3) | 364,568 |
| Transfer agent fees (Note 3) | 171,780 |
| Fund administration fees (Note 3) | 21,947 |
| Blue sky fees (Note 3) | 81,252 |
| Audit and legal fees | 164,695 |
| Printing and postage fees (Note 3) | 48,138 |
| Custodian fees | 135,727 |
| Trustees’ fees (Note 4) | 4,116 |
| Registration and filing fees | 38,930 |
| Miscellaneous | 4,951 |
| | |
| Total expenses | 1,721,854 |
| Less expense reductions (Note 3) | (299,874) |
| | |
| Net expenses | 1,421,980 |
| | |
| Net investment loss | (651,411) |
| |
| Realized and unrealized gain (loss) | |
|
| Net realized gain (loss) on | |
| Investments in unaffiliated issuers | 5,956,467 |
| Net increase from payments by affiliates (Note 9) | 172,697 |
| Futures contracts | (332,537) |
| | 5,796,627 |
| Change in net unrealized appreciation (depreciation) of | |
| Investments in unaffiliated issuers | (27,274,276) |
| Futures contracts | (15,969) |
| | (27,290,245) |
| Net realized and unrealized gain (loss) | (21,493,618) |
| | |
| Increase (decrease) in net assets from operations | ($22,145,029) |
See notes to financial statements
Growth Opportunities Fund | Annual report
26
F I N A N C I A L S T A T E M E N T S
Statement of changes in net assets
These Statements of Changes in Net Assets show how the value of the Fund’s net assets has changed during the last two periods. The difference reflects earnings less expenses, any investment gains and losses, distributions, if any, paid to shareholders and the net of Fund share transactions.
| | |
| | Year | Year |
| | ended | ended |
| | 2-28-07 | 2-29-08 |
| |
| Increase (decrease) in net assets | | |
|
| From operations | | |
| Net investment loss | ($15,019) | ($651,411) |
| Net realized gain (loss) | 145,591 | 5,796,627 |
| Change in net unrealized appreciation (depreciation) | 223,455 | (27,290,245) |
| | | |
| Increase (decrease) in net assets resulting from operations | 354,027 | (22,145,029) |
| | | |
| Distributions to shareholders | | |
| From net realized gain | | |
| Class A | (38,393) | (17,472) |
| Class B | (2,305) | (3,315) |
| Class C | (5,246) | (663) |
| Class I | (1,806) | (7) |
| Class R1 | (1,078) | (26) |
| Class 1 | (1,082) | (69) |
| | | |
| Total distributions | (49,910) | (21,552) |
| | | |
| From Fund share transactions (Note 6) | 4,626,956 | 102,847,160 |
| | | |
| Total increase (decrease) | 4,931,073 | 80,680,579 |
| |
| Net assets | | |
|
| Beginning of year | 1,898,058 | 6,829,131 |
| | | |
| End of year | $6,829,131 | $87,509,710 |
See notes to financial statements
Annual report | Growth Opportunities Fund
27
F I N A N C I A L S T A T E M E N T S
Financial highlights
| | | |
| CLASS A SHARES | | | |
| |
| Period ended | 2-28-061 | 2-28-072 | 2-29-08 |
| |
| Per share operating performance | | | |
|
| Net asset value, beginning of period | $21.31 | $23.29 | $24.34 |
| Net investment income (loss)3 | 0.04 | (0.07)4 | (0.15) |
| Net realized and unrealized | | | |
| gain (loss) on investments | 1.94 | 1.36 | (3.43) |
| Total from investment operations | 1.98 | 1.29 | (3.58) |
| Less distributions | | | |
| From net realized gain | — | (0.24) | — 5 |
| Net asset value, end of period | $23.29 | $24.34 | $20.76 |
| Total return6 (%) | 9.297 | 5.578,9 | (14.69)8 |
| |
| Ratios and supplemental data | | | |
|
| Net assets, end of period (in millions) | $2 | $5 | $72 |
| Ratios (as a percentage of average net assets): | | | |
| Expenses before reductions | 5.4510 | 5.59 | 1.81 |
| Expenses net of fee waivers, if any | 0.4810 | 1.32 | 1.55 |
| Expenses net of all fee waivers and credits | 0.4810 | 1.32 | 1.54 |
| Net investment income (loss) | 0.4110 | (0.34)4 | (0.64) |
| Portfolio turnover (%) | 437 | 96 | 26211 |
1 Class A shares began operations on 9-16-05.
2 Effective June 12, 2006, shareholders of the former GMO Small/Mid Cap Growth Fund (the Predecessor Fund) became owners of an equal number of full and fractional Class A shares of the John Hancock Growth Opportunities Fund. Additionally, the accounting and performance history of the former GMO Small/Mid Cap Growth Fund was redesignated as that of John Hancock Growth Opportunities Fund Class A.
3 Based on the average of the shares outstanding.
4 Net investment loss per share and ratio of net investment loss to average net assets reflects a special dividend received by the Fund which amounted to $0.03 per share and 0.14% of average net assets.
5 Less than $0.01 per share.
6 Total returns would have been lower had certain expenses not been reduced during the periods shown.
7 Not annualized.
8 Assumes dividend reinvestment.
9 Class A returns linked back to the Predecessor Fund.
10 Annualized.
11 Excludes merger activity.
See notes to financial statements
Growth Opportunities Fund | Annual report
28
F I N A N C I A L S T A T E M E N T S
Financial highlights
| | |
| CLASS B SHARES | | |
| |
| Period ended | 2-28-071 | 2-29-08 |
| |
| Per share operating performance | | |
|
| Net asset value, beginning of period | $22.17 | $24.23 |
| Net investment income (loss)2 | (0.20)3 | (0.31) |
| Net realized and unrealized gain | | |
| (loss) on investments | 2.50 | (3.40) |
| Total from investment operations | 2.30 | (3.71) |
| Less distributions | | |
| From net realized gain | (0.24) | — 4 |
| Net asset value, end of period | $24.23 | $20.52 |
| Total return5,6 (%) | 10.407 | (15.29) |
| |
| Ratios and supplemental data | | |
|
| Net assets, end of period (in millions) | — 8 | $13 |
| Ratios (as a percentage of average net assets): | | |
| Expenses before reductions | 14.629 | 2.61 |
| Expenses net of fee waivers, if any | 2.229 | 2.25 |
| Expenses net of all fee waivers and credits | 2.229 | 2.24 |
| Net investment income (loss) | (1.21)3,9 | (1.34) |
| Portfolio turnover (%) | 967 | 26210 |
1 Class B shares began operations on 6-12-06.
2 Based on the average of the shares outstanding.
3 Net investment loss per share and ratio of net investment loss to average net assets reflects a special dividend received by the Fund which amounted to $0.02 per share and 0.11% of average net assets.
4 Less than $0.01 per share.
5 Total returns would have been lower had certain expenses not been reduced during the periods shown.
6 Assumes dividend reinvestment.
7 Not annualized.
8 Less than $500,000.
9 Annualized.
10 Excludes merger activity.
See notes to financial statements
Annual report | Growth Opportunities Fund
29
F I N A N C I A L S T A T E M E N T S
Financial highlights
| | |
| CLASS C SHARES | | |
| |
| Period ended | 2-28-071 | 2-29-08 |
|
| Per share operating performance | | |
| Net asset value, beginning of period | $22.17 | $24.23 |
| Net investment income (loss)2 | (0.19)3 | (0.32) |
| Net realized and unrealized | | |
| gain (loss) on investments | 2.49 | (3.38) |
| Total from investment operations | 2.30 | (3.70) |
| Less distributions | | |
| From net realized gain | (0.24) | — 4 |
| Net asset value, end of period | $24.23 | $20.53 |
| Total return5,6 (%) | 10.407 | (15.25) |
| |
| Ratios and supplemental data | | |
|
| Net assets, end of period (in millions) | $1 | $3 |
| Ratios (as a percentage of average net assets): | | |
| Expenses before reductions | 10.438 | 3.14 |
| Expenses net of fee waivers, if any | 2.228 | 2.25 |
| Expenses net of all fee waivers and credits | 2.228 | 2.24 |
| Net investment income (loss) | (1.15)3,8 | (1.35) |
| Portfolio turnover (%) | 967 | 2629 |
1 Class C shares began operations on 6-12-06.
2 Based on the average of the shares outstanding.
3 Net investment loss per share and ratio of net investment loss to average net assets reflects a special dividend received by the Fund which amounted to $0.03 per share and 0.11% of average net assets.
4 Less than $0.01 per share.
5 Total returns would have been lower had certain expenses not been reduced during the periods shown.
6 Assumes dividend reinvestment.
7 Not annualized.
8 Annualized.
9 Excludes merger activity.
See notes to financial statements
Growth Opportunities Fund | Annual report
30
F I N A N C I A L S T A T E M E N T S
Financial highlights
| | |
| CLASS I SHARES | | |
| |
| Period ended | 2-28-071 | 2-29-08 |
|
| Per share operating performance | | |
| Net asset value, beginning of period | $22.17 | $24.41 |
| Net investment income (loss)2 | (0.02)3 | (0.07) |
| Net realized and unrealized | | |
| gain (loss) on investments | 2.50 | (3.44) |
| Total from investment operations | 2.48 | (3.51) |
| Less distributions | | |
| From net realized gain | (0.24) | — 4 |
| Net asset value, end of period | $24.41 | $20.90 |
| Total return5,6 (%) | 11.227 | (14.36) |
| |
| Ratios and supplemental data | | |
|
| Net assets, end of period (in millions) | — 8 | — 8 |
| Ratios (as a percentage of average net assets): | | |
| Expenses before reductions | 16.269 | 12.17 |
| Expenses net of fee waivers, if any | 1.139 | 1.04 |
| Expenses net of all fee waivers and credits | 1.139 | 1.04 |
| Net investment income (loss) | (0.10)3,9 | (0.30) |
| Portfolio turnover (%) | 967 | 26210 |
1 Class I shares began operations on 6-12-06.
2 Based on the average of the shares outstanding.
3 Net investment loss per share and ratio of net investment loss to average net assets reflects a special dividend received by the Fund which amounted to $0.03 per share and 0.11% of average net assets.
4 Less than $0.01 per share.
5 Total returns would have been lower had certain expenses not been reduced during the periods shown.
6 Assumes dividend reinvestment.
7 Not annualized.
8 Less than $500,000.
9 Annualized.
10 Excludes merger activity.
See notes to financial statements
Annual report | Growth Opportunities Fund
31
F I N A N C I A L S T A T E M E N T S
Financial highlights
| | |
| CLASS R1 SHARES | | |
| |
| Period ended | 2-28-071 | 2-29-08 |
| |
| Per share operating performance | | |
|
| Net asset value, beginning of period | $22.17 | $24.27 |
| Net investment income (loss)2 | (0.14)3 | (0.19) |
| Net realized and unrealized | | |
| gain (loss) on investments | 2.48 | (3.40) |
| Total from investment operations | 2.34 | (3.59) |
| Less distributions | | |
| From net realized gain | (0.24) | — 4 |
| Net asset value, end of period | $24.27 | $20.68 |
| Total return5,6 (%) | 10.587 | (14.77) |
| |
| Ratios and supplemental data | | |
|
| Net assets, end of period (in millions) | — 8 | — 8 |
| Ratios (as a percentage of average net assets): | | |
| Expenses before reductions | 24.209 | 15.83 |
| Expenses net of fee waivers, if any | 1.889 | 1.64 |
| Expenses net of all fee waivers and credits | 1.889 | 1.64 |
| Net investment income (loss) | (0.86)3,9 | (0.78) |
| Portfolio turnover (%) | 967 | 26210 |
1 Class R1 shares began operations on 6-12-06.
2 Based on the average of the shares outstanding.
3 Net investment loss per share and ratio of net investment loss to average net assets reflects a special dividend received by the Fund which amounted to $0.02 per share and 0.11% of average net assets.
4 Less than $0.01 per share.
5 Total returns would have been lower had certain expenses not been reduced during the periods shown.
6 Assumes dividend reinvestment.
7 Not annualized.
8 Less than $500,000.
9 Annualized.
10 Excludes merger activity.
See notes to financial statements
Growth Opportunities Fund | Annual report
32
F I N A N C I A L S T A T E M E N T S
Financial highlights
| | |
| CLASS 1 SHARES | | |
| |
| Period ended | 2-28-071 | 2-29-08 |
|
| Per share operating performance | | |
| | | |
| Net asset value, beginning of period | $22.17 | $24.42 |
| Net investment income (loss)2 | (0.02)3 | (0.05) |
| Net realized and unrealized | | |
| gain (loss) on investments | 2.51 | (3.45) |
| Total from investment operations | 2.49 | (3.50) |
| Less distributions | | |
| From net realized gain | (0.24) | — 4 |
| Net asset value, end of period | $24.42 | $20.92 |
| Total return5,6 (%) | 11.267 | (14.31) |
| |
| Ratios and supplemental data | | |
|
| Net assets, end of period (in millions) | — 8 | $1 |
| Ratios (as a percentage of average net assets): | | |
| Expenses before reductions | 3.819 | 1.81 |
| Expenses net of fee waivers, if any | 1.099 | 1.09 |
| Expenses net of all fee waivers and credits | 1.099 | 1.09 |
| Net investment income (loss) | (0.10)3,9 | (0.22) |
| Portfolio turnover (%) | 967 | 26210 |
1 Class 1 shares began operations on 6-12-06.
2 Based on the average of the shares outstanding.
3 Net investment loss per share and ratio of net investment loss to average net assets reflects a special dividend received by the Fund which amounted to $0.02 per share and 0.10% of average net assets.
4 Less than $0.01 per share.
5 Total returns would have been lower had certain expenses not been reduced during the periods shown.
6 Assumes dividend reinvestment.
7 Not annualized.
8 Less than $500,000.
9 Annualized.
10 Excludes merger activity.
See notes to financial statements
Annual report | Growth Opportunities Fund
33
Notes to financial statements
1. Organization
John Hancock Growth Opportunities Fund (the Fund) is a non-diversified series of John Hancock Funds III (the Trust). The Trust was established as a Massachusetts business trust on June 9, 2005. The Trust is registered under the Investment Company Act of 1940, as amended (the 1940 Act), as an open-end investment management company. The investment objective of the Fund is to seek long-term capital growth.
John Hancock Life Insurance Company of New York (John Hancock New York) is a wholly owned subsidiary of John Hancock Life Insurance Company (U.S.A.) (John Hancock USA). John Hancock USA and John Hancock New York are indirect wholly owned subsidiaries of The Manufacturers Life Insurance Company (Manulife), which in turn is a wholly owned subsidiary of Manulife Financial Corporation (MFC), a publicly traded company. MFC and its subsidiaries are known collectively as “Manulife Financial.”
John Hancock Investment Management Services, LLC (the Adviser), a Delaware limited liability company controlled by John Hancock USA, serves as investment adviser for the Trust and John Hancock Funds, LLC (the Distributor), a Delaware limited liability company, an affiliate of the Adviser, serves as principal underwriter.
The Board of Trustees have authorized the issuance of multiple classes of shares of the Fund, including classes designated as Class A, Class B, Class C, Class I, Class R1 and Class 1 shares. Class A, Class B and Class C shares are open to all retail investors. Class I shares are offered without any sales charge to various institutional and certain individual investors. Class R1 shares are available only to certain retirement plans. Class 1 shares are sold only to certain exempt separate accounts of John Hancock USA and John Hancock New York.
The shares of each class represent an interest in the same portfolio of investments of the Fund, and have equal rights as to voting, redemptions, dividends and liquidation, except that certain expenses, subject to the approval of the Board of Trustees, may be applied differently to each class of shares in accordance with current regulations of the Securities and Exchange Commission (SEC) and the Internal Revenue Service. Shareholders of a class that bear distribution and service expenses under the terms of a distribution plan have exclusive voting rights to that distribution plan. Class B shares will convert to Class A shares eight years after purchase.
The Adviser and other affiliates of John Hancock USA owned 4,557 shares of beneficial interest of Class R1 on February 29, 2008.
The Fund is the accounting and performance successor to the GMO Small/Mid Cap Growth Fund (the Predecessor Fund), a diversified open-end management investment company organized as a Massachusetts business trust. On June 12, 2006, the Fund acquired substantially all the assets and assumed the liabilities of the Predecessor Fund pursuant to an agreement and plan of reorganization, in exchange for Class A shares of the Fund.
2. Significant accounting policies
In the preparation of the financial statements, the Fund follows the policies described below. The preparation of financial statements in conformity with accounting principles generally accepted in the United States of America requires management to make estimates and assumptions that affect the reported amounts of assets and liabilities at the date of the financial statements and the reported amounts of income and expenses during the reporting period. Actual results may differ from these estimates.
Growth Opportunities Fund | Annual report
34
Security valuation
The net asset value of the shares of the Fund is determined daily as of the close of the New York Stock Exchange (NYSE), normally at 4:00 P.M., Eastern Time. Short-term debt investments that have a remaining maturity of 60 days or less are valued at amortized cost, and thereafter assume a constant amortization to maturity of any discount or premium, which approximates market value. Investments in John Hancock Cash Investment Trust (JHCIT), an affiliate of the John Hancock Advisers, LLC (JHA), a wholly owned subsidiary of John Hancock Financial Services, Inc., a subsidiary of MFC, are valued at their net asset value each business day. All other securities held by the Fund are valued at the last sale price or official closing price (closing bid price or last evaluated quote if no sale has occurred) as of the close of business on the principal securiti es exchange (domestic or foreign) on which they trade or, lacking any sales, at the closing bid price. Securities traded only in the over-the-counter market are valued at the last bid price quoted by brokers making markets in the securities at the close of trading. Securities for which there are no such quotations, principally debt securities, are valued based on the evaluated prices provided by an independent pricing service, which utilizes both dealer-supplied and electronic data processing techniques, which take into account factors such as institutional-size trading in similar groups of securities, yield, quality, coupon rate, maturity, type of issue, trading characteristics and other market data.
Other assets and securities for which no such quotations are readily available are valued at fair value as determined in good faith under consistently applied procedures established by and under the general supervision of the Board of Trustees. Generally, trading in non-U.S. securities is substantially completed each day at various times prior to the close of trading on the NYSE. The values of such securities used in computing the net asset value of a Fund’s shares are generally determined as of such times. Occasionally, significant events that affect the values of such securities may occur between the times at which such values are generally determined and the close of the NYSE. Upon such an occurrence, these securities will be valued at fair value as determined in good faith under consistently applied procedures established by and under the general supervision of the Board of Trustees.
In deciding whether to make a fair value adjustment to the price of a security, the Board of Trustees or their designee may review a variety of factors, including developments in foreign markets, the performance of U.S. securities markets and the performance of instruments trading in U.S. markets that represent foreign securities and baskets of foreign securities. The Fund may also fair value securities in other situations, for example, when a particular foreign market is closed, but the Fund is calculating the net asset value. In view of these factors, it is likely that Funds investing significant amounts of assets in securities in foreign markets will be fair valued more frequently than Funds investing signifi-cant amounts of assets in frequently traded, U.S. exchange listed securities of large-capitalization U.S. issuers.
For purposes of determining when fair value adjustments may be appropriate with respect to Funds that invest in securities in foreign markets that close prior to the NYSE, the Fund will, on an ongoing basis, monitor for “sig-nificant market events.” A significant market event may be a certain percentage change in the value of an index or of certain Exchange Traded Funds that track foreign markets in which Funds have significant investments. If a significant market event occurs due to a change in the value of the index or of Exchange Traded Funds, the pricing for the Fund will promptly be reviewed and potential adjustments to the net asset value of the Fund will be recommended to the Trust’s Pricing Committee when applicable.
Fair value pricing of securities is intended to help ensure that the net asset value of the Fund’s shares reflects the value of the Fund’s securities as of the close of the NYSE (as opposed to a value which is no longer accurate as of such close), thus limiting the opportunity for aggressive traders to purchase shares of the Fund at deflated prices, reflecting stale security
Annual report | Growth Opportunities Fund
35
valuations, and to promptly sell such shares at a gain. However, a security’s valuation may differ depending on the method used for determining value and no assurance can be given that fair value pricing of securities will successfully eliminate all potential opportunities for such trading gains.
New accounting pronouncements
In September 2006, Financial Accounting Standards Board (FASB) Standard No. 157, Fair Value Measurements (FAS 157), was issued and is effective for fiscal years beginning after November 15, 2007. FAS 157 defines fair value, establishes a framework for measuring fair value and expands disclosure about fair value measurements. As of February 29, 2008, management does not believe the adoption of FAS 157 will impact the amounts reported in the financial statements; however, additional disclosures regarding pricing sources will be required about the inputs used to develop the measurements of fair value and the related realized and unrealized gain/loss for certain securities valued by significant unobservable market inputs.
In March 2008, FASB No. 161 (FAS 161), Disclosures about Derivative Instruments and Hedging Activities, an amendment of FASB Statement No. 133 (FAS 133), was issued and is effective for fiscal years beginning after November 15, 2008. FAS 161 amends and expands the disclosure requirements of FAS 133 in order to provide financial statement users an understanding of a company’s use of derivative instruments, how derivative instruments are accounted for under FAS 133 and related interpretations and how these instruments affect a company’s financial position, performance, and cash flows. FAS 161 requires companies to disclose information detailing the objectives and strategies for using derivative instruments, the level of derivative activity entered into by the company, and any credit risk-related contingent features of the agreements. Management is currently evaluating the adoption of FAS 1 61 on the Fund’s financial statement disclosures
Guarantees and indemnifications
Under the Trust’s organizational documents, its Officers and Trustees are indemnified against certain liability arising out of the performance of their duties to the Trust. Additionally, in the normal course of business, the Trust enters into contracts with service providers that contain general indemnification clauses. The Trust’s maximum exposure under these arrangements is unknown, as this would involve future claims that may be made against the Trust that have not yet occurred.
Repurchase agreements
The Fund may enter into repurchase agreements. When the Fund enters into a repurchase agreement through its custodian, it receives delivery of securities, the amount of which at the time of purchase and each subsequent business day is required to be maintained at such a level that the market value is generally at least 102% of the repurchase amount. The Fund will take constructive receipt of all securities underlying the repurchase agreements it has entered into until such agreements expire. If the seller defaults, the Fund would suffer a loss to the extent that proceeds from the sale of underlying securities were less than the repurchase amount. The Fund may enter into repurchase agreements maturing within seven days with domestic dealers, banks or other finan-cial institutions deemed to be creditworthy by the Adviser. Collateral for certain tri-party repurchase agreements is held at the custodian bank in a segregated account for the benefit of the Fund and the counterp arty.
Security transactions and related investment income
Investment security transactions are accounted for on a trade date plus one basis for daily net asset value calculations. However, for financial reporting purposes, investment transactions are reported on trade date. Interest income is accrued as earned. Dividend income and distributions to shareholders are recorded on the ex-dividend date. Foreign dividends are recorded on the ex-date or when the Fund becomes aware of the dividends from cash collections. Discounts/premiums are accreted/ amortized for financial reporting purposes.
Growth Opportunities Fund | Annual report
36
Non-cash dividends are recorded at the fair market value of the securities received. Debt obligations may be placed in a non-accrual status and related interest income may be reduced by ceasing current accruals and writing off interest receivables when the collection of all or a portion of interest has become doubtful, based upon consistently applied procedures.
From time to time, the Fund may invest in Real Estate Investment Trusts (REITs) and, as a result, will estimate the components of distributions from these securities. Distributions from REITs received in excess of income are recorded as a reduction of cost of investments and/or as a realized gain.
The Fund uses the specific identification method for determining realized gain or loss on investments for both financial statement and federal income tax reporting purposes.
Allocations of income and expenses
All income, expenses (except class-specific expenses), and realized and unrealized gain/ loss are allocated to each class of shares based upon the relative net assets of each class. Dividends to shareholders from net investment income are determined at a class level and distributions from capital gains are determined at a Fund level.
Expenses not directly attributable to the Fund or share classes are allocated based on the relative share of net assets of the Fund or share class at the time the expense was incurred. Class-specific expenses, as detailed in Note 3, are accrued daily and charged directly to the respective share classes.
Securities lending
The Fund may lend portfolio securities from time to time in order to earn additional income. The Fund retains beneficial ownership of the securities it has loaned and continues to receive interest and dividends paid by the issuer of securities and to participate in any changes in their value. On the settlement date of the loan, the Fund receives collateral against the loaned securities and maintain collateral in an amount not less than 100% of the market value of the loaned securities during the period of the loan. The market value of the loaned securities is determined at the close of business of the Fund and any additional required collateral is delivered to the Fund on the next business day. Any cash collateral received is invested in the JHCIT. If the borrower defaults on its obligation to return the securities loaned because of insolvency or other reasons, a fund could experience delays and costs in recovering the securities loaned or in gaining access to the collateral. The Fund receives compensation for lending its securities either in the form of fees, guarantees, and/or by retaining a portion of interest on the investment of any cash received as collateral.
The Fund has entered into an agreement with Morgan Stanley & Co. Incorporated and MS Securities Services Inc. (collectively, Morgan Stanley), which permits the Fund to lend securities to Morgan Stanley on a principal basis. Morgan Stanley is the primary borrower of fund securities of the Fund. The risk of having one primary borrower of securities (as opposed to several borrowers in an agency relationship) is that should Morgan Stanley fail financially, all securities lent will be affected by the failure and by any delays in recovery of the securities (or in the rare event, loss of rights in the collateral).
Prior to May 8, 2007, cash collateral was invested in the State Street Navigator Securities Lending Portfolio. At February 29, 2008, the Fund loaned securities having a market value of $6,455,481 collateralized by securities in the amount of $6,584,591.
Futures
The Fund may purchase and sell financial futures contracts and options on those contracts. The Fund invests in contracts based on financial instruments, such as U.S. Treasury Bonds or Notes, or on securities indices, such as the Standard & Poor’s 500 Index, in order to hedge against a decline in the value of securities owned by the Fund.
Initial margin deposits required upon entering into futures contracts are satisfied by the delivery of specific securities or cash as collateral to the broker (the Fund’s agent in acquiring the futures position). If the position is closed out by taking an opposite position prior to the settlement date of the futures contract, a final
Annual report | Growth Opportunities Fund
37
determination of variation margin is made, cash is required to be paid to or released by the broker and the Fund realizes a gain or loss.
When the Fund sells a futures contract based on a financial instrument, the Fund becomes obligated to deliver that kind of instrument at an agreed upon date for a specified price. The Fund realizes a gain or loss depending on whether the price of an offsetting purchase is less or more than the price of the initial sale or on whether the price of an offsetting sale is more or less than the price of the initial purchase. The Fund could be exposed to risks if it could not close out futures positions because of an illiquid secondary market or the inability of counterparties to meet the terms of their contracts. Futures contracts are valued at the quoted daily settlement prices established by the exchange on which they trade.
The following is a summary of open futures contracts at February 29, 2008:
| | | | | |
| | | | | | UNREALIZED |
| | NUMBER OF | | EXPIRATION | NOTIONAL | APPRECIATION |
| OPEN CONTRACTS | CONTRACTS | POSITION | DATE | VALUE | (DEPRECIATION) |
|
| Russell 2000 Mini | | | | | |
| Index Futures | 5 | Long | Mar 2008 | $343,400 | ($15,752) |
| S&P Mid 400 E-mini | | | | | |
| Index Futures | 5 | Long | Mar 2008 | 394,700 | (10,673) |
| | | | | | ($26,425) |
Federal income taxes
The Fund qualifies as a regulated investment company by complying with the applicable provisions of the Internal Revenue Code and will not be subject to federal income tax on taxable income that is distributed to shareholders. Therefore, no federal income tax provision is required. For federal income tax purposes, the Fund had $33,521,041 of a capital loss car-ryforward available, to the extent provided by regulations, to offset future net realized capital gains. To the extent that such carryforward is used by the Fund, no capital gain distributions will be made. The loss carryforward expires as follows: February 28, 2009 — $8,514,595 and February 28, 2010 — $25,006,446. Availability of a certain amount of the loss carryforwards, which were acquired on May 25, 2007 in a merger with the John Hancock Mid Cap Growth Fund, may be limited in a given year. Net capital losses of $13,634,044 that are attributable to security transactions incurred after October 31, 2007 , are treated as arising on March 1, 2008, the first day of the Fund’s next taxable year.
The Fund has adopted the provisions of FASB Interpretation No. 48, Accounting for Uncertainty in Income Taxes, an interpretation of FASB Statement 109 (FIN 48), at the beginning of the Fund’s fiscal year. FIN 48 prescribes a minimum threshold for financial statement recognition of the benefit of a tax position taken or expected to be taken in a tax return. The implementation of FIN 48 did not have a material impact on the Fund’s financial statements. Each of the Fund’s federal tax returns for the prior fiscal years remains subject to examination by the Internal Revenue Service.
Distribution of income and gains
The Fund records distributions to shareholders from net investment income and net realized gains, if any, on the ex-dividend date. During the year ended February 28, 2007, the tax character of distributions paid was as follows: ordinary income $37,434 and long-term capital gain $12,476. During the year ended February 29, 2008, the tax character of distributions paid was as follows: long-term capital gain $21,552. Distributions paid by the Fund with respect to each class of shares are calculated in the same manner, at the same time and are in the same amount, except for the effect of expenses that may be applied differently to each class.
As of February 29, 2008, there were no distributable earnings on a tax basis.
Such distributions and distributable earnings, on a tax basis, are determined in conformity with income tax regulations, which may differ from accounting principles generally accepted in the United States of America. Distributions
Growth Opportunities Fund | Annual report
38
in excess of tax basis earnings and profits, if any, are reported in the Fund’s financial statements as a return of capital.
Capital accounts within financial statements are adjusted for permanent book/tax differences. These adjustments have no impact on net assets or the results of operations. Temporary book/ tax differences will reverse in a subsequent period. Permanent book/tax differences are primarily attributable to net operating losses, expiration of capital loss carryforwards and merger-related transactions.
3. Investment advisory and other agreements
The Trust has entered into an Investment Advisory Agreement with the Adviser. The Adviser is responsible for managing the corporate and business affairs of the Trust and for selecting and compensating subadvisers to handle the investment of the assets of the Fund, subject to the supervision of the Trust’s Board of Trustees. As compensation for its services, the Adviser receives an advisory fee from the Trust. Under the Advisory Agreement, the Fund pays a monthly management fee to the Adviser equivalent, on an annual basis, to the sum of: (a) 0.80% of the first $500,000,000 of the Fund’s aggregate daily net assets; (b) 0.78% of the next $500,000,000 of the Fund’s aggregate daily net assets; (c) 0.77% of the next $1,500,000,000 of the Fund’s aggregate daily net assets; and (d) 0.76% of the Fund’s aggregate daily net assets in excess of $2,500,000,000. Aggregate net assets include the net assets of the Fund and Growth Opportunities Trust, a series o f John Hancock Trust, and Growth Opportunities Fund, a series of John Hancock Funds II. The Adviser has a subadvisory agreement with Grantham, Mayo, Van Otterloo & Co. LLC. The Fund is not responsible for payment of the subadvisory fees.
The investment management fees incurred for the year ended February 29, 2008, were equivalent to an annual effective rate of 0.80% of the Fund’s average daily net assets.
Expense reimbursements
The Adviser has contractually agreed to reimburse or limit certain Fund level expenses to 0.24% of the Fund’s average annual net assets which are allocated pro rata to all share classes. Furthermore, the Adviser has voluntarily agreed to reimburse or limit these Fund level expenses to 0.20% for the period from May 26, 2007 to February 29, 2008. The agreements exclude taxes, portfolio brokerage commissions, interest, advisory fees, Rule 12b-1 fees, transfer agency fees, blue sky fees, printing and postage and litigation and indemnification expenses and other extraordinary expenses not incurred in the ordinary course of the Fund’s business. In addition, fees incurred under any agreement or plans of the Fund dealing with services for the shareholders and others with beneficial interest in shares of the Fund, are excluded.
In addition, the Adviser has agreed to reimburse or limit certain expenses for each share class. This agreement excludes taxes, portfolio brokerage commissions, interest and litigation and indemnification expenses and other extraordinary expenses not incurred in the ordinary course of the Fund’s business. In addition, fees incurred under any agreement or plans of the Fund dealing with services for the shareholders and others with beneficial interest in shares of the Fund, are excluded. The reimbursements and limits are such that these expenses will not exceed 1.54% for Class A shares, 2.24% for Class B, 2.24% for Class C, 1.00% for Class I, 1.64% for Class R1 and 1.09% for Class 1. Prior to September 28, 2007, the expense limitation for Class I was 1.14% . Accordingly, the expense reductions or reimbursements related to this agreement were $183,313, $45,918, $24,631, $19,164, $16,539 and $2,473 for Class A, Class B, Class C, Class I, Class R1 and Class 1, respective ly for the year ended February 29, 2008. The expense reimbursements and limits will continue in effect until June 30, 2008 and thereafter until terminated by the Adviser on notice to the Trust.
Fund administration fees
Pursuant to the Advisory Agreement, the Fund reimburses the Adviser for all expenses associated with providing the administrative, financial, legal, accounting and recordkeeping services of the Fund, including the preparation of all tax returns, annual, semiannual and periodic reports to shareholders and the
Annual report | Growth Opportunities Fund
39
preparation of all regulatory reports. These expenses are allocated based on the relative share of net assets of each class at the time the expense was incurred.
The fund administration fees incurred for the year ended February 29, 2008, were $21,947 with an annual effective rate of 0.03% of the Fund’s average daily net assets.
Distribution and shareholder servicing fees
The Trust has a Distribution Agreement with the Distributor. The Fund has adopted Distribution Plans with respect to Class A, Class B, Class C, Class R1 and Class 1, pursuant to Rule 12b-1 under the 1940 Act, to pay the Distributor for the services it provides as distributor of shares of the Fund. Accordingly, the Fund makes monthly payments to the Distributor at an annual rate not to exceed 0.30%, 1.00%, 1.00%, 0.50% and 0.05% of average daily net asset value of Class A, Class B, Class C, Class R1 and Class 1, respectively. A maximum of 0.25% of such payments may be service fees, as defined by the Conduct Rules of Financial Industry Regulatory Authority (formerly the National Association of Securities Dealers). Under the Conduct Rules, curtailment of a portion of the Fund’s 12b-1 payments could occur under certain circumstances.
In addition, the Fund has also adopted a Service Plan for Class R1 shares. Under the Service Plan, the Fund may pay up to 0.25% of Class R1 average daily net asset value for certain other services. There were no Service Plan fees incurred for the year ended February 29, 2008.
Sales charges
Class A shares are assessed up-front sales charges of up to 5.00% of net asset value of such shares. During the year ended February 29, 2008, the Fund was informed that the Distributor received net up-front sales charges of $49,772 with regard to sales of Class A shares. Of this amount, $5,770 was retained and used for printing prospectuses, advertising, sales literature and other purposes; $37,625 was paid as sales commissions to unrelated broker-dealers; and $6,377 was paid as sales commissions to sales personnel of Signator Investors, Inc. (Signator Investors), a related broker-dealer, an indirect subsidiary of MFC.
Class B shares that are redeemed within six years of purchase are subject to a contingent deferred sales charge (CDSC) at declining rates, beginning at 5.00% of the lesser of the current market value at the time of redemption or the original purchase cost of the shares being redeemed. Class C shares that are redeemed within one year of purchase are subject to a CDSC at a rate of 1.00% of the lesser of the current market value at the time of redemption or the original purchase cost of the shares being redeemed. Proceeds from the CDSCs are paid to the Distributor and are used, in whole or in part, to defray its expenses for providing distribution-related services to the Fund in connection with the sale of Class B and Class C shares. During the year ended February 29, 2008, CDSCs received by Distributor amounted to $26,428 for Class B shares and $420 for Class C shares.
Transfer agent fees
The Fund has a Transfer Agency Agreement with John Hancock Signature Services, Inc. (Signature Services), an indirect subsidiary of MFC. For Class A, Class B, Class C, Class I and Class R1 shares, the Fund pays a monthly transfer agent fee at an annual rate of 0.05% of each class’ average daily net assets, plus a fee based on the number of shareholder accounts and reimbursement for certain out-of-pocket expenses. Expenses not directly attributable to a particular class of shares are aggregated and allocated to each class on the basis of its relative net asset value. The Fund pays a monthly fee which is based on an annual rate of $15.00 for each Class A shareholder account, $17.50 for each Class B shareholder account, $16.50 for each Class C shareholder account and $15.00 for each Class R1 shareholder account.
Signature Services has agreed to limit the transfer agent fees so that such fees do not exceed 0.20% annually of Class A, Class B, Class C, Class I and Class R1 share average daily net assets. This agreement is effective until December 31, 2008. Signature Services reserves the right to terminate this limitation in the
Growth Opportunities Fund | Annual report
40
future. There were no transfer agent fee reductions for Class A, Class B, Class C, Class I and Class R1 shares, respectively, during the year ended February 29, 2008.
In addition, Signature Services has voluntarily agreed to further limit transfer agent fees for Class R1 shares so that such fees do not exceed 0.05% annually of each class’s average daily net assets. For the year ended February 29, 2008, the transfer agent fees reductions for Class R1 were $179.
In May 2007, the Fund began receiving earnings credits from its transfer agent as a result of uninvested cash balances. These credits are used to reduce a portion of the Fund’s transfer agent fees and out-of-pocket expenses. During the year ended February 29, 2008, the Fund’s transfer agent fees and out-of-pocket expenses were reduced by $7,657 for transfer agent credits earned.
Class level expenses for the year ended February 29, 2008, were as follows:
| | | | |
| | Distribution and | Transfer | | Printing and |
| Share class | service fees | agent fees | Blue sky fees | postage fees |
|
| |
| Class A | $207,247 | $136,441 | $16,783 | $39,243 |
| Class B | 128,950 | 29,279 | 15,557 | 6,611 |
| Class C | 27,611 | 5,726 | 15,396 | 1,687 |
| Class I | — | 94 | 17,637 | 321 |
| Class R1 | 589 | 240 | 15,879 | 3 |
| Class 1 | 171 | — | — | 273 |
| Total | $364,568 | $171,780 | $81,252 | $48,138 |
4. Trustees’ fees
The Trust compensates each Trustee who is not an employee of the Adviser or its affiliates. Total Trustees’ expenses are allocated to the Fund based on its average daily net asset value.
5. Line of credit
The Fund has entered into an agreement which enables them to participate in a $100 million unsecured committed line of credit with State Street Corporation. Borrowings will be made solely to temporarily finance the repurchase of capital shares. Interest is charged to the Fund based on its borrowings at a rate per annum equal to the Federal Funds rate plus 0.50%. In addition, a commitment fee of 0.05% per annum, payable at the end of each calendar quarter, based on the average daily-unused portion of the line of credit, is charged to the Fund on a prorated basis based on average net assets. Effective October 15, 2007, the commitment fee was changed from 0.07% to 0.05% . For the year ended February 29, 2008, there were no borrowings under the line of credit.
Annual report | Growth Opportunities Fund
41
6. Fund share transactions
Share activities for the Fund for the years ended February 28, 2007, and February 29, 2008, were as follows:
| | | | |
| | Year ended 2-28-071 | Year ended 2-29-08 |
| | Shares | Amount | Shares | Amount |
| Class A shares | | | | |
|
| Sold | 134,743 | $3,150,486 | 199,710 | $4,734,281 |
| Issued in reorganization (Note 8) | — | — | 3,812,316 | 97,964,692 |
| Distributions reinvested | 1,586 | 37,457 | 717 | 16,781 |
| Repurchased | (4,238) | (100,934) | (769,487) | (18,231,640) |
| Net increase (decrease) | 132,091 | $3,087,009 | 3,243,256 | $84,484,114 |
| | | | | |
| Class B shares | | | | |
|
| Sold | 16,576 | $380,025 | 44,734 | $1,047,067 |
| Issued in reorganization (Note 8) | — | — | 781,214 | 19,954,400 |
| Distributions reinvested | 89 | 2,095 | 138 | 3,188 |
| Repurchased | (64) | (1,503) | (228,240) | (5,308,318) |
| Net increase (decrease) | 16,601 | $380,617 | 597,846 | $15,696,337 |
| | | | | |
| Class C shares | | | | |
|
| Sold | 26,822 | $617,497 | 23,285 | $556,494 |
| Issued in reorganization (Note 8) | — | — | 126,693 | 3,236,288 |
| Distributions reinvested | 112 | 2,625 | 26 | 597 |
| Repurchased | (1) | (14) | (54,551) | (1,266,527) |
| Net increase (decrease) | 26,933 | $620,108 | 95,453 | $2,526,852 |
| | | | | |
| Class I shares | | | | |
|
| Sold | 8,222 | $183,402 | 1,206 | $29,806 |
| Issued in reorganization (Note 8) | — | — | 2,191 | 56,536 |
| Distributions reinvested | 76 | 1,806 | — | 7 |
| Repurchased | — | — | (11,091) | (267,783) |
| Net increase (decrease) | 8,298 | $185,208 | (7,694) | ($181,434) |
| | | | | |
| Class R1 shares | | | | |
|
| Sold | 4,574 | $101,500 | 1,329 | $30,792 |
| Distributions reinvested | 46 | 1,078 | 1 | 26 |
| Repurchased | — | — | (166) | (3,725) |
| Net increase (decrease) | 4,620 | $102,578 | 1,164 | $27,093 |
| | | | | |
| Class 1 shares | | | | |
|
| Sold | 10,706 | $250,671 | 27,623 | $639,853 |
| Distributions reinvested | 46 | 1,082 | 3 | 69 |
| Repurchased | (13) | (317) | (14,096) | (345,724) |
| Net increase (decrease) | 10,739 | $251,436 | 13,530 | $294,198 |
| | | | | |
| Net increase (decrease) | 199,282 | $4,626,956 | 3,943,555 | $102,847,160 |
|
1Period from 6-12-06 (commencement of operations) to 2-28-07 for Class B, Class C, Class I and Class R1.
Growth Opportunities Fund | Annual report
42
7. Purchases and sales of securities
Purchases and proceeds from sales or maturities of securities, other than short-term securities and obligations of the U.S. government, during the year ended February 29, 2008, aggregated $217,661,800 and $238,928,994, respectively.
8. Reorganization
On June 12, 2006, the Fund acquired substantially all of the assets and liabilities of the Predecessor Fund in exchange solely for Class A shares of the Fund. The acquisition was accounted for as a tax-free exchange of 81,480 Class A shares of the Fund for the net assets of the Predecessor Fund, which amounted to $1,806,642, including $14,098 of unrealized depreciation, after the close of business on June 9, 2006. Accounting and performance history of the Predecessor Fund was redesignated as that of Class A of the Fund.
On May 9, 2007, the shareholders of John Hancock Mid Cap Growth Fund (Mid Cap Growth Fund) approved an Agreement and Plan of Reorganization, which provided for the transfer of substantially all of the assets and liabilities of the Mid Cap Growth Fund in exchange for Class A, Class B, Class C and Class I shares of the Fund. The acquisition was accounted for as a tax-free exchange of 3,812,316 Class A shares, 781,214 Class B shares, 126,693 Class C shares and 2,191 Class I shares of the Fund for the net assets of the Mid Cap Growth Fund, which amounted to $97,964,692, $19,954,400, $3,236,288 and $56,536 for Class A, Class B, Class C and Class I shares of the Mid Cap Growth Fund, respectively, including the total of $21,282,022 of unrealized appreciation, after the close of business on May 25, 2007.
9. Legal and regulatory matters
On June 25, 2007, the Adviser and the Distributor and two of their affiliates (collectively, the John Hancock Affiliates) reached a settlement with the SEC that resolved an investigation of certain practices relating to the John Hancock Affiliates’ variable annuity and mutual fund operations involving directed brokerage and revenue sharing. Under the terms of the settlement, each John Hancock Affiliate was censured and agreed to pay a $500,000 civil penalty to the United States Treasury. In addition, the Adviser and the Distributor agreed to pay disgorgement of $2,087,477 and prejudgment interest of $359,460 to entities, including certain John Hancock Funds, that participated in the Adviser’s directed brokerage program during the period from 2000 to October 2003. Collectively, all John Hancock Affiliates agreed to pay a total disgorgement of $16,926,420 and prejudgment interest of $2,361,460 to the entities advised or distributed by John Hancock Affiliates. The Adviser discontinued the use of directed brokerage in recognition of the sale of fund shares in October 2003. One of the parties to this settlement was the Mid Cap Growth Fund, which, as noted above, was acquired by the Fund in May 2007. As a result of this settlement, the Fund received $172,697, which was recorded as a realized gain to the Fund’s books on June 25, 2007.
Annual report | Growth Opportunities Fund
43
Auditors’ report
Report of Independent Registered Public Accounting Firm
To the Board of Trustees of John Hancock Funds III and Shareholders of John Hancock Growth Opportunities Fund,
In our opinion, the accompanying statement of assets and liabilities, including the schedule of investments, and the related statements of operations and of changes in net assets and the financial highlights present fairly, in all material respects, the financial position of John Hancock Growth Opportunities Fund (the Fund) at February 29, 2008, and the results of its operations, the changes in its net assets and the financial highlights for each of the periods indicated, in conformity with accounting principles generally accepted in the United States of America. These financial statements and financial highlights (hereafter referred to as “financial statements”) are the responsibility of the Fund’s management. Our responsibility is to express an opinion on these financial statements based on our audits. We conducted our audits of these financial statements in accordance with the standards of the Public Company Accounting Oversight Board (United States). Those standards require that we plan and perform the audits to obtain reasonable assurance about whether the financial statements are free of material misstatement. An audit includes examining, on a test basis, evidence supporting the amounts and disclosures in the financial statements, assessing the accounting principles used and significant estimates made by management, and evaluating the overall financial statement presentation. We believe that our audits, which included confirmation of investments at February 29, 2008 by correspondence with the custodian and brokers, provide a reasonable basis for our opinion.
PricewaterhouseCoopers LLP
Boston, Massachusetts
April 18, 2008
Growth Opportunities Fund | Annual report
44
Tax information
Unaudited
For federal income tax purposes, the following information is furnished with respect to the distributions of the Fund, if any, paid during its taxable year ended February 29, 2008.
The Fund has designated distributions to shareholders of $21,552 as a long-term capital gain dividend.
Shareholders will be mailed a 2008 U.S. Treasury Department Form 1099-DIV in January 2009. This will reflect the total of all distributions that are taxable for calendar year 2008.
Annual report | Growth Opportunities Fund
45
Trustees and Officers
This chart provides information about the Trustees and Officers who oversee your John Hancock fund. Officers elected by the Trustees manage the day-to-day operations of the Fund and execute policies formulated by the Trustees.
| | |
| Independent Trustees | | |
| |
| Name, Year of Birth | | Number of |
| Position(s) held with Fund | Trustee | John Hancock |
| Principal occupation(s) and other | of Fund | funds overseen |
| directorships during past 5 years | since1 | by Trustee |
| |
| James F. Carlin, Born: 1940 | 2006 | 55 |
|
| Chairman (since December 2007); Director and Treasurer, Alpha Analytical Laboratories, Inc. (chemical |
| analysis) (since 1985); Part Owner and Treasurer, Lawrence Carlin Insurance Agency, Inc. (since 1995); |
| Part Owner and Vice President, Mone Lawrence Carlin Insurance Agency, Inc. (until 2005); Chairman |
| and Chief Executive Officer, Carlin Consolidated, Inc. (management/investments) (since 1987); Trustee, |
| Massachusetts Health and Education Tax Exempt Trust (1993–2003). | | |
|
| |
| William H. Cunningham, Born: 1944 | 2006 | 55 |
|
| Professor, University of Texas at Austin (since 1971); former Chancellor, University of Texas System and |
| former President, University of Texas at Austin (until 2001); Chairman and Chief Executive Officer, IBT |
| Technologies (until 2001); Director of the following: Hicks Acquisition Company I, Inc. (since 2007); |
| Hire.com (until 2004), STC Broadcasting, Inc. and Sunrise Television Corp. (until 2001), Symtx, Inc. |
| (electronic manufacturing) (since 2001), Adorno/Rogers Technology, Inc. (until 2004), Pinnacle |
| Foods Corporation (until 2003), rateGenius (until 2003), Lincoln National Corporation (insurance) |
| (since 2006), Jefferson-Pilot Corporation (diversified life insurance company) (until 2006), New |
| Century Equity Holdings (formerly Billing Concepts) (until 2001), eCertain (until 2001), ClassMap.com |
| (until 2001), Agile Ventures (until 2001), AskRed.com (until 2001), Southwest Airlines (since 2000), |
| Introgen (manufacturer of biopharmaceuticals) (since 2000) and Viasystems Group, Inc. (electronic |
| manufacturer) (until 2003); Advisory Director, Interactive Bridge, Inc. (college fundraising) (until 2001); |
| Advisory Director, Q Investments (until 2003); Advisory Director, JPMorgan Chase Bank (formerly Texas |
| Commerce Bank–Austin), LIN Television (until 2008), WilTel Communications (until 2003) and Hayes |
| Lemmerz International, Inc. (diversified automotive parts supply company) (since 2003). | |
|
| |
| Charles L. Ladner,2 Born: 1938 | 2006 | 55 |
|
| Chairman and Trustee, Dunwoody Village, Inc. (retirement services) (until 2003); Senior Vice President |
| and Chief Financial Officer, UGI Corporation (public utility holding company) (retired 1998); Vice |
| President and Director, AmeriGas, Inc. (retired 1998); Director, AmeriGas Partners, L.P. (gas distribution) |
| (until 1997); Director, EnergyNorth, Inc. (until 1997); Director, Parks and History Association (until 2005). |
|
| |
| John A. Moore,2 Born: 1939 | 2006 | 55 |
|
| President and Chief Executive Officer, Institute for Evaluating Health Risks (nonprofit institution) |
| (until 2001); Senior Scientist, Sciences International (health research) (until 2003); Former Assistant |
| Administrator and Deputy Administrator, Environmental Protection Agency; Principal, Hollyhouse |
| (consulting) (since 2000); Director, CIIT Center for Health Science Research (nonprofit research) |
| (until 2007). | | |
Growth Opportunities Fund | Annual report
46
| | |
| Independent Trustees (continued) | | |
| |
| Name, Year of Birth | | Number of |
| Position(s) held with Fund | Trustee | John Hancock |
| Principal occupation(s) and other | of Fund | funds overseen |
| directorships during past 5 years | since1 | by Trustee |
| |
| Patti McGill Peterson,2 Born: 1943 | 2006 | 55 |
|
| Senior Associate, Institute for Higher Education Policy (since 2007); Executive Director, Council for |
| International Exchange of Scholars and Vice President, Institute of International Education (until 2007); |
| Senior Fellow, Cornell Institute of Public Affairs, Cornell University, Ithaca, NY (until 1998); Former |
| President, Wells College, Aurora, NY, and St. Lawrence University, Canton, NY; Director, Niagara |
| Mohawk Power Corporation (until 2003); Director, Ford Foundation, International Fellowships Program |
| (since 2002); Director, Lois Roth Endowment (since 2002); Director, Council for International Educational |
| Exchange (since 2003). | | |
|
| |
| Steven R. Pruchansky, Born: 1944 | 2006 | 55 |
|
| Chairman and Chief Executive Officer, Greenscapes of Southwest Florida, Inc. (since 2000); Director and |
| President, Greenscapes of Southwest Florida, Inc. (until 2000); Managing Director, JonJames, LLC (real |
| estate) (since 2000); Director, First Signature Bank & Trust Company (until 1991); Director, Mast Realty |
| Trust (until 1994); President, Maxwell Building Corp. (until 1991). | | |
| |
| Non-Independent Trustees3 | | |
| |
| Name, Year of Birth | | Number of |
| Position(s) held with Fund | Trustee | John Hancock |
| Principal occupation(s) and other | of Fund | funds overseen |
| directorships during past 5 years | since1 | by Trustee |
| |
| James R. Boyle, Born: 1959 | 2006 | 265 |
|
| Executive Vice President, Manulife Financial Corporation (since 1999); President, John Hancock Variable |
| Life Insurance Company (since March 2007); Executive Vice President, John Hancock Life Insurance |
| Company (since 2004); Chairman and Director, John Hancock Advisers, LLC (the Adviser), John Hancock |
| Funds, LLC and The Berkeley Financial Group, LLC (The Berkeley Group) (holding company) (since 2005); |
| Senior Vice President, The Manufacturers Life Insurance Company (U.S.A.) (until 2004). | |
Annual report | Growth Opportunities Fund
47
| |
| Principal officers who are not Trustees | |
| |
| Name, Year of Birth | |
| Position(s) held with Fund | Officer |
| Principal occupation(s) and other | of Fund |
| directorships during past 5 years | since |
| |
| Keith F. Hartstein, Born: 1956 | 2006 |
|
| President and Chief Executive Officer | |
| Senior Vice President, Manulife Financial Corporation (since 2004); Director, President and Chief | |
| Executive Officer, the Adviser, The Berkeley Group and John Hancock Funds, LLC (since 2005); Director, |
| MFC Global Investment Management (U.S.), LLC (MFC Global (U.S.)) (since 2005); Director, John | |
| Hancock Signature Services, Inc. (since 2005); President and Chief Executive Officer, John Hancock |
| Investment Management Services, LLC (since 2006); President and Chief Executive Officer, John Hancock |
| Funds, John Hancock Funds II, John Hancock Funds III and John Hancock Trust (since 2005); Director, |
| Chairman and President, NM Capital Management, Inc. (since 2005); Member, Investment Company |
| Institute Sales Force Marketing Committee (since 2003); President and Chief Executive Officer, MFC |
| Global (U.S.) (2005–2006); Executive Vice President, John Hancock Funds, LLC (until 2005). | |
| |
| |
| Thomas M. Kinzler, Born: 1955 | 2006 |
|
| Secretary and Chief Legal Officer | |
| Vice President and Counsel, John Hancock Life Insurance Company (U.S.A.) (since 2006); Secretary and |
| Chief Legal Officer, John Hancock Funds and John Hancock Funds II (since 2006); Chief Legal Officer |
| and Assistant Secretary, John Hancock Trust (since 2006); Vice President and Associate General Counsel, |
| Massachusetts Mutual Life Insurance Company (1999–2006); Secretary and Chief Legal Counsel, MML |
| Series Investment Fund (2000–2006); Secretary and Chief Legal Counsel, MassMutual Institutional Funds |
| (2000–2004); Secretary and Chief Legal Counsel, MassMutual Select Funds and MassMutual Premier |
| Funds (2004–2006). | |
| |
| |
| Francis V. Knox, Jr., Born: 1947 | 2006 |
|
| Chief Compliance Officer | |
| Vice President and Chief Compliance Officer, John Hancock Investment Management Services, LLC, |
| the Adviser and MFC Global (U.S.) (since 2005); Vice President and Chief Compliance Officer, John |
| Hancock Funds, John Hancock Funds II, John Hancock Funds III and John Hancock Trust (since 2005); |
| Vice President and Assistant Treasurer, Fidelity Group of Funds (until 2004); Vice President and Ethics & |
| Compliance Officer, Fidelity Investments (until 2001). | |
| |
| |
| Charles A. Rizzo, Born: 1957 | 2007 |
|
| Chief Financial Officer | |
| Chief Financial Officer, John Hancock Funds, John Hancock Funds II, John Hancock Funds III and John |
| Hancock Trust (since June 2007); Assistant Treasurer, Goldman Sachs Mutual Fund Complex (regis- |
| tered investment companies) (2005–June 2007); Vice President, Goldman Sachs (2005–June 2007); |
| Managing Director and Treasurer of Scudder Funds, Deutsche Asset Management (2003–2005); | |
| Director, Tax and Financial Reporting, Deutsche Asset Management (2002–2003); Vice President and |
| Treasurer, Deutsche Global Fund Services (Deutsche Registered Investment Companies) (1999–2002). |
| |
| |
| Gordon M. Shone, Born: 1956 | 2006 |
|
| Treasurer | |
| Senior Vice President, John Hancock Life Insurance Company (U.S.A.) (since 2001); Treasurer, John |
| Hancock Funds (since 2006), John Hancock Funds II, John Hancock Funds III and John Hancock Trust |
| (since 2005); Vice President and Chief Financial Officer, John Hancock Trust (2003–2005); Vice President, |
| John Hancock Investment Management Services, Inc., John Hancock Advisers, LLC (since 2006) and The |
| Manufacturers Life Insurance Company (U.S.A.) (1998–2000). | |
Growth Opportunities Fund | Annual report
48
Principal officers who are not Trustees (continued)
| |
| Name, Year of Birth | |
| Position(s) held with Fund | Officer |
| Principal occupation(s) and other | of Fund |
| directorships during past 5 years | since |
| |
| John G. Vrysen, Born: 1955 | 2006 |
|
| Chief Operating Officer | |
| Senior Vice President, Manulife Financial Corporation (since 2006); Director, Executive Vice President |
| and Chief Operating Officer, the Adviser, The Berkeley Group and John Hancock Funds, LLC (since | |
| June 2007); Executive Vice President and Chief Operating Officer, John Hancock Investment | |
| Management Services, LLC (since December 2007); Chief Operating Officer, John Hancock Funds, |
| John Hancock Funds II, John Hancock Funds III and John Hancock Trust (since June 2007); Director, |
| Executive Vice President and Chief Financial Officer, the Adviser, The Berkeley Group and John Hancock |
| Funds, LLC (2005–2007); Executive Vice President and Chief Financial Officer, John Hancock Investment |
| Management Services, LLC (2005–2007); Executive Vice President and Chief Financial Officer, MFC |
| Global (U.S.) (2005 until August 2007); Director, John Hancock Signature Services, Inc. (since 2005); |
| Chief Financial Officer, John Hancock Funds, John Hancock Funds II, John Hancock Funds III and John |
| Hancock Trust (2005 until June 2007); Vice President and General Manager, John Hancock Fixed | |
| Annuities, U.S. Wealth Management (2004–2005); Vice President, Operations, Manulife Wood Logan |
| (2000–2004). | |
The business address for all Trustees and Officers is 601 Congress Street, Boston, Massachusetts 02210-2805.
The Statement of Additional Information of the Fund includes additional information about members of the Board of Trustees of the Fund and is available without charge, upon request, by calling 1-800-225-5291.
1 Each Trustee serves until resignation, retirement age or until his or her successor is elected.
2 Member of Audit and Compliance Committee.
3 Non-Independent Trustee holds positions with the Fund’s investment adviser, underwriter and certain other affiliates.
Annual report | Growth Opportunities Fund
49
For more information
The Fund’s proxy voting policies, procedures and records are available without charge, upon request:
| | |
| By phone | On the Fund’s Web site | On the SEC’s Web site |
| 1-800-225-5291 | www.jhfunds.com/proxy | www.sec.gov |
|
| |
| Investment adviser | Custodian | Legal counsel |
| John Hancock Investment | State Street Bank & Trust Co. | Kirkpatrick & Lockhart |
| Management Services, LLC | 2 Avenue de Lafayette | Preston Gates Ellis LLP |
| 601 Congress Street | Boston, MA 02111 | One Lincoln Street |
| Boston, MA 02210-2805 | | Boston, MA 02111-2950 |
| | Transfer agent | |
| Subadviser | John Hancock Signature | Independent registered public |
| Grantham, Mayo, Van | Services, Inc. | accounting firm |
| Otterloo & Co. LLC | P.O. Box 9510 | PricewaterhouseCoopers LLP |
| 40 Rowes Wharf | Portsmouth, NH 03802-9510 | 125 High Street |
| Boston, MA 02110 | | Boston, MA 02110 |
| | | |
| Principal distributor | | |
| John Hancock Funds, LLC | | |
| 601 Congress Street | | |
| Boston, MA 02210-2805 | | |
| | |
| How to contact us | |
|
| Internet | www.jhfunds.com | |
|
| Mail | Regular mail: | Express mail: |
| | John Hancock Signature | John Hancock Signature |
| | Services, Inc. | Services, Inc. |
| | P.O. Box 9510 | Mutual Fund Image Operations |
| | Portsmouth, NH 03802-9510 | 164 Corporate Drive |
| | | Portsmouth, NH 03801 |
|
| |
| Phone | Customer service representatives | 1-800-225-5291 |
| | EASI-Line | 1-800-338-8080 |
| | TDD line | 1-800-554-6713 |
A listing of month-end portfolio holdings is available on our Web site, www.jhfunds.com. A more detailed portfolio holdings summary is available on a quarterly basis 60 days after the fiscal quarter on our Web site or upon request by calling 1-800-225-5291, or on the SEC’s Web site, www.sec.gov.
Growth Opportunities Fund | Annual report
50

1-800-225-5291
1-800-554-6713 TDD
1-800-338-8080 EASI-Line
www.jhfunds. com
Now available: electronic delivery
www.jhfunds.com/edelivery
| | |
| This report is for the information of the shareholders of John Hancock Growth Opportunities Fund. | 8400A | 2/08 |
| It is not authorized for distribution to prospective investors unless preceded or accompanied by a prospectus. | | 4/08 |

Discussion of Fund performance
By Grantham, Mayo, Van Otterloo & Co. LLC (GMO)
U.S. stocks went on a wild ride during the 12-month period highlighted both by record highs for broad market indexes and conditions deemed poor enough to warrant numerous interventions by the Federal Reserve. For the period in full, the Standard & Poor’s 500 Index finished down 3.60%, a modest move that belied its frequent violent gyrations. Growth stocks outpaced value stocks during the period. Telecommunication services, financials and consumer discretionary were the worst-performing sectors in the Russell 1000 Growth Index, while energy stocks performed the best.
“U.S. stocks went on a wild
ride during the 12-month
period…”
For the year ended February, 29, 2008, John Hancock Growth Fund’s Class A, Class B, Class C, Class I and Class R1 shares returned –6.28%, –7.01%, –7.01%, –5.94% and –6.39%, respectively, at net asset value while the Russell 1000 Growth Index returned 0.40% and the average large growth fund monitored by Morningstar, Inc. returned 0.64% . Sector and stock selection both detracted from returns versus the benchmark. Sector weightings adding to relative returns included an overweight in energy, while sector weightings detracting from relative returns included an overweight in consumer discretionary. Stock selections in telecommunication services added to relative returns, while picks in consumer discretionary and financials detracted. Individual names adding to returns versus the benchmark included overweight positions in Exxon Mobil Corp., Chevron Corp. and McDonald’s Corp. while overweight positions detractin g from relative returns included Home Depot, Inc., Kohl’s Corp. and Coach, Inc.
This commentary reflects the views of the portfolio management team through the end of the Fund’s period discussed in this report. The team’s statements reflect their own opinions. As such, they are in no way guarantees of future events and are not intended to be used as investment advice or a recommendation regarding any specific security. They are also subject to change at any time as market and other conditions warrant.
Growth Fund | Annual report
6
A look at performance
| | | | | | | | | | | |
| For the periods ended February 29, 2008 | | | | | | |
| |
| | | | Average annual returns | | | | Cumulative total returns | | |
| | | | with maximum sales charge (POP) | | | with maximum sales charge (POP) | | |
| | |
| |
|
| | Inception | | | | | Since | | | | | Since |
| Class | date | | 1-year | 5-year | 10-year | inception | | 1-year | 5-year | 10-year | inception |
|
| A | 6-12-06 | | –10.97% | — | — | –1.42% | | –10.97% | — | — | –2.44% |
|
| B | 6-12-06 | | –11.41 | — | — | –1.39 | | –11.41 | — | — | –2.39 |
|
| C | 6-12-06 | | –7.89 | — | — | 0.82 | | –7.89 | — | — | 1.41 |
|
| I1 | 6-12-06 | | –5.94 | — | — | 2.10 | | –5.94 | — | — | 3.64 |
|
| R11 | 6-12-06 | | –6.39 | — | — | 1.32 | | –6.39 | — | — | 2.28 |
|
Performance figures assume all distributions are reinvested. Public offering price (POP) figures reflect maximum sales charge on Class A shares of 5%, and the applicable contingent deferred sales charge (CDSC) on Class B and Class C shares. The Class B shares’ CDSC declines annually between years 1 to 6 according to the following schedule: 5, 4, 3, 3, 2, 1%. No sales charge will be assessed after the sixth year. Class C shares held for less than one year are subject to a 1% CDSC. Sales charge is not applicable for Class I and Class R1 shares.
The expense ratios of the Fund, both net (including any fee waivers or expense limitations) and gross (excluding any fee waivers or expense limitations), are set forth according to the most recent publicly available prospectuses for the Fund and may differ from the expense ratios disclosed in the Financial Highlights tables in this report. The waivers and expense limitations are contractual at least until 6-30-08. The net expenses are as follows: Class A — 1.39%, Class B — 2.09%, Class C — 2.10%, Class I — 1.00%, Class R1 — 1.74% . Had the fee waivers and expense limitations not been in place, the gross expenses would be as follows: Class A — 2.00%, Class B — 11.94%, Class C — 7.70%, Class I — 1.90%, Class R1 — 21.55% .
The returns reflect past results and should not be considered indicative of future performance. The return and principal value of an investment will fluctuate so that shares, when redeemed, may be worth more or less than their original cost. Due to market volatility, the Fund’s current performance may be higher or lower than the performance shown. For performance data current to the most recent month end, please call 1-800-225-5291 or visit the Fund’s Web site at www.jhfunds.com.
The performance table above and the chart on the next page do not reflect the deduction of taxes that a shareholder would pay on fund distributions or the redemption of fund shares.
The Fund’s performance results reflect any applicable expense reductions, without which the expenses would increase and results would have been less favorable.
Performance is calculated with an opening price (prior day’s close) on the inception date.
1 For certain types of investors as described in the Fund’s Class I and Class R1 share prospectuses.
Annual report | Growth Fund
7
A look at performance
Growth of $10,000
This chart shows what happened to a hypothetical $10,000 investment in Growth Fund Class A shares for the period indicated. For comparison, we’ve shown the same investment in the Russell 1000 Growth Index.
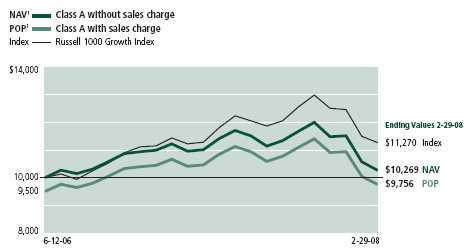
| | | | |
| | Period | Without | With maximum | |
| Class | beginning | sales charge | sales charge | Index |
|
| B | 6-12-06 | $10,141 | $9,761 | $11,270 |
|
| C2 | 6-12-06 | 10,141 | 10,141 | 11,270 |
|
| I3 | 6-12-06 | 10,364 | 10,364 | 11,270 |
|
| R13 | 6-12-06 | 10,228 | 10,228 | 11,270 |
|
Assuming all distributions were reinvested for the period indicated, the table above shows the value of a $10,000 investment in the Fund’s Class B, Class C, Class I and Class R1 shares, respectively, as of February 29, 2008. Performance of the classes will vary based on the difference in sales charges paid by shareholders investing in the different classes and the fee structure of those classes.
Russell 1000 Growth Index is an unmanaged index containing those securities in the Russell 1000 Index with a greater-than-average growth orientation.
It is not possible to invest directly in an index. Index figures do not reflect sales charges, which would have resulted in lower values if they did.
1 NAV represents net asset value and POP represents public offering price.
2 No contingent deferred sales charge applicable.
3 For certain types of investors as described in the Fund’s Class I and Class R1 share prospectuses.
Growth Fund | Annual report
8
Your expenses
These examples are intended to help you understand your ongoing operating expenses.
Understanding fund expenses
As a shareholder of the Fund, you incur two types of costs:
■ Transaction costs which include sales charges (loads) on purchases or redemptions (varies by share class), minimum account fee charge, etc.
■ Ongoing operating expenses including management fees, distribution and service fees (if applicable), and other fund expenses.
We are going to present only your ongoing operating expenses here.
Actual expenses/actual returns
This example is intended to provide information about your fund’s actual ongoing operating expenses, and is based on your fund’s actual return. It assumes an account value of $1,000.00 on September 1, 2007, with the same investment held until February 29, 2008.
| | | |
| | Account value | Ending value | Expenses paid during |
| | on 9-1-07 | on 2-29-08 | period on 2-29-081 |
|
| Class A | $1,000.00 | $905.38 | $6.59 |
|
| Class B | 1,000.00 | 901.95 | 9.93 |
|
| Class C | 1,000.00 | 901.95 | 9.93 |
|
| Class I | 1,000.00 | 907.23 | 4.74 |
|
| Class R1 | 1,000.00 | 905.88 | 5.92 |
|
Together with the value of your account, you may use this information to estimate the operating expenses that you paid over the period. Simply divide your account value at February 29, 2008, by $1,000.00, then multiply it by the “expenses paid” for your share class from the table above. For example, for an account value of $8,600.00, the operating expenses should be calculated as follows:
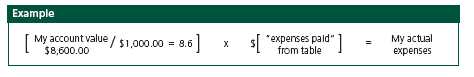
Annual report | Growth Fund
9
Your expenses
Hypothetical example for comparison purposes
This table allows you to compare your fund’s ongoing operating expenses with those of any other fund. It provides an example of the Fund’s hypothetical account values and hypothetical expenses based on each class’s actual expense ratio and an assumed 5% annualized return before expenses (which is not your fund’s actual return). It assumes an account value of $1,000.00 on September 1, 2007, with the same investment held until February 29, 2008. Look in any other fund shareholder report to find its hypothetical example and you will be able to compare these expenses.
| | | |
| | Account value | Ending value | Expenses paid during |
| | on 9-1-07 | on 2-29-08 | period on 2-29-081 |
|
| Class A | $1,000.00 | $1,017.95 | $6.97 |
|
| Class B | 1,000.00 | 1,014.42 | 10.52 |
|
| Class C | 1,000.00 | 1,014.42 | 10.52 |
|
| Class I | 1,000.00 | 1,019.89 | 5.02 |
|
| Class R1 | 1,000.00 | 1,018.65 | 6.27 |
|
Remember, these examples do not include any transaction costs, such as sales charges; therefore, these examples will not help you to determine the relative total costs of owning different funds. If transaction costs were included, your expenses would have been higher. See the prospectus for details regarding transaction costs.
1 Expenses are equal to the Fund’s annualized expense ratio of 1.39%, 2.10%, 2.10%, 1.00% and 1.25% for Class A, Class B, Class C, Class I and Class R1, respectively, multiplied by the average account value over the period, multiplied by the number of days in most recent fiscal half year/366 (to reflect the one-half year period).
Growth Fund | Annual report
10
Portfolio summary
| | | | |
| Top 10 holdings1 | | | | |
|
| Exxon Mobil Corp. | 4.9% | | International Business Machines Corp. | 2.5% |
| |
|
| Wal-Mart Stores, Inc. | 3.4% | | Schlumberger Ltd. | 2.5% |
| |
|
| Microsoft Corp. | 3.2% | | UnitedHealth Group, Inc. | 2.5% |
| |
|
| The Coca-Cola Company | 2.8% | | Altria Group, Inc. | 2.4% |
| |
|
| Apple, Inc. | 2.5% | | Cisco Systems, Inc. | 2.3% |
| |
|
|
| Sector distribution1 | | | | |
|
| Consumer non-cyclical | 30% | | Industrial | 10% |
| |
|
| Technology | 14% | | Financial | 3% |
| |
|
| Consumer cyclical | 14% | | Basic materials | 2% |
| |
|
| Energy | 14% | | Utilities | 1% |
| |
|
| Communications | 10% | | Other | 2% |
| |
|
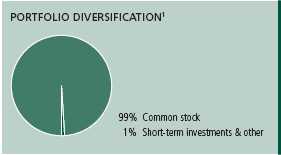
1As a percentage of net assets on February 29, 2008.
Annual report | Growth Fund
11
F I N A N C I A L S T A T E M E N T S
Fund’s investments
Securities owned by the Fund on 2-29-08
This schedule is divided into three main categories: common stocks, short-term investments and repurchase agreements. Common stocks are further broken down by industry group. Repurchase agreements, which represent the Fund’s cash position, are listed last.
| | |
| Issuer | Shares | Value |
| |
| Common stocks 98.78% | | $24,768,139 |
|
| (Cost $25,520,551) | | |
| | | |
| Advertising 0.16% | | 40,908 |
|
| Interpublic Group of Companies, Inc. * | 600 | 5,172 |
|
| Omnicom Group, Inc. | 800 | 35,736 |
| | | |
| Aerospace 1.32% | | 331,982 |
|
| General Dynamics Corp. | 400 | 32,740 |
|
| Goodrich Corp. | 1,100 | 65,153 |
|
| Lockheed Martin Corp. | 100 | 10,320 |
|
| Northrop Grumman Corp. | 200 | 15,722 |
|
| Rockwell Collins, Inc. | 300 | 17,670 |
|
| United Technologies Corp. | 2,700 | 190,377 |
| |
| Agriculture 1.61% | | 404,880 |
|
| Monsanto Company | 3,500 | 404,880 |
| | | |
| Aluminum 0.10% | | 25,998 |
|
| Alcoa, Inc. | 700 | 25,998 |
| | | |
| Apparel & Textiles 0.90% | | 224,435 |
|
| Coach, Inc. * | 2,000 | 60,640 |
|
| Liz Claiborne, Inc. | 600 | 10,668 |
|
| Mohawk Industries, Inc. * (a) | 400 | 28,564 |
|
| NIKE, Inc., Class B | 1,300 | 78,260 |
|
| Polo Ralph Lauren Corp., Class A | 500 | 31,095 |
|
| VF Corp. | 200 | 15,208 |
| | | |
| Auto Parts 0.62% | | 155,083 |
|
| AutoZone, Inc. * | 300 | 34,524 |
|
| Genuine Parts Company | 300 | 12,375 |
|
| Johnson Controls, Inc. | 2,800 | 92,008 |
|
| O’Reilly Automotive, Inc. * | 600 | 16,176 |
| | | |
| Auto Services 0.12% | | 30,597 |
|
| AutoNation, Inc. * | 2,100 | 30,597 |
See notes to financial statements
Growth Fund | Annual report
12
F I N A N C I A L S T A T E M E N T S
| | |
| Issuer | Shares | Value |
| |
| Automobiles 0.39% | | $97,605 |
|
| PACCAR, Inc. | 2,250 | 97,605 |
| | | |
| Biotechnology 0.34% | | 84,661 |
|
| Amgen, Inc. * | 400 | 18,208 |
|
| Genentech, Inc. * | 500 | 37,875 |
|
| Immucor, Inc. * | 500 | 14,900 |
|
| Techne Corp. * | 200 | 13,678 |
| | | |
| Broadcasting 0.33% | | 83,820 |
|
| Discovery Holding Company * | 1,700 | 38,369 |
|
| Liberty Global, Inc., Class A * | 900 | 33,840 |
|
| Liberty Media Corp., Capital, Series A * | 100 | 11,611 |
| | | |
| Building Materials & Construction 0.05% | | 11,214 |
|
| Masco Corp. | 600 | 11,214 |
| | | |
| Business Services 1.65% | | 413,515 |
|
| Accenture, Ltd., Class A | 700 | 24,675 |
|
| Affiliated Computer Services, Inc., Class A * | 100 | 5,075 |
|
| Automatic Data Processing, Inc. | 1,000 | 39,950 |
|
| FactSet Research Systems, Inc. | 300 | 15,792 |
|
| Fiserv, Inc. * | 1,400 | 73,668 |
|
| Fluor Corp. | 700 | 97,475 |
|
| Jacobs Engineering Group, Inc. * | 1,000 | 80,290 |
|
| Moody’s Corp. | 700 | 26,586 |
|
| NCR Corp. * | 1,000 | 22,160 |
|
| Pitney Bowes, Inc. | 500 | 17,890 |
|
| R.R. Donnelley & Sons Company | 100 | 3,183 |
|
| TeleTech Holdings, Inc. * | 300 | 6,771 |
| | | |
| Cable & Television 0.12% | | 30,985 |
|
| Comcast Corp., Class A * | 850 | 16,609 |
|
| DIRECTV Group, Inc. * | 200 | 5,010 |
|
| Time Warner, Inc. | 600 | 9,366 |
| | | |
| Cellular Communications 0.04% | | 9,380 |
|
| Telephone & Data Systems, Inc. | 200 | 9,380 |
| | | |
| Chemicals 0.26% | | 65,712 |
|
| Albemarle Corp. | 200 | 7,588 |
|
| Celanese Corp., Series A | 1,400 | 54,460 |
|
| Hercules, Inc. | 200 | 3,664 |
| | | |
| Colleges & Universities 0.09% | | 22,275 |
|
| Career Education Corp. * | 1,500 | 22,275 |
| | | |
| Computers & Business Equipment 10.64% | | 2,667,987 |
|
| Apple, Inc. * | 5,100 | 637,602 |
|
| Cisco Systems, Inc. * | 23,900 | 582,443 |
|
| Cognizant Technology Solutions Corp., Class A * | 1,000 | 30,210 |
|
| Dell, Inc. * | 17,000 | 337,450 |
|
| EMC Corp. * | 17,700 | 275,058 |
See notes to financial statements
Annual report | Growth Fund
13
F I N A N C I A L S T A T E M E N T S
| | |
| Issuer | Shares | Value |
| | | |
| Computers & Business Equipment (continued) | | |
|
| Hewlett-Packard Company | 1,900 | $90,763 |
|
| Ingram Micro, Inc., Class A * | 1,100 | 16,797 |
|
| International Business Machines Corp. | 5,600 | 637,616 |
|
| Juniper Networks, Inc. * | 1,500 | 40,230 |
|
| Lexmark International, Inc. * | 600 | 19,818 |
| | | |
| Construction Materials 0.45% | | 112,298 |
|
| Martin Marietta Materials, Inc. (a) | 400 | 43,040 |
|
| Sherwin-Williams Company | 100 | 5,178 |
|
| Trane, Inc. | 800 | 36,040 |
|
| Vulcan Materials Company | 400 | 28,040 |
| | | |
| Containers & Glass 0.32% | | 79,030 |
|
| Owens-Illinois, Inc. * | 1,400 | 79,030 |
| | | |
| Cosmetics & Toiletries 3.36% | | 841,766 |
|
| Avon Products, Inc. | 1,000 | 38,060 |
|
| Colgate-Palmolive Company | 1,600 | 121,744 |
|
| International Flavors & Fragrances, Inc. | 200 | 8,626 |
|
| Kimberly-Clark Corp. | 1,700 | 110,806 |
|
| Procter & Gamble Company | 8,500 | 562,530 |
| | | |
| Crude Petroleum & Natural Gas 0.83% | | 206,800 |
|
| Apache Corp. | 500 | 57,355 |
|
| Occidental Petroleum Corp. | 1,300 | 100,581 |
|
| Sunoco, Inc. | 800 | 48,864 |
| | | |
| Drugs & Health Care 0.17% | | 43,620 |
|
| Wyeth | 1,000 | 43,620 |
| | | |
| Educational Services 0.57% | | 142,384 |
|
| Apollo Group, Inc., Class A * | 1,600 | 98,208 |
|
| ITT Educational Services, Inc. * | 800 | 44,176 |
| | | |
| Electrical Equipment 0.36% | | 90,804 |
|
| Emerson Electric Company | 1,000 | 50,960 |
|
| FLIR Systems, Inc. * | 1,400 | 39,844 |
| | | |
| Electrical Utilities 0.84% | | 209,998 |
|
| American Electric Power Company, Inc. | 300 | 12,276 |
|
| CenterPoint Energy, Inc. | 1,000 | 14,680 |
|
| Constellation Energy Group, Inc. | 500 | 44,175 |
|
| Dynegy, Inc., Class A * | 800 | 5,920 |
|
| FPL Group, Inc. | 100 | 6,029 |
|
| Mirant Corp. * | 900 | 33,300 |
|
| PPL Corp. | 300 | 13,614 |
|
| Public Service Enterprise Group, Inc. | 800 | 35,280 |
|
| Quanta Services, Inc. * | 1,300 | 31,044 |
|
| Reliant Energy, Inc. * | 600 | 13,680 |
See notes to financial statements
Growth Fund | Annual report
14
F I N A N C I A L S T A T E M E N T S
| | |
| Issuer | Shares | Value |
| | | |
| Electronics 0.37% | | $92,519 |
|
| Arrow Electronics, Inc. * | 300 | 9,783 |
|
| Avnet, Inc. * | 1,200 | 40,452 |
|
| Garmin, Ltd. | 200 | 11,742 |
|
| L-3 Communications Holdings, Inc. | 200 | 21,258 |
|
| Synopsys, Inc. * | 400 | 9,284 |
| | | |
| Energy 0.25% | | 63,091 |
|
| NRG Energy, Inc. * | 1,400 | 57,778 |
|
| Sempra Energy | 100 | 5,313 |
| | | |
| Financial Services 1.12% | | 279,510 |
|
| Citigroup, Inc. | 3,700 | 87,727 |
|
| Eaton Vance Corp. | 1,100 | 35,035 |
|
| Franklin Resources, Inc. | 400 | 37,748 |
|
| Goldman Sachs Group, Inc. | 300 | 50,889 |
|
| Janus Capital Group, Inc. | 500 | 12,110 |
|
| Merrill Lynch & Company, Inc. | 200 | 9,912 |
|
| SEI Investments Company | 900 | 22,509 |
|
| T. Rowe Price Group, Inc. (c) | 300 | 15,159 |
|
| The First Marblehead Corp. (a) | 700 | 8,421 |
| | | |
| Food & Beverages 5.55% | | 1,392,211 |
|
| General Mills, Inc. | 700 | 39,193 |
|
| H.J. Heinz Company | 400 | 17,644 |
|
| Kellogg Company | 400 | 20,288 |
|
| Kraft Foods, Inc., Class A | 1,707 | 53,207 |
|
| PepsiCo, Inc. | 6,900 | 479,964 |
|
| Sara Lee Corp. | 1,100 | 13,893 |
|
| Sysco Corp. | 1,100 | 30,866 |
|
| The Coca-Cola Company | 12,200 | 713,212 |
|
| William Wrigley Jr. Company | 400 | 23,944 |
| | | |
| Gas & Pipeline Utilities 0.95% | | 237,321 |
|
| Transocean, Inc. * | 1,689 | 237,321 |
| | | |
| Healthcare Products 6.21% | | 1,556,221 |
|
| Baxter International, Inc. | 1,400 | 82,628 |
|
| Becton, Dickinson & Company | 300 | 27,126 |
|
| IDEXX Laboratories, Inc. * | 400 | 22,188 |
|
| Intuitive Surgical, Inc. * | 300 | 84,576 |
|
| Johnson & Johnson | 8,100 | 501,876 |
|
| Kinetic Concepts, Inc. * | 800 | 41,112 |
|
| Medtronic, Inc. | 4,000 | 197,440 |
|
| Patterson Companies, Inc. * | 800 | 28,160 |
|
| Respironics, Inc. * | 500 | 32,840 |
|
| St. Jude Medical, Inc. * | 1,100 | 47,278 |
|
| Stryker Corp. | 2,800 | 182,308 |
|
| Zimmer Holdings, Inc. * | 4,100 | 308,689 |
See notes to financial statements
Annual report | Growth Fund
15
F I N A N C I A L S T A T E M E N T S
| | |
| Issuer | Shares | Value |
| | | |
| Healthcare Services 5.14% | | $1,289,753 |
|
| Cardinal Health, Inc. | 1,000 | 59,140 |
|
| Coventry Health Care, Inc. * | 700 | 36,309 |
|
| Express Scripts, Inc. * | 4,100 | 242,310 |
|
| Lincare Holdings, Inc. * | $200 | 6,500 |
|
| McKesson Corp. | 800 | 47,008 |
|
| Medco Health Solutions, Inc. * | 4,200 | 186,102 |
|
| Quest Diagnostics, Inc. | 800 | 38,136 |
|
| UnitedHealth Group, Inc. | 13,300 | 618,184 |
|
| WellPoint, Inc. * | 800 | 56,064 |
| | | |
| Homebuilders 0.06% | | 14,030 |
|
| D.R. Horton, Inc. | 1,000 | 14,030 |
| | | |
| Hotels & Restaurants 0.66% | | 164,623 |
|
| Jack in the Box, Inc. * | 200 | 5,254 |
|
| Marriott International, Inc., Class A | 200 | 6,820 |
|
| McDonald’s Corp. | 2,000 | 108,220 |
|
| Starbucks Corp. * | 1,700 | 30,549 |
|
| Yum! Brands, Inc. | 400 | 13,780 |
| | | |
| Household Products 0.32% | | 81,392 |
|
| Church & Dwight, Inc. | 100 | 5,346 |
|
| Clorox Company | 200 | 11,638 |
|
| Energizer Holdings, Inc. * | 600 | 55,698 |
|
| Tempur-Pedic International, Inc. (a) | 500 | 8,710 |
| | | |
| Industrial Machinery 2.61% | | 654,729 |
|
| Cameron International Corp. * | 1,400 | 59,472 |
|
| Caterpillar, Inc. | 2,000 | 144,660 |
|
| Crane Company | 300 | 12,369 |
|
| Cummins, Inc. | 1,400 | 70,532 |
|
| Deere & Company | 2,400 | 204,504 |
|
| Dresser-Rand Group, Inc. * | 300 | 10,221 |
|
| Flowserve Corp. | 200 | 21,780 |
|
| ITT Corp. | 800 | 44,992 |
|
| Lincoln Electric Holdings, Inc. | 200 | 13,428 |
|
| Pall Corp. | 1,100 | 43,307 |
|
| W.W. Grainger, Inc. | 400 | 29,464 |
| | | |
| Insurance 1.76% | | 440,648 |
|
| Aetna, Inc. | 1,500 | 74,400 |
|
| AFLAC, Inc. | 1,500 | 93,615 |
|
| Allstate Corp. | 300 | 14,319 |
|
| Ambac Financial Group, Inc. | 200 | 2,228 |
|
| American International Group, Inc. | 1,600 | 74,976 |
|
| Brown & Brown, Inc. | 1,100 | 19,613 |
|
| CIGNA Corp. | 1,200 | 53,496 |
|
| Hartford Financial Services Group, Inc. | 200 | 13,980 |
|
| MBIA, Inc. (a) | 500 | 6,485 |
See notes to financial statements
Growth Fund | Annual report
16
F I N A N C I A L S T A T E M E N T S
| | |
| Issuer | Shares | Value |
| | | |
| Insurance (continued) | | |
|
| Prudential Financial, Inc. | 500 | $36,485 |
|
| The Travelers Companies, Inc. | 1,100 | 51,051 |
| | | |
| International Oil 7.84% | | 1,966,452 |
|
| Anadarko Petroleum Corp. | 500 | 31,870 |
|
| Chevron Corp. | 5,000 | 433,300 |
|
| ConocoPhillips | 2,200 | 181,962 |
|
| Exxon Mobil Corp. | 14,100 | 1,226,841 |
|
| Noble Corp. | 900 | 44,235 |
|
| Weatherford International, Ltd. * | 700 | 48,244 |
| | | |
| Internet Content 1.50% | | 376,944 |
|
| Google, Inc., Class A * | 800 | 376,944 |
| | | |
| Internet Retail 2.15% | | 538,050 |
|
| Amazon.com, Inc. * | 3,700 | 238,539 |
|
| eBay, Inc. * | 9,300 | 245,148 |
|
| Expedia, Inc. * | 1,700 | 38,981 |
|
| IAC/InterActiveCorp. * | 200 | 3,980 |
|
| Priceline.com, Inc. * | 100 | 11,402 |
| | | |
| Internet Software 0.31% | | 78,510 |
|
| McAfee, Inc. * | 1,000 | 33,270 |
|
| VeriSign, Inc. * | 1,300 | 45,240 |
| | | |
| Leisure Time 0.21% | | 52,290 |
|
| MGM MIRAGE * | 849 | 52,290 |
| | | |
| Life Sciences 0.10% | | 23,844 |
|
| Waters Corp. * | 400 | 23,844 |
| | | |
| Liquor 0.47% | | 117,725 |
|
| Anheuser-Busch Companies, Inc. | 2,500 | 117,725 |
| | | |
| Manufacturing 2.68% | | 670,743 |
|
| 3M Company | 3,700 | 290,080 |
|
| Danaher Corp. | 1,000 | 74,150 |
|
| Harley-Davidson, Inc. | 1,400 | 52,024 |
|
| Honeywell International, Inc. | 3,400 | 195,636 |
|
| Illinois Tool Works, Inc. | 500 | 24,535 |
|
| Mettler-Toledo International, Inc. * | 300 | 29,310 |
|
| Tyco International, Ltd. | 125 | 5,008 |
| | | |
| Metal & Metal Products 0.47% | | 118,235 |
|
| Crown Holdings, Inc. * | 300 | 7,473 |
|
| Precision Castparts Corp. | 900 | 99,351 |
|
| Southern Copper Corp. | 100 | 11,411 |
| | | |
| Mobile Homes 0.09% | | 21,336 |
|
| Thor Industries, Inc. | 700 | 21,336 |
| | | |
| Petroleum Services 3.85% | | 966,543 |
|
| Diamond Offshore Drilling, Inc. | 500 | 60,415 |
|
| Schlumberger, Ltd. | 7,200 | 622,440 |
See notes to financial statements
Annual report | Growth Fund
17
F I N A N C I A L S T A T E M E N T S
| | |
| Issuer | Shares | Value |
| | | |
| Petroleum Services (continued) | | |
|
| Smith International, Inc. | 1,400 | $88,242 |
|
| Tidewater, Inc. | 600 | 33,690 |
|
| Valero Energy Corp. | 2,800 | 161,756 |
| | | |
| Pharmaceuticals 6.00% | | 1,503,470 |
|
| Abbott Laboratories | 5,200 | 278,460 |
|
| Allergan, Inc. | 300 | 17,769 |
|
| Bristol-Myers Squibb Company | 2,800 | 63,308 |
|
| Eli Lilly & Company | 2,100 | 105,042 |
|
| Forest Laboratories, Inc. * | 2,100 | 83,517 |
|
| Gilead Sciences, Inc. * | 800 | 37,856 |
|
| Merck & Company, Inc. | 9,600 | 425,280 |
|
| Pfizer, Inc. | 18,100 | 403,268 |
|
| Schering-Plough Corp. | 4,100 | 88,970 |
| | | |
| Publishing 0.11% | | 27,573 |
|
| Gannett Company, Inc. | 100 | 3,015 |
|
| McGraw-Hill Companies, Inc. | 600 | 24,558 |
| | | |
| Real Estate 0.01% | | 3,531 |
|
| General Growth Properties, Inc., REIT | 100 | 3,531 |
| | | |
| Retail Grocery 0.19% | | 48,720 |
|
| Safeway, Inc. | 500 | 14,370 |
|
| SUPERVALU, Inc. | 200 | 5,250 |
|
| The Kroger Company | 1,200 | 29,100 |
| | | |
| Retail Trade 10.11% | | 2,535,938 |
|
| Abercrombie & Fitch Company, Class A | 600 | 46,518 |
|
| Advance Auto Parts, Inc. | 900 | 30,186 |
|
| American Eagle Outfitters, Inc. | 1,200 | 25,644 |
|
| Bed Bath & Beyond, Inc. * | 1,700 | 48,178 |
|
| Best Buy Company, Inc. | 700 | 30,107 |
|
| Big Lots, Inc. * | 300 | 5,055 |
|
| CarMax, Inc. * (a) | 200 | 3,672 |
|
| CVS Caremark Corp. | 1,400 | 56,532 |
|
| Dollar Tree Stores, Inc. * | 1,000 | 26,830 |
|
| Family Dollar Stores, Inc. | 800 | 15,320 |
|
| GameStop Corp., Class A * | 700 | 29,652 |
|
| Home Depot, Inc. | 14,700 | 390,285 |
|
| Kohl’s Corp. * | 1,900 | 84,436 |
|
| Lowe’s Companies, Inc. | 13,000 | 311,610 |
|
| Nordstrom, Inc. | 100 | 3,703 |
|
| RadioShack Corp. | 1,900 | 33,155 |
|
| Staples, Inc. | 2,800 | 62,300 |
|
| Target Corp. | 4,500 | 236,745 |
|
| The TJX Companies, Inc. | 900 | 28,800 |
|
| Tiffany & Company | 1,300 | 48,932 |
See notes to financial statements
Growth Fund | Annual report
18
F I N A N C I A L S T A T E M E N T S
| | |
| Issuer | Shares | Value |
| | | |
| Retail Trade (continued) | | |
|
| Walgreen Company | 4,800 | $175,248 |
|
| Wal-Mart Stores, Inc. | 17,000 | 843,030 |
| | | |
| Sanitary Services 0.04% | | 10,800 |
|
| Nalco Holding Company | 500 | 10,800 |
| | | |
| Semiconductors 0.68% | | 171,186 |
|
| Intel Corp. | 4,100 | 81,795 |
|
| Intersil Corp., Class A | 1,000 | 23,270 |
|
| KLA-Tencor Corp. | 700 | 29,407 |
|
| National Semiconductor Corp. | 600 | 9,882 |
|
| Xilinx, Inc. | 1,200 | 26,832 |
| | | |
| Software 4.98% | | 1,249,418 |
|
| Activision, Inc. * | 200 | 5,450 |
|
| Adobe Systems, Inc. * | 1,200 | 40,380 |
|
| Autodesk, Inc. * | 500 | 15,545 |
|
| BMC Software, Inc. * | 200 | 6,456 |
|
| CA, Inc. | 400 | 9,152 |
|
| Citrix Systems, Inc. * | 400 | 13,172 |
|
| Compuware Corp. * | 2,200 | 17,512 |
|
| Intuit, Inc. * | 1,000 | 26,560 |
|
| Microsoft Corp. | 29,300 | 797,546 |
|
| NAVTEQ Corp. * | 300 | 22,485 |
|
| Oracle Corp. * | 15,700 | 295,160 |
| | | |
| Telecommunications Equipment & Services 2.63% | | 659,939 |
|
| Corning, Inc. | 2,300 | 53,429 |
|
| QUALCOMM, Inc. | 10,200 | 432,174 |
|
| Verizon Communications, Inc. | 4,800 | 174,336 |
| | | |
| Telephone 0.28% | | 69,660 |
|
| AT&T, Inc. | 2,000 | 69,660 |
| | | |
| Tires & Rubber 0.16% | | 40,650 |
|
| Goodyear Tire & Rubber Company * | 1,500 | 40,650 |
| | | |
| Tobacco 2.43% | | 608,721 |
|
| Altria Group, Inc. | 8,100 | 592,434 |
|
| UST, Inc. | 300 | 16,287 |
| | | |
| Toys, Amusements & Sporting Goods 0.07% | | 18,036 |
|
| Hasbro, Inc. | 400 | 10,308 |
|
| Mattel, Inc. | 400 | 7,728 |
| | | |
| Transportation 0.08% | | 20,308 |
|
| C.H. Robinson Worldwide, Inc. | 400 | 20,308 |
| | | |
| Trucking & Freight 0.70% | | 175,732 |
|
| FedEx Corp. | 400 | 35,252 |
|
| United Parcel Service, Inc., Class B | 2,000 | 140,480 |
See notes to financial statements
Annual report | Growth Fund
19
F I N A N C I A L S T A T E M E N T S
| | |
| | Principal | |
| Issuer | Amount | Value |
| |
| Short-term investments 0.33% | | $83,311 |
|
| (Cost $83,311) | | |
|
| John Hancock Cash Investment Trust, 3.5681% (c)(f) | $83,311 | 83,311 |
|
| |
| Repurchase agreements 1.52% | | $381,000 |
|
| (Cost $381,000) | | |
|
| Repurchase Agreement with State Street Corp. dated 2-29-08 at | | |
| 2.35% to be repurchased at $381,075 on 3-3-08, | | |
| collateralized by $395,000 Federal National Mortgage | | |
| Association, 5.57%, due 7-14-28 (valued at $390,556, | | |
| including interest) | $381,000 | 381,000 |
| |
| Total investments (Cost $25,984,862)† 100.63% | | $25,232,450 |
|
| Liabilities in excess of other assets (0.63%) | | ($157,791) |
|
| Total net assets 100.00% | | $25,074,659 |
|
Percentages are stated as a percent of net assets.
REIT Real Estate Investment Trust
* Non-income producing.
(a) All or a portion of this security was out on loan.
(c) Investment is an affiliate of the Trust’s adviser or subadviser.
(f) John Hancock Cash Investment Trust is managed by MFC Global Investment Management (U.S.), LLC. The rate shown is the seven-day effective yield at period end.
† At February 29, 2008, the aggregate cost of investment securities for federal income tax purposes was $26,022,911. Net unrealized depreciation aggregated $790,461, of which $1,325,295 related to appreciated investment securities and $2,115,756 related to depreciated investment securities.
See notes to financial statements
Growth Fund | Annual report
20
F I N A N C I A L S T A T E M E N T S
Financial statements
Statement of assets and liabilities 2-29-08
This Statement of Assets and Liabilities is the Fund’s balance sheet. It shows the value of what the Fund owns, is due and owes. You’ll also find the net asset value and the maximum public offering price per share.
| |
| Assets | |
|
| Investments in unaffiliated issuers, at value (cost $25,520,551) | |
| including $81,677 of securities loaned (Note 2) | $24,768,139 |
| Repurchase agreement, at value (cost $381,000) (Note 2) | 381,000 |
| Investments in affiliated issuers, at value (cost $83,311) (Note 9) | 83,311 |
| | |
| Total investments, at value (cost $25,984,862) | 25,232,450 |
| Cash | 271 |
| Cash collateral at brokers for futures contracts | 67,200 |
| Receivable for investments sold | 10,880 |
| Receivable for fund shares sold | 12,246 |
| Dividends and interest receivable (net of tax) | 41,361 |
| Receivable due from adviser | 702 |
| Other assets | 116 |
| | |
| Total assets | 25,365,226 |
| |
| Liabilities | |
|
| Payable for fund shares repurchased | 143,477 |
| Payable upon return of securities loaned (Note 2) | 83,311 |
| Payable for futures variation margin | 3,885 |
| Payable to affiliates | |
| Fund administration fees | 180 |
| Transfer agent fees | 4,524 |
| Distribution and service fees | 189 |
| Trustees’ fees | 90 |
| Other payables and accrued expenses | 54,911 |
| | |
| Total liabilities | 290,567 |
| |
| Net assets | |
|
| Capital paid-in | $26,579,324 |
| Accumulated undistributed net realized gain (loss) on investments and futures contracts | (750,815) |
| Net unrealized appreciation (depreciation) on investments and futures contracts | (753,850) |
| | |
| Net assets | $25,074,659 |
| |
See notes to financial statements
Annual report | Growth Fund
21
F I N A N C I A L S T A T E M E N T S
Statement of assets and liabilities (continued)
| |
| Net asset value per share | |
|
| The Funds have an unlimited number of shares authorized with no par value. | |
| Net asset value is calculated by dividing the net assets of each class of shares | |
| by the number of outstanding shares in the class. | |
| | |
| Class A | |
| Net assets | $22,346,085 |
| Shares outstanding | 1,162,336 |
| Net asset value and redemption price per share | $19.23 |
| | |
| Class B1 | |
| Net assets | $710,832 |
| Shares outstanding | 37,367 |
| Net asset value and offering price per share | $19.02 |
| | |
| Class C1 | |
| Net assets | $1,832,119 |
| Shares outstanding | 96,304 |
| Net asset value and offering price per share | $19.02 |
| | |
| Class I | |
| Net assets | $63,402 |
| Shares outstanding | 3,272 |
| Net asset value, offering price and redemption price per share | $19.38 |
| | |
| Class R1 | |
| Net assets | $122,221 |
| Shares outstanding | 6,380 |
| Net asset value, offering price and redemption price per share | $19.16 |
| |
| Maximum public offering price per share | |
|
| Class A (net asset value per share ÷ 95%)2 | $20.24 |
1 Redemption price per share is equal to the net asset value less any applicable contingent deferred sales charge.
2 On single retail sales of less than $50,000. On sales of $50,000 or more and on group sales the offering price is reduced.
See notes to financial statements
Growth Fund | Annual report
22
F I N A N C I A L S T A T E M E N T S
Statement of operations For the year ended 2-29-08
This Statement of Operations summarizes the Fund’s investment income earned and expenses incurred in operating the Fund. It also shows net gains (losses) for the period stated.
| |
| Investment income | |
|
| Dividends | $327,889 |
| Interest | 48,824 |
| Securities lending | 568 |
| Income from affiliated issuers | 217 |
| | |
| Total investment income | 377,498 |
| |
| Expenses | |
|
| Investment management fees (Note 3) | 210,900 |
| Distribution and service fees (Note 3) | 95,791 |
| Transfer agent fees (Note 3) | 25,347 |
| Fund administration fees (Note 3) | 11,948 |
| Blue sky fees (Note 3) | 81,231 |
| Audit and legal fees | 70,246 |
| Printing and postage fees (Note 3) | 6,694 |
| Custodian fees | 37,950 |
| Trustees’ fees (Note 3) | 2,075 |
| Registration and filing fees | 24,946 |
| Miscellaneous | 280 |
| | |
| Total expenses | 567,408 |
| Less expense reductions (Note 3) | (182,888) |
| | |
| Net expenses | 384,520 |
| | |
| Net investment loss | (7,022) |
| |
| Realized and unrealized gain (loss) | |
|
| Net realized gain (loss) on | |
| Investments in unaffiliated issuers | 144,161 |
| Futures contracts | (44,965) |
| | 99,196 |
| Change in net unrealized appreciation (depreciation) of | |
| Investments in unaffiliated issuers | (2,064,828) |
| Futures contracts | 11,524 |
| | (2,053,304) |
| Net realized and unrealized gain (loss) | (1,954,108) |
| Increase (decrease) in net assets from operations | ($1,961,130) |
See notes to financial statements
Annual report | Growth Fund
23
F I N A N C I A L S T A T E M E N T S
Statement of changes in net assets
These Statements of Changes in Net Assets show how the value of the Fund’s net assets has changed during the last two periods. The difference reflects earnings less expenses, any investment gains and losses, distributions, if any, paid to shareholders and the net of Fund share transactions.
| | |
| | Year | Year |
| | ended | ended |
| | 2-28-071 | 2-29-08 |
| |
| Increase (decrease) in net assets | | |
|
| From operations | | |
| Net investment income (loss) | $13,947 | ($7,022) |
| Net realized gain (loss) | 863,241 | 99,196 |
| Change in net unrealized appreciation (depreciation) | 1,299,454 | (2,053,304) |
| | | |
| Increase (decrease) in net assets resulting from operations | 2,176,642 | (1,961,130) |
| | | |
| Distributions to shareholders | | |
| From net investment income | | |
| Class A | (38,325) | — |
| Class I | (108) | — |
| Class R1 | (163) | — |
| From net realized gain | | |
| Class A | (197,001) | (1,315,122) |
| Class B | (2,867) | (41,970) |
| Class C | (6,435) | (111,505) |
| Class I | (281) | (11,243) |
| Class R1 | (1,108) | (6,262) |
| | | |
| Total distributions | (246,288) | (1,486,102) |
| | | |
| From Fund share transactions (Note 6) | 20,208,114 | 6,383,423 |
| | | |
| Total increase | 22,138,468 | 2,936,191 |
| |
| Net assets | | |
|
| Beginning of year | — | 22,138,468 |
| | | |
| End of year | $22,138,468 | $25,074,659 |
1 Period from 6-12-06 (commencement of operations) to 2-28-07.
See notes to financial statements
Growth Fund | Annual report
24
F I N A N C I A L S T A T E M E N T S
Financial highlights
The Financial Highlights show how the Fund’s net asset value for a share has changed since the end of the previous period.
| | |
| CLASS A SHARES | | |
| |
| Period ended | 2-28-071 | 2-29-08 |
| |
| Per share operating performance | | |
|
| Net asset value, beginning of period | $20.00 | $21.65 |
| Net investment income (loss)2 | —3 | 0.01 |
| Net realized and unrealized gain | | |
| (loss) on investments | 1.91 | (1.25) |
| Total from investment operations | 1.91 | (1.24) |
| Less distributions | | |
| From net investment income | (0.04) | — |
| From net realized gain | (0.22) | (1.18) |
| | (0.26) | (1.18) |
| Net asset value, end of period | $21.65 | $19.23 |
| Total return4,5 (%) | 9.576 | (6.28) |
| |
| Ratios and supplemental data | | |
|
| Net assets, end of period (in millions) | $21 | $22 |
| Ratios (as a percentage of average net assets): | | |
| Expenses before reductions | 2.007 | 1.85 |
| Expenses net of fee waivers, if any | 1.397 | 1.40 |
| Expenses net of all fee waivers and credits | 1.397 | 1.40 |
| Net investment income (loss) | 0.017 | 0.04 |
| Portfolio turnover (%) | 936 | 95 |
1 Class A shares began operations on 6-12-06.
2 Based on the average of the shares outstanding.
3 Less than $0.01 per share.
4 Total returns would have been lower had certain expenses not been reduced during the periods shown.
5 Assumes dividend reinvestment.
6 Not annualized.
7 Annualized.
See notes to financial statements
Annual report | Growth Fund
25
F I N A N C I A L S T A T E M E N T S
Financial highlights
| | |
| CLASS B SHARES | | |
| |
| Period ended | 2-28-071 | 2-29-08 |
|
| Per share operating performance | | |
| Net asset value, beginning of period | $20.00 | $21.59 |
| Net investment income (loss)2 | (0.11) | (0.15) |
| Net realized and unrealized gain | | |
| (loss) on investments | 1.92 | (1.24) |
| Total from investment operations | 1.81 | (1.39) |
| Less distributions | | |
| From net realized gain | (0.22) | (1.18) |
| Net asset value, end of period | $21.59 | $19.02 |
| Total return3,4 (%) | 9.055 | (7.01) |
| |
| Ratios and supplemental data | | |
|
| Net assets, end of period (in millions) | —6 | $1 |
| Ratios (as a percentage of average net assets): | | |
| Expenses before reductions | 11.947 | 4.74 |
| Expenses net of fee waivers, if any | 2.097 | 2.10 |
| Expenses net of all fee waivers and credits | 2.097 | 2.10 |
| Net investment income (loss) | (0.68)7 | (0.68) |
| Portfolio turnover (%) | 935 | 95 |
1 Class B shares began operations on 6-12-06.
2 Based on the average of the shares outstanding.
3 Total returns would have been lower had certain expenses not been reduced during the periods shown.
4 Assumes dividend reinvestment.
5 Not annualized.
6 Less than $500,000.
7 Annualized.
See notes to financial statements
Growth Fund | Annual report
26
F I N A N C I A L S T A T E M E N T S
Financial highlights
| | |
| CLASS C SHARES | | |
| |
| Period ended | 2-28-071 | 2-29-08 |
|
| Per share operating performance | | |
| Net asset value, beginning of period | $20.00 | $21.59 |
| Net investment income (loss)2 | (0.10) | (0.15) |
| Net realized and unrealized gain | | |
| (loss) on investments | 1.91 | (1.24) |
| Total from investment operations | 1.81 | (1.39) |
| Less distributions | | |
| From net realized gain | (0.22) | (1.18) |
| Net asset value, end of period | $21.59 | $19.02 |
| Total return3,4 (%) | 9.055 | (7.01) |
| |
| Ratios and supplemental data | | |
|
| Net assets, end of period (in millions) | $1 | $2 |
| Ratios (as a percentage of average net assets): | | |
| Expenses before reductions | 7.706 | 3.46 |
| Expenses net of fee waivers, if any | 2.106 | 2.10 |
| Expenses net of all fee waivers and credits | 2.106 | 2.10 |
| Net investment income (loss) | (0.66)6 | (0.68) |
| Portfolio turnover (%) | 935 | 95 |
1 Class C shares began operations on 6-12-06.
2 Based on the average of the shares outstanding.
3 Total returns would have been lower had certain expenses not been reduced during the periods shown.
4 Assumes dividend reinvestment.
5 Not annualized.
6 Annualized.
See notes to financial statements
Annual report | Growth Fund
27
F I N A N C I A L S T A T E M E N T S
Financial highlights
| | |
| CLASS I SHARES | | |
| |
| Period ended | 2-28-071 | 2-29-08 |
| |
| Per share operating performance | | |
|
| Net asset value, beginning of period | $20.00 | $21.73 |
| Net investment income (loss)2 | 0.06 | 0.09 |
| Net realized and unrealized gain | | |
| (loss) on investments | 1.97 | (1.26) |
| Total from investment operations | 2.03 | (1.17) |
| Less distributions | | |
| From net investment income | (0.08) | — |
| From net realized gain | (0.22) | (1.18) |
| | (0.30) | (1.18) |
| Net asset value, end of period | $21.73 | $19.38 |
| Total return3,4 (%) | 10.185 | (5.94) |
| |
| Ratios and supplemental data | | |
|
| Net assets, end of period (in millions) | —6 | —6 |
| Ratios (as a percentage of average net assets): | | |
| Expenses before reductions | 1.907 | 9.72 |
| Expenses net of fee waivers, if any | 1.007 | 1.00 |
| Expenses net of all fee waivers and credits | 1.007 | 1.00 |
| Net investment income (loss) | 0.437 | 0.40 |
| Portfolio turnover (%) | 935 | 95 |
1 Class I shares began operations on 6-12-06.
2 Based on the average of the shares outstanding.
3 Total returns would have been lower had certain expenses not been reduced during the periods shown.
4 Assumes dividend reinvestment.
5 Not annualized.
6 Less than $500,000.
7 Annualized.
See notes to financial statements
Growth Fund | Annual report
28
F I N A N C I A L S T A T E M E N T S
Financial highlights
| | |
| CLASS R1 SHARES | | |
| |
| Period ended | 2-28-071 | 2-29-08 |
| |
| Per share operating performance | | |
|
| Net asset value, beginning of period | $20.00 | $21.60 |
| Net investment income (loss)2 | (0.05) | (0.01) |
| Net realized and unrealized gain | | |
| (loss) on investments | 1.90 | (1.25) |
| Total from investment operations | 1.85 | (1.26) |
| Less distributions | | |
| From net investment income | (0.03) | — |
| From net realized gain | (0.22) | (1.18) |
| | (0.25) | (1.18) |
| Net asset value, end of period | $21.60 | $19.16 |
| Total return3,4 (%) | 9.275 | (6.39) |
| |
| Ratios and supplemental data | | |
|
| Net assets, end of period (in millions) | —6 | —6 |
| Ratios (as a percentage of average net assets): | | |
| Expenses before reductions | 21.557 | 15.85 |
| Expenses net of fee waivers, if any | 1.747 | 1.50 |
| Expenses net of all fee waivers and credits | 1.747 | 1.50 |
| Net investment income (loss) | (0.34)7 | (0.06) |
| Portfolio turnover (%) | 935 | 95 |
1 Class R1 shares began operations on 6-12-06.
2 Based on the average of the shares outstanding.
3 Total returns would have been lower had certain expenses not been reduced during the periods shown.
4 Assumes dividend reinvestment.
5 Not annualized.
6 Less than $500,000.
7 Annualized.
See notes to financial statements
Annual report | Growth Fund
29
Notes to financial statements
1. Organization
John Hancock Growth Fund (the Fund) is a non-diversified series of John Hancock Funds III (the Trust). The Trust was established as a Massachusetts business trust on June 9, 2005. The Trust is registered under the Investment Company Act of 1940, as amended (the 1940 Act), as an open-end investment management company. The investment objective of the Fund is to seek long-term capital growth.
John Hancock Life Insurance Company of New York (John Hancock New York) is a wholly owned subsidiary of John Hancock Life Insurance Company (U.S.A.) (John Hancock USA). John Hancock USA and John Hancock New York are indirect wholly owned subsidiaries of The Manufacturers Life Insurance Company (Manulife), which in turn is a wholly owned subsidiary of Manulife Financial Corporation (MFC), a publicly traded company. MFC and its subsidiaries are known collectively as “Manulife Financial.”
John Hancock Investment Management Services, LLC (the Adviser), a Delaware limited liability company controlled by John Hancock USA, serves as investment adviser for the Trust and John Hancock Funds, LLC (the Distributor), a Delaware limited liability company, an affiliate of the Adviser, serves as principal underwriter.
The Board of Trustees have authorized the issuance of multiple classes of shares of the Fund, including classes designated as Class A, Class B, Class C, Class I and Class R1. Class A, Class B and Class C shares are open to all retail investors. Class I shares are offered without any sales charge to various institutional and certain individual investors. Class R1 shares are available only to certain retirement plans. The shares of each class represent an interest in the same portfolio of investments of the Fund, and have equal rights as to voting, redemptions, dividends and liquidation, except that certain expenses, subject to the approval of the Board of Trustees, may be applied differently to each class of shares in accordance with current regulations of the Securities and Exchange Commission (SEC) and the Internal Revenue Service. Shareholders of a class that bear distribution and service expenses under the terms of a distribution pl an have exclusive voting rights to that distribution plan. Class B shares will convert to Class A shares eight years after purchase.
The Adviser and other affiliates of John Hancock USA owned 779,618 and 5,338 shares of beneficial interest of Class A and Class R1, respectively, on February 29, 2008.
2. Significant accounting policies
In the preparation of the financial statements, the Fund follows the policies described below. The preparation of financial statements in conformity with accounting principles generally accepted in the United States of America requires management to make estimates and assumptions that affect the reported amounts of assets and liabilities at the date of the financial statements and the reported amounts of income and expenses during the reporting period. Actual results may differ from these estimates.
Security valuation
The net asset value of the shares of the Fund is determined daily as of the close of the New York Stock Exchange (NYSE), normally at 4:00 P.M., Eastern Time. Short-term debt investments that have a remaining maturity of 60 days or less are valued at amortized cost, and thereafter assume a constant amortization to maturity of any discount or premium, which approximates market value. Investments in John Hancock Cash Investment Trust (JHCIT), an affiliate of the John Hancock Advisers, LLC (JHA), a wholly owned subsidiary of John Hancock Financial Services, Inc., a subsidiary of MFC, are valued at their net asset value each business day. All other securities held by the
Growth Fund | Annual report
30
Fund are valued at the last sale price or offi-cial closing price (closing bid price or last evaluated quote if no sale has occurred) as of the close of business on the principal securities exchange (domestic or foreign) on which they trade or, lacking any sales, at the closing bid price. Securities traded only in the over-the-counter market are valued at the last bid price quoted by brokers making markets in the securities at the close of trading. Securities for which there are no such quotations, principally debt securities, are valued based on the evaluated prices provided by an independent pricing service, which utilizes both dealer-supplied and electronic data processing techniques, which take into account factors such as institutional-size trading in similar groups of securities, yield, quality, coupon rate, maturity, type of issue, trading characteristics and other market data.
Other assets and securities for which no such quotations are readily available are valued at fair value as determined in good faith under consistently applied procedures established by and under the general supervision of the Board of Trustees. Generally, trading in non-U.S. securities is substantially completed each day at various times prior to the close of trading on the NYSE. The values of such securities used in computing the net asset value of a Fund’s shares are generally determined as of such times. Occasionally, significant events that affect the values of such securities may occur between the times at which such values are generally determined and the close of the NYSE. Upon such an occurrence, these securities will be valued at fair value as determined in good faith under consistently applied procedures established by and under the general supervision of the Board of Trustees.
In deciding whether to make a fair value adjustment to the price of a security, the Board of Trustees or their designee may review a variety of factors, including developments in foreign markets, the performance of U.S. securities markets and the performance of instruments trading in U.S. markets that represent foreign securities and baskets of foreign securities. The Fund may also fair value securities in other situations, for example, when a particular foreign market is closed, but the Fund is calculating the net asset value. In view of these factors, it is likely that Funds investing significant amounts of assets in securities in foreign markets will be fair valued more frequently than Funds investing significant amounts of assets in frequently traded, U.S. exchange listed securities of large-capitalization U.S. issuers.
For purposes of determining when fair value adjustments may be appropriate with respect to Funds that invest in securities in foreign markets that close prior to the NYSE, the Funds will, on an ongoing basis, monitor for “significant market events.” A significant market event may be a certain percentage change in the value of an index or of certain Exchange Traded Funds that track foreign markets in which Funds have significant investments. If a significant market event occurs due to a change in the value of the index or of Exchange Traded Funds, the pricing for the Fund will promptly be reviewed and potential adjustments to the net asset value of the Fund will be recommended to the Trust’s Pricing Committee when applicable.
Fair value pricing of securities is intended to help ensure that the net asset value of the Fund’s shares reflects the value of the Fund’s securities as of the close of the NYSE (as opposed to a value which is no longer accurate as of such close), thus limiting the opportunity for aggressive traders to purchase shares of the Fund at deflated prices, reflecting stale security valuations, and to promptly sell such shares at a gain. However, a security’s valuation may differ depending on the method used for determining value and no assurance can be given that fair value pricing of securities will successfully eliminate all potential opportunities for such trading gains.
New accounting pronouncements
In September 2006, Financial Accounting Standards Board (FASB) Standard No. 157, Fair Value Measurements (FAS 157), was issued and is effective for fiscal years beginning after November 15, 2007. FAS 157 defines fair value, establishes a framework for measuring fair value and expands disclosure about fair value measurements. As of February 29, 2008, management does not believe the adoption of FAS 157 will impact the amounts reported in
Annual report | Growth Fund
31
the financial statements; however, additional disclosures regarding pricing sources will be required about the inputs used to develop the measurements of fair value and the related realized and unrealized gain/loss for certain securities valued by significant unobservable market inputs.
In March 2008, FASB No. 161 (FAS 161), Disclosures about Derivative Instruments and Hedging Activities, an amendment of FASB Statement No. 133 (FAS 133), was issued and is effective for fiscal years beginning after November 15, 2008. FAS 161 amends and expands the disclosure requirements of FAS133 in order to provide financial statement users an understanding of a company’s use of derivative instruments, how derivative instruments are accounted for under FAS 133 and related interpretations and how these instruments affect a company’s financial position, performance, and cash flows. FAS 161 requires companies to disclose information detailing the objectives and strategies for using derivative instruments, the level of derivative activity entered into by the company, and any credit risk-related contingent features of the agreements. Management is currently evaluating the adoption of FAS 16 1 on the Fund’s financial statement disclosures.
Guarantees and indemnifications
Under the Trust’s organizational documents, its Officers and Trustees are indemnified against certain liability arising out of the performance of their duties to the Trust. Additionally, in the normal course of business, the Trust enters into contracts with service providers that contain general indemnification clauses. The Trust’s maximum exposure under these arrangements is unknown, as this would involve future claims that may be made against the Trust that have not yet occurred.
Repurchase agreements
The Fund may enter into repurchase agreements. When the Fund enters into a repurchase agreement through its custodian, it receives delivery of securities, the amount of which at the time of purchase and each subsequent business day is required to be maintained at such a level that the market value is generally at least 102% of the repurchase amount. The Fund will take constructive receipt of all securities underlying the repurchase agreements it has entered into until such agreements expire. If the seller defaults, the Fund would suffer a loss to the extent that proceeds from the sale of underlying securities were less than the repurchase amount. The Fund may enter into repurchase agreements maturing within seven days with domestic dealers, banks or other financial institutions deemed to be creditworthy by the Adviser. Collateral for certain tri-party repurchase agreements is held at the custodian bank in a segregated account for the benefi t of the Fund and the counterparty.
Security transactions and related investment income
Investment security transactions are accounted for on a trade date plus one basis for daily net asset value calculations. However, for financial reporting purposes, investment transactions are reported on trade date. Interest income is accrued as earned. Dividend income and distributions to shareholders are recorded on the ex-dividend date. Foreign dividends are recorded on the ex-date or when the Fund becomes aware of the dividends from cash collections. Discounts/premiums are accreted/ amortized for financial reporting purposes. Non-cash dividends are recorded at the fair market value of the securities received. Debt obligations may be placed in a non-accrual status and related interest income may be reduced by ceasing current accruals and writing off interest receivables when the collection of all or a portion of interest has become doubtful, based upon consistently applied procedures.
From time to time, the Fund may invest in Real Estate Investment Trusts (REITs) and, as a result, will estimate the components of distributions from these securities. Distributions from REITs received in excess of income are recorded as a reduction of cost of investments and/or as a realized gain.
The Fund uses the specific identification method for determining realized gain or loss on investments for both financial statement and federal income tax reporting purposes.
Growth Fund | Annual report
32
Allocations of income and expenses
All income, expenses (except class-specific expenses), and realized and unrealized gain/ loss are allocated to each class of shares based upon the relative net assets of each class. Dividends to shareholders from net investment income are determined at a class level and distributions from capital gains are determined at a Fund level.
Expenses not directly attributable to the Fund or share classes are allocated based on the relative share of net assets of the Fund or share class at the time the expense was incurred. Class-specific expenses, as detailed in Note 3, are accrued daily and charged directly to the respective share classes.
Securities lending
The Fund may lend portfolio securities from time to time in order to earn additional income. The Fund retains beneficial ownership of the securities it has loaned and continues to receive interest and dividends paid by the issuer of securities and to participate in any changes in their value. On the settlement date of the loan, the Fund receives collateral against the loaned securities and maintain collateral in an amount not less than 100% of the market value of the loaned securities during the period of the loan. The market value of the loaned securities is determined at the close of business of the Fund and any additional required collateral is delivered to the Fund on the next business day. Any cash collateral received is invested in the JHCIT. If the borrower defaults on its obligation to return the securities loaned because of insolvency or other reasons, a fund could experience delays and costs in recovering the securities loaned or in gaining access to the collat eral. The Fund receives compensation for lending its securities either in the form of fees, guarantees, and/or by retaining a portion of interest on the investment of any cash received as collateral.
The Fund has entered into an agreement with Morgan Stanley & Co. Incorporated and MS Securities Services Inc. (collectively, Morgan Stanley), which permits the Fund to lend securities to Morgan Stanley on a principal basis. Morgan Stanley is the primary borrower of fund securities of the Fund. The risk of having one primary borrower of securities (as opposed to several borrowers in an agency relationship) is that should Morgan Stanley fail financially, all securities lent will be affected by the failure and by any delays in recovery of the securities (or in the rare event, loss of rights in the collateral).
Prior to May 8, 2007, cash collateral was invested in the State Street Navigator Securities Lending Portfolio. At February 29, 2008, the Fund loaned securities having a market value of $81,677 collateralized by securities in the amount of $83,311.
Futures
The Fund may purchase and sell financial futures contracts and options on those contracts. The Fund invests in contracts based on financial instruments, such as U.S. Treasury Bonds or Notes, or on securities indices such as the Standard & Poor’s 500 Index, in order to hedge against a decline in the value of securities owned by the Fund.
Initial margin deposits required upon entering into futures contracts are satisfied by the delivery of specific securities or cash as collateral to the broker (the Fund’s agent in acquiring the futures position). If the position is closed out by taking an opposite position prior to the settlement date of the futures contract, a final determination of variation margin is made, cash is required to be paid to or released by the broker and the Fund realizes a gain or loss.
When the Fund sells a futures contract based on a financial instrument, the Fund becomes obligated to deliver that kind of instrument at an agreed upon date for a specified price. The Fund realizes a gain or loss depending on whether the price of an offsetting purchase is less or more than the price of the initial sale or on whether the price of an offsetting sale is more or less than the price of the initial purchase. The Fund could be exposed to risks if it could not close out futures positions because of an illiquid secondary market or the inability of counterparties to meet the terms of their contracts. Futures contracts are valued at the quoted daily settlement prices established by the exchange on which they trade.
Annual report | Growth Fund
33
The following is a summary of open futures contracts on February 29, 2008:
| | | | | |
| | | | | | UNREALIZED |
| | NUMBER OF | | EXPIRATION | NOTIONAL | APPRECIATION |
| OPEN CONTRACTS | CONTRACTS | POSITION | DATE | AMOUNT | (DEPRECIATION) |
|
| S&P Mini 500 Index Futures | 1 | Long | Mar 2008 | $66,565 | ($1,438) |
Federal income taxes
The Fund qualifies as a regulated investment company by complying with the applicable provisions of the Internal Revenue Code and will not be subject to federal income tax on taxable income that is distributed to shareholders. Therefore, no federal income tax provision is required. Net capital losses of $733,332 that are attributable to security transactions incurred after October 31, 2007, are treated as arising on March 1, 2008, the first day of the Fund’s next taxable year.
The Fund has adopted the provisions of FASB Interpretation No. 48, Accounting for Uncertainty in Income Taxes, an interpretation of FASB Statement 109 (FIN 48), at the beginning of the Fund’s fiscal year. FIN 48 prescribes a minimum threshold for financial statement recognition of the benefit of a tax position taken or expected to be taken in a tax return. The implementation of FIN 48 did not have a material impact on the Fund’s financial statements. Each of the Fund’s federal tax returns for the prior fiscal years remains subject to examination by the Internal Revenue Service.
Distribution of income and gains
The Fund records distributions to shareholders from net investment income and net realized gains, if any, on the ex-dividend date. During the year ended February 28, 2007, the tax character of distributions paid was as follows: ordinary income $205,911 and long-term capital gain $40,377. During the year ended February 29, 2008, the tax character of distributions paid was as follows: ordinary income $1,248,461 and long-term capital gain $237,641. Distributions paid by the Fund with respect to each class of shares are calculated in the same manner, at the same time and are in the same amount, except for the effect of expenses that may be applied differently to each class.
As of February 29, 2008, the components of distributable earnings on a tax basis included $19,128 of undistributed ordinary income.
Such distributions and distributable earnings, on a tax basis, are determined in conformity with income tax regulations, which may differ from accounting principles generally accepted in the United States of America. Distributions in excess of tax basis earnings and profits, if any, are reported in the Fund’s financial statements as a return of capital.
Capital accounts within financial statements are adjusted for permanent book/tax differences. These adjustments have no impact on net assets or the results of operations. Temporary book/tax differences will reverse in a subsequent period. Permanent book/tax differences are primarily attributable to net operating losses.
3. Investment advisory and other agreements
The Trust has entered into an Investment Advisory Agreement with the Adviser. The Adviser is responsible for managing the corporate and business affairs of the Trust and for selecting and compensating subadvisers to handle the investment of the assets of the Fund, subject to the supervision of the Trust’s Board of Trustees. As compensation for its services, the Adviser receives an advisory fee from the Trust. Under the Advisory Agreement, the Fund pays a monthly management fee to the Adviser equivalent, on an annual basis, to the sum of: (a) 0.80% of the first $500,000,000 of the Fund’s aggregate daily net assets; (b) 0.78% of the next $500,000,000 of the Fund’s aggregate daily net assets; (c) 0.77% of the next $1,500,000,000 of the Fund’s aggregate daily net assets; and (d) 0.76% of the Fund’s aggregate daily net assets in excess of $2,500,000,000. Aggregate net assets include the net assets of the Fund and Growth Trust, a series of John Hancock Trust and Growth Fund, a series of John Hancock Funds II. The Adviser has a subadvisory agreement with Grantham, Mayo, Van Otterloo & Co. LLC. The Fund is not responsible for payment of the subadvisory fees.
Growth Fund | Annual report
34
The investment management fees incurred for the year ended February 29, 2008, were equivalent to an annual effective rate of 0.80% of the Fund’s average daily net assets.
Expense reimbursements
The Adviser has contractually agreed to reimburse or limit certain Fund level expenses to 0.11% of the Fund’s average annual net assets which are allocated pro rata to all share classes. This agreement excludes taxes, portfolio brokerage commissions, interest, advisory fees, Rule 12b-1 fees, transfer agency fees, blue sky fees, printing and postage and litigation and indemnification expenses and other extraordinary expenses not incurred in the ordinary course of the Fund’s business. In addition, fees incurred under any agreement or plans of the Fund dealing with services for the shareholders and others with beneficial interest in shares of the Fund, are excluded.
In addition, the Adviser has agreed to reimburse or limit certain expenses for each share class. This agreement excludes taxes, portfolio brokerage commissions, interest and litigation and indemnification expenses and other extraordinary expenses not incurred in the ordinary course of the Fund’s business. In addition, fees incurred under any agreement or plans of the Fund dealing with services for the shareholders and others with beneficial interest in shares of the Fund, are excluded. The reimbursements and limits are such that these expenses will not exceed 1.40% for Class A shares, 2.10% for Class B, 2.10% for Class C, 1.00% for Class I and 1.50% for Class R1. Accordingly, the expense reductions or reimbursements related to this agreement were $105,810, $18,036, $23,819, $18,464 and $16,302 for Class A, Class B, Class C, Class I and Class R1, respectively for the year ended February 29, 2008. The expense reimbursements and limits will continue in effect until Jun e 30, 2008 and thereafter until terminated by the Adviser on notice to the Trust.
Fund administration fees
Pursuant to the Advisory Agreement, the Fund reimburses the Adviser for all expenses associated with providing the administrative, financial, legal, accounting and recordkeeping services of the Fund, including the preparation of all tax returns, annual, semiannual and periodic reports to shareholders and the preparation of all regulatory reports. These expenses are allocated based on the relative share of net assets of each class at the time the expense was incurred.
The fund administration fees incurred for the year ended February 29, 2008, were $11,948 with an annual effective rate of 0.05% of the Fund’s average daily net assets.
Distribution and shareholder servicing fees
The Trust has a Distribution Agreement with the Distributor. The Fund has adopted Distribution Plans with respect to Class A, Class B, Class C and Class R1, pursuant to Rule 12b-1 under the 1940 Act, to pay the Distributor for the services it provides as distributor of shares of the Fund. Accordingly, the Fund makes monthly payments to the Distributor at an annual rate not to exceed 0.30%, 1.00%, 1.00% and 0.50% of average daily net asset value of Class A, Class B, Class C and Class R1, respectively. A maximum of 0.25% of such payments may be service fees, as defined by the Conduct Rules of Financial Industry Regulatory Authority (formerly the National Association of Securities Dealers). Under the Conduct Rules, curtailment of a portion of the Fund’s 12b-1 payments could occur under certain circumstances.
In addition, the Fund has also adopted a Service Plan for Class R1 shares. Under the Service Plan, the Fund may pay up to 0.25% of Class R1 average daily net asset value for certain other services. There were no Service Plan fees incurred for the year ended February 29, 2008.
Sales charges
Class A shares are assessed up-front sales charges of up to 5.00% of net asset value of such shares. During the year ended February 29, 2008, the Fund was informed that the Distributor received net up-front sales charges of $37,898 with regard to sales of Class A shares. Of this amount, $6,302 was retained and used for printing prospectuses; advertising, sales literature and other purposes; $31,521 was paid as sales commissions to unrelated broker-dealers; and $75 was paid as sales commissions to sales
Annual report | Growth Fund
35
personnel of Signator Investors, Inc. (Signator Investors), a related broker-dealer, an indirect subsidiary of MFC.
Class B shares that are redeemed within six years of purchase are subject to a contingent deferred sales charge (CDSC) at declining rates, beginning at 5.00% of the lesser of the current market value at the time of redemption or the original purchase cost of the shares being redeemed. Class C shares that are redeemed within one year of purchase are subject to a CDSC at a rate of 1.00% of the lesser of the current market value at the time of redemption or the original purchase cost of the shares being redeemed. Proceeds from the CDSCs are paid to the Distributor and are used, in whole or in part, to defray its expenses for providing distribution-related services to the Fund in connection with the sale of Class B and Class C shares. During the year ended February 29, 2008, CDSCs received by Distributor amounted to $1,633 for Class B shares and $509 for Class C shares.
Transfer agent fees
The Fund has a Transfer Agency Agreement with John Hancock Signature Services, Inc. (Signature Services), an indirect subsidiary of MFC. For Class A, Class B, Class C, Class I and Class R1 shares, the Fund pays a monthly transfer agent fee at an annual rate of 0.05% of each class’ average daily net assets, plus a fee based on the number of shareholder accounts and reimbursement for certain out-of-pocket expenses. Expenses not directly attributable to a particular class of shares are aggregated and allocated to each class on the basis of its relative net asset value. The Fund pays a monthly fee which is based on an annual rate of $15.00 for each Class A shareholder account, $17.50 for each Class B shareholder account, $16.50 for each Class C shareholder account, and $15.00 for each Class R1 shareholder account.
Signature Services has agreed to limit the transfer agent fees so that such fees do not exceed 0.20% annually of Class A, Class B, Class C, Class I and Class R1 share average daily net assets. This agreement is effective until December 31, 2008. Signature Services reserves the right to terminate this limitation in the future. There were no transfer agent fee reductions for Class A, Class B, Class C, Class I and Class R1 shares, respectively, during the year ended February 29, 2008.
In addition, Signature Services has voluntarily agreed to further limit transfer agent fees for Class R1 shares so that such fees do not exceed 0.05% annually of each class’s average daily net assets. For the year ended February 29, 2008, the transfer agent fees reductions for Class R1 were $174.
In May 2007, the Fund began receiving earnings credits from its transfer agent as a result of uninvested cash balances. These credits are used to reduce a portion of the Fund’s transfer agent fees and out-of-pocket expenses. During the year ended February 29, 2008, the Fund’s transfer agent fees and out-of-pocket expenses were reduced by $283 for transfer agent credits earned.
Class level expenses for the year ended February 29, 2008, were as follows:
| | | | |
| | Distribution and | Transfer | Blue sky | Printing and |
| Share class | service fees | agent fees | fees | postage fees |
|
| |
| Class A | $70,763 | $20,006 | $18,354 | $5,740 |
| Class B | 6,850 | 1,395 | 14,680 | 148 |
| Class C | 17,604 | 3,599 | 14,820 | 803 |
| Class I | — | 114 | 17,541 | — |
| Class R1 | 574 | 233 | 15,836 | 3 |
| Total | $95,791 | $25,347 | $81,231 | $6,694 |
Growth Fund | Annual report
36
4. Trustees’ fees
The Trust compensates each Trustee who is not an employee of the Adviser or its affiliates. Total Trustees’ expenses are allocated to the Fund based on its average daily net asset value.
5. Line of credit
The Fund has entered into an agreement which enables them to participate in a $100 million unsecured committed line of credit with State Street Corporation. Borrowings will be made solely to temporarily finance the repurchase of capital shares. Interest is charged to the Fund based on its borrowings at a rate per annum equal to the Federal Funds rate plus 0.50% . In addition, a commitment fee of 0.05% per annum, payable at the end of each calendar quarter, based on the average daily-unused portion of the line of credit, is charged to the Fund on a prorated basis based on average net assets. Effective October 15, 2007, the commitment fee was changed from 0.07% to 0.05% . For the year ended February 29, 2008, there were no borrowings under the line of credit.
6. Fund share transactions
Share activities for the Fund for the years ended February 28, 2007, and February 29, 2008, were as follows:
| | | | |
| | | Year ended 2-28-071 | Year ended 2-29-08 |
| | Shares | Amount | Shares | Amount |
| Class A shares | | | | |
|
| Sold | 941,625 | $19,160,734 | 253,211 | $5,635,153 |
| Distributions reinvested | 10,718 | 232,682 | 60,442 | 1,296,476 |
| Repurchased | (3,531) | (77,567) | (100,129) | (2,102,448) |
| Net increase (decrease) | 948,812 | $19,315,849 | 213,524 | $4,829,181 |
| | | | | |
| Class B shares | | | | |
|
| Sold | 19,722 | $418,160 | 29,429 | $643,344 |
| Distributions reinvested | 132 | 2,867 | 1,972 | 41,918 |
| Repurchased | (217) | (4,845) | (13,671) | (298,183) |
| Net increase (decrease) | 19,637 | $416,182 | 17,730 | $387,079 |
| | | | | |
| Class C shares | | | | |
|
| Sold | 42,249 | $911,629 | 71,331 | $1,568,194 |
| Distributions reinvested | 277 | 6,002 | 4,932 | 104,855 |
| Repurchased | (13) | (287) | (22,472) | (471,936) |
| Net increase (decrease) | 42,513 | $917,344 | 53,791 | $1,201,113 |
| | | | | |
| Class I shares | | | | |
|
| Sold | 368,724 | $7,471,000 | 7,959 | $180,651 |
| Distributions reinvested | 18 | 389 | 520 | 11,243 |
| Repurchased | (362,143) | (8,013,922) | (11,806) | (252,855) |
| Net increase (decrease) | 6,599 | ($542,533) | (3,327) | ($60,961) |
| | | | | |
| Class R1 shares | | | | |
|
| Sold | 5,000 | $100,000 | 1,028 | $20,749 |
| Distributions reinvested | 59 | 1,272 | 293 | 6,262 |
| Net increase (decrease) | 5,059 | $101,272 | 1,321 | $27,011 |
| | | | | |
| Net increase (decrease) | 1,022,620 | $20,208,114 | 283,039 | $6,383,423 |
|
1Period from 6-12-06 (commencement of operations) to 2-28-07.
7. Purchases and sales of securities
Purchases and proceeds from sales or maturities of securities, other than short-term securities and obligations of the U.S. government, during the year ended February 29, 2008, aggregated $29,513,673 and $23,884,586, respectively.
Annual report | Growth Fund
37
Auditors’ report
Report of Independent Registered Public Accounting Firm
To the Board of Trustees of John Hancock Funds III and Shareholders of John Hancock Growth Fund,
In our opinion, the accompanying statement of assets and liabilities, including the schedule of investments, and the related statements of operations and of changes in net assets and the financial highlights present fairly, in all material respects, the financial position of John Hancock Growth Fund (the Fund) at February 29, 2008, and the results of its operations, the changes in its net assets and the financial highlights for each of the periods indicated, in conformity with accounting principles generally accepted in the United States of America. These financial statements and financial highlights (hereafter referred to as “financial statements”) are the responsibility of the Fund’s management. Our responsibility is to express an opinion on these financial statements based on our audits. We conducted our audits of these financial statements in accordance with the standards of the Public Company Accounting Oversight Board (United States). Those standards require that we plan and perform the audits to obtain reasonable assurance about whether the financial statements are free of material misstatement. An audit includes examining, on a test basis, evidence supporting the amounts and disclosures in the financial statements, assessing the accounting principles used and significant estimates made by management, and evaluating the overall financial statement presentation. We believe that our audits, which included confirmation of investments at February 29, 2008 by correspondence with the custodian and brokers, provide a reasonable basis for our opinion.
PricewaterhouseCoopers LLP
Boston, Massachusetts
April 18, 2008
Growth Fund | Annual report
38
Tax information
Unaudited
For federal income tax purposes, the following information is furnished with respect to the distributions of the Fund, if any, paid during its taxable year ended February 29, 2008.
The Fund has designated distributions to shareholders of $237,641 as a long-term capital gain dividend. With respect to the ordinary dividends paid by the Fund for the fiscal year ended February 29, 2008, 55.14% of the dividends qualifies for the corporate dividends-received deduction.
The Fund hereby designates the maximum amount allowable of its net taxable income as qualified dividend income as provided in the Jobs and Growth Tax Relief Reconciliation Act of 2003. This amount will be reflected on Form 1099-DIV for the calendar year 2008.
Shareholders will be mailed a 2008 U.S. Treasury Department Form 1099-DIV in January 2009. This will reflect the total of all distributions that are taxable for calendar year 2008.
Annual report | Growth Fund
39
Trustees and Officers
This chart provides information about the Trustees and Officers who oversee your John Hancock fund. Officers elected by the Trustees manage the day-to-day operations of the Fund and execute policies formulated by the Trustees.
| | |
| Independent Trustees | | |
| |
| Name, Year of Birth | | Number of |
| Position(s) held with Fund | Trustee | John Hancock |
| Principal occupation(s) and other | of Fund | funds overseen |
| directorships during past 5 years | since1 | by Trustee |
| |
| James F. Carlin, Born: 1940 | 2006 | 55 |
|
| Chairman (since December 2007); Director and Treasurer, Alpha Analytical Laboratories, Inc. (chemical |
| analysis) (since 1985); Part Owner and Treasurer, Lawrence Carlin Insurance Agency, Inc. (since 1995); |
| Part Owner and Vice President, Mone Lawrence Carlin Insurance Agency, Inc. (until 2005); Chairman |
| and Chief Executive Officer, Carlin Consolidated, Inc. (management/investments) (since 1987); Trustee, |
| Massachusetts Health and Education Tax Exempt Trust (1993–2003). | | |
| |
| |
| William H. Cunningham, Born: 1944 | 2006 | 55 |
|
| Professor, University of Texas at Austin (since 1971); former Chancellor, University of Texas System and |
| former President, University of Texas at Austin (until 2001); Chairman and Chief Executive Officer, IBT |
| Technologies (until 2001); Director of the following: Hicks Acquisition Company I, Inc. (since 2007); |
| Hire.com (until 2004), STC Broadcasting, Inc. and Sunrise Television Corp. (until 2001), Symtx, Inc. |
| (electronic manufacturing) (since 2001), Adorno/Rogers Technology, Inc. (until 2004), Pinnacle |
| Foods Corporation (until 2003), rateGenius (until 2003), Lincoln National Corporation (insurance) |
| (since 2006), Jefferson-Pilot Corporation (diversified life insurance company) (until 2006), New |
| Century Equity Holdings (formerly Billing Concepts) (until 2001), eCertain (until 2001), ClassMap.com |
| (until 2001), Agile Ventures (until 2001), AskRed.com (until 2001), Southwest Airlines (since 2000), |
| Introgen (manufacturer of biopharmaceuticals) (since 2000) and Viasystems Group, Inc. (electronic |
| manufacturer) (until 2003); Advisory Director, Interactive Bridge, Inc. (college fundraising) (until 2001); |
| Advisory Director, Q Investments (until 2003); Advisory Director, JPMorgan Chase Bank (formerly Texas |
| Commerce Bank–Austin), LIN Television (until 2008), WilTel Communications (until 2003) and Hayes |
| Lemmerz International, Inc. (diversified automotive parts supply company) (since 2003). | |
| |
| |
| Charles L. Ladner,2 Born: 1938 | 2006 | 55 |
|
| Chairman and Trustee, Dunwoody Village, Inc. (retirement services) (until 2003); Senior Vice President |
| and Chief Financial Officer, UGI Corporation (public utility holding company) (retired 1998); Vice |
| President and Director, AmeriGas, Inc. (retired 1998); Director, AmeriGas Partners, L.P. (gas distribution) |
| (until 1997); Director, EnergyNorth, Inc. (until 1997); Director, Parks and History Association (until 2005). |
| |
| |
| John A. Moore,2 Born: 1939 | 2006 | 55 |
|
| President and Chief Executive Officer, Institute for Evaluating Health Risks (nonprofit institution) |
| (until 2001); Senior Scientist, Sciences International (health research) (until 2003); Former Assistant |
| Administrator and Deputy Administrator, Environmental Protection Agency; Principal, Hollyhouse |
| (consulting) (since 2000); Director, CIIT Center for Health Science Research (nonprofit research) |
| (until 2007). | | |
Growth Fund | Annual report
40
| | |
| Independent Trustees (continued) | | |
| |
| Name, Year of Birth | | Number of |
| Position(s) held with Fund | Trustee | John Hancock |
| Principal occupation(s) and other | of Fund | funds overseen |
| directorships during past 5 years | since1 | by Trustee |
| |
| Patti McGill Peterson,2 Born: 1943 | 2006 | 55 |
|
| Senior Associate, Institute for Higher Education Policy (since 2007); Executive Director, Council for |
| International Exchange of Scholars and Vice President, Institute of International Education (until 2007); |
| Senior Fellow, Cornell Institute of Public Affairs, Cornell University, Ithaca, NY (until 1998); Former |
| President, Wells College, Aurora, NY, and St. Lawrence University, Canton, NY; Director, Niagara |
| Mohawk Power Corporation (until 2003); Director, Ford Foundation, International Fellowships Program |
| (since 2002); Director, Lois Roth Endowment (since 2002); Director, Council for International Educational |
| Exchange (since 2003). | | |
| |
| |
| Steven R. Pruchansky, Born: 1944 | 2006 | 55 |
|
| Chairman and Chief Executive Officer, Greenscapes of Southwest Florida, Inc. (since 2000); Director and |
| President, Greenscapes of Southwest Florida, Inc. (until 2000); Managing Director, JonJames, LLC (real |
| estate) (since 2000); Director, First Signature Bank & Trust Company (until 1991); Director, Mast Realty |
| Trust (until 1994); President, Maxwell Building Corp. (until 1991). | | |
| |
| Non-Independent Trustees3 | | |
| |
| Name, Year of Birth | | Number of |
| Position(s) held with Fund | Trustee | John Hancock |
| Principal occupation(s) and other | of Fund | funds overseen |
| directorships during past 5 years | since1 | by Trustee |
| |
| James R. Boyle, Born: 1959 | 2006 | 265 |
|
| Executive Vice President, Manulife Financial Corporation (since 1999); President, John Hancock Variable |
| Life Insurance Company (since March 2007); Executive Vice President, John Hancock Life Insurance |
| Company (since 2004); Chairman and Director, John Hancock Advisers, LLC (the Adviser), John Hancock |
| Funds, LLC and The Berkeley Financial Group, LLC (The Berkeley Group) (holding company) (since 2005); |
| Senior Vice President, The Manufacturers Life Insurance Company (U.S.A.) (until 2004). | |
Annual report | Growth Fund
41
| |
| Principal officers who are not Trustees | |
| |
| Name, Year of Birth | |
| Position(s) held with Fund | Officer |
| Principal occupation(s) and other | of Fund |
| directorships during past 5 years | since |
| |
| Keith F. Hartstein, Born: 1956 | 2006 |
|
| President and Chief Executive Officer | |
| Senior Vice President, Manulife Financial Corporation (since 2004); Director, President and Chief | |
| Executive Officer, the Adviser, The Berkeley Group and John Hancock Funds, LLC (since 2005); Director, |
| MFC Global Investment Management (U.S.), LLC (MFC Global (U.S.)) (since 2005); Director, John | |
| Hancock Signature Services, Inc. (since 2005); President and Chief Executive Officer, John Hancock |
| Investment Management Services, LLC (since 2006); President and Chief Executive Officer, John Hancock |
| Funds, John Hancock Funds II, John Hancock Funds III and John Hancock Trust (since 2005); Director, |
| Chairman and President, NM Capital Management, Inc. (since 2005); Member, Investment Company |
| Institute Sales Force Marketing Committee (since 2003); President and Chief Executive Officer, MFC |
| Global (U.S.) (2005–2006); Executive Vice President, John Hancock Funds, LLC (until 2005). | |
|
| |
| Thomas M. Kinzler, Born: 1955 | 2006 |
|
| Secretary and Chief Legal Officer | |
| Vice President and Counsel, John Hancock Life Insurance Company (U.S.A.) (since 2006); Secretary and |
| Chief Legal Officer, John Hancock Funds and John Hancock Funds II (since 2006); Chief Legal Officer |
| and Assistant Secretary, John Hancock Trust (since 2006); Vice President and Associate General Counsel, |
| Massachusetts Mutual Life Insurance Company (1999–2006); Secretary and Chief Legal Counsel, MML |
| Series Investment Fund (2000–2006); Secretary and Chief Legal Counsel, MassMutual Institutional Funds |
| (2000–2004); Secretary and Chief Legal Counsel, MassMutual Select Funds and MassMutual Premier |
| Funds (2004–2006). | |
|
| |
| Francis V. Knox, Jr., Born: 1947 | 2006 |
|
| Chief Compliance Officer | |
| Vice President and Chief Compliance Officer, John Hancock Investment Management Services, LLC, |
| the Adviser and MFC Global (U.S.) (since 2005); Vice President and Chief Compliance Officer, John |
| Hancock Funds, John Hancock Funds II, John Hancock Funds III and John Hancock Trust (since 2005); |
| Vice President and Assistant Treasurer, Fidelity Group of Funds (until 2004); Vice President and Ethics & |
| Compliance Officer, Fidelity Investments (until 2001). | |
|
| |
| Charles A. Rizzo, Born: 1957 | 2007 |
|
| Chief Financial Officer | |
| Chief Financial Officer, John Hancock Funds, John Hancock Funds II, John Hancock Funds III and John |
| Hancock Trust (since June 2007); Assistant Treasurer, Goldman Sachs Mutual Fund Complex (regis- |
| tered investment companies) (2005–June 2007); Vice President, Goldman Sachs (2005–June 2007); |
| Managing Director and Treasurer of Scudder Funds, Deutsche Asset Management (2003–2005); | |
| Director, Tax and Financial Reporting, Deutsche Asset Management (2002–2003); Vice President and |
| Treasurer, Deutsche Global Fund Services (Deutsche Registered Investment Companies) (1999–2002). |
|
| |
| Gordon M. Shone, Born: 1956 | 2006 |
|
| Treasurer | |
| Senior Vice President, John Hancock Life Insurance Company (U.S.A.) (since 2001); Treasurer, John |
| Hancock Funds (since 2006), John Hancock Funds II, John Hancock Funds III and John Hancock Trust |
| (since 2005); Vice President and Chief Financial Officer, John Hancock Trust (2003–2005); Vice President, |
| John Hancock Investment Management Services, Inc., John Hancock Advisers, LLC (since 2006) and The |
| Manufacturers Life Insurance Company (U.S.A.) (1998–2000). | |
Growth Fund | Annual report
42
| |
| Principal officers who are not Trustees (continued) | |
| |
| Name, Year of Birth | |
| Position(s) held with Fund | Officer |
| Principal occupation(s) and other | of Fund |
| directorships during past 5 years | since |
| |
| John G. Vrysen, Born: 1955 | 2006 |
|
| Chief Operating Officer | |
| Senior Vice President, Manulife Financial Corporation (since 2006); Director, Executive Vice President |
| and Chief Operating Officer, the Adviser, The Berkeley Group and John Hancock Funds, LLC (since | |
| June 2007); Executive Vice President and Chief Operating Officer, John Hancock Investment | |
| Management Services, LLC (since December 2007); Chief Operating Officer, John Hancock Funds, |
| John Hancock Funds II, John Hancock Funds III and John Hancock Trust (since June 2007); Director, |
| Executive Vice President and Chief Financial Officer, the Adviser, The Berkeley Group and John Hancock |
| Funds, LLC (2005–2007); Executive Vice President and Chief Financial Officer, John Hancock Investment |
| Management Services, LLC (2005–2007); Executive Vice President and Chief Financial Officer, MFC |
| Global (U.S.) (2005 until August 2007); Director, John Hancock Signature Services, Inc. (since 2005); |
| Chief Financial Officer, John Hancock Funds, John Hancock Funds II, John Hancock Funds III and John |
| Hancock Trust (2005 until June 2007); Vice President and General Manager, John Hancock Fixed | |
| Annuities, U.S. Wealth Management (2004–2005); Vice President, Operations, Manulife Wood Logan |
| (2000–2004). | |
The business address for all Trustees and Officers is 601 Congress Street, Boston, Massachusetts 02210-2805.
The Statement of Additional Information of the Fund includes additional information about members of the Board of Trustees of the Fund and is available without charge, upon request, by calling 1-800-225-5291.
1 Each Trustee serves until resignation, retirement age or until his or her successor is elected.
2 Member of Audit and Compliance Committee.
3 Non-Independent Trustee holds positions with the Fund’s investment adviser, underwriter and certain other affiliates.
Annual report | Growth Fund
43
For more information
The Fund’s proxy voting policies, procedures and records are available without charge, upon request:
| | |
| By phone | On the Fund’s Web site | On the SEC’s Web site |
| 1-800-225-5291 | www.jhfunds.com/proxy | www.sec.gov |
|
| |
| Investment adviser | Custodian | Legal counsel |
| John Hancock Investment | State Street Bank & Trust Co. | Kirkpatrick & Lockhart |
| Management Services, LLC | 2 Avenue de Lafayette | Preston Gates Ellis LLP |
| 601 Congress Street | Boston, MA 02111 | One Lincoln Street |
| Boston, MA 02210-2805 | | Boston, MA 02111-2950 |
| | Transfer agent | |
| Subadviser | John Hancock Signature | Independent registered |
| Grantham, Mayo, Van | Services, Inc. | public accounting firm |
| Otterloo & Co. LLC | P.O. Box 9510 | PricewaterhouseCoopers LLP |
| 40 Rowes Wharf | Portsmouth, NH 03802-9510 | 125 High Street |
| Boston, MA 02110 | | Boston, MA 02110 |
| | | |
| Principal distributor | | |
| John Hancock Funds, LLC | | |
| 601 Congress Street | | |
| Boston, MA 02210-2805 | | |
| | |
| How to contact us | |
|
| Internet | www.jhfunds.com | |
|
| Mail | Regular mail: | Express mail: |
| | John Hancock Signature | John Hancock Signature |
| | Services, Inc. | Services, Inc. |
| | P.O. Box 9510 | Mutual Fund Image Operations |
| | Portsmouth, NH 03802-9510 | 164 Corporate Drive |
| | | Portsmouth, NH 03801 |
|
| Phone | Customer service representatives | 1-800-225-5291 |
| | EASI-Line | 1-800-338-8080 |
| | TDD line | 1-800-554-6713 |
A listing of month-end portfolio holdings is available on our Web site, www.jhfunds.com. A more detailed portfolio holdings summary is available on a quarterly basis 60 days after the fiscal quarter on our Web site or upon request by calling 1-800-225-5291, or on the SEC’s Web site, www.sec.gov.
Growth Fund | Annual report
44

1-800-225-5291 1-800-554-6713 TDD 1-800-338-8080 EASI-Line www.jhfunds. com
Now available: electronic delivery
www.jhfunds.com/edelivery
| | |
| This report is for the information of the shareholders of John Hancock Growth Fund. | 8600A | 2/08 |
| It is not authorized for distribution to prospective investors unless preceded or accompanied by a prospectus. | | 4/08 |

Discussion of Fund performance
By Grantham, Mayo, Van Otterloo & Co. LLC (GMO)
The year ended February 29, 2008, was challenging for international markets. Share prices weakened significantly in the final four months of the period, as a slew of unfavorable data built a convincing case that a serious U.S.-centered slowdown was occurring and might be spreading to other developed countries as well. Against this backdrop, the S&P/Citigroup Primary Market Index (PMI) Europe, Pacific, Asia Composite (EPAC) Growth Style Index gained 3.54%, while the average foreign large blend fund monitored by Morningstar Inc. returned 2.31% . During this period, the Fund’s momentum criteria worked better than its valuation parameters.
“The year ended February 29,
2008, was challenging for
international markets.”
During the past year ended February 29, 2008, John Hancock International Growth Fund’s Class A, Class B, Class C, Class I, Class R1, Class 1 and Class NAV shares returned 2.85%, 2.03%, 1.99%, 3.27%, 2.73%, 3.28% and 3.34%, respectively, at net asset value. Among countries, the Fund received a significant boost from Canada, with lesser contributions from Hong Kong, Italy, Japan and Switzerland. The Fund’s largest contributor was Canada’s Research In Motion, Ltd., maker of the popular BlackBerry handheld messaging device. Fertilizer maker Potash Corp. of Saskatchewan, Inc. was another Canadian standout, along with U.K.-based mining company Rio Tinto PLC. Not owning benchmark components UBS AG, a Swiss bank hurt by the subprime mortgage crisis, and Japanese bank Mitsubishi UFJ Financial Group was beneficial as well. Conversely, our picks in Australia, along with our decision to carry an underweighted exposure to the Australian dollar, detracted from performan ce. For example, underweighting strong-performing mining company and benchmark component BHP Billiton, Ltd. was costly. In the case of Royal Bank of Scotland Group PLC, the stock fell due to the perception that the company overpaid for an acquisition. Two Japanese stocks — automaker Honda Motor Company Ltd. and semiconductor maker Sumco Corp., — further detracted, as did underweighting German electric utility E.ON AG.
This commentary reflects the views of the portfolio management team through the end of the Fund’s period discussed in this report. The team’s statements reflect their own opinions. As such, they are in no way guarantees of future events and are not intended to be used as investment advice or a recommendation regarding any specific security. They are also subject to change at any time as market and other conditions warrant.
International Growth Fund | Annual report
6
A look at performance
For the periods ended February 29, 2008
| | | | | | | | | | | |
| | | | Average annual returns | | | | Cumulative total returns | | |
| | | | with maximum sales charge (POP) | | | with maximum sales charge (POP) | | |
| | |
| |
| |
| | Inception | | | | | Since | | | | | Since |
| Class | date | | 1-year | 5-year | 10-year | inception | | 1-year | 5-year | 10-year | inception |
|
| A | 6-12-06 | | –2.29% | — | — | 10.83% | | –2.29% | — | — | 19.39% |
|
| B | 6-12-06 | | –2.74 | — | — | 11.22 | | –2.74 | — | — | 20.11 |
|
| C | 6-12-06 | | 1.04 | — | — | 13.30 | | 1.04 | — | — | 24.01 |
|
| I1 | 6-12-06 | | 3.27 | — | — | 14.67 | | 3.27 | — | — | 26.61 |
|
| R11 | 6-12-06 | | 2.73 | — | — | 13.96 | | 2.73 | — | — | 25.25 |
|
| 11 | 6-12-06 | | 3.28 | — | — | 14.70 | | 3.28 | — | — | 26.66 |
|
| NAV1 | 12-27-06 | | 3.34 | — | — | 3.54 | | 3.34 | — | — | 4.17 |
|
Performance figures assume all distributions are reinvested. Public offering price (POP) figures reflect maximum sales charge on Class A shares of 5%, and the applicable contingent deferred sales charge (CDSC) on Class B and Class C shares. The Class B shares’ CDSC declines annually between years 1 to 6 according to the following schedule: 5, 4, 3, 3, 2, 1%. No sales charge will be assessed after the sixth year. Class C shares held for less than one year are subject to a 1% CDSC. Sales charge is not applicable for Class I, Class R1, Class 1 and Class NAV shares.
The expense ratios of the Fund, both net (including any fee waivers or expense limitations) and gross (excluding any fee waivers or expense limitations), are set forth according to the most recent publicly available prospectuses for the Fund and may differ from the expense ratios disclosed in the Financial Highlights tables in this report. The waivers and expense limitations are contractual at least until 06-30-08. The net expenses are as follows: Class A — 1.66%, Class B — 2.39%, Class C — 2.39%, Class I — 1.19%, Class R1 — 1.94%, Class 1 — 1.15%, Class NAV — 1.10% . Had the fee waivers and expense limitations not been in place, the gross expenses would be as follows: Class A — 2.28%, Class B — 10.94%, Class C — 6.71%, Class I � 51; 17.20%, Class R1 — 20.78%, Class 1 — 2.00%, Class NAV — 2.75% .
The returns reflect past results and should not be considered indicative of future performance. The return and principal value of an investment will fluctuate so that shares, when redeemed, may be worth more or less than their original cost. Due to market volatility, the Fund’s current performance may be higher or lower than the performance shown. For performance data current to the most recent month end, please call 1-800-225-5291 or visit the Fund’s Web site at www.jhfunds.com.
The performance table above and the chart on the next page do not reflect the deduction of taxes that a shareholder would pay on fund distributions or the redemption of fund shares.
The Fund’s performance results reflect any applicable expense reductions, without which the expenses increase and results would have been less favorable.
Performance is calculated with an opening price (prior day’s close) on the inception date.
1 For certain types of investors as described in the Fund’s Class I, Class R1, Class 1 and Class NAV share prospectuses.
Annual report | International Growth Fund
7
A look at performance
Growth of $10,000
This chart shows what happened to a hypothetical $10,000 investment in International Growth Fund Class A shares for the period indicated. For comparison, we’ve shown the same investment in two separate indexes.
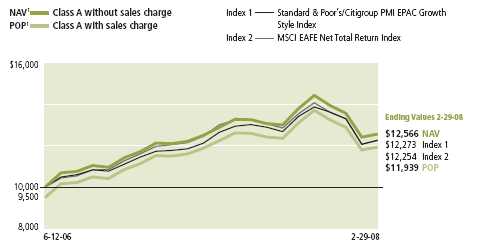
| | | | | |
| | | Without | With maximum | | |
| Class | Period beginning | sales charge | sales charge | Index 1 | Index 2 |
|
| B | 6-12-06 | $12,411 | $12,011 | $12,273 | $12,254 |
|
| C2 | 6-12-06 | 12,401 | 12,401 | 12,273 | 12,254 |
|
| I3 | 6-12-06 | 12,661 | 12,661 | 12,273 | 12,254 |
|
| R13 | 6-12-06 | 12,525 | 12,525 | 12,273 | 12,254 |
|
| 13 | 6-12-06 | 12,666 | 12,666 | 12,273 | 12,254 |
|
| NAV3 | 12-27-06 | 10,417 | 10,417 | 10,256 | 10,485 |
|
Assuming all distributions were reinvested for the period indicated, the table above shows the value of a $10,000 investment in the Fund’s Class B, Class C, Class I, Class R1, Class 1 and Class NAV shares, respectively, as of February 29, 2008. Performance of the classes will vary based on the difference in sales charges paid by shareholders investing in the different classes and the fee structure of those classes.
S&P/Citigroup Primary Market Index (PMI) Europe, Pacific, Asia Composite (EPAC) Growth Style Index — Index 1 — is an independently maintained and published index composed of stocks in the EPAC regions of the PMI that have a growth style. The PMI is the large-capitalization stock component of the S&P/Citigroup Broad Market Index (BMI) (which includes listed shares of companies from developed and emerging market countries with a total available market capitalization of at least the local equivalent of USD100 million), representing the top 80% of available capital of the BMI in each country.
MSCI EAFE (Europe, Australasia, Far East) Net Total Return Index — Index 2 — is a free float-adjusted market capitalization index that is designed to measure developed market equity performance, excluding the U.S. and Canada. As of June 2006, the MSCI EAFE Index consisted of the following 21 developed market country indexes: Australia, Austria, Belgium, Denmark, Finland, France, Germany, Greece, Hong Kong, Ireland, Italy, Japan, Netherlands, New Zealand, Norway, Portugal, Singapore, Spain, Sweden, Switzerland and United Kingdom. Returns are calculated and presented net of withholding tax.
It is not possible to invest directly in an index. Index figures do not reflect sales charges, which would have resulted in lower values if they did.
1 NAV represents net asset value and POP represents public offering price.
2 No contingent deferred sales charge applicable.
3 For certain types of investors as described in the Fund’s Class I, Class R1, Class 1 and Class NAV share prospectuses.
International Growth Fund | Annual report
8
Your expenses
These examples are intended to help you understand your ongoing operating expenses.
Understanding fund expenses
As a shareholder of the Fund, you incur two types of costs:
■ Transaction costs which include sales charges (loads) on purchases or redemptions (varies by share class), minimum account fee charge, etc.
■ Ongoing operating expenses including management fees, distribution and service fees (if applicable), and other fund expenses.
We are going to present only your ongoing operating expenses here.
Actual expenses/actual returns
This example is intended to provide information about your fund’s actual ongoing operating expenses, and is based on your fund’s actual return. It assumes an account value of $1,000.00 on September 1, 2007, with the same investment held until February 29, 2008.
| | | |
| | Account value | Ending value | Expenses paid during |
| | on 9-1-07 | on 2-29-08 | period on 2-29-081 |
|
| Class A | $1,000.00 | $965.96 | $7.48 |
|
| Class B | 1,000.00 | 962.00 | 11.76 |
|
| Class C | 1,000.00 | 961.59 | 11.71 |
|
| Class I | 1,000.00 | 967.70 | 5.87 |
|
| Class R1 | 1,000.00 | 966.60 | 7.14 |
|
| Class 1 | 1,000.00 | 967.82 | 5.63 |
|
| Class NAV | 1,000.00 | 968.22 | 5.38 |
|
Together with the value of your account, you may use this information to estimate the operating expenses that you paid over the period. Simply divide your account value at February 29, 2008, by $1,000.00, then multiply it by the “expenses paid” for your share class from the table above. For example, for an account value of $8,600.00, the operating expenses should be calculated as follows:
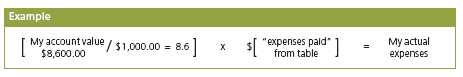
Annual report | International Growth Fund
9
Your expenses
Hypothetical example for comparison purposes
This table allows you to compare your fund’s ongoing operating expenses with those of any other fund. It provides an example of the Fund’s hypothetical account values and hypothetical expenses based on each class’s actual expense ratio and an assumed 5% annualized return before expenses (which is not your fund’s actual return). It assumes an account value of $1,000.00 on September 1, 2007, with the same investment held until February 29, 2008. Look in any other fund shareholder report to find its hypothetical example and you will be able to compare these expenses.
| | | |
| | Account value | Ending value | Expenses paid during |
| | on 9-1-07 | on 2-29-08 | period on 2-29-081 |
|
| Class A | $1,000.00 | $1,017.26 | $7.67 |
|
| Class B | 1,000.00 | 1,012.88 | 12.06 |
|
| Class C | 1,000.00 | 1,012.93 | 12.01 |
|
| Class I | 1,000.00 | 1,018.90 | 6.02 |
|
| Class R1 | 1,000.00 | 1,017.60 | 7.32 |
|
| Class 1 | 1,000.00 | 1,019.14 | 5.77 |
|
| Class NAV | 1,000.00 | 1,019.39 | 5.52 |
|
Remember, these examples do not include any transaction costs, such as sales charges; therefore, these examples will not help you to determine the relative total costs of owning different funds. If transaction costs were included, your expenses would have been higher. See the prospectus for details regarding transaction costs.
1 Expenses are equal to the Fund’s annualized expense ratio of 1.53%, 2.41%, 2.40%, 1.20%, 1.46%, 1.15% and 1.10% for Class A, Class B, Class C, Class I, Class R1, Class 1 and Class NAV, respectively, multiplied by the average account value over the period, multiplied by the number of days in most recent fiscal half year 366 (to reflect the one-half year period).
International Growth Fund | Annual report
10
Portfolio summary
| | | | |
| Top 10 holdings1 | | | | |
|
| Nokia AB Oyj | 4.6% | | BHP Billiton PLC | 2.1% |
| |
|
| Telelfonica SA | 3.0% | | Sanofi-Aventis SA | 1.9% |
| |
|
| Rio Tinto PLC | 2.6% | | Potash Corp. of Saskatchewan, Inc. | 1.7% |
| |
|
| Nestle SA | 2.4% | | Nintendo Company, Ltd. | 1.7% |
| |
|
| Vodafone Group PLC | 2.2% | | Roche Holdings AG-Genusschein | 1.7% |
| |
|
| |
| Sector distribution1 | | | | |
|
| Consumer non-cyclical | 23% | | Financial | 9% |
| |
|
| Industrial | 14% | | Energy | 9% |
| |
|
| Communications | 13% | | Technology | 4% |
| |
|
| Basic materials | 13% | | Utilities | 3% |
| |
|
| Consumer cyclical | 10% | | Other | 2% |
| |
|
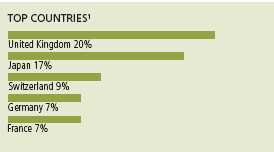
1 As a percentage of net assets on February 29, 2008.
Annual report | International Growth Fund
11
F I N A N C I A L S T A T E M E N T S
Fund’s investments
Securities owned by the Fund on 2-29-08
This schedule is divided into three main categories: common stocks, preferred stocks and repurchase agreements. Common stocks and preferred stocks are further broken down by country. Repurchase agreements, which represent the Fund’s cash position, are listed last.
| | |
| Issuer | Shares | Value |
| |
| Common stocks 97.49% | | $39,956,295 |
|
| (Cost $39,670,231) | | |
| | | |
| Australia 6.67% | | 2,731,854 |
|
| AMP, Ltd. | 7,540 | 55,665 |
|
| Australia and New Zealand Banking Group, Ltd. | 3,551 | 71,657 |
|
| Australian Stock Exchange, Ltd. | 3,499 | 134,528 |
|
| Babcock & Brown, Ltd. | 2,148 | 33,648 |
|
| BHP Billiton, Ltd. | 9,065 | 327,997 |
|
| Bluescope Steel, Ltd. | 4,422 | 44,234 |
|
| Brambles, Ltd. | 6,714 | 64,474 |
|
| CSL, Ltd. | 8,823 | 295,918 |
|
| CSR, Ltd. | 17,494 | 54,504 |
|
| Foster’s Group, Ltd. | 16,592 | 81,747 |
|
| Incitec Pivot, Ltd. | 381 | 51,748 |
|
| Leighton Holdings, Ltd. | 923 | 38,693 |
|
| Macquarie Group, Ltd. | 2,346 | 117,160 |
|
| Newcrest Mining, Ltd. | 4,321 | 150,226 |
|
| NRMA Insurance Group, Ltd. | 5,363 | 18,619 |
|
| QBE Insurance Group, Ltd. | 3,164 | 65,443 |
|
| Rio Tinto, Ltd. | 502 | 62,551 |
|
| St. George Bank, Ltd. | 1,640 | 35,812 |
|
| Suncorp-Metway, Ltd. | 2,771 | 35,547 |
|
| TABCORP Holdings, Ltd. | 3,284 | 46,295 |
|
| Telstra Corp., Ltd. | 16,165 | 72,668 |
|
| Toll Holdings, Ltd. | 6,198 | 58,465 |
|
| Wesfarmers, Ltd. | 1,845 | 63,924 |
|
| Westpac Banking Corp., Ltd. | 5,868 | 125,509 |
|
| Woodside Petroleum, Ltd. | 5,907 | 308,886 |
|
| Woolworths, Ltd. | 6,913 | 184,626 |
|
| WorleyParsons, Ltd. | 2,954 | 101,116 |
|
| Zinifex, Ltd. | 3,001 | 30,194 |
| | | |
| Austria 0.30% | | 121,222 |
|
| Immofinanz Immobilien Anlage AG | 4,969 | 53,906 |
|
| OMV AG | 528 | 38,150 |
|
| Voestalpine AG | 464 | 29,166 |
See notes to financial statements
International Growth Fund | Annual report
12
F I N A N C I A L S T A T E M E N T S
| | |
| Issuer | Shares | Value |
| |
| Belgium 0.47% | | $191,903 |
|
| Belgacom SA | 843 | 40,373 |
|
| Colruyt SA | 163 | 39,829 |
|
| Dexia | 1,027 | 24,145 |
|
| Fortis Group SA | 2,469 | 54,546 |
|
| Interbrew | 250 | 22,595 |
|
| Umicore | 205 | 10,415 |
|
| | | |
| Bermuda 0.15% | | 60,890 |
|
| Frontline, Ltd. | 1,335 | 60,890 |
| | | |
| Canada 5.56% | | 2,278,385 |
|
| Canadian Imperial Bank of Commerce | 800 | 54,287 |
|
| Canadian National Railway Company | 1,500 | 79,324 |
|
| Canadian Natural Resources, Ltd. | 1,300 | 97,422 |
|
| Canadian Pacific Railway, Ltd. | 600 | 43,611 |
|
| EnCana Corp. | 1,500 | 114,346 |
|
| Goldcorp, Inc. | 1,100 | 47,487 |
|
| Husky Energy, Inc. | 1,000 | 42,367 |
|
| IGM Financial, Inc. | 900 | 39,182 |
|
| Penn West Energy Trust | 1,500 | 42,337 |
|
| Potash Corp. of Saskatchewan, Inc. | 4,400 | 699,530 |
|
| Research In Motion, Ltd. * | 6,500 | 677,110 |
|
| Royal Bank of Canada | 2,600 | 130,469 |
|
| Shoppers Drug Mart Corp. | 1,100 | 56,227 |
|
| Suncor Energy, Inc. | 1,500 | 154,686 |
| | | |
| Denmark 2.66% | | 1,092,244 |
|
| A P Moller Maersk AS, Series A | 10 | 103,218 |
|
| A P Moller Maersk AS | 13 | 133,586 |
|
| Carlsberg AS, B Shares | 375 | 46,608 |
|
| H. Lundbeck AS | 2,600 | 62,087 |
|
| Novo Nordisk AS | 6,864 | 469,555 |
|
| Rockwool International AS, B Shares | 322 | 56,158 |
|
| Sydbank AS | 1,344 | 48,690 |
|
| Vestas Wind Systems AS * | 1,700 | 172,342 |
| | | |
| Finland 6.84% | | 2,805,060 |
|
| Elisa Oyj, A Shares | 701 | 21,366 |
|
| Fortum Corp. Oyj | 3,221 | 134,485 |
|
| Kone Corp. Oyj | 2,028 | 70,960 |
|
| Metra Oyj, B Shares | 646 | 44,158 |
|
| Metso Oyj | 1,069 | 55,618 |
|
| Neste Oil Oyj | 1,290 | 45,136 |
|
| Nokia AB Oyj | 52,237 | 1,876,749 |
|
| Nokian Renkaat Oyj | 4,470 | 183,776 |
|
| Outotec Oyj | 2,247 | 124,103 |
|
| Rautaruukki Oyj | 3,269 | 142,530 |
|
| YIT Oyj | 4,274 | 106,179 |
See notes to financial statements
Annual report | International Growth Fund
13
F I N A N C I A L S T A T E M E N T S
| | |
| Issuer | Shares | Value |
| | | |
| France 7.37% | | $3,019,943 |
| | |
|
| Alstom | 849 | 178,425 |
|
| BNP Paribas SA | 529 | 47,293 |
|
| Bouygues SA | 1,111 | 75,881 |
|
| Carrefour SA | 902 | 63,434 |
|
| Credit Agricole SA | 3,060 | 83,002 |
|
| Dassault Systemes SA | 740 | 40,350 |
|
| Electricite de France | 1,328 | 123,862 |
|
| Essilor International SA | 1,210 | 71,847 |
|
| Groupe DANONE | 2,598 | 203,512 |
|
| Hermes International SA | 1,008 | 117,970 |
|
| L’Oreal SA | 1,539 | 182,636 |
|
| LVMH Moet Hennessy SA | 470 | 48,289 |
|
| Neopost SA | 406 | 42,142 |
|
| PSA Peugeot Citroen SA | 555 | 42,191 |
|
| Sanofi-Aventis SA | 10,528 | 778,152 |
|
| Societe Generale NV – New Shares * | 90 | 9,890 |
|
| Societe Generale | 361 | 38,627 |
|
| Total SA | 9,193 | 692,270 |
|
| Veolia Environnement SA | 1,504 | 133,816 |
|
| Wendel, ADR | 411 | 46,354 |
| | | |
| Germany 7.45% | | 3,053,432 |
|
| Adidas-Salomon AG | 1,802 | 114,348 |
|
| Allianz AG | 329 | 56,960 |
|
| BASF AG | 2,486 | 316,317 |
|
| Bayer AG | 499 | 38,425 |
|
| Bilfinger Berger AG | 738 | 58,658 |
|
| Deutsche Bank AG | 1,528 | 170,645 |
|
| Deutsche Boerse AG | 1,803 | 285,785 |
|
| E.ON AG | 956 | 179,673 |
|
| K&S AG | 412 | 119,881 |
|
| MAN AG | 757 | 99,644 |
|
| Muenchener Rueckversicherungs – Gesellschaft AG | 939 | 165,487 |
|
| Premiere AG * | 489 | 10,442 |
|
| Puma AG | 115 | 41,018 |
|
| Q-Cells AG * | 932 | 74,883 |
|
| Salzgitter AG | 1,082 | 190,926 |
|
| SAP AG | 8,244 | 394,438 |
|
| SGL Carbon AG * | 819 | 45,837 |
|
| Siemens AG | 4,252 | 547,488 |
|
| Solarworld AG | 1,515 | 68,704 |
|
| Volkswagen AG | 325 | 73,873 |
| | | |
| Greece 0.33% | | 135,398 |
|
| Bank of Piraeus SA | 935 | 27,830 |
|
| Coca Cola Hellenic Bottling Company SA | 991 | 43,372 |
See notes to financial statements
International Growth Fund | Annual report
14
F I N A N C I A L S T A T E M E N T S
| | |
| Issuer | Shares | Value |
| | | |
| Greece (continued) | | |
|
| Greek Organization of Football Prognostics | 1,182 | $38,668 |
|
| Hellenic Telecommunications Organization SA | 919 | 25,528 |
| | | |
| Hong Kong 1.50% | | 616,273 |
|
| BOC Hong Kong Holdings, Ltd. | 10,000 | 24,531 |
|
| CLP Holdings, Ltd. | 7,000 | 54,720 |
|
| Esprit Holdings, Ltd. | 11,600 | 144,759 |
|
| Hang Seng Bank, Ltd. | 3,500 | 66,337 |
|
| Hong Kong & China Gas Company, Ltd. | 35,000 | 101,035 |
|
| Hong Kong Electric Holdings, Ltd. | 17,000 | 95,625 |
|
| Hong Kong Exchange & Clearing, Ltd. | 4,500 | 85,543 |
|
| Li & Fung, Ltd. | 12,000 | 43,723 |
| | | |
| Ireland 0.69% | | 282,434 |
|
| Allied Irish Banks PLC | 2,426 | 49,110 |
|
| Anglo Irish Bank Corp. PLC | 6,507 | 92,157 |
|
| Bank of Ireland | 5,055 | 71,110 |
|
| CRH PLC | 1,885 | 70,057 |
| | | |
| Italy 0.83% | | 339,084 |
|
| A2A SpA | 2,952 | 11,942 |
|
| Eni SpA | 7,860 | 271,415 |
|
| Saipem SpA | 1,364 | 55,727 |
| | | |
| Japan 16.74% | | 6,859,521 |
|
| Astellas Pharmaceuticals, Inc. | 2,500 | 109,264 |
|
| Canon, Inc. | 8,800 | 394,462 |
|
| Central Japan Railway Company, Ltd. | 5 | 47,613 |
|
| Daikin Industries, Ltd. | 2,600 | 116,993 |
|
| Denso Corp. | 1,700 | 63,464 |
|
| East Japan Railway Company | 6 | 48,158 |
|
| Eisai Company, Ltd. | 1,600 | 57,703 |
|
| Fanuc, Ltd. | 1,200 | 111,875 |
|
| Fast Retailing Company, Ltd. | 600 | 44,323 |
|
| Honda Motor Company, Ltd. | 7,700 | 235,045 |
|
| Hoya Corp. | 5,400 | 137,014 |
|
| Ibiden Company, Ltd. | 1,600 | 76,401 |
|
| Isuzu Motors, Ltd. | 9,000 | 40,984 |
|
| Japan Tobacco, Inc. | 12 | 60,617 |
|
| JFE Holdings, Inc. | 1,700 | 75,748 |
|
| Kao Corp. | 3,000 | 92,363 |
|
| Kawasaki Kisen Kaisha, Ltd. | 13,000 | 131,872 |
|
| Keyence Corp. | 600 | 139,999 |
|
| Komatsu, Ltd. | 12,300 | 312,475 |
|
| Konica Minolta Holdings, Inc. | 3,500 | 49,585 |
|
| Marubeni Corp. | 8,000 | 60,569 |
|
| Matsushita Electric Industrial Company, Ltd. | 3,000 | 63,184 |
|
| Mitsubishi Corp. | 7,700 | 234,931 |
See notes to financial statements
Annual report | International Growth Fund
15
F I N A N C I A L S T A T E M E N T S
| | |
| Issuer | Shares | Value |
| | | |
| Japan (continued) | | |
|
| Mitsubishi Estate Company, Ltd. | 3,000 | $73,112 |
|
| Mitsubishi Gas & Chemicals Company, Inc. | 4,000 | 29,663 |
|
| Mitsui & Company, Ltd. | 7,000 | 152,232 |
|
| Mitsui Fudosan Company, Ltd. | 2,000 | 40,608 |
|
| Mitsui O.S.K. Lines, Ltd. | 17,000 | 220,794 |
|
| Mitsui Trust Holdings, Inc. | 11,000 | 75,828 |
|
| Mizuho Financial Group, Inc. | 13 | 53,756 |
|
| Murata Manufacturing Company, Ltd. | 800 | 43,406 |
|
| NGK INSULATORS, LTD. | 2,000 | 45,416 |
|
| Nikon Corp. | 4,000 | 112,040 |
|
| Nintendo Company, Ltd. | 1,400 | 697,053 |
|
| Nippon Mining Holdings, Inc. | 7,000 | 41,460 |
|
| Nippon Oil Corp. | 14,000 | 95,504 |
|
| Nippon Steel Corp. | 17,000 | 89,440 |
|
| Nippon Yusen Kabushiki Kaisha | 21,000 | 194,049 |
|
| NTT DoCoMo, Inc. | 38 | 55,673 |
|
| Olympus Optical Company, Ltd. | 2,000 | 58,563 |
|
| Osaka Gas Company, Ltd. | 3,000 | 12,037 |
|
| Resona Holdings, Inc. | 39 | 63,083 |
|
| Rohm Company, Ltd. | 500 | 36,468 |
|
| SBI Holdings, Inc. | 56 | 13,715 |
|
| Secom Company, Ltd. | 800 | 40,343 |
|
| SEGA SAMMY HOLDINGS, INC. | 3,000 | 33,099 |
|
| Seven & I Holdings Company, Ltd. | 8,600 | 213,841 |
|
| Shimamura Company, Ltd. | 500 | 36,255 |
|
| Shin-Etsu Chemical Company, Ltd. | 5,200 | 280,625 |
|
| Shiseido Company, Ltd. | 2,000 | 45,578 |
|
| Sony Corp. | 1,900 | 89,762 |
|
| Sumco Corp. | 2,900 | 64,130 |
|
| Sumitomo Metal Industries, Ltd. | 16,000 | 67,777 |
|
| Sumitomo Mitsui Financial Group, Inc. | 8 | 57,784 |
|
| Takeda Pharmaceutical Company, Ltd. | 7,700 | 429,652 |
|
| TDK Corp. | 1,000 | 71,083 |
|
| Terumo Corp. | 2,300 | 124,884 |
|
| The Japan Steel Works, Ltd. | 4,000 | 65,003 |
|
| Tokyo Electron, Ltd. | 900 | 55,784 |
|
| Toyota Tsusho Corp. | 1,000 | 25,386 |
|
| Trend Micro, Inc. | 1,500 | 51,676 |
|
| Yahoo Japan Corp. | 330 | 146,719 |
|
| Yamada Denki Company, Ltd. | 590 | 51,598 |
| | | |
| Netherlands 2.56% | | 1,047,677 |
|
| DSM NV | 377 | 16,591 |
|
| Fugro NV – CVA | 1,192 | 89,928 |
|
| Heineken NV | 4,795 | 270,440 |
See notes to financial statements
International Growth Fund | Annual report
16
F I N A N C I A L S T A T E M E N T S
| | |
| Issuer | Shares | Value |
| | | |
| Netherlands (continued) | | |
|
| Koninklijke (Royal) KPN NV | 7,307 | $137,942 |
|
| Koninklijke Boskalis Westinster NV | 874 | 48,257 |
|
| Reed Elsevier NV | 3,920 | 72,826 |
|
| TNT Post Group NV | 1,112 | 43,793 |
|
| TomTom NV * | 1,079 | 50,565 |
|
| Unilever NV | 9,059 | 280,116 |
|
| Wolters Kluwer NV | 1,439 | 37,219 |
| | | |
| Norway 0.69% | | 284,412 |
|
| Renewable Energy Corp ASA * | 2,403 | 58,772 |
|
| Statoil ASA | 6,350 | 193,493 |
|
| Tandberg ASA | 2,200 | 32,147 |
| | | |
| Portugal 0.13% | | 53,365 |
|
| Portugal Telecom, SGPS, SA | 4,181 | 53,365 |
| | | |
| Singapore 1.48% | | 608,271 |
|
| Capitaland, Ltd. * | 7,000 | 30,926 |
|
| Cosco Corp. Singapore, Ltd. | 7,000 | 19,859 |
|
| Keppel Corp., Ltd. | 5,000 | 37,676 |
|
| Keppel Land, Ltd. | 12,000 | 49,857 |
|
| SembCorp Industries, Ltd. | 20,000 | 67,247 |
|
| SembCorp Marine, Ltd. | 44,000 | 112,684 |
|
| Singapore Airlines, Ltd. | 1,800 | 19,525 |
|
| Singapore Press Holdings, Ltd. | 13,000 | 40,509 |
|
| Singapore Telecommunications, Ltd. | 85,000 | 229,988 |
| | | |
| Spain 3.97% | | 1,628,782 |
|
| Abertis Infraestructuras SA | 805 | 25,404 |
|
| ACS Actividades SA | 1,040 | 53,117 |
|
| Bolsas y Mercados Espanoles | 791 | 39,564 |
|
| Gas Natural SDG SA | 2,160 | 130,882 |
|
| Industria de Diseno Textil SA | 2,341 | 120,687 |
|
| Repsol YPF SA | 1,048 | 36,152 |
|
| Telefonica SA | 42,264 | 1,222,976 |
| | | |
| Sweden 1.99% | | 816,961 |
|
| Alfa Laval AB | 1,075 | 57,726 |
|
| Hennes & Mauritz AB, B shares | 4,185 | 234,729 |
|
| Investor AB, B shares | 1,200 | 25,383 |
|
| Sandvik AB * | 11,100 | 187,168 |
|
| Scania AB, Series B * | 2,300 | 55,488 |
|
| SSAB Svenskt Stal AB, Series A | 2,300 | 64,400 |
|
| Tele2 AB, Series B | 900 | 15,819 |
|
| Volvo AB, Series A * | 6,200 | 91,625 |
|
| Volvo AB, Series B * | 5,700 | 84,623 |
See notes to financial statements
Annual report | International Growth Fund
17
F I N A N C I A L S T A T E M E N T S
| | |
| Issuer | Shares | Value |
| | | |
| Switzerland 8.99% | | $3,684,206 |
|
| ABB, Ltd. | 19,430 | 484,085 |
|
| Actelion, Ltd. * | 1,416 | 73,811 |
|
| Compagnie Financiere Richemont AG, Series A * | 2,871 | 166,198 |
|
| Geberit AG, ADR | 329 | 48,403 |
|
| Nestle SA | 2,051 | 978,918 |
|
| Nobel Biocare Holding AG, Series BR | 215 | 51,996 |
|
| Novartis AG | 13,487 | 666,161 |
|
| Phonak Holding AG | 294 | 27,861 |
|
| Roche Holdings AG - Genusschein | 3,550 | 696,185 |
|
| Societe Generale de Surveillance Holdings AG | 34 | 45,666 |
|
| Swatch Group AG, BR shares | 333 | 97,744 |
|
| Swisscom AG | 127 | 48,303 |
|
| Syngenta AG * | 164 | 47,151 |
|
| Synthes AG | 414 | 58,019 |
|
| UBS AG | 1,357 | 44,277 |
|
| Zurich Financial Services AG | 478 | 149,428 |
| | | |
| United Kingdom 20.12% | | 8,244,978 |
|
| 3i Group PLC | 11,844 | 191,420 |
|
| Antofagasta PLC | 7,289 | 116,174 |
|
| AstraZeneca Group PLC | 9,117 | 340,769 |
|
| Aviva PLC | 4,149 | 50,010 |
|
| Barclays PLC | 11,957 | 112,065 |
|
| BG Group PLC | 29,189 | 688,014 |
|
| BHP Billiton PLC | 26,428 | 845,435 |
|
| British American Tobacco PLC | 6,040 | 226,480 |
|
| British Sky Broadcasting Group PLC | 4,325 | 48,529 |
|
| BT Group PLC | 8,155 | 36,700 |
|
| Burberry Group PLC | 4,055 | 33,673 |
|
| Capita Group PLC * | 3,133 | 40,595 |
|
| Centrica PLC | 8,793 | 56,141 |
|
| Diageo PLC | 13,188 | 269,495 |
|
| EMAP PLC | 2,230 | 40,711 |
|
| Enterprise Inns PLC | 8,229 | 67,561 |
|
| GlaxoSmithKline PLC | 29,223 | 637,897 |
|
| HBOS PLC | 4,270 | 50,740 |
|
| Imperial Tobacco Group PLC | 4,629 | 214,287 |
|
| Kazakhmys PLC | 1,688 | 51,418 |
|
| Marks & Spencer Group PLC | 8,669 | 68,718 |
|
| Michael Page International PLC | 6,669 | 36,903 |
|
| National Grid PLC | 4,027 | 58,391 |
|
| Next Group PLC | 2,458 | 62,339 |
|
| Old Mutual PLC | 10,248 | 25,313 |
|
| Reckitt Benckiser PLC | 5,424 | 292,577 |
|
| Reed Elsevier PLC * | 7,769 | 97,780 |
|
| Reuters Group PLC | 12,675 | 149,692 |
See notes to financial statements
International Growth Fund | Annual report
18
F I N A N C I A L S T A T E M E N T S
| | |
| Issuer | Shares | Value |
| | | |
| United Kingdom (continued) | | |
|
| Rio Tinto PLC | 9,515 | $1,070,508 |
|
| Royal Bank of Scotland Group PLC | 22,363 | 169,076 |
|
| Royal Dutch Shell PLC, A Shares, GBP | 7,372 | 263,596 |
|
| Royal Dutch Shell PLC, B Shares, GBP | 1,022 | 35,854 |
|
| SABMiller PLC | 5,893 | 122,431 |
|
| Scottish & Southern Energy PLC | 3,084 | 90,178 |
|
| Smith & Nephew PLC | 11,398 | 148,096 |
|
| Tesco PLC | 8,035 | 63,496 |
|
| Travis Perkins PLC | 2,014 | 43,054 |
|
| Tullow Oil PLC | 5,468 | 67,783 |
|
| Unilever PLC | 4,455 | 140,360 |
|
| Vedanta Resources PLC | 3,030 | 130,354 |
|
| Vodafone Group PLC | 277,364 | 892,963 |
|
| William Hill PLC | 5,045 | 37,523 |
|
| William Morrison Supermarket PLC | 3,973 | 23,290 |
|
| Wolseley PLC | 2,990 | 36,589 |
| |
| Preferred stocks 0.55% | | $225,456 |
|
| (Cost $174,466) | | |
| | | |
| Germany 0.55% | | 225,456 |
|
| Porsche Automobile Holding SE | 92 | 157,687 |
|
| Volkswagen AG | 487 | 67,769 |
| |
| | Principal | |
| Issuer, description, maturity date | amount | Value |
| |
| Repurchase agreements 1.53% | | $628,000 |
|
| (Cost $628,000) | | |
|
| Repurchase Agreement with State Street Corp. dated 2-29-08 | | |
| at 2.35% to be repurchased at $628,123 on 3-3-08, | | |
| collateralized by $650,000 Federal National Mortgage Association, | | |
| 5.57%, due 7-14-28 (valued at $642,688, including interest) | $628,000 | 628,000 |
| |
| Total investments (Cost $40,472,697)† 99.57% | | $40,809,751 |
|
| Other assets in excess of liabilities 0.43% | | $177,225 |
|
| Total net assets 100.00% | | $40,986,976 |
|
Percentages are stated as a percent of net assets.
The portfolio had the following five top industry concentrations as of February 29, 2008 (as a percentage of total net assets):
| | | |
| Telecommunications equipment & services | 11.41% | | |
| Pharmaceuticals | 7.95% | | |
| Mining | 6.53% | | |
| International oil | 4.27% | | |
| Drugs & health care | 4.01% | | |
ADR American Depositary Receipt
* Non-income producing.
† At February 29, 2008, the aggregate cost of investment securities for federal income tax purposes was $40,796,688. Net unrealized appreciation aggregated $13,063, of which $2,879,295 related to appreciated investment securities and $2,866,232 related to depreciated investment securities.
See notes to financial statements
Annual report | International Growth Fund
19
F I N A N C I A L S T A T E M E N T S
Financial statements
Statement of assets and liabilities 2-29-08
This Statement of Assets and Liabilities is the Fund’s balance sheet. It shows the value of what the Fund owns, is due and owes. You’ll also find the net asset value and the maximum public offering price per share.
| |
| Assets | |
|
| Investments in unaffiliated issuers, at value (cost $39,844,697) | $40,181,751 |
| Repurchase agreement, at value (cost $628,000) (Note 2) | 628,000 |
| Total investments, at value (cost $40,472,697) | 40,809,751 |
| Cash | 675 |
| Foreign currency, at value (cost $184,313) | 187,938 |
| Cash collateral at broker for futures contracts | 700,000 |
| Receivable for forward foreign currency exchange contracts (Note 2) | 348,228 |
| Receivable for fund shares sold | 16,705 |
| Dividends and interest receivable (net of tax) | 90,598 |
| Receivable due from adviser | 18,795 |
| Other assets | 152 |
| | |
| Total assets | 42,172,842 |
| |
| Liabilities | |
|
| Payable for investments purchased | 6,494 |
| Payable for forward foreign currency exchange contracts (Note 2) | 209,487 |
| Payable for fund shares repurchased | 871,645 |
| Payable for futures variation margin | 9,682 |
| Payable to affiliates | |
| Fund administration fees | 687 |
| Transfer agent fees | 5,356 |
| Distribution and service fees | 200 |
| Trustees’ fees | 120 |
| Other payables and accrued expenses | 82,195 |
| | |
| Total liabilities | 1,185,866 |
| |
| Net assets | |
|
| Capital paid-in | $41,320,420 |
| Undistributed net investment income | 312,354 |
| Accumulated undistributed net realized gain (loss) on investments, | |
| futures contracts and foreign currency transactions | (889,199) |
| Net unrealized appreciation (depreciation) on investments, futures | |
| contracts and translation of assets and liabilities in foreign currencies | 243,401 |
| | |
| Net assets | $40,986,976 |
See notes to financial statements
International Growth Fund | Annual report
20
F I N A N C I A L S T A T E M E N T S
Statement of assets and liabilities (continued)
| |
| Net asset value per share | |
|
| The Funds have an unlimited number of shares authorized with no par | |
| value. Net asset value is calculated by dividing the net assets of each class | |
| of shares by the number of outstanding shares in the class. | |
| | |
| Class A | |
| Net assets | $26,320,300 |
| Shares outstanding | 1,151,456 |
| Net asset value and redemption price per share | $22.86 |
| | |
| Class B1 | |
| Net assets | $1,185,119 |
| Shares outstanding | 51,958 |
| Net asset value and offering price per share | $22.81 |
| | |
| Class C1 | |
| Net assets | $2,359,751 |
| Shares outstanding | 103,527 |
| Net asset value and offering price per share | $22.79 |
| | |
| Class I | |
| Net assets | $593,338 |
| Shares outstanding | 25,911 |
| Net asset value, offering price and redemption price per share | $22.90 |
| | |
| Class R1 | |
| Net assets | $136,725 |
| Shares outstanding | 5,995 |
| Net asset value, offering price and redemption price per share | $22.81 |
| | |
| Class 1 | |
| Net assets | $2,815,968 |
| Shares outstanding | 123,028 |
| Net asset value, offering price and redemption price per share | $22.89 |
| | |
| Class NAV | |
| Net assets | $7,575,775 |
| Shares outstanding | 331,666 |
| Net asset value, offering price and redemption price per share | $22.84 |
| |
| Maximum public offering price per share | |
|
| Class A (net asset value per share ÷ 95%)2 | $24.06 |
1 Redemption price per share is equal to the net asset value less any applicable contingent deferred sales charge.
2 On single retail sales of less than $50,000. On sales of $50,000 or more and on group sales the offering price is reduced.
See notes to financial statements
Annual report | International Growth Fund
21
F I N A N C I A L S T A T E M E N T S
Statement of operations For the year ended 2-29-08
This Statement of Operations summarizes the Fund’s investment income earned and expenses incurred in operating the Fund. It also shows net gains (losses) for the period stated.
| |
| Investment income | |
|
| Dividends | $933,118 |
| Interest | 64,554 |
| Less foreign taxes withheld | (78,054) |
| | |
| Total investment income | 919,618 |
| |
| Expenses | |
|
| Investment management fees (Note 3) | 332,899 |
| Distribution and service fees (Note 3) | 106,660 |
| Transfer agent fees (Note 3) | 26,645 |
| Fund administration fees (Note 3) | 14,164 |
| Blue sky fees (Note 3) | 78,839 |
| Audit and legal fees | 72,646 |
| Printing and postage fees (Note 3) | 7,661 |
| Custodian fees | 180,687 |
| Trustees’ fees (Note 3) | 2,279 |
| Registration and filing fees | 28,912 |
| Miscellaneous | 815 |
| | |
| Total expenses | 852,207 |
| Less expense reductions (Note 3) | (297,427) |
| | |
| Net expenses | 554,780 |
| | |
| Net investment income | 364,838 |
| |
| Realized and unrealized gain (loss) | |
|
| Net realized gain (loss) on | |
| Investments in unaffiliated issuers | 1,521,735 |
| Futures contracts | 11,550 |
| Foreign currency transactions | 245,539 |
| | 1,778,824 |
| Change in net unrealized appreciation (depreciation) of | |
| Investments in unaffiliated issuers | (2,373,515) |
| Futures contracts | (215,598) |
| Translation of assets and liabilities in foreign currencies | 135,985 |
| | (2,453,128) |
| Net realized and unrealized gain (loss) | (674,304) |
| | |
| Increase (decrease) in net assets from operations | ($309,466) |
See notes to financial statements
International Growth Fund | Annual report
22
F I N A N C I A L S T A T E M E N T S
Statement of changes in net assets
These Statements of Changes in Net Assets show how the value of the Fund’s net assets has changed during the last two periods. The difference reflects earnings less expenses, any investment gains and losses, distributions, if any, paid to shareholders and the net of Fund share transactions.
| | |
| | Period | Year |
| | ended | ended |
| | 2-28-071 | 2-29-08 |
| |
| Increase (decrease) in net assets | | |
|
| From operations | | |
| Net investment income (loss) | ($12,185) | $364,838 |
| Net realized gain (loss) | 803,556 | 1,778,824 |
| Change in net unrealized appreciation (depreciation) | 2,696,529 | (2,453,128) |
| | | |
| Increase (decrease) in net assets resulting from operations | 3,487,900 | (309,466) |
| | | |
| Distributions to shareholders | | |
| From net investment income | | |
| Class A | (70,554) | (202,592) |
| Class B | (221) | — |
| Class C | (267) | — |
| Class I | (805) | (5,357) |
| Class R1 | (455) | (830) |
| Class 1 | (786) | (26,034) |
| Class NAV | — | (90,102) |
| From net realized gain | | |
| Class A | (308,669) | (1,859,952) |
| Class B | (5,885) | (90,466) |
| Class C | (7,134) | (159,205) |
| Class I | (2,205) | (32,275) |
| Class R1 | (1,991) | (9,214) |
| Class 1 | (2,075) | (149,968) |
| Class NAV | — | (497,276) |
| | | |
| Total distributions | (401,047) | (3,123,271) |
| | | |
| From Fund share transactions (Note 6) | 20,460,257 | 20,872,603 |
| | | |
| Total increase (decrease) | 23,547,110 | 17,439,866 |
| |
| Net assets | | |
|
| Beginning of year | — | 23,547,110 |
| | | |
| End of year | $23,547,110 | $40,986,976 |
| | | |
| Undistributed net investment income (loss) | ($28,697) | $312,354 |
1 Period from 6-12-06 (commencement of operations) to 2-28-07.
See notes to financial statements
Annual report | International Growth Fund
23
F I N A N C I A L S T A T E M E N T S
Financial highlights
The Financial Highlights show how the Fund’s net asset value for a share has changed since the end of the previous period.
| | |
| CLASS A SHARES | | |
| |
| Period ended | 2-28-071 | 2-29-08 |
| |
| Per share operating performance | | |
|
| Net asset value, beginning of period | $20.00 | $23.94 |
| Net investment income (loss)2 | (0.01) | 0.26 |
| Net realized and unrealized | | |
| gain (loss) on investments | 4.44 | 0.53 |
| Total from investment operations | 4.43 | 0.79 |
| Less distributions | | |
| From net investment income | (0.09) | (0.18) |
| From net realized gain | (0.40) | (1.69) |
| | (0.49) | (1.87) |
| Net asset value, end of period | $23.94 | $22.86 |
| Total return3,4 (%) | 22.185 | 2.85 |
| |
| Ratios and supplemental data | | |
|
| Net assets, end of period (in millions) | $20 | $26 |
| Ratios (as a percentage of average net assets): | | |
| Expenses before reductions | 2.286 | 2.21 |
| Expenses net of fee waivers, if any | 1.666 | 1.56 |
| Expenses net of all fee waivers and credits | 1.666 | 1.56 |
| Net investment income (loss) | (0.06)6 | 1.02 |
| Portfolio turnover (%) | 415 | 97 |
1 Class A shares began operations on 6-12-06.
2 Based on the average of the shares outstanding.
3 Total returns would have been lower had certain expenses not been reduced during the periods shown.
4 Assumes dividend reinvestment.
5 Not annualized.
6 Annualized.
See notes to financial statements
International Growth Fund | Annual report
24
F I N A N C I A L S T A T E M E N T S
Financial highlights
| | |
| CLASS B SHARES | | |
| |
| Period ended | 2-28-071 | 2-29-08 |
| |
| Per share operating performance | | |
|
| Net asset value, beginning of period | $20.00 | $23.91 |
| Net investment income (loss)2 | (0.16) | (0.01) |
| Net realized and unrealized | | |
| gain (loss) on investments | 4.48 | 0.60 |
| Total from investment operations | 4.32 | 0.59 |
| Less distributions | | |
| From net investment income | (0.01) | — |
| From net realized gain | (0.40) | (1.69) |
| | (0.41) | (1.69) |
| Net asset value, end of period | $23.91 | $22.81 |
| Total return3,4 (%) | 21.645 | 2.03 |
| |
| Ratios and supplemental data | | |
|
| Net assets, end of period (in millions) | $1 | $1 |
| Ratios (as a percentage of average net assets): | | |
| Expenses before reductions | 10.946 | 4.62 |
| Expenses net of fee waivers, if any | 2.396 | 2.41 |
| Expenses net of all fee waivers and credits | 2.396 | 2.40 |
| Net investment income (loss) | (0.94)6 | (0.03) |
| Portfolio turnover (%) | 415 | 97 |
1 Class B shares began operations on 6-12-06.
2 Based on the average of the shares outstanding.
3 Total returns would have been lower had certain expenses not been reduced during the periods shown.
4 Assumes dividend reinvestment.
5 Not annualized.
6 Annualized.
See notes to financial statements
Annual report | International Growth Fund
25
F I N A N C I A L S T A T E M E N T S
Financial highlights
| | |
| CLASS C SHARES | | |
| |
| Period ended | 2-28-071 | 2-29-08 |
| |
| Per share operating performance | | |
|
| Net asset value, beginning of period | $20.00 | $23.90 |
| Net investment income (loss)2 | (0.16) | 0.05 |
| Net realized and unrealized | | |
| gain (loss) on investments | 4.47 | 0.53 |
| Total from investment operations | 4.31 | 0.58 |
| Less distributions | | |
| From net investment income | (0.01) | — |
| From net realized gain | (0.40) | (1.69) |
| | (0.41) | (1.69) |
| Net asset value, end of period | $23.90 | $22.79 |
| Total return3,4 (%) | 21.595 | 1.99 |
| |
| Ratios and supplemental data | | |
|
| Net assets, end of period (in millions) | $2 | $2 |
| Ratios (as a percentage of average net assets): | | |
| Expenses before reductions | 6.716 | 3.73 |
| Expenses net of fee waivers, if any | 2.396 | 2.40 |
| Expenses net of all fee waivers and credits | 2.396 | 2.40 |
| Net investment income (loss) | (0.98)6 | 0.21 |
| Portfolio turnover (%) | 415 | 97 |
1 Class C shares began operations on 6-12-06.
2 Based on the average of the shares outstanding.
3 Total returns would have been lower had certain expenses not been reduced during the periods shown.
4 Assumes dividend reinvestment.
5 Not annualized.
6 Annualized.
See notes to financial statements
International Growth Fund | Annual report
26
F I N A N C I A L S T A T E M E N T S
Financial highlights
| | |
| CLASS I SHARES | | |
| |
| Period ended | 2-28-071 | 2-29-08 |
| |
| Per share operating performance | | |
|
| Net asset value, beginning of period | $20.00 | $23.97 |
| Net investment income (loss)2 | 0.07 | 0.36 |
| Net realized and unrealized | | |
| gain (loss) on investments | 4.45 | 0.54 |
| Total from investment operations | 4.52 | 0.90 |
| Less distributions | | |
| From net investment income | (0.15) | (0.28) |
| From net realized gain | (0.40) | (1.69) |
| | (0.55) | (1.97) |
| Net asset value, end of period | $23.97 | $22.90 |
| Total return3,4 (%) | 22.605 | 3.27 |
| |
| Ratios and supplemental data | | |
|
| Net assets, end of period (in millions) | — 6 | $1 |
| Ratios (as a percentage of average net assets): | | |
| Expenses before reductions | 17.207 | 5.07 |
| Expenses net of fee waivers, if any | 1.197 | 1.20 |
| Expenses net of all fee waivers and credits | 1.197 | 1.20 |
| Net investment income (loss) | 0.427 | 1.43 |
| Portfolio turnover (%) | 415 | 97 |
1 Class I shares began operations on 6-12-06.
2 Based on the average of the shares outstanding.
3 Total returns would have been lower had certain expenses not been reduced during the periods shown.
4 Assumes dividend reinvestment.
5 Not annualized.
6 Less than $500,000.
7 Annualized.
See notes to financial statements
Annual report | International Growth Fund
27
F I N A N C I A L S T A T E M E N T S
Financial highlights
| | |
| CLASS R1 SHARES | | |
| |
| Period ended | 2-28-071 | 2-29-08 |
| |
| Per share operating performance | | |
|
| Net asset value, beginning of period | $20.00 | $23.89 |
| Net investment income (loss)2 | (0.05) | 0.25 |
| Net realized and unrealized | | |
| gain (loss) on investments | 4.43 | 0.51 |
| Total from investment operations | 4.38 | 0.76 |
| Less distributions | | |
| From net investment income | (0.09) | (0.15) |
| From net realized gain | (0.40) | (1.69) |
| | (0.49) | (1.84) |
| Net asset value, end of period | $23.89 | $22.81 |
| Total return3,4 (%) | 21.925 | 2.73 |
| |
| Ratios and supplemental data | | |
|
| Net assets, end of period (in millions) | —6 | —6 |
| Ratios (as a percentage of average net assets): | | |
| Expenses before reductions | 20.787 | 14.42 |
| Expenses net of fee waivers, if any | 1.947 | 1.70 |
| Expenses net of all fee waivers and credits | 1.947 | 1.70 |
| Net investment income (loss) | (0.32)7 | 1.00 |
| Portfolio turnover (%) | 415 | 97 |
1 Class R1 shares began operations on 6-12-06.
2 Based on the average of the shares outstanding.
3 Total returns would have been lower had certain expenses not been reduced during the periods shown.
4 Assumes dividend reinvestment.
5 Not annualized.
6 Less than $500,000.
7 Annualized.
See notes to financial statements
International Growth Fund | Annual report
28
F I N A N C I A L S T A T E M E N T S
Financial highlights
| | |
| CLASS 1 SHARES | | |
| |
| Period ended | 2-28-071 | 2-29-08 |
| |
| Per share operating performance | | |
|
| Net asset value, beginning of period | $20.00 | $23.97 |
| Net investment income (loss)2 | 0.07 | 0.29 |
| Net realized and unrealized | | |
| gain (loss) on investments | 4.45 | 0.61 |
| Total from investment operations | 4.52 | 0.90 |
| Less distributions | | |
| From net investment income | (0.15) | (0.29) |
| From net realized gain | (0.40) | (1.69) |
| | (0.55) | (1.98) |
| Net asset value, end of period | $23.97 | $22.89 |
| Total return3,4 (%) | 22.635 | 3.28 |
| |
| Ratios and supplemental data | | |
|
| Net assets, end of period (in millions) | $1 | $3 |
| Ratios (as a percentage of average net assets): | | |
| Expenses before reductions | 2.006 | 1.83 |
| Expenses net of fee waivers, if any | 1.156 | 1.15 |
| Expenses net of all fee waivers and credits | 1.156 | 1.15 |
| Net investment income (loss) | 0.416 | 1.14 |
| Portfolio turnover (%) | 415 | 97 |
1 Class 1 shares began operations on 6-12-06.
2 Based on the average of the shares outstanding.
3 Total returns would have been lower had certain expenses not been reduced during the periods shown.
4 Assumes dividend reinvestment.
5 Not annualized.
6 Annualized.
See notes to financial statements
Annual report | International Growth Fund
29
F I N A N C I A L S T A T E M E N T S
Financial highlights
| | |
| CLASS NAV SHARES | | |
| |
| Period ended | 2-28-071 | 2-29-08 |
| |
| Per share operating performance | | |
|
| Net asset value, beginning of period | $23.73 | $23.92 |
| Net investment income (loss)2 | 0.01 | 0.33 |
| Net realized and unrealized | | |
| gain (loss) on investments | 0.18 | 0.59 |
| Total from investment operations | 0.19 | 0.92 |
| Less distributions | | |
| From net investment income | — | (0.31) |
| From net realized gain | — | (1.69) |
| | — | (2.00) |
| Net asset value, end of period | $23.92 | $22.84 |
| Total return3,4 (%) | 0.805 | 3.34 |
| |
| Ratios and supplemental data | | |
|
| Net assets, end of period (in millions) | $1 | $8 |
| Ratios (as a percentage of average net assets): | | |
| Expenses before reductions | 2.756 | 1.77 |
| Expenses net of fee waivers, if any | 1.136 | 1.10 |
| Expenses net of all fee waivers and credits | 1.136 | 1.10 |
| Net investment income (loss) | 0.146 | 1.33 |
| Portfolio turnover (%) | 415 | 97 |
1 Class NAV shares began operations on 12-27-06.
2 Based on the average of the shares outstanding.
3 Total returns would have been lower had certain expenses not been reduced during the periods shown.
4 Assumes dividend reinvestment.
5 Not annualized.
6 Annualized.
See notes to financial statements
International Growth Fund | Annual report
30
Notes to financial statements
1. Organization
John Hancock International Growth Fund (the Fund) is a diversified series of John Hancock Funds III (the Trust). The Trust was established as a Massachusetts business trust on June 9, 2005. The Trust is registered under the Investment Company Act of 1940, as amended (the 1940 Act), as an open-end investment management company. The investment objective of the Fund is to seek high total return.
John Hancock Life Insurance Company of New York (John Hancock New York) is a wholly owned subsidiary of John Hancock Life Insurance Company (U.S.A.) (John Hancock USA). John Hancock USA and John Hancock New York are indirect wholly owned subsidiaries of The Manufacturers Life Insurance Company (Manulife), which in turn is a wholly owned subsidiary of Manulife Financial Corporation (MFC), a publicly traded company. MFC and its subsidiaries are known collectively as “Manulife Financial.”
John Hancock Investment Management Services, LLC (the Adviser), a Delaware limited liability company controlled by John Hancock USA, serves as investment adviser for the Trust and John Hancock Funds, LLC (the Distributor), a Delaware limited liability company, an affiliate of the Adviser, serves as principal underwriter.
The Board of Trustees have authorized the issuance of multiple classes of shares of the Fund, including classes designated as Class A, Class B, Class C, Class I, Class R1, Class 1 and Class NAV shares. Class A, Class B and Class C shares are open to all retail investors. Class I shares are offered without any sales charge to various institutional and certain individual investors. Class R1 shares are available only to certain retirement plans. Class 1 shares are sold only to certain exempt separate accounts of John Hancock USA and John Hancock New York. Class NAV shares are sold to affiliated funds of funds, which are funds of funds within the John Hancock funds complex. The shares of each class represent an interest in the same portfolio of investments of the Fund, and have equal rights as to voting, redemptions, dividends and liquidation, except that certain expenses, subject to the approval of the Board of Trustees, may be applied differe ntly to each class of shares in accordance with current regulations of the Securities and Exchange Commission (SEC) and the Internal Revenue Service. Shareholders of a class that bear distribution and service expenses under the terms of a distribution plan have exclusive voting rights to that distribution plan. Class B shares will convert to Class A shares eight years after purchase.
The Adviser and other subsidiaries of John Hancock USA owned 4,561 shares of beneficial interest of Class NAV on February 29, 2008.
2. Significant accounting policies
In the preparation of the financial statements, the Fund follows the policies described below. The preparation of financial statements in conformity with accounting principles generally accepted in the United States of America requires management to make estimates and assumptions that affect the reported amounts of assets and liabilities at the date of the financial statements and the reported amounts of income and expenses during the reporting period. Actual results may differ from these estimates.
Security valuation
The net asset value of the shares of the Fund is determined daily as of the close of the New York Stock Exchange (NYSE), normally at 4:00 P.M., Eastern Time. Short-term debt investments that have a remaining maturity of 60 days or less are valued at amortized cost,
Annual report | International Growth Fund
31
and thereafter assume a constant amortization to maturity of any discount or premium, which approximates market value. All other securities held by the Fund are valued at the last sale price or official closing price (closing bid price or last evaluated quote if no sale has occurred) as of the close of business on the principal securities exchange (domestic or foreign) on which they trade or, lacking any sales, at the closing bid price. Securities traded only in the over-the-counter market are valued at the last bid price quoted by brokers making markets in the securities at the close of trading. Securities for which there are no such quotations, principally debt securities, are valued based on the evaluated prices provided by an independent pricing service, which utilizes both dealer-supplied and electronic data processing techniques, which take into account factors such as institutional-size trading in similar groups of securities, yield, quality, coupon rate, maturity , type of issue, trading characteristics and other market data.
Other assets and securities for which no such quotations are readily available are valued at fair value as determined in good faith under consistently applied procedures established by and under the general supervision of the Board of Trustees. Generally, trading in non-U.S. securities is substantially completed each day at various times prior to the close of trading on the NYSE. The values of such securities used in computing the net asset value of a Fund’s shares are generally determined as of such times. Occasionally, significant events that affect the values of such securities may occur between the times at which such values are generally determined and the close of the NYSE. Upon such an occurrence, these securities will be valued at fair value as determined in good faith under consistently applied procedures established by and under the general supervision of the Board of Trustees.
In deciding whether to make a fair value adjustment to the price of a security, the Board of Trustees or their designee may review a variety of factors, including developments in foreign markets, the performance of U.S. securities markets and the performance of instruments trading in U.S. markets that represent foreign securities and baskets of foreign securities. The Fund may also fair value securities in other situations, for example, when a particular foreign market is closed, but the Fund is calculating the net asset value. In view of these factors, it is likely that Funds investing significant amounts of assets in securities in foreign markets will be fair valued more frequently than Funds investing signifi-cant amounts of assets in frequently traded, U.S. exchange-listed securities of large-capitalization U.S. issuers.
For purposes of determining when fair value adjustments may be appropriate with respect to Funds that invest in securities in foreign markets that close prior to the NYSE, the Funds will, on an ongoing basis, monitor for “significant market events.” A significant market event may be a certain percentage change in the value of an index or of certain Exchange Traded Funds that track foreign markets in which Funds have significant investments. If a significant market event occurs due to a change in the value of the index or of Exchange Traded Funds, the pricing for the Fund will promptly be reviewed and potential adjustments to the net asset value of the Fund will be recommended to the Trust’s Pricing Committee when applicable.
Fair value pricing of securities is intended to help ensure that the net asset value of the Fund’s shares reflects the value of the Fund’s securities as of the close of the NYSE (as opposed to a value which is no longer accurate as of such close), thus limiting the opportunity for aggressive traders to purchase shares of the Fund at deflated prices, reflecting stale security valuations, and to promptly sell such shares at a gain. However, a security’s valuation may differ depending on the method used for determining value and no assurance can be given that fair value pricing of securities will successfully eliminate all potential opportunities for such trading gains.
New accounting pronouncements
In September 2006, Financial Accounting Standards Board (FASB) Standard No. 157, Fair Value Measurements (FAS 157), was issued and is effective for fiscal years beginning after November 15, 2007. FAS 157 defines fair value, establishes a framework for measuring
International Growth Fund | Annual report
32
fair value and expands disclosure about fair value measurements. As of February 29, 2008, management does not believe the adoption of FAS 157 will impact the amounts reported in the financial statements; however, additional disclosures regarding pricing sources will be required about the inputs used to develop the measurements of fair value and the related realized and unrealized gain/loss for certain securities valued by significant unobservable market inputs.
In March 2008, FASB No. 161 (FAS 161), Disclosures about Derivative Instruments and Hedging Activities, an amendment of FASB Statement No. 133 (FAS 133), was issued and is effective for fiscal years beginning after November 15, 2008. FAS 161 amends and expands the disclosure requirements of FAS 133 in order to provide financial statement users an understanding of a company’s use of derivative instruments, how derivative instruments are accounted for under FAS 133 and related interpretations and how these instruments affect a company’s financial position, performance, and cash flows. FAS 161 requires companies to disclose information detailing the objectives and strategies for using derivative instruments, the level of derivative activity entered into by the company, and any credit risk-related contingent features of the agreements. Management is currently evaluating the adoption of FAS 1 61 on the Fund’s financial statement disclosures.
Guarantees and indemnifications
Under the Trust’s organizational documents, its Officers and Trustees are indemnified against certain liability arising out of the performance of their duties to the Trust. Additionally, in the normal course of business, the Trust enters into contracts with service providers that contain general indemnification clauses. The Trust’s maximum exposure under these arrangements is unknown, as this would involve future claims that may be made against the Trust that have not yet occurred.
Repurchase agreements
The Fund may enter into repurchase agreements. When the Fund enters into a repurchase agreement through its custodian, it receives delivery of securities, the amount of which at the time of purchase and each subsequent business day is required to be maintained at such a level that the market value is generally at least 102% of the repurchase amount. The Fund will take constructive receipt of all securities underlying the repurchase agreements it has entered into until such agreements expire. If the seller defaults, the Fund would suffer a loss to the extent that proceeds from the sale of underlying securities were less than the repurchase amount. The Fund may enter into repurchase agreements maturing within seven days with domestic dealers, banks or other financial institutions deemed to be creditworthy by the Adviser. Collateral for certain tri-party repurchase agreements is held at the custodian bank in a segregated account for the benefi t of the Fund and the counterparty.
Foreign currency transactions
The books and records of the Fund are maintained in U.S. Dollars. Investment securities and other assets and liabilities denominated in a foreign currency are translated into U.S. dollars at the prevailing exchange rates at period end. Purchases and sales of investment securities, income and expenses are translated into U.S. dollars at the prevailing exchange rates on the respective dates of the transactions.
Net realized and unrealized gains and losses on foreign currency transactions represent net gains and losses between trade and settlement dates on securities transactions, the disposition of forward foreign currency exchange contracts and foreign currencies, and the difference between the amount of net investment income accrued and the U.S. dollar amount actually received. That portion of both realized and unrealized gains and losses on investments that results from fluctuations in foreign currency exchange rates is not separately disclosed but is included with net realized and unrealized gain/appreciation and loss/depreciation on investments.
The Fund may be subject to capital gains and repatriation taxes imposed by certain countries in which it invests. Such taxes are generally based upon income and/or capital gains earned or repatriated. Taxes are accrued based upon net investment income, net realized gains and net unrealized appreciation.
Annual report | International Growth Fund
33
The Fund may invest in securities of issuers based in countries with emerging markets or economies and may, therefore, be subject to greater market risk than Funds that invest principally in securities of issuers in more developed countries. Emerging markets securities may be more volatile and less liquid than securities of issuers in developed countries and may be subject to substantial currency fluctuations and affected by sudden economic, social and political developments in the emerging market country. The securities markets of emerging countries may have less government regulation and may be subject to less extensive accounting and financial reporting requirements than the securities markets of more developed countries. Emerging market countries may have currency controls or restrictions which may prevent or delay the Fund from taking money out of the country or may impose additional taxes on money removed from the country.
Security transactions and related investment income
Investment security transactions are accounted for on a trade date plus one basis for daily net asset value calculations. However, for financial reporting purposes, investment transactions are reported on trade date. Interest income is accrued as earned. Dividend income and distributions to shareholders are recorded on the ex-dividend date. Foreign dividends are recorded on the ex-date or when the Fund becomes aware of the dividends from cash collections. Discounts/premiums are accreted/ amortized for financial reporting purposes. Non-cash dividends are recorded at the fair market value of the securities received. Debt obligations may be placed in a non-accrual status and related interest income may be reduced by ceasing current accruals and writing off interest receivables when the collection of all or a portion of interest has become doubtful, based upon consistently applied procedures.
From time to time, the Fund may invest in Real Estate Investment Trusts (REITs) and, as a result, will estimate the components of distributions from these securities. Distributions from REITs received in excess of income are recorded as a reduction of cost of investments and/or as a realized gain.
The Fund uses the specific identification method for determining realized gain or loss on investments for both financial statement and federal income tax reporting purposes.
Allocations of income and expenses
All income, expenses (except class-specific expenses), and realized and unrealized gain/ loss are allocated to each class of shares based upon the relative net assets of each class. Dividends to shareholders from net investment income are determined at a class level and distributions from capital gains are determined at a Fund level.
Expenses not directly attributable to the Fund or share classes are allocated based on the relative share of net assets of the Fund or share class at the time the expense was incurred. Class-specific expenses, as detailed in Note 3, are accrued daily and charged directly to the respective share classes.
Futures
The Fund may purchase and sell financial futures contracts and options on those contracts. The Fund invests in contracts based on financial instruments, such as U.S. Treasury Bonds or Notes, or on securities indices such as the Standard & Poor’s 500 Index, in order to hedge against a decline in the value of securities owned by the Fund.
Initial margin deposits required upon entering into futures contracts are satisfied by the delivery of specific securities or cash as collateral to the broker (the Fund’s agent in acquiring the futures position). If the position is closed out by taking an opposite position prior to the settlement date of the futures contract, a final determination of variation margin is made, cash is required to be paid to or released by the broker and the Fund realizes a gain or loss.
When the Fund sells a futures contract based on a financial instrument, the Fund becomes obligated to deliver that kind of instrument at an agreed upon date for a specified price. The Fund realizes a gain or loss depending on whether the price of an offsetting purchase is less or more than the price of the initial sale
International Growth Fund | Annual report
34
or on whether the price of an offsetting sale is more or less than the price of the initial purchase. The Fund could be exposed to risks if it could not close out futures positions because of an illiquid secondary market or the inability of counterparties to meet the terms of their contracts. Futures contracts are valued at the quoted daily settlement prices established by the exchange on which they trade.
| | | | | | | |
| | | | | |
| The following is a summary of open futures contracts at February 29, 2008: | |
| | | | | | | UNREALIZED |
| | NUMBER OF | | EXPIRATION | | NOTIONAL | | APPRECIATION |
| OPEN CONTRACTS | CONTRACTS | POSITION | DATE | | VALUE | | (DEPRECIATION) |
|
| DAX Index Futures | 6 | Long | Mar 2008 | $1,012,275 | ($270,501) |
| Hang Seng Index Futures | 3 | Long | Mar 2008 | 3,631,500 | 12,998 |
| MSCI Singapore Stock | | | | | |
| Index Futures | 8 | Long | Mar 2008 | 596,000 | (12,099) |
| S&P MIB Index Futures | 1 | Short | Mar 2008 | 168,335 | 38,729 |
| S&P TSE 60 Index Futures | 7 | Short | Mar 2008 | 1,114,540 | (8,109) |
| | | | | | ($238,982) |
Forward foreign currency contracts
The Fund may purchase and sell forward foreign currency contracts in order to hedge a specific transaction or Fund position. Forward foreign currency contracts are valued at forward foreign currency exchange rates and marked to market daily. Net realized gains (losses) on foreign currency and forward foreign currency contracts shown in the Statements of Operations include net gains or losses realized by the Fund on contracts that have matured.
The net U.S. dollar value of foreign currency underlying all contractual commitments held at the end of the period, the resulting net unrealized appreciation (depreciation) and related net receivable or payable amount are determined using forward foreign currency exchange rates supplied by a quotation service. The Fund could be exposed to risks in excess of amounts recognized on the Statements of Assets and Liabilities if the counterparties to the contracts are unable to meet the terms of their contracts or if the value of the forward foreign currency contract changes unfavorably.
At February 29, 2008, the Fund entered into forward foreign currency contracts, which contractually obligate the Fund to deliver currencies at future dates.
Annual report | International Growth Fund
35
Open forward foreign currency contracts as of February 29, 2008, were as follows:
| | | | |
| | | | | UNREALIZED |
| | PRINCIPAL AMOUNT | | SETTLEMENT | APPRECIATION |
| CURRENCY | COVERED BY CONTRACT | | DATE | (DEPRECIATION) |
|
| Buys | | | | |
| Canadian Dollar | 61,000 | | 5/23/08 | $1,889 |
| Danish Kroner | 915,000 | | 5/23/08 | 6,601 |
| Euro | 173,996 | | 5/23/08 | 7,714 |
| Euro | 190,000 | | 5/23/08 | 12,630 |
| Japanese Yen | 132,796,882 | | 5/23/08 | 40,295 |
| Japanese Yen | 124,274,882 | | 5/23/08 | 41,434 |
| Japanese Yen | 128,040,787 | | 5/23/08 | 43,659 |
| Japanese Yen | 22,218,000 | | 5/23/08 | 5,413 |
| New Zealand Dollar | 715,439 | | 5/23/08 | (1,086) |
| Norwegian Krone | 2,758,000 | | 5/23/08 | 27,092 |
| Pound Sterling | 181,000 | | 5/23/08 | 4,432 |
| Pound Sterling | 41,000 | | 5/23/08 | 1,584 |
| Singapore Dollar | 394,000 | | 5/23/08 | 3,042 |
| Swedish Krona | 6,111,394 | | 5/23/08 | 23,469 |
| Swiss Franc | 1,432,220 | | 5/23/08 | 63,427 |
| Swiss Franc | 1,432,220 | | 5/23/08 | 65,379 |
| | | | | $346,974 |
| Sells | | | | |
| Australian Dollar | 1,165,769 | | 5/23/08 | ($12,469) |
| Australian Dollar | 1,163,289 | | 5/23/08 | (14,949) |
| Danish Kroner | 1,151,716 | | 5/23/08 | (35,269) |
| Euro | 175,716 | | 5/23/08 | 136 |
| Hong Kong Dollar | 400,226 | | 5/23/08 | (831) |
| Japanese Yen | 140,634 | | 5/23/08 | (388) |
| Norwegian Krone | 796,419 | | 5/23/08 | (20,591) |
| Pound Sterling | 1,229,794 | | 5/23/08 | (23,405) |
| Pound Sterling | 81,011 | | 5/23/08 | 32 |
| Pound Sterling | 1,230,146 | | 5/23/08 | (23,053) |
| Swiss Franc | 569,270 | | 5/23/08 | (33,047) |
| Swiss Franc | 200,754 | | 5/23/08 | (11,546) |
| Swiss Franc | 571,384 | | 5/23/08 | (32,853) |
| | | | | ($208,233) |
Federal income taxes
The Fund qualifies as a regulated investment company by complying with the applicable provisions of the Internal Revenue Code and will not be subject to federal income tax on taxable income that is distributed to shareholders. Therefore, no federal income tax provision is required. Net capital losses of $590,219 that are attributable to security transactions incurred after October 31, 2007, are treated as arising on March 1, 2008, the first day of the Fund’s next taxable year.
The Fund has adopted the provisions of FASB Interpretation No. 48, Accounting for Uncertainty in Income Taxes, an interpretation of FASB Statement 109 (FIN 48), at the beginning of the Fund’s fiscal year. FIN 48 prescribes a minimum threshold for financial statement recognition of the benefit of a tax position taken or expected to be taken in a tax return. The implementation of FIN 48 did not have a material impact on the Fund’s financial statements. Each of the Fund’s federal tax returns for the prior fiscal years remains subject to examination by the Internal Revenue Service.
Distribution of income and gains
The Fund records distributions to shareholders from net investment income and net realized gains, if any, on the ex-dividend date. During the year ended February 28, 2007, the tax character of distributions paid was as follows: ordinary income $401,047. During the year ended February 29, 2008, the tax character of distributions paid was as follows: ordinary income $2,246,678 and long-term capital gain $876,593. Distributions paid by the Fund with
International Growth Fund | Annual report
36
respect to each class of shares are calculated in the same manner, at the same time and are in the same amount, except for the effect of expenses that may be applied differently to each class.
As of February 29, 2008, the components of distributable earnings on a tax basis included $502,563 of undistributed ordinary income.
Such distributions and distributable earnings, on a tax basis, are determined in conformity with income tax regulations, which may differ from accounting principles generally accepted in the United States of America. Distributions in excess of tax basis earnings and profits, if any, are reported in the Fund’s financial statements as a return of capital.
Capital accounts within financial statements are adjusted for permanent book/tax differences. These adjustments have no impact on net assets or the results of operations. Temporary book/tax differences will reverse in a subsequent period. Permanent book/tax differences are primarily attributable to foreign currency transactions and investments in passive foreign investment companies.
3. Investment advisory and other agreements
The Trust has entered into an Investment Advisory Agreement with the Adviser. The Adviser is responsible for managing the corporate and business affairs of the Trust and for selecting and compensating subadvisers to handle the investment of the assets of the Fund, subject to the supervision of the Trust’s Board of Trustees. As compensation for its services, the Adviser receives an advisory fee from the Trust. Under the Advisory Agreement, the Fund pays a monthly management fee to the Adviser equivalent, on an annual basis, to the sum of: (a) 0.92% of the first $100,000,000 of the Fund’s aggregate daily net assets; (b) 0.895% of the next $900,000,000 of the Fund’s aggregate daily net assets; and (c) 0.880% of the Fund’s aggregate daily net assets in excess of $1,000,000,000. Aggregate net assets include the net assets of the Fund and International Growth Trust, a series of John Hancock Trust and International Growth Fund, a series of John Hancock Funds II. The Adviser has a subadvisory agreement with Grantham, Mayo, Van Otterloo & Co. LLC. The Fund is not responsible for payment of the subadvisory fees.
The investment management fees incurred for the year ended February 29, 2008, were equivalent to an annual effective rate of 0.92% of the Fund’s average daily net assets.
Expense reimbursements
The Adviser has contractually agreed to reimburse or limit certain Fund level expenses to 0.20% of the Fund’s average annual net assets which are allocated pro rata to all share classes. Furthermore, the Adviser has voluntarily agreed to reimburse or limit these Fund level expenses to 0.18% for the year ended February 29, 2008. The agreements exclude taxes, portfolio brokerage commissions, interest, advisory fees, Rule 12b-1 fees, transfer agency fees, blue sky fees, printing and postage and litigation and indemnification expenses and other extraordinary expenses not incurred in the ordinary course of the Fund’s business. In addition, fees incurred under any agreement or plans of the Fund dealing with services for the shareholders and others with beneficial interest in shares of the Fund, are excluded.
In addition, the Adviser has agreed to reimburse or limit certain expenses for each share class. This agreement excludes taxes, portfolio brokerage commissions, interest and litigation and indemnification expenses and other extraordinary expenses not incurred in the ordinary course of the Fund’s business. In addition, fees incurred under any agreement or plans of the Fund dealing with services for the shareholders and others with beneficial interest in shares of the Fund, are excluded. The reimbursements and limits are such that these expenses will not exceed 1.70% for Class A shares, 2.40% for Class B, 2.40% for Class C, 1.20% for Class I, 1.70% for Class R1, 1.15% for Class 1 and 1.10% for Class NAV. Accordingly, the expense reductions or reimbursements related to this agreement were $162,190, $21,310, $26,395, $20,979, $16,604, $11,173 and $38,174 for Class A, Class B, Class C, Class I, Class R1, Class 1 and Class NAV, respectively for the year ended February 29, 2008. The expense
Annual report | International Growth Fund
37
reimbursements and limits will continue in effect until June 30, 2008 and thereafter until terminated by the Adviser on notice to the Trust.
Fund administration fees
Pursuant to the Advisory Agreement, the Fund reimburses the Adviser for all expenses associated with providing the administrative, financial, legal, accounting and recordkeep-ing services of the Fund, including the preparation of all tax returns, annual, semi-annual and periodic reports to shareholders and the preparation of all regulatory reports. These expenses are allocated based on the relative share of net assets of each class at the time the expense was incurred.
The fund administration fees incurred for the year ended February 29, 2008, were $14,164 with an annual effective rate of 0.04% of the Fund’s average daily net assets.
Distribution and shareholder service fees
The Trust has a Distribution Agreement with the Distributor. The Fund has adopted Distribution Plans with respect to Class A, Class B, Class C, Class R1 and Class 1, pursuant to Rule 12b-1 under the 1940 Act, to pay the Distributor for the services it provides as distributor of shares of the Fund. Accordingly, the Fund makes monthly payments to the Distributor at an annual rate not to exceed 0.30%, 1.00%, 1.00%, 0.50% and 0.05% of average daily net asset value of Class A, Class B, Class C, Class R1 and Class 1, respectively. A maximum of 0.25% of such payments may be service fees, as defined by the Conduct Rules of Financial Industry Regulatory Authority (formerly the National Association of Securities Dealers). Under the Conduct Rules, curtailment of a portion of the Fund’s 12b-1 payments could occur under certain circumstances.
In addition, the Fund has also adopted a Service Plan for Class R1 shares. Under the Service Plan, the Fund may pay up to 0.25% of Class R1 average daily net asset value for certain other services. There were no Service Plan fees incurred for the year ended February 29, 2008.
Sales charges
Class A shares are assessed up-front sales charges of up to 5.00% of net asset value of such shares. During the year ended February 29, 2008, the Fund was informed that the Distributor received net up-front sales charges of $52,089 with regard to sales of Class A shares. Of this amount, $9,397 was retained and used for printing prospectuses, advertising, sales literature and other purposes; $42,678 was paid as sales commissions to unrelated broker-dealers; and $14 was paid as sales commissions to sales personnel of Signator Investors, Inc. (Signator Investors), a related broker-dealer, an indirect subsidiary of MFC.
Class B shares that are redeemed within six years of purchase are subject to a contingent deferred sales charge (CDSC) at declining rates, beginning at 5.00% of the lesser of the current market value at the time of redemption or the original purchase cost of the shares being redeemed. Class C shares that are redeemed within one year of purchase are subject to a CDSC at a rate of 1.00% of the lesser of the current market value at the time of redemption or the original purchase cost of the shares being redeemed. Proceeds from the CDSCs are paid to the Distributor and are used, in whole or in part, to defray its expenses for providing distribution-related services to the Fund in connection with the sale of Class B and Class C shares. During the year ended February 29, 2008, CDSCs received by Distributor amounted to $298 for Class B shares and $1,625 for Class C shares.
Transfer agent fees
The Fund has a Transfer Agency Agreement with John Hancock Signature Services, Inc. (Signature Services), an indirect subsidiary of MFC. For Class A, Class B, Class C, Class I and Class R1 shares, the Fund pays a monthly transfer agent fee at an annual rate of 0.05% of each class’ average daily net assets, plus a fee based on the number of shareholder accounts and reimbursement for certain out-of-pocket expenses. Expenses not directly attributable to a particular class of shares are aggregated and allocated to each class on the basis of its relative net asset value. The Fund pays a monthly fee which is based on an annual rate of $15.00
International Growth Fund | Annual report
38
for each Class A shareholder account, $17.50 for each Class B shareholder account, $16.50 for each Class C shareholder account and $15.00 for each Class R1 shareholder account.
Signature Services has agreed to limit the transfer agent fees so that such fees do not exceed 0.30% annually of Class A, Class B, Class C, Class I and Class R1 share average daily net assets. This agreement is effective until December 31, 2008. Signature Services reserves the right to terminate this limitation in the future. There were no transfer agent fee reductions for Class A, Class B, Class C, Class I and Class R1 shares, respectively, during the year ended February 29, 2008. In addition, Signature Services has voluntarily agreed to further limit transfer agent fees for Class R1 shares so that such fees do not exceed 0.05% annually of each class’s average daily net assets. For the year ended February 29, 2008, the transfer agent fees reductions for Class R1 were $334.
In May 2007, the Fund began receiving earnings credits from its transfer agent as a result of uninvested cash balances. These credits are used to reduce a portion of the Fund’s transfer agent fees and out-of-pocket expenses. During the year ended February 29, 2008, the Fund’s transfer agent fees and out-of-pocket expenses were reduced by $268 for transfer agent credits earned.
| | | | |
| Class level expenses for the year ended February 29, 2008, were as follows: | |
| |
| | Distribution and | Transfer | | Printing and |
| Share class | service fees | agent fees | Blue sky fees | postage fees |
|
| Class A | $75,588 | $19,267 | $15,390 | $6,017 |
| Class B | 9,639 | 2,958 | 14,807 | 164 |
| Class C | 19,947 | 3,737 | 15,120 | 863 |
| Class I | — | 281 | 17,698 | 331 |
| Class R1 | 666 | 402 | 15,824 | 3 |
| Class 1 | 820 | — | — | 283 |
| Class NAV | — | — | — | — |
| Total | $106,660 | $26,645 | $78,839 | $7,661 |
4. Trustees’ fees
The Trust compensates each Trustee who is not an employee of the Adviser or its affiliates. Total Trustees’ expenses are allocated to the Fund based on its average daily net asset value.
5. Line of credit
The Fund has entered into an agreement which enables them to participate in a $100 million unsecured committed line of credit with State Street Corporation. Borrowings will be made solely to temporarily finance the repurchase of capital shares. Interest is charged to the Fund based on its borrowings at a rate per annum equal to the Federal Funds rate plus 0.50%. In addition, a commitment fee of 0.05% per annum, payable at the end of each calendar quarter, based on the average daily-unused portion of the line of credit, is charged to the Fund on a prorated basis based on average net assets. Effective October 15, 2007, the commitment fee was changed from 0.07% to 0.05% . For the year ended February 29, 2008, there were no borrowings under the line of credit.
Annual report | International Growth Fund
39
6. Fund share transactions
Share activities for the Fund for the period ended February 28, 2007, and the year ended February 29, 2008, were as follows:
| | | | |
| | Period ended 2-28-07 | Year ended 2-29-08 |
| | Shares | Amount | Shares | Amount |
| Class A shares1 | | | | |
|
| Sold | 813,928 | $16,553,865 | 414,385 | $10,585,758 |
| Distributions reinvested | 15,834 | 374,467 | 80,686 | 1,966,314 |
| Repurchased | (1,140) | (26,802) | (172,237) | (4,088,612) |
| Net increase (decrease) | 828,622 | $16,901,530 | 322,834 | $8,463,460 |
| |
| Class B shares1 | | | | |
|
| Sold | 23,398 | $520,275 | 49,493 | $1,301,454 |
| Distributions reinvested | 247 | 5,833 | 3,261 | 79,442 |
| Repurchased | (2,408) | (52,838) | (22,033) | (551,497) |
| Net increase (decrease) | 21,237 | $473,270 | 30,721 | $829,399 |
| |
| Class C shares1 | | | | |
|
| Sold | 70,102 | $1,611,040 | 55,553 | $1,402,156 |
| Distributions reinvested | 313 | 7,402 | 4,414 | 107,446 |
| Repurchased | (5,000) | (118,700) | (21,855) | (509,068) |
| Net increase (decrease) | 65,415 | $1,499,742 | 38,112 | $1,000,534 |
| |
| Class I shares1 | | | | |
|
| Sold | 8,739 | $188,288 | 148,817 | $3,828,656 |
| Distributions reinvested | 127 | 3,010 | 1,455 | 35,510 |
| Repurchased | — | — | (133,227) | (3,446,247) |
| Net increase (decrease) | 8,866 | $191,298 | 17,045 | $417,919 |
| |
| Class R1 shares1 | | | | |
|
| Sold | 5,000 | $100,000 | 482 | $12,483 |
| Distributions reinvested | 104 | 2,445 | 413 | 10,043 |
| Repurchased | — | — | (4) | (89) |
| Net increase (decrease) | 5,104 | $102,445 | 891 | $22,437 |
| |
| Class 1 shares1 | | | | |
|
| Sold | 23,720 | $544,869 | 124,068 | $3,141,773 |
| Distributions reinvested | 121 | 2,861 | 7,219 | 176,002 |
| Repurchased | (785) | (18,107) | (31,315) | (790,808) |
| Net increase (decrease) | 23,056 | $529,623 | 99,972 | $2,526,967 |
| |
| Class NAV shares2 | | | | |
|
| Sold | 31,844 | $770,789 | 299,764 | $7,594,950 |
| Distributions reinvested | — | — | 24,142 | 587,378 |
| Repurchased | (362) | (8,440) | (23,722) | (570,441) |
| Net increase (decrease) | 31,482 | $762,349 | 300,184 | $7,611,887 |
| |
| Net increase (decrease) | 983,782 | $20,460,257 | 809,759 | $20,872,603 |
|
1Period from 6-12-06 (commencement of operations) to 2-28-07.
2Period from 12-27-06 (commencement of operation) to 2-28-07.
7. Purchases and sales of securities
Purchases and proceeds from sales or maturities of securities, other than short-term securities and obligations of the U.S. government, during the year ended February 29, 2008, aggregated $51,627,814 and $32,771,239, respectively.
International Growth Fund | Annual report
40
Auditors’ report
Report of Independent Registered Public Accounting Firm
To the Board of Trustees of John Hancock Funds III and Shareholders of John Hancock International Growth Fund,
In our opinion, the accompanying statement of assets and liabilities, including the schedule of investments, and the related statements of operations and of changes in net assets and the financial highlights present fairly, in all material respects, the financial position of John Hancock International Growth Fund (the Fund) at February 29, 2008, and the results of its operations, the changes in its net assets and the financial highlights for each of the periods indicated, in conformity with accounting principles generally accepted in the United States of America. These financial statements and financial highlights (hereafter referred to as “financial statements”) are the responsibility of the Fund’s management. Our responsibility is to express an opinion on these financial statements based on our audits. We conducted our audits of these financial statements in accordance with the standards of the Public Company Accounting Oversight Board (United States). T hose standards require that we plan and perform the audits to obtain reasonable assurance about whether the financial statements are free of material misstatement. An audit includes examining, on a test basis, evidence supporting the amounts and disclosures in the financial statements, assessing the accounting principles used and significant estimates made by management, and evaluating the overall financial statement presentation. We believe that our audits, which included confirmation of investments at February 29, 2008 by correspondence with the custodian, provide a reasonable basis for our opinion.
PricewaterhouseCoopers LLP
Boston, Massachusetts
April 18, 2008
Annual report | International Growth Fund
41
Tax information
Unaudited
For federal income tax purposes, the following information is furnished with respect to the distributions of the Fund, if any, paid during its taxable year ended February 29, 2008.
The Fund has designated distributions to shareholders of $876,593 as a long-term capital gain dividend.
The Fund hereby designates the maximum amount allowable of its net taxable income as qualified dividend income as provided in the Jobs and Growth Tax Relief Reconciliation Act of 2003. This amount will be reflected on Form 1099-DIV for the calendar year 2008.
Shareholders will be mailed a 2008 U.S. Treasury Department Form 1099-DIV in January 2009. This will reflect the total of all distributions that are taxable for calendar year 2008.
International Growth Fund | Annual report
42
Trustees and Officers
This chart provides information about the Trustees and Officers who oversee your John Hancock fund. Officers elected by the Trustees manage the day-to-day operations of the Fund and execute policies formulated by the Trustees.
| | |
| Independent Trustees | | |
| |
| Name, Year of Birth | | Number of |
| Position(s) held with Fund | Trustee | John Hancock |
| Principal occupation(s) and other | of Fund | funds overseen |
| directorships during past 5 years | since1 | by Trustee |
| |
| James F. Carlin, Born: 1940 | 2006 | 55 |
|
| Chairman (since December 2007); Director and Treasurer, Alpha Analytical Laboratories, Inc. (chemical |
| analysis) (since 1985); Part Owner and Treasurer, Lawrence Carlin Insurance Agency, Inc. (since 1995); |
| Part Owner and Vice President, Mone Lawrence Carlin Insurance Agency, Inc. (until 2005); Chairman |
| and Chief Executive Officer, Carlin Consolidated, Inc. (management/investments) (since 1987); Trustee, |
| Massachusetts Health and Education Tax Exempt Trust (1993–2003). | | |
| |
| |
| William H. Cunningham, Born: 1944 | 2006 | 55 |
|
| Professor, University of Texas at Austin (since 1971); former Chancellor, University of Texas System and |
| former President, University of Texas at Austin (until 2001); Chairman and Chief Executive Officer, IBT |
| Technologies (until 2001); Director of the following: Hicks Acquisition Company I, Inc. (since 2007); |
| Hire.com (until 2004), STC Broadcasting, Inc. and Sunrise Television Corp. (until 2001), Symtx, Inc. |
| (electronic manufacturing) (since 2001), Adorno/Rogers Technology, Inc. (until 2004), Pinnacle |
| Foods Corporation (until 2003), rateGenius (until 2003), Lincoln National Corporation (insurance) |
| (since 2006), Jefferson-Pilot Corporation (diversified life insurance company) (until 2006), New |
| Century Equity Holdings (formerly Billing Concepts) (until 2001), eCertain (until 2001), ClassMap.com |
| (until 2001), Agile Ventures (until 2001), AskRed.com (until 2001), Southwest Airlines (since 2000), |
| Introgen (manufacturer of biopharmaceuticals) (since 2000) and Viasystems Group, Inc. (electronic |
| manufacturer) (until 2003); Advisory Director, Interactive Bridge, Inc. (college fundraising) (until 2001); |
| Advisory Director, Q Investments (until 2003); Advisory Director, JPMorgan Chase Bank (formerly Texas |
| Commerce Bank–Austin), LIN Television (until 2008), WilTel Communications (until 2003) and Hayes |
| Lemmerz International, Inc. (diversified automotive parts supply company) (since 2003). | |
| |
| |
| Charles L. Ladner,2 Born: 1938 | 2006 | 55 |
|
| Chairman and Trustee, Dunwoody Village, Inc. (retirement services) (until 2003); Senior Vice President |
| and Chief Financial Officer, UGI Corporation (public utility holding company) (retired 1998); Vice |
| President and Director, AmeriGas, Inc. (retired 1998); Director, AmeriGas Partners, L.P. (gas distribution) |
| (until 1997); Director, EnergyNorth, Inc. (until 1997); Director, Parks and History Association (until 2005). |
| |
| |
| John A. Moore,2 Born: 1939 | 2006 | 55 |
|
| President and Chief Executive Officer, Institute for Evaluating Health Risks (nonprofit institution) |
| (until 2001); Senior Scientist, Sciences International (health research) (until 2003); Former Assistant |
| Administrator and Deputy Administrator, Environmental Protection Agency; Principal, Hollyhouse |
| (consulting) (since 2000); Director, CIIT Center for Health Science Research (nonprofit research) |
| (until 2007). | | |
Annual report | International Growth Fund
43
| | |
| Independent Trustees (continued) | | |
| |
| Name, Year of Birth | | Number of |
| Position(s) held with Fund | Trustee | John Hancock |
| Principal occupation(s) and other | of Fund | funds overseen |
| directorships during past 5 years | since1 | by Trustee |
| |
| Patti McGill Peterson,2 Born: 1943 | 2006 | 55 |
|
| Senior Associate, Institute for Higher Education Policy (since 2007); Executive Director, Council for |
| International Exchange of Scholars and Vice President, Institute of International Education (until 2007); |
| Senior Fellow, Cornell Institute of Public Affairs, Cornell University, Ithaca, NY (until 1998); Former |
| President, Wells College, Aurora, NY, and St. Lawrence University, Canton, NY; Director, Niagara |
| Mohawk Power Corporation (until 2003); Director, Ford Foundation, International Fellowships Program |
| (since 2002); Director, Lois Roth Endowment (since 2002); Director, Council for International Educational |
| Exchange (since 2003). | | |
| |
| |
| Steven R. Pruchansky, Born: 1944 | 2006 | 55 |
|
| Chairman and Chief Executive Officer, Greenscapes of Southwest Florida, Inc. (since 2000); Director and |
| President, Greenscapes of Southwest Florida, Inc. (until 2000); Managing Director, JonJames, LLC (real |
| estate) (since 2000); Director, First Signature Bank & Trust Company (until 1991); Director, Mast Realty |
| Trust (until 1994); President, Maxwell Building Corp. (until 1991). | | |
| |
| Non-Independent Trustees3 | | |
| |
| Name, Year of Birth | | Number of |
| Position(s) held with Fund | Trustee | John Hancock |
| Principal occupation(s) and other | of Fund | funds overseen |
| directorships during past 5 years | since1 | by Trustee |
| |
| James R. Boyle, Born: 1959 | 2006 | 265 |
|
| Executive Vice President, Manulife Financial Corporation (since 1999); President, John Hancock Variable |
| Life Insurance Company (since March 2007); Executive Vice President, John Hancock Life Insurance |
| Company (since 2004); Chairman and Director, John Hancock Advisers, LLC (the Adviser), John Hancock |
| Funds, LLC and The Berkeley Financial Group, LLC (The Berkeley Group) (holding company) (since 2005); |
| Senior Vice President, The Manufacturers Life Insurance Company (U.S.A.) (until 2004). | |
International Growth Fund | Annual report
44
| |
| Principal officers who are not Trustees | |
| |
| Name, Year of Birth | |
| Position(s) held with Fund | Officer |
| Principal occupation(s) and other | of Fund |
| directorships during past 5 years | since |
| |
| Keith F. Hartstein, Born: 1956 | 2006 |
|
| President and Chief Executive Officer | |
| Senior Vice President, Manulife Financial Corporation (since 2004); Director, President and Chief | |
| Executive Officer, the Adviser, The Berkeley Group and John Hancock Funds, LLC (since 2005); Director, |
| MFC Global Investment Management (U.S.), LLC (MFC Global (U.S.)) (since 2005); Director, John | |
| Hancock Signature Services, Inc. (since 2005); President and Chief Executive Officer, John Hancock |
| Investment Management Services, LLC (since 2006); President and Chief Executive Officer, John Hancock |
| Funds, John Hancock Funds II, John Hancock Funds III and John Hancock Trust (since 2005); Director, |
| Chairman and President, NM Capital Management, Inc. (since 2005); Member, Investment Company |
| Institute Sales Force Marketing Committee (since 2003); President and Chief Executive Officer, MFC |
| Global (U.S.) (2005–2006); Executive Vice President, John Hancock Funds, LLC (until 2005). | |
|
| |
| Thomas M. Kinzler, Born: 1955 | 2006 |
|
| Secretary and Chief Legal Officer | |
| Vice President and Counsel, John Hancock Life Insurance Company (U.S.A.) (since 2006); Secretary and |
| Chief Legal Officer, John Hancock Funds and John Hancock Funds II (since 2006); Chief Legal Officer |
| and Assistant Secretary, John Hancock Trust (since 2006); Vice President and Associate General Counsel, |
| Massachusetts Mutual Life Insurance Company (1999–2006); Secretary and Chief Legal Counsel, MML |
| Series Investment Fund (2000–2006); Secretary and Chief Legal Counsel, MassMutual Institutional Funds |
| (2000–2004); Secretary and Chief Legal Counsel, MassMutual Select Funds and MassMutual Premier |
| Funds (2004–2006). | |
| |
| |
| Francis V. Knox, Jr., Born: 1947 | 2006 |
|
| Chief Compliance Officer | |
| Vice President and Chief Compliance Officer, John Hancock Investment Management Services, LLC, |
| the Adviser and MFC Global (U.S.) (since 2005); Vice President and Chief Compliance Officer, John |
| Hancock Funds, John Hancock Funds II, John Hancock Funds III and John Hancock Trust (since 2005); |
| Vice President and Assistant Treasurer, Fidelity Group of Funds (until 2004); Vice President and Ethics & |
| Compliance Officer, Fidelity Investments (until 2001). | |
| |
| |
| Charles A. Rizzo, Born: 1957 | 2007 |
|
| Chief Financial Officer | |
| Chief Financial Officer, John Hancock Funds, John Hancock Funds II, John Hancock Funds III and John |
| Hancock Trust (since June 2007); Assistant Treasurer, Goldman Sachs Mutual Fund Complex (regis- |
| tered investment companies) (2005–June 2007); Vice President, Goldman Sachs (2005–June 2007); |
| Managing Director and Treasurer of Scudder Funds, Deutsche Asset Management (2003–2005); | |
| Director, Tax and Financial Reporting, Deutsche Asset Management (2002–2003); Vice President and |
| Treasurer, Deutsche Global Fund Services (Deutsche Registered Investment Companies) (1999–2002). |
| |
| |
| Gordon M. Shone, Born: 1956 | 2006 |
|
| Treasurer | |
| Senior Vice President, John Hancock Life Insurance Company (U.S.A.) (since 2001); Treasurer, John |
| Hancock Funds (since 2006), John Hancock Funds II, John Hancock Funds III and John Hancock Trust |
| (since 2005); Vice President and Chief Financial Officer, John Hancock Trust (2003–2005); Vice President, |
| John Hancock Investment Management Services, Inc., John Hancock Advisers, LLC (since 2006) and The |
| Manufacturers Life Insurance Company (U.S.A.) (1998–2000). | |
Annual report | International Growth Fund
45
| |
| Principal officers who are not Trustees (continued) | |
| |
| Name, Year of Birth | |
| Position(s) held with Fund | Officer |
| Principal occupation(s) and other | of Fund |
| directorships during past 5 years | since |
| |
| John G. Vrysen, Born: 1955 | 2006 |
|
| Chief Operating Officer | |
| Senior Vice President, Manulife Financial Corporation (since 2006); Director, Executive Vice President |
| and Chief Operating Officer, the Adviser, The Berkeley Group and John Hancock Funds, LLC (since | |
| June 2007); Executive Vice President and Chief Operating Officer, John Hancock Investment | |
| Management Services, LLC (since December 2007); Chief Operating Officer, John Hancock Funds, |
| John Hancock Funds II, John Hancock Funds III and John Hancock Trust (since June 2007); Director, |
| Executive Vice President and Chief Financial Officer, the Adviser, The Berkeley Group and John Hancock |
| Funds, LLC (2005–2007); Executive Vice President and Chief Financial Officer, John Hancock Investment |
| Management Services, LLC (2005–2007); Executive Vice President and Chief Financial Officer, MFC |
| Global (U.S.) (2005 until August 2007); Director, John Hancock Signature Services, Inc. (since 2005); |
| Chief Financial Officer, John Hancock Funds, John Hancock Funds II, John Hancock Funds III and John |
| Hancock Trust (2005 until June 2007); Vice President and General Manager, John Hancock Fixed | |
| Annuities, U.S. Wealth Management (2004–2005); Vice President, Operations, Manulife Wood Logan |
| (2000–2004). | |
The business address for all Trustees and Officers is 601 Congress Street, Boston, Massachusetts 02210-2805.
The Statement of Additional Information of the Fund includes additional information about members of the Board of Trustees of the Fund and is available without charge, upon request, by calling 1-800-225-5291.
1 Each Trustee serves until resignation, retirement age or until his or her successor is elected.
2 Member of Audit and Compliance Committee.
3 Non-Independent Trustee holds positions with the Fund’s investment adviser, underwriter and certain other affiliates.
International Growth Fund | Annual report
46
For more information
The Fund’s proxy voting policies, procedures and records are available without charge, upon request:
| | |
| By phone | On the Fund’s Web site | On the SEC’s Web site |
| 1-800-225-5291 | www.jhfunds.com/proxy | www.sec.gov |
|
| |
| Investment adviser | Custodian | Legal counsel |
| John Hancock Investment | State Street Bank & Trust Co. | Kirkpatrick & Lockhart |
| Management Services, LLC | 2 Avenue de Lafayette | Preston Gates Ellis LLP |
| 601 Congress Street | Boston, MA 02111 | One Lincoln Street |
| Boston, MA 02210-2805 | | Boston, MA 02111-2950 |
| | Transfer agent | |
| Subadviser | John Hancock Signature | Independent registered |
| Grantham, Mayo, Van | Services, Inc. | public accounting firm |
| Otterloo & Co. LLC | P.O. Box 9510 | PricewaterhouseCoopers LLP |
| 40 Rowes Wharf | Portsmouth, NH 03802-9510 | 125 High Street |
| Boston, MA 02110 | | Boston, MA 02110 |
| | | |
| Principal distributor | | |
| John Hancock Funds, LLC | | |
| 601 Congress Street | | |
| Boston, MA 02210-2805 | | |
| | |
| How to contact us | |
|
| |
| Internet | www.jhfunds.com | |
|
| |
| Mail | Regular mail: | Express mail: |
| | John Hancock Signature | John Hancock Signature |
| | Services, Inc. | Services, Inc. |
| | P.O. Box 9510 | Mutual Fund Image Operations |
| | Portsmouth, NH 03802-9510 | 164 Corporate Drive |
| | | Portsmouth, NH 03801 |
|
| |
| Phone | Customer service representatives | 1-800-225-5291 |
| | EASI-Line | 1-800-338-8080 |
| | TDD line | 1-800-554-6713 |
A listing of month-end portfolio holdings is available on our Web site, www.jhfunds.com. A more detailed portfolio holdings summary is available on a quarterly basis 60 days after the fiscal quarter on our Web site or upon request by calling 1-800-225-5291, or on the SEC’s Web site, www.sec.gov.
Annual report | International Growth Fund
47

1-800-225-5291
1-800-554-6713 TDD
1-800-338-8080 EASI-Line
www.jhfunds. com
Now available: electronic delivery
www.jhfunds.com/edelivery
| | |
| This report is for the information of the shareholders of John Hancock International Growth Fund. | 8700A | 2/08 |
| It is not authorized for distribution to prospective investors unless preceded or accompanied by a prospectus. | | 4/08 |

Discussion of Fund performance
By MFC Global Investment Management (U.S.A.) LLC
The year ended February 29, 2008, was a challenging one for international markets. While foreign stocks continued to outperform U.S. equities, highlighted by particularly strong results in emerging markets, share prices weakened notably in the final four months of the period, as a slew of unfavorable economic and corporate earnings data built a convincing case that a serious U.S.-centered slowdown was, in fact, occurring, and that the fallout from the subprime mortgage crisis was by no means as contained as investors had previously hoped. Against this backdrop, the MSCI EAFE Gross Total Return Index posted a modest 1.27% gain, topping the –3.60% return of the Standard & Poor’s 500 Index. Meanwhile, the MSCI Emerging Markets Index gained 27.69% . While the EAFE index trailed the S&P 500 in local currency terms, a weak U.S. dollar bolstered the benchmark’s dollar-based results.
“The year ended February 29,
2008, was a challenging one for
international markets.”
During the past year, John Hancock International Allocation Portfolio’s Class A, Class B, Class C and Class I shares returned 0.70%, –0.13%, –0.13% and 1.02%, respectively, at net asset value. The Portfolio’s performance was undermined by its position in International Classic Value, which registered a double-digit loss due to overweightings in the beleaguered financials sector and in Japan. Also detracting from our results was International Value, which lagged the benchmark by a much smaller margin but represented a much larger position. Positive factors included International Opportunities, which benefited from overweighting Hong Kong, Canada and Brazil, as well as from underweighting Japan. Among sectors, underweighting global financials helped. The other notable positive influence was Greater China Opportunities, which posted the largest gain of all our holdings but had a smaller overall impact on performance due to its relatively small position si ze of 2.6%, on average.
This commentary reflects the views of the portfolio managers through the end of the Portfolio’s period discussed in this report. The managers’ statements reflect their own opinions. As such, they are in no way guarantees of future events and are not intended to be used as investment advice or a recommendation regarding any specific security. They are also subject to change at any time as market and other conditions warrant.
International Allocation Portfolio | Annual report
6
A look at performance
For the periods ended February 29, 2008
| | | | | | | | | | | |
| | | | Average annual returns | | | | Cumulative total returns | | |
| | | | with maximum sales charge (POP) | | | with maximum sales charge (POP) | | |
| | Inception | | | | | Since | | | | | Since |
| Class | date | | 1-year | 5-year | 10-year | inception | | 1-year | 5-year | 10-year | inception |
|
| A | 12-29-06 | | –4.30% | — | — | –4.08% | | –4.30% | — | — | –4.75% |
|
|
| B | 12-29-06 | | –4.88 | — | — | –3.78 | | –4.88 | — | — | –4.41 |
|
|
| C | 12-29-06 | | –1.08 | — | — | –0.54 | | –1.08 | — | — | –0.63 |
|
|
| I1 | 12-29-06 | | 1.02 | — | — | 0.61 | | 1.02 | — | — | 0.71 |
|
Performance figures assume all distributions are reinvested. Public offering price (POP) figures reflect maximum sales charge on Class A shares of 5%, and the applicable contingent deferred sales charge (CDSC) on Class B and Class C shares. The Class B shares’ CDSC declines annually between years 1 to 6 according to the following schedule: 5, 4, 3, 3, 2, 1%. No sales charge will be assessed after the sixth year. Class C shares held for less than one year are subject to a 1% CDSC. Sales charge is not applicable for Class I shares.
The expense ratios of the Portfolio, both net (including any fee waivers or expense limitations) and gross (excluding any fee waivers or expense limitations), are set forth according to the most recent publicly available prospectuses for the Portfolio and may differ from the expense ratios disclosed in the Financial Highlights tables in this report. The waivers and expense limitations are contractual at least until 06-30-08. The following expense ratios include expenses of the underlying affiliated funds in which the Portfolio invests. The net expenses are as follows: Class A — 1.70%, Class B — 2.40%, Class C — 2.40%, Class I — 1.25% . Had the fee waivers and expense limitations not been in place, the gross expenses would be as follows: Class A — 1.79%, Cl ass B — 2.67%, Class C — 2.55%, Class I — 1.39% .
The returns reflect past results and should not be considered indicative of future performance. The return and principal value of an investment will fluctuate so that shares, when redeemed, may be worth more or less than their original cost. Due to market volatility, the Portfolio’s current performance may be higher or lower than the performance shown. For performance data current to the most recent month end, please call 1-800-225-5291 or visit the Portfolio’s Web site at www.jhfunds.com.
The performance table above and the chart on the next page do not reflect the deduction of taxes that a shareholder would pay on fund distributions or the redemption of fund shares.
The Portfolio’s performance results reflect any applicable expense reductions, without which the expenses increase and results would have been less favorable.
Performance is calculated with an opening price (prior day’s close) on the inception date.
1 For certain types of investors as described in the Portfolio’s Class I share prospectus.
Annual report | International Allocation Portfolio
7
A look at performance
Growth of $10,000
This chart shows what happened to a hypothetical $10,000 investment in International Allocation Portfolio Class A shares for the period indicated. For comparison, we’ve shown the same investment in two separate indexes.
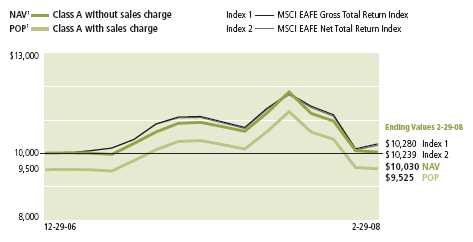
| | | | | |
| | | Without sales | With maximum | | |
| Class | Period beginning | charge | sales charge | Index 1 | Index 2 |
|
| B2 | 12-29-06 | $9,937 | $9,559 | $10,280 | $10,239 |
|
| C2 | 12-29-06 | 9,937 | 9,937 | 10,280 | 10,239 |
|
| I2,3 | 12-29-06 | 10,071 | 10,071 | 10,280 | 10,239 |
|
Assuming all distributions were reinvested for the period indicated, the table above shows the value of a $10,000 investment in the Portfolio’s Class B, Class C and Class I shares, respectively, as of February 29, 2008. Performance of the classes will vary based on the difference in sales charges paid by shareholders investing in the different classes and the fee structure of those classes.
MSCI EAFE Gross Total Return Index — Index 1 — is an unmanaged market capitalization weighted composite of securities in 21 developed markets outside of North America, in Europe, Australia and the Far East. The MSCI EAFE (gross) Index includes the maximum dividend reinvestment. The Composite Index figures do not reflect any deduction for fees, taxes or expenses.
MSCI EAFE Net Total Return Index (Europe, Australasia, Far East)— Index 2 — is a free float-adjusted market capitalization index that is designed to measure developed market equity performance, excluding the U.S. and Canada. Since June 2006, the MSCI EAFE Index consisted of the following 21 developed market country indexes: Australia, Austria, Belgium, Denmark, Finland, France, Germany, Greece, Hong Kong, Ireland, Italy, Japan, Netherlands, New Zealand, Norway, Portugal, Singapore, Spain, Sweden, Switzerland and the United Kingdom. Returns are calculated and presented net of withholding tax.
It is not possible to invest directly in an index. Index figures do not reflect sales charges, which would have resulted in lower values if they did.
1 NAV represents net asset value and POP represents public offering price.
2 Index 1 figure as of closest month end to fund inception date.
3 For certain types of investors as described in the Portfolio’s Class I share prospectus.
International Allocation Portfolio | Annual report
8
Your expenses
These examples are intended to help you understand your ongoing operating expenses.
Understanding fund expenses
As a shareholder of the Portfolio, you incur two types of costs:
■ Transaction costs which include sales charges (loads) on purchases or redemptions (varies by share class), minimum account fee charge, etc.
■ Ongoing operating expenses including management fees, distribution and service fees (if applicable), and other fund expenses.
We are going to present only your ongoing operating expenses here.
Actual expenses/actual returns
This example is intended to provide information about your fund’s actual ongoing operating expenses, and is based on your fund’s actual return. It assumes an account value of $1,000.00 on September 1, 2007, with the same investment held until February 29, 2008.
| | | |
| | Account value | Ending value | Expenses paid during |
| | on 9-1-07 | on 2-29-08 | period on 2-29-081 |
|
| Class A | $1,000.00 | $940.88 | $2.70 |
|
| Class B | 1,000.00 | 937.48 | 6.46 |
|
| Class C | 1,000.00 | 936.55 | 6.40 |
|
| Class I | 1,000.00 | 942.12 | 0.92 |
|
Together with the value of your account, you may use this information to estimate the operating expenses that you paid over the period. Simply divide your account value at February 29, 2008, by $1,000.00, then multiply it by the “expenses paid” for your share class from the table above. For example, for an account value of $8,600.00, the operating expenses should be calculated as follows:
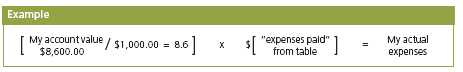
Annual report | International Allocation Portfolio
9
Your expenses
Hypothetical example for comparison purposes
This table allows you to compare your fund’s ongoing operating expenses with those of any other fund. It provides an example of the Portfolio’s hypothetical account values and hypothetical expenses based on each class’s actual expense ratio and an assumed 5% annualized return before expenses (which is not your fund’s actual return). It assumes an account value of $1,000.00 on September 1, 2007, with the same investment held until February 29, 2008. Look in any other fund shareholder report to find its hypothetical example and you will be able to compare these expenses.
| | | |
| | Account value | Ending value | Expenses paid during |
| | on 9-1-07 | on 2-29-08 | period on 2-29-081 |
|
| Class A | $1,000.00 | $1,022.08 | $2.82 |
|
| Class B | 1,000.00 | 1,018.20 | 6.72 |
|
| Class C | 1,000.00 | 1,018.25 | 6.67 |
|
| Class I | 1,000.00 | 1,023.92 | 0.96 |
|
Remember, these examples do not include any transaction costs, such as sales charges; therefore, these examples will not help you to determine the relative total costs of owning different funds. If transaction costs were included, your expenses would have been higher. See the prospectus for details regarding transaction costs.
1 Expenses are equal to the Portfolio’s annualized expense ratio of 0.56%, 1.34%, 1.33% and 0.19% for Class A, Class B, Class C and Class I, respectively, multiplied by the average account value over the period, multiplied by the number of days in most recent fiscal half year/366 (to reflect the one-half year period). Ratios do not include expenses incurred from underlying funds whose annualized weighted average expense ratio was 1.02%, based on the mix of underlying funds held by the Portfolio.
International Allocation Portfolio | Annual report
10
Portfolio summary
| |
| Asset allocation1 | % of Total |
|
| International Large Cap | 76.0% |
|
| International Small Cap | 16.0% |
|
| Emerging Markets | 6.0% |
|
| China | 2.0% |
|
1 As a percentage of net assets on February 29, 2008.
11 Annual report | International Allocation Portfolio
F I N A N C I A L S T A T E M E N T S
Portfolio’s investments
Securities owned by the Portfolio on 2-29-08
Portfolio of investments, showing all affiliated underlying funds.
| | |
| Issuer | Shares | Value |
| | | |
| Investment companies 100.13% | | $41,074,409 |
|
| (Cost $45,918,142) | | |
| | | |
| John Hancock Funds 17.10% | | 7,015,603 |
|
| Greater China Opportunities | | |
| (MFC Global Investment Management (U.S.A.) Ltd.) (f) | 36,506 | $799,111 |
|
| International Classic Value | | |
| (Pzena Investment Management, LLC) (f) | 706,419 | 6,216,492 |
| | | |
| John Hancock Funds II 64.81% | | 26,587,709 |
|
| Emerging Markets Value | | |
| (Dimensional Fund Advisors, Inc.) (f) | 209,581 | 2,332,641 |
|
| International Opportunities | | |
| (Marsico Capital Management, LLC) (f) | 528,469 | 9,105,512 |
|
| International Small Company | | |
| (Dimensional Fund Advisors, Inc.) (f) | 671,480 | 6,459,635 |
|
| International Value | | |
| (Franklin® Templeton®) (f) | 509,374 | 8,689,921 |
| | | |
| John Hancock Funds III 18.22% | | 7,471,097 |
|
| International Growth | | |
| (Grantham, Mayo, Van Otterloo & Company) (f) | 327,106 | 7,471,097 |
|
| Total investments (Cost $45,918,142)† 100.13% | | $41,074,409 |
|
| |
| Liabilities in excess of other assets (0.13%) | | ($51,621) |
|
| |
| Total net assets 100.00% | | $41,022,788 |
|
Percentages are stated as a percent of net assets.
(f) The underlying fund’s subadviser.
† At February 29, 2008, the aggregate cost of investment securities for federal income tax purposes was $46,441,526. Net unrealized depreciation aggregated $5,367,117, of which $81,281 related to appreciated investment securities and $5,448,398 related to depreciated investment securities.
See notes to financial statements
International Allocation Portfolio | Annual report
12
F I N A N C I A L S T A T E M E N T S
Financial statements
Statement of assets and liabilities 2-29-08
This Statement of Assets and Liabilities is the Portfolio’s balance sheet. It shows the value of what the Portfolio owns, is due and owes. You’ll also find the net asset value and the maximum public offering price per share.
| |
| Assets | |
|
| Investments in affiliated funds, at value (cost $45,918,142) (Note 8) | $41,074,409 |
| | |
| Total investments, at value (cost $45,918,142) | 41,074,409 |
| Receivable for investments sold | 626,458 |
| Receivable for fund shares sold | 90,502 |
| Receivable due from adviser | 23,451 |
| Other assets | 228 |
| | |
| Total assets | 41,815,048 |
| |
| Liabilities | |
|
| Due to custodian | 62,217 |
| Payable for investments purchased | 6,903 |
| Payable for fund shares repurchased | 646,147 |
| Payable to affiliates | |
| Fund administration fees | 630 |
| Transfer agent fees | 9,442 |
| Trustees’ fees | 60 |
| Other payables and accrued expenses | 66,861 |
| | |
| Total liabilities | 792,260 |
| |
| Net assets | |
|
| Capital paid-in | $45,373,395 |
| Accumulated undistributed net realized gain (loss) on investments | 493,126 |
| Net unrealized appreciation (depreciation) on investments | (4,843,733) |
| | |
| Net assets | $41,022,788 |
See notes to financial statements
Annual report | International Allocation Portfolio
13
F I N A N C I A L S T A T E M E N T S
Statement of assets and liabilities continued
| |
| Net asset value per share | |
|
| The Portfolio has an unlimited number of shares authorized with no par | |
| value. Net asset value is calculated by dividing the net assets of each class | |
| of shares by the number of outstanding shares in the class. | |
| | |
| Class A | |
| Net assets | $30,219,567 |
| Shares outstanding | 3,187,026 |
| Net asset value and redemption price per share | $9.48 |
| | |
| Class B1 | |
| Net assets | $1,715,170 |
| Shares outstanding | 181,383 |
| Net asset value and offering price per share | $9.46 |
| | |
| Class C1 | |
| Net assets | $8,242,267 |
| Shares outstanding | 870,835 |
| Net asset value and offering price per share | $9.46 |
| | |
| Class I | |
| Net assets | $845,784 |
| Shares outstanding | 89,099 |
| Net asset value, offering price and redemption price per share | $9.49 |
| |
| Maximum public offering price per share | |
|
| Class A (net asset value per share ÷ 95%)2 | $9.98 |
1 Redemption price per share is equal to the net asset value less any applicable contingent deferred sales charge.
2 On single retail sales of less than $50,000. On sales of $50,000 or more and on group sales the offering price is reduced.
See notes to financial statements
14 International Allocation Portfolio | Annual report
F I N A N C I A L S T A T E M E N T S
Statement of operations For the year ended 2-29-08
This Statement of Operations summarizes the Portfolio’s investment income earned and expenses incurred in operating the Portfolio. It also shows net gains (losses) for the period stated.
| |
| Investment income | |
|
| Income distributions received from affiliated underlying funds | $608,654 |
| | |
| Total investment income | 608,654 |
| |
| Expenses | |
|
| Investment management fees (Note 3) | 43,023 |
| Distribution and service fees (Note 3) | 142,621 |
| Transfer agent fees (Note 3) | 41,823 |
| Fund administration fees (Note 3) | 9,769 |
| Blue sky fees (Note 3) | 124,211 |
| Audit and legal fees | 69,636 |
| Printing and postage fees (Note 3) | 15,367 |
| Custodian fees | 17,417 |
| Trustees’ fees (Note 3) | 1,440 |
| Registration and filing fees | 30,751 |
| Miscellaneous | 8,191 |
| | |
| Total expenses | 504,249 |
| | |
| Less expense reductions (Note 3) | (267,516) |
| | |
| Net expenses | 236,733 |
| | |
| Net investment income | 371,921 |
| |
| Realized and unrealized gain (loss) | |
|
| Net realized gain (loss) on | |
| Investments in affiliated underlying funds | (487,660) |
| Capital gain distributions received from affiliated underlying funds | 2,814,726 |
| | 2,327,066 |
| Change in net unrealized appreciation (depreciation) of | |
| investments in affiliated underlying funds | (4,761,706) |
| | (4,761,706) |
| Net realized and unrealized gain (loss) | (2,434,640) |
| Increase (decrease) in net assets from operations | ($2,062,719) |
See notes to financial statements
Annual report | International Allocation Portfolio
15
F I N A N C I A L S T A T E M E N T S
Statement of changes in net assets
These Statements of Changes in Net Assets show how the value of the Portfolio’s net assets has changed during the last two periods. The difference reflects earnings less expenses, any investment gains and losses, distributions, if any, paid to shareholders and the net of Portfolio share transactions.
| | |
| | Period | Year |
| | ended | ended |
| | 2-28-071 | 2-29-08 |
| Increase (decrease) in net assets | | |
|
| From operations | | |
| Net investment income (loss) | ($1,551) | $371,921 |
| Net realized gain (loss) | (547) | 2,327,066 |
| Change in net unrealized appreciation (depreciation) | (82,027) | (4,761,706) |
| | | |
| Increase (decrease) in net assets resulting from operations | (84,125) | (2,062,719) |
| | | |
| Distributions to shareholders | | |
| From net investment income | | |
| Class A | — | (368,791) |
| Class B | — | (8,046) |
| Class C | — | (36,417) |
| Class I | — | (11,786) |
| From net realized gain | | |
| Class A | — | (1,337,953) |
| Class B | — | (74,015) |
| Class C | — | (335,022) |
| Class I | — | (33,949) |
| | | |
| Total distributions | — | (2,205,979) |
| | | |
| From Fund share transactions (Note 6) | 4,651,047 | 40,724,564 |
| | |
| Total increase (decrease) | 4,566,922 | 36,455,866 |
| |
| Net assets | | |
|
| Beginning of year | — | 4,566,922 |
| | | |
| End of year | $4,566,922 | $41,022,788 |
1 Period from 12-29-06 (commencement of operations) to 2-28-07.
See notes to financial statements
International Allocation Portfolio | Annual report
16
F I N A N C I A L S T A T E M E N T S
Financial highlights
The Financial Highlights show how the Portfolio’s net asset value for a share has changed since the end of the previous period.
| | |
| CLASS A SHARES | | |
| |
| Period ended | 2-28-071 | 2-29-08 |
| |
| Per share operating performance | | |
|
| Net asset value, beginning of period | $10.00 | $9.96 |
| Net investment income (loss)2,3 | (0.01) | 0.13 |
| Net realized and unrealized gain | | |
| (loss) on investments | (0.03) | (0.03) |
| | | |
| Total from investment operations | (0.04) | 0.10 |
| | | |
| Less distributions | | |
| From net investment income | — | (0.13) |
| From net realized gain | — | (0.45) |
| | — | (0.58) |
| Net asset value, end of period | $9.96 | $9.48 |
| | | |
| Total return4,5 (%) | (0.40)6 | 0.70 |
| |
| Ratios and supplemental data | | |
|
| Net assets, end of period (in millions) | $3 | $30 |
| Ratios (as a percentage of average net assets): | | |
| Expenses before reductions | 8.537 | 1.118 |
| Expenses net of fee waivers, if any | 0.607 | 0.588 |
| Expenses net of all fee waivers and credits | 0.607 | 0.588 |
| Net investment income (loss)3 | (0.60)7 | 1.21 |
| Portfolio turnover (%) | 36 | 23 |
1 Class A shares began operations on 12-29-06.
2 Based on the average of the shares outstanding.
3 Recognition of net investment income by the Portfolio is affected by the timing of the declaration of dividends by the underlying funds in which the Portfolio invests.
4 Total returns would have been lower had certain expenses not been reduced during the periods shown.
5 Assumes dividend reinvestment.
6 Not annualized.
7 Annualized.
8 Ratios do not include expenses incurred from underlying funds whose annualized weighted average was 1.02%, based on the mix of underlying funds held by the Portfolio.
See notes to financial statements
Annual report | International Allocation Portfolio
17
F I N A N C I A L S T A T E M E N T S
Financial highlights
CLASS B SHARES
| | |
| Period ended | 2-28-071 | 2-29-08 |
| |
| Per share operating performance | | |
|
| Net asset value, beginning of period | $10.00 | $9.95 |
| Net investment income (loss)2,3 | (0.02) | 0.07 |
| Net realized and unrealized gain | | |
| (loss) on investments | (0.03) | (0.06) |
| | | |
| Total from investment operations | (0.05) | 0.01 |
| | | |
| Less distributions | | |
| From net investment income | — | (0.05) |
| From net realized gain | — | (0.45) |
| | — | (0.50) |
| Net asset value, end of period | $9.95 | $9.46 |
| | | |
| Total return4,5 (%) | (0.50)6 | (0.13) |
|
| Ratios and supplemental data | | |
|
| Net assets, end of period (in millions) | — 7 | $2 |
| Ratios (as a percentage of average net assets): | | |
| Expenses before reductions | 28.588 | 4.029 |
| Expenses net of fee waivers, if any | 1.268 | 1.349 |
| Expenses net of all fee waivers and credits | 1.268 | 1.339 |
| Net investment income (loss)3 | (1.26)8 | 0.70 |
| Portfolio turnover (%) | 36 | 23 |
1 Class B shares began operations on 12-29-06.
2 Based on the average of the shares outstanding.
3 Recognition of net investment income by the Portfolio is affected by the timing of the declaration of dividends by the underlying funds in which the Portfolio invests.
4 Total returns would have been lower had certain expenses not been reduced during the periods shown.
5 Assumes dividend reinvestment.
6 Not annualized.
7 Less than $500,000.
8 Annualized.
9 Ratios do not include expenses incurred from underlying funds whose annualized weighted average was 1.02%, based on the mix of underlying funds held by the Portfolio.
See notes to financial statements
International Allocation Portfolio | Annual report
18
F I N A N C I A L S T A T E M E N T S
Financial highlights
| | |
| CLASS C SHARES | | |
| |
| Period ended | 2-28-071 | 2-29-08 |
| |
| Per share operating performance | | |
|
| Net asset value, beginning of period | $10.00 | $9.95 |
| Net investment income (loss)2,3 | (0.02) | 0.08 |
| Net realized and unrealized gain | | |
| (loss) on investments | (0.03) | (0.07) |
| | | |
| Total from investment operations | (0.05) | 0.01 |
| | | |
| Less distributions | | |
| From net investment income | — | (0.05) |
| From net realized gain | — | (0.45) |
| | — | (0.50) |
| Net asset value, end of period | $9.95 | $9.46 |
| | | |
| Total return4,5 (%) | (0.50)6 | (0.13) |
| |
| Ratios and supplemental data | | |
|
| Net assets, end of period (in millions) | $1 | $8 |
| Ratios (as a percentage of average net assets): | | |
| Expenses before reductions | 18.627 | 2.318 |
| Expenses net of fee waivers, if any | 1.277 | 1.338 |
| Expenses net of all fee waivers and credits | 1.277 | 1.338 |
| Net investment income (loss)3 | (1.27)7 | 0.79 |
| Portfolio turnover (%) | 36 | 23 |
1 Class C shares began operations on 12-29-06.
2 Based on the average of the shares outstanding.
3 Recognition of net investment income by the Portfolio is affected by the timing of the declaration of dividends by the underlying funds in which the Portfolio invests.
4 Total returns would have been lower had certain expenses not been reduced during the periods shown.
5 Assumes dividend reinvestment.
6 Not annualized.
7 Annualized.
8 Ratios do not include expenses incurred from underlying funds whose annualized weighted average was 1.02%, based on the mix of underlying funds held by the Portfolio.
See notes to financial statements
Annual report | International Allocation Portfolio
19
F I N A N C I A L S T A T E M E N T S
Financial highlights
| | |
| CLASS I SHARES | | |
| |
| Period ended | 2-28-071 | 2-29-08 |
| |
| Per share operating performance | | |
|
| Net asset value, beginning of period | $10.00 | $9.97 |
| Net investment income (loss)2,3 | — 4 | 0.16 |
| Net realized and unrealized gain | | |
| (loss) on investments | (0.03) | (0.03) |
| | | |
| Total from investment operations | (0.03) | 0.13 |
| | | |
| Less distributions | | |
| From net investment income | — | (0.16) |
| From net realized gain | — | (0.45) |
| | — | (0.61) |
| Net asset value, end of period | $9.97 | $9.49 |
| | | |
| Total return5,6 (%) | (0.30)7 | 1.02 |
| |
| Ratios and supplemental data | | |
|
| Net assets, end of period (in millions) | — 8 | $1 |
| Ratios (as a percentage of average net assets): | | |
| Expenses before reductions | 25.019 | 7.1710 |
| Expenses net of fee waivers, if any | 0.179 | 0.1810 |
| Expenses net of all fee waivers and credits | 0.179 | 0.1810 |
| Net investment income (loss)3 | (0.17)9 | 1.55 |
| Portfolio turnover (%) | 37 | 23 |
1 Class I shares began operations on 12-29-06.
2 Based on the average of the shares outstanding.
3 Recognition of net investment income by the Portfolio is affected by the timing of the declaration of dividends by the underlying funds in which the Portfolio invests.
4 Less than ($0.01) per share.
5 Total returns would have been lower had certain expenses not been reduced during the periods shown.
6 Assumes dividend reinvestment.
7 Not annualized.
8 Less than $500,000.
9 Annualized.
10 Ratios do not include expenses incurred from underlying funds whose annualized weighted average was 1.02%, based on the mix of underlying funds held by the Portfolio.
See notes to financial statements
International Allocation Portfolio | Annual report
20
Notes to financial statements
1. Organization of the Trust
John Hancock International Allocation Portfolio (the Portfolio) is a diversified series of John Hancock Funds III (the Trust). The Trust was established as a Massachusetts business trust on June 9, 2005. The Trust is registered under the Investment Company Act of 1940, as amended (the 1940 Act), as an open-end investment management company. The investment objective of the Portfolio is to seek long term growth of capital.
The Portfolio operates as a “fund of funds”, investing in Class NAV shares of affiliated underlying funds of the Trust and John Hancock Funds II (JHF II) and also in other affiliated funds of the John Hancock funds complex. The Portfolio may also invest in unaffiliated underlying funds and other permitted investments.
The accounting policies of the affiliated underlying funds are outlined in the shareholder reports for such funds, available without charge by calling 1-800-225-5291 or on the Securities and Exchange Commission (SEC) Web site at www.sec.gov, File #811-21779, CIK 0001331971 for JHF II, File #811-21777, CIK 0001329954 for JHF III, File #811-01677, CIK 0000045291 for JH International Classic Value Fund and File #811-04630, CIK 0000791271 for JH Greater China Opportunities Fund. The affiliated underlying funds are not covered by this report.
John Hancock Investment Management Services, LLC (JHIMS or the Adviser), a Delaware limited liability company controlled by John Hancock Life Insurance Company (U.S.A.) (John Hancock USA) serves as investment adviser for the Trust and John Hancock Funds, LLC (the Distributor), an affiliate of the Adviser, serves as principal underwriter. John Hancock Life Insurance Company of New York (John Hancock New York) is a wholly owned subsidiary of John Hancock USA. John Hancock USA and John Hancock New York are indirect wholly owned subsidiaries of the Manufactures Life Insurance Company (Manulife), which in turn is a wholly owned subsidiary of Manulife Financial Corporation (MFC), a publicly traded company. MFC and its subsidiaries are known collectively as “Manulife Financial.”
The JHF II funds are retail mutual funds advised by JHIMS and distributed by the Distributor.
The Board of Trustees have authorized the issuance of multiple classes of shares of the Portfolio, including classes designated as Class A, Class B, Class C and Class I shares. Class A, Class B and Class C shares are open to all retail investors. Class I shares are offered without any sales charge to various institutional and certain individual investors. The shares of each class represent an interest in the same portfolio of investments of the Portfolio, and have equal rights as to voting, redemptions, dividends and liquidation, except that certain expenses, subject to the approval of the Board of Trustees, may be applied differently to each class of shares in accordance with current regulations of the SEC and the Internal Revenue Service. Shareholders of a class that bears distribution and service expenses under the terms of a distribution plan have exclusive voting rights to that distribution plan. Class B shares will convert to Class A shares eight years after purcha se.
The Adviser and other affiliates of John Hancock USA owned 1,555,846, 10,505, 10,504 and 10,612 shares of beneficial interest of Class A, Class B, Class C and Class I, respectively, on February 29, 2008.
2. Significant accounting policies
In the preparation of the financial statements, the Portfolio follows the policies described below. The preparation of financial statements in conformity with accounting principles generally accepted in the United States of America requires
Annual report | International Allocation Portfolio
21
management to make estimates and assumptions that affect the reported amounts of assets and liabilities at the date of the financial statements and the reported amounts of income and expenses during the reporting period. Actual results may differ from these estimates.
Securities valuation
The net asset value of the shares of the Portfolio is determined daily as of the close of the New York Stock Exchange (NYSE), normally at 4:00 P.M., Eastern Time. Investments by the Portfolio in underlying affiliated funds are valued at their respective net asset values each business day and securities in the underlying funds are valued in accordance with their respective valuation polices, as outlined in the underlying funds’ financial statements.
New accounting pronouncement
In September 2006, Financial Accounting Standards Board (FASB) Standard No. 157, Fair Value Measurements (FAS 157), was issued and is effective for fiscal years beginning after November 15, 2007. FAS 157 defines fair value, establishes a framework for measuring fair value and expands disclosure about fair value measurements. As of February 29, 2008, management does not believe the adoption of FAS 157 will impact the amounts reported in the financial statements; however, additional disclosures regarding pricing sources will be required about the inputs used to develop the measurements of fair value and the related realized and unrealized gain/loss for certain securities valued by significant unobservable market inputs.
Security transactions and related investment income
Investment security and underlying affiliated funds transactions are accounted for on a trade date plus one basis for daily net asset value calculations. However, for financial reporting purposes, investment transactions are reported on trade date. Interest income is accrued as earned. Dividend income is recorded by the underlying affiliated funds on the ex-dividend date. Distributions from the underlying affiliated funds are recorded on the ex-dividend date. Distributions to shareholders are recorded on the ex-dividend date. The Portfolio uses the specific identification method for determining realized gain or loss on investments for both financial statement and federal income tax reporting purposes.
Guarantees and indemnifications
Under the Trust’s organizational documents, its Officers and Trustees are indemnified against certain liabilities arising out of the performance of their duties to the Trust. Additionally, in the normal course of business, the Trust enters into contracts with service providers that contain general indemnification clauses. The Trust’s maximum exposure under these arrangements is unknown, as this would involve future claims that may be made against the Trust that have not yet occurred. However, based on experience, the Trust believes the risk of loss to be remote.
Allocations of income and expenses
All income, expenses (except class-specific expenses), and realized and unrealized gain/ loss are allocated to each class of shares based upon the relative net assets of each class. Dividends to shareholders from net investment income are determined at a class level and distributions from capital gains are determined at a Portfolio level.
Expenses not directly attributable to a particular Portfolio or share class are allocated based on the relative share of net assets of the Portfolio or share class at the time the expense was incurred. Class-specific expenses, as detailed in Note 3, transfer agency fees, blue sky fees, and printing and postage fees, are accrued daily and charged directly to the respective share classes. Expenses in the Portfolio’s Statement of Operations reflect the expenses of the Portfolio and do not include any indirect expenses related to the underlying affiliated funds. Because the affiliated underlying funds have varied expense levels and the Portfolio may own different proportions of the affiliated underlying funds at different times, the amount of fees and expenses incurred indirectly by the Portfolio will vary.
Federal income taxes
The Fund qualifies as a regulated investment company by complying with the applicable
International Allocation Portfolio | Annual report
22
provisions of the Internal Revenue Code and will not be subject to federal income tax on taxable income that is distributed to shareholders. Therefore, no federal income tax provision is required.
The Fund has adopted the provisions of FASB Interpretation No. 48, Accounting for Uncertainty in Income Taxes, an interpretation of FASB Statement 109 (FIN 48), at the beginning of the Fund’s fiscal year. FIN 48 prescribes a minimum threshold for financial statement recognition of the benefit of a tax position taken or expected to be taken in a tax return. The implementation of FIN 48 did not have a material impact on the Fund’s financial statements. Each of the Fund’s federal tax returns for the prior fiscal years remains subject to examination by the Internal Revenue Service.
Distribution of income and gains
The Fund records distributions to shareholders from net investment income and net realized gains, if any, on the ex-dividend date. During the year ended February 29, 2008, the tax character of distributions paid was as follows: ordinary income $2,153,570 and long-term capital gain $52,409. Distributions paid by the Fund with respect to each class of shares are calculated in the same manner, at the same time and are in the same amount, except for the effect of expenses that may be applied differently to each class.
As of February 29, 2008, the components of distributable earnings on a tax basis included $1,016,510 of undistributed long-term gain.
Such distributions and distributable earnings, on a tax basis, are determined in conformity with income tax regulations, which may differ from accounting principles generally accepted in the United States of America. Distributions in excess of tax basis earnings and profits, if any, are reported in the Fund’s financial statements as a return of capital.
Capital accounts within financial statements are adjusted for permanent book/tax differences. These adjustments have no impact on net assets or the results of operations. Temporary book/tax differences will reverse in a subsequent period. Permanent book/tax differences are primarily attributable to short-term distributions received from underlying funds.
3. Investment advisory and other agreements
Advisory fees
The Trust has entered into an Investment Advisory Agreement with the Adviser. The Adviser is responsible for managing the corporate and business affairs of the Trust and for selecting and compensating subad-visers to handle the investment of the assets of the Portfolio, subject to the supervision of the Board of Trustees. Under the Advisory Agreement the Portfolio pays the Adviser a management fee that has two components: (a) a fee on assets invested in the funds of the Trust or JHF II (Fund Assets) and (b) a fee on investments in other affiliated Funds of the John Hancock complex and assets invested in unaffiliated funds (Other Assets). The Portfolio pays a monthly management fee to the Adviser equivalent, on an annual basis, to the sum of: (a) 0.05% of the first $500,000,000 of the Portfolio’s Fund Assets, (b) 0.04% of the Portfolio’s Fund Assets in excess of $500,000,000, (c) 0.50% of the first $500,000,000 of the Portfolio’s Other Assets and (d) 0.49% of the Portfolio’s Other Assets in excess of $500,000,000. The Portfolio is not responsible for payment of the subadvisory fees.
MFC Global Investment Management (U.S.A.) Limited acts as subadviser to the Portfolio. Deutsche Investment Management Americas, Inc. serves as subadviser consultant.
The investment management fees incurred for the year ended February 29, 2008, were equivalent to an annual effective rate of 0.13% of the Fund’s average daily net assets.
Expense reimbursements
The Adviser has contractually agreed to reimburse or limit certain Fund level expenses to 0.13% of the Fund’s average annual net assets which are allocated pro rata to all share classes. This agreement excludes taxes, portfolio brokerage commissions, interest, Rule 12b-1 fees, transfer agency fees, blue sky fees, printing and postage and litigation and indemnification expenses and other extraordinary expenses not
Annual report | International Allocation Portfolio
23
incurred in the ordinary course of the Fund’s business. In addition, fees incurred under any agreement or plans of the Fund dealing with services for the shareholders and others with beneficial interest in shares of the Fund, are excluded.
In addition, the Adviser has agreed to reimburse or limit certain expenses for each share class. This agreement excludes taxes, portfolio brokerage commissions, interest and litigation and indemnification expenses and other extraordinary expenses not incurred in the ordinary course of the Fund’s business. In addition, fees incurred under any agreement or plans of the Fund dealing with services for the shareholders and others with beneficial interest in shares of the Fund, are excluded. The reimbursements and limits are such that these expenses will not exceed 0.63% for Class A shares, 1.33% for Class B, 1.33% for Class C and 0.18% for Class I. Accordingly, the expense reductions or reimbursements related to this agreement were $134,448, $33,156, $52,397 and $46,855 for Class A, Class B, Class C and Class I, respectively for the year ended February 29, 2008. The expense reimbursements and limits will continue in effect until June 30, 2008 and thereafter until termina ted by the Adviser on notice to the Trust.
Fund administration fees
Pursuant to the Advisory Agreement, the Portfolio reimburses the Adviser for all expenses associated with providing the administrative, financial, legal, accounting and recordkeeping services of the Portfolio, including the preparation of all tax returns, annual, semiannual and periodic reports to shareholders and the preparation of all regulatory reports. These expenses are allocated based on the relative share of net assets of the class at the time the expense was incurred.
The fund administration fees incurred for the year ended February 29, 2008, were $9,769 with an annual effective rate of 0.03% of the Portfolio’s average daily net assets.
Distribution and shareholder servicing fees
The Trust has a Distribution Agreement with the Distributor. The Portfolio has adopted Distribution Plans with respect to Class A, Class B and Class C, pursuant to Rule 12b-1 under the 1940 Act, to pay the Distributor for the services it provides as distributor of shares of the Portfolios. Accordingly, the Portfolio makes monthly payments to the Distributor at an annual rate not to exceed 0.30%, 1.00% and 1.00% of the average daily net assets of Class A, Class B and Class C, respectively. A maximum of 0.25% of such payments may be service fees, as defined by the Conduct Rules of the Financial Industry Regulatory Authority (formerly, National Association of Securities Dealers). Under the Conduct Rules, curtailment of a portion of the Portfolio’s 12b-1 payments could occur under certain circumstances.
Sales charges
Class A shares are assessed up-front sales charges of up to 5.00% of net asset value of such shares. During the year ended February 29, 2008, the Fund was informed that the Distributor received net up-front sales charges of $276,419 with regard to sales of Class A shares. Of this amount, $44,955 was retained and used for printing prospectuses, advertising, sales literature and other purposes; $230,352 was paid as sales commissions to unrelated broker-dealers; and $1,112 was paid as sales commissions to sales personnel of Signator Investors, Inc. (Signator Investors), a related broker-dealer, an indirect subsidiary of MFC.
Class B shares that are redeemed within six years of purchase are subject to a contingent deferred sales charge (CDSC) at declining rates, beginning at 5.00% of the lesser of the current market value at the time of redemption or the original purchase cost of the shares being redeemed. Class C shares that are redeemed within one year of purchase are subject to a CDSC at a rate of 1.00% of the lesser of the current market value at the time of redemption or the original purchase cost of the shares being redeemed. Proceeds from the CDSCs are paid to the Distributor and are used, in whole or in part, to defray its expenses for providing distribution-related services to the Fund in connection with the sale of Class B and Class C shares. During the year ended February 29, 2008, CDSCs received by
International Allocation Portfolio | Annual report
24
Distributor amounted to $2,387 for Class B shares and $3,938 for Class C shares.
Transfer agent fees
The Portfolio has a Transfer Agency Agreement with John Hancock Signature Services, Inc. (Signature Services), an indirect subsidiary of MFC. For Class A, Class B, Class C and Class I shares, the Portfolio pays a monthly transfer agent fee at an annual rate of 0.05% of each class’s average daily net assets, plus a fee based on the number of shareholder accounts and reimbursement for certain out-of-pocket expenses. Expenses not directly attributable to a particular class of shares are aggregated and allocated to each class on the basis of its relative net asset value. The Fund pays a monthly fee which is based on an annual rate of $15.00 for each Class A shareholder account, $17.50 for each Class B shareholder account and $16.50 for each Class C shareholder account.
Signature Services has agreed to limit the transfer agent fees so that such fees do not exceed 0.30% annually of Class A, Class B, Class C and Class I share average daily net assets. This agreement is effective until December 31, 2008. Signature Services reserves the right to terminate this limitation in the future. There were no transfer agent fee reductions for Class A, Class B, Class C and Class I shares, respectively, during the year ended February 29, 2008.
In May 2007, the Portfolio began receiving earnings credits from its transfer agent as a result of uninvested cash balances. These credits are used to reduce a portion of the Portfolio’s transfer agent fees and out-of-pocket expenses. During the year ended February 29, 2008, the Portfolio’s transfer agent fees and out-of-pocket expenses were reduced by $660 for transfer agent credits earned.
Class level expenses for the year ended February 29, 2008, were as follows:
| | | | |
| | Distribution and | Transfer | Blue | Printing and |
| Share class | service fees | agent fees | sky fees | postage fees |
|
| |
| Class A | $76,736 | $26,626 | $27,166 | $11,610 |
| Class B | 12,374 | 3,748 | 26,211 | 640 |
| Class C | 53,511 | 11,091 | 27,635 | 2,467 |
| Class I | — | 358 | 43,199 | 650 |
| Total | $142,621 | $41,823 | $124,211 | $15,367 |
4. Trustees’ fees
The Trust compensates each Trustee who is not an employee of the Adviser or its affiliates. Total Trustees’ expenses are allocated to the Portfolio based on its average daily net asset value.
5. Line of credit
The Portfolio has entered into an agreement which enables them to participate in a $100 million unsecured committed line of credit with State Street Corporation. Borrowings will be made solely to temporarily finance the repurchase of capital shares. Interest is charged to the Portfolio based on its borrowings at a rate per annum equal to the Federal Funds rate plus 0.50% . In addition, a commitment fee of 0.05% per annum, payable at the end of each calendar quarter, based on the average daily-unused portion of the line of credit, is charged to the Portfolio on a prorated basis based on average net assets. Effective October 15, 2007, the commitment fee was changed from 0.07% to 0.05% . For the year ended February 29, 2008, there were no borrowings under the line of credit.
Annual report | International Allocation Portfolio
25
6. Fund share transactions
Share activities for the Portfolio for the period ended February 28, 2007, and the year ended February 29, 2008, were as follows:
| | | | |
| | Period ended 2-28-071 | Year ended 2-29-08 |
| | Shares | Amount | Shares | Amount |
| Class A shares | | | | |
|
| Sold | 326,619 | $3,320,543 | 3,069,699 | $32,165,731 |
| Distributions reinvested | — | — | 161,717 | 1,625,253 |
| Repurchased | — | — | (371,009) | (3,794,178) |
| Net increase (decrease) | 326,619 | $3,320,543 | 2,860,407 | $29,996,806 |
| | | | | |
| Class B shares | | | | |
|
| Sold | 19,756 | $198,648 | 181,757 | $1,935,091 |
| Distributions reinvested | — | — | 6,812 | 68,388 |
| Repurchased | (27) | (277) | (26,915) | (281,028) |
| Net increase (decrease) | 19,729 | $198,371 | 161,654 | $1,722,451 |
| | | | | |
| Class C shares | | | | |
|
| Sold | 91,833 | $927,133 | 814,878 | $8,637,166 |
| Distributions reinvested | — | — | 34,010 | 341,797 |
| Repurchased | — | — | (69,886) | (711,703) |
| Net increase (decrease) | 91,833 | $927,133 | 779,002 | $8,267,260 |
| | | | | |
| Class I shares | | | | |
|
| Sold | 20,460 | $205,000 | 94,013 | $985,183 |
| Distributions reinvested | — | — | 4,530 | 45,522 |
| Repurchased | — | — | (29,904) | (292,658) |
| Net increase (decrease) | 20,460 | $205,000 | 68,639 | $738,047 |
| | | | | |
| Net increase (decrease) | 458,641 | $4,651,047 | 3,869,702 | $40,724,564 |
|
| 1Period from 12-29-06 (commencement of operations) to 2-28-07. | | |
7. Purchases and sales of securities
Purchases and proceeds from sales or maturities of securities, other than short-term securities and obligations of the U.S. government, during the year ended February 29, 2008, aggregated $49,948,885 and $7,660,691, respectively.
8. Investment in affiliated underlying funds
The Portfolio invests primarily in affiliated underlying funds that are managed by affiliates of the Adviser. The Portfolio does not invest in affiliated underlying funds for the purpose of exercising management or control; however, the Portfolio’s investments may represent a significant portion of each underlying fund’s net assets. A summary of the Portfolio’s investments in affiliated funds during the year ended February 29, 2008, is set forth below:
International Allocation Portfolio | Annual report
26
| | | | | | | | |
| | | | | | Capital gain | | | |
| | Beginning | | | Ending | distribution | | | |
| Affiliate — | share | Shares | Shares | share | from under- | Dividend | Sale | Ending |
| Class NAV | amount | purchased | sold | amount | lying Funds | income | proceeds | value |
|
| JHF Greater China | | | | | | | | |
| Opportunities Fund | 6,802 | 51,734 | 22,030 | 36,506 | $46,673 | $6,827 | $668,054 | $799,111 |
| JHF International | | | | | | | | |
| Classic Value Fund | 55,898 | 686,357 | 35,836 | 706,419 | 158,150 | 120,035 | 354,009 | 6,216,492 |
| JHF II Emerging | | | | | | | | |
| Markets Value Fund | — | 221,506 | 11,925 | 209,581 | 11,871 | 11,140 | 136,440 | 2,332,641 |
| JHF II International | | | | | | | | |
| Opportunities Fund | 50,726 | 528,775 | 51,032 | 528,469 | 1,080,868 | 115,452 | 978,898 | 9,105,512 |
| JHF II International | | | | | | | | |
| Small Company Fund | 93,498 | 967,174 | 389,192 | 671,480 | 588,363 | 102,924 | 4,225,435 | 6,459,635 |
| JHF II International | | | | | | | | |
| Value Fund | 41,799 | 502,619 | 35,044 | 509,374 | 438,664 | 163,468 | 648,807 | 8,689,921 |
| JHF III International | | | | | | | | |
| Growth Fund | 27,268 | 326,585 | 26,747 | 327,106 | 490,137 | 88,808 | 649,049 | 7,471,097 |
Annual report | International Allocation Portfolio
27
Auditors’ report
Report of Independent Registered Public Accounting Firm
To the Board of Trustees of John Hancock Funds III and Shareholders of John Hancock International Allocation Portfolio,
In our opinion, the accompanying statement of assets and liabilities, including the schedule of investments, and the related statements of operations and of changes in net assets and the financial highlights present fairly, in all material respects, the financial position of John Hancock International Allocation Portfolio (the Portfolio) at February 29, 2008, and the results of its operations, the changes in its net assets and the financial highlights for each of the periods indicated, in conformity with accounting principles generally accepted in the United States of America. These financial statements and financial highlights (hereafter referred to as “financial statements”) are the responsibility of the Portfolio’s management. Our responsibility is to express an opinion on these financial statements based on our audits. We conducted our audits of these financial statements in accordance with the standards of the Public Company Accounting Oversight Board (United States). Those standards require that we plan and perform the audits to obtain reasonable assurance about whether the financial statements are free of material misstatement. An audit includes examining, on a test basis, evidence supporting the amounts and disclosures in the financial statements, assessing the accounting principles used and significant estimates made by management, and evaluating the overall financial statement presentation. We believe that our audits, which included confirmation of investments at February 29, 2008 by correspondence with the transfer agent, provide a reasonable basis for our opinion.
PricewaterhouseCoopers LLP
Boston, Massachusetts
April 18, 2008
International Allocation Portfolio | Annual report
28
Tax information
Unaudited
For federal income tax purposes, the following information is furnished with respect to the distributions of the Fund, if any, paid during its taxable year ended February 29, 2008.
The Fund has designated distributions to shareholders of $52,409 as a long-term capital gain dividend. With respect to the ordinary dividends paid by the Fund for the fiscal year ended February 29, 2008, 5.67% of the dividends qualifies for the corporate dividends-received deduction.
The Fund hereby designates the maximum amount allowable of its net taxable income as qualified dividend income as provided in the Jobs and Growth Tax Relief Reconciliation Act of 2003. This amount will be reflected on Form 1099-DIV for the calendar year 2008.
Shareholders will be mailed a 2008 U.S. Treasury Department Form 1099-DIV in January 2009. This will reflect the total of all distributions that are taxable for calendar year 2008.
Annual report | International Allocation Portfolio
29
Trustees and Officers
This chart provides information about the Trustees and Officers who oversee your John Hancock fund. Officers elected by the Trustees manage the day-to-day operations of the Fund and execute policies formulated by the Trustees.
| | |
| Independent Trustees | | |
| |
| Name, Year of Birth | | Number of |
| Position(s) held with Fund | Trustee | John Hancock |
| Principal occupation(s) and other | of Fund | funds overseen |
| directorships during past 5 years | since1 | by Trustee |
| |
| James F. Carlin, Born: 1940 | 2006 | 55 |
|
| Chairman (since December 2007); Director and Treasurer, Alpha Analytical Laboratories, Inc. (chemical |
| analysis) (since 1985); Part Owner and Treasurer, Lawrence Carlin Insurance Agency, Inc. (since 1995); |
| Part Owner and Vice President, Mone Lawrence Carlin Insurance Agency, Inc. (until 2005); Chairman |
| and Chief Executive Officer, Carlin Consolidated, Inc. (management/investments) (since 1987); Trustee, |
| Massachusetts Health and Education Tax Exempt Trust (1993–2003). | | |
| |
| William H. Cunningham, Born: 1944 | 2006 | 55 |
|
| Professor, University of Texas at Austin (since 1971); former Chancellor, University of Texas System and |
| former President, University of Texas at Austin (until 2001); Chairman and Chief Executive Officer, IBT |
| Technologies (until 2001); Director of the following: Hicks Acquisition Company I, Inc. (since 2007); |
| Hire.com (until 2004), STC Broadcasting, Inc. and Sunrise Television Corp. (until 2001), Symtx, Inc. |
| (electronic manufacturing) (since 2001), Adorno/Rogers Technology, Inc. (until 2004), Pinnacle |
| Foods Corporation (until 2003), rateGenius (until 2003), Lincoln National Corporation (insurance) |
| (since 2006), Jefferson-Pilot Corporation (diversified life insurance company) (until 2006), New |
| Century Equity Holdings (formerly Billing Concepts) (until 2001), eCertain (until 2001), ClassMap.com |
| (until 2001), Agile Ventures (until 2001), AskRed.com (until 2001), Southwest Airlines (since 2000), |
| Introgen (manufacturer of biopharmaceuticals) (since 2000) and Viasystems Group, Inc. (electronic |
| manufacturer) (until 2003); Advisory Director, Interactive Bridge, Inc. (college fundraising) (until 2001); |
| Advisory Director, Q Investments (until 2003); Advisory Director, JPMorgan Chase Bank (formerly Texas |
| Commerce Bank–Austin), LIN Television (until 2008), WilTel Communications (until 2003) and Hayes |
| Lemmerz International, Inc. (diversified automotive parts supply company) (since 2003). | |
| |
| Charles L. Ladner,2 Born: 1938 | 2006 | 55 |
|
| Chairman and Trustee, Dunwoody Village, Inc. (retirement services) (until 2003); Senior Vice President |
| and Chief Financial Officer, UGI Corporation (public utility holding company) (retired 1998); Vice |
| President and Director, AmeriGas, Inc. (retired 1998); Director, AmeriGas Partners, L.P. (gas distribution) |
| (until 1997); Director, EnergyNorth, Inc. (until 1997); Director, Parks and History Association (until 2005). |
| |
| John A. Moore,2 Born: 1939 | 2006 | 55 |
|
| President and Chief Executive Officer, Institute for Evaluating Health Risks (nonprofit institution) |
| (until 2001); Senior Scientist, Sciences International (health research) (until 2003); Former Assistant |
| Administrator and Deputy Administrator, Environmental Protection Agency; Principal, Hollyhouse |
| (consulting) (since 2000); Director, CIIT Center for Health Science Research (nonprofit research) |
| (until 2007). | | |
International Allocation Portfolio | Annual report
30
| | |
| Independent Trustees (continued) | | |
| |
| Name, Year of Birth | | Number of |
| Position(s) held with Fund | Trustee | John Hancock |
| Principal occupation(s) and other | of Fund | funds overseen |
| directorships during past 5 years | since1 | by Trustee |
| |
| Patti McGill Peterson,2 Born: 1943 | 2006 | 55 |
|
| Senior Associate, Institute for Higher Education Policy (since 2007); Executive Director, Council for |
| International Exchange of Scholars and Vice President, Institute of International Education (until 2007); |
| Senior Fellow, Cornell Institute of Public Affairs, Cornell University, Ithaca, NY (until 1998); Former |
| President, Wells College, Aurora, NY, and St. Lawrence University, Canton, NY; Director, Niagara |
| Mohawk Power Corporation (until 2003); Director, Ford Foundation, International Fellowships Program |
| (since 2002); Director, Lois Roth Endowment (since 2002); Director, Council for International Educational |
| Exchange (since 2003). | | |
| |
| Steven R. Pruchansky, Born: 1944 | 2006 | 55 |
|
| Chairman and Chief Executive Officer, Greenscapes of Southwest Florida, Inc. (since 2000); Director and |
| President, Greenscapes of Southwest Florida, Inc. (until 2000); Managing Director, JonJames, LLC (real |
| estate) (since 2000); Director, First Signature Bank & Trust Company (until 1991); Director, Mast Realty |
| Trust (until 1994); President, Maxwell Building Corp. (until 1991). | | |
| |
| Non-Independent Trustees3 | | |
| |
| Name, Year of Birth | | Number of |
| Position(s) held with Fund | Trustee | John Hancock |
| Principal occupation(s) and other | of Fund | funds overseen |
| directorships during past 5 years | since1 | by Trustee |
| |
| James R. Boyle, Born: 1959 | 2006 | 265 |
|
| Executive Vice President, Manulife Financial Corporation (since 1999); President, John Hancock Variable |
| Life Insurance Company (since March 2007); Executive Vice President, John Hancock Life Insurance |
| Company (since 2004); Chairman and Director, John Hancock Advisers, LLC (the Adviser), John Hancock |
| Funds, LLC and The Berkeley Financial Group, LLC (The Berkeley Group) (holding company) (since 2005); |
| Senior Vice President, The Manufacturers Life Insurance Company (U.S.A.) (until 2004). | |
Annual report | International Allocation Portfolio
31
| |
| Principal officers who are not Trustees | |
| |
| Name, Year of Birth | |
| Position(s) held with Fund | Officer |
| Principal occupation(s) and other | of Fund |
| directorships during past 5 years | since |
| |
| Keith F. Hartstein, Born: 1956 | 2006 |
|
| President and Chief Executive Officer | |
| Senior Vice President, Manulife Financial Corporation (since 2004); Director, President and Chief | |
| Executive Officer, the Adviser, The Berkeley Group and John Hancock Funds, LLC (since 2005); Director, |
| MFC Global Investment Management (U.S.), LLC (MFC Global (U.S.)) (since 2005); Director, John | |
| Hancock Signature Services, Inc. (since 2005); President and Chief Executive Officer, John Hancock |
| Investment Management Services, LLC (since 2006); President and Chief Executive Officer, John Hancock |
| Funds, John Hancock Funds II, John Hancock Funds III and John Hancock Trust (since 2005); Director, |
| Chairman and President, NM Capital Management, Inc. (since 2005); Member, Investment Company |
| Institute Sales Force Marketing Committee (since 2003); President and Chief Executive Officer, MFC |
| Global (U.S.) (2005–2006); Executive Vice President, John Hancock Funds, LLC (until 2005). | |
|
| |
| Thomas M. Kinzler, Born: 1955 | 2006 |
|
| Secretary and Chief Legal Officer | |
| Vice President and Counsel, John Hancock Life Insurance Company (U.S.A.) (since 2006); Secretary and |
| Chief Legal Officer, John Hancock Funds and John Hancock Funds II (since 2006); Chief Legal Officer |
| and Assistant Secretary, John Hancock Trust (since 2006); Vice President and Associate General Counsel, |
| Massachusetts Mutual Life Insurance Company (1999–2006); Secretary and Chief Legal Counsel, MML |
| Series Investment Fund (2000–2006); Secretary and Chief Legal Counsel, MassMutual Institutional Funds |
| (2000–2004); Secretary and Chief Legal Counsel, MassMutual Select Funds and MassMutual Premier |
| Funds (2004–2006). | |
| |
| |
| Francis V. Knox, Jr., Born: 1947 | 2006 |
|
| Chief Compliance Officer | |
| Vice President and Chief Compliance Officer, John Hancock Investment Management Services, LLC, |
| the Adviser and MFC Global (U.S.) (since 2005); Vice President and Chief Compliance Officer, John |
| Hancock Funds, John Hancock Funds II, John Hancock Funds III and John Hancock Trust (since 2005); |
| Vice President and Assistant Treasurer, Fidelity Group of Funds (until 2004); Vice President and Ethics & |
| Compliance Officer, Fidelity Investments (until 2001). | |
| |
| |
| Charles A. Rizzo, Born: 1957 | 2007 |
|
| Chief Financial Officer | |
| Chief Financial Officer, John Hancock Funds, John Hancock Funds II, John Hancock Funds III and John |
| Hancock Trust (since June 2007); Assistant Treasurer, Goldman Sachs Mutual Fund Complex (regis- |
| tered investment companies) (2005–June 2007); Vice President, Goldman Sachs (2005–June 2007); |
| Managing Director and Treasurer of Scudder Funds, Deutsche Asset Management (2003–2005); | |
| Director, Tax and Financial Reporting, Deutsche Asset Management (2002–2003); Vice President and |
| Treasurer, Deutsche Global Fund Services (Deutsche Registered Investment Companies) (1999–2002). |
| |
| |
| Gordon M. Shone, Born: 1956 | 2006 |
|
| Treasurer | |
| Senior Vice President, John Hancock Life Insurance Company (U.S.A.) (since 2001); Treasurer, John |
| Hancock Funds (since 2006), John Hancock Funds II, John Hancock Funds III and John Hancock Trust |
| (since 2005); Vice President and Chief Financial Officer, John Hancock Trust (2003–2005); Vice President, |
| John Hancock Investment Management Services, Inc., John Hancock Advisers, LLC (since 2006) and The |
| Manufacturers Life Insurance Company (U.S.A.) (1998–2000). | |
International Allocation Portfolio | Annual report
32
| |
| Principal officers who are not Trustees (continued) | |
| |
| Name, Year of Birth | |
| Position(s) held with Fund | Officer |
| Principal occupation(s) and other | of Fund |
| directorships during past 5 years | since |
| |
| John G. Vrysen, Born: 1955 | 2006 |
|
| Chief Operating Officer | |
| Senior Vice President, Manulife Financial Corporation (since 2006); Director, Executive Vice President |
| and Chief Operating Officer, the Adviser, The Berkeley Group and John Hancock Funds, LLC (since | |
| June 2007); Executive Vice President and Chief Operating Officer, John Hancock Investment | |
| Management Services, LLC (since December 2007); Chief Operating Officer, John Hancock Funds, |
| John Hancock Funds II, John Hancock Funds III and John Hancock Trust (since June 2007); Director, |
| Executive Vice President and Chief Financial Officer, the Adviser, The Berkeley Group and John Hancock |
| Funds, LLC (2005–2007); Executive Vice President and Chief Financial Officer, John Hancock Investment |
| Management Services, LLC (2005–2007); Executive Vice President and Chief Financial Officer, MFC |
| Global (U.S.) (2005 until August 2007); Director, John Hancock Signature Services, Inc. (since 2005); |
| Chief Financial Officer, John Hancock Funds, John Hancock Funds II, John Hancock Funds III and John |
| Hancock Trust (2005 until June 2007); Vice President and General Manager, John Hancock Fixed | |
| Annuities, U.S. Wealth Management (2004–2005); Vice President, Operations, Manulife Wood Logan |
| (2000–2004). | |
The business address for all Trustees and Officers is 601 Congress Street, Boston, Massachusetts 02210-2805.
The Statement of Additional Information of the Fund includes additional information about members of the Board of Trustees of the Fund and is available without charge, upon request, by calling 1-800-225-5291.
1 Each Trustee serves until resignation, retirement age or until his or her successor is elected.
2 Member of Audit and Compliance Committee.
3 Non-Independent Trustee holds positions with the Fund’s investment adviser, underwriter and certain other affiliates.
Annual report | International Allocation Portfolio
33
For more information
The Fund’s proxy voting policies, procedures and records are available without charge, upon request:
| | |
| By phone | On the Fund’s Web site | On the SEC’s Web site |
| 1-800-225-5291 | www.jhfunds.com/proxy | www.sec.gov |
|
| |
| Investment adviser | Custodian | Legal counsel |
| John Hancock Advisers, LLC | State Street Bank & Trust Co. | Kirkpatrick & Lockhart |
| 601 Congress Street | 2 Avenue de Lafayette | Preston Gates Ellis LLP |
| Boston, MA 02210-2805 | Boston, MA 02111 | One Lincoln Street |
| | | Boston, MA 02111-2950 |
| Subadviser | Transfer agent | |
| MFC Global Investment | John Hancock Signature | Independent registered |
| Management (U.S.A.) Limited | Services, Inc. | public accounting firm |
| 200 Bloor Street East | P.O. Box 9510 | PricewaterhouseCoopers LLP |
| Toronto, Ontario, Canada | Portsmouth, NH 03802-9510 | 125 High Street |
| M4W 1E5 | | Boston, MA 02110 |
| | | |
| Principal distributor | | |
| John Hancock Funds, LLC | | |
| 601 Congress Street | | |
| Boston, MA 02210-2805 | | |
| | |
| How to contact us | |
|
| |
| Internet | www.jhfunds.com | |
|
| |
| Mail | Regular mail: | Express mail: |
| | John Hancock Signature | John Hancock Signature |
| | Services, Inc. | Services, Inc. |
| | P.O. Box 9510 | Mutual Fund Image Operations |
| | Portsmouth, NH 03802-9510 | 164 Corporate Drive |
| | | Portsmouth, NH 03801 |
|
| |
| Phone | Customer service representatives | 1-800-225-5291 |
| | EASI-Line | 1-800-338-8080 |
| | TDD line | 1-800-554-6713 |
A listing of month-end portfolio holdings is available on our Web site, www.jhfunds.com. A more detailed portfolio holdings summary is available on a quarterly basis 60 days after the fiscal quarter on our Web site or upon request by calling 1-800-225-5291, or on the SEC’s Web site, www.sec.gov.
International Allocation Portfolio | Annual report
34

1-800-225-5291
1-800-554-6713 TDD
1-800-338-8080 EASI-Line
www.jhfunds.com
Now available: electronic delivery
www.jhfunds.com/edelivery
| | |
| This report is for the information of the shareholders of John Hancock International Allocation Portfolio. | 3180A | 2/08 |
| It is not authorized for distribution to prospective investors unless preceded or accompanied by a prospectus. | | 4/08 |

Discussion of Fund performance
By Epoch Investment Partners, Inc.
Global stock markets experienced sharp volatility during the 12 months ended February 29, 2008, when many U.S. and foreign stock indexes reached all-time highs before being brought down by the bursting U.S. housing bubble and related credit crunch. But despite widespread speculation that the world’s largest economy was headed for recession, economies in Europe and Asia appeared to be relatively healthy. Better growth and a slumping dollar made for better performance on overseas investments.
“Global stock markets experienced
sharp volatility during the 12
months ended February 29, 2008…”
For the 12 months ended February 29, 2008, John Hancock Global Shareholder Yield Fund’s Class A, Class B, Class C, Class I and Class R1 shares posted total returns of –1.84%, –2.54%, –2.54%, –1.43% and –2.01%, respectively, at net asset value. That compares with the –0.21% return of the S&P/Citigroup Broad Market Index–World Equity Index and the 0.94% average return of the world stock funds tracked by Morningstar, Inc.
Many of the leading contributors to performance came from the utility and telecommunication services sectors, including Terna SpA and Fortum Corp., as well as France Telecom SA, Belgacom SA and Far EasTone Telecommunications, Company, Ltd. Another group of key contributors came from the consumer staples sector, as the portfolio benefited from holdings in multinational European and U.S. companies with exposure to rapidly growing emerging-market economies. The portfolio also benefited from an underweight position and stock selection among financials shares, which were weighed down by worry about exposure to subprime loans.
The leading detractors from Fund performance were in the economically sensitive consumer discretionary sector, which suffered from a significant change in macroeconimc views and downward revisions to earnings estimates. In that environment, Idearc, Inc., a telephone directory business, and GateHouse Media, Inc. a local newspaper publishing concern, led detractors. As a result, we cut our exposure to U.S.-based discretionary stocks, preferring to maintain our discretionary holdings in companies based in growing overseas economies.
This commentary reflects the views of the portfolio managers through the end of the Fund’s period discussed in this report. The managers’ statements reflect their own opinions. As such, they are in no way guarantees of future events and are not intended to be used as investment advice or a recommendation regarding any specific security. They are also subject to change at any time as market and other conditions warrant.
Global Shareholder Yield Fund | Annual report
6
A look at performance
For the periods ended February 29, 2008
| | | | | | | | | | | |
| | | | Average annual returns | | | | Cumulative total returns | | |
| | | | with maximum sales charge (POP) | | | with maximum sales charge (POP) | | |
| | |
| |
|
| | Inception | | | | | Since | | | | | Since |
| Class | date | | 1-year | 5-year | 10-year | inception | | 1-year | 5-year | 10-year | inception |
|
| A | 3-1-07 | | –6.78% | — | — | –6.78% | | –6.78% | — | — | –6.78% |
|
| B | 3-1-07 | | –7.30 | — | — | –7.30 | | –7.30 | — | — | –7.30 |
|
| C | 3-1-07 | | –3.49 | — | — | –3.49 | | –3.49 | — | — | –3.49 |
|
| I 1 | 3-1-07 | | –1.43 | — | — | –1.43 | | –1.43 | — | — | –1.43 |
|
| R1 1 | 3-1-07 | | –2.01 | — | — | –2.01 | | –2.01 | — | — | –2.01 |
|
Performance figures assume all distributions are reinvested. Public offering price (POP) figures reflect maximum sales charge on Class A shares of 5%, and the applicable contingent deferred sales charge (CDSC) on Class B and Class C shares. The Class B shares' CDSC declines annually between years 1 to 6 according to the following schedule: 5, 4, 3, 3, 2, 1%. No sales charge will be assessed after the sixth year. Class C shares held for less than one year are subject to a 1% CDSC. Sales charge is not applicable for Class I and Class R1 shares.
The expense ratios of the Fund, both net (including any fee waivers or expense limitations) and gross (excluding any fee waivers or expense limitations), are set forth according to the most recent publicly available prospectuses for the Fund and may differ from the expense ratios disclosed in the Financial Highlights tables in this report. The waivers and expense limitations are contractual at least until 02-29-08. The net expenses are as follows: Class A — 1.55%, Class B — 2.25%, Class C — 2.25%, Class I — 1.10%, Class R1 — 1.85% . Had the fee waivers and expense limitations not been in place, the gross expenses would be as follows: Class A — 1.65%, Class B — 2.58%, Class C — 2.41%, Class I — 1.26%, Class R1 — 2.53% .
The returns reflect past results and should not be considered indicative of future performance. The return and principal value of an investment will fluctuate so that shares, when redeemed, may be worth more or less than their original cost. Due to market volatility, the Fund's current performance may be higher or lower than the performance shown. For performance data current to the most recent month end, please call 1-800-225-5291 or visit the Fund's Web site at www.jhfunds.com.
The performance table above and the chart on the next page do not reflect the deduction of taxes that a shareholder would pay on fund distributions or the redemption of fund shares.
The Fund's performance results reflect any applicable expense reductions, without which the expenses increase and results would have been less favorable.
Performance is calculated with an opening price (prior day's close) on the inception date.
1 For certain types of investors as described in the Fund's Class I and Class R1 share prospectuses.
Annual report | Global Shareholder Yield Fund
7
A look at performance
Growth of $10,000
This chart shows what happened to a hypothetical $10,000 investment in Global Shareholder Yield Fund Class A shares for the period indicated. For comparison, we've shown the same investment in the S&P 500/Citigroup BMI World Index.
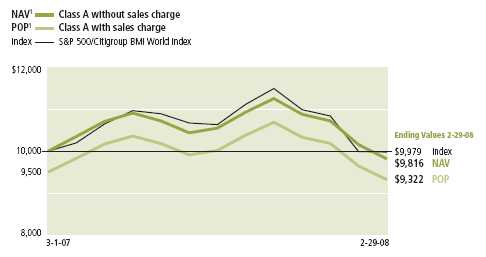
| | | | |
| | | | With maximum | |
| Class | Period beginning | Without sales charge | sales charge | Index |
|
| B | 3-1-07 | $9,746 | $9,270 | $9,979 |
|
| C | 3-1-07 | 9,746 | 9,651 | 9,979 |
|
| I 2 | 3-1-07 | 9,857 | 9,857 | 9,979 |
|
| R1 2 | 3-1-07 | 9,799 | 9,799 | 9,979 |
|
Assuming all distributions were reinvested for the period indicated, the table above shows the value of a $10,000 investment in the fund's Class B, Class C , Class I and Class R1 shares, respectively, as of February 29, 2008. Performance of the classes will vary based on the difference in sales charges paid by shareholders investing in the different classes and the fee structure of those classes.
S&P 500/Citigroup BMI World is an unmanaged subset of the BMI Global Index that reflects the stock markets of over 30 countries and over 9,000 securities with values expressed in U.S. dollars. The BMI World Index represents the developed market portion of the broader index.
It is not possible to invest directly in an index. Index figures do not reflect sales charges, which would have resulted in lower values if they did.
1 NAV represents net asset value and POP represents public offering price.
2 For certain types of investors as described in the Fund's Class I and Class R1 share prospectuses.
Global Shareholder Yield Fund | Annual report
8
Your expenses
These examples are intended to help you understand your ongoing operating expenses.
Understanding fund expenses
As a shareholder of the Fund, you incur two types of costs:
■ Transaction costs which include sales charges (loads) on purchases or redemptions (varies by share class), minimum account fee charge, etc.
■ Ongoing operating expenses including management fees, distribution and service fees (if applicable), and other fund expenses.
We are going to present only your ongoing operating expenses here.
Actual expenses/actual returns
This example is intended to provide information about your fund’s actual ongoing operating expenses, and is based on your fund’s actual return. It assumes an account value of $1,000.00 on September 1, 2007, with the same investment held until February 29, 2008.
| | | |
| | Account value | Ending value | Expenses paid during |
| | on 9-1-07 | on 2-29-08 | period on 2-29-081 |
|
| Class A | $1,000.00 | $930.38 | $7.30 |
|
| Class B | 1,000.00 | 926.82 | 10.78 |
|
| Class C | 1,000.00 | 926.82 | 10.78 |
|
| Class I | 1,000.00 | 931.46 | 5.28 |
|
| Class R1 | 1,000.00 | 929.67 | 7.92 |
|
Together with the value of your account, you may use this information to estimate the operating expenses that you paid over the period. Simply divide your account value at February 29, 2008, by $1,000.00, then multiply it by the “expenses paid” for your share class from the table above. For example, for an account value of $8,600.00, the operating expenses should be calculated as follows:
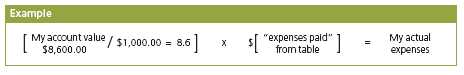
Annual report | Global Shareholder Yield Fund
9
Your expenses
Hypothetical example for comparison purposes
This table allows you to compare your fund’s ongoing operating expenses with those of any other fund. It provides an example of the Fund’s hypothetical account values and hypothetical expenses based on each class’s actual expense ratio and an assumed 5% annualized return before expenses (which is not your fund’s actual return). It assumes an account value of $1,000.00 on September 1, 2007, with the same investment held until February 29, 2008. Look in any other fund shareholder report to find its hypothetical example and you will be able to compare these expenses.
| | | | |
| | Account value | Ending value | Expenses paid during |
| | on 9-1-07 | on 2-29-08 | period on 2-29-081 |
|
| Class A | $1,000.00 | $1,017.30 | $7.62 |
|
| Class B | 1,000.00 | 1,013.67 | 11.27 |
|
| Class C | 1,000.00 | 1,013.67 | 11.27 |
|
| Class I | 1,000.00 | 1,019.39 | 5.52 |
|
| Class R1 | 1,000.00 | 1,016.66 | 8.27 |
|
Remember, these examples do not include any transaction costs, such as sales charges; therefore, these examples will not help you to determine the relative total costs of owning different funds. If transaction costs were included, your expenses would have been higher. See the prospectus for details regarding transaction costs.
1 Expenses are equal to the Fund's annualized expense ratio of 1.52%, 2.25%, 2.25%, 1.10% and 1.65% for Class A, Class B, Class C, Class I and Class R1, respectively, multiplied by the average account value over the period, multiplied by the number of days in most recent fiscal half year/366 (to reflect the one-half year period).
Global Shareholder Yield Fund | Annual report
10
Portfolio summary
| | | | |
| Top 10 holdings 1 | | | | |
|
| Reynolds American, Inc. | 2.2% | | E. I. Du Pont de Nemours & Company | 2.1% |
| |
|
| Nestle SA | 2.2% | | Duke Energy Corp. | 2.0% |
| |
|
| France Telecom SA | 2.1% | | Enel SpA | 2.0% |
| |
|
| Terna SpA | 2.1% | | StatoilHydro ASA | 1.9% |
| |
|
| UST, Inc. | 2.1% | | Windstream Corp. | 1.9% |
| |
|
| |
| Sector distribution 1 | | | | |
|
| Communications | 30% | | Industrial | 5% |
| |
|
| Consumer non-cyclical | 16% | | Diversified | 1% |
| |
|
| Utilities | 14% | | Technology | 1% |
| |
|
| Energy | 11% | | Consumer cyclical | 0.5% |
| |
|
| Financial | 10% | | Other | 6.5% |
| |
|
| Basic materials | 5% | | | |
| | |
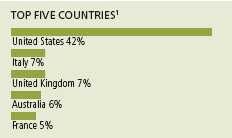
1 As a percentage of net assets on February 29, 2008.
Annual report | Global Shareholder Yield Fund
11
F I N A N C I A L S T A T E M E N T S
Fund’s investments
Securities owned by the Fund on 2-29-08
This schedule is divided into two main categories: common stocks and repurchase agreements. Common stocks are further broken down by country. Repurchase agreements, which represent the Fund’s cash position, are listed last.
| | |
| Issuer | Shares | Value |
| |
| Common stocks 91.75% | | $33,352,374 |
|
| (Cost $36,009,474) | | |
| | | |
| Australia 5.70% | | 2,072,857 |
|
| APN News & Media, Ltd. | 97,500 | 446,928 |
|
| Australia and New Zealand Banking Group, Ltd. | 13,900 | 280,493 |
|
| John Fairfax Holdings, Ltd. | 146,700 | 524,593 |
|
| NRMA Insurance Group, Ltd. | 80,800 | 280,513 |
|
| St. George Bank, Ltd. | 17,300 | 377,776 |
|
| Westpac Banking Corp. , Ltd. | 7,600 | 162,554 |
| | | |
| Austria 0.90% | | 327,984 |
|
| Telekom Austria AG | 14,500 | 327,984 |
| | | |
| Belgium 3.15% | | 1,145,677 |
|
| Belgacom SA | 13,920 | 666,657 |
|
| InBev | 5,300 | 479,020 |
| | | |
| Canada 3.38% | | 1,229,855 |
|
| Manitoba Telecom Services, Inc. | 15,200 | 638,732 |
|
| TransAlta Corp. | 4,400 | 156,956 |
|
| Yellow Pages Income Fund | 39,900 | 434,167 |
| | | |
| Finland 0.80% | | 290,181 |
|
| Fortum Corp. Oyj | 6,950 | 290,181 |
| | | |
| France 5.13% | | 1,864,124 |
|
| France Telecom SA | 23,100 | 775,446 |
|
| PagesJaunes Groupe SA | 22,800 | 424,088 |
|
| Total SA | 3,000 | 225,912 |
|
| Vivendi SA | 11,100 | 438,678 |
| | | |
| Germany 2.21% | | 803,763 |
|
| BASF AG | 2,800 | 356,270 |
|
| RWE AG | 3,700 | 447,493 |
| | | |
| Hong Kong 0.16% | | 57,152 |
|
| Vitasoy International Holdings, Ltd. | 138,000 | 57,152 |
| | | |
| Ireland 2.03% | | 736,322 |
|
| C&C Group PLC - London | 4,300 | 28,741 |
|
| C&C Group PLC | 66,200 | 450,809 |
|
| Independent News & Media PLC | 85,200 | 256,772 |
See notes to financial statements
Global Shareholder Yield Fund | Annual report
12
F I N A N C I A L S T A T E M E N T S
| | |
| Issuer | Shares | Value |
| | | |
| Italy 7.39% | | $2,685,458 |
|
| Enel SpA | 68,000 | 733,744 |
|
| Eni SpA, SADR | 6,300 | 434,259 |
|
| Intesa Sanpaolo SpA | 26,200 | 175,972 |
|
| Mondadori (Arnoldo) Editore SpA | 33,800 | 273,243 |
|
| Telecom Italia SpA | 121,900 | 303,920 |
|
| Terna SpA | 176,700 | 764,320 |
| | | |
| Malaysia 0.22% | | 80,359 |
|
| British American Tobacco Malaysia BHD | 6,000 | 80,359 |
| | | |
| Netherlands 0.41% | | 150,015 |
|
| Wolters Kluwer NV | 5,800 | 150,015 |
| | | |
| New Zealand 1.50% | | 544,212 |
|
| Telecom Corp. of New Zealand, SADR | 35,686 | 544,212 |
| | | |
| Norway 3.09% | | 1,122,366 |
|
| Den Norske Bank ASA | 13,700 | 200,398 |
|
| StatoilHydro ASA, SADR | 22,200 | 677,988 |
|
| Veidekke ASA | 27,400 | 243,980 |
| | | |
| Philippines 0.59% | | 212,850 |
|
| Philippine Long Distance Telephone Company, SADR | 3,000 | 212,850 |
| | | |
| Singapore 1.11% | | 401,975 |
|
| Singapore Press Holdings, Ltd. | 129,000 | 401,975 |
| | | |
| South Korea 0.50% | | 182,175 |
|
| KT Corp. , SADR * | 7,500 | 182,175 |
| | | |
| Spain 0.54% | | 196,769 |
|
| Telefonica SA | 6,800 | 196,769 |
| | | |
| Sweden 0.57% | | 207,428 |
|
| Swedish Match AB | 8,900 | 207,428 |
| | | |
| Switzerland 2.23% | | 811,390 |
|
| Nestle SA | 1,700 | 811,390 |
| | | |
| Taiwan 0.86% | | 312,791 |
|
| Far EasTone Telecommunications Company, Ltd. | 224,000 | 312,791 |
| | | |
| United Kingdom 7.15% | | 2,600,460 |
|
| Barclays PLC | 19,900 | 186,509 |
|
| Diageo PLC, SADR | 6,300 | 517,230 |
|
| GKN PLC | 32,900 | 171,435 |
|
| Legal & General Group PLC | 59,400 | 146,142 |
|
| Lloyds TSB Group PLC | 37,470 | 334,917 |
|
| National Grid PLC | 35,800 | 519,095 |
|
| Tomkins PLC | 99,800 | 334,611 |
|
| Vodafone Group PLC | 121,300 | 390,521 |
| | | |
| United States 42.13% | | 15,316,211 |
|
| AllianceBernstein Holding LP * | 10,100 | 626,705 |
|
| Altria Group, Inc. | 6,900 | 504,666 |
See notes to financial statements
Annual report | Global Shareholder Yield Fund
13
F I N A N C I A L S T A T E M E N T S
| | |
| Issuer | Shares | Value |
| | | |
| United States (continued) | | |
|
| AT&T, Inc. | 19,100 | $665,253 |
|
| Automatic Data Processing, Inc. | 8,000 | 319,600 |
|
| Ball Corp. | 9,800 | 432,180 |
|
| Bristol-Myers Squibb Company | 19,300 | 436,373 |
|
| CBS Corp. , Class B | 7,600 | 173,432 |
|
| Citizens Communications Company | 61,900 | 664,806 |
|
| ConocoPhillips | 5,100 | 421,821 |
|
| DaVita, Inc. * | 3,400 | 168,742 |
|
| Diamond Offshore Drilling, Inc. | 3,300 | 398,739 |
|
| Dow Chemical Company | 4,800 | 180,912 |
|
| Duke Energy Corp. | 42,000 | 736,680 |
|
| E. I. Du Pont de Nemours & Company | 16,300 | 756,646 |
|
| GateHouse Media, Inc. | 22,830 | 143,144 |
|
| General Electric Company | 15,900 | 526,926 |
|
| General Maritime Corp. | 4,100 | 96,514 |
|
| Great Plains Energy, Inc. | 19,900 | 506,057 |
|
| HCP, Inc. , REIT | 2,000 | 58,360 |
|
| Idearc, Inc. | 39,300 | 189,426 |
|
| Magellan Midstream Partners LP | 7,900 | 342,149 |
|
| ONEOK Partners LP | 7,800 | 483,834 |
|
| Packaging Corp. of America | 23,000 | 524,170 |
|
| Pfizer, Inc. | 12,400 | 276,272 |
|
| Progress Energy, Inc. | 11,600 | 486,156 |
|
| Reynolds American, Inc. | 12,800 | 815,616 |
|
| SCANA Corp. | 2,960 | 112,095 |
|
| Southern Copper Corp. | 5,100 | 581,961 |
|
| Spectra Energy Corp. | 3,400 | 78,574 |
|
| Teco Energy, Inc. | 22,700 | 340,046 |
|
| The Laclede Group, Inc. | 3,800 | 129,770 |
|
| The Southern Company | 9,900 | 341,847 |
|
| U. S. Bancorp | 15,700 | 502,714 |
|
| UST, Inc. | 14,000 | 760,060 |
|
| Ventas, Inc. , REIT | 4,300 | 179,827 |
|
| Verizon Communications, Inc. | 14,600 | 530,272 |
|
| Westar Energy, Inc. | 6,600 | 150,018 |
|
| Windstream Corp. | 57,300 | 673,848 |
See notes to financial statements
Global Shareholder Yield Fund | Annual report
14
F I N A N C I A L S T A T E M E N T S
| | |
| | Principal | |
| Issuer, description, maturity date | amount | Value |
| |
| Repurchase agreements 7.14% | | $2,596,000 |
|
| (Cost $2,596,000) | | |
|
| Repurchase Agreement with State Street Corp. dated 2-29-08 at | | |
| 2.35% to be repurchased at $2,596,508 on 3-3-08, | | |
| collateralized by $2,095,000 Federal Home Loan Mortgage Corp. , | | |
| 6.75%, due 3-15-31 (valued at $2,650,175, including interest) | $2,596,000 | 2,596,000 |
| |
| Total investments (cost $38,605,474)† 98.89% | | $35,948,374 |
|
| |
| Other assets in excess of liabilities 1.11% | | $405,296 |
|
| |
| Total net assets 100.00% | | $36,353,670 |
|
The portfolio had the following five top industry concentrations as of February 29, 2008 (as a percentage of total net assets):
| | |
| Telecommunications | | |
| equipment & services | 15.81% | |
| Electrical utilities | 9.66% | |
| Tobacco | 6.51% | |
| Food & beverages | 6.45% | |
| Energy | 6.23% | |
Percentages are stated as a percent of net assets.
PLC Public Limited Company
REIT Real Estate Investment Trust
SADR Sponsored American Depositary Receipt
* Non-income producing.
† At February 29, 2008, the aggregate cost of investment securities for federal income tax purposes was $38,723,849. Net unrealized depreciation aggregated $2,775,475, of which $1,380,133 related to appreciated investment securities and $4,155,608 related to depreciated investment securities.
See notes to financial statements
Annual report | Global Shareholder Yield Fund
15
F I N A N C I A L S T A T E M E N T S
Financial statements
Statement of assets and liabilities 2-29-08
This Statement of Assets and Liabilities is the Fund’s balance sheet. It shows the value of what the Fund owns, is due and owes. You’ll also find the net asset value and the maximum public offering price per share.
| |
| Assets | |
|
| Investments, at value (cost $36,009,474) | $33,352,374 |
| Repurchase agreement, at value (cost $2,596,000) (Note 2) | 2,596,000 |
| | |
| Total investments, at value (cost $38,605,474) | 35,948,374 |
| Cash | 318 |
| Foreign currency, at value (cost $23,721) | 24,322 |
| Receivable for investments sold | 292,473 |
| Receivable for fund shares sold | 122,306 |
| Dividends and interest receivable (net of tax) | 113,404 |
| Other assets | 126 |
| | |
| Total assets | 36,501,323 |
| |
| Liabilities | |
|
| Payable for investments purchased | 76,881 |
| Payable for fund shares repurchased | 5,049 |
| Payable to affiliates | |
| Fund administration fees | 97 |
| Transfer agent fees | 7,723 |
| Distribution and service fees | 438 |
| Investment management fees | 5,234 |
| Trustees’ fees | 56 |
| Other payables and accrued expenses | 52,175 |
| | |
| Total liabilities | 147,653 |
| |
| Net assets | |
|
| Capital paid-in | $39,611,380 |
| Undistributed net investment income | 55,884 |
| Accumulated undistributed net realized gain (loss) on investments and | |
| foreign currency transactions | (658,777) |
| Net unrealized appreciation (depreciation) on investments and translation | |
| of assets and liabilities in foreign currencies | (2,654,817) |
| | |
| Net assets | $36,353,670 |
See notes to financial statements
Global Shareholder Yield Fund | Annual report
16
F I N A N C I A L S T A T E M E N T S
Statement of assets and liabilities (continued)
| |
| Net asset value per share | |
|
| The Fund has an unlimited number of shares authorized with no par value. | |
| Net asset value is calculated by dividing the net assets of each class of | |
| shares by the number of outstanding shares in the class. | |
| | |
| Class A | |
| Net assets | $27,373,863 |
| Shares outstanding | 2,875,294 |
| Net asset value and redemption price per share | $9.52 |
| | |
| Class B 1 | |
| Net assets | $1,266,247 |
| Shares outstanding | 133,131 |
| Net asset value and offering price per share | $9.51 |
| | |
| Class C 1 | |
| Net assets | $4,584,769 |
| Shares outstanding | 481,904 |
| Net asset value and offering price per share | $9.51 |
| | |
| Class I | |
| Net assets | $3,030,841 |
| Shares outstanding | 317,924 |
| Net asset value, offering price and redemption price per share | $9.53 |
| | |
| Class R1 | |
| Net assets | $97,950 |
| Shares outstanding | 10,293 |
| Net asset value, offering price and redemption price per share | $9.52 |
| |
| Maximum public offering price per share | |
|
| Class A (net asset value per share ÷ 95%) 2 | $10.02 |
1 Redemption price per share is equal to the net asset value less any applicable contingent deferred sales charge.
2 On single retail sales of less than $50,000. On sales of $50,000 or more and on group sales the offering price is reduced.
See notes to financial statements
Annual report | Global Shareholder Yield Fund
17
F I N A N C I A L S T A T E M E N T S
Statement of operations For the year ended 2-29-08
This Statement of Operations summarizes the Fund’s investment income earned and expenses incurred in operating the Fund. It also shows net gains (losses) for the period stated.
| |
| Investment income | |
|
| Dividends | $1,382,962 |
| Interest | 125,968 |
| Less foreign taxes withheld | (67,854) |
| | |
| Total investment income | 1,441,076 |
| |
| Expenses | |
|
| Investment management fees (Note 3) | 292,547 |
| Distribution and service fees (Note 3) | 112,324 |
| Transfer agent fees (Note 3) | 32,996 |
| Fund administration fees (Note 3) | 9,126 |
| Blue sky fees (Note 3) | 70,571 |
| Audit and legal fees | 36,777 |
| Printing and postage fees (Note 3) | 10,803 |
| Custodian fees | 45,986 |
| Trustees’ fees (Note 4) | 1,348 |
| Registration and filing fees | 13,716 |
| Miscellaneous | 352 |
| | |
| Total expenses | 626,546 |
| Less expense reductions (Note 3) | (157,762) |
| | |
| Net expenses | 468,784 |
| | |
| Net investment income | 972,292 |
| |
| Realized and unrealized gain (loss) | |
|
| Net realized gain (loss) on | |
| Investments in unaffiliated issuers | (556,827) |
| Foreign currency transactions | 12,816 |
| | (544,011) |
| Change in net unrealized appreciation (depreciation) of | |
| Investments in unaffiliated issuers | (2,657,100) |
| Translation of assets and liabilities in foreign currencies | 2,283 |
| | (2,654,817) |
| Net realized and unrealized gain (loss) | (3,198,828) |
| | |
| Increase (decrease) in net assets from operations | ($2,226,536) |
See notes to financial statements
Global Shareholder Yield Fund | Annual report
18
F I N A N C I A L S T A T E M E N T S
Statement of changes in net assets
This Statement of Changes in Net Assets show how the value of the Fund’s net assets has changed since inception. The difference reflects earnings less expenses, any investment gains and losses, distributions, if any, paid to shareholders and the net of Fund share transactions.
| |
| | Year |
| | ended |
| | 2-29-08 |
|
| Increase (decrease) in net assets | |
|
| From operations | |
| Net investment income | $972,292 |
| Net realized gain (loss) | (544,011) |
| Change in net unrealized appreciation (depreciation) | (2,654,817) |
| | |
| Increase (decrease) in net assets resulting from operations | (2,226,536) |
| | |
| Distributions to shareholders | |
| From net investment income | |
| Class A | (758,310) |
| Class B | (25,168) |
| Class C | (74,029) |
| Class I | (83,716) |
| Class R1 | (2,790) |
| From net realized gain | |
| Class A | (76,015) |
| Class B | (3,843) |
| Class C | (12,123) |
| Class I | (9,685) |
| Class R1 | (288) |
| | |
| Total distributions | (1,045,967) |
| | |
| From Fund share transactions (Note 6) | 39,626,173 |
| | |
| Total increase (decrease) | 36,353,670 |
| |
| Net assets | |
|
| Beginning of year | — |
| | |
| End of year | $36,353,670 |
| | |
| Undistributed net investment income | $55,884 |
See notes to financial statements
Annual report | Global Shareholder Yield Fund
19
F I N A N C I A L S T A T E M E N T S
Financial highlights
The Financial Highlights show how the Fund’s net asset value for a share has changed since inception.
CLASS A SHARES
| |
| Period ended | 2-29-08 1 |
| |
| Per share operating performance | |
|
| Net asset value, beginning of period | $10.00 |
| Net investment income 2 | 0.35 |
| Net realized and unrealized gain | |
| (loss) on investments | (0.51) |
| Total from investment operations | (0.16) |
| Less distributions | |
| From net investment income | (0.29) |
| From net realized gain | (0.03) |
| | (0.32) |
| Net asset value, end of period | $9.52 |
| Total return3,4 (%) | (1.84) |
| |
| Ratios and supplemental data | |
|
| Net assets, end of period (in millions) | $27 |
| Ratios (as a percentage of average net assets): | |
| Expenses before reductions | 1.79 |
| Expenses net of fee waivers, if any | 1.45 |
| Expenses net of all fee waivers and credits | 1.45 |
| Net investment income | 3.31 |
| Portfolio turnover (%) | 24 |
1 Class A shares began operations on 3-1-07.
2 Based on the average of the shares outstanding.
3 Assumes dividend reinvestment.
4 Total returns would have been lower had certain expenses not been reduced during the period shown.
See notes to financial statements
Global Shareholder Yield Fund | Annual report
20
F I N A N C I A L S T A T E M E N T S
Financial highlights
CLASS B SHARES
| |
| Period ended | 2-29-08 1 |
| |
| Per share operating performance | |
|
| Net asset value, beginning of period | $10.00 |
| Net investment income 2 | 0.22 |
| Net realized and unrealized gain | |
| (loss) on investments | (0.45) |
| Total from investment operations | (0.23) |
| Less distributions | |
| From net investment income | (0.23) |
| From net realized gain | (0.03) |
| | (0.26) |
| Net asset value, end of period | $9.51 |
| Total return3,4 (%) | (2.54) |
| |
| Ratios and supplemental data | |
|
| Net assets, end of period (in millions) | $1 |
| Ratios (as a percentage of average net assets): | |
| Expenses before reductions | 3.89 |
| Expenses net of fee waivers, if any | 2.23 |
| Expenses net of all fee waivers and credits | 2.23 |
| Net investment income | 2.11 |
| Portfolio turnover (%) | 24 |
1 Class B shares began operations on 3-1-07.
2 Based on the average of the shares outstanding.
3 Assumes dividend reinvestment.
4 Total returns would have been lower had certain expenses not been reduced during the period shown.
See notes to financial statements
Annual report | Global Shareholder Yield Fund
21
F I N A N C I A L S T A T E M E N T S
Financial highlights
CLASS C SHARES
| |
| Period ended | 2-29-08 1 |
| |
| Per share operating performance | |
|
| Net asset value, beginning of period | $10.00 |
| Net investment income 2 | 0.22 |
| Net realized and unrealized gain | |
| (loss) on investments | (0.45) |
| Total from investment operations | (0.23) |
| Less distributions | |
| From net investment income | (0.23) |
| From net realized gain | (0.03) |
| | (0.26) |
| Net asset value, end of period | $9.51 |
| Total return3,4 (%) | (2.54) |
| |
| Ratios and supplemental data | |
|
| Net assets, end of period (in millions) | $5 |
| Ratios (as a percentage of average net assets): | |
| Expenses before reductions | 3.00 |
| Expenses net of fee waivers, if any | 2.23 |
| Expenses net of all fee waivers and credits | 2.22 |
| Net investment income | 2.08 |
| Portfolio turnover (%) | 24 |
1 Class C shares began operations on 3-1-07.
2 Based on the average of the shares outstanding.
3 Assumes dividend reinvestment.
4 Total returns would have been lower had certain expenses not been reduced during the period shown.
See notes to financial statements
Global Shareholder Yield Fund | Annual report
22
F I N A N C I A L S T A T E M E N T S
Financial highlights
CLASS I SHARES
| |
| Period ended | 2-29-08 1 |
|
| Per share operating performance | |
| Net asset value, beginning of period | $10.00 |
| Net investment income 2 | 0.33 |
| Net realized and unrealized gain | |
| (loss) on investments | (0.44) |
| Total from investment operations | (0.11) |
| Less distributions | |
| From net investment income | (0.33) |
| From net realized gain | (0.03) |
| | (0.36) |
| Net asset value, end of period | $9.53 |
| Total return3,4 (%) | (1.43) |
| |
| Ratios and supplemental data | |
|
| Net assets, end of period (in millions) | $3 |
| Ratios (as a percentage of average net assets): | |
| Expenses before reductions | 2.16 |
| Expenses net of fee waivers, if any | 1.09 |
| Expenses net of all fee waivers and credits | 1.09 |
| Net investment income | 3.14 |
| Portfolio turnover (%) | 24 |
1 Class I shares began operations on 3-1-07.
2 Based on the average of the shares outstanding.
3 Assumes dividend reinvestment.
4 Total returns would have been lower had certain expenses not been reduced during the period shown.
See notes to financial statements
Annual report | Global Shareholder Yield Fund
23
F I N A N C I A L S T A T E M E N T S
Financial highlights
CLASS R1 SHARES
| |
| Period ended | 2-29-08 1 |
| |
| Per share operating performance | |
|
| Net asset value, beginning of period | $10.00 |
| Net investment income 2 | 0.35 |
| Net realized and unrealized gain | |
| (loss) on investments | (0.52) |
| Total from investment operations | (0.17) |
| Less distributions | |
| From net investment income | (0.28) |
| From net realized gain | (0.03) |
| | (0.31) |
| Net asset value, end of period | $9.52 |
| Total return3,4 (%) | (2.01) |
| |
| Ratios and supplemental data | |
|
| Net assets, end of period (in millions) | — 5 |
| Ratios (as a percentage of average net assets): | |
| Expenses before reductions | 16.23 |
| Expenses net of fee waivers, if any | 1.64 |
| Expenses net of all fee waivers and credits | 1.64 |
| Net investment income | 3.37 |
| Portfolio turnover (%) | 24 |
1 Class R1 shares began operations on 3-1-07.
2 Based on the average of the shares outstanding.
3 Assumes dividend reinvestment.
4 Total returns would have been lower had certain expenses not been reduced during the period shown.
5 Less than $500,000.
See notes to financial statements
Global Shareholder Yield Fund | Annual report
24
Notes to financial statements
1. Organization
John Hancock Global Shareholder Yield Fund (the Fund) is a diversified series of John Hancock Funds III (the Trust). The Trust was established as a Massachusetts business trust on June 9, 2005. The Trust is registered under the Investment Company Act of 1940, as amended (the 1940 Act), as an open-end investment management company. The investment objective of the Fund is to provide a high level of income. Capital appreciation is a secondary investment objective.
John Hancock Life Insurance Company of New York (John Hancock New York) is a wholly owned subsidiary of John Hancock Life Insurance Company (U.S.A.) (John Hancock USA). John Hancock USA and John Hancock New York are indirect wholly owned subsidiaries of The Manufacturers Life Insurance Company (Manulife), which in turn is a wholly owned subsidiary of Manulife Financial Corporation (MFC), a publicly traded company. MFC and its subsidiaries are known collectively as “Manulife Financial.”
John Hancock Investment Management Services, LLC (the Adviser), a Delaware limited liability company controlled by John Hancock USA, serves as investment adviser for the Trust and John Hancock Funds, LLC (the Distributor), a Delaware limited liability company, an affiliate of the Adviser, serves as principal underwriter.
The Board of Trustees have authorized the issuance of multiple classes of shares of the Fund, including classes designated as Class A, Class B, Class C, Class I and Class R1 shares. Class A, Class B and Class C shares are open to all retail investors. Class I shares are offered without any sales charge to various institutional and certain individual investors. Class R1 shares are available only to certain retirement plans. The shares of each class represent an interest in the same portfolio of investments of the Fund, and have equal rights as to voting, redemptions, dividends and liquidation, except that certain expenses, subject to the approval of the Board of Trustees, may be applied differently to each class of shares in accordance with current regulations of the Securities and Exchange Commission (SEC) and the Internal Revenue Service. Shareholders of a class that bear distribution and service expenses under the terms of a distribution plan have exclusive voting rights to that distribution plan. Class B shares will convert to Class A shares eight years after purchase.
The Adviser and other affiliates of John Hancock USA owned 1,128,768, 10,248, 10,248, 10,343 and 10,293 shares of beneficial interest of Class A, Class B, Class C, Class I and Class R1, respectively, on February 29, 2008.
2. Significant accounting policies
In the preparation of the financial statements, the Fund follows the policies described below. The preparation of financial statements in conformity with accounting principles generally accepted in the United States of America requires management to make estimates and assumptions that affect the reported amounts of assets and liabilities at the date of the financial statements and the reported amounts of income and expenses during the reporting period. Actual results may differ from these estimates.
Security valuation
The net asset value of the shares of the Fund is determined daily as of the close of the New York Stock Exchange (NYSE), normally at 4:00 p.m., Eastern Time. Short-term debt investments that have a remaining maturity of 60 days or less are valued at amortized cost, and thereafter assume a constant amortization to maturity of any discount or premium, which approximates market value. All other securities held by the Fund are valued at the last sale price or official closing price (closing bid price
Annual report | Global Shareholder Yield Fund
25
or last evaluated quote if no sale has occurred) as of the close of business on the principal securities exchange (domestic or foreign) on which they trade or, lacking any sales, at the closing bid price. Securities traded only in the over-the-counter market are valued at the last bid price quoted by brokers making markets in the securities at the close of trading. Securities for which there are no such quotations, principally debt securities, are valued based on the evaluated prices provided by an independent pricing service, which utilizes both dealer-supplied and electronic data processing techniques, which take into account factors such as institutional-size trading in similar groups of securities, yield, quality, coupon rate, maturity, type of issue, trading characteristics and other market data.
Other assets and securities for which no such quotations are readily available are valued at fair value as determined in good faith under consistently applied procedures established by and under the general supervision of the Board of Trustees. Generally, trading in non-U.S. securities is substantially completed each day at various times prior to the close of trading on the NYSE. The values of such securities used in computing the net asset value of a Fund’s shares are generally determined as of such times. Occasionally, significant events that affect the values of such securities may occur between the times at which such values are generally determined and the close of the NYSE. Upon such an occurrence, these securities will be valued at fair value as determined in good faith under consistently applied procedures established by and under the general supervision of the Board of Trustees.
In deciding whether to make a fair value adjustment to the price of a security, the Board of Trustees or their designee may review a variety of factors, including developments in foreign markets, the performance of U.S. securities markets and the performance of instruments trading in U.S. markets that represent foreign securities and baskets of foreign securities. The Fund may also fair value securities in other situations, for example, when a particular foreign market is closed, but the Fund is calculating the net asset value. In view of these factors, it is likely that Funds investing significant amounts of assets in securities in foreign markets will be fair valued more frequently than Funds investing significant amounts of assets in frequently traded, U.S. exchange listed securities of large-capitalization U.S. issuers.
For purposes of determining when fair value adjustments may be appropriate with respect to Funds that invest in securities in foreign markets that close prior to the NYSE, the Fund will, on an ongoing basis, monitor for “significant market events.” A significant market event may be a certain percentage change in the value of an index or of certain Exchange Traded Funds that track foreign markets in which Funds have significant investments. If a significant market event occurs due to a change in the value of the index or of Exchange Traded Funds, the pricing for the Fund will promptly be reviewed and potential adjustments to the net asset value of the Fund will be recommended to the Trust’s Pricing Committee when applicable.
Fair value pricing of securities is intended to help ensure that the net asset value of the Fund’s shares reflects the value of the Fund’s securities as of the close of the NYSE (as opposed to a value which is no longer accurate as of such close), thus limiting the opportunity for aggressive traders to purchase shares of the Fund at deflated prices, reflecting stale security valuations, and to promptly sell such shares at a gain. However, a security’s valuation may differ depending on the method used for determining value and no assurance can be given that fair value pricing of securities will successfully eliminate all potential opportunities for such trading gains.
New accounting pronouncement
In September 2006, Financial Accounting Standards Board (FASB) Standard No. 157, Fair Value Measurements (FAS 157), was issued and is effective for fiscal years beginning after November 15, 2007. FAS 157 defines fair value, establishes a framework for measuring fair value and expands disclosure about fair value measurements. As of February 29, 2008, management does not believe the adoption of FAS 157 will impact the amounts reported in the financial statements; however, additional
Global Shareholder Yield Fund | Annual report
26
disclosures regarding pricing sources will be required about the inputs used to develop the measurements of fair value and the related realized and unrealized gain/loss for certain securities valued by significant unobservable market inputs.
Guarantees and indemnifications
Under the Trust’s organizational documents, its Officers and Trustees are indemnified against certain liability arising out of the performance of their duties to the Trust. Additionally, in the normal course of business, the Trust enters into contracts with service providers that contain general indemnification clauses. The Trust’s maximum exposure under these arrangements is unknown, as this would involve future claims that may be made against the Trust that have not yet occurred.
Repurchase agreements
The Fund may enter into repurchase agreements. When the Fund enters into a repurchase agreement through its custodian, it receives delivery of securities, the amount of which at the time of purchase and each subsequent business day is required to be maintained at such a level that the market value is generally at least 102% of the repurchase amount. The Fund will take constructive receipt of all securities underlying the repurchase agreements it has entered into until such agreements expire. If the seller defaults, the Fund would suffer a loss to the extent that proceeds from the sale of underlying securities were less than the repurchase amount. The Fund may enter into repurchase agreements maturing within seven days with domestic dealers, banks or other financial institutions deemed to be creditworthy by the Adviser. Collateral for certain tri-party repurchase agreements is held at the custodian bank in a segregated account for the benefit of the Fund and the counterparty.
Foreign currency transactions
The books and records of the Fund are maintained in U.S. Dollars. Investment securities and other assets and liabilities denominated in a foreign currency are translated into U.S. dollars at the prevailing exchange rates at period end. Purchases and sales of investment securities, income and expenses are translated into U.S. dollars at the prevailing exchange rates on the respective dates of the transactions.
Net realized and unrealized gains and losses on foreign currency transactions represent net gains and losses between trade and settlement dates on securities transactions, the disposition of forward foreign currency exchange contracts and foreign currencies, and the difference between the amount of net investment income accrued and the U.S. dollar amount actually received. That portion of both realized and unrealized gains and losses on investments that results from fluctuations in foreign currency exchange rates is not separately disclosed but is included with net realized and unrealized gain/appreciation and loss/depreciation on investments.
The Fund may be subject to capital gains and repatriation taxes imposed by certain countries in which it invests. Such taxes are generally based upon income and/or capital gains earned or repatriated. Taxes are accrued based upon net investment income, net realized gains and net unrealized appreciation.
The Fund may invest in securities of issuers based in countries with emerging markets or economies and may, therefore, be subject to greater market risk than Funds that invest principally in securities of issuers in more developed countries. Emerging markets securities may be more volatile and less liquid than securities of issuers in developed countries and may be subject to substantial currency fluctuations and affected by sudden economic, social and political developments in the emerging market country. The securities markets of emerging countries may have less government regulation and may be subject to less extensive accounting and financial reporting requirements than the securities markets of more developed countries. Emerging market countries may have currency controls or restrictions which may prevent or delay the Fund from taking money out of the country or may impose additional taxes on money removed from the country.
Security transactions and related investment income
Investment security transactions are accounted for on a trade date plus one basis for daily net asset value calculations. However, for financial reporting purposes, investment
Annual report | Global Shareholder Yield Fund
27
transactions are reported on trade date. Interest income is accrued as earned. Dividend income and distributions to shareholders are recorded on the ex-dividend date. Foreign dividends are recorded on the ex-date or when the Fund becomes aware of the dividends from cash collections. Discounts/premiums are accreted/ amortized for financial reporting purposes. Non-cash dividends are recorded at the fair market value of the securities received. Debt obligations may be placed in a non-accrual status and related interest income may be reduced by ceasing current accruals and writing off interest receivables when the collection of all or a portion of interest has become doubtful, based upon consistently applied procedures.
From time to time, the Fund may invest in Real Estate Investment Trusts (REITs) and, as a result, will estimate the components of distributions from these securities. Distributions from REITs received in excess of income are recorded as a reduction of cost of investments and/or as a realized gain.
The Fund uses the specific identification method for determining realized gain or loss on investments for both financial statement and federal income tax reporting purposes.
Allocations of income and expenses
All income, expenses (except class-specific expenses), and realized and unrealized gain/loss are allocated to each class of shares based upon the relative net assets of each class. Dividends to shareholders from net investment income are determined at a class level and distributions from capital gains are determined at a Fund level.
Expenses not directly attributable to the Fund or share classes are allocated based on the relative share of net assets of the Fund or share class at the time the expense was incurred. Class-specific expenses, as detailed in Note 3, are accrued daily and charged directly to the respective share classes.
Federal income taxes
The Fund qualifies as a regulated investment company by complying with the applicable provisions of the Internal Revenue Code and will not be subject to federal income tax on taxable income that is distributed to shareholders. Therefore, no federal income tax provision is required. Net capital losses of $540,402 that are attributable to security transactions incurred after October 31, 2007, are treated as arising on March 1, 2008, the first day of the Fund’s next taxable year.
The Fund has adopted the provisions of FASB Interpretation No. 48, Accounting for Uncertainty in Income Taxes, an interpretation of FASB Statement 109 (FIN 48), at the beginning of the Fund’s fiscal year. FIN 48 prescribes a minimum threshold for financial statement recognition of the benefit of a tax position taken or expected to be taken in a tax return. The implementation of FIN 48 did not have a material impact on the Fund’s financial statements. The Fund’s federal tax return for this fiscal year remains subject to examination by the Internal Revenue Service.
Distribution of income and gains
The Fund records distributions to shareholders from net investment income and net realized gains, if any, on the ex-dividend date. During the year ended February 29, 2008, the tax character of distributions paid was as follows: ordinary income $1,045,967. Distributions paid by the Fund with respect to each class of shares are calculated in the same manner, at the same time and are in the same amount, except for the effect of expenses that may be applied differently to each class.
As of February 29, 2008, the components of distributable earnings on a tax basis included $55,884 of undistributed ordinary income.
Such distributions and distributable earnings, on a tax basis, are determined in conformity with income tax regulations, which may differ from accounting principles generally accepted in the United States of America. Distributions in excess of tax basis earnings and profits, if any, are reported in the Fund’s financial statements as a return of capital.
Capital accounts within financial statements are adjusted for permanent book/tax differences. These adjustments have no impact on net assets or the results of operations. Temporary book/tax differences will reverse in a subsequent period. Permanent book/tax differences are primarily attributable to foreign currency transactions.
Global Shareholder Yield Fund | Annual report
28
3. Investment advisory and
other agreements
The Trust has entered into an Investment Advisory Agreement with the Adviser. The Adviser is responsible for managing the corporate and business affairs of the Trust and for selecting and compensating subadvisers to handle the investment of the assets of the Fund, subject to the supervision of the Trust’s Board of Trustees. As compensation for its services, the Adviser receives an advisory fee from the Trust. Under the Advisory Agreement, the Fund pays a monthly management fee to the Adviser equivalent, on an annual basis, to the sum of: (a) 0.950% of the first $500,000,000 of the Fund’s daily net assets; (b) 0.925% of the next $500,000,000 of the Fund’s daily net assets; and (c) 0.900% of the Fund’s daily net assets in excess of $1,000,000,000. The Adviser has a subadvisory agreement with Epoch Investment Partners, Inc. The Fund is not responsible for payment of the subadvisory fees.
The investment management fees incurred for the year ended February 29, 2008, were equivalent to an annual effective rate of 0.95% of the Fund’s average daily net assets.
Expense reimbursements
The Adviser has contractually agreed to reimburse or limit certain Fund level expenses to 0.10% of the Fund’s average annual net assets which are allocated pro rata to all share classes. This agreement excludes taxes, portfolio brokerage commissions, interest, advisory fees, Rule 12b-1 fees, transfer agency fees, blue sky fees, printing and postage and litigation and indemnification expenses and other extraordinary expenses not incurred in the ordinary course of the Fund’s business. In addition, fees incurred under any agreement or plans of the Fund dealing with services for the shareholders and others with beneficial interest in shares of the Fund, are excluded.
Additionally, the Adviser had a voluntary advisory fee waiver of 0.45% in effect from March 1, 2007 to May 31, 2007.
Finally, the Adviser has agreed to reimburse or limit certain expenses for each share class. This agreement excludes taxes, portfolio brokerage commissions, interest and litigation and indemnification expenses and other extraordinary expenses not incurred in the ordinary course of the Fund’s business. In addition, fees incurred under any agreement or plans of the Fund dealing with services for the shareholders and others with beneficial interest in shares of the Fund, are excluded. The reimbursements and limits are such that these expenses will not exceed 1.55% for Class A shares, 2.25% for Class B, 2.25% for Class C, 1.10% for Class I and 1.60% for Class R1. Accordingly, the expense reductions or reimbursements related to this agreement were $83,352, $15,148, $21,130, $22,142 and $15,278 for Class A, Class B, Class C, Class I and Class R1, respectively for the year ended February 29, 2008. The expense reimbursements and limits will co ntinue in effect until June 30, 2009 and thereafter until terminated by the Adviser on notice to the Trust.
Fund administration fees
Pursuant to the Advisory Agreement, the Fund reimburses the Adviser for all expenses associated with providing the administrative, financial, legal, accounting and recordkeeping services of the Fund, including the preparation of all tax returns, annual, semiannual and periodic reports to shareholders and the preparation of all regulatory reports. These expenses are allocated based on the relative share of net assets of each class at the time the expense was incurred.
The fund administration fees incurred for the year ended February 29, 2008, were $9,126 with an annual effective rate of 0.03% of the Fund’s average daily net assets.
Distribution and shareholder servicing fees
The Trust has a Distribution Agreement with the Distributor. The Fund has adopted Distribution Plans with respect to Class A, Class B, Class C and Class R1, pursuant to Rule 12b-1 under the 1940 Act, to pay the Distributor for the services it provides as distributor of shares of the Fund. Accordingly, the Fund makes monthly payments to the Distributor at an annual rate not to exceed 0.30%, 1.00%, 1.00% and 0.50% of average daily net asset value of Class A, Class B, Class C and Class R1, respectively. A maximum of 0.25% of such payments may be service fees, as defined by the Conduct Rules of Financial
Annual report | Global Shareholder Yield Fund
29
Industry Regulatory Authority (formerly the National Association of Securities Dealers). Under the Conduct Rules, curtailment of a portion of the Fund’s 12b-1 payments could occur under certain circumstances.
In addition, the Fund has also adopted a Service Plan for Class R1 shares. Under the Service Plan, the Fund may pay up to 0.25% of Class R1 average daily net asset value for certain other services. The Service Plan fees incurred for the year ended February 29, 2008, were equivalent to an annual effective rate of 0.15% of the Class R1 average daily net assets.
Sales charges
Class A shares are assessed up-front sales charges of up to 5.00% of net asset value of such shares. During the year ended February 29, 2008, the Fund was informed that the Distributor received net up-front sales charges of $221,015 with regard to sales of Class A shares. Of this amount, $35,356 was retained and used for printing prospectuses, advertising, sales literature and other purposes; $184,744 was paid as sales commissions to unrelated broker-dealers; and $915 was paid as sales commissions to sales personnel of Signator Investors, Inc. (Signator Investors), a related broker-dealer, an indirect subsidiary of MFC.
Class B shares that are redeemed within six years of purchase are subject to a contingent deferred sales charge (CDSC) at declining rates, beginning at 5.00% of the lesser of the current market value at the time of redemption or the original purchase cost of the shares being redeemed. Class C shares that are redeemed within one year of purchase are subject to a CDSC at a rate of 1.00% of the lesser of the current market value at the time of redemption or the original purchase cost of the shares being redeemed. Proceeds from the CDSCs are paid to the Distributor and are used, in whole or in part, to defray its expenses for providing distribution-related services to the Fund in connection with the sale of Class B and Class C shares. During the year ended February 29, 2008, CDSCs received by Distributor amounted to $1,410 for Class B shares and $2,013 for Class C shares.
Transfer agent fees
The Fund has a Transfer Agency Agreement with John Hancock Signature Services, Inc. (Signature Services), an indirect subsidiary of MFC. For Class A, Class B, Class C, Class I and Class R1 shares, the Fund pays a monthly transfer agent fee at an annual rate of 0.05% of each class’ average daily net assets, plus a fee based on the number of shareholder accounts and reimbursement for certain out-of-pocket expenses. Expenses not directly attributable to a particular class of shares are aggregated and allocated to each class on the basis of its relative net asset value. The Fund pays a monthly fee which is based on an annual rate of $15.00 for each Class A shareholder account, $17.50 for each Class B shareholder account, $16.50 for each Class C shareholder account and $15.00 for each Class R1 shareholder account.
Signature Services has agreed to limit the transfer agent fees so that such fees do not exceed 0.20% annually of Class A, Class B, Class C, Class I and Class R1 share average daily net assets. This agreement is effective until December 31, 2008. Signature Services reserves the right to terminate this limitation in the future. There were no transfer agent fee reductions for Class A, Class B, Class C, Class I and Class R1 shares, respectively, during the year ended February 29, 2008.
In addition, Signature Services has voluntarily agreed to further limit transfer agent fees for Class R1 shares so that such fees do not exceed 0.05% annually of each class’s average daily net assets. For the year ended February 29, 2008, the transfer agent fees reductions for Class R1 were $152.
In May 2007, the Fund began receiving earnings credits from its transfer agent as a result of uninvested cash balances. These credits are used to reduce a portion of the Fund’s transfer agent fees and out-of-pocket expenses. During the year ended February 29, 2008, the Fund’s transfer agent fees and out-of-pocket expenses were reduced by $560 for transfer agent credits earned.
Global Shareholder Yield Fund | Annual report
30
Class level expenses for the year ended February 29, 2008, were as follows:
| | | | |
| | Distribution and | Transfer | Blue | Printing and |
| Share class | service fees | agent fees | sky fees | postage fees |
|
| Class A | $74,931 | $24,181 | $13,646 | $8,978 |
| Class B | 9,128 | 1,877 | 12,572 | 195 |
| Class C | 27,576 | 5,641 | 13,228 | 812 |
| Class I | — | 1,091 | 16,329 | 729 |
| Class R1 | 689 | 206 | 14,796 | 89 |
| Total | $112,324 | $32,996 | $70,571 | $10,803 |
4. Trustees’ fees
The Trust compensates each Trustee who is not an employee of the Adviser or its affiliates. Total Trustees’ expenses are allocated to the Fund based on its average daily net asset value.
5. Line of credit
The Fund has entered into an agreement which enables them to participate in a $100 million unsecured committed line of credit with State Street Corporation. Borrowings will be made solely to temporarily finance the repurchase of capital shares. Interest is charged to the Fund based on its borrowings at a rate per annum equal to the Federal Funds rate plus 0.50% . In addition, a commitment fee of 0.05% per annum, payable at the end of each calendar quarter, based on the average daily-unused portion of the line of credit, is charged to the Fund on a prorated basis based on average net assets. Effective October 15, 2007, the commitment fee was changed from 0.07% to 0.05% . For the year ended February 29, 2008, there were no borrowings under the line of credit.
Annual report | Global Shareholder Yield Fund
31
6. Fund share transactions
Share activities for the Fund for the year ended February 29, 2008, were as follows:
| | |
| | Year ended 2-29-08 |
| | Shares | Amount |
| Class A shares | | |
|
| Sold | 3,579,005 | $36,990,887 |
| Distributions reinvested | 74,870 | 786,460 |
| Repurchased | (778,581) | (8,201,185) |
| Net increase (decrease) | 2,875,294 | $29,576,162 |
| |
| Class B shares | | |
|
| Sold | 152,636 | $1,617,383 |
| Distributions reinvested | 2,550 | 26,721 |
| Repurchased | (22,055) | (222,085) |
| Net increase (decrease) | 133,131 | $1,422,019 |
| |
| Class C shares | | |
|
| Sold | 545,185 | $5,766,651 |
| Distributions reinvested | 7,254 | 75,951 |
| Repurchased | (70,535) | (720,096) |
| Net increase (decrease) | 481,904 | $5,122,506 |
| |
| Class I shares | | |
|
| Sold | 373,901 | $3,986,954 |
| Distributions reinvested | 2,569 | 26,908 |
| Repurchased | (58,546) | (611,454) |
| Net increase (decrease) | 317,924 | $3,402,408 |
| |
| Class R1 shares | | |
|
| Sold | 10,000 | $100,000 |
| Distributions reinvested | 293 | 3,078 |
| Net increase (decrease) | 10,293 | $103,078 |
| |
| Net increase (decrease) | 3,818,546 | $39,626,173 |
|
7. Purchases and sales of securities
Purchases and proceeds from sales or maturities of securities, other than short-term securities and obligations of the U.S. government, during the year ended February 29, 2008, aggregated $43,551,383 and $6,978,600, respectively.
Global Shareholder Yield Fund | Annual report
32
Auditors’ report
Report of Independent Registered Public Accounting Firm
To the Board of Trustees of John Hancock Funds III and Shareholders of John Hancock Global Shareholder Yield Fund,
In our opinion, the accompanying statement of assets and liabilities, including the schedule of investments, and the related statements of operations and of changes in net assets and the financial highlights present fairly, in all material respects, the financial position of John Hancock Global Shareholder Yield Fund (the Fund) at February 29, 2008, and the results of its operations, the changes in its net assets and the financial highlights for the period March 1, 2007 (commencement of operations), through February 29, 2008, in conformity with accounting principles generally accepted in the United States of America. These financial statements and financial highlights (hereafter referred to as "financial statements") are the responsibility of the Fund's management. Our responsibility is to express an opinion on these financial statements based on our audit. We conducted our audit of these financial statements in accordance with the standards of the Public Company Account ing Oversight Board (United States). Those standards require that we plan and perform the audit to obtain reasonable assurance about whether the financial statements are free of material misstatement. An audit includes examining, on a test basis, evidence supporting the amounts and disclosures in the financial statements, assessing the accounting principles used and significant estimates made by management, and evaluating the overall financial statement presentation. We believe that our audit, which included confirmation of investments at February 29, 2008 by correspondence with the custodian and brokers, provides a reasonable basis for our opinion.
PricewaterhouseCoopers LLP
Boston, Massachusetts
April 18, 2008
Annual report | Global Shareholder Yield Fund
33
Tax information
Unaudited
For federal income tax purposes, the following information is furnished with respect to the distributions of the Fund, if any, paid during its taxable year ended February 29, 2008.
With respect to the ordinary dividends paid by the Fund for the fiscal year ended February 29, 2008, 100.00% of the dividends qualifies for the corporate dividends-received deduction.
The Fund hereby designates the maximum amount allowable of its net taxable income as qualified dividend income as provided in the Jobs and Growth Tax Relief Reconciliation Act of 2003. This amount will be reflected on Form 1099-DIV for the calendar year 2008.
Shareholders will be mailed a 2008 U.S. Treasury Department Form 1099-DIV in January 2009. This will reflect the total of all distributions that are taxable for calendar year 2008.
Global Shareholder Yield Fund | Annual report
34
Trustees and Officers
This chart provides information about the Trustees and Officers who oversee your John Hancock fund. Officers elected by the Trustees manage the day-to-day operations of the Fund and execute policies formulated by the Trustees.
Independent Trustees
| | |
| Name, Year of Birth | | Number of John |
| Position(s) held with Fund | Trustee | Hancock Funds |
| Principal occupation(s) and other | of Fund | overseen by |
| directorships during past 5 years | since 1 | Trustee |
| |
| James F. Carlin, Born: 1940 | 2007 | 55 |
|
| Chairman (since December 2007); Director and Treasurer, Alpha Analytical Laboratories, Inc. (chemical |
| analysis) (since 1985); Part Owner and Treasurer, Lawrence Carlin Insurance Agency, Inc. (since 1995); |
| Part Owner and Vice President, Mone Lawrence Carlin Insurance Agency, Inc. (until 2005); Chairman |
| and Chief Executive Officer, Carlin Consolidated, Inc. (management/investments) (since 1987); Trustee, |
| Massachusetts Health and Education Tax Exempt Trust (1993–2003) . | | |
|
| |
| William H. Cunningham, Born: 1944 | 2007 | 55 |
|
| Professor, University of Texas at Austin (since 1971); former Chancellor, University of Texas System and |
| former President, University of Texas at Austin (until 2001); Chairman and Chief Executive Officer, IBT |
| Technologies (until 2001); Director of the following: Hicks Acquisition Company I, Inc. (since 2007); |
| Hire.com (until 2004), STC Broadcasting, Inc. and Sunrise Television Corp. (until 2001), Symtx, Inc. |
| (electronic manufacturing) (since 2001), Adorno/Rogers Technology, Inc. (until 2004), Pinnacle |
| Foods Corporation (until 2003), rateGenius (until 2003), Lincoln National Corporation (insurance) |
| (since 2006), Jefferson-Pilot Corporation (diversified life insurance company) (until 2006), New |
| Century Equity Holdings (formerly Billing Concepts) (until 2001), eCertain (until 2001), ClassMap.com |
| (until 2001), Agile Ventures (until 2001), AskRed.com (until 2001), Southwest Airlines (since 2000), |
| Introgen (manufacturer of biopharmaceuticals) (since 2000) and Viasystems Group, Inc. (electronic |
| manufacturer) (until 2003); Advisory Director, Interactive Bridge, Inc. (college fundraising) (until 2001); |
| Advisory Director, Q Investments (until 2003); Advisory Director, JPMorgan Chase Bank (formerly Texas |
| Commerce Bank–Austin), LIN Television (until 2008), WilTel Communications (until 2003) and Hayes |
| Lemmerz International, Inc. (diversified automotive parts supply company) (since 2003) . | |
|
| |
| Charles L. Ladner, 2 Born: 1938 | 2007 | 55 |
|
| Chairman and Trustee, Dunwoody Village, Inc. (retirement services) (until 2003); Senior Vice President |
| and Chief Financial Officer, UGI Corporation (public utility holding company) (retired 1998); Vice |
| President and Director, AmeriGas, Inc. (retired 1998); Director, AmeriGas Partners, L. P. (gas distribution) |
| (until 1997); Director, EnergyNorth, Inc. (until 1997); Director, Parks and History Association (until 2005) . |
|
| |
| John A. Moore, 2 Born: 1939 | 2007 | 55 |
|
| President and Chief Executive Officer, Institute for Evaluating Health Risks (nonprofit institution) |
| (until 2001); Senior Scientist, Sciences International (health research) (until 2003); Former Assistant |
| Administrator and Deputy Administrator, Environmental Protection Agency; Principal, Hollyhouse |
| (consulting) (since 2000); Director, CIIT Center for Health Science Research (nonprofit research) |
| (until 2007) . | | |
Annual report | Global Shareholder Yield Fund
35
Independent Trustees (continued)
| | |
| Name, Year of Birth | | Number of John |
| Position(s) held with Fund | Trustee | Hancock Funds |
| Principal occupation(s) and other | of Fund | overseen by |
| directorships during past 5 years | since 1 | Trustee |
| |
| Patti McGill Peterson, 2 Born: 1943 | 2007 | 55 |
|
| Senior Associate, Institute for Higher Education Policy (since 2007); Executive Director, Council for |
| International Exchange of Scholars and Vice President, Institute of International Education (until 2007); |
| Senior Fellow, Cornell Institute of Public Affairs, Cornell University, Ithaca, NY (until 1998); Former |
| President, Wells College, Aurora, NY, and St. Lawrence University, Canton, NY; Director, Niagara |
| Mohawk Power Corporation (until 2003); Director, Ford Foundation, International Fellowships Program |
| (since 2002); Director, Lois Roth Endowment (since 2002); Director, Council for International Educational |
| Exchange (since 2003) . | | |
|
| |
| Steven R. Pruchansky, Born: 1944 | 2007 | 55 |
|
| Chairman and Chief Executive Officer, Greenscapes of Southwest Florida, Inc. (since 2000); Director and |
| President, Greenscapes of Southwest Florida, Inc. (until 2000); Managing Director, JonJames, LLC (real |
| estate) (since 2000); Director, First Signature Bank & Trust Company (until 1991); Director, Mast Realty |
| Trust (until 1994); President, Maxwell Building Corp. (until 1991) . | | |
Non-Independent Trustees 3
| | |
| Name, Year of Birth | | Number of John |
| Position(s) held with Fund | Trustee | Hancock Funds |
| Principal occupation(s) and other | of Fund | overseen by |
| directorships during past 5 years | since 1 | Trustee |
| |
| James R. Boyle, Born: 1959 | 2007 | 265 |
|
| Executive Vice President, Manulife Financial Corporation (since 1999); President, John Hancock Variable |
| Life Insurance Company (since March 2007); Executive Vice President, John Hancock Life Insurance |
| Company (since 2004); Chairman and Director, John Hancock Advisers, LLC (the Adviser), John Hancock |
| Funds, LLC and The Berkeley Financial Group, LLC (The Berkeley Group) (holding company) (since 2005); |
| Senior Vice President, The Manufacturers Life Insurance Company (U.S. A. ) (until 2004) . | |
Global Shareholder Yield Fund | Annual report
36
Principal officers who are not Trustees
| |
| Name, Year of Birth | |
| Position(s) held with Fund | Officer |
| Principal occupation(s) and other | of Fund |
| directorships during past 5 years | since |
| |
| Keith F. Hartstein, Born: 1956 | 2007 |
|
| President and Chief Executive Officer | |
| Senior Vice President, Manulife Financial Corporation (since 2004); Director, President and Chief | |
| Executive Officer, the Adviser, The Berkeley Group and John Hancock Funds, LLC (since 2005); Director, |
| MFC Global Investment Management (U.S. ), LLC (MFC Global (U.S. )) (since 2005); Director, John | |
| Hancock Signature Services, Inc. (since 2005); President and Chief Executive Officer, John Hancock |
| Investment Management Services, LLC (since 2006); President and Chief Executive Officer, John Hancock |
| Funds, John Hancock Funds II, John Hancock Funds III and John Hancock Trust (since 2005); Director, |
| Chairman and President, NM Capital Management, Inc. (since 2005); Member, Investment Company |
| Institute Sales Force Marketing Committee (since 2003); President and Chief Executive Officer, MFC |
| Global (U.S. ) (2005–2006); Executive Vice President, John Hancock Funds, LLC (until 2005) . | |
|
| |
| Thomas M. Kinzler, Born: 1955 | 2007 |
|
| Secretary and Chief Legal Officer | |
| Vice President and Counsel, John Hancock Life Insurance Company (U.S. A. ) (since 2006); Secretary and |
| Chief Legal Officer, John Hancock Funds and John Hancock Funds II (since 2006); Chief Legal Officer |
| and Assistant Secretary, John Hancock Trust (since 2006); Vice President and Associate General Counsel, |
| Massachusetts Mutual Life Insurance Company (1999–2006); Secretary and Chief Legal Counsel, MML |
| Series Investment Fund (2000–2006); Secretary and Chief Legal Counsel, MassMutual Institutional Funds |
| (2000–2004); Secretary and Chief Legal Counsel, MassMutual Select Funds and MassMutual Premier |
| Funds (2004–2006) . | |
|
| |
| Francis V. Knox, Jr. , Born: 1947 | 2007 |
|
| Chief Compliance Officer | |
| Vice President and Chief Compliance Officer, John Hancock Investment Management Services, LLC, |
| the Adviser and MFC Global (U.S. ) (since 2005); Vice President and Chief Compliance Officer, John |
| Hancock Funds, John Hancock Funds II, John Hancock Funds III and John Hancock Trust (since 2005); |
| Vice President and Assistant Treasurer, Fidelity Group of Funds (until 2004); Vice President and Ethics & |
| Compliance Officer, Fidelity Investments (until 2001) . | |
|
| |
| Charles A. Rizzo, Born: 1957 | 2007 |
|
| Chief Financial Officer | |
| Chief Financial Officer, John Hancock Funds, John Hancock Funds II, John Hancock Funds III and John |
| Hancock Trust (since June 2007); Assistant Treasurer, Goldman Sachs Mutual Fund Complex (regis- |
| tered investment companies) (2005–June 2007); Vice President, Goldman Sachs (2005–June 2007); |
| Managing Director and Treasurer of Scudder Funds, Deutsche Asset Management (2003–2005); | |
| Director, Tax and Financial Reporting, Deutsche Asset Management (2002–2003); Vice President and |
| Treasurer, Deutsche Global Fund Services (Deutsche Registered Investment Companies) (1999–2002) . |
|
| |
| Gordon M. Shone, Born: 1956 | 2007 |
|
| Treasurer | |
| Senior Vice President, John Hancock Life Insurance Company (U.S. A. ) (since 2001); Treasurer, John |
| Hancock Funds (since 2006), John Hancock Funds II, John Hancock Funds III and John Hancock Trust |
| (since 2005); Vice President and Chief Financial Officer, John Hancock Trust (2003–2005); Vice President, |
| John Hancock Investment Management Services, Inc., John Hancock Advisers, LLC (since 2006) and The |
| Manufacturers Life Insurance Company (U.S. A. ) (1998–2000) . | |
Annual report | Global Shareholder Yield Fund
37
Principal officers who are not Trustees (continued)
| |
| Name, Year of Birth | |
| Position(s) held with Fund | Officer |
| Principal occupation(s) and other | of Fund |
| directorships during past 5 years | since |
| |
| John G. Vrysen, Born: 1955 | 2007 |
|
| Chief Operating Officer | |
| Senior Vice President, Manulife Financial Corporation (since 2006); Director, Executive Vice President |
| and Chief Operating Officer, the Adviser, The Berkeley Group and John Hancock Funds, LLC (since | |
| June 2007); Executive Vice President and Chief Operating Officer, John Hancock Investment | |
| Management Services, LLC (since December 2007); Chief Operating Officer, John Hancock Funds, |
| John Hancock Funds II, John Hancock Funds III and John Hancock Trust (since June 2007); Director, |
| Executive Vice President and Chief Financial Officer, the Adviser, The Berkeley Group and John Hancock |
| Funds, LLC (2005–2007); Executive Vice President and Chief Financial Officer, John Hancock Investment |
| Management Services, LLC (2005–2007); Executive Vice President and Chief Financial Officer, MFC |
| Global (U.S. ) (2005 until August 2007); Director, John Hancock Signature Services, Inc. (since 2005); |
| Chief Financial Officer, John Hancock Funds, John Hancock Funds II, John Hancock Funds III and John |
| Hancock Trust (2005 until June 2007); Vice President and General Manager, John Hancock Fixed | |
| Annuities, U.S. Wealth Management (2004–2005); Vice President, Operations, Manulife Wood Logan |
| (2000–2004) . | |
The business address for all Trustees and Officers is 601 Congress Street, Boston, Massachusetts 02210-2805.
The Statement of Additional Information of the Fund includes additional information about members of the Board of Trustees of the Fund and is available without charge, upon request, by calling 1-800-225-5291.
1 Each Trustee serves until resignation, retirement age or until his or her successor is elected.
2 Member of Audit and Compliance Committee.
3 Non-Independent Trustee holds positions with the Fund’s investment adviser, underwriter and certain other affiliates.
Global Shareholder Yield Fund | Annual report
38
For more information
The Fund’s proxy voting policies, procedures and records are available without charge, upon request:
| | |
| By phone | On the Fund’s Web site | On the SEC’s Web site |
| 1-800-225-5291 | www. jhfunds. com/proxy | www. sec. gov |
|
| Investment adviser | Custodian | Legal counsel |
| John Hancock Investment | State Street Bank & Trust Co. | Kirkpatrick & Lockhart |
| Management Services, LLC | 2 Avenue de Lafayette | Preston Gates Ellis LLP |
| 601 Congress Street | Boston, MA 02111 | One Lincoln Street |
| Boston, MA 02210-2805 | | Boston, MA 02111-2950 |
| Transfer agent | |
| Subadviser | John Hancock Signature | Independent registered |
| Epoch Investment Partners, Inc. | Services, Inc. | public accounting firm |
| 640 Fifth Avenue, 18th Floor | P. O. Box 9510 | PricewaterhouseCoopers LLP |
| New York, NY 10019 | Portsmouth, NH 03802-9510 | 125 High Street |
| | | Boston, MA 02110 |
| Principal distributor | | |
| John Hancock Funds, LLC | | |
| 601 Congress Street | | |
| Boston, MA 02210-2805 | | |
| | |
| How to contact us | |
|
| |
| Internet | www. jhfunds.com | |
|
| |
| Mail | Regular mail: | Express mail: |
| | John Hancock Signature | John Hancock Signature |
| | Services, Inc. | Services, Inc. |
| | P. O. Box 9510 | Mutual Fund Image Operations |
| | Portsmouth, NH 03802-9510 | 164 Corporate Drive |
| | | Portsmouth, NH 03801 |
|
| |
| Phone | Customer service representatives | 1-800-225-5291 |
| | EASI-Line | 1-800-338-8080 |
| | TDD line | 1-800-554-6713 |
|
A listing of month-end portfolio holdings is available on our Web site, www.jhfunds.com. A more detailed portfolio holdings summary is available on a quarterly basis 60 days after the fiscal quarter on our Web site or upon request by calling 1-800-225-5291, or on the SEC’s Web site, www.sec.gov.
Annual report | Global Shareholder Yield Fund
39

1-800-225-5291
1-800-554-6713 TDD
1-800-338-8080 EASI-Line
www. jhfunds.com
Now available: electronic delivery
www. jhfunds.com/edelivery
| | |
| This report is for the information of the shareholders of John Hancock Global Shareholder Yield Fund. | 3200A | 2/08 |
| It is not authorized for distribution to prospective investors unless preceded or accompanied by a prospectus. | | 4/08 |

Discussion of Fund performance
By Pzena Investment Management, LLC
Market environment
U.S. stocks declined during the 12-month period ended February 29, 2008. The market rallied in the first four months of the period, but a meltdown in the subprime mortgage industry, a credit crunch in the financial sector and a slowing U.S. economy led to a sharp increase in volatility and a stock market decline over the last few months.
As growth stocks outperformed value over the past year, the valuation spread between the overall market and its most undervalued segment widened dramatically after several years at very narrow levels. In fact, we have seen large-cap valuation spreads this wide only five times in the last 40 years.
“U.S. stocks declined during the
12-month period ended
February 29, 2008.”
Fund performance
For the year ended February 29, 2008, John Hancock Classic Value Mega Cap Fund’s Class A, Class B, Class C, Class I and Class R1 shares posted total returns of –21.28%, –21.85%, –21.75%, –20.87% and –21.46%, respectively, at net asset value. The Fund trailed both the –7.91% return of the Russell 1000 Value Index and the –6.64% return of the average large value fund, according to Morningstar, Inc.
Portfolio review
The John Hancock Classic Value Mega Cap Fund lagged its benchmark index and peer group average during the period, with most of the underperformance occurring over the last eight months. The recent decline in financial stocks, which comprised the portfolio’s largest sector weighting, had the biggest negative impact on performance. Government-sponsored mortgage enterprises Fannie Mae and Freddie Mac, as well as diversified financial services provider Citigroup, Inc., were the most significant detractors. Outside of financials, telecommunications equipment maker Alcatel-Lucent was the weakest performer.
On the positive side, discount retailer Wal-Mart Stores, Inc. and defense contractor Northrop Grumman Corp. were among the best performance contributors. Railroad operator Union Pacific and software makers Microsoft Corp. and Oracle Corp. also generated solid returns.
This commentary reflects the views of the portfolio managers through the end of the Fund’s period discussed in this report. The managers’ statements reflect their own opinions. As such, they are in no way guarantees of future events and are not intended to be used as investment advice or a recommendation regarding any specific security. They are also subject to change at any time as market and other conditions warrant.
Classic Value Mega Cap Fund | Annual report
6
A look at performance
For the periods ended February 29, 2008
| | | | | | | | | | |
| | | | Average annual returns | | | Cumulative total returns | | |
| | | | with maximum sales charge (POP) | | with maximum sales charge (POP) | | |
| | Inception | | | | | Since | | | | Since |
| Class | date | | 1-year | 5-year | 10-year | inception | 1-year | 5-year | 10-year | inception |
|
| A | 3-1-07 | | –25.24% | — | — | –25.24% | –25.24% | — | — | –25.24% |
|
| B | 3-1-07 | | –25.65 | — | — | –25.65 | –25.65 | — | — | –25.65 |
|
| C | 3-1-07 | | –22.51 | — | — | –22.51 | –22.51 | — | — | –22.51 |
|
| I1 | 3-1-07 | | –20.87 | — | — | –20.87 | –20.87 | — | — | –20.87 |
|
| R11 | 3-1-07 | | –21.46 | — | — | –21.46 | –21.46 | — | — | –21.46 |
|
Performance figures assume all distributions are reinvested. Public offering price (POP) figures reflect maximum sales charge on Class A shares of 5%, and the applicable contingent deferred sales charge (CDSC) on Class B and Class C shares. The Class B shares' CDSC declines annually between years 1 to 6 according to the following schedule: 5, 4, 3, 3, 2, 1%. No sales charge will be assessed after the sixth year. Class C shares held for less than one year are subject to a 1% CDSC. Sales charge is not applicable for Class I and Class R1 shares.
The expense ratios of the Fund, both net (including any fee waivers or expense limitations) and gross (excluding any fee waivers or expense limitations), are set forth according to the most recent publicly available prospectuses for the Fund and may differ from the expense ratios disclosed in the Financial Highlights tables in this report. The waivers and expense limitations are contractual at least until 2-29-08. The net expenses are as follows: Class A — 1.37%, Class B — 2.12%, Class C — 2.12%, Class I — 0.97%, Class R1 — 1.72% . Had the fee waivers and expense limitations not been in place, the gross expenses would be as follows: Class A — 1.42%, Class B — 2.40%, Class C — 2.23%, Class I — 1.08%, Class R1 — 2.35% .
The returns reflect past results and should not be considered indicative of future performance. The return and principal value of an investment will fluctuate so that shares, when redeemed, may be worth more or less than their original cost. Due to market volatility, the Fund's current performance may be higher or lower than the performance shown. For performance data current to the most recent month end, please call 1-800-225-5291 or visit the Fund's Web site at www.jhfunds.com.
The performance table above and the chart on the next page do not reflect the deduction of taxes that a shareholder would pay on fund distributions or the redemption of fund shares.
The Fund's performance results reflect any applicable expense reductions, without which the expenses increase and results would have been less favorable.
Performance is calculated with an opening price (prior day's close) on the inception date.
1 For certain types of investors as described in the Fund's Class I and Class R1 share prospectuses.
Annual report | Classic Value Mega Cap Fund
7
A look at performance
Growth of $10,000
This chart shows what happened to a hypothetical $10,000 investment in Classic Value Mega Cap Fund Class A shares for the period indicated. For comparison, we've shown the same investment in two separate indexes.
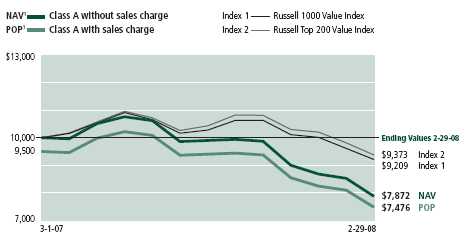
| | | | | |
| | | Without sales | With maximum | | |
| Class | Period beginning | charge | sales charge | Index 1 | Index 2 |
|
| B | 3-1-07 | $7,815 | $7,435 | $9,209 | $9,373 |
|
| C | 3-1-07 | 7,825 | 7,749 | 9,209 | 9,373 |
|
| I2 | 3-1-07 | 7,913 | 7,913 | 9,209 | 9,373 |
|
| R12 | 3-1-07 | 7,854 | 7,854 | 9,209 | 9,373 |
|
Assuming all distributions were reinvested for the period indicated, the table above shows the value of a $10,000 investment in the Fund's Class B, Class C, Class I and Class R1 shares, respectively, as of February 29, 2008. Performance of the classes will vary based on the difference in sales charges paid by shareholders investing in the different classes and the fee structure of those classes.
Russell 1000 Value — Index 1 — is an unmanaged index containing those securities in the Russell 1000 Index with a less-than-average growth orientation.
Russell Top 200 Value — Index 2 — is an unmanaged index which measures the performance of the largest 200 companies within the Russell 3000 Index with a less-than-average growth orientation.
It is not possible to invest directly in an index. Index figures do not reflect sales charges, which would have resulted in lower values if they did.
1 NAV represents net asset value and POP represents public offering price.
2 For certain types of investors as described in the Fund's Class I and Class R1 share prospectuses.
Classic Value Mega Cap Fund | Annual report
8
Your expenses
These examples are intended to help you understand your ongoing operating expenses.
Understanding fund expenses
As a shareholder of the Fund, you incur two types of costs:
■ Transaction costs which include sales charges (loads) on purchases or redemptions (varies by share class), minimum account fee charge, etc.
■ Ongoing operating expenses including management fees, distribution and service fees (if applicable), and other fund expenses.
We are going to present only your ongoing operating expenses here.
Actual expenses/actual returns
This example is intended to provide information about your fund’s actual ongoing operating expenses, and is based on your fund’s actual return. It assumes an account value of $1,000.00 on September 1, 2007, with the same investment held until February 29, 2008.
| | | |
| | Account value | Ending value | Expenses paid during |
| | on 9-1-07 | on 2-29-08 | period on 2-29-081 |
|
| Class A | $1,000.00 | $795.14 | $6.11 |
|
| Class B | 1,000.00 | 791.76 | 9.44 |
|
| Class C | 1,000.00 | 791.99 | 9.45 |
|
| Class I | 1,000.00 | 796.84 | 4.33 |
|
| Class R1 | 1,000.00 | 794.16 | 6.87 |
|
Together with the value of your account, you may use this information to estimate the operating expenses that you paid over the period. Simply divide your account value at February 29, 2008, by $1,000.00, then multiply it by the “expenses paid” for your share class from the table above. For example, for an account value of $8,600.00, the operating expenses should be calculated as follows:
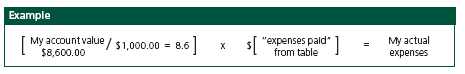
Annual report | Classic Value Mega Cap Fund
9
Your expenses
Hypothetical example for comparison purposes
This table allows you to compare your fund’s ongoing operating expenses with those of any other fund. It provides an example of the Fund’s hypothetical account values and hypothetical expenses based on each class’s actual expense ratio and an assumed 5% annualized return before expenses (which is not your fund’s actual return). It assumes an account value of $1,000.00 on September 1, 2007, with the same investment held until February 29, 2008. Look in any other fund shareholder report to find its hypothetical example and you will be able to compare these expenses.
| | | |
| | Account value | Ending value | Expenses paid during |
| | on 9-1-07 | on 2-29-08 | period on 2-29-081 |
|
| Class A | $1,000.00 | $1,018.05 | $6.87 |
|
| Class B | 1,000.00 | 1,014.32 | 10.62 |
|
| Class C | 1,000.00 | 1,014.32 | 10.62 |
|
| Class I | 1,000.00 | 1,020.04 | 4.87 |
|
| Class R1 | 1,000.00 | 1,017.21 | 7.72 |
|
Remember, these examples do not include any transaction costs, such as sales charges; therefore, these examples will not help you to determine the relative total costs of owning different funds. If transaction costs were included, your expenses would have been higher. See the prospectus for details regarding transaction costs.
1 Expenses are equal to the Fund's annualized expense ratio of 1.37%, 2.12%, 2.12%, 0.97% and 1.54% for Class A, Class B, Class C, Class I and Class R1, respectively, multiplied by the average account value over the period, multiplied by the number of days in most recent fiscal half year/ 366 (to reflect the one-half year period).
Classic Value Mega Cap Fund | Annual report
10
Portfolio summary
| | | | |
| Top 10 holdings1 | | | | |
|
| Alcatel-Lucent | 5.0% | | Northrop Grumman Corp. | 4.1% |
| |
|
| Allstate Corp. | 4.8% | | Bank of America Corp. | 4.1% |
| |
|
| Citigroup, Inc. | 4.5% | | Johnson & Johnson | 3.9% |
| |
|
| Federal Home Loan Mortgage Corp. | 4.3% | | Federal National Mortgage Association | 3.8% |
| |
|
| Capital One Financial Corp. | 4.2% | | Wal-Mart Stores, Inc. | 3.6% |
| |
|
| |
| Sector distribution1 | | | | |
|
| Financial | 44% | | Industrial | 5% |
| |
|
| Consumer non-cyclical | 27% | | Technology | 3% |
| |
|
| Communications | 8% | | Utilities | 3% |
| |
|
| Consumer cyclical | 8% | | Energy | 2% |
| |
|
|
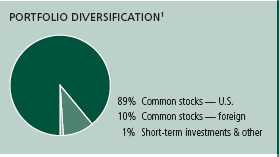
1As a percentage of net assets on February 29, 2008.
Annual report | Classic Value Mega Cap Fund
11
F I N A N C I A L S T A T E M E N T S
Fund’s investments
Securities owned by the Fund on 2-29-08
This schedule is divided into two main categories: common stocks and repurchase agreements. Common stocks are further broken down by industry group. Repurchase agreements, which represent the Fund’s cash position, are listed last.
| | |
| Issuer | Shares | Value |
| |
| Common stocks 99.69% | | $5,344,852 |
|
| (Cost $6,792,857) | | |
| | | |
| Aerospace 4.10% | | 220,108 |
|
| Northrop Grumman Corp. | 2,800 | 220,108 |
| | | |
| Banking 4.08% | | 218,570 |
|
| Bank of America Corp. | 5,500 | 218,570 |
| | | |
| Biotechnology 2.80% | | 150,216 |
|
| Amgen, Inc. * | 3,300 | 150,216 |
| | | |
| Cable & Television 2.82% | | 151,050 |
|
| Viacom, Inc., Class B * | 3,800 | 151,050 |
| | | |
| Cosmetics & Toiletries 2.64% | | 141,767 |
|
| Kimberly-Clark Corp. | 2,175 | 141,767 |
| | | |
| Electronics 0.50% | | 26,715 |
|
| Tyco Electronics, Ltd. | 812 | 26,715 |
| | | |
| Energy 3.17% | | 170,016 |
|
| Sempra Energy | 3,200 | 170,016 |
| | | |
| Financial Services 28.31% | | 1,517,611 |
|
| Capital One Financial Corp. | 4,850 | 223,245 |
|
| Citigroup, Inc. | 10,125 | 240,064 |
|
| Discover Financial Services | 675 | 10,186 |
|
| Federal Home Loan Mortgage Corp. | 9,050 | 227,879 |
|
| Federal National Mortgage Association | 7,275 | 201,154 |
|
| JP Morgan Chase & Company | 4,125 | 167,681 |
|
| Lehman Brothers Holdings, Inc. | 2,950 | 150,420 |
|
| Morgan Stanley | 4,600 | 193,752 |
|
| Washington Mutual, Inc. | 6,975 | 103,230 |
| | | |
| Food & Beverages 3.36% | | 180,007 |
|
| Kraft Foods, Inc., Class A | 5,775 | 180,007 |
| | | |
| Healthcare Products 7.62% | | 408,499 |
|
| Boston Scientific Corp. * | 13,200 | 166,188 |
|
| Covidien, Ltd. | 812 | 34,745 |
|
| Johnson & Johnson | 3,350 | 207,566 |
See notes to financial statements
Classic Value Mega Cap Fund | Annual report
12
F I N A N C I A L S T A T E M E N T S
| | |
| Issuer | Shares | Value |
| | | |
| Healthcare Services 3.31% | | $177,420 |
|
| Cardinal Health, Inc. | 3,000 | 177,420 |
| | | |
| Insurance 11.89% | | 637,477 |
|
| ACE, Ltd. | 2,600 | 146,224 |
|
| Allstate Corp. | 5,425 | 258,935 |
|
| Chubb Corp. | 2,275 | 115,798 |
|
| MetLife, Inc. | 2,000 | 116,520 |
| | | |
| International Oil 1.97% | | 105,414 |
|
| BP PLC, SADR | 1,625 | 105,414 |
| | | |
| Manufacturing 0.61% | | 32,529 |
|
| Tyco International, Ltd. | 812 | 32,529 |
| | | |
| Pharmaceuticals 6.69% | | 358,996 |
|
| Bristol-Myers Squibb Company | 7,625 | 172,401 |
|
| Pfizer, Inc. | 8,375 | 186,595 |
| | | |
| Retail Trade 7.63% | | 408,982 |
|
| Home Depot, Inc. | 3,875 | 102,881 |
|
| Lowe’s Companies, Inc. | 4,650 | 111,460 |
|
| Wal-Mart Stores, Inc. | 3,925 | 194,641 |
| | | |
| Software 3.24% | | 173,858 |
|
| Microsoft Corp. | 3,400 | 92,548 |
|
| Oracle Corp. * | 4,325 | 81,310 |
| | | |
| Telecommunications Equipment & Services 4.95% | | 265,617 |
|
| Alcatel-Lucent, SADR | 45,250 | 265,617 |
| |
| |
| | Principal | |
| | amount | Value |
|
| Repurchase agreements 1.27% | | $68,000 |
|
| (Cost $68,000) | | |
|
| Repurchase Agreement with State Street Corp. dated 2-29-08 at | | |
| 2.35% to be repurchased at $68,013 on 3-3-08, collateralized | | |
| by $65,000 Federal National Mortgage Association, 5.50%, due | | |
| 7-18-16 (valued at $71,419, including interest) | $68,000 | 68,000 |
|
| Total investments (Cost $6,860,857)† 100.96% | | $5,412,852 |
|
| |
| Liabilities in excess of other assets (0.96%) | | ($51,551) |
|
| |
| Total net assets 100.00% | | $5,361,301 |
|
Percentages are stated as a percent of net assets.
SADR Sponsored American Depositary Receipt
* Non-income producing.
† At February 29, 2008, the aggregate cost of investment securities for federal income tax purposes was $6,866,490. Net unrealized depreciation aggregated $1,453,638, of which $44,548 related to appreciated investment securities and $1,498,186 related to depreciated investment securities.
See notes to financial statements
Annual report | Classic Value Mega Cap Fund
13
F I N A N C I A L S T A T E M E N T S
Financial statements
Statement of assets and liabilities 2-29-08
This Statement of Assets and Liabilities is the Fund’s balance sheet. It shows the value of what the Fund owns, is due and owes. You’ll also find the net asset value and the maximum public offering price per share.
| |
| Assets | |
|
| Investments, at value (cost $6,792,857) | $5,344,852 |
| Repurchase agreement, at value (cost $68,000) (Note 2) | 68,000 |
| Total investments, at value (cost $6,860,857) | 5,412,852 |
| Cash | 2,961 |
| Receivable for fund shares sold | 48 |
| Dividends and interest receivable (net of tax) | 7,213 |
| Other assets | 2 |
| | |
| Total assets | 5,423,076 |
| |
| Liabilities | |
|
| Payable for fund shares repurchased | 7,898 |
| Payable to affiliates | |
| Fund administration fees | 172 |
| Transfer agent fees | 1,248 |
| Distribution and service fees | 483 |
| Investment management fees | 10,383 |
| Other payables and accrued expenses | 41,591 |
| | |
| Total liabilities | 61,775 |
| |
| Net assets | |
|
| Capital paid-in | $7,080,863 |
| Undistributed net investment income | 7,815 |
| Accumulated undistributed net realized gain (loss) on investments | (279,372) |
| Net unrealized appreciation (depreciation) on investments | (1,448,005) |
| | |
| Net assets | $5,361,301 |
See notes to financial statements
Classic Value Mega Cap Fund | Annual report
14
F I N A N C I A L S T A T E M E N T S
Statement of assets and liabilities continued
| |
| Net asset value per share | |
|
| The Fund has an unlimited number of shares authorized with no par value. | |
| Net asset value is calculated by dividing the net assets of each class of | |
| shares by the number of outstanding shares in the class. | |
| Class A | |
| Net assets | $4,541,673 |
| Shares outstanding | 597,282 |
| Net asset value and redemption price per share | $7.60 |
| Class B1 | |
| Net assets | $145,430 |
| Shares outstanding | 19,125 |
| Net asset value and offering price per share | $7.60 |
| Class C1 | |
| Net assets | $459,587 |
| Shares outstanding | 60,407 |
| Net asset value and offering price per share | $7.61 |
| Class I | |
| Net assets | $130,852 |
| Shares outstanding | 17,199 |
| Net asset value, and offering price per share | $7.61 |
| Class R1 | |
| Net assets | $83,759 |
| Shares outstanding | 11,032 |
| Net asset value, offering price and redemption price per share | $7.59 |
| |
| Maximum public offering price per share | |
|
| Class A (net asset value per share ÷ 95%)2 | $8.00 |
1 Redemption price per share is equal to the net asset value less any applicable contingent deferred sales charge.
2 On single retail sales of less than $50,000. On sales of $50,000 or more and on group sales the offering price is reduced.
See notes to financial statements
Annual report | Classic Value Mega Cap Fund
15
F I N A N C I A L S T A T E M E N T S
Statement of operations For the year ended 2-29-08
This Statement of Operations summarizes the Fund’s investment income earned and expenses incurred in operating the Fund. It also shows net gains (losses) for the period stated.
| |
| Investment income | |
|
| Dividends | $147,749 |
| Interest | 14,576 |
| Less foreign taxes withheld | (615) |
| | |
| Total investment income | 161,710 |
| |
| Expenses | |
|
| Investment management fees (Note 3) | 50,592 |
| Distribution and service fees (Note 3) | 18,695 |
| Transfer agent fees (Note 3) | 6,350 |
| Fund administration fees (Note 3) | 2,129 |
| Blue sky fees (Note 3) | 64,675 |
| Audit and legal fees | 34,358 |
| Printing and postage fees (Note 3) | 4,372 |
| Custodian fees | 14,178 |
| Trustees’ fees (Note 4) | 215 |
| Registration and filing fees | 10,606 |
| Miscellaneous | 95 |
| | |
| Total expenses | 206,265 |
| Less expense reductions (Note 3) | (121,245) |
| | |
| Net expenses | 85,020 |
| | |
| Net investment income | 76,690 |
| |
| Realized and unrealized gain (loss) | |
|
| Net realized gain (loss) on investments in unaffiliated issuers | (144,795) |
| | (144,795) |
| Change in net unrealized appreciation (depreciation) of | |
| investments in unaffiliated issuers | (1,448,005) |
| | (1,448,005) |
| Net realized and unrealized gain (loss) | (1,592,800) |
| Increase (decrease) in net assets from operations | ($1,516,110) |
See notes to financial statements
Classic Value Mega Cap Fund | Annual report
16
F I N A N C I A L S T A T E M E N T S
Statement of changes in net assets
This Statement of Changes in Net Assets show how the value of the Fund’s net assets has changed since inception. The difference reflects earnings less expenses, any investment gains and losses, distributions, if any, paid to shareholders and the net of Fund share transactions.
| |
| | Year |
| | ended |
| | 2-29-08 |
|
| Increase (decrease) in net assets | |
|
| From operations | |
| Net investment income | $76,690 |
| Net realized gain (loss) | (144,795) |
| Change in net unrealized appreciation (depreciation) | (1,448,005) |
| | |
| Increase (decrease) in net assets resulting from operations | (1,516,110) |
| | |
| Distributions to shareholders | |
| From net investment income | |
| Class A | (65,289) |
| Class B | (691) |
| Class C | (2,761) |
| Class I | (2,886) |
| Class R1 | (1,138) |
| From net realized gain | |
| Class A | (114,341) |
| Class B | (2,856) |
| Class C | (11,361) |
| Class I | (3,867) |
| Class R1 | (2,159) |
| Total distributions | (207,349) |
| |
| From Fund share transactions (Note 6) | 7,084,760 |
| | |
| Total increase (decrease) | 5,361,301 |
| |
| Net assets | |
|
| Beginning of year | — |
| End of year | $5,361,301 |
| Undistributed net investment income | $7,815 |
See notes to financial statements
Annual report | Classic Value Mega Cap Fund
17
F I N A N C I A L S T A T E M E N T S
Financial highlights
The Financial Highlights show how the Fund’s net asset value for a share has changed since inception.
| |
| CLASS A SHARES | |
| |
| Period ended | 2-29-081 |
| |
| Per share operating performance | |
|
| Net asset value, beginning of period | $10.00 |
| Net investment income2 | 0.13 |
| Net realized and unrealized gain | |
| (loss) on investments | (2.23) |
| Total from investment operations | (2.10) |
| Less distributions | |
| From net investment income | (0.11) |
| From net realized gain | (0.19) |
| | (0.30) |
| Net asset value, end of period | $7.60 |
| Total return3,4 (%) | (21.28) |
| |
| Ratios and supplemental data | |
|
| Net assets, end of period (in millions) | $5 |
| Ratios (as a percentage of average net assets): | |
| Expenses before reductions | 2.52 |
| Expenses net of fee waivers, if any | 1.37 |
| Expenses net of all fee waivers and credits | 1.37 |
| Net investment income | 1.34 |
| Portfolio turnover (%) | 38 |
1 Class A shares began operations on 3-1-07.
2 Based on the average of the shares outstanding.
3 Assumes dividend reinvestment.
4 Total returns would have been lower had certain expenses not been reduced during the period shown.
See notes to financial statements
Classic Value Mega Cap Fund | Annual report
18
F I N A N C I A L S T A T E M E N T S
Financial highlights
| |
| CLASS B SHARES | |
| |
| Period ended | 2-29-081 |
| |
| Per share operating performance | |
|
| Net asset value, beginning of period | $10.00 |
| Net investment income2 | 0.05 |
| Net realized and unrealized gain | |
| (loss) on investments | (2.21) |
| Total from investment operations | (2.16) |
| Less distributions | |
| From net investment income | (0.05) |
| From net realized gain | (0.19) |
| | (0.24) |
| Net asset value, end of period | $7.60 |
| Total return3,4 (%) | (21.85) |
| |
| Ratios and supplemental data | |
|
| Net assets, end of period (in millions) | — 5 |
| Ratios (as a percentage of average net assets): | |
| Expenses before reductions | 11.98 |
| Expenses net of fee waivers, if any | 2.12 |
| Expenses net of all fee waivers and credits | 2.12 |
| Net investment income | 0.58 |
| Portfolio turnover (%) | 38 |
1 Class B shares began operations on 3-1-07.
2 Based on the average of the shares outstanding.
3 Assumes dividend reinvestment.
4 Total returns would have been lower had certain expenses not been reduced during the period shown.
5 Less than $500,000.
See notes to financial statements
Annual report | Classic Value Mega Cap Fund
19
F I N A N C I A L S T A T E M E N T S
Financial highlights
| |
| CLASS C SHARES | |
| |
| Period ended | 2-29-081 |
| |
| Per share operating performance | |
|
| Net asset value, beginning of period | $10.00 |
| Net investment income2 | 0.06 |
| Net realized and unrealized gain | |
| (loss) on investments | (2.21) |
| Total from investment operations | (2.15) |
| Less distributions | |
| From net investment income | (0.05) |
| From net realized gain | (0.19) |
| | (0.24) |
| Net asset value, end of period | $7.61 |
| Total return3,4 (%) | (21.75) |
| |
| Ratios and supplemental data | |
|
| Net assets, end of period (in millions) | — 5 |
| Ratios (as a percentage of average net assets): | |
| Expenses before reductions | 6.38 |
| Expenses net of fee waivers, if any | 2.12 |
| Expenses net of all fee waivers and credits | 2.12 |
| Net investment income | 0.68 |
| Portfolio turnover (%) | 38 |
1 Class C shares began operations on 3-1-07.
2 Based on the average of the shares outstanding.
3 Assumes dividend reinvestment.
4 Total returns would have been lower had certain expenses not been reduced during the period shown.
5 Less than $500,000.
See notes to financial statements
Classic Value Mega Cap Fund | Annual report
20
F I N A N C I A L S T A T E M E N T S
Financial highlights
| |
| CLASS I SHARES | |
| |
| Period ended | 2-29-081 |
| |
| Per share operating performance | |
|
| Net asset value, beginning of period | $10.00 |
| Net investment income2 | 0.17 |
| Net realized and unrealized gain | |
| (loss) on investments | (2.23) |
| Total from investment operations | (2.06) |
| Less distributions | |
| From net investment income | (0.14) |
| From net realized gain | (0.19) |
| | (0.33) |
| Net asset value, end of period | $7.61 |
| Total return3,4 (%) | (20.87) |
| |
| Ratios and supplemental data | |
|
| Net assets, end of period (in millions) | — 5 |
| Ratios (as a percentage of average net assets): | |
| Expenses before reductions | 13.02 |
| Expenses net of fee waivers, if any | 0.97 |
| Expenses net of all fee waivers and credits | 0.97 |
| Net investment income | 1.80 |
| Portfolio turnover (%) | 38 |
1 Class I shares began operations on 3-1-07.
2 Based on the average of the shares outstanding.
3 Assumes dividend reinvestment.
4 Total returns would have been lower had certain expenses not been reduced during the period shown.
5 Less than $500,000.
See notes to financial statements
Annual report | Classic Value Mega Cap Fund
21
F I N A N C I A L S T A T E M E N T S
Financial highlights
| |
| CLASS R1 SHARES | |
| |
| Period ended | 2-29-081 |
| |
| Per share operating performance | |
|
| Net asset value, beginning of period | $10.00 |
| Net investment income2 | 0.11 |
| Net realized and unrealized gain | |
| (loss) on investments | (2.23) |
| Total from investment operations | (2.12) |
| Less distributions | |
| From net investment income | (0.10) |
| From net realized gain | (0.19) |
| | (0.29) |
| Net asset value, end of period | $7.59 |
| Total return3,4 (%) | (21.46) |
| |
| Ratios and supplemental data | |
|
| Net assets, end of period (in millions) | — 5 |
| Ratios (as a percentage of average net assets): | |
| Expenses before reductions | 13.76 |
| Expenses net of fee waivers, if any | 1.65 |
| Expenses net of all fee waivers and credits | 1.64 |
| Net investment income | 1.08 |
| Portfolio turnover (%) | 38 |
1 Class R1 shares began operations on 3-1-07.
2 Based on the average of the shares outstanding.
3 Assumes dividend reinvestment.
4 Total returns would have been lower had certain expenses not been reduced during the period shown.
5 Less than $500,000.
See notes to financial statements
Classic Value Mega Cap Fund | Annual report
22
Notes to financial statements
1. Organization
John Hancock Classic Value Mega Cap Fund (the Fund) is a non-diversified series of John Hancock Funds III (the Trust). The Trust was established as a Massachusetts business trust on June 9, 2005. The Trust is registered under the Investment Company Act of 1940, as amended (the 1940 Act), as an open-end investment management company. The investment objective of the Fund is to seek long-term growth of capital.
John Hancock Life Insurance Company of New York (John Hancock New York) is a wholly owned subsidiary of John Hancock Life Insurance Company (U.S.A.) (John Hancock USA). John Hancock USA and John Hancock New York are indirect wholly owned subsidiaries of The Manufacturers Life Insurance Company (Manulife), which in turn is a wholly owned subsidiary of Manulife Financial Corporation (MFC), a publicly traded company. MFC and its subsidiaries are known collectively as “Manulife Financial.”
John Hancock Investment Management Services, LLC (the Adviser), a Delaware limited liability company controlled by John Hancock USA, serves as investment adviser for the Trust and John Hancock Funds, LLC (the Distributor), a Delaware limited liability company, an affiliate of the Adviser, serves as principal underwriter.
The Board of Trustees have authorized the issuance of multiple classes of shares of the Fund, including classes designated as Class A, Class B, Class C, Class I and Class R1 shares. Class A, Class B and Class C shares are open to all retail investors. Class I shares are offered without any sales charge to various institutional and certain individual investors. Class R1 shares are available only to certain retirement plans. The shares of each class represent an interest in the same portfolio of investments of the Fund, and have equal rights as to voting, redemptions, dividends and liquidation, except that certain expenses, subject to the approval of the Board of Trustees, may be applied differently to each class of shares in accordance with current regulations of the Securities and Exchange Commission (SEC) and the Internal Revenue Service. Shareholders of a class that bear distribution and service expenses under the terms of a distrib ution plan have exclusive voting rights to that distribution plan. Class B shares will convert to Class A shares eight years after purchase.
The Adviser and other affiliates of John Hancock USA owned 476,456, 10,283, 10,282, 10,398 and 10,348 shares of beneficial interest of Class A, Class B, Class C, Class I and Class R1, respectively, on February 29, 2008.
2. Significant accounting policies
In the preparation of the financial statements, the Fund follows the policies described below. The preparation of financial statements in conformity with accounting principles generally accepted in the United States of America requires management to make estimates and assumptions that affect the reported amounts of assets and liabilities at the date of the financial statements and the reported amounts of income and expenses during the reporting period. Actual results may differ from these estimates.
Security valuation
The net asset value of the shares of the Fund is determined daily as of the close of the New York Stock Exchange (NYSE), normally at 4:00 P.M., Eastern Time. Short-term debt investments that have a remaining maturity of 60 days or less are valued at amortized cost, and thereafter assume a constant amortization to maturity of any discount or premium, which approximates market value. All other securities held by the Fund are valued at the last sale price or official closing price (closing bid price or last evaluated quote if no sale has occurred)
Annual report | Classic Value Mega Cap Fund
23
as of the close of business on the principal securities exchange (domestic or foreign) on which they trade or, lacking any sales, at the closing bid price. Securities traded only in the over-the-counter market are valued at the last bid price quoted by brokers making markets in the securities at the close of trading. Securities for which there are no such quotations, principally debt securities, are valued based on the evaluated prices provided by an independent pricing service, which utilizes both dealer-supplied and electronic data processing techniques, which take into account factors such as institutional-size trading in similar groups of securities, yield, quality, coupon rate, maturity, type of issue, trading characteristics and other market data.
Other assets and securities for which no such quotations are readily available are valued at fair value as determined in good faith under consistently applied procedures established by and under the general supervision of the Board of Trustees. Generally, trading in non-U.S. securities is substantially completed each day at various times prior to the close of trading on the NYSE. The values of such securities used in computing the net asset value of a Fund’s shares are generally determined as of such times. Occasionally, significant events that affect the values of such securities may occur between the times at which such values are generally determined and the close of the NYSE. Upon such an occurrence, these securities will be valued at fair value as determined in good faith under consistently applied procedures established by and under the general supervision of the Board of Trustees.
In deciding whether to make a fair value adjustment to the price of a security, the Board of Trustees or their designee may review a variety of factors, including developments in foreign markets, the performance of U.S. securities markets and the performance of instruments trading in U.S. markets that represent foreign securities and baskets of foreign securities. The Fund may also fair value securities in other situations, for example, when a particular foreign market is closed, but the Fund is calculating the net asset value. In view of these factors, it is likely that Funds investing significant amounts of assets in securities in foreign markets will be fair valued more frequently than Funds investing significant amounts of assets in frequently traded, U.S. exchange listed securities of large-capitalization U.S. issuers.
For purposes of determining when fair value adjustments may be appropriate with respect to Funds that invest in securities in foreign markets that close prior to the NYSE, the Fund will, on an ongoing basis, monitor for “significant market events.” A significant market event may be a certain percentage change in the value of an index or of certain Exchange Traded Funds that track foreign markets in which Funds have significant investments. If a significant market event occurs due to a change in the value of the index or of Exchange Traded Funds, the pricing for the Fund will promptly be reviewed and potential adjustments to the net asset value of the Fund will be recommended to the Trust’s Pricing Committee when applicable.
Fair value pricing of securities is intended to help ensure that the net asset value of the Fund’s shares reflects the value of the Fund’s securities as of the close of the NYSE (as opposed to a value which is no longer accurate as of such close), thus limiting the opportunity for aggressive traders to purchase shares of the Fund at deflated prices, reflecting stale security valuations, and to promptly sell such shares at a gain. However, a security’s valuation may differ depending on the method used for determining value and no assurance can be given that fair value pricing of securities will successfully eliminate all potential opportunities for such trading gains.
New accounting pronouncement
In September 2006, Financial Accounting Standards Board (FASB) Standard No. 157, Fair Value Measurements (FAS 157), was issued and is effective for fiscal years beginning after November 15, 2007. FAS 157 defines fair value, establishes a framework for measuring fair value and expands disclosure about fair value measurements. As of February 29, 2008, management does not believe the adoption of FAS 157 will impact the amounts reported in the financial statements; however, additional disclosures regarding pricing sources will be
Classic Value Mega Cap Fund | Annual report
24
required about the inputs used to develop the measurements of fair value and the related realized and unrealized gain/loss for certain securities valued by significant unobservable market inputs.
Guarantees and indemnifications
Under the Trust’s organizational documents, its Officers and Trustees are indemnified against certain liability arising out of the performance of their duties to the Trust. Additionally, in the normal course of business, the Trust enters into contracts with service providers that contain general indemnification clauses. The Trust’s maximum exposure under these arrangements is unknown, as this would involve future claims that may be made against the Trust that have not yet occurred.
Repurchase agreements
The Fund may enter into repurchase agreements. When the Fund enters into a repurchase agreement through its custodian, it receives delivery of securities, the amount of which at the time of purchase and each subsequent business day is required to be maintained at such a level that the market value is generally at least 102% of the repurchase amount. The Fund will take constructive receipt of all securities underlying the repurchase agreements it has entered into until such agreements expire. If the seller defaults, the Fund would suffer a loss to the extent that proceeds from the sale of underlying securities were less than the repurchase amount. The Fund may enter into repurchase agreements maturing within seven days with domestic dealers, banks or other financial institutions deemed to be creditworthy by the Adviser. Collateral for certain tri-party repurchase agreements is held at the custodian bank in a segregated account for the benefit of the Fund and the counterpa rty.
Security transactions and related investment income
Investment security transactions are accounted for on a trade date plus one basis for daily net asset value calculations. However, for financial reporting purposes, investment transactions are reported on trade date. Interest income is accrued as earned. Dividend income and distributions to shareholders are recorded on the ex-dividend date. Foreign dividends are recorded on the ex-date or when the Fund becomes aware of the dividends from cash collections. Discounts/premiums are accreted/ amortized for financial reporting purposes. Non-cash dividends are recorded at the fair market value of the securities received. Debt obligations may be placed in a non-accrual status and related interest income may be reduced by ceasing current accruals and writing off interest receivables when the collection of all or a portion of interest has become doubtful, based upon consistently applied procedures.
From time to time, the Fund may invest in Real Estate Investment Trusts (REITs) and, as a result, will estimate the components of distributions from these securities. Distributions from REITs received in excess of income are recorded as a reduction of cost of investments and/or as a realized gain.
The Fund uses the specific identification method for determining realized gain or loss on investments for both financial statement and federal income tax reporting purposes.
Allocations of income and expenses
All income, expenses (except class-specific expenses), and realized and unrealized gain/ loss are allocated to each class of shares based upon the relative net assets of each class. Dividends to shareholders from net investment income are determined at a class level and distributions from capital gains are determined at a Fund level.
Expenses not directly attributable to the Fund or share classes are allocated based on the relative share of net assets of the Fund or share class at the time the expense was incurred. Class-specific expenses, as detailed in Note 3, are accrued daily and charged directly to the respective share classes.
Federal income taxes
The Fund qualifies as a regulated investment company by complying with the applicable provisions of the Internal Revenue Code and will not be subject to federal income tax on taxable income that is distributed to shareholders. Therefore, no federal income tax provision is required. Net capital losses of $273,739 that are attributable to security transactions
Annual report | Classic Value Mega Cap Fund
25
incurred after October 31, 2007, are treated as arising on March 1, 2008, the first day of the Fund’s next taxable year.
The Fund has adopted the provisions of FASB Interpretation No. 48, Accounting for Uncertainty in Income Taxes, an interpretation of FASB Statement 109 (FIN 48), at the beginning of the Fund’s fiscal year. FIN 48 prescribes a minimum threshold for financial statement recognition of the benefit of a tax position taken or expected to be taken in a tax return. The implementation of FIN 48 did not have a material impact on the Fund’s financial statements. The Fund’s federal tax return for this fiscal year remains subject to examination by the Internal Revenue Service.
Distribution of income and gains
The Fund records distributions to shareholders from net investment income and net realized gains, if any, on the ex-dividend date. During the year ended February 29, 2008, the tax character of distributions paid was as follows: ordinary income $207,349. Distributions paid by the Fund with respect to each class of shares are calculated in the same manner, at the same time and are in the same amount, except for the effect of expenses that may be applied differently to each class.
As of February 29, 2008, the components of distributable earnings on a tax basis included $7,815 of undistributed ordinary income.
Such distributions and distributable earnings, on a tax basis, are determined in conformity with income tax regulations, which may differ from accounting principles generally accepted in the United States of America. Distributions in excess of tax basis earnings and profits, if any, are reported in the Fund’s financial statements as a return of capital.
Capital accounts within financial statements are adjusted for permanent book/tax differences. These adjustments have no impact on net assets or the results of operations. Temporary book/tax differences will reverse in a subsequent period. Permanent book/tax differences are primarily attributable to derivative transactions, foreign currency transactions and investments in passive foreign investment companies.
3. Investment advisory and other agreements
The Trust has entered into an Investment Advisory Agreement with the Adviser. The Adviser is responsible for managing the corporate and business affairs of the Trust and for selecting and compensating subadvisers to handle the investment of the assets of the Fund, subject to the supervision of the Trust’s Board of Trustees. As compensation for its services, the Adviser receives an advisory fee from the Trust. Under the Advisory Agreement, the Fund pays a monthly management fee to the Adviser equivalent, on an annual basis, to the sum of: (a) 0.85% of the first $2,500,000,000 of the Fund’s daily net assets; (b) 0.825% of the next $2,500,000,000 of the Fund’s daily net assets; and (c) 0.80% of the Fund’s daily net assets in excess of $5,000,000,000. The Adviser has a subadvisory agreement with Pzena Investment Management, LLC. The Fund is not responsible for payment of the subadvisory fees.
The investment management fees incurred for the year ended February 29, 2008, were equivalent to an annual effective rate of 0.85% of the Fund’s average daily net assets.
Expense reimbursements
The Adviser has contractually agreed to reimburse or limit certain Fund level expenses to 0.07% of the Fund’s average annual net assets which are allocated pro rata to all share classes. This agreement excludes taxes, portfolio brokerage commissions, interest, advisory fees, Rule 12b-1 fees, transfer agency fees, blue sky fees, printing and postage and litigation and indemnification expenses and other extraordinary expenses not incurred in the ordinary course of the Fund’s business. In addition, fees incurred under any agreement or plans of the Fund dealing with services for the shareholders and others with beneficial interest in shares of the Fund, are excluded.
In addition, the Adviser has agreed to reimburse or limit certain expenses for each share class. This agreement excludes taxes, portfolio brokerage commissions, interest and litigation and indemnification expenses and other extraordinary expenses not incurred in
Classic Value Mega Cap Fund | Annual report
26
the ordinary course of the Fund’s business. In addition, fees incurred under any agreement or plans of the Fund dealing with services for the shareholders and others with beneficial interest in shares of the Fund, are excluded. The reimbursements and limits are such that these expenses will not exceed 1.37% for Class A shares, 2.12% for Class B, 2.12% for Class C, 0.97% for Class I and 1.47% for Class R1. Accordingly, the expense reductions or reimbursements related to this agreement were $59,539, $12,724, $15,015, $18,023 and $15,667 for Class A, Class B, Class C, Class I and Class R1, respectively for the year ended February 29, 2008. The expense reimbursements and limits will continue in effect until June 30, 2009 and thereafter until terminated by the Adviser on notice to the Trust.
Fund administration fees
Pursuant to the Advisory Agreement, the Fund reimburses the Adviser for all expenses associated with providing the administrative, financial, legal, accounting and recordkeeping services of the Fund, including the preparation of all tax returns, annual, semiannual and periodic reports to shareholders and the preparation of all regulatory reports. These expenses are allocated based on the relative share of net assets of each class at the time the expense was incurred.
The fund administration fees incurred for the year ended February 29, 2008, were $2,129 with an annual effective rate of 0.04% of the Fund’s average daily net assets.
Distribution and shareholder servicing fees
The Trust has a Distribution Agreement with the Distributor. The Fund has adopted Distribution Plans with respect to Class A, Class B, Class C and Class R1, pursuant to Rule 12b-1 under the 1940 Act, to pay the Distributor for the services it provides as distributor of shares of the Fund. Accordingly, the Fund makes monthly payments to the Distributor at an annual rate not to exceed 0.30%, 1.00%, 1.00% and 0.50% of average daily net asset value of Class A, Class B, Class C and Class R1, respectively. The Trustees approved distribution and service fee payments of 0.25% of average net assets of Class A. A maximum of 0.25% of such payments may be service fees, as defined by the Conduct Rules of Financial Industry Regulatory Authority (formerly the National Association of Securities Dealers). Under the Conduct Rules, curtailment of a portion of the Fund’s 12b-1 payments could occur under certain circumstances.
In addition, the Fund has also adopted a Service Plan for Class R1 shares. Under the Service Plan, the Fund may pay up to 0.25% of Class R1 average daily net asset value for certain other services. The Service Plan fees incurred for the year ended February 29, 2008, were equivalent to an annual effective rate of 0.17% of the Class R1 average daily net assets.
Sales charges
Class A shares are assessed up-front sales charges of up to 5.00% of net asset value of such shares. During the year ended February 29, 2008, the Fund was informed that the Distributor received net up-front sales charges of $28,227 with regard to sales of Class A shares. Of this amount, $4,584 was retained and used for printing prospectuses, advertising, sales literature and other purposes and $23,643 was paid as sales commissions to unrelated broker-dealers.
Class B shares that are redeemed within six years of purchase are subject to a contingent deferred sales charge (CDSC) at declining rates, beginning at 5.00% of the lesser of the current market value at the time of redemption or the original purchase cost of the shares being redeemed. Class C shares that are redeemed within one year of purchase are subject to a CDSC at a rate of 1.00% of the lesser of the current market value at the time of redemption or the original purchase cost of the shares being redeemed. Proceeds from the CDSCs are paid to the Distributor and are used, in whole or in part, to defray its expenses for providing distribution-related services to the Fund in connection with the sale of Class B and Class C shares. During the year ended February 29, 2008, CDSCs received by Distributor amounted to $152 for Class B shares and $931 for Class C shares.
Transfer agent fees
The Fund has a Transfer Agency Agreement with John Hancock Signature Services, Inc. (Signature
Annual report | Classic Value Mega Cap Fund
27
Services), an indirect subsidiary of MFC. For Class A, Class B, Class C, Class I and Class R1 shares, the Fund pays a monthly transfer agent fee at an annual rate of 0.05% of each class’ average daily net assets, plus a fee based on the number of shareholder accounts and reimbursement for certain out-of-pocket expenses. Expenses not directly attributable to a particular class of shares are aggregated and allocated to each class on the basis of its relative net asset value. The Fund pays a monthly fee which is based on an annual rate of $15.00 for each Class A shareholder account, $17.50 for each Class B shareholder account, $16.50 for each Class C shareholder account and $15.00 for each Class R1 shareholder account.
Signature Services has agreed to limit the transfer agent fees so that such fees do not exceed 0.20% annually of Class A, Class B, Class C, Class I and Class R1 share average daily net assets. This agreement is effective until December 31, 2008. Signature Services reserves the right to terminate this limitation in the future. There were no transfer agent fee reductions for Class A, Class B, Class C, Class I and Class R1 shares, respectively, during the year ended February 29, 2008.
In addition, Signature Services has voluntarily agreed to further limit transfer agent fees for Class R1 shares so that such fees do not exceed 0.05% annually of each class’s average daily net assets. For the year ended February 29, 2008, the transfer agent fees reductions for Class R1 were $198.
In May 2007, the Fund began receiving earnings credits from its transfer agent as a result of uninvested cash balances. These credits are used to reduce a portion of the Fund’s transfer agent fees and out-of-pocket expenses. During the year ended February 29, 2008, the Fund’s transfer agent fees and out-of-pocket expenses were reduced by $79 for transfer agent credits earned.
Class level expenses for the year ended February 29, 2008, were as follows:
| | | | |
| | Distribution and | Transfer | Blue | Printing and |
| Share class | service fees | agent fees | sky fees | postage fees |
|
| |
| Class A | $12,991 | $5,023 | $11,555 | $3,535 |
| Class B | 1,292 | 264 | 11,277 | 195 |
| Class C | 3,532 | 717 | 11,277 | 195 |
| Class I | — | 78 | 16,329 | 241 |
| Class R1 | 880 | 268 | 14,237 | 206 |
| Total | $18,695 | $6,350 | $64,675 | $4,372 |
4. Trustees’ fees
The Trust compensates each Trustee who is not an employee of the Adviser or its affiliates. Total Trustees’ expenses are allocated to the Fund based on its average daily net asset value.
5. Line of credit
The Fund has entered into an agreement which enables them to participate in a $100 million unsecured committed line of credit with State Street Corporation. Borrowings will be made solely to temporarily finance the repurchase of capital shares. Interest is charged to the Fund based on its borrowings at a rate per annum equal to the Federal Funds rate plus 0.50% . In addition, a commitment fee of 0.05% per annum, payable at the end of each calendar quarter, based on the average daily-unused portion of the line of credit, is charged to the Fund on a prorated basis based on average net assets. Effective October 15, 2007, the commitment fee was changed from 0.07% to 0.05% . For the year ended February 29, 2008, there were no borrowings under the line of credit.
Classic Value Mega Cap Fund | Annual report
28
6. Fund share transactions
Share activities for the Fund for the year ended February 29, 2008, were as follows:
| | |
| | Year ended 2-29-08 |
| | Shares | Amount |
| Class A shares | | |
|
| Sold | 644,426 | $6,413,956 |
| Distributions reinvested | 20,663 | 172,537 |
| Repurchased | (67,807) | (594,397) |
| Net increase (decrease) | 597,282 | $5,992,096 |
| | | |
| Class B shares | | |
|
| Sold | 20,319 | $195,176 |
| Distributions reinvested | 424 | 3,547 |
| Repurchased | (1,618) | (13,795) |
| Net increase (decrease) | 19,125 | $184,928 |
| | | |
| Class C shares | | |
|
| Sold | 72,248 | $710,339 |
| Distributions reinvested | 1,482 | 12,408 |
| Repurchased | (13,323) | (110,704) |
| Net increase (decrease) | 60,407 | $612,043 |
| | | |
| Class I shares | | |
|
| Sold | 20,337 | $205,270 |
| Distributions reinvested | 809 | 6,753 |
| Repurchased | (3,947) | (30,867) |
| Net increase (decrease) | 17,199 | $181,156 |
| | | |
| Class R1 shares | | |
|
| Sold | 15,442 | $154,310 |
| Distributions reinvested | 362 | 3,018 |
| Repurchased | (4,772) | (42,791) |
| Net increase (decrease) | 11,032 | $114,537 |
| | | |
| Net increase (decrease) | 705,045 | $7,084,760 |
|
7. Purchases and sales of securities
Purchases and proceeds from sales or maturities of securities, other than short-term securities and obligations of the U.S. government, during the year ended February 29, 2008, aggregated $9,133,373 and $2,195,721, respectively.
Annual report | Classic Value Mega Cap Fund
29
Auditors’ report
Report of Independent Registered Public Accounting Firm
To the Board of Trustees of John Hancock Funds III and Shareholders of John Hancock Classic Value Mega Cap Fund,
In our opinion, the accompanying statement of assets and liabilities, including the schedule of investments, and the related statements of operations and of changes in net assets and the financial highlights present fairly, in all material respects, the financial position of John Hancock Classic Value Mega Cap Fund (the Fund) at February 29, 2008, and the results of its operations, the changes in its net assets and the financial highlights for the period March 1, 2007 (commencement of operations), through February 29, 2008, in conformity with accounting principles generally accepted in the United States of America. These financial statements and financial highlights (hereafter referred to as “financial statements”) are the responsibility of the Fund’s management. Our responsibility is to express an opinion on these financial statements based on our audit. We conducted our audit of these financial statements in accordance with the standards of the Public Company Accounting Oversight Board (United States). Those standards require that we plan and perform the audit to obtain reasonable assurance about whether the financial statements are free of material misstatement. An audit includes examining, on a test basis, evidence supporting the amounts and disclosures in the financial statements, assessing the accounting principles used and significant estimates made by management, and evaluating the overall financial statement presentation. We believe that our audit, which included confirmation of investments at February 29, 2008 by correspondence with the custodian and brokers, provides a reasonable basis for our opinion.
PricewaterhouseCoopers LLP
Boston, Massachusetts
April 18, 2008
Classic Value Mega Cap Fund | Annual report
30
Tax information
Unaudited
For federal income tax purposes, the following information is furnished with respect to the distributions of the Fund, if any, paid during its taxable year ended February 29, 2008.
With respect to the ordinary dividends paid by the Fund for the fiscal year ended February 29, 2008, 63.16% of the dividends qualifies for the corporate dividends-received deduction.
The Fund hereby designates the maximum amount allowable of its net taxable income as qualified dividend income as provided in the Jobs and Growth Tax Relief Reconciliation Act of 2003. This amount will be reflected on Form 1099-DIV for the calendar year 2008.
Shareholders will be mailed a 2008 U.S. Treasury Department Form 1099-DIV in January 2009. This will reflect the total of all distributions that are taxable for calendar year 2008.
Annual report | Classic Value Mega Cap Fund
31
Trustees and Officers
This chart provides information about the Trustees and Officers who oversee your John Hancock fund. Officers elected by the Trustees manage the day-to-day operations of the Fund and execute policies formulated by the Trustees.
| | |
| Independent Trustees | | |
| |
| Name, Year of Birth | | Number of |
| Position(s) held with Fund | Trustee | John Hancock |
| Principal occupation(s) and other | of Fund | funds overseen |
| directorships during past 5 years | since1 | by Trustee |
| |
| James F. Carlin, Born: 1940 | 2007 | 55 |
|
| Chairman (since December 2007); Director and Treasurer, Alpha Analytical Laboratories, Inc. (chemical |
| analysis) (since 1985); Part Owner and Treasurer, Lawrence Carlin Insurance Agency, Inc. (since 1995); |
| Part Owner and Vice President, Mone Lawrence Carlin Insurance Agency, Inc. (until 2005); Chairman |
| and Chief Executive Officer, Carlin Consolidated, Inc. (management/investments) (since 1987); Trustee, |
| Massachusetts Health and Education Tax Exempt Trust (1993–2003). | | |
|
| |
| William H. Cunningham, Born: 1944 | 2007 | 55 |
|
| Professor, University of Texas at Austin (since 1971); former Chancellor, University of Texas System and |
| former President, University of Texas at Austin (until 2001); Chairman and Chief Executive Officer, IBT |
| Technologies (until 2001); Director of the following: Hicks Acquisition Company I, Inc. (since 2007); |
| Hire.com (until 2004), STC Broadcasting, Inc. and Sunrise Television Corp. (until 2001), Symtx, Inc. |
| (electronic manufacturing) (since 2001), Adorno/Rogers Technology, Inc. (until 2004), Pinnacle |
| Foods Corporation (until 2003), rateGenius (until 2003), Lincoln National Corporation (insurance) |
| (since 2006), Jefferson-Pilot Corporation (diversified life insurance company) (until 2006), New |
| Century Equity Holdings (formerly Billing Concepts) (until 2001), eCertain (until 2001), ClassMap.com |
| (until 2001), Agile Ventures (until 2001), AskRed.com (until 2001), Southwest Airlines (since 2000), |
| Introgen (manufacturer of biopharmaceuticals) (since 2000) and Viasystems Group, Inc. (electronic |
| manufacturer) (until 2003); Advisory Director, Interactive Bridge, Inc. (college fundraising) (until 2001); |
| Advisory Director, Q Investments (until 2003); Advisory Director, JPMorgan Chase Bank (formerly Texas |
| Commerce Bank–Austin), LIN Television (until 2008), WilTel Communications (until 2003) and Hayes |
| Lemmerz International, Inc. (diversified automotive parts supply company) (since 2003). | |
|
| |
| Charles L. Ladner,2 Born: 1938 | 2007 | 55 |
|
| Chairman and Trustee, Dunwoody Village, Inc. (retirement services) (until 2003); Senior Vice President |
| and Chief Financial Officer, UGI Corporation (public utility holding company) (retired 1998); Vice |
| President and Director, AmeriGas, Inc. (retired 1998); Director, AmeriGas Partners, L.P. (gas distribution) |
| (until 1997); Director, EnergyNorth, Inc. (until 1997); Director, Parks and History Association (until 2005). |
|
| |
| John A. Moore,2 Born: 1939 | 2007 | 55 |
|
| President and Chief Executive Officer, Institute for Evaluating Health Risks (nonprofit institution) |
| (until 2001); Senior Scientist, Sciences International (health research) (until 2003); Former Assistant |
| Administrator and Deputy Administrator, Environmental Protection Agency; Principal, Hollyhouse |
| (consulting) (since 2000); Director, CIIT Center for Health Science Research (nonprofit research) |
| (until 2007). | | |
Classic Value Mega Cap Fund | Annual report
32
| | |
| Independent Trustees (continued) | | |
| |
| Name, Year of Birth | | Number of |
| Position(s) held with Fund | Trustee | John Hancock |
| Principal occupation(s) and other | of Fund | funds overseen |
| directorships during past 5 years | since1 | by Trustee |
| |
| Patti McGill Peterson,2 Born: 1943 | 2007 | 55 |
|
| Senior Associate, Institute for Higher Education Policy (since 2007); Executive Director, Council for |
| International Exchange of Scholars and Vice President, Institute of International Education (until 2007); |
| Senior Fellow, Cornell Institute of Public Affairs, Cornell University, Ithaca, NY (until 1998); Former |
| President, Wells College, Aurora, NY, and St. Lawrence University, Canton, NY; Director, Niagara |
| Mohawk Power Corporation (until 2003); Director, Ford Foundation, International Fellowships Program |
| (since 2002); Director, Lois Roth Endowment (since 2002); Director, Council for International Educational |
| Exchange (since 2003). | | |
|
| |
| Steven R. Pruchansky, Born: 1944 | 2007 | 55 |
|
| Chairman and Chief Executive Officer, Greenscapes of Southwest Florida, Inc. (since 2000); Director and |
| President, Greenscapes of Southwest Florida, Inc. (until 2000); Managing Director, JonJames, LLC (real |
| estate) (since 2000); Director, First Signature Bank & Trust Company (until 1991); Director, Mast Realty |
| Trust (until 1994); President, Maxwell Building Corp. (until 1991). | | |
| |
| Non-Independent Trustees3 | | |
| |
| Name, Year of Birth | | Number of |
| Position(s) held with Fund | Trustee | John Hancock |
| Principal occupation(s) and other | of Fund | funds overseen |
| directorships during past 5 years | since1 | by Trustee |
| |
| James R. Boyle, Born: 1959 | 2007 | 265 |
|
| Executive Vice President, Manulife Financial Corporation (since 1999); President, John Hancock Variable |
| Life Insurance Company (since March 2007); Executive Vice President, John Hancock Life Insurance |
| Company (since 2004); Chairman and Director, John Hancock Advisers, LLC (the Adviser), John Hancock |
| Funds, LLC and The Berkeley Financial Group, LLC (The Berkeley Group) (holding company) (since 2005); |
| Senior Vice President, The Manufacturers Life Insurance Company (U.S.A.) (until 2004). | |
Annual report | Classic Value Mega Cap Fund
| |
| Principal officers who are not Trustees | |
| |
| Name, Year of Birth | |
| Position(s) held with Fund | Officer |
| Principal occupation(s) and other | of Fund |
| directorships during past 5 years | since |
| |
| Keith F. Hartstein, Born: 1956 | 2007 |
|
| President and Chief Executive Officer | |
| Senior Vice President, Manulife Financial Corporation (since 2004); Director, President and Chief | |
| Executive Officer, the Adviser, The Berkeley Group and John Hancock Funds, LLC (since 2005); Director, |
| MFC Global Investment Management (U.S.), LLC (MFC Global (U.S.)) (since 2005); Director, John | |
| Hancock Signature Services, Inc. (since 2005); President and Chief Executive Officer, John Hancock |
| Investment Management Services, LLC (since 2006); President and Chief Executive Officer, John Hancock |
| Funds, John Hancock Funds II, John Hancock Funds III and John Hancock Trust (since 2005); Director, |
| Chairman and President, NM Capital Management, Inc. (since 2005); Member, Investment Company |
| Institute Sales Force Marketing Committee (since 2003); President and Chief Executive Officer, MFC |
| Global (U.S.) (2005–2006); Executive Vice President, John Hancock Funds, LLC (until 2005). | |
|
| |
| Thomas M. Kinzler, Born: 1955 | 2007 |
|
| Secretary and Chief Legal Officer | |
| Vice President and Counsel, John Hancock Life Insurance Company (U.S.A.) (since 2006); Secretary and |
| Chief Legal Officer, John Hancock Funds and John Hancock Funds II (since 2006); Chief Legal Officer |
| and Assistant Secretary, John Hancock Trust (since 2006); Vice President and Associate General Counsel, |
| Massachusetts Mutual Life Insurance Company (1999–2006); Secretary and Chief Legal Counsel, MML |
| Series Investment Fund (2000–2006); Secretary and Chief Legal Counsel, MassMutual Institutional Funds |
| (2000–2004); Secretary and Chief Legal Counsel, MassMutual Select Funds and MassMutual Premier |
| Funds (2004–2006). | |
|
| |
| Francis V. Knox, Jr., Born: 1947 | 2007 |
|
| Chief Compliance Officer | |
| Vice President and Chief Compliance Officer, John Hancock Investment Management Services, LLC, |
| the Adviser and MFC Global (U.S.) (since 2005); Vice President and Chief Compliance Officer, John |
| Hancock Funds, John Hancock Funds II, John Hancock Funds III and John Hancock Trust (since 2005); |
| Vice President and Assistant Treasurer, Fidelity Group of Funds (until 2004); Vice President and Ethics & |
| Compliance Officer, Fidelity Investments (until 2001). | |
|
| |
| Charles A. Rizzo, Born: 1957 | 2007 |
|
| Chief Financial Officer | |
| Chief Financial Officer, John Hancock Funds, John Hancock Funds II, John Hancock Funds III and John |
| Hancock Trust (since June 2007); Assistant Treasurer, Goldman Sachs Mutual Fund Complex (regis- |
| tered investment companies) (2005–June 2007); Vice President, Goldman Sachs (2005–June 2007); |
| Managing Director and Treasurer of Scudder Funds, Deutsche Asset Management (2003–2005); | |
| Director, Tax and Financial Reporting, Deutsche Asset Management (2002–2003); Vice President and |
| Treasurer, Deutsche Global Fund Services (Deutsche Registered Investment Companies) (1999–2002). |
|
| |
| Gordon M. Shone, Born: 1956 | 2007 |
|
| Treasurer | |
| Senior Vice President, John Hancock Life Insurance Company (U.S.A.) (since 2001); Treasurer, John |
| Hancock Funds (since 2006), John Hancock Funds II, John Hancock Funds III and John Hancock Trust |
| (since 2005); Vice President and Chief Financial Officer, John Hancock Trust (2003–2005); Vice President, |
| John Hancock Investment Management Services, Inc., John Hancock Advisers, LLC (since 2006) and The |
| Manufacturers Life Insurance Company (U.S.A.) (1998–2000). | |
Classic Value Mega Cap Fund | Annual report
34
Principal officers who are not Trustees (continued)
| |
| Name, Year of Birth | |
| Position(s) held with Fund | Officer |
| Principal occupation(s) and other | of Fund |
| directorships during past 5 years | since |
| |
| John G. Vrysen, Born: 1955 | 2007 |
|
| Chief Operating Officer | |
| Senior Vice President, Manulife Financial Corporation (since 2006); Director, Executive Vice President |
| and Chief Operating Officer, the Adviser, The Berkeley Group and John Hancock Funds, LLC (since | |
| June 2007); Executive Vice President and Chief Operating Officer, John Hancock Investment | |
| Management Services, LLC (since December 2007); Chief Operating Officer, John Hancock Funds, |
| John Hancock Funds II, John Hancock Funds III and John Hancock Trust (since June 2007); Director, |
| Executive Vice President and Chief Financial Officer, the Adviser, The Berkeley Group and John Hancock |
| Funds, LLC (2005–2007); Executive Vice President and Chief Financial Officer, John Hancock Investment |
| Management Services, LLC (2005–2007); Executive Vice President and Chief Financial Officer, MFC |
| Global (U.S.) (2005 until August 2007); Director, John Hancock Signature Services, Inc. (since 2005); |
| Chief Financial Officer, John Hancock Funds, John Hancock Funds II, John Hancock Funds III and John |
| Hancock Trust (2005 until June 2007); Vice President and General Manager, John Hancock Fixed | |
| Annuities, U.S. Wealth Management (2004–2005); Vice President, Operations, Manulife Wood Logan |
| (2000–2004). | |
The business address for all Trustees and Officers is 601 Congress Street, Boston, Massachusetts 02210-2805.
The Statement of Additional Information of the Fund includes additional information about members of the Board of Trustees of the Fund and is available without charge, upon request, by calling 1-800-225-5291.
1 Each Trustee serves until resignation, retirement age or until his or her successor is elected.
2 Member of Audit and Compliance Committee.
3 Non-Independent Trustee holds positions with the Fund’s investment adviser, underwriter and certain other affiliates.
Annual report | Classic Value Mega Cap Fund
35
For more information
The Fund’s proxy voting policies, procedures and records are available without charge, upon request:
| | |
| By phone | On the Fund’s Web site | On the SEC’s Web site |
| 1-800-225-5291 | www.jhfunds.com/proxy | www.sec.gov |
|
| |
| Investment adviser | Custodian | Legal counsel |
| John Hancock Investment | State Street Bank & Trust Co. | Kirkpatrick & Lockhart |
| Management Services, LLC | 2 Avenue de Lafayette | Preston Gates Ellis LLP |
| 601 Congress Street | Boston, MA 02111 | One Lincoln Street |
| Boston, MA 02210-2805 | | Boston, MA 02111-2950 |
| Transfer agent | |
| Subadviser | John Hancock Signature | Independent registered |
| Pzena Investment | Services, Inc. | public accounting firm |
| Management, LLC | P.O. Box 9510 | PricewaterhouseCoopers LLP |
| 120 West 45th Street, | Portsmouth, NH 03802-9510 | 125 High Street |
| 20th Floor | | Boston, MA 02110 |
| New York, NY 10036 | | |
| | | |
| Principal distributor | | |
| John Hancock Funds, LLC | | |
| 601 Congress Street | | |
| Boston, MA 02210-2805 | | |
| | |
| How to contact us | |
|
| |
| Internet | www.jhfunds.com | |
|
| |
| Mail | Regular mail: | Express mail: |
| | John Hancock Signature | John Hancock Signature |
| | Services, Inc. | Services, Inc. |
| | P.O. Box 9510 | Mutual Fund Image Operations |
| | Portsmouth, NH 03802-9510 | 164 Corporate Drive |
| | | Portsmouth, NH 03801 |
|
| |
| Phone | Customer service representatives | 1-800-225-5291 |
| | EASI-Line | 1-800-338-8080 |
| | TDD line | 1-800-554-6713 |
A listing of month-end portfolio holdings is available on our Web site, www.jhfunds.com. A more detailed portfolio holdings summary is available on a quarterly basis 60 days after the fiscal quarter on our Web site or upon request by calling 1-800-225-5291, or on the SEC’s Web site, www.sec.gov.
Classic Value Mega Cap Fund | Annual report
36

1-800-225-5291
1-800-554-6713 (TDD)
1-800-338-8080 EASI-Line
www.jhfunds.com
Now available: electronic delivery
www.jhfunds.com/edelivery
| | |
| This report is for the information of the shareholders of John Hancock Classic Value Mega Cap Fund. | 3220A | 2/08 |
| It is not authorized for distribution to prospective investors unless preceded or accompanied by a prospectus. | | 4/08 |
ITEM 2. CODE OF ETHICS.
As of the end of the period, February 29, 2008, the registrant has adopted a code of ethics, as defined in Item 2 of Form N-CSR, that applies to its Chief Executive Officer and Chief Financial Officer (respectively, the principal executive officer, the principal financial officer, the “Covered Officers”). A copy of the code of ethics is filed as an exhibit to this Form N-CSR.
ITEM 3. AUDIT COMMITTEE FINANCIAL EXPERT.
The Board of Trustees of the Registrant has determined that it has one “audit committee financial expert” as that term is defined in Item 3(b) of Form N-CSR: Charles L. Ladner who is “independent” as that term is defined in Item 3(a) (2) of Form N-CSR.
ITEM 4. PRINCIPAL ACCOUNTANT FEES AND SERVICES.
(a) Audit Fees
The aggregate fees billed for professional services rendered by the principal accountant, PricewaterhouseCoopers LLP (“PWC”) for the audits of the registrant’s annual financial statements or services that are normally provided by the accountant in connection with statutory and regulatory filings or engagements amounted to $254,400 for the fiscal year ended February 29, 2008 (broken out as follows: John Hancock Classic Mega Cap Fund (commenced operations March 1, 2007) - $24,680, John Hancock Global Shareholder Yield Fund (commenced operations March 1, 2007) - $24,680, John Hancock Intrinsic Value Fund - $24,680, John Hancock Growth Opportunities Fund - $27,410, John Hancock Growth Fund $24,680, John Hancock International Growth Fund - $27,410, John Hancock Value Opportunities Fund - $24,680, John Hancock U.S. Core Fund - $24,680, John Hancock International Core Fund - $28,510 and John Hancock International Allocation Fund - $22,990) and $168,778 for the fisc al year ended February 28, 2007 (broken out as follows: John Hancock Intrinsic Value Fund - $19,913, John Hancock Growth Opportunities Fund - $19,913, John Hancock Growth Fund - $19,113, John Hancock International Growth Fund - $23,354, John Hancock Value Opportunities Fund - $19,913, John Hancock U.S. Core Fund - $19,113, John Hancock International Core Fund - $23,354 and John Hancock International Allocation Portfolio - $24,105).
(b) Audit-Related Services
Audit-related fees for assurance and related services by PWC amounted to $4,992 for the fiscal year ended February 29, 2008 for the 17f-2 count for the John Hancock International Allocation Fund and $34,744 for the fiscal year ended February 28, 2007 for out-of-pocket expenses (broken out as follows: John Hancock Intrinsic Value Fund - $4,343, John Hancock Growth Opportunities Fund - $4,343, John Hancock Growth Fund - $4,343, John Hancock International Growth Fund - $4,343, John Hancock Value Opportunities Fund - $4,343, John Hancock U.S. Core Fund - $4,343, John Hancock International Core Fund - $4,343 and John Hancock International Allocation Portfolio - $4,343) billed to the registrant or to the registrant's investment adviser (not including any sub-adviser whose role is primarily portfolio management and is subcontracted with or overseen by another investment adviser), and any entity controlling, controlled by, or under common control with the adviser that provides ong oing services to the registrant ("control affiliates"). The nature of the services comprising the out-of-pocket expenses was testing conversion of accounting records from one service provider to another involving multiple service providers in the registrant’s initial year.
(c) Tax Fees
The aggregate fees billed for professional services rendered by PWC for the tax compliance, tax advice and tax planning (“tax fees”) amounted to $74,200 for the fiscal year ended February 29, 2008 (broken out as follows: John Hancock Classic Mega Cap Fund - $7,360, John Hancock Global Shareholder Yield Fund - $7,360, John Hancock Intrinsic Value Fund - $7,360, John Hancock Growth Opportunities - $7,620, John Hancock Growth Fund - $7,360, John Hancock
International Growth Fund - $7,620, John Hancock Value Opportunities Fund - $7,360, John Hancock U.S. Core Fund - $7,360, John Hancock International Core Fund - $7,820 and John Hancock International Allocation Portfolio - $6,980) and $59,360 for the fiscal year ended February 28. 2007 (broken out as follows: John Hancock Intrinsic Value Fund - $7,420, John Hancock Growth Opportunities Fund - $7,420, John Hancock Growth Fund - $7,420, John Hancock International Growth Fund - $7,420, John Hancock Value Opportunities Fund - $7,420, John Hancock U.S. Core Fund - $7,420, John Hancock International Core Fund - $7,420 and John Hancock International Allocation Portfolio - $7,420). The nature of the services comprising the tax fees was the review of the registrant’s income and excise tax returns and tax distribution requirements.
(d) All Other Fees
There were no other fees for the fiscal year ended February 29, 2008. Other fees for the fiscal year ended February 28, 2007 amounted to $103,560 for review of merger activity; Growth Opportunities Fund - $45,280 and International Core Fund - $45,280 and $13,000 for the seed audit, billed to the registrant or to the control affiliates.
(e)(1) Audit Committee Pre-Approval Policies and Procedures:
The trust’s Audit Committee must pre-approve all audit and non-audit services provided by the independent registered public accounting firm (the “Auditor”) relating to the operations or financial reporting of the funds. Prior to the commencement of any audit or non-audit services to a fund, the Audit Committee reviews the services to determine whether they are appropriate and permissible under applicable law.
The trust’s Audit Committee has adopted policies and procedures to, among other purposes, provide a framework for the Committee’s consideration of audit-related and non-audit services by the Auditor. The policies and procedures require that any audit-related and non-audit service provided by the Auditor and any non-audit service provided by the Auditor to a fund service provider that relates directly to the operations and financial reporting of a fund are subject to approval by the Audit Committee before such service is provided. Audit-related services provided by the Auditor that are expected to exceed $50,000 per year/per fund are subject to specific pre-approval by the Audit Committee. Tax services provided by the Auditor that are expected to exceed $50,000 per year/per fund are subject to specific pre-approval by the Audit Committee. Other services provided by the Auditor that are expected to exceed $10,000 per year/per fund are subject to specific pre - -approval by the Audit Committee.
All audit services, as well as the audit-related and non-audit services that are expected to exceed the amounts stated above, must be approved in advance of provision of the service by formal resolution of the Audit Committee. At the regularly scheduled Audit Committee meetings, the Committee reviews a report summarizing the services, including fees, provided by the Auditor.
(e)(2) Services approved pursuant to paragraph (c)(7)(i)(C) of Rule 2-01 of Regulation S-X:
Audit-Related Fees, Tax Fees and All Other Fees: There were no amounts that were approved by the Audit Committee pursuant to the de minimis exception under Rule 2-01 of Regulation S-X.
(f) According to PWC for the Reporting Period, the percentage of hours spent on the audit of the registrant's financial statements for the most recent fiscal year that were attributed to work performed by persons who were not full-time, permanent employees of principal accountant was less than 50%.
(g) The aggregate non-audit fees billed by PWC for non-audit services rendered to the registrant and rendered to the registrant's control affiliates for the fiscal year ended February 29, 2008 were $1,509,733 and for the fiscal year ended February 28, 2007 were $872,192.
(h) The registrant’s audit committee of the Board of Trustees has considered the provision of non-audit services that were rendered by PWC to the investment adviser and any control affiliate that provides services that were not pre-approved pursuant to paragraph (c) (7) (ii) of Rule 2-01 of Regulation S-X, to be compatible with maintaining PWC’s independence.
ITEM 5. AUDIT COMMITTEE OF LISTED REGISTRANTS.
The registrant has a separately-designated standing audit committee comprised of independent trustees. The members of the audit committee are as follows:
Dr. John A. Moore - Chairman
Charles L. Ladner
Patti McGill Peterson
ITEM 6. SCHEDULE OF INVESTMENTS.
Not applicable.
ITEM 7. DISCLOSURE OF PROXY VOTING POLICIES AND PROCEDURES FOR CLOSED-END MANAGEMENT INVESTMENT COMPANIES.
Not applicable.
ITEM 8. PORTFOLIO MANAGERS OF CLOSED-END MANAGEMENT INVESTMENT COMPANIES.
Not applicable.
ITEM 9. PURCHASES OF EQUITY SECURITIES BY CLOSED-END MANAGEMENT INVESTMENT COMPANY AND AFFILIATED PURCHASERS.
Not applicable.
ITEM 10. SUBMISSION OF MATTERS TO A VOTE OF SECURITY HOLDERS.
The registrant has adopted procedures by which shareholders may recommend nominees to the registrant's Board of Trustees. A copy of the procedures is filed as an exhibit to this Form N-CSR. See attached “John Hancock Funds – Governance Committee Charter”.
ITEM 11. CONTROLS AND PROCEDURES.
(a) EVALUATION OF DISCLOSURE CONTROLS AND PROCEDURES. The registrant maintains disclosure controls and procedures that are designed to ensure that information required to be disclosed in this Form N-CSR is recorded, processed, summarized and reported within the periods specified in the rules and forms of the Securities and Exchange Commission. Such disclosure controls and procedures include controls and procedures designed to ensure that such information is accumulated and communicated to the registrant’s management, including its principal executive officer and principal financial officer, as appropriate, to allow timely decisions regarding required disclosure.
Within 90 days prior to the filing date of this Form N-CSR, the registrant had carried out an evaluation, under the supervision and with the participation of the registrant’s management, including the registrant's principal executive officer and the registrant’s principal financial officer, of the effectiveness of the design and operation of the registrant’s disclosure controls and procedures relating to information required to be disclosed on Form N-CSR. Based on such evaluation, the registrant’s principal executive officer and principal financial officer concluded that the registrant’s disclosure controls and procedures are operating effectively to ensure that:
(i) information required to be disclosed in this Form N-CSR is recorded, processed, summarized and reported within the periods specified in the rules and forms of the Securities and Exchange Commission, and
(ii) information is accumulated and communicated to the registrant’s management, including its principal executive officer and principal financial officer, as appropriate, to allow timely decisions regarding required disclosure.
(b) CHANGE IN REGISTRANT’S INTERNAL CONTROL: Not applicable.
ITEM 12. EXHIBITS.
(a)(1) See attached Code of Ethics.
(a)(2)(i) CERTIFICATION OF PRINCIPAL EXECUTIVE OFFICER.
(a)(2)(ii) CERTIFICATION OF PRINCIPAL FINANCIAL OFFICER.
(b) CERTIFICATION PURSUANT TO Rule 30a-2(b) OF THE INVESTMENT COMPANY ACT OF 1940.
(c)(1) Submission of Matters to a Vote of Security Holders is attached. See attached “John Hancock Funds – Governance Committee Charter”.
(c)(2) Contact person at the registrant.
SIGNATURES
Pursuant to the requirements of the Securities Exchange Act of 1934 and the Investment Company Act of 1940, the registrant has duly caused this report to be signed on its behalf by the undersigned, thereunto duly authorized.
John Hancock Funds III
By: /s/ Keith F. Hartstein
-------------------------------------
Keith F. Hartstein
President and Chief Executive Officer
Date: April 23, 2008
Pursuant to the requirements of the Securities Exchange Act of 1934 and the Investment Company Act of 1940, this report has been signed below by the following persons on behalf of the registrant and in the capacities and on the dates indicated.
By: /s/ Keith F. Hartstein
-------------------------------------
Keith F. Hartstein
President and Chief Executive Officer
Date: April 23, 2008
By: /s/ Charles A. Rizzo
-------------------------------------
Charles A. Rizzo
Chief Financial Officer
Date: April 23, 2008