| |
| UNITED STATES |
| SECURITIES AND EXCHANGE COMMISSION |
| Washington, D.C. 20549 |
| |
| FORM N-CSR |
| |
| CERTIFIED SHAREHOLDER REPORT OF REGISTERED |
| |
| MANAGEMENT INVESTMENT COMPANIES |
| |
| Investment Company Act file number 811-21777 |
|
| John Hancock Funds III |
| (Exact name of registrant as specified in charter) |
|
| 601 Congress Street, Boston, Massachusetts 02210 |
| |
| (Address of principal executive offices) (Zip code) |
| |
| Salvatore Schiavone |
| Treasurer |
| |
| 601 Congress Street |
|
| Boston, Massachusetts 02210 |
| |
| (Name and address of agent for service) |
| |
| Registrant's telephone number, including area code: 617-663-4497 |
| | |
| Date of fiscal year end: | March 31 |
| |
| Date of reporting period: | March 31, 2011 |

A look at performance
Total returns for the period ended March 31, 2011
| | | | | | |
| | Average annual total returns (%) | | Cumulative total returns (%) | |
| | with maximum sales charge (POP) | | with maximum sales charge (POP) | |
|
| | 1-year | 5-year | 10-year | 1-year | 5-year | 10-year |
|
| Class A1 | 10.64 | 1.22 | 3.45 | 10.64 | 6.23 | 40.36 |
|
| Class B1 | 10.47 | 0.84 | 2.78 | 10.47 | 4.30 | 31.57 |
|
| Class C1 | 14.47 | 1.23 | 2.78 | 14.47 | 6.30 | 31.57 |
|
| Class I1,2 | 16.93 | 2.62 | 4.32 | 16.93 | 13.82 | 52.61 |
|
| Class R11,2 | 15.96 | 1.63 | 3.19 | 15.96 | 8.41 | 36.89 |
|
| Class R31,2 | 16.09 | 1.74 | 3.30 | 16.09 | 8.99 | 38.32 |
|
| Class R41,2 | 16.43 | 2.04 | 3.61 | 16.43 | 10.65 | 42.55 |
|
| Class R51,2 | 16.78 | 2.35 | 3.92 | 16.78 | 12.30 | 46.86 |
|
| Class T1,2 | 10.42 | 0.63 | 2.78 | 10.42 | 3.20 | 31.60 |
|
| Class AdV 1,2 | 16.60 | 2.36 | 4.06 | 16.60 | 12.38 | 48.82 |
|
| Class NAV 1,2 | 17.00 | 2.70 | 4.41 | 17.00 | 14.23 | 53.94 |
|
Performance figures assume all distributions are reinvested. Public offering price (POP) figures reflect maximum sales charge on Class A and Class T shares of 5%, and the applicable contingent deferred sales charge (CDSC) on Class B and Class C shares. The Class B shares’ CDSC declines annually between years 1 to 6 according to the following schedule: 5, 4, 3, 3, 2, 1%. No sales charge will be assessed after the sixth year. Class C shares held for less than one year are subject to a 1% CDSC. Sales charges are not applicable for Class I, R1, R3, R4, R5, ADV and NAV shares.
The expense ratios of the Fund, both net (including any fee waivers or expense limitations) and gross (excluding any fee waivers or expense limitations), are set forth according to the most recent publicly available prospectuses for the Fund and may differ from those disclosed in the Financial Highlights tables in this report. The fee waivers and expense limitations are contractual at least until 7-31-11 for Classes A, B, C, R1, R3, R4, R5, T and ADV. Had the fee waivers and expense limitations not been in place gross expenses would apply. For Classes I and NAV the net expenses equal the gross expenses. The expense ratios are as follows:
| | | | | | | | | | | |
| | Class A | Class B | Class C | Class I | Class R1 | Class R3 | Class R4 | Class R5 | Class T | Class ADV | Class NAV |
| Net (%) | 1.35 | 2.10 | 2.10 | 0.89 | 1.69 | 1.59 | 1.29 | 0.99 | 1.40 | 1.14 | 0.80 |
| Gross (%) | 1.39 | 2.15 | 2.27 | 0.89 | 13.21 | 12.58 | 12.23 | 11.87 | 1.43 | 1.41 | 0.80 |
The returns reflect past results and should not be considered indicative of future performance. The return and principal value of an investment will fluctuate so that shares, when redeemed, may be worth more or less than their original cost. Due to market volatility, the Fund’s current performance may be higher or lower than the performance shown. For performance data current to the most recent month end, please call 1–800–225–5291 or visit the Fund’s Web site at www.jhfunds.com.
The performance table above and the chart on the next page do not reflect the deduction of taxes that a shareholder would pay on fund distributions or the redemption of fund shares. The Fund’s performance results reflect any applicable expense reductions, without which the expenses would increase and results would have been less favorable.
| |
| 6 | Rainier Growth Fund | Annual report |
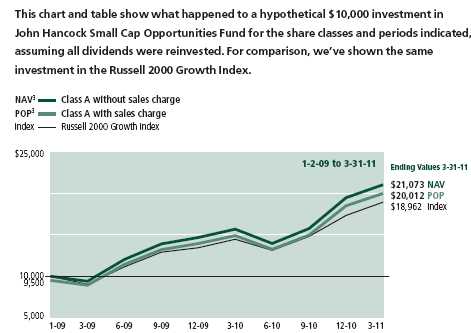
This chart and table show what happened to a hypothetical $10,000 investment in John Hancock Rainier Growth Fund1 for the share classes and periods indicated, assuming all dividends were reinvested. For comparison, we’ve shown the same investment in two separate indexes.

| | | | | | | | | | |
| | | | | |
| Class B1,4 | Class C1,4 | Class I1,2 | Class R11,2 | Class R31,2 | Class R41,2 | Class R51,2 | Class T1,2 | Class ADV1,2 | Class NAV1,2 |
|
| Began | 3-31-01 | 3-31-01 | 3-31-01 | 3-31-01 | 3-31-01 | 3-31-01 | 3-31-01 | 3-31-01 | 3-31-01 | 3-31-01 |
|
| NAV | $13,157 | $13,157 | $15,261 | $13,689 | $13,832 | $14,255 | $14,686 | $13,853 | $14,882 | $15,394 |
|
| POP | $13,157 | $13,157 | $15,261 | $13,689 | $13,832 | $14,255 | $14,686 | $13,160 | $14,882 | $15,394 |
|
| Index 1 | $13,428 | $13,428 | $13,428 | $13,428 | $13,428 | $13,428 | $13,428 | $13,428 | $13,428 | $13,428 |
|
| Index 2 | $13,828 | $13,828 | $13,828 | $13,828 | $13,828 | $13,828 | $13,828 | $13,828 | $13,828 | $13,828 |
|
Russell 1000 growth index is an unmanaged index containing those securities in the Russell 1000 Index with a greater-than-average growth orientation.
S&P 500 index is an unmanaged index that includes 500 widely traded common stocks.
It is not possible to invest directly in an index. Index figures do not reflect sales charges, which would have resulted in lower values if they did.
1 On 4-25-08, through a reorganization, the Fund acquired all of the assets of the Rainier Large Cap Growth Equity Portfolio (the Predecessor Fund). On that date, the Predecessor Fund offered its original share class and institutional share class in exchange for Class A and Class I shares, respectively, of John Hancock Rainier Growth Fund. Class A, Class B, Class C, Class I, Class R1, Class R3, Class R4 Class R5, Class ADV and Class NAV shares of John Hancock Rainier Growth Fund were first offered on 4-28-08. The Predecessor Fund’s original share class returns have been recalculated to reflect the gross fees and expenses of Class A shares. The returns prior to 4-28-08 are those of Class A shares that have been recalculated to apply the gross fees and expenses of Class B, Class C, Class I, Class R1, Class R3, Class R4, Class R5, Class ADV and Class NAV shares, respectively. Class T shares were first offered 10-6-08; the returns prior to this date are those of Class A shares that have been recalculated to apply the gross fees and expenses of Class T shares.
2 For certain types of investors, as described in the Fund’s prospectuses.
3 NAV represents net asset value and POP represents public offering price. Performance of the classes will vary based on the difference in sales charges paid by shareholders investing in the different classes and the fee structure of those classes.
4 The contingent deferred sales charge, if any, is not applicable.
| |
| Annual report | Rainier Growth Fund | 7 |
Management’s discussion of
Fund performance
By Rainier Investment Management, Inc.
The market surprised investors by posting strong gains for the year ended March 31, 2011. The start of the period was rocky last spring as the European debt crisis, anemic economic growth and the possibility of a double-dip recession heightened investor fears. But then, equities began a sharp and sustained rebound in the fall after the Federal Reserve announced another initiative to help stimulate the economy. Stronger economic data, good corporate earnings news and growing evidence that the recovery was taking hold in early 2011 helped the market withstand unexpected shocks from political unrest in the Middle East and Africa and a devastating earthquake and tsunami in Japan.
For the year ended March 31, 2011, John Hancock Rainier Growth Fund’s Class A shares returned 16.44% at net asset value. The Fund’s performance was roughly in line with the average 16.77% advance of its peer group, the Morningstar, Inc. large-cap growth fund category, but lagged the 18.26% return of its benchmark, the Russell 1000 Growth Index. The Fund underperformed the index because of slight deviations in sector weightings which in aggregate hurt performance. Stock selection, which focused on companies with above-average earnings growth and reasonable stock valuations, was helpful.
Producer durables (industrials) had the biggest positive impact on results versus the index, largely because of very strong stock selection in a sector that posted strong gains as the economy recovered. Winners included Cummins, Inc. and Deere & Company. Financial services detracted the most from relative results, largely because of weak stock selection. The sector was one of the year’s worst performers due to pressures from both financial regulatory reform and litigation. Consumer staples also cost us some ground, including an ill-timed investment in Anheuser-Busch InBev NV. Energy overall had little impact on performance versus the index, but accounted for some of the year’s best and worst stock contributors. Standouts included Concho Resources, Inc., an oil company buoyed by a sharp rise in oil prices and Halliburton Company, a worldwide oil services company. In contrast, the Fund did not own ExxonMobil Corp., an integrated energy company that was a large index component. This lack of exposure hampered results versus the index, as rising oil prices lifted the stock.
This commentary reflects the views of the portfolio management team through the end of the Fund’s period discussed in this report. The team’s statements reflect their own opinions. As such, they are in no way guarantees of future events and are not intended to be used as investment advice or a recommendation regarding any specific security. They are also subject to change at any time as market and other conditions warrant.
Past performance is no guarantee of future results.
Sector investing is subject to greater risks than the market as a whole. Because the Fund may focus on particular sectors of the economy, its performance may depend on the performance of those sectors.
| |
| 8 | Rainier Growth Fund | Annual report |
Your expenses
These examples are intended to help you understand your ongoing operating expenses.
Understanding fund expenses
As a shareholder of the Fund, you incur two types of costs:
■ Transaction costs which include sales charges (loads) on purchases or redemptions (varies by share class), minimum account fee charge, etc.
■ Ongoing operating expenses including management fees, distribution and service fees (if applicable), and other fund expenses.
We are going to present only your ongoing operating expenses here.
Actual expenses/actual returns
This example is intended to provide information about the Fund’s actual ongoing operating expenses, and is based on the Fund’s actual return. It assumes an account value of $1,000.00 on October 1, 2010 with the same investment held until March 31, 2011.
| | | |
| | Account value | Ending value | Expenses paid during |
| | on 10-1-10 | on 3-31-11 | period ended 3-31-111 |
|
| Class A | $1,000.00 | $1,165.70 | $6.75 |
|
| Class B | 1,000.00 | 1,160.50 | 11.31 |
|
| Class C | 1,000.00 | 1,160.50 | 11.31 |
|
| Class I | 1,000.00 | 1,168.00 | 4.65 |
|
| Class R1 | 1,000.00 | 1,163.50 | 9.12 |
|
| Class R3 | 1,000.00 | 1,164.10 | 8.58 |
|
| Class R4 | 1,000.00 | 1,166.20 | 6.97 |
|
| Class R5 | 1,000.00 | 1,167.20 | 5.35 |
|
| Class T | 1,000.00 | 1,165.50 | 7.13 |
|
| Class ADV | 1,000.00 | 1,166.70 | 6.16 |
|
| Class NAV | 1,000.00 | 1,168.70 | 4.27 |
|
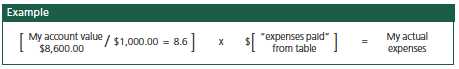
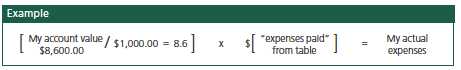
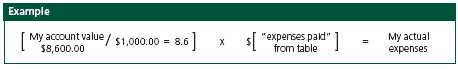
Together with the value of your account, you may use this information to estimate the operating expenses that you paid over the period. Simply divide your account value at March 31, 2011, by $1,000.00, then multiply it by the “expenses paid” for your share class from the table above. For example, for an account value of $8,600.00, the operating expenses should be calculated as follows:
| |
| Annual report | Rainier Growth Fund | 9 |
Your expenses
Hypothetical example for comparison purposes
This table allows you to compare the Fund’s ongoing operating expenses with those of any other fund. It provides an example of the Fund’s hypothetical account values and hypothetical expenses based on each class’s actual expense ratio and an assumed 5% annualized return before expenses (which is not the Fund’s actual return). It assumes an account value of $1,000.00 on October 1, 2010, with the same investment held until March 31, 2011. Look in any other fund shareholder report to find its hypothetical example and you will be able to compare these expenses.
| | | |
| | Account value | Ending value | Expenses paid during |
| | on 10-1-10 | on 3-31-11 | period ended 3-31-111 |
|
| Class A | $1,000.00 | $1,018.70 | $6.29 |
|
| Class B | 1,000.00 | 1,014.50 | 10.55 |
|
| Class C | 1,000.00 | 1,014.50 | 10.55 |
|
| Class I | 1,000.00 | 1,020.60 | 4.33 |
|
| Class R1 | 1,000.00 | 1,016.50 | 8.50 |
|
| Class R3 | 1,000.00 | 1,017.00 | 8.00 |
|
| Class R4 | 1,000.00 | 1,018.50 | 6.49 |
|
| Class R5 | 1,000.00 | 1,020.00 | 4.99 |
|
| Class T | 1,000.00 | 1,018.30 | 6.64 |
|
| Class ADV | 1,000.00 | 1,019.20 | 5.74 |
|
| Class NAV | 1,000.00 | 1,021.00 | 3.98 |
|
Remember, these examples do not include any transaction costs, therefore, these examples will not help you to determine the relative total costs of owning different funds. If transaction costs were included, your expenses would have been higher. See the prospectus for details regarding transaction costs.
1 Expenses are equal to the Fund’s annualized expense ratio of 1.25%, 2.10%, 2.10%, 0.86%, 1.69%, 1.59%, 1.29%, 0.99%, 1.32%, 1.14% and 0.79% for Class A, Class B, Class C, Class I, Class R1, Class R3, Class R4, Class R5, Class T, Class ADV and Class NAV shares, respectively, multiplied by the average account value over the period, multiplied by 182/365 (to reflect the one-half year period).
| |
| 10 | Rainier Growth Fund | Annual report |
Portfolio summary
| | | | |
| Top 10 Holdings (27.8% of Net Assets on 3-31-11)1 | | | |
|
| Apple, Inc. | 5.7% | | Amazon.com, Inc. | 2.4% |
| |
|
| Deere & Company | 3.6% | | QUALCOMM, Inc. | 2.2% |
| |
|
| Oracle Corp. | 2.8% | | Precision Castparts Corp. | 2.0% |
| |
|
| Google, Inc., Class A | 2.7% | | EMC Corp. | 1.9% |
| |
|
| Schlumberger, Ltd. | 2.6% | | National Oilwell Varco, Inc. | 1.9% |
| |
|
| |
| Sector Composition2,3 | | | | |
|
| Information Technology | 29% | | Consumer Staples | 6% |
| |
|
| Industrials | 16% | | Materials | 6% |
| |
|
| Consumer Discretionary | 16% | | Financials | 5% |
| |
|
| Energy | 10% | | Telecommunication Services | 1% |
| |
|
| Health Care | 10% | | Short-Term Investments & Other | 1% |
| |
|
1 Cash and cash equivalents not included in Top 10 Holdings.
2 As a percentage of net assets on 3-31-11.
3 Sector investing is subject to greater risks than the market as a whole. Because the Fund may focus on particular sectors of the economy, its performance may depend on the performance of those sectors.
| |
| Annual report | Rainier Growth Fund | 11 |
Fund’s investments
As of 3-31-11
| | |
| | Shares | Value |
| Common Stocks 98.51% | $1,597,133,556 |
|
| (Cost $1,244,648,649) | | |
| | | |
| Consumer Discretionary 15.56% | | 252,215,408 |
| | | |
| Auto Components 0.89% | | |
|
| TRW Automotive Holdings Corp. (I) | 262,350 | 14,450,232 |
| | | |
| Automobiles 1.39% | | |
|
| Ford Motor Company (I) | 1,505,030 | 22,439,997 |
| | | |
| Hotels, Restaurants & Leisure 3.05% | | |
|
| Las Vegas Sands Corp. (I) | 183,470 | 7,746,103 |
|
| Marriott International, Inc., Class A (L) | 620,480 | 22,076,678 |
|
| McDonald’s Corp. | 257,555 | 19,597,360 |
| | | |
| Internet & Catalog Retail 3.91% | | |
|
| Amazon.com, Inc. (I) | 218,970 | 39,443,066 |
|
| Netflix, Inc. (I) | 28,860 | 6,849,344 |
|
| priceline.com, Inc. (I) | 33,740 | 17,087,286 |
| | | |
| Media 1.46% | | |
|
| The Walt Disney Company | 550,620 | 23,726,216 |
| | | |
| Multiline Retail 1.98% | | |
|
| Kohl’s Corp. | 272,330 | 14,444,383 |
|
| Target Corp. | 353,550 | 17,681,036 |
| | | |
| Specialty Retail 1.68% | | |
|
| Limited Brands, Inc. | 539,350 | 17,733,828 |
|
| Tiffany & Company | 153,460 | 9,428,582 |
| | | |
| Textiles, Apparel & Luxury Goods 1.20% | | |
|
| NIKE, Inc., Class B | 257,745 | 19,511,297 |
| | | |
| Consumer Staples 5.76% | | 93,287,504 |
| | | |
| Beverages 4.69% | | |
|
| Anheuser-Busch InBev NV, ADR (L) | 357,990 | 20,466,288 |
|
| Coca-Cola Enterprises, Inc. | 592,550 | 16,176,615 |
|
| Hansen Natural Corp. (I) | 255,990 | 15,418,278 |
|
| The Coca-Cola Company | 360,190 | 23,898,607 |
| | | |
| Food & Staples Retailing 1.07% | | |
|
| Costco Wholesale Corp. | 236,330 | 17,327,716 |
| | |
| 12 | Rainier Growth Fund | Annual report | See notes to financial statements |
| | |
| | Shares | Value |
| Energy 10.06% | | $163,148,557 |
| | | |
| Energy Equipment & Services 5.51% | | |
|
| Halliburton Company | 340,730 | 16,981,983 |
|
| National Oilwell Varco, Inc. | 381,620 | 30,251,017 |
|
| Schlumberger, Ltd. | 452,070 | 42,160,048 |
| | | |
| Oil, Gas & Consumable Fuels 4.55% | | |
|
| Concho Resources, Inc. (I) | 258,680 | 27,756,364 |
|
| Noble Energy, Inc. | 180,710 | 17,465,622 |
|
| Pioneer Natural Resources Company | 279,960 | 28,533,523 |
| | | |
| Financials 5.46% | | 88,582,540 |
| | | |
| Capital Markets 3.82% | | |
|
| BlackRock, Inc. | 46,980 | 9,443,450 |
|
| Franklin Resources, Inc. | 96,605 | 12,083,353 |
|
| T. Rowe Price Group, Inc. | 422,800 | 28,082,376 |
|
| The Charles Schwab Corp. | 685,370 | 12,357,221 |
| | | |
| Consumer Finance 0.66% | | |
|
| American Express Company | 236,340 | 10,682,568 |
| | | |
| Diversified Financial Services 0.98% | | |
|
| IntercontinentalExchange, Inc. (I) | 128,975 | 15,933,572 |
| | | |
| Health Care 10.00% | | 162,154,630 |
| | | |
| Biotechnology 1.12% | | |
|
| Alexion Pharmaceuticals, Inc. (I)(L) | 80,940 | 7,987,159 |
|
| Celgene Corp. (I) | 177,355 | 10,203,233 |
| | | |
| Health Care Equipment & Supplies 0.88% | | |
|
| Intuitive Surgical, Inc. (I)(L) | 42,780 | 14,265,419 |
| | | |
| Health Care Providers & Services 2.52% | | |
|
| AmerisourceBergen Corp. | 420,210 | 16,623,508 |
|
| Express Scripts, Inc. (I) | 289,020 | 16,072,402 |
|
| HCA Holdings, Inc. (I) | 238,420 | 8,075,285 |
| | | |
| Health Care Technology 0.68% | | |
|
| SXC Health Solutions Corp. (I) | 201,390 | 11,036,172 |
| | | |
| Life Sciences Tools & Services 1.28% | | |
|
| Agilent Technologies, Inc. (I) | 464,780 | 20,812,848 |
| | | |
| Pharmaceuticals 3.52% | | |
|
| Allergan, Inc. | 259,265 | 18,413,000 |
|
| Perrigo Company | 170,590 | 13,565,317 |
|
| Shire PLC, ADR (L) | 182,360 | 15,883,556 |
|
| Teva Pharmaceutical Industries, Ltd., SADR (L) | 183,710 | 9,216,731 |
| | | |
| Industrials 15.77% | | 255,629,495 |
| | | |
| Aerospace & Defense 2.03% | | |
|
| Precision Castparts Corp. | 223,210 | 32,852,048 |
| | | |
| Air Freight & Logistics 1.20% | | |
|
| Expeditors International of Washington, Inc. (L) | 388,270 | 19,467,858 |
| | |
| See notes to financial statements | Annual report | Rainier Growth Fund | 13 |
| | |
| | Shares | Value |
| Electrical Equipment 3.95% | | |
|
| AMETEK, Inc. | 384,330 | $16,860,557 |
|
| Emerson Electric Company | 298,750 | 17,455,963 |
|
| Rockwell Automation, Inc. (L) | 313,880 | 29,708,742 |
| | | |
| Machinery 7.40% | | |
|
| Cummins, Inc. | 179,920 | 19,722,830 |
|
| Deere & Company | 597,710 | 57,912,122 |
|
| Joy Global, Inc. | 170,090 | 16,806,593 |
|
| PACCAR, Inc. (L) | 489,120 | 25,605,432 |
| | | |
| Road & Rail 1.19% | | |
|
| CSX Corp. | 244,750 | 19,237,350 |
| | | |
| Information Technology 28.77% | | 466,499,699 |
| | | |
| Communications Equipment 4.36% | | |
|
| BancTec, Inc. (I)(R) | 197,026 | 837,361 |
|
| F5 Networks, Inc. (I) | 98,880 | 10,142,122 |
|
| Juniper Networks, Inc. (I) | 573,905 | 24,149,922 |
|
| QUALCOMM, Inc. | 648,020 | 35,530,937 |
| | | |
| Computers & Peripherals 9.58% | | |
|
| Apple, Inc. (I) | 263,850 | 91,938,533 |
|
| EMC Corp. (I) | 1,148,735 | 30,498,914 |
|
| Hewlett-Packard Company (I) | 608,650 | 24,936,391 |
|
| NetApp, Inc. (I) | 163,450 | 7,875,021 |
| | | |
| Electronic Equipment, Instruments & Components 0.57% | | |
|
| Corning, Inc. | 446,940 | 9,220,372 |
| | | |
| Internet Software & Services 2.68% | | |
|
| Google, Inc., Class A (I) | 74,270 | 43,537,817 |
| | | |
| IT Services 2.09% | | |
|
| Cognizant Technology Solutions Corp., Class A (I) | 194,310 | 15,816,834 |
|
| Visa, Inc., Class A | 246,475 | 18,145,490 |
| | | |
| Semiconductors & Semiconductor Equipment 1.80% | | |
|
| Broadcom Corp., Class A | 505,475 | 19,905,606 |
|
| Marvell Technology Group, Ltd. (I) | 599,360 | 9,320,048 |
| | | |
| Software 7.69% | | |
|
| Autodesk, Inc. (I) | 326,920 | 14,420,441 |
|
| Check Point Software Technologies, Ltd. (I)(L) | 514,710 | 26,275,946 |
|
| Citrix Systems, Inc. (I) | 167,850 | 12,330,261 |
|
| Intuit, Inc. (I) | 277,250 | 14,721,975 |
|
| Oracle Corp. | 1,376,750 | 45,942,148 |
|
| Salesforce.com, Inc. (I) | 82,000 | 10,953,560 |
| | | |
| Materials 5.65% | | 91,636,536 |
| | |
| Chemicals 3.63% | | |
|
| E.I. du Pont de Nemours & Company | 345,370 | 18,984,989 |
|
| FMC Corp. | 194,035 | 16,479,393 |
|
| Potash Corp. of Saskatchewan, Inc. | 397,050 | 23,398,157 |
| | | |
| Metals & Mining 2.02% | | |
|
| Goldcorp, Inc. | 324,650 | 16,167,570 |
|
| Walter Energy, Inc. | 122,620 | 16,606,427 |
| | |
| 14 | Rainier Growth Fund | Annual report | See notes to financial statements |
| | | |
| | | Shares | Value |
| Telecommunication Services 1.48% | | | $23,979,187 |
| | | |
| Wireless Telecommunication Services 1.48% | | | |
|
| American Tower Corp., Class A (I) | | 462,740 | 23,979,187 |
| |
| | Yield (%) | Shares | Value |
| Securities Lending Collateral 4.57% | | | $74,026,931 |
|
| (Cost $74,024,767) | | | |
| | | | |
| John Hancock Collateral Investment Trust (W) | 0.2867 (Y) | 7,397,589 | 74,026,931 |
| |
| | | Par value | Value |
| |
| Short-Term Investments 0.70% | | | $11,417,000 |
|
| (Cost $11,417,000) | | | |
| | | | |
| Repurchase Agreement 0.70% | | | 11,417,000 |
| Repurchase Agreement with State Street Corp. dated 3-31-11 at | | | |
| 0.010% to be repurchased at $11,417,003 on 4-1-11, | | | |
| collateralized by $11,575,000 Federal National Mortgage Association, | | | |
| 2.000% due 7-14-14 (valued at $11,647,344, including interest) | | $11,417,000 | 11,417,000 |
| |
| Total investments (Cost $1,330,090,416)† 103.78% | $1,682,577,487 |
|
| |
| Other assets and liabilities, net (3.78%) | | | ($61,250,700) |
|
| |
| Total net assets 100.00% | | $1,621,326,787 |
|
The percentage shown for each investment category is the total value of the category as a percentage of the net assets of the Fund.
ADR American Depositary Receipts
SADR Sponsored American Depositary Receipts
(I) Non-income producing security.
(L) All or a portion of this security is on loan as of 3-31-11.
(R) Direct placement securities are restricted to resale and the Fund has limited rights to registration under the Securities Act of 1933.
| | | | |
| | | | Value as a percentage of | Value as of |
| Issuer, description | Acquisition date | Acquisition cost | Fund’s net assets | 3-31-11 |
|
| BancTec, Inc. | 6-20-07 | $4,728,640 | 0.05% | $837,361 |
| common stock | | | | |
(W) Investment is an affiliate of the Fund, the adviser and/or subadviser. Also, it represents the investment of securities lending collateral received.
(Y) The rate shown is the annualized seven-day yield as of 3-31-11.
† At 3-31-11, the aggregate cost of investment securities for federal income tax purposes was $1,339,605,356. Net unrealized appreciation aggregated $342,972,131, of which $353,676,944 related to appreciated investment securities and $10,704,813 related to depreciated investment securities.
| | |
| See notes to financial statements | Annual report | Rainier Growth Fund | 15 |
F I N A N C I A L S T A T E M E N T SFinancial statements
Statement of assets and liabilities 3-31-11
This Statement of Assets and Liabilities is the Fund’s balance sheet. It shows the value of what the Fund owns, is due and owes. You’ll also find the net asset value and the maximum public offering price per share.
| | |
| Assets | | |
|
| Investments in unaffiliated issuers, at value (Cost $1,256,065,649) | | |
| including $72,389,264 of securities loaned (Note 2) | | $1,608,550,556 |
| Investments in affiliated issuers, at value (Cost $74,024,767) (Note 2) | | 74,026,931 |
| | | |
| Total investments, at value (Cost $1,330,090,416) | | 1,682,577,487 |
| Cash | | 225 |
| Receivable for investments sold | | 26,458,735 |
| Receivable for fund shares sold | | 878,902 |
| Dividends and interest receivable | | 900,619 |
| Receivable for securities lending income | | 15,583 |
| Other receivables and prepaid expenses | | 199,867 |
| | | |
| Total assets | | 1,711,031,418 |
| |
| Liabilities | | |
|
| Payable for investments purchased | | 13,459,806 |
| Payable for fund shares repurchased | | 1,762,831 |
| Payable upon return of securities loaned (Note 2) | | 74,068,784 |
| Payable to affiliates | | |
| Accounting and legal services fees | | 31,137 |
| Transfer agent fees | | 182,223 |
| Distribution and service fees | | 36 |
| Trustees’ fees | | 74,933 |
| Due to adviser | | 6,602 |
| Other liabilities and accrued expenses | | 118,279 |
| | | |
| Total liabilities | | 89,704,631 |
| |
| Net assets | | |
|
| Capital paid-in | | $1,692,989,418 |
| Accumulated distributions in excess of net investment income | | (54,521) |
| Accumulated net realized loss on investments | | (424,095,725) |
| Net unrealized appreciation (depreciation) on investments and translation | | |
| of assets and liabilities in foreign currencies | | 352,487,615 |
| | |
| Net assets | | $1,621,326,787 |
| | |
| 16 | Rainier Growth Fund | Annual report | See notes to financial statements |
F I N A N C I A L S T A T E M E N T S
Statement of assets and liabilities (continued)
| | |
| Net asset value per share | | |
|
| Based on net asset values and shares outstanding — the Fund has an | | |
| unlimited number of shares authorized with no par value | | |
| Class A ($412,625,344 ÷ 19,353,612 shares) | | $21.32 |
| Class B ($30,533,831 ÷ 1,460,622 shares)1 | | $20.90 |
| Class C ($21,719,132 ÷ 1,039,031 shares)1 | | $20.90 |
| Class I ($237,080,154 ÷ 10,969,174 shares) | | $21.61 |
| Class R1 ($229,983 ÷ 10,881 shares) | | $21.14 |
| Class R3 ($94,427 ÷ 4,452 shares) | | $21.21 |
| Class R4 ($95,259 ÷ 4,452 shares) | | $21.40 |
| Class R5 ($96,100 ÷ 4,458 shares) | | $21.56 |
| Class T ($83,287,050 ÷ 3,928,928 shares) | | $21.20 |
| Class ADV ($22,221,215 ÷ 1,034,229 shares) | | $21.49 |
| Class NAV ($813,344,292 ÷ 37,605,910 shares) | | $21.63 |
| |
| Maximum offering price per share | | |
|
| Class A (net asset value per share ÷ 95%)2 | | $22.44 |
| Class T (net asset value per share ÷ 95%)2 | | $22.32 |
1 Redemption price per share is equal to the net asset value less any applicable contingent deferred sales charge.
2 On single retail sales of less than $50,000. On sales of $50,000 or more and on group sales the offering price is reduced.
| | |
| See notes to financial statements | Annual report | Rainier Growth Fund | 17 |
F I N A N C I A L S T A T E M E N T S
Statement of operations For the year ended 3-31-11
This Statement of Operations summarizes the Fund’s investment income earned and expenses incurred in operating the Fund. It also shows net gains (losses) for the period stated.
| | |
| Investment income | | |
|
| Dividends | | $13,884,344 |
| Securities lending | | 168,498 |
| Interest | | 66,383 |
| Less foreign taxes withheld | | (17,833) |
| | | |
| Total investment income | | 14,101,392 |
| |
| Expenses | | |
|
| Investment management fees (Note 4) | | 10,927,738 |
| Distribution and service fees (Note 4) | | 1,768,176 |
| Accounting and legal services fees (Note 4) | | 216,689 |
| Transfer agent fees (Note 4) | | 1,388,801 |
| Trustees’ fees (Note 4) | | 109,825 |
| State registration fees (Note 4) | | 156,809 |
| Printing and postage (Note 4) | | 82,266 |
| Professional fees | | 180,404 |
| Custodian fees | | 197,394 |
| Registration and filing fees | | 27,270 |
| Other | | 53,356 |
| | | |
| Total expenses | | 15,108,728 |
| Less expense reductions (Note 4) | | (114,970) |
| | | |
| Net expenses | | 14,993,758 |
| | |
| Net investment loss | | (892,366) |
| |
| Realized and unrealized gain (loss) | | |
|
| Net realized gain (loss) on | | |
| Investments in unaffiliated issuers | | 130,661,700 |
| Investments in affiliated issuers | | (35,592) |
| | | 130,626,108 |
| Change in net unrealized appreciation (depreciation) of | | |
| Investments in unaffiliated issuers | | 102,957,897 |
| Investments in affiliated issuers | | 4,179 |
| Translation of assets and liabilities in foreign currencies | | 314 |
| | | 102,962,390 |
| | | |
| Net realized and unrealized gain | | 233,588,498 |
| | | |
| Increase in net assets from operations | | $232,696,132 |
| | |
| 18 | Rainier Growth Fund | Annual report | See notes to financial statements |
F I N A N C I A L S T A T E M E N T S
Statements of changes in net assets
These Statements of Changes in Net Assets show how the value of the Fund’s net assets has changed during the last two periods. The difference reflects earnings less expenses, any investment gains and losses, distributions, if any, paid to shareholders and the net of Fund share transactions.
| | | |
| | | Year | Year |
| | | ended | ended |
| | | 3-31-11 | 3-31-10 |
| Increase (decrease) in net assets | | | |
|
| From operations | | | |
| Net investment income (loss) | | ($892,366) | $837,443 |
| Net realized gain (loss) | | 130,626,108 | (35,593,479) |
| Change in net unrealized appreciation (depreciation) | | 102,962,390 | 446,159,707 |
| | | | |
| Increase in net assets resulting from operations | | 232,696,132 | 411,403,671 |
| | | | |
| Distributions to shareholders | | | |
| From net investment income | | | |
| Class I | | (217,850) | (8,940) |
| Class R5 | | (41) | (1) |
| Class NAV | | (907,978) | (33,551) |
| | | | |
| Total distributions | | (1,125,869) | (42,492) |
| | | | |
| From Fund share transactions (Note 5) | | (72,729,494) | 194,788,353 |
| | | | |
| Total increase | | 158,840,769 | 606,149,532 |
| |
| Net assets | | | |
|
| Beginning of year | | 1,462,486,018 | 856,336,486 |
| | | | |
| End of year | | $1,621,326,787 | $1,462,486,018 |
| | | |
| Undistributed (accumulated distributions in excess of) net | | | |
investment income | | ($54,521) | $791,607 |
| | |
| See notes to financial statements | Annual report | Rainier Growth Fund | 19 |
Financial highlights
The Financial Highlights show how the Fund’s net asset value for a share has changed since the end of the previous period.
| | | | | |
| CLASS A SHARES Period ended | 3-31-11 | 3-31-10 | 3-31-091 | 3-31-082 | 3-31-072 |
| | | | | | |
| Per share operating performance | | | | | |
|
| Net asset value, beginning of year | $18.31 | $12.84 | $20.91 | $20.44 | $19.07 |
| Net investment loss | (0.06)3 | (0.03)3 | (0.01)3 | (0.02) | (0.04) |
| Net realized and unrealized gain (loss) on investments | 3.07 | 5.50 | (8.06) | 0.49 | 1.41 |
| Total from investment operations | 3.01 | 5.47 | (8.07) | 0.47 | 1.37 |
| Net asset value, end of year | $21.32 | $18.31 | $12.84 | $20.91 | $20.44 |
| Total return (%)4 | 16.44 | 42.605 | (38.59)5 | 2.305 | 7.185 |
| |
| Ratios and supplemental data | | | | | |
|
| Net assets, end of year (in millions) | $413 | $384 | $193 | $164 | $33 |
| Ratios (as a percentage of average net assets): | | | | | |
| Expenses before reductions | 1.30 | 1.45 | 1.47 | 1.176 | 1.30 |
| Expenses net of fee waivers | 1.30 | 1.38 | 1.18 | 1.196 | 1.19 |
| Expenses net of fee waivers and credits | 1.30 | 1.34 | 1.18 | 1.196 | 1.19 |
| Net investment loss | (0.33) | (0.18) | (0.04) | (0.27) | (0.38) |
| Portfolio turnover (%) | 90 | 102 | 101 | 86 | 101 |
| |
1 After the close of business on 4-25-08, holders of Original Shares of the former Rainier Large Cap Growth Equity
Portfolio (the Predecessor Fund) became owners of an equal number of full and fractional Class A shares of John
Hancock Rainier Growth Fund. These shares were first offered on 4-28-08. Additionally, the accounting and
performance history of the Original Shares of the Predecessor Fund was redesignated as that of John Hancock
Rainier Growth Fund Class A.
2 Audited by previous independent registered public accounting firm.
3 Based on the average daily shares outstanding.
4 Does not reflect the effect of sales charges, if any.
5 Total returns would have been lower had certain expenses not been reduced during the periods shown.
6 Prior to the reorganization (see Note 7), the Fund was subject to a contractual expense reimbursement and
recoupment plan.
| | | | | |
| CLASS B SHARES Period ended | | | 3-31-11 | 3-31-10 | 3-31-091 |
| | | | | | |
| Per share operating performance | | | | | |
|
| Net asset value, beginning of year | | | $18.10 | $12.79 | $22.46 |
| Net investment loss2 | | | (0.21) | (0.15) | (0.09) |
| Net realized and unrealized gain (loss) on investments | | | 3.01 | 5.46 | (9.58) |
| Total from investment operations | | | 2.80 | 5.31 | (9.67) |
| Net asset value, end of year | | | $20.90 | $18.10 | $12.79 |
| Total return (%)3,4 | | | 15.47 | 41.52 | (43.05)5 |
| |
| Ratios and supplemental data | | | | | |
|
| Net assets, end of year (in millions) | | | $31 | $37 | $27 |
| Ratios (as a percentage of average net assets): | | | | | |
| Expenses before reductions | | | 2.13 | 2.45 | 2.826 |
| Expenses net of fee waivers | | | 2.10 | 2.11 | 2.056 |
| Expenses net of fee waivers and credits | | | 2.10 | 2.09 | 2.046 |
| Net investment loss | | | (1.13) | (0.94) | (0.75)6 |
| Portfolio turnover (%) | | | 90 | 102 | 1017 |
| | | |
1 The inception date for Class B shares is 4-28-08.
2 Based on the average daily shares outstanding.
3 Does not reflect the effect of sales charges, if any.
4 Total returns would have been lower had certain expenses not been reduced during the periods shown.
5 Not annualized.
6 Annualized.
7 Portfolio turnover is shown for the period from 4-1-08 to 3-31-09.
| | |
| 20 | Rainier Growth Fund | Annual report | See notes to financial statements |
| | | | | |
| CLASS C SHARES Period ended | | | 3-31-11 | 3-31-10 | 3-31-091 |
| | | | | | |
| Per share operating performance | | | | | |
|
| Net asset value, beginning of year | | | $18.10 | $12.79 | $22.46 |
| Net investment loss2 | | | (0.21) | (0.15) | (0.09) |
| Net realized and unrealized gain (loss) on investments | | | 3.01 | 5.46 | (9.58) |
| Total from investment operations | | | 2.80 | 5.31 | (9.67) |
| Net asset value, end of year | | | $20.90 | $18.10 | $12.79 |
| Total return (%)3,4 | | | 15.47 | 41.52 | (43.05)5 |
| |
| Ratios and supplemental data | | | | | |
|
| Net assets, end of year (in millions) | | | $22 | $24 | $15 |
| Ratios (as a percentage of average net assets): | | | | | |
| Expenses before reductions | | | 2.16 | 2.34 | 2.826 |
| Expenses net of fee waivers | | | 2.10 | 2.21 | 2.056 |
| Expenses net of fee waivers and credits | | | 2.10 | 2.09 | 2.046 |
| Net investment loss | | | (1.13) | (0.93) | (0.77)6 |
| Portfolio turnover (%) | | | 90 | 102 | 1017 |
| | | |
1 The inception date for Class C shares is 4-28-08.
2 Based on the average daily shares outstanding.
3 Does not reflect the effect of sales charges, if any.
4 Total returns would have been lower had certain expenses not been reduced during the periods shown.
5 Not annualized.
6 Annualized.
7 Portfolio turnover is shown for the period from 4-1-08 to 3-31-09.
| | | | | |
| CLASS I SHARES Period ended | 3-31-11 | 3-31-10 | 3-31-091 | 3-31-082 | 3-31-072,3 |
| | | | | |
| Per share operating performance | | | | | |
|
| Net asset value, beginning of year | $18.50 | $12.92 | $20.98 | $20.44 | $20.94 |
| Net investment income4 | 0.02 | 0.04 | 0.04 | —5 | —5 |
| Net realized and unrealized gain (loss) on investments | 3.11 | 5.54 | (8.09) | 0.54 | (0.50) |
| Total from investment operations | 3.13 | 5.58 | (8.05) | 0.54 | (0.50) |
| Less distributions | | | | | |
| From net investment income | (0.02) | —5 | (0.01) | — | — |
| Net asset value, end of year | $21.61 | $18.50 | $12.92 | $20.98 | $20.44 |
| Total return (%) | 16.93 | 43.20 | (38.36) | 2.64 | (2.39)6,7 |
| |
| Ratios and supplemental data | | | | | |
|
| Net assets, end of year (in millions) | $237 | $208 | $133 | $136 | $537 |
| Ratios (as a percentage of average net assets): | | | | | |
| Expenses before reductions | 0.86 | 0.90 | 0.86 | 0.928 | 1.009 |
| Expenses net of fee waivers | 0.86 | 0.90 | 0.86 | 0.948 | 0.949 |
| Expenses net of fee waivers and credits | 0.86 | 0.90 | 0.86 | 0.948 | 0.949 |
| Net investment income (loss) | 0.10 | 0.26 | 0.22 | (0.02) | 0.159 |
| Portfolio turnover (%) | 90 | 102 | 101 | 86 | 10110 |
| |
1 After the close of business on 4-25-08, holders of Institutional Shares of the former Rainier Large Cap Growth
Equity Portfolio (the Predecessor Fund) became owners of an equal number of full and fractional Class I shares of
John Hancock Rainier Growth Fund. These shares were first offered on 4-28-08. Additionally, the accounting and
performance history of the Institutional Shares of the Predecessor Fund was redesignated as that of John Hancock
Rainier Growth Fund Class I.
2 Audited by previous independent registered public accounting firm.
3 The inception date for Class I shares is 2-20-07.
4 Based on the average daily shares outstanding.
5 Less than ($0.005) per share.
6 Total returns would have been lower had certain expenses not been reduced during the periods shown.
7 Not annualized.
8 Prior to the reorganization (see Note 7), the Fund was subject to a contractual expense reimbursement and
recoupment plan.
9 Annualized.
10 Annualized based on investments held for a full year.
| | |
| See notes to financial statements | Annual report | Rainier Growth Fund | 21 |
| | | | | |
| CLASS R1 SHARES Period ended | | | 3-31-11 | 3-31-10 | 3-31-091 |
| | | | | | |
| Per share operating performance | | | | | |
|
| Net asset value, beginning of year | | | $18.23 | $12.84 | $22.46 |
| Net investment loss2 | | | (0.14) | (0.11) | (0.08) |
| Net realized and unrealized gain (loss) on investments | | | 3.05 | 5.50 | (9.54) |
| Total from investment operations | | | 2.91 | 5.39 | (9.62) |
| Net asset value, end of year | | | $21.14 | $18.23 | $12.84 |
| Total return (%)3 | | | 15.96 | 41.98 | (42.83)4 |
| |
| Ratios and supplemental data | | | | | |
|
| Net assets, end of year (in millions) | | | —5 | —5 | —5 |
| Ratios (as a percentage of average net assets): | | | | | |
| Expenses before reductions | | | 8.39 | 13.91 | 8.706 |
| Expenses net of fee waivers | | | 1.72 | 1.78 | 1.646 |
| Expenses net of fee waivers and credits | | | 1.72 | 1.78 | 1.646 |
| Net investment loss | | | (0.75) | (0.65) | (0.50)6 |
| Portfolio turnover (%) | | | 90 | 102 | 101 |
| | | |
1 The inception date for Class R1 shares is 4-28-08.
2 Based on the average daily shares outstanding.
3 Total returns would have been lower had certain expenses not been reduced during the periods shown.
4 Not annualized.
5 Less than $500,000.
6 Annualized.
7 Portfolio turnover is shown for the period from 4-1-08 to 3-31-09.
| | | | | |
| CLASS R3 SHARES Period ended | | | 3-31-11 | 3-31-10 | 3-31-091 |
| | | | | | |
| Per share operating performance | | | | | |
|
| Net asset value, beginning of year | | | $18.27 | $12.85 | $22.46 |
| Net investment loss2 | | | (0.12) | (0.07) | (0.06) |
| Net realized and unrealized gain (loss) on investments | | | 3.06 | 5.49 | (9.55) |
| Total from investment operations | | | 2.94 | 5.42 | (9.61) |
| Net asset value, end of year | | | $21.21 | $18.27 | $12.85 |
| Total return (%)3 | | | 16.09 | 42.18 | (42.79)4 |
| |
| Ratios and supplemental data | | | | | |
|
| Net assets, end of year (in millions) | | | —5 | —5 | —5 |
| Ratios (as a percentage of average net assets): | | | | | |
| Expenses before reductions | | | 16.72 | 13.68 | 8.576 |
| Expenses net of fee waivers | | | 1.61 | 1.62 | 1.546 |
| Expenses net of fee waivers and credits | | | 1.61 | 1.62 | 1.546 |
| Net investment loss | | | (0.64) | (0.46) | (0.40)6 |
| Portfolio turnover (%) | | | 90 | 102 | 1017 |
| | | |
1 The inception date for Class R3 shares is 4-28-08.
2 Based on the average daily shares outstanding.
3 Total returns would have been lower had certain expenses not been reduced during the periods shown.
4 Not annualized.
5 Less than $500,000.
6 Annualized.
7 Portfolio turnover is shown for the period from 4-1-08 to 3-31-09.
| | |
| 22 | Rainier Growth Fund | Annual report | See notes to financial statements |
| | | | | |
| CLASS R4 SHARES Period ended | | | 3-31-11 | 3-31-10 | 3-31-091 |
| | | | | | |
| Per share operating performance | | | | | |
|
| Net asset value, beginning of year | | | $18.38 | $12.88 | $22.46 |
| Net investment loss2 | | | (0.06) | (0.03) | (0.02) |
| Net realized and unrealized gain (loss) on investments | | | 3.08 | 5.53 | (9.56) |
| Total from investment operations | | | 3.02 | 5.50 | (9.58) |
| Net asset value, end of year | | | $21.40 | $18.38 | $12.88 |
| Total return (%)3 | | | 16.43 | 42.70 | (42.65)4 |
|
| Ratios and supplemental data | | | | | |
| Net assets, end of year (in millions) | | | —5 | —5 | —5 |
| Ratios (as a percentage of average net assets): | | | | | |
| Expenses before reductions | | | 16.45 | 13.33 | 8.266 |
| Expenses net of fee waivers | | | 1.31 | 1.32 | 1.246 |
| Expenses net of fee waivers and credits | | | 1.31 | 1.32 | 1.246 |
| Net investment loss | | | (0.34) | (0.16) | (0.10)6 |
| Portfolio turnover (%) | | | 90 | 102 | 1017 |
| | | |
1 The inception date for Class R4 shares is 4-28-08.
2 Based on the average daily shares outstanding.
3 Total returns would have been lower had certain expenses not been reduced during the periods shown.
4 Not annualized.
5 Less than $500,000.
6 Annualized.
7 Portfolio turnover is shown for the period from 4-1-08 to 3-31-09.
| | | | | |
| CLASS R5 SHARES Period ended | | | 3-31-11 | 3-31-10 | 3-31-091 |
| | | | | | |
| Per share operating performance | | | | | |
|
| Net asset value, beginning of year | | | $18.47 | $12.91 | $22.46 |
| Net investment income (loss)2 | | | (0.02) | 0.02 | 0.03 |
| Net realized and unrealized gain (loss) on investments | | | 3.12 | 5.54 | (9.57) |
| Total from investment operations | | | 3.10 | 5.56 | (9.54) |
| Less distributions | | | | | |
| From net investment income | | | (0.01) | —3 | (0.01) |
| Net asset value, end of year | | | $21.56 | $18.47 | $12.91 |
| Total return (%)4 | | | 16.78 | 43.07 | (42.48)5 |
| |
| Ratios and supplemental data | | | | | |
|
| Net assets, end of year (in millions) | | | —6 | —6 | —6 |
| Ratios (as a percentage of average net assets): | | | | | |
| Expenses before reductions | | | 16.17 | 12.97 | 7.957 |
| Expenses net of fee waivers | | | 1.01 | 1.02 | 0.947 |
| Expenses net of fee waivers and credits | | | 1.01 | 1.02 | 0.947 |
| Net investment income (loss) | | | (0.03) | 0.14 | 0.207 |
| Portfolio turnover (%) | | | 90 | 102 | 1018 |
| | | |
1 The inception date for Class R5 shares is 4-28-08.
2 Based on the average daily shares outstanding.
3 Less than ($0.005) per share.
4 Total returns would have been lower had certain expenses not been reduced during the periods shown.
5 Not annualized.
6 Less than $500,000.
7 Annualized.
8 Portfolio turnover is shown for the period from 4-1-08 to 3-31-09.
| | |
| See notes to financial statements | Annual report | Rainier Growth Fund | 23 |
| | | | | |
| CLASS T SHARES Period ended | | | 3-31-11 | 3-31-10 | 3-31-091 |
| | | | | | |
| Per share operating performance | | | | | |
|
| Net asset value, beginning of year | | | $18.24 | $12.86 | $16.59 |
| Net investment loss2 | | | (0.09) | (0.11) | (0.05) |
| Net realized and unrealized gain (loss) on investments | | | 3.05 | 5.49 | (3.68) |
| Total from investment operations | | | 2.96 | 5.38 | (3.73) |
| Net asset value, end of year | | | $21.20 | $18.24 | $12.86 |
| Total return (%)3 | | | 16.23 | 41.84 | (22.48)4,5 |
| |
| Ratios and supplemental data | | | | | |
|
| Net assets, end of year (in millions) | | | $83 | $83 | $72 |
| Ratios (as a percentage of average net assets): | | | | | |
| Expenses before reductions | | | 1.47 | 1.84 | 2.076 |
| Expenses net of fee waivers | | | 1.47 | 1.84 | 1.996 |
| Expenses net of fee waivers and credits | | | 1.47 | 1.84 | 1.986 |
| Net investment loss | | | (0.50) | (0.69) | (0.74)6 |
| Portfolio turnover (%) | | | 90 | 102 | 1017 |
| | | |
1 The inception date for Class T shares is 10-6-08.
2 Based on the average daily shares outstanding.
3 Does not reflect the effect of sales charges, if any.
4 Total returns would have been lower had certain expenses not been reduced during the periods shown.
5 Not annualized.
6 Annualized.
7 Portfolio turnover is shown for the period from 4-1-08 to 3-31-09.
| | | | | |
| CLASS ADV SHARES Period ended | | | 3-31-11 | 3-31-10 | 3-31-091 |
| | | | | | |
| Per share operating performance | | | | | |
|
| Net asset value, beginning of year | | | $18.43 | $12.90 | $22.46 |
| Net investment income (loss)2 | | | (0.03) | —3 | (0.01) |
| Net realized and unrealized gain (loss) on investments | | | 3.09 | 5.53 | (9.55) |
| Total from investment operations | | | 3.06 | 5.53 | (9.56) |
| Net asset value, end of year | | | $21.49 | $18.43 | $12.90 |
| Total return (%) | | | 16.604 | 42.874 | (42.56)5 |
| |
| Ratios and supplemental data | | | | | |
|
| Net assets, end of year (in millions) | | | $22 | $18 | $17 |
| Ratios (as a percentage of average net assets): | | | | | |
| Expenses before reductions | | | 1.37 | 1.25 | 1.146 |
| Expenses net of fee waivers | | | 1.14 | 1.14 | 1.146 |
| Expenses net of fee waivers and credits | | | 1.14 | 1.14 | 1.146 |
| Net investment income (loss) | | | (0.17) | 0.01 | (0.04)6 |
| Portfolio turnover (%) | | | 90 | 102 | 1017 |
| | | |
1 The inception date for Class ADV shares is 4-28-08.
2 Based on the average daily shares outstanding.
3 Less than $0.005 per share.
4 Total returns would have been lower had certain expenses not been reduced during the periods shown.
5 Not annualized.
6 Annualized.
7 Portfolio turnover is shown for the period from 4-1-08 to 3-31-09.
| | |
| 24 | Rainier Growth Fund | Annual report | See notes to financial statements |
| | | | | |
| CLASS NAV SHARES Period ended | | | 3-31-11 | 3-31-10 | 3-31-091 |
| | | | | | |
| Per share operating performance | | | | | |
|
| Net asset value, beginning of year | | | $18.51 | $12.91 | $22.46 |
| Net investment income2 | | | 0.03 | 0.05 | 0.04 |
| Net realized and unrealized gain (loss) on investments | | | 3.11 | 5.55 | (9.57) |
| Total from investment operations | | | 3.14 | 5.60 | (9.53) |
| Less distributions | | | | | |
| From net investment income | | | (0.02) | —3 | (0.02) |
| Net asset value, end of year | | | $21.63 | $18.51 | $12.91 |
| Total return (%) | | | 17.00 | 43.38 | (42.44)4 |
| |
| Ratios and supplemental data | | | | | |
|
| Net assets, end of year (in millions) | | | $813 | $708 | $400 |
| Ratios (as a percentage of average net assets): | | | | | |
| Expenses before reductions | | | 0.80 | 0.82 | 0.835 |
| Expenses net of fee waivers | | | 0.80 | 0.82 | 0.835 |
| Expenses net of fee waivers and credits | | | 0.80 | 0.82 | 0.835 |
| Net investment income | | | 0.16 | 0.33 | 0.265 |
| Portfolio turnover (%) | | | 90 | 102 | 1016 |
| | | |
1 The inception date for Class NAV shares is 4-28-08.
2 Based on the average daily shares outstanding.
3 Less than ($0.005) per share.
4 Not annualized.
5 Annualized.
6 Portfolio turnover is shown for the period from 4-1-08 to 3-31-09.
| | |
| See notes to financial statements | Annual report | Rainier Growth Fund | 25 |
Notes to financial statements
Note 1 — Organization
John Hancock Rainier Growth Fund (the Fund) is a diversified series of John Hancock Funds III (the Trust), an open-end management investment company organized as a Massachusetts business trust and registered under the Investment Company Act of 1940, as amended (the 1940 Act). The investment objective of the Fund is to seek to maximize long-term capital appreciation.
The Fund may offer multiple classes of shares. The shares currently offered are detailed in the Statement of Assets and Liabilities. Class A, Class B and Class C shares are offered to all investors. Class I shares are offered to institutions and certain investors. Class R1, Class R3, Class R4 and Class R5 shares are available only to certain retirement plans. Class T and Class ADV shares are closed to new investors. Class NAV shares are sold to John Hancock affiliated funds of funds. Shareholders of each class have exclusive voting rights to matters that affect that class. The distribution and service fees, if any, printing and postage, transfer agent fees and state registration fees for each class may differ. Class B shares convert to Class A shares eight years after purchase. Effective at the close of business on August 31, 2009, Class R2 converted into Class A and Class R converted into Class R1.
The Fund is the accounting and performance successor of the Rainier Large Cap Growth Equity Portfolio (the Predecessor Fund). On April 28, 2008, the Fund acquired substantially all the assets and assumed the liabilities of the Predecessor Fund pursuant to an agreement and plan of reorganization, in exchange for Class A and Class I shares of the Fund.
Note 2 — Significant accounting policies
The financial statements have been prepared in conformity with accounting principles generally accepted in the United States of America, which require management to make certain estimates and assumptions at the date of the financial statements. Actual results could differ from those estimates. Events or transactions occurring after the end of the fiscal period through the date that the financial statements were issued have been evaluated in the preparation of the financial statements. The following summarizes the significant accounting policies of the Fund:
Security valuation. Investments are stated at value as of the close of regular trading on the New York Stock Exchange (NYSE), normally at 4:00 P.M., Eastern Time. The Fund uses a three-tier hierarchy to prioritize the pricing assumptions, referred to as inputs, used in valuation techniques to measure fair value. Level 1 includes securities valued using quoted prices in active markets for identical securities. Level 2 includes securities valued using significant observable inputs. Observable inputs may include quoted prices for similar securities, interest rates, prepayment speeds and credit risk. Prices for securities valued using these inputs are received from independent pricing vendors and brokers and are based on an evaluation of the inputs described. Level 3 includes securities valued using significant unobservable inputs when market prices are not readily available or reliable, including the Fund’s own assumptions in determining the fair value of investments. Factors used in determining value may include market or issuer specific events, changes in interest rates and credit quality. The inputs or methodology used for valuing securities are not necessarily an indication of the risk associated with investing in those securities.
| |
| 26 | Rainier Growth Fund | Annual report |
The following is a summary of the values by input classification of the Fund’s investments as of March 31, 2011, by major security category or type:
| | | | | |
| | | | | | LEVEL 3 |
| | | | | LEVEL 2 | SIGNIFICANT |
| | | TOTAL MARKET | LEVEL 1 | SIGNIFICANT | UNOBSERVABLE |
| | | VALUE AT 3-31-11 | QUOTED PRICE | OBSERVABLE INPUTS | INPUTS |
|
| Common Stocks | | | | | |
| Consumer Discretionary | | $252,215,408 | $252,215,408 | — | — |
| Consumer Staples | | 93,287,504 | 93,287,504 | — | — |
| Energy | | 163,148,557 | 163,148,557 | — | — |
| Financials | | 88,582,540 | 88,582,540 | — | — |
| Health Care | | 162,154,630 | 162,154,630 | — | — |
| Industrials | | 255,629,495 | 255,629,495 | — | — |
| Information Technology | | 466,499,699 | 465,662,338 | — | $837,361 |
| Materials | | 91,636,536 | 91,636,536 | — | — |
| Telecommunication | | | | | |
| Services | | 23,979,187 | 23,979,187 | — | — |
| Securities Lending | | | | | |
| Collateral | | 74,026,931 | 74,026,931 | — | — |
| Short-Term Investments | | 11,417,000 | — | $11,417,000 | — |
| | |
|
| Total Investments in | | | | | |
| Securities | | $1,682,577,487 | $1,670,323,126 | $11,417,000 | $837,361 |
Changes in valuation techniques may result in transfers in or out of an assigned level within the disclosure hierarchy. During the year ended March 31, 2011, there were no significant transfers in or out of Level 1 or Level 2 assets.
The following is a reconciliation of Level 3 assets for which significant unobservable inputs were used to determine fair value. Transfers in or out of Level 3 represent the beginning value of any security or instrument where a change in the level has occurred from the beginning to the end of the period.
| | | | | |
| | | | | INFORMATION | |
| INVESTMENTS IN SECURITIES | | | HEALTH CARE | TECHNOLOGY | TOTAL |
|
| Balance as of 3-31-10 | | | $486,050 | $1,293,918 | $1,779,968 |
| Realized gain (loss) | | | (745,463) | — | (745,463) |
| Changed in unrealized appreciation (depreciation) | | 826,285 | (456,557) | 369,728 |
| Purchases | | | — | — | — |
| Sales | | | (566,872) | — | (566,872) |
| Transfers into Level 3 | | | — | — | — |
| Transfers out of Level 3 | | | — | — | — |
| Balance as of 3-31-11 | | | — | $837,361 | $837,361 |
| Change in unrealized at year end* | | | — | (456,557) | (456,557) |
*Change in unrealized appreciation (depreciation) attributable to Level 3 securities held at year end.
In order to value the securities, the Fund uses the following valuation techniques. Equity securities held by the Fund are valued at the last sale price or official closing price on the principal securities exchange on which they trade. In the event there were no sales during the day or closing prices are not available, then securities are valued using the last quoted bid or evaluated price. Investments in open-end mutual funds, including John Hancock Collateral Investment Trust (JHCIT), are valued at their closing net asset values each day. Certain securities traded only in the over-the-counter market are valued at the last bid price quoted by brokers making markets in the securities at the close of trading. Certain short-term securities are valued at amortized cost.
| |
| Annual report | Rainier Growth Fund | 27 |
Other portfolio securities and assets, where market quotations are not readily available, are valued at fair value, as determined in good faith by the Fund’s Pricing Committee, following procedures established by the Board of Trustees. Generally, trading in non-U.S. securities is substantially completed each day at various times prior to the close of trading on the NYSE. Significant market events that affect the values of non-U.S. securities may occur between the time when the valuation of the securities is generally determined and the close of the NYSE. During significant market events, these securities will be valued at fair value, as determined in good faith, following procedures established by the Board of Trustees. The Fund may use a fair valuation model to value non-U.S. securities in order to adjust for events which may occur between the close of foreign exchanges and the close of the NYSE.
Repurchase agreements. The Fund may enter into repurchase agreements. When the Fund enters into a repurchase agreement, it receives collateral which is held in a segregated account by the Fund’s custodian. The collateral amount is marked-to-market and monitored on a daily basis to ensure that the collateral held is in an amount not less than the principal amount of the repurchase agreement plus any accrued interest. In the event of a default by the counterparty, realization of the collateral proceeds could be delayed, during which time the collateral value may decline.
Security transactions and related investment income. Investment security transactions are accounted for on a trade date plus one basis for daily net asset value calculations. However, for financial reporting purposes, investment transactions are reported on trade date. Interest income is accrued as earned. Gains and losses on securities sold are determined on the basis of identified cost and may include proceeds from litigation. Dividend income is recorded on the ex-date, except for dividends of foreign securities where the dividend may not be known until after the ex-date. In those cases, dividend income is recorded when the Fund becomes aware of the dividends.
Securities lending. The Fund may lend its securities to earn additional income. It receives and maintains cash collateral received from the borrower in an amount not less than the market value of the loaned securities. The Fund will invest its collateral in JHCIT, an affiliate of the Fund, and as a result, the Fund will receive the benefit of any gains and bear any losses generated by JHCIT. Although risk of the loss of the securities lent is mitigated by holding the collateral, the Fund could experience a delay in recovering its securities and a possible loss of income or value if the borrower fails to return the securities or if collateral investments decline in value. The Fund may receive compensation for lending its securities by retaining a portion of the return on the investment of the collateral and compensation from fees earned from borrowers of the securities. Income received from JHCIT is a component of securities lending income as recorded on the Statement of Operations.
Line of credit. The Fund may borrow from banks for temporary or emergency purposes, including meeting redemption requests that otherwise might require the untimely sale of securities. Pursuant to the custodian agreement, the custodian may loan money to the Fund to make properly authorized payments. The Fund is obligated to repay the custodian for any overdraft, including any related costs or expenses. The custodian has a lien, security interest or security entitlement in any Fund property that is not segregated, to the maximum extent permitted by law for any overdraft.
In addition, effective March 30, 2011, the Fund and other affiliated funds have entered into an agreement with Citibank N.A. which enables them to participate in a $100 million unsecured committed line of credit. Prior to March 30, 2011, the Fund had a similar arrangement with State Street Bank and Trust Company. A commitment fee, payable at the end of each calendar quarter, based on the average daily unused portion of the line of credit, is charged to each participating fund on a pro rata basis and is reflected in other expenses on the Statement of Operations. For the year ended March 31, 2011, the Fund had no borrowings under the line of credit.
| |
| 28 | Rainier Growth Fund | Annual report |
Expenses. The majority of expenses are directly attributable to an individual fund. Expenses that are not readily attributable to a specific fund are allocated among all funds in an equitable manner, taking into consideration, among other things, the nature and type of expense and the fund’s relative assets. Expense estimates are accrued in the period to which they relate and adjustments are made when actual amounts are known.
Class allocations. Income, common expenses and realized and unrealized gains (losses) are determined at the fund level and allocated daily to each class of shares based on the net asset value of the class. Class-specific expenses, such as distribution and service fees, if any, printing and postage, transfer agent fees and state registration fees, for all classes, are calculated daily at the class level based on the appropriate net asset value of each class and the specific expense rates applicable to each class.
Federal income taxes. The Fund intends to continue to qualify as a regulated investment company by complying with the applicable provisions of the Internal Revenue Code and will not be subject to federal income tax on taxable income that is distributed to shareholders. Therefore, no federal income tax provision is required.
For federal income tax purposes, the Fund has a capital loss carryforward of $414,580,785 available to offset future net realized capital gains as of March 31, 2011.
At March 31, 2011, capital loss carryforward available to offset future realized gains is as follows:
| | | | | |
| CAPITAL LOSS CARRYFORWARD EXPIRING AT MARCH 31 | | | |
| | |
| 2012 | 2016 | 2017 | 2018 | | |
| | |
| $86,800,122 | $25,121,985 | $47,871,200 | $254,787,478 | | |
It is estimated that $81,871,220 of the loss carryforward, which was acquired on October 3, 2008, in a merger with John Hancock Technology Fund, will likely expire unused because of limitations.
Under the recently enacted Regulated Investment Company Modernization Act of 2010, the Fund will be permitted to carry forward capital losses incurred in taxable years beginning after December 22, 2010 for an unlimited period. However, any losses incurred during those future taxable years will be required to be utilized prior to the losses incurred in pre-enactment taxable years. As a result of this ordering rule, pre-enactment capital loss carryforwards may be more likely to expire unused. Additionally, post-enactment capital losses that are carried forward will retain their character as either short-term or long-term capital losses rather than being considered all short-term as under previous law.
As of March 31, 2011, the Fund had no uncertain tax positions that would require financial statement recognition, de-recognition or disclosure. The Fund’s federal tax return is subject to examination by the Internal Revenue Service for a period of three years.
Distribution of income and gains. Distributions to shareholders from net investment income and net realized gains, if any, are recorded on the ex-date. The Fund generally declares and pays dividends and capital gain distributions, if any, at least, annually. The tax character of distributions for the years ended March 31, 2011 and March 31, 2010 was as follows:
| | | | |
| | MARCH 31, 2011 | MARCH 31, 2010 | | |
| | |
| Ordinary Income | $1,125,869 | $42,492 | | |
Distributions paid by the Fund with respect to each class of shares are calculated in the same manner, at the same time and are in the same amount, except for the effect of expenses that may be applied differently to each class. As of March 31, 2011, the Fund had no distributable earnings on a tax basis.
| |
| Annual report | Rainier Growth Fund | 29 |
Such distributions and distributable earnings, on a tax basis, are determined in conformity with income tax regulations, which may differ from accounting principles generally accepted in the United States of America. Material distributions in excess of tax basis earnings and profits, if any, are reported in the Fund’s financial statements as a return of capital.
Capital accounts within financial statements are adjusted for permanent book-tax differences. These adjustments have no impact on net assets or the results of operations. Temporary book-tax differences, if any, will reverse in a subsequent period. Book-tax differences are primarily attributable to net operating losses, expiration of capital loss carryforward, wash sale loss deferrals and merger related transactions.
Note 3 — Guarantees and indemnifications
Under the Fund’s organizational documents, its Officers and Trustees are indemnified against certain liabilities arising out of the performance of their duties to the Fund. Additionally, in the normal course of business, the Fund enters into contracts with service providers that contain general indemnification clauses. The Fund’s maximum exposure under these arrangements is unknown, as this would involve future claims that may be made against the Fund that have not yet occurred. The risk of material loss from such claims is considered remote.
Note 4 — Fees and transactions with affiliates
John Hancock Investment Management Services, LLC (the Adviser) serves as investment adviser for the Fund. John Hancock Funds, LLC (the Distributor), an affiliate of the Adviser, serves as principal underwriter of the Trust. The Adviser and the Distributor are indirect wholly owned subsidiaries of Manulife Financial Corporation (MFC).
Management fee. The Fund has an investment management contract with the Adviser under which the Fund pays a daily management fee to the Adviser based on aggregate net assets of the Fund and John Hancock Growth Equity Trust (Growth Equity). Growth Equity is a series of John Hancock Variable Insurance Trust (formerly John Hancock Trust), an affiliate of the Fund, managed by the Adviser. The management fee is equivalent, on an annual basis, to the sum of: (a) 0.750% of the first $3,000,000,000 of the Fund’s aggregate net assets; (b) 0.725% of the next $3,000,000,000; and (c) 0.700% of the Fund’s aggregate net assets in excess of $6,000,000,000. The Adviser has a subadvisory agreement with Rainier Investment Management, Inc. The Fund is not responsible for payment of the subadvisory fees.
The investment management fees incurred for the year ended March 31, 2011 were equivalent to an annual effective rate of 0.75% of the Fund’s average daily net assets.
The Adviser has agreed to reimburse or limit certain expenses for each share class of the Fund. This agreement excludes taxes, portfolio brokerage commissions, interest and litigation and indemnification expenses, shareholder services fees and other extraordinary expenses not incurred in the ordinary course of the Fund’s business. The reimbursements and limits are such that these expenses will not exceed 1.35%, 2.10%, 2.10%, 0.94%, 1.69%, 1.59%, 1.29%, 0.99%, 1.40% and 1.14% for Class A, Class B, Class C, Class I, Class R1, Class R3, Class R4, Class R5, Class T and Class ADV shares, respectively. The expense reimbursements and limits will continue in effect until July 31, 2011. Prior to August 1, 2010, the fee waivers and/or reimbursements were such that the above expenses would not exceed 0.92% for Class I shares. Prior to July 1, 2010, the fee waivers and/or reimbursements were such that the above expenses would not exceed 1.80%, 1.65%, 1.35%, 1.05% and 1.98% for Class R1, Class R3, Class R4, Class R5 and Class T shares, respectively.
| |
| 30 | Rainier Growth Fund | Annual report |
Accordingly, these expense reductions amounted to $9,473, $13,980, $12,389, $12,602, $12,712, $12,825 and $40,989 for Class B, Class C, Class R1, Class R3, Class R4, Class R5 and Class ADV shares, respectively, for the year ended March 31, 2011.
Accounting and legal services. Pursuant to a service agreement, the Fund reimburses the Adviser for all expenses associated with providing the administrative, financial, legal, accounting and recordkeeping services of the Fund, including the preparation of all tax returns, periodic reports to shareholders and regulatory reports, among other services. These expenses are allocated to each share class based on its relative net assets at the time the expense was incurred. The accounting and legal services fees incurred for the year ended March 31, 2011 amounted to an annual rate of 0.01% of the Fund’s average daily net assets.
Distribution and service plans. The Fund has a distribution agreement with the Distributor. The Fund has adopted distribution and service plans with respect to Class A, Class B, Class C, Class R1, Class R3, Class R4, Class T and Class ADV shares pursuant to Rule 12b-1 under the 1940 Act, to pay the Distributor for services provided as the distributor of shares of the Fund. In addition, under a service plan for Class R1, Class R3, Class R4 and Class R5 shares, the Fund pays for certain other services. The Fund may pay up to the following contractual rates of distribution and service fees under these arrangements, expressed as an annual percentage of average daily net assets for each class of the Fund’s shares.
| | | | |
| CLASS | 12b–1 FEE | SERVICE FEE | | |
| | |
| Class A | 0.30% | — | | |
| Class B | 1.00% | — | | |
| Class C | 1.00% | — | | |
| Class R1 | 0.50% | 0.25% | | |
| Class R3 | 0.50% | 0.15% | | |
| Class R4 | 0.25% | 0.10% | | |
| Class R5 | — | 0.05% | | |
| Class T | 0.30% | — | | |
| Class ADV | 0.25% | — | | |
Currently, only 0.25% is charged to Class A shares for 12b-1 fees.
Sales charges. Class A and Class T shares are assessed up-front sales charges, which resulted in payments to the Distributor amounting to $125,006 and $40,962, respectively, for the year ended March 31, 2011. Of this amount, $16,146 and $6,189 were retained and used for printing prospectuses, advertising, sales literature and other purposes, $87,527 and $24,195 were paid as sales commissions to broker-dealers and $21,333 and $10,578 were paid as sales commissions to sales personnel of Signator Investors, Inc. (Signator Investors), a broker-dealer affiliate of the Adviser for Class A and Class T shares, respectively.
Class B and Class C shares are subject to contingent deferred sales charges (CDSC). Class B shares that are redeemed within six years of purchase are subject to CDSC, at declining rates, beginning at 5.00% of the lesser of the current market value at the time of redemption or the original purchase cost of the shares being redeemed. Class C shares that are redeemed within one year of purchase are subject to a 1.00% CDSC on the lesser of the current market value at the time of redemption or the original purchase cost of the shares being redeemed. Proceeds from CDSCs are used to compensate the Distributor for providing distribution-related services in connection with the sale of these shares. During the year ended March 31, 2011, CDSCs received by the Distributor amounted to $54,175 and $1,193 for Class B and Class C shares, respectively.
Transfer agent fees. The Fund has a transfer agent agreement with John Hancock Signature Services, Inc. (Signature Services or Transfer Agent), an affiliate of the Adviser. Class NAV shares do
| |
| Annual report | Rainier Growth Fund | 31 |
not pay transfer agent fees. The transfer agent fees paid to Signature Services are determined based on the cost to Signature Services (Signature Services Cost) of providing recordkeeping services. The Signature Services Cost includes a component of allocated John Hancock corporate overhead for providing transfer agent services to the Fund and to all other John Hancock affiliated funds. It also includes out-of-pocket expenses that are comprised of payments made to third-parties for recordkeeping services provided to their clients who invest in one or more John Hancock funds. In addition, Signature Services Cost may be reduced by certain revenues that Signature Services receives in connection with the service it provides to the funds. Signature Services Cost is calculated monthly and allocated, as applicable, to four categories of share classes: Institutional Share Classes, Retirement Share Classes, Municipal Bond Classes and all other Retail Share Classes. Within each of these categories, the applicable costs are allocated to the affected John Hancock affiliated funds and/or classes, based on the relative average daily net assets.
Prior to July 1, 2010, the transfer agent fees were made up of three components:
• The Fund paid a monthly transfer agent fee at an annual rate of 0.05% for Class A, B, C, R1, R3, R4, R5, T and ADV shares and 0.04% for Class I shares, based on each class’s average daily net assets.
• The Fund paid a monthly fee based on an annual rate of $16.50 per shareholder account for Class A, B, C, I, R1, R3, R4, R5 and T shares. Class ADV shares were not assessed for these monthly fees.
• In addition, Signature Services was reimbursed for certain out-of-pocket expenses.
Class level expenses. Class level expenses for the year ended March 31, 2011 were:
| | | | | |
| | | DISTRIBUTION | TRANSFER | STATE | PRINTING AND |
| CLASS | | AND SERVICE FEES | AGENT FEES | REGISTRATION FEES | POSTAGE |
|
| Class A | | $953,053 | $852,895 | $26,843 | $45,073 |
| Class B | | 316,893 | 85,126 | 15,060 | 3,359 |
| Class C | | 216,119 | 57,325 | 14,798 | 5,950 |
| Class I | | — | 97,981 | 27,854 | — |
| Class R1 | | 281 | 360 | 13,388 | 57 |
| Class R3 | | 208 | 278 | 13,595 | — |
| Class R4 | | 71 | 278 | 13,595 | — |
| Class R5 | | — | 278 | 13,595 | — |
| Class T | | 236,158 | 255,135 | 3,201 | 25,115 |
| Class ADV | | 45,393 | 39,145 | 14,880 | 2,712 |
| | | | | |
| Total | | $1,768,176 | $1,388,801 | $156,809 | $82,266 |
Trustee expenses. The Trust compensates each Trustee who is not an employee of the Adviser or its affiliates. These Trustees may, for tax purposes, elect to defer receipt of this compensation under the John Hancock Group of Funds Deferred Compensation Plan (the Plan). Deferred amounts are invested in various John Hancock funds and remain in the funds until distributed in accordance with the Plan. The investment of deferred amounts and the offsetting liability are included within Other receivables and prepaid expenses and Payable to affiliates — Trustees’ fees, respectively, in the accompanying Statement of Assets and Liabilities.
| |
| 32 | Rainier Growth Fund | Annual report |
Note 5 — Fund share transactions
Transactions in Fund shares for the year ended March 31, 2011 and year ended March 31, 2010 were as follows:
| | | | | |
| | | Year ended 3-31-11 | Year ended 3-31-10 |
| | | Shares | Amount | Shares | Amount |
| Class A shares | | | | | |
|
| Sold | | 3,094,419 | $57,820,459 | 4,995,167 | $79,987,175 |
| Issued in reorganization (Note 7) | | — | — | 4,832,192 | 76,878,774 |
| Exchanged from Class R2 | | — | — | 4,460 | 69,930 |
| Repurchased | | (4,714,525) | (89,251,765) | (3,868,875) | (63,049,457) |
| | | | | | |
| Net increase (decrease) | | (1,620,106) | ($31,431,306) | 5,962,944 | $93,886,422 |
| |
| Class B shares | | | | | |
|
| Sold | | 142,985 | $2,677,017 | 153,015 | $2,413,612 |
| Issued in reorganization (Note 7) | | — | — | 916,109 | 14,459,832 |
| Repurchased | | (748,365) | (13,742,006) | (1,145,331) | (18,226,006) |
| | | | | | |
| Net decrease | | (605,380) | ($11,064,989) | (76,207) | ($1,352,562) |
| |
| Class C shares | | | | | |
|
| Sold | | 52,563 | $977,754 | 81,494 | $1,284,710 |
| Issued in reorganization (Note 7) | | — | — | 373,087 | 5,888,163 |
| Repurchased | | (321,596) | (5,930,646) | (308,528) | (4,923,072) |
| | | | | | |
| Net increase (decrease) | | (269,033) | ($4,952,892) | 146,053 | $2,249,801 |
| |
| Class I shares | | | | | |
|
| Sold | | 2,591,470 | $49,596,314 | 3,279,891 | $52,265,579 |
| Distributions reinvested | | 8,647 | 178,817 | 416 | 7,253 |
| Repurchased | | (2,889,847) | (53,823,414) | (2,314,726) | (37,707,245) |
| | | | | | |
| Net increase (decrease) | | (289,730) | ($4,048,283) | 965,581 | $14,565,587 |
| |
| Class R shares | | | | | |
|
| Exchanged for Class R1 | | — | — | (4,669) | ($72,849) |
| | | | | | |
| Net decrease | | — | — | (4,669) | ($72,849) |
| |
| Class R1 shares | | | | | |
|
| Sold | | 1,300 | $26,275 | 451 | $7,546 |
| Exchanged from Class R | | — | — | 4,654 | 72,849 |
| Repurchased | | (125) | (2,162) | (3) | (46) |
| | | | | | |
| Net increase | | 1,175 | $24,113 | 5,102 | $80,349 |
| |
| Class R2 shares | | | | | |
|
| Exchanged for Class A | | — | — | (4,452) | ($69,930) |
| | | | | | |
| Net decrease | | — | — | (4,452) | ($69,930) |
| |
| Class R5 shares | | | | | |
|
| Distributions reinvested | | 2 | $41 | — | — |
| | | | | | |
| Net increase | | 2 | $41 | — | — |
| |
| Class T shares | | | | | |
|
| Sold | | 87,219 | $1,620,253 | 143,513 | $2,254,141 |
| Repurchased | | (707,067) | (13,076,910) | (1,159,979) | (18,515,245) |
| | | | | | |
| Net decrease | | (619,848) | ($11,456,657) | (1,016,466) | ($16,261,104) |
| |
| Annual report | Rainier Growth Fund | 33 |
| | | | | |
| | | Year ended 3-31-11 | Year ended 3-31-10 |
| | | Shares | Amount | Shares | Amount |
| Class ADV shares | | | | | |
|
| Sold | | 410,535 | $7,788,383 | 476,085 | $7,145,887 |
| Repurchased | | (340,936) | (6,229,450) | (795,118) | (12,194,104) |
| | | | | | |
| Net increase (decrease) | | 69,599 | $1,558,933 | (319,033) | ($5,048,217) |
| |
| Class NAV shares | | | | | |
|
| Sold | | 2,133,669 | $40,791,972 | 7,913,853 | $117,933,320 |
| Distributions reinvested | | 43,885 | 907,978 | 1,923 | 33,551 |
| Repurchased | | (2,810,046) | (53,058,404) | (650,429) | (11,156,015) |
| | | | | |
| Net increase (decrease) | | (632,492) | ($11,358,454) | 7,265,347 | $106,810,856 |
| |
| Net increase (decrease) | | (3,965,813) | ($72,729,494) | 12,924,200 | $194,788,353 |
|
There were no Fund share transactions for the years ended March 31, 2011 and March 31, 2010 for Class R3 and Class R4 shares.
Affiliates of the Fund owned 82%, 100%, 100%, 100% and 100% of shares of beneficial interest of Class R1, Class R3, Class R4, Class R5 and Class NAV shares, respectively, on March 31, 2011.
Note 6 — Purchase and sale of securities
Purchases and sales of securities, other than short-term securities, aggregated $1,288,393,551 and $1,371,217,802, respectively, for the year ended March 31, 2011.
Note 7 — Reorganization
On September 25, 2009, the shareholders of John Hancock Health Sciences Fund (the Acquired Fund) voted to approve an Agreement and Plan of Reorganization (the Agreement) in exchange for a representative amount of shares of John Hancock Rainier Growth Fund (the Acquiring Fund).
The Agreement provided for (a) the acquisition of all the assets, subject to all of the liabilities, of the Acquired Fund in exchange for a representative amount of shares of the Acquiring Fund; (b) the liquidation of the Acquired Fund; and (c) the distribution to the Acquired Fund’s shareholders of such Acquiring Fund’s shares. The reorganization consolidated the Acquired Fund with a fund with a similar objective and the combined fund is better positioned in the market to increase asset size and achieve economies of scale. As a result of the reorganization, the Acquiring Fund is the legal and accounting survivor.
Based on the opinion of tax counsel, the reorganization qualified as a tax-free reorganization for federal income tax purposes with no gain or loss recognized by the Acquired Fund or its shareholders. Thus, the investments were transferred to the Acquiring Fund at the Acquired Fund’s identified cost. All distributable amounts of net income and realized gains from the Acquired Fund were distributed prior to the reorganization. In addition, the expenses of the reorganization were borne by the Acquired Fund. The effective time of the reorganization occurred immediately after the close of regularly scheduled trading on the New York Stock Exchange (NYSE) on October 2, 2009.
| |
| 34 | Rainier Growth Fund | Annual report |
| | | | | | | | | | | | | | |
| The following outlines the reorganization: | | | | | | | | |
|
| | | | | | | | SHARES | | SHARES | | | | |
| | | | ACQUIRED NET | | DEPRECIATION | | REDEEMED | | ISSUED | | | | ACQUIRING |
| | | | ASSET VALUE OF | | OF ACQUIRED | | BY THE | | BY THE | | ACQUIRING FUND | | FUND TOTAL NET |
| ACQUIRING | | ACQUIRED | | THE ACQUIRED | | FUND’S | | ACQUIRED | | ACQUIRING | | NET ASSETS PRIOR | | ASSETS AFTER |
| FUND | | FUND | | FUND | | INVESTMENTS | | FUND | | FUND | | TO COMBINATION | | COMBINATION |
|
| Rainier | | Health | | $97,226,769 | | $412,956 | | 3,813,093 | | 6,121,388 | | $1,174,437,197 | | $1,271,663,966 |
| Growth | | Sciences | | | | | | | | | | | | |
| Fund | | Fund | | | | | | | | | | | | |
Because the combined Fund has been managed as a single integrated Fund since the reorganization was completed, it is not practicable to separate the amounts of net investment income and gains attributable to the Acquired Fund that have been included in the Acquiring Fund’s Statement of Operations for the year ended March 31, 2010. See Note 5 for capital shares issued in connection with the above referenced reorganization.
| |
| Annual report | Rainier Growth Fund | 35 |
Auditors’ report
Report of Independent Registered Public Accounting Firm
To the Board of Trustees of John Hancock Funds III and Shareholders of John Hancock Rainier Growth Fund:
In our opinion, the accompanying statement of assets and liabilities, including the portfolio of investments, and the related statements of operations and of changes in net assets and the financial highlights present fairly, in all material respects, the financial position of John Hancock Rainier Growth Fund (the “Fund”) at March 31, 2011, and the results of its operations for the year ended, the changes in its net assets for the two years then ended and the financial highlights for the three years then ended, in conformity with accounting principles generally accepted in the United States of America. These financial statements and financial highlights (hereafter referred to as “financial statements”) are the responsibility of the Fund’s management; our responsibility is to express an opinion on these financial statements based on our audits. We conducted our audits of these financial statements in accordance with the standards of the Public Company Accounting Oversight Board (United States). Those standards require that we plan and perform the audit to obtain reasonable assurance about whether the financial statements are free of material misstatement. An audit includes examining, on a test basis, evidence supporting the amounts and disclosures in the financial statements, assessing the accounting principles used and significant estimates made by management, and evaluating the overall financial statement presentation. We believe that our audits, which included confirmation of securities at March 31, 2011 by correspondence with the custodian, and the application of alternative auditing procedures where securities purchased confirmations had not been received, provide a reasonable basis for our opinion.
The financial highlights of the Fund for the periods ending on or before March 31, 2008 were audited by another independent registered public accounting firm, whose report dated May 20, 2008 expressed an unqualified opinion thereon.
PricewaterhouseCoopers LLP
Boston, Massachusetts
May 20, 2011
| |
| 36 | Rainier Growth Fund | Annual report |
Tax information
Unaudited
For federal income tax purposes, the following information is furnished with respect to the distributions of the Fund, if any, paid during its taxable year ended March 31, 2011.
The Fund designates the maximum amount allowable for the corporate dividends received deduction for the fiscal year ended March 31, 2011.
The Fund designates the maximum amount allowable of its net taxable income as qualified dividend income as provided in the Jobs and Growth Tax Relief Reconciliation Act of 2003. This amount will be reflected on Form 1099-DIV for the calendar year 2011.
Shareholders will be mailed a 2011 Form 1099-DIV in January 2012. This will reflect the total of all distributions for calendar year 2011.
| |
| Annual report | Rainier Growth Fund | 37 |
Trustees and Officers
This chart provides information about the Trustees and Officers who oversee your John Hancock fund. Officers elected by the Trustees manage the day-to-day operations of the Fund and execute policies formulated by the Trustees.
| | |
| Independent Trustees | | |
| Name, Year of Birth | Trustee | Number of John |
| Position(s) held with Fund | of the | Hancock funds |
| Principal occupation(s) and other | Trust | overseen by |
| directorships during past 5 years | since1 | Trustee |
| |
| Steven R. Pruchansky, Born: 1944 | 2006 | 47 |
|
| Chairperson (since January 2011); Chairman and Chief Executive Officer, Greenscapes of Southwest |
| Florida, Inc. (since 2000); Director and President, Greenscapes of Southwest Florida, Inc. (until 2000); |
| Member, Board of Advisors, First American Bank (since 2008); Managing Director, Jon James, LLC (real |
| estate) (since 2000); Director, First Signature Bank & Trust Company (until 1991); Director, Mast Realty |
| Trust (until 1994); President, Maxwell Building Corp. (until 1991). |
| |
| James F. Carlin, Born: 1940 | 2006 | 47 |
|
| Chief Executive Officer, Director and Treasurer, Alpha Analytical Laboratories (environmental, chemical |
| and pharmaceutical analysis) (since 1985); Part Owner and Treasurer, Lawrence Carlin Insurance |
| Agency, Inc. (since 1995); Chairman and Chief Executive Officer, CIMCO, LLC (management/ |
| investments) (since 1987). |
| |
| William H. Cunningham, Born: 1944 | 2006 | 47 |
|
| Professor, University of Texas, Austin, Texas (since 1971); former Chancellor, University of Texas System |
| and former President of the University of Texas, Austin, Texas; Director of the following: LIN Television |
| (since 2009); Lincoln National Corporation (insurance) (Chairman since 2009 and Director since 2006); |
| Resolute Energy Corporation (since 2009); Nanomedical Systems, Inc. (biotechnology company) |
| (Chairman since 2008); Yorktown Technologies, LP (tropical fish) (Chairman since 2007); Greater Austin |
| Crime Commission (since 2001); Southwest Airlines (since 2000); former Director of the following: |
| Introgen (manufacturer of biopharmaceuticals) (until 2008); Hicks Acquisition Company I, Inc. (until |
| 2007); Jefferson-Pilot Corporation (diversified life insurance company) (until 2006); and former Advisory |
| Director, JP Morgan Chase Bank (formerly Texas Commerce Bank–Austin) (until 2009). |
| |
| Deborah C. Jackson,2 Born: 1952 | 2008 | 47 |
|
| Chief Executive Officer, American Red Cross of Massachusetts Bay (since 2002); Board of Directors of |
| Eastern Bank Corporation (since 2001); Board of Directors of Eastern Bank Charitable Foundation (since |
| 2001); Board of Directors of American Student Assistance Corp. (1996–2009); Board of Directors of |
| Boston Stock Exchange (2002–2008); Board of Directors of Harvard Pilgrim Healthcare (health benefits |
| company) (since 2007). |
| |
| Charles L. Ladner,2 Born: 1938 | 2006 | 47 |
|
| Vice Chairperson (since March 2011); Chairman and Trustee, Dunwoody Village, Inc. (retirement |
| services) (since 2008); Director, Philadelphia Archdiocesan Educational Fund (since 2009); Senior Vice |
| President and Chief Financial Officer, UGI Corporation (public utility holding company) (retired 1998); |
| Vice President and Director for AmeriGas, Inc. (retired 1998); Director of AmeriGas Partners, L.P. (gas |
| distribution) (until 1997); Director, EnergyNorth, Inc. (until 1995); Director, Parks and History Association |
| (Cooperating Association, National Park Service) (until 2005). |
| |
| 38 | Rainier Growth Fund | Annual report |
| | |
| Independent Trustees (continued) | | |
| |
| Name, Year of Birth | Trustee | Number of John |
| Position(s) held with Fund | of the | Hancock funds |
| Principal occupation(s) and other | Trust | overseen by |
| directorships during past 5 years | since1 | Trustee |
| |
| Stanley Martin,2 Born: 1947 | 2008 | 47 |
|
| Senior Vice President/Audit Executive, Federal Home Loan Mortgage Corporation (2004–2006); |
| Executive Vice President/Consultant, HSBC Bank USA (2000–2003); Chief Financial Officer/Executive |
| Vice President, Republic New York Corporation & Republic National Bank of New York (1998–2000); |
| Partner, KPMG LLP (1971–1998). |
| |
| Dr. John A. Moore, Born: 1939 | 2006 | 47 |
|
| President and Chief Executive Officer, Institute for Evaluating Health Risks, (nonprofit institution) |
| (until 2001); Senior Scientist, Sciences International (health research) (until 2003); Former |
| Assistant Administrator & Deputy Administrator, Environmental Protection Agency; Principal, |
| Hollyhouse (consulting) (since 2000); Director, CIIT Center for Health Science Research (nonprofit |
| research) (until 2007). |
| |
| Patti McGill Peterson,2 Born: 1943 | 2006 | 47 |
|
| Principal, PMP Globalinc (consulting) (since 2007); Senior Associate, Institute for Higher Education Policy |
| (since 2007); Executive Director, CIES (international education agency) (until 2007); Vice President, |
| Institute of International Education (until 2007); Senior Fellow, Cornell University Institute of Public |
| Affairs, Cornell University (1997–1998); Former President Wells College, St. Lawrence University and the |
| Association of Colleges and Universities of the State of New York. Director of the following: Niagara |
| Mohawk Power Corporation (until 2003); Security Mutual Life (insurance) (until 1997); ONBANK (until |
| 1993). Trustee of the following: Board of Visitors, The University of Wisconsin, Madison (since 2007); |
| Ford Foundation, International Fellowships Program (until 2007); UNCF, International Development |
| Partnerships (until 2005); Roth Endowment (since 2002); Council for International Educational |
| Exchange (since 2003). | | |
| |
| Gregory A. Russo, Born: 1949 | 2008 | 47 |
|
| Vice Chairman, Risk & Regulatory Matters, KPMG LLP (“KPMG”) (2002–2006); Vice Chairman, Industrial |
| Markets, KPMG (1998–2002). |
| |
| Non-Independent Trustees3 | | |
| | | |
| Name, Year of Birth | Trustee | Number of John |
| Position(s) held with Fund | of the | Hancock funds |
| Principal occupation(s) and other | Trust | overseen by |
| directorships during past 5 years | since1 | Trustee |
| |
| Hugh McHaffie, Born: 1959 | 2010 | 47 |
|
| Executive Vice President, John Hancock Financial Services (since 2006, including prior positions); |
| President of John Hancock Trust and John Hancock Funds II (since 2009); Trustee, John Hancock retail |
| funds (since 2010); Chairman and Director, John Hancock Advisers, LLC, John Hancock Investment |
| Management Services, LLC and John Hancock Funds, LLC (since 2010); Senior Vice President, Individual |
| Business Product Management, MetLife, Inc. (1999–2006). |
| |
| Annual report | Rainier Growth Fund | 39 |
| | |
| Non-Independent Trustees3 (continued) | | |
| |
| Name, Year of Birth | Trustee | Number of John |
| Position(s) held with Fund | of the | Hancock funds |
| Principal occupation(s) and other | Trust | overseen by |
| directorships during past 5 years | since1 | Trustee |
| |
| John G. Vrysen, Born: 1955 | 2009 | 47 |
|
| Senior Vice President, John Hancock Financial Services (since 2006); Director, Executive Vice President |
| and Chief Operating Officer, John Hancock Advisers, LLC, John Hancock Investment Management |
| Services, LLC and John Hancock Funds, LLC (since 2005); Chief Operating Officer, John Hancock Funds II |
| and John Hancock Trust (since 2007); Chief Operating Officer, John Hancock retail funds (until 2009); |
| Trustee, John Hancock retail funds (since 2009). |
| |
| Principal officers who are not Trustees | | |
| | | |
| Name, Year of Birth | | Officer |
| Position(s) held with Fund | | of the |
| Principal occupation(s) and other | | Trust |
| directorships during past 5 years | | since |
| |
| Keith F. Hartstein, Born: 1956 | | 2006 |
|
| President and Chief Executive Officer |
| Senior Vice President, John Hancock Financial Services (since 2004); Director, President and Chief |
| Executive Officer, John Hancock Advisers, LLC and John Hancock Funds, LLC (since 2005); Director, |
| John Hancock Asset Management a division of Manulife Asset Management (US) LLC (since 2005); |
| Director, John Hancock Investment Management Services, LLC (since 2006); President and Chief |
| Executive Officer, John Hancock retail funds (since 2005); Member, Investment Company Institute Sales |
| Force Marketing Committee (since 2003). |
| |
| Andrew G. Arnott, Born: 1971 | | 2009 |
|
| Senior Vice President and Chief Operating Officer | | |
| Senior Vice President, John Hancock Financial Services (since 2009); Executive Vice President, |
| John Hancock Advisers, LLC (since 2005); Executive Vice President, John Hancock Investment |
| Management Services, LLC (since 2006); Executive Vice President, John Hancock Funds, LLC (since |
| 2004); Chief Operating Officer, John Hancock retail funds (since 2009); Senior Vice President, |
| John Hancock retail funds (since 2010); Vice President, John Hancock Funds II and John Hancock Trust |
| (since 2006); Senior Vice President, Product Management and Development, John Hancock Funds, |
| LLC (until 2009). |
| |
| Thomas M. Kinzler, Born: 1955 | | 2006 |
|
| Secretary and Chief Legal Officer | | |
| Vice President, John Hancock Financial Services (since 2006); Secretary and Chief Legal Counsel, |
| John Hancock Advisers, LLC, John Hancock Investment Management Services, LLC and John Hancock |
| Funds, LLC (since 2007); Secretary and Chief Legal Officer, John Hancock retail funds, John Hancock |
| Funds II and John Hancock Trust (since 2006); Vice President and Associate General Counsel, |
| Massachusetts Mutual Life Insurance Company (1999–2006); Secretary and Chief Legal Counsel, MML |
| Series Investment Fund (2000–2006); Secretary and Chief Legal Counsel, MassMutual Select Funds and |
| MassMutual Premier Funds (2004–2006). |
| |
| 40 | Rainier Growth Fund | Annual report |
| |
| Principal officers who are not Trustees (continued) | |
| |
| Name, Year of Birth | Officer |
| Position(s) held with Fund | of the |
| Principal occupation(s) and other | Trust |
| directorships during past 5 years | since |
| |
| Francis V. Knox, Jr., Born: 1947 | 2006 |
|
| Chief Compliance Officer |
| Vice President, John Hancock Financial Services (since 2005); Chief Compliance Officer, John Hancock |
| retail funds, John Hancock Funds II, John Hancock Trust, John Hancock Advisers, LLC and John Hancock |
| Investment Management Services, LLC (since 2005); Vice President and Chief Compliance Officer, |
| John Hancock Asset Management a division of Manulife Asset Management (US) LLC (2005–2008). |
| |
| Charles A. Rizzo, Born: 1957 | 2007 |
|
| Chief Financial Officer |
| Vice President, John Hancock Financial Services (since 2008); Senior Vice President, John Hancock |
| Advisers, LLC and John Hancock Investment Management Services, LLC (since 2008); Chief Financial |
| Officer, John Hancock retail funds, John Hancock Funds II and John Hancock Trust (since 2007); |
| Assistant Treasurer, Goldman Sachs Mutual Fund Complex (2005–2007); Vice President, Goldman |
| Sachs (2005–2007). |
| |
| Salvatore Schiavone, Born: 1965 | 2010 |
|
| Treasurer |
| Assistant Vice President, John Hancock Financial Services (since 2007); Vice President, John Hancock |
| Advisers, LLC and John Hancock Investment Management Services, LLC (since 2007); Treasurer, |
| John Hancock retail funds (since 2010); Treasurer, John Hancock Closed-End Funds (since 2009); |
| Assistant Treasurer, John Hancock Funds II and John Hancock Trust (since 2007); Assistant Treasurer, |
| John Hancock retail funds, John Hancock Funds II and John Hancock Trust (2007–2009); Assistant |
| Treasurer, Fidelity Group of Funds (2005–2007); Vice President, Fidelity Management Research |
| Company (2005–2007). |
The business address for all Trustees and Officers is 601 Congress Street, Boston, Massachusetts 02210-2805.
The Statement of Additional Information of the Fund includes additional information about members of the Board of Trustees of the Fund and is available without charge, upon request, by calling 1-800-225-5291.
1 Each Trustee holds office until his or her successor is elected and qualified, or until the Trustee’s death, retirement, resignation or removal.
2 Member of Audit Committee.
3 Because Messrs. McHaffie and Vrysen are senior executives or directors with the Adviser and/or its affiliates, each of them is considered an “interested person,” as defined in the Investment Company Act of 1940, of the Fund.
| |
| Annual report | Rainier Growth Fund | 41 |
More information
| | |
| Trustees | Investment adviser | |
| Steven R. Pruchansky, Chairperson | John Hancock Investment Management | |
| James F. Carlin | Services, LLC | |
| William H. Cunningham | | |
| Deborah C. Jackson* | Subadviser | |
| Charles L. Ladner, Vice Chairperson* | Rainier Investment Management, Inc. | |
| Stanley Martin* | | |
| Hugh McHaffie† | Principal distributor | |
| Dr. John A. Moore | John Hancock Funds, LLC | |
| Patti McGill Peterson* | | |
| Gregory A. Russo | Custodian | |
| John G. Vrysen† | State Street Bank and Trust Company | |
| | | |
| Officers | Transfer agent | |
| Keith F. Hartstein | John Hancock Signature Services, Inc. | |
| President and Chief Executive Officer | | |
| | Legal counsel | |
| Andrew G. Arnott | K&L Gates LLP | |
| Senior Vice President and Chief Operating Officer | | |
| | Independent registered | |
| Thomas M. Kinzler | public accounting firm | |
| Secretary and Chief Legal Officer | PricewaterhouseCoopers LLP | |
| | | |
| Francis V. Knox, Jr. | | |
| Chief Compliance Officer | | |
| | | |
| Charles A. Rizzo | | |
| Chief Financial Officer | | |
| | | |
| Salvatore Schiavone | | |
| Treasurer | | |
| | |
| *Member of the Audit Committee | | |
| †Non-Independent Trustee | | |
| | The Fund’s proxy voting policies and procedures, as well as the Fund’s proxy voting record for the most recent twelve-month period ended June 30, are available free of charge on the Securities and Exchange Commission (SEC) Web site at www.sec.gov or on our Web site.
The Fund’s complete list of portfolio holdings, for the first and third fiscal quarters, is filed with the SEC on Form N-Q. The Fund’s Form N-Q is available on our Web site and the SEC’s Web site, www.sec.gov, and can be reviewed and copied (for a fee) at the SEC’s Public Reference Room in Washington, DC. Call 1-800-SEC-0330 to receive information on the operation of the SEC’s Public Reference Room.
We make this information on your fund, as well as monthly portfolio holdings, and other fund details available on our Web site www.jhfunds.com or by calling 1-800-225-5291.
| | |
| You can also contact us: | | |
| 1-800-225-5291 | Regular mail: | Express mail: |
| jhfunds.com | John Hancock Signature Services, Inc. | John Hancock Signature Services, Inc. |
| | P.O. Box 55913 | Mutual Fund Image Operations |
| | Boston, MA 02205-5913 | 30 Dan Road |
| | | Canton, MA 02021 |
| |
| 42 | Rainier Growth Fund | Annual report |

1-800-225-5291
1-800-554-6713 TDD
1-800-338-8080 EASI-Line
www.jhfunds.com
Now available: electronic delivery
www.jhfunds.com/edelivery
| | |
| This report is for the information of the shareholders of John Hancock Rainier Growth Fund. | | 3340A 3/11 |
| It is not authorized for distribution to prospective investors unless preceded or accompanied by a prospectus. | | 5/11 |
| | |
| John Hancock Leveraged Companies Fund | | |
| | |
| Table of Contents | | |
| | |
| Management’s discussion of Fund performance | Page 3 | |
| A look at performance | Page 4 | |
| Your expenses | Page 6 | |
| Portfolio summary | Page 7 | |
| Portfolio of investments | Page 8 | |
| Financial statements | Page 12 | |
| Financial highlights | Page 15 | |
| Notes to financial statements | Page 19 | |
| Trustees and Officers | Page 28 | |
| More information | Page 36 | |
John Hancock Leveraged Companies Fund
Management’s Discussion of Fund Performance
By John Hancock Asset Management (formerly MFC Global Investment Management (U.S.), LLC) 1
The 12 months ended March 31, 2011 included an ongoing rebound by the economy and financial markets, supported by stimulative monetary and fiscal policies. These included the extension of Bush-era tax cuts and the Federal Reserve’s decision to enact a second round of quantitative easing. Against that backdrop, investors continued to reach for risk assets, making for positive returns for stocks and credit-sensitive bonds. For the 12 month period, John Hancock Leveraged Companies Fund’s Class A shares posted a total return of 12.09% at net asset value. That compares with the 24.17% return of the Fund’s benchmark, the Credit Suisse Leveraged Equity Index, the 15.65% return of the broad S&P 500 Index, the 14.18% return of the Bank of America Merrill Lynch U.S. High Yield Master II Index and the 11.97% average return of the moderate allocation funds tracked by Morningstar, Inc.
The Fund managed positive, double-digit gains thanks to significant contributions from a broad range of investments, including stakes in cable, media, finance and auto-related securities. Leading contributions came from holding the stock and convertible bonds of Sirius XM Radio, Inc. and the stock and corporate bonds of Canadian Satellite Radio Holdings, Inc., whose subscriber growth is tied to auto sales. Auto battery and parts makers Exide Technologies, Autoliv, Inc. and Tenneco, Inc. were other leading auto-related contributors. In addition, the stock of paper and packaging company Smurfit-Stone Container Corp. made a key contribution when it became the target of a takeover offer at a significant premium. Charter Communications, Inc., Cablevision Systems Corp. and Time Warner Cable, Inc. were key contributors in the cable and media space.
Two of the largest detractors were airline securities hurt by the effect of $100 a barrel oil -- Delta Air Lines, Inc. and United Continental Holdings, Inc. Nevertheless, we believe our investment thesis for the sector remains intact as airlines continue to benefit from debt reduction, ample liquidity, industry consolidation, cost controls and capacity discipline. These factors have so far allowed the airlines to maintain profitability and pass through fare increases despite modest economic growth and surging oil prices. A number of other detractors were gaming securities hurt by regional economic downturns, including the stocks and convertible securities of Greektown Superholdings, Inc., Mashantucket Western Pequot Tribe and Trump Entertainment Resorts, Inc.
This commentary reflects the views of the portfolio management team through the end of the Fund’s period discussed in this report. The team’s statements reflect their own opinions. As such, they are in no way guarantees of future events, and are not intended to be used as investment advice or a recommendation regarding any specific security. They are also subject to change at any time as market and other conditions warrant. Sector investing is subject to greater risks than the market as a whole. Because the Fund may focus on particular sectors of the economy, its performance may depend on the performance of those sectors.
Past performance is no guarantee of future results.
1 Manulife Asset Management (US) LLC is doing business as John Hancock Asset Management.
A Look at Performance
Leveraged Companies Fund
For the period ended March 31, 2011
| | | | | | | | |
| | Average annual total returns (%) | | Cumulative total returns (%) | | |
| | with maximum sales charge (POP) | | with maximum sales charge (POP) | |
|
| | | | | Since | | | | Since |
| Class | 1-year | 5-year | 10-year | Inception1 | 1-year | 5-year | 10-year | Inception1 |
|
| A | 6.46 | - | - | 9.42 | 6.46 | - | - | 30.03 |
|
| B | 6.33 | - | - | 9.76 | 6.33 | - | - | 31.22 |
|
| C | 10.33 | - | - | 10.61 | 10.33 | - | - | 34.22 |
|
| I2 | 12.66 | - | - | 11.78 | 12.66 | - | - | 38.40 |
|
Performance figures assume all distributions are reinvested. Public offering price (POP) figures reflect maximum sales charge on Class A shares of 5%, and the applicable contingent deferred sales charge (CDSC) on Class B and Class C shares. The Class B shares’ CDSC declines annually between years 1 to 6 according to the following schedule: 5, 4, 3, 3, 2, 1%. No sales charge will be assessed after the sixth year. Class C shares held for less than one year are subject to a 1% CDSC. Sales charges are not applicable for Class I shares.
The expense ratios of the Fund, both net (including any fee waivers or expense limitations) and gross (excluding any fee waivers or expense limitations), are set forth according to the most recent publicly available prospectuses for the Fund and may differ from those disclosed in the Financial Highlights tables in this report. The fee waivers and expense limitations are contractual at least until 7 31 11. Had the fee waivers and expense limitations not been in place gross expenses would apply. The expense ratios are as follows:
| | | | |
| | | | | |
|
| | Class A | Class B | Class C | Class I |
|
| Net (%) | 1.35 | 2.05 | 2.05 | 0.89 |
|
| Gross (%) | 10.79 | 11.50 | 11.50 | 9.17 |
|
The returns reflect past results and should not be considered indicative of future performance. The return and principal value of an investment will fluctuate so that shares, when redeemed, may be worth more or less than their original cost. Due to market volatility, the Fund’s current performance may be higher or lower than the performance shown. For performance data current to the most recent month end, please call 1–800–225–5291 or visit the Fund’s Web site at www.jhfunds.com.
The performance table above and the chart on the next page do not reflect the deduction of taxes that a shareholder would pay on fund distributions or the redemption of fund shares. The Fund’s performance results reflect any applicable expense reductions, without which the expenses would increase and results would have been less favorable.
Footnotes on the following page.
A look at performance

| | | |
| | Class B | Class C4 | Class I2 |
|
| Began | 5-1-08 | 5-1-08 | 5-1-08 |
|
| NAV | $13,422 | $13,422 | $13,840 |
|
| POP | $13,122 | $13,422 | $13,840 |
|
| Index 1 | $9,850 | $9,850 | $9,850 |
|
| Index 2 | $10,225 | $10,225 | $10,225 |
|
| Index 3 | $13,739 | $13,739 | $13,739 |
|
Credit Suisse Leveraged Equity Index is an unmanaged market-weighted index designed to represent securities of the investable universe of the U.S. dollar denominated high-yield debt market.
S&P 500 Index is an unmanaged index that includes 500 widely traded common stocks.
Bank of America Merrill Lynch U.S. High Yield Master II Index is an unmanaged index composed of U.S. currency high-yield bonds issued by U.S. and non-U.S. issuers.
It is not possible to invest directly in an index. Index figures do not reflect sales charges, which would have resulted in lower values if they did.
1 From 5-1-08.
2 For certain types of investors, as described in the Fund’s prospectuses.
3 NAV represents net asset value and POP represents public offering price. Performance of the classes will vary based on the difference in sales charges paid by shareholders investing in the different classes and the fee structure of those classes.
4 The contingent deferred sales charge, if any, is not applicable.
| |
| Annual report | Leveraged Companies Fund |
| 5 |
Leveraged Companies Fund
Your expenses
These examples are intended to help you understand your ongoing operating expenses.
Understanding your fund expenses
As a shareholder of the Fund, you incur two types of costs:
• Transaction costs which include sales charges (loads) on purchases or redemptions (if applicable), minimum account fee charge, etc.
• Ongoing operating expenses including management fees, distribution and service fees (if applicable), and other fund expenses.
We are going to present only your ongoing operating expenses here.
Actual expenses/actual returns
This example is intended to provide information about your fund’s actual ongoing operating expenses, and is based on your fund’s actual return. It assumes an account value of $1,000.00 on October 1, 2010 with the same investment held until March 31, 2011.
| | | |
| | Account value | Ending value | Expenses paid during |
| | on 10-1-10 | on 3-31-11 | period ended 3-31-111 |
|
| Class A | $1,000.00 | $1,131.40 | $7.17 |
| Class B | 1,000.00 | 1,128.00 | 10.88 |
| Class C | 1,000.00 | 1,128.00 | 10.88 |
| Class I | 1,000.00 | 1,135.00 | 4.74 |
Together with the value of your account, you may use this information to estimate the operating expenses that you paid over the period. Simply divide your account value at March 31, 2011, by $1,000.00, then multiply it by the “expenses paid” for your share class from the table above. For example, for an account value of $8,600.00, the operating expenses should be calculated as follows:
Example
[ My account value $8,600.00 / $1,000.00 = 8.6 ] x $[ “expenses paid” from table ] = My actual expenses
Hypothetical example for comparison purposes
This table allows you to compare your fund’s ongoing operating expenses with those of any other fund. It provides an example of the Fund’s hypothetical account values and hypothetical expenses based on each class’s actual expense ratio and an assumed 5% annualized return before expenses (which is not your fund’s actual return). It assumes an account value of $1,000.00 on October 1, 2010, with the same investment held until March 31, 2011. Look in any other fund shareholder report to find its hypothetical example and you will be able to compare these expenses. Please remember that these hypothetical account values and expenses may not be used to estimate the actual ending account balance or expenses you paid for the period.
| | | |
| | Account value | Ending value | Expenses paid during |
| | on 10-1-10 | on 3-31-11 | period ended 3-31-111 |
|
| Class A | $1,000.00 | $1,018.20 | $6.79 |
| Class B | 1,000.00 | 1,014.70 | 10.30 |
| Class C | 1,000.00 | 1,014.70 | 10.30 |
| Class I | 1,000.00 | 1,020.50 | 4.48 |
Remember, these examples do not include any transaction costs, therefore, these examples will not help you to determine the relative total costs of owning different funds. If transaction costs were included, your expenses would have been higher. See the prospectus for details regarding transaction costs.
1 Expenses are equal to the Fund's annualized expense ratio of 1.35%, 2.05%, 2.05% and 0.89% for Class A, Class B, Class C and Class I shares, respectively, multiplied by the average account value over the period, multiplied by 182/365 (to reflect the one-half year period).
Leveraged Companies Fund
Portfolio Summary
| |
| | Value as a |
| | percentage of |
| Top 10 Holdings1 (55.2% of Net Assets) | Fund's net assets |
| Delta Air Lines, Inc. | 8.8% |
| Greektown Superholdings, Inc., Series A | 7.9% |
| Exide Technologies | 6.5% |
| Charter Communications, Inc., Class A | 6.0% |
| Sirius XM Radio, Inc. | 6.0% |
| US Airways Group, Inc. | 5.4% |
| United Continental Holdings, Inc. | 5.0% |
| Ford Motor Company (Expiration Date 01/01/2013; Strike Price $9.20) | 3.5% |
| MBIA Insurance Corp. (14.000% to 01/15/2013, then 3 month LIBOR + 11.260%) | 3.1% |
| AMR Corp. | 3.0% |
| |
| | Value as a |
| | percentage of |
| Sector Composition2 | Fund's net assets |
| Consumer Discretionary | 46% |
| Industrials | 28% |
| Financials | 14% |
| Materials | 3% |
| Investment Companies | 3% |
| Telecommunication Services | 1% |
| Health Care | 1% |
| Consumer Staples | 1% |
| Securities Lending Collateral & Other | 3% |
| |
| | Value as a |
| | percentage of |
| Portfolio Composition | Fund's net assets |
| Common Stocks | 69% |
| Preferred Securities | 8% |
| Corporate Bonds | 8% |
| Convertible Bonds | 5% |
| Warrants | 4% |
| Investment Companies | 3% |
| Securities Lending Collateral & Other | 3% |
1 Cash and cash equivalents are not included in Top 10 Holdings.
2 Sector investing is subject to greater risks than the market as a whole. Because the Fund may focus on particular sectors of the economy, its performance may depend on the performance of those sectors.
| |
| See notes to financial statements | |
| | |
| 7 |
Leveraged Companies Fund
As of 3-31-11
| | |
| | Shares | Value |
| |
| Common Stocks 69.59% | | $1,228,420 |
|
| (Cost $963,690) | | |
| |
| Consumer Discretionary 29.10% | | 513,748 |
|
| Auto Components 10.38% | | |
| Autoliv, Inc. | 150 | 11,135 |
| Exide Technologies (I) | 10,220 | 114,260 |
| Federal Mogul Corp. (I) | 800 | 19,920 |
| Tenneco, Inc. (I) | 894 | 37,950 |
| | | |
| Hotels, Restaurants & Leisure 0.90%�� | | |
| Greektown Superholdings, Inc. (I) | 92 | 8,194 |
| Trump Entertainment Resorts, Inc. (I) | 260 | 1,170 |
| Wendy's/Arby's Group, Inc., Class A | 1,285 | 6,464 |
| | | |
| Media 17.82% | | |
| Cablevision Systems Corp., Class A | 1,495 | 51,742 |
| Canadian Satellite Radio Holdings, Inc., Class A (I) | 5,900 | 19,170 |
| Charter Communications, Inc., Class A (I) | 2,104 | 106,526 |
| Madison Square Garden, Inc., Class A (I) | 373 | 10,067 |
| Sirius XM Radio, Inc. (I) | 64,006 | 106,250 |
| SuperMedia, Inc. (I) | 91 | 568 |
| Time Warner Cable, Inc. | 285 | 20,332 |
| |
| Consumer Staples 0.63% | | 11,133 |
|
| Food Products 0.63% | | |
| Kraft Foods, Inc., Class A | 355 | 11,133 |
| |
| Energy 0.19% | | 3,335 |
|
| Oil, Gas & Consumable Fuels 0.19% | | |
| Dominion Petroleum, Ltd., GDR (I) | 33,000 | 3,335 |
| |
| Financials 10.79% | | 190,449 |
|
| Capital Markets 3.79% | | |
| American Capital, Ltd. (I) | 560 | 5,544 |
| Janus Capital Group, Inc. | 460 | 5,736 |
| Knight Capital Group, Inc., Class A (I) | 160 | 2,144 |
| Morgan Stanley | 525 | 14,343 |
| Solar Senior Capital, Ltd. (I) | 360 | 6,707 |
| Tetragon Financial Group, Ltd. | 1,365 | 10,370 |
| The Blackstone Group LP | 350 | 6,258 |
| The Goldman Sachs Group, Inc. | 100 | 15,847 |
| | | |
| Commercial Banks 0.70% | | |
| Wells Fargo & Company | 390 | 12,363 |
| | | |
| Consumer Finance 0.29% | | |
| Discover Financial Services | 215 | 5,186 |
| | | |
| Diversified Financial Services 3.82% | | |
| Bank of America Corp. | 3,320 | 44,256 |
| Citigroup, Inc. (I) | 785 | 3,470 |
| KKR Financial Holdings LLC | 2,010 | 19,678 |
| | | |
| Insurance 0.20% | | |
| American International Group, Inc. (I) | 100 | 3,514 |
| | | |
| Real Estate Investment Trusts 1.30% | | |
| iStar Financial, Inc. (I) | 2,500 | 22,950 |
| |
| See notes to financial statements | |
| | |
| 8 |
Leveraged Companies Fund
As of 3-31-11
| | |
| | Shares | Value |
| Financials (continued) | | |
|
| Thrifts & Mortgage Finance 0.69% | | |
| The PMI Group, Inc. (I) | 4,475 | $12,083 |
| | | |
| Health Care 0.67% | | 11,850 |
|
| Pharmaceuticals 0.67% | | |
| Johnson & Johnson | 200 | 11,850 |
| | | |
| Industrials 23.70% | | 418,321 |
|
| Aerospace & Defense 0.50% | | |
| AAR Corp. (I) | 315 | 8,732 |
| | | |
| Air Freight & Logistics 0.50% | | |
| FedEx Corp. | 95 | 8,887 |
| | | |
| Airlines 21.92% | | |
| Delta Air Lines, Inc. (I) | 15,843 | 155,261 |
| Pinnacle Airlines Corp. (I) | 8,265 | 47,524 |
| United Continental Holdings, Inc. (I)(L) | 3,840 | 88,282 |
| US Airways Group, Inc. (I)(L) | 11,000 | 95,810 |
| | | |
| Building Products 0.17% | | |
| USG Corp. (I) | 185 | 3,082 |
| | | |
| Road & Rail 0.36% | | |
| Union Pacific Corp. | 65 | 6,391 |
| | | |
| Trading Companies & Distributors 0.25% | | |
| TAL International Group, Inc. | 120 | 4,352 |
| | | |
| Information Technology 0.42% | | 7,354 |
|
| Software 0.42% | | |
| Microsoft Corp. | 290 | 7,354 |
| | | |
| Materials 3.16% | | 55,760 |
|
| Chemicals 2.80% | | |
| American Pacific Corp. (I) | 6,550 | 39,824 |
| Huntsman Corp. | 550 | 9,559 |
| | | |
| Containers & Packaging 0.36% | | |
| Smurfit-Stone Container Corp. (I) | 165 | 6,377 |
| | | |
| Telecommunication Services 0.69% | | 12,264 |
|
| Wireless Telecommunication Services 0.69% | | |
| Leap Wireless International, Inc. (I) | 275 | 4,260 |
| Sprint Nextel Corp. (I) | 1,725 | 8,004 |
| | |
| Utilities 0.24% | | 4,206 |
|
| Independent Power Producers & Energy Traders 0.24% | | |
| Calpine Corp. (I) | 265 | 4,206 |
| | |
| Preferred Securities 8.25% | | $145,652 |
|
| (Cost $164,208) | | |
| | | |
| Consumer Discretionary 8.25% | | 145,652 |
|
| Auto Components 0.36% | | |
| The Goodyear Tire & Rubber Company, 5.875% | 126 | 6,436 |
| |
| See notes to financial statements | |
| 9 |
Leveraged Companies Fund
As of 3-31-11
| | | | |
| | | | Shares | Value |
| Consumer Discretionary (continued) | | | | |
|
| Hotels, Restaurants & Leisure 7.89% | | | | |
| Greektown Superholdings, Inc., Series A (I) | | | 1,563 | $139,216 |
| | | | | |
| | | Maturity | Par value | |
| | Rate (%) | date | | Value |
| Corporate Bonds 7.80% | | | | $137,688 |
|
| (Cost $160,864) | | | | |
| | | | | |
| Consumer Discretionary 3.30% | | | | 58,238 |
|
| Hotels, Restaurants & Leisure 0.68% | | | | |
| Fontainebleau Las Vegas Holdings LLC (H)(S) | 10.250 | 06/15/15 | $100,000 | 500 |
| Mashantucket Western Pequot Tribe, Series A (H)(S) | 8.500 | 11/15/15 | 115,000 | 11,500 |
| | | | | |
| Media 2.62% | | | | |
| Canadian Satellite Radio Holdings, Inc. | 12.750 | 02/15/14 | 45,000 | 46,238 |
| SuperMedia, Inc., Escrow Certificates (I) | — | 11/15/16 | 115,000 | 0 |
| | | | | |
| Financials 3.12% | | | | 55,000 |
|
| Insurance 3.12% | | | | |
| MBIA Insurance Corp. (14.000% to 01/15/2013, then 3 month | | | | |
| LIBOR + 11.260%) (S) | 14.000 | 01/15/33 | 100,000 | 55,000 |
| | | | | |
| Industrials 1.38% | | | | 24,450 |
|
| Aerospace & Defense 1.38% | | | | |
| Colt Defense LLC/Colt Finance Corp. (S) | 8.750 | 11/15/17 | 30,000 | 24,450 |
| | | | | |
| Convertible Bonds 4.78% | | | | $84,420 |
|
| (Cost $72,898) | | | | |
| | | | | |
| Consumer Discretionary 1.80% | | | | 31,800 |
|
| Media 1.80% | | | | |
| XM Satellite Radio, Inc. (S) | 7.000 | 12/01/14 | 24,000 | 31,800 |
| | | | | |
| Industrials 2.98% | | | | 52,620 |
|
| Airlines 2.98% | | | | |
| AMR Corp. | 6.250 | 10/15/14 | 50,000 | 52,620 |
| | | | | |
| | | | Shares | Value |
| |
| Investment Companies 2.50% | | | | $44,019 |
|
| (Cost $35,419) | | | | |
| | | | | |
| iShares MSCI Japan Index Fund | | | 1,880 | 19,383 |
| ProShares Ultra Dow 30 | | | 315 | 19,508 |
| ProShares Ultra MSCI Japan | | | 75 | 5,128 |
| |
| Warrants 3.57% | | | | $63,037 |
|
| (Cost $66,806) | | | | |
| | | | | |
| Consumer Discretionary 3.54% | | | | 62,447 |
|
| Charter Communications, Inc., Class A (Expiration Date: 11/30/2014; Strike Price: | | |
| $46.86) (I) | | | 102 | 1,199 |
| Ford Motor Company (Expiration Date 01/01/2013; Strike Price $9.20) (I) | | 9,600 | 61,248 |
| | | | |
| Financials 0.03% | | | | 590 |
|
| American International Group, Inc. (Expiration Date 01/19/2021; Strike Price $45.00) (I) | 53 | 590 |
| |
| See notes to financial statements | |
| | |
| 10 |
Leveraged Companies Fund
As of 3-31-11
| | | |
| | Yield | Shares | Value |
| Securities Lending Collateral 8.02% | | | $141,510 |
|
| (Cost $141,514) | | | |
| | | | |
| John Hancock Collateral Investment Trust (W) | 0.2867% (Y) | 14,141 | 141,510 |
| |
| Total investments (Cost $1,605,399)† 104.51% | | | $1,844,746 |
|
| Other assets and liabilities, net (4.51%) | | | ($79,590) |
|
| Total net assets 100.00% | | | $1,765,156 |
|
The percentage shown for each investment category is the total value that the category as a percentage of the net assets of the Fund.
GDR Global Depositary Receipt
LIBOR London Interbank Offered Rate
MSCI Morgan Stanley Capital International
(H) Non-income producing - Issuer is in default.
(I) Non-income producing security.
(L) All or a portion of this security is on loan as of 3-31-11.
(S) These securities are exempt from registration under Rule 144A of the Securities Act of 1933. Such securities may be resold, normally to qualified institutional buyers, in transactions exempt from registration.
(W) The subadviser is an affiliate of the adviser and/or the Fund and represents the investment of securities lending collateral received.
(Y) The rate shown is the annualized seven-day yield as of 3-31-11.
† At 3-31-11, the aggregate cost of investment securities for federal income tax purposes was $1,612,575. Net unrealized appreciation aggregated $232,171, of which $434,784 related to appreciated investment securities and $202,613 related to depreciated investment securities.
| |
| See notes to financial statements | |
| | |
| 11 |
Leveraged Companies Fund
Statement of Assets and Liabilities — March 31, 2011
| |
| Assets | |
|
| Investments in unaffiliated issuers, at value | |
| (Cost $1,463,885) including $133,080 of | |
| securities loaned (Note 2) | $1,703,236 |
| Investments in affiliated issuers, at value (Cost | |
| $141,514) (Note 2) | 141,510 |
| | |
| Total investments, at value (Cost $1,605,399) | 1,844,746 |
| | |
| Cash | 94,588 |
| Dividends and interest receivable | 6,821 |
| Receivable for securities lending income | 23 |
| Receivable due from adviser | 297 |
| Other receivables and prepaid expenses | 72 |
| | |
| Total assets | 1,946,547 |
| |
| |
| Liabilities | |
|
| Payable for investments purchased | 24 |
| Payable upon return of securities loaned (Note | |
| 2) | 141,500 |
| Payable to affiliates | |
| Accounting and legal services fees | 29 |
| Transfer agent fees | 353 |
| Trustees' fees | 14 |
| Other liabilities and accrued expenses | 39,471 |
| | |
| Total liabilities | 181,391 |
| |
| |
| Net assets | |
|
| Capital paid-in | $1,539,520 |
| Accumulated undistributed net investment | |
| income | 5,336 |
| Accumulated net realized loss on investments | |
| and foreign currency transactions | (19,023) |
| Net unrealized appreciation (depreciation) on | |
| investments and translation of assets and | |
| liabilities in foreign currencies | 239,323 |
| | |
| Net assets | $1,765,156 |
| |
| |
| Net asset value per share | |
|
| Based on net asset values and shares | |
| outstanding-the Fund has an unlimited number | |
| of shares authorized with no par value | |
| Class A ($342,402 ÷ 29,307 shares) | $11.68 |
| Class B ($335,489 ÷ 28,802 shares)1 | $11.65 |
| Class C ($335,473 ÷ 28,803 shares)1 | $11.65 |
| Class I ($751,792 ÷ 64,221 shares) | $11.71 |
| |
| Maximum offering price per share | |
| Class A (net asset value per share ÷ 95%)2 | $12.29 |
1 Redemption price is equal to net asset value less any applicable contingent deferred sales charge.
2 On single retail sales of less than $50,000. On sales of $50,000 or more and on group sales the offering price is reduced.
| |
| See notes to financial statements | |
| | |
| 12 |
Leveraged Companies Fund
Statement of Operations — For the Year Ended March 31, 2011
| |
| Investment income | |
|
| Interest | $26,272 |
| Dividends | 8,191 |
| Securities lending | 376 |
| Less foreign taxes withheld | (71) |
| | |
| Total investment income | 34,768 |
| |
| Expenses | |
|
| Investment management fees (Note 5) | 10,797 |
| Distribution and service fees (Note 5) | 7,338 |
| Accounting and legal services fees (Note 5) | 183 |
| Transfer agent fees (Note 5) | 1,673 |
| Trustees' fees (Note 5) | 167 |
| State registration fees (Note 5) | 139 |
| Professional fees | 48,843 |
| Custodian fees | 16,836 |
| Registration and filing fees | 15,495 |
| Other | 8,071 |
| | |
| Total expenses | 109,542 |
| | |
| Less expense reductions (Note 5) | (87,681) |
| | |
| Net expenses | 21,861 |
| |
| Net investment income | 12,907 |
| |
| Realized and unrealized gain (loss) | |
|
| Net realized gain (loss) on | |
| Investments in unaffiliated issuers | (5,038) |
| Investments in affiliated issuers | 29 |
| Foreign currency transactions | (1,788) |
| | (6,797) |
| |
| Change in net unrealized appreciation | |
| (depreciation) of | |
| Investments in unaffiliated issuers | 145,698 |
| Investments in affiliated issuers | 2 |
| Translation of assets and liabilities in foreign | |
| currencies | 322 |
| | 146,022 |
| |
| Net realized and unrealized gain | 139,225 |
| |
| Increase in net assets from operations | $152,132 |
| |
| See notes to financial statements. | |
| | |
| 13 |
| | |
| Leveraged Companies Fund | | |
| |
| Statements of Changes in Net Assets | | |
| |
| |
| | Year ended | Year ended |
| | 3-31-11 | 3-31-10 |
| |
| Increase (decrease) in net assets | | |
|
| From operations | | |
| Net investment income | $12,907 | $28,945 |
| Net realized gain (loss) | (6,797) | 106,434 |
| Change in net unrealized appreciation | | |
| (depreciation) | 146,022 | 646,527 |
| | | |
| Increase in net assets resulting from | | |
| operations | 152,132 | 781,906 |
| |
| |
| Distributions to shareholders | | |
| From net investment income | | |
| Class A | (3,450) | (14,079) |
| Class B | (1,313) | (12,806) |
| Class C | (1,312) | (12,807) |
| Class I | (6,583) | (14,628) |
| From net realized gain | | |
| Class A | (8,144) | (4,304) |
| Class B | (8,052) | (4,275) |
| Class C | (8,053) | (4,276) |
| Class I | (11,545) | (4,316) |
| Total distributions | (48,452) | (71,491) |
| |
| From Fund share transactions (Note 6) | 319,964 | 191,393 |
| |
| |
| Total increase | 423,644 | 901,808 |
| |
| Net assets | | |
|
| Beginning of year | 1,341,512 | 439,704 |
| | | |
| End of year | $1,765,156 | $1,341,512 |
| |
| Accumulated undistributed net investment | | |
| income | $5,336 | $3,732 |
| |
| See notes to financial statements. | |
| | |
| 14 |
Leveraged Companies Fund
Financial Highlights (For a share outstanding throughout the period)
| | | |
| Class A Shares | | | |
| |
| Period ended | | | |
| | 3-31-11 | 3-31-10 | 3-31-091 |
| Per share operating performance | | | |
|
| Net asset value, beginning of period | $10.78 | $4.19 | $10.00 |
| Net investment income2 | 0.12 | 0.29 | 0.33 |
| Net realized and unrealized gain (loss) on | | | |
| investments | 1.19 | 7.00 | (5.83) |
| | | | |
| Total from investment operations | 1.31 | 7.29 | (5.50) |
| |
| Less distributions | | | |
| From net investment income | (0.12) | (0.54) | (0.31) |
| From net realized gain | (0.29) | (0.16) | — |
| | | | |
| Total distributions | (0.41) | (0.70) | (0.31) |
| |
| Net asset value, end of period | $11.68 | $10.78 | $4.19 |
| |
| Total return (%)3,4 | 12.09 | 177.42 | (55.97)5 |
| |
| Ratios and supplemental data | | | |
|
| Net assets, end of period (in thousands) | $342 | $305 | $110 |
| Ratios (as a percentage of average net | | | |
| assets): | | | |
| Expenses before reductions | 7.43 | 10.56 | 13.916 |
| Expenses net of fee waivers | 1.35 | 1.41 | 1.216 |
| Expenses net of fee waivers and credits | 1.35 | 1.35 | 1.216 |
| Net investment income | 1.07 | 3.63 | 4.876 |
| Portfolio turnover (%) | 34 | 83 | 18 |
1 The inception date for Class A shares is 5-1-08.
2 Based on the average daily shares outstanding.
3 Does not reflect the effect of sales charges, if any.
4 Total returns would have been lower had certain expenses not been reduced during the periods shown.
5 Not annualized.
6 Annualized.
| |
| See notes to financial statements | |
| | |
| 15 |
Leveraged Companies Fund
Financial Highlights (For a share outstanding throughout the period)
| | | |
| Class B Shares | | | |
| |
| Period ended | | | |
| | 3-31-11 | 3-31-10 | 3-31-091 |
| Per share operating performance | | | |
|
| Net asset value, beginning of period | $10.76 | $4.19 | $10.00 |
| Net investment income2 | 0.04 | 0.23 | 0.28 |
| Net realized and unrealized gain (loss) on | | | |
| investments | 1.19 | 6.99 | (5.82) |
| Total from investment operations | 1.23 | 7.22 | (5.54) |
| |
| Less distributions | | | |
| From net investment income | (0.05) | (0.49) | (0.27) |
| From net realized gain | (0.29) | (0.16) | — |
| Total distributions | (0.34) | (0.65) | (0.27) |
| |
| Net asset value, end of period | $11.65 | $10.76 | $4.19 |
| |
| Total return (%)3,4 | 11.33 | 175.60 | (56.26)5 |
| |
| Ratios and supplemental data | | | |
|
| Net assets, end of period (in thousands) | $335 | $301 | $109 |
| Ratios (as a percentage of average net | | | |
| assets): | | | |
| Expenses before reductions | 8.13 | 11.27 | 14.586 |
| Expenses net of fee waivers | 2.05 | 2.11 | 1.916 |
| Expenses net of fee waivers and credits | 2.05 | 2.05 | 1.916 |
| Net investment income | 0.37 | 2.93 | 4.166 |
| Portfolio turnover (%) | 34 | 83 | 18 |
1 The inception date for Class B shares is 5-1-08.
2 Based on the average daily shares outstanding.
3 Does not reflect the effect of sales charges, if any.
4 Total returns would have been lower had certain expenses not been reduced during the periods shown.
5 Not annualized.
6 Annualized.
| |
| See notes to financial statements | |
| | |
| 16 |
Leveraged Companies Fund
Financial Highlights (For a share outstanding throughout the period)
| | | |
| Class C Shares | | | |
| |
| Period ended | | | |
| | 3-31-11 | 3-31-10 | 3-31-091 |
| Per share operating performance | | | |
|
| Net asset value, beginning of period | $10.76 | $4.19 | $10.00 |
| Net investment income2 | 0.04 | 0.23 | 0.28 |
| Net realized and unrealized gain (loss) on | | | |
| investments | 1.19 | 6.99 | (5.82) |
| Total from investment operations | 1.23 | 7.22 | (5.54) |
| |
| Less distributions | | | |
| From net investment income | (0.05) | (0.49) | (0.27) |
| From net realized gain | (0.29) | (0.16) | — |
| Total distributions | (0.34) | (0.65) | (0.27) |
| |
| Net asset value, end of period | $11.65 | $10.76 | $4.19 |
| |
| Total return (%)3,4 | 11.33 | 175.60 | (56.26)5 |
| |
| Ratios and supplemental data | | | |
|
| Net assets, end of period (in thousands) | $335 | $301 | $109 |
| Ratios (as a percentage of average net | | | |
| assets): | | | |
| Expenses before reductions | 8.13 | 11.27 | 14.596 |
| Expenses net of fee waivers | 2.05 | 2.11 | 1.916 |
| Expenses net of fee waivers and credits | 2.05 | 2.05 | 1.916 |
| Net investment income | 0.37 | 2.93 | 4.166 |
| Portfolio turnover (%) | 34 | 83 | 18 |
1 The inception date for Class C shares is 5-1-08.
2 Based on the average daily shares outstanding.
3 Does not reflect the effect of sales charges, if any.
4 Total returns would have been lower had certain expenses not been reduced during the periods shown.
5 Not annualized.
6 Annualized.
| |
| See notes to financial statements | |
| | |
| 17 |
Leveraged Companies Fund
Financial Highlights (For a share outstanding throughout the period)
| | | |
| Class I Shares | | | |
| |
| Period ended | | | |
| | 3-31-11 | 3-31-10 | 3-31-091 |
| Per share operating performance | | | |
|
| Net asset value, beginning of period | $10.79 | $4.19 | $10.00 |
| Net investment income2 | 0.17 | 0.32 | 0.35 |
| Net realized and unrealized gain (loss) on | | | |
| investments | 1.20 | 7.00 | (5.83) |
| Total from investment operations | 1.37 | 7.32 | (5.48) |
| |
| Less distributions | | | |
| From net investment income | (0.16) | (0.56) | (0.33) |
| From net realized gain | (0.29) | (0.16) | — |
| Total distributions | (0.45) | (0.72) | (0.33) |
| |
| Net asset value, end of period | $11.71 | $10.79 | $4.19 |
| |
| Total return (%)3 | 12.66 | 178.23 | (55.85)4 |
| |
| Ratios and supplemental data | | | |
|
| Net assets, end of period (in thousands) | $752 | $433 | $111 |
| Ratios (as a percentage of average net | | | |
| assets): | | | |
| Expenses before reductions | 7.03 | 9.14 | 13.625 |
| Expenses net of fee waivers | 0.93 | 1.09 | 0.905 |
| Expenses net of fee waivers and credits | 0.93 | 1.04 | 0.905 |
| Net investment income | 1.48 | 4.01 | 5.185 |
| Portfolio turnover (%) | 34 | 83 | 18 |
1 The inception date for Class I shares is 5-1-08.
2 Based on the average daily shares outstanding.
3 Total returns would have been lower had certain expenses not been reduced during the periods shown.
4 Not annualized.
5 Annualized.
| |
| See notes to financial statements | |
| | |
| 18 |
Leveraged Companies
Notes to financial statements
Note 1 — Organization
John Hancock Leveraged Companies Fund (the Fund) is a diversified series of John Hancock Funds III (the Trust), an open-end management investment company organized as a Massachusetts business trust and registered under the Investment Company Act of 1940, as amended (the 1940 Act). The investment objective of the Fund is to seek capital appreciation.
The Fund may offer multiple classes of shares. The shares currently offered are detailed in the Statement of Assets and Liabilities. Class A, Class B and Class C shares are offered to all investors. Class I shares are offered to institutions and certain investors. Shareholders of each class have exclusive voting rights to matters that affect that class. The distribution and service fees, transfer agent fees, printing and postage and state registration fees for each class may differ. Class B shares convert to Class A shares eight years after purchase.
Note 2 - Significant accounting policies
The financial statements have been prepared in conformity with accounting principles generally accepted in the United States of America, which require management to make certain estimates and assumptions at the date of the financial statements. Actual results could differ from those estimates. Events or transactions occurring after the end of the fiscal period through the date that the financial statements were issued have been evaluated in the preparation of the financial statements. The following summarizes the significant accounting policies of the Fund:
Security valuation. Investments are stated at value as of the close of regular trading on the New York Stock Exchange (NYSE), normally at 4:00 P.M., Eastern Time. The Fund uses a three-tier hierarchy to prioritize the pricing assumptions, referred to as inputs, used in valuation techniques to measure fair value. Level 1 includes securities valued using quoted prices in active markets for identical securities. Level 2 includes securities valued using significant observable inputs. Observable inputs may include quoted prices for similar securities, interest rates, prepayment speeds and credit risk. Prices for securities valued using these inputs are received from independent pricing vendors and brokers and are based on an evaluation of the inputs described. Level 3 includes securities valued using significant unobservable inputs when market prices are not readily available or reliable, including the Fund’s own assumptions in determining the fair value of investments. Factors used in determining value may include market or issuer specific events, changes in interest rates, credit quality and fundamental financial data of the underlying issuer. The inputs or methodology used for valuing securities are not necessarily an indication of the risk associated with investing in those securities.
The following is a summary of the values by input classification of the Fund’s investments as of March 31, 2011 by major security category or type:
| | | | |
| | Total | | Level 2 | Level 3 |
| | Market | Level 1 | Significant | Significant |
| | Value at | Quoted | Observable | Unobservable |
| | 3-31-11 | Price | Inputs | Inputs |
|
| Common Stocks | $1,228,420 | $1,205,351 | $13,705 | $9,364 |
| Preferred Securities | 145,652 | 6,436 | — | 139,216 |
| Corporate Bonds | 137,688 | — | 137,688 | — |
| Convertible Bonds | 84,420 | — | 84,420 | — |
| Investment Companies | 44,019 | 44,019 | — | — |
| Warrants | 63,037 | 63,037 | — | — |
| Securities Lending Collateral | 141,510 | 141,510 | — | — |
| Total Investments in Securities | $1,844,746 | $1,460,353 | $235,813 | $148,580 |
Changes in valuation techniques may result in transfers in or out of an assigned level within the disclosure hierarchy. During the year ended March 31, 2011, there were no significant transfers in or out of Level 1 or Level 2 assets.
The following is a reconciliation of Level 3 assets for which significant unobservable inputs were used to determine fair value. Transfers in or out of Level 3 represent the beginning value of any security or instrument where a change in the level has occurred from the beginning to the end of the period.
| | | | |
| | Common | Preferred | Corporate | |
| Investment in Securities | Stocks | Securities | Bonds | Total |
|
| Balance as of 3-31-10 | — | $16,983 | $25,571 | $42,554 |
| Realized gain (loss) | — | 9,523 | — | 9,523 |
| Change in unrealized appreciation | | | | |
| (depreciation) | ($8,271) | (29,473) | (2,013) | (39,757) |
| Purchases | 17,635 | 157,908 | — | 175,543 |
| Sales | — | (15,725) | — | (15,725) |
| Transfers into Level 3 | — | — | — | — |
| Transfers out of Level 3 | — | — | (23,558) | (23,558) |
| Balance as of 3-31-11 | $9,364 | $139,216 | — | $148,580 |
| Change in unrealized at period end* | ($8,271) | ($18,692) | ($2,013) | ($28,976) |
*Change in unrealized appreciation (depreciation) attributable to level 3 securities held at the period end.
In order to value the securities, the Fund uses the following valuation techniques. Equity securities held by the Fund are valued at the last sale price or official closing price on the principal securities exchange on which they trade. In the event there were no sales during the day or closing prices are not available, then securities are valued using the last quoted bid or evaluated price. Investments by the Fund in open-end management investment companies are valued at their respective net asset values each business day. Debt obligations are valued based on the evaluated prices provided by an independent pricing service, which utilizes both dealer-supplied and electronic data processing techniques, taking into account factors such as institutional-size trading in similar groups of securities, yield, quality, coupon rate, maturity, type of issue, trading characteristics and other market data. Foreign securities and currencies, including forward foreign currency contracts, are valued in U.S. dollars, based on foreign currency exchange rates supplied by an independent pricing service. Certain securities and forward foreign currency contracts traded only in the over-the-counter market are valued at the last bid price quoted by brokers making markets in the securities at the close of trading. Certain short-term securities are valued at amortized cost.
Other portfolio securities and assets, where market quotations are not readily available, are valued at fair value, as determined in good faith by the Fund’s Pricing Committee, following procedures established by the Board of Trustees, which may include methodologies based on market inputs, income assumptions, or cost basis. Such securities represent 8.4% of net assets as of March 31, 2011. Generally, trading in non-U.S. securities is substantially completed each day at various times prior to the close of trading on the NYSE. Significant market events that affect the values of non-U.S. securities may occur between the time when the valuation of the securities is generally determined and the close of the NYSE. During significant market events, these securities will be valued at fair value, as determined in good faith, following procedures established by the Board of Trustees. The Fund may use a fair valuation model to value non-U.S. securities in order to adjust for events which may occur between the close of foreign exchanges and the close of the NYSE.
Security transactions and related investment income. Investment security transactions are accounted for on a trade date plus one basis for daily net asset value calculations. However, for financial reporting purposes, investment transactions are reported on trade date. Interest income is accrued as earned. Gains and losses on securities sold are determined on the basis of identified cost and may include
proceeds from litigation. Dividend income is recorded on the ex-date, except for dividends of foreign securities where the dividend may not be known until after the ex-date. In those cases, dividend income is recorded when the Fund becomes aware of the dividends. Interest income includes coupon interest and amortization/accretion of premiums/discounts on debt securities. Debt obligations may be placed in a non-accrual status and related interest income may be reduced by stopping current accruals and writing off interest receivable when the collection of all or a portion of interest has become doubtful.
Real estate investment trusts. From time to time, the Fund may invest in real estate investment trusts (REITs) and, as a result, will estimate the components of distributions from these securities. Distributions from REITs received in excess of income are recorded as a reduction of cost of investments and/or as a realized gain.
Securities lending. The Fund may lend its securities to earn additional income. It receives and maintains cash collateral received from the borrower in an amount not less than the market value of the loaned securities. The Fund will invest its collateral in John Hancock Collateral Investment Trust (JHCIT), an affiliate of the Fund, and as a result, the Fund will receive the benefit of any gains and bear any losses generated by JHCIT. Although risk of the loss of the securities lent is mitigated by holding the collateral, the Fund could experience a delay in recovering its securities and a possible loss of income or value if the borrower fails to return the securities or if collateral investments decline in value. The Fund may receive compensation for lending its securities by retaining a portion of the return on the investment of the collateral and compensation from fees earned from borrowers of the securities. Income received from JHCIT is a component of securities lending income as recorded on the Statement of Operations.
Foreign currency translation. Assets, including investments and liabilities denominated in foreign currencies, are translated into U.S. dollar values each day at the prevailing exchange rate. Purchases and sales of securities, income and expenses are translated into U.S. dollars at the prevailing exchange rate on the date of the transaction. The effect of changes in foreign currency exchange rates on securities is reflected as a component of the realized and unrealized gains (losses) on investments.
Funds that invest internationally generally carry more risk than funds that invest strictly in U.S. securities. Risks can result from differences in economic and political conditions, regulations, market practices (including higher transaction costs) and accounting standards. Foreign investments are also subject to a decline in the value of a foreign currency versus the U.S. dollar, which reduces the dollar value of securities denominated in that currency.
Line of credit. The Fund may borrow from banks for temporary or emergency purposes, including meeting redemption requests that otherwise might require the untimely sale of securities. Pursuant to the custodian agreement, the custodian may loan money to the Fund to make properly authorized payments. The Fund is obligated to repay the custodian for any overdraft, including any related costs or expenses. The custodian has a lien, security interest or security entitlement in any Fund property that is not segregated, to the maximum extent permitted by law for any overdraft.
In addition, effective March 30, 2011, the Fund and other affiliated funds have entered into an agreement with Citibank N.A. which enables them to participate in a $100 million unsecured committed line of credit. Prior to March 30, 2011 the Fund had a similar arrangement with State Street Bank and Trust Company. A commitment fee, payable at the end of each calendar quarter, based on the average daily unused portion of the line of credit, is charged to each participating fund on a pro rata basis and is reflected in other expenses on the Statement of Operations. For the year ended March 31, 2011, the Fund had no borrowings under the line of credit.
Expenses. The majority of expenses are directly attributable to an individual fund. Expenses that are not readily attributable to a specific fund are allocated among all funds in an equitable manner, taking into consideration, among other things, the nature and type of expense and the fund’s relative assets. Expense estimates are accrued in the period to which they relate and adjustments are made when actual amounts are known.
Class allocations. Income, common expenses and realized and unrealized gains (losses) are determined at the fund level and allocated daily to each class of shares based on the net asset value of the class. Class-specific expenses, such as distribution and service fees, if any, transfer agent fees, state registration fees and printing and postage, for all classes, are calculated daily at the class level based on the appropriate net asset value of each class and the specific expense rates applicable to each class.
Federal income taxes. The Fund intends to continue to qualify as a regulated investment company by complying with the applicable provisions of the Internal Revenue Code and will not be subject to federal income tax on taxable income that is distributed to shareholders. Therefore, no federal income tax provision is required.
Net capital losses of $11,847, that are a result of security transactions occurring after October 31, 2010 are treated as occurring on April 1, 2011, the first day of the Fund’s next taxable year.
As of March 31, 2011, the Fund had no uncertain tax positions that would require financial statement recognition, de-recognition or disclosure. The Fund’s federal tax return is subject to examination by the Internal Revenue Service for a period of three years.
Distribution of income and gains. Distributions to shareholders from net investment income and net realized gains, if any, are recorded on the ex-date. The Fund generally declares and pays dividends and capital gain distributions, if any, annually. The tax character of distributions for the years ended March 31, 2011 and March 31, 2010 was as follows:
| | |
| | March 31, 2011 | March 31, 2010 |
|
| Ordinary Income | $44,990 | $64,128 |
|
| Long-Term Capital Gain | 3,462 | 7,363 |
|
Distributions paid by the Fund with respect to each class of shares are calculated in the same manner, at the same time and in the same amount, except for the effect of expenses that may be applied differently to each class. As of March 31, 2011, the components of distributable earnings on a tax basis included $5,318 of undistributed ordinary income.
Such distributions and distributable earnings, on a tax basis, are determined in conformity with income tax regulations, which may differ from accounting principles generally accepted in the United States of America. Material distributions in excess of tax basis earnings and profits, if any, are reported in the Fund’s financial statements as a return of capital.
Capital accounts within financial statements are adjusted for permanent book-tax differences. These adjustments have no impact on net assets or the results of operations. Temporary book-tax differences, if any, will reverse in a subsequent period. Book-tax differences are primarily attributable to defaulted bonds, foreign currency transactions and partnerships.
Note 3 — Derivative instruments
The Fund may invest in derivatives in order to meet its investment objectives. The use of derivatives may involve risks different from, or potentially greater than, the risks associated with investing directly in securities. Specifically, derivatives expose the Fund to the risk that the counterparty to an over-the-counter (OTC) derivatives contract will be unable or unwilling to make timely settlement payments or otherwise honor its obligations. OTC derivatives transactions typically can only be closed out with the other party to the transaction. If the counterparty defaults, the Fund will have contractual remedies, but there is no assurance that the counterparty will meet its contractual obligations or that the Fund will succeed in enforcing them.
Forward foreign currency contracts. A forward foreign currency contract is an agreement between two parties to buy and sell a specific currency at a price that is set on the date of the contract. The forward contract calls for delivery of the currency on a future date that is specified in the contract. Risks related to the use of forwards include the possible failure of counterparties to meet the terms of the
forward agreement, the risk that currency movements will not occur thereby reducing the Fund’s total return, and the potential for losses in excess of the amounts recognized on the Statement of Assets and Liabilities.
The market value of a forward foreign currency contract fluctuates with changes in foreign currency exchange rates. Forward foreign currency contracts are marked-to-market daily and the change in value is recorded by a Fund as an unrealized gain or loss. Realized gains or losses, equal to the difference between the value of the contract at the time it was opened and the value at the time it was closed, are recorded upon delivery or receipt of the currency.
During the year ended March 31, 2011, the Fund used forward foreign currency contracts to manage currency exposure from a non-US common stock portfolio holding. The following table summarizes the contracts held at March 31, 2011. During the year ended March 31, 2011, the Fund held forward foreign currency contracts with USD absolute values ranging up to approximately $28,500, as measured at each quarter end.
| | | | | |
| | PRINCIPAL | PRINCIPAL | | | |
| | AMOUNT | AMOUNT | | | UNREALIZED |
| | COVERED BY | COVERED BY | | SETTLEMENT | APPRECIATION |
| CURRENCY | CONTRACT | CONTRACT (USD) | COUNTERPARTY | DATE | (DEPRECATION) |
|
| SELL | | | | | |
|
| EUR | 20,110 | $28,476 | Canadian Imperial Bank | 6-30-11 | ($24) |
| |
| |
| Currency Abbreviation | | | | |
| EUR | Euro | | | | |
Note 4 - Guarantees and indemnifications
Under the Fund’s organizational documents, its Officers and Trustees are indemnified against certain liabilities arising out of the performance of their duties to the Fund. Additionally, in the normal course of business, the Fund enters into contracts with service providers that contain general indemnification clauses. The Fund’s maximum exposure under these arrangements is unknown, as this would involve future claims that may be made against the Fund that have not yet occurred. The risk of material loss from such claims is considered remote.
Note 5 – Fees and transactions with affiliates
John Hancock Investment Management Services, LLC (the Adviser) serves as investment adviser for the Trust. John Hancock Funds, LLC (the Distributor), an affiliate of the Adviser, serves as principal underwriter of the Trust. The Adviser and the Distributor are indirect wholly owned subsidiaries of Manulife Financial Corporation (MFC).
Management fee. The Fund has an investment management contract with the Adviser under which the Fund pays a daily management fee to the Adviser equivalent, on an annual basis, to the sum of: (a) 0.750% of the first $500,000,000 of the Fund’s average daily net assets; (b) 0.725% of the next $500,000,000 of the Fund’s average net assets; and (c) 0.700% of the Fund’s average daily net assets in excess of $1,000,000,000. The Adviser has a subadvisory agreement with John Hancock Asset Management a division of Manulife Asset Management (US) LLC (formerly MFC Global Investment Management (U.S.), LLC), an indirectly owned subsidiary of MFC and an affiliate of the Adviser. The Fund is not responsible for payment of the subadvisory fees.
The investment management fees incurred for the year ended March 31, 2011 were equivalent to an annual effective rate of 0.75% of the Fund’s average daily net assets.
Effective July 1, 2010, the Adviser has contractually agreed to waive fees and/or reimburse certain expenses for each share class of the Fund. This agreement excludes taxes, brokerage commissions, interest, litigation and indemnification expenses and other extraordinary expenses not incurred in the ordinary course of the Fund’s business. The fee waivers and/or reimbursements are such that these expenses will not exceed 1.35% for Class A, 2.05% for Class B, 2.05% for Class C and 0.89% for Class I
shares. The fee waivers and/or reimbursements will continue in effect until July 31, 2011. Prior to July 1, 2010, the fee waivers and/or reimbursements were such that these expenses would not exceed 1.35% for Class A, 2.05% for Class B, 2.05% for Class C and 1.05% for Class I shares.
Accordingly, the expense reductions or reimbursements related to these agreements were $19,695, $19,363, $19,362 and $29,261 for Class A, Class B, Class C and Class I shares, respectively, for the year ended March 31, 2011.
Accounting and legal services. Pursuant to a service agreement, the Fund reimburses the Adviser for all expenses associated with providing the administrative, financial, legal, accounting and recordkeeping services of the Fund, including the preparation of all tax returns, periodic reports to shareholders and regulatory reports, among other services. These expenses are allocated to each share class based on its relative net assets at the time the expense was incurred. These accounting and legal services fees incurred for the year ended March 31, 2011, amounted to an annual rate of 0.01% of the Fund’s average daily net assets.
Distribution and service plans. The Fund has a distribution agreement with the Distributor. The Fund has adopted distribution and service plans with respect to Class A, Class B and Class C shares pursuant to Rule 12b-1 under the 1940 Act, to pay the Distributor for services provided as the distributor of shares of the Fund. The Fund may pay up to the following contractual rates of distribution and service fees under these arrangements, expressed as an annual percentage of average daily net assets for each class of the Fund’s shares.
| | | | |
| Class | 12b-1 Fee | | | |
| | | |
| Class A | 0.30% | | | |
| | | |
| Class B | 1.00% | | | |
| | | |
| Class C | 1.00% | | | |
| | | |
Sales charges. Class A shares are assessed up-front sales charges. For the year ended March 31, 2011, there were no up-front sales charges received by the Distributor with regard to sales of Class A shares.
Class B and Class C shares are subject to contingent deferred sales charges (CDSC). Class B shares that are redeemed within six years of purchase are subject to CDSC, at declining rates, beginning at 5.00% of the lesser of the current market value at the time of redemption or the original purchase cost of the shares being redeemed. Class C shares that are redeemed within one year of purchase are subject to a 1.00% CDSC on the lesser of the current market value at the time of redemption or the original purchase cost of the shares being redeemed. Proceeds from CDSCs are used to compensate the Distributor for providing distribution-related services in connection with the sale of these shares. During the year ended March 31, 2011, there were no CDSCs received by the Distributor for Class B and Class C shares, respectively.
Transfer agent fees. The Fund has a transfer agent agreement with John Hancock Signature Services, Inc. (Signature Services or Transfer Agent), an affiliate of the Adviser. The transfer agent fees paid to Signature Services are determined based on the cost to Signature Services (Signature Services Cost) of providing recordkeeping services. The Signature Services Cost includes a component of allocated John Hancock corporate overhead for providing transfer agent services to the Fund and to all other John Hancock affiliated funds. It also includes out-of-pocket expenses that are comprised of payments made to third-parties for recordkeeping services provided to their clients who invest in one or more John Hancock funds. In addition, Signature Services Cost may be reduced by certain revenues that Signature Services receives in connection with the service it provides to the funds. Signature Services Cost is calculated monthly and allocated, as applicable, to four categories of share classes: Institutional Share Classes, Retirement Share Classes, Municipal Bond Classes and all other Retail Share Classes. Within each of these categories, the applicable costs are allocated to the affected John Hancock affiliated funds and/or classes, based on the relative average daily net assets.
Prior to July 1, 2010, the transfer agent fees were made up of three components:
• The Fund paid a monthly transfer agent fee at an annual rate of 0.05% for Class A, Class B and Class C shares and 0.04% for Class I shares, based on each class’s average daily net assets.
• The Fund paid a monthly fee based on an annual rate of $16.50 per shareholder account for all share classes.
• In addition, Signature Services was reimbursed for certain out-of-pocket expenses.
Class level expenses. Class level expenses for the year ended March 31, 2011 were:
| | | |
| | Distribution and | | State registration |
| Class | service fees | Transfer agent fees | fees |
|
| Class A | $971 | $487 | $35 |
|
| Class B | 3,184 | 478 | 35 |
|
| Class C | 3,183 | 478 | 35 |
|
| Class I | — | 230 | 34 |
|
| Total | $7,338 | $1,673 | $139 |
|
Trustee expenses. The Trust compensates each Trustee who is not an employee of the Adviser or its affiliates. These Trustees may, for tax purposes, elect to defer receipt of this compensation under the John Hancock Group of Funds Deferred Compensation Plan (the Plan). Deferred amounts are invested in various John Hancock funds and remain in the funds until distributed in accordance with the Plan. The investment of deferred amounts and the offsetting liability are included within Other receivables and prepaid expenses and Payable to affiliates - Trustees' fees, respectively, in the accompanying Statement of Assets and Liabilities.
Note 6 - Fund share transactions
Transactions in Fund shares for the year ended March 31, 2011 and for the year ended March 31, 2010 were as follows:
| | | | | | | | |
| | | Year ended | | Year ended |
| | | 3-31-11 | | 3-31-10 |
| |
| |
|
| | | Shares | | Amount | | Shares | | Amount |
| Class A shares | | | | | | | | |
| Distributions reinvested | | 980 | | $11,594 | | 2,056 | | $18,382 |
| Repurchased | | — | | — | | (11) | | (91) |
| |
| |
| |
| |
|
| Net increase | | 980 | | $11,594 | | 2,045 | | $18,291 |
| |
| |
| |
| |
|
| | | |
| Class B shares | | | | | | | | |
| Distributions reinvested | | 792 | | $9,365 | | 1,911 | | $17,081 |
| |
| |
| |
| |
|
| Net increase | | 792 | | $9,365 | | 1,911 | | $17,081 |
| |
| |
| |
| |
|
| | | |
| Class C shares | | | | | | | | |
| Distributions reinvested | | 792 | | $9,365 | | 1,911 | | $17,082 |
| |
| |
| |
| |
|
| Net increase | | 792 | | $9,365 | | 1,911 | | $17,082 |
| |
| |
| |
| |
|
| | | |
| Class I shares | | | | | | | | |
| Sold | | 22,532 | | $271,512 | | 11,695 | | $119,995 |
| Distributions reinvested | | 1,530 | | 18,128 | | 2,119 | | 18,944 |
| Net increase | | 24,062 | | $289,640 | | 13,814 | | $138,939 |
| |
| |
| |
| |
|
| Net increase | | 26,626 | | $319,964 | | 19,681 | | $191,393 |
| |
| |
| |
| |
|
Affiliates of the Fund owned 100% of the shares of beneficial interest of the Fund on March 31, 2011.
Note 7 - Purchase and sale of securities
Purchases and sales of securities, other than short-term securities, aggregated $750,923 and $484,153, respectively, for the year ended March 31, 2011.
To the Board of Trustees of John Hancock Funds III and Shareholders of John Hancock Leveraged Companies Fund:
In our opinion, the accompanying statement of assets and liabilities, including the portfolio of investments, and the related statements of operations and of changes in net assets and the financial highlights present fairly, in all material respects, the financial position of John Hancock Leveraged Companies Fund (the “Fund”) at March 31, 2011, and the results of its operations, the changes in its net assets and the financial highlights for each of the periods indicated, in conformity with accounting principles generally accepted in the United States of America. These financial statements and financial highlights (hereafter referred to as “financial statements”) are the responsibility of the Fund’s management; our responsibility is to express an opinion on these financial statements based on our audits. We conducted our audits of these financial statements in accordance with the standards of the Public Company Accounting Oversight Board (United States). Those standards require that we plan and perform the audit to obtain reasonable assurance about whether the financial statements are free of material misstatement. An audit includes examining, on a test basis, evidence supporting the amounts and disclosures in the financial statements, assessing the accounting principles used and significant estimates made by management, and evaluating the overall financial statement presentation. We believe that our audits, which included confirmation of securities at March 31, 2011 by correspondence with the custodian and brokers, provide a reasonable basis for our opinion.
PricewaterhouseCoopers LLP
Boston, Massachusetts
May 25, 2011
Tax information
Unaudited
For federal income tax purposes, the following information is furnished with respect to the distributions of the Fund, if any, paid during its taxable year ended March 31, 2011.
The Fund designates the maximum amount allowable for the corporate dividends received deduction for the fiscal year ended March 31, 2011.
The Fund designates distributions to shareholders of $3,462 as a long-term capital gain dividend for the fiscal year ended March 31, 2011.
The Fund designates the maximum amount allowable of its net taxable income as qualified dividend income as provided in the Jobs and Growth Tax Relief Reconciliation Act of 2003. This amount will be reflected on Form 1099-DIV for the calendar year 2011.
Shareholders will be mailed a 2011 Form 1099-DIV in January 2012. This will reflect the total of all distributions for calendar year 2011.
Trustees and Officers
This chart provides information about the Trustees and Officers who oversee your John Hancock fund. Officers elected by the Trustees manage the day-to-day operations of the Fund and execute policies formulated by the Trustees.
| | | | |
| Independent Trustees | | | |
|
| |
| Name | Year of | Position(s) held with Fund | Trustee | Number |
| | Birth | Principal occupation(s) and other | of the | of John |
| | | Directorships during the past 5 years | Trust | Hancock |
| | | | since(1) | funds |
| | | | | overseen |
| | | | | by |
| | | | | Trustee |
|
| Steven R. | 1944 | Chairperson (since January 2011); Chairman | 2006 | 46 |
| Pruchansky | | and Chief Executive Officer, Greenscapes of | | |
| | | Southwest Florida, Inc. (since 2000); Director | | |
| | and President, Greenscapes of Southwest | | |
| | | Florida, Inc. (until 2000); Member, Board of | | |
| | | Advisors, First American Bank (since 2008); | | |
| | Managing Director, Jon James, LLC (real | | |
| | | estate) (since 2000); Director, First Signature | | |
| | | Bank & Trust Company (until 1991); | | |
| | Director, Mast Realty Trust (until 1994); | | |
| | President, Maxwell Building Corp. (until | | |
| | | 1991). | | |
|
| James F. | 1940 | Chief Executive Officer, Director and Treasurer, | 2006 | 46 |
| Carlin | | Alpha Analytical Laboratories (environmental, | | |
| | chemical and pharmaceutical analysis) (since | | |
| | 1985); Part Owner and Treasurer, Lawrence | | |
| | Carlin Insurance Agency, Inc. (since 1995); | | |
| | | Chairman and Chief Executive Officer, CIMCO, | | |
| | | LLC (management/investments) (since 1987). | | |
|
| | | | |
| Name | Year of | Position(s) held with Fund | Trustee | Number |
| | Birth | Principal occupation(s) and other | of the | of John |
| | | Directorships during the past 5 years | Trust | Hancock |
| | | | since(1) | funds |
| | | | | overseen |
| | | | | by |
| | | | | Trustee |
|
| William H. | 1944 | Professor, University of Texas, Austin, Texas | 2006 | 46 |
| Cunningham | | (since 1971); former Chancellor, University | | |
| | | of Texas System and former President of the | | |
| | | University of Texas, Austin, Texas; Director | | |
| | of the following: LIN Television (since | | |
| | | 2009); Lincoln National Corporation | | |
| | (insurance) (Chairman since 2009 and | | |
| | Director since 2006); Resolute Energy | | |
| | Corporation (since 2009); Nanomedical | | |
| | Systems, Inc. (biotechnology company) | | |
| | | (Chairman since 2008); Yorktown | | |
| | | Technologies, LP (tropical fish) (Chairman | | |
| | | since 2007); Greater Austin Crime | | |
| | | Commission (since 2001); Southwest | | |
| | | Airlines (since 2000); former Director of the | | |
| | | following: Introgen (manufacturer of | | |
| | biopharmaceuticals) (until 2008); Hicks | | |
| | Acquisition Company I, Inc. (until 2007); | | |
| | | Jefferson-Pilot Corporation (diversified life | | |
| | | insurance company) (until 2006); and former | | |
| | | Advisory Director, JP Morgan Chase Bank | | |
| | | (formerly Texas Commerce Bank–Austin) | | |
| | | (until 2009). | | |
|
| Deborah C. | 1952 | Chief Executive Officer, American Red | 2008 | 46 |
| Jackson(2) | | Cross of Massachusetts Bay (since 2002); | | |
| | | Board of Directors of Eastern Bank | | |
| | | Corporation (since 2001); Board of Directors | | |
| | | of Eastern Bank Charitable Foundation (since | | |
| | 2001); Board of Directors of American | | |
| | Student Assistance Corporation. (1996- | | |
| | | 2009); Board of Directors of Boston Stock | | |
| | | Exchange (2002–2008); Board of Directors | | |
| | of Harvard Pilgrim Healthcare (health | | |
| | | benefits company) (since 2007). | | |
| | | | |
| Name | Year of | Position(s) held with Fund | Trustee | Number |
| | Birth | Principal occupation(s) and other | of the | of John |
| | | Directorships during the past 5 years | Trust | Hancock |
| | | | since(1) | funds |
| | | | | overseen |
| | | | | by |
| | | | | Trustee |
|
| Charles L. | 1938 | Vice Chairperson (since March 2011); | 2006 | 46 |
| Ladner(2) | | Chairman and Trustee, Dunwoody Village, | | |
| | Inc. (retirement services) (since 2008); | | |
| | | Director, Philadelphia Archdiocesan | | |
| | | Educational Fund (since 2009); Senior Vice | | |
| | | President and Chief Financial Officer, UGI | | |
| | | Corporation (public utility holding company) | | |
| | | (retired 1998); Vice President and Director | | |
| | | for AmeriGas, Inc. (retired 1998); Director of | | |
| | | AmeriGas Partners, L.P. (gas distribution) | | |
| | (until 1997); Director, EnergyNorth, Inc. | | |
| | (until 1995); Director, Parks and History | | |
| | Association (Cooperating Association, | | |
| | | National Park Service) (until 2005). | | |
|
| |
| Stanley | 1947 | Senior Vice President/Audit Executive, | 2008 | 46 |
| Martin(2) | | Federal Home Loan Mortgage Corporation | | |
| | | (2004–2006); Executive Vice | | |
| | President/Consultant, HSBC Bank USA | | |
| | | (2000–2003); Chief Financial | | |
| | | Officer/Executive Vice President, Republic | | |
| | | New York Corporation & Republic National | | |
| | Bank of New York (1998–2000); Partner, | | |
| | | KPMG LLP (1971–1998). | | |
|
| |
| Dr. John A. | 1939 | President and Chief Executive Officer, | 2006 | 46 |
| Moore | | Institute for Evaluating Health Risks, | | |
| | | (nonprofit institution) (until 2001); Senior | | |
| | Scientist, Sciences International (health | | |
| | research) (until 2003); Former Assistant | | |
| | Administrator & Deputy Administrator, | | |
| | | Environmental Protection Agency; Principal, | | |
| | Hollyhouse (consulting) (since 2000); | | |
| | Director, CIIT Center for Health Science | | |
| | | Research (nonprofit research) (until 2007). | | |
| | | | |
| Name | Year of | Position(s) held with Fund | Trustee | Number |
| | Birth | Principal occupation(s) and other | of the | of John |
| | | Directorships during the past 5 years | Trust | Hancock |
| | | | since(1) | funds |
| | | | | overseen |
| | | | | by |
| | | | | Trustee |
|
| Patti McGill | 1943 | Principal, PMP Globalinc (consulting) (since | 2006 | 47 |
| Peterson(2) | | 2007); Senior Associate, Institute for Higher | | |
| | Education Policy (since 2007); Executive | | |
| | Director, CIES (international education | | |
| | | agency) (until 2007); Vice President, Institute | | |
| | of International Education (until 2007); | | |
| | | Senior Fellow, Cornell University Institute of | | |
| | Public Affairs, Cornell University (1997– | | |
| | | 1998); Former President Wells College, St. | | |
| | | Lawrence University and the Association of | | |
| | | Colleges and Universities of the State of New | | |
| | York. Director of the following: Niagara | | |
| | Mohawk Power Corporation (until 2003); | | |
| | | Security Mutual Life (insurance) (until 1997); | | |
| | ONBANK (until 1993). Trustee of the | | |
| | | following: Board of Visitors, The University | | |
| | | of Wisconsin, Madison (since 2007); Ford | | |
| | Foundation, International Fellowships | | |
| | | Program (until 2007); UNCF, International | | |
| | | Development Partnerships (until 2005); Roth | | |
| | Endowment (since 2002); Council for | | |
| | | International Educational Exchange (since | | |
| | | 2003). | | |
|
| |
| Gregory A. | 1949 | Vice Chairman, Risk & Regulatory Matters, | 2008 | 46 |
| Russo | | KPMG LLP (“KPMG”) (2002–2006); Vice | | |
| | | Chairman, Industrial Markets, KPMG (1998– | | |
| | | 2002). | | |
| | | | |
| Non-Independent Trustees(3) | | |
|
| |
| Name | Year of | Position(s) held with Fund | Trustee | Number |
| | Birth | Principal occupation(s) and other | of the | of John |
| | | Directorships during the past 5 years | Trust | Hancock |
| | | | since(1) | funds |
| | | | | overseen |
| | | | | by |
| | | | | Trustee |
|
| Hugh | 1959 | Executive Vice President, John Hancock | 2010 | 46 |
| McHaffie | | Financial Services (since 2006, including | | |
| | | prior positions); President of John Hancock | | |
| | Trust and John Hancock Funds II (since | | |
| | | 2009); Trustee, John Hancock retail funds | | |
| | | (since 2010) Chairman and Director, John | | |
| | Hancock Advisers, LLC, John Hancock | | |
| | | Investment Management Services, LLC and | | |
| | John Hancock Funds, LLC (since 2010); | | |
| | | Senior Vice President, Individual Business | | |
| | | Product Management, MetLife, Inc. (1999- | | |
| | | 2006). | | |
|
| John G. | 1955 | Senior Vice President, John Hancock | 2009 | 47 |
| Vrysen | | Financial Services (since 2006); Director, | | |
| | | Executive Vice President and Chief | | |
| | | Operating Officer, John Hancock Advisers, | | |
| | | LLC, John Hancock Investment | | |
| | Management Services, LLC and John | | |
| | | Hancock Funds, LLC (since 2005); Chief | | |
| | | Operating Officer, John Hancock Funds II | | |
| | | and John Hancock Trust (since 2007); Chief | | |
| | Operating Officer, John Hancock retail | | |
| | | funds (until 2009); Trustee, John Hancock | | |
| | | retail funds (since 2009). | | |
| | | |
| Principal officers who are not Trustees | |
| |
| |
| Name | Year | Position(s) held with Fund | Officer of the |
| | of | Principal occupation(s) and other | Trust since |
| | Birth | Directorships during the past 5 years | |
|
| Keith F. Hartstein | 1956 | Senior Vice President, John Hancock | 2006 |
| President and Chief | | Financial Services (since 2004); Director, | |
| Executive Officer | | President and Chief Executive Officer, | |
| | | John Hancock Advisers, LLC and John | |
| | | Hancock Funds, LLC (since 2005); | |
| | | Director, John Hancock Asset Management | |
| | | a division of Manulife Asset Management | |
| | | (US) LLC(since 2005); Director, John | |
| | | Hancock Investment Management | |
| | | Services, LLC (since 2006); President and | |
| | | Chief Executive Officer, John Hancock | |
| | | retail funds (since 2005); Member, | |
| | | Investment Company Institute Sales Force | |
| | | Marketing Committee (since 2003). | |
|
| |
| Andrew G. Arnott | 1971 | Senior Vice President, John Hancock | 2009 |
| Senior Vice | | Financial Services (since 2009); Executive | |
| President and Chief | | Vice President, John Hancock Advisers, | |
| Operating Officer | | LLC (since 2005); Executive Vice | |
| | | President, John Hancock Investment | |
| | | Management Services, LLC (since 2006); | |
| | | Executive Vice President, John Hancock | |
| | | Funds, LLC (since 2004); Chief Operating | |
| | | Officer, John Hancock retail funds (since | |
| | | 2009); Senior Vice President, John | |
| | | Hancock retail funds (since 2010) Vice | |
| | | President, John Hancock Funds II and John | |
| | | Hancock Trust (since 2006); Senior Vice | |
| | | President, Product Management and | |
| | | Development, John Hancock Funds, LLC | |
| | | (until 2009). | |
| | | |
| Name | Year | Position(s) held with Fund | Officer of the |
| | of | Principal occupation(s) and other | Trust since |
| | Birth | Directorships during the past 5 years | |
|
| Thomas M. Kinzler | 1955 | Vice President, John Hancock Financial | 2006 |
| Secretary and Chief | | Services (since 2006); Secretary and Chief | |
| Legal Officer | | Legal Counsel, John Hancock Advisers, | |
| | | LLC, John Hancock Investment | |
| | | Management Services, LLC and John | |
| | | Hancock Funds, LLC (since 2007); | |
| | | Secretary and Chief Legal Officer, John | |
| | | Hancock retail funds, John Hancock Funds | |
| | | II and John Hancock Trust (since | |
| | | 2006);Vice President and Associate | |
| | | General Counsel, Massachusetts Mutual | |
| | | Life Insurance Company (1999–2006); | |
| | | Secretary and Chief Legal Counsel, MML | |
| | | Series Investment Fund (2000–2006); | |
| | | Secretary and Chief Legal Counsel, | |
| | | MassMutual Select Funds and MassMutual | |
| | Premier Funds (2004–2006). | |
|
| |
| Francis V. Knox, Jr. | 1947 | Vice President, John Hancock Financial | 2006 |
| Chief Compliance | | Services (since 2005); Chief Compliance | |
| Officer | | Officer, John Hancock retail funds, John | |
| | | Hancock Funds II, John Hancock Trust, | |
| | | John Hancock Advisers, LLC and John | |
| | | Hancock Investment Management | |
| | | Services, LLC (since 2005); Vice President | |
| | | and Chief Compliance Officer, John | |
| | | Hancock Asset Management a division of | |
| | | Manulife Asset Management (US) | |
| | | LLC(2005–2008). | |
|
| |
| Charles A. Rizzo | 1957 | Vice President, John Hancock Financial | 2007 |
| Chief Financial | | Services (since 2008); Senior Vice | |
| Officer | | President, John Hancock Advisers, LLC | |
| | | and John Hancock Investment Management | |
| | | Services, LLC (since 2008); Chief | |
| | | Financial Officer, John Hancock retail | |
| | | funds, John Hancock Funds II and John | |
| | | Hancock Trust (since 2007);Assistant | |
| | | Treasurer, Goldman Sachs Mutual Fund | |
| | | Complex (2005–2007); Vice President, | |
| | Goldman Sachs (2005–2007). | |
|
| | | |
| Name | Year | Position(s) held with Fund | Officer of the |
| | of | Principal occupation(s) and other | Trust since |
| | Birth | Directorships during the past 5 years | |
|
| Salvatore | 1965 | Assistant Vice President, John Hancock | 2010 |
| Schiavone | | Financial Services (since 2007); Vice | |
| Treasurer | | President, John Hancock Advisers, LLC | |
| | | and John Hancock Investment Management | |
| | | Services, LLC (since 2007); Treasurer, | |
| | | John Hancock retail funds (since 2010); | |
| | | Treasurer, John Hancock Closed-End | |
| | | Funds (2009-2010);Assistant Treasurer, | |
| | | John Hancock Funds II and John Hancock | |
| | | Trust (since 2007); Assistant Treasurer, | |
| | | John Hancock retail funds, John Hancock | |
| | | Funds II and John Hancock Trust (2007- | |
| | | 2009); Assistant Treasurer, Fidelity Group | |
| | | of Funds (2005–2007); Vice President, | |
| | | Fidelity Management Research Company | |
| | | (2005–2007). | |
| |
The business address for all Trustees and Officers is 601 Congress Street, Boston, Massachusetts 02210-2805.
The Statement of Additional Information of the Fund includes additional information about members of the Board of Trustees of the Fund and is available without charge, upon request, by calling 1-800-225-5291.
1Each Trustee serves until resignation, retirement age or until his or her successor is elected.
2Member of Audit Committee.
3Because Messrs. McHaffie and Vrysen are senior executives or directors with the Adviser and/or its affiliates, each of them is considered an “interested person,” as defined in the Investment Company Act of 1040, of the Fund.
More information
| |
| Trustees | Investment adviser |
| Steven R. Pruchansky, Chairperson | John Hancock Investment Management Services, LLC |
| James F. Carlin | |
| William H. Cunningham | Subadviser |
| Deborah C. Jackson* | John Hancock Asset Management |
| Charles L. Ladner, Vice Chairperson* | |
| Stanley Martin* | Principal distributor |
| Hugh McHaffie† | John Hancock Funds, LLC |
| Dr. John A. Moore | |
| Patti McGill Peterson* | Custodian |
| Gregory A. Russo | State Street Bank and Trust Company |
| John G. Vrysen† | |
| | Transfer agent |
| | John Hancock Signature Services, Inc. |
| Officers | |
| Keith F. Hartstein | Legal counsel |
| President and Chief Executive Officer | K&L Gates LLP |
| Andrew G. Arnott | |
| Senior Vice President and Chief Operating Officer | Independent registered public accounting firm |
| Thomas M. Kinzler | PricewaterhouseCoopers LLP |
| Secretary and Chief Legal Officer | |
| Francis V. Knox, Jr. | |
| Chief Compliance Officer | |
| Charles A. Rizzo | |
| Chief Financial Officer | |
| Salvatore Schiavone | |
| Treasurer | |
| |
| *Member of the Audit Committee | |
| †Non-Independent Trustee | |
The Fund’s proxy voting policies and procedures, as well as the Fund’s proxy voting record, if any, for the most recent twelve-month period ended June 30, are available free of charge on the Securities and Exchange Commission (SEC) Web site at www.sec.gov or on our Web site.
The Fund’s complete list of portfolio holdings, for the first and third fiscal quarters, is filed with the SEC on Form N-Q. The Fund’s Form N-Q is available on our Web site and the SEC’s Web site, www.sec.gov, and can be reviewed and copied (for a fee) at the SEC’s Public Reference Room in Washington, DC. Call 1-800-SEC-0330 to receive information on the operation of the SEC's Public Reference Room.
We make this information on your fund, as well as monthly portfolio holdings, and other fund details available on our Web site www.jhfunds.com or by calling 1-800-225-5291.
| | |
| You can also contact us: | | |
| 1-800-225-5291 | Regular mail: | Express mail: |
| www. jhfunds.com | John Hancock Signature Services, Inc. | John Hancock Signature Services, Inc. |
| | P.O. Box 55913 | Mutual Fund Image Operations |
| | Boston, MA 02205-5913 | 30 Dan Road |
| | | Canton, MA 02021 |
John Hancock Small Cap Opportunities Fund
| |
| Table of Contents | |
| |
| Management’s discussion of Fund performance | Page 3 |
| A look at performance | Page 4 |
| Your expenses | Page 6 |
| Portfolio summary | Page 7 |
| Portfolio of investments | Page 8 |
| Financial statements | Page 12 |
| Financial highlights | Page 15 |
| Notes to financial statements | Page 19 |
| Trustees and Officers | Page 29 |
| More information | Page 37 |
John Hancock Small Cap Opportunities Fund
Management’s Discussion of Fund Performance
By John Hancock Asset Management (formerly MFC Investment Management (U.S.), LLC)1
U.S. stocks posted double-digit gains for the year ended March 31, 2011. The stock market was choppy in the spring and summer of 2010 as weaker-than-expected economic data cast doubts on the sustainability of the burgeoning economic recovery. During the latter half of the year, however, economic activity improved markedly, boosting investor confidence that a full-fledged economic expansion was under way. As a result, stocks enjoyed a sharp rally over the last six months. For the full year, the broad equity indexes gained more than 15%, with small-cap stocks leading the market’s advance. In addition, growth-oriented issues outperformed value shares across all market capitalizations.
Fund performance
For the year ended March 31, 2011, John Hancock Small Cap Opportunities Fund’s Class A shares posted a total return of 34.27% at net asset value, outpacing both the 29.11% return of the average small growth fund, according to Morningstar, Inc., and the 31.04% return of the Fund’s benchmark, the Russell 2000 Growth Index.
Portfolio review
One of the primary contributing factors to the Fund’s outperformance of its benchmark index and peer group average was our ability and willingness to capitalize on investment opportunities created by day-to-day market volatility, particularly during the erratic market environment in the first six months of the year. The market fluctuations allowed us to add to some of our favorite portfolio holdings at relatively cheap prices and Fund shareholders were rewarded when these stocks rebounded during the last half of the year.
Sector allocation and stock selection were also important contributors to the Fund’s robust performance during the year. From a sector allocation perspective, overweight positions relative to the benchmark in the energy and materials sectors added value as rising commodity prices provided a lift to these segments of the market. Stock selection in the materials sector also played a significant role, led by Canadian metals producer Avalon Rare Metals, Inc. and agricultural chemicals maker LSB Industries, Inc. Other top contributors included semiconductor manufacturer Atmel Corp. and energy producer Brigham Exploration Company. The most significant individual detractors included language software maker Rosetta Stone, Inc. and gaming equipment maker WMS Industries, Inc.
This commentary reflects the views of the portfolio managers through the end of the Fund’s period discussed in this report. The managers’ statements reflect their own opinions. As such, they are in no way guarantees of future events and are not intended to be used as investment advice or a recommendation regarding any specific security. They are also subject to change at any time as market and other conditions warrant.
Past performance is no guarantee of future results.
Investments in smaller companies may involve greater risks than those in larger, more well-known companies. See the prospectus for the risks of investing in small-cap stocks. Sector investing is subject to greater risks than the market as a whole. Because the Fund may focus on particular sectors of the economy, its performance may depend on the performance of those sectors.
1 Manulife Asset Management (US) LLC is doing business as John Hancock Asset Management.
A Look at Performance
Small Cap Opportunities Fund
For the period ended March 31, 2011
| | | | | | | | | |
| | | | | | | | | | |
| |
| | Average annual total returns (%) | | | Cumulative total returns (%) | | |
| | with maximum sales charge (POP) | | | with maximum sales charge (POP) | |
|
| | | | | Since | | | | | Since |
| Class | 1-year | 5-year | 10-year | Inception1 | | 1-year | 5-year | 10-year | Inception1 |
|
| A | 27.58 | - | - | 36.18 | | 27.58 | - | - | 100.12 |
|
| B | 28.31 | - | - | 37.49 | | 28.31 | - | - | 104.46 |
|
| C | 32.31 | - | - | 38.38 | | 32.31 | - | - | 107.46 |
|
| I2 | 34.77 | - | - | 39.86 | | 34.77 | - | - | 112.47 |
|
Performance figures assume all distributions are reinvested. Public offering price (POP) figures reflect maximum sales charge on Class A shares of 5%, and the applicable contingent deferred sales charge (CDSC) on Class B and Class C shares. The Class B shares’ CDSC declines annually between years 1 to 6 according to the following schedule: 5, 4, 3, 3, 2, 1%. No sales charge will be assessed after the sixth year. Class C shares held for less than one year are subject to a 1% CDSC. Sales charges are not applicable for Class I shares.
The expense ratios of the Fund, both net (including any fee waivers or expense limitations) and gross (excluding any fee waivers or expense limitations), are set forth according to the most recent publicly available prospectuses for the Fund and may differ from those disclosed in the Financial Highlights tables in this report. The fee waivers and expense limitations are contractual at least until 7 31 11. Had the fee waivers and expense limitations not been in place gross expenses would apply. The expense ratios are as follows:
| | | | |
| | Class A | Class B | Class C | Class I |
|
| Net (%) | 1.65 | 2.35 | 2.35 | 1.19 |
|
| Gross (%) | 4.26 | 4.96 | 4.96 | 3.75 |
|
The returns reflect past results and should not be considered indicative of future performance. The return and principal value of an investment will fluctuate so that shares, when redeemed, may be worth more or less than their original cost. Due to market volatility, the Fund’s current performance may be higher or lower than the performance shown. For performance data current to the most recent month end, please call 1–800–225–5291 or visit the Fund’s Web site at www.jhfunds.com.
The performance table above and the chart on the next page do not reflect the deduction of taxes that a shareholder would pay on fund distributions or the redemption of fund shares. The Fund’s performance results reflect any applicable expense reductions, without which the expenses would increase and results would have been less favorable.
Footnotes on the following page.
A look at performance
| | | |
| | Class B | Class C4 | Class I2 |
|
| Began | 1-2-09 | 1-2-09 | 1-2-09 |
|
| NAV | $20,746 | $20,746 | $21,247 |
|
| POP | $20,446 | $20,746 | $21,247 |
|
| Index | $18,962 | $18,962 | $18,962 |
|
Russell 2000 Growth Index is an unmanaged index which measures the performance of the small-cap growth segment of the U.S. equity universe. It includes those Russell 2000 companies with higher price-to-book ratios and higher forecasted growth values.
It is not possible to invest directly in an index. Index figures do not reflect sales charges, which would have resulted in lower values if they did.
1 From 1-2-09.
2 For certain types of investors, as described in the Fund’s prospectuses.
3 NAV represents net asset value and POP represents public offering price. Performance of the classes will vary based on the difference in sales charges paid by shareholders investing in the different classes and the fee structure of those classes.
4 The contingent deferred sales charge, if any, is not applicable.
|
| Annual report | Small Cap Opportunities Fund |
Small Cap Opportunities Fund
Your expenses
These examples are intended to help you understand your ongoing operating expenses.
Understanding your fund expenses
As a shareholder of the Fund, you incur two types of costs:
• Transaction costs which include sales charges (loads) on purchases or redemptions (varies by share class), minimum account fee charge, etc.
• Ongoing operating expenses including management fees, distribution and service fees (if applicable), and other fund expenses.
We are going to present only your ongoing operating expenses here.
Actual expenses/actual returns
This example is intended to provide information about the Fund’s actual ongoing operating expenses, and is based on the Fund’s actual return. It assumes an account value of $1,000.00 on October 1, 2010 with the same investment held until March 31, 2011.
| | | |
| | Account value | Ending value | Expenses paid during |
| | on 10-1-10 | on 3-31-11 | period ended 3-31-111 |
|
| Class A | $1,000.00 | $1,336.20 | $9.61 |
|
| Class B | 1,000.00 | 1,331.20 | 13.66 |
|
| Class C | 1,000.00 | 1,331.20 | 13.66 |
|
| Class I | 1,000.00 | 1,338.50 | 6.94 |
|
Together with the value of your account, you may use this information to estimate the operating expenses that you paid over the period. Simply divide your account value at March 31, 2011, by $1,000.00, then multiply it by the “expenses paid” for your share class from the table above. For example, for an account value of $8,600.00, the operating expenses should be calculated as follows:

Hypothetical example for comparison purposes
This table allows you to compare the Fund’s ongoing operating expenses with those of any other fund. It provides an example of the Fund’s hypothetical account values and hypothetical expenses based on each class’s actual expense ratio and an assumed 5% annualized return before expenses (which is not the Fund’s actual return). It assumes an account value of $1,000.00 on October 1, 2010, with the same investment held until March 31, 2011. Look in any other fund shareholder report to find its hypothetical example and you will be able to compare these expenses.
| | | |
| | Account value | Ending value | Expenses paid during |
| | on 10-1-10 | on 3-31-11 | period ended 3-31-111 |
|
| Class A | $1,000.00 | $1,016.70 | $8.30 |
|
| Class B | 1,000.00 | 1,013.20 | 11.80 |
|
| Class C | 1,000.00 | 1,013.20 | 11.80 |
|
| Class I | 1,000.00 | 1,019.00 | 5.99 |
|
Remember, these examples do not include any transaction costs, therefore, these examples will not help you to determine the relative total costs of owning different funds. If transaction costs were included, your expenses would have been higher. See the prospectus for details regarding transaction costs.
1 Expenses are equal to the Fund's annualized expense ratio of 1.65%, 2.35%, 2.35% and 1.19% for Class A, Class B, Class C and Class I shares, respectively, multiplied by the average account value over the period, multiplied by 182/365 (to reflect the one-half year period).
Small Cap Opportunities Fund
Portfolio Summary
| |
| | Value as a |
| | percentage of |
| Top 10 Holdings1 (23.2% of Net Assets) | Fund's net assets |
| KVH Industries, Inc. | 3.1% |
| Darling International, Inc. | 2.8% |
| Coventry Health Care, Inc. | 2.7% |
| Ancestry.com, Inc. | 2.4% |
| Atmel Corp. | 2.1% |
| Lazard, Ltd., Class A | 2.1% |
| MEDNAX, Inc. | 2.0% |
| Tempur-Pedic International, Inc. | 2.0% |
| Trex Company, Inc. | 2.0% |
| International Coal Group, Inc. | 2.0% |
| |
| | Value as a |
| | percentage of |
| Country Concentration | Fund's net assets |
| United States | 75% |
| Canada | 15% |
| Bermuda | 2% |
| Panama | 1% |
| Virgin Islands | 1% |
| Spain | 1% |
| Cayman Islands | 1% |
| Netherlands | 1% |
| Short-Term Investments & Other | 3% |
| |
| | Value as a |
| | percentage of |
| Sector Concentration2 | Fund's net assets |
| Information Technology | 24% |
| Consumer Discretionary | 15% |
| Health Care | 14% |
| Industrials | 12% |
| Materials | 12% |
| Energy | 10% |
| Financials | 7% |
| Consumer Staples | 3% |
| Short-Term Investments & Other | 3% |
1 Cash and cash equivalents are not included in Top 10 Holdings.
2 Sector investing is subject to greater risks than the market as a whole. Because the Fund may focus on particular sectors of the economy, its performance may depend on the performance of those sectors.
Small Cap Opportunities Fund
As of 3-31-11
| | |
| | Shares | Value |
|
| Common Stocks 96.54% | | $4,044,854 |
|
| (Cost $2,987,215) | | |
| |
| Consumer Discretionary 14.75% | | 617,906 |
|
| Diversified Consumer Services 0.95% | | |
|
| Global Education & Technology Group, Ltd., ADR (I)(L) | 6,491 | 39,791 |
| | | |
| Hotels, Restaurants & Leisure 4.12% | | |
|
| Bally Technologies, Inc. (I) | 2,147 | 81,264 |
| Bravo Brio Restaurant Group, Inc. (I) | 1,856 | 32,833 |
| WMS Industries, Inc. (I) | 1,651 | 58,363 |
| | | |
| Household Durables 4.19% | | |
|
| iRobot Corp. (I)(L) | 1,500 | 49,335 |
| Lennar Corp., Class A | 2,283 | 41,368 |
| Tempur-Pedic International, Inc. (I) | 1,673 | 84,754 |
| | | |
| Media 1.97% | | |
|
| IMAX Corp. (I) | 2,577 | 82,412 |
| | | |
| Specialty Retail 1.84% | | |
|
| A.C. Moore Arts & Crafts, Inc. (I) | 9,555 | 26,181 |
| Lumber Liquidators Holdings, Inc. (I) | 2,045 | 51,105 |
| | | |
| Textiles, Apparel & Luxury Goods 1.68% | | |
|
| G-III Apparel Group, Ltd. (I) | 1,876 | 70,500 |
| | | |
| Consumer Staples 2.85% | | 119,317 |
|
| Food Products 2.85% | | |
|
| Darling International, Inc. (I) | 7,763 | 119,317 |
| | | |
| Energy 10.16% | | 425,807 |
|
| Oil, Gas & Consumable Fuels 10.16% | | |
|
| Africa Oil Corp. (I) | 20,521 | 41,063 |
| Americas Petrogas, Inc. (I) | 17,058 | 40,031 |
| Americas Petrogas, Inc., Common Shares (I) | 12,307 | 30,466 |
| BNK Petroleum, Inc. (I) | 6,130 | 29,717 |
| Brigham Exploration Company (I)(L) | 1,507 | 56,030 |
| International Coal Group, Inc. (I) | 7,331 | 82,840 |
| Ivanhoe Energy, Inc. (I) | 18,141 | 50,976 |
| Patriot Coal Corp. (I) | 2,455 | 63,413 |
| Surge Energy, Inc. (I) | 3,513 | 31,271 |
| | | |
| Financials 7.18% | | 300,810 |
|
| Capital Markets 4.59% | | |
|
| Evercore Partners, Inc., Class A | 1,303 | 44,680 |
| Lazard, Ltd., Class A | 2,116 | 87,983 |
| Solar Senior Capital, Ltd. (I) | 3,212 | 59,840 |
| | | |
| Commercial Banks 2.59% | | |
|
| East West Bancorp, Inc. | 1,850 | 40,626 |
| Zions Bancorporation | 2,935 | 67,681 |
See notes to financial statements
Small Cap Opportunities Fund
As of 3-31-11
| | |
| | Shares | Value |
| Health Care 13.66% | | $572,497 |
|
| Biotechnology 1.15% | | |
|
| Isis Pharmaceuticals, Inc. (I) | 1,785 | 16,136 |
| United Therapeutics Corp. (I) | 480 | 32,170 |
| | | |
| Health Care Equipment & Supplies 4.97% | | |
|
| Align Technology, Inc. (I) | 2,312 | 47,350 |
| ArthroCare Corp. (I) | 865 | 28,839 |
| RTI Biologics, Inc. (I) | 14,962 | 42,791 |
| SonoSite, Inc. (I) | 942 | 31,387 |
| Thoratec Corp. (I) | 2,241 | 58,109 |
| | | |
| Health Care Providers & Services 4.70% | | |
|
| Coventry Health Care, Inc. (I) | 3,491 | 111,328 |
| MEDNAX, Inc. (I) | 1,284 | 85,527 |
| | | |
| Life Sciences Tools & Services 0.05% | | |
|
| Sequenom, Inc. (I) | 328 | 2,076 |
| | | |
| Pharmaceuticals 2.79% | | |
|
| Impax Laboratories, Inc. (I) | 1,666 | 42,400 |
| Par Pharmaceutical Companies, Inc. (I) | 1,700 | 52,836 |
| Somaxon Pharmaceuticals, Inc. (I)(L) | 7,614 | 21,548 |
| | | |
| Industrials 12.29% | | 514,754 |
|
| Aerospace & Defense 2.82% | | |
|
| Hexcel Corp. (I) | 3,358 | 66,119 |
| The Keyw Holding Corp. (I) | 4,226 | 51,895 |
| | | |
| Air Freight & Logistics 2.03% | | |
|
| Atlas Air Worldwide Holdings, Inc. (I) | 601 | 41,902 |
| UTi Worldwide, Inc. | 2,137 | 43,253 |
| | | |
| Airlines 1.45% | | |
|
| Copa Holdings SA, Class A | 1,153 | 60,878 |
| | | |
| Building Products 2.74% | | |
|
| Quanex Building Products Corp. | 1,597 | 31,349 |
| Trex Company, Inc. (I) | 2,551 | 83,214 |
| | | |
| Commercial Services & Supplies 1.26% | | |
|
| Steelcase, Inc., Class A | 4,652 | 52,940 |
| | | |
| Machinery 1.20% | | |
|
| Flow International Corp. (I) | 493 | 2,164 |
| Graham Corp. | 2,013 | 48,191 |
| | | |
| Professional Services 0.79% | | |
|
| FTI Consulting, Inc. (I) | 857 | 32,849 |
| | | |
| Information Technology 23.44% | | 982,012 |
|
| Communications Equipment 3.57% | | |
|
| KVH Industries, Inc. (I) | 8,579 | 129,714 |
| Meru Networks, Inc. (I) | 971 | 19,721 |
| | | |
| Electronic Equipment, Instruments & Components 0.81% | | |
|
| NeoPhotonics Corp. (I) | 2,983 | 33,738 |
See notes to financial statements
Small Cap Opportunities Fund
As of 3-31-11
| | | |
| | | Shares | Value |
| Information Technology (continued) | | | |
|
| Internet Software & Services 6.62% | | | |
|
| Ancestry.com, Inc. (I) | | 2,802 | $99,331 |
| Dice Holdings, Inc. (I) | | 2,790 | 42,157 |
| TechTarget, Inc. (I) | | 6,037 | 53,790 |
| The Knot, Inc. (I) | | 4,096 | 49,357 |
| VistaPrint NV (I) | | 631 | 32,749 |
| | | | |
| IT Services 2.68% | | | |
|
| Cardtronics, Inc. (I) | | 3,526 | 71,754 |
| Telvent GIT SA | | 1,399 | 40,725 |
| | | | |
| Semiconductors & Semiconductor Equipment 4.06% | | | |
|
| Atmel Corp. (I) | | 6,491 | 88,472 |
| Cypress Semiconductor Corp. (I) | | 3,108 | 60,233 |
| Netlogic Microsystems, Inc. (I) | | 509 | 21,388 |
| | | | |
| Software 5.70% | | | |
|
| Concur Technologies, Inc. (I) | | 969 | 53,731 |
| Monotype Imaging Holdings, Inc. (I) | | 4,891 | 70,920 |
| Rosetta Stone, Inc. (I)(L) | | 4,280 | 56,539 |
| Ultimate Software Group, Inc. (I) | | 982 | 57,693 |
| | | | |
| Materials 12.21% | | | 511,751 |
|
| Chemicals 4.00% | | | |
|
| Karnalyte Resources, Inc. (I) | | 2,808 | 35,915 |
| LSB Industries, Inc. (I) | | 2,081 | 82,491 |
| Neo Material Technologies, Inc. (I) | | 5,091 | 48,993 |
| | | | |
| Construction Materials 0.96% | | | |
|
| Eagle Materials, Inc. | | 1,334 | 40,367 |
| | | | |
| Metals & Mining 5.46% | | | |
|
| Avalon Rare Metals, Inc. (I) | | 9,565 | 77,151 |
| Frontier Rare Earths, Ltd. (I) | | 2,478 | 6,894 |
| Pretium Resources, Inc. (I) | | 3,296 | 33,725 |
| Rare Element Resources, Ltd. (I)(L) | | 5,399 | 70,996 |
| San Gold Corp. (I) | | 15,230 | 40,215 |
| | | | |
| Paper & Forest Products 1.79% | | | |
|
| Schweitzer-Mauduit International, Inc. | | 1,482 | 75,004 |
| |
| Warrants 0.05% | | | $1,902 |
|
| (Cost $0) | | | |
| Frontier Rare Earths, Ltd. (Expiration Date: 11-30-12, Strike Price: CAD 4.60) (I) | 4,394 | 1,902 |
| | | | |
| | Yield | Shares | Value |
| |
| Securities Lending Collateral 3.55% | | | $148,769 |
|
| (Cost $148,762) | | | |
| John Hancock Collateral Investment Trust (W) | 0.2867%(Y) | 14,867 | 148,769 |
See notes to financial statements
Small Cap Opportunities Fund
As of 3-31-11
| | |
| | Shares | Value |
|
| Short-Term Investments 3.96% | | $166,000 |
|
| (Cost $166,000) | | |
| |
| Repurchase Agreement 3.96% | | 166,000 |
|
| Repurchase Agreement with State Street Corp. dated 3-31-11 at | | |
| 0.010% to be repurchased at $166,000 on 4-1-11, collateralized by | | |
| $160,000 Federal Home Loan Mortgage Corp., 4.500% due 7-15-13 | | |
| (valued at $173,800, including interest) | 166,000 | 166,000 |
| |
| Total investments (Cost $3,301,977)† 104.10% | | $4,361,525 |
|
| Other assets and liabilities, net (4.10%) | | ($171,614) |
|
| Total net assets 100.00% | | $4,189,911 |
|
The percentage shown for each investment category is the total value of the category as a percentage of the net assets of the Fund.
ADR American Depositary Receipts
CAD Canadian Dollar
(I) Non-income producing security.
(L) All or a portion of this security is on loan as of 3-31-11.
(W) Investment is an affiliate of the Fund, the adviser and/or subadviser. Also, it represents the investment of securities lending collateral received.
(Y) The rate shown is the annualized seven-day yield as of 3-31-11.
† At 3-31-11, the aggregate cost of investment securities for federal income tax purposes was $3,396,060. Net unrealized appreciation aggregated $965,465, of which $1,089,744 related to appreciated investment securities and $124,279 related to depreciated investment securities.
The Fund had the following country composition as a percentage of total net assets on 3-31-11:
| | | |
| United States | 75% | | |
| Canada | 15% | | |
| Bermuda | 2% | | |
| Panama | 1% | | |
| Virgin Islands | 1% | | |
| Spain | 1% | | |
| Cayman Islands | 1% | | |
| Netherlands | 1% | | |
| Short-Term Investments & Other | 3% | | |
See notes to financial statements
Small Cap Opportunities Fund
Statement of Assets and Liabilities — March 31, 2011
| |
| Assets | |
|
| Investments in unaffiliated issuers, at value | |
| (Cost $3,153,215) including $144,051 of | |
| securities loaned (Note 2) | $4,212,756 |
| Investments in affiliated issuers, at value (Cost | |
| $148,762) (Note 2) | 148,769 |
| | |
| Total investments, at value (Cost $3,301,977) | 4,361,525 |
| | |
| Cash | 877 |
| Foreign currency, at value (Cost $18,613) | 18,746 |
| Receivable for investments sold | 30,449 |
| Dividends and interest receivable | 721 |
| Receivable for securities lending income | 650 |
| Receivable due from adviser | 177 |
| Other receivables and prepaid expenses | 157 |
| | |
| Total assets | 4,413,302 |
| |
| Liabilities | |
|
| Payable for investments purchased | 33,734 |
| Payable upon return of securities loaned (Note 2) | 148,830 |
| Payable to affiliates | |
| Accounting and legal services fees | 67 |
| Transfer agent fees | 971 |
| Trustees' fees | 25 |
| Other liabilities and accrued expenses | 39,764 |
| | |
| Total liabilities | 223,391 |
| |
| Net assets | |
|
| Capital paid-in | $2,648,155 |
| Accumulated undistributed net investment loss | (8,816) |
| Accumulated net realized gain (loss) on | |
| investments, written options and foreign | |
| currency transactions | 490,732 |
| Net unrealized appreciation (depreciation) on | |
| investments and translation of assets and | |
| liabilities in foreign currencies | 1,059,840 |
| | |
| Net assets | $4,189,911 |
| |
| Net asset value per share | |
|
| Based on net asset values and shares outstanding-the Fund has an |
| unlimited number of shares authorized with no par value | |
| Class A ($1,053,403 ÷ 61,329 shares) | $17.18 |
| Class B ($1,037,029 ÷ 61,161 shares)1 | $16.96 |
| Class C ($1,037,040 ÷ 61,161 shares)1 | $16.96 |
| Class I ($1,062,439 ÷ 61,444 shares) | $17.29 |
| |
| Maximum offering price per share | |
| Class A (net asset value per share ÷ 95%)2 | $18.08 |
1 Redemption price is equal to net asset value less any applicable contingent deferred sales charge.
2 On single retail sales of less than $50,000. On sales of $50,000 or more and on group sales the offering price is reduced.
See notes to financial statements
Small Cap Opportunities Fund
Statement of Operations — For the Year Ended March 31, 2011
| |
| Investment income | |
|
| Dividends | $13,436 |
| Securities lending | 3,681 |
| Interest | 15 |
| Less foreign taxes withheld | (43) |
| | |
| Total investment income | 17,089 |
| |
| Expenses | |
|
| Investment management fees (Note 5) | 30,302 |
| Distribution and service fees (Note 5) | 19,239 |
| Accounting and legal services fees (Note 5) | 415 |
| Transfer agent fees (Note 5) | 4,153 |
| Trustees' fees (Note 5) | 361 |
| State registration fees (Note 5) | 221 |
| Professional fees | 38,233 |
| Custodian fees | 16,955 |
| Registration and filing fees | 15,069 |
| Other | 8,171 |
| | |
| Total expenses | 133,119 |
| Less expense reductions (Note 5) | (71,545) |
| | |
| Net expenses | 61,574 |
| |
| Net investment loss | (44,485) |
| |
| Realized and unrealized gain (loss) | |
|
| Net realized gain (loss) on | |
| Investments in unaffiliated issuers | 821,993 |
| Investments in affiliated issuers | (37) |
| Written options (Note 3) | 1,969 |
| Foreign currency transactions | (828) |
| | 823,097 |
| |
| Change in net unrealized appreciation | |
| (depreciation) of | |
| Investments in unaffiliated issuers | 281,234 |
| Investments in affiliated issuers | 18 |
| Written options (Note 3) | (144) |
| Translation of assets and liabilities in foreign | |
| currencies | 292 |
| | 281,400 |
| |
| Net realized and unrealized gain | 1,104,497 |
| |
| Increase in net assets from operations | $1,060,012 |
See notes to financial statements
Small Cap Opportunities Fund
Statements of Changes in Net Assets
| | |
| | Year ended | Year ended |
| | 3-31-11 | 3-31-10 |
| |
| Increase (decrease) in net assets | | |
|
| From operations | | |
| Net investment loss | ($44,485) | ($35,438) |
| Net realized gain | 823,097 | 434,245 |
| Change in net unrealized appreciation | | |
| (depreciation) | 281,400 | 853,399 |
| | | |
| Increase in net assets resulting from | | |
| operations | 1,060,012 | 1,252,206 |
| |
| Distributions to shareholders | | |
| From net investment income | | |
| Class A | (4,267) | — |
| Class I | (6,925) | — |
| From net realized gain | | |
| Class A | (105,616) | (55,334) |
| Class B | (105,671) | (55,334) |
| Class C | (105,671) | (55,335) |
| Class I | (105,579) | (55,335) |
| | | |
| Total distributions | (433,729) | (221,338) |
| |
| From Fund share transactions (Note 6) | 433,729 | 221,338 |
| |
| Total increase | 1,060,012 | 1,252,206 |
| |
| Net assets | | |
|
| Beginning of year | 3,129,899 | 1,877,693 |
| | | |
| End of year | $4,189,911 | $3,129,899 |
| |
| Accumulated undistributed net investment | | |
| loss | ($8,816) | ($14,959) |
See notes to financial statements
Small Cap Opportunities Fund
Financial Highlights (For a share outstanding throughout the period)
Class A Shares
| | | | |
| Period ended | | | | |
| | 3-31-11 | 3-31-10 | 3-31-091 | |
| Per share operating performance | | | | |
| |
| Net asset value, beginning of period | $14.49 | $9.39 | $10.00 | |
| Net investment loss2 | (0.16) | (0.14) | (0.03) | |
| Net realized and unrealized gain (loss) on | | | | |
| investments | 4.88 | 6.35 | (0.58) | |
| Total from investment operations | 4.72 | 6.21 | (0.61) | |
| | |
| Less distributions | | | | |
| From net investment income | (0.08) | — | — | |
| From net realized gain | (1.95) | (1.11) | — | |
| Total distributions | (2.03) | (1.11) | — | |
| | |
| Net asset value, end of period | $17.18 | $14.49 | $9.39 | |
| | |
| Total return (%)3,4 | 34.27 | 67.14 | (6.10)5 | |
| | |
| Ratios and supplemental data | | | | |
| |
| Net assets, end of period (in thousands) | $1,053 | $785 | $470 | |
| Ratios (as a percentage of average net | | | | |
| assets): | | | | |
| Expenses before reductions | 3.71 | 4.03 | 12.346 | |
| Expenses net of fee waivers | 1.59 | 1.36 | 1.656 | |
| Expenses net of fee waivers and credits | 1.59 | 1.36 | 1.656 | |
| Net investment loss | (1.08) | (1.07) | (1.42)6 | |
| Portfolio turnover (%) | 105 | 101 | 27 | |
1 Period from 1-2-09 (inception date) to 3-31-09.
2 Based on the average daily shares outstanding.
3 Does not reflect the effect of sales charges, if any.
4 Total returns would have been lower had certain expenses not been reduced during the periods shown.
5 Not annualized.
6 Annualized.
See notes to financial statements
Small Cap Opportunities Fund
Financial Highlights (For a share outstanding throughout the period)
Class B Shares
| | | | |
| Period ended | | | | |
| | 3-31-11 | 3-31-10 | 3-31-091 | |
| Per share operating performance | | | | |
| |
| Net asset value, beginning of period | $14.36 | $9.38 | $10.00 | |
| Net investment loss2 | (0.26) | (0.23) | (0.05) | |
| Net realized and unrealized gain (loss) on | | | | |
| investments | 4.81 | 6.32 | (0.57) | |
| Total from investment operations | 4.55 | 6.09 | (0.62) | |
| | |
| Less distributions | | | | |
| From net realized gain | (1.95) | (1.11) | — | |
| Net asset value, end of period | $16.96 | $14.36 | $9.38 | |
| | |
| Total return (%)3,4 | 33.31 | 65.91 | (6.20)5 | |
| | |
| Ratios and supplemental data | | | | |
| |
| Net assets, end of period (in thousands) | $1,037 | $778 | $469 | |
| Ratios (as a percentage of average net | | | | |
| assets): | | | | |
| Expenses before reductions | 4.41 | 4.73 | 13.046 | |
| Expenses net of fee waivers | 2.29 | 2.06 | 2.356 | |
| Expenses net of fee waivers and credits | 2.29 | 2.06 | 2.356 | |
| Net investment loss | (1.78) | (1.77) | (2.12)6 | |
| Portfolio turnover (%) | 105 | 101 | 27 | |
1 Period from 1-2-09 (inception date) to 3-31-09.
2 Based on the average daily shares outstanding.
3 Does not reflect the effect of sales charges, if any.
4 Total returns would have been lower had certain expenses not been reduced during the periods shown.
5 Not annualized.
6 Annualized.
See notes to financial statements
Small Cap Opportunities Fund
Financial Highlights (For a share outstanding throughout the period)
Class C Shares
| | | | |
| Period ended | | | | |
| | 3-31-11 | 3-31-10 | 3-31-091 | |
| Per share operating performance | | | | |
| |
| Net asset value, beginning of period | $14.36 | $9.38 | $10.00 | |
| Net investment loss2 | (0.26) | (0.23) | (0.05) | |
| Net realized and unrealized gain (loss) on | | | | |
| investments | 4.81 | 6.32 | (0.57) | |
| Total from investment operations | 4.55 | 6.09 | (0.62) | |
| | |
| Less distributions | | | | |
| From net realized gain | (1.95) | (1.11) | — | |
| Net asset value, end of period | $16.96 | $14.36 | $9.38 | |
| | |
| Total return (%)3,4 | 33.31 | 65.91 | (6.20)5 | |
| | |
| Ratios and supplemental data | | | | |
| |
| Net assets, end of period (in thousands) | $1,037 | $778 | $469 | |
| Ratios (as a percentage of average net | | | | |
| assets): | | | | |
| Expenses before reductions | 4.41 | 4.73 | 13.046 | |
| Expenses net of fee waivers | 2.29 | 2.06 | 2.356 | |
| Expenses net of fee waivers and credits | 2.29 | 2.06 | 2.356 | |
| Net investment loss | (1.78) | (1.77) | (2.12)6 | |
| Portfolio turnover (%) | 105 | 101 | 27 | |
1 Period from 1-2-09 (inception date) to 3-31-09.
2 Based on the average daily shares outstanding.
3 Does not reflect the effect of sales charges, if any.
4 Total returns would have been lower had certain expenses not been reduced during the periods shown.
5 Not annualized.
6 Annualized.
See notes to financial statements
Small Cap Opportunities Fund
Financial Highlights (For a share outstanding throughout the period)
Class I Shares
| | | | |
| Period ended | | | | |
| | 3-31-11 | 3-31-10 | 3-31-091 | |
| Per share operating performance | | | | |
| |
| Net asset value, beginning of period | $14.56 | $9.41 | $10.00 | |
| Net investment loss2 | (0.10) | (0.10) | (0.02) | |
| Net realized and unrealized gain (loss) on | | | | |
| investments | 4.91 | 6.36 | (0.57) | |
| Total from investment operations | 4.81 | 6.26 | (0.59) | |
| | |
| Less distributions | | | | |
| From net investment income | (0.13) | — | — | |
| From net realized gain | (1.95) | (1.11) | — | |
| Total distributions | (2.08) | (1.11) | — | |
| | |
| Net asset value, end of period | $17.29 | $14.56 | $9.41 | |
| | |
| Total return (%)3 | 34.77 | 67.54 | (5.90)4 | |
| | |
| Ratios and supplemental data | | | | |
| |
| Net assets, end of period (in thousands) | $1,062 | $788 | $470 | |
| Ratios (as a percentage of average net | | | | |
| assets): | | | | |
| Expenses before reductions | 3.30 | 3.72 | 12.045 | |
| Expenses net of fee waivers | 1.17 | 1.06 | 1.105 | |
| Expenses net of fee waivers and credits | 1.17 | 1.06 | 1.105 | |
| Net investment loss | (0.66) | (0.77) | (0.87)5 | |
| Portfolio turnover (%) | 105 | 101 | 27 | |
1 Period from 1-2-09 (inception date) to 3-31-09.
2 Based on the average daily shares outstanding.
3 Total returns would have been lower had certain expenses not been reduced during the periods shown.
4 Not annualized.
5 Annualized.
See notes to financial statements
Small Cap Opportunities Fund
Notes to financial statements
Note 1 — Organization
John Hancock Small Cap Opportunities Fund (the Fund) is a diversified series of John Hancock Funds III (the Trust), an open-end management investment company organized as a Massachusetts business trust and registered under the Investment Company Act of 1940, as amended (the 1940 Act). The investment objective of the Fund is to seek long-term capital appreciation.
The Fund may offer multiple classes of shares. The shares currently offered are detailed in the Statement of Assets and Liabilities. Class A, Class B and Class C shares are offered to all investors. Class I shares are offered to institutions and certain investors. Shareholders of each class have exclusive voting rights to matters that affect that class. The distribution and service fees, transfer agent fees, printing and postage and state registration fees for each class may differ. Class B shares convert to Class A shares eight years after purchase.
Note 2 — Significant accounting policies
The financial statements have been prepared in conformity with accounting principles generally accepted in the United States of America, which require management to make certain estimates and assumptions at the date of the financial statements. Actual results could differ from those estimates. Events or transactions occurring after the end of the fiscal period through the date that the financial statements were issued have been evaluated in the preparation of the financial statements. The following summarizes the significant accounting policies of the Fund:
Security valuation. Investments are stated at value as of the close of regular trading on the New York Stock Exchange (NYSE), normally at 4:00 P.M., Eastern Time. The Fund uses a three-tier hierarchy to prioritize the pricing assumptions, referred to as inputs, used in valuation techniques to measure fair value. Level 1 includes securities valued using quoted prices in active markets for identical securities. Level 2 includes securities valued using significant observable inputs. Observable inputs may include quoted prices for similar securities, interest rates, prepayment speeds and credit risk. Prices for securities valued using these inputs are received from independent pricing vendors and brokers and are based on an evaluation of the inputs described. Level 3 includes securities valued using significant unobservable inputs when market prices are not readily available or reliable, including the Fund’s own assumptions in determining the fair value of investments. Factors used in determining value may include market or issuer specific events, changes in interest rates and credit quality. The inputs or methodology used for valuing securities are not necessarily an indication of the risk associated with investing in those securities.
The following is a summary of the values by input classification of the Fund’s investments as of March 31, 2011 by major security category or type:
| | | | |
| | | | Level 2 | Level 3 |
| | Total Market | | Significant | Significant |
| | Value at | Level 1 Quoted | Observable | Unobservable |
| | 3-31-11 | Price | Inputs | Inputs |
|
| Common Stocks | | | | |
| Consumer Discretionary | $617,906 | $617,906 | — | — |
| Consumer Staples | 119,317 | 119,317 | — | — |
| Energy | 425,807 | 385,776 | $40,031 | — |
| Financials | 300,810 | 300,810 | — | — |
| Health Care | 572,497 | 572,497 | — | — |
| Industrials | 514,754 | 514,754 | — | — |
| Information Technology | 982,012 | 982,012 | — | — |
| Materials | 511,751 | 511,751 | — | — |
| Warrants | 1,902 | 1,902 | — | — |
|
| Securities Lending Collateral | 148,769 | 148,769 | — | — |
|
| Short-Term Investments | 166,000 | — | 166,000 | — |
|
| Total Investments in Securities | $4,361,525 | $4,155,494 | $206,031 | — |
|
Changes in valuation techniques may result in transfers in or out of an assigned level within the disclosure hierarchy. During the year ended March 31, 2011, there were no significant transfers in or out of Level 1 or Level 2 assets.
In order to value the securities, the Fund uses the following valuation techniques. Equity securities held by the Fund are valued at the last sale price or official closing price on the principal securities exchange on which they trade. In the event there were no sales during the day or closing prices are not available, then securities are valued using the last quoted bid or evaluated price. Investments by the Fund in open-end management investment companies are valued at their respective net asset values each business day. Foreign securities and currencies, including forward foreign currency contracts, are valued in U.S. dollars, based on foreign currency exchange rates supplied by an independent pricing service. Certain securities and forward foreign currency contracts traded only in the over-the-counter market are valued at the last bid price quoted by brokers making markets in the securities at the close of trading. Certain short-term securities are valued at amortized cost. Other portfolio securities and assets, where market quotations are not readily available, are valued at fair value, as determined in good faith by the Fund’s Pricing Committee, following procedures established by the Board of Trustees.
Security transactions and related investment income. Investment security transactions are accounted for on a trade date plus one basis for daily net asset value calculations. However, for financial reporting purposes, investment transactions are reported on trade date. Interest income is accrued as earned. Gains and losses on securities sold are determined on the basis of identified cost and may include proceeds from litigation. Dividend income is recorded on the ex-date, except for dividends of foreign securities where the dividend may not be known until after the ex-date. In those cases, dividend income is recorded when the Fund becomes aware of the dividends.
Securities lending. The Fund may lend its securities to earn additional income. It receives and maintains cash collateral received from the borrower in an amount not less than the market value of the loaned securities. The Fund will invest its collateral in John Hancock Collateral Investment Trust (JHCIT), an affiliate of the Fund, and as a result, the Fund will receive the benefit of any gains and bear any losses generated by JHCIT. Although risk of the loss of the securities lent is mitigated by holding the collateral, the Fund could experience a delay in recovering its securities and a possible loss of income or value if the borrower fails to return the securities or if collateral investments decline in value. The Fund may receive compensation for lending its securities by retaining a portion of the return on the investment of the collateral and compensation from fees earned from borrowers of the securities. Income received from JHCIT is a component of securities lending income as recorded on the Statement of Operations.
Foreign currency translation. Assets, including investments and liabilities denominated in foreign currencies, are translated into U.S. dollar values each day at the prevailing exchange rate. Purchases and sales of securities, income and expenses are translated into U.S. dollars at the prevailing exchange
rate on the date of the transaction. The effect of changes in foreign currency exchange rates on securities is reflected as a component of the realized and unrealized gains (losses) on investments.
Funds that invest internationally generally carry more risk than funds that invest strictly in U.S. securities. Risks can result from differences in economic and political conditions, regulations, market practices (including higher transaction costs) and accounting standards. Foreign investments are also subject to a decline in the value of a foreign currency versus the U.S. dollar, which reduces the dollar value of securities denominated in that currency.
Line of credit. The Fund may borrow from banks for temporary or emergency purposes, including meeting redemption requests that otherwise might require the untimely sale of securities. Pursuant to the custodian agreement, the custodian may loan money to the Fund to make properly authorized payments. The Fund is obligated to repay the custodian for any overdraft, including any related costs or expenses. The custodian has a lien, security interest or security entitlement in any Fund property that is not segregated, to the maximum extent permitted by law for any overdraft.
In addition, effective March 30, 2011, the Fund and other affiliated funds have entered into an agreement with Citibank N.A. which enables them to participate in a $100 million unsecured committed line of credit. Prior to March 30, 2011, the Fund had a similar arrangement with State Street Bank and Trust Company. A commitment fee, payable at the end of each calendar quarter, based on the average daily unused portion of the line of credit, is charged to each participating fund on a pro rata basis and is reflected in other expenses on the Statement of Operations. For the year ended March 31, 2011, the Fund had no borrowings under the line of credit.
Expenses. The majority of expenses are directly attributable to an individual fund. Expenses that are not readily attributable to a specific fund are allocated among all funds in an equitable manner, taking into consideration, among other things, the nature and type of expense and the fund’s relative assets. Expense estimates are accrued in the period to which they relate and adjustments are made when actual amounts are known.
Class allocations. Income, common expenses, and realized and unrealized gains (losses) are determined at the fund level and allocated daily to each class of shares based on the net asset value of the class. Class-specific expenses, such as distribution and service fees, if any, transfer agent fees, state registration fees and printing and postage, for all classes, are calculated daily at the class level based on the appropriate net asset value of each class and the specific expense rates applicable to each class.
Federal income taxes. The Fund intends to continue to qualify as a regulated investment company by complying with the applicable provisions of the Internal Revenue Code and will not be subject to federal income tax on taxable income that is distributed to shareholders. Therefore, no federal income tax provision is required.
As of March 31, 2011, the Fund had no uncertain tax positions that would require financial statement recognition, de-recognition or disclosure. The Fund’s federal tax return is subject to examination by the Internal Revenue Service for a period of three years.
Distribution of income and gains. Distributions to shareholders from net investment income and net realized gains, if any, are recorded on the ex-date. The Fund generally declares and pays dividends and capital gain distributions, if any, annually. The tax character of distributions for the years ended March 31, 2011 and March 31, 2010 was as follows:
| | |
| | March 31, 2011 | March 31, 2010 |
|
| Ordinary Income | $224,463 | $221,338 |
|
| Long -Term Capital Gain | $209,266 | — |
|
Distributions paid by the Fund with respect to each class of shares are calculated in the same manner, at the same time and in the same amount, except for the effect of expenses that may be applied
differently to each class. As of March 31, 2011, the components of distributable earnings on a tax basis included $305,923 of undistributed ordinary income and $270,009 of undistributed long-term capital gains.
Such distributions and distributable earnings, on a tax basis, are determined in conformity with income tax regulations, which may differ from accounting principles generally accepted in the United States of America. Material distributions in excess of tax basis earnings and profits, if any, are reported in the Fund’s financial statements as a return of capital.
Capital accounts within financial statements are adjusted for permanent book-tax differences. These adjustments have no impact on net assets or the results of operations. Temporary book-tax differences, if any, will reverse in a subsequent period. Book-tax differences are primarily attributable to passive foreign investment companies and wash sale loss deferrals.
Note 3 — Derivative instruments
The Fund may invest in derivatives in order to meet its investment objectives. The use of derivatives may involve risks different from, or potentially greater than, the risks associated with investing directly in securities. Specifically, derivatives expose the Fund to the risk that the counterparty to an over-the-counter (OTC) derivatives contract will be unable or unwilling to make timely settlement payments or otherwise honor its obligations. OTC derivatives transactions typically can only be closed out with the other party to the transaction. If the counterparty defaults, the Fund will have contractual remedies, but there is no assurance that the counterparty will meet its contractual obligations or that the Fund will succeed in enforcing them.
Options. There are two types of options, a put option and a call option. Options are traded either over-the-counter or on an exchange. A call option gives the purchaser of the option the right to buy (and the seller the obligation to sell) the underlying instrument at the exercise price. A put option gives the purchaser of the option the right to sell (and the writer the obligation to buy) the underlying instrument at the exercise price. Writing puts and buying calls may increase the Fund’s exposure to changes in the value of the underlying instrument. Buying puts and writing calls may decrease the Fund’s exposure to such changes. Risks related to the use of options include the loss of the premium, possible illiquidity of the options markets, trading restrictions imposed by an exchange and movements in underlying security values, and for written options, potential losses in excess of the amounts recognized on the Statement of Assets and Liabilities.
Options listed on an exchange are valued at their closing price. If no closing price is available, then they are valued at the mean between the last bid and ask prices from the exchange on which they are principally traded. For options not listed on an exchange, an independent pricing source is used to value the options at the mean between the last bid and ask prices. When the Fund purchases an option, the premium paid by the Fund is included in the Portfolio of Investments and subsequently “marked-to-market” to reflect current market value. If the purchased option expires, the Fund realizes a loss equal to the cost of the option. If the Fund exercises a call option, the cost of the securities acquired by exercising the call is increased by the premium paid to buy the call. If the Fund exercises a put option, it realizes a gain or loss from the sale of the underlying security and the proceeds from such sale are decreased by the premium paid. If the Fund enters into a closing sale transaction, the Fund realizes a gain or loss, depending on whether proceeds from the closing sale are greater or less than the original cost. When the Fund writes an option, the premium received is included as a liability and subsequently “marked-to-market” to reflect current market value of the option written. Premiums received from writing options that expire unexercised are recorded as realized gains. Premiums received from writing options which are exercised or are closed are added to or offset against the proceeds or amount paid on the transaction to determine the realized gain or loss. If a put option on a security is exercised, the premium received reduces the cost basis of the securities purchased by the Fund.
During the year ended March 31, 2011, the Fund wrote option contracts to manage against anticipated currency exchange rates. The following table summarizes the Fund’s written options activities during the year ended March 31, 2011 and there were no open written option contracts as of March 31, 2011.
| | | | |
| | | PREMIUMS | | |
| | NUMBER OF | RECEIVED | | |
| | CONTRACTS | (PAID) | | |
| | |
| Outstanding, beginning of year | 2 | $414 | | |
| Options written | 12 | 2,432 | | |
| Options closed | (12) | (2,432) | | |
| Options expired | (2) | (414) | | |
| Outstanding, end of year | - | - | | |
Effect of derivative instruments on the Statement of Operations
The table below summarizes the net realized gain (loss) included in the net increase (decrease) in net assets from operations, classified by derivative instrument and risk category, for the year ended March 31, 2011:
| | | | |
| | | Investments | Written | |
| | Statement of Operations | (Purchased | Options | |
| Risk | Location | Options) | Contracts | Total |
|
| Equity contracts | Net realized gain (loss) | ($1,186) | $1969 | $783 |
|
| Total | | ($1,186) | $1,969 | $783 |
The table below summarizes the net change in unrealized appreciation (depreciation) included in the net increase (decrease) in net assets from operations, classified by derivative instrument and risk category, for the year ended March 31, 2011:
| | | | |
| | | Written | | |
| | Statement of Operations | Options | | |
| Risk | Location | Contracts | | |
| | |
| | Change in unrealized | | | |
| | appreciation | | | |
| Equity contracts | (depreciation) | ($144) | | |
| | |
| Total | | ($144) | | |
Note 4 — Guarantees and indemnifications
Under the Fund’s organizational documents, its Officers and Trustees are indemnified against certain liabilities arising out of the performance of their duties to the Fund. Additionally, in the normal course of business, the Fund enters into contracts with service providers that contain general indemnification clauses. The Fund’s maximum exposure under these arrangements is unknown, as this would involve future claims that may be made against the Fund that have not yet occurred. The risk of material loss from such claims is considered remote.
Note 5 — Fees and transactions with affiliates
John Hancock Investment Management Services, LLC (the Adviser) serves as investment adviser for the Trust. John Hancock Funds, LLC (the Distributor), an affiliate of the Adviser, serves as principal underwriter of the Trust. The Adviser and the Distributor are indirect wholly owned subsidiaries of Manulife Financial Corporation (MFC).
Management fee. The Fund has an investment management contract with the Adviser under which the Fund pays a daily management fee to the Adviser equivalent, on an annual basis, to the sum of: (a) 0.90% of the first $1,000,000,000 of the Fund’s average daily net assets; and (b) 0.85% of the Fund’s average daily net assets in excess of $1,000,000,000. The Adviser has a subadvisory agreement with John Hancock Asset Management a division of Manulife Asset Management (US) LLC (formerly, MFC Global Investment Management (U.S.), LLC), an indirectly owned subsidiary of MFC and an affiliate of the Adviser. The Fund is not responsible for payment of the subadvisory fees.
The investment management fees incurred for the year ended March 31, 2011 were equivalent to an annual effective rate of 0.90% of the Fund’s average daily net assets.
Effective October 19, 2010, the Adviser voluntarily agreed to waive fees and/or reimburse certain fund level expenses to 0.27% of the Fund’s average net assets which are allocated pro rata to all share classes of the Fund. For the period between April 1, 2010 and October 18, 2010, the Adviser voluntarily agreed to waive fees and/or reimburse certain fund level expenses to 0.19% of the Fund’s average net assets which are allocated pro rata to all share classes of the Fund. This agreement excludes brokerage commissions, interest, advisory fees, distribution and service fees, transfer agent fees, state registration fees, printing and postage, litigation and indemnification expenses and other extraordinary expenses not incurred in the ordinary course of the Fund’s business.
The Adviser has contractually agreed to waive fees and/or reimburse certain expenses for each share class of the Fund. This agreement excludes taxes, brokerage commissions, interest, litigation and indemnification expenses and other extraordinary expenses not incurred in the ordinary course of the Fund’s business. The fee waivers and/or reimbursements are such that these expenses will not exceed 1.65% for Class A, 2.35% for Class B, 2.35% for Class C and 1.19% for Class I shares. The fee waivers and/or reimbursements will continue in effect until July 31, 2011. Prior to July 1, 2010, the fee waivers and/or reimbursements were such that these expenses would not exceed 1.65% for Class A, 2.35% for Class B, 2.35% for Class C and 1.10% for Class I shares.
Accordingly, the expense reductions or reimbursements related to these agreements were $17,941, $17,719, $17,719 and $18,166 for Class A, Class B, Class C and Class I shares, respectively, for the year ended March 31, 2011.
Accounting and legal services. Pursuant to a service agreement, the Fund reimburses the Adviser for all expenses associated with providing the administrative, financial, legal, accounting and recordkeeping services of the Fund, including the preparation of all tax returns, periodic reports to shareholders and regulatory reports, among other services. These expenses are allocated to each share class based on its relative net assets at the time the expense was incurred. These accounting and legal services fees incurred for the year ended March 31, 2011, amounted to an annual rate of 0.01% of the Fund’s average daily net assets.
Distribution and service plans. The Fund has a distribution agreement with the Distributor. The Fund has adopted distribution and service plans with respect to Class A, Class B and Class C shares pursuant to Rule 12b-1 under the 1940 Act, to pay the Distributor for services provided as the distributor of shares of the Fund. The Fund may pay up to the following contractual rates of distribution and service fees under these arrangements, expressed as an annual percentage of average daily net assets for each class of the Fund’s shares.
| | | | |
| Class | 12b-1 Fee | | | |
| | | |
| Class A | 0.30% | | | |
| | | |
| Class B | 1.00% | | | |
| | | |
| Class C | 1.00% | | | |
| | | |
Sales charges. Class A shares are assessed up-front sales charges. For the year ended March 31, 2011, there were no up-front sales charges received by the Distributor with regard to sales of Class A shares.
Class B and Class C shares are subject to contingent deferred sales charges (CDSC). Class B shares that are redeemed within six years of purchase are subject to CDSC, at declining rates, beginning at 5.00% of the lesser of the current market value at the time of redemption or the original purchase cost of the shares being redeemed. Class C shares that are redeemed within one year of purchase are subject to a 1.00% CDSC on the lesser of the current market value at the time of redemption or the original purchase cost of the shares being redeemed. Proceeds from CDSCs are used to compensate the Distributor for providing distribution-related services in connection with the sale of these shares. During the year ended March 31, 2011, there were no CDSCs received by the Distributor for Class B or Class C shares.
Transfer agent fees. The Fund has a transfer agent agreement with John Hancock Signature Services, Inc. (Signature Services or Transfer Agent), an affiliate of the Adviser. The transfer agent fees paid to Signature Services are determined based on the cost to Signature Services (Signature Services Cost) of providing recordkeeping services. The Signature Services Cost includes a component of allocated John Hancock corporate overhead for providing transfer agent services to the Fund and to all other John Hancock affiliated funds. It also includes out-of-pocket expenses that are comprised of payments made to third-parties for recordkeeping services provided to their clients who invest in one or more John Hancock funds. In addition, Signature Services Cost may be reduced by certain revenues that Signature Services receives in connection with the service it provides to the funds. Signature Services Cost is calculated monthly and allocated, as applicable, to four categories of share classes: Institutional Share Classes, Retirement Share Classes, Municipal Bond Classes and all other Retail Share Classes. Within each of these categories, the applicable costs are allocated to the affected John Hancock affiliated funds and/or classes, based on the relative average daily net assets.
Prior to July 1, 2010, the transfer agent fees were made up of three components:
• The Fund paid a monthly transfer agent fee at an annual rate of 0.05% for Class A, Class B and Class C shares and 0.04% for Class I shares, based on each class’s average daily net assets.
• The Fund paid a monthly fee based on an annual rate of $16.50 per shareholder account for all share classes.
• In addition, Signature Services was reimbursed for certain out-of-pocket expenses.
Class level expenses. Class level expenses for the year ended March 31, 2011 were:
| | | |
| Class | Distribution and | Transfer agent fees | State registration |
| | service fees | | fees |
|
| Class A | $2,537 | $1,268 | $62 |
|
| Class B | 8,351 | 1,252 | 56 |
|
| Class C | 8,351 | 1,252 | 46 |
|
| Class I | — | 381 | 57 |
|
| Total | $19,239 | $4,153 | $221 |
|
Trustee expenses. The Trust compensates each Trustee who is not an employee of the Adviser or its affiliates. These Trustees may, for tax purposes, elect to defer receipt of this compensation under the John Hancock Group of Funds Deferred Compensation Plan (the Plan). Deferred amounts are invested in various John Hancock funds and remain in the funds until distributed in accordance with the Plan. The investment of deferred amounts and the offsetting liability are included within Other receivables and prepaid expenses and Payable to affiliates - Trustees' fees, respectively, in the accompanying Statement of Assets and Liabilities.
Note 6 — Fund share transactions
Transactions in Fund shares for the year ended March 31, 2011 and for the year ended March 31, 2010
were as follows:
| | | | | | | |
| | Year ended | | Year ended |
| | 3-31-11 | | 3-31-10 |
| |
| |
|
| | Shares | | Amount | | Shares | | Amount |
| Class A shares | | | | | | | |
| Distributions reinvested | 7,172 | $ | 109,883 | | 4,157 | $ | 55,334 |
| |
| |
| |
| |
|
| Net increase | 7,172 | $ | 109,883 | | 4,157 | $ | 55,334 |
| |
| |
| |
| |
|
| Class B shares | | | | | | | |
| Distributions reinvested | 6,975 | $ | 105,671 | | 4,186 | $ | 55,334 |
| |
| |
| |
| |
|
| Net increase | 6,975 | $ | 105,671 | | 4,186 | $ | 55,334 |
| |
| |
| |
| |
|
| Class C shares | | | | | | | |
| Distributions reinvested | 6,975 | $ | 105,671 | | 4,186 | $ | 55,335 |
| |
| |
| |
| |
|
| Net increase | 6,975 | $ | 105,671 | | 4,186 | $ | 55,335 |
| |
| |
| |
| |
|
| Class I shares | | | | | | | |
| Distributions reinvested | 7,305 | $ | 112,504 | | 4,139 | $ | 55,335 |
| |
| |
| |
| |
|
| Net increase | 7,305 | $ | 112,504 | | 4,139 | $ | 55,335 |
| |
| |
| |
| |
|
| Net increase | 28,427 | $ | 433,729 | | 16,668 | $ | 221,338 |
|
| |
| |
| |
|
| | |
Affiliates of the Fund owned 100% of shares of beneficial interest of the Fund on March 31, 2011.
Note 7 — Purchase and sale of securities
Purchases and sales of securities, other than short-term securities, aggregated $3,463,734 and $3,669,656, respectively, for the year ended March 31, 2011.
To the Board of Trustees of John Hancock Funds III and Shareholders of John Hancock Small Cap Opportunities Fund:
In our opinion, the accompanying statement of assets and liabilities, including the portfolio of investments, and the related statements of operations and of changes in net assets and the financial highlights present fairly, in all material respects, the financial position of John Hancock Small Cap Opportunities Fund (the “Fund”) at March 31, 2011, and the results of its operations, the changes in its net assets and the financial highlights for each of the periods indicated, in conformity with accounting principles generally accepted in the United States of America. These financial statements and financial highlights (hereafter referred to as “financial statements”) are the responsibility of the Fund’s management; our responsibility is to express an opinion on these financial statements based on our audits. We conducted our audits of these financial statements in accordance with the standards of the Public Company Accounting Oversight Board (United States). Those standards require that we plan and perform the audit to obtain reasonable assurance about whether the financial statements are free of material misstatement. An audit includes examining, on a test basis, evidence supporting the amounts and disclosures in the financial statements, assessing the accounting principles used and significant estimates made by management, and evaluating the overall financial statement presentation. We believe that our audits, which included confirmation of securities at March 31, 2011 by correspondence with the custodian and brokers, and the application of alternative auditing procedures where securities purchased confirmations had not been received, provide a reasonable basis for our opinion.
PricewaterhouseCoopers LLP
Boston, Massachusetts
May 20, 2011
Tax information
Unaudited
For federal income tax purposes, the following information is furnished with respect to the distributions of the Fund, if any, paid during its taxable year ended March 31, 2011.
The Fund has designated distributions to shareholders of $209,266 as a long-term capital gain dividend.
The Fund designates the maximum amount allowable for the corporate dividends received deduction for the fiscal year ended March 31, 2011.
The Fund designates the maximum amount allowable of its net taxable income as qualified dividend income as provided in the Jobs and Growth Tax Relief Reconciliation Act of 2003. This amount will be reflected on Form 1099-DIV for the calendar year 2011.
Shareholders will be mailed a 2011 Form 1099-DIV in January 2012. This will reflect the total of all distributions for calendar year 2011.
Trustees and Officers
This chart provides information about the Trustees and Officers who oversee your John Hancock fund. Officers elected by the Trustees manage the day-to-day operations of the Fund and execute policies formulated by the Trustees.
Independent Trustees
| | | | | |
| Name | Year of | Position(s) held with Fund | Trustee | Number |
| | Birth | Principal occupation(s) and other | of the | of John |
| | | Directorships during the past 5 years | Trust | Hancock |
| | | | since(1) | funds |
| | | | | overseen |
| | | | | by |
| | | | | Trustee |
|
| Steven R. | 1944 | Chairperson (since January 2011); Chairman | 2006 | 46 |
| Pruchansky | | and Chief Executive Officer, Greenscapes of | | |
| | | Southwest Florida, Inc. (since 2000); Director | | |
| | and President, Greenscapes of Southwest | | |
| | | Florida, Inc. (until 2000); Member, Board of | | |
| | | Advisors, First American Bank (since 2008); | | |
| | Managing Director, Jon James, LLC (real | | |
| | | estate) (since 2000); Director, First Signature | | |
| | | Bank & Trust Company (until 1991); | | |
| | Director, Mast Realty Trust (until 1994); | | |
| President, Maxwell Building Corp. (until | | |
| | | 1991). | | |
|
| |
| James F. | 1940 | Chief Executive Officer, Director and Treasurer, | 2006 | 46 |
| Carlin | | Alpha Analytical Laboratories (environmental, | | |
| chemical and pharmaceutical analysis) (since | | |
| 1985); Part Owner and Treasurer, Lawrence | | |
| Carlin Insurance Agency, Inc. (since 1995); | | |
| | | Chairman and Chief Executive Officer, CIMCO, | | |
| | | LLC (management/investments) (since 1987). | | |
|
| | | | |
| Name | Year of | Position(s) held with Fund | Trustee | Number |
| | Birth | Principal occupation(s) and other | of the | of John |
| | | Directorships during the past 5 years | Trust | Hancock |
| | | | since(1) | funds |
| | | | | overseen |
| | | | | by |
| | | | | Trustee |
|
| William H. | 1944 | Professor, University of Texas, Austin, Texas | 2006 | 46 |
| Cunningham | | (since 1971); former Chancellor, University | | |
| | | of Texas System and former President of the | | |
| | | University of Texas, Austin, Texas; Director | | |
| of the following: LIN Television (since | | |
| | | 2009); Lincoln National Corporation | | |
| (insurance) (Chairman since 2009 and | | |
| Director since 2006); Resolute Energy | | |
| Corporation (since 2009); Nanomedical | | |
| Systems, Inc. (biotechnology company) | | |
| | | (Chairman since 2008); Yorktown | | |
| | | Technologies, LP (tropical fish) (Chairman | | |
| | | since 2007); Greater Austin Crime | | |
| | | Commission (since 2001); Southwest | | |
| | | Airlines (since 2000); former Director of the | | |
| | | following: Introgen (manufacturer of | | |
| biopharmaceuticals) (until 2008); Hicks | | |
| Acquisition Company I, Inc. (until 2007); | | |
| | | Jefferson-Pilot Corporation (diversified life | | |
| | | insurance company) (until 2006); and former | | |
| | | Advisory Director, JP Morgan Chase Bank | | |
| | | (formerly Texas Commerce Bank–Austin) | | |
| | | (until 2009). | | |
|
| |
| Deborah C. | 1952 | Chief Executive Officer, American Red | 2008 | 46 |
| Jackson(2) | | Cross of Massachusetts Bay (since 2002); | | |
| | | Board of Directors of Eastern Bank | | |
| | | Corporation (since 2001); Board of Directors | | |
| | | of Eastern Bank Charitable Foundation (since | | |
| 2001); Board of Directors of American | | |
| Student Assistance Corporation. (1996- | | |
| | | 2009); Board of Directors of Boston Stock | | |
| | | Exchange (2002–2008); Board of Directors | | |
| of Harvard Pilgrim Healthcare (health | | |
| | | benefits company) (since 2007). | | |
|
| | | | |
| Name | Year of | Position(s) held with Fund | Trustee | Number |
| | Birth | Principal occupation(s) and other | of the | of John |
| | | Directorships during the past 5 years | Trust | Hancock |
| | | | since(1) | funds |
| | | | | overseen |
| | | | | by |
| | | | | Trustee |
|
| Charles L. | 1938 | Vice Chairperson (since March 2011); | 2006 | 46 |
| Ladner(2) | | Chairman and Trustee, Dunwoody Village, | | |
| Inc. (retirement services) (since 2008);�� | | |
| | | Director, Philadelphia Archdiocesan | | |
| | | Educational Fund (since 2009); Senior Vice | | |
| | | President and Chief Financial Officer, UGI | | |
| | | Corporation (public utility holding company) | | |
| | | (retired 1998); Vice President and Director | | |
| | | for AmeriGas, Inc. (retired 1998); Director of | | |
| | | AmeriGas Partners, L.P. (gas distribution) | | |
| (until 1997); Director, EnergyNorth, Inc. | | |
| (until 1995); Director, Parks and History | | |
| Association (Cooperating Association, | | |
| | | National Park Service) (until 2005). | | |
|
| |
| Stanley | 1947 | Senior Vice President/Audit Executive, | 2008 | 46 |
| Martin(2) | | Federal Home Loan Mortgage Corporation | | |
| | | (2004–2006); Executive Vice | | |
| President/Consultant, HSBC Bank USA | | |
| | | (2000–2003); Chief Financial | | |
| | | Officer/Executive Vice President, Republic | | |
| | | New York Corporation & Republic National | | |
| Bank of New York (1998–2000); Partner, | | |
| | | KPMG LLP (1971–1998). | | |
|
| |
| Dr. John A. | 1939 | President and Chief Executive Officer, | 2006 | 46 |
| Moore | | Institute for Evaluating Health Risks, | | |
| | | (nonprofit institution) (until 2001); Senior | | |
| Scientist, Sciences International (health | | |
| research) (until 2003); Former Assistant | | |
| Administrator & Deputy Administrator, | | |
| | | Environmental Protection Agency; Principal, | | |
| Hollyhouse (consulting) (since 2000); | | |
| Director, CIIT Center for Health Science | | |
| | | Research (nonprofit research) (until 2007). | | |
|
| | | | |
| Name | Year of | Position(s) held with Fund | Trustee | Number |
| | Birth | Principal occupation(s) and other | of the | of John |
| | | Directorships during the past 5 years | Trust | Hancock |
| | | | since(1) | funds |
| | | | | overseen |
| | | | | by |
| | | | | Trustee |
|
| Patti McGill | 1943 | Principal, PMP Globalinc (consulting) (since | 2006 | 47 |
| Peterson(2) | | 2007); Senior Associate, Institute for Higher | | |
| Education Policy (since 2007); Executive | | |
| Director, CIES (international education | | |
| | | agency) (until 2007); Vice President, Institute | | |
| of International Education (until 2007); | | |
| | | Senior Fellow, Cornell University Institute of | | |
| Public Affairs, Cornell University (1997– | | |
| | | 1998); Former President Wells College, St. | | |
| | | Lawrence University and the Association of | | |
| | | Colleges and Universities of the State of New | | |
| York. Director of the following: Niagara | | |
| Mohawk Power Corporation (until 2003); | | |
| | | Security Mutual Life (insurance) (until 1997); | | |
| ONBANK (until 1993). Trustee of the | | |
| | | following: Board of Visitors, The University | | |
| | | of Wisconsin, Madison (since 2007); Ford | | |
| Foundation, International Fellowships | | |
| | | Program (until 2007); UNCF, International | | |
| | | Development Partnerships (until 2005); Roth | | |
| Endowment (since 2002); Council for | | |
| | | International Educational Exchange (since | | |
| | | 2003). | | |
|
| |
| Gregory A. | 1949 | Vice Chairman, Risk & Regulatory Matters, | 2008 | 46 |
| Russo | | KPMG LLP (“KPMG”) (2002–2006); Vice | | |
| | | Chairman, Industrial Markets, KPMG (1998– | | |
| | | 2002). | | |
|
Non-Independent Trustees(3)
| | | | |
| Name | Year of | Position(s) held with Fund | Trustee | Number |
| | Birth | Principal occupation(s) and other | of the | of John |
| | | Directorships during the past 5 years | Trust | Hancock |
| | | | since(1) | funds |
| | | | | overseen |
| | | | | by |
| | | | | Trustee |
|
| Hugh | 1959 | Executive Vice President, John Hancock | 2010 | 46 |
| McHaffie | | Financial Services (since 2006, including | | |
| | | prior positions); President of John Hancock | | |
| Trust and John Hancock Funds II (since | | |
| | | 2009); Trustee, John Hancock retail funds | | |
| | | (since 2010) Chairman and Director, John | | |
| Hancock Advisers, LLC, John Hancock | | |
| | | Investment Management Services, LLC and | | |
| John Hancock Funds, LLC (since 2010); | | |
| | | Senior Vice President, Individual Business | | |
| | | Product Management, MetLife, Inc. (1999- | | |
| | | 2006). | | |
|
| John G. | 1955 | Senior Vice President, John Hancock | 2009 | 47 |
| Vrysen | | Financial Services (since 2006); Director, | | |
| | | Executive Vice President and Chief | | |
| | | Operating Officer, John Hancock Advisers, | | |
| | | LLC, John Hancock Investment | | |
| Management Services, LLC and John | | |
| | | Hancock Funds, LLC (since 2005); Chief | | |
| | | Operating Officer, John Hancock Funds II | | |
| | | and John Hancock Trust (since 2007); Chief | | |
| Operating Officer, John Hancock retail | | |
| | | funds (until 2009); Trustee, John Hancock | | |
| | | retail funds (since 2009). | | |
|
Principal officers who are not Trustees
| | | |
| Name | Year | Position(s) held with Fund | Officer of the |
| | of | Principal occupation(s) and other | Trust since |
| | Birth | Directorships during the past 5 years | |
|
| Keith F. Hartstein | 1956 | Senior Vice President, John Hancock | 2006 |
| President and Chief | | Financial Services (since 2004); Director, | |
| Executive Officer | | President and Chief Executive Officer, | |
| | | John Hancock Advisers, LLC and John | |
| | | Hancock Funds, LLC (since 2005); | |
| | | Director, John Hancock Asset Management | |
| | | a division of Manulife Asset Management | |
| | | (US) LLC(since 2005); Director, John | |
| | | Hancock Investment Management | |
| | | Services, LLC (since 2006); President and | |
| | | Chief Executive Officer, John Hancock | |
| | | retail funds (since 2005); Member, | |
| | | Investment Company Institute Sales Force | |
| | | Marketing Committee (since 2003). | |
|
| |
| Andrew G. Arnott | 1971 | Senior Vice President, John Hancock | 2009 |
| Senior Vice | | Financial Services (since 2009); Executive | |
| President and Chief | | Vice President, John Hancock Advisers, | |
| Operating Officer | | LLC (since 2005); Executive Vice | |
| | | President, John Hancock Investment | |
| | | Management Services, LLC (since 2006); | |
| | | Executive Vice President, John Hancock | |
| | | Funds, LLC (since 2004); Chief Operating | |
| | | Officer, John Hancock retail funds (since | |
| | | 2009); Senior Vice President, John | |
| | | Hancock retail funds (since 2010) Vice | |
| | | President, John Hancock Funds II and John | |
| | | Hancock Trust (since 2006); Senior Vice | |
| | | President, Product Management and | |
| | | Development, John Hancock Funds, LLC | |
| | | (until 2009). | |
|
| | | |
| Name | Year | Position(s) held with Fund | Officer of the |
| | of | Principal occupation(s) and other | Trust since |
| | Birth | Directorships during the past 5 years | |
|
| Thomas M. Kinzler | 1955 | Vice President, John Hancock Financial | 2006 |
| Secretary and Chief | | Services (since 2006); Secretary and Chief | |
| Legal Officer | | Legal Counsel, John Hancock Advisers, | |
| | | LLC, John Hancock Investment | |
| | | Management Services, LLC and John | |
| | | Hancock Funds, LLC (since 2007); | |
| | | Secretary and Chief Legal Officer, John | |
| | | Hancock retail funds, John Hancock Funds | |
| | | II and John Hancock Trust (since | |
| | | 2006);Vice President and Associate | |
| | | General Counsel, Massachusetts Mutual | |
| | | Life Insurance Company (1999–2006); | |
| | | Secretary and Chief Legal Counsel, MML | |
| | | Series Investment Fund (2000–2006); | |
| | | Secretary and Chief Legal Counsel, | |
| | | MassMutual Select Funds and MassMutual | |
| | Premier Funds (2004–2006). | |
|
| |
| Francis V. Knox, Jr. | 1947 | Vice President, John Hancock Financial | 2006 |
| Chief Compliance | | Services (since 2005); Chief Compliance | |
| Officer | | Officer, John Hancock retail funds, John | |
| | | Hancock Funds II, John Hancock Trust, | |
| | | John Hancock Advisers, LLC and John | |
| | | Hancock Investment Management | |
| | | Services, LLC (since 2005); Vice President | |
| | | and Chief Compliance Officer, John | |
| | | Hancock Asset Management a division of | |
| | | Manulife Asset Management (US) | |
| | | LLC(2005–2008). | |
|
| |
| Charles A. Rizzo | 1957 | Vice President, John Hancock Financial | 2007 |
| Chief Financial | | Services (since 2008); Senior Vice | |
| Officer | | President, John Hancock Advisers, LLC | |
| | | and John Hancock Investment Management | |
| | | Services, LLC (since 2008); Chief | |
| | | Financial Officer, John Hancock retail | |
| | | funds, John Hancock Funds II and John | |
| | | Hancock Trust (since 2007);Assistant | |
| | | Treasurer, Goldman Sachs Mutual Fund | |
| | | Complex (2005–2007); Vice President, | |
| Goldman Sachs (2005–2007). | |
| | | |
| Name | Year | Position(s) held with Fund | Officer of the |
| | of | Principal occupation(s) and other | Trust since |
| | Birth | Directorships during the past 5 years | |
|
| Salvatore | 1965 | Assistant Vice President, John Hancock | 2010 |
| Schiavone | | Financial Services (since 2007); Vice | |
| Treasurer | | President, John Hancock Advisers, LLC | |
| | | and John Hancock Investment Management | |
| | | Services, LLC (since 2007); Treasurer, | |
| | | John Hancock retail funds (since 2010); | |
| | | Treasurer, John Hancock Closed-End | |
| | | Funds (2009-2010);Assistant Treasurer, | |
| | | John Hancock Funds II and John Hancock | |
| | | Trust (since 2007); Assistant Treasurer, | |
| | | John Hancock retail funds, John Hancock | |
| | | Funds II and John Hancock Trust (2007- | |
| | | 2009); Assistant Treasurer, Fidelity Group | |
| | | of Funds (2005–2007); Vice President, | |
| | | Fidelity Management Research Company | |
| | | (2005–2007). | |
|
The business address for all Trustees and Officers is 601 Congress Street, Boston, Massachusetts 02210-2805.
The Statement of Additional Information of the Fund includes additional information about members of the Board of Trustees of the Fund and is available without charge, upon request, by calling 1-800-225-5291.
1Each Trustee serves until resignation, retirement age or until his or her successor is elected.
2Member of Audit Committee.
3Because Messrs. McHaffie and Vrysen are senior executives or directors with the Adviser and/or its affiliates, each of them is considered an “interested person,” as defined in the Investment Company Act of 1040, of the Fund.
More information
| |
| Trustees | Investment adviser |
| Steven R. Pruchansky, Chairperson | John Hancock Investment Management Services, LLC |
| James F. Carlin | |
| William H. Cunningham | Subadviser |
| Deborah C. Jackson* | John Hancock Asset Management |
| Charles L. Ladner | |
| Stanley Martin, Vice Chairperson * | Principal distributor |
| Hugh McHaffie† | John Hancock Funds, LLC |
| Dr. John A. Moore | |
| Patti McGill Peterson* | Custodian |
| Gregory A. Russo | State Street Bank and Trust Company |
| John G. Vrysen† | |
| | Transfer agent |
| Officers | John Hancock Signature Services, Inc. |
| Keith F. Hartstein | |
| President and Chief Executive Officer | Legal counsel |
| Andrew G. Arnott | K&L Gates LLP |
| Senior Vice President and Chief Operating Officer | |
| Thomas M. Kinzler | Independent registered public accounting firm |
| Secretary and Chief Legal Officer | PricewaterhouseCoopers LLP |
| Francis V. Knox, Jr. | |
| Chief Compliance Officer | |
| Charles A. Rizzo | |
| Chief Financial Officer | |
| Salvatore Schiavone | |
| Treasurer | |
| |
| *Member of the Audit Committee | |
| †Non-Independent Trustee | |
The Fund’s proxy voting policies and procedures, as well as the Fund’s proxy voting record, if any, for the most recent twelve-month period ended June 30, are available free of charge on the Securities and Exchange Commission (SEC) Web site at www.sec.gov or on our Web site.
The Fund’s complete list of portfolio holdings, for the first and third fiscal quarters, is filed with the SEC on Form N-Q. The Fund’s Form N-Q is available on our Web site and the SEC’s Web site, www.sec.gov, and can be reviewed and copied (for a fee) at the SEC’s Public Reference Room in Washington, DC. Call 1-800-SEC-0330 to receive information on the operation of the SEC's Public Reference Room.
We make this information on your fund, as well as monthly portfolio holdings, and other fund details available on our Web site www.jhfunds.com or by calling 1-800-225-5291.
| | |
| You can also contact us: | | |
| 1-800-225-5291 | Regular mail: | Express mail: |
| www. jhfunds.com | John Hancock Signature Services, Inc. | John Hancock Signature Services, Inc. |
| | P.O. Box 55913 | Mutual Fund Image Operations |
| | Boston, MA 02205-5913 | 30 Dan Road |
| | | Canton, MA 02021 |

A look at performance
Total returns for the period ended March 31, 2011
| | | | | | | | | |
| | Average annual total returns (%) | | | Cumulative total returns (%) | |
| | with maximum sales charge (POP) | | | with maximum sales charge (POP) | |
|
| | | | | Since | | | | | Since |
| | 1-year | 5-year | 10-year | inception | | 1-year | 5-year | 10-year | inception |
|
| Class A1 | 7.54 | 2.44 | 4.86 | — | | 7.54 | 12.80 | 60.73 | — |
|
| Class B1 | 7.28 | 2.14 | 4.34 | — | | 7.28 | 11.15 | 52.95 | — |
|
| Class C1 | 11.28 | 2.48 | 4.34 | — | | 11.28 | 13.04 | 52.95 | — |
|
| Class i1,2 | 13.66 | 3.86 | 5.79 | — | | 13.66 | 20.87 | 75.59 | — |
|
| Class i21,2 | 13.65 | 3.72 | 5.57 | — | | 13.65 | 20.05 | 71.98 | — |
|
| Class R11,2 | 12.80 | 3.12 | 5.02 | — | | 12.80 | 16.62 | 63.24 | — |
|
| Class R31,2 | 12.93 | 3.23 | 5.13 | — | | 12.93 | 17.22 | 64.90 | — |
|
| Class R41,2 | 13.25 | 3.53 | 5.44 | — | | 13.25 | 18.97 | 69.87 | — |
|
| Class R51,2 | 13.61 | 3.85 | 5.76 | — | | 13.61 | 20.79 | 75.08 | — |
|
| Class AdV 1,2 | 13.42 | 3.39 | 5.19 | — | | 13.42 | 18.12 | 65.91 | — |
|
| Class NAV 2 | 13.71 | — | — | 24.623 | | 13.71 | — | — | 49.973 |
|
Performance figures assume all distributions are reinvested. Public offering price (POP) figures reflect maximum sales charge on Class A shares of 5%, and the applicable contingent deferred sales charge (CDSC) on Class B and Class C shares. The Class B shares’ CDSC declines annually between years 1 to 6 according to the following schedule: 5, 4, 3, 3, 2, 1%. No sales charge will be assessed after the sixth year. Class C shares held for less than one year are subject to a 1% CDSC. Sales charges are not applicable for Class I, I2, R1, R3, R4, R5, ADV and NAV shares.
The expense ratios of the Fund, both net (including any fee waivers or expense limitations) and gross (excluding any fee waivers or expense limitations), are set forth according to the most recent publicly available prospectuses for the Fund and may differ from those disclosed in the Financial Highlights tables in this report. The fee waivers and expense limitations are contractual at least until 6-30-11 for classes A, B, C, I2 and ADV and 7-31-11 for classes R1, R3, R4 and R5. Had the fee waivers and expense limitations not been in place gross expenses would apply. For Classes I and NAV the net expenses equal the gross expenses. The expense ratios are as follows:
| | | | | | | | | | | |
| | Class A | Class B | Class C | Class I | Class I2 | Class R1 | Class R3 | Class R4 | Class R5 | Class ADV | Class NAV |
| Net (%) | 1.30 | 2.05 | 2.05 | 0.88 | 0.85 | 1.64 | 1.54 | 1.24 | 0.94 | 1.00 | 0.83 |
| Gross (%) | 1.33 | 2.41 | 2.17 | 0.88 | 1.14 | 2.61 | 8.21 | 2.55 | 7.75 | 31.96 | 0.83 |
The returns reflect past results and should not be considered indicative of future performance. The return and principal value of an investment will fluctuate so that shares, when redeemed, may be worth more or less than their original cost. Due to market volatility, the Fund’s current performance may be higher or lower than the performance shown. For performance data current to the most recent month end, please call 1–800–225–5291 or visit the Fund’s Web site at www.jhfunds.com.
The performance table above and the chart on the next page do not reflect the deduction of taxes that a shareholder would pay on fund distributions or the redemption of fund shares. The Fund’s performance results reflect any applicable expense reductions, without which the expenses would increase and results would have been less favorable.
| |
| 6 | Disciplined Value Fund | Annual report |
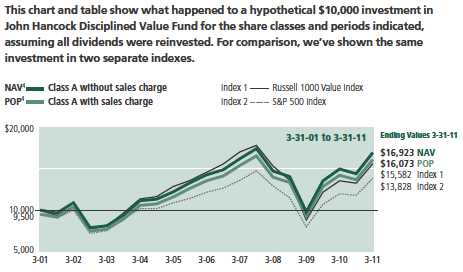
| | | | | | | | | | |
| | Class B1,5 | Class C1,5 | Class I1,2 | Class I21,2 | Class R11,2 | Class R31,2 | Class R41,2 | Class R51,2 | Class ADV1,2 | Class NAV2,3 |
|
| Began | 3-31-01 | 3-31-01 | 3-31-01 | 3-31-01 | 3-31-01 | 3-31-01 | 3-31-01 | 3-31-01 | 3-31-01 | 5-29-09 |
|
| NAV | $15,295 | $15,295 | $17,559 | $17,198 | $16,324 | $16,490 | $16,987 | $17,508 | $16,591 | $14,997 |
|
| POP | $15,295 | $15,295 | $17,559 | $17,198 | $16,324 | $16,490 | $16,987 | $17,508 | $16,591 | $14,997 |
|
| Index 1 | $15,582 | $15,582 | $15,582 | $15,582 | $15,582 | $15,582 | $15,582 | $15,582 | $15,582 | $15,232 |
|
| Index 2 | $13,828 | $13,828 | $13,828 | $13,828 | $13,828 | $13,828 | $13,828 | $13,828 | $13,828 | $15,173 |
|
Russell 1000 V alue index is an unmanaged index containing those securities in the Russell 1000 Index with a lower price-to-book ratio and less-than-average growth orientation.
S&P 500 index is an unmanaged index that includes 500 widely traded common stocks.
It is not possible to invest directly in an index. Index figures do not reflect sales charges, which would have resulted in lower values if they did.
1 On 12-19-08, through a reorganization, the Fund acquired all of the assets of the Robeco Boston Partners Large Cap Value Fund (the predecessor fund). On that date, the predecessor fund offered its Investor share class in exchange for Class A shares (inception 12-22-08) and its institutional class in exchange for Class I. Class B, Class C and Class ADV shares were first offered on 12-22-08; the inception date of Class R3, Class R4 and Class R5 shares is 5-22-09; the inception date of Class NAV shares is 5-29-09; the inception date of Class R1 shares is 7-13-09. The returns prior to these dates are those of Class A shares that have been recalculated to apply the gross fees and expenses of Class B, Class C, Class ADV, Class R3, Class R4, Class R5 and Class R1, respectively. The predecessor fund’s Institutional share class returns have been recalculated to reflect the gross fees and expenses of Class I shares. The inception date of Class I2 shares is 12-22-08; returns prior to that date are those of Class I shares recalculated to apply the gross fees and expenses of Class I2 shares.
2 For certain types of investors, as described in the Fund’s prospectuses.
3 From 5-29-09.
4 NAV represents net asset value and POP represents public offering price. Performance of the classes will vary based on the difference in sales charges paid by shareholders investing in the different classes and the fee structure of those classes.
5 The contingent deferred sales charge, if any, is not applicable.
| |
| Annual report | Disciplined Value Fund | 7 |
Management’s discussion of
Fund performance
By Robeco Investment Management, Inc.
The 12-month period ended March 31, 2011 was marked by a series of catastrophes — starting with the European sovereign debt crisis and the Gulf of Mexico oil spill in April 2010 and culminating in Middle Eastern and African political turmoil and the Japanese earthquake. At the same time, inflation worries and commodity prices were on the rise. Nonetheless, the equity market powered through these challenges, fueled by two significant developments during the reporting period. First, corporate America experienced a very robust earnings recovery that propelled stock valuations, and second, the Federal Reserve’s stimulus measures gave investors the confidence to move back toward riskier assets, including stocks.
For the 12-month period ended March 31, 2011, John Hancock Disciplined Value Fund’s Class A shares had a total return of 13.20% at net asset value. That performance trailed the 14.16% return of the average large-cap value fund, according to Morningstar, Inc., as well as the 15.65% return of the S&P 500 Index and the 15.15% return of the Fund’s benchmark, the Russell 1000 Value Index.
The main source of the Fund’s underperformance was its overweighting in the struggling technology sector — primarily its positions in Microsoft Corp. and Hewlett-Packard Company, which were dogged by concerns about the long-term viability of the desktop computer market in the era of tablet computing. Stock selection in the energy sector was also disappointing. Although the Fund’s energy holdings generally fared well, they did not outperform to the same extent as energy companies whose returns are closely linked to oil prices — a group to which we had limited exposure. The communications sector was another source of underperformance, largely due to the Fund’s underweighting in this strong-performing category.
On the positive side, good stock selection in consumer services was a notable contributor to performance, especially our holdings in Autoliv, Inc., a Swedish maker of automotive safety components, and media companies Viacom, Inc. and CBS Corp. In the finance sector, our stock selection was very favorable, especially Capital One Financial Corp., Discover Financial Services and Berkshire Hathaway, Inc. This upside was tempered, however, by the Fund’s overweighting in the group, as the sector’s return lagged the broad market.
This commentary reflects the views of the portfolio managers through the end of the Fund’s period discussed in this report. The managers’ statements reflect their own opinions. As such, they are in no way guarantees of future events and are not intended to be used as investment advice or a recommendation regarding any specific security. They are also subject to change at any time as market and other conditions warrant.
Past performance is no guarantee of future results.
Sector investing is subject to greater risks than the market as a whole. Because the Fund may focus on particular sectors of the economy, its performance may depend on the performance of those sectors.
| |
| 8 | Disciplined Value Fund | Annual report |
Your expenses
These examples are intended to help you understand your ongoing operating expenses.
Understanding fund expenses
As a shareholder of the Fund, you incur two types of costs:
▪ Transaction costs which include sales charges (loads) on purchases or redemptions (varies by share class), minimum account fee charge, etc.
▪ Ongoing operating expenses including management fees, distribution and service fees (if applicable), and other fund expenses.
We are going to present only your ongoing operating expenses here.
Actual expenses/actual returns
This example is intended to provide information about the Fund’s actual ongoing operating expenses, and is based on the Fund’s actual return. It assumes an account value of $1,000.00 on October 1, 2010 with the same investment held until March 31, 2011.
| | | |
| | Account value | Ending value | Expenses paid during |
| | on 10-1-10 | on 3-31-11 | period ended 3-31-111 |
|
| Class A | $1,000.00 | $1,176.00 | $6.67 |
|
| Class B | 1,000.00 | 1,171.00 | 11.10 |
|
| Class C | 1,000.00 | 1,171.00 | 11.10 |
|
| Class I | 1,000.00 | 1,178.70 | 4.62 |
|
| Class I2 | 1,000.00 | 1,178.60 | 4.62 |
|
| Class R1 | 1,000.00 | 1,173.80 | 8.89 |
|
| Class R3 | 1,000.00 | 1,174.20 | 8.35 |
|
| Class R4 | 1,000.00 | 1,175.40 | 6.73 |
|
| Class R5 | 1,000.00 | 1,178.20 | 5.10 |
|
| Class ADV | 1,000.00 | 1,177.20 | 5.43 |
|
| Class NAV | 1,000.00 | 1,178.20 | 4.24 |
|
Together with the value of your account, you may use this information to estimate the operating expenses that you paid over the period. Simply divide your account value at March 31, 2011, by $1,000.00, then multiply it by the “expenses paid” for your share class from the table above. For example, for an account value of $8,600.00, the operating expenses should be calculated as follows:
| |
| Annual report | Disciplined Value Fund | 9 |
Your expenses
Hypothetical example for comparison purposes
This table allows you to compare the Fund’s ongoing operating expenses with those of any other fund. It provides an example of the Fund’s hypothetical account values and hypothetical expenses based on each class’s actual expense ratio and an assumed 5% annualized return before expenses (which is not the Fund’s actual return). It assumes an account value of $1,000.00 on October 1, 2010, with the same investment held until March 31, 2011. Look in any other fund shareholder report to find its hypothetical example and you will be able to compare these expenses.
| | | |
| | Account value | Ending value | Expenses paid during |
| | on 10-1-10 | on 3-31-11 | period ended 3-31-111 |
|
| Class A | $1,000.00 | $1,018.80 | $6.19 |
|
| Class B | 1,000.00 | 1,014.70 | 10.30 |
|
| Class C | 1,000.00 | 1,014.70 | 10.30 |
|
| Class I | 1,000.00 | 1,020.70 | 4.28 |
|
| Class I2 | 1,000.00 | 1,020.70 | 4.28 |
|
| Class R1 | 1,000.00 | 1,016.80 | 8.25 |
|
| Class R3 | 1,000.00 | 1,017.30 | 7.75 |
|
| Class R4 | 1,000.00 | 1,018.70 | 6.24 |
|
| Class R5 | 1,000.00 | 1,020.20 | 4.73 |
|
| Class ADV | 1,000.00 | 1,019.90 | 5.04 |
|
| Class NAV | 1,000.00 | 1,021.00 | 3.93 |
|
Remember, these examples do not include any transaction costs, therefore, these examples will not help you to determine the relative total costs of owning different funds. If transaction costs were included, your expenses would have been higher. See the prospectus for details regarding transaction costs.
1 Expenses are equal to the Fund’s annualized expense ratio of 1.23%, 2.05%, 2.05%, 0.85%, 0.85%, 1.64%, 1.54%, 1.24%, 0.94%, 1.00% and 0.78% for Class A, Class B, Class C, Class I, Class I2, Class R1, Class R3, Class R4, Class R5, Class ADV and Class NAV shares, respectively, multiplied by the average account value over the period, multiplied by 182/365 (to reflect the one-half year period).
| |
| 10 | Disciplined Value Fund | Annual report |
Portfolio summary
| | | | |
| Top 10 Holdings (29.5% of Net Assets on 3-31-11)1 | | | |
|
| JPMorgan Chase & Company | 4.4% | | Occidental Petroleum Corp. | 3.1% |
| |
|
| Chevron Corp. | 3.7% | | Microsoft Corp. | 2.3% |
| |
|
| Wells Fargo & Company | 3.2% | | Bank of America Corp. | 2.3% |
| |
|
| Berkshire Hathaway, Inc., Class B | 3.2% | | Viacom, Inc., Class B | 2.2% |
| |
|
| Pfizer, Inc. | 3.2% | | SLM Corp. | 1.9% |
| |
|
| |
| Sector Composition2,3 | | | | |
|
| Financials | 27% | | Consumer Staples | 4% |
| |
|
| Information Technology | 15% | | Materials | 2% |
| |
|
| Consumer Discretionary | 14% | | Telecommunication Services | 1% |
| |
|
| Energy | 12% | | Utilities | 1% |
| |
|
| Health Care | 12% | | Short-Term Investments & Other | 3% |
| |
|
| Industrials | 9% | | | |
| | | |
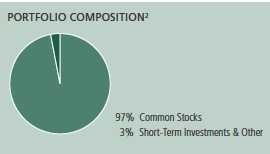
1 Cash and cash equivalents are not included in Top 10 Holdings.
2 As a percentage of net assets on 3-31-11.
3 Sector investing is subject to greater risks than the market as a whole. Because the Fund may focus on particular sectors of the economy, its performance may depend on the performance of those sectors.
| |
| Annual report | Disciplined Value Fund | 11 |
Fund’s investments
As of 3-31-11
| | |
| | Shares | Value |
| Common Stocks 97.01% | $1,440,038,943 |
|
| (Cost $1,213,844,958) | | |
| | | |
| Consumer Discretionary 14.55% | | 216,035,933 |
| | | |
| Auto Components 1.54% | | |
|
| Autoliv, Inc. (L) | 181,130 | 13,445,276 |
|
| Visteon Corp. (I)(L) | 150,194 | 9,385,623 |
| | | |
| Media 7.84% | | |
|
| CBS Corp., Class B (L) | 780,505 | 19,543,845 |
|
| Cinemark Holdings, Inc. (L) | 384,910 | 7,448,009 |
|
| Comcast Corp., Class A (L) | 653,035 | 16,143,025 |
|
| Liberty Media Corp. — Starz, Series A (I) | 157,937 | 12,255,911 |
|
| Omnicom Group, Inc. | 290,150 | 14,234,759 |
|
| Time Warner, Inc. | 401,375 | 14,329,088 |
|
| Viacom, Inc., Class B | 699,515 | 32,541,438 |
| | | |
| Multiline Retail 1.96% | | |
|
| Kohl’s Corp. | 180,422 | 9,569,583 |
|
| Macy’s, Inc. | 463,675 | 11,248,756 |
|
| Target Corp. | 165,220 | 8,262,652 |
| | | |
| Specialty Retail 3.21% | | |
|
| Guess?, Inc. | 338,095 | 13,304,038 |
|
| Home Depot, Inc. | 201,355 | 7,462,216 |
|
| Lowe’s Companies, Inc. | 294,690 | 7,788,657 |
|
| The Gap, Inc. (L) | 487,465 | 11,045,957 |
|
| Williams-Sonoma, Inc. (L) | 198,200 | 8,027,100 |
| | | |
| Consumer Staples 3.66% | | 54,288,497 |
| | | |
| Beverages 0.64% | | |
|
| Anheuser-Busch InBev NV, ADR (L) | 166,030 | 9,491,935 |
| | | |
| Food & Staples Retailing 1.83% | | |
|
| Wal-Mart Stores, Inc. | 363,535 | 18,921,997 |
|
| Walgreen Company | 205,420 | 8,245,559 |
| | | |
| Tobacco 1.19% | | |
|
| Philip Morris International, Inc. | 268,612 | 17,629,006 |
| | | |
| Energy 11.72% | | 173,947,728 |
| | | |
| Oil, Gas & Consumable Fuels 11.72% | | |
|
| Canadian Natural Resources, Ltd. (L) | 163,035 | 8,058,820 |
|
| Chevron Corp. | 518,045 | 55,653,574 |
|
| EOG Resources, Inc. (L) | 139,630 | 16,547,551 |
| | |
| 12 | Disciplined Value Fund | Annual report | See notes to financial statements |
| | |
| | Shares | Value |
| Oil, Gas & Consumable Fuels (continued) | | |
|
| Exxon Mobil Corp. | 199,644 | $16,796,050 |
|
| Noble Energy, Inc. | 74,595 | 7,209,607 |
|
| Occidental Petroleum Corp. | 436,330 | 45,592,122 |
|
| PetroBakken Energy, Ltd., Class A | 238,920 | 4,539,480 |
|
| Royal Dutch Shell PLC, ADR (L) | 268,330 | 19,550,524 |
| | | |
| Financials 27.10% | | 402,278,891 |
| | | |
| Capital Markets 1.32% | | |
|
| Morgan Stanley | 449,245 | 12,273,373 |
|
| Raymond James Financial, Inc. (L) | 191,540 | 7,324,490 |
| | | |
| Commercial Banks 6.58% | | |
|
| Barclays PLC, SADR (L) | 639,395 | 11,598,625 |
|
| PNC Financial Services Group, Inc. | 194,035 | 12,222,265 |
|
| U.S. Bancorp | 987,335 | 26,095,264 |
|
| Wells Fargo & Company | 1,505,835 | 47,734,970 |
| | | |
| Consumer Finance 5.67% | | |
|
| American Express Company | 412,356 | 18,638,491 |
|
| Capital One Financial Corp. (L) | 272,100 | 14,138,316 |
|
| Discover Financial Services | 967,315 | 23,331,638 |
|
| SLM Corp. (I) | 1,832,285 | 28,033,961 |
| | | |
| Diversified Financial Services 6.68% | | |
|
| Bank of America Corp. | 2,531,280 | 33,741,962 |
|
| JPMorgan Chase & Company | 1,420,180 | 65,470,298 |
| | | |
| Insurance 6.85% | | |
|
| ACE, Ltd. | 156,039 | 10,095,723 |
|
| Berkshire Hathaway, Inc., Class B (I) | 565,539 | 47,296,027 |
|
| MetLife, Inc. | 328,013 | 14,672,021 |
|
| Reinsurance Group of America, Inc. | 132,055 | 8,290,413 |
|
| The Travelers Companies, Inc. | 173,304 | 10,308,122 |
|
| Validus Holdings, Ltd. | 330,421 | 11,012,932 |
| | | |
| Health Care 11.67% | | 173,238,503 |
| | | |
| Biotechnology 1.12% | | |
|
| Amgen, Inc. (I) | 310,675 | 16,605,579 |
| | | |
| Health Care Equipment & Supplies 0.52% | | |
|
| Covidien PLC | 148,570 | 7,716,726 |
| | | |
| Health Care Providers & Services 5.06% | | |
|
| DaVita, Inc. (I) | 116,160 | 9,932,842 |
|
| Humana, Inc. (I) | 377,385 | 26,394,307 |
|
| Lincare Holdings, Inc. (L) | 248,330 | 7,365,468 |
|
| McKesson Corp. | 267,085 | 21,113,069 |
|
| Omnicare, Inc. (L) | 343,600 | 10,304,564 |
| | | |
| Pharmaceuticals 4.97% | | |
|
| Johnson & Johnson | 450,896 | 26,715,588 |
|
| Pfizer, Inc. | 2,318,580 | 47,090,360 |
| | |
| See notes to financial statements | Annual report | Disciplined Value Fund | 13 |
| | |
| | Shares | Value |
| Industrials 9.16% | | $135,936,807 |
| | | |
| Aerospace & Defense 4.22% | | |
|
| Honeywell International, Inc. | 401,010 | 23,944,307 |
|
| Huntington Ingalls Industries, Inc. (I) | 29,039 | 1,205,125 |
|
| Northrop Grumman Corp. | 174,235 | 10,926,277 |
|
| Raytheon Company | 279,620 | 14,224,269 |
|
| United Technologies Corp. | 144,595 | 12,239,967 |
| | | |
| Industrial Conglomerates 2.47% | | |
|
| Koninklijke Philips Electronics NV (L) | 337,770 | 10,866,061 |
|
| Siemens AG, SADR (L) | 75,419 | 10,358,045 |
|
| Tyco International, Ltd. | 345,535 | 15,469,602 |
| | | |
| Machinery 1.05% | | |
|
| Illinois Tool Works, Inc. | 211,655 | 11,370,107 |
|
| Oshkosh Corp. (I) | 119,340 | 4,222,249 |
| | | |
| Professional Services 1.42% | | |
|
| Equifax, Inc. (L) | 197,860 | 7,686,861 |
|
| Manpower, Inc. | 213,485 | 13,423,937 |
| | | |
| Information Technology 15.58% | | 231,269,716 |
| | | |
| Communications Equipment 1.39% | | |
|
| Harris Corp. (L) | 416,665 | 20,666,584 |
| | | |
| Computers & Peripherals 3.33% | | |
|
| EMC Corp. (I) | 465,515 | 12,359,423 |
|
| Hewlett-Packard Company | 645,198 | 26,433,762 |
|
| Seagate Technology PLC (I) | 347,240 | 5,000,256 |
|
| Western Digital Corp. (I) | 150,105 | 5,597,415 |
| | | |
| Electronic Equipment, Instruments & Components 2.36% | | |
|
| Avnet, Inc. (I)(L) | 386,690 | 13,182,262 |
|
| TE Connectivity, Ltd. | 628,295 | 21,877,232 |
| | | |
| Internet Software & Services 1.65% | | |
|
| eBay, Inc. (I) | 559,685 | 17,372,622 |
|
| IAC/InterActiveCorp (I) | 228,505 | 7,058,519 |
| | | |
| IT Services 2.14% | | |
|
| CGI Group, Inc., Class A (I) | 801,762 | 16,780,879 |
|
| International Business Machines Corp. | 46,035 | 7,506,927 |
|
| The Western Union Company | 358,490 | 7,445,837 |
| | | |
| Office Electronics 0.82% | | |
|
| Xerox Corp. | 1,150,275 | 12,250,429 |
| | | |
| Software 3.89% | | |
|
| Microsoft Corp. | 1,352,069 | 34,288,470 |
|
| Oracle Corp. | 702,700 | 23,449,099 |
| | | |
| Materials 2.09% | | 31,108,305 |
| | | |
| Chemicals 0.59% | | |
|
| Albemarle Corp. | 146,336 | 8,746,503 |
| | | |
| Containers & Packaging 0.90% | | |
|
| Ball Corp. | 272,210 | 9,758,729 |
|
| Rock-Tenn Company, Class A (L) | 52,480 | 3,639,488 |
| | |
| 14 | Disciplined Value Fund | Annual report | See notes to financial statements |
| | | |
| | | Shares | Value |
| Metals & Mining 0.60% | | | |
|
| Reliance Steel & Aluminum Company | | 155,133 | $8,963,585 |
| | | | |
| Telecommunication Services 0.75% | | | 11,135,939 |
| | | | |
| Wireless Telecommunication Services 0.75% | | | |
|
| Vodafone Group PLC, SADR | | 387,337 | 11,135,939 |
| | | | |
| Utilities 0.73% | | | 10,798,624 |
| | | | |
| Electric Utilities 0.73% | | | |
|
| Edison International | | 295,125 | 10,798,624 |
| | | | |
| | Yield (%) | Shares | Value |
| Securities Lending Collateral 7.01% | | | $103,991,733 |
|
| (Cost $103,990,345) | | | |
| | | | |
| John Hancock Collateral Investment Trust (W) | 0.2867 (Y) | 10,392,003 | 103,991,733 |
| | | | |
| | | Par value | Value |
| Short-Term Investments 2.61% | | | $38,714,000 |
|
| (Cost $38,714,000) | | | |
| | | | |
| Repurchase Agreement 2.61% | | | 38,714,000 |
| | | | |
| Repurchase Agreement with State Street Corp. dated 3-31-11 at 0.010% to | | |
| be repurchased at $38,714,011 on 4-1-11, collateralized by $38,435,000 | | |
| U.S. Treasury Notes, 3.500% due 5-15-20 (valued at $39,491,963, | | |
| including interest) | | $38,714,000 | 38,714,000 |
| |
| Total investments (Cost $1,356,549,303)† 106.63% | $1,582,744,676 |
|
| |
| Other assets and liabilities, net (6.63%) | | | ($98,361,248) |
|
| |
| Total net assets 100.00% | | $1,484,383,428 |
|
The percentage shown for each investment category is the total value of the category as a percentage of the net assets of the Fund.
ADR American Depositary Receipts
SADR Sponsored American Depositary Receipts
(I) Non-income producing security.
(L) All or a portion of this security is on loan as of 3-31-11.
(W) Investment is an affiliate of the Fund, the adviser and/or subadviser. Also, it represents the investment of securities lending collateral received.
(Y) The rate shown is the annualized seven-day yield as of 3-31-11.
† At 3-31-11, the aggregate cost of investment securities for federal income tax purposes was $1,361,546,930. Net unrealized appreciation aggregated $221,197,746, of which $233,914,505 related to appreciated investment securities and $12,716,759 related to depreciated investment securities.
| | |
| See notes to financial statements | Annual report | Disciplined Value Fund | 15 |
F I N A N C I A L S T A T E M E N T S
Financial statements
Statement of assets and liabilities 3-31-11
This Statement of Assets and Liabilities is the Fund’s balance sheet. It shows the value of what the Fund owns, is due and owes. You’ll also find the net asset value and the maximum public offering price per share.
| |
| Assets | |
|
| Investments in unaffiliated issuers, at value (Cost $1,252,558,958) | |
| including $101,640,389 of securities loaned (Note 2) | $1,478,752,943 |
| Investments in affiliated issuers, at value (Cost $103,990,345) (Note 2) | 103,991,733 |
| | |
| Total investments, at value (Cost $1,356,549,303) | 1,582,744,676 |
| Cash | 959 |
| Receivable for investments sold | 8,623,935 |
| Receivable for fund shares sold | 4,161,195 |
| Dividends and interest receivable | 1,411,202 |
| Receivable for securities lending income | 18,385 |
| Other receivables and prepaid expenses | 122,200 |
| | |
| Total assets | 1,597,082,552 |
| |
| Liabilities | |
|
| Payable for investments purchased | 7,376,428 |
| Payable for fund shares repurchased | 870,848 |
| Payable upon return of securities loaned (Note 2) | 104,021,765 |
| Payable to affiliates | |
| Accounting and legal services fees | 28,000 |
| Transfer agent fees | 203,750 |
| Distribution and service fees | 2,208 |
| Trustees’ fees | 4,075 |
| Due to adviser | 4,463 |
| Other liabilities and accrued expenses | 187,587 |
| | |
| Total liabilities | 112,699,124 |
| |
| Net assets | |
|
| Capital paid-in | $1,292,779,756 |
| Undistributed net investment income | 1,141,305 |
| Accumulated net realized loss on investments and foreign | |
| currency transactions | (35,733,418) |
| Net unrealized appreciation (depreciation) on investments and translation | |
| of assets and liabilities in foreign currencies | 226,195,785 |
| | |
| Net assets | $1,484,383,428 |
| | |
| 16 | Disciplined Value Fund | Annual report | See notes to financial statements |
F I N A N C I A L S T A T E M E N T S
Statement of assets and liabilities (continued)
| |
| Net asset value per share | |
|
| Based on net asset values and shares outstanding — the Fund has an | |
| unlimited number of shares authorized with no par value | |
| Class A ($600,969,386 ÷ 43,443,912 shares) | $13.83 |
| Class B ($7,961,219 ÷ 598,551 shares)1 | $13.30 |
| Class C ($30,423,081 ÷ 2,287,156 shares)1 | $13.30 |
| Class I ($399,330,107 ÷ 29,543,185 shares) | $13.52 |
| Class I2 ($23,101,158 ÷ 1,707,654 shares) | $13.53 |
| Class R1 ($1,386,464 ÷ 102,575 shares) | $13.52 |
| Class R3 ($104,902 ÷ 7,760 shares) | $13.52 |
| Class R4 ($1,045,669 ÷ 77,342 shares) | $13.52 |
| Class R5 ($14,708,741 ÷ 1,087,190 shares) | $13.53 |
| Class ADV ($38,809 ÷ 2,873 shares) | $13.51 |
| Class NAV ($405,313,892 ÷ 29,951,571 shares) | $13.53 |
| |
| Maximum offering price per share | |
|
| Class A (net asset value per share ÷ 95%)2 | $14.56 |
1 Redemption price is equal to net asset value less any applicable contingent deferred sales charge.
2 On single retail sales of less than $50,000. On sales of $50,000 or more and on group sales the offering price is reduced.
| | |
| See notes to financial statements | Annual report | Disciplined Value Fund | 17 |
F I N A N C I A L S T A T E M E N T S
Statement of operations For the year ended 3-31-11
This Statement of Operations summarizes the Fund’s investment income earned and expenses incurred in operating the Fund. It also shows net gains (losses) for the period stated.
| |
| Investment income | |
|
| Dividends | $16,489,915 |
| Securities lending | 181,284 |
| Interest | 5,696 |
| Less foreign taxes withheld | (120,077) |
| | |
| Total investment income | 16,556,818 |
| |
| Expenses | |
|
| Investment management fees (Note 4) | 7,538,232 |
| Distribution and service fees (Note 4) | 1,263,428 |
| Accounting and legal services fees (Note 4) | 138,251 |
| Transfer agent fees (Note 4) | 915,311 |
| Trustees’ fees (Note 4) | 60,279 |
| State registration fees (Note 4) | 179,393 |
| Printing and postage (Note 4) | 36,447 |
| Professional fees | 109,480 |
| Custodian fees | 141,355 |
| Registration and filing fees | 120,081 |
| Other | 25,895 |
| | |
| Total expenses | 10,528,152 |
| Less expense reductions (Note 4) | (98,850) |
| | |
| Net expenses | 10,429,302 |
| | |
| Net investment income | 6,127,516 |
| |
| Realized and unrealized gain (loss) | |
|
| Net realized gain (loss) on | |
| Investments in unaffiliated issuers | 37,526,250 |
| Investments in affiliated issuers | (28,118) |
| Foreign currency transactions | 1,905 |
| |
| | 37,500,037 |
| Change in net unrealized appreciation (depreciation) of | |
| Investments in unaffiliated issuers | 155,605,904 |
| Investments in affiliated issuers | 4,189 |
| Translation of assets and liabilities in foreign currencies | 379 |
| | |
| | 155,610,472 |
| | |
| Net realized and unrealized gain | 193,110,509 |
| | |
| Increase in net assets from operations | $199,238,025 |
| | |
| 18 | Disciplined Value Fund | Annual report | See notes to financial statements |
F I N A N C I A L S T A T E M E N T S
Statements of changes in net assets
These Statements of Changes in Net Assets show how the value of the Fund’s net assets has changed during the last two periods. The difference reflects earnings less expenses, any investment gains and losses, distributions, if any, paid to shareholders and the net of Fund share transactions.
| | | | |
| | | | Year | Year |
| | | | ended | ended |
| | | | 3-31-11 | 3-31-10 |
| |
| Increase (decrease) in net assets | | | | |
|
| From operations | | | | |
| Net investment income | | | $6,127,516 | $2,671,090 |
| Net realized gain | | | 37,500,037 | 5,628,114 |
| Change in net unrealized appreciation (depreciation) | | | 155,610,472 | 84,592,845 |
| | | | | |
| Increase in net assets resulting from operations | | | 199,238,025 | 92,892,049 |
| | | | | |
| Distributions to shareholders | | | | |
| From net investment income | | | | |
| Class A | | | (1,174,517) | (317,909) |
| Class I | | | (1,922,243) | (734,059) |
| Class I2 | | | (119,077) | (422) |
| Class R3 | | | (34) | — |
| Class R4 | | | (2,863) | (81) |
| Class R5 | | | (895) | (164) |
| Class ADV | | | (163) | (111) |
| Class NAV | | | (2,402,882) | (1,182,121) |
| From net realized gain | | | | |
| Class A | | | (2,592,490) | — |
| Class B | | | (34,905) | — |
| Class C | | | (133,777) | — |
| Class I | | | (1,734,582) | — |
| Class I2 | | | (107,108) | — |
| Class R1 | | | (5,586) | — |
| Class R3 | | | (518) | — |
| Class R4 | | | (4,917) | — |
| Class R5 | | | (855) | — |
| Class ADV | | | (191) | — |
| Class NAV | | | (1,991,992) | — |
| | | | | |
| Total distributions | | | (12,229,595) | (2,234,867) |
| | | | | |
| From Fund share transactions (Note 5) | | | 705,112,078 | 458,333,062 |
| | | | | |
| Total increase | | | 892,120,508 | 548,990,244 |
| |
| Net assets | | | | |
|
| Beginning of year | | | 592,262,920 | 43,272,676 |
| | | | | |
| End of year | | | $1,484,383,428 | $592,262,920 |
| | | | | |
| Undistributed net investment income | | | $1,141,305 | $634,558 |
| | |
| See notes to financial statements | Annual report | Disciplined Value Fund | 19 |
Financial highlights
The Financial Highlights show how the Fund’s net asset value for a share has changed since the end of the previous period.
| | | | | | |
| CLASS A SHARES Period ended | 3-31-11 | 3-31-10 | 3-31-091,2 | 8-31-083 | 8-31-073 | 8-31-063 |
| |
| Per share operating performance | | | | | | |
|
| Net asset value, beginning of period | $12.31 | $8.09 | $12.32 | $15.62 | $14.77 | $15.22 |
| Net investment income4 | 0.05 | 0.08 | 0.08 | 0.15 | 0.15 | 0.13 |
| Net realized and unrealized gain (loss) | | | | | | |
| on investments | 1.57 | 4.18 | (4.18) | (1.90) | 2.07 | 1.57 |
| Total from investment operations | 1.62 | 4.26 | (4.10) | (1.75) | 2.22 | 1.70 |
| Less distributions | | | | | | |
| From net investment income | (0.03) | (0.04) | (0.13) | (0.15) | (0.13) | (0.13) |
| From net realized gain | (0.07) | — | — | (1.40) | (1.24) | (2.02) |
| Total distributions | (0.10) | (0.04) | (0.13) | (1.55) | (1.37) | (2.15) |
| Net asset value, end of period | $13.83 | $12.31 | $8.09 | $12.32 | $15.62 | $14.77 |
| Total return (%)5 | 13.20 | 52.686 | (33.33)6,7 | (12.29)6 | 15.456 | 12.146 |
| |
| Ratios and supplemental data | | | | | | |
|
| Net assets, end of period (in millions) | $601 | $162 | $10 | $16 | $23 | $21 |
| Ratios (as a percentage of average net assets): | | | | | | |
| Expenses before reductions | 1.24 | 1.26 | 1.768 | 1.39 | 1.32 | 1.46 |
| Expenses net of fee waivers | 1.24 | 1.06 | 1.008 | 1.00 | 1.00 | 1.11 |
| Expenses net of fee waivers and credits | 1.24 | 1.05 | 1.008 | 1.00 | 1.00 | 1.11 |
| Net investment income | 0.38 | 0.74 | 1.458 | 1.10 | 0.95 | 0.87 |
| Portfolio turnover (%) | 50 | 59 | 529 | 78 | 62 | 58 |
1 For the seven-month period ended 3-31-09. The Fund changed its fiscal year end from August 31 to March 31.
2 After the close of business on 12-19-08, holders of Investor share class of the former Robeco Large Cap Value Fund (the Predecessor Fund) became owners of an equal number of full and fractional Class A shares of the John Hancock Disciplined Value Fund. These shares were first offered on 12-22-08. Additionally, the accounting and performance history of the Investor share class of the Predecessor Fund was redesignated as that of John Hancock Disciplined Value Fund Class A.
3 Audited by previous independent registered public accounting firm.
4 Based on the average daily shares outstanding.
5 Does not reflect the effect of sales charges, if any.
6 Total returns would have been lower had certain expenses not been reduced during the periods shown.
7 Not annualized.
8 Annualized.
9 Portfolio turnover is shown for the period from 9-1-08 to 3-31-09.
| | |
| 20 | Disciplined Value Fund | Annual report | See notes to financial statements |
| | | | | | |
| CLASS B SHARES Period ended | | | | 3-31-11 | 3-31-10 | 3-31-091 |
| |
| Per share operating performance | | | | | | |
|
| Net asset value, beginning of period | | | | $11.91 | $7.88 | $8.82 |
| Net investment income (loss)2 | | | | (0.05) | (0.03) | 0.02 |
| Net realized and unrealized gain (loss) on investments | | | | 1.51 | 4.06 | (0.96) |
| Total from investment operations | | | | 1.46 | 4.03 | (0.94) |
| Less distributions | | | | | | |
| From net realized gain | | | | (0.07) | — | — |
| Net asset value, end of period | | | | $13.30 | $11.91 | $7.88 |
| Total return (%)3,4 | | | | 12.28 | 51.14 | (10.66)5 |
| |
| Ratios and supplemental data | | | | | | |
|
| Net assets, end of period (in millions) | | | | $8 | $5 | —6 |
| Ratios (as a percentage of average net assets): | | | | | | |
| Expenses before reductions | | | | 2.27 | 2.58 | 4.247 |
| Expenses net of fee waivers | | | | 2.05 | 2.12 | 2.077 |
| Expenses net of fee waivers and credits | | | | 2.05 | 2.05 | 2.057 |
| Net investment income (loss) | | | | (0.45) | (0.25) | 1.187 |
| Portfolio turnover (%) | | | | 50 | 59 | 528 |
1 The inception date for Class B shares is 12-22-08.
2 Based on the average daily shares outstanding.
3 Does not reflect the effect of sales charges, if any.
4 Total returns would have been lower had certain expenses not been reduced during the periods shown.
5 Not annualized.
6 Less than $500,000.
7 Annualized.
8 Portfolio turnover is shown for the period from 9-1-08 to 3-31-09.
| | | | | | |
| CLASS C SHARES Period ended | | | | 3-31-11 | 3-31-10 | 3-31-091 |
| |
| Per share operating performance | | | | | | |
|
| Net asset value, beginning of period | | | | $11.91 | $7.87 | $8.82 |
| Net investment income (loss)2 | | | | (0.05) | (0.03) | 0.02 |
| Net realized and unrealized gain (loss) on investments | | | | 1.51 | 4.07 | (0.97) |
| Total from investment operations | | | | 1.46 | 4.04 | (0.95) |
| Less distributions | | | | | | |
| From net realized gain | | | | (0.07) | — | — |
| Net asset value, end of period | | | | $13.30 | $11.91 | $7.87 |
| Total return (%)3,4 | | | | 12.28 | 51.33 | (10.77)5 |
| |
| Ratios and supplemental data | | | | | | |
|
| Net assets, end of period (in millions) | | | | $30 | $19 | —6 |
| Ratios (as a percentage of average net assets): | | | | | | |
| Expenses before reductions | | | | 2.07 | 2.24 | 4.417 |
| Expenses net of fee waivers | | | | 2.05 | 2.08 | 2.067 |
| Expenses net of fee waivers and credits | | | | 2.05 | 2.05 | 2.057 |
| Net investment income (loss) | | | | (0.45) | (0.27) | 1.267 |
| Portfolio turnover (%) | | | | 50 | 59 | 528 |
1 The inception date for Class C shares is 12-22-08.
2 Based on the average daily shares outstanding.
3 Does not reflect the effect of sales charges, if any.
4 Total returns would have been lower had certain expenses not been reduced during the periods shown.
5 Not annualized.
6 Less than $500,000.
7 Annualized.
8 Portfolio turnover is shown for the period from 9-1-08 to 3-31-09.
| | |
| See notes to financial statements | Annual report | Disciplined Value Fund | 21 |
| | | | | | |
| CLASS I SHARES Period ended | 3-31-11 | 3-31-10 | 3-31-091,2 | 8-31-083 | 8-31-073 | 8-31-063 |
| |
| Per share operating performance | | | | | | |
|
| Net asset value, beginning of period | $12.03 | $7.90 | $12.08 | $15.34 | $14.53 | $15.00 |
| Net investment income4 | 0.09 | 0.11 | 0.09 | 0.18 | 0.20 | 0.16 |
| Net realized and unrealized gain (loss) | | | | | | |
| on investments | 1.54 | 4.08 | (4.10) | (1.84) | 2.02 | 1.55 |
| Total from investment operations | 1.63 | 4.19 | (4.01) | (1.66) | 2.22 | 1.71 |
| Less distributions | | | | | | |
| From net investment income | (0.07) | (0.06) | (0.17) | (0.20) | (0.17) | (0.16) |
| From net realized gain | (0.07) | — | — | (1.40) | (1.24) | (2.02) |
| Total distributions | (0.14) | (0.06) | (0.17) | (1.60) | (1.41) | (2.18) |
| Net asset value, end of period | $13.52 | $12.03 | $7.90 | $12.08 | $15.34 | $14.53 |
| Total return (%) | 13.66 | 53.145 | (33.33)5,6 | (11.99)5 | 15.705 | 12.435 |
| |
| Ratios and supplemental data | | | | | | |
|
| Net assets, end of period (in millions) | $399 | $158 | $33 | $44 | $43 | $36 |
| Ratios (as a percentage of average net assets): | | | | | | |
| Expenses before reductions | 0.86 | 0.88 | 1.377 | 1.14 | 1.07 | 1.22 |
| Expenses net of fee waivers | 0.86 | 0.80 | 0.757 | 0.75 | 0.75 | 0.86 |
| Expenses net of fee waivers and credits | 0.86 | 0.80 | 0.757 | 0.75 | 0.75 | 0.86 |
| Net investment income | 0.75 | 1.01 | 1.727 | 1.37 | 1.20 | 1.11 |
| Portfolio turnover (%) | 50 | 59 | 528 | 78 | 62 | 58 |
1 For the seven-month period ended 3-31-09. The Fund changed its fiscal year end from August 31 to March 31.
2 After the close of business on 12-19-08, holders of Institutional share class of the former Robeco Large Cap Value Fund (the Predecessor Fund) became owners of an equal number of full and fractional Class I shares of the John Hancock Disciplined Value Fund. These shares were first offered on 12-22-08. Additionally, the accounting and performance history of the Institutional share class of the Predecessor Fund was redesignated as that of John Hancock Disciplined Value Fund Class I.
3 Audited by previous independent registered public accounting firm.
4 Based on the average daily shares outstanding.
5 Total returns would have been lower had certain expenses not been reduced during the periods shown.
6 Not annualized.
7 Annualized.
8 Portfolio turnover is shown for the period from 9-1-08 to 3-31-09.
| | | | | | |
| CLASS I2 SHARES Period ended | | | | 3-31-11 | 3-31-10 | 3-31-091 |
| |
| Per share operating performance | | | | | | |
|
| Net asset value, beginning of period | | | | $12.04 | $7.90 | $8.82 |
| Net investment income2 | | | | 0.09 | 0.11 | 0.05 |
| Net realized and unrealized gain (loss) on investments | | | | 1.54 | 4.09 | (0.97) |
| Total from investment operations | | | | 1.63 | 4.20 | (0.92) |
| Less distributions | | | | | | |
| From net investment income | | | | (0.07) | (0.06) | — |
| From net realized gain | | | | (0.07) | — | — |
| Total distributions | | | | (0.14) | (0.06) | — |
| Net assets, end of period (in millions) | | | | $13.53 | $12.04 | $7.90 |
| Total return (%)3 | | | | 13.65 | 53.27 | (10.43)4 |
| |
| Ratios and supplemental data | | | | | | |
|
| Net assets, end of period (in millions) | | | | $23 | $19 | —5 |
| Ratios (as a percentage of average net assets): | | | | | | |
| Expenses before reductions | | | | 0.92 | 1.13 | 5.086 |
| Expenses net of fee waivers | | | | 0.85 | 0.75 | 0.756 |
| Expenses net of fee waivers and credits | | | | 0.85 | 0.75 | 0.756 |
| Net investment income | | | | 0.74 | 0.99 | 2.236 |
| Portfolio turnover (%) | | | | 50 | 59 | 527 |
1 The inception date for Class I2 shares is 12-22-08.
2 Based on the average daily shares outstanding.
3 Total returns would have been lower had certain expenses not been reduced during the periods shown.
4 Not annualized.
5 Less than $500,000.
6 Annualized.
7 Portfolio turnover is shown for the period from 9-1-08 to 3-31-09.
| | |
| 22 | Disciplined Value Fund | Annual report | See notes to financial statements |
| | | | | | |
| CLASS R1 SHARES Period ended | | | | | 3-31-11 | 3-31-101 |
| |
| Per share operating performance | | | | | | |
|
| Net asset value, beginning of period | | | | | $12.05 | $9.01 |
| Net investment income2 | | | | | —3 | 0.02 |
| Net realized and unrealized gain on investments | | | | | 1.54 | 3.02 |
| Total from investment operations | | | | | 1.54 | 3.04 |
| Less distributions | | | | | | |
| From net realized gain | | | | | (0.07) | — |
| Net asset value, end of period | | | | | $13.52 | $12.05 |
| Total return (%)4 | | | | | 12.80 | 33.745 |
| |
| Ratios and supplemental data | | | | | | |
|
| Net assets, end of period (in millions) | | | | | $1 | —6 |
| Ratios (as a percentage of average net assets): | | | | | | |
| Expenses before reductions | | | | | 3.21 | 2.967 |
| Expenses net of fee waivers | | | | | 1.61 | 1.507 |
| Expenses net of fee waivers and credits | | | | | 1.61 | 1.507 |
| Net investment income | | | | | 0.01 | 0.297 |
| Portfolio turnover (%) | | | | | 50 | 598 |
1 The inception date for Class R1 shares is 7-13-09.
2 Based on the average daily shares outstanding.
3 Less than $0.005 per share.
4 Total returns would have been lower had certain expenses not been reduced during the periods shown.
5 Not annualized.
6 Less than $500,000.
7 Annualized.
8 Portfolio turnover is shown for the period from 4-1-09 to 3-31-10.
| | | | | | |
| CLASS R3 SHARES Period ended | | | | | 3-31-11 | 3-31-101 |
| |
| Per share operating performance | | | | | | |
|
| Net asset value, beginning of period | | | | | $12.04 | $8.98 |
| Net investment income2 | | | | | 0.01 | 0.04 |
| Net realized and unrealized gain on investments | | | | | 1.54 | 3.02 |
| Total from investment operations | | | | | 1.55 | 3.06 |
| Less distributions | | | | | | |
| From net investment income | | | | | —3 | — |
| From net realized gain | | | | | (0.07) | — |
| Total distributions | | | | | (0.07) | — |
| Net asset value, end of period | | | | | $13.52 | $12.04 |
| Total return (%)4 | | | | | 12.93 | 34.085 |
| |
| Ratios and supplemental data | | | | | | |
|
| Net assets, end of period (in thousands) | | | | | $105 | $38 |
| Ratios (as a percentage of average net assets): | | | | | | |
| Expenses before reductions | | | | | 20.34 | 10.236 |
| Expenses net of fee waivers | | | | | 1.52 | 1.406 |
| Expenses net of fee waivers and credits | | | | | 1.52 | 1.406 |
| Net investment income | | | | | 0.10 | 0.436 |
| Portfolio turnover (%) | | | | | 50 | 597 |
1 The inception date for Class R3 shares is 5-22-09.
2 Based on the average daily shares outstanding.
3 Less than ($0.005) per share.
4 Total returns would have been lower had certain expenses not been reduced during the periods shown.
5 Not annualized.
6 Annualized.
7 Portfolio turnover is shown for the period from 4-1-09 to 3-31-10.
| | |
| See notes to financial statements | Annual report | Disciplined Value Fund | 23 |
| | | | | | |
| CLASS R4 SHARES Period ended | | | | | 3-31-11 | 3-31-101 |
| | | | | | | |
| Per share operating performance | | | | | | |
|
| Net asset value, beginning of period | | | | | $12.04 | $8.98 |
| Net investment income2 | | | | | 0.05 | 0.07 |
| Net realized and unrealized gain on investments | | | | | 1.54 | 3.02 |
| Total from investment operations | | | | | 1.59 | 3.09 |
| Less distributions | | | | | | |
| From net investment income | | | | | (0.04) | (0.03) |
| From net realized gain | | | | | (0.07) | — |
| Total distributions | | | | | (0.11) | (0.03) |
| Net asset value, end of period | | | | | $13.52 | $12.04 |
| Total return (%)3 | | | | | 13.25 | 34.424 |
| |
| Ratios and supplemental data | | | | | | |
|
| Net assets, end of period (in millions) | | | | | $1 | $1 |
| Ratios (as a percentage of average net assets): | | | | | | |
| Expenses before reductions | | | | | 2.81 | 2.885 |
| Expenses net of fee waivers | | | | | 1.20 | 1.105 |
| Expenses net of fee waivers and credits | | | | | 1.20 | 1.105 |
| Net investment income | | | | | 0.40 | 0.755 |
| Portfolio turnover (%) | | | | | 50 | 596 |
1 The inception date for Class R4 shares is 5-22-09.
2 Based on the average daily shares outstanding.
3 Total returns would have been lower had certain expenses not been reduced during the periods shown.
4 Not annualized.
5 Annualized.
6 Portfolio turnover is shown for the period from 4-1-09 to 3-31-10.
| | | | | | |
| CLASS R5 SHARES Period ended | | | | | 3-31-11 | 3-31-101 |
| |
| Per share operating performance | | | | | | |
|
| Net asset value, beginning of period | | | | | $12.04 | $8.98 |
| Net investment income2 | | | | | 0.08 | 0.10 |
| Net realized and unrealized gain on investments | | | | | 1.55 | 3.02 |
| Total from investment operations | | | | | 1.63 | 3.12 |
| Less distributions | | | | | | |
| From net investment income | | | | | (0.07) | (0.06) |
| From net realized gain | | | | | (0.07) | — |
| Total distributions | | | | | (0.14) | (0.06) |
| Net asset value, end of period | | | | | $13.53 | $12.04 |
| Total return (%)3 | | | | | 13.61 | 34.774 |
| |
| Ratios and supplemental data | | | | | | |
|
| Net assets, end of period (in millions) | | | | | $15 | —5 |
| Ratios (as a percentage of average net assets): | | | | | | |
| Expenses before reductions | | | | | 1.23 | 9.546 |
| Expenses net of fee waivers | | | | | 0.94 | 0.806 |
| Expenses net of fee waivers and credits | | | | | 0.94 | 0.806 |
| Net investment income | | | | | 0.59 | 1.036 |
| Portfolio turnover (%) | | | | | 50 | 597 |
1 The inception date for Class R5 shares is 5-22-09.
2 Based on the average daily shares outstanding.
3 Total returns would have been lower had certain expenses not been reduced during the periods shown.
4 Not annualized.
5 Less than $500,000.
6 Annualized.
7 Portfolio turnover is shown for the period from 4-1-09 to 3-31-10.
| | |
| 24 | Disciplined Value Fund | Annual report | See notes to financial statements |
| | | | | | |
| CLASS ADV SHARES Period ended | | | | 3-31-11 | 3-31-10 | 3-31-091 |
| |
| Per share operating performance | | | | | | |
|
| Net asset value, beginning of period | | | | $12.03 | $7.90 | $8.82 |
| Net investment income2 | | | | 0.07 | 0.09 | 0.04 |
| Net realized and unrealized gain (loss) on investments | | | | 1.53 | 4.08 | (0.96) |
| Total from investment operations | | | | 1.60 | 4.17 | (0.92) |
| Less distributions | | | | | | |
| From net investment income | | | | (0.05) | (0.04) | — |
| From net realized gain | | | | (0.07) | — | — |
| Total distributions | | | | (0.12) | (0.04) | — |
| Net asset value, end of period | | | | $13.51 | $12.03 | $7.90 |
| Total return (%)3 | | | | 13.42 | 52.81 | (10.43)4 |
| |
| Ratios and supplemental data | | | | | | |
|
| Net assets, end of period (in thousands) | | | | $39 | $34 | $22 |
| Ratios (as a percentage of average net assets): | | | | | | |
| Expenses before reductions | | | | 45.27 | 31.79 | 3.215 |
| Expenses net of fee waivers and credits | | | | 1.00 | 1.00 | 1.005 |
| Expenses net of fee waivers | | | | 1.00 | 1.00 | 1.005 |
| Net investment income | | | | 0.59 | 0.84 | 1.965 |
| Portfolio turnover (%) | | | | 50 | 59 | 526 |
1 The inception date for Class ADV shares is 12-22-08.
2 Based on the average daily shares outstanding.
3 Total returns would have been lower had certain expenses not been reduced during the periods shown.
4 Not annualized.
5 Annualized.
6 Portfolio turnover is shown for the period from 9-1-08 to 3-31-09.
| | | | | | |
| CLASS NAV SHARES Period ended | | | | | 3-31-11 | 3-31-101 |
| |
| Per share operating performance | | | | | | |
|
| Net asset value, beginning of period | | | | | $12.04 | $9.18 |
| Net investment income2 | | | | | 0.10 | 0.10 |
| Net realized and unrealized gain on investments | | | | | 1.54 | 2.82 |
| Total from investment operations | | | | | 1.64 | 2.92 |
| Less distributions | | | | | | |
| From net investment income | | | | | (0.08) | (0.06) |
| From net realized gain | | | | | (0.07) | — |
| Total distributions | | | | | (0.15) | (0.06) |
| Net asset value, end of period | | | | | $13.53 | $12.04 |
| Total return (%) | | | | | 13.71 | 31.893,4 |
| |
| Ratios and supplemental data | | | | | | |
|
| Net assets, end of period (in millions) | | | | | $405 | $228 |
| Ratios (as a percentage of average net assets): | | | | | | |
| Expenses before reductions | | | | | 0.79 | 0.835 |
| Expenses net of fee waivers | | | | | 0.79 | 0.755 |
| Expenses net of fee waivers and credits | | | | | 0.79 | 0.755 |
| Net investment income | | | | | 0.82 | 1.055 |
| Portfolio turnover (%) | | | | | 50 | 596 |
1 The inception date for Class NAV shares is 5-29-09.
2 Based on the average daily shares outstanding.
3 Total returns would have been lower had certain expenses not been reduced during the periods shown.
4 Not annualized.
5 Annualized.
6 Portfolio turnover is shown for the period from 4-1-09 to 3-31-10.
| | |
| See notes to financial statements | Annual report | Disciplined Value Fund | 25 |
Notes to financial statements
Note 1 — Organization
John Hancock Disciplined Value Fund (the Fund) is a diversified series of John Hancock Funds III (the Trust), an open-end management investment company organized as a Massachusetts business trust and registered under the Investment Company Act of 1940, as amended (the 1940 Act). The investment objective of the Fund is to seek to provide long-term growth of capital primarily through investment in equity securities. Current income is a secondary objective.
The Fund may offer multiple classes of shares. The shares currently offered are detailed in the Statement of Assets and Liabilities. Class A, Class B and Class C shares are offered to all investors. Class I shares are offered to institutions and certain investors. Class R1, Class R3, Class R4 and Class R5 shares are available only to certain retirement plans. Class I2 and Class ADV shares are closed to new investors. Class NAV shares are sold to John Hancock affiliated funds of funds. Shareholders of each class have exclusive voting rights to matters that affect that class. The distribution and service fees, if any, printing and postage, transfer agent fees and state registration fees for each class may differ. Class B shares convert to Class A shares eight years after purchase.
The Fund is the accounting and performance successor of the Robeco Boston Partners Large Cap Value Fund (the Predecessor Fund). On December 19, 2008, the Fund acquired substantially all the assets and assumed the liabilities of the Predecessor Fund pursuant to an agreement and plan of reorganization, in exchange for Class A and Class I shares of the Fund.
Note 2 — Significant accounting policies
The financial statements have been prepared in conformity with accounting principles generally accepted in the United States of America, which require management to make certain estimates and assumptions at the date of the financial statements. Actual results could differ from those estimates. Events or transactions occurring after the end of the fiscal period through the date that the financial statements were issued have been evaluated in the preparation of the financial statements. The following summarizes the significant accounting policies of the Fund:
Security valuation. Investments are stated at value as of the close of regular trading on the New York Stock Exchange (NYSE), normally at 4:00 P.M., Eastern Time. The Fund uses a three-tier hierarchy to prioritize the pricing assumptions, referred to as inputs, used in valuation techniques to measure fair value. Level 1 includes securities valued using quoted prices in active markets for identical securities. Level 2 includes securities valued using significant observable inputs. Observable inputs may include quoted prices for similar securities, interest rates, prepayment speeds and credit risk. Prices for securities valued using these inputs are received from independent pricing vendors and brokers and are based on an evaluation of the inputs described. Level 3 includes securities valued using significant unobservable inputs when market prices are not readily available or reliable, including the Fund’s own assumptions in determining the fair value of investments. Factors used in determining value may include market or issuer specific events, changes in interest rates and credit quality. The inputs or methodology used for valuing securities are not necessarily an indication of the risk associated with investing in those securities.
As of March 31, 2011, all investments of the Fund are categorized as Level 1 under the hierarchy described above, except repurchase agreements, which are Level 2. Changes in valuation techniques may result in transfers in or out of an assigned level within the disclosure hierarchy. During the year ended March 31, 2011, there were no significant transfers in or out of Level 1 or Level 2 assets.
| |
| 26 | Disciplined Value Fund | Annual report |
In order to value the securities, the Fund uses the following valuation techniques. Equity securities held by the Fund are valued at the last sale price or official closing price on the principal securities exchange on which they trade. In the event there were no sales during the day or closing prices are not available, then securities are valued using the last quoted bid or evaluated price. Investments in open-end mutual funds, including John Hancock Collateral Investment Trust (JHCIT), are valued at their closing net asset values each day. Certain securities traded only in the over-the-counter market are valued at the last bid price quoted by brokers making markets in the securities at the close of trading. Certain short-term securities are valued at amortized cost. Other portfolio securities and assets, where market quotations are not readily available, are valued at fair value, as determined in good faith by the Fund’s Pricing Committee, following procedures established by the Board of Trustees.
Repurchase agreements. The Fund may enter into repurchase agreements. When the Fund enters into a repurchase agreement, it receives collateral which is held in a segregated account by the Fund’s custodian. The collateral amount is marked-to-market and monitored on a daily basis to ensure that the collateral held is in an amount not less than the principal amount of the repurchase agreement plus any accrued interest. In the event of a default by the counterparty, realization of the collateral proceeds could be delayed, during which time the collateral value may decline.
Security transactions and related investment income. Investment security transactions are accounted for on a trade date plus one basis for daily net asset value calculations. However, for financial reporting purposes, investment transactions are reported on trade date. Interest income is accrued as earned. Gains and losses on securities sold are determined on the basis of identified cost and may include proceeds from litigation. Dividend income is recorded on the ex-date, except for dividends of foreign securities where the dividend may not be known until after the ex-date. In those cases, dividend income is recorded when the Fund becomes aware of the dividends.
Securities lending. The Fund may lend its securities to earn additional income. It receives and maintains cash collateral received from the borrower in an amount not less than the market value of the loaned securities. The Fund will invest its collateral in JHCIT, an affiliate of the Fund, and as a result, the Fund will receive the benefit of any gains and bear any losses generated by JHCIT. Although risk of the loss of the securities lent is mitigated by holding the collateral, the Fund could experience a delay in recovering its securities and a possible loss of income or value if the borrower fails to return the securities or if collateral investments decline in value. The Fund may receive compensation for lending its securities by retaining a portion of the return on the investment of the collateral and compensation from fees earned from borrowers of the securities. Income received from JHCIT is a component of securities lending income as recorded on the Statement of Operations.
Line of credit. The Fund may borrow from banks for temporary or emergency purposes, including meeting redemption requests that otherwise might require the untimely sale of securities. Pursuant to the custodian agreement, the custodian may loan money to the Fund to make properly authorized payments. The Fund is obligated to repay the custodian for any overdraft, including any related costs or expenses. The custodian has a lien, security interest or security entitlement in any Fund property that is not segregated, to the maximum extent permitted by law for any overdraft.
In addition, effective March 30, 2011, the Fund and other affiliated funds have entered into an agreement with Citibank N.A. which enables them to participate in a $100 million unsecured committed line of credit. Prior to March 30, 2011, the Fund had a similar arrangement with State Street Bank and Trust Company. A commitment fee, payable at the end of each calendar quarter, based on the average daily unused portion of the line of credit, is charged to each participating fund on a pro rata basis and is reflected in other expenses on the Statement of Operations. For the year ended March 31, 2011, the Fund had no borrowings under the line of credit.
| |
| Annual report | Disciplined Value Fund | 27 |
Expenses. The majority of expenses are directly attributable to an individual fund. Expenses that are not readily attributable to a specific fund are allocated among all funds in an equitable manner, taking into consideration, among other things, the nature and type of expense and the fund’s relative assets. Expense estimates are accrued in the period to which they relate and adjustments are made when actual amounts are known.
Class allocations. Income, common expenses, and realized and unrealized gains (losses) are determined at the fund level and allocated daily to each class of shares based on the net asset value of the class. Class-specific expenses, such as distribution and service fees, if any, printing and postage, transfer agent fees and state registration fees, for all classes, are calculated daily at the class level based on the appropriate net asset value of each class and the specific expense rates applicable to each class.
Federal income taxes. The Fund intends to continue to qualify as a regulated investment company by complying with the applicable provisions of the Internal Revenue Code and will not be subject to federal income tax on taxable income that is distributed to shareholders. Therefore, no federal income tax provision is required.
For federal income tax purposes, the Fund has a capital loss carryforward of $58,898,901 available to offset future net realized capital gains as of March 31, 2011. Availability of a certain amount of the loss carryforward, which was acquired in a merger, may be limited in a given year. The loss carryforward expires as follows: March 31, 2016 — $16,285,226 and March 31, 2017 — $42,613,675.
It is estimated that $50,300,349 of the loss carryforwards, which was acquired on July 10, 2009, in a merger with John Hancock Classic Value Fund II, will likely expire unused because of limitations.
Under the recently enacted Regulated Investment Company Modernization Act of 2010, the Fund will be permitted to carry forward capital losses incurred in taxable years beginning after December 22, 2010 for an unlimited period. However, any losses incurred during those future taxable years will be required to be utilized prior to the losses incurred in pre-enactment taxable years. As a result of this ordering rule, pre-enactment capital loss carryforwards may be more likely to expire unused. Additionally, post-enactment capital losses that are carried forward will retain their character as either short-term or long-term capital losses rather than being considered all short-term as under previous law.
As of March 31, 2011, the Fund had no uncertain tax positions that would require financial statement recognition, de-recognition or disclosure. The Fund’s federal tax return is subject to examination by the Internal Revenue Service for a period of three years.
Distribution of income and gains. Distributions to shareholders from net investment income and net realized gains, if any, are recorded on the ex-date. The Fund generally declares and pays dividends and capital gain distributions, if any, annually. The tax character of distributions for the year ended March 31, 2011 and year ended March 31, 2010 was as follows:
| | | | | |
| | MARCH 31, 2011 | MARCH 31, 2010 | | | |
| | | |
| Ordinary Income | $5,622,674 | $2,234,867 | | | |
| Long-Term Capital Gain | 6,606,921 | — | | | |
Distributions paid by the Fund with respect to each class of shares are calculated in the same manner, at the same time and are in the same amount, except for the effect of expenses that may be applied differently to each class. As of March 31, 2011, the components of distributable earnings on a tax basis included $1,423,696 of undistributed ordinary income and $27,882,471 of long-term capital gains.
| |
| 28 | Disciplined Value Fund | Annual report |
Such distributions and distributable earnings, on a tax basis, are determined in conformity with income tax regulations, which may differ from accounting principles generally accepted in the United States of America. Material distributions in excess of tax basis earnings and profits, if any, are reported in the Fund’s financial statements as a return of capital.
Capital accounts within financial statements are adjusted for permanent book-tax differences. These adjustments have no impact on net assets or the results of operations. Temporary book-tax differences, if any, will reverse in a subsequent period. Book-tax differences are primarily attributable to wash sale loss deferrals.
Note 3 — Guarantees and indemnifications
Under the Fund’s organizational documents, its Officers and Trustees are indemnified against certain liabilities arising out of the performance of their duties to the Fund. Additionally, in the normal course of business, the Fund enters into contracts with service providers that contain general indemnification clauses. The Fund’s maximum exposure under these arrangements is unknown, as this would involve future claims that may be made against the Fund that have not yet occurred. The risk of material loss from such claims is considered remote.
Note 4 — Fees and transactions with affiliates
John Hancock Investment Management Services, LLC (the Adviser) serves as investment adviser for the Fund. John Hancock Funds, LLC (the Distributor), an affiliate of the Adviser, serves as principal underwriter of the Trust. The Adviser and the Distributor are indirect wholly owned subsidiaries of Manulife Financial Corporation (MFC).
Management fee. The Fund has an investment management contract with the Adviser under which the Fund pays a daily management fee to the Adviser equivalent, on an annual basis, to the sum of: (a) 0.750% of the first $500,000,000 of the Fund’s average daily net assets; (b) 0.725% of the next $500,000,000; (c) 0.700% of the next $500,000,000; (d) 0.675% of the next $1,000,000,000; and (e) 0.650% of the Fund’s average daily net assets in excess of $2,500,000,000. The Adviser has a subadvisory agreement with Robeco Investment Management, Inc. The Fund is not responsible for payment of the subadvisory fees.
The investment management fees incurred for the year ended March 31, 2011 were equivalent to an annual effective rate of 0.73% of the Fund’s average daily net assets.
The Adviser has agreed to reimburse or limit certain expenses for each share class of the Fund. This agreement excludes taxes, portfolio brokerage commissions, interest and litigation and indemnification expenses, shareholder services fees and other extraordinary expenses not incurred in the ordinary course of the Fund’s business. The reimbursements and limits are such that these expenses will not exceed 1.30%, 2.05%, 2.05%, 0.90%, 0.85%, 1.64%, 1.54%, 1.24%, 0.94% and 1.00% for Class A, Class B, Class C, Class I, Class I2, Class R1, Class R3, Class R4, Class R5 and Class ADV shares, respectively. The expense reimbursements and limits will continue in effect until June 30, 2011 for Class A, Class B, Class C, Class I2 and Class ADV shares and July 31, 2011 for Class R1, Class R3, Class R4 and Class R5 shares. Prior to August 1, 2010, the fee waivers and/or reimbursements were such that the above expenses would not exceed 1.50%, 1.40%, 1.10% and 0.80% for Class R1, Class R3, Class R4 and Class R5 shares, respectively.
Accordingly, these expense reductions amounted to $13,433, $4,127, $13,962, $13,710, $13,845, $14,172, $10,366 and $15,235 for Class B, Class C, Class I2, Class R1, Class R3, Class R4, Class R5 and Class ADV shares, respectively, for the year ended March 31, 2011.
Accounting and legal services. Pursuant to a service agreement, the Fund reimburses the Adviser for all expenses associated with providing the administrative, financial, legal, accounting and
| |
| Annual report | Disciplined Value Fund | 29 |
recordkeeping services of the Fund, including the preparation of all tax returns, periodic reports to shareholders and regulatory reports, among other services. These expenses are allocated to each share class based on its relative net assets at the time the expense was incurred. The accounting and legal services fees incurred for the year ended March 31, 2011 amounted to an annual rate of 0.01% of the Fund’s average daily net assets.
Distribution and service plans. The Fund has a distribution agreement with the Distributor. The Fund has adopted distribution and service plans with respect to Class A, Class B, Class C, Class R1, Class R3, Class R4 and Class ADV shares pursuant to Rule 12b-1 under the 1940 Act, to pay the Distributor for services provided as the distributor of shares of the Fund. In addition, under a service plan for Class R1, Class R3, Class R4 and Class R5 shares, the Fund pays for certain other services. The Fund may pay up to the following contractual rates of distribution and service fees under these arrangements, expressed as an annual percentage of average daily net assets for each class of the Fund’s shares.
| | | | | |
| CLASS | 12b–1 FEE | SERVICE FEE | | | |
| | | |
| A | 0.30% | — | | | |
| B | 1.00% | — | | | |
| C | 1.00% | — | | | |
| R1 | 0.50% | 0.25% | | | |
| R3 | 0.50% | 0.15% | | | |
| R4 | 0.25% | 0.10% | | | |
| R5 | — | 0.05% | | | |
| ADV | 0.25% | — | | | |
Currently, only 0.25% is charged to Class A shares for 12b-1 fees.
Sales charges. Class A shares are assessed up-front sales charges, which resulted in payments to the Distributor amounting to $467,774 for the year ended March 31, 2011. Of this amount, $65,369 was retained and used for printing prospectuses, advertising, sales literature and other purposes, $398,794 was paid as sales commissions to broker-dealers and $3,611 was paid as sales commissions to sales personnel of Signator Investors, Inc. (Signator Investors), a broker-dealer affiliate of the Adviser.
Class B and Class C shares are subject to contingent deferred sales charges (CDSC). Class B shares that are redeemed within six years of purchase are subject to CDSC, at declining rates, beginning at 5.00% of the lesser of the current market value at the time of redemption or the original purchase cost of the shares being redeemed. Class C shares that are redeemed within one year of purchase are subject to a 1.00% CDSC on the lesser of the current market value at the time of redemption or the original purchase cost of the shares being redeemed. Proceeds from CDSCs are used to compensate the Distributor for providing distribution-related services in connection with the sale of these shares. During the year ended March 31, 2011, CDSCs received by the Distributor amounted to $10,416 and $8,685 for Class B and Class C shares, respectively.
Transfer agent fees. The Fund has a transfer agent agreement with John Hancock Signature Services, Inc. (Signature Services or Transfer Agent), an affiliate of the Adviser. Class NAV shares do not pay transfer agent fees. The transfer agent fees paid to Signature Services are determined based on the cost to Signature Services (Signature Services Cost) of providing recordkeeping services. The Signature Services Cost includes a component of allocated John Hancock corporate overhead for providing transfer agent services to the Fund and to all other John Hancock affiliated funds. It also includes out-of-pocket expenses that are comprised of payments made to third-parties for recordkeeping services provided to their clients who invest in one or more John Hancock funds. In addition, Signature Services Cost may be reduced by certain revenues that Signature Services
| |
| 30 | Disciplined Value Fund | Annual report |
receives in connection with the service it provides to the funds. Signature Services Cost is calculated monthly and allocated, as applicable, to four categories of share classes: Institutional Share Classes, Retirement Share Classes, Municipal Bond Classes and all other Retail Share Classes. Within each of these categories, the applicable costs are allocated to the affected John Hancock affiliated funds and/or classes, based on the relative average daily net assets.
Prior to July 1, 2010, the transfer agent fees were made up of three components:
• The Fund paid a monthly transfer agent fee at an annual rate of 0.05% for Class A, B, C, R1, R3, R4, R5 and ADV shares and 0.04% for Class I and Class I2 shares, based on each class’s average daily net assets.
• The Fund paid a monthly fee based on an annual rate of $16.50 per shareholder account for Class A, B, C, I, I2, R1, R3, R4 and R5 shares. Class ADV shares were not assessed these monthly fees.
• In addition, Signature Services was reimbursed for certain out-of-pocket expenses.
Class level expenses. Class level expenses for the year ended March 31, 2011 were:
| | | | |
| | DISTRIBUTION | TRANSFER | STATE | PRINTING AND |
| CLASS | AND SERVICE FEES | AGENT FEES | REGISTRATION FEES | POSTAGE |
|
| Class A | $963,126 | $706,331 | $32,630 | $25,997 |
| Class B | 60,698 | 12,858 | 15,477 | 890 |
| Class C | 230,394 | 44,801 | 16,508 | 2,719 |
| Class I | — | 137,527 | 29,973 | 5,535 |
| Class I2 | — | 10,231 | 14,657 | 818 |
| Class R1 | 5,851 | 929 | 13,866 | 130 |
| Class R3 | 368 | 229 | 13,750 | 34 |
| Class R4 | 2,885 | 635 | 14,159 | 97 |
| Class R5 | 20 | 1,351 | 13,750 | 44 |
| Class ADV | 86 | 419 | 14,623 | 183 |
| Total | $1,263,428 | $915,311 | $179,393 | $36,447 |
Trustee expenses. The Trust compensates each Trustee who is not an employee of the Adviser or its affiliates. These Trustees may, for tax purposes, elect to defer receipt of this compensation under the John Hancock Group of Funds Deferred Compensation Plan (the Plan). Deferred amounts are invested in various John Hancock funds and remain in the funds until distributed in accordance with the Plan. The investment of deferred amounts and the offsetting liability are included within Other receivables and prepaid expenses and Payable to affiliates — Trustees’ fees, respectively, in the accompanying Statement of Assets and Liabilities.
Note 5 — Fund share transactions
Transactions in Fund shares for the years ended March 31, 2011 and 2010 were as follows:
| | | | |
| | Year ended 3-31-11 | Year ended 3-31-10 |
| | Shares | Amount | Shares | Amount |
| Class A shares | | | | |
|
| Sold | 36,716,106 | $445,364,310 | 11,661,288 | $132,046,024 |
| Issued in reorganization (Note 7) | — | — | 1,765,491 | 16,252,306 |
| Distributions reinvested | 286,656 | 3,680,665 | 26,373 | 304,610 |
| Repurchased | (6,747,902) | (84,227,777) | (1,471,480) | (16,576,033) |
| | | | | |
| Net increase | 30,254,860 | $364,817,198 | 11,981,672 | $132,026,907 |
| |
| Annual report | Disciplined Value Fund | 31 |
| | | | |
| | Year ended 3-31-11 | Year ended 3-31-10 |
| | Shares | Amount | Shares | Amount |
| Class B shares | | | | |
|
| Sold | 243,352 | $2,966,977 | 170,090 | $1,774,402 |
| Issued in reorganization (Note 7) | — | — | 301,474 | 2,694,363 |
| Distributions reinvested | 2,470 | 30,553 | — | — |
| Repurchased | (87,333) | (1,047,461) | (60,848) | (655,998) |
| | | | | |
| Net increase | 158,489 | $1,950,069 | 410,716 | $3,812,767 |
| |
| Class C shares | | | | |
|
| Sold | 1,078,990 | $13,057,994 | 936,552 | $10,261,715 |
| Issued in reorganization (Note 7) | — | — | 785,159 | 7,017,238 |
| Distributions reinvested | 8,799 | 108,844 | — | — |
| Repurchased | (384,621) | (4,559,653) | (199,589) | (2,167,113) |
| | | | | |
| Net increase | 703,168 | $8,607,185 | 1,522,122 | $15,111,840 |
| |
| Class I shares | | | | |
|
| Sold | 19,998,813 | $232,555,941 | 14,153,339 | $142,031,860 |
| Issued in reorganization (Note 7) | — | — | 554,639 | 4,991,870 |
| Distributions reinvested | 273,381 | 3,425,460 | 61,516 | 693,903 |
| Repurchased | (3,865,108) | (47,125,267) | (5,776,844) | (59,398,021) |
| | | | | |
| Net increase | 16,407,086 | $188,856,134 | 8,992,650 | $88,319,612 |
| |
| Class I2 shares | | | | |
|
| Sold | 157,294 | $1,966,666 | 1,612,432 | $17,985,940 |
| Distributions reinvested | 17,994 | 225,645 | 16 | 180 |
| Repurchased | (18,139) | (225,000) | (64,777) | (734,120) |
| | | | | |
| Net increase | 157,149 | $1,967,311 | 1,547,671 | $17,252,000 |
| |
| Class R1 shares | | | | |
|
| Sold | 88,526 | $1,050,353 | 17,629 | $186,389 |
| Issued in reorganization (Note 7) | — | — | 14,527 | 130,825 |
| Distributions reinvested | 445 | 5,586 | — | — |
| Repurchased | (12,676) | (152,985) | (5,876) | (69,405) |
| | | | | |
| Net increase | 76,295 | $902,954 | 26,280 | $247,8091 |
| |
| Class R3 shares | | | | |
|
| Sold | 7,879 | $97,121 | 3,148 | $28,978 |
| Distributions reinvested | 28 | 353 | — | — |
| Repurchased | (3,295) | (44,100) | — | — |
| | | | | |
| Net increase | 4,612 | $53,374 | 3,148 | $28,9782 |
| |
| Class R4 shares | | | | |
|
| Sold | 39,785 | $482,048 | 66,865 | $724,084 |
| Distributions reinvested | 620 | 7,780 | — | — |
| Repurchased | (22,003) | (271,391) | (7,925) | (92,454) |
| | | | | |
| Net increase | 18,402 | $218,437 | 58,940 | $631,6302 |
| |
| Class R5 shares | | | | |
|
| Sold | 1,183,682 | $15,138,724 | 3,584 | $34,031 |
| Distributions reinvested | 109 | 1,366 | — | — |
| Repurchased | (99,788) | (1,314,672) | (397) | (4,500) |
| | | | | |
| Net increase | 1,084,003 | $13,825,418 | 3,187 | $29,5312 |
| |
| 32 | Disciplined Value Fund | Annual report |
| | | | |
| | Year ended 3-31-11 | Year ended 3-31-10 |
| | Shares | Amount | Shares | Amount |
| Class ADV shares | | | | |
|
| Distributions reinvested | 29 | $354 | 10 | $111 |
| | | | | |
| Net increase | 29 | $354 | 10 | $111 |
| |
| Class NAV shares | | | | |
|
| Sold | 11,061,089 | $124,314,742 | 19,018,330 | $202,006,891 |
| Distributions reinvested | 350,468 | 4,394,874 | 104,798 | 1,182,121 |
| Repurchased | (384,097) | (4,795,972) | (199,017) | (2,317,135) |
| | | | | |
| Net increase | 11,027,460 | $123,913,644 | 18,924,111 | $200,871,8773 |
| |
| Net increase | 59,891,553 | $705,112,078 | 43,470,507 | $458,333,062 |
|
1 Period from 7-13-09 (inception date) to 3-31-10.
2 Period from 5-22-09 (inception date) to 3-31-10.
3 Period from 5-29-09 (inception date) to 3-31-10.
Affiliates of the Fund owned 100% of shares of beneficial interest of Class ADV and Class NAV on March 31, 2011.
Note 6 — Purchase and sale of securities
Purchases and sales of securities, other than short-term securities, aggregated $1,163,640,067 and $494,063,914, respectively, for the year ended March 31, 2011.
Note 7 — Reorganization
On July 1, 2009, the shareholders of John Hancock Classic Value Fund II (the Acquired Fund) voted to approve an Agreement and Plan of Reorganization (the Agreement) in exchange for a representative amount of shares of John Hancock Disciplined Value Fund (the Acquiring Fund).
The Agreement provided for (a) the acquisition of all the assets, subject to all of the liabilities, of the Acquired Fund in exchange for a representative amount of shares of the Acquiring Fund; (b) the liquidation of the Acquired Fund; and (c) the distribution to the Acquired Fund’s shareholders of such Acquiring Fund’s shares. The reorganization was intended to consolidate the Acquired Fund with a similar fund. The combined fund may be better positioned in the market to increase asset size and achieve economies of scale. As a result of the reorganization, the Acquiring Fund is the legal and accounting survivor.
Based on the opinion of tax counsel, the reorganization qualified as a tax-free reorganization for federal income tax purposes with no gain or loss recognized by the Acquired Fund or its shareholders. Thus, the investments were transferred to the Acquiring Fund at the Acquired Fund’s identified cost. All distributable amounts of net income and realized gains from the Acquired Fund were distributed prior to the reorganization. In addition, the expenses of the reorganization were borne by the Acquired Fund. The reorganization was effective immediately after the close of regularly scheduled trading on the New York Stock Exchange (NYSE) on July 10, 2009.
The following outlines the reorganization:
| | | | | | | |
| | | | | SHARES | SHARES | | |
| | | ACQUIRED NET | DEPRECIATION | REDEEMED | ISSUED | ACQUIRING | ACQUIRING |
| | | ASSET VALUE OF | OF ACQUIRED | BY THE | BY THE | FUND NET | FUND TOTAL NET |
| ACQUIRING | ACQUIRED | THE ACQUIRED | FUND’S | ACQUIRED | ACQUIRING | ASSETS PRIOR TO | ASSETS AFTER |
| FUND | FUND | FUND | INVESTMENTS | FUND | FUND | COMBINATION | COMBINATION |
|
| Disciplined | Classic | $31,086,602 | $2,067,505 | 6,066,189 | 3,421,290 | $146,891,793 | $177,978,395 |
| Value Fund | Value | | | | | | |
| | Fund II | | | | | | |
| |
| Annual report | Disciplined Value Fund | 33 |
Assuming the acquisition had been completed on April 1, 2009, the beginning of the annual reporting period, the Acquiring Fund’s pro forma results of operations for the year ended March 31, 2010 were as follows:
| | | | |
| Net investment income | $2,747,253 | | | |
| Net realized and unrealized gain | 113,536,316 | | | |
| Increase (decrease) in net assets from operations | 116,283,569 | | | |
See Note 5 for capital shares issued in connection with the above referenced reorganization.
| |
| 34 | Disciplined Value Fund | Annual report |
Auditors’ report
Report of Independent Registered Public Accounting Firm
To the Board of Trustees of John Hancock Funds III and Shareholders of John Hancock Disciplined Value Fund:
In our opinion, the accompanying statement of assets and liabilities, including the portfolio of investments, and the related statements of operations and of changes in net assets and the financial highlights present fairly, in all material respects, the financial position of John Hancock Disciplined Value Fund (the “Fund”) at March 31, 2011, and the results of its operations for the year then ended, the changes in its net assets for each of the two years then ended and the financial highlights for each of the fiscal periods ending March 31, 2009, 2010 and 2011, in conformity with accounting principles generally accepted in the United States of America. These financial statements and financial highlights (hereafter referred to as “financial statements”) are the responsibility of the Fund’s management; our responsibility is to express an opinion on these financial statements based on our audits. We conducted our audits of these financial statements in accordance with the standards of the Public Company Accounting Oversight Board (United States). Those standards require that we plan and perform the audit to obtain reasonable assurance about whether the financial statements are free of material misstatement. An audit includes examining, on a test basis, evidence supporting the amounts and disclosures in the financial statements, assessing the accounting principles used and significant estimates made by management, and evaluating the overall financial statement presentation. We believe that our audits, which included confirmation of securities at March 31, 2011 by correspondence with the custodian and brokers and the application of alternative auditing procedures where securities purchased confirmations had not been received, provide a reasonable basis for our opinion.
The financial highlights of the Fund for periods ending on or before August 31, 2008 were audited by another independent registered public accounting firm, whose report dated October 30, 2008 expressed an unqualified opinion thereon.
PricewaterhouseCoopers LLP
Boston, Massachusetts
May 20, 2011
| |
| Annual report | Disciplined Value Fund | 35 |
Tax information
Unaudited
For federal income tax purposes, the following information is furnished with respect to the distributions of the Fund, if any, paid during its taxable year ended March 31, 2011.
The Fund designates distributions to shareholders of $6,606,921 as a long-term capital gain dividend for the fiscal year ended March 31, 2011.
The Fund designates the maximum amount allowable of its net taxable income as qualified dividend income as provided in the Jobs and Growth Tax Relief Reconciliation Act of 2003. This amount will be reflected on Form 1099-DIV for the calendar year 2011.
The Fund designates the maximum amount allowable for the corporate dividends received deduction for the fiscal year ended March 31, 2011.
Shareholders will be mailed a 2011 Form 1099-DIV in January 2012. This will reflect the total of all distributions for calendar year 2011.
| |
| 36 | Disciplined Value Fund | Annual report |
Trustees and Officers
This chart provides information about the Trustees and Officers who oversee your John Hancock fund. Officers elected by the Trustees manage the day-to-day operations of the Fund and execute policies formulated by the Trustees.
| | |
| Independent Trustees | | |
| | | |
| Name, Year of Birth | Trustee | Number of John |
| Position(s) held with Fund | of the | Hancock funds |
| Principal occupation(s) and other | Trust | overseen by |
| directorships during past 5 years | since1 | Trustee |
| |
| Steven R. Pruchansky, Born: 1944 | 2006 | 47 |
|
| Chairperson (since January 2011); Chairman and Chief Executive Officer, Greenscapes of Southwest |
| Florida, Inc. (since 2000); Director and President, Greenscapes of Southwest Florida, Inc. (until 2000); |
| Member, Board of Advisors, First American Bank (since 2008); Managing Director, Jon James, LLC (real |
| estate) (since 2000); Director, First Signature Bank & Trust Company (until 1991); Director, Mast Realty |
| Trust (until 1994); President, Maxwell Building Corp. (until 1991). | | |
| |
| James F. Carlin, Born: 1940 | 2006 | 47 |
|
| Chief Executive Officer, Director and Treasurer, Alpha Analytical Laboratories (environmental, chemical |
| and pharmaceutical analysis) (since 1985); Part Owner and Treasurer, Lawrence Carlin Insurance |
| Agency, Inc. (since 1995); Chairman and Chief Executive Officer, CIMCO, LLC (management/ |
| investments) (since 1987). | | |
| |
| William H. Cunningham, Born: 1944 | 2006 | 47 |
|
| Professor, University of Texas, Austin, Texas (since 1971); former Chancellor, University of Texas System |
| and former President of the University of Texas, Austin, Texas; Director of the following: LIN Television |
| (since 2009); Lincoln National Corporation (insurance) (Chairman since 2009 and Director since 2006); |
| Resolute Energy Corporation (since 2009); Nanomedical Systems, Inc. (biotechnology company) |
| (Chairman since 2008); Yorktown Technologies, LP (tropical fish) (Chairman since 2007); Greater Austin |
| Crime Commission (since 2001); Southwest Airlines (since 2000); former Director of the following: |
| Introgen (manufacturer of biopharmaceuticals) (until 2008); Hicks Acquisition Company I, Inc. (until |
| 2007); Jefferson-Pilot Corporation (diversified life insurance company) (until 2006); and former Advisory |
| Director, JP Morgan Chase Bank (formerly Texas Commerce Bank–Austin) (until 2009). | |
| |
| Deborah C. Jackson,2 Born: 1952 | 2008 | 47 |
|
| Chief Executive Officer, American Red Cross of Massachusetts Bay (since 2002); Board of Directors of |
| Eastern Bank Corporation (since 2001); Board of Directors of Eastern Bank Charitable Foundation (since |
| 2001); Board of Directors of American Student Assistance Corp. (1996–2009); Board of Directors of |
| Boston Stock Exchange (2002–2008); Board of Directors of Harvard Pilgrim Healthcare (health benefits |
| company) (since 2007). | | |
| |
| Charles L. Ladner,2 Born: 1938 | 2006 | 47 |
|
| Vice Chairperson (since March 2011); Chairman and Trustee, Dunwoody Village, Inc. (retirement |
| services) (since 2008); Director, Philadelphia Archdiocesan Educational Fund (since 2009); Senior Vice |
| President and Chief Financial Officer, UGI Corporation (public utility holding company) (retired 1998); |
| Vice President and Director for AmeriGas, Inc. (retired 1998); Director of AmeriGas Partners, L.P. (gas |
| distribution) (until 1997); Director, EnergyNorth, Inc. (until 1995); Director, Parks and History Association |
| (Cooperating Association, National Park Service) (until 2005). | | |
| |
| Annual report | Disciplined Value Fund | 37 |
| | |
| Independent Trustees (continued) | | |
| |
| Name, Year of Birth | Trustee | Number of John |
| Position(s) held with Fund | of the | Hancock funds |
| Principal occupation(s) and other | Trust | overseen by |
| directorships during past 5 years | since1 | Trustee |
| |
| Stanley Martin,2 Born: 1947 | 2008 | 47 |
|
| Senior Vice President/Audit Executive, Federal Home Loan Mortgage Corporation (2004–2006); |
| Executive Vice President/Consultant, HSBC Bank USA (2000–2003); Chief Financial Officer/Executive |
| Vice President, Republic New York Corporation & Republic National Bank of New York (1998–2000); |
| Partner, KPMG LLP (1971–1998). | | |
| |
| Dr. John A. Moore, Born: 1939 | 2006 | 47 |
|
| President and Chief Executive Officer, Institute for Evaluating Health Risks, (nonprofit institution) |
| (until 2001); Senior Scientist, Sciences International (health research) (until 2003); Former | |
| Assistant Administrator & Deputy Administrator, Environmental Protection Agency; Principal, |
| Hollyhouse (consulting) (since 2000); Director, CIIT Center for Health Science Research (nonprofit |
| research) (until 2007). | | |
| |
| Patti McGill Peterson,2 Born: 1943 | 2006 | 47 |
|
| Principal, PMP Globalinc (consulting) (since 2007); Senior Associate, Institute for Higher Education Policy |
| (since 2007); Executive Director, CIES (international education agency) (until 2007); Vice President, |
| Institute of International Education (until 2007); Senior Fellow, Cornell University Institute of Public |
| Affairs, Cornell University (1997–1998); Former President Wells College, St. Lawrence University and the |
| Association of Colleges and Universities of the State of New York. Director of the following: Niagara |
| Mohawk Power Corporation (until 2003); Security Mutual Life (insurance) (until 1997); ONBANK (until |
| 1993). Trustee of the following: Board of Visitors, The University of Wisconsin, Madison (since 2007); |
| Ford Foundation, International Fellowships Program (until 2007); UNCF, International Development |
| Partnerships (until 2005); Roth Endowment (since 2002); Council for International Educational |
| Exchange (since 2003). | | |
| |
| Gregory A. Russo, Born: 1949 | 2008 | 47 |
|
| Vice Chairman, Risk & Regulatory Matters, KPMG LLP (“KPMG”) (2002–2006); Vice Chairman, Industrial |
| Markets, KPMG (1998–2002). | | |
| |
| Non-Independent Trustees3 | | |
| | | |
| Name, Year of Birth | Trustee | Number of John |
| Position(s) held with Fund | of the | Hancock funds |
| Principal occupation(s) and other | Trust | overseen by |
| directorships during past 5 years | since1 | Trustee |
| |
| Hugh McHaffie, Born: 1959 | 2010 | 47 |
|
| Executive Vice President, John Hancock Financial Services (since 2006, including prior positions); |
| President of John Hancock Trust and John Hancock Funds II (since 2009); Trustee, John Hancock retail |
| funds (since 2010); Chairman and Director, John Hancock Advisers, LLC, John Hancock Investment |
| Management Services, LLC and John Hancock Funds, LLC (since 2010); Senior Vice President, Individual |
| Business Product Management, MetLife, Inc. (1999–2006). | | |
| |
| 38 | Disciplined Value Fund | Annual report |
| | |
| Non-Independent Trustees3 (continued) | | |
| |
| Name, Year of Birth | Trustee | Number of John |
| Position(s) held with Fund | of the | Hancock funds |
| Principal occupation(s) and other | Trust | overseen by |
| directorships during past 5 years | since1 | Trustee |
| |
| John G. Vrysen, Born: 1955 | 2009 | 47 |
|
| Senior Vice President, John Hancock Financial Services (since 2006); Director, Executive Vice President |
| and Chief Operating Officer, John Hancock Advisers, LLC, John Hancock Investment Management |
| Services, LLC and John Hancock Funds, LLC (since 2005); Chief Operating Officer, John Hancock Funds II |
| and John Hancock Trust (since 2007); Chief Operating Officer, John Hancock retail funds (until 2009); |
| Trustee, John Hancock retail funds (since 2009). | | |
| |
| Principal officers who are not Trustees | | |
| | | |
| Name, Year of Birth | | Officer |
| Position(s) held with Fund | | of the |
| Principal occupation(s) and other | | Trust |
| directorships during past 5 years | | since |
| |
| Keith F. Hartstein, Born: 1956 | | 2006 |
|
| President and Chief Executive Officer | | |
| Senior Vice President, John Hancock Financial Services (since 2004); Director, President and Chief |
| Executive Officer, John Hancock Advisers, LLC and John Hancock Funds, LLC (since 2005); Director, |
| John Hancock Asset Management a division of Manulife Asset Management (US) LLC (since 2005); |
| Director, John Hancock Investment Management Services, LLC (since 2006); President and Chief |
| Executive Officer, John Hancock retail funds (since 2005); Member, Investment Company Institute Sales |
| Force Marketing Committee (since 2003). | | |
| |
| Andrew G. Arnott, Born: 1971 | | 2009 |
|
| Senior Vice President and Chief Operating Officer | | |
| Senior Vice President, John Hancock Financial Services (since 2009); Executive Vice President, |
| John Hancock Advisers, LLC (since 2005); Executive Vice President, John Hancock Investment |
| Management Services, LLC (since 2006); Executive Vice President, John Hancock Funds, LLC (since |
| 2004); Chief Operating Officer, John Hancock retail funds (since 2009); Senior Vice President, |
| John Hancock retail funds (since 2010); Vice President, John Hancock Funds II and John Hancock Trust |
| (since 2006); Senior Vice President, Product Management and Development, John Hancock Funds, |
| LLC (until 2009). | | |
| |
| Thomas M. Kinzler, Born: 1955 | | 2006 |
|
| Secretary and Chief Legal Officer | | |
| Vice President, John Hancock Financial Services (since 2006); Secretary and Chief Legal Counsel, |
| John Hancock Advisers, LLC, John Hancock Investment Management Services, LLC and John Hancock |
| Funds, LLC (since 2007); Secretary and Chief Legal Officer, John Hancock retail funds, John Hancock |
| Funds II and John Hancock Trust (since 2006); Vice President and Associate General Counsel, |
| Massachusetts Mutual Life Insurance Company (1999–2006); Secretary and Chief Legal Counsel, MML |
| Series Investment Fund (2000–2006); Secretary and Chief Legal Counsel, MassMutual Select Funds and |
| MassMutual Premier Funds (2004–2006). | | |
| |
| Annual report | Disciplined Value Fund | 39 |
| |
| Principal officers who are not Trustees (continued) | |
| |
| Name, Year of Birth | Officer |
| Position(s) held with Fund | of the |
| Principal occupation(s) and other | Trust |
| directorships during past 5 years | since |
| |
| Francis V. Knox, Jr., Born: 1947 | 2006 |
|
| Chief Compliance Officer | |
| Vice President, John Hancock Financial Services (since 2005); Chief Compliance Officer, John Hancock |
| retail funds, John Hancock Funds II, John Hancock Trust, John Hancock Advisers, LLC and John Hancock |
| Investment Management Services, LLC (since 2005); Vice President and Chief Compliance Officer, | |
| John Hancock Asset Management a division of Manulife Asset Management (US) LLC (2005–2008). |
| |
| Charles A. Rizzo, Born: 1957 | 2007 |
|
| Chief Financial Officer | |
| Vice President, John Hancock Financial Services (since 2008); Senior Vice President, John Hancock | |
| Advisers, LLC and John Hancock Investment Management Services, LLC (since 2008); Chief Financial |
| Officer, John Hancock retail funds, John Hancock Funds II and John Hancock Trust (since 2007); | |
| Assistant Treasurer, Goldman Sachs Mutual Fund Complex (2005–2007); Vice President, Goldman | |
| Sachs (2005–2007). | |
| |
| Salvatore Schiavone, Born: 1965 | 2010 |
|
| Treasurer | |
| Assistant Vice President, John Hancock Financial Services (since 2007); Vice President, John Hancock |
| Advisers, LLC and John Hancock Investment Management Services, LLC (since 2007); Treasurer, | |
| John Hancock retail funds (since 2010); Treasurer, John Hancock Closed-End Funds (since 2009); | |
| Assistant Treasurer, John Hancock Funds II and John Hancock Trust (since 2007); Assistant Treasurer, |
| John Hancock retail funds, John Hancock Funds II and John Hancock Trust (2007–2009); Assistant | |
| Treasurer, Fidelity Group of Funds (2005–2007); Vice President, Fidelity Management Research | |
| Company (2005–2007). | |
The business address for all Trustees and Officers is 601 Congress Street, Boston, Massachusetts 02210-2805.
The Statement of Additional Information of the Fund includes additional information about members of the Board of Trustees of the Fund and is available without charge, upon request, by calling 1-800-225-5291.
1 Each Trustee holds office until his or her successor is elected and qualified, or until the Trustee’s death, retirement, resignation or removal.
2 Member of Audit Committee.
3 Because Messrs. McHaffie and Vrysen are senior executives or directors with the Adviser and/or its affiliates, each of them is considered an “interested person,” as defined in the Investment Company Act of 1940, of the Fund.
| |
| 40 | Disciplined Value Fund | Annual report |
More information
| | |
| Trustees | Investment adviser | |
| Steven R. Pruchansky, Chairperson | John Hancock Investment Management | |
| James F. Carlin | Services, LLC | |
| William H. Cunningham | | |
| Deborah C. Jackson* | Subadviser | |
| Charles L. Ladner, Vice Chairperson* | Robeco Investment Management, Inc. | |
| Stanley Martin* | | |
| Hugh McHaffie† | Principal distributor | |
| Dr. John A. Moore | John Hancock Funds, LLC | |
| Patti McGill Peterson* | | |
| Gregory A. Russo | Custodian | |
| John G. Vrysen† | State Street Bank and Trust Company | |
| | | |
| Officers | Transfer agent | |
| Keith F. Hartstein | John Hancock Signature Services, Inc. | |
| President and Chief Executive Officer | | |
| | Legal counsel | |
| Andrew G. Arnott | K&L Gates LLP | |
| Senior Vice President and Chief Operating Officer | | |
| | Independent registered | |
| Thomas M. Kinzler | public accounting firm | |
| Secretary and Chief Legal Officer | PricewaterhouseCoopers LLP | |
| | | |
| Francis V. Knox, Jr. | | |
| Chief Compliance Officer | | |
| | | |
| Charles A. Rizzo | | |
| Chief Financial Officer | | |
| | | |
| Salvatore Schiavone | | |
| Treasurer | | |
| | |
| *Member of the Audit Committee | | |
| †Non-Independent Trustee | | |
The Fund’s proxy voting policies and procedures, as well as the Fund’s proxy voting record for the most recent twelve-month period ended June 30, are available free of charge on the Securities and Exchange Commission (SEC) Web site at www.sec.gov or on our Web site.
The Fund’s complete list of portfolio holdings, for the first and third fiscal quarters, is filed with the SEC on Form N-Q. The Fund’s Form N-Q is available on our Web site and the SEC’s Web site, www.sec.gov, and can be reviewed and copied (for a fee) at the SEC’s Public Reference Room in Washington, DC. Call 1-800-SEC-0330 to receive information on the operation of the SEC’s Public Reference Room.
We make this information on your fund, as well as monthly portfolio holdings, and other fund details available on our Web site www.jhfunds.com or by calling 1-800-225-5291.
| | |
| You can also contact us: | | |
| 1-800-225-5291 | Regular mail: | Express mail: |
| jhfunds.com | John Hancock Signature Services, Inc. | John Hancock Signature Services, Inc. |
| | P.O. Box 55913 | Mutual Fund Image Operations |
| | Boston, MA 02205-5913 | 30 Dan Road |
| | | Canton, MA 02021 |
| |
| Annual report | Disciplined Value Fund | 41 |

1-800-225-5291
1-800-554-6713 TDD
1-800-338-8080 EASI-Line
www.jhfunds.com
Now available: electronic delivery
www.jhfunds.com/edelivery
| |
| This report is for the information of the shareholders of John Hancock Disciplined Value Fund. | 3400A 3/11 |
| It is not authorized for distribution to prospective investors unless preceded or accompanied by a prospectus. | 5/11 |
| | | |
| John Hancock Core High Yield Fund | | | |
| |
| Table of Contents | | | |
| |
| Management’s discussion of Fund performance | .................................................................................................. | | Page 3 |
| A look at performance | .................................................................................................. | | Page 4 |
| Your expenses | .................................................................................................. | | Page 6 |
| Portfolio summary | .................................................................................................. | | Page 7 |
| Portfolio of investments | .................................................................................................. | | Page 8 |
| Financial statements | .................................................................................................. | | Page 11 |
| Financial highlights | .................................................................................................. | | Page 14 |
| Notes to financial statements | .................................................................................................. | | Page 16 |
| Trustees and Officers | .................................................................................................. | | Page 23 |
| More information | .................................................................................................. | | Page 31 |
John Hancock Core High Yield Fund
Management’s Discussion of Fund Performance
By John Hancock Asset Management (formerly MFC Global Investment Management (U.S.A.) Limited) 1
Despite substantial volatility, the high-yield market produced strong results in the 12 months ended March 31, 2011, returning 14.14% as measured by the Bank of America Merrill Lynch U.S. High Yield Master II Constrained Index. May 2010 was the weakest month, as markets came to grips with sovereign debt issues in southern Europe and the possibility of a double-dip recession in the U.S. economy. July was the strongest month. Within the high-yield market, lower-rated paper outperformed higher-rated issues.
For this 12-month period, John Hancock Core High Yield Fund’s Class A shares returned 19.34% at net asset value, outperforming the 14.14% return of its benchmark index, the Bank of America Merrill Lynch U.S. High Yield Master II Constrained Index, and the average 13.58% return of Morningstar, Inc.’s high-yield bond fund category.
Portfolio Review
The Fund’s performance was enhanced by credit-quality focus, new issues and security selection. At March 31, 2011, the Fund’s largest sector overweights relative to the benchmark were consumer products, energy and gaming. The financial sector was the largest underweight. The Fund’s average credit rating remained stable throughout the period at B-.
Some of the better-performing securities were issued by MTR Gaming Group, Inc. and Circus Circus, a casino owned by Mandalay Resort Group. MTR Gaming, a hospitality company based in Chester, West Virginia, holds (mostly through several subsidiaries) hotels, casinos and sports facilities. The company continues to actively look for additional opportunities for acquisitions. Circus Circus and Mandalay Resort Group are under the MGM Resorts International umbrella. The Fund’s largest detractor from performance was Dynegy Holdings, Inc.
This commentary reflects the views of the portfolio management team through the end of the Fund’s period discussed in this report. The team’s statements reflect their own opinions. As such, they are in no way guarantees of future events, and are not intended to be used as investment advice or a recommendation regarding any specific security. They are also subject to change at any time as market and other conditions warrant.
Past performance is no guarantee of future results.
The major factors in this Fund's performance are interest rate and credit risk. When interest rates rise, bond prices usually fall. Higher-yielding bonds are riskier than lower-yielding bonds, and their value may fluctuate more in response to market conditions. The Fund may not be appropriate for all investors. Sector investing is subject to greater risks than the market as a whole. Because the Fund may focus on particular sectors of the economy, its performance may depend on the performance of those sectors.
1 Manulife Asset Management (North America) Limited is doing business as John Hancock Asset Management.
A look at performance
Core High Yield Fund
For the period ended March 31, 2011
| | | | | | | | | | | | | |
| | | | | | | | | | | | SEC 30-day | | SEC 30-day yield |
| | Average annual total returns (%) | | Cumulative returns (%) | | | | yield (%) | | (%) |
| | with maximum sales charge (POP) | | with maximum sales charge (POP) | | | (subsidized) | | (unsubsidized)2 |
|
| | 1- | 5- | 10- | Since | | 1-year | 5-year | 10- | Since | | as of | | as of |
| | year | year | year | Inception1 | | | | year | Inception1 | | 3-31-11 | | 3-31-11 |
|
| A | 13.94 | - | - | 24.56 | | 13.94 | - | - | 52.46 | | 6.93 | | 6.21 |
|
| I3 | 19.87 | - | - | 28.03 | | 19.87 | - | - | 60.72 | | 7.64 | | 6.62 |
|
Performance figures assume all distributions are reinvested. Public offering price (POP) figures reflect maximum sales charge on Class A shares of 4.5%. Sales charges are not applicable for Class I shares.
The expense ratios of the Fund, both net (including any fee waivers or expense limitations) and gross (excluding any fee waivers or expense limitations), are set forth according to the most recent publicly available prospectuses for the Fund and may differ from those disclosed in the Financial Highlights tables in this report. The fee waivers and expense limitations are contractual at least until 7-31-11. Had the fee waivers and expense limitations not been in place gross expenses would apply. The expense ratios are as follows:
| | | | | | |
| | Class A | Class I | | | | |
| | | | |
| Net (%) | 1.25 | 0.84 | | | | |
| | | | |
| Gross (%) | 1.60 | 3.57 | | | | |
| | | | |
The returns reflect past results and should not be considered indicative of future performance. The return and principal value of an investment will fluctuate so that shares, when redeemed, may be worth more or less than their original cost. Due to market volatility, the Fund’s current performance may be higher or lower than the performance shown. For performance data current to the most recent month end, please call 1–800–225–5291 or visit the Fund’s Web site at www.jhfunds.com.
The performance table above and the chart on the next page do not reflect the deduction of taxes that a shareholder would pay on fund distributions or the redemption of fund shares. The Fund’s performance results reflect any applicable expense reductions, without which the expenses would increase and results would have been less favorable.
Footnotes on following page.
A look at performance
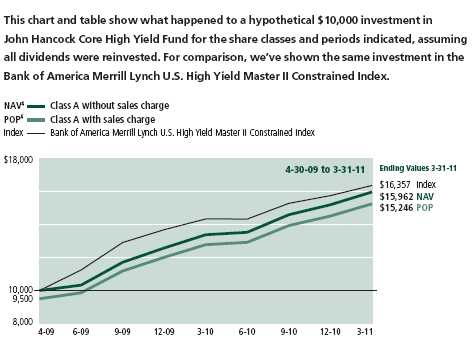
| | | |
| | Class I3 | | |
| | |
| Began | 4-30-09 | | |
| | |
| NAV | $16,072 | | |
| | |
| POP | $16,072 | | |
| | |
| Index | $16,357 | | |
| | |
Bank of America Merrill Lynch U.S. High Yield Master II Constrained Index is an unmanaged index composed of U.S. currency high-yield bonds issued by U.S. and non-U.S. issuers.
It is not possible to invest directly in an index. Index figures do not reflect sales charges, which would have resulted in lower values if they did.
1 From 4-30-09.
2 Unsubsidized yields reflect what the yield would have been without the effect of reimbursements and waivers.
3 For certain types of investors, as described in the Fund’s prospectuses.
4 NAV represents net asset value and POP represents public offering price. Performance of the classes will vary based on the difference in sales charges paid by shareholders investing in the different classes and the fee structure of those classes.
| |
| Annual report | Core High Yield Fund |
| 5 |
Your expenses
These examples are intended to help you understand your ongoing operating expenses.
Understanding your fund expenses
As a shareholder of the Fund, you incur two types of costs:
• Transaction costs which include sales charges (loads) on purchases or redemptions (if applicable), minimum account fee charge, etc.
• Ongoing operating expenses including management fees, distribution and service fees (if applicable), and other fund expenses.
We are going to present only your ongoing operating expenses here.
Actual expenses/actual returns
This example is intended to provide information about your fund’s actual ongoing operating expenses, and is based on your fund’s actual return. It assumes an account value of $1,000.00 on October 1, 2010 with the same investment held until March 31, 2011.
| | | |
| | Account value | Ending value | Expenses paid during |
| | on 10-1-10 | on 3-31-11 | period ended 3-31-111 |
|
| Class A | $1,000.00 | $1,094.40 | $6.27 |
|
| Class I | 1,000.00 | 1,097.20 | 4.39 |
|
Together with the value of your account, you may use this information to estimate the operating expenses that you paid over the period. Simply divide your account value at March 31, 2011, by $1,000.00, then multiply it by the “expenses paid” for your share class from the table above. For example, for an account value of $8,600.00, the operating expenses should be calculated as follows:
Example
[ My account value $8,600.00 / $1,000.00 = 8.6 ] x $[ “expenses paid” from table ] = My actual expenses
Hypothetical example for comparison purposes
This table allows you to compare your fund’s ongoing operating expenses with those of any other fund. It provides an example of the Fund’s hypothetical account values and hypothetical expenses based on each class’s actual expense ratio and an assumed 5% annualized return before expenses (which is not your fund’s actual return). It assumes an account value of $1,000.00 on October 1, 2010, with the same investment held until March 31, 2011. Look in any other fund shareholder report to find its hypothetical example and you will be able to compare these expenses. Please remember that these hypothetical account values and expenses may not be used to estimate the actual ending account balance or expenses you paid for the period.
| | | |
| | Account value | Ending value | Expenses paid during |
| | on 10-1-10 | on 3-31-11 | period ended 3-31-111 |
|
| Class A | $1,000.00 | $1,018.90 | $6.04 |
|
| Class I | 1,000.00 | 1,020.70 | 4.23 |
|
Remember, these examples do not include any transaction costs, therefore, these examples will not help you to determine the relative total costs of owning different funds. If transaction costs were included, your expenses would have been higher. See the prospectus for details regarding transaction costs.
1 Expenses are equal to the Fund's annualized expense ratio of 1.20% and 0.84% for Class A and Class I shares, multiplied by the average account value over the period, multiplied by 182/365 (to reflect the one-half year period).
| |
| Core High Yield Fund | |
| |
| |
| Portfolio Summary | |
| | Value as a |
| | percentage of |
| Top 10 Issuers1 (46.3% of Net Assets) | Fund's net assets |
| MTR Gaming Group, Inc., Series B | 5.5% |
| Columbus International, Inc. | 5.1% |
| Offshore Group Investments, Ltd. | 4.9% |
| TMX Finance LLC/TitleMax Finance Corp. | 4.9% |
| Southern States Cooperative, Inc. | 4.8% |
| Connacher Oil and Gas, Ltd. | 4.7% |
| BioScrip, Inc. | 4.6% |
| Mandalay Resort Group | 4.4% |
| Kratos Defense & Security Solutions, Inc. | 3.9% |
| UPM-Kymmene OYJ | 3.5% |
| |
| | Value as a |
| | percentage of |
| Sector Composition2 | Fund's net assets |
| Consumer Discretionary | 26% |
| Energy | 17% |
| Financials | 13% |
| Consumer Staples | 11% |
| Industrials | 10% |
| Health Care | 9% |
| Telecommunication Services | 6% |
| Materials | 5% |
| Information Technology | 2% |
| Utilities | 1% |
| |
| | Value as a |
| | percentage of |
| Portfolio Diversification | Fund's net assets |
| Corporate Bonds | 99% |
| Convertible Bonds | 1% |
| |
| | Value as a |
| | percentage of |
| Country Composition | Fund's net assets |
| United States | 69% |
| Canada | 11% |
| Barbados | 5% |
| Cayman Islands | 5% |
| Finland | 3% |
| Bermuda | 3% |
| Nigeria | 2% |
| Italy | 2% |
| |
| | Value as a |
| | percentage of |
| Quality Composition3 | Fund’s net assets |
| BB | 18% |
| B | 67% |
| CCC & Below | 13% |
| Not Rated | 2% |
1 Cash and cash equivalents are not included in Top 10 Issuers.
2 Sector investing is subject to greater risks than the market as a whole. Because the Fund may focus on particular sectors of the economy, its performance may depend on the performance of those sectors.
3 Ratings are from Moody’s Investors Services, Inc. If not available, we have used S&P ratings. In the absence of ratings from these agencies, we have used Fitch, Inc. ratings. Not Rated securities are those with no ratings available. They may have internal ratings similar to those shown. All as of 3-31-11 and do not reflect subsequent changes.
Core High Yield Fund
As of 3-31-11
| | | | |
| | | Maturity | | |
| | Rate (%) | date | Par value | Value |
| |
| Corporate Bonds 98.87% | | | | $16,839,173 |
|
| (Cost $15,112,015) | | | | |
| |
| Consumer Discretionary 26.04% | | | | 4,434,812 |
|
| |
| Auto Components 1.54% | | | | |
| Uncle Acquisition 2010 Corp. (S) | 8.625 | 02/15/19 | $250,000 | 262,500 |
| | | | | |
| Diversified Consumer Services 6.70% | | | | |
| Bankrate, Inc. (S) | 11.750 | 07/15/15 | 500,000 | 568,750 |
| Trans Union LLC/TransUnion Financing Corp. (S) | 11.375 | 06/15/18 | 500,000 | 571,250 |
| | | | | |
| Hotels, Restaurants & Leisure 12.10% | | | | |
| Caesars Entertainment Operating Company, Inc. | 11.250 | 06/01/17 | 250,000 | 284,062 |
| Mandalay Resort Group | 7.625 | 07/15/13 | 750,000 | 742,500 |
| Marina District Finance Company, Inc. (S) | 9.875 | 08/15/18 | 100,000 | 104,625 |
| MTR Gaming Group, Inc., Series B | 9.000 | 06/01/12 | 1,000,000 | 930,000 |
| | | | | |
| Media 5.70% | | | | |
| AMO Escrow Corp. (S) | 11.500 | 12/15/17 | 100,000 | 106,750 |
| Columbus International, Inc. (S) | 11.500 | 11/20/14 | 750,000 | 864,375 |
| |
| Consumer Staples 10.82% | | | | 1,843,750 |
|
| |
| Food Products 7.85% | | | | |
| Reddy Ice Corp. | 11.250 | 03/15/15 | 500,000 | 521,250 |
| Southern States Cooperative, Inc. (S) | 11.250 | 05/15/15 | 750,000 | 815,625 |
| | | | | |
| Tobacco 2.97% | | | | |
| Alliance One International, Inc. | 10.000 | 07/15/16 | 500,000 | 506,875 |
| |
| Energy 17.51% | | | | 2,981,687 |
|
| |
| Energy Equipment & Services 10.88% | | | | |
| Allis-Chalmers Energy, Inc. | 9.000 | 01/15/14 | 500,000 | 510,625 |
| Geokinetics Holdings USA, Inc. | 9.750 | 12/15/14 | 250,000 | 240,312 |
| Offshore Group Investments, Ltd. | 11.500 | 08/01/15 | 750,000 | 832,500 |
| Pioneer Drilling Company | 9.875 | 03/15/18 | 250,000 | 268,750 |
| | | | | |
| Oil, Gas & Consumable Fuels 6.63% | | | | |
| Connacher Oil and Gas, Ltd. (S) | 10.250 | 12/15/15 | 750,000 | 795,000 |
| Gibson Energy ULC/GEP Midstream Finance Corp. | 11.750 | 05/27/14 | 300,000 | 334,500 |
| |
| Financials 13.03% | | | | 2,218,735 |
|
| |
| Diversified Financial Services 9.42% | | | | |
| CNG Holdings, Inc. (S) | 12.250 | 02/15/15 | 200,000 | 223,000 |
| Reliance Intermediate Holdings LP (S) | 9.500 | 12/15/19 | 500,000 | 548,750 |
| TMX Finance LLC/TitleMax Finance Corp. (S) | 13.250 | 07/15/15 | 750,000 | 832,500 |
| | | | | |
| Real Estate Management & Development 3.61% | | | | |
| CB Richard Ellis Services, Inc. | 11.625 | 06/15/17 | 100,000 | 118,000 |
| Kennedy-Wilson, Inc. (S) | 8.750 | 04/01/19 | 500,000 | 496,485 |
| |
| Health Care 9.02% | | | | 1,537,002 |
|
| |
| Health Care Equipment & Supplies 1.59% | | | | |
| Apria Healthcare Group, Inc. | 12.375 | 11/01/14 | 250,000 | 271,563 |
| | | | | |
| Health Care Providers & Services 7.43% | | | | |
| American Renal Holdings Company, Inc. | 8.375 | 05/15/18 | 100,000 | 105,500 |
| BioScrip, Inc. | 10.250 | 10/01/15 | 750,000 | 780,938 |
| OnCure Holdings, Inc. | 11.750 | 05/15/17 | 175,000 | 175,438 |
| |
| See notes to financial statements | |
| 8 |
Core High Yield Fund
As of 3-31-11
| | | | |
| | | Maturity | | |
| | Rate (%) | date | Par value | Value |
| Health Care (continued) | | | | |
|
| Radiation Therapy Services, Inc. | 9.875 | 04/15/17 | $150,000 | $153,000 |
| Radnet Management, Inc. | 10.375 | 04/01/18 | 50,000 | 50,563 |
| | | | | |
| Industrials 8.36% | | | | 1,423,937 |
|
| | | | | |
| Aerospace & Defense 3.88% | | | | |
| Kratos Defense & Security Solutions, Inc. | 10.000 | 06/01/17 | 600,000 | 661,500 |
| | | | | |
| Commercial Services & Supplies 1.22% | | | | |
| Casella Waste Systems, Inc. (S) | 7.750 | 02/15/19 | 100,000 | 100,000 |
| Garda World Security Corp. (S) | 9.750 | 03/15/17 | 100,000 | 107,750 |
| | | | | |
| Marine 1.69% | | | | |
| Commercial Barge Line Company | 12.500 | 07/15/17 | 250,000 | 288,125 |
| | | | | |
| Trading Companies & Distributors 1.57% | | | | |
| FGI Operating Company, Inc. | 10.250 | 08/01/15 | 250,000 | 266,562 |
| | | | | |
| Information Technology 1.65% | | | | 280,625 |
|
| | | | | |
| IT Services 1.65% | | | | |
| Unisys Corp. | 12.500 | 01/15/16 | 250,000 | 280,625 |
| | | | | |
| Materials 4.74% | | | | 806,750 |
|
| | | | | |
| Chemicals 0.60% | | | | |
| Nexeo Solutions LLC/Nexeo Solutions Finance Corp. (S) | 8.375 | 03/01/18 | 100,000 | 102,000 |
| | | | | |
| Metals & Mining 0.65% | | | | |
| Novelis, Inc. (S) | 8.750 | 12/15/20 | 100,000 | 110,000 |
| | | | | |
| Paper & Forest Products 3.49% | | | | |
| UPM-Kymmene OYJ (S) | 7.450 | 11/26/27 | 600,000 | 594,750 |
| | | | | |
| Telecommunication Services 6.47% | | | | 1,102,500 |
|
| | | | | |
| Diversified Telecommunication Services 6.47% | | | | |
| Broadview Networks Holdings, Inc. | 11.375 | 09/01/12 | 250,000 | 245,000 |
| Global Crossing, Ltd. | 12.000 | 09/15/15 | 500,000 | 570,000 |
| Wind Acquisition Finance SA (S) | 11.750 | 07/15/17 | 250,000 | 287,500 |
| | | | | |
| Utilities 1.23% | | | | 209,375 |
|
| | | | | |
| Independent Power Producers & Energy Traders 1.23% | | | | |
| Dynegy Holdings, Inc. | 8.375 | 05/01/16 | 250,000 | 209,375 |
| |
| Convertible Bonds 1.78% | | | | $303,000 |
|
| (Cost $294,206) | | | | |
| |
| Industrials 1.78% | | | | 303,000 |
|
| Sea Trucks Group (10.000% Steps up to 11.000% on | | | | |
| 7-31-12) | 10.000 | 01/31/15 | 300,000 | 303,000 |
| |
| See notes to financial statements | |
| 9 |
Core High Yield Fund
As of 3-31-11
| | |
| | Par value | Value |
| |
| Short-Term Investments 0.76% | | $130,000 |
|
| (Cost $130,000) | | |
| |
| Repurchase Agreement 0.76% | | 130,000 |
|
| Repurchase Agreement with State Street Corp. dated 3-31-11 at | | |
| 0.010% to be repurchased at $130,000 on 4-1-11, collateralized by | | |
| $135,000 U.S. Treasury Bills, 1.000% due 4-30-12 (valued at | | |
| $136,507, including interest) | $130,000 | 130,000 |
| |
| Total investments (Cost $15,536,221)† 101.41% | | $17,272,173 |
|
| Other assets and liabilities, net (1.41%) | | ($240,495) |
|
| Total net assets 100.00% | | $17,031,678 |
|
The percentage shown for each investment category is the total value of the category as a percentage of the net assets of the Fund.
(S) These securities are exempt from registration under Rule 144A of the Securities Act of 1933. Such securities may be resold, normally to qualified institutional buyers, in transactions exempt from registration. Rule 144A securities amounted to $7,491,610 or 43.99% of the Fund's net assets as of 3-31-11.
† At 3-31-11, the aggregate cost of investment securities for federal income tax purposes was $15,536,279. Net unrealized appreciation aggregated $1,735,894, of which $1,745,667 related to appreciated investment securities and $9,773 related to depreciated investment securities.
The portfolio had the following country concentration as a percentage of total net assets on 3-31-11:
| | | | | |
| United States | 69% | | | | |
| Canada | 11% | | | | |
| Barbados | 5% | | | | |
| Cayman Islands | 5% | | | | |
| Finland | 3% | | | | |
| Bermuda | 3% | | | | |
| Nigeria | 2% | | | | |
| Italy | 2% | | | | |
| |
| See notes to financial statements | |
| 10 |
Core High Yield Fund
Statement of Assets and Liabilities — 3-31-11
| |
| Assets | |
|
| Investments in unaffiliated issuers, at value | |
| (Cost $15,406,221) | $17,142,173 |
| Repurchase agreements, at value (Cost $130,000) | 130,000 |
| | |
| Total investments, at value (Cost $15,536,221) | 17,272,173 |
| | |
| Cash | 136,613 |
| Receivable for investments sold | 1,255,938 |
| Dividends and interest receivable | 427,722 |
| Receivable due from adviser | 215 |
| Other receivables and prepaid expenses | 694 |
| | |
| Total assets | 19,093,355 |
| |
| |
| Liabilities | |
|
| Payable for investments purchased | 1,869,923 |
| Distributions payable | 135,094 |
| Payable to affiliates | |
| Accounting and legal services fees | 548 |
| Transfer agent fees | 5,175 |
| Trustees' fees | 74 |
| Other liabilities and accrued expenses | 50,863 |
| | |
| Total liabilities | 2,061,677 |
| |
| |
| Net assets | |
|
| Capital paid-in | $14,988,504 |
| Accumulated undistributed net investment income | 5,697 |
| Accumulated net realized gain on investments | 301,525 |
| Net unrealized appreciation (depreciation) on | |
| investments | 1,735,952 |
| | |
| Net assets | $17,031,678 |
| |
| |
| Net asset value per share | |
|
| Based on net asset values and shares | |
| outstanding-the Fund has an unlimited number of | |
| shares authorized with no par value | |
| Class A ($17,003,290 ÷ 1,497,500 shares) | $11.35 |
| Class I ($28,388 ÷ 2,500 shares) | $11.36 |
| |
| Maximum offering price per share | |
| Class A (net asset value per share ÷ 95.5%)1 | $11.88 |
1 On single retail sales of less than $50,000. On sales of $50,000 or more and on group sales the offering price is reduced.
| |
| The accompanying notes are an integral part of the financial statements. | |
| 11 |
Core High Yield Fund
Statement of Operations — For the year ended 3-31-11
| |
| Investment income | |
|
| Interest | $1,956,076 |
| Less foreign taxes withheld | (500) |
| | |
| Total investment income | 1,955,576 |
| |
| Expenses | |
|
| Investment management fees (Note 4) | 113,559 |
| Distribution and service fees (Note 4) | 43,603 |
| Accounting and legal services fees (Note 4) | 2,852 |
| Transfer agent fees (Note 4) | 24,692 |
| Trustees' fees (Note 4) | 1,533 |
| State registration fees (Note 4) | 69 |
| Professional fees | 51,841 |
| Custodian fees | 12,574 |
| Registration and filing fees | 19,357 |
| Other | 86 |
| | |
| Total expenses | 270,166 |
| | |
| Less expense reductions (Note 4) | (59,709) |
| | |
| Net expenses | 210,457 |
| |
| Net investment income | 1,745,119 |
| |
| |
| Realized and unrealized gain | |
|
| Net realized gain on | |
| Investments | 1,053,074 |
| Change in net unrealized appreciation | |
| (depreciation) of | |
| Investments | 298,683 |
| | |
| Net realized and unrealized gain | 1,351,757 |
| |
| Increase in net assets from operations | $3,096,876 |
| |
| The accompanying notes are an integral part of the financial statements. | |
| 12 |
Core High Yield Fund
Statements of Changes in Net Assets
| | |
| | Year ended | Year ended |
| | 3-31-11 | 3-31-10 |
| Increase (decrease) in net assets | | |
|
| From operations | | |
| Net investment income | $1,745,119 | $1,481,237 |
| Net realized gain | 1,053,074 | 1,893,102 |
| Change in net unrealized appreciation | | |
| (depreciation) | 298,683 | 1,437,269 |
| | | |
| Increase in net assets resulting from | | |
| operations | 3,096,876 | 4,811,608 |
| |
| |
| Distributions to shareholders | | |
| From net investment income | | |
| Class A | (1,775,169) | (1,474,324) |
| Class I | (3,068) | (2,530) |
| From net realized gain | | |
| Class A | (1,675,553) | (941,793) |
| Class I | (2,797) | (1,572) |
| | | |
| Total distributions | (3,456,587) | (2,420,219) |
| |
| From Fund share transactions (Note 5) | — | 15,000,000 |
| |
| |
| Total increase (decrease) | (359,711) | 17,391,389 |
| |
| Net assets | | |
|
| Beginning of year | 17,391,389 | — |
| | | |
| End of year | $17,031,678 | $17,391,389 |
| |
| Accumulated undistributed net investment | | |
| income | $5,697 | $17,569 |
| |
| The accompanying notes are an integral part of the financial statements. | |
| 13 |
Core High Yield Fund
Financial Highlights (For a share outstanding throughout the period)
| | | | |
| Class A Shares | | | | |
| | | |
| Period ended | 3-31-11 | 3-31-101 | | |
| | | | | |
| Per share operating performance | | | | |
| | |
| Net asset value, beginning of year | $11.59 | $10.00 | | |
| Net investment income2 | 1.16 | 0.99 | | |
| Net realized and unrealized gain on investments | 0.92 | 2.21 | | |
| | | | | |
| Total from investment operations | 2.08 | 3.20 | | |
| | | | | |
| Less distributions | | | | |
| From net investment income | (1.20) | (0.98) | | |
| From net realized gain | (1.12) | (0.63) | | |
| | | | | |
| Total distributions | (2.32) | (1.61) | | |
| | | | | |
| Net asset value, end of year | $11.35 | $11.59 | | |
| | | | | |
| Total return (%)3 | 19.34 | 33.754 | | |
| | | | | |
| Ratios and supplemental data | | | | |
| | |
| Net assets, end of year (in millions) | $17 | $17 | | |
| Ratios (as a percentage of average net assets): | | | | |
| Expenses before reductions | 1.55 | 1.365 | | |
| Expenses net of fee waivers | 1.21 | 1.135 | | |
| Net investment income | 9.99 | 9.825 | | |
| Portfolio turnover (%) | 207 | 389 | | |
1 Period from 4-30-09 (inception date) to 3-31-10.
2 Based on the average daily shares outstanding.
3 Total returns would have been lower had certain expenses not been reduced during the periods shown.
4 Not annualized.
5 Annualized.
| |
| The accompanying notes are an integral part of the financial statements. | |
| 14 |
Core High Yield Fund
Financial Highlights (For a share outstanding throughout the period)
| | | | |
| Class I Shares | | | | |
| | | |
| Period ended | 3-31-11 | 3-31-101 | | |
| | | | | |
| Per share operating performance | | | | |
| | |
| Net asset value, beginning of year | $11.59 | $10.00 | | |
| Net investment income2 | 1.21 | 1.02 | | |
| Net realized and unrealized gain on investments | 0.92 | 2.20 | | |
| | | | | |
| Total from investment operations | 2.13 | 3.22 | | |
| | | | | |
| Less distributions | | | | |
| From net investment income | (1.24) | (1.00) | | |
| From net realized gain | (1.12) | (0.63) | | |
| | | | | |
| Total distributions | (2.36) | (1.63) | | |
| | | | | |
| Net asset value, end of year | $11.36 | $11.59 | | |
| | | | | |
| Total return (%)3 | 19.87 | 34.084 | | |
| | | | | |
| Ratios and supplemental data | | | | |
| | |
| Net assets, end of year (in thousands) | $28 | $29 | | |
| Ratios (as a percentage of average net assets): | | | | |
| Expenses before reductions | 1.35 | 3.525 | | |
| Expenses net of fee waivers | 0.85 | 0.855 | | |
| Net investment income | 10.35 | 10.105 | | |
| Portfolio turnover (%) | 207 | 389 | | |
1 Period from 4-30-09 (inception date) to 3-31-10.
2 Based on the average daily shares outstanding.
3 Total returns would have been lower had certain expenses not been reduced during the periods shown.
4 Not annualized.
5 Annualized.
| |
| The accompanying notes are an integral part of the financial statements. | |
| 15 |
Core High Yield Fund
Notes to financial statements
Note 1 - Organization
John Hancock Core High Yield Fund (the Fund) is a diversified series of John Hancock Funds III (the Trust), an open-end management investment company organized as a Massachusetts business trust and registered under the Investment Company Act of 1940, as amended (the 1940 Act). The investment objective of the Fund is to seek total return, consisting of a high level of current income and capital appreciation.
The Fund may offer multiple classes of shares. The shares currently offered are detailed in the Statement of Assets and Liabilities. Class A shares are offered to all investors. Class I shares are offered to institutions and certain investors. Shareholders of each class have exclusive voting rights to matters that affect that class. The distribution and service fees, transfer agent fees, printing and postage and state registration fees for each class may differ.
Note 2 - Significant accounting policies
The financial statements have been prepared in conformity with accounting principles generally accepted in the United States of America, which require management to make certain estimates and assumptions at the date of the financial statements. Actual results could differ from those estimates. Events or transactions occurring after the end of the fiscal period through the date that the financial statements were issued have been evaluated in the preparation of the financial statements. The following summarizes the significant accounting policies of the Fund.
Security valuation. Investments are stated at value as of the close of regular trading on the New York Stock Exchange (NYSE), normally at 4:00 P.M., Eastern Time. The Fund uses a three-tier hierarchy to prioritize the pricing assumptions, referred to as inputs, used in valuation techniques to measure fair value. Level 1 includes securities valued using quoted prices in active markets for identical securities. Level 2 includes securities valued using significant observable inputs. Observable inputs may include quoted prices for similar securities, interest rates, prepayment speeds and credit risk. Prices for securities valued using these inputs are received from independent pricing vendors and brokers and are based on an evaluation of the inputs described. Level 3 includes securities valued using significant unobservable inputs when market prices are not readily available or reliable, including the Fund’s own assumptions in determining the fair value of investments. Factors used in determining value may include market or issuer specific events, changes in interest rates and credit quality. The inputs or methodology used for valuing securities are not necessarily an indication of the risk associated with investing in those securities.
As of March 31, 2011, all investments are categorized as Level 2 under the hierarchy described above. Changes in valuation techniques may result in transfers in or out of an assigned level within the disclosure hierarchy. During the year ended March 31, 2011, there were no significant transfers in or out of Level 1 or Level 2 assets.
In order to value the securities, the Fund uses the following valuation techniques. Debt obligations are valued based on the evaluated prices provided by an independent pricing service, which utilizes both dealer-supplied and electronic data processing techniques, taking into account factors such as institutional-size trading in similar groups of securities, yield, quality, coupon rate, maturity, type of issue, trading characteristics and other market data. Certain securities and forward foreign currency contracts traded only in the over-the-counter market are valued at the last bid price quoted by brokers making markets in the securities at the close of trading. Certain short-term securities are valued at amortized cost.
Other portfolio securities and assets, where market quotations are not readily available, are valued at fair value, as determined in good faith by the Fund’s Pricing Committee, following procedures established by the Board of Trustees. Generally, trading in non-U.S. securities is substantially completed each day at various times prior to the close of trading on the NYSE. Significant market events that affect the values of non-U.S. securities may occur between the time when the valuation of the securities is generally determined and the close of the NYSE. During significant market events, these securities will be valued at fair value, as determined in good faith, following procedures established by the Board of Trustees. The Fund may use a fair valuation model to value non-U.S. securities in order to adjust for events which may occur between the close of foreign exchanges and the close of the NYSE.
Security transactions and related investment income. Investment security transactions are accounted for on a trade date plus one basis for daily net asset value calculations. However, for financial reporting purposes, investment transactions are reported on trade date. Interest income is accrued as earned. Gains and losses on securities sold are determined on the basis of identified cost and may include proceeds from litigation. Interest income includes coupon interest and amortization/accretion of premiums/discounts on debt securities. Debt obligations may be placed in a non-accrual status and related interest income may be reduced by stopping current accruals and writing off interest receivable when the collection of all or a portion of interest has become doubtful.
Line of credit. The Fund may borrow from banks for temporary or emergency purposes, including meeting redemption requests that otherwise might require the untimely sale of securities. Pursuant to the custodian agreement, the custodian may loan money to the Fund to make properly authorized payments. The Fund is obligated to repay the custodian for any overdraft, including any related costs or expenses. The custodian has a lien, security interest or security entitlement in any Fund property that is not segregated, to the maximum extent permitted by law for any overdraft.
In addition, effective March 30, 2011, the Fund and other affiliated funds have entered into an agreement with Citibank N.A. which enables them to participate in a $100 million unsecured committed line of credit. Prior to March 30, 2011, the Fund had a similar arrangement with State Street Bank and Trust Company. A commitment fee, payable at the end of each calendar quarter, based on the average daily unused portion of the line of credit, is charged to each participating fund on a pro rata basis and is reflected in other expenses on the Statement of Operations. For the year ended March 31, 2011, the Fund had no borrowings under the line of credit.
Expenses. The majority of expenses are directly attributable to an individual fund. Expenses that are not readily attributable to a specific fund are allocated among all funds in an equitable manner, taking into consideration, among other things, the nature and type of expense and the fund’s relative assets. Expense estimates are accrued in the period to which they relate and adjustments are made when actual amounts are known.
Class allocations. Income, common expenses, and realized and unrealized gains (losses) are determined at the fund level and allocated daily to each class of shares based on the net asset value of the class. Class-specific expenses, such as distribution and service fees, if any, transfer agent fees, state registration fees and printing and postage, for all classes, are calculated daily at the class level based on the appropriate net asset value of each class and the specific expense rates applicable to each class.
Federal income taxes. The Fund intends to continue to qualify as a regulated investment company by complying with the applicable provisions of the Internal Revenue Code and will not be subject to federal income tax on taxable income that is distributed to shareholders. Therefore, no federal income tax provision is required.
As of March 31, 2011, the Fund had no uncertain tax positions that would require financial statement recognition, de-recognition or disclosure. The Fund’s federal tax return is subject to examination by the Internal Revenue Service for a period of three years.
Distribution of income and gains. Distributions to shareholders from net investment income and net realized gains, if any, are recorded on the ex-date. The Fund generally declares dividends daily and pays them monthly. Capital gain distributions, if any, are paid annually. The tax character of distributions for the years ended March 31, 2011 and March 31, 2010 was as follows:
| | |
| | March 31, 2011 | March 31, 2010 |
|
| Ordinary Income | $3,318,242 | $2,420,219 |
|
| Long-Term Capital Gains | 138,345 | - |
|
Distributions paid by the Fund with respect to each class of shares are calculated in the same manner, at the same time and in the same amount, except for the effect of expenses that may be applied differently to each class. As of March 31, 2011, the components of distributable earnings on a tax basis included $189,635 of undistributed ordinary income and $117,695 of undistributed long-term capital gain.
Such distributions and distributable earnings, on a tax basis, are determined in conformity with income tax regulations, which may differ from accounting principles generally accepted in the United States of America. Material distributions in excess of tax basis earnings and profits, if any, are reported in the Fund’s financial statements as a return of capital.
Capital accounts within financial statements are adjusted for permanent book-tax differences. These adjustments have no impact on net assets or the results of operations. Temporary book-tax differences, if any, will reverse in a subsequent period. Book-tax differences are primarily attributable to defaulted bonds and tender consent fees.
Note 3 - Guarantees and indemnifications
Under the Fund’s organizational documents, its Officers and Trustees are indemnified against certain liabilities arising out of the performance of their duties to the Fund. Additionally, in the normal course of business, the Fund enters into contracts with service providers that contain general indemnification clauses. The Fund’s maximum exposure under these arrangements is unknown, as this would involve future claims that may be made against the Fund that have not yet occurred. The risk of material loss from such claims is considered remote.
Note 4 - Fees and transactions with affiliates
John Hancock Investment Management Services, LLC (the Adviser) serves as investment adviser for the Trust. John Hancock Funds, LLC (the Distributor), an affiliate of the Adviser, serves as principal underwriter of the Trust. The Adviser and the Distributor are indirect wholly owned subsidiaries of Manulife Financial Corporation (MFC).
Management fee. The Fund has an investment management contract with the Adviser under which the Fund pays a daily management fee to the Adviser equivalent, on an annual basis, to the sum of: (a) 0.650% of the first $250,000,000 of the Fund’s average daily net assets; (b) 0.625% of the next $250,000,000 of the Fund’s average daily net assets; (c) 0.600% of the next $500,000,000 of the Fund’s average daily net assets; (d) 0.550% of the next $1,500,000,000 of the Fund’s average daily net assets; and (e) 0.525% of the Fund’s average daily net assets in excess of $2,500,000,000. The Adviser has a subadvisory agreement with John Hancock Asset Management a division of Manulife Asset Management (North America) Limited (formerly MFC Global Investment Management (U.S.A.) Limited), an indirectly owned subsidiary of MFC and an affiliate of the Adviser. The Fund is not responsible for payment of the subadvisory fees.
The investment management fees incurred for the year ended March 31, 2011 were equivalent to an annual effective rate of 0.65% of the Fund’s average daily net assets.
The Adviser has contractually agreed to waive fees and/or reimburse certain expenses for each share class of the Fund. This agreement excludes taxes, brokerage commissions, interest, litigation and indemnification expenses and other extraordinary expenses not incurred in the ordinary course of the Fund’s business. The fee waivers and/or reimbursements are such that these expenses will not exceed 1.25% for Class A and 0.84% for Class I shares. The fee waivers and/or reimbursements will continue in effect until July 31, 2011. Prior to July 1, 2010, the fee waivers and/or reimbursements were such that these expenses would not exceed 1.25% for Class A and 0.85% for Class I shares. In addition, the Adviser has voluntarily agreed to limit the Fund’s total expenses, excluding transfer agent fees, distribution and service fees, brokerage commissions, interest and other extraordinary expenses not incurred in the ordinary course of the Fund’s business, to 0.19% of the Fund’s average daily net assets, on an annual basis. The voluntary fee waiver and/or reimbursement may be amended or terminated at any time by the Adviser.
Accordingly, the expense reductions or reimbursements related to these agreements were $59,563 and $146 for Class A and Class I shares, respectively, for the year ended March 31, 2011.
Accounting and legal services. Pursuant to a service agreement, the Fund reimburses the Adviser for all expenses associated with providing the administrative, financial, legal, accounting and recordkeeping services of the Fund, including the preparation of all tax returns, periodic reports to shareholders and regulatory reports, among other services. These expenses are allocated to each share class based on its relative net assets at the time the expense was incurred. These accounting and legal services fees incurred for the year ended March 31, 2011, amounted to an annual rate of 0.02% of the Fund’s average daily net assets.
Distribution and service plans. The Fund has a distribution agreement with the Distributor. The Fund has adopted distribution and service plans with respect to Class A shares pursuant to Rule 12b-1 under the 1940 Act, to pay the Distributor for services provided as the distributor of shares of the Fund. The Fund may pay up to an annual rate of 0.30% of average daily net assets for Class A shares for distribution and service fees. Currently, only 0.25% is charged to Class A shares for distribution and service fees.
Sales charges. Class A shares are assessed up-front sales charges which result in payments to the Distributor. For the year ended March 31, 2011, no sales charges were assessed.
Transfer agent fees. The Fund has a transfer agent agreement with John Hancock Signature Services, Inc. (Signature Services or Transfer Agent), an affiliate of the Adviser. The transfer agent fees paid to Signature Services are determined based on the cost to Signature Services (Signature Services Cost) of providing recordkeeping services. The Signature Services Cost includes a component of allocated John Hancock corporate overhead for providing transfer agent services to the Fund and to all other John Hancock affiliated funds. It also includes out-of-pocket expenses that are comprised of payments made to third-parties for recordkeeping services provided to their clients who invest in one or more John Hancock funds. In addition, Signature Services Cost may be reduced by certain revenues that Signature Services receives in connection with the service it provides to the funds. Signature Services Cost is calculated monthly and allocated, as applicable, to four categories of share classes: Institutional Share Classes, Retirement Share Classes, Municipal Bond Classes and all other Retail Share Classes. Within each of these categories, the applicable costs are allocated to the affected John Hancock affiliated funds and/or classes, based on the relative average daily net assets.
Prior to July 1, 2010, the transfer agent fees were made up of three components:
• The Fund paid a monthly transfer agent fee at an annual rate of 0.015% for Class A and Class I shares, based on each class’s average daily net assets.
• The Fund paid a monthly fee based on an annual rate of $17.50 per shareholder account for all share classes.
• In addition, Signature Services was reimbursed for certain out-of-pocket expenses.
Class level expenses. Class level expenses for the year ended March 31, 2011 were:
| | | |
| Class | Distribution and service fees | Transfer agent fees | State registration fees |
|
| Class A | $43,603 | $24,678 | $35 |
| Class I | - | 14 | 34 |
| Total | $43,603 | $24,692 | $69 |
Trustee expenses. The Trust compensates each Trustee who is not an employee of the Adviser or its affiliates. These Trustees may, for tax purposes, elect to defer receipt of this compensation under the John Hancock Group of Funds Deferred Compensation Plan (the Plan). Deferred amounts are invested in various John Hancock funds and remain in the funds until distributed in accordance with the Plan. The investment of deferred amounts and the offsetting liability are included within Other receivables and prepaid expenses and Payable to affiliates - Trustees' fees, respectively, in the accompanying Statement of Assets and Liabilities.
Note 5 - Fund share transactions
Transactions in Fund shares for the years ended March 31, 2011 and 2010 were as follows:
| | | | | |
| | Year ended | | Year ended |
| | 3-31-11 | | 3-31-101 |
| |
| |
|
| | Shares | Amount | | Shares | Amount |
| Class A shares | | | | | |
| Sold | — | — | | 1,497,500 | $14,975,000 |
| |
| |
|
| Net increase | — | — | | 1,497,500 | $14,975,000 |
| |
| |
|
| Class I shares | | | | | |
| Sold | — | — | | 2,500 | $25,000 |
| |
| |
|
| Net increase | — | — | | 2,500 | $25,000 |
| |
| |
|
| Net increase | — | — | | 1,500,000 | $15,000,000 |
| |
| |
|
1 Period from 4-30-09 (inception date) to 3-31-10.
Affiliates of the Fund owned 100% of shares of beneficial interest of the Fund on March 31, 2011.
Note 6 - Purchase and sale of securities
Purchases and sales of securities, other than short-term securities, aggregated $36,011,398 and $40,057,975, respectively, for the year ended March 31, 2011.
Auditors’ Report
Report of Independent Registered Public Accounting Firm
To the Board of Trustees of John Hancock Funds III and Shareholders of John Hancock Core High Yield Fund:
In our opinion, the accompanying statement of assets and liabilities, including the portfolio of investments, and the related statements of operations and of changes in net assets and the financial highlights present fairly, in all material respects, the financial position of John Hancock Core High Yield Fund (the “Fund") at March 31, 2011, and the results of its operations, the changes in its net assets and the financial highlights for each of the periods indicated, in conformity with accounting principles generally accepted in the United States of America. These financial statements and financial highlights (hereafter referred to as “financial statements”) are the responsibility of the Fund's management; our responsibility is to express an opinion on these financial statements based on our audits. We conducted our audits of these financial statements in accordance with the standards of the Public Company Accounting Oversight Board (United States). Those standards require that we plan and perform the audit to obtain reasonable assurance about whether the financial statements are free of material misstatement. An audit includes examining, on a test basis, evidence supporting the amounts and disclosures in the financial statements, assessing the accounting principles used and significant estimates made by management, and evaluating the overall financial statement presentation. We believe that our audits, which included confirmation of securities at March 31, 2011 by correspondence with the custodian and brokers and the application of alternative auditing procedures where securities purchased confirmations had not been received, provide a reasonable basis for our opinion.
PricewaterhouseCoopers LLP
Boston, Massachusetts
May 20, 2011
Tax information
Unaudited
For federal income tax purposes, the following information is furnished with respect to the distributions of the Fund, if any, paid during its taxable year ended March 31, 2011.
The Fund designates distribution to shareholders of $138,345 as a long-term capital gain dividend for the fiscal year ended March 31, 2011.
Shareholders will be mailed a 2011 Form 1099-DIV in January 2012. This will reflect the total of all distributions for calendar year 2011.
Trustees and Officers
This chart provides information about the Trustees and Officers who oversee your John Hancock fund. Officers elected by the Trustees manage the day-to-day operations of the Fund and execute policies formulated by the Trustees.
Independent Trustees
| | | | |
| Name | Year of | Position(s) held with Fund | Trustee | Number |
| | Birth | Principal occupation(s) and other | of the | of John |
| | | Directorships during the past 5 years | Trust | Hancock |
| | | | since(1) | funds |
| | | | | overseen |
| | | | | by |
| | | | | Trustee |
|
| Steven R. | 1944 | Chairperson (since January 2011); Chairman | 2006 | 46 |
| Pruchansky | | and Chief Executive Officer, Greenscapes of | | |
| | | Southwest Florida, Inc. (since 2000); Director | | |
| | and President, Greenscapes of Southwest | | |
| | | Florida, Inc. (until 2000); Member, Board of | | |
| | | Advisors, First American Bank (since 2008); | | |
| | Managing Director, Jon James, LLC (real | | |
| | | estate) (since 2000); Director, First Signature | | |
| | | Bank & Trust Company (until 1991); | | |
| | Director, Mast Realty Trust (until 1994); | | |
| | President, Maxwell Building Corp. (until | | |
| | | 1991). | | |
|
| James F. | 1940 | Chief Executive Officer, Director and Treasurer, | 2006 | 46 |
| Carlin | | Alpha Analytical Laboratories (environmental, | | |
| | chemical and pharmaceutical analysis) (since | | |
| | 1985); Part Owner and Treasurer, Lawrence | | |
| | Carlin Insurance Agency, Inc. (since 1995); | | |
| | | Chairman and Chief Executive Officer, CIMCO, | | |
| | | LLC (management/investments) (since 1987). | | |
|
| | | | |
| Name | Year of | Position(s) held with Fund | Trustee | Number |
| | Birth | Principal occupation(s) and other | of the | of John |
| | | Directorships during the past 5 years | Trust | Hancock |
| | | | since(1) | funds |
| | | | | overseen |
| | | | | by |
| | | | | Trustee |
|
| William H. | 1944 | Professor, University of Texas, Austin, Texas | 2006 | 46 |
| Cunningham | | (since 1971); former Chancellor, University | | |
| | | of Texas System and former President of the | | |
| | | University of Texas, Austin, Texas; Director | | |
| | of the following: LIN Television (since | | |
| | | 2009); Lincoln National Corporation | | |
| | (insurance) (Chairman since 2009 and | | |
| | Director since 2006); Resolute Energy | | |
| | Corporation (since 2009); Nanomedical | | |
| | Systems, Inc. (biotechnology company) | | |
| | | (Chairman since 2008); Yorktown | | |
| | | Technologies, LP (tropical fish) (Chairman | | |
| | | since 2007); Greater Austin Crime | | |
| | | Commission (since 2001); Southwest | | |
| | | Airlines (since 2000); former Director of the | | |
| | | following: Introgen (manufacturer of | | |
| | biopharmaceuticals) (until 2008); Hicks | | |
| | Acquisition Company I, Inc. (until 2007); | | |
| | | Jefferson-Pilot Corporation (diversified life | | |
| | | insurance company) (until 2006); and former | | |
| | | Advisory Director, JP Morgan Chase Bank | | |
| | | (formerly Texas Commerce Bank–Austin) | | |
| | | (until 2009). | | |
|
| Deborah C. | 1952 | Chief Executive Officer, American Red | 2008 | 46 |
| Jackson(2) | | Cross of Massachusetts Bay (since 2002); | | |
| | | Board of Directors of Eastern Bank | | |
| | | Corporation (since 2001); Board of Directors | | |
| | | of Eastern Bank Charitable Foundation (since | | |
| | 2001); Board of Directors of American | | |
| | Student Assistance Corporation. (1996- | | |
| | | 2009); Board of Directors of Boston Stock | | |
| | | Exchange (2002–2008); Board of Directors | | |
| | of Harvard Pilgrim Healthcare (health | | |
| | | benefits company) (since 2007). | | |
|
| | | | |
| Name | Year of | Position(s) held with Fund | Trustee | Number |
| | Birth | Principal occupation(s) and other | of the | of John |
| | | Directorships during the past 5 years | Trust | Hancock |
| | | | since(1) | funds |
| | | | | overseen |
| | | | | by |
| | | | | Trustee |
|
| Charles L. | 1938 | Vice Chairperson (since March 2011); | 2006 | 46 |
| Ladner(2) | | Chairman and Trustee, Dunwoody Village, | | |
| | Inc. (retirement services) (since 2008); | | |
| | | Director, Philadelphia Archdiocesan | | |
| | | Educational Fund (since 2009); Senior Vice | | |
| | | President and Chief Financial Officer, UGI | | |
| | | Corporation (public utility holding company) | | |
| | | (retired 1998); Vice President and Director | | |
| | | for AmeriGas, Inc. (retired 1998); Director of | | |
| | | AmeriGas Partners, L.P. (gas distribution) | | |
| | (until 1997); Director, EnergyNorth, Inc. | | |
| | (until 1995); Director, Parks and History | | |
| | Association (Cooperating Association, | | |
| | | National Park Service) (until 2005). | | |
|
| Stanley | 1947 | Senior Vice President/Audit Executive, | 2008 | 46 |
| Martin(2) | | Federal Home Loan Mortgage Corporation | | |
| | | (2004–2006); Executive Vice | | |
| | President/Consultant, HSBC Bank USA | | |
| | | (2000–2003); Chief Financial | | |
| | | Officer/Executive Vice President, Republic | | |
| | | New York Corporation & Republic National | | |
| | Bank of New York (1998–2000); Partner, | | |
| | | KPMG LLP (1971–1998). | | |
|
| Dr. John A. | 1939 | President and Chief Executive Officer, | 2006 | 46 |
| Moore | | Institute for Evaluating Health Risks, | | |
| | | (nonprofit institution) (until 2001); Senior | | |
| | Scientist, Sciences International (health | | |
| | research) (until 2003); Former Assistant | | |
| | Administrator & Deputy Administrator, | | |
| | | Environmental Protection Agency; Principal, | | |
| | Hollyhouse (consulting) (since 2000); | | |
| | Director, CIIT Center for Health Science | | |
| | | Research (nonprofit research) (until 2007). | | |
|
| | | | |
| Name | Year of | Position(s) held with Fund | Trustee | Number |
| | Birth | Principal occupation(s) and other | of the | of John |
| | | Directorships during the past 5 years | Trust | Hancock |
| | | | since(1) | funds |
| | | | | overseen |
| | | | | by |
| | | | | Trustee |
|
| Patti McGill | 1943 | Principal, PMP Globalinc (consulting) (since | 2006 | 47 |
| Peterson(2) | | 2007); Senior Associate, Institute for Higher | | |
| | Education Policy (since 2007); Executive | | |
| | Director, CIES (international education | | |
| | | agency) (until 2007); Vice President, Institute | | |
| | of International Education (until 2007); | | |
| | | Senior Fellow, Cornell University Institute of | | |
| | Public Affairs, Cornell University (1997– | | |
| | | 1998); Former President Wells College, St. | | |
| | | Lawrence University and the Association of | | |
| | | Colleges and Universities of the State of New | | |
| | York. Director of the following: Niagara | | |
| | Mohawk Power Corporation (until 2003); | | |
| | | Security Mutual Life (insurance) (until 1997); | | |
| | ONBANK (until 1993). Trustee of the | | |
| | | following: Board of Visitors, The University | | |
| | | of Wisconsin, Madison (since 2007); Ford | | |
| | Foundation, International Fellowships | | |
| | | Program (until 2007); UNCF, International | | |
| | | Development Partnerships (until 2005); Roth | | |
| | Endowment (since 2002); Council for | | |
| | | International Educational Exchange (since | | |
| | | 2003). | | |
|
| Gregory A. | 1949 | Vice Chairman, Risk & Regulatory Matters, | 2008 | 46 |
| Russo | | KPMG LLP (“KPMG”) (2002–2006); Vice | | |
| | | Chairman, Industrial Markets, KPMG (1998– | | |
| | | 2002). | | |
|
Non-Independent Trustees(3)
| | | | |
| Name | Year of | Position(s) held with Fund | Trustee | Number |
| | Birth | Principal occupation(s) and other | of the | of John |
| | | Directorships during the past 5 years | Trust | Hancock |
| | | | since(1) | funds |
| | | | | overseen |
| | | | | by |
| | | | | Trustee |
|
| Hugh | 1959 | Executive Vice President, John Hancock | 2010 | 46 |
| McHaffie | | Financial Services (since 2006, including | | |
| | | prior positions); President of John Hancock | | |
| | Trust and John Hancock Funds II (since | | |
| | | 2009); Trustee, John Hancock retail funds | | |
| | | (since 2010) Chairman and Director, John | | |
| | Hancock Advisers, LLC, John Hancock | | |
| | | Investment Management Services, LLC and | | |
| | John Hancock Funds, LLC (since 2010); | | |
| | | Senior Vice President, Individual Business | | |
| | | Product Management, MetLife, Inc. (1999- | | |
| | | 2006). | | |
|
| John G. | 1955 | Senior Vice President, John Hancock | 2009 | 47 |
| Vrysen | | Financial Services (since 2006); Director, | | |
| | | Executive Vice President and Chief | | |
| | | Operating Officer, John Hancock Advisers, | | |
| | | LLC, John Hancock Investment | | |
| | Management Services, LLC and John | | |
| | | Hancock Funds, LLC (since 2005); Chief | | |
| | | Operating Officer, John Hancock Funds II | | |
| | | and John Hancock Trust (since 2007); Chief | | |
| | Operating Officer, John Hancock retail | | |
| | | funds (until 2009); Trustee, John Hancock | | |
| | | retail funds (since 2009). | | |
|
Principal officers who are not Trustees
| | | |
| Name | Year | Position(s) held with Fund | Officer of the |
| | of | Principal occupation(s) and other | Trust since |
| | Birth | Directorships during the past 5 years | |
|
| Keith F. Hartstein | 1956 | Senior Vice President, John Hancock | 2006 |
| President and Chief | | Financial Services (since 2004); Director, | |
| Executive Officer | | President and Chief Executive Officer, | |
| | | John Hancock Advisers, LLC and John | |
| | | Hancock Funds, LLC (since 2005); | |
| | | Director, John Hancock Asset Management | |
| | | a division of Manulife Asset Management | |
| | | (US) LLC(since 2005); Director, John | |
| | | Hancock Investment Management | |
| | | Services, LLC (since 2006); President and | |
| | | Chief Executive Officer, John Hancock | |
| | | retail funds (since 2005); Member, | |
| | | Investment Company Institute Sales Force | |
| | | Marketing Committee (since 2003). | |
|
| Andrew G. Arnott | 1971 | Senior Vice President, John Hancock | 2009 |
| Senior Vice | | Financial Services (since 2009); Executive | |
| President and Chief | | Vice President, John Hancock Advisers, | |
| Operating Officer | | LLC (since 2005); Executive Vice | |
| | | President, John Hancock Investment | |
| | | Management Services, LLC (since 2006); | |
| | | Executive Vice President, John Hancock | |
| | | Funds, LLC (since 2004); Chief Operating | |
| | | Officer, John Hancock retail funds (since | |
| | | 2009); Senior Vice President, John | |
| | | Hancock retail funds (since 2010) Vice | |
| | | President, John Hancock Funds II and John | |
| | | Hancock Trust (since 2006); Senior Vice | |
| | | President, Product Management and | |
| | | Development, John Hancock Funds, LLC | |
| | | (until 2009). | |
|
| | | |
| Name | Year | Position(s) held with Fund | Officer of the |
| | of | Principal occupation(s) and other | Trust since |
| | Birth | Directorships during the past 5 years | |
|
| Thomas M. Kinzler | 1955 | Vice President, John Hancock Financial | 2006 |
| Secretary and Chief | | Services (since 2006); Secretary and Chief | |
| Legal Officer | | Legal Counsel, John Hancock Advisers, | |
| | | LLC, John Hancock Investment | |
| | | Management Services, LLC and John | |
| | | Hancock Funds, LLC (since 2007); | |
| | | Secretary and Chief Legal Officer, John | |
| | | Hancock retail funds, John Hancock Funds | |
| | | II and John Hancock Trust (since | |
| | | 2006);Vice President and Associate | |
| | | General Counsel, Massachusetts Mutual | |
| | | Life Insurance Company (1999–2006); | |
| | | Secretary and Chief Legal Counsel, MML | |
| | | Series Investment Fund (2000–2006); | |
| | | Secretary and Chief Legal Counsel, | |
| | | MassMutual Select Funds and MassMutual | |
| | Premier Funds (2004–2006). | |
|
| Francis V. Knox, Jr. | 1947 | Vice President, John Hancock Financial | 2006 |
| Chief Compliance | | Services (since 2005); Chief Compliance | |
| Officer | | Officer, John Hancock retail funds, John | |
| | | Hancock Funds II, John Hancock Trust, | |
| | | John Hancock Advisers, LLC and John | |
| | | Hancock Investment Management | |
| | | Services, LLC (since 2005); Vice President | |
| | | and Chief Compliance Officer, John | |
| | | Hancock Asset Management a division of | |
| | | Manulife Asset Management (US) | |
| | | LLC(2005–2008). | |
|
| Charles A. Rizzo | 1957 | Vice President, John Hancock Financial | 2007 |
| Chief Financial | | Services (since 2008); Senior Vice | |
| Officer | | President, John Hancock Advisers, LLC | |
| | | and John Hancock Investment Management | |
| | | Services, LLC (since 2008); Chief | |
| | | Financial Officer, John Hancock retail | |
| | | funds, John Hancock Funds II and John | |
| | | Hancock Trust (since 2007);Assistant | |
| | | Treasurer, Goldman Sachs Mutual Fund | |
| | | Complex (2005–2007); Vice President, | |
| | Goldman Sachs (2005–2007). | |
|
| | | |
| Name | Year | Position(s) held with Fund | Officer of the |
| | of | Principal occupation(s) and other | Trust since |
| | Birth | Directorships during the past 5 years | |
|
| Salvatore | 1965 | Assistant Vice President, John Hancock | 2010 |
| Schiavone | | Financial Services (since 2007); Vice | |
| Treasurer | | President, John Hancock Advisers, LLC | |
| | | and John Hancock Investment Management | |
| | | Services, LLC (since 2007); Treasurer, | |
| | | John Hancock retail funds (since 2010); | |
| | | Treasurer, John Hancock Closed-End | |
| | | Funds (2009-2010);Assistant Treasurer, | |
| | | John Hancock Funds II and John Hancock | |
| | | Trust (since 2007); Assistant Treasurer, | |
| | | John Hancock retail funds, John Hancock | |
| | | Funds II and John Hancock Trust (2007- | |
| | | 2009); Assistant Treasurer, Fidelity Group | |
| | | of Funds (2005–2007); Vice President, | |
| | | Fidelity Management Research Company | |
| | | (2005–2007). | |
|
The business address for all Trustees and Officers is 601 Congress Street, Boston, Massachusetts 02210-2805.
The Statement of Additional Information of the Fund includes additional information about members of the Board of Trustees of the Fund and is available without charge, upon request, by calling 1-800-225-5291.
1Each Trustee serves until resignation, retirement age or until his or her successor is elected.
2Member of Audit Committee.
3Because Messrs. McHaffie and Vrysen are senior executives or directors with the Adviser and/or its affiliates, each of them is considered an “interested person,” as defined in the Investment Company Act of 1040, of the Fund.
More information
| |
| Trustees | Investment adviser |
| Steven R. Pruchansky, Chairperson | John Hancock Investment Management Services, LLC |
| James F. Carlin | |
| William H. Cunningham | Subadviser |
| Deborah C. Jackson* | John Hancock Asset Management |
| Charles L. Ladner, Vice Chairperson* | |
| Stanley Martin* | Principal distributor |
| Hugh McHaffie† | John Hancock Funds, LLC |
| Dr. John A. Moore | |
| Patti McGill Peterson* | Custodian |
| Gregory A. Russo | State Street Bank and Trust Company |
| John G. Vrysen† | |
| | Transfer agent |
| Officers | John Hancock Signature Services, Inc. |
| Keith F. Hartstein | |
| President and Chief Executive Officer | Legal counsel |
| Andrew G. Arnott | K&L Gates LLP |
| Senior Vice President and Chief Operating Officer | |
| Thomas M. Kinzler | Independent registered public accounting firm |
| Secretary and Chief Legal Officer | PricewaterhouseCoopers LLP |
| Francis V. Knox, Jr. | |
| Chief Compliance Officer | |
| Charles A. Rizzo | |
| Chief Financial Officer | |
| Salvatore Schiavone | |
| Treasurer | |
| |
| *Member of the Audit Committee | |
| †Non-Independent Trustee | |
The Fund’s proxy voting policies and procedures, as well as the Fund’s proxy voting record, if any, for the most recent twelve-month period ended June 30, are available free of charge on the Securities and Exchange Commission (SEC) Web site at www.sec.gov or on our Web site.
The Fund’s complete list of portfolio holdings, for the first and third fiscal quarters, is filed with the SEC on Form N-Q. The Fund’s Form N-Q is available on our Web site and the SEC’s Web site, www.sec.gov, and can be reviewed and copied (for a fee) at the SEC’s Public Reference Room in Washington, DC. Call 1-800-SEC-0330 to receive information on the operation of the SEC's Public Reference Room.
We make this information on your fund, as well as monthly portfolio holdings, and other fund details available on our Web site www.jhfunds.com or by calling 1-800-225-5291.
| | |
| You can also contact us: | | |
| 1-800-225-5291 | Regular mail: | Express mail: |
| www. jhfunds.com | John Hancock Signature Services, Inc. | John Hancock Signature Services, Inc. |
| | P.O. Box 55913 | Mutual Fund Image Operations |
| | Boston, MA 02205-5913 | 30 Dan Road |
| | | Canton, MA 02021 |

A look at performance
Total returns for the period ended March 31, 2011
| | | | | | | |
| | Average annual total returns (%) | | | Cumulative total returns (%) | |
| | with maximum sales charge (POP) | | | with maximum sales charge (POP) | |
|
| | 1-year | 5-year | 10-year | | 1-year | 5-year | 10-year |
|
| Class A1 | 14.29 | 3.02 | 7.44 | | 14.29 | 16.01 | 105.05 |
|
| Class I1,2 | 20.57 | 4.43 | 8.39 | | 20.57 | 24.23 | 123.89 |
|
| Class R11,2 | 19.76 | 3.64 | 7.54 | | 19.76 | 19.55 | 106.96 |
|
| Class R31,2 | 19.88 | 3.74 | 7.65 | | 19.88 | 20.15 | 109.04 |
|
| Class R41,2 | 20.19 | 4.04 | 7.97 | | 20.19 | 21.91 | 115.28 |
|
| Class R51,2 | 20.55 | 4.35 | 8.29 | | 20.55 | 23.75 | 121.82 |
|
| Class ADV 1,2 | 20.31 | 3.93 | 7.82 | | 20.31 | 21.28 | 112.37 |
|
Performance figures assume all distributions are reinvested. Public offering price (POP) figures reflect maximum sales charge on Class A shares of 5%. Sales charges are not applicable for Class I, R1, R3, R4, R5 and ADV shares.
The expense ratios of the Fund, both net (including any fee waivers or expense limitations) and gross (excluding any fee waivers or expense limitations), are set forth according to the most recent publicly available prospectuses for the Fund and may differ from those disclosed in the Financial Highlights tables in this report. The fee waivers and expense limitations are contractual at least until 7-31-11 for Class A shares,12-31-11 for Class R1, R3, R4 and R5 shares and 12-11-11 for Class I and ADV shares. Had the fee waivers and expense limitations not been in place gross expenses would apply. The expense ratios are as follows:
| | | | | | | |
| | Class A | Class I | Class R1 | Class R3 | Class R4 | Class R5 | Class ADV |
| Net (%) | 1.34 | 1.11 | 1.80 | 1.70 | 1.40 | 1.10 | 1.34 |
| Gross (%) | 1.86 | 1.12 | 1.92 | 1.82 | 1.52 | 1.22 | 1.81 |
The returns reflect past results and should not be considered indicative of future performance. The return and principal value of an investment will fluctuate so that shares, when redeemed, may be worth more or less than their original cost. Due to market volatility, the Fund’s current performance may be higher or lower than the performance shown. For performance data current to the most recent month end, please call 1–800–225–5291 or visit the Fund’s Web site at www.jhfunds.com.
The performance table above and the chart on the next page do not reflect the deduction of taxes that a shareholder would pay on fund distributions or the redemption of fund shares. The Fund’s performance results reflect any applicable expense reductions, without which the expenses would increase and results would have been less favorable.
| |
| 6 | Small Company Fund | Annual report |
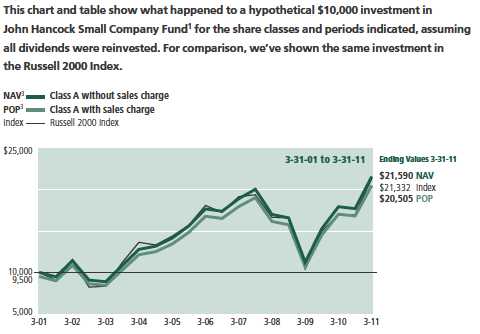
| | | | | | |
| | Class I1,2 | Class R11,2 | Class R31,2 | Class R41,2 | Class R51,2 | Class ADV1,2 |
|
| Began | 3-31-01 | 3-31-01 | 3-31-01 | 3-31-01 | 3-31-01 | 3-31-01 |
|
| NAV | $22,389 | $20,696 | $20,904 | $21,528 | $22,182 | $21,237 |
|
| POP | $22,389 | $20,696 | $20,904 | $21,528 | $22,182 | $21,237 |
|
| Index | $21,332 | $21,332 | $21,332 | $21,332 | $21,332 | $21,332 |
|
Russell 2000 index is an index that measures performance of the 2,000 smallest companies in the Russell 3000 Index, which represents approximately 8% of total market capitalization of the Russell 3000 Index.
It is not possible to invest directly in an index. Index figures do not reflect sales charges, which would have resulted in lower values if they did.
1 On 12-11-09, through a reorganization, the Fund acquired all of the assets of the FMA Small Company Portfolio (the Predecessor Fund). On that date, the Predecessor Fund offered its Investor share class in exchange for Class A shares and the Institutional share class in exchange for Class I shares. Class A, Class I and Class ADV shares were first offered on 12-14-09. The Class A and Class ADV returns prior to that date are those of the Predecessor Fund’s Investor shares that have been recalculated to apply the gross fees and expenses of Class A and Class ADV shares, respectively. The Predecessor Fund’s Institutional share class returns have been recalculated to reflect the gross fees and expenses of Class I shares. The Class I returns prior to 5-1-08 are those of the Predecessor Fund’s Investor shares that have been recalculated to apply the gross fees and expenses of Class I shares. The inception date of Class R1, Class R3, Class R4 and Class R5 shares is 4-30-10; returns prior to that date are those of Class A shares recalculated to apply the gross fees and expenses of Class R1, Class R3, Class R4 and Class R5 shares, respectively.
2 For certain types of investors, as described in the Fund’s prospectuses.
3 NAV represents net asset value and POP represents public offering price. Performance of the classes will vary based on the difference in sales charges paid by shareholders investing in the different classes and fees structure of those classes.
| |
| Annual report | Small Company Fund | 7 |
Management’s discussion of
Fund performance
By Fiduciary Management Associates, LLC
Despite seemingly one crisis after another, stocks still managed to enjoy very strong returns during the 12 months ended March 31, 2011. In this period, John Hancock Small Company Fund’s Class A shares had a total return of 20.31% at net asset value. That performance lagged the 25.29% return of Morningstar, Inc.’s small blend fund category, as well as the 25.79% return of its benchmark, the Russell 2000 Index. Despite its strong absolute return, the Fund trailed its benchmark. In part, this was because the market environment significantly favored growth stocks and our investment style tends to lead us toward value-oriented companies, which lagged their growth counterparts by a wide margin. To make up the performance gap, we would have had to generate significant outperformance through stock selection. Unfortunately, several securities we owned in the portfolio did relatively poorly. Combined with the challenging market backdrop, this left the Fund unable to keep pace with its benchmark during the past 12 months.
The biggest source of underperformance came from the technology sector, as our underweighting in this strong-performing group hampered returns. Moreover, several individual technology stocks were notable laggards — Emulex Corporation, a maker of storage networking products, and Cognex Corporation, a manufacturer of machine-vision systems whose earnings lagged on higher capital investment costs. We sold both positions during the period. Stock selection in the materials sector also hurt, especially a position in Cytec Industries, Inc., a specialty chemicals company. Elsewhere, bank holding company Whitney Holding Corp. was a significant underperformer, as was health care stock RehabCare Group, Inc. Neither stock was in the Fund at period end. On the positive side, Fossil, Inc. was an especially strong performer. As the stock gained in value, its market capitalization grew larger than we could comfortably own in a small-cap fund, so we sold our shares at a healthy profit. In health care, drug maker Questcor Pharmaceuticals, Inc., and software company Medidata Solutions, Inc., were standouts. The Fund’s holdings in WESCO International, Inc., a distributor of industrial products, also added to results.
This commentary reflects the views of the portfolio managers through the end of the Fund’s period discussed in this report. The managers’ statements reflect their own opinions. As such, they are in no way guarantees of future events and are not intended to be used as investment advice or a recommendation regarding any specific security. They are also subject to change at any time as market and other conditions warrant.
Past performance is no guarantee of future results.
Investments in smaller companies may involve greater risks than those in larger, more well-known companies. See the prospectus for the risks of investing in small-cap stocks. Sector investing is subject to greater risks than the market as a whole. Because the Fund may focus on particular sectors of the economy, its performance may depend on the performance of those sectors.
| |
| 8 | Small Company Fund | Annual report |
Your expenses
These examples are intended to help you understand your ongoing operating expenses.
Understanding fund expenses
As a shareholder of the Fund, you incur two types of costs:
▪ Transaction costs which include sales charges (loads) on purchases or redemptions (varies by share class), minimum account fee charge, etc.
▪ Ongoing operating expenses including management fees, distribution and service fees (if applicable), and other fund expenses.
We are presenting only your ongoing operating expenses here.
Actual expenses/actual returns
This example is intended to provide information about the Fund’s actual ongoing operating expenses, and is based on the Fund’s actual return. It assumes an account value of $1,000.00 on October 1, 2010 with the same investment held until March 31, 2011.
| | | |
| | Account value | Ending value | Expenses paid during |
| | on 10-1-10 | on 3-31-11 | period ended 3-31-111 |
|
| Class A | $1,000.00 | $1,218.90 | $7.41 |
|
| Class I | 1,000.00 | 1,220.10 | 6.20 |
|
| Class R1 | 1,000.00 | 1,216.30 | 9.95 |
|
| Class R3 | 1,000.00 | 1,216.70 | 9.40 |
|
| Class R4 | 1,000.00 | 1,218.20 | 7.74 |
|
| Class R5 | 1,000.00 | 1,219.50 | 6.09 |
|
| Class ADV | 1,000.00 | 1,218.90 | 7.41 |
|
Together with the value of your account, you may use this information to estimate the operating expenses that you paid over the period. Simply divide your account value at March 31, 2011, by $1,000.00, then multiply it by the “expenses paid” for your share class from the table above. For example, for an account value of $8,600.00, the operating expenses should be calculated as follows:
| |
| Annual report | Small Company Fund | 9 |
Your expenses
Hypothetical example for comparison purposes
This table allows you to compare the Fund’s ongoing operating expenses with those of any other fund. It provides an example of the Fund’s hypothetical account values and hypothetical expenses based on each class’s actual expense ratio and an assumed 5% annualized return before expenses (which is not the Fund’s actual return). It assumes an account value of $1,000.00 on October 1, 2010, with the same investment held until March 31, 2011. Look in any other fund shareholder report to find its hypothetical example and you will be able to compare these expenses.
| | | |
| | Account value | Ending value | Expenses paid during |
| | on 10-1-10 | on 3-31-11 | period ended 3-31-111 |
|
| Class A | $1,000.00 | $1,018.20 | $6.74 |
|
| Class I | 1,000.00 | 1,019.30 | 5.64 |
|
| Class R1 | 1,000.00 | 1,016.00 | 9.05 |
|
| Class R3 | 1,000.00 | 1,016.50 | 8.55 |
|
| Class R4 | 1,000.00 | 1,018.00 | 7.04 |
|
| Class R5 | 1,000.00 | 1,019.40 | 5.54 |
|
| Class ADV | 1,000.00 | 1,018.20 | 6.74 |
|
Remember, these examples do not include any transaction costs, therefore, these examples will not help you to determine the relative total costs of owning different funds. If transaction costs were included, your expenses would have been higher. See the prospectus for details regarding transaction costs.
1 Expenses are equal to the Fund’s annualized expense ratio of 1.34%, 1.12%, 1.80%, 1.70%, 1.40%, 1.10% and 1.34% for Class A, Class I, Class R1, Class R3, Class R4, Class R5 and Class ADV shares, respectively, multiplied by the average account value over the period, multiplied by 182/365 (to reflect the one-half year period).
| |
| 10 | Small Company Fund | Annual report |
Portfolio summary
| | | | |
| Top 10 Holdings (16.8% of Net Assets on 3-31-11)1 | | | |
|
| Portland General Electric Company | 2.0% | | Robbins & Myers, Inc. | 1.6% |
| |
|
| Unisource Energy Corp. | 1.9% | | Lufkin Industries, Inc. | 1.6% |
| |
|
| Highwoods Properties, Inc. | 1.8% | | EnerSys | 1.6% |
| |
|
| WESCO International, Inc. | 1.6% | | United Stationers, Inc. | 1.6% |
| |
|
| Signature Bank | 1.6% | | Home Properties, Inc. | 1.5% |
| |
|
| |
| Sector Composition2,3 | | | | |
|
| Financials | 24% | | Energy | 8% |
| |
|
| Industrials | 19% | | Materials | 5% |
| |
|
| Information Technology | 12% | | Utilities | 4% |
| |
|
| Health Care | 11% | | Consumer Staples | 3% |
| |
|
| Consumer Discretionary | 10% | | Short-Term Investments & Other | 4% |
| |
|
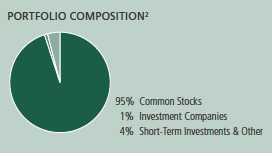
1 Cash and cash equivalents not included in Top 10 Holdings.
2 As a percentage of net assets on 3-31-11.
3 Sector investing is subject to greater risks than the market as a whole. Because the Fund may focus on particular sectors of the economy, its performance may depend on the performance of those sectors.
| |
| Annual report | Small Company Fund | 11 |
Fund’s investments
As of 3-31-11
| | |
| | Shares | Value |
| Common Stocks 95.05% | | $148,060,402 |
|
| (Cost $122,033,711) | | |
| | | |
| Consumer Discretionary 9.89% | | 15,400,938 |
| | | |
| Auto Components 0.97% | | |
|
| Dana Holding Corp. (I) | 86,960 | 1,512,228 |
| | | |
| Hotels, Restaurants & Leisure 1.42% | | |
|
| Bally Technologies, Inc. (I) | 58,540 | 2,215,739 |
| | | |
| Household Durables 0.95% | | |
|
| Meritage Homes Corp. (I) | 61,160 | 1,475,791 |
| | | |
| Media 2.33% | | |
|
| Arbitron, Inc. | 39,220 | 1,569,977 |
|
| Cinemark Holdings, Inc. | 106,540 | 2,061,549 |
| | | |
| Specialty Retail 0.43% | | |
|
| Express, Inc. | 34,430 | 672,762 |
| | | |
| Textiles, Apparel & Luxury Goods 3.79% | | |
|
| G-III Apparel Group, Ltd. (I) | 45,550 | 1,711,769 |
|
| Steven Madden, Ltd. (I) | 43,370 | 2,035,354 |
|
| The Warnaco Group, Inc. (I) | 37,520 | 2,145,769 |
| | | |
| Consumer Staples 3.29% | | 5,127,710 |
| | | |
| Food Products 2.30% | | |
|
| Snyders-Lance, Inc. | 103,590 | 2,056,262 |
|
| TreeHouse Foods, Inc. (I) | 26,890 | 1,529,234 |
| | | |
| Personal Products 0.99% | | |
|
| Elizabeth Arden, Inc. (I) | 51,390 | 1,542,214 |
| | | |
| Energy 7.50% | | 11,682,289 |
| | | |
| Energy Equipment & Services 5.12% | | |
|
| Complete Production Services, Inc. (I) | 52,880 | 1,682,113 |
|
| Gulfmark Offshore, Inc., Class A (I) | 40,030 | 1,781,735 |
|
| Lufkin Industries, Inc. | 26,080 | 2,437,698 |
|
| Superior Energy Services, Inc. (I) | 50,720 | 2,079,520 |
| | | |
| Oil, Gas & Consumable Fuels 2.38% | | |
|
| Cloud Peak Energy, Inc. (I) | 86,240 | 1,861,922 |
|
| Georesources, Inc. (I) | 58,820 | 1,839,301 |
| | |
| 12 | Small Company Fund | Annual report | See notes to financial statements |
| | |
| | Shares | Value |
| Financials 22.65% | | $35,282,672 |
| | | |
| Capital Markets 3.13% | | |
|
| Evercore Partners, Inc., Class A | 62,920 | 2,157,527 |
|
| MF Global Holdings, Ltd. (I) | 176,910 | 1,464,815 |
|
| Piper Jaffray Companies (I) | 30,240 | 1,252,843 |
| | | |
| Commercial Banks 9.25% | | |
|
| Bank of the Ozarks, Inc. | 35,190 | 1,538,155 |
|
| First Midwest Bancorp, Inc. | 163,540 | 1,928,137 |
|
| Hancock Holding Company | 71,250 | 2,339,850 |
|
| PacWest Bancorp | 87,770 | 1,908,998 |
|
| Prosperity Bancshares, Inc. | 55,920 | 2,391,698 |
|
| Signature Bank (I) | 43,540 | 2,455,656 |
|
| Western Alliance Bancorp (I) | 224,610 | 1,846,294 |
| | | |
| Insurance 2.42% | | |
|
| Delphi Financial Group, Inc., Class A | 74,510 | 2,288,202 |
|
| The Hanover Insurance Group, Inc. | 32,580 | 1,474,245 |
| | | |
| Real Estate Investment Trusts 7.85% | | |
|
| CommonWealth | 10,180 | 264,375 |
|
| Entertainment Properties Trust | 48,590 | 2,274,984 |
|
| Highwoods Properties, Inc. | 78,060 | 2,732,881 |
|
| Home Properties, Inc. | 40,790 | 2,404,571 |
|
| Invesco Mortgage Capital, Inc. | 105,860 | 2,313,041 |
|
| LaSalle Hotel Properties | 83,200 | 2,246,400 |
| | | |
| Health Care 11.22% | | 17,479,959 |
| | | |
| Health Care Equipment & Supplies 1.50% | | |
|
| American Medical Systems Holdings, Inc. (I) | 108,040 | 2,337,986 |
| | | |
| Health Care Providers & Services 7.38% | | |
|
| Bio-Reference Labs, Inc. (I) | 63,360 | 1,421,798 |
|
| Hanger Orthopedic Group, Inc. (I) | 56,560 | 1,472,257 |
|
| Healthspring, Inc. (I) | 62,300 | 2,328,151 |
|
| LifePoint Hospitals, Inc. (I) | 39,190 | 1,574,654 |
|
| Owens & Minor, Inc. | 72,060 | 2,340,509 |
|
| PSS World Medical, Inc. (I) | 87,170 | 2,366,666 |
| | | |
| Pharmaceuticals 2.34% | | |
|
| Impax Laboratories, Inc. (I) | 74,790 | 1,903,406 |
|
| Questcor Pharmaceuticals, Inc. (I) | 120,370 | 1,734,532 |
| | | |
| Industrials 19.42% | | 30,247,839 |
| | | |
| Aerospace & Defense 2.46% | | |
|
| Moog, Inc., Class A (I) | 36,940 | 1,695,915 |
|
| Orbital Sciences Corp., Class A (I) | 112,430 | 2,127,176 |
| | | |
| Commercial Services & Supplies 1.56% | | |
|
| United Stationers, Inc. | 34,160 | 2,427,068 |
| | | |
| Construction & Engineering 1.42% | | |
|
| EMCOR Group, Inc. (I) | 71,620 | 2,218,071 |
| | |
| See notes to financial statements | Annual report | Small Company Fund | 13 |
| | |
| | Shares | Value |
| Electrical Equipment 4.81% | | |
|
| Belden, Inc. | 48,770 | $1,831,314 |
|
| EnerSys (I) | 61,560 | 2,447,010 |
|
| Thomas & Betts Corp. (I) | 26,970 | 1,603,906 |
|
| Woodward, Inc. | 46,590 | 1,610,150 |
| | | |
| Machinery 3.03% | | |
|
| Actuant Corp., Class A | 78,520 | 2,277,080 |
|
| Robbins & Myers, Inc. | 53,170 | 2,445,288 |
| | | |
| Professional Services 1.07% | | |
|
| Korn/Ferry International (I) | 74,940 | 1,668,914 |
| | | |
| Road & Rail 2.53% | | |
|
| Genesee & Wyoming, Inc., Class A (I) | 28,440 | 1,655,208 |
|
| Old Dominion Freight Line, Inc. (I) | 65,150 | 2,286,114 |
| | | |
| Trading Companies & Distributors 2.54% | | |
|
| Titan Machinery, Inc. (I) | 58,500 | 1,477,125 |
|
| WESCO International, Inc. (I) | 39,640 | 2,477,500 |
| | | |
| Information Technology 11.86% | | 18,481,114 |
| | | |
| Communications Equipment 1.01% | | |
|
| Viasat, Inc. (I) | 39,550 | 1,575,672 |
| | | |
| Electronic Equipment, Instruments & Components 2.62% | | |
|
| Anixter International, Inc. | 24,600 | 1,719,294 |
|
| Coherent, Inc. (I) | 40,650 | 2,362,172 |
| | | |
| Semiconductors & Semiconductor Equipment 4.50% | | |
|
| Cirrus Logic, Inc. (I) | 97,870 | 2,058,206 |
|
| Entropic Communications, Inc. (I) | 183,210 | 1,548,125 |
|
| MKS Instruments, Inc. | 48,410 | 1,612,053 |
|
| PMC–Sierra, Inc. (I) | 238,210 | 1,786,575 |
| | | |
| Software 3.73% | | |
|
| ACI Worldwide, Inc. (I) | 49,250 | 1,615,400 |
|
| Netscout Systems, Inc. (I) | 36,680 | 1,002,098 |
|
| Progress Software Corp. (I) | 53,440 | 1,554,570 |
|
| Websense, Inc. (I) | 71,700 | 1,646,949 |
| | | |
| Materials 5.26% | | 8,197,881 |
| | | |
| Chemicals 1.68% | | |
|
| Cytec Industries, Inc. | 34,040 | 1,850,755 |
|
| Olin Corp. | 33,760 | 773,779 |
| | | |
| Containers & Packaging 1.06% | | |
|
| Temple-Inland, Inc. | 70,640 | 1,652,976 |
| | | |
| Metals & Mining 2.52% | | |
|
| Century Aluminum Company (I) | 108,840 | 2,033,131 |
|
| Schnitzer Steel Industries, Inc. | 29,030 | 1,887,240 |
| | | |
| Utilities 3.96% | | 6,160,000 |
| | | |
| Electric Utilities 3.96% | | |
|
| Portland General Electric Company | 131,730 | 3,131,222 |
|
| Unisource Energy Corp. | 83,830 | 3,028,778 |
| | |
| 14 | Small Company Fund | Annual report | See notes to financial statements |
| | | |
| | | Shares | Value |
| Investment Companies 0.99% | | | $1,549,570 |
|
| (Cost $1,508,858) | | | |
| | | | |
| Financials 0.99% | | | 1,549,570 |
| | | | |
| iShares Russell 2000 Index Fund | | 18,410 | 1,549,570 |
| | | | |
| | Yield (%) | Shares | Value |
| Short-Term Investments 2.92% | | | $4,544,724 |
|
| (Cost $4,544,724) | | | |
| | | | |
| Money Market Funds 2.92% | | | 4,544,724 |
| | | | |
| State Street Institutional Liquid Reserves Fund | 0.1854 (Y) | 4,544,724 | 4,544,724 |
| |
| Total investments (Cost $128,087,293)† 98.96% | | $154,154,696 |
|
| Other assets and liabilities, net 1.04% | | | $1,615,622 |
|
| Total net assets 100.00% | | | $155,770,318 |
|
The percentage shown for each investment category is the total value of the category as a percentage of the net assets of the Fund.
(I) Non-income producing security.
(Y) The rate shown is the annualized seven-day yield as of 3-31-11.
† At 3-31-11, the aggregate cost of investment securities for federal income tax purposes was $129,447,727. Net unrealized appreciation aggregated $24,706,969, of which $25,816,648 related to appreciated investment securities and $1,109,679 related to depreciated investment securities.
| | |
| See notes to financial statements | Annual report | Small Company Fund | 15 |
F I N A N C I A L S T A T E M E N T S
Financial statements
Statement of assets and liabilities 3-31-11
This Statement of Assets and Liabilities is the Fund’s balance sheet. It shows the value of what the Fund owns, is due and owes. You’ll also find the net asset value and the maximum offering price per share.
| |
| Assets | |
|
| Investments, at value (Cost $128,087,293) | $154,154,696 |
| Receivable for investments sold | 4,769,168 |
| Receivable for fund shares sold | 291,085 |
| Dividends and interest receivable | 201,635 |
| Other receivables and prepaid expenses | 41,788 |
| | |
| Total assets | 159,458,372 |
| |
| Liabilities | |
|
| Payable for investments purchased | 3,505,409 |
| Payable for fund shares repurchased | 98,687 |
| Payable to affiliates | |
| Accounting and legal services fees | 3,110 |
| Transfer agent fees | 28,776 |
| Trustees’ fees | 330 |
| Due to adviser | 3,899 |
| Other liabilities and accrued expenses | 47,843 |
| | |
| Total liabilities | 3,688,054 |
| |
| Net assets | |
|
| Capital paid-in | $147,743,698 |
| Undistributed net investment income | 139,186 |
| Accumulated net realized loss on investments | (18,179,969) |
| Net unrealized appreciation (depreciation) on investments | 26,067,403 |
| | |
| Net assets | $155,770,318 |
| |
| Net asset value per share | |
|
| Based on net asset values and shares outstanding — the Fund has an | |
| unlimited number of shares authorized with no par value | |
| Class A ($87,831,564 ÷ 4,096,917 shares) | $21.44 |
| Class I ($66,605,919 ÷ 3,096,874 shares) | $21.51 |
| Class R1 ($116,628 ÷ 5,458 shares) | $21.37 |
| Class R3 ($456,621 ÷ 21,347 shares) | $21.39 |
| Class R4 ($45,075 ÷ 2,102 shares) | $21.44 |
| Class R5 ($164,335 ÷ 7,642 shares) | $21.50 |
| Class ADV ($550,176 ÷ 25,662 shares) | $21.44 |
| |
| Maximum offering price per share | |
|
| Class A (net asset value per share ÷ 95%)1 | $22.57 |
1 On single retail sales of less than $50,000. On sales of $50,000 or more and on group sales the offering price is reduced.
| | |
| 16 | Small Company Fund | Annual report | See notes to financial statements |
F I N A N C I A L S T A T E M E N T S
Statement of operations For the year ended 3-31-11
This Statement of Operations summarizes the Fund’s investment income earned and expenses incurred in operating the Fund. It also shows net gains (losses) for the period stated.
| |
| Investment income | |
|
| Dividends | $1,576,992 |
| Interest | 9,786 |
| | |
| Total investment income | 1,586,778 |
| |
| Expenses | |
|
| Investment management fees (Note 4) | 1,206,224 |
| Distribution and service fees (Note 4) | 248,560 |
| Accounting and legal services fees (Note 4) | 19,174 |
| Transfer agent fees (Note 4) | 140,689 |
| Trustees’ fees (Note 4) | 9,187 |
| State registration fees (Note 4) | 44,736 |
| Printing and postage (Note 4) | 17,090 |
| Professional fees | 56,899 |
| Custodian fees | 25,904 |
| Registration and filing fees | 45,551 |
| Other | 11,301 |
| | |
| Total expenses | 1,825,315 |
| Less expense reductions (Note 4) | (146,527) |
| | |
| Net expenses | 1,678,788 |
| | |
| Net investment income | (92,010) |
| |
| Realized and unrealized gain | |
|
| Net realized gain on | |
| Investments | 22,658,659 |
| | |
| Change in net unrealized appreciation (depreciation) of | |
| Investments | 3,181,254 |
| | |
| Net realized and unrealized gain | 25,839,913 |
| | |
| Increase in net assets from operations | $25,747,903 |
| | |
| See notes to financial statements | Annual report | Small Company Fund | 17 |
F I N A N C I A L S T A T E M E N T S
Statements of changes in net assets
These Statements of Changes in Net Assets show how the value of the Fund’s net assets has changed during the last three periods. The difference reflects earnings less expenses, any investment gains and losses, distributions, if any, paid to shareholders and the net of Fund share transactions.
| | | | |
| | | Year | Period | Year |
| | | ended | ended | ended |
| | | 3-31-11 | 3-31-101 | 10-31-09 |
| | | | | |
| Increase (decrease) in net assets | | | | |
|
| From operations | | | | |
| Net investment income (loss) | | ($92,010) | ($83,476) | $51,853 |
| Net realized gain (loss) | | 22,658,659 | 7,017,779 | (22,397,443) |
| Change in net unrealized appreciation (depreciation) | | 3,181,254 | 15,888,460 | 27,512,072 |
| | | | | |
| Increase in net assets resulting from operations | | 25,747,903 | 22,822,763 | 5,166,482 |
| | | | | |
| Distributions to shareholders | | | | |
| From net investment income | | | | |
| Class A | | — | (89,814) | (165,164) |
| Class I | | — | (76,915) | (67,134) |
| | | | | |
| Total distributions | | — | (166,729) | (232,298) |
| | | | | |
| Increase in capital from settlement payments | | 231,252 | — | — |
| | | | | |
| From Fund share transactions (Note 5) | | 2,290,103 | (4,491,462) | (25,905,731) |
| | | | | |
| Total increase (decrease) | | 28,269,258 | 18,164,572 | (20,971,547) |
| | | | | |
| Net assets | | | | |
|
| Beginning of year | | 127,501,060 | 109,336,488 | 130,308,035 |
| | | | | |
| End of year | | $155,770,318 | $127,501,060 | $109,336,488 |
| | | | | |
| Accumulated undistributed (accumulated | | | | |
| distributions in excess of) net | | | | |
| investment income | | $139,186 | ($56) | $166,181 |
1 For the five-month period ended 3-31-10. The Fund changed its fiscal year end from October 31 to March 31.
| | |
| 18 | Small Company Fund | Annual report | See notes to financial statements |
Financial highlights
The Financial Highlights show how the Fund’s net asset value for a share has changed since the end of the previous period.
| | | | | | |
| CLASS A SHARES Period ended | 3-31-11 | 3-31-101,2 | 10-31-09 | 10-31-083 | 10-31-07 | 10-31-06 |
| |
| Per share operating performance | | | | | | |
|
| Net asset value, beginning of year | $17.82 | $14.68 | $13.83 | $22.55 | $23.04 | $22.40 |
| Net investment income (loss)4 | (0.03) | (0.02) | —5 | 0.05 | (0.04) | (0.05) |
| Net realized and unrealized gain (loss) | | | | | | |
| on investments | 3.62 | 3.18 | 0.87 | (6.01) | 2.06 | 4.24 |
| Total from investment operations | 3.59 | 3.16 | 0.87 | (5.96) | 2.02 | 4.19 |
| Less distributions | | | | | | |
| From net investment income | — | (0.02) | (0.02) | (0.01) | (0.01) | — |
| From net realized gain | — | — | — | (2.75) | (2.50) | (3.55) |
| Total distributions | — | (0.02) | (0.02) | (2.76) | (2.51) | (3.55) |
| Non-recurring reimbursement | 0.036 | — | — | — | — | — |
| Net asset value, end of year | $21.44 | $17.82 | $14.68 | $13.83 | $22.55 | $23.04 |
| Total return (%)7,8 | 20.31 | 21.519 | 6.34 | (29.67) | 9.43 | 21.07 |
| |
| Ratios and supplemental data | | | | | | |
|
| Net assets, end of year (in millions) | $88 | $92 | $87 | $104 | $209 | $212 |
| Ratios (as a percentage of average net | | | | | | |
| assets): | | | | | | |
| Expenses before reductions | 1.49 | 1.6610 | 1.42 | 1.37 | 1.30 | 1.27 |
| Expenses net of fee waivers | 1.34 | 1.3910 | 1.39 | 1.31 | 1.25 | 1.24 |
| Net investment income (loss) | (0.17) | (0.23)10 | (0.01) | 0.27 | (0.20) | (0.17) |
| Portfolio turnover (%) | 159 | 4211 | 155 | 177 | 132 | 13512 |
1 For the five-month period ended 3-31-10. The Fund changed its fiscal year end from October 31 to March 31.
2 After the close of business on 12-11-09, holders of Investor Shares of the former FMA Small Company Portfolio (the Predecessor Fund) became owners of an equal number of full and fractional Class A shares of John Hancock Small Company Fund. These shares were first offered on 12-14-09. Additionally, the accounting and performance history of the Investor Shares of the Predecessor Fund was redesignated as that of John Hancock Small Company Fund Class A.
3 Prior to 5-1-08, Investor Shares were offered as Institutional Shares.
4 Based on the average daily shares outstanding.
5 Less than ($0.005) per share.
6 Reflects a non-recurring reimbursement pursuant to a settlement between the SEC and Millennium Partners, L.P., Millennium Management, L.L.C., and Millennium International Management, L.L.C., which amounted to $0.03 per share.
7 Does not reflect the effect of sales charges, if any.
8 Total returns would have been lower had certain expenses not been reduced during the periods shown.
9 Not annualized.
10 Annualized.
11 Portfolio turnover is shown for the period from 11-1-09 to 3-31-10.
12 Includes the effects of in-kind transactions. If the in-kind transactions were not included, the portfolio turnover rate would have been 127%.
| | |
| See notes to financial statements | Annual report | Small Company Fund | 19 |
| | | | | | |
| CLASS I SHARES Period ended | | | 3-31-11 | 3-31-101,2 | 10-31-09 | 10-31-083 |
| |
| Per share operating performance | | | | | | |
|
| Net asset value, beginning of year | | | $17.84 | $14.71 | $13.84 | $17.99 |
| Net investment income4 | | | 0.02 | —5 | 0.03 | 0.04 |
| Net realized and unrealized gain (loss) on investments | | | 3.62 | 3.18 | 0.87 | (4.17) |
| Total from investment operations | | | 3.64 | 3.18 | 0.90 | (4.13) |
| Less distributions | | | | | | |
| From net investment income | | | — | (0.05) | (0.03) | (0.02) |
| Non-recurring reimbursement | | | 0.036 | — | — | — |
| Net asset value, end of year | | | $21.51 | $17.84 | $14.71 | $13.84 |
| Total return (%)7 | | | 20.57 | 21.678 | 6.56 | (22.95)8 |
| |
| Ratios and supplemental data | | | | | | |
|
| Net assets, end of year (in millions) | | | $67 | $36 | $23 | $27 |
| Ratios (as a percentage of average net assets): | | | | | | |
| Expenses before reductions | | | 1.12 | 1.189 | 1.17 | 1.189 |
| Expenses net of fee waivers | | | 1.11 | 1.149 | 1.14 | 1.089 |
| Net investment income | | | 0.09 | 0.019 | 0.24 | 0.559 |
| Portfolio turnover (%) | | | 159 | 4210 | 155 | 177 |
1 For the five-month period ended 3-31-10. The Fund changed its fiscal year end from October 31 to March 31.
2 After the close of business on 12-11-09, holders of Institutional Shares of the former FMA Small Company Portfolio (the Predecessor Fund) became owners of an equal number of full and fractional Class I shares of John Hancock Small Company Fund. These shares were first offered on 12-14-09. Additionally, the accounting and performance history of the Institutional Shares of the Predecessor Fund was redesignated as that of John Hancock Small Company Fund Class I.
3 Commencement of operations 5-2-08.
4 Based on the average daily shares outstanding.
5 Less than $0.005 per share.
6 Reflects a non-recurring reimbursement pursuant to a settlement between the SEC and Millennium Partners, L.P., Millennium Management, L.L.C., and Millennium International Management, L.L.C., which amounted to $0.03 per share.
7 Total returns would have been lower had certain expenses not been reduced during the periods shown.
8 Not annualized.
9 Annualized.
10 Portfolio turnover is shown for the period from 11-1-09 to 3-31-10.
| | |
| 20 | Small Company Fund | Annual report | See notes to financial statements |
| |
| CLASS R1 SHARES Period ended | 3-31-111 |
| |
| Per share operating performance | |
|
| Net asset value, beginning of period | $19.38 |
| Net investment loss2 | (0.07) |
| Net realized and unrealized gain on investments | 2.03 |
| Total from investment operations | 1.96 |
| Non-recurring reimbursement | 0.033 |
| Net asset value, end of period | $21.37 |
| Total return (%)4 | 10.275 |
| |
| Ratios and supplemental data | |
|
| Net assets, end of period (in thousands) | $117 |
| Ratios (as a percentage of average net assets): | |
| Expenses before reductions | 7.226 |
| Expenses net of fee waivers | 1.806 |
| Net investment loss | (0.42)6 |
| Portfolio turnover (%) | 159 |
1 Period from 4-30-10 (inception date) to 3-31-11.
2 Based on the average daily shares outstanding.
3 Reflects a non-recurring reimbursement pursuant to a settlement between the SEC and Millennium Partners, L.P., Millennium Management, L.L.C., and Millennium International Management, L.L.C., which amounted to $0.03 per share.
4 Total returns would have been lower had certain expenses not been reduced during the period shown.
5 Not annualized.
6 Annualized.
| |
| CLASS R3 SHARES Period ended | 3-31-111 |
| |
| Per share operating performance | |
|
| Net asset value, beginning of period | $19.38 |
| Net investment loss2 | (0.10) |
| Net realized and unrealized gain on investments | 2.08 |
| Total from investment operations | 1.98 |
| Non-recurring reimbursement | 0.033 |
| Net asset value, end of period | $21.39 |
| Total return (%)4 | 10.375 |
| |
| Ratios and supplemental data | |
|
| Net assets, end of period (in thousands) | $457 |
| Ratios (as a percentage of average net assets): | |
| Expenses before reductions | 3.006 |
| Expenses net of fee waivers | 1.706 |
| Net investment loss | (0.52)6 |
| Portfolio turnover (%) | 159 |
1 Period from 4-30-10 (inception date) to 3-31-11.
2 Based on the average daily shares outstanding.
3 Reflects a non-recurring reimbursement pursuant to a settlement between the SEC and Millennium Partners, L.P., Millennium Management, L.L.C., and Millennium International Management, L.L.C., which amounted to $0.03 per share.
4 Total returns would have been lower had certain expenses not been reduced during the period shown.
5 Not annualized.
6 Annualized.
| | |
| See notes to financial statements | Annual report | Small Company Fund | 21 |
| |
| CLASS R4 SHARES Period ended | 3-31-111 |
| |
| Per share operating performance | |
|
| Net asset value, beginning of period | $19.38 |
| Net investment loss2 | (0.03) |
| Net realized and unrealized gain on investments | 2.06 |
| Total from investment operations | 2.03 |
| Non-recurring reimbursement | 0.033 |
| Net asset value, end of period | $21.44 |
| Total return (%)4 | 10.635 |
| |
| Ratios and supplemental data | |
|
| Net assets, end of period (in thousands) | $45 |
| Ratios (as a percentage of average net assets): | |
| Expenses before reductions | 7.406 |
| Expenses net of fee waivers | 1.406 |
| Net investment loss | (0.16)6 |
| Portfolio turnover (%) | 159 |
1 Period from 4-30-10 (inception date) to 3-31-11.
2 Based on the average daily shares outstanding.
3 Reflects a non-recurring reimbursement pursuant to a settlement between the SEC and Millennium Partners, L.P., Millennium Management, L.L.C., and Millennium International Management, L.L.C., which amounted to $0.03 per share.
4 Total returns would have been lower had certain expenses not been reduced during the period shown.
5 Not annualized.
6 Annualized.
| |
| CLASS R5 SHARES Period ended | 3-31-111 |
| |
| Per share operating performance | |
|
| Net asset value, beginning of period | $19.38 |
| Net investment income2 | 0.01 |
| Net realized and unrealized gain on investments | 2.08 |
| Total from investment operations | 2.09 |
| Non-recurring reimbursement | 0.033 |
| Net asset value, end of period | $21.50 |
| Total return (%)4 | 10.945 |
| |
| Ratios and supplemental data | |
|
| Net assets, end of period (in thousands) | $164 |
| Ratios (as a percentage of average net assets): | |
| Expenses before reductions | 3.666 |
| Expenses net of fee waivers | 1.106 |
| Net investment income | 0.056 |
| Portfolio turnover (%) | 159 |
1 Period from 4-30-10 (inception date) to 3-31-11.
2 Based on the average daily shares outstanding.
3 Reflects a non-recurring reimbursement pursuant to a settlement between the SEC and Millennium Partners, L.P., Millennium Management, L.L.C., and Millennium International Management, L.L.C., which amounted to $0.03 per share.
4 Total returns would have been lower had certain expenses not been reduced during the period shown.
5 Not annualized.
6 Annualized.
| | |
| 22 | Small Company Fund | Annual report | See notes to financial statements |
| | | | | | |
| CLASS ADV SHARES Period ended | | | | | 3-31-11 | 3-31-101 |
| |
| Per share operating performance | | | | | | |
|
| Net asset value, beginning of year | | | | | $17.82 | $15.71 |
| Net investment loss2 | | | | | (0.01) | (0.01) |
| Net realized and unrealized gain on investments | | | | | 3.60 | 2.12 |
| Total from investment operations | | | | | 3.59 | 2.11 |
| Non-recurring reimbursement | | | | | 0.033 | |
| Net asset value, end of year | | | | | $21.44 | $17.82 |
| Total return (%)4 | | | | | 20.31 | 13.435 |
| |
| Ratios and supplemental data | | | | | | |
|
| Net assets, end of year (in thousands) | | | | | $550 | $69 |
| Ratios (as a percentage of average net assets): | | | | | | |
| Expenses before reductions | | | | | 4.99 | 2.766 |
| Expenses net of fee waivers | | | | | 1.34 | 1.336 |
| Net investment loss | | | | | (0.07) | (0.17)6 |
| Portfolio turnover (%) | | | | | 159 | 427 |
1 Period from 12-14-09 (inception date) to 3-31-10.
2 Based on the average daily shares outstanding.
3 Reflects a non-recurring reimbursement pursuant to a settlement between the SEC and Millennium Partners, L.P., Millennium Management, L.L.C., and Millennium International Management, L.L.C., which amounted to $0.03 per share.
4 Total returns would have been lower had certain expenses not been reduced during the periods shown.
5 Not annualized.
6 Annualized.
7 Portfolio turnover is shown for the period from 11-1-09 to 3-31-10.
| | |
| See notes to financial statements | Annual report | Small Company Fund | 23 |
Notes to financial statements
Note 1 — Organization
John Hancock Small Company Fund (the Fund) is a diversified series of John Hancock Funds III (the Trust), an open-end management investment company organized as a Massachusetts business trust and registered under the Investment Company Act of 1940, as amended (the 1940 Act). The investment objective of the Fund is to seek maximum long-term total return.
The Fund may offer multiple classes of shares. The shares currently offered are detailed in the Statement of Assets and Liabilities. Class A shares are offered to all investors. Class I shares are offered to institutions and certain investors. Class R1, Class R3, Class R4 and Class R5 shares are available only to certain retirement plans. Class ADV shares are available to investors who acquired Class A shares as a result of the reorganization of the FMA Small Company Portfolio (the Predecessor Fund) into the Fund and are closed to new investors. Shareholders of each class have exclusive voting rights to matters that affect that class. The distribution and service fees, transfer agent fees, printing and postage and state registration fees for each class may differ.
The Fund is the accounting and performance successor of the Predecessor Fund. At the close of business on December 11, 2009, the Fund acquired substantially all the assets and assumed the liabilities of the Predecessor Fund pursuant to an agreement and plan on reorganization, in exchange for Class A and Class I shares of the Fund.
Note 2 — Significant accounting policies
The financial statements have been prepared in conformity with accounting principles generally accepted in the United States of America, which require management to make certain estimates and assumptions at the date of the financial statements. Actual results could differ from those estimates. Events or transactions occurring after the end of the fiscal period through the date that the financial statements were issued have been evaluated in the preparation of the financial statements. The following summarizes the significant accounting policies of the Fund:
Security valuation. Investments are stated at value as of the close of the regular trading on the New York Stock Exchange (NYSE), normally at 4:00 P.M., Eastern Time. The Fund uses a three-tier hierarchy to prioritize the pricing assumptions, referred to as inputs, used in valuation techniques to measure fair value. Level 1 includes securities valued using quoted prices in active markets for identical securities. Level 2 includes securities valued using significant observable inputs. Observable inputs may include quoted prices for similar securities, interest rates, prepayment speeds and credit risk. Prices for securities valued using these techniques are received from independent pricing vendors and brokers and are based on an evaluation of the inputs described. Level 3 includes securities valued using significant unobservable inputs when market prices are not readily available or reliable, including the Fund’s own assumptions in determining the fair value of investments. Factors used in determining value may include market or issuer specific events, changes in interest rates and credit quality. The inputs or methodology used for valuing securities are not necessarily an indication of the risk associated with investing in those securities.
As of March 31, 2011, all investments are categorized as Level 1 under the hierarchy described above.
Changes in valuation techniques may result in transfers in or out of an assigned level within the disclosure hierarchy. During year ended March 31, 2011, there were no significant transfers in or out of Level 1 assets.
| |
| 24 | Small Company Fund | Annual report |
In order to value the securities, the Fund uses the following valuation techniques. Equity securities held by the Fund are valued at the last sale price or official closing price on the principal securities exchange on which they trade. In the event there were no sales during the day or closing prices are not available, then securities are valued using the last quoted bid or evaluated price. Certain securities traded only in the over-the-counter market are valued at the last bid price quoted by brokers making markets in the securities at the close of trading. Certain short-term securities are valued at amortized cost. Other portfolio securities and assets, where market quotations are not readily available, are valued at fair value, as determined in good faith by the Fund’s Pricing Committee, following procedures established by the Board of Trustees.
Security transactions and related investment income. Investment security transactions are accounted for on a trade date plus one basis for daily net asset value calculations. However, for financial reporting purposes, investment transactions are reported on trade date. Interest income is accrued as earned. Gains and losses on securities sold are determined on the basis of identified cost and may include proceeds from litigation. Dividend income is recorded on the ex-date, except for dividends of foreign securities where the dividend may not be known until after ex-date. In these cases dividend income is recorded when the Fund becomes aware of the dividends.
Real estate investment trusts. From time to time, the Fund may invest in real estate investment trusts (REITs) and, as a result, will estimate the components of distributions from these securities. Distributions from REITs received in excess of income are recorded as a reduction of cost of investments and/or as a realized gain.
Line of credit. The Fund may borrow from banks for temporary or emergency purposes, including meeting redemption requests that otherwise might require the untimely sale of securities. Pursuant to the custodian agreement, the custodian may loan money to the Fund to make properly authorized payments. The Fund is obligated to repay the custodian for any overdraft, including any related costs or expenses. The custodian has a lien, security interest or security entitlement in any Fund property that is not segregated, to the maximum extent permitted by law for any overdraft.
In addition, effective March 30, 2011, the Fund and other affiliated funds have entered into an agreement with Citibank N.A. which enables them to participate in a $100 million unsecured committed line of credit. Prior to March 30, 2011, the Fund had a similar arrangement with State Street Bank and Trust Company. A commitment fee, payable at the end of each calendar quarter, based on the average daily unused portion of the line of credit, is charged to each participating fund on a pro rata basis and is reflected in other expenses on the Statement of Operations. For the year ended March 31, 2011, the Fund had no borrowings under the line of credit.
Expenses. The majority of expenses are directly attributable to an individual fund. Expenses that are not readily attributable to a specific fund are allocated among all funds in an equitable manner, taking into consideration, among other things, the nature and type of expense and the fund’s relative assets. Expense estimates are accrued in the period to which they relate and adjustments are made when actual amounts are known.
Class allocations. Income, common expenses, and realized and unrealized gains (losses) are determined at the fund level and allocated daily to each class of shares based on the net asset value of the class. Class-specific expenses, such as distribution and service fees, if any, transfer agent fees, state registration fees and printing and postage, for all classes are calculated daily at the class level based on the appropriate net asset value of each class and the specific expense rates applicable to each class.
Federal income taxes. The Fund intends to continue to qualify as a regulated investment company by complying with the applicable provisions of the Internal Revenue Code and will not be subject to federal income tax on taxable income that is distributed to shareholders. Therefore, no federal income tax provision is required.
| |
| Annual report | Small Company Fund | 25 |
For federal income tax purposes, the Fund has a capital loss carryforward of $16,819,535 available to offset future net realized capital gains as of March 31, 2011. The capital loss carryforward expires as follows: March 31, 2016 — $16,819,535.
Under the recently enacted Regulated Investment Company Modernization Act of 2010, the Fund will be permitted to carry forward capital losses incurred in taxable years beginning after December 22, 2010 for an unlimited period. However, any losses incurred during those future taxable years will be required to be utilized prior to the losses incurred in pre-enactment taxable years. As a result of this ordering rule, pre-enactment capital loss carryforwards may be more likely to expire unused. Additionally, post-enactment capital losses that are carried forward will retain their character as either short-term or long-term capital losses rather than being considered all short-term as under previous law.
As of March 31, 2011, the Fund had no uncertain tax positions that would require financial statement recognition, de-recognition or disclosure. The Fund’s federal tax return is subject to examination by the Internal Revenue Service for a period of three years.
Distribution of income and gains. Distributions to shareholders from net investment income and net realized gains, if any, are recorded on the ex-date. The Fund generally declares and pays dividends and capital gain distributions, if any, at least annually. The tax character of distributions for the years ended March 31, 2011 and March 31, 2010 was as follows:
| | | | | |
| | MARCH 31, 2011 | MARCH 31, 2010 | | | |
| | | |
| Ordinary Income | — | $166,729 | | | |
Distributions paid by the Fund with respect to each class of shares are calculated in the same manner, at the same time and are in the same amount, except for the effect of expenses that may be applied differently to each class. As of March 31, 2011, the components of distributable earnings on a tax basis included $139,415 of undistributed ordinary income.
Such distributions and distributable earnings, on a tax basis, are determined in conformity with income tax regulations, which may differ from accounting principles generally accepted in the United States of America. Material distributions in excess of tax basis earnings and profits, if any, are reported in the Fund’s financial statements as a return of capital.
Capital accounts within financial statements are adjusted for permanent book-tax differences. These adjustments have no impact on net assets or the results of operations. Temporary book-tax differences, if any, will reverse in a subsequent period. Book-tax differences are primarily attributable to wash sale loss deferrals and litigation proceeds.
Note 3 — Guarantees and indemnifications
Under the Fund’s organizational documents, its Officers and Trustees are indemnified against certain liabilities arising out of the performance of their duties to the Fund. Additionally, in the normal course of business, the Fund enters into contracts with service providers that contain general indemnification clauses. The Fund’s maximum exposure under these arrangements is unknown, as this would involve future claims that may be made against the Fund that have not yet occurred. The risk of material loss from such claims is considered remote.
Note 4 — Fees and transactions with affiliates
John Hancock Investment Management Services, LLC (the Adviser) serves as investment adviser for the Trust. John Hancock Funds, LLC (the Distributor), an affiliate of the Adviser, serves as principal underwriter of the Trust. The Adviser and the Distributor are indirect wholly owned subsidiaries of Manulife Financial Corporation (MFC).
| |
| 26 | Small Company Fund | Annual report |
Management Fee. The Fund has an investment management contract with the Adviser under which the Fund pays a daily management fee to the Adviser equivalent, on an annual basis, to the sum of: (a) 0.90% of the first $500,000,000 of the Fund’s average daily net assets; (b) 0.85% of the next $500,000,000; and (c) 0.80% of the Fund’s average daily net assets in excess of $1,000,000,000. The Adviser has a subadvisory agreement with Fiduciary Management Associates, LLC. The Fund is not responsible for payment of the subadvisory fees.
The investment management fees incurred for the year ended March 31, 2011 were equivalent to an annual effective rate of 0.90% of the Fund’s average daily net assets.
The Adviser has contractually agreed to waive fees and/or reimburse certain expenses for each share class of the Fund. This agreement excludes taxes, brokerage commissions, interest, litigation and indemnification expenses and other extraordinary expenses not incurred in the ordinary course of the Fund’s business. The fee waivers and/or reimbursements were such that these expenses will not exceed 1.34%, 1.11%, 1.80%, 1.70%, 1.40%, 1.10% and 1.34% for Class A, Class I, Class R1, Class R3, Class R4, Class R5 and Class ADV shares, respectively. The fee waivers and/or reimbursements will continue in effect until July 31, 2011 for Class A, December 31, 2011 for Class R1, Class R3, Class R4 and Class R5 and December 11, 2011 for Class I and Class ADV shares.
Accordingly, the expense reductions or reimbursements related to these agreements were $122,338, $4,609, $1,712, $1,757, $1,756, $1,819 and $12,536 for Class A, Class I, Class R1, Class R3, Class R4, Class R5 and Class ADV shares, respectively, for the year ended March 31, 2011.
Accounting and legal services. Pursuant to a service agreement, the Fund reimburses the Adviser for all expenses associated with providing the administrative, financial, legal, accounting and recordkeeping services of the Fund, including the preparation of all tax returns, periodic reports to shareholders and regulatory reports, among other services. These expenses are allocated to each share class based on its relative net assets at the time the expense was incurred. These accounting and legal services fees incurred for the year ended March 31, 2011 amounted to an annual rate of 0.01% of the Fund’s average daily net assets.
Distribution and service plans. The Fund has a distribution agreement with the Distributor. The Fund has adopted distribution and service plans with respect to Class A, Class R1, Class R3, Class R4 and Class ADV shares pursuant to Rule 12b-1 under the 1940 Act, to pay the Distributor for services provided as the distributor of shares of the Fund. In addition, under a service plan for Class R1, Class R3, Class R4 and Class R5 shares, the Fund pays for certain other services. The Fund may pay up to the following contractual rates of distribution and service fees under these arrangements, expressed as an annual percentage of average daily net assets for each class of the Fund’s shares.
| | | | | |
| CLASS | 12b–1 FEE | SERVICE FEE | | | |
| | | |
| Class A | 0.30% | — | | | |
| Class R1 | 0.50% | 0.25% | | | |
| Class R3 | 0.50% | 0.15% | | | |
| Class R4 | 0.25% | 0.10% | | | |
| Class R5 | — | 0.05% | | | |
| Class ADV | 0.25% | — | | | |
Sales charges. Class A shares are assessed up-front sales charges, which resulted in payments to the Distributor amounting to $68,247 for the year ended March 31, 2011. Of this amount, $11,946 was retained and used for printing prospectuses, advertising, sales literature and other purposes, $55,156 was paid as sales commissions to broker-dealers and $1,145 was paid as sales commissions to sales personnel of Signator Investors, Inc. (Signator Investors), a broker-dealer affiliate of the Adviser.
| |
| Annual report | Small Company Fund | 27 |
Transfer agent fees. The Fund has a transfer agent agreement with John Hancock Signature Services, Inc. (Signature Services or Transfer Agent), an affiliate of the Adviser. The transfer agent fees paid to Signature Services are determined based on the cost to Signature Services (Signature Services Cost) of providing recordkeeping services. The Signature Services Cost includes a component of allocated John Hancock corporate overhead for providing transfer agent services to the Fund and to all other John Hancock affiliated funds. It also includes out-of-pocket expenses that are comprised of payments made to third-parties for recordkeeping services provided to their clients who invest in one or more John Hancock funds. In addition, Signature Services Cost may be reduced by certain revenues that Signature Services receives in connection with the service it provides to the funds. Signature Services Cost is calculated monthly and allocated, as applicable, to four categories of share classes: Institutional Share Classes, Retirement Share Classes, Municipal Bond Classes and all other Retail Share Classes. Within each of these categories, the applicable costs are allocated to the affected John Hancock affiliated funds and/or classes, based on the relative average daily net assets.
Prior to July 1, 2010, the transfer agent fees were made up of three components:
• The Fund paid a monthly transfer agent fee at an annual rate of 0.05% for Class A, Class R1, Class R3, Class R4, Class R5 and Class ADV shares and 0.04% for Class I shares, based on each class’s average daily net assets.
• The Fund paid a monthly fee based on an annual rate of $16.50 per shareholder account for all share classes (excluding Class ADV shares).
• In addition, Signature Services was reimbursed for certain out-of-pocket expenses.
Class level expenses. Class level expenses for the year ended March 31, 2011 were:
| | | | |
| | DISTRIBUTION | TRANSFER | STATE | PRINTING AND |
| SHARE CLASS | AND SERVICE FEES | AGENT FEES | REGISTRATION FEES | POSTAGE |
|
| Class A | $246,795 | $114,457 | $13,658 | $8,268 |
| Class I | — | 25,109 | 12,562 | 8,360 |
| Class R1 | 158 | 81 | 1,677 | 29 |
| Class R3 | 675 | 113 | 1,677 | 173 |
| Class R4 | 73 | 81 | 1,677 | 33 |
| Class R5 | — | 93 | 1,677 | 94 |
| Class ADV | 859 | 755 | 11,808 | 133 |
| Total | $248,560 | $140,689 | $44,736 | $17,090 |
Trustee expenses. The Trust compensates each Trustee who is not an employee of the Adviser or its affiliates. These Trustees may, for tax purposes, elect to defer receipt of this compensation under the John Hancock Group of Funds Deferred Compensation Plan (the Plan). Deferred amounts are invested in various John Hancock funds and remain in the funds until distributed in accordance with the Plan. The investment of deferred amounts and the offsetting liability are included within Other receivables and prepaid expenses and Payable to affiliates — Trustees’ fees, respectively, in the accompanying Statement of Assets and Liabilities.
| |
| 28 | Small Company Fund | Annual report |
Note 5 — Fund share transactions
Transactions in Fund shares for the year ended March 31, 2011, the period ended March 31, 2010 and the year ended October 31, 2009 were as follows:
| | | | | | |
| | Year ended 3-31-11 | Period ended 3-31-101,2 | Year ended 10-31-09 |
| | Shares | Amount | Shares | Amount | Shares | Amount |
| Class A shares | | | | | | |
|
| Sold | 1,125,695 | $20,882,210 | 436,923 | $7,481,082 | 1,121,281 | $14,394,716 |
| Distributions | | | | | | |
| reinvested | — | — | 5,373 | 83,872 | 11,880 | 153,251 |
| Repurchased | (2,180,365) | (39,600,144) | (1,190,634) | (19,439,329) | (2,717,492) | (34,890,126) |
| | | | | | | |
| Net decrease | (1,054,670) | ($18,717,934) | (748,338) | ($11,874,375) | (1,584,331) | ($20,342,159) |
| | | | | | | |
| Class I shares | | | | | | |
|
| Sold | 1,751,999 | $32,912,574 | 580,444 | $9,479,362 | 448,819 | $5,597,754 |
| Distributions | | | | | | |
| reinvested | — | — | 4,761 | 74,319 | 4,884 | 63,003 |
| Repurchased | (651,679) | (13,027,537) | (135,551) | (2,234,345) | (842,105) | (11,224,329) |
| | | | | | | |
| Net increase | | | | | | |
| (decrease) | 1,100,320 | $19,885,037 | 449,654 | $7,319,336 | (388,402) | ($5,563,572) |
| | | | | | | |
| Class R1 shares3 | | | | | | |
|
| Sold | 7,061 | $146,595 | — | — | — | — |
| Repurchased | (1,603) | (33,713) | — | — | — | — |
| | | | | | | |
| Net increase | 5,458 | $112,882 | — | — | — | — |
| | | | | | | |
| Class R3 shares3 | | | | | | |
|
| Sold | 22,905 | $461,120 | — | — | — | — |
| Repurchased | (1,558) | (32,422) | — | — | — | — |
| | | | | | | |
| Net increase | 21,347 | $428,698 | — | — | — | — |
| | | | | | | |
| Class R4 shares3 | | | | | | |
|
| Sold | 2,245 | $42,744 | — | — | — | — |
| Repurchased | (143) | (2,929) | — | — | — | — |
| | | | | | | |
| Net increase | 2,102 | $39,815 | — | — | — | — |
| | | | | | | |
| Class R5 shares3 | | | | | | |
|
| Sold | 9,517 | $188,219 | — | — | — | — |
| Repurchased | (1,875) | (39,006) | — | — | — | — |
| | | | | | | |
| Net increase | 7,642 | $149,213 | — | — | — | — |
| | | | | | | |
| Class ADV shares | | | | | |
|
| Sold | 23,836 | $433,429 | 3,900 | $63,577 | — | — |
| Repurchased | (2,074) | (41,037) | — | — | — | — |
| | | | | | | |
| Net increase | 21,762 | $392,392 | 3,900 | $63,577 | — | — |
| | | | | | | |
| Net increase | | | | | | |
| (decrease) | 103,961 | $2,290,103 | (294,784) | ($4,491,462) | (1,972,733) | ($25,905,731) |
|
1 Period from 12-14-09 (inception date) to 3-31-10 for Class ADV.
2 For the five month period ended 3-31-10. The Fund changed its fiscal year end from October 31 to March 31.
3 Period from 4-30-10 (inception date) to 3-31-11.
Affiliates of the Fund owned 24%, and 17% of shares of beneficial interest of Class R1 and Class R4, respectively, on March 31, 2011.
Note 6 — Purchase and sale of securities
Purchases and sales of securities, other than short-term securities, aggregated $207,407,364 and $205,142,489, respectively, for the year ended March 31, 2011.
| |
| Annual report | Small Company Fund | 29 |
Note 7 — Reorganization
At the close of business on December 11, 2009, the Fund acquired all the assets and liabilities of FMA Small Company Portfolio (the Predecessor Fund) in exchange for the Class A and Class I shares of the Fund. The Fund had no assets, liabilities or operations prior to the reorganization.
The Agreement provided for (a) the acquisition of substantially all the assets, subject to substantially all of the liabilities, of the Predecessor Fund in exchange for a representative amount of shares of the Fund; (b) the liquidation of the Predecessor Fund; and (c) the distribution to the Predecessor Fund’s shareholders of the Fund’s shares. The reorganization was intended to allow the Fund to be better positioned to increase asset size and achieve additional economies of scale by achieving net prices on securities trades and spread fixed expenses over a larger asset base. As a result of the reorganization, the Fund is the legal survivor, however, the accounting and performance history of the Investor Shares and Institutional Shares of the Predecessor Fund have been redesignated as that of Class A and Class I of the Fund, respectively.
Based on the opinion of tax counsel, the reorganization qualified as a tax-free reorganization for federal income tax purposes with no gain or loss recognized by the Predecessor Fund or its shareholders. Thus, the investments were transferred to the Fund at the Predecessor Fund’s identified cost. All distributable amounts of net income and realized gains from the Predecessor Fund were distributed prior to the reorganization. In addition, the expenses of the reorganization were borne by the Advisers of both the Predecessor Fund and the Fund. The effective time of the reorganization occurred immediately after the close of regularly scheduled trading on the NYSE on December 11, 2009. The following outlines the reorganization:
| | | | |
| | ACQUIRED NET | APPRECIATION OF | | |
| | ASSET VALUE OF THE | PREDECESSOR FUND’S | SHARES ISSUED | TOTAL NET ASSETS |
| PREDECESSOR FUND | PREDECESSOR FUND | INVESTMENTS | BY THE FUND | AFTER COMBINATION |
|
| FMA Small Company | | | | |
| Portfolio | $114,978,635 | $13,294,586 | 7,316,559* | $114,978,635 |
*The Fund issued 5,788,995 shares of Class A and 1,527,564 shares of Class I as a result of the above reorganization.
Note 8 — Subsequent event
At the close of business on April 8, 2011, the Fund acquired the John Hancock Growth Opportunities Fund (the Acquired Fund). This reorganization was approved by the Board of Trustees on December 7, 2010 and subsequently approved by the shareholders of the Acquired Fund on March 23, 2011. Under the terms of the reorganization, the Acquired Fund transferred substantially all of its assets and liabilities to the Fund in exchange for shares of equal value of the Fund.
| |
| 30 | Small Company Fund | Annual report |
Auditors’ report
Report of Independent Registered Public Accounting Firm
To the Board of Trustees of John Hancock Funds III and Shareholders of John Hancock Small Company Fund:
In our opinion, the accompanying statement of assets and liabilities, including the portfolio of investments, and the related statements of operations and of changes in net assets and the financial highlights present fairly, in all material respects, the financial position of John Hancock Small Company Fund (the “Fund”) at March 31, 2011, and the results of its operations, the changes in its net assets and the financial highlights for each of the periods indicated, in conformity with accounting principles generally accepted in the United States of America. These financial statements and financial highlights (hereafter referred to as “financial statements”) are the responsibility of the Fund’s management; our responsibility is to express an opinion on these financial statements based on our audits. We conducted our audits of these financial statements in accordance with the standards of the Public Company Accounting Oversight Board (United States). Those standards require that we plan and perform the audit to obtain reasonable assurance about whether the financial statements are free of material misstatement. An audit includes examining, on a test basis, evidence supporting the amounts and disclosures in the financial statements, assessing the accounting principles used and significant estimates made by management, and evaluating the overall financial statement presentation. We believe that our audits, which included confirmation of securities at March 31, 2011 by correspondence with the custodian, and the application of alternative auditing procedures where securities purchased confirmations had not been received, provide a reasonable basis for our opinion.
PricewaterhouseCoopers LLP
Boston, Massachusetts
May 20, 2011
| |
| Annual report | Small Company Fund | 31 |
Trustees and Officers
This chart provides information about the Trustees and Officers who oversee your John Hancock fund. Officers elected by the Trustees manage the day-to-day operations of the Fund and execute policies formulated by the Trustees.
| | |
| Independent Trustees | | |
| | | |
| Name, Year of Birth | Trustee | Number of John |
| Position(s) held with Fund | of the | Hancock funds |
| Principal occupation(s) and other | Trust | overseen by |
| directorships during past 5 years | since1 | Trustee |
| |
| Steven R. Pruchansky, Born: 1944 | 2006 | 47 |
|
| Chairperson (since January 2011); Chairman and Chief Executive Officer, Greenscapes of Southwest |
| Florida, Inc. (since 2000); Director and President, Greenscapes of Southwest Florida, Inc. (until 2000); |
| Member, Board of Advisors, First American Bank (since 2008); Managing Director, Jon James, LLC (real |
| estate) (since 2000); Director, First Signature Bank & Trust Company (until 1991); Director, Mast Realty |
| Trust (until 1994); President, Maxwell Building Corp. (until 1991). | | |
| |
| James F. Carlin, Born: 1940 | 2006 | 47 |
|
| Chief Executive Officer, Director and Treasurer, Alpha Analytical Laboratories (environmental, chemical |
| and pharmaceutical analysis) (since 1985); Part Owner and Treasurer, Lawrence Carlin Insurance |
| Agency, Inc. (since 1995); Chairman and Chief Executive Officer, CIMCO, LLC (management/ |
| investments) (since 1987). | | |
| |
| William H. Cunningham, Born: 1944 | 2006 | 47 |
|
| Professor, University of Texas, Austin, Texas (since 1971); former Chancellor, University of Texas System |
| and former President of the University of Texas, Austin, Texas; Director of the following: LIN Television |
| (since 2009); Lincoln National Corporation (insurance) (Chairman since 2009 and Director since 2006); |
| Resolute Energy Corporation (since 2009); Nanomedical Systems, Inc. (biotechnology company) |
| (Chairman since 2008); Yorktown Technologies, LP (tropical fish) (Chairman since 2007); Greater Austin |
| Crime Commission (since 2001); Southwest Airlines (since 2000); former Director of the following: |
| Introgen (manufacturer of biopharmaceuticals) (until 2008); Hicks Acquisition Company I, Inc. (until |
| 2007); Jefferson-Pilot Corporation (diversified life insurance company) (until 2006); and former Advisory |
| Director, JP Morgan Chase Bank (formerly Texas Commerce Bank–Austin) (until 2009). | |
| |
| Deborah C. Jackson,2 Born: 1952 | 2008 | 47 |
|
| Chief Executive Officer, American Red Cross of Massachusetts Bay (since 2002); Board of Directors of |
| Eastern Bank Corporation (since 2001); Board of Directors of Eastern Bank Charitable Foundation (since |
| 2001); Board of Directors of American Student Assistance Corp. (1996–2009); Board of Directors of |
| Boston Stock Exchange (2002–2008); Board of Directors of Harvard Pilgrim Healthcare (health benefits |
| company) (since 2007). | | |
| |
| Charles L. Ladner,2 Born: 1938 | 2006 | 47 |
|
| Vice Chairperson (since March 2011); Chairman and Trustee, Dunwoody Village, Inc. (retirement |
| services) (since 2008); Director, Philadelphia Archdiocesan Educational Fund (since 2009); Senior Vice |
| President and Chief Financial Officer, UGI Corporation (public utility holding company) (retired 1998); |
| Vice President and Director for AmeriGas, Inc. (retired 1998); Director of AmeriGas Partners, L.P. (gas |
| distribution) (until 1997); Director, EnergyNorth, Inc. (until 1995); Director, Parks and History Association |
| (Cooperating Association, National Park Service) (until 2005). | | |
| |
| 32 | Small Company Fund | Annual report |
| | |
| Independent Trustees (continued) | | |
| |
| Name, Year of Birth | Trustee | Number of John |
| Position(s) held with Fund | of the | Hancock funds |
| Principal occupation(s) and other | Trust | overseen by |
| directorships during past 5 years | since1 | Trustee |
| |
| Stanley Martin,2 Born: 1947 | 2008 | 47 |
|
| Senior Vice President/Audit Executive, Federal Home Loan Mortgage Corporation (2004–2006); |
| Executive Vice President/Consultant, HSBC Bank USA (2000–2003); Chief Financial Officer/Executive |
| Vice President, Republic New York Corporation & Republic National Bank of New York (1998–2000); |
| Partner, KPMG LLP (1971–1998). | | |
| |
| Dr. John A. Moore, Born: 1939 | 2006 | 47 |
|
| President and Chief Executive Officer, Institute for Evaluating Health Risks, (nonprofit institution) |
| (until 2001); Senior Scientist, Sciences International (health research) (until 2003); Former | |
| Assistant Administrator & Deputy Administrator, Environmental Protection Agency; Principal, |
| Hollyhouse (consulting) (since 2000); Director, CIIT Center for Health Science Research (nonprofit |
| research) (until 2007). | | |
| |
| Patti McGill Peterson,2 Born: 1943 | 2006 | 47 |
|
| Principal, PMP Globalinc (consulting) (since 2007); Senior Associate, Institute for Higher Education Policy |
| (since 2007); Executive Director, CIES (international education agency) (until 2007); Vice President, |
| Institute of International Education (until 2007); Senior Fellow, Cornell University Institute of Public |
| Affairs, Cornell University (1997–1998); Former President Wells College, St. Lawrence University and the |
| Association of Colleges and Universities of the State of New York. Director of the following: Niagara |
| Mohawk Power Corporation (until 2003); Security Mutual Life (insurance) (until 1997); ONBANK (until |
| 1993). Trustee of the following: Board of Visitors, The University of Wisconsin, Madison (since 2007); |
| Ford Foundation, International Fellowships Program (until 2007); UNCF, International Development |
| Partnerships (until 2005); Roth Endowment (since 2002); Council for International Educational |
| Exchange (since 2003). | | |
| |
| Gregory A. Russo, Born: 1949 | 2008 | 47 |
|
| Vice Chairman, Risk & Regulatory Matters, KPMG LLP (“KPMG”) (2002–2006); Vice Chairman, Industrial |
| Markets, KPMG (1998–2002). | | |
| |
| Non-Independent Trustees3 | | |
| | | |
| Name, Year of Birth | Trustee | Number of John |
| Position(s) held with Fund | of the | Hancock funds |
| Principal occupation(s) and other | Trust | overseen by |
| directorships during past 5 years | since1 | Trustee |
| |
| Hugh McHaffie, Born: 1959 | 2010 | 47 |
|
| Executive Vice President, John Hancock Financial Services (since 2006, including prior positions); |
| President of John Hancock Trust and John Hancock Funds II (since 2009); Trustee, John Hancock retail |
| funds (since 2010); Chairman and Director, John Hancock Advisers, LLC, John Hancock Investment |
| Management Services, LLC and John Hancock Funds, LLC (since 2010); Senior Vice President, Individual |
| Business Product Management, MetLife, Inc. (1999–2006). | | |
| |
| Annual report | Small Company Fund | 33 |
| | |
| Non-Independent Trustees3 (continued) | | |
| |
| Name, Year of Birth | Trustee | Number of John |
| Position(s) held with Fund | of the | Hancock funds |
| Principal occupation(s) and other | Trust | overseen by |
| directorships during past 5 years | since1 | Trustee |
| |
| John G. Vrysen, Born: 1955 | 2009 | 47 |
|
| Senior Vice President, John Hancock Financial Services (since 2006); Director, Executive Vice President |
| and Chief Operating Officer, John Hancock Advisers, LLC, John Hancock Investment Management |
| Services, LLC and John Hancock Funds, LLC (since 2005); Chief Operating Officer, John Hancock Funds II |
| and John Hancock Trust (since 2007); Chief Operating Officer, John Hancock retail funds (until 2009); |
| Trustee, John Hancock retail funds (since 2009). | | |
| |
| Principal officers who are not Trustees | | |
| | | |
| Name, Year of Birth | | Officer |
| Position(s) held with Fund | | of the |
| Principal occupation(s) and other | | Trust |
| directorships during past 5 years | | since |
| |
| Keith F. Hartstein, Born: 1956 | | 2006 |
|
| President and Chief Executive Officer | | |
| Senior Vice President, John Hancock Financial Services (since 2004); Director, President and Chief |
| Executive Officer, John Hancock Advisers, LLC and John Hancock Funds, LLC (since 2005); Director, |
| John Hancock Asset Management a division of Manulife Asset Management (US) LLC (since 2005); |
| Director, John Hancock Investment Management Services, LLC (since 2006); President and Chief |
| Executive Officer, John Hancock retail funds (since 2005); Member, Investment Company Institute Sales |
| Force Marketing Committee (since 2003). | | |
| |
| Andrew G. Arnott, Born: 1971 | | 2009 |
|
| Senior Vice President and Chief Operating Officer | | |
| Senior Vice President, John Hancock Financial Services (since 2009); Executive Vice President, |
| John Hancock Advisers, LLC (since 2005); Executive Vice President, John Hancock Investment |
| Management Services, LLC (since 2006); Executive Vice President, John Hancock Funds, LLC (since |
| 2004); Chief Operating Officer, John Hancock retail funds (since 2009); Senior Vice President, |
| John Hancock retail funds (since 2010); Vice President, John Hancock Funds II and John Hancock Trust |
| (since 2006); Senior Vice President, Product Management and Development, John Hancock Funds, |
| LLC (until 2009). | | |
| |
| Thomas M. Kinzler, Born: 1955 | | 2006 |
|
| Secretary and Chief Legal Officer | | |
| Vice President, John Hancock Financial Services (since 2006); Secretary and Chief Legal Counsel, |
| John Hancock Advisers, LLC, John Hancock Investment Management Services, LLC and John Hancock |
| Funds, LLC (since 2007); Secretary and Chief Legal Officer, John Hancock retail funds, John Hancock |
| Funds II and John Hancock Trust (since 2006); Vice President and Associate General Counsel, |
| Massachusetts Mutual Life Insurance Company (1999–2006); Secretary and Chief Legal Counsel, MML |
| Series Investment Fund (2000–2006); Secretary and Chief Legal Counsel, MassMutual Select Funds and |
| MassMutual Premier Funds (2004–2006). | | |
| |
| 34 | Small Company Fund | Annual report |
| |
| Principal officers who are not Trustees (continued) | |
| |
| Name, Year of Birth | Officer |
| Position(s) held with Fund | of the |
| Principal occupation(s) and other | Trust |
| directorships during past 5 years | since |
| |
| Francis V. Knox, Jr., Born: 1947 | 2006 |
|
| Chief Compliance Officer | |
| Vice President, John Hancock Financial Services (since 2005); Chief Compliance Officer, John Hancock |
| retail funds, John Hancock Funds II, John Hancock Trust, John Hancock Advisers, LLC and John Hancock |
| Investment Management Services, LLC (since 2005); Vice President and Chief Compliance Officer, | |
| John Hancock Asset Management a division of Manulife Asset Management (US) LLC (2005–2008). |
| |
| Charles A. Rizzo, Born: 1957 | 2007 |
|
| Chief Financial Officer | |
| Vice President, John Hancock Financial Services (since 2008); Senior Vice President, John Hancock | |
| Advisers, LLC and John Hancock Investment Management Services, LLC (since 2008); Chief Financial |
| Officer, John Hancock retail funds, John Hancock Funds II and John Hancock Trust (since 2007); | |
| Assistant Treasurer, Goldman Sachs Mutual Fund Complex (2005–2007); Vice President, Goldman | |
| Sachs (2005–2007). | |
| |
| Salvatore Schiavone, Born: 1965 | 2010 |
|
| Treasurer | |
| Assistant Vice President, John Hancock Financial Services (since 2007); Vice President, John Hancock |
| Advisers, LLC and John Hancock Investment Management Services, LLC (since 2007); Treasurer, | |
| John Hancock retail funds (since 2010); Treasurer, John Hancock Closed-End Funds (since 2009); | |
| Assistant Treasurer, John Hancock Funds II and John Hancock Trust (since 2007); Assistant Treasurer, |
| John Hancock retail funds, John Hancock Funds II and John Hancock Trust (2007–2009); Assistant | |
| Treasurer, Fidelity Group of Funds (2005–2007); Vice President, Fidelity Management Research | |
| Company (2005–2007). | |
The business address for all Trustees and Officers is 601 Congress Street, Boston, Massachusetts 02210-2805.
The Statement of Additional Information of the Fund includes additional information about members of the Board of Trustees of the Fund and is available without charge, upon request, by calling 1-800-225-5291.
1 Each Trustee holds office until his or her successor is elected and qualified, or until the Trustee’s death, retirement, resignation or removal.
2 Member of Audit Committee.
3 Because Messrs. McHaffie and Vrysen are senior executives or directors with the Adviser and/or its affiliates, each of them is considered an “interested person,” as defined in the Investment Company Act of 1940, of the Fund.
| |
| Annual report | Small Company Fund | 35 |
More information
| | |
| Trustees | Investment adviser | |
| Steven R. Pruchansky, Chairperson | John Hancock Investment Management | |
| James F. Carlin | Services, LLC | |
| William H. Cunningham | | |
| Deborah C. Jackson* | Subadviser | |
| Charles L. Ladner, Vice Chairperson* | Fiduciary Management Associates, LLC | |
| Stanley Martin* | | |
| Hugh McHaffie† | | |
| Dr. John A. Moore | Principal distributor | |
| Patti McGill Peterson* | John Hancock Funds, LLC | |
| Gregory A. Russo | | |
| John G. Vrysen† | Custodian | |
| | State Street Bank and Trust Company | |
| Officers | | |
| Keith F. Hartstein | Transfer agent | |
| President and Chief Executive Officer | John Hancock Signature Services, Inc. | |
| | |
| Andrew G. Arnott | Legal counsel | |
| Senior Vice President and Chief Operating Officer | K&L Gates LLP | |
| | | |
| Thomas M. Kinzler | Independent registered | |
| Secretary and Chief Legal Officer | public accounting firm | |
| | PricewaterhouseCoopers LLP | |
| Francis V. Knox, Jr. | | |
| Chief Compliance Officer | | |
| | | |
| Charles A. Rizzo | | |
| Chief Financial Officer | | |
| | | |
| Salvatore Schiavone | | |
| Treasurer | | |
| | |
| *Member of the Audit Committee | | |
| †Non-Independent Trustee | | |
The Fund’s proxy voting policies and procedures, as well as the Fund’s proxy voting record for the most recent twelve-month period ended June 30, are available free of charge on the Securities and Exchange Commission (SEC) Web site at www.sec.gov or on our Web site.
The Fund’s complete list of portfolio holdings, for the first and third fiscal quarters, is filed with the SEC on Form N-Q. The Fund’s Form N-Q is available on our Web site and the SEC’s Web site, www.sec.gov, and can be reviewed and copied (for a fee) at the SEC’s Public Reference Room in Washington, DC. Call 1-800-SEC-0330 to receive information on the operation of the SEC’s Public Reference Room.
We make this information on your fund, as well as monthly portfolio holdings, and other fund details available on our Web site www.jhfunds.com or by calling 1-800-225-5291.
| | |
| You can also contact us: | | |
| 1-800-225-5291 | Regular mail: | Express mail: |
| jhfunds.com | John Hancock Signature Services, Inc. | John Hancock Signature Services, Inc. |
| | P.O. Box 55913 | Mutual Fund Image Operations |
| | Boston, MA 02205-5913 | 30 Dan Road |
| | | Canton, MA 02021 |
| |
| 36 | Small Company Fund | Annual report |

1-800-225-5291
1-800-554-6713 TDD
1-800-338-8080 EASI-Line
www.jhfunds.com
Now available: electronic delivery
www.jhfunds.com/edelivery
| |
| This report is for the information of the shareholders of John Hancock Small Company Fund. | 3480A 3/11 |
| It is not authorized for distribution to prospective investors unless preceded or accompanied by a prospectus. | 5/11 |

A look at performance
Total returns for the period ended March 31, 2011
| | | | | | | |
| | Average annual total returns (%) | | | Cumulative total returns (%) | |
| | with maximum sales charge (POP) | | | with maximum sales charge (POP) | |
|
| | 1-year | 5-year | 10-year | | 1-year | 5-year | 10-year |
|
| Class A1 | 17.85 | 6.96 | 9.86 | | 17.85 | 40.03 | 156.02 |
|
| Class I1,2 | 24.41 | 8.49 | 10.85 | | 24.41 | 50.27 | 180.25 |
|
| Class ADV 1,2 | 23.96 | 8.05 | 10.41 | | 23.96 | 47.27 | 169.26 |
|
Performance figures assume all distributions are reinvested. Public offering price (POP) figures reflect maximum sales charges on Class A shares of 5%. Sales charges are not applicable for Class I and ADV shares.
The expense ratios of the Fund, both net (including any fee waivers or expense limitations) and gross (excluding any fee waivers or expense limitations), are set forth according to the most recent publicly available prospectuses for the Fund and may differ from those disclosed in the Financial Highlights tables in this report. The fee waivers and expense limitations are contractual at least until 12-31-11 for Class A shares and 7-9-12 for Class I and ADV shares. Had the fee waivers and expense limitations not been in place gross expenses would apply. The expense ratios are as follows:
| | | | | | | |
| | Class A | Class I | Class ADV | | | | |
| Net (%) | 1.25 | 1.00 | 1.25 | | | | |
| Gross (%) | 1.43 | 1.02 | 1.43 | | | | |
The returns reflect past results and should not be considered indicative of future performance. The return and principal value of an investment will fluctuate so that shares, when redeemed, may be worth more or less than their original cost. Due to market volatility, the Fund’s current performance may be higher or lower than the performance shown. For current to the most recent month-end performance data, please call 1–800–225–5291 or visit the Fund’s Web site at www.jhfunds.com.
The performance table above and the chart on the next page do not reflect the deduction of taxes that a shareholder would pay on fund distributions or the redemption of fund shares. The Fund’s performance results reflect any applicable expense reductions, without which the expenses increase and results would have been less favorable.
| |
| 6 | Disciplined Value Mid Cap Fund | Annual report |
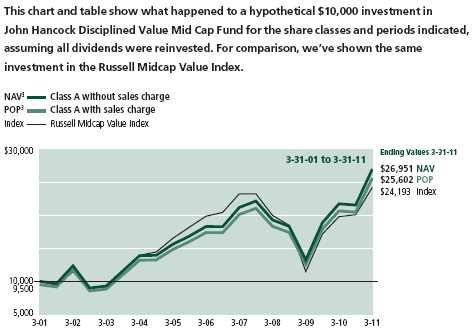
| | | | | |
| | Class I1,2 | Class ADV1,2 | | | |
| | | |
| Began | 3-31-01 | 3-31-01 | | | |
| | | |
| NAV | $28,025 | $26,926 | | | |
| | | |
| POP | $28,025 | $26,926 | | | |
| | | |
| Index | $24,193 | $24,193 | | | |
| | | |
Russell Midcap Value index is an unmanaged index that measures the performance of those Russell Midcap companies with lower price-to-book ratios and lower forecasted growth values.
It is not possible to invest directly in an index. Index figures do not reflect sales charges, which would have resulted in lower values if they did.
1 After the close of business on 7-9-10, holders of Investor Class Shares and Institutional Class Shares of the former Robeco Boston Partners Mid Cap Value Fund (the Predecessor Fund) became owners of an equal number of full and fractional Class A and Class I shares, respectively, of the John Hancock Disciplined Value Mid Cap Fund. Class A, Class I and Class ADV shares were first offered on 7-12-10. The returns prior to this date for Class A and Class ADV shares are those of the Predecessor Fund’s Investor Class Shares recalculated to reflect the gross fees and expenses of the Fund’s Class A and Class ADV shares. For Class I shares, the returns prior to this date are for the Predecessor Fund’s Institutional Class Shares recalculated to reflect the gross fees and expenses of the Fund’s Class I shares.
2 For certain types of investors, as described in the Fund’s prospectuses.
3 NAV represents net asset value and POP represents public offering price. Performance of the classes will vary based on the difference in sales charges paid by shareholders investing in the different classes and the fee structure of those classes.
| |
| Annual report | Disciplined Value Mid Cap Fund | 7 |
Management’s discussion of
Fund performance
By Robeco Investment Management, Inc.
Recently the Fund changed its fiscal year end from August 31 to March 31. What follows is a discussion of the Fund’s performance over the seven-month period from September 1, 2010 through March 31, 2011.
As the reporting period began in September 2010, the stock market was close to its lowest point of the calendar year. In retrospect, the stage was set for a major stock market rally. A variety of factors combined to boost investors’ optimism as the period progressed, including “quantitative easing” undertaken by the Federal Reserve Board and a gradually improving economic picture. For the seven-month period ended March 31, 2011, John Hancock Disciplined Value Mid Cap Fund’s Class A shares had a total return of 38.47% at net asset value, significantly outpacing the 32.44% gain of the average mid-cap value fund, according to Morningstar, Inc., as well as the 31.74% return of the Fund’s benchmark, the Russell Midcap Value Index.
The Fund benefited from very favorable security selection, as well as from being invested in the right sectors during the seven-month period. In most cases, the Fund’s best individual performers relative to the benchmark were cyclical stocks — meaning those that have historically performed well in a strengthening economy. For example, in the capital goods (industrial) sector, WESCO International, Inc., an industrial and electrical-products distributor, was a particularly good performer relative to the Fund’s benchmark, as was Thomas & Betts Corp. The technology sector was another source of strength, with electronics distributor, Arrow Electronics, Inc., making an especially big contribution. Elsewhere, positions in independent energy exploration and production companies Rosetta Resources, Inc. and SM Energy Company both benefited from rising oil prices and favorable drilling results.
There were very few sources of underperformance. Health care was the only sector to generate a negative relative performance contribution for the Fund, and even that was minimal. In individual terms, our position in Harris Corp., a communications and electronics company, was disappointing. Several insurance stocks also hampered performance compared to the benchmark.
This commentary reflects the views of the portfolio managers through the end of the Fund’s period discussed in this report. The managers’ statements reflect their own opinions. As such, they are in no way guarantees of future events and are not intended to be used as investment advice or a recommendation regarding any specific security. They are also subject to change at any time as market and other conditions warrant.
Past performance is no guarantee of future results.
Sector investing is subject to greater risks than the market as a whole. Because the Fund may focus on particular sectors of the economy, its performance may depend on the performance of those sectors.
| |
| 8 | Disciplined Value Mid Cap Fund | Annual report |
Your expenses
These examples are intended to help you understand your ongoing operating expenses.
Understanding fund expenses
As a shareholder of the Fund, you incur two types of costs:
▪ Transaction costs which include sales charges (loads) on purchases or redemptions (varies by share class), minimum account fee charge, etc.
▪ Ongoing operating expenses including management fees, distribution and service fees (if applicable), and other fund expenses.
We are going to present only your ongoing operating expenses here.
Actual expenses/actual returns
This example is intended to provide information about the Fund’s actual ongoing operating expenses, and is based on the Fund’s actual return. It assumes an account value of $1,000.00 on October 1, 2010 with the same investment held until March 31, 2011.
| | | |
| | Account value | Ending value | Expenses paid during |
| | on 10-1-10 | on 3-31-11 | period ended 3-31-111 |
|
| Class A | $1,000.00 | $1,251.70 | $7.02 |
|
| Class I | 1,000.00 | 1,253.00 | 5.56 |
|
| Class ADV | 1,000.00 | 1,251.80 | 7.02 |
|
Together with the value of your account, you may use this information to estimate the operating expenses that you paid over the period. Simply divide your account value at March 31, 2011, by $1,000.00, then multiply it by the “expenses paid” for your share class from the table above. For example, for an account value of $8,600.00, the operating expenses should be calculated as follows:
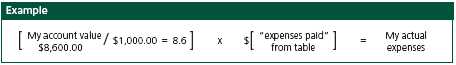
| |
| Annual report | Disciplined Value Mid Cap Fund | 9 |
Your expenses
Hypothetical example for comparison purposes
This table allows you to compare the Fund’s ongoing operating expenses with those of any other fund. It provides an example of the Fund’s hypothetical account values and hypothetical expenses based on each class’s actual expense ratio and an assumed 5% annualized return before expenses (which is not the Fund’s actual return). It assumes an account value of $1,000.00 on October 1, 2010, with the same investment held until March 31, 2011. Look in any other fund shareholder report to find its hypothetical example and you will be able to compare these expenses.
| | | |
| | Account value | Ending value | Expenses paid during |
| | on 10-1-10 | on 3-31-11 | period ended 3-31-111 |
|
| Class A | $1,000.00 | $1,018.70 | $6.29 |
|
| Class I | 1,000.00 | 1,020.00 | 4.99 |
|
| Class ADV | 1,000.00 | 1,018.70 | 6.29 |
|
Remember, these examples do not include any transaction costs, therefore, these examples will not help you to determine the relative total costs of owning different funds. If transaction costs were included, your expenses would have been higher. See the prospectus for details regarding transaction costs.
1 Expenses are equal to the Fund’s annualized expense ratio of 1.25%, 0.99% and 1.25% for Class A, Class I and Class ADV shares, respectively, multiplied by the average account value over the period, multiplied by 182/365 (to reflect the one-half year period).
| |
| 10 | Disciplined Value Mid Cap Fund | Annual report |
Portfolio summary
| | | | |
| Top 10 Holdings (14.5% of Net Assets on 3-31-11)1 | | | |
|
| Discover Financial Services | 1.7% | | Avnet, Inc. | 1.4% |
| |
|
| Thomas & Betts Corp. | 1.6% | | Raymond James Financial, Inc. | 1.4% |
| |
|
| WESCO International, Inc. | 1.6% | | Arrow Electronics, Inc. | 1.3% |
| |
|
| Williams-Sonoma, Inc. | 1.5% | | Rosetta Resources, Inc. | 1.3% |
| |
|
| Moody’s Corp. | 1.4% | | CareFusion Corp. | 1.3% |
| |
|
| |
| Sector Composition2,3 | | | | |
|
| Financials | 22% | | Energy | 6% |
| |
|
| Information Technology | 13% | | Utilities | 5% |
| |
|
| Industrials | 12% | | Consumer Staples | 2% |
| |
|
| Consumer Discretionary | 11% | | Telecommunication Services | 1% |
| |
|
| Health Care | 8% | | Short-Term Investments & Other | 13% |
| |
|
| Materials | 7% | | | |
| | |
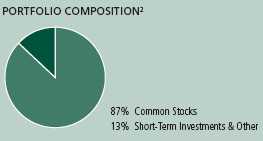
1 Cash and cash equivalents are not included in Top 10 Holdings.
2 As a percentage of net assets on 3-31-11.
3 Sector investing is subject to greater risks than the market as a whole. Because the Fund may focus on particular sectors of the economy, its performance may depend on the performance of those sectors.
| |
| Annual report | Disciplined Value Mid Cap Fund | 11 |
Fund’s investments
As of 3-31-11
| | |
| | Shares | Value |
| Common Stocks 86.33% | | $366,731,537 |
|
| (Cost $310,854,824) | | |
| | | |
| Consumer Discretionary 11.21% | | 47,630,655 |
| | | |
| Hotels, Restaurants & Leisure 0.54% | | |
|
| CEC Entertainment, Inc. | 60,310 | 2,275,491 |
| | | |
| Household Durables 2.28% | | |
|
| Mohawk Industries, Inc. (I) | 65,160 | 3,984,534 |
|
| NVR, Inc. (I)(L) | 3,020 | 2,283,120 |
|
| Stanley Black & Decker, Inc. | 44,575 | 3,414,445 |
| | | |
| Internet & Catalog Retail 0.42% | | |
|
| Expedia, Inc. | 79,059 | 1,791,477 |
| | | |
| Leisure Equipment & Products 0.32% | | |
|
| Mattel, Inc. | 54,255 | 1,352,577 |
| | | |
| Media 3.10% | | |
|
| CBS Corp., Class B | 192,190 | 4,812,438 |
|
| Omnicom Group, Inc. | 105,815 | 5,191,284 |
|
| The McGraw-Hill Companies, Inc. | 80,020 | 3,152,788 |
| | | |
| Multiline Retail 0.45% | | |
|
| Kohl’s Corp. | 36,335 | 1,927,208 |
| | | |
| Specialty Retail 2.94% | | |
|
| Bed Bath & Beyond, Inc. (I) | 61,015 | 2,945,194 |
|
| Guess?, Inc. | 40,750 | 1,603,513 |
|
| The Gap, Inc. | 77,415 | 1,754,224 |
|
| Williams-Sonoma, Inc. | 153,270 | 6,207,435 |
| | | |
| Textiles, Apparel & Luxury Goods 1.16% | | |
|
| Coach, Inc. | 56,385 | 2,934,275 |
|
| VF Corp. (L) | 20,305 | 2,000,652 |
| | | |
| Consumer Staples 1.88% | | 7,979,078 |
| | | |
| Beverages 1.17% | | |
|
| Coca-Cola Enterprises, Inc. | 113,320 | 3,093,636 |
|
| Dr. Pepper Snapple Group, Inc. | 50,555 | 1,878,624 |
| | | |
| Food & Staples Retailing 0.21% | | |
|
| The Kroger Company | 36,535 | 875,744 |
| | | |
| Tobacco 0.50% | | |
|
| Lorillard, Inc. | 22,430 | 2,131,074 |
| | |
| 12 | Disciplined Value Mid Cap Fund | Annual report | See notes to financial statements |
| | |
| | Shares | Value |
| Energy 5.50% | | $23,363,384 |
| | | |
| Energy Equipment & Services 1.36% | | |
|
| Oil States International, Inc. (I) | 50,555 | 3,849,258 |
|
| Pride International, Inc. (I) | 44,955 | 1,930,817 |
| | | |
| Oil, Gas & Consumable Fuels 4.14% | | |
|
| EOG Resources, Inc. | 27,380 | 3,244,804 |
|
| Noble Energy, Inc. | 39,415 | 3,809,460 |
|
| Rosetta Resources, Inc. (I) | 117,145 | 5,569,073 |
|
| SM Energy Company | 66,855 | 4,959,972 |
| | | |
| Financials 22.46% | | 95,396,276 |
| | | |
| Capital Markets 3.90% | | |
|
| Affiliated Managers Group, Inc. (I) | 34,170 | 3,737,173 |
|
| Raymond James Financial, Inc. | 152,645 | 5,837,145 |
|
| SEI Investments Company | 79,730 | 1,903,952 |
|
| TD Ameritrade Holding Corp. | 242,830 | 5,067,862 |
| | | |
| Commercial Banks 3.26% | | |
|
| Comerica, Inc. | 59,500 | 2,184,840 |
|
| East West Bancorp, Inc. | 125,645 | 2,759,164 |
|
| Fifth Third Bancorp | 127,550 | 1,770,394 |
|
| M&T Bank Corp. (L) | 25,075 | 2,218,385 |
|
| Popular, Inc. (I) | 693,428 | 2,017,875 |
|
| SunTrust Banks, Inc. | 59,035 | 1,702,569 |
|
| Zions Bancorporation (L) | 52,650 | 1,214,109 |
| | | |
| Consumer Finance 3.42% | | |
|
| Capital One Financial Corp. | 95,685 | 4,971,793 |
|
| Discover Financial Services | 298,495 | 7,199,699 |
|
| SLM Corp. (I) | 154,090 | 2,357,577 |
| | | |
| Diversified Financial Services 1.39% | | |
|
| Moody’s Corp. (L) | 174,740 | 5,925,433 |
| | | |
| Insurance 7.64% | | |
|
| ACE, Ltd. | 25,295 | 1,636,587 |
|
| Alleghany Corp. (I) | 15,018 | 4,970,538 |
|
| AON Corp. | 39,025 | 2,066,764 |
|
| Assurant, Inc. | 39,585 | 1,524,418 |
|
| Loews Corp. | 52,875 | 2,278,384 |
|
| Marsh & McLennan Companies, Inc. | 161,750 | 4,821,768 |
|
| Reinsurance Group of America, Inc. | 50,810 | 3,189,852 |
|
| Symetra Financial Corp. | 136,130 | 1,851,368 |
|
| The Hanover Insurance Group, Inc. (L) | 82,175 | 3,718,419 |
|
| Unum Group | 196,350 | 5,154,188 |
|
| W.R. Berkley Corp. (L) | 38,090 | 1,226,879 |
| | | |
| Real Estate Investment Trusts 2.85% | | |
|
| American Assets Trust, Inc. | 51,300 | 1,091,151 |
|
| Duke Realty Corp. | 97,815 | 1,370,388 |
|
| Equity Residential | 31,570 | 1,780,864 |
|
| Kimco Realty Corp. | 153,025 | 2,806,479 |
|
| Regency Centers Corp. | 29,495 | 1,282,443 |
| | |
| See notes to financial statements | Annual report | Disciplined Value Mid Cap Fund | 13 |
| | |
| | Shares | Value |
| Real Estate Investment Trusts (continued) | | |
|
| Taubman Centers, Inc. | 41,125 | $2,203,478 |
|
| Ventas, Inc. (L) | 28,625 | 1,554,338 |
| | | |
| Health Care 8.13% | | 34,547,225 |
| | | |
| Health Care Equipment & Supplies 1.78% | | |
|
| CareFusion Corp. (I) | 195,080 | 5,501,256 |
|
| Hologic, Inc. (I) | 92,780 | 2,059,716 |
| | | |
| Health Care Providers & Services 5.44% | | |
|
| Cardinal Health, Inc. | 69,410 | 2,854,833 |
|
| DaVita, Inc. (I) | 31,010 | 2,651,665 |
|
| Humana, Inc. (I) | 37,110 | 2,595,473 |
|
| Lincare Holdings, Inc. | 137,925 | 4,090,856 |
|
| McKesson Corp. | 60,910 | 4,814,936 |
|
| Omnicare, Inc. (L) | 127,215 | 3,815,178 |
|
| Quest Diagnostics, Inc. | 39,630 | 2,287,444 |
| | | |
| Pharmaceuticals 0.91% | | |
|
| Hospira, Inc. (I) | 70,215 | 3,875,868 |
| | | |
| Industrials 11.73% | | 49,812,548 |
| | | |
| Aerospace & Defense 0.56% | | |
|
| ITT Corp. | 39,525 | 2,373,476 |
| | | |
| Electrical Equipment 2.39% | | |
|
| Cooper Industries PLC | 50,125 | 3,253,113 |
|
| Thomas & Betts Corp. (I) | 116,240 | 6,912,793 |
| | | |
| Machinery 2.34% | | |
|
| Ingersoll-Rand PLC | 103,205 | 4,985,834 |
|
| Kennametal, Inc. | 127,110 | 4,957,290 |
| | | |
| Professional Services 4.82% | | |
|
| Equifax, Inc. | 135,275 | 5,255,434 |
|
| FTI Consulting, Inc. (I)(L) | 59,580 | 2,283,701 |
|
| Manpower, Inc. | 79,350 | 4,989,528 |
|
| Robert Half International, Inc. | 150,660 | 4,610,196 |
|
| Towers Watson & Company, Class A | 59,935 | 3,323,995 |
| | | |
| Trading Companies & Distributors 1.62% | | |
|
| WESCO International, Inc. (I)(L) | 109,875 | 6,867,188 |
| | | |
| Information Technology 13.23% | | 56,221,882 |
| | | |
| Communications Equipment 0.49% | | |
|
| Harris Corp. | 42,280 | 2,097,088 |
| | | |
| Computers & Peripherals 0.56% | | |
|
| Seagate Technology PLC (I) | 81,370 | 1,171,728 |
|
| Western Digital Corp. (I) | 32,245 | 1,202,416 |
| | | |
| Electronic Equipment, Instruments & Components 4.64% | | |
|
| Aeroflex Holding Corp. (I) | 126,510 | 2,303,747 |
|
| Arrow Electronics, Inc. (I) | 134,430 | 5,629,928 |
|
| Avnet, Inc. (I) | 173,730 | 5,922,456 |
|
| Ingram Micro, Inc., Class A (I) | 188,385 | 3,961,737 |
|
| TE Connectivity, Ltd. | 54,230 | 1,888,289 |
| | |
| 14 | Disciplined Value Mid Cap Fund | Annual report | See notes to financial statements |
| | |
| | Shares | Value |
| Internet Software & Services 0.41% | | |
|
| Monster Worldwide, Inc. (I)(L) | 110,515 | $1,757,189 |
| | | |
| IT Services 2.60% | | |
|
| Alliance Data Systems Corp. (I)(L) | 26,305 | 2,259,336 |
|
| Amdocs, Ltd. (I) | 56,100 | 1,618,485 |
|
| Broadridge Financial Solutions, Inc. | 63,695 | 1,445,240 |
|
| CGI Group, Inc., Class A (I) | 148,275 | 3,103,396 |
|
| The Western Union Company | 126,385 | 2,625,016 |
| | | |
| Office Electronics 0.58% | | |
|
| Xerox Corp. | 230,475 | 2,454,559 |
| | | |
| Semiconductors & Semiconductor Equipment 1.82% | | |
|
| Analog Devices, Inc. | 75,675 | 2,980,082 |
|
| Micron Technology, Inc. (I) | 193,655 | 2,219,286 |
|
| STMicroelectronics NV (L) | 205,345 | 2,550,385 |
| | | |
| Software 2.13% | | |
|
| CA, Inc. | 151,970 | 3,674,635 |
|
| Electronic Arts, Inc. (I) | 274,290 | 5,356,884 |
| | | |
| Materials 6.80% | | 28,886,720 |
| | | |
| Chemicals 2.95% | | |
|
| Albemarle Corp. | 86,135 | 5,148,289 |
|
| Ashland, Inc. | 31,570 | 1,823,483 |
|
| Cytec Industries, Inc. | 45,140 | 2,454,262 |
|
| PPG Industries, Inc. | 32,450 | 3,089,565 |
| | | |
| Containers & Packaging 1.49% | | |
|
| Ball Corp. | 84,390 | 3,025,382 |
|
| Crown Holdings, Inc. (I) | 85,505 | 3,298,783 |
| | | |
| Metals & Mining 2.36% | | |
|
| Allegheny Technologies, Inc. (L) | 25,820 | 1,748,530 |
|
| Globe Specialty Metals, Inc. | 177,760 | 4,045,818 |
|
| Reliance Steel & Aluminum Company | 73,600 | 4,252,608 |
| | | |
| Telecommunication Services 0.63% | | 2,682,302 |
| | | |
| Diversified Telecommunication Services 0.63% | | |
|
| CenturyLink, Inc. (L) | 64,556 | 2,682,302 |
| | | |
| Utilities 4.76% | | 20,211,467 |
| | | |
| Electric Utilities 3.16% | | |
|
| American Electric Power Company, Inc. | 24,390 | 857,065 |
|
| Edison International | 89,455 | 3,273,158 |
|
| FirstEnergy Corp. | 80,248 | 2,976,398 |
|
| NV Energy, Inc. | 205,760 | 3,063,766 |
|
| Westar Energy, Inc. (L) | 123,285 | 3,257,190 |
| | | |
| Multi-Utilities 1.60% | | |
|
| Alliant Energy Corp. | 76,215 | 2,967,050 |
|
| Ameren Corp. | 80,920 | 2,271,424 |
|
| PG&E Corp. | 34,980 | 1,545,416 |
| | |
| See notes to financial statements | Annual report | Disciplined Value Mid Cap Fund | 15 |
| | | |
| | Yield (%) | Shares | Value |
| Securities Lending Collateral 5.34% | | | $22,668,402 |
|
| (Cost $22,668,741) | | | |
| | | | |
| John Hancock Collateral Investment Trust (W) | 0.2867 (Y) | 2,265,277 | 22,668,402 |
| | | | |
| | | Par value | Value |
| Short-Term Investments 4.68% | | | $19,893,000 |
|
| (Cost $19,893,000) | | | |
| | | | |
| Repurchase Agreement 4.68% | | | 19,893,000 |
| Repurchase Agreement with State Street Corp. dated 3-31-11 at 0.010% to | | |
| be repurchased at $19,893,006 on 4-1-11, collateralized by $19,470,000 | | |
| U.S. Treasury Notes, 3.125% due 4-30-17 (valued at $20,291,924, | | |
| including interest) | | $19,893,000 | 19,893,000 |
| |
| Total investments (Cost $353,416,565)† 96.35% | | $409,292,939 |
|
| Other assets and liabilities, net 3.65% | | | $15,485,887 |
|
| Total net assets 100.00% | | | $424,778,826 |
|
The percentage shown for each investment category is the total value of the category as a percentage of the net assets of the Fund.
(I) Non-income producing security.
(L) All or a portion of this security is on loan as of 3-31-11.
(W) Investment is an affiliate of the Fund, the adviser and/or subadviser. Also, it represents the investment of securities lending collateral received.
(Y) The rate shown is the annualized seven-day yield as of 3-31-11.
† At 3-31-11, the aggregate cost of investment securities for federal income tax purposes was $353,984,307. Net unrealized appreciation aggregated $55,308,632, of which $56,326,103 related to appreciated investment securities and $1,017,471 related to depreciated investment securities.
| | |
| 16 | Disciplined Value Mid Cap Fund | Annual report | See notes to financial statements |
F I N A N C I A L S T A T E M E N T S
Financial statements
Statement of assets and liabilities 3-31-11
This Statement of Assets and Liabilities is the Fund’s balance sheet. It shows the value of what the Fund owns, is due and owes. You’ll also find the net asset value and the maximum offering price per share.
| |
| Assets | |
|
| Investments in unaffiliated issuers, at value (Cost $330,747,824) including | |
| $22,055,051 of securities loaned (Note 2) | $386,624,537 |
| Investments in affiliated issuers, at value (Cost $22,668,741) (Note 2) | 22,668,402 |
| | |
| Total investments, at value (Cost $353,416,565) | 409,292,939 |
| Cash | 695 |
| Receivable for fund shares sold | 55,629,297 |
| Dividends and interest receivable | 260,654 |
| Receivable for securities lending income | 4,840 |
| Receivable due from adviser | 479 |
| Other receivables and prepaid expenses | 53,081 |
| | |
| Total assets | 465,241,985 |
| |
| Liabilities | |
|
| Payable for investments purchased | 17,208,358 |
| Payable for fund shares repurchased | 400,194 |
| Payable upon return of securities loaned (Note 2) | 22,673,409 |
| Payable to affiliates | |
| Accounting and legal services fees | 5,312 |
| Transfer agent fees | 51,385 |
| Trustees’ fees | 317 |
| Other liabilities and accrued expenses | 124,184 |
| | |
| Total liabilities | 40,463,159 |
| |
| Net assets | |
|
| Capital paid-in | $366,765,488 |
| Accumulated distributions in excess of net investment income | (142) |
| Accumulated net realized gain on investments | 2,137,106 |
| Net unrealized appreciation (depreciation) on investments | 55,876,374 |
|
| Net assets | $424,778,826 |
| |
| Net asset value per share | |
|
| Based on net asset values and shares outstanding — the Fund has an | |
| unlimited number of shares authorized with no par value | |
| Class A ($170,702,297 ÷ 14,250,534 shares) | $11.98 |
| Class I ($253,993,557 ÷ 20,598,680 shares) | $12.33 |
| Class ADV ($82,972 ÷ 6,930 shares) | $11.97 |
| |
| Maximum offering price per share | |
|
| Class A (net asset value per share ÷ 95%)1 | $12.61 |
1 On single retail sales of less than $50,000. On sales of $50,000 or more and on group sales the offering price is reduced.
| | |
| See notes to financial statements | Annual report | Disciplined Value Mid Cap Fund | 17 |
F I N A N C I A L S T A T E M E N T S
Statements of operations
For the period ended 3-31-11 and the year ended 8-31-10
These Statements of Operations summarize the Fund’s investment income earned and expenses incurred in operating the Fund. They also show net gains (losses) for the periods stated.
| | |
| | Period | Year |
| | ended | ended |
| | 3-31-111 | 8-31-10 |
| Investment income | | |
|
| Dividends | $1,863,231 | $1,364,760 |
| Securities lending | 25,389 | 13,788 |
| Interest | 517 | 2,208 |
| Less foreign taxes withheld | (6,042) | (4,942) |
| | | |
| Total investment income | 1,883,095 | 1,375,814 |
| |
| Expenses | | |
|
| Investment management fees (Note 4) | 1,110,139 | 798,091 |
| Distribution and service fees (Note 4) | 162,773 | 104,829 |
| Accounting and legal services fees (Note 4) | 19,211 | 96,895 |
| Transfer agent fees (Note 4) | 139,109 | 199,070 |
| Trustees’ fees (Note 4) | 6,150 | 8,281 |
| State registration fees (Note 4) | 20,587 | 45,823 |
| Printing and postage (Note 4) | 11,372 | 26,582 |
| Professional fees | 53,875 | 50,045 |
| Custodian fees | 22,026 | 33,207 |
| Registration and filing fees | 56,983 | 20,296 |
| Other | 4,241 | 11,230 |
| | | |
| Total expenses | 1,606,466 | 1,394,349 |
| Less expense reductions (Note 4) | (65,034) | (294,676) |
| | | |
| Net expenses | 1,541,432 | 1,099,673 |
| | | |
| Net investment income | 341,663 | 276,141 |
| |
| Realized and unrealized gain (loss) | | |
|
| Net realized gain (loss) on | | |
| Investments in unaffiliated issuers | 6,936,014 | 2,324,516 |
| Investments in affiliated issuers | (4,534) | (134) |
| | 6,931,480 | 2,324,382 |
| Change in net unrealized appreciation | | |
| (depreciation) of | | |
| Investments in unaffiliated issuers | 64,707,886 | (8,884,681) |
| Investments in affiliated issuers | (246) | (93) |
| | 64,707,640 | (8,884,774) |
| Net realized and unrealized gain (loss) | 71,639,120 | (6,560,392) |
| | | |
| Increase (decrease) in net assets | | |
| from operations | $71,980,783 | ($6,284,251) |
1For the seven-month period ended 3-31-11. The Fund changed its fiscal year end from August 31 to March 31.
| | |
| 18 | Disciplined Value Mid Cap Fund | Annual report | See notes to financial statements |
F I N A N C I A L S T A T E M E N T S
Statements of changes in net assets
These Statements of Changes in Net Assets show how the value of the Fund’s net assets has changed during the last three periods. The difference reflects earnings less expenses, any investment gains and losses, distributions, if any, paid to shareholders and the net of Fund share transactions.
| | | | |
| | | Period | Year | Year |
| | | ended | ended | ended |
| | | 3-31-111 | 8-31-10 | 8-31-09 |
| Increase (decrease) in net assets | | | | |
|
| From operations | | | | |
| Net investment income | | $341,663 | $276,141 | $477,239 |
| Net realized gain (loss) | | 6,931,480 | 2,324,382 | (5,878,181) |
| Change in net unrealized | | | | |
| appreciation (depreciation) | | 64,707,640 | (8,884,774) | (324,285) |
| | | | | |
| Increase (decrease) in net assets resulting | | | | |
| from operations | | 71,980,783 | (6,284,251) | (5,725,227) |
| | | | | |
| Distributions to shareholders | | | | |
| From net investment income | | | | |
| Class A | | (100,122) | (92,302) | (110,208) |
| Class I | | (372,245) | (307,672) | (341,607) |
| Class ADV | | (26) | — | — |
| From net realized gain | | | | |
| Class A | | — | — | (496) |
| Class I | | — | — | (1,154) |
| | | | | |
| Total distributions | | (472,393) | (399,974) | (453,465) |
| | | | | |
| From Fund share transactions (Note 5) | | 190,782,100 | 122,565,661 | 528,327 |
| | | | | |
| Total increase (decrease) | | 262,290,490 | 115,881,436 | (5,650,365) |
| |
| Net assets | | | | |
|
| Beginning of period | | 162,488,336 | 46,606,900 | 52,257,265 |
| | | | | |
| End of period | | $424,778,826 | $162,488,336 | $46,606,900 |
| | | | | |
| Undistributed/(Accumulated distributions in | | | | |
| excess of) net investment income | | ($142) | $108,182 | $232,015 |
1 For the seven-month period ended 3-31-11. The Fund changed its fiscal year end from August 31 to March 31.
| | |
| See notes to financial statements | Annual report | Disciplined Value Mid Cap Fund | 19 |
Financial highlights
The Financial Highlights show how the Fund’s net asset value for a share has changed since the end of the previous period.
| | | | | | |
| CLASS A SHARES Period ended | 3-31-111 | 8-31-102 | 8-31-093 | 8-31-083 | 8-31-073 | 8-31-06 |
| |
| Per share operating performance | | | | | | |
|
| Net asset value, beginning of period | $8.66 | $8.10 | $9.08 | $11.16 | $12.81 | $13.80 |
| Net investment income (loss)4 | 0.01 | 0.015 | 0.07 | 0.06 | 0.02 | (0.01) |
| Net realized and unrealized gain (loss) | | | | | | |
| on investments | 3.32 | 0.60 | (0.98)6 | (0.74) | 2.39 | 0.87 |
| Total from investment operations | 3.33 | 0.61 | (0.91) | (0.68) | 2.41 | 0.86 |
| Less distributions | | | | | | |
| From net investment income | (0.01) | (0.05) | (0.07) | (0.04) | — | — |
| From net realized gain | — | — | —7 | (1.36) | (4.06) | (1.85) |
| Total distributions | (0.01) | (0.05) | (0.07) | (1.40) | (4.06) | (1.85) |
| Net asset value, end of period | $11.98 | $8.66 | $8.10 | $9.08 | $11.16 | $12.81 |
| Total return (%)8,9 | 38.4710 | 7.54 | (9.79)6 | (6.62) | 21.02 | 6.59 |
| |
| Ratios and supplemental data | | | | | | |
|
| Net assets, end of period (in millions) | $171 | $75 | $14 | $17 | $13 | $5 |
| Ratios (as a percentage of average net assets): | | | | | | |
| Expenses before reductions | 1.3511 | 1.56 | 1.93 | 1.73 | 1.73 | 1.70 |
| Expenses net of fee waivers and credits | 1.2511 | 1.25 | 1.25 | 1.25 | 1.25 | 1.25 |
| Net investment income (loss) | 0.1011 | 0.09 | 1.09 | 0.55 | 0.14 | (0.04) |
| Portfolio turnover (%) | 27 | 38 | 58 | 64 | 89 | 97 |
1 For the seven-month period ended 3-31-11. The Fund changed its fiscal year end from August 31 to March 31.
2 After the close of business on 7-9-10, holders of Investor Class Shares of the former Robeco Boston Partners Mid Cap Value Fund (the Predecessor Fund) became owners of an equal number of full and fractional Class A shares of the John Hancock Disciplined Value Mid Cap Fund. These shares were first offered on 7-12-10. Additionally, the accounting and performance history of the Investor Class Shares of the Predecessor Fund was redesignated as that of John Hancock Disciplined Value Mid Cap Fund Class A.
3 Audited by previous independent registered public accounting firm.
4 Based on the average daily shares outstanding.
5 The amount shown for a share outstanding may differ with the distributions from net investment income for the period due to the timing of distributions in relations to fluctuations of shares outstanding during the period.
6 In 2009, the investment advisor fully reimbursed the Fund for a loss on a transaction not meeting the Fund’s investment guidelines, which otherwise would have reduced total return by 0.11% and net realized and unrealized gain/(loss) on investment by $0.01 per share.
7 Less than $0.01 per share.
8 Total returns would have been lower had certain expenses not been reduced during the periods shown.
9 Does not reflect the effect of sales charges, if any.
10 Not annualized.
11 Annualized.
| | |
| 20 | Disciplined Value Mid Cap Fund | Annual report | See notes to financial statements |
| | | | | | |
| CLASS I SHARES Period ended | 3-31-111 | 8-31-102 | 8-31-093 | 8-31-083 | 8-31-073 | 8-31-06 |
| |
| Per share operating performance | | | | | | |
|
| Net asset value, beginning of period | $8.92 | $8.34 | $9.35 | $11.45 | $13.05 | $14.02 |
| Net investment income4 | 0.03 | 0.045 | 0.09 | 0.08 | 0.05 | 0.04 |
| Net realized and unrealized gain (loss) | | | | | | |
| on investments | 3.41 | 0.61 | (1.01)6 | (0.76) | 2.44 | 0.86 |
| Total from investment operations | 3.44 | 0.65 | (0.92) | (0.68) | 2.49 | 0.90 |
| Less distributions | | | | | | |
| From net investment income | (0.03) | (0.07) | (0.09) | (0.06) | (0.03) | (0.02) |
| From net realized gain | — | — | —7 | (1.36) | (4.06) | (1.85) |
| Total distributions | (0.03) | (0.07) | (0.09) | (1.42) | (4.09) | (1.87) |
| Net asset value, end of period | $12.33 | $8.92 | $8.34 | $9.35 | $11.45 | $13.05 |
| Total return (%) | 38.648 | 7.769 | (9.50)6,9 | (6.41)9 | 21.329 | 6.829 |
| |
| Ratios and supplemental data | | | | | | |
|
| Net assets, end of period (in millions) | $254 | $87 | $33 | $35 | $36 | $28 |
| Ratios (as a percentage of average net | | | | | | |
| assets): | | | | | | |
| Expenses before reductions | 0.9910 | 1.28 | 1.69 | 1.48 | 1.48 | 1.38 |
| Expenses net of fee waivers and credits | 0.9910 | 1.00 | 1.00 | 1.00 | 1.00 | 1.00 |
| Net investment income | 0.3710 | 0.41 | 1.33 | 0.80 | 0.38 | 0.28 |
| Portfolio turnover (%) | 27 | 38 | 58 | 64 | 89 | 97 |
1 For the seven-month period ended 3-31-11. The Fund changed its fiscal year end from August 31 to March 31.
2 After the close of business on 7-9-10, holders of Institutional Class Shares of the former Robeco Boston Partners Mid Cap Value Fund (the Predecessor Fund) became owners of an equal number of full and fractional Class I shares of the John Hancock Disciplined Value Mid Cap Fund. These shares were first offered on 7-12-10. Additionally, the accounting and performance history of the Institutional Class Shares of the Predecessor Fund was redesignated as that of John Hancock Disciplined Value Mid Cap Fund Class I.
3 Audited by previous independent registered public accounting firm.
4 Based on the average daily shares outstanding.
5 The amount shown for a share outstanding may differ with the distributions from net investment income for the period due to the timing of distributions in relations to fluctuations of shares outstanding during the period.
6 In 2009, the investment advisor fully reimbursed the Fund for a loss on a transaction not meeting the Fund’s investment guidelines, which otherwise would have reduced total return by 0.11% and net realized and unrealized gain/(loss) on investment by $0.01 per share.
7 Less than $0.01 per share.
8 Not annualized.
9 Total returns would have been lower had certain expenses not been reduced during the periods shown.
10 Annualized.
| | | | | | |
| CLASS ADV SHARES Period ended | | | | | 3-31-111 | 8-31-102 |
| |
| Per share operating performance | | | | | | |
|
| Net asset value, beginning of period | | | | | $8.65 | $8.86 |
| Net investment income3 | | | | | 0.01 | —4 |
| Net realized and unrealized gain (loss) on investments | | | | | 3.32 | (0.21) |
| Total from investment operations | | | | | 3.33 | (0.21) |
| Less distributions | | | | | | |
| From net investment income | | | | | (0.01) | — |
| Net asset value, end of period | | | | | $11.97 | $8.65 |
| Total return (%)5 | | | | | 38.506 | (2.37)6 |
| |
| Ratios and supplemental data | | | | | | |
|
| Net assets, end of period (in thousands) | | | | | $83 | $24 |
| Ratios (as a percentage of average net assets): | | | | | | |
| Expenses before reductions | | | | | 5.787 | 1.427 |
| Expenses net of fee waivers and credits | | | | | 1.257 | 1.257 |
| Net investment income (loss) | | | | | 0.157 | (0.37)7 |
| Portfolio turnover (%) | | | | | 27 | 388 |
1 For the seven-month period ended 3-31-11. The Fund changed its fiscal year end from August 31 to March 31.
2 Period from 7-12-10 (inception date) to 8-31-10.
3 Based on the average daily shares outstanding.
4 Less than $0.005 per share.
5 Total returns would have been lower had certain expenses not been reduced during the periods shown.
6 Not annualized.
7 Annualized.
8 Portfolio turnover is shown for the period from 9-1-09 to 8-31-10.
| | |
| See notes to financial statements | Annual report | Disciplined Value Mid Cap Fund | 21 |
Notes to financial statements
Note 1 — Organization
John Hancock Disciplined Value Mid Cap Fund (the Fund) is a diversified series of John Hancock Funds III (the Trust), an open-end management investment company organized as a Massachusetts business trust and registered under the Investment Company Act of 1940, as amended (the 1940 Act). The investment objective of the Fund is to seek long-term growth of capital with current income as a secondary objective. During the period ended March 31, 2011, the Fund changed its fiscal year end from August 31 to March 31.
The Fund may offer multiple classes of shares. The shares currently offered are detailed in the Statement of Assets and Liabilities. Class A shares are offered to all investors. Class I shares are offered to institutions and certain investors. Class ADV shares are available to investors who acquired Class A shares as a result of the reorganization of the Robeco Boston Partners Mid Cap Value Fund (the Predecessor Fund) into the Fund and are closed to new investors. Shareholders of each class have exclusive voting rights to matters that affect that class. The distribution and service fees, if any, transfer agent fees, state registration fees and printing and postage, for each class may differ.
As a result of the reorganization, the Fund is the legal survivor, however, the accounting and performance history of the Investor Class and Institutional Class shares of the Predecessor Fund have been redesignated as that of Class A and Class I shares of the Fund, respectively. At the close of business on July 9, 2010, the Fund acquired substantially all the assets and assumed the liabilities of the Predecessor Fund pursuant to an agreement and plan of reorganization, in exchange for Class A and Class I shares of the Fund.
Note 2 — Significant accounting policies
The financial statements have been prepared in conformity with accounting principles generally accepted in the United States of America, which require management to make certain estimates and assumptions at the date of the financial statements. Actual results could differ from those estimates. Events or transactions occurring after the end of the fiscal period through the date that the financial statements were issued have been evaluated in the preparation of the financial statements. The following summarizes the significant accounting policies of the Fund:
Security valuation. Investments are stated at value as of the close of regular trading on the New York Stock Exchange (NYSE), normally at 4:00 P.M., Eastern Time. The Fund uses a three-tier hierarchy to prioritize the pricing assumptions, referred to as inputs, used in valuation techniques to measure fair value. Level 1 includes securities valued using quoted prices in active markets for identical securities. Level 2 includes securities valued using significant observable inputs. Observable inputs may include quoted prices for similar securities, interest rates, prepayment speeds and credit risk. Prices for securities valued using these inputs are received from independent pricing vendors and brokers and are based on an evaluation of the inputs described. Level 3 includes securities valued using significant unobservable inputs when market prices are not readily available or reliable, including the Fund’s own assumptions in determining the fair value of investments. Factors used in determining value may include market or issuer specific events, changes in interest rates and credit quality. The inputs or methodology used for valuing securities are not necessarily an indication of the risk associated with investing in those securities.
| |
| 22 | Disciplined Value Mid Cap Fund | Annual report |
As of March 31, 2011, all investments of the Fund are categorized as Level 1 under the hierarchy described above, except for repurchase agreements, which are Level 2. Changes in valuation techniques may result in transfers in or out of an assigned level within the disclosure hierarchy. During the period ended March 31, 2011, there were no significant transfers in or out of Level 1 or Level 2 assets.
In order to value the securities, the Fund uses the following valuation techniques. Equity securities held by the Fund are valued at the last sale price or official closing price on the principal securities exchange on which they trade. In the event there were no sales during the day or closing prices are not available, then securities are valued using the last quoted bid or evaluated price. Investments in open-end mutual funds, including John Hancock Collateral Investment Trust (JHCIT), are valued at their closing net asset values each day. Foreign securities and currencies are valued in U.S. dollars, based on foreign currency exchange rates supplied by an independent pricing service. Certain securities traded only in the over-the-counter market are valued at the last bid price quoted by brokers making markets in the securities at the close of trading. Certain short-term securities are valued at amortized cost. Other portfolio securities and assets, where market quotations are not readily available, are valued at fair value, as determined in good faith by the Fund’s Pricing Committee, following procedures established by the Board of Trustees.
Repurchase agreements. The Fund may enter into repurchase agreements. When the Fund enters into a repurchase agreement, it receives collateral which is held in a segregated account by the Fund’s custodian. The collateral amount is marked-to-market and monitored on a daily basis to ensure that the collateral held is in an amount not less than the principal amount of the repurchase agreement plus any accrued interest. In the event of a default by the counterparty, realization of the collateral proceeds could be delayed, during which time the collateral value may decline.
Security transactions and related investment income. Investment security transactions are accounted for on a trade date plus one basis for daily net asset value calculations. However, for financial reporting purposes, investment transactions are reported on trade date. Interest income is accrued as earned. Gains and losses on securities sold are determined on the basis of identified cost and may include proceeds from litigation. Dividend income is recorded on the ex-date, except for dividends of foreign securities where the dividend may not be known until after the ex-date. In those cases, dividend income is recorded when the Fund becomes aware of the dividends.
Securities lending. The Fund may lend its securities to earn additional income. It receives and maintains cash collateral received from the borrower in an amount not less than the market value of the loaned securities. The Fund will invest its collateral in JHCIT, an affiliate of the Fund, and as a result, the Fund will receive the benefit of any gains and bear any losses generated by JHCIT. Although risk of the loss of the securities lent is mitigated by holding the collateral, the Fund could experience a delay in recovering its securities and a possible loss of income or value if the borrower fails to return the securities or if collateral investments decline in value. The Fund may receive compensation for lending its securities by retaining a portion of the return on the investment of the collateral and compensation from fees earned from borrowers of the securities. Income received from JHCIT is a component of securities lending income as recorded on the Statements of Operations.
Line of credit. The Fund may borrow from banks for temporary or emergency purposes, including meeting redemption requests that otherwise might require the untimely sale of securities. Pursuant to the custodian agreement, the custodian may loan money to the Fund to make properly authorized payments. The Fund is obligated to repay the custodian for any overdraft, including any related costs or expenses. The custodian has a lien, security interest or security entitlement in any Fund property that is not segregated, to the maximum extent permitted by law for any overdraft.
| |
| Annual report | Disciplined Value Mid Cap Fund | 23 |
In addition, effective March 30, 2011, the Fund and other affiliated funds have entered into an agreement with Citibank N.A. which enables them to participate in a $100 million unsecured committed line of credit. Prior to March 30, 2011, the Fund had a similar arrangement with State Street Bank and Trust Company. A commitment fee, payable at the end of each calendar quarter, based on the average daily unused portion of the line of credit, is charged to each participating fund on a pro rata basis and is reflected in other expenses on the Statements of Operations. For the period ended March 31, 2011, the Fund had no borrowings under the line of credit.
Expenses. The majority of expenses are directly attributable to an individual fund. Expenses that are not readily attributable to a specific fund are allocated among all funds in an equitable manner, taking into consideration, among other things, the nature and type of expense and the fund’s relative assets. Expense estimates are accrued in the period to which they relate and adjustments are made when actual amounts are known.
Class allocations. Income, common expenses, and realized and unrealized gains (losses) are determined at the fund level and allocated daily to each class of shares based on the net asset value of the class. Class-specific expenses, such as distribution and service fees, if any, transfer agent fees, state registration fees and printing and postage, for all classes, are calculated daily at the class level based on the appropriate net asset value of each class and the specific expense rates applicable to each class.
Federal income taxes. The Fund intends to continue to qualify as a regulated investment company by complying with the applicable provisions of the Internal Revenue Code and will not be subject to federal income tax on taxable income that is distributed to shareholders. Therefore, no federal income tax provision is required.
As of March 31, 2011, the Fund had no uncertain tax positions that would require financial statement recognition, de-recognition or disclosure. The Fund’s federal tax return is subject to examination by the Internal Revenue Service for a period of three years.
Distribution of income and gains. Distributions to shareholders from net investment income and net realized gains, if any, are recorded on the ex-date. The Fund generally declares and pays dividends and capital gain distributions, if any, annually. The tax character of distributions for the period ended March 31, 2011, year ended August 31, 2010 and year ended August 31, 2009 was as follows:
| | | | |
| | MARCH 31, 2011 | AUGUST 31, 2010 | AUGUST 31, 2009 | |
| |
| Ordinary Income | $472,393 | $399,974 | $452,583 | |
| Long-Term Capital Gain | — | — | 882 | |
Distributions paid by the Fund with respect to each class of shares are calculated in the same manner, at the same time and are in the same amount, except for the effect of expenses that may be applied differently to each class. As of March 31, 2011, the components of distributable earnings on a tax basis included $925,041 of undistributed ordinary income and $1,768,798 of undistributed long-term capital gains.
Such distributions and distributable earnings, on a tax basis, are determined in conformity with income tax regulations, which may differ from accounting principles generally accepted in the United States of America. Material distributions in excess of tax basis earnings and profits, if any, are reported in the Fund’s financial statements as a return of capital.
| |
| 24 | Disciplined Value Mid Cap Fund | Annual report |
Capital accounts within financial statements are adjusted for permanent book-tax differences. These adjustments have no impact on net assets or the results of operations. Temporary book-tax differences, if any, will reverse in a subsequent period. Book-tax differences are primarily attributable to wash sale loss deferrals.
Note 3 — Guarantees and indemnifications
Under the Fund’s organizational documents, its Officers and Trustees are indemnified against certain liabilities arising out of the performance of their duties to the Fund. Additionally, in the normal course of business, the Fund enters into contracts with service providers that contain general indemnification clauses. The Fund’s maximum exposure under these arrangements is unknown, as this would involve future claims that may be made against the Fund that have not yet occurred. The risk of material loss from such claims is considered remote.
Note 4 — Fees and transactions with affiliates
John Hancock Investment Management Services, LLC (the Adviser) serves as investment adviser for the Fund. John Hancock Funds, LLC (the Distributor), an affiliate of the Adviser, serves as principal underwriter of the Trust. The Adviser and the Distributor are indirect wholly owned subsidiaries of Manulife Financial Corporation (MFC).
Management fee. The Fund has an investment management contract with the Adviser under which the Fund pays a daily management fee to the Adviser equivalent, on an annual basis, to the sum of: (a) 0.800% of the first $500,000,000 of the Fund’s average daily net assets; (b) 0.775% of the next $500,000,000; (c) 0.750% of the next $500,000,000; (d) 0.725% of the next $1,000,000,000; and (e) 0.700% of the Fund’s average daily net assets in excess of $2,500,000,000. The Adviser has a subadvisory agreement with Robeco Investment Management, Inc. The Fund is not responsible for payment of the subadvisory fees.
The investment management fees incurred for the period ended March 31, 2011 were equivalent to an annual effective rate of 0.80% of the Fund’s average daily net assets.
The Adviser has agreed to reimburse or limit certain expenses for each share class of the Fund. This agreement excludes taxes, portfolio brokerage commissions, interest and litigation and indemnification expenses, shareholder services fees and other extraordinary expenses not incurred in the ordinary course of the Fund’s business. The reimbursements and limits are such that these expenses will not exceed 1.25%, 1.00% and 1.25% for Class A, Class I and Class ADV shares, respectively. The expense reimbursements and limits will continue in effect until December 31, 2011 for Class A shares and July 9, 2012 for Class I and Class ADV shares.
Accordingly, these expense reductions amounted to $64,099 and $935 for Class A and Class ADV shares, respectively, for the period ended March 31, 2011.
Accounting and legal services. Pursuant to a service agreement, the Fund reimburses the Adviser for all expenses associated with providing the administrative, financial, legal, accounting and recordkeeping services of the Fund, including the preparation of all tax returns, periodic reports to shareholders and regulatory reports, among other services. These expenses are allocated to each share class based on its relative net assets at the time the expense was incurred. The accounting and legal services fees incurred for the period ended March 31, 2011 amounted to an annual rate of 0.01% of the Fund’s average daily net assets.
| |
| Annual report | Disciplined Value Mid Cap Fund | 25 |
Distribution and service plans. The Fund has a distribution agreement with the Distributor. The Fund has adopted distribution and service plans with respect to Class A and Class ADV shares pursuant to Rule 12b-1 under the 1940 Act, to pay the Distributor for services provided as the distributor of shares of the Fund. The Fund may pay up to 0.30% and 0.25% for Class A and Class ADV shares, respectively, for distribution and service fees under these arrangements, expressed as an annual percentage of average daily net assets. Currently, only 0.25% is charged to Class A shares for 12b-1 fees.
Sales charges. Class A shares are assessed up-front sales charges, which resulted in payments to the Distributor amounting to $136,087 for the period ended March 31, 2011. Of this amount, $21,822 was retained and used for printing prospectuses, advertising, sales literature and other purposes, $111,865 was paid as sales commissions to broker-dealers and $2,400 was paid as sales commissions to sales personnel of Signator Investors, Inc. (Signator Investors), a broker-dealer affiliate of the Adviser.
Transfer agent fees. The Fund has a transfer agent agreement with John Hancock Signature Services, Inc. (Signature Services or Transfer Agent), an affiliate of the Adviser. The transfer agent fees paid to Signature Services are determined based on the cost to Signature Services (Signature Services Cost) of providing recordkeeping services. The Signature Services Cost includes a component of allocated John Hancock corporate overhead for providing transfer agent services to the Fund and to all other John Hancock affiliated funds. It also includes out-of-pocket expenses that are comprised of payments made to third-parties for recordkeeping services provided to their clients who invest in one or more John Hancock funds. In addition, Signature Services Cost may be reduced by certain revenues that Signature Services receives in connection with the service it provides to the funds. Signature Services Cost is calculated monthly and allocated, as applicable, to four categories of share classes: Institutional Share Classes, Retirement Share Classes, Municipal Bond Classes and all other Retail Share Classes. Within each of these categories, the applicable costs are allocated to the affected John Hancock affiliated funds and/or classes, based on the relative average daily net assets.
Class level expenses. Class level expenses for the period ended March 31, 2011 were:
| | | | |
| | DISTRIBUTION | TRANSFER | STATE | PRINTING AND |
| CLASS | AND SERVICE FEES | AGENT FEES | REGISTRATION FEES | POSTAGE |
|
| Class A | $162,722 | $109,544 | $3,440 | $5,536 |
| Class I | — | 29,528 | 16,404 | 5,666 |
| Class ADV | 51 | 37 | 743 | 170 |
| Total | $162,773 | $139,109 | $20,587 | $11,372 |
Trustee expenses. The Trust compensates each Trustee who is not an employee of the Adviser or its affiliates. These Trustees may, for tax purposes, elect to defer receipt of this compensation under the John Hancock Group of Funds Deferred Compensation Plan (the Plan). Deferred amounts are invested in various John Hancock funds and remain in the funds until distributed in accordance with the Plan. The investment of deferred amounts and the offsetting liability are included within Other receivables and prepaid expenses and Payable to affiliates — Trustees’ fees, respectively, in the accompanying Statement of Assets and Liabilities.
| |
| 26 | Disciplined Value Mid Cap Fund | Annual report |
Note 5 — Fund share transactions
Transactions in Fund shares for the period ended March 31, 2011, year ended August 31, 2010 and year ended August 31, 2009 were as follows:
| | | | | | |
| | Period ended 3-31-111 | Year ended 8-31-10 | Year ended 8-31-09 |
| | Shares | Amount | Shares | Amount | Shares | Amount |
| Class A shares | | | | | | |
|
| Sold | 7,005,591 | $77,872,436 | 8,777,014 | $83,785,587 | 741,258 | $5,122,885 |
| Distributions | | | | | | |
| reinvested | 8,933 | 97,188 | 10,325 | 90,650 | 17,469 | 107,613 |
| Repurchased | (1,470,217) | (15,870,855) | (1,798,769) | (16,412,636) | (935,943) | (5,791,669) |
| | | | | | | |
| Net increase | | | | | | |
| (decrease) | 5,544,307 | $62,098,769 | 6,988,570 | $67,463,601 | (177,216) | ($561,171) |
| | | | | | | |
| Class I shares | | | | | | |
|
| Sold | 11,421,411 | $135,086,113 | 6,811,708 | $64,123,319 | 794,979 | $5,308,485 |
| Distributions | | | | | | |
| reinvested | 13,096 | 146,545 | 33,541 | 302,876 | 53,081 | 335,472 |
| Repurchased | (601,401) | (6,597,427) | (1,000,633) | (9,349,135) | (675,830) | (4,554,459) |
| | | | | | | |
| Net increase | 10,833,106 | $128,635,231 | 5,844,616 | $55,077,060 | 172,230 | $1,089,498 |
| | | | | | |
| Class ADV shares | | | | | |
|
| Sold | 4,108 | $48,100 | 2,822 | $25,000 | — | — |
| | | | | | | |
| Net increase | 4,108 | $48,100 | 2,822 | $25,000 | — | — |
| | | | | | | |
| Net increase | | | | | | |
| (decrease) | 16,381,521 | $190,782,100 | 12,836,008 | $122,565,661 | (4,986) | $528,327 |
1 For the seven-month period ended 3-31-11. The Fund changed its fiscal year end from August 31 to March 31.
Affiliates of the Fund owned 41% of shares of beneficial interest of Class ADV shares on March 31, 2011.
Note 6 — Purchase and sale of securities
Purchases and sales of securities, other than short-term securities, aggregated $200,925,102 and $62,454,332, respectively, for the period ended March 31, 2011.
Note 7 — Reorganization
At the close of business on July 9, 2010, the Fund acquired all the assets and liabilities of the Predecessor Fund in exchange for the Class A and Class I shares of the Fund. The Fund had no assets, liabilities or operations prior to the reorganization.
The Agreement provided for (a) the acquisition of all the assets, subject to all of the liabilities, of the Predecessor Fund in exchange for a representative amount of shares of the Fund; (b) the liquidation of the Predecessor Fund; and (c) the distribution to the Predecessor Fund’s shareholders of the Fund’s shares. The reorganization was intended to allow the Fund to be better positioned to increase asset size and achieve additional economies of scale by achieving net prices on securities trades and spread fixed expenses over a larger asset base. As a result of the reorganization, the Fund is the legal survivor, however, the accounting and performance history of the Investor Class and Institutional Class of the Predecessor Fund have been redesignated as that of Class A and Class I of the Fund.
| |
| Annual report | Disciplined Value Mid Cap Fund | 27 |
Based on the opinion of tax counsel, the reorganization qualified as a tax-free reorganization for federal income tax purposes with no gain or loss recognized by the Predecessor Fund or its shareholders. In addition, the expenses of the reorganization were borne by the Advisers of both the Predecessor Fund and the Fund. The effective time of the reorganization occurred immediately after the close of regularly scheduled trading on the New York Stock Exchange (NYSE) on July 9, 2010. The following outlines the reorganization:
| | | | |
| | ACQUIRED NET | DEPRECIATION OF | | |
| | ASSET VALUE OF THE | ACQUIRED FUND’S | SHARES ISSUED | TOTAL NET ASSETS |
| ACQUIRED FUND | ACQUIRED FUND | INVESTMENTS | BY THE FUND | AFTER COMBINATION |
|
| Robeco Boston Partners | $154,240,210 | ($5,243,829) | 17,142,708 | $154,240,210 |
| Mid Cap Value Fund | | | | |
| |
| 28 | Disciplined Value Mid Cap Fund | Annual report |
Auditors’ report
Report of Independent Registered Public Accounting Firm
To the Board of Trustees of John Hancock Funds III and Shareholders of
John Hancock Disciplined Value Mid Cap Fund:
In our opinion, the accompanying statement of assets and liabilities, including the portfolio of investments, and the related statements of operations and of changes in net assets and the financial highlights present fairly, in all material respects, the financial position of John Hancock Disciplined Value Mid Cap Fund (the “Fund”) at March 31, 2011, and the results of its operations, the changes in its net assets and the financial highlights for each of the periods ending August 31, 2010 and March 31, 2011, in conformity with accounting principles generally accepted in the United States of America. These financial statements and financial highlights (hereafter referred to as “financial statements”) are the responsibility of the Fund’s management; our responsibility is to express an opinion on these financial statements based on our audits. We conducted our audits of these financial statements in accordance with the standards of the Public Company Accounting Oversight Board (United States). Those standards require that we plan and perform the audit to obtain reasonable assurance about whether the financial statements are free of material misstatement. An audit includes examining, on a test basis, evidence supporting the amounts and disclosures in the financial statements, assessing the accounting principles used and significant estimates made by management, and evaluating the overall financial statement presentation. We believe that our audits, which included confirmation of securities at March 31, 2011 by correspondence with the custodian and brokers and the application of alternative auditing procedures where securities purchased confirmations had not been received, provide a reasonable basis for our opinion.
The statement of changes in net assets and the financial highlights of the Fund for periods ending on or before August 31, 2009 were audited by another independent registered public accounting firm, whose report dated October 27, 2009 expressed an unqualified opinion thereon.
PricewaterhouseCoopers LLP
Boston, Massachusetts
May 20, 2011
| |
| Annual report | Disciplined Value Mid Cap Fund | 29 |
Tax information
Unaudited
For federal income tax purposes, the following information is furnished with respect to the distributions of the Fund, if any, paid during its taxable year ended March 31, 2011.
The Fund designates the maximum amount allowable for the corporate dividends received deduction for the fiscal year ended March 31, 2011.
The Fund designates the maximum amount allowable of its net taxable income as qualified dividend income as provided in the Jobs and Growth Tax Relief Reconciliation Act of 2003. This amount will be reflected on Form 1099-DIV for the calendar year 2011.
Shareholders will be mailed a 2011 Form 1099-DIV in January 2012. This will reflect the total of all distributions for calendar year 2011.
| |
| 30 | Disciplined Value Mid Cap Fund | Annual report |
Trustees and Officers
This chart provides information about the Trustees and Officers who oversee your John Hancock fund. Officers elected by the Trustees manage the day-to-day operations of the Fund and execute policies formulated by the Trustees.
Independent Trustees
| | |
| Name, Year of Birth | Trustee | Number of John |
| Position(s) held with Fund | of the | Hancock funds |
| Principal occupation(s) and other | Trust | overseen by |
| directorships during past 5 years | since1 | Trustee |
| |
| Steven R. Pruchansky, Born: 1944 | 2006 | 47 |
|
| Chairperson (since January 2011); Chairman and Chief Executive Officer, Greenscapes of Southwest |
| Florida, Inc. (since 2000); Director and President, Greenscapes of Southwest Florida, Inc. (until 2000); |
| Member, Board of Advisors, First American Bank (since 2008); Managing Director, Jon James, LLC (real |
| estate) (since 2000); Director, First Signature Bank & Trust Company (until 1991); Director, Mast Realty |
| Trust (until 1994); President, Maxwell Building Corp. (until 1991). | | |
| |
| James F. Carlin, Born: 1940 | 2006 | 47 |
|
| Chief Executive Officer, Director and Treasurer, Alpha Analytical Laboratories (environmental, chemical |
| and pharmaceutical analysis) (since 1985); Part Owner and Treasurer, Lawrence Carlin Insurance |
| Agency, Inc. (since 1995); Chairman and Chief Executive Officer, CIMCO, LLC (management/ |
| investments) (since 1987). | | |
| |
| William H. Cunningham, Born: 1944 | 2006 | 47 |
|
| Professor, University of Texas, Austin, Texas (since 1971); former Chancellor, University of Texas System |
| and former President of the University of Texas, Austin, Texas; Director of the following: LIN Television |
| (since 2009); Lincoln National Corporation (insurance) (Chairman since 2009 and Director since 2006); |
| Resolute Energy Corporation (since 2009); Nanomedical Systems, Inc. (biotechnology company) |
| (Chairman since 2008); Yorktown Technologies, LP (tropical fish) (Chairman since 2007); Greater Austin |
| Crime Commission (since 2001); Southwest Airlines (since 2000); former Director of the following: |
| Introgen (manufacturer of biopharmaceuticals) (until 2008); Hicks Acquisition Company I, Inc. (until |
| 2007); Jefferson-Pilot Corporation (diversified life insurance company) (until 2006); and former Advisory |
| Director, JP Morgan Chase Bank (formerly Texas Commerce Bank–Austin) (until 2009). | |
| |
| Deborah C. Jackson,2 Born: 1952 | 2008 | 47 |
|
| Chief Executive Officer, American Red Cross of Massachusetts Bay (since 2002); Board of Directors of |
| Eastern Bank Corporation (since 2001); Board of Directors of Eastern Bank Charitable Foundation (since |
| 2001); Board of Directors of American Student Assistance Corp. (1996–2009); Board of Directors of |
| Boston Stock Exchange (2002–2008); Board of Directors of Harvard Pilgrim Healthcare (health benefits |
| company) (since 2007). | | |
| |
| Charles L. Ladner,2 Born: 1938 | 2006 | 47 |
|
| Vice Chairperson (since March 2011); Chairman and Trustee, Dunwoody Village, Inc. (retirement |
| services) (since 2008); Director, Philadelphia Archdiocesan Educational Fund (since 2009); Senior Vice |
| President and Chief Financial Officer, UGI Corporation (public utility holding company) (retired 1998); |
| Vice President and Director for AmeriGas, Inc. (retired 1998); Director of AmeriGas Partners, L.P. (gas |
| distribution) (until 1997); Director, EnergyNorth, Inc. (until 1995); Director, Parks and History Association |
| (Cooperating Association, National Park Service) (until 2005). | | |
| |
| Annual report | Disciplined Value Mid Cap Fund | 31 |
Independent Trustees (continued)
| | |
| Name, Year of Birth | Trustee | Number of John |
| Position(s) held with Fund | of the | Hancock funds |
| Principal occupation(s) and other | Trust | overseen by |
| directorships during past 5 years | since1 | Trustee |
| |
| Stanley Martin,2 Born: 1947 | 2008 | 47 |
|
| Senior Vice President/Audit Executive, Federal Home Loan Mortgage Corporation (2004–2006); |
| Executive Vice President/Consultant, HSBC Bank USA (2000–2003); Chief Financial Officer/Executive |
| Vice President, Republic New York Corporation & Republic National Bank of New York (1998–2000); |
| Partner, KPMG LLP (1971–1998). | | |
| |
| Dr. John A. Moore, Born: 1939 | 2006 | 47 |
|
| President and Chief Executive Officer, Institute for Evaluating Health Risks, (nonprofit institution) |
| (until 2001); Senior Scientist, Sciences International (health research) (until 2003); Former | |
| Assistant Administrator & Deputy Administrator, Environmental Protection Agency; Principal, |
| Hollyhouse (consulting) (since 2000); Director, CIIT Center for Health Science Research (nonprofit |
| research) (until 2007). | | |
| |
| Patti McGill Peterson,2 Born: 1943 | 2006 | 47 |
|
| Principal, PMP Globalinc (consulting) (since 2007); Senior Associate, Institute for Higher Education Policy |
| (since 2007); Executive Director, CIES (international education agency) (until 2007); Vice President, |
| Institute of International Education (until 2007); Senior Fellow, Cornell University Institute of Public |
| Affairs, Cornell University (1997–1998); Former President Wells College, St. Lawrence University and the |
| Association of Colleges and Universities of the State of New York. Director of the following: Niagara |
| Mohawk Power Corporation (until 2003); Security Mutual Life (insurance) (until 1997); ONBANK (until |
| 1993). Trustee of the following: Board of Visitors, The University of Wisconsin, Madison (since 2007); |
| Ford Foundation, International Fellowships Program (until 2007); UNCF, International Development |
| Partnerships (until 2005); Roth Endowment (since 2002); Council for International Educational |
| Exchange (since 2003). | | |
| |
| Gregory A. Russo, Born: 1949 | 2008 | 47 |
|
| Vice Chairman, Risk & Regulatory Matters, KPMG LLP (“KPMG”) (2002–2006); Vice Chairman, Industrial |
| Markets, KPMG (1998–2002). | | |
Non-Independent Trustees3
| | |
| Name, Year of Birth | Trustee | Number of John |
| Position(s) held with Fund | of the | Hancock funds |
| Principal occupation(s) and other | Trust | overseen by |
| directorships during past 5 years | since1 | Trustee |
| |
| Hugh McHaffie, Born: 1959 | 2010 | 47 |
|
| Executive Vice President, John Hancock Financial Services (since 2006, including prior positions); |
| President of John Hancock Trust and John Hancock Funds II (since 2009); Trustee, John Hancock retail |
| funds (since 2010); Chairman and Director, John Hancock Advisers, LLC, John Hancock Investment |
| Management Services, LLC and John Hancock Funds, LLC (since 2010); Senior Vice President, Individual |
| Business Product Management, MetLife, Inc. (1999–2006). | | |
| |
| 32 | Disciplined Value Mid Cap Fund | Annual report |
Non-Independent Trustees3 (continued)
| | |
| Name, Year of Birth | Trustee | Number of John |
| Position(s) held with Fund | of the | Hancock funds |
| Principal occupation(s) and other | Trust | overseen by |
| directorships during past 5 years | since1 | Trustee |
| |
| John G. Vrysen, Born: 1955 | 2009 | 47 |
|
| Senior Vice President, John Hancock Financial Services (since 2006); Director, Executive Vice President |
| and Chief Operating Officer, John Hancock Advisers, LLC, John Hancock Investment Management |
| Services, LLC and John Hancock Funds, LLC (since 2005); Chief Operating Officer, John Hancock Funds II |
| and John Hancock Trust (since 2007); Chief Operating Officer, John Hancock retail funds (until 2009); |
| Trustee, John Hancock retail funds (since 2009). | | |
Principal officers who are not Trustees
| |
| Name, Year of Birth | Officer |
| Position(s) held with Fund | of the |
| Principal occupation(s) and other | Trust |
| directorships during past 5 years | since |
| |
| Keith F. Hartstein, Born: 1956 | 2006 |
|
| President and Chief Executive Officer | |
| Senior Vice President, John Hancock Financial Services (since 2004); Director, President and Chief | |
| Executive Officer, John Hancock Advisers, LLC and John Hancock Funds, LLC (since 2005); Director, |
| John Hancock Asset Management a division of Manulife Asset Management (US) LLC (since 2005); |
| Director, John Hancock Investment Management Services, LLC (since 2006); President and Chief | |
| Executive Officer, John Hancock retail funds (since 2005); Member, Investment Company Institute Sales |
| Force Marketing Committee (since 2003). | |
| |
| Andrew G. Arnott, Born: 1971 | 2009 |
|
| Senior Vice President and Chief Operating Officer | |
| Senior Vice President, John Hancock Financial Services (since 2009); Executive Vice President, | |
| John Hancock Advisers, LLC (since 2005); Executive Vice President, John Hancock Investment | |
| Management Services, LLC (since 2006); Executive Vice President, John Hancock Funds, LLC (since | |
| 2004); Chief Operating Officer, John Hancock retail funds (since 2009); Senior Vice President, | |
| John Hancock retail funds (since 2010); Vice President, John Hancock Funds II and John Hancock Trust |
| (since 2006); Senior Vice President, Product Management and Development, John Hancock Funds, |
| LLC (until 2009). | |
| |
| Thomas M. Kinzler, Born: 1955 | 2006 |
|
| Secretary and Chief Legal Officer | |
| Vice President, John Hancock Financial Services (since 2006); Secretary and Chief Legal Counsel, | |
| John Hancock Advisers, LLC, John Hancock Investment Management Services, LLC and John Hancock |
| Funds, LLC (since 2007); Secretary and Chief Legal Officer, John Hancock retail funds, John Hancock |
| Funds II and John Hancock Trust (since 2006); Vice President and Associate General Counsel, | |
| Massachusetts Mutual Life Insurance Company (1999–2006); Secretary and Chief Legal Counsel, MML |
| Series Investment Fund (2000–2006); Secretary and Chief Legal Counsel, MassMutual Select Funds and |
| MassMutual Premier Funds (2004–2006). | |
| |
| Annual report | Disciplined Value Mid Cap Fund | 33 |
Principal officers who are not Trustees (continued)
| |
| Name, Year of Birth | Officer |
| Position(s) held with Fund | of the |
| Principal occupation(s) and other | Trust |
| directorships during past 5 years | since |
| |
| Francis V. Knox, Jr., Born: 1947 | 2006 |
|
| Chief Compliance Officer | |
| Vice President, John Hancock Financial Services (since 2005); Chief Compliance Officer, John Hancock |
| retail funds, John Hancock Funds II, John Hancock Trust, John Hancock Advisers, LLC and John Hancock |
| Investment Management Services, LLC (since 2005); Vice President and Chief Compliance Officer, | |
| John Hancock Asset Management a division of Manulife Asset Management (US) LLC (2005–2008). |
| |
| Charles A. Rizzo, Born: 1957 | 2007 |
|
| Chief Financial Officer | |
| Vice President, John Hancock Financial Services (since 2008); Senior Vice President, John Hancock | |
| Advisers, LLC and John Hancock Investment Management Services, LLC (since 2008); Chief Financial |
| Officer, John Hancock retail funds, John Hancock Funds II and John Hancock Trust (since 2007); | |
| Assistant Treasurer, Goldman Sachs Mutual Fund Complex (2005–2007); Vice President, Goldman | |
| Sachs (2005–2007). | |
| |
| Salvatore Schiavone, Born: 1965 | 2010 |
|
| Treasurer | |
| Assistant Vice President, John Hancock Financial Services (since 2007); Vice President, John Hancock |
| Advisers, LLC and John Hancock Investment Management Services, LLC (since 2007); Treasurer, | |
| John Hancock retail funds (since 2010); Treasurer, John Hancock Closed-End Funds (since 2009); | |
| Assistant Treasurer, John Hancock Funds II and John Hancock Trust (since 2007); Assistant Treasurer, |
| John Hancock retail funds, John Hancock Funds II and John Hancock Trust (2007–2009); Assistant | |
| Treasurer, Fidelity Group of Funds (2005–2007); Vice President, Fidelity Management Research | |
| Company (2005–2007). | |
The business address for all Trustees and Officers is 601 Congress Street, Boston, Massachusetts 02210-2805.
The Statement of Additional Information of the Fund includes additional information about members of the Board of Trustees of the Fund and is available without charge, upon request, by calling 1-800-225-5291.
1 Each Trustee holds office until his or her successor is elected and qualified, or until the Trustee’s death, retirement, resignation or removal.
2 Member of Audit Committee.
3 Because Messrs. McHaffie and Vrysen are senior executives or directors with the Adviser and/or its affiliates, each of them is considered an “interested person,” as defined in the Investment Company Act of 1940, of the Fund.
| |
| 34 | Disciplined Value Mid Cap Fund | Annual report |
More information
| |
| Trustees | Investment adviser |
| Steven R. Pruchansky, Chairperson | John Hancock Investment Management |
| James F. Carlin | Services, LLC |
| William H. Cunningham | |
| Deborah C. Jackson* | Subadviser |
| Charles L. Ladner, Vice Chairperson* | Robeco Investment Management, Inc. |
| Stanley Martin* | |
| Hugh McHaffie† | Principal distributor |
| Dr. John A. Moore | John Hancock Funds, LLC |
| Patti McGill Peterson* | |
| Gregory A. Russo | Custodian |
| John G. Vrysen† | State Street Bank and Trust Company |
| | |
| Officers | Transfer agent |
| Keith F. Hartstein | John Hancock Signature Services, Inc. |
| President and Chief Executive Officer | |
| | Legal counsel |
| Andrew G. Arnott | K&L Gates LLP |
| Senior Vice President and Chief Operating Officer | |
| | Independent registered |
| Thomas M. Kinzler | public accounting firm |
| Secretary and Chief Legal Officer | PricewaterhouseCoopers LLP |
| | |
| Francis V. Knox, Jr. | |
| Chief Compliance Officer | |
| | |
| Charles A. Rizzo | |
| Chief Financial Officer | |
| | |
| Salvatore Schiavone | |
| Treasurer | |
| |
| *Member of the Audit Committee | |
| †Non-Independent Trusteee | |
The Fund’s proxy voting policies and procedures, as well as the Fund’s proxy voting record for the most recent twelve-month period ended June 30, are available free of charge on the Securities and Exchange Commission (SEC) Web site at www.sec.gov or on our Web site.
The Fund’s complete list of portfolio holdings, for the first and third fiscal quarters, is filed with the SEC on Form N-Q. The Fund’s Form N-Q is available on our Web site and the SEC’s Web site, www.sec.gov, and can be reviewed and copied (for a fee) at the SEC’s Public Reference Room in Washington, DC. Call 1-800-SEC-0330 to receive information on the operation of the SEC’s Public Reference Room.
We make this information on your fund, as well as monthly portfolio holdings, and other fund details available on our Web site www.jhfunds.com or by calling 1-800-225-5291.
| | |
| You can also contact us: | | |
| 1-800-225-5291 | Regular mail: | Express mail: |
| jhfunds.com | John Hancock Signature Services, Inc. | John Hancock Signature Services, Inc. |
| | P.O. Box 55913 | Mutual Fund Image Operations |
| | Boston, MA 02205-5913 | 30 Dan Road |
| | | Canton, MA 02021 |
| |
| Annual report | Disciplined Value Mid Cap Fund | 35 |

1-800-225-5291
1-800-554-6713 TDD
1-800-338-8080 EASI-Line
www.jhfunds.com
Now available: electronic delivery
www.jhfunds.com/edelivery
| |
| This report is for the information of the shareholders of John Hancock Disciplined Value Mid Cap Fund. | 3630A 3/11 |
| It is not authorized for distribution to prospective investors unless preceded or accompanied by a prospectus. | 5/11 |

A look at performance
Total returns for the period ended March 31, 2011
| | | | | | | |
| | Average annual total returns (%) | | | Cumulative total returns (%) | |
| | with maximum sales charge (POP) | | | with maximum sales charge (POP) | |
|
| | 1-year | 5-year | 10-year | | 1-year | 5-year | 10-year |
|
| Class A1 | 7.98 | 1.58 | 6.77 | | 7.98 | 8.13 | 92.58 |
|
| Class I1,2 | 13.67 | 2.62 | 7.32 | | 13.67 | 13.82 | 102.76 |
|
Performance figures assume all distributions are reinvested. Public offering price (POP) figures reflect maximum sales charge on Class A shares of 5%. Sales charges are not applicable for Class I shares.
The expense ratios of the Fund, both net (including any fee waivers or expense limitations) and gross (excluding any fee waivers or expense limitations), are set forth according to the most recent publicly available prospectuses for the Fund and may differ from those disclosed in the Financial Highlights tables in this report. The fee waivers and expense limitations are contractual at least until 2-11-13 for Class A shares and 2-11-12 for Class I shares. Had the fee waivers and expense limitations not been in place gross expenses would apply. The expense ratios are as follows:
| | | | | | |
| | Class A | Class I | | | | |
| Net (%) | 1.60 | 1.18 | | | | |
| Gross (%) | 1.67 | 1.25 | | | | |
The returns reflect past results and should not be considered indicative of future performance. The return and principal value of an investment will fluctuate so that shares, when redeemed, may be worth more or less than their original cost. Due to market volatility, the Fund’s current performance may be higher or lower than the performance shown. For performance data current to the most recent month end, please call 1–800–225–5291 or visit the Fund’s Web site at www.jhfunds.com.
The performance table above and the chart on the next page do not reflect the deduction of taxes that a shareholder would pay on fund distributions or the redemption of fund shares. The Fund’s performance results reflect any applicable expense reductions, without which the expenses would increase and results would have been less favorable.
| |
| 6 | International Value Equity Fund | Annual report |
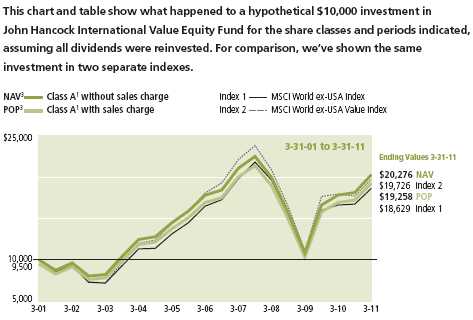
| | | | |
| | Class I1,2 | | | |
| | | |
| Began | 3-31-01 | | | |
| | | |
| NAV | $20,276 | | | |
| | | |
| POP | $20,276 | | | |
| | | |
| Index 1 | $18,629 | | | |
| | | |
| Index 2 | $19,726 | | | |
| | | |
MSCI World ex-USA Index (gross of foreign withholding taxes on dividends) is a free float-adjusted market capitalization weighted index that is designed to measure the equity market performance of developed markets, excluding the United States of America.
MSCI World ex-USA Value Index (gross of foreign withholding taxes on dividends) is a free float-adjusted market capitalization weighted index that is designed to measure the equity market performance of developed markets, excluding the United States of America, that have higher than average value characteristics.
It is not possible to invest directly in an index. Index figures do not reflect sales charges, which would have resulted in lower values if they did.
1 After the close of business on 2-11-11, holders of Class A shares of the former Optique International Value Fund (the Predecessor Fund) became owners of an equal number of full and fractional Class A shares of John Hancock International Value Equity Fund. These shares were first offered on 2-14-11. Additionally, the accounting and performance history of the Class A shares of the Predecessor Fund was redesignated as that of John Hancock International Value Equity Fund Class A. Class I shares were first offered on 2-14-11. Performance prior to 2-14-11 is that of Class A shares recalculated to reflect the gross fees and expenses of Class I shares.
2 For certain types of investors, as described in the Fund’s prospectuses.
3 NAV represents net asset value and POP represents public offering price. Performance of the classes will vary based on the difference in sales charges paid by shareholders investing in the different classes and the fee structure of those classes.
| |
| Annual report | International Value Equity Fund | 7 |
Management’s discussion of
Fund performance
By John Hancock Asset Management
John Hancock International Value Equity Fund (the Fund) is the successor fund to Optique International Value Fund (Optique). Optique’s fiscal year end was October 31 and the Fund’s fiscal year end is March 31. What follows is the managers’ commentary for the five-month period from October 31, 2010 through March 31, 2011.
International stocks performed well during the five-month reporting period ended March 31, 2011, as the global economic recovery continued to gain traction. The overall upward trend was marred only by brief sell-offs in November and March in response to renewed concern about European sovereign debt and a major earthquake in Japan, respectively. For the five months ended March 31, 2011, the Fund’s benchmark, the MSCI World ex-USA Index, returned 7.56%, while the foreign large-cap value fund group monitored by Morningstar, Inc. posted an average 6.42% gain.
During the five-month period, John Hancock International Value Equity Fund’s Class A shares returned 9.13% at net asset value, topping the benchmark and the peer average. Relative to the benchmark, the Fund’s performance was aided by stock selection in Japan, Spain, the U.K. and France. A combination of solid picks and an overweighting in the strong-performing Dutch stock market also helped. At the sector level, our picks in financials, industrials and materials added value. The Fund’s top individual contributor was Japanese specialty chemical holding Nitto Denko Corp., which benefited from robust demand for its polarizing film that is used on LCD displays for smartphones, tablet devices and televisions. We liquidated the position for valuation reasons. Also boosting our results were two energy holdings: Australian exploration and production firm Santos, Ltd. and Spain-based Repsol YPF SA, an integrated oil and natural gas company. Other notable contributors included Canada’s Bombardier, Inc., a manufacturer of jets and trains, and Techtronic Industries Company, Ltd., a Hong Kong maker of hand-held power tools. On the negative side, out-of-benchmark exposures to China and South Africa hurt. Among sectors, security selection in information technology and health care weighed on the Fund’s results, as did a small cash position. French discount retailer Carrefour SA was the Fund’s largest individual detractor. Also dampening performance were Finnish wireless handset maker Nokia OYJ, as well as three Asian holdings.
This commentary reflects the views of the portfolio managers through the end of the Fund’s period discussed in this report. The managers’ statements reflect their own opinions. As such, they are in no way guarantees of future events and are not intended to be used as investment advice or a recommendation regarding any specific security. They are also subject to change at any time as market and other conditions warrant.
Past performance is no guarantee of future results.
International investing involves special risks such as political, economic and currency risks and differences in accounting standards and financial reporting. Sector investing is subject to greater risks than the market as a whole. Because the Fund may focus on particular sectors of the economy, its performance may depend on the performance of those sectors.
| |
| 8 | International Value Equity Fund | Annual report |
Your expenses
These examples are intended to help you understand your ongoing operating expenses.
Understanding fund expenses
As a shareholder of the Fund, you incur two types of costs:
▪ Transaction costs which include sales charges (loads) on purchases or redemptions (varies by share class), minimum account fee charge, etc.
▪ Ongoing operating expenses including management fees, distribution and service fees (if applicable), and other fund expenses.
We are presenting only your ongoing operating expenses here.
Actual expenses/actual returns
This example is intended to provide information about the Fund’s actual ongoing operating expenses, and is based on the Fund’s actual return. It assumes an account value of $1,000.00 on November 1, 2010 with the same investment held until March 31, 2011.
| | | |
| | Account value | Ending value | Expenses paid during |
| | on 11-1-10 | on 3-31-11 | period ended 3-31-111 |
|
| Class A | $1,000.00 | $1,091.30 | $7.66 |
For the class noted below, the example assumes an account value of $1,000 on February 14, 2011 (inception date for Class I), with the same investment held until March 31, 2011.
| | | |
| | Account value | Ending value | Expenses paid during |
| | on 2-14-11 | on 3-31-11 | period ended 3-31-112 |
|
| Class I | $1,000.00 | $1,012.20 | $1.50 |
|
Together with the value of your account, you may use this information to estimate the operating expenses that you paid over the period. Simply divide your account value at March 31, 2011, by $1,000.00, then multiply it by the “expenses paid” for your share class from the table above. For example, for an account value of $8,600.00, the operating expenses should be calculated as follows:
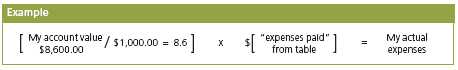
| |
| Annual report | International Value Equity Fund | 9 |
Your expenses
Hypothetical example for comparison purposes
This table allows you to compare the Fund’s ongoing operating expenses with those of any other fund. It provides an example of the Fund’s hypothetical account values and hypothetical expenses based on each class’s actual expense ratio and an assumed 5% annualized return before expenses (which is not the Fund’s actual return). It assumes an account value of $1,000.00 on October 1, 2010, with the same investment held until March 31, 2011. Look in any other fund shareholder report to find its hypothetical example and you will be able to compare these expenses.
| | | |
| | Account value | Ending value | Expenses paid during |
| | on 10-1-10 | on 3-31-11 | period ended 3-31-113 |
|
| Class A | $1,000.00 | $1,016.00 | $8.90 |
|
| Class I | 1,000.00 | 1,019.00 | 5.94 |
|
Remember, these examples do not include any transaction costs, therefore, these examples will not help you to determine the relative total costs of owning different funds. If transaction costs were included, your expenses would have been higher. See the prospectus for details regarding transaction costs.
1 Expenses are equal to the Fund’s annualized expense ratio of 1.77% for Class A shares, multiplied by the average account value over the period, multiplied by 151/365 (to reflect the period).
2 Expenses are equal to the Fund’s annualized expense ratio of 1.18% for Class I shares, multiplied by the average account value over the period, multiplied by 46/365 (to reflect the period).
3 Expenses are equal to the Fund’s annualized expense ratio multiplied by the average account value over the period, multiplied by 182/365 (to reflect the one-half year period).
| |
| 10 | International Value Equity Fund | Annual report |
Portfolio summary
| | | | |
| Top 10 Holdings (12.8% of Net Assets on 3-31-11)1 | | | |
|
| BHP Billiton, Ltd. | 1.7% | | The Toronto-Dominion Bank | 1.2% |
| |
|
| Santos, Ltd. | 1.4% | | Repsol YPF SA | 1.2% |
| |
|
| Encana Corp. | 1.4% | | DBS Group Holdings, Ltd. | 1.1% |
| |
|
| Total SA | 1.3% | | DnB NOR ASA | 1.1% |
| |
|
| Anglo American PLC | 1.3% | | BASF SE | 1.1% |
| |
|
| |
| Sector Composition2,3 | | | | |
|
| Financials | 21% | | Consumer Discretionary | 6% |
| |
|
| Industrials | 13% | | Telecommunication Services | 6% |
| |
|
| Materials | 12% | | Utilities | 6% |
| |
|
| Energy | 10% | | Information Technology | 4% |
| |
|
| Health Care | 7% | | Short-Term Securities & Other | 8% |
| |
|
| Consumer Staples | 7% | | | |
| | |
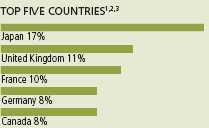
1 Cash and cash equivalents not included in Top 10 Holdings or Top 5 Countries.
2 International investing involves special risks such as political, economic and currency risks and differences in accounting standards and financial reporting. Sector investing is subject to greater risks than the market as a whole. Because the Fund may focus on particular sectors of the economy, its performance may depend on the performance of those sectors.
3 As a percentage of net assets on 3-31-11.
| |
| Annual report | International Value Equity Fund | 11 |
Fund’s investments
As of 3-31-11
| | |
| | Shares | Value |
| Common Stocks 90.94% | | $2,773,297 |
|
| (Cost $2,503,214) | | |
| | | |
| Australia 6.68% | | 203,711 |
| | | |
| AGL Energy, Ltd. | 1,450 | 21,447 |
|
| Amcor, Ltd. | 4,200 | 30,648 |
|
| BHP Billiton, Ltd., SADR | 540 | 51,775 |
|
| National Australia Bank, Ltd. | 925 | 24,742 |
|
| Santos, Ltd. | 2,650 | 42,420 |
|
| Westpac Banking Corp. | 1,300 | 32,679 |
| | | |
| Austria 2.54% | | 77,538 |
| | | |
| Mayr-Melnhof Karton AG (I) | 180 | 21,027 |
|
| OMV AG | 700 | 31,623 |
|
| Telekom Austria AG | 1,700 | 24,888 |
| | | |
| Bermuda 0.93% | | 28,450 |
| | | |
| Hiscox, Ltd. | 4,700 | 28,450 |
| | | |
| Canada 7.54% | | 229,887 |
| | | |
| Bombardier, Inc. | 3,600 | 26,476 |
|
| Encana Corp. | 1,200 | 41,502 |
|
| Husky Energy, Inc. | 1,000 | 30,387 |
|
| Magna International, Inc. | 450 | 21,574 |
|
| Royal Bank of Canada | 400 | 24,751 |
|
| Sun Life Financial, Inc. | 770 | 24,201 |
|
| The Toronto-Dominion Bank | 420 | 37,170 |
|
| Thompson Creek Metals Company, Inc. (I) | 1,900 | 23,826 |
| | | |
| China 1.75% | | 53,394 |
| | | |
| China Petroleum & Chemical Corp. | 32,000 | 32,212 |
|
| Sinotrans, Ltd., Class H | 87,000 | 21,182 |
| | | |
| Finland 0.80% | | 24,251 |
| | | |
| Nokia OYJ | 2,850 | 24,251 |
| | | |
| France 9.53% | | 290,521 |
| | | |
| BNP Paribas | 390 | 28,539 |
|
| Carrefour SA | 490 | 21,719 |
|
| Cie de Saint-Gobain | 435 | 26,634 |
|
| GDF Suez | 630 | 25,705 |
|
| Nexans SA | 280 | 26,790 |
|
| Sanofi-Aventis SA | 375 | 26,337 |
|
| Societe BIC SA | 210 | 18,660 |
| | |
| 12 | International Value Equity Fund | Annual report | See notes to financial statements |
| | |
| | Shares | Value |
| France (continued) | | |
| | | |
| Societe Generale | 360 | $23,408 |
|
| Total SA | 11,470 | 40,802 |
|
| Vinci SA | 420 | 26,239 |
|
| Vivendi SA | 900 | 25,688 |
| | | |
| Germany 7.66% | | 233,500 |
| | | |
| Allianz SE | 180 | 25,256 |
|
| BASF SE | 380 | 32,947 |
|
| Deutsche Bank AG | 430 | 25,285 |
|
| Deutsche Boerse AG | 300 | 22,764 |
|
| Deutsche Telekom AG | 1,700 | 26,268 |
|
| E.ON AG | 780 | 23,833 |
|
| Rhoen-Klinikum AG | 1,000 | 21,691 |
|
| Salzgitter AG | 390 | 30,799 |
|
| Siemens AG | 180 | 24,657 |
| | | |
| Hong Kong 4.32% | | 131,769 |
| | | |
| Cheung Kong Infrastructure Holdings, Ltd. | 6,000 | 28,405 |
|
| China Mobile, Ltd. | 2,500 | 23,096 |
|
| Hang Lung Group, Ltd. | 3,000 | 18,745 |
|
| Swire Pacific, Ltd., Class A | 1,000 | 14,688 |
|
| Techtronic Industries Company, Ltd. | 15,500 | 21,471 |
|
| Yue Yuen Industrial Holdings, Ltd. | 8,000 | 25,364 |
| | | |
| Israel 0.90% | | 27,594 |
| | | |
| Teva Pharmaceutical Industries, Ltd., SADR (I) | 550 | 27,594 |
| | | |
| Japan 17.23% | | 525,481 |
| | | |
| Aisin Seiki Company, Ltd. | 700 | 24,304 |
|
| Asahi Glass Company, Ltd. | 2,000 | 25,150 |
|
| Astellas Pharma, Inc. | 700 | 25,812 |
|
| Canon, Inc. | 500 | 21,760 |
|
| East Japan Railway Company | 300 | 16,485 |
|
| Electric Power Development Company, Ltd. | 800 | 24,641 |
|
| Fujitsu, Ltd. | 4,000 | 22,602 |
|
| Honda Motor Company, Ltd. | 600 | 22,460 |
|
| JGC Corp. | 1,000 | 23,246 |
|
| Kyocera Corp. | 300 | 30,404 |
|
| Mitsubishi Corp. | 1,000 | 27,759 |
|
| Mitsubishi UFJ Financial Group | 5,500 | 25,391 |
|
| Nippon Telegraph & Telephone Corp. | 500 | 22,431 |
|
| Nomura Holdings, Inc. | 4,800 | 25,102 |
|
| Secom Company, Ltd. | 500 | 23,095 |
|
| Sony Corp. | 700 | 22,201 |
|
| Sumitomo Chemical Company, Ltd. | 6,000 | 29,935 |
|
| Takeda Pharmaceutical Company, Ltd. | 400 | 18,658 |
|
| Toyo Suisan Kaisha, Ltd. | 1,000 | 21,712 |
|
| Tsuruha Holdings, Inc. | 600 | 27,230 |
|
| Unihair Company, Ltd. | 2,000 | 23,130 |
|
| Yamada Denki Company, Ltd. | 330 | 21,973 |
| | |
| See notes to financial statements | Annual report | International Value Equity Fund | 13 |
| | |
| | Shares | Value |
| Mexico 0.81% | | $24,669 |
| | | |
| Cemex SAB de CV (I) | 27,578 | 24,669 |
| | | |
| Netherlands 5.41% | | 165,101 |
| | | |
| Aegon NV | 3,680 | 27,571 |
|
| Akzo Nobel NV | 440 | 30,270 |
|
| Heineken Holding NV | 570 | 27,428 |
|
| Koninklijke Philips Electronics NV, ADR | 780 | 25,093 |
|
| Royal Dutch Shell PLC, A Shares | 870 | 31,619 |
|
| TNT NV | 900 | 23,120 |
| | | |
| Norway 1.11% | | 33,757 |
| | | |
| DnB NOR ASA | 2,200 | 33,757 |
| | | |
| Singapore 1.93% | | 58,740 |
| | | |
| DBS Group Holdings, Ltd. | 3,000 | 34,882 |
|
| Fraser and Neave, Ltd. | 5,000 | 23,858 |
| | | |
| South Africa 0.76% | | 23,267 |
| | | |
| Tiger Brands, Ltd. | 900 | 23,267 |
| | | |
| South Korea 1.75% | | 53,458 |
| | | |
| LG Display Company, Ltd., ADR | 1,800 | 28,314 |
|
| POSCO, ADR | 220 | 25,144 |
| | | |
| Spain 3.86% | | 117,767 |
| | | |
| Banco Santander SA | 1,750 | 20,396 |
|
| Fomento de Construcciones SA | 950 | 31,490 |
|
| Repsol YPF SA | 1,060 | 36,374 |
|
| Telefonica SA, SADR | 1,170 | 29,507 |
| | | |
| Sweden 0.66% | | 20,244 |
| | | |
| Securitas AB, Series B | 1,700 | 20,244 |
| | | |
| Switzerland 3.18% | | 96,830 |
| | | |
| Credit Suisse Group AG, SADR | 540 | 22,993 |
|
| Nestle SA | 400 | 22,952 |
|
| Novartis AG, ADR | 515 | 27,990 |
|
| Swiss Reinsurance Company, Ltd. | 400 | 22,895 |
| | | |
| Taiwan 0.77% | | 23,557 |
| | | |
| Chunghwa Telecom Company, Ltd., ADR | 756 | 23,557 |
| | | |
| United Kingdom 10.82% | | 329,811 |
| | | |
| Anglo American PLC | 750 | 38,563 |
|
| AstraZeneca PLC | 565 | 25,976 |
|
| Aviva PLC | 3,700 | 25,696 |
|
| Barclays PLC | 6,500 | 29,159 |
|
| Diageo PLC | 1,400 | 26,645 |
|
| GlaxoSmithKline PLC | 1,550 | 29,577 |
|
| HSBC Holdings PLC | 2,850 | 29,307 |
|
| National Grid PLC | 2,750 | 26,268 |
|
| Smith & Nephew PLC, SADR | 400 | 22,564 |
|
| Unilever PLC | 810 | 24,703 |
|
| United Utilities Group PLC | 2,500 | 23,747 |
|
| Vodafone Group PLC | 9,750 | 27,606 |
| | |
| 14 | International Value Equity Fund | Annual report | See notes to financial statements |
| | | |
| | | Shares | Value |
| Preferred Securities 1.79% | | | $54,588 |
|
| (Cost $50,523) | | | |
| | | | |
| Brazil 1.79% | | | 54,588 |
| | | | |
| Petroleo Brasileiro SA | | 1,630 | 28,464 |
|
| Vale SA (I) | | 900 | 26,124 |
| |
| | | | |
| | Yield (%)* | Shares | Value |
| Short-Term Investments 4.33% | | | $132,172 |
|
| (Cost $132,172) | | | |
| | | | |
| Money Market Funds 4.33% | | | 132,172 |
| | | | |
| SSGA Money Market Fund | 0.010 | 131,672 | 131,672 |
|
| SSGA U.S. Government Money Market Fund | 0.000 | 500 | 500 |
| |
| Total investments (Cost $2,685,909)† 97.06% | | $2,960,057 |
|
| Other assets and liabilities, net 2.94% | | | $89,557 |
|
| Total net assets 100.00% | | | $3,049,614 |
|
The percentage shown for each investment category is the total value of the category as a percentage of the net assets of the Fund.
ADR American Depositary Receipts
SADR Sponsored American Depositary Receipts
(I) Non-income producing security.
* Yield represents the annualized yield at the date of purchase.
† At 3-31-11, the aggregate cost of investment securities for federal income tax purposes was $2,853,340. Net unrealized appreciation aggregated $106,717, of which $183,212 related to appreciated investment securities and $76,495 related to depreciated investment securities.
The Fund had the following sector composition as a percentage of net assets on 3-31-11:
| | | | | | |
| Financials | 21% | | | | | |
| Industrials | 13% | | | | | |
| Materials | 12% | | | | | |
| Energy | 10% | | | | | |
| Health Care | 7% | | | | | |
| Consumer Staples | 7% | | | | | |
| Consumer Discretionary | 6% | | | | | |
| Telecommunication Services | 6% | | | | | |
| Utilities | 6% | | | | | |
| Information Technology | 4% | | | | | |
| Short-Term Securities & Other | 8% | | | | | |
| | |
| See notes to financial statements | Annual report | International Value Equity Fund | 15 |
F I N A N C I A L S T A T E M E N T S
Financial statements
Statement of assets and liabilities 3-31-11
This Statement of Assets and Liabilities is the Fund’s balance sheet. It shows the value of what the Fund owns, is due and owes. You’ll also find the net asset value and the maximum offering price per share.
| |
| Assets | |
|
| Investments, at value (Cost $2,685,909) | $2,960,057 |
| Cash | 207,622 |
| Foreign currency, at value (Cost $2,232) | 2,226 |
| Receivable for fund shares sold | 3,800 |
| Dividends receivable | 23,090 |
| Receivable due from adviser | 2,851 |
| Other receivables and prepaid expenses | 141 |
| | |
| Total assets | 3,199,787 |
| |
| Liabilities | |
|
| Payable for investments purchased | 75,986 |
| Payable to affiliates | |
| Accounting and legal services fees | 45 |
| Transfer agent fees | 3,434 |
| Trustees’ fees | 138 |
| Other liabilities and accrued expenses | 70,570 |
| | |
| Total liabilities | 150,173 |
| |
| Net assets | |
|
| Capital paid-in | $2,872,680 |
| Accumulated undistributed net investment income | 2,511 |
| Accumulated net realized loss on investments and foreign | |
| currency transactions | (101,229) |
| Net unrealized appreciation on investments and translation of assets and | |
| liabilities in foreign currencies | 275,652 |
| | |
| Net assets | $3,049,614 |
| |
| Net asset value per share | |
|
| Based on net asset values and shares outstanding — the Fund has an | |
| unlimited number of shares authorized with no par value | |
| Class A ($2,944,019 ÷ 323,967 shares) | $9.09 |
| Class I ($105,595 ÷ 11,614 shares) | $9.09 |
| |
| Maximum offering price per share | |
|
| Class A (net asset value per share ÷ 95%)1 | $9.57 |
1 On single retail sales of less than $50,000. On sales of $50,000 or more and on group sales the offering price is reduced.
| | |
| 16 | International Value Equity Fund | Annual report | See notes to financial statements |
F I N A N C I A L S T A T E M E N T S
Statements of operations
For the period ended 3-31-11 and year ended 10-31-10
These Statements of Operations summarize the Fund’s investment income earned and expenses incurred in operating the Fund. They also show net gains (losses) for the periods stated.
| | |
| | Period | Year |
| | ended | ended |
| | 3-31-111 | 10-31-10 |
| Investment income | | |
|
| Dividends | $31,257 | $219,902 |
| Less foreign taxes withheld | (2,269) | (19,997) |
| | | |
| Total investment income | 28,988 | 199,905 |
| |
| Expenses | | |
|
| Investment management fees (Note 4) | 11,625 | 82,341 |
| Distribution and service fees (Note 4) | 3,171 | 75,492 |
| Accounting and legal services fees (Note 4) | 38,153 | 135,000 |
| Transfer agent fees (Note 4) | 19,996 | 54,108 |
| Trustees’ fees (Note 4) | 18,298 | 42,516 |
| Printing and postage (Note 4) | 8,823 | 23,219 |
| Professional fees | 67,348 | 84,808 |
| Custodian fees | 3,953 | 49,551 |
| Registration and filing fees (Note 4) | 21,388 | 27,869 |
| Other | 12,643 | 38,820 |
| | | |
| Total expenses | 205,398 | 613,724 |
| Less expense reductions (Note 4) | (182,712) | (444,463) |
| | | |
| Net expenses | 22,686 | 169,261 |
| | | |
| Net investment income | 6,302 | 30,644 |
| |
| Realized and unrealized gain (loss) | | |
|
| Net realized gain on | | |
| Investments | 209,892 | 4,830,728 |
| Foreign currency transactions | 309 | 50,902 |
| | | |
| | 210,201 | 4,881,630 |
| Change in net unrealized appreciation (depreciation) of | | |
| Investments | 53,259 | (2,715,748) |
| Translation of assets and liabilities in | | |
| foreign currencies | 466 | (2,388) |
| | | |
| | 53,725 | (2,718,136) |
| | | |
| Net realized and unrealized gain | 263,926 | 2,163,494 |
| | | |
| Increase in net assets from operations | $270,228 | $2,194,138 |
1For the five-month period ended 3-31-11. The Fund changed its fiscal year end from October 31 to March 31.
| | |
| See notes to financial statements | Annual report | International Value Equity Fund | 17 |
F I N A N C I A L S T A T E M E N T S
Statements of changes in net assets
These Statements of Changes in Net Assets show how the value of the Fund’s net assets has changed during the last three periods. The difference reflects earnings less expenses, any investment gains and losses, distributions, if any, paid to shareholders and the net of Fund share transactions.
| | | | |
| | | Period | Year | Year |
| | | ended | ended | ended |
| | | 3-31-111 | 10-31-10 | 10-31-09 |
|
| Increase (decrease) in net assets | | | | |
| From operations | | | | |
| Net investment income | | $6,302 | $30,644 | $196,542 |
| Net realized gain (loss) | | 210,201 | 4,881,630 | (2,891,000) |
| Change in net unrealized appreciation (depreciation) | | 53,725 | (2,718,136) | 8,220,096 |
| | | | | |
| Increase in net assets resulting from operations | | 270,228 | 2,194,138 | 5,525,638 |
| | | | | |
| Distributions to shareholders | | | | |
| From net investment income | | | | |
| Class A | | (102,551) | (168,896) | (1,658,679) |
| From net realized gain | | | | |
| Class A | | (766,235) | — | — |
| | | | | |
| Total distributions | | (868,786) | (168,896) | (1,658,679) |
| | | | | |
| From Fund share transactions (Note 5) | | 371,078 | (28,639,625) | 2,029,679 |
| | | | | |
| Total increase (decrease) | | (227,480) | (26,614,383) | 5,896,638 |
| | | | | |
| Net assets | | | | |
|
| Beginning of period | | 3,277,094 | 29,891,477 | 23,994,839 |
| | | | | |
| End of period | | $3,049,614 | $3,277,094 | $29,891,477 |
| | | | | |
| Accumulated undistributed net investment income | | 2,511 | $95,016 | $55,800 |
1 For the five-month period ended 3-31-11. The Fund changed its fiscal year end from October 31 to March 31.
| | |
| 18 | International Value Equity Fund | Annual report | See notes to financial statements |
Financial highlights
The Financial Highlights show how the Fund’s net asset value for a share has changed since the end of the previous period.
| | | | | | |
| CLASS A SHARES Period ended | 3-31-111,2 | 10-31-103 | 10-31-093 | 10-31-083 | 10-31-073 | 10-31-063 |
| |
| Per share operating performance | | | | | | |
|
| Net asset value, beginning of period | $11.26 | $9.90 | $7.97 | $18.21 | $16.62 | $14.12 |
| Net investment income | 0.024 | 0.034 | 0.074 | 0.284 | 0.26 | 0.28 |
| Net realized and unrealized gain (loss) | | | | | | |
| on investments | 0.79 | 1.395 | 2.545 | (7.82)5 | 3.065 | 3.045 |
| Total from investment operations | 0.81 | 1.42 | 2.61 | (7.54) | 3.32 | 3.32 |
| Less distributions | | | | | | |
| From net investment income | (0.28) | (0.06) | (0.68) | (0.25) | (0.26) | (0.23) |
| From net realized gain | (2.70) | — | — | (2.45) | (1.47) | (0.59) |
| Total distributions | (2.98) | (0.06) | (0.68) | (2.70) | (1.73) | (0.82) |
| Net asset value, end of period | $9.09 | $11.26 | $9.90 | $7.97 | $18.21 | $16.62 |
| Total return (%) | 9.136,7 | 14.466 | 35.616 | (48.17) | 21.61 | 24.57 |
| |
| Ratios and supplemental data | | | | | | |
|
| Net assets, end of period (in millions) | $3 | $3 | $30 | $24 | $111 | $99 |
| Ratios (as a percentage of average net | | | | | | |
| assets): | | | | | | |
| Expenses before reductions | 16.058 | 6.71 | 2.68 | 1.56 | 1.38 | 1.40 |
| Expenses net of fee waivers and credits | 1.778 | 1.85 | 1.85 | 1.56 | 1.38 | 1.40 |
| Net investment income | 0.488 | 0.33 | 0.88 | 2.09 | 1.58 | 1.79 |
| Portfolio turnover (%) | 129 | 80 | 123 | 13 | 21 | 21 |
1 For the five-month period ended 3-31-11. The Fund changed its fiscal year end from October 31 to March 31.
2 After the close of business on 2-11-11, holders of Class A shares of the former Optique International Value Fund (the Predecessor Fund) became owners of an equal number of full and fractional Class A shares of John Hancock International Value Equity Fund. These shares were first offered on 2-14-11. Additionally, the accounting and performance history of the Class A shares of the Predecessor Fund was redesignated as that of John Hancock International Value Equity Fund Class A.
3 Audited by previous independent registered public accounting firm.
4 Based on the average daily shares outstanding.
5 Includes redemption fees retained by the Fund. Such redemption fees represent less than $0.01 per share.
6 Total returns would have been lower had certain expenses not been reduced during the periods shown.
7 Not annualized.
8 Annualized.
9 Portfolio turnover is shown for the period from 11-1-10 to 3-31-11.
| | |
| See notes to financial statements | Annual report | International Value Equity Fund | 19 |
| | | | | | |
| CLASS I SHARES Period ended | | | | | | 3-31-111 |
| |
| Per share operating performance | | | | | | |
|
| Net asset value, beginning of period | | | | | | $8.98 |
| Net investment income | | | | | | 0.022 |
| Net realized and unrealized gain on investments | | | | | | 0.09 |
| Total from investment operations | | | | | | 0.11 |
| Net asset value, end of period | | | | | | $9.09 |
| Total return (%) | | | | | | 1.223,4 |
| |
| Ratios and supplemental data | | | | | | |
|
| Net assets, end of period (in thousands) | | | | | | $106 |
| Ratios (as a percentage of average net assets): | | | | | | |
| Expenses before reductions | | | | | | 12.905 |
| Expenses net of fee waivers and credits | | | | | | 1.185 |
| Net investment income | | | | | | 1.895 |
| Portfolio turnover (%) | | | | | | 126 |
1 Period from 2-14-11 (inception date) to 3-31-11.
2 Based on the average daily shares outstanding.
3 Not annualized.
4 Total returns would have been lower had certain expenses not been reduced during the period shown.
5 Annualized.
6 Portfolio turnover is shown for the period from 11-1-10 to 3-31-11.
| | |
| 20 | International Value Equity Fund | Annual report | See notes to financial statements |
Notes to financial statements
Note 1 — Organization
John Hancock International Value Equity Fund (the Fund) is a diversified series of John Hancock Funds III (the Trust), an open-end management investment company organized as a Massachusetts business trust and registered under the Investment Company Act of 1940, as amended (the 1940 Act). The investment objective of the Fund is to seek maximum long-term capital appreciation. During the period ended March 31, 2011, the Fund changed its fiscal year end from October 31 to March 31.
The Fund may offer multiple classes of shares. The shares currently offered are detailed in the Statement of Assets and Liabilities. Class A shares are offered to all investors. Class I shares are offered to institutions and certain investors. Shareholders of each class have exclusive voting rights to matters that affect that class. The distribution and service fees, transfer agent fees, printing and postage and state registration fees for each class may differ.
The Fund is the accounting and performance successor of the Optique International Value Fund (the Predecessor Fund). At the close of business on February 11, 2011, the Fund acquired substantially all the assets and assumed the liabilities of the Predecessor Fund pursuant to an agreement and plan on reorganization, in exchange for Class A shares of the Fund.
Note 2 — Significant accounting policies
The financial statements have been prepared in conformity with accounting principles generally accepted in the United States of America, which require management to make certain estimates and assumptions at the date of the financial statements. Actual results could differ from those estimates. Events or transactions occurring after the end of the fiscal period through the date that the financial statements were issued have been evaluated in the preparation of the financial statements. The following summarizes the significant accounting policies of the Fund:
Security valuation. Investments are stated at value as of the close of the regular trading on the New York Stock Exchange (NYSE), normally at 4:00 P.M., Eastern Time. The Fund uses a three-tier hierarchy to prioritize the pricing assumptions, referred to as inputs, used in valuation techniques to measure fair value. Level 1 includes securities valued using quoted prices in active markets for identical securities. Level 2 includes securities valued using significant observable inputs. Observable inputs may include quoted prices for similar securities, interest rates, prepayment speeds and credit risk. Prices for securities valued using these techniques are received from independent pricing vendors and brokers and are based on an evaluation of the inputs described. Level 3 includes securities valued using significant unobservable inputs when market prices are not readily available or reliable, including the Fund’s own assumptions in determining the fair value of investments. Factors used in determining value may include market or issuer specific events, changes in interest rates and credit quality. The inputs or methodology used for valuing securities are not necessarily an indication of the risk associated with investing in those securities.
| |
| Annual report | International Value Equity Fund | 21 |
The following is a summary of the values by input classification of the Fund’s investments as of March 31, 2011, by major security category or type:
| | | | | |
| | | | | | LEVEL 3 |
| | | | | LEVEL 2 | SIGNIFICANT |
| | | TOTAL MARKET | LEVEL 1 | SIGNIFICANT | UNOBSERVABLE |
| | | VALUE AT 3-31-11 | QUOTED PRICE | OBSERVABLE INPUTS | INPUTS |
|
| Common Stocks | | | | | |
| Australia | | $203,711 | $51,775 | $151,936 | — |
| Austria | | 77,538 | — | 77,538 | — |
| Bermuda | | 28,450 | — | 28,450 | — |
| Canada | | 229,887 | 229,887 | — | — |
| China | | 53,394 | — | 53,394 | — |
| Finland | | 24,251 | — | 24,251 | — |
| France | | 290,521 | — | 290,521 | — |
| Germany | | 233,500 | — | 233,500 | — |
| Hong Kong | | 131,769 | — | 131,769 | — |
| Israel | | 27,594 | 27,594 | — | — |
| Japan | | 525,481 | — | 525,481 | — |
| Mexico | | 24,669 | 24,669 | — | — |
| Netherlands | | 165,101 | 25,093 | 140,008 | — |
| Norway | | 33,757 | — | 33,757 | — |
| Singapore | | 58,740 | — | 58,740 | — |
| South Africa | | 23,267 | — | 23,267 | — |
| South Korea | | 53,458 | 53,458 | — | — |
| Spain | | 117,767 | 29,507 | 88,260 | — |
| Sweden | | 20,244 | — | 20,244 | — |
| Switzerland | | 96,830 | 50,983 | 45,847 | — |
| Taiwan | | 23,557 | 23,557 | — | — |
| United Kingdom | | 329,811 | 22,564 | 307,247 | — |
| |
| Preferred Securities | | | | | |
| Brazil | | 54,588 | 54,588 | — | — |
| |
| Short-Term Investments | | | | | |
| Money Market Funds | | 132,172 | 132,172 | — | — |
| | |
|
| Total investments | | | | | |
| in Securities | | $2,960,057 | $725,847 | $2,234,210 | — |
Changes in valuation techniques may result in transfers in or out of an assigned level within the disclosure hierarchy. As a result of the reorganization (see Note 7) and the Fund’s valuation techniques as described above, certain securities were transferred from Level 1 to Level 2 during the period ended March 31, 2011.
In order to value the securities, the Fund uses the following valuation techniques. Equity securities held by the Fund are valued at the last sale price or official closing price on the principal securities exchange on which they trade. In the event there were no sales during the day or closing prices are not available, then securities are valued using the last quoted bid or evaluated price. Foreign securities and currencies are valued in U.S. dollars, based on foreign currency exchange rates supplied by an independent pricing service. Certain securities traded only in the over-the-counter market are valued at the last bid price quoted by brokers making markets in the securities at the close of trading. Certain short-term securities are valued at amortized cost.
Other portfolio securities and assets, where market quotations are not readily available, are valued at fair value, as determined in good faith by the Fund’s Pricing Committee, following procedures established by the Board of Trustees. Generally, trading in non-U.S. securities is substantially completed each day at various times prior to the close of trading on the NYSE. Significant market
| |
| 22 | International Value Equity Fund | Annual report |
events that affect the values of non-U.S. securities may occur between the time when the valuation of the securities is generally determined and the close of the NYSE. During significant events, these securities will be valued at fair value, as determined in good faith, following procedures established by the Board of Trustees. The Fund may use a fair valuation model to value non-U.S. securities in order to adjust for events which may occur between the close of foreign exchanges and the close of the NYSE.
Security transactions and related investment income. Investment security transactions are accounted for on a trade date plus one basis for daily net asset value calculations. However, for financial reporting purposes, investment transactions are reported on trade date. Interest income is accrued as earned. Gains and losses on securities sold are determined on the basis of identified cost and may include proceeds from litigation. Dividend income is recorded on the ex-date, except for dividends of foreign securities where the dividend may not be known until after ex-date. In these cases dividend income is recorded when the Fund becomes aware of the dividends.
Line of credit. The Fund may borrow from banks for temporary or emergency purposes, including meeting redemption requests that otherwise might require the untimely sale of securities. Pursuant to the custodian agreement, the custodian may loan money to the Fund to make properly authorized payments. The Fund is obligated to repay the custodian for any overdraft, including any related costs or expenses. The custodian has a lien, security interest or security entitlement in any Fund property that is not segregated, to the maximum extent permitted by law for any overdraft.
In addition, effective March 30, 2011, the Fund and other affiliated funds have entered into an agreement with Citibank N.A. which enables them to participate in a $100 million unsecured committed line of credit. For the period from February 14, 2011 to March 30, 2011, the Fund had a similar arrangement with State Street Bank and Trust Company. A commitment fee, payable at the end of each calendar quarter, based on the average daily unused portion of the line of credit, is charged to each participating fund on a pro rata basis and is reflected in other expenses on the Statements of Operations. For the period from February 14, 2011 to March 31, 2011, the Fund had no borrowings under the line of credit.
Expenses. The majority of expenses are directly attributable to an individual fund. Expenses that are not readily attributable to a specific fund are allocated among all funds in an equitable manner, taking into consideration, among other things, the nature and type of expense and the fund’s relative assets. Expense estimates are accrued in the period to which they relate and adjustments are made when actual amounts are known.
Class allocations. Income, common expenses, and realized and unrealized gains (losses) are determined at the fund level and allocated daily to each class of shares based on the net asset value of the class. Class-specific expenses, such as distribution and service fees, if any, transfer agent fees, state registration fees and printing and postage, for all classes are calculated daily at the class level based on the appropriate net asset value of each class and the specific expense rates applicable to each class.
Federal income taxes. The Fund intends to continue to qualify as a regulated investment company by complying with the applicable provisions of the Internal Revenue Code and will not be subject to federal income tax on taxable income that is distributed to shareholders. Therefore, no federal income tax provision is required.
As of March 31, 2011, the Fund had no uncertain tax positions that would require financial statement recognition, de-recognition or disclosure. The Fund’s federal tax return is subject to examination by the Internal Revenue Service for a period of three years.
| |
| Annual report | International Value Equity Fund | 23 |
Distribution of income and gains. Distributions to shareholders from net investment income and net realized gains, if any, are recorded on the ex-date. The Fund generally declares and pays dividends and capital gain distributions, if any, at least annually. The tax character of distributions for the period ended March 31, 2011 and the years ended October 31, 2010 and October 31, 2009 was as follows:
| | | |
| | MARCH 31, 2011 | OCTOBER 31, 2010 | OCTOBER 31, 2009 |
|
| Ordinary Income | $868,786 | $168,896 | $1,658,679 |
Distributions paid by the Fund with respect to each class of shares are calculated in the same manner, at the same time and are in the same amount, except for the effect of expenses that may be applied differently to each class. As of March 31, 2011, the components of distributable earnings on a tax basis included $68,713 of undistributed ordinary income.
Such distributions and distributable earnings, on a tax basis, are determined in conformity with income tax regulations, which may differ from accounting principles generally accepted in the United States of America. Material distributions in excess of tax basis earnings and profits, if any, are reported in the Fund’s financial statements as a return of capital.
Capital accounts within financial statements are adjusted for permanent book-tax differences. These adjustments have no impact on net assets or the results of operations. Temporary book-tax differences, if any, will reverse in a subsequent period. Book-tax differences are primarily attributable to passive foreign investment companies and wash sale loss deferrals.
Note 3 — Guarantees and indemnifications
Under the Fund’s organizational documents, its Officers and Trustees are indemnified against certain liabilities arising out of the performance of their duties to the Fund. Additionally, in the normal course of business, the Fund enters into contracts with service providers that contain general indemnification clauses. The Fund’s maximum exposure under these arrangements is unknown, as this would involve future claims that may be made against the Fund that have not yet occurred. The risk of material loss from such claims is considered remote.
Note 4 — Fees and transactions with affiliates
John Hancock Investment Management Services, LLC (the Adviser) serves as investment adviser for the Trust. John Hancock Funds, LLC (the Distributor), an affiliate of the Adviser, serves as principal underwriter of the Trust. The Adviser and the Distributor are indirect wholly owned subsidiaries of Manulife Financial Corporation (MFC).
Management Fee. The Fund has an investment management contract with the Adviser under which the Fund pays a daily management fee to the Adviser equivalent, on an annual basis, to the sum of: (a) 0.900% of the first $100,000,000 of the Fund’s average daily net assets; (b) 0.875% of the next $900,000,000; (c) 0.850% of the next $1,000,000,000; (d) 0.825% of the next $1,000,000,000; (e) 0.800% of the next $1,000,000,000 and (f) 0.775% of the Fund’s average daily net assets in excess of $4,000,000,000. The Adviser has a subadvisory agreement with John Hancock Asset Management a division of Manulife Asset Management (US) LLC (formerly, MFC Global Investment Management (U.S.), LLC), an indirect owned subsidiary of MFC and an affiliate of the Adviser. In addition, John Hancock Asset Management a division of Manulife Asset Management (US) LLC acquired the Predecessor Fund’s investment adviser, Optique Capital Management, Inc. The Fund is not responsible for payment of the subadvisory fees. Prior to February 11, 2011, the Fund paid a monthly fee based on the Fund’s average daily net assets at an annual rate of 0.90%.
| |
| 24 | International Value Equity Fund | Annual report |
The investment management fees incurred for the five-month period ended March 31, 2011 were equivalent to an annual effective rate of 0.90% of the Fund’s average daily net assets.
The Adviser has contractually agreed to waive all or a portion of its management fee and reimburse or pay operating expenses of the Fund to the extent necessary to maintain the Fund’s total operating expenses at 1.60% and 1.18% for Class A and Class I shares, respectively. This agreement excludes taxes, brokerage commissions, interest, litigation, underlying fund expenses, short dividend and extraordinary expenses for two years from the inception date of the Fund. Prior to February 11, 2011, under the Predecessor Fund’s investment advisory agreement, if the aggregate annual operating expenses (including the investment advisory fee and the administration fee, excluding interest, taxes, brokerage commissions and other costs incurred in connection with the purchase or sale of portfolio securities, and extraordinary items) exceeded 1.85% of the average daily net assets of the Fund, the Adviser would reimburse the Fund for the amount of such excess.
Accordingly, the expense reductions or reimbursements related to the investment advisory agreements were $181,197 and $1,515 for Class A and Class I shares, respectively, for the five-month period ended March 31, 2011.
For the year ended October 31, 2010, the Predecessor Fund had expenses reduced by $444,463 under the agreement described above.
Accounting and legal services. Pursuant to a service agreement, the Fund reimburses the Adviser for all expenses associated with providing the administrative, financial, legal, accounting and recordkeeping services of the Fund, including the preparation of all tax returns, periodic reports to shareholders and regulatory reports, among other services. These expenses are allocated to each share class based on its relative net assets at the time the expense was incurred. Prior to February 11, 2011, the administrator accrued fees equal to an annual minimum of $135,000, which amounted to $38,096 for the period November 1, 2010 to February 11, 2011. The accounting and legal services fees incurred for the period from February 12, 2011 to March 31, 2011 amounted to $57.
Distribution and service plans. The Fund has a distribution agreement with the Distributor. The Fund has adopted distribution and service plans with respect to Class A shares pursuant to Rule 12b-1 under the 1940 Act, to pay the Distributor for services provided as the distributor of shares of the Fund. The Fund may pay up to the following contractual rates of distribution and service fees under these arrangements, expressed as an annual percentage of average daily net assets for each class of the Fund’s shares.
| | | | | | |
| CLASS | 12b–1 FEES | | | | | |
| | | | | |
| Class A | 0.30% | | | | | |
However, the Board of Trustees has agreed to limit the distribution and service fees to 0.25% of average daily net assets for Class A shares for the first year after the closing date of February 11, 2011. Prior to February 11, 2011, the Fund paid up to an annual rate of 0.25% of the average daily net assets of the Fund.
Sales charges. Effective February 14, 2011, Class A shares are assessed up-front sales charges, which resulted in payments to the Distributor amounting to $1,587 for the five-month period ended March 31, 2011. Of this amount, $246 was retained and used for printing prospectuses, advertising, sales literature and other purposes and $1,341 was paid as sales commissions to broker-dealers.
Transfer agent fees. The Fund has a transfer agent agreement with John Hancock Signature Services, Inc. (Signature Services or Transfer Agent), an affiliate of the Adviser. The transfer agent fees paid to Signature Services are determined based on the cost to Signature Services (Signature Services Cost) of providing recordkeeping services. The Signature Services Cost includes a
| |
| Annual report | International Value Equity Fund | 25 |
component of allocated John Hancock corporate overhead for providing transfer agent services to the Fund and to all other John Hancock affiliated funds. It also includes out-of-pocket expenses that are comprised of payments made to third-parties for recordkeeping services provided to their clients who invest in one or more John Hancock funds. In addition, Signature Services Cost may be reduced by certain revenues that Signature Services receives in connection with the service it provides to the funds. Signature Services Cost is calculated monthly and allocated, as applicable, to four categories of share classes: Institutional Share Classes, Retirement Share Classes, Municipal Bond Classes and all other Retail Share Classes. Within each of these categories, the applicable costs are allocated to the affected John Hancock affiliated funds and/or classes, based on the relative average daily net assets.
Prior to February 11, 2011, the transfer agent agreement was not with an affiliate of the Fund and/or Adviser.
From February 11, 2011 to March 31, 2011, the transfer agent fees accrued for Signature Services amounted to $708.
Redemption fees. Prior to February 11, 2011, the Predecessor Fund imposed a 2.00% redemption fee applicable to all shares purchased after September 17, 2001 and redeemed by shareholders within 30 days of their purchase date. The redemption fee was intended to limit short-term trading of the Predecessor Fund. Proceeds of the fees were credited to the assets of the Predecessor Fund. The redemption fees retained by the Predecessor Fund were $1,240 and $1,235 for the years ended October 31, 2010 and October 31, 2009, respectively.
Class level expenses. Class level expenses for the five-month period ended March 31, 2011 were:
| | | | |
| | DISTRIBUTION | TRANSFER | PRINTING AND | STATE REGISTRATION |
| CLASS | AND SERVICE FEES | AGENT FEES | POSTAGE | FEES |
|
| Class A | $3,171 | $19,990 | $8,819 | $16,6941 |
| Class I | — | 6 | 4 | — |
| Total | $3,171 | $19,996 | $8,823 | $16,694 |
1 Class A state registration fees are included in $21,388 Registration and filing fees located on the Statement of Operations for the period ended March 31, 2011.
Trustee expenses. The Trust compensates each Trustee who is not an employee of the Adviser or its affiliates. These Trustees may, for tax purposes, elect to defer receipt of this compensation under the John Hancock Group of Funds Deferred Compensation Plan (the Plan). Deferred amounts are invested in various John Hancock funds and remain in the funds until distributed in accordance with the Plan. The investment of deferred amounts and the offsetting liability are included within Other receivables and prepaid expenses and Payable to affiliates — Trustees’ fees, respectively, in the accompanying Statement of Assets and Liabilities.
Prior to February 11, 2011, the Predecessor Fund paid each Trustee who was not an officer of the Predecessor Fund an annual fee of $7,500, a fee of $2,500 for each meeting of the Board of Trustees attended, and a fee of $500 for each meeting of the audit committee attended. Additionally, the Predecessor Fund paid the chairman of the audit committee an annual fee of $2,500. For the period from November 1, 2010 to February 11, 2011, the compensation to Trustees amounted to $18,141.
| |
| 26 | International Value Equity Fund | Annual report |
Note 5 — Fund share transactions
Transactions in Fund shares for the five-month period ended March 31, 2011 and the years ended October 31, 2010 and October 31, 2009 were as follows:
| | | | | | |
| | Period ended 3-31-111 | Year ended 10-31-10 | Year ended 10-31-09 |
| | Shares | Amount | Shares | Amount | Shares | Amount |
| Class A shares | | | | | | |
|
| Sold | 22,417 | $207,807 | 188,187 | $1,922,601 | 3,389,456 | $29,226,038 |
| Distributions | | | | | | |
| reinvested | 98,300 | 857,982 | 16,346 | 166,899 | 189,115 | 1,405,127 |
| Repurchased | (87,737) | (799,098) | (2,933,725) | (30,729,125) | (3,568,562) | (28,601,486) |
| | | | | | | |
| Net increase | | | | | | |
| (decrease) | 32,980 | $266,691 | (2,729,192) | ($28,639,625) | 10,009 | $2,029,679 |
| | | | | | | |
| Class I shares2 | | | | | | |
|
| Sold | 11,614 | $104,387 | — | — | — | — |
| | | | | | | |
| Net increase | 11,614 | $104,387 | — | — | — | — |
| | | | | | | |
| Net increase | 44,594 | $371,078 | (2,729,192) | ($28,639,625) | 10,009 | $2,029,679 |
1 For the five-month period ended 3-31-11. The Fund changed its fiscal year end from October 31 to March 31.
2 Period from 2-14-11 (inception date) to 3-31-11.
Affiliates of the Fund owned 96% of shares of beneficial interest of Class I on March 31, 2011.
Note 6 — Purchase and sale of securities
Purchases and sales of securities, other than short-term securities, aggregated $352,359 and $1,002,481, respectively, for the five-month period ended March 31, 2011.
Note 7 — Reorganization
At the close of business on February 11, 2011, the Fund acquired all the assets and liabilities of the Predecessor Fund in exchange for the Class A shares of the Fund. The Fund had no assets, liabilities or operations prior to the reorganization.
The Agreement provided for (a) the acquisition of all the assets, subject to all of the liabilities, of the Predecessor Fund in exchange for a representative amount of shares of the Fund; (b) the liquidation of the Predecessor Fund; and (c) the distribution to the Predecessor Fund’s shareholders of the Fund’s shares. The reorganization was intended to allow the Fund to be better positioned to increase asset size and achieve additional economies of scale by achieving net prices on securities trades and spread fixed expenses over a larger asset base. As a result of the reorganization, the Fund is the legal survivor, however, the accounting and performance history of the Capital Stock of the Predecessor Fund have been redesignated as that of Class A shares of the Fund.
Based on the opinion of tax counsel, the reorganization qualified as a tax-free reorganization for federal income tax purposes with no gain or loss recognized by the Predecessor Fund or its shareholders. Thus, the investments were transferred to the Fund at the Predecessor Fund’s identified cost. All distributable amounts of net income and realized gains from the Predecessor Fund were distributed prior to the reorganization. In addition, the expenses of the reorganization were borne by the Advisers of both the Predecessor Fund and the Fund. The effective time of the reorganization occurred immediately after the close of regularly scheduled trading on the NYSE on February 11, 2011. The following outlines the reorganization:
| | | | |
| | ACQUIRED NET ASSET | APPRECIATION OF | | |
| | VALUE OF THE | PREDECESSOR FUND’S | SHARES ISSUED | TOTAL NET ASSETS |
| PREDECESSOR FUND | PREDECESSOR FUND | INVESTMENTS | BY THE FUND | AFTER COMBINATION |
|
| Optique International | $2,914,429 | $288,668 | 324,714 | $2,914,429 |
| Value Fund | | | | |
| |
| Annual report | International Value Equity Fund | 27 |
Auditors’ report
Report of Independent Registered Public Accounting Firm
To the Board of Trustees of John Hancock Funds III and Shareholders of
John Hancock International Value Equity Fund:
In our opinion, the accompanying statement of assets and liabilities, including the portfolio of investments, and the related statements of operations and of changes in net assets and the financial highlights present fairly, in all material respects, the financial position of John Hancock International Value Equity Fund (formerly Optique International Value Fund) (the “Fund”) at March 31, 2011, and the results of its operations, the changes in its net assets and the financial highlights for the period from November 1, 2010 through March 31, 2011, in conformity with accounting principles generally accepted in the United States of America. These financial statements and financial highlights (hereafter referred to as “financial statements”) are the responsibility of the Fund’s management; our responsibility is to express an opinion on these financial statements based on our audit. We conducted our audit of these financial statements in accordance with the standards of the Public Company Accounting Oversight Board (United States). Those standards require that we plan and perform the audit to obtain reasonable assurance about whether the financial statements are free of material misstatement. An audit includes examining, on a test basis, evidence supporting the amounts and disclosures in the financial statements, assessing the accounting principles used and significant estimates made by management, and evaluating the overall financial statement presentation. We believe that our audit, which included confirmation of securities at March 31, 2011 by correspondence with the custodian and brokers, and the application of alternative auditing procedures where securities purchased confirmations had not been received, provides a reasonable basis for our opinion.
The statement of operations of the Fund for the year ending October 31, 2010, the statements of changes in net assets for the years ending October 31, 2010 and October 31, 2009, and the financial highlights for the years ending October 31, 2006 through October 31, 2010 were audited by another independent registered public accounting firm, whose report dated December 21, 2010 expressed an unqualified opinion on those financial statements and included an explanatory paragraph relating to the Fund’s ability to continue as a going concern, which was further discussed in Note 12 to those financial statements.
PricewaterhouseCoopers LLP
Boston, Massachusetts
May 25, 2011
| |
| 28 | International Value Equity Fund | Annual report |
Tax information
Unaudited
For federal income tax purposes, the following information is furnished with respect to the distributions of the Fund, if any, paid during its taxable year ended March 31, 2011.
The Fund designates the maximum amount allowable for the corporate dividends received deduction for the fiscal year ended March 31, 2011.
The Fund designates the maximum amount allowable of its net taxable income as qualified dividend income as provided in the Jobs and Growth Tax Relief Reconciliation Act of 2003. This amount will be reflected on Form 1099-DIV for the calendar year 2011.
Shareholders will be mailed a 2011 Form 1099-DIV in January 2012. This will reflect the total of all distributions for calendar year 2011.
| |
| Annual report | International Value Equity Fund | 29 |
Trustees and Officers
This chart provides information about the Trustees and Officers who oversee your John Hancock fund. Officers elected by the Trustees manage the day-to-day operations of the Fund and execute policies formulated by the Trustees.
Independent Trustees
| | |
| Name, Year of Birth | Trustee | Number of John |
| Position(s) held with Fund | of the | Hancock funds |
| Principal occupation(s) and other | Trust | overseen by |
| directorships during past 5 years | since1 | Trustee |
| |
| Steven R. Pruchansky, Born: 1944 | 2006 | 47 |
|
| Chairperson (since January 2011); Chairman and Chief Executive Officer, Greenscapes of Southwest |
| Florida, Inc. (since 2000); Director and President, Greenscapes of Southwest Florida, Inc. (until 2000); |
| Member, Board of Advisors, First American Bank (since 2008); Managing Director, Jon James, LLC (real |
| estate) (since 2000); Director, First Signature Bank & Trust Company (until 1991); Director, Mast Realty |
| Trust (until 1994); President, Maxwell Building Corp. (until 1991). | | |
| |
| James F. Carlin, Born: 1940 | 2006 | 47 |
|
| Chief Executive Officer, Director and Treasurer, Alpha Analytical Laboratories (environmental, chemical |
| and pharmaceutical analysis) (since 1985); Part Owner and Treasurer, Lawrence Carlin Insurance |
| Agency, Inc. (since 1995); Chairman and Chief Executive Officer, CIMCO, LLC (management/ |
| investments) (since 1987). | | |
| |
| William H. Cunningham, Born: 1944 | 2006 | 47 |
|
| Professor, University of Texas, Austin, Texas (since 1971); former Chancellor, University of Texas System |
| and former President of the University of Texas, Austin, Texas; Director of the following: LIN Television |
| (since 2009); Lincoln National Corporation (insurance) (Chairman since 2009 and Director since 2006); |
| Resolute Energy Corporation (since 2009); Nanomedical Systems, Inc. (biotechnology company) |
| (Chairman since 2008); Yorktown Technologies, LP (tropical fish) (Chairman since 2007); Greater Austin |
| Crime Commission (since 2001); Southwest Airlines (since 2000); former Director of the following: |
| Introgen (manufacturer of biopharmaceuticals) (until 2008); Hicks Acquisition Company I, Inc. (until |
| 2007); Jefferson-Pilot Corporation (diversified life insurance company) (until 2006); and former Advisory |
| Director, JP Morgan Chase Bank (formerly Texas Commerce Bank–Austin) (until 2009). | |
| |
| Deborah C. Jackson,2 Born: 1952 | 2008 | 47 |
|
| Chief Executive Officer, American Red Cross of Massachusetts Bay (since 2002); Board of Directors of |
| Eastern Bank Corporation (since 2001); Board of Directors of Eastern Bank Charitable Foundation (since |
| 2001); Board of Directors of American Student Assistance Corp. (1996–2009); Board of Directors of |
| Boston Stock Exchange (2002–2008); Board of Directors of Harvard Pilgrim Healthcare (health benefits |
| company) (since 2007). | | |
| |
| Charles L. Ladner,2 Born: 1938 | 2006 | 47 |
|
| Vice Chairperson (since March 2011); Chairman and Trustee, Dunwoody Village, Inc. (retirement |
| services) (since 2008); Director, Philadelphia Archdiocesan Educational Fund (since 2009); Senior Vice |
| President and Chief Financial Officer, UGI Corporation (public utility holding company) (retired 1998); |
| Vice President and Director for AmeriGas, Inc. (retired 1998); Director of AmeriGas Partners, L.P. (gas |
| distribution) (until 1997); Director, EnergyNorth, Inc. (until 1995); Director, Parks and History Association |
| (Cooperating Association, National Park Service) (until 2005). | | |
| |
| 30 | International Value Equity Fund | Annual report |
Independent Trustees (continued)
| | |
| Name, Year of Birth | Trustee | Number of John |
| Position(s) held with Fund | of the | Hancock funds |
| Principal occupation(s) and other | Trust | overseen by |
| directorships during past 5 years | since1 | Trustee |
| |
| Stanley Martin,2 Born: 1947 | 2008 | 47 |
|
| Senior Vice President/Audit Executive, Federal Home Loan Mortgage Corporation (2004–2006); |
| Executive Vice President/Consultant, HSBC Bank USA (2000–2003); Chief Financial Officer/Executive |
| Vice President, Republic New York Corporation & Republic National Bank of New York (1998–2000); |
| Partner, KPMG LLP (1971–1998). | | |
| |
| Dr. John A. Moore, Born: 1939 | 2006 | 47 |
|
| President and Chief Executive Officer, Institute for Evaluating Health Risks, (nonprofit institution) |
| (until 2001); Senior Scientist, Sciences International (health research) (until 2003); Former | |
| Assistant Administrator & Deputy Administrator, Environmental Protection Agency; Principal, |
| Hollyhouse (consulting) (since 2000); Director, CIIT Center for Health Science Research (nonprofit |
| research) (until 2007). | | |
| |
| Patti McGill Peterson,2 Born: 1943 | 2006 | 47 |
|
| Principal, PMP Globalinc (consulting) (since 2007); Senior Associate, Institute for Higher Education Policy |
| (since 2007); Executive Director, CIES (international education agency) (until 2007); Vice President, |
| Institute of International Education (until 2007); Senior Fellow, Cornell University Institute of Public |
| Affairs, Cornell University (1997–1998); Former President Wells College, St. Lawrence University and the |
| Association of Colleges and Universities of the State of New York. Director of the following: Niagara |
| Mohawk Power Corporation (until 2003); Security Mutual Life (insurance) (until 1997); ONBANK (until |
| 1993). Trustee of the following: Board of Visitors, The University of Wisconsin, Madison (since 2007); |
| Ford Foundation, International Fellowships Program (until 2007); UNCF, International Development |
| Partnerships (until 2005); Roth Endowment (since 2002); Council for International Educational |
| Exchange (since 2003). | | |
| |
| Gregory A. Russo, Born: 1949 | 2008 | 47 |
|
| Vice Chairman, Risk & Regulatory Matters, KPMG LLP (“KPMG”) (2002–2006); Vice Chairman, Industrial |
| Markets, KPMG (1998–2002). | | |
Non-Independent Trustees3
| | |
| Name, Year of Birth | Trustee | Number of John |
| Position(s) held with Fund | of the | Hancock funds |
| Principal occupation(s) and other | Trust | overseen by |
| directorships during past 5 years | since1 | Trustee |
| |
| Hugh McHaffie, Born: 1959 | 2010 | 47 |
|
| Executive Vice President, John Hancock Financial Services (since 2006, including prior positions); |
| President of John Hancock Trust and John Hancock Funds II (since 2009); Trustee, John Hancock retail |
| funds (since 2010); Chairman and Director, John Hancock Advisers, LLC, John Hancock Investment |
| Management Services, LLC and John Hancock Funds, LLC (since 2010); Senior Vice President, Individual |
| Business Product Management, MetLife, Inc. (1999–2006). | | |
| |
| Annual report | International Value Equity Fund | 31 |
Non-Independent Trustees3 (continued)
| | |
| Name, Year of Birth | Trustee | Number of John |
| Position(s) held with Fund | of the | Hancock funds |
| Principal occupation(s) and other | Trust | overseen by |
| directorships during past 5 years | since1 | Trustee |
| |
| John G. Vrysen, Born: 1955 | 2009 | 47 |
|
| Senior Vice President, John Hancock Financial Services (since 2006); Director, Executive Vice President |
| and Chief Operating Officer, John Hancock Advisers, LLC, John Hancock Investment Management |
| Services, LLC and John Hancock Funds, LLC (since 2005); Chief Operating Officer, John Hancock Funds II |
| and John Hancock Trust (since 2007); Chief Operating Officer, John Hancock retail funds (until 2009); |
| Trustee, John Hancock retail funds (since 2009). | | |
Principal officers who are not Trustees
| |
| Name, Year of Birth | Officer |
| Position(s) held with Fund | of the |
| Principal occupation(s) and other | Trust |
| directorships during past 5 years | since |
| |
| Keith F. Hartstein, Born: 1956 | 2006 |
|
| President and Chief Executive Officer | |
| Senior Vice President, John Hancock Financial Services (since 2004); Director, President and Chief | |
| Executive Officer, John Hancock Advisers, LLC and John Hancock Funds, LLC (since 2005); Director, |
| John Hancock Asset Management a division of Manulife Asset Management (US) LLC (since 2005); |
| Director, John Hancock Investment Management Services, LLC (since 2006); President and Chief | |
| Executive Officer, John Hancock retail funds (since 2005); Member, Investment Company Institute Sales |
| Force Marketing Committee (since 2003). | |
| |
| Andrew G. Arnott, Born: 1971 | 2009 |
|
| Senior Vice President and Chief Operating Officer | |
| Senior Vice President, John Hancock Financial Services (since 2009); Executive Vice President, | |
| John Hancock Advisers, LLC (since 2005); Executive Vice President, John Hancock Investment | |
| Management Services, LLC (since 2006); Executive Vice President, John Hancock Funds, LLC (since | |
| 2004); Chief Operating Officer, John Hancock retail funds (since 2009); Senior Vice President, | |
| John Hancock retail funds (since 2010); Vice President, John Hancock Funds II and John Hancock Trust |
| (since 2006); Senior Vice President, Product Management and Development, John Hancock Funds, |
| LLC (until 2009). | |
| |
| Thomas M. Kinzler, Born: 1955 | 2006 |
|
| Secretary and Chief Legal Officer | |
| Vice President, John Hancock Financial Services (since 2006); Secretary and Chief Legal Counsel, | |
| John Hancock Advisers, LLC, John Hancock Investment Management Services, LLC and John Hancock |
| Funds, LLC (since 2007); Secretary and Chief Legal Officer, John Hancock retail funds, John Hancock |
| Funds II and John Hancock Trust (since 2006); Vice President and Associate General Counsel, | |
| Massachusetts Mutual Life Insurance Company (1999–2006); Secretary and Chief Legal Counsel, MML |
| Series Investment Fund (2000–2006); Secretary and Chief Legal Counsel, MassMutual Select Funds and |
| MassMutual Premier Funds (2004–2006). | |
| |
| 32 | International Value Equity Fund | Annual report |
Principal officers who are not Trustees (continued)
| |
| Name, Year of Birth | Officer |
| Position(s) held with Fund | of the |
| Principal occupation(s) and other | Trust |
| directorships during past 5 years | since |
| |
| Francis V. Knox, Jr., Born: 1947 | 2006 |
|
| Chief Compliance Officer | |
| Vice President, John Hancock Financial Services (since 2005); Chief Compliance Officer, John Hancock |
| retail funds, John Hancock Funds II, John Hancock Trust, John Hancock Advisers, LLC and John Hancock |
| Investment Management Services, LLC (since 2005); Vice President and Chief Compliance Officer, | |
| John Hancock Asset Management a division of Manulife Asset Management (US) LLC (2005–2008). |
| |
| Charles A. Rizzo, Born: 1957 | 2007 |
|
| Chief Financial Officer | |
| Vice President, John Hancock Financial Services (since 2008); Senior Vice President, John Hancock | |
| Advisers, LLC and John Hancock Investment Management Services, LLC (since 2008); Chief Financial |
| Officer, John Hancock retail funds, John Hancock Funds II and John Hancock Trust (since 2007); | |
| Assistant Treasurer, Goldman Sachs Mutual Fund Complex (2005–2007); Vice President, Goldman | |
| Sachs (2005–2007). | |
| |
| Salvatore Schiavone, Born: 1965 | 2010 |
|
| Treasurer | |
| Assistant Vice President, John Hancock Financial Services (since 2007); Vice President, John Hancock |
| Advisers, LLC and John Hancock Investment Management Services, LLC (since 2007); Treasurer, | |
| John Hancock retail funds (since 2010); Treasurer, John Hancock Closed-End Funds (since 2009); | |
| Assistant Treasurer, John Hancock Funds II and John Hancock Trust (since 2007); Assistant Treasurer, |
| John Hancock retail funds, John Hancock Funds II and John Hancock Trust (2007–2009); Assistant | |
| Treasurer, Fidelity Group of Funds (2005–2007); Vice President, Fidelity Management Research | |
| Company (2005–2007). | |
The business address for all Trustees and Officers is 601 Congress Street, Boston, Massachusetts 02210-2805.
The Statement of Additional Information of the Fund includes additional information about members of the Board of Trustees of the Fund and is available without charge, upon request, by calling 1-800-225-5291.
1 Each Trustee holds office until his or her successor is elected and qualified, or until the Trustee’s death, retirement, resignation or removal.
2 Member of Audit Committee.
3 Because Messrs. McHaffie and Vrysen are senior executives or directors with the Adviser and/or its affiliates, each of them is considered an “interested person,” as defined in the Investment Company Act of 1940, of the Fund.
| |
| Annual report | International Value Equity Fund | 33 |
More information
| |
| Trustees | Investment adviser |
| Steven R. Pruchansky, Chairperson | John Hancock Investment Management |
| James F. Carlin | Services, LLC |
| William H. Cunningham | |
| Deborah C. Jackson* | Subadviser |
| Charles L. Ladner, Vice Chairperson* | John Hancock Asset Management |
| Stanley Martin* | (formerly MFC Global Investment |
| Hugh McHaffie† | Management (U.S.), LLC) |
| Dr. John A. Moore | |
| Patti McGill Peterson* | Principal distributor |
| Gregory A. Russo | John Hancock Funds, LLC |
| John G. Vrysen† | |
| | Custodian |
| Officers | State Street Bank and Trust Company |
| Keith F. Hartstein | |
| President and Chief Executive Officer | Transfer agent |
| | John Hancock Signature Services, Inc. |
| Andrew G. Arnott | |
| Senior Vice President and Chief Operating Officer | Legal counsel |
| | K&L Gates LLP |
| Thomas M. Kinzler | |
| Secretary and Chief Legal Officer | Independent registered |
| | public accounting firm |
| Francis V. Knox, Jr. | PricewaterhouseCoopers LLP |
| Chief Compliance Officer | |
| | |
| Charles A. Rizzo | |
| Chief Financial Officer | |
| | |
| Salvatore Schiavone | |
| Treasurer | |
| |
| *Member of the Audit Committee | |
| †Non-Independent Trustee | |
The Fund’s proxy voting policies and procedures, as well as the Fund’s proxy voting record for the most recent twelve-month period ended June 30, are available free of charge on the Securities and Exchange Commission (SEC) Web site at www.sec.gov or on our Web site.
The Fund’s complete list of portfolio holdings, for the first and third fiscal quarters, is filed with the SEC on Form N-Q. The Fund’s Form N-Q is available on our Web site and the SEC’s Web site, www.sec.gov, and can be reviewed and copied (for a fee) at the SEC’s Public Reference Room in Washington, DC. Call 1-800-SEC-0330 to receive information on the operation of the SEC’s Public Reference Room.
We make this information on your fund, as well as monthly portfolio holdings, and other fund details available on our Web site www.jhfunds.com or by calling 1-800-225-5291.
| | |
| You can also contact us: | | |
| 1-800-225-5291 | Regular mail: | Express mail: |
| jhfunds.com | John Hancock Signature Services, Inc. | John Hancock Signature Services, Inc. |
| | P.O. Box 55913 | Mutual Fund Image Operations |
| | Boston, MA 02205-5913 | 30 Dan Road |
| | | Canton, MA 02021 |
| |
| 34 | International Value Equity Fund | Annual report |

1-800-225-5291
1-800-554-6713 TDD
1-800-338-8080 EASI-Line
www.jhfunds.com
Now available: electronic delivery
www.jhfunds.com/edelivery
| |
| This report is for the information of the shareholders of John Hancock International Value Equity Fund. | 3660A 3/11 |
| It is not authorized for distribution to prospective investors unless preceded or accompanied by a prospectus. | 5/11 |
ITEM 2. CODE OF ETHICS.
As of the end of the period, March 31, 2011, the registrant has adopted a code of ethics, as defined in Item 2 of Form N-CSR, that applies to its Chief Executive Officer and Chief Financial Officer (respectively, the principal executive officer, the principal financial officer, the “Covered Officers”). A copy of the code of ethics is filed as an exhibit to this Form N-CSR.
ITEM 3. AUDIT COMMITTEE FINANCIAL EXPERT.
The Board of Trustees of the Registrant has determined that it has one “audit committee financial expert” as that term is defined in Item 3(b) of Form N-CSR: Stanley Martin who is “independent” as that term is defined in Item 3(a) (2) of Form N-CSR.
ITEM 4. PRINCIPAL ACCOUNTANT FEES AND SERVICES.
(a) Audit Fees
The aggregate fees billed for professional services rendered by the principal accountant, PricewaterhouseCoopers LLP (“PWC”) for the audits of the registrant’s annual financial statements or services that are normally provided by the accountant in connection with statutory and regulatory filings or engagements amounted to $264,780 for the fiscal period ended March 31, 2011 (broken out as follows: John Hancock Leveraged Companies Fund - $30,387, John Hancock Rainier Growth Fund - $32,144, John Hancock Disciplined Value Fund - $28,874, John Hancock Small Cap Opportunities Fund - $29,208, John Hancock Core High Yield Fund -$39,791, John Hancock Small Company Fund - $34,396, John Hancock Disciplined Value Mid Cap Fund - $27,210 and John Hancock International Value Equity Fund - $42,770)(John Hancock Disciplined Value Mid Cap Fund changed its fiscal year end from August 31 to March 31 and John Hancock International Value Equity was adopted during the period ended March 31, 2011) and $181,363 for the fiscal period ended March 31, 2010 (broken out as follows: John Hancock Leveraged Companies Fund - $29,876, John Hancock Rainier Growth Fund - $35,013, John Hancock Disciplined Value Fund - $28,403, John Hancock Small Cap Opportunities Fund -$28,733, John Hancock Core High Yield Fund - $29,105 and John Hancock Small Company Fund - $30,233).
(b) Audit-Related Services
Audit-related fees for assurance and related services by PWC amounted to $2,429 for the fiscal period ended March 31, 2011 (broken out as follows: John Hancock Leveraged Companies Fund - $347, John Hancock Rainier Growth Fund - $347, John Hancock Disciplined Value Fund - $347, John Hancock Small Cap Opportunities Fund - $347, John Hancock Core High Yield Fund -$347, John Hancock Small Company Fund - $347, John Hancock Disciplined Value Mid Cap Fund - $0 and John Hancock International Value Equity Fund - $347) and $7,104 for the fiscal period ended March 31, 2010 (broken out as follows: John Hancock Leveraged Companies Fund - $1,184, John Hancock Rainier Growth Fund - $1,184, John Hancock Disciplined Value Fund -$1,184, John Hancock Small Cap Opportunities Fund - $1,184, John Hancock Core High Yield Fund - $1,184 and John Hancock Small Company Fund - $1,184) billed to the registrant or to the registrant's investment adviser (not including any sub-adviser whose role is primarily portfolio management and is subcontracted with or overseen by another investment adviser), and any entity controlling, controlled by, or under common control with the adviser that provides ongoing services to the registrant ("control affiliates"). The nature of the services provided was service provider internal controls review.
(c) Tax Fees
The aggregate fees billed for professional services rendered by PWC for the tax compliance, tax advice and tax planning (“tax fees”) amounted to $19,944 for the fiscal period ended March 31, 2011 (broken out as follows: John Hancock Leveraged Companies Fund - $1,053, John Hancock Rainier Growth Fund - $1,737, John Hancock Disciplined Value Fund - $2,200, John Hancock
Small Cap Opportunities Fund - $2,395, John Hancock Core High Yield Fund - $3,976, John Hancock Small Company Fund - $2,395, John Hancock Disciplined Value Mid Cap Fund - $2,473 and John Hancock International Value Equity Fund - $3,715) and $14,355 for the fiscal period ended March 31, 2010 (broken out as follows: John Hancock Leveraged Companies Fund -$1,022, John Hancock Rainier Growth Fund - $1,687, John Hancock Disciplined Value Fund -$2,136, John Hancock Small Cap Opportunities Fund - $2,325, John Hancock Core High Yield Fund - $3,860 and John Hancock Small Company Fund - $3,325). The nature of the services comprising the tax fees was the review of the registrant’s tax returns and tax distribution requirements. These fees were billed to the registrant and were approved by the registrant’s audit committee.
(d) All Other Fees
The aggregate fees billed for professional services rendered by the principal accountant(s) amounted to $133 for the fiscal period ended March 31, 2011 (broken out as follows: John Hancock Leveraged Companies Fund - $19, John Hancock Rainier Growth Fund - $19, John Hancock Disciplined Value Fund - $19, John Hancock Small Cap Opportunities Fund - $19, John Hancock Core High Yield Fund - $19, John Hancock Small Company Fund - $19, John Hancock Disciplined Value Mid Cap Fund - $0 and John Hancock International Value Equity Fund - $19) and $330 for the fiscal period ended March 31, 2010 (broken out as follows: John Hancock Leveraged Companies Fund - $55, John Hancock Rainier Growth Fund - $55, John Hancock Disciplined Value Fund - $55, John Hancock Small Cap Opportunities Fund - $55, John Hancock Core High Yield Fund - $55 and John Hancock Small Company Fund - $55) billed to the registrant or to the control affiliates.
(e)(1) Audit Committee Pre-Approval Policies and Procedures:
The trust’s Audit Committee must pre-approve all audit and non-audit services provided by the independent registered public accounting firm (the “Auditor”) relating to the operations or financial reporting of the funds. Prior to the commencement of any audit or non-audit services to a fund, the Audit Committee reviews the services to determine whether they are appropriate and permissible under applicable law.
The trust’s Audit Committee has adopted policies and procedures to, among other purposes, provide a framework for the Committee’s consideration of audit-related and non-audit services by the Auditor. The policies and procedures require that any audit-related and non-audit service provided by the Auditor and any non-audit service provided by the Auditor to a fund service provider that relates directly to the operations and financial reporting of a fund are subject to approval by the Audit Committee before such service is provided. Audit-related services provided by the Auditor that are expected to exceed $25,000 per year/per fund are subject to specific pre-approval by the Audit Committee. Tax services provided by the Auditor that are expected to exceed $30,000 per year/per fund are subject to specific pre-approval by the Audit Committee.
All audit services, as well as the audit-related and non-audit services that are expected to exceed the amounts stated above, must be approved in advance of provision of the service by formal resolution of the Audit Committee. At the regularly scheduled Audit Committee meetings, the Committee reviews a report summarizing the services, including fees, provided by the Auditor.
(e)(2) Services approved pursuant to paragraph (c)(7)(i)(C) of Rule 2-01 of Regulation S-X:
Audit-Related Fees, Tax Fees and All Other Fees:
There were no amounts that were approved by the Audit Committee pursuant to the de minimis exception under Rule 2-01 of Regulation S-X.
(f) According to PWC for the Reporting Period, the percentage of hours spent on the audit of the registrant's financial statements for the most recent fiscal year that were attributed to work performed by persons who were not full-time, permanent employees of principal accountant was less than 50%.
(g) The aggregate non-audit fees billed by PWC for non-audit services rendered to the registrant and rendered to the registrant's control affiliates for the fiscal period ended March 31, 2011 were $1,985,439 and for the fiscal period ended March 31, 2010 were $5,416,301.
(h) The registrant’s audit committee of the Board of Trustees has considered the provision of non-audit services that were rendered by PWC to the investment adviser and any control affiliate that provides services that were not pre-approved pursuant to paragraph (c) (7) (ii) of Rule 2-01 of Regulation S-X, to be compatible with maintaining PWC’s independence.
ITEM 5. AUDIT COMMITTEE OF LISTED REGISTRANTS.
The registrant has a separately-designated standing audit committee comprised of independent trustees. The members of the audit committee are as follows:
Stanley Martin - Chairman
Deborah C. Jackson
Charles L. Ladner
Patti McGill Peterson
ITEM 6. SCHEDULE OF INVESTMENTS.
(a) Not applicable.
(b) Not applicable.
ITEM 7. DISCLOSURE OF PROXY VOTING POLICIES AND PROCEDURES FOR CLOSED-END MANAGEMENT INVESTMENT COMPANIES.
Not applicable.
ITEM 8. PORTFOLIO MANAGERS OF CLOSED-END MANAGEMENT INVESTMENT COMPANIES.
Not applicable.
ITEM 9. PURCHASES OF EQUITY SECURITIES BY CLOSED-END MANAGEMENT INVESTMENT COMPANY AND AFFILIATED PURCHASERS.
Not applicable.
ITEM 10. SUBMISSION OF MATTERS TO A VOTE OF SECURITY HOLDERS.
The registrant has adopted procedures by which shareholders may recommend nominees to the registrant's Board of Trustees. A copy of the procedures is filed as an exhibit to this Form N-CSR. See attached “John Hancock Funds – Governance Committee Charter”.
ITEM 11. CONTROLS AND PROCEDURES.
(a) EVALUATION OF DISCLOSURE CONTROLS AND PROCEDURES. The registrant maintains disclosure controls and procedures that are designed to ensure that information required to be disclosed in this Form N-CSR is recorded, processed, summarized and reported within the periods specified in the rules and forms of the Securities and Exchange Commission. Such disclosure controls and procedures include controls and procedures designed to ensure that such information is accumulated and communicated to the registrant’s management,
including its principal executive officer and principal financial officer, as appropriate, to allow timely decisions regarding required disclosure.
Within 90 days prior to the filing date of this Form N-CSR, the registrant had carried out an evaluation, under the supervision and with the participation of the registrant’s management, including the registrant's principal executive officer and the registrant’s principal financial officer, of the effectiveness of the design and operation of the registrant’s disclosure controls and procedures relating to information required to be disclosed on Form N-CSR. Based on such evaluation, the registrant’s principal executive officer and principal financial officer concluded that the registrant’s disclosure controls and procedures are operating effectively to ensure that:
(i) information required to be disclosed in this Form N-CSR is recorded, processed, summarized and reported within the periods specified in the rules and forms of the Securities and Exchange Commission, and
(ii) information is accumulated and communicated to the registrant’s management, including its principal executive officer and principal financial officer, as appropriate, to allow timely decisions regarding required disclosure.
(b) CHANGE IN REGISTRANT’S INTERNAL CONTROL: Not applicable.
ITEM 12. EXHIBITS.
(a)(1) See attached Code of Ethics.
(a)(2)(i) CERTIFICATION OF PRINCIPAL EXECUTIVE OFFICER.
(a)(2)(ii) CERTIFICATION OF PRINCIPAL FINANCIAL OFFICER.
(b) CERTIFICATION PURSUANT TO Rule 30a-2(b) OF THE INVESTMENT COMPANY ACT OF 1940.
(c)(1) Submission of Matters to a Vote of Security Holders is attached. See attached “John Hancock Funds – Governance Committee Charter”.
(c)(2) Contact person at the registrant.
Pursuant to the requirements of the Securities Exchange Act of 1934 and the Investment Company Act of 1940, the registrant has duly caused this report to be signed on its behalf by the undersigned, thereunto duly authorized.
John Hancock Funds III
By: /s/ Keith F. Hartstein
------------------------------
Keith F. Hartstein
President and
Chief Executive Officer
Date: May 20, 2011
Pursuant to the requirements of the Securities Exchange Act of 1934 and the Investment Company Act of 1940, this report has been signed below by the following persons on behalf of the registrant and in the capacities and on the dates indicated.
By: /s/ Keith F. Hartstein
-------------------------------
Keith F. Hartstein
President and
Chief Executive Officer
Date: May 20, 2011
By: /s/ Charles A. Rizzo
--------------------------------
Charles A. Rizzo
Chief Financial Officer
Date: May 20, 2011