| |
| UNITED STATES |
| SECURITIES AND EXCHANGE COMMISSION |
| Washington, D.C. 20549 |
| |
| FORM N-CSR |
| |
| CERTIFIED SHAREHOLDER REPORT OF REGISTERED |
| |
| MANAGEMENT INVESTMENT COMPANIES |
| |
| Investment Company Act file number 811-21777 |
| |
| John Hancock Funds III |
| (Exact name of registrant as specified in charter) |
| |
| 601 Congress Street, Boston, Massachusetts 02210 |
| (Address of principal executive offices) (Zip code) |
| |
| Salvatore Schiavone |
| Treasurer |
| |
| 601 Congress Street |
| |
| Boston, Massachusetts 02210 |
| |
| (Name and address of agent for service) |
| |
| Registrant's telephone number, including area code: 617-663-4497 |
| |
| Date of fiscal year end: | February 28 |
| |
| Date of reporting period: | February 28, 2013 |
ITEM 1. REPORTS TO STOCKHOLDERS.

A look at performance
Total returns for the period ended February 28, 2013
| | | | | | | | |
| | Average annual total returns (%) | | | Cumulative total returns (%) |
| | with maximum sales charge | | | | with maximum sales charge |
|
| | | | | Since | | | | Since |
| | 1-year | 5-year | 10-year | inception | | 5-year | 10-year | inception |
|
| Class A1 | 2.03 | –3.24 | — | 1.41 | | –15.17 | — | 11.03 |
|
| Class B2 | 1.71 | –3.25 | — | 1.40 | | –15.22 | — | 10.95 |
|
| Class C2 | 5.71 | –2.92 | — | 1.40 | | –13.76 | — | 10.95 |
|
| Class I2,3 | 7.92 | –1.76 | — | 2.60 | | –8.51 | — | 21.12 |
|
| Class R12,3 | 7.10 | –2.47 | — | 1.86 | | –11.77 | — | 14.75 |
|
| Class R22,3 | 7.39 | –3.25 | — | 1.08 | | –15.24 | — | 8.31 |
|
| Class R33,4 | 7.28 | — | — | 7.78 | | — | — | 32.71 |
|
| Class R43,4 | 7.61 | — | — | 8.11 | | — | — | 34.25 |
|
| Class R53,4 | 7.88 | — | — | 8.43 | | — | — | 35.74 |
|
| Class R62,3 | 7.95 | –1.68 | — | 2.81 | | –8.11 | — | 22.98 |
|
| Class 13,5 | 8.00 | –1.70 | — | –0.16 | | –8.22 | — | –1.02 |
|
| Class NAV3,6 | 8.06 | –1.65 | — | 0.42 | | –7.99 | — | 2.76 |
|
Performance figures assume all distributions have been reinvested. Figures reflect maximum sales charges on Class A shares of 5%, and the applicable contingent deferred sales charge (CDSC) on Class B and Class C shares. The Class B shares’ CDSC declines annually between years 1 to 6 according to the following schedule: 5, 4, 3, 3, 2, 1%. No sales charge will be assessed after the sixth year. Class C shares held for less than one year are subject to a 1% CDSC. Sales charges are not applicable to Class I, Class R1, Class R2, Class R3, Class R4, Class R5, Class R6, Class 1 and Class NAV shares.
The expense ratios of the Fund, both net (including any fee waivers or expense limitations) and gross (excluding any fee waivers or expense limitations), are set forth according to the most recent publicly available prospectuses for the Fund and may differ from those disclosed in the Financial highlights tables in this report. The fee waivers and expense limitations are contractual until at least 6-30-13 for Class B, Class C, Class R1, Class R2, Class R3, Class R4, Class R5, and Class R6 shares. Had the fee waivers and expense limitations not been in place, gross expenses would apply. For all other classes the net expenses equal the gross expenses. The expense ratios are as follows:
| | | | | | | | | | | | |
| | Class A | Class B | Class C | Class I | Class R1 | Class R2* | Class R3 | Class R4 | Class R5 | Class R6 | Class 1 | Class NAV |
| Net (%) | 1.58 | 2.30 | 2.30 | 1.16 | 1.90 | 1.65 | 1.80 | 1.40 | 1.20 | 1.12 | 1.07 | 1.02 |
| Gross (%) | 1.58 | 2.49 | 2.50 | 1.16 | 7.37 | 2.97 | 45.66 | 42.64 | 20.87 | 16.83 | 1.07 | 1.02 |
* Expenses have been estimated for the Class’s first full year of operations.
The returns reflect past results and should not be considered indicative of future performance. The return and principal value of an investment will fluctuate so that shares, when redeemed, may be worth more or less than their original cost. Due to market volatility, the Fund’s current performance may be higher or lower than the performance shown. For current to the most recent month-end performance data, please call 1-800-225-5291 or visit the Fund’s Web site at www.jhfunds.com.
The performance table above and the chart on the next page do not reflect the deduction of taxes that a shareholder would pay on fund distributions or the redemption of fund shares. The Fund’s performance results reflect any applicable expense reductions, without which the expenses increase and results would have been less favorable.
See the following page for footnotes.
| |
| 6 | International Core Fund | Annual report |
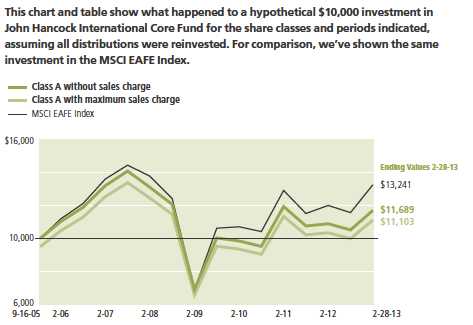
| | | | |
| | | Without | With maximum | |
| | Start date | sales charge | sales charge | Index |
|
| Class B2,7 | 9-16-05 | $11,095 | $11,095 | $13,241 |
|
| Class C2,7 | 9-16-05 | 11,095 | 11,095 | 13,241 |
|
| Class I2,3 | 9-16-05 | 12,112 | 12,112 | 13,241 |
|
| Class R12,3 | 9-16-05 | 11,475 | 11,475 | 13,241 |
|
| Class R22,3 | 9-16-05 | 10,831 | 10,831 | 13,241 |
|
| Class R33 | 5-22-09 | 13,271 | 13,271 | 14,692 |
|
| Class R43 | 5-22-09 | 13,425 | 13,425 | 14,692 |
|
| Class R53 | 5-22-09 | 13,574 | 13,574 | 14,692 |
|
| Class R62,3 | 9-16-05 | 12,298 | 12,298 | 13,241 |
|
| Class 13 | 11-6-06 | 9,898 | 9,898 | 10,531 |
|
| Class NAV3 | 8-29-06 | 10,276 | 10,276 | 11,061 |
|
MSCI EAFE Index (gross of foreign withholding tax on dividends) (Europe, Australasia, Far East) is a free float-adjusted market capitalization index that is designed to measure developed market equity performance, excluding the U.S. and Canada. The index consists of 21 developed market country indexes.
It is not possible to invest directly in an index. Index figures do not reflect expenses or sales charges, which would have resulted in lower values if they did.
Footnotes related to performance pages
1 On 6-9-06, through a reorganization, the Fund acquired all of the assets of the GMO International Disciplined Equity Fund (the predecessor fund). The predecessor fund’s Class III shares, inception date 9-16-05, were exchanged for Class A shares, which were first offered on 6-12-06. The predecessor fund’s Class III shares returns have been recalculated to reflect the gross fees and expenses of Class A shares.
2 Class B, Class C, Class I and Class R1 shares were first offered on 6-12-06; Class R2 shares were first offered on 3-1-12; Class R6 shares were first offered on 9-1-11. Returns prior to these dates are those of Class A shares that have been recalculated to apply the gross fees and expenses of Class B, Class C, Class I, Class R1, Class R2 and Class R6 shares, as applicable.
3 For certain types of investors, as described in the Fund’s prospectuses.
4 From 5-22-09.
5 From 11-6-06.
6 From 8-29-06.
7 The contingent deferred sales charge is not applicable.
| |
| Annual report | International Core Fund | 7 |
Management’s discussion of
Fund performance
By Grantham, Mayo, Van Otterloo & Co. LLC
For the 12 months ended February 28, 2013, stocks in international developed markets fared poorly early on amid renewed concern about the European sovereign debt crisis, but subsequently rallied to end the period with healthy gains. A major turning point occurred in July when European Central Bank (ECB) President Mario Draghi stated he would do “whatever it takes” to preserve the euro. In September, the ECB backed up that statement with a new bond-buying program, and central banks in the United States and Japan also announced stimulative measures. Against this backdrop, the Fund’s benchmark, the MSCI EAFE Index, returned 10.37%, while the average large value fund monitored by Morningstar, Inc. finished at 7.54%.†
For the year ended February 28, 2013, John Hancock International Core Fund’s Class A shares returned 7.41%, excluding sales charges. Among our stock-picking tools, momentum served the Fund relatively well while our valuation stock-picking tools were less successful, guiding us to an overweighting in energy and an underweighting in financials, both of which detracted substantially from Fund performance. Partially offsetting unrewarding sector allocation, stock selection was a net positive for the Fund. Two of the Fund’s five biggest contributors were large pharmaceutical companies: France-based Sanofi and the U.K.’s GlaxoSmithKline PLC, the latter of which we sold. Also aiding performance was Australian telecommunication services provider Telstra Corp. Ltd. and an underweighting in weak-performing benchmark component BG Group PLC, a U.K. supplier of natural gas and crude oil that we sold. Avoiding U.K. weak performing mining stock Anglo American PLC lifted our results as well. Conversely, overweighting German electric utility E.ON AG proved unrewarding. This stock took a hit in November, when the company lowered its 2013 profit guidance. Total SA, the Fund’s largest holding, also disappointed us, along with Japanese electronics retailer Yamada Denki Company, Ltd. and Spanish telecommunications services provider Telefonica SA. Underweighting strong-performing U.K.-based bank HSBC Holdings PLC, which we sold, further undercut Fund returns.
This commentary reflects the views of the portfolio management team through the end of the period discussed in this report. The team’s statements reflect their own opinions. As such, they are in no way guarantees of future events and are not intended to be used as investment advice or a recommendation regarding any specific security. They are also subject to change at any time as market and other conditions warrant.
Past performance is no guarantee of future results.
Foreign investing, especially in emerging markets, has additional risks, such as currency and market volatility and political and social instability. Hedging and other strategic transactions may increase volatility of a fund and, if the transaction is not successful, could result in a significant loss. For additional information on these and other risk considerations, please see the Fund’s prospectus.
† Figures from Morningstar, Inc. include reinvested dividends and do not take into account sales charges. Actual load-adjusted performance is lower.
| |
| 8 | International Core Fund | Annual report |
Your expenses
These examples are intended to help you understand your ongoing operating expenses of investing in the Fund so you can compare these costs with the ongoing costs of investing in other mutual funds.
Understanding fund expenses
As a shareholder of the Fund, you incur two types of costs:
▪ Transaction costs which include sales charges (loads) on purchases or redemptions (varies by share class), minimum account fee charge, etc.
▪ Ongoing operating expenses including management fees, distribution and service fees (if applicable), and other fund expenses.
We are going to present only your ongoing operating expenses here.
Actual expenses/actual returns
This example is intended to provide information about the Fund’s actual ongoing operating expenses, and is based on the Fund’s actual return. It assumes an account value of $1,000.00 on September 1, 2012 with the same investment held until February 28, 2013.
| | | |
| | Account value | Ending value | Expenses paid during |
| | on 9-1-12 | on 2-28-13 | period ended 2-28-131 |
|
| Class A | $1,000.00 | $1,112.20 | $8.22 |
|
| Class B | 1,000.00 | 1,108.90 | 12.03 |
|
| Class C | 1,000.00 | 1,108.90 | 12.03 |
|
| Class I | 1,000.00 | 1,115.00 | 6.14 |
|
| Class R1 | 1,000.00 | 1,110.80 | 9.94 |
|
| Class R2 | 1,000.00 | 1,112.30 | 8.64 |
|
| Class R3 | 1,000.00 | 1,111.50 | 9.42 |
|
| Class R4 | 1,000.00 | 1,113.80 | 7.34 |
|
| Class R5 | 1,000.00 | 1,115.00 | 6.29 |
|
| Class R6 | 1,000.00 | 1,153.70 | 5.98 |
|
| Class 1 | 1,000.00 | 1,115.30 | 5.72 |
|
| Class NAV | 1,000.00 | 1,115.90 | 5.51 |
|
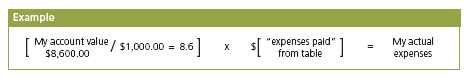
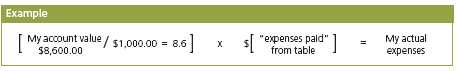
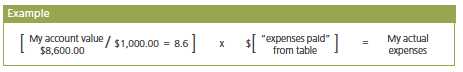
Together with the value of your account, you may use this information to estimate the operating expenses that you paid over the period. Simply divide your account value at February 28, 2013, by $1,000.00, then multiply it by the “expenses paid” for your share class from the table above. For example, for an account value of $8,600.00, the operating expenses should be calculated as follows:
| |
| Annual report | International Core Fund | 9 |
Your expenses
Hypothetical example for comparison purposes
This table allows you to compare the Fund’s ongoing operating expenses with those of any other fund. It provides an example of the Fund’s hypothetical account values and hypothetical expenses based on each class’s actual expense ratio and an assumed 5% annualized return before expenses (which is not the Fund’s actual return). It assumes an account value of $1,000.00 on September 1, 2012, with the same investment held until February 28, 2013. Look in any other fund shareholder report to find its hypothetical example and you will be able to compare these expenses. Please remember that these hypothetical account values and expenses may not be used to estimate the actual ending account balance or expenses you paid for the period.
| | | |
| | Account value | Ending value | Expenses paid during |
| | on 9-1-12 | on 2-28-13 | period ended 2-28-131 |
|
| Class A | $1,000.00 | $1,017.00 | $7.85 |
|
| Class B | 1,000.00 | 1,013.40 | 11.48 |
|
| Class C | 1,000.00 | 1,013.40 | 11.48 |
|
| Class I | 1,000.00 | 1,019.00 | 5.86 |
|
| Class R1 | 1,000.00 | 1,015.40 | 9.49 |
|
| Class R2 | 1,000.00 | 1,016.60 | 8.25 |
|
| Class R3 | 1,000.00 | 1,015.90 | 9.00 |
|
| Class R4 | 1,000.00 | 1,017.90 | 7.00 |
|
| Class R5 | 1,000.00 | 1,018.80 | 6.01 |
|
| Class R6 | 1,000.00 | 1,019.20 | 5.61 |
|
| Class 1 | 1,000.00 | 1,019.40 | 5.46 |
|
| Class NAV | 1,000.00 | 1,019.60 | 5.26 |
|
Remember, these examples do not include any transaction costs, therefore, these examples will not help you to determine the relative total costs of owning different funds. If transaction costs were included, your expenses would have been higher. See the prospectus for details regarding transaction costs.
1 Expenses are equal to the Fund’s annualized expense ratio of 1.57%, 2.30%, 2.30%, 1.17%, 1.90%, 1.65%, 1.80%, 1.40%, 1.20%, 1.12%, 1.09% and 1.05% for Class A, Class B, Class C, Class I, Class R1, Class R2, Class R3, Class R4, Class R5, Class R6, Class 1 and Class NAV shares, respectively, multiplied by the average account value over the period, multiplied by 181/365 (to reflect the one-half year period).
| |
| 10 | International Core Fund | Annual report |
Portfolio summary
| | | | |
| Top 10 Holdings (21.6% of Net Assets on 2-28-13)1,2 | | | |
|
| Total SA | 3.9% | | Rio Tinto PLC | 1.8% |
| |
|
| Sanofi | 2.9% | | E.ON AG | 1.6% |
| |
|
| AstraZeneca PLC | 2.4% | | Barclays PLC | 1.6% |
| |
|
| BP PLC, ADR | 2.4% | | Enel SpA | 1.5% |
| |
|
| Banco Santander SA | 2.0% | | Telefonica SA | 1.5% |
| |
|
| |
| Sector Composition1,3 | | | | |
|
| Financials | 17.9% | | Consumer Staples | 6.7% |
| |
|
| Energy | 13.0% | | Utilities | 6.1% |
| |
|
| Health Care | 11.9% | | Materials | 5.9% |
| |
|
| Industrials | 10.9% | | Information Technology | 3.4% |
| |
|
| Consumer Discretionary | 10.8% | | Short-Term Investments & Other | 4.5% |
| |
|
| Telecommunication Services | 8.9% | | | |
| | |
| |
| Top 10 Countries1,2,3 | | | | |
|
| Japan | 23.0% | | Australia | 6.5% |
| |
|
| United Kingdom | 17.5% | | Italy | 5.0% |
| |
|
| France | 11.1% | | Netherlands | 3.3% |
| |
|
| Germany | 7.3% | | Canada | 2.8% |
| |
|
| Spain | 7.3% | | Belgium | 1.8% |
| |
|
1 As a percentage of net assets on 2-28-13.
2 Cash and cash equivalents not included.
3 International investing involves special risks such as political, economic and currency risks and differences in accounting standards and financial reporting. Sector investing is subject to greater risks than the market as a whole. Because the Fund may focus on particular sectors of the economy, its performance may depend on the performance of those sectors.
| |
| Annual report | International Core Fund | 11 |
Fund’s investments
As of 2-28-13
| | |
| | Shares | Value |
| Common Stocks 94.6% | $1,077,791,646 |
|
| (Cost $1,003,102,485) | | |
| | | |
| Australia 6.5% | | 74,122,440 |
| | | |
| ALS, Ltd. | 105,256 | 1,260,219 |
|
| Arrium, Ltd. | 2,219,020 | 2,722,588 |
|
| BHP Billiton, Ltd. | 84,501 | 3,171,929 |
|
| Billabong International, Ltd. | 437,242 | 381,001 |
|
| BlueScope Steel, Ltd. (I) | 803,220 | 3,723,824 |
|
| Caltex Australia, Ltd. | 7,173 | 146,065 |
|
| Commonwealth Bank of Australia | 36,153 | 2,481,229 |
|
| CSL, Ltd. | 116,709 | 7,144,001 |
|
| David Jones, Ltd. | 25,970 | 73,822 |
|
| Dexus Property Group | 1,696,124 | 1,888,685 |
|
| Goodman Fielder, Ltd. (I) | 2,527,182 | 1,903,329 |
|
| Goodman Group | 446,926 | 2,118,727 |
|
| GPT Group | 450,990 | 1,801,040 |
|
| Insurance Australia Group, Ltd. | 18,789 | 109,184 |
|
| Investa Office Fund | 598,615 | 1,865,159 |
|
| JB Hi-Fi, Ltd. (L) | 117,604 | 1,552,781 |
|
| Macquarie Group, Ltd. | 61,108 | 2,339,809 |
|
| Mirvac Group | 1,201,353 | 2,013,207 |
|
| Myer Holdings, Ltd. (L) | 182,055 | 518,894 |
|
| Pacific Brands, Ltd. | 756,107 | 610,894 |
|
| Qantas Airways, Ltd. (I) | 517,011 | 868,565 |
|
| QBE Insurance Group, Ltd. | 690,886 | 9,395,094 |
|
| Stockland | 1,191,249 | 4,567,548 |
|
| Tabcorp Holdings, Ltd. | 475,443 | 1,540,411 |
|
| Tatts Group, Ltd. | 171,251 | 556,156 |
|
| Telstra Corp., Ltd. | 2,263,154 | 10,601,353 |
|
| Westpac Banking Corp. | 279,499 | 8,766,926 |
| | | |
| Austria 0.8% | | 9,169,445 |
| | | |
| Andritz AG | 24,384 | 1,718,069 |
|
| Austriamicrosystems AG | 1,376 | 169,725 |
|
| Erste Group Bank AG (I) | 1,083 | 34,709 |
|
| OMV AG | 100,662 | 4,370,270 |
|
| Raiffeisen Bank International AG | 21,002 | 792,920 |
|
| Voestalpine AG | 61,695 | 2,083,752 |
| | |
| 12 | International Core Fund | Annual report | See notes to financial statements |
| | |
| | Shares | Value |
| Belgium 1.8% | | $20,710,826 |
| | | |
| Ageas | 111,972 | 3,802,272 |
|
| Anheuser-Busch InBev NV | 137,011 | 12,843,553 |
|
| Belgacom SA | 77,869 | 2,173,073 |
|
| Delhaize Group SA | 30,760 | 1,477,727 |
|
| KBC Groep NV | 11,159 | 414,201 |
| | | |
| Canada 2.8% | | 32,106,597 |
| | | |
| Agrium, Inc. | 6,900 | 714,522 |
|
| Alimentation Couche Tard, Inc., Class B | 10,300 | 533,552 |
|
| Bank of Montreal | 4,700 | 292,642 |
|
| Bombardier, Inc., Class B (L) | 110,600 | 445,081 |
|
| Canadian National Railway Company | 36,800 | 3,734,776 |
|
| Canadian Natural Resources, Ltd. | 122,000 | 3,728,912 |
|
| Canadian Oil Sands, Ltd. | 16,800 | 343,901 |
|
| Canadian Pacific Railway, Ltd. | 7,200 | 875,869 |
|
| Canadian Tire Corp., Ltd., Class A | 5,600 | 373,713 |
|
| Dollarama, Inc. | 9,000 | 528,873 |
|
| Encana Corp. (L) | 138,300 | 2,487,724 |
|
| First Quantum Minerals, Ltd. | 115,400 | 2,149,657 |
|
| Husky Energy, Inc. | 58,200 | 1,789,597 |
|
| IGM Financial, Inc. | 26 | 1,149 |
|
| Magna International, Inc. | 8,800 | 468,053 |
|
| Methanex Corp. (L) | 13,000 | 475,879 |
|
| Metro, Inc. (L) | 32,900 | 2,060,617 |
|
| Research In Motion, Ltd. (I)(L) | 274,800 | 3,725,289 |
|
| Royal Bank of Canada | 36,100 | 2,241,088 |
|
| Sherritt International Corp. | 68,500 | 352,713 |
|
| Sun Life Financial, Inc. (L) | 165,000 | 4,609,600 |
|
| Teck Resources, Ltd., Class B, Class B | 5,600 | 173,390 |
| | | |
| China 0.1% | | 1,086,878 |
| | | |
| AAC Technologies Holdings, Inc. | 19,500 | 82,254 |
|
| China Minzhong Food Corp., Ltd. (I)(L) | 291,000 | 280,317 |
|
| Yangzijiang Shipbuilding Holdings, Ltd. | 929,000 | 724,307 |
| | | |
| Denmark 1.0% | | 11,873,125 |
| | | |
| Coloplast A/S, Class B | 10,357 | 540,309 |
|
| GN Store Nord A/S | 13,321 | 238,048 |
|
| Novo Nordisk A/S, Class B | 63,430 | 11,094,768 |
| | | |
| Finland 0.6% | | 7,117,614 |
| | | |
| Kone OYJ, Class B (L) | 2,329 | 187,903 |
|
| Neste Oil OYJ | 63,751 | 955,220 |
|
| Nokia OYJ (L) | 1,603,745 | 5,840,107 |
|
| Tieto OYJ | 5,783 | 134,384 |
| | | |
| France 11.1% | | 126,649,026 |
| | | |
| Air France KLM (I) | 323,344 | 3,429,089 |
|
| AXA SA | 96,998 | 1,677,592 |
|
| BNP Paribas SA | 121,533 | 6,785,776 |
|
| Bouygues SA | 28,499 | 805,432 |
|
| Cie Generale d’Optique Essilor International SA | 21,736 | 2,237,318 |
| | |
| See notes to financial statements | Annual report | International Core Fund | 13 |
| | |
| | Shares | Value |
| France (continued) | | |
| | | |
| Cie Generale des Etablissements Michelin | 18,794 | $1,679,595 |
|
| Credit Agricole SA (I) | 24,054 | 226,267 |
|
| France Telecom SA | 271,628 | 2,623,755 |
|
| GDF Suez | 69,071 | 1,301,489 |
|
| L’Oreal SA | 9,294 | 1,387,785 |
|
| Lafarge SA | 12,328 | 828,336 |
|
| Lagardere SCA | 66,188 | 2,355,992 |
|
| Peugeot SA (I)(L) | 443,773 | 3,347,920 |
|
| Rallye SA | 18,060 | 656,424 |
|
| Remy Cointreau SA | 1,666 | 210,473 |
|
| Renault SA | 132,172 | 8,395,574 |
|
| Safran SA | 16,568 | 758,875 |
|
| Sanofi | 348,667 | 32,920,913 |
|
| Societe Generale SA (I) | 78,199 | 3,004,431 |
|
| Total SA | 887,111 | 44,333,390 |
|
| Vivendi SA | 259,816 | 5,470,511 |
|
| Zodiac Aerospace | 19,703 | 2,212,089 |
| | | |
| Germany 6.4% | | 73,420,735 |
| | | |
| Allianz SE | 22,639 | 3,093,753 |
|
| Aurubis AG (L) | 45,862 | 3,217,836 |
|
| Bayer AG | 141,161 | 13,982,483 |
|
| Beiersdorf AG | 6,840 | 596,110 |
|
| Continental AG | 14,856 | 1,741,261 |
|
| Deutsche Bank AG | 21,059 | 961,865 |
|
| Deutsche Lufthansa AG | 134,539 | 2,713,968 |
|
| Deutsche Post AG | 75,460 | 1,691,331 |
|
| Duerr AG | 22,556 | 2,474,030 |
|
| E.ON AG | 1,106,481 | 18,435,273 |
|
| Lanxess AG | 20,190 | 1,709,508 |
|
| Leoni AG | 48,587 | 2,190,475 |
|
| Muenchener Rueckversicherungs AG | 29,208 | 5,242,884 |
|
| RWE AG | 171,811 | 6,312,256 |
|
| Salzgitter AG | 30,887 | 1,473,765 |
|
| SAP AG | 58,771 | 4,587,482 |
|
| Suedzucker AG | 68,422 | 2,996,455 |
| | | |
| Greece 0.4% | | 4,106,450 |
| | | |
| OPAP SA | 259,462 | 2,203,188 |
|
| Public Power Corp. SA (I) | 193,010 | 1,903,262 |
| | | |
| Hong Kong 1.0% | | 11,112,435 |
| | | |
| Cheung Kong Holdings, Ltd. | 80,000 | 1,242,693 |
|
| Esprit Holdings, Ltd. (L) | 1,189,451 | 1,550,187 |
|
| Galaxy Entertainment Group, Ltd. (I) | 424,000 | 1,777,441 |
|
| Melco International Development, Ltd. | 417 | 663 |
|
| Noble Group, Ltd. | 1,056,000 | 1,006,605 |
|
| Pacific Basin Shipping, Ltd. | 1,395,121 | 820,657 |
|
| Power Assets Holdings, Ltd. | 207 | 1,850 |
|
| Sino-Forest Corp. (I) | 26,210 | 0 |
| | |
| 14 | International Core Fund | Annual report | See notes to financial statements |
| | |
| | Shares | Value |
| Hong Kong (continued) | | |
| | | |
| Sun Hung Kai Properties, Ltd. | 57,000 | $881,023 |
|
| Swire Pacific, Ltd., Class A, Class A | 152,000 | 1,968,747 |
|
| Swire Properties, Ltd. | 100 | 375 |
|
| The Link REIT | 69,000 | 368,750 |
|
| Wharf Holdings, Ltd. | 30,000 | 263,029 |
|
| Yue Yuen Industrial Holdings, Ltd. | 363,380 | 1,230,415 |
| | | |
| Ireland 0.7% | | 7,410,277 |
| | | |
| C&C Group PLC | 143,849 | 919,186 |
|
| DCC PLC | 41,475 | 1,458,006 |
|
| Kerry Group PLC, Class A | 49,225 | 2,758,184 |
|
| Paddy Power PLC | 27,527 | 2,274,901 |
| | | |
| Israel 0.2% | | 2,540,930 |
| | | |
| Africa Israel Investments, Ltd. (I) | 217,585 | 539,923 |
|
| Mellanox Technologies, Ltd. (I) | 20,340 | 1,048,951 |
|
| Partner Communications Company, Ltd. | 169,883 | 952,056 |
| | | |
| Italy 5.0% | | 57,283,831 |
| | | |
| A2A SpA | 287,992 | 155,105 |
|
| Azimut Holding SpA | 51,586 | 818,374 |
|
| Enel SpA | 4,820,931 | 17,454,717 |
|
| Eni SpA | 702,994 | 15,987,096 |
|
| Exor SpA | 6,835 | 191,550 |
|
| Fiat Industrial SpA | 169,660 | 2,063,829 |
|
| Fiat SpA (I)(L) | 394,827 | 2,115,839 |
|
| Finmeccanica SpA (I)(L) | 724,811 | 3,560,655 |
|
| Intesa Sanpaolo SpA | 858,218 | 1,393,735 |
|
| Lottomatica SpA | 1,956 | 45,161 |
|
| Luxottica Group SpA | 15,095 | 699,503 |
|
| Mediaset SpA | 151,615 | 334,276 |
|
| Mediolanum SpA | 272,769 | 1,505,848 |
|
| Pirelli & C. SpA (L) | 215,363 | 2,501,673 |
|
| Recordati SpA | 72,112 | 714,815 |
|
| Telecom Italia RSP | 4,105,346 | 2,648,614 |
|
| Telecom Italia SpA | 5,408,642 | 3,994,733 |
|
| Terna Rete Elettrica Nazionale SpA | 262,644 | 1,098,308 |
| | | |
| Japan 23.0% | | 261,527,101 |
| | | |
| ABC–MART, Inc. | 1,900 | 66,280 |
|
| Accordia Golf Company, Ltd. | 1,257 | 1,185,692 |
|
| Advance Residence Investment Corp. | 364 | 772,506 |
|
| Advantest Corp. | 44,200 | 633,624 |
|
| Aeon Company, Ltd. (L) | 402,700 | 4,526,039 |
|
| Alps Electric Company, Ltd. | 46 | 299 |
|
| Anritsu Corp. | 152,000 | 2,247,052 |
|
| Astellas Pharma, Inc. | 154,300 | 8,336,479 |
|
| Credit Saison Company, Ltd. | 67,400 | 1,431,553 |
|
| Daikyo, Inc. | 749,000 | 1,800,834 |
|
| Daito Trust Construction Company, Ltd. | 87,500 | 7,833,573 |
|
| Daiwa House Industry Company, Ltd. | 9,000 | 165,176 |
| | |
| See notes to financial statements | Annual report | International Core Fund | 15 |
| | |
| | Shares | Value |
| Japan (continued) | | |
| | | |
| Daiwabo Holdings Company, Ltd. | 204,000 | $398,190 |
|
| Dena Company, Ltd. (L) | 102,261 | 2,868,302 |
|
| DIC Corp. | 364,000 | 729,986 |
|
| Eisai Company, Ltd. | 47,080 | 2,095,465 |
|
| Fast Retailing Company, Ltd. (L) | 6,100 | 1,672,604 |
|
| Fuji Electric Company, Ltd. | 317,000 | 905,680 |
|
| Fuji Heavy Industries, Ltd. | 231,116 | 3,452,721 |
|
| Fuji Oil Company, Ltd. | 42,500 | 618,902 |
|
| Gunze, Ltd. | 228,000 | 577,979 |
|
| Hanwa Company, Ltd. | 175,000 | 737,924 |
|
| Haseko Corp. (I) | 2,108,500 | 1,857,491 |
|
| Hikari Tsushin, Inc. | 29,000 | 1,393,187 |
|
| Inpex Corp. | 286 | 1,520,410 |
|
| ITOCHU Corp. | 625,800 | 7,220,063 |
|
| J Trust Company, Ltd. | 13,500 | 240,563 |
|
| Japan Tobacco, Inc. | 165,000 | 5,204,930 |
|
| JFE Holdings, Inc. | 151,000 | 3,233,459 |
|
| Juki Corp. (I)(L) | 174,000 | 270,057 |
|
| JX Holdings, Inc. | 1,635,600 | 9,982,136 |
|
| K’s Holding Corp. (L) | 97,800 | 2,521,150 |
|
| Kajima Corp. | 1,096,000 | 3,233,758 |
|
| Kakaku.com, Inc. | 27,400 | 1,064,047 |
|
| Kao Corp. | 71,250 | 2,277,565 |
|
| Kawasaki Kisen Kaisha, Ltd. (I)(L) | 1,429,000 | 3,203,849 |
|
| KDDI Corp. | 153,500 | 11,521,633 |
|
| Kinugawa Rubber Industrial Company, Ltd. (L) | 120,000 | 581,005 |
|
| Kobe Steel, Ltd. (I) | 452,000 | 609,015 |
|
| Kohnan Shoji Company, Ltd. (L) | 59,600 | 726,419 |
|
| Konami Corp. | 23 | 447 |
|
| Kurimoto, Ltd. | 60,000 | 207,697 |
|
| Lawson, Inc. (L) | 33,900 | 2,519,550 |
|
| Leopalace21 Corp. (I)(L) | 396,800 | 1,445,987 |
|
| Look, Inc. (L) | 88,000 | 303,207 |
|
| Marubeni Corp. | 598,824 | 4,370,878 |
|
| Mazda Motor Corp. (I) | 1,073,000 | 3,225,645 |
|
| Medipal Holdings Corp. | 102,535 | 1,324,915 |
|
| MEIJI Holdings Company, Ltd. | 10,700 | 460,484 |
|
| Misawa Homes Company, Ltd. | 3,100 | 43,522 |
|
| Mitsubishi Chemical Holdings Corp. | 590,500 | 2,769,513 |
|
| Mitsubishi Corp. | 438,195 | 8,688,064 |
|
| Mitsubishi Estate Company, Ltd. | 52,000 | 1,294,993 |
|
| Mitsui & Company, Ltd. | 270,600 | 4,008,809 |
|
| Mitsui Engineering & Shipbuilding Company, Ltd. | 656,000 | 1,272,898 |
|
| Mitsui Fudosan Company, Ltd. | 34,000 | 864,428 |
|
| Mitsui Mining & Smelting Company, Ltd. | 644,000 | 1,589,828 |
|
| Mitsui O.S.K. Lines, Ltd. | 694,000 | 2,431,229 |
|
| Mizuho Financial Group, Inc. | 3,463,800 | 7,618,362 |
|
| Namco Bandai Holdings, Inc. | 96,300 | 1,530,653 |
| | |
| 16 | International Core Fund | Annual report | See notes to financial statements |
| | |
| | Shares | Value |
| Japan (continued) | | |
| | | |
| Nikon Corp. | 49,500 | $1,112,076 |
|
| Nintendo Company, Ltd. | 16,900 | 1,632,958 |
|
| Nippon Light Metal Holdings Co Ltd. (I) | 1,151,100 | 1,327,876 |
|
| Nippon Paper Group, Inc. (L) | 130,400 | 2,269,166 |
|
| Nippon Steel Corp. | 851,000 | 2,302,570 |
|
| Nippon Telegraph & Telephone Corp. | 265,900 | 12,189,607 |
|
| Nippon Yusen KK | 853,000 | 2,142,597 |
|
| Nipro Corp. (L) | 156,200 | 1,269,464 |
|
| Nitori Holdings Company, Ltd. | 31,750 | 2,361,612 |
|
| Nitto Denko Corp. | 18,900 | 1,110,623 |
|
| North Pacific Bank, Ltd. (I) | 161,400 | 534,389 |
|
| NTT DOCOMO, Inc. | 2,320 | 3,588,099 |
|
| Obayashi Corp. | 444,000 | 2,283,840 |
|
| OKI Electric Industry Company, Ltd. (I) | 472,857 | 530,133 |
|
| Ono Pharmaceutical Company, Ltd. | 22,700 | 1,203,606 |
|
| Orient Corp. (I)(L) | 36,000 | 119,910 |
|
| Osaka Gas Company, Ltd. | 120 | 466 |
|
| Penta-Ocean Construction Company, Ltd. (L) | 552,500 | 1,435,859 |
|
| Point, Inc. (L) | 47,200 | 1,741,389 |
|
| Resona Holdings, Inc. | 1,747,700 | 8,009,089 |
|
| Ricoh Company, Ltd. (L) | 167,000 | 1,789,206 |
|
| Round One Corp. | 207,800 | 1,468,368 |
|
| Ryohin Keikaku Company, Ltd. | 32,100 | 2,102,058 |
|
| Sankyo Company, Ltd. | 54,100 | 2,277,461 |
|
| Seven Bank, Ltd. | 46,300 | 121,843 |
|
| Shinko Electric Industries Company, Ltd. | 127,900 | 1,032,163 |
|
| Ship Healthcare Holdings, Inc. | 1,700 | 48,613 |
|
| SHO-BOND Holdings Company, Ltd. | 1,900 | 69,259 |
|
| Softbank Corp. | 168,800 | 6,252,108 |
|
| Sojitz Corp. | 1,363,800 | 2,088,139 |
|
| Sumitomo Corp. | 572,100 | 6,995,655 |
|
| Sumitomo Light Metal Industries, Ltd. | 760,000 | 745,765 |
|
| Sumitomo Mitsui Financial Group, Inc. | 54,600 | 2,183,869 |
|
| Sumitomo Mitsui Trust Holdings, Inc. | 123,000 | 477,393 |
|
| Sumitomo Realty & Development Company, Ltd. | 14,000 | 473,196 |
|
| Taisei Corp. | 1,024,000 | 3,020,873 |
|
| Taiyo Yuden Company, Ltd. | 92,700 | 1,018,177 |
|
| Takeda Pharmaceutical Company, Ltd. | 229,789 | 11,883,817 |
|
| The Daiei, Inc. (I)(L) | 173,558 | 431,352 |
|
| Tokyo Electric Power Company, Inc. (I) | 135,800 | 305,564 |
|
| Tokyo Gas Company, Ltd. | 72,000 | 347,937 |
|
| Tokyu Land Corp. | 23,000 | 173,567 |
|
| TonenGeneral Sekiyu KK | 115,133 | 1,141,834 |
|
| Tosoh Corp. | 273,000 | 741,664 |
|
| Toyota Motor Corp. | 99,900 | 5,132,072 |
|
| Toyota Tsusho Corp. | 226,600 | 5,770,185 |
|
| Unitika, Ltd. (I) | 913,000 | 502,089 |
|
| UNY Company, Ltd. | 272,700 | 1,944,526 |
| | |
| See notes to financial statements | Annual report | International Core Fund | 17 |
| | |
| | Shares | Value |
| Japan (continued) | | |
| | | |
| USS Company, Ltd. | 17,330 | $1,904,770 |
|
| Wacom Company, Ltd. | 383 | 1,377,433 |
|
| Yamada Denki Company, Ltd. (L) | 133,500 | 4,852,110 |
| | | |
| Jersey, C.I. 0.1% | | 1,003,620 |
| | | |
| Randgold Resources, Ltd. | 12,087 | 1,003,620 |
| | | |
| Netherlands 3.3% | | 37,944,687 |
| | | |
| Aegon NV | 529,053 | 3,151,657 |
|
| ASML Holding NV | 41,496 | 2,941,876 |
|
| CSM NV | 53,185 | 1,187,727 |
|
| Delta Lloyd NV | 22,712 | 401,311 |
|
| Gemalto NV | 19,575 | 1,782,641 |
|
| ING Groep NV (I) | 201,345 | 1,615,440 |
|
| Koninklijke BAM Groep NV | 354,612 | 1,438,966 |
|
| Koninklijke Philips Electronics NV | 26,449 | 747,885 |
|
| Koninklijke Vopak NV | 6,486 | 466,698 |
|
| PostNL NV (I) | 21,486 | 50,644 |
|
| Royal Dutch Shell PLC, Class A (London Stock Exchange) | 408,064 | 13,435,181 |
|
| Royal Dutch Shell PLC, Class B | 280,207 | 9,453,411 |
|
| SNS REAAL NV (I) | 69,009 | 0 |
|
| Wereldhave NV | 18,163 | 1,271,250 |
| | | |
| New Zealand 0.8% | | 8,506,481 |
| | | |
| Chorus, Ltd. | 493,461 | 1,183,293 |
|
| Fletcher Building, Ltd. | 296,960 | 2,243,027 |
|
| Telecom Corp. of New Zealand, Ltd. | 2,538,318 | 5,080,161 |
| | | |
| Norway 0.4% | | 4,445,055 |
| | | |
| Aker Solutions ASA | 63,335 | 1,248,332 |
|
| Petroleum Geo-Services ASA | 27,792 | 438,267 |
|
| STX OSV Holdings, Ltd. | 187,000 | 190,445 |
|
| TGS-NOPEC Geophysical Company ASA | 68,064 | 2,568,011 |
| | | |
| Portugal 0.3% | | 3,732,085 |
| | | |
| EDP — Energias de Portugal SA | 1,225,505 | 3,676,624 |
|
| Portugal Telecom SGPS SA | 10,983 | 55,461 |
| | | |
| Singapore 1.3% | | 14,506,214 |
| | | |
| Asiasons Capital, Ltd. (I) | 34,000 | 24,163 |
|
| Ezion Holdings, Ltd. | 321,000 | 516,089 |
|
| Ezra Holdings, Ltd. (I) | 1,037,000 | 943,487 |
|
| Golden Agri-Resources, Ltd. | 10,392,000 | 5,440,066 |
|
| Jaya Holdings, Ltd. | 760,000 | 444,486 |
|
| Liongold Corp., Ltd. (I)(L) | 566,000 | 491,274 |
|
| Singapore Telecommunications, Ltd. | 2,396,350 | 6,646,649 |
| | | |
| Spain 7.3% | | 82,979,041 |
| | | |
| Abengoa SA, B Shares (I) | 45,185 | 117,445 |
|
| Amadeus IT Holding SA, A Shares | 12,069 | 308,131 |
|
| Banco Bilbao Vizcaya Argentaria SA | 944,123 | 9,126,928 |
|
| Banco Santander SA (I) | 3,035,836 | 23,031,952 |
|
| Distribuidora Internacional de Alimentacion SA | 242,255 | 1,888,061 |
| | |
| 18 | International Core Fund | Annual report | See notes to financial statements |
| | |
| | Shares | Value |
| Spain (continued) | | |
| | | |
| Ferrovial SA | 47,406 | $740,936 |
|
| Fomento de Construcciones y Contratas SA (L) | 43,846 | 512,304 |
|
| Gas Natural SDG SA | 328,765 | 6,521,826 |
|
| Grifols SA (I) | 102,114 | 3,628,675 |
|
| Iberdrola SA | 1,750,931 | 8,668,818 |
|
| Inditex SA | 51,983 | 6,927,040 |
|
| Repsol SA | 224,297 | 4,756,508 |
|
| Telefonica SA | 1,282,410 | 16,750,417 |
| | | |
| Sweden 0.9% | | 10,166,079 |
| | | |
| Boliden AB | 100,425 | 1,696,591 |
|
| Investor AB, B Shares | 103,370 | 3,019,425 |
|
| NCC AB, B Shares | 46,296 | 1,204,090 |
|
| Skandinaviska Enskilda Banken AB, Series A | 51,399 | 533,526 |
|
| Svenska Handelsbanken AB, Class A | 28,735 | 1,241,550 |
|
| Swedbank AB, Class A | 103,212 | 2,470,897 |
| | | |
| Switzerland 1.3% | | 15,151,229 |
| | | |
| Cie Financiere Richemont SA | 2,803 | 224,089 |
|
| Novartis AG | 100,538 | 6,809,176 |
|
| Roche Holdings AG | 9,668 | 2,204,296 |
|
| Swiss Life Holding (I) | 1,683 | 275,775 |
|
| Swiss Re, Ltd. (I) | 27,766 | 2,212,544 |
|
| Wolseley PLC | 72,735 | 3,425,349 |
| | | |
| United Kingdom 17.5% | | 199,119,445 |
| | | |
| Aberdeen Asset Management PLC | 327,678 | 2,132,337 |
|
| Admiral Group PLC | 12,784 | 242,006 |
|
| Aegis Group PLC | 118,615 | 429,098 |
|
| Aggreko PLC | 66,521 | 1,708,470 |
|
| ARM Holdings PLC | 38,320 | 555,013 |
|
| Ashtead Group PLC | 21,610 | 168,396 |
|
| AstraZeneca PLC | 608,918 | 27,618,407 |
|
| Aviva PLC | 305,469 | 1,646,755 |
|
| Babcock International Group PLC | 40,961 | 666,269 |
|
| BAE Systems PLC | 1,792,999 | 9,659,902 |
|
| Barclays PLC | 3,811,037 | 17,725,559 |
|
| BBA Aviation PLC | 9,034 | 34,983 |
|
| BP PLC, ADR | 4,099,403 | 27,608,093 |
|
| Bunzl PLC | 83,660 | 1,598,238 |
|
| Croda International PLC | 5,663 | 222,740 |
|
| Darty PLC | 54,738 | 38,905 |
|
| Diageo PLC | 494,417 | 14,821,528 |
|
| Dixons Retail PLC (I) | 3,824,358 | 1,577,024 |
|
| Drax Group PLC | 289,909 | 2,705,464 |
|
| easyJet PLC | 50,534 | 764,751 |
|
| FirstGroup PLC | 467,849 | 1,371,532 |
|
| Halfords Group PLC | 2,156 | 10,309 |
|
| Hargreaves Lansdown PLC | 14,461 | 190,283 |
|
| Home Retail Group PLC (L) | 1,421,536 | 2,740,593 |
| | |
| See notes to financial statements | Annual report | International Core Fund | 19 |
| | | |
| | | Shares | Value |
| United Kingdom (continued) | | | |
| | | | |
| HSBC Holdings PLC | | 164,411 | $1,821,702 |
|
| Intercontinental Hotels Group PLC | | 37,805 | 1,096,095 |
|
| Intertek Group PLC | | 11,654 | 590,439 |
|
| ITV PLC | | 897,663 | 1,687,926 |
|
| Lancashire Holdings, Ltd. | | 86,982 | 1,200,187 |
|
| Lloyds Banking Group PLC (I) | | 10,129,022 | 8,352,455 |
|
| Micro Focus International PLC | | 7,229 | 75,180 |
|
| Next PLC | | 122,621 | 7,800,746 |
|
| Persimmon PLC | | 12,925 | 178,942 |
|
| Playtech, Ltd. | | 134,476 | 1,165,306 |
|
| Premier Foods PLC (I) | | 196,568 | 273,838 |
|
| Prudential PLC | | 325,723 | 4,834,096 |
|
| Reed Elsevier PLC | | 33,708 | 362,805 |
|
| Rio Tinto PLC | | 384,863 | 20,690,959 |
|
| Rolls-Royce Holdings PLC | | 313,573 | 4,876,941 |
|
| Royal Bank of Scotland Group PLC (I) | | 311,852 | 1,526,855 |
|
| SABMiller PLC | | 55,685 | 2,765,607 |
|
| Spectris PLC | | 44,718 | 1,611,543 |
|
| SSE PLC | | 56,884 | 1,245,872 |
|
| Standard Life PLC | | 57,685 | 307,640 |
|
| Telecity Group PLC | | 49,927 | 706,270 |
|
| Thomas Cook Group PLC (I) | | 1,486,714 | 1,954,423 |
|
| Trinity Mirror PLC (I) | | 121,865 | 217,825 |
|
| Tullett Prebon PLC | | 172,999 | 732,115 |
|
| Vodafone Group PLC | | 3,814,353 | 9,575,746 |
|
| WH Smith PLC | | 83,774 | 856,666 |
|
| Whitbread PLC | | 11,750 | 449,840 |
|
| William Hill PLC | | 529,856 | 3,244,789 |
|
| WPP PLC | | 167,542 | 2,679,982 |
| |
| | | Shares | Value |
| Preferred Securities 0.9% | | | $10,440,550 |
|
| (Cost $8,105,174) | | | |
| | | | |
| Germany 0.9% | | | 10,440,550 |
| | | | |
| Henkel AG & Company KgaA | | 43,575 | 3,837,452 |
|
| Porsche Automobil Holding SE | | 83,284 | 6,603,098 |
| |
| | Yield (%) | Shares | Value |
| Securities Lending Collateral 5.8% | | | $65,450,328 |
|
| (Cost $65,452,198) | | | |
| | | | |
| John Hancock Collateral Investment Trust (W) | 0.2514 (Y) | 6,539,540 | 65,450,328 |
| | |
| 20 | International Core Fund | Annual report | See notes to financial statements |
| | | |
| | Yield (%) | Shares | Value |
| Short-Term Investments 3.4% | | | $38,967,563 |
|
| (Cost $38,967,563) | | | |
| | | | |
| Money Market Funds 3.4% | | | 38,967,563 |
| | | | |
| State Street Institutional Treasury Money | | | |
| Market Fund | 0.0000 (Y) | 38,967,563 | 38,967,563 |
| |
| Total investments (Cost $1,115,627,420)† 104.7% | $1,192,650,087 |
|
| Other assets and liabilities, net (4.7%) | | | ($53,069,185) |
|
| Total net assets 100.0% | | $1,139,580,902 |
|
The percentage shown for each investment category is the total value of the category as a percentage of the net assets of the Fund.
(I) Non-income producing security.
(L) A portion of this security is on loan as of 2-28-13.
(W) Investment is an affiliate of the Fund, the advisor and/or subadvisor. This investment represents collateral recieved for securities lending.
(Y) The rate shown is the annualized seven-day yield as of 2-28-13.
† At 2-28-13, the aggregate cost of investment securities for federal income tax purposes was $1,181,027,437. Net unrealized appreciation aggregated $11,622,650, of which $70,404,348 related to appreciated investment securities and $58,781,698 related to depreciated investment securities.
The Fund had the following sector allocation as a percentage of net assets on 2-28-13:
| | | |
| Financials | 17.9% | | |
| Energy | 13.0% | | |
| Health Care | 11.9% | | |
| Industrials | 10.9% | | |
| Consumer Discretionary | 10.8% | | |
| Telecommunication Services | 8.9% | | |
| Consumer Staples | 6.7% | | |
| Utilities | 6.1% | | |
| Materials | 5.9% | | |
| Information Technology | 3.4% | | |
| Short-Term Investments & Other | 4.5% | | |
| | |
| See notes to financial statements | Annual report | International Core Fund | 21 |
F I N A N C I A L S T A T E M E N T S
Financial statements
Statement of assets and liabilities 2-28-13
This Statement of assets and liabilities is the Fund’s balance sheet. It shows the value of what the Fund owns, is due and owes. You’ll also find the net asset value and the maximum public offering price per share.
| |
| Assets | |
|
| Investments in unaffiliated issuers, at value (Cost $1,050,175,222) | |
| including $62,139,788 of securities loaned) | $1,127,199,759 |
| Investments in affiliated issuers, at value (Cost $65,452,198) | 65,450,328 |
| | |
| Total investments, at value (Cost $1,115,627,420) | 1,192,650,087 |
| Foreign currency, at value (Cost $573,289) | 572,627 |
| Cash held at broker for futures contracts | 4,927,405 |
| Receivable for fund shares sold | 2,382,748 |
| Receivable for forward foreign currency exchange contracts | 1,985,054 |
| Dividends and interest receivable | 5,072,601 |
| Receivable for securities lending income | 72,325 |
| Receivable for futures variation margin | 284,059 |
| Other receivables and prepaid expenses | 88,080 |
| | |
| Total assets | 1,208,034,986 |
| |
| Liabilities | |
|
| Payable for forward foreign currency exchange contracts | 1,512,829 |
| Payable for fund shares repurchased | 554,574 |
| Payable upon return of securities loaned | 65,407,241 |
| Payable to affiliates | |
| Accounting and legal services fees | 54,676 |
| Transfer agent fees | 114,592 |
| Distribution and service fees | 17 |
| Trustees’ fees | 31,584 |
| Investment management fees | 1,335 |
| Other liabilities and accrued expenses | 777,236 |
| | |
| Total liabilities | 68,454,084 |
| | |
| Net assets | 1,139,580,902 |
| |
| Net assets consist of | |
|
| Paid-in capital | $1,335,103,135 |
| Undistributed net investment income | 17,198,315 |
| Accumulated net realized gain (loss) on investments, futures contracts and | |
| foreign currency transactions | (289,137,761) |
| Net unrealized appreciation (depreciation) on investments, futures | |
| contracts and translation of assets and liabilities in foreign currencies | 76,417,213 |
| | |
| Net assets | $1,139,580,902 |
| | |
| 22 | International Core Fund | Annual report | See notes to financial statements |
F I N A N C I A L S T A T E M E N T S
Statement of assets and liabilities (continued)
| |
| Net asset value per share | |
|
| Based on net asset values and shares outstanding — the Fund has an | |
| unlimited number of shares authorized with no par value | |
| Class A ($90,652,158 ÷ 3,146,376 shares)1 | $28.81 |
| Class B ($3,153,370 ÷ 109,886 shares)1 | $28.70 |
| Class C ($4,405,386 ÷ 153,498 shares)1 | $28.70 |
| Class I ($392,451,773 ÷ 13,580,826 shares) | $28.90 |
| Class R1 ($299,214 ÷ 10,407 shares) | $28.75 |
| Class R2 ($104,002 ÷ 3,597 shares) | $28.91 |
| Class R3 ($35,017 ÷ 1,211 shares) | $28.92 |
| Class R4 ($39,737 ÷ 1,375.3 shares) | $28.89 |
| Class R5 ($79,860 ÷ 2,763.6 shares) | $28.90 |
| Class R6 ($109,947 ÷ 3,799 shares) | $28.94 |
| Class 1 ($37,407,229 ÷ 1,292,383 shares) | $28.94 |
| Class NAV ($610,843,209 ÷ 21,121,827 shares) | $28.92 |
| |
| Maximum offering price per share | |
|
| Class A (net asset value per share ÷ 95%)2 | $30.33 |
1 Redemption price is equal to net asset value less any applicable contingent deferred sales charge.
2 On single retail sales of less than $50,000. On sales of $50,000 or more and on group sales the offering price is reduced.
| | |
| See notes to financial statements | Annual report | International Core Fund | 23 |
F I N A N C I A L S T A T E M E N T S
Statement of operations For the year ended 2-28-13
This Statement of operations summarizes the Fund’s investment income earned and expenses incurred in operating the Fund. It also shows net gains (losses) for the period stated.
| |
| Investment income | |
|
| Dividends | $59,741,218 |
| Securities lending | 2,415,402 |
| Interest | 6,891 |
| Less foreign taxes withheld | (4,370,159) |
| | |
| Total investment income | 57,793,352 |
| |
| Expenses | |
|
| Investment management fees | 12,905,257 |
| Distribution and service fees | 991,599 |
| Accounting and legal services fees | 276,947 |
| Transfer agent fees | 1,066,413 |
| Trustees’ fees | 92,121 |
| State registration fees | 226,654 |
| Printing and postage | 272,703 |
| Professional fees | 138,686 |
| Custodian fees | 1,506,073 |
| Registration and filing fees | 49,600 |
| Other | 52,393 |
| | |
| Total expenses | 17,578,446 |
| Less expense reductions | (138,076) |
| | |
| Net expenses | 17,440,370 |
| | |
| Net investment income | 40,352,982 |
| |
| Realized and unrealized gain (loss) | |
|
| Net realized gain (loss) on | |
| Investments in unaffiliated issuers | (66,246,870) |
| Investments in affiliated issuers | (876) |
| Futures contracts | 1,186,102 |
| Foreign currency transactions | 6,279,940 |
| | |
| | (58,781,704) |
| Change in net unrealized appreciation (depreciation) of | |
| Investments in unaffiliated issuers | 100,292,950 |
| Investments in affiliated issuers | (6,358) |
| Futures contracts | (3,785,102) |
| Translation of assets and liabilities in foreign currencies | (565,720) |
| | |
| | 95,935,770 |
| | |
| Net realized and unrealized gain | 37,154,066 |
| | |
| Increase in net assets from operations | $77,507,048 |
| | |
| 24 | International Core Fund | Annual report | See notes to financial statements |
F I N A N C I A L S T A T E M E N T S
Statements of changes in net assets
These Statements of changes in net assets show how the value of the Fund’s net assets has changed during the last two periods. The difference reflects earnings less expenses, any investment gains and losses, distributions, if any, paid to shareholders and the net of Fund share transactions.
| | |
| | Year | Year |
| | ended | ended |
| | 2-28-13 | 2-29-12 |
| |
| Increase (decrease) in net assets | | |
|
| From operations | | |
| Net investment income | $40,352,982 | $41,312,921 |
| Net realized loss | (58,781,704) | (1,026,871) |
| Change in net unrealized appreciation (depreciation) | 95,935,770 | (181,194,192) |
| | | |
| Increase (decrease) in net assets resulting from operations | 77,507,048 | (140,908,142) |
| | | |
| Distributions to shareholders | | |
| From net investment income | | |
| Class A | (2,647,541) | (6,432,365) |
| Class B | (81,696) | (26,198) |
| Class C | (110,204) | (31,262) |
| Class I | (18,793,937) | (7,098,312) |
| Class R1 | (8,398) | (2,560) |
| Class R2 | (3,287) | — |
| Class R3 | (1,054) | (359) |
| Class R4 | (1,317) | (492) |
| Class R5 | (2,763) | (1,226) |
| Class R6 | (3,906) | (1,923) |
| Class 1 | (1,358,914) | (779,516) |
| Class NAV | (21,987,219) | (15,625,962) |
| | | |
| Total distributions | (45,000,236) | (30,000,175) |
| | | |
| From Fund share transactions | (478,701,052) | 154,369,410 |
| | | |
| Total decrease | (446,194,240) | (16,538,907) |
| |
| Net assets | | |
|
| Beginning of year | 1,585,775,142 | 1,602,314,049 |
| | | |
| End of year | $1,139,580,902 | $1,585,775,142 |
| | | |
| Undistributed net investment income | $17,198,315 | $11,462,292 |
| | |
| See notes to financial statements | Annual report | International Core Fund | 25 |
Financial highlights
The Financial highlights show how the Fund’s net asset value for a share has changed during the period.
| | | | | |
| CLASS A SHARES Period ended | 2-28-13 | 2-29-12 | 2-28-11 | 2-28-10 | 2-28-09 |
| |
| Per share operating performance | | | | | |
|
| Net asset value, beginning of period | $27.72 | $30.85 | $25.74 | $18.43 | $39.06 |
| Net investment income1 | 0.71 | 0.58 | 0.33 | 0.24 | 0.76 |
| Net realized and unrealized gain (loss) on investments | 1.31 | (3.32) | 5.09 | 7.59 | (18.65) |
| Total from investment operations | 2.02 | (2.74) | 5.42 | 7.83 | (17.89) |
| Less distributions | | | | | |
| From net investment income | (0.93) | (0.39) | (0.31) | (0.52) | (1.56) |
| From net realized gain | — | — | — | — | (1.18) |
| Total distributions | (0.93) | (0.39) | (0.31) | (0.52) | (2.74) |
| Net asset value, end of period | $28.81 | $27.72 | $30.85 | $25.74 | $18.43 |
| Total return (%)2,3 | 7.41 | (8.73) | 21.13 | 42.33 | (47.16) |
| |
| Ratios and supplemental data | | | | | |
|
| Net assets, end of period (in millions) | $91 | $374 | $333 | $225 | $54 |
| Ratios (as a percentage of average net assets): | | | | | |
| Expenses before reductions | 1.58 | 1.58 | 1.61 | 1.954 | 1.75 |
| Expenses net of fee waivers | 1.58 | 1.58 | 1.60 | 1.664 | 1.75 |
| Expenses net of fee waivers and credits | 1.58 | 1.58 | 1.60 | 1.624 | 1.70 |
| Net investment income | 2.66 | 2.05 | 1.21 | 0.94 | 2.33 |
| Portfolio turnover (%) | 53 | 42 | 39 | 44 | 54 |
1 Based on the average daily shares outstanding.
2 Does not reflect the effect of sales charges, if any.
3 Total returns would have been lower had certain expenses not been reduced during the applicable periods shown.
4 Includes the impact of proxy expenses, which amounted to 0.02% of average net assets.
| | |
| 26 | International Core Fund | Annual report | See notes to financial statements |
| | | | | |
| CLASS B SHARES Period ended | 2-28-13 | 2-29-12 | 2-28-11 | 2-28-10 | 2-28-09 |
| |
| Per share operating performance | | | | | |
|
| Net asset value, beginning of period | $27.61 | $30.70 | $25.62 | $18.36 | $38.80 |
| Net investment income1 | 0.42 | 0.44 | 0.18 | 0.17 | 0.53 |
| Net realized and unrealized gain (loss) on investments | 1.41 | (3.34) | 5.01 | 7.44 | (18.49) |
| Total from investment operations | 1.83 | (2.90) | 5.19 | 7.61 | (17.96) |
| Less distributions | | | | | |
| From net investment income | (0.74) | (0.19) | (0.11) | (0.35) | (1.30) |
| From net realized gain | — | — | — | — | (1.18) |
| Total distributions | (0.74) | (0.19) | (0.11) | (0.35) | (2.48) |
| Net asset value, end of period | $28.70 | $27.61 | $30.70 | $25.62 | $18.36 |
| Total return (%)2,3 | 6.71 | (9.38) | 20.28 | 41.35 | (47.53) |
| |
| Ratios and supplemental data | | | | | |
|
| Net assets, end of period (in millions) | $3 | $4 | $5 | $6 | $7 |
| Ratios (as a percentage of average net assets): | | | | | |
| Expenses before reductions | 2.94 | 2.49 | 2.36 | 3.074 | 2.75 |
| Expenses net of fee waivers | 2.30 | 2.30 | 2.30 | 2.364 | 2.63 |
| Expenses net of fee waivers and credits | 2.30 | 2.30 | 2.30 | 2.334 | 2.40 |
| Net investment income | 1.56 | 1.58 | 0.65 | 0.69 | 1.64 |
| Portfolio turnover (%) | 53 | 42 | 39 | 44 | 54 |
1 Based on the average daily shares outstanding.
2 Does not reflect the effect of sales charges, if any.
3 Total returns would have been lower had certain expenses not been reduced during the applicable periods shown.
4 Includes the impact of proxy expenses, which amounted to 0.03% of average net assets.
| | | | | |
| CLASS C SHARES Period ended | 2-28-13 | 2-29-12 | 2-28-11 | 2-28-10 | 2-28-09 |
| |
| Per share operating performance | | | | | |
|
| Net asset value, beginning of period | $27.61 | $30.71 | $25.62 | $18.36 | $38.81 |
| Net investment income1 | 0.42 | 0.43 | 0.17 | 0.15 | 0.55 |
| Net realized and unrealized gain (loss) on investments | 1.41 | (3.34) | 5.03 | 7.46 | (18.52) |
| Total from investment operations | 1.83 | (2.91) | 5.20 | 7.61 | (17.97) |
| Less distributions | | | | | |
| From net investment income | (0.74) | (0.19) | (0.11) | (0.35) | (1.30) |
| From net realized gain | — | — | — | — | (1.18) |
| Total distributions | (0.74) | (0.19) | (0.11) | (0.35) | (2.48) |
| Net asset value, end of period | $28.70 | $27.61 | $30.71 | $25.62 | $18.36 |
| Total return (%)2,3 | 6.71 | (9.41) | 20.32 | 41.35 | (47.55) |
| |
| Ratios and supplemental data | | | | | |
|
| Net assets, end of period (in millions) | $4 | $4 | $5 | $5 | $4 |
| Ratios (as a percentage of average net assets): | | | | | |
| Expenses before reductions | 2.77 | 2.50 | 2.47 | 2.694 | 2.59 |
| Expenses net of fee waivers | 2.30 | 2.30 | 2.30 | 2.364 | 2.43 |
| Expenses net of fee waivers and credits | 2.30 | 2.30 | 2.30 | 2.334 | 2.40 |
| Net investment income | 1.54 | 1.53 | 0.62 | 0.60 | 1.69 |
| Portfolio turnover (%) | 53 | 42 | 39 | 44 | 54 |
1 Based on the average daily shares outstanding.
2 Does not reflect the effect of sales charges, if any.
3 Total returns would have been lower had certain expenses not been reduced during the applicable periods shown.
4 Includes the impact of proxy expenses, which amounted to 0.03% of average net assets.
| | |
| See notes to financial statements | Annual report | International Core Fund | 27 |
| | | | | |
| CLASS I SHARES Period ended | 2-28-13 | 2-29-12 | 2-28-11 | 2-28-10 | 2-28-09 |
| |
| Per share operating performance | | | | | |
|
| Net asset value, beginning of period | $27.78 | $30.94 | $25.80 | $18.45 | $39.20 |
| Net investment income1 | 0.68 | 0.72 | 0.45 | 0.35 | 0.94 |
| Net realized and unrealized gain (loss) on investments | 1.49 | (3.36) | 5.12 | 7.63 | (18.77) |
| Total from investment operations | 2.17 | (2.64) | 5.57 | 7.98 | (17.83) |
| Less distributions | | | | | |
| From net investment income | (1.05) | (0.52) | (0.43) | (0.63) | (1.74) |
| From net realized gain | — | — | — | — | (1.18) |
| Total distributions | (1.05) | (0.52) | (0.43) | (0.63) | (2.92) |
| Net asset value, end of period | $28.90 | $27.78 | $30.94 | $25.80 | $18.45 |
| Total return (%)2,3 | 7.92 | (8.33) | 21.73 | 43.10 | (46.91) |
| |
| Ratios and supplemental data | | | | | |
|
| Net assets, end of period (in millions) | $392 | $411 | $291 | $84 | $1 |
| Ratios (as a percentage of average net assets): | | | | | |
| Expenses before reductions | 1.17 | 1.16 | 1.12 | 1.06 | 2.37 |
| Expenses net of fee waivers | 1.17 | 1.16 | 1.12 | 1.06 | 1.18 |
| Expenses net of fee waivers and credits | 1.17 | 1.16 | 1.12 | 1.06 | 1.18 |
| Net investment income | 2.49 | 2.54 | 1.61 | 1.34 | 2.87 |
| Portfolio turnover (%) | 53 | 42 | 39 | 44 | 54 |
1 Based on the average daily shares outstanding.
2 Does not reflect the effect of sales charges, if any.
3 Total returns would have been lower had certain expenses not been reduced during the applicable periods shown.
| | | | | |
| CLASS R1 SHARES Period ended | 2-28-13 | 2-29-12 | 2-28-11 | 2-28-10 | 2-28-09 |
| |
| Per share operating performance | | | | | |
|
| Net asset value, beginning of period | $27.66 | $30.77 | $25.67 | $18.36 | $38.94 |
| Net investment income1 | 0.51 | 0.53 | 0.24 | 0.23 | 0.69 |
| Net realized and unrealized gain (loss) on investments | 1.43 | (3.33) | 5.06 | 7.50 | (18.54) |
| Total from investment operations | 1.94 | (2.80) | 5.30 | 7.73 | (17.85) |
| Less distributions | | | | | |
| From net investment income | (0.85) | (0.31) | (0.20) | (0.42) | (1.55) |
| From net realized gain | — | — | — | — | (1.18) |
| Total distributions | (0.85) | (0.31) | (0.20) | (0.42) | (2.73) |
| Net asset value, end of period | $28.75 | $27.66 | $30.77 | $25.67 | $18.36 |
| Total return (%)2 | 7.10 | (9.00) | 20.71 | 42.00 | (47.16) |
| |
| Ratios and supplemental data | | | | | |
|
| Net assets, end of period (in millions) | —3 | —3 | —3 | —3 | —3 |
| Ratios (as a percentage of average net assets): | | | | | |
| Expenses before reductions | 7.16 | 7.37 | 6.88 | 8.854 | 15.16 |
| Expenses net of fee waivers | 1.90 | 1.90 | 1.92 | 1.924 | 2.10 |
| Expenses net of fee waivers and credits | 1.90 | 1.90 | 1.92 | 1.924 | 1.70 |
| Net investment income | 1.87 | 1.88 | 0.90 | 0.92 | 2.21 |
| Portfolio turnover (%) | 53 | 42 | 39 | 44 | 54 |
1 Based on the average daily shares outstanding.
2 Total returns would have been lower had certain expenses not been reduced during the applicable periods shown.
3 Less than $500,000.
4 Includes the impact of proxy expenses, which amounted to 0.02% of average net assets.
| | |
| 28 | International Core Fund | Annual report | See notes to financial statements |
| |
| CLASS R2 SHARES Period ended | 2-28-131 |
| |
| Per share operating performance | |
|
| Net asset value, beginning of period | $27.80 |
| Net investment income2 | 0.59 |
| Net realized and unrealized gain on investments | 1.43 |
| Total from investment operations | 2.02 |
| Less distributions | |
| From net investment income | (0.91) |
| Net asset value, end of period | $28.91 |
| Total return (%)3 | 7.39 |
| |
| Ratios and supplemental data | |
|
| Net assets, end of period (in millions) | —4 |
| Ratios (as a percentage of average net assets): | |
| Expenses before reductions | 20.70 |
| Expenses net of fee waivers | 1.65 |
| Expenses including reductions and amounts recaptured | 1.65 |
| Net investment income | 2.16 |
| Portfolio turnover (%) | 53 |
1 The inception date for Class R2 shares is 3-1-12.
2 Based on the average daily shares outstanding.
3 Total returns would have been lower had certain expenses not been reduced during the applicable periods shown.
4 Less than $500,000.
| | | | | |
| CLASS R3 SHARES Period ended | | 2-28-13 | 2-29-12 | 2-28-11 | 2-28-101 |
| |
| Per share operating performance | | | | | |
|
| Net asset value, beginning of period | | $27.80 | $30.94 | $25.80 | $23.33 |
| Net investment income2 | | 0.53 | 0.57 | 0.29 | 0.02 |
| Net realized and unrealized gain (loss) on investments | | 1.46 | (3.38) | 5.08 | 2.90 |
| Total from investment operations | | 1.99 | (2.81) | 5.37 | 2.92 |
| Less distributions | | | | | |
| From net investment income | | (0.87) | (0.33) | (0.23) | (0.45) |
| Net asset value, end of period | | $28.92 | $27.80 | $30.94 | $25.80 |
| Total return (%)3 | | 7.28 | (8.95) | 20.87 | 12.404 |
| |
| Ratios and supplemental data | | | | | |
|
| Net assets, end of period (in millions) | | —5 | —5 | —5 | —5 |
| Ratios (as a percentage of average net assets): | | | | | |
| Expenses before reductions | | 47.36 | 45.66 | 44.55 | 10.976 |
| Expenses net of fee waivers | | 1.80 | 1.80 | 1.83 | 1.916 |
| Expenses net of fee waivers and credits | | 1.80 | 1.80 | 1.83 | 1.916 |
| Net investment income | | 1.93 | 2.01 | 1.05 | 0.106 |
| Portfolio turnover (%) | | 53 | 42 | 39 | 44 |
1 The inception date for Class R3 shares is 5-22-09.
2 Based on the average daily shares outstanding.
3 Total returns would have been lower had certain expenses not been reduced during the applicable periods shown.
4 Not annualized.
5 Less than $500,000.
6 Annualized.
| | |
| See notes to financial statements | Annual report | International Core Fund | 29 |
| | | | | |
| CLASS R4 SHARES Period ended | | 2-28-13 | 2-29-12 | 2-28-11 | 2-28-101 |
| |
| Per share operating performance | | | | | |
|
| Net asset value, beginning of period | | $27.79 | $30.94 | $25.80 | $23.33 |
| Net investment income2 | | 0.64 | 0.65 | 0.37 | 0.08 |
| Net realized and unrealized gain (loss) on investments | | 1.44 | (3.38) | 5.08 | 2.91 |
| Total from investment operations | | 2.08 | (2.73) | 5.45 | 2.99 |
| Less distributions | | | | | |
| From net investment income | | (0.98) | (0.42) | (0.31) | (0.52) |
| Net asset value, end of period | | $28.89 | $27.79 | $30.94 | $25.80 |
| Total return (%)3 | | 7.61 | (8.67) | 21.21 | 12.694 |
| |
| Ratios and supplemental data | | | | | |
|
| Net assets, end of period (in millions) | | —5 | —5 | —5 | —5 |
| Ratios (as a percentage of average net assets): | | | | | |
| Expenses before reductions | | 42.45 | 42.74 | 44.22 | 10.716 |
| Expenses net of fee waivers | | 1.43 | 1.50 | 1.53 | 1.616 |
| Expenses net of fee waivers and credits | | 1.43 | 1.50 | 1.53 | 1.616 |
| Net investment income | | 2.34 | 2.29 | 1.34 | 0.406 |
| Portfolio turnover (%) | | 53 | 42 | 39 | 44 |
1 The inception date for class R4 shares is 5-22-09.
2 Based on the average daily shares outstanding.
3 Total returns would have been lower had certain expenses not been reduced during the applicable periods shown.
4 Not annualized.
5 Less than $500,000.
6 Annualized.
| | | | | |
| CLASS R5 SHARES Period ended | | 2-28-13 | 2-29-12 | 2-28-11 | 2-28-101 |
| |
| Per share operating performance | | | | | |
|
| Net asset value, beginning of period | | $27.78 | $30.94 | $25.79 | $23.33 |
| Net investment income2 | | 0.70 | 0.73 | 0.44 | 0.14 |
| Net realized and unrealized gain (loss) on investments | | 1.45 | (3.38) | 5.10 | 2.91 |
| Total from investment operations | | 2.15 | (2.65) | 5.54 | 3.05 |
| Less distributions | | | | | |
| From net investment income | | (1.03) | (0.51) | (0.39) | (0.59) |
| Net asset value, end of period | | $28.90 | $27.78 | $30.94 | $25.79 |
| Total return (%)3 | | 7.88 | (8.38) | 21.59 | 12.954 |
| |
| Ratios and supplemental data | | | | | |
|
| Net assets, end of period (in millions) | | —5 | —5 | —5 | —5 |
| Ratios (as a percentage of average net assets): | | | | | |
| Expenses before reductions | | 21.14 | 20.87 | 31.41 | 10.506 |
| Expenses net of fee waivers | | 1.20 | 1.20 | 1.22 | 1.316 |
| Expenses net of fee waivers and credits | | 1.20 | 1.20 | 1.22 | 1.316 |
| Net investment income | | 2.57 | 2.58 | 1.58 | 0.706 |
| Portfolio turnover (%) | | 53 | 42 | 39 | 44 |
1 The inception date for Class R5 shares is 5-22-09.
2 Based on the average daily shares outstanding.
3 Total returns would have been lower had certain expenses not been reduced during the applicable periods shown.
4 Not annualized.
5 Less than $500,000.
6 Annualized.
| | |
| 30 | International Core Fund | Annual report | See notes to financial statements |
| | | | | |
| CLASS R6 SHARES Period ended | | | | 2-28-13 | 2-29-121 |
| |
| Per share operating performance | | | | | |
|
| Net asset value, beginning of period | | | | $27.82 | $28.00 |
| Net investment income2 | | | | 0.73 | 0.26 |
| Net realized and unrealized gain on investments | | | | 1.45 | 0.10 |
| Total from investment operations | | | | 2.18 | 0.36 |
| Less distributions | | | | | |
| From net investment income | | | | (1.06) | (0.54) |
| Net asset value, end of period | | | | $28.94 | $27.82 |
| Total return (%)3 | | | | 7.95 | 1.494 |
| |
| Ratios and supplemental data | | | | | |
|
| Net assets, end of period (in millions) | | | | —5 | —5 |
| Ratios (as a percentage of average net assets): | | | | | |
| Expenses before reductions | | | | 21.97 | 16.836 |
| Expenses net of fee waivers | | | | 1.12 | 1.126 |
| Expenses including reductions and amounts recaptured | | | | 1.12 | 1.126 |
| Net investment income | | | | 2.66 | 1.986 |
| Portfolio turnover (%) | | | | 53 | 427 |
1 The inception date for Class R6 shares is 9-1-11.
2 Based on the average daily shares outstanding.
3 Total returns would have been lower had certain expenses not been reduced during the applicable periods shown.
4 Not annualized.
5 Less than $500,000.
6 Annualized.
7 Portfolio turnover is shown for the period from 3-1-11 to 2-29-12.
| | | | | |
| CLASS 1 SHARES Period ended | 2-28-13 | 2-29-12 | 2-28-11 | 2-28-10 | 2-28-09 |
| |
| Per share operating performance | | | | | |
|
| Net asset value, beginning of period | $27.82 | $30.99 | $25.84 | $18.48 | $39.22 |
| Net investment income1 | 0.75 | 0.79 | 0.50 | 0.46 | 0.93 |
| Net realized and unrealized gain (loss) on investments | 1.44 | (3.41) | 5.09 | 7.54 | (18.74) |
| Total from investment operations | 2.19 | (2.62) | 5.59 | 8.00 | (17.81) |
| Less distributions | | | | | |
| From net investment income | (1.07) | (0.55) | (0.44) | (0.64) | (1.75) |
| From net realized gain | — | — | — | — | (1.18) |
| Total distributions | (1.07) | (0.55) | (0.44) | (0.64) | (2.93) |
| Net asset value, end of period | $28.94 | $27.82 | $30.99 | $25.84 | $18.48 |
| Total return (%)2 | 8.00 | (8.27) | 21.75 | 43.11 | (46.83) |
| |
| Ratios and supplemental data | | | | | |
|
| Net assets, end of period (in millions) | $37 | $39 | $47 | $44 | $34 |
| Ratios (as a percentage of average net assets): | | | | | |
| Expenses before reductions and amounts recaptured | 1.08 | 1.07 | 1.07 | 1.083 | 1.10 |
| Expenses net of fee waivers | 1.08 | 1.07 | 1.07 | 1.073 | 1.10 |
| Expenses including reductions and amounts recaptured | 1.08 | 1.07 | 1.07 | 1.073 | 1.10 |
| Net investment income | 2.76 | 2.76 | 1.83 | 1.83 | 2.88 |
| Portfolio turnover (%) | 53 | 42 | 39 | 44 | 54 |
1 Based on the average daily shares outstanding.
2 Total returns would have been lower had certain expenses not been reduced during the applicable periods shown.
3 Includes the impact of proxy expenses, which amounted to 0.03% of average net assets.
| | |
| See notes to financial statements | Annual report | International Core Fund | 31 |
| | | | | |
| CLASS NAV SHARES Period ended | 2-28-13 | 2-29-12 | 2-28-11 | 2-28-10 | 2-28-09 |
| |
| Per share operating performance | | | | | |
|
| Net asset value, beginning of period | $27.80 | $30.98 | $25.82 | $18.47 | $39.21 |
| Net investment income1 | 0.82 | 0.81 | 0.51 | 0.49 | 0.99 |
| Net realized and unrealized gain (loss) on investments | 1.38 | (3.43) | 5.10 | 7.51 | (18.78) |
| Total from investment operations | 2.20 | (2.62) | 5.61 | 8.00 | (17.79) |
| Less distributions | | | | | |
| From net investment income | (1.08) | (0.56) | (0.45) | (0.65) | (1.77) |
| From net realized gain | — | — | — | — | (1.18) |
| Total distributions | (1.08) | (0.56) | (0.45) | (0.65) | (2.95) |
| Net asset value, end of period | $28.92 | $27.80 | $30.98 | $25.82 | $18.47 |
| Total return (%)2 | 8.06 | (8.24) | 21.85 | 43.14 | (46.80) |
| |
| Ratios and supplemental data | | | | | |
|
| Net assets, end of period (in millions) | $611 | $753 | $920 | $800 | $603 |
| Ratios (as a percentage of average net assets): | | | | | |
| Expenses before reductions | 1.03 | 1.02 | 1.02 | 1.043 | 1.04 |
| Expenses net of fee waivers | 1.03 | 1.02 | 1.02 | 1.023 | 1.04 |
| Expenses including reductions and amounts recaptured | 1.03 | 1.02 | 1.02 | 1.023 | 1.04 |
| Net investment income | 3.03 | 2.84 | 1.87 | 1.99 | 3.06 |
| Portfolio turnover (%) | 53 | 42 | 39 | 44 | 54 |
1 Based on the average daily shares outstanding.
2 Total returns would have been lower had certain expenses not been reduced during the applicable periods shown.
3 Includes the impact of proxy expenses, which amounted to 0.03% of average net assets.
| | |
| 32 | International Core Fund | Annual report | See notes to financial statements |
Notes to financial statements
Note 1 — Organization
John Hancock International Core Fund (the Fund) is a series of John Hancock III (the Trust), an open-end management investment company organized as a Massachusetts business trust and registered under the Investment Company Act of 1940, as amended (the 1940 Act). The investment objective of the Fund is to seek high total return.
The Fund may offer multiple classes of shares. The shares currently offered are detailed in the Statement of assets and liabilities. Class A shares and Class C shares are offered to all investors. Effective April 12, 2013, Class B shares are closed to new investors. Class I shares are offered to institutions and certain investors. Class R1 shares, Class R2 shares, Class R3 shares, Class R4 shares and Class R5 shares are available only to certain retirement plans. Class R6 shares are available only to certain retirement plans, institutions and other investors. Class 1 shares are offered only to certain affiliates of Manulife Financial Corporation (MFC). Class NAV shares are offered to John Hancock affiliated funds of funds and certain 529 plans. Shareholders of each class have exclusive voting rights to matters that affect that class. The distribution and service fees, if any, transfer agent fees, printing and postage and registration fees for each class may differ. Class B shares convert to Class A shares eight years after purchase.
Note 2 — Significant accounting policies
The financial statements have been prepared in conformity with accounting principles generally accepted in the United States of America, which require management to make certain estimates and assumptions at the date of the financial statements. Actual results could differ from those estimates and those differences could be significant. Events or transactions occurring after the end of the fiscal period through the date that the financial statements were issued have been evaluated in the preparation of the financial statements. The following summarizes the significant accounting policies of the Fund:
Security valuation. Investments are stated at value as of the close of regular trading on the New York Stock Exchange (NYSE), normally at 4:00 P.M., Eastern Time. In order to value the securities, the Fund uses the following valuation techniques: Equity securities, including exchange-traded funds, held by the Fund are valued at the last sale price or official closing price on the principal securities exchange on which they trade. In the event there were no sales during the day or closing prices are not available, then the securities are valued using the last quoted bid or evaluated price. Investments by the Fund in open-end mutual funds, including John Hancock Collateral Investment Trust (JHCIT), are valued at their respective net asset values each business day. Futures contracts are valued at the quoted daily settlement prices established by the exchange on which they trade. Foreign securities and currencies, including forward foreign currency contracts, are valued in U.S. dollars, based on foreign currency exchange rates supplied by an independent pricing service. Certain securities and forward foreign currency contracts traded only in the over-the-counter market are valued at the last bid price quoted by brokers making markets in the securities at the close of trading. Certain short-term securities are valued at amortized cost.
Other portfolio securities and assets, where reliable market quotations are not available, are valued at fair value as determined in good faith by the Fund’s Pricing Committee following procedures established by the Board of Trustees, which include price verification procedures. The frequency with which these fair valuation procedures are used cannot be predicted. Generally, trading in foreign securities is substantially completed each day at various times prior to the close of trading on the NYSE. Significant market events that affect the values of foreign securities may occur
| |
| Annual report | International Core Fund | 33 |
between the time when the valuation of the securities is generally determined and the close of the NYSE. During significant market events, these securities will be valued at fair value, as determined in good faith, following procedures established by the Board of Trustees. The Fund may use a fair valuation model to value foreign securities in order to adjust for events that may occur between the close of foreign exchanges and the close of the NYSE.
The Fund uses a three-tier hierarchy to prioritize the pricing assumptions, referred to as inputs, used in valuation techniques to measure fair value. Level 1 includes securities valued using quoted prices in active markets for identical securities. Level 2 includes securities valued using other significant observable inputs. Observable inputs may include quoted prices for similar securities, interest rates, prepayment speeds and credit risk. Prices for securities valued using these inputs are received from independent pricing vendors and brokers and are based on an evaluation of the inputs described. Level 3 includes securities valued using significant unobservable inputs when market prices are not readily available or reliable, including the Fund’s own assumptions in determining the fair value of investments. Factors used in determining value may include market or issuer specific events or trends, changes in interest rates and credit quality. The inputs or methodology used for valuing securities are not necessarily an indication of the risks associated with investing in those securities. Changes in valuation techniques may result in transfers into or out of an assigned level within the disclosure hierarchy.
The following is a summary of the values by input classification of the Fund’s investments as of February 28, 2013, by major security category or type:
| | | | |
| | | | | LEVEL 3 |
| | | | LEVEL 2 | SIGNIFICANT |
| | TOTAL MARKET | LEVEL 1 | SIGNIFICANT | UNOBSERVABLE |
| | VALUE AT 2-28-13 | QUOTED PRICE | OBSERVABLE INPUTS | INPUTS |
|
| Common Stocks | | | | |
| Australia | $74,122,440 | — | $74,122,440 | — |
| Austria | 9,169,445 | — | 9,169,445 | — |
| Belgium | 20,710,826 | — | 20,710,826 | — |
| Canada | 32,106,597 | $32,106,597 | — | — |
| China | 1,086,878 | — | 1,086,878 | — |
| Denmark | 11,873,125 | — | 11,873,125 | — |
| Finland | 7,117,614 | — | 7,117,614 | — |
| France | 126,649,026 | — | 126,649,026 | ��� |
| Germany | 73,420,735 | — | 73,420,735 | — |
| Greece | 4,106,450 | — | 4,106,450 | — |
| Hong Kong | 11,112,435 | — | 11,112,435 | — |
| Ireland | 7,410,277 | — | 7,410,277 | — |
| Israel | 2,540,930 | — | 2,540,930 | — |
| Italy | 57,283,831 | — | 57,283,831 | — |
| Japan | 261,527,101 | — | 261,527,101 | — |
| Jersey, C.I. | 1,003,620 | — | 1,003,620 | — |
| Netherlands | 37,944,687 | — | 37,944,687 | — |
| New Zealand | 8,506,481 | — | 8,506,481 | — |
| Norway | 4,445,055 | — | 4,445,055 | — |
| Portugal | 3,732,085 | — | 3,732,085 | — |
| Singapore | 14,506,214 | — | 14,506,214 | — |
| Spain | 82,979,041 | — | 82,979,041 | — |
| Sweden | 10,166,079 | — | 10,166,079 | — |
| Switzerland | 15,151,229 | — | 15,151,229 | — |
| United Kingdom | 199,119,445 | — | 199,119,445 | — |
| |
| 34 | International Core Fund | Annual report |
| | | | |
| | | | | LEVEL 3 |
| | | | LEVEL 2 | SIGNIFICANT |
| | TOTAL MARKET | LEVEL 1 | SIGNIFICANT | UNOBSERVABLE |
| | VALUE AT 2-28-13 | QUOTED PRICE | OBSERVABLE INPUTS | INPUTS |
|
| Preferred Securities | $10,440,550 | — | $10,440,550 | — |
| Securities Lending | | | | |
| Collateral | 65,450,328 | $65,450,328 | — | — |
| Short-Term Investments | 38,967,563 | 38,967,563 | — | — |
| |
|
| Total Investments | | | | |
| in Securities | $1,192,650,087 | $136,524,488 | $1,056,125,599 | — |
| Other Financial | | | | |
| Instruments: | | | | |
| Futures | ($1,012,863) | ($1,017,027) | $4,164 | — |
| Forward Foreign | | | | |
| Currency Contracts | $472,225 | — | $472,225 | — |
Security transactions and related investment income. Investment security transactions are accounted for on a trade date plus one basis for daily net asset value calculations. However, for financial reporting purposes, investment transactions are reported on trade date. Interest income is accrued as earned. Dividend income is recorded on the ex-date, except for dividends of foreign securities where the dividend may not be known until after the ex-date. In those cases, dividend income, net of withholding taxes, is recorded when the Fund becomes aware of the dividends. Foreign taxes are provided for based on the Fund’s understanding of the tax rules and rates that exist in the foreign markets in which it invests. Gains and losses on securities sold are determined on the basis of identified cost and may include proceeds from litigation.
Securities lending. The Fund may lend its securities to earn additional income. It receives cash collateral from the borrower in an amount not less than the market value of the loaned securities. The Fund will invest its collateral in JHCIT, an affiliate of the Fund, which has a floating net asset value (NAV) and invests in short term investments as part of the securities lending program, and as a result, the Fund will receive the benefit of any gains and bear any losses generated by JHCIT. Although risk of the loss of the securities lent is mitigated by holding the collateral and through securities lending provider indemnification, the Fund could experience a delay in recovering its securities and a possible loss of income or value if the borrower fails to return the securities or if collateral investments decline in value or possible loss of rights in the collateral should the borrower fail financially. The Fund may receive compensation for lending its securities by retaining a portion of the return on the investment of the collateral and compensation from fees earned from borrowers of the securities. Net income received from JHCIT is a component of securities lending income as recorded on the Statement of operations.
Foreign currency translation. Assets, including investments and liabilities denominated in foreign currencies, are translated into U.S. dollar values each day at the prevailing exchange rate. Purchases and sales of securities, income and expenses are translated into U.S. dollars at the prevailing exchange rate on the date of the transaction. The effect of changes in foreign currency exchange rates on the value of securities is reflected as a component of the realized and unrealized gains (losses) on investments.
Funds that invest internationally generally carry more risk than funds that invest strictly in U.S. securities. Risks can result from differences in economic and political conditions, regulations, market practices (including higher transaction costs), accounting standards and other factors. Foreign investments are also subject to a decline in the value of a foreign currency versus the U.S. dollar, which reduces the dollar value of securities denominated in that currency.
| |
| Annual report | International Core Fund | 35 |
Foreign taxes. The Fund may be subject to withholding tax on income or capital gains or repatriation taxes as imposed by certain countries in which it invests. Taxes are accrued based upon net investment income, net realized gains or net unrealized appreciation.
Line of credit. The Fund may borrow from banks for temporary or emergency purposes, including meeting redemption requests that otherwise might require the untimely sale of securities. Pursuant to the custodian agreement, the custodian may loan money to the Fund to make properly authorized payments. The Fund is obligated to repay the custodian for any overdraft, including any related costs or expenses. The custodian may have a lien, security interest or security entitlement in any Fund property that is not otherwise segregated or pledged, to the maximum extent permitted by law, to the extent of any overdraft.
In addition, the Fund and other affiliated funds have entered into an agreement with Citibank N.A. that enables them to participate in a $100 million unsecured committed line of credit. A commitment fee, payable at the end of each calendar quarter, based on the average daily unused portion of the line of credit, is charged to each participating fund on a pro rata basis and is reflected in other expenses on the Statement of operations. Commitment fees for the year ended February 28, 2013 were $2,847. For the year ended February 28, 2013, the Fund had no borrowings under the line of credit. The current agreement will expire on March 31, 2013 and will be replaced with a new agreement which will enable the Fund to participate in a $300 million unsecured line of credit, also with Citibank, with terms otherwise similar to the existing agreement.
Expenses. Within the John Hancock Funds complex, expenses that are directly attributable to an individual fund are allocated to such fund. Expenses that are not readily attributable to a specific fund are allocated among all funds in an equitable manner, taking into consideration, among other things, the nature and type of expense and the fund’s relative net assets. Expense estimates are accrued in the period to which they relate and adjustments are made when actual amounts are known.
Class allocations. Income, common expenses and realized and unrealized gains (losses) are determined at the fund level and allocated daily to each class of shares based on the net assets of the class. Class-specific expenses, such as distribution and service fees, if any, transfer agent fees, state registration fees and printing and postage, for all classes, are calculated daily at the class level based on the appropriate net assets of each class and the specific expense rates applicable to each class.
Federal income taxes. The Fund intends to continue to qualify as a regulated investment company by complying with the applicable provisions of the Internal Revenue Code and will not be subject to federal income tax on taxable income that is distributed to shareholders. Therefore, no federal income tax provision is required.
Under the Regulated Investment Company Modernization Act of 2010, the Fund is permitted to carry forward capital losses incurred in taxable years beginning after December 22, 2010 for an unlimited period. Any losses incurred during those taxable years will be required to be utilized prior to the losses incurred in pre-enactment taxable years. As a result of this ordering rule, pre-enactment capital loss carryforwards may be more likely to expire unused. Additionally, post-enactment capital losses that are carried forward will retain their character as either short-term or long-term capital losses rather than being considered all short-term as under previous law.
| |
| 36 | International Core Fund | Annual report |
For federal income tax purposes, the Fund has a capital loss carryforward of $220,110,762 available to offset future net realized capital gains as of February 28, 2013. The following table details the capital loss carryforward available as of February 28, 2013:
| | | |
| CAPITAL LOSS CARRYFORWARD |
| EXPIRING | EXPIRING | NO EXPIRATION DATE |
|
| FEBRUARY 28, 2018 | FEBRUARY 28, 2019 | SHORT TERM | LONG TERM |
| $173,798,079 | $7,043,412 | $7,502,125 | $31,767,146 |
Availability of a certain amount of the loss carryforward may be limited in a given year. Net capital losses of $7,594,063 that are the result of security transactions occurring after October 31, 2012, are treated as occurring on March 1, 2013, the first day of the Fund’s next taxable year.
As of February 28, 2013, the Fund had no uncertain tax positions that would require financial statement recognition, derecognition or disclosure. The Fund’s federal tax returns are subject to examination by the Internal Revenue Service for a period of three years.
Distribution of income and gains. Distributions to shareholders from net investment income and net realized gains, if any, are recorded on the ex-date. The Fund generally declares and pays dividends and capital gain distributions, if any, annually. The tax character of distributions for the years ended February 28, 2013 and February 29, 2012 was as follows:
| | | | |
| | FEBRUARY 28, 2013 | FEBRUARY 29, 2012 | | |
| | |
| Ordinary Income | $45,000,236 | $30,000,175 | | |
Distributions paid by the Fund with respect to each class of shares are calculated in the same manner, at the same time and in the same amount, except for the effect of class level expenses that may be applied differently to each class. As of February 28, 2013, the components of distributable earnings on a tax basis consisted of $21,505,557 of undistributed ordinary income.
Such distributions and distributable earnings, on a tax basis, are determined in conformity with income tax regulations, which may differ from accounting principles generally accepted in the United States of America. Material distributions in excess of tax basis earnings and profits, if any, are reported in the Fund’s financial statements as a return of capital.
Capital accounts within the financial statements are adjusted for permanent book-tax differences. These adjustments have no impact on net assets or the results of operations. Temporary book-tax differences, if any, will reverse in a subsequent period. Book-tax differences are primarily attributable to foreign currency transactions, passive foreign investment companies, wash sale loss deferrals, derivative transactions and litigation proceeds.
New accounting pronouncements. In December 2011, the Financial Accounting Standards Board issued Accounting Standards Update No. 2011-11 (ASU 2011-11), Disclosures about Offsetting Assets and Liabilities and in January 2013, Accounting Standards Update No. 2013-1, Clarifying the Scope of Disclosures about Offsetting Assets and Liabilities. These updates create new disclosure requirements requiring entities to disclose both gross and net information for derivatives and other financial instruments that are either offset in the Statement of assets and liabilities or subject to an enforceable master netting arrangement or similar agreement. The disclosure requirements are effective for annual reporting periods beginning on or after January 1, 2013 and interim periods within those annual periods. These updates may result in additional disclosure relating to the presentation of derivatives and certain other financial instruments.
| |
| Annual report | International Core Fund | 37 |
Note 3 — Derivative instruments
The Fund may invest in derivatives in order to meet its investment objective. The use of derivatives may involve risks different from, or potentially greater than, the risks associated with investing directly in securities. Specifically, the Fund is exposed to the risk that the counterparty to an over-the-counter (OTC) derivatives contract will be unable or unwilling to make timely settlement payments or otherwise honor its obligations. OTC derivatives transactions typically can only be closed out with the other party to the transaction. If the counterparty defaults, the Fund will have contractual remedies, but there is no assurance that the counterparty will meet its contractual obligations or that the Fund will succeed in enforcing them.
Futures. A futures contract is a contractual agreement to buy or sell a particular currency or financial instrument at a pre-determined price in the future. Risks related to the use of futures contracts include possible illiquidity of the futures markets, contract prices that can be highly volatile and imperfectly correlated to movements in the underlying financial instrument and potential losses in excess of the amounts recognized on the Statement of assets and liabilities. Use of long futures contracts subjects the funds to the risk of loss up to the notional value of the futures contracts. Use of short futures contracts subjects the funds to unlimited risk of loss.
The Fund has entered into collateral agreements with certain counterparties to mitigate counterparty risk on over-the-counter derivatives. Subject to established minimum levels, collateral is generally determined based on the net aggregate unrealized gain or loss on contracts with a particular counterparty. Collateral pledged to the Fund is held by the custodian bank for the benefit of the Fund and can be in the form of cash or debt securities issued by the U.S. government or related agencies; collateral posted by the Fund is held in a segregated account at the Fund’s custodian and is noted in the accompanying portfolio of investments, or if cash is posted, on the Statement of assets and liabilities. As of February 28, 2013, $572,627 was posted by the Fund for the benefit of counterparties.
Upon entering into a futures contract, the Fund is required to deposit initial margin with the broker in the form of cash or securities. The amount of required margin is generally based on a percentage of the contract value; this amount is the initial margin for the trade. The margin deposit must then be maintained at the established level over the life of the contract. Futures collateral receivable/payable is included on the Statement of assets and liabilities. Futures contracts are marked-to-market daily and an appropriate payable or receivable for the change in value (variation margin) and unrealized gain or loss is recorded by the Fund. When the contract is closed, the Fund records a realized gain or loss equal to the difference between the value of the contract at the time it was opened and the value at the time it was closed.
During the year ended February 28, 2013, the Fund used futures contracts to gain exposure to certain securities markets. During the year ended February 28, 2013, the Fund held futures contracts with notional values ranging from $73 million to $135 million, as measured at each quarter end. The following table summarizes the contracts held at February 28, 2013.
| |
| 38 | International Core Fund | Annual report |
| | | | | | | |
| | NUMBER | | | | | | UNREALIZED |
| OPEN | OF | | | EXPIRATION | NOTIONAL | NOTIONAL | APPRECIATION |
| CONTRACTS | CONTRACTS | | POSITION | DATE | BASIS | VALUE | (DEPRECIATION) |
|
| CAC 40 Index Futures | 18 | | Long | 3/15/13 | $856,968 | $874,901 | $17,933 |
| DAX Index Futures | 39 | | Long | 3/15/13 | 9,723,695 | 9,865,695 | 142,000 |
| FTSE MIB Index | 151 | | Long | 3/15/13 | 16,936,781 | 15,689,226 | (1,247,555) |
| Futures | | | | | | | |
| SGX MSCI Singapore | 73 | | Long | 3/27/13 | 4,388,383 | 4,352,649 | (35,734) |
| Index Futures | | | | | | | |
| TOPIX Index Futures | 138 | | Long | 3/8/13 | 13,242,552 | 14,494,271 | 1,251,719 |
| ASX SPI 200 Index | 54 | | Short | 3/21/13 | (6,528,166) | (7,012,002) | (483,836) |
| Futures | | | | | | | |
| S&P TSE 60 Index | 145 | | Short | 3/14/13 | (20,087,628) | (20,745,018) | (657,390) |
| Futures | | | | | | | |
| Total | | | | | | | ($1,012,863) |
Notional basis refers to the contractual amount agreed upon at inception of the open contracts; notional value represents the current value of the open contracts.
Forward foreign currency contracts. A forward foreign currency contract is an agreement between two parties to buy and sell a specific currency at a price that is set on the date of the contract. The forward contract calls for delivery of the currency on a future date that is specified in the contract. Risks related to the use of forwards include the possible failure of counterparties to meet the terms of the forward agreement, the failure of the counterparties to timely post collateral, the risk that currency movements will not occur thereby reducing the Fund’s total return, and the potential for losses in excess of the amounts recognized on the Statement of assets and liabilities.
The market value of a forward foreign currency contract fluctuates with changes in foreign currency exchange rates. Forward foreign currency contracts are marked-to-market daily and the change in value is recorded by the Fund as an unrealized gain or loss. Realized gains or losses, equal to the difference between the value of the contract at the time it was opened and the value at the time it was closed, are recorded upon delivery or receipt of the currency or settlement with the counterparty.
During the year ended February 28, 2013, the Fund used forward foreign currency contracts to manage against anticipated currency exchange rates. During the year ended February 28, 2013, the Fund held forward foreign currency contracts with USD notional values ranging from $263.6 million to $316.4 million, as measured at each quarter end. The following table summarizes the contracts held at February 28, 2013.
| | | | | | |
| | PRINCIPAL AMOUNT | PRINCIPAL AMOUNT | | | | UNREALIZED |
| | COVERED BY | COVERED BY | | | SETTLEMENT | APPRECIATION |
| CURRENCY | CONTRACT | CONTRACT (USD) | | COUNTERPARTY | DATE | (DEPRECIATION) |
|
| Buys | | | | | | |
| HKD | 64,103,389 | $8,268,620 | | Bank of America | 4-19-13 | ($581) |
| | | | | N.A. | | |
| HKD | 58,456,799 | 7,540,293 | | Brown Brothers | 4-19-13 | (549) |
| | | | | Harriman & | | |
| | | | | Company | | |
| HKD | 41,093,478 | 5,300,846 | | Morgan Stanley | 4-19-13 | (619) |
| | | | | Capital Services, | | |
| | | | | Inc. | | |
| HKD | 64,103,389 | 8,268,898 | | Mellon Bank NA | 4-19-13 | (858) |
| HKD | 24,623,000 | 3,176,067 | | JPMorgan Chase | 4-19-13 | (198) |
| | | | | Bank | | |
| HKD | 41,093,478 | 5,300,421 | | Barclays Bank PLC | 4-19-13 | (195) |
| HKD | 81,092,551 | 10,459,978 | | State Street Bank & | 4-19-13 | (681) |
| | | | | Trust Company | | |
| |
| Annual report | International Core Fund | 39 |
| | | | | | |
| | PRINCIPAL AMOUNT | PRINCIPAL AMOUNT | | | | UNREALIZED |
| | COVERED BY | COVERED BY | | | SETTLEMENT | APPRECIATION |
| CURRENCY | CONTRACT | CONTRACT (USD) | | COUNTERPARTY | DATE | (DEPRECIATION) |
|
| Buys continued | | | | | |
| GBP | 3,601,435 | $5,566,706 | | JPMorgan Chase | 4-19-13 | ($97,814) |
| | | | | Bank | | |
| GBP | 1,977,736 | 3,057,333 | | Mellon Bank NA | 4-19-13 | (54,079) |
| GBP | 3,899,895 | 6,028,068 | | Brown Brothers | 4-19-13 | (105,955) |
| | | | | Harriman & | | |
| | | | | Company | | |
| GBP | 1,994,865 | 3,086,764 | | Royal Bank of | 4-19-13 | (57,499) |
| | | | | Scotland PLC | | |
| SGD | 19,608,202 | 15,833,612 | | Bank of America | 4-19-13 | 16,454 |
| | | | | N.A. | | |
| SGD | 3,337,439 | 2,695,167 | | Mellon Bank NA | 4-19-13 | 2,614 |
| SGD | 1,285,689 | 1,038,175 | | Morgan Stanley | 4-19-13 | 1,097 |
| | | | | Capital Services, | | |
| | | | | Inc. | | |
| SGD | 9,439,547 | 7,621,265 | | Barclays Bank PLC | 4-19-13 | 9,085 |
| SGD | 11,058,671 | 8,926,072 | | State Street Bank & | 4-19-13 | 13,079 |
| | | | | Trust Company | | |
| SGD | 1,942,000 | 1,567,633 | | JPMorgan Chase | 4-19-13 | 2,160 |
| | | | | Bank | | |
| SGD | 3,752,879 | 3,030,112 | | Royal Bank of | 4-19-13 | 3,485 |
| | | | | Scotland PLC | | |
| SEK | 16,592,546 | 2,618,327 | | Barclays Bank PLC | 4-19-13 | (49,338) |
| SEK | 9,275,289 | 1,464,296 | | Brown Brothers | 4-19-13 | (28,223) |
| | | | | Harriman & | | |
| | | | | Company | | |
| SEK | 41,461,187 | 6,549,951 | | Deutsche Bank AG | 4-19-13 | (130,604) |
| | | | | London | | |
| SEK | 13,070,974 | 2,061,273 | | Bank of America | 4-19-13 | (37,522) |
| | | | | N.A. | | |
| CHF | 7,285,000 | 7,886,051 | | Bank of America | 4-19-13 | (79,333) |
| | | | | N.A. | | |
| CHF | 10,906,840 | 11,815,320 | | Morgan Stanley | 4-19-13 | (127,382) |
| | | | | Capital Services, | | |
| | | | | Inc. | | |
| CHF | 8,357,010 | 9,054,427 | | JPMorgan Chase | 4-19-13 | (98,927) |
| | | | | Bank | | |
| CHF | 5,424,630 | 5,876,154 | | Brown Brothers | 4-19-13 | (63,037) |
| | | | | Harriman & | | |
| | | | | Company | | |
| CHF | 1,246,125 | 1,349,635 | | Barclays Bank PLC | 4-19-13 | (14,269) |
| CHF | 4,319,776 | 4,685,223 | | Deutsche Bank AG | 4-19-13 | (56,085) |
| | | | | London | | |
| CHF | 4,485,557 | 4,856,049 | | State Street Bank & | 4-19-13 | (49,257) |
| | | | | Trust Company | | |
| Total | | $164,982,736 | | | | ($1,005,031) |
| |
| Sells | | | | | | |
| AUD | 562,862 | $579,334 | | State Street Bank & | 4-19-13 | $5,001 |
| | | | | Trust Company | | |
| AUD | 1,869,851 | 1,925,825 | | Mellon Bank NA | 4-19-13 | 17,865 |
| AUD | 4,102,760 | 4,223,828 | | Bank of America | 4-19-13 | 37,450 |
| | | | | N.A. | | |
| |
| 40 | International Core Fund | Annual report |
| | | | | | |
| | PRINCIPAL AMOUNT | PRINCIPAL AMOUNT | | | | UNREALIZED |
| | COVERED BY | COVERED BY | | | SETTLEMENT | APPRECIATION |
| CURRENCY | CONTRACT | CONTRACT (USD) | | COUNTERPARTY | DATE | (DEPRECIATION) |
|
| Sells continued | | | | | |
| AUD | 1,897,502 | $1,954,503 | | Brown Brothers | 4-19-13 | $18,328 |
| | | | | Harriman & | | |
| | | | | Company | | |
| AUD | 8,104,562 | 8,345,778 | | Morgan Stanley | 4-19-13 | 76,038 |
| | | | | Capital Services, | | |
| | | | | Inc. | | |
| AUD | 5,579,237 | 5,745,610 | | Barclays Bank PLC | 4-19-13 | 52,663 |
| CAD | 1,439,388 | 1,418,625 | | Royal Bank of | 4-19-13 | 20,705 |
| | | | | Scotland PLC | | |
| CAD | 5,849,825 | 5,769,570 | | Barclays Bank PLC | 4-19-13 | 88,275 |
| CAD | 6,671,168 | 6,574,561 | | JPMorgan Chase | 4-19-13 | 95,586 |
| | | | | Bank | | |
| CAD | 6,572,429 | 6,486,758 | | Bank of America | 4-19-13 | 103,677 |
| | | | | N.A. | | |
| CAD | 835,807 | 825,180 | | Morgan Stanley | 4-19-13 | 13,452 |
| | | | | Capital Services, | | |
| | | | | Inc. | | |
| CAD | 5,093,827 | 5,029,947 | | Mellon Bank NA | 4-19-13 | 82,870 |
| CAD | 5,093,827 | 5,026,497 | | State Street Bank & | 4-19-13 | 79,420 |
| | | | | Trust Company | | |
| DKK | 29,337,547 | 5,252,025 | | Barclays Bank PLC | 4-19-13 | 103,170 |
| DKK | 2,212,781 | 396,159 | | Brown Brothers | 4-19-13 | 7,807 |
| | | | | Harriman & | | |
| | | | | Company | | |
| EUR | 6,147,461 | 8,203,233 | | State Street Bank & | 4-19-13 | 160,260 |
| | | | | Trust Company | | |
| EUR | 4,020,944 | 5,375,315 | | Royal Bank of | 4-19-13 | 114,550 |
| | | | | Scotland PLC | | |
| EUR | 8,338,399 | 11,133,681 | | Brown Brothers | 4-19-13 | 224,213 |
| | | | | Harriman & | | |
| | | | | Company | | |
| EUR | 1,152,552 | 1,538,553 | | Mellon Bank NA | 4-19-13 | 30,622 |
| EUR | 4,639,676 | 6,203,247 | | Deutsche Bank AG | 4-19-13 | 132,970 |
| | | | | London | | |
| EUR | 1,152,552 | 1,537,805 | | Bank of America | 4-19-13 | 29,874 |
| | | | | N.A. | | |
| EUR | 4,525,960 | 6,043,972 | | JPMorgan Chase | 4-19-13 | 122,474 |
| | | | | Bank | | |
| EUR | 4,025,835 | 5,374,256 | | Morgan Stanley | 4-19-13 | 107,092 |
| | | | | Capital Services, | | |
| | | | | Inc. | | |
| JPY | 111,020,868 | 1,187,826 | | JPMorgan Chase | 4-19-13 | (14,515) |
| | | | | Bank | | |
| JPY | 1,086,870,175 | 11,624,728 | | Morgan Stanley | 4-19-13 | (145,943) |
| | | | | Capital Services, | | |
| | | | | Inc. | | |
| JPY | 514,361,341 | 5,503,816 | | Bank of America | 4-19-13 | (66,654) |
| | | | | N.A. | | |
| JPY | 152,430,105 | 1,630,103 | | Mellon Bank NA | 4-19-13 | (20,696) |
| JPY | 898,395,891 | 9,614,168 | | Barclays Bank PLC | 4-19-13 | (115,350) |
| JPY | 661,566,036 | 7,068,013 | | Deutsche Bank AG | 4-19-13 | (96,666) |
| | | | | London | | |
| NZD | 3,685,759 | 3,099,244 | | Barclays Bank PLC | 4-19-13 | 54,867 |
| |
| Annual report | International Core Fund | 41 |
| | | | | | |
| | PRINCIPAL AMOUNT | PRINCIPAL AMOUNT | | | | UNREALIZED |
| | COVERED BY | COVERED BY | | | SETTLEMENT | APPRECIATION |
| CURRENCY | CONTRACT | CONTRACT (USD) | | COUNTERPARTY | DATE | (DEPRECIATION) |
|
| Sells continued | | | | | |
| NZD | 3,685,759 | $3,098,544 | | Brown Brothers | 4-19-13 | $54,167 |
| | | | | Harriman & | | |
| | | | | Company | | |
| NOK | 10,141,365 | 1,821,686 | | Brown Brothers | 4-19-13 | 52,610 |
| | | | | Harriman & | | |
| | | | | Company | | |
| NOK | 10,141,365 | 1,820,151 | | Bank of America | 4-19-13 | 51,074 |
| | | | | N.A. | | |
| Total | | $151,432,541 | | | | $1,477,256 |
Fair value of derivative instruments by risk category
The table below summarizes the fair value of derivatives held by the Fund at February 28, 2013 by risk category:
| | | | |
| | | FINANCIAL | ASSET | LIABILITY |
| | STATEMENT OF ASSETS AND | INSTRUMENTS | DERIVATIVES | DERIVATIVES |
| RISK | LIABILITIES LOCATION | LOCATION | FAIR VALUE | FAIR VALUE |
|
| Equity contracts | Receivable for futures | Futures* | $1,411,652 | ($2,424,515) |
| |
| |
| Foreign exchange | Receivable-payable for | Forward foreign | 1,985,054 | (1,512,829) |
| contracts | forward foreign currency | currency | | |
| | contracts | contracts | | |
| Total | | | $3,396,706 | ($3,937,344) |
* Reflects cumulative appreciation/depreciation of futures as disclosed herein. Only the period end variation margin is separately disclosed on the Statement of asset and Liabilities.
Effect of derivative instruments on the Statement of operations
The table below summarizes the net realized gain (loss) included in the net increase (decrease) in net assets from operations, classified by derivative instrument and risk category, for the year ended February 28, 2013:
| | | | |
| | STATEMENT OF | | FOREIGN | |
| | OPERATIONS | FUTURES | CURRENCY | |
| RISK | LOCATION | CONTRACTS | TRANSACTION* | TOTAL |
|
| Equity contracts | Net realized | $1,186,102 | — | $1,186,102 |
| | gain (loss) | | | |
| Foreign exchange | Net realized | — | $6,888,792 | 6,888,792 |
| contracts | gain (loss) | | | |
| Total | | $1,186,102 | $6,888,792 | $8,074,894 |
* Realized gain-loss associated with forward foreign currency contracts is included in the caption on the Statement of operations.
| |
| 42 | International Core Fund | Annual report |
The table below summarizes the net change in unrealized appreciation (depreciation) included in the net increase (decrease) in net assets from operations, classified by derivative instrument and risk category, for the year ended February 28, 2013:
| | | | |
| | | | TRANSLATION | |
| | | | OF ASSETS | |
| | STATEMENT OF | | AND LIABILITIES | |
| | OPERATIONS | FUTURES | IN FOREIGN | |
| RISK | LOCATION | CONTRACTS | CURRENCIES* | TOTAL |
|
| Equity contracts | Change in | ($3,785,102) | — | ($3,785,102) |
| | unrealized | | | |
| | appreciation | | | |
| | (depreciation) | | | |
| Foreign exchange | Change in | — | ($345,452) | ($345,452) |
| contracts | unrealized | | | |
| | appreciation | | | |
| | (depreciation) | | | |
| Total | | ($3,785,102) | ($345,452) | ($4,130,554) |
* Change in unrealized appreciation-depreciation associated with forward foreign currency contracts is included in the caption on the Statement of operations.
Note 4 — Guarantees and indemnifications
Under the Trust’s organizational documents, its Officers and Trustees are indemnified against certain liabilities arising out of the performance of their duties to the Trust, including the Fund. Additionally, in the normal course of business, the Fund enters into contracts with service providers that contain general indemnification clauses. The Fund’s maximum exposure under these arrangements is unknown, as this would involve future claims that may be made against the Fund that have not yet occurred. The risk of material loss from such claims is considered remote.
Note 5 — Fees and transactions with affiliates
John Hancock Investment Management Services, LLC (the Advisor) serves as investment advisor for the Trust. John Hancock Funds, LLC (the Distributor), an affiliate of the Advisor, serves as principal underwriter of the Trust. The Advisor and the Distributor are indirect, wholly owned subsidiaries of MFC.
Management fee. The Fund has an investment management agreement with the Advisor under which the Fund pays a daily management fee to the Advisor equivalent, on an annual basis, to the sum of: a) 0.920% of the first $100,000,000 of the Fund’s average daily net assets; b) 0.895% of the next $900,000,000; c) 0.880% of the next $1,000,000,000; d) 0.850% of the next $1,000,000,000; e) 0.825% of the next $1,000,000,000; and f) 0.800% of the Fund’s average daily net asset in excess of $4,000,000,000. The Advisor has a subadvisory agreement with Grantham, Mayo, Van Otterloo & Co. LLC. The Fund is not responsible for payment of the subadvisory fees.
The Advisor has contractually agreed to waive fees and/or reimburse certain expenses for each share class of the Fund. This agreement excludes certain expenses such as taxes, portfolio brokerage commissions, interest expense, litigation and indemnification expenses and other extraordinary expenses not incurred in the ordinary course of the Fund’s business, acquired fund fees and expenses paid indirectly and short dividend expense. The fee waivers and/or reimbursements are such that these expenses will not exceed 1.60%, 2.30%, 2.30%, 1.90%, 1.65%, 1.80%, 1.40%, 1.20% and 1.12% for Class A, Class B, Class C, Class R1, Class R2, Class R3, Class R4, Class R5 and Class R6 shares, respectively. These expense limitations will remain in effect through June 30, 2013, unless renewed by mutual agreement of the Fund and the Advisor based upon a determination that this is appropriate under the circumstances at the time. Prior to July 1, 2012, the fee waivers and/or
| |
| Annual report | International Core Fund | 43 |
reimbursements were such that these expenses did not exceed 1.24%, 1.50% and 1.15% for Class I, Class R4 and Class 1, respectively.
Accordingly, these expense reductions amounted to $20,854, $19,954, $13,779, $18,657, $14,651, $14,664, $14,705 and $20,785 for Class B, Class C, Class R1, Class R2, Class R3, Class R4, Class R5 and Class R6 shares, respectively, for the year ended February 28, 2013.
The investment management fees incurred for the year ended February 28, 2013 were equivalent to a net annual effective rate of 0.88% of the Fund’s average daily net assets.
Accounting and legal services. Pursuant to a service agreement, the Fund reimburses the Advisor for all expenses associated with providing the administrative, financial, legal, accounting and recordkeeping services to the Fund, including the preparation of all tax returns, periodic reports to shareholders and regulatory reports, among other services. These expenses are allocated to each share class based on its relative net assets at the time the expense was incurred. These accounting and legal services fees incurred for the year ended February 28, 2013 amounted to an annual rate of 0.02% of the Fund’s average daily net assets.
Distribution and service plans. The Fund has a distribution agreement with the Distributor. The Fund has adopted distribution and service plans with respect to Class A, Class B, Class C, Class R1, Class R3, Class R4, Class R5 and Class 1 shares pursuant to Rule 12b-1 under the 1940 Act, to pay the Distributor for services provided as the distributor of shares of the Fund. In addition, under a service plan for Class R1, Class R3, Class R4 and Class R5 shares, the Fund pays for certain other services. The Fund may pay up to the following contractual rates of distribution and service fees under these arrangements, expressed as an annual percentage of average daily net assets for each class of the Fund’s shares.
| | | | | |
| CLASS | 12b-1 FEE | SERVICE FEE | | | |
| | | |
| Class A | 0.30% | — | | | |
| Class B | 1.00% | — | | | |
| Class C | 1.00% | — | | | |
| Class R1 | 0.50% | 0.25% | | | |
| Class R2 | 0.25% | 0.25% | | | |
| Class R3 | 0.50% | 0.15% | | | |
| Class R41 | 0.25% | 0.10% | | | |
| Class R5 | — | 0.05% | | | |
| Class 1 | 0.05% | — | | | |
1 Effective June 1, 2012, the Distributor has contractually agreed to waive 0.10% of 12b-1 fees for Class R4 shares to limit the 12b-1 fees on Class R4 shares to 0.15% of the average daily net assets of Class R4 shares, until at least June 31, 2013, unless renewed by mutual agreement of the Fund and the Distributor based upon a determination that this is appropriate under the circumstances at the time. Accordingly, the fee limitation amounted to $27 for Class R4 shares for the year ended February 28, 2013.
Sales charges. Class A shares are assessed up-front sales charges, which resulted in payments to the Distributor amounting to $133,789 for the year ended February 28, 2013. Of this amount, $22,625 was retained and used for printing prospectuses, advertising, sales literature and other purposes, $107,275 was paid as sales commissions to broker-dealers and $3,889 was paid as sales commissions to sales personnel of Signator Investors, Inc., a broker-dealer affiliate of the Advisor.
Class A, Class B and Class C shares may be subject to contingent deferred sales charges (CDSCs). Certain Class A shares that are redeemed within one year of purchase are subject to a 1.00% sales charge. Class B shares that are redeemed within six years of purchase are subject to CDSCs, at declining rates, beginning at 5.00%. Class C shares that are redeemed within one year of purchase are subject to a 1.00% CDSC. CDSCs are applied to the lesser of the current market value at the time of redemption or the original purchase cost of the shares being redeemed. Proceeds
| |
| 44 | International Core Fund | Annual report |
from CDSCs are used to compensate the Distributor for providing distribution-related services in connection with the sale of these shares. During the year ended February 28, 2013, CDSCs received by the Distributor amounted to $89, $3,699 and $100 for Class A, Class B and Class C shares, respectively.
Transfer agent fees. The Fund has a transfer agent agreement with John Hancock Signature Services, Inc. (Signature Services), an affiliate of the Advisor. The transfer agent fees paid to Signature Services are determined based on the cost to Signature Services (Signature Services Cost) of providing recordkeeping services. The Signature Services Cost includes a component of allocated John Hancock corporate overhead for providing transfer agent services to the Fund and to all other John Hancock affiliated funds. It also includes out-of-pocket expenses that are comprised of payments made to third-parties for recordkeeping services provided to their clients who invest in one or more John Hancock funds. In addition, Signature Services Cost may be reduced by certain fees that Signature Services receives in connection with retirement and small accounts. Signature Services Cost is calculated monthly and allocated, as applicable, to four categories of share classes: Institutional Share Classes, Retirement Share Classes, Municipal Bond Classes and all other Retail Share Classes. Within each of these categories, the applicable costs are allocated to the affected John Hancock affiliated funds and/or classes, based on the relative average daily net assets.
Class level expenses. Class level expenses for the year ended February 28, 2013 were:
| | | | |
| | DISTRIBUTION | TRANSFER | STATE | PRINTING AND |
| CLASS | AND SERVICE FEES | AGENT FEES | REGISTRATION FEES | POSTAGE |
|
| Class A | $896,696 | $566,272 | $43,626 | $152,524 |
| Class B | 32,581 | 6,293 | 15,556 | 7,705 |
| Class C | 42,162 | 8,162 | 15,056 | 7,942 |
| Class I | — | 485,516 | 54,893 | 103,392 |
| Class R1 | 1,368 | 74 | 14,286 | 315 |
| Class R2 | 245 | 28 | 18,744 | 242 |
| Class R3 | 166 | 9 | 14,613 | 111 |
| Class R4 | 96 | 10 | 14,613 | 114 |
| Class R5 | 23 | 21 | 14,613 | 170 |
| Class R6 | — | 28 | 20,654 | 188 |
| Class 1 | 18,262 | — | — | — |
| Total | $991,599 | $1,066,413 | $226,654 | $272,703 |
Trustee expenses. The Fund compensates each Trustee who is not an employee of the Advisor or its affiliates. Under the John Hancock Group of Funds Deferred Compensation Plan (the Plan) which was terminated in November 2012, certain Trustees could have elected, for tax purposes, to defer receipt of this compensation. Any deferred amounts were invested in various John Hancock funds. The investment of deferred amounts and the offsetting liability are included within Other receivables and prepaid expenses and Payable to affiliates — Trustees’ fees, respectively, in the accompanying Statement of assets and liabilities. Plan assets will be liquidated in accordance with the Plan documents.
| |
| Annual report | International Core Fund | 45 |
Note 6 — Fund share transactions
Transactions in Fund shares for the years ended February 28, 2013 and February 29, 2012 were as follows:
| | | | |
| | | Year ended 2-28-13 | | Year ended 2-29-12 |
| | Shares | Amount | Shares | Amount |
| Class A shares | | | | |
|
| Sold | 4,184,895 | $113,473,414 | 9,664,641 | $283,603,855 |
| Distributions reinvested | 92,891 | 2,589,802 | 256,155 | 6,396,207 |
| Repurchased | (14,607,121) | (395,841,939) | (7,236,095) | (200,862,649) |
| | | | | |
| Net increase (decrease) | (10,329,335) | ($279,778,723) | 2,684,701 | $89,137,413 |
| |
| Class B shares | | | | |
|
| Sold | 16,963 | $453,201 | 19,415 | $552,860 |
| Distributions reinvested | 2,780 | 77,294 | 1,017 | 25,331 |
| Repurchased | (43,400) | (1,182,374) | (64,561) | (1,836,330) |
| | | | | |
| Net decrease | (23,657) | ($651,879) | (44,129) | ($1,258,139) |
| |
| Class C shares | | | | |
|
| Sold | 26,519 | $731,362 | 20,551 | $588,450 |
| Distributions reinvested | 3,511 | 97,597 | 1,054 | 26,257 |
| Repurchased | (35,376) | (961,865) | (40,063) | (1,110,406) |
| | | | | |
| Net decrease | (5,346) | ($132,906) | (18,458) | ($495,699) |
| |
| Class I shares | | | | |
|
| Sold | 8,474,389 | $232,106,900 | 7,061,327 | $199,845,476 |
| Distributions reinvested | 666,942 | 18,627,692 | 280,468 | 7,011,688 |
| Repurchased | (10,366,118) | (294,915,181) | (1,927,978) | (54,524,977) |
| | | | | |
| Net increase (decrease) | (1,224,787) | ($44,180,589) | 5,413,817 | $152,332,187 |
| |
| Class R1 shares | | | | |
|
| Sold | 2,046 | $56,945 | 2,236 | $60,522 |
| Distributions reinvested | 302 | 8,398 | 102 | 2,560 |
| Repurchased | (968) | (27,733) | (757) | (21,279) |
| | | | | |
| Net increase | 1,380 | $37,610 | 1,581 | $41,803 |
| |
| Class R2 shares1 | | | | |
|
| Sold | 3,597 | $100,000 | — | — |
| | | | | |
| Net increase | 3,597 | $100,000 | — | — |
| |
| Class R3 shares | | | | |
|
| Sold | 135 | $3,372 | — | — |
| Distributions reinvested | 4 | 118 | — | — |
| | | | | |
| Net increase | 139 | $3,490 | — | — |
| |
| Class R4 shares | | | | |
|
| Sold | 116 | $3,182 | 160 | $4,313 |
| Distributions reinvested | 10 | 266 | 1 | 39 |
| Repurchased | — | — | — | (2) |
| | | | | |
| Net increase | 126 | $3,448 | 161 | $4,350 |
| |
| Class R5 shares | | | | |
|
| Sold | 408 | $10,959 | 672 | $18,393 |
| Distributions reinvested | 59 | 1,655 | 27 | 680 |
| Repurchased | (260) | (7,099) | (361) | (9,367) |
| | | | | |
| Net increase | 207 | $5,515 | 338 | $9,706 |
| |
| 46 | International Core Fund | Annual report |
| | | | |
| | | Year ended 2-28-13 | | Year ended 2-29-12 |
| | Shares | Amount | Shares | Amount |
| Class R6 shares2 | | | | |
|
| Sold | 217 | $6,070 | 3,577 | $100,148 |
| Distributions reinvested | 5 | 135 | — | — |
| | | | | |
| Net increase | 222 | $6,205 | 3,577 | $100,148 |
| |
| Class 1 shares | | | | |
|
| Sold | 75,968 | $2,070,732 | 96,037 | $2,833,836 |
| Distributions reinvested | 48,585 | 1,358,914 | 31,131 | 779,516 |
| Repurchased | (237,152) | (6,491,709) | (242,275) | (6,879,292) |
| | | | | |
| Net increase | (112,599) | ($3,062,063) | (115,107) | ($3,265,940) |
| |
| Class NAV shares | | | | |
|
| Sold | 4,217,064 | $112,431,436 | 2,458,509 | $67,970,413 |
| Distributions reinvested | 786,663 | 21,987,219 | 624,789 | 15,625,962 |
| Repurchased | (10,977,300) | (285,469,815) | (5,700,418) | (165,832,794) |
| | | | | |
| Net decrease | (5,973,573) | ($151,051,160) | (2,617,120) | ($82,236,419) |
| |
| Net increase (decrease) | (17,663,626) | ($478,701,052) | 5,309,361 | $154,369,410 |
|
1The inception date for Class R2 shares is 3-1-12.
2The inception date for Class R6 shares is 9-1-11.
Affiliates of the Fund owned 35%, 100%, 89%, 78%, 39%, 94% and 100% of shares of beneficial interest of Class R1, Class R2, Class R3, Class R4, Class R5, Class R6 and Class NAV, respectively, on February 28, 2013.
Note 7 — Purchase and sale of securities
Purchases and sales of securities, other than short-term securities, aggregated $732,074,939 and $1,184,006,395, respectively, for the year ended February 28, 2013.
| |
| Annual report | International Core Fund | 47 |
Auditor’s report
Report of Independent Registered Public Accounting Firm
To the Board of Trustees and Shareholders of
John Hancock Funds III International Core Fund:
In our opinion, the accompanying statement of assets and liabilities, including the portfolio of investments, and the related statements of operations and of changes in net assets and the financial highlights present fairly, in all material respects, the financial position of John Hancock Funds III International Core Fund (the “Fund”) at February 28, 2013, the results of its operations for the year then ended, the changes in its net assets for each of the two years in the period then ended and the financial highlights for each of the periods indicated, in conformity with accounting principles generally accepted in the United States of America. These financial statements and financial highlights (hereafter referred to as “financial statements”) are the responsibility of the Fund’s management; our responsibility is to express an opinion on these financial statements based on our audits. We conducted our audits of these financial statements in accordance with the standards of the Public Company Accounting Oversight Board (United States). Those standards require that we plan and perform the audit to obtain reasonable assurance about whether the financial statements are free of material misstatement. An audit includes examining, on a test basis, evidence supporting the amounts and disclosures in the financial statements, assessing the accounting principles used and significant estimates made by management, and evaluating the overall financial statement presentation. We believe that our audits, which included confirmation of securities at February 28, 2013 by correspondence with the custodian, transfer agent, and brokers, provide a reasonable basis for our opinion.
PricewaterhouseCoopers LLP
Boston, Massachusetts
April 22, 2013
| |
| 48 | International Core Fund | Annual report |
Tax information
Unaudited
For federal income tax purposes, the following information is furnished with respect to the distributions of the Fund, if any, paid during its taxable year ended February 28, 2013.
The Fund reports the maximum amount allowable of its net taxable income as eligible for the corporate dividends-received deduction.
The Fund reports the maximum amount allowable of its net taxable income as qualified dividend income as provided in the Jobs and Growth Tax Relief Reconciliation Act of 2003.
Income derived from foreign sources was $41,050,907. The fund intends to pass through foreign tax credits of $1,709,112.
Eligible shareholders will be mailed a 2013 Form 1099-DIV in early 2014. This will reflect the tax character of all distributions paid in calendar year 2013.
Please consult a tax advisor regarding the tax consequences of your investment in the Fund.
| |
| Annual report | International Core Fund | 49 |
Special Shareholder Meeting
Unaudited
On November 13, 2012, a Special Meeting of the Shareholders of John Hancock Funds III and each of its series, including John Hancock International Core Fund, was held at 601 Congress Street, Boston, Massachusetts, for the purpose of considering and voting on the following proposal:
Proposal: Election of thirteen (13) Trustees as members of the Board of Trustees of John Hancock Funds III.
| | |
| | TOTAL VOTES | TOTAL VOTES WITHHELD |
| | FOR THE NOMINEE | FROM THE NOMINEE |
|
| Independent Trustees | | |
| Charles L. Bardelis | 657,515,396.49 | 7,284,346.35 |
| Peter S. Burgess | 657,435,609.53 | 7,364,133.30 |
| William H. Cunningham | 654,078,766.31 | 10,720,976.53 |
| Grace K. Fey | 657,602,863.91 | 7,196,878.92 |
| Theron S. Hoffman | 657,614,243.23 | 7,185,499.60 |
| Deborah C. Jackson | 657,542,023.74 | 7,257,719.09 |
| Hassell H. McClellan | 657,319,823.50 | 7,479,919.34 |
| James M. Oates | 656,971,552.43 | 7,828,190.40 |
| Steven R. Pruchansky | 657,559,900.72 | 7,239,842.11 |
| Gregory A. Russo | 658,072,539.03 | 6,727,203.80 |
| Non-Independent Trustees | | |
| James R. Boyle | 657,895,765.77 | 6,903,977.06 |
| Craig Bromley | 657,588,989.57 | 7,210,753.26 |
| Warren A. Thomson | 657,817,862.75 | 6,981,880.08 |
| |
| 50 | International Core Fund | Annual report |
Trustees and Officers
This chart provides information about the Trustees and Officers who oversee your John Hancock fund as of December 1, 2012. Officers elected by the Trustees manage the day-to-day operations of the Fund and execute policies formulated by the Trustees.
| | |
| Independent Trustees | | |
| | | |
| Name, Year of Birth | Trustee | Number of |
| Position(s) held with Fund | of the | John Hancock |
| Principal occupation(s) and other | Trust | funds overseen |
| directorships during past 5 years | since1 | by Trustee |
| |
| James M. Oates,2 Born: 1946 | 2012 | 234 |
|
| Managing Director, Wydown Group (financial consulting firm) (since 1994); Chairman and Director, |
| Emerson Investment Management, Inc. (since 2000); Independent Chairman, Hudson Castle Group, Inc. |
| (formerly IBEX Capital Markets, Inc.) (financial services company) (1997–2011); Director, Stifel Financial |
| (since 1996); Director, Investor Financial Services Corporation (1995–2007); Director, Connecticut |
| River Bancorp (since 1998); Director, Virtus Funds (formerly Phoenix Mutual Funds) (since 1988). |
| Trustee and Chairperson of the Board, John Hancock retail funds (since 2012); Trustee, John Hancock |
| Funds III (2005–2006 and since 2012); Trustee (since 2004) and Chairperson of the Board (since |
| 2005), John Hancock Variable Insurance Trust; Trustee and Chairperson of the Board (since 2005), |
| John Hancock Funds II. | | |
| |
| Charles L. Bardelis,2,3 Born: 1941 | 2012 | 234 |
|
| Director, Island Commuter Corp. (marine transport). Trustee, John Hancock retail funds (since 2012); |
| Trustee, John Hancock Funds III (2005–2006 and since 2012); Trustee, John Hancock Variable Insurance |
| Trust (since 1988); Trustee, John Hancock Funds II (since 2005). | | |
| |
| Peter S. Burgess,2,3 Born: 1942 | 2012 | 234 |
|
| Consultant (financial, accounting and auditing matters) (since 1999); Certified Public Accountant; |
| Partner, Arthur Andersen (independent public accounting firm) (prior to 1999); Director, Lincoln |
| Educational Services Corporation (since 2004); Director, Symetra Financial Corporation (since 2010); |
| former Director, PMA Capital Corporation (2004–2010). Trustee, John Hancock retail funds (since 2012); |
| Trustee, John Hancock Funds III (2005–2006 and since 2012); Trustee, John Hancock Variable Insurance |
| Trust and John Hancock Funds II (since 2005). | | |
| |
| William H. Cunningham, Born: 1944 | 2006 | 234 |
|
| Professor, University of Texas, Austin, Texas (since 1971); former Chancellor, University of Texas |
| System and former President of the University of Texas, Austin, Texas; Director, LIN Television (since |
| 2009); Chairman (since 2009) and Director (since 2006), Lincoln National Corporation (insurance); |
| Director, Resolute Energy Corporation (since 2009); Director, Southwest Airlines (since 2000); former |
| Director, Introgen (manufacturer of biopharmaceuticals) (until 2008); former Director, Hicks Acquisition |
| Company I, Inc. (until 2007); former Director, Texas Exchange Bank, SSB (formerly Bank of Crowley) |
| (until 2009); former Advisory Director, JP Morgan Chase Bank (formerly Texas Commerce Bank–Austin) |
| (until 2009). Trustee, John Hancock retail funds (since 1986); Trustee, John Hancock Variable Insurance |
| Trust (since 2012); Trustee, John Hancock Funds II (since 2012 and 2005–2006). | |
| |
| Grace K. Fey,2 Born: 1946 | 2012 | 234 |
|
| Chief Executive Officer, Grace Fey Advisors (since 2007); Director and Executive Vice President, |
| Frontier Capital Management Company (1988–2007); Director, Fiduciary Trust (since 2009). |
| Trustee, John Hancock retail funds (since 2012); Trustee, John Hancock Variable Insurance Trust and |
| John Hancock Funds II (since 2008). | | |
| |
| Annual report | International Core Fund | 51 |
| | |
| Independent Trustees (continued) | | |
| |
| Name, Year of Birth | Trustee | Number of John |
| Position(s) held with Fund | of the | Hancock funds |
| Principal occupation(s) and other | Trust | overseen by |
| directorships during past 5 years | since1 | Trustee |
| |
| Theron S. Hoffman,2,3 Born: 1947 | 2012 | 234 |
|
| Chief Executive Officer, T. Hoffman Associates, LLC (consulting firm) (since 2003); Director, The Todd |
| Organization (consulting firm) (2003–2010); President, Westport Resources Management (investment |
| management consulting firm) (2006–2008); Senior Managing Director, Partner and Operating Head, |
| Putnam Investments (2000–2003); Executive Vice President, The Thomson Corp. (financial and |
| legal information publishing) (1997–2000). Trustee, John Hancock retail funds (since 2012); Trustee, |
| John Hancock Variable Insurance Trust and John Hancock Funds II (since 2008). | |
| |
| Deborah C. Jackson, Born: 1952 | 2008 | 234 |
|
| President, Cambridge College, Cambridge, Massachusetts (since 2011); Chief Executive Officer, |
| American Red Cross of Massachusetts Bay (2002–2011); Board of Directors of Eastern Bank Corporation |
| (since 2001); Board of Directors of Eastern Bank Charitable Foundation (since 2001); Board of Directors |
| of American Student Assistance Corporation (1996–2009); Board of Directors of Boston Stock Exchange |
| (2002–2008); Board of Directors of Harvard Pilgrim Healthcare (health benefits company) (2007–2011). |
| Trustee, John Hancock retail funds (since 2008); Trustee of John Hancock Variable Insurance Trust and |
| John Hancock Funds II (since 2012). | | |
| |
| Hassell H. McClellan,2 Born: 1945 | 2012 | 234 |
|
| Associate Professor, The Wallace E. Carroll School of Management, Boston College (since 1984); |
| Trustee, Virtus Variable Insurance Trust (formerly Phoenix Edge Series Funds) (since 2008); Director, |
| The Barnes Group (since 2010). Trustee, John Hancock retail funds (since 2012); Trustee, John Hancock |
| Funds III (2005–2006 and since 2012); Trustee, John Hancock Variable Insurance Trust and | |
| John Hancock Funds II (since 2005). | | |
| |
| Steven R. Pruchansky, Born: 1944 | 2006 | 234 |
|
| Chairman and Chief Executive Officer, Greenscapes of Southwest Florida, Inc. (since 2000); Director |
| and President, Greenscapes of Southwest Florida, Inc. (until 2000); Member, Board of Advisors, First |
| American Bank (until 2010); Managing Director, Jon James, LLC (real estate) (since 2000); Director, |
| First Signature Bank & Trust Company (until 1991); Director, Mast Realty Trust (until 1994); President, |
| Maxwell Building Corp. (until 1991). Trustee (since 1992) and Chairperson of the Board (2011–2012), |
| John Hancock retail funds; Trustee and Vice Chairperson of the Board, John Hancock retail funds, |
| John Hancock Variable Insurance Trust and John Hancock Funds II (since 2012). | |
| |
| Gregory A. Russo, Born: 1949 | 2008 | 234 |
|
| Director and Audit Committee Chairman (since 2012) and Member, Audit Committee and Finance |
| Committee (since 2011), NCH Healthcare System, Inc. (holding company for multi-entity healthcare |
| system); Director and Member of Finance Committee, The Moorings, Inc. (nonprofit continuing care |
| community) (since 2012); Vice Chairman, Risk & Regulatory Matters, KPMG LLP (KPMG) (2002–2006); |
| Vice Chairman, Industrial Markets, KPMG (1998–2002); Chairman and Treasurer, Westchester |
| County, New York, Chamber of Commerce (1986–1992); Director, Treasurer and Chairman of |
| Audit and Finance Committees, Putnam Hospital Center (1989–1995); Director and Chairman of |
| Fundraising Campaign, United Way of Westchester and Putnam Counties, New York (1990–1995). |
| Trustee, John Hancock retail funds (since 2008); Trustee, John Hancock Variable Insurance Trust and |
| John Hancock Funds II (since 2012). | | |
| |
| 52 | International Core Fund | Annual report |
| | |
| Non-Independent Trustees4 | | |
| | | |
| Name, Year of Birth | Trustee | Number of |
| Position(s) held with Fund | of the | John Hancock |
| Principal occupation(s) and other | Trust | funds overseen |
| directorships during past 5 years | since1 | by Trustee |
| |
| James R. Boyle,2 Born: 1959 | 2012 | 234 |
|
| Senior Executive Vice President, John Hancock Financial Services (since 1999, including prior positions); |
| Chairman and Director, John Hancock Advisers, LLC, John Hancock Funds, LLC and John Hancock |
| Investment Management Services, LLC (2005–2010). Trustee, John Hancock retail funds (since 2012 and |
| 2005–2010), Trustee, John Hancock Variable Insurance Trust and John Hancock Funds II (since 2005). |
| |
| Craig Bromley,2 Born: 1966 | 2012 | 234 |
|
| President, John Hancock Financial Services (since 2012); Senior Executive Vice President and General |
| Manager, U.S. Division, John Hancock Financial Services (since 2012); President and Chief Executive |
| Officer, Manulife Insurance Company (Manulife (Japan) (2005–2012), including prior positions). |
| Trustee, John Hancock retail funds (since 2012); Trustee, John Hancock Variable Insurance Trust and |
| John Hancock Funds II (since 2012). | | |
| |
| Warren A. Thomson,2 Born: 1955 | 2012 | 234 |
|
| Senior Executive Vice President and Chief Investment Officer, Manulife Financial Corporation (since |
| 2001, including prior positions); Director, Manulife Trust Company and Manulife Bank of Canada (since |
| 2001, including prior positions); Director and Chairman, Manulife Asset Management (2001–2013, |
| including prior positions). Trustee, John Hancock retail funds, John Hancock Variable Insurance Trust and |
| John Hancock Funds II (since 2012). | | |
| |
| Principal officers who are not Trustees | | |
| | | |
| Name, Year of Birth | | Officer |
| Position(s) held with Fund | | of the |
| Principal occupation(s) and other | | Trust |
| directorships during past 5 years | | since |
| |
| Hugh McHaffie, Born: 1959 | | 2012 |
|
| President | | |
| Executive Vice President, John Hancock Financial Services (since 2006, including prior positions); |
| Chairman and Director, John Hancock Advisers, LLC, John Hancock Investment Management Services, |
| LLC and John Hancock Funds, LLC (since 2010); President, John Hancock Advisers, LLC (since 2012); |
| President, John Hancock Investment Management Services, LLC (since 2010). President (since 2012) and |
| former Trustee (2010–2012), John Hancock retail funds; President, John Hancock Variable Insurance |
| Trust and John Hancock Funds II (since 2009). | | |
| |
| Andrew G. Arnott, Born: 1971 | | 2009 |
|
| Executive Vice President | | |
| Senior Vice President, John Hancock Financial Services (since 2009); Executive Vice President, |
| John Hancock Advisers, LLC (since 2005); Executive Vice President, John Hancock Investment |
| Management Services, LLC (since 2006); President, John Hancock Funds, LLC (since 2004, including |
| prior positions); Executive Vice President, John Hancock retail funds (since 2007, including prior |
| positions); Executive Vice President, John Hancock Variable Insurance Trust and John Hancock Funds II |
| (since 2007, including prior positions). | | |
| |
| Thomas M. Kinzler, Born: 1955 | | 2006 |
|
| Secretary and Chief Legal Officer | | |
| Vice President, John Hancock Financial Services (since 2006); Secretary and Chief Legal Counsel, |
| John Hancock Funds, LLC (since 2007); Secretary and Chief Legal Officer, John Hancock retail funds, |
| John Hancock Variable Insurance Trust and John Hancock Funds II (since 2006). | |
| |
| Annual report | International Core Fund | 53 |
| |
| Principal officers who are not Trustees (continued) | |
| |
| Name, Year of Birth | Officer |
| Position(s) held with Fund | of the |
| Principal occupation(s) and other | Trust |
| directorships during past 5 years | since |
| |
| Francis V. Knox, Jr., Born: 1947 | 2006 |
|
| Chief Compliance Officer | |
| Vice President, John Hancock Financial Services (since 2005); Chief Compliance Officer, John Hancock |
| retail funds, John Hancock Variable Insurance Trust, John Hancock Funds II, John Hancock Advisers, |
| LLC and John Hancock Investment Management Services, LLC (since 2005); Vice President and Chief |
| Compliance Officer, John Hancock Asset Management a division of Manulife Asset Management (US) |
| LLC (2005–2008). | |
| |
| Charles A. Rizzo, Born: 1957 | 2007 |
|
| Chief Financial Officer | |
| Vice President, John Hancock Financial Services (since 2008); Senior Vice President, John Hancock | |
| Advisers, LLC and John Hancock Investment Management Services, LLC (since 2008); Chief Financial |
| Officer, John Hancock retail funds, John Hancock Variable Insurance Trust and John Hancock | |
| Funds II (since 2007). | |
| |
| Salvatore Schiavone, Born: 1965 | 2010 |
|
| Treasurer | |
| Assistant Vice President, John Hancock Financial Services (since 2007); Vice President, John Hancock |
| Advisers, LLC and John Hancock Investment Management Services, LLC (since 2007); Treasurer, | |
| John Hancock retail funds (since 2007, including prior positions); Treasurer, John Hancock Variable | |
| Insurance Trust and John Hancock Funds II (since 2010 and 2007–2009, including prior positions). | |
John Hancock retail funds is comprised of John Hancock Funds III and 33 other John Hancock funds consisting of 23 series of other John Hancock trusts and 10 closed-end funds.
The business address for all Trustees and Officers is 601 Congress Street, Boston, Massachusetts 02210–2805.
The Statement of Additional Information of the Fund includes additional information about members of the Board of Trustees of the Fund and is available without charge, upon request, by calling 1-800–225-5291.
1 Each Trustee holds office until his or her successor is elected and qualified, or until the Trustee’s death, retirement, resignation or removal.
2 Became a Trustee of the Fund effective December 1, 2012.
3 Member of Audit Committee.
4 Because Messrs. Bromley and Thomson are senior executives or directors and Mr. Boyle held prior positions as a senior executive and director of the Advisor and/or its affiliates, each of them is considered an “interested person,” as defined in the Investment Company Act of 1940, of the Fund.
| |
| 54 | International Core Fund | Annual report |
More information
| |
| Trustees | Investment advisor |
| James M. Oates, Chairman | John Hancock Investment Management |
| Steven R. Pruchansky, Vice Chairman | Services, LLC |
| Charles L. Bardelis* | |
| James R. Boyle† | Subadvisor |
| Craig Bromley† | Grantham, Mayo, Van Otterloo & Co. LLC |
| Peter S. Burgess* | |
| William H. Cunningham | Principal distributor |
| Grace K. Fey | John Hancock Funds, LLC |
| Theron S. Hoffman* | |
| Deborah C. Jackson | Custodian |
| Hassell H. McClellan | State Street Bank and Trust Company |
| Gregory A. Russo | |
| Warren A. Thomson† | Transfer agent |
| | John Hancock Signature Services, Inc. |
| Officers | |
| Hugh McHaffie | Legal counsel |
| President | K&L Gates LLP |
| | |
| Andrew G. Arnott | Independent registered |
| Executive Vice President | public accounting firm |
| | PricewaterhouseCoopers LLP |
| Thomas M. Kinzler | |
| Secretary and Chief Legal Officer | |
| | |
| Francis V. Knox, Jr. | |
| Chief Compliance Officer | |
| | |
| Charles A. Rizzo | |
| Chief Financial Officer | |
| | |
| Salvatore Schiavone | |
| Treasurer | |
| |
| *Member of the Audit Committee | |
| †Non-Independent Trustee | |
The Fund’s proxy voting policies and procedures, as well as the Fund’s proxy voting record for the most recent twelve-month period ended June 30, are available free of charge on the Securities and Exchange Commission (SEC) Web site at www.sec.gov or on our Web site.
The Fund’s complete list of portfolio holdings, for the first and third fiscal quarters, is filed with the SEC on Form N-Q. The Fund’s Form N-Q is available on our Web site and the SEC’s Web site, www.sec.gov, and can be reviewed and copied (for a fee) at the SEC’s Public Reference Room in Washington, DC. Call 1-800-SEC-0330 to receive information on the operation of the SEC’s Public Reference Room.
We make this information on your fund, as well as monthly portfolio holdings, and other fund details available on our Web site at www.jhfunds.com or by calling 1-800-225-5291.
| | |
| You can also contact us: | | |
| 1-800-225-5291 | Regular mail: | Express mail: |
| jhfunds.com | John Hancock Signature Services, Inc. | John Hancock Signature Services, Inc. |
| | P.O. Box 55913 | Mutual Fund Image Operations |
| | Boston, MA 02205-5913 | 30 Dan Road |
| | | Canton, MA 02021 |
| |
| Annual report | International Core Fund | 55 |

1-800-225-5291
1-800-554-6713 TDD
1-800-338-8080 EASI-Line
www.jhfunds.com

www.jhfunds.com/edelivery
| |
| This report is for the information of the shareholders of John Hancock International Core Fund. | |
| It is not authorized for distribution to prospective investors unless preceded or accompanied by a prospectus. | 66A 2/13 |
| MF135741 | 4/13 |

A look at performance
Total returns for the period ended February 28, 2013
| | | | | | | | |
| | Average annual total returns (%) | | | Cumulative total returns (%) |
| | with maximum sales charge | | | | with maximum sales charge | |
|
| | | | | Since | | | | Since |
| | 1-year | 5-year | 10-year | inception1 | | 5-year | 10-year | inception1 |
|
| Class A | 9.09 | 0.02 | — | 3.47 | | 0.09 | — | 25.76 |
|
| Class B | 9.00 | –0.07 | — | 3.49 | | –0.36 | — | 25.97 |
|
| Class C | 12.97 | 0.28 | — | 3.47 | | 1.41 | — | 25.75 |
|
| Class I2 | 15.23 | 1.47 | — | 4.71 | | 7.59 | — | 36.23 |
|
| Class 12 | 15.29 | 1.51 | — | 4.74 | | 7.79 | — | 36.52 |
|
Performance figures assume all distributions have been reinvested. Figures reflect maximum sales charges on Class A shares of 5%, and the applicable contingent deferred sales charge (CDSC) on Class B and Class C shares. The Class B shares’ CDSC declines annually between years 1 to 6 according to the following schedule: 5, 4, 3, 3, 2, 1%. No sales charge will be assessed after the sixth year. Class C shares held for less than one year are subject to a 1% CDSC. Sales charges are not applicable to Class I and Class 1 shares.
The expense ratios of the Fund, both net (including any fee waivers or expense limitations) and gross (excluding any fee waivers or expense limitations), are set forth according to the most recent publicly available prospectuses for the Fund and may differ from those disclosed in the Financial highlights tables in this report. The fee waivers and expense limitations are contractual until at least 6-30-13 for Class A, Class B, Class C and Class 1 shares. Had the fee waivers and expense limitations not been in place, gross expenses would apply. For Class I shares, the net expenses equal the gross expenses. The expense ratios are as follows:
| | | | | |
| | Class A | Class B | Class C | Class I | Class 1 |
| Net (%) | 1.60 | 2.30 | 2.30 | 1.20 | 1.15 |
| Gross (%) | 1.66 | 4.00 | 3.34 | 1.20 | 1.16 |
The returns reflect past results and should not be considered indicative of future performance. The return and principal value of an investment will fluctuate so that shares, when redeemed, may be worth more or less than their original cost. Due to market volatility, the Fund’s current performance may be higher or lower than the performance shown. For current to the most recent month-end performance data, please call 1-800-225-5291 or visit the Fund’s Web site at www.jhfunds.com.
The performance table above and the chart on the next page do not reflect the deduction of taxes that a shareholder would pay on fund distributions or the redemption of fund shares. The Fund’s performance results reflect any applicable expense reductions, without which the expenses increase and results would have been less favorable.
See the following page for footnotes.
| |
| 6 | International Growth Fund | Annual report |
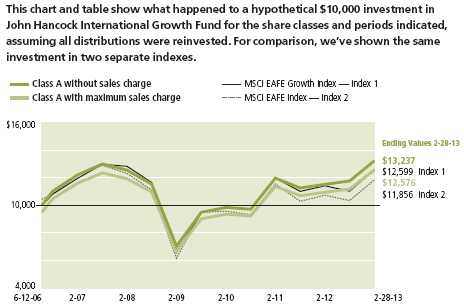
| | | | | |
| | | Without | With maximum | | |
| | Start date | sales charge | sales charge | Index 1 | Index 2 |
|
| Class B3 | 6-12-06 | $12,597 | $12,597 | $12,599 | $11,856 |
|
| Class C3 | 6-12-06 | 12,575 | 12,575 | 12,599 | 11,856 |
|
| Class I2 | 6-12-06 | 13,623 | 13,623 | 12,599 | 11,856 |
|
| Class 12 | 6-12-06 | 13,652 | 13,652 | 12,599 | 11,856 |
|
MSCI EAFE Growth Index (gross of foreign withholding tax on dividends) is a free float-adjusted market capitalization index that is designed to measure the performance of growth-oriented developed market stocks within Europe, Australasia and the Far East. The Index consists of 21 developed market country indexes.
MSCI EAFE Index (gross of foreign withholding tax on dividends) is a free float-adjusted market capitalization index that is designed to measure the equity market performance of developed markets, excluding the U.S. and Canada. The index consists of 21 developed market country indexes.
It is not possible to invest directly in an index. Index figures do not reflect expenses or sales charges, which would have resulted in lower values if they did.
Footnotes related to performance pages
1 From 6-12-06.
2 For certain types of investors, as described in the Fund’s prospectuses.
3 The contingent deferred sales charge is not applicable.
| |
| Annual report | International Growth Fund | 7 |
Management’s discussion of
Fund performance
By Grantham, Mayo, Van Otterloo & Co. LLC
For the 12 months ended February 28, 2013, stocks in international developed markets fared poorly early on amid renewed concerns about the European sovereign debt crisis, but subsequently rallied to end the period with healthy gains. A major turning point occurred in July, when European Central Bank (ECB) President Mario Draghi stated he would do “whatever it takes” to preserve the euro. In September, the ECB backed up that statement with a new bond-buying program, and central banks in the United States and Japan also announced stimulative measures. Against this backdrop, the Fund’s benchmark, the MSCI EAFE Growth Index, returned 10.27%, while the average foreign large growth fund category monitored by Morningstar Inc. finished at 7.47%.†
For the year, John Hancock International Growth Fund’s Class A shares returned 14.82%, excluding sales charges. Two inputs to our investment strategy — momentum and quality — steered us to a sizable overweighting in health care and to underweightings in energy and materials, all of which contributed to the Fund’s performance. In addition to its favorable sector allocation, stock selection was a net positive for the Fund. Two of the Fund’s contributors were large pharmaceutical companies: Switzerland-based Roche Holdings AG and the U.K.’s GlaxoSmithKline PLC. Also aiding performance was an overweighted stake in U.K-listed Lloyds Banking Group PLC and underweightings in BG Group PLC, a U.K.-based supplier of natural gas and crude oil, and metals miner Anglo American PLC, also headquartered in the U.K. Conversely, an out-of-benchmark stake in Dutch telecommunication services provider Koninklijke KPN NV was counterproductive for the Fund, given this stock’s significant decline. Other significant relative detractors were underweighted benchmark components that performed well, including two Japanese holdings, automaker Toyota Motor Corp. and information technology conglomerate Softbank Corp., as well as British consumer goods supplier Unilever NV.
This commentary reflects the views of the portfolio management team through the end of the period discussed in this report. The team’s statements reflect their own opinions. As such, they are in no way guarantees of future events and are not intended to be used as investment advice or a recommendation regarding any specific security. They are also subject to change at any time as market and other conditions warrant.
Past performance is no guarantee of future results.
Foreign investing, especially in emerging markets, has additional risks, such as currency and market volatility and political and social instability. Growth stocks may be subject to greater price fluctuations because their prices tend to place greater emphasis on earnings expectations. Hedging and other strategic transactions may increase volatility of a fund and, if the transaction is not successful, could result in a significant loss. For additional information on these and other risk considerations, please see the Fund’s prospectus.
† Figures from Morningstar, Inc. include reinvested dividends and do not take into account sales charges. Actual load-adjusted performance is lower.
| |
| 8 | International Growth Fund | Annual report |
Your expenses
These examples are intended to help you understand your ongoing operating expenses of investing in the Fund so you can compare these costs with the ongoing costs of investing in other mutual funds.
Understanding fund expenses
As a shareholder of the Fund, you incur two types of costs:
■ Transaction costs which include sales charges (loads) on purchases or redemptions (varies by share class), minimum account fee charge, etc.
■ Ongoing operating expenses including management fees, distribution and service fees (if applicable), and other fund expenses.
We are going to present only your ongoing operating expenses here.
Actual expenses/actual returns
This example is intended to provide information about the Fund’s actual ongoing operating expenses, and is based on the Fund’s actual return. It assumes an account value of $1,000.00 on September 1, 2012 with the same investment held until February 28, 2013.
| | | |
| | Account value | Ending value | Expenses paid during |
| | on 9-1-12 | on 2-28-13 | period ended 2-28-131 |
|
| Class A | $1,000.00 | $1,124.00 | $8.43 |
|
| Class B | 1,000.00 | 1,119.80 | 12.09 |
|
| Class C | 1,000.00 | 1,120.00 | 12.09 |
|
| Class I | 1,000.00 | 1,126.40 | 6.54 |
|
| Class 1 | 1,000.00 | 1,126.40 | 6.06 |
|
Together with the value of your account, you may use this information to estimate the operating expenses that you paid over the period. Simply divide your account value at February 28, 2013, by $1,000.00, then multiply it by the “expenses paid” for your share class from the table above. For example, for an account value of $8,600.00, the operating expenses should be calculated as follows:
| |
| Annual report | International Growth Fund | 9 |
Your expenses
Hypothetical example for comparison purposes
This table allows you to compare the Fund’s ongoing operating expenses with those of any other fund. It provides an example of the Fund’s hypothetical account values and hypothetical expenses based on each class’s actual expense ratio and an assumed 5% annualized return before expenses (which is not the Fund’s actual return). It assumes an account value of $1,000.00 on September 1, 2012, with the same investment held until February 28, 2013. Look in any other fund shareholder report to find its hypothetical example and you will be able to compare these expenses. Please remember that these hypothetical account values and expenses may not be used to estimate the actual ending account balance or expenses you paid for the period.
| | | |
| | Account value | Ending value | Expenses paid during |
| | on 9-1-12 | on 2-28-13 | period ended 2-28-131 |
|
| Class A | $1,000.00 | $1,016.90 | $8.00 |
|
| Class B | 1,000.00 | 1,013.40 | 11.48 |
|
| Class C | 1,000.00 | 1,013.40 | 11.48 |
|
| Class I | 1,000.00 | 1,018.60 | 6.21 |
|
| Class 1 | 1,000.00 | 1,019.10 | 5.76 |
|
Remember, these examples do not include any transaction costs, therefore, these examples will not help you to determine the relative total costs of owning different funds. If transaction costs were included, your expenses would have been higher. See the prospectus for details regarding transaction costs.
1 Expenses are equal to the Fund’s annualized expense ratio of 1.60%, 2.30%, 2.30%, 1.24% and 1.15% for Class A, Class B, Class C, Class I and Class 1 shares, respectively, multiplied by the average account value over the period, multiplied by 181/365 (to reflect the one-half year period).
| |
| 10 | International Growth Fund | Annual report |
Portfolio summary
| | | | |
| Top 10 Holdings (20.9% of Net Assets on 2-28-13)1,2 | | | |
|
| Roche Holdings AG | 3.0% | | Rio Tinto PLC | 1.9% |
| |
|
| Nestle SA | 2.6% | | Bayer AG | 1.8% |
| |
|
| Diageo PLC | 2.5% | | GlaxoSmithKline PLC | 1.7% |
| |
|
| Novo Nordisk A/S, Class B | 2.4% | | Canadian National Railway Company | 1.4% |
| |
|
| British American Tobacco PLC | 2.4% | | SAP AG | 1.2% |
| |
|
| |
| |
| Sector Composition1,3 | | | | |
|
| Health Care | 17.6% | | Information Technology | 6.0% |
| |
|
| Consumer Staples | 17.0% | | Telecommunication Services | 4.2% |
| |
|
| Financials | 14.1% | | Energy | 2.1% |
| |
|
| Consumer Discretionary | 12.3% | | Utilities | 2.0% |
| |
|
| Industrials | 11.9% | | Short-Term Investments & Other | 6.3% |
| |
|
| Materials | 6.5% | | | |
| | | |
| |
| | | | | |
| Top 10 Countries1,2,3 | | | | |
|
| Japan | 20.6% | | Australia | 4.4% |
| |
|
| United Kingdom | 19.7% | | Canada | 3.1% |
| |
|
| Germany | 9.1% | | Hong Kong | 3.1% |
| |
|
| Switzerland | 8.7% | | Denmark | 3.0% |
| |
|
| France | 5.9% | | Netherlands | 2.3% |
| |
|
1 As a percentage of net assets on 2-28-13.
2 Cash and cash equivalents not included.
3 International investing involves special risks such as political, economic and currency risks and differences in accounting standards and financial reporting. Sector investing is subject to greater risks than the market as a whole. Because the Fund may focus on particular sectors of the economy, its performance may depend on the performance of those sectors.
| |
| Annual report | International Growth Fund | 11 |
Fund’s investments
As of 2-28-13
| | |
| | Shares | Value |
|
| Common Stocks 92.5% | | $153,538,711 |
|
| (Cost $127,444,089) | | |
| | | |
| Australia 4.4% | | 7,294,497 |
| ALS, Ltd. | 12,550 | 150,259 |
|
| Australia & New Zealand Banking Group, Ltd. | 5,801 | 169,898 |
|
| Coca-Cola Amatil, Ltd. | 14,738 | 218,339 |
|
| Cochlear, Ltd. | 1,549 | 111,989 |
|
| CSL, Ltd. | 32,342 | 1,979,721 |
|
| Fortescue Metals Group, Ltd. (L) | 39,487 | 189,796 |
|
| Insurance Australia Group, Ltd. | 20,323 | 118,098 |
|
| Telstra Corp., Ltd. | 232,057 | 1,087,031 |
|
| Westfield Group | 18,617 | 212,337 |
|
| Westpac Banking Corp. | 37,293 | 1,169,754 |
|
| Woolworths, Ltd. | 53,050 | 1,887,275 |
| | | |
| Austria 0.2% | | 303,345 |
| Erste Group Bank AG (I) | 9,465 | 303,345 |
| | | |
| Belgium 1.7% | | 2,781,863 |
| Ageas | 11,158 | 378,896 |
|
| Anheuser-Busch InBev NV | 18,369 | 1,721,929 |
|
| Bekaert SA | 2,847 | 77,197 |
|
| Colruyt SA | 5,243 | 258,302 |
|
| Mobistar SA | 3,858 | 91,148 |
|
| UCB SA | 2,262 | 130,456 |
|
| Umicore SA | 2,482 | 123,935 |
| | | |
| Canada 3.1% | | 5,150,332 |
| Agrium, Inc. | 2,400 | 248,529 |
|
| BCE, Inc. (L) | 8,100 | 365,158 |
|
| Canadian National Railway Company | 22,200 | 2,253,044 |
|
| Canadian Pacific Railway, Ltd. | 4,300 | 523,088 |
|
| Enbridge, Inc. (L) | 12,100 | 539,499 |
|
| Potash Corp. of Saskatchewan, Inc. | 5,300 | 212,668 |
|
| Rogers Communications, Inc., Class B (L) | 6,900 | 327,721 |
|
| Royal Bank of Canada (L) | 6,100 | 378,688 |
|
| Saputo, Inc. (L) | 3,100 | 153,429 |
|
| Valeant Pharmaceuticals International, Inc. (I) | 2,202 | 148,508 |
| | | |
| China 0.2% | | 366,639 |
| AAC Technologies Holdings, Inc. | 64,000 | 269,961 |
|
| Yangzijiang Shipbuilding Holdings, Ltd. | 124,000 | 96,678 |
| | |
| 12 | International Growth Fund | Annual report | See notes to financial statements |
| | |
| | Shares | Value |
| Denmark 3.0% | | $5,046,113 |
| Chr Hansen Holding A/S | 2,719 | 98,243 |
|
| Coloplast A/S | 9,287 | 484,488 |
|
| GN Store Nord A/S | 7,746 | 138,422 |
|
| Novo Nordisk A/S, Class B | 22,700 | 3,970,537 |
|
| Novozymes A/S, B shares (L) | 10,163 | 354,423 |
| | | |
| Finland 1.2% | | 1,987,175 |
| Fortum OYJ | 14,800 | 282,372 |
|
| Kone OYJ (L) | 9,800 | 790,663 |
|
| Neste Oil OYJ | 5,563 | 83,354 |
|
| Nokia OYJ (L) | 60,522 | 220,393 |
|
| Nokian Renkaat OYJ | 2,175 | 98,578 |
|
| Orion OYJ, Series B | 1,129 | 33,339 |
|
| Sampo OYJ, Class A | 7,410 | 272,922 |
|
| Wartsila OYJ | 4,454 | 205,554 |
| | | |
| France 5.9% | | 9,813,457 |
| Air France KLM (I) | 8,471 | 89,836 |
|
| Alcatel-Lucent (I) | 74,791 | 104,023 |
|
| AtoS | 1,239 | 92,047 |
|
| BNP Paribas SA | 8,168 | 456,059 |
|
| Bureau Veritas SA | 3,626 | 466,988 |
|
| Carrefour SA | 9,157 | 248,960 |
|
| Casino Guichard Perrachon SA | 1,736 | 174,235 |
|
| Cie de Saint-Gobain | 2,168 | 86,196 |
|
| Cie Generale d’Optique Essilor International SA | 8,519 | 876,873 |
|
| Cie Generale des Etablissements Michelin | 6,730 | 601,451 |
|
| Credit Agricole SA (I) | 30,813 | 289,846 |
|
| Danone SA | 4,423 | 306,460 |
|
| Dassault Systemes SA | 4,211 | 476,982 |
|
| Eutelsat Communications | 5,252 | 189,266 |
|
| ICADE | 1,054 | 94,547 |
|
| Iliad SA | 1,750 | 334,075 |
|
| L’Oreal SA | 5,245 | 783,186 |
|
| Lafarge SA | 5,412 | 363,640 |
|
| Neopost SA | 1,309 | 75,473 |
|
| Remy Cointreau SA | 1,588 | 200,619 |
|
| Sanofi | 21,282 | 2,009,433 |
|
| Societe BIC SA | 805 | 93,636 |
|
| Societe Generale SA (I) | 10,778 | 414,094 |
|
| Sodexo | 1,688 | 156,110 |
|
| Suez Environnement Company | 5,666 | 75,581 |
|
| Unibail-Rodamco SE | 849 | 196,093 |
|
| Valeo SA | 1,451 | 81,904 |
|
| Vallourec SA | 1,185 | 63,183 |
|
| Wendel SA | 1,507 | 166,000 |
|
| Zodiac Aerospace | 2,197 | 246,661 |
| | |
| See notes to financial statements | Annual report | International Growth Fund | 13 |
| | |
| | Shares | Value |
| Germany 7.9% | | $13,121,202 |
| Allianz SE | 6,714 | 917,508 |
|
| Aurubis AG (L) | 3,308 | 232,101 |
|
| BASF SE | 1,860 | 175,024 |
|
| Bayer AG | 30,335 | 3,004,786 |
|
| Beiersdorf AG | 4,102 | 357,492 |
|
| Brenntag AG | 1,097 | 156,409 |
|
| Continental AG | 2,724 | 319,278 |
|
| Deutsche Lufthansa AG | 14,583 | 294,173 |
|
| Deutsche Post AG | 19,911 | 446,277 |
|
| Duerr AG | 1,888 | 207,083 |
|
| Fielmann AG | 1,685 | 159,759 |
|
| Freenet AG | 14,485 | 323,590 |
|
| Hannover Rueckversicherung AG | 3,754 | 293,720 |
|
| Henkel AG & Company, KGaA | 3,229 | 238,882 |
|
| Hochtief AG (I) | 1,026 | 69,039 |
|
| Hugo Boss AG | 1,529 | 177,265 |
|
| Kabel Deutschland Holding AG | 2,312 | 200,488 |
|
| Lanxess AG | 2,130 | 180,349 |
|
| Leoni AG | 1,496 | 67,445 |
|
| Merck KGaA | 1,935 | 272,785 |
|
| Metro AG | 6,561 | 203,033 |
|
| Muenchener Rueckversicherungs AG | 7,062 | 1,267,640 |
|
| Salzgitter AG | 1,416 | 67,564 |
|
| SAP AG | 26,467 | 2,065,932 |
|
| Sky Deutschland AG (I) | 27,673 | 177,096 |
|
| Software AG | 2,230 | 87,932 |
|
| Stada Arzneimittel AG | 3,742 | 146,269 |
|
| Suedzucker AG | 7,485 | 327,796 |
|
| Symrise AG | 2,439 | 92,482 |
|
| ThyssenKrupp AG (I) | 10,549 | 237,259 |
|
| TUI AG (I) | 10,526 | 105,300 |
|
| Volkswagen AG | 876 | 180,526 |
|
| Wacker Chemie AG | 770 | 68,920 |
| | | |
| Guernsey, C.I. 0.1% | | 108,463 |
| Resolution, Ltd. | 27,419 | 108,463 |
| | | |
| Hong Kong 3.1% | | 5,089,940 |
| ASM Pacific Technology, Ltd. | 3,200 | 42,269 |
|
| BOC Hong Kong Holdings, Ltd. | 82,000 | 276,106 |
|
| Cheung Kong Infrastructure Holdings, Ltd. | 24,000 | 157,092 |
|
| CLP Holdings, Ltd. | 43,000 | 370,401 |
|
| Esprit Holdings, Ltd. | 39,800 | 51,871 |
|
| Galaxy Entertainment Group, Ltd. (I) | 105,000 | 440,168 |
|
| Hang Seng Bank, Ltd. | 16,500 | 266,076 |
|
| Henderson Land Development Company, Ltd. | 22,000 | 153,982 |
|
| Hong Kong & China Gas Company, Ltd. | 308,255 | 863,204 |
|
| Hong Kong Exchanges & Clearing, Ltd. | 12,100 | 217,671 |
|
| Hong Kong Land Holdings, Ltd. | 22,000 | 169,619 |
|
| Jardine Matheson Holdings, Ltd. | 1,600 | 101,004 |
| | |
| 14 | International Growth Fund | Annual report | See notes to financial statements |
| | |
| | Shares | Value |
| Hong Kong (continued) | | |
| Luk Fook Holdings International, Ltd. | 8,000 | $26,536 |
|
| New World Development Company, Ltd. | 52,000 | 95,181�� |
|
| Noble Group, Ltd. | 153,000 | 145,843 |
|
| Power Assets Holdings, Ltd. | 52,000 | 464,689 |
|
| Sun Hung Kai Properties, Ltd. | 22,000 | 340,044 |
|
| The Link REIT | 86,011 | 459,660 |
|
| Wharf Holdings, Ltd. | 40,000 | 350,706 |
|
| Xinyi Glass Holdings Company, Ltd. | 146,000 | 97,818 |
| | | |
| Ireland 1.3% | | 2,092,619 |
| DCC PLC | 5,439 | 191,202 |
|
| Elan Corp. PLC (I) | 21,034 | 235,834 |
|
| Experian PLC | 27,255 | 451,267 |
|
| Kerry Group PLC | 8,847 | 495,717 |
|
| Paddy Power PLC | 7,819 | 646,182 |
|
| UBM PLC | 6,165 | 72,417 |
| | | |
| Israel 0.3% | | 455,195 |
| Israel Chemicals, Ltd. | 9,130 | 118,082 |
|
| Mellanox Technologies, Ltd. (I) | 2,318 | 119,541 |
|
| Teva Pharmaceutical Industries, Ltd. | 5,814 | 217,572 |
| | | |
| Italy 0.8% | | 1,281,759 |
| Assicurazioni Generali SpA | 20,820 | 337,758 |
|
| Atlantia SpA | 13,487 | 233,411 |
|
| Azimut Holding SpA | 3,301 | 52,368 |
|
| Fiat Industrial SpA | 9,726 | 118,312 |
|
| Fiat SpA (I) | 36,416 | 195,150 |
|
| Mediobanca SpA | 10,194 | 61,633 |
|
| Mediolanum SpA | 13,878 | 76,615 |
|
| UniCredit SpA (I) | 40,615 | 206,512 |
| | | |
| Japan 20.6% | | 34,158,046 |
| ABC-MART, Inc. (L) | 3,300 | 115,117 |
|
| Accordia Golf Company, Ltd. | 85 | 80,178 |
|
| Advantest Corp. | 5,800 | 83,145 |
|
| Aeon Company, Ltd. | 11,400 | 128,127 |
|
| Ajinomoto Company, Inc. | 16,000 | 212,215 |
|
| Anritsu Corp. | 10,000 | 147,832 |
|
| Astellas Pharma, Inc. | 31,500 | 1,701,874 |
|
| Calbee, Inc. | 1,700 | 144,878 |
|
| Canon, Inc. | 15,800 | 573,131 |
|
| Central Japan Railway Company, Ltd. | 2,400 | 233,221 |
|
| Century Tokyo Leasing Corp. | 700 | 16,304 |
|
| Chiyoda Corp. | 7,000 | 87,321 |
|
| Chugai Pharmaceutical Company, Ltd. | 13,400 | 289,746 |
|
| Credit Saison Company, Ltd. | 6,100 | 129,562 |
|
| Daihatsu Motor Company, Ltd. | 9,000 | 182,751 |
|
| Daito Trust Construction Company, Ltd. | 5,900 | 528,207 |
|
| Daiwa House Industry Company, Ltd. | 15,000 | 275,293 |
|
| Dena Company, Ltd. (L) | 10,100 | 283,293 |
| | |
| See notes to financial statements | Annual report | International Growth Fund | 15 |
| | |
| | Shares | Value |
| Japan (continued) | | |
| DIC Corp. | 50,000 | $100,273 |
|
| Eisai Company, Ltd. | 10,400 | 462,889 |
|
| FANUC Corp. | 2,800 | 431,955 |
|
| Fast Retailing Company, Ltd. | 2,400 | 658,074 |
|
| Fuji Heavy Industries, Ltd. | 21,000 | 313,726 |
|
| Gree, Inc. (L) | 6,100 | 74,233 |
|
| Hankyu Hanshin Holdings, Inc. | 20,000 | 109,824 |
|
| Haseko Corp. (I) | 96,000 | 84,572 |
|
| Hino Motors, Ltd. | 17,000 | 179,430 |
|
| Hirose Electric Company, Ltd. | 1,100 | 132,842 |
|
| Hisamitsu Pharmaceutical Company, Inc. | 7,600 | 440,170 |
|
| Hitachi, Ltd. | 38,000 | 213,037 |
|
| Honda Motor Company, Ltd. | 3,900 | 145,240 |
|
| Hoya Corp. | 18,500 | 354,704 |
|
| Idemitsu Kosan Company, Ltd. | 600 | 54,545 |
|
| IHI Corp. | 44,000 | 123,409 |
|
| Inpex Corp. | 57 | 303,019 |
|
| Isuzu Motors, Ltd. | 34,000 | 208,960 |
|
| ITO EN, Ltd. | 4,400 | 89,087 |
|
| ITOCHU Corp. | 67,300 | 776,463 |
|
| Izumi Company, Ltd. | 5,100 | 111,656 |
|
| Japan Real Estate Investment Corp. | 14 | 153,582 |
|
| Japan Retail Fund Investment Corp. | 47 | 91,858 |
|
| Japan Tobacco, Inc. | 18,000 | 567,811 |
|
| JFE Holdings, Inc. | 13,700 | 293,367 |
|
| JGC Corp. | 6,000 | 165,505 |
|
| K’s Holding Corp. | 4,700 | 121,160 |
|
| Kakaku.com, Inc. | 3,300 | 128,152 |
|
| Kao Corp. | 22,600 | 722,428 |
|
| KDDI Corp. | 13,000 | 975,773 |
|
| Keio Corp. | 24,000 | 191,810 |
|
| Keyence Corp. | 2,300 | 647,529 |
|
| Kintetsu Corp. (L) | 54,000 | 227,171 |
|
| Kobe Steel, Ltd. (I) | 111,000 | 149,559 |
|
| Komatsu, Ltd. | 11,400 | 287,314 |
|
| Kubota Corp. | 11,000 | 132,720 |
|
| Lawson, Inc. | 6,300 | 468,235 |
|
| Leopalace21 Corp. (I) | 35,800 | 130,460 |
|
| Makita Corp. | 2,900 | 131,065 |
|
| Marubeni Corp. | 31,000 | 226,272 |
|
| Mazda Motor Corp. (I) | 143,000 | 429,886 |
|
| Medipal Holdings Corp. | 15,200 | 196,408 |
|
| Mitsubishi Corp. | 21,100 | 418,348 |
|
| Mitsubishi Estate Company, Ltd. | 25,000 | 622,593 |
|
| Mitsui Engineering & Shipbuilding Company, Ltd. (L) | 38,000 | 73,735 |
|
| Mitsui Fudosan Company, Ltd. | 13,000 | 330,517 |
|
| Mizuho Financial Group, Inc. (L) | 355,600 | 782,115 |
|
| Namco Bandai Holdings, Inc. | 10,800 | 171,662 |
| | |
| 16 | International Growth Fund | Annual report | See notes to financial statements |
| | |
| | Shares | Value |
| Japan (continued) | | |
| NEC Corp. (I) | 70,000 | $172,811 |
|
| Nidec Corp. (L) | 2,500 | 146,660 |
|
| Nikon Corp. | 13,000 | 292,060 |
|
| Nintendo Company, Ltd. | 3,300 | 318,862 |
|
| Nippon Building Fund, Inc. | 16 | 178,976 |
|
| Nitori Holdings Company, Ltd. | 4,550 | 338,436 |
|
| Nitto Denko Corp. | 7,600 | 446,600 |
|
| Nomura Holdings, Inc. | 31,600 | 181,213 |
|
| Nomura Research Institute, Ltd. | 8,300 | 187,946 |
|
| NTT DOCOMO, Inc. | 330 | 510,376 |
|
| Odakyu Electric Railway Company, Ltd. | 40,000 | 421,933 |
|
| OJI Paper Company, Ltd. | 36,000 | 137,014 |
|
| Ono Pharmaceutical Company, Ltd. | 3,000 | 159,067 |
|
| Oracle Corp. Japan | 2,000 | 84,122 |
|
| Orient Corp. (I)(L) | 44,500 | 148,222 |
|
| Oriental Land Company, Ltd. | 3,800 | 561,186 |
|
| Panasonic Corp. | 24,800 | 178,075 |
|
| Park24 Company, Ltd. | 9,800 | 179,075 |
|
| Point, Inc. | 1,230 | 45,379 |
|
| Rakuten, Inc. | 16,200 | 139,966 |
|
| Ricoh Company, Ltd. | 11,000 | 117,852 |
|
| Sankyo Company, Ltd. | 2,000 | 84,194 |
|
| Santen Pharmaceutical Company, Ltd. | 5,800 | 259,563 |
|
| Sawai Pharmaceutical Company, Ltd. | 1,200 | 130,233 |
|
| Secom Company, Ltd. | 3,000 | 153,998 |
|
| Seven & I Holdings Company, Ltd. (L) | 9,500 | 277,098 |
|
| Seven Bank, Ltd. | 38,600 | 101,580 |
|
| Sharp Corp. (L) | 24,000 | 75,956 |
|
| Shimamura Company, Ltd. | 2,400 | 245,162 |
|
| Shimano, Inc. | 4,600 | 329,526 |
|
| Shimizu Corp. | 23,000 | 73,912 |
|
| Shin-Etsu Chemical Company, Ltd. | 6,500 | 399,421 |
|
| Shionogi & Company, Ltd. | 4,100 | 83,534 |
|
| Shiseido Company, Ltd. | 11,400 | 150,942 |
|
| SMC Corp. | 1,200 | 208,055 |
|
| Softbank Corp. | 27,200 | 1,007,449 |
|
| Stanley Electric Company, Ltd. | 7,400 | 128,999 |
|
| Sumitomo Metal Mining Company, Ltd. | 8,000 | 125,994 |
|
| Sumitomo Mitsui Financial Group, Inc. | 8,200 | 327,980 |
|
| Sumitomo Realty & Development Company, Ltd. | 8,000 | 270,398 |
|
| Sumitomo Rubber Industries, Ltd. | 9,100 | 141,660 |
|
| Suzuken Company, Ltd. | 2,900 | 100,868 |
|
| Suzuki Motor Corp. | 4,400 | 105,169 |
|
| Sysmex Corp. | 4,300 | 225,155 |
|
| Takeda Pharmaceutical Company, Ltd. | 9,000 | 465,446 |
|
| Terumo Corp. | 9,000 | 394,936 |
|
| Tobu Railway Company, Ltd. | 46,000 | 252,536 |
|
| Tokyo Gas Company, Ltd. | 46,000 | 222,293 |
| | |
| See notes to financial statements | Annual report | International Growth Fund | 17 |
| | |
| | Shares | Value |
| Japan (continued) | | |
| Tokyu Land Corp. | 21,000 | $158,475 |
|
| Toray Industries, Inc. | 30,000 | 184,951 |
|
| Toshiba Corp. | 54,000 | 248,547 |
|
| Tosoh Corp. | 20,000 | 54,334 |
|
| Toyo Suisan Kaisha, Ltd. | 6,000 | 175,691 |
|
| Toyota Motor Corp. | 10,400 | 534,270 |
|
| Toyota Tsusho Corp. | 7,500 | 190,981 |
|
| Trend Micro, Inc. | 9,300 | 262,745 |
|
| Tsumura & Company, Ltd. | 6,500 | 227,504 |
|
| Unicharm Corp. | 7,200 | 417,046 |
|
| USS Company, Ltd. | 2,050 | 225,319 |
|
| Wacom Company, Ltd. | 35 | 125,875 |
|
| Yahoo Japan Corp. | 1,071 | 453,361 |
|
| Yamada Denki Company, Ltd. (L) | 5,330 | 193,721 |
| | | |
| Jersey, C.I. 0.1% | | 141,654 |
| Randgold Resources, Ltd. | 1,706 | 141,654 |
| | | |
| Luxembourg 0.3% | | 544,819 |
| Millicom International Cellular SA, SDR | 2,829 | 221,511 |
|
| SES SA | 10,520 | 323,308 |
| | | |
| Macau 0.1% | | 214,633 |
| Sands China, Ltd. | 45,200 | 214,633 |
| | | |
| Netherlands 2.3% | | 3,794,186 |
| ASML Holding NV | 5,979 | 423,884 |
|
| Gemalto NV | 4,806 | 437,669 |
|
| Heineken NV | 1,782 | 132,746 |
|
| Koninklijke Ahold NV | 24,397 | 349,596 |
|
| Koninklijke KPN NV (L) | 20,425 | 69,103 |
|
| Koninklijke Philips Electronics NV | 13,642 | 385,748 |
|
| Koninklijke Vopak NV (I) | 2,680 | 192,838 |
|
| Randstad Holdings NV | 2,601 | 110,238 |
|
| Reed Elsevier NV | 10,553 | 160,141 |
|
| Unilever NV (L) | 39,597 | 1,532,223 |
| | | |
| New Zealand 0.1% | | 193,622 |
| Telecom Corp. of New Zealand, Ltd. | 96,744 | 193,622 |
| | | |
| Norway 0.8% | | 1,417,596 |
| Aker Solutions ASA | 6,730 | 132,648 |
|
| Fred Olsen Energy ASA | 798 | 34,652 |
|
| Marine Harvest ASA (I) | 77,620 | 81,764 |
|
| Seadrill, Ltd. | 7,178 | 260,425 |
|
| Statoil ASA | 17,132 | 424,705 |
|
| Telenor ASA | 5,289 | 113,900 |
|
| TGS-NOPEC Geophysical Company ASA | 3,803 | 143,485 |
|
| Yara International ASA | 4,727 | 226,017 |
| | | |
| Singapore 2.2% | | 3,607,333 |
| CapitaCommercial Trust | 98,000 | 131,333 |
|
| Ezion Holdings, Ltd. | 55,000 | 88,426 |
| | |
| 18 | International Growth Fund | Annual report | See notes to financial statements |
| | |
| | Shares | Value |
| Singapore (continued) | | |
| Golden Agri-Resources, Ltd. | 381,000 | $199,448 |
|
| Hyflux, Ltd. | 74,500 | 84,400 |
|
| Keppel Corp., Ltd. | 18,400 | 172,045 |
|
| Oversea-Chinese Banking Corp., Ltd. | 12,006 | 97,705 |
|
| SATS, Ltd. | 60,000 | 142,293 |
|
| SembCorp Industries, Ltd. | 48,000 | 204,476 |
|
| Singapore Exchange, Ltd. | 41,000 | 251,236 |
|
| Singapore Press Holdings, Ltd. | 94,000 | 317,328 |
|
| Singapore Technologies Engineering, Ltd. | 126,000 | 431,677 |
|
| Singapore Telecommunications, Ltd. | 288,000 | 798,813 |
|
| SMRT Corp., Ltd. | 74,000 | 96,159 |
|
| StarHub, Ltd. | 66,000 | 223,336 |
|
| United Overseas Bank, Ltd. | 12,000 | 184,537 |
|
| Wilmar International, Ltd. | 40,000 | 114,690 |
|
| Yanlord Land Group, Ltd. (I) | 56,000 | 69,431 |
| | | |
| Spain 2.2% | | 3,581,775 |
| Banco Bilbao Vizcaya Argentaria SA | 26,771 | 258,798 |
|
| Enagas SA | 6,776 | 162,336 |
|
| Grifols SA (I) | 4,032 | 143,279 |
|
| Iberdrola SA | 70,100 | 347,063 |
|
| Inditex SA | 14,052 | 1,872,511 |
|
| Red Electrica Corp. SA | 4,532 | 250,750 |
|
| Repsol SA | 25,796 | 547,038 |
| | | |
| Sweden 2.2% | | 3,733,668 |
| Assa Abloy AB, Series B | 5,303 | 210,093 |
|
| Boliden AB | 3,137 | 52,997 |
|
| Electrolux AB, Series B | 3,825 | 97,668 |
|
| Elekta AB, Series B | 11,821 | 177,311 |
|
| Hennes & Mauritz AB, B Shares | 38,170 | 1,363,908 |
|
| Investment AB Kinnevik | 9,037 | 206,156 |
|
| Investor AB, B Shares | 4,631 | 135,271 |
|
| Scania AB, Series B | 11,951 | 248,453 |
|
| Skandinaviska Enskilda Banken AB, Series A | 29,941 | 310,790 |
|
| Svenska Handelsbanken AB, Class A | 7,506 | 324,311 |
|
| Swedbank AB, Class A | 18,128 | 433,985 |
|
| Volvo AB, Series B | 11,570 | 172,725 |
| | | |
| Switzerland 8.7% | | 14,523,969 |
| ABB, Ltd. (I) | 7,191 | 163,395 |
|
| Actelion, Ltd. (I) | 5,736 | 295,276 |
|
| Adecco SA | 1,545 | 88,133 |
|
| Cie Financiere Richemont SA | 4,266 | 341,051 |
|
| Credit Suisse Group AG (I) | 8,210 | 218,681 |
|
| Geberit AG (I) | 1,818 | 439,009 |
|
| Glencore International PLC | 15,574 | 91,318 |
|
| Kuehne & Nagel International AG | 736 | 84,587 |
|
| Nestle SA | 61,516 | 4,293,036 |
|
| Novartis AG | 12,556 | 850,385 |
| | |
| See notes to financial statements | Annual report | International Growth Fund | 19 |
| | |
| | Shares | Value |
| Switzerland (continued) | | |
| Partners Group Holding AG | 1,132 | $261,288 |
|
| Roche Holdings AG | 21,673 | 4,941,425 |
|
| Schindler Holding AG, Participation Certificates | 1,119 | 172,998 |
|
| SGS SA | 248 | 627,964 |
|
| Sonova Holding AG (I) | 891 | 106,604 |
|
| Straumann Holding AG | 371 | 51,139 |
|
| Swiss Re, Ltd. | 4,688 | 373,565 |
|
| Swisscom AG | 377 | 171,358 |
|
| Syngenta AG | 868 | 367,446 |
|
| The Swatch Group AG | 1,453 | 147,712 |
|
| The Swatch Group AG (Bearer Shares) | 460 | 260,579 |
|
| Xstrata PLC (I) | 10,035 | 177,020 |
| | | |
| United Kingdom 19.7% | | 32,734,811 |
| Aberdeen Asset Management PLC | 47,733 | 310,619 |
|
| Admiral Group PLC | 15,134 | 286,492 |
|
| Aegis Group PLC | 30,499 | 110,332 |
|
| Aggreko PLC | 8,539 | 219,309 |
|
| AMEC PLC | 8,485 | 134,416 |
|
| Anglo American PLC | 17,069 | 498,010 |
|
| ARM Holdings PLC | 15,793 | 228,740 |
|
| Ashmore Group PLC | 29,107 | 158,222 |
|
| Ashtead Group PLC | 17,629 | 137,374 |
|
| ASOS PLC (I) | 3,058 | 126,879 |
|
| Associated British Foods PLC (I) | 6,487 | 181,956 |
|
| AstraZeneca PLC | 17,854 | 809,795 |
|
| Babcock International Group PLC | 13,055 | 212,352 |
|
| Balfour Beatty PLC | 25,151 | 108,580 |
|
| Barclays PLC | 161,878 | 752,913 |
|
| Barratt Developments PLC (I) | 34,507 | 125,402 |
|
| BG Group PLC | 20,877 | 369,216 |
|
| BHP Billiton PLC | 14,902 | 471,530 |
|
| British American Tobacco PLC | 75,748 | 3,946,582 |
|
| British Sky Broadcasting Group PLC | 23,359 | 301,455 |
|
| BT Group PLC | 60,868 | 247,252 |
|
| Bunzl PLC | 23,789 | 454,464 |
|
| Burberry Group PLC | 10,599 | 221,295 |
|
| Capita PLC | 18,632 | 232,369 |
|
| Chemring Group PLC | 13,664 | 57,441 |
|
| Cobham PLC | 80,079 | 280,784 |
|
| Compass Group PLC (I) | 15,355 | 186,525 |
|
| Croda International PLC | 7,182 | 282,486 |
|
| Debenhams PLC | 67,417 | 96,539 |
|
| Diageo PLC | 137,722 | 4,128,601 |
|
| easyJet PLC | 10,835 | 163,970 |
|
| Eurasian Natural Resources Corp. PLC | 10,669 | 54,814 |
|
| GlaxoSmithKline PLC | 125,574 | 2,768,332 |
|
| HSBC Holdings PLC | 64,068 | 709,884 |
|
| ICAP PLC | 10,071 | 50,674 |
| | |
| 20 | International Growth Fund | Annual report | See notes to financial statements |
| | |
| | Shares | Value |
| United Kingdom (continued) | | |
| IG Group Holdings PLC | 17,765 | $132,667 |
|
| IMI PLC | 8,125 | 150,299 |
|
| Intercontinental Hotels Group PLC | 11,004 | 319,043 |
|
| Intertek Group PLC | 7,618 | 385,959 |
|
| ITV PLC | 124,725 | 234,527 |
|
| John Wood Group PLC | 16,797 | 195,218 |
|
| Johnson Matthey PLC | 4,563 | 158,727 |
|
| Kazakhmys PLC | 8,050 | 75,640 |
|
| Lancashire Holdings, Ltd. | 13,491 | 186,150 |
|
| Lloyds Banking Group PLC (I) | 1,499,007 | 1,236,091 |
|
| Man Group PLC | 65,877 | 99,778 |
|
| Micro Focus International PLC | 12,780 | 132,909 |
|
| Next PLC | 12,459 | 792,601 |
|
| Persimmon PLC | 7,111 | 98,449 |
|
| Petrofac, Ltd. | 4,358 | 96,121 |
|
| Playtech, Ltd. | 11,497 | 99,628 |
|
| Prudential PLC | 70,072 | 1,039,947 |
|
| Reckitt Benckiser Group PLC | 15,397 | 1,034,545 |
|
| Reed Elsevier PLC | 17,947 | 193,167 |
|
| Rexam PLC | 23,265 | 181,263 |
|
| Rightmove PLC | 10,424 | 272,172 |
|
| Rio Tinto PLC | 57,508 | 3,091,738 |
|
| Rolls-Royce Holdings PLC (I) | 13,870 | 215,717 |
|
| SABMiller PLC | 4,289 | 213,014 |
|
| Smith & Nephew PLC | 18,414 | 197,346 |
|
| Smiths Group PLC | 12,546 | 239,339 |
|
| Spectris PLC | 6,692 | 241,166 |
|
| Standard Life PLC | 64,817 | 345,676 |
|
| Tate & Lyle PLC | 7,520 | 92,606 |
|
| Taylor Wimpey PLC | 50,126 | 61,619 |
|
| Telecity Group PLC | 12,870 | 182,060 |
|
| Tesco PLC | 62,528 | 350,164 |
|
| The Sage Group PLC | 20,417 | 105,327 |
|
| Tullett Prebon PLC | 18,108 | 76,631 |
|
| Whitbread PLC | 6,359 | 243,450 |
|
| William Hill PLC | 50,569 | 309,680 |
|
| WPP PLC | 14,302 | 228,773 |
| |
| Preferred Securities 1.2% | | $1,936,055 |
|
| (Cost $1,732,280) | | |
| | | |
| Germany 1.2% | | 1,936,055 |
| Bayerische Motoren Werke AG | 2,286 | 148,540 |
|
| Fuchs Petrolub Ag | 1,645 | 126,949 |
|
| Henkel AG & Company KgaA | 7,554 | 665,246 |
|
| Porsche Automobil Holding SE | 2,358 | 186,952 |
|
| Volkswagen AG | 3,702 | 808,368 |
| | |
| See notes to financial statements | Annual report | International Growth Fund | 21 |
| | | |
| | | Shares | Value |
| Warrants 0.0% | | | $220 |
|
| (Cost $5,399) | | | |
| | | | |
| Canada 0.0% | | | 220 |
| Kinross Gold Corp. (Expiration Date: 09-17-14; Strike Price: $21.30) (I) | 1,133 | 220 |
|
| Escrow Shares 0.0% | | | $0 |
|
| (Cost $0) | | | |
| | | | |
| Austria 0.0% | | | 0 |
| Immofinanz AG (L) | | 49,581 | 0 |
| | | | |
| | Yield (%) | Shares | Value |
| Securities Lending Collateral 3.1% | | | $5,060,224 |
|
| (Cost $5,060,024) | | | |
| John Hancock Collateral Investment Trust (W) | 0.2514 (Y) | 505,598 | 5,060,224 |
| |
| Short-Term Investments 5.0% | | | $8,337,587 |
|
| (Cost $8,337,587) | | | |
| | | | |
| Money Market Funds 5.0% | | | 8,337,587 |
|
| State Street Institutional Treasury Money Market Fund | 0.0000 (Y) | 8,337,587 | 8,337,587 |
| |
| Total investments (Cost $142,579,379)† 101.8% | | | $168,872,797 |
|
| Other assets and liabilities, net (1.8%) | | | ($2,949,015) |
|
| Total net assets 100.0% | | | $165,923,782 |
|
The percentage shown for each investment category is the total value of the category as a percentage of the net assets of the Fund.
SDR Swedish Depositary Receipt
(I) Non-income producing security.
(L) A portion of this security is on loan as of 2-28-13.
(W) Investment is an affiliate of the Fund, the advisor and/or subadvisor. This investment represents collateral recieved for securities lending.
(Y) The rate shown is the annualized seven-day yield as of 2-28-13.
† At 2-28-13, the aggregate cost of investment securities for federal income tax purposes was $143,623,547. Net unrealized appreciation aggregated $25,249,250, of which $28,297,475 related to appreciated investment securities and $3,048,225 related to depreciated investment securities.
The Fund had the following sector allocation as a percentage of net assets on 2-28-13:
| | | | |
| Health Care | 17.6% | | | |
| Consumer Staples | 17.0% | | | |
| Financials | 14.1% | | | |
| Consumer Discretionary | 12.3% | | | |
| Industrials | 11.9% | | | |
| Materials | 6.5% | | | |
| Information Technology | 6.0% | | | |
| Telecommunication Services | 4.2% | | | |
| Energy | 2.1% | | | |
| Utilities | 2.0% | | | |
| Short-Term Investments & Other | 6.3% | | | |
| | |
| 22 | International Growth Fund | Annual report | See notes to financial statements |
F I N A N C I A L S T A T E M E N T S
Financial statements
Statement of assets and liabilities 2-28-13
This Statement of assets and liabilities is the Fund’s balance sheet. It shows the value of what the Fund owns, is due and owes. You’ll also find the net asset value and the maximum public offering price per share.
| |
| Assets | |
|
| Investments in unaffiliated issuers, at value (Cost $137,519,355) including | |
| $4,805,973 of securities loaned | $163,812,573 |
| Investments in affiliated issuers, at value (Cost $5,060,024) | 5,060,224 |
| | |
| Total investments, at value (Cost $142,579,379) | 168,872,797 |
| Foreign currency, at value (Cost $27,511) | 27,411 |
| Cash held at broker for futures contracts | 790,640 |
| Receivable for fund shares sold | 1,148,172 |
| Receivable for forward foreign currency exchange contracts | 181,480 |
| Dividends and interest receivable | 671,978 |
| Receivable for securities lending income | 4,073 |
| Receivable for futures variation margin | 33,950 |
| Other receivables and prepaid expenses | 14,003 |
| | |
| Total assets | 171,744,504 |
| |
| Liabilities | |
|
| Payable for forward foreign currency exchange contracts | 58,020 |
| Payable for fund shares repurchased | 535,136 |
| Payable upon return of securities loaned | 5,062,455 |
| Payable to affiliates | |
| Accounting and legal services fees | 6,801 |
| Transfer agent fees | 36,787 |
| Trustees’ fees | 1,490 |
| Investment management fees | 214 |
| Other liabilities and accrued expenses | 119,819 |
| | |
| Total liabilities | 5,820,722 |
| | |
| Net assets | 165,923,782 |
| |
| Net assets consist of | |
|
| Paid-in capital | $136,183,682 |
| Accumulated distributions in excess of net investment income | (68,504) |
| Accumulated net realized gain (loss) on investments, futures contracts and | |
| foreign currency transactions | 3,455,335 |
| Net unrealized appreciation (depreciation) on investments, futures | |
| contracts and translation of assets and liabilities in foreign currencies | 26,353,269 |
| | |
| Net assets | $165,923,782 |
| | |
| See notes to financial statements | Annual report | International Growth Fund | 23 |
F I N A N C I A L S T A T E M E N T S
Statement of assets and liabilities (continued)
| |
| Net asset value per share | |
|
| Based on net asset values and shares outstanding — the Fund has an | |
| unlimited number of shares authorized with no par value | |
| Class A ($72,518,003 ÷ 3,407,913 shares)1 | $21.28 |
| Class B ($1,327,353 ÷ 62,547 shares)1 | $21.22 |
| Class C ($2,320,715 ÷ 109,553 shares)1 | $21.18 |
| Class I ($78,861,770 ÷ 3,701,300 shares) | $21.31 |
| Class 1 ($10,895,941 ÷ 511,535 shares) | $21.30 |
| |
| Maximum offering price per share | |
|
| Class A (net asset value per share ÷ 95%)2 | $22.40 |
1 Redemption price is equal to net asset value less any applicable contingent deferred sales charge.
2 On single retail sales of less than $50,000. On sales of $50,000 or more and on group sales the offering price is reduced.
| | |
| 24 | International Growth Fund | Annual report | See notes to financial statements |
F I N A N C I A L S T A T E M E N T S
Statement of operations For the year ended 2-28-13
This Statement of operations summarizes the Fund’s investment income earned and expenses incurred in operating the Fund. It also shows net gains (losses) for the period stated.
| |
| Investment income | |
|
| Dividends | $5,046,015 |
| Securities lending | 118,353 |
| Interest | 65 |
| Less foreign taxes withheld | (368,022) |
| | |
| Total investment income | 4,796,411 |
| |
| Expenses | |
|
| Investment management fees | 1,422,455 |
| Distribution and service fees | 208,335 |
| Accounting and legal services fees | 29,744 |
| Transfer agent fees | 211,052 |
| Trustees’ fees | 11,165 |
| State registration fees | 72,876 |
| Printing and postage | 14,165 |
| Professional fees | 54,525 |
| Custodian fees | 204,069 |
| Registration and filing fees | 28,798 |
| Other | 21,441 |
| | |
| Total expenses | 2,278,625 |
| Less expense reductions | (102,438) |
| | |
| Net expenses | 2,176,187 |
| | |
| Net investment income | 2,620,224 |
| |
| Realized and unrealized gain (loss) | |
|
| Net realized gain (loss) on | |
| Investments in unaffiliated issuers | 14,858,490 |
| Investments in affiliated issuers | 1,185 |
| Futures contracts | 869,607 |
| Foreign currency transactions | 5,694 |
| | 15,734,976 |
| Change in net unrealized appreciation (depreciation) of | |
| Investments in unaffiliated issuers | 2,613,550 |
| Investments in affiliated issuers | (1,770) |
| Futures contracts | (540,025) |
| Translation of assets and liabilities in foreign currencies | 227,384 |
| | 2,299,139 |
| Net realized and unrealized gain | 18,034,115 |
| | |
| Increase in net assets from operations | $20,654,339 |
| | |
| See notes to financial statements | Annual report | International Growth Fund | 25 |
F I N A N C I A L S T A T E M E N T S
Statements of changes in net assets
These Statements of changes in net assets show how the value of the Fund’s net assets has changed during the last two periods. The difference reflects earnings less expenses, any investment gains and losses, distributions, if any, paid to shareholders and the net of Fund share transactions.
| | |
| | Year | Year |
| | ended | ended |
| | 2-28-13 | 2-29-12 |
|
| |
| Increase (decrease) in net assets | | |
|
| From operations | | |
| Net investment income | $2,620,224 | $4,479,341 |
| Net realized gain (loss) | 15,734,976 | (1,856,288) |
| Change in net unrealized appreciation (depreciation) | 2,299,139 | (15,386,119) |
| | | |
| Increase (decrease) in net assets resulting from operations | 20,654,339 | (12,763,066) |
| | | |
| Distributions to shareholders | | |
| From net investment income | | |
| Class A | (1,285,069) | (431,740) |
| Class B | (15,681) | (2,245) |
| Class C | (25,379) | (4,082) |
| Class I | (1,697,349) | (2,612,306) |
| Class 1 | (235,326) | (126,750) |
| From net realized gain | | |
| Class A | (3,481,244) | — |
| Class B | (63,206) | — |
| Class C | (102,296) | — |
| Class I | (3,872,467) | — |
| Class 1 | (526,505) | — |
| | | |
| Total distributions | (11,304,522) | (3,177,123) |
| | | |
| From Fund share transactions | (66,009,785) | (19,513,581) |
| | | |
| Total decrease | (56,659,968) | (35,453,770) |
| |
| Net assets | | |
|
| Beginning of year | 222,583,750 | 258,037,520 |
| | | |
| End of year | $165,923,782 | $222,583,750 |
| | | |
| Undistributed (accumulated distributions in excess of) net | | |
| investment income | ($68,504) | $341,320 |
| | |
| 26 | International Growth Fund | Annual report | See notes to financial statements |
Financial highlights
The Financial highlights show how the Fund’s net asset value for a share has changed during the period.
| | | | | |
| CLASS A SHARES Period ended | 2-28-13 | 2-29-12 | 2-28-11 | 2-28-10 | 2-28-09 |
| |
| Per share operating performance | | | | | |
|
| Net asset value, beginning of period | $19.98 | $20.99 | $17.36 | $12.46 | $22.86 |
| Net investment income1 | 0.23 | 0.30 | 0.13 | 0.14 | 0.31 |
| Net realized and unrealized gain (loss) on investments | 2.65 | (1.12) | 3.61 | 4.86 | (10.31) |
| Total from investment operations | 2.88 | (0.82) | 3.74 | 5.00 | (10.00) |
| Less distributions | | | | | |
| From net investment income | (0.42) | (0.19) | (0.11) | (0.10) | (0.40) |
| From net realized gain | (1.16) | — | — | — | — |
| Total distributions | (1.58) | (0.19) | (0.11) | (0.10) | (0.40) |
| Net asset value, end of period | $21.28 | $19.98 | $20.99 | $17.36 | $12.46 |
| Total return (%)2,3 | 14.82 | (3.80) | 21.58 | 40.07 | (44.00) |
| |
| Ratios and supplemental data | | | | | |
|
| Net assets, end of period (in millions) | $73 | $49 | $45 | $23 | $13 |
| Ratios (as a percentage of average net assets): | | | | | |
| Expenses before reductions | 1.68 | 1.66 | 1.60 | 1.684 | 1.94 |
| Expenses net of fee waivers | 1.60 | 1.59 | 1.60 | 1.644 | 1.62 |
| Expenses net of fee waivers and credits | 1.60 | 1.59 | 1.60 | 1.634 | 1.62 |
| Net investment income | 1.13 | 1.50 | 0.69 | 0.86 | 1.59 |
| Portfolio turnover (%) | 61 | 55 | 48 | 37 | 59 |
| |
1 Based on the average daily shares outstanding.
2 Total returns would have been lower had certain expenses not been reduced during the applicable periods shown.
3 Does not reflect the effect of sales charges, if any.
4 Includes the impact of proxy expenses, which amounted to 0.03% of average net assets.
| | | | | |
| CLASS B SHARES Period ended | 2-28-13 | 2-29-12 | 2-28-11 | 2-28-10 | 2-28-09 |
| |
| Per share operating performance | | | | | |
|
| Net asset value, beginning of period | $19.94 | $20.93 | $17.36 | $12.48 | $22.81 |
| Net investment income1 | 0.10 | 0.12 | 0.01 | 0.05 | 0.15 |
| Net realized and unrealized gain (loss) on investments | 2.62 | (1.06) | 3.56 | 4.83 | (10.25) |
| Total from investment operations | 2.72 | (0.94) | 3.57 | 4.88 | (10.10) |
| Less distributions | | | | | |
| From net investment income | (0.28) | (0.05) | — | — | (0.23) |
| From net realized gain | (1.16) | — | — | — | — |
| Total distributions | (1.44) | (0.05) | — | — | (0.23) |
| Net asset value, end of period | $21.22 | $19.94 | $20.93 | $17.36 | $12.48 |
| Total return (%)2,3 | 14.00 | (4.47) | 20.56 | 39.10 | (44.43) |
| |
| Ratios and supplemental data | | | | | |
|
| Net assets, end of period (in millions) | $1 | $1 | $1 | $1 | $1 |
| Ratios (as a percentage of average net assets): | | | | | |
| Expenses before reductions | 3.92 | 4.00 | 4.24 | 4.834 | 4.68 |
| Expenses net of fee waivers | 2.30 | 2.33 | 2.40 | 2.444 | 2.65 |
| Expenses net of fee waivers and credits | 2.30 | 2.33 | 2.40 | 2.404 | 2.40 |
| Net investment income | 0.47 | 0.63 | 0.04 | 0.29 | 0.80 |
| Portfolio turnover (%) | 61 | 55 | 48 | 37 | 59 |
| |
1 Based on the average daily shares outstanding.
2 Total returns would have been lower had certain expenses not been reduced during the applicable periods shown.
3 Does not reflect the effect of sales charges, if any.
4 Includes the impact of proxy expenses, which amounted to 0.03% of average net assets.
| | |
| See notes to financial statements | Annual report | International Growth Fund | 27 |
| | | | | |
| CLASS C SHARES Period ended | 2-28-13 | 2-29-12 | 2-28-11 | 2-28-10 | 2-28-09 |
| |
| Per share operating performance | | | | | |
|
| Net asset value, beginning of period | $19.91 | $20.91 | $17.34 | $12.47 | $22.79 |
| Net investment income (loss)1 | 0.10 | 0.10 | 0.01 | (0.01) | 0.20 |
| Net realized and unrealized gain (loss) on investments | 2.61 | (1.05) | 3.56 | 4.88 | (10.29) |
| Total from investment operations | 2.71 | (0.95) | 3.57 | 4.87 | (10.09) |
| Less distributions | | | | | |
| From net investment income | (0.28) | (0.05) | — | — | (0.23) |
| From net realized gain | (1.16) | — | — | — | — |
| Total distributions | (1.44) | (0.05) | — | — | (0.23) |
| Net asset value, end of period | $21.18 | $19.91 | $20.91 | $17.34 | $12.47 |
| Total return (%)2,3 | 13.97 | (4.52) | 20.59 | 39.05 | (44.43) |
| |
| Ratios and supplemental data | | | | | |
|
| Net assets, end of period (in millions) | $2 | $2 | $1 | $1 | $1 |
| Ratios (as a percentage of average net assets): | | | | | |
| Expenses before reductions | 3.32 | 3.34 | 3.45 | 3.954 | 3.81 |
| Expenses net of fee waivers | 2.30 | 2.33 | 2.40 | 2.414 | 2.42 |
| Expenses net of fee waivers and credits | 2.30 | 2.33 | 2.40 | 2.404 | 2.40 |
| Net investment income (loss) | 0.48 | 0.52 | 0.03 | (0.06) | 1.03 |
| Portfolio turnover (%) | 61 | 55 | 48 | 37 | 59 |
| |
1 Based on the average daily shares outstanding.
2 Total returns would have been lower had certain expenses not been reduced during the applicable periods shown.
3 Does not reflect the effect of sales charges, if any.
4 Includes the impact of proxy expenses, which amounted to 0.03% of average net assets.
| | | | | |
| CLASS I SHARES Period ended | 2-28-13 | 2-29-12 | 2-28-11 | 2-28-10 | 2-28-09 |
| |
| Per share operating performance | | | | | |
|
| Net asset value, beginning of period | $20.01 | $21.04 | $17.40 | $12.48 | $22.90 |
| Net investment income1 | 0.43 | 0.37 | 0.23 | 0.14 | 0.18 |
| Net realized and unrealized gain (loss) on investments | 2.53 | (1.12) | 3.60 | 4.95 | (10.12) |
| Total from investment operations | 2.96 | (0.75) | 3.83 | 5.09 | (9.94) |
| Less distributions | | | | | |
| From net investment income | (0.50) | (0.28) | (0.19) | (0.17) | (0.48) |
| From net realized gain | (1.16) | — | — | — | — |
| Total distributions | (1.66) | (0.28) | (0.19) | (0.17) | (0.48) |
| Net asset value, end of period | $21.31 | $20.01 | $21.04 | $17.40 | $12.48 |
| Total return (%)2 | 15.23 | (3.42) | 22.08 | 40.76 | (43.74) |
| |
| Ratios and supplemental data | | | | | |
|
| Net assets, end of period (in millions) | $79 | $162 | $204 | $134 | $23 |
| Ratios (as a percentage of average net assets): | | | | | |
| Expenses before reductions | 1.27 | 1.20 | 1.14 | 1.233 | 1.67 |
| Expenses net of fee waivers | 1.25 | 1.20 | 1.14 | 1.213 | 1.20 |
| Expenses net of fee waivers and credits | 1.25 | 1.20 | 1.14 | 1.213 | 1.20 |
| Net investment income | 2.09 | 1.88 | 1.21 | 0.84 | 1.16 |
| Portfolio turnover (%) | 61 | 55 | 48 | 37 | 59 |
| |
1 Based on the average daily shares outstanding.
2 Total returns would have been lower had certain expenses not been reduced during the applicable periods shown.
3 Includes the impact of proxy expenses, which amounted to 0.01% of average net assets.
| | |
| 28 | International Growth Fund | Annual report | See notes to financial statements |
| | | | | |
| CLASS 1 SHARES Period ended | 2-28-13 | 2-29-12 | 2-28-11 | 2-28-10 | 2-28-09 |
| |
| Per share operating performance | | | | | |
|
| Net asset value, beginning of period | $20.00 | $21.02 | $17.38 | $12.47 | $22.89 |
| Net investment income1 | 0.34 | 0.36 | 0.23 | 0.20 | 0.36 |
| Net realized and unrealized gain (loss) on investments | 2.63 | (1.09) | 3.60 | 4.89 | (10.29) |
| Total from investment operations | 2.97 | (0.73) | 3.83 | 5.09 | (9.93) |
| Less distributions | | | | | |
| From net investment income | (0.51) | (0.29) | (0.19) | (0.18) | (0.49) |
| From net realized gain | (1.16) | — | — | — | — |
| Total distributions | (1.67) | (0.29) | (0.19) | (0.18) | (0.49) |
| Net asset value, end of period | $21.30 | $20.00 | $21.02 | $17.38 | $12.47 |
| Total return (%)2 | 15.29 | (3.33) | 22.11 | 40.73 | (43.72) |
| |
| Ratios and supplemental data | | | | | |
|
| Net assets, end of period (in millions) | $11 | $9 | $8 | $5 | $3 |
| Ratios (as a percentage of average net assets): | | | | | |
| Expenses before reductions and amounts recaptured | 1.19 | 1.16 | 1.13 | 1.243 | 1.51 |
| Expenses net of fee waivers | 1.15 | 1.14 | 1.13 | 1.193 | 1.15 |
| Expenses including reductions and amounts recaptured | 1.15 | 1.14 | 1.13 | 1.193 | 1.15 |
| Net investment income | 1.68 | 1.83 | 1.21 | 1.23 | 1.94 |
| Portfolio turnover (%) | 61 | 55 | 48 | 37 | 59 |
| |
1 Based on the average daily shares outstanding.
2 Total returns would have been lower had certain expenses not been reduced during the applicable periods shown.
3 Includes the impact of proxy expenses, which amounted to 0.02% of average net assets.
| | |
| See notes to financial statements | Annual report | International Growth Fund | 29 |
Notes to financial statements
Note 1 — Organization
John Hancock International Growth Fund (the Fund) is a series of John Hancock Funds III (the Trust), an open-end management investment company organized as a Massachusetts business trust and registered under the Investment Company Act of 1940, as amended (the 1940 Act). The investment objective of the Fund is to seek high total return primarily through capital appreciation.
The Fund may offer multiple classes of shares. The shares currently offered are detailed in the Statement of assets and liabilities. Class A shares and Class C shares are offered to all investors. Effective April 12, 2013, Class B shares are closed to new investors. Class I shares are offered to institutions and certain investors. Class 1 shares are offered only to certain affiliates of Manulife Financial Corporation (MFC). Shareholders of each class have exclusive voting rights to matters that affect that class. The distribution and service fees, if any, and transfer agent fees for each class may differ. Class B shares convert to Class A shares eight years after purchase.
Note 2 — Significant accounting policies
The financial statements have been prepared in conformity with accounting principles generally accepted in the United States of America, which require management to make certain estimates and assumptions at the date of the financial statements. Actual results could differ from those estimates and those differences could be significant. Events or transactions occurring after the end of the fiscal period through the date that the financial statements were issued have been evaluated in the preparation of the financial statements. The following summarizes the significant accounting policies of the Fund:
Security valuation. Investments are stated at value as of the close of regular trading on the New York Stock Exchange (NYSE), normally at 4:00 P.M., Eastern Time. In order to value the securities, the Fund uses the following valuation techniques: Equity securities held by the Fund are valued at the last sale price or official closing price on the principal securities exchange on which they trade. In the event there were no sales during the day or closing prices are not available, then the securities are valued using the last quoted bid or evaluated price. Investments by the Fund in open-end mutual funds, including John Hancock Collateral Investment Trust (JHCIT), are valued at their respective net asset values each business day. Futures contracts are valued at the quoted daily settlement prices established by the exchange on which they trade. Foreign securities and currencies, including forward foreign currency contracts, are valued in U.S. dollars, based on foreign currency exchange rates supplied by an independent pricing service. Certain securities and forward foreign currency contracts traded only in the over-the-counter market are valued at the last bid price quoted by brokers making markets in the securities at the close of trading. Certain short-term securities are valued at amortized cost.
Other portfolio securities and assets, where reliable market quotations are not available, are valued at fair value as determined in good faith by the Fund’s Pricing Committee following procedures established by the Board of Trustees, which include price verification procedures. The frequency with which these fair valuation procedures are used cannot be predicted. Generally, trading in foreign securities is substantially completed each day at various times prior to the close of trading on the NYSE. Significant market events that affect the values of foreign securities may occur between the time when the valuation of the securities is generally determined and the close of the NYSE. During significant market events, these securities will be valued at fair value, as determined in good faith, following procedures established by the Board of Trustees. The Fund may use a fair
| |
| 30 | International Growth Fund | Annual report |
valuation model to value foreign securities in order to adjust for events that may occur between the close of foreign exchanges and the close of the NYSE.
The Fund uses a three-tier hierarchy to prioritize the pricing assumptions, referred to as inputs, used in valuation techniques to measure fair value. Level 1 includes securities valued using quoted prices in active markets for identical securities. Level 2 includes securities valued using other significant observable inputs. Observable inputs may include quoted prices for similar securities, interest rates, prepayment speeds and credit risk. Prices for securities valued using these inputs are received from independent pricing vendors and brokers and are based on an evaluation of the inputs described. Level 3 includes securities valued using significant unobservable inputs when market prices are not readily available or reliable, including the Fund’s own assumptions in determining the fair value of investments. Factors used in determining value may include market or issuer specific events or trends, changes in interest rates and credit quality. The inputs or methodology used for valuing securities are not necessarily an indication of the risks associated with investing in those securities. Changes in valuation techniques may result in transfers into or out of an assigned level within the disclosure hierarchy.
The following is a summary of the values by input classification of the Fund’s investments as of February 28, 2013, by major security category or type:
| | | | |
| | | | | LEVEL 3 |
| | | | LEVEL 2 | SIGNIFICANT |
| | TOTAL MARKET | LEVEL 1 | SIGNIFICANT | UNOBSERVABLE |
| | VALUE AT 2-28-13 | QUOTED PRICE | OBSERVABLE INPUTS | INPUTS |
|
| Common Stocks | | | | |
| Australia | $7,294,497 | — | $7,294,497 | — |
| Austria | 303,345 | — | 303,345 | — |
| Belgium | 2,781,863 | — | 2,781,863 | — |
| Canada | 5,150,332 | $5,150,332 | — | — |
| China | 366,639 | — | 366,639 | — |
| Denmark | 5,046,113 | — | 5,046,113 | — |
| Finland | 1,987,175 | — | 1,987,175 | — |
| France | 9,813,457 | — | 9,813,457 | — |
| Germany | 13,121,202 | — | 13,121,202 | — |
| Guernsey, C.I. | 108,463 | — | 108,463 | — |
| Hong Kong | 5,089,940 | — | 5,089,940 | — |
| Ireland | 2,092,619 | — | 2,092,619 | — |
| Israel | 455,195 | — | 455,195 | — |
| Italy | 1,281,759 | — | 1,281,759 | — |
| Japan | 34,158,046 | — | 34,158,046 | — |
| Jersey, C.I. | 141,654 | — | 141,654 | — |
| Luxembourg | 544,819 | — | 544,819 | — |
| Macau | 214,633 | — | 214,633 | — |
| Netherlands | 3,794,186 | — | 3,794,186 | — |
| New Zealand | 193,622 | — | 193,622 | — |
| Norway | 1,417,596 | — | 1,417,596 | — |
| Singapore | 3,607,333 | — | 3,607,333 | — |
| Spain | 3,581,775 | — | 3,581,775 | — |
| Sweden | 3,733,668 | — | 3,733,668 | — |
| Switzerland | 14,523,969 | — | 14,523,969 | — |
| United Kingdom | 32,734,811 | — | 32,734,811 | — |
| |
| Annual report | International Growth Fund | 31 |
| | | | |
| | | | | LEVEL 3 |
| | | | LEVEL 2 | SIGNIFICANT |
| | TOTAL MARKET | LEVEL 1 | SIGNIFICANT | UNOBSERVABLE |
| | VALUE AT 2-28-13 | QUOTED PRICE | OBSERVABLE INPUTS | INPUTS |
|
| Preferred Securities | $1,936,055 | — | $1,936,055 | — |
| Warrants | 220 | $220 | — | — |
| Securities Lending | | | | |
| Collateral | 5,060,224 | 5,060,224 | — | — |
| Short-Term | | | | |
| Investments | 8,337,587 | 8,337,587 | — | — |
| Total Investments | | | | |
| in Securities | $168,872,797 | $18,548,363 | $150,324,434 | — |
| Other Financial | | | | |
| Instruments | | | | |
| Futures | ($46,920) | ($46,920) | — | — |
| Forward Foreign | | | | |
| Currency Contracts | $123,460 | — | $123,460 | — |
Security transactions and related investment income. Investment security transactions are accounted for on a trade date plus one basis for daily net asset value calculations. However, for financial reporting purposes, investment transactions are reported on trade date. Interest income is accrued as earned. Dividend income is recorded on the ex-date, except for dividends of foreign securities where the dividend may not be known until after the ex-date. In those cases, dividend income, net of withholding taxes, is recorded when the Fund becomes aware of the dividends. Foreign taxes are provided for based on the Fund’s understanding of the tax rules and rates that exist in the foreign markets in which it invests. Gains and losses on securities sold are determined on the basis of identified cost and may include proceeds from litigation.
Securities lending. The Fund may lend its securities to earn additional income. It receives cash collateral from the borrower in an amount not less than the market value of the loaned securities. The Fund will invest its collateral in JHCIT, an affiliate of the Fund, which has a floating net asset value (NAV) and invests in short term investments as part of the securities lending program, and as a result, the Fund will receive the benefit of any gains and bear any losses generated by JHCIT. Although risk of the loss of the securities lent is mitigated by holding the collateral and through securities lending provider indemnification, the Fund could experience a delay in recovering its securities and a possible loss of income or value if the borrower fails to return the securities or if collateral investments decline in value or possible loss of rights in the collateral should the borrower fail financially. The Fund may receive compensation for lending its securities by retaining a portion of the return on the investment of the collateral and compensation from fees earned from borrowers of the securities. Net income received from JHCIT is a component of securities lending income as recorded on the Statement of operations.
Foreign currency translation. Assets, including investments and liabilities denominated in foreign currencies, are translated into U.S. dollar values each day at the prevailing exchange rate. Purchases and sales of securities, income and expenses are translated into U.S. dollars at the prevailing exchange rate on the date of the transaction. The effect of changes in foreign currency exchange rates on the value of securities is reflected as a component of the realized and unrealized gains (losses) on investments.
Funds that invest internationally generally carry more risk than funds that invest strictly in U.S. securities. Risks can result from differences in economic and political conditions, regulations, market practices (including higher transaction costs), accounting standards and other factors. Foreign investments are also subject to a decline in the value of a foreign currency versus the U.S. dollar, which reduces the dollar value of securities denominated in that currency.
| |
| 32 | International Growth Fund | Annual report |
Foreign taxes. The Fund may be subject to withholding tax on income or capital gains or repatriation taxes as imposed by certain countries in which it invests. Taxes are accrued based upon net investment income, net realized gains or net unrealized appreciation.
Line of credit. The Fund may borrow from banks for temporary or emergency purposes, including meeting redemption requests that otherwise might require the untimely sale of securities. Pursuant to the custodian agreement, the custodian may loan money to the Fund to make properly authorized payments. The Fund is obligated to repay the custodian for any overdraft, including any related costs or expenses. The custodian may have a lien, security interest or security entitlement in any Fund property that is not otherwise segregated or pledged, to the maximum extent permitted by law, to the extent of any overdraft.
In addition, the Fund and other affiliated funds have entered into an agreement with Citibank N.A. that enables them to participate in a $100 million unsecured committed line of credit. A commitment fee, payable at the end of each calendar quarter, based on the average daily unused portion of the line of credit, is charged to each participating fund on a pro rata basis and is reflected in other expenses on the Statement of operations. Commitment fees for the year ended February 28, 2013 were $1,084. The current agreement will expire on March 31, 2013 and will be replaced with a new agreement which will enable the Fund to participate in a $300 million unsecured line of credit, also with Citibank, with terms otherwise similar to the existing agreement.
Expenses. Within the John Hancock Funds complex, expenses that are directly attributable to an individual fund are allocated to such fund. Expenses that are not readily attributable to a specific fund are allocated among all funds in an equitable manner, taking into consideration, among other things, the nature and type of expense and the fund’s relative net assets. Expense estimates are accrued in the period to which they relate and adjustments are made when actual amounts are known.
Class allocations. Income, common expenses and realized and unrealized gains (losses) are determined at the fund level and allocated daily to each class of shares based on the net assets of the class. Class-specific expenses, such as distribution and service fees, if any, and transfer agent fees, are calculated daily for each class, based on the net asset value of the class and the applicable specific expense rates.
Federal income taxes. The Fund intends to continue to qualify as a regulated investment company by complying with the applicable provisions of the Internal Revenue Code and will not be subject to federal income tax on taxable income that is distributed to shareholders. Therefore, no federal income tax provision is required.
As of February 28, 2013, the Fund had no uncertain tax positions that would require financial statement recognition, derecognition or disclosure. The Fund’s federal tax returns are subject to examination by the Internal Revenue Service for a period of three years.
Distribution of income and gains. Distributions to shareholders from net investment income and net realized gains, if any, are recorded on the ex-date. The Fund generally declares and pays dividends and capital gain distributions, if any, annually. The tax character of distributions for the years ended February 28, 2013 and February 29, 2012 was as follows:
| | | | |
| | FEBRUARY 28, 2013 | FEBRUARY 29, 2012 | | |
| | |
| Ordinary Income | $3,258,804 | $3,177,123 | | |
| Long-term Capital Gains | $8,045,718 | — | | |
Distributions paid by the Fund with respect to each class of shares are calculated in the same manner, at the same time and in the same amount, except for the effect of class level expenses that may be applied differently to each class. As of February 28, 2013, the components of distributable
| |
| Annual report | International Growth Fund | 33 |
earnings on a tax basis consisted of $111,707 and $4,379,663 of undistributed ordinary income and undistributed long-term capital gains.
Such distributions and distributable earnings, on a tax basis, are determined in conformity with income tax regulations, which may differ from accounting principles generally accepted in the United States of America. Material distributions in excess of tax basis earnings and profits, if any, are reported in the Fund’s financial statements as a return of capital.
Capital accounts within the financial statements are adjusted for permanent book-tax differences. These adjustments have no impact on net assets or the results of operations. Temporary book-tax differences, if any, will reverse in a subsequent period. Book-tax differences are primarily attributable to passive foreign investment companies, wash sale loss deferrals and derivative transactions.
New accounting pronouncements. In December 2011, the Financial Accounting Standards Board issued Accounting Standards Update No. 2011-11 (ASU 2011-11), Disclosures about Offsetting Assets and Liabilities, and in January 2013, Accounting Standards Update No. 2013-1, Clarifying the Scope of Disclosures about Offsetting Assets and Liabilities. These updates create new disclosure requirements requiring entities to disclose both gross and net information for derivatives and other financial instruments that are either offset in the Statement of assets and liabilities or subject to an enforceable master netting arrangement or similar agreement. The disclosure requirements are effective for annual reporting periods beginning on or after January 1, 2013 and interim periods within those annual periods. These updates may result in additional disclosure relating to the presentation of derivatives and certain other financial instruments.
Note 3 — Derivative instruments
The Fund may invest in derivatives in order to meet its investment objective. The use of derivatives may involve risks different from, or potentially greater than, the risks associated with investing directly in securities. Specifically, the Fund is exposed to the risk that the counterparty to an over-the-counter (OTC) derivatives contract will be unable or unwilling to make timely settlement payments or otherwise honor its obligations. OTC derivatives transactions typically can only be closed out with the other party to the transaction. If the counterparty defaults, the Fund will have contractual remedies, but there is no assurance that the counterparty will meet its contractual obligations or that the Fund will succeed in enforcing them.
The Fund has entered into collateral agreements with certain counterparties to mitigate counterparty risk on over-the-counter derivatives. Subject to established minimum levels, collateral is generally determined based on the net aggregate unrealized gain or loss on contracts with a particular counterparty. Collateral pledged to the Fund is held by the custodian bank for the benefit of the Fund and can be in the form of cash or debt securities issued by the U.S. government or related agencies; collateral posted by the Fund is held in a segregated account at the Fund’s custodian and is noted in the accompanying portfolio of investments, or if cash is posted, on the Statement of assets and liabilities. As of February 28, 2013, no collateral was posted by the Fund for the benefit of counterparties to over-the-counter derivatives transactions.
Futures. A futures contract is a contractual agreement to buy or sell a particular currency or financial instrument at a pre-determined price in the future. Risks related to the use of futures contracts include possible illiquidity of the futures markets, contract prices that can be highly volatile and imperfectly correlated to movements in the underlying financial instrument and potential losses in excess of the amounts recognized on the Statement of assets and liabilities. Use of long futures contracts subjects the Fund to the risk of loss up to the notional value of the futures contracts. Use of short futures contracts subjects the Fund to unlimited risk of loss.
| |
| 34 | International Growth Fund | Annual report |
Upon entering into a futures contract, the Fund is required to deposit initial margin with the broker in the form of cash or securities. The amount of required margin is generally based on a percentage of the contract value; this amount is the initial margin for the trade. The margin deposit must then be maintained at the established level over the life of the contract. Futures collateral receivable/payable is included on the Statement of assets and liabilities. Futures contracts are marked-to-market daily and an appropriate payable or receivable for the change in value (variation margin) and unrealized gain or loss is recorded by the Fund. When the contract is closed, the Fund records a realized gain or loss equal to the difference between the value of the contract at the time it was opened and the value at the time it was closed.
During the year ended February 28, 2013, the Fund used futures contracts to gain exposure to certain securities markets and substitute for securities purchased or to be purchased. During the year ended February 28, 2013, the Fund held futures contracts with notional values ranging from $8.3 million to $73.3 million, as measured at each quarter end. The following table summarizes the contracts held at February 28, 2013.
| | | | | | |
| | | | | | | UNREALIZED |
| OPEN | NUMBER OF | | EXPIRATION | NOTIONAL | NOTIONAL | APPRECIATION |
| CONTRACTS | CONTRACTS | POSITION | DATE | BASIS | VALUE | (DEPRECIATION) |
|
| CAC 40 Index Futures | 6 | Long | Mar 2013 | $285,656 | $291,634 | $5,978 |
| DAX Index Futures | 27 | Long | Mar 2013 | 6,696,461 | 6,830,096 | 133,635 |
| ASX SPI 200 Index | 2 | Short | Mar 2013 | (240,827) | (259,704) | (18,877) |
| Futures | | | | | | |
| S&P TSE 60 Index | 27 | Short | Mar 2013 | (3,695,209) | (3,862,865) | (167,656) |
| Futures | | | | | | |
| Total | | | | | | ($46,920) |
Notional basis refers to the contractual amount agreed upon at inception of the open contracts; notional value represents the current value of the open contracts.
Forward foreign currency contracts. A forward foreign currency contract is an agreement between two parties to buy and sell a specific currency at a price that is set on the date of the contract. The forward contract calls for delivery of the currency on a future date that is specified in the contract. Risks related to the use of forwards include the possible failure of counterparties to meet the terms of the forward agreement, the failure of the counterparties to timely post collateral, the risk that currency movements will not occur thereby reducing the Fund’s total return, and the potential for losses in excess of the amounts recognized on the Statement of assets and liabilities.
The market value of a forward foreign currency contract fluctuates with changes in foreign currency exchange rates. Forward foreign currency contracts are marked-to-market daily and the change in value is recorded by the Fund as an unrealized gain or loss. Realized gains or losses, equal to the difference between the value of the contract at the time it was opened and the value at the time it was closed, are recorded upon delivery or receipt of the currency or settlement with the counterparty.
During the year ended February 28, 2013, the Fund used forward foreign currency contracts to manage against anticipated currency exchange rates. During the year ended February 28, 2013, the Fund held forward foreign currency contracts with USD notional values ranging from $24.3 million to $78.7 million, as measured at each quarter end. The following table summarizes the contracts held at February 28, 2013.
| |
| Annual report | International Growth Fund | 35 |
| | | | | | | |
| | | PRINCIPAL | | | | | |
| | PRINCIPAL | AMOUNT | | | | | |
| | AMOUNT | COVERED | | | | | UNREALIZED |
| | COVERED BY | BY CONTRACT | | | | SETTLEMENT | APPRECIATION |
| CURRENCY | CONTRACT | (USD) | | COUNTERPARTY | | DATE | (DEPRECIATION) |
|
| Buys | | | | | | | |
| CHF | 379,547 | $410,862 | | Bank Of America N.A. | | 4-19-13 | ($5,709) |
| CHF | 428,259 | 463,833 | | Barclays Bank PLC | | 4-19-13 | (6,682) |
| CHF | 325,325 | 352,847 | | Deutsche Bank AG | | 4-19-13 | (5,575) |
| CHF | 379,546 | 411,060 | | Mellon Bank NA | | 4-19-13 | (5,909) |
| GBP | 94,291 | 145,837 | | Barclays Bank PLC | | 4-19-13 | (2,829) |
| GBP | 214,453 | 331,510 | | Morgan Stanley & Company, Inc. | | 4-19-13 | (6,254) |
| GBP | 103,156 | 159,619 | | The Royal Bank of Scotland PLC | | 4-19-13 | (3,165) |
| HKD | 19,528,716 | 2,518,986 | | Bank Of America N.A. | | 4-19-13 | (462) |
| HKD | 6,988,911 | 901,461 | | Barclays Bank PLC | | 4-19-13 | (135) |
| HKD | 6,245,911 | 805,655 | | Brown Brothers Harriman & | | 4-19-13 | (150) |
| | | | | Company | | | |
| HKD | 9,192,270 | 1,185,740 | | Mellon Bank NA | | 4-19-13 | (257) |
| HKD | 5,097,061 | 657,494 | | Morgan Stanley & Company, Inc. | | 4-19-13 | (151) |
| HKD | 3,047,597 | 393,104 | | State Street Bank & Trust | | 4-19-13 | (70) |
| | | | | Company | | | |
| SGD | 568,341 | 458,935 | | Bank Of America N.A. | | 4-19-13 | 2 |
| SGD | 922,641 | 744,918 | | Barclays Bank PLC | | 4-19-13 | 117 |
| SGD | 852,564 | 688,293 | | Brown Brothers Harriman & | | 4-19-13 | 156 |
| | | | | Company | | | |
| SGD | 751,694 | 607,035 | | Mellon Bank NA | | 4-19-13 | (39) |
| SGD | 1,010,876 | 816,267 | | Morgan Stanley & Company, Inc. | | 4-19-13 | 18 |
| SGD | 751,694 | 606,925 | | The Royal Bank of Scotland PLC | | 4-19-13 | 70 |
| SGD | 751,694 | 606,734 | | State Street Bank & Trust | | 4-19-13 | 261 |
| | | | | Company | | | |
| | | | | | | | |
| Total | | $13,267,115 | | | | | ($36,763) |
|
| |
| Sells | | | | | | | |
| AUD | 528,167 | $543,978 | | Mellon Bank NA | | 4-19-13 | $6,367 |
| CAD | 1,212,560 | 1,196,755 | | Bank Of America N.A. | | 4-19-13 | 22,185 |
| CAD | 488,456 | 481,755 | | Barclays Bank PLC | | 4-19-13 | 8,602 |
| CAD | 933,979 | 922,103 | | Morgan Stanley & Company, Inc. | | 4-19-13 | 17,386 |
| CAD | 1,177,436 | 1,160,452 | | The Royal Bank of Scotland PLC | | 4-19-13 | 19,906 |
| CAD | 177,998 | 175,645 | | State Street Bank & Trust | | 4-19-13 | 3,224 |
| | | | | Company | | | |
| DKK | 8,521,890 | 1,525,144 | | Bank Of America N.A. | | 4-19-13 | 32,199 |
| DKK | 8,521,891 | 1,525,692 | | Brown Brothers Harriman & | | 4-19-13 | 32,746 |
| | | | | Company | | | |
| JPY | 54,009,927 | 577,986 | | Barclays Bank PLC | | 4-19-13 | (4,887) |
| JPY | 37,768,313 | 404,088 | | JPMorgan Chase Bank | | 4-19-13 | (3,507) |
| JPY | 63,011,581 | 673,852 | | Mellon Bank NA | | 4-19-13 | (6,167) |
| JPY | 63,011,581 | 673,947 | | Morgan Stanley & Company, Inc. | | 4-19-13 | (6,072) |
| NOK | 1,799,867 | 323,036 | | Bank Of America N.A. | | 4-19-13 | 10,047 |
| NOK | 1,449,969 | 260,457 | | Brown Brothers Harriman & | | 4-19-13 | 8,313 |
| | | | | Company | | | |
| NOK | 1,754,214 | 315,236 | | JPMorgan Chase Bank | | 4-19-13 | 10,186 |
| NOK | 1,673,672 | 300,740 | | Morgan Stanley & Company, Inc. | | 4-19-13 | 9,695 |
| |
| Total | | $11,060,866 | | | | | $160,223 |
| |
| 36 | International Growth Fund | Annual report |
| | | | | | |
| Currency Abbreviations | | | | | |
| AUD | Australian Dollar | | HKD | Hong Kong Dollar | | |
| CAD | Canadian Dollar | | JPY | Japanese Yen | | |
| CHF | Swiss Franc | | NOK | Norwegian Krone | | |
| DKK | Danish Krone | | SGD | Singapore Dollar | | |
| GBP | Pound Sterling | | | | | |
Fair value of derivative instruments by risk category
The table below summarizes the fair value of derivatives held by the Fund at February 28, 2013 by risk category:
| | | | |
| | | FINANCIAL | ASSET | LIABILITY |
| | STATEMENT OF ASSET AND | INSTRUMENT | DERIVATIVES | DERIVATIVES |
| RISK | LIABILITIES LOCATION | LOCATION | FAIR VALUE | FAIR VALUE |
|
| Equity contracts | Receivable for future variation | Future† | $139,613 | ($186,533) |
| | margin; net unrealized | | | |
| | appreciation (depreciation) | | | |
| | on investments | | | |
| | | | | |
| Foreign exchange | Receivable/Payable for | Forward foreign | 181,480 | (58,020) |
| contracts | forward foreign currency | currency | | |
| | exchange contracts | contracts | | |
| | | | | |
| Total | | | $321,093 | ($244,553) |
† Reflects cumulative appreciation/depreciation of futures as disclosed above. Only the period end variation margin is separately disclosed on the Statement of assets and liabilities.
Effect of derivative instruments on the Statement of operations
The table below summarizes the net realized gain (loss) included in the net increase (decrease) in net assets from operations, classified by derivative instrument and risk category, for the year ended February 28, 2013:
| | | | |
| | STATEMENT OF | | FOREIGN | |
| | OPERATIONS | FUTURES | CURRENCY | |
| RISK | LOCATION | CONTRACTS | TRANSACTIONS* | TOTAL |
|
| Equity contracts | Net realized gain | $869,607 | — | $869,607 |
| | (loss) on | | | |
| | | | | |
| Foreign exchange | Net realized gain | — | 76,836 | 76,836 |
| contracts | (loss) on | | | |
| Total | | $869,607 | $76,836 | $946,443 |
* Realized gain/loss associated with forward foreign currency contracts is included in this caption on the Statement of operations.
The table below summarizes the net change in unrealized appreciation (depreciation) included in the net increase (decrease) in net assets from operations, classified by derivative instrument and risk category, for the year ended February 28, 2013:
| | | | |
| | | | TRANSLATION OF | |
| | | | ASSETS AND | |
| | | | LIABILITIES IN | |
| | | FUTURES | FOREIGN | |
| RISK | STATEMENT OF OPERATIONS LOCATION | CONTRACTS | TRANSACTIONS* | TOTAL |
|
| Equity contracts | Change in unrealized appreciation | ($540,025) | | ($540,025) |
| | (depreciation) | | — | |
| | | | | |
| Foreign exchange | Change in unrealized appreciation | | $248,876 | $248,876 |
| contracts | (depreciation) | — | | |
| Total | | ($540,025) | $248,876 | ($291,149) |
* Change in unrealized appreciation/depreciation associated with forward foreign currency contracts is included in this caption on the Statement of operations.
| |
| Annual report | International Growth Fund | 37 |
Note 4 — Guarantees and indemnifications
Under the Trust’s organizational documents, its Officers and Trustees are indemnified against certain liabilities arising out of the performance of their duties to the Trust, including the Fund. Additionally, in the normal course of business, the Fund enters into contracts with service providers that contain general indemnification clauses. The Fund’s maximum exposure under these arrangements is unknown, as this would involve future claims that may be made against the Fund that have not yet occurred. The risk of material loss from such claims is considered remote.
Note 5 — Fees and transactions with affiliates
John Hancock Investment Management Services, LLC (the Advisor) serves as investment advisor for the Trust. John Hancock Funds, LLC (the Distributor), an affiliate of the Advisor, serves as principal underwriter of the Trust. The Advisor and the Distributor are indirect, wholly owned subsidiaries of MFC.
Management fee. The Fund has an investment management agreement with the Advisor under which the Fund pays a daily management fee to the Advisor equivalent, on an annual basis, to the sum of: (a) 0.920% of the first $100,000,000 of the Fund’s average daily net assets; (b) 0.895% of the next $900,000,000; (c) 0.880% of the next $1,000,000,000; (d) 0.850% of the next $1,000,000,000; (e) 0.825% of the next $1,000,000,000 and (f) 0.800% of the Fund’s average daily net assets in excess of $4,000,000,000. The Advisor has a subadvisory agreement with Grantham, Mayo, Van Otterloo & Co. LLC. The Fund is not responsible for payment of the subadvisory fees.
The Advisor has contractually agreed to waive fees and/or reimburse certain expenses for each share class of the Fund. This agreement excludes taxes, portfolio brokerage commissions, interest expense, litigation and indemnification expenses and other extraordinary expenses not incurred in the ordinary course of the Fund’s business, short dividend expense and acquired fund fees. The fee waivers and/or reimbursements are such that these expenses will not exceed 1.60%, 2.30%, 2.30%, 1.24% and 1.15% for Class A, Class B, Class C, Class I and Class 1 shares, respectively. The current expense limitation agreement will remain in effect through June 30, 2013, unless renewed by mutual agreement of the Fund and the Advisor based upon a determination that this is appropriate under the circumstances at the time.
Accordingly, these expense reductions amounted to $46,865, $17,213, $17,512, $17,750 and $3,098 for Class A, Class B, Class C, Class I and Class 1 shares, respectively, for the year ended February 28, 2013.
The investment management fees, including the impact of the waivers and reimbursements described above, incurred for the year ended February 28, 2013 were equivalent to the net annual effective rate of 0.85% of the Fund’s average daily net assets.
Accounting and legal services. Pursuant to a service agreement, the Fund reimburses the Advisor for all expenses associated with providing the administrative, financial, legal, accounting and recordkeeping services to the Fund, including the preparation of all tax returns, periodic reports to shareholders and regulatory reports, among other services. These expenses are allocated to each share class based on its relative net assets at the time the expense was incurred. These accounting and legal services fees incurred for the year ended February 28, 2013 amounted to an annual rate of 0.02% of the Fund’s average daily net assets.
Distribution and service plans. The Fund has a distribution agreement with the Distributor. The Fund has adopted distribution and service plans with respect to Class A, Class B, Class C and Class 1 shares pursuant to Rule 12b-1 under the 1940 Act, to pay the Distributor for services provided as the distributor of shares of the Fund. The Fund pays the following contractual rates of distribution and service fees under these arrangements, expressed as an annual percentage of average daily net assets for each class of the Fund’s shares.
| |
| 38 | International Growth Fund | Annual report |
| | | | | |
| CLASS | 12b–1 FEE | | | | |
| | | | |
| Class A | 0.30% | | | | |
| Class B | 1.00% | | | | |
| Class C | 1.00% | | | | |
| Class 1 | 0.05% | | | | |
Sales charges. Class A shares are assessed up-front sales charges, which resulted in payments to the Distributor amounting to $144,332 for the year ended February 28, 2013. Of this amount, $24,884 was retained and used for printing prospectuses, advertising, sales literature and other purposes, $118,989 was paid as sales commissions to broker-dealers and $459 was paid as sales commissions to sales personnel of Signator Investors, Inc., a broker-dealer affiliate of the Advisor.
Class A, Class B and Class C shares may be subject to contingent deferred sales charges (CDSCs). Certain Class A shares that are redeemed within one year of purchase are subject to a 1.00% sales charge. Class B shares that are redeemed within six years of purchase are subject to CDSCs, at declining rates, beginning at 5.00%. Class C shares that are redeemed within one year of purchase are subject to a 1.00% CDSC. CDSCs are applied to the lesser of the current market value at the time of redemption or the original purchase cost of the shares being redeemed. Proceeds from CDSCs are used to compensate the Distributor for providing distribution-related services in connection with the sale of these shares. During the year ended February 28, 2013, CDSCs received by the Distributor amounted to $96, $2,324 and $286 for Class A, Class B and Class C shares, respectively.
Transfer agent fees. The Fund has a transfer agent agreement with John Hancock Signature Services, Inc. (Signature Services), an affiliate of the Advisor. The transfer agent fees paid to Signature Services are determined based on the cost to Signature Services (Signature Services Cost) of providing recordkeeping services. The Signature Services Cost includes a component of allocated John Hancock corporate overhead for providing transfer agent services to the Fund and to all other John Hancock affiliated funds. It also includes out-of-pocket expenses that are comprised of payments made to third-parties for recordkeeping services provided to their clients who invest in one or more John Hancock funds. In addition, Signature Services Cost may be reduced by certain fees that Signature Services receives in connection with retirement and small accounts. Signature Services Cost is calculated monthly and allocated, as applicable, to four categories of share classes: Institutional Share Classes, Retirement Share Classes, Municipal Bond Classes and all other Retail Share Classes. Within each of these categories, the applicable costs are allocated to the affected John Hancock affiliated funds and/or classes, based on the relative average daily net assets.
Class level expenses. Class level expenses for the year ended February 28, 2013 were:
| | | | |
| | DISTRIBUTION | TRANSFER | STATE | PRINTING AND |
| CLASS | AND SERVICE FEES | AGENT FEES | REGISTRATION FEES | POSTAGE |
|
| Class A | $175,725 | $114,273 | $21,698 | $7,970 |
| Class B | 10,639 | 2,073 | 16,355 | 550 |
| Class C | 17,312 | 3,372 | 16,354 | 657 |
| Class I | — | 91,334 | 18,469 | 4,988 |
| Class 1 | 4,659 | — | — | — |
| | | | | |
| Total | $208,335 | $211,052 | $72,876 | $14,165 |
Trustee expenses. The Fund compensates each Trustee who is not an employee of the Advisor or its affiliates. Under the John Hancock Group of Funds Deferred Compensation Plan (the Plan) which was terminated in November 2012, certain Trustees could have elected, for tax purposes, to defer receipt of this compensation. Any deferred amounts were invested in various John Hancock funds. The investment of deferred amounts and the offsetting liability are included within Other receivables and prepaid expenses and Payable to affiliates — Trustees’ fees, respectively, in the
| |
| Annual report | International Growth Fund | 39 |
accompanying Statement of assets and liabilities. Plan assets will be liquidated in accordance with the Plan documents.
Interfund Lending Program. Pursuant to an Exemptive Order issued by the SEC, the Fund, along with other funds advised by the Advisor, may participate in an interfund lending program. This program provides an alternative credit facility allowing the funds to borrow from, or lend money to, other participating affiliated funds. At period end, there were no interfund loans outstanding. The Fund’s activity in this program during the period for which loans were outstanding was as follows:
| | | |
| | | WEIGHTED | |
| BORROWER | AVERAGE | AVERAGE | |
| OR LENDER | LOAN BALANCE | INTEREST RATE | INTEREST |
|
| |
| Borrower | $4,008,434 | 0.96% | $55 |
Note 6 — Fund share transactions
Transactions in Fund shares for the years ended February 28, 2013 and February 29, 2012 were as follows:
| | | | |
| | Year ended 2-28-13 | Year ended 2-29-12 |
| | | |
| | Shares | Amount | Shares | Amount |
| Class A shares | | | | |
|
| Sold | 1,767,870 | $36,112,556 | 1,620,299 | $32,324,292 |
| Distributions reinvested | 233,886 | 4,738,520 | 23,931 | 428,365 |
| Repurchased | (1,065,421) | (22,127,831) | (1,304,021) | (27,324,773) |
| | | | | |
| Net increase | 936,335 | $18,723,245 | 340,209 | $5,427,884 |
| |
| Class B shares | | | | |
|
| Sold | 20,059 | $411,385 | 25,355 | $511,368 |
| Distributions reinvested | 3,222 | 65,178 | 117 | 2,099 |
| Repurchased | (9,527) | (191,978) | (14,555) | (291,119) |
| | | | | |
| Net increase | 13,754 | $284,585 | 10,917 | $222,348 |
| |
| Class C shares | | | | |
|
| Sold | 51,637 | $1,066,773 | 41,214 | $820,514 |
| Distributions reinvested | 5,639 | 113,904 | 185 | 3,306 |
| Repurchased | (29,273) | (602,604) | (13,390) | (262,293) |
| | | | | |
| Net increase | 28,003 | $578,073 | 28,009 | $561,527 |
| |
| Class I shares | | | | |
|
| Sold | 797,965 | $16,495,650 | 2,600,769 | $52,660,106 |
| Distributions reinvested | 11,539 | 233,886 | 2,431 | 43,561 |
| Repurchased | (5,181,141) | (103,567,384) | (4,208,665) | (80,252,057) |
| | | | | |
| Net decrease | (4,371,637) | ($86,837,848) | (1,605,465) | ($27,548,390) |
| |
| Class 1 shares | | | | |
|
| Sold | 141,847 | $2,917,529 | 218,296 | $4,496,153 |
| Distributions reinvested | 37,603 | 761,831 | 7,081 | 126,750 |
| Repurchased | (120,232) | (2,437,200) | (141,980) | (2,799,853) |
| | | | | |
| Net increase | 59,218 | $1,242,160 | 83,397 | $1,823,050 |
| |
| Net decrease | (3,334,327) | ($66,009,785) | (1,142,933) | ($19,513,581) |
|
Note 7 — Purchase and sale of securities
Purchases and sales of securities, other than short-term securities, aggregated $92,687,077 and $169,742,488, respectively, for the year ended February 28, 2013.
| |
| 40 | International Growth Fund | Annual report |
Auditor’s report
Report of Independent Registered Public Accounting Firm
To the Board of Trustees and Shareholders of John Hancock Funds III International Growth Fund:
In our opinion, the accompanying statement of assets and liabilities, including the portfolio of investments, and the related statements of operations and of changes in net assets and the financial highlights present fairly, in all material respects, the financial position of John Hancock Funds III International Growth Fund (the “Fund”) at February 28, 2013, the results of its operations for the year then ended, the changes in its net assets for each of the two years in the period then ended and the financial highlights for each of the five years in the period then ended, in conformity with accounting principles generally accepted in the United States of America. These financial statements and financial highlights (hereafter referred to as “financial statements”) are the responsibility of the Fund’s management; our responsibility is to express an opinion on these financial statements based on our audits. We conducted our audits of these financial statements in accordance with the standards of the Public Company Accounting Oversight Board (United States). Those standards require that we plan and perform the audit to obtain reasonable assurance about whether the financial statements are free of material misstatement. An audit includes examining, on a test basis, evidence supporting the amounts and disclosures in the financial statements, assessing the accounting principles used and significant estimates made by management, and evaluating the overall financial statement presentation. We believe that our audits, which included confirmation of securities at February 28, 2013 by correspondence with the custodian, transfer agent, and brokers, provide a reasonable basis for our opinion.
PricewaterhouseCoopers LLP
Boston, Massachusetts
April 22, 2013
| |
| Annual report | International Growth Fund | 41 |
Tax information
Unaudited
For federal income tax purposes, the following information is furnished with respect to the distributions of the Fund, if any, paid during its taxable year ended February 28, 2013.
The Fund reports the maximum amount allowable of its net taxable income as eligible for the corporate dividends-received deduction.
The Fund reports the maximum amount allowable of its net taxable income as qualified dividend income as provided in the Jobs and Growth Tax Relief Reconciliation Act of 2003.
Income derived from foreign sources was $3,922,174. The Fund intends to pass through foreign tax credits of $221,363.
The Fund paid $8,045,718 in capital gain dividends.
Eligible shareholders will be mailed a 2013 Form 1099-DIV in early 2014. This will reflect the tax character of all distributions paid in calendar year 2013.
Please consult a tax advisor regarding the tax consequences of your investment in the Fund.
| |
| 42 | International Growth Fund | Annual report |
Special Shareholder Meeting
Unaudited
On November 13, 2012, a Special Meeting of the Shareholders of John Hancock Funds III and each of its series, including John Hancock International Growth Fund, was held at 601 Congress Street, Boston, Massachusetts, for the purpose of considering and voting on the following proposal:
Proposal: Election of thirteen (13) Trustees as members of the Board of Trustees of John Hancock Funds III.
| | |
| | TOTAL VOTES | TOTAL VOTES WITHHELD |
| | FOR THE NOMINEE | FROM THE NOMINEE |
|
| Independent Trustees | | |
| Charles L. Bardelis | 657,515,396.49 | 7,284,346.35 |
| Peter S. Burgess | 657,435,609.53 | 7,364,133.30 |
| William H. Cunningham | 654,078,766.31 | 10,720,976.53 |
| Grace K. Fey | 657,602,863.91 | 7,196,878.92 |
| Theron S. Hoffman | 657,614,243.23 | 7,185,499.60 |
| Deborah C. Jackson | 657,542,023.74 | 7,257,719.09 |
| Hassell H. McClellan | 657,319,823.50 | 7,479,919.34 |
| James M. Oates | 656,971,552.43 | 7,828,190.40 |
| Steven R. Pruchansky | 657,559,900.72 | 7,239,842.11 |
| Gregory A. Russo | 658,072,539.03 | 6,727,203.80 |
| Non-Independent Trustees | | |
| James R. Boyle | 657,895,765.77 | 6,903,977.06 |
| Craig Bromley | 657,588,989.57 | 7,210,753.26 |
| Warren A. Thomson | 657,817,862.75 | 6,981,880.08 |
| |
| Annual report | International Growth Fund | 43 |
Trustees and Officers
This chart provides information about the Trustees and Officers who oversee your John Hancock fund as of December 1, 2012. Officers elected by the Trustees manage the day-to-day operations of the Fund and execute policies formulated by the Trustees.
Independent Trustees
| | |
| Name, Year of Birth | Trustee | Number of |
| Position(s) held with Fund | of the | John Hancock |
| Principal occupation(s) and other | Trust | funds overseen |
| directorships during past 5 years | since1 | by Trustee |
| |
| James M. Oates,2 Born: 1946 | 2012 | 234 |
|
| Managing Director, Wydown Group (financial consulting firm) (since 1994); Chairman and Director, |
| Emerson Investment Management, Inc. (since 2000); Independent Chairman, Hudson Castle Group, Inc. |
| (formerly IBEX Capital Markets, Inc.) (financial services company) (1997–2011); Director, Stifel Financial |
| (since 1996); Director, Investor Financial Services Corporation (1995–2007); Director, Connecticut |
| River Bancorp (since 1998); Director, Virtus Funds (formerly Phoenix Mutual Funds) (since 1988). |
| Trustee and Chairperson of the Board, John Hancock retail funds (since 2012); Trustee, John Hancock |
| Funds III (2005–2006 and since 2012); Trustee (since 2004) and Chairperson of the Board (since |
| 2005), John Hancock Variable Insurance Trust; Trustee and Chairperson of the Board (since 2005), |
| John Hancock Funds II. | | |
|
| |
| Charles L. Bardelis,2,3 Born: 1941 | 2012 | 234 |
|
| Director, Island Commuter Corp. (marine transport). Trustee, John Hancock retail funds (since 2012); |
| Trustee, John Hancock Funds III (2005–2006 and since 2012); Trustee, John Hancock Variable Insurance |
| Trust (since 1988); Trustee, John Hancock Funds II (since 2005). | | |
|
| |
| Peter S. Burgess,2,3 Born: 1942 | 2012 | 234 |
|
| Consultant (financial, accounting and auditing matters) (since 1999); Certified Public Accountant; |
| Partner, Arthur Andersen (independent public accounting firm) (prior to 1999); Director, Lincoln |
| Educational Services Corporation (since 2004); Director, Symetra Financial Corporation (since 2010); |
| former Director, PMA Capital Corporation (2004–2010). Trustee, John Hancock retail funds (since 2012); |
| Trustee, John Hancock Funds III (2005–2006 and since 2012); Trustee, John Hancock Variable Insurance |
| Trust and John Hancock Funds II (since 2005). | | |
|
| |
| William H. Cunningham, Born: 1944 | 2006 | 234 |
|
| Professor, University of Texas, Austin, Texas (since 1971); former Chancellor, University of Texas |
| System and former President of the University of Texas, Austin, Texas; Director, LIN Television (since |
| 2009); Chairman (since 2009) and Director (since 2006), Lincoln National Corporation (insurance); |
| Director, Resolute Energy Corporation (since 2009); Director, Southwest Airlines (since 2000); former |
| Director, Introgen (manufacturer of biopharmaceuticals) (until 2008); former Director, Hicks Acquisition |
| Company I, Inc. (until 2007); former Director, Texas Exchange Bank, SSB (formerly Bank of Crowley) |
| (until 2009); former Advisory Director, JP Morgan Chase Bank (formerly Texas Commerce Bank–Austin) |
| (until 2009). Trustee, John Hancock retail funds (since 1986); Trustee, John Hancock Variable Insurance |
| Trust (since 2012); Trustee, John Hancock Funds II (since 2012 and 2005–2006). | |
|
| |
| Grace K. Fey,2 Born: 1946 | 2012 | 234 |
|
| Chief Executive Officer, Grace Fey Advisors (since 2007); Director and Executive Vice President, |
| Frontier Capital Management Company (1988–2007); Director, Fiduciary Trust (since 2009). |
| Trustee, John Hancock retail funds (since 2012); Trustee, John Hancock Variable Insurance Trust and |
| John Hancock Funds II (since 2008). | | |
| |
| 44 | International Growth Fund | Annual report |
Independent Trustees (continued)
| | |
| Name, Year of Birth | Trustee | Number of John |
| Position(s) held with Fund | of the | Hancock funds |
| Principal occupation(s) and other | Trust | overseen by |
| directorships during past 5 years | since1 | Trustee |
| |
| Theron S. Hoffman,2,3 Born: 1947 | 2012 | 234 |
|
| Chief Executive Officer, T. Hoffman Associates, LLC (consulting firm) (since 2003); Director, The Todd |
| Organization (consulting firm) (2003–2010); President, Westport Resources Management (investment |
| management consulting firm) (2006–2008); Senior Managing Director, Partner and Operating Head, |
| Putnam Investments (2000–2003); Executive Vice President, The Thomson Corp. (financial and |
| legal information publishing) (1997–2000). Trustee, John Hancock retail funds (since 2012); Trustee, |
| John Hancock Variable Insurance Trust and John Hancock Funds II (since 2008). | |
|
| |
| Deborah C. Jackson, Born: 1952 | 2008 | 234 |
|
| President, Cambridge College, Cambridge, Massachusetts (since 2011); Chief Executive Officer, |
| American Red Cross of Massachusetts Bay (2002–2011); Board of Directors of Eastern Bank Corporation |
| (since 2001); Board of Directors of Eastern Bank Charitable Foundation (since 2001); Board of Directors |
| of American Student Assistance Corporation (1996–2009); Board of Directors of Boston Stock Exchange |
| (2002–2008); Board of Directors of Harvard Pilgrim Healthcare (health benefits company) (2007–2011). |
| Trustee, John Hancock retail funds (since 2008); Trustee of John Hancock Variable Insurance Trust and |
| John Hancock Funds II (since 2012). | | |
|
| |
| Hassell H. McClellan,2 Born: 1945 | 2012 | 234 |
|
| Associate Professor, The Wallace E. Carroll School of Management, Boston College (since 1984); |
| Trustee, Virtus Variable Insurance Trust (formerly Phoenix Edge Series Funds) (since 2008); Director, |
| The Barnes Group (since 2010). Trustee, John Hancock retail funds (since 2012); Trustee, John Hancock |
| Funds III (2005–2006 and since 2012); Trustee, John Hancock Variable Insurance Trust and | |
| John Hancock Funds II (since 2005). | | |
|
| |
| Steven R. Pruchansky, Born: 1944 | 2006 | 234 |
|
| Chairman and Chief Executive Officer, Greenscapes of Southwest Florida, Inc. (since 2000); Director |
| and President, Greenscapes of Southwest Florida, Inc. (until 2000); Member, Board of Advisors, First |
| American Bank (until 2010); Managing Director, Jon James, LLC (real estate) (since 2000); Director, |
| First Signature Bank & Trust Company (until 1991); Director, Mast Realty Trust (until 1994); President, |
| Maxwell Building Corp. (until 1991). Trustee (since 1992) and Chairperson of the Board (2011–2012), |
| John Hancock retail funds; Trustee and Vice Chairperson of the Board, John Hancock retail funds, |
| John Hancock Variable Insurance Trust and John Hancock Funds II (since 2012). | |
|
| |
| Gregory A. Russo, Born: 1949 | 2008 | 234 |
|
| Director and Audit Committee Chairman (since 2012) and Member, Audit Committee and Finance |
| Committee (since 2011), NCH Healthcare System, Inc. (holding company for multi-entity healthcare |
| system); Director and Member of Finance Committee, The Moorings, Inc. (nonprofit continuing care |
| community) (since 2012); Vice Chairman, Risk & Regulatory Matters, KPMG LLP (KPMG) (2002–2006); |
| Vice Chairman, Industrial Markets, KPMG (1998–2002); Chairman and Treasurer, Westchester |
| County, New York, Chamber of Commerce (1986–1992); Director, Treasurer and Chairman of |
| Audit and Finance Committees, Putnam Hospital Center (1989–1995); Director and Chairman of |
| Fundraising Campaign, United Way of Westchester and Putnam Counties, New York (1990–1995). |
| Trustee, John Hancock retail funds (since 2008); Trustee, John Hancock Variable Insurance Trust and |
| John Hancock Funds II (since 2012). | | |
| |
| Annual report | International Growth Fund | 45 |
Non-Independent Trustees4
| | |
| Name, Year of Birth | Trustee | Number of |
| Position(s) held with Fund | of the | John Hancock |
| Principal occupation(s) and other | Trust | funds overseen |
| directorships during past 5 years | since1 | by Trustee |
| |
| James R. Boyle,2 Born: 1959 | 2012 | 234 |
|
| Senior Executive Vice President, John Hancock Financial Services (since 1999, including prior positions); |
| Chairman and Director, John Hancock Advisers, LLC, John Hancock Funds, LLC and John Hancock |
| Investment Management Services, LLC (2005–2010). Trustee, John Hancock retail funds (since 2012 and |
| 2005–2010), Trustee, John Hancock Variable Insurance Trust and John Hancock Funds II (since 2005). |
|
| |
| Craig Bromley,2 Born: 1966 | 2012 | 234 |
|
| President, John Hancock Financial Services (since 2012); Senior Executive Vice President and General |
| Manager, U.S. Division, John Hancock Financial Services (since 2012); President and Chief Executive |
| Officer, Manulife Insurance Company (Manulife (Japan) (2005–2012), including prior positions). |
| Trustee, John Hancock retail funds (since 2012); Trustee, John Hancock Variable Insurance Trust and |
| John Hancock Funds II (since 2012). | | |
|
| |
| Warren A. Thomson,2 Born: 1955 | 2012 | 234 |
|
| Senior Executive Vice President and Chief Investment Officer, Manulife Financial Corporation (since |
| 2001, including prior positions); Director, Manulife Trust Company and Manulife Bank of Canada (since |
| 2001, including prior positions); Director and Chairman, Manulife Asset Management (2001–2013, |
| including prior positions). Trustee, John Hancock retail funds, John Hancock Variable Insurance Trust and |
| John Hancock Funds II (since 2012). | | |
Principal officers who are not Trustees
| |
| Name, Year of Birth | Officer |
| Position(s) held with Fund | of the |
| Principal occupation(s) and other | Trust |
| directorships during past 5 years | since |
| |
| Hugh McHaffie, Born: 1959 | 2012 |
|
| President | |
| Executive Vice President, John Hancock Financial Services (since 2006, including prior positions); | |
| Chairman and Director, John Hancock Advisers, LLC, John Hancock Investment Management Services, |
| LLC and John Hancock Funds, LLC (since 2010); President, John Hancock Advisers, LLC (since 2012); |
| President, John Hancock Investment Management Services, LLC (since 2010). President (since 2012) and |
| former Trustee (2010–2012), John Hancock retail funds; President, John Hancock Variable Insurance |
| Trust and John Hancock Funds II (since 2009). | |
|
| |
| Andrew G. Arnott, Born: 1971 | 2009 |
|
| Executive Vice President | |
| Senior Vice President, John Hancock Financial Services (since 2009); Executive Vice President, | |
| John Hancock Advisers, LLC (since 2005); Executive Vice President, John Hancock Investment | |
| Management Services, LLC (since 2006); President, John Hancock Funds, LLC (since 2004, including |
| prior positions); Executive Vice President, John Hancock retail funds (since 2007, including prior | |
| positions); Executive Vice President, John Hancock Variable Insurance Trust and John Hancock Funds II |
| (since 2007, including prior positions). | |
|
| |
| Thomas M. Kinzler, Born: 1955 | 2006 |
|
| Secretary and Chief Legal Officer | |
| Vice President, John Hancock Financial Services (since 2006); Secretary and Chief Legal Counsel, | |
| John Hancock Funds, LLC (since 2007); Secretary and Chief Legal Officer, John Hancock retail funds, |
| John Hancock Variable Insurance Trust and John Hancock Funds II (since 2006). | |
| |
| 46 | International Growth Fund | Annual report |
Principal officers who are not Trustees (continued)
| |
| Name, Year of Birth | Officer |
| Position(s) held with Fund | of the |
| Principal occupation(s) and other | Trust |
| directorships during past 5 years | since |
| |
| Francis V. Knox, Jr., Born: 1947 | 2006 |
|
| Chief Compliance Officer | |
| Vice President, John Hancock Financial Services (since 2005); Chief Compliance Officer, John Hancock |
| retail funds, John Hancock Variable Insurance Trust, John Hancock Funds II, John Hancock Advisers, |
| LLC and John Hancock Investment Management Services, LLC (since 2005); Vice President and Chief |
| Compliance Officer, John Hancock Asset Management a division of Manulife Asset Management (US) |
| LLC (2005–2008). | |
|
| |
| Charles A. Rizzo, Born: 1957 | 2007 |
|
| Chief Financial Officer | |
| Vice President, John Hancock Financial Services (since 2008); Senior Vice President, John Hancock | |
| Advisers, LLC and John Hancock Investment Management Services, LLC (since 2008); Chief Financial |
| Officer, John Hancock retail funds, John Hancock Variable Insurance Trust and John Hancock | |
| Funds II (since 2007). | |
|
| |
| Salvatore Schiavone, Born: 1965 | 2010 |
|
| Treasurer | |
| Assistant Vice President, John Hancock Financial Services (since 2007); Vice President, John Hancock |
| Advisers, LLC and John Hancock Investment Management Services, LLC (since 2007); Treasurer, | |
| John Hancock retail funds (since 2007, including prior positions); Treasurer, John Hancock Variable | |
| Insurance Trust and John Hancock Funds II (since 2010 and 2007–2009, including prior positions). | |
John Hancock retail funds is comprised of John Hancock Funds III and 33 other John Hancock funds consisting of 23 series of other John Hancock trusts and 10 closed-end funds.
The business address for all Trustees and Officers is 601 Congress Street, Boston, Massachusetts 02210–2805.
The Statement of Additional Information of the Fund includes additional information about members of the Board of Trustees of the Fund and is available without charge, upon request, by calling 1-800–225-5291.
1 Each Trustee holds office until his or her successor is elected and qualified, or until the Trustee’s death, retirement, resignation or removal.
2 Became a Trustee of the Fund effective December 1, 2012.
3 Member of Audit Committee.
4 Because Messrs. Bromley and Thomson are senior executives or directors and Mr. Boyle held prior positions as a senior executive and director of the Advisor and/or its affiliates, each of them is considered an “interested person,” as defined in the Investment Company Act of 1940, of the Fund.
| |
| Annual report | International Growth Fund | 47 |
More information
| |
| Trustees | Investment advisor |
| James M. Oates, Chairman | John Hancock Investment Management |
| Steven R. Pruchansky, Vice Chairman | Services, LLC |
| Charles L. Bardelis* | |
| James R. Boyle† | Subadvisor |
| Craig Bromley† | Grantham, Mayo, Van Otterloo & Co. LLC |
| Peter S. Burgess* | |
| William H. Cunningham | Principal distributor |
| Grace K. Fey | John Hancock Funds, LLC |
| Theron S. Hoffman* | |
| Deborah C. Jackson | Custodian |
| Hassell H. McClellan | State Street Bank and Trust Company |
| Gregory A. Russo | |
| Warren A. Thomson† | Transfer agent |
| | John Hancock Signature Services, Inc. |
| Officers | |
| Hugh McHaffie | Legal counsel |
| President | K&L Gates LLP |
| | |
| Andrew G. Arnott | Independent registered |
| Executive Vice President | public accounting firm |
| | PricewaterhouseCoopers LLP |
| Thomas M. Kinzler | |
| Secretary and Chief Legal Officer | |
| | |
| Francis V. Knox, Jr. | |
| Chief Compliance Officer | |
| | |
| Charles A. Rizzo | |
| Chief Financial Officer | |
| | |
| Salvatore Schiavone | |
| Treasurer | |
| |
| *Member of the Audit Committee | |
| †Non-Independent Trustee | |
The Fund’s proxy voting policies and procedures, as well as the Fund’s proxy voting record for the most recent twelve-month period ended June 30, are available free of charge on the Securities and Exchange Commission (SEC) Web site at www.sec.gov or on our Web site.
The Fund’s complete list of portfolio holdings, for the first and third fiscal quarters, is filed with the SEC on Form N-Q. The Fund’s Form N-Q is available on our Web site and the SEC’s Web site, www.sec.gov, and can be reviewed and copied (for a fee) at the SEC’s Public Reference Room in Washington, DC. Call 1-800-SEC-0330 to receive information on the operation of the SEC’s Public Reference Room.
We make this information on your fund, as well as monthly portfolio holdings, and other fund details available on our Web site at www.jhfunds.com or by calling 1-800-225-5291.
| | |
| You can also contact us: | | |
| 1-800-225-5291 | Regular mail: | Express mail: |
| jhfunds.com | John Hancock Signature Services, Inc. | John Hancock Signature Services, Inc. |
| | P.O. Box 55913 | Mutual Fund Image Operations |
| | Boston, MA 02205-5913 | 30 Dan Road |
| | | Canton, MA 02021 |
| |
| 48 | International Growth Fund | Annual report |

1-800-225-5291
1-800-554-6713 TDD
1-800-338-8080 EASI-Line
www.jhfunds.com
| |
| This report is for the information of the shareholders of John Hancock International Growth Fund. | |
| It is not authorized for distribution to prospective investors unless preceded or accompanied by a prospectus. | 87A 2/13 |
| MF135742 | 4/13 |

A look at performance
Total returns for the period ended February 28, 2013
| | | | | | | |
| | Average annual total returns (%) | | Cumulative total returns (%) |
| | with maximum sales charge | | | with maximum sales charge | |
|
| | | | | Since | | | Since |
| | 1-year | 5-year | 10-year | inception1 | 5-year | 10-year | inception1 |
|
| Class A | 0.57 | –2.13 | — | –1.69 | –10.21 | — | –9.96 |
|
| Class B | 0.14 | –2.17 | — | –1.56 | –10.37 | — | –9.26 |
|
| Class C | 4.27 | –1.78 | — | –1.54 | –8.57 | — | –9.15 |
|
| Class I2 | 6.31 | –0.67 | — | –0.43 | –3.32 | — | –2.64 |
|
Performance figures assume all distributions have been reinvested. Figures reflect maximum sales charges on Class A shares of 5%, and the applicable contingent deferred sales charge (CDSC) on Class B and Class C shares. The Class B shares’ CDSC declines annually between years 1 to 6 according to the following schedule: 5, 4, 3, 3, 2, 1%. No sales charge will be assessed after the sixth year. Class C shares held for less than one year are subject to a 1% CDSC. Sales charges are not applicable to Class I shares.
The expense ratios of the Portfolio, both net (including any fee waivers or expense limitations) and gross (excluding any fee waivers or expense limitations), are set forth according to the most recent publicly available prospectuses for the Portfolio and may differ from those disclosed in the Financial highlights tables in this report. The fee waivers and expense limitations are contractual until at least 6-30-13. Had the fee waivers and expense limitations not been in place, gross expenses would apply. The following expense ratios include expenses of the underlying affiliated funds in which the Portfolio invests. The expense ratios are as follows:
| | | | | |
| | Class A | Class B | Class C | Class I | |
| Net (%) | 1.61 | 2.31 | 2.31 | 1.25 | |
| Gross (%) | 2.26 | 3.46 | 3.04 | 7.56 | |
The returns reflect past results and should not be considered indicative of future performance. The return and principal value of an investment will fluctuate so that shares, when redeemed, may be worth more or less than their original cost. Due to market volatility, the Portfolio’s current performance may be higher or lower than the performance shown. For current to the most recent month-end performance data, please call 1-800-225-5291 or visit the Portfolio’s Web site at www.jhfunds.com.
The performance table above and the chart on the next page do not reflect the deduction of taxes that a shareholder would pay on portfolio distributions or the redemption of portfolio shares. The Portfolio’s performance results reflect any applicable expense reductions, without which the expenses increase and results would have been less favorable.
See the following page for footnotes.
| |
| 6 | International Allocation Portfolio | Annual report |
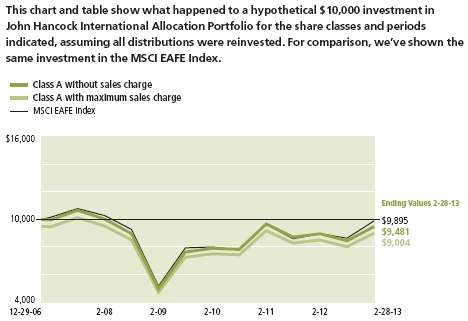
| | | | |
| | | Without | With maximum | |
| | Start date | sales charge | sales charge | Index |
|
| Class B3 | 12-29-06 | $9,074 | $9,074 | $9,895 |
|
| Class C3 | 12-29-06 | 9,085 | 9,085 | 9,895 |
|
| Class I2 | 12-29-06 | 9,736 | 9,736 | 9,895 |
|
MSCI EAFE Index (gross of foreign withholding tax on dividends) (Europe, Australasia, Far East) is a free float-adjusted market capitalization index that is designed to measure the equity market performance of developed markets, excluding the U.S. and Canada.
It is not possible to invest directly in an index. Index figures do not reflect expenses or sales charges, which would have resulted in lower values if they did.
Footnotes related to performance pages
1 From 12-29-06.
2 For certain types of investors, as described in the Portfolio’s prospectus.
3 The contingent deferred sales charge is not applicable.
| |
| Annual report | International Allocation Portfolio | 7 |
Management’s discussion of
Portfolio performance
By John Hancock Asset Management
Global markets outside the United States faced a number of challenges over the 12 months ended February 28, 2013, especially early in the period. The obstacles to growth in Japan and recession-wracked Europe, the potential implications of the U.S. economy diving over the “fiscal cliff” and critical leadership transitions in Japan and China were just a few headlines that set a generally negative tone. In spite of this, in the final months of the year equity and fixed-income markets around the globe began to regain their footing. Developed markets, as represented by the MSCI EAFE Index, rose 10.37%, an overwhelmingly large portion of those gains coming during the final six months of the period. The MSCI Emerging Markets Index followed a similar pattern with weakness at the beginning of the year, but its second half rally barely pushed the index’s one-year return into positive territory (up 0.62%).
For the year ended February 28, 2013, John Hancock International Allocation Portfolio’s Class A shares rose 5.83%, excluding sales charges, trailing its benchmark, the MSCI EAFE Index, which rose 10.37%, and the foreign large blend fund peer group tracked by Morningstar, Inc., which rose an average 8.61%.† Emerging-market equities were weak during the period, in spite of their growth and their relatively benign valuations. Because the Portfolio had exposure to emerging markets, it lagged its benchmark index, which focuses on developed markets and does not include emerging markets. Another factor contributing to the Portfolio’s relative shortfall was the performance of some of our underlying fund managers, especially in the first half of the year. That said, these same assets and managers were generally contributors later in the period. During the period, we made changes to our international developed country manager line-up in order to increase diversification. Additionally, we introduced positions in a number of country-specific exchange-traded funds in order to capture opportunities where we believe individual countries offer long-term total return potential based on their prospects for growth and/or improvement in their valuations.
This commentary reflects the views of the portfolio managers through the end of the period discussed in this report. The managers’ statements reflect their own opinions. As such, they are in no way guarantees of future events and are not intended to be used as investment advice or a recommendation regarding any specific security. They are also subject to change at any time as market and other conditions warrant.
Past performance is no guarantee of future results.
Foreign investing, especially in emerging markets, has additional risks, such as currency and market volatility and political and social instability. The Portfolio’s performance depends on the Advisor’s skill in determining the strategic asset class allocations, the mix of underlying funds and the performance of those underlying funds. The underlying funds’ performance may be lower than the performance of the asset class which they were selected to represent. The Portfolio is subject to the same risks as the underlying funds in which it invests, which include the following: stocks and bonds can decline due to adverse issuer, market, regulatory or economic developments; foreign investing, especially in emerging markets, has additional risks, such as currency and market volatility and political and social instability; and the securities of small-capitalization companies are subject to higher volatility than larger, more established companies. For additional information on these and other risk considerations, please see the Portfolio’s prospectus.
† Figures from Morningstar, Inc. include reinvested dividends and do not take into account sales charges. Actual load-adjusted performance is lower.
| |
| 8 | International Allocation Portfolio | Annual report |
Your expenses
These examples are intended to help you understand your ongoing operating expenses of investing in the Fund so you can compare these costs with the ongoing costs of investing in other mutual funds.
Understanding fund expenses
As a shareholder of the Portfolio, you incur two types of costs:
■ Transaction costs which include sales charges (loads) on purchases or redemptions (varies by share class), minimum account fee charge, etc.
■ Ongoing operating expenses including management fees, distribution and service fees (if applicable), and other fund expenses.
We are going to present only your ongoing operating expenses here.
Actual expenses/actual returns
This example is intended to provide information about the Portfolio’s actual ongoing operating expenses, and is based on the Portfolio’s actual return. It assumes an account value of $1,000.00 on September 1, 2012 with the same investment held until February 28, 2013.
| | | |
| | Account value | Ending value | Expenses paid during |
| | on 9-1-12 | on 2-28-13 | period ended 2-28-131,2 |
|
| Class A | $1,000.00 | $1,123.00 | $3.32 |
|
| Class B | 1,000.00 | 1,119.10 | 6.99 |
|
| Class C | 1,000.00 | 1,119.00 | 6.99 |
|
| Class I | 1,000.00 | 1,124.70 | 1.42 |
|
Together with the value of your account, you may use this information to estimate the operating expenses that you paid over the period. Simply divide your account value at February 28, 2013, by $1,000.00, then multiply it by the “expenses paid” for your share class from the table above. For example, for an account value of $8,600.00, the operating expenses should be calculated as follows:
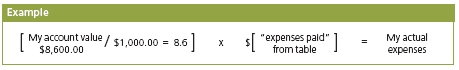
| |
| Annual report | International Allocation Portfolio | 9 |
Your expenses
Hypothetical example for comparison purposes
This table allows you to compare the Portfolio’s ongoing operating expenses with those of any other fund. It provides an example of the Portfolio’s hypothetical account values and hypothetical expenses based on each class’s actual expense ratio and an assumed 5% annualized return before expenses (which is not the Portfolio’s actual return). It assumes an account value of $1,000.00 on September 1, 2012, with the same investment held until February 28, 2013. Look in any other fund shareholder report to find its hypothetical example and you will be able to compare these expenses. Please remember that these hypothetical account values and expenses may not be used to estimate the actual ending account balance or expenses you paid for the period.
| | | |
| | Account value | Ending value | Expenses paid during |
| | on 9-1-12 | on 2-28-13 | period ended 2-28-131,2 |
|
| Class A | $1,000.00 | $1,021.70 | $3.16 |
|
| Class B | 1,000.00 | 1,018.20 | 6.66 |
|
| Class C | 1,000.00 | 1,018.20 | 6.66 |
|
| Class I | 1,000.00 | 1,023.50 | 1.35 |
|
Remember, these examples do not include any transaction costs, therefore, these examples will not help you to determine the relative total costs of owning different funds. If transaction costs were included, your expenses would have been higher. See the prospectus for details regarding transaction costs.
1 Expenses are equal to the Fund’s annualized expense ratio of 0.63%, 1.33%, 1.33% and 0.27% for Class A, Class B, Class C and Class I shares, respectively, multiplied by the average account value over the period, multiplied by 181/365 (to reflect the one-half year period).
2 The Fund’s expense ratios do not include fees and expenses indirectly incurred by the underlying funds, whose ratios can vary based on the mix of underlying funds. The range of expense ratios of the underlying funds held were 0.64% to 1.28%.
| |
| 10 | International Allocation Portfolio | Annual report |
Portfolio summary

1 As a percentage of net assets on 2-28-13.
| |
| Annual report | International Allocation Portfolio | 11 |
Portfolio’s investments
Investment companies
| |
| Underlying Funds’ Subadvisors | |
| |
| Atlantis Investment Management (Hong Kong) Ltd. | (Atlantis) |
| Baillie Gifford Overseas Ltd. | (Baillie Gifford) |
| Dimensional Fund Advisors, Inc. | (DFA) |
| Templeton Investment Counsel, LLC | (Franklin) |
| Grantham, Mayo, Van Otterloo & Co. LLC | (GMO) |
| Invesco Advisers, Inc. | (Invesco) |
| John Hancock Asset Management* | (John Hancock) |
*Manulife Asset Management (US) LLC and Manulife Asset Management (North America) Limited are doing business as John Hancock Asset Management.
As of 2-28-13
| | |
| | Shares | Value |
| Affiliated Investment Companies 95.0% | | $16,146,703 |
|
| (Cost $14,278,190) | | |
| | | |
| EQUITY 95.0% | | 16,146,703 |
| | | |
| International Large Cap 69.3% | | |
|
| John Hancock Funds II (G) | | |
| | | |
| International Growth Opportunities, Class NAV (Baillie Gifford) | 146,019 | 1,705,498 |
|
| International Growth Stock, Class NAV (Invesco) | 216,933 | 2,553,299 |
|
| International Value, Class NAV (Franklin) | 290,747 | 4,192,570 |
| | | |
| John Hancock Funds III (G) | | |
| | | |
| International Core, Class NAV (GMO) | 56,029 | 1,620,358 |
|
| International Value Equity, Class NAV (John Hancock1) (A) | 198,459 | 1,704,764 |
| | | |
| Emerging Markets 19.0% | | |
|
| John Hancock Funds II (G) | | |
| | | |
| China Emerging Leaders, Class NAV (Atlantis) | 40,589 | 427,398 |
|
| Emerging Markets, Class NAV (DFA) | 193,455 | 2,083,507 |
| | | |
| John Hancock Investment Trust III (G) | | |
| | | |
| Greater China Opportunities, Class NAV (John Hancock2) (A) | 35,458 | 718,736 |
| | | |
| International Small Cap 6.7% | | |
|
| John Hancock Funds II (G) | | |
| | | |
| International Small Company, Class NAV (DFA) | 131,706 | 1,140,573 |
| | |
| 12 | International Allocation Portfolio | Annual report | See notes to financial statements |
| | |
| | Shares | Value |
|
| Exchange Traded Funds 5.1% | | $859,593 |
|
| (Cost $848,365) | | |
| | | |
| iShares MSCI France Index Fund | 7,266 | 170,533 |
|
| iShares MSCI Germany Index Fund | 13,780 | 339,953 |
|
| iShares MSCI Indonesia Investable Market Index Fund | 2,632 | 89,778 |
|
| iShares MSCI Italy Capped Index Fund | 6,816 | 84,791 |
|
| iShares MSCI Malaysia Index Fund | 5,983 | 87,471 |
|
| iShares MSCI Turkey Index Fund | 1,321 | 87,067 |
| |
| Total investments (Cost $15,126,555)† 100.1% | | $17,006,296 |
|
| |
| Other assets and liabilities, net (0.1%) | | ($13,746) |
|
| |
| Total net assets 100.0% | | $16,992,550 |
|
The percentage shown for each investment category is the total value of that category as a percentage of the net assets of the Portfolio.
(A) The subadvisor is an affiliate of the advisor.
(G) The Portfolio’s subadvisor is shown parenthetically.
† At 2-28-13, the aggregate cost of investment securities for federal income tax purposes was $17,064,830. Net unrealized depreciation aggregated $58,534, of which $0 related to appreciated investment securities and $58,534 related to depreciated investment securities.
(1) Manulife Asset Management (US) LLC is doing business as John Hancock Asset Management.
(2) Manulife Asset Management (North America) Limited is doing business as John Hancock Asset Management.
| | |
| See notes to financial statements | Annual report | International Allocation Portfolio | 13 |
F I N A N C I A L S T A T E M E N T S
Financial statements
Statement of assets and liabilities 2-28-13
This Statement of assets and liabilities is the Portfolio’s balance sheet. It shows the value of what the Portfolio owns, is due and owes. You’ll also find the net asset value and the maximum public offering price per share.
| |
| Assets | |
|
| Investments in unaffiliated issuers, at value (Cost $848,365) | $859,593 |
| Investments in affiliated funds, at value (Cost $14,278,190) | 16,146,703 |
| | |
| Total investments, at value (Cost $15,126,555) | 17,006,296 |
| Cash | 23,124 |
| Receivable for portfolio shares sold | 10,187 |
| Dividends receivable | 1,196 |
| Receivable due from advisor | 684 |
| Other receivables and prepaid expenses | 25,302 |
| | |
| Total assets | 17,066,789 |
| |
| Liabilities | |
|
| Payable for investments purchased | 11,128 |
| Payable for portfolio shares repurchased | 5,455 |
| Payable to affiliates | |
| Accounting and legal services fees | 901 |
| Transfer agent fees | 5,519 |
| Trustees’ fees | 582 |
| Other liabilities and accrued expenses | 50,654 |
| | |
| Total liabilities | 74,239 |
| | |
| Net assets | 16,992,550 |
| |
| Net assets consist of | |
|
| Paid-in capital | $30,774,284 |
| Undistributed net investment income | 140,651 |
| Accumulated net realized gain (loss) on investments | (15,802,126) |
| Net unrealized appreciation (depreciation) on investments | 1,879,741 |
| | |
| Net assets | $16,992,550 |
| |
| Net asset value per share | |
|
| Based on net asset values and shares outstanding — the Portfolio has an | |
| unlimited number of shares authorized with no par value | |
| Class A ($8,788,562 ÷ 1,099,755 shares)1 | $7.99 |
| Class B ($2,659,898 ÷ 334,502 shares)1 | $7.95 |
| Class C ($4,849,468 ÷ 609,442 shares)1 | $7.96 |
| Class I ($694,622 ÷ 86,539 shares) | $8.03 |
| |
| Maximum offering price per share | |
|
| Class A (net asset value per share ÷ 95%)2 | $8.41 |
1 Redemption price is equal to net asset value less any applicable contingent deferred sales charge.
2 On single retail sales of less than $50,000. On sales of $50,000 or more and on group sales the offering price is reduced.
| | |
| 14 | International Allocation Portfolio | Annual report | See notes to financial statements |
F I N A N C I A L S T A T E M E N T S
Statement of operations For the year ended 2-28-13
This Statement of operations summarizes the Portfolio’s investment income earned and expenses incurred in operating the Portfolio. It also shows net gains (losses) for the period stated.
| |
| Investment income | |
|
| Income distributions received from affiliated underlying funds | $242,763 |
| Dividends | 2,830 |
| | |
| Total investment income | 245,593 |
| |
| Expenses | |
|
| Investment management fees | 11,780 |
| Distribution and service fees | 95,193 |
| Accounting and legal services fees | 3,513 |
| Transfer agent fees | 29,747 |
| Trustees’ fees | 980 |
| State registration fees | 64,755 |
| Printing and postage | 12,403 |
| Professional fees | 46,596 |
| Custodian fees | 13,000 |
| Registration and filing fees | 29,378 |
| Other | 6,262 |
| | |
| Total expenses | 313,607 |
| Less expense reductions | (167,302) |
| | |
| Net expenses | 146,305 |
| | |
| Net investment income | 99,288 |
| |
| Realized and unrealized gain (loss) | |
|
| |
| Net realized gain (loss) on | |
| Investments in unaffiliated issuers | 2,721 |
| Investments in affiliated issuers | 332,707 |
| Capital gain distributions received from affiliated underlying funds | 41,791 |
| | 377,219 |
| Change in net unrealized appreciation (depreciation) of | |
| Investments in unaffiliated issuers | 7,867 |
| Investments in affiliated issuers | 304,043 |
| | 311,910 |
| Net realized and unrealized gain | 689,129 |
| | |
| Increase in net assets from operations | $788,417 |
| | |
| See notes to financial statements | Annual report | International Allocation Portfolio | 15 |
F I N A N C I A L S T A T E M E N T S
Statements of changes in net assets
These Statements of changes in net assets show how the value of the Portfolio’s net assets has changed during the last two periods. The difference reflects earnings less expenses, any investment gains and losses, distributions, if any, paid to shareholders and the net of Portfolio share transactions.
| | |
| | Year | Year |
| | ended | ended |
| | 2-28-13 | 2-29-12 |
| |
| Increase (decrease) in net assets | | |
|
| |
| From operations | | |
| Net investment income | $99,288 | $139,498 |
| Net realized gain (loss) | 377,219 | (350,628) |
| Change in net unrealized appreciation (depreciation) | 311,910 | (1,463,033) |
| | | |
| Increase (decrease) in net assets resulting from operations | 788,417 | (1,674,163) |
| | | |
| Distributions to shareholders | | |
| From net investment income | | |
| Class A | (74,313) | (96,271) |
| Class B | (6,253) | (9,867) |
| Class C | (11,336) | (25,766) |
| Class I | (8,285) | (3,759) |
| From net realized gain | | |
| Class A | (21,071) | (1,275) |
| Class B | (6,762) | (330) |
| Class C | (12,258) | (862) |
| Class I | (1,703) | (38) |
| | | |
| Total distributions | (141,981) | (138,168) |
| | | |
| From Portfolio share transactions | (65,399) | (1,872,270) |
| | | |
| Total increase (decrease) | 581,037 | (3,684,601) |
| |
| Net assets | | |
|
| Beginning of year | 16,411,513 | 20,096,114 |
| | | |
| End of year | $16,992,550 | $16,411,513 |
| | | |
| Undistributed net investment income | $140,651 | $141,553 |
| | |
| 16 | International Allocation Portfolio | Annual report | See notes to financial statements |
Financial highlights
The Financial highlights show how the Portfolio’s net asset value for a share has changed during the period.
| | | | | |
| CLASS A SHARES Period ended | 2-28-13 | 2-29-12 | 2-28-11 | 2-28-10 | 2-28-09 |
| |
| Per share operating performance | | | | | |
|
| Net asset value, beginning of period | $7.64 | $8.35 | $6.82 | $4.31 | $9.48 |
| Net investment income1,2 | 0.07 | 0.08 | 0.05 | 0.02 | 0.12 |
| Net realized and unrealized gain (loss) on investments | 0.37 | (0.70) | 1.48 | 2.55 | (4.86) |
| Total from investment operations | 0.44 | (0.62) | 1.53 | 2.57 | (4.74) |
| Less distributions | | | | | |
| From net investment income | (0.07) | (0.09) | — | (0.06) | (0.14) |
| From net realized gain | (0.02) | —3 | — | —3 | (0.29) |
| Total distributions | (0.09) | (0.09) | — | (0.06) | (0.43) |
| Net asset value, end of period | $7.99 | $7.64 | $8.35 | $6.82 | $4.31 |
| Total return (%)4,5 | 5.83 | (7.34) | 22.43 | 59.59 | (50.67) |
| |
| Ratios and supplemental data | | | | | |
|
| Net assets, end of period (in millions) | $9 | $8 | $11 | $10 | $13 |
| Ratios (as a percentage of average net assets): | | | | | |
| Expenses before reductions | 1.506 | 1.286 | 1.156 | 1.066,7 | 0.926 |
| Expenses net of fee waivers | 0.636 | 0.636 | 0.656 | 0.676,7 | 0.616 |
| Expenses net of fee waivers and credits | 0.636 | 0.636 | 0.656 | 0.666,7 | 0.616 |
| Net investment income2 | 0.93 | 1.01 | 0.62 | 0.29 | 1.56 |
| Portfolio turnover (%) | 52 | 18 | 64 | 41 | 23 |
| |
1 Based on the average daily shares outstanding.
2 Recognition of net investment income by the Portfolio is affected by the timing and frequency of the declaration of
dividends by the underlying funds in which the Portfolio invests.
3 Less than $0.005 per share.
4 Does not reflect the effect of sales charges, if any.
5 Total returns would have been lower had certain expenses not been reduced during the applicable periods shown.
6 Ratios do not include expenses incurred from underlying funds whose annualized expense ratios were 0.64% to
1.28%, 0.48% to 1.35%, 0.91% to 1.11%, 0.91% to 1.17% and 0.99% to 1.17% for the years ended 2-28-13,
2-29-12, 2-28-11, 2-28-10 and 2-28-09, respectively, based on the mix of underlying funds held by the Portfolio.
7 Includes the impact of proxy expenses, which amounted to 0.03% of average net assets.
| | |
| See notes to financial statements | Annual report | International Allocation Portfolio | 17 |
| | | | | |
| CLASS B SHARES Period ended | 2-28-13 | 2-29-12 | 2-28-11 | 2-28-10 | 2-28-09 |
| |
| Per share operating performance | | | | | |
|
| Net asset value, beginning of period | $7.60 | $8.30 | $6.84 | $4.32 | $9.46 |
| Net investment income1,2 | 0.03 | 0.03 | — | 0.03 | 0.06 |
| Net realized and unrealized gain (loss) on investments | 0.36 | (0.70) | 1.46 | 2.51 | (4.83) |
| Total from investment operations | 0.39 | (0.67) | 1.46 | 2.54 | (4.77) |
| Less distributions | | | | | |
| From net investment income | (0.02) | (0.03) | — | (0.02) | (0.08) |
| From net realized gain | (0.02) | —3 | — | —3 | (0.29) |
| Total distributions | (0.04) | (0.03) | — | (0.02) | (0.37) |
| Net asset value, end of period | $7.95 | $7.60 | $8.30 | $6.84 | $4.32 |
| Total return (%)4,5 | 5.14 | (7.96) | 21.35 | 58.73 | (51.01) |
|
| Ratios and supplemental data | | | | | |
|
| Net assets, end of period (in millions) | $3 | $2 | $2 | $1 | $1 |
| Ratios (as a percentage of average net assets): | | | | | |
| Expenses before reductions | 2.646 | 2.486 | 2.336 | 3.066,7 | 3.036 |
| Expenses net of fee waivers | 1.336 | 1.336 | 1.346 | 1.446,7 | 1.536 |
| Expenses net of fee waivers and credits | 1.336 | 1.336 | 1.346 | 1.376,7 | 1.316 |
| Net investment income2 | 0.37 | 0.43 | 0.05 | 0.48 | 0.80 |
| Portfolio turnover (%) | 52 | 18 | 64 | 41 | 23 |
| |
1 Based on the average daily shares outstanding.
2 Recognition of net investment income by the Portfolio is affected by the timing and frequency of the declaration of
dividends by the underlying funds in which the Portfolio invests.
3 Less than $0.005 per share.
4 Does not reflect the effect of sales charges, if any.
5 Total returns would have been lower had certain expenses not been reduced during the applicable periods shown.
6 Ratios do not include expenses incurred from underlying funds whose annualized expense ratios were 0.64% to
1.28%, 0.48% to 1.35%, 0.91% to 1.11%, 0.91% to 1.17% and 0.99% to 1.17% for the years ended 2-28-13,
2-29-12, 2-28-11, 2-28-10 and 2-28-09, respectively, based on the mix of underlying funds held by the Portfolio.
7 Includes the impact of proxy expenses, which amounted to 0.02% of average net assets.
| | | | | |
| CLASS C SHARES Period ended | 2-28-13 | 2-29-12 | 2-28-11 | 2-28-10 | 2-28-09 |
| |
| Per share operating performance | | | | | |
|
| Net asset value, beginning of period | $7.60 | $8.31 | $6.84 | $4.32 | $9.46 |
| Net investment income1,2 | 0.01 | 0.04 | —3 | 0.03 | 0.06 |
| Net realized and unrealized gain (loss) on investments | 0.39 | (0.72) | 1.47 | 2.51 | (4.83) |
| Total from investment operations | 0.40 | (0.68) | 1.47 | 2.54 | (4.77) |
| Less distributions | | | | | |
| From net investment income | (0.02) | (0.03) | — | (0.02) | (0.08) |
| From net realized gain | (0.02) | —3 | — | —3 | (0.29) |
| Total distributions | (0.04) | (0.03) | — | (0.02) | (0.37) |
| Net asset value, end of period | $7.96 | $7.60 | $8.31 | $6.84 | $4.32 |
| Total return (%)4,5 | 5.27 | (8.07) | 21.49 | 58.73 | (51.01) |
|
| Ratios and supplemental data | | | | | |
|
| Net assets, end of period (in millions) | $5 | $6 | $6 | $5 | $3 |
| Ratios (as a percentage of average net assets): | | | | | |
| Expenses before reductions | 2.286 | 2.066 | 1.966 | 2.116,7 | 1.926 |
| Expenses net of fee waivers | 1.336 | 1.336 | 1.356 | 1.406,7 | 1.316 |
| Expenses net of fee waivers and credits | 1.336 | 1.336 | 1.356 | 1.376,7 | 1.316 |
| Net investment income (loss)2 | 0.17 | 0.52 | (0.06) | 0.44 | 0.76 |
| Portfolio turnover (%) | 52 | 18 | 64 | 41 | 23 |
| |
1 Based on the average daily shares outstanding.
2 Recognition of net investment income by the Portfolio is affected by the timing and frequency of the declaration of
dividends by the underlying funds in which the Portfolio invests.
3 Less than $0.005 per share.
4 Does not reflect the effect of sales charges, if any.
5 Total returns would have been lower had certain expenses not been reduced during the applicable periods shown.
6 Ratios do not include expenses incurred from underlying funds whose annualized expense ratios were 0.64% to
1.28%, 0.48% to 1.35%, 0.91% to 1.11%, 0.91% to 1.17% and 0.99% to 1.17% for the years ended 2-28-13,
2-29-12, 2-28-11, 2-28-10 and 2-28-09, respectively, based on the mix of underlying funds held by the Portfolio.
7 Includes the impact of proxy expenses, which amounted to 0.03% of average net assets.
| | |
| 18 | International Allocation Portfolio | Annual report | See notes to financial statements |
| | | | | |
| CLASS I SHARES Period ended | 2-28-13 | 2-29-12 | 2-28-11 | 2-28-10 | 2-28-09 |
| |
| Per share operating performance | | | | | |
|
| Net asset value, beginning of period | $7.67 | $8.38 | $6.82 | $4.30 | $9.49 |
| Net investment income1,2 | 0.13 | 0.13 | 0.07 | 0.09 | 0.11 |
| Net realized and unrealized gain (loss) on investments | 0.35 | (0.73) | 1.49 | 2.52 | (4.84) |
| Total from investment operations | 0.48 | (0.60) | 1.56 | 2.61 | (4.73) |
| Less distributions | | | | | |
| From net investment income | (0.10) | (0.11) | — | (0.09) | (0.17) |
| From net realized gain | (0.02) | —3 | — | —3 | (0.29) |
| Total distributions | (0.12) | (0.11) | — | (0.09) | (0.46) |
| Net asset value, end of period | $8.03 | $7.67 | $8.38 | $6.82 | $4.30 |
| Total return (%)4 | 6.31 | (6.96) | 22.87 | 60.62 | (50.48) |
| |
| Ratios and supplemental data | | | | | |
|
| Net assets, end of period (in millions) | $1 | —5 | —5 | —5 | —5 |
| Ratios (as a percentage of average net assets): | | | | | |
| Expenses before reductions | 4.686 | 6.586 | 5.696 | 4.686,7 | 1.356 |
| Expenses net of fee waivers | 0.276 | 0.236 | 0.186 | 0.196,7 | 0.166 |
| Expenses net of fee waivers and credits | 0.276 | 0.236 | 0.186 | 0.196,7 | 0.166 |
| Net investment income2 | 1.72 | 1.63 | 0.91 | 1.46 | 1.44 |
| Portfolio turnover (%) | 52 | 18 | 64 | 41 | 23 |
| |
1 Based on the average daily shares outstanding.
2 Recognition of net investment income by the Portfolio is affected by the timing and frequency of the declaration of
dividends by the underlying funds in which the Portfolio invests.
3 Less than $0.005 per share.
4 Total returns would have been lower had certain expenses not been reduced during the applicable periods shown.
5 Less than $500,000.
6 Ratios do not include expenses incurred from underlying funds whose annualized expense ratios were 0.64% to
1.28%, 0.48% to 1.35%, 0.91% to 1.11%, 0.91% to 1.17% and 0.99% to 1.17% for the years ended 2-28-13,
2-29-12, 2-28-11, 2-28-10 and 2-28-09, respectively, based on the mix of underlying funds held by the Portfolio.
7 Includes the impact of proxy expenses, which amounted to 0.03% of average net assets.
| | |
| See notes to financial statements | Annual report | International Allocation Portfolio | 19 |
Notes to financial statements
Note 1 — Organization
John Hancock International Allocation Portfolio (the Portfolio) is a series of John Hancock Funds III (JHF III or the Trust), an open-end management investment company organized as a Massachusetts business trust and registered under the Investment Company Act of 1940, as amended (the 1940 Act). The investment objective of the Portfolio is to seek long-term growth of capital. The Portfolio is designed to provide diversification of investments within the international asset class.
The Portfolio operates as a “fund of funds” investing in Class NAV shares of affiliated underlying funds of the Trust, John Hancock Funds II (JHF II), other affiliated John Hancock Funds and other permitted investments, including exchange-traded funds.
The Portfolio may offer multiple classes of shares. The shares currently offered are detailed in the Statement of assets and liabilities. Class A and Class C shares are offered to all investors. Effective April 12, 2013, Class B shares are closed to new investors. Class I shares are offered to institutions and certain investors. Shareholders of each class have exclusive voting rights to matters that affect that class. The distribution and service fees, if any, and transfer agent fees, printing and postage and state registration fees for each class may differ. Class B shares convert to Class A shares eight years after purchase.
The accounting policies of the underlying funds of the Portfolio are outlined in the underlying funds’ shareholder reports, available without charge by calling 1-800-344-1029 and jhfunds.com, on the Securities and Exchange Commission (SEC) Web site at www.sec.gov or at the SEC’s public reference room in Washington, D.C. The underlying funds are not covered by this report.
Note 2 — Significant accounting policies
The financial statements have been prepared in conformity with accounting principles generally accepted in the United States of America, which require management to make certain estimates and assumptions at the date of the financial statements. Actual results could differ from those estimates and those differences could be significant. Events or transactions occurring after the end of the fiscal period through the date that the financial statements were issued have been evaluated in the preparation of the financial statements. The following summarizes the significant accounting policies of the Portfolio:
Security valuation. Investments are stated at value as of the close of regular trading on the New York Stock Exchange (NYSE), normally at 4:00 P.M., Eastern Time. In order to value the securities, the Portfolio uses the following valuation techniques: Equity securities, including exchange-traded funds, held by the Portfolio are valued at the last sale price or official closing price on the principal securities exchange on which they trade. In the event there were no sales during the day or closing prices are not available, then the securities are valued using the last quoted bid or evaluated price. Investments by the Portfolio in underlying affiliated funds and/or other open-end management investment companies are valued at their respective net asset values each business day. Other portfolio securities and assets, where reliable market quotations are not available, are valued at fair value as determined in good faith by the Portfolio’s Pricing Committee following procedures established by the Board of Trustees, which include price verification procedures. The frequency with which these fair valuation procedures are used cannot be predicted.
The Portfolio uses a three-tier hierarchy to prioritize the pricing assumptions, referred to as inputs, used in valuation techniques to measure fair value. Level 1 includes securities valued using quoted
| |
| 20 | International Allocation Portfolio | Annual report |
prices in active markets for identical securities, including registered investment companies. Level 2 includes securities valued using other significant observable inputs. Observable inputs may include quoted prices for similar securities, interest rates, prepayment speeds and credit risk. Prices for securities valued using these inputs are received from independent pricing vendors and brokers and are based on an evaluation of the inputs described. Level 3 includes securities valued using significant unobservable inputs when market prices are not readily available or reliable, including the Portfolio’s own assumptions in determining the fair value of investments. Factors used in determining value may include market or issuer specific events or trends, changes in interest rates and credit quality. The inputs or methodology used for valuing securities are not necessarily an indication of the risks associated with investing in those securities. Changes in valuation techniques may result in transfers into or out of an assigned level within the disclosure hierarchy. As of February 28, 2013, all investments are categorized as Level 1 under the hierarchy described above.
Security transactions and related investment income. Investment security transactions are accounted for on a trade date plus one basis for daily net asset value calculations. However, for financial reporting purposes, investment transactions are reported on trade date. Dividend income is recorded on the ex-date. Income and capital gain distributions from underlying funds are recorded on ex-date. Gains and losses on securities sold are determined on the basis of identified cost and may include proceeds from litigation.
Line of credit. The Portfolio may borrow from banks for temporary or emergency purposes, including meeting redemption requests that otherwise might require the untimely sale of securities. Pursuant to the custodian agreement, the custodian may loan money to the Portfolio to make properly authorized payments. The Portfolio is obligated to repay the custodian for any overdraft, including any related costs or expenses. The custodian may have a lien, security interest or security entitlement in any Portfolio property that is not otherwise segregated or pledged, to the maximum extent permitted by law, to the extent of any overdraft.
In addition, the Portfolio and other affiliated funds have entered into an agreement with Citibank N.A. that enables them to participate in a $100 million unsecured committed line of credit. A commitment fee, payable at the end of each calendar quarter, based on the average daily unused portion of the line of credit, is charged to each participating fund on a pro rata basis and is reflected in other expenses on the Statement of operations. Commitment fees for the year ended February 28, 2013 were $924. For the year ended February 28, 2013, the Portfolio had no borrowings under the line of credit. The current agreement will expire March 31, 2013 and will be replaced with a new agreement which will enable the Fund to participate in a $300 million unsecured line of credit, also with Citibank, with terms otherwise similar to the existing agreement.
Expenses. Within the John Hancock Funds complex, expenses that are directly attributable to an individual fund are allocated to such fund. Expenses that are not readily attributable to a specific fund are allocated among all funds in an equitable manner, taking into consideration, among other things, the nature and type of expense and the fund’s relative net assets. Expense estimates are accrued in the period to which they relate and adjustments are made when actual amounts are known.
Class allocations. Income, common expenses and realized and unrealized gains (losses) are determined at the fund level and allocated daily to each class of shares based on the net assets of the class. Class-specific expenses, such as distribution and service fees, if any, transfer agent fees, state registration fees and printing and postage, for all classes, are calculated daily at the class level based on the appropriate net assets of each class and the specific expense rates applicable to each class.
Federal income taxes. The Portfolio intends to continue to qualify as a regulated investment company by complying with the applicable provisions of the Internal Revenue Code and will not
| |
| Annual report | International Allocation Portfolio | 21 |
be subject to federal income tax on taxable income that is distributed to shareholders. Therefore, no federal income tax provision is required.
Under the Regulated Investment Company Modernization Act of 2010, the Portfolio is permitted to carry forward capital losses incurred in taxable years beginning after December 22, 2010 for an unlimited period. Any losses incurred during those taxable years will be required to be utilized prior to the losses incurred in pre-enactment taxable years. As a result of this ordering rule, pre-enactment capital loss carryforwards may be more likely to expire unused. Additionally, post-enactment capital losses that are carried forward will retain their character as either short-term or long-term capital losses rather than being considered all short-term as under previous law.
For federal income tax purposes, the Portfolio has a capital loss carryforward of $13,863,850 available to offset future net realized capital gains as of February 28, 2013. The following table details the capital loss carryforward available as of February 28, 2013.
| | | | |
| CAPITAL LOSS CARRYFORWARD EXPIRING AT FEBRUARY 28 | | NO EXPIRATION DATE |
| 2017 | 2018 | 2019 | SHORT-TERM | LONG-TERM |
|
| $1,965,278 | $6,868,187 | $4,555,665 | — | $474,720 |
As of February 28, 2013, the Portfolio had no uncertain tax positions that would require financial statement recognition, derecognition or disclosure. The Portfolio’s federal tax returns are subject to examination by the Internal Revenue Service for a period of three years.
Distribution of income and gains. Distributions to shareholders from net investment income and net realized gains, if any, are recorded on the ex-date. The Portfolio generally declares and pays dividends and capital gain distributions, if any, annually.
The tax character of distributions for the years ended February 28, 2013 and February 29, 2012 was as follows:
| | | | |
| | FEBRUARY 28, 2013 | FEBRUARY 29, 2012 | | |
| | |
| Ordinary Income | $141,981 | $138,168 | | |
Distributions paid by the Portfolio with respect to each class of shares are calculated in the same manner, at the same time and in the same amount, except for the effect of class level expenses that may be applied differently to each class. As of February 28, 2013, the components of distributable earnings on a tax basis consisted of $141,087 of undistributed ordinary income.
Such distributions and distributable earnings, on a tax basis, are determined in conformity with income tax regulations, which may differ from accounting principles generally accepted in the United States of America. Material distributions in excess of tax basis earnings and profits, if any, are reported in the Portfolio’s financial statements as a return of capital.
Capital accounts within the financial statements are adjusted for permanent book-tax differences. These adjustments have no impact on net assets or the results of operations. Temporary book-tax differences, if any, will reverse in a subsequent period. Book-tax differences are primarily attributable to wash sale loss deferrals.
Note 3 — Guarantees and indemnifications
Under the Portfolio’s organizational documents, its Officers and Trustees are indemnified against certain liabilities arising out of the performance of their duties to the Trust, including the Portfolio. Additionally, in the normal course of business, the Portfolio enters into contracts with service providers that contain general indemnification clauses. The Portfolio’s maximum exposure under these arrangements is unknown, as this would involve future claims that may be made
| |
| 22 | International Allocation Portfolio | Annual report |
against the Portfolio that have not yet occurred. The risk of material loss from such claims is considered remote.
Note 4 — Fees and transactions with affiliates
John Hancock Investment Management Services, LLC (the Advisor) serves as investment advisor for the Trust. John Hancock Funds, LLC (the Distributor), an affiliate of the Advisor, serves as principal underwriter of the Trust. The Advisor and the Distributor are indirect, wholly owned subsidiaries of Manulife Financial Corporation (MFC).
Management fee. The Portfolio has an investment management agreement with the Advisor under which the Portfolio pays the Advisor a management fee that has two components: (a) a fee on assets invested in the funds of JHF II and JHF III (Portfolio Assets) and (b) a fee on assets invested in other permitted investments (other than JHF II and JHF III), including other affiliated funds in the John Hancock Funds complex (Other Assets). The Portfolio pays a daily management fee to the Advisor equivalent, on an annual basis, to the sum of: (a) 0.05% of the first $500,000,000 of the Portfolio Assets; (b) 0.04% of the Portfolio Assets in excess of $500,000,000; (c) 0.50% of the first $500,000,000 of the Other Assets; and (d) 0.49% of the Other Assets in excess of $500,000,000. The Advisor has a subadvisory agreement with John Hancock Asset Management a division of Manulife Asset Management (North America) Limited and John Hancock Asset Management, a division of Manulife Asset Management (US) LLC, each an indirectly owned subsidiary of MFC and an affiliate of the Advisor. The Portfolio is not responsible for payment of the subadvisory fees.
The Advisor has contractually agreed to waive fees and/or reimburse certain expenses for each share class of the Portfolio. This agreement excludes certain expenses such as taxes, acquired fund fees, portfolio brokerage commissions, interest expense, short dividend expense, litigation and indemnification expenses and other extraordinary expenses not incurred in the ordinary course of the Portfolio’s business. The fee waivers and/or reimbursements are such that these expenses will not exceed 0.63%, 1.33%, 1.33% and 0.27% for Class A, Class B, Class C and Class I shares, respectively. The current expense limitation agreement will remain in effect through June 30, 2013, unless renewed by mutual agreement of the Portfolio and the Advisor based upon a determination that this is appropriate under the circumstances at the time.
The Advisor has voluntarily agreed to waive fees and/or reimburse certain other expenses of the Portfolio excluding advisory fees, Rule 12b-1 fees, transfer agent fees, service fees, blue sky fees, taxes, portfolio brokerage commissions, interest expense, printing and postage, acquired fund fees, short dividend expense, litigation and indemnification expenses and other extraordinary expenses not incurred in the ordinary course of business. This voluntary expense reimbursement will continue in effect until terminated at any time by the Advisor on notice to the Portfolio. The fee waivers and/or reimbursements are such that these expenses will not exceed 0.16% of average net assets.
In addition, the Advisor has voluntarily agreed to waive its advisory fees for the Portfolio so that the amount retained by the Advisor after payment of the subadvisory fees, including Advisor fees collected on the underlying investments after payment of the subadvisory fees, does not exceed 0.50% of the Portfolio’s average net assets.
Accordingly, these expense reductions amounted to $68,767, $30,050, $46,194 and $22,291 for Class A, Class B, Class C and Class I shares, respectively, for the year ended February 28, 2013.
The investment management fees, including the impact of the waivers and reimbursements described above, incurred for the year ended February 28, 2013 were equivalent to a net annual effective rate of 0.00% of the Portfolio’s average daily net assets.
| |
| Annual report | International Allocation Portfolio | 23 |
Accounting and legal services. Pursuant to a service agreement, the Portfolio reimburses the Advisor for all expenses associated with providing the administrative, financial, legal, accounting and recordkeeping services to the Portfolio, including the preparation of all tax returns, periodic reports to shareholders and regulatory reports, among other services. These expenses are allocated to each share class based on its relative net assets at the time the expense was incurred. These accounting and legal services fees incurred for the year ended February 28, 2013 amounted to an annual rate of 0.02% of the Portfolio’s average daily net assets.
Distribution and service plans. The Portfolio has a distribution agreement with the Distributor. The Portfolio has adopted distribution and service plans with respect to Class A, Class B and Class C shares pursuant to Rule 12b-1 under the 1940 Act, to pay the Distributor for services provided as the distributor of shares of the Portfolio. The Portfolio pays the following contractual rates of distribution and service fees under these arrangements, expressed as an annual percentage of average daily net assets for each class of the Portfolio’s shares.
| | | |
| CLASS | 12b–1 FEE | | |
| | |
| Class A | 0.30% | | |
| Class B | 1.00% | | |
| Class C | 1.00% | | |
Sales charges. Class A shares are assessed up-front sales charges, which resulted in payments to the Distributor amounting to $13,579 for the year ended February 28, 2013. Of this amount, $2,240 was retained and used for printing prospectuses, advertising, sales literature and other purposes, $10,694 was paid as sales commissions to broker-dealers and $645 was paid as sales commissions to sales personnel of Signator Investors, Inc., a broker-dealer affiliate of the Advisor.
Class A, Class B and Class C shares may be subject to contingent deferred sales charges (CDSCs). Certain Class A shares that are redeemed within one year of purchase are subject to a 1.00% sales charge. Class B shares that are redeemed within six years of purchase are subject to CDSCs, at declining rates, beginning at 5.00%. Class C shares that are redeemed within one year of purchase are subject to a 1.00% CDSC. CDSCs are applied to the lesser of the current market value at the time of redemption or the original purchase cost of the shares being redeemed. Proceeds from CDSCs are used to compensate the Distributor for providing distribution-related services in connection with the sale of these shares. During the year ended February 28, 2013, CDSCs received by the Distributor amounted to $0, $3,542 and $787 for Class A, Class B and Class C shares, respectively.
Transfer agent fees. The Portfolio has a transfer agent agreement with John Hancock Signature Services, Inc. (Signature Services), an affiliate of the Advisor. The transfer agent fees paid to Signature Services are determined based on the cost to Signature Services (Signature Services Cost) of providing recordkeeping services. The Signature Services Cost includes a component of allocated John Hancock corporate overhead for providing transfer agent services to the Portfolio and to all other John Hancock affiliated funds. It also includes out-of-pocket expenses that are comprised of payments made to third-parties for recordkeeping services provided to their clients who invest in one or more John Hancock funds. In addition, Signature Services Cost may be reduced by certain fees that Signature Services receives in connection with retirement and small accounts. Signature Services Cost is calculated monthly and allocated, as applicable, to four categories of share classes: Institutional Share Classes, Retirement Share Classes, Municipal Bond Classes and all other Retail Share Classes. Within each of these categories, the applicable costs are allocated to the affected John Hancock affiliated funds and/or classes, based on the relative average daily net assets.
| |
| 24 | International Allocation Portfolio | Annual report |
Class level expenses. Class level expenses for the year ended February 28, 2013 were:
| | | | |
| | DISTRIBUTION | TRANSFER | STATE | PRINTING AND |
| CLASS | AND SERVICE FEES | AGENT FEES | REGISTRATION FEES | POSTAGE |
|
| Class A | $23,809 | $15,362 | $15,476 | $7,438 |
| Class B | 23,007 | 4,469 | 15,179 | 1,456 |
| Class C | 48,377 | 9,384 | 15,220 | 2,853 |
| Class I | — | 532 | 18,880 | 656 |
| Total | $95,193 | $29,747 | $64,755 | $12,403 |
Trustee expenses. The Portfolio compensates each Trustee who is not an employee of the Advisor or its affiliates. Under the John Hancock Group of Funds Deferred Compensation Plan (the Plan) which was terminated in November 2012, certain Trustees could have elected, for tax purposes, to defer receipt of this compensation. Any deferred amounts were invested in various John Hancock funds. The investment of deferred amounts and the offsetting liability are included within Other receivables and prepaid expenses and Payable to affiliates — Trustees’ fees, respectively, in the accompanying Statement of assets and liabilities. Plan assets will be liquidated in accordance with the Plan documents.
Note 5 — Portfolio share transactions
Transactions in Portfolio shares for the years ended February 28, 2013 and February 29, 2012 were as follows:
| | | | |
| | Year ended 2-28-13 | Year ended 2-29-12 |
| | Shares | Amount | Shares | Amount |
| Class A shares | | | | |
|
| Sold | 343,665 | $2,574,609 | 210,670 | $1,670,818 |
| Distributions reinvested | 12,021 | 94,127 | 13,601 | 92,622 |
| Repurchased | (357,362) | (2,634,090) | (498,441) | (3,784,069) |
| | | | | |
| Net increase (decrease) | (1,676) | $34,646 | (274,170) | ($2,020,629) |
| |
| Class B shares | | | | |
|
| Sold | 75,225 | $558,093 | 68,532 | $540,059 |
| Distributions reinvested | 1,628 | 12,696 | 1,396 | 9,475 |
| Repurchased | (31,907) | (231,859) | (58,582) | (433,759) |
| | | | | |
| Net increase | 44,946 | $338,930 | 11,346 | $115,775 |
| |
| Class C shares | | | | |
|
| Sold | 68,714 | $523,106 | 160,969 | $1,211,850 |
| Distributions reinvested | 2,870 | 22,416 | 3,389 | 23,014 |
| Repurchased | (195,322) | (1,413,303) | (157,331) | (1,182,384) |
| | | | | |
| Net increase (decrease) | (123,738) | ($867,781) | 7,027 | $52,480 |
| |
| Class I shares | | | | |
|
| Sold | 72,964 | $551,189 | 21,746 | $166,343 |
| Distributions reinvested | 1,214 | 9,547 | 540 | 3,694 |
| Repurchased | (17,090) | (131,930) | (24,949) | (189,933) |
| | | | | |
| Net increase (decrease) | 57,088 | $428,806 | (2,663) | ($19,896) |
| | | | | |
| Net decrease | (23,380) | ($65,399) | (258,460) | ($1,872,270) |
|
| |
| Annual report | International Allocation Portfolio | 25 |
Note 6 — Purchase and sale of securities
Purchases and sales of securities, other than short-term securities, aggregated $8,226,585 and $8,277,453, respectively, for the year ended February 28, 2013.
Note 7 — Investment in affiliated underlying funds
The Portfolio invests primarily in affiliated underlying funds that are managed by the Advisor and its affiliates. The Portfolio does not invest in the affiliated underlying funds for the purpose of exercising management or control; however, the Portfolio’s investment may represent a significant portion of each underlying fund’s net assets. For the year ended February 28, 2013, the Portfolio did not hold 5% or more of an underlying fund’s net assets.
| |
| 26 | International Allocation Portfolio | Annual report |
Auditor’s report
Report of Independent Registered Public Accounting Firm
To the Board of Trustees and Shareholders of
John Hancock Funds III International Allocation Portfolio:
In our opinion, the accompanying statement of assets and liabilities, including the portfolio of investments, and the related statements of operations and of changes in net assets and the financial highlights present fairly, in all material respects, the financial position of John Hancock Funds III International Allocation Portfolio (the “Portfolio”) at February 28, 2013, the results of its operations for the year then ended, the changes in its net assets for each of the two years in the period then ended and the financial highlights for each of the five years in the period then ended, in conformity with accounting principles generally accepted in the United States of America. These financial statements and financial highlights (hereafter referred to as “financial statements”) are the responsibility of the Portfolio’s management; our responsibility is to express an opinion on these financial statements based on our audits. We conducted our audits of these financial statements in accordance with the standards of the Public Company Accounting Oversight Board (United States). Those standards require that we plan and perform the audit to obtain reasonable assurance about whether the financial statements are free of material misstatement. An audit includes examining, on a test basis, evidence supporting the amounts and disclosures in the financial statements, assessing the accounting principles used and significant estimates made by management, and evaluating the overall financial statement presentation. We believe that our audits, which included confirmation of securities at February 28, 2013 by correspondence with the custodian and transfer agents, provide a reasonable basis for our opinion.
PricewaterhouseCoopers LLP
Boston, Massachusetts
April 22, 2013
| |
| Annual report | International Allocation Portfolio | 27 |
Tax information
Unaudited
For federal income tax purposes, the following information is furnished with respect to the distributions of the Portfolio, if any, paid during its taxable year ended February 28, 2013.
The Portfolio reports the maximum amount allowable of its net taxable income as eligible for the corporate dividends-received deduction.
The Portfolio reports the maximum amount allowable of its net taxable income as qualified dividend income as provided in the Jobs and Growth Tax Relief Reconciliation Act of 2003.
Income derived from foreign sources was $177,996. The fund intends to pass through foreign tax credits of $25,108.
Eligible shareholders will be mailed a 2013 Form 1099-DIV in early 2014. This will reflect the tax character of all distributions paid in calendar year 2013.
Please consult your tax advisor regarding the tax consequences of your investment in the fund.
| |
| 28 | International Allocation Portfolio | Annual report |
Special Shareholder Meeting Unaudited
On November 13, 2012, a Special Meeting of the Shareholders of John Hancock Funds III and each of its series, including John Hancock International Allocation Portfolio, was held at 601 Congress Street, Boston, Massachusetts, for the purpose of considering and voting on the following proposal:
Proposal: Election of thirteen (13) Trustees as members of the Board of Trustees of John Hancock Funds III.
| | |
| | TOTAL VOTES | TOTAL VOTES WITHHELD |
| | FOR THE NOMINEE | FROM THE NOMINEE |
|
| Independent Trustees | | |
| Charles L. Bardelis | 657,515,396.49 | 7,284,346.35 |
| Peter S. Burgess | 657,435,609.53 | 7,364,133.30 |
| William H. Cunningham | 654,078,766.31 | 10,720,976.53 |
| Grace K. Fey | 657,602,863.91 | 7,196,878.92 |
| Theron S. Hoffman | 657,614,243.23 | 7,185,499.60 |
| Deborah C. Jackson | 657,542,023.74 | 7,257,719.09 |
| Hassell H. McClellan | 657,319,823.50 | 7,479,919.34 |
| James M. Oates | 656,971,552.43 | 7,828,190.40 |
| Steven R. Pruchansky | 657,559,900.72 | 7,239,842.11 |
| Gregory A. Russo | 658,072,539.03 | 6,727,203.80 |
| Non-Independent Trustees | | |
| James R. Boyle | 657,895,765.77 | 6,903,977.06 |
| Craig Bromley | 657,588,989.57 | 7,210,753.26 |
| Warren A. Thomson | 657,817,862.75 | 6,981,880.08 |
| |
| Annual report | International Allocation Portfolio | 29 |
Trustees and Officers
This chart provides information about the Trustees and Officers who oversee your John Hancock fund as of December 1, 2012. Officers elected by the Trustees manage the day-to-day operations of the Fund and execute policies formulated by the Trustees.
Independent Trustees
| | |
| Name, Year of Birth | Trustee | Number of |
| Position(s) held with Fund | of the | John Hancock |
| Principal occupation(s) and other | Trust | funds overseen |
| directorships during past 5 years | since1 | by Trustee |
| |
| James M. Oates,2 Born: 1946 | 2012 | 234 |
|
| Managing Director, Wydown Group (financial consulting firm) (since 1994); Chairman and Director, |
| Emerson Investment Management, Inc. (since 2000); Independent Chairman, Hudson Castle Group, Inc. |
| (formerly IBEX Capital Markets, Inc.) (financial services company) (1997–2011); Director, Stifel Financial |
| (since 1996); Director, Investor Financial Services Corporation (1995–2007); Director, Connecticut |
| River Bancorp (since 1998); Director, Virtus Funds (formerly Phoenix Mutual Funds) (since 1988). |
| Trustee and Chairperson of the Board, John Hancock retail funds (since 2012); Trustee, John Hancock |
| Funds III (2005–2006 and since 2012); Trustee (since 2004) and Chairperson of the Board (since |
| 2005), John Hancock Variable Insurance Trust; Trustee and Chairperson of the Board (since 2005), |
| John Hancock Funds II. | | |
|
| |
| Charles L. Bardelis,2,3 Born: 1941 | 2012 | 234 |
|
| Director, Island Commuter Corp. (marine transport). Trustee, John Hancock retail funds (since 2012); |
| Trustee, John Hancock Funds III (2005–2006 and since 2012); Trustee, John Hancock Variable Insurance |
| Trust (since 1988); Trustee, John Hancock Funds II (since 2005). | | |
|
| |
| Peter S. Burgess,2,3 Born: 1942 | 2012 | 234 |
|
| Consultant (financial, accounting and auditing matters) (since 1999); Certified Public Accountant; |
| Partner, Arthur Andersen (independent public accounting firm) (prior to 1999); Director, Lincoln |
| Educational Services Corporation (since 2004); Director, Symetra Financial Corporation (since 2010); |
| former Director, PMA Capital Corporation (2004–2010). Trustee, John Hancock retail funds (since 2012); |
| Trustee, John Hancock Funds III (2005–2006 and since 2012); Trustee, John Hancock Variable Insurance |
| Trust and John Hancock Funds II (since 2005). | | |
|
| |
| William H. Cunningham, Born: 1944 | 2006 | 234 |
|
| Professor, University of Texas, Austin, Texas (since 1971); former Chancellor, University of Texas |
| System and former President of the University of Texas, Austin, Texas; Director, LIN Television (since |
| 2009); Chairman (since 2009) and Director (since 2006), Lincoln National Corporation (insurance); |
| Director, Resolute Energy Corporation (since 2009); Director, Southwest Airlines (since 2000); former |
| Director, Introgen (manufacturer of biopharmaceuticals) (until 2008); former Director, Hicks Acquisition |
| Company I, Inc. (until 2007); former Director, Texas Exchange Bank, SSB (formerly Bank of Crowley) |
| (until 2009); former Advisory Director, JP Morgan Chase Bank (formerly Texas Commerce Bank–Austin) |
| (until 2009). Trustee, John Hancock retail funds (since 1986); Trustee, John Hancock Variable Insurance |
| Trust (since 2012); Trustee, John Hancock Funds II (since 2012 and 2005–2006). | |
|
| |
| Grace K. Fey,2 Born: 1946 | 2012 | 234 |
|
| Chief Executive Officer, Grace Fey Advisors (since 2007); Director and Executive Vice President, |
| Frontier Capital Management Company (1988–2007); Director, Fiduciary Trust (since 2009). |
| Trustee, John Hancock retail funds (since 2012); Trustee, John Hancock Variable Insurance Trust and |
| John Hancock Funds II (since 2008). | | |
| |
| 30 | International Allocation Portfolio | Annual report |
Independent Trustees (continued)
| | |
| Name, Year of Birth | Trustee | Number of John |
| Position(s) held with Fund | of the | Hancock funds |
| Principal occupation(s) and other | Trust | overseen by |
| directorships during past 5 years | since1 | Trustee |
| |
| Theron S. Hoffman,2,3 Born: 1947 | 2012 | 234 |
|
| Chief Executive Officer, T. Hoffman Associates, LLC (consulting firm) (since 2003); Director, The Todd |
| Organization (consulting firm) (2003–2010); President, Westport Resources Management (investment |
| management consulting firm) (2006–2008); Senior Managing Director, Partner and Operating Head, |
| Putnam Investments (2000–2003); Executive Vice President, The Thomson Corp. (financial and |
| legal information publishing) (1997–2000). Trustee, John Hancock retail funds (since 2012); Trustee, |
| John Hancock Variable Insurance Trust and John Hancock Funds II (since 2008). | |
|
| |
| Deborah C. Jackson, Born: 1952 | 2008 | 234 |
|
| President, Cambridge College, Cambridge, Massachusetts (since 2011); Chief Executive Officer, |
| American Red Cross of Massachusetts Bay (2002–2011); Board of Directors of Eastern Bank Corporation |
| (since 2001); Board of Directors of Eastern Bank Charitable Foundation (since 2001); Board of Directors |
| of American Student Assistance Corporation (1996–2009); Board of Directors of Boston Stock Exchange |
| (2002–2008); Board of Directors of Harvard Pilgrim Healthcare (health benefits company) (2007–2011). |
| Trustee, John Hancock retail funds (since 2008); Trustee of John Hancock Variable Insurance Trust and |
| John Hancock Funds II (since 2012). | | |
|
| |
| Hassell H. McClellan,2 Born: 1945 | 2012 | 234 |
|
| Associate Professor, The Wallace E. Carroll School of Management, Boston College (since 1984); |
| Trustee, Virtus Variable Insurance Trust (formerly Phoenix Edge Series Funds) (since 2008); Director, |
| The Barnes Group (since 2010). Trustee, John Hancock retail funds (since 2012); Trustee, John Hancock |
| Funds III (2005–2006 and since 2012); Trustee, John Hancock Variable Insurance Trust and | |
| John Hancock Funds II (since 2005). | | |
|
| |
| Steven R. Pruchansky, Born: 1944 | 2006 | 234 |
|
| Chairman and Chief Executive Officer, Greenscapes of Southwest Florida, Inc. (since 2000); Director |
| and President, Greenscapes of Southwest Florida, Inc. (until 2000); Member, Board of Advisors, First |
| American Bank (until 2010); Managing Director, Jon James, LLC (real estate) (since 2000); Director, |
| First Signature Bank & Trust Company (until 1991); Director, Mast Realty Trust (until 1994); President, |
| Maxwell Building Corp. (until 1991). Trustee (since 1992) and Chairperson of the Board (2011–2012), |
| John Hancock retail funds; Trustee and Vice Chairperson of the Board, John Hancock retail funds, |
| John Hancock Variable Insurance Trust and John Hancock Funds II (since 2012). | |
|
| |
| Gregory A. Russo, Born: 1949 | 2008 | 234 |
|
| Director and Audit Committee Chairman (since 2012) and Member, Audit Committee and Finance |
| Committee (since 2011), NCH Healthcare System, Inc. (holding company for multi-entity healthcare |
| system); Director and Member of Finance Committee, The Moorings, Inc. (nonprofit continuing care |
| community) (since 2012); Vice Chairman, Risk & Regulatory Matters, KPMG LLP (KPMG) (2002–2006); |
| Vice Chairman, Industrial Markets, KPMG (1998–2002); Chairman and Treasurer, Westchester |
| County, New York, Chamber of Commerce (1986–1992); Director, Treasurer and Chairman of |
| Audit and Finance Committees, Putnam Hospital Center (1989–1995); Director and Chairman of |
| Fundraising Campaign, United Way of Westchester and Putnam Counties, New York (1990–1995). |
| Trustee, John Hancock retail funds (since 2008); Trustee, John Hancock Variable Insurance Trust and |
| John Hancock Funds II (since 2012). | | |
| |
| Annual report | International Allocation Portfolio | 31 |
Non-Independent Trustees4
| | |
| Name, Year of Birth | Trustee | Number of |
| Position(s) held with Fund | of the | John Hancock |
| Principal occupation(s) and other | Trust | funds overseen |
| directorships during past 5 years | since1 | by Trustee |
| |
| James R. Boyle,2 Born: 1959 | 2012 | 234 |
|
| Senior Executive Vice President, John Hancock Financial Services (since 1999, including prior positions); |
| Chairman and Director, John Hancock Advisers, LLC, John Hancock Funds, LLC and John Hancock |
| Investment Management Services, LLC (2005–2010). Trustee, John Hancock retail funds (since 2012 and |
| 2005–2010), Trustee, John Hancock Variable Insurance Trust and John Hancock Funds II (since 2005). |
|
| |
| Craig Bromley,2 Born: 1966 | 2012 | 234 |
|
| President, John Hancock Financial Services (since 2012); Senior Executive Vice President and General |
| Manager, U.S. Division, John Hancock Financial Services (since 2012); President and Chief Executive |
| Officer, Manulife Insurance Company (Manulife (Japan) (2005–2012), including prior positions). |
| Trustee, John Hancock retail funds (since 2012); Trustee, John Hancock Variable Insurance Trust and |
| John Hancock Funds II (since 2012). | | |
|
| |
| Warren A. Thomson,2 Born: 1955 | 2012 | 234 |
|
| Senior Executive Vice President and Chief Investment Officer, Manulife Financial Corporation (since |
| 2001, including prior positions); Director, Manulife Trust Company and Manulife Bank of Canada (since |
| 2001, including prior positions); Director and Chairman, Manulife Asset Management (2001–2013, |
| including prior positions). Trustee, John Hancock retail funds, John Hancock Variable Insurance Trust and |
| John Hancock Funds II (since 2012). | | |
Principal officers who are not Trustees
| |
| Name, Year of Birth | Officer |
| Position(s) held with Fund | of the |
| Principal occupation(s) and other | Trust |
| directorships during past 5 years | since |
| |
| Hugh McHaffie, Born: 1959 | 2012 |
|
| President | |
| Executive Vice President, John Hancock Financial Services (since 2006, including prior positions); | |
| Chairman and Director, John Hancock Advisers, LLC, John Hancock Investment Management Services, |
| LLC and John Hancock Funds, LLC (since 2010); President, John Hancock Advisers, LLC (since 2012); |
| President, John Hancock Investment Management Services, LLC (since 2010). President (since 2012) and |
| former Trustee (2010–2012), John Hancock retail funds; President, John Hancock Variable Insurance |
| Trust and John Hancock Funds II (since 2009). | |
|
| |
| Andrew G. Arnott, Born: 1971 | 2009 |
|
| Executive Vice President | |
| Senior Vice President, John Hancock Financial Services (since 2009); Executive Vice President, | |
| John Hancock Advisers, LLC (since 2005); Executive Vice President, John Hancock Investment | |
| Management Services, LLC (since 2006); President, John Hancock Funds, LLC (since 2004, including |
| prior positions); Executive Vice President, John Hancock retail funds (since 2007, including prior | |
| positions); Executive Vice President, John Hancock Variable Insurance Trust and John Hancock Funds II |
| (since 2007, including prior positions). | |
|
| |
| Thomas M. Kinzler, Born: 1955 | 2006 |
|
| Secretary and Chief Legal Officer | |
| Vice President, John Hancock Financial Services (since 2006); Secretary and Chief Legal Counsel, | |
| John Hancock Funds, LLC (since 2007); Secretary and Chief Legal Officer, John Hancock retail funds, |
| John Hancock Variable Insurance Trust and John Hancock Funds II (since 2006). | |
| |
| 32 | International Allocation Portfolio | Annual report |
Principal officers who are not Trustees (continued)
| |
| Name, Year of Birth | Officer |
| Position(s) held with Fund | of the |
| Principal occupation(s) and other | Trust |
| directorships during past 5 years | since |
| |
| Francis V. Knox, Jr., Born: 1947 | 2006 |
|
| Chief Compliance Officer | |
| Vice President, John Hancock Financial Services (since 2005); Chief Compliance Officer, John Hancock |
| retail funds, John Hancock Variable Insurance Trust, John Hancock Funds II, John Hancock Advisers, |
| LLC and John Hancock Investment Management Services, LLC (since 2005); Vice President and Chief |
| Compliance Officer, John Hancock Asset Management a division of Manulife Asset Management (US) |
| LLC (2005–2008). | |
|
| |
| Charles A. Rizzo, Born: 1957 | 2007 |
|
| Chief Financial Officer | |
| Vice President, John Hancock Financial Services (since 2008); Senior Vice President, John Hancock | |
| Advisers, LLC and John Hancock Investment Management Services, LLC (since 2008); Chief Financial |
| Officer, John Hancock retail funds, John Hancock Variable Insurance Trust and John Hancock | |
| Funds II (since 2007). | |
|
| |
| Salvatore Schiavone, Born: 1965 | 2010 |
|
| Treasurer | |
| Assistant Vice President, John Hancock Financial Services (since 2007); Vice President, John Hancock |
| Advisers, LLC and John Hancock Investment Management Services, LLC (since 2007); Treasurer, | |
| John Hancock retail funds (since 2007, including prior positions); Treasurer, John Hancock Variable | |
| Insurance Trust and John Hancock Funds II (since 2010 and 2007–2009, including prior positions). | |
John Hancock retail funds is comprised of John Hancock Funds III and 33 other John Hancock funds consisting of 23 series of other John Hancock trusts and 10 closed-end funds.
The business address for all Trustees and Officers is 601 Congress Street, Boston, Massachusetts 02210–2805.
The Statement of Additional Information of the Fund includes additional information about members of the Board of Trustees of the Fund and is available without charge, upon request, by calling 1-800–225-5291.
1 Each Trustee holds office until his or her successor is elected and qualified, or until the Trustee’s death, retirement, resignation or removal.
2 Became a Trustee of the Fund effective December 1, 2012.
3 Member of Audit Committee.
4 Because Messrs. Bromley and Thomson are senior executives or directors and Mr. Boyle held prior positions as a senior executive and director of the Advisor and/or its affiliates, each of them is considered an “interested person,” as defined in the Investment Company Act of 1940, of the Fund.
| |
| Annual report | International Allocation Portfolio | 33 |
More information
| |
| Trustees | Investment advisor |
| James M. Oates, Chairman | John Hancock Investment Management |
| Steven R. Pruchansky, Vice Chairman | Services, LLC |
| Charles L. Bardelis* | |
| James R. Boyle† | Subadvisor |
| Craig Bromley† | John Hancock Asset Management a division of |
| Peter S. Burgess* | Manulife Asset Management (US) LLC |
| William H. Cunningham | |
| Grace K. Fey | Principal distributor |
| Theron S. Hoffman* | John Hancock Funds, LLC |
| Deborah C. Jackson | |
| Hassell H. McClellan | Custodian |
| Gregory A. Russo | State Street Bank and Trust Company |
| Warren A. Thomson† | |
| | Transfer agent |
| Officers | John Hancock Signature Services, Inc. |
| Hugh McHaffie | |
| President | Legal counsel |
| | K&L Gates LLP |
| Andrew G. Arnott | |
| Executive Vice President | Independent registered |
| | public accounting firm |
| Thomas M. Kinzler | PricewaterhouseCoopers LLP |
| Secretary and Chief Legal Officer | |
| | |
| Francis V. Knox, Jr. | |
| Chief Compliance Officer | |
| | |
| Charles A. Rizzo | |
| Chief Financial Officer | |
| | |
| Salvatore Schiavone | |
| Treasurer | |
*Member of the Audit Committee
†Non-Independent Trustee
The Fund’s proxy voting policies and procedures, as well as the Fund’s proxy voting record for the most recent twelve-month period ended June 30, are available free of charge on the Securities and Exchange Commission (SEC) Web site at www.sec.gov or on our Web site.
The Fund’s complete list of portfolio holdings, for the first and third fiscal quarters, is filed with the SEC on Form N-Q. The Fund’s Form N-Q is available on our Web site and the SEC’s Web site, www.sec.gov, and can be reviewed and copied (for a fee) at the SEC’s Public Reference Room in Washington, DC. Call 1-800-SEC-0330 to receive information on the operation of the SEC’s Public Reference Room.
We make this information on your fund, as well as monthly portfolio holdings, and other fund details available on our Web site at www.jhfunds.com or by calling 1-800-225-5291.
| | |
| You can also contact us: | | |
| 1-800-225-5291 | Regular mail: | Express mail: |
| jhfunds.com | John Hancock Signature Services, Inc. | John Hancock Signature Services, Inc. |
| | P.O. Box 55913 | Mutual Fund Image Operations |
| | Boston, MA 02205-5913 | 30 Dan Road |
| | | Canton, MA 02021 |
| |
| 34 | International Allocation Portfolio | Annual report |

1-800-225-5291
1-800-554-6713 TDD
1-800-338-8080 EASI-Line
www.jhfunds.com

| |
| This report is for the information of the shareholders of John Hancock International Allocation Portfolio. | |
| It is not authorized for distribution to prospective investors unless preceded or accompanied by a prospectus. | 318A 2/13 |
| MF135740 | 4/13 |

A look at performance
Total returns for the period ended February 28, 2013
| | | | | | | | | | | | |
| | | | | | | | | | | SEC 30-day | | SEC 30-day |
| | Average annual total returns (%) | | Cumulative total returns (%) | | yield (%) | | yield (%) |
| | with maximum sales charge | | | with maximum sales charge | | subsidized | | unsubsidized1 |
|
| | | | | Since | | | | Since | | as of | | as of |
| | 1-year | 5-year | 10-year | inception | | 5-year | 10-year | inception | | 2-28-13 | | 2-28-13 |
|
| Class A2 | 4.14 | 3.75 | — | 2.79 | | 20.23 | — | 17.96 | | 2.38 | | 2.37 |
|
| Class B2 | 3.90 | 3.76 | — | 2.82 | | 20.29 | — | 18.17 | | 1.90 | | 1.68 |
|
| Class C2 | 7.90 | 4.11 | — | 2.97 | | 22.29 | — | 19.18 | | 1.90 | | 1.79 |
|
| Class I2,3 | 10.07 | 5.31 | — | 4.16 | | 29.55 | — | 27.70 | | 2.87 | | 2.87 |
|
| Class R23,4 | 9.58 | 3.66 | — | 2.46 | | 19.71 | — | 15.71 | | 2.55 | | –20.04 |
|
| Class R63,4 | 10.12 | 5.31 | — | 4.13 | | 29.53 | — | 27.51 | | 3.05 | | –9.80 |
|
| Class NAV3,5 | 10.17 | — | — | 5.08 | | — | — | 27.11 | | 3.09 | | 3.09 |
|
Performance figures assume all distributions have been reinvested. Figures reflect maximum sales charges on Class A shares of 5%, and the applicable contingent deferred sales charge (CDSC) on Class B and Class C shares. The Class B shares’ CDSC declines annually between years 1 to 6 according to the following schedule: 5, 4, 3, 3, 2, 1%. No sales charge will be assessed after the sixth year. Class C shares held for less than one year are subject to a 1% CDSC. Sales charges are not applicable to Class I, Class NAV, Class R2 and Class R6 shares.
The expense ratios of the Fund, both net (including any fee waivers or expense limitations) and gross (excluding any fee waivers or expense limitations), are set forth according to the most recent publicly available prospectuses for the Fund and may differ from those disclosed in the Financial highlights tables in this report. The fee waivers and expense limitations are contractual until at least 6-30-13 for Class A, Class B, Class C, Class R2 and Class R6 shares. Had the fee waivers and expense limitations not been in place, gross expenses would apply. For all other classes the net expenses equal the gross expenses. The expense ratios are as follows:
| | | | | | | | | | | |
| | Class A | Class B | Class C | Class I | Class R2* | Class R6 | Class NAV | | | | |
| Net (%) | 1.42 | 2.12 | 2.12 | 1.06 | 1.47 | 0.97 | 0.93 | | | | |
| Gross (%) | 1.47 | 2.48 | 2.23 | 1.06 | 2.88 | 15.87 | 0.93 | | | | |
* Expenses have been estimated for the Class’s first full year of operations.
The returns reflect past results and should not be considered indicative of future performance. The return and principal value of an investment will fluctuate so that shares, when redeemed, may be worth more or less than their original cost. Due to market volatility, the Fund’s current performance may be higher or lower than the performance shown. For current to the most recent month-end performance data, please call 1-800-225-5291 or visit the Fund’s Web site at www.jhfunds.com.
The performance table above and the chart on the next page do not reflect the deduction of taxes that a shareholder would pay on fund distributions or the redemption of fund shares. The Fund’s performance results reflect any applicable expense reductions, without which the expenses increase and results would have been less favorable.
See the following page for footnotes.
| |
| 6 | Global Shareholder Yield Fund | Annual report |
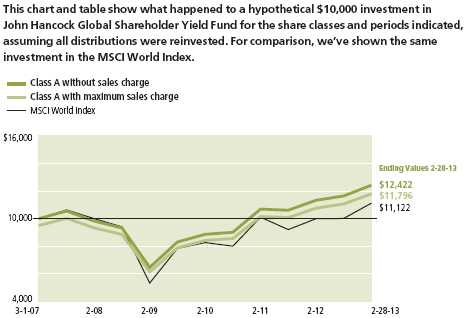
| | | | |
| | | Without | With maximum | |
| | Start date | sales charge | sales charge | Index |
|
| Class B | 3-1-07 | $11,917 | $11,817 | $11,122 |
|
| Class C6 | 3-1-07 | 11,918 | 11,918 | 11,122 |
|
| Class I3 | 3-1-07 | 12,770 | 12,770 | 11,122 |
|
| Class R23,4 | 3-1-07 | 11,571 | 11,571 | 11,122 |
|
| Class R63,4 | 3-1-07 | 12,751 | 12,751 | 11,122 |
|
| Class NAV3 | 4-28-08 | 12,711 | 12,711 | 10,625 |
|
MSCI World Index (gross of foreign withholding tax on dividends) — is a free float-adjusted market capitalization weighted index that is designed to measure the equity market performance of developed markets.
It is not possible to invest directly in an index. Index figures do not reflect expenses or sales charges, which would have resulted in lower values if they did.
Footnotes related to performance pages
1 Unsubsidized yields reflect what the yield would have been without the effect of reimbursements and waivers.
2 From 3-1-07.
3 For certain types of investors, as described in the Fund’s prospectuses.
4 Class R6 and Class R2 shares were first offered 9-1-11 and 3-1-12, respectively. The returns prior to these dates are those of Class A shares that have been recalculated to apply the gross fees and expenses of Class R6 and Class R2 shares, as applicable.
5 From 4-28-08.
6 The contingent deferred sales charge is not applicable.
| |
| Annual report | Global Shareholder Yield Fund | 7 |
Management’s discussion of
Fund performance
By Epoch investment Partners, inc.
Equities enjoyed gains during the 12 months ended February 28, 2013, despite uncertainty and volatility surrounding economies and financial markets around the globe. Subdued global economic activity meant slower corporate earnings growth in aggregate. Nevertheless, unconventional attempts by many central banks to stimulate growth led to an environment that favored equities. For the 12-month period ended February 28, 2013, John Hancock Global Shareholder Yield Fund’s Class A shares had a total return of 9.66%, excluding sales charges. By comparison, the Fund’s benchmark, the MSCI World Index, had a return of 11.37%. The average return of the world stock funds category tracked by Morningstar, Inc. was 9.41%.† The Fund trailed its benchmark during the last 12 months in part because of its sector allocation. It hurt relative performance to be underrepresented in financials while holding an overweight position in the lagging utilities sector. Individual security selection decisions had a slightly positive effect overall; nevertheless, the Fund’s industrials and consumer staples holdings underperformed the comparable sectors in the benchmark.
Industrials, financials and consumer staples shares were the leading detractors from performance. In the industrials space, the key detractors were U.K- based transportation company FirstGroup, PLC, a global mail technology company, Pitney Bowes, which we sold, and commercial print and communication firm R.R. Donnelley & Sons Company. The leading detractor in the financial space was the stock exchange NYSE Euronext. In the consumer staples sector, the leading detractor was U.S. tobacco manufacturer Lorillard, Inc. Among the leading individual contributors to performance were Canadian cable provider Shaw Communications, Inc. and Taiwanese semiconductor manufacturer Taiwan Semiconductor Manufacturing Company, Ltd. Other notable contributions came from the Fund’s utilities sector.
This commentary reflects the views of the portfolio managers through the end of the period discussed in this report. The managers’ statements reflect their own opinions. As such, they are in no way guarantees of future events and are not intended to be used as investment advice or a recommendation regarding any specific security. They are also subject to change at any time as market and other conditions warrant.
Past performance is no guarantee of future results.
Foreign investing, especially in emerging markets, has additional risks, such as currency and market volatility and political and social instability. If the Fund invests in illiquid securities, it may be difficult to sell them at a price approximating their value. Hedging and other strategic transactions may increase volatility of a fund and, if the transaction is not successful, could result in a significant loss. The distribution rate and income amounts reflect past amounts distributed and may not be indicative of future rates or income amounts. The distribution amounts paid by the Fund generally depend on the amount of income and/or dividends received by the Fund’s investments. The Fund may not be able to pay distributions or may have to reduce its distribution level if the amount of such income and/or dividends received from its investment decline. Therefore, distribution rates and income amounts can change at any time. For additional information on these and other risk considerations, please see the Fund’s prospectus.
† Figures from Morningstar, Inc. include reinvested dividends and do not take into account sales charges. Actual load-adjusted performance is lower.
| |
| 8 | Global Shareholder Yield Fund | Annual report |
Your expenses
These examples are intended to help you understand your ongoing operating expenses of investing in the Fund so you can compare these costs with the ongoing costs of investing in other mutual funds.
Understanding fund expenses
As a shareholder of the Fund, you incur two types of costs:
▪ Transaction costs which include sales charges (loads) on purchases or redemptions (varies by share class), minimum account fee charge, etc.
▪ Ongoing operating expenses including management fees, distribution and service fees (if applicable), and other fund expenses.
We are going to present only your ongoing operating expenses here.
Actual expenses/actual returns
This example is intended to provide information about the Fund’s actual ongoing operating expenses, and is based on the Fund’s actual return. It assumes an account value of $1,000.00 on September 1, 2012 with the same investment held until February 28, 2013.
| | | |
| | Account value | Ending value | Expenses paid during |
| | on 9-1-12 | on 2-28-13 | period ended 2-28-131 |
|
| Class A | $1,000.00 | $1,066.70 | $7.28 |
|
| Class B | 1,000.00 | 1,063.00 | 10.84 |
|
| Class C | 1,000.00 | 1,063.00 | 10.84 |
|
| Class I | 1,000.00 | 1,068.30 | 5.38 |
|
| Class R2 | 1,000.00 | 1,066.20 | 7.53 |
|
| Class R6 | 1,000.00 | 1,068.80 | 4.98 |
|
| Class NAV | 1,000.00 | 1,069.00 | 4.57 |
|
Together with the value of your account, you may use this information to estimate the operating expenses that you paid over the period. Simply divide your account value at February 28, 2013, by $1,000.00, then multiply it by the “expenses paid” for your share class from the table above. For example, for an account value of $8,600.00, the operating expenses should be calculated as follows:
| |
| Annual report | Global Shareholder Yield Fund | 9 |
Your expenses
Hypothetical example for comparison purposes
This table allows you to compare the Fund’s ongoing operating expenses with those of any other fund. It provides an example of the Fund’s hypothetical account values and hypothetical expenses based on each class’s actual expense ratio and an assumed 5% annualized return before expenses (which is not the Fund’s actual return). It assumes an account value of $1,000.00 on September 1, 2012 with the same investment held until February 28, 2013. Look in any other fund shareholder report to find its hypothetical example and you will be able to compare these expenses. Please remember that these hypothetical account values and expenses may not be used to estimate the actual ending account balance or expenses you paid for the period.
| | | |
| | Account value | Ending value | Expenses paid during |
| | on 9-1-12 | on 2-28-13 | period ended 2-28-131 |
|
| Class A | $1,000.00 | $1,017.80 | $7.10 |
|
| Class B | 1,000.00 | 1,014.30 | 10.59 |
|
| Class C | 1,000.00 | 1,014.30 | 10.59 |
|
| Class I | 1,000.00 | 1,019.60 | 5.26 |
|
| Class R2 | 1,000.00 | 1,066.20 | 7.53 |
|
| Class R6 | 1,000.00 | 1,020.00 | 4.86 |
|
| Class NAV | 1,000.00 | 1,020.40 | 4.46 |
|
Remember, these examples do not include any transaction costs therefore, these examples will not help you to determine the relative total costs of owning different funds. If transaction costs were included, your expenses would have been higher. See the prospectuses for details regarding transaction costs.
1 Expenses are equal to the Fund’s annualized expense ratio of 1.42%, 2.12%, 2.12%, 1.05%, 1.47%, 0.97% and 0.89% for Class A, Class B, Class C, Class I, Class R2, Class R6 and Class NAV shares, respectively, multiplied by the average account value over the period, multiplied by 181/365 (to reflect the one-half year period).
| |
| 10 | Global Shareholder Yield Fund | Annual report |
Portfolio summary
| | | | |
| Top 10 Holdings (16.4% of Net Assets on 2-28-13)1,2 | | | |
|
| BCE, Inc. | 1.9% | | Verizon Communications, Inc. | 1.6% |
| |
|
| Swisscom AG | 1.8% | | CenturyLink, Inc. | 1.6% |
| |
|
| Daimler AG | 1.7% | | Vodafone Group PLC | 1.5% |
| |
|
| Kimberly-Clark Corp. | 1.7% | | Altria Group, Inc. | 1.5% |
| |
|
| Duke Energy Corp. | 1.6% | | BASF SE | 1.5% |
| |
|
| |
| Sector Composition1,3 | | | | |
|
| Consumer Staples | 15.8% | | Energy | 8.7% |
| |
|
| Telecommunication Services | 14.4% | | Financials | 7.7% |
| |
|
| Utilities | 14.2% | | Information Technology | 4.6% |
| |
|
| Consumer Discretionary | 10.6% | | Materials | 2.3% |
| |
|
| Health Care | 9.7% | | Short-Term Investments & Other | 3.2% |
| |
|
| Industrials | 8.8% | | | |
| | |
| |
| Country Composition1,3 | | | | |
|
| United States | 53.8% | | Canada | 3.9% |
| |
|
| United Kingdom | 16.8% | | Australia | 2.1% |
| |
|
| Germany | 6.9% | | Netherlands | 1.4% |
| |
|
| France | 5.6% | | Italy | 1.2% |
| |
|
| Switzerland | 5.3% | | Other Countries | 3.0% |
| |
|
1 As a percentage of net assets on 2-28-13.
2 Cash and cash equivalents not included.
3 International investing involves special risks such as political, economic and currency risks and differences in accounting standards and financial reporting. Sector investing is subject to greater risks than the market as a whole. Because the Fund may focus on particular sectors of the economy, its performance may depend on the performance of those sectors.
| |
| Annual report | Global Shareholder Yield Fund | 11 |
Fund’s investments
As of 2-28-13
| | |
| | Shares | Value |
| |
| Common Stocks 96.2% | $1,864,520,382 |
|
| (Cost $1,618,789,515) | | |
| | | |
| Australia 2.1% | | 40,529,628 |
| | | |
| Telstra Corp., Ltd. | 5,022,500 | 23,527,032 |
|
| Westpac Banking Corp. | 542,061 | 17,002,596 |
| | | |
| Belgium 0.7% | | 14,400,498 |
| | | |
| Anheuser-Busch InBev NV | 153,620 | 14,400,498 |
| | | |
| Canada 3.9% | | 75,869,227 |
| | | |
| BCE, Inc. | 820,100 | 36,971,102 |
|
| Rogers Communications, Inc., Class B | 383,000 | 18,190,875 |
|
| Shaw Communications, Inc., Class B | 865,600 | 20,707,250 |
| | | |
| France 5.6% | | 107,542,678 |
| | | |
| Sanofi | 176,350 | 16,650,853 |
|
| SCOR SE | 833,100 | 23,565,492 |
|
| Total SA | 563,700 | 28,170,919 |
|
| Vinci SA | 423,000 | 19,585,687 |
|
| Vivendi SA | 929,443 | 19,569,727 |
| | | |
| Germany 6.9% | | 134,086,370 |
| | | |
| BASF SE | 308,400 | 29,020,061 |
|
| Bayer AG | 138,450 | 13,713,949 |
|
| Daimler AG | 549,600 | 32,714,434 |
|
| Deutsche Post AG | 418,700 | 9,384,579 |
|
| Deutsche Telekom AG | 2,092,500 | 22,444,779 |
|
| Muenchener Rueckversicherungs AG | 149,350 | 26,808,568 |
| | | |
| Italy 1.2% | | 23,581,648 |
| | | |
| Terna Rete Elettrica Nazionale SpA | 5,639,200 | 23,581,648 |
| | | |
| Netherlands 1.4% | | 26,850,850 |
| | | |
| Royal Dutch Shell PLC, ADR | 409,000 | 26,850,850 |
| | | |
| Norway 0.7% | | 13,345,293 |
| | | |
| Orkla ASA | 1,632,700 | 13,345,293 |
| | | |
| Philippines 0.6% | | 11,576,609 |
| | | |
| Philippine Long Distance Telephone Company, ADR | 162,251 | 11,576,609 |
| | | |
| Sweden 0.2% | | 4,695,940 |
| | | |
| Svenska Handelsbanken AB, Class A | 108,685 | 4,695,940 |
| | |
| 12 | Global Shareholder Yield Fund | Annual report | See notes to financial statements |
| | |
| | Shares | Value |
| | | |
| Switzerland 5.3% | | $102,731,747 |
| | | |
| Nestle SA | 285,600 | 19,931,254 |
|
| Novartis AG | 295,400 | 20,006,670 |
|
| Roche Holdings AG | 124,400 | 28,363,091 |
|
| Swisscom AG | 75,750 | 34,430,732 |
| | | |
| Taiwan 0.8% | | 15,481,566 |
| | | |
| Taiwan Semiconductor Manufacturing Company, Ltd., ADR | 848,305 | 15,481,566 |
| | | |
| United Kingdom 16.8% | | 325,638,172 |
| | | |
| AstraZeneca PLC, ADR | 508,530 | 23,107,603 |
|
| BAE Systems PLC | 4,089,800 | 22,034,071 |
|
| British American Tobacco PLC | 307,300 | 16,010,782 |
|
| Compass Group PLC | 1,190,200 | 14,457,978 |
|
| Diageo PLC, ADR | 115,800 | 13,862,418 |
|
| FirstGroup PLC | 4,665,072 | 13,675,980 |
|
| GlaxoSmithKline PLC | 1,040,850 | 22,945,976 |
|
| Imperial Tobacco Group PLC | 755,200 | 27,379,827 |
|
| National Grid PLC | 2,622,660 | 28,974,072 |
|
| Pearson PLC | 1,641,300 | 28,712,496 |
|
| Reckitt Benckiser Group PLC | 237,000 | 15,924,352 |
|
| SSE PLC | 972,700 | 21,304,049 |
|
| Unilever PLC | 274,800 | 10,930,374 |
|
| United Utilities Group PLC | 2,502,563 | 27,942,279 |
|
| Vodafone Group PLC | 11,908,100 | 29,894,701 |
|
| WM Morrison Supermarkets PLC | 2,155,250 | 8,481,214 |
| | | |
| United States 50.0% | | 968,190,156 |
| | | |
| AbbVie, Inc. | 537,720 | 19,852,622 |
|
| Altria Group, Inc. | 881,800 | 29,584,390 |
|
| Arthur J. Gallagher & Company | 525,800 | 20,232,784 |
|
| AT&T, Inc. | 612,400 | 21,991,284 |
|
| Automatic Data Processing, Inc. | 183,900 | 11,284,104 |
|
| Bristol-Myers Squibb Company | 377,600 | 13,959,872 |
|
| CenturyLink, Inc. | 870,970 | 30,196,530 |
|
| CME Group, Inc. | 331,100 | 19,806,402 |
|
| CMS Energy Corp. | 585,300 | 15,574,833 |
|
| Coca-Cola Enterprises, Inc. | 326,800 | 11,692,904 |
|
| Comcast Corp., Special Class A | 571,300 | 21,886,503 |
|
| ConocoPhillips | 309,400 | 17,929,730 |
|
| Deere & Company | 110,400 | 9,696,432 |
|
| Diamond Offshore Drilling, Inc. | 392,800 | 27,370,304 |
|
| Dominion Resources, Inc. | 257,500 | 14,420,000 |
|
| Duke Energy Corp. | 446,818 | 30,942,147 |
|
| E.I. du Pont de Nemours & Company | 307,300 | 14,719,670 |
|
| Emerson Electric Company | 259,700 | 14,724,990 |
|
| Enterprise Products Partners LP | 274,800 | 15,572,916 |
|
| Exxon Mobil Corp. | 113,600 | 10,172,880 |
|
| Genuine Parts Company | 176,400 | 12,529,692 |
|
| H.J. Heinz Company | 163,200 | 11,820,576 |
|
| Health Care REIT, Inc. | 229,400 | 14,713,716 |
| | |
| See notes to financial statements | Annual report | Global Shareholder Yield Fund | 13 |
| | |
| | Shares | Value |
| | | |
| United States (continued) | | |
| | | |
| Honeywell International, Inc. | 215,300 | $15,092,530 |
|
| Integrys Energy Group, Inc. | 247,790 | 14,017,480 |
|
| Johnson & Johnson | 195,800 | 14,902,338 |
|
| Kimberly-Clark Corp. | 345,100 | 32,536,028 |
|
| Kinder Morgan Energy Partners LP | 229,400 | 20,028,914 |
|
| KLA–Tencor Corp. | 291,000 | 15,935,160 |
|
| Lockheed Martin Corp. | 253,200 | 22,281,600 |
|
| Lorillard, Inc. | 568,000 | 21,890,720 |
|
| MarkWest Energy Partners LP | 204,500 | 11,691,265 |
|
| Mattel, Inc. | 555,000 | 22,616,250 |
|
| McDonald’s Corp. | 203,400 | 19,506,060 |
|
| Merck & Company, Inc. | 325,700 | 13,917,161 |
|
| Microchip Technology, Inc. | 641,600 | 23,399,152 |
|
| Microsoft Corp. | 506,400 | 14,077,920 |
|
| NiSource, Inc. | 409,000 | 11,329,300 |
|
| Oracle Corp. | 271,600 | 9,305,016 |
|
| PepsiCo, Inc. | 143,900 | 10,903,303 |
|
| Philip Morris International, Inc. | 293,200 | 26,901,100 |
|
| PPL Corp. | 779,000 | 24,008,780 |
|
| R.R. Donnelley & Sons Company | 1,047,300 | 10,933,812 |
|
| Regal Entertainment Group, Class A | 897,990 | 14,071,503 |
|
| Reynolds American, Inc. | 547,500 | 23,914,800 |
|
| SCANA Corp. | 227,200 | 11,096,448 |
|
| Spectra Energy Corp. | 364,600 | 10,587,984 |
|
| TECO Energy, Inc. | 1,086,300 | 18,738,675 |
|
| The Coca-Cola Company | 267,200 | 10,345,984 |
|
| The Southern Company | 424,100 | 19,088,741 |
|
| The Travelers Companies, Inc. | 150,400 | 12,095,168 |
|
| Time Warner, Inc. | 332,200 | 17,663,074 |
|
| Vectren Corp. | 415,500 | 13,711,500 |
|
| Verizon Communications, Inc. | 658,900 | 30,658,617 |
|
| Waste Management, Inc. | 543,100 | 20,268,492 |
| |
| |
| Preferred Securities 0.6% | | $10,607,766 |
|
| (Cost $10,325,774) | | |
| | | |
| United States 0.6% | | 10,607,766 |
| | | |
| MetLife, Inc., Series B, 6.500% | 417,300 | 10,607,766 |
| | |
| 14 | Global Shareholder Yield Fund | Annual report | See notes to financial statements |
| | |
| | Shares | Value |
| |
| Short-Term Investments 2.9% | | $56,445,954 |
|
| (Cost $56,445,954) | | |
| | | |
| Money Market Funds 2.9% | | 56,445,954 |
| | | |
| State Street Institutional Treasury Money Market Fund, 0.000% (Y) | 56,445,954 | 56,445,954 |
| |
| Total investments (Cost $1,685,561,243)† 99.7% | $1,931,574,102 |
|
| Other assets and liabilities, net 0.3% | | $5,804,003 |
|
| Total net assets 100.0% | $1,937,378,105 |
|
The percentage shown for each investment category is the total value of the category as a percentage of the net assets of the Fund.
ADR American Depositary Receipts
† At 2-28-13, the aggregate cost of investment securities for federal income tax purposes was $1,689,837,080. Net unrealized appreciation aggregated $241,737,022, of which $262,562,126 related to appreciated investment securities and $20,825,104 related to depreciated investment securities.
(Y) The rate shown is the annualized seven-day yield as of 2-28-13.
The Fund had the following sector composition as a percentage of total net assets on 2-28-13:
| | | | | | |
| Consumer Staples | 15.8% | | | | | |
| Telecommunication Services | 14.4% | | | | | |
| Utilities | 14.2% | | | | | |
| Consumer Discretionary | 10.6% | | | | | |
| Health Care | 9.7% | | | | | |
| Industrials | 8.8% | | | | | |
| Energy | 8.7% | | | | | |
| Financials | 7.7% | | | | | |
| Information Technology | 4.6% | | | | | |
| Materials | 2.3% | | | | | |
| Short-Term Investments & Other | 3.2% | | | | | |
| | |
| See notes to financial statements | Annual report | Global Shareholder Yield Fund | 15 |
FINANCIAL STATEMENTS
Financial statements
Statement of assets and liabilities 2-28-13
This Statement of assets and liabilities is the Fund’s balance sheet. It shows the value of what the Fund owns, is due and owes. You’ll also find the net asset value and the maximum public offering price per share.
| |
| Assets | |
|
| Investments, at value (Cost $1,685,561,243) | $1,931,574,102 |
| Foreign currency, at value (Cost $82) | 81 |
| Receivable for fund shares sold | 4,746,801 |
| Dividends and interest receivable | 8,788,946 |
| Receivable due from advisor | 2,020 |
| Other receivables and prepaid expenses | 112,130 |
| | |
| Total assets | 1,945,224,080 |
| |
| Liabilities | |
|
| Payable for investments purchased | 4,695,185 |
| Payable for fund shares repurchased | 2,336,014 |
| Payable to affiliates | |
| Accounting and legal services fees | 95,268 |
| Transfer agent fees | 213,923 |
| Trustees’ fees | 7,722 |
| Other liabilities and accrued expenses | 497,863 |
| | |
| Total liabilities | 7,845,975 |
| | |
| Net assets | 1,937,378,105 |
| |
| Net assets consist of | |
|
| Paid-in capital | $1,707,194,444 |
| Undistributed net investment income | 5,246,247 |
| Accumulated net realized gain (loss) on investments and foreign | |
| currency transactions | (21,024,264) |
| Net unrealized appreciation (depreciation) on investments and translation | |
| of assets and liabilities in foreign currencies | 245,961,678 |
| | |
| Net assets | $1,937,378,105 |
| | |
| 16 | Global Shareholder Yield Fund | Annual report | See notes to financial statements |
FINANCIAL STATEMENTS
Statement of assets and liabilities (continued)
| |
| Net asset value per share | |
|
| Based on net asset values and shares outstanding — the Fund has an | |
| unlimited number of shares authorized with no par value | |
| Class A ($275,534,906 ÷ 26,344,045 shares)1 | $10.46 |
| Class B ($11,411,855 ÷ 1,091,347 shares)1 | $10.46 |
| Class C ($64,726,853 ÷ 6,190,836 shares)1 | $10.46 |
| Class I ($641,438,835 ÷ 61,146,118 shares) | $10.49 |
| Class R2 ($121,596 ÷ 11,593 shares) | $10.49 |
| Class R6 ($136,184 ÷ 12,988 shares) | $10.49 |
| Class NAV ($944,007,876 ÷ 89,993,594 shares) | $10.49 |
| |
| Maximum offering price per share | |
|
| Class A (net asset value per share ÷ 95%)2 | $11.01 |
1 Redemption price per share is equal to the net asset value less any applicable contingent deferred sales charge.
2 On single retail sales of less than $50,000. On sales of $50,000 or more and on group sales the offering price is reduced.
| | |
| See notes to financial statements | Annual report | Global Shareholder Yield Fund | 17 |
FINANCIAL STATEMENTSStatement of operations For the year ended 2-28-13
This Statement of operations summarizes the Fund’s investment income earned and expenses incurred in operating the Fund. It also shows net gains (losses) for the period stated.
| |
| Investment income | |
|
| Dividends | $77,629,190 |
| Interest | 343 |
| Less foreign taxes withheld | (3,409,786) |
| | |
| Total investment income | 74,219,747 |
| |
| Expenses | |
|
| Investment management fees | 13,877,962 |
| Distribution and service fees | 1,347,852 |
| Accounting and legal services fees | 340,305 |
| Transfer agent fees | 1,071,080 |
| Trustees’ fees | 107,069 |
| State registration fees | 200,308 |
| Printing and postage | 173,396 |
| Professional fees | 137,577 |
| Custodian fees | 863,451 |
| Registration and filing fees | 47,735 |
| Other | 47,339 |
| | |
| Total expenses | 18,214,074 |
| Less expense reductions | (330,594) |
| | |
| Net expenses | 17,883,480 |
| | |
| Net investment income | 56,336,267 |
| |
| Realized and unrealized gain (loss) | |
|
| Net realized gain (loss) on | |
| Investments | 1,504,421 |
| Foreign currency transactions | (169,362) |
| | |
| | 1,335,059 |
| Change in net unrealized appreciation (depreciation) of | |
| Investments | 116,727,159 |
| Translation of assets and liabilities in foreign currencies | (45,480) |
| | |
| | 116,681,679 |
| | |
| Net realized and unrealized gain | 118,016,738 |
| | |
| Increase in net assets from operations | $174,353,005 |
| | |
| 18 | Global Shareholder Yield Fund | Annual report | See notes to financial statements |
FINANCIAL STATEMENTS
Statements of changes in net assets
These Statements of changes in net assets show how the value of the Fund’s net assets has changed during the last two periods. The difference reflects earnings less expenses, any investment gains and losses, distributions, if any, paid to shareholders and the net of Fund share transactions.
| | |
| | Year | Year |
| | ended | ended |
| | 2-28-13 | 2-29-12 |
|
| |
| Increase (decrease) in net assets | | |
|
| From operations | | |
| Net investment income | $56,336,267 | $24,108,157 |
| Net realized gain (loss) | 1,335,059 | 8,348,730 |
| Change in net unrealized appreciation (depreciation) | 116,681,679 | 72,909,926 |
| | | |
| Increase in net assets resulting from operations | 174,353,005 | 105,366,813 |
| | | |
| Distributions to shareholders | | |
| From net investment income | | |
| Class A | (6,537,708) | (2,555,172) |
| Class B | (189,434) | (74,651) |
| Class C | (1,056,210) | (348,064) |
| Class I | (14,320,551) | (4,826,128) |
| Class R2 | (2,785) | — |
| Class R6 | (4,432) | (1,084) |
| Class NAV | (30,896,355) | (10,611,958) |
| | | |
| Total distributions | (53,007,475) | (18,417,057) |
| | | |
| From Fund share transactions | 279,874,516 | 1,095,081,829 |
| | | |
| Total increase | 401,220,046 | 1,182,031,585 |
| |
| Net assets | | |
|
| Beginning of year | 1,536,158,059 | 354,126,474 |
| | | |
| End of year | $1,937,378,105 | $1,536,158,059 |
| | | |
| Undistributed net investment income | $5,246,247 | $5,269,247 |
| | |
| See notes to financial statements | Annual report | Global Shareholder Yield Fund | 19 |
Financial highlights
The Financial highlights show how the Fund’s net asset value for a share has changed during the period.
| | | | | |
| CLASS A SHARES Period ended | 2-28-13 | 2-29-12 | 2-28-11 | 2-28-10 | 2-28-09 |
| |
| Per share operating performance | | | | | |
|
| Net asset value, beginning of period | $9.81 | $9.50 | $8.10 | $6.10 | $9.52 |
| Net investment income1 | 0.29 | 0.26 | 0.24 | 0.25 | 0.36 |
| Net realized and unrealized gain (loss) on investments | 0.63 | 0.29 | 1.40 | 1.99 | (3.57) |
| Total from investment operations | 0.92 | 0.55 | 1.64 | 2.24 | (3.21) |
| Less distributions | | | | | |
| From net investment income | (0.27) | (0.24) | (0.24) | (0.24) | (0.21) |
| Total distributions | (0.27) | (0.24) | (0.24) | (0.24) | (0.21) |
| Net asset value, end of period | $10.46 | $9.81 | $9.50 | $8.10 | $6.10 |
| Total return (%)2,3 | 9.66 | 5.98 | 20.64 | 37.19 | (34.21) |
| |
| Ratios and supplemental data | | | | | |
|
| Net assets, end of period (in millions) | $276 | $215 | $56 | $22 | $11 |
| Ratios (as a percentage of average net assets): | | | | | |
| Expenses before reductions | 1.43 | 1.53 | 1.55 | 1.664 | 1.72 |
| Expenses net of fee waivers | 1.42 | 1.42 | 1.55 | 1.564 | 1.56 |
| Expenses net of fee waivers and credits | 1.42 | 1.42 | 1.55 | 1.554 | 1.55 |
| Net investment income | 2.92 | 2.78 | 2.80 | 3.34 | 4.28 |
| Portfolio turnover (%) | 21 | 19 | 39 | 53 | 54 |
1 Based on the average daily shares outstanding.
2 Does not reflect the effect of sales charges, if any.
3 Total returns would have been lower had certain expenses not been reduced during the applicable periods shown.
4 Includes the impact of proxy expenses, which amounted to 0.02% of average net assets.
| | | | | |
| CLASS B SHARES Period ended | 2-28-13 | 2-29-12 | 2-28-11 | 2-28-10 | 2-28-09 |
| |
| Per share operating performance | | | | | |
|
| Net asset value, beginning of period | $9.81 | $9.49 | $8.10 | $6.09 | $9.51 |
| Net investment income1 | 0.22 | 0.20 | 0.19 | 0.20 | 0.29 |
| Net realized and unrealized gain (loss) on investments | 0.64 | 0.29 | 1.38 | 2.00 | (3.56) |
| Total from investment operations | 0.86 | 0.49 | 1.57 | 2.20 | (3.27) |
| Less distributions | | | | | |
| From net investment income | (0.21) | (0.17) | (0.18) | (0.19) | (0.15) |
| Net asset value, end of period | $10.46 | $9.81 | $9.49 | $8.10 | $6.09 |
| Total return (%)2,3 | 8.90 | 5.33 | 19.65 | 36.49 | (34.72) |
| |
| Ratios and supplemental data | | | | | |
|
| Net assets, end of period (in millions) | $11 | $8 | $2 | $1 | $1 |
| Ratios (as a percentage of average net assets): | | | | | |
| Expenses before reductions | 2.29 | 2.54 | 2.91 | 3.544 | 3.94 |
| Expenses net of fee waivers | 2.12 | 2.11 | 2.25 | 2.294 | 2.43 |
| Expenses net of fee waivers and credits | 2.12 | 2.11 | 2.25 | 2.254 | 2.25 |
| Net investment income | 2.21 | 2.17 | 2.18 | 2.68 | 3.50 |
| Portfolio turnover (%) | 21 | 19 | 39 | 53 | 54 |
1 Based on the average daily shares outstanding.
2 Does not reflect the effect of sales charges, if any.
3 Total returns would have been lower had certain expenses not been reduced during the applicable periods shown.
4 Includes the impact of proxy expenses, which amounted to 0.02% of average net assets.
| | |
| 20 | Global Shareholder Yield Fund | Annual report | See notes to financial statements |
| | | | | |
| CLASS C SHARES Period ended | 2-28-13 | 2-29-12 | 2-28-11 | 2-28-10 | 2-28-09 |
| |
| Per share operating performance | | | | | |
|
| Net asset value, beginning of period | $9.81 | $9.50 | $8.10 | $6.10 | $9.51 |
| Net investment income1 | 0.22 | 0.20 | 0.18 | 0.20 | 0.29 |
| Net realized and unrealized gain (loss) on investments | 0.64 | 0.28 | 1.40 | 1.99 | (3.55) |
| Total from investment operations | 0.86 | 0.48 | 1.58 | 2.19 | (3.26) |
| Less distributions | | | | | |
| From net investment income | (0.21) | (0.17) | (0.18) | (0.19) | (0.15) |
| Net asset value, end of period | $10.46 | $9.81 | $9.50 | $8.10 | $6.10 |
| Total return (%)2,3 | 8.90 | 5.22 | 19.78 | 36.27 | (34.62) |
| |
| Ratios and supplemental data | | | | | |
|
| Net assets, end of period (in millions) | $65 | $45 | $11 | $4 | $3 |
| Ratios (as a percentage of average net assets): | | | | | |
| Expenses before reductions | 2.15 | 2.29 | 2.39 | 2.634 | 2.72 |
| Expenses net of fee waivers | 2.12 | 2.11 | 2.25 | 2.274 | 2.28 |
| Expenses net of fee waivers and credits | 2.12 | 2.11 | 2.25 | 2.254 | 2.25 |
| Net investment income | 2.22 | 2.13 | 2.10 | 2.66 | 3.50 |
| Portfolio turnover (%) | 21 | 19 | 39 | 53 | 54 |
1 Based on the average daily shares outstanding.
2 Does not reflect the effect of sales charges, if any.
3 Total returns would have been lower had certain expenses not been reduced during the applicable periods shown.
4 Includes the impact of proxy expenses, which amounted to 0.03% of average net assets.
| | | | | |
| CLASS I SHARES Period ended | 2-28-13 | 2-29-12 | 2-28-11 | 2-28-10 | 2-28-09 |
| |
| Per share operating performance | | | | | |
|
| Net asset value, beginning of period | $9.84 | $9.53 | $8.13 | $6.11 | $9.53 |
| Net investment income1 | 0.31 | 0.32 | 0.29 | 0.30 | 0.29 |
| Net realized and unrealized gain (loss) on investments | 0.65 | 0.27 | 1.38 | 2.00 | (3.46) |
| Total from investment operations | 0.96 | 0.59 | 1.67 | 2.30 | (3.17) |
| Less distributions | | | | | |
| From net investment income | (0.31) | (0.28) | (0.27) | (0.28) | (0.25) |
| Net asset value, end of period | $10.49 | $9.84 | $9.53 | $8.13 | $6.11 |
| Total return (%)2 | 10.07 | 6.45 | 21.09 | 38.08 | (33.87) |
| |
| Ratios and supplemental data | | | | | |
|
| Net assets, end of period (in millions) | $641 | $249 | $123 | $86 | $57 |
| Ratios (as a percentage of average net assets): | | | | | |
| Expenses before reductions | 1.05 | 1.12 | 1.09 | 1.193 | 1.21 |
| Expenses net of fee waivers | 1.03 | 0.97 | 1.08 | 1.083 | 1.10 |
| Expenses net of fee waivers and credits | 1.03 | 0.97 | 1.08 | 1.083 | 1.10 |
| Net investment income | 3.10 | 3.43 | 3.40 | 3.96 | 3.78 |
| Portfolio turnover (%) | 21 | 19 | 39 | 53 | 54 |
1 Based on the average daily shares outstanding.
2 Total returns would have been lower had certain expenses not been reduced during the applicable periods shown.
3 Includes the impact of proxy expenses, which amounted to 0.03% of average net assets.
| | |
| See notes to financial statements | Annual report | Global Shareholder Yield Fund | 21 |
| | | | | |
| CLASS R2 SHARES Period ended | | | | | 2-28-131 |
| |
| Per share operating performance | | | | | |
|
| Net asset value, beginning of period | | | | | $9.84 |
| Net investment income2 | | | | | 0.29 |
| Net realized and unrealized gain on investments | | | | | 0.63 |
| Total from investment operations | | | | | 0.92 |
| Less distributions | | | | | |
| From net investment income | | | | | (0.27) |
| Net asset value, end of period | | | | | $10.49 |
| Total return (%)3 | | | | | 9.58 |
| |
| Ratios and supplemental data | | | | | |
|
| Net assets, end of period (in millions) | | | | | —4 |
| Ratios (as a percentage of average net assets): | | | | | |
| Expenses before reductions | | | | | 19.42 |
| Expenses net of fee waivers | | | | | 1.47 |
| Expenses net of fee waivers and credits | | | | | 1.47 |
| Net investment income | | | | | 2.91 |
| Portfolio turnover (%) | | | | | 21 |
1 The inception date for Class R2 shares is 3-1-12.
2 Based on the average daily shares outstanding.
3 Total returns would have been lower had certain expenses not been reduced during the applicable periods shown.
4 Less than $500,000.
| | | | | |
| CLASS R6 SHARES Period ended | | | | 2-28-13 | 2-29-121 |
| |
| Per share operating performance | | | | | |
|
| Net asset value, beginning of period | | | | $9.84 | $9.29 |
| Net investment income2 | | | | 0.33 | 0.13 |
| Net realized and unrealized gain on investments | | | | 0.64 | 0.52 |
| Total from investment operations | | | | 0.97 | 0.65 |
| Less distributions | | | | | |
| From net investment income | | | | (0.32) | (0.10) |
| Total distributions | | | | (0.32) | (0.10) |
| Net asset value, end of period | | | | $10.49 | $9.84 |
| Total return (%)3 | | | | 10.12 | 7.124 |
| |
| Ratios and supplemental data | | | | | |
|
| Net assets, end of period (in millions) | | | | —5 | —5 |
| Ratios (as a percentage of average net assets): | | | | | |
| Expenses before reductions | | | | 10.38 | 15.936 |
| Expenses net of fee waivers | | | | 0.97 | 0.976 |
| Expenses net of fee waivers and credits | | | | 0.97 | 0.976 |
| Net investment income | | | | 3.29 | 2.826 |
| Portfolio turnover (%) | | | | 21 | 197 |
1 The inception date for Class R6 shares is 9-1-11.
2 Based on the average daily shares outstanding.
3 Total returns would have been lower had certain expenses not been reduced during the applicable periods shown.
4 Not annualized.
5 Less than $500,000.
6 Annualized.
7 Portfolio turnover is shown for the period from 3-1-11 to 2-29-12.
| | |
| 22 | Global Shareholder Yield Fund | Annual report | See notes to financial statements |
| | | | | |
| CLASS NAV SHARES Period ended | 2-28-13 | 2-29-12 | 2-28-11 | 2-28-10 | 2-28-091 |
| |
| Per share operating performance | | | | | |
|
| Net asset value, beginning of period | $9.84 | $9.53 | $8.13 | $6.11 | $9.71 |
| Net investment income2 | 0.35 | 0.29 | 0.30 | 0.29 | 0.29 |
| Net realized and unrealized gain (loss) on investments | 0.62 | 0.31 | 1.38 | 2.01 | (3.67) |
| Total from investment operations | 0.97 | 0.60 | 1.68 | 2.30 | (3.38) |
| Less distributions | | | | | |
| From net investment income | (0.32) | (0.29) | (0.28) | (0.28) | (0.22) |
| Net asset value, end of period | $10.49 | $9.84 | $9.53 | $8.13 | $6.11 |
| Total return (%)3 | 10.17 | 6.53 | 21.19 | 38.16 | (35.32)4 |
| |
| Ratios and supplemental data | | | | | |
|
| Net assets, end of period (in millions) | $944 | $1,019 | $162 | $129 | $67 |
| Ratios (as a percentage of average net assets): | | | | | |
| Expenses before reductions | 0.90 | 0.99 | 0.99 | 1.055 | 1.096 |
| Expenses net of fee waivers | 0.89 | 0.94 | 0.99 | 1.005 | 1.056 |
| Expenses net of fee waivers and credits | 0.89 | 0.94 | 0.99 | 1.005 | 1.056 |
| Net investment income | 3.56 | 3.11 | 3.49 | 3.84 | 4.276 |
| Portfolio turnover (%) | 21 | 19 | 39 | 53 | 54 |
1 The inception date for Class NAV shares is 4-28-08.
2 Based on the average daily shares outstanding.
3 Total returns would have been lower had certain expenses not been reduced during the applicable periods shown.
4 Not annualized.
5 Includes the impact of proxy expenses, which amounted to 0.02% of average net assets.
6 Annualized.
| | |
| See notes to financial statements | Annual report | Global Shareholder Yield Fund | 23 |
Notes to financial statements
Note 1 — Organization
John Hancock Global Shareholder Yield Fund (the Fund) is a series of John Hancock Funds III (the Trust), an open-end management investment company organized as a Massachusetts business trust and registered under the Investment Company Act of 1940, as amended (the 1940 Act). The investment objective of the Fund is to seek to provide a high level of income. Capital appreciation is a secondary investment objective.
The Fund may offer multiple classes of shares. The shares currently offered are detailed in the Statement of assets and liabilities. Class A and Class C shares are offered to all investors. Effective April 12, 2013, Class B shares are closed to new investors. Class I shares are offered to institutions and certain investors. Class R2 shares are available only to certain retirement plans. Class R6 shares are available only to certain retirement plans, institutions and other investors. Class NAV shares are offered to John Hancock affiliated funds of funds and certain 529 plans. Shareholders of each class have exclusive voting rights to matters that affect that class. The distribution and service fees, if any, transfer agent fees, printing and postage and state registration fees for each class may differ. Class B shares convert to Class A shares eight years after purchase.
Note 2 — Significant accounting policies
The financial statements have been prepared in conformity with accounting principles generally accepted in the United States of America, which require management to make certain estimates and assumptions at the date of the financial statements. Actual results could differ from those estimates and those differences could be significant. Events or transactions occurring after the end of the fiscal period through the date that the financial statements were issued have been evaluated in the preparation of the financial statements. The following summarizes the significant accounting policies of the Fund:
Security valuation. Investments are stated at value as of the close of regular trading on the New York Stock Exchange (NYSE), normally at 4:00 P.M., Eastern Time. In order to value the securities, the Fund uses the following valuation techniques: Equity securities held by the Fund are valued at the last sale price or official closing price on the principal securities exchange on which they trade. In the event there were no sales during the day or closing prices are not available, then the securities are valued using the last quoted bid or evaluated price. Investments by the Fund in open-end mutual funds are valued at their respective net asset values each business day. Foreign securities and currencies are valued in U.S. dollars, based on foreign currency exchange rates supplied by an independent pricing service. Certain securities traded only in the over-the-counter market are valued at the last bid price quoted by brokers making markets in the securities at the close of trading. Certain short-term securities are valued at amortized cost.
Other portfolio securities and assets, where reliable market quotations are not available, are valued at fair value as determined in good faith by the Fund’s Pricing Committee following procedures established by the Board of Trustees, which include price verification procedures. The frequency with which these fair valuation procedures are used cannot be predicted. Generally, trading in foreign securities is substantially completed each day at various times prior to the close of trading on the NYSE. Significant market events that affect the values of foreign securities may occur between the time when the valuation of the securities is generally determined and the close of the NYSE. During significant market events, these securities will be valued at fair value, as determined in good faith, following procedures established by the Board of Trustees. The Fund may use a fair
| |
| 24 | Global Shareholder Yield Fund | Annual report |
valuation model to value foreign securities in order to adjust for events that may occur between the close of foreign exchanges and the close of the NYSE.
The Fund uses a three-tier hierarchy to prioritize the pricing assumptions, referred to as inputs, used in valuation techniques to measure fair value. Level 1 includes securities valued using quoted prices in active markets for identical securities. Level 2 includes securities valued using other significant observable inputs. Observable inputs may include quoted prices for similar securities, interest rates, prepayment speeds and credit risk. Prices for securities valued using these inputs are received from independent pricing vendors and brokers and are based on an evaluation of the inputs described. Level 3 includes securities valued using significant unobservable inputs when market prices are not readily available or reliable, including the Fund’s own assumptions in determining the fair value of investments. Factors used in determining value may include market or issuer specific events or trends, changes in interest rates and credit quality. The inputs or methodology used for valuing securities are not necessarily an indication of the risks associated with investing in those securities. Changes in valuation techniques may result in transfers into or out of an assigned level within the disclosure hierarchy.
The following is a summary of the values by input classification of the Fund’s investments as of February 28, 2013, by major security category or type:
| | | | |
| | | | | LEVEL 3 |
| | | | LEVEL 2 | SIGNIFICANT |
| | TOTAL MARKET | LEVEL 1 | SIGNIFICANT | UNOBSERVABLE |
| | VALUE AT 2-28-13 | QUOTED PRICE | OBSERVABLE INPUTS | INPUTS |
|
| Common Stocks | | | | |
| Australia | $40,529,628 | — | $40,529,628 | — |
| Belgium | 14,400,498 | — | 14,400,498 | — |
| Canada | 75,869,227 | $75,869,227 | — | — |
| France | 107,542,678 | — | 107,542,678 | — |
| Germany | 134,086,370 | — | 134,086,370 | — |
| Italy | 23,581,648 | — | 23,581,648 | — |
| Netherlands | 26,850,850 | 26,850,850 | — | — |
| Norway | 13,345,293 | — | 13,345,293 | — |
| Philippines | 11,576,609 | 11,576,609 | — | — |
| Sweden | 4,695,940 | — | 4,695,940 | — |
| Switzerland | 102,731,747 | — | 102,731,747 | — |
| Taiwan | 15,481,566 | 15,481,566 | — | — |
| United Kingdom | 325,638,172 | 36,970,021 | 288,668,151 | — |
| United States | 968,190,156 | 968,190,156 | — | — |
| Preferred Securities | | | | |
| United States | 10,607,766 | 10,607,766 | — | — |
| Short-Term Investments | 56,445,954 | 56,445,954 | — | — |
| |
|
| Total Investments | | | | |
| in Securities | $1,931,574,102 | $1,201,992,149 | $729,581,953 | — |
Security transactions and related investment income. Investment security transactions are accounted for on a trade date plus one basis for daily net asset value calculations. However, for financial reporting purposes, investment transactions are reported on trade date. Interest income is accrued as earned. Dividend income is recorded on the ex-date, except for dividends of foreign securities where the dividend may not be known until after the ex-date. In those cases, dividend income, net of withholding taxes, is recorded when the Fund becomes aware of the dividends. Distributions received on securities that represent a return of capital or capital gain are recorded as a reduction of cost of investments and/or as a realized gain. Foreign taxes are provided for based on the Fund’s understanding of the tax rules and rates that exist in the foreign markets in which it
| |
| Annual report | Global Shareholder Yield Fund | 25 |
invests. Gains and losses on securities sold are determined on the basis of identified cost and may include proceeds from litigation.
Foreign currency translation. Assets, including investments and liabilities denominated in foreign currencies, are translated into U.S. dollar values each day at the prevailing exchange rate. Purchases and sales of securities, income and expenses are translated into U.S. dollars at the prevailing exchange rate on the date of the transaction. The effect of changes in foreign currency exchange rates on the value of securities is reflected as a component of the realized and unrealized gains (losses) on investments.
Funds that invest internationally generally carry more risk than funds that invest strictly in U.S. securities. Risks can result from differences in economic and political conditions, regulations, market practices (including higher transaction costs), accounting standards and other factors. Foreign investments are also subject to a decline in the value of a foreign currency versus the U.S. dollar, which reduces the dollar value of securities denominated in that currency.
Foreign taxes. The Fund may be subject to withholding tax on income or capital gains or repatriation taxes as imposed by certain countries in which it invests. Taxes are accrued based upon net investment income, net realized gains or net unrealized appreciation.
Line of credit. The Fund may borrow from banks for temporary or emergency purposes, including meeting redemption requests that otherwise might require the untimely sale of securities. Pursuant to the custodian agreement, the custodian may loan money to the Fund to make properly authorized payments. The Fund is obligated to repay the custodian for any overdraft, including any related costs or expenses. The custodian may have a lien, security interest or security entitlement in any Fund property that is not otherwise segregated or pledged, to the maximum extent permitted by law, to the extent of any overdraft.
In addition, the Fund and other affiliated funds have entered into an agreement with Citibank N.A. that enables them to participate in a $100 million unsecured committed line of credit. A commitment fee, payable at the end of each calendar quarter, based on the average daily unused portion of the line of credit, is charged to each participating fund on a pro rata basis and is reflected in other expenses on the Statement of operations. Commitment fees for the year ended February 28, 2013 were $3,062. For the year ended February 28, 2013, the Fund had no borrowings under the line of credit. The current agreement will expire on March 31, 2013 and will be replaced with a new agreement which will enable the Fund to participate in a $300 million unsecured line of credit, also with Citibank, with terms otherwise similar to the existing agreement.
Expenses. Within the John Hancock Funds complex, expenses that are directly attributable to an individual fund are allocated to such fund. Expenses that are not readily attributable to a specific fund are allocated among all funds in an equitable manner, taking into consideration, among other things, the nature and type of expense and the fund’s relative net assets. Expense estimates are accrued in the period to which they relate and adjustments are made when actual amounts are known.
Class allocations. Income, common expenses and realized and unrealized gains (losses) are determined at the fund level and allocated daily to each class of shares based on the net assets of the class. Class-specific expenses, such as distribution and service fees, if any, transfer agent fees, state registration fees and printing and postage, for all classes, are calculated daily at the class level based on the appropriate net assets of each class and the specific expense rates applicable to each class.
Federal income taxes. The Fund intends to continue to qualify as a regulated investment company by complying with the applicable provisions of the Internal Revenue Code and will not be subject
| |
| 26 | Global Shareholder Yield Fund | Annual report |
to federal income tax on taxable income that is distributed to shareholders. Therefore, no federal income tax provision is required.
Under the Regulated Investment Company Modernization Act of 2010, the Fund is permitted to carry forward capital losses incurred in taxable years beginning after December 22, 2010 for an unlimited period. Any losses incurred during those taxable years will be required to be utilized prior to the losses incurred in pre-enactment taxable years. As a result of this ordering rule, pre-enactment capital loss carryforwards may be more likely to expire unused. Additionally, post-enactment capital losses that are carried forward will retain their character as either short-term or long-term capital losses rather than being considered all short-term as under previous law.
For federal income tax purposes, the Fund has a capital loss carryforward of $16,748,427 available to offset future net realized capital gains as of February 28, 2013. The following table details the capital loss carryforward available as of February 28, 2013.
| | |
| CAPITAL LOSS CARRYFORWARD EXPIRING AT FEBRUARY 28 | NO EXPIRATION DATE |
| 2018 | SHORT-TERM | LONG-TERM |
|
| $16,355,664 | $392,763 | — |
As of February 28, 2013, the Fund had no uncertain tax positions that would require financial statement recognition, derecognition or disclosure. The Fund’s federal tax returns are subject to examination by the Internal Revenue Service for a period of three years.
Distribution of income and gains. Distributions to shareholders from net investment income and net realized gains, if any, are recorded on the ex-date. The Fund generally declares and pays dividends quarterly. Capital gain distributions, if any, are paid annually. The tax character of distributions for the years ended February 28, 2013 and February 29, 2012 was as follows:
| | | | |
| | FEBRUARY 28, 2013 | FEBRUARY 29, 2012 | | |
| | |
| Ordinary Income | $53,007,475 | $18,417,057 | | |
Distributions paid by the Fund with respect to each class of shares are calculated in the same manner, at the same time and in the same amount, except for the effect of class level expenses that may be applied differently to each class. As of February 28, 2013, the components of distributable earnings on a tax basis consisted of $5,233,735 of undistributed ordinary income.
Such distributions and distributable earnings, on a tax basis, are determined in conformity with income tax regulations, which may differ from accounting principles generally accepted in the United States of America. Material distributions in excess of tax basis earnings and profits, if any, are reported in the Fund’s financial statements as a return of capital.
Capital accounts within the financial statements are adjusted for permanent book-tax differences. These adjustments have no impact on net assets or the results of operations. Temporary book-tax differences, if any, will reverse in a subsequent period. Book-tax differences are primarily attributable to partnerships and wash sale loss deferrals.
Note 3 — Guarantees and indemnifications
Under the Trust’s organizational documents, its Officers and Trustees are indemnified against certain liabilities arising out of the performance of their duties to the Trust, including the Fund. Additionally, in the normal course of business, the Fund enters into contracts with service providers that contain general indemnification clauses. The Fund maximum exposure under these arrangements is unknown, as this would involve future claims that may be made against the Fund that have not yet occurred. The risk of material loss from such claims is considered remote.
| |
| Annual report | Global Shareholder Yield Fund | 27 |
Note 4 — Fees and transactions with affiliates
John Hancock Investment Management Services, LLC (the Advisor) serves as investment advisor for the Trust. John Hancock Funds, LLC (the Distributor), an affiliate of the Advisor, serves as principal underwriter of the Trust. The Advisor and the Distributor are indirect, wholly owned subsidiaries of Manulife Financial Corporation (MFC).
Management fee. The Fund has an investment management agreement with the Advisor under which the Fund pays a daily management fee to the Advisor equivalent, on an annual basis, to 0.800% of average daily net assets. Prior to July 1, 2012, the Fund paid a daily management fee to the Advisor equivalent, on an annual basis, to the sum of: (a) 0.875% of the first $500,000,000 of the Fund’s average daily net assets; (b) 0.850% of the next $500,000,000; and (c) 0.800% of the Fund’s average daily net assets in excess of $1,000,000,000. The Advisor has a subadvisory agreement with Epoch Investments Partners, Inc. The Fund is not responsible for payment of the subadvisory fees. The Advisor has contractually agreed to limit the Fund’s management fee to 0.800% of the Fund’s average daily net assets until June 30, 2013.
The Advisor has contractually agreed to waive fees and/or reimburse certain expenses for each share class of the Fund. This agreement excludes certain expenses such as taxes, portfolio brokerage commissions, interest expense, litigation and indemnification expenses and other extraordinary expenses not incurred in the ordinary course of the Fund’s business, acquired fund fees and short dividend expense. The fee waivers and/or reimbursements are such that these expenses will not exceed 1.42%, 2.12%, 2.12%, 1.06%, 1.47% and 0.97% for Class A, Class B, Class C, Class I, Class R2 and Class R6 shares, respectively. Prior to July 1, 2012, the fee waivers and/or reimbursements were such that the expenses would not exceed 0.97% for Class I shares. These expense limitations shall remain in effect until June 30, 2013, unless renewed by mutual agreement of the Fund and the Advisor based upon a determination that this is appropriate under the circumstances at the time.
Accordingly, these expense reductions amounted to $32,455, $16,258, $17,977, $98,977, $18,519, $12,363 and $134,045 for Class A, Class B, Class C, Class I, Class R2, Class R6 and Class NAV shares, respectively, for the year ended February 28, 2013.
The investment management fees, including the impact of the waivers and reimbursements described above, incurred for the year ended February 28, 2013 were equivalent to a net annual effective rate of 0.79% of the Fund’s average daily net assets.
Accounting and legal services. Pursuant to a service agreement, the Fund reimburses the Advisor for all expenses associated with providing the administrative, financial, legal, accounting and recordkeeping services to the Fund, including the preparation of all tax returns, periodic reports to shareholders and regulatory reports, among other services. These expenses are allocated to each share class based on its relative net assets at the time the expense was incurred. These accounting and legal services fees incurred for the year ended February 28, 2013 amounted to an annual rate of 0.02% of the Fund’s average daily net assets.
Distribution and service plans. The Fund has a distribution agreement with the Distributor. The Fund has adopted distribution and service plans with respect to Class A, Class B, Class C and Class R2 shares pursuant to Rule 12b-1 under the 1940 Act, to pay the Distributor for services provided as the distributor of shares of the Fund. In addition, under a service plan for Class R2 shares, the Fund pays up to 0.25% for certain other services. The Fund pays the following contractual rates of distribution and service fees under these arrangements, expressed as an annual percentage of average daily net assets for each class of the Fund’s shares.
| |
| 28 | Global Shareholder Yield Fund | Annual report |
| | | | | | |
| CLASS | 12b-1 FEE | SERVICE FEE | | | | |
| | | | |
| Class A | 0.30% | — | | | | |
| Class B | 1.00% | — | | | | |
| Class C | 1.00% | — | | | | |
| Class R2 | 0.25% | 0.25% | | | | |
Sales charges. Class A shares are assessed up-front sales charges, which resulted in payments to the Distributor amounting to $1,184,926 for the year ended February 28, 2013. Of this amount, $199,927 was retained and used for printing prospectuses, advertising, sales literature and other purposes, $976,872 was paid as sales commissions to broker-dealers and $8,127 was paid as sales commissions to sales personnel of Signator Investors, Inc., a broker-dealer affiliate of the Advisor.
Class A, Class B and Class C shares may be subject to contingent deferred sales charges (CDSCs). Certain Class A shares that are redeemed within one year of purchase are subject to a 1.00% sales charge. Class B shares that are redeemed within six years of purchase are subject to CDSCs, at declining rates, beginning at 5.00%. Class C shares that are redeemed within one year of purchase are subject to a 1.00% CDSC. CDSCs are applied to the lesser of the current market value at the time of redemption or the original purchase cost of the shares being redeemed. Proceeds from CDSCs are used to compensate the Distributor for providing distribution-related services in connection with the sale of these shares. During the year ended February 28, 2013, CDSCs received by the Distributor amounted to $1,138, $13,462 and $12,910 for Class A, Class B and Class C shares, respectively.
Transfer agent fees. The Fund has a transfer agent agreement with John Hancock Signature Services, Inc. (Signature Services), an affiliate of the Advisor. The transfer agent fees paid to Signature Services are determined based on the cost to Signature Services (Signature Services Cost) of providing recordkeeping services. The Signature Services Cost includes a component of allocated John Hancock corporate overhead for providing transfer agent services to the Fund and to all other John Hancock affiliated funds. It also includes out-of-pocket expenses that are comprised of payments made to third-parties for recordkeeping services provided to their clients who invest in one or more John Hancock funds. In addition, Signature Services Cost may be reduced by certain fees that Signature Services receives in connection with retirement and small accounts. Signature Services Cost is calculated monthly and allocated, as applicable, to four categories of share classes: Institutional Share Classes, Retirement Share Classes, Municipal Bond Classes and all other Retail Share Classes. Within each of these categories, the applicable costs are allocated to the affected John Hancock affiliated funds and/or classes, based on the relative average daily net assets.
Class level expenses. Class level expenses for the year ended February 28, 2013 were:
| | | | |
| | DISTRIBUTION | TRANSFER | STATE | PRINTING AND |
| CLASS | AND SERVICE FEES | AGENT FEES | REGISTRATION FEES | POSTAGE |
|
| Class A | $727,001 | $470,033 | $49,413 | $39,616 |
| Class B | 94,177 | 18,402 | 15,473 | 2,844 |
| Class C | 526,415 | 102,949 | 20,596 | 8,636 |
| Class I | — | 479,630 | 84,185 | 121,707 |
| Class R2 | 259 | 29 | 18,479 | 337 |
| Class R6 | — | 37 | 12,162 | 256 |
| | | | | |
| Total | $1,347,852 | $1,071,080 | $200,308 | $173,396 |
Trustee expenses. The Fund compensates each Trustee who is not an employee of the Advisor or its affiliates. Under the John Hancock Group of Funds Deferred Compensation Plan (the Plan) which was terminated in November 2012, certain Trustees could have elected, for tax purposes, to defer receipt of this compensation. Any deferred amounts were invested in various John Hancock funds. The investment of deferred amounts and the offsetting liability are included within Other
| |
| Annual report | Global Shareholder Yield Fund | 29 |
receivables and prepaid expenses and Payable to affiliates — Trustees’ fees, respectively, in the accompanying Statement of assets and liabilities. Plan assets will be liquidated in accordance with the Plan documents.
Note 5 — Fund share transactions
Transactions in Fund shares for the years ended February 28, 2013 and February 29, 2012 were as follows:
| | | | |
| | | Year ended 2-28-13 | | Year ended 2-29-12 |
| | Shares | Amount | Shares | Amount |
| Class A shares | | | | |
|
| Sold | 15,669,201 | $155,358,732 | 23,923,894 | $222,879,898 |
| Distributions reinvested | 663,208 | 6,439,490 | 264,170 | 2,420,399 |
| Repurchased | (11,924,145) | (117,263,582) | (8,136,254) | (76,349,490) |
| | | | | |
| Net increase | 4,408,264 | $44,534,640 | 16,051,810 | $148,950,807 |
| |
| Class B shares | | | | |
|
| Sold | 403,386 | $3,993,369 | 707,569 | $6,681,380 |
| Distributions reinvested | 12,717 | 123,106 | 4,514 | 41,724 |
| Repurchased | (160,580) | (1,581,789) | (96,598) | (901,603) |
| | | | | |
| Net increase | 255,523 | $2,534,686 | 615,485 | $5,821,501 |
| |
| Class C shares | | | | |
|
| Sold | 2,470,863 | $24,558,880 | 3,815,363 | $35,728,262 |
| Distributions reinvested | 91,535 | 886,020 | 30,880 | 284,377 |
| Repurchased | (928,504) | (9,120,364) | (398,328) | (3,718,939) |
| | | | | |
| Net increase | 1,633,894 | $16,324,536 | 3,447,915 | $32,293,700 |
| |
| Class I shares | | | | |
|
| Sold | 47,431,648 | $461,972,978 | 19,098,047 | $180,093,293 |
| Distributions reinvested | 1,400,880 | 13,641,460 | 468,780 | 4,324,243 |
| Repurchased | (12,975,975) | (128,113,677) | (7,200,716) | (67,155,686) |
| | | | | |
| Net increase | 35,856,553 | $347,500,761 | 12,366,111 | $117,261,850 |
| |
| Class R2 shares1 | | | | |
|
| Sold | 11,593 | $114,476 | — | — |
| | | | | |
| Net increase | 11,593 | $114,476 | — | — |
| |
| Class R6 shares2 | | | | |
|
| Sold | 6,168 | $59,632 | 10,764 | $100,000 |
| Distributions reinvested | 105 | 1,020 | — | — |
| Repurchased | (4,049) | (40,764) | — | — |
| | | | | |
| Net increase | 2,224 | $19,888 | 10,764 | $100,000 |
| |
| Class NAV shares | | | | |
|
| Sold | 3,327,918 | $32,345,438 | 86,174,622 | $787,875,241 |
| Distributions reinvested | 3,176,278 | 30,896,355 | 1,163,218 | 10,611,958 |
| Repurchased | (20,096,481) | (194,396,264) | (808,409) | (7,833,228) |
| | | | | |
| Net increase (decrease) | (13,592,285) | ($131,154,471) | 86,529,431 | $790,653,971 |
| |
| Net increase | 28,575,766 | $279,874,516 | 119,021,516 | $1,095,081,829 |
|
1 Period from 3-1-12 (inception date) to 2-28-13.
2 Period from 9-1-11 (inception date) to 2-29-12.
Affiliates of the Fund owned 88%, 83% and 100% of shares of beneficial interest of Class R2, Class R6 and Class NAV, respectively, on February 28, 2013.
| |
| 30 | Global Shareholder Yield Fund | Annual report |
Note 6 — Purchase and sale of securities
Purchases and sales of securities, other than short-term securities, aggregated $609,546,560 and $342,627,607, respectively, for the year ended February 28, 2013.
Note 7 — Investment by affiliated funds
Certain investors in the Fund are affiliated funds and are managed by the Advisor and its affiliates. The affiliated funds do not invest in the Fund for the purpose of exercising management or control; however, this investment may represent a significant portion of the Fund’s net assets. For the year ended February 28, 2013, the following funds had an affiliate ownership of 5% or more of the Fund’s net assets:
| | | |
| | AFFILIATED | | |
| FUND | CONCENTRATION | | |
| | |
| Lifestyle Balanced Portfolio | 15.5% | | |
| Lifestyle Growth Portfolio | 15.4% | | |
| |
| Annual report | Global Shareholder Yield Fund | 31 |
Auditor’s report
Report of Independent Registered Public Accounting Firm
To the Board of Trustees and Shareholders of
John Hancock Funds III Global Shareholder Yield Fund:
In our opinion, the accompanying statement of assets and liabilities, including the portfolio of investments, and the related statements of operations and of changes in net assets and the financial highlights present fairly, in all material respects, the financial position of John Hancock Funds III Global Shareholder Yield Fund (the “Fund”) at February 28, 2013, the results of its operations for the year then ended, the changes in its net assets for each of the two years in the period then ended and the financial highlights for each of the periods indicated, in conformity with accounting principles generally accepted in the United States of America. These financial statements and financial highlights (hereafter referred to as “financial statements”) are the responsibility of the Fund’s management; our responsibility is to express an opinion on these financial statements based on our audits. We conducted our audits of these financial statements in accordance with the standards of the Public Company Accounting Oversight Board (United States). Those standards require that we plan and perform the audit to obtain reasonable assurance about whether the financial statements are free of material misstatement. An audit includes examining, on a test basis, evidence supporting the amounts and disclosures in the financial statements, assessing the accounting principles used and significant estimates made by management, and evaluating the overall financial statement presentation. We believe that our audits, which included confirmation of securities at February 28, 2013 by correspondence with the custodian and brokers, provide a reasonable basis for our opinion.
PricewaterhouseCoopers LLP
Boston, Massachusetts
April 22, 2013
| |
| 32 | Global Shareholder Yield Fund | Annual report |
Tax information
Unaudited
For federal income tax purposes, the following information is furnished with respect to the distributions of the Fund, if any, paid during its taxable year ended February 28, 2013.
The Fund reports the maximum amount allowable of its net taxable income as eligible for the corporate dividends-received deduction.
The Fund reports the maximum amount allowable of its net taxable income as qualified dividend income as provided in the Jobs and Growth Tax Relief Reconciliation Act of 2003.
Eligible shareholders will be mailed a 2013 Form 1099-DIV in early 2014. This will reflect the tax character of all distributions paid in calendar year 2013.
Please consult a tax advisor regarding the tax consequences of your investment in the Fund.
| |
| Annual report | Global Shareholder Yield Fund | 33 |
Special Shareholder Meeting
Unaudited
On November 13, 2012, a Special Meeting of the Shareholders of John Hancock Funds III and each of its series, including John Hancock Global Shareholder Yield Fund, was held at 601 Congress Street, Boston, Massachusetts, for the purpose of considering and voting on the following proposal:
Proposal: Election of thirteen (13) Trustees as members of the Board of Trustees of John Hancock Funds III.
| | |
| | TOTAL VOTES | TOTAL VOTES WITHHELD |
| | FOR THE NOMINEE | FROM THE NOMINEE |
|
| Independent Trustees | | |
| Charles L. Bardelis | 657,515,396.49 | 7,284,346.35 |
| Peter S. Burgess | 657,435,609.53 | 7,364,133.30 |
| William H. Cunningham | 654,078,766.31 | 10,720,976.53 |
| Grace K. Fey | 657,602,863.91 | 7,196,878.92 |
| Theron S. Hoffman | 657,614,243.23 | 7,185,499.60 |
| Deborah C. Jackson | 657,542,023.74 | 7,257,719.09 |
| Hassell H. McClellan | 657,319,823.50 | 7,479,919.34 |
| James M. Oates | 656,971,552.43 | 7,828,190.40 |
| Steven R. Pruchansky | 657,559,900.72 | 7,239,842.11 |
| Gregory A. Russo | 658,072,539.03 | 6,727,203.80 |
| Non-Independent Trustees | | |
| James R. Boyle | 657,895,765.77 | 6,903,977.06 |
| Craig Bromley | 657,588,989.57 | 7,210,753.26 |
| Warren A. Thomson | 657,817,862.75 | 6,981,880.08 |
| |
| 34 | Global Shareholder Yield Fund | Annual report |
Trustees and Officers
This chart provides information about the Trustees and Officers who oversee your John Hancock fund as of December 1, 2012. Officers elected by the Trustees manage the day-to-day operations of the Fund and execute policies formulated by the Trustees.
| | |
| Independent Trustees | | |
| | | |
| Name, Year of Birth | Trustee | Number of |
| Position(s) held with Fund | of the | John Hancock |
| Principal occupation(s) and other | Trust | funds overseen |
| directorships during past 5 years | since1 | by Trustee |
| |
| James M. Oates,2 Born: 1946 | 2012 | 234 |
|
| Managing Director, Wydown Group (financial consulting firm) (since 1994); Chairman and Director, |
| Emerson Investment Management, Inc. (since 2000); Independent Chairman, Hudson Castle Group, Inc. |
| (formerly IBEX Capital Markets, Inc.) (financial services company) (1997–2011); Director, Stifel Financial |
| (since 1996); Director, Investor Financial Services Corporation (1995–2007); Director, Connecticut |
| River Bancorp (since 1998); Director, Virtus Funds (formerly Phoenix Mutual Funds) (since 1988). |
| Trustee and Chairperson of the Board, John Hancock retail funds (since 2012); Trustee, John Hancock |
| Funds III (2005–2006 and since 2012); Trustee (since 2004) and Chairperson of the Board (since |
| 2005), John Hancock Variable Insurance Trust; Trustee and Chairperson of the Board (since 2005), |
| John Hancock Funds II. | | |
|
| |
| Charles L. Bardelis,2,3 Born: 1941 | 2012 | 234 |
|
| Director, Island Commuter Corp. (marine transport). Trustee, John Hancock retail funds (since 2012); |
| Trustee, John Hancock Funds III (2005–2006 and since 2012); Trustee, John Hancock Variable Insurance |
| Trust (since 1988); Trustee, John Hancock Funds II (since 2005). | | |
|
| |
| Peter S. Burgess,2,3 Born: 1942 | 2012 | 234 |
|
| Consultant (financial, accounting and auditing matters) (since 1999); Certified Public Accountant; |
| Partner, Arthur Andersen (independent public accounting firm) (prior to 1999); Director, Lincoln |
| Educational Services Corporation (since 2004); Director, Symetra Financial Corporation (since 2010); |
| former Director, PMA Capital Corporation (2004–2010). Trustee, John Hancock retail funds (since 2012); |
| Trustee, John Hancock Funds III (2005–2006 and since 2012); Trustee, John Hancock Variable Insurance |
| Trust and John Hancock Funds II (since 2005). | | |
|
| |
| William H. Cunningham, Born: 1944 | 2006 | 234 |
|
| Professor, University of Texas, Austin, Texas (since 1971); former Chancellor, University of Texas |
| System and former President of the University of Texas, Austin, Texas; Director, LIN Television (since |
| 2009); Chairman (since 2009) and Director (since 2006), Lincoln National Corporation (insurance); |
| Director, Resolute Energy Corporation (since 2009); Director, Southwest Airlines (since 2000); former |
| Director, Introgen (manufacturer of biopharmaceuticals) (until 2008); former Director, Hicks Acquisition |
| Company I, Inc. (until 2007); former Director, Texas Exchange Bank, SSB (formerly Bank of Crowley) |
| (until 2009); former Advisory Director, JP Morgan Chase Bank (formerly Texas Commerce Bank–Austin) |
| (until 2009). Trustee, John Hancock retail funds (since 1986); Trustee, John Hancock Variable Insurance |
| Trust (since 2012); Trustee, John Hancock Funds II (since 2012 and 2005–2006). | |
|
| |
| Grace K. Fey,2 Born: 1946 | 2012 | 234 |
|
| Chief Executive Officer, Grace Fey Advisors (since 2007); Director and Executive Vice President, |
| Frontier Capital Management Company (1988–2007); Director, Fiduciary Trust (since 2009). |
| Trustee, John Hancock retail funds (since 2012); Trustee, John Hancock Variable Insurance Trust and |
| John Hancock Funds II (since 2008). | | |
| |
| Annual report | Global Shareholder Yield Fund | 35 |
| | |
| Independent Trustees (continued) | | |
| |
| Name, Year of Birth | Trustee | Number of John |
| Position(s) held with Fund | of the | Hancock funds |
| Principal occupation(s) and other | Trust | overseen by |
| directorships during past 5 years | since1 | Trustee |
| |
| Theron S. Hoffman,2,3 Born: 1947 | 2012 | 234 |
|
| Chief Executive Officer, T. Hoffman Associates, LLC (consulting firm) (since 2003); Director, The Todd |
| Organization (consulting firm) (2003–2010); President, Westport Resources Management (investment |
| management consulting firm) (2006–2008); Senior Managing Director, Partner and Operating Head, |
| Putnam Investments (2000–2003); Executive Vice President, The Thomson Corp. (financial and |
| legal information publishing) (1997–2000). Trustee, John Hancock retail funds (since 2012); Trustee, |
| John Hancock Variable Insurance Trust and John Hancock Funds II (since 2008). | |
|
| |
| Deborah C. Jackson, Born: 1952 | 2008 | 234 |
|
| President, Cambridge College, Cambridge, Massachusetts (since 2011); Chief Executive Officer, |
| American Red Cross of Massachusetts Bay (2002–2011); Board of Directors of Eastern Bank Corporation |
| (since 2001); Board of Directors of Eastern Bank Charitable Foundation (since 2001); Board of Directors |
| of American Student Assistance Corporation (1996–2009); Board of Directors of Boston Stock Exchange |
| (2002–2008); Board of Directors of Harvard Pilgrim Healthcare (health benefits company) (2007–2011). |
| Trustee, John Hancock retail funds (since 2008); Trustee of John Hancock Variable Insurance Trust and |
| John Hancock Funds II (since 2012). | | |
|
| |
| Hassell H. McClellan,2 Born: 1945 | 2012 | 234 |
|
| Associate Professor, The Wallace E. Carroll School of Management, Boston College (since 1984); |
| Trustee, Virtus Variable Insurance Trust (formerly Phoenix Edge Series Funds) (since 2008); Director, |
| The Barnes Group (since 2010). Trustee, John Hancock retail funds (since 2012); Trustee, John Hancock |
| Funds III (2005–2006 and since 2012); Trustee, John Hancock Variable Insurance Trust and | |
| John Hancock Funds II (since 2005). | | |
|
| |
| Steven R. Pruchansky, Born: 1944 | 2006 | 234 |
|
| Chairman and Chief Executive Officer, Greenscapes of Southwest Florida, Inc. (since 2000); Director |
| and President, Greenscapes of Southwest Florida, Inc. (until 2000); Member, Board of Advisors, First |
| American Bank (until 2010); Managing Director, Jon James, LLC (real estate) (since 2000); Director, |
| First Signature Bank & Trust Company (until 1991); Director, Mast Realty Trust (until 1994); President, |
| Maxwell Building Corp. (until 1991). Trustee (since 1992) and Chairperson of the Board (2011–2012), |
| John Hancock retail funds; Trustee and Vice Chairperson of the Board, John Hancock retail funds, |
| John Hancock Variable Insurance Trust and John Hancock Funds II (since 2012). | |
|
| |
| Gregory A. Russo, Born: 1949 | 2008 | 234 |
|
| Director and Audit Committee Chairman (since 2012) and Member, Audit Committee and Finance |
| Committee (since 2011), NCH Healthcare System, Inc. (holding company for multi-entity healthcare |
| system); Director and Member of Finance Committee, The Moorings, Inc. (nonprofit continuing care |
| community) (since 2012); Vice Chairman, Risk & Regulatory Matters, KPMG LLP (KPMG) (2002–2006); |
| Vice Chairman, Industrial Markets, KPMG (1998–2002); Chairman and Treasurer, Westchester |
| County, New York, Chamber of Commerce (1986–1992); Director, Treasurer and Chairman of |
| Audit and Finance Committees, Putnam Hospital Center (1989–1995); Director and Chairman of |
| Fundraising Campaign, United Way of Westchester and Putnam Counties, New York (1990–1995). |
| Trustee, John Hancock retail funds (since 2008); Trustee, John Hancock Variable Insurance Trust and |
| John Hancock Funds II (since 2012). | | |
| |
| 36 | Global Shareholder Yield Fund | Annual report |
| | |
| Non-Independent Trustees4 | | |
| | | |
| Name, Year of Birth | Trustee | Number of |
| Position(s) held with Fund | of the | John Hancock |
| Principal occupation(s) and other | Trust | funds overseen |
| directorships during past 5 years | since1 | by Trustee |
| |
| James R. Boyle,2 Born: 1959 | 2012 | 234 |
|
| Senior Executive Vice President, John Hancock Financial Services (since 1999, including prior positions); |
| Chairman and Director, John Hancock Advisers, LLC, John Hancock Funds, LLC and John Hancock |
| Investment Management Services, LLC (2005–2010). Trustee, John Hancock retail funds (since 2012 and |
| 2005–2010), Trustee, John Hancock Variable Insurance Trust and John Hancock Funds II (since 2005). |
|
| |
| Craig Bromley,2 Born: 1966 | 2012 | 234 |
|
| President, John Hancock Financial Services (since 2012); Senior Executive Vice President and General |
| Manager, U.S. Division, John Hancock Financial Services (since 2012); President and Chief Executive |
| Officer, Manulife Insurance Company (Manulife (Japan) (2005–2012), including prior positions). |
| Trustee, John Hancock retail funds (since 2012); Trustee, John Hancock Variable Insurance Trust and |
| John Hancock Funds II (since 2012). | | |
|
| |
| Warren A. Thomson,2 Born: 1955 | 2012 | 234 |
|
| Senior Executive Vice President and Chief Investment Officer, Manulife Financial Corporation (since |
| 2001, including prior positions); Director, Manulife Trust Company and Manulife Bank of Canada (since |
| 2001, including prior positions); Director and Chairman, Manulife Asset Management (2001–2013, |
| including prior positions). Trustee, John Hancock retail funds, John Hancock Variable Insurance Trust and |
| John Hancock Funds II (since 2012). | | |
| |
| Principal officers who are not Trustees | | |
| | | |
| Name, Year of Birth | | Officer |
| Position(s) held with Fund | | of the |
| Principal occupation(s) and other | | Trust |
| directorships during past 5 years | | since |
| |
| Hugh McHaffie, Born: 1959 | | 2012 |
|
| President | | |
| Executive Vice President, John Hancock Financial Services (since 2006, including prior positions); |
| Chairman and Director, John Hancock Advisers, LLC, John Hancock Investment Management Services, |
| LLC and John Hancock Funds, LLC (since 2010); President, John Hancock Advisers, LLC (since 2012); |
| President, John Hancock Investment Management Services, LLC (since 2010). President (since 2012) and |
| former Trustee (2010–2012), John Hancock retail funds; President, John Hancock Variable Insurance |
| Trust and John Hancock Funds II (since 2009). | | |
|
| |
| Andrew G. Arnott, Born: 1971 | | 2009 |
|
| Executive Vice President | | |
| Senior Vice President, John Hancock Financial Services (since 2009); Executive Vice President, |
| John Hancock Advisers, LLC (since 2005); Executive Vice President, John Hancock Investment |
| Management Services, LLC (since 2006); President, John Hancock Funds, LLC (since 2004, including |
| prior positions); Executive Vice President, John Hancock retail funds (since 2007, including prior |
| positions); Executive Vice President, John Hancock Variable Insurance Trust and John Hancock Funds II |
| (since 2007, including prior positions). | | |
|
| |
| Thomas M. Kinzler, Born: 1955 | | 2006 |
|
| Secretary and Chief Legal Officer | | |
| Vice President, John Hancock Financial Services (since 2006); Secretary and Chief Legal Counsel, |
| John Hancock Funds, LLC (since 2007); Secretary and Chief Legal Officer, John Hancock retail funds, |
| John Hancock Variable Insurance Trust and John Hancock Funds II (since 2006). | |
| |
| Annual report | Global Shareholder Yield Fund | 37 |
| |
| Principal officers who are not Trustees (continued) | |
| |
| Name, Year of Birth | Officer |
| Position(s) held with Fund | of the |
| Principal occupation(s) and other | Trust |
| directorships during past 5 years | since |
| |
| Francis V. Knox, Jr., Born: 1947 | 2006 |
|
| Chief Compliance Officer | |
| Vice President, John Hancock Financial Services (since 2005); Chief Compliance Officer, John Hancock |
| retail funds, John Hancock Variable Insurance Trust, John Hancock Funds II, John Hancock Advisers, |
| LLC and John Hancock Investment Management Services, LLC (since 2005); Vice President and Chief |
| Compliance Officer, John Hancock Asset Management a division of Manulife Asset Management (US) |
| LLC (2005–2008). | |
|
| |
| Charles A. Rizzo, Born: 1957 | 2007 |
|
| Chief Financial Officer | |
| Vice President, John Hancock Financial Services (since 2008); Senior Vice President, John Hancock | |
| Advisers, LLC and John Hancock Investment Management Services, LLC (since 2008); Chief Financial |
| Officer, John Hancock retail funds, John Hancock Variable Insurance Trust and John Hancock | |
| Funds II (since 2007). | |
|
| |
| Salvatore Schiavone, Born: 1965 | 2010 |
|
| Treasurer | |
| Assistant Vice President, John Hancock Financial Services (since 2007); Vice President, John Hancock |
| Advisers, LLC and John Hancock Investment Management Services, LLC (since 2007); Treasurer, | |
| John Hancock retail funds (since 2007, including prior positions); Treasurer, John Hancock Variable | |
| Insurance Trust and John Hancock Funds II (since 2010 and 2007–2009, including prior positions). | |
John Hancock retail funds is comprised of John Hancock Funds III and 33 other John Hancock funds consisting of 23 series of other John Hancock trusts and 10 closed-end funds.
The business address for all Trustees and Officers is 601 Congress Street, Boston, Massachusetts 02210–2805.
The Statement of Additional Information of the Fund includes additional information about members of the Board of Trustees of the Fund and is available without charge, upon request, by calling 1-800–225-5291.
1 Each Trustee holds office until his or her successor is elected and qualified, or until the Trustee’s death, retirement, resignation or removal.
2 Became a Trustee of the Fund effective December 1, 2012.
3 Member of Audit Committee.
4 Because Messrs. Bromley and Thomson are senior executives or directors and Mr. Boyle held prior positions as a senior executive and director of the Advisor and/or its affiliates, each of them is considered an “interested person,” as defined in the Investment Company Act of 1940, of the Fund.
| |
| 38 | Global Shareholder Yield Fund | Annual report |
More information
| |
| Trustees | Investment advisor |
| James M. Oates, Chairman | John Hancock Investment Management |
| Steven R. Pruchansky, Vice Chairman | Services, LLC |
| Charles L. Bardelis* | |
| James R. Boyle† | Subadvisor |
| Craig Bromley† | Epoch Investment Partners, Inc. |
| Peter S. Burgess* | |
| William H. Cunningham | Principal distributor |
| Grace K. Fey | John Hancock Funds, LLC |
| Theron S. Hoffman* | |
| Deborah C. Jackson | Custodian |
| Hassell H. McClellan | State Street Bank and Trust Company |
| Gregory A. Russo | |
| Warren A. Thomson† | Transfer agent |
| | John Hancock Signature Services, Inc. |
| Officers | |
| Hugh McHaffie | Legal counsel |
| President | K&L Gates LLP |
| | |
| Andrew G. Arnott | Independent registered |
| Executive Vice President | public accounting firm |
| | PricewaterhouseCoopers LLP |
| Thomas M. Kinzler | |
| Secretary and Chief Legal Officer | |
| | |
| Francis V. Knox, Jr. | |
| Chief Compliance Officer | |
| | |
| Charles A. Rizzo | |
| Chief Financial Officer | |
| | |
| Salvatore Schiavone | |
| Treasurer | |
| |
| *Member of the Audit Committee | |
| †Non-Independent Trustee | |
The Fund’s proxy voting policies and procedures, as well as the Fund’s proxy voting record for the most recent twelve-month period ended June 30, are available free of charge on the Securities and Exchange Commission (SEC) Web site at www.sec.gov or on our Web site.
The Fund’s complete list of portfolio holdings, for the first and third fiscal quarters, is filed with the SEC on Form N-Q. The Fund’s Form N-Q is available on our Web site and the SEC’s Web site, www.sec.gov, and can be reviewed and copied (for a fee) at the SEC’s Public Reference Room in Washington, DC. Call 1-800-SEC-0330 to receive information on the operation of the SEC’s Public Reference Room.
We make this information on your fund, as well as monthly portfolio holdings, and other fund details available on our Web site at www.jhfunds.com or by calling 1-800-225-5291.
| | |
| You can also contact us: | | |
| 1-800-225-5291 | Regular mail: | Express mail: |
| jhfunds.com | John Hancock Signature Services, Inc. | John Hancock Signature Services, Inc. |
| | P.O. Box 55913 | Mutual Fund Image Operations |
| | Boston, MA 02205-5913 | 30 Dan Road |
| | | Canton, MA 02021 |
| |
| Annual report | Global Shareholder Yield Fund | 39 |

1-800-225-5291
1-800-554-6713 TDD
1-800-338-8080 EASI-Line
www.jhfunds.com
| |
| This report is for the information of the shareholders of John Hancock Global Shareholder Yield Fund. | |
| It is not authorized for distribution to prospective investors unless preceded or accompanied by a prospectus. | 320A 2/13 |
| MF135743 | 4/13 |
ITEM 2. CODE OF ETHICS.
As of the end of the year, February 28, 2013, the registrant has adopted a code of ethics, as defined in Item 2 of Form N-CSR, that applies to its Chief Executive Officer, Chief Financial Officer and Treasurer (respectively, the principal executive officer, the principal financial officer and the principal accounting officer, the “Senior Financial Officers”). A copy of the code of ethics is filed as an exhibit to this Form N-CSR.
ITEM 3. AUDIT COMMITTEE FINANCIAL EXPERT.
Peter S. Burgess is the audit committee financial expert and is “independent”, pursuant to general instructions on Form N-CSR Item 3.
ITEM 4. PRINCIPAL ACCOUNTANT FEES AND SERVICES.
(a) Audit Fees
The aggregate fees billed for professional services rendered by the principal accountant, for the audits of the registrant’s annual financial statements or services that are normally provided by the accountant in connection with statutory and regulatory filings or engagements amounted to $137,627 for the fiscal year ended February 28, 2013 (broken out as follows: John Hancock Global Shareholder Yield Fund - $31,547, John Hancock International Growth Fund - $36,703, John Hancock International Core Fund - $43,414 and John Hancock International Allocation Fund - $25,963) and $127,599 for the fiscal year ended February 29, 2012 (broken out as follows: John Hancock Global Shareholder Yield Fund - $27,376, John Hancock International Growth Fund -$35,808, John Hancock International Core Fund - $38,958 and John Hancock International Allocation Fund - $25,457). These fees were billed to the registrant and were approved by the registrant’s audit committee.
(b) Audit-Related Services
Audit-related fees amounted to $14,906 for the fiscal year ended February 28, 2013 (broken out as follows: John Hancock Global Shareholder Yield Fund - $2,225, John Hancock International Growth Fund - $2,225, John Hancock International Core Fund - $2,225 and John Hancock International Allocation Fund - $8,231) and $14,783 for the fiscal year ended February 29, 2012 (broken out as follows: John Hancock Global Shareholder Yield Fund - $2,238, John Hancock International Growth Fund - $2,238, John Hancock International Core Fund - $2,238 and John Hancock International Allocation Fund - $8,069) billed to the registrant or to the registrant's investment adviser (not including any sub-adviser whose role is primarily portfolio management and is subcontracted with or overseen by another investment adviser), and any entity controlling, controlled by, or under common control with the adviser that provides ongoing services to the registrant ("control affiliates"). The nature of the services provided was security counts and affiliated service provider internal controls review.
(c) Tax Fees
The aggregate fees billed for professional services rendered by the principal accountant for tax compliance, tax advice and tax planning (“tax fees”) amounted to $14,894 for the fiscal year ended February 28, 2013 (broken out as follows: John Hancock Global Shareholder Yield Fund -$3,164, John Hancock International Growth Fund - $4,017, John Hancock International Core Fund - $4,930 and John Hancock International Allocation Portfolio - $2,783) and $14,460 for the fiscal year ended February 29, 2012 (broken out as follows: John Hancock Global Shareholder Yield Fund - $3,072, John Hancock International Growth Fund - $3,900, John Hancock International Core Fund - $4,786 and John Hancock International Allocation Portfolio - $2,702). The nature of the services comprising the tax fees was the review of the registrant’s tax returns and tax distribution requirements. These fees were billed to the registrant and were approved by the registrant’s audit committee.
(d) All Other Fees
Other fees amounted to $1,412 for the fiscal year ended February 28, 2013 (broken out as follows: John Hancock Global Shareholder Yield Fund - $415, John Hancock International Growth Fund - $415, John Hancock International Core Fund - $415 and John Hancock International Allocation Portfolio - $167) and $4,733 for the fiscal year ended February 29, 2012 (broken out as follows: John Hancock Global Shareholder Yield Fund - $1,461, John Hancock International Growth Fund - $1,461, John Hancock International Core Fund - $1,461 and John Hancock International Allocation Portfolio - $350) billed to the registrant or to the control affiliates.
(e)(1) Audit Committee Pre-Approval Policies and Procedures:
The trust’s Audit Committee must pre-approve all audit and non-audit services provided by the independent registered public accounting firm (the “Auditor”) relating to the operations or financial reporting of the funds. Prior to the commencement of any audit or non-audit services to a fund, the Audit Committee reviews the services to determine whether they are appropriate and permissible under applicable law.
The trust’s Audit Committee has adopted policies and procedures to, among other purposes, provide a framework for the Committee’s consideration of audit-related and non-audit services by the Auditor. The policies and procedures require that any audit-related and non-audit service provided by the Auditor and any non-audit service provided by the Auditor to a fund service provider that relates directly to the operations and financial reporting of a fund are subject to approval by the Audit Committee before such service is provided. Audit-related services provided by the Auditor that are expected to exceed $25,000 per year/per fund are subject to specific pre-approval by the Audit Committee. Tax services provided by the Auditor that are expected to exceed $30,000 per year/per fund are subject to specific pre-approval by the Audit Committee.
All audit services, as well as the audit-related and non-audit services that are expected to exceed the amounts stated above, must be approved in advance of provision of the service by formal resolution of the Audit Committee. At the regularly scheduled Audit Committee meetings, the Committee reviews a report summarizing the services, including fees, provided by the Auditor.
(e)(2) Services approved pursuant to paragraph (c)(7)(i)(C) of Rule 2-01 of Regulation S-X:
Audit-Related Fees, Tax Fees and All Other Fees:
There were no amounts that were approved by the Audit Committee pursuant to the de minimis exception under Rule 2-01 of Regulation S-X.
(f) According to the registrant’s principal accountant for the fiscal year ended February 28, 2013, the percentage of hours spent on the audit of the registrant's financial statements for the most recent fiscal year that were attributed to work performed by persons who were not full-time, permanent employees of principal accountant was less than 50%.
(g) The aggregate non-audit fees billed by the registrant’s principal accountant for non-audit services rendered to the registrant and rendered to the registrant's control affiliates were $2,866,638 for the fiscal year ended February 28, 2013 and $2,673,534 for the fiscal year ended February 29, 2012.
(h) The audit committee of the registrant has considered the non-audit services provided by the registrant’s principal accountant to the control affiliates and has determined that the services that were not pre-approved are compatible with maintaining the principal accountant’s independence.
ITEM 5. AUDIT COMMITTEE OF LISTED REGISTRANTS.
The registrant has a separately-designated standing audit committee comprised of independent trustees. The members of the audit committee are as follows:
Peter S. Burgess - Chairman
Charles L. Bardelis
Theron S. Hoffman
ITEM 6. SCHEDULE OF INVESTMENTS.
(a) Not applicable.
(b) Not applicable.
ITEM 7. DISCLOSURE OF PROXY VOTING POLICIES AND PROCEDURES FOR CLOSED-END MANAGEMENT INVESTMENT COMPANIES.
Not applicable.
ITEM 8. PORTFOLIO MANAGERS OF CLOSED-END MANAGEMENT INVESTMENT COMPANIES.
Not applicable.
ITEM 9. PURCHASES OF EQUITY SECURITIES BY CLOSED-END MANAGEMENT INVESTMENT COMPANY AND AFFILIATED PURCHASERS.
Not applicable.
ITEM 10. SUBMISSION OF MATTERS TO A VOTE OF SECURITY HOLDERS.
The registrant has adopted procedures by which shareholders may recommend nominees to the registrant's Board of Trustees. A copy of the procedures is filed as an exhibit to this Form N-CSR. See attached “John Hancock Funds – Nominating, Governance and Administration Committee Charter”.
ITEM 11. CONTROLS AND PROCEDURES.
(a) Based upon their evaluation of the registrant's disclosure controls and procedures as conducted within 90 days of the filing date of this Form N-CSR, the registrant's principal executive officer and principal financial officer have concluded that those disclosure controls and procedures provide reasonable assurance that the material information required to be disclosed by the registrant on this report is recorded, processed, summarized and reported within the time periods specified in the Securities and Exchange Commission's rules and forms.
(b) There were no changes in the registrant's internal control over financial reporting that occurred during the registrant's most recent fiscal half-year (the registrant's second fiscal half-year in the case of an annual report) that have materially affected, or are reasonably likely to materially affect, the registrant's internal control over financial reporting.
ITEM 12. EXHIBITS.
(a)(1) Code of Ethics for Senior Financial Officers is attached.
(a)(2) Separate certifications for the registrant's principal executive officer and principal financial officer, as required by Section 302 of the Sarbanes-Oxley Act of 2002 and Rule 30a-2(a) under the Investment Company Act of 1940, are attached.
(b)(1) Separate certifications for the registrant's principal executive officer and principal financial officer, as required by 18 U.S.C. Section 1350, as adopted pursuant to Section 906 of the Sarbanes-Oxley Act of 2002, and Rule 30a-2(b) under the Investment Company Act of 1940, are
attached. The certifications furnished pursuant to this paragraph are not deemed to be "filed" for purposes of Section 18 of the Securities Exchange Act of 1934, or otherwise subject to the liability of that section. Such certifications are not deemed to be incorporated by reference into any filing under the Securities Act of 1933 or the Securities Exchange Act of 1934, except to the extent that the Registrant specifically incorporates them by reference.
(c)(1) Submission of Matters to a Vote of Security Holders is attached. See attached “John Hancock Funds – Nominating, Governance and Administration Committee Charter”.
(c)(2) Contact person at the registrant.
Pursuant to the requirements of the Securities Exchange Act of 1934 and the Investment Company Act of 1940, the registrant has duly caused this report to be signed on its behalf by the undersigned, thereunto duly authorized.
| |
| John Hancock Funds III |
| |
| |
| By: | /s/ Hugh McHaffie |
| | ------------------------------ |
| Hugh McHaffie |
| | President |
| |
| |
| Date: | April 22, 2013 |
Pursuant to the requirements of the Securities Exchange Act of 1934 and the Investment Company Act of 1940, this report has been signed below by the following persons on behalf of the registrant and in the capacities and on the dates indicated.
| |
| By: | /s/ Hugh McHaffie |
| | ------------------------------- |
| Hugh McHaffie |
| | President |
| |
| |
| Date: | April 22, 2013 |
| |
| |
| |
| By: | /s/ Charles A. Rizzo |
| | -------------------------------- |
| Charles A. Rizzo |
| | Chief Financial Officer |
| |
| |
| Date: | April 22, 2013 |