| |
| UNITED STATES |
| SECURITIES AND EXCHANGE COMMISSION |
| Washington, D.C. 20549 |
|
| FORM N-CSR |
|
| CERTIFIED SHAREHOLDER REPORT OF REGISTERED |
|
| MANAGEMENT INVESTMENT COMPANIES |
|
| Investment Company Act file number 811-21777 |
|
| John Hancock Funds III |
| (Exact name of registrant as specified in charter) |
|
| 601 Congress Street, Boston, Massachusetts 02210 |
| (Address of principal executive offices) (Zip code) |
|
| Salvatore Schiavone |
| Treasurer |
|
| 601 Congress Street |
|
| Boston, Massachusetts 02210 |
| |
| (Name and address of agent for service) |
|
| Registrant's telephone number, including area code: 617-663-4497 |
| |
| Date of fiscal year end: | August 31 |
| |
| Date of reporting period: | August 31, 2010 |
ITEM 1. SCHEDULE OF INVESTMENTS

Management’s discussion of
Fund performance
By Robeco Investment Management, Inc.
During the 12 months ended August 31, 2010, U.S. equity markets experienced a dramatic tug-of-war between opposing economic conditions. On one hand, Corporate America generated strong financial performance. During the second quarter of 2010, operating earnings for companies that comprise the S&P 500 Index increased more than 50% year-over-year, with continued improvement on the cost side and increased revenue growth. On the other hand, despite these results, rising uncertainty about the prospects for U.S. and global economic growth weighed on stock prices in the closing months of the period. For the 12-month period ended August 31, 2010, John Hancock Disciplined Value Mid Cap Fund’s Class A shares had a total return of 7.37% at net asset value. That performance lagged the 9.35% return of the average midcap value fund, according to Morningstar, Inc., as well as the 13.01% return of the Fund’s benchmark , the Russell Midcap Value Index.
The Fund’s underperformance during the period was driven by its technology and consumer services positions, and by its underweighting in real estate investment trusts (REITs). Notable detractors included retailer The Gap, Inc., which we sold during the period, staffing companies Manpower, Inc. and Robert Half International, Inc, and electronics distributors Arrow Electronics, Inc. and Avnet, Inc. Technology stocks were also a source of weakness, both because the Fund was overweighted in this poor-performing sector and because of unfavorable stock selection. The Fund’s significant underweighting in REITs due to expensive valuations detracted from relative performance, as REITs benefited from their relatively generous dividend yields in a low interest-rate environment. The Fund was supported by strong stock selection in basic industries and energy, including iron-ore mining company Cliffs Natural Resources, Inc., which we sold when it reached our pr ice target, and exploration and production companies Concho Resources, Inc. and Noble Energy, Inc., whose stock prices rose in concert with above-average production growth and commodity prices. Another source of outperformance was a handful of companies that agreed to be acquired for premium prices during the period, including human resources outsourcing company Hewitt Associates, Inc., oil services firm Smith International, Inc. and business software maker Sybase, Inc.
This commentary reflects the views of the portfolio managers through the end of the Fund’s period discussed in this report. The managers’ statements reflect their own opinions. As such, they are in no way guarantees of future events and are not intended to be used as investment advice or a recommendation regarding any specific security. They are also subject to change at any time as market and other conditions warrant.
Past performance is no guarantee of future results.
Sector investing is subject to greater risks than the market as a whole. Because the Fund may focus on particular sectors of the economy, its performance may depend on the performance of those sectors.
| |
| 6 | Disciplined Value Mid Cap Fund | Annual report |
A look at performance
| | | | | | | |
| For the period ended August 31, 2010 | | | | | |
| |
| | Average annual total returns (%) | | | Cumulative total returns (%) | |
| | with maximum sales charge (POP) | | | with maximum sales charge (POP) | |
|
| | 1-year | 5-year | 10-year | | 1-year | 5-year | 10-year |
| |
|
| Class A1 | 1.96 | 1.93 | 6.21 | | 1.96 | 10.02 | 82.69 |
| |
|
| Class I1,2 | 7.74 | 3.39 | 7.18 | | 7.74 | 18.16 | 100.10 |
| |
|
| Class ADV1,2 | 7.25 | 2.96 | 6.75 | | 7.25 | 15.70 | 92.12 |
| |
|
Performance figures assume all distributions are reinvested. Public offering price (POP) figures reflect maximum sales charges on Class A shares of 5%. Sales charges are not applicable for Class ADV and I shares.
The expense ratios of the Fund, both net (including any fee waivers or expense limitations) and gross (excluding any fee waivers or expense limitations), are set forth according to the most recent publicly available prospectuses for the Fund and may differ from the expense ratios disclosed in the Financial Highlights tables in this report. The waivers and expense limitations are contractual at least until 6-30-12. The net expenses are as follows: Class A — 1.25%, Class ADV — 1.25% and Class I — 1.00%. Had the fee waivers and expense limitations not been in place, the gross expenses would be as follows: Class A — 1.43%, Class ADV — 1.43% and Class I — 1.02%.
The returns reflect past results and should not be considered indicative of future performance. The return and principal value of an investment will fluctuate so that shares, when redeemed, may be worth more or less than their original cost. Due to market volatility, the Fund’s current performance may be higher or lower than the performance shown. For current to the most recent month-end performance data, please call 1–800–225–5291 or visit the Fund’s Web site at www.jhfunds.com.
The performance table above and the chart on the next page do not reflect the deduction of taxes that a shareholder would pay on fund distributions or the redemption of fund shares.
The Fund’s performance results reflect any applicable expense reductions, without which the expenses increase and results would have been less favorable.
1 After the close of business on 7-9-10, holders of Investor Class Shares and Institutional Class Shares of the former Robeco Boston Partners Mid Cap Value Fund (the Predecessor Fund) became owners of an equal number of full and fractional Class A and Class I shares, respectively, of the John Hancock Disciplined Value Mid Cap Fund. Class A, Class I and Class ADV shares were first offered on 7-12-10. The returns prior to this date for Class A and Class ADV shares are those of the Predecessor Fund’s Investor Class Shares recalculated to reflect the gross fees and expenses of the Fund’s Class A and Class ADV shares. For Class I shares, the returns prior to this date are for the Predecessor Fund’s Institutional Class Shares recalculated to reflect the gross fees and expenses of the Fund’s Class I shares.
2 For certain types of investors, as described in the Fund’s Class ADV and Class I shares prospectuses.
| |
| Annual report | Disciplined Value Mid Cap Fund | 7 |
A look at performance
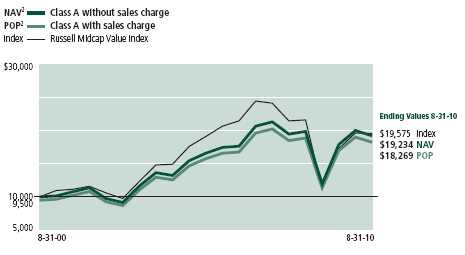
Growth of $10,000
This chart shows what happened to a hypothetical $10,000 investment in John Hancock Disciplined Value Mid Cap Fund Class A1 shares for the period indicated. For comparison, we’ve shown the same investment in the Russell Midcap Value Index.
| | | | |
| | Period | Without | With maximum | |
| | beginning | sales charge | sales charge | Index |
|
| Class I1,3 | 8-31-00 | $20,010 | $20,010 | $19,575 |
|
| Class ADV1,3 | 8-31-00 | 19,212 | 19,212 | 19,575 |
|
Assuming all distributions were reinvested for the period indicated, the table above shows the value of a $10,000 investment in the Fund’s Class ADV and Class I shares, respectively, as of 8-31-10. Performance of the classes will vary based on the difference in sales charges paid by shareholders investing in the different classes and the fee structure of those classes.
Russell Midcap Value Index is an unmanaged index that measures the performance of those Russell Midcap companies with lower price-to-book ratios and lower forecasted growth values.
It is not possible to invest directly in an index. Index figures do not reflect sales charges, which would have resulted in lower values if they did.
1 After the close of business on 7-9-10, holders of Investor Class Shares and Institutional Class Shares of the former Robeco Boston Partners Mid Cap Value Fund (the Predecessor Fund) became owners of an equal number of full and fractional Class A and Class I shares, respectively, of the John Hancock Disciplined Value Mid Cap Fund. Class A, Class I and Class ADV shares were first offered on 7-12-10. The returns prior to this date for Class A and Class ADV shares are those of the Predecessor Fund’s Investor Class Shares recalculated to reflect the gross fees and expenses of the Fund’s Class A and Class ADV shares. For Class I shares, the returns prior to this date are for the Predecessor Fund’s Institutional Class Shares recalculated to reflect the gross fees and expenses of the Fund’s Class I shares.
2 NAV represents net asset value and POP represents public offering price.
3 For certain types of investors, as described in the Fund’s Class ADV and Class I shares prospectuses.
| |
8 | Disciplined Value Mid Cap Fund | Annual report |
Your expenses
These examples are intended to help you understand your ongoing operating expenses.
Understanding fund expenses
As a shareholder of the Fund, you incur two types of costs:
■ Transaction costs which include sales charges (loads) on purchases or redemptions (varies by share class), minimum account fee charge, etc.
■ Ongoing operating expenses including management fees, distribution and service fees (if applicable), and other fund expenses.
We are going to present only your ongoing operating expenses here.
Actual expenses/actual returns
This example is intended to provide information about your fund’s actual ongoing operating expenses, and is based on your fund’s actual return. It assumes an account value of $1,000.00 on March 1, 2010 with the same investment held until August 31, 2010.
| | | |
| | Account value | Ending value | Expenses paid during |
| | on 3-1-10 | on 8-31-10 | period ended 8-31-101 |
|
| Class A | $1,000.00 | $960.10 | $6.18 |
|
| Class I | 1,000.00 | 961.20 | 4.94 |
|
For the class noted below, the example assumes an account value of $1,000 on July 12, 2010 with the same investment held until August 31, 2010.
| | | |
| | Account value | Ending value | Expenses paid during |
| | on 7-12-10 | on 8-31-10 | period ended 8-31-102 |
|
| |
| Class ADV | $1,000.00 | $976.30 | $1.73 |
|
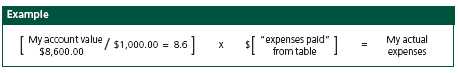
Together with the value of your account, you may use this information to estimate the operating expenses that you paid over the period. Simply divide your account value at August 31, 2010, by $1,000.00, then multiply it by the “expenses paid” for your share class from the table above. For example, for an account value of $8,600.00, the operating expenses should be calculated as follows:
| |
| Annual report | Disciplined Value Mid Cap Fund | 9 |
Your expenses
Hypothetical example for comparison purposes
This table allows you to compare your fund’s ongoing operating expenses with those of any other fund. It provides an example of the Fund’s hypothetical account values and hypothetical expenses based on each class’s actual expense ratio and an assumed 5% annualized return before expenses (which is not your fund’s actual return). It assumes an account value of $1,000.00 on March 1, 2010, with the same investment held until August 31, 2010. Look in any other fund shareholder report to find its hypothetical example and you will be able to compare these expenses.
| | | |
| | Account value | Ending value | Expenses paid during |
| | on 3-1-10 | on 8-31-10 | period ended 8-31-103 |
|
| Class A | $1,000.00 | $1,018.90 | $6.36 |
|
| Class I | 1,000.00 | 1,020.20 | 5.09 |
|
| Class ADV | 1,000.00 | 1,018.90 | 6.36 |
|
Remember, these examples do not include any transaction costs, therefore, these examples will not help you to determine the relative total costs of owning different funds. If transaction costs were included, your expenses would have been higher. See the prospectus for details regarding transaction costs.
1 Expenses are equal to the Fund’s annualized expense ratio of 1.25% and 1.00% for Class A and Class I shares, respectively, multiplied by the average account value over the period, multiplied by 184/365 (to reflect the one-half year period).
2 Expenses are equal to the Fund’s annualized expense ratio of 1.25% for Class ADV shares multiplied by the average account value over the period, multiplied by 51/365 (to reflect the period).
3 Expenses are equal to the Fund’s annualized expense ratio multiplied by the average account value over the period, multiplied by 184/365 (to reflect the one-half year period).
| |
| 10 | Disciplined Value Mid Cap Fund | Annual report |
Portfolio summary
| | | | |
| Top 10 Holdings1 | | | | |
|
| WESCO International, Inc. | 2.0% | | Alleghany Corp. | 1.6% |
| |
|
| Noble Energy, Inc. | 1.8% | | Hewitt Associates, Inc. | 1.5% |
| |
|
| Expedia, Inc. | 1.8% | | Harris Corp. | 1.5% |
| |
|
| PPG Industries, Inc. | 1.8% | | Omnicom Group, Inc. | 1.5% |
| |
|
| DaVita, Inc. | 1.6% | | Crown Holdings, Inc. | 1.5% |
| |
|
|
| |
| Sector Composition2,3 | | | | |
|
| Financials | 24% | | Energy | 7% |
| |
|
| Information Technology | 15% | | Utilities | 6% |
| |
|
| Consumer Discretionary | 13% | | Consumer Staples | 3% |
| |
|
| Industrials | 12% | | Telecommunication Services | 1% |
| |
|
| Health Care | 8% | | Short-Term Investments & Other | 4% |
| |
|
| Materials | 7% | | | |
| | |
1 As a percentage of net assets on 8-31-10. Excludes cash and cash equivalents.
2 As a percentage of net assets on 8-31-10.
3 Sector investing is subject to greater risks than the market as a whole. Because the Fund may focus on particular sectors of the economy, its performance may depend on the performance of those sectors.
| |
| Annual report | Disciplined Value Mid Cap Fund | 11 |
Fund’s investments
As of 8-31-10
| | |
| | Shares | Value |
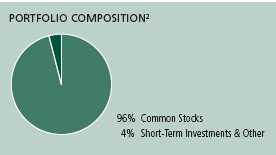
| Common Stocks 96.44% | | $156,710,142 |
|
| (Cost $165,541,315) | | |
| | | |
| Consumer Discretionary 13.16% | | 21,387,932 |
| | | |
| Hotels, Restaurants & Leisure 0.98% | | |
|
| CEC Entertainment, Inc. (I) | 33,145 | 1,039,749 |
|
| Starwood Hotels & Resorts Worldwide, Inc. | 11,870 | 554,685 |
| | | |
| Household Durables 2.86% | | |
|
| Lennar Corp., Class A | 78,455 | 1,033,252 |
|
| Mohawk Industries, Inc. (I) | 39,660 | 1,757,335 |
|
| NVR, Inc. (I) | 1,620 | 978,739 |
|
| Stanley Black & Decker, Inc. | 16,310 | 874,868 |
| | | |
| Internet & Catalog Retail 1.77% | | |
|
| Expedia, Inc. | 125,779 | 2,875,308 |
| | | |
| Leisure Equipment & Products 0.37% | | |
|
| Mattel, Inc. | 29,005 | 608,815 |
| | | |
| Media 1.90% | | |
|
| Omnicom Group, Inc. | 69,925 | 2,448,074 |
|
| The McGraw-Hill Companies, Inc. | 23,240 | 642,586 |
| | | |
| Specialty Retail 2.67% | | |
|
| Abercrombie & Fitch Company, Class A (L) | 30,075 | 1,040,595 |
|
| Bed Bath & Beyond, Inc. (I) | 32,615 | 1,173,162 |
|
| Williams-Sonoma, Inc. (L) | 81,930 | 2,126,903 |
| | | |
| Textiles, Apparel & Luxury Goods 2.61% | | |
|
| Coach, Inc. | 44,620 | 1,599,181 |
|
| The Timberland Company, Class A (I) | 83,860 | 1,347,630 |
|
| VF Corp. | 18,225 | 1,287,050 |
| | | |
| Consumer Staples 2.54% | | 4,131,193 |
| | | |
| Beverages 0.61% | | |
|
| Dr. Pepper Snapple Group, Inc. | 27,025 | 995,061 |
| | | |
| Food & Staples Retailing 0.80% | | |
|
| Safeway, Inc. | 44,940 | 844,872 |
|
| The Kroger Company | 23,430 | 462,274 |
| | | |
| Personal Products 0.57% | | |
|
| Herbalife, Ltd. | 16,510 | 917,626 |
| | | |
| Tobacco 0.56% | | |
|
| Lorillard, Inc. | 11,990 | 911,360 |
| | |
| 12 | Disciplined Value Mid Cap Fund | Annual report | See notes to financial statements |
| | |
| | Shares | Value |
| Energy 7.16% | | $11,634,179 |
| | | |
| Energy Equipment & Services 2.96% | | |
|
| Bristow Group, Inc. (I) | 51,510 | 1,699,830 |
|
| Pride International, Inc. (I) | 77,970 | 1,836,194 |
|
| Schlumberger, Ltd. | 23,945 | 1,276,987 |
| | | |
| Oil, Gas & Consumable Fuels 4.20% | | |
|
| Concho Resources, Inc. (I) | 27,665 | 1,616,189 |
|
| Noble Energy, Inc. | 41,875 | 2,922,038 |
|
| Rosetta Resources, Inc. (I) | 80,905 | 1,593,829 |
|
| Ultra Petroleum Corp. (I) | 17,665 | 689,112 |
| | | |
| Financials 24.25% | | 39,396,144 |
| | | |
| Capital Markets 3.03% | | |
|
| Affiliated Managers Group, Inc. (I) | 18,265 | 1,172,796 |
|
| Federated Investors, Inc., Class B (L) | 29,255 | 609,967 |
|
| SEI Investments Company | 70,280 | 1,243,956 |
|
| TD Ameritrade Holding Corp. (I) | 129,805 | 1,896,451 |
| | | |
| Commercial Banks 4.14% | | |
|
| Bank of Hawaii Corp. | 7,080 | 316,193 |
|
| Comerica, Inc. | 22,125 | 761,321 |
|
| East West Bancorp, Inc. | 67,165 | 981,952 |
|
| Fifth Third Bancorp | 98,850 | 1,092,293 |
|
| KeyCorp | 42,780 | 315,289 |
|
| M&T Bank Corp. | 9,490 | 812,724 |
|
| Popular, Inc. (I) | 370,683 | 948,948 |
|
| Regions Financial Corp. | 43,180 | 277,647 |
|
| SunTrust Banks, Inc. | 31,570 | 710,009 |
|
| Zions Bancorporation | 28,150 | 518,805 |
| | | |
| Consumer Finance 2.65% | | |
|
| Capital One Financial Corp. | 28,570 | 1,081,660 |
|
| Discover Financial Services | 159,560 | 2,315,216 |
|
| SLM Corp. (I) | 82,365 | 910,133 |
| | | |
| Insurance 10.43% | | |
|
| ACE, Ltd. | 16,225 | 867,551 |
|
| Alleghany Corp. (I) | 8,732 | 2,599,080 |
|
| Aon Corp. (L) | 41,840 | 1,516,282 |
|
| Assurant, Inc. | 21,160 | 773,610 |
|
| Genworth Financial, Inc., Class A (I) | 21,005 | 227,484 |
|
| Hanover Insurance Group, Inc. | 43,925 | 1,905,467 |
|
| Lincoln National Corp. | 17,850 | 416,976 |
|
| Loews Corp. | 32,570 | 1,144,510 |
|
| Marsh & McLennan Companies, Inc. | 90,070 | 2,136,460 |
|
| Reinsurance Group of America, Inc. | 27,160 | 1,187,978 |
|
| Symetra Financial Corp. | 141,950 | 1,524,543 |
|
| Unum Group | 104,970 | 2,104,649 |
|
| W.R. Berkley Corp. | 20,350 | 536,223 |
| | |
| See notes to financial statements | Annual report | Disciplined Value Mid Cap Fund | 13 |
| | |
| | Shares | Value |
| Real Estate Investment Trusts 3.82% | | |
|
| Annaly Capital Management, Inc. | 23,026 | $400,192 |
|
| Duke Realty Corp. | 62,715 | 703,035 |
|
| Equity Residential | 20,235 | 927,370 |
|
| Kimco Realty Corp. | 98,100 | 1,462,671 |
|
| Regency Centers Corp. | 18,910 | 689,459 |
|
| Taubman Centers, Inc. | 26,360 | 1,093,676 |
|
| Ventas, Inc. | 18,350 | 926,859 |
| | | |
| Thrifts & Mortgage Finance 0.18% | | |
|
| People’s United Financial, Inc. | 22,540 | 286,709 |
| | | |
| Health Care 7.63% | | 12,403,760 |
| | | |
| Health Care Equipment & Supplies 2.70% | | |
|
| Hologic, Inc. (I) | 110,985 | 1,574,877 |
|
| Hospira, Inc. (I) | 31,075 | 1,596,012 |
|
| STERIS Corp. | 42,120 | 1,211,792 |
| | | |
| Health Care Providers & Services 4.93% | | |
|
| Cardinal Health, Inc. | 26,255 | 786,600 |
|
| DaVita, Inc. (I) | 40,940 | 2,645,543 |
|
| Humana, Inc. (I) | 13,740 | 656,635 |
|
| Laboratory Corp. of America Holdings (I) | 22,500 | 1,633,950 |
|
| McKesson Corp. | 17,100 | 992,655 |
|
| Omnicare, Inc. | 68,005 | 1,305,696 |
| | | |
| Industrials 12.20% | | 19,831,190 |
| | | |
| Building Products 0.49% | | |
|
| Lennox International, Inc. | 18,935 | 802,655 |
| | | |
| Electrical Equipment 2.18% | | |
|
| Cooper Industries PLC | 29,415 | 1,238,077 |
|
| Thomas & Betts Corp. (I) | 62,135 | 2,295,888 |
| | | |
| Machinery 1.97% | | |
|
| Ingersoll-Rand PLC | 45,945 | 1,494,591 |
|
| Kennametal, Inc. | 44,565 | 1,123,038 |
|
| Terex Corp. (I)(L) | 32,170 | 585,816 |
| | | |
| Professional Services 4.91% | | |
|
| Equifax, Inc. | 72,305 | 2,130,828 |
|
| Manpower, Inc. | 44,185 | 1,877,863 |
|
| Robert Half International, Inc. | 80,540 | 1,738,053 |
|
| Towers Watson & Company, Class A | 49,715 | 2,232,204 |
| | | |
| Road & Rail 0.31% | | |
|
| Norfolk Southern Corp. | 9,510 | 510,497 |
| | | |
| Trading Companies & Distributors 2.34% | | |
|
| WESCO International, Inc. (I) | 100,550 | 3,245,754 |
|
| WW Grainger, Inc. | 5,255 | 555,926 |
| | | |
| Information Technology 14.97% | | 24,330,586 |
| | | |
| Communications Equipment 1.51% | | |
|
| Harris Corp. | 58,195 | 2,448,264 |
| | |
| 14 | Disciplined Value Mid Cap Fund | Annual report | See notes to financial statements |
| | |
| | Shares | Value |
| Electronic Equipment, Instruments & Components 3.73% | | |
|
| Arrow Electronics, Inc. (I) | 95,775 | $2,191,332 |
|
| Avnet, Inc. (I) | 102,955 | 2,357,670 |
|
| Ingram Micro, Inc., Class A (I) | 100,695 | 1,516,467 |
| | | |
| Internet Software & Services 0.40% | | |
|
| Monster Worldwide, Inc. (I)(L) | 59,080 | 651,652 |
| | | |
| IT Services 4.10% | | |
|
| Amdocs, Ltd. (I) | 66,430 | 1,742,459 |
|
| Broadridge Financial Solutions, Inc. | 35,925 | 766,999 |
|
| CACI International, Inc., Class A (I) | 16,260 | 663,571 |
|
| Hewitt Associates, Inc. (I) | 51,565 | 2,489,043 |
|
| The Western Union Company | 64,265 | 1,007,675 |
| | | |
| Office Electronics 0.71% | | |
|
| Xerox Corp. | 136,900 | 1,155,436 |
| | | |
| Semiconductors & Semiconductor Equipment 2.59% | | |
|
| Analog Devices, Inc. | 65,950 | 1,838,686 |
|
| Micron Technology, Inc. (I)(L) | 124,160 | 802,694 |
|
| STMicroelectronics NV (L) | 240,005 | 1,569,633 |
| | | |
| Software 1.93% | | |
|
| CA, Inc. | 64,180 | 1,155,882 |
|
| Electronic Arts, Inc. (I) | 129,470 | 1,973,123 |
| | | |
| Materials 7.20% | | 11,692,590 |
| | | |
| Chemicals 4.13% | | |
|
| Albemarle Corp. | 46,045 | 1,845,944 |
|
| Ashland, Inc. | 43,000 | 1,997,780 |
|
| PPG Industries, Inc. (L) | 43,575 | 2,868,542 |
| | | |
| Containers & Packaging 1.49% | | |
|
| Crown Holdings, Inc. (I) | 86,560 | 2,411,562 |
| | | |
| Metals & Mining 1.58% | | |
|
| Allegheny Technologies, Inc. | 13,795 | 561,732 |
|
| Reliance Steel & Aluminum Company | 53,880 | 2,007,030 |
| | | |
| Telecommunication Services 1.03% | | 1,665,566 |
| | | |
| Diversified Telecommunication Services 1.03% | | |
|
| CenturyLink, Inc. | 46,061 | 1,665,566 |
| | |
| Utilities 6.30% | | 10,237,002 |
| | | |
| Electric Utilities 4.08% | | |
|
| Allegheny Energy, Inc. | 66,130 | 1,491,232 |
|
| American Electric Power Company, Inc. | 15,030 | 532,212 |
|
| Edison International | 47,815 | 1,613,756 |
|
| NV Energy, Inc. | 109,995 | 1,407,936 |
|
| Westar Energy, Inc. | 65,905 | 1,579,743 |
| | | |
| Multi-Utilities 2.22% | | |
|
| Alliant Energy Corp. | 40,745 | 1,426,890 |
|
| Ameren Corp. | 43,250 | 1,214,028 |
|
| PG&E Corp. | 20,770 | 971,205 |
| | |
| See notes to financial statements | Annual report | Disciplined Value Mid Cap Fund | 15 |
| | | |
| | | Shares | Value |
|
| Short-Term Investments 8.56% | | | $13,907,192 |
| (Cost $13,907,285) | | | |
| | | | |
| Repurchase Agreement 4.15% | | | 6,743,000 |
| Repurchase Agreement with State Street Corp. dated 8-31-10 at 0.010% | | |
| to be repurchased at $6,743,002 on 9-1-10, collateralized by $6,310,000 | | |
| United States Treasury Notes, 3.125% due 4-30-17 (valued at $6,885,788, | | |
| including interest) | | 6,743,000 | 6,743,000 |
| | | | |
| Securities Lending Collateral 4.41% | | | 7,164,192 |
| John Hancock Collateral Investment Trust (W) | 0.3330% (Y) | 715,696 | 7,164,192 |
| |
| Total investments (Cost $179,448,600)† 105.00% | | $170,617,334 |
|
| |
| Other assets and liabilities, net (5.00%) | | | ($8,128,998) |
|
| |
| Total net assets 100.00% | | | $162,488,336 |
|
The percentage shown for each investment category is the total value of the category as a percentage of the net assets of the Fund.
(I) Non-income producing security.
(L) All or a portion of this security is on loan as of 8-31-10.
(W) Investment is an affiliate of the Fund, the adviser and/or subadviser. Also, it represents the investment of securities lending collateral received.
(Y) The rate shown is the annualized seven-day yield as of 8-31-10.
† At 8-31-10, the aggregate cost of investment securities for federal income tax purposes was $179,864,718. Net unrealized depreciation aggregated $9,247,384, of which $4,914,808 related to appreciated investment securities and $14,162,192 related to depreciated investment securities.
| | |
| 16 | Disciplined Value Mid Cap Fund | Annual report | See notes to financial statements |
F I N A N C I A L S T A T E M E N T SFinancial statements
Statement of assets and liabilities 8-31-10
This Statement of Assets and Liabilities is the Fund’s balance sheet. It shows the value of what the Fund owns, is due and owes. You’ll also find the net asset value and the maximum offering price per share.
| |
| Assets | |
|
| Investments in unaffiliated issuers, at value (Cost $165,541,315) including | |
| $6,883,082 of securities loaned | $156,710,142 |
| Investments in affiliated issuers, at value (Cost $7,164,285) (Note 2) | 7,164,192 |
| Repurchase agreements, at value (Cost $6,743,000) (Note 2) | 6,743,000 |
| | |
| Total investments, at value (Cost $179,448,600) | 170,617,334 |
| Cash | 60 |
| Receivable for investments sold | 727,638 |
| Receivable for fund shares sold | 867,148 |
| Dividends and interest receivable | 180,706 |
| Receivable for securities lending income | 1,944 |
| Receivable due from adviser | 23,193 |
| Total assets | 172,418,023 |
| |
| Liabilities | |
|
| Payable for investments purchased | 2,426,238 |
| Payable for fund shares repurchased | 266,465 |
| Payable upon return of securities loaned (Note 2) | 7,164,420 |
| Payable to affiliates | |
| Accounting and legal services fees | 2,274 |
| Transfer agent fees | 17,363 |
| Other liabilities and accrued expenses | 52,927 |
| Total liabilities | 9,929,687 |
| |
| Net assets | |
|
| Capital paid-in | $175,983,390 |
| Accumulated undistributed net investment income | 108,182 |
| Accumulated net realized loss on investments | (4,771,970) |
| Net unrealized depreciation on investments | (8,831,266) |
| Net assets | $162,488,336 |
| |
| Net asset value per share | |
|
| Based on net asset values and shares outstanding — the Fund has an | |
| unlimited number of shares authorized with no par value | |
| Class A ($75,381,926 ÷ 8,706,227 shares) | $8.66 |
| Class I ($87,081,990 ÷ 9,765,574 shares) | $8.92 |
| Class ADV ($24,420 ÷ 2,822 shares) | $8.65 |
| |
| Maximum offering price per share | |
|
| Class A (net asset value per share ÷ 95%)1 | $9.12 |
| |
| 1 On single retail sales of less than $50,000. On sales of $50,000 or more and on group sales the offering price is reduced. |
| |
| | |
| See notes to financial statements | Annual report | Disciplined Value Mid Cap Fund | 17 |
F I N A N C I A L S T A T E M E N T SStatement of operations For the year ended 8-31-10
This Statement of Operations summarizes the Fund’s investment income earned and expenses incurred in operating the Fund. It also shows net gains (losses) for the period stated.
| |
| Investment income | |
|
| Dividends | $1,364,760 |
| Securities lending | 13,788 |
| Interest | 2,208 |
| Less foreign taxes withheld | (4,942) |
| | |
| Total investment income | 1,375,814 |
| |
| Expenses | |
|
| Investment management fees (Note 4) | 798,091 |
| Distribution and service fees (Note 4) | 104,829 |
| Accounting and legal services fees (Note 4) | 96,895 |
| Transfer agent fees (Note 4) | 199,070 |
| Trustees’ fees (Note 4) | 8,281 |
| State registration fees (Note 4) | 45,823 |
| Printing and postage fees (Note 4) | 26,582 |
| Professional fees | 50,045 |
| Custodian fees | 33,207 |
| Registration and filing fees | 20,296 |
| Other | 11,230 |
| | |
| Total expenses | 1,394,349 |
| Less expense reductions (Note 4) | (294,676) |
| | |
| Net expenses | 1,099,673 |
| |
| Net investment income | 276,141 |
| |
| Realized and unrealized gain (loss) | |
|
| |
| Net realized gain (loss) on | |
| Investments in unaffiliated issuers | 2,324,516 |
| Investments in affiliated issuers | (134) |
| | 2,324,382 |
| Change in net unrealized appreciation (depreciation) of | |
| Investments in unaffiliated issuers | (8,884,681) |
| Investments in affiliated issuers | (93) |
| | (8,884,774) |
| Net realized and unrealized loss | (6,560,392) |
| | |
| Decrease in net assets from operations | ($6,284,251) |
| | |
| 18 | Disciplined Value Mid Cap Fund | Annual report | See notes to financial statements |
F I N A N C I A L S T A T E M E N T SStatements of changes in net assets
These Statements of Changes in Net Assets show how the value of the Fund’s net assets has changed during the last two periods. The difference reflects earnings less expenses, any investment gains and losses, distributions, if any, paid to shareholders and the net of Fund share transactions.
| | | |
| | Year | Year |
| | ended | ended |
| | 8-31-10 | 8-31-09 |
| Increase (decrease) in net assets | | |
|
| |
| From operations | | |
| Net investment income | $276,141 | $477,239 |
| Net realized gain (loss) | 2,324,382 | (5,878,181) |
| Change in net unrealized appreciation (depreciation) | (8,884,774) | (324,285) |
| | |
| Decrease in net assets resulting from operations | (6,284,251) | (5,725,227) |
| | |
| Distributions to shareholders | | |
| From net investment income | | |
| Class A | (92,302) | (110,208) |
| Class I | (307,672) | (341,607) |
| From net realized gain | | |
| Class A | — | (496) |
| Class I | — | (1,154) |
| | | |
| Total distributions | (399,974) | (453,465) |
| | | |
| From Fund share transactions (Note 5) | 122,565,661 | 528,327 |
| | | |
| Total increase (decrease) | 115,881,436 | (5,650,365) |
| |
| Net assets | | |
|
| Beginning of year | 46,606,900 | 52,257,265 |
| | | |
| End of year | $162,488,336 | $46,606,900 |
| | |
| Accumulated undistributed net investment income | $108,182 | $232,015 |
| | |
| | | |
| | | |
| | | |
See notes to financial statements | Annual report | Disciplined Value Mid Cap Fund 19 |
Financial highlights
The Financial Highlights show how the Fund’s net asset value for a share has changed since the end of the previous period.
| | | | | |
| CLASS A SHARES Period ended | 8-31-101 | 8-31-092 | 8-31-082 | 8-31-072 | 8-31-06 |
| Per share operating performance | | | | | |
|
| Net asset value, beginning of year | $8.10 | $9.08 | $11.16 | $12.81 | $13.80 |
| Net investment income3 | 0.014 | 0.07 | 0.06 | 0.02 | (0.01) |
| Net realized and unrealized gain (loss) on investments | 0.60 | (0.98)5 | (0.74) | 2.39 | 0.87 |
| Total from investment operations | 0.61 | (0.91) | (0.68) | 2.41 | 0.86 |
| Less distributions | | | | | |
| From net investment income | (0.05) | (0.07) | (0.04) | — | — |
| From net realized gain | — | —6 | (1.36) | (4.06) | (1.85) |
| Total distributions | (0.05) | (0.07) | (1.40) | (4.06) | (1.85) |
| Net asset value, end of year | $8.66 | $8.10 | $9.08 | $11.16 | $12.81 |
| Total return (%)7,8,9 | 7.54 | (9.79)5 | (6.62) | 21.02 | 6.59 |
| |
| Ratios and supplemental data | | | | | |
|
| Net assets, end of year (in millions) | $75 | $14 | $17 | $13 | $5 |
| Ratios (as a percentage of average net assets): | | | | | |
| Expenses before reductions | 1.56 | 1.93 | 1.73 | 1.73 | 1.70 |
| Expenses net of fee waivers and credits | 1.25 | 1.25 | 1.25 | 1.25 | 1.25 |
| Net investment income (loss) | 0.09 | 1.09 | 0.55 | 0.14 | (0.04) |
| Portfolio turnover (%) | 38 | 58 | 64 | 89 | 97 |
| |
1 After the close of business on 7-9-10, holders of Investor Class Shares of the former Robeco Boston Partners Mid Cap Value Fund (the Predecessor Fund) became owners of an equal number of full and fractional Class A shares of the John Hancock Disciplined Value Mid Cap Fund. These shares were first offered on 7-12-10. Additionally, the accounting and performance history of the Investor Class Shares of the Predecessor Fund was redesignated as that of John Hancock Disciplined Value Mid Cap Fund Class A.
2 Audited by previous independent registered public accounting firm.
3 Based on the average daily shares outstanding.
4 The amount shown for a share outstanding may differ with the distributions from net investment income for the period due to the timing of distributions in relation to fluctuations of shares outstanding during the period.
5 In 2009, the investment advisor fully reimbursed the Fund for a loss on a transaction not meeting the Fund’s investment guidelines, which otherwise would have reduced total return by 0.11% and net realized and unrealized gain/(loss) on investment by $0.01 per share.
6 Less than $0.01 per share.
7 Assumes dividend reinvestment (if applicable).
8 Total returns would have been lower had certain expenses not been reduced during the periods shown.
9 Does not reflect the effect of sales charges, if any.
| | |
| 20 | Disciplined Value Mid Cap Fund | Annual report | See notes to financial statements |
| | | | | |
| CLASS I SHARES Period ended | 8-31-101 | 8-31-092 | 8-31-082 | 8-31-072 | 8-31-06 |
| Per share operating performance | | | | | |
|
| Net asset value, beginning of year | $8.34 | $9.35 | $11.45 | $13.05 | $14.02 |
| Net investment income3 | 0.044 | 0.09 | 0.08 | 0.05 | 0.04 |
| Net realized and unrealized gain (loss) on investments | 0.61 | (1.01)5 | (0.76) | 2.44 | 0.86 |
| Total from investment operations | 0.65 | (0.92) | (0.68) | 2.49 | 0.90 |
| Less distributions | | | | | |
| From net investment income | (0.07) | (0.09) | (0.06) | (0.03) | (0.02) |
| From net realized gain | — | —6 | (1.36) | (4.06) | (1.85) |
| Total distributions | (0.07) | (0.09) | (1.42) | (4.09) | (1.87) |
| Net asset value, end of year | $8.92 | $8.34 | $9.35 | $11.45 | $13.05 |
| Total return (%)7,8 | 7.76 | (9.50)5 | (6.41) | 21.32 | 6.82 |
| |
| Ratios and supplemental data | | | | | |
|
| Net assets, end of year (in millions) | $87 | $33 | $35 | $36 | $28 |
| Ratios (as a percentage of average net assets): | | | | | |
| Expenses before reductions | 1.28 | 1.69 | 1.48 | 1.48 | 1.38 |
| Expenses net of fee waivers and credits | 1.00 | 1.00 | 1.00 | 1.00 | 1.00 |
| Net investment income | 0.41 | 1.33 | 0.80 | 0.38 | 0.28 |
| Portfolio turnover (%) | 38 | 58 | 64 | 89 | 97 |
| |
1 After the close of business on 7-9-10, holders of Institutional Class Shares of the former Robeco Boston Partners Mid Cap Value Fund (the Predecessor Fund) became owners of an equal number of full and fractional Class I shares of the John Hancock Disciplined Value Mid Cap Fund. These shares were first offered on 7-12-10. Additionally, the accounting and performance history of the Institutional Class Shares of the Predecessor Fund was redesignated as that of John Hancock Disciplined Value Mid Cap Fund Class I.
2 Audited by previous independent registered public accounting firm.
3 Based on the average daily shares outstanding.
4 Recognition of net investment income by the Fund is affected by the timing of the declaration of dividends.
5 In 2009, the investment advisor fully reimbursed the Fund for a loss on a transaction not meeting the Fund’s investment guidelines, which otherwise would have reduced total return by 0.11% and net realized and unrealized gain/(loss) on investment by $0.01 per share.
6 Less than $0.01 per share.
7 Assumes dividend reinvestment (if applicable).
8 Total returns would have been lower had certain expenses not been reduced during the periods shown.
| |
| CLASS ADV SHARES Period ended | 8-31-101 |
| Per share operating performance | |
|
| Net asset value, beginning of period | $8.86 |
| Net investment loss2 | —3,4 |
| Net realized and unrealized loss on investments | (0.21) |
| Total from investment operations | (0.21) |
| Net asset value, end of period | $8.65 |
| Total return (%)5,6 | (2.37)7 |
| |
| Ratios and supplemental data | |
|
| Net assets, end of period (in thousands) | 24 |
| Ratios (as a percentage of average net assets): | |
| Expenses before reductions | 1.428 |
| Expenses net of fee waivers and credits | 1.258 |
| Net investment loss | (0.37)8 |
| Portfolio turnover (%) | 389 |
| |
1 Period from 7-12-10 (inception date) to 8-31-10.
2 Based on the average daily shares outstanding.
3 Recognition of net investment income by the Fund is affected by the timing of the declaration of dividends.
4 Less than $0.005 per share.
5 Assumes dividend reinvestment (if applicable).
6 Total returns would have been lower had certain expenses not been reduced during the period shown.
7 Not annualized.
8 Annualized.
9 Portfolio turnover is shown for the year from 9-1-09 to 8-31-10.
| | |
| See notes to financial statements | Annual report | Disciplined Value Mid Cap Fund | 21 |
Notes to financial statements
Note 1 — Organization
John Hancock Disciplined Value Mid Cap Fund (the Fund) is a diversified series of John Hancock Funds III (the Trust), an open-end management investment company organized as a Massachusetts business trust and registered under the Investment Company Act of 1940, as amended (the 1940 Act). The investment objective of the Fund is to seek long-term growth of capital with current income as a secondary objective.
The Fund may offer multiple classes of shares. The shares currently offered are detailed in the Statement of Assets and Liabilities. Class A shares are offered to all investors. Class I shares are offered to institutions and certain investors. Class ADV shares are available to certain affiliates and investors who acquired Class A shares as a result of the reorganization of the Robeco Boston Partners Mid Cap Value Fund (the Predecessor Fund) into the Fund and are closed to new investors. Shareholders of each class have exclusive voting rights to matters that affect that class. The distribution and service fees and transfer agent fees for each class may differ.
As a result of the reorganization, the Fund is the legal survivor, however, the accounting and performance history of the Investor Class and Institutional Class shares of the Predecessor Fund have been redesignated as that of Class A and Class I shares of the Fund, respectively. At the close of business on July 9, 2010, the Fund acquired substantially all the assets and assumed the liabilities of the Predecessor Fund pursuant to an agreement and plan of reorganization, in exchange for Class A and Class I shares of the Fund. Certain prior year amounts have been reclassified to conform with current year presentation.
Affiliates of the Fund owned 100% of shares of beneficial interest of Class ADV shares on August 31, 2010.
Note 2 — Significant accounting policies
The financial statements have been prepared in conformity with accounting principles generally accepted in the United States of America, which require management to make certain estimates and assumptions at the date of the financial statements. Actual results could differ from those estimates. Events or transactions occurring after the end of the fiscal period through the date that the financial statements were issued have been evaluated in the preparation of the financial statements. The following summarizes the significant accounting policies of the Fund:
Security valuation. Investments are stated at value as of the close of regular trading on the New York Stock Exchange (NYSE), normally at 4:00 P.M., Eastern Time. The Fund uses a three-tier hierarchy to prioritize the pricing assumptions, referred to as inputs, used in valuation techniques to measure fair value. Level 1 includes quoted prices in active markets for identical securities. Level 2 includes significant observable inputs. Observable inputs may include quoted prices for similar securities, interest rates, prepayment speeds and credit risk. Prices for securities valued using these techniques are received from independent pricing vendors and brokers and are based on an evaluation of the inputs described. Level 3 includes significant unobservable inputs wh en market prices are not readily available or reliable, including the Fund’s own assumptions in determining the fair value of investments. The inputs or methodology used for valuing securities are not necessarily an indication of the risk associated with investing in those securities.
| |
| 22 | Disciplined Value Mid Cap Fund | Annual report |
The following is a summary of the values by input classification of the Fund’s investments as of August 31, 2010, by major security category or type:
| | | | |
| | | | | LEVEL 3 |
| | | | LEVEL 2 | SIGNIFICANT |
| | TOTAL MARKET | LEVEL 1 | SIGNIFICANT | UNOBSERVABLE |
| | VALUE AT 8-31-10 | QUOTED PRICE | OBSERVABLE INPUTS | INPUTS |
|
| Common Stocks | | | | |
|
| Consumer Discretionary | $21,387,932 | $21,387,932 | — | — |
|
| Consumer Staples | 4,131,193 | 4,131,193 | — | — |
|
| Energy | 11,634,179 | 11,634,179 | — | — |
|
| Financials | 39,396,144 | 39,396,144 | — | — |
|
| Health Care | 12,403,760 | 12,403,760 | — | — |
|
| Industrials | 19,831,190 | 19,831,190 | — | — |
|
| Information Technology | 24,330,586 | 24,330,586 | — | — |
|
| Materials | 11,692,590 | 11,692,590 | — | — |
| Telecommunication | | | | |
| Services | 1,665,566 | 1,665,566 | — | — |
|
| Utilities | 10,237,002 | 10,237,002 | — | — |
|
| Short-Term Investments | 13,907,192 | 7,164,192 | $6,743,000 | — |
| |
|
| Total Investments in | | | | |
| Securities | $170,617,334 | $163,874,334 | $6,743,000 | — |
During the year ended August 31, 2010, there were no significant transfers in or out of Level 1 or Level 2 assets.
In order to value the securities, the Fund uses the following valuation techniques. Equity securities held by the Fund are valued at the last sale price or official closing price on the principal securities exchange on which they trade. In the event there were no sales during the day or closing prices are not available, then securities are valued using the last quoted bid or evaluated price. Foreign securities and currencies are valued in U.S. dollars, based on foreign currency exchange rates supplied by an independent pricing service. Certain securities traded only in the over-the-counter market are valued at the last bid price quoted by brokers making markets in the securities at the close of trading. Certain short-term securities are valued at amortized cost. John Hancock Collateral Investment Trust (JHCIT), an affiliate of the Fund, is valued at its closing net asset value (NAV). JHCIT has a floating NAV and invests in short-term investments as part of a securities lending program.
Other portfolio securities and assets, where market quotations are not readily available, are valued at fair value, as determined in good faith by the Fund’s Pricing Committee, following procedures established by the Board of Trustees. Generally, trading in non-U.S. securities is substantially completed each day at various times prior to the close of trading on the NYSE. Significant market events that affect the values of non-U.S. securities may occur after the time when the valuation of the securities is generally determined and the close of the NYSE. During significant market events, these securities will be valued at fair value, as determined in good faith, following procedures established by the Board of Trustees. The Fund may use a fair valuation model to value non-U.S. securities in order to adjust for events which may occur between the close of foreign exchanges and the close of the NYSE.
Security transactions and related investment income. Investment security transactions are accounted for on a trade date plus one basis for daily net asset value calculations. However, for financial reporting purposes, investment transactions are reported on trade date. Interest income is accrued as earned. Gains and losses on securities sold are determined on the basis of identified cost and may include proceeds from litigation. Dividend income is recorded on the ex-date.
| |
| Annual report | Disciplined Value Mid Cap Fund | 23 |
Securities lending. Effective July 12, 2010, the Fund may lend its securities to earn additional income. It receives and maintains cash collateral received from the borrower in an amount not less than the market value of the loaned securities. The Fund will invest its collateral in JHCIT, as a result, the Fund will receive the benefit of any gains and bear any losses generated by JHCIT. Although risk of the loss of the securities lent is mitigated by holding the collateral, the Fund could experience a delay in recovering its securities and a possible loss of income or value if the borrower fails to return the securities or if collateral investments decline in value. The Fund may receive compensation for lending its securities by retaining a portion of the return on the investment of the collateral and compensation from fees earned from borrowers of the securities. Income received from JHCIT is a component of securi ties lending income as recorded on the Statement of Operations.
Expenses. The majority of expenses are directly attributable to an individual fund. Expenses that are not readily attributable to a specific fund are allocated among all funds in an equitable manner, taking into consideration, among other things, the nature and type of expense and the fund’s relative assets. Expense estimates are accrued in the period to which they relate and adjustments are made when actual amounts are known.
Class allocations. Effective July 12, 2010, income, common expenses, and realized and unrealized gains (losses) are determined at the fund level and allocated daily to each class of shares based on the net asset value of the class. Class-specific expenses, such as distribution and service fees, if any, and transfer agent fees, state registration fees and printing and postage fees, for all classes are calculated daily at the class level based on the appropriate net asset value of each class and the specific expense rates applicable to each class.
Prior to July 12, 2010, investment income, expenses (other than class-specific distribution fees) and unrealized and realized gains and losses were allocated daily to each class of shares based upon the relative proportion of net assets of each class at the beginning of the day. Expenses incurred on behalf of a specific class were charged directly to the class.
Federal income taxes. The Fund intends to qualify as a regulated investment company by complying with the applicable provisions of the Internal Revenue Code and will not be subject to federal income tax on taxable income that is distributed to shareholders. Therefore, no federal income tax provision is required.
For federal income tax purposes, the Fund has a capital loss carryforward of $4,366,859 available to offset future net realized capital gains as of August 31, 2010. The loss carryforward expires as follows: August 31, 2017 — $2,550,027 and August 31, 2018 — $1,816,832.
As of August 31, 2010, the Fund had no uncertain tax positions that would require financial statement recognition, de-recognition or disclosure. The Fund’s federal tax return is subject to examination by the Internal Revenue Service for a period of three years.
Distribution of income and gains. Distributions to shareholders from net investment income and net realized gains, if any, are recorded on the ex-date. The Fund generally declares and pays dividends and capital gain distributions, if any, at least annually. The tax character of distributions for the years ended August 31, 2010 and August 31, 2009 were as follows:
| | | |
| | AUGUST 31, 2010 | AUGUST 31, 2009 | |
| |
| Ordinary Income | $399,974 | $452,583 | |
| |
| Long-Term Capital Gain | — | 882 | |
Distributions paid by the Fund with respect to each series of shares are calculated in the same manner, at the same time and in the same amount, except for the effect of expenses that may be applied differently to each class. As of August 31, 2010, the components of distributable earnings on a tax basis included $108,182 of undistributed ordinary income.
| |
| 24 | Disciplined Value Mid Cap Fund | Annual report |
Such distributions and distributable earnings, on a tax basis, are determined in conformity with income tax regulations, which may differ from accounting principles generally accepted in the United States of America. Material distributions in excess of tax basis earnings and profits, if any, are reported in the Fund’s financial statements as a tax return of capital.
Capital accounts within financial statements are adjusted for permanent book/tax differences. These adjustments have no impact on net assets or the results of operations. Temporary book/tax differences, if any, will reverse in a subsequent period. For the year ended August 31, 2010, the Fund had no material permanent book-tax differences.
Note 3 — Guarantees and indemnifications
Under the Fund’s organizational documents, its Officers and Trustees are indemnified against certain liabilities arising out of the performance of their duties to the Fund. Additionally, in the normal course of business, the Fund enters into contracts with service providers that contain general indemnification clauses. The Fund’s maximum exposure under these arrangements is unknown, as this would involve future claims that may be made against the Fund that have not yet occurred. The risk of material loss from such claims is considered remote.
Note 4 — Fees and transactions with affiliates
John Hancock Investment Management Services, LLC (the Adviser) serves as investment adviser for the Trust. John Hancock Funds, LLC (the Distributor), an affiliate of the Adviser, serves as principal underwriter of the Trust. The Adviser and the Distributor are indirect wholly owned subsidiaries of Manulife Financial Corporation (MFC).
Management Fee. The Fund has an investment management contract with the Adviser under which the Fund pays a daily management fee to the Adviser equivalent, on an annual basis, to the sum of: (a) 0.80% of the first $500,000,000 of the Fund’s average daily net assets; (b) 0.775% of the next $500,000,000; (c) 0.75% of the next $500,000,000; (d) 0.725% of the next $1,000,000,000; and (e) 0.70% of the Fund’s average daily net assets in excess of $2,500,000,000. The Adviser has a subadvisory agreement with Robeco Investment Management, Inc. The Fund is not responsible for payment of the subadvisory fees.
Prior to July 12, 2010, under the terms of an investment advisory agreement, Robeco Investment Management, Inc. (the Predecessor Fund’s Adviser), provided investment advisory services to the Predecessor Fund at a fee calculated at an annual rate of 0.80% of the Fund’s average daily net assets.
The investment management fees incurred for the year ended August 31, 2010 were equivalent to an annual effective rate of 0.80% of the Fund’s average daily net assets.
Effective July 12, 2010, the Adviser has contractually agreed to reimburse or limit certain expenses for each share class. This agreement excludes taxes, portfolio brokerage commissions, interest and litigation and indemnification expenses and other extraordinary expenses not incurred in the ordinary course of the Fund’s business and shareholder service fees. The reimbursements and limits are such that these expenses will not exceed 1.25% for Class A shares, 1.00% for Class I and 1.25% for Class ADV. The expense reimbursements and limits will continue in effect until July 9, 2011 for Class A shares and July 9, 2012 for Class I and ADV shares.
Accordingly, these expense reductions, described above, amounted to $131,860, $162,810 and $6 for Class A, Class I and Class ADV shares, respectively, for the year ended August 31, 2010.
Prior to July 12, 2010, the Predecessor Fund’s Adviser has contractually agreed to limit the Predecessor Fund’s total operating expenses (other than brokerage commissions, extraordinary items, interest, dividends on short sales, or taxes) to the extent that such expenses exceed the
| |
| Annual report | Disciplined Value Mid Cap Fund | 25 |
1.25% and 1.00% for Class A and Class I shares. This limit is calculated daily based on the Predecessor Fund’s average daily net assets. This limitation is effected in waivers of advisory fees and reimbursements of expenses exceeding the advisory fee as necessary. The Predecessor Fund’s Adviser may not recoup any of its waived investment advisory fees.
Accounting and legal services. Pursuant to the service agreement, the Fund reimburses the Adviser for all expenses associated with providing the administrative, financial, legal, accounting and recordkeeping services of the Fund, including the preparation of all tax returns, periodic reports to shareholders and regulatory reports, among other services. These expenses are allocated to each share class based on its relative net assets at the time the expense was incurred. From July 12, 2010 to August 31, 2010, the accounting and legal services fees amounted to $3,532.
Prior to July 12, 2010, PNC Global Investment Servicing (U.S.), Inc. (PNC), served as administrator for the Predecessor Fund. For providing administration and accounting services, PNC was entitled to receive a monthly fee equal to an annual percentage rate of each Fund’s average daily net assets, subject to certain minimum monthly fees. From September 1, 2009 to July 9, 2010, the administration and accounting services fees amounted to $93,363.
Distribution and service plans. The Fund has a distribution agreement with the Distributor. The Fund has adopted distribution and service plans with respect to Class A and Class ADV shares pursuant to Rule 12b-1 under the 1940 Act, to pay the Distributor for services provided as the distributor of shares of the Fund. The Fund may pay up to 0.30% for Class A and 0.25% for Class ADV under these arrangements, expressed as an annual percentage of average daily net assets for each class. As of August 31, 2010, Class A paid 0.25% of average daily assets under these arrangements.
Prior to July 12, 2010, the Predecessor Fund had adopted a 12b-1 plan for Investor Shares that provided that the Predecessor Fund may pay financial intermediaries for shareholder services in an annual amount not to exceed 0.25% based on the Investor Shares’ average daily net assets.
Sales charges. Class A shares are assessed up-front sales charges, which resulted in payments to the Distributor amounting to $5,899 for the year ended August 31, 2010. Of this amount, $920 was retained and used for printing prospectuses, advertising, sales literature and other purposes, $4,979 was paid as sales commissions to broker-dealers and $0 was paid as sales commissions to sales personnel of Signator Investors, Inc. (Signator Investors), a broker-dealer affiliate of the Adviser.
Transfer agent fees. Effective July 12, 2010, the Fund has a transfer agent agreement with John Hancock Signature Services, Inc. (Signature Services or Transfer Agent), an affiliate of the Adviser.
The transfer agent fees paid to Signature Services are determined based on the cost to Signature Services (Signature Services Cost) of providing recordkeeping services. The Signature Services Cost is comprised of a component of allocated John Hancock corporate overhead for providing transfer agent services to the Fund and to all other John Hancock affiliated funds. It also includes out-of-pocket expenses that are comprised of payments made to third-parties for recordkeeping services provided to their clients who invest in one or more John Hancock funds. In addition, Signature Services Cost may be reduced by certain revenues that Signature Services received in connection with the performance of the service they provide to the funds. Signature Services Cost is calculated monthly and allocated, as applicable, to four categories of share classes: Institutional Share Classes, Retirement Share Classes, Municipal Bond Classes and all other Retail Share Classes. Wi thin each of these categories, the applicable costs are allocated to the affected John Hancock affiliated funds and/ or classes, based on the relative average daily net assets.
| |
| 26 | Disciplined Value Mid Cap Fund | Annual report |
From September 1, 2009 to July 9, 2010, PNC also served as the transfer agent and dividend disbursing agent for the Predecessor Fund under a transfer agency agreement, under which, PNC received a monthly fee equal to an annual percentage rate of the Fund’s average daily net assets, subject to certain minimum monthly fees.
Class level expenses. Class level expenses for the year ended August 31, 2010 were:
| | | | |
| | DISTRIBUTION | TRANSFER | STATE | PRINTING AND |
| CLASS | AND SERVICE FEES | AGENT FEES | REGISTRATION FEES | POSTAGE FEES |
|
| Class A | $104,820 | $95,011 | $19,407 | $12,484 |
|
| Class I | — | 104,051 | 26,416 | 14,096 |
|
| Class ADV | 9 | 8 | — | 2 |
| Total | $104,829 | $199,070 | $45,823 | $26,582 |
Trustee expenses. Effective July 12, 2010, the Trust compensates each Trustee who is not an employee of the Adviser or its affiliates. These Trustees may, for tax purposes, elect to defer receipt of this compensation under the John Hancock Group of Funds Deferred Compensation Plan (the Plan). Deferred amounts are invested in various John Hancock funds and remain in the funds until distributed in accordance with the Plan. The investment of deferred amounts and the offsetting liability are included in the accompanying Statement of Assets and Liabilities. As of August 31, 2010, there were no deferred amounts under the Plan. From July 12, 2010 to August 31, 2010, the Trustees’ compensation amounted to $791 and from September 1, 2009 to July 9, 2010, the Trustees’ compensation amounted to $7,490.
Note 5 — Fund share transactions
Transactions in Fund shares for the years ended August 31, 2010 and August 31, 2009 were as follows:
| | | | |
| | Year ended 8-31-10 | Year ended 8-31-09 |
| | Shares | Amount | Shares | Amount |
| Class A shares | | | | |
|
| Sold | 8,777,014 | $83,785,587 | 741,258 | $5,122,885 |
| Distributions reinvested | 10,325 | 90,650 | 17,469 | 107,613 |
| Repurchased | (1,798,769) | (16,412,636) | (935,943) | (5,791,669) |
| Net increase (decrease) | 6,988,570 | $67,463,601 | (177,216) | ($561,171) |
| |
| Class I shares | | | | |
|
| Sold | 6,811,708 | $64,123,319 | 794,979 | $5,308,485 |
| Distributions reinvested | 33,541 | 302,876 | 53,081 | 335,472 |
| Repurchased | (1,000,633) | (9,349,135) | (675,830) | (4,554,459) |
| Net increase | 5,844,616 | $55,077,060 | 172,230 | $1,089,498 |
| |
| Class ADV shares1 | | | | |
|
| Sold | 2,822 | $25,000 | — | — |
| Net increase | 2,822 | $25,000 | — | — |
| |
| Net increase (decrease) | 12,836,008 | $122,565,661 | (4,986) | $528,327 |
|
| |
| 1Period from 7-12-10 (inception date) to 8-31-10. | | | |
Note 6 — Purchase and sale of securities
Purchases and sales of securities, other than short-term securities and U.S. Treasury obligations, aggregated $155,723,026 and $36,286,327, respectively for the year ended August 31, 2010.
| |
| Annual report | Disciplined Value Mid Cap Fund | 27 |
Note 7 — Reorganization
At the close of business on July 9, 2010, the Fund acquired all the assets and liabilities of the Predecessor Fund in exchange for the Class A and Class I shares of the Fund. The Fund had no assets, liabilities or operations prior to the reorganization.
The Agreement provided for (a) the acquisition of all the assets, subject to all of the liabilities, of the Predecessor Fund in exchange for a representative amount of shares of the Fund; (b) the liquidation of the Predecessor Fund; and (c) the distribution to the Predecessor Fund’s shareholders of the Fund’s shares. The reorganization was intended to allow the Fund to be better positioned to increase asset size and achieve additional economies of scale by achieving net prices on securities trades and spread fixed expenses over a larger asset base. As a result of the reorganization, the Fund is the legal survivor, however, the accounting and performance history of the Investor Class and Institutional Class of the Predecessor Fund have been redesignated as that of Class A and Class I of the Fund.
Based on the opinion of tax counsel, the reorganization qualified as a tax-free reorganization for federal income tax purposes with no gain or loss recognized by the Predecessor Fund or its shareholders. In addition, the expenses of the reorganization were borne by the Advisers of both the Predecessor Fund and the Fund. The effective time of the reorganization occurred immediately after the close of regularly scheduled trading on the New York Stock Exchange (NYSE) on July 9, 2010. The following outlines the reorganization:
| | | | |
| | ACQUIRED NET ASSET | DEPRECIATION OF | | |
| | VALUE OF THE | ACQUIRED FUND’S | SHARES ISSUED | TOTAL NET ASSETS |
| ACQUIRING FUND | ACQUIRED FUND | INVESTMENTS | BY THE FUND | AFTER COMBINATION |
|
| |
| Robeco Boston Partners | $154,240,210 | ($5,243,829) | 17,142,708 | $154,240,210 |
| Mid Cap Value Fund | | | | |
At the time of the reorganization, certain capital loss carryforward attributable to the Predecessor Fund may be able to be used by the Fund to offset future net realized capital gains. To the extent that such carryforward are used by the Fund, it will reduce the amount of capital gain distributions to be paid. Capital loss carryforward transferred from the Predecessor Fund to the Fund was $2,550,027 and expires on August 31, 2017.
| |
| 28 | Disciplined Value Mid Cap Fund | Annual report |
Auditors’ report
Report of Independent Registered Public Accounting Firm
To the Board of Trustees of John Hancock Funds III and Shareholders of
John Hancock Disciplined Value Mid Cap Fund:
In our opinion, the accompanying statement of assets and liabilities, including the portfolio of investments, and the related statements of operations and of changes in net assets and the financial highlights present fairly, in all material respects, the financial position of John Hancock Disciplined Value Mid Cap Fund (the “Fund”), formerly the Robeco Boston Partners Mid Cap Value Fund, at August 31, 2010, and the results of its operations, the changes in its net assets and the financial highlights for each of the periods indicated, in conformity with accounting principles generally accepted in the United States of America. These financial statements and financial highlights (hereafter referred to as “financial statements”) are the responsibility of the Fund’s management; our responsibility is to express an opinion on these financial statements based on our audits. We conducted our audit of these financial statements in accordance with the standards of the Public Company Accounting Oversight Board (United States). Those standards require that we plan and perform the audit to obtain reasonable assurance about whether the financial statements are free of material misstatement. An audit includes examining, on a test basis, evidence supporting the amounts and disclosures in the financial statements, assessing the accounting principles used and significant estimates made by management, and evaluating the overall financial statement presentation. We believe that our audit, which included confirmation of securities at August 31, 2010 by correspondence with the custodian and brokers, and the application of alternative auditing procedures where securities purchased confirmations had not been received, provides a reasonable basis for our opinion.
The statement of changes in net assets of the Fund for the year ending August 31, 2009, and the financial highlights for the years ending August 31, 2007 through August 31, 2009, were audited by another independent registered accounting firm, whose report dated October 27, 2009 expressed an unqualified opinion thereon.
PricewaterhouseCoopers LLP
Boston, Massachusetts
October 22, 2010
| |
| Annual report | Disciplined Value Mid Cap Fund | 29 |
Tax information
Unaudited
For federal income tax purposes, the following information is furnished with respect to the distributions of the Fund, if any, paid during its taxable year ended August 31, 2010.
With respect to the ordinary dividends paid by the Fund for the fiscal year ended August 31, 2010, 100.00% of the dividends qualifies for the corporate dividends-received deduction.
The Fund hereby designates the maximum amount allowable of its net taxable income as qualified dividend income as provided in the Jobs and Growth Tax Relief Reconciliation Act of 2003. This amount will be reflected on Form 1099-DIV for the calendar year 2010.
Shareholders will be mailed a 2010 Form 1099-DIV in January 2011. This will reflect the total of all distributions that are taxable for calendar year 2010.
| |
| 30 | Disciplined Value Mid Cap Fund | Annual report |
Board Consideration of Investment Advisory Agreement and Subadvisory Agreement
The Board of Trustees (the Board, the members of which are referred to as Trustees) of John Hancock Disciplined Value Mid Cap Fund (the Fund), a series of John Hancock Funds III, met in-person on March 10–12, 2010 to consider the initial approval of the Fund’s investment advisory agreement (the Advisory Agreement) with John Hancock Investment Management Services, LLC (the Adviser), the Fund’s investment adviser. The Board also considered the initial approval of the investment subadvisory agreement (the Subadvisory Agreement) between the Adviser and Robeco Investment Management, Inc. (the Subadviser) on behalf of the Fund. The Advisory Agreement and the Subadvisory Agreement are referred to as the Agreements.
Activities and composition of the Board
The Board consists of eleven individuals, nine of whom are Independent Trustees. Independent Trustees are generally those individuals who are unaffiliated with the Fund, the Adviser and the Subadviser. The Trustees are responsible for the oversight of operations of the Fund and perform the various duties required of directors of investment companies by the Investment Company Act of 1940, as amended (the 1940 Act). The Independent Trustees have retained independent legal counsel to assist them in connection with their duties. The Board has appointed an Independent Trustee as Chairperson. The Board has established four standing committees that are composed entirely of Independent Trustees: the Audit Committee; the Compliance Committee; the Nominating, Governance and Administration Committee; and the Contracts/Operations Committee. Additionally, Investment Performance Committees A and B are standing committees of the Board that are each composed of Independent Trustees and one Trustee who is affiliated with the Adviser. Investment Performance Committee B oversees and monitors matters relating to the investment performance of the Fund. The Board has also designated a Vice Chairperson to serve in the absence of the Chairperson, who also serves as Chairman of the Board’s Nominating, Governance and Administration Committee. The Board also designates working groups or ad hoc committees as it deems appropriate.
The approval process
At an in-person meeting held on March 10–12, 2010, the Board reviewed materials relating to its consideration of the Agreements. The Board considered all factors it believed relevant with respect to the Fund under these Agreements, including, among other factors: (a) the nature, extent and quality of the services to be provided by the Adviser and Subadviser; (b) the investment performance of the Adviser in general; (c) the cost of the services to be provided and profits to be realized by the Adviser from its relationship with the Fund; (d) economies of scale; and (e) other factors.
In determining to approve the Agreements, the Board met with the relevant investment advisory personnel from the Adviser and the Subadviser and considered all information reasonably necessary to evaluate the terms of the Agreements. The Board received materials in advance of the March 2010 meeting relating to its consideration of the Agreements, including (a) fees and estimated expense ratios of each class of the Fund in comparison to the fees and expense ratios of a peer group of funds selected by the Adviser (the Category); (b) information regarding the Adviser’s and Subadviser’s economic outlook for the Fund and their general investment outlook for the markets; (c) information regarding fees paid to service providers that are affiliates of the Adviser; (d) information regarding compliance records and regulatory matters relating to the Adviser and Subadviser; and (e) information outlining the legal duties of the Board under the 1940 Act with res pect to the consideration and approval of the Agreements.
The Board also considered other matters important to the approval process, such as payments made to the Adviser or its affiliates relating to the distribution of Fund shares and other services. The Board reviewed services related to the valuation and pricing of Fund portfolio holdings. Other important matters considered by the Board were the direct and indirect benefits to the Adviser, the Subadviser, and their affiliates from their relationship with the Fund and advice from independent
| |
| Annual report | Disciplined Value Mid Cap Fund | 31 |
legal counsel with respect to the review process and materials submitted for the Board’s review. Each Trustee may have attributed different weights to the various items considered.
The key factors considered by the Board and the conclusions reached are described below.
Nature, extent and quality of services
The Board, including the Independent Trustees, reviewed the nature, extent and quality of services expected to be provided by the Adviser and the Subadviser, including the investment advisory services. The Board received information concerning the investment philosophy and investment process to be used by the Adviser and Subadviser in managing the Fund, as well as a description of the capabilities, personnel and services of the Adviser and Subadviser. The Board considered the scope of the services to be provided by the Adviser and Subadviser to the Fund under the Agreements relative to services typically provided by third parties to other funds. The Board noted that the standard of care applicable under the Agreements was comparable to that found generally in investment company advisory and sub-advisory agreements. The Board concluded that the scope of the Adviser’s and Subadviser’s services to be provided to the Fund was consistent with the Fund& #146;s operational requirements, including, in addition to seeking to meet its investment objective, compliance with investment restrictions, tax and reporting requirements and related shareholder services.
The Board, including the Independent Trustees, also considered the quality of the services to be provided by the Adviser and Subadviser to the Fund. The Trustees evaluated the procedures of the Adviser and Subadviser designed to fulfill their fiduciary duty to the Fund with respect to possible conflicts of interest, including their code of ethics (regulating the personal trading of their officers and employees), the procedures by which the Adviser and Subadviser allocate trades among its various investment advisory clients, the integrity of the systems in place to ensure compliance with the foregoing and the record of compliance of the Adviser and Subadviser in each of these matters. The Trustees also considered the responsibilities of the Adviser’s and Subadviser’s compliance departments, and a report from the Fund’s Chief Compliance Officer (CCO) regarding the CCO Office’s review of the Subadviser’s compliance program.
The Board, including the Independent Trustees, considered, among other factors, the number, education and experience of the Adviser’s and Subadviser’s investment professionals and other personnel who would provide services under the Agreements. The Trustees also took into account the time and attention to be devoted by senior management of the Adviser and Subadviser to the Fund. The Trustees also considered the business reputation of the Adviser and Subadviser and its financial resources and concluded that they would be able to meet any reasonably foreseeable obligation under the Agreements.
The Board also considered, among other things, the nature, cost and character of advisory and non-investment advisory services provided by the Adviser and its affiliates and by the Subadviser. The Board noted that the Adviser and its affiliates will provide the Fund with certain administrative, transfer agency, shareholder and other services (in addition to any such services provided to the Fund by third parties) and officers and other personnel as will be necessary for the operations of the Fund.
The Board also received information about the nature, extent and quality of services and fee rates offered by the Adviser and Subadviser to their other clients, including other registered investment companies, institutional investors and separate accounts. The Board reviewed a general analysis provided by the Adviser and the Subadviser concerning investment advisory fees charged to such other clients under similar investment mandates, the services provided to such other clients as compared to the services provided to the Fund, the performance of such other clients, and other factors relating to such other clients. The Board considered the significant differences between the Adviser’s and Subadviser’s services to the Fund and those services they provide to other clients which, to the
| |
| 32 | Disciplined Value Mid Cap Fund | Annual report |
extent the other client is not a mutual fund, may generally be attributable to the greater frequency of shareholder redemptions in a mutual fund, the higher turnover of mutual fund assets, the more burdensome regulatory and legal obligations of mutual funds, and the higher marketing costs for mutual funds.
Fund performance
The Board, including the Independent Trustees, had previously received and considered information about the Adviser’s investment performance for other funds. The Board considered historical performance information of a similar fund managed by the Subadviser that was proposed to merge into the Fund. The Board, however, did not consider the performance history of the Fund because the Fund was newly organized and had not yet commenced operations as of the March 2010 meeting.
Expenses and fees
In connection with the initial approval of the Agreements, the Board, including the Independent Trustees, reviewed the Fund’s contractual advisory fee rate payable by the Fund to the Adviser as compared with the other funds in its Category. The Board also received information about the investment subadvisory fee rate payable by the Adviser to the Subadviser for investment subadvisory services. The Board considered the services provided and the fees charged by the Adviser and the Subadviser to other types of clients with similar investment mandates.
In addition, the Board considered the cost of the services provided to the Fund by the Adviser. The Board received and considered estimated expense information regarding the Fund’s various expense components, including advisory fees, distribution fees and fees other than advisory and distribution fees, including transfer agent fees, custodian fees, administration fees and other miscellaneous fees (e.g., fees for accounting and legal services). The Board considered comparisons of these expenses to the other funds in the Category. The Board also received and considered estimated expense information regarding the Fund’s total operating expense ratio (Gross Expense Ratio) and total operating expense ratio after taking the fee waiver arrangement applicable to the Advisory Agreement rate into account (Net Expense Ratio). The Board received and considered information comparing the Gross Expense Ratio and Net Expense Ratio of the Fund to that of the funds in the Category. As part of its analysis, the Board reviewed the Adviser’s methodology in allocating its costs to the management of the Fund.
Following consideration of this information, the Board, including the Independent Trustees, concluded that the fees to be paid pursuant to the Agreements were fair and reasonable in light of the services expected to be provided.
As the Fund had not commenced operations as of the date of the March 2010 meeting, the Adviser was not able to provide the Board with specific information concerning the expected profits to be realized by the Adviser and its affiliates from their relationships with the Fund. The Board did not consider profitability information with respect to the Subadviser, which is not affiliated with the Adviser. The Board considered that the subadvisory fee under the Subadvisory Agreement had been negotiated by the Adviser and the Subadviser on an arm’s length basis and that the Subadviser’s separate profitability from its relationship with the Fund was not a material factor in determining whether to approve the Subadvisory Agreement.
Economies of scale
The Board, including the Independent Trustees, considered the extent to which economies of scale might be realized as the assets of the Fund increase. Since the Fund is newly formed, the Adviser was not able to provide the Board with specific information concerning the extent to which economies of scale would be realized as the Fund grows and whether fee levels would reflect such economies of scale, if any.
| |
| Annual report | Disciplined Value Mid Cap Fund | 33 |
Other benefits to the Adviser and the Subadviser
The Board understands that the Adviser, the Subadviser, or their affiliates may derive other ancillary benefits from their relationship with the Fund, both tangible and intangible, such as their ability to leverage investment professionals who manage other portfolios, an increase in their profile in the investment advisory community, and the engagement of their affiliates and/or significant shareholders as service providers to the Fund, including for administrative, transfer agency and distribution services. The Board believes that certain of these benefits are difficult to quantify. The Board also noted that the Subadviser may use third party research obtained by soft dollars generated by certain mutual fund transactions to assist itself in managing all or a number of its other client accounts.
The Board, including all of the Independent Trustees, concluded that these ancillary benefits that the Adviser, the Subadviser and their affiliates could receive with regard to providing investment advisory and other services to the Fund were consistent with those generally available to other mutual fund sponsors.
Board determination
The Board, including all of the Independent Trustees, approved the Advisory Agreement between the Adviser and John Hancock Funds III, on behalf of the Fund, for a two-year term and the Subadvisory Agreement between the Adviser and the Subadviser with respect to the Fund for a two-year term. Based upon its evaluation of relevant factors in their totality, the Board, including all of the Independent Trustees, was satisfied that the terms of the Agreements were fair and reasonable and in the best interest of the Fund and its shareholders. In arriving at a decision to approve the Agreements, the Board did not identify any single factor listed above, or any group of factors listed above, as all-important or controlling, but considered all factors together, and different Board Members may have attributed different weights to the various factors considered. The Independent Trustees were also assisted by the advice of independent legal counsel in making this determ ination.
| |
| 34 | Disciplined Value Mid Cap Fund | Annual report |
Trustees and Officers
This chart provides information about the Trustees and Officers who oversee your John Hancock fund. Officers elected by the Trustees manage the day-to-day operations of the Fund and execute policies formulated by the Trustees.
| | |
| Independent Trustees | | |
| Name, Year of Birth | Trustee | Number of John |
| Position(s) held with Fund | of the | Hancock funds |
| Principal occupation(s) and other | Trust | overseen by |
| directorships during past 5 years | since1 | Trustee |
| | | |
| Patti McGill Peterson, Born: 1943 | 2006 | 47 |
|
| Chairperson (since December 2008); Principal, PMP Globalinc (consulting) (since 2007); Senior |
| Associate, Institute for Higher Education Policy (since 2007); Executive Director, CIES (international |
| education agency) (until 2007); Vice President, Institute of International Education (until 2007); Senior |
| Fellow, Cornell University Institute of Public Affairs, Cornell University (1997–1998); Former President |
| Wells College, St. Lawrence University and the Association of Colleges and Universities of the State |
| of New York. Director of the following: Niagara Mohawk Power Corporation (until 2003); Security |
| Mutual Life (insurance) (until 1997); ONBANK (until 1993). Trustee of the following: Board of Visitors, |
| The University of Wisconsin, Madison (since 2007); Ford Foundation, International Fellowships Program |
| (until 2007); UNCF, International Development Partnerships (until 2005); Roth Endowment (since 2002); |
| Council for International Educational Exchange (since 2003). | | |
| |
| James F. Carlin, Born: 1940 | 2006 | 47 |
|
| Chief Executive Officer, Director and Treasurer, Alpha Analytical Laboratories (environmental, chemical |
| and pharmaceutical analysis) (since 1985); Part Owner and Treasurer, Lawrence Carlin Insurance Agency, |
| Inc. (since 1995); Chairman and Chief Executive Officer, Carlin Consolidated, Inc. (management/ |
| investments) (since 1987). | | |
| |
| William H. Cunningham, Born: 1944 | 2006 | 47 |
|
| Professor, University of Texas, Austin, Texas (since 1971); former Chancellor, University of Texas System |
| and former President of the University of Texas, Austin, Texas; Director of the following: LIN Television |
| (since 2009); Lincoln National Corporation (insurance) (Chairman since 2009 and Director since 2006); |
| Resolute Energy Corporation (since 2009); Nanomedical Systems, Inc. (biotechnology company) |
| (Chairman since 2008); Yorktown Technologies, LP (tropical fish) (Chairman since 2007); Greater Austin |
| Crime Commission (since 2001); Southwest Airlines (since 2000); former Director of the following: |
| Introgen (manufacturer of biopharmaceuticals) (until 2008); Hicks Acquisition Company I, Inc. (until |
| 2007); Jefferson-Pilot Corporation (diversified life insurance company) (until 2006); and former Advisory |
| Director, JP Morgan Chase Bank (formerly Texas Commerce Bank–Austin) (until 2009). | |
| |
| Deborah C. Jackson,2 Born: 1952 | 2008 | 47 |
|
| Chief Executive Officer, American Red Cross of Massachusetts Bay (since 2002); Board of Directors |
| of Eastern Bank Corporation (since 2001); Board of Directors of Eastern Bank Charitable Foundation |
| (since 2001); Board of Directors of American Student Assistance Corporation (1996–2009); Board of |
| Directors of Boston Stock Exchange (2002–2008); Board of Directors of Harvard Pilgrim Healthcare |
| (health benefits company) (since 2007). | | |
| |
| Annual report | Disciplined Value Mid Cap Fund | 35 |
| | |
| Independent Trustees (continued) | | |
| |
| Name, Year of Birth | Trustee | Number of John |
| Position(s) held with Fund | of the | Hancock funds |
| Principal occupation(s) and other | Trust | overseen by |
| directorships during past 5 years | since1 | Trustee |
| |
| Charles L. Ladner, Born: 1938 | 2006 | 47 |
|
| Chairman and Trustee, Dunwoody Village, Inc. (retirement services) (since 2008); Director, Philadelphia |
| Archdiocesan Educational Fund (since 2009); Senior Vice President and Chief Financial Officer, UGI |
| Corporation (public utility holding company) (retired 1998); Vice President and Director for AmeriGas, |
| Inc. (retired 1998); Director of AmeriGas Partners, L.P. (gas distribution) (until 1997); Director, |
| EnergyNorth, Inc. (until 1995); Director, Parks and History Association (Cooperating Association, |
| National Park Service) (until 2005). | | |
| |
| Stanley Martin,2 Born: 1947 | 2008 | 47 |
|
| Senior Vice President/Audit Executive, Federal Home Loan Mortgage Corporation (2004–2006); |
| Executive Vice President/Consultant, HSBC Bank USA (2000–2003); Chief Financial Officer/Executive |
| Vice President, Republic New York Corporation & Republic National Bank of New York (1998–2000); |
| Partner, KPMG LLP (1971–1998). | | |
| |
| Dr. John A. Moore, Born: 1939 | 2006 | 47 |
|
| President and Chief Executive Officer, Institute for Evaluating Health Risks, (nonprofit institution) |
| (until 2001); Senior Scientist, Sciences International (health research) (until 2003); Former | |
| Assistant Administrator & Deputy Administrator, Environmental Protection Agency; Principal, |
| Hollyhouse (consulting) (since 2000); Director, CIIT Center for Health Science Research (nonprofit |
| research) (until 2007). | | |
| |
| Steven R. Pruchansky,2 Born: 1944 | 2006 | 47 |
|
| Chairman and Chief Executive Officer, Greenscapes of Southwest Florida, Inc. (since 2000); Director |
| and President, Greenscapes of Southwest Florida, Inc. (until 2000); Member, Board of Advisors, First |
| American Bank (since 2008); Managing Director, Jon James, LLC (real estate) (since 2000); Director, |
| First Signature Bank & Trust Company (until 1991); Director, Mast Realty Trust (until 1994); President, |
| Maxwell Building Corp. (until 1991). | | |
| |
| Gregory A. Russo, Born: 1949 | 2008 | 47 |
|
| Vice Chairman, Risk & Regulatory Matters, KPMG LLP (“KPMG”) (2002–2006); Vice Chairman, Industrial |
| Markets, KPMG (1998–2002). | | |
| |
| Non-Independent Trustees3 | | |
| Name, Year of Birth | Trustee | Number of John |
| Position(s) held with Fund | of the | Hancock funds |
| Principal occupation(s) and other | Trust | overseen by |
| directorships during past 5 years | since1 | Trustee |
| |
| Hugh McHaffie, Born: 1959 | 2010 | 47 |
|
| Executive Vice President, John Hancock Financial Services (since 2006, including prior positions); |
| Chairman and Director, John Hancock Investment Management Services, LLC, John Hancock Advisers, |
| LLC and John Hancock Funds, LLC (since 2010); President, John Hancock Trust and John Hancock |
| Funds II (since 2009); Senior Vice President, Individual Business Product Management, MetLife, |
| Inc. (1999–2006). | | |
| |
| 36 | Disciplined Value Mid Cap Fund | Annual report |
| | |
| Non-Independent Trustees3 (continued) | | |
| |
| Name, Year of Birth | Trustee | Number of John |
| Position(s) held with Fund | of the | Hancock funds |
| Principal occupation(s) and other | Trust | overseen by |
| directorships during past 5 years | since1 | Trustee |
| |
| John G. Vrysen, Born: 1955 | 2009 | 47 |
|
| Senior Vice President, John Hancock Financial Services (since 2006); Director, Executive Vice President |
| and Chief Operating Officer, John Hancock Advisers, LLC, John Hancock Investment Management |
| Services, LLC and John Hancock Funds, LLC (since 2005); Chief Operating Officer, John Hancock Funds |
| II and John Hancock Trust (since 2007); Chief Operating Officer, John Hancock retail funds (until 2009); |
| Trustee, John Hancock retail funds (since 2009). | | |
| |
| Principal officers who are not Trustees | | |
| Name, Year of Birth | | Officer |
| Position(s) held with Fund | | of the |
| Principal occupation(s) and other | | Trust |
| directorships during past 5 years | | since |
| |
| Keith F. Hartstein, Born: 1956 | | 2006 |
|
| President and Chief Executive Officer | | |
| Senior Vice President, John Hancock Financial Services (since 2004); Director, President and Chief |
| Executive Officer, John Hancock Advisers, LLC and John Hancock Funds, LLC (since 2005); Director, |
| MFC Global Investment Management (U.S.), LLC (since 2005); Director, John Hancock Investment |
| Management Services, LLC (since 2006); President and Chief Executive Officer, John Hancock |
| retail funds (since 2005); Member, Investment Company Institute Sales Force Marketing | |
| Committee (since 2003). | | |
| |
| Andrew G. Arnott, Born: 1971 | | 2009 |
|
| Senior Vice President and Chief Operating Officer | | |
| Senior Vice President, John Hancock Financial Services (since 2009); Executive Vice President, |
| John Hancock Advisers, LLC (since 2005); Executive Vice President, John Hancock Investment |
| Management Services, LLC (since 2006); Executive Vice President, John Hancock Funds, LLC (since |
| 2004); Chief Operating Officer, John Hancock retail funds (since 2009); Vice President, John Hancock |
| Funds II and John Hancock Trust (since 2006); Senior Vice President, Product Management and |
| Development, John Hancock Funds, LLC (until 2009). | | |
| |
| Thomas M. Kinzler, Born: 1955 | | 2006 |
|
| Secretary and Chief Legal Officer | | |
| Vice President, John Hancock Financial Services (since 2006); Secretary and Chief Legal Officer, |
| John Hancock retail funds, John Hancock Funds II and John Hancock Trust (since 2006); Secretary and |
| Chief Legal Counsel, John Hancock Advisers, LLC, John Hancock Investment Management Services, |
| LLC and John Hancock Funds, LLC (since 2007); Vice President and Associate General Counsel, |
| Massachusetts Mutual Life Insurance Company (1999–2006); Secretary and Chief Legal Counsel, MML |
| Series Investment Fund (2000–2006); Secretary and Chief Legal Counsel, MassMutual Select Funds and |
| MassMutual Premier Funds (2004–2006). | | |
| |
| Francis V. Knox, Jr., Born: 1947 | | 2006 |
|
| Chief Compliance Officer | | |
| Vice President, John Hancock Financial Services (since 2005); Chief Compliance Officer, John Hancock |
| retail funds, John Hancock Funds II, John Hancock Trust, Chief Compliance Officer, John Hancock |
| Advisers, LLC and John Hancock Investment Management Services, LLC (since 2005); Vice President and |
| Chief Compliance Officer, MFC Global Investment Management (U.S.), LLC (2005–2008). | |
| |
| Annual report | Disciplined Value Mid Cap Fund | 37 |
| |
| Principal officers who are not Trustees (continued) | |
| |
| Name, Year of Birth | Officer |
| Position(s) held with Fund | of the |
| Principal occupation(s) and other | Trust |
| directorships during past 5 years | since |
| |
| Charles A. Rizzo, Born: 1957 | 2007 |
|
| Chief Financial Officer | |
| Vice President, John Hancock Financial Services (since 2008); Chief Financial Officer, John Hancock retail |
| funds, John Hancock Funds II and John Hancock Trust (since 2007); Senior Vice President, John Hancock |
| Advisers, LLC and John Hancock Investment Management Services, LLC (since 2008); Assistant | |
| Treasurer, Goldman Sachs Mutual Fund Complex (2005–2007); Vice President, Goldman Sachs (2005– |
| 2007); Managing Director and Treasurer, Scudder Funds, Deutsche Asset Management (2003–2005). |
| |
| Salvatore Schiavone, Born: 1965 | 2010 |
|
| Treasurer | |
| Assistant Vice President, John Hancock Financial Services (since 2007); Treasurer, John Hancock retail |
| funds (since 2010); Assistant Treasurer, John Hancock Funds II and John Hancock Trust (since 2010); |
| Treasurer, John Hancock Closed-End Funds (2009–2010); Assistant Treasurer, John Hancock retail funds, |
| John Hancock Funds II and John Hancock Trust (2007–2009); Vice President, John Hancock Advisers, |
| LLC and John Hancock Investment Management Services, LLC (since 2007); Assistant Treasurer, | |
| Fidelity Group of Funds (2005–2007); Vice President, Fidelity Management Research Company | |
| (2005–2007); Assistant Treasurer, Scudder Group of Funds (2003–2005); Director, Deutsche Asset | |
| Management (2003–2005). | |
The business address for all Trustees and Officers is 601 Congress Street, Boston, Massachusetts 02210-2805.
1 Mr. Carlin, Mr. Cunningham and Mr. Russo serve as Trustees for a term expiring in 2011;
Mr. Ladner, Mr. Martin, Mr. Moore and Mr. Vrysen serve as Trustees for a term expiring in 2012; and Mr. McHaffie, Mr. Pruchansky,
Ms. Jackson and Ms. McGill Peterson serve as Trustees for a term expiring in 2013.
2 Member of Audit Committee.
3 Non-Independent Trustees hold positions with the Fund’s investment adviser or certain other affiliates.
| |
| 38 | Disciplined Value Mid Cap Fund | Annual report |
More information
| |
| Trustees | Investment adviser |
| Patti McGill Peterson, Chairperson | John Hancock Investment Management |
| James F. Carlin | Services, LLC |
| William H. Cunningham | |
| Deborah C. Jackson* | Subadviser |
| Charles L. Ladner | Robeco Investment Management, Inc. |
| Stanley Martin* | |
| Hugh McHaffie†** | Principal distributor |
| Dr. John A. Moore | John Hancock Funds, LLC |
| Steven R. Pruchansky* | |
| Gregory A. Russo | Custodian |
| John G. Vrysen† | State Street Bank and Trust Company |
| |
| Officers | Transfer agent |
| Keith F. Hartstein | John Hancock Signature Services, Inc. |
| President and Chief Executive Officer | |
| | Legal counsel |
| Andrew G. Arnott | K&L Gates LLP |
| Senior Vice President** and Chief Operating Officer | |
| | Independent registered |
| Thomas M. Kinzler | public accounting firm |
| Secretary and Chief Legal Officer | PricewaterhouseCoopers LLP |
| | |
| Francis V. Knox, Jr. | The report is certified under the Sarbanes-Oxley |
| Chief Compliance Officer | Act, which requires mutual funds and other public |
| | companies to affirm that, to the best of their |
| Charles A. Rizzo | knowledge, the information in their financial reports |
| Chief Financial Officer | is fairly and accurately stated in all material respects. |
| | |
| Salvatore Schiavone** | |
| Treasurer | |
| |
| *Member of the Audit Committee | |
| **Effective 8-31-10 | |
| †Non-Independent Trustee | |
The Fund’s proxy voting policies and procedures, as well as the Fund’s proxy voting record for the most recent twelve-month period ended June 30, are available free of charge on the Securities and Exchange Commission (SEC) Web site at www.sec.gov or on our Web site.
The Fund’s complete list of portfolio holdings, for the first and third fiscal quarters, is filed with the SEC on Form N-Q. The Fund’s Form N-Q is available on our Web site and the SEC’s Web site, www.sec.gov, and can be reviewed and copied (for a fee) at the SEC’s Public Reference Room in Washington, DC. Call 1-800-SEC-0330 to receive information on the operation of the SEC’s Public Reference Room.
We make this information on your fund, as well as monthly portfolio holdings, and other fund details available on our Web site www.jhfunds.com or by calling 1-800-225-5291.
| | |
| You can also contact us: | | |
| 1-800-225-5291 | Regular mail: | Express mail: |
| jhfunds.com | John Hancock Signature Services, Inc. | John Hancock Signature Services, Inc. |
| | P.O. Box 55913 | Mutual Fund Image Operations |
| | Boston, MA 02205-5913 | 30 Dan Road |
| | | Canton, MA 02021 |
| |
| Annual report | Disciplined Value Mid Cap Fund | 39 |

1-800-225-5291
1-800-554-6713 TDD
1-800-338-8080 EASI-Line
www.jhfunds.com
Now available: electronic delivery
www.jhfunds.com/edelivery
| |
| This report is for the information of the shareholders of John Hancock Disciplined Value Mid Cap Fund. | 3630A 8/10 |
| It is not authorized for distribution to prospective investors unless preceded or accompanied by a prospectus. | 10/10 |
ITEM 2. CODE OF ETHICS.
As of the end of the period, August 31, 2010, the registrant has adopted a code of ethics, as defined in Item 2 of Form N-CSR, that applies to its Chief Executive Officer and Chief Financial Officer (respectively, the principal executive officer, the principal financial officer, the “Covered Officers”). A copy of the code of ethics is filed as an exhibit to this Form N-CSR.
ITEM 3. AUDIT COMMITTEE FINANCIAL EXPERT.
The Board of Trustees of the Registrant has determined that it has one “audit committee financial expert” as that term is defined in Item 3(b) of Form N-CSR: Stanley Martin who is “independent” as that term is defined in Item 3(a) (2) of Form N-CSR.
ITEM 4. PRINCIPAL ACCOUNTANT FEES AND SERVICES.
(a) Audit Fees
The aggregate fees billed for professional services rendered by the principal accountant, PricewaterhouseCoopers LLP (“PWC”) for the audit of the registrant’s annual financial statements or services that are normally provided by the accountant in connection with statutory and regulatory filings or engagements amounted to $40,470 for John Hancock Disciplined Value Mid Cap Fund (began operations during the fiscal year ended August 31, 2010) for the fiscal year ended August 31, 2010 and $0 for the fiscal year ended August 31, 2009.
(b) Audit-Related Services
Audit-related fees for assurance and related services by PWC amounted to $347 for John Hancock Disciplined Value Mid Cap Fund for the fiscal year ended August 31, 2010 and $0 for the fiscal year ended August 31, 2009 billed to the registrant or to the registrant's investment adviser (not including any sub-adviser whose role is primarily portfolio management and is subcontracted with or overseen by another investment adviser), and any entity controlling, controlled by, or under common control with the adviser that provides ongoing services to the registrant ("control affiliates"). The nature of the services comprising the out-of-pocket expenses was testing conversion of accounting records from one service provider to another involving multiple service providers in the registrant’s initial year.
(c) Tax Fees
The aggregate fees billed for professional services rendered by PWC for the tax compliance, tax advice and tax planning (“tax fees”) amounted to $2,473 for John Hancock Disciplined Value Mid Cap Fund for the fiscal year ended August 31, 2010 and $0 for the fiscal year ended August 31, 2009. The nature of the services comprising the tax fees was the review of the registrant’s income and excise tax returns and tax distribution requirements.
(d) All Other Fees
The aggregate fees billed for professional services rendered by the principal accountant(s) amounted to $75 for John Hancock Disciplined Value Mid Cap Fund for the fiscal year ended August 31, 2010 and $0 for the fiscal year ended August 31, 2009 billed to the registrant or to the control affiliates.
(e)(1) Audit Committee Pre-Approval Policies and Procedures:
The trust’s Audit Committee must pre-approve all audit and non-audit services provided by the independent registered public accounting firm (the “Auditor”) relating to the operations or financial reporting of the funds. Prior to the commencement of any audit or non-audit services to a fund, the Audit Committee reviews the services to determine whether they are appropriate and permissible under applicable law.
The trust’s Audit Committee has adopted policies and procedures to, among other purposes, provide a framework for the Committee’s consideration of audit-related and non-audit services by the Auditor. The policies and procedures require that any audit-related and non-audit service provided by the Auditor and any non-audit service provided by the Auditor to a fund service provider that relates directly to the operations and financial reporting of a fund are subject to approval by the Audit Committee before such service is provided. Audit-related services provided by the Auditor that are expected to exceed $25,000 per year/per fund are subject to specific pre-approval by the Audit Committee. Tax services provided by the Auditor that are expected to exceed $30,000 per year/per fund are subject to specific pre-approval by the Audit Committee.
All audit services, as well as the audit-related and non-audit services that are expected to exceed the amounts stated above, must be approved in advance of provision of the service by formal resolution of the Audit Committee. At the regularly scheduled Audit Committee meetings, the Committee reviews a report summarizing the services, including fees, provided by the Auditor.
(e)(2) Services approved pursuant to paragraph (c)(7)(i)(C) of Rule 2-01 of Regulation S-X:
Audit-Related Fees, Tax Fees and All Other Fees:
There were no amounts that were approved by the Audit Committee pursuant to the de minimis exception under Rule 2-01 of Regulation S-X.
(f) According to PWC for the Reporting Period, the percentage of hours spent on the audit of the registrant's financial statements for the most recent fiscal year that were attributed to work performed by persons who were not full-time, permanent employees of principal accountant was less than 50%.
(g) The aggregate non-audit fees billed by PWC for non-audit services rendered to the registrant and rendered to the registrant's control affiliates for the fiscal year ended August 31, 2010 were $4,417,779 for John Hancock Disciplined Value Mid Cap Fund and for the fiscal year ended August 31, 2009 were $0.
(h) The registrant’s audit committee of the Board of Trustees has considered the provision of non-audit services that were rendered by PWC to the investment adviser and any control affiliate that provides services that were not pre-approved pursuant to paragraph (c) (7) (ii) of Rule 2-01 of Regulation S-X, to be compatible with maintaining PWC’s independence.
ITEM 5. AUDIT COMMITTEE OF LISTED REGISTRANTS.
The registrant has a separately-designated standing audit committee comprised of independent trustees. The members of the audit committee are as follows:
Stanley Martin - Chairman
William H. Cunningham
Deborah C. Jackson
ITEM 6. SCHEDULE OF INVESTMENTS.
(a) Not applicable.
(b) Not applicable.
ITEM 7. DISCLOSURE OF PROXY VOTING POLICIES AND PROCEDURES FOR CLOSED-END MANAGEMENT INVESTMENT COMPANIES.
Not applicable.
ITEM 8. PORTFOLIO MANAGERS OF CLOSED-END MANAGEMENT INVESTMENT COMPANIES.
Not applicable.
ITEM 9. PURCHASES OF EQUITY SECURITIES BY CLOSED-END MANAGEMENT INVESTMENT COMPANY AND AFFILIATED PURCHASERS.
Not applicable.
ITEM 10. SUBMISSION OF MATTERS TO A VOTE OF SECURITY HOLDERS.
The registrant has adopted procedures by which shareholders may recommend nominees to the registrant's Board of Trustees. A copy of the procedures is filed as an exhibit to this Form N-CSR. See attached “John Hancock Funds – Governance Committee Charter”.
ITEM 11. CONTROLS AND PROCEDURES.
(a) EVALUATION OF DISCLOSURE CONTROLS AND PROCEDURES. The registrant maintains disclosure controls and procedures that are designed to ensure that information required to be disclosed in this Form N-CSR is recorded, processed, summarized and reported within the periods specified in the rules and forms of the Securities and Exchange Commission. Such disclosure controls and procedures include controls and procedures designed to ensure that such information is accumulated and communicated to the registrant’s management, including its principal executive officer and principal financial officer, as appropriate, to allow timely decisions regarding required disclosure.
Within 90 days prior to the filing date of this Form N-CSR, the registrant had carried out an evaluation, under the supervision and with the participation of the registrant’s management, including the registrant's principal executive officer and the registrant’s principal financial officer, of the effectiveness of the design and operation of the registrant’s disclosure controls and procedures relating to information required to be disclosed on Form N-CSR. Based on such evaluation, the registrant’s principal executive officer and principal financial officer concluded that the registrant’s disclosure controls and procedures are operating effectively to ensure that:
(i) information required to be disclosed in this Form N-CSR is recorded, processed, summarized and reported within the periods specified in the rules and forms of the Securities and Exchange Commission, and
(ii) information is accumulated and communicated to the registrant’s management, including its principal executive officer and principal financial officer, as appropriate, to allow timely decisions regarding required disclosure.
(b) CHANGE IN REGISTRANT’S INTERNAL CONTROL: Not applicable.
ITEM 12. EXHIBITS.
(a)(1) See attached Code of Ethics.
(a)(2)(i) CERTIFICATION OF PRINCIPAL EXECUTIVE OFFICER.
(a)(2)(ii) CERTIFICATION OF PRINCIPAL FINANCIAL OFFICER.
(b) CERTIFICATION PURSUANT TO Rule 30a-2(b) OF THE INVESTMENT COMPANY ACT OF 1940.
(c)(1) Submission of Matters to a Vote of Security Holders is attached. See attached “John Hancock Funds – Governance Committee Charter”.
(c)(2) Contact person at the registrant.
Pursuant to the requirements of the Securities Exchange Act of 1934 and the Investment Company Act of 1940, the registrant has duly caused this report to be signed on its behalf by the undersigned, thereunto duly authorized.
| |
| John Hancock Funds III |
| |
| |
| By: | /s/ Keith F. Hartstein |
| ------------------------------ |
| Keith F. Hartstein |
| President and |
| Chief Executive Officer |
| |
| |
| Date: | October 27, 2010 |
Pursuant to the requirements of the Securities Exchange Act of 1934 and the Investment Company Act of 1940, this report has been signed below by the following persons on behalf of the registrant and in the capacities and on the dates indicated.
| |
| By: | /s/ Keith F. Hartstein |
| | ------------------------------- |
| Keith F. Hartstein |
| President and |
| | Chief Executive Officer |
| |
| |
| Date: | October 27, 2010 |
| |
| |
| |
| By: | /s/ Charles A. Rizzo |
| | -------------------------------- |
| Charles A. Rizzo |
| | Chief Financial Officer |
| |
| |
| Date: | October 27, 2010 |