| UNITED STATES | |
| SECURITIES AND EXCHANGE COMMISSION | |
| Washington, D.C. 20549 | |
| FORM N-CSR | |
| CERTIFIED SHAREHOLDER REPORT OF REGISTERED | |
| MANAGEMENT INVESTMENT COMPANIES | |
| Investment Company Act file number 811-21777 | |
| John Hancock Funds III | |
| (Exact name of registrant as specified in charter) | |
| 601 Congress Street, Boston, Massachusetts 02210 | |
| (Address of principal executive offices) (Zip code) | |
| Salvatore Schiavone | |
| Treasurer | |
| 601 Congress Street | |
| Boston, Massachusetts 02210 | |
| (Name and address of agent for service) | |
| Registrant's telephone number, including area code: 617-663-4497 | |
| Date of fiscal year end: | February 28 |
| Date of reporting period: | August 31, 2013 |
ITEM 1. REPORTS TO STOCKHOLDERS.
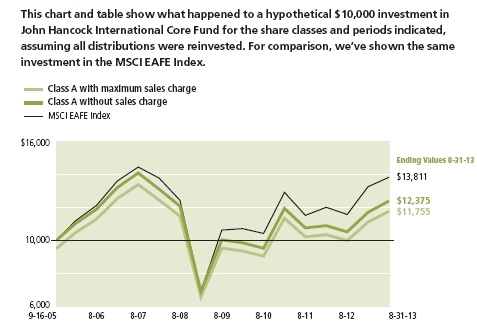
A look at performance
Total returns for the period ended August 31, 2013
| Average annual total returns (%) | Cumulative total returns (%) | |||||||||
| with maximum sales charge | with maximum sales charge | |||||||||
| Since | Since | |||||||||
| 1-year | 5-year | 10-year | inception | 6-months | 1-year | 5-year | 10-year | inception | ||
| Class A1 | 11.85 | –0.51 | — | 2.05 | 0.56 | 11.85 | –2.51 | — | 17.55 | |
| Class B2 | 11.88 | –0.54 | — | 1.99 | 0.40 | 11.88 | –2.69 | — | 16.94 | |
| Class C2 | 15.88 | –0.20 | — | 1.99 | 4.40 | 15.88 | –0.99 | — | 16.94 | |
| Class I2,3 | 18.21 | 0.98 | — | 3.19 | 6.02 | 18.21 | 5.01 | — | 28.41 | |
| Class R12,3 | 17.34 | 0.23 | — | 2.45 | 5.63 | 17.34 | 1.18 | — | 21.22 | |
| Class R22,3 | 17.62 | –0.42 | — | 1.72 | 5.74 | 17.62 | –2.08 | — | 14.53 | |
| Class R33,4 | 17.46 | –1.47 | — | –3.00 | 5.67 | 17.46 | –7.14 | — | –21.52 | |
| Class R43,4 | 17.93 | –1.16 | — | –2.70 | 5.88 | 17.93 | –5.66 | — | –19.56 | |
| Class R53,4 | 18.17 | –0.88 | — | –2.42 | 5.99 | 18.17 | –4.31 | — | –17.69 | |
| Class R62,3 | 18.26 | 1.07 | — | 3.39 | 6.05 | 18.26 | 5.44 | — | 30.42 | |
| Class 13,5 | 18.31 | 1.06 | — | 0.72 | 6.08 | 18.31 | 5.40 | — | 4.99 | |
| Class NAV3,6 | 18.38 | 1.10 | — | 1.24 | 6.09 | 18.38 | 5.64 | — | 9.01 | |
| Index1,† | 19.17 | 2.11 | — | 4.14 | 4.05 | 19.17 | 10.98 | — | 38.11 | |
Performance figures assume all distributions are reinvested. Figures reflect maximum sales charges on Class A shares of 5%, and the applicable contingent deferred sales charge (CDSC) on Class B and Class C shares. The Class B shares’ CDSC declines annually between years 1 to 6 according to the following schedule: 5, 4, 3, 3, 2, 1%. No sales charge will be assessed after the sixth year. Class C shares held for less than one year are subject to a 1% CDSC. Sales charges are not applicable to Class I, Class R1, Class R2, Class R3, Class R4, Class R5, Class R6, Class 1, and Class NAV shares.
The expense ratios of the fund, both net (including any fee waivers or expense limitations) and gross (excluding any fee waivers or expense limitations), are set forth according to the most recent publicly available prospectuses for the fund and may differ from those disclosed in the Financial highlights tables in this report. The fee waivers and expense limitations are contractual at least until 6-30-14 for Class A, Class B, Class C, Class R1, Class R2, Class R3, Class R4, Class R5, and Class R6 shares. Had the fee waivers and expense limitations not been in place, gross expenses would apply. For all other classes, the net expenses equal the gross expenses. The expense ratios are as follows:
| Class A | Class B | Class C | Class I | Class R1 | Class R2 | Class R3 | Class R4 | Class R5 | Class R6 | Class 1 | Class NAV | |
| Net (%) | 1.58 | 2.30 | 2.30 | 1.17 | 1.90 | 1.65 | 1.80 | 1.40 | 1.20 | 1.12 | 1.08 | 1.03 |
| Gross (%) | 1.58 | 2.94 | 2.77 | 1.17 | 7.39 | 20.95 | 47.50 | 42.43 | 21.16 | 21.97 | 1.08 | 1.03 |
The returns reflect past results and should not be considered indicative of future performance. The return and principal value of an investment will fluctuate so that shares, when redeemed, may be worth more or less than their original cost. Due to market volatility, the fund’s current performance may be higher or lower than the performance shown. For current to the most recent month-end performance data, please call 800-225-5291 or visit the fund’s website at jhinvestments.com.
The performance table above and the chart on the next page do not reflect the deduction of taxes that a shareholder would pay on fund distributions or the redemption of fund shares. The fund’s performance results reflect any applicable fee waivers or expense reductions, without which the expenses would increase and results would have been less favorable.
† Index is the MSCI EAFE Index.
See the following page for footnotes.
| 6 | International Core Fund | Semiannual report |
| With maximum | Without | |||
| Start date | sales charge | sales charge | Index | |
| Class B2,7 | 9-16-05 | $11,694 | $11,694 | $13,811 |
| Class C2,3,7 | 9-16-05 | 11,694 | 11,694 | 13,811 |
| Class I2,3 | 9-16-05 | 12,841 | 12,841 | 13,811 |
| Class R12,3 | 9-16-05 | 12,122 | 12,122 | 13,811 |
| Class R23 | 9-16-05 | 11,453 | 11,453 | 13,811 |
| Class R33 | 5-22-09 | 7,848 | 7,848 | 15,287 |
| Class R43 | 5-22-09 | 8,044 | 8,044 | 15,287 |
| Class R53 | 5-22-09 | 8,231 | 8,231 | 15,287 |
| Class R63 | 9-16-05 | 13,042 | 13,042 | 13,811 |
| Class 13 | 11-6-06 | 10,499 | 10,499 | 10,957 |
| Class NAV3 | 8-29-06 | 10,901 | 10,901 | 11,470 |
MSCI EAFE Index (gross of foreign withholding tax on dividends) (Europe, Australasia, Far East) is a free float-adjusted market capitalization index that is designed to measure developed market equity performance, excluding the U.S. and Canada. The index consists of 21 developed market country indexes.
It is not possible to invest directly in an index. Index figures do not reflect expenses or sales charges, which would have resulted in lower values.
Footnotes related to performance pages
1 On 6-9-06, through a reorganization, the fund acquired all of the assets of the GMO International Disciplined Equity Fund (the predecessor fund). The predecessor fund offered its Class III shares, inception date 9-16-05, in exchange for Class A shares, which were first offered on 6-12-06. The predecessor fund’s Class III shares returns have been recalculated to reflect the gross fees and expenses of Class A shares.
2 Class B, Class C, Class I, and Class R1 shares were first offered on 6-12-06; Class R6 shares were first offered on 9-1-11; Class R2 shares were first offered on 3-1-12. Returns prior to these dates are those of Class A shares that have been recalculated to apply the gross fees and expenses of Class B, Class C, Class I, Class R1, Class R6, and Class R2 shares, as applicable.
3 For certain types of investors, as described in the fund’s Class I, Class R1, Class R2, Class R3, Class R4, Class R5, Class R6, Class 1, and Class NAV share prospectuses.
4 From 5-22-09.
5 From 11-6-06.
6 From 8-29-06.
7 The contingent deferred sales charge is not applicable.
| Semiannual report | International Core Fund | 7 |
Your expenses
These examples are intended to help you understand your ongoing operating expenses of investing in the fund so you can compare these costs with the ongoing costs of investing in other mutual funds.
Understanding fund expenses
As a shareholder of the fund, you incur two types of costs:
■ Transaction costs, which include sales charges (loads) on purchases or redemptions (varies by share class), minimum account fee charge, etc.
■ Ongoing operating expenses, including management fees, distribution and service fees (if applicable) and other fund expenses.
We are going to present only your ongoing operating expenses here.
Actual expenses/actual returns
This example is intended to provide information about the fund’s actual ongoing operating expenses and is based on the fund’s actual return. It assumes an account value of $1,000.00 on March 1, 2013, with the same investment held until August 31, 2013.
| Account value | Ending value | Expenses paid during | |
| on 3-1-13 | on 8-31-13 | period ended 8-31-131 | |
| Class A | $1,000.00 | $1,058.66 | $7.47 |
| Class B | 1,000.00 | 1,054.01 | 11.91 |
| Class C | 1,000.00 | 1,054.01 | 11.91 |
| Class I | 1,000.00 | 1,060.21 | 5.92 |
| Class R1 | 1,000.00 | 1,056.35 | 9.85 |
| Class R2 | 1,000.00 | 1,057.42 | 8.56 |
| Class R3 | 1,000.00 | 1,056.71 | 9.33 |
| Class R4 | 1,000.00 | 1,058.84 | 7.27 |
| Class R5 | 1,000.00 | 1,059.86 | 6.23 |
| Class R6 | 1,000.00 | 1,060.47 | 5.82 |
| Class 1 | 1,000.00 | 1,060.82 | 5.51 |
| Class NAV | 1,000.00 | 1,060.86 | 5.25 |
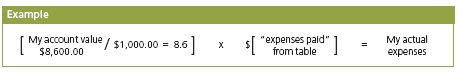
Together with the value of your account, you may use this information to estimate the operating expenses that you paid over the period. Simply divide your account value at August 31, 2013, by $1,000.00, then multiply it by the “expenses paid” for your
| 8 | International Core Fund | Semiannual report |
share class from the table above. For example, for an account value of $8,600.00, the operating expenses should be calculated as follows:
Hypothetical example for comparison purposes
This table allows you to compare the fund’s ongoing operating expenses with those of any other fund. It provides an example of the fund’s hypothetical account values and hypothetical expenses based on each class’s actual expense ratio and an assumed 5% annualized return before expenses (which is not the fund’s actual return). It assumes an account value of $1,000.00 on March 1, 2013, with the same investment held until August 31, 2013. Look in any other fund shareholder report to find its hypothetical example and you will be able to compare these expenses. Please remember that these hypothetical account values and expenses may not be used to estimate the actual ending account balance or expenses you paid for the period.
| Account value | Ending value | Expenses paid during | |
| on 3-1-13 | on 8-31-13 | period ended 8-31-131 | |
| Class A | $1,000.00 | $1,017.90 | $7.32 |
| Class B | 1,000.00 | 1,013.60 | 11.67 |
| Class C | 1,000.00 | 1,013.60 | 11.67 |
| Class I | 1,000.00 | 1,019.50 | 5.80 |
| Class R1 | 1,000.00 | 1,015.60 | 9.65 |
| Class R2 | 1,000.00 | 1,016.90 | 8.39 |
| Class R3 | 1,000.00 | 1,016.10 | 9.15 |
| Class R4 | 1,000.00 | 1,018.10 | 7.12 |
| Class R5 | 1,000.00 | 1,019.20 | 6.11 |
| Class R6 | 1,000.00 | 1,019.60 | 5.70 |
| Class 1 | 1,000.00 | 1,019.90 | 5.40 |
| Class NAV | 1,000.00 | 1,020.10 | 5.14 |
Remember, these examples do not include any transaction costs, therefore, these examples will not help you to determine the relative total costs of owning different funds. If transaction costs were included, your expenses would have been higher. See the prospectus for details regarding transaction costs.
1 Expenses are equal to the fund’s annualized expense ratio of 1.44%, 2.30%, 2.30%, 1.14%, 1.90%, 1.65%, 1.80%, 1.40%, 1.20%, 1.12%, 1.06% and 1.01% for Class A, Class B, Class C, Class I, Class R1, Class R2, Class R3, Class R4, Class R5, Class R6, Class 1 and Class NAV shares, respectively, multiplied by the average account value over the period, multiplied by 184/365 (to reflect the one-half year period).
| Semiannual report | International Core Fund | 9 |
Portfolio summary
| Top 10 Holdings (22.9% of Net Assets on 8-31-13)1,2 | ||||
| Total SA | 4.2% | Vodafone Group PLC | 2.2% | |
| BP PLC | 2.7% | Telefonica SA | 1.8% | |
| Banco Santander SA | 2.4% | Sanofi | 1.6% | |
| Royal Dutch Shell PLC, Class A | 2.4% | Toyota Motor Corp. | 1.6% | |
| AstraZeneca PLC | 2.4% | Rio Tinto PLC | 1.6% | |
| Sector Composition1,3 | ||||
| Financials | 21.4% | Utilities | 6.3% | |
| Energy | 14.6% | Materials | 5.8% | |
| Consumer Discretionary | 13.1% | Consumer Staples | 3.7% | |
| Industrials | 10.3% | Information Technology | 2.7% | |
| Health Care | 9.7% | Short-Term Investments & Other | 3.4% | |
| Telecommunication Services | 9.0% | |||
| Top 10 Countries1,3 | ||||
| Japan | 21.7% | Australia | 6.3% | |
| United Kingdom | 20.4% | Italy | 4.9% | |
| France | 12.3% | Netherlands | 4.9% | |
| Spain | 7.6% | Switzerland | 3.0% | |
| Germany | 6.3% | Hong Kong | 1.9% | |
1 As a percentage of net assets on 8-31-13.
2 Cash and cash equivalents not included.
3 Foreign investing, especially in emerging markets, has additional risks, such as currency and market volatility and political and social instability. Hedging and other strategic transactions may increase volatility and result in losses if not successful. Sector investing is subject to greater risks than the market as a whole. Because the fund may focus on particular sectors of the economy, its performance may depend on the performance of those sectors and investments focused in one sector may fluctuate more widely than investments diversified across sectors. Please see the fund’s prospectus for additional risks.
| 10 | International Core Fund | Semiannual report |
Fund’s investments
As of 8-31-13 (unaudited)
| Shares | Value | |
| Common Stocks 96.0% | $1,235,996,853 | |
| (Cost $1,162,314,135) | ||
| Australia 5.3% | 67,720,983 | |
| Amcor, Ltd. | 48,442 | 448,085 |
| Arrium, Ltd. | 2,275,488 | 2,256,143 |
| BHP Billiton, Ltd. | 78,393 | 2,481,448 |
| BlueScope Steel, Ltd. (I) | 739,340 | 3,271,754 |
| Commonwealth Bank of Australia | 54,110 | 3,486,645 |
| CSL, Ltd. | 133,461 | 8,073,712 |
| David Jones, Ltd. | 53,708 | 134,587 |
| Goodman Fielder, Ltd. (I) | 2,273,432 | 1,496,489 |
| GPT Group | 416,541 | 1,310,073 |
| Insurance Australia Group, Ltd. | 151,007 | 779,104 |
| Investa Office Fund | 502,916 | 1,310,924 |
| JB Hi-Fi, Ltd. (L) | 117,467 | 1,961,048 |
| Macquarie Group, Ltd. | 62,803 | 2,427,213 |
| Mirvac Group | 1,268,470 | 1,846,204 |
| Myer Holdings, Ltd. (L) | 241,172 | 586,278 |
| National Australia Bank, Ltd. | 90,783 | 2,605,399 |
| Pacific Brands, Ltd. | 756,107 | 510,661 |
| Qantas Airways, Ltd. (I) | 624,056 | 758,183 |
| QBE Insurance Group, Ltd. (L) | 642,323 | 8,664,149 |
| Stockland | 1,056,492 | 3,488,957 |
| Tabcorp Holdings, Ltd. | 506,897 | 1,449,495 |
| Tatts Group, Ltd. | 212,060 | 604,423 |
| Telstra Corp., Ltd. | 1,025,887 | 4,461,448 |
| Westpac Banking Corp. | 479,996 | 13,308,561 |
| Austria 0.6% | 7,665,897 | |
| OMV AG | 95,077 | 4,388,106 |
| Raiffeisen Bank International AG | 18,843 | 646,166 |
| Voestalpine AG | 61,594 | 2,631,625 |
| Belgium 0.8% | 10,276,357 | |
| Ageas | 113,846 | 4,480,835 |
| Belgacom SA | 85,811 | 2,052,759 |
| Delhaize Group SA | 43,175 | 2,754,679 |
| KBC Groep NV | 22,485 | 988,084 |
| See notes to financial statements | Semiannual report | International Core Fund | 11 |
| Shares | Value | |
| Canada 1.4% | $17,385,520 | |
| Blackberry, Ltd. (I)(L) | 366,500 | 3,702,231 |
| Bombardier, Inc., Class B | 222,600 | 1,012,298 |
| Canadian Oil Sands, Ltd. | 34,600 | 663,881 |
| Canadian Pacific Railway, Ltd. | 19,200 | 2,257,955 |
| Canadian Tire Corp., Ltd., Class A | 8,300 | 702,029 |
| First Quantum Minerals, Ltd. | 138,600 | 2,301,447 |
| Husky Energy, Inc. (L) | 64,700 | 1,829,266 |
| IGM Financial, Inc. | 26 | 1,167 |
| Magna International, Inc. (L) | 22,600 | 1,737,108 |
| Methanex Corp. (L) | 19,600 | 910,871 |
| Metro, Inc. (L) | 30,800 | 1,972,042 |
| Sherritt International Corp. | 84,500 | 295,225 |
| China 0.2% | 2,204,622 | |
| AAC Technologies Holdings, Inc. | 292,500 | 1,322,343 |
| China Minzhong Food Corp., Ltd. (I)(L) | 365,000 | 151,654 |
| Yangzijiang Shipbuilding Holdings, Ltd. (L) | 993,000 | 730,625 |
| Denmark 0.1% | 1,556,255 | |
| Coloplast A/S, Class B | 16,016 | 869,588 |
| GN Store Nord A/S | 23,519 | 483,434 |
| Pandora A/S | 5,656 | 203,233 |
| Finland 0.9% | 12,035,882 | |
| Kone OYJ, Class B | 12,887 | 1,052,767 |
| Neste Oil OYJ | 73,485 | 1,347,634 |
| Nokia OYJ (I)(L) | 1,942,780 | 7,558,786 |
| Sampo OYJ, Class A | 34,037 | 1,415,307 |
| Tieto OYJ | 8,508 | 169,397 |
| Wartsila OYJ Abp | 10,553 | 491,991 |
| France 12.3% | 158,972,478 | |
| Air France KLM (I)(L) | 366,049 | 2,755,176 |
| AXA SA | 246,195 | 5,358,515 |
| BNP Paribas SA | 144,696 | 9,040,086 |
| Bouygues SA | 68,131 | 2,128,504 |
| Carrefour SA | 34,688 | 1,085,848 |
| Cie Generale des Etablissements Michelin (L) | 24,660 | 2,354,259 |
| Credit Agricole SA (I) | 59,726 | 602,738 |
| European Aeronautic Defence & Space Company NV | 96,636 | 5,558,309 |
| GDF Suez | 336,473 | 7,293,072 |
| L’Oreal SA | 21,191 | 3,532,564 |
| Lagardere SCA | 61,598 | 1,873,011 |
| Orange SA | 435,262 | 4,404,793 |
| Peugeot SA (I)(L) | 498,820 | 7,064,467 |
| Publicis Groupe SA | 19,971 | 1,486,548 |
| Rallye SA | 18,060 | 635,273 |
| Renault SA | 137,330 | 9,780,626 |
| Safran SA | 24,640 | 1,366,371 |
| Sanofi | 219,264 | 21,064,854 |
| Societe Generale SA | 259,466 | 11,310,149 |
| 12 | International Core Fund | Semiannual report | See notes to financial statements |
| Shares | Value | |
| France (continued) | ||
| Total SA | 975,827 | $53,995,031 |
| Valeo SA | 2,656 | 199,760 |
| Vivendi SA | 300,477 | 6,082,524 |
| Germany 5.7% | 73,540,099 | |
| Adidas AG | 19,432 | 2,054,040 |
| Allianz SE | 47,079 | 6,744,098 |
| Aurubis AG | 44,128 | 2,545,741 |
| Bayer AG | 69,941 | 7,766,686 |
| Continental AG | 4,125 | 622,728 |
| Daimler AG | 33,784 | 2,317,773 |
| Deutsche Bank AG | 43,338 | 1,876,045 |
| Deutsche Lufthansa AG (I) | 166,397 | 2,970,609 |
| Deutsche Post AG | 105,907 | 3,059,475 |
| Duerr AG | 42,482 | 2,849,419 |
| E.ON AG | 1,252,296 | 19,828,199 |
| Leoni AG | 50,170 | 2,752,707 |
| Merck KGaA | 8,453 | 1,284,398 |
| Metro AG | 20,722 | 760,603 |
| Muenchener Rueckversicherungs AG | 33,731 | 6,146,714 |
| ProSiebenSat.1 Media AG | 13,333 | 565,358 |
| RWE AG | 203,665 | 5,596,641 |
| Salzgitter AG | 35,613 | 1,351,388 |
| Sky Deutschland AG (I) | 18,307 | 153,425 |
| Suedzucker AG | 71,099 | 2,294,052 |
| Greece 0.3% | 4,478,079 | |
| Hellenic Exchanges SA Holding Clearing Settlement and Registry (I) | 1,759 | 12,909 |
| OPAP SA | 272,211 | 2,696,965 |
| Public Power Corp. SA | 187,539 | 1,768,205 |
| Hong Kong 1.9% | 23,929,532 | |
| AIA Group, Ltd. | 309,200 | 1,348,100 |
| Cheung Kong Holdings, Ltd. | 195,000 | 2,778,465 |
| Esprit Holdings, Ltd. | 1,250,251 | 2,129,547 |
| Galaxy Entertainment Group, Ltd. (I) | 689,000 | 4,177,846 |
| Melco International Development, Ltd. | 417 | 950 |
| Noble Group, Ltd. | 1,295,000 | 814,941 |
| Pacific Basin Shipping, Ltd. | 1,395,121 | 869,768 |
| Power Assets Holdings, Ltd. | 207 | 1,779 |
| Sands China, Ltd. | 510,400 | 2,919,312 |
| Sun Hung Kai Properties, Ltd. | 258,000 | 3,330,155 |
| Swire Pacific, Ltd., Class A, Class A | 167,500 | 1,912,092 |
| Swire Properties, Ltd. | 100 | 279 |
| The Link REIT | 120,519 | 551,614 |
| Wharf Holdings, Ltd. | 192,000 | 1,566,743 |
| Xinyi Glass Holdings Company, Ltd. | 460,000 | 428,678 |
| Yue Yuen Industrial Holdings, Ltd. | 359,880 | 1,099,263 |
| See notes to financial statements | Semiannual report | International Core Fund | 13 |
| Shares | Value | |
| Ireland 0.2% | $2,769,896 | |
| C&C Group PLC | 156,903 | 869,755 |
| Paddy Power PLC | 23,629 | 1,900,141 |
| Isle of Man 0.1% | 1,399,625 | |
| Playtech, Ltd. | 133,406 | 1,399,625 |
| Israel 0.2% | 2,525,517 | |
| Africa Israel Investments, Ltd. (I) | 217,585 | 382,291 |
| Bezeq The Israeli Telecommunication Corp., Ltd. | 112,785 | 183,592 |
| Partner Communications Company, Ltd. | 161,757 | 1,188,445 |
| Paz Oil Company, Ltd. (I) | 150 | 23,079 |
| Teva Pharmaceutical Industries, Ltd. | 19,621 | 748,110 |
| Italy 4.9% | 62,765,523 | |
| A2A SpA | 736,036 | 639,841 |
| Ansaldo STS SpA | 13,728 | 118,618 |
| Azimut Holding SpA | 76,103 | 1,634,450 |
| Enel SpA | 5,382,953 | 17,800,178 |
| Eni SpA | 649,829 | 14,759,153 |
| EXOR SpA | 13,579 | 463,617 |
| Fiat SpA (I) | 620,456 | 4,674,119 |
| Finmeccanica SpA (I)(L) | 782,583 | 4,002,744 |
| Intesa Sanpaolo SpA | 2,259,615 | 4,432,430 |
| Mediaset SpA (I) | 507,350 | 2,080,281 |
| Mediolanum SpA | 282,362 | 1,968,737 |
| Recordati SpA | 72,112 | 812,864 |
| Telecom Italia RSP | 4,177,390 | 2,315,433 |
| Telecom Italia SpA | 6,416,594 | 4,488,843 |
| UniCredit SpA | 458,035 | 2,574,215 |
| Japan 21.7% | 279,652,984 | |
| ABC–MART, Inc. | 7,100 | 296,556 |
| Accordia Golf Company, Ltd. | 1,281 | 1,385,151 |
| Advance Residence Investment Corp. | 436 | 884,201 |
| Aeon Company, Ltd. (L) | 191,900 | 2,612,370 |
| Alps Electric Company, Ltd. | 46 | 328 |
| Astellas Pharma, Inc. | 102,100 | 5,197,560 |
| Avex Group Holdings, Inc. | 6,500 | 182,523 |
| Bridgestone Corp. | 57,000 | 1,858,477 |
| Credit Saison Company, Ltd. | 65,300 | 1,490,462 |
| Daikyo, Inc. | 725,000 | 2,094,946 |
| Daito Trust Construction Company, Ltd. | 79,300 | 7,236,512 |
| Daiwa Securities Group, Inc. | 399,000 | 3,197,467 |
| Daiwabo Holdings Company, Ltd. | 215,000 | 355,553 |
| Dena Company, Ltd. (L) | 169,361 | 3,306,629 |
| DIC Corp. | 443,000 | 1,127,611 |
| Fast Retailing Company, Ltd. | 1,500 | 482,721 |
| Fuji Electric Company, Ltd. | 386,000 | 1,415,501 |
| Fuji Heavy Industries, Ltd. | 283,116 | 6,790,693 |
| Fuji Oil Company, Ltd. | 43,900 | 768,672 |
| GMO Internet, Inc. | 22,900 | 251,682 |
| 14 | International Core Fund | Semiannual report | See notes to financial statements |
| Shares | Value | |
| Japan (continued) | ||
| Gungho Online Entertainment, Inc. (I)(L) | 1,761 | $1,181,461 |
| Gunze, Ltd. | 228,000 | 566,885 |
| Hanwa Company, Ltd. | 175,000 | 753,044 |
| Haseko Corp. (I) | 2,319,000 | 2,692,499 |
| Hino Motors, Ltd. | 121,000 | 1,565,920 |
| Inpex Corp. | 416 | 1,878,650 |
| ITOCHU Corp. | 719,100 | 8,101,639 |
| J Trust Company, Ltd. | 34,600 | 513,408 |
| JFE Holdings, Inc. | 192,900 | 4,237,314 |
| Juki Corp. (I)(L) | 193,000 | 290,305 |
| JX Holdings, Inc. | 1,763,600 | 9,282,420 |
| K’s Holding Corp. | 96,300 | 2,929,252 |
| Kakaku.com, Inc. | 130,800 | 2,388,815 |
| Kao Corp. | 84,350 | 2,453,702 |
| Kawasaki Kisen Kaisha, Ltd. | 1,824,000 | 4,086,459 |
| KDDI Corp. | 193,500 | 9,202,354 |
| Kinugawa Rubber Industrial Company, Ltd. | 125,000 | 693,877 |
| Kobe Steel, Ltd. (I) | 745,000 | 1,180,910 |
| Kohnan Shoji Company, Ltd. (L) | 59,600 | 638,079 |
| Konami Corp. | 23 | 504 |
| Kubota Corp. | 121,000 | 1,629,506 |
| Kurimoto, Ltd. | 75,000 | 205,119 |
| Leopalace21 Corp. (I) | 421,300 | 2,579,224 |
| Marubeni Corp. | 704,824 | 5,104,440 |
| Mazda Motor Corp. (I) | 1,512,000 | 6,009,578 |
| Medinet Company, Ltd. (I) | 455 | 163,925 |
| Medipal Holdings Corp. | 102,735 | 1,143,455 |
| MEIJI Holdings Company, Ltd. | 14,600 | 752,977 |
| Misawa Homes Company, Ltd. | 6,600 | 93,592 |
| Mitsubishi Chemical Holdings Corp. | 680,000 | 3,185,497 |
| Mitsubishi Corp. | 510,595 | 9,527,101 |
| Mitsubishi Estate Company, Ltd. | 116,000 | 3,000,462 |
| Mitsubishi Heavy Industries, Ltd. | 288,000 | 1,568,929 |
| Mitsui & Company, Ltd. | 367,000 | 5,085,876 |
| Mitsui Engineering & Shipbuilding Company, Ltd. | 590,000 | 1,061,623 |
| Mitsui Fudosan Company, Ltd. | 76,000 | 2,380,638 |
| Mitsui Mining & Smelting Company, Ltd. | 587,000 | 1,366,372 |
| Mitsui O.S.K. Lines, Ltd. (I) | 948,000 | 3,726,815 |
| Mizuho Financial Group, Inc. | 2,038,800 | 4,143,283 |
| Murata Manufacturing Company, Ltd. | 19,200 | 1,310,473 |
| Namco Bandai Holdings, Inc. | 101,200 | 1,611,583 |
| NEC Corp. | 283,000 | 598,190 |
| Nippon Light Metal Holdings Company, Ltd. | 1,121,300 | 1,417,334 |
| Nippon Paper Industries Company, Ltd. (L) | 133,000 | 1,804,406 |
| Nippon Steel & Sumitomo Metal Corp. | 560,000 | 1,584,029 |
| Nippon Telegraph & Telephone Corp. | 133,700 | 6,805,161 |
| Nippon Yusen KK | 1,117,000 | 3,162,828 |
| Nipro Corp. (L) | 143,400 | 1,229,618 |
| See notes to financial statements | Semiannual report | International Core Fund | 15 |
| Shares | Value | |
| Japan (continued) | ||
| Nitori Holdings Company, Ltd. | 31,000 | $2,766,363 |
| Nitto Denko Corp. | 30,300 | 1,603,288 |
| Nomura Holdings, Inc. | 587,600 | 4,077,783 |
| North Pacific Bank, Ltd. | 161,400 | 626,959 |
| NTT DOCOMO, Inc. | 3,028 | 4,838,724 |
| Orient Corp. (I) | 349,500 | 820,689 |
| Osaka Gas Company, Ltd. | 120 | 483 |
| Pigeon Corp. | 8,000 | 366,924 |
| Point, Inc. | 43,740 | 2,051,716 |
| Resona Holdings, Inc. | 1,804,100 | 8,564,391 |
| Ricoh Company, Ltd. | 197,000 | 2,119,333 |
| Round One Corp. | 213,200 | 1,194,732 |
| Ryohin Keikaku Company, Ltd. | 32,800 | 2,875,659 |
| Sanix, Inc. (I)(L) | 23,100 | 310,517 |
| Sankyo Company, Ltd. | 54,800 | 2,542,861 |
| Ship Healthcare Holdings, Inc. | 4,500 | 162,429 |
| SHO-BOND Holdings Company, Ltd. | 5,500 | 216,163 |
| Softbank Corp. | 45,900 | 2,864,551 |
| Sojitz Corp. | 1,427,600 | 2,534,990 |
| Sumitomo Corp. (L) | 647,900 | 8,172,354 |
| Sumitomo Light Metal Industries, Ltd. | 760,000 | 746,591 |
| Sumitomo Mitsui Company, Ltd. (I)(L) | 691,600 | 531,880 |
| Sumitomo Mitsui Financial Group, Inc. | 108,500 | 4,801,887 |
| Sumitomo Mitsui Trust Holdings, Inc. | 387,000 | 1,671,175 |
| Sumitomo Realty & Development Company, Ltd. | 59,000 | 2,578,666 |
| Taisei Corp. | 387,000 | 1,578,477 |
| Takara Bio, Inc. (L) | 14,900 | 290,833 |
| Takeda Pharmaceutical Company, Ltd. | 200,989 | 9,103,565 |
| The Daiei, Inc. (I) | 176,908 | 603,908 |
| Tokyo Electric Power Company, Inc. (I) | 365,900 | 1,842,174 |
| Tokyu Land Corp. | 83,000 | 765,227 |
| TonenGeneral Sekiyu KK | 122,133 | 1,106,306 |
| Toshiba Corp. | 320,000 | 1,262,099 |
| Tosoh Corp. | 284,000 | 1,008,402 |
| Toyobo Company, Ltd. | 167,000 | 273,530 |
| Toyota Motor Corp. | 346,100 | 20,907,655 |
| Toyota Tsusho Corp. | 230,200 | 5,268,988 |
| Unitika, Ltd. (I) | 882,000 | 473,417 |
| UNY Group Holdings Company, Ltd. | 274,500 | 1,747,034 |
| Wacom Company, Ltd. | 180,800 | 1,540,248 |
| Yahoo Japan Corp. | 976 | 481,207 |
| Yamada Denki Company, Ltd. | 143,790 | 4,533,660 |
| Luxembourg 0.1% | 1,127,914 | |
| ArcelorMittal | 87,863 | 1,127,914 |
| Netherlands 4.9% | 62,482,876 | |
| Aegon NV | 612,673 | 4,365,495 |
| CSM NV (L) | 59,293 | 1,401,517 |
| Delta Lloyd NV | 38,598 | 737,139 |
| 16 | International Core Fund | Semiannual report | See notes to financial statements |
| Shares | Value | |
| Netherlands (continued) | ||
| Heineken NV | 8,725 | $598,107 |
| ING Groep NV (I) | 247,036 | 2,689,748 |
| Koninklijke BAM Groep NV | 333,005 | 1,359,518 |
| Koninklijke KPN NV (I) | 349,411 | 1,020,576 |
| Koninklijke Philips Electronics NV | 62,925 | 1,942,840 |
| PostNL NV (I) | 134,909 | 475,412 |
| Royal Dutch Shell PLC, Class A | 950,809 | 30,758,668 |
| Royal Dutch Shell PLC, Class B | 468,489 | 15,766,376 |
| SNS REAAL NV (I) | 69,009 | 0 |
| Wereldhave NV | 20,541 | 1,367,480 |
| New Zealand 0.5% | 6,685,844 | |
| Chorus, Ltd. | 493,461 | 1,105,995 |
| Fletcher Building, Ltd. | 314,112 | 2,120,392 |
| Telecom Corp. of New Zealand, Ltd. | 1,975,177 | 3,459,457 |
| Norway 0.4% | 5,570,628 | |
| Aker Solutions ASA | 67,245 | 1,019,453 |
| DNB ASA | 45,779 | 709,973 |
| Norwegian Air Shuttle ASA (I) | 5,668 | 202,386 |
| Statoil ASA | 60,619 | 1,329,611 |
| TGS-NOPEC Geophysical Company ASA | 72,775 | 2,139,445 |
| Vard Holdings, Ltd. (I) | 253,000 | 169,760 |
| Portugal 0.4% | 5,255,148 | |
| EDP — Energias de Portugal SA | 1,312,505 | 4,633,864 |
| Portugal Telecom SGPS SA (L) | 164,537 | 621,284 |
| Singapore 1.0% | 13,022,650 | |
| Ezion Holdings, Ltd. | 435,000 | 770,264 |
| Ezra Holdings, Ltd. (I)(L) | 1,037,000 | 672,510 |
| Golden Agri-Resources, Ltd. | 10,861,000 | 4,752,428 |
| Singapore Telecommunications, Ltd. | 2,488,350 | 6,827,448 |
| Spain 7.6% | 97,921,995 | |
| Abengoa SA, B Shares (L) | 55,376 | 144,455 |
| ACS Actividades de Construccion y Servicios SA | 53,045 | 1,493,628 |
| Amadeus IT Holding SA, A Shares | 66,590 | 2,150,084 |
| Banco Bilbao Vizcaya Argentaria SA | 1,257,824 | 11,990,366 |
| Banco Santander SA (I) | 4,384,192 | 30,912,242 |
| Distribuidora Internacional de Alimentacion SA | 301,238 | 2,376,805 |
| Enagas SA | 67,808 | 1,537,939 |
| Ferrovial SA | 63,911 | 1,058,856 |
| Fomento de Construcciones y Contratas SA (I)(L) | 45,856 | 814,997 |
| Gas Natural SDG SA | 368,202 | 7,200,206 |
| Grifols SA | 8,104 | 325,449 |
| Iberdrola SA | 1,606,869 | 8,516,915 |
| Repsol SA | 285,390 | 6,619,098 |
| Telefonica SA (I) | 1,679,831 | 22,780,955 |
| Sweden 1.1% | 13,701,829 | |
| Boliden AB | 117,568 | 1,716,328 |
| Investor AB, B Shares | 112,355 | 3,238,067 |
| See notes to financial statements | Semiannual report | International Core Fund | 17 |
| Shares | Value | |
| Sweden (continued) | ||
| NCC AB, B Shares | 46,999 | $1,228,987 |
| Skandinaviska Enskilda Banken AB, Series A | 102,709 | 1,053,725 |
| Svenska Cellulosa AB, B Shares | 54,667 | 1,334,181 |
| Svenska Handelsbanken AB, Class A | 37,127 | 1,593,234 |
| Swedbank AB, Class A | 129,043 | 2,918,300 |
| Telefonaktiebolaget LM Ericsson, B Shares | 52,707 | 619,007 |
| Switzerland 3.0% | 38,305,204 | |
| ABB, Ltd. (I) | 71,292 | 1,524,758 |
| Cie Financiere Richemont SA | 17,575 | 1,665,487 |
| Credit Suisse Group AG (I) | 111,238 | 3,198,903 |
| Givaudan AG (I) | 228 | 306,666 |
| Novartis AG | 214,485 | 15,640,612 |
| Roche Holdings AG | 44,000 | 10,975,764 |
| Swiss Life Holding (I) | 3,985 | 746,505 |
| Swiss Re, Ltd. (I) | 27,750 | 2,127,829 |
| The Swatch Group AG | 3,685 | 2,118,680 |
| United Kingdom 20.4% | 263,043,516 | |
| Aberdeen Asset Management PLC | 355,164 | 1,936,996 |
| Admiral Group PLC | 22,838 | 446,294 |
| ARM Holdings PLC | 152,657 | 2,056,162 |
| Ashtead Group PLC | 62,215 | 621,538 |
| Associated British Foods PLC | 22,376 | 639,774 |
| AstraZeneca PLC | 618,860 | 30,439,916 |
| Aviva PLC | 380,824 | 2,282,751 |
| BAE Systems PLC | 1,742,023 | 11,746,020 |
| Barclays PLC | 3,839,084 | 16,805,010 |
| BBA Aviation PLC | 13,853 | 66,003 |
| BG Group PLC | 249,858 | 4,751,006 |
| BHP Billiton PLC | 339,137 | 9,870,031 |
| BP PLC | 5,040,166 | 34,759,092 |
| BT Group PLC | 505,794 | 2,549,796 |
| Bunzl PLC | 85,150 | 1,795,935 |
| Darty PLC | 66,523 | 83,227 |
| Dixons Retail PLC (I)(L) | 3,743,484 | 2,393,028 |
| Drax Group PLC | 258,723 | 2,798,051 |
| easyJet PLC | 86,303 | 1,649,061 |
| FirstGroup PLC | 353,895 | 628,229 |
| GlaxoSmithKline PLC | 372,075 | 9,483,942 |
| Halfords Group PLC | 11,537 | 64,722 |
| Hargreaves Lansdown PLC | 17,694 | 273,793 |
| Home Retail Group PLC | 1,300,862 | 2,871,744 |
| Imperial Tobacco Group PLC | 85,112 | 2,812,068 |
| Intercontinental Hotels Group PLC | 48,588 | 1,363,338 |
| ITV PLC | 1,068,135 | 2,724,606 |
| Lancashire Holdings, Ltd. | 86,982 | 969,013 |
| Lloyds Banking Group PLC (I) | 11,585,795 | 13,025,998 |
| Micro Focus International PLC (I) | 8,408 | 103,132 |
| Mondi PLC | 24,483 | 377,326 |
| 18 | International Core Fund | Semiannual report | See notes to financial statements |
| Shares | Value | ||
| United Kingdom (continued) | |||
| Next PLC | 102,869 | $7,801,826 | |
| Persimmon PLC (I) | 45,964 | 782,822 | |
| Premier Foods PLC (I) | 196,568 | 400,577 | |
| Prudential PLC | 374,489 | 6,256,127 | |
| Reckitt Benckiser Group PLC | 52,684 | 3,580,108 | |
| Reed Elsevier PLC | 99,877 | 1,225,079 | |
| Rio Tinto PLC | 457,613 | 20,657,920 | |
| Rolls-Royce Holdings PLC (I) | 322,757 | 5,561,965 | |
| Royal Bank of Scotland Group PLC (I) | 435,268 | 2,243,641 | |
| Spectris PLC | 55,629 | 1,914,686 | |
| SSE PLC | 77,086 | 1,867,163 | |
| Standard Life PLC | 254,302 | 1,304,051 | |
| Taylor Wimpey PLC | 91,168 | 140,435 | |
| Tesco PLC | 936,556 | 5,320,038 | |
| Thomas Cook Group PLC (I) | 1,177,788 | 2,573,558 | |
| Trinity Mirror PLC (I) | 121,865 | 224,940 | |
| Tullett Prebon PLC | 172,999 | 916,086 | |
| Vodafone Group PLC | 8,849,860 | 28,522,924 | |
| WH Smith PLC | 88,947 | 1,168,204 | |
| Whitbread PLC | 18,500 | 883,019 | |
| William Hill PLC | 543,606 | 3,497,755 | |
| WPP PLC | 205,897 | 3,812,990 | |
| Preferred Securities 0.6% | $8,361,393 | ||
| (Cost $6,372,082) | |||
| Germany 0.6% | 8,361,393 | ||
| Porsche Automobil Holding SE | 85,963 | 7,223,272 | |
| Volkswagen AG | 5,005 | 1,138,121 | |
| Yield (%) | Shares | Value | |
| Securities Lending Collateral 4.5% | $58,412,835 | ||
| (Cost $58,412,922) | |||
| John Hancock Collateral Investment Trust (W) | 0.1754 (Y) | 5,836,789 | 58,412,835 |
| Short-Term Investments 2.6% | $33,204,816 | ||
| (Cost $33,204,816) | |||
| Money Market Funds 2.6% | 33,204,816 | ||
| State Street Institutional Treasury Money | |||
| Market Fund | 0.0000 (Y) | 33,204,816 | 33,204,816 |
| Total investments (Cost $1,260,303,955)† 103.7% | $1,335,975,897 | ||
| Other assets and liabilities, net (3.7%) | ($48,014,217) | ||
| Total net assets 100.0% | $1,287,961,680 | ||
The percentage shown for each investment category is the total value of the category as a percentage of the net assets of the Fund.
| See notes to financial statements | Semiannual report | International Core Fund | 19 |
Notes to Schedule of Investments
(I) Non-income producing security.
(L) A portion of this security is on loan as of 8-31-13.
(W) Investment is an affiliate of the fund, the advisor and/or subadvisor. This investment represents collateral received for securities lending.
(Y) The rate shown is the annualized seven-day yield as of 8-31-13.
† At 8-31-13, the aggregate cost of investment securities for federal income tax purposes was $1,325,703,972. Net unrealized appreciation aggregated $10,271,925, of which $72,524,533 related to appreciated investment securities and $62,252,608 related to depreciated investment securities.
The Fund had the following sector allocation as a percentage of net assets on 8-31-13:
| Financials | 21.4% | ||||
| Energy | 14.6% | ||||
| Consumer Discretionary | 13.1% | ||||
| Industrials | 10.3% | ||||
| Health Care | 9.7% | ||||
| Telecommunication Services | 9.0% | ||||
| Utilities | 6.3% | ||||
| Materials | 5.8% | ||||
| Consumer Staples | 3.7% | ||||
| Information Technology | 2.7% | ||||
| Short-Term Investments & Other | 3.4% | ||||
| Total | 100% | ||||
| 20 | International Core Fund | Semiannual report | See notes to financial statements |
F I N A N C I A L S T AT E M E N T S
Financial statements
Statement of assets and liabilities 8-31-13 (unaudited)
This Statement of assets and liabilities is the fund’s balance sheet. It shows the value of what the fund owns, is due and owes. You’ll also find the net asset value and the maximum public offering price per share.
| Assets | |
| Investments in unaffiliated issuers, at value (Cost $1,201,891,033) | |
| including $55,391,520 of securities loaned) | $1,277,563,062 |
| Investments in affiliated issuers, at value (Cost $58,412,922) | 58,412,835 |
| Total investments, at value (Cost $1,260,303,955) | 1,335,975,897 |
| Cash | 16,000 |
| Foreign currency, at value (Cost $469,734) | 469,680 |
| Cash held at broker for futures contracts | 3,215,405 |
| Receivable for investments sold | 173,125 |
| Receivable for fund shares sold | 2,176,711 |
| Receivable for forward foreign currency exchange contracts | 2,198,621 |
| Dividends and interest receivable | 4,652,742 |
| Receivable for securities lending income | 69,887 |
| Other receivables and prepaid expenses | 167,059 |
| Total assets | 1,349,115,127 |
| Liabilities | |
| Payable for forward foreign currency exchange contracts | 935,801 |
| Payable for fund shares repurchased | 1,032,310 |
| Payable upon return of securities loaned | 58,375,430 |
| Payable for futures variation margin | 217,800 |
| Payable to affiliates | |
| Accounting and legal services fees | 94,638 |
| Transfer agent fees | 52,230 |
| Distribution and service fees | 19 |
| Trustees’ fees | 39,593 |
| Investment management fees | 816 |
| Other liabilities and accrued expenses | 404,810 |
| Total liabilities | 61,153,447 |
| Net assets | $1,287,961,680 |
| Net assets consist of | |
| Paid-in capital | $1,412,139,814 |
| Undistributed net investment income | 38,562,609 |
| Accumulated net realized gain (loss) on investments, futures contracts and | |
| foreign currency transactions | (238,961,509) |
| Net unrealized appreciation (depreciation) on investments, futures | |
| contracts and translation of assets and liabilities in foreign currencies | 76,220,766 |
| Net assets | $1,287,961,680 |
| See notes to financial statements | Semiannual report | International Core Fund | 21 |
F I N A N C I A L S T AT E M E N T S
Statement of assets and liabilities (continued)
| Net asset value per share | |
| Based on net asset values and shares outstanding — the Fund has an | |
| unlimited number of shares authorized with no par value | |
| Class A ($81,935,585 ÷ 2,686,453 shares)1 | $30.50 |
| Class B ($2,962,949 ÷ 97,945 shares)1 | $30.25 |
| Class C ($4,752,264 ÷ 157,104 shares)1 | $30.25 |
| Class I ($451,007,071 ÷ 14,721,380 shares) | $30.64 |
| Class R1 ($347,191 ÷ 11,433.6 shares) | $30.37 |
| Class R2 ($114,590 ÷ 3,748 shares) | $30.57 |
| Class R3 ($72,441 ÷ 2,370.8 shares) | $30.56 |
| Class R4 ($76,831 ÷ 2,511.4 shares) | $30.59 |
| Class R5 ($90,477 ÷ 2,954 shares) | $30.63 |
| Class R6 ($119,684 ÷ 3,900 shares) | $30.69 |
| Class 1 ($38,928,666 ÷ 1,268,110 shares) | $30.70 |
| Class NAV ($707,553,931 ÷ 23,062,279 shares) | $30.68 |
| Maximum offering price per share | |
| Class A (net asset value per share ÷ 95%)2 | $32.11 |
1 Redemption price is equal to net asset value less any applicable contingent deferred sales charge.
2 On single retail sales of less than $50,000. On sales of $50,000 or more and on group sales the offering price is reduced.
| 22 | International Core Fund | Semiannual report | See notes to financial statements |
F I N A N C I A L S T AT E M E N T S
Statement of operations For the six-month period ended 8-31-13
(unaudited)
This Statement of operations summarizes the fund’s investment income earned and expenses incurred in operating the fund. It also shows net gains (losses) for the period stated.
| Investment income | |
| Dividends | $29,191,766 |
| Securities lending | 1,508,865 |
| Less foreign taxes withheld | (2,503,517) |
| Total investment income | 28,197,114 |
| Expenses | |
| Investment management fees | 5,541,535 |
| Distribution and service fees | 185,431 |
| Accounting and legal services fees | 130,239 |
| Transfer agent fees | 300,619 |
| Trustees’ fees | 29,335 |
| State registration fees | 105,017 |
| Professional fees | 39,768 |
| Custodian fees | 528,277 |
| Registration and filing fees | 26,829 |
| Other | 18,659 |
| Total expenses | 6,905,709 |
| Less expense reductions | (72,889) |
| Net expenses | 6,832,820 |
| Net investment income | 21,364,294 |
| Realized and unrealized gain (loss) | |
| Net realized gain (loss) on | |
| Investments in unaffiliated issuers | 42,429,460 |
| Investments in affiliated issuers | (7,465) |
| Futures contracts | 4,926,537 |
| Foreign currency transactions | 2,827,720 |
| 50,176,252 | |
| Change in net unrealized appreciation (depreciation) of | |
| Investments in unaffiliated issuers | (1,352,508) |
| Investments in affiliated issuers | 1,783 |
| Futures contracts | 401,648 |
| Translation of assets and liabilities in foreign currencies | 752,630 |
| (196,447) | |
| Net realized and unrealized gain | 49,979,805 |
| Increase in net assets from operations | $71,344,099 |
| See notes to financial statements | Semiannual report | International Core Fund | 23 |
F I N A N C I A L S T AT E M E N T S
Statements of changes in net assets
These Statements of changes in net assets show how the value of the fund’s net assets has changed during the last two periods. The difference reflects earnings less expenses, any investment gains and losses, distributions, if any, paid to shareholders and the net of fund share transactions.
| Six months | ||
| ended | Year | |
| 8-31-13 | ended | |
| (Unaudited) | 2-28-13 | |
| Increase (decrease) in net assets | ||
| From operations | ||
| Net investment income | $21,364,294 | $40,352,982 |
| Net realized gain (loss) | 50,176,252 | (58,781,704) |
| Change in net unrealized appreciation (depreciation) | (196,447) | 95,935,770 |
| Increase in net assets resulting from operations | 71,344,099 | 77,507,048 |
| Distributions to shareholders | ||
| From net investment income | ||
| Class A | — | (2,647,541) |
| Class B | — | (81,696) |
| Class C | — | (110,204) |
| Class I | — | (18,793,937) |
| Class R1 | — | (8,398) |
| Class R2 | — | (3,287) |
| Class R3 | — | (1,054) |
| Class R4 | — | (1,317) |
| Class R5 | — | (2,763) |
| Class R6 | — | (3,906) |
| Class 1 | — | (1,358,914) |
| Class NAV | — | (21,987,219) |
| Total distributions | — | (45,000,236) |
| From Fund share transactions | 77,036,679 | (478,701,052) |
| Total increase (decrease) | 148,380,778 | (446,194,240) |
| Net assets | ||
| Beginning of period | 1,139,580,902 | 1,585,775,142 |
| End of period | $1,287,961,680 | $1,139,580,902 |
| Undistributed net investment income | $38,562,609 | $17,198,315 |
| 24 | International Core Fund | Semiannual report | See notes to financial statements |
Financial highlights
The Financial highlights show how the Fund’s net asset value for a share has changed during the period.
| CLASS A SHARES Period ended | 8-31-131 | 2-28-13 | 2-29-12 | 2-28-11 | 2-28-10 | 2-28-09 |
| Per share operating performance | ||||||
| Net asset value, beginning of period | $28.81 | $27.72 | $30.85 | $25.74 | $18.43 | $39.06 |
| Net investment income2 | 0.49 | 0.71 | 0.58 | 0.33 | 0.24 | 0.76 |
| Net realized and unrealized gain (loss) | ||||||
| on investments | 1.20 | 1.31 | (3.32) | 5.09 | 7.59 | (18.65) |
| Total from investment operations | 1.69 | 2.02 | (2.74) | 5.42 | 7.83 | (17.89) |
| Less distributions | ||||||
| From net investment income | — | (0.93) | (0.39) | (0.31) | (0.52) | (1.56) |
| From net realized gain | — | — | — | — | — | (1.18) |
| Total distributions | — | (0.93) | (0.39) | (0.31) | (0.52) | (2.74) |
| Net asset value, end of period | $30.50 | $28.81 | $27.72 | $30.85 | $25.74 | $18.43 |
| Total return (%)3,4 | 5.875 | 7.41 | (8.73) | 21.13 | 42.33 | (47.16) |
| Ratios and supplemental data | ||||||
| Net assets, end of period (in millions) | $82 | $91 | $374 | $333 | $225 | $54 |
| Ratios (as a percentage of average net assets): | ||||||
| Expenses before reductions | 1.446 | 1.58 | 1.58 | 1.61 | 1.957 | 1.75 |
| Expenses net of fee waivers | 1.446 | 1.58 | 1.58 | 1.60 | 1.667 | 1.75 |
| Expenses net of fee waivers and credits | 1.446 | 1.58 | 1.58 | 1.60 | 1.627 | 1.70 |
| Net investment income | 3.236 | 2.66 | 2.05 | 1.21 | 0.94 | 2.33 |
| Portfolio turnover (%) | 24 | 53 | 42 | 39 | 44 | 54 |
1 Six months ended 8-31-13. Unaudited.
2 Based on the average daily shares outstanding.
3 Does not reflect the effect of sales charges, if any.
4 Total returns would have been lower had certain expenses not been reduced during the applicable periods shown.
5 Not annualized.
6 Annualized.
7 Includes the impact of proxy expenses, which amounted to 0.02% of average net assets.
| See notes to financial statements | Semiannual report | International Core Fund | 25 |
| CLASS B SHARES Period ended | 8-31-131 | 2-28-13 | 2-29-12 | 2-28-11 | 2-28-10 | 2-28-09 |
| Per share operating performance | ||||||
| Net asset value, beginning of period | $28.70 | $27.61 | $30.70 | $25.62 | $18.36 | $38.80 |
| Net investment income2 | 0.35 | 0.42 | 0.44 | 0.18 | 0.17 | 0.53 |
| Net realized and unrealized gain (loss) | ||||||
| on investments | 1.20 | 1.41 | (3.34) | 5.01 | 7.44 | (18.49) |
| Total from investment operations | 1.55 | 1.83 | (2.90) | 5.19 | 7.61 | (17.96) |
| Less distributions | ||||||
| From net investment income | — | (0.74) | (0.19) | (0.11) | (0.35) | (1.30) |
| From net realized gain | — | — | — | — | — | (1.18) |
| Total distributions | — | (0.74) | (0.19) | (0.11) | (0.35) | (2.48) |
| Net asset value, end of period | $30.25 | $28.70 | $27.61 | $30.70 | $25.62 | $18.36 |
| Total return (%)3,4 | 5.405 | 6.71 | (9.38) | 20.28 | 41.35 | (47.53) |
| Ratios and supplemental data | ||||||
| Net assets, end of period (in millions) | $3 | $3 | $4 | $5 | $6 | $7 |
| Ratios (as a percentage of average net assets): | ||||||
| Expenses before reductions | 2.786 | 2.94 | 2.49 | 2.36 | 3.077 | 2.75 |
| Expenses net of fee waivers | 2.306 | 2.30 | 2.30 | 2.30 | 2.367 | 2.63 |
| Expenses net of fee waivers and credits | 2.306 | 2.30 | 2.30 | 2.30 | 2.337 | 2.40 |
| Net investment income | 2.326 | 1.56 | 1.58 | 0.65 | 0.69 | 1.64 |
| Portfolio turnover (%) | 24 | 53 | 42 | 39 | 44 | 54 |
1 Six months ended 8-31-13. Unaudited.
2 Based on the average daily shares outstanding.
3 Does not reflect the effect of sales charges, if any.
4 Total returns would have been lower had certain expenses not been reduced during the applicable periods shown.
5 Not annualized.
6 Annualized.
7 Includes the impact of proxy expenses, which amounted to 0.03% of average net assets.
| CLASS C SHARES Period ended | 8-31-131 | 2-28-13 | 2-29-12 | 2-28-11 | 2-28-10 | 2-28-09 |
| Per share operating performance | ||||||
| Net asset value, beginning of period | $28.70 | $27.61 | $30.71 | $25.62 | $18.36 | $38.81 |
| Net investment income2 | 0.34 | 0.42 | 0.43 | 0.17 | 0.15 | 0.55 |
| Net realized and unrealized gain (loss) | ||||||
| on investments | 1.21 | 1.41 | (3.34) | 5.03 | 7.46 | (18.52) |
| Total from investment operations | 1.55 | 1.83 | (2.91) | 5.20 | 7.61 | (17.97) |
| Less distributions | ||||||
| From net investment income | — | (0.74) | (0.19) | (0.11) | (0.35) | (1.30) |
| From net realized gain | — | — | — | — | — | (1.18) |
| Total distributions | — | (0.74) | (0.19) | (0.11) | (0.35) | (2.48) |
| Net asset value, end of period | $30.25 | $28.70 | $27.61 | $30.71 | $25.62 | $18.36 |
| Total return (%)3,4 | 5.405 | 6.71 | (9.41) | 20.32 | 41.35 | (47.55) |
| Ratios and supplemental data | ||||||
| Net assets, end of period (in millions) | $5 | $4 | $4 | $5 | $5 | $4 |
| Ratios (as a percentage of average net assets): | ||||||
| Expenses before reductions | 2.576 | 2.77 | 2.50 | 2.47 | 2.697 | 2.59 |
| Expenses net of fee waivers | 2.306 | 2.30 | 2.30 | 2.30 | 2.367 | 2.43 |
| Expenses net of fee waivers and credits | 2.306 | 2.30 | 2.30 | 2.30 | 2.337 | 2.40 |
| Net investment income | 2.246 | 1.54 | 1.53 | 0.62 | 0.60 | 1.69 |
| Portfolio turnover (%) | 24 | 53 | 42 | 39 | 44 | 54 |
1 Six months ended 8-31-13. Unaudited.
2 Based on the average daily shares outstanding.
3 Does not reflect the effect of sales charges, if any.
4 Total returns would have been lower had certain expenses not been reduced during the applicable periods shown.
5 Not annualized.
6 Annualized.
7 Includes the impact of proxy expenses, which amounted to 0.03% of average net assets.
| 26 | International Core Fund | Semiannual report | See notes to financial statements |
| CLASS I SHARES Period ended | 8-31-131 | 2-28-13 | 2-29-12 | 2-28-11 | 2-28-10 | 2-28-09 |
| Per share operating performance | ||||||
| Net asset value, beginning of period | $28.90 | $27.78 | $30.94 | $25.80 | $18.45 | $39.20 |
| Net investment income2 | 0.52 | 0.68 | 0.72 | 0.45 | 0.35 | 0.94 |
| Net realized and unrealized gain (loss) | ||||||
| on investments | 1.22 | 1.49 | (3.36) | 5.12 | 7.63 | (18.77) |
| Total from investment operations | 1.74 | 2.17 | (2.64) | 5.57 | 7.98 | (17.83) |
| Less distributions | ||||||
| From net investment income | — | (1.05) | (0.52) | (0.43) | (0.63) | (1.74) |
| From net realized gain | — | — | — | — | — | (1.18) |
| Total distributions | — | (1.05) | (0.52) | (0.43) | (0.63) | (2.92) |
| Net asset value, end of period | $30.64 | $28.90 | $27.78 | $30.94 | $25.80 | $18.45 |
| Total return (%)3 | 6.024 | 7.92 | (8.33) | 21.73 | 43.10 | (46.91) |
| Ratios and supplemental data | ||||||
| Net assets, end of period (in millions) | $451 | $392 | $411 | $291 | $84 | $1 |
| Ratios (as a percentage of average net assets): | ||||||
| Expenses before reductions | 1.145 | 1.17 | 1.16 | 1.12 | 1.06 | 2.37 |
| Expenses net of fee waivers | 1.145 | 1.17 | 1.16 | 1.12 | 1.06 | 1.18 |
| Expenses net of fee waivers and credits | 1.145 | 1.17 | 1.16 | 1.12 | 1.06 | 1.18 |
| Net investment income | 3.395 | 2.49 | 2.54 | 1.61 | 1.34 | 2.87 |
| Portfolio turnover (%) | 24 | 53 | 42 | 39 | 44 | 54 |
1 Six months ended 8-31-13. Unaudited.
2 Based on the average daily shares outstanding.
3 Total returns would have been lower had certain expenses not been reduced during the applicable periods shown.
4 Not annualized.
5 Annualized.
| CLASS R1 SHARES Period ended | 8-31-131 | 2-28-13 | 2-29-12 | 2-28-11 | 2-28-10 | 2-28-09 |
| Per share operating performance | ||||||
| Net asset value, beginning of period | $28.75 | $27.66 | $30.77 | $25.67 | $18.36 | $38.94 |
| Net investment income2 | 0.40 | 0.51 | 0.53 | 0.24 | 0.23 | 0.69 |
| Net realized and unrealized gain (loss) | ||||||
| on investments | 1.22 | 1.43 | (3.33) | 5.06 | 7.50 | (18.54) |
| Total from investment operations | 1.62 | 1.94 | (2.80) | 5.30 | 7.73 | (17.85) |
| Less distributions | ||||||
| From net investment income | — | (0.85) | (0.31) | (0.20) | (0.42) | (1.55) |
| From net realized gain | — | — | — | — | — | (1.18) |
| Total distributions | — | (0.85) | (0.31) | (0.20) | (0.42) | (2.73) |
| Net asset value, end of period | $30.37 | $28.75 | $27.66 | $30.77 | $25.67 | $18.36 |
| Total return (%)3 | 5.634 | 7.10 | (9.00) | 20.71 | 42.00 | (47.16) |
| Ratios and supplemental data | ||||||
| Net assets, end of period (in millions) | —5 | —5 | —5 | —5 | —5 | —5 |
| Ratios (as a percentage of average net assets): | ||||||
| Expenses before reductions | 5.896 | 7.16 | 7.37 | 6.88 | 8.857 | 15.16 |
| Expenses net of fee waivers | 1.906 | 1.90 | 1.90 | 1.92 | 1.927 | 2.10 |
| Expenses net of fee waivers and credits | 1.906 | 1.90 | 1.90 | 1.92 | 1.927 | 1.70 |
| Net investment income | 2.616 | 1.87 | 1.88 | 0.90 | 0.92 | 2.21 |
| Portfolio turnover (%) | 24 | 53 | 42 | 39 | 44 | 54 |
1 Six months ended 8-31-13. Unaudited.
2 Based on the average daily shares outstanding.
3 Total returns would have been lower had certain expenses not been reduced during the applicable periods shown.
4 Not annualized.
5 Less than $500,000.
6 Annualized.
7 Includes the impact of proxy expenses, which amounted to 0.02% of average net assets.
| See notes to financial statements | Semiannual report | International Core Fund | 27 |
| CLASS R2 SHARES Period ended | 8-31-131 | 2-28-132 | ||||
| Per share operating performance | ||||||
| Net asset value, beginning of period | $28.91 | $27.80 | ||||
| Net investment income3 | 0.44 | 0.59 | ||||
| Net realized and unrealized gain on investments | 1.22 | 1.43 | ||||
| Total from investment operations | 1.66 | 2.02 | ||||
| Less distributions | ||||||
| From net investment income | — | (0.91) | ||||
| Total distributions | — | (0.91) | ||||
| Net asset value, end of period | $30.57 | $28.91 | ||||
| Total return (%)4 | 5.745 | 7.39 | ||||
| Ratios and supplemental data | ||||||
| Net assets, end of period (in millions) | —6 | —6 | ||||
| Ratios (as a percentage of average net assets): | ||||||
| Expenses before reductions | 12.637 | 20.70 | ||||
| Expenses net of fee waivers | 1.657 | 1.65 | ||||
| Expenses net of fee waivers and credits | 1.657 | 1.65 | ||||
| Net investment income | 2.897 | 2.16 | ||||
| Portfolio turnover (%) | 24 | 538 | ||||
1 Six months ended 8-31-13. Unaudited.
2 The inception date for Class R2 shares is 3-1-12.
3 Based on the average daily shares outstanding.
4 Total returns would have been lower had certain expenses not been reduced during the applicable periods shown.
5 Not annualized.
6 Less than $500,000.
7 Annualized.
8 Portfolio turnover is shown for the period from 3-1-12 to 2-28-13.
| CLASS R3 SHARES Period ended | 8-31-131 | 2-28-13 | 2-29-12 | 2-28-11 | 2-28-102 | |
| Per share operating performance | ||||||
| Net asset value, beginning of period | $28.92 | $27.80 | $30.94 | $25.80 | $23.33 | |
| Net investment income3 | 0.41 | 0.53 | 0.57 | 0.29 | 0.02 | |
| Net realized and unrealized gain (loss) on investments | 1.23 | 1.46 | (3.38) | 5.08 | 2.90 | |
| Total from investment operations | 1.64 | 1.99 | (2.81) | 5.37 | 2.92 | |
| Less distributions | ||||||
| From net investment income | — | (0.87) | (0.33) | (0.23) | (0.45) | |
| Total distributions | — | (0.87) | (0.33) | (0.23) | (0.45) | |
| Net asset value, end of period | $30.56 | $28.92 | $27.80 | $30.94 | $25.80 | |
| Total return (%)4 | 5.675 | 7.28 | (8.95) | 20.87 | 12.405 | |
| Ratios and supplemental data | ||||||
| Net assets, end of period (in millions) | —6 | —6 | —6 | —6 | —6 | |
| Ratios (as a percentage of average net assets): | ||||||
| Expenses before reductions | 24.667 | 47.36 | 45.66 | 44.55 | 10.977 | |
| Expenses net of fee waivers | 1.807 | 1.80 | 1.80 | 1.83 | 1.917 | |
| Expenses net of fee waivers and credits | 1.807 | 1.80 | 1.80 | 1.83 | 1.917 | |
| Net investment income | 2.697 | 1.93 | 2.01 | 1.05 | 0.107 | |
| Portfolio turnover (%) | 24 | 53 | 42 | 39 | 448 | |
1 Six months ended 8-31-13. Unaudited.
2 The inception date for Class R3 shares is 5-22-09.
3 Based on the average daily shares outstanding.
4 Total returns would have been lower had certain expenses not been reduced during the applicable periods shown.
5 Not annualized.
6 Less than $500,000.
7 Annualized.
8 Portfolio turnover is shown for the period from 3-1-09 to 2-28-10.
| 28 | International Core Fund | Semiannual report | See notes to financial statements |
| CLASS R4 SHARES Period ended | 8-31-131 | 2-28-13 | 2-29-12 | 2-28-11 | 2-28-102 | |
| Per share operating performance | ||||||
| Net asset value, beginning of period | $28.89 | $27.79 | $30.94 | $25.80 | $23.33 | |
| Net investment income3 | 0.42 | 0.64 | 0.65 | 0.37 | 0.08 | |
| Net realized and unrealized gain (loss) on investments | 1.28 | 1.44 | (3.38) | 5.08 | 2.91 | |
| Total from investment operations | 1.70 | 2.08 | (2.73) | 5.45 | 2.99 | |
| Less distributions | ||||||
| From net investment income | — | (0.98) | (0.42) | (0.31) | (0.52) | |
| Total distributions | — | (0.98) | (0.42) | (0.31) | (0.52) | |
| Net asset value, end of period | $30.59 | $28.89 | $27.79 | $30.94 | $25.80 | |
| Total return (%)4 | 5.885 | 7.61 | (8.67) | 21.21 | 12.695 | |
| Ratios and supplemental data | ||||||
| Net assets, end of period (in millions) | —6 | —6 | —6 | —6 | —6 | |
| Ratios (as a percentage of average net assets): | ||||||
| Expenses before reductions | 24.627 | 42.45 | 42.74 | 44.22 | 10.717 | |
| Expenses net of fee waivers | 1.407 | 1.43 | 1.50 | 1.53 | 1.617 | |
| Expenses net of fee waivers and credits | 1.407 | 1.43 | 1.50 | 1.53 | 1.617 | |
| Net investment income | 2.747 | 2.34 | 2.29 | 1.34 | 0.407 | |
| Portfolio turnover (%) | 24 | 53 | 42 | 39 | 448 | |
1 Six months ended 8-31-13. Unaudited.
2 The inception date for Class R4 shares is 5-22-09.
3 Based on the average daily shares outstanding.
4 Total returns would have been lower had certain expenses not been reduced during the applicable periods shown.
5 Not annualized.
6 Less than $500,000.
7 Annualized.
8 Portfolio turnover is shown for the period from 3-1-09 to 2-28-10.
| CLASS R5 SHARES Period ended | 8-31-131 | 2-28-13 | 2-29-12 | 2-28-11 | 2-28-102 | |
| Per share operating performance | ||||||
| Net asset value, beginning of period | $28.90 | $27.78 | $30.94 | $25.79 | $23.33 | |
| Net investment income3 | 0.51 | 0.70 | 0.73 | 0.44 | 0.14 | |
| Net realized and unrealized gain (loss) on investments | 1.22 | 1.45 | (3.38) | 5.10 | 2.91 | |
| Total from investment operations | 1.73 | 2.15 | (2.65) | 5.54 | 3.05 | |
| Less distributions | ||||||
| From net investment income | — | (1.03) | (0.51) | (0.39) | (0.59) | |
| Total distributions | — | (1.03) | (0.51) | (0.39) | (0.59) | |
| Net asset value, end of period | $30.63 | $28.90 | $27.78 | $30.94 | $25.79 | |
| Total return (%)4 | 5.995 | 7.88 | (8.38) | 21.59 | 12.955 | |
| Ratios and supplemental data | ||||||
| Net assets, end of period (in millions) | —6 | —6 | —6 | —6 | —6 | |
| Ratios (as a percentage of average net assets): | ||||||
| Expenses before reductions | 17.067 | 21.14 | 20.87 | 31.41 | 10.507 | |
| Expenses net of fee waivers | 1.207 | 1.20 | 1.20 | 1.22 | 1.317 | |
| Expenses net of fee waivers and credits | 1.207 | 1.20 | 1.20 | 1.22 | 1.317 | |
| Net investment income | 3.357 | 2.57 | 2.58 | 1.58 | 0.707 | |
| Portfolio turnover (%) | 24 | 53 | 42 | 39 | 448 | |
1 Six months ended 8-31-13. Unaudited.
2 The inception date for Class R5 shares is 5-22-09.
3 Based on the average daily shares outstanding.
4 Total returns would have been lower had certain expenses not been reduced during the applicable periods shown.
5 Not annualized.
6 Less than $500,000.
7 Annualized.
8 Portfolio turnover is shown for the period from 3-1-09 to 2-28-10.
| See notes to financial statements | Semiannual report | International Core Fund | 29 |
| CLASS R6 SHARES Period ended | 8-31-131 | 2-28-13 | 2-29-122 | |||
| Per share operating performance | ||||||
| Net asset value, beginning of period | $28.94 | $27.82 | $28.00 | |||
| Net investment income3 | 0.53 | 0.73 | 0.26 | |||
| Net realized and unrealized gain on investments | 1.22 | 1.45 | 0.10 | |||
| Total from investment operations | 1.75 | 2.18 | 0.36 | |||
| Less distributions | ||||||
| From net investment income | — | (1.06) | (0.54) | |||
| Total distributions | — | (1.06) | (0.54) | |||
| Net asset value, end of period | $30.69 | $28.94 | $27.82 | |||
| Total return (%)4 | 6.055 | 7.95 | 1.495 | |||
| Ratios and supplemental data | ||||||
| Net assets, end of period (in millions) | —6 | —6 | —6 | |||
| Ratios (as a percentage of average net assets): | ||||||
| Expenses before reductions | 14.627 | 21.97 | 16.837 | |||
| Expenses net of fee waivers | 1.127 | 1.12 | 1.127 | |||
| Expenses net of fee waivers and credits | 1.127 | 1.12 | 1.127 | |||
| Net investment income | 3.437 | 2.66 | 1.987 | |||
| Portfolio turnover (%) | 24 | 53 | 428 | |||
1 Six months ended 8-31-13. Unaudited.
2 The inception date for Class R6 shares is 9-1-11.
3 Based on the average daily shares outstanding.
4 Total returns would have been lower had certain expenses not been reduced during the applicable periods shown.
5 Not annualized.
6 Less than $500,000.
7 Annualized.
8 Portfolio turnover is shown for the period from 3-1-11 to 2-28-12.
| CLASS 1 SHARES Period ended | 8-31-131 | 2-28-13 | 2-29-12 | 2-28-11 | 2-28-10 | 2-28-09 |
| Per share operating performance | ||||||
| Net asset value, beginning of period | $28.94 | $27.82 | $30.99 | $25.84 | $18.48 | $39.22 |
| Net investment income2 | 0.54 | 0.75 | 0.79 | 0.50 | 0.46 | 0.93 |
| Net realized and unrealized gain (loss) | ||||||
| on investments | 1.22 | 1.44 | (3.41) | 5.09 | 7.54 | (18.74) |
| Total from investment operations | 1.76 | 2.19 | (2.62) | 5.59 | 8.00 | (17.81) |
| Less distributions | ||||||
| From net investment income | — | (1.07) | (0.55) | (0.44) | (0.64) | (1.75) |
| From net realized gain | — | — | — | — | — | (1.18) |
| Total distributions | — | (1.07) | (0.55) | (0.44) | (0.64) | (2.93) |
| Net asset value, end of period | $30.70 | $28.94 | $27.82 | $30.99 | $25.84 | $18.48 |
| Total return (%)3 | 6.084 | 8.00 | (8.27) | 21.75 | 43.11 | (46.83) |
| Ratios and supplemental data | ||||||
| Net assets, end of period (in millions) | $39 | $37 | $39 | $47 | $44 | $34 |
| Ratios (as a percentage of average net assets): | ||||||
| Expenses before reductions | 1.065 | 1.08 | 1.07 | 1.07 | 1.086 | 1.10 |
| Expenses net of fee waivers | 1.065 | 1.08 | 1.07 | 1.07 | 1.076 | 1.10 |
| Expenses net of fee waivers and credits | 1.065 | 1.08 | 1.07 | 1.07 | 1.076 | 1.10 |
| Net investment income | 3.515 | 2.76 | 2.76 | 1.83 | 1.83 | 2.88 |
| Portfolio turnover (%) | 24 | 53 | 42 | 39 | 44 | 54 |
1 Six months ended 8-31-13. Unaudited.
2 Based on the average daily shares outstanding.
3 Total returns would have been lower had certain expenses not been reduced during the applicable periods shown.
4 Not annualized.
5 Annualized.
6 Includes the impact of proxy expenses, which amounted to 0.03% of average net assets.
| 30 | International Core Fund | Semiannual report | See notes to financial statements |
| CLASS NAV SHARES Period ended | 8-31-131 | 2-28-13 | 2-29-12 | 2-28-11 | 2-28-10 | 2-28-09 |
| Per share operating performance | ||||||
| Net asset value, beginning of period | $28.92 | $27.80 | $30.98 | $25.82 | $18.47 | $39.21 |
| Net investment income2 | 0.53 | 0.82 | 0.81 | 0.51 | 0.49 | 0.99 |
| Net realized and unrealized gain (loss) | ||||||
| on investments | 1.23 | 1.38 | (3.43) | 5.10 | 7.51 | (18.78) |
| Total from investment operations | 1.76 | 2.20 | (2.62) | 5.61 | 8.00 | (17.79) |
| Less distributions | ||||||
| From net investment income | — | (1.08) | (0.56) | (0.45) | (0.65) | (1.77) |
| From net realized gain | — | — | — | — | — | (1.18) |
| Total distributions | — | (1.08) | (0.56) | (0.45) | (0.65) | (2.95) |
| Net asset value, end of period | $30.68 | $28.92 | $27.80 | $30.98 | $25.82 | $18.47 |
| Total return (%)3 | 6.094 | 8.06 | (8.24) | 21.85 | 43.14 | (46.80) |
| Ratios and supplemental data | ||||||
| Net assets, end of period (in millions) | $708 | $611 | $753 | $920 | $800 | $603 |
| Ratios (as a percentage of average net assets): | ||||||
| Expenses before reductions | 1.015 | 1.03 | 1.02 | 1.02 | 1.046 | 1.04 |
| Expenses net of fee waivers | 1.015 | 1.03 | 1.02 | 1.02 | 1.026 | 1.04 |
| Expenses net of fee waivers and credits | 1.015 | 1.03 | 1.02 | 1.02 | 1.026 | 1.04 |
| Net investment income | 3.485 | 3.03 | 2.84 | 1.87 | 1.99 | 3.06 |
| Portfolio turnover (%) | 24 | 53 | 42 | 39 | 44 | 54 |
1 Six months ended 8-31-13. Unaudited.
2 Based on the average daily shares outstanding.
3 Total returns would have been lower had certain expenses not been reduced during the applicable periods shown.
4 Not annualized.
5 Annualized.
6 Includes the impact of proxy expenses, which amounted to 0.03% of average net assets.
| See notes to financial statements | Semiannual report | International Core Fund | 31 |
Notes to financial statements
(unaudited)
Note 1 — Organization
John Hancock International Core Fund (the fund) is a series of John Hancock Funds III (the Trust), an open-end management investment company organized as a Massachusetts business trust and registered under the Investment Company Act of 1940, as amended (the 1940 Act). The investment objective of the fund is to seek high total return.
The fund may offer multiple classes of shares. The shares currently offered are detailed in the Statement of assets and liabilities. Class A and Class C shares are offered to all investors. Class B shares are closed to new investors. Class I shares are offered to institutions and certain investors. Class R1, Class R2, Class R3, Class R4 and Class R5 shares are available only to certain retirement plans. Class R6 shares are available only to certain retirement plans, institutions and other investors. Class 1 shares are offered only to certain affiliates of Manulife Financial Corporation (MFC). Class NAV shares are offered to John Hancock affiliated funds of funds and certain 529 plans. Shareholders of each class have exclusive voting rights to matters that affect that class. The distribution and service fees, if any, transfer agent fees, printing and postage and state registration fees for each class may differ. Class B shares convert to Class A shares eight years after purchase.
Note 2 — Significant accounting policies
The financial statements have been prepared in conformity with accounting principles generally accepted in the United States of America, which require management to make certain estimates and assumptions as of the date of the financial statements. Actual results could differ from those estimates and those differences could be significant. Events or transactions occurring after the end of the fiscal period through the date that the financial statements were issued have been evaluated in the preparation of the financial statements. The following summarizes the significant accounting policies of the fund:
Security valuation. Investments are stated at value as of the close of regular trading on the New York Stock Exchange (NYSE), normally at 4:00 P.M., Eastern Time. In order to value the securities, the fund uses the following valuation techniques: Equity securities held by the fund are valued at the last sale price or official closing price on the principal securities exchange on which they trade. In the event there were no sales during the day or closing prices are not available, the securities are valued using the last quoted bid or evaluated price. Investments by the fund in open-end mutual funds, including John Hancock Collateral Investment Trust (JHCIT), are valued at their respective net asset values each business day. Futures contracts are valued at the quoted daily settlement prices established by the exchange on which they trade. Foreign securities and currencies, including forward foreign currency contracts, are valued in U.S. dollars, based on foreign currency exchange rates supplied by an independent pricing service. Certain securities and forward foreign currency contracts traded only in the over-the-counter (OTC) market are valued at the last bid price quoted by brokers making markets in the securities at the close of trading. Certain short-term securities are valued at amortized cost.
Other portfolio securities and assets, for which reliable market quotations are not readily available, are valued at fair value as determined in good faith by the fund’s Pricing Committee following procedures established by the Board of Trustees, which include price verification procedures. The frequency with which the/se fair valuation procedures are used cannot be predicted and fair value of securities may differ significantly from the value that would have been used had a ready market for such securities existed. Generally, trading in foreign securities is substantially completed each day at various times prior to the close of trading on the NYSE. Significant market events that affect
| 32 | International Core Fund | Semiannual report |
the values of foreign securities may occur between the time when the valuation of the securities is generally determined and the close of the NYSE. During significant market events, these securities will be valued at fair value, as determined in good faith, following procedures established by the Board of Trustees. The fund may use a fair valuation model to value foreign securities in order to adjust for events that may occur between the close of foreign exchanges and the close of the NYSE.
The fund uses a three-tier hierarchy to prioritize the pricing assumptions, referred to as inputs, used in valuation techniques to measure fair value. Level 1 includes securities valued using quoted prices in active markets for identical securities. Level 2 includes securities valued using other significant observable inputs. Observable inputs may include quoted prices for similar securities, interest rates, prepayment speeds and credit risk. Prices for securities valued using these inputs are received from independent pricing vendors and brokers and are based on an evaluation of the inputs described. Level 3 includes securities valued using significant unobservable inputs when market prices are not readily available or reliable, including the fund’s own assumptions in determining the fair value of investments. Factors used in determining value may include market or issuer specific events or trends, changes in interest rates and credit quality. The inputs or methodology used for valuing securities are not necessarily an indication of the risks associated with investing in those securities. Changes in valuation techniques may result in transfers into or out of an assigned level within the disclosure hierarchy.
The following is a summary of the values by input classification of the fund’s investments as of August 31, 2013, by major security category or type:
| LEVEL 3 | ||||
| LEVEL 2 | SIGNIFICANT | |||
| TOTAL MARKET | LEVEL 1 | SIGNIFICANT | UNOBSERVABLE | |
| VALUE AT 8-31-13 | QUOTED PRICE | OBSERVABLE INPUTS | INPUTS | |
| Common Stocks | ||||
| Australia | $67,720,983 | — | $67,720,983 | — |
| Austria | 7,665,897 | — | 7,665,897 | — |
| Belgium | 10,276,357 | — | 10,276,357 | — |
| Canada | 17,385,520 | $17,385,520 | — | — |
| China | 2,204,622 | — | 2,052,968 | $151,654 |
| Denmark | 1,556,255 | — | 1,556,255 | — |
| Finland | 12,035,882 | — | 12,035,882 | — |
| France | 158,972,478 | — | 158,972,478 | — |
| Germany | 73,540,099 | — | 73,540,099 | — |
| Greece | 4,478,079 | — | 4,478,079 | — |
| Hong Kong | 23,929,532 | — | 23,929,532 | — |
| Ireland | 2,769,896 | — | 2,769,896 | — |
| Isle of Man | 1,399,625 | — | 1,399,625 | — |
| Israel | 2,525,517 | — | 2,525,517 | — |
| Italy | 62,765,523 | — | 62,765,523 | — |
| Japan | 279,652,984 | — | 279,652,984 | — |
| Luxembourg | 1,127,914 | — | 1,127,914 | — |
| Netherlands | 62,482,876 | — | 62,482,876 | — |
| New Zealand | 6,685,844 | — | 6,685,844 | — |
| Norway | 5,570,628 | — | 5,570,628 | — |
| Portugal | 5,255,148 | — | 5,255,148 | — |
| Singapore | 13,022,650 | — | 13,022,650 | — |
| Spain | 97,921,995 | — | 97,921,995 | — |
| Sweden | 13,701,829 | — | 13,701,829 | — |
| Switzerland | 38,305,204 | — | 38,305,204 | — |
| United Kingdom | 263,043,516 | — | 263,043,516 | — |
| Semiannual report | International Core Fund | 33 |
| LEVEL 3 | ||||
| LEVEL 2 | SIGNIFICANT | |||
| TOTAL MARKET | LEVEL 1 | SIGNIFICANT | UNOBSERVABLE | |
| VALUE AT 8-31-13 | QUOTED PRICE | OBSERVABLE INPUTS | INPUTS | |
| Preferred Securities | ||||
| Germany | $8,361,393 | — | $8,361,393 | — |
| Securities Lending | ||||
| Collateral | 58,412,835 | $58,412,835 | — | — |
| Short-Term Investments | ||||
| Money Market Funds | 33,204,816 | 33,204,816 | — | — |
| Total Investments in | ||||
| Securities | $1,335,975,897 | $109,003,171 | $1,226,821,072 | $151,654 |
| Other Financial | ||||
| Instruments | ||||
| Futures | ($611,215) | ($611,215) | — | — |
| Forward Foreign | ||||
| Currency Contracts | $1,262,820 | — | $1,262,820 | — |
Security transactions and related investment income. Investment security transactions are accounted for on a trade date plus one basis for daily net asset value calculations. However, for financial reporting purposes, investment transactions are reported on trade date. Interest income is accrued as earned. Dividend income is recorded on the ex-date, except for dividends of foreign securities where the dividend may not be known until after the ex-date. In those cases, dividend income, net of withholding taxes, is recorded when the fund becomes aware of the dividends. Foreign taxes are provided for based on the fund’s understanding of the tax rules and rates that exist in the foreign markets in which it invests. Gains and losses on securities sold are determined on the basis of identified cost and may include proceeds from litigation.
Securities lending. The fund may lend its securities to earn additional income. The fund receives cash collateral from the borrower in an amount not less than the market value of the loaned securities. The fund will invest its collateral in JHCIT, an affiliate of the fund, which has a floating net asset value (NAV) and is registered with the SEC as an investment company. JHCIT invests cash received as collateral as part of the securities lending program in short-term money market investments. The fund will receive the benefit of any gains and bear any losses generated by JHCIT with respect to the cash collateral.
If a borrower fails to return loaned securities when due, then the lending agent is responsible to and indemnifies the fund for the lent securities. The lending agent uses the collateral received from the borrower to purchase replacement securities of the same issue, type, class and series of the loaned securities. If the value of the collateral is less than the purchase cost of replacement securities, the lending agent is responsible for satisfying the shortfall but only to the extent that the shortfall is not due to any decrease in the value of JHCIT.
Although the risk of the loss of the securities lent is mitigated by receiving collateral from the borrower and through lending agent indemnification, the fund could experience a delay in recovering its securities or could experience a lower than expected return if the borrower fails to return the securities on a timely basis. The fund may receive compensation for lending its securities by retaining a portion of the return on the investment of the collateral and compensation from fees earned from borrowers of the securities. Net income received from JHCIT is a component of securities lending income as recorded on the Statement of operations.
Obligations to repay collateral received by the fund is shown on the Statement of assets and liabilities as Payable upon return of securities loaned.
| 34 | International Core Fund | Semiannual report |
Foreign currency translation. Assets, including investments and liabilities denominated in foreign currencies, are translated into U.S. dollar values each day at the prevailing exchange rate. Purchases and sales of securities, income and expenses are translated into U.S. dollars at the prevailing exchange rate on the date of the transaction. The effect of changes in foreign currency exchange rates on the value of securities is reflected as a component of the realized and unrealized gains (losses) on investments.
Funds that invest internationally generally carry more risk than funds that invest strictly in U.S. securities. Risks can result from differences in economic and political conditions, regulations, market practices (including higher transaction costs), accounting standards and other factors. Foreign investments are also subject to a decline in the value of a foreign currency versus the U.S. dollar, which reduces the dollar value of securities denominated in that currency.
Foreign taxes. The fund may be subject to withholding tax on income and/or capital gains or repatriation taxes imposed by certain countries in which the fund invests. Taxes are accrued based upon investment income, realized gains or unrealized appreciation.
Line of credit. The fund may borrow from banks for temporary or emergency purposes, including meeting redemption requests that otherwise might require the untimely sale of securities. Pursuant to the fund’s custodian agreement, the custodian may loan money to the fund to make properly authorized payments. The fund is obligated to repay the custodian for any overdraft, including any related costs or expenses. The custodian may have a lien, security interest or security entitlement in any fund property that is not otherwise segregated or pledged, to the maximum extent permitted by law, to the extent of any overdraft.
In addition, the fund and other affiliated funds have entered into an agreement with Citibank N.A. that enables them to participate in a $300 million unsecured committed line of credit. A commitment fee, payable at the end of each calendar quarter, based on the average daily unused portion of the line of credit, is charged to each participating fund on a pro rata basis and is reflected in other expenses on the Statement of operations. Prior to March 27, 2013, the fund participated in a $100 million unsecured line of credit, also with Citibank N.A., with terms otherwise similar to the existing agreement. Commitment fees for the six months ended August 31, 2013 were $478. For the six months ended August 31, 2013, the fund had no borrowings under either line of credit.
Expenses. Within the John Hancock funds complex, expenses that are directly attributable to an individual fund are allocated to such fund. Expenses that are not readily attributable to a specific fund are allocated among all funds in an equitable manner, taking into consideration, among other things, the nature and type of expense and the fund’s relative net assets. Expense estimates are accrued in the period to which they relate and adjustments are made when actual amounts are known.
Class allocations. Income, common expenses and realized and unrealized gains (losses) are determined at the fund level and allocated daily to each class of shares based on the net assets of the class. Class-specific expenses, such as distribution and service fees, if any, transfer agent fees, state registration fees and printing and postage expenses, for all classes, are calculated daily at the class level based on the appropriate net assets of each class and the specific expense rates applicable to each class.
Federal income taxes. The fund intends to continue to qualify as a regulated investment company by complying with the applicable provisions of the Internal Revenue Code and will not be subject to federal income tax on taxable income that is distributed to shareholders. Therefore, no federal income tax provision is required.
| Semiannual report | International Core Fund | 35 |
Under the Regulated Investment Company Modernization Act of 2010, the fund are permitted to carry forward capital losses incurred in taxable years beginning after December 22, 2010 for an unlimited period. Any losses incurred during those taxable years will be required to be utilized prior to the losses incurred in pre-enactment taxable years. As a result of this ordering rule, pre-enactment capital loss carryforwards may be more likely to expire unused. Additionally, post-enactment capital losses that are carried forward will retain their character as either short-term or long-term capital losses rather than being considered all short-term as under previous law.
For federal income tax purposes, as of February 28, 2013, the fund has a capital loss carryforward of $220,110,762 available to offset future net realized capital gains. The following table details the capital loss carryforward available as of February 28, 2013:
| CAPITAL LOSS CARRYFORWARD | ||||
| EXPIRING | EXPIRING | NO EXPIRATION DATE | ||
| FEBRUARY 28, 2018 | FEBRUARY 28, 2019 | SHORT TERM | LONG TERM | |
| $173,798,079 | $7,043,412 | $7,502,125 | $31,767,146 | |
Availability of a certain amount of the loss carryforward, may be limited in a given year. Net capital losses of $7,594,063 that are the result of security transactions occurring after October 31, 2012, are treated as occurring on March 1, 2013, the first day of the fund’s next taxable year.
As of February 28, 2013, the fund had no uncertain tax positions that would require financial statement recognition, derecognition or disclosure. The fund’s federal tax returns are subject to examination by the Internal Revenue Service for a period of three years.
Distribution of income and gains. Distributions to shareholders from net investment income and net realized gains, if any, are recorded on the ex-date. The fund generally declares and pays dividends and capital gain distributions, if any, annually.
Distributions paid by the fund with respect to each class of shares are calculated in the same manner, at the same time and in the same amount, except for the effect of class level expenses that may be applied differently to each class.
Such distributions, on a tax basis, are determined in conformity with income tax regulations, which may differ from accounting principles generally accepted in the United States of America.
Capital accounts within the financial statements are adjusted for permanent book-tax differences. These adjustments have no impact on net assets or the results of operations. Temporary book-tax differences, if any, will reverse in a subsequent period. Book-tax differences are primarily attributable to foreign currency transactions, passive foreign investment companies, wash sale loss deferrals, derivative transactions and litigation proceeds.
Note 3 — Derivative instruments
The fund may invest in derivatives in order to meet its investment objectives. Derivatives include a variety of different instruments that may be traded in the over-the-counter market, on a regulated exchange or through a clearing facility. The risks in using derivatives vary depending upon the structure of the instruments, including the use of leverage, optionality, the liquidity or lack of liquidity of the contract, the creditworthiness of the counterparty or clearing organization and the volatility of the position. Some derivatives involve risks that are potentially greater than the risks associated with investing directly in the referenced securities or other referenced underlying instrument. Specifically, the fund is exposed to the risk that the counterparty to an OTC derivatives contract will be unable or unwilling to make timely settlement payments or otherwise honor its obligations. OTC derivatives transactions typically can only be closed out with the other party to the transaction.
| 36 | International Core Fund | Semiannual report |
Forward foreign currency contracts, certain options and certain swaps are typically traded through the OTC market. Non-deliverable forwards, currency options and cash settled currency swaps are all regulated by the Commodity Futures Trading Commission (the CFTC) as swaps. Derivative counterparty risk is managed through an ongoing evaluation of the creditworthiness of all potential counterparties and, if applicable, designated clearing organizations. The fund attempts to reduce its exposure to counterparty risk for derivatives traded in the OTC market, whenever possible, by entering into an International Swaps and Derivatives Association (ISDA) Master Agreement with each of its OTC counterparties. The ISDA gives each party to the agreement the right to terminate all transactions traded under the agreement if there is certain deterioration in the credit quality or contractual default of the other party, as defined in the ISDA. Upon an event of default or a termination of the ISDA, the non-defaulting party has the right to close out all transactions and to net amounts owed. This right to close out and net payments across all transactions traded under the ISDA could result in a reduction of the fund’s risk to a counterparty equal to any amounts payable by the fund, if any.
Futures, certain options and cleared swaps are traded or cleared on an exchange or central clearinghouse. Exchange-traded or cleared transactions generally present less counterparty risk to a fund than OTC transactions. The exchange or clearinghouse stands between the fund and the broker to the contract and therefore, credit risk is generally limited to the failure of the exchange or clearinghouse and the clearing member.
For financial reporting purposes, the fund does not offset OTC derivative assets or liabilities that are subject to master netting arrangements, as defined by the ISDAs, in the Statement of assets and liabilities. In the event of default by the counterparty or a termination of the agreement, the ISDA allows an offset of amounts across the various transactions between the fund and the applicable counterparty.
Futures. A futures contract is a contractual agreement to buy or sell a particular currency or financial instrument at a pre-determined price in the future. Risks related to the use of futures contracts include possible illiquidity of the futures markets, contract prices that can be highly volatile and imperfectly correlated to movements in the underlying financial instrument and potential losses in excess of the amounts recognized on the Statement of assets and liabilities. Use of long futures contracts subjects the fund to the risk of loss up to the notional value of the futures contracts. Use of short futures contracts subjects the fund to unlimited risk of loss.
Upon entering into a futures contract, the fund is required to deposit initial margin with the broker in the form of cash or securities. The amount of required margin is generally based on a percentage of the contract value; this amount is the initial margin for the trade. The margin deposit must then be maintained at the established level over the life of the contract. Futures collateral receivable/payable is included on the Statement of assets and liabilities. Futures contracts are marked-to-market daily and an appropriate payable or receivable for the change in value (variation margin) and unrealized gain or loss is recorded by the fund. When the contract is closed, the fund records a realized gain or loss equal to the difference between the value of the contract at the time it was opened and the value at the time it was closed.
During the six months ended August 31, 2013, the fund used futures contracts to gain exposure to certain securities markets. During the six months ended August 31, 2013, the fund held futures contracts with U.S. Dollar notional values ranging from $40.0 million to $73.0 million, as measured at each quarter end. The following table summarizes the contracts held at August 31, 2013.
| Semiannual report | International Core Fund | 37 |
| UNREALIZED | |||||||
| OPEN | NUMBER OF | EXPIRATION | NOTIONAL | NOTIONAL | APPRECIATION | ||
| CONTRACTS | CONTRACTS | POSITION | DATE | BASIS | VALUE | (DEPRECIATION) | |
| ASX SPI 200 | 12 | Long | Sep 2013 | $1,364,463 | $1,366,583 | $2,120 | |
| Index Futures | |||||||
| DAX Index Future | 115 | Long | Sep 2013 | 31,220,496 | 30,844,419 | (376,077) | |
| SGX MSCI Singapore | 8 | Long | Sep 2013 | 435,277 | 431,609 | (3,668) | |
| Index Futures | |||||||
| S&P TSE 60 | 53 | Short | Sep 2013 | (7,076,616) | (7,310,206) | (233,590) | |
| Index Futures | |||||||
| ($611,215) | |||||||
Forward foreign currency contracts. A forward foreign currency contract is an agreement between two parties to buy and sell a specific currency at a price that is set on the date of the contract. The forward contract calls for delivery of the currency on a future date that is specified in the contract. Risks related to the use of forwards include the possible failure of counterparties to meet the terms of the forward agreement, the risk that currency movements will not favor the fund thereby reducing the fund’s total return, and the potential for losses in excess of the amounts recognized on the Statement of assets and liabilities.
The market value of a forward foreign currency contract fluctuates with changes in foreign currency exchange rates. Forward foreign currency contracts are marked-to-market daily and the change in value is recorded by the fund as an unrealized gain or loss. Realized gains or losses, equal to the difference between the value of the contract at the time it was opened and the value at the time it was closed, are recorded upon delivery or receipt of the currency or settlement with the counterparty.
During the six months ended August 31, 2013, the fund used forward foreign currency contracts to manage against anticipated changes in currency exchange rates. During the six months ended August 31, 2013, the fund held forward foreign currency contracts with U.S. Dollar notional values ranging from $290.0 million to $316.4 million, as measured at each quarter end. The following table summarizes the contracts held at August 31, 2013.
| CONTRACTUAL | NET UNREALIZED | ||||||||
| CONTRACT | CONTRACT | SETTLEMENT | UNREALIZED | UNREALIZED | APPRECIATION/ | ||||
| TO BUY | TO SELL | COUNTERPARTY | DATE | APPRECIATION | DEPRECIATION | (DEPRECIATION) | |||
| CHF | 7,285,000 | USD | 7,929,511 | Bank of America N.A. | 10-25-13 | — | ($96,661) | ($96,661) | |
| CHF | 1,246,125 | USD | 1,361,127 | Barclays Bank PLC | 10-25-13 | — | (21,290) | (21,290) | |
| Wholesale | |||||||||
| CHF | 6,975,655 | USD | 7,599,581 | Brown Brothers Harriman | 10-25-13 | — | (99,339) | (99,339) | |
| & Company | |||||||||
| CHF | 5,870,802 | USD | 6,409,172 | Deutsche Bank AG | 10-25-13 | — | (96,872) | (96,872) | |
| London | |||||||||
| CHF | 8,357,010 | USD | 9,112,311 | JPMorgan Chase Bank | 10-25-13 | — | (126,834) | (126,834) | |
| CHF | 10,906,840 | USD | 11,883,497 | Morgan Stanley and | 10-25-13 | — | (156,436) | (156,436) | |
| Company International | |||||||||
| PLC | |||||||||
| CHF | 4,485,557 | USD | 4,880,300 | State Street Bank and | 10-25-13 | — | (57,418) | (57,418) | |
| Trust Company | |||||||||
| HKD | 44,732,320 | USD | 5,769,920 | Bank of America N.A. | 10-25-13 | — | (247) | (247) | |
| HKD | 64,103,389 | USD | 8,268,290 | Bank of New York | 10-25-13 | — | (94) | (94) | |
| HKD | 54,917,553 | USD | 7,083,570 | Barclays Bank PLC | 10-25-13 | — | (184) | (184) | |
| Wholesale | |||||||||
| HKD | 58,456,799 | USD | 7,540,166 | Brown Brothers Harriman | 10-25-13 | — | (280) | (280) | |
| & Company | |||||||||
| HKD | 22,522,100 | USD | 2,904,784 | Deutsche Bank AG | 10-25-13 | $165 | — | 165 | |
| London | |||||||||
| 38 | International Core Fund | Semiannual report |
| CONTRACTUAL | NET UNREALIZED | ||||||||
| CONTRACT | CONTRACT | SETTLEMENT | UNREALIZED | UNREALIZED | APPRECIATION/ | ||||
| TO BUY | TO SELL | COUNTERPARTY | DATE | APPRECIATION | DEPRECIATION | (DEPRECIATION) | |||
| HKD | 24,623,000 | USD | 3,175,984 | JPMorgan Chase Bank | 10-25-13 | — | ($56) | ($56) | |
| HKD | 54,917,553 | USD | 7,083,799 | Morgan Stanley and | 10-25-13 | — | (412) | (412) | |
| Company International | |||||||||
| PLC | |||||||||
| HKD | 81,092,551 | USD | 10,459,762 | State Street Bank and | 10-25-13 | — | (267) | (267) | |
| Trust Company | |||||||||
| JPY | 862,804,280 | USD | 8,967,648 | Bank of New York | 10-25-13 | — | (177,930) | (177,930) | |
| JPY | 862,804,281 | USD | 8,788,521 | Barclays Bank PLC | 10-25-13 | $1,196 | — | 1,196 | |
| Wholesale | |||||||||
| SEK | 78,289 | USD | 12,032 | Bank of America N.A. | 10-25-13 | — | (232) | (232) | |
| SEK | 2,995,833 | USD | 462,598 | Barclays Bank PLC | 10-25-13 | — | (11,079) | (11,079) | |
| Wholesale | |||||||||
| SEK | 968,491 | USD | 148,959 | Brown Brothers Harriman | 10-25-13 | — | (2,992) | (2,992) | |
| & Company | |||||||||
| SEK | 21,241,975 | USD | 3,275,985 | Deutsche Bank AG | 10-25-13 | — | (74,485) | (74,485) | |
| London | |||||||||
| SGD | 15,474,418 | USD | 12,130,091 | Bank of America N.A. | 10-25-13 | 1,956 | — | 1,956 | |
| SGD | 3,337,439 | USD | 2,619,448 | Bank of New York | 10-25-13 | — | (2,874) | (2,874) | |
| SGD | 9,439,547 | USD | 7,404,159 | Barclays Bank PLC | 10-25-13 | — | (3,491) | (3,491) | |
| Wholesale | |||||||||
| SGD | 1,942,000 | USD | 1,524,072 | JPMorgan Chase Bank | 10-25-13 | — | (1,531) | (1,531) | |
| SGD | 8,652,209 | USD | 6,784,727 | Morgan Stanley and | 10-25-13 | — | (1,337) | (1,337) | |
| Company International | |||||||||
| PLC | |||||||||
| SGD | 11,058,671 | USD | 8,666,534 | State Street Bank and | 10-25-13 | 3,537 | — | 3,537 | |
| Trust Company | |||||||||
| SGD | 3,752,879 | USD | 2,945,743 | The Royal Bank of | 10-25-13 | — | (3,460) | (3,460) | |
| Scotland PLC | |||||||||
| USD | 3,706,064 | AUD | 4,102,760 | Bank of America N.A. | 10-25-13 | 66,795 | — | 66,795 | |
| USD | 3,216,527 | AUD | 3,558,597 | Bank of New York | 10-25-13 | 59,946 | — | 59,946 | |
| USD | 3,907,116 | AUD | 4,325,045 | Barclays Bank PLC | 10-25-13 | 70,674 | — | 70,674 | |
| Wholesale | |||||||||
| USD | 1,714,621 | AUD | 1,897,502 | Brown Brothers Harriman | 10-25-13 | 31,481 | — | 31,481 | |
| & Company | |||||||||
| USD | 3,922,741 | AUD | 4,341,986 | Morgan Stanley and | 10-25-13 | 71,272 | — | 71,272 | |
| Company International | |||||||||
| PLC | |||||||||
| USD | 2,033,846 | AUD | 2,251,608 | State Street Bank and | 10-25-13 | 36,603 | — | 36,603 | |
| Trust Company | |||||||||
| USD | 3,088,576 | CAD | 3,208,197 | Bank of America N.A. | 10-25-13 | 46,518 | — | 46,518 | |
| USD | 1,040,707 | CAD | 1,084,198 | Bank of New York | 10-25-13 | 12,655 | — | 12,655 | |
| USD | 4,985,987 | CAD | 5,188,618 | Barclays Bank PLC | 10-25-13 | 66,065 | — | 66,065 | |
| Wholesale | |||||||||
| USD | 51,294 | CAD | 53,422 | JPMorgan Chase Bank | 10-25-13 | 638 | — | 638 | |
| USD | 802,871 | CAD | 835,807 | Morgan Stanley and | 10-25-13 | 10,346 | — | 10,346 | |
| Company International | |||||||||
| PLC | |||||||||
| USD | 4,266,934 | CAD | 4,432,619 | State Street Bank and | 10-25-13 | 63,860 | — | 63,860 | |
| Trust Company | |||||||||
| USD | 1,383,143 | CAD | 1,439,388 | The Royal Bank of | 10-25-13 | 18,294 | — | 18,294 | |
| Scotland PLC | |||||||||
| USD | 8,565,545 | EUR | 6,399,395 | Bank of America N.A. | 10-25-13 | 106,324 | — | 106,324 | |
| USD | 18,504,182 | EUR | 13,792,725 | Bank of New York | 10-25-13 | 271,878 | — | 271,878 | |
| USD | 5,390,428 | EUR | 4,038,409 | Barclays Bank PLC | 10-25-13 | 52,143 | — | 52,143 | |
| Wholesale | |||||||||
| USD | 11,198,637 | EUR | 8,338,399 | Brown Brothers Harriman | 10-25-13 | 176,288 | — | 176,288 | |
| & Company | |||||||||
| Semiannual report | International Core Fund | 39 |
| CONTRACTUAL | NET UNREALIZED | ||||||||
| CONTRACT | CONTRACT | SETTLEMENT | UNREALIZED | UNREALIZED | APPRECIATION/ | ||||
| TO BUY | TO SELL | COUNTERPARTY | DATE | APPRECIATION | DEPRECIATION | (DEPRECIATION) | |||
| USD | 6,236,189 | EUR | 4,639,676 | Deutsche Bank AG | 10-25-13 | $103,101 | — | $103,101 | |
| London | |||||||||
| USD | 8,763,568 | EUR | 6,524,444 | JPMorgan Chase Bank | 10-25-13 | 139,047 | — | 139,047 | |
| USD | 5,406,306 | EUR | 4,025,835 | Morgan Stanley and | 10-25-13 | 84,642 | — | 84,642 | |
| Company International | |||||||||
| PLC | |||||||||
| USD | 13,601,962 | EUR | 10,185,869 | State Street Bank and | 10-25-13 | 137,483 | — | 137,483 | |
| Trust Company | |||||||||
| USD | 5,403,582 | EUR | 4,020,944 | The Royal Bank of | 10-25-13 | 88,383 | — | 88,383 | |
| Scotland PLC | |||||||||
| USD | 5,746,166 | GBP | 3,706,367 | Bank of America N.A. | 10-25-13 | 4,696 | — | 4,696 | |
| USD | 2,872,297 | GBP | 1,831,892 | Bank of New York | 10-25-13 | 34,544 | — | 34,544 | |
| USD | 7,961,325 | GBP | 5,083,091 | Barclays Bank PLC | 10-25-13 | 87,195 | — | 87,195 | |
| Wholesale | |||||||||
| USD | 2,840,545 | GBP | 1,813,573 | Brown Brothers Harriman | 10-25-13 | 31,170 | — | 31,170 | |
| & Company | |||||||||
| USD | 5,770,698 | GBP | 3,682,100 | Deutsche Bank AG | 10-25-13 | 66,819 | — | 66,819 | |
| London | |||||||||
| USD | 1,695,034 | NOK | 10,141,365 | Bank of America N.A. | 10-25-13 | 41,064 | — | 41,064 | |
| USD | 1,113,142 | NOK | 6,638,999 | Brown Brothers Harriman | 10-25-13 | 30,378 | — | 30,378 | |
| & Company | |||||||||
| USD | 2,913,849 | NZD | 3,666,146 | Bank of America N.A. | 10-25-13 | 90,694 | — | 90,694 | |
| USD | 2,913,926 | NZD | 3,666,146 | Barclays Bank PLC | 10-25-13 | 90,771 | — | 90,771 | |
| Wholesale | |||||||||
| $2,198,621 | ($935,801) | $1,262,820 | |||||||
Fair value of derivative instruments by risk category
The table below summarizes the fair value of derivatives held by the fund at August 31, 2013 by risk category:
| FINANCIAL | ASSET | LIABILITY | ||
| STATEMENT OF ASSETS AND | INSTRUMENTS | DERIVATIVES | DERIVATIVES | |
| RISK | LIABILITIES LOCATION | LOCATION | FAIR VALUE | FAIR VALUE |
| Equity contracts | Receivable for futures | Futures* | $2,120 | ($613,335) |
| Foreign exchange | Receivable-payable for | Forward foreign | 2,198,621 | (935,801) |
| contracts | forward foreign | currency contracts | ||
| currency contracts | ||||
| Total | $2,200,741 | ($1,549,136) | ||
* Reflects cumulative appreciation/depreciation of futures as disclosed herein. Only the period end variation margin is separately disclosed on the Statement of assets and liabilities.
| 40 | International Core Fund | Semiannual report |
Effect of derivative instruments on the Statement of operations
The table below summarizes the net realized gain (loss) included in the net increase (decrease) in net assets from operations, classified by derivative instrument and risk category, for the six months ended August 31, 2013:
| FOREIGN | ||||
| STATEMENT OF | FUTURES | CURRENCY | ||
| RISK | OPERATIONS LOCATION | CONTRACTS | TRANSACTION* | TOTAL |
| Equity contracts | Net realized | $4,926,537 | — | $4,926,537 |
| gain (loss) | ||||
| Foreign exchange | Net realized | — | $3,472,499 | 3,472,499 |
| contracts | gain (loss) | |||
| Total | $4,926,537 | $3,472,499 | $8,399,036 | |
* Realized gain-loss associated with forward foreign currency contracts is included in the caption on the Statement of operations.
The table below summarizes the net change in unrealized appreciation (depreciation) included in the net increase (decrease) in net assets from operations, classified by derivative instrument and risk category, for the six months ended August 31, 2013:
| TRANSLATION | ||||
| OF ASSETS | ||||
| AND LIABILITIES | ||||
| STATEMENT OF | FUTURES | IN FOREIGN | ||
| RISK | OPERATIONS LOCATION | CONTRACTS | CURRENCIES* | TOTAL |
| Equity contracts | Change in unrealized | $401,648 | — | $401,648 |
| appreciation (depreciation) | ||||
| Foreign exchange | Change in unrealized | — | $790,595 | 790,595 |
| contracts | appreciation (depreciation) | |||
| Total | $401,648 | $790,595 | $1,192,243 | |
* Change in unrealized appreciation-depreciation associated with forward foreign currency contracts is included in the caption on the Statement of operations.
Note 4 — Guarantees and indemnifications
Under the Trust’s organizational documents, its Officers and Trustees are indemnified against certain liabilities arising out of the performance of their duties to the Trust, including the fund. Additionally, in the normal course of business, the fund enters into contracts with service providers that contain general indemnification clauses. The fund’s maximum exposure under these arrangements is unknown, as this would involve future claims that may be made against the fund that have not yet occurred. The risk of material loss from such claims is considered remote.
Note 5 — Fees and transactions with affiliates
John Hancock Investment Management Services, LLC (the Advisor) serves as investment advisor for the Trust. John Hancock Funds, LLC (the Distributor), an affiliate of the Advisor, serves as principal underwriter of the Trust. The Advisor and the Distributor are indirect, wholly owned subsidiaries of Manulife Financial Corporation (MFC).
Management fee. The fund has an investment management agreement with the Advisor under which the fund pays a daily management fee to the Advisor equivalent, on an annual basis, to the sum of: a) 0.920% of the first $100,000,000 of the fund’s average daily net assets; b) 0.895% of the next $900,000,000; c) 0.880% of the next $1,000,000,000; d) 0.850% of the next $1,000,000,000; e) 0.825% of the next $1,000,000,000; and f) 0.800% of the fund’s average daily net assets in excess of $4,000,000,000. The Advisor has a subadvisory agreement with Grantham, Mayo, Van Otterloo & Co. LLC. The fund is not responsible for payment of the subadvisory fees.
| Semiannual report | International Core Fund | 41 |
Effective June 1, 2013, the Advisor has contractually agreed to waive a portion of its management fee for certain funds (the Participating portfolios) of the Trust, John Hancock Funds, John Hancock Funds II and John Hancock Variable Insurance Trust. The waiver equals, on an annualized basis, 0.01% of that portion of the aggregate net assets of all the Participating portfolios that exceeds $75 billion but is less than or equal to $125 billion; 0.0125% of that portion of the aggregate net assets of all the Participating portfolios that exceeds $125 billion but is less than or equal to $150 billion; and 0.015% of that portion of the aggregate net assets of all the Participating portfolios that exceeds $150 billion. The amount of the reimbursement is calculated daily and allocated among all the Participating portfolios in proportion to the daily net assets of each fund. This arrangement may be amended or terminated at any time by the Advisor upon notice to the fund and with the approval of the Board of Trustees.
The Advisor has contractually agreed to waive fees and/or reimburse certain expenses for each share class of the fund. This agreement excludes certain expenses such as taxes, brokerage commissions, interest expense, litigation and indemnification expenses and other extraordinary expenses not incurred in the ordinary course of the fund’s business, acquired fund fees and expenses paid indirectly and short dividend expense. The fee waivers and/or reimbursements are such that these expenses will not exceed 1.60%, 2.30%, 2.30%, 1.90%, 1.65%, 1.80%, 1.40%, 1.20% and 1.12% for Class A, Class B, Class C, Class R1, Class R2, Class R3, Class R4, Class R5 and Class R6 shares, respectively. These expense limitations will remain in effect through June 30, 2014, unless renewed by mutual agreement of the fund and the Advisor based upon a determination that this is appropriate under the circumstances at the time.
Accordingly, these expense reductions amounted to $1,170, $7,473, $6,275, $6,090, $6,642, $6,086, $6,996, $7,014, $7,048, $7,968, $538 and $9,559 for Class A, Class B, Class C, Class I, Class R1, Class R2, Class R3, Class R4, Class R5, Class R6, Class 1 and Class NAV shares, respectively, for the six months ended August 31, 2013.
The investment management fees incurred for the six months ended August 31, 2013 were equivalent to a net annual effective rate of 0.88% of the fund’s average daily net assets.
Accounting and legal services. Pursuant to a service agreement, the fund reimburses the Advisor for all expenses associated with providing the administrative, financial, legal, accounting and recordkeeping services to the fund, including the preparation of all tax returns, periodic reports to shareholders and regulatory reports, among other services. These expenses are allocated to each share class based on its relative net assets at the time the expense was incurred. These accounting and legal services fees incurred for the six months ended August 31, 2013 amounted to an annual rate of 0.02% of the fund’s average daily net assets.
Distribution and service plans. The fund has a distribution agreement with the Distributor. The fund has adopted distribution and service plans with respect to Class A, Class B, Class C, Class R1, Class R2, Class R3, Class R4, Class R5 and Class 1 shares pursuant to Rule 12b-1 under the 1940 Act, to pay the Distributor for services provided as the distributor of shares of the fund. In addition, under a service plan for Class R1, Class R2, Class R3, Class R4 and Class R5 shares, the fund pays for certain other services. The fund pays up to the following contractual rates of distribution and service fees under these arrangements, expressed as an annual percentage of average daily net assets for each class of the fund’s shares.
| 42 | International Core Fund | Semiannual report |
| CLASS | RULE 12b-1 FEE | SERVICE FEE | ||||
| Class A | 0.30% | — | ||||
| Class B | 1.00% | — | ||||
| Class C | 1.00% | — | ||||
| Class R1 | 0.50% | 0.25% | ||||
| Class R2 | 0.25% | 0.25% | ||||
| Class R3 | 0.50% | 0.15% | ||||
| Class R41 | 0.25% | 0.10% | ||||
| Class R5 | — | 0.05% | ||||
| Class 1 | 0.05% | — | ||||
1 The Distributor has contractually agreed to waive 0.10% of 12b-1 fees for Class R4 shares to limit the 12b-1 fees on Class R4 shares to 0.15% of the average daily net assets of Class R4 shares, until at least June 30, 2014, unless renewed by mutual agreement of the fund and the Distributor based upon a determination that this is appropriate under the circumstances at the time. Accordingly, the fee limitation amounted to $30 for Class R4 shares for the period ended August 31, 2013.
Sales charges. Class A shares are assessed up-front sales charges, which resulted in payments to the Distributor amounting to $274,346 for the six months ended August 31, 2013. Of this amount, $46,919 was retained and used for printing prospectuses, advertising, sales literature and other purposes, $224,511 was paid as sales commissions to broker-dealers and $2,916 was paid as sales commissions to sales personnel of Signator Investors, Inc., a broker-dealer affiliate of the Advisor.
Class A, Class B and Class C shares may be subject to contingent deferred sales charges (CDSCs). Certain Class A shares that are acquired through purchases of $1 million or more and are redeemed within one year of purchase are subject to a 1.00% sales charge. Class B shares that are redeemed within six years of purchase are subject to CDSCs, at declining rates, beginning at 5.00%. Class C shares that are redeemed within one year of purchase are subject to a 1.00% CDSC. CDSCs are applied to the lesser of the current market value at the time of redemption or the original purchase cost of the shares being redeemed. Proceeds from CDSCs are used to compensate the Distributor for providing distribution-related services in connection with the sale of these shares. During the six months ended August 31, 2013, CDSCs received by the Distributor amounted to $1,131 and $291 for Class B and Class C shares, respectively. The fund did not pay CDSCs for Class A shares.
Transfer agent fees. The fund has a transfer agent agreement with John Hancock Signature Services, Inc. (Signature Services), an affiliate of the Advisor. The transfer agent fees paid to Signature Services are determined based on the cost to Signature Services (Signature Services Cost) of providing recordkeeping services. The Signature Services Cost includes a component of allocated John Hancock corporate overhead for providing transfer agent services to the fund and to all other John Hancock affiliated funds. It also includes out-of-pocket expenses that are comprised of payments made to third-parties for recordkeeping services provided to their clients who invest in one or more John Hancock funds. In addition, Signature Services Cost may be reduced by certain fees that Signature Services receives in connection with retirement and small accounts. Signature Services Cost is calculated monthly and allocated, as applicable, to four categories of share classes: Institutional Share Classes, Retirement Share Classes, Municipal Bond Classes and all other Retail Share Classes. Within each of these categories, the applicable costs are allocated to the affected John Hancock affiliated funds and/or classes, based on the relative average daily net assets.
| Semiannual report | International Core Fund | 43 |
Class level expenses. Class level expenses for the six months ended August 31, 2013 were:
| DISTRIBUTION | TRANSFER | STATE | ||
| CLASS | AND SERVICE FEES | AGENT FEES | REGISTRATION FEES | |
| Class A | $135,631 | $67,607 | $17,799 | |
| Class B | 15,461 | 2,301 | 7,710 | |
| Class C | 23,188 | 3,463 | 7,442 | |
| Class I | — | 227,153 | 29,917 | |
| Class R1 | 853 | 41 | 7,045 | |
| Class R2 | 139 | 14 | 6,162 | |
| Class R3 | 156 | 7 | 7,026 | |
| Class R4 | 84 | 7 | 7,026 | |
| Class R5 | 13 | 11 | 7,026 | |
| Class R6 | — | 15 | 7,864 | |
| Class 1 | 9,906 | — | — | |
| Total | $185,431 | $300,619 | $105,017 | |
Trustee expenses. The fund compensates each Trustee who is not an employee of the Advisor or its affiliates. The costs of paying Trustee compensation and expenses are allocated to the fund based on its net assets relative to other fund’s within the John Hancock funds complex.
Note 6 — Fund share transactions
Transactions in fund shares for the six months ended August 31, 2013 and for the year ended February 28, 2013 were as follows:
| Six months ended 8-31-13 | Year ended 2-28-13 | |||
| Shares | Amount | Shares | Amount | |
| Class A shares | ||||
| Sold | 545,220 | $16,442,282 | 4,184,895 | $113,473,414 |
| Distributions reinvested | — | — | 92,891 | 2,589,802 |
| Repurchased | (1,005,143) | (31,156,315) | (14,607,121) | (395,841,939) |
| Net decrease | (459,923) | ($14,714,033) | (10,329,335) | ($279,778,723) |
| Class B shares | ||||
| Sold | 5,361 | $161,195 | 16,963 | $453,201 |
| Distributions reinvested | — | — | 2,780 | 77,294 |
| Repurchased | (17,302) | (519,833) | (43,400) | (1,182,374) |
| Net decrease | (11,941) | ($358,638) | (23,657) | ($651,879) |
| Class C shares | ||||
| Sold | 22,692 | $687,545 | 26,519 | $731,362 |
| Distributions reinvested | — | — | 3,511 | 97,597 |
| Repurchased | (19,086) | (569,111) | (35,376) | (961,865) |
| Net increase (decrease) | 3,606 | $118,434 | (5,346) | ($132,906) |
| Class I shares | ||||
| Sold | 2,529,980 | $76,806,441 | 8,474,389 | $232,106,900 |
| Distributions reinvested | — | — | 666,942 | 18,627,692 |
| Repurchased | (1,389,426) | (42,436,822) | (10,366,118) | (294,915,181) |
| Net increase (decrease) | 1,140,554 | $34,369,619 | (1,224,787) | ($44,180,589) |
| 44 | International Core Fund | Semiannual report |
| Six months ended 8-31-13 | Year ended 2-28-13 | |||
| Shares | Amount | Shares | Amount | |
| Class R1 shares | ||||
| Sold | 1,244 | $36,328 | 2,046 | $56,945 |
| Distributions reinvested | — | — | 302 | 8,398 |
| Repurchased | (217) | (6,767) | (968) | (27,733) |
| Net increase | 1,027 | $29,561 | 1,380 | $37,610 |
| Class R2 shares1 | ||||
| Sold | 151 | $4,707 | 3,597 | $100,000 |
| Net increase | 151 | $4,707 | 3,597 | $100,000 |
| Class R3 shares | ||||
| Sold | 1,167 | $35,050 | 135 | $3,372 |
| Distributions reinvested | — | — | 4 | 118 |
| Repurchased | (7) | (223) | — | — |
| Net increase | 1,160 | $34,827 | 139 | $3,490 |
| Class R4 shares | ||||
| Sold | 1,137 | $34,761 | 116 | $3,182 |
| Distributions reinvested | — | — | 10 | 266 |
| Repurchased | (2) | (50) | — | — |
| Net increase | 1,135 | $34,711 | 126 | $3,448 |
| Class R5 shares | ||||
| Sold | 259 | $7,783 | 408 | $10,959 |
| Distributions reinvested | — | — | 59 | 1,655 |
| Repurchased | (68) | (2,077) | (260) | (7,099) |
| Net increase | 191 | $5,706 | 207 | $5,515 |
| Class R6 shares | ||||
| Sold | 102 | $3,114 | 217 | $6,070 |
| Distributions reinvested | — | — | 5 | 135 |
| Repurchased | (1) | (19) | — | — |
| Net increase | 101 | $3,095 | 222 | $6,205 |
| Class 1 shares | ||||
| Sold | 64,678 | $1,955,131 | 75,968 | $2,070,732 |
| Distributions reinvested | — | — | 48,585 | 1,358,914 |
| Repurchased | (88,951) | (2,695,608) | (237,152) | (6,491,709) |
| Net decrease | (24,273) | ($740,477) | (112,599) | ($3,062,063) |
| Class NAV shares | ||||
| Sold | 1,944,728 | $58,378,519 | 4,217,064 | $112,431,436 |
| Distributions reinvested | — | — | 786,663 | 21,987,219 |
| Repurchased | (4,276) | (129,352) | (10,977,300) | (285,469,815) |
| Net increase (decrease) | 1,940,452 | $58,249,167 | (5,973,573) | ($151,051,160) |
| Total net increase (decrease) | 2,592,240 | $77,036,679 | (17,663,626) | ($478,701,052) |
1 The inception date for Class R2 shares is 3-1-12.
Affiliates of the Fund owned 32%, 96%, 45%, 43%, 36%, 92% and 100% of shares of beneficial interest of Class R1, Class R2, Class R3, Class R4, Class R5, Class R6 and Class NAV, respectively, on August 31, 2013.
| Semiannual report | International Core Fund | 45 |
Note 7 — Purchase and sale of securities
Purchases and sales of securities, other than short-term securities, amounted to $389,695,875 and $274,633,079, respectively, for the six months ended August 31, 2013.
Note 8 — Investment by affiliated funds
Certain investors in the fund are affiliated funds that are managed by the Advisor and its affiliates. The affiliated funds do not invest in the fund for the purpose of exercising management or control; however, the investment may represent a significant portion of the fund’s net assets. At August 31, 2013, funds within the John Hancock funds complex held 54.9% of the fund. The following funds had an affiliate ownership of 5% or more of the fund’s net assets:
| AFFILIATE | ||
| FUND | CONCENTRATION | |
| John Hancock Lifestyle Growth Portfolio | 20.0% | |
| John Hancock Lifestyle Balanced Portfolio | 16.5% | |
| John Hancock Lifestyle Aggressive Portfolio | 8.5% | |
| 46 | International Core Fund | Semiannual report |
Evaluation of Advisory and Subadvisory Agreements by the Board of Trustees
This section describes the evaluation by the Board of Trustees (the Board) of John Hancock Funds III (the Trust) of the Advisory Agreement (the Advisory Agreement) with John Hancock Investment Management Services, LLC (the Advisor) and the Subadvisory Agreement (the Subadvisory Agreement) with Grantham, Mayo, Van Otterloo & Co. LLC (the Subadvisor) for John Hancock International Core Fund (the fund). The Advisory Agreement and Subadvisory Agreement are collectively referred to as the Agreements.
Approval of Advisory and Subadvisory Agreements
At in-person meetings held on May 16–17, 2013, the Board, including the Trustees who are not considered to be interested persons of the Trust under the Investment Company Act of 1940, as amended (the 1940 Act) (the Independent Trustees), reapproved for an annual period the continuation of the Advisory Agreement between the Trust and the Advisor and the Subadvisory Agreement between the Advisor and the Subadvisor with respect to the fund.
In considering the Advisory Agreement and the Subadvisory Agreement, the Board received in advance of the meeting a variety of materials relating to the fund, the Advisor, and the Subadvisor, including comparative performance, fee and expense information for peer groups of similar mutual funds prepared by an independent third-party provider of mutual fund data; performance information for the fund’s benchmark index; and, with respect to the Subadvisor, comparative performance information for comparably managed accounts; and other information provided by the Advisor and the Subadvisor regarding the nature, extent, and quality of services provided by the Advisor and the Subadvisor under their respective Agreements, as well as information regarding the Advisor’s revenues and costs of providing services to the fund and any compensation paid to affiliates of the Advisor. At the meeting at which the renewal of the Advisory Agreement and Subadvisory Agreement is considered, particular focus is given to information concerning fund performance, comparability of fees and total expenses and profitability. However, the Board notes that the evaluation process with respect to the Advisor and the Subadvisor is an ongoing one. In this regard, the Board also took into account discussions with management and information provided to the Board at prior meetings with respect to the services provided by the Advisor and the Subadvisor to the fund, including quarterly performance reports prepared by management containing reviews of investment results and prior presentations from the Subadvisor with respect to the fund. The Board also considered the nature, quality, and extent of non-advisory services, if any, to be provided to the fund by the Advisor’s affiliates, including distribution services.
Throughout the process, the Board asked questions of and requested additional information from management. The Board is assisted by counsel for the Trust and the Independent Trustees are also separately assisted by independent legal counsel throughout the process. The Independent Trustees also received a memorandum from their independent counsel discussing the legal standards for their consideration of the proposed continuation of the Agreements and discussed the proposed continuation of the Agreements in private sessions with their independent legal counsel at which no representatives of management were present.
Approval of Advisory Agreement
In approving the Advisory Agreement with respect to the fund, the Board, including the Independent Trustees, considered a variety of factors, including those discussed below. The Board also considered other factors (including conditions and trends prevailing generally in the economy, the securities markets, and the industry) and does not treat any single factor as determinative and each Trustee may attribute different weights to different factors. The Board’s conclusions may be based in part on its consideration of the Advisory and Subadvisory Agreements in prior years and on the Board’s ongoing regular review of fund performance and operations throughout the year.
| Semiannual report | International Core Fund | 47 |
Nature, extent, and quality of services. Among the information received by the Board from the Advisor relating to the nature, extent, and quality of services provided to the fund, the Board reviewed information provided by the Advisor relating to its operations and personnel, descriptions of its organizational and management structure, and information regarding the Advisor’s compliance and regulatory history, including its Form ADV. The Board also noted that on a regular basis it receives and reviews information from the Trust’s Chief Compliance Officer (CCO) regarding the fund’s compliance policies and procedures established pursuant to Rule 38a-1 under the 1940 Act. The Board also considered the Advisor’s risk management processes. The Board considered that the Advisor is responsible for the management of the day-to-day operations of the fund, including, but not limited to, general supervision of and coordination of the services provided by the Subadvisor, and is also responsible for monitoring and reviewing the activities of the Subadvisor and other third-party service providers.
In considering the nature, extent, and quality of the services provided by the Advisor, the Trustees also took into account their knowledge of the Advisor’s management and the quality of the performance of the Advisor’s duties through Board meetings, discussions, and reports during the preceding year and through each Trustee’s experience as a Trustee of the Trust and of the other trusts in the complex.
In the course of their deliberations regarding the Advisory Agreement, the Board considered, among other things:
(a) the skills and competency with which the Advisor has in the past managed the Trust’s affairs and its subadvisory relationship, the Advisor’s oversight and monitoring of the Subadvisor’s investment performance and compliance programs, such as the Subadvisor’s compliance with fund policies and objective; review of brokerage matters, including with respect to trade allocation and best execution; and the Advisor’s timeliness in responding to performance issues;
(b) the background, qualifications and skills of the Advisor’s personnel;
(c) the Advisor’s compliance policies and procedures and its responsiveness to regulatory changes and mutual fund industry developments;
(d) the Advisor’s administrative capabilities, including its ability to supervise the other service providers for the fund;
(e) the financial condition of the Advisor and whether it has the financial wherewithal to provide a high level and quality of services to the fund; and
(f) the Advisor’s reputation and experience in serving as an investment adviser to the Trust and the benefit to shareholders of investing in funds that are part of a family of funds offering a variety of investments.
The Board concluded that the Advisor may reasonably be expected to continue to provide a high quality of services under the Advisory Agreement with respect to the fund.
Investment performance. In considering the fund’s performance, the Board noted that it reviews at its regularly scheduled meetings information about the fund’s performance results. In connection with the consideration of the Advisory Agreement, the Board:
(a) reviewed information prepared by management regarding the fund’s performance;
(b) considered the comparative performance of the fund’s benchmark;
| 48 | International Core Fund | Semiannual report |
(c) considered the performance of comparable funds, if any, as included in the report prepared by an independent third-party provider of mutual fund data. Such report included the fund’s ranking within a smaller group of peer funds and the fund’s ranking within broader groups of funds; and
(d) took into account the Advisor’s analysis of the fund’s performance and its plans and recommendations regarding the Trust’s subadvisory arrangements generally.
The Board noted that the fund underperformed its benchmark index for the one- and five-year periods and outperformed the index for the three-year period ended December 31, 2012. The Board noted also that the fund underperformed its peer group average for the one- and five-year periods and outperformed the average for the three-year period ended December 31, 2012.
The Board took into account management’s discussion of the fund’s performance, including the impact of market conditions on the Subadvisor’s investment style. The Board also noted the difference between the investment strategy of the fund and those of its peer group.
The Board concluded that the fund’s performance is being monitored and reasonably addressed.
Fees and expenses. The Board reviewed comparative information prepared by an independent third-party provider of mutual fund data, including, among other data, the fund’s contractual and net management fees and total expenses as compared to similarly situated investment companies deemed to be comparable to the fund. The Board considered the fund’s ranking within a smaller group of peer funds chosen by the independent third-party provider, as well as the fund’s ranking within a broader group of funds. In comparing the fund’s contractual and net management fees to those of comparable funds, the Board noted that such fees include both advisory and administrative costs.
The Board noted that net management fees for this fund are higher than the peer group median and that total expenses for this fund are equal to the peer group median. The Board took into account management’s discussion of the fund’s expenses.
The Board took into account management’s discussion with respect to the advisory/subadvisory fee structure, including the amount of the advisory fee retained by the Advisor after payment of the subadvisory fee. The Board also took into account that management had agreed to implement an overall fee waiver across a number of funds in the complex, including the fund, which is discussed further below. The Board also noted that, in addition, the Advisor is currently waiving fees and/or reimbursing expenses with respect to the fund. The Board also noted that the Advisor pays the subadvisory fees of the fund, and that such fees are negotiated at arm’s length with respect to the Subadvisor. The Board also noted management’s discussion of the fund’s expenses, as well as certain actions taken over the past several years to reduce the fund’s operating expenses. The Board reviewed information provided by the Advisor concerning investment advisory fees charged to other clients (including other funds in the complex) having similar investment mandates, if any. The Board considered any differences between the Advisor’s and Subadvisor’s services to the fund and the services they provide to other comparable clients or funds. The Board concluded that the advisory fee paid with respect to the fund is reasonable.
Profitability/indirect benefits. In considering the costs of the services to be provided and the profits to be realized by the Advisor and its affiliates from the Advisor’s relationship with the Trust, the Board:
(a) reviewed financial information of the Advisor;
(b) reviewed and considered an analysis presented by the Advisor regarding the net profitability to the Advisor and its affiliates with respect to the fund;
| Semiannual report | International Core Fund | 49 |
(c) received and reviewed profitability information with respect to the John Hancock fund complex as a whole;
(d) received information with respect to the Advisor’s allocation methodologies used in preparing the profitability data;
(e) considered that the Advisor also provides administrative services to the fund on a cost basis pursuant to an administrative services agreement;
(f) noted that affiliates of the Advisor provide transfer agency services and distribution services to the fund, and that the Trust’s distributor also receives Rule 12b-1 payments to support distribution of the fund;
(g) noted that the Advisor also derives reputational and other indirect benefits from providing advisory services to the fund;
(h) noted that the subadvisory fees for the fund are paid by the and are negotiated at arm’s length; and
(i) considered that the Advisor should be entitled to earn a reasonable level of profits in exchange for the level of services it provides to the fund and the entrepreneurial risk that it assumes as Advisor.
Based upon its review, the Board concluded that the level of profitability, if any, of the Advisor and its affiliates from their relationship with the fund was reasonable and not excessive.
Economies of scale. In considering the extent to which economies of scale would be realized as the fund grows and whether fee levels reflect these economies of scale for the benefit of fund shareholders, the Board:
(a) considered that the Advisor has agreed, effective June 1, 2013, to waive its management fee for the fund and each of the open-end funds of John Hancock Funds II, John Hancock Funds III, each other John Hancock fund (except those listed below) (the Participating Portfolios) or otherwise reimburse the expenses of the Participating Portfolios as follows (the Reimbursement):
The Reimbursement shall equal, on an annualized basis, 0.01% of that portion of the aggregate net assets of all the Participating Portfolios that exceeds $75 billion but is less than or equal to $125 billion, 0.0125% of that portion of the aggregate net assets of all the Participating Portfolios that exceeds $125 billion but is less than or equal to $150 billion and 0.015% of that portion of the aggregate net assets of all the Participating Portfolios that exceeds $150 billion. (The funds that are not Participating Portfolios as of the date of this semiannual report are each of the fund of funds, money market funds, index funds and closed-end funds);
(b) reviewed the Trust’s advisory fee structure and the incorporation therein of any subadvisory fee breakpoints in the advisory fees charged and concluded that (i) the fund’s fee structure contains breakpoints at the subadvisory fee level and that such breakpoints are reflected as breakpoints in the advisory fees for the fund and (ii) although economies of scale cannot be measured with precision, these arrangements permit shareholders of the fund to benefit from economies of scale if the fund grows. The Board also took into account management’s discussion of the fund’s advisory fee structure; and
(c) the Board also considered the effect of the fund’s growth in size on its performance and fees. The Board also noted that if the fund’s assets increase over time, the fund may realize other economies of scale.
| 50 | International Core Fund | Semiannual report |
Approval of Subadvisory Agreement
In making its determination with respect to approval of the Subadvisory Agreement, the Board reviewed:
(1) information relating to the Subadvisor’s business, including current subadvisory services to the Trust (and other funds in the John Hancock family of funds);
(2) the historical and current performance of the fund, and comparative performance information relating to the fund’s benchmark and comparable funds;
(3) the subadvisory fee for the fund, including any breakpoints, and comparative fee information, where available, prepared by an independent third-party provider of mutual fund data; and
(4) information relating to the nature and scope of any material relationships and their significance to the Trust’s Advisor and Subadvisor.
Nature, extent, and quality of services. With respect to the services provided by the Subadvisor, the Board received information provided to the Board by the Subadvisor, including the Subadvisor’s Form ADV, as well as took into account information presented throughout the past year. The Board considered the Subadvisor’s current level of staffing and its overall resources, as well as received information relating to the Subadvisor’s compensation program. The Board reviewed the Subadvisor’s history and investment experience, as well as information regarding the qualifications, background, and responsibilities of the Subadvisor’s investment and compliance personnel who provide services to the fund. The Board also considered, among other things, the Subadvisor’s compliance program and any disciplinary history. The Board also considered the Subadvisor’s risk assessment and monitoring process. The Board reviewed the Subadvisor’s regulatory history, including whether it was currently involved in any regulatory actions or investigations as well as material litigation, and any settlements and amelioratory actions undertaken, as appropriate. The Board noted that the Advisor conducts regular, periodic reviews of the Subadvisor and its operations, including regarding investment processes and organizational and staffing matters. The Board also noted that the Trust’s CCO and his staff conduct regular, periodic compliance reviews with the Subadvisor and present reports to the Independent Trustees regarding the same, which includes evaluating the regulatory compliance systems of the Subadvisor and procedures reasonably designed by it to assure compliance with the federal securities laws. The Board also took into account the financial condition of the Subadvisor.
The Board considered the Subadvisor’s investment process and philosophy. The Board took into account that the Subadvisor’s responsibilities include the development and maintenance of an investment program for the fund, that is consistent with the fund’s investment objective, the selection of investment securities and the placement of orders for the purchase and sale of such securities, as well as the implementation of compliance controls related to performance of these services. The Board also received information with respect to the Subadvisor’s brokerage policies and practices, including with respect to best execution and soft dollars.
Subadvisor compensation. In considering the cost of services to be provided by the Subadvisor and the profitability to the Subadvisor of its relationship with the fund, the Board noted that the fees under the Subadvisory Agreement are paid by the Advisor and not the fund.
The Board also relied on the ability of the Advisor to negotiate the Subadvisory Agreement with the Subadvisor, which is not affiliated with the Advisor, and the fees thereunder at arm’s length. As a result, the costs of the services to be provided and the profits to be realized by the Subadvisor from its relationship with the Trust were not a material factor in the Board’s consideration of the Subadvisory Agreement.
| Semiannual report | International Core Fund | 51 |
The Board also received information regarding the nature and scope (including their significance to the Advisor and its affiliates and to the Subadvisor) of any material relationships with respect to the Subadvisor, which includes arrangements in which the Subadvisor or its affiliates provide advisory, distribution, or management services in connection with financial products sponsored by the Trust’s Advisor or its affiliates, and may include other registered investment companies, a 529 education savings plan, managed separate account, and exempt group annuity contracts sold to qualified plans. The Board also received information and took into account any other potential conflicts of interest the Advisor might have in connection with the Subadvisory Agreement.
In addition, the Board considered other potential indirect benefits that the Subadvisor and its affiliates may receive from the Subadvisor’s relationship with the fund, such as the opportunity to provide advisory services to additional funds in the John Hancock fund complex and reputational benefits.
Subadvisory fees. The Board considered that the fund pays an advisory fee to the Advisor and that, in turn, the Advisor pays a subadvisory fee to the Subadvisor. The Board also took into account the subadvisory fees paid by the Advisor to the Subadvisor with respect to the fund to fees charged by the fund’s Subadvisor to manage other subadvised portfolios and portfolios not subject to regulation under the 1940 Act, as applicable.
Subadvisor performance. As noted above, the Board considered the fund’s performance as compared to the fund’s peer group and benchmark and noted that the Board reviews information about the fund’s performance results at its regularly scheduled meetings. The Board noted the Advisor’s expertise and resources in monitoring the performance, investment style, and risk-adjusted performance of the Subadvisor. The Board was mindful of the Advisor’s focus on the Subadvisor’s performance. The Board also noted the Subadvisor’s long-term performance record for similar accounts, as applicable.
The Board’s decision to approve the Subadvisory Agreement was based on a number of determinations, including the following:
(1) The Subadvisor has extensive experience and demonstrated skills as a manager;
(2) The performance of the fund is being monitored and reasonably addressed;
(3) The subadvisory fees are reasonable in relation to the level and quality of services being provided; and
(4) Subadvisory fee breakpoints are reflected as breakpoints in the advisory fees for the fund in order to permit shareholders to benefit from economies of scale if the fund grows.
| * * * |
Based on the Board’s evaluation of all factors that the Board deemed to be material, including those factors described above, the Board, including the Independent Trustees, concluded that renewal of the Advisory Agreement and the Subadvisory Agreement would be in the best interest of the fund and its shareholders. Accordingly, the Board, and the Independent Trustees voting separately, approved the Advisory Agreement and Subadvisory Agreement for an additional one-year period.
| 52 | International Core Fund | Semiannual report |
More information
| Trustees | Investment advisor |
| James M. Oates, Chairman | John Hancock Investment Management |
| Steven R. Pruchansky, Vice Chairman | Services, LLC |
| Charles L. Bardelis* | |
| James R. Boyle† | Subadvisor |
| Craig Bromley† | Grantham, Mayo, Van Otterloo & Co. LLC |
| Peter S. Burgess* | |
| William H. Cunningham | Principal distributor |
| Grace K. Fey | John Hancock Funds, LLC |
| Theron S. Hoffman* | |
| Deborah C. Jackson | Custodian |
| Hassell H. McClellan | State Street Bank and Trust Company |
| Gregory A. Russo | |
| Warren A. Thomson† | Transfer agent |
| John Hancock Signature Services, Inc. | |
| Officers | |
| Hugh McHaffie | Legal counsel |
| President | K&L Gates LLP |
| Andrew G. Arnott | |
| Executive Vice President | |
| Thomas M. Kinzler | |
| Secretary and Chief Legal Officer | |
| Francis V. Knox, Jr. | |
| Chief Compliance Officer | |
| Charles A. Rizzo | |
| Chief Financial Officer | |
| Salvatore Schiavone | |
| Treasurer | |
| *Member of the Audit Committee | |
| †Non-Independent Trustee | |
The fund’s proxy voting policies and procedures, as well as the fund’s proxy voting record for the most recent twelve-month period ended June 30, are available free of charge on the Securities and Exchange Commission (SEC) website at sec.gov or on our website.
The fund’s complete list of portfolio holdings, for the first and third fiscal quarters, is filed with the SEC on Form N-Q. The fund’s Form N-Q is available on our website and the SEC’s website, sec.gov, and can be reviewed and copied (for a fee) at the SEC’s Public Reference Room in Washington, DC. Call 800-SEC-0330 to receive information on the operation of the SEC’s Public Reference Room.
We make this information on your fund, as well as monthly portfolio holdings, and other fund details available on our website at jhinvestments.com or by calling 800-225-5291.
| You can also contact us: | ||
| 800-225-5291 | Regular mail: | Express mail: |
| jhinvestments.com | Investment Operations | Investment Operations |
| John Hancock Signature Services, Inc. | John Hancock Signature Services, Inc. | |
| P.O. Box 55913 | 30 Dan Road | |
| Boston, MA 02205-5913 | Canton, MA 02021 |
| Semiannual report | International Core Fund | 53 |

800-225-5291
800-338-8080 EASI-Line
jhinvestments.com

| This report is for the information of the shareholders of John Hancock International Core Fund. | |
| It is not authorized for distribution to prospective investors unless preceded or accompanied by a prospectus. | 66SA 8/13 |
| MF159388 | 10/13 |
A look at performance
Total returns for the period ended August 31, 2013
| Average annual total returns (%) | Cumulative total returns (%) | ||||||||
| with maximum sales charge | with maximum sales charge | ||||||||
| 1-year | 5-year | 10-year | Since inception1 | 6-months | 1-year | 5-year | 10-year | Since inception1 | |
| Class A | 11.22 | 2.57 | — | 3.80 | –1.07 | 11.22 | 13.52 | — | 30.97 |
| Class B | 11.15 | 2.50 | — | 3.77 | –1.28 | 11.15 | 13.12 | — | 30.66 |
| Class C | 15.23 | 2.84 | — | 3.75 | 2.78 | 15.23 | 15.03 | — | 30.50 |
| Class I2 | 17.50 | 4.05 | — | 4.98 | 4.32 | 17.50 | 21.99 | — | 42.11 |
| Class 12 | 17.56 | 4.09 | — | 5.02 | 4.37 | 17.56 | 22.21 | — | 42.48 |
| Index 1† | 18.63 | 2.34 | — | 3.80 | 3.92 | 18.63 | 12.27 | — | 30.92 |
| Index 2† | 19.17 | 2.11 | — | 2.95 | 4.05 | 19.17 | 10.98 | — | 23.36 |
Performance figures assume all distributions are reinvested. Figures reflect maximum sales charges on Class A shares of 5%, and the applicable contingent deferred sales charge (CDSC) on Class B and Class C shares. The Class B shares’ CDSC declines annually between years 1 to 6 according to the following schedule: 5, 4, 3, 3, 2, 1%. No sales charge will be assessed after the sixth year. Class C shares held for less than one year are subject to a 1% CDSC. Sales charges are not applicable to Class I and Class 1 shares.
The expense ratios of the fund, both net (including any fee waivers or expense limitations) and gross (excluding any fee waivers or expense limitations), are set forth according to the most recent publicly available prospectuses for the fund and may differ from those disclosed in the Financial highlights tables in this report. The fee waivers and expense limitations are contractual at least until 6-30-14 for Class A, Class B, Class C, Class I, and Class 1 shares. Had the fee waivers and expense limitations not been in place, gross expenses would apply. The expense ratios are as follows:
| Class A | Class B | Class C | Class I | Class 1 | |
| Net (%) | 1.60 | 2.30 | 2.30 | 1.24 | 1.15 |
| Gross (%) | 1.68 | 3.92 | 3.32 | 1.27 | 1.19 |
The returns reflect past results and should not be considered indicative of future performance. The return and principal value of an investment will fluctuate so that shares, when redeemed, may be worth more or less than their original cost. Due to market volatility, the fund’s current performance may be higher or lower than the performance shown. For current to the most recent month-end performance data, please call 800-225-5291 or visit the fund’s website at jhinvestments.com.
The performance table above and the chart on the next page do not reflect the deduction of taxes that a shareholder would pay on fund distributions or the redemption of fund shares. The fund’s performance results reflect any applicable fee waivers or expense reductions, without which the expenses would increase and results would have been less favorable.
† Index 1 is the MSCI EAFE Growth Index; Index 2 is the MSCI EAFE Index.
See the following page for footnotes.
| 6 | International Growth Fund | Semiannual report |
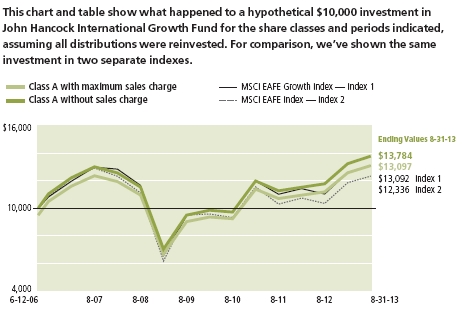
| With maximum | Without | ||||
| Start date | sales charge | sales charge | Index 1 | Index 2 | |
| Class B3 | 6-12-06 | $13,072 | $13,072 | $13,092 | $12,336 |
| Class C3 | 6-12-06 | 13,050 | 13,050 | 13,092 | 12,336 |
| Class I2 | 6-12-06 | 14,211 | 14,211 | 13,092 | 12,336 |
| Class 12 | 6-12-06 | 14,248 | 14,248 | 13,092 | 12,336 |
MSCI EAFE Index (gross of foreign withholding tax on dividends) is a free float-adjusted market capitalization index that is designed to measure the equity market performance of developed markets, excluding the U.S. and Canada. The index consists of 21 developed market country indexes.
MSCI EAFE Growth Index (gross of foreign withholding tax on dividends) is a free float-adjusted market capitalization index that is designed to measure the performance of growth-oriented developed market stocks within Europe, Australasia, and the Far East. The index consists of 21 developed market country indexes.
It is not possible to invest directly in an index. Index figures do not reflect expenses or sales charges, which would have resulted in lower values.
Footnotes related to performance pages
1 From 6-12-06.
2 For certain types of investors, as described in the fund’s prospectuses.
3 The contingent deferred sales charge is not applicable.
| Semiannual report | International Growth Fund | 7 |
Your expenses
These examples are intended to help you understand your ongoing operating expenses of investing in the fund so you can compare these costs with the ongoing costs of investing in other mutual funds.
Understanding fund expenses
As a shareholder of the fund, you incur two types of costs:
■ Transaction costs, which include sales charges (loads) on purchases or redemptions (varies by share class), minimum account fee charge, etc.
■ Ongoing operating expenses, including management fees, distribution and service fees (if applicable), and other fund expenses.
We are going to present only your ongoing operating expenses here.
Actual expenses/actual returns
This example is intended to provide information about the fund’s actual ongoing operating expenses and is based on the fund’s actual return. It assumes an account value of $1,000.00 on March 1, 2013, with the same investment held until August 31, 2013.
| Account value | Ending value | Expenses paid during | |
| on 3-1-13 | on 8-31-13 | period ended 8-31-131 | |
| Class A | $1,000.00 | $1,041.40 | $8.03 |
| Class B | 1,000.00 | 1,037.20 | 11.81 |
| Class C | 1,000.00 | 1,037.80 | 11.81 |
| Class I | 1,000.00 | 1,043.20 | 6.13 |
| Class 1 | 1,000.00 | 1,043.70 | 5.77 |
Together with the value of your account, you may use this information to estimate the operating expenses that you paid over the period. Simply divide your account value at August 31, 2013, by $1,000.00, then multiply it by the “expenses paid” for your share class from the table above. For example, for an account value of $8,600.00, the operating expenses should be calculated as follows:
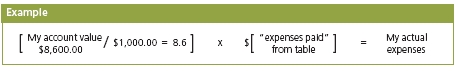
| 8 | International Growth Fund | Semiannual report |
Hypothetical example for comparison purposes
This table allows you to compare the fund’s ongoing operating expenses with those of any other fund. It provides an example of the fund’s hypothetical account values and hypothetical expenses based on each class’s actual expense ratio and an assumed 5% annualized return before expenses (which is not the fund’s actual return). It assumes an account value of $1,000.00 on March 1, 2013, with the same investment held until August 31, 2013. Look in any other fund shareholder report to find its hypothetical example and you will be able to compare these expenses. Please remember that these hypothetical account values and expenses may not be used to estimate the actual ending account balance or expenses you paid for the period.
| Account value | Ending value | Expenses paid during | |
| on 3-1-13 | on 8-31-13 | period ended 8-31-131 | |
| Class A | $1,000.00 | $1,017.30 | $7.93 |
| Class B | 1,000.00 | 1,013.60 | 11.67 |
| Class C | 1,000.00 | 1,013.60 | 11.67 |
| Class I | 1,000.00 | 1,019.20 | 6.06 |
| Class 1 | 1,000.00 | 1,019.60 | 5.70 |
Remember, these examples do not include any transaction costs, therefore, these examples will not help you to determine the relative total costs of owning different funds. If transaction costs were included, your expenses would have been higher. See the prospectus for details regarding transaction costs.
1. Expenses are equal to the fund’s annualized espense ratio of 1.56%, 2.30%, 2.30%, 1.19%, and 1.12% for Class A, Class B, Class C, Class I, and Class 1 shares, respectively, multiplied by the average account value over the period, multiplied by 184/365 (to reflect the one-half year period).
| Semiannual report | International Growth Fund | 9 |
Portfolio summary
| Top 10 Holdings (19.4% of Net Assets on 8-31-13)1,2 | ||||
| Roche Holdings AG | 3.2% | Diageo PLC | 1.6% | |
| GlaxoSmithKline PLC | 2.6% | Rio Tinto PLC | 1.6% | |
| British American Tobacco PLC | 2.3% | Novo Nordisk A/S, Class B | 1.4% | |
| Nestle SA | 2.3% | Unilever NV | 1.3% | |
| Toyota Motor Corp. | 2.0% | Lloyds Banking Group PLC | 1.1% | |
| Sector Composition1,3 | ||||
| Financials | 16.5% | Information Technology | 5.3% | |
| Health Care | 15.2% | Telecommunication Services | 3.3% | |
| Consumer Discretionary | 15.1% | Energy | 2.7% | |
| Consumer Staples | 14.8% | Utilities | 1.7% | |
| Industrials | 10.4% | Short-Term Investments & Other | 9.0% | |
| Materials | 6.0% | |||
| Top 10 Countries1,2,3 | ||||
| United Kingdom | 19.9% | France | 5.6% | |
| Japan | 19.9% | Hong Kong | 2.8% | |
| Switzerland | 9.9% | Canada | 2.5% | |
| Germany | 6.7% | Spain | 2.3% | |
| Australia | 5.9% | Sweden | 2.3% | |
1 As a percentage of net assets on 8-31-13.
2 Cash and cash equivalents not included.
3 Foreign investing, especially in emerging markets, has additional risks, such as currency and market volatility and political and social instability. Growth stocks may be subject to greater price fluctuations because their prices tend to place greater emphasis on earnings expectations. Hedging and other strategic transactions may increase volatility of a fund and, if the transaction is not successful, could result in a significant loss. Sector investing is subject to greater risks than the market as a whole. Because the fund may focus on particular sectors of the economy, its performance may depend on the performance of those sectors and investments focused in one sector may fluctuate more widely than investments diversified across sectors. For additional information on these and other risk considerations, please see the fund’s prospectuses.
| 10 | International Growth Fund | Semiannual report |
Fund’s investments
As of 8-31-13 (unaudited)
| Shares | Value | |
| Common Stocks 90.0% | $243,104,686 | |
| (Cost $219,905,518) | ||
| Australia 5.9% | 15,872,686 | |
| BHP Billiton, Ltd. | 68,794 | 2,177,598 |
| Coca-Cola Amatil, Ltd. | 24,679 | 268,680 |
| Commonwealth Bank of Australia | 7,714 | 497,061 |
| CSL, Ltd. | 37,903 | 2,292,940 |
| Insurance Australia Group, Ltd. | 81,858 | 422,338 |
| JB Hi-Fi, Ltd. | 5,545 | 92,571 |
| Myer Holdings, Ltd. (L) | 40,437 | 98,300 |
| National Australia Bank, Ltd. | 16,195 | 464,783 |
| Primary Health Care, Ltd. | 18,691 | 85,482 |
| QBE Insurance Group, Ltd. | 39,001 | 526,076 |
| Rio Tinto, Ltd. | 31,115 | 1,602,146 |
| Suncorp Group, Ltd. | 38,532 | 419,591 |
| Telstra Corp., Ltd. | 306,854 | 1,334,468 |
| Westpac Banking Corp. | 79,060 | 2,192,049 |
| Woodside Petroleum, Ltd. | 21,526 | 728,232 |
| Woolworths, Ltd. | 84,210 | 2,670,371 |
| Austria 0.2% | 649,327 | |
| Erste Group Bank AG | 19,064 | 610,589 |
| Verbund AG, Class A | 2,011 | 38,738 |
| Belgium 1.0% | 2,572,395 | |
| Ageas | 21,134 | 831,808 |
| Anheuser-Busch InBev NV | 6,327 | 591,434 |
| Bekaert SA | 4,208 | 149,597 |
| Colruyt SA | 7,749 | 428,915 |
| Delhaize Group SA | 4,106 | 261,974 |
| Mobistar SA | 5,350 | 79,696 |
| Umicore SA | 4,954 | 228,971 |
| Bermuda 0.2% | 641,496 | |
| Seadrill, Ltd. | 13,930 | 641,496 |
| Canada 2.5% | 6,649,044 | |
| Canadian National Railway Company | 24,700 | 2,316,402 |
| Canadian Pacific Railway, Ltd. | 8,500 | 999,615 |
| Enbridge, Inc. (L) | 19,600 | 803,687 |
| Magna International, Inc. | 8,500 | 653,337 |
| Potash Corp. of Saskatchewan, Inc. | 11,900 | 351,927 |
| See notes to financial statements | Semiannual report | International Growth Fund | 11 |
| Canada (continued) | ||
| Rogers Communications, Inc., Class B (L) | 15,300 | $604,127 |
| Royal Bank of Canada (L) | 7,900 | 486,765 |
| Saputo, Inc. | 5,200 | 230,848 |
| Tim Hortons, Inc. | 3,700 | 202,336 |
| China 0.2% | 604,290 | |
| AAC Technologies Holdings, Inc. | 106,000 | 479,208 |
| Yangzijiang Shipbuilding Holdings, Ltd. | 170,000 | 125,082 |
| Denmark 2.2% | 5,976,337 | |
| Chr Hansen Holding A/S | 4,332 | 143,377 |
| Coloplast A/S | 14,592 | 792,272 |
| GN Store Nord A/S | 11,921 | 245,037 |
| Novo Nordisk A/S, Class B | 23,341 | 3,898,977 |
| Novozymes A/S, B shares | 16,381 | 597,000 |
| Pandora A/S | 5,762 | 207,042 |
| Vestas Wind Systems A/S (I) | 4,970 | 92,632 |
| Finland 1.4% | 3,845,160 | |
| Fortum OYJ | 24,239 | 481,936 |
| Kone OYJ | 15,758 | 1,287,305 |
| Neste Oil OYJ | 11,616 | 213,025 |
| Nokia OYJ (I)(L) | 126,935 | 493,867 |
| Nokian Renkaat OYJ | 3,586 | 167,539 |
| Orion OYJ, Series B | 6,340 | 146,888 |
| Outotec OYJ (L) | 9,574 | 123,954 |
| Sampo OYJ, Class A | 14,099 | 586,257 |
| Wartsila OYJ Abp | 7,387 | 344,389 |
| France 5.6% | 15,220,261 | |
| Air France KLM (I)(L) | 28,757 | 216,448 |
| Alcatel-Lucent (I)(L) | 117,980 | 304,046 |
| AtoS | 1 | 74 |
| AXA SA | 10,337 | 224,988 |
| BNP Paribas SA | 8,119 | 507,246 |
| Bureau Veritas SA | 24,363 | 736,002 |
| Carrefour SA | 14,700 | 460,158 |
| Casino Guichard Perrachon SA | 4,265 | 403,654 |
| Cie Generale des Etablissements Michelin | 6,694 | 639,068 |
| Credit Agricole SA (I) | 38,801 | 391,569 |
| Danone SA | 6,987 | 520,264 |
| Dassault Systemes SA | 5,236 | 668,436 |
| Essilor International SA | 9,749 | 1,050,765 |
| European Aeronautic Defence & Space Company NV | 27,139 | 1,560,981 |
| ICADE | 1,474 | 128,162 |
| Iliad SA | 2,841 | 681,259 |
| Kering | 1,153 | 260,357 |
| L’Oreal SA | 12,467 | 2,078,263 |
| Lafarge SA | 4,704 | 287,227 |
| Neopost SA (L) | 1,938 | 135,580 |
| Publicis Groupe SA | 7,434 | 553,352 |
| 12 | International Growth Fund | Semiannual report | See notes to financial statements |
| France (continued) | ||
| Remy Cointreau SA | 2,549 | $268,163 |
| Safran SA | 5,399 | 299,393 |
| Sanofi | 9,202 | 884,043 |
| Societe BIC SA | 1,255 | 144,234 |
| Societe Generale SA | 21,333 | 929,908 |
| Suez Environnement Company | 9,851 | 146,755 |
| Teleperformance SA | 1,896 | 85,510 |
| Valeo SA | 3,071 | 230,972 |
| Vallourec SA | 2,154 | 129,198 |
| Wendel SA | 2,417 | 294,186 |
| Germany 5.7% | 15,344,119 | |
| Adidas AG | 1,652 | 174,623 |
| Allianz SE | 11,349 | 1,625,752 |
| Aurubis AG | 5,523 | 318,622 |
| BASF SE | 2,861 | 250,011 |
| Bayer AG | 15,812 | 1,755,863 |
| Beiersdorf AG | 5,435 | 468,314 |
| Daimler AG | 6,299 | 432,147 |
| Deutsche Lufthansa AG (I) | 27,770 | 495,765 |
| Deutsche Post AG | 8,997 | 259,908 |
| Duerr AG | 5,582 | 374,405 |
| Fielmann AG | 2,102 | 214,005 |
| Freenet AG (I) | 22,301 | 525,963 |
| Hannover Rueckversicherung AG | 6,208 | 433,080 |
| Henkel AG & Company, KGaA | 3,554 | 288,876 |
| Hochtief AG | 2,344 | 166,132 |
| Hugo Boss AG | 1,529 | 186,305 |
| Kabel Deutschland Holding AG | 3,401 | 386,146 |
| KUKA AG | 2,595 | 109,113 |
| Merck KGaA | 3,188 | 484,403 |
| Metro AG | 5,666 | 207,971 |
| Muenchener Rueckversicherungs AG | 9,953 | 1,813,710 |
| Salzgitter AG | 3,756 | 142,527 |
| SAP AG | 24,557 | 1,815,232 |
| Sky Deutschland AG (I) | 54,274 | 454,852 |
| Software AG | 4,024 | 123,252 |
| Stada Arzneimittel AG | 4,908 | 237,464 |
| Suedzucker AG | 12,566 | 405,450 |
| Symrise AG | 3,599 | 157,460 |
| ThyssenKrupp AG (I) | 13,206 | 277,558 |
| TUI AG (I) | 16,720 | 193,808 |
| Volkswagen AG | 1,977 | 439,481 |
| Wacker Chemie AG (L) | 1,283 | 125,921 |
| Greece 0.0% | 86,391 | |
| Hellenic Telecommunications Organization SA (I) | 9,575 | 86,391 |
| Guernsey, Channel Islands 0.1% | 206,416 | |
| Resolution, Ltd. | 41,819 | 206,416 |
| See notes to financial statements | Semiannual report | International Growth Fund | 13 |
| Hong Kong 2.8% | $7,440,514 | |
| AIA Group, Ltd. | 39,000 | 170,039 |
| ASM Pacific Technology, Ltd. | 8,600 | 88,421 |
| Cheung Kong Infrastructure Holdings, Ltd. | 32,000 | 215,929 |
| CLP Holdings, Ltd. | 40,000 | 319,360 |
| Galaxy Entertainment Group, Ltd. (I) | 178,000 | 1,079,327 |
| Hang Seng Bank, Ltd. | 26,300 | 408,231 |
| Henderson Land Development Company, Ltd. | 37,700 | 220,140 |
| Hong Kong & China Gas Company, Ltd. | 444,580 | 1,030,115 |
| Hong Kong Exchanges & Clearing, Ltd. | 18,700 | 286,209 |
| Hong Kong Land Holdings, Ltd. | 30,000 | 193,314 |
| Jardine Matheson Holdings, Ltd. | 2,430 | 129,062 |
| Luk Fook Holdings International, Ltd. | 21,000 | 71,459 |
| Noble Group, Ltd. | 289,000 | 181,867 |
| Power Assets Holdings, Ltd. | 83,500 | 717,645 |
| Sands China, Ltd. | 94,800 | 542,223 |
| Sun Hung Kai Properties, Ltd. | 35,000 | 451,765 |
| The Link REIT | 76,841 | 351,700 |
| Wharf Holdings, Ltd. | 92,000 | 750,731 |
| Xinyi Glass Holdings Company, Ltd. | 250,000 | 232,977 |
| Ireland 0.9% | 2,497,126 | |
| Elan Corp. PLC (I) | 21,034 | 318,124 |
| Experian PLC | 37,581 | 656,983 |
| Kerry Group PLC | 10,360 | 653,533 |
| Paddy Power PLC | 8,962 | 720,685 |
| Smurfit Kappa Group PLC | 7,278 | 147,801 |
| Isle of Man 0.1% | 184,503 | |
| Playtech, Ltd. | 17,586 | 184,503 |
| Israel 0.5% | 1,367,911 | |
| Bezeq The Israeli Telecommunication Corp., Ltd. | 28,031 | 45,629 |
| Israel Chemicals, Ltd. | 21,689 | 150,215 |
| Mellanox Technologies, Ltd. (I) | 3,322 | 128,312 |
| Teva Pharmaceutical Industries, Ltd. | 27,375 | 1,043,755 |
| Italy 1.1% | 2,883,751 | |
| Assicurazioni Generali SpA | 48,093 | 921,309 |
| Atlantia SpA | 20,068 | 361,268 |
| Azimut Holding SpA | 16,865 | 362,206 |
| Fiat SpA (I) | 81,401 | 613,223 |
| Mediolanum SpA | 18,698 | 130,370 |
| UniCredit SpA | 88,143 | 495,375 |
| Japan 19.9% | 53,648,569 | |
| 3-D Matrix, Ltd. (I) | 5,600 | 151,606 |
| ABC-MART, Inc. | 5,300 | 221,373 |
| Accordia Golf Company, Ltd. | 108 | 116,781 |
| Aeon Company, Ltd. (L) | 19,300 | 262,734 |
| Aeon Mall Company, Ltd. | 5,400 | 140,358 |
| Ajinomoto Company, Inc. | 11,000 | 140,667 |
| Anritsu Corp. | 16,500 | 200,353 |
| 14 | International Growth Fund | Semiannual report | See notes to financial statements |
| Japan (continued) | ||
| Arnest One Corp. | 3,000 | $62,208 |
| Asahi Kasei Corp. | 41,000 | 300,016 |
| Astellas Pharma, Inc. | 25,800 | 1,313,389 |
| Bridgestone Corp. | 13,700 | 446,687 |
| Calbee, Inc. | 2,600 | 252,938 |
| Central Japan Railway Company, Ltd. | 2,100 | 239,250 |
| Chugai Pharmaceutical Company, Ltd. | 22,100 | 451,686 |
| Daihatsu Motor Company, Ltd. | 11,000 | 205,085 |
| Dainippon Sumitomo Pharma Company, Ltd. | 6,600 | 84,075 |
| Daito Trust Construction Company, Ltd. | 8,500 | 775,666 |
| Daiwa House Industry Company, Ltd. | 24,000 | 430,017 |
| Daiwa Securities Group, Inc. | 106,000 | 849,452 |
| Dena Company, Ltd. (L) | 20,700 | 404,150 |
| Eisai Company, Ltd. | 10,800 | 438,531 |
| FANUC Corp. | 4,400 | 668,688 |
| Fast Retailing Company, Ltd. | 2,600 | 836,716 |
| Fuji Heavy Industries, Ltd. | 52,000 | 1,247,249 |
| Gree, Inc. (L) | 10,900 | 86,454 |
| Hino Motors, Ltd. | 28,000 | 362,362 |
| Hirose Electric Company, Ltd. | 1,300 | 170,285 |
| Hisamitsu Pharmaceutical Company, Inc. | 10,400 | 555,330 |
| Hitachi, Ltd. | 124,000 | 741,964 |
| Hoya Corp. | 25,400 | 539,419 |
| Idemitsu Kosan Company, Ltd. | 1,000 | 83,111 |
| IHI Corp. | 57,000 | 228,948 |
| Inpex Corp. | 47 | 212,251 |
| ITO EN, Ltd. | 7,600 | 170,643 |
| ITOCHU Corp. | 76,000 | 856,243 |
| Izumi Company, Ltd. | 8,100 | 223,837 |
| J Trust Company, Ltd. | 10,600 | 157,287 |
| Japan Exchange Group, Inc. | 1,000 | 78,478 |
| Japan Real Estate Investment Corp. | 21 | 222,914 |
| Japan Retail Fund Investment Corp. | 113 | 207,465 |
| Japan Tobacco, Inc. | 11,400 | 384,257 |
| JFE Holdings, Inc. | 21,700 | 476,670 |
| JGC Corp. | 9,000 | 306,083 |
| K’s Holding Corp. | 4,300 | 130,797 |
| Kakaku.com, Inc. | 21,600 | 394,483 |
| Kao Corp. | 27,200 | 791,235 |
| KDDI Corp. | 30,100 | 1,431,477 |
| Keio Corp. | 26,000 | 175,275 |
| Keyence Corp. | 3,700 | 1,216,519 |
| Kintetsu Corp. (L) | 76,000 | 281,312 |
| Kobe Steel, Ltd. (I) | 187,000 | 296,416 |
| Kubota Corp. | 34,000 | 457,878 |
| Lawson, Inc. | 6,000 | 450,460 |
| Makita Corp. | 5,200 | 273,928 |
| Matsui Securities Company, Ltd. (I) | 19,100 | 160,933 |
| See notes to financial statements | Semiannual report | International Growth Fund | 15 |
| Japan (continued) | ||
| Mazda Motor Corp. (I) | 297,000 | $1,180,453 |
| Medinet Company, Ltd. (I) | 190 | 68,452 |
| Medipal Holdings Corp. | 20,700 | 230,394 |
| Mitsubishi Estate Company, Ltd. | 32,000 | 827,714 |
| Mitsubishi Heavy Industries, Ltd. | 74,000 | 403,127 |
| Mitsui Engineering & Shipbuilding Company, Ltd. | 55,000 | 98,965 |
| Mitsui Fudosan Company, Ltd. | 21,000 | 657,808 |
| Mizuho Financial Group, Inc. | 274,900 | 558,656 |
| Monex Group, Inc. | 111 | 40,344 |
| Murata Manufacturing Company, Ltd. | 4,900 | 334,444 |
| NEC Corp. | 181,000 | 382,588 |
| Nintendo Company, Ltd. | 2,400 | 270,063 |
| Nippon Building Fund, Inc. | 20 | 217,049 |
| Nippon Carbide Industries Company, Inc. | 32,000 | 93,938 |
| Nitori Holdings Company, Ltd. | 6,650 | 593,429 |
| Nitto Denko Corp. | 8,100 | 428,602 |
| Nomura Holdings, Inc. | 181,200 | 1,257,478 |
| Nomura Research Institute, Ltd. | 12,700 | 394,747 |
| NTT DOCOMO, Inc. | 456 | 728,685 |
| Odakyu Electric Railway Company, Ltd. | 56,000 | 509,226 |
| OJI Paper Company, Ltd. | 45,000 | 179,579 |
| Ono Pharmaceutical Company, Ltd. | 5,100 | 306,235 |
| Oracle Corp. Japan | 3,100 | 126,301 |
| Orient Corp. (I) | 80,500 | 189,029 |
| Oriental Land Company, Ltd. | 3,700 | 595,098 |
| Panasonic Corp. (I) | 37,700 | 340,528 |
| Park24 Company, Ltd. | 14,600 | 252,603 |
| Point, Inc. | 1,680 | 78,804 |
| Rakuten, Inc. | 13,900 | 170,069 |
| Ricoh Company, Ltd. | 26,000 | 279,709 |
| Santen Pharmaceutical Company, Ltd. | 8,700 | 403,557 |
| Sawai Pharmaceutical Company, Ltd. | 2,100 | 273,038 |
| Secom Company, Ltd. | 4,800 | 273,404 |
| Sekisui House, Ltd. | 11,000 | 132,449 |
| Seven Bank, Ltd. | 70,800 | 230,802 |
| Sharp Corp. (I)(L) | 39,000 | 150,619 |
| Shimamura Company, Ltd. | 3,800 | 386,993 |
| Shimano, Inc. | 7,400 | 611,705 |
| Shinsei Bank, Ltd. | 64,000 | 125,328 |
| Shionogi & Company, Ltd. | 10,200 | 198,169 |
| SMC Corp. | 1,300 | 271,019 |
| Softbank Corp. | 4,100 | 255,875 |
| Stanley Electric Company, Ltd. | 12,100 | 231,208 |
| Sumitomo Metal Mining Company, Ltd. | 24,000 | 321,831 |
| Sumitomo Mitsui Financial Group, Inc. | 23,200 | 1,026,763 |
| Sumitomo Mitsui Trust Holdings, Inc. | 69,000 | 297,961 |
| Sumitomo Realty & Development Company, Ltd. | 11,000 | 480,768 |
| Sumitomo Rubber Industries, Ltd. | 16,100 | 225,029 |
| 16 | International Growth Fund | Semiannual report | See notes to financial statements |
| Shares | Value | |
| Japan (continued) | ||
| Suzuken Company, Ltd. | 3,600 | $110,693 |
| Suzuki Motor Corp. | 6,500 | 138,626 |
| Sysmex Corp. | 7,200 | 415,419 |
| Takeda Pharmaceutical Company, Ltd. | 21,300 | 964,759 |
| Terumo Corp. | 14,600 | 696,193 |
| The Dai-ichi Life Insurance Company, Ltd. | 673 | 895,610 |
| Tobu Railway Company, Ltd. | 66,000 | 331,131 |
| Tokyo Gas Company, Ltd. | 30,000 | 155,062 |
| Tokyu Land Corp. | 31,000 | 285,808 |
| Toshiba Corp. | 125,000 | 493,008 |
| Tosoh Corp. | 36,000 | 127,826 |
| Toyo Suisan Kaisha, Ltd. | 6,000 | 179,847 |
| Toyota Boshoku Corp. | 4,900 | 63,915 |
| Toyota Motor Corp. | 89,700 | 5,418,713 |
| Toyota Tsusho Corp. | 9,300 | 212,865 |
| Trend Micro, Inc. | 10,200 | 355,216 |
| Tsumura & Company, Ltd. | 10,700 | 286,298 |
| Tsuruha Holdings, Inc. | 1,600 | 144,407 |
| Unicharm Corp. | 8,200 | 423,600 |
| USS Company, Ltd. | 3,220 | 401,725 |
| Wacom Company, Ltd. | 28,100 | 239,386 |
| Yahoo Japan Corp. | 1,716 | 846,056 |
| Yamada Denki Company, Ltd. | 8,640 | 272,417 |
| Yamaha Motor Company, Ltd. | 10,500 | 134,965 |
| Luxembourg 0.3% | 869,305 | |
| Millicom International Cellular SA,SDR | 4,393 | 356,891 |
| SES SA | 17,468 | 512,414 |
| Netherlands 2.2% | 6,078,602 | |
| ASML Holding NV | 2,569 | 225,144 |
| Heineken NV (L) | 7,214 | 494,526 |
| Koninklijke Ahold NV | 26,112 | 416,242 |
| Koninklijke Philips Electronics NV | 25,368 | 783,249 |
| Randstad Holdings NV | 4,228 | 196,019 |
| Reed Elsevier NV | 17,971 | 324,259 |
| Unilever NV | 96,963 | 3,639,163 |
| New Zealand 0.1% | 240,254 | |
| Telecom Corp. of New Zealand, Ltd. | 137,173 | 240,254 |
| Norway 0.6% | 1,686,207 | |
| DNB ASA | 23,801 | 369,122 |
| Marine Harvest ASA | 134,982 | 125,315 |
| Norwegian Air Shuttle ASA (I)(L) | 2,820 | 100,693 |
| Statoil ASA | 32,043 | 702,828 |
| TGS-NOPEC Geophysical Company ASA | 6,584 | 193,557 |
| Yara International ASA | 4,932 | 194,692 |
| Portugal 0.0% | 72,432 | |
| Jeronimo Martins SGPS SA | 3,036 | 58,985 |
| Zon Optimus SGPS SA | 2,444 | 13,447 |
| See notes to financial statements | Semiannual report | International Growth Fund | 17 |
| Singapore 1.9% | $5,024,644 | |
| CapitaCommercial Trust | 138,000 | 145,000 |
| Ezion Holdings, Ltd. | 72,000 | 127,492 |
| Golden Agri-Resources, Ltd. | 332,000 | 145,273 |
| Keppel Corp., Ltd. | 33,400 | 263,894 |
| Keppel REIT | 2,672 | 2,488 |
| Oversea-Chinese Banking Corp., Ltd. | 89,006 | 687,803 |
| SATS, Ltd. | 64,000 | 150,654 |
| SembCorp Industries, Ltd. | 61,000 | 232,809 |
| Singapore Exchange, Ltd. | 63,000 | 358,104 |
| Singapore Press Holdings, Ltd. | 115,000 | 354,243 |
| Singapore Technologies Engineering, Ltd. | 180,000 | 556,960 |
| Singapore Telecommunications, Ltd. | 462,000 | 1,267,620 |
| SMRT Corp., Ltd. | 74,000 | 75,395 |
| StarHub, Ltd. | 95,000 | 310,267 |
| United Overseas Bank, Ltd. | 19,000 | 295,348 |
| Yanlord Land Group, Ltd. | 56,000 | 51,294 |
| Spain 2.3% | 6,201,965 | |
| Amadeus IT Holding SA, A Shares | 10,888 | 351,556 |
| Banco Bilbao Vizcaya Argentaria SA | 58,837 | 560,871 |
| Distribuidora Internacional de Alimentacion SA | 54,382 | 429,081 |
| Enagas SA | 11,351 | 257,450 |
| Ferrovial SA | 32,967 | 546,186 |
| Gas Natural SDG SA | 17,274 | 337,794 |
| Grifols SA | 4,909 | 197,141 |
| Iberdrola SA | 96,532 | 511,650 |
| Inditex SA | 13,049 | 1,725,116 |
| Red Electrica Corp. SA | 9,822 | 508,822 |
| Repsol SA | 33,471 | 776,298 |
| Sweden 2.3% | 6,194,682 | |
| Boliden AB | 11,171 | 163,081 |
| Hennes & Mauritz AB, B Shares | 71,703 | 2,632,026 |
| Investment AB Kinnevik, B Shares | 10,837 | 338,235 |
| Investor AB, B Shares | 23,505 | 677,413 |
| Scania AB, Series B | 14,488 | 289,122 |
| Skandinaviska Enskilda Banken AB, Series A | 48,158 | 494,069 |
| Svenska Cellulosa AB, B Shares | 19,907 | 485,842 |
| Swedbank AB, Class A | 36,165 | 817,869 |
| Telefonaktiebolaget LM Ericsson, B Shares | 25,291 | 297,025 |
| Switzerland 9.9% | 26,674,394 | |
| ABB, Ltd. (I) | 27,044 | 578,404 |
| Actelion, Ltd. (I) | 9,452 | 642,527 |
| Cie Financiere Richemont SA | 11,664 | 1,105,334 |
| Credit Suisse Group AG (I) | 44,676 | 1,284,760 |
| Geberit AG | 2,889 | 702,166 |
| Givaudan AG (I) | 77 | 103,567 |
| Glencore Xstrata PLC (I) | 58,804 | 278,124 |
| Holcim, Ltd. (I) | 2,293 | 155,447 |
| 18 | International Growth Fund | Semiannual report | See notes to financial statements |
| Switzerland (continued) | ||
| Kuehne & Nagel International AG | 1,342 | $167,117 |
| Nestle SA | 94,573 | 6,197,432 |
| Novartis AG | 26,246 | 1,913,903 |
| Pargesa Holding SA | 495 | 35,184 |
| Partners Group Holding AG | 2,019 | 517,050 |
| Roche Holdings AG | 34,569 | 8,623,209 |
| Schindler Holding AG, Participation Certificates | 2,328 | 320,717 |
| SGS SA | 400 | 909,548 |
| Sonova Holding AG (I) | 1,547 | 171,207 |
| Straumann Holding AG | 563 | 102,722 |
| Swiss Life Holding (I) | 1,546 | 289,610 |
| Swisscom AG | 615 | 278,665 |
| Syngenta AG | 1,390 | 544,975 |
| The Swatch Group AG | 2,677 | 267,683 |
| The Swatch Group AG, Bearer Shares | 1,917 | 1,102,174 |
| Transocean, Ltd. | 8,443 | 382,869 |
| United Kingdom 19.9% | 53,811,070 | |
| Aberdeen Asset Management PLC | 79,608 | 434,167 |
| Admiral Group PLC | 20,843 | 407,308 |
| Aggreko PLC | 10,326 | 259,972 |
| Anglo American PLC | 17,061 | 390,907 |
| ARM Holdings PLC | 84,938 | 1,144,044 |
| Ashmore Group PLC | 44,426 | 229,742 |
| Ashtead Group PLC | 28,435 | 284,070 |
| ASOS PLC (I) | 5,342 | 393,229 |
| Associated British Foods PLC | 12,597 | 360,173 |
| AstraZeneca PLC | 12,423 | 611,051 |
| Babcock International Group PLC | 19,305 | 340,455 |
| Barclays PLC | 386,788 | 1,693,106 |
| Barratt Developments PLC (I) | 63,656 | 299,042 |
| BG Group PLC | 108,090 | 2,055,312 |
| BHP Billiton PLC | 30,012 | 873,450 |
| British American Tobacco PLC | 124,414 | 6,275,784 |
| British Sky Broadcasting Group PLC | 27,721 | 360,581 |
| BT Group PLC | 129,135 | 650,992 |
| Bunzl PLC | 27,013 | 569,743 |
| Burberry Group PLC | 17,286 | 410,930 |
| Capita PLC | 30,506 | 450,769 |
| Cobham PLC | 110,023 | 485,421 |
| Croda International PLC | 6,447 | 259,664 |
| Debenhams PLC | 101,769 | 168,909 |
| Diageo PLC | 138,902 | 4,261,456 |
| easyJet PLC | 20,414 | 390,067 |
| GlaxoSmithKline PLC | 276,759 | 7,054,401 |
| ICAP PLC | 16,588 | 94,445 |
| IG Group Holdings PLC | 20,957 | 184,349 |
| IMI PLC | 12,835 | 285,427 |
| Intercontinental Hotels Group PLC | 16,682 | 468,083 |
| See notes to financial statements | Semiannual report | International Growth Fund | 19 |
| Shares | Value | |
| United Kingdom (continued) | ||
| Intertek Group PLC | 8,471 | $419,847 |
| ITV PLC | 221,790 | 565,743 |
| John Wood Group PLC | 20,871 | 260,529 |
| Lloyds Banking Group PLC (I) | 2,565,886 | 2,884,845 |
| Man Group PLC | 105,687 | 133,181 |
| Micro Focus International PLC | 14,708 | 180,407 |
| Mondi PLC | 10,248 | 157,940 |
| Next PLC | 12,605 | 955,993 |
| Persimmon PLC (I) | 15,720 | 267,731 |
| Prudential PLC | 90,861 | 1,517,903 |
| Reckitt Benckiser Group PLC | 33,914 | 2,304,604 |
| Reed Elsevier PLC | 39,918 | 489,629 |
| Rightmove PLC | 12,614 | 454,685 |
| Rio Tinto PLC | 94,000 | 4,243,421 |
| Rolls-Royce Holdings PLC | 37,696 | 649,603 |
| Royal Bank of Scotland Group PLC (I) | 57,584 | 296,824 |
| Smith & Nephew PLC | 30,196 | 350,961 |
| Smiths Group PLC | 15,304 | 303,477 |
| Spectris PLC | 8,523 | 293,352 |
| Standard Chartered PLC | 22,155 | 494,432 |
| Standard Life PLC | 134,745 | 690,967 |
| Taylor Wimpey PLC | 192,790 | 296,974 |
| Telecity Group PLC | 16,987 | 215,731 |
| The Sage Group PLC | 35,284 | 188,153 |
| UBM PLC | 9,456 | 101,259 |
| Unilever PLC | 34,056 | 1,297,777 |
| Whitbread PLC | 10,542 | 503,178 |
| William Hill PLC | 82,936 | 533,640 |
| WPP PLC | 33,006 | 611,235 |
| United States 0.2% | 560,835 | |
| Valeant Pharmaceuticals International, Inc. (I) | 5,702 | 560,835 |
| Preferred Securities 1.0% | $2,686,858 | |
| (Cost $2,426,498) | ||
| Germany 1.0% | 2,686,858 | |
| Bayerische Motoren Werke AG | 3,090 | 226,615 |
| Fuchs Petrolub AG | 2,458 | 198,855 |
| Henkel AG & Company KgaA | 1,656 | 160,457 |
| Porsche Automobil Holding SE | 3,594 | 301,995 |
| Volkswagen AG | 7,911 | 1,798,936 |
| 20 | International Growth Fund | Semiannual report | See notes to financial statements |
| Shares | Value | ||
| Warrants 0.0% | $86 | ||
| (Cost $5,399) | |||
| Canada 0.0% | 86 | ||
| Kinross Gold Corp. (Expiration Date: 09-17-14; Strike Price: $21.30) (I) | 1,133 | 86 | |
| Yield (%) | Shares | Value | |
| Securities Lending Collateral 1.4% | $3,825,898 | ||
| (Cost $3,825,705) | |||
| John Hancock Collateral Investment Trust (W) | 0.1754 (Y) | 382,295 | 3,825,898 |
| Yield | Par value | Value | |
| Short-Term Investments 7.8% | $21,067,416 | ||
| (Cost $21,067,416) | |||
| Money Market Funds 7.8% | 21,067,416 | ||
| State Street Institutional Treasury Money | |||
| Market Fund | 0.0000 (Y) | 21,067,416 | 21,067,416 |
| Total investments (Cost $247,230,536)† 100.2% | $270,684,944 | ||
| Other assets and liabilities, net (0.2%) | ($639,810) | ||
| Total net assets 100.0% | $270,045,134 | ||
The percentage shown for each investment category is the total value of the category as a percentage of the net assets of the fund.
(I) Non-income producing security.
(L) A portion of this security is on loan as of 8-31-13.
(W) Investment is an affiliate of the fund, the advisor and/or subadvisor. This investment represents collateral received for securities lending.
(Y) The rate shown is the annualized seven-day yield as of 8-31-13.
† At 8-31-13, the aggregate cost of investment securities for federal income tax purposes was $248,274,704. Net unrealized appreciation aggregated $22,410,240, of which $27,975,820 related to appreciated investment securities and $5,565,580 related to depreciated investment securities.
The fund had the following sector allocation as a percentage of net assets on 8-31-13:
| Financials | 16.5% | ||||
| Health Care | 15.2% | ||||
| Consumer Discretionary | 15.1% | ||||
| Consumer Staples | 14.8% | ||||
| Industrials | 10.4% | ||||
| Materials | 6.0% | ||||
| Information Technology | 5.3% | ||||
| Telecommunication Services | 3.3% | ||||
| Energy | 2.7% | ||||
| Utilities | 1.7% | ||||
| Short-Term Investments & Other | 9.0% | ||||
| Total | 100.0% | ||||
| See notes to financial statements | Semiannual report | International Growth Fund | 21 |
F I N A N C I A L S T A T E M E N T S
Financial statements
Statement of assets and liabilities 8-31-13 (unaudited)
This Statement of assets and liabilities is the fund’s balance sheet. It shows the value of what the fund owns, is due and owes. You’ll also find the net asset value and the maximum public offering price per share.
| Assets | |
| Investments in unaffiliated issuers, at value (Cost $243,404,831) including | |
| $3,597,711 of securities loaned | $266,859,046 |
| Investments in affiliated issuers, at value (Cost $3,825,705) | 3,825,898 |
| Total investments, at value (Cost $247,230,536) | 270,684,944 |
| Foreign currency, at value (Cost $101,408) | 101,301 |
| Cash held at broker for futures contracts | 1,015,640 |
| Receivable for fund shares sold | 1,488,926 |
| Receivable for forward foreign currency exchange contracts | 368,173 |
| Dividends and interest receivable | 1,162,301 |
| Receivable for securities lending income | 4,718 |
| Receivable due from advisor | 136 |
| Other receivables and prepaid expenses | 50,008 |
| Total assets | 274,876,147 |
| Liabilities | |
| Due to custodian | 350,000 |
| Payable for investments purchased | 2,459 |
| Payable for forward foreign currency exchange contracts | 184,712 |
| Payable for fund shares repurchased | 111,501 |
| Payable upon return of securities loaned | 3,828,366 |
| Payable for futures variation margin | 207,875 |
| Payable to affiliates | |
| Accounting and legal services fees | 11,957 |
| Transfer agent fees | 26,604 |
| Trustees’ fees | 1,323 |
| Other liabilities and accrued expenses | 106,216 |
| Total liabilities | 4,831,013 |
| Net assets | $270,045,134 |
| Net assets consist of | |
| Paid-in capital | $234,469,031 |
| Undistributed net investment income | 2,132,580 |
| Accumulated net realized gain (loss) on investments, futures contracts and | |
| foreign currency transactions | 10,046,460 |
| Net unrealized appreciation (depreciation) on investments, futures | |
| contracts and translation of assets and liabilities in foreign currencies | 23,397,063 |
| Net assets | $270,045,134 |
| 22 | International Growth Fund | Semiannual report | See notes to financial statements |
Statement of assets and liabilities (continued)
| Net asset value per share | |
| Based on net asset values and shares outstanding — the Fund has an | |
| unlimited number of shares authorized with no par value | |
| Class A ($94,660,742 ÷ 4,272,197 shares)1 | $22.16 |
| Class B ($1,440,845 ÷ 65,450 shares)1 | $22.01 |
| Class C ($4,010,160 ÷ 182,479 shares)1 | $21.98 |
| Class I ($157,758,287 ÷ 7,098,126 shares) | $22.23 |
| Class 1 ($12,175,100 ÷ 547,729 shares) | $22.23 |
| Maximum offering price per share | |
| Class A (net asset value per share ÷ 95%)2 | $23.33 |
1 Redemption price is equal to net asset value less any applicable contingent deferred sales charge.
2 On single retail sales of less than $50,000. On sales of $50,000 or more and on group sales the offering price is reduced.
| See notes to financial statements | Semiannual report | International Growth Fund | 23 |
Statement of operations For the six-month period ended 8-31-13 (unaudited)
This Statement of operations summarizes the fund’s investment income earned and expenses incurred in operating the fund. It also shows net gains (losses) for the period stated.
| Investment income | |
| Dividends | $3,899,576 |
| Securities lending | 118,292 |
| Less foreign taxes withheld | (305,984) |
| Total investment income | 3,711,884 |
| Expenses | |
| Investment management fees | 1,012,693 |
| Distribution and service fees | 154,366 |
| Accounting and legal services fees | 18,937 |
| Transfer agent fees | 130,544 |
| Trustees’ fees | 3,955 |
| State registration fees | 36,144 |
| Printing and postage | 9,261 |
| Professional fees | 25,938 |
| Custodian fees | 114,244 |
| Registration and filing fees | 15,288 |
| Other | 7,531 |
| Total expenses | 1,528,901 |
| Less expense reductions | (18,101) |
| Net expenses | 1,510,800 |
| Net investment income | 2,201,084 |
| Realized and unrealized gain (loss) | |
| Net realized gain (loss) on | |
| Investments in unaffiliated issuers | 4,362,197 |
| Futures contracts | 1,432,200 |
| Foreign currency transactions | 796,728 |
| 6,591,125 | |
| Change in net unrealized appreciation (depreciation) of | |
| Investments in unaffiliated issuers | (2,839,003) |
| Investments in affiliated issuers | (7) |
| Futures contracts | (175,514) |
| Translation of assets and liabilities in foreign currencies | 58,318 |
| (2,956,206) | |
| Net realized and unrealized gain | 3,634,919 |
| Increase in net assets from operations | $5,836,003 |
| 24 | International Growth Fund | Semiannual report | See notes to financial statements |
Statements of changes in net assets
These Statements of changes in net assets show how the value of the fund’s net assets has changed during the last two periods. The difference reflects earnings less expenses, any investment gains and losses, distributions, if any, paid to shareholders and the net of fund share transactions.
| Six months | ||
| ended | Year | |
| 8-31-13 | ended | |
| (Unaudited) | 2-28-13 | |
| Increase (decrease) in net assets | ||
| From operations | ||
| Net investment income | $2,201,084 | $2,620,224 |
| Net realized gain | 6,591,125 | 15,734,976 |
| Change in net unrealized appreciation (depreciation) | (2,956,206) | 2,299,139 |
| Increase in net assets resulting from operations | 5,836,003 | 20,654,339 |
| Distributions to shareholders | ||
| From net investment income | ||
| Class A | — | (1,285,069) |
| Class B | — | (15,681) |
| Class C | — | (25,379) |
| Class I | — | (1,697,349) |
| Class 1 | — | (235,326) |
| From net realized gain | ||
| Class A | — | (3,481,244) |
| Class B | — | (63,206) |
| Class C | — | (102,296) |
| Class I | — | (3,872,467) |
| Class 1 | — | (526,505) |
| Total distributions | — | (11,304,522) |
| From Fund share transactions | 98,285,349 | (66,009,785) |
| Total increase (decrease) | 104,121,352 | (56,659,968) |
| Net assets | ||
| Beginning of period | 165,923,782 | 222,583,750 |
| End of period | $270,045,134 | $165,923,782 |
| Undistributed (accumulated distributions in excess of) net | ||
| investment income | $2,132,580 | ($68,504) |
| See notes to financial statements | Semiannual report | International Growth Fund | 25 |
Financial highlights
The Financial highlights show how the fund’s net asset value for a share has changed during the period.
| CLASS A SHARES Period ended | 8-31-131 | 2-28-13 | 2-29-12 | 2-28-11 | 2-28-10 | 2-28-09 |
| Per share operating performance | ||||||
| Net asset value, beginning of period | $21.28 | $19.98 | $20.99 | $17.36 | $12.46 | $22.86 |
| Net investment income2 | 0.21 | 0.23 | 0.30 | 0.13 | 0.14 | 0.31 |
| Net realized and unrealized gain (loss) | ||||||
| on investments | 0.67 | 2.65 | (1.12) | 3.61 | 4.86 | (10.31) |
| Total from investment operations | 0.88 | 2.88 | (0.82) | 3.74 | 5.00 | (10.00) |
| Less distributions | ||||||
| From net investment income | — | (0.42) | (0.19) | (0.11) | (0.10) | (0.40) |
| From net realized gain | — | (1.16) | — | — | — | — |
| Total distributions | — | (1.58) | (0.19) | (0.11) | (0.10) | (0.40) |
| Net asset value, end of period | $22.16 | $21.28 | $19.98 | $20.99 | $17.36 | $12.46 |
| Total return (%)3,4 | 4.145 | 14.82 | (3.80) | 21.58 | 40.07 | (44.00) |
| Ratios and supplemental data | ||||||
| Net assets, end of period (in millions) | $95 | $73 | $49 | $45 | $23 | $13 |
| Ratios (as a percentage of average net assets): | ||||||
| Expenses before reductions | 1.566 | 1.68 | 1.66 | 1.60 | 1.687 | 1.94 |
| Expenses net of fee waivers | 1.566 | 1.60 | 1.59 | 1.60 | 1.647 | 1.62 |
| Expenses net of fee waivers and credits | 1.566 | 1.60 | 1.59 | 1.60 | 1.637 | 1.62 |
| Net investment income | 1.896 | 1.13 | 1.50 | 0.69 | 0.86 | 1.59 |
| Portfolio turnover (%) | 19 | 61 | 55 | 48 | 37 | 59 |
1 Six months ended 8-31-13. Unaudited.
2 Based on the average daily shares outstanding.
3 Does not reflect the effect of sales charges, if any.
4 Total returns would have been lower had certain expenses not been reduced during the applicable periods shown.
5 Not annualized.
6 Annualized.
7 Includes the impact of proxy expenses, which amounted to 0.03% of average net assets.
| 26 | International Growth Fund | Semiannual report | See notes to financial statements |
| CLASS B SHARES Period ended | 8-31-131 | 2-28-13 | 2-29-12 | 2-28-11 | 2-28-10 | 2-28-09 |
| Per share operating performance | ||||||
| Net asset value, beginning of period | $21.22 | $19.94 | $20.93 | $17.36 | $12.48 | $22.81 |
| Net investment income2 | 0.14 | 0.10 | 0.12 | 0.01 | 0.05 | 0.15 |
| Net realized and unrealized gain (loss) | ||||||
| on investments | 0.65 | 2.62 | (1.06) | 3.56 | 4.83 | (10.25) |
| Total from investment operations | 0.79 | 2.72 | (0.94) | 3.57 | 4.88 | (10.10) |
| Less distributions | ||||||
| From net investment income | — | (0.28) | (0.05) | — | — | (0.23) |
| From net realized gain | — | (1.16) | — | — | — | — |
| Total distributions | — | (1.44) | (0.05) | — | — | (0.23) |
| Net asset value, end of period | $22.01 | $21.22 | $19.94 | $20.93 | $17.36 | $12.48 |
| Total return (%)3,4 | 3.725 | 14.00 | (4.47) | 20.56 | 39.10 | (44.43) |
| Ratios and supplemental data | ||||||
| Net assets, end of period (in millions) | $1 | $1 | $1 | $1 | $1 | $1 |
| Ratios (as a percentage of average net assets): | ||||||
| Expenses before reductions | 3.356 | 3.92 | 4.00 | 4.24 | 4.837 | 4.68 |
| Expenses net of fee waivers | 2.306 | 2.30 | 2.33 | 2.40 | 2.447 | 2.65 |
| Expenses net of fee waivers and credits | 2.306 | 2.30 | 2.33 | 2.40 | 2.407 | 2.40 |
| Net investment income | 1.216 | 0.47 | 0.63 | 0.04 | 0.29 | 0.80 |
| Portfolio turnover (%) | 19 | 61 | 55 | 48 | 37 | 59 |
1 Six months ended 8-31-13. Unaudited.
2 Based on the average daily shares outstanding.
3 Does not reflect the effect of sales charges, if any.
4 Total returns would have been lower had certain expenses not been reduced during the applicable periods shown.
5 Not annualized.
6 Annualized.
7 Includes the impact of proxy expenses, which amounted to 0.03% of average net assets.
| CLASS C SHARES Period ended | 8-31-131 | 2-28-13 | 2-29-12 | 2-28-11 | 2-28-10 | 2-28-09 |
| Per share operating performance | ||||||
| Net asset value, beginning of period | $21.18 | $19.91 | $20.91 | $17.34 | $12.47 | $22.79 |
| Net investment income (loss)2 | 0.12 | 0.10 | 0.10 | 0.01 | (0.01) | 0.20 |
| Net realized and unrealized gain (loss) | ||||||
| on investments | 0.68 | 2.61 | (1.05) | 3.56 | 4.88 | (10.29) |
| Total from investment operations | 0.80 | 2.71 | (0.95) | 3.57 | 4.87 | (10.09) |
| Less distributions | ||||||
| From net investment income | — | (0.28) | (0.05) | — | — | (0.23) |
| From net realized gain | — | (1.16) | — | — | — | — |
| Total distributions | — | (1.44) | (0.05) | — | — | (0.23) |
| Net asset value, end of period | $21.98 | $21.18 | $19.91 | $20.91 | $17.34 | $12.47 |
| Total return (%)3,4 | 3.785 | 13.97 | (4.52) | 20.59 | 39.05 | (44.43) |
| Ratios and supplemental data | ||||||
| Net assets, end of period (in millions) | $4 | $2 | $2 | $1 | $1 | $1 |
| Ratios (as a percentage of average net assets): | ||||||
| Expenses before reductions | 2.756 | 3.32 | 3.34 | 3.45 | 3.957 | 3.81 |
| Expenses net of fee waivers | 2.306 | 2.30 | 2.33 | 2.40 | 2.417 | 2.42 |
| Expenses net of fee waivers and credits | 2.306 | 2.30 | 2.33 | 2.40 | 2.407 | 2.40 |
| Net investment income (loss) | 1.056 | 0.48 | 0.52 | 0.03 | (0.06) | 1.03 |
| Portfolio turnover (%) | 19 | 61 | 55 | 48 | 37 | 59 |
1 Six months ended 8-31-13. Unaudited.
2 Based on the average daily shares outstanding.
3 Does not reflect the effect of sales charges, if any.
4 Total returns would have been lower had certain expenses not been reduced during the applicable periods shown.
5 Not annualized.
6 Annualized.
7 Includes the impact of proxy expenses, which amounted to 0.03% of average net assets.
| See notes to financial statements | Semiannual report | International Growth Fund | 27 |
| CLASS I SHARES Period ended | 8-31-131 | 2-28-13 | 2-29-12 | 2-28-11 | 2-28-10 | 2-28-09 |
| Per share operating performance | ||||||
| Net asset value, beginning of period | $21.31 | $20.01 | $21.04 | $17.40 | $12.48 | $22.90 |
| Net investment income2 | 0.23 | 0.43 | 0.37 | 0.23 | 0.14 | 0.18 |
| Net realized and unrealized gain (loss) | ||||||
| on investments | 0.69 | 2.53 | (1.12) | 3.60 | 4.95 | (10.12) |
| Total from investment operations | 0.92 | 2.96 | (0.75) | 3.83 | 5.09 | (9.94) |
| Less distributions | ||||||
| From net investment income | — | (0.50) | (0.28) | (0.19) | (0.17) | (0.48) |
| From net realized gain | — | (1.16) | — | — | — | — |
| Total distributions | — | (1.66) | (0.28) | (0.19) | (0.17) | (0.48) |
| Net asset value, end of period | $22.23 | $21.31 | $20.01 | $21.04 | $17.40 | $12.48 |
| Total return (%)3 | 4.324 | 15.23 | (3.42) | 22.08 | 40.76 | (43.74) |
| Ratios and supplemental data | ||||||
| Net assets, end of period (in millions) | $158 | $79 | $162 | $204 | $134 | $23 |
| Ratios (as a percentage of average net assets): | ||||||
| Expenses before reductions | 1.205 | 1.27 | 1.20 | 1.14 | 1.236 | 1.67 |
| Expenses net of fee waivers | 1.195 | 1.25 | 1.20 | 1.14 | 1.216 | 1.20 |
| Expenses net of fee waivers and credits | 1.195 | 1.25 | 1.20 | 1.14 | 1.216 | 1.20 |
| Net investment income | 2.025 | 2.09 | 1.88 | 1.21 | 0.84 | 1.16 |
| Portfolio turnover (%) | 19 | 61 | 55 | 48 | 37 | 59 |
1 Six months ended 8-31-13. Unaudited.
2 Based on the average daily shares outstanding.
3 Total returns would have been lower had certain expenses not been reduced during the applicable periods shown.
4 Not annualized.
5 Annualized.
6 Includes the impact of proxy expenses, which amounted to 0.01% of average net assets.
| CLASS 1 SHARES Period ended | 8-31-131 | 2-28-13 | 2-29-12 | 2-28-11 | 2-28-10 | 2-28-09 |
| Per share operating performance | ||||||
| Net asset value, beginning of period | $21.30 | $20.00 | $21.02 | $17.38 | $12.47 | $22.89 |
| Net investment income2 | 0.26 | 0.34 | 0.36 | 0.23 | 0.20 | 0.36 |
| Net realized and unrealized gain (loss) | ||||||
| on investments | 0.67 | 2.63 | (1.09) | 3.60 | 4.89 | (10.29) |
| Total from investment operations | 0.93 | 2.97 | (0.73) | 3.83 | 5.09 | (9.93) |
| Less distributions | ||||||
| From net investment income | — | (0.51) | (0.29) | (0.19) | (0.18) | (0.49) |
| From net realized gain | — | (1.16) | — | — | — | — |
| Total distributions | — | (1.67) | (0.29) | (0.19) | (0.18) | (0.49) |
| Net asset value, end of period | $22.23 | $21.30 | $20.00 | $21.02 | $17.38 | $12.47 |
| Total return (%)3 | 4.374 | 15.29 | (3.33) | 22.11 | 40.73 | (43.72) |
| Ratios and supplemental data | ||||||
| Net assets, end of period (in millions) | $12 | $11 | $9 | $8 | $5 | $3 |
| Ratios (as a percentage of average net assets): | ||||||
| Expenses before reductions and | ||||||
| amounts recaptured | 1.125 | 1.19 | 1.16 | 1.13 | 1.246 | 1.51 |
| Expenses net of fee waivers | 1.125 | 1.15 | 1.14 | 1.13 | 1.196 | 1.15 |
| Expenses net of fee waivers and credits | 1.125 | 1.15 | 1.14 | 1.13 | 1.196 | 1.15 |
| Net investment income | 2.355 | 1.68 | 1.83 | 1.21 | 1.23 | 1.94 |
| Portfolio turnover (%) | 19 | 61 | 55 | 48 | 37 | 59 |
1 Six months ended 8-31-13. Unaudited.
2 Based on the average daily shares outstanding.
3 Total returns would have been lower had certain expenses not been reduced during the applicable periods shown.
4 Not annualized.
5 Annualized.
6 Includes the impact of proxy expenses, which amounted to 0.02% of average net assets.
| 28 | International Growth Fund | Semiannual report | See notes to financial statements |
Notes to financial statements
(unaudited)
Note 1 — Organization
John Hancock International Growth Fund (the fund) is a series of John Hancock Funds III (the Trust), an open-end management investment company organized as a Massachusetts business trust and registered under the Investment Company Act of 1940, as amended (the 1940 Act). The investment objective of the fund is to seek high total return primarily through capital appreciation.
The fund may offer multiple classes of shares. The shares currently offered are detailed in the Statement of assets and liabilities. Class A shares and Class C shares are offered to all investors. Class B shares are closed to new investors. Class I shares are offered to institutions and certain investors. Class 1 shares are offered only to certain affiliates of Manulife Financial Corporation (MFC). Shareholders of each class have exclusive voting rights to matters that affect that class. The distribution and service fees, if any, and transfer agent fees for each class may differ. Class B shares convert to Class A shares eight years after purchase.
Note 2 — Significant accounting policies
The financial statements have been prepared in conformity with accounting principles generally accepted in the United States of America, which require management to make certain estimates and assumptions at the date of the financial statements. Actual results could differ from those estimates and those differences could be significant. Events or transactions occurring after the end of the fiscal period through the date that the financial statements were issued have been evaluated in the preparation of the financial statements. The following summarizes the significant accounting policies of the fund:
Security valuation. Investments are stated at value as of the close of regular trading on the New York Stock Exchange (NYSE), normally at 4:00 P.M., Eastern Time. In order to value the securities, the fund uses the following valuation techniques: Equity securities held by the fund are valued at the last sale price or official closing price on the principal securities exchange on which they trade. In the event there were no sales during the day or closing prices are not available, then the securities are valued using the last quoted bid or evaluated price. Investments by the fund in open-end mutual funds, including John Hancock Collateral Investment Trust (JHCIT), are valued at their respective net asset values each business day. Futures contracts are valued at the quoted daily settlement prices established by the exchange on which they trade. Foreign securities and currencies, including forward foreign currency contracts, are valued in U.S. dollars, based on foreign currency exchange rates supplied by an independent pricing service. Certain securities and forward foreign currency contracts traded only in the over-the-counter (OTC) market are valued at the last bid price quoted by brokers making markets in the securities at the close of trading. Certain short term securities are valued at amortized cost.
Other portfolio securities and assets, where reliable market quotations are not available, are valued at fair value as determined in good faith by the Fund’s Pricing Committee following procedures established by the Board of Trustees, which include price verification procedures. The frequency with which these fair valuation procedures are used cannot be predicted. Generally, trading in foreign securities is substantially completed each day at various times prior to the close of trading on the NYSE. Significant market events that affect the values of foreign securities may occur between the time when the valuation of the securities is generally determined and the close of the NYSE. During significant market events, these securities will be valued at fair value, as determined in good faith, following procedures established by the Board of Trustees. The fund may use a fair
| Semiannual report | International Growth Fund | 29 |
valuation model to value foreign securities in order to adjust for events that may occur between the close of foreign exchanges and the close of the NYSE.
The fund uses a three-tier hierarchy to prioritize the pricing assumptions, referred to as inputs, used in valuation techniques to measure fair value. Level 1 includes securities valued using quoted prices in active markets for identical securities. Level 2 includes securities valued using other significant observable inputs. Observable inputs may include quoted prices for similar securities, interest rates, prepayment speeds and credit risk. Prices for securities valued using these inputs are received from independent pricing vendors and brokers and are based on an evaluation of the inputs described. Level 3 includes securities valued using significant unobservable inputs when market prices are not readily available or reliable, including the fund’s own assumptions in determining the fair value of investments. Factors used in determining value may include market or issuer specific events or trends, changes in interest rates and credit quality. The inputs or methodology used for valuing securities are not necessarily an indication of the risks associated with investing in those securities. Changes in valuation techniques may result in transfers into or out of an assigned level within the disclosure hierarchy.
The following is a summary of the values by input classification of the fund’s investments as of August 31, 2013, by major security category or type:
| LEVEL 3 | ||||
| LEVEL 2 | SIGNIFICANT | |||
| TOTAL MARKET | LEVEL 1 | SIGNIFICANT | UNOBSERVABLE | |
| VALUE AT 8-31-13 | QUOTED PRICE | OBSERVABLE INPUTS | INPUTS | |
| Common Stocks | ||||
| Australia | $15,872,686 | — | $15,872,686 | — |
| Austria | 649,327 | — | 649,327 | — |
| Belgium | 2,572,395 | — | 2,572,395 | — |
| Bermuda | 641,496 | — | 641,496 | — |
| Canada | 6,649,044 | $6,649,044 | — | — |
| China | 604,290 | — | 604,290 | — |
| Denmark | 5,976,337 | — | 5,976,337 | — |
| Finland | 3,845,160 | — | 3,845,160 | — |
| France | 15,220,261 | — | 15,220,261 | — |
| Germany | 15,344,119 | — | 15,344,119 | — |
| Greece | 86,391 | — | 86,391 | — |
| Guernsey, Channel | ||||
| Islands | 206,416 | — | 206,416 | — |
| Hong Kong | 7,440,514 | — | 7,440,514 | — |
| Ireland | 2,497,126 | — | 2,497,126 | — |
| Isle of Man | 184,503 | — | 184,503 | — |
| Israel | 1,367,911 | — | 1,367,911 | — |
| Italy | 2,883,751 | — | 2,883,751 | — |
| Japan | 53,648,569 | — | 53,648,569 | — |
| Luxembourg | 869,305 | — | 869,305 | — |
| Netherlands | 6,078,602 | — | 6,078,602 | — |
| New Zealand | 240,254 | — | 240,254 | — |
| Norway | 1,686,207 | — | 1,686,207 | — |
| Portugal | 72,432 | — | 72,432 | — |
| Singapore | 5,024,644 | — | 5,024,644 | — |
| Spain | 6,201,965 | — | 6,201,965 | — |
| Sweden | 6,194,682 | — | 6,194,682 | — |
| Switzerland | 26,674,394 | — | 26,674,394 | — |
| United Kingdom | 53,811,070 | — | 53,811,070 | — |
| United States | 560,835 | 560,835 | — | — |
| 30 | International Growth Fund | Semiannual report |
| LEVEL 3 | ||||
| LEVEL 2 | SIGNIFICANT | |||
| TOTAL MARKET | LEVEL 1 | SIGNIFICANT | UNOBSERVABLE | |
| VALUE AT 8-31-13 | QUOTED PRICE | OBSERVABLE INPUTS | INPUTS | |
| Preferred Securities | $2,686,858 | — | $2,686,858 | — |
| Warrants | 86 | $86 | — | — |
| Securities Lending | ||||
| Collateral | 3,825,898 | 3,825,898 | — | — |
| Short-Term Investments | 21,067,416 | 21,067,416 | — | — |
| Total Investments in | ||||
| Securities | $270,684,944 | $32,103,279 | $238,581,665 | — |
| Other Financial | ||||
| Instruments | ||||
| Futures | ($222,434) | ($222,434) | — | — |
| Forward Foreign | ||||
| Currency Contracts | $183,461 | — | $183,461 | — |
Security transactions and related investment income. Investment security transactions are accounted for on a trade date plus one basis for daily net asset value calculations. However, for financial reporting purposes, investment transactions are reported on trade date. Interest income is accrued as earned. Dividend income is recorded on the ex-date, except for dividends of foreign securities where the dividend may not be known until after the ex-date. In those cases, dividend income, net of withholding taxes, is recorded when the fund becomes aware of the dividends. Foreign taxes are provided for based on the fund’s understanding of the tax rules and rates that exist in the foreign markets in which it invests. Gains and losses on securities sold are determined on the basis of identified cost and may include proceeds from litigation.
Securities lending. The fund may lend its securities to earn additional income. The fund receives cash collateral from the borrower in an amount not less than the market value of the loaned securities. The fund will invest its collateral in JHCIT, an affiliate of the fund, which has a floating net asset value (NAV) and is registered with the Securities and Exchange Commission as an investment company. JHCIT invests cash received as collateral as part of the securities lending program in short-term money market investments. The fund will receive the benefit of any gains and bear any losses generated by JHCIT with respect to the cash collateral.
If a borrower fails to return loaned securities when due, then the lending agent is responsible to and indemnifies the fund for the lent securities. The lending agent uses the collateral received from the borrower to purchase replacement securities of the same issue, type, class and series of the loaned securities. If the value of the collateral is less than the purchase cost of replacement securities, the lending agent is responsible for satisfying the shortfall but only to the extent that the shortfall is not due to any decrease in the value of JHCIT.
Although the risk of the loss of the securities lent is mitigated by receiving collateral from the borrower and through lending agent indemnification, the fund could experience a delay in recovering its securities or could experience a lower than expected return if the borrower fails to return the securities on a timely basis. The fund may receive compensation for lending its securities by retaining a portion of the return on the investment of the collateral and compensation from fees earned from borrowers of the securities. Net income received from JHCIT is a component of securities lending income as recorded on the Statement of Operations.
Obligations to repay collateral received by the fund is shown on the Statement of assets and liabilities as Payable upon return of securities loaned.
| Semiannual report | International Growth Fund | 31 |
Foreign currency translation. Assets, including investments and liabilities denominated in foreign currencies, are translated into U.S. dollar values each day at the prevailing exchange rate. Purchases and sales of securities, income and expenses are translated into U.S. dollars at the prevailing exchange rate on the date of the transaction. The effect of changes in foreign currency exchange rates on the value of securities is reflected as a component of the realized and unrealized gains (losses) on investments.
Funds that invest internationally generally carry more risk than funds that invest strictly in U.S. securities. Risks can result from differences in economic and political conditions, regulations, market practices (including higher transaction costs), accounting standards and other factors. Foreign investments are also subject to a decline in the value of a foreign currency versus the U.S. dollar, which reduces the dollar value of securities denominated in that currency.
Foreign taxes. The fund may be subject to withholding tax on income and/or capital gains or repatriation taxes as imposed by certain countries in which it invests. Taxes are accrued based upon net investment income, net realized gains or net unrealized appreciation.
Line of credit. The fund may borrow from banks for temporary or emergency purposes, including meeting redemption requests that otherwise might require the untimely sale of securities. Pursuant to the fund’s custodian agreement, the custodian may loan money to the fund to make properly authorized payments. The fund is obligated to repay the custodian for any overdraft, including any related costs or expenses. The custodian may have a lien, security interest or security entitlement in any fund property that is not otherwise segregated or pledged, to the maximum extent permitted by law, to the extent of any overdraft.
In addition, the fund and other affiliated funds have entered into an agreement with Citibank N.A. that enables them to participate in a $300 million unsecured committed line of credit. A commitment fee, payable at the end of each calendar quarter, based on the average daily unused portion of the line of credit, is charged to each participating fund on a pro rata basis and is reflected in other expenses on the Statement of operations. Prior to March 27, 2013, the fund participated in a $100 million unsecured line of credit, also with Citibank N.A., with terms otherwise similar to the existing agreement. Commitment fees for the six months ended August 31, 2013 were $318. For the six months ended August 31, 2013 the fund had no borrowings under either line of credit.
Expenses. Within the John Hancock Funds complex, expenses that are directly attributable to an individual fund are allocated to such fund. Expenses that are not readily attributable to a specific fund are allocated among all funds in an equitable manner, taking into consideration, among other things, the nature and type of expense and the fund’s relative net assets. Expense estimates are accrued in the period to which they relate and adjustments are made when actual amounts are known.
Class allocations. Income, common expenses and realized and unrealized gains (losses) are determined at the fund level and allocated daily to each class of shares based on the net assets of the class. Class-specific expenses, such as distribution and service fees, if any, and transfer agent fees, are calculated daily for each class, based on the net asset value of the class and the applicable specific expense rates.
Federal income taxes. The fund intends to continue to qualify as a regulated investment company by complying with the applicable provisions of the Internal Revenue Code and will not be subject to federal income tax on taxable income that is distributed to shareholders. Therefore, no federal income tax provision is required.
| 32 | International Growth Fund | Semiannual report |
As of February 28, 2013, the fund had no uncertain tax positions that would require financial statement recognition, derecognition or disclosure. The fund’s federal tax returns are subject to examination by the Internal Revenue Service for a period of three years.
Distribution of income and gains. Distributions to shareholders from net investment income and net realized gains, if any, are recorded on the ex-date. The fund generally declares and pays dividends and capital gain distributions, if any, annually.
Distributions paid by the fund with respect to each class of shares are calculated in the same manner, at the same time and in the same amount, except for the effect of class level expenses that may be applied differently to each class.
Such distributions, on a tax basis, are determined in conformity with income tax regulations, which may differ from accounting principles generally accepted in the United States of America.
Capital accounts within the financial statements are adjusted for permanent book-tax differences. These adjustments have no impact on net assets or the results of operations. Temporary book-tax differences, if any, will reverse in a subsequent period. Book-tax differences are primarily attributable to passive foreign investment companies, wash sale loss deferrals and derivative transactions.
Note 3 — Derivative instruments
The fund may invest in derivatives in order to meet its investment objectives. Derivatives include a variety of different instruments that may be traded in the OTC market, on a regulated exchange or through a clearing facility. The risks in using derivatives vary depending upon the structure of the instruments, including the use of leverage, optionality, the liquidity or lack of liquidity of the contract, the creditworthiness of the counterparty or clearing organization and the volatility of the position. Some derivatives involve risks that are potentially greater than the risks associated with investing directly in the referenced securities or other referenced underlying instrument. Specifically, the fund is exposed to the risk that the counterparty to an OTC derivatives contract will be unable or unwilling to make timely settlement payments or otherwise honor its obligations. OTC derivatives transactions typically can only be closed out with the other party to the transaction.
Forward foreign currency contracts, certain options and certain swaps are typically traded through the OTC market. Non-deliverable forwards, currency options and cash settled currency swaps are all regulated by the Commodity Futures Trading Commission (the CFTC) as swaps. Derivative counterparty risk is managed through an ongoing evaluation of the creditworthiness of all potential counterparties and, if applicable, designated clearing organizations. The fund attempts to reduce its exposure to counterparty risk for derivatives traded in the OTC market, whenever possible, by entering into an International Swaps and Derivatives Association (ISDA) Master Agreement with each of its OTC counterparties. The ISDA gives each party to the agreement the right to terminate all transactions traded under the agreement if there is certain deterioration in the credit quality or contractual default of the other party, as defined in the ISDA. Upon an event of default or a termination of the ISDA, the non-defaulting party has the right to close out all transactions and to net amounts owed. This right to close out and net payments across all transactions traded under the ISDA could result in a reduction of the fund’s risk to a counterparty equal to any amounts payable by the fund, if any.
Futures, certain options and cleared swaps are traded or cleared on an exchange or central clearinghouse. Exchange-traded or cleared transactions generally present less counterparty risk to a fund than OTC transactions. The exchange or clearinghouse stands between the fund and the broker to the contract and therefore, credit risk is generally limited to the failure of the exchange or clearinghouse and the clearing member. Securities pledged by the portfolios for exchanged-traded and cleared transactions, if any, are identified in the Portfolio of investments.
| Semiannual report | International Growth Fund | 33 |
For financial reporting purposes, the fund does not offset OTC derivative assets or liabilities that are subject to master netting arrangements, as defined by the ISDAs, in the Statement of assets and liabilities. In the event of default by the counterparty or a termination of the agreement, the ISDA allows an offset of amounts across the various transactions between the fund and the applicable counterparty.
Futures. A futures contract is a contractual agreement to buy or sell a particular currency or financial instrument at a pre-determined price in the future. Risks related to the use of futures contracts include possible illiquidity of the futures markets, contract prices that can be highly volatile and imperfectly correlated to movements in the underlying financial instrument and potential losses in excess of the amounts recognized on the Statement of assets and liabilities. Use of long futures contracts subjects the fund to the risk of loss up to the notional value of the futures contracts. Use of short futures contracts subjects the fund to unlimited risk of loss.
Upon entering into a futures contract, the fund is required to deposit initial margin with the broker in the form of cash or securities. The amount of required margin is generally based on a percentage of the contract value; this amount is the initial margin for the trade. The margin deposit must then be maintained at the established level over the life of the contract. Futures collateral receivable/payable is included on the Statement of assets and liabilities. Futures contracts are marked-to-market daily and an appropriate payable or receivable for the change in value (variation margin) and unrealized gain or loss is recorded by the fund. When the contract is closed, the fund records a realized gain or loss equal to the difference between the value of the contract at the time it was opened and the value at the time it was closed.
During the six months ended August 31, 2013, the fund used futures contracts to gain exposure to certain securities markets and substitute for securities purchased or to be purchased. During the six months ended August 31, 2013, the fund held futures contracts with notional values ranging from $11.2 million to $37.0 million, as measured at each quarter end. The following table summarizes the contracts held at August 31, 2013.
| UNREALIZED | ||||||
| OPEN | NUMBER OF | EXPIRATION | NOTIONAL | NOTIONAL | APPRECIATION | |
| CONTRACTS | CONTRACTS | POSITION | DATE | BASIS | VALUE | (DEPRECIATION) |
| Amsterdam Index | 4 | Long | Sep 2013 | $388,208 | $383,648 | ($4,560) |
| Futures | ||||||
| CAC 40 Index Futures | 47 | Long | Sep 2013 | 2,549,733 | 2,444,947 | (104,786) |
| DAX Index Futures | 5 | Long | Sep 2013 | 1,337,359 | 1,341,062 | 3,703 |
| EURO STOXX 50 | 111 | Long | Sep 2013 | 4,049,978 | 3,990,326 | (59,652) |
| Index Futures | ||||||
| FTSE 100 Index | 30 | Long | Sep 2013 | 3,029,511 | 2,977,749 | (51,762) |
| Futures | ||||||
| FTSE MIB Index | 7 | Long | Sep 2013 | 731,785 | 771,995 | 40,210 |
| Futures | ||||||
| Hang Seng Index | 4 | Long | Sep 2013 | 556,997 | 556,274 | (723) |
| Futures | ||||||
| MSCI Singapore Index | 8 | Long | Sep 2013 | 431,906 | 431,609 | (297) |
| Futures | ||||||
| OMX Stockholm 30 | 35 | Long | Sep 2013 | 647,821 | 641,923 | (5,898) |
| Index Futures | ||||||
| S&P/TSX 60 Index | 1 | Long | Sep 2013 | 138,707 | 137,928 | (779) |
| Futures | ||||||
| SPI 200 Index Futures | 17 | Long | Sep 2013 | 1,894,995 | 1,935,993 | 40,998 |
| TOPIX Index Futures | 26 | Long | Sep 2013 | 2,980,895 | 2,902,007 | (78,888) |
| Total | ($222,434) | |||||
| 34 | International Growth Fund | Semiannual report |
Forward foreign currency contracts. A forward foreign currency contract is an agreement between two parties to buy and sell a specific currency at a price that is set on the date of the contract. The forward contract calls for delivery of the currency on a future date that is specified in the contract. Risks related to the use of forwards include the possible failure of counterparties to meet the terms of the forward agreement, the risk that currency movements will not occur thereby reducing the fund’s total return, and the potential for losses in excess of the amounts recognized on the Statement of assets and liabilities.
The market value of a forward foreign currency contract fluctuates with changes in foreign currency exchange rates. Forward foreign currency contracts are marked-to-market daily and the change in value is recorded by the fund as an unrealized gain or loss. Realized gains or losses, equal to the difference between the value of the contract at the time it was opened and the value at the time it was closed, are recorded upon delivery or receipt of the currency or settlement with the counterparty.
During the six months ended August 31, 2013, the fund used forward foreign currency contracts to manage against anticipated currency exchange rates. During the six months ended August 31, 2013, the fund held forward foreign changes in currency contracts with U.S. Dollar notional values ranging from $24.3 million to $52.3 million, as measured at each quarter end. The following table summarizes the contracts held at August 31, 2013.
| CONTRACTUAL | NET UNREALIZED | ||||||||
| CONTRACT | CONTRACT | SETTLEMENT | UNREALIZED | UNREALIZED | APPRECIATION/ | ||||
| TO BUY | TO SELL | COUNTERPARTY | DATE | APPRECIATION | DEPRECIATION | (DEPRECIATION) | |||
| EUR | 1,971,380 | USD | 2,644,784 | Bank of | 10-25-13 | — | ($38,859) | ($38,859) | |
| New York | |||||||||
| EUR | 325,238 | USD | 434,124 | Barclays Bank | 10-25-13 | — | (4,199) | (4,199) | |
| PLC Wholesale | |||||||||
| EUR | 444,756 | USD | 597,797 | Deutsche Bank | 10-25-13 | — | (9,883) | (9,883) | |
| AG London | |||||||||
| EUR | 325,239 | USD | 432,819 | State Street | 10-25-13 | — | (2,893) | (2,893) | |
| Bank and Trust | |||||||||
| Company | |||||||||
| HKD | 19,528,716 | USD | 2,518,965 | Bank of | 10-25-13 | — | (108) | (108) | |
| America N.A. | |||||||||
| HKD | 9,192,270 | USD | 1,185,653 | Bank of | 10-25-13 | — | (13) | (13) | |
| New York | |||||||||
| HKD | 15,687,746 | USD | 2,023,492 | Barclays Bank | 10-25-13 | — | (52) | (52) | |
| PLC Wholesale | |||||||||
| HKD | 9,987,251 | USD | 1,288,226 | Brown Brothers | 10-25-13 | — | (48) | (48) | |
| Harriman and | |||||||||
| Company | |||||||||
| HKD | 7,483,650 | USD | 965,203 | Deutsche Bank | 10-25-13 | $55 | — | 55 | |
| AG London | |||||||||
| HKD | 11,447,016 | USD | 1,476,547 | Morgan Stanley | 10-25-13 | — | (86) | (86) | |
| and Company | |||||||||
| International PLC | |||||||||
| HKD | 7,451,586 | USD | 961,146 | State Street | 10-25-13 | — | (25) | (25) | |
| Bank and Trust | |||||||||
| Company | |||||||||
| JPY | 195,976,678 | USD | 2,014,190 | Bank of | 10-25-13 | — | (17,701) | (17,701) | |
| New York | |||||||||
| JPY | 93,751,411 | USD | 969,565 | JPMorgan | 10-25-13 | — | (14,484) | (14,484) | |
| Chase Bank | |||||||||
| JPY | 88,061,135 | USD | 915,142 | Morgan Stanley | 10-25-13 | — | (18,029) | (18,029) | |
| and Company | |||||||||
| International PLC | |||||||||
| Semiannual report | International Growth Fund | 35 |
| CONTRACTUAL | NET UNREALIZED | ||||||||
| CONTRACT | CONTRACT | SETTLEMENT | UNREALIZED | UNREALIZED | APPRECIATION/ | ||||
| TO BUY | TO SELL | COUNTERPARTY | DATE | APPRECIATION | DEPRECIATION | (DEPRECIATION) | |||
| SGD | 568,341 | USD | 445,511 | Bank of | 10-25-13 | $72 | — | $72 | |
| America N.A. | |||||||||
| SGD | 751,694 | USD | 589,980 | Bank of | 10-25-13 | — | ($647) | (647) | |
| New York | |||||||||
| SGD | 922,641 | USD | 723,698 | Barclays Bank | 10-25-13 | — | (341) | (341) | |
| PLC Wholesale | |||||||||
| SGD | 852,564 | USD | 668,531 | Brown Brothers | 10-25-13 | — | (115) | (115) | |
| Harriman and | |||||||||
| Company | |||||||||
| SGD | 553,990 | USD | 434,502 | Deutsche Bank | 10-25-13 | — | (170) | (170) | |
| AG London | |||||||||
| SGD | 1,010,876 | USD | 792,690 | Morgan Stanley | 10-25-13 | — | (156) | (156) | |
| and Company | |||||||||
| International PLC | |||||||||
| SGD | 751,694 | USD | 590,026 | Royal Bank of | 10-25-13 | — | (693) | (693) | |
| Scotland PLC | |||||||||
| SGD | 751,694 | USD | 589,093 | State Street | 10-25-13 | 240 | — | 240 | |
| Bank and Trust | |||||||||
| Company | |||||||||
| CHF | 1,050,801 | USD | 1,143,766 | Bank of | 10-25-13 | — | (13,943) | (13,943) | |
| America N.A. | |||||||||
| CHF | 1,347,363 | USD | 1,468,820 | Bank of | 10-25-13 | — | (20,132) | (20,132) | |
| New York | |||||||||
| CHF | 1,978,824 | USD | 2,160,288 | Deutsche Bank | 10-25-13 | — | (32,652) | (32,652) | |
| AG London | |||||||||
| CHF | 661,166 | USD | 720,370 | Morgan Stanley | 10-25-13 | — | (9,483) | (9,483) | |
| and Company | |||||||||
| International PLC | |||||||||
| USD | 796,141 | AUD | 881,360 | Bank of | 10-25-13 | 14,349 | — | 14,349 | |
| America N.A. | |||||||||
| USD | 477,397 | AUD | 528,167 | Bank of | 10-25-13 | 8,897 | — | 8,897 | |
| New York | |||||||||
| USD | 136,353 | AUD | 150,938 | Barclays Bank | 10-25-13 | 2,466 | — | 2,466 | |
| PLC Wholesale | |||||||||
| USD | 2,019,541 | AUD | 2,234,945 | Brown Brothers | 10-25-13 | 37,079 | — | 37,079 | |
| Harriman and | |||||||||
| Company | |||||||||
| USD | 684,225 | AUD | 749,197 | JPMorgan | 10-25-13 | 19,665 | — | 19,665 | |
| Chase Bank | |||||||||
| USD | 1,552,841 | AUD | 1,718,802 | Morgan Stanley | 10-25-13 | 28,213 | — | 28,213 | |
| and Company | |||||||||
| International PLC | |||||||||
| USD | 1,057,256 | AUD | 1,170,455 | State Street | 10-25-13 | 19,028 | — | 19,028 | |
| Bank and Trust | |||||||||
| Company | |||||||||
| USD | 1,167,348 | CAD | 1,212,560 | Bank of | 10-25-13 | 17,582 | — | 17,582 | |
| America N.A. | |||||||||
| USD | 469,380 | CAD | 488,456 | Barclays Bank | 10-25-13 | 6,219 | — | 6,219 | |
| PLC Wholesale | |||||||||
| USD | 536,849 | CAD | 558,833 | Brown Brothers | 10-25-13 | 6,956 | — | 6,956 | |
| Harriman and | |||||||||
| Company | |||||||||
| USD | 492,699 | CAD | 512,717 | Deutsche Bank | 10-25-13 | 6,533 | — | 6,533 | |
| AG London | |||||||||
| 36 | International Growth Fund | Semiannual report |
| CONTRACTUAL | NET UNREALIZED | ||||||||
| CONTRACT | CONTRACT | SETTLEMENT | UNREALIZED | UNREALIZED | APPRECIATION/ | ||||
| TO BUY | TO SELL | COUNTERPARTY | DATE | APPRECIATION | DEPRECIATION | (DEPRECIATION) | |||
| USD | 2,058,639 | CAD | 2,143,091 | Morgan Stanley | 10-25-13 | $26,530 | — | $26,530 | |
| and Company | |||||||||
| International PLC | |||||||||
| USD | 1,131,426 | CAD | 1,177,436 | Royal Bank of | 10-25-13 | 14,965 | — | 14,965 | |
| Scotland PLC | |||||||||
| USD | 171,345 | CAD | 177,998 | State Street | 10-25-13 | 2,564 | — | 2,564 | |
| Bank and Trust | |||||||||
| Company | |||||||||
| USD | 1,530,363 | DKK | 8,521,890 | Bank of | 10-25-13 | 19,764 | — | 19,764 | |
| America N.A. | |||||||||
| USD | 2,021,659 | DKK | 11,209,271 | Barclays Bank | 10-25-13 | 34,692 | — | 34,692 | |
| PLC Wholesale | |||||||||
| USD | 1,453,920 | DKK | 8,093,722 | Brown Brothers | 10-25-13 | 19,218 | — | 19,218 | |
| Harriman and | |||||||||
| Company | |||||||||
| USD | 300,831 | NOK | 1,799,867 | Bank of | 10-25-13 | 7,288 | — | 7,288 | |
| America N.A. | |||||||||
| USD | 684,482 | NOK | 4,086,460 | Bank of | 10-25-13 | 18,016 | — | 18,016 | |
| New York | |||||||||
| USD | 243,112 | NOK | 1,449,969 | Brown Brothers | 10-25-13 | 6,635 | — | 6,635 | |
| Harriman and | |||||||||
| Company | |||||||||
| USD | 293,982 | NOK | 1,754,214 | JPMorgan | 10-25-13 | 7,884 | — | 7,884 | |
| Chase Bank | |||||||||
| USD | 280,390 | NOK | 1,673,672 | Morgan Stanley | 10-25-13 | 7,428 | — | 7,428 | |
| and Company | |||||||||
| International PLC | |||||||||
| USD | 812,104 | GBP | 523,820 | Bank of | 10-25-13 | 664 | — | 664 | |
| America N.A. | |||||||||
| USD | 778,713 | GBP | 497,187 | Barclays Bank | 10-25-13 | 8,529 | — | 8,529 | |
| PLC Wholesale | |||||||||
| USD | 735,555 | GBP | 469,622 | Brown Brothers | 10-25-13 | 8,071 | — | 8,071 | |
| Harriman and | |||||||||
| Company | |||||||||
| USD | 917,141 | GBP | 585,563 | Morgan Stanley | 10-25-13 | 10,055 | — | 10,055 | |
| and Company | |||||||||
| International PLC | |||||||||
| USD | 769,547 | GBP | 491,278 | Royal Bank of | 10-25-13 | 8,516 | — | 8,516 | |
| Scotland PLC | |||||||||
| $368,173 | ($184,712) | $183,461 | |||||||
| Semiannual report | International Growth Fund | 37 |
Fair value of derivative instruments by risk category
The table below summarizes the fair value of derivatives held by the fund at August 31, 2013 by risk category:
| FINANCIAL | ASSET | LIABILITY | ||
| STATEMENT OF ASSET AND | INSTRUMENTS | DERIVATIVES | DERIVATIVES | |
| RISK | LIABILITIES LOCATION | LOCATION | FAIR VALUE | FAIR VALUE |
| Equity contracts | Receivable for futures | Futures* | $84,911 | ($307,345) |
| Foreign exchange | Receivable-payable for | Forward foreign | 368,173 | (184,712) |
| contracts | forward foreign currency | currency | ||
| contracts | contracts | |||
| Total | $453,084 | ($492,057) | ||
* Reflects cumulative appreciation/depreciation of futures as disclosed herein. Only the period end variation margin is separately disclosed on the Statement of assets and Liabilities.
Effect of derivative instruments on the Statement of operations
The table below summarizes the net realized gain (loss) included in the net increase (decrease) in net assets from operations, classified by derivative instrument and risk category, for the six months ended August 31, 2013:
| STATEMENT OF | FOREIGN | |||
| OPERATIONS | FUTURES | CURRENCY | ||
| RISK | LOCATION | CONTRACTS | TRANSACTIONS* | TOTAL |
| Equity contracts | Net realized | $1,432,200 | — | $1,432,200 |
| gain (loss) | ||||
| Foreign exchange | Net realized | — | $909,665 | 909,665 |
| contracts | gain (loss) | |||
| Total | $1,432,200 | $909,665 | $2,341,865 | |
* Realized gain (loss) associated with forward foreign currency contracts is included in this caption on the Statement of operations.
The table below summarizes the net change in unrealized appreciation (depreciation) included in the net increase (decrease) in net assets from operations, classified by derivative instrument and risk category, for the six months ended August 31, 2013:
| TRANSLATION OF ASSETS | ||||
| STATEMENT OF OPERATIONS | FUTURES | AND LIABILITIES IN | ||
| RISK | LOCATION | CONTRACTS | FOREIGN CURRENCIES* | TOTAL |
| Equity contracts | Change in unrealized | ($175,514) | — | ($175,514) |
| appreciation (depreciation) | ||||
| Foreign exchange | Change in unrealized | — | $60,001 | 60,001 |
| contracts | appreciation (depreciation) | |||
| Total | ($175,514) | $60,001 | ($115,513) | |
* Change in unrealized appreciation-depreciation associated with forward foreign currency contracts is included in this caption on the Statement of operations.
| 38 | International Growth Fund | Semiannual report |
Note 4 — Guarantees and indemnifications
Under the Trust’s organizational documents, its Officers and Trustees are indemnified against certain liabilities arising out of the performance of their duties to the Trust, including the fund. Additionally, in the normal course of business, the fund enters into contracts with service providers that contain general indemnification clauses. The fund’s maximum exposure under these arrangements is unknown, as this would involve future claims that may be made against the fund that have not yet occurred. The risk of material loss from such claims is considered remote.
Note 5 — Fees and transactions with affiliates
John Hancock Investment Management Services, LLC (the Advisor) serves as investment advisor for the trust. John Hancock Funds, LLC (the Distributor), an affiliate of the Advisor, serves as principal underwriter of the trust. The Advisor and the Distributor are indirect, wholly owned subsidiaries of MFC.
Management fee. The fund has an investment management agreement with the Advisor under which the fund pays a daily management fee to the Advisor equivalent, on an annual basis, to the sum of: (a) 0.920% of the first $100,000,000 of the fund’s average daily net assets; (b) 0.895% of the next $900,000,000; (c) 0.880% of the next $1,000,000,000; (d) 0.850% of the next $1,000,000,000; (e) 0.825% of the next $1,000,000,000, and (f) 0.800% of the fund’s average daily net assets in excess of $4,000,000,000. The Advisor has a subadvisory agreement with Grantham, Mayo, Van Otterloo & Co. LLC. The fund is not responsible for payment of the subadvisory fees.
Effective June 1, 2013, the Advisor has contractually agreed to waive a portion of its management fee for certain funds (the Participating portfolios) of the Trust, John Hancock Funds, John Hancock Funds II and John Hancock Variable Insurance Trust. The waiver equals, on an annualized basis, 0.01% of that portion of the aggregate net assets of all the Participating portfolios that exceeds $75 billion but is less than or equal to $125 billion; 0.0125% of that portion of the aggregate net assets of all the Participating portfolios that exceeds $125 billion but is less than or equal to $150 billion; and 0.015% of that portion of the aggregate net assets of all the Participating portfolios that exceeds $150 billion. The amount of the reimbursement is calculated daily and allocated among all the Participating portfolios in proportion to the daily net assets of each fund. This arrangement may be amended or terminated at any time by the Advisor upon notice to the fund and with the approval of the Board of Trustees.
The Advisor has contractually agreed to waive fees and/or reimburse certain expenses for each share class of the fund. This agreement excludes taxes, brokerage commissions, interest expense, litigation and indemnification expenses and other extraordinary expenses not incurred in the ordinary course of the fund’s business acquired fees and expenses paid indirectly and short dividend expense. The fee waivers and/or reimbursements are such that these expenses will not exceed 1.60%, 2.30%, 2.30%, 1.24% and 1.15% for Class A, Class B, Class C, Class I and Class 1 shares, respectively. The current expense limitation agreement will remain in effect through June 30, 2014, unless renewed by mutual agreement of the fund and the Advisor based upon a determination that this is appropriate under the circumstances at the time.
Accordingly, these expense reductions amounted to $1,225, $7,648, $7,109, $1,952 and $167 for Class A, Class B, Class C, Class I and Class 1 shares, respectively, for the six months ended August 31, 2013.
The investment management fees, including the impact of the waivers and reimbursements described above, incurred for the six months ended August 31, 2013 were equivalent to the net annual effective rate of 0.89% of the fund’s average daily net assets.
| Semiannual report | International Growth Fund | 39 |
Accounting and legal services. Pursuant to a service agreement, the fund reimburses the Advisor for all expenses associated with providing the administrative, financial, legal, accounting and recordkeeping services to the fund, including the preparation of all tax returns, periodic reports to shareholders and regulatory reports, among other services. These expenses are allocated to each share class based on its relative net assets at the time the expense was incurred. These accounting and legal services fees incurred for the six months ended August 31, 2013 amounted to an annual rate of 0.02% of the fund’s average daily net assets.
Distribution and service plans. The fund has a distribution agreement with the Distributor. The fund has adopted distribution and service plans with respect to Class A, Class B, Class C and Class 1 shares pursuant to Rule 12b-1 under the 1940 Act, to pay the Distributor for services provided as the distributor of shares of the fund. The fund pays the following contractual rates of distribution and service fees under these arrangements, expressed as an annual percentage of average daily net assets for each class of the fund’s shares.
| CLASS | RULE 12b-1 FEE | ||
| Class A | 0.30% | ||
| Class B | 1.00% | ||
| Class C | 1.00% | ||
| Class 1 | 0.05% | ||
Sales charges. Class A shares are assessed up-front sales charges, which resulted in payments to the Distributor amounting to $278,631 for the six months ended August 31, 2013. Of this amount, $47,600 was retained and used for printing prospectuses, advertising, sales literature and other purposes, $230,827 was paid as sales commissions to broker-dealers and $204 was paid as sales commissions to sales personnel of Signator Investors, Inc., a broker-dealer affiliate of the Advisor.
Class A, Class B and Class C shares may be subject to contingent deferred sales charges (CDSCs). Certain Class A shares that are redeemed within one year of purchase are subject to a 1.00% sales charge. Class B shares that are redeemed within six years of purchase are subject to CDSCs, at declining rates, beginning at 5.00%. Class C shares that are redeemed within one year of purchase are subject to a 1.00% CDSC. CDSCs are applied to the lesser of the current market value at the time of redemption or the original purchase cost of the shares being redeemed. Proceeds from CDSCs are used to compensate the Distributor for providing distribution related services in connection with the sale of these shares. During the six months ended August 31, 2013, CDSCs received by the Distributor amounted to $18, $374 and $82 for Class A, Class B and Class C shares, respectively.
Transfer agent fees. The fund has a transfer agent agreement with John Hancock Signature Services, Inc. (Signature Services), an affiliate of the Advisor. The transfer agent fees paid to Signature Services are determined based on the cost to Signature Services (Signature Services Cost) of providing recordkeeping services. The Signature Services Cost includes a component of allocated John Hancock corporate overhead for providing transfer agent services to the fund and to all other John Hancock affiliated funds. It also includes out-of-pocket expenses that are comprised of payments made to third-parties for recordkeeping services provided to their clients who invest in one or more John Hancock funds. In addition, Signature Services Cost may be reduced by certain fees that Signature Services receives in connection with retirement and small accounts. Signature Services Cost is calculated monthly and allocated, as applicable, to four categories of share classes: Institutional Share Classes, Retirement Share Classes, Municipal Bond Classes and all other Retail Share Classes. Within each of these categories, the applicable costs are allocated to the affected John Hancock affiliated funds and/or classes, based on the relative average daily net assets.
| 40 | International Growth Fund | Semiannual report |
| Class level expenses. Class level expenses for the six months ended August 31, 2013 were: | ||||
| DISTRIBUTION | TRANSFER | STATE | PRINTING AND | |
| CLASS | AND SERVICE FEES | AGENT FEES | REGISTRATION FEES | POSTAGE |
| Class A | $128,428 | $64,387 | $11,310 | $5,749 |
| Class B | 7,254 | 1,088 | 7,963 | 265 |
| Class C | 15,694 | 2,372 | 7,963 | 337 |
| Class I | — | 62,697 | 8,908 | 2,910 |
| Class 1 | 2,990 | — | — | — |
| Total | $154,366 | $130,544 | $36,144 | $9,261 |
Trustee expenses. The fund compensates each trustee who is not an employee of the Advisor or its affiliates. The costs of paying Trustee compensation and expenses are allocated to the fund based on its net assets relative to other funds within the John Hancock funds complex.
Interfund Lending Program. Pursuant to an Exemptive Order issued by the SEC, the fund, along with other funds advised by the Advisor, may participate in an interfund lending program. This program provides an alternative credit facility allowing the funds to borrow from, or lend money to, other participating affiliated funds. At period end, there were no interfund loans outstanding. The fund’s activity in this program during the period for which loans were outstanding was as follows:
| AVERAGE LOAN | DAYS | WEIGHTED AVERAGE | INTEREST | |
| BORROWER OR LENDER | BALANCE | OUTSTANDING | INTEREST RATE | EXPENSE |
| Borrower | $4,008,434 | 1 | 0.49% | $55 |
Note 6 — Fund share transactions
Transactions in fund shares for the six months ended August 31, 2013 and the year ended February 28, 2013 were as follows:
| Six months ended 8-31-13 | Year ended 2-28-13 | |||
| Shares | Amount | Shares | Amount | |
| Class A shares | ||||
| Sold | 1,344,551 | $30,033,501 | 1,767,870 | $36,112,556 |
| Distributions reinvested | — | — | 233,886 | 4,738,520 |
| Repurchased | (480,267) | (10,420,799) | (1,065,421) | (22,127,831) |
| Net increase | 864,284 | $19,612,702 | 936,335 | $18,723,245 |
| Class B shares | ||||
| Sold | 7,480 | $164,054 | 20,059 | $411,385 |
| Distributions reinvested | — | — | 3,222 | 65,178 |
| Repurchased | (4,577) | (101,793) | (9,527) | (191,978) |
| Net increase | 2,903 | $62,261 | 13,754 | $284,585 |
| Class C shares | ||||
| Sold | 78,329 | $1,743,766 | 51,637 | $1,066,773 |
| Distributions reinvested | — | — | 5,639 | 113,904 |
| Repurchased | (5,403) | (118,893) | (29,273) | (602,604) |
| Net increase | 72,926 | $1,624,873 | 28,003 | $578,073 |
| Class I shares | ||||
| Sold | 3,740,917 | $83,844,558 | 797,965 | $16,495,650 |
| Distributions reinvested | — | — | 11,539 | 233,886 |
| Repurchased | (344,091) | (7,704,152) | (5,181,141) | (103,567,384) |
| Net increase (decrease) | 3,396,826 | $76,140,406 | (4,371,637) | ($86,837,848) |
| Semiannual report | International Growth Fund | 41 |
| Six months ended 8-31-13 | Year ended 2-28-13 | |||
| Shares | Amount | Shares | Amount | |
| Class 1 shares | ||||
| Sold | 124,535 | $2,808,532 | 141,847 | $2,917,529 |
| Distributions reinvested | — | — | 37,603 | 761,831 |
| Repurchased | (88,341) | (1,963,425) | (120,232) | (2,437,200) |
| Net increase | 36,194 | $845,107 | 59,218 | $1,242,160 |
| Total net increase (decrease) | 4,373,133 | $98,285,349 | (3,334,327) | ($66,009,785) |
Note 7 — Purchase and sale of securities
Purchases and sales of securities, other than short-term securities, aggregated $128,115,936 and $39,322,717, respectively, for the six months ended August 31, 2013.
| 42 | International Growth Fund | Semiannual report |
Evaluation of Advisory and Subadvisory Agreements by the Board of Trustees
This section describes the evaluation by the Board of Trustees (the Board) of John Hancock Funds III (the Trust) of the Advisory Agreement (the Advisory Agreement) with John Hancock Investment Management Services, LLC (the Advisor) and the Subadvisory Agreement (the Subadvisory Agreement) with Grantham, Mayo, Van Otterloo & Co. LLC (the Subadvisor) for John Hancock International Growth Fund (the fund). The Advisory Agreement and Subadvisory Agreement are collectively referred to as the Agreements.
Approval of Advisory and Subadvisory Agreements
At in-person meetings held on May 16-17, 2013, the Board, including the Trustees who are not considered to be interested persons of the Trust under the Investment Company Act of 1940, as amended (the 1940 Act) (the Independent Trustees), reapproved for an annual period the continuation of the Advisory Agreement between the Trust and the Advisor and the Subadvisory Agreement between the Advisor and the Subadvisor with respect to the fund.
In considering the Advisory Agreement and the Subadvisory Agreement, the Board received in advance of the meeting a variety of materials relating to the fund, the Advisor, and the Subadvisor, including comparative performance, fee and expense information for peer groups of similar mutual funds prepared by an independent third-party provider of mutual fund data; performance information for the fund’s benchmark index; and, with respect to the Subadvisor, comparative performance information for comparably managed accounts; and other information provided by the Advisor and the Subadvisor regarding the nature, extent, and quality of services provided by the Advisor and the Subadvisor under their respective Agreements, as well as information regarding the Advisor’s revenues and costs of providing services to the fund and any compensation paid to affiliates of the Advisor. At the meeting at which the renewal of the Advisory Agreement and Subadvisory Agreement is considered, particular focus is given to information concerning fund performance, comparability of fees and total expenses and profitability. However, the Board notes that the evaluation process with respect to the Advisor and the Subadvisor is an ongoing one. In this regard, the Board also took into account discussions with management and information provided to the Board at prior meetings with respect to the services provided by the Advisor and the Subadvisor to the fund, including quarterly performance reports prepared by management containing reviews of investment results and prior presentations from the Subadvisor with respect to the fund. The Board also considered the nature, quality, and extent of non-advisory services, if any, to be provided to the fund by the Advisor’s affiliates, including distribution services.
Throughout the process, the Board asked questions of and requested additional information from management. The Board is assisted by counsel for the Trust and the Independent Trustees are also separately assisted by independent legal counsel throughout the process. The Independent Trustees also received a memorandum from their independent counsel discussing the legal standards for their consideration of the proposed continuation of the Agreements and discussed the proposed continuation of the Agreements in private sessions with their independent legal counsel at which no representatives of management were present.
Approval of Advisory Agreement
In approving the Advisory Agreement with respect to the fund, the Board, including the Independent Trustees, considered a variety of factors, including those discussed below. The Board also considered other factors (including conditions and trends prevailing generally in the economy, the securities markets, and the industry) and does not treat any single factor as determinative and each Trustee may attribute different weights to different factors. The Board’s conclusions may be based in part on its consideration of the Advisory and Subadvisory Agreements in prior years and on the Board’s ongoing regular review of fund performance and operations throughout the year.
| Semiannual report | International Growth Fund | 43 |
Nature, extent, and quality of services. Among the information received by the Board from the Advisor relating to the nature, extent, and quality of services provided to the fund, the Board reviewed information provided by the Advisor relating to its operations and personnel, descriptions of its organizational and management structure, and information regarding the Advisor’s compliance and regulatory history, including its Form ADV. The Board also noted that on a regular basis it receives and reviews information from the Trust’s Chief Compliance Officer (CCO) regarding the fund’s compliance policies and procedures established pursuant to Rule 38a-1 under the 1940 Act. The Board also considered the Advisor’s risk management processes. The Board considered that the Advisor is responsible for the management of the day-to-day operations of the fund, including, but not limited to, general supervision of and coordination of the services provided by the Subadvisor, and is also responsible for monitoring and reviewing the activities of the Subadvisor and other third-party service providers.
In considering the nature, extent, and quality of the services provided by the Advisor, the Trustees also took into account their knowledge of the Advisor’s management and the quality of the performance of the Advisor’s duties through Board meetings, discussions, and reports during the preceding year and through each Trustee’s experience as a Trustee of the Trust and of the other trusts in the complex.
In the course of their deliberations regarding the Advisory Agreement, the Board considered, among other things:
(a) the skills and competency with which the Advisor has in the past managed the Trust’s affairs and its subadvisory relationship, the Advisor’s oversight and monitoring of the Subadvisor’s investment performance and compliance programs, such as the Subadvisor’s compliance with fund policies and objective; review of brokerage matters, including with respect to trade allocation and best execution; and the Advisor’s timeliness in responding to performance issues;
(b) the background, qualifications and skills of the Advisor’s personnel;
(c) the Advisor’s compliance policies and procedures and its responsiveness to regulatory changes and mutual fund industry developments;
(d) the Advisor’s administrative capabilities, including its ability to supervise the other service providers for the fund;
(e) the financial condition of the Advisor and whether it has the financial wherewithal to provide a high level and quality of services to the fund; and
(f) the Advisor’s reputation and experience in serving as an investment adviser to the Trust and the benefit to shareholders of investing in funds that are part of a family of funds offering a variety of investments.
The Board concluded that the Advisor may reasonably be expected to continue to provide a high quality of services under the Advisory Agreement with respect to the fund.
Investment performance. In considering the fund’s performance, the Board noted that it reviews at its regularly scheduled meetings information about the fund’s performance results. In connection with the consideration of the Advisory Agreement, the Board:
(a) reviewed information prepared by management regarding the fund’s performance;
(b) considered the comparative performance of the fund’s benchmark;
| 44 | International Growth Fund | Semiannual report |
(c) considered the performance of comparable funds, if any, as included in the report prepared by an independent third-party provider of mutual fund data. Such report included the fund’s ranking within a smaller group of peer funds and the fund’s ranking within broader groups of funds; and
(d) took into account the Advisor’s analysis of the fund’s performance and its plans and recommendations regarding the Trust’s subadvisory arrangements generally.
The Board noted favorably that the fund outperformed its benchmark index and peer group average for the one-, three-, and five-year periods ended December 31, 2012.
The Board concluded that the performance of the fund has generally been in line with or outperformed the historical performance of comparable funds and the fund’s benchmark.
Fees and expenses. The Board reviewed comparative information prepared by an independent third-party provider of mutual fund data, including, among other data, the fund’s contractual and net management fees and total expenses as compared to similarly situated investment companies deemed to be comparable to the fund. The Board considered the fund’s ranking within a smaller group of peer funds chosen by the independent third-party provider, as well as the fund’s ranking within a broader group of funds. In comparing the fund’s contractual and net management fees to those of comparable funds, the Board noted that such fees include both advisory and administrative costs.
The Board noted that the subadvisory fees for this fund are equal to the peer group median. The Board noted also that the net management fees for this fund are lower than the peer group median and that total expenses for this fund are higher than the peer group median. The Board took into account management’s discussion of the fund’s expenses.
The Board took into account management’s discussion with respect to the advisory/subadvisory fee structure, including the amount of the advisory fee retained by the Advisor after payment of the subadvisory fee. The Board also took into account that management had agreed to implement an overall fee waiver across a number of funds in the complex, including the fund, which is discussed further below. The Board also noted that, in addition, the Advisor is currently waiving fees and/ or reimbursing expenses with respect to the fund. The Board also noted that the Advisor pays the subadvisory fees of the fund, and that such fees are negotiated at arm’s length with respect to the Subadvisor. The Board also noted management’s discussion of the fund’s expenses, as well as certain actions taken over the past several years to reduce the fund’s operating expenses. The Board reviewed information provided by the Advisor concerning investment advisory fees charged to other clients (including other funds in the complex) having similar investment mandates, if any. The Board considered any differences between the Advisor’s and Subadvisor’s services to the fund and the services they provide to other comparable clients or funds. The Board concluded that the advisory fee paid with respect to the fund is reasonable.
Profitability/indirect benefits. In considering the costs of the services to be provided and the profits to be realized by the Advisor and its affiliates from the Advisor’s relationship with the Trust, the Board:
(a) reviewed financial information of the Advisor;
(b) reviewed and considered an analysis presented by the Advisor regarding the net profitability to the Advisor and its affiliates with respect to the fund;
(c) received and reviewed profitability information with respect to the John Hancock fund complex as a whole;
| Semiannual report | International Growth Fund | 45 |
(d) received information with respect to the Advisor’s allocation methodologies used in preparing the profitability data;
(e) considered that the Advisor also provides administrative services to the fund on a cost basis pursuant to an administrative services agreement;
(f) noted that affiliates of the Advisor provide transfer agency services and distribution services to the fund, and that the Trust’s distributor also receives Rule 12b-1 payments to support distribution of the fund;
(g) noted that the Advisor also derives reputational and other indirect benefits from providing advisory services to the fund;
(h) noted that the subadvisory fees for the fund are paid by the Advisor and are negotiated at arm’s length; and
(i) considered that the Advisor should be entitled to earn a reasonable level of profits in exchange for the level of services it provides to the fund and the entrepreneurial risk that it assumes as Advisor.
Based upon its review, the Board concluded that the level of profitability, if any, of the Advisor and its affiliates from their relationship with the fund was reasonable and not excessive.
Economies of scale. In considering the extent to which economies of scale would be realized as the fund grows and whether fee levels reflect these economies of scale for the benefit of fund shareholders, the Board:
(a) considered that the Advisor has agreed, effective June 1, 2013, to waive its management fee for the fund and each of the open-end funds of John Hancock Funds II, John Hancock Funds III, each other John Hancock fund (except those listed below) (the Participating Portfolios) or otherwise reimburse the expenses of the Participating Portfolios as follows (the Reimbursement):
The Reimbursement shall equal, on an annualized basis, 0.01% of that portion of the aggregate net assets of all the Participating Portfolios that exceeds $75 billion but is less than or equal to $125 billion, 0.0125% of that portion of the aggregate net assets of all the Participating Portfolios that exceeds $125 billion but is less than or equal to $150 billion and 0.015% of that portion of the aggregate net assets of all the Participating Portfolios that exceeds $150 billion. (The funds that are not Participating Portfolios as of the date of this semiannual report are each of the fund of funds, money market funds, index funds and closed-end funds);
(b) reviewed the Trust’s advisory fee structure and the incorporation therein of any subadvisory fee breakpoints in the advisory fees charged and concluded that (i) the fund’s fee structure contains breakpoints at the subadvisory fee level and that such breakpoints are reflected as breakpoints in the advisory fees for the fund and (ii) although economies of scale cannot be measured with precision, these arrangements permit shareholders of the fund to benefit from economies of scale if the fund grows. The Board also took into account management’s discussion of the fund’s advisory fee structure; and
(c) the Board also considered the effect of the fund’s growth in size on its performance and fees. The Board also noted that if the fund’s assets increase over time, the fund may realize other economies of scale.
| 46 | International Growth Fund | Semiannual report |
Approval of Subadvisory Agreement
In making its determination with respect to approval of the Subadvisory Agreement, the Board reviewed:
(1) information relating to the Subadvisor’s business, including current subadvisory services to the Trust (and other funds in the John Hancock family of funds);
(2) the historical and current performance of the fund, and comparative performance information relating to the fund’s benchmark and comparable funds;
(3) the subadvisory fee for the fund, including any breakpoints, and comparative fee information, where available, prepared by an independent third-party provider of mutual fund data; and
(4) information relating to the nature and scope of any material relationships and their significance to the Trust’s Advisor and Subadvisor.
Nature, extent, and quality of services. With respect to the services provided by the Subadvisor, the Board received information provided to the Board by the Subadvisor, including the Subadvisor’s Form ADV, as well as took into account information presented throughout the past year. The Board considered the Subadvisor’s current level of staffing and its overall resources, as well as received information relating to the Subadvisor’s compensation program. The Board reviewed the Subadvisor’s history and investment experience, as well as information regarding the qualifications, background, and responsibilities of the Subadvisor’s investment and compliance personnel who provide services to the fund. The Board also considered, among other things, the Subadvisor’s compliance program and any disciplinary history. The Board also considered the Subadvisor’s risk assessment and monitoring process. The Board reviewed the Subadvisor’s regulatory history, including whether it was currently involved in any regulatory actions or investigations as well as material litigation, and any settlements and amelioratory actions undertaken, as appropriate. The Board noted that the Advisor conducts regular, periodic reviews of the Subadvisor and its operations, including regarding investment processes and organizational and staffing matters. The Board also noted that the Trust’s CCO and his staff conduct regular, periodic compliance reviews with the Subadvisor and present reports to the Independent Trustees regarding the same, which includes evaluating the regulatory compliance systems of the Subadvisor and procedures reasonably designed by it to assure compliance with the federal securities laws. The Board also took into account the financial condition of the Subadvisor.
The Board considered the Subadvisor’s investment process and philosophy. The Board took into account that the Subadvisor’s responsibilities include the development and maintenance of an investment program for the fund, that is consistent with the fund’s investment objective, the selection of investment securities and the placement of orders for the purchase and sale of such securities, as well as the implementation of compliance controls related to performance of these services. The Board also received information with respect to the Subadvisor’s brokerage policies and practices, including with respect to best execution and soft dollars.
Subadvisor compensation. In considering the cost of services to be provided by the Subadvisor and the profitability to the Subadvisor of its relationship with the fund, the Board noted that the fees under the Subadvisory Agreement are paid by the Advisor and not the fund.
The Board also relied on the ability of the Advisor to negotiate the Subadvisory Agreement with the Subadvisor, which is not affiliated with the Advisor, and the fees thereunder at arm’s length. As a result, the costs of the services to be provided and the profits to be realized by the Subadvisor from its relationship with the Trust were not a material factor in the Board’s consideration of the Subadvisory Agreement.
| Semiannual report | International Growth Fund | 47 |
The Board also received information regarding the nature and scope (including their significance to the Advisor and its affiliates and to the Subadvisor) of any material relationships with respect to the Subadvisor, which includes arrangements in which the Subadvisor or its affiliates provide advisory, distribution, or management services in connection with financial products sponsored by the Trust’s Advisor or its affiliates, and may include other registered investment companies, a 529 education savings plan, managed separate account, and exempt group annuity contracts sold to qualified plans. The Board also received information and took into account any other potential conflicts of interest the Advisor might have in connection with the Subadvisory Agreement.
In addition, the Board considered other potential indirect benefits that the Subadvisor and its affiliates may receive from the Subadvisor’s relationship with the fund, such as the opportunity to provide advisory services to additional funds in the John Hancock fund complex and reputational benefits.
Subadvisory fees. The Board considered that the fund pays an advisory fee to the Advisor and that, in turn, the Advisor pays a subadvisory fee to the Subadvisor. The Board also took into account the subadvisory fees paid by the Advisor to the Subadvisor with respect to the fund to fees charged by the fund’s Subadvisor to manage other subadvised portfolios and portfolios not subject to regulation under the 1940 Act, as applicable.
Subadvisor performance. As noted above, the Board considered the fund’s performance as compared to the fund’s peer group and benchmark and noted that the Board reviews information about the fund’s performance results at its regularly scheduled meetings. The Board noted the Advisor’s expertise and resources in monitoring the performance, investment style, and risk-adjusted performance of the Subadvisor. The Board was mindful of the Advisor’s focus on the Subadvisor’s performance. The Board also noted the Subadvisor’s long-term performance record for similar accounts, as applicable.
The Board’s decision to approve the Subadvisory Agreement was based on a number of determinations, including the following:
(1) The Subadvisor has extensive experience and demonstrated skills as a manager;
(2) The performance of the fund generally has been in line with or outperformed the historical performance of comparable funds and the fund’s benchmark and the fund’s overall performance is satisfactory;
(3) The subadvisory fees are reasonable in relation to the level and quality of services being provided; and
(4) Subadvisory fee breakpoints are reflected as breakpoints in the advisory fees for the fund in order to permit shareholders to benefit from economies of scale if the fund grows.
| * * * | |
Based on the Board’s evaluation of all factors that the Board deemed to be material, including those factors described above, the Board, including the Independent Trustees, concluded that renewal of the Advisory Agreement and the Subadvisory Agreement would be in the best interest of the fund and its shareholders. Accordingly, the Board, and the Independent Trustees voting separately, approved the Advisory Agreement and Subadvisory Agreement for an additional one-year period.
| 48 | International Growth Fund | Semiannual report |
More information
| Trustees | Investment advisor |
| James M. Oates, Chairman | John Hancock Investment Management |
| Steven R. Pruchansky, Vice Chairman | Services, LLC |
| Charles L. Bardelis* | |
| James R. Boyle† | Subadvisor |
| Craig Bromley† | Grantham, Mayo, Van Otterloo & Co. LLC |
| Peter S. Burgess* | |
| William H. Cunningham | Principal distributor |
| Grace K. Fey | John Hancock Funds, LLC |
| Theron S. Hoffman* | |
| Deborah C. Jackson | Custodian |
| Hassell H. McClellan | State Street Bank and Trust Company |
| Gregory A. Russo | |
| Warren A. Thomson† | Transfer agent |
| John Hancock Signature Services, Inc. | |
| Officers | |
| Hugh McHaffie | Legal counsel |
| President | K&L Gates LLP |
| Andrew G. Arnott | |
| Executive Vice President | |
| Thomas M. Kinzler | |
| Secretary and Chief Legal Officer | |
| Francis V. Knox, Jr. | |
| Chief Compliance Officer | |
| Charles A. Rizzo | |
| Chief Financial Officer | |
| Salvatore Schiavone | |
| Treasurer | |
| *Member of the Audit Committee | |
| †Non-Independent Trustee | |
The fund’s proxy voting policies and procedures, as well as the fund’s proxy voting record for the most recent twelve-month period ended June 30, are available free of charge on the Securities and Exchange Commission (SEC) website at sec.gov or on our website.
The fund’s complete list of portfolio holdings, for the first and third fiscal quarters, is filed with the SEC on Form N-Q. The fund’s Form N-Q is available on our website and the SEC’s website, sec.gov, and can be reviewed and copied (for a fee) at the SEC’s Public Reference Room in Washington, DC. Call 800-SEC-0330 to receive information on the operation of the SEC’s Public Reference Room.
We make this information on your fund, as well as monthly portfolio holdings, and other fund details available on our website at jhinvestments.com or by calling 800-225-5291.
| You can also contact us: | ||
| 800-225-5291 | Regular mail: | Express mail: |
| jhinvestments.com | Investment Operations | Investment Operations |
| John Hancock Signature Services, Inc. | John Hancock Signature Services, Inc. | |
| P.O. Box 55913 | 30 Dan Road | |
| Boston, MA 02205-5913 | Canton, MA 02021 |
| Semiannual report | International Growth Fund | 49 |

800-225-5291
800-338-8080 EASI-Line
jhinvestments.com

| This report is for the information of the shareholders of John Hancock International Growth Fund. | |
| It is not authorized for distribution to prospective investors unless preceded or accompanied by a prospectus. | 87SA 8/13 |
| MF159389 | 10/13 |
A look at performance
Total returns for the period ended August 31, 2013
| Average annual total returns (%) | Cumulative total returns (%) | |||||||||
| with maximum sales charge | with maximum sales charge | |||||||||
| Since | Since | |||||||||
| 1-year | 5-year | 10-year | inception 1 | 6-months | 1-year | 5-year | 10-year | inception 1 | ||
| Class A | 9.08 | 0.54 | — | –1.23 | –2.85 | 9.08 | 2.72 | — | –7.94 | |
| Class B | 9.03 | 0.52 | — | –1.17 | –3.11 | 9.03 | 2.60 | — | –7.55 | |
| Class C | 13.01 | 0.89 | — | –1.15 | 0.88 | 13.01 | 4.53 | — | –7.44 | |
| Class I2 | 15.13 | 2.01 | — | –0.05 | 2.37 | 15.13 | 10.49 | — | –0.33 | |
| Index† | 19.17 | 2.11 | — | 0.44 | 4.05 | 19.17 | 10.98 | — | 2.96 | |
Performance figures assume all distributions are reinvested. Figures reflect maximum sales charges on Class A shares of 5%, and the applicable contingent deferred sales charge (CDSC) on Class B and Class C shares. The Class B shares’ CDSC declines annually between years 1 to 6 according to the following schedule: 5, 4, 3, 3, 2, 1%. No sales charge will be assessed after the sixth year. Class C shares held for less than one year are subject to a 1% CDSC. Sales charges are not applicable to Class I shares.
The expense ratios of the portfolio, both net (including any fee waivers or expense limitations) and gross (excluding any fee waivers or expense limitations), are set forth according to the most recent publicly available prospectuses for the portfolio and may differ from those disclosed in the Financial highlights tables in this report. The fee waivers and expense limitations are contractual at least until 6-30-14. Had the fee waivers and expense limitations not been in place, gross expenses would apply. The following expense ratios include expenses of the underlying affiliated funds in which the portfolio invests. The expense ratios are as follows:
| Class A | Class B | Class C | Class I | ||||||
| Net (%) | 1.62 | 2.32 | 2.32 | 1.26 | |||||
| Gross (%) | 2.49 | 3.63 | 3.27 | 5.67 |
The returns reflect past results and should not be considered indicative of future performance. The return and principal value of an investment will fluctuate so that shares, when redeemed, may be worth more or less than their original cost. Due to market volatility, the portfolio’s current performance may be higher or lower than the performance shown. For current to the most recent month-end performance data, please call 800-225-5291 or visit the portfolio’s website at jhinvestments.com.
The performance table above and the chart on the next page do not reflect the deduction of taxes that a shareholder would pay on portfolio distributions or the redemption of portfolio shares. The portfolio’s performance results reflect any applicable fee waivers or expense reductions, without which the expenses would increase and results would have been less favorable.
† Index is the MSCI EAFE Index.
See the following page for footnotes.
| Semiannual report | International Allocation Portfolio | 5 |
A look at performance
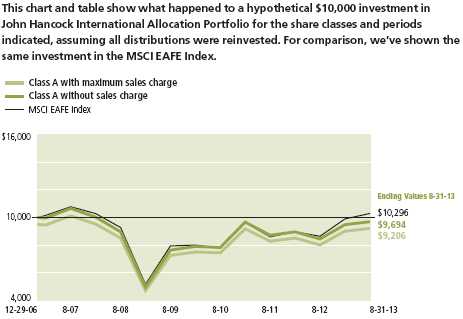
| With maximum | Without | |||
| Start date | sales charge | sales charge | Index | |
| Class B3 | 12-29-06 | $9,245 | $9,245 | $10,296 |
| Class C3 | 12-29-06 | 9,256 | 9,256 | 10,296 |
| Class I2 | 12-29-06 | 9,967 | 9,967 | 10,296 |
MSCI EAFE Index (gross of foreign withholding tax on dividends) (Europe, Australasia, Far East) is a free float-adjusted market capitalization index that is designed to measure the equity market performance of developed markets, excluding the U.S. and Canada.
It is not possible to invest directly in an index. Index figures do not reflect expenses or sales charges, which would have resulted in lower values.
Footnotes related to performance pages
1 From 12-29-06.
2 For certain types of investors, as described in the portfolio’s prospectus.
3 The contingent deferred sales charge is not applicable.
| 6 | International Allocation Portfolio | Semiannual report |
Your expenses
These examples are intended to help you understand your ongoing operating expenses of investing in the portfolio so you can compare these costs with the ongoing costs of investing in other mutual funds.
Understanding fund expenses
As a shareholder of the portfolio, you incur two types of costs:
▪ Transaction costs, which include sales charges (loads) on purchases or redemptions (varies by share class), minimum account fee charge, etc.
▪ Ongoing operating expenses, including management fees, distribution and service fees (if applicable) and other fund expenses.
We are going to present only your ongoing operating expenses here.
Actual expenses/actual returns
This example is intended to provide information about the portfolio’s actual ongoing operating expenses and is based on the portfolio’s actual return. It assumes an account value of $1,000.00 on March 1, 2013, with the same investment held until August 31, 2013.
| Account value | Ending value | Expenses paid during | |
| on 3-1-13 | on 8-31-13 | period ended on 8-31-131 | |
| Class A | $1,000.00 | $1,022.50 | $3.21 |
| Class B | 1,000.00 | 1,018.90 | 6.77 |
| Class C | 1,000.00 | 1,018.80 | 6.77 |
| Class I | 1,000.00 | 1,023.70 | 1.38 |
Together with the value of your account, you may use this information to estimate the operating expenses that you paid over the period. Simply divide your account value at August 31, 2013, by $1,000.00, then multiply it by the “expenses paid” for your share class from the table above. For example, for an account value of $8,600.00, the operating expenses should be calculated as follows:

| Semiannual report | International Allocation Portfolio | 7 |
Your expenses
Hypothetical example for comparison purposes
This table allows you to compare the portfolio’s ongoing operating expenses with those of any other fund. It provides an example of the portfolio’s hypothetical account values and hypothetical expenses based on each class’s actual expense ratio and an assumed 5% annualized return before expenses (which is not the fund’s actual return). It assumes an account value of $1,000.00 on March 1, 2013, with the same investment held until August 31, 2013. Look in any other fund shareholder report to find its hypothetical example and you will be able to compare these expenses. Please remember that these hypothetical account values and expenses may not be used to estimate the actual ending account balance or expenses you paid for the period.
| Account value | Ending value | Expenses paid during | |
| on 3-1-13 | on 8-31-13 | period ended on 8-31-131,2 | |
| Class A | $1,000.00 | $1,022.00 | $3.21 |
| Class B | 1,000.00 | 1,018.50 | 6.77 |
| Class C | 1,000.00 | 1,018.50 | 6.77 |
| Class I | 1,000.00 | 1,023.80 | 1.38 |
Remember, these examples do not include any transaction costs, therefore, these examples will not help you to determine the relative total costs of owning different funds. If transaction costs were included, your expenses would have been higher. See the prospectus for details regarding transaction costs.
1 Expenses are equal to the portfolio’s annualized expense ratio of 0.63%, 1.33%, 1.33% and 0.27% for Class A, Class B, Class C, and Class I shares, respectively, multiplied by the average account value over the period, multiplied by 184/365 (to reflect the one-half year period).
2 The portfolio’s expense ratios do not include fees and expenses indirectly incurred by the underlying funds, whose ratios can vary based on the mix of underlying funds. The range of expense ratios of the underlying funds held were 0.53% to 1.34%.
| 8 | International Allocation Portfolio | Semiannual report |
Portfolio summary
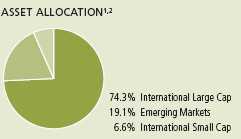
1 As a percentage of net assets on 8-31-13.
2 Foreign investing, especially in emerging markets, has additional risks, such as currency and market volatility and political and social instability. The portfolio’s performance depends on the Advisor’s skill in determining the strategic asset class allocations, the mix of underlying funds and the performance of those underlying funds. The underlying funds’ performance may be lower than the performance of the asset class which they were selected to represent. The portfolio is subject to the same risks as the underlying funds in which it invests, which include the following: stocks and bonds can decline due to adverse issuer, market, regulatory or economic developments; foreign investing, especially in emerging markets, has additional risks, such as currency and market volatility and political and social instability; and the securities of small capitalization companies are subject to higher volatility than larger, more established companies. For additional information on these and other risk considerations, please see the portfolios’ prospectuses.
| Semiannual report | International Allocation Portfolio | 9 |
Portfolio’s investments
As of 8-31-13 (unaudited)
| Shares | Value | |
| Affiliated Investment Companies 92.1% | $16,399,667 | |
| (Cost $14,187,898) | ||
| EQUITY 92.1% | 16,399,667 | |
| International Large Cap 66.4% | ||
| John Hancock Funds II (G) | ||
| International Growth Opportunities, Class NAV (Baillie Gifford) | 144,419 | 1,763,355 |
| International Growth Stock, Class NAV (Invesco) | 220,975 | 2,682,639 |
| International Value, Class NAV (Templeton) | 250,076 | 3,926,195 |
| John Hancock Funds III (G) | ||
| International Core, Class NAV (GMO) | 54,557 | 1,673,815 |
| International Value Equity, Class NAV (John Hancock1) (A) | 203,067 | 1,774,807 |
| Emerging Markets 19.1% | ||
| John Hancock Funds II (G) | ||
| China Emerging Leaders, Class NAV (Atlantis) | 51,461 | 447,194 |
| Emerging Markets, Class NAV (DFA) | 228,758 | 2,196,079 |
| John Hancock Investment Trust III (G) | ||
| Greater China Opportunities, Class NAV (John Hancock2) (A) | 36,890 | 752,552 |
| International Small Cap 6.6% | ||
| John Hancock Funds II (G) | ||
| International Small Company, Class NAV (DFA) | 129,718 | 1,183,031 |
| Unaffiliated Investment Companies 7.9% | $1,410,599 | |
| (Cost $1,389,279) | ||
| EQUITY 7.9% | ||
| International Large Cap 7.9% | 1,410,599 | |
| iShares MSCI France Index Fund | 7,031 | 175,283 |
| iShares MSCI Germany Index Fund | 13,652 | 350,037 |
| iShares MSCI Italy Capped Index Fund | 6,765 | 88,216 |
| iShares MSCI Japan Index Fund | 48,331 | 525,357 |
| iShares MSCI Malaysia Index Fund | 3,185 | 45,991 |
| 10 | International Allocation Portfolio | Semiannual report | See notes to financial statements |
| Shares | Value | |
| Investment Companies continued | ||
| iShares MSCI Taiwan Index Fund | 10,108 | $136,256 |
| Market Vectors Vietnam ETF | 5,186 | 89,459 |
| Total investments (Cost $15,577,177)† 100.0% | $17,810,266 | |
| Other assets and liabilities, net 0.0% | $1,242 | |
| Total net assets 100.0% | $17,811,508 | |
The percentage shown for each investment category is the total value of that category as a percentage of the net assets of the portfolio.
(A) The subadvisor is an affiliate of the advisor.
(G) The portfolio’s subadvisor is shown parenthetically.
† At 8-31-13, the aggregate cost of investment securities for federal income tax purposes was $17,515,452. Net unrealized appreciation aggregated $294,814, of which $386,947 related to appreciated investment securities and $92,133 related to depreciated investment securities.
(1) Manulife Asset Management (US) LLC is doing business as John Hancock Asset Management.
(2) Manulife Asset Management (North America) Limited is doing business as John Hancock Asset Management.
| Investment companies | |
| Underlying Funds’ Subadvisors | |
| Atlantis Investment Management (Hong Kong) Ltd. | (Atlantis) |
| Baillie Gifford Overseas, Ltd. | (Baillie Gifford) |
| Dimensional Fund Advisors, Inc. | (DFA) |
| Templeton Investment Counsel, LLC | (Templeton) |
| Grantham, Mayo, Van Otterloo & Co. LLC | (GMO) |
| Invesco Advisers, Inc. | (Invesco) |
| John Hancock Asset Management* | (John Hancock) |
*Manulife Asset Management (US) LLC and Manulife Asset Management (North America) Limited are doing business as John Hancock Asset Management.
| See notes to financial statements | Semiannual report | International Allocation Portfolio | 11 |
FINANCIAL STATEMENTS
Financial statements
Statement of assets and liabilities 8-31-13 (unaudited)
This Statement of assets and liabilities is the portfolio’s balance sheet. It shows the value of what the portfolio owns, is due and owes. You’ll also find the net asset value and the maximum public offering price per share.
| Assets | |
| Investments in unaffiliated issuers, at value (Cost $1,389,279) | $1,410,599 |
| Investments in affiliated funds, at value (Cost $14,187,898) | 16,399,667 |
| Total investments, at value (Cost $15,577,177) | 17,810,266 |
| Receivable for investments sold | 2,928 |
| Receivable for fund shares sold | 48,927 |
| Dividends receivable | 1,125 |
| Receivable due from advisor | 739 |
| Other receivables and prepaid expenses | 24,218 |
| Total assets | 17,888,203 |
| Liabilities | |
| Due to custodian | 16,461 |
| Payable for investments purchased | 4,817 |
| Payable for fund shares repurchased | 16,817 |
| Payable to affiliates | |
| Accounting and legal services fees | 1,123 |
| Transfer agent fees | 2,315 |
| Trustees’ fees | 741 |
| Other liabilities and accrued expenses | 34,421 |
| Total liabilities | 76,695 |
| Net assets | $17,811,508 |
| Net assets consist of | |
| Paid-in capital | $31,237,687 |
| Undistributed net investment income | 74,488 |
| Accumulated net realized gain (loss) on investments | (15,733,756) |
| Net unrealized appreciation (depreciation) on investments | 2,233,089 |
| Net assets | $17,811,508 |
| Net asset value per share | |
| Based on net asset values and shares outstanding — the fund has an | |
| unlimited number of shares authorized with no par value | |
| Class A ($8,704,584 ÷ 1,065,251 shares)1 | $8.17 |
| Class B ($2,441,873 ÷ 301,368 shares)1 | $8.10 |
| Class C ($5,331,121 ÷ 657,529 shares)1 | $8.11 |
| Class I ($1,333,930 ÷ 162,236 shares) | $8.22 |
| Maximum offering price per share | |
| Class A (net asset value per share ÷ 95%)2 | $8.60 |
1 Redemption price is equal to net asset value less any applicable contingent deferred sales charge.
2 On single retail sales of less than $50,000. On sales of $50,000 or more and on group sales the offering price is reduced.
| 12 | International Allocation Portfolio | Semiannual report | See notes to financial statements |
FINANCIAL STATEMENTS
Statement of operations For the six-month period ended 8-31-13
(unaudited)
This Statement of operations summarizes the portfolio’s investment income earned and expenses incurred in operating the portfolio. It also shows net gains (losses) for the period stated.
| Investment income | |
| Dividends | $14,099 |
| Expenses | |
| Investment management fees | 8,485 |
| Distribution and service fees | 51,596 |
| Accounting and legal services fees | 1,750 |
| Transfer agent fees | 12,858 |
| Trustees’ fees | 378 |
| State registration fees | 30,714 |
| Printing and postage | 2,065 |
| Professional fees | 21,611 |
| Custodian fees | 6,123 |
| Registration and filing fees | 13,062 |
| Other | 4,633 |
| Total expenses | 153,275 |
| Less expense reductions | (73,013) |
| Net expenses | 80,262 |
| Net investment loss | (66,163) |
| Realized and unrealized gain (loss) | |
| Net realized gain (loss) on | |
| Investments in unaffiliated issuers | 26,271 |
| Investments in affiliated issuers | 42,099 |
| 68,370 | |
| Change in net unrealized appreciation (depreciation) of | |
| Investments in unaffiliated issuers | 10,092 |
| Investments in affiliated issuers | 343,256 |
| 353,348 | |
| Net realized and unrealized gain | 421,718 |
| Increase in net assets from operations | $355,555 |
| See notes to financial statements | Semiannual report | International Allocation Portfolio | 13 |
Statements of changes in net assets
These Statements of changes in net assets show how the value of the portfolio’s net assets has changed during the last two periods. The difference reflects earnings less expenses, any investment gains and losses, distributions, if any, paid to shareholders and the net of portfolio share transactions.
| Six months | ||
| ended | Year | |
| 8-31-13 | ended | |
| (Unaudited) | 2-28-13 | |
| Increase (decrease) in net assets | ||
| From operations | ||
| Net investment income (loss) | ($66,163) | $99,288 |
| Net realized gain (loss) | 68,370 | 377,219 |
| Change in net unrealized appreciation (depreciation) | 353,348 | 311,910 |
| Increase (decrease) in net assets resulting from operations | 355,555 | 788,417 |
| Distributions to shareholders | ||
| From net investment income | ||
| Class A | — | (74,313) |
| Class B | — | (6,253) |
| Class C | — | (11,336) |
| Class I | — | (8,285) |
| From net realized gain | ||
| Class A | — | (21,071) |
| Class B | — | (6,762) |
| Class C | — | (12,258) |
| Class I | — | (1,703) |
| Total distributions | — | (141,981) |
| From portfolio share transactions | 463,403 | (65,399) |
| Total increase (decrease) | 818,958 | (581,037) |
| Net assets | ||
| Beginning of period | 16,992,550 | 16,411,513 |
| End of period | $17,811,508 | $16,992,550 |
| Undistributed net investment income | $74,488 | $140,651 |
| 14 | International Allocation Portfolio | Semiannual report | See notes to financial statements |
Financial highlights
The Financial highlights show how the portfolio’s net asset value for a share has changed during the period.
| CLASS A SHARES Period ended | 8-31-131 | 2-28-13 | 2-29-12 | 2-28-11 | 2-28-10 | 2-28-09 |
| Per share operating performance | ||||||
| Net asset value, beginning of period | $7.99 | $7.64 | $8.35 | $6.82 | $4.31 | $9.48 |
| Net investment income (loss)2,3 | (0.02) | 0.07 | 0.08 | 0.05 | 0.02 | 0.12 |
| Net realized and unrealized gain (loss) | ||||||
| on investments | 0.20 | 0.37 | (0.70) | 1.48 | 2.55 | (4.86) |
| Total from investment operations | 0.18 | 0.44 | (0.62) | 1.53 | 2.57 | (4.74) |
| Less distributions | ||||||
| From net investment income | — | (0.07) | (0.09) | — | (0.06) | (0.14) |
| From net realized gain | — | (0.02) | —4 | — | —4 | (0.29) |
| Total distributions | — | (0.09) | (0.09) | — | (0.06) | (0.43) |
| Net asset value, end of period | $8.17 | $7.99 | $7.64 | $8.35 | $6.82 | $4.31 |
| Total return (%)5,6 | 2.257 | 5.83 | (7.34) | 22.43 | 59.59 | (50.67) |
| Ratios and supplemental data | ||||||
| Net assets, end of period (in millions) | $9 | $9 | $8 | $11 | $10 | $13 |
| Ratios (as a percentage of average | ||||||
| net assets): | ||||||
| Expenses before reductions | 1.248,9 | 1.508 | 1.288 | 1.158 | 1.068,10 | 0.928 |
| Expenses net of fee waivers | 0.638,9 | 0.638 | 0.638 | 0.658 | 0.678,10 | 0.618 |
| Expenses net of fee waivers | ||||||
| and credits | 0.638,9 | 0.638 | 0.638 | 0.658 | 0.668,10 | 0.618 |
| Net investment income (loss)3 | (0.47)9 | 0.93 | 1.01 | 0.62 | 0.29 | 1.56 |
| Portfolio turnover (%) | 13 | 52 | 18 | 64 | 41 | 23 |
1 Six months ended 8-31-13. Unaudited.
2 Based on the average daily shares outstanding.
3 Recognition of net investment income by the portfolio is affected by the timing and frequency of the declaration of dividends by the underlying funds in which the portfolio invests.
4 Less than $0.005 per share.
5 Does not reflect the effect of sales charges, if any.
6 Total returns would have been lower had certain expenses not been reduced during the applicable periods shown.
7 Not annualized.
8 Ratios do not include expenses incurred from underlying funds whose annualized expense ratios were 0.53% to 1.34%, 0.64% to 1.28%, 0.48% to 1.35%, 0.91% to 1.11%, 0.91% to 1.17% and 0.99% to 1.17% for the periods ended 8-31-13, 2-28-13, 2-29-12, 2-28-11, 2-28-10 and 2-28-09, respectively, based on the mix of underlying funds held by the portfolio.
9 Annualized.
10 Includes the impact of proxy expenses, which amounted to 0.03% of average net assets.
| See notes to financial statements | Semiannual report | International Allocation Portfolio | 15 |
| CLASS B SHARES Period ended | 8-31-131 | 2-28-13 | 2-29-12 | 2-28-11 | 2-28-10 | 2-28-09 |
| Per share operating performance | ||||||
| Net asset value, beginning of period | $7.95 | $7.60 | $8.30 | $6.84 | $4.32 | $9.46 |
| Net investment income (loss)2,3 | (0.05) | 0.03 | 0.03 | — | 0.03 | 0.06 |
| Net realized and unrealized gain (loss) | ||||||
| on investments | 0.20 | 0.36 | (0.70) | 1.46 | 2.51 | (4.83) |
| Total from investment operations | 0.15 | 0.39 | (0.67) | 1.46 | 2.54 | (4.77) |
| Less distributions | ||||||
| From net investment income | — | (0.02) | (0.03) | — | (0.02) | (0.08) |
| From net realized gain | — | (0.02) | —4 | — | —4 | (0.29) |
| Total distributions | — | (0.04) | (0.03) | — | (0.02) | (0.37) |
| Net asset value, end of period | $8.10 | $7.95 | $7.60 | $8.30 | $6.84 | $4.32 |
| Total return (%)5,6 | 1.897 | 5.14 | (7.96) | 21.35 | 58.73 | (51.01) |
| Ratios and supplemental data | ||||||
| Net assets, end of period (in millions) | $2 | $3 | $2 | $2 | $1 | $1 |
| Ratios (as a percentage of average | ||||||
| net assets): | ||||||
| Expenses before reductions | 2.438,9 | 2.649 | 2.489 | 2.339 | 3.069,10 | 3.039 |
| Expenses net of fee waivers | 1.338,9 | 1.339 | 1.339 | 1.349 | 1.449,10 | 1.539 |
| Expenses net of fee waivers | ||||||
| and credits | 1.338,9 | 1.339 | 1.339 | 1.349 | 1.379,10 | 1.319 |
| Net investment income (loss)3 | (1.17)8 | 0.37 | 0.43 | 0.05 | 0.48 | 0.80 |
| Portfolio turnover (%) | 13 | 52 | 18 | 64 | 41 | 23 |
1 Six months ended 8-31-13. Unaudited.
2 Based on the average daily shares outstanding.
3 Recognition of net investment income by the portfolio is affected by the timing and frequency of the declaration of dividends by the underlying funds in which the portfolio invests.
4 Less than $0.005 per share.
5 Does not reflect the effect of sales charges, if any.
6 Total returns would have been lower had certain expenses not been reduced during the applicable periods shown.
7 Not annualized.
8 Annualized.
9 Ratios do not include expenses incurred from underlying funds whose annualized expense ratios were 0.53% to 1.34%, 0.64% to 1.28%, 0.48% to 1.35%, 0.91% to 1.11%, 0.91% to 1.17% and 0.99% to 1.17% for the periods ended 8-31-13, 2-28-13, 2-29-12, 2-28-11, 2-28-10 and 2-28-09, respectively, based on the mix of underlying funds held by the portfolio.
10 Includes the impact of proxy expenses, which amounted to 0.02% of average net assets.
| 16 | International Allocation Portfolio | Semiannual report | See notes to financial statements |
| CLASS C SHARES Period ended | 8-31-131 | 2-28-13 | 2-29-12 | 2-28-11 | 2-28-10 | 2-28-09 |
| Per share operating performance | ||||||
| Net asset value, beginning of period | $7.96 | $7.60 | $8.31 | $6.84 | $4.32 | $9.46 |
| Net investment income (loss)2,3 | (0.05) | 0.01 | 0.04 | —4 | 0.03 | 0.06 |
| Net realized and unrealized gain (loss) | ||||||
| on investments | 0.20 | 0.39 | (0.72) | 1.47 | 2.51 | (4.83) |
| Total from investment operations | 0.15 | 0.40 | (0.68) | 1.47 | 2.54 | (4.77) |
| Less distributions | ||||||
| From net investment income | — | (0.02) | (0.03) | — | (0.02) | (0.08) |
| From net realized gain | — | (0.02) | —4 | — | —4 | (0.29) |
| Total distributions | — | (0.04) | (0.03) | — | (0.02) | (0.37) |
| Net asset value, end of period | $8.11 | $7.96 | $7.60 | $8.31 | $6.84 | $4.32 |
| Total return (%)5,6 | 1.887 | 5.27 | (8.07) | 21.49 | 58.73 | (51.01) |
| Ratios and supplemental data | ||||||
| Net assets, end of period (in millions) | $5 | $5 | $6 | $6 | $5 | $3 |
| Ratios (as a percentage of average | ||||||
| net assets): | ||||||
| Expenses before reductions | 2.138,9 | 2.289 | 2.069 | 1.969 | 2.119,10 | 1.929 |
| Expenses net of fee waivers | 1.338,9 | 1.339 | 1.339 | 1.359 | 1.409,10 | 1.319 |
| Expenses net of fee waivers | ||||||
| and credits | 1.338,9 | 1.339 | 1.339 | 1.359 | 1.379,10 | 1.319 |
| Net investment income (loss)3 | (1.17)8 | 0.17 | 0.52 | (0.06) | 0.44 | 0.76 |
| Portfolio turnover (%) | 13 | 52 | 18 | 64 | 41 | 23 |
1 Six months ended 8-31-13. Unaudited.
2 Based on the average daily shares outstanding.
3 Recognition of net investment income by the portfolio is affected by the timing and frequency of the declaration of dividends by the underlying funds in which the portfolio invests.
4 Less than $0.005 per share.
5 Does not reflect the effect of sales charges, if any.
6 Total returns would have been lower had certain expenses not been reduced during the applicable periods shown.
7 Not annualized.
8 Annualized.
9 Ratios do not include expenses incurred from underlying funds whose annualized expense ratios were 0.53% to 1.34%, 0.64% to 1.28%, 0.48% to 1.35%, 0.91% to 1.11%, 0.91% to 1.17% and 0.99% to 1.17% for the periods ended 8-31-13, 2-28-13, 2-29-12, 2-28-11, 2-28-10 and 2-28-09, respectively, based on the mix of underlying funds held by the portfolio.
10 Includes the impact of proxy expenses, which amounted to 0.03% of average net assets.
| See notes to financial statements | Semiannual report | International Allocation Portfolio | 17 |
| CLASS I SHARES Period ended | 8-31-131 | 2-28-13 | 2-29-12 | 2-28-11 | 2-28-10 | 2-28-09 |
| Per share operating performance | ||||||
| Net asset value, beginning of period | $8.03 | $7.67 | $8.38 | $6.82 | $4.30 | $9.49 |
| Net investment income2,3 | — | 0.13 | 0.13 | 0.07 | 0.09 | 0.11 |
| Net realized and unrealized gain (loss) | ||||||
| on investments | 0.19 | 0.35 | (0.73) | 1.49 | 2.52 | (4.84) |
| Total from investment operations | 0.19 | 0.48 | (0.60) | 1.56 | 2.61 | (4.73) |
| Less distributions | ||||||
| From net investment income | — | (0.10) | (0.11) | — | (0.09) | (0.17) |
| From net realized gain | — | (0.02) | —4 | — | —4 | (0.29) |
| Total distributions | — | (0.12) | (0.11) | — | (0.09) | (0.46) |
| Net asset value, end of period | $8.22 | $8.03 | $7.67 | $8.38 | $6.82 | $4.30 |
| Total return (%)5 | 2.376 | 6.31 | (6.96) | 22.87 | 60.62 | (50.48) |
| Ratios and supplemental data | ||||||
| Net assets, end of period (in millions) | $1 | $1 | —7 | —7 | —7 | —7 |
| Ratios (as a percentage of average | ||||||
| net assets): | ||||||
| Expenses before reductions | 2.358,9 | 4.688 | 6.588 | 5.698 | 4.688,10 | 1.358 |
| Expenses net of fee waivers | 0.278,9 | 0.278 | 0.238 | 0.188 | 0.198,10 | 0.168 |
| Expenses net of fee waivers | ||||||
| and credits | 0.278,9 | 0.278 | 0.238 | 0.188 | 0.198,10 | 0.168 |
| Net investment income (loss)3 | (0.11)9 | 1.72 | 1.63 | 0.91 | 1.46 | 1.44 |
| Portfolio turnover (%) | 13 | 52 | 18 | 64 | 41 | 23 |
1 Six months ended 8-31-13. Unaudited.
2 Based on the average daily shares outstanding.
3 Recognition of net investment income by the portfolio is affected by the timing and frequency of the declaration of dividends by the underlying funds in which the portfolio invests.
4 Less than $0.005 per share.
5 Total returns would have been lower had certain expenses not been reduced during the applicable periods shown.
6 Not annualized.
7 Less than $500,000.
8 Ratios do not include expenses incurred from underlying funds whose annualized expense ratios were 0.53% to 1.34%,0.64% to 1.28%, 0.48% to 1.35%, 0.91% to 1.11%, 0.91% to 1.17% and 0.99% to 1.17% for the periods ended 8-31-13, 2-28-13, 2-29-12, 2-28-11, 2-28-10 and 2-28-09, respectively, based on the mix of underlying funds held by the portfolio.
9 Annualized.
10 Includes the impact of proxy expenses, which amounted to 0.03% of average net assets.
| 18 | International Allocation Portfolio | Semiannual report | See notes to financial statements |
Notes to financial statements
(unaudited)
Note 1 — Organization
John Hancock International Allocation Portfolio (the portfolio) is a series of John Hancock Funds III (the Trust), an open-end management investment company organized as a Massachusetts business trust and registered under the Investment Company Act of 1940, as amended (the 1940 Act). The investment objective of the portfolio is to seek long-term growth of capital. The portfolio is designed to provide diversification of investments within the international asset class.
The portfolio operates as a “fund of funds”, investing in Class NAV shares of affiliated underlying funds of the Trust, John Hancock Funds II (JHF II), other affiliated John Hancock funds and other permitted investments, including exchange traded funds.
The portfolio may offer multiple classes of shares. The shares currently offered are detailed in the Statement of assets and liabilities. Class A and Class C shares are offered to all investors. Class B shares are closed to new investors Class I shares are offered to institutions and certain investors. Shareholders of each class have exclusive voting rights to matters that affect that class. The distribution and service fees, if any, and transfer agent fees, printing and postage and state registration fees for each class may differ. Class B shares convert to Class A shares eight years after purchase.
The accounting policies of the underlying funds of the portfolio are outlined in the underlying funds’ shareholder reports, which include the underlying funds’ financial statements, available without charge by calling 800-344-1029, or visiting jhinvestments.com, on the Securities and Exchange Commission (SEC) website at sec.gov or at the SEC’s public reference room in Washington, D.C. The underlying funds are not covered by this report.
Note 2 — Significant accounting policies
The financial statements have been prepared in conformity with accounting principles generally accepted in the United States of America, which require management to make certain estimates and assumptions as of the date of the financial statements. Actual results could differ from those estimates and those differences could be significant. Events or transactions occurring after the end of the fiscal period through the date that the financial statements were issued have been evaluated in the preparation of the financial statements. The following summarizes the significant accounting policies of the portfolio:
Security valuation. Investments are stated at value as of the close of regular trading on the New York Stock Exchange (NYSE), normally at 4:00 P.M., Eastern Time. In order to value the securities, the portfolio uses the following valuation techniques: equity securities, including exchange-traded funds, held by the portfolio are valued at the last sale price or official closing price on the principal securities exchange on which they trade. In the event there were no sales during the day or closing prices are not available, the securities are valued using the last quoted bid or evaluated price. Investments by the portfolio in underlying affiliated funds and/or other open-end management investment companies are valued at their respective net asset values each business day. Other portfolio securities and assets, for which reliable market quotations are not readily available, are valued at fair value as determined in good faith by the fund’s Pricing Committee following procedures established by the Board of Trustees, which include price verification procedures. The frequency with which these fair valuation procedures are used cannot be predicted and fair value of securities may differ significantly from the value that would have been used had a ready market for such securities existed.
| Semiannual report | International Allocation Portfolio | 19 |
The portfolio uses a three-tier hierarchy to prioritize the pricing assumptions, referred to as inputs, used in valuation techniques to measure fair value. Level 1 includes securities valued using quoted prices in active markets for identical securities, including registered investment companies. Level 2 includes securities valued using other significant observable inputs. Observable inputs may include quoted prices for similar securities, interest rates, prepayment speeds and credit risk. Prices for securities valued using these inputs are received from independent pricing vendors and brokers and are based on an evaluation of the inputs described. Level 3 includes securities valued using significant unobservable inputs when market prices are not readily available or reliable, including the fund’s own assumptions in determining the fair value of investments. Factors used in determining value may include market or issuer specific events or trends, changes in interest rates and credit quality. The inputs or methodology used for valuing securities are not necessarily an indication of the risks associated with investing in those securities. Changes in valuation techniques may result in transfers into or out of an assigned level within the disclosure hierarchy. As of August 31, 2013, all investments are categorized as Level 1 under the hierarchy described above.
Security transactions and related investment income. Investment security transactions are accounted for on a trade date plus one basis for daily net asset value calculations. However, for financial reporting purposes, investment transactions are reported on trade date. Dividend income is recorded on the ex-date. Income and capital gain distributions from underlying funds are recorded on ex-date. Gains and losses on securities sold are determined on the basis of identified cost and may include proceeds from litigation.
Line of credit. The portfolio may borrow from banks for temporary or emergency purposes, including meeting redemption requests that otherwise might require the untimely sale of securities. Pursuant to the portfolio custodian agreement, the custodian may loan money to the portfolio to make properly authorized payments. The portfolio is obligated to repay the custodian for any overdraft, including any related costs or expenses. The custodian may have a lien, security interest or security entitlement in any portfolio property that is not otherwise segregated or pledged, to the maximum extent permitted by law, to the extent of any overdraft.
In addition, the portfolio and other affiliated funds have entered into an agreement with Citibank N.A. that enables them to participate in a $300 million unsecured committed line of credit. A commitment fee, payable at the end of each calendar quarter, based on the average daily unused portion of the line of credit, is charged to each participating fund on a pro rata basis and is reflected in other expenses on the Statement of operations. Prior to March 27, 2013, the portfolio participated in a $100 million unsecured line of credit, also with Citibank N.A., with terms otherwise similar to the existing agreement. Commitment fees for the six months ended August 31, 2013 were $269. For the six months ended August 31, 2013, the portfolio had no borrowings under either line of credit.
Expenses. Within the John Hancock Funds complex, expenses that are directly attributable to an individual fund are allocated to such fund. Expenses that are not readily attributable to a specific fund are allocated among all funds in an equitable manner, taking into consideration, among other things, the nature and type of expense and the fund’s relative net assets. Expense estimates are accrued in the period to which they relate and adjustments are made when actual amounts are known.
Class allocations. Income, common expenses and realized and unrealized gains (losses) are determined at the fund level and allocated daily to each class of shares based on the net assets of the class. Class-specific expenses, such as distribution and service fees, if any, transfer agent fees, state registration fees and printing and postage expenses, for all classes, are calculated daily at the class level based on the appropriate net assets of each class and the specific expense rates applicable to each class.
| 20 | International Allocation Portfolio | Semiannual report |
Federal income taxes. The portfolio intends to continue to qualify as a regulated investment company by complying with the applicable provisions of the Internal Revenue Code and will not be subject to federal income tax on taxable income that is distributed to shareholders. Therefore, no federal income tax provision is required.
Under the Regulated Investment Company Modernization Act of 2010, the portfolio is permitted to carry forward capital losses incurred in taxable years beginning after December 22, 2010 for an unlimited period. Any losses incurred during those taxable years will be required to be utilized prior to the losses incurred in pre-enactment taxable years. As a result of this ordering rule, pre-enactment capital loss carryforwards may be more likely to expire unused. Additionally, post-enactment capital losses that are carried forward will retain their character as either short-term or long-term capital losses rather than being considered all short-term as under previous law.
For federal income tax purposes, as of February 28, 2013 the portfolio has a capital loss carryforward of $13,863,850 available to offset future net realized capital gains. The following table details the capital loss carryforward available as of February 28, 2013.
| CAPITAL LOSS CARRYFORWARD EXPIRING AT FEBRUARY 28 | NO EXPIRATION DATE | |||
| 2017 | 2018 | 2019 | SHORT-TERM | LONG-TERM |
| $1,965,278 | $6,868,187 | $4,555,665 | — | $474,720 |
As of February 28, 2013, the portfolio had no uncertain tax positions that would require financial statement recognition, derecognition or disclosure. The portfolio’s federal tax returns are subject to examination by the Internal Revenue Service for a period of three years.
Distribution of income and gains. Distributions to shareholders from net investment income and net realized gains, if any, are recorded on the ex-date. The portfolio generally declares and pays dividends and capital gain distributions, if any, annually.
Distributions paid by the fund with respect to each class of shares are calculated in the same manner, at the same time and in the same amount, except for the effect of class level expenses that may be applied differently to each class.
Such distributions on a tax basis, are determined in conformity with income tax regulations, which may differ from accounting principles generally accepted in the United States of America.
Capital accounts within the financial statements are adjusted for permanent book-tax differences. These adjustments have no impact on net assets or the results of operations. Temporary book-tax differences, if any, will reverse in a subsequent period. Book-tax differences are primarily attributable to wash sales deferrals.
Note 3 — Guarantees and indemnifications
Under the Trust’s organizational documents, its Officers and Trustees are indemnified against certain liabilities arising out of the performance of their duties to the Trust, including the portfolio. Additionally, in the normal course of business, the portfolio enters into contracts with service providers that contain general indemnification clauses. The portfolio maximum exposure under these arrangements is unknown, as this would involve future claims that may be made against the portfolio that have not yet occurred. The risk of material loss from such claims is considered remote.
Note 4 — Fees and transactions with affiliates
John Hancock Investment Management Services, LLC (the Advisor) serves as investment advisor for the portfolio. John Hancock Funds, LLC (the Distributor), an affiliate of the Advisor, serves as
| Semiannual report | International Allocation Portfolio | 21 |
principal underwriter of the portfolio. The Advisor and the Distributor are indirect, wholly owned subsidiaries of Manulife Financial Corporation (MFC).
Management fee. The portfolio has an investment management agreement with the Advisor under which the portfolio pays the Advisor a management fee that has two components: (a) a fee on assets invested in the funds of JHF II and JHF III (portfolio assets) and (b) a fee on assets invested in other permitted investments (other than JHF II and JHF III), including other affiliated funds in the John Hancock funds complex (Other Assets). The portfolio pays a daily management fee to the Advisor equivalent, on an annual basis, to the sum of: (a) 0.05% of the first $500,000,000 of the Portfolio Assets; (b) 0.04% of the portfolio assets in excess of $500,000,000; (c) 0.50% of the first $500,000,000 of the Other Assets and (d) 0.49% of the Other Assets in excess of $500,000,000. The Advisor has a subadvisory agreement with John Hancock Asset Management a division of Manulife Asset Management (North America) Limited and John Hancock Asset Management, a division of Manulife Asset Management (US) LLC, each an indirectly owned subsidiary of MFC and an affiliate of the Advisor. The portfolio is not responsible for payment of the subadvisory fees.
The Advisor has contractually agreed to waive fees and/or reimburse certain expenses for each share class of the portfolio. This agreement excludes certain expenses such as taxes, acquired fund fees, and expenses paid indirectly, brokerage commissions, interest expense, litigation and indemnification expenses and other extraordinary expenses not incurred in the ordinary course of the portfolio’s business and short dividend expense. The fee waivers and/or reimbursements are such that these expenses will not exceed 0.63%, 1.33%, 1.33% and 0.27% for Class A, Class B, Class C and Class I shares, respectively. The current expense limitation agreement will remain in effect through June 30, 2014, unless renewed by mutual agreement of the portfolio and the Advisor based upon a determination that this is appropriate under the circumstances at the time.
The Advisor has voluntarily agreed to waive fees and/or reimburse certain other expenses of the portfolio excluding advisor fees, Rule 12b-1 fees, transfer agent fees, service fees, blue sky fees, taxes, portfolio brokerage commissions, interest expense, acquired fund fees, short dividend expense, printing and postage, litigation and indemnification expenses and other extraordinary expenses not incurred in the ordinary course of business. This voluntary expense reimbursement will continue in effect until terminated at any time by the Advisor on notice to the portfolio. The fee waivers and/or reimbursements are such that these expenses will not exceed 0.16% of average net assets.
In addition, the Advisor has voluntarily agreed to waive its advisory fees for the portfolio so that the amount retained by the Advisor after payment of the subadvisory fees, including Advisor fees collected on the underlying investments after payment of the subadvisory fees, does not exceed 0.50% of the fund’s average annual net assets.
Accordingly, these expense reductions amounted to $27,028, $14,075, $20,546 and $11,364 for Class A, Class B, Class C and Class I shares, respectively, for the six months ended August 31, 2013.
The investment management fees, including the impact of the waivers and reimbursements described above, incurred for the six months ended August 31, 2013 were equivalent to a net effective rate of 0.00% of the Portfolio’s average daily net assets.
Accounting and legal services. Pursuant to a service agreement, the portfolio reimburses the Advisor for all expenses associated with providing the administrative, financial, legal, accounting and recordkeeping services to the fund, including the preparation of all tax returns, periodic reports to shareholders and regulatory reports, among other services. These expenses are allocated to each share class based on its relative net assets at the time the expense was incurred. These accounting and legal services fees incurred for the six months ended August 31, 2013 amounted to an annual rate of 0.02% of the portfolio’s average daily net assets.
| 22 | International Allocation Portfolio | Semiannual report |
Distribution and service plans. The portfolio has a distribution agreement with the Distributor. The portfolio has adopted distribution and service plans with respect to Class A, Class B and Class C shares pursuant to Rule 12b-1 under the 1940 Act, to pay the Distributor for services provided as the distributor of shares of the portfolio. The portfolio pays the following contractual rates of distribution and service fees under these arrangements, expressed as an annual percentage of average daily net assets for each class of the portfolio’s shares.
| CLASS | 12b–1 FEE | ||||||
| Class A | 0.30% | ||||||
| Class B | 1.00% | ||||||
| Class C | 1.00% | ||||||
Sales charges. Class A shares are assessed up-front sales charges, which resulted in payments to the Distributor amounting to $23,497 for the six months ended August 31, 2013. Of this amount, $3,883 was retained and used for printing prospectuses, advertising, sales literature and other purposes, $19,366 was paid as sales commissions to broker-dealers and $248 was paid as sales commissions to sales personnel of Signator Investors, Inc., a broker-dealer affiliate of the Advisor.
Class A, Class B and Class C shares may be subject to contingent deferred sales charges (CDSCs). Certain Class A shares that are acquired through purchases of $1 million or more and are redeemed within one year of purchase are subject to a 1.00% sales charge. Class B and Class C shares may be subject to contingent deferred sales charges (CDSCs). Class B shares that are redeemed within six years of purchase are subject to CDSCs, at declining rates, beginning at 5.00%. Class C shares that are redeemed within one year of purchase are subject to a 1.00% CDSC. CDSCs are applied to the lesser of the current market value at the time of redemption or the original purchase cost of the shares being redeemed. Proceeds from CDSCs are used to compensate the Distributor for providing distribution-related services in connection with the sale of these shares. During the six months ended August 31, 2013, CDSCs received by the Distributor amounted to $2,707 and $204 for Class B and Class C shares, respectively.
Transfer agent fees. The portfolio has a transfer agent agreement with John Hancock Signature Services, Inc. (Signature Services), an affiliate of the Advisor. The transfer agent fees paid to Signature Services are determined based on the cost to Signature Services (Signature Services Cost) of providing recordkeeping services. The Signature Services Cost includes a component of allocated John Hancock corporate overhead for providing transfer agent services to the fund and to all other John Hancock affiliated funds. It also includes out-of-pocket expenses that are comprised of payments made to third-parties for recordkeeping services provided to their clients who invest in one or more John Hancock funds. In addition, Signature Services Cost may be reduced by certain fees that Signature Services receives in connection with retirement and small accounts. Signature Services Cost is calculated monthly and allocated, as applicable, to four categories of share classes: Institutional Share Classes, Retirement Share Classes, Municipal Bond Classes and all other Retail Share Classes. Within each of these categories, the applicable costs are allocated to the affected John Hancock affiliated funds and/or classes, based on the relative average daily net assets.
Class level expenses. Class level expenses for the six months ended August 31, 2013 were:
| DISTRIBUTION | TRANSFER | STATE | PRINTING AND | |
| CLASS | AND SERVICE FEES | AGENT FEES | REGISTRATION FEES | POSTAGE |
| Class A | $13,201 | $6,565 | $7,581 | — |
| Class B | 12,810 | 1,906 | 7,408 | $645 |
| Class C | 25,585 | 3,822 | 7,440 | 1,017 |
| Class I | — | 565 | 8,285 | 403 |
| Total | $51,596 | $12,858 | $30,714 | $2,065 |
| Semiannual report | International Allocation Portfolio | 23 |
Trustee expenses. The portfolio compensates each Trustee who is not an employee of the Advisor or its affiliates. The costs of paying Trustee compensation and expenses are allocated to the portfolio based on its net assets relative to other funds within the John Hancock funds complex.
Note 5 — Portfolio share transactions
Transactions in portfolio shares for the six months ended August 31, 2013 and for the year ended February 28, 2013 were as follows:
| Six months ended 8-31-13 | Year ended 2-28-13 | |||
| Shares | Amount | Shares | Amount | |
| Class A shares | ||||
| Sold | 163,791 | $1,337,033 | 343,665 | $2,574,609 |
| Distributions reinvested | — | — | 12,021 | 94,127 |
| Repurchased | (198,295) | (1,615,426) | (357,362) | (2,634,090) |
| Net increase (decrease) | (34,504) | ($278,393) | (1,676) | $34,646 |
| Class B shares | ||||
| Sold | 3,767 | $30,098 | 75,225 | $558,093 |
| Distributions reinvested | — | — | 1,628 | 12,696 |
| Repurchased | (36,901) | (297,994) | (31,907) | (231,859) |
| Net increase (decrease) | (33,134) | ($267,896) | 44,946 | $338,930 |
| Class C shares | ||||
| Sold | 110,142 | $889,384 | 68,714 | $523,106 |
| Distributions reinvested | — | — | 2,870 | 22,416 |
| Repurchased | (62,055) | (498,336) | (195,322) | (1,413,303) |
| Net increase (decrease) | 48,087 | $391,048 | (123,738) | ($867,781) |
| Class I shares | ||||
| Sold | 102,485 | $834,759 | 72,964 | $551,189 |
| Distributions reinvested | — | — | 1,214 | 9,547 |
| Repurchased | (26,788) | (216,115) | (17,090) | (131,930) |
| Net increase | 75,697 | $618,644 | 57,088 | $428,806 |
| Total net increase (decrease) | 56,146 | $463,403 | (23,380) | ($65,399) |
Note 6 — Purchase and sale of securities
Purchases and sales of securities, other than short-term securities, amounted to $2,577,026 and $2,194,774, respectively, for the six months ended August 31, 2013.
Note 7 — Investment in affiliated underlying funds
International Allocation Portfolio invests primarily in affiliated underlying funds that are managed by the Advisor and its affiliates. The portfolio does not invest in the affiliated underlying funds for the purpose of exercising management or control; however, the portfolio’s investment may represent a significant portion of each underlying fund’s net assets. As of August 31, 2013, the portfolio did not hold 5% or more of any underlying fund’s net assets.
| 24 | International Allocation Portfolio | Semiannual report |
Evaluation of Advisory and Subadvisory Agreements by the Board of Trustees
This section describes the evaluation by the Board of Trustees (the Board) of John Hancock Funds III (the Trust) of the Advisory Agreement (the Advisory Agreement) with John Hancock Investment Management Services, LLC (the Advisor) and the Subadvisory Agreements (the Subadvisory Agreements) with John Hancock Asset Management a division of Manulife Asset Management (North America) Limited and John Hancock Asset Management a division of Manulife Asset Management (US) LLC (the Subadvisors) for John Hancock International Allocation Portfolio (the fund). The Advisory Agreement and Subadvisory Agreements are collectively referred to as the Agreements.
Approval of Advisory and Subadvisory Agreements
At in-person meetings held on May 16-17, 2013, the Board, including the Trustees who are not considered to be interested persons of the Trust under the Investment Company Act of 1940, as amended (the 1940 Act) (the Independent Trustees), reapproved for an annual period the continuation of the Advisory Agreement between the Trust and the Advisor and the Subadvisory Agreements between the Advisor and the Subadvisors with respect to the fund.
In considering the Advisory Agreement and the Subadvisory Agreements, the Board received in advance of the meeting a variety of materials relating to the fund, the Advisor, and the Subadvisors, including comparative performance, fee and expense information for peer groups of similar mutual funds prepared by an independent third-party provider of mutual fund data; performance information for the fund’s benchmark index; and, with respect to each Subadvisor, comparative performance information for comparably managed accounts; and other information provided by the Advisor and each Subadvisor regarding the nature, extent, and quality of services provided by the Advisor and the Subadvisor under their respective Agreements, as well as information regarding the Advisor’s revenues and costs of providing services to the fund and any compensation paid to affiliates of the Advisor. At the meeting at which the renewal of the Advisory Agreement and Subadvisory Agreements is considered, particular focus is given to information concerning fund performance, comparability of fees and total expenses and profitability. However, the Board notes that the evaluation process with respect to the Advisor and the Subadvisors is an ongoing one. In this regard, the Board also took into account discussions with management and information provided to the Board at prior meetings with respect to the services provided by the Advisor and the Subadvisors to the fund, including quarterly performance reports prepared by management containing reviews of investment results and prior presentations from the Subadvisors with respect to the fund. The Board noted the affiliation of the Subadvisors with the Advisor, noting any potential conflicts of interest. The Board also considered the nature, quality, and extent of non-advisory services, if any, to be provided to the fund by the Advisor’s affiliates, including distribution services.
Throughout the process, the Board asked questions of and requested additional information from management. The Board is assisted by counsel for the Trust and the Independent Trustees are also separately assisted by independent legal counsel throughout the process. The Independent Trustees also received a memorandum from their independent counsel discussing the legal standards for their consideration of the proposed continuation of the Agreements and discussed the proposed continuation of the Agreements in private sessions with their independent legal counsel at which no representatives of management were present.
Approval of Advisory Agreement
In approving the Advisory Agreement with respect to the fund, the Board, including the Independent Trustees, considered a variety of factors, including those discussed below. The Board also considered other factors (including conditions and trends prevailing generally in the economy, the securities markets, and the industry) and does not treat any single factor as determinative and each Trustee may attribute different weights to different factors. The Board’s conclusions may be
| Semiannual report | International Allocation Portfolio | 25 |
based in part on its consideration of the Advisory and Subadvisory Agreements in prior years and on the Board’s ongoing regular review of fund performance and operations throughout the year.
Nature, extent, and quality of services. Among the information received by the Board from the Advisor relating to the nature, extent, and quality of services provided to the fund, the Board reviewed information provided by the Advisor relating to its operations and personnel, descriptions of its organizational and management structure, and information regarding the Advisor’s compliance and regulatory history, including its Form ADV. The Board also noted that on a regular basis it receives and reviews information from the Trust’s Chief Compliance Officer (CCO) regarding the fund’s compliance policies and procedures established pursuant to Rule 38a-1 under the 1940 Act. The Board also considered the Advisor’s risk management processes. The Board considered that the Advisor is responsible for the management of the day-to-day operations of the fund, including, but not limited to, general supervision of and coordination of the services provided by the Subadvisors, and is also responsible for monitoring and reviewing the activities of the Subadvisors and third-party service providers.
In considering the nature, extent, and quality of the services provided by the Advisor, the Trustees also took into account their knowledge of the Advisor’s management and the quality of the performance of the Advisor’s duties through Board meetings, discussions, and reports during the preceding year and through each Trustee’s experience as a Trustee of the Trust and of the other trusts in the complex.
In the course of their deliberations regarding the Advisory Agreement, the Board considered, among other things:
(a) the skills and competency with which the Advisor has in the past managed the Trust’s affairs and its subadvisory relationships, the Advisor’s oversight and monitoring of each Subadvisor’s investment performance and compliance programs, such as the Subadvisor’s compliance with fund policies and objective; review of brokerage matters, including with respect to trade allocation and best execution; and the Advisor’s timeliness in responding to performance issues;
(b) the background, qualifications and skills of the Advisor’s personnel;
(c) the Advisor’s compliance policies and procedures and its responsiveness to regulatory changes and mutual fund industry developments;
(d) the Advisor’s administrative capabilities, including its ability to supervise the other service providers for the fund;
(e) the financial condition of the Advisor and whether it has the financial wherewithal to provide a high level and quality of services to the fund; and
(f) the Advisor’s reputation and experience in serving as an investment adviser to the Trust and the benefit to shareholders of investing in funds that are part of a family of funds offering a variety of investments.
The Board concluded that the Advisor may reasonably be expected to continue to provide a high quality of services under the Advisory Agreement with respect to the fund.
Investment performance. In considering the fund’s performance, the Board noted that it reviews at its regularly scheduled meetings information about the fund’s performance results. In connection with the consideration of the Advisory Agreement, the Board:
| 26 | International Allocation Portfolio | Semiannual report |
(a) reviewed information prepared by management regarding the fund’s performance;
(b) considered the comparative performance of the fund’s benchmark;
(c) considered the performance of comparable funds, if any, as included in the report prepared by an independent third-party provider of mutual fund data. Such report included the fund’s ranking within a smaller group of peer funds and the fund’s ranking within broader groups of funds; and
(d) took into account the Advisor’s analysis of the fund’s performance and its plans and recommendations regarding the Trust’s subadvisory arrangements generally.
The Board noted that the fund underperformed its benchmark index for the one-year period and outperformed the index for the three- and five-year periods ended December 31, 2012. The Board noted also that the fund underperformed its peer group average for the one-period and outperformed the average for the three- and five-year periods ended December 31, 2012.
The Board took into account management’s discussion of the fund’s performance including the favorable performance relative to its peer group and benchmark index for the three- and five-year periods.
The Board concluded that the performance of the fund has generally been in line with or outperformed the historical performance of comparable funds and the fund’s benchmark.
Fees and expenses. The Board reviewed comparative information prepared by an independent third-party provider of mutual fund data, including, among other data, the fund’s contractual and net management fees and total expenses as compared to similarly situated investment companies deemed to be comparable to the fund. The Board considered the fund’s ranking within a smaller group of peer funds chosen by the independent third-party provider, as well as the fund’s ranking within a broader group of funds. In comparing the fund’s contractual and net management fees to those of comparable funds, the Board noted that such fees include both advisory and administrative costs.
The Board noted that net management fees for this fund are equal to the peer group median and that total expenses for this fund are equal to the peer group median.
The Board took into account management’s discussion with respect to the advisory/subadvisory fee structure, including the amount of the advisory fee retained by the Advisor after payment of the subadvisory fee. The Board also noted that, in addition, the Advisor is currently waiving fees and/or reimbursing expenses with respect to the fund. The Board also noted management’s discussion of the fund’s expenses, as well as certain actions taken over the past several years to reduce the fund’s operating expenses. The Board reviewed information provided by the Advisor concerning investment advisory fees charged to other clients (including other funds in the complex) having similar investment mandates, if any. The Board considered any differences between the Advisor’s and Subadvisors’ services to the fund and the services they provide to other comparable clients or funds. The Board concluded that the advisory fee paid with respect to the fund is reasonable.
In addition, the Trustees reviewed the advisory fee to be paid to the Advisor for the fund and concluded that the advisory fee is based on services provided that are in addition to, rather than duplicative of, the services provided pursuant to the advisory agreements for the underlying portfolios of the fund and that the additional services are necessary because of the differences between the investment policies, strategies, and techniques of a fund of funds and those of its underlying portfolios.
| Semiannual report | International Allocation Portfolio | 27 |
Profitability/indirect benefits. In considering the costs of the services to be provided and the profits to be realized by the Advisor and its affiliates (including the Subadvisors) from the Advisor’s relationship with the Trust, the Board:
(a) reviewed financial information of the Advisor;
(b) reviewed and considered an analysis presented by the Advisor regarding the net profitability to the Advisor and its affiliates with respect to the fund;
(c) received and reviewed profitability information with respect to the John Hancock fund complex as a whole;
(d) received information with respect to the Advisor’s allocation methodologies used in preparing the profitability data;
(e) considered that the Advisor also provides administrative services to the fund on a cost basis pursuant to an administrative services agreement;
(f) noted that the fund’s Subadvisors are affiliates of the Advisor;
(g) noted that affiliates of the Advisor provide transfer agency services and distribution services to the fund, and that the Trust’s distributor also receives Rule 12b-1 payments to support distribution of the fund;
(h) noted that the Advisor also derives reputational and other indirect benefits from providing advisory services to the fund;
(i) noted that the subadvisory fees for the fund are paid by the Advisor;
(j) noted that the advisory fee is in addition to the fees received by the Advisor and its affiliates with regard to the underlying portfolios in which the fund invests; and
(k) considered that the Advisor should be entitled to earn a reasonable level of profits in exchange for the level of services it provides to the fund and the entrepreneurial risk that it assumes as Advisor.
Based upon its review, the Board concluded that the level of profitability, if any, of the Advisor and its affiliates (including the Subadvisors) from their relationship with the fund was reasonable and not excessive.
Economies of scale. In considering the extent to which economies of scale would be realized as the fund grows and whether fee levels reflect these economies of scale for the benefit of fund shareholders, the Board:
(a) reviewed the Trust’s advisory fee structure and the incorporation therein of any subadvisory fee breakpoints in the advisory fees charged and concluded that (i) the fund’s fee structure contains breakpoints at the subadvisory fee level and that certain breakpoints are reflected as breakpoints in the advisory fees for the fund and (ii) although economies of scale cannot be measured with precision, these arrangements permit shareholders of the fund to benefit from economies of scale if the fund grows. The Board also took into account management’s discussion of the fund’s advisory fee structure; and
(b) the Board also considered the effect of the fund’s growth in size on its performance and fees. The Board also noted that if the fund’s assets increase over time, the fund may realize other economies of scale.
| 28 | International Allocation Portfolio | Semiannual report |
Approval of Subadvisory Agreements
In making its determination with respect to approval of the Subadvisory Agreements, the Board reviewed:
(1) information relating to each Subadvisor’s business, including current subadvisory services to the Trust (and other funds in the John Hancock family of funds);
(2) the historical and current performance of the fund, and comparative performance information relating to the fund’s benchmark and comparable funds; and
(3) the subadvisory fees for the fund, including any breakpoints, and comparative fee information, where available, prepared by an independent third-party provider of mutual fund data.
Nature, extent, and quality of services. With respect to the services provided by the Subadvisors, the Board received information provided to the Board by each Subadvisor, including the Subadvisor’s Form ADV, as well as took into account information presented throughout the past year. The Board considered each Subadvisor’s current level of staffing and its overall resources, as well as received information relating to the Subadvisor’s compensation program. The Board reviewed each Subadvisor’s history and investment experience, as well as information regarding the qualifications, background, and responsibilities of the Subadvisor’s investment and compliance personnel who provide services to the fund. The Board also considered, among other things, each Subadvisor’s compliance program and any disciplinary history. The Board also considered each Subadvisor’s risk assessment and monitoring process. The Board reviewed each Subadvisor’s regulatory history, including whether it was currently involved in any regulatory actions or investigations as well as material litigation, and any settlements and amelioratory actions undertaken, as appropriate. The Board noted that the Advisor conducts regular, periodic reviews of the Subadvisors and their operations, including regarding investment processes and organizational and staffing matters. The Board also noted that the Trust’s CCO and his staff conduct regular, periodic compliance reviews with the Subadvisors and present reports to the Independent Trustees regarding the same, which includes evaluating the regulatory compliance systems of the Subadvisors and procedures reasonably designed by them to assure compliance with the federal securities laws. The Board also took into account the financial condition of the Subadvisors.
The Board considered each Subadvisor’s investment process and philosophy. The Board took into account that each Subadvisor’s responsibilities include the development and maintenance of an investment program for the fund, that is consistent with the fund’s investment objective, the selection of investment securities and the placement of orders for the purchase and sale of such securities, as well as the implementation of compliance controls related to performance of these services. The Board also received information with respect to each Subadvisor’s brokerage policies and practices, including with respect to best execution and soft dollars.
Subadvisor compensation. In considering the cost of services to be provided by the Subadvisors and the profitability to the Subadvisors of their relationship with the fund, the Board noted that the fees under the Subadvisory Agreements are paid by the Advisor and not the fund.
The Board also received information and took into account any other potential conflicts of interest the Advisor might have in connection with the Subadvisory Agreements. In addition, the Board considered other potential indirect benefits that the Subadvisors and their affiliates may receive from the Subadvisors’ relationships with the fund, such as the opportunity to provide advisory services to additional funds in the John Hancock fund complex and reputational benefits.
| Semiannual report | International Allocation Portfolio | 29 |
Subadvisory fees. The Board considered that the fund pays an advisory fee to the Advisor and that, in turn, the Advisor pays a subadvisory fees to the Subadvisors. The Board also took into account the subadvisory fees paid by the Advisor to the Subadvisors with respect to the fund to fees charged by the fund’s Subadvisors to manage other subadvised portfolios and portfolios not subject to regulation under the 1940 Act, as applicable.
Subadvisor performance. As noted above, the Board considered the fund’s performance as compared to the fund’s peer group and benchmark and noted that the Board reviews information about the fund’s performance results at its regularly scheduled meetings. The Board noted the Advisor’s expertise and resources in monitoring the performance, investment style, and risk-adjusted performance of the Subadvisors. The Board was mindful of the Advisor’s focus on the Subadvisors’ performance. The Board also noted each Subadvisor’s long-term performance record for similar accounts, as applicable.
The Board’s decision to approve the Subadvisory Agreements was based on a number of determinations, including the following:
(1) Each Subadvisor has extensive experience and demonstrated skills as a manager;
(2) The performance of the fund generally has been in line with or outperformed the historical performance of comparable funds and the fund’s benchmark and the fund’s overall performance is satisfactory;
(3) The subadvisory fees are reasonable in relation to the level and quality of services being provided; and
(4) Certain subadvisory fee breakpoints are reflected as breakpoints in the advisory fees for the fund in order to permit shareholders to benefit from economies of scale if the fund grows.
In addition, the Trustees reviewed the subadvisory fees to be paid to the Subadvisors for the fund and concluded that the subadvisory fees are based on services provided that are in addition to, rather than duplicative of, the services provided pursuant to the subadvisory agreements for the underlying portfolios in which the fund invests and that the additional services are necessary because of the differences between the investment policies, strategies and techniques of a fund of funds and those of the underlying portfolios.
| * * * |
Based on the Board’s evaluation of all factors that the Board deemed to be material, including those factors described above, the Board, including the Independent Trustees, concluded that renewal of the Advisory Agreement and the Subadvisory Agreements would be in the best interest of the fund and its shareholders. Accordingly, the Board, and the Independent Trustees voting separately, approved the Advisory Agreement and Subadvisory Agreements for an additional one-year period.
| 30 | International Allocation Portfolio | Semiannual report |
More information
| Trustees | Investment advisor |
| James M. Oates, Chairman | John Hancock Investment Management |
| Steven R. Pruchansky, Vice Chairman | Services, LLC |
| Charles L. Bardelis* | |
| James R. Boyle† | Subadvisor |
| Craig Bromley† | John Hancock Asset Management a division of |
| Peter S. Burgess* | Manulife Asset Management (US) LLC |
| William H. Cunningham | |
| Grace K. Fey | Principal distributor |
| Theron S. Hoffman* | John Hancock Funds, LLC |
| Deborah C. Jackson | |
| Hassell H. McClellan | Custodian |
| Gregory A. Russo | State Street Bank and Trust Company |
| Warren A. Thomson† | |
| Transfer agent | |
| Officers | John Hancock Signature Services, Inc. |
| Hugh McHaffie | |
| President | Legal counsel |
| K&L Gates LLP | |
| Andrew G. Arnott | |
| Executive Vice President | |
| Thomas M. Kinzler | |
| Secretary and Chief Legal Officer | |
| Francis V. Knox, Jr. | |
| Chief Compliance Officer | |
| Charles A. Rizzo | |
| Chief Financial Officer | |
| Salvatore Schiavone | |
| Treasurer | |
| *Member of the Audit Committee | |
| †Non-Independent Trustee | |
The fund’s proxy voting policies and procedures, as well as the fund’s proxy voting record for the most recent twelve-month period ended June 30, are available free of charge on the Securities and Exchange Commission (SEC) website at sec.gov or on our website.
The fund’s complete list of portfolio holdings, for the first and third fiscal quarters, is filed with the SEC on Form N-Q. The fund’s Form N-Q is available on our website and the SEC’s website, sec.gov, and can be reviewed and copied (for a fee) at the SEC’s Public Reference Room in Washington, DC. Call 800-SEC-0330 to receive information on the operation of the SEC’s Public Reference Room.
We make this information on your fund, as well as monthly portfolio holdings, and other fund details available on our website at jhinvestments.com or by calling 800-225-5291.
| You can also contact us: | ||
| 800-225-5291 | Regular mail: | Express mail: |
| jhinvestments.com | Investment Operations | Investment Operations |
| John Hancock Signature Services, Inc. | John Hancock Signature Services, Inc. | |
| P.O. Box 55913 | 30 Dan Road | |
| Boston, MA 02205-5913 | Canton, MA 02021 |
| Semiannual report | International Allocation Portfolio | 31 |

800-225-5291
800-338-8080 EASI-Line
jhinvestments.com

| This report is for the information of the shareholders of John Hancock International Allocation Portfolio. | |
| It is not authorized for distribution to prospective investors unless preceded or accompanied by a prospectus. | 318SA 8/13 |
| MF159390 | 10/13 |
A look at performance
Total returns for the period ended August 31, 2013
| SEC 30-day | SEC 30-day | ||||||||||||||
| Average annual total returns (%) | Cumulative total returns (%) | yield (%) | yield (%) | ||||||||||||
| with maximum sales charge | with maximum sales charge | subsidized | unsubsidized1 | ||||||||||||
| Since | Since | as of | as of | ||||||||||||
| 1-year | 5-year | 10-year | inception | 6-months | 1-year | 5-year | 10-year | inception | 8-31-13 | 8-31-13 | |||||
| Class A2 | 7.98 | 6.18 | — | 3.58 | 1.22 | 7.98 | 34.97 | — | 25.69 | 2.77 | 2.77 | ||||
| Class B2 | 7.74 | 6.21 | — | 3.67 | 1.06 | 7.74 | 35.13 | — | 26.39 | 2.09 | 2.09 | ||||
| Class C2 | 11.84 | 6.54 | — | 3.68 | 5.15 | 11.84 | 37.26 | — | 26.51 | 2.19 | 2.19 | ||||
| Class I2,3 | 14.00 | 7.76 | — | 4.87 | 6.71 | 14.00 | 45.29 | — | 36.26 | 3.29 | 3.28 | ||||
| Class R23,4 | 13.53 | 6.23 | — | 3.26 | 6.48 | 13.53 | 35.30 | — | 23.21 | 2.75 | –3.28 | ||||
| Class R63,4 | 13.99 | 7.76 | — | 4.84 | 6.66 | 13.99 | 45.28 | — | 36.00 | 3.27 | –3.26 | ||||
| Class NAV3,5 | 14.16 | 7.82 | — | 5.89 | 6.79 | 14.16 | 45.73 | — | 35.74 | 3.38 | 3.38 | ||||
| Index2,† | 18.31 | 4.73 | — | 2.63 | 6.46 | 18.31 | 25.98 | — | 18.40 | — | — | ||||
Performance figures assume all distributions are reinvested. Figures reflect maximum sales charges on Class A shares of 5%, and the applicable contingent deferred sales charge (CDSC) on Class B and Class C shares. The Class B shares’ CDSC declines annually between years 1 to 6 according to the following schedule: 5, 4, 3, 3, 2, 1%. No sales charge will be assessed after the sixth year. Class C shares held for less than one year are subject to a 1% CDSC. Sales charges are not applicable to Class I, Class NAV, Class R2, and Class R6 shares.
The expense ratios of the fund, both net (including any fee waivers or expense limitations) and gross (excluding any fee waivers or expense limitations), are set forth according to the most recent publicly available prospectuses for the fund and may differ from those disclosed in the Financial highlights tables in this report. The fee waivers and expense limitations are contractual at least until 6-30-14 for Class B, Class C, Class R2, and Class R6 shares. Had the fee waivers and expense limitations not been in place, gross expenses would apply. For all other classes, the net expenses equal the gross expenses. The expense ratios are as follows:
| Class A | Class B | Class C | Class I | Class R2 | Class R6 | Class NAV | ||||
| Net (%) | 1.42 | 2.12 | 2.12 | 1.04 | 1.47 | 0.97 | 0.90 | |||
| Gross (%) | 1.42 | 2.28 | 2.14 | 1.04 | 19.66 | 10.37 | 0.90 |
The returns reflect past results and should not be considered indicative of future performance. The return and principal value of an investment will fluctuate so that shares, when redeemed, may be worth more or less than their original cost. Due to market volatility, the fund’s current performance may be higher or lower than the performance shown. For current to the most recent month-end performance data, please call 800-225-5291 or visit the fund’s website at jhinvestments.com.
The performance table above and the chart on the next page do not reflect the deduction of taxes that a shareholder would pay on fund distributions or the redemption of fund shares. The fund’s performance results reflect any applicable fee waivers or expense reductions, without which the expenses would increase and results would have been less favorable.
† Index is the MSCI World Index.
See the following page for footnotes.
| 6 | Global Shareholder Yield Fund | Semiannual report |
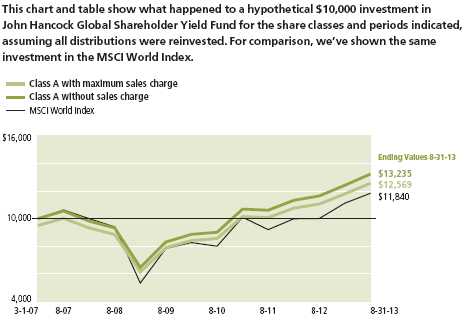
| With maximum | Without | |||
| Start date | sales charge | sales charge | Index | |
| Class B6 | 3-1-07 | $12,639 | $12,639 | $11,840 |
| Class C6 | 3-1-07 | 12,651 | 12,651 | 11,840 |
| Class I3 | 3-1-07 | 13,626 | 13,626 | 11,840 |
| Class R23 | 3-1-07 | 12,321 | 12,321 | 11,840 |
| Class R63 | 3-1-07 | 13,600 | 13,600 | 11,840 |
| Class NAV3 | 4-28-08 | 13,574 | 13,574 | 11,282 |
MSCI World Index (gross of foreign withholding tax on dividends) — is a free float-adjusted market capitalization weighted index that is designed to measure the equity market performance of developed markets.
It is not possible to invest directly in an index. Index figures do not reflect expenses or sales charges, which would have resulted in lower values.
Footnotes related to performance pages
1 Unsubsidized yields reflect what the yield would have been without the effect of reimbursements and waivers.
2 From 3-1-07.
3 For certain types of investors, as described in the fund’s prospectuses.
4 Class R6 and Class R2 shares were first offered 9-1-11 and 2-29-12, respectively. The returns prior to these dates are those of Class A shares that have been recalculated to apply the gross fees and expenses of Class R6 and Class R2 shares, as applicable.
5 From 4-28-08.
6 The contingent deferred sales charge is not applicable.
| Semiannual report | Global Shareholder Yield Fund | 7 |
Your expenses
These examples are intended to help you understand your ongoing operating expenses of investing in the fund so you can compare these costs with the ongoing costs of investing in other mutual funds.
Understanding fund expenses
As a shareholder of the fund, you incur two types of costs:
▪ Transaction costs, which include sales charges (loads) on purchases or redemptions (varies by share class), minimum account fee charge, etc.
▪ Ongoing operating expenses, including management fees, distribution and service fees (if applicable) and other fund expenses.
We are going to present only your ongoing operating expenses here.
Actual expenses/actual returns
This example is intended to provide information about the fund’s actual ongoing operating expenses and is based on the fund’s actual return. It assumes an account value of $1,000.00 on March 1, 2013, with the same investment held until August 31, 2013.
| Account value | Ending value | Expenses paid during | |
| on 3-1-13 | on 8-31-13 | period ended 8-31-131 | |
| Class A | $1,000.00 | $1,065.50 | $7.03 |
| Class B | 1,000.00 | 1,060.60 | 11.01 |
| Class C | 1,000.00 | 1,061.50 | 10.70 |
| Class I | 1,000.00 | 1,067.10 | 5.26 |
| Class R2 | 1,000.00 | 1,064.80 | 7.65 |
| Class R6 | 1,000.00 | 1,066.60 | 5.05 |
| Class NAV | 1,000.00 | 1,067.90 | 4.53 |
Together with the value of your account, you may use this information to estimate the operating expenses that you paid over the period. Simply divide your account value at August 31, 2013, by $1,000.00, then multiply it by the “expenses paid” for your share class from the table above. For example, for an account value of $8,600.00, the operating expenses should be calculated as follows:
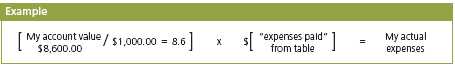
| 8 | Global Shareholder Yield Fund | Semiannual report |
Hypothetical example for comparison purposes
This table allows you to compare the fund’s ongoing operating expenses with those of any other fund. It provides an example of the fund’s hypothetical account values and hypothetical expenses based on each class’s actual expense ratio and an assumed 5% annualized return before expenses (which is not the fund’s actual return). It assumes an account value of $1,000.00 on March 1, 2013, with the same investment held until August 31, 2013. Look in any other fund shareholder report to find its hypothetical example and you will be able to compare these expenses. Please remember that these hypothetical account values and expenses may not be used to estimate the actual ending account balance or expenses you paid for the period.
| Account value | Ending value | Expenses paid during | |
| on 3-1-13 | on 8-31-13 | period ended 8-31-131 | |
| Class A | $1,000.00 | $1,018.40 | $6.87 |
| Class B | 1,000.00 | 1,014.50 | 10.76 |
| Class C | 1,000.00 | 1,014.80 | 10.46 |
| Class I | 1,000.00 | 1,020.10 | 5.14 |
| Class R2 | 1,000.00 | 1,017.80 | 7.48 |
| Class R6 | 1,000.00 | 1,020.30 | 4.94 |
| Class NAV | 1,000.00 | 1,020.80 | 4.43 |
Remember, these examples do not include any transaction costs, therefore, these examples will not help you to determine the relative total costs of owning different funds. If transaction costs were included, your expenses would have been higher. See the prospectus for details regarding transaction costs.
1 Expenses are equal to the fund’s annualized expense ratio of 1.35%, 2.12%, 2.06%, 1.01%, 1.47%, 0.97% and 0.87% for Class A, Class B, Class C, Class I, Class R2, Class R6 and Class NAV shares, respectively, multiplied by the average account value over the period, multiplied by 184/365 (to reflect the one-half year period).
| Semiannual report | Global Shareholder Yield Fund | 9 |
Portfolio summary
| Top 10 Holdings (17.0% of Net Assets on 8-31-13)1,2 | ||||
| Vodafone Group PLC | 1.9% | AstraZeneca PLC | 1.7% | |
| Total SA | 1.8% | Swisscom AG | 1.6% | |
| Lockheed Martin Corp. | 1.8% | BAE Systems PLC | 1.6% | |
| Altria Group, Inc. | 1.7% | PPL Corp. | 1.6% | |
| National Grid PLC | 1.7% | BCE, Inc. | 1.6% | |
| Sector Composition1,3 | ||||
| Utilities | 17.4% | Financials | 8.4% | |
| Telecommunication Services | 14.2% | Consumer Discretionary | 7.5% | |
| Consumer Staples | 13.3% | Materials | 4.4% | |
| Industrials | 10.0% | Information Technology | 3.5% | |
| Health Care | 9.7% | Short-Term Investments & Other | 2.6% | |
| Energy | 9.0% | |||
| Country Composition1,3 | ||||
| United States | 50.6% | Australia | 3.5% | |
| United Kingdom | 18.2% | Canada | 3.3% | |
| France | 7.3% | Italy | 1.6% | |
| Germany | 6.4% | Netherlands | 1.5% | |
| Switzerland | 4.5% | Other Countries | 3.1% | |
1 As a percentage of net assets on 8-31-13.
2 Cash and cash equivalents not included.
3 Foreign investing, especially in emerging markets, has additional risks, such as currency and market volatility and political and social instability. If the fund invests in illiquid securities, it may be difficult to sell them at a price approximating their value. Hedging and other strategic transactions may increase volatility of a fund and, if the transaction is not successful, could result in a significant loss. Sector investing is subject to greater risks than the market as a whole. Because the fund may focus on particular sectors of the economy, its performance may depend on the performance of those sectors and investments focused in one sector may fluctuate more widely than investments diversified across sectors. Therefore, distribution rates and income amounts can change at any time. For additional information on these and other risk considerations, please see the fund’s prospectus.
| 10 | Global Shareholder Yield Fund | Semiannual report |
Fund’s investments
As of 8-31-13 (unaudited)
| Shares | Value | |
| Common Stocks 97.2% | $1,760,611,906 | |
| (Cost $1,511,249,338) | ||
| Australia 3.5% | 62,774,128 | |
| BHP Billiton, Ltd. | 434,800 | 13,763,115 |
| Commonwealth Bank of Australia | 157,400 | 10,142,265 |
| Telstra Corp., Ltd. | 5,944,600 | 25,852,284 |
| Westpac Banking Corp. | 469,461 | 13,016,464 |
| Belgium 0.6% | 10,499,425 | |
| Anheuser-Busch InBev NV | 112,320 | 10,499,425 |
| Canada 3.3% | 60,287,331 | |
| BCE, Inc. | 710,300 | 29,125,469 |
| Rogers Communications, Inc., Class B | 331,700 | 13,097,316 |
| Shaw Communications, Inc., Class B | 749,700 | 18,064,546 |
| France 7.3% | 131,991,927 | |
| Electricite de France SA | 592,200 | 16,608,071 |
| Sanofi | 152,750 | 14,674,805 |
| SCOR SE | 721,500 | 22,559,457 |
| Total SA | 600,600 | 33,232,751 |
| Vinci SA | 555,700 | 28,622,467 |
| Vivendi SA | 804,943 | 16,294,376 |
| Germany 6.4% | 116,987,384 | |
| BASF SE | 267,100 | 23,340,785 |
| Daimler AG | 327,300 | 22,454,631 |
| Deutsche Post AG | 703,700 | 20,328,711 |
| Deutsche Telekom AG | 2,130,100 | 27,292,135 |
| Muenchener Rueckversicherungs AG | 129,350 | 23,571,122 |
| Italy 1.6% | 28,313,700 | |
| Terna Rete Elettrica Nazionale SpA | 6,638,600 | 28,313,700 |
| Netherlands 1.5% | 27,902,880 | |
| Royal Dutch Shell PLC, ADR | 432,000 | 27,902,880 |
| Norway 1.5% | 26,577,778 | |
| Orkla ASA | 1,414,000 | 10,195,537 |
| Yara International ASA | 415,000 | 16,382,241 |
| Philippines 0.5% | 8,903,906 | |
| Philippine Long Distance Telephone Company, ADR | 140,551 | 8,903,906 |
| See notes to financial statements | Semiannual report | Global Shareholder Yield Fund | 11 |
| Shares | Value | |
| Sweden 0.5% | $10,054,535 | |
| Svenska Handelsbanken AB, Class A | 234,300 | 10,054,535 |
| Switzerland 4.5% | 81,267,492 | |
| Nestle SA | 164,600 | 10,786,349 |
| Novartis AG | 255,800 | 18,653,372 |
| Roche Holdings AG | 88,700 | 22,126,143 |
| Swisscom AG | 65,550 | 29,701,628 |
| United Kingdom 18.2% | 328,868,784 | |
| AstraZeneca PLC, ADR | 630,540 | 31,028,873 |
| BAE Systems PLC | 4,404,200 | 29,696,405 |
| British American Tobacco PLC | 266,100 | 13,422,816 |
| Centrica PLC | 3,728,600 | 22,298,124 |
| Compass Group PLC | 739,300 | 9,807,137 |
| Diageo PLC, ADR | 75,900 | 9,311,412 |
| GlaxoSmithKline PLC | 1,131,050 | 28,829,705 |
| Imperial Tobacco Group PLC | 813,400 | 26,874,422 |
| National Grid PLC | 2,720,360 | 31,301,892 |
| Pearson PLC | 953,000 | 18,770,948 |
| Severn Trent PLC | 481,700 | 12,600,763 |
| SSE PLC | 1,157,000 | 28,024,643 |
| United Utilities Group PLC | 2,086,163 | 21,935,415 |
| Vodafone Group PLC | 10,642,300 | 34,299,922 |
| WM Morrison Supermarkets PLC | 2,371,750 | 10,666,307 |
| United States 47.8% | 866,182,636 | |
| AbbVie, Inc. | 566,920 | 24,156,461 |
| Altria Group, Inc. | 926,400 | 31,386,432 |
| Ameren Corp. | 395,400 | 13,368,474 |
| Apple, Inc. | 30,935 | 15,066,892 |
| Arthur J. Gallagher & Company | 253,000 | 10,459,020 |
| AT&T, Inc. | 666,000 | 22,530,780 |
| Automatic Data Processing, Inc. | 159,300 | 11,335,788 |
| Bristol-Myers Squibb Company | 206,190 | 8,596,061 |
| CenturyLink, Inc. | 820,170 | 27,164,030 |
| CME Group, Inc. | 146,700 | 10,431,837 |
| CMS Energy Corp. | 507,000 | 13,450,710 |
| Comcast Corp., Special Class A | 264,600 | 10,779,804 |
| ConocoPhillips | 384,200 | 25,472,460 |
| Corrections Corp. of America | 333,000 | 10,969,020 |
| Deere & Company | 118,100 | 9,877,884 |
| Diamond Offshore Drilling, Inc. | 340,200 | 21,783,006 |
| Dominion Resources, Inc. | 223,000 | 13,012,050 |
| Duke Energy Corp. | 387,018 | 25,388,381 |
| E.I. du Pont de Nemours & Company | 186,900 | 10,582,278 |
| Emerson Electric Company | 224,900 | 13,577,213 |
| Enterprise Products Partners LP | 238,000 | 14,141,960 |
| Health Care REIT, Inc. | 384,400 | 23,617,536 |
| Honeywell International, Inc. | 136,940 | 10,896,316 |
| Integrys Energy Group, Inc. | 214,590 | 11,999,872 |
| 12 | Global Shareholder Yield Fund | Semiannual report | See notes to financial statements |
| Shares | Value | |
| United States (continued) | ||
| Johnson & Johnson | 169,600 | $14,655,136 |
| Kimberly-Clark Corp. | 238,800 | 22,323,024 |
| Kinder Morgan Energy Partners LP | 334,800 | 27,306,288 |
| KLA–Tencor Corp. | 252,100 | 13,903,315 |
| Lockheed Martin Corp. | 268,900 | 32,918,738 |
| Lorillard, Inc. | 645,800 | 27,317,340 |
| MarkWest Energy Partners LP | 199,030 | 13,293,214 |
| Mattel, Inc. | 480,700 | 19,468,350 |
| McDonald’s Corp. | 133,100 | 12,559,316 |
| Merck & Company, Inc. | 282,100 | 13,340,509 |
| Microchip Technology, Inc. | 332,500 | 12,904,325 |
| Microsoft Corp. | 326,100 | 10,891,740 |
| PepsiCo, Inc. | 124,600 | 9,934,358 |
| Philip Morris International, Inc. | 253,900 | 21,185,416 |
| PPL Corp. | 967,100 | 29,689,970 |
| R.R. Donnelley & Sons Company | 907,100 | 15,130,428 |
| Regal Entertainment Group, Class A | 777,790 | 13,914,663 |
| Reynolds American, Inc. | 585,700 | 27,896,891 |
| SCANA Corp. | 196,800 | 9,470,016 |
| TECO Energy, Inc. | 940,800 | 15,551,424 |
| The Coca-Cola Company | 231,500 | 8,838,670 |
| The Dow Chemical Company | 405,700 | 15,173,180 |
| The Southern Company | 367,300 | 15,287,026 |
| Time Warner, Inc. | 176,440 | 10,679,913 |
| Vectren Corp. | 219,005 | 7,139,563 |
| Verizon Communications, Inc. | 471,300 | 22,330,194 |
| Waste Management, Inc. | 470,400 | 19,022,976 |
| Wells Fargo & Company | 341,100 | 14,012,388 |
| Preferred Securities 0.2% | $3,396,275 | |
| (Cost $3,275,864) | ||
| United States 0.2% | 3,396,275 | |
| MetLife, Inc., Series B, 6.500% | 137,501 | 3,396,275 |
| See notes to financial statements | Semiannual report | Global Shareholder Yield Fund | 13 |
| Yield (%) | Shares | Value | |
| Short-Term Investments 1.3% | $23,231,512 | ||
| (Cost $23,231,512) | |||
| Money Market Funds 1.3% | $23,231,512 | ||
| State Street Institutional Treasury Money | |||
| Market Fund | 0.0000 (Y) | 23,231,512 | 23,231,512 |
| Total investments (Cost $1,537,756,714)† 98.7% | $1,787,239,693 | ||
| Other assets and liabilities, net 1.3% | $22,696,985 | ||
| Total net assets 100.0% | $1,809,936,678 | ||
The percentage shown for each investment category is the total value of the category as a percentage of the net assets of the fund.
ADR American Depositary Receipts
(Y) The rate shown is the annualized seven-day yield as of 8-31-13.
† At 8-31-13, the aggregate cost of investment securities for federal income tax purposes was $1,542,032,551. Net unrealized appreciation aggregated $245,207,142, of which $255,621,161 related to appreciated investment securities and $10,414,019 related to depreciated investment securities.
The fund had the following sector composition as a percentage of net assets on 8-31-13:
| Utilities | 17.4% | ||||||
| Telecommunication Services | 14.2% | ||||||
| Consumer Staples | 13.3% | ||||||
| Industrials | 10.0% | ||||||
| Health Care | 9.7% | ||||||
| Energy | 9.0% | ||||||
| Financials | 8.4% | ||||||
| Consumer Discretionary | 7.5% | ||||||
| Materials | 4.4% | ||||||
| Information Technology | 3.5% | ||||||
| Short-Term Investments & Other | 2.6% | ||||||
| Total | 100.0% |
| 14 | Global Shareholder Yield Fund | Semiannual report | See notes to financial statements |
FINANCIAL STATEMENTS
Financial statements
Statement of assets and liabilities 8-31-13 (unaudited)
This Statement of assets and liabilities is the fund’s balance sheet. It shows the value of what the fund owns, is due and owes. You’ll also find the net asset value and the maximum public offering price per share.
| Assets | |
| Investments, at value (Cost $1,537,756,714) | $1,787,239,693 |
| Foreign currency, at value (Cost $2,054,112) | 2,058,863 |
| Receivable for investments sold | 18,902,252 |
| Receivable for fund shares sold | 7,563,742 |
| Dividends and interest receivable | 9,309,840 |
| Receivable due from advisor | 155 |
| Other receivables and prepaid expenses | 104,265 |
| Total assets | 1,825,178,810 |
| Liabilities | |
| Payable for investments purchased | 12,544,768 |
| Payable for fund shares repurchased | 2,085,173 |
| Payable to affiliates | |
| Accounting and legal services fees | 119,144 |
| Transfer agent fees | 124,310 |
| Distribution and service fees | 26 |
| Trustees’ fees | 6,688 |
| Other liabilities and accrued expenses | 362,023 |
| Total liabilities | 15,242,132 |
| Net assets | $1,809,936,678 |
| Net assets consist of | |
| Paid-in capital | $1,488,130,245 |
| Undistributed net investment income | 9,035,788 |
| Accumulated net realized gain (loss) on investments and foreign | |
| currency transactions | 63,298,139 |
| Net unrealized appreciation (depreciation) on investments and translation | |
| of assets and liabilities in foreign currencies | 249,472,506 |
| Net assets | $1,809,936,678 |
| See notes to financial statements | Semiannual report | Global Shareholder Yield Fund | 15 |
Statement of assets and liabilities (continued)
| Net asset value per share | |
| Based on net asset values and shares outstanding — the fund has an | |
| unlimited number of shares authorized with no par value | |
| Class A ($369,249,967 ÷ 33,728,159 shares)1 | $10.95 |
| Class B ($13,298,437 ÷ 1,215,226 shares)1 | $10.94 |
| Class C ($94,166,534 ÷ 8,603,492 shares)1 | $10.95 |
| Class I ($705,672,418 ÷ 64,260,581 shares) | $10.98 |
| Class R2 ($242,597 ÷ 22,102 shares) | $10.98 |
| Class R6 ($183,354 ÷ 16,709 shares) | $10.97 |
| Class NAV ($627,123,371 ÷ 57,116,470 shares) | $10.98 |
| Maximum offering price per share | |
| Class A (net asset value per share ÷ 95%)2 | $11.53 |
1 Redemption price per share is equal to the net asset value less any applicable contingent deferred sales charge.
2 On single retail sales of less than $50,000. On sales of $50,000 or more and on group sales the offering price is reduced.
| 16 | Global Shareholder Yield Fund | Semiannual report | See notes to financial statements |
FINANCIAL STATEMENTS
Statement of operations For the six-month period ended 8-31-13
(unaudited)
This Statement of operations summarizes the fund’s investment income earned and expenses incurred in operating the fund. It also shows net gains (losses) for the period stated.
| Investment income | |
| Dividends | $53,104,225 |
| Less foreign taxes withheld | (3,170,770) |
| Total investment income | 49,933,455 |
| Expenses | |
| Investment management fees | 7,903,595 |
| Distribution and service fees | 960,711 |
| Accounting and legal services fees | 167,255 |
| Transfer agent fees | 684,204 |
| Trustees’ fees | 42,597 |
| State registration fees | 106,061 |
| Printing and postage | 66,190 |
| Professional fees | 40,743 |
| Custodian fees | 476,049 |
| Registration and filing fees | 22,487 |
| Other | 31,232 |
| Total expenses | 10,501,124 |
| Less expense reductions | (39,779) |
| Net expenses | 10,461,345 |
| Net investment income | 39,472,110 |
| Realized and unrealized gain (loss) | |
| Net realized gain (loss) on | |
| Investments | 84,279,147 |
| Foreign currency transactions | 43,256 |
| 84,322,403 | |
| Change in net unrealized appreciation (depreciation) of | |
| Investments | 3,470,120 |
| Translation of assets and liabilities in foreign currencies | 40,708 |
| 3,510,828 | |
| Net realized and unrealized gain | 87,833,231 |
| Increase in net assets from operations | $127,305,341 |
| See notes to financial statements | Semiannual report | Global Shareholder Yield Fund | 17 |
Statements of changes in net assets
These Statements of changes in net assets show how the value of the fund’s net assets has changed during the last two periods. The difference reflects earnings less expenses, any investment gains and losses, distributions, if any, paid to shareholders and the net of fund share transactions.
| Six months | ||
| ended | Year | |
| 8-31-13 | ended | |
| (Unaudited) | 2-28-13 | |
| Increase (decrease) in net assets | ||
| From operations | ||
| Net investment income | $39,472,110 | $56,336,267 |
| Net realized gain | 84,322,403 | 1,335,059 |
| Change in net unrealized appreciation (depreciation) | 3,510,828 | 116,681,679 |
| Increase in net assets resulting from operations | 127,305,341 | 174,353,005 |
| Distributions to shareholders | ||
| From net investment income | ||
| Class A | (5,517,917) | (6,537,708) |
| Class B | (173,424) | (189,434) |
| Class C | (1,071,197) | (1,056,210) |
| Class I | (12,988,888) | (14,320,551) |
| Class R2 | (3,251) | (2,785) |
| Class R6 | (3,218) | (4,432) |
| Class NAV | (15,924,674) | (30,896,355) |
| Total distributions | (35,682,569) | (53,007,475) |
| From fund share transactions | (219,064,199) | 279,874,516 |
| Total increase (decrease) | (127,441,427) | 401,220,046 |
| Net assets | ||
| Beginning of period | 1,937,378,105 | 1,536,158,059 |
| End of period | $1,809,936,678 | $1,937,378,105 |
| Undistributed net investment income | $9,035,788 | $5,246,247 |
| 18 | Global Shareholder Yield Fund | Semiannual report | See notes to financial statements |
Financial highlights
The Financial highlights show how the fund’s net asset value for a share has changed during the period.
| CLASS A SHARES Period ended | 8-31-131 | 2-28-13 | 2-29-12 | 2-28-11 | 2-28-10 | 2-28-09 |
| Per share operating performance | ||||||
| Net asset value, beginning of period | $10.46 | $9.81 | $9.50 | $8.10 | $6.10 | $9.52 |
| Net investment income2 | 0.20 | 0.29 | 0.26 | 0.24 | 0.25 | 0.36 |
| Net realized and unrealized gain (loss) | ||||||
| on investments | 0.48 | 0.63 | 0.29 | 1.40 | 1.99 | (3.57) |
| Total from investment operations | 0.68 | 0.92 | 0.55 | 1.64 | 2.24 | (3.21) |
| Less distributions | ||||||
| From net investment income | (0.19) | (0.27) | (0.24) | (0.24) | (0.24) | (0.21) |
| Net asset value, end of period | $10.95 | $10.46 | $9.81 | $9.50 | $8.10 | $6.10 |
| Total return (%)3,4 | 6.555 | 9.66 | 5.98 | 20.64 | 37.19 | (34.21) |
| Ratios and supplemental data | ||||||
| Net assets, end of period (in millions) | $369 | $276 | $215 | $56 | $22 | $11 |
| Ratios (as a percentage of average net assets): | ||||||
| Expenses before reductions | 1.356 | 1.43 | 1.53 | 1.55 | 1.667 | 1.72 |
| Expenses net of fee waivers | 1.356 | 1.42 | 1.42 | 1.55 | 1.567 | 1.56 |
| Expenses net of fee waivers and credits | 1.356 | 1.42 | 1.42 | 1.55 | 1.557 | 1.55 |
| Net investment income | 3.576 | 2.92 | 2.78 | 2.80 | 3.34 | 4.28 |
| Portfolio turnover (%) | 22 | 21 | 19 | 39 | 53 | 54 |
1 Six months ended 8-31-13. Unaudited.
2 Based on the average daily shares outstanding.
3 Does not reflect the effect of sales charges, if any.
4 Total returns would have been lower had certain expenses not been reduced during the applicable periods shown.
5 Not annualized.
6 Annualized.
7 Includes the impact of proxy expenses, which amounted to 0.02% of average net assets.
| See notes to financial statements | Semiannual report | Global Shareholder Yield Fund | 19 |
| CLASS B SHARES Period ended | 8-31-131 | 2-28-13 | 2-29-12 | 2-28-11 | 2-28-10 | 2-28-09 |
| Per share operating performance | ||||||
| Net asset value, beginning of period | $10.46 | $9.81 | $9.49 | $8.10 | $6.09 | $9.51 |
| Net investment income2 | 0.16 | 0.22 | 0.20 | 0.19 | 0.20 | 0.29 |
| Net realized and unrealized gain (loss) | ||||||
| on investments | 0.47 | 0.64 | 0.29 | 1.38 | 2.00 | (3.56) |
| Total from investment operations | 0.63 | 0.86 | 0.49 | 1.57 | 2.20 | (3.27) |
| Less distributions | ||||||
| From net investment income | (0.15) | (0.21) | (0.17) | (0.18) | (0.19) | (0.15) |
| Net asset value, end of period | $10.94 | $10.46 | $9.81 | $9.49 | $8.10 | $6.09 |
| Total return (%)3,4 | 6.065 | 8.90 | 5.33 | 19.65 | 36.49 | (34.72) |
| Ratios and supplemental data | ||||||
| Net assets, end of period (in millions) | $13 | $11 | $8 | $2 | $1 | $1 |
| Ratios (as a percentage of average net assets): | ||||||
| Expenses before reductions | 2.176 | 2.29 | 2.54 | 2.91 | 3.547 | 3.94 |
| Expenses net of fee waivers | 2.126 | 2.12 | 2.11 | 2.25 | 2.297 | 2.43 |
| Expenses net of fee waivers and credits | 2.126 | 2.12 | 2.11 | 2.25 | 2.257 | 2.25 |
| Net investment income | 2.836 | 2.21 | 2.17 | 2.18 | 2.68 | 3.50 |
| Portfolio turnover (%) | 22 | 21 | 19 | 39 | 53 | 54 |
1 Six months ended 8-31-13. Unaudited.
2 Based on the average daily shares outstanding.
3 Does not reflect the effect of sales charges, if any.
4 Total returns would have been lower had certain expenses not been reduced during the applicable periods shown.
5 Not annualized.
6 Annualized.
7 Includes the impact of proxy expenses, which amounted to 0.02% of average net assets.
| CLASS C SHARES Period ended | 8-31-131 | 2-28-13 | 2-29-12 | 2-28-11 | 2-28-10 | 2-28-09 |
| Per share operating performance | ||||||
| Net asset value, beginning of period | $10.46 | $9.81 | $9.50 | $8.10 | $6.10 | $9.51 |
| Net investment income2 | 0.16 | 0.22 | 0.20 | 0.18 | 0.20 | 0.29 |
| Net realized and unrealized gain (loss) | ||||||
| on investments | 0.48 | 0.64 | 0.28 | 1.40 | 1.99 | (3.55) |
| Total from investment operations | 0.64 | 0.86 | 0.48 | 1.58 | 2.19 | (3.26) |
| Less distributions | ||||||
| From net investment income | (0.15) | (0.21) | (0.17) | (0.18) | (0.19) | (0.15) |
| Net asset value, end of period | $10.95 | $10.46 | $9.81 | $9.50 | $8.10 | $6.10 |
| Total return (%)3,4 | 6.155 | 8.90 | 5.22 | 19.78 | 36.27 | (34.62) |
| Ratios and supplemental data | ||||||
| Net assets, end of period (in millions) | $94 | $65 | $45 | $11 | $4 | $3 |
| Ratios (as a percentage of average net assets): | ||||||
| Expenses before reductions | 2.076 | 2.15 | 2.29 | 2.39 | 2.637 | 2.72 |
| Expenses net of fee waivers | 2.066 | 2.12 | 2.11 | 2.25 | 2.277 | 2.28 |
| Expenses net of fee waivers and credits | 2.066 | 2.12 | 2.11 | 2.25 | 2.257 | 2.25 |
| Net investment income | 2.846 | 2.22 | 2.13 | 2.10 | 2.66 | 3.50 |
| Portfolio turnover (%) | 22 | 21 | 19 | 39 | 53 | 54 |
1 Six months ended 8-31-13. Unaudited.
2 Based on the average daily shares outstanding.
3 Does not reflect the effect of sales charges, if any.
4 Total returns would have been lower had certain expenses not been reduced during the applicable periods shown.
5 Not annualized.
6 Annualized.
7 Includes the impact of proxy expenses, which amounted to 0.03% of average net assets.
| 20 | Global Shareholder Yield Fund | Semiannual report | See notes to financial statements |
| CLASS I SHARES Period ended | 8-31-131 | 2-28-13 | 2-29-12 | 2-28-11 | 2-28-10 | 2-28-09 |
| Per share operating performance | ||||||
| Net asset value, beginning of period | $10.49 | $9.84 | $9.53 | $8.13 | $6.11 | $9.53 |
| Net investment income2 | 0.22 | 0.31 | 0.32 | 0.29 | 0.30 | 0.29 |
| Net realized and unrealized gain (loss) | ||||||
| on investments | 0.48 | 0.65 | 0.27 | 1.38 | 2.00 | (3.46) |
| Total from investment operations | 0.70 | 0.96 | 0.59 | 1.67 | 2.30 | (3.17) |
| Less distributions | ||||||
| From net investment income | (0.21) | (0.31) | (0.28) | (0.27) | (0.28) | (0.25) |
| Net asset value, end of period | $10.98 | $10.49 | $9.84 | $9.53 | $8.13 | $6.11 |
| Total return (%)3 | 6.714 | 10.07 | 6.45 | 21.09 | 38.08 | (33.87) |
| Ratios and supplemental data | ||||||
| Net assets, end of period (in millions) | $706 | $641 | $249 | $123 | $86 | $57 |
| Ratios (as a percentage of average net assets): | ||||||
| Expenses before reductions | 1.015 | 1.05 | 1.12 | 1.09 | 1.196 | 1.21 |
| Expenses net of fee waivers | 1.015 | 1.03 | 0.97 | 1.08 | 1.086 | 1.10 |
| Expenses net of fee waivers and credits | 1.015 | 1.03 | 0.97 | 1.08 | 1.086 | 1.10 |
| Net investment income | 3.965 | 3.10 | 3.43 | 3.40 | 3.96 | 3.78 |
| Portfolio turnover (%) | 22 | 21 | 19 | 39 | 53 | 54 |
1 Six months ended 8-31-13. Unaudited.
2 Based on the average daily shares outstanding.
3 Total returns would have been lower had certain expenses not been reduced during the applicable periods shown.
4 Not annualized.
5 Annualized.
6 Includes the impact of proxy expenses, which amounted to 0.03% of average net assets.
| CLASS R2 SHARES Period ended | 8-31-131 | 2-28-132 | ||||
| Per share operating performance | ||||||
| Net asset value, beginning of period | $10.49 | $9.84 | ||||
| Net investment income3 | 0.18 | 0.29 | ||||
| Net realized and unrealized gain on investments | 0.49 | 0.63 | ||||
| Total from investment operations | 0.67 | 0.92 | ||||
| Less distributions | ||||||
| From net investment income | (0.18) | (0.27) | ||||
| Net asset value, end of period | $10.98 | $10.49 | ||||
| Total return (%)4 | 6.485 | 9.58 | ||||
| Ratios and supplemental data | ||||||
| Net assets, end of period (in millions) | —6 | —6 | ||||
| Ratios (as a percentage of average net assets): | ||||||
| Expenses before reductions | 9.077 | 19.42 | ||||
| Expenses net of fee waivers | 1.477 | 1.47 | ||||
| Expenses net of fee waivers and credits | 1.477 | 1.47 | ||||
| Net investment income | 3.227 | 2.91 | ||||
| Portfolio turnover (%) | 22 | 21 | ||||
1 Six months ended 8-31-13. Unaudited.
2 The inception date for Class R2 shares is 3-1-12.
3 Based on the average daily shares outstanding.
4 Total returns would have been lower had certain expenses not been reduced during the applicable periods shown.
5 Not annualized.
6 Less than $500,000.
7 Annualized.
| See notes to financial statements | Semiannual report | Global Shareholder Yield Fund | 21 |
| CLASS R6 SHARES Period ended | 8-31-131 | 2-28-13 | 2-29-122 | |||
| Per share operating performance | ||||||
| Net asset value, beginning of period | $10.49 | $9.84 | $9.29 | |||
| Net investment income3 | 0.22 | 0.33 | 0.13 | |||
| Net realized and unrealized gain on investments | 0.47 | 0.64 | 0.52 | |||
| Total from investment operations | 0.69 | 0.97 | 0.65 | |||
| Less distributions | ||||||
| From net investment income | (0.21) | (0.32) | (0.10) | |||
| Net asset value, end of period | $10.97 | $10.49 | $9.84 | |||
| Total return (%)4 | 6.665 | 10.12 | 7.125 | |||
| Ratios and supplemental data | ||||||
| Net assets, end of period (in millions) | —6 | —6 | —6 | |||
| Ratios (as a percentage of average net assets): | ||||||
| Expenses before reductions | 6.607 | 10.38 | 15.937 | |||
| Expenses net of fee waivers | 0.977 | 0.97 | 0.977 | |||
| Expense net of fee waivers and credits | 0.977 | 0.97 | 0.977 | |||
| Net investment income | 3.997 | 3.29 | 2.827 | |||
| Portfolio turnover (%) | 22 | 21 | 198 | |||
1 Six months ended 8-31-13. Unaudited.
2 The inception date for Class R6 shares is 9-1-11.
3 Based on the average daily shares outstanding.
4 Total returns would have been lower had certain expenses not been reduced during the applicable periods shown.
5 Not annualized.
6 Less than $500,000.
7 Annualized.
8 Portfolio turnover is shown for the period from 3-1-11 to 2-29-12.
| CLASS NAV SHARES Period ended | 8-31-131 | 2-28-13 | 2-29-12 | 2-28-11 | 2-28-10 | 2-28-092 |
| Per share operating performance | ||||||
| Net asset value, beginning of period | $10.49 | $9.84 | $9.53 | $8.13 | $6.11 | $9.71 |
| Net investment income3 | 0.24 | 0.35 | 0.29 | 0.30 | 0.29 | 0.29 |
| Net realized and unrealized gain (loss) | ||||||
| on investments | 0.46 | 0.62 | 0.31 | 1.38 | 2.01 | (3.67) |
| Total from investment operations | 0.70 | 0.97 | 0.60 | 1.68 | 2.30 | (3.38) |
| Less distributions | ||||||
| From net investment income | (0.21) | (0.32) | (0.29) | (0.28) | (0.28) | (0.22) |
| Net asset value, end of period | $10.98 | $10.49 | $9.84 | $9.53 | $8.13 | $6.11 |
| Total return (%)4 | 6.795 | 10.17 | 6.53 | 21.19 | 38.16 | (35.32)5 |
| Ratios and supplemental data | ||||||
| Net assets, end of period (in millions) | $627 | $944 | $1,019 | $162 | $129 | $67 |
| Ratios (as a percentage of average net assets): | ||||||
| Expenses before reductions | 0.886 | 0.90 | 0.99 | 0.99 | 1.057 | 1.096 |
| Expenses net of fee waivers | 0.876 | 0.89 | 0.94 | 0.99 | 1.007 | 1.056 |
| Expenses net of fee waivers and credits | 0.876 | 0.89 | 0.94 | 0.99 | 1.007 | 1.056 |
| Net investment income | 4.326 | 3.56 | 3.11 | 3.49 | 3.84 | 4.276 |
| Portfolio turnover (%) | 22 | 21 | 19 | 39 | 53 | 548 |
1 Six months ended 8-31-13. Unaudited.
2 The inception date for Class NAV shares is 4-28-08.
3 Based on the average daily shares outstanding.
4 Total returns would have been lower had certain expenses not been reduced during the applicable periods shown.
5 Not annualized.
6 Annualized.
7 Includes the impact of proxy expenses, which amounted to 0.02% of average net assets.
8 Portfolio turnover is shown for the period from 3-1-08 to 2-28-09.
| 22 | Global Shareholder Yield Fund | Semiannual report | See notes to financial statements |
Notes to financial statements
(unaudited)
Note 1 — Organization
John Hancock Global Shareholder Yield Fund (the fund) is a series of John Hancock Funds III (the Trust), an open-end management investment company organized as a Massachusetts business trust and registered under the Investment Company Act of 1940, as amended (the 1940 Act). The investment objective of the fund is to seek to provide a high level of income. Capital appreciation is a secondary objective.
The fund may offer multiple classes of shares. The shares currently offered are detailed in the Statement of assets and liabilities. Class A and Class C shares are offered to all investors. Class B shares are closed to new investors. Class I shares are offered to institutions and certain investors. Class R2 shares are available only to certain retirement plans. Class R6 shares are available only to certain retirement plans, institutions and other investors. Class NAV shares are offered to John Hancock affiliated funds of funds and certain 529 plans. Shareholders of each class have exclusive voting rights to matters that affect that class. The distribution and service fees, if any, transfer agent fees, printing and postage and state registration fees for each class may differ. Class B shares convert to Class A shares eight years after purchase.
Note 2 — Significant accounting policies
The financial statements have been prepared in conformity with accounting principles generally accepted in the United States of America, which require management to make certain estimates and assumptions as of the date of the financial statements. Actual results could differ from those estimates and those differences could be significant. Events or transactions occurring after the end of the fiscal period through the date that the financial statements were issued have been evaluated in the preparation of the financial statements. The following summarizes the significant accounting policies of the fund:
Security valuation. Investments are stated at value as of the close of regular trading on the New York Stock Exchange (NYSE), normally at 4:00 P.M., Eastern Time. In order to value the securities, the fund uses the following valuation techniques: Equity securities held by the fund are valued at the last sale price or official closing price on the principal securities exchange on which they trade. In the event there were no sales during the day or closing prices are not available, the securities are valued using the last quoted bid or evaluated price. Investments by the fund in open-end mutual funds are valued at their respective net asset values each business day. Foreign securities and currencies are valued in U.S. dollars, based on foreign currency exchange rates supplied by an independent pricing service. Certain securities traded only in the over-the-counter market are valued at the last bid price quoted by brokers making markets in the securities at the close of trading. Certain short-term securities are valued at amortized cost.
Other portfolio securities and assets, for which reliable market quotations are not readily available, are valued at fair value as determined in good faith by the fund’s Pricing Committee following procedures established by the Board of Trustees, which include price verification procedures. The frequency with which these fair valuation procedures are used cannot be predicted and fair value of securities may differ significantly from the value that would have been used had a ready market for such securities existed. Generally, trading in foreign securities is substantially completed each day at various times prior to the close of trading on the NYSE. Significant market events that affect the values of foreign securities may occur between the time when the valuation of the securities is generally determined and the close of the NYSE. During significant market events, these securities will be valued at fair value, as determined in good faith, following procedures established by the
| Semiannual report | Global Shareholder Yield Fund | 23 |
Board of Trustees. The fund may use a fair valuation model to value foreign securities in order to adjust for events that may occur between the close of foreign exchanges and the close of the NYSE.
The fund uses a three-tier hierarchy to prioritize the pricing assumptions, referred to as inputs, used in valuation techniques to measure fair value. Level 1 includes securities valued using quoted prices in active markets for identical securities. Level 2 includes securities valued using other significant observable inputs. Observable inputs may include quoted prices for similar securities, interest rates, prepayment speeds and credit risk. Prices for securities valued using these inputs are received from independent pricing vendors and brokers and are based on an evaluation of the inputs described. Level 3 includes securities valued using significant unobservable inputs when market prices are not readily available or reliable, including the fund’s own assumptions in determining the fair value of investments. Factors used in determining value may include market or issuer specific events or trends, changes in interest rates and credit quality. The inputs or methodology used for valuing securities are not necessarily an indication of the risks associated with investing in those securities. Changes in valuation techniques may result in transfers into or out of an assigned level within the disclosure hierarchy.
The following is a summary of the values by input classification of the fund’s investments as of August 31, 2013, by major security category or type:
| LEVEL 3 | |||||
| LEVEL 2 | SIGNIFICANT | ||||
| TOTAL MARKET | LEVEL 1 | SIGNIFICANT | UNOBSERVABLE | ||
| VALUE AT 8-31-13 | QUOTED PRICE | OBSERVABLE INPUTS | INPUTS | ||
| Common Stocks | |||||
| Australia | $62,774,128 | — | $62,774,128 | — | |
| Belgium | 10,499,425 | — | 10,499,425 | — | |
| Canada | 60,287,331 | $60,287,331 | — | — | |
| France | 131,991,927 | — | 131,991,927 | — | |
| Germany | 116,987,384 | — | 116,987,384 | — | |
| Italy | 28,313,700 | — | 28,313,700 | — | |
| Netherlands | 27,902,880 | 27,902,880 | — | — | |
| Norway | 26,577,778 | — | 26,577,778 | — | |
| Philippines | 8,903,906 | 8,903,906 | — | — | |
| Sweden | 10,054,535 | — | 10,054,535 | — | |
| Switzerland | 81,267,492 | — | 81,267,492 | — | |
| United Kingdom | 328,868,784 | 40,340,285 | 288,528,499 | — | |
| United States | 866,182,636 | 866,182,636 | — | — | |
| Preferred Securities | |||||
| United States | 3,396,275 | 3,396,275 | — | — | |
| Short-Term Investments | 23,231,512 | 23,231,512 | — | — | |
| Total Investments | |||||
| in Securities | $1,787,239,693 | $1,030,244,825 | $756,994,868 | — | |
Security transactions and related investment income. Investment security transactions are accounted for on a trade date plus one basis for daily net asset value calculations. However, for financial reporting purposes, investment transactions are reported on trade date. Interest income is accrued as earned. Dividend income is recorded on the ex-date, except for dividends of foreign securities where the dividend may not be known until after the ex-date. In those cases, dividend income, net of withholding taxes, is recorded when the fund becomes aware of the dividends. Distributions received on securities that represent a return of capital or capital gain are recorded as a reduction of cost of investments and/or as a realized gain if amounts are estimable. Foreign taxes are provided for based on the fund’s understanding of the tax rules and rates that exist in the foreign markets in which it invests. Gains and losses on securities sold are determined on the basis of identified cost and may include proceeds from litigation.
| 24 | Global Shareholder Yield Fund | Semiannual report |
Foreign currency translation. Assets, including investments and liabilities denominated in foreign currencies, are translated into U.S. dollar values each day at the prevailing exchange rate. Purchases and sales of securities, income and expenses are translated into U.S. dollars at the prevailing exchange rate on the date of the transaction. The effect of changes in foreign currency exchange rates on the value of securities is reflected as a component of the realized and unrealized gains (losses) on investments.
Funds that invest internationally generally carry more risk than funds that invest strictly in U.S. securities. These risks are heightened for investments in emerging markets. Risks can result from differences in economic and political conditions, regulations, market practices (including higher transaction costs), accounting standards and other factors. Foreign investments are also subject to a decline in the value of a foreign currency versus the U.S. dollar, which reduces the dollar value of securities denominated in that currency.
Foreign taxes. The fund may be subject to withholding tax on income and/or capital gains or repatriation taxes imposed by certain countries in which the fund invests. Taxes are accrued based upon investment income, realized gains or unrealized appreciation.
Line of credit. The fund may borrow from banks for temporary or emergency purposes, including meeting redemption requests that otherwise might require the untimely sale of securities. Pursuant to the fund’s custodian agreement, the custodian may loan money to the fund to make properly authorized payments. The fund is obligated to repay the custodian for any overdraft, including any related costs or expenses. The custodian may have a lien, security interest or security entitlement in any fund property that is not otherwise segregated or pledged, to the maximum extent permitted by law, to the extent of any overdraft.
In addition, the fund and other affiliated funds have entered into an agreement with Citibank N.A. that enables them to participate in a $300 million unsecured committed line of credit. A commitment fee, payable at the end of each calendar quarter, based on the average daily unused portion of the line of credit, is charged to each participating fund on a pro rata basis and is reflected in other expenses on the Statement of operations. Prior to March 27, 2013, the fund participated in a $100 million unsecured line of credit, also with Citibank N.A., with terms otherwise similar to the existing agreement. Commitment fees for the six months ended August 31, 2013 were $729. For the six months ended August 31, 2013, the fund had no borrowings under either line of credit.
Expenses. Within the John Hancock funds complex, expenses that are directly attributable to an individual fund are allocated to such fund. Expenses that are not readily attributable to a specific fund are allocated among all funds in an equitable manner, taking into consideration, among other things, the nature and type of expense and the fund’s relative net assets. Expense estimates are accrued in the period to which they relate and adjustments are made when actual amounts are known.
Class allocations. Income, common expenses and realized and unrealized gains (losses) are determined at the fund level and allocated daily to each class of shares based on the net assets of the class. Class-specific expenses, such as distribution and service fees, if any, transfer agent fees, state registration fees and printing and postage expenses, for all classes, are calculated daily at the class level based on the appropriate net assets of each class and the specific expense rates applicable to each class.
Federal income taxes. The fund intends to continue to qualify as a regulated investment company by complying with the applicable provisions of the Internal Revenue Code and will not be subject to federal income tax on taxable income that is distributed to shareholders. Therefore, no federal income tax provision is required.
| Semiannual report | Global Shareholder Yield Fund | 25 |
Under the Regulated Investment Company Modernization Act of 2010, the fund is permitted to carry forward capital losses incurred in taxable years beginning after December 22, 2010 for an unlimited period. Any losses incurred during those taxable years will be required to be utilized prior to the losses incurred in pre-enactment taxable years. As a result of this ordering rule, pre-enactment capital loss carryforwards may be more likely to expire unused. Additionally, post-enactment capital losses that are carried forward will retain their character as either short-term or long-term capital losses rather than being considered all short-term as under previous law.
For federal income tax purposes, as of February 28, 2013, the fund has a capital loss carryforward of $16,748,427 available to offset future net realized capital gains. The following table details the capital loss carryforward available:
| CAPITAL LOSS CARRYFORWARD EXPIRING AT FEBRUARY 28, | NO EXPIRATION DATE | |||
| 2018 | SHORT-TERM | LONG-TERM | ||
| $16,355,664 | $392,763 | — | ||
As of February 28, 2013, the fund had no uncertain tax positions that would require financial statement recognition, derecognition or disclosure. The fund’s federal tax returns are subject to examination by the Internal Revenue Service for a period of three years.
Distribution of income and gains. Distributions to shareholders from net investment income and net realized gains, if any, are recorded on the ex-date. The fund generally declares and pays dividends quarterly. Capital gain distributions, if any, are paid annually.
Distributions paid by the fund with respect to each class of shares are calculated in the same manner, at the same time and in the same amount, except for the effect of class level expenses that may be applied differently to each class.
Such distributions, on a tax basis, are determined in conformity with income tax regulations, which may differ from accounting principles generally accepted in the United States of America. Material distributions in excess of tax basis earnings and profits, if any, are reported in the fund’s financial statements as a return of capital.
Capital accounts within the financial statements are adjusted for permanent book-tax differences. These adjustments have no impact on net assets or the results of operations. Temporary book-tax differences, if any, will reverse in a subsequent period. Book-tax differences are primarily attributable partnerships and wash sale loss deferrals.
Note 3 — Guarantees and indemnifications
Under the Trust’s organizational documents, its Officers and Trustees are indemnified against certain liabilities arising out of the performance of their duties to the Trust, including the fund. Additionally, in the normal course of business, the fund enters into contracts with service providers that contain general indemnification clauses. The fund’s maximum exposure under these arrangements is unknown, as this would involve future claims that may be made against the fund that have not yet occurred. The risk of material loss from such claims is considered remote.
Note 4 — Fees and transactions with affiliates
John Hancock Investment Management Services, LLC (the Advisor) serves as investment advisor for the Trust. John Hancock Funds, LLC (the Distributor), an affiliate of the Advisor, serves as principal underwriter of the Trust. The Advisor and the Distributor are indirect, wholly owned subsidiaries of Manulife Financial Corporation.
Management fee. The fund has an investment management agreement with the Advisor under which the fund pays a daily management fee to the Advisor equivalent, on an annual basis, to 0.800% of average daily net assets. The Advisor has a subadvisory agreement with Epoch Investments Partners, Inc. The fund is not responsible for payment of the subadvisory fees.
| 26 | Global Shareholder Yield Fund | Semiannual report |
Effective June 1, 2013, the Advisor has contractually agreed to waive a portion of its management fee for certain funds (the Participating portfolios) of the Trust, John Hancock Funds, John Hancock Funds II and John Hancock Variable Insurance Trust. The waiver equals, on an annualized basis, 0.01% of that portion of the aggregate net assets of all the Participating portfolios that exceeds $75 billion but is less than or equal to $125 billion; 0.0125% of that portion of the aggregate net assets of all the Participating portfolios that exceeds $125 billion but is less than or equal to $150 billion; and 0.015% of that portion of the aggregate net assets of all the Participating portfolios that exceeds $150 billion. The amount of the reimbursement is calculated daily and allocated among all the Participating portfolios in proportion to the daily net assets of each fund. This arrangement may be amended or terminated at any time by the Advisor upon notice to the fund and with the approval of the Board of Trustees.
The Advisor has contractually agreed to waive fees and/or reimburse certain expenses for each share class of the fund. This agreement excludes certain expenses such as taxes, and expenses paid indirectly, brokerage commissions, interest expense, litigation and indemnification expenses and other extraordinary expenses not incurred in the ordinary course of the fund’s business, acquired fund fees and short dividend expense. The fee waivers and/or reimbursements are such that these expenses will not exceed 2.12%, 2.12%, 1.47%, and 0.97% for Class B, Class C, Class R2 and Class R6 shares, respectively. These expense limitations shall remain in effect until June 30, 2014, unless renewed by mutual agreement of the fund and the Advisor based upon a determination that this is appropriate under the circumstances at the time. Prior to July 1, 2013, the fee waivers and/or reimbursements were such that the expenses would not exceed 1.42% and 1.06% for Class A and Class I shares, respectively.
Accordingly, these expense reductions amounted to $4,759, $3,016, $1,200, $9,749, $6,708, $4,790 and $9,557 for Class A, Class B, Class C, Class I, Class R2, Class R6 and Class NAV shares, respectively, for the six months ended August 31, 2013.
The investment management fees, including the impact of the waivers and reimbursements described above, incurred for the six months ended August 31, 2013 were equivalent to a net annual effective rate of 0.80% of the fund’s average daily net assets.
Accounting and legal services. Pursuant to a service agreement, the fund reimburses the Advisor for all expenses associated with providing the administrative, financial, legal, accounting and recordkeeping services to the fund, including the preparation of all tax returns, periodic reports to shareholders and regulatory reports, among other services. These expenses are allocated to each share class based on its relative net assets at the time the expense was incurred. These accounting and legal services fees incurred for the six months ended August 31, 2013 amounted to an annual rate of 0.02% of the fund’s average daily net assets.
Distribution and service plans. The fund has a distribution agreement with the Distributor. The fund has adopted distribution and service plans with respect to Class A, Class B, Class C and Class R2 shares pursuant to Rule 12b-1 under the 1940 Act, to pay the Distributor for services provided as the distributor of shares of the fund. In addition, under a service plan for Class R2 shares, the fund pays for certain other services. The fund pays up to the following contractual rates of distribution and service fees under these arrangements, expressed as an annual percentage of average daily net assets for each class of the fund’s shares.
| CLASS | 12b-1 FEE | SERVICE FEE | ||||
| Class A | 0.30% | — | ||||
| Class B | 1.00% | — | ||||
| Class C | 1.00% | — | ||||
| Class R2 | 0.25% | 0.25% | ||||
| Semiannual report | Global Shareholder Yield Fund | 27 |
Sales charges. Class A shares are assessed up-front sales charges, which resulted in payments to the Distributor amounting to $1,650,793 for the six months ended August 31, 2013. Of this amount, $279,337 was retained and used for printing prospectuses, advertising, sales literature and other purposes, $1,359,321 was paid as sales commissions to broker-dealers and $12,135 was paid as sales commissions to sales personnel of Signator Investors, Inc., a broker-dealer affiliate of the Advisor.
Class A, Class B and Class C shares may be subject to contingent deferred sales charges (CDSCs). Certain Class A shares that are acquired through purchases of $1 million or more and are redeemed within one year of purchase are subject to a 1.00% sales charge. Class B shares that are redeemed within six years of purchase are subject to CDSCs, at declining rates, beginning at 5.00%. Class C shares that are redeemed within one year of purchase are subject to a 1.00% CDSC. CDSCs are applied to the lesser of the current market value at the time of redemption or the original purchase cost of the shares being redeemed. Proceeds from CDSCs are used to compensate the Distributor for providing distribution-related services in connection with the sale of these shares. During the six months ended August 31, 2013, CDSCs received by the Distributor amounted to $64, $9,135 and $3,807 for Class A, Class B and Class C shares, respectively.
Transfer agent fees. The fund has a transfer agent agreement with John Hancock Signature Services, Inc. (Signature Services), an affiliate of the Advisor. The transfer agent fees paid to Signature Services are determined based on the cost to Signature Services (Signature Services Cost) of providing recordkeeping services. The Signature Services Cost includes a component of allocated John Hancock corporate overhead for providing transfer agent services to the fund and to all other John Hancock affiliated funds. It also includes out-of-pocket expenses that are comprised of payments made to third-parties for recordkeeping services provided to their clients who invest in one or more John Hancock funds. In addition, Signature Services Cost may be reduced by certain fees that Signature Services receives in connection with retirement and small accounts. Signature Services Cost is calculated monthly and allocated, as applicable, to four categories of share classes: Institutional Share Classes, Retirement Share Classes, Municipal Bond Classes and all other Retail Share Classes. Within each of these categories, the applicable costs are allocated to the affected John Hancock affiliated funds and/or classes, based on the relative average daily net assets.
Class level expenses. Class level expenses for the six months ended August 31, 2013 were:
| DISTRIBUTION | TRANSFER | STATE | PRINTING AND | |
| CLASS | AND SERVICE FEES | AGENT FEES | REGISTRATION FEES | POSTAGE |
| Class A | $491,741 | $246,279 | $24,115 | $12,990 |
| Class B | 65,010 | 9,764 | 8,058 | 900 |
| Class C | 403,691 | 60,798 | 10,510 | 3,179 |
| Class I | — | 367,320 | 52,029 | 48,685 |
| Class R2 | 269 | 22 | 6,691 | 248 |
| Class R6 | — | 21 | 4,658 | 188 |
| Total | $960,711 | $684,204 | $106,061 | $66,190 |
Trustee expenses. The fund compensates each Trustee who is not an employee of the Advisor or its affiliates. The costs of paying Trustee compensation and expenses are allocated to the fund based on its net assets relative to other funds within the John Hancock funds complex.
| 28 | Global Shareholder Yield Fund | Semiannual report |
Interfund Lending Program: Pursuant to an Exemptive Order issued by the SEC, the fund, along with other funds advised by the Advisor, may participate in an interfund lending program. This program provides an alternative credit facility allowing the funds to borrow from, or lend money to, other participating affiliated funds. At period end, no interfund loans were outstanding. The fund’s activity in this program during the period for which loans were outstanding was as follows:
| DAYS | WEIGHTED AVERAGE | WEIGHTED AVERAGE | INTEREST | |
| BORROWER OR LENDER | OUTSTANDING | LOAN BALANCE | INTEREST RATE | EXPENSE |
| Borrower | 30 | $16,054,854 | 0.45% | $6,038 |
Note 5 — Fund share transactions
Transactions in fund shares for the six months ended August 31, 2013 and for the year ended February 28, 2013 were as follows:
| Six months ended 8-31-13 | Year ended 2-28-13 | |||
| Shares | Amount | Shares | Amount | |
| Class A shares | ||||
| Sold | 10,823,145 | $119,362,532 | 15,669,201 | $155,358,732 |
| Distributions reinvested | 510,798 | 5,410,710 | 663,208 | 6,439,490 |
| Repurchased | (3,949,829) | (43,419,465) | (11,924,145) | (117,263,582) |
| Net increase | 7,384,114 | $81,353,777 | 4,408,264 | $44,534,640 |
| Class B shares | ||||
| Sold | 195,217 | $2,136,206 | 403,386 | $3,993,369 |
| Distributions reinvested | 11,685 | 123,870 | 12,717 | 123,106 |
| Repurchased | (83,023) | (911,840) | (160,580) | (1,581,789) |
| Net increase | 123,879 | $1,348,236 | 255,523 | $2,534,686 |
| Class C shares | ||||
| Sold | 2,768,815 | $30,435,187 | 2,470,863 | $24,558,880 |
| Distributions reinvested | 87,780 | 930,480 | 91,535 | 886,020 |
| Repurchased | (443,939) | (4,868,528) | (928,504) | (9,120,364) |
| Net increase | 2,412,656 | $26,497,139 | 1,633,894 | $16,324,536 |
| Class I shares | ||||
| Sold | 11,496,207 | $126,952,793 | 47,431,648 | $461,972,978 |
| Distributions reinvested | 1,176,936 | 12,492,857 | 1,400,880 | 13,641,460 |
| Repurchased | (9,558,680) | (105,777,364) | (12,975,975) | (128,113,677) |
| Net increase | 3,114,463 | $33,668,286 | 35,856,553 | $347,500,761 |
| Class R2 shares1 | ||||
| Sold | 12,591 | $140,001 | 11,593 | $114,476 |
| Distributions reinvested | 116 | 1,227 | — | — |
| Repurchased | (2,198) | (24,904) | — | — |
| Net increase | 10,509 | $116,324 | 11,593 | $114,476 |
| Class R6 shares | ||||
| Sold | 3,634 | $39,605 | 6,168 | $59,632 |
| Distributions reinvested | 90 | 957 | 105 | 1,020 |
| Repurchased | (3) | (28) | (4,049) | (40,764) |
| Net increase | 3,721 | $40,534 | 2,224 | $19,888 |
| Semiannual report | Global Shareholder Yield Fund | 29 |
| Six months ended 8-31-13 | Year ended 2-28-13 | |||
| Shares | Amount | Shares | Amount | |
| Class NAV shares | ||||
| Sold | 142,388 | $1,576,762 | 3,327,918 | $32,345,438 |
| Distributions reinvested | 1,499,726 | 15,924,674 | 3,176,278 | 30,896,355 |
| Repurchased | (34,519,238) | (379,589,931) | (20,096,481) | (194,396,264) |
| Net decrease | (32,877,124) | ($362,088,495) | (13,592,285) | ($131,154,471) |
| Total net increase (decrease) | (19,827,782) | ($219,064,199) | 28,575,766 | $279,874,516 |
1 The inception date for Class R2 shares is 3-1-12.
Affiliates of the fund owned 46%, 64% and 100% of shares of beneficial interest of Class R2, Class R6 and Class NAV, respectively, on August 31, 2013.
Note 6 — Purchase and sale of securities
Purchases and sales of securities, other than short-term securities, amounted to $410,295,457 and $609,049,937, respectively, for the six months ended August 31, 2013.
Note 7 — Investment by affiliated funds
Certain investors in the fund are affiliated funds that are managed by the Advisor and its affiliates. The affiliated funds do not invest in the fund for the purpose of exercising management or control; however, affiliated fund investments may represent a significant portion of the fund’s net assets. At August 31, 2013, the following funds had an affiliate ownership of 5% or more of the fund’s net assets:
| AFFILIATE | |||
| FUND | CONCENTRATION | ||
| Lifestyle Growth Portfolio | 10.9% | ||
| Lifestyle Balanced Portfolio | 11.3% | ||
| 30 | Global Shareholder Yield Fund | Semiannual report |
Evaluation of Advisory and Subadvisory Agreements by the Board of Trustees
This section describes the evaluation by the Board of Trustees (the Board) of John Hancock Funds III (the Trust) of the Advisory Agreement (the Advisory Agreement) with John Hancock Investment Management Services, LLC (the Advisor) and the Subadvisory Agreement (the Subadvisory Agreement) with Epoch Investment Partners, Inc. (the Subadvisor) for John Hancock Global Shareholder Yield Fund (the fund). The Advisory Agreement and Subadvisory Agreement are collectively referred to as the Agreements.
Approval of Advisory and Subadvisory Agreements
At in-person meetings held on May 16-17, 2013, the Board, including the Trustees who are not considered to be interested persons of the Trust under the Investment Company Act of 1940, as amended (the 1940 Act) (the Independent Trustees), reapproved for an annual period the continuation of the Advisory Agreement between the Trust and the Advisor and the Subadvisory Agreement between the Advisor and the Subadvisor with respect to the fund.
In considering the Advisory Agreement and the Subadvisory Agreement, the Board received in advance of the meeting a variety of materials relating to the fund, the Advisor, and the Subadvisor, including comparative performance, fee and expense information for peer groups of similar mutual funds prepared by an independent third-party provider of mutual fund data; performance information for the fund’s benchmark index; and, with respect to the Subadvisor, comparative performance information for comparably managed accounts; and other information provided by the Advisor and the Subadvisor regarding the nature, extent, and quality of services provided by the Advisor and the Subadvisor under their respective Agreements, as well as information regarding the Advisor’s revenues and costs of providing services to the fund and any compensation paid to affiliates of the Advisor. At the meeting at which the renewal of the Advisory Agreement and Subadvisory Agreement is considered, particular focus is given to information concerning fund performance, comparability of fees and total expenses and profitability. However, the Board notes that the evaluation process with respect to the Advisor and the Subadvisor is an ongoing one. In this regard, the Board also took into account discussions with management and information provided to the Board at prior meetings with respect to the services provided by the Advisor and the Subadvisor to the fund, including quarterly performance reports prepared by management containing reviews of investment results and prior presentations from the Subadvisor with respect to the fund. The Board also considered the nature, quality, and extent of non-advisory services, if any, to be provided to the fund by the Advisor’s affiliates, including distribution services.
Throughout the process, the Board asked questions of and requested additional information from management. The Board is assisted by counsel for the Trust and the Independent Trustees are also separately assisted by independent legal counsel throughout the process. The Independent Trustees also received a memorandum from their independent counsel discussing the legal standards for their consideration of the proposed continuation of the Agreements and discussed the proposed continuation of the Agreements in private sessions with their independent legal counsel at which no representatives of management were present.
Approval of Advisory Agreement
In approving the Advisory Agreement with respect to the fund, the Board, including the Independent Trustees, considered a variety of factors, including those discussed below. The Board also considered other factors (including conditions and trends prevailing generally in the economy, the securities markets, and the industry) and does not treat any single factor as determinative and each Trustee may attribute different weights to different factors. The Board’s conclusions may be based in part on its consideration of the Advisory and Subadvisory Agreements in prior years and on the Board’s ongoing regular review of fund performance and operations throughout the year.
| Semiannual report | Global Shareholder Yield Fund | 31 |
Nature, extent, and quality of services. Among the information received by the Board from the Advisor relating to the nature, extent, and quality of services provided to the fund, the Board reviewed information provided by the Advisor relating to its operations and personnel, descriptions of its organizational and management structure, and information regarding the Advisor’s compliance and regulatory history, including its Form ADV. The Board also noted that on a regular basis it receives and reviews information from the Trust’s Chief Compliance Officer (CCO) regarding the fund’s compliance policies and procedures established pursuant to Rule 38a-1 under the 1940 Act. The Board also considered the Advisor’s risk management processes. The Board considered that the Advisor is responsible for the management of the day-to-day operations of the fund, including, but not limited to, general supervision of and coordination of the services provided by the Subadvisor, and is also responsible for monitoring and reviewing the activities of the Subadvisor and other third-party service providers.
In considering the nature, extent, and quality of the services provided by the Advisor, the Trustees also took into account their knowledge of the Advisor’s management and the quality of the performance of the Advisor’s duties through Board meetings, discussions, and reports during the preceding year and through each Trustee’s experience as a Trustee of the Trust and of the other trusts in the complex.
In the course of their deliberations regarding the Advisory Agreement, the Board considered, among other things:
(a) the skills and competency with which the Advisor has in the past managed the Trust’s affairs and its subadvisory relationship, the Advisor’s oversight and monitoring of the Subadvisor’s investment performance and compliance programs, such as the Subadvisor’s compliance with fund policies and objectives; review of brokerage matters, including with respect to trade allocation and best execution; and the Advisor’s timeliness in responding to performance issues;
(b) the background, qualifications and skills of the Advisor’s personnel;
(c) the Advisor’s compliance policies and procedures and its responsiveness to regulatory changes and mutual fund industry developments;
(d) the Advisor’s administrative capabilities, including its ability to supervise the other service providers for the fund;
(e) the financial condition of the Advisor and whether it has the financial wherewithal to provide a high level and quality of services to the fund; and
(f) the Advisor’s reputation and experience in serving as an investment adviser to the Trust and the benefit to shareholders of investing in funds that are part of a family of funds offering a variety of investments.
The Board concluded that the Advisor may reasonably be expected to continue to provide a high quality of services under the Advisory Agreement with respect to the fund.
Investment performance. In considering the fund’s performance, the Board noted that it reviews at its regularly scheduled meetings information about the fund’s performance results. In connection with the consideration of the Advisory Agreement, the Board:
(a) reviewed information prepared by management regarding the fund’s performance;
(b) considered the comparative performance of the fund’s benchmark;
| 32 | Global Shareholder Yield Fund | Semiannual report |
(c) considered the performance of comparable funds, if any, as included in the report prepared by an independent third-party provider of mutual fund data. Such report included the fund’s ranking within a smaller group of peer funds and the fund’s ranking within broader groups of funds; and
(d) took into account the Advisor’s analysis of the fund’s performance and its plans and recommendations regarding the Trust’s subadvisory arrangements generally.
The Board noted that the fund underperformed its benchmark index for the one-year period and outperformed the index for the three-year period ended December 31, 2012. The Board noted also that the fund outperformed its peer group average for the one- and three-year periods ended December 31, 2012.
The Board took into account management’s discussion of the factors that contributed to the fund’s performance, noting the differences between the investment strategies of the fund and those of its peer group and the impact of market conditions on the fund’s investment strategies relative to the peer group.
The Board concluded that the performance of the fund has generally been in line with or outperformed the historical performance of comparable funds and the fund’s benchmark.
Fees and expenses. The Board reviewed comparative information prepared by an independent third-party provider of mutual fund data, including, among other data, the fund’s contractual and net management fees and total expenses as compared to similarly situated investment companies deemed to be comparable to the fund. The Board considered the fund’s ranking within a smaller group of peer funds chosen by the independent third-party provider, as well as the fund’s ranking within a broader group of funds. In comparing the fund’s contractual and net management fees to those of comparable funds, the Board noted that such fees include both advisory and administrative costs.
The Board noted that net management fees for this fund are equal to the peer group median and that total expenses for this fund are lower than the peer group median. The Board also noted the reduction in the advisory and subadvisory fee rates that became effective in July 2012.
The Board took into account management’s discussion with respect to the advisory/subadvisory fee structure, including the amount of the advisory fee retained by the Advisor after payment of the subadvisory fee. The Board also took into account that management had agreed to implement an overall fee waiver across a number of funds in the complex, including the fund, which is discussed further below. The Board also noted that, in addition, the Advisor is currently waiving fees and/or reimbursing expenses with respect to the fund. The Board also noted that the Advisor pays the subadvisory fees of the fund, and that such fees are negotiated at arm’s length with respect to the Subadvisor. The Board also noted management’s discussion of the fund’s expenses, as well as certain actions taken over the past several years to reduce the fund’s operating expenses. The Board reviewed information provided by the Advisor concerning investment advisory fees charged to other clients (including other funds in the complex) having similar investment mandates, if any. The Board considered any differences between the Advisor’s and Subadvisor’s services to the fund and the services they provide to other comparable clients or funds. The Board concluded that the advisory fee paid with respect to the fund is reasonable.
Profitability/indirect benefits. In considering the costs of the services to be provided and the profits to be realized by the Advisor and its affiliates from the Advisor’s relationship with the Trust, the Board:
| Semiannual report | Global Shareholder Yield Fund | 33 |
(a) reviewed financial information of the Advisor;
(b) reviewed and considered an analysis presented by the Advisor regarding the net profitability to the Advisor and its affiliates with respect to the fund;
(c) received and reviewed profitability information with respect to the John Hancock fund complex as a whole;
(d) received information with respect to the Advisor’s allocation methodologies used in preparing the profitability data;
(e) considered that the Advisor also provides administrative services to the fund on a cost basis pursuant to an administrative services agreement;
(f) noted that affiliates of the Advisor provide transfer agency services and distribution services to the fund, and that the Trust’s distributor also receives Rule 12b-1 payments to support distribution of the fund;
(g) noted that the Advisor also derives reputational and other indirect benefits from providing advisory services to the fund;
(h) noted that the subadvisory fees for the fund are paid by the Advisor and are negotiated at arm’s length; and
(i) considered that the Advisor should be entitled to earn a reasonable level of profits in exchange for the level of services it provides to the fund and the entrepreneurial risk that it assumes as Advisor.
Based upon its review, the Board concluded that the level of profitability, if any, of the Advisor and its affiliates from their relationship with the fund was reasonable and not excessive.
Economies of scale. In considering the extent to which economies of scale would be realized as the fund grows and whether fee levels reflect these economies of scale for the benefit of fund shareholders, the Board:
(a) considered that the Advisor has agreed, effective June 1, 2013, to waive its management fee for the fund and each of the open-end funds of John Hancock Funds II, John Hancock Funds III, each other John Hancock fund (except those listed below) (the Participating Portfolios) or otherwise reimburse the expenses of the Participating Portfolios as follows (the Reimbursement):
The Reimbursement shall equal, on an annualized basis, 0.01% of that portion of the aggregate net assets of all the Participating Portfolios that exceeds $75 billion but is less than or equal to $125 billion, 0.0125% of that portion of the aggregate net assets of all the Participating Portfolios that exceeds $125 billion but is less than or equal to $150 billion and 0.015% of that portion of the aggregate net assets of all the Participating Portfolios that exceeds $150 billion. (The funds that are not Participating Portfolios as of the date of this semiannual report are each of the fund of funds, money market funds, index funds and closed-end funds); and
(b) the Board also considered the effect of the fund’s growth in size on its performance and fees. The Board also noted that if the fund’s assets increase over time, the fund may realize other economies of scale.
| 34 | Global Shareholder Yield Fund | Semiannual report |
Approval of Subadvisory Agreement
In making its determination with respect to approval of the Subadvisory Agreement, the Board reviewed:
(1) information relating to the Subadvisor’s business, including current subadvisory services to the Trust (and other funds in the John Hancock family of funds);
(2) the historical and current performance of the fund, and comparative performance information relating to the fund’s benchmark and comparable funds;
(3) the subadvisory fee for the fund, including any breakpoints, and comparative fee information, where available, prepared by an independent third-party provider of mutual fund data; and
(4) information relating to the nature and scope of any material relationships and their significance to the Trust’s Advisor and Subadvisor.
Nature, extent, and quality of services. With respect to the services provided by the Subadvisor, the Board received information provided to the Board by the Subadvisor, including the Subadvisor’s Form ADV, as well as took into account information presented throughout the past year. The Board considered the Subadvisor’s current level of staffing and its overall resources, as well as received information relating to the Subadvisor’s compensation program. The Board reviewed the Subadvisor’s history and investment experience, as well as information regarding the qualifications, background, and responsibilities of the Subadvisor’s investment and compliance personnel who provide services to the fund. The Board also considered, among other things, the Subadvisor’s compliance program and any disciplinary history. The Board also considered the Subadvisor’s risk assessment and monitoring process. The Board reviewed the Subadvisor’s regulatory history, including whether it was currently involved in any regulatory actions or investigations as well as material litigation, and any settlements and amelioratory actions undertaken, as appropriate. The Board noted that the Advisor conducts regular, periodic reviews of the Subadvisor and its operations, including regarding investment processes and organizational and staffing matters. The Board also noted that the Trust’s CCO and his staff conduct regular, periodic compliance reviews with the Subadvisor and present reports to the Independent Trustees regarding the same, which includes evaluating the regulatory compliance systems of the Subadvisor and procedures reasonably designed by it to assure compliance with the federal securities laws. The Board also took into account the financial condition of the Subadvisor.
The Board considered the Subadvisor’s investment process and philosophy. The Board took into account that the Subadvisor’s responsibilities include the development and maintenance of an investment program for the fund, that is consistent with the fund’s investment objectives, the selection of investment securities and the placement of orders for the purchase and sale of such securities, as well as the implementation of compliance controls related to performance of these services. The Board also received information with respect to the Subadvisor’s brokerage policies and practices, including with respect to best execution and soft dollars.
Subadvisor compensation. In considering the cost of services to be provided by the Subadvisor and the profitability to the Subadvisor of its relationship with the fund, the Board noted that the fees under the Subadvisory Agreement are paid by the Advisor and not the fund.
The Board also relied on the ability of the Advisor to negotiate the Subadvisory Agreement with the Subadvisor, which is not affiliated with the Advisor, and the fees thereunder at arm’s length. As a result, the costs of the services to be provided and the profits to be realized by the Subadvisor from its relationship with the Trust were not a material factor in the Board’s consideration of the Subadvisory Agreement.
| Semiannual report | Global Shareholder Yield Fund | 35 |
The Board also received information regarding the nature and scope (including their significance to the Advisor and its affiliates and to the Subadvisor) of any material relationships with respect to the Subadvisor, which includes arrangements in which the Subadvisor or its affiliates provide advisory, distribution, or management services in connection with financial products sponsored by the Trust’s Advisor or its affiliates, and may include other registered investment companies, a 529 education savings plan, managed separate account, and exempt group annuity contracts sold to qualified plans. The Board also received information and took into account any other potential conflicts of interest the Advisor might have in connection with the Subadvisory Agreement.
In addition, the Board considered other potential indirect benefits that the Subadvisor and its affiliates may receive from the Subadvisor’s relationship with the fund, such as the opportunity to provide advisory services to additional funds in the John Hancock fund complex and reputational benefits.
Subadvisory fees. The Board considered that the fund pays an advisory fee to the Advisor and that, in turn, the Advisor pays a subadvisory fee to the Subadvisor. The Board also took into account the subadvisory fees paid by the Advisor to the Subadvisor with respect to the fund to fees charged by the fund’s Subadvisor to manage other subadvised portfolios and portfolios not subject to regulation under the 1940 Act, as applicable.
Subadvisor performance. As noted above, the Board considered the fund’s performance as compared to the fund’s peer group and benchmark and noted that the Board reviews information about the fund’s performance results at its regularly scheduled meetings. The Board noted the Advisor’s expertise and resources in monitoring the performance, investment style, and risk-adjusted performance of the Subadvisor. The Board was mindful of the Advisor’s focus on the Subadvisor’s performance. The Board also noted the Subadvisor’s long-term performance record for similar accounts, as applicable.
The Board’s decision to approve the Subadvisory Agreement was based on a number of determinations, including the following:
(1) The Subadvisor has extensive experience and demonstrated skills as a manager;
(2) The performance of the fund generally has been in line with or outperformed the historical performance of comparable funds and the fund’s benchmark and the fund’s overall performance is satisfactory; and
(3) The subadvisory fees are reasonable in relation to the level and quality of services being provided.
| * * * |
Based on the Board’s evaluation of all factors that the Board deemed to be material, including those factors described above, the Board, including the Independent Trustees, concluded that renewal of the Advisory Agreement and the Subadvisory Agreement would be in the best interest of the fund and its shareholders. Accordingly, the Board, and the Independent Trustees voting separately, approved the Advisory Agreement and Subadvisory Agreement for an additional one-year period.
| 36 | Global Shareholder Yield Fund | Semiannual report |
More information
| Trustees | Investment advisor |
| James M. Oates, Chairman | John Hancock Investment Management |
| Steven R. Pruchansky, Vice Chairman | Services, LLC |
| Charles L. Bardelis* | |
| James R. Boyle† | Subadvisor |
| Craig Bromley† | Epoch Investment Partners, Inc. |
| Peter S. Burgess* | |
| William H. Cunningham | Principal distributor |
| Grace K. Fey | John Hancock Funds, LLC |
| Theron S. Hoffman* | |
| Deborah C. Jackson | Custodian |
| Hassell H. McClellan | State Street Bank and Trust Company |
| Gregory A. Russo | |
| Warren A. Thomson† | Transfer agent |
| John Hancock Signature Services, Inc. | |
| Officers | |
| Hugh McHaffie | Legal counsel |
| President | K&L Gates LLP |
| Andrew G. Arnott | |
| Executive Vice President | |
| Thomas M. Kinzler | |
| Secretary and Chief Legal Officer | |
| Francis V. Knox, Jr. | |
| Chief Compliance Officer | |
| Charles A. Rizzo | |
| Chief Financial Officer | |
| Salvatore Schiavone | |
| Treasurer | |
| *Member of the Audit Committee | |
| †Non-Independent Trustee | |
The fund’s proxy voting policies and procedures, as well as the fund’s proxy voting record for the most recent twelve-month period ended June 30, are available free of charge on the Securities and Exchange Commission (SEC) website at sec.gov or on our website.
The fund’s complete list of portfolio holdings, for the first and third fiscal quarters, is filed with the SEC on Form N-Q. The fund’s Form N-Q is available on our website and the SEC’s website, sec.gov, and can be reviewed and copied (for a fee) at the SEC’s Public Reference Room in Washington, DC. Call 800-SEC-0330 to receive information on the operation of the SEC’s Public Reference Room.
We make this information on your fund, as well as monthly portfolio holdings, and other fund details available on our website at jhinvestments.com or by calling 800-225-5291.
| You can also contact us: | ||
| 800-225-5291 | Regular mail: | Express mail: |
| jhinvestments.com | Investment Operations | Investment Operations |
| John Hancock Signature Services, Inc. | John Hancock Signature Services, Inc. | |
| P.O. Box 55913 | 30 Dan Road | |
| Boston, MA 02205-5913 | Canton, MA 02021 |
| Semiannual report | Global Shareholder Yield Fund | 37 |

800-225-5291
800-338-8080 EASI-Line
jhinvestments.com

| This report is for the information of the shareholders of John Hancock Global Shareholder Yield Fund. | |
| It is not authorized for distribution to prospective investors unless preceded or accompanied by a prospectus. | 320SA 8/13 |
| MF159391 | 10/13 |
ITEM 2. CODE OF ETHICS.
Not applicable at this time.
ITEM 3. AUDIT COMMITTEE FINANCIAL EXPERT.
Not applicable at this time.
ITEM 4. PRINCIPAL ACCOUNTANT FEES AND SERVICES.
Not applicable at this time.
ITEM 5. AUDIT COMMITTEE OF LISTED REGISTRANTS.
Not applicable at this time.
ITEM 6. SCHEDULE OF INVESTMENTS.
(a) This schedule is included as part of the Report to shareholders filed under Item 1 of this form.
(b) Not applicable.
ITEM 7. DISCLOSURE OF PROXY VOTING POLICIES AND PROCEDURES FOR CLOSED-END MANAGEMENT INVESTMENT COMPANIES.
Not applicable.
ITEM 8. PORTFOLIO MANAGERS OF CLOSED-END MANAGEMENT INVESTMENT COMPANIES.
Not applicable.
ITEM 9. PURCHASES OF EQUITY SECURITIES BY CLOSED-END MANAGEMENT INVESTMENT COMPANY AND AFFILIATED PURCHASERS.
Not applicable.
ITEM 10. SUBMISSION OF MATTERS TO A VOTE OF SECURITY HOLDERS.
Not applicable.
ITEM 11. CONTROLS AND PROCEDURES.
(a) EVALUATION OF DISCLOSURE CONTROLS AND PROCEDURES. The registrant maintains disclosure controls and procedures that are designed to ensure that information required to be disclosed in this Form N-CSR is recorded, processed, summarized and reported within the time periods specified in the rules and forms of the Securities and Exchange Commission. Such disclosure and procedures include controls and procedures designed to ensure that such information is accumulated and communicated to the registrant’s management, including its principal executive officer and principal financial officer, as appropriate, to allow timely decisions regarding required disclosure.
Within 90 days prior to the filing date of this Form N-CSR, the registrant had carried out an evaluation, under the supervision and with the participation of the registrant��s management, including the registrant’s principal executive officer and the registrant’s principal financial officer, of the effectiveness of the design and operation of the registrant’s disclosure controls and
procedures relating to information required to be disclosed on Form N-CSR. Based on such evaluation, the registrant’s principal executive officer and principal financial officer concluded that the registrant’s disclosure controls and procedures are operating effectively to ensure that:
(i) information required to be disclosed in this Form N-CSR is recorded, processed, summarized and reported within the periods specified in the rules and forms of the Securities and Exchange Commission, and
(ii) information is accumulated and communicated to the registrant’s management, including its principal executive officer and principal financial officer, as appropriate, to allow timely decisions regarding required disclosure.
(b) CHANGE IN REGISTRANT’S INTERNAL CONTROL: Not applicable.
ITEM 12. EXHIBITS.
(a) The certification required by Rule 30a-2(a) under the 1940 Act.
(b) The certification required by Rule 30a-2(b) under the 1940 Act.
(c) Contact person at the registrant.
| SIGNATURES |
Pursuant to the requirements of the Securities Exchange Act of 1934 and the Investment Company Act of 1940, the registrant has duly caused this report to be signed on its behalf by the undersigned, thereunto duly authorized.
| John Hancock Funds III | |
| By: | /s/ Hugh McHaffie |
| ------------------------------ | |
| Hugh McHaffie | |
| President | |
| Date: October 25, 2013 | |
Pursuant to the requirements of the Securities Exchange Act of 1934 and the Investment Company Act of 1940, this report has been signed below by the following persons on behalf of the registrant and in the capacities and on the dates indicated.
| By: | /s/ Hugh McHaffie |
| ------------------------------- | |
| Hugh McHaffie | |
| President | |
| Date: October 25, 2013 | |
| By: | /s/ Charles A. Rizzo |
| -------------------------------- | |
| Charles A. Rizzo | |
| Chief Financial Officer | |
| Date: October 25, 2013 | |