| UNITED STATES | |
| SECURITIES AND EXCHANGE COMMISSION | |
| Washington, D.C. 20549 | |
| FORM N-CSR | |
| CERTIFIED SHAREHOLDER REPORT OF REGISTERED | |
| MANAGEMENT INVESTMENT COMPANIES | |
| Investment Company Act file number 811-21777 | |
| John Hancock Funds III | |
| (Exact name of registrant as specified in charter) | |
| 601 Congress Street, Boston, Massachusetts 02210 | |
| (Address of principal executive offices) (Zip code) | |
| Salvatore Schiavone | |
| Treasurer | |
| 601 Congress Street | |
| Boston, Massachusetts 02210 | |
| (Name and address of agent for service) | |
| Registrant's telephone number, including area code: 617-663-4497 | |
| Date of fiscal year end: | March 31 |
| Date of reporting period: | September 30, 2011 |
ITEM 1. SCHEDULE OF INVESTMENTS
A look at performance
Total returns for the period ended September 30, 2011
| Average annual total returns (%) | Cumulative total returns (%) | |||||||
| with maximum sales charge (POP) | with maximum sales charge (POP) | |||||||
| 1-year | 5-year | 10-year | 6-months | 1-year | 5-year | 10-year | ||
| Class A1 | –5.87 | –1.45 | 3.24 | –19.25 | –5.87 | –7.03 | 37.59 | |
| Class B1 | –6.69 | –1.79 | 2.60 | –19.59 | –6.69 | –8.65 | 29.30 | |
| Class C1 | –2.76 | –1.39 | 2.60 | –16.21 | –2.76 | –6.75 | 29.30 | |
| Class I1,2 | –0.55 | –0.07 | 4.11 | –14.85 | –0.55 | –0.35 | 49.67 | |
| Class R11,2 | –1.38 | –1.01 | 3.01 | –15.23 | –1.38 | –4.94 | 34.47 | |
| Class R31,2 | –1.26 | –0.90 | 3.11 | –15.18 | –1.26 | –4.42 | 35.88 | |
| Class R41,2 | –0.93 | –0.60 | 3.43 | –15.05 | –0.93 | –2.96 | 40.04 | |
| Class R51,2 | –0.71 | –0.31 | 3.73 | –14.94 | –0.71 | –1.53 | 44.25 | |
| Class R61,2 | –0.45 | –0.04 | 4.16 | –14.80 | –0.45 | –0.19 | 50.36 | |
| Class T1,2 | –6.01 | –1.97 | 2.61 | –19.35 | –6.01 | –9.45 | 29.34 | |
| Class ADV 1,2 | –0.81 | –0.33 | 3.85 | –14.98 | –0.81 | –1.64 | 45.90 | |
| Class NAV 1,2 | –0.47 | –0.01 | 4.20 | –14.84 | –0.47 | –0.03 | 50.91 | |
Performance figures assume all distributions are reinvested. Public offering price (POP) figures reflect maximum sales charge on Class A and Class T shares of 5%, and the applicable contingent deferred sales charge (CDSC) on Class B and Class C shares. The Class B shares’ CDSC declines annually between years 1 to 6 according to the following schedule: 5, 4, 3, 3, 2, 1%. No sales charge will be assessed after the sixth year. Class C shares held for less than one year are subject to a 1% CDSC. Sales charges are not applicable for Class I, R1, R3, R4, R5, R6, ADV and NAV shares.
The expense ratios of the Fund, both net (including any fee waivers or expense limitations) and gross (excluding any fee waivers or expense limitations), are set forth according to the most recent publicly available prospectuses for the Fund and may differ from those disclosed in the Financial highlights tables in this report. The fee waivers and expense limitations are contractual at least until 6-30-12 for Class R1, R3, R4, R5 and ADV shares. Had the fee waivers and expense limitations not been in place gross expenses would apply. For all other classes the net expenses equal the gross expenses. The expense ratios are as follows:
| Class A | Class B | Class C | Class I | Class R1 | Class R3 | Class R4 | Class R5 | Class R6 | Class T | Class ADV | Class NAV | |
| Net (%) | 1.28 | 2.06 | 2.09 | 0.89 | 1.70 | 1.60 | 1.30 | 1.00 | 0.84 | 1.35 | 1.14 | 0.80 |
| Gross (%) | 1.28 | 2.06 | 2.09 | 0.89 | 8.24 | 16.43 | 16.16 | 15.88 | 0.84 | 1.35 | 1.35 | 0.80 |
The returns reflect past results and should not be considered indicative of future performance. The return and principal value of an investment will fluctuate so that shares, when redeemed, may be worth more or less than their original cost. Due to market volatility, the Fund’s current performance may be higher or lower than the performance shown. For performance data current to the most recent month end, please call 1–800–225–5291 or visit the Fund’s Web site at www.jhfunds.com.
The performance table above and the chart on the next page do not reflect the deduction of taxes that a shareholder would pay on fund distributions or the redemption of fund shares. The Fund’s performance results reflect any applicable expense reductions, without which the expenses would increase and results would have been less favorable.
| 6 | Rainier Growth Fund | Semiannual report |
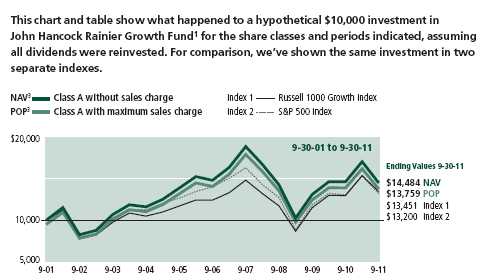
| Without | With maximum | ||||
| Start date | sales charge | sales charge | Index 1 | Index 2 | |
| Class B 4 | 9-30-01 | $12,930 | $12,930 | $13,451 | $13,200 |
| Class C4 | 9-30-01 | 12,930 | 12,930 | 13,451 | 13,200 |
| Class I 2 | 9-30-01 | 14,967 | 14,967 | 13,451 | 13,200 |
| Class R1 2 | 9-30-01 | 13,447 | 13,447 | 13,451 | 13,200 |
| Class R3 2 | 9-30-01 | 13,588 | 13,588 | 13,451 | 13,200 |
| Class R42 | 9-30-01 | 14,004 | 14,004 | 13,451 | 13,200 |
| Class R5 2 | 9-30-01 | 14,425 | 14,425 | 13,451 | 13,200 |
| Class R6 2 | 9-30-01 | 15,036 | 15,036 | 13,451 | 13,200 |
| Class T 2 | 9-30-01 | 13,616 | 12,934 | 13,451 | 13,200 |
| Class ADV 2 | 9-30-01 | 14,590 | 14,590 | 13,451 | 13,200 |
| Class NAV 2 | 9-30-01 | 15,091 | 15,091 | 13,451 | 13,200 |
Russell 1000 Growth Index is an unmanaged index containing those securities in the Russell 1000 Index with a greater-than-average growth orientation.
S&P 500 Index is an unmanaged index that includes 500 widely traded common stocks.
It is not possible to invest directly in an index. Index figures do not reflect sales charges, which would have resulted in lower values if they did.
1 On 4-25-08, through a reorganization, the Fund acquired all of the assets of the Rainier Large Cap Growth Equity Portfolio (the Predecessor Fund). On that date, the Predecessor Fund offered its original share class and institutional share class in exchange for Class A and Class I shares, respectively, of John Hancock Rainier Growth Fund. Class A, Class B, Class C, Class I, Class R1, Class R3, Class R4 Class R5, Class ADV and Class NAV shares of John Hancock Rainier Growth Fund were first offered on 4-28-08. The Predecessor Fund’s original share class returns have been recalculated to reflect the gross fees and expenses of Class A shares. The returns prior to 4-28-08 are those of Class A shares that have been recalculated to apply the gross fees and expenses of Class B, Class C, Class I, Class R1, Class R3, Class R4, Class R5, Class ADV and Class NAV shares, respectively. Class T shares were first offered 10-6-08; the returns prior to this date are those of Class A shares that have been recalculated to apply the gross fees and expenses of Class T shares. Class R6 shares were first offered 9-1-11; the returns prior to this date are those of Class A shares that have been recalculated to apply the gross fees and expenses of Class R6 shares.
2 For certain types of investors, as described in the Fund’s prospectuses.
3 NAV represents net asset value and POP represents public offering price. Performance of the classes will vary based on the difference in sales charges paid by shareholders investing in the different classes and the fee structure of those classes.
4 No contingent deferred sales charge is applicable.
| Semiannual report | Rainier Growth Fund | 7 |
Your expenses
These examples are intended to help you understand your ongoing operating expenses.
Understanding fund expenses
As a shareholder of the Fund, you incur two types of costs:
■ Transaction costs which include sales charges (loads) on purchases or redemptions (varies by share class), minimum account fee charge, etc.
■ Ongoing operating expenses including management fees, distribution and service fees (if applicable), and other fund expenses.
We are going to present only your ongoing operating expenses here.
Actual expenses/actual returns
This example is intended to provide information about the Fund’s actual ongoing operating expenses, and is based on the Fund’s actual return. It assumes an account value of $1,000.00 on April 1, 2011 with the same investment held until September 30, 2011.
| Account value | Ending value | Expenses paid during | |
| on 4-1-11 | on 9-30-11 | period ended 9-30-111 | |
| Class A | $1,000.00 | $849.90 | $5.78 |
| Class B | 1,000.00 | 846.40 | 9.42 |
| Class C | 1,000.00 | 846.40 | 9.65 |
| Class I | 1,000.00 | 851.50 | 4.12 |
| Class R1 | 1,000.00 | 847.70 | 7.81 |
| Class R3 | 1,000.00 | 848.20 | 7.35 |
| Class R4 | 1,000.00 | 849.50 | 5.96 |
| Class R5 | 1,000.00 | 850.70 | 4.58 |
| Class T | 1,000.00 | 849.10 | 6.19 |
| Class ADV | 1,000.00 | 850.20 | 5.27 |
| Class NAV | 1,000.00 | 851.60 | 3.70 |
For the class noted below, the example assumes an account value of $1,000 on September 1, 2011, with the same investment held until September 30, 2011.
| Account value | Ending value | Expenses paid during | |
| on 9-1-11 | on 9-30-11 | period ended 9-30-112 | |
| Class R6 | $1,000.00 | $920.50 | $0.68 |
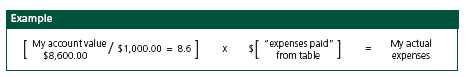
Together with the value of your account, you may use this information to estimate the operating expenses that you paid over the period. Simply divide your account value at September 30, 2011, by $1,000.00, then multiply it by the “expenses paid” for your share class from the table above. For example, for an account value of $8,600.00, the operating expenses should be calculated as follows:
| 8 | Rainier Growth Fund | Semiannual report |
Hypothetical example for comparison purposes
This table allows you to compare the Fund’s ongoing operating expenses with those of any other fund. It provides an example of the Fund’s hypothetical account values and hypothetical expenses based on each class’s actual expense ratio and an assumed 5% annualized return before expenses (which is not the Fund’s actual return). It assumes an account value of $1,000.00 on April 1, 2011, with the same investment held until September 30, 2011. Look in any other fund shareholder report to find its hypothetical example and you will be able to compare these expenses.
| Account value | Ending value | Expenses paid during | |
| on 4-1-11 | on 9-30-11 | period ended 9-30-113 | |
| Class A | $1,000.00 | $1,018.70 | $6.31 |
| Class B | 1,000.00 | 1,014.80 | 10.28 |
| Class C | 1,000.00 | 1,014.50 | 10.53 |
| Class I | 1,000.00 | 1,020.50 | 4.50 |
| Class R1 | 1,000.00 | 1,016.50 | 8.52 |
| Class R3 | 1,000.00 | 1,017.00 | 8.02 |
| Class R4 | 1,000.00 | 1,018.50 | 6.51 |
| Class R5 | 1,000.00 | 1,020.00 | 5.00 |
| Class R6 | 1,000.00 | 1,020.70 | 4.34 |
| Class T | 1,000.00 | 1,018.30 | 6.76 |
| Class ADV | 1,000.00 | 1,019.30 | 5.76 |
| Class NAV | 1,000.00 | 1,021.00 | 4.04 |
Remember, these examples do not include any transaction costs, therefore, these examples will not help you to determine the relative total costs of owning different funds. If transaction costs were included, your expenses would have been higher. See the prospectus for details regarding transaction costs.
1 Expenses are equal to the Fund’s annualized expense ratio of 1.25%, 2.04%, 2.09%, 0.89%, 1.69%, 1.59%, 1.29%, 0.99%, 1.34%, 1.14% and 0.80% for Class A, Class B, Class C, Class I, Class R1, Class R3, Class R4, Class R5, Class T, Class ADV and Class NAV shares, respectively, multiplied by the average account value over the period, multiplied by 183/366 (to reflect the one-half year period).
2 Expenses are equal to the Fund’s annualized expense ratio of 0.86% for Class R6 shares, multiplied by the average account value over the period, multiplied by 30/366 (to reflect the period).
3 Expenses are equal to the Fund’s annualized expense ratio multiplied by the average account value over the period, multiplied by 183/366 (to reflect the one-half year period).
| Semiannual report | Rainier Growth Fund | 9 |
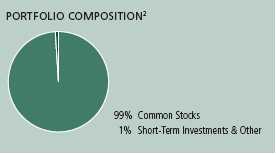
Portfolio summary
| Top 10 Holdings (30.0% of Net Assets on 9-30-11)1,2 | ||||
| Apple, Inc. | 6.6% | Precision Castparts Corp. | 2.6% | |
| Amazon.com, Inc. | 3.5% | Schlumberger, Ltd. | 2.3% | |
| Google, Inc., Class A | 2.9% | Oracle Corp. | 2.2% | |
| The Coca-Cola Company | 2.9% | Visa, Inc., Class A | 2.2% | |
| QUALCOMM, Inc. | 2.8% | American Tower Corp., Class A | 2.0% | |
| Sector Composition2,3 | ||||
| Information Technology | 33% | Financials | 5% | |
| Consumer Discretionary | 13% | Materials | 4% | |
| Health Care | 13% | Telecommunication Services | 2% | |
| Industrials | 12% | Utilities | 1% | |
| Energy | 8% | Short-Term Investments & Other | 1% | |
| Consumer Staples | 8% | |||
1 Cash and cash equivalents not included.
2 As a percentage of net assets on 9-30-11.
3 Sector investing is subject to greater risks than the market as a whole. Because the Fund may focus on particular sectors of the economy, its performance may depend on the performance of those sectors.
| 10 | Rainier Growth Fund | Semiannual report |
Fund’s investments
As of 9-30-11 (unaudited)
| Shares | Value | |
| Common Stocks 99.30% | $1,263,162,606 | |
| (Cost $1,195,534,684) | ||
| Consumer Discretionary 13.47% | 171,413,286 | |
| Hotels, Restaurants & Leisure 1.27% | ||
| Las Vegas Sands Corp. (I) | 423,610 | 16,241,207 |
| Internet & Catalog Retail 4.32% | ||
| Amazon.com, Inc. (I) | 206,810 | 44,718,526 |
| priceline.com, Inc. (I)(L) | 22,890 | 10,288,139 |
| Specialty Retail 3.25% | ||
| Abercrombie & Fitch Company, Class A | 274,620 | 16,905,607 |
| Dick’s Sporting Goods, Inc. (I) | 373,260 | 12,489,280 |
| Limited Brands, Inc. | 309,280 | 11,910,373 |
| Textiles, Apparel & Luxury Goods 4.63% | ||
| Coach, Inc. | 263,760 | 13,670,681 |
| NIKE, Inc., Class B | 299,345 | 25,596,991 |
| Ralph Lauren Corp. | 151,060 | 19,592,482 |
| Consumer Staples 7.54% | 95,855,639 | |
| Beverages 4.16% | ||
| Hansen Natural Corp. (I) | 186,020 | 16,237,686 |
| The Coca-Cola Company | 542,720 | 36,666,163 |
| Food & Staples Retailing 2.01% | ||
| Costco Wholesale Corp. | 311,470 | 25,577,916 |
| Personal Products 1.37% | ||
| The Estee Lauder Companies, Inc., Class A | 197,790 | 17,373,874 |
| Energy 7.84% | 99,685,430 | |
| Energy Equipment & Services 5.06% | ||
| Baker Hughes, Inc. | 449,210 | 20,735,534 |
| Ensco International PLC, ADR | 349,460 | 14,128,668 |
| Schlumberger, Ltd. | 493,380 | 29,469,587 |
| Oil, Gas & Consumable Fuels 2.78% | ||
| Noble Energy, Inc. | 341,290 | 24,163,332 |
| Plains Exploration & Production Company (I) | 492,660 | 11,188,309 |
| Financials 5.39% | 68,560,380 | |
| Capital Markets 1.38% | ||
| Franklin Resources, Inc. | 183,935 | 17,591,543 |
| See notes to financial statements | Semiannual report | Rainier Growth Fund | 11 |
| Shares | Value | |
| Consumer Finance 1.50% | ||
| American Express Company | 423,280 | $19,005,272 |
| Diversified Financial Services 2.51% | ||
| CME Group, Inc. | 37,670 | 9,281,888 |
| IntercontinentalExchange, Inc. (I) | 191,795 | 22,681,677 |
| Health Care 13.46% | 171,251,906 | |
| Biotechnology 2.34% | ||
| Alexion Pharmaceuticals, Inc. (I) | 187,410 | 12,005,485 |
| Biogen Idec, Inc. (I) | 190,390 | 17,734,829 |
| Health Care Providers & Services 2.15% | ||
| AmerisourceBergen Corp. | 425,740 | 15,867,330 |
| Express Scripts, Inc. (I)(L) | 310,950 | 11,526,917 |
| Health Care Technology 1.86% | ||
| Cerner Corp. (I)(L) | 180,890 | 12,394,583 |
| SXC Health Solutions Corp. (I) | 203,560 | 11,338,292 |
| Life Sciences Tools & Services 1.65% | ||
| Agilent Technologies, Inc. (I) | 670,960 | 20,967,500 |
| Pharmaceuticals 5.46% | ||
| Allergan, Inc. | 304,965 | 25,123,017 |
| Perrigo Company | 164,160 | 15,941,578 |
| Shire PLC, ADR | 147,600 | 13,864,068 |
| Valeant Pharmaceuticals International, Inc. (Toronto Exchange) | 390,310 | 14,488,307 |
| Industrials 12.07% | 153,515,582 | |
| Aerospace & Defense 3.81% | ||
| Goodrich Corp. | 129,860 | 15,671,505 |
| Precision Castparts Corp. | 210,990 | 32,800,505 |
| Air Freight & Logistics 1.37% | ||
| Expeditors International of Washington, Inc. | 428,660 | 17,382,163 |
| Construction & Engineering 0.72% | ||
| Fluor Corp. | 197,660 | 9,201,073 |
| Electrical Equipment 1.44% | ||
| AMETEK, Inc. | 555,520 | 18,315,494 |
| Machinery 3.09% | ||
| Cummins, Inc. | 115,940 | 9,467,660 |
| Eaton Corp. | 327,250 | 11,617,375 |
| Joy Global, Inc. | 292,700 | 18,258,626 |
| Road & Rail 1.64% | ||
| CSX Corp. | 1,114,150 | 20,801,181 |
| Information Technology 33.10% | 421,119,059 | |
| Communications Equipment 5.02% | ||
| BancTec, Inc. (I)(R) | 197,026 | 541,822 |
| F5 Networks, Inc. (I) | 142,480 | 10,123,204 |
| Polycom, Inc. (I) | 508,230 | 9,336,185 |
| Qualcomm, Inc. | 729,230 | 35,462,455 |
| Riverbed Technology, Inc. (I) | 420,910 | 8,401,364 |
| 12 | Rainier Growth Fund | Semiannual report | See notes to financial statements |
| Shares | Value | ||
| Computers & Peripherals 8.70% | |||
| Apple, Inc. (I) | 220,470 | $84,038,755 | |
| EMC Corp. (I) | 1,016,805 | 21,342,737 | |
| NetApp, Inc. (I) | 156,510 | 5,311,949 | |
| Electronic Equipment, Instruments & Components 0.40% | |||
| Trimble Navigation, Ltd. (I) | 150,620 | 5,053,301 | |
| Internet Software & Services 4.03% | |||
| Baidu, Inc., ADR (I) | 130,650 | 13,967,792 | |
| Google, Inc., Class A (I) | 72,550 | 37,318,269 | |
| IT Services 5.27% | |||
| Cognizant Technology Solutions Corp., Class A (I) | 320,500 | 20,095,350 | |
| MasterCard, Inc., Class A | 59,910 | 19,001,056 | |
| Visa, Inc., Class A | 326,705 | 28,005,153 | |
| Semiconductors & Semiconductor Equipment 2.87% | |||
| Altera Corp. | 257,140 | 8,107,624 | |
| Avago Technologies, Ltd. | 352,400 | 11,548,148 | |
| Broadcom Corp., Class A (I) | 506,135 | 16,849,234 | |
| Software 6.81% | |||
| Autodesk, Inc. (I) | 365,440 | 10,151,923 | |
| Check Point Software Technologies, Ltd. (I) | 293,880 | 15,505,109 | |
| Citrix Systems, Inc. (I) | 217,320 | 11,850,460 | |
| Intuit, Inc. | 271,620 | 12,885,653 | |
| Oracle Corp. | 992,630 | 28,528,186 | |
| Salesforce.com, Inc. (I) | 67,320 | 7,693,330 | |
| Materials 3.91% | 49,691,320 | ||
| Chemicals 1.75% | |||
| E.I. du Pont de Nemours & Company | 209,500 | 8,373,715 | |
| Potash Corp. of Saskatchewan, Inc. | 321,020 | 13,874,484 | |
| Metals & Mining 2.16% | |||
| Allegheny Technologies, Inc. | 232,830 | 8,612,382 | |
| Barrick Gold Corp. | 403,660 | 18,830,739 | |
| Telecommunication Services 2.02% | 25,683,578 | ||
| Wireless Telecommunication Services 2.02% | |||
| American Tower Corp., Class A (I) | 477,390 | 25,683,578 | |
| Utilities 0.50% | 6,386,426 | ||
| Electric Utilities 0.50% | |||
| ITC Holdings Corp. | 82,480 | 6,386,426 | |
| Yield | Shares | Value | |
| Securities Lending Collateral 2.11% | $26,854,888 | ||
| (Cost $26,853,062) | |||
| John Hancock Collateral Investment Trust (W) | 0.2515% (Y) | 2,684,093 | 26,854,888 |
| See notes to financial statements | Semiannual report | Rainier Growth Fund | 13 |
| Par value | Value | |
| Short-Term Investments 0.32% | $4,111,000 | |
| (Cost $4,111,000) | ||
| Repurchase Agreement 0.32% | 4,111,000 | |
| Repurchase Agreement with State Street Corp. dated 9-30-11 at | ||
| 0.010% to be repurchased at $4,111,003 on 10-3-11, collateralized | ||
| by $4,075,000 U.S. Treasury Notes, 1.500% due 12-31-13 (valued | ||
| at $4,197,250, including interest) | $4,111,000 | 4,111,000 |
| Total investments (Cost $1,226,498,746)† 101.73% | $1,294,128,494 | |
| Other assets and liabilities, net (1.73%) | ($22,044,093) | |
| Total net assets 100.00% | $1,272,084,401 | |
The percentage shown for each investment category is the total value of the category as a percentage of the net assets of the Fund.
ADR American Depositary Receipts
(I) Non-income producing security.
(L) All or a portion of this security is on loan as of 9-30-11.
(R) Direct placement securities are restricted to resale and the Fund has limited rights to registration under the Securities Act of 1933.
| Value as a percentage of | Value as of | |||
| Issuer, description | Acquisition date | Acquisition cost | Fund’s net assets | 9-30-11 |
| BancTec, Inc. | 6-20-07 | $4,728,640 | 0.04% | $541,822 |
| common stock | ||||
(W) Investment is an affiliate of the Fund, the adviser and/or subadviser. Also, it represents the investment of securities lending collateral received.
(Y) The rate shown is the annualized seven-day yield as of 9-30-11.
† At 9-30-11, the aggregate cost of investment securities for federal income tax purposes was $1,236,013,686. Net unrealized appreciation aggregated $58,114,808, of which $191,857,026 related to appreciated investment securities and $133,742,218 related to depreciated investment securities.
| 14 | Rainier Growth Fund | Semiannual report | See notes to financial statements |
F I N A N C I A L S T A T E M E N T S
Financial statements
Statement of assets and liabilities 9-30-11 (unaudited)
This Statement of assets and liabilities is the Fund’s balance sheet. It shows the value of what the Fund owns, is due and owes. You’ll also find the net asset value and the maximum public offering price per share.
| Assets | |
| Investments in unaffiliated issuers, at value (Cost $1,199,645,684) | |
| including $26,301,162 of securities loaned (Note 2) | $1,267,273,606 |
| Investments in affiliated issuers, at value (Cost $26,853,062) (Note 2) | 26,854,888 |
| Total investments, at value (Cost $1,226,498,746) | 1,294,128,494 |
| Cash | 975 |
| Receivable for investments sold | 8,186,746 |
| Receivable for fund shares sold | 739,323 |
| Dividends and interest receivable | 650,884 |
| Receivable for securities lending income | 3,664 |
| Receivable due from adviser | 338 |
| Other receivables and prepaid expenses | 189,250 |
| Total assets | 1,303,899,674 |
| Liabilities | |
| Payable for investments purchased | 3,859,797 |
| Payable for fund shares repurchased | 784,682 |
| Payable upon return of securities loaned (Note 2) | 26,852,868 |
| Payable to affiliates | |
| Accounting and legal services fees | 8,868 |
| Transfer agent fees | 88,263 |
| Trustees’ fees | 76,593 |
| Other liabilities and accrued expenses | 144,202 |
| Total liabilities | 31,815,273 |
| Net assets | |
| Paid-in capital | $1,576,113,729 |
| Accumulated net investment loss | (1,899,802) |
| Accumulated net realized loss on investments | (369,759,274) |
| Net unrealized appreciation (depreciation) on investments and translation | |
| of assets and liabilities in foreign currencies | 67,629,748 |
| Net assets | $1,272,084,401 |
| See notes to financial statements | Semiannual report | Rainier Growth Fund | 15 |
F I N A N C I A L S T A T E M E N T S
Statement of assets and liabilities (continued)
| Net asset value per share | |
| Based on net asset values and shares outstanding — the Fund has an | |
| unlimited number of shares authorized with no par value | |
| Class A ($327,667,829 ÷ 18,088,049 shares) | $18.12 |
| Class B ($23,046,112 ÷ 1,302,667 shares)1 | $17.69 |
| Class C ($16,904,644 ÷ 955,753 shares)1 | $17.69 |
| Class I ($217,915,837 ÷ 11,844,210 shares) | $18.40 |
| Class R1 ($205,057 ÷ 11,443 shares) | $17.92 |
| Class R3 ($80,098 ÷ 4,452 shares) | $17.99 |
| Class R4 ($80,925 ÷ 4,452 shares) | $18.18 |
| Class R5 ($81,763 ÷ 4,458 shares) | $18.34 |
| Class R6 ($92,040 ÷ 4,998 shares) | $18.42 |
| Class T ($65,461,918 ÷ 3,636,169 shares) | $18.00 |
| Class ADV ($17,815,735 ÷ 975,294 shares) | $18.27 |
| Class NAV ($602,732,443 ÷ 32,723,433 shares) | $18.42 |
| Maximum offering price per share | |
| Class A (net asset value per share ÷ 95%)2 | $19.07 |
| Class T (net asset value per share ÷ 95%)2 | $18.95 |
1 Redemption price per share is equal to the net asset value less any applicable contingent deferred sales charge.
2 On single retail sales of less than $50,000. On sales of $50,000 or more and on group sales the offering price is reduced.
| 16 | Rainier Growth Fund | Semiannual report | See notes to financial statements |
F I N A N C I A L S T A T E M E N T S
Statement of operations For the six-month period ended 9-30-11
(unaudited)
This Statement of operations summarizes the Fund’s investment income earned and expenses incurred in operating the Fund. It also shows net gains (losses) for the period stated.
| Investment income | |
| Dividends | $5,426,992 |
| Interest | 734 |
| Securities lending | 85,940 |
| Other income | 407,247 |
| Less foreign taxes withheld | (79,870) |
| Total investment income | 5,841,043 |
| Expenses | |
| Investment management fees (Note 4) | 5,790,532 |
| Distribution and service fees (Note 4) | 859,087 |
| Accounting and legal services fees (Note 4) | 98,604 |
| Transfer agent fees (Note 4) | 543,724 |
| Trustees’ fees (Note 4) | 50,783 |
| State registration fees (Note 4) | 72,539 |
| Printing and postage (Note 4) | 96,653 |
| Professional fees | 94,114 |
| Custodian fees | 95,681 |
| Registration and filing fees | 23,199 |
| Other | 4,443 |
| Total expenses | 7,729,359 |
| Less expense reductions (Note 4) | (43,035) |
| Net expenses | 7,686,324 |
| Net investment loss | (1,845,281) |
| Realized and unrealized gain (loss) | |
| Net realized gain (loss) on | |
| Investments in unaffiliated issuers | 54,336,025 |
| Investments in affiliated issuers | (99) |
| Foreign currency transactions | 525 |
| 54,336,451 | |
| Change in net unrealized appreciation (depreciation) of | |
| Investments in unaffiliated issuers | (284,856,985) |
| Investments in affiliated issuers | (338) |
| Translation of assets and liabilities in foreign currencies | (544) |
| (284,857,867) | |
| Net realized and unrealized loss | (230,521,416) |
| Decrease in net assets from operations | ($232,366,697) |
| See notes to financial statements | Semiannual report | Rainier Growth Fund | 17 |
F I N A N C I A L S T A T E M E N T S
Statements of changes in net assets
These Statements of changes in net assets show how the value of the Fund’s net assets has changed during the last two periods. The difference reflects earnings less expenses, any investment gains and losses, distributions, if any, paid to shareholders and the net of Fund share transactions.
| Six months | ||
| ended | Year | |
| 9-30-11 | ended | |
| (Unaudited) | 3-31-11 | |
| Increase (decrease) in net assets | ||
| From operations | ||
| Net investment loss | ($1,845,281) | ($892,366) |
| Net realized gain | 54,336,451 | 130,626,108 |
| Change in net unrealized appreciation (depreciation) | (284,857,867) | 102,962,390 |
| Increase (decrease) in net assets resulting from operations | (232,366,697) | 232,696,132 |
| Distributions to shareholders | ||
| From net investment income | ||
| Class I | — | (217,850) |
| Class R5 | — | (41) |
| Class NAV | — | (907,978) |
| Total distributions | — | (1,125,869) |
| From Fund share transactions (Note 5) | (116,875,689) | (72,729,494) |
| Total increase (decrease) | (349,242,386) | 158,840,769 |
| Net assets | ||
| Beginning of period | 1,621,326,787 | 1,462,486,018 |
| End of period | $1,272,084,401 | $1,621,326,787 |
| Accumulated net investment loss | ($1,899,802) | ($54,521) |
| 18 | Rainier Growth Fund | Semiannual report | See notes to financial statements |
Financial highlights
The Financial highlights show how the Fund’s net asset value for a share has changed since the end of the previous period.
| CLASS A SHARES Period ended | 9-30-111 | 3-31-11 | 3-31-10 | 3-31-092 | 3-31-083 | 3-31-073 |
| Per share operating performance | ||||||
| Net asset value, beginning of period | $21.32 | $18.31 | $12.84 | $20.91 | $20.44 | $19.07 |
| Net investment loss | (0.05)4 | (0.06)4 | (0.03)4 | (0.01)4 | (0.02) | (0.04) |
| Net realized and unrealized gain (loss) | ||||||
| on investments | (3.15) | 3.07 | 5.50 | (8.06) | 0.49 | 1.41 |
| Total from investment operations | (3.20) | 3.01 | 5.47 | (8.07) | 0.47 | 1.37 |
| Net asset value, end of period | $18.12 | $21.32 | $18.31 | $12.84 | $20.91 | $20.44 |
| Total return (%)5 | (15.01)6 | 16.44 | 42.607 | (38.59)7 | 2.307 | 7.187 |
| Ratios and supplemental data | ||||||
| Net assets, end of period (in millions) | $328 | $413 | $384 | $193 | $164 | $33 |
| Ratios (as a percentage of average net assets): | ||||||
| Expenses before reductions | 1.258 | 1.30 | 1.45 | 1.47 | 1.179 | 1.30 |
| Expenses net of fee waivers | 1.258 | 1.30 | 1.38 | 1.18 | 1.199 | 1.19 |
| Expenses net of fee waivers and credits | 1.258 | 1.30 | 1.34 | 1.18 | 1.199 | 1.19 |
| Net investment loss | (0.50)8 | (0.33) | (0.18) | (0.04) | (0.27) | (0.38) |
| Portfolio turnover (%) | 51 | 90 | 102 | 101 | 86 | 101 |
1 Unaudited.
2 After the close of business on 4-25-08, holders of Original Shares of the former Rainier Large Cap Growth Equity
Portfolio (the Predecessor Fund) became owners of an equal number of full and fractional Class A shares of the
John Hancock Rainier Growth Fund. These shares were first offered on 4-28-08. Additionally, the accounting and
performance history of the Original Shares of the Predecessor Fund was redesignated as that of John Hancock
Rainier Growth Fund Class A.
3 Audited by previous independent registered public accounting firm.
4 Based on the average daily shares outstanding.
5 Does not reflect the effect of sales charges, if any.
6 Not annualized.
7 Total returns would have been lower had certain expenses not been reduced during the periods shown.
8 Annualized.
9 Prior to the reorganization (see Note 1), the Fund was subject to a contractual expense reimbursement and recoupment plan.
| See notes to financial statements | Semiannual report | Rainier Growth Fund | 19 |
| CLASS B SHARES Period ended | 9-30-111 | 3-31-11 | 3-31-10 | 3-31-092 | ||
| Per share operating performance | ||||||
| Net asset value, beginning of period | $20.90 | $18.10 | $12.79 | $22.46 | ||
| Net investment loss3 | (0.13) | (0.21) | (0.15) | (0.09) | ||
| Net realized and unrealized gain (loss) on investments | (3.08) | 3.01 | 5.46 | (9.58) | ||
| Total from investment operations | (3.21) | 2.80 | 5.31 | (9.67) | ||
| Net asset value, end of period | $17.69 | $20.90 | $18.10 | $12.79 | ||
| Total return (%)4 | (15.36)5 | 15.476 | 41.526 | (43.05)5,6 | ||
| Ratios and supplemental data | ||||||
| Net assets, end of period (in millions) | $23 | $31 | $37 | $27 | ||
| Ratios (as a percentage of average net assets): | ||||||
| Expenses before reductions | 2.047 | 2.13 | 2.45 | 2.827 | ||
| Expenses net of fee waivers | 2.047 | 2.10 | 2.11 | 2.057 | ||
| Expenses net of fee waivers and credits | 2.047 | 2.10 | 2.09 | 2.047 | ||
| Net investment loss | (1.29)7 | (1.13) | (0.94) | (0.75)7 | ||
| Portfolio turnover (%) | 51 | 90 | 102 | 1018 | ||
1 Unaudited.
2 The inception date for Class B shares is 4-28-08.
3 Based on the average daily shares outstanding.
4 Does not reflect the effect of sales charges, if any.
5 Not annualized.
6 Total returns would have been lower had certain expenses not been reduced during the periods shown.
7 Annualized.
8 Portfolio turnover is shown for the period from 4-1-08 to 3-31-09.
| CLASS C SHARES Period ended | 9-30-111 | 3-31-11 | 3-31-10 | 3-31-092 | ||
| Per share operating performance | ||||||
| Net asset value, beginning of period | $20.90 | $18.10 | $12.79 | $22.46 | ||
| Net investment loss3 | (0.13) | (0.21) | (0.15) | (0.09) | ||
| Net realized and unrealized gain (loss) on investments | (3.08) | 3.01 | 5.46 | (9.58) | ||
| Total from investment operations | (3.21) | 2.80 | 5.31 | (9.67) | ||
| Net asset value, end of period | $17.69 | $20.90 | $18.10 | $12.79 | ||
| Total return (%)4 | (15.36)5 | 15.476 | 41.526 | (43.05)5,6 | ||
| Ratios and supplemental data | ||||||
| Net assets, end of period (in millions) | $17 | $22 | $24 | $15 | ||
| Ratios (as a percentage of average net assets): | ||||||
| Expenses before reductions | 2.097 | 2.16 | 2.34 | 2.827 | ||
| Expenses net of fee waivers | 2.097 | 2.10 | 2.21 | 2.057 | ||
| Expenses net of fee waivers and credits | 2.097 | 2.10 | 2.09 | 2.047 | ||
| Net investment loss | (1.33)7 | (1.13) | (0.93) | (0.77)7 | ||
| Portfolio turnover (%) | 51 | 90 | 102 | 1018 | ||
1 Unaudited.
2 The inception date for Class C shares is 4-28-08.
3 Based on the average daily shares outstanding.
4 Does not reflect the effect of sales charges, if any.
5 Not annualized.
6 Total returns would have been lower had certain expenses not been reduced during the periods shown.
7 Annualized.
8 Portfolio turnover is shown for the period from 4-1-08 to 3-31-09.
| 20 | Rainier Growth Fund | Semiannual report | See notes to financial statements |
| CLASS I SHARES Period ended | 9-30-111 | 3-31-11 | 3-31-10 | 3-31-092 | 3-31-083 | 3-31-073,4 |
| Per share operating performance | ||||||
| Net asset value, beginning of period | $21.61 | $18.50 | $12.92 | $20.98 | $20.44 | $20.94 |
| Net investment income (loss)5 | (0.01) | 0.02 | 0.04 | 0.04 | —6 | —6 |
| Net realized and unrealized gain (loss) | ||||||
| on investments | (3.20) | 3.11 | 5.54 | (8.09) | 0.54 | (0.50) |
| Total from investment operations | (3.21) | 3.13 | 5.58 | (8.05) | 0.54 | (0.50) |
| Less distributions | ||||||
| From net investment income | — | (0.02) | —6 | (0.01) | — | — |
| Net asset value, end of period | $18.40 | $21.61 | $18.50 | $12.92 | $20.98 | $20.44 |
| Total return (%) | (14.85)7 | 16.93 | 43.20 | (38.36) | 2.64 | (2.39)7,8 |
| Ratios and supplemental data | ||||||
| Net assets, end of period (in millions) | $218 | $237 | $208 | $133 | $136 | $537 |
| Ratios (as a percentage of average net assets): | ||||||
| Expenses before reductions | 0.8910 | 0.86 | 0.90 | 0.86 | 0.929 | 1.0010 |
| Expenses net of fee waivers | 0.8910 | 0.86 | 0.90 | 0.86 | 0.949 | 0.9410 |
| Expenses net of fee waivers and credits | 0.8910 | 0.86 | 0.90 | 0.86 | 0.949 | 0.9410 |
| Net investment income (loss) | (0.13)10 | 0.10 | 0.26 | 0.22 | (0.02) | 0.1510 |
| Portfolio turnover (%) | 51 | 90 | 102 | 101 | 86 | 10111 |
1 Unaudited.
2 After the close of business on 4-25-08, holders of Institutional Shares of the former Rainier Large Cap Growth
Equity Portfolio (the Predecessor Fund) became owners of an equal number of full and fractional Class I shares of
the John Hancock Rainier Growth Fund. These shares were first offered on 4-28-08. Additionally, the accounting and
performance history of the Institutional Shares of the Predecessor Fund was redesignated as that of John Hancock
Rainier Growth Fund Class I.
3 Audited by previous independent registered public accounting firm.
4 The inception date for Class I shares is 2-20-07.
5 Based on the average daily shares outstanding.
6 Less than ($0.005) per share.
7 Not annualized.
8 Total returns would have been lower had certain expenses not been reduced during the periods shown.
9 Prior to the reorganization (see Note 1), the Fund was subject to a contractual expense reimbursement and
recoupment plan.
10 Annualized.
11 Annualized based on investments held for a full year.
| CLASS R1 SHARES Period ended | 9-30-111 | 3-31-11 | 3-31-10 | 3-31-092 | ||
| Per share operating performance | ||||||
| Net asset value, beginning of period | $21.14 | $18.23 | $12.84 | $22.46 | ||
| Net investment loss3 | (0.10) | (0.14) | (0.11) | (0.08) | ||
| Net realized and unrealized gain (loss) on investments | (3.12) | 3.05 | 5.50 | (9.54) | ||
| Total from investment operations | (3.22) | 2.91 | 5.39 | (9.62) | ||
| Net asset value, end of period | $17.92 | $21.14 | $18.23 | $12.84 | ||
| Total return (%)4 | (15.23)5 | 15.96 | 41.98 | (42.83)5 | ||
| Ratios and supplemental data | ||||||
| Net assets, end of period (in millions) | —6 | —6 | —6 | —6 | ||
| Ratios (as a percentage of average net assets): | ||||||
| Expenses before reductions | 6.727 | 8.39 | 13.91 | 8.707 | ||
| Expenses net of fee waivers | 1.697 | 1.72 | 1.78 | 1.647 | ||
| Expenses net of fee waivers and credits | 1.697 | 1.72 | 1.78 | 1.647 | ||
| Net investment loss | (0.94)7 | (0.75) | (0.65) | (0.50)7 | ||
| Portfolio turnover (%) | 51 | 90 | 102 | 1018 | ||
1 Unaudited.
2 The inception date for Class R1 shares is 4-28-08.
3 Based on the average daily shares outstanding.
4 Total returns would have been lower had certain expenses not been reduced during the periods shown.
5 Not annualized.
6 Less than $500,000.
7 Annualized.
8 Portfolio turnover is shown for the period from 4-1-08 to 3-31-09.
| See notes to financial statements | Semiannual report | Rainier Growth Fund | 21 |
| CLASS R3 SHARES Period ended | 9-30-111 | 3-31-11 | 3-31-10 | 3-31-092 | ||
| Per share operating performance | ||||||
| Net asset value, beginning of period | $21.21 | $18.27 | $12.85 | $22.46 | ||
| Net investment loss3 | (0.09) | (0.12) | (0.07) | (0.06) | ||
| Net realized and unrealized gain (loss) on investments | (3.13) | 3.06 | 5.49 | (9.55) | ||
| Total from investment operations | (3.22) | 2.94 | 5.42 | (9.61) | ||
| Net asset value, end of period | $17.99 | $21.21 | $18.27 | $12.85 | ||
| Total return (%)4 | (15.18)5 | 16.09 | 42.18 | (42.79)5 | ||
| Ratios and supplemental data | ||||||
| Net assets, end of period (in millions) | —6 | —6 | —6 | —6 | ||
| Ratios (as a percentage of average net assets): | ||||||
| Expenses before reductions | 14.727 | 16.72 | 13.68 | 8.577 | ||
| Expenses net of fee waivers | 1.597 | 1.61 | 1.62 | 1.547 | ||
| Expenses net of fee waivers and credits | 1.597 | 1.61 | 1.62 | 1.547 | ||
| Net investment loss | (0.84)7 | (0.64) | (0.46) | (0.40)7 | ||
| Portfolio turnover (%) | 51 | 90 | 102 | 1018 | ||
1 Unaudited.
2 The inception date for Class R3 shares is 4-28-08.
3 Based on the average daily shares outstanding.
4 Total returns would have been lower had certain expenses not been reduced during the periods shown.
5 Not annualized.
6 Less than $500,000.
7 Annualized.
8 Portfolio turnover is shown for the period from 4-1-08 to 3-31-09.
| CLASS R4 SHARES Period ended | 9-30-111 | 3-31-10 | 3-31-092 | |||
| Per share operating performance | ||||||
| Net asset value, beginning of period | $18.38 | $12.88 | $22.46 | |||
| Net investment loss3 | (0.06) | (0.03) | (0.02) | |||
| Net realized and unrealized gain (loss) on investments | (0.14) | 5.53 | (9.56) | |||
| Total from investment operations | (0.20) | 5.50 | (9.58) | |||
| Net asset value, end of period | $18.18 | $18.38 | $12.88 | |||
| Total return (%)4 | (15.05)5 | 42.70 | (42.65)5 | |||
| Ratios and supplemental data | ||||||
| Net assets, end of period (in millions) | —6 | —6 | —6 | |||
| Ratios (as a percentage of average net assets): | ||||||
| Expenses before reductions | 14.347 | 13.33 | 8.267 | |||
| Expenses net of fee waivers | 1.297 | 1.32 | 1.247 | |||
| Expenses net of fee waivers and credits | 1.297 | 1.32 | 1.247 | |||
| Net investment loss | (0.54)7 | (0.16) | (0.10)7 | |||
| Portfolio turnover (%) | 51 | 102 | 1018 | |||
1 Unaudited.
2 The inception date for Class R4 shares is 4-28-08.
3 Based on the average daily shares outstanding.
4 Total returns would have been lower had certain expenses not been reduced during the periods shown.
5 Not annualized.
6 Less than $500,000.
7 Annualized.
8 Portfolio turnover is shown for the period from 4-1-08 to 3-31-09.
| 22 | Rainier Growth Fund | Semiannual report | See notes to financial statements |
| CLASS R5 SHARES Period ended | 9-30-111 | 3-31-11 | 3-31-10 | 3-31-092 | ||
| Per share operating performance | ||||||
| Net asset value, beginning of period | $21.56 | $18.47 | $12.91 | $22.46 | ||
| Net investment income (loss)3 | (0.02) | (0.02) | 0.02 | 0.03 | ||
| Net realized and unrealized gain (loss) on investments | (3.20) | 3.12 | 5.54 | (9.57) | ||
| Total from investment operations | (3.22) | 3.10 | 5.56 | (9.54) | ||
| Less distributions | ||||||
| From net investment income (loss) | — | (0.01) | —4 | (0.01) | ||
| Net asset value, end of period | $18.34 | $21.56 | $18.47 | $12.91 | ||
| Total return (%)5 | (14.94)6 | 16.78 | 43.07 | (42.48)6 | ||
| Ratios and supplemental data | ||||||
| Net assets, end of period (in millions) | —7 | —7 | —7 | —7 | ||
| Ratios (as a percentage of average net assets): | ||||||
| Expenses before reductions | 13.968 | 16.17 | 12.97 | 7.958 | ||
| Expenses net of fee waivers | 0.998 | 1.01 | 1.02 | 0.948 | ||
| Expenses net of fee waivers and credits | 0.998 | 1.01 | 1.02 | 0.948 | ||
| Net investment income (loss) | (0.24)8 | (0.03) | 0.14 | 0.208 | ||
| Portfolio turnover (%) | 51 | 90 | 102 | 1019 | ||
1 Unaudited.
2 The inception date for Class R5 shares is 4-28-08.
3 Based on the average daily shares outstanding.
4 Less than ($0.005) per share.
5 Total returns would have been lower had certain expenses not been reduced during the periods shown.
6 Not annualized.
7 Less than $500,000.
8 Annualized.
9 Portfolio turnover is shown for the period from 4-1-08 to 3-31-09.
| CLASS R6 SHARES Period ended | 9-30-111,2 |
| Per share operating performance | |
| Net asset value, beginning of period | $20.01 |
| Net investment loss3 | —4 |
| Net realized and unrealized loss on investments | (1.59) |
| Total from investment operations | (1.59) |
| Net asset value, end of period | $18.42 |
| Total return (%)5 | (7.95)6 |
| Ratios and supplemental data | |
| Net assets, end of period (in millions) | —7 |
| Ratios (as a percentage of average net assets): | |
| Expenses before reductions | 16.328 |
| Expenses net of fee waivers | 0.868 |
| Expenses net of fee waivers and credits | 0.868 |
| Net investment loss | (0.14)8 |
| Portfolio turnover (%) | 51 |
1 Unaudited.
2 Period from 9-1-11 (inception date) to 9-30-11.
3 Based on the average daily shares outstanding.
4 Less than ($0.005) per share.
5 Total returns would have been lower had certain expenses not been reduced during the periods shown.
6 Not annualized.
7 Less than $500,000.
8 Annualized.
| See notes to financial statements | Semiannual report | Rainier Growth Fund | 23 |
| CLASS T SHARES Period ended | 9-30-111 | 3-31-11 | 3-31-10 | 3-31-092 | ||
| Per share operating performance | ||||||
| Net asset value, beginning of period | $21.20 | $18.24 | $12.86 | $16.59 | ||
| Net investment loss3 | (0.06) | (0.09) | (0.11) | (0.05) | ||
| Net realized and unrealized gain (loss) on investments | (3.14) | 3.05 | 5.49 | (3.68) | ||
| Total from investment operations | (3.20) | 2.96 | 5.38 | (3.73) | ||
| Net asset value, end of period | $18.00 | $21.20 | $18.24 | $12.86 | ||
| Total return (%)4 | (15.09)6 | 16.23 | 41.84 | (22.48)5,6 | ||
| Ratios and supplemental data | ||||||
| Net assets, end of period (in millions) | $65 | $83 | $83 | $72 | ||
| Ratios (as a percentage of average net assets): | ||||||
| Expenses before reductions | 1.347 | 1.47 | 1.84 | 2.077 | ||
| Expenses net of fee waivers | 1.347 | 1.47 | 1.84 | 1.997 | ||
| Expenses net of fee waivers and credits | 1.347 | 1.47 | 1.84 | 1.987 | ||
| Net investment loss | (0.59)7 | (0.50) | (0.69) | (0.74)7 | ||
| Portfolio turnover (%) | 51 | 90 | 102 | 1018 | ||
1 Unaudited.
2 The inception date for Class T shares is 10-6-08.
3 Based on the average daily shares outstanding.
4 Does not reflect the effect of sales charges, if any.
5 Total returns would have been lower had certain expenses not been reduced during the periods shown.
6 Not annualized.
7 Annualized.
8 Portfolio turnover is shown for the period from 4-1-08 to 3-31-09.
| CLASS ADV SHARES Period ended | 9-30-111 | 3-31-11 | 3-31-10 | 3-31-092 | ||
| Per share operating performance | ||||||
| Net asset value, beginning of period | $21.49 | $18.43 | $12.90 | $22.46 | ||
| Net investment income (loss)3 | (0.04) | (0.03) | —4 | (0.01) | ||
| Net realized and unrealized gain (loss) on investments | (3.18) | 3.09 | 5.53 | (9.55) | ||
| Total from investment operations | (3.22) | 3.06 | 5.53 | (9.56) | ||
| Net asset value, end of period | $18.27 | $21.49 | $18.43 | $12.90 | ||
| Total return (%)5 | (14.98)6 | 16.60 | 42.87 | (42.56)6 | ||
| Ratios and supplemental data | ||||||
| Net assets, end of period (in millions) | $18 | $22 | $18 | $17 | ||
| Ratios (as a percentage of average net assets): | ||||||
| Expenses before reductions | 1.317 | 1.37 | 1.25 | 1.147 | ||
| Expenses net of fee waivers | 1.147 | 1.14 | 1.14 | 1.147 | ||
| Expenses net of fee waivers and credits | 1.147 | 1.14 | 1.14 | 1.147 | ||
| Net investment income (loss) | (0.38)7 | (0.17) | 0.01 | (0.04)7 | ||
| Portfolio turnover (%) | 51 | 90 | 102 | 1018 | ||
1 Unaudited.
2 The inception date for Class ADV shares is 4-28-08.
3 Based on the average daily shares outstanding.
4 Less than $0.005 per share.
5 Total returns would have been lower had certain expenses not been reduced during the periods shown.
6 Not annualized.
7 Annualized.
8 Portfolio turnover is shown for the period from 4-1-08 to 3-31-09.
| 24 | Rainier Growth Fund | Semiannual report | See notes to financial statements |
| CLASS NAV SHARES Period ended | 9-30-111 | 3-31-11 | 3-31-10 | 3-31-092 | ||
| Per share operating performance | ||||||
| Net asset value, beginning of period | $21.63 | $18.51 | $12.91 | $22.46 | ||
| Net investment income (loss)3 | —4 | 0.03 | 0.05 | 0.04 | ||
| Net realized and unrealized gain (loss) on investments | (3.21) | 3.11 | 5.55 | (9.57) | ||
| Total from investment operations | (3.21) | 3.14 | 5.60 | (9.53) | ||
| Less distributions | ||||||
| From net investment income | — | (0.02) | —4 | (0.02) | ||
| Net asset value, end of period | $18.42 | $21.63 | $18.51 | $12.91 | ||
| Total return (%) | (14.84)5 | 17.00 | 43.38 | (42.44)5 | ||
| Ratios and supplemental data | ||||||
| Net assets, end of period (in millions) | $603 | $813 | $708 | $400 | ||
| Ratios (as a percentage of average net assets): | ||||||
| Expenses before reductions | 0.806 | 0.80 | 0.82 | 0.836 | ||
| Expenses net of fee waivers | 0.806 | 0.80 | 0.82 | 0.836 | ||
| Expenses net of fee waivers and credits | 0.806 | 0.80 | 0.82 | 0.836 | ||
| Net investment income (loss) | (0.04)6 | 0.16 | 0.33 | 0.266 | ||
| Portfolio turnover (%) | 51 | 90 | 102 | 1017 | ||
1 Unaudited.
2 The inception date for Class NAV shares is 4-28-08.
3 Based on the average daily shares outstanding.
4 Less than ($0.005) per share.
5 Not annualized.
6 Annualized.
7 Portfolio turnover is shown for the period from 4-1-08 to 3-31-09.
| See notes to financial statements | Semiannual report | Rainier Growth Fund | 25 |
Notes to financial statements
(unaudited)
Note 1 — Organization
John Hancock Rainier Growth Fund (the Fund) is a diversified series of John Hancock Funds III (the Trust), an open-end management investment company organized as a Massachusetts business trust and registered under the Investment Company Act of 1940, as amended (the 1940 Act). The investment objective of the Fund is to seek to maximize long-term capital appreciation.
The Fund may offer multiple classes of shares. The shares currently offered are detailed in the Statement of assets and liabilities. Class A, Class B and Class C shares are offered to all investors. Class I shares are offered to institutions and certain investors. Class R1, Class R3, Class R4 and Class R5 shares are available only to certain retirement plans. Class R6 shares are only available to certain retirement plans, institutions and other investors. Class T and Class ADV shares are closed to new investors. Class NAV shares are sold to John Hancock affiliated funds of funds. Shareholders of each class have exclusive voting rights to matters that affect that class. The distribution and service fees, if any, transfer agent fees, printing and postage and state registration fees for each class may differ. Class B shares convert to Class A shares eight years after purchase. Under certain circumstances, Class I shares may be converted to Class R6 shares within one year after the commencement of operations of Class R6.
The Fund is the accounting and performance successor of the Rainier Large Cap Growth Equity Portfolio (the Predecessor Fund). On April 28, 2008, the Fund acquired substantially all the assets and assumed the liabilities of the Predecessor Fund pursuant to an agreement and plan of reorganization, in exchange for Class A and Class I shares of the Fund.
Note 2 — Significant accounting policies
The financial statements have been prepared in conformity with accounting principles generally accepted in the United States of America, which require management to make certain estimates and assumptions at the date of the financial statements. Actual results could differ from those estimates. Events or transactions occurring after the end of the fiscal period through the date that the financial statements were issued have been evaluated in the preparation of the financial statements. The following summarizes the significant accounting policies of the Fund:
Security valuation. Investments are stated at value as of the close of regular trading on the New York Stock Exchange (NYSE), normally at 4:00 P.M., Eastern Time. The Fund uses a three-tier hierarchy to prioritize the pricing assumptions, referred to as inputs, used in valuation techniques to measure fair value. Level 1 includes securities valued using quoted prices in active markets for identical securities. Level 2 includes securities valued using significant observable inputs. Observable inputs may include quoted prices for similar securities, interest rates, prepayment speeds and credit risk. Prices for securities valued using these inputs are received from independent pricing vendors and brokers and are based on an evaluation of the inputs described. Level 3 includes securities valued using significant unobservable inputs when market prices are not readily available or reliable, including the Fund’s own assumptions in determining the fair value of investments. Factors used in determining value may include market or issuer specific events, changes in interest rates and credit quality. The inputs or methodology used for valuing securities are not necessarily an indication of the risk associated with investing in those securities.
| 26 | Rainier Growth Fund | Semiannual report |
The following is a summary of the values by input classification of the Fund’s investments as of September 30, 2011, by major security category or type:
| LEVEL 3 | ||||
| LEVEL 2 | SIGNIFICANT | |||
| TOTAL MARKET | LEVEL 1 | SIGNIFICANT | UNOBSERVABLE | |
| VALUE AT 9-30-11 | QUOTED PRICE | OBSERVABLE INPUTS | INPUTS | |
| Common Stocks | ||||
| Consumer Discretionary | $171,413,286 | $171,413,286 | — | — |
| Consumer Staples | 95,855,639 | 95,855,639 | — | — |
| Energy | 99,685,430 | 99,685,430 | — | — |
| Financials | 68,560,380 | 68,560,380 | — | — |
| Health Care | 171,251,906 | 171,251,906 | — | — |
| Industrials | 153,515,582 | 153,515,582 | — | — |
| Information Technology | 421,119,059 | 420,577,237 | — | $541,822 |
| Materials | 49,691,320 | 49,691,320 | — | — |
| Telecommunication | ||||
| Services | 25,683,578 | 25,683,578 | — | — |
| Utilities | 6,386,426 | 6,386,426 | — | — |
| Securities Lending | ||||
| Collateral | 26,854,888 | 26,854,888 | — | — |
| Short-Term Investments | 4,111,000 | — | $4,111,000 | — |
| Total Investments | ||||
| in Securities | $1,294,128,494 | $1,289,475,672 | $4,111,000 | $541,822 |
Changes in valuation techniques may result in transfers in or out of an assigned level within the disclosure hierarchy. During the six months ended September 30, 2011, there were no significant transfers in or out of Level 1, Level 2 or Level 3 assets.
In order to value the securities, the Fund uses the following valuation techniques. Equity securities held by the Fund are valued at the last sale price or official closing price on the principal securities exchange on which they trade. In the event there were no sales during the day or closing prices are not available, then securities are valued using the last quoted bid or evaluated price. Investments by the Fund in open-end mutual funds, including John Hancock Collateral Investment Trust (JHCIT), are valued at their closing net asset values each business day. Certain securities traded only in the over-the-counter market are valued at the last bid price quoted by brokers making markets in the securities at the close of trading. Other portfolio securities and assets, where market quotations are not readily available, are valued at fair value, as determined in good faith by the Fund’s Pricing Committee, following procedures established by the Board of Trustees.
Repurchase agreements. The Fund may enter into repurchase agreements. When the Fund enters into a repurchase agreement, it receives collateral which is held in a segregated account by the Fund’s custodian. The collateral amount is marked-to-market and monitored on a daily basis to ensure that the collateral held is in an amount not less than the principal amount of the repurchase agreement plus any accrued interest. In the event of a default by the counterparty, realization of the collateral proceeds could be delayed, during which time the collateral value may decline.
Security transactions and related investment income. Investment security transactions are accounted for on a trade date plus one basis for daily net asset value calculations. However, for financial reporting purposes, investment transactions are reported on trade date. Interest income is accrued as earned. Gains and losses on securities sold are determined on the basis of identified cost and may include proceeds from litigation. Dividend income is recorded on the ex-date, except for dividends of foreign securities where the dividend may not be known until after the ex-date. In those cases, dividend income is recorded when the Fund becomes aware of the dividends.
| Semiannual report | Rainier Growth Fund | 27 |
Securities lending. The Fund may lend its securities to earn additional income. It receives and maintains cash collateral received from the borrower in an amount not less than the market value of the loaned securities. The Fund will invest its collateral in JHCIT, an affiliate of the Fund, and as a result, the Fund will receive the benefit of any gains and bear any losses generated by JHCIT. Although risk of the loss of the securities lent is mitigated by holding the collateral, the Fund could experience a delay in recovering its securities and a possible loss of income or value if the borrower fails to return the securities or if collateral investments decline in value. The Fund may receive compensation for lending its securities by retaining a portion of the return on the investment of the collateral and compensation from fees earned from borrowers of the securities. Net income received from JHCIT is a component of securities lending income as recorded on the Statement of operations.
Line of credit. The Fund may borrow from banks for temporary or emergency purposes, including meeting redemption requests that otherwise might require the untimely sale of securities. Pursuant to the custodian agreement, the custodian may loan money to the Fund to make properly authorized payments. The Fund is obligated to repay the custodian for any overdraft, including any related costs or expenses. The custodian has a lien, security interest or security entitlement in any Fund property that is not segregated, to the maximum extent permitted by law for any overdraft.
The Fund and other affiliated funds have entered into an agreement with Citibank N.A. which enables them to participate in a $100 million unsecured committed line of credit. A commitment fee, payable at the end of each calendar quarter, based on the average daily unused portion of the line of credit, is charged to each participating fund on a pro rata basis and is reflected in other expenses on the Statement of operations. For the six months ended September 30, 2011, the Fund had no borrowings under the line of credit.
Expenses. The majority of expenses are directly attributable to an individual fund. Expenses that are not readily attributable to a specific fund are allocated among all funds in an equitable manner, taking into consideration, among other things, the nature and type of expense and the fund’s relative assets. Expense estimates are accrued in the period to which they relate and adjustments are made when actual amounts are known.
Class allocations. Income, common expenses and realized and unrealized gains (losses) are determined at the fund level and allocated daily to each class of shares based on the net assets of the class. Class-specific expenses, such as distribution and service fees, if any, transfer agent fees, state registration fees and printing and postage, for all classes, are calculated daily at the class level based on the appropriate net assets of each class and the specific expense rates applicable to each class.
Federal income taxes. The Fund intends to continue to qualify as a regulated investment company by complying with the applicable provisions of the Internal Revenue Code and will not be subject to federal income tax on taxable income that is distributed to shareholders. Therefore, no federal income tax provision is required.
For federal income tax purposes, the Fund has a capital loss carryforward of $414,580,785 available to offset future net realized capital gains as of March 31, 2011.
At March 31, 2011, capital loss carryforward available to offset future realized gains is as follows:
| CAPITAL LOSS CARRYFORWARD EXPIRING AT MARCH 31 | |||
| 2012 | 2016 | 2017 | 2018 |
| $86,800,122 | $25,121,985 | $47,871,200 | $254,787,478 |
Under the Regulated Investment Company Modernization Act of 2010, the Fund will be permitted to carry forward capital losses incurred in taxable years beginning after December 22, 2010 for an unlimited period. However, any losses incurred during those future taxable years will be required
| 28 | Rainier Growth Fund | Semiannual report |
to be utilized prior to the losses incurred in pre-enactment taxable years. As a result of this ordering rule, pre-enactment capital loss carryforwards may be more likely to expire unused. Additionally, post-enactment capital losses that are carried forward will retain their character as either short-term or long-term capital losses rather than being considered all short-term as under previous law.
As of March 31, 2011, the Fund had no uncertain tax positions that would require financial statement recognition, derecognition or disclosure. The Fund’s federal tax returns are subject to examination by the Internal Revenue Service for a period of three years.
Distribution of income and gains. Distributions to shareholders from net investment income and net realized gains, if any, are recorded on the ex-date. The Fund generally declares and pays dividends and capital gain distributions, if any, annually.
Distributions paid by the Fund with respect to each class of shares are calculated in the same manner, at the same time and in the same amount, except for the effect of expenses that may be applied differently to each class.
Such distributions, on a tax basis, are determined in conformity with income tax regulations, which may differ from accounting principles generally accepted in the United States of America.
Capital accounts within financial statements are adjusted for permanent book-tax differences. These adjustments have no impact on net assets or the results of operations. Temporary book-tax differences, if any, will reverse in a subsequent period. Book-tax differences are primarily attributable to net operating losses, expiration of capital loss carryforward, wash sale loss deferrals and merger related transactions.
New accounting pronouncement. In May 2011, Accounting Standards Update 2011-04 (ASU 2011-04), Amendments to Achieve Common Fair Value Measurement and Disclosure Requirements in U.S. GAAP and IFRSs, was issued and is effective during interim and annual periods beginning after December 15, 2011. ASU 2011-04 amends Financial Accounting Standards Board (FASB) Topic 820, Fair Value Measurement. The amendments are the result of the work by the FASB and the International Accounting Standards Board to develop common requirements for measuring fair value and for disclosing information about fair value measurements in accordance with GAAP. Management is currently evaluating the application of ASU 2011-04 and its impact, if any, on the Fund’s financial statements.
Note 3 — Guarantees and indemnifications
Under the Fund’s organizational documents, its Officers and Trustees are indemnified against certain liabilities arising out of the performance of their duties to the Fund. Additionally, in the normal course of business, the Fund enters into contracts with service providers that contain general indemnification clauses. The Fund’s maximum exposure under these arrangements is unknown, as this would involve future claims that may be made against the Fund that have not yet occurred. The risk of material loss from such claims is considered remote.
Note 4 — Fees and transactions with affiliates
John Hancock Investment Management Services, LLC (the Adviser) serves as investment adviser for the Trust. John Hancock Funds, LLC (the Distributor), an affiliate of the Adviser, serves as principal underwriter of the Trust. The Adviser and the Distributor are indirect wholly owned subsidiaries of Manulife Financial Corporation (MFC).
Management fee. The Fund has an investment management contract with the Adviser under which the Fund pays a daily management fee to the Adviser based on aggregate net assets of the Fund and John Hancock Growth Equity Trust (Growth Equity). Growth Equity is a series of John Hancock Variable Insurance Trust, an affiliate of the Fund, managed by the Adviser.
| Semiannual report | Rainier Growth Fund | 29 |
The management fee is equivalent, on an annual basis, to the sum of: (a) 0.750% of the first $3,000,000,000 of the Fund’s aggregate net assets; (b) 0.725% of the next $3,000,000,000; and (c) 0.700% of the Fund’s aggregate net assets in excess of $6,000,000,000. The Adviser has a subadvisory agreement with Rainier Investment Management, Inc. The Fund is not responsible for payment of the subadvisory fees.
The Adviser has contractually agreed to waive fees and/or reimburse certain expenses for each share class of the Fund. This agreement excludes taxes, brokerage commissions, interest, litigation expenses and other extraordinary expenses not incurred in the ordinary course of the Fund’s business. The fee waivers and/or reimbursements are such that these expenses will not exceed 1.35%, 2.10%, 2.10%, 1.04%, 1.70%, 1.60%, 1.30%, 1.00%, 0.86%, 1.40%, and 1.14% for Class A, Class B, Class C, Class I, Class R1, Class R3, Class R4, Class R5, Class R6, Class T and Class ADV shares, respectively. The fee waivers and/or expense reimbursements will continue in effect until at least June 30, 2012 for Class A, Class B, Class C, Class I, Class R1, Class R3, Class R4, Class R5, Class T and Class ADV shares and June 30, 2013 for Class R6 shares. Prior to August 1, 2011, the fee waivers and/or reimbursements were such that the above expenses would not exceed 1.69%, 1.59%, 1.29% and 0.99% for Class R1, Class R3, Class R4 and Class R5 shares, respectively, and the limits for the remainder of the share classes above were unchanged.
For the six months ended September 30, 2011, the expense reductions amounted to the following:
| EXPENSE | ||||
| CLASS | REDUCTIONS | |||
| Class A | — | |||
| Class B | — | |||
| Class C | — | |||
| Class I | — | |||
| Class R1 | $5,721 | |||
| Class R3 | 5,956 | |||
| Class R4 | 5,979 | |||
| Class R5 | 6,002 | |||
| Class R6 | 1,194 | |||
| Class T | — | |||
| Class ADV | 18,183 | |||
| Total | $43,035 | |||
The investment management fees, including the impact of the waivers and reimbursements described above, incurred for the six months ended September 30, 2011 were equivalent to a net annual affective rate of 0.74% of the Fund’s average daily net assets.
Accounting and legal services. Pursuant to a service agreement, the Fund reimburses the Adviser for all expenses associated with providing the administrative, financial, legal, accounting and recordkeeping services of the Fund, including the preparation of all tax returns, periodic reports to shareholders and regulatory reports, among other services. These expenses are allocated to each share class based on its relative net assets at the time the expense was incurred. These accounting and legal services fees incurred for the six months ended September 30, 2011 amounted to an annual rate of 0.01% of the Fund’s average daily net assets.
Distribution and service plans. The Fund has a distribution agreement with the Distributor. The Fund has adopted distribution and service plans with respect to Class A, Class B, Class C, Class R1, Class R3, Class R4, Class T and Class ADV shares pursuant to Rule 12b-1 under the 1940 Act, to pay the Distributor for services provided as the distributor of shares of the Fund. In addition, under
| 30 | Rainier Growth Fund | Semiannual report |
a service plan for Class R1, Class R3, Class R4 and Class R5 shares, the Fund pays for certain other services. The Fund may pay up to the following contractual rates of distribution and service fees under these arrangements, expressed as an annual percentage of average daily net assets for each class of the Fund’s shares.
| CLASS | 12b–1 FEE | SERVICE FEE | ||
| Class A | 0.30% | — | ||
| Class B | 1.00% | — | ||
| Class C | 1.00% | — | ||
| Class R1 | 0.50% | 0.25% | ||
| Class R3 | 0.50% | 0.15% | ||
| Class R4 | 0.25% | 0.10% | ||
| Class R5 | — | 0.05% | ||
| Class T | 0.30% | — | ||
| Class ADV | 0.25% | — | ||
Currently, only 0.25% is charged to Class A shares for 12b-1 fees.
Sales charges. Class A and Class T shares are assessed up-front sales charges, which resulted in payments to the Distributor amounting to $53,229 and $18,179, respectively, for the six months ended September 30, 2011. Of this amount, $5,260 and $2,760 was retained and used for printing prospectuses, advertising, sales literature and other purposes, $9,891 and $5,060 was paid as sales commissions to broker-dealers and $38,078 and $10,359 was paid as sales commissions to sales personnel of Signator Investors, Inc. (Signator Investors), a broker-dealer affiliate of the Adviser for Class A and Class T shares, respectively.
Class B and Class C shares are subject to contingent deferred sales charges (CDSCs). Class B shares that are redeemed within six years of purchase are subject to CDSCs, at declining rates, beginning at 5.00% of the lesser of the current market value at the time of redemption or the original purchase cost of the shares being redeemed. Class C shares that are redeemed within one year of purchase are subject to a 1.00% CDSC on the lesser of the current market value at the time of redemption or the original purchase cost of the shares being redeemed. Proceeds from CDSCs are used to compensate the Distributor for providing distribution-related services in connection with the sale of these shares. During the six months ended September 30, 2011, CDSCs received by the Distributor amounted to $17,998 and $545 for Class B and Class C shares, respectively.
Transfer agent fees. The Fund has a transfer agent agreement with John Hancock Signature Services, Inc. (Signature Services), an affiliate of the Adviser. The transfer agent fees paid to Signature Services are determined based on the cost to Signature Services (Signature Services Cost) of providing recordkeeping services. The Signature Services Cost includes a component of allocated John Hancock corporate overhead for providing transfer agent services to the Fund and to all other John Hancock affiliated funds. It also includes out-of-pocket expenses that are comprised of payments made to third-parties for recordkeeping services provided to their clients who invest in one or more John Hancock funds. In addition, Signature Services Cost may be reduced by certain fees that Signature Services receives in connection with retirement and small accounts. Signature Services Cost is calculated monthly and allocated, as applicable, to four categories of share classes: Institutional Share Classes, Retirement Share Classes, Municipal Bond Classes and all other Retail Share Classes. Within each of these categories, the applicable costs are allocated to the affected John Hancock affiliated funds and/or classes, based on the relative average daily net assets.
| Semiannual report | Rainier Growth Fund | 31 |
Class level expenses. Class level expenses for the six months ended September 30, 2011 were:
| DISTRIBUTION | TRANSFER | STATE | PRINTING AND | |
| CLASS | AND SERVICE FEES | AGENT FEES | REGISTRATION FEES | POSTAGE |
| Class A | $479,187 | $327,836 | $10,305 | $56,600 |
| Class B | 136,891 | 23,379 | 6,225 | 3,737 |
| Class C | 100,485 | 17,173 | 6,392 | 5,421 |
| Class I | — | 91,635 | 10,489 | 5,892 |
| Class R1 | 589 | 37 | 6,074 | 38 |
| Class R3 | 225 | 15 | 6,074 | 2 |
| Class R4 | 113 | 15 | 6,074 | 2 |
| Class R5 | — | 15 | 6,074 | 2 |
| Class R6 | — | 2 | 1,192 | 2 |
| Class T | 115,924 | 66,072 | 6,727 | 21,980 |
| Class ADV | 25,673 | 17,545 | 6,913 | 2,977 |
| Total | $859,087 | $543,724 | $72,539 | $96,653 |
Trustee expenses. The Fund compensates each Trustee who is not an employee of the Adviser or its affiliates. These Trustees may, for tax purposes, elect to defer receipt of this compensation under the John Hancock Group of Funds Deferred Compensation Plan (the Plan). Deferred amounts are invested in various John Hancock funds and remain in the funds until distributed in accordance with the Plan. The investment of deferred amounts and the offsetting liability are included within Other receivables and prepaid expenses and Payable to affiliates — Trustees’ fees, respectively, in the accompanying Statement of assets and liabilities.
Note 5 — Fund share transactions
Transactions in Fund shares for the six months ended September 30, 2011 and for the year ended March 31, 2011 were as follows:
| Six months ended 9-30-11 | Year ended 3-31-11 | |||
| Shares | Amount | Shares | Amount | |
| Class A shares | ||||
| Sold | 1,783,751 | $36,205,493 | 3,094,419 | $57,820,459 |
| Repurchased | (3,049,314) | (62,231,429) | (4,714,525) | (89,251,765) |
| Net decrease | (1,265,563) | ($26,025,936) | (1,620,106) | ($31,431,306) |
| Class B shares | ||||
| Sold | 93,243 | $1,914,929 | 142,985 | $2,677,017 |
| Repurchased | (251,198) | (5,078,222) | (748,365) | (13,742,006) |
| Net decrease | (157,955) | ($3,163,293) | (605,380) | ($11,064,989) |
| Class C shares | ||||
| Sold | 20,626 | $411,926 | 52,563 | $977,754 |
| Repurchased | (103,904) | (2,064,420) | (321,596) | (5,930,646) |
| Net decrease | (83,278) | ($1,652,494) | (269,033) | ($4,952,892) |
| Class I shares | ||||
| Sold | 2,901,868 | $62,751,641 | 2,591,470 | $49,596,314 |
| Distributions reinvested | — | — | 8,647 | 178,817 |
| Repurchased | (2,026,832) | (42,052,863) | (2,889,847) | (53,823,414) |
| Net increase (decrease) | 875,036 | $20,698,778 | (289,730) | ($4,048,283) |
| 32 | Rainier Growth Fund | Semiannual report |
| Six months ended 9-30-11 | Year ended 3-31-11 | |||
| Shares | Amount | Shares | Amount | |
| Class R1 shares | ||||
| Sold | 630 | $12,572 | 1,300 | $26,275 |
| Repurchased | (68) | (1,268) | (125) | (2,162) |
| Net increase | 562 | $11,304 | 1,175 | $24,113 |
| Class R5 shares | ||||
| Distributions reinvested | — | — | 2 | $41 |
| Net increase | — | — | 2 | $41 |
| Class R6 Shares1 | ||||
| Sold | 4,998 | $100,000 | — | — |
| Net increase | 4,998 | $100,000 | — | — |
| Class T shares | ||||
| Sold | 33,361 | $676,768 | 87,219 | $1,620,253 |
| Repurchased | (326,120) | (6,650,172) | (707,067) | (13,076,910) |
| Net decrease | (292,759) | ($5,973,404) | (619,848) | ($11,456,657) |
| Class ADV shares | ||||
| Sold | 193,634 | $4,028,980 | 410,535 | $7,788,383 |
| Repurchased | (252,569) | (5,248,635) | (340,936) | (6,229,450) |
| Net increase (decrease) | (58,935) | ($1,219,655) | 69,599 | $1,558,933 |
| Class NAV shares | ||||
| Sold | 461,406 | $9,538,723 | 2,133,669 | $40,791,972 |
| Distributions reinvested | — | — | 43,885 | 907,978 |
| Repurchased | (5,343,883) | (109,189,712) | (2,810,046) | (53,058,404) |
| Net decrease | (4,882,477) | ($99,650,989) | (632,492) | ($11,358,454) |
| Net decrease | (5,860,371) | ($116,875,689) | (3,965,813) | ($72,729,494) |
1 Period from 9-1-11 (inception date) to 9-30-11.
There were no Fund share transactions for the six months ended September 30, 2011 and for the year ended March 31, 2011 for Class R3 and Class R4 shares.
Affiliates of the Fund owned 78%, 100%, 100%, 100%, 100% and 100% of shares of beneficial interest of Class R1, Class R3, Class R4, Class R5, Class R6 and Class NAV shares, respectively, on September 30, 2011.
Note 6 — Purchase and sale of securities
Purchases and sales of securities, other than short-term securities, aggregated $783,458,825 and $886,792,173, respectively, for the six months ended September 30, 2011.
| Semiannual report | Rainier Growth Fund | 33 |
Board Consideration of and Continuation of Investment Advisory Agreement and Subadvisory Agreement
The Board of Trustees (the Board, the members of which are referred to as Trustees) of John Hancock Rainier Growth Fund (the Fund), a series of John Hancock Funds III, met in-person on May 1–3 and June 5–7, 2011 to consider the approval of the Fund’s investment advisory agreement (the Advisory Agreement) with John Hancock Investment Management Services, LLC (the Adviser), the Fund’s investment adviser. The Board also considered the approval of the investment subadvisory agreement (the Subadvisory Agreement) between the Adviser and Rainier Investment Management, Inc. (the Subadviser) on behalf of the Fund. The Advisory Agreement and the Subadvisory Agreement are referred to as the Agreements.
Activities and composition of the Board
The Board consists of eleven individuals, nine of whom are Independent Trustees. Independent Trustees are generally those individuals who are not employed by or have any significant business or professional relationship with the Adviser or the Subadviser. The Trustees are responsible for the oversight of operations of the Fund and perform various duties required of directors of investment companies by the Investment Company Act of 1940, as amended (the 1940 Act). The Independent Trustees have hired independent legal counsel to assist them in connection with their duties. The Board has appointed an Independent Trustee as Chairperson. The Board has established four standing committees that are composed entirely of Independent Trustees: the Audit Committee; the Compliance Committee; the Nominating, Governance and Administration Committee; and the Contracts/Operations Committee. Additionally, Investment Performance Committees A and B are standing committees of the Board that are each composed of Independent Trustees and one Trustee who is affiliated with the Adviser. Investment Performance Committee B oversees and monitors matters relating to the investment performance of the Fund. The Board has also designated an Independent Trustee as Vice Chairperson to serve in the absence of the Chairperson. The Board also designates working groups or ad hoc committees as it deems appropriate.
The approval process
Under the 1940 Act, the Board is required to consider the continuation of the Agreements each year. Throughout the year, the Board, acting directly and through its committees, regularly reviews and assesses the quality of the services that the Fund receives under these Agreements. The Board reviews reports of the Adviser at least quarterly, which include Fund performance reports and compliance reports. In addition, the Board meets with portfolio managers and senior investment officers at various times throughout the year. The Board considers at each of its meetings factors that are relevant to its annual consideration of the renewal of the Agreements, including the services and support provided by the Adviser and Subadviser to the Fund and its shareholders.
Prior to the May 1–3, 2011 meeting, the Board requested and received materials specifically relating to the Agreements. The materials provided in connection with the May meeting included information compiled and prepared by Morningstar, Inc. (Morningstar) on Fund fees and expenses, and the investment performance of the Fund. This Fund information is assembled in a format that permits comparison with similar information from a Category and a subset of the Category referred to as the Peer Group, each as determined by Morningstar, and with the Fund’s benchmark index. The Category includes all funds that invest similarly to the way the Fund invests. The Peer Group represents funds of similar size, excluding passively managed funds and funds-of-funds. The Fund’s benchmark index is an unmanaged index of securities that is provided as a basis for comparison with the Fund’s performance. Other material provided for the Fund review included (a) information on the profitability of the Agreements to the Adviser and a discussion of any additional benefits to the Adviser or Subadviser or their affiliates that result from being the Adviser or Subadviser to the Fund; (b) a general analysis provided by the Adviser and the Subadviser concerning investment advisory fees charged to other clients, such as institutional clients and other investment companies, having similar investment mandates, as well as the performance of those other clients and a comparison of
| 34 | Rainier Growth Fund | Semiannual report |
the services provided to those other clients and the services provided to the Fund; (c) the impact of economies of scale; (d) a summary of aggregate amounts paid by the Fund to the Adviser; and (e) sales and redemption data regarding the Fund’s shares.
At an in-person meeting held on May 1–3, 2011, the Board reviewed materials relevant to its consideration of the Agreements. As a result of the discussions that occurred during the May 1–3, 2011 meeting, the Board asked the Adviser for additional information on certain matters. The Adviser provided the additional information and the Board also considered this information as part of its consideration of the Agreements.
At an in-person meeting held on June 5-7, 2011, the Board, including the Independent Trustees, formally considered the continuation of the Advisory Agreement between the Adviser and the Fund and the Subadvisory Agreement between the Adviser and the Subadviser with respect to the Fund, each for an additional one-year term. The Board considered what it believed were key relevant factors that are described under separate headings presented below.
The Board also considered other matters important to the approval process, such as payments made to and by the Adviser or its affiliates relating to the distribution of Fund shares and other services. The Board reviewed services related to the valuation and pricing of Fund portfolio holdings. Other important matters considered by the Board were the direct and indirect benefits to the Adviser, the Subadviser and their affiliates from their relationship with the Fund and advice from independent legal counsel with respect to the review process and materials submitted for the Board’s review.
Nature, extent and quality of services
The Board reviewed the nature, extent and quality of services provided by the Adviser and the Subadviser, including the investment advisory services and the resulting performance of the Fund.
The Board considered the ability of the Adviser and the Subadviser, based on their resources, reputation and other attributes, to attract and retain qualified investment professionals, including research, advisory and supervisory personnel. It considered the background and experience of senior management and investment professionals responsible for managing the Fund. The Board considered the investment philosophy, research and investment decision-making processes of the Adviser and the Subadviser responsible for the daily investment activities of the Fund, including, among other things, portfolio trading capabilities, use of technology, commitment to compliance and approach to training and retaining portfolio managers and other research, advisory and management personnel.
The Board considered the Subadviser’s history and experience providing investment services to the Fund. The Board considered the Adviser’s execution of its oversight responsibilities. The Board further considered the culture of compliance, resources dedicated to compliance, compliance programs, record of compliance with applicable laws and regulation, with the Fund’s investment policies and restrictions and with the applicable Code of Ethics, and the responsibilities of the Adviser’s and Subadviser’s compliance departments.
In addition to advisory services, the Board considered the quality of the administrative and non-investment advisory services provided to the Fund by the Adviser under a separate agreement. The Board noted that the Adviser and its affiliates provide the Fund with certain administrative, transfer agency, shareholder and other services (in addition to any such services provided to the Fund by third parties) and officers and other personnel as are necessary for the operations of the Fund. The Board reviewed the structure and duties of the Adviser’s administration, accounting, legal and compliance departments and its affiliate’s transfer agency operations and considered the Adviser’s and its affiliate’s policies and procedures for assuring compliance with applicable laws and regulations.
The Board also received information about the nature, extent and quality of services provided by and fee rates charged by the Adviser and Subadviser to their other clients, including other registered
| Semiannual report | Rainier Growth Fund | 35 |
investment companies, institutional investors and separate accounts. The Board reviewed a general analysis provided by the Adviser and the Subadviser concerning investment advisory fees charged to other clients having similar investment mandates, the services provided to those other clients as compared to the services provided to the Fund, the performance of those other clients as compared to the performance by the Fund and other factors relating to those other clients. The Board considered the significant differences between the Adviser’s and Subadviser’s services to the Fund and the services they provide to other clients. For other clients that are not mutual funds, the differences in services relate to the greater share purchase and redemption activity in a mutual fund, the generally higher turnover of mutual fund portfolio holdings, the more burdensome regulatory and legal obligations of mutual funds and the higher marketing costs for mutual funds. When compared to all clients including mutual funds, the Adviser has greater oversight and supervisory responsibility for the Fund and undertakes greater entrepreneurial risk as the sponsor of the Fund.
Fund performance
The Board was provided with reports, independently prepared by Morningstar, which included a comprehensive analysis of the Fund’s performance. The Board also examined materials provided by the Fund’s portfolio management team discussing Fund performance and the Fund’s investment objective, strategies and outlook. The Board also reviewed a narrative and statistical analysis of the Morningstar data that was prepared by the Adviser, which analyzed various factors that may affect the Morningstar rankings. The Board reviewed information regarding the investment performance of the Fund as compared to its Morningstar Category as well as its benchmark index (see chart below). The Board was provided with a description of the methodology used by Morningstar to select the funds in the Category. The Board also considered updated performance information provided by the Adviser at its May and June 2011 meetings. The Board regularly reviews the performance of the Fund throughout the year and attaches more importance to performance over relatively longer periods of time, typically three to five years.
Set forth below is the performance of the Fund over certain time periods ended December 31, 2010 and that of its Category and benchmark index over the same periods:
| 1 YEAR | 3 YEAR | 5 YEAR | 10 YEAR | |
| Rainier Growth Fund Class A Shares | 16.59% | –4.85% | 2.18% | 0.02% |
| Large Growth Category Average | 15.84% | –2.17% | 3.07% | 0.76% |
| Russell 1000 Growth TR Index | 16.71% | –0.47% | 3.75% | 0.02% |
The Board noted that, although the Fund had underperformed its Category’s average performance over three longer comparison periods, the Fund’s performance had recently improved. The Board noted that the Fund had underperformed its benchmark index’s performance over a sustained period. The Board concluded that the steps the Adviser and Subadviser were taking had not yet resulted in outperformance and that the Board would continue to monitor Fund performance for improvement over time.
Expenses and fees
The Board, including the Independent Trustees, reviewed the Fund’s contractual advisory fee rate payable by the Fund to the Adviser as compared with the other funds in its Peer Group. The Board also received information about the investment subadvisory fee rate payable by the Adviser to the Subadviser for investment subadvisory services. The Board considered the services provided and the fees charged by the Adviser and the Subadviser to other clients with similar investment mandates, including separately managed institutional accounts.
In addition, the Board considered the cost of the services provided to the Fund by the Adviser. The Board received and considered expense information regarding the Fund’s various components, including advisory fees, distribution fees and fees other than advisory and distribution fees, including
| 36 | Rainier Growth Fund | Semiannual report |
transfer agent fees, custodian fees, administration fees and other miscellaneous fees (e.g., fees for accounting and legal services). The Board considered comparisons of these expenses to the Peer Group median. The Board also considered expense information regarding the Fund’s total operating expense ratio (Gross Expense Ratio) and total operating expense ratio after taking the Adviser’s contractual fee waiver/expense reimbursement agreement into account (Net Expense Ratio). The Board considered information comparing the Gross Expense Ratio and Net Expense Ratio of the Fund to that of the Peer Group median. As part of its analysis, the Board reviewed the Adviser’s methodology in allocating its costs to the management of the Fund and the Fund complex.
The Board noted that the Fund’s advisory fee ratio was three basis points above the Peer Group median advisory fee ratio. The Board noted the following information about the Fund’s Gross and Net Expense Ratios for Class A shares contained in the Fund’s 2010 financial statements in relation with the Fund’s Peer Group median provided by Morningstar in April 2011:
| FUND (CLASS A) | PEER GROUP MEDIAN | |
| Advisory Fee Ratio | 0.75% | 0.72% |
| Gross Expense Ratio | 1.35% | 1.30% |
| Net Expense Ratio | 1.35% | 1.24% |
The Board viewed favorably the Adviser’s contractual agreement to waive all or a portion of its advisory fees and to reimburse or pay operating expenses to the extent necessary to maintain the Fund’s expense ratio at 1.35% for Class A shares, excluding certain expenses such as taxes, brokerage commissions, interest, litigation and extraordinary expenses, until June 30, 2012. The Board favorably considered the impact of this contractual agreement toward ultimately lowering the Fund’s Gross Expense Ratio. The Board also received and considered information relating to the Fund’s Gross Expense Ratio and Net Expense Ratio that reflected the new methodology for calculating transfer agent fees that was approved by the Trustees at the June 2010 meeting, which has had the effect of lowering the expense ratio.
The Board received and reviewed statements relating to the Adviser’s financial condition and was also provided with a profitability analysis that detailed the revenues earned and the expenses incurred by the Adviser for services under the Advisory Agreement, as well as from other relationships between the Fund and the Adviser and its affiliates. The Board reviewed the Adviser’s profitability with respect to the Fund and other funds the Board currently oversees for the year ended December 31, 2010 compared to available aggregate profitability data provided for the year ended December 31, 2009. The Board reviewed the Adviser’s profitability with respect to other fund complexes managed by the Adviser and/or its affiliates. The Board reviewed the Adviser’s assumptions and methodology of allocating expenses in the profitability analysis, noting the inherent limitations in allocating costs among various advisory products.
The Board also considered a comparison of the Adviser’s profitability to that of other similar investment advisers whose profitability information is publicly available. The Board recognized that profitability may be affected by numerous factors including, among other things, fee waivers and expense reimbursements by the Adviser, the types of funds managed, expense allocations and business mix, and therefore comparability of profitability is somewhat limited.
The Board did not consider profitability information with respect to the Subadviser, which is not affiliated with the Adviser. The Board considered that the subadvisory fee under the Subadvisory Agreement had been negotiated by the Adviser and the Subadviser on an arm’s-length basis. For this reason, the Subadviser’s separate profitability from its relationship with the Fund was not a factor in determining whether to renew the Subadvisory Agreement. In evaluating overall fees for investment management, the Board recognized the inherently higher cost structure of subadvised funds.
| Semiannual report | Rainier Growth Fund | 37 |
Economies of scale
The Board, including the Independent Trustees, considered the extent to which economies of scale might be realized as the assets of the Fund increase. Possible changes in the advisory fee rate or structure in order to enable the Fund to participate in these economies of scale (e.g., through the use of breakpoints in the advisory fee at higher asset levels) are periodically discussed. The Board also considered the Adviser’s overall operations and its ongoing investment in its business in order to expand the scale of, and improve the quality of, its operations that benefit the Fund.
The Board recognized the inherent limitations of any analysis of economies of scale, stemming largely from the Board’s understanding that most of the Adviser’s costs are not specific to individual funds, but rather are incurred across a variety of products and services. To ensure that any economies are reasonably shared with the Fund as its assets increase, the Adviser and the Board agreed to continue the existing breakpoints to the contractual advisory fee rate.
Other benefits to the Adviser and the Subadviser
The Board understands that the Adviser, the Subadviser or their affiliates may derive other ancillary benefits from their relationship with the Fund, both tangible and intangible, such as their ability to leverage investment professionals who manage other portfolios, an increase in their profile in the investment advisory community and, in the case of the Adviser, the engagement of its affiliates and/or significant shareholders as service providers to the Fund, including for administrative, transfer agency and distribution services. The Board believes that certain of these benefits are difficult to quantify. The Board also was informed that the Subadviser may use third-party research obtained by soft dollars generated by certain mutual fund transactions to assist itself in managing all or a number of its other client accounts.
Board determination
The Board unanimously approved the continuation of the Advisory Agreement between the Adviser and the Fund for an additional one-year term. The Subadvisory Agreement between the Adviser and Subadviser with respect to the Fund was also approved for an additional one-year term. Based upon its evaluation of relevant factors in their totality, the Board was satisfied that the terms of the Agreements, including the advisory and subadvisory fee rates, were fair and reasonable and in the best interest of the Fund and its shareholders. In arriving at its decision to approve the Agreements, the Board did not identify any single factor or any group of factors as all-important or controlling, but considered all factors together. Different Trustees may have attributed different weights to the various factors considered. The Independent Trustees were also assisted by independent legal counsel in making this determination. The Trustees’ conclusions may be based in part on their consideration of these arrangements in prior years and on their ongoing regular review of Fund performance and operations throughout the year.
| 38 | Rainier Growth Fund | Semiannual report |
More information
| Trustees | Investment adviser |
| Steven R. Pruchansky, Chairman | John Hancock Investment Management |
| James F. Carlin | Services, LLC |
| William H. Cunningham | |
| Deborah C. Jackson | Subadviser |
| Charles L. Ladner,* Vice Chairman | Rainier Investment Management, Inc. |
| Stanley Martin* | |
| Hugh McHaffie† | Principal distributor |
| Dr. John A. Moore*# | John Hancock Funds, LLC |
| Patti McGill Peterson* | |
| Gregory A. Russo | Custodian |
| John G. Vrysen† | State Street Bank and Trust Company |
| Officers | Transfer agent |
| Keith F. Hartstein | John Hancock Signature Services, Inc. |
| President and Chief Executive Officer | |
| Legal counsel | |
| Andrew G. Arnott | K&L Gates LLP |
| Senior Vice President and Chief Operating Officer | |
| Thomas M. Kinzler | |
| Secretary and Chief Legal Officer | |
| Francis V. Knox, Jr. | |
| Chief Compliance Officer | |
| Charles A. Rizzo | |
| Chief Financial Officer | |
| Salvatore Schiavone | |
| Treasurer | |
| *Member of the Audit Committee | |
| †Non-Independent Trustee | |
| #Effective 9-13-11 | |
The Fund’s proxy voting policies and procedures, as well as the Fund’s proxy voting record for the most recent twelve-month period ended June 30, are available free of charge on the Securities and Exchange Commission (SEC) Web site at www.sec.gov or on our Web site.
The Fund’s complete list of portfolio holdings, for the first and third fiscal quarters, is filed with the SEC on Form N-Q. The Fund’s Form N-Q is available on our Web site and the SEC’s Web site, www.sec.gov, and can be reviewed and copied (for a fee) at the SEC’s Public Reference Room in Washington, DC. Call 1-800-SEC-0330 to receive information on the operation of the SEC’s Public Reference Room.
We make this information on your fund, as well as monthly portfolio holdings, and other fund details available on our Web site at www.jhfunds.com or by calling 1-800-225-5291.
| You can also contact us: | ||
| 1-800-225-5291 | Regular mail: | Express mail: |
| jhfunds.com | John Hancock Signature Services, Inc. | John Hancock Signature Services, Inc. |
| P.O. Box 55913 | Mutual Fund Image Operations | |
| Boston, MA 02205-5913 | 30 Dan Road | |
| Canton, MA 02021 |
| Semiannual report | Rainier Growth Fund | 39 |

1-800-225-5291
1-800-554-6713 TDD
1-800-338-8080 EASI-Line
www.jhfunds.com
Now available: electronic delivery
www.jhfunds.com/edelivery
| This report is for the information of the shareholders of John Hancock Rainier Growth Fund. | 334SA 9/11 |
| It is not authorized for distribution to prospective investors unless preceded or accompanied by a prospectus. | 11/11 |
| John Hancock Leveraged Companies Fund | |
| Table of Contents | |
| Your expenses | Page 3 |
| Portfolio summary | Page 4 |
| Portfolio of investments | Page 5 |
| Financial statements | Page 9 |
| Financial highlights | Page 12 |
| Notes to financial statements | Page 16 |
| More information | Page 30 |
| 2 |
Leveraged Companies Fund
Your expenses
These examples are intended to help you understand your ongoing operating expenses.
Understanding your fund expenses
As a shareholder of the Fund, you incur two types of costs:
• Transaction costs which include sales charges (loads) on purchases or redemptions (varies by share class), minimum account fee charge, etc.
• Ongoing operating expenses including management fees, distribution and service fees (if applicable), and other fund expenses.
We are going to present only your ongoing operating expenses here.
Actual expenses/actual returns
This example is intended to provide information about your fund’s actual ongoing operating expenses, and is based on the fund’s actual return. It assumes an account value of $1,000.00 on April 1, 2011 with the same investment held until September 30, 2011.
| Account value | Ending value | Expenses paid during | |
| on 4-1-11 | on 9-30-11 | period ended 9-30-111 | |
| Class A | $1,000.00 | $714.90 | $5.79 |
| Class B | 1,000.00 | 712.40 | 8.78 |
| Class C | 1,000.00 | 712.40 | 8.78 |
| Class I | 1,000.00 | 716.50 | 3.95 |
Together with the value of your account, you may use this information to estimate the operating expenses that you paid over the period. Simply divide your account value at September 30, 2011, by $1,000.00, then multiply it by the “expenses paid” for your share class from the table above. For example, for an account value of $8,600.00, the operating expenses should be calculated as follows:
Example
[ My account value $8,600.00 / $1,000.00 = 8.6 ] x $[ “expenses paid” from table ] = My actual expenses
Hypothetical example for comparison purposes
This table allows you to compare your fund’s ongoing operating expenses with those of any other fund. It provides an example of the Fund’s hypothetical account values and hypothetical expenses based on each class’s actual expense ratio and an assumed 5% annualized return before expenses (which is not your fund’s actual return). It assumes an account value of $1,000.00 on April 1, 2011, with the same investment held until September 30, 2011. Look in any other fund shareholder report to find its hypothetical example and you will be able to compare these expenses.
| Account value | Ending value | Expenses paid during | |
| on 4-1-11 | on 9-30-11 | period ended 9-30-111 | |
| Class A | $1,000.00 | $1,018.30 | $6.81 |
| Class B | 1,000.00 | 1,014.80 | 10.33 |
| Class C | 1,000.00 | 1,014.80 | 10.33 |
| Class I | 1,000.00 | 1,020.40 | 4.65 |
Remember, these examples do not include any transaction costs, therefore, these examples will not help you to determine the relative total costs of owning different funds. If transaction costs were included, your expenses would have been higher. See the prospectus for details regarding transaction costs.
1 Expenses are equal to the Fund's annualized expense ratio of 1.35%, 2.05%, 2.05%, and 0.92% for Class A, Class B, Class C, and Class I shares, respectively, multiplied by the average account value over the period, multiplied by 183/366 (to reflect the one-half year period).
| 3 |
Leveraged Companies Fund
Portfolio Summary
| Value as a | |
| percentage of | |
| Top 10 Holdings (56.27% of Net Assets on 9-30-11)1 | Fund’s net assets |
| Delta Air Lines, Inc. | 9.4% |
| Charter Communications, Inc., Class A | 7.8% |
| Greektown Superholdings, Inc., Series A | 7.7% |
| Sirius XM Radio, Inc. | 7.7% |
| United Continental Holdings, Inc. | 6.3% |
| US Airways Group, Inc. | 4.8% |
| Exide Technologies | 3.7% |
| MBIA Insurance Corp. (14.000% to 01/15/2013, then 3 month LIBOR + 11.260%) | 3.6% |
| American Pacific Corp. | 2.9% |
| AMR Corp. | 2.4% |
| Value as a | |
| percentage of | |
| Sector Composition2 | Fund’s net assets |
| Consumer Discretionary | 44% |
| Industrials | 30% |
| Financials | 10% |
| Materials | 5% |
| Consumer Staples | 2% |
| Investment Companies | 2% |
| Telecommunication Services | 1% |
| Other Sectors | 1% |
| Securities Lending Collateral & Other | 5% |
| Value as a | |
| percentage of | |
| Portfolio Composition | Fund’s net assets |
| Common Stocks | 73% |
| Preferred Securities | 8% |
| Corporate Bonds | 6% |
| Convertible Bonds | 4% |
| Investment Companies | 2% |
| Warrants | 2% |
| Securities Lending Collateral & Other | 5% |
1 Cash and cash equivalents are not included in Top 10 Holdings.
2 Sector investing is subject to greater risks than the market as a whole. Because the Fund may focus on particular sectors of the economy, its performance may depend on the performance of those sectors.
| See notes to financial statements | |
| 4 |
Leveraged Companies Fund
As of 9-30-11 (Unaudited)
| Shares | Value | |
| Common Stocks 72.81% | $917,593 | |
| (Cost $977,220) | ||
| Consumer Discretionary 31.20% | 393,219 | |
| Auto Components 7.31% | ||
| Autoliv, Inc. | 150 | 7,270 |
| Exide Technologies (I) | 11,545 | 46,180 |
| Federal-Mogul Corp. (I) | 800 | 11,800 |
| Lear Corp. | 50 | 2,145 |
| Tenneco, Inc. (I) | 964 | 24,688 |
| Automobiles 0.15% | ||
| Ford Motor Company (I) | 195 | 1,886 |
| Hotels, Restaurants & Leisure 1.37% | ||
| Greektown Superholdings, Inc. (I) | 92 | 5,704 |
| The Wendy's Company | 1,285 | 5,898 |
| Trump Entertainment Resorts, Inc. (I) | 260 | 1,040 |
| WMS Industries, Inc. (I) | 265 | 4,661 |
| Internet & Catalog Retail 0.16% | ||
| Liberty Media Corp. - Interactive, Series A (I) | 135 | 1,994 |
| Media 22.21% | ||
| AMC Networks, Inc. (I) | 302 | 9,649 |
| Cablevision Systems Corp., Class A | 1,209 | 19,018 |
| Canadian Satellite Radio Holdings, Inc., Class A (I) | 5,900 | 16,947 |
| Charter Communications, Inc., Class A (I) | 2,104 | 98,551 |
| Cinemark Holdings, Inc. | 100 | 1,888 |
| DISH Network Corp. (I) | 605 | 15,161 |
| Sinclair Broadcast Group, Inc., Class A | 1,750 | 12,548 |
| Sirius XM Radio, Inc. (I) | 64,006 | 96,649 |
| SuperMedia, Inc. (I) | 91 | 141 |
| Time Warner Cable, Inc. | 150 | 9,401 |
| Consumer Staples 1.51% | 19,007 | |
| Food Products 0.95% | ||
| Kraft Foods, Inc., Class A | 355 | 11,921 |
| Household Products 0.56% | ||
| Spectrum Brands Holdings, Inc. (I) | 300 | 7,086 |
| Energy 0.45% | 5,699 | |
| Energy Equipment & Services 0.16% | ||
| Vantage Drilling Company (I) | 1,650 | 2,063 |
| Oil, Gas & Consumable Fuels 0.29% | ||
| Dominion Petroleum, Ltd., GDR (I) | 33,000 | 1,754 |
| YPF SA ADR | 55 | 1,882 |
| Financials 5.77% | 72,673 | |
| Capital Markets 2.81% | ||
| Janus Capital Group, Inc. (L) | 460 | 2,760 |
| Morgan Stanley | 525 | 7,088 |
| Solar Senior Capital, Ltd. | 506 | 7,231 |
| Tetragon Financial Group, Ltd. | 1,391 | 8,830 |
| The Goldman Sachs Group, Inc. | 100 | 9,455 |
| Consumer Finance 0.39% | ||
| Discover Financial Services | 215 | 4,932 |
| See notes to financial statements | |
| 5 |
Leveraged Companies Fund
As of 9-30-11 (Unaudited)
| Shares | Value | |
| Financials (continued) | ||
| Diversified Financial Services 1.34% | ||
| Citigroup, Inc. | 78 | $1,998 |
| KKR Financial Holdings LLC | 2,010 | 14,934 |
| Real Estate Investment Trusts 1.16% | ||
| iStar Financial, Inc. (I)(L) | 2,500 | 14,550 |
| Thrifts & Mortgage Finance 0.07% | ||
| The PMI Group, Inc. (I) | 4,475 | 895 |
| Health Care 1.15% | 14,511 | |
| Health Care Equipment & Supplies 0.14% | ||
| Alere, Inc. (I) | 90 | 1,769 |
| Pharmaceuticals 1.01% | ||
| Johnson & Johnson | 200 | 12,742 |
| Industrials 26.46% | 333,512 | |
| Air Freight & Logistics 0.51% | ||
| FedEx Corp. | 95 | 6,430 |
| Airlines 23.03% | ||
| Alaska Air Group, Inc. (I) | 120 | 6,755 |
| Delta Air Lines, Inc. (I) | 15,843 | 118,823 |
| Pinnacle Airlines Corp. (I) | 8,265 | 24,216 |
| United Continental Holdings, Inc. (I) | 4,125 | 79,943 |
| US Airways Group, Inc. (I)(L) | 11,000 | 60,500 |
| Building Products 0.10% | ||
| USG Corp. (I)(L) | 185 | 1,245 |
| Road & Rail 0.42% | ||
| Union Pacific Corp. | 65 | 5,309 |
| Trading Companies & Distributors 2.40% | ||
| TAL International Group, Inc. | 1,120 | 27,933 |
| United Rentals, Inc. (I)(L) | 140 | 2,358 |
| Information Technology 0.57% | 7,218 | |
| Software 0.57% | ||
| Microsoft Corp. | 290 | 7,218 |
| Materials 4.50% | 56,660 | |
| Chemicals 3.97% | ||
| American Pacific Corp. (I) | 5,050 | 37,017 |
| Huntsman Corp. | 550 | 5,319 |
| LyondellBasell Industries NV, Class A | 315 | 7,695 |
| Containers & Packaging 0.53% | ||
| Rock-Tenn Company, Class A | 95 | 4,625 |
| Sealed Air Corp. | 120 | 2,004 |
| Telecommunication Services 0.90% | 11,363 | |
| Wireless Telecommunication Services 0.90% | ||
| American Tower Corp., Class A (I) | 40 | 2,152 |
| Leap Wireless International, Inc. (I) | 275 | 1,898 |
| SBA Communications Corp., Class A (I) | 60 | 2,069 |
| Sprint Nextel Corp. (I) | 1,725 | 5,244 |
| See notes to financial statements | |
| 6 |
Leveraged Companies Fund
As of 9-30-11 (Unaudited)
| Shares | Value | |||
| Utilities 0.30% | $3,731 | |||
| Independent Power Producers & Energy Traders 0.30% | ||||
| Calpine Corp. (I) | 265 | 3,731 | ||
| Preferred Securities 8.36% | $105,427 | |||
| (Cost $168,371) | ||||
| Consumer Discretionary 8.23% | 103,743 | |||
| Auto Components 0.39% | ||||
| The Goodyear Tire & Rubber Company, 5.875% | 126 | 4,908 | ||
| Automobiles 0.15% | ||||
| General Motors Company, Series B, 4.750% | 55 | 1,929 | ||
| Hotels, Restaurants & Leisure 7.69% | ||||
| Greektown Superholdings, Inc., Series A (I) | 1,563 | 96,906 | ||
| Financials 0.13% | 1,684 | |||
| Diversified Financial Services 0.13% | ||||
| 2010 Swift Mandatory Common Exchange Security Trust, 6.000% (S) | 225 | 1,684 | ||
| Maturity | Par value | |||
| Rate (%) | date | Value | ||
| Corporate Bonds 5.65% | $71,181 | |||
| (Cost $134,593) | ||||
| Consumer Discretionary 0.50% | 6,306 | |||
| Hotels, Restaurants & Leisure 0.50% | ||||
| Fontainebleau Las Vegas Holdings LLC (H)(S) | 10.250 | 06/15/15 | $100,000 | 125 |
| Mashantucket Western Pequot Tribe, Series A (H)(S) | 8.500 | 11/15/15 | 115,000 | 6,181 |
| Media 0.00% | ||||
| SuperMedia, Inc., Escrow Certificates (I) | -- | 11/15/16 | 115,000 | 0 |
| Financials 3.57% | 45,000 | |||
| Insurance 3.57% | ||||
| MBIA Insurance Corp. (14.000% to 01/15/2013, then 3 month | ||||
| LIBOR + 11.260%) (S) | 14.000 | 01/15/33 | 100,000 | 45,000 |
| Industrials 1.58% | 19,875 | |||
| Aerospace & Defense 1.58% | ||||
| Colt Defense LLC/Colt Finance Corp. | 8.750 | 11/15/17 | 30,000 | 19,875 |
| Convertible Bonds 4.56% | $57,523 | |||
| (Cost $73,396) | ||||
| Consumer Discretionary 2.22% | 27,960 | |||
| Media 2.22% | ||||
| XM Satellite Radio, Inc. (S) | 7.000 | 12/01/14 | 24,000 | 27,960 |
| Industrials 2.34% | 29,563 | |||
| Airlines 2.34% | ||||
| AMR Corp. | 6.250 | 10/15/14 | 50,000 | 29,563 |
| See notes to financial statements | |
| 7 |
Leveraged Companies Fund
As of 9-30-11 (Unaudited)
| Shares | Value | ||
| Investment Companies 1.91% | $24,041 | ||
| (Cost $21,419) | |||
| AP Alternative Assets LP | 350 | 3,565 | |
| ProShares Ultra Dow 30 | 315 | 15,174 | |
| ProShares UltraShort Euro (I) | 275 | 5,302 | |
| Warrants 1.98% | $24,913 | ||
| (Cost $70,142) | |||
| Consumer Discretionary 1.78% | 22,389 | ||
| Charter Communications, Inc., Class A (Expiration Date: 11/30/2014; Strike Price: | �� | ||
| $46.86) (I) | 102 | 1,173 | |
| Ford Motor Company (Expiration Date: 01/01/2013; Strike Price: $9.20) (I) | 9,600 | 21,216 | |
| Financials 0.20% | 2,524 | ||
| American International Group, Inc. (Expiration Date: 01/19/2021; Strike Price: | |||
| $45.00) (I) | 53 | 324 | |
| Citigroup, Inc. (Expiration Date: 1/4/2019; Strike Price: $106.10) (I) | 5,000 | 2,200 | |
| Yield | Shares | Value | |
| Securities Lending Collateral 6.46% | $81,374 | ||
| (Cost $81,372) | |||
| John Hancock Collateral Investment Trust (W) | 0.2515%(Y) | 8,133 | 81,374 |
| Total investments (Cost $1,526,012)† 101.73% | $1,282,052 | ||
| Other assets and liabilities, net (1.73%) | ($21,762) | ||
| Total net assets 100.00% | $1,260,290 | ||
The percentage shown for each investment category is the total value of that category as a percentage of the net assets of the Fund.
ADR American Depositary Receipt
GDR Global Depositary Receipt
LIBOR London Interbank Offered Rate
(H) Non-income producing - Issuer is in default.
(I) Non-income producing security.
(L) All or a portion of this security is on loan as of 9-30-11.
(S) These securities are exempt from registration under Rule 144A of the Securities Act of 1933. Such securities may be resold, normally to qualified institutional buyers, in transactions exempt from registration.
(W) Investment is an affiliate of the Fund, the adviser and/or subadviser. Also, it represents the investment of securities lending collateral received.
(Y) The rate shown is the annualized seven-day yield as of 9-30-11.
† At 9-30-11, the aggregate cost of investment securities for federal income tax purposes was $1,533,637. Net unrealized depreciation aggregated $251,585, of which $173,309 related to appreciated investment securities and $424,894 related to depreciated investment securities.
| See notes to financial statements | |
| 8 |
Leveraged Companies Fund
Statement of Assets and Liabilities — September 30, 2011 (Unaudited)
| Assets | |
| Investments in unaffiliated issuers, at value (Cost | |
| $1,444,640) including $81,372 of securities loaned | |
| (Note 2) | $1,200,678 |
| Investments in affiliated issuers, at value (Cost | |
| $81,372) (Note 2) | 81,374 |
| Total investments, at value (Cost $1,526,012) | 1,282,052 |
| Cash | 46,541 |
| Receivable for investments sold | 28,123 |
| Dividends and interest receivable | 6,227 |
| Receivable for securities lending income | 18 |
| Other receivables and prepaid expenses | 61 |
| Total assets | 1,363,022 |
| Liabilities | |
| Payable upon return of securities loaned (Note 2) | 81,375 |
| Payable to affiliates | |
| Accounting and legal services fees | 13 |
| Transfer agent fees | 158 |
| Trustees' fees | 10 |
| Due to adviser | 3,522 |
| Other liabilities and accrued expenses | 17,654 |
| Total liabilities | 102,732 |
| Net assets | |
| Paid in capital | $1,537,475 |
| Undistributed net investment income | 12,068 |
| Accumulated net realized (loss) on investments | |
| and foreign currency transactions | (45,293) |
| Net unrealized appreciation (depreciation) on | |
| investments and translation of assets and | |
| liabilities in foreign currencies | (243,960) |
| Net assets | $1,260,290 |
| Net asset value per share | |
| Based on net asset values and shares | |
| outstanding-the Fund has an unlimited number of | |
| shares authorized with no par value | |
| Class A ($244,861 ÷ 29,307.2 shares) | $8.35 |
| Class B ($239,076 ÷ 28,802 shares)1 | $8.30 |
| Class C ($239,064 ÷ 28,803 shares)1 | $8.30 |
| Class I ($537,289 ÷ 64,044 shares) | $8.39 |
| Maximum offering price per share | |
| Class A (net asset value per share ÷ 95%)2 | $8.79 |
1 Redemption price is equal to net asset value less any applicable contingent deferred sales charge.
2 On single retail sales of less than $50,000. On sales of $50,000 or more and on group sales the offering price is reduced.
| See notes to financial statements | |
| 9 |
Leveraged Companies Fund
Statement of Operations — For the six-month period ended September 30, 2011 (Unaudited)
| Investment income | |
| Interest | $13,461 |
| Dividends | 4,738 |
| Securities lending | 152 |
| Total investment income | 18,351 |
| Expenses | |
| Investment management fees (Note 5) | 6,086 |
| Distribution and service fees (Note 5) | 3,554 |
| Accounting and legal services fees (Note 5) | 109 |
| Transfer agent fees (Note 5) | 1,040 |
| Trustees' fees (Note 5) | 50 |
| Professional fees | 18,957 |
| Custodian fees | 7,498 |
| Registration and filing fees | 5,070 |
| Other | 5,202 |
| Total expenses | 47,566 |
| Less expense reductions (Note 5) | (35,947) |
| Net expenses | 11,619 |
| Net investment income | 6,732 |
| Realized and unrealized gain (loss) | |
| Net realized gain (loss) on | |
| Investments in unaffiliated issuers | (26,544) |
| Investments in affiliated issuers | (17) |
| Foreign currency transactions | 291 |
| (26,270) | |
| Change in net unrealized appreciation | |
| (depreciation) of | |
| Investments in unaffiliated issuers | (483,313) |
| Investments in affiliated issuers | 6 |
| Translation of assets and liabilities in foreign | |
| currencies | 24 |
| (483,283) | |
| Net realized and unrealized loss | (509,553) |
| Decrease in net assets from operations | $ (502,821) |
| See notes to financial statements | |
| 10 |
Leveraged Companies Fund
Statements of Changes in Net Assets
| Six months | ||
| ended | Year ended | |
| 9/30/11 | 3/31/11 | |
| (Unaudited) | ||
| Increase (decrease) in net assets | ||
| From operations | ||
| Net investment income | $6,732 | $12,907 |
| Net realized loss | (26,270) | (6,797) |
| Change in net unrealized appreciation | ||
| (depreciation) | (483,283) | 146,022 |
| Increase (decrease) in net assets resulting | ||
| from operations | (502,821) | 152,132 |
| Distributions to shareholders | ||
| From net investment income | ||
| Class A | — | (3,450) |
| Class B | — | (1,313) |
| Class C | — | (1,312) |
| Class I | — | (6,583) |
| From net realized gain | ||
| Class A | — | (8,144) |
| Class B | — | (8,052) |
| Class C | — | (8,053) |
| Class I | — | (11,545) |
| Total distributions | — | (48,452) |
| From Fund share transactions (Note 6) | (2,045) | 319,964 |
| Total increase (decrease) | (504,866) | 423,644 |
| Net assets | ||
| Beginning of period | 1,765,156 | 1,341,512 |
| End of period | $1,260,290 | $1,765,156 |
| Undistributed net investment income | $12,068 | $5,336 |
| See notes to financial statements | |
| 11 |
Leveraged Companies Fund
Financial Highlights (For a share outstanding throughout the period)
| Class A Shares | ||||||||
| Period ended | ||||||||
| 9-30-111 | 3-31-11 | 3-31-10 | 3-31-092 | |||||
| Per share operating performance | ||||||||
| Net asset value, beginning of period | $11.68 | $10.78 | $4.19 | $10.00 | ||||
| Net investment income3 | 0.05 | 0.12 | 0.29 | 0.33 | ||||
| Net realized and unrealized gain (loss) on | ||||||||
| investments | (3.38) | 1.19 | 7.00 | (5.83) | ||||
| Total from investment operations | (3.33) | 1.31 | 7.29 | (5.50) | ||||
| Less distributions | ||||||||
| From net investment income | — | (0.12) | (0.54) | (0.31) | ||||
| From net realized gain | — | (0.29) | (0.16) | — | ||||
| Total distributions | — | (0.41) | (0.70) | (0.31) | ||||
| Net asset value, end of period | $8.35 | $11.68 | $10.78 | $4.19 | ||||
| Total return (%)4,5 | (28.51)6 | 12.09 | 177.42 | (55.97)6 | ||||
| Ratios and supplemental data | ||||||||
| Net assets, end of period (in thousands) | $245 | $342 | $305 | $110 | ||||
| Ratios (as a percentage of average net | ||||||||
| assets): | ||||||||
| Expenses before reductions | 5.777 | 7.43 | 10.56 | 13.917 | ||||
| Expenses net of fee waivers | 1.357 | 1.35 | 1.41 | 1.217 | ||||
| Expenses net of fee waivers and credits | 1.357 | 1.35 | 1.35 | 1.217 | ||||
| Net investment income | 0.917 | 1.07 | 3.63 | 4.877 | ||||
| Portfolio turnover (%) | 13 | 34 | 83 | 18 | ||||
1 Unaudited.
2 The inception date for Class A shares is 5-1-08.
3 Based on the average daily shares outstanding.
4 Does not reflect the effect of sales charges, if any.
5 Total returns would have been lower had certain expenses not been reduced during the periods shown.
6 Not annualized.
7 Annualized.
| See notes to financial statements | |
| 12 |
Leveraged Companies Fund
Financial Highlights (For a share outstanding throughout the period)
| Class B Shares | ||||||||
| Period ended | ||||||||
| 9-30-111 | 3-31-11 | 3-31-10 | 3-31-092 | |||||
| Per share operating performance | ||||||||
| Net asset value, beginning of period | $11.65 | $10.76 | $4.19 | $10.00 | ||||
| Net investment income3 | 0.01 | 0.04 | 0.23 | 0.28 | ||||
| Net realized and unrealized gain (loss) on | ||||||||
| investments | (3.36) | 1.19 | 6.99 | (5.82) | ||||
| Total from investment operations | (3.35) | 1.23 | 7.22 | (5.54) | ||||
| Less distributions | ||||||||
| From net investment income | — | (0.05) | (0.49) | (0.27) | ||||
| From net realized gain | — | (0.29) | (0.16) | — | ||||
| Total distributions | — | (0.34) | (0.65) | (0.27) | ||||
| Net asset value, end of period | $8.30 | $11.65 | $10.76 | $4.19 | ||||
| Total return (%)4,5 | (28.76)6 | 11.33 | 175.60 | (56.26)6 | ||||
| Ratios and supplemental data | ||||||||
| Net assets, end of period (in thousands) | $239 | $335 | $301 | $109 | ||||
| Ratios (as a percentage of average net | ||||||||
| assets): | ||||||||
| Expenses before reductions | 6.477 | 8.13 | 11.27 | 14.587 | ||||
| Expenses net of fee waivers | 2.057 | 2.05 | 2.11 | 1.917 | ||||
| Expenses net of fee waivers and credits | 2.057 | 2.05 | 2.05 | 1.917 | ||||
| Net investment income | 0.217 | 0.37 | 2.93 | 4.167 | ||||
| Portfolio turnover (%) | 13 | 34 | 83 | 18 | ||||
1 Unaudited.
2 The inception date for Class B shares is 5-1-08.
3 Based on the average daily shares outstanding.
4 Does not reflect the effect of sales charges, if any.
5 Total returns would have been lower had certain expenses not been reduced during the periods shown.
6 Not annualized.
7 Annualized.
| See notes to financial statements | |
| 13 |
Leveraged Companies Fund
Financial Highlights (For a share outstanding throughout the period)
| Class C Shares | ||||||||
| Period ended | ||||||||
| 9-30-111 | 3-31-11 | 3-31-10 | 3-31-092 | |||||
| Per share operating performance | ||||||||
| Net asset value, beginning of period | $11.65 | $10.76 | $4.19 | $10.00 | ||||
| Net investment income3 | 0.01 | 0.04 | 0.23 | 0.28 | ||||
| Net realized and unrealized gain (loss) on | ||||||||
| investments | (3.36) | 1.19 | 6.99 | (5.82) | ||||
| Total from investment operations | (3.35) | 1.23 | 7.22 | (5.54) | ||||
| Less distributions | ||||||||
| From net investment income | — | (0.05) | (0.49) | (0.27) | ||||
| From net realized gain | — | (0.29) | (0.16) | — | ||||
| Total distributions | — | (0.34) | (0.65) | (0.27) | ||||
| Net asset value, end of period | $8.30 | $11.65 | $10.76 | $4.19 | ||||
| Total return (%)4,5 | (28.76)6 | 11.33 | 175.60 | (56.26)6 | ||||
| Ratios and supplemental data | ||||||||
| Net assets, end of period (in thousands) | $239 | $335 | $301 | $109 | ||||
| Ratios (as a percentage of average net | ||||||||
| assets): | ||||||||
| Expenses before reductions | 6.477 | 8.13 | 11.27 | 14.597 | ||||
| Expenses net of fee waivers | 2.057 | 2.05 | 2.11 | 1.917 | ||||
| Expenses net of fee waivers and credits | 2.057 | 2.05 | 2.05 | 1.917 | ||||
| Net investment income | 0.217 | 0.37 | 2.93 | 4.167 | ||||
| Portfolio turnover (%) | 13 | 34 | 83 | 18 | ||||
1 Unaudited.
2 The inception date for Class C shares is 5-1-08.
3 Based on the average daily shares outstanding.
4 Does not reflect the effect of sales charges, if any.
5 Total returns would have been lower had certain expenses not been reduced during the periods shown.
6 Not annualized.
7 Annualized.
| See notes to financial statements | |
| 14 |
Leveraged Companies Fund
Financial Highlights (For a share outstanding throughout the period)
| Class I Shares | ||||||||
| Period ended | ||||||||
| 9-30-111 | 3-31-11 | 3-31-10 | 3-31-092 | |||||
| Per share operating performance | ||||||||
| Net asset value, beginning of period | $11.71 | $10.79 | $4.19 | $10.00 | ||||
| Net investment income3 | 0.07 | 0.17 | 0.32 | 0.35 | ||||
| Net realized and unrealized gain (loss) on | ||||||||
| investments | (3.39) | 1.20 | 7.00 | (5.83) | ||||
| Total from investment operations | (3.32) | 1.37 | 7.32 | (5.48) | ||||
| Less distributions | ||||||||
| From net investment income | — | (0.16) | (0.56) | (0.33) | ||||
| From net realized gain | — | (0.29) | (0.16) | — | ||||
| Total distributions | — | (0.45) | (0.72) | (0.33) | ||||
| Net asset value, end of period | $8.39 | $11.71 | $10.79 | $4.19 | ||||
| Total return (%)4 | (28.35)5 | 12.66 | 178.23 | (55.85)5 | ||||
| Ratios and supplemental data | ||||||||
| Net assets, end of period (in thousands) | $537 | $752 | $433 | $111 | ||||
| Ratios (as a percentage of average net | ||||||||
| assets): | ||||||||
| Expenses before reductions | 5.376 | 7.03 | 9.14 | 13.626 | ||||
| Expenses net of fee waivers | 0.926 | 0.93 | 1.09 | 0.906 | ||||
| Expenses net of fee waivers and credits | 0.926 | 0.93 | 1.04 | 0.906 | ||||
| Net investment income | 1.346 | 1.48 | 4.01 | 5.186 | ||||
| Portfolio turnover (%) | 13 | 34 | 83 | 18 | ||||
1 Unaudited.
2 The inception date for Class I shares is 5-1-08.
3 Based on the average daily shares outstanding.
4 Total returns would have been lower had certain expenses not been reduced during the periods shown.
5 Not annualized.
6 Annualized.
| See notes to financial statements | |
| 15 |
Leveraged Companies Fund
Notes to financial statements (unaudited)
Note 1 — Organization
John Hancock Leveraged Companies Fund (the Fund) is a diversified series of John Hancock Funds III (the Trust), an open-end management investment company organized as a Massachusetts business trust and registered under the Investment Company Act of 1940, as amended (the 1940 Act). The investment objective of the Fund is to seek capital appreciation.
The Fund may offer multiple classes of shares. The shares currently offered are detailed in the Statement of Assets and Liabilities. Class A, Class B and Class C shares are offered to all investors. Class I shares are offered to institutions and certain investors. Shareholders of each class have exclusive voting rights to matters that affect that class. The distribution and service fees, if any, and transfer agent fees for each class may differ. Class B shares convert to Class A shares eight years after purchase.
Note 2 - Significant accounting policies
The financial statements have been prepared in conformity with accounting principles generally accepted in the United States of America, which require management to make certain estimates and assumptions at the date of the financial statements. Actual results could differ from those estimates. Events or transactions occurring after the end of the fiscal period through the date that the financial statements were issued have been evaluated in the preparation of the financial statements. The following summarizes the significant accounting policies of the Fund:
Security valuation. Investments are stated at value as of the close of regular trading on the New York Stock Exchange (NYSE), normally at 4:00 P.M., Eastern Time. The Fund uses a three-tier hierarchy to prioritize the pricing assumptions, referred to as inputs, used in valuation techniques to measure fair value. Level 1 includes securities valued using quoted prices in active markets for identical securities. Level 2 includes securities valued using significant observable inputs. Observable inputs may include quoted prices for similar securities, interest rates, prepayment speeds and credit risk. Prices for securities valued using these inputs are received from independent pricing vendors and brokers and are based on an evaluation of the inputs described. Level 3 includes securities valued using significant unobservable inputs when market prices are not readily available or reliable, including the Fund’s own assumptions in determining the fair value of investments. Factors used in determining value may include market or issuer specific events, changes in interest rates and credit quality. The inputs or methodology used for valuing securities are not necessarily an indication of the risk associated with investing in those securities.
The following is a summary of the values by input classification of the Fund’s investments as of September 30, 2011, by major security category or type:
| Level 2 | Level 3 | |||
| Total Market | Level 1 | Significant | Significant | |
| Value at | Quoted | Observable | Unobservable | |
| 09/30/11 | Price | Inputs | Inputs | |
| Common Stocks | $917,593 | $900,265 | $10,584 | $6,744 |
| Preferred Securities | 105,427 | 6,837 | 1,684 | 96,906 |
| Corporate Bonds | 71,181 | — | 71,181 | — |
| Convertible Bonds | 57,523 | — | 57,523 | — |
| Investment Companies | 24,041 | 24,041 | — | — |
| Warrants | 24,913 | 24,913 | — | — |
| Securities Lending Collateral | 81,374 | 81,374 | — | — |
| Total investments in | ||||
| Securities | $1,282,052 | $1,037,430 | $140,972 | $103,650 |
| 16 |
Changes in valuation techniques may result in transfers in or out of an assigned level within the disclosure hierarchy. During the six months ended September 30, 2011, there were no significant transfers in or out of Level 1 or Level 2 assets.
The following is a reconciliation of Level 3 assets for which significant unobservable inputs were used to determine fair value. Transfers in or out of Level 3 represent the beginning value of any security or instrument where a change in the level has occurred from the beginning to the end of the period.
| Common | Preferred | ||
| Investment in Securities | Stocks | Stocks | Total |
| Balance as of 3-31-11 | $9,364 | $139,216 | $148,580 |
| Realized gain (loss) | - | - | - |
| Changed in unrealized appreciation | |||
| (depreciation) | (2,620) | (42,310) | (44,930) |
| Purchases | - | - | - |
| Sales | - | - | - |
| Transfers into Level 3 | - | - | - |
| Transfers out of Level 3 | - | - | - |
| Balance as of 9-30-11 | $6,744 | $96,906 | $103,650 |
| Change in unrealized at period end * | ($2,620) | ($42,310) | ($44,930) |
*Change in unrealized appreciation (depreciation) attributable to Level 3 securities held at the period end.
In order to value the securities, the Fund uses the following valuation techniques. Equity securities, including exchange-traded funds, held by the Fund are valued at the last sale price or official closing price on the principal securities exchange on which they trade. In the event there were no sales during the day or closing prices are not available, then securities are valued using the last quoted bid or evaluated price. Investments by the Fund in open-end mutual funds, including John Hancock Collateral Investment Trust (JHCIT), are valued at their respective net asset values each business day. Debt obligations are valued based on the evaluated prices provided by an independent pricing service, which utilizes both dealer-supplied and electronic data processing techniques, taking into account factors such as institutional-size trading in similar groups of securities, yield, quality, coupon rate, maturity, type of issue, trading characteristics and other market data. Foreign securities are valued in U.S. dollars, based on foreign currency exchange rates supplied by an independent pricing service. Certain securities traded only in the over-the-counter market are valued at the last bid price quoted by brokers making markets in the securities at the close of trading. Other portfolio securities and assets, where market quotations are not readily available, are valued at fair value, as determined in good faith by the Fund’s Pricing Committee, following procedures established by the Board of Trustees.
Security transactions and related investment income. Investment security transactions are accounted for on a trade date plus one basis for daily net asset value calculations. However, for financial reporting purposes, investment transactions are reported on trade date. Interest income is accrued as earned. Gains and losses on securities sold are determined on the basis of identified cost and may include proceeds from litigation. Dividend income is recorded on the ex-date, except for dividends of foreign securities where the dividend may not be known until after the ex-date. In those cases, dividend income is recorded when the Fund becomes aware of the dividends. Interest income includes coupon interest and amortization/accretion of premiums/discounts on debt securities. Debt obligations may be placed in a non-accrual status and related interest income may be reduced by stopping current accruals and writing off interest receivable when the collection of all or a portion of interest has become doubtful.
| 17 |
Securities lending. The Fund may lend its securities to earn additional income. It receives and maintains cash collateral received from the borrower in an amount not less than the market value of the loaned securities. The Fund will invest its collateral in JHCIT and as a result, the Fund will receive the benefit of any gains and bear any losses generated by JHCIT. Although risk of the loss of the securities lent is mitigated by holding the collateral, the Fund could experience a delay in recovering its securities and a possible loss of income or value if the borrower fails to return the securities or if collateral investments decline in value. The Fund may receive compensation for lending its securities by retaining a portion of the return on the investment of the collateral and compensation from fees earned from borrowers of the securities. Net income received from JHCIT is a component of securities lending income as recorded on the Statement of Operations.
Foreign currency translation. Assets, including investments and liabilities denominated in foreign currencies, are translated into U.S. dollar values each day at the prevailing exchange rate. Purchases and sales of securities, income and expenses are translated into U.S. dollars at the prevailing exchange rate on the date of the transaction. The effect of changes in foreign currency exchange rates on securities is reflected as a component of the realized and unrealized gains (losses) on investments.
Funds that invest internationally generally carry more risk than funds that invest strictly in U.S. securities. Risks can result from differences in economic and political conditions, regulations, market practices (including higher transaction costs) and accounting standards. Foreign investments are also subject to a decline in the value of a foreign currency versus the U.S. dollar, which reduces the dollar value of securities denominated in that currency.
Line of credit. The Fund may borrow from banks for temporary or emergency purposes, including meeting redemption requests that otherwise might require the untimely sale of securities. Pursuant to the custodian agreement, the custodian may loan money to the Fund to make properly authorized payments. The Fund is obligated to repay the custodian for any overdraft, including any related costs or expenses. The custodian has a lien, security interest or security entitlement in any Fund property that is not segregated, to the maximum extent permitted by law for any overdraft.
The Fund and other affiliated funds have entered into an agreement with Citibank N.A. which enables them to participate in a $100 million unsecured committed line of credit. A commitment fee, payable at the end of each calendar quarter, based on the average daily unused portion of the line of credit, is charged to each participating fund on a pro rata basis and is reflected in other expenses on the Statement of Operations. For the six months ended September 30, 2011, the Fund had no borrowings under the line of credit.
Expenses. The majority of expenses are directly attributable to an individual fund. Expenses that are not readily attributable to a specific fund are allocated among all funds in an equitable manner, taking into consideration, among other things, the nature and type of expense and the fund’s relative assets. Expense estimates are accrued in the period to which they relate and adjustments are made when actual amounts are known.
Class allocations. Income, common expenses and realized and unrealized gains (losses) are determined at the fund level and allocated daily to each class of shares based on the net assets of the class. Class-specific expenses, such as distribution and service fees, if any, and transfer agent fees, are calculated daily for each class, based on the net asset value of the class and the applicable specific expense rates.
Federal income taxes. The Fund intends to continue to qualify as a regulated investment company by complying with the applicable provisions of the Internal Revenue Code and will not be subject to federal income tax on taxable income that is distributed to shareholders. Therefore, no federal income tax provision is required.
| 18 |
As of March 31, 2011, the Fund had no uncertain tax positions that would require financial statement recognition, derecognition or disclosure. The Fund’s federal tax returns are subject to examination by the Internal Revenue Service for a period of three years.
Distribution of income and gains. Distributions to shareholders from net investment income and net realized gains, if any, are recorded on the ex-date. The Fund generally declares and pays dividends and capital gain distributions, if any, annually.
Distributions paid by the Fund with respect to each class of shares are calculated in the same manner, at the same time and in the same amount, except for the effect of expenses that may be applied differently to each class.
Such distributions, on a tax basis, are determined in conformity with income tax regulations, which may differ from accounting principles generally accepted in the United States of America.
Capital accounts within financial statements are adjusted for permanent book-tax differences. These adjustments have no impact on net assets or the results of operations. Temporary book-tax differences, if any, will reverse in a subsequent period. Book-tax differences are primarily attributable to defaulted bonds, foreign currency transactions and partnerships.
New accounting pronouncement. In May 2011, Accounting Standards Update 2011-04 (ASU 2011-04), Amendments to Achieve Common Fair Value Measurement and Disclosure Requirements in U.S. GAAP and IFRSs, was issued and is effective during interim and annual periods beginning after December 15, 2011. ASU 2011-04 amends Financial Accounting Standards Board (FASB) Topic 820, Fair Value Measurement. The amendments are the result of the work by the FASB and the International Accounting Standards Board to develop common requirements for measuring fair value and for disclosing information about fair value measurements in accordance with GAAP. Management is currently evaluating the application of ASU 2011-04 and its impact, if any, on the Fund’s financial statements.
Note 3 — Derivative instruments
The Fund may invest in derivatives in order to meet its investment objectives. The use of derivatives may involve risks different from, or potentially greater than, the risks associated with investing directly in securities. Specifically, derivatives expose the Fund to the risk that the counterparty to an over-the-counter (OTC) derivatives contract will be unable or unwilling to make timely settlement payments or otherwise honor its obligations. OTC derivatives transactions typically can only be closed out with the other party to the transaction. If the counterparty defaults, the Fund will have contractual remedies, but there is no assurance that the counterparty will meet its contractual obligations or that the Fund will succeed in enforcing them.
Forward foreign currency contracts. A forward foreign currency contract is an agreement between two parties to buy and sell a specific currency at a price that is set on the date of the contract. The forward contract calls for delivery of the currency on a future date that is specified in the contract. Risks related to the use of forwards include the possible failure of counterparties to meet the terms of the forward agreement, the risk that currency movements will not occur thereby reducing the Fund’s total return, and the potential for losses in excess of the amounts recognized on the Statement of Assets and Liabilities.
The market value of a forward foreign currency contract fluctuates with changes in foreign currency exchange rates. Forward foreign currency contracts are marked-to-market daily and the change in value is recorded by a Fund as an unrealized gain or loss. Realized gains or losses, equal to the difference between the value of the contract at the time it was opened and the value at the time it was closed, are recorded upon delivery or receipt of the currency.
During the six months ended September 30, 2011, the Fund used forward foreign currency contracts to manage currency exposure and held forward foreign currency contracts with USD
| 19 |
absolute values ranging up to approximately $28,500, as measured at each quarter end. There were no open forward foreign currency contracts on September 30, 2011.
Effect of derivative instruments on the Statement of operations
The table below summarizes the net realized gain (loss) included in the net increase (decrease) in net assets from operations, classified by derivative instrument and risk category, for the six months ended September 30, 2011:
| STATEMENT OF | |||
| OPERATIONS | FOREIGN CURRENCY | ||
| RISK | LOCATION | TRANSACTIONS* | TOTAL |
| Foreign Exchange | Net realized gain (loss) | $127 | $127 |
| Contracts | |||
| Totals | $127 | $127 | |
*Realized gain/loss associated with forward foreign currency contracts is included in this caption on the Statement of Operations.
The table below summarizes the net change in unrealized appreciation (depreciation) included in the net increase (decrease) in net assets from operations, classified by derivative instrument and risk category, for the six months ended September 30, 2011:
| TRANSLATION OF | |||
| ASSETS AND | |||
| STATEMENT OF | LIABILITIES IN | ||
| OPERATIONS | FOREIGN | ||
| RISK | LOCATION | CURRENCIES* | TOTAL |
| Foreign Exchange | Change in net unrealized | $24 | $24 |
| Contracts | appreciation | ||
| (depreciation) | |||
| Totals | $24 | $24 | |
*Change in unrealized appreciation/depreciation associated with forward foreign currency contracts is included in this caption on the Statement of Operations.
Note 4 - Guarantees and indemnifications
Under the Fund’s organizational documents, its Officers and Trustees are indemnified against certain liabilities arising out of the performance of their duties to the Fund. Additionally, in the normal course of business, the Fund enters into contracts with service providers that contain general indemnification clauses. The Fund’s maximum exposure under these arrangements is unknown, as this would involve future claims that may be made against the Fund that have not yet occurred. The risk of material loss from such claims is considered remote.
Note 5 – Fees and transactions with affiliates
John Hancock Investment Management Services, LLC (the Adviser) serves as investment adviser for the Trust. John Hancock Funds, LLC (the Distributor), an affiliate of the Adviser, serves as principal underwriter of the Trust. The Adviser and the Distributor are indirect wholly owned subsidiaries of Manulife Financial Corporation (MFC).
Management fee. The Fund has an investment management agreement with the Adviser under which the Fund pays a daily management fee to the Adviser equivalent, on an annual basis, to the sum of: (a) 0.750% of the first $500,000,000 of the Fund’s average daily net assets; (b) 0.725% of the next $500,000,000 of the Fund’s average net assets; and (c) 0.700% of the Fund’s average daily net assets in excess of $1,000,000,000. The Adviser has a subadvisory agreement with John Hancock Asset Management a division of Manulife Asset Management (US) LLC, an indirectly owned subsidiary of MFC and an affiliate of the Adviser. The Fund is not responsible for payment of the
| 20 |
subadvisory fees.
The Adviser has contractually agreed to waive fees and/or reimburse certain expenses for each share class of the Fund. This agreement excludes taxes, brokerage commissions, interest, litigation and indemnification expenses and other extraordinary expenses not incurred in the ordinary course of the Fund’s business. The fee waivers and/or reimbursements are such that these expenses will not exceed 1.35% for Class A, 2.05% for Class B, 2.05% for Class C and 0.99% for Class I shares. The fee waivers and/or reimbursements will continue in effect until June 30, 2012. Prior to August 1, 2011, the fee waivers and/or reimbursements were such that these expenses would not exceed the amounts listed above for Class A, Class B and Class C shares and 0.89% for Class I shares.
Accordingly, these expense reductions amounted to $6,958, $6,803, $6,803 and $15,383 for Class A, Class B, Class C, and Class I shares, respectively, for the six months ended September 30, 2011.
The investment management fees, including the impact of the waivers and reimbursements described above, incurred for the six months ended September 30, 2011 were equivalent to a net annual effective rate of 0.00% of the Fund’s average daily net assets.
Accounting and legal services. Pursuant to a service agreement, the Fund reimburses the Adviser for all expenses associated with providing the administrative, financial, legal, accounting and recordkeeping services of the Fund, including the preparation of all tax returns, periodic reports to shareholders and regulatory reports, among other services. These expenses are allocated to each share class based on its relative net assets at the time the expense was incurred. These accounting and legal services fees incurred for the six months ended September 30, 2011 amounted to an annual rate of 0.01% of the Fund’s average daily net assets.
Distribution and service plans. The Fund has a distribution agreement with the Distributor. The Fund has adopted distribution and service plans with respect to Class A, Class B and Class C shares pursuant to Rule 12b-1 under the 1940 Act, to pay the Distributor for services provided as the distributor of shares of the Fund. The Fund may pay up to the following contractual rates of distribution and service fees under these arrangements, expressed as an annual percentage of average daily net assets for each class of the Fund’s shares.
| Class | 12b-1 Fee | ||||
| Class A | 0.30% | ||||
| Class B | 1.00% | ||||
| Class C | 1.00% | ||||
Sales charges. Class A shares are assessed up-front sales charges. For the six months ended September 30, 2011, there were no up-front sales charges received by the Distributor with regard to sales of Class A shares.
Class B and Class C shares are subject to contingent deferred sales charges (CDSCs). Class B shares that are redeemed within six years of purchase are subject to CDSCs, at declining rates, beginning at 5.00% of the lesser of the current market value at the time of redemption or the original purchase cost of the shares being redeemed. Class C shares that are redeemed within one year of purchase are subject to a 1.00% CDSC on the lesser of the current market value at the time of redemption or the original purchase cost of the shares being redeemed. Proceeds from CDSCs are used to compensate the Distributor for providing distribution-related services in connection with the sale of these shares. During the six months ended September 30, 2011, there were no CDSCs received by the Distributor for Class B and Class C shares, respectively.
Transfer agent fees. The Fund has a transfer agent agreement with John Hancock Signature Services, Inc. (Signature Services), an affiliate of the Adviser. The transfer agent fees paid to Signature Services are determined based on the cost to Signature Services (Signature Services Cost) of providing recordkeeping services. The Signature Services Cost includes a component of
| 21 |
allocated John Hancock corporate overhead for providing transfer agent services to the Fund and to all other John Hancock affiliated funds. It also includes out-of-pocket expenses that are comprised of payments made to third-parties for recordkeeping services provided to their clients who invest in one or more John Hancock funds. In addition, Signature Services Cost may be reduced by certain fees that Signature Services receives with retirement and small accounts. Signature Services Cost is calculated monthly and allocated, as applicable, to four categories of share classes: Institutional Share Classes, Retirement Share Classes, Municipal Bond Classes and all other Retail Share Classes. Within each of these categories, the applicable costs are allocated to the affected John Hancock affiliated funds and/or classes, based on the relative average daily net assets.
Class level expenses. Class level expenses for the six months ended September 30, 2011 were:
| Class | Distribution and | Transfer agent fees | |||
| service fees | |||||
| Class A | $472 | $268 | |||
| Class B | 1,541 | 262 | |||
| Class C | 1,541 | 262 | |||
| Class I | - | 248 | |||
| Total | $3,554 | $1,040 | |||
Trustee expenses. The Fund compensates each Trustee who is not an employee of the Adviser or its affiliates. These Trustees may, for tax purposes, elect to defer receipt of this compensation under the John Hancock Group of Funds Deferred Compensation Plan (the Plan). Deferred amounts are invested in various John Hancock funds and remain in the funds until distributed in accordance with the Plan. The investment of deferred amounts and the offsetting liability are included within Other receivables and prepaid expenses and Payable to affiliates - Trustees' fees, respectively, in the accompanying Statement of Assets and Liabilities.
Note 6 - Fund share transactions
Transactions in Fund shares for the six months ended September 30, 2011 and for the year ended March 31, 2011 were as follows:
| Six months ended | Year ended | ||||||
| 9/30/11 | 3/31/11 | ||||||
| Shares | Amount | Shares | Amount | ||||
| Class A shares | |||||||
| Distributions reinvested | — | — | 980 | $11,594 | |||
| Net increase | — | — | 980 | $11,594 | |||
| Class B shares | |||||||
| Distributions reinvested | — | — | 792 | $9,365 | |||
| Net increase | — | — | 792 | $9,365 | |||
| Class C shares | |||||||
| Distributions reinvested | — | — | 792 | $9,365 | |||
| Net increase | — | — | 792 | $9,365 | |||
| Class I shares | |||||||
| Sold | — | — | 22,532 | $271,512 | |||
| Distributions reinvested | — | — | 1,530 | 18,128 | |||
| Repurchased | (177) | $ (2,045) | — | — | |||
| Net increase (decrease) | (177) | $ (2,045) | 24,062 | $289,640 | |||
| Net increase (decrease) | (177) | $ (2,045) | 26,626 | $319,964 | |||
Affiliates of the Fund owned 100% of shares of beneficial interest of the Fund on September 30, 2011.
| 22 |
Note 7 - Purchase and sale of securities
Purchases and sales of securities, other than short-term securities, aggregated $218,942 and $213,014, respectively, for the six months ended September 30, 2011.
| 23 |
Board Consideration of and Continuation of Investment Advisory Agreement and Subadvisory Agreement: John Hancock Leveraged Companies Fund
The Board of Trustees (the Board, the members of which are referred to as Trustees) of John Hancock Leveraged Companies Fund (the Fund), a series of John Hancock Funds III, met in-person on May 1–3 and June 5–7, 2011 to consider the approval of the Fund’s investment advisory agreement (the Advisory Agreement) with John Hancock Investment Management Services, LLC (the Adviser), the Fund’s investment adviser. The Board also considered the approval of the investment subadvisory agreement (the Subadvisory Agreement) between the Adviser and Manulife Asset Management (US) LLC (the Subadviser) on behalf of the Fund. The Advisory Agreement and the Subadvisory Agreement are referred to as the Agreements.
Activities and composition of the Board
The Board consists of eleven individuals, nine of whom are Independent Trustees. Independent Trustees are generally those individuals who are not employed by or have any significant business or professional relationship with the Adviser or the Subadviser. The Trustees are responsible for the oversight of operations of the Fund and perform various duties required of directors of investment companies by the Investment Company Act of 1940, as amended (the 1940 Act). The Independent Trustees have hired independent legal counsel to assist them in connection with their duties. The Board has appointed an Independent Trustee as Chairperson. The Board has established four standing committees that are composed entirely of Independent Trustees: the Audit Committee; the Compliance Committee; the Nominating, Governance and Administration Committee; and the Contracts/Operations Committee. Additionally, Investment Performance Committees A and B are standing committees of the Board that are each composed of Independent Trustees and one Trustee who is affiliated with the Adviser. Investment Performance Committee A oversees and monitors matters relating to the investment performance of the Fund. The Board has also designated an Independent Trustee as Vice Chairperson to serve in the absence of the Chairperson. The Board also designates working groups or ad hoc committees as it deems appropriate.
The approval process
Under the 1940 Act, the Board is required to consider the continuation of the Agreements each year. Throughout the year, the Board, acting directly and through its committees, regularly reviews and assesses the quality of the services that the Fund receives under these Agreements. The Board reviews reports of the Adviser at least quarterly, which include Fund performance reports and compliance reports. In addition, the Board meets with portfolio managers and senior investment officers at various times throughout the year. The Board considers at each of its meetings factors that are relevant to its annual consideration of the renewal of the Agreements, including the services and support provided by the Adviser and Subadviser to the Fund and its shareholders.
Prior to the May 1–3, 2011 meeting, the Board requested and received materials specifically relating to the Agreements. The materials provided in connection with the May meeting included information compiled and prepared by Morningstar, Inc. (Morningstar) on Fund fees and
| 24 |
expenses, and the investment performance of the Fund. This Fund information is assembled in a format that permits comparison with similar information from a Category and a subset of the Category referred to as the Peer Group, each as determined by Morningstar, and with the Fund’s benchmark index. The Category includes all funds that invest similarly to the way the Fund invests. The Peer Group represents funds of similar size, excluding passively managed funds and funds-of-funds. The Fund’s benchmark index is an unmanaged index of securities that is provided as a basis for comparison with the Fund’s performance.
At an in-person meeting held on May 1–3, 2011, the Board reviewed materials relevant to its consideration of the Agreements. As a result of the discussions that occurred during the May 1–3, 2011 meeting, the Board asked the Adviser for additional information on certain matters. The Adviser provided the additional information and the Board also considered this information as part of its consideration of the Agreements.
At an in-person meeting held on June 5–7, 2011, the Board, including the Independent Trustees, formally considered the continuation of the Advisory Agreement between the Adviser and the Fund and the Subadvisory Agreement between the Adviser and the Subadviser with respect to the Fund, each for an additional one-year term. The Board considered what it believed were key relevant factors that are described under separate headings presented below.
The Board also considered other matters important to the approval process, such as payments made to and by the Adviser or its affiliates relating to the distribution of Fund shares and other services. The Board reviewed services related to the valuation and pricing of Fund portfolio holdings. Other important matters considered by the Board were the direct and indirect benefits to the Adviser, the Subadviser and their affiliates from their relationship with the Fund and advice from independent legal counsel with respect to the review process and materials submitted for the Board’s review.
Nature, extent and quality of services
The Board reviewed the nature, extent and quality of services provided by the Adviser and the Subadviser, including the investment advisory services and the resulting performance of the Fund.
The Board considered the ability of the Adviser and the Subadviser, based on their resources, reputation and other attributes, to attract and retain qualified investment professionals, including research, advisory and supervisory personnel. It considered the background and experience of senior management and investment professionals responsible for managing the Fund. The Board considered the investment philosophy, research and investment decision-making processes of the Adviser and the Subadviser responsible for the daily investment activities of the Fund, including, among other things, portfolio trading capabilities, use of technology, commitment to compliance and approach to training and retaining portfolio managers and other research, advisory and management personnel.
The Board considered the Subadviser’s history and experience providing investment services to the Fund. The Board considered the Adviser’s execution of its oversight responsibilities. The
| 25 |
Board further considered the culture of compliance, resources dedicated to compliance, compliance programs, record of compliance with applicable laws and regulation, with the Fund’s investment policies and restrictions and with the applicable Code of Ethics, and the responsibilities of the Adviser’s and Subadviser’s compliance departments.
In addition to advisory services, the Board considered the quality of the administrative and non-investment advisory services provided to the Fund by the Adviser under a separate agreement. The Board noted that the Adviser and its affiliates provide the Fund with certain administrative, transfer agency, shareholder and other services (in addition to any such services provided to the Fund by third parties) and officers and other personnel as are necessary for the operations of the Fund. The Board reviewed the structure and duties of the Adviser’s administration, accounting, legal and compliance departments and its affiliate’s transfer agency operations and considered the Adviser’s and its affiliates’ policies and procedures for assuring compliance with applicable laws and regulations.
The Board also received information about the nature, extent and quality of services provided by and fee rates charged by the Adviser and Subadviser to their other clients, including other registered investment companies, institutional investors and separate accounts. The Board reviewed a general analysis provided by the Adviser and the Subadviser concerning investment advisory fees charged to other clients having similar investment mandates, the services provided to those other clients as compared to the services provided to the Fund, the performance of those other clients as compared to the performance by the Fund and other factors relating to those other clients. The Board considered the significant differences between the Adviser’s and Subadviser’s services to the Fund and the services they provide to other clients. For other clients that are not mutual funds, the differences in services relate to the greater share purchase and redemption activity in a mutual fund, the generally higher turnover of mutual fund portfolio holdings, the more burdensome regulatory and legal obligations of mutual funds and the higher marketing costs for mutual funds. When compared to all clients including mutual funds, the Adviser has greater oversight and supervisory responsibility for the Fund and undertakes greater entrepreneurial risk as the sponsor of the Fund.
Fund performance
The Board had previously received and considered information about the Adviser’s investment performance for other funds. The Board was provided with reports, independently prepared by Morningstar, which included a comprehensive analysis of the Fund’s performance. The Board also examined materials provided by the Fund’s portfolio management team discussing Fund performance and the Fund’s investment objective, strategies and outlook. The Board also reviewed a narrative and statistical analysis of the Morningstar data that was prepared by the Adviser, which analyzed various factors that may affect the Morningstar rankings. The Board reviewed information regarding the investment performance of the Fund as compared to its Morningstar Category as well as its benchmark index (see chart below). The Board was provided with a description of the methodology used by Morningstar to select the funds in the Category. The Board also considered updated performance information provided by the Adviser at its May and June 2011 meetings. The Board regularly reviews the performance of the Fund throughout
| 26 |
the year and attaches more importance to performance over relatively longer periods of time, typically three to five years. The Board noted that the Fund had limited operational history.
Set forth below is the performance of the Fund over the one-year period ended December 31, 2010 and that of its Category and benchmark index over the same period:
| 1-Yr | 3-Yr | 5-Yr | 10-Yr | |
| Leveraged Companies Fund Class A | 38.29% | — | — | — |
| Moderate Allocation Category Average | 12.17% | — | — | — |
| Russell 1000 Value TR Index | 15.51% | — | — | — |
The Board noted that the Fund’s performance compared favorably to the average performance of its Category and to its benchmark index’s performance for the period shown. However, the Board noted that, because of the Fund’s investment approach, no Morningstar category provides a very meaningful performance comparison.
Expenses and fees
The Board, including the Independent Trustees, reviewed the Fund’s contractual advisory fee rate payable by the Fund to the Adviser as compared with the other funds in its Peer Group. The Board also received information about the investment subadvisory fee rate payable by the Adviser to the Subadviser for investment subadvisory services. The Board considered the services provided and the fees charged by the Adviser and the Subadviser to other clients with similar investment mandates, including separately managed institutional accounts.
In addition, the Board considered the cost of the services provided to the Fund by the Adviser. The Board received and considered expense information regarding the Fund’s various components, including advisory fees, distribution fees and fees other than advisory and distribution fees, including transfer agent fees, custodian fees, administration fees and other miscellaneous fees (e.g., fees for accounting and legal services). The Board considered comparisons of these expenses to the Peer Group median. The Board also considered expense information regarding the Fund’s total operating expense ratio (Gross Expense Ratio) and total operating expense ratio after taking the Adviser’s contractual fee waiver/expense reimbursement agreement into account (Net Expense Ratio). The Board considered information comparing the Gross Expense Ratio and Net Expense Ratio of the Fund to that of the Peer Group median. As part of its analysis, the Board reviewed the Adviser’s methodology in allocating its costs to the management of the Fund and the Fund complex.
The Board noted that the Fund’s advisory fee ratio was the same as the Peer Group median advisory fee ratio. The Board noted the following information about the Fund’s Gross and Net Expense Ratios for Class A shares contained in the Fund’s 2010 financial statements in relation with the Fund’s Peer Group median provided by Morningstar in April 2011:
| Fund (Class A) | Peer Group Median | |||
| Advisory Fee Ratio | 0.75% | 0.75% | ||
| 27 |
| Gross Expense Ratio | 8.42% | 1.40% | ||
| Net Expense Ratio | 1.35% | 1.26% | ||
The Board viewed favorably the Adviser’s contractual agreement to waive all or a portion of its advisory fees and to reimburse or pay operating expenses to the extent necessary to maintain the Fund’s Net Expense Ratio at 1.35% for Class A shares, excluding certain expenses such as taxes, brokerage commissions, interest, litigation and extraordinary expenses, until June 30, 2012. The Board favorably considered the impact of this contractual agreement toward ultimately lowering the Fund’s Gross Expense Ratio.
As the Fund is owned only by the Adviser or its affiliates and has no other shareholders, the Fund is considered “in development” and so the Adviser was not able to provide the Board with credible information concerning the expected profits to be realized by the Adviser and its affiliates from their relationships with the Fund.
Economies of scale
The Board, including the Independent Trustees, considered the extent to which economies of scale might be realized as the assets of the Fund increase. Possible changes in the advisory fee rate or structure in order to enable the Fund to participate in these economies of scale (e.g., through the use of breakpoints in the advisory fee at higher asset levels) are periodically discussed. The Board also considered the Adviser’s overall operations and its ongoing investment in its business in order to expand the scale of, and improve the quality of, its operations that benefit the Fund.
The Board recognized the inherent limitations of any analysis of economies of scale, stemming largely from the Board’s understanding that most of the Adviser’s costs are not specific to individual funds, but rather are incurred across a variety of products and services. To ensure that any economies are reasonably shared with the Fund as its assets increase, the Adviser and the Board agreed to continue the existing breakpoints to the contractual advisory fee rate.
Other benefits to the Adviser and the Subadviser
The Board understands that the Adviser, the Subadviser or their affiliates may derive other ancillary benefits from their relationship with the Fund, both tangible and intangible, such as their ability to leverage investment professionals who manage other portfolios, an increase in their profile in the investment advisory community and the engagement of their affiliates and/or significant shareholders as service providers to the Fund, including for administrative, transfer agency and distribution services. The Board believes that certain of these benefits are difficult to quantify. The Board also was informed that the Subadviser may use third-party research obtained by soft dollars generated by certain mutual fund transactions to assist itself in managing all or a number of its other client accounts.
| 28 |
Board determination
The Board unanimously approved the continuation of the Advisory Agreement between the Adviser and the Fund for an additional one-year term. The Subadvisory Agreement between the Adviser and Subadviser with respect to the Fund was also approved for an additional one-year term. Based upon its evaluation of relevant factors in their totality, the Board was satisfied that the terms of the Agreements, including the advisory and subadvisory fee rates, were fair and reasonable and in the best interest of the Fund and its shareholders. In arriving at its decision to approve the Agreements, the Board did not identify any single factor or any group of factors as all-important or controlling, but considered all factors together. Different Trustees may have attributed different weights to the various factors considered. The Independent Trustees were also assisted by independent legal counsel in making this determination. The Trustees’ conclusions may be based in part on their consideration of these arrangements in the prior year and on their ongoing regular review of Fund performance and operations throughout the year.
| 29 |
More information
| Trustees | Investment adviser |
| Steven R. Pruchansky, Chairperson | John Hancock Investment Management Services, LLC |
| James F. Carlin | |
| William H. Cunningham | Subadviser |
| Deborah C. Jackson* | John Hancock Asset Management |
| Charles L. Ladner, Vice Chairperson* | |
| Stanley Martin* | Principal distributor |
| Hugh McHaffie† | John Hancock Funds, LLC |
| Dr. John A. Moore | |
| Patti McGill Peterson* | Custodian |
| Gregory A. Russo | State Street Bank and Trust Company |
| John G. Vrysen† | |
| Transfer agent | |
| John Hancock Signature Services, Inc. | |
| Officers | |
| Keith F. Hartstein | Legal counsel |
| President and Chief Executive Officer | K&L Gates LLP |
| Andrew G. Arnott | Independent registered public accounting firm |
| Senior Vice President and Chief Operating Officer | PricewaterhouseCoopers LLP |
| Thomas M. Kinzler | |
| Secretary and Chief Legal Officer | |
| Francis V. Knox, Jr. | |
| Chief Compliance Officer | |
| Charles A. Rizzo | |
| Chief Financial Officer | |
| Salvatore Schiavone | |
| Treasurer | |
| *Member of the Audit Committee | |
| †Non-Independent Trustee | |
The Fund’s proxy voting policies and procedures, as well as the Fund’s proxy voting record, if any, for the most recent twelve-month period ended June 30, are available free of charge on the Securities and Exchange Commission (SEC) Web site at www.sec.gov or on our Web site.
The Fund’s complete list of portfolio holdings, for the first and third fiscal quarters, is filed with the SEC on Form N-Q. The Fund’s Form N-Q is available on our Web site and the SEC’s Web site, www.sec.gov, and can be reviewed and copied (for a fee) at the SEC’s Public Reference Room in Washington, DC. Call 1-800-SEC-0330 to receive information on the operation of the SEC's Public Reference Room.
We make this information on your fund, as well as monthly portfolio holdings, and other fund details available on our Web site www.jhfunds.com or by calling 1-800-225-5291.
| You can also contact us: | ||
| 1-800-225-5291 | Regular mail: | Express mail: |
| jhfunds.com | John Hancock Signature Services, Inc. | John Hancock Signature Services, Inc. |
| P.O. Box 55913 | Mutual Fund Image Operations | |
| Boston, MA 02205-5913 | 30 Dan Road | |
| Canton, MA 02021 |
| 30 |
John Hancock Small Cap Opportunities Fund
| Table of Contents | |
| Your expenses | Page 3 |
| Portfolio summary | Page 4 |
| Portfolio of investments | Page 5 |
| Financial statements | Page 8 |
| Financial highlights | Page 11 |
| Notes to financial statements | Page 15 |
| More information | Page 29 |
| 2 |
Small Cap Opportunities Fund
Your expenses
These examples are intended to help you understand your ongoing operating expenses.
Understanding your fund expenses
As a shareholder of the Fund, you incur two types of costs:
• Transaction costs which include sales charges (loads) on purchases or redemptions (varies by share class), minimum account fee charge, etc.
• Ongoing operating expenses including management fees, distribution and service fees (if applicable), and other fund expenses.
We are going to present only your ongoing operating expenses here.
Actual expenses/actual returns
This example is intended to provide information about your fund’s actual ongoing operating expenses, and is based on the fund’s actual return. It assumes an account value of $1,000.00 on April 1, 2011 with the same investment held until September 30, 2011.
| Account value | Ending value | Expenses paid during | |
| on 4-1-11 | on 9-30-11 | period ended 9-30-111 | |
| Class A | $1,000.00 | $734.60 | $7.03 |
| Class B | 1,000.00 | 731.70 | 10.04 |
| Class C | 1,000.00 | 731.70 | 10.04 |
| Class I | 1,000.00 | 736.30 | 5.21 |
Together with the value of your account, you may use this information to estimate the operating expenses that you paid over the period. Simply divide your account value at September 30, 2011, by $1,000.00, then multiply it by the “expenses paid” for your share class from the table above. For example, for an account value of $8,600.00, the operating expenses should be calculated as follows:

Hypothetical example for comparison purposes
This table allows you to compare your fund’s ongoing operating expenses with those of any other fund. It provides an example of the Fund’s hypothetical account values and hypothetical expenses based on each class’s actual expense ratio and an assumed 5% annualized return before expenses (which is not your fund’s actual return). It assumes an account value of $1,000.00 on April 1, 2011, with the same investment held until September 30, 2011. Look in any other fund shareholder report to find its hypothetical example and you will be able to compare these expenses.
| Account value | Ending value | Expenses paid during | |
| on 4-1-11 | on 9-30-11 | period ended 9-30-111 | |
| Class A | $1,000.00 | $1,016.90 | $8.17 |
| Class B | 1,000.00 | 1,013.40 | 11.68 |
| Class C | 1,000.00 | 1,013.40 | 11.68 |
| Class I | 1,000.00 | 1,019.00 | 6.06 |
Remember, these examples do not include any transaction costs, therefore, these examples will not help you to determine the relative total costs of owning different funds. If transaction costs were included, your expenses would have been higher. See the prospectus for details regarding transaction costs.
1 Expenses are equal to the Fund's annualized expense ratio of 1.62%, 2.32%, 2.32%, and 1.20% for Class A, Class B, Class C, and Class I shares, respectively, multiplied by the average account value over the period, multiplied by 183/366 (to reflect the one-half year period).
| 3 |
Small Cap Opportunities Fund
As of 9-30-11 (Unaudited)
Portfolio Summary
| Value as a | |
| percentage of | |
| Top 10 Holdings1 (25.4% of Net Assets) | Fund's net assets |
| Hexcel Corp. | 3.2% |
| IMAX Corp. | 3.0% |
| Cardtronics, Inc. | 2.7% |
| KVH Industries, Inc. | 2.7% |
| Cavium, Inc. | 2.6% |
| Darling International, Inc. | 2.4% |
| MEDNAX, Inc. | 2.4% |
| VeriFone Systems, Inc. | 2.2% |
| Ancestry.com, Inc. | 2.1% |
| Coventry Health Care, Inc. | 2.1% |
| Value as a | |
| percentage of | |
| Sector Concentration2 | Fund's net assets |
| Information Technology | 29% |
| Industrials | 15% |
| Consumer Discretionary | 15% |
| Health Care | 12% |
| Energy | 11% |
| Materials | 10% |
| Financials | 4% |
| Consumer Staples | 2% |
| Other | 2% |
| Value as a | |
| percentage of | |
| Fund's net | |
| Country Concentration | assets |
| United States | 79% |
| Canada | 16% |
| Panama | 2% |
| China | 1% |
| Other | 2% |
1 Cash and cash equivalents are not included in Top 10 Holdings.
2 Sector investing is subject to greater risks than the market as a whole. Because the Fund may focus on particular sectors of the economy, its performance may depend on the performance of those sectors.
| 4 |
Small Cap Opportunities Fund
As of 9-30-11 (Unaudited)
| Shares | Value | |
| Common Stocks 98.18% | $3,017,950 | |
| (Cost $3,249,543) | ||
| Consumer Discretionary 14.41% | 442,879 | |
| Diversified Consumer Services 1.00% | ||
| Global Education & Technology Group, Ltd., ADR (I) | 6,491 | 30,702 |
| Hotels, Restaurants & Leisure 2.53% | ||
| Bally Technologies, Inc. (I) | 1,538 | 41,495 |
| Bravo Brio Restaurant Group, Inc. (I) | 357 | 5,940 |
| Buffalo Wild Wings, Inc. (I) | 505 | 30,199 |
| Household Durables 2.85% | ||
| iRobot Corp. (I) | 2,166 | 54,497 |
| Tempur-Pedic International, Inc. (I) | 630 | 33,144 |
| Internet & Catalog Retail 0.79% | ||
| HomeAway, Inc. (I) | 722 | 24,274 |
| Media 2.99% | ||
| IMAX Corp. (I) | 6,355 | 92,020 |
| Specialty Retail 3.16% | ||
| Lumber Liquidators Holdings, Inc. (I) | 4,114 | 62,121 |
| Teavana Holdings, Inc. (I) | 1,724 | 35,066 |
| Textiles, Apparel & Luxury Goods 1.09% | ||
| G-III Apparel Group, Ltd. (I) | 1,462 | 33,421 |
| Consumer Staples 2.43% | 74,659 | |
| Food Products 2.43% | ||
| Darling International, Inc. (I) | 5,930 | 74,659 |
| Energy 10.68% | 328,248 | |
| Energy Equipment & Services 3.43% | ||
| Gulfmark Offshore, Inc., Class A (I) | 594 | 21,586 |
| Lufkin Industries, Inc. | 1,029 | 54,753 |
| Pioneer Drilling Company (I) | 4,059 | 29,144 |
| Oil, Gas & Consumable Fuels 7.25% | ||
| Africa Oil Corp. (I) | 24,064 | 30,313 |
| Americas Petrogas, Inc. (I) | 38,686 | 63,129 |
| BlackPearl Resources, Inc. (I) | 9,054 | 32,228 |
| Brigham Exploration Company (I) | 1,662 | 41,982 |
| Ivanhoe Energy, Inc. (I) | 32,224 | 34,480 |
| KiOR, Inc., Class A (I) | 594 | 12,320 |
| Solazyme, Inc. (I) | 865 | 8,313 |
| Financials 4.35% | 133,819 | |
| Capital Markets 2.97% | ||
| Evercore Partners, Inc., Class A | 2,365 | 53,922 |
| Solar Senior Capital, Ltd. | 2,616 | 37,383 |
| Consumer Finance 1.38% | ||
| Cash America International, Inc. | 831 | 42,514 |
| See notes to financial statements | 5 |
Small Cap Opportunities Fund
As of 9-30-11 (Unaudited)
| Shares | Value | |
| Health Care 12.24% | $376,380 | |
| Health Care Equipment & Supplies 5.16% | ||
| Align Technology, Inc. (I) | 3,325 | 50,440 |
| Arthrocare Corp. (I) | 865 | 24,886 |
| SonoSite, Inc. (I) | 1,145 | 34,739 |
| Thoratec Corp. (I) | 1,490 | 48,634 |
| Health Care Providers & Services 4.54% | ||
| Coventry Health Care, Inc. (I) | 2,278 | 65,629 |
| MEDNAX, Inc. (I) | 1,181 | 73,978 |
| Pharmaceuticals 2.54% | ||
| Impax Laboratories, Inc. (I) | 1,996 | 35,748 |
| Par Pharmaceutical Companies, Inc. (I) | 1,590 | 42,326 |
| Industrials 14.95% | 459,521 | |
| Aerospace & Defense 7.16% | ||
| BE Aerospace, Inc. (I) | 1,553 | 51,420 |
| Hexcel Corp. (I) | 4,431 | 98,191 |
| The Keyw Holding Corp. (I) | 4,469 | 31,775 |
| Triumph Group, Inc. | 792 | 38,602 |
| Airlines 2.05% | ||
| Copa Holdings SA, Class A | 1,028 | 62,986 |
| Building Products 3.13% | ||
| Quanex Building Products Corp. | 3,268 | 35,785 |
| Trex Company, Inc. (I) | 3,763 | 60,321 |
| Machinery 1.36% | ||
| Graham Corp. | 2,518 | 41,900 |
| Professional Services 1.25% | ||
| RPX Corp. (I) | 1,861 | 38,541 |
| Information Technology 29.21% | 897,876 | |
| Communications Equipment 2.67% | ||
| KVH Industries, Inc. (I) | 10,358 | 81,932 |
| Internet Software & Services 6.65% | ||
| Ancestry.com, Inc. (I) | 2,802 | 65,847 |
| Bankrate, Inc. (I) | 2,270 | 34,527 |
| Demand Media, Inc. (I) | 4,091 | 32,728 |
| TechTarget, Inc. (I) | 6,647 | 37,954 |
| XO Group, Inc. (I) | 4,096 | 33,464 |
| IT Services 4.96% | ||
| Cardtronics, Inc. (I) | 3,683 | 84,414 |
| VeriFone Systems, Inc. (I) | 1,948 | 68,219 |
| Semiconductors & Semiconductor Equipment 5.17% | ||
| Atmel Corp. (I) | 3,499 | 28,237 |
| Cavium, Inc. (I) | 2,997 | 80,949 |
| Ceva, Inc. (I) | 2,042 | 49,641 |
| Software 9.76% | ||
| BroadSoft, Inc. (I) | 2,003 | 60,791 |
| See notes to financial statements | 6 |
Small Cap Opportunities Fund
As of 9-30-11 (Unaudited)
| Shares | Value | |
| Information Technology (continued) | ||
| Concur Technologies, Inc. (I) | 1,420 | $52,852 |
| Fortinet, Inc. (I) | 1,819 | 30,559 |
| Monotype Imaging Holdings, Inc. (I) | 5,034 | 61,062 |
| Rosetta Stone, Inc. (I) | 3,957 | 36,207 |
| Ultimate Software Group, Inc. (I) | 1,252 | 58,493 |
| Materials 9.91% | 304,568 | |
| Chemicals 3.90% | ||
| Karnalyte Resources, Inc. (I) | 3,808 | 53,710 |
| LSB Industries, Inc. (I) | 909 | 26,061 |
| Neo Material Technologies, Inc. (I) | 6,599 | 40,177 |
| Metals & Mining 6.01% | ||
| Avalon Rare Metals, Inc. (I) | 13,549 | 35,815 |
| Carpenter Technology Corp. | 909 | 40,805 |
| Focus Metals, Inc. | 13,903 | 9,022 |
| Pretium Resources, Inc. (I) | 4,716 | 44,914 |
| San Gold Corp. (I) | 25,988 | 54,064 |
| Issuer | Notional par | Value |
| Options Purchased 0.41% | $12,600 | |
| (Cost $8,064) | ||
| Put Options 0.41% | 12,600 | |
| Keyw Holding Corp. (Expiration Date:11-19-11; Strike Price: $10.00) (I) | 4,200 | 12,600 |
| Shares | Value | |
| Warrants 0.03% | $1,051 | |
| (Cost $0) | ||
| Focus Metals Inc. (Expiration Date: 5-13-13, Strike Price: CAD 1.25) (I) | 6,951 | 862 |
| Frontier Rare Earths, Ltd. (Expiration Date: 11-30-12, Strike Price: CAD 4.60) (I) | 4,394 | 189 |
| Total investments (Cost $3,257,607)† 98.62% | $3,031,601 | |
| Other assets and liabilities, net 1.38% | $42,304 | |
| Total net assets 100.00% | $3,073,905 | |
The percentage shown for each investment category is the total value of the category as a percentage of the net assets of the Fund.
ADR American Depositary Receipts
CAD Canadian Dollar
(I) Non-income producing security.
† At 9-30-11, the aggregate cost of investment securities for federal income tax purposes was $3,351,690. Net unrealized depreciation aggregated $320,089, of which $263,765 related to appreciated investment securities and $583,854 related to depreciated investment securities.
The Fund had the following country composition as a percentage of total net assets on 9-30-11:
| United States | 79% | ||
| Canada | 16% | ||
| Panama | 2% | ||
| China | 1% | ||
| Other | 2% |
| See notes to financial statements | 7 |
Small Cap Opportunities Fund
Statement of Assets and Liabilities — September 30, 2011 (Unaudited)
| Assets | ||
| Investments at value (Cost $3,257,607) | $ | 3,031,601 |
| Cash | 29,422 | |
| Receivable for investments sold | 49,344 | |
| Dividends receivable | 307 | |
| Receivable due from adviser | 237 | |
| Other receivables and prepaid expenses | 103 | |
| Total assets | 3,111,014 | |
| Liabilities | ||
| Payable for investments purchased | 10,824 | |
| Written options, at value, (Premiums received | ||
| $3,584) (Note 3) | 7,743 | |
| Payable to affiliates | ||
| Accounting and legal services fees | 34 | |
| Transfer agent fees | 432 | |
| Trustees’ fees | 19 | |
| Other liabilities and accrued expenses | 18,057 | |
| Total liabilities | 37,109 | |
| Net assets | ||
| Paid in capital | $ | 2,648,155 |
| Accumulated net investment loss | (38,119) | |
| Accumulated net realized gain on investments, | ||
| written options and foreign currency transactions | 694,039 | |
| Net unrealized appreciation (depreciation) on | ||
| investments, written options and translation of | ||
| assets and liabilities in foreign currencies | (230,170) | |
| Net assets | $ | 3,073,905 |
| Net asset value per share | ||
| Based on net asset values and shares | ||
| outstanding-the Fund has an unlimited number | ||
| of shares authorized with no par value | ||
| Class A ($773,763 ÷ 61,329 shares) | $ | 12.62 |
| Class B ($759,067 ÷ 61,161 shares)1 | $ | 12.41 |
| Class C ($759,073 ÷ 61,161 shares)1 | $ | 12.41 |
| Class I ($782,002 ÷ 61,444 shares) | $ | 12.73 |
| Maximum offering price per share | ||
| Class A (net asset value per share ÷ 95%)2 | $ | 13.28 |
1 Redemption price is equal to net asset value less any applicable contingent deferred sales charge.
2 On single retail sales of less than $50,000. On sales of $50,000 or more and on group sales the offering price is reduced.
| See notes to financial statements | 8 |
Small Cap Opportunities Fund
Statement of Operations — For the six-month period ended September 30, 2011 (Unaudited)
| Investment income | |
| Dividends | $5,588 |
| Securities lending | 1,507 |
| Interest | 2 |
| Total investment income | 7,097 |
| Expenses | |
| Investment management fees (Note 5) | 17,640 |
| Distribution and service fees (Note 5) | 11,171 |
| Accounting and legal services fees (Note 5) | 262 |
| Transfer agent fees (Note 5) | 2,856 |
| Trustees' fees (Note 5) | 120 |
| Professional fees | 16,992 |
| Custodian fees | 9,668 |
| Registration and filing fees | 5,578 |
| Other | 5,130 |
| Total expenses | 69,417 |
| Less expense reductions (Note 5) | (33,017) |
| Net expenses | 36,400 |
| Net investment loss | (29,303) |
| Realized and unrealized gain (loss) | |
| Net realized gain (loss) on | |
| Investments in unaffiliated issuers | 207,956 |
| Investments in affiliated issuers | 22 |
| Written options (Note 3) | (4,421) |
| Foreign currency transactions | (250) |
| 203,307 | |
| Change in net unrealized appreciation | |
| (depreciation) of | |
| Investments in unaffiliated issuers | (1,285,547) |
| Investments in affiliated issuers | (7) |
| Written options (Note 3) | (4,159) |
| Translation of assets and liabilities in foreign | |
| currencies | (297) |
| (1,290,010) | |
| Net realized and unrealized loss | (1,086,703) |
| Decrease in net assets from operations | $ (1,116,006) |
| See notes to financial statements | 9 |
Small Cap Opportunities Fund
Statements of Changes in Net Assets
| Six months | ||
| ended | Year ended | |
| 9-30-11 | 3-31-11 | |
| (Unaudited) | ||
| Increase (decrease) in net assets | ||
| From operations | ||
| Net investment loss | ($29,303) | ($44,485) |
| Net realized gain | 203,307 | 823,097 |
| Change in net unrealized appreciation | ||
| (depreciation) | (1,290,010) | 281,400 |
| Increase (decrease) in net assets resulting | ||
| from operations | (1,116,006) | 1,060,012 |
| Distributions to shareholders | ||
| From net investment income | ||
| Class A | — | (4,267) |
| Class I | — | (6,925) |
| From net realized gain | ||
| Class A | — | (105,616) |
| Class B | — | (105,671) |
| Class C | — | (105,671) |
| Class I | — | (105,579) |
| Total distributions | — | (433,729) |
| From Fund share transactions (Note 6) | — | 433,729 |
| Total increase (decrease) | (1,116,006) | 1,060,012 |
| Net assets | ||
| Beginning of period | 4,189,911 | 3,129,899 |
| End of period | $3,073,905 | $4,189,911 |
| Accumulated net investment loss | ($38,119) | ($8,816) |
| See notes to financial statements | 10 |
Small Cap Opportunities Fund
Financial Highlights (For a share outstanding throughout the period)
Class A Shares
| Period ended | ||||||||
| 9-30-111 | 3-31-11 | 3-31-10 | 3-31-092 | |||||
| Per share operating performance | ||||||||
| Net asset value, beginning of period | $17.18 | $14.49 | $9.39 | $10.00 | ||||
| Net investment loss3 | (0.10) | (0.16) | (0.14) | (0.03) | ||||
| Net realized and unrealized gain (loss) on | ||||||||
| investments | (4.46) | 4.88 | 6.35 | (0.58) | ||||
| Total from investment operations | (4.56) | 4.72 | 6.21 | (0.61) | ||||
| Less distributions | ||||||||
| From net investment income | — | (0.08) | — | — | ||||
| From net realized gain | — | (1.95) | (1.11) | — | ||||
| Total distributions | — | (2.03) | (1.11) | — | ||||
| Net asset value, end of period | $12.62 | $17.18 | $14.49 | $9.39 | ||||
| Total return (%)4,5 | (26.54)6 | 34.27 | 67.14 | (6.10)6 | ||||
| Ratios and supplemental data | ||||||||
| Net assets, end of period (in thousands) | $774 | $ | 1,053 | $785 | $470 | |||
| Ratios (as a percentage of average net | ||||||||
| assets): | ||||||||
| Expenses before reductions | 3.307 | 3.71 | 4.03 | 12.347 | ||||
| Expenses net of fee waivers and credits | 1.627 | 1.59 | 1.36 | 1.657 | ||||
| Net investment loss | (1.25)7 | (1.08) | (1.07) | (1.42)7 | ||||
| Portfolio turnover (%) | 55 | 105 | 101 | 27 | ||||
1 Unaudited.
2 Period from 1-2-09 (inception date) to 3-31-09.
3 Based on the average daily shares outstanding.
4 Does not reflect the effect of sales charges, if any.
5 Total returns would have been lower had certain expenses not been reduced during the periods shown.
6 Not annualized.
7 Annualized.
| See notes to financial statements | 11 |
Small Cap Opportunities Fund
Financial Highlights (For a share outstanding throughout the period)
Class B Shares
| Period ended | ||||||||
| 9-30-111 | 3-31-11 | 3-31-10 | 3-31-092 | |||||
| Per share operating performance | ||||||||
| Net asset value, beginning of period | $16.96 | $14.36 | $9.38 | $10.00 | ||||
| Net investment loss3 | (0.15) | (0.26) | (0.23) | (0.05) | ||||
| Net realized and unrealized gain (loss) on | ||||||||
| investments | (4.40) | 4.81 | 6.32 | (0.57) | ||||
| Total from investment operations | (4.55) | 4.55 | 6.09 | (0.62) | ||||
| Less distributions | ||||||||
| From net realized gain | — | (1.95) | (1.11) | — | ||||
| Net asset value, end of period | $12.41 | $16.96 | $14.36 | $9.38 | ||||
| Total return (%)4,5 | (26.83)6 | 33.31 | 65.91 | (6.20)6 | ||||
| Ratios and supplemental data | ||||||||
| Net assets, end of period (in thousands) | $759 | $1,037 | $778 | $469 | ||||
| Ratios (as a percentage of average net | ||||||||
| assets): | ||||||||
| Expenses before reductions | 4.007 | 4.41 | 4.73 | 13.047 | ||||
| Expenses net of fee waivers and credits | 2.327 | 2.29 | 2.06 | 2.357 | ||||
| Net investment loss | (1.95)7 | (1.78) | (1.77) | (2.12)7 | ||||
| Portfolio turnover (%) | 55 | 105 | 101 | 27 | ||||
1 Unaudited.
2 Period from 1-2-09 (inception date) to 3-31-09.
3 Based on the average daily shares outstanding.
4 Does not reflect the effect of sales charges, if any.
5 Total returns would have been lower had certain expenses not been reduced during the periods shown.
6 Not annualized.
7 Annualized.
| See notes to financial statements | 12 |
Small Cap Opportunities Fund
Financial Highlights (For a share outstanding throughout the period)
Class C Shares
| Period ended | ||||||||
| 9-30-111 | 3-31-11 | 3-31-10 | 3-31-092 | |||||
| Per share operating performance | ||||||||
| Net asset value, beginning of period | $16.96 | $14.36 | $9.38 | $10.00 | ||||
| Net investment loss3 | (0.15) | (0.26) | (0.23) | (0.05) | ||||
| Net realized and unrealized gain (loss) on | ||||||||
| investments | (4.40) | 4.81 | 6.32 | (0.57) | ||||
| Total from investment operations | (4.55) | 4.55 | 6.09 | (0.62) | ||||
| Less distributions | ||||||||
| From net realized gain | — | (1.95) | (1.11) | — | ||||
| Net asset value, end of period | $12.41 | $16.96 | $14.36 | $9.38 | ||||
| Total return (%)4,5 | (26.83)6 | 33.31 | 65.91 | (6.20)6 | ||||
| Ratios and supplemental data | ||||||||
| Net assets, end of period (in thousands) | $759 | $1,037 | $778 | $469 | ||||
| Ratios (as a percentage of average net | ||||||||
| assets): | ||||||||
| Expenses before reductions | 4.007 | 4.41 | 4.73 | 13.047 | ||||
| Expenses net of fee waivers and credits | 2.327 | 2.29 | 2.06 | 2.357 | ||||
| Net investment loss | (1.95)7 | (1.78) | (1.77) | (2.12)7 | ||||
| Portfolio turnover (%) | 55 | 105 | 101 | 27 | ||||
1 Unaudited.
2 Period from 1-2-09 (inception date) to 3-31-09.
3 Based on the average daily shares outstanding.
4 Does not reflect the effect of sales charges, if any.
5 Total returns would have been lower had certain expenses not been reduced during the periods shown.
6 Not annualized.
7 Annualized.
| See notes to financial statements | 13 |
Small Cap Opportunities Fund
Financial Highlights (For a share outstanding throughout the period)
| Class I Shares | ||||||||
| Period ended | ||||||||
| 9-30-111 | 3-31-11 | 3-31-10 | 3-31-092 | |||||
| Per share operating performance | ||||||||
| Net asset value, beginning of period | $17.29 | $14.56 | $9.41 | $10.00 | ||||
| Net investment loss3 | (0.07) | (0.10) | (0.10) | (0.02) | ||||
| Net realized and unrealized gain (loss) on | ||||||||
| investments | (4.49) | 4.91 | 6.36 | (0.57) | ||||
| Total from investment operations | (4.56) | 4.81 | 6.26 | (0.59) | ||||
| Less distributions | ||||||||
| From net investment income | — | (0.13) | — | — | ||||
| From net realized gain | — | (1.95) | (1.11) | — | ||||
| Total distributions | — | (2.08) | (1.11) | — | ||||
| Net asset value, end of period | $12.73 | $17.29 | $14.56 | $9.41 | ||||
| Total return (%)4 | (26.37)5 | 34.77 | 67.54 | (5.90)5 | ||||
| Ratios and supplemental data | ||||||||
| Net assets, end of period (in thousands) | $782 | $1,062 | $788 | $470 | ||||
| Ratios (as a percentage of average net | ||||||||
| assets): | ||||||||
| Expenses before reductions | 2.906 | 3.30 | 3.72 | 12.046 | ||||
| Expenses net of fee waivers and credits | 1.206 | 1.17 | 1.06 | 1.106 | ||||
| Net investment loss | (0.84)6 | (0.66) | (0.77) | (0.87)6 | ||||
| Portfolio turnover (%) | 55 | 105 | 101 | 27 | ||||
1 Unaudited.
2 Period from 1-2-09 (inception date) to 3-31-09.
3 Based on the average daily shares outstanding.
4 Total returns would have been lower had certain expenses not been reduced during the periods shown.
5 Not annualized.
6 Annualized.
| See notes to financial statements | 14 |
Small Cap Opportunities Fund
Notes to financial statements (unaudited)
Note 1 - Organization
John Hancock Small Cap Opportunities Fund (the Fund) is a diversified series of John Hancock Funds III (the Trust), an open-end management investment company organized as a Massachusetts business trust and registered under the Investment Company Act of 1940, as amended (the 1940 Act). The investment objective of the Fund is to seek long-term capital appreciation.
The Fund may offer multiple classes of shares. The shares currently offered are detailed in the Statement of Assets and Liabilities. Class A, Class B and Class C shares are offered to all investors. Class I shares are offered to institutions and certain investors. Shareholders of each class have exclusive voting rights to matters that affect that class. The distribution and service fees, if any, transfer agent fees, and printing and postage and state registration fees for each class may differ. Class B shares convert to Class A shares eight years after purchase.
Note 2 - Significant accounting policies
The financial statements have been prepared in conformity with accounting principles generally accepted in the United States of America, which require management to make certain estimates and assumptions at the date of the financial statements. Actual results could differ from those estimates. Events or transactions occurring after the end of the fiscal period through the date that the financial statements were issued have been evaluated in the preparation of the financial statements. The following summarizes the significant accounting policies of the Fund:
Security valuation. Investments are stated at value as of the close of the regular trading on the New York Stock Exchange (NYSE), normally at 4:00 p.m., Eastern Time. The Fund uses a three-tier hierarchy to prioritize the pricing assumptions, referred to as inputs, used in valuation techniques to measure fair value. Level 1 includes securities valued using quoted prices in active markets for identical securities. Level 2 includes securities valued using significant observable inputs. Observable inputs may include quoted prices for similar securities, interest rates, prepayment speeds and credit risk. Prices for securities valued using these inputs are received from independent pricing vendors and brokers and are based on an evaluation of the inputs described. Level 3 includes securities valued using significant unobservable inputs when market prices are not readily available or reliable, including the Fund’s own assumptions in determining the fair value of investments. Factors used in determining value may include market or issuer specific events, changes in interest rates and credit quality. The inputs or methodology used for valuing securities are not necessarily an indication of the risk associated with investing in those securities.
As of September 30, 2011, all investments are categorized as Level 1 under the hierarchy described above.
Changes in valuation techniques may result in transfers in or out of an assigned level within the disclosure hierarchy. During the six months ended September 30, 2011, there were no significant transfers in or out of Level 1 assets.
| 15 |
In order to value the securities, the Fund uses the following valuation techniques. Equity securities held by the Fund are valued at the last sale price or official closing price on the principal securities exchange on which they trade. In the event there were no sales during the day or closing prices are not available, then securities are valued using the last quoted bid or evaluated price. Foreign securities and currencies are valued in U.S. dollars, based on foreign currency exchange rates supplied by an independent pricing service. Certain securities traded only in the over-the-counter market are valued at the last bid price quoted by brokers making markets in the securities at the close of trading. Certain short-term securities are valued at amortized cost. Other portfolio securities and assets, where market quotations are not readily available, are valued at fair value, as determined in good faith by the Fund’s Pricing Committee, following procedures established by the Board of Trustees.
Security transactions and related investment income. Investment security transactions are accounted for on a trade date plus one basis for daily net asset value calculations. However, for financial reporting purposes, investment transactions are reported on trade date. Interest income is accrued as earned. Gains and losses on securities sold are determined on the basis of identified cost and may include proceeds from litigation. Dividend income is recorded on the ex-date, except for dividends of foreign securities where the dividend may not be known until after the ex-date. In those cases, dividend income is recorded when the Fund becomes aware of the dividends.
Securities lending. The Fund may lend its securities to earn additional income. It receives and maintains cash collateral received from the borrower in an amount not less than the market value of the loaned securities. The Fund will invest its collateral in John Hancock Collateral Investment Trust (JHCIT), an affiliate of the Fund, which has a floating net asset value (NAV) and invests in short term investments as part of the securities lending program, and as result, the Fund will receive the benefit of any gains and bear any losses generated by JHCIT. Although risk of the loss of the securities lent is mitigated by holding the collateral, the Fund could experience a delay in recovering its securities and a possible loss of income or value if the borrower fails to return the securities or if collateral investments decline in value. The Fund may receive compensation for lending its securities by retaining a portion of the return on the investment of the collateral and compensation from fees earned from borrowers of the securities. Net income received from JHCIT is a component of securities lending income as recorded on the Statement of Operations.
Foreign currency translation. Assets, including investments and liabilities denominated in foreign currencies, are translated into U.S. dollar values each day at the prevailing exchange rate. Purchases and sales of securities, income, and expenses are translated into U.S. dollars at the prevailing exchange rate on the date of the transaction. The effect of changes in foreign currency exchange rates on securities is reflected as a component of the realized and unrealized gains (losses) on investments.
Funds that invest internationally generally carry more risk than funds that invest strictly in U.S. securities. Risks can result from differences in economic and political conditions, regulations, market practices (including higher transaction costs) and accounting standards. Foreign investments are also subject to a decline in the value of a foreign currency versus the U.S. dollar, which reduces the dollar value of securities denominated in that currency.
Line of credit. The Fund may borrow from banks for temporary or emergency purposes, including meeting redemption requests that otherwise might require the untimely sale of securities. Pursuant to the custodian agreement, the custodian may loan money to the Fund to make properly authorized payments. The Fund is obligated to repay the custodian for any overdraft, including any related costs or expenses. The custodian has a lien, security interest or security entitlement in any Fund property that is not segregated, to the maximum extent permitted by law for any overdraft.
| 16 |
The Fund and other affiliated funds have entered into an agreement with Citibank N.A. which enables them to participate in a $100 million unsecured committed line of credit. A commitment fee, payable at the end of each calendar quarter, based on the average daily unused portion of the line of credit, is charged to each participating fund on a pro rata basis and is reflected in other expenses on the Statement of operations. For the six months ended September 30, 2011, the Fund had no borrowings under the line of credit.
Expenses. The majority of expenses are directly attributable to an individual fund. Expenses that are not readily attributable to a specific fund are allocated among all funds in an equitable manner, taking into consideration, among other things, the nature and type of expense and the fund’s relative assets. Expense estimates are accrued in the period to which they relate and adjustments are made when actual amounts are known.
Class allocations. Income, common expenses, and realized and unrealized gains (losses) are determined at the fund level and allocated daily to each class of shares based on the net assets of the class. Class-specific expenses, such as distribution and service fees, if any, transfer agent fees, state registration fees and printing and postage, for all classes, are calculated daily at the class level based on the appropriate net assets of each class and the specific expense rates applicable to each class.
Federal income taxes. The Fund intends to continue to qualify as a regulated investment company by complying with the applicable provisions of the Internal Revenue Code and will not be subject to federal income tax on taxable income that is distributed to shareholders. Therefore, no federal income tax provision is required.
As of March 31, 2011, the Fund had no uncertain tax positions that would require financial statement recognition, derecognition or disclosure. The Fund’s federal tax return is subject to examination by the Internal Revenue Service for a period of three years.
Distribution of income and gains. Distributions to shareholders from net investment income and net realized gains, if any, are recorded on the ex-date. The Fund generally declares and pays dividends and capital gain distributions, if any, annually.
Distributions paid by the Fund with respect to each class of shares are calculated in the same manner, at the same time and are in the same amount, except for the effect of expenses that may be applied differently to each class.
Such distributions, on a tax basis, are determined in conformity with income tax regulations, which may differ from accounting principles generally accepted in the United States of America.
Capital accounts within financial statements are adjusted for permanent book-tax differences. These adjustments have no impact on net assets or the results of operations. Temporary book-tax differences, if any, will reverse in a subsequent period. Book-tax differences are primarily attributable to passive foreign investment companies and wash sale loss deferrals.
New accounting pronouncement. In May 2011, Accounting Standards Update 2011-04 (ASU 2011-04), Amendments to Achieve Common Fair Value Measurement and Disclosure Requirements in U.S. GAAP and IFRSs, was issued and is effective during interim and annual periods beginning after December 15, 2011. ASU 2011-04 amends Financial Accounting Standards Board (FASB) Topic 820, Fair Value Measurement. The amendments are the result of the work by the FASB and the International Accounting Standards Board to develop common requirements for measuring fair value and for disclosing information about fair value measurements in accordance with GAAP. Management is currently evaluating the application of ASU 2011-04 and its impact, if any, on the Fund’s financial statements.
| 17 |
Note 3 – Derivative instruments
The Fund may invest in derivatives in order to meet its investment objective. The use of derivatives may involve risks different from, or potentially greater than, the risks associated with investing directly in securities. Specifically, derivatives expose the Fund to the risk that the counterparty to an over-the-counter (OTC) derivatives contract will be unable or unwilling to make timely settlement payments or otherwise honor its obligations. OTC derivatives transactions typically can only be closed out with the other party to the transaction. If the counterparty defaults, the Fund will have contractual remedies, but there is no assurance that the counterparty will meet its contractual obligations or that the Fund will succeed in enforcing them.
Options. There are two types of options, a put option and a call option. Options are traded either over-the-counter or on an exchange. A call option gives the purchaser of the option the right to buy (and the seller the obligation to sell) the underlying instrument at the exercise price. A put option gives the purchaser of the option the right to sell (and the writer the obligation to buy) the underlying instrument at the exercise price. Writing puts and buying calls may increase the Fund’s exposure to changes in the value of the underlying instrument. Buying puts and writing calls may decrease the Fund’s exposure to such changes. Risks related to the use of options include the loss of the premium, possible illiquidity of the options markets, trading restrictions imposed by an exchange and movements in underlying security values, and for written options, potential losses in excess of the amounts recognized on the Statement of assets and liabilities.
Options listed on an exchange are valued at their closing price. If no closing price is available, then they are valued at the mean between the last bid and ask prices from the exchange on which they are principally traded. For options not listed on an exchange, an independent pricing source is used to value the options at the mean between the last bid and ask prices. When the Fund purchases an option, the premium paid by the Fund is included in the Portfolio of Investments and subsequently “marked-to-market” to reflect current market value. If the purchased option expires, the Fund realizes a loss equal to the cost of the option. If the Fund exercises a call option, the cost of the securities acquired by exercising the call is increased by the premium paid to buy the call. If the Fund exercises a put option, it realizes a gain or loss from the sale of the underlying security and the proceeds from such sale are decreased by the premium paid. If the Fund enters into a closing sale transaction, the Fund realizes a gain or loss, depending on whether proceeds from the closing sale are greater or less than the original cost. When the Fund writes an option, the premium received is included as a liability and subsequently “marked-to-market” to reflect current market value of the option written. Premiums received from writing options that expire unexercised are recorded as realized gains. Premiums received from writing options which are exercised or are closed are added to or offset against the proceeds or amount paid on the transaction to determine the realized gain or loss. If a put option on a security is exercised, the premium received reduces the cost basis of the securities purchased by the Fund.
During the six months ended September 30, 2011, the Fund used purchased options to provide protection against event-driven downside risk in the equity in the near term while desiring to hold the equity for the long term earnings power of the company. During the six months ended September 30, 2011, the Fund held purchased options with markets values up to $12,600 as measured at each quarter end.
During the six months ended September 30, 2011, the Fund wrote option contracts to manage against anticipated currency exchange rates. The following tables summarize the Fund’s written options activities during the six months ended September 30, 2011 and the contracts held at September 30, 2011.
| 18 |
| PREMIUMS | ||||
| NUMBER OF | Received | |||
| CONTRACTS | (PAID) | |||
| Outstanding, beginning of | ||||
| period | - | - | ||
| Options written | 204 | $10,437 | ||
| Options closed | (123) | (6,853) | ||
| Options exercised | - | - | ||
| Options expired | - | - | ||
| Outstanding, end of period | 81 | $3,584 | ||
Options on Securities
| Number | ||||||
| Exercise | Expiration | of | Notional | |||
| Name of Issuer | Price | Date | Contracts | Par | Premium | Value |
| Calls | ||||||
| Keyw Holding Corp. | $12.50 | May-12 | 17 | 1700 | $1,088 | $383 |
| 17 | 1700 | $1,088 | $383 | |||
| Puts | ||||||
| Keyw Holding Corp. | $7.50 | Nov-11 | 64 | 6400 | $2,496 | $7,360 |
| 64 | 6400 | $2,496 | $7,360 | |||
Fair value of derivative instruments by risk category
The table below summarizes the fair value of derivatives held by the Fund at September 30, 2011 by risk category:
| Financial | |||||
| Statement of Assets and | instruments | Asset Derivatives | Liability Derivatives Fair | ||
| Risk | Liabilities location | location | Fair Value | Value | |
| Equity contracts | Written options, at value | Options | - | ($7,743) | |
| Total | ($7,743) | ||||
Effect of derivative instruments on the Statement of operations
The table below summarizes the net realized gain (loss) included in the net increase (decrease) in net assets from operations, classified by derivative instrument and risk category, for the six months ended September 30, 2011:
| Written | |||||
| STATEMENT OF OPERATIONS | Investments (Purchased | Options | |||
| RISK | LOCATION | Options) | Contracts | Total | |
| Equity contracts | Net realized gain (loss) | $12,980 | ($4,421) | $8,559 | |
| Total | 12,980 | (4,421) | 8,559 | ||
| 19 |
The table below summarizes the net change in unrealized appreciation (depreciation) included in the net increase (decrease) in net assets from operations, classified by derivative instrument and risk category, for the six months ended September 30, 2011:
| RISK | Statement of Operations Location | Written Options Contracts |
| Equity contracts | Change in unrealized appreciation (depreciation) | ($4,159) |
| Total | (4,159) | |
Note 4 – Guarantees and indemnifications
Under the Fund’s organizational documents, its Officers and Trustees are indemnified against certain liabilities arising out of the performance of their duties to the Fund. Additionally, in the normal course of business, the Fund enters into contracts with service providers that contain general indemnification clauses. The Fund’s maximum exposure under these arrangements is unknown, as this would involve future claims that may be made against the Fund that have not yet occurred. The risk of material loss from such claims is considered remote.
Note 5 – Fees and transactions with affiliates
John Hancock Investment Management Services, LLC (the Adviser) serves as investment adviser for the Trust. John Hancock Funds, LLC (the Distributor), an affiliate of the Adviser, serves as principal underwriter of the Trust. The Adviser and the Distributor are indirect wholly owned subsidiaries of Manulife Financial Corporation (MFC).
Management Fee. The Fund has an investment management contract with the Adviser under which the Fund pays a daily management fee to the Adviser equivalent, on an annual basis, to the sum of: (a) 0.90% of the first $1,000,000,000 of the Fund’s average daily net assets; and (b) 0.85% of the Fund’s average daily net assets in excess of $1,000,000,000. The Adviser has a subadvisory agreement with John Hancock Asset Management a division of Manulife Asset Management (US) LLC, an indirectly owned subsidiary of MFC and an affiliate of the Adviser. The Fund is not responsible for payment of the subadvisory fees.
The Adviser has contractually agreed to waive fees and/or reimburse certain expenses for each share class of the Fund. This agreement excludes taxes, brokerage commissions, interest, litigation and indemnification expenses and other extraordinary expenses not incurred in the ordinary course of the Fund’s business. The fee waivers and/or reimbursements are such that these expenses will not exceed 1.60% for Class A, 2.30% for Class B, 2.30% for Class C and 1.24% for Class I shares. The fee waivers and/or reimbursements continue in effect until June 30, 2012, for class I shares and until July 31, 2012 for Class A, Class B and Class C shares. The fee waivers and/or reimbursements were such that these expenses would not exceed 1.65% for Class A, 2.35% for Class B and 2.35% for Class C shares prior to July 1, 2011 and 1.19% for Class I shares prior to August 1, 2011.
Accordingly, the expense reductions or reimbursements related to these agreements were $8,291, $8,144, $8,144, and $8,438 for Class A, Class B, Class C and Class I shares, respectively, for the six months ended September 30, 2011.
The investment management fees, including the impact of the waivers and reimbursements described above, incurred for the six months ended September 30, 2011 were equivalent to a net annual effective rate of 0.00% of the Fund’s average daily net assets.
Accounting and legal services. Pursuant to the service agreement, the Fund reimburses the Adviser for all expenses associated with providing the administrative, financial, legal, accounting and recordkeeping services of the Fund, including the preparation of all tax returns, periodic reports to shareholders and regulatory reports, among other services. These expenses are allocated to each share class based on its relative net assets at the time the expense
| 20 |
was incurred. The accounting and legal services fees incurred for the six months ended September 30, 2011 amounted to an annual rate of 0.01% of the Fund’s average daily net assets.
Distribution and service plans. The Fund has a distribution agreement with the Distributor. The Fund has adopted distribution and service plans with respect to Class A, Class B and Class C shares pursuant to Rule 12b-1 under the 1940 Act, to pay the Distributor for services provided as the distributor of shares of the Fund. The Fund may pay up to the following contractual rates of distribution and service fees under these arrangements, expressed as an annual percentage of average daily net assets for each class of the Fund’s shares.
| Class | 12b-1 Fee | |
| Class A | 0.30% | |
| Class B | 1.00% | |
| Class C | 1.00% | |
Sales charges. Class A shares are assessed up-front sales charges. For the six months ended September 30, 2011, there were no up-front sales charges received by the Distributor with regard to sales of Class A shares.
Class B and Class C shares are subject to contingent deferred sales charges (CDSCs). Class B shares that are redeemed within six years of purchase are subject to CDSCs, at declining rates, beginning at 5.00% of the lesser of the current market value at the time of redemption or the original purchase cost of the shares being redeemed. Class C shares that are redeemed within one year of purchase are subject to a 1.00% CDSC on the lesser of the current market value at the time of redemption or the original purchase cost of the shares being redeemed. Proceeds from CDSCs are used to compensate the Distributor for providing distribution-related services in connection with the sale of these shares. During the six months ended September 30, 2011, there were no CDSCs received by the Distributor for Class B and Class C shares.
Transfer agent fees. The Fund has a transfer agent agreement with John Hancock Signature Services, Inc. (Signature Services), an affiliate of the Adviser. The transfer agent fees paid to Signature Services are determined based on the cost to Signature Services (Signature Services Cost) of providing recordkeeping services. The Signature Services Cost includes a component of allocated John Hancock corporate overhead for providing transfer agent services to the Fund and to all other John Hancock affiliated funds. It also includes out-of-pocket expenses that are comprised of payments made to third-parties for recordkeeping services provided to their clients who invest in one or more John Hancock funds. In addition, Signature Services Cost may be reduced by certain fees that Signature Services receives with retirement and small accounts. Signature Services Cost is calculated monthly and allocated, as applicable, to four categories of share classes: Institutional Share Classes, Retirement Share Classes, Municipal Bond Classes and all other Retail Share Classes. Within each of these categories, the applicable costs are allocated to the affected John Hancock affiliated funds and/or classes, based on the relative average daily net assets.
Class level expenses. Class level expenses for the six months ended September 30, 2011 were:
| Distribution and | |||
| Class | service fees | Transfer agent fees | |
| A | $1,479 | $841 | |
| B | 4,846 | 828 | |
| C | 4,846 | 828 | |
| I | - | 359 | |
| Total | $11,171 | $2,856 | |
| 21 |
Trustee expenses. The Fund compensates each Trustee who is not an employee of the Adviser or its affiliates. These Trustees may, for tax purposes, elect to defer receipt of this compensation under the John Hancock Group of Funds Deferred Compensation Plan (the Plan). Deferred amounts are invested in various John Hancock funds and remain in the funds until distributed in accordance with the Plan. The investment of deferred amounts and the offsetting liability are included within Other receivables and prepaid expenses and Payable to affiliates - Trustees' fees, respectively, in the accompanying Statement of assets and liabilities.
Note 6 - Fund share transactions
Transactions in Fund shares for the six months ended September 30, 2011 and year ended March 31, 2011 were as follows:
| Six months ended | Year ended | ||||||
| 9/30/11 | 3/31/11 | ||||||
| Shares | Amount | Shares | Amount | ||||
| Class A shares | |||||||
| Distributions reinvested | — | — | 7,172 | $109,883 | |||
| Net increase | — | — | 7,172 | $109,883 | |||
| Class B shares | |||||||
| Distributions reinvested | — | — | 6,975 | $105,671 | |||
| Net increase | — | — | 6,975 | $105,671 | |||
| Class C shares | |||||||
| Distributions reinvested | — | — | 6,975 | $105,671 | |||
| Net increase | — | — | 6,975 | $105,671 | |||
| Class I shares | |||||||
| Distributions reinvested | — | — | 7,305 | $112,504 | |||
| Net increase | — | — | 7,305 | $112,504 | |||
| Net increase | — | — | 28,427 | $433,729 | |||
Affiliates of the Fund owned 100% of shares of beneficial interest of Class A, Class B, Class C and Class I on September 30, 2011.
Note 7 - Purchase and sale of securities
Purchases and sales of securities, other than short-term securities, aggregated $2,194,799 and $2,127,167, respectively, for the six months ended September 30, 2011.
| 22 |
Board Consideration of and Continuation of Investment Advisory Agreement and Subadvisory Agreement: John Hancock Small Cap Opportunities Fund
The Board of Trustees (the Board, the members of which are referred to as Trustees) of John Hancock Small Cap Opportunities Fund (the Fund), a series of John Hancock Funds III, met in-person on May 1–3 and June 5–7, 2011 to consider the approval of the Fund’s investment advisory agreement (the Advisory Agreement) with John Hancock Investment Management Services, LLC (the Adviser), the Fund’s investment adviser. The Board also considered the approval of the investment subadvisory agreement (the Subadvisory Agreement) between the Adviser and Manulife Asset Management (US) LLC (the Subadviser) on behalf of the Fund. The Advisory Agreement and the Subadvisory Agreement are referred to as the Agreements.
Activities and composition of the Board
The Board consists of eleven individuals, nine of whom are Independent Trustees. Independent Trustees are generally those individuals who are not employed by or have any significant business or professional relationship with the Adviser or the Subadviser. The Trustees are responsible for the oversight of operations of the Fund and perform various duties required of directors of investment companies by the Investment Company Act of 1940, as amended (the 1940 Act). The Independent Trustees have hired independent legal counsel to assist them in connection with their duties. The Board has appointed an Independent Trustee as Chairperson. The Board has established four standing committees that are composed entirely of Independent Trustees: the Audit Committee; the Compliance Committee; the Nominating, Governance and Administration Committee; and the Contracts/Operations Committee. Additionally, Investment Performance Committees A and B are standing committees of the Board that are each composed of Independent Trustees and one Trustee who is affiliated with the Adviser. Investment Performance Committee B oversees and monitors matters relating to the investment performance of the Fund. The Board has also designated an Independent Trustee as Vice Chairperson to serve in the absence of the Chairperson. The Board also designates working groups or ad hoc committees as it deems appropriate.
The approval process
Under the 1940 Act, the Board is required to consider the continuation of the Agreements each year. Throughout the year, the Board, acting directly and through its committees, regularly reviews and assesses the quality of the services that the Fund receives under these Agreements. The Board reviews reports of the Adviser at least quarterly, which include Fund performance reports and compliance reports. In addition, the Board meets with portfolio managers and senior investment officers at various times throughout the year. The Board considers at each of its meetings factors that are relevant to its annual consideration of the renewal of the Agreements, including the services and support provided by the Adviser and Subadviser to the Fund and its shareholders.
Prior to the May 1–3, 2011 meeting, the Board requested and received materials specifically relating to the Agreements. The materials provided in connection with the May meeting included information compiled and prepared by Morningstar, Inc. (Morningstar) on Fund fees and expenses, and the investment performance of the Fund. This Fund information is assembled in a
| 23 |
format that permits comparison with similar information from a Category and a subset of the Category referred to as the Peer Group, each as determined by Morningstar, and with the Fund’s benchmark index. The Category includes all funds that invest similarly to the way the Fund invests. The Peer Group represents funds of similar size, excluding passively managed funds and funds-of-funds. The Fund’s benchmark index is an unmanaged index of securities that is provided as a basis for comparison with the Fund’s performance.
At an in-person meeting held on May 1–3, 2011, the Board reviewed materials relevant to its consideration of the Agreements. As a result of the discussions that occurred during the May 1–3, 2011 meeting, the Board asked the Adviser for additional information on certain matters. The Adviser provided the additional information and the Board also considered this information as part of its consideration of the Agreements.
At an in-person meeting held on June 5–7, 2011, the Board, including the Independent Trustees, formally considered the continuation of the Advisory Agreement between the Adviser and the Fund and the Subadvisory Agreement between the Adviser and the Subadviser with respect to the Fund, each for an additional one-year term. The Board considered what it believed were key relevant factors that are described under separate headings presented below.
The Board also considered other matters important to the approval process, such as payments made to and by the Adviser or its affiliates relating to the distribution of Fund shares and other services. The Board reviewed services related to the valuation and pricing of Fund portfolio holdings. Other important matters considered by the Board were the direct and indirect benefits to the Adviser, the Subadviser and their affiliates from their relationship with the Fund and advice from independent legal counsel with respect to the review process and materials submitted for the Board’s review.
Nature, extent and quality of services
The Board reviewed the nature, extent and quality of services provided by the Adviser and the Subadviser, including the investment advisory services and the resulting performance of the Fund.
The Board considered the ability of the Adviser and the Subadviser, based on their resources, reputation and other attributes, to attract and retain qualified investment professionals, including research, advisory and supervisory personnel. It considered the background and experience of senior management and investment professionals responsible for managing the Fund. The Board considered the investment philosophy, research and investment decision-making processes of the Adviser and the Subadviser responsible for the daily investment activities of the Fund, including, among other things, portfolio trading capabilities, use of technology, commitment to compliance and approach to training and retaining portfolio managers and other research, advisory and management personnel.
The Board considered the Subadviser’s history and experience providing investment services to the Fund. The Board considered the Adviser’s execution of its oversight responsibilities. The Board further considered the culture of compliance, resources dedicated to compliance, compliance programs, record of compliance with applicable laws and regulation, with the Fund’s
| 24 |
investment policies and restrictions and with the applicable Code of Ethics, and the responsibilities of the Adviser’s and Subadviser’s compliance departments.
In addition to advisory services, the Board considered the quality of the administrative and non-investment advisory services provided to the Fund by the Adviser under a separate agreement. The Board noted that the Adviser and its affiliates provide the Fund with certain administrative, transfer agency, shareholder and other services (in addition to any such services provided to the Fund by third parties) and officers and other personnel as are necessary for the operations of the Fund. The Board reviewed the structure and duties of the Adviser’s administration, accounting, legal and compliance departments and its affiliate’s transfer agency operations and considered the Adviser’s and its affiliates’ policies and procedures for assuring compliance with applicable laws and regulations.
The Board also received information about the nature, extent and quality of services provided by and fee rates charged by the Adviser and Subadviser to their other clients, including other registered investment companies, institutional investors and separate accounts. The Board reviewed a general analysis provided by the Adviser and the Subadviser concerning investment advisory fees charged to other clients having similar investment mandates, the services provided to those other clients as compared to the services provided to the Fund, the performance of those other clients as compared to the performance by the Fund and other factors relating to those other clients. The Board considered the significant differences between the Adviser’s and Subadviser’s services to the Fund and the services they provide to other clients. For other clients that are not mutual funds, the differences in services relate to the greater share purchase and redemption activity in a mutual fund, the generally higher turnover of mutual fund portfolio holdings, the more burdensome regulatory and legal obligations of mutual funds and the higher marketing costs for mutual funds. When compared to all clients including mutual funds, the Adviser has greater oversight and supervisory responsibility for the Fund and undertakes greater entrepreneurial risk as the sponsor of the Fund.
Fund performance
The Board had previously received and considered information about the Adviser’s investment performance for other funds. The Board was provided with reports, independently prepared by Morningstar, which included a comprehensive analysis of the Fund’s performance. The Board also examined materials provided by the Fund’s portfolio management team discussing Fund performance and the Fund’s investment objective, strategies and outlook. The Board also reviewed a narrative and statistical analysis of the Morningstar data that was prepared by the Adviser, which analyzed various factors that may affect the Morningstar rankings. The Board reviewed information regarding the investment performance of the Fund as compared to its Morningstar Category as well as its benchmark index (see chart below). The Board was provided with a description of the methodology used by Morningstar to select the funds in the Category. The Board also considered updated performance information provided by the Adviser at its May and June 2011 meetings. The Board regularly reviews the performance of the Fund throughout the year and attaches more importance to performance over relatively longer periods of time, typically three to five years. The Board noted that the Fund had limited operational history.
| 25 |
Set forth below is the performance of the Fund over the one-year period ended December 31, 2010 and that of its Category and benchmark index over the same period:
| 1-Yr | 3-Yr | 5-Yr | 10-Yr | |
| Small Cap Opportunities Fund Class A | 32.79% | — | — | — |
| Small Growth Category Average | 27.04% | — | — | — |
| Russell 2000 Growth TR Index | 29.09% | — | — | — |
The Board noted that the Fund’s performance compared favorably to the average performance of its Category and to its benchmark index’s performance for the period shown.
Expenses and fees
The Board, including the Independent Trustees, reviewed the Fund’s contractual advisory fee rate payable by the Fund to the Adviser as compared with the other funds in its Peer Group. The Board also received information about the investment subadvisory fee rate payable by the Adviser to the Subadviser for investment subadvisory services. The Board considered the services provided and the fees charged by the Adviser and the Subadviser to other clients with similar investment mandates, including separately managed institutional accounts.
In addition, the Board considered the cost of the services provided to the Fund by the Adviser. The Board received and considered expense information regarding the Fund’s various components, including advisory fees, distribution fees and fees other than advisory and distribution fees, including transfer agent fees, custodian fees, administration fees and other miscellaneous fees (e.g., fees for accounting and legal services). The Board considered comparisons of these expenses to the Peer Group median. The Board also considered expense information regarding the Fund’s total operating expense ratio (Gross Expense Ratio) and total operating expense ratio after taking the Adviser’s contractual fee waiver/expense reimbursement agreement into account (Net Expense Ratio). The Board considered information comparing the Gross Expense Ratio and Net Expense Ratio of the Fund to that of the Peer Group median. As part of its analysis, the Board reviewed the Adviser’s methodology in allocating its costs to the management of the Fund and the Fund complex.
The Board noted that the Fund’s advisory fee ratio was five basis points above the Peer Group median advisory fee ratio. The Board noted the following information about the Fund’s Gross and Net Expense Ratios for Class A shares contained in the Fund’s 2010 financial statements in relation with the Fund’s Peer Group median provided by Morningstar in April 2011:
| Fund (Class A) | Peer Group Median | ||
| Advisory Fee Ratio | 0.90% | 0.85% | |
| Gross Expense Ratio | 4.20% | 1.88% | |
| Net Expense Ratio | 1.52% | 1.50% | |
| 26 |
The Board viewed favorably the Adviser’s contractual agreement to waive all or a portion of its advisory fees and to reimburse or pay operating expenses to the extent necessary to maintain the Fund’s Net Expense Ratio at 1.60% for Class A shares, excluding certain expenses such as taxes, brokerage commissions, interest, litigation and extraordinary expenses, until June 30, 2012. The Board favorably considered the impact of this contractual agreement toward ultimately lowering the Fund’s Gross Expense Ratio.
As the Fund is owned only by the Adviser or its affiliates and has no other shareholders, the Fund is considered “in development” and so the Adviser was not able to provide the Board with credible information concerning the expected profits to be realized by the Adviser and its affiliates from their relationships with the Fund.
Economies of scale
The Board, including the Independent Trustees, considered the extent to which economies of scale might be realized as the assets of the Fund increase. Possible changes in the advisory fee rate or structure in order to enable the Fund to participate in these economies of scale (e.g., through the use of breakpoints in the advisory fee at higher asset levels) are periodically discussed. The Board also considered the Adviser’s overall operations and its ongoing investment in its business in order to expand the scale of, and improve the quality of, its operations that benefit the Fund.
The Board recognized the inherent limitations of any analysis of economies of scale, stemming largely from the Board’s understanding that most of the Adviser’s costs are not specific to individual funds, but rather are incurred across a variety of products and services. To ensure that any economies are reasonably shared with the Fund as its assets increase, the Adviser and the Board agreed to continue the existing breakpoints to the contractual advisory fee rate.
Other benefits to the Adviser and the Subadviser
The Board understands that the Adviser, the Subadviser or their affiliates may derive other ancillary benefits from their relationship with the Fund, both tangible and intangible, such as their ability to leverage investment professionals who manage other portfolios, an increase in their profile in the investment advisory community and the engagement of their affiliates and/or significant shareholders as service providers to the Fund, including for administrative, transfer agency and distribution services. The Board believes that certain of these benefits are difficult to quantify. The Board also was informed that the Subadviser may use third-party research obtained by soft dollars generated by certain mutual fund transactions to assist itself in managing all or a number of its other client accounts.
Board determination
The Board unanimously approved the continuation of the Advisory Agreement between the Adviser and the Fund for an additional one-year term. The Subadvisory Agreement between the Adviser and Subadviser with respect to the Fund was also approved for an additional one-year term. Based upon its evaluation of relevant factors in their totality, the Board was satisfied that the terms of the Agreements, including the advisory and subadvisory fee rates, were fair and
| 27 |
reasonable and in the best interest of the Fund and its shareholders. In arriving at its decision to approve the Agreements, the Board did not identify any single factor or any group of factors as all-important or controlling, but considered all factors together. Different Trustees may have attributed different weights to the various factors considered. The Independent Trustees were also assisted by independent legal counsel in making this determination. The Trustees’ conclusions may be based in part on their consideration of these arrangements in the prior year and on their ongoing regular review of Fund performance and operations throughout the year.
| 28 |
More information
| Trustees | Investment adviser |
| Steven R. Pruchansky, Chairperson | John Hancock Investment Management Services, LLC |
| James F. Carlin | |
| William H. Cunningham | Subadviser |
| Deborah C. Jackson | John Hancock Asset Management |
| Charles L. Ladner,* Vice Chairperson | |
| Stanley Martin* | Principal distributor |
| Hugh McHaffie† | John Hancock Funds, LLC |
| Dr. John A. Moore * # | |
| Patti McGill Peterson* | Custodian |
| Gregory A. Russo | State Street Bank and Trust Company |
| John G. Vrysen† | |
| Transfer agent | |
| John Hancock Signature Services, Inc. | |
| Officers | |
| Keith F. Hartstein | Legal counsel |
| President and Chief Executive Officer | K&L Gates LLP |
| Andrew G. Arnott | |
| Senior Vice President and Chief Operating Officer | |
| Thomas M. Kinzler | |
| Secretary and Chief Legal Officer | |
| Francis V. Knox, Jr. | |
| Chief Compliance Officer | |
| Charles A. Rizzo | |
| Chief Financial Officer | |
| Salvatore Schiavone | |
| Treasurer | |
| * Member of the Audit Committee | |
| † Non-Independent Trustee | |
| # Effective 9-13-11 | |
The Fund’s proxy voting policies and procedures, as well as the Fund’s proxy voting record, if any, for the most recent twelve-month period ended June 30, are available free of charge on the Securities and Exchange Commission (SEC) Web site at www.sec.gov or on our Web site.
The Fund’s complete list of portfolio holdings, for the first and third fiscal quarters, is filed with the SEC on Form N-Q. The Fund’s Form N-Q is available on our Web site and the SEC’s Web site, www.sec.gov, and can be reviewed and copied (for a fee) at the SEC’s Public Reference Room in Washington, DC. Call 1-800-SEC-0330 to receive information on the operation of the SEC's Public Reference Room.
We make this information on your fund, as well as monthly portfolio holdings, and other fund details available on our Web site at www.jhfunds.com or by calling 1-800-225-5291.
| You can also contact us: | ||
| 1-800-225-5291 | Regular mail: | Express mail: |
| www. jhfunds.com | John Hancock Signature Services, Inc. | John Hancock Signature Services, Inc. |
| P.O. Box 55913 | Mutual Fund Image Operations | |
| Boston, MA 02205-5913 | 30 Dan Road | |
| Canton, MA 02021 |
| 29 |
A look at performance
Total returns for the period ended September 30, 2011
| Average annual total returns (%) | Cumulative total returns (%) | |||||||||
| with maximum sales charge (POP) | with maximum sales charge (POP) | |||||||||
| Since | Since | |||||||||
| 1-year | 5-year | 10-year | inception | 6-months | 1-year | 5-year | 10-year | inception | ||
| Class A1 | –7.75 | –2.23 | 3.25 | — | –21.55 | –7.75 | –10.66 | 37.70 | — | |
| Class B1 | –8.47 | –2.49 | 2.75 | — | –21.86 | –8.47 | –11.87 | 31.16 | — | |
| Class C1 | –4.64 | –2.17 | 2.75 | — | –18.57 | –4.64 | –10.38 | 31.16 | — | |
| Class I1 | –2.53 | –0.87 | 4.16 | — | –17.31 | –2.53 | –4.30 | 50.33 | — | |
| Class I21,2 | –2.53 | –0.98 | 3.96 | — | –17.29 | –2.53 | –4.80 | 47.47 | — | |
| Class R11,2 | –3.28 | –1.59 | 3.40 | — | –17.60 | –3.28 | –7.69 | 39.75 | — | |
| Class R31,2 | –3.16 | –1.48 | 3.51 | — | –17.53 | –3.16 | –7.18 | 41.22 | — | |
| Class R41,2 | –2.98 | –1.20 | 3.81 | — | –17.46 | –2.98 | –5.86 | 45.39 | — | |
| Class R51,2 | –2.56 | –0.89 | 4.13 | — | –17.29 | –2.56 | –4.37 | 49.92 | — | |
| Class R61,2 | –2.46 | –0.85 | 4.20 | — | –17.23 | –2.46 | –4.18 | 50.90 | — | |
| Class ADV 1,2 | –2.67 | –1.28 | 3.60 | — | –17.32 | –2.67 | –6.22 | 42.47 | — | |
| Class NAV 2 | –2.47 | — | — | 9.673 | –17.22 | –2.47 | — | — | 24.153 | |
Performance figures assume all distributions are reinvested. Public offering price (POP) figures reflect maximum sales charge on Class A shares of 5%, and the applicable contingent deferred sales charge (CDSC) on Class B and Class C shares. The Class B shares’ CDSC declines annually between years 1 to 6 according to the following schedule: 5, 4, 3, 3, 2, 1%. No sales charge will be assessed after the sixth year. Class C shares held for less than one year are subject to a 1% CDSC. Sales charges are not applicable for Class I, I2, R1, R3, R4, R5, R6, ADV and NAV shares.
The expense ratios of the Fund, both net (including any fee waivers or expense limitations) and gross (excluding any fee waivers or expense limitations), are set forth according to the most recent publicly available prospectuses for the Fund and may differ from those disclosed in the Financial highlights tables in this report. The fee waivers and expense limitations are contractual at least until 6-30-12 for Class B, C, I2, R1, R3, R4, R5 and ADV shares. Had the fee waivers and expense limitations not been in place gross expenses would apply. For all other classes the net expenses equal the gross expenses. The expense ratios are as follows:
| Class A | Class B | Class C | Class I | Class I2 | Class R1 | Class R3 | Class R4 | Class R5 | Class R6 | Class ADV | Class NAV | |
| Net (%) | 1.26 | 2.05 | 2.05 | 0.89 | 0.85 | 1.65 | 1.55 | 1.25 | 0.95 | 0.84 | 1.00 | 0.79 |
| Gross (%) | 1.26 | 2.26 | 2.08 | 0.89 | 0.95 | 3.14 | 20.07 | 2.78 | 1.23 | 0.84 | 44.25 | 0.79 |
The returns reflect past results and should not be considered indicative of future performance. The return and principal value of an investment will fluctuate so that shares, when redeemed, may be worth more or less than their original cost. Due to market volatility, the Fund’s current performance may be higher or lower than the performance shown. For performance data current to the most recent month end, please call 1–800–225–5291 or visit the Fund’s Web site at www.jhfunds.com.
The performance table above and the chart on the next page do not reflect the deduction of taxes that a shareholder would pay on fund distributions or the redemption of fund shares. The Fund’s performance results reflect any applicable expense reductions, without which the expenses would increase and results would have been less favorable.
| 6 | Disciplined Value Fund | Semiannual report |
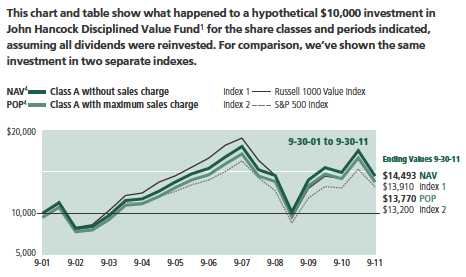
| Without | With maximum | ||||
| Start date | sales charge | sales charge | Index 1 | Index 2 | |
| Class B5 | 9-30-01 | $13,116 | $13,116 | $13,910 | $13,200 |
| Class C5 | 9-30-01 | 13,116 | 13,116 | 13,910 | 13,200 |
| Class I2 | 9-30-01 | 15,033 | 15,033 | 13,910 | 13,200 |
| Class I 22 | 9-30-01 | 14,747 | 14,747 | 13,910 | 13,200 |
| Class R12 | 9-30-01 | 13,975 | 13,975 | 13,910 | 13,200 |
| Class R32 | 9-30-01 | 14,122 | 14,122 | 13,910 | 13,200 |
| Class R42 | 9-30-01 | 14,539 | 14,539 | 13,910 | 13,200 |
| Class R52 | 9-30-01 | 14,992 | 14,992 | 13,910 | 13,200 |
| Class R6 2 | 9-30-01 | 15,090 | 15,090 | 13,910 | 13,200 |
| Class ADV2 | 9-30-01 | 14,247 | 14,247 | 13,910 | 13,200 |
| Class NAV2 | 5-29-09 | 12,415 | 12,415 | 12,699 | 13,082 |
Russell 1000 Value Index is an unmanaged index containing those securities in the Russell 1000 Index with a lower price-to-book ratio and less-than-average growth orientation.
S&P 500 Index is an unmanaged index that includes 500 widely traded common stocks.
It is not possible to invest directly in an index. Index figures do not reflect sales charges, which would have resulted in lower values if they did.
1 On 12-19-08, through a reorganization, the Fund acquired all of the assets of the Robeco Boston Partners Large Cap Value Fund (the predecessor fund). On that date, the predecessor fund offered its Investor share class in exchange for Class A shares (inception 12-22-08) and its institutional share class in exchange for Class I shares. Class B, Class C and Class ADV shares were first offered on 12-22-08; the inception date of Class R3, Class R4 and Class R5 shares is 5-22-09; the inception date of Class R1 shares is 7-13-09. The returns prior to these dates are those of Class A shares that have been recalculated to apply the gross fees and expenses of Class B, Class C, Class ADV, Class R3, Class R4, Class R5 and Class R1 shares, respectively. The predecessor fund’s Institutional share class returns have been recalculated to reflect the gross fees and expenses of Class I shares. The inception date of Class I2 shares is 12-22-08; returns prior to that date are those of Class I shares recalculated to apply the gross fees and expenses of Class I2 shares. Class R6 shares were first offered 9-1-11; the returns prior to this date are those of Class A shares that have been recalculated to apply the gross fees and expenses of Class R6 shares.
2 For certain types of investors, as described in the Fund’s prospectuses.
3 From 5-29-09.
4 NAV represents net asset value and POP represents public offering price. Performance of the classes will vary based on the difference in sales charges paid by shareholders investing in the different classes and the fee structure of those classes.
5 No contingent deferred sales charge is applicable.
| Semiannual report | Disciplined Value Fund | 7 |
Your expenses
These examples are intended to help you understand your ongoing operating expenses.
Understanding fund expenses
As a shareholder of the Fund, you incur two types of costs:
▪ Transaction costs which include sales charges (loads) on purchases or redemptions (varies by share class), minimum account fee charge, etc.
▪ Ongoing operating expenses including management fees, distribution and service fees (if applicable), and other fund expenses.
We are going to present only your ongoing operating expenses here.
Actual expenses/actual returns
This example is intended to provide information about the Fund’s actual ongoing operating expenses, and is based on the Fund’s actual return. It assumes an account value of $1,000.00 on April 1, 2011 with the same investment held until September 30, 2011.
| Account value | Ending value | Expenses paid during | |
| on 4-1-11 | on 9-30-11 | period ended 9-30-111 | |
| Class A | $1,000.00 | $825.70 | $5.52 |
| Class B | 1,000.00 | 822.60 | 9.34 |
| Class C | 1,000.00 | 822.60 | 9.07 |
| Class I | 1,000.00 | 826.90 | 3.93 |
| Class I2 | 1,000.00 | 827.10 | 3.88 |
| Class R1 | 1,000.00 | 824.00 | 7.48 |
| Class R3 | 1,000.00 | 824.70 | 7.03 |
| Class R4 | 1,000.00 | 825.40 | 5.66 |
| Class R5 | 1,000.00 | 827.10 | 4.07 |
| Class ADV | 1,000.00 | 826.80 | 4.57 |
| Class NAV | 1,000.00 | 827.80 | 3.52 |
For the class noted below, the example assumes an account value of $1,000 on September 1, 2011, with the same investment held until September 30, 2011.
| Account value | Ending value | Expenses paid during | |
| on 9-1-11 | on 9-30-11 | period ended 9-30-112 | |
| Class R6 | $1,000.00 | $918.80 | $0.68 |
Together with the value of your account, you may use this information to estimate the operating expenses that you paid over the period. Simply divide your account value at
| 8 | Disciplined Value Fund | Semiannual report |
September 30, 2011, by $1,000.00, then multiply it by the “expenses paid” for your share class from the table above. For example, for an account value of $8,600.00, the operating expenses should be calculated as follows:
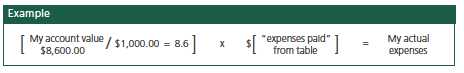
Hypothetical example for comparison purposes
This table allows you to compare your Fund’s ongoing operating expenses with those of any other fund. It provides an example of the Fund’s hypothetical account values and hypothetical expenses based on each class’ actual expense ratio and an assumed 5% annualized return before expenses (which is not the Fund’s actual return). It assumes an account value of $1,000.00 on April 1, 2011, with the same investment held until September 30, 2011. Look in any other fund shareholder report to find its hypothetical example and you will be able to compare these expenses.
| Account value | Ending value | Expenses paid during | |
| on 4-1-11 | on 9-30-11 | period ended 9-30-113 | |
| Class A | $1,000.00 | $1,018.90 | $6.11 |
| Class B | 1,000.00 | 1,014.70 | 10.33 |
| Class C | 1,000.00 | 1,015.00 | 10.02 |
| Class I | 1,000.00 | 1,020.70 | 4.34 |
| Class I2 | 1,000.00 | 1,020.70 | 4.29 |
| Class R1 | 1,000.00 | 1,016.80 | 8.27 |
| Class R3 | 1,000.00 | 1,017.30 | 7.77 |
| Class R4 | 1,000.00 | 1,018.80 | 6.26 |
| Class R5 | 1,000.00 | 1,020.50 | 4.50 |
| Class R6 | 1,000.00 | 1,020.70 | 4.34 |
| Class ADV | 1,000.00 | 1,020.00 | 5.05 |
| Class NAV | 1,000.00 | 1,021.10 | 3.89 |
Remember, these examples do not include any transaction costs, therefore, these examples will not help you to determine the relative total costs of owning different funds. If transaction costs were included, your expenses would have been higher. See the prospectus for details regarding transaction costs.
1 Expenses are equal to the Fund’s annualized expense ratio of 1.21%, 2.05%, 1.99%, 0.86%, 0.85%, 1.64%, 1.54%, 1.24%, 0.89%, 1.00% and 0.77% for Class A, Class B, Class C, Class I, Class I2, Class R1, Class R3, Class R4, Class R5, Class ADV and Class NAV shares, respectively, multiplied by the average account value over the period, multiplied by 183/366 (to reflect the one-half year period).
2 Expenses are equal to the Fund’s annualized expense ratio of 0.86% for Class R6 shares, multiplied by the average account value over the period, multiplied by 30/366 (to reflect the period).
3 Expenses are equal to the Fund’s annualized expense ratio multiplied by the average account value over the period, multiplied by 183/366 (to reflect the one-half year period).
| Semiannual report | Disciplined Value Fund | 9 |
Portfolio summary
| Top 10 Holdings (28.2% of Net Assets on 9-30-11)1,2 | ||||
| Wells Fargo & Company | 3.8% | Chevron Corp. | 2.7% | |
| JPMorgan Chase & Company | 3.5% | Microsoft Corp. | 2.4% | |
| Pfizer, Inc. | 3.4% | Humana, Inc. | 2.2% | |
| Berkshire Hathaway, Inc., Class B | 3.3% | Occidental Petroleum Corp. | 2.1% | |
| Johnson & Johnson | 2.9% | Oracle Corp. | 1.9% | |
| Sector Composition2,3 | ||||
| Financials | 24% | Consumer Staples | 4% | |
| Information Technology | 17% | Materials | 1% | |
| Consumer Discretionary | 16% | Utilities | 1% | |
| Health Care | 13% | Telecommunication Services | 1% | |
| Energy | 11% | Short-Term Investments & Other | 3% | |
| Industrials | 9% | |||
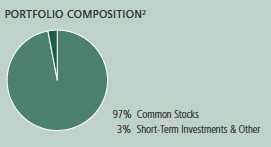
1 Cash and cash equivalents not included.
2 As a percentage of net assets on 9-30-11.
3 Sector investing is subject to greater risks than the market as a whole. Because the Fund may focus on particular sectors of the economy, its performance may depend on the performance of those sectors.
| 10 | Disciplined Value Fund | Semiannual report |
Fund’s investments
As of 9-30-11 (unaudited)
| Shares | Value | |
| Common Stocks 97.27% | $1,274,770,179 | |
| (Cost $1,340,279,651) | ||
| Consumer Discretionary 16.10% | 210,920,780 | |
| Auto Components 2.23% | ||
| Autoliv, Inc. (L) | 194,035 | 9,410,698 |
| Lear Corp. | 370,794 | 15,907,063 |
| Visteon Corp. (I) | 91,214 | 3,922,202 |
| Media 10.17% | ||
| CBS Corp., Class B | 993,070 | 20,238,767 |
| Cinemark Holdings, Inc. | 412,330 | 7,784,790 |
| Comcast Corp., Class A | 1,101,295 | 23,017,066 |
| Liberty Media Corp. – Starz, Series A (I) | 169,187 | 10,753,526 |
| Omnicom Group, Inc. | 377,450 | 13,905,258 |
| The McGraw-Hill Companies, Inc. (L) | 438,120 | 17,962,920 |
| Time Warner, Inc. (L) | 525,990 | 15,763,920 |
| Viacom, Inc., Class B | 614,070 | 23,789,072 |
| Multiline Retail 2.72% | ||
| Kohl’s Corp. | 193,272 | 9,489,655 |
| Macy’s, Inc. | 496,710 | 13,073,407 |
| Target Corp. | 267,405 | 13,113,541 |
| Specialty Retail 0.98% | ||
| Home Depot, Inc. | 389,075 | 12,788,895 |
| Consumer Staples 3.89% | 50,954,258 | |
| Beverages 0.72% | ||
| Anheuser-Busch InBev NV, ADR | 177,860 | 9,423,023 |
| Food & Staples Retailing 2.25% | ||
| CVS Caremark Corp. | 445,600 | 14,963,248 |
| Wal-Mart Stores, Inc. | 279,945 | 14,529,146 |
| Tobacco 0.92% | ||
| Philip Morris International, Inc. | 192,992 | 12,038,841 |
| Energy 11.15% | 146,129,628 | |
| Oil, Gas & Consumable Fuels 11.15% | ||
| Canadian Natural Resources, Ltd. | 271,135 | 7,936,121 |
| Chevron Corp. | 387,905 | 35,888,971 |
| EOG Resources, Inc. | 178,505 | 12,675,640 |
| Exxon Mobil Corp. | 311,319 | 22,611,099 |
| Noble Energy, Inc. | 186,285 | 13,188,978 |
| See notes to financial statements | Semiannual report | Disciplined Value Fund | 11 |
| Shares | Value | |
| Oil, Gas & Consumable Fuels (continued) | ||
| Occidental Petroleum Corp. | 379,405 | $27,127,458 |
| Royal Dutch Shell PLC, ADR | 287,445 | 17,683,616 |
| SM Energy Company | 148,685 | 9,017,745 |
| Financials 23.90% | 313,238,119 | |
| Capital Markets 0.58% | ||
| Raymond James Financial, Inc. | 291,365 | 7,563,835 |
| Commercial Banks 7.40% | ||
| PNC Financial Services Group, Inc. | 474,790 | 22,880,130 |
| U.S. Bancorp | 1,057,675 | 24,897,670 |
| Wells Fargo & Company | 2,038,570 | 49,170,308 |
| Consumer Finance 3.26% | ||
| Capital One Financial Corp. | 291,485 | 11,551,551 |
| Discover Financial Services | 554,060 | 12,710,136 |
| SLM Corp. | 1,484,230 | 18,478,664 |
| Diversified Financial Services 5.04% | ||
| Citigroup, Inc. | 790,404 | 20,250,150 |
| JPMorgan Chase & Company | 1,521,350 | 45,823,062 |
| Insurance 7.13% | ||
| Berkshire Hathaway, Inc., Class B (I) | 605,824 | 43,037,737 |
| Marsh & McLennan Companies, Inc. | 245,115 | 6,505,352 |
| MetLife, Inc. | 560,833 | 15,708,932 |
| Reinsurance Group of America, Inc. | 141,470 | 6,500,547 |
| The Travelers Companies, Inc. | 269,354 | 13,125,620 |
| Validus Holdings, Ltd. | 345,656 | 8,613,748 |
| Real Estate Investment Trusts 0.49% | ||
| Annaly Capital Management, Inc. | 386,090 | 6,420,677 |
| Health Care 13.46% | 176,402,818 | |
| Biotechnology 1.40% | ||
| Amgen, Inc. | 332,805 | 18,287,635 |
| Health Care Equipment & Supplies 1.44% | ||
| CareFusion Corp. (I) | 317,510 | 7,604,365 |
| Covidien PLC | 256,005 | 11,289,821 |
| Health Care Providers & Services 4.38% | ||
| AmerisourceBergen Corp. (L) | 196,340 | 7,317,592 |
| Humana, Inc. | 403,340 | 29,334,918 |
| McKesson Corp. | 286,110 | 20,800,197 |
| Pharmaceuticals 6.24% | ||
| Johnson & Johnson | 594,186 | 37,855,590 |
| Pfizer, Inc. | 2,483,750 | 43,912,700 |
| Industrials 8.81% | 115,405,275 | |
| Aerospace & Defense 6.02% | ||
| Honeywell International, Inc. | 443,695 | 19,482,647 |
| Huntington Ingalls Industries, Inc. (I)(L) | 174,253 | 4,239,575 |
| ITT Corp. | 301,060 | 12,644,520 |
| 12 | Disciplined Value Fund | Semiannual report | See notes to financial statements |
| Shares | Value | |
| Aerospace & Defense (continued) | ||
| Northrop Grumman Corp. | 186,645 | $9,735,403 |
| Raytheon Company | 423,715 | 17,317,232 |
| United Technologies Corp. | 220,185 | 15,492,217 |
| Industrial Conglomerates 2.79% | ||
| General Electric Company | 1,615,990 | 24,627,688 |
| Tyco International, Ltd. | 291,190 | 11,865,993 |
| Information Technology 16.88% | 221,238,995 | |
| Communications Equipment 1.16% | ||
| Harris Corp. | 446,345 | 15,251,609 |
| Computers & Peripherals 3.71% | ||
| Apple, Inc. (I) | 53,160 | 20,263,529 |
| EMC Corp. (I) | 498,675 | 10,467,188 |
| Seagate Technology PLC | 966,055 | 9,931,045 |
| Western Digital Corp. (I) | 310,035 | 7,974,100 |
| Electronic Equipment, Instruments & Components 1.45% | ||
| TE Connectivity, Ltd. | 673,050 | 18,939,627 |
| Internet Software & Services 2.75% | ||
| eBay, Inc. (I) | 819,355 | 24,162,779 |
| IAC/InterActiveCorp (I) | 301,645 | 11,930,060 |
| IT Services 2.08% | ||
| CGI Group, Inc., Class A (I) | 345,932 | 6,506,981 |
| International Business Machines Corp. | 49,315 | 8,631,604 |
| The Western Union Company | 791,955 | 12,108,992 |
| Office Electronics 0.87% | ||
| Xerox Corp. | 1,643,135 | 11,452,651 |
| Software 4.86% | ||
| CA, Inc. | 345,120 | 6,698,779 |
| Microsoft Corp. | 1,279,544 | 31,847,850 |
| Oracle Corp. | 872,380 | 25,072,201 |
| Materials 1.35% | 17,744,374 | |
| Containers & Packaging 0.65% | ||
| Rock-Tenn Company, Class A | 175,375 | 8,537,255 |
| Metals & Mining 0.70% | ||
| Reliance Steel & Aluminum Company | 270,718 | 9,207,119 |
| Telecommunication Services 0.81% | 10,643,003 | |
| Wireless Telecommunication Services 0.81% | ||
| Vodafone Group PLC, ADR | 414,932 | 10,643,003 |
| Utilities 0.92% | 12,092,929 | |
| Electric Utilities 0.92% | ||
| Edison International | 316,155 | 12,092,929 |
| See notes to financial statements | Semiannual report | Disciplined Value Fund | 13 |
| Yield | Shares | Value | |
| Securities Lending Collateral 2.27% | $29,681,285 | ||
| (Cost $29,679,810) | |||
| John Hancock Collateral Investment Trust (W) | 0.2515% (Y) | 2,966,586 | 29,681,285 |
| Par value | Value | ||
| Short-Term Investments 2.07% | $27,171,000 | ||
| (Cost $27,171,000) | |||
| Repurchase Agreement 2.07% | 27,171,000 | ||
| Repurchase Agreement with State Street Corp. dated 9-30-11 at 0.010% to | |||
| be repurchased at $27,171,008 on 10-3-11, collateralized by $25,725,000 | |||
| U.S. Treasury Notes, 2.625% due 11-15-20 (valued at $27,718,688, | |||
| including interest) | $27,171,000 | 27,171,000 | |
| Total investments (Cost $1,397,130,461)† 101.61% | $1,331,622,464 | ||
| Other assets and liabilities, net (1.61%) | ($21,136,004) | ||
| Total net assets 100.00% | $1,310,486,460 | ||
The percentage shown for each investment category is the total value of the category as a percentage of the net assets of the Fund.
ADR American Depositary Receipts
(I) Non-income producing security.
(L) All or a portion of this security is on loan as of 9-30-11.
(W) Investment is an affiliate of the Fund, the adviser and/or subadviser. Also, it represents the investment of securities lending collateral received.
(Y) The rate shown is the annualized seven-day yield as of 9-30-11.
† At 9-30-11, the aggregate cost of investment securities for federal income tax purposes was $1,402,128,088. Net unrealized depreciation aggregated $70,505,624, of which $54,421,414 related to appreciated investment securities and $124,927,038 related to depreciated investment securities.
| 14 | Disciplined Value Fund | Semiannual report | See notes to financial statements |
F I N A N C I A L S T A T E M E N T S
Financial statements
Statement of assets and liabilities 9-30-11 (unaudited)
This Statement of assets and liabilities is the Fund’s balance sheet. It shows the value of what the Fund owns, is due and owes.
| Assets | |
| Investments in unaffiliated issuers, at value (Cost $1,367,450,651) | |
| including $29,014,931 of securities loaned (Note 2) | $1,301,941,179 |
| Investments in affiliated issuers, at value (Cost $29,679,810) (Note 2) | 29,681,285 |
| Total investments, at value (Cost $1,397,130,461) | 1,331,622,464 |
| Cash | 335 |
| Receivable for investments sold | 4,084,727 |
| Receivable for fund shares sold | 9,572,031 |
| Dividends and interest receivable | 1,587,189 |
| Receivable for securities lending income | 6,023 |
| Receivable due from adviser | 271 |
| Other receivables and prepaid expenses | 138,649 |
| Total assets | 1,347,011,689 |
| Liabilities | |
| Payable for investments purchased | 4,011,838 |
| Payable for fund shares repurchased | 2,560,638 |
| Payable upon return of securities loaned (Note 2) | 29,706,169 |
| Payable to affiliates | |
| Accounting and legal services fees | 12,709 |
| Transfer agent fees | 118,688 |
| Trustees’ fees | 3,763 |
| Other liabilities and accrued expenses | 111,424 |
| Total liabilities | 36,525,229 |
| Net assets | |
| Paid-in capital | $1,394,951,837 |
| Undistributed net investment income | 8,102,680 |
| Accumulated net realized loss on investments and foreign | |
| currency transactions | (27,058,973) |
| Net unrealized (depreciation) on investments and translation of assets and | |
| liabilities in foreign currencies | (65,509,084) |
| Net assets | $1,310,486,460 |
| See notes to financial statements | Semiannual report | Disciplined Value Fund | 15 |
F I N A N C I A L S T A T E M E N T S
Statement of assets and liabilities (continued)
| Net asset value per share | |
| Based on net asset values and shares outstanding — the Fund has an | |
| unlimited number of shares authorized with no par value | |
| Class A ($537,007,814 ÷ 47,018,156 shares) | $11.42 |
| Class B ($7,446,756 ÷ 680,942 shares)1 | $10.94 |
| Class C ($30,416,493 ÷ 2,780,227 shares)1 | $10.94 |
| Class I ($374,821,782 ÷ 33,523,492 shares) | $11.18 |
| Class I2 ($18,829,783 ÷ 1,682,779 shares) | $11.19 |
| Class R1 ($1,863,780 ÷ 167,364 shares) | $11.14 |
| Class R3 ($51,363 ÷ 4,608 shares) | $11.15 |
| Class R4 ($922,196 ÷ 82,625 shares) | $11.16 |
| Class R5 ($19,170,131 ÷ 1,713,346 shares) | $11.19 |
| Class R6 ($1,031,195 ÷ 92,096 shares) | $11.20 |
| Class ADV ($32,077 ÷ 2,872.5 shares) | $11.17 |
| Class NAV ($318,893,090 ÷ 28,478,239 shares) | $11.20 |
| Maximum offering price per share | |
| Class A (net asset value per share ÷ 95%)2 | $12.02 |
1 Redemption price is equal to net asset value less any applicable contingent deferred sales charge.
2 On single retail sales of less than $50,000. On sales of $50,000 or more and on group sales the offering price is reduced.
| 16 | Disciplined Value Fund | Semiannual report | See notes to financial statements |
F I N A N C I A L S T A T E M E N T S
Statement of operations For the six-month period ended 9-30-11
(unaudited)
This Statement of operations summarizes the Fund’s investment income earned and expenses incurred in operating the Fund. It also shows net gains (losses) for the period stated.
| Investment income | |
| Dividends | $14,460,594 |
| Securities lending | 170,670 |
| Interest | 8,639 |
| Less foreign taxes withheld | (175,169) |
| Total investment income | 14,464,734 |
| Expenses | |
| Investment management fees (Note 4) | 5,366,979 |
| Distribution and service fees (Note 4) | 975,453 |
| Accounting and legal services fees (Note 4) | 94,307 |
| Transfer agent fees (Note 4) | 714,052 |
| Trustees’ fees (Note 4) | 44,835 |
| State registration fees (Note 4) | 75,332 |
| Printing and postage (Note 4) | 57,639 |
| Professional fees | 92,107 |
| Custodian fees | 77,002 |
| Registration and filing fees | 12,437 |
| Other | 21,840 |
| Total expenses | 7,531,983 |
| Less expense reductions (Note 4) | (28,624) |
| Net expenses | 7,503,359 |
| Net investment income | 6,961,375 |
| Realized and unrealized gain (loss) | |
| Net realized gain (loss) on | |
| Investments in unaffiliated issuers | 8,689,979 |
| Investments in affiliated issuers | (18,477) |
| Foreign currency transactions | 2,943 |
| 8,674,445 | |
| Change in net unrealized appreciation (depreciation) of | |
| Investments in unaffiliated issuers | (291,703,457) |
| Investments in affiliated issuers | 87 |
| Translation of assets and liabilities in foreign currencies | (1,499) |
| (291,704,869) | |
| Net realized and unrealized loss | (283,030,424) |
| Decrease in net assets from operations | ($276,069,049) |
| See notes to financial statements | Semiannual report | Disciplined Value Fund | 17 |
F I N A N C I A L S T A T E M E N T S
Statements of changes in net assets
These Statements of changes in net assets show how the value of the Fund’s net assets has changed during the last two periods. The difference reflects earnings less expenses, any investment gains and losses, distributions, if any, paid to shareholders and the net of Fund share transactions.
| Six months | ||||
| ended | Year | |||
| 9-30-11 | ended | |||
| (Unaudited) | 3-31-11 | |||
| Increase (decrease) in net assets | ||||
| From operations | ||||
| Net investment income | $6,961,375 | $6,127,516 | ||
| Net realized gain | 8,674,445 | 37,500,037 | ||
| Change in net unrealized appreciation (depreciation) | (291,704,869) | 155,610,472 | ||
| Increase (decrease) in net assets resulting from operations | (276,069,049) | 199,238,025 | ||
| Distributions to shareholders | ||||
| From net investment income | ||||
| Class A | — | (1,174,517) | ||
| Class I | — | (1,922,243) | ||
| Class I2 | — | (119,077) | ||
| Class R3 | — | (34) | ||
| Class R4 | — | (2,863) | ||
| Class R5 | — | (895) | ||
| Class ADV | — | (163) | ||
| Class NAV | — | (2,402,882) | ||
| From net realized gain | ||||
| Class A | — | (2,592,490) | ||
| Class B | — | (34,905) | ||
| Class C | — | (133,777) | ||
| Class I | — | (1,734,582) | ||
| Class I2 | — | (107,108) | ||
| Class R1 | — | (5,586) | ||
| Class R3 | — | (518) | ||
| Class R4 | — | (4,917) | ||
| Class R5 | — | (855) | ||
| Class ADV | — | (191) | ||
| Class NAV | — | (1,991,992) | ||
| Total distributions | — | (12,229,595) | ||
| From Fund share transactions (Note 5) | 102,172,081 | 705,112,078 | ||
| Total increase (decrease) | (173,896,968) | 892,120,508 | ||
| Net assets | ||||
| Beginning of period | 1,484,383,428 | 592,262,920 | ||
| End of period | $1,310,486,460 | $1,484,383,428 | ||
| Undistributed net investment income | $8,102,680 | $1,141,305 | ||
| 18 | Disciplined Value Fund | Semiannual report | See notes to financial statements |
Financial highlights
The Financial highlights show how the Fund’s net asset value for a share has changed since the end of the previous period.
| CLASS A SHARES Period ended | 9-30-111 | 3-31-11 | 3-31-10 | 3-31-092,3 | 8-31-084 | 8-31-074 | 8-31-064 |
| Per share operating performance | |||||||
| Net asset value, beginning | |||||||
| of period | $13.83 | $12.31 | $8.09 | $12.32 | $15.62 | $14.77 | $15.22 |
| Net investment income5 | 0.05 | 0.05 | 0.08 | 0.08 | 0.15 | 0.15 | 0.13 |
| Net realized and unrealized gain | |||||||
| (loss) on investments | (2.46) | 1.57 | 4.18 | (4.18) | (1.90) | 2.07 | 1.57 |
| Total from | |||||||
| investment operations | (2.41) | 1.62 | 4.26 | (4.10) | (1.75) | 2.22 | 1.70 |
| Less distributions | |||||||
| From net investment income | — | (0.03) | (0.04) | (0.13) | (0.15) | (0.13) | (0.13) |
| From net realized gain | — | (0.07) | — | — | (1.40) | (1.24) | (2.02) |
| Total distributions | — | (0.10) | (0.04) | (0.13) | (1.55) | (1.37) | (2.15) |
| Net asset value, end of period | $11.42 | $13.83 | $12.31 | $8.09 | $12.32 | $15.62 | $14.77 |
| Total return (%)6 | (17.43)8 | 13.20 | 52.687 | (33.33)7,8 | (12.29)7 | 15.457 | 12.147 |
| Ratios and supplemental data | |||||||
| Net assets, end of period | |||||||
| (in millions) | $537 | $601 | $162 | $10 | $16 | $23 | $21 |
| Ratios (as a percentage of average | |||||||
| net assets): | |||||||
| Expenses before reductions | 1.219 | 1.24 | 1.26 | 1.769 | 1.39 | 1.32 | 1.46 |
| Expenses net of fee waivers | 1.219 | 1.24 | 1.06 | 1.009 | 1.00 | 1.00 | 1.11 |
| Expenses net of fee waivers | |||||||
| and credits | 1.219 | 1.24 | 1.05 | 1.009 | 1.00 | 1.00 | 1.11 |
| Net investment income | 0.749 | 0.38 | 0.74 | 1.459 | 1.10 | 0.95 | 0.87 |
| Portfolio turnover (%) | 25 | 50 | 59 | 5210 | 78 | 62 | 58 |
1 Unaudited.
2 For the seven-month period ended 3-31-09. The Fund changed its fiscal year end from August 31 to March 31.
3 After the close of business on 12-19-08, holders of Investor share class of the former Robeco Large Cap Value Fund (the Predecessor Fund) became owners of an equal number of full and fractional Class A shares of the John Hancock Disciplined Value Fund. These shares were first offered on 12-22-08. Additionally, the accounting and performance history of the Investor share class of the Predecessor Fund was redesignated as that of John Hancock Disciplined Value Fund Class A.
4 Audited by previous independent registered public accounting firm.
5 Based on the average daily shares outstanding.
6 Does not reflect the effect of sales charges, if any.
7 Total returns would have been lower had certain expenses not been reduced during the periods shown.
8 Not annualized.
9 Annualized.
10 Portfolio turnover is shown for the period from 9-1-08 to 3-31-09.
| See notes to financial statements | Semiannual report | Disciplined Value Fund | 19 |
| CLASS B SHARES Period ended | 9-30-111 | 3-31-11 | 3-31-10 | 3-31-092 | ||
| Per share operating performance | ||||||
| Net asset value, beginning of period | $13.30 | $11.91 | $7.88 | $8.82 | ||
| Net investment income (loss)3 | (0.01) | (0.05) | (0.03) | 0.02 | ||
| Net realized and unrealized gain (loss) on investments | (2.35) | 1.51 | 4.06 | (0.96) | ||
| Total from investment operations | (2.36) | 1.46 | 4.03 | (0.94) | ||
| Less distributions | ||||||
| From net realized gain | — | (0.07) | — | — | ||
| Net asset value, end of period | $10.94 | $13.30 | $11.91 | $7.88 | ||
| Total return (%)4,5 | (17.74)6 | 12.28 | 51.14 | (10.66)6 | ||
| Ratios and supplemental data | ||||||
| Net assets, end of period (in millions) | $7 | $8 | $5 | —7 | ||
| Ratios (as a percentage of average net assets): | ||||||
| Expenses before reductions | 2.098 | 2.27 | 2.58 | 4.248 | ||
| Expenses net of fee waivers | 2.058 | 2.05 | 2.12 | 2.078 | ||
| Expenses net of fee waivers and credits | 2.058 | 2.05 | 2.05 | 2.058 | ||
| Net investment income (loss) | (0.10)8 | (0.45) | (0.25) | 1.188 | ||
| Portfolio turnover (%) | 25 | 50 | 59 | 529 | ||
1 Unaudited.
2 The inception date for Class B shares is 12-22-08.
3 Based on the average daily shares outstanding.
4 Does not reflect the effect of sales charges, if any.
5 Total returns would have been lower had certain expenses not been reduced during the periods shown.
6 Not annualized.
7 Less than $500,000.
8 Annualized.
9 Portfolio turnover is shown for the period from 9-1-08 to 3-31-09.
| CLASS C SHARES Period ended | 9-30-111 | 3-31-11 | 3-31-10 | 3-31-092 | ||
| Per share operating performance | ||||||
| Net asset value, beginning of period | $13.30 | $11.91 | $7.87 | $8.82 | ||
| Net investment income (loss)3 | —4 | (0.05) | (0.03) | 0.02 | ||
| Net realized and unrealized gain (loss) on investments | (2.36) | 1.51 | 4.07 | (0.97) | ||
| Total from investment operations | (2.36) | 1.46 | 4.04 | (0.95) | ||
| Less distributions | ||||||
| From net realized gain | — | (0.07) | — | — | ||
| Net asset value, end of period | $10.94 | $13.30 | $11.91 | $7.87 | ||
| Total return (%)5 | (17.74)7 | 12.286 | 51.336 | (10.77)6,7 | ||
| Ratios and supplemental data | ||||||
| Net assets, end of period (in millions) | $30 | $30 | $19 | —8 | ||
| Ratios (as a percentage of average net assets): | ||||||
| Expenses before reductions | 1.999 | 2.07 | 2.24 | 4.419 | ||
| Expenses net of fee waivers | 1.999 | 2.05 | 2.08 | 2.069 | ||
| Expenses net of fee waivers and credits | 1.999 | 2.05 | 2.05 | 2.059 | ||
| Net investment income (loss) | (0.03)9 | (0.45) | (0.27) | 1.269 | ||
| Portfolio turnover (%) | 25 | 50 | 59 | 5210 | ||
1 Unaudited.
2 The inception date for Class C shares is 12-22-08.
3 Based on the average daily shares outstanding.
4 Less than ($0.005) per share.
5 Does not reflect the effect of sales charges, if any.
6 Total returns would have been lower had certain expenses not been reduced during the periods shown.
7 Not annualized.
8 Less than $500,000.
9 Annualized.
10 Portfolio turnover is shown for the period from 9-1-08 to 3-31-09.
| 20 | Disciplined Value Fund | Semiannual report | See notes to financial statements |
| CLASS I SHARES Period ended | 9-30-111 | 3-31-11 | 3-31-10 | 3-31-092,3 | 8-31-084 | 8-31-074 | 8-31-064 |
| Per share operating performance | |||||||
| Net asset value, beginning | |||||||
| of period | $13.52 | $12.03 | $7.90 | $12.08 | $15.34 | $14.53 | $15.00 |
| Net investment income5 | 0.07 | 0.09 | 0.11 | 0.09 | 0.18 | 0.20 | 0.16 |
| Net realized and unrealized gain | |||||||
| (loss) on investments | (2.41) | 1.54 | 4.08 | (4.10) | (1.84) | 2.02 | 1.55 |
| Total from | |||||||
| investment operations | (2.34) | 1.63 | 4.19 | (4.01) | (1.66) | 2.22 | 1.71 |
| Less distributions | |||||||
| From net investment income | — | (0.07) | (0.06) | (0.17) | (0.20) | (0.17) | (0.16) |
| From net realized gain | — | (0.07) | — | — | (1.40) | (1.24) | (2.02) |
| Total distributions | — | (0.14) | (0.06) | (0.17) | (1.60) | (1.41) | (2.18) |
| Net asset value, end of period | $11.18 | $13.52 | $12.03 | $7.90 | $12.08 | $15.34 | $14.53 |
| Total return (%) | (17.31)7 | 13.66 | 53.146 | (33.33)6,7 | (11.99)6 | 15.706 | 12.436 |
| Ratios and supplemental data | |||||||
| Net assets, end of period | |||||||
| (in millions) | $375 | $399 | $158 | $33 | $44 | $43 | $36 |
| Ratios (as a percentage of average | |||||||
| net assets): | |||||||
| Expenses before reductions | 0.868 | 0.86 | 0.88 | 1.378 | 1.14 | 1.07 | 1.22 |
| Expenses net of fee waivers | 0.868 | 0.86 | 0.80 | 0.758 | 0.75 | 0.75 | 0.86 |
| Expenses net of fee waivers | |||||||
| and credits | 0.868 | 0.86 | 0.80 | 0.758 | 0.75 | 0.75 | 0.86 |
| Net investment income | 1.108 | 0.75 | 1.01 | 1.728 | 1.37 | 1.20 | 1.11 |
| Portfolio turnover (%) | 25 | 50 | 59 | 529 | 78 | 62 | 58 |
1 Unaudited.
2 For the seven-month period ended 3-31-09. The Fund changed its fiscal year end from August 31 to March 31.
3 After the close of business on 12-19-08, holders of Institutional share class of the former Robeco Large Cap Value Fund (the Predecessor Fund) became owners of an equal number of full and fractional Class I shares of the John Hancock Disciplined Value Fund. These shares were first offered on 12-22-08. Additionally, the accounting and performance history of the Institutional share class of the Predecessor Fund was redesignated as that of John Hancock Disciplined Value Fund Class I.
4 Audited by previous independent registered public accounting firm.
5 Based on the average daily shares outstanding.
6 Total returns would have been lower had certain expenses not been reduced during the periods shown.
7 Not annualized.
8 Annualized.
9 Portfolio turnover is shown for the period from 9-1-08 to 3-31-09.
| See notes to financial statements | Semiannual report | Disciplined Value Fund | 21 |
| CLASS I2 SHARES Period ended | 9-30-111 | 3-31-11 | 3-31-10 | 3-31-092 | ||
| Per share operating performance | ||||||
| Net asset value, beginning of period | $13.53 | $12.04 | $7.90 | $8.82 | ||
| Net investment income3 | 0.07 | 0.09 | 0.11 | 0.05 | ||
| Net realized and unrealized gain (loss) on investments | (2.41) | 1.54 | 4.09 | (0.97) | ||
| Total from investment operations | (2.34) | 1.63 | 4.20 | (0.92) | ||
| Less distributions | ||||||
| From net investment income | — | (0.07) | (0.06) | — | ||
| From net realized gain | — | (0.07) | — | — | ||
| Total distributions | — | (0.14) | (0.06) | — | ||
| Net assets, end of period (in millions) | $11.19 | $13.53 | $12.04 | $7.90 | ||
| Total return (%)4 | (17.29)5 | 13.65 | 53.27 | (10.43)5 | ||
| Ratios and supplemental data | ||||||
| Net assets, end of period (in millions) | $19 | $23 | $19 | —6 | ||
| Ratios (as a percentage of average net assets): | ||||||
| Expenses before reductions | 0.897 | 0.92 | 1.13 | 5.087 | ||
| Expenses net of fee waivers | 0.857 | 0.85 | 0.75 | 0.757 | ||
| Expenses net of fee waivers and credits | 0.857 | 0.85 | 0.75 | 0.757 | ||
| Net investment income | 1.107 | 0.74 | 0.99 | 2.237 | ||
| Portfolio turnover (%) | 25 | 50 | 59 | 528 | ||
1 Unaudited.
2 The inception date for Class I2 shares is 12-22-08.
3 Based on the average daily shares outstanding.
4 Total returns would have been lower had certain expenses not been reduced during the periods shown.
5 Not annualized.
6 Less than $500,000.
7 Annualized.
8 Portfolio turnover is shown for the period from 9-1-08 to 3-31-09.
| CLASS R1 SHARES Period ended | 9-30-111 | 3-31-11 | 3-31-102 | |||
| Per share operating performance | ||||||
| Net asset value, beginning of period | $13.52 | $12.05 | $9.01 | |||
| Net investment income3 | 0.02 | —4 | 0.02 | |||
| Net realized and unrealized gain (loss) on investments | (2.40) | 1.54 | 3.02 | |||
| Total from investment operations | (2.38) | 1.54 | 3.04 | |||
| Less distributions | ||||||
| From net realized gain | — | (0.07) | — | |||
| Net asset value, end of period | $11.14 | $13.52 | $12.05 | |||
| Total return (%)5 | (17.60)6 | 12.80 | 33.746 | |||
| Ratios and supplemental data | ||||||
| Net assets, end of period (in millions) | $2 | $1 | —7 | |||
| Ratios (as a percentage of average net assets): | ||||||
| Expenses before reductions | 2.298 | 3.21 | 2.968 | |||
| Expenses net of fee waivers | 1.648 | 1.61 | 1.508 | |||
| Expenses net of fee waivers and credits | 1.648 | 1.61 | 1.508 | |||
| Net investment income | 0.338 | 0.01 | 0.298 | |||
| Portfolio turnover (%) | 25 | 50 | 599 | |||
1 Unaudited.
2 The inception date for Class R1 shares is 7-13-09.
3 Based on the average daily shares outstanding.
4 Less than $0.005 per share.
5 Total returns would have been lower had certain expenses not been reduced during the periods shown.
6 Not annualized.
7 Less than $500,000.
8 Annualized.
9 Portfolio turnover is shown for the period from 4-1-09 to 3-31-10.
| 22 | Disciplined Value Fund | Semiannual report | See notes to financial statements |
| CLASS R3 SHARES Period ended | 9-30-111 | 3-31-11 | 3-31-102 | |||
| Per share operating performance | ||||||
| Net asset value, beginning of period | $13.52 | $12.04 | $8.98 | |||
| Net investment income3 | 0.03 | 0.01 | 0.04 | |||
| Net realized and unrealized gain (loss) on investments | (2.40) | 1.54 | 3.02 | |||
| Total from investment operations | (2.37) | 1.55 | 3.06 | |||
| Less distributions | ||||||
| From net investment income | — | —4 | — | |||
| From net realized gain | — | (0.07) | — | |||
| Total distributions | — | (0.07) | — | |||
| Net asset value, end of period | $11.15 | $13.52 | $12.04 | |||
| Total return (%)5 | (17.53)6 | 12.93 | 34.086 | |||
| Ratios and supplemental data | ||||||
| Net assets, end of period (in millions) | —7 | —7 | —7 | |||
| Ratios (as a percentage of average net assets): | ||||||
| Expenses before reductions | 11.948 | 20.34 | 10.238 | |||
| Expenses net of fee waivers | 1.548 | 1.52 | 1.408 | |||
| Expenses net of fee waivers and credits | 1.548 | 1.52 | 1.408 | |||
| Net investment income | 0.438 | 0.10 | 0.438 | |||
| Portfolio turnover (%) | 25 | 50 | 599 | |||
1 Unaudited.
2 The inception date for Class R3 shares is 5-22-09.
3 Based on the average daily shares outstanding.
4 Less than ($0.005) per share.
5 Total returns would have been lower had certain expenses not been reduced during the periods shown.
6 Not annualized.
7 Less than $500,000.
8 Annualized.
9 Portfolio turnover is shown for the period from 4-1-09 to 3-31-10.
| CLASS R4 SHARES Period ended | 9-30-111 | 3-31-11 | 3-31-102 | |||
| Per share operating performance | ||||||
| Net asset value, beginning of period | $13.52 | $12.04 | $8.98 | |||
| Net investment income3 | 0.05 | 0.05 | 0.07 | |||
| Net realized and unrealized gain (loss) on investments | (2.41) | 1.54 | 3.02 | |||
| Total from investment operations | (2.36) | 1.59 | 3.09 | |||
| Less distributions | ||||||
| From net investment income | — | (0.04) | (0.03) | |||
| From net realized gain | — | (0.07) | — | |||
| Total distributions | — | (0.11) | (0.03) | |||
| Net asset value, end of period | $11.16 | $13.52 | $12.04 | |||
| Total return (%)4 | (17.46)5 | 13.25 | 34.425 | |||
| Ratios and supplemental data | ||||||
| Net assets, end of period (in millions) | $1 | $1 | $1 | |||
| Ratios (as a percentage of average net assets): | ||||||
| Expenses before reductions | 2.346 | 2.81 | 2.886 | |||
| Expenses net of fee waivers | 1.246 | 1.20 | 1.106 | |||
| Expenses net of fee waivers and credits | 1.246 | 1.20 | 1.106 | |||
| Net investment loss | 0.706 | 0.40 | 0.756 | |||
| Portfolio turnover (%) | 25 | 50 | 597 | |||
1 Unaudited.
2 The inception date for Class R4 shares is 5-22-09.
3 Based on the average daily shares outstanding.
4 Total returns would have been lower had certain expenses not been reduced during the periods shown.
5 Not annualized.
6 Annualized.
7 Portfolio turnover is shown for the period from 4-1-09 to 3-31-10.
| See notes to financial statements | Semiannual report | Disciplined Value Fund | 23 |
| CLASS R5 SHARES Period ended | 9-30-111 | 3-31-11 | 3-31-102 | |||
| Per share operating performance | ||||||
| Net asset value, beginning of period | $13.53 | $12.04 | $8.98 | |||
| Net investment income3 | 0.07 | 0.08 | 0.10 | |||
| Net realized and unrealized gain (loss) on investments | (2.41) | 1.55 | 3.02 | |||
| Total from investment operations | (2.34) | 1.63 | 3.12 | |||
| Less distributions | ||||||
| From net investment income | — | (0.07) | (0.06) | |||
| From net realized gain | — | (0.07) | — | |||
| Total distributions | — | (0.14) | (0.06) | |||
| Net asset value, end of period | $11.19 | $13.53 | $12.04 | |||
| Total return (%) | (17.29)5 | 13.614 | 34.774,5 | |||
| Ratios and supplemental data | ||||||
| Net assets, end of period (in millions) | $19 | $15 | —6 | |||
| Ratios (as a percentage of average net assets): | ||||||
| Expenses before reductions | 0.897 | 1.23 | 9.547 | |||
| Expenses net of fee waivers | 0.897 | 0.94 | 0.807 | |||
| Expenses net of fee waivers and credits | 0.897 | 0.94 | 0.807 | |||
| Net investment income | 1.087 | 0.59 | 1.037 | |||
| Portfolio turnover (%) | 25 | 50 | 598 | |||
1 Unaudited.
2 The inception date for Class R5 shares is 5-22-09.
3 Based on the average daily shares outstanding.
4 Total returns would have been lower had certain expenses not been reduced during the periods shown.
5 Not annualized.
6 Less than $500,000.
7 Annualized.
8 Portfolio turnover is shown for the period from 4-1-09 to 3-31-10.
| CLASS R6 SHARES Period ended | 9-30-111,2 |
| Per share operating performance | |
| Net asset value, beginning of period | $12.19 |
| Net investment income3 | 0.01 |
| Net realized and unrealized loss on investments | (1.00) |
| Total from investment operations | (0.99) |
| Net asset value, end of period | $11.20 |
| Total return (%)4 | (8.12)5 |
| Ratios and supplemental data | |
| Net assets, end of period (in millions) | $1 |
| Ratios (as a percentage of average net assets): | |
| Expenses before reductions | 16.926 |
| Expenses net of fee waivers | 0.866 |
| Expenses net of fee waivers and credits | 0.866 |
| Net investment income | 0.906 |
| Portfolio turnover (%) | 25 |
1 Unaudited.
2 Period from 9-1-11 (inception date) to 9-30-11.
3 Based on the average daily shares outstanding.
4 Total returns would have been lower had certain expenses not been reduced during the periods shown.
5 Not annualized.
6 Annualized.
| 24 | Disciplined Value Fund | Semiannual report | See notes to financial statements |
| CLASS ADV SHARES Period ended | 9-30-111 | 3-31-11 | 3-31-10 | 3-31-092 | ||
| Per share operating performance | ||||||
| Net asset value, beginning of period | $13.51 | $12.03 | $7.90 | $8.82 | ||
| Net investment income3 | 0.06 | 0.07 | 0.09 | 0.04 | ||
| Net realized and unrealized gain (loss) on investments | (2.40) | 1.53 | 4.08 | (0.96) | ||
| Total from investment operations | (2.34) | 1.60 | 4.17 | (0.92) | ||
| Less distributions | ||||||
| From net investment income | — | (0.05) | (0.04) | — | ||
| From net realized gain | — | (0.07) | — | — | ||
| Total distributions | — | (0.12) | (0.04) | — | ||
| Net asset value, end of period | $11.17 | $13.51 | $12.03 | $7.90 | ||
| Total return (%)4 | (17.32)5 | 13.42 | 52.81 | (10.43)5 | ||
| Ratios and supplemental data | ||||||
| Net assets, end of period (in millions) | —6 | —6 | —6 | —6 | ||
| Ratios (as a percentage of average net assets): | ||||||
| Expenses before reductions | 31.587 | 45.27 | 31.79 | 3.217 | ||
| Expenses net of fee waivers | 1.007 | 1.00 | 1.00 | 1.007 | ||
| Expenses net of fee waivers and credits | 1.007 | 1.00 | 1.00 | 1.007 | ||
| Net investment income | 0.957 | 0.59 | 0.84 | 1.967 | ||
| Portfolio turnover (%) | 25 | 50 | 59 | 528 | ||
1 Unaudited.
2 The inception date for Class ADV shares is 12-22-08.
3 Based on the average daily shares outstanding.
4 Total returns would have been lower had certain expenses not been reduced during the periods shown.
5 Not annualized.
6 Less than $500,000.
7 Annualized.
8 Portfolio turnover is shown for the period from 9-1-08 to 3-31-09.
| CLASS NAV SHARES Period ended | 9-30-111 | 3-31-11 | 3-31-102 | |||
| Per share operating performance | ||||||
| Net asset value, beginning of period | $13.53 | $12.04 | $9.18 | |||
| Net investment income3 | 0.08 | 0.10 | 0.10 | |||
| Net realized and unrealized gain (loss) on investments | (2.41) | 1.54 | 2.82 | |||
| Total from investment operations | (2.33) | 1.64 | 2.92 | |||
| Less distributions | ||||||
| From net investment income | — | (0.08) | (0.06) | |||
| From net realized gain | — | (0.07) | — | |||
| Total distributions | — | (0.15) | (0.06) | |||
| Net asset value, end of period | $11.20 | $13.53 | $12.04 | |||
| Total return (%) | (17.22)5 | 13.71 | 31.894,5 | |||
| Ratios and supplemental data | ||||||
| Net assets, end of period (in millions) | $319 | $405 | $228 | |||
| Ratios (as a percentage of average net assets): | ||||||
| Expenses before reductions | 0.776 | 0.79 | 0.836 | |||
| Expenses net of fee waivers | 0.776 | 0.79 | 0.756 | |||
| Expenses net of fee waivers and credits | 0.776 | 0.79 | 0.756 | |||
| Net investment income | 1.186 | 0.82 | 1.056 | |||
| Portfolio turnover (%) | 25 | 50 | 597 | |||
1 Unaudited.
2 The inception date for Class NAV shares is 5-29-09.
3 Based on the average daily shares outstanding.
4 Total returns would have been lower had certain expenses not been reduced during the periods shown.
5 Not annualized.
6 Annualized.
7 Portfolio turnover is shown for the period from 4-1-09 to 3-31-10.
| See notes to financial statements | Semiannual report | Disciplined Value Fund | 25 |
Notes to financial statements
(unaudited)
Note 1 — Organization
John Hancock Disciplined Value Fund (the Fund) is a diversified series of John Hancock Funds III (the Trust), an open-end management investment company organized as a Massachusetts business trust and registered under the Investment Company Act of 1940, as amended (the 1940 Act). The investment objective of the Fund is to seek to provide long-term growth of capital primarily through investment in equity securities. Current income is a secondary objective.
The Fund may offer multiple classes of shares. The shares currently offered are detailed in the Statement of assets and liabilities. Class A, Class B and Class C shares are offered to all investors. Class I shares are offered to institutions and certain investors. Class R1, Class R3, Class R4 and Class R5 shares are available only to certain retirement plans. Class R6 shares are only available to certain retirement plans, institutions and other investors. Class I2 and Class ADV shares are closed to new investors. Class NAV shares are sold to John Hancock affiliated funds of funds. Shareholders of each class have exclusive voting rights to matters that affect that class. The distribution and service fees, if any, transfer agent fees, printing and postage and state registration fees for each class may differ. Class B shares convert to Class A shares eight years after purchase. Under certain circumstances, Class I shares may be converted to Class R6 shares within one year after the commencement of operations of Class R6.
The Fund is the accounting and performance successor of the Robeco Boston Partners Large Cap Value Fund (the Predecessor Fund). On December 19, 2008, the Fund acquired substantially all the assets and assumed the liabilities of the Predecessor Fund pursuant to an agreement and plan of reorganization, in exchange for Class A and Class I shares of the Fund.
Note 2 — Significant accounting policies
The financial statements have been prepared in conformity with accounting principles generally accepted in the United States of America, which require management to make certain estimates and assumptions at the date of the financial statements. Actual results could differ from those estimates. Events or transactions occurring after the end of the fiscal period through the date that the financial statements were issued have been evaluated in the preparation of the financial statements. The following summarizes the significant accounting policies of the Fund:
Security valuation. Investments are stated at value as of the close of regular trading on the New York Stock Exchange (NYSE), normally at 4:00 P.M., Eastern Time. The Fund uses a three-tier hierarchy to prioritize the pricing assumptions, referred to as inputs, used in valuation techniques to measure fair value. Level 1 includes securities valued using quoted prices in active markets for identical securities. Level 2 includes securities valued using significant observable inputs. Observable inputs may include quoted prices for similar securities, interest rates, prepayment speeds and credit risk. Prices for securities valued using these inputs are received from independent pricing vendors and brokers and are based on an evaluation of the inputs described. Level 3 includes securities valued using significant unobservable inputs when market prices are not readily available or reliable, including the Fund’s own assumptions in determining the fair value of investments. Factors used in determining value may include market or issuer specific events, changes in interest rates and credit quality. The inputs or methodology used for valuing securities are not necessarily an indication of the risk associated with investing in those securities.
| 26 | Disciplined Value Fund | Semiannual report |
As of September 30, 2011, all investments are categorized as Level 1 under the hierarchy described above. Changes in valuation techniques may result in transfers in or out of an assigned level within the disclosure hierarchy. During the six months ended September 30, 2011, there were no significant transfers in or out of Level 1 or Level 2 assets.
In order to value the securities, the Fund uses the following valuation techniques. Equity securities held by the Fund are valued at the last sale price or official closing price on the principal securities exchange on which they trade. In the event there were no sales during the day or closing prices are not available, then securities are valued using the last quoted bid or evaluated price. Investments by the Fund in open-end mutual funds, including John Hancock Collateral Investment Trust (JHCIT), are valued at their respective net asset values each business day. Certain securities traded only in the over-the-counter market are valued at the last bid price quoted by brokers making markets in the securities at the close of trading. Other portfolio securities and assets, where market quotations are not readily available, are valued at fair value, as determined in good faith by the Fund’s Pricing Committee, following procedures established by the Board of Trustees.
Repurchase agreements. The Fund may enter into repurchase agreements. When the Fund enters into a repurchase agreement, it receives collateral which is held in a segregated account by the Fund’s custodian. The collateral amount is marked-to-market and monitored on a daily basis to ensure that the collateral held is in an amount not less than the principal amount of the repurchase agreement plus any accrued interest. In the event of a default by the counterparty, realization of the collateral proceeds could be delayed, during which time the collateral value may decline.
Security transactions and related investment income. Investment security transactions are accounted for on a trade date plus one basis for daily net asset value calculations. However, for financial reporting purposes, investment transactions are reported on trade date. Interest income is accrued as earned. Gains and losses on securities sold are determined on the basis of identified cost and may include proceeds from litigation. Dividend income is recorded on the ex-date, except for dividends of foreign securities where the dividend may not be known until after the ex-date. In those cases, dividend income is recorded when the Fund becomes aware of the dividends.
Securities lending. The Fund may lend its securities to earn additional income. It receives and maintains cash collateral received from the borrower in an amount not less than the market value of the loaned securities. The Fund will invest its collateral in JHCIT and as a result, the Fund will receive the benefit of any gains and bear any losses generated by JHCIT. Although risk of the loss of the securities lent is mitigated by holding the collateral, the Fund could experience a delay in recovering its securities and a possible loss of income or value if the borrower fails to return the securities or if collateral investments decline in value. The Fund may receive compensation for lending its securities by retaining a portion of the return on the investment of the collateral and compensation from fees earned from borrowers of the securities. Net income received from JHCIT is a component of securities lending income as recorded on the Statement of operations.
Line of credit. The Fund may borrow from banks for temporary or emergency purposes, including meeting redemption requests that otherwise might require the untimely sale of securities. Pursuant to the custodian agreement, the custodian may loan money to the Fund to make properly authorized payments. The Fund is obligated to repay the custodian for any overdraft, including any related costs or expenses. The custodian has a lien, security interest or security entitlement in any Fund property that is not segregated, to the maximum extent permitted by law for any overdraft.
The Fund and other affiliated funds have entered into an agreement with Citibank N.A. which enables them to participate in a $100 million unsecured committed line of credit. A commitment fee, payable at the end of each calendar quarter, based on the average daily unused portion of the line of credit, is charged to each participating fund on a pro rata basis and is reflected in other expenses on the Statement of operations. For the six months ended September 30, 2011, the Fund had no borrowings under the line of credit.
| Semiannual report | Disciplined Value Fund | 27 |
Expenses. The majority of expenses are directly attributable to an individual fund. Expenses that are not readily attributable to a specific fund are allocated among all funds in an equitable manner, taking into consideration, among other things, the nature and type of expense and the fund’s relative assets. Expense estimates are accrued in the period to which they relate and adjustments are made when actual amounts are known.
Class allocations. Income, common expenses and realized and unrealized gains (losses) are determined at the fund level and allocated daily to each class of shares based on the net assets of the class. Class-specific expenses, such as distribution and service fees, if any, transfer agent fees, state registration fees and printing and postage, for all classes, are calculated daily at the class level based on the appropriate net assets of each class and the specific expense rates applicable to each class.
Federal income taxes. The Fund intends to continue to qualify as a regulated investment company by complying with the applicable provisions of the Internal Revenue Code and will not be subject to federal income tax on taxable income that is distributed to shareholders. Therefore, no federal income tax provision is required.
For federal income tax purposes, the Fund has a capital loss carryforward of $58,898,901 available to offset future net realized capital gains as of March 31, 2011. Availability of a certain amount of the loss carryforward, which was acquired in a merger, may be limited in a given year. The loss carryforward expires as follows: March 31, 2016 — $16,285,226 and March 31, 2017 — $42,613,675.
Under the Regulated Investment Company Modernization Act of 2010, the Fund is permitted to carry forward capital losses incurred in taxable years beginning after December 22, 2010 for an unlimited period. However, any losses incurred during those future taxable years will be required to be utilized prior to the losses incurred in pre-enactment taxable years. As a result of this ordering rule, pre-enactment capital loss carryforwards may be more likely to expire unused. Additionally, post-enactment capital losses that are carried forward will retain their character as either short-term or long-term capital losses rather than being considered all short-term as under previous law.
As of March 31, 2011, the Fund had no uncertain tax positions that would require financial statement recognition, derecognition or disclosure. The Fund’s federal tax returns are subject to examination by the Internal Revenue Service for a period of three years.
Distribution of income and gains. Distributions to shareholders from net investment income and net realized gains, if any, are recorded on the ex-date. The Fund generally declares and pays dividends and capital gain distributions, if any, annually.
Distributions paid by the Fund with respect to each class of shares are calculated in the same manner, at the same time and in the same amount, except for the effect of expenses that may be applied differently to each class.
Such distributions, on a tax basis, are determined in conformity with income tax regulations, which may differ from accounting principles generally accepted in the United States of America.
Capital accounts within financial statements are adjusted for permanent book-tax differences. These adjustments have no impact on net assets or the results of operations. Temporary book-tax differences, if any, will reverse in a subsequent period. Book-tax differences are primarily attributable to wash sale loss deferrals.
| 28 | Disciplined Value Fund | Semiannual report |
New accounting pronouncement. In May 2011, Accounting Standards Update 2011-04 (ASU 2011-04), Amendments to Achieve Common Fair Value Measurement and Disclosure Requirements in U.S. GAAP and IFRSs, was issued and shall be effective during interim and annual periods beginning after December 15, 2011. ASU 2011-04 amends Financial Accounting Standards Board (FASB) Topic 820, Fair Value Measurement. The amendments are the result of the work by the FASB and the International Accounting Standards Board to develop common requirements for measuring fair value and for disclosing information about fair value measurements in accordance with GAAP. Management is currently evaluating the application of ASU 2011-04 and its impact, if any, on the Fund’s financial statements.
Note 3 — Guarantees and indemnifications
Under the Fund’s organizational documents, its Officers and Trustees are indemnified against certain liabilities arising out of the performance of their duties to the Fund. Additionally, in the normal course of business, the Fund enters into contracts with service providers that contain general indemnification clauses. The Fund’s maximum exposure under these arrangements is unknown, as this would involve future claims that may be made against the Fund that have not yet occurred. The risk of material loss from such claims is considered remote.
Note 4 — Fees and transactions with affiliates
John Hancock Investment Management Services, LLC (the Adviser) serves as investment adviser for the Trust. John Hancock Funds, LLC (the Distributor), an affiliate of the Adviser, serves as principal underwriter of the Trust. The Adviser and the Distributor are indirect wholly owned subsidiaries of Manulife Financial Corporation (MFC).
Management fee. The Fund has an investment management contract with the Adviser under which the Fund pays a daily management fee to the Adviser equivalent, on an annual basis, to the sum of: (a) 0.750% of the first $500,000,000 of the Fund’s average daily net assets; (b) 0.725% of the next $500,000,000; (c) 0.700% of the next $500,000,000; (d) 0.675% of the next $1,000,000,000; and (e) 0.650% of the Fund’s average daily net assets in excess of $2,500,000,000. The Adviser has a subadvisory agreement with Robeco Investment Management, Inc. The Fund is not responsible for payment of the subadvisory fees.
The Adviser has contractually agreed to waive fees and/or reimburse certain expenses for each share class of the Fund. This agreement excludes taxes, portfolio brokerage commissions, interest and litigation and indemnification expenses, shareholder services fees and other extraordinary expenses not incurred in the ordinary course of the Fund’s business. The fee waivers and/or reimbursements are such that these expenses will not exceed 1.30%, 2.05%, 2.05%, 0.99%, 0.85%, 1.65%, 1.55%, 1.25%, 0.95%, 0.86% and 1.00% for Class A, Class B, Class C, Class I, Class I2, Class R1, Class R3, Class R4, Class R5, Class R6 and Class ADV shares, respectively. The fee waivers and/or expense reimbursements will continue in effect until June 30, 2012 for Class A, Class B, Class C, Class I, Class I2, Class R1, Class R3, Class R4, Class R5 and Class ADV shares and June 30, 2013 for Class R6 shares. Prior to August 1, 2011, the fee waivers and/or reimbursements were such that the above expenses would not exceed 1.64%, 1.54%, 1.24% and 0.94% for Class R1, Class R3, Class R4 and Class R5 shares, respectively, and the limits for the remainder of the share classes above were unchanged.
| Semiannual report | Disciplined Value Fund | 29 |
For the six months ended September 30, 2011, the expense reductions amounted to the following:
| EXPENSE | ||||
| CLASS | REDUCTIONS | |||
| Class A | — | |||
| Class B | $1,507 | |||
| Class C | — | |||
| Class I | — | |||
| Class I2 | 3,985 | |||
| Class R1 | 4,607 | |||
| Class R3 | 6,080 | |||
| Class R4 | 5,587 | |||
| Class R5 | — | |||
| Class R6 | 1,214 | |||
| Class ADV | 5,644 | |||
| Total | $28,624 | |||
The investment management fees, including the impact of the waivers and reimbursements described above, incurred for the six months ended September 30, 2011 were equivalent to a net annual affective rate of 0.72% of the Fund’s average daily net assets.
Accounting and legal services. Pursuant to a service agreement, the Fund reimburses the Adviser for all expenses associated with providing the administrative, financial, legal, accounting and recordkeeping services of the Fund, including the preparation of all tax returns, periodic reports to shareholders and regulatory reports, among other services. These expenses are allocated to each share class based on its relative net assets at the time the expense was incurred. These accounting and legal services fees incurred for the six months ended September 30, 2011 amounted to an annual rate of 0.01% of the Fund’s average daily net assets.
Distribution and service plans. The Fund has a distribution agreement with the Distributor. The Fund has adopted distribution and service plans with respect to Class A, Class B, Class C, Class R1, Class R3, Class R4 and Class ADV shares pursuant to Rule 12b-1 under the 1940 Act, to pay the Distributor for services provided as the distributor of shares of the Fund. In addition, under a service plan for Class R1, Class R3, Class R4 and Class R5 shares, the Fund pays for certain other services. The Fund may pay up to the following contractual rates of distribution and service fees under these arrangements, expressed as an annual percentage of average daily net assets for each class of the Fund’s shares.
| CLASS | 12b–1 FEE | SERVICE FEE | ||
| Class A | 0.30% | — | ||
| Class B | 1.00% | — | ||
| Class C | 1.00% | — | ||
| Class R1 | 0.50% | 0.25% | ||
| Class R3 | 0.50% | 0.15% | ||
| Class R4 | 0.25% | 0.10% | ||
| Class R5 | — | 0.05% | ||
| Class ADV | 0.25% | — | ||
Currently, only 0.25% is charged to Class A shares for 12b-1 fees.
Sales charges. Class A shares are assessed up-front sales charges, which resulted in payments to the Distributor amounting to $375,873 for the six months ended September 30, 2011. Of this amount, $33,721 was retained and used for printing prospectuses, advertising, sales literature and
| 30 | Disciplined Value Fund | Semiannual report |
other purposes, $337,924 was paid as sales commissions to broker-dealers and $4,228 was paid as sales commissions to sales personnel of Signator Investors, Inc. (Signator Investors), a broker-dealer affiliate of the Adviser.
Class B and Class C shares are subject to contingent deferred sales charges (CDSCs). Class B shares that are redeemed within six years of purchase are subject to CDSCs, at declining rates, beginning at 5.00% of the lesser of the current market value at the time of redemption or the original purchase cost of the shares being redeemed. Class C shares that are redeemed within one year of purchase are subject to a 1.00% CDSC on the lesser of the current market value at the time of redemption or the original purchase cost of the shares being redeemed. Proceeds from CDSCs are used to compensate the Distributor for providing distribution-related services in connection with the sale of these shares. During the six months ended September 30, 2011, CDSCs received by the Distributor amounted to $10,477 and $2,012 for Class B and Class C shares, respectively.
Transfer agent fees. The Fund has a transfer agent agreement with John Hancock Signature Services, Inc. (Signature Services), an affiliate of the Adviser. The transfer agent fees paid to Signature Services are determined based on the cost to Signature Services (Signature Services Cost) of providing recordkeeping services. The Signature Services Cost includes a component of allocated John Hancock corporate overhead for providing transfer agent services to the Fund and to all other John Hancock affiliated funds. It also includes out-of-pocket expenses that are comprised of payments made to third-parties for recordkeeping services provided to their clients who invest in one or more John Hancock funds. In addition, Signature Services Cost may be reduced by certain fees that Signature Services receives in connection with retirement and small accounts. Signature Services Cost is calculated monthly and allocated, as applicable, to four categories of share classes: Institutional Share Classes, Retirement Share Classes, Municipal Bond Classes and all other Retail Share Classes. Within each of these categories, the applicable costs are allocated to the affected John Hancock affiliated funds and/or classes, based on the relative average daily net assets.
Class level expenses. Class level expenses for the six months ended September 30, 2011 were:
| DISTRIBUTION | TRANSFER | STATE | PRINTING AND | |
| CLASS | AND SERVICE FEES | AGENT FEES | REGISTRATION FEES | POSTAGE |
| Class A | $757,295 | $519,771 | $12,097 | $50,212 |
| Class B | 41,140 | 7,066 | 5,555 | 348 |
| Class C | 168,270 | 28,975 | 6,035 | 1,110 |
| Class I | — | 147,066 | 17,461 | 5,397 |
| Class I2 | — | 7,868 | 4,433 | 303 |
| Class R1 | 4,993 | 234 | 5,446 | 114 |
| Class R3 | 367 | 19 | 6,105 | 37 |
| Class R4 | 1,649 | 167 | 6,147 | 38 |
| Class R5 | 1,693 | 2,852 | 5,282 | 47 |
| Class R6 | — | 2 | 1,192 | 2 |
| Class ADV | 46 | 32 | 5,579 | 31 |
| Total | $975,453 | $714,052 | $75,332 | $57,639 |
Trustee expenses. The Fund compensates each Trustee who is not an employee of the Adviser or its affiliates. These Trustees may, for tax purposes, elect to defer receipt of this compensation under the John Hancock Group of Funds Deferred Compensation Plan (the Plan). Deferred amounts are invested in various John Hancock funds and remain in the funds until distributed in accordance with the Plan. The investment of deferred amounts and the offsetting liability are included within Other receivables and prepaid expenses and Payable to affiliates — Trustees’ fees, respectively, in the accompanying Statement of assets and liabilities.
| Semiannual report | Disciplined Value Fund | 31 |
Note 5 — Fund share transactions
Transactions in Fund shares for the six months ended September 30, 2011 and for the year ended March 31, 2011 were as follows:
| Six months ended 9-30-11 | Year ended 3-31-11 | |||
| Shares | Amount | Shares | Amount | |
| Class A shares | ||||
| Sold | 10,947,057 | $145,989,543 | 36,716,106 | $445,364,310 |
| Distributions reinvested | — | — | 286,656 | 3,680,665 |
| Repurchased | (7,372,813) | (94,672,738) | (6,747,902) | (84,227,777) |
| Net increase | 3,574,244 | $51,316,805 | 30,254,860 | $364,817,198 |
| Class B shares | ||||
| Sold | 194,200 | $2,449,816 | 243,352 | $2,966,977 |
| Distributions reinvested | — | — | 2,470 | 30,553 |
| Repurchased | (111,809) | (1,347,638) | (87,333) | (1,047,461) |
| Net increase | 82,391 | $1,102,178 | 158,489 | $1,950,069 |
| Class C shares | ||||
| Sold | 939,746 | $12,029,729 | 1,078,990 | $13,057,994 |
| Distributions reinvested | — | — | 8,799 | 108,844 |
| Repurchased | (446,675) | (5,380,961) | (384,621) | (4,559,653) |
| Net increase | 493,071 | $6,648,768 | 703,168 | $8,607,185 |
| Class I shares | ||||
| Sold | 9,262,728 | $118,168,273 | 19,998,813 | $232,555,941 |
| Distributions reinvested | — | — | 273,381 | 3,425,460 |
| Repurchased | (5,282,421) | (67,456,393) | (3,865,108) | (47,125,267) |
| Net increase | 3,980,307 | $50,711,880 | 16,407,086 | $188,856,134 |
| Class I2 shares | ||||
| Sold | 25,147 | $300,000 | 157,294 | $1,966,666 |
| Distributions reinvested | — | — | 17,994 | 225,645 |
| Repurchased | (50,022) | (650,000) | (18,139) | (225,000) |
| Net increase (decrease) | (24,875) | ($350,000) | 157,149 | $1,967,311 |
| Class R1 shares | ||||
| Sold | 71,535 | $861,254 | 88,526 | $1,050,353 |
| Distributions reinvested | — | — | 445 | 5,586 |
| Repurchased | (6,746) | (84,716) | (12,676) | (152,985) |
| Net increase | 64,789 | $776,538 | 76,295 | $902,954 |
| Class R3 shares | ||||
| Sold | 3,838 | $49,343 | 7,879 | $97,121 |
| Distributions reinvested | — | — | 28 | 353 |
| Repurchased | (6,990) | (78,114) | (3,295) | (44,100) |
| Net increase (decrease) | (3,152) | ($28,771) | 4,612 | $53,374 |
| Class R4 shares | ||||
| Sold | 13,563 | $172,243 | 39,785 | $482,048 |
| Distributions reinvested | — | — | 620 | 7,780 |
| Repurchased | (8,280) | (106,339) | (22,003) | (271,391) |
| Net increase | 5,283 | $65,904 | 18,402 | $218,437 |
| 32 | Disciplined Value Fund | Semiannual report |
| Six months ended 9-30-11 | Year ended 3-31-11 | |||
| Shares | Amount | Shares | Amount | |
| Class R5 shares | ||||
| Sold | 704,714 | $8,956,813 | 1,183,682 | $15,138,724 |
| Distributions reinvested | — | — | 109 | 1,366 |
| Repurchased | (78,558) | (1,003,402) | (99,788) | (1,314,672) |
| Net increase | 626,156 | $7,953,411 | 1,084,003 | $13,825,418 |
| Class R6 shares1 | ||||
| Sold | 92,096 | $1,065,610 | — | — |
| Net increase | 92,096 | $1,065,610 | — | — |
| Class ADV shares | ||||
| Distributions reinvested | — | — | 29 | $354 |
| Net increase | — | — | 29 | $354 |
| Class NAV shares | ||||
| Sold | 884,502 | $11,692,753 | 11,061,089 | $124,314,742 |
| Distributions reinvested | — | — | 350,468 | 4,394,874 |
| Repurchased | (2,357,834) | (28,782,995) | (384,097) | (4,795,972) |
| Net increase (decrease) | (1,473,332) | ($17,090,242) | 11,027,460 | $123,913,644 |
| Net increase | 7,416,978 | $102,172,081 | 59,891,553 | $705,112,078 |
1 Period from 9-1-11 (inception date) to 9-30-11.
Affiliates of the Fund owned 100% of shares of beneficial interest of Class ADV and Class NAV, respectively, on September 30, 2011.
Note 6 — Purchase and sale of securities
Purchases and sales of securities, other than short-term securities, aggregated $488,168,729 and $370,421,372, respectively, for the six months ended September 30, 2011.
| Semiannual report | Disciplined Value Fund | 33 |
Board Consideration of and Continuation of Investment Advisory Agreement and Subadvisory Agreement
The Board of Trustees (the Board, the members of which are referred to as Trustees) of John Hancock Disciplined Value Fund (the Fund), a series of John Hancock Funds III, met in-person on May 1–3 and June 5–7, 2011 to consider the approval of the Fund’s investment advisory agreement (the Advisory Agreement) with John Hancock Investment Management Services, LLC (the Adviser), the Fund’s investment adviser. The Board also considered the approval of the investment subadvisory agreement (the Subadvisory Agreement) between the Adviser and Robeco Investment Management, Inc. (the Subadviser) on behalf of the Fund. The Advisory Agreement and the Subadvisory Agreement are referred to as the Agreements.
Activities and composition of the Board
The Board consists of eleven individuals, nine of whom are Independent Trustees. Independent Trustees are generally those individuals who are not employed by or have any significant business or professional relationship with the Adviser or the Subadviser. The Trustees are responsible for the oversight of operations of the Fund and perform various duties required of directors of investment companies by the Investment Company Act of 1940, as amended (the 1940 Act). The Independent Trustees have hired independent legal counsel to assist them in connection with their duties. The Board has appointed an Independent Trustee as Chairperson. The Board has established four standing committees that are composed entirely of Independent Trustees: the Audit Committee; the Compliance Committee; the Nominating, Governance and Administration Committee; and the Contracts/Operations Committee. Additionally, Investment Performance Committees A and B are standing committees of the Board that are each composed of Independent Trustees and one Trustee who is affiliated with the Adviser. Investment Performance Committee B oversees and monitors matters relating to the investment performance of the Fund. The Board has also designated an Independent Trustee as Vice Chairperson to serve in the absence of the Chairperson. The Board also designates working groups or ad hoc committees as it deems appropriate.
The approval process
Under the 1940 Act, the Board is required to consider the continuation of the Agreements each year. Throughout the year, the Board, acting directly and through its committees, regularly reviews and assesses the quality of the services that the Fund receives under these Agreements. The Board reviews reports of the Adviser at least quarterly, which include Fund performance reports and compliance reports. In addition, the Board meets with portfolio managers and senior investment officers at various times throughout the year. The Board considers at each of its meetings factors that are relevant to its annual consideration of the renewal of the Agreements, including the services and support provided by the Adviser and Subadviser to the Fund and its shareholders.
Prior to the May 1–3, 2011 meeting, the Board requested and received materials specifically relating to the Agreements. The materials provided in connection with the May meeting included information compiled and prepared by Morningstar, Inc. (Morningstar) on Fund fees and expenses, and the investment performance of the Fund. This Fund information is assembled in a format that permits comparison with similar information from a Category and a subset of the Category referred to as the Peer Group, each as determined by Morningstar, and with the Fund’s benchmark index. The Category includes all funds that invest similarly to the way the Fund invests. The Peer Group represents funds of similar size, excluding passively managed funds and funds-of-funds. The Fund’s benchmark index is an unmanaged index of securities that is provided as a basis for comparison with the Fund’s performance. Other material provided for the Fund review included (a) information on the profitability of the Agreements to the Adviser and a discussion of any additional benefits to the Adviser or Subadviser or their affiliates that result from being the Adviser or Subadviser to the Fund; (b) a general analysis provided by the Adviser and the Subadviser concerning investment advisory fees charged to other clients, such as institutional clients and other investment companies, having similar investment mandates, as well as the performance of those other clients and a comparison of
| 34 | Disciplined Value Fund | Semiannual report |
the services provided to those other clients and the services provided to the Fund; (c) the impact of economies of scale; (d) a summary of aggregate amounts paid by the Fund to the Adviser; and (e) sales and redemption data regarding the Fund’s shares.
At an in-person meeting held on May 1–3, 2011, the Board reviewed materials relevant to its consideration of the Agreements. As a result of the discussions that occurred during the May 1–3, 2011 meeting, the Board asked the Adviser for additional information on certain matters. The Adviser provided the additional information and the Board also considered this information as part of its consideration of the Agreements.
At an in-person meeting held on June 5–7, 2011, the Board, including the Independent Trustees, formally considered the continuation of the Advisory Agreement between the Adviser and the Fund and the Subadvisory Agreement between the Adviser and the Subadviser with respect to the Fund, each for an additional one-year term. The Board considered what it believed were key relevant factors that are described under separate headings presented below.
The Board also considered other matters important to the approval process, such as payments made to and by the Adviser or its affiliates relating to the distribution of Fund shares and other services. The Board reviewed services related to the valuation and pricing of Fund portfolio holdings. Other important matters considered by the Board were the direct and indirect benefits to the Adviser, the Subadviser and their affiliates from their relationship with the Fund and advice from independent legal counsel with respect to the review process and materials submitted for the Board’s review.
Nature, extent and quality of services
The Board reviewed the nature, extent and quality of services provided by the Adviser and the Subadviser, including the investment advisory services and the resulting performance of the Fund.
The Board considered the ability of the Adviser and the Subadviser, based on their resources, reputation and other attributes, to attract and retain qualified investment professionals, including research, advisory and supervisory personnel. It considered the background and experience of senior management and investment professionals responsible for managing the Fund. The Board considered the investment philosophy, research and investment decision-making processes of the Adviser and the Subadviser responsible for the daily investment activities of the Fund, including, among other things, portfolio trading capabilities, use of technology, commitment to compliance and approach to training and retaining portfolio managers and other research, advisory and management personnel.
The Board considered the Subadviser’s history and experience providing investment services to the Fund. The Board considered the Adviser’s execution of its oversight responsibilities. The Board further considered the culture of compliance, resources dedicated to compliance, compliance programs, record of compliance with applicable laws and regulation, with the Fund’s investment policies and restrictions and with the applicable Code of Ethics, and the responsibilities of the Adviser’s and Subadviser’s compliance departments.
In addition to advisory services, the Board considered the quality of the administrative and non-investment advisory services provided to the Fund by the Adviser under a separate agreement. The Board noted that the Adviser and its affiliates provide the Fund with certain administrative, transfer agency, shareholder and other services (in addition to any such services provided to the Fund by third parties) and officers and other personnel as are necessary for the operations of the Fund. The Board reviewed the structure and duties of the Adviser’s administration, accounting, legal and compliance departments and its affiliate’s transfer agency operations and considered the Adviser’s and its affiliate’s policies and procedures for assuring compliance with applicable laws and regulations.
The Board also received information about the nature, extent and quality of services provided by and fee rates charged by the Adviser and Subadviser to their other clients, including other registered
| Semiannual report | Disciplined Value Fund | 35 |
investment companies, institutional investors and separate accounts. The Board reviewed a general analysis provided by the Adviser and the Subadviser concerning investment advisory fees charged to other clients having similar investment mandates, the services provided to those other clients as compared to the services provided to the Fund, the performance of those other clients as compared to the performance by the Fund and other factors relating to those other clients. The Board considered the significant differences between the Adviser’s and Subadviser’s services to the Fund and the services they provide to other clients. For other clients that are not mutual funds, the differences in services relate to the greater share purchase and redemption activity in a mutual fund, the generally higher turnover of mutual fund portfolio holdings, the more burdensome regulatory and legal obligations of mutual funds and the higher marketing costs for mutual funds. When compared to all clients including mutual funds, the Adviser has greater oversight and supervisory responsibility for the Fund and undertakes greater entrepreneurial risk as the sponsor of the Fund.
Fund performance
The Board was provided with reports, independently prepared by Morningstar, which included a comprehensive analysis of the Fund’s performance. The Board also examined materials provided by the Fund’s portfolio management team discussing Fund performance and the Fund’s investment objective, strategies and outlook. The Board also reviewed a narrative and statistical analysis of the Morningstar data that was prepared by the Adviser, which analyzed various factors that may affect the Morningstar rankings. The Board reviewed information regarding the investment performance of the Fund as compared to its Morningstar Category as well as its benchmark index (see chart below). The Board was provided with a description of the methodology used by Morningstar to select the funds in the Category. The Board also considered updated performance information provided by the Adviser at its May and June 2011 meetings. The Board regularly reviews the performance of the Fund throughout the year and attaches more importance to performance over relatively longer periods of time, typically three to five years.
Set forth below is the performance of the Fund over certain time periods ended December 31, 2010 and that of its Category and benchmark index over the same periods:
| 1 YEAR | 3 YEAR | 5 YEAR | 10 YEAR | |
| Disciplined Value Fund Class A | 12.78% | –1.74% | 3.37% | 4.65% |
| Large Value Category Average | 13.73% | –3.60% | 1.53% | 3.39% |
| Russell 1000 Value TR Index | 15.51% | –4.42% | 1.28% | 3.26% |
The Board noted that, although the Fund had underperformed its Category’s average performance and its benchmark index’s performance over the one-year period, the Fund had outperformed its Category’s average performance and its benchmark index’s performance over all other periods.
Expenses and fees
The Board, including the Independent Trustees, reviewed the Fund’s contractual advisory fee rate payable by the Fund to the Adviser as compared with the other funds in its Peer Group. The Board also received information about the investment subadvisory fee rate payable by the Adviser to the Subadviser for investment subadvisory services. The Board considered the services provided and the fees charged by the Adviser and the Subadviser to other clients with similar investment mandates, including separately managed institutional accounts.
In addition, the Board considered the cost of the services provided to the Fund by the Adviser. The Board received and considered expense information regarding the Fund’s various components, including advisory fees, distribution fees and fees other than advisory and distribution fees, including transfer agent fees, custodian fees, administration fees and other miscellaneous fees (e.g., fees for accounting and legal services). The Board considered comparisons of these expenses to the Peer Group median. The Board also considered expense information regarding the Fund’s total operating
| 36 | Disciplined Value Fund | Semiannual report |
expense ratio (Gross Expense Ratio) and total operating expense ratio after taking the Adviser’s contractual fee waiver/expense reimbursement agreement into account (Net Expense Ratio). The Board considered information comparing the Gross Expense Ratio and Net Expense Ratio of the Fund to that of the Peer Group median. As part of its analysis, the Board reviewed the Adviser’s methodology in allocating its costs to the management of the Fund and the Fund complex.
The Board noted that the Fund’s advisory fee ratio was nine basis points above the Peer Group median advisory fee ratio. The Board noted the following information about the Fund’s Gross and Net Expense Ratios for Class A shares contained in the Fund’s 2010 financial statements in relation with the Fund’s Peer Group median provided by Morningstar in April 2011:
| FUND (CLASS A) | PEER GROUP MEDIAN | |
| Advisory Fee Ratio | 0.74% | 0.65% |
| Gross Expense Ratio | 1.26% | 1.18% |
| Net Expense Ratio | 1.26% | 1.18% |
The Board viewed favorably the Adviser’s contractual agreement to waive all or a portion of its advisory fees and to reimburse or pay operating expenses to the extent necessary to maintain the Fund’s Net Expense Ratio at 1.30% for Class A shares, excluding certain expenses such as taxes, brokerage commissions, interest, litigation and extraordinary expenses, until June 30, 2012. The Board favorably considered the impact of this contractual agreement toward ultimately lowering the Fund’s Gross Expense Ratio. The Board also received and considered information relating to the Fund’s Gross Expense Ratio and Net Expense Ratio that reflected the new methodology for calculating transfer agent fees that was approved by the Trustees at the June 2010 meeting, which has had the effect of lowering the expense ratio.
The Board received and reviewed statements relating to the Adviser’s financial condition and was also provided with a profitability analysis that detailed the revenues earned and the expenses incurred by the Adviser for services under the Advisory Agreement, as well as from other relationships between the Fund and the Adviser and its affiliates. The Board reviewed the Adviser’s profitability with respect to the Fund and other funds the Board currently oversees for the year ended December 31, 2010 compared to available aggregate profitability data provided for the year ended December 31, 2009. The Board reviewed the Adviser’s profitability with respect to other fund complexes managed by the Adviser and/or its affiliates. The Board reviewed the Adviser’s assumptions and methodology of allocating expenses in the profitability analysis, noting the inherent limitations in allocating costs among various advisory products.
The Board also considered a comparison of the Adviser’s profitability to that of other similar investment advisers whose profitability information is publicly available. The Board recognized that profitability may be affected by numerous factors including, among other things, fee waivers and expense reimbursements by the Adviser, the types of funds managed, expense allocations and business mix, and therefore comparability of profitability is somewhat limited.
The Board did not consider profitability information with respect to the Subadviser, which is not affiliated with the Adviser. The Board considered that the subadvisory fee under the Subadvisory Agreement had been negotiated by the Adviser and the Subadviser on an arm’s-length basis. For this reason, the Subadviser’s separate profitability from its relationship with the Fund was not a factor in determining whether to renew the Subadvisory Agreement. In evaluating overall fees for investment management, the Board recognized the inherently higher cost structure of subadvised funds.
| Semiannual report | Disciplined Value Fund | 37 |
Economies of scale
The Board, including the Independent Trustees, considered the extent to which economies of scale might be realized as the assets of the Fund increase. Possible changes in the advisory fee rate or structure in order to enable the Fund to participate in these economies of scale (e.g., through the use of breakpoints in the advisory fee at higher asset levels) are periodically discussed. The Board also considered the Adviser’s overall operations and its ongoing investment in its business in order to expand the scale of, and improve the quality of, its operations that benefit the Fund.
The Board recognized the inherent limitations of any analysis of economies of scale, stemming largely from the Board’s understanding that most of the Adviser’s costs are not specific to individual funds, but rather are incurred across a variety of products and services. To ensure that any economies are reasonably shared with the Fund as its assets increase, the Adviser and the Board agreed to continue the existing breakpoints to the contractual advisory fee rate.
Other benefits to the Adviser and the Subadviser
The Board understands that the Adviser, the Subadviser or their affiliates may derive other ancillary benefits from their relationship with the Fund, both tangible and intangible, such as their ability to leverage investment professionals who manage other portfolios, an increase in their profile in the investment advisory community and, in the case of the Adviser, the engagement of its affiliates and/or significant shareholders as service providers to the Fund, including for administrative, transfer agency and distribution services. The Board believes that certain of these benefits are difficult to quantify. The Board also was informed that the Subadviser may use third-party research obtained by soft dollars generated by certain mutual fund transactions to assist itself in managing all or a number of its other client accounts.
Board determination
The Board unanimously approved the continuation of the Advisory Agreement between the Adviser and the Fund for an additional one-year term. The Subadvisory Agreement between the Adviser and Subadviser with respect to the Fund was also approved for an additional one-year term. Based upon its evaluation of relevant factors in their totality, the Board was satisfied that the terms of the Agreements, including the advisory and subadvisory fee rates, were fair and reasonable and in the best interest of the Fund and its shareholders. In arriving at its decision to approve the Agreements, the Board did not identify any single factor or any group of factors as all-important or controlling, but considered all factors together. Different Trustees may have attributed different weights to the various factors considered. The Independent Trustees were also assisted by independent legal counsel in making this determination. The Trustees’ conclusions may be based in part on their consideration of these arrangements in prior years and on their ongoing regular review of Fund performance and operations throughout the year.
| 38 | Disciplined Value Fund | Semiannual report |
More information
| Trustees | Investment adviser |
| Steven R. Pruchansky, Chairman | John Hancock Investment Management |
| James F. Carlin | Services, LLC |
| William H. Cunningham | |
| Deborah C. Jackson | Subadviser |
| Charles L. Ladner,* Vice Chairman | Robeco Investment Management, Inc. |
| Stanley Martin* | |
| Hugh McHaffie† | Principal distributor |
| Dr. John A. Moore*# | John Hancock Funds, LLC |
| Patti McGill Peterson* | |
| Gregory A. Russo | Custodian |
| John G. Vrysen† | State Street Bank and Trust Company |
| Officers | Transfer agent |
| Keith F. Hartstein | John Hancock Signature Services, Inc. |
| President and Chief Executive Officer | |
| Legal counsel | |
| Andrew G. Arnott | K&L Gates LLP |
| Senior Vice President and Chief Operating Officer | |
| Thomas M. Kinzler | |
| Secretary and Chief Legal Officer | |
| Francis V. Knox, Jr. | |
| Chief Compliance Officer | |
| Charles A. Rizzo | |
| Chief Financial Officer | |
| Salvatore Schiavone | |
| Treasurer | |
| *Member of the Audit Committee | |
| †Non-Independent Trustee | |
| #Effective 9-13-11 | |
The Fund’s proxy voting policies and procedures, as well as the Fund’s proxy voting record for the most recent twelve-month period ended June 30, are available free of charge on the Securities and Exchange Commission (SEC) Web site at www.sec.gov or on our Web site.
The Fund’s complete list of portfolio holdings, for the first and third fiscal quarters, is filed with the SEC on Form N-Q. The Fund’s Form N-Q is available on our Web site and the SEC’s Web site, www.sec.gov, and can be reviewed and copied (for a fee) at the SEC’s Public Reference Room in Washington, DC. Call 1-800-SEC-0330 to receive information on the operation of the SEC’s Public Reference Room.
We make this information on your fund, as well as monthly portfolio holdings, and other fund details available on our Web site at www.jhfunds.com or by calling 1-800-225-5291.
| You can also contact us: | ||
| 1-800-225-5291 | Regular mail: | Express mail: |
| jhfunds.com | John Hancock Signature Services, Inc. | John Hancock Signature Services, Inc. |
| P.O. Box 55913 | Mutual Fund Image Operations | |
| Boston, MA 02205-5913 | 30 Dan Road | |
| Canton, MA 02021 |
| Semiannual report | Disciplined Value Fund | 39 |

1-800-225-5291
1-800-554-6713 TDD
1-800-338-8080 EASI-Line
www.jhfunds.com
Now available: electronic delivery
www.jhfunds.com/edelivery
| This report is for the information of the shareholders of John Hancock Disciplined Value Fund. | 340SA 9/11 |
| It is not authorized for distribution to prospective investors unless preceded or accompanied by a prospectus. | 11/11 |
| John Hancock Core High Yield Fund | |
| Table of Contents | |
| Your expenses | Page 3 |
| Portfolio summary | Page 4 |
| Portfolio of investments | Page 5 |
| Financial statements | Page 8 |
| Financial highlights | Page 11 |
| Notes to financial statements | Page 13 |
| More information | Page 24 |
| 2 |
Core High Yield Fund
Your expenses
These examples are intended to help you understand your ongoing operating expenses.
Understanding your fund expenses
As a shareholder of the Fund, you incur two types of costs:
• Transaction costs which include sales charges (loads) on purchases or redemptions (if applicable), minimum account fee charge, etc.
• Ongoing operating expenses including management fees, distribution and service fees (if applicable), and other fund expenses.
We are going to present only your ongoing operating expenses here.
Actual expenses/actual returns
This example is intended to provide information about your fund’s actual ongoing operating expenses, and is based on your fund’s actual return. It assumes an account value of $1,000.00 on April 1, 2011 with the same investment held until September 30, 2011.
| Account value | Ending value | Expenses paid during | |
| on 4-1-11 | on 9-30-11 | period ended 9-30-111 | |
| Class A | $1,000.00 | $968.00 | $6.15 |
| Class I | 1,000.00 | 969.00 | 4.33 |
Together with the value of your account, you may use this information to estimate the operating expenses that you paid over the period. Simply divide your account value at September 30, 2011, by $1,000.00, then multiply it by the “expenses paid” for your share class from the table above. For example, for an account value of $8,600.00, the operating expenses should be calculated as follows:
Example
[ My account value $8,600.00 / $1,000.00 = 8.6 ] x $[ “expenses paid” from table ] = My actual expenses
Hypothetical example for comparison purposes
This table allows you to compare your fund’s ongoing operating expenses with those of any other fund. It provides an example of the Fund’s hypothetical account values and hypothetical expenses based on each class’s actual expense ratio and an assumed 5% annualized return before expenses (which is not your fund’s actual return). It assumes an account value of $1,000.00 on April 1, 2011, with the same investment held until September 30, 2011. Look in any other fund shareholder report to find its hypothetical example and you will be able to compare these expenses. Please remember that these hypothetical account values and expenses may not be used to estimate the actual ending account balance or expenses you paid for the period.
| Account value | Ending value | Expenses paid during | |
| on 4-1-11 | on 9-30-11 | period ended 9-30-111 | |
| Class A | $1,000.00 | $1,018.80 | $6.31 |
| Class I | 1,000.00 | 1,020.60 | 4.45 |
Remember, these examples do not include any transaction costs, therefore, these examples will not help you to determine the relative total costs of owning different funds. If transaction costs were included, your expenses would have been higher. See the prospectus for details regarding transaction costs.
1 Expenses are equal to the Fund's annualized expense ratio of 1.25% and 0.88% for Class A and Class I shares, respectively, multiplied by the average account value over the period, multiplied by 183/366 (to reflect the one-half year period).
| 3 |
Core High Yield Fund
Portfolio Summary
| Value as a | |
| percentage of | |
| Top 10 Issuers1 (44.5% of Net Assets) | Fund's net assets |
| TMX Finance LLC | 5.1% |
| Southern States Cooperative, Inc. | 4.9% |
| Offshore Group Investments, Ltd. | 4.9% |
| BioScrip, Inc. | 4.8% |
| Columbus International, Inc. | 4.7% |
| Mandalay Resort Group | 4.7% |
| Reddy Ice Corp. | 4.1% |
| Alliance One International, Inc. | 3.9% |
| Kratos Defense & Security Solutions, Inc. | 3.8% |
| Goodman Networks, Inc. | 3.6% |
| Value as a | |
| percentage of | |
| Portfolio Diversification | Fund's net assets |
| Corporate Bonds | 96% |
| Convertible Bonds | 2% |
| Other | 2% |
| Value as a | |
| percentage of | |
| Quality Composition2 | Fund's net assets |
| BB | 12% |
| B | 65% |
| CCC & Below | 18% |
| Not Rated | 5% |
| Value as a | |
| percentage of | |
| Sector Composition3 | Fund's net assets |
| Consumer Staples | 17% |
| Industrials | 17% |
| Consumer Discretionary | 16% |
| Financials | 13% |
| Energy | 10% |
| Health Care | 9% |
| Materials | 7% |
| Telecommunication Services | 6% |
| Information Technology | 2% |
| Utilities | 1% |
| Other | 2% |
| Value as a | |
| percentage of | |
| Country Composition | Fund's net assets |
| United States | 78% |
| Cayman Islands | 5% |
| Barbados | 5% |
| Canada | 4% |
| Finland | 3% |
| Nigeria | 2% |
| Luxembourg | 1% |
| Other | 2% |
1 Cash and cash equivalents are not included in Top 10 Issuers.
2 Ratings are from Moody’s Investors Services, Inc. if not available, we have used S&P ratings. In the absence of ratings from these agencies, we have used Fitch, Inc. ratings. Not Rated securities are those with no ratings available. They may have internal ratings similar to those shown. All as of 9-30-11 and do not reflect subsequent changes.
3 Sector investing is subject to greater risks than the market as a whole. Because the Fund may focus on particular sectors of the economy, its performance may depend on the performance of those sectors.
| 4 |
Core High Yield Fund
As of 9-30-11 (Unaudited)
| Maturity | Par value | |||
| Rate (%) | date | Value | ||
| Corporate Bonds 95.73% | $15,042,350 | |||
| (Cost $15,225,047) | ||||
| Consumer Discretionary 15.80% | 2,482,571 | |||
| Auto Components 1.47% | ||||
| UCI International, Inc. | 8.625 | 02/15/19 | $250,000 | 231,563 |
| Diversified Consumer Services 2.32% | ||||
| Bankrate, Inc. | 11.750 | 07/15/15 | 325,000 | 364,000 |
| Hotels, Restaurants & Leisure 6.79% | ||||
| Caesars Entertainment Operating Company, Inc. | 11.250 | 06/01/17 | 250,000 | 252,188 |
| Mandalay Resort Group | 7.625 | 07/15/13 | 750,000 | 731,250 |
| Marina District Finance Company, Inc. | 9.875 | 08/15/18 | 100,000 | 83,500 |
| Media 5.22% | ||||
| American Media, Inc. (S) | 11.500 | 12/15/17 | 94,000 | 85,070 |
| Columbus International, Inc. (S) | 11.500 | 11/20/14 | 750,000 | 735,000 |
| Consumer Staples 17.27% | 2,713,750 | |||
| Food Products 10.35% | ||||
| Del Monte Foods Company (S) | 7.625 | 02/15/19 | 250,000 | 211,250 |
| Reddy Ice Corp. | 11.250 | 03/15/15 | 700,000 | 638,750 |
| Southern States Cooperative, Inc. (S) | 11.250 | 05/15/15 | 750,000 | 776,250 |
| Tobacco 6.92% | ||||
| Alliance One International, Inc. | 10.000 | 07/15/16 | 750,000 | 618,750 |
| North Atlantic Trading Company, Inc. (S) | 11.500 | 07/15/16 | 500,000 | 468,750 |
| Energy 9.57% | 1,504,404 | |||
| Energy Equipment & Services 8.11% | ||||
| Allis-Chalmers Energy, Inc. | 9.000 | 01/15/14 | 44,000 | 43,780 |
| Geokinetics Holdings USA, Inc. | 9.750 | 12/15/14 | 250,000 | 196,874 |
| Offshore Group Investments, Ltd. | 11.500 | 08/01/15 | 750,000 | 772,500 |
| Pioneer Drilling Company | 9.875 | 03/15/18 | 250,000 | 261,250 |
| Oil, Gas & Consumable Fuels 1.46% | ||||
| Energy Partners, Ltd. | 8.250 | 02/15/18 | 250,000 | 230,000 |
| Financials 13.48% | 2,118,250 | |||
| Consumer Finance 5.13% | ||||
| TMX Finance LLC / TitleMax Finance Corp. | 13.250 | 07/15/15 | 750,000 | 806,250 |
| Diversified Financial Services 4.67% | ||||
| CNG Holdings, Inc. (S) | 12.250 | 02/15/15 | 200,000 | 208,000 |
| Reliance Intermediate Holdings LP (S) | 9.500 | 12/15/19 | 500,000 | 525,000 |
| Real Estate Management & Development 3.68% | ||||
| CB Richard Ellis Services, Inc. | 11.625 | 06/15/17 | 100,000 | 112,750 |
| Kennedy-Wilson, Inc. (S) | 8.750 | 04/01/19 | 500,000 | 466,250 |
| Health Care 8.97% | 1,409,500 | |||
| Health Care Equipment & Supplies 1.46% | ||||
| Apria Healthcare Group, Inc. | 12.375 | 11/01/14 | 250,000 | 230,000 |
| Health Care Providers & Services 7.51% | ||||
| American Renal Holdings Company, Inc. | 8.375 | 05/15/18 | 100,000 | 100,500 |
| BioScrip, Inc. | 10.250 | 10/01/15 | 750,000 | 750,000 |
| See notes to financial statements | 5 |
Core High Yield Fund
As of 9-30-11 (Unaudited)
| Maturity | Par value | |||
| Rate (%) | date | Value | ||
| Health Care (continued) | ||||
| OnCure Holdings, Inc. | 11.750 | 05/15/17 | $175,000 | $154,875 |
| Radiation Therapy Services, Inc. | 9.875 | 04/15/17 | 150,000 | 127,875 |
| Radnet Management, Inc. | 10.375 | 04/01/18 | 50,000 | 46,250 |
| Industrials 15.09% | 2,370,875 | |||
| Aerospace & Defense 3.80% | ||||
| Kratos Defense & Security Solutions, Inc. | 10.000 | 06/01/17 | 600,000 | 597,000 |
| Commercial Services & Supplies 3.99% | ||||
| Casella Waste Systems, Inc. (S) | 7.750 | 02/15/19 | 100,000 | 94,500 |
| Garda World Security Corp. (S) | 9.750 | 03/15/17 | 100,000 | 102,000 |
| The Sheridan Group, Inc. | 12.500 | 04/15/14 | 500,000 | 430,000 |
| Marine 1.69% | ||||
| Commercial Barge Line Company | 12.500 | 07/15/17 | 250,000 | 265,625 |
| Professional Services 3.46% | ||||
| TransUnion LLC/TransUnion Financing Corp. | 11.375 | 06/15/18 | 500,000 | 543,750 |
| Trading Companies & Distributors 2.15% | ||||
| FGI Operating Company, Inc. | 10.250 | 08/01/15 | 325,000 | 338,000 |
| Information Technology 1.69% | 266,250 | |||
| IT Services 1.69% | ||||
| Unisys Corp. | 12.500 | 01/15/16 | 250,000 | 266,250 |
| Materials 6.70% | 1,052,000 | |||
| Metals & Mining 3.49% | ||||
| Novelis, Inc. | 8.750 | 12/15/20 | 100,000 | 98,000 |
| United States Steel Corp. | 7.375 | 04/01/20 | 500,000 | 450,000 |
| Paper & Forest Products 3.21% | ||||
| UPM-Kymmene OYJ (S) | 7.450 | 11/26/27 | 600,000 | 504,000 |
| Telecommunication Services 6.20% | 973,500 | |||
| Diversified Telecommunication Services 2.63% | ||||
| Broadview Networks Holdings, Inc. | 11.375 | 09/01/12 | 250,000 | 200,000 |
| Wind Acquisition Finance SA (S) | 11.750 | 07/15/17 | 250,000 | 212,500 |
| Wireless Telecommunication Services 3.57% | ||||
| Goodman Networks, Inc. (S) | 12.125 | 07/01/18 | 600,000 | 561,000 |
| Utilities 0.96% | 151,250 | |||
| Independent Power Producers & Energy Traders 0.96% | ||||
| Dynegy Holdings, Inc. | 8.375 | 05/01/16 | 250,000 | 151,250 |
| Convertible Bonds 1.77% | $277,500 | |||
| (Cost $294,842) | ||||
| Industrials 1.77% | 277,500 | |||
| Sea Trucks Group (10.000% Steps up to 11.000% on | ||||
| 7-31-12) | 10.000 | 01/31/15 | 300,000 | 277,500 |
| See notes to financial statements | 6 |
Core High Yield Fund
As of 9-30-11 (Unaudited)
| Total investments (Cost $15,519,889)† 97.50% | $15,319,850 |
| Other assets and liabilities, net 2.50% | $393,601 |
| Total net assets 100.00% | $15,713,451 |
The percentage shown for each investment category is the total value of the category as a percentage of the net assets of the Fund.
(S) These securities are exempt from registration under Rule 144A of the Securities Act of 1933. Such securities may be resold, normally to qualified institutional buyers, in transactions exempt from registration. Rule 144A securities amounted to $4,949,570 or 31.50% of the Fund's net assets as of 9-30-11.
† At 9-30-11, the aggregate cost of investment securities for federal income tax purposes was $15,520,439. Net unrealized depreciation aggregated $200,589, of which $498,897 related to appreciated investment securities and $699,486 related to depreciated investment securities.
The Fund had the following country concentration as a percentage of net assets on 9-30-11:
| United States | 78% | ||||
| Cayman Islands | 5% | ||||
| Barbados | 5% | ||||
| Canada | 4% | ||||
| Finland | 3% | ||||
| Nigeria | 2% | ||||
| Luxembourg | 1% | ||||
| Other | 2% |
| See notes to financial statements | 7 |
Core High Yield Fund
Statement of assets and liabilities — September 30, 2011 (unaudited)
| Assets | ||
| Investments, at value (Cost $15,519,889) | $ | 15,319,850 |
| Cash | 93,588 | |
| Receivable for investments sold | 506,875 | |
| Interest receivable | 456,967 | |
| Receivable due from adviser | 197 | |
| Other receivables and prepaid expenses | 345 | |
| Total assets | 16,377,822 | |
| Liabilities | ||
| Payable for investments purchased | 500,000 | |
| Distributions payable | 132,051 | |
| Payable to affiliates | ||
| Accounting and legal services fees | 281 | |
| Transfer agent fees | 2,355 | |
| Trustees' fees | 70 | |
| Other liabilities and accrued expenses | 29,614 | |
| Total liabilities | 664,371 | |
| Net assets | ||
| Capital paid-in | $ | 14,988,504 |
| Undistributed net investment income | 67,306 | |
| Accumulated net realized gain on investments | 857,680 | |
| Net unrealized appreciation (depreciation) on | ||
| investments | (200,039) | |
| Net assets | $ | 15,713,451 |
| Net asset value per share | ||
| Based on net asset values and shares | ||
| outstanding-the Fund has an unlimited number | ||
| of shares authorized with no par value | ||
| Class A ($15,687,260 ÷ 1,497,500 shares) | $ | 10.48 |
| Class I ($26,191 ÷ 2,500 shares) | $ | 10.48 |
| Maximum offering price per share | ||
| Class A (net asset value per share ÷ 95.5%)1 | $ | 10.97 |
1 On single retail sales of less than $50,000. On sales of $50,000 or more and on group sales the offering price is reduced.
| See notes to financial statements | 8 |
Core High Yield Fund
Statement of operations — September 30, 2011 (unaudited)
| Investment income | ||
| Interest | $ | 959,833 |
| Expenses | ||
| Investment management fees (Note 4) | 54,719 | |
| Distribution and service fees (Note 4) | 21,010 | |
| Accounting and legal services fees (Note 4) | 974 | |
| Transfer agent fees (Note 4) | 14,433 | |
| Trustees' fees (Note 4) | 577 | |
| Professional fees | 23,662 | |
| Custodian fees | 6,016 | |
| Registration and filing fees | 4,667 | |
| Other | 4,626 | |
| Total expenses | 130,684 | |
| Less expense reductions (Note 4) | (25,510) | |
| Net expenses | 105,174 | |
| Net investment income | 854,659 | |
| Realized and unrealized gain (loss) | ||
| Net realized gain on | ||
| Investments | 556,155 | |
| 556,155 | ||
| Change in net unrealized appreciation | ||
| (depreciation) of | ||
| Investments | (1,935,991) | |
| (1,935,991) | ||
| Net realized and unrealized loss | (1,379,836) | |
| Decrease in net assets from operations | $ | (525,177) |
| See notes to financial statements | 9 |
Core High Yield Fund
Statements of changes in net assets
| Six months | ||||
| ended | Year ended | |||
| 9/30/11 | 3/31/11 | |||
| (unaudited) | ||||
| Increase (decrease) in net assets | ||||
| From operations | ||||
| Net investment income | $ | 854,659 | $ | 1,745,119 |
| Net realized gain | 556,155 | 1,053,074 | ||
| Change in net unrealized appreciation | ||||
| (depreciation) | (1,935,991) | 298,683 | ||
| Increase (decrease) in net assets resulting | ||||
| from operations | (525,177) | 3,096,876 | ||
| Distributions to shareholders | ||||
| From net investment income | ||||
| Class A | (791,675) | (1,775,169) | ||
| Class I | (1,375) | (3,068) | ||
| From net realized gain | ||||
| Class A | — | (1,675,553) | ||
| Class I | — | (2,797) | ||
| Total distributions | (793,050) | (3,456,587) | ||
| From Fund share transactions (Note 5) | — | — | ||
| Total decrease | (1,318,227) | (359,711) | ||
| Net assets | ||||
| Beginning of period | 17,031,678 | 17,391,389 | ||
| End of period | $ | 15,713,451 | $ | 17,031,678 |
| Undistributed net investment income | $ | 67,306 | $ | 5,697 |
| See notes to financial statements | 10 |
Core High Yield Fund
Financial Highlights (For a share outstanding throughout the period)
Class A Shares
| Period ended | ||||||
| 9-30-111 | 3-31-11 | 3-31-102 | ||||
| Per share operating performance | ||||||
| Net asset value, beginning of period | $ | 11.35 | $ | 11.59 | $ | 10.00 |
| Net investment income3 | 0.57 | 1.16 | 0.99 | |||
| Net realized and unrealized gain (loss) on | ||||||
| investments | (0.91) | 0.92 | 2.21 | |||
| Total from investment operations | (0.34) | 2.08 | 3.20 | |||
| Less distributions | ||||||
| From net investment income | (0.53) | (1.20) | (0.98) | |||
| From net realized gain | — | (1.12) | (0.63) | |||
| Total distributions | (0.53) | (2.32) | (1.61) | |||
| Net asset value, end of period | $ | 10.48 | $ | 11.35 | $ | 11.59 |
| Total return (%)4 | (3.20)5 | 19.34 | 33.755 | |||
| Ratios and supplemental data | ||||||
| Net assets, end of period (in millions) | $ | 16 | $ | 17 | $ | 17 |
| Ratios (as a percentage of average net | ||||||
| assets): | ||||||
| Expenses before reductions | 1.556 | 1.55 | 1.366 | |||
| Expenses net of fee waivers | 1.256 | 1.21 | 1.136 | |||
| Net investment income | 10.156 | 9.99 | 9.826 | |||
| Portfolio turnover (%) | 49 | 207 | 389 | |||
1 Unaudited.
2 Period from 4-30-09 (inception date) to 3-31-10.
3 Based on the average daily shares outstanding.
4 Total returns would have been lower had certain expenses not been reduced during the periods shown.
5 Not annualized.
6 Annualized.
| See notes to financial statements | 11 |
Core High Yield Fund
Financial Highlights (For a share outstanding throughout the period)
Class I Shares
| Period ended | ||||||
| 9-30-111 | 3-31-11 | 3-31-102 | ||||
| Per share operating performance | ||||||
| Net asset value, beginning of period | $ | 11.36 | $ | 11.59 | $ | 10.00 |
| Net investment income3 | 0.59 | 1.21 | 1.02 | |||
| Net realized and unrealized gain (loss) on | ||||||
| investments | (0.92) | 0.92 | 2.20 | |||
| Total from investment operations | (0.33) | 2.13 | 3.22 | |||
| Less distributions | ||||||
| From net investment income | (0.55) | (1.24) | (1.00) | |||
| From net realized gain | — | (1.12) | (0.63) | |||
| Total distributions | (0.55) | (2.36) | (1.63) | |||
| Net asset value, end of period | $ | 10.48 | $ | 11.36 | $ | 11.59 |
| Total return (%)4 | (3.10)5 | 19.87 | 34.085 | |||
| Ratios and supplemental data | ||||||
| Net assets, end of period (in thousands) | $ | 26 | $ | 28 | $ | 29 |
| Ratios (as a percentage of average net | ||||||
| assets): | ||||||
| Expenses before reductions | 1.206 | 1.35 | 3.526 | |||
| Expenses net of fee waivers | 0.886 | 0.85 | 0.856 | |||
| Net investment income | 10.526 | 10.35 | 10.106 | |||
| Portfolio turnover (%) | 49 | 207 | 389 | |||
1 Unaudited.
2 Period from 4-30-09 (inception date) to 3-31-10.
3 Based on the average daily shares outstanding.
4 Total returns would have been lower had certain expenses not been reduced during the periods shown.
5 Not annualized.
6 Annualized.
| See notes to financial statements | 12 |
Core High Yield Fund
Notes to financial statements (unaudited)
Note 1 - Organization
John Hancock Core High Yield Fund (the Fund) is a diversified series of John Hancock Funds III (the Trust), an open-end management investment company organized as a Massachusetts business trust and registered under the Investment Company Act of 1940, as amended (the 1940 Act). The investment objective of the Fund is to seek total return, consisting of a high level of current income and capital appreciation.
The Fund may offer multiple classes of shares. The shares currently offered are detailed in the Statement of assets and liabilities. Class A shares are offered to all investors. Class I shares are offered to institutions and certain investors. Shareholders of each class have exclusive voting rights to matters that affect that class. The distribution and service fees, if any, and transfer agent fees for each class may differ.
Note 2 - Significant accounting policies
The financial statements have been prepared in conformity with accounting principles generally accepted in the United States of America, which require management to make certain estimates and assumptions at the date of the financial statements. Actual results could differ from those estimates. Events or transactions occurring after the end of the fiscal period through the date that the financial statements were issued have been evaluated in the preparation of the financial statements. The following summarizes the significant accounting policies of the Fund:
Security valuation. Investments are stated at value as of the close of regular trading on the New York Stock Exchange (NYSE), normally at 4:00 p.m., Eastern Time. The Fund uses a three-tier hierarchy to prioritize the pricing assumptions, referred to as inputs, used in valuation techniques to measure fair value. Level 1 includes securities valued using quoted prices in active markets for identical securities. Level 2 includes securities valued using significant observable inputs. Observable inputs may include quoted prices for similar securities, interest rates, prepayment speeds and credit risk. Prices for securities valued using these inputs are received from independent pricing vendors and brokers and are based on an evaluation of the inputs described. Level 3 includes securities valued using significant unobservable inputs when market prices are not readily available or reliable, including the Fund’s own assumptions in determining the fair value of investments. Factors used in determining value may include market or issuer specific events, changes in interest rates and credit quality. The inputs or methodology used for valuing securities are not necessarily an indication of the risk associated with investing in those securities.
The following is a summary of the values by input classification of the Fund’s investments as of September 30, 2011, by major security category or type:
| Level 2 | Level 3 | |||||||
| Total Market | Significant | Significant | ||||||
| Value at | Level 1 Quoted | Observable | Unobservable | |||||
| 09-30-11 | Price | Inputs | Inputs | |||||
| Corporate Bonds | ||||||||
| Consumer Discretionary | $2,482,571 | — | $2,482,571 | — | ||||
| Consumer Staples | 2,713,750 | — | 2,713,750 | — | ||||
| Energy | 1,504,404 | — | 1,504,404 | — | ||||
| Financials | 2,118,250 | — | 2,118,250 | — | ||||
| Health Care | 1,409,500 | — | 1,409,500 | — | ||||
| Industrials | 2,370,875 | — | 2,370,875 | — | ||||
| Information Technology | 266,250 | — | 266,250 | — | ||||
| Materials | 1,052,000 | — | 1,052,000 | — | ||||
| Telecommunication Services | 973,500 | — | 973,500 | — | ||||
| Utilities | 151,250 | — | 151,250 | — | ||||
| Convertible Bonds | ||||||||
| Industrials | 277,500 | — | — | $277,500 | ||||
| Total Investments in Securities | $15,319,850 | — | $15,042,350 | $277,500 | ||||
| 13 |
Changes in valuation techniques may result in transfers in or out of an assigned level within the disclosure hierarchy. During the six months ended September 30, 2011, there were no significant transfers in or out of Level 2 assets.
The following is a reconciliation of Level 3 assets for which significant unobservable inputs were used to determine fair value. Transfers in or out of Level 3 represent the beginning value of any security or instrument where a change in the level has occurred from the beginning to the end of the period.
| Investment in Securities | Convertible Bonds | ||
| Balance as of 3-31-11 | - | ||
| Realized gain (loss) | - | ||
| Changed in unrealized appreciation | |||
| (depreciation) | ($25,500) | ||
| Purchases | - | ||
| Sales | - | ||
| Transfers into Level 3 | 303,000 | ||
| Transfers out of Level 3 | - | ||
| Balance as of 9-30-11 | $277,500 | ||
| Change in unrealized at period end * | ($25,500) | ||
*Change in unrealized appreciation (depreciation) attributable to Level 3 securities held at the period end.
In order to value the securities, the Fund uses the following valuation techniques. Debt obligations are valued based on the evaluated prices provided by an independent pricing service, which utilizes both dealer-supplied and electronic data processing techniques, taking into account factors such as institutional-size trading in similar groups of securities, yield, quality, coupon rate, maturity, type of issue, trading characteristics and other market data. Foreign securities and currencies are valued in U.S. dollars, based on foreign currency exchange rates supplied by an independent pricing service. Certain securities traded only in the over-the-counter market are valued at the last bid price quoted by brokers making markets in the securities at the close of trading.
Other portfolio securities and assets, where market quotations are not readily available, are valued at fair value, as determined in good faith by the Fund’s Pricing Committee, following procedures established by the Board of Trustees. Generally, trading in non-U.S. securities is substantially completed each day at various times prior to the close of trading on the NYSE. Significant market events that affect the values of non-U.S. securities may occur between the time when the valuation of the securities is generally determined and the close of the NYSE. During significant market events, these securities will be valued at fair value, as determined in good faith, following procedures established by the Board of Trustees. The Fund may use a fair valuation model to value non-U.S. securities in order to adjust for events which may occur between the close of foreign exchanges and the close of the NYSE.
Security transactions and related investment income. Investment security transactions are accounted for on a trade date plus one basis for daily net asset value calculations. However, for financial reporting purposes, investment transactions are reported on trade date. Interest income is accrued as earned. Gains and losses on securities sold are determined on the basis of identified cost and may include proceeds from litigation. Interest income includes coupon interest and amortization/accretion of premiums/discounts on debt securities. Debt obligations may be placed in a non-accrual status and related interest income may be reduced by stopping current accruals and writing off interest receivable when the collection of all or a portion of interest has become doubtful.
Line of credit. The Fund may borrow from banks for temporary or emergency purposes, including meeting redemption requests that otherwise might require the untimely sale of securities. Pursuant to
| 14 |
the custodian agreement, the custodian may loan money to the Fund to make properly authorized payments. The Fund is obligated to repay the custodian for any overdraft, including any related costs or expenses. The custodian has a lien, security interest or security entitlement in any Fund property that is not segregated, to the maximum extent permitted by law for any overdraft.
The Fund and other affiliated funds have entered into an agreement with Citibank N.A. which enables them to participate in a $100 million unsecured committed line of credit. A commitment fee, payable at the end of each calendar quarter, based on the average daily unused portion of the line of credit, is charged to each participating fund on a pro rata basis and is reflected in Other expenses on the Statement of operations. For the six months ended September 30, 2011, the Fund had no borrowings under the line of credit.
Expenses. The majority of expenses are directly attributable to an individual fund. Expenses that are not readily attributable to a specific fund are allocated among all funds in an equitable manner, taking into consideration, among other things, the nature and type of expense and the fund’s relative assets. Expense estimates are accrued in the period to which they relate and adjustments are made when actual amounts are known.
Class allocations. Income, common expenses and realized and unrealized gains (losses) are determined at the fund level and allocated daily to each class of shares based on the net assets of the class. Class-specific expenses, such as distribution and service fees, if any, and transfer agent fees, are calculated daily for each class, based on the net asset value of the class and the applicable specific expense rates.
Federal income taxes. The Fund intends to continue to qualify as a regulated investment company by complying with the applicable provisions of the Internal Revenue Code and will not be subject to federal income tax on taxable income that is distributed to shareholders. Therefore, no federal income tax provision is required.
As of March 31, 2011, the Fund had no uncertain tax positions that would require financial statement recognition, de-recognition or disclosure. The Fund’s federal tax return is subject to examination by the Internal Revenue Service for a period of three years.
Distribution of income and gains. Distributions to shareholders from net investment income and net realized gains, if any, are recorded on the ex-date. The Fund generally declares dividends daily and pays them monthly. Capital gain distributions, if any, are paid annually.
Distributions paid by the Fund with respect to each class of shares are calculated in the same manner, at the same time and in the same amount, except for the effect of expenses that may be applied differently to each class.
Such distributions, on a tax basis, are determined in conformity with income tax regulations, which may differ from accounting principles generally accepted in the United States of America.
Capital accounts within financial statements are adjusted for permanent book-tax differences. These adjustments have no impact on net assets or the results of operations. Temporary book-tax differences, if any, will reverse in a subsequent period. Book-tax differences are primarily attributable to defaulted bonds and tender consent fees.
New accounting pronouncement. In May 2011, Accounting Standards Update 2011-04 (ASU 2011-04), Amendments to Achieve Common Fair Value Measurement and Disclosure Requirements in U.S. GAAP and IFRSs, was issued and is effective during interim and annual periods beginning after December 15, 2011. ASU 2011-04 amends Financial Accounting Standards Board (FASB) Topic 820, Fair Value Measurement. The amendments are the result of the work by the FASB and the International Accounting Standards Board to develop common requirements for measuring fair value and for disclosing information about fair value measurements in accordance with GAAP. Management is
| 15 |
currently evaluating the application of ASU 2011-04 and its impact, if any, on the Fund’s financial statements.
Note 3 - Guarantees and indemnifications
Under the Fund’s organizational documents, its Officers and Trustees are indemnified against certain liabilities arising out of the performance of their duties to the Fund. Additionally, in the normal course of business, the Fund enters into contracts with service providers that contain general indemnification clauses. The Fund’s maximum exposure under these arrangements is unknown, as this would involve future claims that may be made against the Fund that have not yet occurred. The risk of material loss from such claims is considered remote.
Note 4 - Fees and transactions with affiliates
John Hancock Investment Management Services, LLC (the Adviser) serves as investment adviser for the Trust. John Hancock Funds, LLC (the Distributor), an affiliate of the Adviser, serves as principal underwriter of the Trust. The Adviser and the Distributor are indirect wholly owned subsidiaries of Manulife Financial Corporation (MFC).
Management fee. The Fund has an investment management contract with the Adviser under which the Fund pays a daily management fee to the Adviser equivalent, on an annual basis, to the sum of: (a) 0.650% of the first $250,000,000 of the Fund’s average daily net assets; (b) 0.625% of the next $250,000,000 of the Fund’s average daily net assets; (c) 0.600% of the next $500,000,000 of the Fund’s average daily net assets; (d) 0.550% of the next $1,500,000,000 of the Fund’s average daily net assets; and (e) 0.525% of the Fund’s average daily net assets in excess of $2,500,000,000. The Adviser has a subadvisory agreement with John Hancock Asset Management a division of Manulife Asset Management (North America) Limited, an indirectly owned subsidiary of MFC and an affiliate of the Adviser. The Fund is not responsible for payment of the subadvisory fees.
The Adviser has contractually agreed to waive fees and/or reimburse certain expenses for each share class of the Fund. This agreement excludes taxes, brokerage commissions, interest, litigation and indemnification expenses and other extraordinary expenses not incurred in the ordinary course of the Fund’s business. The fee waivers and/or reimbursements are such that these expenses will not exceed 1.25% for Class A shares and 0.94% for Class I shares. Prior to August 1, 2011, the fee waivers and/or reimbursements were such that these expenses did not exceed 1.25% for Class A shares and 0.84% for Class I shares. The fee waivers and/or reimbursements will continue in effect until July 30, 2012. In addition, the Adviser has voluntarily agreed to limit the Fund’s total expenses, excluding management fees, transfer agent fees, distribution and service fees, brokerage commissions, interest and other extraordinary expenses not incurred in the ordinary course of the Fund’s business, to 0.19% of the Fund’s average daily net asset value, on an annual basis. The voluntary fee waiver and/or reimbursement may be amended or terminated at any time by the Adviser.
Accordingly, the expense reductions or reimbursements related to these agreements were $25,464 and $46, for Class A and Class I shares, respectively, for the six months ended September 30, 2011.
The investment management fees, including the impact of the waivers and reimbursements described above, incurred for the six months ended September 30, 2011 were equivalent to a net annual effective rate of 0.35% of the Fund’s average daily net assets.
Accounting and legal services. Pursuant to a service agreement, the Fund reimburses the Adviser for all expenses associated with providing the administrative, financial, legal, accounting and recordkeeping services of the Fund, including the preparation of all tax returns, periodic reports to shareholders and regulatory reports, among other services. These expenses are allocated to each share class based on its relative net assets at the time the expense was incurred. These accounting and legal services fees incurred for the six months ended September 30, 2011, amounted to an annual rate of 0.01% of the Fund’s average daily net assets.
Distribution and service plans. The Fund has a distribution agreement with the Distributor. The Fund
| 16 |
has adopted distribution and service plans with respect to Class A shares pursuant to Rule 12b-1 under the 1940 Act, to pay the Distributor for services provided as the distributor of shares of the Fund. The Fund may pay up to an annual rate of 0.30% of average daily net assets for Class A shares for distribution and service fees. Currently, only 0.25% is charged to Class A shares for distribution and service fees.
Sales charges. Class A shares are assessed up-front sales charges, which result in payments to the Distributor. For the six months ended September 30, 2011, no sales charges were assessed.
Transfer agent fees. The Fund has a transfer agent agreement with John Hancock Signature Services, Inc. (Signature Services), an affiliate of the Adviser. The transfer agent fees paid to Signature Services are determined based on the cost to Signature Services (Signature Services Cost) of providing recordkeeping services. The Signature Services Cost includes a component of allocated John Hancock corporate overhead for providing transfer agent services to the Fund and to all other John Hancock affiliated funds. It also includes out-of-pocket expenses that are comprised of payments made to third-parties for recordkeeping services provided to their clients who invest in one or more John Hancock funds. In addition, Signature Services Cost may be reduced by certain fees that Signature Services receives in connection with retirement and small accounts. Signature Services Cost is calculated monthly and allocated, as applicable, to four categories of share classes: Institutional Share Classes, Retirement Share Classes, Municipal Bond Classes and all other Retail Share Classes. Within each of these categories, the applicable costs are allocated to the affected John Hancock affiliated funds and/or classes, based on the relative average daily net assets.
Class level expenses. Class level expenses for the six months ended September 30, 2011 were:
| Class | Distribution and service fees | Transfer agent fees | |
| Class A | $21,010 | $14,423 | |
| Class I | -- | 10 | |
| Total | $21,010 | $14,433 | |
Trustee expenses. The Fund compensates each Trustee who is not an employee of the Adviser or its affiliates. These Trustees may, for tax purposes, elect to defer receipt of this compensation under the John Hancock Group of Funds Deferred Compensation Plan (the Plan). Deferred amounts are invested in various John Hancock funds and remain in the funds until distributed in accordance with the Plan. The investment of deferred amounts and the offsetting liability are included within Other receivables and prepaid expenses and Payable to affiliates - Trustees' fees, respectively, in the accompanying Statement of assets and liabilities.
Note 5 - Fund share transactions
The Fund had no fund share transactions for the six months ended September 30, 2011 or the year ended March 31, 2011.
Affiliates of the Fund owned 100% of shares of beneficial interest of the Fund on September 30, 2011.
Note 6 - Purchase and sale of securities
Purchases and sales of securities, other than short-term securities, aggregated $8,042,158 and $8,565,454 respectively, for the six months ended September 30, 2011.
| 17 |
Board Consideration of and Continuation of Investment Advisory Agreement and Subadvisory Agreement: John Hancock Core High Yield Fund
The Board of Trustees (the Board, the members of which are referred to as Trustees) of John Hancock Core High Yield Fund (the Fund), a series of John Hancock Funds III, met in-person on May 1–3 and June 5–7, 2011 to consider the approval of the Fund’s investment advisory agreement (the Advisory Agreement) with John Hancock Investment Management Services, LLC (the Adviser), the Fund’s investment adviser. The Board also considered the approval of the investment subadvisory agreement (the Subadvisory Agreement) between the Adviser and Manulife Asset Management (North America) Limited (the Subadviser) on behalf of the Fund. The Advisory Agreement and the Subadvisory Agreement are referred to as the Agreements.
Activities and composition of the Board
The Board consists of eleven individuals, nine of whom are Independent Trustees. Independent Trustees are generally those individuals who are not employed by or have any significant business or professional relationship with the Adviser or the Subadviser. The Trustees are responsible for the oversight of operations of the Fund and perform various duties required of directors of investment companies by the Investment Company Act of 1940, as amended (the 1940 Act). The Independent Trustees have hired independent legal counsel to assist them in connection with their duties. The Board has appointed an Independent Trustee as Chairperson. The Board has established four standing committees that are composed entirely of Independent Trustees: the Audit Committee; the Compliance Committee; the Nominating, Governance and Administration Committee; and the Contracts/Operations Committee. Additionally, Investment Performance Committees A and B are standing committees of the Board that are each composed of Independent Trustees and one Trustee who is affiliated with the Adviser. Investment Performance Committee A oversees and monitors matters relating to the investment performance of the Fund. The Board has also designated an Independent Trustee as Vice Chairperson to serve in the absence of the Chairperson. The Board also designates working groups or ad hoc committees as it deems appropriate.
The approval process
Under the 1940 Act, the Board is required to consider the continuation of the Agreements each year. Throughout the year, the Board, acting directly and through its committees, regularly reviews and assesses the quality of the services that the Fund receives under these Agreements. The Board reviews reports of the Adviser at least quarterly, which include Fund performance reports and compliance reports. In addition, the Board meets with portfolio managers and senior investment officers at various times throughout the year. The Board considers at each of its meetings factors that are relevant to its annual consideration of the renewal of the Agreements, including the services and support provided by the Adviser and Subadviser to the Fund and its shareholders.
Prior to the May 1–3, 2011 meeting, the Board requested and received materials specifically relating to the Agreements. The materials provided in connection with the May meeting included information compiled and prepared by Morningstar, Inc. (Morningstar) on Fund fees and
| 18 |
expenses, and the investment performance of the Fund. This Fund information is assembled in a format that permits comparison with similar information from a Category and a subset of the Category referred to as the Peer Group, each as determined by Morningstar, and with the Fund’s benchmark index. The Category includes all funds that invest similarly to the way the Fund invests. The Peer Group represents funds of similar size, excluding passively managed funds and funds-of-funds. The Fund’s benchmark index is an unmanaged index of securities that is provided as a basis for comparison with the Fund’s performance.
At an in-person meeting held on May 1–3, 2011, the Board reviewed materials relevant to its consideration of the Agreements. As a result of the discussions that occurred during the May 1 –3, 2011 meeting, the Board asked the Adviser for additional information on certain matters. The Adviser provided the additional information and the Board also considered this information as part of its consideration of the Agreements.
At an in-person meeting held on June 5–7, 2011, the Board, including the Independent Trustees, formally considered the continuation of the Advisory Agreement between the Adviser and the Fund and the Subadvisory Agreement between the Adviser and the Subadviser with respect to the Fund, each for an additional one-year term. The Board considered what it believed were key relevant factors that are described under separate headings presented below.
The Board also considered other matters important to the approval process, such as payments made to and by the Adviser or its affiliates relating to the distribution of Fund shares and other services. The Board reviewed services related to the valuation and pricing of Fund portfolio holdings. Other important matters considered by the Board were the direct and indirect benefits to the Adviser, the Subadviser and their affiliates from their relationship with the Fund and advice from independent legal counsel with respect to the review process and materials submitted for the Board’s review.
Nature, extent and quality of services
The Board reviewed the nature, extent and quality of services provided by the Adviser and the Subadviser, including the investment advisory services and the resulting performance of the Fund.
The Board considered the ability of the Adviser and the Subadviser, based on their resources, reputation and other attributes, to attract and retain qualified investment professionals, including research, advisory and supervisory personnel. It considered the background and experience of senior management and investment professionals responsible for managing the Fund. The Board considered the investment philosophy, research and investment decision-making processes of the Adviser and the Subadviser responsible for the daily investment activities of the Fund, including, among other things, portfolio trading capabilities, use of technology, commitment to compliance and approach to training and retaining portfolio managers and other research, advisory and management personnel.
The Board considered the Subadviser’s history and experience providing investment services to the Fund. The Board considered the Adviser’s execution of its oversight responsibilities. The
| 19 |
Board further considered the culture of compliance, resources dedicated to compliance, compliance programs, record of compliance with applicable laws and regulation, with the Fund’s investment policies and restrictions and with the applicable Code of Ethics, and the responsibilities of the Adviser’s and Subadviser’s compliance departments.
In addition to advisory services, the Board considered the quality of the administrative and non-investment advisory services provided to the Fund by the Adviser under a separate agreement. The Board noted that the Adviser and its affiliates provide the Fund with certain administrative, transfer agency, shareholder and other services (in addition to any such services provided to the Fund by third parties) and officers and other personnel as are necessary for the operations of the Fund. The Board reviewed the structure and duties of the Adviser’s administration, accounting, legal and compliance departments and its affiliate’s transfer agency operations and considered the Adviser’s and its affiliates’ policies and procedures for assuring compliance with applicable laws and regulations.
The Board also received information about the nature, extent and quality of services provided by and fee rates charged by the Adviser and Subadviser to their other clients, including other registered investment companies, institutional investors and separate accounts. The Board reviewed a general analysis provided by the Adviser and the Subadviser concerning investment advisory fees charged to other clients having similar investment mandates, the services provided to those other clients as compared to the services provided to the Fund, the performance of those other clients as compared to the performance by the Fund and other factors relating to those other clients. The Board considered the significant differences between the Adviser’s and Subadviser’s services to the Fund and the services they provide to other clients. For other clients that are not mutual funds, the differences in services relate to the greater share purchase and redemption activity in a mutual fund, the generally higher turnover of mutual fund portfolio holdings, the more burdensome regulatory and legal obligations of mutual funds and the higher marketing costs for mutual funds. When compared to all clients including mutual funds, the Adviser has greater oversight and supervisory responsibility for the Fund and undertakes greater entrepreneurial risk as the sponsor of the Fund.
Fund performance
The Board had previously received and considered information about the Adviser’s investment performance for other funds. The Board was provided with reports, independently prepared by Morningstar, which included a comprehensive analysis of the Fund’s performance. The Board also examined materials provided by the Fund’s portfolio management team discussing Fund performance and the Fund’s investment objective, strategies and outlook. The Board also reviewed a narrative and statistical analysis of the Morningstar data that was prepared by the Adviser, which analyzed various factors that may affect the Morningstar rankings. The Board reviewed information regarding the investment performance of the Fund as compared to its Morningstar Category as well as its benchmark index (see chart below). The Board was provided with a description of the methodology used by Morningstar to select the funds in the Category. The Board also considered updated performance information provided by the Adviser at its May and June 2011 meetings. The Board regularly reviews the performance of the Fund throughout
| 20 |
the year and attaches more importance to performance over relatively longer periods of time, typically three to five years. The Board noted that the Fund had limited operational history.
Set forth below is the performance of the Fund over the one-year period ended December 31, 2010 and that of its Category and benchmark index over the same period:
| 1-Yr | 3-Yr | 5-Yr | 10-Yr | |||
| Core High Yield Fund Class A | 20.82% | — | — | — | ||
| High Yield Bond Category Average | 14.27% | — | — | — | ||
| BofAML US HY Master II TR Index | 15.19% | — | — | — | ||
The Board noted that the Fund’s performance compared favorably to the average performance of its Category and to its benchmark index’s performance for the period shown.
Expenses and fees
The Board, including the Independent Trustees, reviewed the Fund’s contractual advisory fee rate payable by the Fund to the Adviser as compared with the other funds in its Peer Group. The Board also received information about the investment subadvisory fee rate payable by the Adviser to the Subadviser for investment subadvisory services. The Board considered the services provided and the fees charged by the Adviser and the Subadviser to other clients with similar investment mandates, including separately managed institutional accounts.
In addition, the Board considered the cost of the services provided to the Fund by the Adviser. The Board received and considered expense information regarding the Fund’s various components, including advisory fees, distribution fees and fees other than advisory and distribution fees, including transfer agent fees, custodian fees, administration fees and other miscellaneous fees (e.g., fees for accounting and legal services). The Board considered comparisons of these expenses to the Peer Group median. The Board also considered expense information regarding the Fund’s total operating expense ratio (Gross Expense Ratio) and total operating expense ratio after taking the Adviser’s contractual fee waiver/expense reimbursement agreement into account (Net Expense Ratio). The Board considered information comparing the Gross Expense Ratio and Net Expense Ratio of the Fund to that of the Peer Group median. As part of its analysis, the Board reviewed the Adviser’s methodology in allocating its costs to the management of the Fund and the Fund complex.
The Board noted that the Fund’s advisory fee ratio was the same as the Peer Group median advisory fee ratio. The Board noted the following information about the Fund’s Gross and Net Expense Ratios for Class A shares contained in the Fund’s 2010 financial statements in relation with the Fund’s Peer Group median provided by Morningstar in April 2011:
| Fund (Class A) | Peer Group Median | |||
| Advisory Fee Ratio | 0.65% | 0.65% | ||
| Gross Expense Ratio | 1.53% | 1.35% | ||
| Net Expense Ratio | 1.21% | 1.15% | ||
| 21 |
The Board viewed favorably the Adviser’s contractual agreement to waive all or a portion of its advisory fees and to reimburse or pay operating expenses to the extent necessary to maintain the Fund’s Net Expense Ratio at 1.25% for Class A shares, excluding certain expenses such as taxes, brokerage commissions, interest, litigation and extraordinary expenses, until June 30, 2012. The Board favorably considered the impact of this contractual agreement toward ultimately lowering the Fund’s Gross Expense Ratio.
As the Fund is owned only by the Adviser or its affiliates and has no other shareholders, the Fund is considered “in development” and so the Adviser was not able to provide the Board with credible information concerning the expected profits to be realized by the Adviser and its affiliates from their relationships with the Fund.
Economies of scale
The Board, including the Independent Trustees, considered the extent to which economies of scale might be realized as the assets of the Fund increase. Possible changes in the advisory fee rate or structure in order to enable the Fund to participate in these economies of scale (e.g., through the use of breakpoints in the advisory fee at higher asset levels) are periodically discussed. The Board also considered the Adviser’s overall operations and its ongoing investment in its business in order to expand the scale of, and improve the quality of, its operations that benefit the Fund.
The Board recognized the inherent limitations of any analysis of economies of scale, stemming largely from the Board’s understanding that most of the Adviser’s costs are not specific to individual funds, but rather are incurred across a variety of products and services. To ensure that any economies are reasonably shared with the Fund as its assets increase, the Adviser and the Board agreed to continue the existing breakpoints to the contractual advisory fee rate.
Other benefits to the Adviser and the Subadviser
The Board understands that the Adviser, the Subadviser or their affiliates may derive other ancillary benefits from their relationship with the Fund, both tangible and intangible, such as their ability to leverage investment professionals who manage other portfolios, an increase in their profile in the investment advisory community and the engagement of their affiliates and/or significant shareholders as service providers to the Fund, including for administrative, transfer agency and distribution services. The Board believes that certain of these benefits are difficult to quantify. The Board also was informed that the Subadviser may use third-party research obtained by soft dollars generated by certain mutual fund transactions to assist itself in managing all or a number of its other client accounts.
Board determination
The Board unanimously approved the continuation of the Advisory Agreement between the Adviser and the Fund for an additional one-year term. The Subadvisory Agreement between the Adviser and Subadviser with respect to the Fund was also approved for an additional one-year term. Based upon its evaluation of relevant factors in their totality, the Board was satisfied that
| 22 |
the terms of the Agreements, including the advisory and subadvisory fee rates, were fair and reasonable and in the best interest of the Fund and its shareholders. In arriving at its decision to approve the Agreements, the Board did not identify any single factor or any group of factors as all-important or controlling, but considered all factors together. Different Trustees may have attributed different weights to the various factors considered. The Independent Trustees were also assisted by independent legal counsel in making this determination. The Trustees’ conclusions may be based in part on their consideration of these arrangements in the prior year and on their ongoing regular review of Fund performance and operations throughout the year.
| 23 |
More information
| Trustees | Investment adviser |
| Steven R. Pruchansky, Chairman | John Hancock Investment Management Services, LLC |
| James F. Carlin | |
| William H. Cunningham | Subadviser |
| Deborah C. Jackson | John Hancock Asset Management |
| Charles L. Ladner*, Vice Chairman | |
| Stanley Martin* | Principal distributor |
| Hugh McHaffie† | John Hancock Funds, LLC |
| Dr. John A. Moore*# | |
| Patti McGill Peterson* | Custodian |
| Gregory A. Russo | State Street Bank and Trust Company |
| John G. Vrysen† | |
| Transfer agent | |
| John Hancock Signature Services, Inc. | |
| Officers | |
| Keith F. Hartstein | Legal counsel |
| President and Chief Executive Officer | K&L Gates LLP |
| Andrew G. Arnott | |
| Senior Vice President and Chief Operating Officer | |
| Thomas M. Kinzler | |
| Secretary and Chief Legal Officer | |
| Francis V. Knox, Jr. | |
| Chief Compliance Officer | |
| Charles A. Rizzo | |
| Chief Financial Officer | |
| Salvatore Schiavone | |
| Treasurer | |
| *Member of the Audit Committee | |
| †Non-Independent Trustee | |
| #Effective 9-13-11 | |
The Fund’s proxy voting policies and procedures, as well as the Fund’s proxy voting record, if any, for the most recent twelve-month period ended June 30, are available free of charge on the Securities and Exchange Commission (SEC) Web site at www.sec.gov or on our Web site.
The Fund’s complete list of portfolio holdings, for the first and third fiscal quarters, is filed with the SEC on Form N-Q. The Fund’s Form N-Q is available on our Web site and the SEC’s Web site, www.sec.gov, and can be reviewed and copied (for a fee) at the SEC’s Public Reference Room in Washington, DC. Call 1-800-SEC-0330 to receive information on the operation of the SEC's Public Reference Room.
We make this information on your fund, as well as monthly portfolio holdings, and other fund details available on our Web site www.jhfunds.com or by calling 1-800-225-5291.
| You can also contact us: | ||
| 1-800-225-5291 | Regular mail: | Express mail: |
| jhfunds.com | John Hancock Signature Services, Inc. | John Hancock Signature Services, Inc. |
| P.O. Box 55913 | Mutual Fund Image Operations | |
| Boston, MA 02205-5913 | 30 Dan Road | |
| Canton, MA 02021 |
| 24 |
A look at performance
Total returns for the period ended September 30, 2011
| Average annual total returns (%) | Cumulative total returns (%) | |||||||
| with maximum sales charge (POP) | with maximum sales charge (POP) | |||||||
| 1-year | 5-year | 10-year | 6-months | 1-year | 5-year | 10-year | ||
| Class A1 | –11.07 | –1.96 | 5.24 | –27.03 | –11.07 | –9.44 | 66.60 | |
| Class I1,2 | –6.13 | –0.62 | 6.16 | –23.06 | –6.13 | –3.07 | 81.84 | |
| Class R11,2 | –6.77 | –1.38 | 5.33 | –23.35 | –6.77 | –6.70 | 68.13 | |
| Class R31,2 | –6.66 | –1.27 | 5.44 | –23.28 | –6.66 | –6.20 | 69.88 | |
| Class R41,2 | –6.42 | –0.99 | 5.75 | –23.18 | –6.42 | –4.84 | 74.93 | |
| Class R51,2 | –6.18 | –0.69 | 6.07 | –23.07 | –6.18 | –3.41 | 80.23 | |
| Class R61,2 | –6.14 | –0.59 | 6.19 | –23.10 | –6.14 | –2.90 | 82.26 | |
| Class AdV 1,2 | –6.37 | –1.07 | 5.62 | –23.18 | –6.37 | –5.25 | 72.71 | |
Performance figures assume all distributions are reinvested. Public offering price (POP) figures reflect maximum sales charge on Class A shares of 5%. Sales charges are not applicable for Class I, R1, R3, R4, R5, R6 and ADV shares.
The expense ratios of the Fund, both net (including any fee waivers or expense limitations) and gross (excluding any fee waivers or expense limitations), are set forth according to the most recent publicly available prospectuses for the Fund and may differ from those disclosed in the Financial highlights tables in this report. The fee waivers and expense limitations are contractual at least until 6-30-12 for Class A, I, R1, R3, R4, R5 and ADV shares and 6-30-13 for Class R6 shares. Had the fee waivers and expense limitations not been in place gross expenses would apply. The expense ratios are as follows:
| Class A | Class I | Class R1 | Class R3 | Class R4 | Class R5 | Class R6 | Class ADV | |
| Net (%) | 1.50 | 1.04 | 1.80 | 1.70 | 1.40 | 1.10 | 1.04 | 1.34 |
| Gross (%) | 1.55 | 1.15 | 7.00 | 2.96 | 7.16 | 3.57 | 1.10 | 4.97 |
The returns reflect past results and should not be considered indicative of future performance. The return and principal value of an investment will fluctuate so that shares, when redeemed, may be worth more or less than their original cost. Due to market volatility, the Fund’s current performance may be higher or lower than the performance shown. For performance data current to the most recent month end, please call 1–800–225–5291 or visit the Fund’s Web site at www.jhfunds.com.
The performance table above and the chart on the next page do not reflect the deduction of taxes that a shareholder would pay on fund distributions or the redemption of fund shares. The Fund’s performance results reflect any applicable expense reductions, without which the expenses would increase and results would have been less favorable.
| 6 | Small Company Fund | Semiannual report |
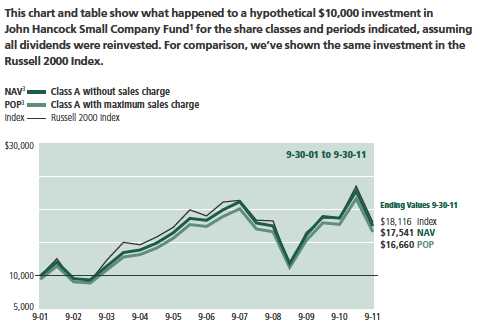
| Without | With maximum | |||
| Start date | sales charge | sales charge | Index | |
| Class I 2 | 9-30-01 | $18,184 | $18,184 | $18,116 |
| Class R1 2 | 9-30-01 | 16,813 | 16,813 | 18,116 |
| Class R3 2 | 9-30-01 | 16,988 | 16,988 | 18,116 |
| Class R4 2 | 9-30-01 | 17,493 | 17,493 | 18,116 |
| Class R5 2 | 9-30-01 | 18,023 | 18,023 | 18,116 |
| Class R62 | 9-30-01 | 18,226 | 18,226 | 18,116 |
| Class ADV 2 | 9-30-01 | 17,271 | 17,271 | 18,116 |
Russell 2000 Index is an index that measures performance of the 2,000 smallest companies in the Russell 3000 Index, which represents approximately 8% of total market capitalization of the Russell 3000 Index.
It is not possible to invest directly in an index. Index figures do not reflect sales charges, which would have resulted in lower values if they did.
1 On 12-11-09, through a reorganization, the Fund acquired all of the assets of the FMA Small Company Portfolio (the Predecessor Fund). On that date, the Predecessor Fund offered its Investor share class in exchange for Class A shares and the Institutional share class in exchange for Class I shares. Class A, Class I and Class ADV shares were first offered on 12-14-09. The Class A and Class ADV returns prior to that date are those of the Predecessor Fund’s Investor shares that have been recalculated to apply the gross fees and expenses of Class A and Class ADV shares, respectively. The Class I returns prior to 5-2-08 are those of the Predecessor Fund’s Investor shares that have been recalculated to apply the gross fees and expenses of Class I shares. The inception date of Class R1, Class R3, Class R4 and Class R5 shares is 4-30-10; returns prior to that date are those of Class A shares recalculated to apply the gross fees and expenses of Class R1, Class R3, Class R4 and Class R5 shares, respectively. The inception date of Class R6 shares is 9-1-11, returns prior to that date are those of Class A shares recalculated to apply the gross fees and expenses of Class R6 shares.
2 For certain types of investors, as described in the Fund’s prospectuses.
3 NAV represents net asset value and POP represents public offering price. Performance of the classes will vary based on the difference in sales charges paid by shareholders investing in the different classes and fees structure of those classes.
| Semiannual report | Small Company Fund | 7 |
Your expenses
These examples are intended to help you understand your ongoing operating expenses.
Understanding fund expenses
As a shareholder of the Fund, you incur two types of costs:
▪ Transaction costs which include sales charges (loads) on purchases or redemptions (varies by share class), minimum account fee charge, etc.
▪ Ongoing operating expenses including management fees, distribution and service fees (if applicable), and other fund expenses.
We are going to present only your ongoing operating expenses here.
Actual expenses/actual returns
This example is intended to provide information about the Fund’s actual ongoing operating expenses, and is based on the Fund’s actual return. It assumes an account value of $1,000.00 on April 1, 2011 with the same investment held until September 30, 2011.
| Account value | Ending value | Expenses paid during | |
| on 4-1-11 | on 9-30-11 | period ended 9-30-111 | |
| Class A | $1,000.00 | $768.20 | $6.14 |
| Class I | 1,000.00 | 769.40 | 4.60 |
| Class R1 | 1,000.00 | 766.50 | 7.95 |
| Class R3 | 1,000.00 | 767.20 | 7.51 |
| Class R4 | 1,000.00 | 768.20 | 6.19 |
| Class R5 | 1,000.00 | 769.30 | 4.87 |
| Class ADV | 1,000.00 | 768.20 | 5.92 |
For the class noted below, the example assumes an account value of $1,000.00 on September 1, 2011, with the same investment held until September 30, 2011.
| Account value | Ending value | Expenses paid during | |
| on 9-1-11 | on 9-30-11 | period ended 9-30-112 | |
| Class R6 | $1,000.00 | $885.50 | $0.80 |
Together with the value of your account, you may use this information to estimate the operating expenses that you paid over the period. Simply divide your account value at September 30, 2011, by $1,000.00, then multiply it by the “expenses paid” for your share class from the table above. For example, for an account value of $8,600.00, the operating expenses should be calculated as follows:
| 8 | Small Company Fund | Semiannual report |
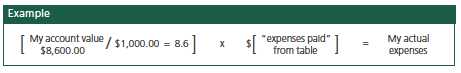
Hypothetical example for comparison purposes
This table allows you to compare the Fund’s ongoing operating expenses with those of any other fund. It provides an example of the Fund’s hypothetical account values and hypothetical expenses based on each class’s actual expense ratio and an assumed 5% annualized return before expenses (which is not the Fund’s actual return). It assumes an account value of $1,000.00 on April 1, 2011, with the same investment held until September 30, 2011. Look in any other fund shareholder report to find its hypothetical example and you will be able to compare these expenses.
| Account value | Ending value | Expenses paid during | |
| on 4-1-11 | on 9-30-11 | period ended 9-30-113 | |
| Class A | $1,000.00 | $1,018.00 | $7.01 |
| Class I | 1,000.00 | 1,019.80 | 5.25 |
| Class R1 | 1,000.00 | 1,016.00 | 9.07 |
| Class R3 | 1,000.00 | 1,016.50 | 8.57 |
| Class R4 | 1,000.00 | 1,018.00 | 7.06 |
| Class R5 | 1,000.00 | 1,019.50 | 5.55 |
| Class R6 | 1,000.00 | 1,019.80 | 5.25 |
| Class ADV | 1,000.00 | 1,018.30 | 6.76 |
Remember, these examples do not include any transaction costs, therefore, these examples will not help you to determine the relative total costs of owning different funds. If transaction costs were included, your expenses would have been higher. See the prospectus for details regarding transaction costs.
1 Expenses are equal to the Fund’s annualized expense ratio of 1.39%, 1.04%, 1.80%, 1.70%, 1.40%, 1.10% and 1.34% for Class A, Class I, Class R1, Class R3, Class R4, Class R5 and Class ADV shares, multiplied by the average account value over the period, multiplied by 183/366 (to reflect the one-half year period).
2 Expenses are equal to the Fund’s annualized expense ratio of 1.04% for Class R6 shares, multiplied by the average account value over the period, multiplied by 30/366 (to reflect the period).
3 Expenses are equal to the Fund’s annualized expense ratio multiplied by the average account value over the period, multiplied by 183/366 (to reflect the one-half year period).
| Semiannual report | Small Company Fund | 9 |
Portfolio summary
| Top 10 Holdings (17.6% of Net Assets on 9-30-11)1,2 | ||||
| Unisource Energy Corp. | 2.4% | Home Properties, Inc. | 1.6% | |
| Portland General Electric Company | 2.3% | Hancock Holding Company | 1.6% | |
| TreeHouse Foods, Inc. | 1.8% | Prosperity Bancshares, Inc. | 1.6% | |
| Washington Real Estate | Highwoods Properties, Inc. | 1.6% | ||
| Investment Trust | 1.6% | |||
| WGL Holdings, Inc. | 1.5% | |||
| Teleflex, Inc. | 1.6% | |||
| Sector Composition2,3 | ||||
| Financials | 21% | Utilities | 6% | |
| Consumer Discretionary | 16% | Energy | 5% | |
| Industrials | 15% | Consumer Staples | 5% | |
| Information Technology | 15% | Materials | 2% | |
| Health Care | 11% | Short-Term Investments & Other | 4% | |
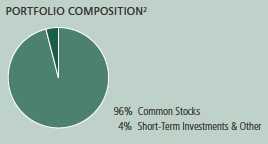
1 Cash and cash equivalents not included.
2 As a percentage of net assets on 9-30-11.
3 Sector investing is subject to greater risks than the market as a whole. Because the Fund may focus on particular sectors of the economy, its performance may depend on the performance of those sectors.
| 10 | Small Company Fund | Semiannual report |
Fund’s investments
As of 9-30-11 (unaudited)
| Shares | Value | |
| Common Stocks 95.65% | $161,285,787 | |
| (Cost $177,083,441) | ||
| Consumer Discretionary 16.41% | 27,670,107 | |
| Auto Components 0.63% | ||
| Dana Holding Corp. (I) | 100,750 | 1,057,876 |
| Hotels, Restaurants & Leisure 2.27% | ||
| Bob Evans Farms, Inc. | 74,010 | 2,110,765 |
| Vail Resorts, Inc. | 45,620 | 1,723,980 |
| Household Durables 1.32% | ||
| iRobot Corp. (I) | 88,510 | 2,226,912 |
| Media 1.47% | ||
| Arbitron, Inc. | 74,650 | 2,469,422 |
| Specialty Retail 5.56% | ||
| Asbury Automotive Group, Inc. (I) | 101,590 | 1,675,219 |
| Express, Inc. | 126,050 | 2,557,555 |
| Hibbett Sports, Inc. (I) | 76,020 | 2,576,318 |
| Sally Beauty Holdings, Inc. (I) | 154,700 | 2,568,020 |
| Textiles, Apparel & Luxury Goods 5.16% | ||
| Steven Madden, Ltd. (I) | 78,345 | 2,358,185 |
| The Warnaco Group, Inc. (I) | 36,000 | 1,659,240 |
| True Religion Apparel, Inc. (I) | 82,000 | 2,210,720 |
| Wolverine World Wide, Inc. | 74,463 | 2,475,895 |
| Consumer Staples 4.47% | 7,530,590 | |
| Food Products 3.25% | ||
| Snyders-Lance, Inc. | 121,050 | 2,523,893 |
| TreeHouse Foods, Inc. (I) | 47,730 | 2,951,623 |
| Personal Products 1.22% | ||
| Elizabeth Arden, Inc. (I) | 72,260 | 2,055,074 |
| Energy 5.31% | 8,958,435 | |
| Energy Equipment & Services 4.35% | ||
| Atwood Oceanics, Inc. (I) | 60,070 | 2,064,005 |
| Complete Production Services, Inc. (I) | 65,100 | 1,227,135 |
| Gulfmark Offshore, Inc., Class A (I) | 57,100 | 2,075,014 |
| Lufkin Industries, Inc. | 29,950 | 1,593,640 |
| Superior Energy Services, Inc. (I) | 14,540 | 381,530 |
| See notes to financial statements | Semiannual report | Small Company Fund | 11 |
| Shares | Value | |
| Oil, Gas & Consumable Fuels 0.96% | ||
| Georesources, Inc. (I) | 90,900 | $1,617,111 |
| Financials 21.00% | 35,404,257 | |
| Capital Markets 2.40% | ||
| Evercore Partners, Inc., Class A | 112,510 | 2,565,228 |
| Waddell & Reed Financial, Inc., Class A | 59,000 | 1,475,590 |
| Commercial Banks 8.05% | ||
| Bank of the Ozarks, Inc. | 100,460 | 2,102,628 |
| First Midwest Bancorp, Inc. | 229,470 | 1,679,720 |
| Hancock Holding Company | 101,230 | 2,710,939 |
| Prosperity Bancshares, Inc. | 82,430 | 2,693,812 |
| Signature Bank (I) | 53,860 | 2,570,738 |
| Webster Financial Corp. | 118,630 | 1,815,039 |
| Insurance 1.47% | ||
| Delphi Financial Group, Inc., Class A | 114,940 | 2,473,509 |
| Real Estate Investment Trusts 9.08% | ||
| Colonial Properties Trust | 139,120 | 2,526,419 |
| Entertainment Properties Trust | 65,630 | 2,558,257 |
| Highwoods Properties, Inc. | 92,880 | 2,624,789 |
| Home Properties, Inc. | 48,070 | 2,728,453 |
| Tanger Factory Outlet Centers, Inc. | 81,140 | 2,110,451 |
| Washington Real Estate Investment Trust | 98,250 | 2,768,685 |
| Health Care 11.07% | 18,659,169 | |
| Health Care Equipment & Supplies 2.69% | ||
| Integra LifeSciences Holdings Corp. (I) | 49,540 | 1,772,046 |
| Teleflex, Inc. | 51,290 | 2,757,863 |
| Health Care Providers & Services 6.15% | ||
| Bio-Reference Labs, Inc. (I) | 97,650 | 1,797,737 |
| Chemed Corp. | 37,070 | 2,037,367 |
| Hanger Orthopedic Group, Inc. (I) | 107,700 | 2,034,453 |
| LifePoint Hospitals, Inc. (I) | 59,070 | 2,164,325 |
| Owens & Minor, Inc. | 82,190 | 2,340,771 |
| Pharmaceuticals 2.23% | ||
| Impax Laboratories, Inc. (I) | 98,010 | 1,755,359 |
| Questcor Pharmaceuticals, Inc. (I) | 73,340 | 1,999,248 |
| Industrials 14.77% | 24,909,741 | |
| Aerospace & Defense 4.09% | ||
| Hexcel Corp. (I) | 97,620 | 2,163,259 |
| Orbital Sciences Corp., Class A (I) | 167,620 | 2,145,536 |
| Triumph Group, Inc. | 52,980 | 2,582,245 |
| Commercial Services & Supplies 1.47% | ||
| United Stationers, Inc. | 91,290 | 2,487,653 |
| Electrical Equipment 2.26% | ||
| Belden, Inc. | 50,280 | 1,296,721 |
| Woodward, Inc. | 91,530 | 2,507,922 |
| 12 | Small Company Fund | Semiannual report | See notes to financial statements |
| Shares | Value | |
| Machinery 1.67% | ||
| CLARCOR, Inc. | 18,190 | $752,702 |
| Robbins & Myers, Inc. | 59,430 | 2,062,815 |
| Professional Services 1.12% | ||
| Acacia Research (I) | 52,290 | 1,881,917 |
| Road & Rail 2.04% | ||
| Genesee & Wyoming, Inc., Class A (I) | 37,380 | 1,738,918 |
| Old Dominion Freight Line, Inc. (I) | 58,990 | 1,708,940 |
| Trading Companies & Distributors 2.12% | ||
| Titan Machinery, Inc. (I) | 81,700 | 1,462,430 |
| WESCO International, Inc. (I) | 63,150 | 2,118,683 |
| Information Technology 14.53% | 24,506,874 | |
| Communications Equipment 1.11% | ||
| Viasat, Inc. (I) | 56,410 | 1,879,017 |
| Electronic Equipment, Instruments & Components 3.44% | ||
| Anixter International, Inc. | 48,460 | 2,298,942 |
| Coherent, Inc. (I) | 43,660 | 1,875,634 |
| Littelfuse, Inc. | 40,250 | 1,618,453 |
| Internet Software & Services 2.25% | ||
| j2 Global Communications, Inc. | 66,910 | 1,799,879 |
| LivePerson, Inc. (I) | 201,180 | 2,001,741 |
| IT Services 1.53% | ||
| Jack Henry & Associates, Inc. | 88,770 | 2,572,555 |
| Office Electronics 1.49% | ||
| Zebra Technologies Corp., Class A (I) | 81,290 | 2,515,113 |
| Semiconductors & Semiconductor Equipment 3.19% | ||
| Cavium, Inc. (I) | 52,640 | 1,421,806 |
| Cirrus Logic, Inc. (I) | 157,240 | 2,317,718 |
| Lattice Semiconductor Corp. (I) | 312,260 | 1,639,365 |
| Software 1.52% | ||
| SolarWinds, Inc. (I) | 116,560 | 2,566,651 |
| Materials 1.91% | 3,223,648 | |
| Chemicals 1.91% | ||
| Olin Corp. | 95,780 | 1,724,998 |
| PolyOne Corp. | 139,930 | 1,498,650 |
| Utilities 6.18% | 10,422,966 | |
| Electric Utilities 4.65% | ||
| Portland General Electric Company | 159,860 | 3,787,083 |
| Unisource Energy Corp. | 112,280 | 4,052,184 |
| Gas Utilities 1.53% | ||
| WGL Holdings, Inc. | 66,130 | 2,583,699 |
| See notes to financial statements | Semiannual report | Small Company Fund | 13 |
| Yield (%) | Shares | Value | |
| Short-Term Investments 4.22% | $7,112,149 | ||
| (Cost $7,112,149) | |||
| Money Market Funds 4.22% | 7,112,149 | ||
| State Street Institutional Liquid Reserves Fund, 0.0927% | 0.0927 (Y) | 7,112,149 | 7,112,149 |
| Total investments (Cost $184,195,590)† 99.87% | $168,397,936 | ||
| Other assets and liabilities, net 0.13% | $212,409 | ||
| Total net assets 100.00% | $168,610,345 | ||
The percentage shown for each investment category is the total value of the category as a percentage of the net assets of the Fund.
(I) Non-income producing security.
(Y) The rate shown is the annualized seven-day yield as of 9-30-11.
† At 9-30-11, the aggregate cost of investment securities for federal income tax purposes was $185,556,024. Net unrealized depreciation aggregated $17,158,088, of which $5,681,837 related to appreciated investment securities and $22,839,925 related to depreciated investment securities.
| 14 | Small Company Fund | Semiannual report | See notes to financial statements |
F I N A N C I A L S T A T E M E N T S
Financial statements
Statement of assets and liabilities 9-30-11 (unaudited)
This Statement of assets and liabilities is the Fund’s balance sheet. It shows the value of what the Fund owns, is due and owes. You’ll also find the net asset value and the maximum offering price per share.
| Assets | |
| Investments, at value (Cost $184,195,590) | $168,397,936 |
| Receivable for investments sold | 2,662,843 |
| Receivable for fund shares sold | 59,364 |
| Dividends and interest receivable | 283,392 |
| Receivable from affiliates | 178 |
| Receivable due from adviser | 1,021 |
| Other receivables and prepaid expenses | 68,171 |
| Total assets | 171,472,905 |
| Liabilities | |
| Payable for investments purchased | 2,460,031 |
| Payable for fund shares repurchased | 315,025 |
| Payable to affiliates | |
| Accounting and legal services fees | 1,858 |
| Transfer agent fees | 21,940 |
| Trustees’ fees | 8,230 |
| Other liabilities and accrued expenses | 55,476 |
| Total liabilities | 2,862,560 |
| Net assets | |
| Paid-in capital | $212,026,732 |
| Undistributed net investment income | 225,028 |
| Accumulated net realized loss on investments | (27,843,761) |
| Net unrealized appreciation (depreciation) on investments | (15,797,654) |
| Net assets | $168,610,345 |
| Net asset value per share | |
| Based on net asset values and shares outstanding — the Fund has an | |
| unlimited number of shares authorized with no par value | |
| Class A ($110,342,483 ÷ 6,700,480 shares) | $16.47 |
| Class I ($57,076,122 ÷ 3,448,688 shares) | $16.55 |
| Class R1 ($88,808 ÷ 5,421 shares) | $16.38 |
| Class R3 ($395,394 ÷ 24,101 shares) | $16.41 |
| Class R4 ($38,294 ÷ 2,325 shares) | $16.47 |
| Class R5 ($156,945 ÷ 9,487 shares) | $16.54 |
| Class R6 ($88,570 ÷ 5,351 shares) | $16.55 |
| Class ADV ($423,729 ÷ 25,723 shares) | $16.47 |
| Maximum offering price per share | |
| Class A (net asset value per share ÷ 95%)1 | $17.34 |
1 On single retail sales of less than $50,000. On sales of $50,000 or more and on group sales the offering price is reduced.
| See notes to financial statements | Semiannual report | Small Company Fund | 15 |
F I N A N C I A L S T A T E M E N T S
Statement of operations For the six-month period ended 9-30-11
(unaudited)
This Statement of operations summarizes the Fund’s investment income earned and expenses incurred in operating the Fund. It also shows net gains (losses) for the period stated.
| Investment income | |
| Dividends | $1,362,246 |
| Interest | 4,550 |
| Other income | 36,716 |
| Total investment income | 1,403,512 |
| Expenses | |
| Investment management fees (Note 4) | 931,574 |
| Distribution and service fees (Note 4) | 207,935 |
| Accounting and legal services fees (Note 4) | 15,663 |
| Transfer agent fees (Note 4) | 142,302 |
| Trustees’ fees (Note 4) | 5,763 |
| State registration fees (Note 4) | 44,642 |
| Printing and postage (Note 4) | 33,064 |
| Professional fees | 27,436 |
| Custodian fees | 13,351 |
| Registration and filing fees | 20,205 |
| Other | 10,732 |
| Total expenses | 1,452,667 |
| Less expense reductions (Note 4) | (134,997) |
| Net expenses | 1,317,670 |
| Net investment income | 85,842 |
| Realized and unrealized loss | |
| Net realized loss on | |
| Investments | (9,663,792) |
| Change in net unrealized appreciation (depreciation) of | |
| Investments | (42,222,676) |
| Net realized and unrealized loss | (51,886,468) |
| Decrease in net assets from operations | ($51,800,626) |
| 16 | Small Company Fund | Semiannual report | See notes to financial statements |
F I N A N C I A L S T A T E M E N T S
Statements of changes in net assets
These Statements of changes in net assets show how the value of the Fund’s net assets has changed during the last two periods. The difference reflects earnings less expenses, any investment gains and losses, distributions, if any, paid to shareholders and the net of Fund share transactions.
| Six months | ||
| ended | Year | |
| 9-30-11 | ended | |
| (Unaudited) | 3-31-11 | |
| Increase (decrease) in net assets | ||
| From operations | ||
| Net investment income (loss) | $85,842 | ($92,010) |
| Net realized gain (loss) | (9,663,792) | 22,658,659 |
| Change in net unrealized appreciation (depreciation) | (42,222,676) | 3,181,254 |
| Increase (decrease) in net assets resulting from operations | (51,800,626) | 25,747,903 |
| Increase in capital from settlement payments | __ | 231,252 |
| From Fund share transactions (Note 5) | 64,640,653 | 2,290,103 |
| Total increase | 12,840,027 | 28,269,258 |
| Net assets | ||
| Beginning of period | 155,770,318 | 127,501,060 |
| End of period | $168,610,345 | $155,770,318 |
| Undistributed net investment income | $225,028 | $139,186 |
| See notes to financial statements | Semiannual report | Small Company Fund | 17 |
Financial highlights
The Financial highlights show how the Fund’s net asset value for a share has changed since the end of the previous period.
| CLASS A SHARES | |||||||
| Period ended | 9-30-111 | 3-31-11 | 3-31-102,3 | 10-31-09 | 10-31-084 | 10-31-07 | 10-31-06 |
| Per share operating performance | |||||||
| Net asset value, | |||||||
| beginning of period | $21.44 | $17.82 | $14.68 | $13.83 | $22.55 | $23.04 | $22.40 |
| Net investment income | |||||||
| (loss)5 | —6 | (0.03) | (0.02) | —6 | 0.05 | (0.04) | (0.05) |
| Net realized and | |||||||
| unrealized gain (loss) | |||||||
| on investments | (4.97) | 3.62 | 3.18 | 0.87 | (6.01) | 2.06 | 4.24 |
| Total from investment | |||||||
| operations | (4.97) | 3.59 | 3.16 | 0.87 | (5.96) | 2.02 | 4.19 |
| Less distributions | |||||||
| From net | |||||||
| investment income | — | — | (0.02) | (0.02) | (0.01) | (0.01) | — |
| From net realized gain | — | — | — | — | (2.75) | (2.50) | (3.55) |
| Total distributions | — | — | (0.02) | (0.02) | (2.76) | (2.51) | (3.55) |
| Non-recurring | |||||||
| reimbursement | — | 0.037 | — | — | — | — | — |
| Net asset value, end | |||||||
| of period | $16.47 | $21.44 | $17.82 | $14.68 | $13.83 | $22.55 | $23.04 |
| Total return (%)8,9 | (23.18)10 | 20.31 | 21.5110 | 6.34 | (29.67) | 9.43 | 21.07 |
| Ratios and supplemental data | |||||||
| Net assets, end of period | |||||||
| (in thousands) | $110,342 | $88,000 | $92,000 | $87,000 | $104,000 | $209,000 | $212,000 |
| Ratios (as a percentage | |||||||
| of average net assets): | |||||||
| Expenses before | |||||||
| reductions | 1.5011 | 1.49 | 1.6611 | 1.42 | 1.37 | 1.30 | 1.27 |
| Expenses net of | |||||||
| fee waivers | 1.3911 | 1.34 | 1.3911 | 1.39 | 1.31 | 1.25 | 1.24 |
| Net investment | |||||||
| income (loss) | (0.04)11 | (0.17) | (0.23)11 | (0.01) | 0.27 | (0.20) | (0.17) |
| Portfolio turnover (%) | 62 | 159 | 4212 | 155 | 177 | 132 | 13513 |
1 Unaudited.
2 For the five month period ended 3-31-10. The Fund changed its fiscal year end from October 31 to March 31.
3 After the close of business on 12-11-09, holders of Investor Shares of the former FMA Small Company Portfolio (the Predecessor Fund) became owners of an equal number of full and fractional Class A shares of John Hancock Small Company Fund. These shares were first offered on 12-14-09. Additionally, the accounting and performance history of the Investor Shares of the Predecessor Fund was redesignated as that of John Hancock Small Company Fund Class A.
4 Prior to 5-1-08, Investor Shares were offered as Institutional Class Shares.
5 Based on the average daily shares outstanding.
6 Less than ($0.005) per share.
7 Reflects a non-recurring reimbursement pursuant to a settlement between the SEC and Millennium Partners, L.P., Millennium Management, L.L.C., and Millennium International Management, L.L.C., which amounted to $0.03 per share.
8 Does not reflect the effect of sales charges, if any.
9 Total returns would have been lower had certain expenses not been reduced during the periods shown.
10 Not annualized.
11 Annualized.
12 Portfolio turnover is shown for the period from 11-1-09 to 3-31-10.
13 Includes the effects of in-kind transactions. If the in-kind transactions were not included, the portfolio turnover rate would have been 127%.
| 18 | Small Company Fund | Semiannual report | See notes to financial statements |
| CLASS I SHARES Period ended | 9-30-111 | 3-31-11 | 3-31-102,3 | 10-31-09 | 10-31-084 | ||
| Per share operating performance | |||||||
| Net asset value, beginning of period | $21.51 | $17.84 | $14.71 | $13.84 | $17.99 | ||
| Net investment income5 | 0.03 | 0.02 | —6 | 0.03 | 0.04 | ||
| Net realized and unrealized gain (loss) | |||||||
| on investments | (4.99) | 3.62 | 3.18 | 0.87 | (4.17) | ||
| Total from investment operations | (4.96) | 3.64 | 3.18 | 0.90 | (4.13) | ||
| Less distributions | |||||||
| From net investment income | — | — | (0.05) | (0.03) | (0.02) | ||
| Non-recurring reimbursement | — | 0.037 | — | — | — | ||
| Net asset value, end of period | $16.55 | $21.51 | $17.84 | $14.71 | $13.84 | ||
| Total return (%)8 | (23.06)9 | 20.57 | 21.679 | 6.56 | (22.95)9 | ||
| Ratios and supplemental data | |||||||
| Net assets, end of period (in thousands) | $57,076 | $67,000 | $36,000 | $23,000 | $27,000 | ||
| Ratios (as a percentage of average net assets): | |||||||
| Expenses before reductions | 1.1210 | 1.12 | 1.1810 | 1.17 | 1.1810 | ||
| Expenses net of fee waivers | 1.0410 | 1.11 | 1.1410 | 1.14 | 1.0810 | ||
| Net investment income | 0.3210 | 0.09 | 0.0110 | 0.24 | 0.5510 | ||
| Portfolio turnover (%) | 62 | 159 | 4211 | 155 | 177 | ||
1 Unaudited.
2 For the five month period ended 3-31-10. The Fund changed its fiscal year end from October 31 to March 31.
3 After the close of business on 12-11-09, holders of Institutional Shares of the former FMA Small Company Portfolio (the Predecessor Fund) became owners of an equal number of full and fractional Class I shares of John Hancock Small Company Fund. These shares were first offered on 12-14-09. Additionally, the accounting and performance history of the Institutional Shares of the Predecessor Fund was redesignated as that of John Hancock Small Company Fund Class I.
4 Commencement of operations 5-2-08.
5 Based on the average daily shares outstanding.
6 Less than $0.005 per share.
7 Reflects a non-recurring reimbursement pursuant to a settlement between the SEC and Millennium Partners, L.P., Millennium Management, L.L.C., and Millennium International Management, L.L.C., which amounted to $0.03 per share.
8 Total returns would have been lower had certain expenses not been reduced during the periods shown.
9 Not annualized.
10 Annualized.
11 Portfolio turnover is shown for the period from 11-1-09 to 3-31-10.
| CLASS R1 SHARES Period ended | 9-30-111 | 3-31-112 | |||||
| Per share operating performance | |||||||
| Net asset value, beginning of period | $21.37 | $19.38 | |||||
| Net investment loss3 | (0.05) | (0.07) | |||||
| Net realized and unrealized gain (loss) on investments | (4.94) | 2.03 | |||||
| Total from investment operations | (4.99) | 1.96 | |||||
| Non-recurring reimbursement | — | 0.034 | |||||
| Net asset value, end of period | $16.38 | $21.37 | |||||
| Total return (%)5 | (23.35)6 | 10.276 | |||||
| Ratios and supplemental data | |||||||
| Net assets, end of period (in thousands) | $89 | $117 | |||||
| Ratios (as a percentage of average net assets): | |||||||
| Expenses before reductions | 10.757 | 7.227 | |||||
| Expenses net of fee waivers | 1.807 | 1.807 | |||||
| Net investment loss | (0.45)7 | (0.42)7 | |||||
| Portfolio turnover (%) | 62 | 159 | |||||
1 Unaudited.
2 Period from 4-30-10 (inception date) to 3-31-11.
3 Based on the average daily shares outstanding.
4 Reflects a non-recurring reimbursement pursuant to a settlement between the SEC and Millennium Partners, L.P., Millennium Management, L.L.C., and Millennium International Management, L.L.C., which amounted to $0.03 per share.
5 Total returns would have been lower had certain expenses not been reduced during the periods shown.
6 Not annualized.
7 Annualized.
| See notes to financial statements | Semiannual report | Small Company Fund | 19 |
| CLASS R3 SHARES Period ended | 9-30-111 | 3-31-112 | |||||
| Per share operating performance | |||||||
| Net asset value, beginning of period | $21.39 | $19.38 | |||||
| Net investment loss3 | (0.03) | (0.10) | |||||
| Net realized and unrealized gain (loss) on investments | (4.95) | 2.08 | |||||
| Total from investment operations | (4.98) | 1.98 | |||||
| Non-recurring reimbursement | — | 0.034 | |||||
| Net asset value, end of period | $16.41 | $21.39 | |||||
| Total return (%)5 | (23.28)6 | 10.376 | |||||
| Ratios and supplemental data | |||||||
| Net assets, end of period (in thousands) | $395 | $457 | |||||
| Ratios (as a percentage of average net assets): | |||||||
| Expenses before reductions | 3.857 | 3.007 | |||||
| Expenses net of fee waivers | 1.707 | 1.707 | |||||
| Net investment loss | (0.34)7 | (0.52)7 | |||||
| Portfolio turnover (%) | 62 | 159 | |||||
1 Unaudited.
2 Period from 4-30-10 (inception date) to 3-31-11.
3 Based on the average daily shares outstanding.
4 Reflects a non-recurring reimbursement pursuant to a settlement between the SEC and Millennium Partners, L.P., Millennium Management, L.L.C., and Millennium International Management, L.L.C., which amounted to $0.03 per share.
5 Total returns would have been lower had certain expenses not been reduced during the periods shown.
6 Not annualized.
7 Annualized.
| CLASS R4 SHARES Period ended | 9-30-111 | 3-31-112 | |||||
| Per share operating performance | |||||||
| Net asset value, beginning of period | $21.44 | $19.38 | |||||
| Net investment loss3 | (0.01) | (0.03) | |||||
| Net realized and unrealized gain (loss) on investments | (4.96) | 2.06 | |||||
| Total from investment operations | (4.97) | 2.03 | |||||
| Non-recurring reimbursement | — | 0.034 | |||||
| Net asset value, end of period | $16.47 | $21.44 | |||||
| Total return (%)5 | (23.18)6 | 10.636 | |||||
| Ratios and supplemental data | |||||||
| Net assets, end of period (in thousands) | $38 | $45 | |||||
| Ratios (as a percentage of average net assets): | |||||||
| Expenses before reductions | 23.257 | 7.407 | |||||
| Expenses net of fee waivers | 1.407 | 1.407 | |||||
| Net investment loss | (0.06)7 | (0.16)7 | |||||
| Portfolio turnover (%) | 62 | 159 | |||||
1 Unaudited.
2 Period from 4-30-10 (inception date) to 3-31-11.
3 Based on the average daily shares outstanding.
4 Reflects a non-recurring reimbursement pursuant to a settlement between the SEC and Millennium Partners, L.P., Millennium Management, L.L.C., and Millennium International Management, L.L.C., which amounted to $0.03 per share.
5 Total returns would have been lower had certain expenses not been reduced during the periods shown.
6 Not annualized.
7 Annualized.
| 20 | Small Company Fund | Semiannual report | See notes to financial statements |
| CLASS R5 SHARES Period ended | 9-30-111 | 3-31-112 | |||||
| Per share operating performance | |||||||
| Net asset value, beginning of period | $21.50 | $19.38 | |||||
| Net investment income3 | 0.03 | 0.01 | |||||
| Net realized and unrealized gain (loss) on investments | (4.99) | 2.08 | |||||
| Total from investment operations | (4.96) | 2.09 | |||||
| Non-recurring reimbursement | — | 0.034 | |||||
| Net asset value, end of period | $16.54 | $21.50 | |||||
| Total return (%)5 | (23.07)6 | 10.946 | |||||
| Ratios and supplemental data | |||||||
| Net assets, end of period (in thousands) | $157 | $164 | |||||
| Ratios (as a percentage of average net assets): | |||||||
| Expenses before reductions | 7.317 | 3.667 | |||||
| Expenses net of fee waivers | 1.107 | 1.107 | |||||
| Net investment income | 0.267 | 0.057 | |||||
| Portfolio turnover (%) | 62 | 159 | |||||
1 Unaudited.
2 Period from 4-30-10 (inception date) to 3-31-11.
3 Based on the average daily shares outstanding.
4 Reflects a non-recurring reimbursement pursuant to a settlement between the SEC and Millennium Partners, L.P., Millennium Management, L.L.C., and Millennium International Management, L.L.C., which amounted to $0.03 per share.
5 Total returns would have been lower had certain expenses not been reduced during the periods shown.
6 Not annualized.
7 Annualized.
| CLASS R6 SHARES Period ended | 9-30-111,2 |
| Per share operating performance | |
| Net asset value, beginning of period | $18.69 |
| Net investment income3 | 0.02 |
| Net realized and unrealized loss on investments | (2.16) |
| Total from investment operations | (2.14) |
| Net asset value, end of period | $16.55 |
| Total return (%)4 | (11.45)5 |
| Ratios and supplemental data | |
| Net assets, end of period (in thousands) | $89 |
| Ratios (as a percentage of average net assets): | |
| Expenses before reductions | 17.166 |
| Expenses net of fee waivers | 1.046 |
| Net investment income | 1.676 |
| Portfolio turnover (%) | 62 |
1 Period from 9-1-11 (inception date) to 9-30-11.
2 Unaudited.
3 Based on the average daily shares outstanding.
4 Total returns would have been lower had certain expenses not been reduced during the period shown.
5 Not annualized.
6 Annualized.
| See notes to financial statements | Semiannual report | Small Company Fund | 21 |
| CLASS ADV SHARES Period ended | 9-30-111 | 3-31-11 | 3-31-102 | ||||
| Per share operating performance | |||||||
| Net asset value, beginning of period | $21.44 | $17.82 | $15.71 | ||||
| Net investment income (loss)3 | —4 | (0.01) | (0.01) | ||||
| Net realized and unrealized gain (loss) on investments | (4.97) | 3.60 | 2.12 | ||||
| Total from investment operations | (4.97) | 3.59 | 2.11 | ||||
| Non-recurring reimbursement | — | 0.035 | — | ||||
| Net asset value, end of period | $16.47 | $21.44 | $17.82 | ||||
| Total return (%)5 | (23.18)6 | 20.31 | 13.436 | ||||
| Ratios and supplemental data | |||||||
| Net assets, end of year (in thousands) | $424 | $550 | $69 | ||||
| Ratios (as a percentage of average net assets): | |||||||
| Expenses before reductions | 3.727 | 4.99 | 2.767 | ||||
| Expenses net of fee waivers | 1.347 | 1.34 | 1.337 | ||||
| Net investment income (loss) | —7,8 | (0.07) | (0.17)7 | ||||
| Portfolio turnover (%) | 62 | 159 | 429 | ||||
1 Unaudited.
2 Period from 12-14-09 (inception date) to 3-31-10.
3 Based on the average daily shares outstanding.
4 Less than $0.005.
5 Reflects a non-recurring reimbursement pursuant to a settlement between the SEC and Millennium Partners, L.P., Millennium Management, L.L.C., and Millennium International Management, L.L.C., which amounted to $0.03 per share.
5 Total returns would have been lower had certain expenses not been reduced during the periods shown.
6 Not annualized.
7 Annualized.
8 Less than 0.005%.
9 Portfolio turnover is shown for the period from 11-1-09 to 3-31-10.
| 22 | Small Company Fund | Semiannual report | See notes to financial statements |
Notes to financial statements
(unaudited)
Note 1 — Organization
John Hancock Small Company Fund (the Fund) is a diversified series of John Hancock Funds III (the Trust), an open-end management investment company organized as a Massachusetts business trust and registered under the Investment Company Act of 1940, as amended (the 1940 Act). The investment objective of the Fund is to seek maximum long-term total return.
The Fund may offer multiple classes of shares. The shares currently offered are detailed in the Statement of assets and liabilities. Class A shares are offered to all investors. Class I shares are offered to institutions and certain investors. Class R1, Class R3, Class R4 and Class R5 shares are available only to certain retirement plans. Class R6 shares are only available to certain retirement plans, institutions and other investors. Class ADV shares are available to investors who acquired Class A shares as a result of the reorganization of the FMA Small Company Portfolio (the Predecessor Fund) into the Fund and are closed to new investors. Shareholders of each class have exclusive voting rights to matters that affect that class. The distribution and service fees, if any, transfer agent fees, printing and postage fees and state registration fees for each class may differ. Under certain circumstances, Class I shares may be converted to Class R6 shares within one year after the commencement of operations of Class R6.
The Fund is the accounting and performance successor of the Predecessor Fund. At the close of business on December 11, 2009, the Fund acquired substantially all the assets and assumed the liabilities of the Predecessor Fund pursuant to an agreement and plan on reorganization, in exchange for Class A and Class I shares of the Fund.
Note 2 — Significant accounting policies
The financial statements have been prepared in conformity with accounting principles generally accepted in the United States of America, which require management to make certain estimates and assumptions at the date of the financial statements. Actual results could differ from those estimates. Events or transactions occurring after the end of the fiscal period through the date that the financial statements were issued have been evaluated in the preparation of the financial statements. The following summarizes the significant accounting policies of the Fund:
Security valuation. Investments are stated at value as of the close of regular trading on the New York Stock Exchange (NYSE), normally at 4:00 P.M., Eastern Time. The Fund uses a three-tier hierarchy to prioritize the pricing assumptions, referred to as inputs, used in valuation techniques to measure fair value. Level 1 includes securities valued using quoted prices in active markets for identical securities. Level 2 includes securities valued using significant observable inputs. Observable inputs may include quoted prices for similar securities, interest rates, prepayment speeds and credit risk. Prices for securities valued using these inputs are received from independent pricing vendors and brokers and are based on an evaluation of the inputs described. Level 3 includes securities valued using significant unobservable inputs when market prices are not readily available or reliable, including the Fund’s own assumptions in determining the fair value of investments. Factors used in determining value may include market or issuer specific events, changes in interest rates and credit quality. The inputs or methodology used for valuing securities are not necessarily an indication of the risk associated with investing in those securities.
As of September 30, 2011, all investments are categorized as Level 1 under the hierarchy described above. Changes in valuation techniques may result in transfers in or out of an assigned level
| Semiannual report | Small Company Fund | 23 |
within the disclosure hierarchy. During the six months ended September 30, 2011, there were no significant transfers in or out of Level 1 assets.
In order to value the securities, the Fund uses the following valuation techniques. Equity securities held by the Fund are valued at the last sale price or official closing price on the principal securities exchange on which they trade. In the event there were no sales during the day or closing prices are not available, then securities are valued using the last quoted bid or evaluated price. Investments by the Fund in other open-end management investment companies are valued at their respective net asset values each business day. Certain securities traded only in the over-the-counter market are valued at the last bid price quoted by brokers making markets in the securities at the close of trading. Certain short-term securities are valued at amortized cost. Other portfolio securities and assets, where market quotations are not readily available, are valued at fair value, as determined in good faith by the Fund’s Pricing Committee, following procedures established by the Board of Trustees.
Security transactions and related investment income. Investment security transactions are accounted for on a trade date plus one basis for daily net asset value calculations. However, for financial reporting purposes, investment transactions are reported on trade date. Interest income is accrued as earned. Gains and losses on securities sold are determined on the basis of identified cost and may include proceeds from litigation. Dividend income is recorded on the ex-date, except for dividends of foreign securities where the dividend may not be known until after the ex-date. In those cases, dividend income is recorded when the Fund becomes aware of the dividends.
Real estate investment trusts. From time to time, the Fund may invest in real estate investment trusts (REITs) and, as a result, will estimate the components of distributions from these securities. Distributions from REITs received in excess of income are recorded as a reduction of cost of investments and/or as a realized gain.
Line of credit. The Fund may borrow from banks for temporary or emergency purposes, including meeting redemption requests that otherwise might require the untimely sale of securities. Pursuant to the custodian agreement, the custodian may loan money to the Fund to make properly authorized payments. The Fund is obligated to repay the custodian for any overdraft, including any related costs or expenses. The custodian has a lien, security interest or security entitlement in any Fund property that is not segregated, to the maximum extent permitted by law for any overdraft.
The Fund and other affiliated funds have entered into an agreement with Citibank N.A. which enables them to participate in a $100 million unsecured committed line of credit. A commitment fee, payable at the end of each calendar quarter, based on the average daily unused portion of the line of credit, is charged to each participating fund on a pro rata basis and is reflected in other expenses on the Statement of operations. For the six months ended September 30, 2011, the Fund had no borrowings under the line of credit.
Expenses. The majority of expenses are directly attributable to an individual fund. Expenses that are not readily attributable to a specific fund are allocated among all funds in an equitable manner, taking into consideration, among other things, the nature and type of expense and the fund’s relative assets. Expense estimates are accrued in the period to which they relate and adjustments are made when actual amounts are known.
Class allocations. Income, common expenses and realized and unrealized gains (losses) are determined at the fund level and allocated daily to each class of shares based on the net assets of the class. Class-specific expenses, such as distribution and service fees, if any, transfer agent fees, state registration fees and printing and postage, for all classes, are calculated daily at the class level based on the appropriate net assets of each class and the specific expense rates applicable to each class.
| 24 | Small Company Fund | Semiannual report |
Federal income taxes. The Fund intends to continue to qualify as a regulated investment company by complying with the applicable provisions of the Internal Revenue Code and will not be subject to federal income tax on taxable income that is distributed to shareholders. Therefore, no federal income tax provision is required.
For federal income tax purposes, the Fund has a capital loss carryforward of $16,819,535 available to offset future net realized capital gains as of March 31, 2011. The capital loss carryforward expires as follows: March 31, 2016 — $16,819,535.
Under the Regulated Investment Company Modernization Act of 2010, the Fund will be permitted to carry forward capital losses incurred in taxable years beginning after December 22, 2010 for an unlimited period. However, any losses incurred during those future taxable years will be required to be utilized prior to the losses incurred in pre-enactment taxable years. As a result of this ordering rule, pre-enactment capital loss carryforwards may be more likely to expire unused. Additionally, post-enactment capital losses that are carried forward will retain their character as either short-term or long-term capital losses rather than being considered all short-term as under previous law.
As of March 31, 2011, the Fund had no uncertain tax positions that would require financial statement recognition, derecognition or disclosure. The Fund’s federal tax returns are subject to examination by the Internal Revenue Service for a period of three years.
Distribution of income and gains. Distributions to shareholders from net investment income and net realized gains, if any, are recorded on the ex-date. The Fund generally declares and pays dividends and capital gain distributions, if any, annually.
Distributions paid by the Fund with respect to each class of shares are calculated in the same manner, at the same time and in the same amount, except for the effect of expenses that may be applied differently to each class.
Such distributions, on a tax basis, are determined in conformity with income tax regulations, which may differ from accounting principles generally accepted in the United States of America.
Capital accounts within financial statements are adjusted for permanent book-tax differences. These adjustments have no impact on net assets or the results of operations. Temporary book-tax differences, if any, will reverse in a subsequent period. Book-tax differences are primarily attributable to wash sale loss deferral and litigation proceeds.
New accounting pronouncement. In May 2011, Accounting Standards Update 2011-04 (ASU 2011-04), Amendments to Achieve Common Fair Value Measurement and Disclosure Requirements in U.S. GAAP and IFRSs, was issued and is effective during interim and annual periods beginning after December 15, 2011. ASU 2011-04 amends Financial Accounting Standards Board (FASB) Topic 820, Fair Value Measurement. The amendments are the result of the work by the FASB and the International Accounting Standards Board to develop common requirements for measuring fair value and for disclosing information about fair value measurements in accordance with GAAP. Management is currently evaluating the application of ASU 2011-04 and its impact, if any, on the Fund’s financial statements.
Note 3 — Guarantees and indemnifications
Under the Fund’s organizational documents, its Officers and Trustees are indemnified against certain liabilities arising out of the performance of their duties to the Fund. Additionally, in the normal course of business, the Fund enters into contracts with service providers that contain general indemnification clauses. The Fund’s maximum exposure under these arrangements is unknown, as this would involve future claims that may be made against the Fund that have not yet occurred. The risk of material loss from such claims is considered remote.
| Semiannual report | Small Company Fund | 25 |
Note 4 — Fees and transactions with affiliates
John Hancock Investment Management Services, LLC (the Adviser) serves as investment adviser for the Trust. John Hancock Funds, LLC (the Distributor), an affiliate of the Adviser, serves as principal underwriter of the Trust. The Adviser and the Distributor are indirect wholly owned subsidiaries of Manulife Financial Corporation (MFC).
Management Fee. The Fund has an investment management agreement with the Adviser under which the Fund pays a daily management fee to the Adviser equivalent, on an annual basis, to the sum of: (a) 0.90% of the first $500,000,000 of the Fund’s average daily net assets; (b) 0.85% of the next $500,000,000; and (c) 0.80% of the Fund’s average daily net assets in excess of $1,000,000,000. The Adviser has a subadvisory agreement with Fiduciary Management Associates, LLC. The Fund is not responsible for payment of the subadvisory fees.
The Adviser has contractually agreed to waive fees and/or reimburse certain expenses for each share class of the Fund. This agreement excludes taxes, brokerage commissions, interest, litigation and indemnification expenses and other extraordinary expenses not incurred in the ordinary course of the Fund’s business. The fee waivers and/or reimbursements are such that these expenses will not exceed the average daily net assets of 1.50%, 1.04%, 1.80%, 1.70%, 1.40%, 1.10%, 1.04% and 1.34% for Class A, Class I, Class R1, Class R3, Class R4, Class R5, Class R6 and Class ADV shares, respectively. The fee waivers and/or reimbursements will continue in effect until June 30, 2012 for Class A, Class I, Class R1, Class R3, Class R4, Class R5 and Class ADV shares and June 30, 2013 for Class R6 shares. Prior to May 4, 2011, the fee waivers and/or reimbursements for Class I were such that these expenses would not exceed 1.11% of the average net assets of Class I. In addition, prior to August 1, 2011, the fee waivers and/or reimbursements for Class A were such that these expenses would not exceed 1.34% of the average net assets for Class A. Fee waivers and/or reimbursements for all other classes remained the same during the period.
Accordingly, the expense reductions or reimbursements related to these agreements were $80,460, $27,562, $4,529, $4,916, $5,113, $5,101, $1,197 and $6,119 for Class A, Class I, Class R1, Class R3, Class R4, Class R5, Class R6 and Class ADV shares, respectively, for the six months ended September 30, 2011.
The investment management fees, including the impact of the waivers and reimbursements described above, incurred for the six months ended September 30, 2011 were equivalent to a net annual effective rate of 0.77% of the Fund’s average daily net assets.
Accounting and legal services. Pursuant to a service agreement, the Fund reimburses the Adviser for all expenses associated with providing the administrative, financial, legal, accounting and recordkeeping services of the Fund, including the preparation of all tax returns, periodic reports to shareholders and regulatory reports, among other services. These expenses are allocated to each share class based on its relative net assets at the time the expense was incurred. These accounting and legal services fees incurred for the six months ended September 30, 2011, amounted to an annual rate of 0.02%of the Fund’s average daily net assets.
Distribution and service plans. The Fund has a distribution agreement with the Distributor. The Fund has adopted distribution and service plans with respect to Class A, Class R1, Class R3, Class R4 and Class ADV shares pursuant to Rule 12b-1 under the 1940 Act, to pay the Distributor for services provided as the distributor of shares of the Fund. In addition, under a service plan for Class R1, Class R3, Class R4, and Class R5 shares, the Fund pays for certain other services. The Fund may pay up to the following contractual rates of distribution and service fees under these arrangements, expressed as an annual percentage of average daily net assets for each class of the Fund’s shares.
| 26 | Small Company Fund | Semiannual report |
| CLASS | 12b–1 FEE | SERVICE FEE | |||
| Class A | 0.30% | — | |||
| Class R1 | 0.50% | 0.25% | |||
| Class R3 | 0.50% | 0.15% | |||
| Class R4 | 0.25% | 0.10% | |||
| Class R5 | — | 0.05% | |||
| Class R6 | — | — | |||
| Class ADV | 0.25% | — | |||
Sales charges. Class A shares are assessed up-front sales charges, which resulted in payments to the Distributor amounting to $41,598 for the six months ended September 30, 2011. Of this amount, $6,528 was retained and used for printing prospectuses, advertising, sales literature and other purposes, $30,333 was paid as sales commissions to broker-dealers and $4,737 was paid as sales commissions to sales personnel of Signator Investors, Inc. (Signator Investors), a broker-dealer affiliate of the Adviser.
Transfer agent fees. The Fund has a transfer agent agreement with John Hancock Signature Services, Inc. (Signature Services), an affiliate of the Adviser. The transfer agent fees paid to Signature Services are determined based on the cost to Signature Services (Signature Services Cost) of providing recordkeeping services. The Signature Services Cost includes a component of allocated John Hancock corporate overhead for providing transfer agent services to the Fund and to all other John Hancock affiliated funds. It also includes out-of-pocket expenses that are comprised of payments made to third-parties for recordkeeping services provided to their clients who invest in one or more John Hancock funds. In addition, Signature Services Cost may be reduced by certain fees that Signature Services receives in connection with retirement and small accounts. Signature Services Cost is calculated monthly and allocated, as applicable, to four categories of share classes: Institutional Share Classes, Retirement Share Classes, Municipal Bond Classes and all other Retail Share Classes. Within each of these categories, the applicable costs are allocated to the affected John Hancock affiliated funds and/or classes, based on the relative average daily net assets.
Class level expenses. Class level expenses for the six months ended September 30, 2011 were:
| DISTRIBUTION | TRANSFER | STATE | PRINTING AND | |
| CLASS | AND SERVICE FEES | AGENT FEES | REGISTRATION FEES | POSTAGE |
| Class A | $205,647 | $116,742 | $9,536 | $21,068 |
| Class I | — | 24,993 | 8,122 | 11,753 |
| Class R1 | 291 | 16 | 4,604 | 25 |
| Class R3 | 1,286 | 75 | 5,118 | 54 |
| Class R4 | 62 | 8 | 5,118 | 24 |
| Class R5 | 8 | 27 | 5,118 | 37 |
| Class R6 | — | 2 | 1,192 | 2 |
| Class ADV | 641 | 439 | 5,834 | 101 |
| Total | $207,935 | $142,302 | $44,642 | $33,064 |
Trustee expenses. The Fund compensates each Trustee who is not an employee of the Adviser or its affiliates. These Trustees may, for tax purposes, elect to defer receipt of this compensation under the John Hancock Group of Funds Deferred Compensation Plan (the Plan). Deferred amounts are invested in various John Hancock funds and remain in the funds until distributed in accordance with the Plan. The investment of deferred amounts and the offsetting liability are included within Other receivables and prepaid expenses and Payable to affiliates — Trustees’ fees, respectively, in the accompanying Statement of assets and liabilities.
| Semiannual report | Small Company Fund | 27 |
Note 5 — Fund share transactions
Transactions in Fund shares for the six months ended September 30, 2011 and for the year ended March 31, 2011 were as follows:
| Six months ended 9-30-11 | Year ended 3-31-111 | |||
| Shares | Amount | Shares | Amount | |
| Class A shares | ||||
| Sold | 379,112 | $7,555,751 | 1,125,695 | $20,882,210 |
| Issued in reorganization (Note 7) | 3,452,513 | 74,129,240 | — | — |
| Repurchased | (1,228,062) | (25,216,990) | (2,180,365) | (39,600,144) |
| Net increase (decrease) | 2,603,563 | $56,468,001 | (1,054,670) | ($18,717,934) |
| Class I shares | ||||
| Sold | 643,089 | $13,720,568 | 1,751,999 | $32,912,574 |
| Issued in reorganization (Note 7) | 8,264 | 178,025 | — | — |
| Repurchased | (299,539) | (5,921,808) | (651,679) | (13,027,537) |
| Net increase | 351,814 | $7,976,785 | 1,100,320 | $19,885,037 |
| Class R1 shares | ||||
| Sold | 808 | $16,192 | 7,061 | $146,595 |
| Repurchased | (845) | (17,782) | (1,603) | (33,713) |
| Net increase (decrease) | (37) | ($1,590) | 5,458 | $112,882 |
| Class R3 shares | ||||
| Sold | 3,420 | $69,068 | 22,905 | $461,120 |
| Repurchased | (666) | (13,453) | (1,558) | (32,422) |
| Net increase | 2,754 | $55,615 | 21,347 | $428,698 |
| Class R4 shares | ||||
| Sold | 309 | $6,593 | 2,245 | $42,744 |
| Repurchased | (86) | (1,818) | (143) | (2,929) |
| Net increase | 223 | $4,775 | 2,102 | $39,815 |
| Class R5 shares | ||||
| Sold | 2,216 | $43,219 | 9,517 | $188,219 |
| Repurchased | (371) | (7,352) | (1,875) | (39,006) |
| Net increase | 1,845 | $35,867 | 7,642 | $149,213 |
| Class R6 shares2 | ||||
| Sold | 5,351 | $100,000 | — | — |
| Issued in reorganization | — | — | — | — |
| Net increase | 5,351 | $100,000 | — | — |
| Class ADV shares | ||||
| Sold | 61 | $1,200 | 23,836 | $433,429 |
| Repurchased | — | — | (2,074) | (41,037) |
| Net increase | 61 | $1,200 | 21,762 | $392,392 |
| Net increase | 2,965,574 | $64,640,653 | 103,961 | $2,290,103 |
1 Period from 4-30-10 (inception date) to 3-31-11 for Class R1, Class R3, Class R4 and Class R5 Shares.
2 Period from 9-1-11 (inception date) to 9-30-11.
Affiliates of the Fund owned 24%, 55% and 100% of shares of beneficial interest of Class R1, Class R4 and Class R6, respectively, on September 30, 2011.
| 28 | Small Company Fund | Semiannual report |
Note 6 — Purchase and sale of securities
Purchases and sales of securities, other than short-term securities, aggregated $121,542,716 and $129,399,464, respectively, for the six months ended September 30, 2011.
Note 7 — Reorganization
On March 23, 2011, the shareholders of John Hancock Growth Opportunities Fund (the Acquired Fund) voted to approve an Agreement and Plan of Reorganization (the Agreement) in exchange for a representative amount of shares of John Hancock Small Company Fund (the Acquiring Fund).
The Agreement provided for (a) the acquisition of all the assets, subject to all the liabilities, of the Acquired Fund in exchange for a representative amount of shares of the Acquiring Fund; (b) the liquidation of the Acquired Fund; and (c) the distribution to the Acquired Fund’s shareholders of such Acquiring Fund’s shares. The reorganization consolidated the Acquired Fund with a fund with a similar objective and the combined fund is better positioned in the market to increase asset size and achieve economies of scale. As a result of the reorganization, the Acquiring Fund is the legal and accounting survivor.
Based on the opinion of tax counsel, the reorganization qualified as a tax-free reorganization for federal income tax purposes with no gain or loss recognized by the Acquired Fund or its shareholders. Thus, the investments were transferred to the Acquiring Fund at the Acquiring Fund’s identified cost. All distributable amounts of net income and realized gains from the Acquired Fund were distributed prior to the reorganization. In addition, the expenses of the reorganization were borne by the Acquired Fund. The effective time of the reorganization occurred immediately after the close of regularly scheduled trading on the New York Stock Exchange (NYSE) on April 8, 2011.
The following outlines the reorganization:
| SHARES | SHARES | ||||||
| ACQUIRED NET | DEPRECIATION | REDEEMED | ISSUED | ACQUIRING | ACQUIRING | ||
| ASSET VALUE OF | OF ACQUIRED | BY THE | BY THE | FUND NET | FUND TOTAL NET | ||
| ACQUIRING | ACQUIRED | THE ACQUIRED | FUND’S | ACQUIRED | ACQUIRING | ASSETS PRIOR TO | ASSETS AFTER |
| FUND | FUND | FUND | INVESTMENTS | FUND | FUND | COMBINATION | COMBINATION |
| Small | Growth | ||||||
| Company | Opportunities | ||||||
| Fund | Fund | $74,307,265 | $357,619 | 2,999,974 | 3,460,777 | $156,083,429 | $230,390,694 |
Because the combined Fund has been managed as a single integrated Fund since the reorganization was completed, it is not practicable to separate the amounts of net investment income and gains attributable to the Acquired Fund that have been included in the Acquiring Fund’s Statement of Operations for the six months ended September 30, 2011. See Note 5 for capital shares issued in connection with the above referenced reorganization.
| Semiannual report | Small Company Fund | 29 |
Board Consideration of and Continuation of Investment Advisory Agreement and Subadvisory Agreement
The Board of Trustees (the Board, the members of which are referred to as Trustees) of John Hancock Small Company Fund (the Fund), a series of John Hancock Funds III, met in-person on May 1–3 and June 5–7, 2011 to consider the approval of the Fund’s investment advisory agreement (the Advisory Agreement) with John Hancock Investment Management Services, LLC (the Adviser), the Fund’s investment adviser. The Board also considered the approval of the investment subadvisory agreement (the Subadvisory Agreement) between the Adviser and Fiduciary Management Associates, LLC (the Subadviser) on behalf of the Fund. The Advisory Agreement and the Subadvisory Agreement are referred to as the Agreements.
Activities and composition of the Board
The Board consists of eleven individuals, nine of whom are Independent Trustees. Independent Trustees are generally those individuals who are not employed by or have any significant business or professional relationship with the Adviser or the Subadviser. The Trustees are responsible for the oversight of operations of the Fund and perform various duties required of directors of investment companies by the Investment Company Act of 1940, as amended (the 1940 Act). The Independent Trustees have hired independent legal counsel to assist them in connection with their duties. The Board has appointed an Independent Trustee as Chairperson. The Board has established four standing committees that are composed entirely of Independent Trustees: the Audit Committee; the Compliance Committee; the Nominating, Governance and Administration Committee; and the Contracts/Operations Committee. Additionally, Investment Performance Committees A and B are standing committees of the Board that are each composed of Independent Trustees and one Trustee who is affiliated with the Adviser. Investment Performance Committee B oversees and monitors matters relating to the investment performance of the Fund. The Board has also designated an Independent Trustee as Vice Chairperson to serve in the absence of the Chairperson. The Board also designates working groups or ad hoc committees as it deems appropriate.
The approval process
Under the 1940 Act, the Board is required to consider the continuation of the Agreements each year. Throughout the year, the Board, acting directly and through its committees, regularly reviews and assesses the quality of the services that the Fund receives under these Agreements. The Board reviews reports of the Adviser at least quarterly, which include Fund performance reports and compliance reports. In addition, the Board meets with portfolio managers and senior investment officers at various times throughout the year. The Board considers at each of its meetings factors that are relevant to its annual consideration of the renewal of the Agreements, including the services and support provided by the Adviser and Subadviser to the Fund and its shareholders.
Prior to the May 1–3, 2011 meeting, the Board requested and received materials specifically relating to the Agreements. The materials provided in connection with the May meeting included information compiled and prepared by Morningstar, Inc. (Morningstar) on Fund fees and expenses, and the investment performance of the Fund. This Fund information is assembled in a format that permits comparison with similar information from a Category and a subset of the Category referred to as the Peer Group, each as determined by Morningstar, and with the Fund’s benchmark index. The Category includes all funds that invest similarly to the way the Fund invests. The Peer Group represents funds of similar size, excluding passively managed funds and funds-of-funds. The Fund’s benchmark index is an unmanaged index of securities that is provided as a basis for comparison with the Fund’s performance. Other material provided for the Fund review included (a) information on the profitability of the Agreements to the Adviser and a discussion of any additional benefits to the Adviser or Subadviser or their affiliates that result from being the Adviser or Subadviser to the Fund; (b) a general analysis provided by the Adviser and the Subadviser concerning investment advisory fees charged to other clients, such as institutional clients and other investment companies, having similar investment mandates, as well as the performance of those other clients and a
| 30 | Small Company Fund | Semiannual report |
comparison of the services provided to those other clients and the services provided to the Fund; (c) the impact of economies of scale; (d) a summary of aggregate amounts paid by the Fund to the Adviser; and (e) sales and redemption data regarding the Fund’s shares.
At an in-person meeting held on May 1–3, 2011, the Board reviewed materials relevant to its consideration of the Agreements. As a result of the discussions that occurred during the May 1–3, 2011 meeting, the Board asked the Adviser for additional information on certain matters. The Adviser provided the additional information and the Board also considered this information as part of its consideration of the Agreements.
At an in-person meeting held on June 5–7, 2011, the Board, including the Independent Trustees, formally considered the continuation of the Advisory Agreement between the Adviser and the Fund and the Subadvisory Agreement between the Adviser and the Subadviser with respect to the Fund, each for an additional one-year term. The Board considered what it believed were key relevant factors that are described under separate headings presented below.
The Board also considered other matters important to the approval process, such as payments made to and by the Adviser or its affiliates relating to the distribution of Fund shares and other services. The Board reviewed services related to the valuation and pricing of Fund portfolio holdings. Other important matters considered by the Board were the direct and indirect benefits to the Adviser, the Subadviser and their affiliates from their relationship with the Fund and advice from independent legal counsel with respect to the review process and materials submitted for the Board’s review.
Nature, extent and quality of services
The Board reviewed the nature, extent and quality of services provided by the Adviser and the Subadviser, including the investment advisory services and the resulting performance of the Fund.
The Board considered the ability of the Adviser and the Subadviser, based on their resources, reputation and other attributes, to attract and retain qualified investment professionals, including research, advisory and supervisory personnel. It considered the background and experience of senior management and investment professionals responsible for managing the Fund. The Board considered the investment philosophy, research and investment decision-making processes of the Adviser and the Subadviser responsible for the daily investment activities of the Fund, including, among other things, portfolio trading capabilities, use of technology, commitment to compliance and approach to training and retaining portfolio managers and other research, advisory and management personnel.
The Board considered the Subadviser’s history and experience providing investment services to the Fund. The Board considered the Adviser’s execution of its oversight responsibilities. The Board further considered the culture of compliance, resources dedicated to compliance, compliance programs, record of compliance with applicable laws and regulation, with the Fund’s investment policies and restrictions and with the applicable Code of Ethics, and the responsibilities of the Adviser’s and Subadviser’s compliance departments.
In addition to advisory services, the Board considered the quality of the administrative and non-investment advisory services provided to the Fund by the Adviser under a separate agreement. The Board noted that the Adviser and its affiliates provide the Fund with certain administrative, transfer agency, shareholder and other services (in addition to any such services provided to the Fund by third parties) and officers and other personnel as are necessary for the operations of the Fund. The Board reviewed the structure and duties of the Adviser’s administration, accounting, legal and compliance departments and its affiliate’s transfer agency operations and considered the Adviser’s and its affiliate’s policies and procedures for assuring compliance with applicable laws and regulations.
| Semiannual report | Small Company Fund | 31 |
The Board also received information about the nature, extent and quality of services provided by and fee rates charged by the Adviser and Subadviser to their other clients, including other registered investment companies, institutional investors and separate accounts. The Board reviewed a general analysis provided by the Adviser and the Subadviser concerning investment advisory fees charged to other clients having similar investment mandates, the services provided to those other clients as compared to the services provided to the Fund, the performance of those other clients as compared to the performance by the Fund and other factors relating to those other clients. The Board considered the significant differences between the Adviser’s and Subadviser’s services to the Fund and the services they provide to other clients. For other clients that are not mutual funds, the differences in services relate to the greater share purchase and redemption activity in a mutual fund, the generally higher turnover of mutual fund portfolio holdings, the more burdensome regulatory and legal obligations of mutual funds and the higher marketing costs for mutual funds. When compared to all clients including mutual funds, the Adviser has greater oversight and supervisory responsibility for the Fund and undertakes greater entrepreneurial risk as the sponsor of the Fund.
Fund performance
The Board was provided with reports, independently prepared by Morningstar, which included a comprehensive analysis of the Fund’s performance. The Board also examined materials provided by the Fund’s portfolio management team discussing Fund performance and the Fund’s investment objective, strategies and outlook. The Board also reviewed a narrative and statistical analysis of the Morningstar data that was prepared by the Adviser, which analyzed various factors that may affect the Morningstar rankings. The Board reviewed information regarding the investment performance of the Fund as compared to its Morningstar Category as well as its benchmark index (see chart below). The Board was provided with a description of the methodology used by Morningstar to select the funds in the Category. The Board also considered updated performance information provided by the Adviser at its May and June 2011 meetings. The Board regularly reviews the performance of the Fund throughout the year and attaches more importance to performance over relatively longer periods of time, typically three to five years.
Set forth below is the performance of the Fund over certain time periods ended December 31, 2010 and that of its Category and benchmark index over the same periods:
| 1 YEAR | 3 YEAR | 5 YEAR | 10 YEAR | |
| Small Company Fund Class A | 23.80% | 3.20% | 5.95% | 7.45% |
| Small Blend Category Average | 25.76% | 2.09% | 3.93% | 7.55% |
| Russell 2000 TR Index | 26.85% | 2.22% | 4.47% | 6.33% |
The Board noted that the Fund had outperformed its Category’s average performance over certain periods shown and had underperformed its Category’s average performance for other periods shown. The Board noted that, although the Fund had underperformed its benchmark index’s performance over the one-year period, the Fund had outperformed its benchmark index’s performance over all other periods.
Expenses and fees
The Board, including the Independent Trustees, reviewed the Fund’s contractual advisory fee rate payable by the Fund to the Adviser as compared with the other funds in its Peer Group. The Board also received information about the investment subadvisory fee rate payable by the Adviser to the Subadviser for investment subadvisory services. The Board considered the services provided and the fees charged by the Adviser and the Subadviser to other clients with similar investment mandates, including separately managed institutional accounts.
In addition, the Board considered the cost of the services provided to the Fund by the Adviser. The Board received and considered expense information regarding the Fund’s various components, including advisory fees, distribution fees and fees other than advisory and distribution fees, including
| 32 | Small Company Fund | Semiannual report |
transfer agent fees, custodian fees, administration fees and other miscellaneous fees (e.g., fees for accounting and legal services). The Board considered comparisons of these expenses to the Peer Group median. The Board also considered expense information regarding the Fund’s total operating expense ratio (Gross Expense Ratio) and total operating expense ratio after taking the Adviser’s contractual fee waiver/expense reimbursement agreement into account (Net Expense Ratio). The Board considered information comparing the Gross Expense Ratio and Net Expense Ratio of the Fund to that of the Peer Group median. As part of its analysis, the Board reviewed the Adviser’s methodology in allocating its costs to the management of the Fund and the Fund complex.
The Board noted that the Fund’s advisory fee ratio was eight basis points above the Peer Group median advisory fee ratio. The Board noted the following information about the Fund’s Gross and Net Expense Ratios for Class A shares contained in the Fund’s 2010 financial statements in relation with the Fund’s Peer Group median provided by Morningstar in April 2011:
| FUND (CLASS A) | PEER GROUP MEDIAN | |
| Advisory Fee Ratio | 0.90% | 0.82% |
| Gross Expense Ratio | 1.42% | 1.56% |
| Net Expense Ratio | 1.34% | 1.43% |
The Board viewed favorably the Adviser’s contractual agreement to waive all or a portion of its advisory fees and to reimburse or pay operating expenses to the extent necessary to maintain the Fund’s Net Expense Ratio at 1.34% for Class A shares, excluding certain expenses such as taxes, brokerage commissions, interest, litigation and extraordinary expenses, until July 31, 2011, recognizing that the waiver would be reset to 1.50% after that date through June 30, 2012. The Board also received and considered information relating to the Fund’s Gross Expense Ratio and Net Expense Ratio that reflected the new methodology for calculating transfer agent fees that was approved by the Trustees at the June 2010 meeting.
The Board received and reviewed statements relating to the Adviser’s financial condition and was also provided with a profitability analysis that detailed the revenues earned and the expenses incurred by the Adviser for services under the Advisory Agreement, as well as from other relationships between the Fund and the Adviser and its affiliates. The Board reviewed the Adviser’s profitability with respect to the Fund and other funds the Board currently oversees for the year ended December 31, 2010 compared to available aggregate profitability data provided for the year ended December 31, 2009. The Board reviewed the Adviser’s profitability with respect to other fund complexes managed by the Adviser and/or its affiliates. The Board reviewed the Adviser’s assumptions and methodology of allocating expenses in the profitability analysis, noting the inherent limitations in allocating costs among various advisory products.
The Board also considered a comparison of the Adviser’s profitability to that of other similar investment advisers whose profitability information is publicly available. The Board recognized that profitability may be affected by numerous factors including, among other things, fee waivers and expense reimbursements by the Adviser, the types of funds managed, expense allocations and business mix, and therefore comparability of profitability is somewhat limited.
The Board did not consider profitability information with respect to the Subadviser, which is not affiliated with the Adviser. The Board considered that the subadvisory fee under the Subadvisory Agreement had been negotiated by the Adviser and the Subadviser on an arm’s-length basis. For this reason, the Subadviser’s separate profitability from its relationship with the Fund was not a factor in determining whether to renew the Subadvisory Agreement. In evaluating overall fees for investment management, the Board recognized the inherently higher cost structure of subadvised funds.
| Semiannual report | Small Company Fund | 33 |
Economies of scale
The Board, including the Independent Trustees, considered the extent to which economies of scale might be realized as the assets of the Fund increase. Possible changes in the advisory fee rate or structure in order to enable the Fund to participate in these economies of scale (e.g., through the use of breakpoints in the advisory fee at higher asset levels) are periodically discussed. The Board also considered the Adviser’s overall operations and its ongoing investment in its business in order to expand the scale of, and improve the quality of, its operations that benefit the Fund.
The Board recognized the inherent limitations of any analysis of economies of scale, stemming largely from the Board’s understanding that most of the Adviser’s costs are not specific to individual funds, but rather are incurred across a variety of products and services. To ensure that any economies are reasonably shared with the Fund as its assets increase, the Adviser and the Board agreed to continue the existing breakpoints to the contractual advisory fee rate.
Other benefits to the Adviser and the Subadviser
The Board understands that the Adviser, the Subadviser or their affiliates may derive other ancillary benefits from their relationship with the Fund, both tangible and intangible, such as their ability to leverage investment professionals who manage other portfolios, an increase in their profile in the investment advisory community and, in the case of the Adviser, the engagement of its affiliates and/or significant shareholders as service providers to the Fund, including for administrative, transfer agency and distribution services. The Board believes that certain of these benefits are difficult to quantify. The Board also was informed that the Subadviser may use third-party research obtained by soft dollars generated by certain mutual fund transactions to assist itself in managing all or a number of its other client accounts.
Board determination
The Board unanimously approved the continuation of the Advisory Agreement between the Adviser and the Fund for an additional one-year term. The Subadvisory Agreement between the Adviser and Subadviser with respect to the Fund was also approved for an additional one-year term. Based upon its evaluation of relevant factors in their totality, the Board was satisfied that the terms of the Agreements, including the advisory and subadvisory fee rates, were fair and reasonable and in the best interest of the Fund and its shareholders. In arriving at its decision to approve the Agreements, the Board did not identify any single factor or any group of factors as all-important or controlling, but considered all factors together. Different Trustees may have attributed different weights to the various factors considered. The Independent Trustees were also assisted by independent legal counsel in making this determination. The Trustees’ conclusions may be based in part on their consideration of these arrangements in prior years and on their ongoing regular review of Fund performance and operations throughout the year.
| 34 | Small Company Fund | Semiannual report |
More information
| Trustees | Investment adviser |
| Steven R. Pruchansky, Chairman | John Hancock Investment Management |
| James F. Carlin | Services, LLC |
| William H. Cunningham | |
| Deborah C. Jackson | Subadviser |
| Charles L. Ladner,* Vice Chairman | Fiduciary Management Associates, LLC |
| Stanley Martin* | |
| Hugh McHaffie† | Principal distributor |
| Dr. John A. Moore*# | John Hancock Funds, LLC |
| Patti McGill Peterson* | |
| Gregory A. Russo | Custodian |
| John G. Vrysen† | State Street Bank and Trust Company |
| Officers | Transfer agent |
| Keith F. Hartstein | John Hancock Signature Services, Inc. |
| President and Chief Executive Officer | |
| Legal counsel | |
| Andrew G. Arnott | K&L Gates LLP |
| Senior Vice President and Chief Operating Officer | |
| Thomas M. Kinzler | |
| Secretary and Chief Legal Officer | |
| Francis V. Knox, Jr. | |
| Chief Compliance Officer | |
| Charles A. Rizzo | |
| Chief Financial Officer | |
| Salvatore Schiavone | |
| Treasurer | |
| *Member of the Audit Committee | |
| †Non-Independent Trustee | |
| #Effective 9-13-11 | |
The Fund’s proxy voting policies and procedures, as well as the Fund’s proxy voting record for the most recent twelve-month period ended June 30, are available free of charge on the Securities and Exchange Commission (SEC) Web site at www.sec.gov or on our Web site.
The Fund’s complete list of portfolio holdings, for the first and third fiscal quarters, is filed with the SEC on Form N-Q. The Fund’s Form N-Q is available on our Web site and the SEC’s Web site, www.sec.gov, and can be reviewed and copied (for a fee) at the SEC’s Public Reference Room in Washington, DC. Call 1-800-SEC-0330 to receive information on the operation of the SEC’s Public Reference Room.
We make this information on your fund, as well as monthly portfolio holdings, and other fund details available on our Web site at www.jhfunds.com or by calling 1-800-225-5291.
| You can also contact us: | ||
| 1-800-225-5291 | Regular mail: | Express mail: |
| jhfunds.com | John Hancock Signature Services, Inc. | John Hancock Signature Services, Inc. |
| P.O. Box 55913 | Mutual Fund Image Operations | |
| Boston, MA 02205-5913 | 30 Dan Road | |
| Canton, MA 02021 |
| Semiannual report | Small Company Fund | 35 |

1-800-225-5291
1-800-554-6713 TDD
1-800-338-8080 EASI-Line
www.jhfunds.com
Now available: electronic delivery
www.jhfunds.com/edelivery
| This report is for the information of the shareholders of John Hancock Small Company Fund. | 348SA 9/11 |
| It is not authorized for distribution to prospective investors unless preceded or accompanied by a prospectus. | 11/11 |
A look at performance
Total returns for the period ended September 30, 2011
| Average annual total returns (%) | Cumulative total returns (%) | |||||||
| with maximum sales charge (POP) | with maximum sales charge (POP) | |||||||
| 1-year | 5-year | 10-year | 6-months | 1-year | 5-year | 10-year | ||
| Class A1 | –4.08 | 2.48 | 7.92 | –23.39 | –4.08 | 13.01 | 114.31 | |
| Class C1 | –0.84 | 2.73 | 7.64 | –20.48 | –0.84 | 14.43 | 108.79 | |
| Class I1,2 | 1.21 | 3.92 | 8.90 | –19.22 | 1.21 | 21.22 | 134.58 | |
| Class R61,2 | 1.35 | 4.00 | 8.97 | –19.21 | 1.35 | 21.68 | 136.10 | |
| Class ADV 1,2 | 0.92 | 3.51 | 8.47 | –19.38 | 0.92 | 18.83 | 125.38 | |
Performance figures assume all distributions are reinvested. Public offering price (POP) figures reflect maximum sales charges on Class A shares of 5%. Class C shares held for less than one year are subject to a 1% CDSC. Sales charges are not applicable for Class I, R6 and ADV shares.
The expense ratios of the Fund, both net (excluding any fee waivers or expense limitations) and gross (including any fee waivers or expense limitations), are set forth according to the most recent publicly available prospectuses for the Fund and may differ from those disclosed in the Financial highlights tables in this report. The fee waivers and expense limitations are contractual at least until 7-31-12 for Class A and C shares and 7-9-12 for Class ADV and I shares. Had the fee waivers and expense limitations not been in place gross expenses would apply. For Class R6 the net expenses equal the gross expenses. The expense ratios are as follows:
| Class A | Class C | Class I | Class R6 | Class ADV | |||||
| Net (%) | 1.35 | 2.10 | 1.00 | 0.97 | 1.25 | ||||
| Gross (%) | 1.38 | 2.21 | 1.03 | 0.97 | 5.80 |
The returns reflect past results and should not be considered indicative of future performance. The return and principal value of an investment will fluctuate so that shares, when redeemed, may be worth more or less than their original cost. Due to market volatility, the Fund’s current performance may be higher or lower than the performance shown. For current to the most recent month-end performance data, please call 1–800–225–5291 or visit the Fund’s Web site at www.jhfunds.com.
The performance table above and the chart on the next page do not reflect the deduction of taxes that a shareholder would pay on fund distributions or the redemption of fund shares. The Fund’s performance results reflect any applicable expense reductions, without which the expenses increase and results would have been less favorable.
| 6 | Disciplined Value Mid Cap Fund | Semiannual report |
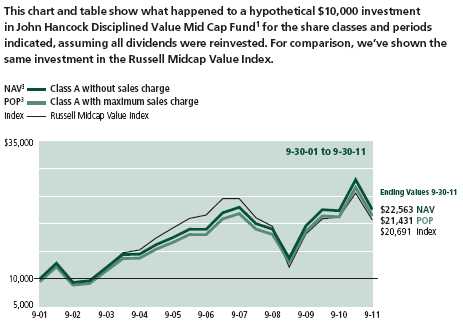
| Without | With maximum | |||||||
| Start date | sales charge | sales charge | Index | |||||
| Class C4 | 9-30-01 | $20,879 | $20,879 | $20,691 | ||||
| Class I 2 | 9-30-01 | 23,458 | 23,458 | 20,691 | ||||
| Class R6 2 | 9-30-01 | 23,610 | 23,610 | 20,691 | ||||
| Class ADV 2 | 9-30-01 | 22,538 | 22,538 | 20,691 | ||||
Russell Midcap Value Index is an unmanaged index that measures the performance of those Russell Midcap companies with lower price-to-book ratios and lower forecasted growth values.
It is not possible to invest directly in an index. Index figures do not reflect sales charges, which would have resulted in lower values if they did.
1 After the close of business on 7-9-10, holders of Investor Class Shares and Institutional Class Shares of the former Robeco Boston Partners Mid Cap Value Fund (the Predecessor Fund) became owners of an equal number of full and fractional Class A and Class I shares, respectively, of John Hancock Disciplined Value Mid Cap Fund. Class A, Class I and Class ADV shares were first offered on 7-12-10. The returns prior to this date for Class A and Class ADV shares are those of the Predecessor Fund’s Investor Class Shares recalculated to reflect the gross fees and expenses of the Fund’s Class A and Class ADV shares, respectively. For Class I shares, the returns prior to this date are for the Predecessor Fund’s Institutional Class Shares recalculated to reflect the gross fees and expenses of the Fund’s Class I shares. Class C and Class R6 shares were first offered on 8-15-11 and 9-1-11 respectively; the returns prior to these dates are those of Class A shares that have been recalculated to apply the gross fees and expenses of Class C and Class R6 shares, respectively.
2 For certain types of investors, as described in the Fund’s prospectuses.
3 NAV represents net asset value and POP represents public offering price. Performance of the classes will vary based on the difference in sales charges paid by shareholders investing in the different classes and the fee structure of those classes.
4 No contingent deferred sales charge is applicable.
| Semiannual report | Disciplined Value Mid Cap Fund | 7 |
Your expenses
These examples are intended to help you understand your ongoing operating expenses.
Understanding fund expenses
As a shareholder of the Fund, you incur two types of costs:
▪ Transaction costs which include sales charges (loads) on purchases or redemptions (varies by share class), minimum account fee charge, etc.
▪ Ongoing operating expenses including management fees, distribution and service fees (if applicable), and other fund expenses.
We are going to present only your ongoing operating expenses here.
Actual expenses/actual returns
This example is intended to provide information about the Fund’s actual ongoing operating expenses, and is based on the Fund’s actual return. It assumes an account value of $1,000.00 on April 1, 2011 with the same investment held until September 30, 2011.
| Account value | Ending value | Expenses paid during | |
| on 4-1-11 | on 9-30-11 | period ended 9-30-111 | |
| Class A | $1,000.00 | $806.30 | $5.64 |
| Class I | 1,000.00 | 807.80 | 4.25 |
| Class ADV | 1,000.00 | 806.20 | 5.64 |
For the class noted below, the example assumes an account value of $1,000 on August 15, 2011, with the same investment held until September 30, 2011.
| Account value | Ending value | Expenses paid during | |
| on 8-15-11 | on 9-30-11 | period ended 9-30-112 | |
| Class C | $1,000.00 | $936.00 | $2.55 |
For the class noted below, the example assumes an account value of $1,000 on September 1, 2011, with the same investment held until September 30, 2011.
| Account value | Ending value | Expenses paid during | |
| on 9-1-11 | on 9-30-11 | period ended 9-30-113 | |
| Class R6 | $1,000.00 | $909.60 | $0.77 |
Together with the value of your account, you may use this information to estimate the operating expenses that you paid over the period. Simply divide your account value at September 30, 2011, by $1,000.00, then multiply it by the “expenses paid” for your share class from the table above. For example, for an account value of $8,600.00, the operating expenses should be calculated as follows:
| 8 | Disciplined Value Mid Cap Fund | Semiannual report |
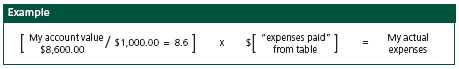
Hypothetical example for comparison purposes
This table allows you to compare the Fund’s ongoing operating expenses with those of any other fund. It provides an example of the Fund’s hypothetical account values and hypothetical expenses based on each class’s actual expense ratio and an assumed 5% annualized return before expenses (which is not the Fund’s actual return). It assumes an account value of $1,000.00 on April 1, 2011, with the same investment held until September 30, 2011. Look in any other fund shareholder report to find its hypothetical example and you will be able to compare these expenses.
| Account value | Ending value | Expenses paid during | |
| on 4-1-11 | on 9-30-11 | period ended 9-30-114 | |
| Class A | $1,000.00 | $1,018.70 | $6.31 |
| Class C | 1,000.00 | 1,014.50 | 10.58 |
| Class I | 1,000.00 | 1,020.30 | 4.75 |
| Class R6 | 1,000.00 | 1,020.00 | 5.00 |
| Class ADV | 1,000.00 | 1,018.70 | 6.31 |
Remember, these examples do not include any transaction costs, therefore, these examples will not help you to determine the relative total costs of owning different funds. If transaction costs were included, your expenses would have been higher. See the prospectus for details regarding transaction costs.
1 Expenses are equal to the Fund’s annualized expense ratio of 1.25%, 0.94% and 1.25%, for Class A, Class I and Class ADV shares, respectively, multiplied by the average account value over the period, multiplied by 183/366 (to reflect the one-half year period).
2 Expenses are equal to the Fund’s annualized expense ratio of 2.10% for Class C shares, multiplied by the average account value over the period, multiplied by 46/366 (to reflect the period).
3 Expenses are equal to the Fund’s annualized expense ratio of 0.99% for Class R6 shares, multiplied by the average account value over the period, multiplied by 30/366 (to reflect the period).
4 Expenses are equal to the Fund’s annualized expense ratio multiplied by the average account value over the period, multiplied by 183/366 (to reflect the one-half year period).
| Semiannual report | Disciplined Value Mid Cap Fund | 9 |
Portfolio summary
| Top 10 Holdings (14.9% of Net Assets on 9-30-11)1,2 | ||||
| CBS Corp., Class B | 1.8% | Kennametal, Inc. | 1.4% | |
| CareFusion Corp. | 1.6% | FTI Consulting, Inc. | 1.4% | |
| Alleghany Corp. | 1.5% | Unum Group | 1.4% | |
| Moody’s Corp. | 1.5% | Raymond James Financial, Inc. | 1.4% | |
| The McGraw-Hill Companies, Inc. | 1.5% | SM Energy Company | 1.4% | |
| Sector Composition2,3 | ||||
| Financials | 25% | Utilities | 7% | |
| Industrials | 14% | Materials | 7% | |
| Consumer Discretionary | 13% | Energy | 5% | |
| Information Technology | 13% | Consumer Staples | 3% | |
| Health Care | 10% | Short-Term Investments & Other | 3% | |
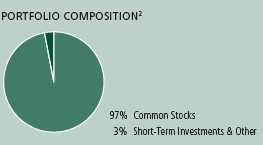
1 Cash and cash equivalents not included.
2 As a percentage of net assets on 9-30-11.
3 Sector investing is subject to greater risks than the market as a whole. Because the Fund may focus on particular sectors of the economy, its performance may depend on the performance of those sectors.
| 10 | Disciplined Value Mid Cap Fund | Semiannual report |
Fund’s investments
As of 9-30-11 (unaudited)
| Shares | Value | |
| Common Stocks 96.79% | $610,428,033 | |
| (Cost $686,160,966) | ||
| Consumer Discretionary 12.58% | 79,342,723 | |
| Auto Components 1.14% | ||
| Lear Corp. | 167,120 | 7,169,448 |
| Diversified Consumer Services 0.33% | ||
| DeVry Inc. | 56,620 | 2,092,675 |
| Household Durables 0.40% | ||
| Mohawk Industries, Inc. (I) | 58,370 | 2,504,657 |
| Internet & Catalog Retail 0.93% | ||
| Expedia, Inc. | 228,584 | 5,886,038 |
| Leisure Equipment & Products 0.49% | ||
| Mattel, Inc. | 118,400 | 3,065,376 |
| Media 4.23% | ||
| CBS Corp., Class B | 572,510 | 11,667,753 |
| Omnicom Group, Inc. | 155,270 | 5,720,147 |
| The McGraw-Hill Companies, Inc. | 226,505 | 9,286,705 |
| Multiline Retail 1.05% | ||
| Kohl’s Corp. | 134,485 | 6,603,214 |
| Specialty Retail 3.16% | ||
| Bed Bath & Beyond, Inc. (I) | 133,150 | 7,630,827 |
| Guess?, Inc. | 141,200 | 4,022,788 |
| Williams-Sonoma, Inc. | 269,885 | 8,309,759 |
| Textiles, Apparel & Luxury Goods 0.85% | ||
| VF Corp. (L) | 44,300 | 5,383,336 |
| Consumer Staples 3.22% | 20,277,969 | |
| Beverages 1.75% | ||
| Coca-Cola Enterprises, Inc. | 270,745 | 6,736,136 |
| Dr. Pepper Snapple Group, Inc. | 110,320 | 4,278,210 |
| Food & Staples Retailing 0.61% | ||
| The Kroger Company | 175,135 | 3,845,965 |
| Tobacco 0.86% | ||
| Lorillard, Inc. | 48,940 | 5,417,658 |
| Energy 4.72% | 29,776,811 | |
| Energy Equipment & Services 0.50% | ||
| Oil States International, Inc. (I) | 62,525 | 3,183,773 |
| See notes to financial statements | Semiannual report | Disciplined Value Mid Cap Fund | 11 |
| Shares | Value | |
| Oil, Gas & Consumable Fuels 4.22% | ||
| EOG Resources, Inc. (L) | 25,630 | $1,819,986 |
| Noble Energy, Inc. | 110,260 | 7,806,408 |
| Rosetta Resources, Inc. (I)(L) | 190,430 | 6,516,515 |
| SemGroup Corp., Class A (I) | 92,030 | 1,836,919 |
| SM Energy Company | 142,015 | 8,613,210 |
| Financials 25.23% | 159,106,557 | |
| Capital Markets 3.63% | ||
| Affiliated Managers Group, Inc. (I) | 49,455 | 3,859,963 |
| Raymond James Financial, Inc. | 333,120 | 8,647,795 |
| SEI Investments Company | 167,565 | 2,577,150 |
| TD Ameritrade Holding Corp. | 529,945 | 7,792,841 |
| Commercial Banks 4.06% | ||
| Comerica, Inc. | 175,270 | 4,025,952 |
| East West Bancorp, Inc. | 375,570 | 5,599,749 |
| Fifth Third Bancorp | 435,395 | 4,397,490 |
| Huntington Bancshares, Inc. | 573,980 | 2,755,104 |
| M&T Bank Corp. | 54,720 | 3,824,928 |
| SunTrust Banks, Inc. | 187,375 | 3,363,381 |
| Zions Bancorporation (L) | 114,900 | 1,616,643 |
| Consumer Finance 3.03% | ||
| Capital One Financial Corp. (L) | 171,800 | 6,808,434 |
| Discover Financial Services | 363,545 | 8,339,722 |
| SLM Corp. | 318,755 | 3,968,500 |
| Diversified Financial Services 1.48% | ||
| Moody’s Corp. (L) | 307,075 | 9,350,434 |
| Insurance 8.28% | ||
| ACE, Ltd. | 39,035 | 2,365,521 |
| Alleghany Corp. (I) | 32,777 | 9,456,165 |
| AON Corp. | 85,170 | 3,575,437 |
| Loews Corp. | 117,015 | 4,042,868 |
| Marsh & McLennan Companies, Inc. | 281,365 | 7,467,427 |
| Reinsurance Group of America, Inc. | 110,895 | 5,095,625 |
| Symetra Financial Corp. | 297,090 | 2,421,284 |
| The Hanover Insurance Group, Inc. | 179,330 | 6,366,215 |
| Unum Group | 428,505 | 8,981,465 |
| W.R. Berkley Corp. | 83,125 | 2,467,981 |
| Real Estate Investment Trusts 4.75% | ||
| American Assets Trust, Inc. | 113,340 | 2,034,453 |
| Duke Realty Corp. (L) | 216,070 | 2,268,735 |
| Equity Residential | 94,930 | 4,924,019 |
| Kimco Realty Corp. | 427,165 | 6,420,290 |
| Regency Centers Corp. | 100,665 | 3,556,494 |
| Taubman Centers, Inc. | 90,850 | 4,570,664 |
| Ventas, Inc. | 63,235 | 3,123,809 |
| Vornado Realty Trust | 40,740 | 3,040,019 |
| 12 | Disciplined Value Mid Cap Fund | Semiannual report | See notes to financial statements |
| Shares | Value | |
| Health Care 10.32% | $65,120,255 | |
| Health Care Equipment & Supplies 2.47% | ||
| CareFusion Corp. (I) | 425,745 | 10,196,593 |
| Hologic, Inc. (I) | 354,390 | 5,390,272 |
| Health Care Providers & Services 6.52% | ||
| AmerisourceBergen Corp. | 204,100 | 7,606,807 |
| DaVita, Inc. (I) | 81,900 | 5,132,673 |
| Humana, Inc. | 100,045 | 7,276,273 |
| Lincare Holdings, Inc. | 229,715 | 5,168,588 |
| McKesson Corp. | 93,985 | 6,832,710 |
| Omnicare, Inc. (L) | 173,435 | 4,410,452 |
| Quest Diagnostics, Inc. | 94,755 | 4,677,107 |
| Life Sciences Tools & Services 0.68% | ||
| Parexel International Corp. (I)(L) | 226,290 | 4,283,670 |
| Pharmaceuticals 0.65% | ||
| Hospira, Inc. (I) | 112,030 | 4,145,110 |
| Industrials 14.14% | 89,185,200 | |
| Aerospace & Defense 1.60% | ||
| Curtiss-Wright Corp. | 162,035 | 4,671,469 |
| ITT Corp. | 129,165 | 5,424,930 |
| Electrical Equipment 1.69% | ||
| Cooper Industries PLC | 63,465 | 2,927,006 |
| Thomas & Betts Corp. (I) | 193,760 | 7,732,962 |
| Machinery 3.68% | ||
| Flowserve Corp. | 42,680 | 3,158,320 |
| Ingersoll-Rand PLC (L) | 220,900 | 6,205,081 |
| Kennametal, Inc. | 277,415 | 9,082,567 |
| Stanley Black & Decker, Inc. | 97,285 | 4,776,694 |
| Professional Services 6.13% | ||
| Equifax, Inc. | 267,710 | 8,229,405 |
| FTI Consulting, Inc. (I)(L) | 244,405 | 8,996,548 |
| Manpower, Inc. | 197,335 | 6,634,403 |
| Robert Half International, Inc. | 328,825 | 6,977,667 |
| Towers Watson & Company, Class A | 130,805 | 7,819,523 |
| Trading Companies & Distributors 1.04% | ||
| WESCO International, Inc. (I)(L) | 195,190 | 6,548,625 |
| Information Technology 12.57% | 79,257,719 | |
| Communications Equipment 0.50% | ||
| Harris Corp. (L) | 92,290 | 3,153,549 |
| Computers & Peripherals 1.19% | ||
| Seagate Technology PLC | 365,595 | 3,758,317 |
| Western Digital Corp. (I) | 145,370 | 3,738,916 |
| Electronic Equipment, Instruments & Components 4.10% | ||
| Arrow Electronics, Inc. (I) | 218,320 | 6,064,930 |
| Avnet, Inc. (I) | 176,815 | 4,611,335 |
| Flextronics International, Ltd. (I) | 879,340 | 4,950,684 |
| See notes to financial statements | Semiannual report | Disciplined Value Mid Cap Fund | 13 |
| Shares | Value | |
| Electronic Equipment, Instruments & Components (continued) | ||
| Ingram Micro, Inc., Class A (I) | 277,915 | $4,482,769 |
| TE Connectivity, Ltd. | 204,050 | 5,741,967 |
| Internet Software & Services 1.11% | ||
| Monster Worldwide, Inc. (I)(L) | 443,040 | 3,181,027 |
| Yahoo!, Inc. (I) | 290,820 | 3,827,191 |
| IT Services 2.53% | ||
| Alliance Data Systems Corp. (I)(L) | 55,280 | 5,124,456 |
| Amdocs, Ltd. (I) | 122,405 | 3,319,624 |
| CGI Group, Inc., Class A (I) | 207,555 | 3,904,110 |
| The Western Union Company | 237,710 | 3,634,586 |
| Office Electronics 1.18% | ||
| Xerox Corp. | 1,065,510 | 7,426,605 |
| Semiconductors & Semiconductor Equipment 0.71% | ||
| Analog Devices, Inc. | 143,620 | 4,488,125 |
| Software 1.25% | ||
| Electronic Arts, Inc. (I) | 383,840 | 7,849,528 |
| Materials 6.67% | 42,081,404 | |
| Chemicals 2.82% | ||
| Albemarle Corp. | 71,525 | 2,889,610 |
| Ashland, Inc. | 68,910 | 3,041,687 |
| Cytec Industries, Inc. | 163,630 | 5,749,958 |
| Ferro Corp. (I) | 406,740 | 2,501,451 |
| PPG Industries, Inc. | 50,580 | 3,573,983 |
| Containers & Packaging 2.21% | ||
| Ball Corp. | 184,165 | 5,712,798 |
| Crown Holdings, Inc. (I) | 142,755 | 4,369,731 |
| Rock-Tenn Company, Class A | 79,480 | 3,869,086 |
| Metals & Mining 1.64% | ||
| Globe Specialty Metals, Inc. | 283,385 | 4,114,750 |
| Reliance Steel & Aluminum Company | 184,015 | 6,258,350 |
| Telecommunication Services 0.44% | 2,787,381 | |
| Diversified Telecommunication Services 0.44% | ||
| Windstream Corp. (L) | 239,055 | 2,787,381 |
| Utilities 6.90% | 43,492,014 | |
| Electric Utilities 4.31% | ||
| American Electric Power Company, Inc. | 69,575 | 2,645,242 |
| Edison International | 195,225 | 7,467,349 |
| FirstEnergy Corp. | 110,018 | 4,940,908 |
| NV Energy, Inc. | 449,035 | 6,605,305 |
| Westar Energy, Inc. (L) | 208,570 | 5,510,419 |
| Multi-Utilities 2.59% | ||
| Alliant Energy Corp. | 166,340 | 6,434,031 |
| Ameren Corp. | 176,590 | 5,257,084 |
| PG&E Corp. | 109,470 | 4,631,676 |
| 14 | Disciplined Value Mid Cap Fund | Semiannual report | See notes to financial statements |
| Yield | Shares | Value | |
| Securities Lending Collateral 8.33% | $52,567,966 | ||
| (Cost $52,569,385) | |||
| John Hancock Collateral Investment Trust (W) | 0.2515% (Y) | 5,254,065 | 52,567,966 |
| Par value | Value | ||
| Short-Term Investments 4.30% | $27,116,000 | ||
| (Cost $27,116,000) | |||
| Repurchase Agreement 4.30% | 27,116,000 | ||
| Repurchase Agreement with State Street Corp. dated 9-30-11 at 0.010% to | |||
| be repurchased at $27,116,023 on 10-3-11, collateralized by $27,645,000 | |||
| Federal Home Loan Mortgage Corp., 0.780% due 9-8-14 (valued at | |||
| $27,660,951, including interest) | $27,116,000 | 27,116,000 | |
| Total investments (Cost $765,846,351)† 109.42% | $690,111,999 | ||
| Other assets and liabilities, net (9.42%) | ($59,413,911) | ||
| Total net assets 100.00% | $630,698,088 | ||
The percentage shown for each investment category is the total value of the category as a percentage of the net assets of the Fund.
(I) Non-income producing security.
(L) All or a portion of this security is on loan as of 9-30-11.
(W)Investment is an affiliate of the Fund, the adviser and/or subadviser. Also, it represents the investment of securities lending collateral received.
(Y) The rate shown is the annualized seven-day yield as of 9-30-11.
† At 9-30-11, the aggregate cost of investment securities for federal income tax purposes was $766,414,093. Net unrealized depreciation aggregated $76,302,094, of which $11,267,205 related to appreciated investment securities and $87,569,299 related to depreciated investment securities.
| See notes to financial statements | Semiannual report | Disciplined Value Mid Cap Fund | 15 |
F I N A N C I A L S T A T E M E N T S
Financial statements
Statement of assets and liabilities 9-30-11 (unaudited)
This Statement of assets and liabilities is the Fund’s balance sheet. It shows the value of what the Fund owns, is due and owes. You’ll also find the net asset value and the maximum offering price per share.
| Assets | |
| Investments in unaffiliated issuers, at value (Cost $713,276,966) including | |
| $51,316,408 of securities loaned (Note 2) | $637,544,033 |
| Investments in affiliated issuers, at value (Cost $52,569,385) (Note 2) | 52,567,966 |
| Total investments, at value (Cost $765,846,351) | 690,111,999 |
| Cash | 899 |
| Receivable for fund shares sold | 4,913,932 |
| Dividends and interest receivable | 685,693 |
| Receivable for securities lending income | 8,074 |
| Receivable due from adviser | 988 |
| Other receivables and prepaid expenses | 112,026 |
| Total assets | 695,833,611 |
| Liabilities | |
| Payable for investments purchased | 11,612,077 |
| Payable for fund shares repurchased | 832,488 |
| Payable upon return of securities loaned (Note 2) | 52,583,720 |
| Payable to affiliates | |
| Accounting and legal services fees | 1,094 |
| Transfer agent fees | 65,875 |
| Other liabilities and accrued expenses | 40,269 |
| Total liabilities | 65,135,523 |
| Net assets | |
| Paid-in capital | $711,745,926 |
| Undistributed net investment income | 1,265,522 |
| Accumulated net realized loss on investments | (6,579,008) |
| Net unrealized appreciation (depreciation) on investments | (75,734,352) |
| Net assets | $630,698,088 |
| Net asset value per share | |
| Based on net asset values and shares outstanding — the Fund has an | |
| unlimited number of shares authorized with no par value | |
| Class A ($246,029,747 ÷ 25,475,150 shares) | $9.66 |
| Class C ($818,691 ÷ 82,293 shares) | $9.95 |
| Class I ($383,256,572 ÷ 38,492,079 shares) | $9.96 |
| Class R6 ($90,922 ÷ 9,132 shares) | $9.96 |
| Class ADV ($502,156 ÷ 52,027 shares) | $9.65 |
| Maximum offering price per share | |
| Class A (net asset value per share ÷ 95%)1 | $10.17 |
1 On single retail sales of less than $50,000. On sales of $50,000 or more and on group sales the offering price is reduced.
| 16 | Disciplined Value Mid Cap Fund | Semiannual report | See notes to financial statements |
F I N A N C I A L S T A T E M E N T S
Statement of operations For the six-month period ended 9-30-11
(unaudited)
This Statement of operations summarizes the Fund’s investment income earned and expenses incurred in operating the Fund. It also shows net gains (losses) for the period stated.
| Investment income | |
| Dividends | $4,236,200 |
| Securities lending | 50,212 |
| Interest | 1,099 |
| Less foreign taxes withheld | (4,411) |
| Total investment income | 4,283,100 |
| Expenses | |
| Investment management fees (Note 4) | 2,259,926 |
| Distribution and service fees (Note 4) | 282,469 |
| Accounting and legal services fees (Note 4) | 33,193 |
| Transfer agent fees (Note 4) | 326,258 |
| Trustees’ fees (Note 4) | 11,724 |
| State registration fees (Note 4) | 54,275 |
| Printing and postage (Note 4) | 27,745 |
| Professional fees | 26,330 |
| Custodian fees | 29,811 |
| Registration and filing fees | 12,343 |
| Other | 9,687 |
| Total expenses | 3,073,761 |
| Less expense reductions (Note 4) | (56,325) |
| Net expenses | 3,017,436 |
| Net investment income | 1,265,664 |
| Realized and unrealized gain (loss) | |
| Net realized loss on | |
| Investments in unaffiliated issuers | (8,706,448) |
| Investments in affiliated issuers | (9,666) |
| (8,716,114) | |
| Change in net unrealized appreciation (depreciation) of | |
| Investments in unaffiliated issuers | (131,609,646) |
| Investments in affiliated issuers | (1,080) |
| (131,610,726) | |
| Net realized and unrealized loss | (140,326,840) |
| Decrease in net assets from operations | ($139,061,176) |
| See notes to financial statements | Semiannual report | Disciplined Value Mid Cap Fund | 17 |
F I N A N C I A L S T A T E M E N T S
Statements of changes in net assets
These Statements of changes in net assets show how the value of the Fund’s net assets has changed during the last three periods. The difference reflects earnings less expenses, any investment gains and losses, distributions, if any, paid to shareholders and the net of Fund share transactions.
| Six months | |||
| ended | Period | Year | |
| 9-30-11 | ended | ended | |
| (Unaudited) | 3-31-111 | 8-31-10 | |
| Increase (decrease) in net assets | |||
| From operations | |||
| Net investment income | $1,265,664 | $341,663 | $276,141 |
| Net realized gain (loss) | (8,716,114) | 6,931,480 | 2,324,382 |
| Change in net unrealized | |||
| appreciation (depreciation) | (131,610,726) | 64,707,640 | (8,884,774) |
| Increase (decrease) in net assets resulting | |||
| from operations | (139,061,176) | 71,980,783 | (6,284,251) |
| Distributions to shareholders | |||
| From net investment income | |||
| Class A | — | (100,122) | (92,302) |
| Class I | — | (372,245) | (307,672) |
| Class ADV | — | (26) | — |
| Total distributions | — | (472,393) | (399,974) |
| From Fund share transactions (Note 5) | 344,980,438 | 190,782,100 | 122,565,661 |
| Total increase | 205,919,262 | 262,290,490 | 115,881,436 |
| Net assets | |||
| Beginning of period | 424,778,826 | 162,488,336 | 46,606,900 |
| End of period | $630,698,088 | $424,778,826 | $162,488,336 |
| Undistributed/(Accumulated distributions in | |||
| excess of) net investment income | $1,265,522 | ($142) | $108,182 |
1 For the seven-month period ended 3-31-11. The Fund changed its fiscal year end from August 31 to March 31.
| 18 | Disciplined Value Mid Cap Fund | Semiannual report | See notes to financial statements |
Financial highlights
The Financial highlights show how the Fund’s net asset value for a share has changed since the end of the previous period.
| CLASS A SHARES Period ended | 9-30-111 | 3-31-112 | 8-31-103 | 8-31-094 | 8-31-084 | 8-31-074 | 8-31-06 |
| Per share operating performance | |||||||
| Net asset value, beginning | |||||||
| of period | $11.98 | $8.66 | $8.10 | $9.08 | $11.16 | $12.81 | $13.80 |
| Net investment income (loss)5 | 0.01 | 0.01 | 0.016 | 0.07 | 0.06 | 0.02 | (0.01) |
| Net realized and unrealized gain | |||||||
| (loss) on investments | (2.33) | 3.32 | 0.60 | (0.98)7 | (0.74) | 2.39 | 0.87 |
| Total from investment operations | (2.32) | 3.33 | 0.61 | (0.91) | (0.68) | 2.41 | 0.86 |
| Less distributions | |||||||
| From net investment income | — | (0.01) | (0.05) | (0.07) | (0.04) | — | — |
| From net realized gain | — | — | — | —8 | (1.36) | (4.06) | (1.85) |
| Total distributions | — | (0.01) | (0.05) | (0.07) | (1.40) | (4.06) | (1.85) |
| Net asset value, end of period | $9.66 | $11.98 | $8.66 | $8.10 | $9.08 | $11.16 | $12.81 |
| Total return (%)9,10 | (19.37)11 | 38.4711 | 7.54 | (9.79)7 | (6.62) | 21.02 | 6.59 |
| Ratios and supplemental data | |||||||
| Net assets, end of period | |||||||
| (in millions) | $246 | $171 | $75 | $14 | $17 | $13 | $5 |
| Ratios (as a percentage of average | |||||||
| net assets): | |||||||
| Expenses before reductions | 1.2912 | 1.3512 | 1.56 | 1.93 | 1.73 | 1.73 | 1.70 |
| Expenses net of fee waivers | |||||||
| and credits | 1.2512 | 1.2512 | 1.25 | 1.25 | 1.25 | 1.25 | 1.25 |
| Net investment income (loss) | 0.2612 | 0.1012 | 0.09 | 1.09 | 0.55 | 0.14 | (0.04) |
| Portfolio turnover (%) | 22 | 27 | 38 | 58 | 64 | 89 | 97 |
1 Unaudited.
2 For the seven-month period ended 3-31-11. The Fund changed its fiscal year end from August 31 to March 31.
3 After the close of business on 7-9-10, holders of Investor Class Shares of the former Robeco Boston Partners Mid Cap Value Fund (the Predecessor Fund) became owners of an equal number of full and fractional Class A shares of the John Hancock Disciplined Value Mid Cap Fund. These shares were first offered on 7-12-10. Additionally, the accounting and performance history of the Investor Class Shares of the Predecessor Fund was redesignated as that of John Hancock Disciplined Value Mid Cap Fund Class A.
4 Audited by previous independent registered public accounting firm.
5 Based on the average daily shares outstanding.
6 The amount shown for a share outstanding may differ with the distributions from net investment income for the period due to the timing of distributions in relations to fluctuations of shares outstanding during the period.
7 In 2009, the investment advisor fully reimbursed the Fund for a loss on a transaction not meeting the Fund’s investment guidelines, which otherwise would have reduced total return by 0.11% and net realized and unrealized gain/(loss) on investment by $0.01 per share.
8 Less than $0.01 per share.
9 Total returns would have been lower had certain expenses not been reduced during the periods shown.
10 Does not reflect the effect of sales charges, if any.
11 Not annualized.
12 Annualized.
| See notes to financial statements | Semiannual report | Disciplined Value Mid Cap Fund | 19 |
| CLASS C SHARES Period ended | 9-30-111,2 | ||||
| Per share operating performance | |||||
| Net asset value, beginning of period | $10.63 | ||||
| Net investment income | —3 | ||||
| Net realized and unrealized loss on investments | (0.68) | ||||
| Total from investment operations | (0.68) | ||||
| Net asset value, end of period | $9.95 | ||||
| Total return (%)4,5 | (6.40)6 | ||||
| Ratios and supplemental data | |||||
| Net assets, end of period (in millions) | $1 | ||||
| Ratios (as a percentage of average net assets): | |||||
| Expenses before reductions | 5.947 | ||||
| Expenses net of fee waivers and credits | 2.107 | ||||
| Net investment income | 0.177 | ||||
| Portfolio turnover (%) | 22 | ||||
1 Period from 8-15-11 (inception date) to 9-30-11.
2 Unaudited.
3 Less than $0.005 per share.
4 Not annualized.
5 Does not reflect the effect of sales charges, if any.
6 Total returns would have been lower had certain expenses not been reduced during the periods shown.
7 Annualized.
| 20 | Disciplined Value Mid Cap Fund | Semiannual report | See notes to financial statements |
| CLASS I SHARES | |||||||
| Period ended | 9-30-111 | 3-31-112 | 8-31-103 | 8-31-094 | 8-31-084 | 8-31-074 | 8-31-06 |
| Per share operating performance | |||||||
| Net asset value, beginning | |||||||
| of period | $12.33 | $8.92 | $8.34 | $9.35 | $11.45 | $13.05 | $14.02 |
| Net investment income5 | 0.03 | 0.03 | 0.046 | 0.09 | 0.08 | 0.05 | 0.04 |
| Net realized and unrealized | |||||||
| gain (loss) on investments | (2.40) | 3.41 | 0.61 | (1.01)7 | (0.76) | 2.44 | 0.86 |
| Total from | |||||||
| investment operations | (2.37) | 3.44 | 0.65 | (0.92) | (0.68) | 2.49 | 0.90 |
| Less distributions | |||||||
| From net investment income | — | (0.03) | (0.07) | (0.09) | (0.06) | (0.03) | (0.02) |
| From net realized gain | — | — | — | —8 | (1.36) | (4.06) | (1.85) |
| Total distributions | — | (0.03) | (0.07) | (0.09) | (1.42) | (4.09) | (1.87) |
| Net asset value, end | |||||||
| of period | $9.96 | $12.33 | $8.92 | $8.34 | $9.35 | $11.45 | $13.05 |
| Total return (%) | (19.22)9 | 38.649 | 7.7610 | (9.50)7,10 | (6.41)10 | 21.3210 | 6.8210 |
| Ratios and supplemental data | |||||||
| Net assets, end of period | |||||||
| (in millions) | $383 | $254 | $87 | $33 | $35 | $36 | $28 |
| Ratios (as a percentage of | |||||||
| average net assets): | |||||||
| Expenses before reductions | 0.9411 | 0.9911 | 1.28 | 1.69 | 1.48 | 1.48 | 1.38 |
| Expenses net of fee waivers | |||||||
| and credits | 0.9411 | 0.9911 | 1.00 | 1.00 | 1.00 | 1.00 | 1.00 |
| Net investment income | 0.5711 | 0.3711 | 0.41 | 1.33 | 0.80 | 0.38 | 0.28 |
| Portfolio turnover (%) | 22 | 27 | 38 | 58 | 64 | 89 | 97 |
1 Unaudited.
2 For the seven-month period ended 3-31-11. The Fund changed its fiscal year end from August 31 to March 31.
3 After the close of business on 7-9-10, holders of Institutional Class Shares of the former Robeco Boston Partners Mid Cap Value Fund (the Predecessor Fund) became owners of an equal number of full and fractional Class I shares of the John Hancock Disciplined Value Mid Cap Fund. These shares were first offered on 7-12-10. Additionally, the accounting and performance history of the Institutional Class Shares of the Predecessor Fund was redesignated as that of John Hancock Disciplined Value Mid Cap Fund Class I.
4 Audited by previous independent registered public accounting firm.
5 Based on the average daily shares outstanding.
6 The amount shown for a share outstanding may differ with the distributions from net investment income for the period due to the timing of distributions in relations to fluctuations of shares outstanding during the period.
7 In 2009, the investment advisor fully reimbursed the Fund for a loss on a transaction not meeting the Fund’s investment guidelines, which otherwise would have reduced total return by 0.11% and net realized and unrealized gain/(loss) on investment by $0.01 per share.
8 Less than $0.01 per share.
9 Not annualized.
10 Total returns would have been lower had certain expenses not been reduced during the periods shown.
11 Annualized.
| See notes to financial statements | Semiannual report | Disciplined Value Mid Cap Fund | 21 |
| CLASS R6 SHARES Period ended | 9-30-111,2 | ||||||
| Per share operating performance | |||||||
| Net asset value, beginning of period | $10.95 | ||||||
| Net investment income3 | 0.01 | ||||||
| Net realized and unrealized loss on investments | (1.00) | ||||||
| Total from investment operations | (0.99) | ||||||
| Net asset value, end of period | $9.96 | ||||||
| Total return (%)4 | (9.04)5 | ||||||
| Ratios and supplemental data | |||||||
| Net assets, end of period (in millions) | —6 | ||||||
| Ratios (as a percentage of average net assets): | |||||||
| Expenses before reductions | 16.707 | ||||||
| Expenses net of fee waivers and credits | 0.997 | ||||||
| Net investment income | 1.117 | ||||||
| Portfolio turnover (%) | 22 | ||||||
1 Period from 9-1-11 (inception date) to 9-30-11.
2 Unaudited.
3 Based on the average daily shares outstanding.
4 Total returns would have been lower had certain expenses not been reduced during the periods shown.
5 Not annualized.
6 Less than $500,000.
7 Annualized.
| CLASS ADV SHARES Period ended | 9-30-111 | 3-31-112 | 8-31-103 | ||||
| Per share operating performance | |||||||
| Net asset value, beginning of period | $11.97 | $8.65 | $8.86 | ||||
| Net investment income4 | 0.02 | 0.01 | —5 | ||||
| Net realized and unrealized gain (loss) on investments | (2.34) | 3.32 | (0.21) | ||||
| Total from investment operations | (2.32) | 3.33 | (0.21) | ||||
| Less distributions | |||||||
| From net investment income | — | (0.01) | — | ||||
| Net asset value, end of period | $9.65 | $11.97 | $8.65 | ||||
| Total return (%)6 | (19.38)7 | 38.507 | (2.37)7 | ||||
| Ratios and supplemental data | |||||||
| Net assets, end of period (in millions) | $1 | —8 | —8 | ||||
| Ratios (as a percentage of average net assets): | |||||||
| Expenses before reductions | 4.399 | 5.789 | 1.429 | ||||
| Expenses net of fee waivers and credits | 1.259 | 1.259 | 1.259 | ||||
| Net investment income (loss) | 0.359 | 0.159 | (0.37)9 | ||||
| Portfolio turnover (%) | 22 | 27 | 3810 | ||||
1 Unaudited.
2 For the seven-month period ended 3-31-11. The Fund changed its fiscal year end from August 31 to March 31.
3 Period from 7-12-10 (inception date) to 8-31-10.
4 Based on the average daily shares outstanding.
5 Less than $0.005 per share.
6 Total returns would have been lower had certain expenses not been reduced during the periods shown.
7 Not annualized.
8 Less than $500,000.
9 Annualized.
10 Portfolio turnover is shown for the period from 9-1-09 to 8-31-10.
| 22 | Disciplined Value Mid Cap Fund | Semiannual report | See notes to financial statements |
Notes to financial statements
(unaudited)
Note 1 — Organization
John Hancock Disciplined Value Mid Cap Fund (the Fund) is a diversified series of John Hancock Funds III (the Trust), an open-end management investment company organized as a Massachusetts business trust and registered under the Investment Company Act of 1940, as amended (the 1940 Act). The investment objective of the Fund is to seek long-term growth of capital with current income as a secondary objective.
The Fund may offer multiple classes of shares. The shares currently offered are detailed in the Statement of assets and liabilities. Class A and Class C shares are offered to all investors. Class I shares are offered to institutions and certain investors. Class R6 shares are only available to certain retirement plans, institutions and other investors. Class ADV shares are available to investors who acquired Class A shares as a result of the reorganization of the Robeco Boston Partners Mid Cap Value Fund (the Predecessor Fund) into the Fund and is closed to new investors. Shareholders of each class have exclusive voting rights to matters that affect that class. The distribution and service fees, if any, transfer agent fees, printing and postage and state registration fees for each class may differ. Under certain circumstances, Class I shares may be converted to Class R6 shares within one year after the commencement of operations of Class R6.
At the close of business on July 9, 2010, the Fund acquired substantially all the assets and assumed the liabilities of the Predecessor Fund pursuant to an agreement and plan of reorganization, in exchange for Class A and Class I shares of the Fund. As a result of the reorganization, the Fund is the legal survivor, however, the accounting and performance history of the Investor Class and Institutional Class shares of the Predecessor Fund have been redesignated as that of Class A and Class I shares of the Fund, respectively.
Note 2 — Significant accounting policies
The financial statements have been prepared in conformity with accounting principles generally accepted in the United States of America, which require management to make certain estimates and assumptions at the date of the financial statements. Actual results could differ from those estimates. Events or transactions occurring after the end of the fiscal period through the date that the financial statements were issued have been evaluated in the preparation of the financial statements. The following summarizes the significant accounting policies of the Fund:
Security valuation. Investments are stated at value as of the close of regular trading on the New York Stock Exchange (NYSE), normally at 4:00 P.M., Eastern Time. The Fund uses a three-tier hierarchy to prioritize the pricing assumptions, referred to as inputs, used in valuation techniques to measure fair value. Level 1 includes securities valued using quoted prices in active markets for identical securities. Level 2 includes securities valued using significant observable inputs. Observable inputs may include quoted prices for similar securities, interest rates, prepayment speeds and credit risk. Prices for securities valued using these inputs are received from independent pricing vendors and brokers and are based on an evaluation of the inputs described. Level 3 includes securities valued using significant unobservable inputs when market prices are not readily available or reliable, including the Fund’s own assumptions in determining the fair value of investments. Factors used in determining value may include market or issuer specific events, changes in interest rates and credit quality. The inputs or methodology used for valuing securities are not necessarily an indication of the risk associated with investing in those securities.
| Semiannual report | Disciplined Value Mid Cap Fund | 23 |
As September 30, 2011, all investments are categorized as Level 1 under the hierarchy described above, except for repurchase agreements, which are Level 2. Changes in valuation techniques may result in transfers in or out of an assigned level within the disclosure hierarchy. During the six months ended September 30, 2011, there were no significant transfers in or out of Level 1 or Level 2 assets.
In order to value the securities, the Fund uses the following valuation techniques. Equity securities held by the Fund are valued at the last sale price or official closing price on the principal securities exchange on which they trade. In the event there were no sales during the day or closing prices are not available, then securities are valued using the last quoted bid or evaluated price. Investments by the Fund in open-end mutual funds, including John Hancock Collateral Investment Trust (JHCIT), are valued at their respective net asset values each business day. Foreign securities are valued in U.S. dollars, based on foreign currency exchange rates supplied by an independent pricing service. Certain securities traded only in the over-the-counter market are valued at the last bid price quoted by brokers making markets in the securities at the close of trading. Other portfolio securities and assets, where market quotations are not readily available, are valued at fair value, as determined in good faith by the Fund’s Pricing Committee, following procedures established by the Board of Trustees.
Repurchase agreements. The Fund may enter into repurchase agreements. When the Fund enters into a repurchase agreement, it receives collateral which is held in a segregated account by the Fund’s custodian. The collateral amount is marked-to-market and monitored on a daily basis to ensure that the collateral held is in an amount not less than the principal amount of the repurchase agreement plus any accrued interest. In the event of a default by the counterparty, realization of the collateral proceeds could be delayed, during which time the collateral value may decline.
Security transactions and related investment income. Investment security transactions are accounted for on a trade date plus one basis for daily net asset value calculations. However, for financial reporting purposes, investment transactions are reported on trade date. Interest income is accrued as earned. Gains and losses on securities sold are determined on the basis of identified cost and may include proceeds from litigation. Dividend income is recorded on the ex-date, except for dividends of foreign securities where the dividend may not be known until after the ex-date. In those cases, dividend income is recorded when the Fund becomes aware of the dividends.
Securities lending. The Fund may lend its securities to earn additional income. It receives and maintains cash collateral received from the borrower in an amount not less than the market value of the loaned securities. The Fund will invest its collateral in JHCIT, an affiliate of the Fund, and as a result, the Fund will receive the benefit of any gains and bear any losses generated by JHCIT. Although risk of the loss of the securities lent is mitigated by holding the collateral, the Fund could experience a delay in recovering its securities and a possible loss of income or value if the borrower fails to return the securities or if collateral investments decline in value. The Fund may receive compensation for lending its securities by retaining a portion of the return on the investment of the collateral and compensation from fees earned from borrowers of the securities. Net income received from JHCIT is a component of securities lending income as recorded on the Statement of operations.
Line of credit. The Fund may borrow from banks for temporary or emergency purposes, including meeting redemption requests that otherwise might require the untimely sale of securities. Pursuant to the custodian agreement, the custodian may loan money to the Fund to make properly authorized payments. The Fund is obligated to repay the custodian for any overdraft, including any related costs or expenses. The custodian has a lien, security interest or security entitlement in any Fund property that is not segregated, to the maximum extent permitted by law for any overdraft.
| 24 | Disciplined Value Mid Cap Fund | Semiannual report |
The Fund and other affiliated funds have entered into an agreement with Citibank N.A. which enables them to participate in a $100 million unsecured committed line of credit. A commitment fee, payable at the end of each calendar quarter, based on the average daily unused portion of the line of credit, is charged to each participating fund on a pro rata basis and is reflected in other expenses on the Statement of operations. For the six months ended September 30, 2011, the Fund had no borrowings under the line of credit.
Expenses. The majority of expenses are directly attributable to an individual fund. Expenses that are not readily attributable to a specific fund are allocated among all funds in an equitable manner, taking into consideration, among other things, the nature and type of expense and the fund’s relative assets. Expense estimates are accrued in the period to which they relate and adjustments are made when actual amounts are known.
Class allocations. Income, common expenses and realized and unrealized gains (losses) are determined at the fund level and allocated daily to each class of shares based on the net assets of the class. Class-specific expenses, such as distribution and service fees, if any, transfer agent fees, state registration fees and printing and postage, for all classes, are calculated daily at the class level based on the appropriate net assets of each class and the specific expense rates applicable to each class.
Federal income taxes. The Fund intends to continue to qualify as a regulated investment company by complying with the applicable provisions of the Internal Revenue Code and will not be subject to federal income tax on taxable income that is distributed to shareholders. Therefore, no federal income tax provision is required.
As of March 31, 2011, the Fund had no uncertain tax positions that would require financial statement recognition, de-recognition or disclosure. The Fund’s federal tax return is subject to examination by the Internal Revenue Service for a period of three years.
Distribution of income and gains. Distributions to shareholders from net investment income and net realized gains, if any, are recorded on the ex-date. The Fund generally declares and pays dividends and capital gain distributions, if any, annually.
Distributions paid by the Fund with respect to each class of shares are calculated in the same manner, at the same time and in the same amount, except for the effect of expenses that may be applied differently to each class.
Such distributions, on a tax basis, are determined in conformity with income tax regulations, which may differ from accounting principles generally accepted in the United States of America.
Capital accounts within financial statements are adjusted for permanent book-tax differences. These adjustments have no impact on net assets or the results of operations. Temporary book-tax differences, if any, will reverse in a subsequent period. Book-tax differences are primarily attributable to wash sale loss deferrals.
New accounting pronouncement. In May 2011, Accounting Standards Update 2011-04 (ASU 2011-04), Amendments to Achieve Common Fair Value Measurement and Disclosure Requirements in U.S. GAAP and IFRSs, was issued and shall be effective during interim and annual periods beginning after December 15, 2011. ASU 2011-04 amends Financial Accounting Standards Board (FASB) Topic 820, Fair Value Measurement. The amendments are the result of the work by the FASB and the International Accounting Standards Board to develop common requirements for measuring fair value and for disclosing information about fair value measurements in accordance with GAAP. Management is currently evaluating the application of ASU 2011-04 and its impact, if any, on the Fund’s financial statements.
| Semiannual report | Disciplined Value Mid Cap Fund | 25 |
Note 3 — Guarantees and indemnifications
Under the Fund’s organizational documents, its Officers and Trustees are indemnified against certain liabilities arising out of the performance of their duties to the Fund. Additionally, in the normal course of business, the Fund enters into contracts with service providers that contain general indemnification clauses. The Fund’s maximum exposure under these arrangements is unknown, as this would involve future claims that may be made against the Fund that have not yet occurred. The risk of material loss from such claims is considered remote.
Note 4 — Fees and transactions with affiliates
John Hancock Investment Management Services, LLC (the Adviser) serves as investment adviser for the Trust. John Hancock Funds, LLC (the Distributor), an affiliate of the Adviser, serves as principal underwriter of the Trust. The Adviser and the Distributor are indirect wholly owned subsidiaries of Manulife Financial Corporation (MFC).
Management fee. The Fund has an investment management contract with the Adviser under which the Fund pays a daily management fee to the Adviser equivalent, on an annual basis, to the sum of: (a) 0.800% of the first $500,000,000 of the Fund’s average daily net assets; (b) 0.775% of the next $500,000,000; (c) 0.750% of the next $500,000,000; (d) 0.725% of the next $1,000,000,000; and (e) 0.700% of the Fund’s average daily net assets in excess of $2,500,000,000. The Adviser has a subadvisory agreement with Robeco Investment Management, Inc. The Fund is not responsible for payment of the subadvisory fees.
The Adviser has contractually agreed to waive fees and/or reimburse certain expenses for each share class of the Fund. This agreement excludes taxes, brokerage commissions, interest, litigation expenses and other extraordinary expenses not incurred in the ordinary course of the Fund’s business. The reimbursements are such that these expenses will not exceed 1.35%, 2.10%, 1.00%, 0.99% and 1.25% for Class A, Class C, Class I, Class R6 and Class ADV shares, respectively. The expense reimbursements will continue in effect until at least July 31, 2012 for Class A and Class C shares, July 9, 2012 for Class I and Class ADV shares and June 30, 2013 for Class R6 shares. Prior to July 1, 2011, the fee waivers and/or reimbursements were such that these expenses would not exceed 1.25%, 1.00% and 1.25% for Class A, Class I and Class ADV shares, respectively.
For the six months ended September 30, 2011, the expense reductions amounted to the following:
| EXPENSE | ||||||
| CLASS | REDUCTIONS | |||||
| Class A | $48,702 | |||||
| Class C | 1,956 | |||||
| Class I | — | |||||
| Class R6 | 1,185 | |||||
| Class ADV | 4,482 | |||||
| Total | $56,325 | |||||
The investment management fees, including the impact of the waivers and reimbursements described above, incurred for the six months ended September 30, 2011 were equivalent to a net annual effective rate of 0.777% of the Fund’s average daily net assets.
Accounting and legal services. Pursuant to a service agreement, the Fund reimburses the Adviser for all expenses associated with providing the administrative, financial, legal, accounting and recordkeeping services of the Fund, including the preparation of all tax returns, periodic reports to shareholders and regulatory reports, among other services. These expenses are allocated to each share class based on its relative net assets at the time the expense was incurred. These accounting and legal services fees incurred for the six months ended September 30, 2011 amounted to an annual rate of 0.01% of the Fund’s average daily net assets.
| 26 | Disciplined Value Mid Cap Fund | Semiannual report |
Distribution and service plans. The Fund has a distribution agreement with the Distributor. The Fund has adopted distribution and service plans with respect to Class A, Class C and Class ADV shares pursuant to Rule 12b-1 under the 1940 Act, to pay the Distributor for services provided as the distributor of shares of the Fund. The Fund may pay up to the following contractual rates of distribution and service fees under these arrangements, expressed as an annual percentage of average daily net assets for each class of the Fund’s shares.
| CLASS | 12b–1 FEE | |||||
| Class A | 0.30% | |||||
| Class C | 1.00% | |||||
| Class ADV | 0.25% | |||||
Currently, only 0.25% is charged to Class A shares for 12b-1 fees.
Sales charges. Class A shares are assessed up-front sales charges, which resulted in payments to the Distributor amounting to $638,987 for the six months ended September 30, 2011. Of this amount, $100,616 was retained and used for printing prospectuses, advertising, sales literature and other purposes, $532,755 was paid as sales commissions to broker-dealers and $5,616 was paid as sales commissions to sales personnel of Signator Investors, Inc. (Signator Investors), a broker-dealer affiliate of the Adviser.
Class C shares are subject to contingent deferred sales charges (CDSCs). Class C shares that are redeemed within one year of purchase are subject to a 1.00% CDSC on the lesser of the current market value at the time of redemption or the original purchase cost of the shares being redeemed. Proceeds from CDSCs are used to compensate the Distributor for providing distribution-related services in connection with the sale of these shares. During the six months ended September 30, 2011, CDSCs received by the Distributor amounted to $12,378 for Class C shares.
Transfer agent fees. The Fund has a transfer agent agreement with John Hancock Signature Services, Inc. (Signature Services), an affiliate of the Adviser. The transfer agent fees paid to Signature Services are determined based on the cost to Signature Services (Signature Services Cost) of providing recordkeeping services. The Signature Services Cost includes a component of allocated John Hancock corporate overhead for providing transfer agent services to the Fund and to all other John Hancock affiliated funds. It also includes out-of-pocket expenses that are comprised of payments made to third-parties for recordkeeping services provided to their clients who invest in one or more John Hancock funds. In addition, Signature Services Cost may be reduced by certain fees that Signature Services receives in connection with retirement and small accounts. Signature Services Cost is calculated monthly and allocated, as applicable, to four categories of share classes: Institutional Share Classes, Retirement Share Classes, Municipal Bond Classes and all other Retail Share Classes. Within each of these categories, the applicable costs are allocated to the affected John Hancock affiliated funds and/or classes, based on the relative average daily net assets.
Class level expenses. Class level expenses for the six months ended September 30, 2011 were:
| DISTRIBUTION | TRANSFER | STATE | PRINTING AND | |
| CLASS | AND SERVICE FEES | AGENT FEES | REGISTRATION FEES | POSTAGE |
| Class A | $281,602 | $195,616 | $10,704 | $23,475 |
| Class C | 510 | 93 | 1,948 | 15 |
| Class I | — | 130,292 | 36,037 | 4,195 |
| Class R6 | — | 3 | 1,192 | 2 |
| Class ADV | 357 | 254 | 4,394 | 58 |
| Total | $282,469 | $326,258 | $54,275 | $27,745 |
| Semiannual report | Disciplined Value Mid Cap Fund | 27 |
Trustee expenses. The Fund compensates each Trustee who is not an employee of the Adviser or its affiliates. These Trustees may, for tax purposes, elect to defer receipt of this compensation under the John Hancock Group of Funds Deferred Compensation Plan (the Plan). Deferred amounts are invested in various John Hancock funds and remain in the funds until distributed in accordance with the Plan. The investment of deferred amounts and the offsetting liability are included within Other receivables and prepaid expenses and Payable to affiliates — Trustees’ fees, respectively, in the accompanying Statement of assets and liabilities.
Note 5 — Fund share transactions
Transactions in Fund shares for the six months ended September 30, 2011, period ended March 31, 2011 and year ended August 31, 2010 were as follows:
| Six months ended 9-30-11 | Period ended 3-31-111 | Year ended 8-31-10 | ||||
| Shares | Amount | Shares | Amount | Shares | Amount | |
| Class A shares | ||||||
| Sold | 16,980,052 | $192,862,611 | 7,005,591 | $77,872,436 | 8,777,014 | $83,785,587 |
| Distributions | ||||||
| reinvested | — | — | 8,933 | 97,188 | 10,325 | 90,650 |
| Repurchased | (5,755,436) | (62,980,841) | (1,470,217) | (15,870,855) | (1,798,769) | (16,412,636) |
| Net increase | 11,224,616 | $129,881,770 | 5,544,307 | $62,098,769 | 6,988,570 | $67,463,601 |
| Class C shares2 | ||||||
| Sold | 101,389 | $1,056,008 | — | — | — | — |
| Repurchased | (19,096) | (199,928) | — | — | — | — |
| Net increase | 82,293 | $856,080 | — | — | — | — |
| Class I shares | ||||||
| Sold | 21,154,344 | $249,595,811 | 11,421,411 | $135,086,113 | 6,811,708 | $64,123,319 |
| Distributions | ||||||
| reinvested | — | — | 13,096 | 146,545 | 33,541 | 302,876 |
| Repurchased | (3,260,945) | (35,966,757) | (601,401) | (6,597,427) | (1,000,633) | (9,349,135) |
| Net increase | 17,893,399 | $213,629,054 | 10,833,106 | $128,635,231 | 5,844,616 | $55,077,060 |
| Class R6 Shares3 | ||||||
| Sold | 9,132 | $100,000 | — | — | — | — |
| Net increase | 9,132 | $100,000 | — | — | — | — |
| Class ADV shares | ||||||
| Sold | 45,938 | $523,374 | 4,108 | $48,100 | 2,822 | $25,000 |
| Repurchased | (841) | (9,840) | — | — | — | — |
| Net increase | 45,097 | $513,534 | 4,108 | $48,100 | 2,822 | $25,000 |
| Net increase | 29,254,537 | $344,980,438 | 16,381,521 | $190,782,100 | 12,836,008 | $122,565,661 |
1 For the seven-month period ended 3-31-11. The Fund changed its fiscal year end from August 31 to March 31.
2 Period from 8-15-11 (inception date) to 9-30-11.
3 Period from 9-1-11 (inception date) to 9-30-11.
Affiliates of the Fund owned 12%, 100% and 5% of shares of beneficial interest of Class C, Class R6 and Class ADV, respectively, on September 30, 2011.
Note 6 — Purchase and sale of securities
Purchases and sales of securities, other than short-term securities, aggregated $503,830,572 and $119,817,982, respectively, for the six months ended September 30, 2011.
| 28 | Disciplined Value Mid Cap Fund | Semiannual report |
Note 7 — Reorganization
At the close of business on July 9, 2010, the Fund acquired all the assets and liabilities of the Predecessor Fund in exchange for the Class A and Class I shares of the Fund. The Fund had no assets, liabilities or operations prior to the reorganization.
The agreement and plan of reorganization provided for (a) the acquisition of all the assets, subject to all of the liabilities, of the Predecessor Fund in exchange for a representative amount of shares of the Fund; (b) the liquidation of the Predecessor Fund; and (c) the distribution to the Predecessor Fund’s shareholders of the Fund’s shares. The reorganization was intended to allow the Fund to be better positioned to increase asset size and achieve additional economies of scale by achieving net prices on securities trades and spread fixed expenses over a larger asset base. As a result of the reorganization, the Fund is the legal survivor, however, the accounting and performance history of the Investor Class and Institutional Class of the Predecessor Fund have been redesignated as that of Class A and Class I of the Fund.
Based on the opinion of tax counsel, the reorganization qualified as a tax-free reorganization for federal income tax purposes with no gain or loss recognized by the Predecessor Fund or its shareholders. In addition, the expenses of the reorganization were borne by the Advisers of both the Predecessor Fund and the Fund. The effective time of the reorganization occurred immediately after the close of regularly scheduled trading on the NYSE on July 9, 2010. The following outlines the reorganization:
| ACQUIRED NET | DEPRECIATION OF | |||
| ASSET VALUE OF THE | ACQUIRED FUND’S | SHARES ISSUED | TOTAL NET ASSETS | |
| ACQUIRED FUND | ACQUIRED FUND | INVESTMENTS | BY THE FUND | AFTER COMBINATION |
| Robeco Boston Partners | $154,240,210 | ($5,243,829) | 17,142,708 | $154,240,210 |
| Mid Cap Value Fund | ||||
| Semiannual report | Disciplined Value Mid Cap Fund | 29 |
Board Consideration of and Continuation of Investment Advisory Agreement and Subadvisory Agreement
The Board of Trustees (the Board, the members of which are referred to as Trustees) of John Hancock Disciplined Value Mid Cap Fund (the Fund), a series of John Hancock Funds III, met in-person on May 1–3 and June 5–7, 2011 to consider the approval of the Fund’s investment advisory agreement (the Advisory Agreement) with John Hancock Investment Management Services, LLC (the Adviser), the Fund’s investment adviser. The Board also considered the approval of the investment subadvisory agreement (the Subadvisory Agreement) between the Adviser and Robeco Investment Management, Inc. (the Subadviser) on behalf of the Fund. The Advisory Agreement and the Subadvisory Agreement are referred to as the Agreements.
Activities and composition of the Board
The Board consists of eleven individuals, nine of whom are Independent Trustees. Independent Trustees are generally those individuals who are not employed by or have any significant business or professional relationship with the Adviser or the Subadviser. The Trustees are responsible for the oversight of operations of the Fund and perform various duties required of directors of investment companies by the Investment Company Act of 1940, as amended (the 1940 Act). The Independent Trustees have hired independent legal counsel to assist them in connection with their duties. The Board has appointed an Independent Trustee as Chairperson. The Board has established four standing committees that are composed entirely of Independent Trustees: the Audit Committee; the Compliance Committee; the Nominating, Governance and Administration Committee; and the Contracts/Operations Committee. Additionally, Investment Performance Committees A and B are standing committees of the Board that are each composed of Independent Trustees and one Trustee who is affiliated with the Adviser. Investment Performance Committee B oversees and monitors matters relating to the investment performance of the Fund. The Board has also designated an Independent Trustee as Vice Chairperson to serve in the absence of the Chairperson. The Board also designates working groups or ad hoc committees as it deems appropriate.
The approval process
Under the 1940 Act, the Board is required to consider the continuation of the Agreements each year. Throughout the year, the Board, acting directly and through its committees, regularly reviews and assesses the quality of the services that the Fund receives under these Agreements. The Board reviews reports of the Adviser at least quarterly, which include Fund performance reports and compliance reports. In addition, the Board meets with portfolio managers and senior investment officers at various times throughout the year. The Board considers at each of its meetings factors that are relevant to its annual consideration of the renewal of the Agreements, including the services and support provided by the Adviser and Subadviser to the Fund and its shareholders.
Prior to the May 1–3, 2011 meeting, the Board requested and received materials specifically relating to the Agreements. The materials provided in connection with the May meeting included information compiled and prepared by Morningstar, Inc. (Morningstar) on Fund fees and expenses, and the investment performance of the Fund. This Fund information is assembled in a format that permits comparison with similar information from a Category and a subset of the Category referred to as the Peer Group, each as determined by Morningstar, and with the Fund’s benchmark index. The Category includes all funds that invest similarly to the way the Fund invests. The Peer Group represents funds of similar size, excluding passively managed funds and funds-of-funds. The Fund’s benchmark index is an unmanaged index of securities that is provided as a basis for comparison with the Fund’s performance. Other material provided for the Fund review included (a) information on the profitability of the Agreements to the Adviser and a discussion of any additional benefits to the Adviser or Subadviser or their affiliates that result from being the Adviser or Subadviser to the Fund; (b) a general analysis provided by the Adviser and the Subadviser concerning investment advisory fees charged to other clients, such as institutional clients and other investment companies, having similar investment mandates, as well as the performance of those other clients and a comparison of
| 30 | Disciplined Value Mid Cap Fund | Semiannual report |
the services provided to those other clients and the services provided to the Fund; (c) the impact of economies of scale; (d) a summary of aggregate amounts paid by the Fund to the Adviser; and (e) sales and redemption data regarding the Fund’s shares.
At an in-person meeting held on May 1–3, 2011, the Board reviewed materials relevant to its consideration of the Agreements. As a result of the discussions that occurred during the May 1–3, 2011 meeting, the Board asked the Adviser for additional information on certain matters. The Adviser provided the additional information and the Board also considered this information as part of its consideration of the Agreements.
At an in-person meeting held on June 5–7, 2011, the Board, including the Independent Trustees, formally considered the continuation of the Advisory Agreement between the Adviser and the Fund and the Subadvisory Agreement between the Adviser and the Subadviser with respect to the Fund, each for an additional one-year term. The Board considered what it believed were key relevant factors that are described under separate headings presented below.
The Board also considered other matters important to the approval process, such as payments made to and by the Adviser or its affiliates relating to the distribution of Fund shares and other services. The Board reviewed services related to the valuation and pricing of Fund portfolio holdings. Other important matters considered by the Board were the direct and indirect benefits to the Adviser, the Subadviser and their affiliates from their relationship with the Fund and advice from independent legal counsel with respect to the review process and materials submitted for the Board’s review.
Nature, extent and quality of services
The Board reviewed the nature, extent and quality of services provided by the Adviser and the Subadviser, including the investment advisory services and the resulting performance of the Fund.
The Board considered the ability of the Adviser and the Subadviser, based on their resources, reputation and other attributes, to attract and retain qualified investment professionals, including research, advisory and supervisory personnel. It considered the background and experience of senior management and investment professionals responsible for managing the Fund. The Board considered the investment philosophy, research and investment decision-making processes of the Adviser and the Subadviser responsible for the daily investment activities of the Fund, including, among other things, portfolio trading capabilities, use of technology, commitment to compliance and approach to training and retaining portfolio managers and other research, advisory and management personnel.
The Board considered the Subadviser’s history and experience providing investment services to the Fund. The Board considered the Adviser’s execution of its oversight responsibilities. The Board further considered the culture of compliance, resources dedicated to compliance, compliance programs, record of compliance with applicable laws and regulation, with the Fund’s investment policies and restrictions and with the applicable Code of Ethics, and the responsibilities of the Adviser’s and Subadviser’s compliance departments.
In addition to advisory services, the Board considered the quality of the administrative and non-investment advisory services provided to the Fund by the Adviser under a separate agreement. The Board noted that the Adviser and its affiliates provide the Fund with certain administrative, transfer agency, shareholder and other services (in addition to any such services provided to the Fund by third parties) and officers and other personnel as are necessary for the operations of the Fund. The Board reviewed the structure and duties of the Adviser’s administration, accounting, legal and compliance departments and its affiliate’s transfer agency operations and considered the Adviser’s and its affiliate’s policies and procedures for assuring compliance with applicable laws and regulations.
| Semiannual report | Disciplined Value Mid Cap Fund | 31 |
The Board also received information about the nature, extent and quality of services provided by and fee rates charged by the Adviser and Subadviser to their other clients, including other registered investment companies, institutional investors and separate accounts. The Board reviewed a general analysis provided by the Adviser and the Subadviser concerning investment advisory fees charged to other clients having similar investment mandates, the services provided to those other clients as compared to the services provided to the Fund, the performance of those other clients as compared to the performance by the Fund and other factors relating to those other clients. The Board considered the significant differences between the Adviser’s and Subadviser’s services to the Fund and the services they provide to other clients. For other clients that are not mutual funds, the differences in services relate to the greater share purchase and redemption activity in a mutual fund, the generally higher turnover of mutual fund portfolio holdings, the more burdensome regulatory and legal obligations of mutual funds and the higher marketing costs for mutual funds. When compared to all clients including mutual funds, the Adviser has greater oversight and supervisory responsibility for the Fund and undertakes greater entrepreneurial risk as the sponsor of the Fund.
Fund performance
The Board was provided with reports, independently prepared by Morningstar, which included a comprehensive analysis of the Fund’s performance. The Board also examined materials provided by the Fund’s portfolio management team discussing Fund performance and the Fund’s investment objective, strategies and outlook. The Board also reviewed a narrative and statistical analysis of the Morningstar data that was prepared by the Adviser, which analyzed various factors that may affect the Morningstar rankings. The Board reviewed information regarding the investment performance of the Fund as compared to its Morningstar Category as well as its benchmark index (see chart below). The Board was provided with a description of the methodology used by Morningstar to select the funds in the Category. The Board also considered updated performance information provided by the Adviser at its May and June 2011 meetings. The Board regularly reviews the performance of the Fund throughout the year and attaches more importance to performance over relatively longer periods of time, typically three to five years.
Set forth below is the performance of the Fund over certain time periods ended December 31, 2010 and that of its Category and benchmark index over the same periods:
| 1 YEAR | 3 YEAR | 5 YEAR | 10 YEAR | |
| Disciplined Value Mid Cap Fund Class A | 22.96% | 5.32% | 7.47% | 9.12% |
| Mid-Cap Value Category Average | 21.48% | 1.19% | 4.20% | 7.49% |
| Russell Mid Cap Value TR Index | 24.75% | 1.01% | 4.08% | 8.07% |
The Board noted that the Fund’s performance compared favorably to the average performance of its Category for all periods shown. The Board noted that, although the Fund had underperformed its benchmark index’s performance over the one-year period, the Fund had outperformed its benchmark index’s performance over all other periods.
Expenses and fees
The Board, including the Independent Trustees, reviewed the Fund’s contractual advisory fee rate payable by the Fund to the Adviser as compared with the other funds in its Peer Group. The Board also received information about the investment subadvisory fee rate payable by the Adviser to the Subadviser for investment subadvisory services. The Board considered the services provided and the fees charged by the Adviser and the Subadviser to other clients with similar investment mandates, including separately managed institutional accounts.
In addition, the Board considered the cost of the services provided to the Fund by the Adviser. The Board received and considered expense information regarding the Fund’s various components, including advisory fees, distribution fees and fees other than advisory and distribution fees, including
| 32 | Disciplined Value Mid Cap Fund | Semiannual report |
transfer agent fees, custodian fees, administration fees and other miscellaneous fees (e.g., fees for accounting and legal services). The Board considered comparisons of these expenses to the Peer Group median. The Board also considered expense information regarding the Fund’s total operating expense ratio (Gross Expense Ratio) and total operating expense ratio after taking the Adviser’s contractual fee waiver/expense reimbursement agreement into account (Net Expense Ratio). The Board considered information comparing the Gross Expense Ratio and Net Expense Ratio of the Fund to that of the Peer Group median. As part of its analysis, the Board reviewed the Adviser’s methodology in allocating its costs to the management of the Fund and the Fund complex.
The Board noted that the Fund’s advisory fee ratio was six basis points above the Peer Group median advisory fee ratio. The Board noted the following information about the Fund’s Gross and Net Expense Ratios for Class A shares contained in the Fund’s 2010 financial statements in relation with the Fund’s Peer Group median provided by Morningstar in April 2011:
| FUND (CLASS A) | PEER GROUP MEDIAN | |
| Advisory Fee Ratio | 0.80% | 0.74% |
| Gross Expense Ratio | 1.56% | 1.38% |
| Net Expense Ratio | 1.25% | 1.30% |
The Board viewed favorably the Adviser’s contractual agreement to waive all or a portion of its advisory fees and to reimburse or pay operating expenses to the extent necessary to maintain the Fund’s Net Expense Ratio: (i) at 1.25% for Class A shares, excluding certain expenses such as taxes, brokerage commissions, interest, litigation and extraordinary expenses, until December 31, 2011; and (ii) at 1.35% for Class A shares, excluding certain expenses such as taxes, brokerage commissions, interest, litigation and extraordinary expenses, from January 1, 2012 until July 31, 2012. The Board favorably considered the impact of this contractual agreement toward ultimately lowering the Fund’s Gross Expense Ratio. The Board also received and considered information relating to the Fund’s Gross Expense Ratio and Net Expense Ratio that reflected the new methodology for calculating transfer agent fees that was approved by the Trustees at the June 2010 meeting.
The Board received and reviewed statements relating to the Adviser’s financial condition and was also provided with a profitability analysis that detailed the revenues earned and the expenses incurred by the Adviser for services under the Advisory Agreement, as well as from other relationships between the Fund and the Adviser and its affiliates. The Board reviewed the Adviser’s profitability with respect to the Fund and other funds the Board currently oversees for the year ended December 31, 2010 compared to available aggregate profitability data provided for the year ended December 31, 2009. The Board reviewed the Adviser’s profitability with respect to other fund complexes managed by the Adviser and/or its affiliates. The Board reviewed the Adviser’s assumptions and methodology of allocating expenses in the profitability analysis, noting the inherent limitations in allocating costs among various advisory products.
The Board also considered a comparison of the Adviser’s profitability to that of other similar investment advisers whose profitability information is publicly available. The Board recognized that profitability may be affected by numerous factors including, among other things, fee waivers and expense reimbursements by the Adviser, the types of funds managed, expense allocations and business mix, and therefore comparability of profitability is somewhat limited.
The Board did not consider profitability information with respect to the Subadviser, which is not affiliated with the Adviser. The Board considered that the subadvisory fee under the Subadvisory Agreement had been negotiated by the Adviser and the Subadviser on an arm’s-length basis. For this reason, the Subadviser’s separate profitability from its relationship with the Fund was not a factor in determining whether to renew the Subadvisory Agreement. In evaluating overall fees for investment management, the Board recognized the inherently higher cost structure of subadvised funds.
| Semiannual report | Disciplined Value Mid Cap Fund | 33 |
Economies of scale
The Board, including the Independent Trustees, considered the extent to which economies of scale might be realized as the assets of the Fund increase. Possible changes in the advisory fee rate or structure in order to enable the Fund to participate in these economies of scale (e.g., through the use of breakpoints in the advisory fee at higher asset levels) are periodically discussed. The Board also considered the Adviser’s overall operations and its ongoing investment in its business in order to expand the scale of, and improve the quality of, its operations that benefit the Fund.
The Board recognized the inherent limitations of any analysis of economies of scale, stemming largely from the Board’s understanding that most of the Adviser’s costs are not specific to individual funds, but rather are incurred across a variety of products and services. To ensure that any economies are reasonably shared with the Fund as its assets increase, the Adviser and the Board agreed to continue the existing breakpoints to the contractual advisory fee rate.
Other benefits to the Adviser and the Subadviser
The Board understands that the Adviser, the Subadviser or their affiliates may derive other ancillary benefits from their relationship with the Fund, both tangible and intangible, such as their ability to leverage investment professionals who manage other portfolios, an increase in their profile in the investment advisory community and, in the case of the Adviser, the engagement of its affiliates and/or significant shareholders as service providers to the Fund, including for administrative, transfer agency and distribution services. The Board believes that certain of these benefits are difficult to quantify. The Board also was informed that the Subadviser may use third-party research obtained by soft dollars generated by certain mutual fund transactions to assist itself in managing all or a number of its other client accounts.
Board determination
The Board unanimously approved the continuation of the Advisory Agreement between the Adviser and the Fund for an additional one-year term. The Subadvisory Agreement between the Adviser and Subadviser with respect to the Fund was also approved for an additional one-year term. Based upon its evaluation of relevant factors in their totality, the Board was satisfied that the terms of the Agreements, including the advisory and subadvisory fee rates, were fair and reasonable and in the best interest of the Fund and its shareholders. In arriving at its decision to approve the Agreements, the Board did not identify any single factor or any group of factors as all-important or controlling, but considered all factors together. Different Trustees may have attributed different weights to the various factors considered. The Independent Trustees were also assisted by independent legal counsel in making this determination. The Trustees’ conclusions may be based in part on their consideration of these arrangements in prior years and on their ongoing regular review of Fund performance and operations throughout the year.
| 34 | Disciplined Value Mid Cap Fund | Semiannual report |
More information
| Trustees | Investment adviser |
| Steven R. Pruchansky, Chairman | John Hancock Investment Management |
| James F. Carlin | Services, LLC |
| William H. Cunningham | |
| Deborah C. Jackson | Subadviser |
| Charles L. Ladner,* Vice Chairman | Robeco Investment Management, Inc. |
| Stanley Martin* | |
| Hugh McHaffie† | Principal distributor |
| Dr. John A. Moore*# | John Hancock Funds, LLC |
| Patti McGill Peterson* | |
| Gregory A. Russo | Custodian |
| John G. Vrysen† | State Street Bank and Trust Company |
| Officers | Transfer agent |
| Keith F. Hartstein | John Hancock Signature Services, Inc. |
| President and Chief Executive Officer | |
| Legal counsel | |
| Andrew G. Arnott | K&L Gates LLP |
| Senior Vice President and Chief Operating Officer | |
| Thomas M. Kinzler | |
| Secretary and Chief Legal Officer | |
| Francis V. Knox, Jr. | |
| Chief Compliance Officer | |
| Charles A. Rizzo | |
| Chief Financial Officer | |
| Salvatore Schiavone | |
| Treasurer | |
| *Member of the Audit Committee | |
| †Non-Independent Trustee | |
| #Effective 9-13-11 | |
The Fund’s proxy voting policies and procedures, as well as the Fund’s proxy voting record for the most recent twelve-month period ended June 30, are available free of charge on the Securities and Exchange Commission (SEC) Web site at www.sec.gov or on our Web site.
The Fund’s complete list of portfolio holdings, for the first and third fiscal quarters, is filed with the SEC on Form N-Q. The Fund’s Form N-Q is available on our Web site and the SEC’s Web site, www.sec.gov, and can be reviewed and copied (for a fee) at the SEC’s Public Reference Room in Washington, DC. Call 1-800-SEC-0330 to receive information on the operation of the SEC’s Public Reference Room.
We make this information on your fund, as well as monthly portfolio holdings, and other fund details available on our Web site at www.jhfunds.com or by calling 1-800-225-5291.
| You can also contact us: | ||
| 1-800-225-5291 | Regular mail: | Express mail: |
| jhfunds.com | John Hancock Signature Services, Inc. | John Hancock Signature Services, Inc. |
| P.O. Box 55913 | Mutual Fund Image Operations | |
| Boston, MA 02205-5913 | 30 Dan Road | |
| Canton, MA 02021 |
| Semiannual report | Disciplined Value Mid Cap Fund | 35 |

1-800-225-5291
1-800-554-6713 TDD
1-800-338-8080 EASI-Line
www.jhfunds.com
Now available: electronic delivery
www.jhfunds.com/edelivery
| This report is for the information of the shareholders of John Hancock Disciplined Value Mid Cap Fund. | 363SA 9/11 |
| It is not authorized for distribution to prospective investors unless preceded or accompanied by a prospectus. | 11/11 |
A look at performance
Total returns for the period ended September 30, 2011
| Average annual total returns (%) | Cumulative total returns (%) | ||||||
| with maximum sales charge (POP) | with maximum sales charge (POP) | ||||||
| 1-year | 5-year | 10-year | 6-months | 1-year | 5-year | 10-year | |
| Class A1 | –15.29 | –3.58 | 5.85 | –24.23 | –15.29 | –16.65 | 76.54 |
| Class I1,2 | –10.58 | –2.53 | 6.42 | –20.02 | –10.58 | –12.02 | 86.30 |
Performance figures assume all distributions are reinvested. Public offering price (POP) figures reflect maximum sales charge on Class A shares of 5%. Sales charges are not applicable for Class I shares.
The expense ratios of the Fund, both net (excluding any fee waivers or expense limitations) and gross (including any fee waivers or expense limitations), are set forth according to the most recent publicly available prospectuses for the Fund and may differ from those disclosed in the Financial highlights tables in this report. The fee waivers and expense limitations are contractual at least until 2-11-13 for Class A shares and 6-30-12 for Class I shares. Had the fee waivers and expense limitations not been in place gross expenses would apply. The expense ratios are as follows:
| Class A | Class I | |||
| Net (%) | 1.60 | 1.18 | ||
| Gross (%) | 14.68 | 12.93 |
The returns reflect past results and should not be considered indicative of future performance. The return and principal value of an investment will fluctuate so that shares, when redeemed, may be worth more or less than their original cost. Due to market volatility, the Fund’s current performance may be higher or lower than the performance shown. For performance data current to the most recent month end, please call 1–800–225–5291 or visit the Fund’s Web site at www.jhfunds.com.
The performance table above and the chart on the next page do not reflect the deduction of taxes that a shareholder would pay on fund distributions or the redemption of fund shares. The Fund’s performance results reflect any applicable expense reductions, without which the expenses would increase and results would have been less favorable.
| 6 International Value Equity Fund | Semiannual report | |
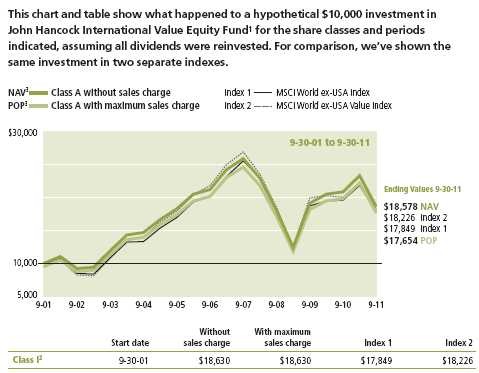
MSCI World ex-USA Index (gross of foreign withholding taxes on dividends) is a free float-adjusted market capitalization weighted index that is designed to measure the equity market performance of developed markets, excluding the United States of America.
MSCI World ex-USA Value Index (gross of foreign withholding taxes on dividends) is a free float-adjusted market capitalization weighted index that is designed to measure the equity market performance of developed markets, excluding the United States of America, that have higher than average value characteristics.
It is not possible to invest directly in an index. Index figures do not reflect sales charges, which would have resulted in lower values if they did.
1 After the close of business on 2-11-11, holders of Class A shares of the former Optique International Value Fund (the Predecessor Fund) became owners of an equal number of full and fractional Class A shares of John Hancock International Value Equity Fund. These shares were first offered on 2-14-11. Additionally, the accounting and performance history of the Class A shares of the Predecessor Fund was redesignated as that of John Hancock International Value Equity Fund Class A. Class I shares were first offered on 2-14-11. Performance prior to 2-14-11 is that of Class A shares recalculated to reflect the gross fees and expenses of Class I shares.
2 For certain types of investors, as described in the Fund’s Class I prospectus.
3 NAV represents net asset value and POP represents public offering price. Performance of the classes will vary based on the difference in sales charges paid by shareholders investing in the different classes and the fee structure of those classes.
| Semiannual report | International Value Equity Fund 7 | ||
Your expenses
These examples are intended to help you understand your ongoing operating expenses.
Understanding fund expenses
As a shareholder of the Fund, you incur two types of costs:
■ Transaction costs which include sales charges (loads) on purchases or redemptions (varies by share class), minimum account fee charge, etc.
■ Ongoing operating expenses including management fees, distribution and service fees (if applicable), and other fund expenses.
We are going to present only your ongoing operating expenses here.
Actual expenses/actual returns
This example is intended to provide information about the Fund’s actual ongoing operating expenses, and is based on the Fund’s actual return. It assumes an account value of $1,000.00 on April 1, 2011 with the same investment held until September 30, 2011.
| Account value | Ending value | Expenses paid during | |
| on 4-1-11 | on 9-30-11 | period ended 9-30-111 | |
| Class A | $1,000.00 | $797.60 | $7.19 |
| Class I | 1,000.00 | 799.80 | 5.31 |
Together with the value of your account, you may use this information to estimate the operating expenses that you paid over the period. Simply divide your account value at September 30, 2011, by $1,000.00, then multiply it by the “expenses paid” for your share class from the table above. For example, for an account value of $8,600.00, the operating expenses should be calculated as follows:
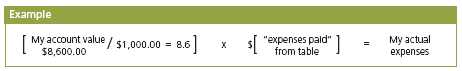
| 8 International Value Equity Fund | Semiannual report | |
Hypothetical example for comparison purposes
This table allows you to compare the Fund’s ongoing operating expenses with those of any other fund. It provides an example of the Fund’s hypothetical account values and hypothetical expenses based on each class’s actual expense ratio and an assumed 5% annualized return before expenses (which is not the Fund’s actual return). It assumes an account value of $1,000.00 on April 1, 2011, with the same investment held until September 30, 2011. Look in any other fund shareholder report to find its hypothetical example and you will be able to compare these expenses.
| Account value | Ending value | Expenses paid during | |
| on 4-1-11 | on 9-30-11 | period ended 9-30-111 | |
| Class A | $1,000.00 | $1,017.00 | $8.07 |
| Class I | 1,000.00 | 1,019.10 | 5.96 |
Remember, these examples do not include any transaction costs, therefore, these examples will not help you to determine the relative total costs of owning different funds. If transaction costs were included, your expenses would have been higher. See the prospectus for details regarding transaction costs.
1 Expenses are equal to the Fund’s annualized expense ratio of 1.60% and 1.18% for Class A and Class I shares, respectively, multiplied by the average account value over the period, multiplied by 183/366 (to reflect the one-half year period).
| Semiannual report | International Value Equity Fund 9 | ||
Portfolio summary
| Top 10 Holdings (11.4% of Net Assets on 9-30-11)1 | ||||
| Tsuruha Holdings, Inc. | 1.3% | Nippon Telegraph & Telephone Corp. | 1.1% | |
| Electric Power Development | Novartis AG | 1.1% | ||
| Company, Ltd. | 1.2% | |||
| GlaxoSmithKline PLC | 1.1% | |||
| China Petroleum & Chemical Corp. | 1.2% | |||
| Repsol YPF SA | 1.1% | |||
| East Japan Railway Company | 1.2% | |||
| Societe BIC SA | 1.0% | |||
| Guangdong Investment, Ltd. | 1.1% | |||
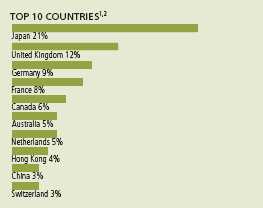
| Sector Composition1,2 | ||||
| Financials | 19% | Consumer Staples | 8% | |
| Industrials | 12% | Utilities | 7% | |
| Energy | 9% | Telecommunication Services | 6% | |
| Consumer Discretionary | 9% | Information Technology | 5% | |
| Materials | 9% | Short-Term Investments & Other | 7% | |
| Health Care | 9% | |||
1 As a percentage of net assets on 9-30-11. Cash and cash equivalents not included.
2 International investing involves special risks such as political, economic and currency risks and differences in accounting standards and financial reporting. Sector investing is subject to greater risks than the market as a whole. Because the Fund may focus on particular sectors of the economy, its performance may depend on the performance of those sectors.
| 10 International Value Equity Fund | Semiannual report | |
Fund’s investments
As of 9-30-11 (unaudited)
| Shares | Value | |
| Common Stocks 91.67% | $2,400,854 | |
| (Cost $2,790,673) | ||
| Australia 5.23% | 136,997 | |
| AGL Energy, Ltd. | 1,956 | 26,822 |
| Amcor, Ltd. | 2,943 | 19,365 |
| BHP Billiton, Ltd., ADR | 338 | 22,457 |
| National Australia Bank, Ltd. | 925 | 19,652 |
| Santos, Ltd. | 2,193 | 23,715 |
| Westpac Banking Corp. | 1,300 | 24,986 |
| Austria 2.56% | 67,151 | |
| Mayr-Melnhof Karton AG | 252 | 22,680 |
| OMV AG | 700 | 20,934 |
| Telekom Austria AG | 2,333 | 23,537 |
| Bermuda 0.87% | 22,772 | |
| Hiscox, Ltd. | 3,988 | 22,772 |
| Canada 6.47% | 169,391 | |
| Bombardier, Inc. | 4,666 | 16,341 |
| Encana Corp. | 1,200 | 23,098 |
| Husky Energy, Inc. | 1,151 | 24,922 |
| Magna International, Inc. | 608 | 20,104 |
| Royal Bank of Canada | 515 | 23,620 |
| Sun Life Financial, Inc. (L) | 943 | 22,434 |
| The Toronto-Dominion Bank | 340 | 24,201 |
| Thompson Creek Metals Company, Inc. (I) | 2,417 | 14,671 |
| China 3.24% | 84,812 | |
| China Petroleum & Chemical Corp. | 32,000 | 30,819 |
| Guangdong Investment, Ltd. | 48,000 | 29,714 |
| Sinotrans, Ltd., Class H | 125,000 | 24,279 |
| France 7.72% | 202,187 | |
| BNP Paribas | 390 | 15,437 |
| Carrefour SA | 659 | 14,992 |
| Cie de Saint-Gobain SA | 435 | 16,615 |
| GDF Suez | 630 | 18,820 |
| Sanofi | 375 | 24,622 |
| Societe BIC SA | 323 | 27,483 |
| Societe Generale | 685 | 17,948 |
| Total SA | 11,388 | 25,939 |
| See notes to financial statements | Semiannual report | International Value Equity Fund 11 | |
| Shares | Value | |
| France (continued) | ||
| Vinci SA | 420 | $18,035 |
| Vivendi SA | 1,092 | 22,296 |
| Germany 8.78% | 229,945 | |
| Allianz SE | 241 | 22,678 |
| BASF SE | 380 | 23,057 |
| Bayer AG | 403 | 22,147 |
| Deutsche Bank AG | 546 | 19,024 |
| Deutsche Boerse AG (I) | 387 | 19,434 |
| E.ON AG | 1,115 | 24,317 |
| Muenchener Rueckversicherungs AG | 195 | 24,171 |
| Rheinmetall AG | 345 | 16,180 |
| Rhoen-Klinikum AG | 1,032 | 20,893 |
| Salzgitter AG | 390 | 18,711 |
| Siemens AG | 214 | 19,333 |
| Hong Kong 3.78% | 98,936 | |
| China Mobile, Ltd. | 2,500 | 24,397 |
| Hang Lung Group, Ltd. | 3,000 | 15,255 |
| Swire Pacific, Ltd., Class A | 2,000 | 20,664 |
| Techtronic Industries Company | 27,000 | 18,124 |
| Yue Yuen Industrial Holdings, Ltd. | 8,000 | 20,496 |
| Israel 0.92% | 24,007 | |
| Teva Pharmaceutical Industries, Ltd., ADR | 645 | 24,007 |
| Japan 20.88% | 546,758 | |
| Aderans Company, Ltd. (I) | 2,000 | 18,542 |
| Aisin Seiki Company, Ltd. | 700 | 23,256 |
| Asahi Glass Company, Ltd. | 2,000 | 19,500 |
| Astellas Pharma, Inc. | 700 | 26,408 |
| Canon, Inc. | 600 | 27,163 |
| East Japan Railway Company | 500 | 30,360 |
| Electric Power Development Company, Ltd. | 1,100 | 32,415 |
| Fujitsu, Ltd. | 5,000 | 23,554 |
| Honda Motor Company, Ltd. | 800 | 23,456 |
| JGC Corp. | 1,000 | 24,555 |
| Kyocera Corp. | 300 | 25,061 |
| Mitsubishi Corp. | 1,000 | 20,365 |
| Mitsubishi UFJ Financial Group | 5,500 | 24,720 |
| Nidec Corp. | 300 | 24,133 |
| Nippon Telegraph & Telephone Corp. | 600 | 28,836 |
| Nomura Holdings, Inc. | 6,700 | 24,414 |
| Secom Company, Ltd. | 500 | 24,039 |
| Sony Corp. | 1,000 | 19,191 |
| Sumitomo Chemical Company, Ltd. | 6,000 | 23,077 |
| Toyo Suisan Kaisha, Ltd. | 1,000 | 27,403 |
| Tsuruha Holdings, Inc. | 600 | 33,270 |
| Yamada Denki Company, Ltd. | 330 | 23,040 |
| 12 International Value Equity Fund | Semiannual report | See notes to financial statements | |
| Shares | Value | |
| Netherlands 4.76% | $124,699 | |
| Aegon NV (I) | 5,113 | 20,613 |
| Akzo Nobel NV | 440 | 19,451 |
| Heineken Holding NV | 570 | 21,987 |
| Koninklijke Philips Electronics NV | 1,028 | 18,442 |
| Royal Dutch Shell PLC, A Shares | 870 | 27,012 |
| TNT Express NV | 2,492 | 17,194 |
| Norway 1.32% | 34,684 | |
| DnB NOR ASA | 2,200 | 21,963 |
| Fred Olsen Energy ASA | 447 | 12,721 |
| Singapore 2.69% | 70,417 | |
| DBS Group Holdings, Ltd. | 2,500 | 22,412 |
| Fraser and Neave, Ltd. | 6,000 | 26,263 |
| Singapore Telecommunications, Ltd. | 9,000 | 21,742 |
| South Africa 0.76% | 19,829 | |
| Tiger Brands, Ltd. | 765 | 19,829 |
| South Korea 1.55% | 40,737 | |
| LG Display Company, Ltd., ADR | 2,443 | 19,910 |
| POSCO, ADR | 274 | 20,827 |
| Spain 2.72% | 71,145 | |
| Banco Santander SA | 2,550 | 20,846 |
| Repsol YPF SA | 1,060 | 27,929 |
| Telefonica SA, ADR | 1,170 | 22,370 |
| Sweden 1.51% | 39,567 | |
| Electrolux AB, Series B | 1,456 | 21,344 |
| Securitas AB, Series B | 2,500 | 18,223 |
| Switzerland 2.94% | 77,119 | |
| Credit Suisse Group AG, ADR | 864 | 22,671 |
| Nestle SA | 468 | 25,726 |
| Novartis AG, ADR | 515 | 28,722 |
| United Kingdom 12.17% | 318,636 | |
| Anglo American PLC | 750 | 25,864 |
| AstraZeneca PLC | 565 | 25,016 |
| Barclays PLC | 8,302 | 20,380 |
| British Sky Broadcasting Group PLC | 2,146 | 22,032 |
| Diageo PLC | 1,400 | 26,636 |
| GlaxoSmithKline PLC | 1,384 | 28,575 |
| HSBC Holdings PLC | 2,850 | 21,721 |
| National Grid PLC | 2,750 | 27,266 |
| Reed Elsevier PLC | 2,938 | 22,382 |
| Smith & Nephew PLC, ADR | 537 | 23,999 |
| Unilever PLC | 810 | 25,374 |
| United Utilities Group PLC | 2,500 | 24,213 |
| Vodafone Group PLC | 9,750 | 25,178 |
| Venezuela 0.80% | 21,065 | |
| Aviva PLC | 4,458 | 21,065 |
| See notes to financial statements | Semiannual report | International Value Equity Fund 13 | |
| Shares | Value | ||
| Preferred Securities 1.50% | $39,403 | ||
| (Cost $57,182) | |||
| Brazil 1.50% | 39,403 | ||
| Petroleo Brasileiro SA | 2,030 | 20,625 | |
| Vale SA | 900 | 18,778 | |
| Yield | Shares | Value | |
| Securities Lending Collateral 0.76% | $19,801 | ||
| (Cost $19,800) | |||
| John Hancock Collateral Investment Trust (W) | 0.2515% (Y) | 1,979 | 19,801 |
| Total investments (Cost $2,867,655)† 93.93% | $2,460,058 | ||
| Other assets and liabilities, net 6.07% | $159,020 | ||
| Total net assets 100.00% | $2,619,078 | ||
The percentage shown for each investment category is the total value of the category as a percentage of the net assets of the Fund.
ADR American Depositary Receipts
(I) Non-income producing security.
(L) All or a portion of this security is on loan as of 9-30-11.
(W) Investment is an affiliate of the Fund, the adviser and/or subadviser. Also, it represents the investment of securities lending collateral received.
(Y) The rate shown is the annualized seven-day yield as of 9-30-11.
† At 9-30-11, the aggregate cost of investment securities for federal income tax purposes was $3,035,086. Net unrealized depreciation aggregated $575,028, of which $85,822 related to appreciated investment securities and $660,850 related to depreciated investment securities.
The Fund had the following sector composition as a percentage of net assets on 9-30-11:
| Financials | 19% | |
| Industrials | 12% | |
| Energy | 9% | |
| Consumer Discretionary | 9% | |
| Materials | 9% | |
| Health Care | 9% | |
| Consumer Staples | 8% | |
| Utilities | 7% | |
| Telecommunication Services | 6% | |
| Information Technology | 5% | |
| Short-Term Investments & Other | 7% |
| 14 International Value Equity Fund | Semiannual report | See notes to financial statements | |
F I N A N C I A L S T A T E M E N T S
Financial statements
Statement of assets and liabilities 9-30-11 (unaudited)
This Statement of assets and liabilities is the Fund’s balance sheet. It shows the value of what the Fund owns, is due and owes. You’ll also find the net asset value and the maximum offering price per share.
| Assets | |||
| Investments in unaffiliated issuers, at value (Cost $2,847,855) including | |||
| $19,400 of securities loaned (Note 2) | $2,440,257 | ||
| Investments, in affiliated issuers, at value (Cost $19,800) (Note 2) | 19,801 | ||
| Total investments, at value (Cost $2,867,655) | 2,460,058 | ||
| Cash | 101,807 | ||
| Foreign currency, at value (Cost $3,251) | 3,403 | ||
| Receivable for investments sold | 26,374 | ||
| Receivable for fund shares sold | 51,511 | ||
| Dividends and interest receivable | 22,436 | ||
| Receivable for securities lending income | 5 | ||
| Receivable due from adviser | 540 | ||
| Other receivables and prepaid expenses | 14,713 | ||
| Total assets | 2,680,847 | ||
| Liabilities | |||
| Payable upon return of securities loaned (Note 2) | 19,800 | ||
| Payable to affiliates | |||
| Accounting and legal services fees | 28 | ||
| Transfer agent fees | 379 | ||
| Other liabilities and accrued expenses | 41,562 | ||
| Total liabilities | 61,769 | ||
| Net assets | |||
| Paid-in capital | $3,087,291 | ||
| Undistributed net investment income | 42,189 | ||
| Accumulated net realized loss on investments and foreign | |||
currency transactions | (103,234) | ||
| Net unrealized appreciation (depreciation) on investments and translation | |||
| of assets and liabilities in foreign currencies | (407,168) | ||
| Net assets | $2,619,078 | ||
| Net asset value per share | |||
| Based on net asset values and shares outstanding — the Fund has an | |||
| unlimited number of shares authorized with no par value | |||
| Class A ($2,472,157 ÷ 340,845 shares) | $7.25 | ||
| Class I ($146,921 ÷ 20,203 shares) | $7.27 | ||
| Maximum offering price per share | |||
| Class A (net asset value per share ÷ 95%)1 | $7.63 | ||
| 1 On single retail sales of less than $50,000. On sales of $50,000 or more and on group sales the offering price is reduced. | |||
| See notes to financial statements | Semiannual report | International Value Equity Fund 15 | |
F I N A N C I A L S T A T E M E N T S
Statement of operations For the six-month period ended 9-30-11 (unaudited)
This Statement of operations summarizes the Fund’s investment income earned and expenses incurred in operating the Fund. It also shows net gains (losses) for the period stated.
| Investment income | |
| Dividends | $69,840 |
| Interest | 470 |
| Securities lending | 366 |
| Less foreign taxes withheld | (7,112) |
| Total investment income | 63,564 |
| Expenses | |
| Investment management fees (Note 5) | 13,596 |
| Distribution and service fees (Note 5) | 3,608 |
| Accounting and legal services fees (Note 5) | 219 |
| Transfer agent fees | 2,497 |
| State registration fees (Note 5) | 7,594 |
| Printing and postage (Note 5) | 4,084 |
| Professional fees | 21,772 |
| Custodian fees | 4,505 |
| Registration and filing fees | 2,896 |
| Total expenses | 60,771 |
| Less expense reductions (Note 5) | (36,885) |
| Net expenses | 23,886 |
| Net investment income | 39,678 |
| Realized and unrealized gain (loss) | |
| Net realized loss on | |
| Investments in unaffiliated issuers | (1,079) |
| Investments in affiliated issuers | (2) |
| Foreign currency transactions | (924) |
| (2,005) | |
| Change in net unrealized appreciation (depreciation) of | |
| Investments in unaffiliated issuers | (681,746) |
| Investments in affiliated issuers | 1 |
| Translation of assets and liabilities in foreign currencies | (1,075) |
| (682,820) | |
| Net realized and unrealized loss | (684,825) |
| Decrease in net assets from operations | ($645,147) |
| 16 International Value Equity Fund | Semiannual report | See notes to financial statements | |
F I N A N C I A L S T A T E M E N T S
Statements of changes in net assets
These Statements of changes in net assets show how the value of the Fund’s net assets has changed during the last three periods. The difference reflects earnings less expenses, any investment gains and losses, distributions, if any, paid to shareholders and the net of Fund share transactions.
| Six months | |||
| ended | Period | Year | |
| 9-30-11 | ended | ended | |
| (Unaudited) | 3-31-111 | 10-31-10 | |
| Increase (decrease) in net assets | |||
| From operations | |||
| Net investment income | $39,678 | $6,302 | $30,644 |
| Net realized gain (loss) | (2,005) | 210,201 | 4,881,630 |
| Change in net unrealized appreciation (depreciation) | (682,820) | 53,725 | (2,718,136) |
| Increase (decrease) in net assets resulting | |||
| from operations | (645,147) | 270,228 | 2,194,138 |
| Distributions to shareholders | |||
| From net investment income | |||
| Class A | — | (102,551) | (168,896) |
| From net realized gain | |||
| Class A | — | (766,235) | — |
| Total distributions | — | (868,786) | (168,896) |
| From Fund share transactions (Note 6) | 214,611 | 371,078 | (28,639,625) |
| Total decrease | (430,536) | (227,480) | (26,614,383) |
| Net assets | |||
| Beginning of period | 3,049,614 | 3,277,094 | 29,891,477 |
| End of period | $2,619,078 | $3,049,614 | $3,277,094 |
| Undistributed net investment income | $42,189 | $2,511 | $95,016 |
1 For the five-month period ended 3-31-11. The Fund changed its fiscal year end from October 31 to March 31.
| See notes to financial statements | Semiannual report | International Value Equity Fund 17 | |
Financial highlights
The Financial highlights show how the Fund’s net asset value for a share has changed since the end of the previous period.
| CLASS A SHARES | |||||||
| Period ended | 9-30-111 | 3-31-112,3 | 10-31-104 | 10-31-094 | 10-31-084 | 10-31-074 | 10-31-064 |
| Per share operating performance | |||||||
| Net asset value, beginning | |||||||
| of period | $9.09 | $11.26 | $9.90 | $7.97 | $18.21 | $16.62 | 14.12 |
| Net investment income | 0.115 | 0.025 | 0.035 | 0.075 | 0.285 | 0.26 | 0.28 |
| Net realized and unrealized | |||||||
| gain (loss) on investments | (1.95) | 0.79 | 1.396 | (2.54)6 | (7.82)6 | 3.066 | 3.046 |
| Total from | |||||||
| investment operations | (1.84) | 0.81 | 1.42 | (2.61) | (7.54) | 3.32 | 3.32 |
| Less distributions | |||||||
| From net investment income | — | (0.28) | (0.06) | (0.68) | (0.25) | (0.26) | (0.23) |
| From net realized gain | — | (2.70) | — | — | (2.45) | (1.47) | (0.59) |
| Total distributions | — | (2.98) | (0.06) | (0.68) | (2.70) | (1.73) | (0.82) |
| Net asset value, end | |||||||
| of period | $7.25 | $9.09 | $11.26 | $9.90 | $7.97 | $18.21 | 16.62 |
| Total return (%) | (20.24)7,8 | 9.137,8 | 14.468 | 35.618 | (48.17) | 21.61 | 24.57 |
| Ratios and supplemental data | |||||||
| Net assets, end of period | |||||||
| (in millions) | $2 | $3 | $3 | $30 | $24 | $111 | 99 |
| Ratios (as a percentage of | |||||||
| average net assets): | |||||||
| Expenses before reductions | 3.759 | 16.059 | 6.71 | 2.68 | 1.56 | 1.38 | 1.40 |
| Expenses net of fee waivers | |||||||
| and credits | 1.609 | 1.779 | 1.85 | 1.85 | 1.56 | 1.38 | 1.40 |
| Net investment income | 2.629 | 0.489 | 0.33 | 0.88 | 2.09 | 1.58 | 1.79 |
| Portfolio turnover (%) | 13 | 1210 | 80 | 123 | 13 | 21 | 21 |
1 Unaudited.
2 For the five-month period ended 3-31-11. The Fund changed its fiscal year end from October 31 to March 31.
3 After the close of business on 2-11-11, holders of Class A shares of the former Optique International Value Fund
(the Predecessor Fund) became owners of an equal number of full and fractional Class A shares of the John
Hancock International Value Equity Fund. These shares were first offered on 2-14-11. Additionally, the accounting
and performance history of the Class A shares of the Predecessor Fund was redesignated as that of John Hancock
International Value Equity Fund Class A.
4 Audited by previous independent registered public accounting firm.
5 Based on the average daily shares outstanding.
6 Includes redemption fees retained by the Fund. Such redemption fees represent less than $0.01 per share.
7 Not annualized.
8 Total returns would have been lower had certain expenses not been reduced during the periods shown.
9 Annualized.
10 Portfolio turnover is shown for the period from 11-1-10 to 3-31-11.
| 18 International Value Equity Fund | Semiannual report | See notes to financial statements | |
| CLASS I SHARES Period ended | 9-30-111 | 3-31-112 |
| Per share operating performance | ||
| Net asset value, beginning of period | $9.09 | $8.98 |
| Net investment income3 | 0.12 | 0.02 |
| Net realized and unrealized loss on investments | (1.94) | 0.09 |
| Total from investment operations | (1.82) | 0.11 |
| Net asset value, end of period | $7.27 | $9.09 |
| Total return (%)4,5 | (20.02) | 1.22 |
| Ratios and supplemental data | ||
| Net assets, end of period (in millions) | $—6 | $—6 |
| Ratios (as a percentage of average net assets): | ||
| Expenses before reductions | 9.917 | 12.907 |
| Expenses net of fee waivers and credits | 1.187 | 1.187 |
| Net investment income | 2.807 | 1.897 |
| Portfolio turnover (%) | 13 | 128 |
1 Unaudited.
2 Period from 2-14-11 (inception date) to 3-31-11.
3 Based on the average daily shares outstanding.
4 Not annualized.
5 Total returns would have been lower had certain expenses not been reduced during the periods shown.
6 Less than $500,000.
7 Annualized.
8 Portfolio turnover is shown for the period from 11-1-10 to 3-31-11.
| See notes to financial statements | Semiannual report | International Value Equity Fund 19 | |
Notes to financial statements
(unaudited)
Note 1 — Organization
John Hancock International Value Equity Fund (the Fund) is a diversified series of John Hancock Funds III (the Trust), an open-end management investment company organized as a Massachusetts business trust and registered under the Investment Company Act of 1940, as amended (the 1940 Act). The investment objective of the Fund is to seek maximum long-term total return.
The Fund may offer multiple classes of shares. The shares currently offered are detailed in the Statement of assets and liabilities. Class A shares are offered to all investors. Class I shares are offered to institutions and certain investors. Shareholders of each class have exclusive voting rights to matters that affect that class. The distribution and service fees, if any, and transfer agent fees, printing and postage and state registration fees for each class may differ.
The Fund is the accounting and performance successor of the Optique International Value Fund (the Acquired Fund). At the close of business on February 11, 2011, the Fund acquired substantially all the assets and assumed the liabilities of the Acquired Fund pursuant to an agreement and plan on reorganization, in exchange for Class A shares of the Fund.
Note 2 — Significant accounting policies
The financial statements have been prepared in conformity with accounting principles generally accepted in the United States of America, which require management to make certain estimates and assumptions at the date of the financial statements. Actual results could differ from those estimates. Events or transactions occurring after the end of the fiscal period through the date that the financial statements were issued have been evaluated in the preparation of the financial statements. The following summarizes the significant accounting policies of the Fund:
Security valuation. Investments are stated at value as of the close of the regular trading on the New York Stock Exchange (NYSE), normally at 4:00 P.M., Eastern Time. The Fund uses a three-tier hierarchy to prioritize the pricing assumptions, referred to as inputs, used in valuation techniques to measure fair value. Level 1 includes securities valued using quoted prices in active markets for identical securities. Level 2 includes significant observable inputs. Observable inputs may include quoted prices for similar securities, interest rates, prepayment speeds and credit risk. Prices for securities valued using these techniques are received from independent pricing vendors and brokers and are based on an evaluation of the inputs described. Level 3 includes securities valued using significant unobservable inputs when market prices are not readily available or reliable, including the Fund’s own assumptions in determining the fair value of investments. Factors used in determining value may include market or issuer specific events, changes in interest rates and credit quality. The inputs or methodology used for valuing securities are not necessarily an indication of the risk associated with investing in those securities.
| 20 International Value Equity Fund | Semiannual report | |
The following is a summary of the values by input classification of the Fund’s investments as of September 30, 2011, by major security category or type:
| LEVEL 3 | ||||
| LEVEL 2 | SIGNIFICANT | |||
| TOTAL MARKET | LEVEL 1 | SIGNIFICANT | UNOBSERVABLE | |
| VALUE AT 9-30-11 | QUOTED PRICE | OBSERVABLE INPUTS | INPUTS | |
| Common Stocks | ||||
| Australia | $136,997 | $22,457 | $114,540 | — |
| Austria | 67,151 | — | 67,151 | — |
| Bermuda | 22,772 | — | 22,772 | — |
| Canada | 169,391 | 169,391 | — | — |
| China | 84,812 | — | 84,812 | — |
| France | 202,187 | — | 202,187 | — |
| Germany | 229,945 | — | 229,945 | — |
| Hong Kong | 98,936 | — | 98,936 | — |
| Israel | 24,007 | 24,007 | — | — |
| Japan | 546,758 | — | 546,758 | — |
| Netherlands | 124,699 | 18,442 | 106,257 | — |
| Norway | 34,684 | — | 34,684 | — |
| Singapore | 70,417 | — | 70,417 | — |
| South Africa | 19,829 | — | 19,829 | — |
| South Korea | 40,737 | 40,737 | — | — |
| Spain | 71,145 | 22,370 | 48,775 | — |
| Sweden | 39,567 | — | 39,567 | — |
| Switzerland | 77,119 | 51,393 | 25,726 | — |
| United Kingdom | 318,636 | 23,999 | 294,637 | — |
| Venezuela | 21,065 | — | 21,065 | — |
| Preferred Securities | ||||
| Brazil | 39,403 | 39,403 | — | — |
| Securities Lending | ||||
| Collateral | 19,801 | 19,801 | — | — |
| Total investments in | ||||
| Securities | $2,460,058 | $432,000 | $2,028,058 | — |
Changes in valuation techniques may result in transfers in or out of an assigned level within the disclosure hierarchy. During the six months ended September 30, 2011, there were no significant transfers in or out of Level 1 or Level 2 assets.
In order to value the securities, the Fund uses the following valuation techniques. Equity securities held by the Fund are valued at the last sale price or official closing price on the principal securities exchange on which they trade. In the event there were no sales during the day or closing prices are not available, then securities are valued using the last quoted bid or evaluated price. Foreign securities and currencies are valued in U.S. dollars, based on foreign currency exchange rates supplied by an independent pricing service. Investments by the Fund in open-end mutual funds, including John Hancock Collateral Investment Trust (JHCIT), are valued at their respective net asset values each business day. Certain securities traded only in the over-the-counter market are valued at the last bid price quoted by brokers making markets in the securities at the close of trading.
Generally, trading in non-U.S. securities is substantially completed each day at various times prior to the close of trading on the NYSE. Significant market events that affect the values of non-U.S. securities may occur between the time when the valuation of the securities is generally determined and the close of the NYSE. During significant events, these securities will be valued at fair value, as determined in good faith, following procedures established by the Board of Trustees. The Fund may
| Semiannual report | International Value Equity Fund 21 | ||
use a fair valuation model to value non-U.S. securities in order to adjust for events which may occur between the close of foreign exchanges and the close of the NYSE.
Security transactions and related investment income. Investment security transactions are accounted for on a trade date plus one basis for daily net asset value calculations. However, for financial reporting purposes, investment transactions are reported on trade date. Interest income is accrued as earned. Dividend income is recorded on the ex-date, except for dividends of foreign securities where the dividend may not be known until after ex-date. In those cases dividend income is recorded when the Fund becomes aware of the dividends. Gains and losses on securities sold are determined on the basis of identified cost and may include proceeds from litigation.
Securities lending. The Fund may lend its securities to earn additional income. It receives and maintains cash collateral received from the borrower in an amount not less than the market value of the loaned securities. The Fund will invest its collateral in John Hancock Collateral Investment Trust (JHCIT), an affiliate of the Fund, and as a result, the Fund will receive the benefit of any gains and bear any losses generated by JHCIT. Although risk of the loss of the securities lent is mitigated by holding the collateral, the Fund could experience a delay in recovering its securities and a possible loss of income or value if the borrower fails to return the securities or if collateral investments decline in value. The Fund may receive compensation for lending its securities by retaining a portion of the return on the investment of the collateral and compensation from fees earned from borrowers of the securities. Net income received from JHCIT is a component of securities lending income as recorded on the Statement of operations.
Line of credit. The Fund may borrow from banks for temporary or emergency purposes, including meeting redemption requests that otherwise might require the untimely sale of securities. Pursuant to the custodian agreement, the custodian may loan money to the Fund to make properly authorized payments. The Fund is obligated to repay the custodian for any overdraft, including any related costs or expenses. The custodian has a lien, security interest or security entitlement in any Fund property that is not segregated, to the maximum extent permitted by law for any overdraft.
The Fund and other affiliated funds have entered into an agreement with Citibank N.A. which enables them to participate in a $100 million unsecured committed line of credit. A commitment fee, payable at the end of each calendar quarter, based on the average daily unused portion of the line of credit, is charged to each participating fund on a pro rata basis and is reflected in other expenses on the Statement of operations. For the six months ended September 30, 2011, the Fund had no borrowings under the line of credit.
Expenses. The majority of expenses are directly attributable to an individual fund. Expenses that are not readily attributable to a specific fund are allocated among all funds in an equitable manner, taking into consideration, among other things, the nature and type of expense and the fund’s relative assets. Expense estimates are accrued in the period to which they relate and adjustments are made when actual amounts are known.
Class allocations. Income, common expenses, and realized and unrealized gains (losses) are determined at the fund level and allocated daily to each class of shares based on the net asset value of the class. Class-specific expenses, such as distribution and service fees, if any, transfer agent fees, state registration fees and printing and postage, for all classes are calculated daily at the class level based on the appropriate net asset value of each class and the specific expense rates applicable to each class.
Federal income taxes. The Fund intends to continue to qualify as a regulated investment company by complying with the applicable provisions of the Internal Revenue Code and will not be subject to federal income tax on taxable income that is distributed to shareholders. Therefore, no federal income tax provision is required.
| 22 International Value Equity Fund | Semiannual report | |
As of March 31, 2011, the Fund had no uncertain tax positions that would require financial statement recognition, de-recognition or disclosure. The Fund’s federal tax returns are subject to examination by the Internal Revenue Service for a period of three years.
Distribution of income and gains. Distributions to shareholders from net investment income and net realized gains, if any, are recorded on the ex-date. The Fund generally declares and pays dividends and capital gain distributions, if any, annually.
Distributions paid by the Fund with respect to each class of shares are calculated in the same manner, at the same time and are in the same amount, except for the effect of expenses that may be applied differently to each class.
Such distributions, on a tax basis, are determined in conformity with income tax regulations, which may differ from accounting principles generally accepted in the United States of America.
Capital accounts within financial statements are adjusted for permanent book-tax differences. These adjustments have no impact on net assets or the results of operations. Temporary book-tax differences, if any, will reverse in a subsequent period. Book-tax differences are primarily attributable to passive foreign investment companies and wash sale loss deferrals.
New accounting pronouncement. In May 2011, Accounting Standards Update 2011-04 (ASU 2011-04), Amendments to Achieve Common Fair Value Measurement and Disclosure Requirements in U.S. GAAP and IFRSs, was issued and is effective during interim and annual periods beginning after December 15, 2011. ASU 2011-04 amends Financial Accounting Standards Board (FASB) Topic 820, Fair Value Measurement. The amendments are the result of the work by the FASB and the International Accounting Standards Board to develop common requirements for measuring fair value and for disclosing information about fair value measurements in accordance with GAAP. Management is currently evaluating the application of ASU 2011-04 and its impact, if any, on the Fund’s financial statements.
Note 3 — Guarantees and indemnifications
Under the Fund’s organizational documents, its Officers and Trustees are indemnified against certain liabilities arising out of the performance of their duties to the Fund. Additionally, in the normal course of business, the Fund enters into contracts with service providers that contain general indemnification clauses. The Fund’s maximum exposure under these arrangements is unknown, as this would involve future claims that may be made against the Fund that have not yet occurred. The risk of material loss from such claims is considered remote.
Note 4 — Fees and transactions with affiliates
John Hancock Investment Management Services, LLC (the Adviser) serves as investment adviser for the Trust. John Hancock Funds, LLC (the Distributor), an affiliate of the Adviser, serves as principal underwriter of the Trust. The Adviser and the Distributor are indirect wholly owned subsidiaries of Manulife Financial Corporation (MFC).
Management Fee. The Fund has an investment management contract with the Adviser under which the Fund pays a daily management fee to the Adviser equivalent, on an annual basis, to the sum of: (a) 0.900% of the first $100,000,000 of the Fund’s average daily net assets; (b) 0.875% of the next $900,000,000; (c) 0.850% of the next $1,000,000,000; (d) 0.825% of the next $1,000,000,000; (e) 0.800% of the next $1,000,000,000 and (f) 0.775% of the Fund’s average daily net assets in excess of $4,000,000,000. The Adviser has a subadvisory agreement with John Hancock Asset Management a division of Manulife Asset Management (US) LLC, an indirectly owned subsidiary of MFC and an affiliate of the Adviser. The Fund is not responsible for payment of the subadvisory fees.
| Semiannual report | International Value Equity Fund 23 | ||
The Adviser has contractually agreed to waive all or a portion of its management fee and reimburse or pay operating expenses of the Fund to the extent necessary to maintain the Fund’s total operating expenses at 1.60% for Class A shares and 1.18% for Class I shares, respectively, excluding certain expenses such as taxes, brokerage commissions, interest, litigation, underlying fund expenses (acquired fund fees), short dividend and extraordinary expenses. For Class A shares, this expense limitation shall remain in effect until February 11, 2013, and thereafter until terminated by the Adviser. For Class I shares, this expense limitation shall remain in effect until June 30, 2012, and thereafter until terminated by the Adviser. In addition, the Adviser voluntarily waived certain expenses.
Accordingly, the expense reductions or reimbursements related to the agreement were $30,987 and $5,898 for Class A and Class I shares, respectively, for the six months ended September 30, 2011.
The investment management fees, including the impact of the waivers and reimbursements described above, incurred for the six months ended September 30, 2011 were equivalent to a net annual effective rate of 0.00% of the Fund’s average daily net assets.
Accounting and legal services. Pursuant to a service agreement, the Fund reimburses the Adviser for all expenses associated with providing the administrative, financial, legal, accounting and recordkeeping services of the Fund, including the preparation of all tax returns, periodic reports to shareholders and regulatory reports, among other services. These expenses are allocated to each share class based on its relative net assets at the time the expense was incurred. The accounting and legal services fees incurred for the six months ended September 30, 2011, amounted to an annual rate of 0.01% of the Fund’s average daily net assets.
Distribution and service plans. The Fund has a distribution agreement with the Distributor. The Fund has adopted distribution and service plans with respect to Class A shares pursuant to Rule 12b-1 under the 1940 Act, to pay the Distributor for services provided as the distributor of shares of the Fund. The Fund may pay up to 0.30% of distribution and service fees for Class A shares under these arrangements, expressed as an annual percentage of average daily net assets. However, the Board of Trustees has agreed to limit the distribution and service fees to 0.25% of the average daily net assets for Class A shares until February 11, 2012.
Sales charges. Class A shares are assessed up-front sales charges, which resulted in payments to the Distributor amounting to $1,587 for the period six months September 30, 2011. Of this amount, $246 was retained and used for printing prospectuses, advertising, sales literature and other purposes and $1,341 was paid as sales commissions to broker-dealers.
Transfer agent fees. The Fund has a transfer agent agreement with John Hancock Signature Services, Inc. (Signature Services), an affiliate of the Adviser. The transfer agent fees paid to Signature Services are determined based on the cost to Signature Services (Signature Services Cost) of providing recordkeeping services. The Signature Services Cost includes a component of allocated John Hancock corporate overhead for providing transfer agent services to the Fund and to all other John Hancock affiliated funds. It also includes out-of-pocket expenses that are comprised of payments made to third-parties for recordkeeping services provided to their clients who invest in one or more John Hancock funds. In addition, Signature Services Cost may be reduced by certain fees that Signature Services receives in connection with retirement and small accounts. Signature Services Cost is calculated monthly and allocated, as applicable, to four categories of share classes: Institutional Share Classes, Retirement Share Classes, Municipal Bond Classes and all other Retail Share Classes. Within each of these categories, the applicable costs are allocated to the affected John Hancock affiliated funds and/or classes, based on the relative average daily net assets.
| 24 International Value Equity Fund | Semiannual report | |
Class level expenses. Class level expenses for the six months ended September 30, 2011 were:
| DISTRIBUTION | TRANSFER | STATE | PRINTING AND | |
| CLASS | AND SERVICE FEES | AGENT FEES | REGISTRATION FEES | POSTAGE |
| Class A | $3,608 | $2,447 | $3,142 | $3,891 |
| Class I | — | 50 | 4,452 | 193 |
| Total | $3,608 | $2,497 | $7,594 | $4,084 |
Trustee expenses. The Fund compensates each Trustee who is not an employee of the Adviser or its affiliates. These Trustees may, for tax purposes, elect to defer receipt of this compensation under the John Hancock Group of Funds Deferred Compensation Plan (the Plan). Deferred amounts are invested in various John Hancock funds and remain in the funds until distributed in accordance with the Plan. The investment of deferred amounts and the offsetting liability are included within Other receivables and prepaid expenses and Payable to affiliates — Trustees’ fees, respectively, in the accompanying Statement of assets and liabilities.
Note 5 — Fund share transactions
Transactions in Fund shares for the six months ended September 30, 2011, the period ended March 31, 2011 and the year ended October 31, 2010 were as follows:
| Six months ended 9-30-11 | Period ended 3-31-111 | Year ended 10-31-10 | ||||
| Shares | Amount | Shares | Amount | Shares | Amount | |
| Class A shares | ||||||
| Sold | 91,517 | $787,519 | 22,417 | $207,807 | 188,187 | $1,922,601 |
| Distributions reinvested | — | — | 98,300 | 857,982 | 16,346 | 166,899 |
| Repurchased | (74,639) | (646,689) | (87,737) | (799,098) | (2,933,725) | (30,729,125) |
| Net increase | ||||||
| (decrease) | 16,878 | $140,830 | 32,980 | $266,691 | (2,729,192) | ($28,639,625) |
| Class I shares2 | ||||||
| Sold | 9,061 | $77,824 | 11,614 | $104,387 | — | — |
| Repurchased | (472) | (4,043) | — | — | — | — |
| Net increase | 8,589 | $73,781 | 11,614 | $104,387 | — | — |
| Net increase (decrease) | 25,467 | $214,611 | 44,594 | $371,078 | (2,729,192) | ($28,639,625) |
1 For the five-month period ended 3-31-11. The Fund changed its fiscal year end from October 31 to March 31.
2 Period from 2-14-11 (inception date) to 3-31-11.
Affiliates of the Fund owned 55% of shares of beneficial interest of Class I on September 30, 2011.
Note 6 — Purchase and sale of securities
Purchases and sales of securities, other than short-term securities, aggregated $680,472 and $385,270, respectively, for the six months ended September 30, 2011.
Note 7 — Reorganization
At the close of business on February 11, 2011, the Fund acquired all the assets and liabilities of Optique International Value Fund (the Acquired Fund) in exchange for the Class A shares of the Fund. The Fund had no assets, liabilities or operations prior to the reorganization.
The Agreement provided for (a) the acquisition of all the assets, subject to all of the liabilities, of the Acquired Fund in exchange for a representative amount of shares of the Fund; (b) the liquidation of the Acquired Fund; and (c) the distribution to the Acquired Fund’s shareholders of the Fund’s shares. The reorganization was intended to allow the Fund to be better positioned to increase asset size and achieve additional economies of scale by achieving net prices on securities trades and spread fixed expenses over a larger asset base. As a result of the reorganization, the Fund is the legal
| Semiannual report | International Value Equity Fund 25 | ||
survivor, however, the accounting and performance history of the Capital Stock of the Acquired Fund have been redesignated as that of Class A shares of the Fund.
Based on the opinion of tax counsel, the reorganization qualified as a tax-free reorganization for federal income tax purposes with no gain or loss recognized by the Acquired Fund or its shareholders. Thus, the investments were transferred to the Fund at the Acquired Fund’s identified cost. All distributable amounts of net income and realized gains from the Acquired Fund were distributed prior to the reorganization. In addition, the expenses of the reorganization were borne by the Advisers of both the Acquired Fund and the Fund. The effective time of the reorganization occurred immediately after the close of regularly scheduled trading on the NYSE on February 11, 2011. The following outlines the reorganization:
| ACQUIRED NET ASSET | APPRECIATION OF | |||
| VALUE OF THE | ACQUIRED FUND’S | SHARES ISSUED | TOTAL NET ASSETS | |
| ACQUIRED FUND | ACQUIRED FUND | INVESTMENTS | BY THE FUND | AFTER COMBINATION |
| Optique International | $2,914,429 | $288,668 | 324,714 | $2,914,429 |
| Value Fund | ||||
At the time of the reorganization, certain capital loss carryforward attributable to the Acquired Fund may be able to be used by the Fund to offset future net realized capital gains. To the extent that such carryforward are used by the Fund, it will reduce the amount of capital gain distributions to be paid, though the availability of the capital loss carryforward attributable to the reorganization may be limited in any given year.
| 26 International Value Equity Fund | Semiannual report | |
Board Consideration of Investment Advisory Agreement and Subadvisory Agreement
The Board of Trustees (the Board, the members of which are referred to as Trustees) of John Hancock International Value Equity Fund (the Fund), a series of John Hancock Funds III, met in-person on October 4, 2010 to consider the initial approval of the Fund’s investment advisory agreement (the Advisory Agreement) with John Hancock Investment Management Services, LLC (the Adviser), the Fund’s investment adviser. The Board also considered the initial approval of the investment subadvisory agreement (the Subadvisory Agreement) between the Adviser and Manulife Asset Management (US) LLC (the Subadviser) on behalf of the Fund. The Advisory Agreement and the Subadvisory Agreement are referred to as the Agreements.
Activities and composition of the Board
The Board consists of eleven individuals, nine of whom are Independent Trustees. Independent Trustees are generally those individuals who are not employed by or have any significant business or professional relationship with the Adviser or the Subadviser. The Trustees are responsible for the oversight of operations of the Fund and perform the various duties required of directors of investment companies by the Investment Company Act of 1940, as amended (the 1940 Act). The Independent Trustees have hired independent legal counsel to assist them in connection with their duties. The Board has appointed an Independent Trustee as Chairperson. The Board has established four standing committees that are composed entirely of Independent Trustees: the Audit Committee; the Compliance Committee; the Nominating, Governance and Administration Committee; and the Contracts/Operations Committee. Additionally, Investment Performance Committees A and B are standing committees of the Board that are each composed of Independent Trustees and one Trustee who is affiliated with the Adviser. Investment Performance Committee B oversees and monitors matters relating to the investment performance of the Fund. The Board has also designated an Independent Trustee as Vice Chairperson to serve in the absence of the Chairperson. The Board also designates working groups or ad hoc committees as it deems appropriate.
The approval process
At an in-person meeting held on October 4, 2010, the Board reviewed materials relating to its consideration of the Agreements. The Board considered what it believed were key relevant factors that are described under separate headings presented below.
In determining to approve the Agreements, the Board met with the relevant investment advisory personnel from the Adviser and the Subadviser and considered all information reasonably necessary to evaluate the terms of the Agreements. The Board received materials in advance of the October 2010 meeting relating to its consideration of the Agreements, including (a) fees and estimated expense ratios of each class of the Fund in comparison to the fees and expense ratios of the Fund’s proposed benchmark index and a Morningstar, Inc. peer group of funds selected by the Adviser (the Category); (b) information regarding the Adviser’s and Subadviser’s economic outlook for the Fund and their general investment outlook for the markets; (c) information regarding fees paid to service providers that are affiliates of the Adviser; (d) information regarding compliance records and regulatory matters relating to the Adviser and Subadviser; and (e) information outlining the legal duties of the Board under the 1940 Act with respect to the consideration and approval of the Agreements.
The Board also considered other matters important to the approval process, such as payments made to and by the Adviser or its affiliates relating to the distribution of Fund shares and other services. The Board reviewed services related to the valuation and pricing of Fund portfolio holdings. Other important matters considered by the Board were the direct and indirect benefits to the Adviser, the Subadviser and their affiliates from their relationship with the Fund and advice from independent legal counsel with respect to the review process and materials submitted for the Board’s review.
| Semiannual report | International Value Equity Fund 27 | |
Nature, extent and quality of services
The Board reviewed the nature, extent and quality of services expected to be provided by the Adviser and the Subadviser, including the investment advisory services. The Board received information concerning the investment philosophy and investment process to be used by the Adviser and Subadviser in managing the Fund, as well as a description of the capabilities, personnel and services of the Adviser and Subadviser. The Board considered the scope of the services to be provided by the Adviser and Subadviser to the Fund under the Agreements relative to services typically provided by third parties to other funds. The Board noted that the standard of care applicable under the Agreements was comparable to that found generally in investment company advisory and subadvisory agreements. The Board concluded that the scope of the Adviser’s and Subadviser’s services to be provided to the Fund was consistent with the Fund’s operational requirements, including, in addition to seeking to meet its investment objective, compliance with investment restrictions, tax and reporting requirements and related shareholder services.
The Board also considered the quality of the services to be provided by the Adviser and Subadviser to the Fund. The Trustees evaluated the procedures of the Adviser and Subadviser designed to fulfill their fiduciary duty to the Fund with respect to possible conflicts of interest, including their code of ethics (regulating the personal trading of their officers and employees), the procedures by which the Adviser and Subadviser allocate trades among their various investment advisory clients, the integrity of the systems in place to ensure compliance with the foregoing and the record of compliance of the Adviser and Subadviser in each of these matters. The Trustees also considered the responsibilities of the Adviser’s and Subadviser’s compliance departments, and a report from the Fund’s Chief Compliance Officer (CCO) regarding the CCO Office’s review of the Subadviser’s compliance program.
The Board considered, among other factors, the number, education and experience of the Adviser’s and Subadviser’s investment professionals and other personnel who would provide services under the Agreements. The Trustees also took into account the time and attention to be devoted by senior management of the Adviser and Subadviser to the Fund. The Trustees also considered the business reputation of the Adviser and Subadviser and their financial resources and concluded that they would be able to meet any reasonably foreseeable obligation under the Agreements.
The Board also considered, among other things, the nature, cost and character of advisory and non-investment advisory services provided by the Adviser and its affiliates and by the Subadviser. The Board noted that the Adviser and its affiliates will provide the Fund with certain administrative, transfer agency, shareholder and other services (in addition to any such services provided to the Fund by third parties) and officers and other personnel as will be necessary for the operations of the Fund.
The Board also received information about the nature, extent and quality of services and fee rates offered by the Adviser and Subadviser to their other clients, including other registered investment companies, institutional investors and separate accounts. The Board reviewed a general analysis provided by the Adviser and the Subadviser concerning investment advisory fees charged to such other clients under similar investment mandates, the services provided to such other clients as compared to the services provided to the Fund, the performance of such other clients, and other factors relating to such other clients. The Board considered the significant differences between the Adviser’s and Subadviser’s services to the Fund and the services they provide to other clients. For other clients that are not mutual funds, the differences in services relate to the greater share purchase and redemption activity in a mutual fund, the generally higher turnover of mutual fund portfolio holdings, the more burdensome regulatory and legal obligations of mutual funds and the higher marketing costs for mutual funds. When compared to all clients including mutual funds, the Adviser has greater oversight and supervisory responsibility for the Fund and undertakes greater entrepreneurial risk as the sponsor of the Fund.
| 28 International Value Equity Fund | Semiannual report | |
Fund performance
The Board had previously received and considered information about the Adviser’s investment performance for other funds in relation to the Fund’s proposed benchmark index and the Category average. The Board considered historical performance information of a similar fund that had been managed by investment professionals of Optique Capital Management that was proposed to merge into the Fund. The Board, however, did not consider the performance history of the Fund because the Fund was newly organized and had not yet commenced operations as of the October 2010 meeting.
Expenses and fees
In connection with the initial approval of the Agreements, the Board reviewed the Fund’s contractual advisory fee rate payable by the Fund to the Adviser as compared with the other funds in its Category. The Board also received information about the investment subadvisory fee rate payable by the Adviser to the Subadviser for investment subadvisory services. The Board considered the services provided and the fees charged by the Adviser and the Subadviser to other types of clients with similar investment mandates.
In addition, the Board considered the cost of the services provided to the Fund by the Adviser. The Board received and considered estimated expense information regarding the Fund’s various expense components, including advisory fees, distribution fees and fees other than advisory and distribution fees, including transfer agent fees, custodian fees, administration fees and other miscellaneous fees (e.g., fees for accounting and legal services). The Board considered comparisons of these expenses to the other funds in the Category. The Board also received and considered estimated expense information regarding the Fund’s total operating expense ratio (Gross Expense Ratio) and total operating expense ratio after taking the fee waiver/expense reimbursement arrangement into account (Net Expense Ratio). The Board received and considered information comparing the Gross Expense Ratio and Net Expense Ratio of the Fund to that of the funds in the Category.
As part of its analysis, the Board reviewed the Adviser’s methodology in allocating its costs to the management of the Fund.
Following consideration of this information, the Board, including the Independent Trustees, concluded that the fees to be paid pursuant to the Agreements were fair and reasonable in light of the services expected to be provided.
As the Fund had not commenced operations as of the date of the October 2010 meeting, the Adviser was not able to provide the Board with specific information concerning the expected profits to be realized by the Adviser and its affiliates (including the Subadviser) from their relationships with the Fund.
Economies of scale
The Board, including the Independent Trustees, considered the extent to which economies of scale might be realized as the assets of the Fund increase. Since the Fund is newly formed, the Adviser was not able to provide the Board with specific information concerning the extent to which economies of scale would be realized as the Fund grows and whether fee levels would reflect such economies of scale, if any.
Other benefits to the Adviser and the Subadviser
The Board understands that the Adviser, the Subadviser or their affiliates may derive other ancillary benefits from their relationship with the Fund, both tangible and intangible, such as their ability to leverage investment professionals who manage other portfolios, an increase in their profile in the investment advisory community and the engagement of their affiliates and/or significant shareholders as service providers to the Fund, including for administrative, transfer agency and distribution services. The Board believes that certain of these benefits are difficult to quantify. The Board also was informed that the Subadviser may use third party research obtained by soft dollars
| Semiannual report | International Value Equity Fund 29 | |
generated by certain mutual fund transactions to assist itself in managing all or a number of its other client accounts.
The Board, including all of the Independent Trustees, concluded that these ancillary benefits that the Adviser, the Subadviser and their affiliates could receive with regard to providing investment advisory and other services to the Fund were consistent with those generally available to other mutual fund sponsors.
Board determination
The Board approved the Advisory Agreement between the Adviser and John Hancock Funds III, on behalf of the Fund, for a two-year term and the Subadvisory Agreement between the Adviser and the Subadviser with respect to the Fund for a two-year term. Based upon its evaluation of relevant factors in their totality, the Board was satisfied that the terms of the Agreements, including the advisory and subadvisory fee rates, were fair and reasonable and in the best interest of the Fund and its shareholders. In arriving at its decision to approve the Agreements, the Board did not identify any single factor or any group of factors as all-important or controlling, but considered all factors together. Different Trustees may have attributed different weights to the various factors considered. The Independent Trustees were also assisted by independent legal counsel in making this determination.
| 30 International Value Equity Fund | Semiannual report | |
More information
| Trustees | Investment adviser |
| Steven R. Pruchansky, Chairman | John Hancock Investment Management |
| James F. Carlin | Services, LLC |
| William H. Cunningham | |
| Deborah C. Jackson | Subadviser |
| Charles L. Ladner,* Vice Chairman | John Hancock Asset Management |
| Stanley Martin* | |
| Hugh McHaffie† | Principal distributor |
| Dr. John A. Moore*# | John Hancock Funds, LLC |
| Patti McGill Peterson* | |
| Gregory A. Russo | Custodian |
| John G. Vrysen† | State Street Bank and Trust Company |
| Officers | Transfer agent |
| Keith F. Hartstein | John Hancock Signature Services, Inc. |
| President and Chief Executive Officer | |
| Legal counsel | |
| Andrew G. Arnott | K&L Gates LLP |
| Senior Vice President and Chief Operating Officer | |
| Thomas M. Kinzler | |
| Secretary and Chief Legal Officer | |
| Francis V. Knox, Jr. | |
| Chief Compliance Officer | |
| Charles A. Rizzo | |
| Chief Financial Officer | |
| Salvatore Schiavone | |
| Treasurer | |
| *Member of the Audit Committee | |
| †Non-Independent Trustee | |
| #Effective 9-13-11 | |
The Fund’s proxy voting policies and procedures, as well as the Fund’s proxy voting record for the most recent twelve-month period ended June 30, are available free of charge on the Securities and Exchange Commission (SEC) Web site at www.sec.gov or on our Web site.
The Fund’s complete list of portfolio holdings, for the first and third fiscal quarters, is filed with the SEC on Form N-Q. The Fund’s Form N-Q is available on our Web site and the SEC’s Web site, www.sec.gov, and can be reviewed and copied (for a fee) at the SEC’s Public Reference Room in Washington, DC. Call 1-800-SEC-0330 to receive information on the operation of the SEC’s Public Reference Room.
We make this information on your fund, as well as monthly portfolio holdings, and other fund details available on our Web site at www.jhfunds.com or by calling 1-800-225-5291.
| You can also contact us: | ||
| 1-800-225-5291 | Regular mail: | Express mail: |
| jhfunds.com | John Hancock Signature Services, Inc. | John Hancock Signature Services, Inc. |
| P.O. Box 55913 | Mutual Fund Image Operations | |
| Boston, MA 02205-5913 | 30 Dan Road | |
| Canton, MA 02021 |
| Semiannual report | International Value Equity Fund 31 | |

1-800-225-5291
1-800-554-6713 TDD
1-800-338-8080 EASI-Line
www.jhfunds.com
Now available: electronic delivery
www.jhfunds.com/edelivery
| This report is for the information of the shareholders of John Hancock International Value Equity Fund. | 366SA 9/11 |
| It is not authorized for distribution to prospective investors unless preceded or accompanied by a prospectus. | 11/11 |
ITEM 2. CODE OF ETHICS.
Not applicable at this time.
ITEM 3. AUDIT COMMITTEE FINANCIAL EXPERT.
Not applicable at this time.
ITEM 4. PRINCIPAL ACCOUNTANT FEES AND SERVICES.
Not applicable at this time.
ITEM 5. AUDIT COMMITTEE OF LISTED REGISTRANTS.
Not applicable at this time.
ITEM 6. SCHEDULE OF INVESTMENTS.
Not applicable.
ITEM 7. DISCLOSURE OF PROXY VOTING POLICIES AND PROCEDURES FOR CLOSED-END MANAGEMENT INVESTMENT COMPANIES.
Not applicable.
ITEM 8. PORTFOLIO MANAGERS OF CLOSED-END MANAGEMENT INVESTMENT COMPANIES.
Not applicable.
ITEM 9. PURCHASES OF EQUITY SECURITIES BY CLOSED-END MANAGEMENT INVESTMENT COMPANY AND AFFILIATED PURCHASERS.
Not applicable.
ITEM 10. SUBMISSION OF MATTERS TO A VOTE OF SECURITY HOLDERS.
Not applicable.
ITEM 11. CONTROLS AND PROCEDURES.
(a) EVALUATION OF DISCLOSURE CONTROLS AND PROCEDURES. The registrant maintains disclosure controls and procedures that are designed to ensure that information required to be disclosed in this Form N-CSR is recorded, processed, summarized and reported within the time periods specified in the rules and forms of the Securities and Exchange Commission. Such disclosure and procedures include controls and procedures designed to ensure that such information is accumulated and communicated to the registrant’s management, including its principal executive officer and principal financial officer, as appropriate, to allow timely decisions regarding required disclosure.
Within 90 days prior to the filing date of this Form N-CSR, the registrant had carried out an evaluation, under the supervision and with the participation of the registrant’s management, including the registrant’s principal executive officer and the registrant’s principal financial officer, of the effectiveness of the design and operation of the registrant’s disclosure controls and procedures relating to information required to be disclosed on Form N-CSR. Based on such
evaluation, the registrant’s principal executive officer and principal financial officer concluded that the registrant’s disclosure controls and procedures are operating effectively to ensure that:
(i) information required to be disclosed in this Form N-CSR is recorded, processed, summarized and reported within the periods specified in the rules and forms of the Securities and Exchange Commission, and
(ii) information is accumulated and communicated to the registrant’s management, including its principal executive officer and principal financial officer, as appropriate, to allow timely decisions regarding required disclosure.
(b) CHANGE IN REGISTRANT’S INTERNAL CONTROL: Not applicable.
ITEM 12. EXHIBITS.
(a)(1)(i) CERTIFICATION OF PRINCIPAL EXECUTIVE OFFICER.
(a)(1)(ii) CERTIFICATION OF PRINCIPAL FINANCIAL OFFICER.
(b) CERTIFICATION PURSUANT TO Rule 30a-2(b) OF THE INVESTMENT COMPANY ACT OF 1940.
(c)(1) Contact person at the registrant.
| SIGNATURES |
Pursuant to the requirements of the Securities Exchange Act of 1934 and the Investment Company Act of 1940, the registrant has duly caused this report to be signed on its behalf by the undersigned, thereunto duly authorized.
| John Hancock Funds III | |
| By: | /s/ Keith F. Hartstein |
| ------------------------------ | |
| Keith F. Hartstein | |
| President and | |
| Chief Executive Officer | |
| Date: | November 22, 2011 |
Pursuant to the requirements of the Securities Exchange Act of 1934 and the Investment Company Act of 1940, this report has been signed below by the following persons on behalf of the registrant and in the capacities and on the dates indicated.
| By: | /s/ Keith F. Hartstein |
| ------------------------------- | |
| Keith F. Hartstein | |
| President and | |
| Chief Executive Officer | |
| Date: | November 22, 2011 |
| By: | /s/ Charles A. Rizzo |
| -------------------------------- | |
| Charles A. Rizzo | |
| Chief Financial Officer | |
| Date: | November 22, 2011 |