| UNITED STATES | |
| SECURITIES AND EXCHANGE COMMISSION | |
| Washington, D.C. 20549 | |
| FORM N-CSR | |
| CERTIFIED SHAREHOLDER REPORT OF REGISTERED | |
| MANAGEMENT INVESTMENT COMPANIES | |
| Investment Company Act file numbers 811-21777 | |
| John Hancock Funds III | |
| (Exact name of registrant as specified in charter) | |
| 601 Congress Street, Boston, Massachusetts 02210 | |
| (Address of principal executive offices) (Zip code) | |
| Salvatore Schiavone | |
| Treasurer | |
| 601 Congress Street | |
| Boston, Massachusetts 02210 | |
| (Name and address of agent for service) | |
| Registrant's telephone number, including area code: 617-663-4497 | |
| Date of fiscal year end: | August 31 |
| Date of reporting period: | February 28, 2011 |
ITEM 1. REPORTS TO STOCKHOLDERS.
A look at performance
For the period ended February 28, 2011
| Average annual total returns (%) | Cumulative total returns (%) | |||||||
| with maximum sales charge (POP) | with maximum sales charge (POP) | |||||||
| 1-year | 5-year | 10-year | 6-months | 1-year | 5-year | 10-year | ||
| Class A1 | 24.17 | 7.31 | 9.37 | 29.29 | 24.17 | 42.31 | 144.97 | |
| Class I1,2 | 31.09 | 8.84 | 10.38 | 36.39 | 31.09 | 52.76 | 168.45 | |
| Class AdV 1,2 | 30.62 | 8.42 | 9.94 | 36.30 | 30.62 | 49.83 | 157.92 | |
Performance figures assume all distributions are reinvested. Public offering price (POP) figures reflect maximum sales charges on Class A shares of 5%. Sales charges are not applicable for Class ADV and I shares.
The expense ratios of the Fund, both net (including any fee waivers or expense limitations) and gross (excluding any fee waivers or expense limitations), are set forth according to the most recent publicly available prospectuses for the Fund and may differ from the expense ratios disclosed in the Financial Highlights tables in this report. The waivers and expense limitations are contractual at least until 12-31-11 for Class A and 7-9-12 for Class I and Class ADV. The net expenses are as follows: Class A — 1.25%, Class I — 1.00% and Class ADV — 1.25%. Had the fee waivers and expense limitations not been in place, the gross expenses would be as follows: Class A —1.43%, Class I — 1.02% and Class ADV — 1.43%.
The returns reflect past results and should not be considered indicative of future performance. The return and principal value of an investment will fluctuate so that shares, when redeemed, may be worth more or less than their original cost. Due to market volatility, the Fund’s current performance may be higher or lower than the performance shown. For current to the most recent month-end performance data, please call 1–800–225–5291 or visit the Fund’s Web site at www.jhfunds.com.
The performance table above and the chart on the next page do not reflect the deduction of taxes that a shareholder would pay on fund distributions or the redemption of fund shares.
The Fund’s performance results reflect any applicable expense reductions, without which the expenses increase and results would have been less favorable.
1 After the close of business on 7-9-10, holders of Investor Class Shares and Institutional Class Shares of the former Robeco Boston Partners Mid Cap Value Fund (the Predecessor Fund) became owners of an equal number of full and fractional Class A and Class I shares, respectively, of the John Hancock Disciplined Value Mid Cap Fund. Class A, Class I and Class ADV shares were first offered on 7-12-10. The returns prior to this date for Class A and Class ADV shares are those of the Predecessor Fund’s Investor Class Shares recalculated to reflect the gross fees and expenses of the Fund’s Class A and Class ADV shares. For Class I shares, the returns prior to this date are for the Predecessor Fund’s Institutional Class Shares recalculated to reflect the gross fees and expenses of the Fund’s Class I shares.
2 For certain types of investors, as described in the Fund’s Class ADV and Class I shares prospectuses.
| 6 | Disciplined Value Mid Cap Fund | Semiannual report |
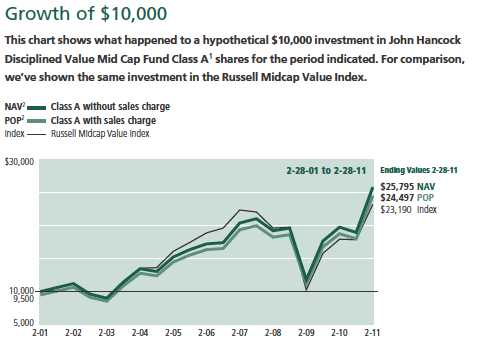
| Period | Without | With maximum | ||
| beginning | sales charge | sales charge | Index | |
| Class I1,3 | 2-28-01 | $26,845 | $26,845 | $23,190 |
| Class ADV1,3 | 2-28-01 | 25,792 | 25,792 | 23,190 |
Assuming all distributions were reinvested for the period indicated, the table above shows the value of a $10,000 investment in the Fund’s Class ADV and Class I shares, respectively, as of 2-28-11. Performance of the classes will vary based on the difference in sales charges paid by shareholders investing in the different classes and the fee structure of those classes.
Russell Midcap Value Index is an unmanaged index that measures the performance of those Russell Midcap companies with lower price-to-book ratios and lower forecasted growth values.
It is not possible to invest directly in an index. Index figures do not reflect sales charges, which would have resulted in lower values if they did.
1 After the close of business on 7-9-10, holders of Investor Class Shares and Institutional Class Shares of the former Robeco Boston Partners Mid Cap Value Fund (the Predecessor Fund) became owners of an equal number of full and fractional Class A and Class I shares, respectively, of the John Hancock Disciplined Value Mid Cap Fund. Class A, Class I and Class ADV shares were first offered on 7-12-10. The returns prior to this date for Class A and Class ADV shares are those of the Predecessor Fund’s Investor Class Shares recalculated to reflect the gross fees and expenses of the Fund’s Class A and Class ADV shares. For Class I shares, the returns prior to this date are for the Predecessor Fund’s Institutional Class Shares recalculated to reflect the gross fees and expenses of the Fund’s Class I shares.
2 NAV represents net asset value and POP represents public offering price.
3 For certain types of investors, as described in the Fund’s Class ADV and Class I shares prospectuses.
| Semiannual report | Disciplined Value Mid Cap Fund | 7 |
Your expenses
These examples are intended to help you understand your ongoing operating expenses.
Understanding fund expenses
As a shareholder of the Fund, you incur two types of costs:
▪ Transaction costs which include sales charges (loads) on purchases or redemptions (varies by share class), minimum account fee charge, etc.
▪ Ongoing operating expenses including management fees, distribution and service fees (if applicable), and other fund expenses.
We are going to present only your ongoing operating expenses here.
Actual expenses/actual returns
This example is intended to provide information about the Fund’s actual ongoing operating expenses, and is based on the Fund’s actual return. It assumes an account value of $1,000.00 on September 1, 2010 with the same investment held until February 28, 2011.
| Account value | Ending value | Expenses paid during | |
| on 9-1-10 | on 2-28-11 | period ended 2-28-111 | |
| Class A | $1,000.00 | $1,361.50 | $7.32 |
| Class I | 1,000.00 | 1,363.90 | 5.69 |
| Class ADV | 1,000.00 | 1,363.00 | 7.32 |
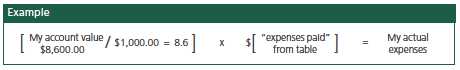
Together with the value of your account, you may use this information to estimate the operating expenses that you paid over the period. Simply divide your account value at February 28, 2011, by $1,000.00, then multiply it by the “expenses paid” for your share class from the table above. For example, for an account value of $8,600.00, the operating expenses should be calculated as follows:
| 8 | Disciplined Value Mid Cap Fund | Semiannual report |
Hypothetical example for comparison purposes
This table allows you to compare the Fund’s ongoing operating expenses with those of any other fund. It provides an example of the Fund’s hypothetical account values and hypothetical expenses based on each class’s actual expense ratio and an assumed 5% annualized return before expenses (which is not the Fund’s actual return). It assumes an account value of $1,000.00 on September 1, 2010, with the same investment held until February 28, 2011. Look in any other fund shareholder report to find its hypothetical example and you will be able to compare these expenses.
| Account value | Ending value | Expenses paid during | |
| on 9-1-10 | on 2-28-11 | period ended 2-28-111 | |
| Class A | $1,000.00 | $1,018.60 | $6.26 |
| Class I | 1,000.00 | 1,020.00 | 4.86 |
| Class ADV | 1,000.00 | 1,018.60 | 6.26 |
Remember, these examples do not include any transaction costs, therefore, these examples will not help you to determine the relative total costs of owning different funds. If transaction costs were included, your expenses would have been higher. See the prospectus for details regarding transaction costs.
1 Expenses are equal to the Fund’s annualized expense ratio of 1.25%, 0.97% and 1.25% for Class A, Class I and Class ADV shares, respectively, multiplied by the average account value over the period, multiplied by 181/365 (to reflect the one-half year period).
| Semiannual report | Disciplined Value Mid Cap Fund | 9 |
Portfolio summary
| Top 10 Holdings1 | ||||
| WESCO International, Inc. | 1.8% | Avnet, Inc. | 1.6% | |
| Omnicom Group, Inc. | 1.8% | Raymond James Financial, Inc. | 1.5% | |
| Discover Financial Services | 1.7% | Moody’s Corp. | 1.5% | |
| Thomas & Betts Corp. | 1.7% | Williams-Sonoma, Inc. | 1.5% | |
| Arrow Electronics, Inc. | 1.7% | CareFusion Corp. | 1.4% | |
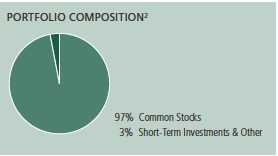
| Sector Composition2,3 | ||||
| Financials | 26% | Energy | 6% | |
| Information Technology | 15% | Utilities | 5% | |
| Consumer Discretionary | 14% | Consumer Staples | 2% | |
| Industrials | 12% | Telecommunication Services | 1% | |
| Health Care | 8% | Short-Term Investments & Other | 3% | |
| Materials | 8% | |||
1 As a percentage of net assets on 2-28-11. Cash and cash equivalents are not included in Top 10 Holdings.
2 As a percentage of net assets on 2-28-11.
3 Sector investing is subject to greater risks than the market as a whole. Because the Fund may focus on particular sectors of the economy, its performance may depend on the performance of those sectors.
| 10 | Disciplined Value Mid Cap Fund | Semiannual report |
Fund’s investments
As of 2-28-11 (unaudited)
| Shares | Value | |
| Common Stocks 96.81% | $295,500,260 | |
| (Cost $244,742,401) | ||
| Consumer Discretionary 14.09% | 43,014,783 | |
| Auto Components 0.60% | ||
| Visteon Corp. (I) | 24,730 | 1,828,784 |
| Hotels, Restaurants & Leisure 0.61% | ||
| CEC Entertainment, Inc. (I) | 48,490 | 1,876,078 |
| Household Durables 3.11% | ||
| Lennar Corp., Class A (L) | 44,350 | 894,096 |
| Mohawk Industries, Inc. (I) | 70,595 | 4,102,275 |
| NVR, Inc. (I)(L) | 2,435 | 1,772,339 |
| Stanley Black & Decker, Inc. | 35,845 | 2,718,126 |
| Internet & Catalog Retail 0.41% | ||
| Expedia, Inc. | 63,569 | 1,262,480 |
| Leisure Equipment & Products 0.36% | ||
| Mattel, Inc. | 43,620 | 1,093,117 |
| Media 3.78% | ||
| CBS Corp., Class B | 154,530 | 3,687,086 |
| Omnicom Group, Inc. | 105,180 | 5,353,656 |
| The McGraw-Hill Companies, Inc. | 64,345 | 2,488,865 |
| Multiline Retail 0.52% | ||
| Kohl’s Corp. | 29,210 | 1,574,127 |
| Specialty Retail 3.62% | ||
| Bed Bath & Beyond, Inc. (I)(L) | 49,055 | 2,361,998 |
| Guess?, Inc. | 32,760 | 1,483,700 |
| The Gap, Inc. | 122,720 | 2,764,882 |
| Williams-Sonoma, Inc. | 123,235 | 4,447,551 |
| Textiles, Apparel & Luxury Goods 1.08% | ||
| Coach, Inc. | 29,975 | 1,646,227 |
| VF Corp. (L) | 17,345 | 1,659,396 |
| Consumer Staples 1.94% | 5,920,258 | |
| Beverages 1.27% | ||
| Coca-Cola Enterprises, Inc. | 91,115 | 2,396,325 |
| Dr. Pepper Snapple Group, Inc. | 40,660 | 1,466,200 |
| Food & Staples Retailing 0.22% | ||
| The Kroger Company | 29,380 | 672,802 |
| See notes to financial statements | Semiannual report | Disciplined Value Mid Cap Fund | 11 |
| Shares | Value | |
| Tobacco 0.45% | ||
| Lorillard, Inc. | 18,040 | $1,384,931 |
| Energy 6.05% | 18,480,212 | |
| Energy Equipment & Services 1.86% | ||
| Bristow Group, Inc. (I) | 25,540 | 1,223,877 |
| Oil States International, Inc. (I) | 40,660 | 2,959,641 |
| Pride International, Inc. (I) | 36,140 | 1,500,171 |
| Oil, Gas & Consumable Fuels 4.19% | ||
| EOG Resources, Inc. | 27,380 | 3,075,048 |
| Noble Energy, Inc. | 31,700 | 2,937,322 |
| Rosetta Resources, Inc. (I) | 78,770 | 3,573,007 |
| SM Energy Company | 44,310 | 3,211,146 |
| Financials 25.91% | 79,094,528 | |
| Capital Markets 4.40% | ||
| Affiliated Managers Group, Inc. (I) | 27,470 | 2,932,423 |
| Raymond James Financial, Inc. | 122,730 | 4,703,014 |
| SEI Investments Company | 67,645 | 1,556,511 |
| TD Ameritrade Holding Corp. | 195,250 | 4,256,450 |
| Commercial Banks 4.43% | ||
| Bank of Hawaii Corp. | 10,655 | 502,490 |
| Comerica, Inc. | 47,840 | 1,860,976 |
| East West Bancorp, Inc. | 101,035 | 2,346,033 |
| Fifth Third Bancorp | 192,250 | 2,806,850 |
| M&T Bank Corp. | 20,160 | 1,775,088 |
| Popular, Inc. (I) | 557,558 | 1,812,064 |
| SunTrust Banks, Inc. | 47,475 | 1,432,321 |
| Zions Bancorporation (L) | 42,335 | 988,946 |
| Consumer Finance 3.57% | ||
| Capital One Financial Corp. | 76,930 | 3,828,806 |
| Discover Financial Services | 240,005 | 5,220,109 |
| SLM Corp. (I) | 123,895 | 1,836,124 |
| Diversified Financial Services 1.47% | ||
| Moody’s Corp. | 140,500 | 4,481,950 |
| Insurance 8.61% | ||
| ACE, Ltd. | 20,335 | 1,286,189 |
| Alleghany Corp. (I)(L) | 11,847 | 4,036,865 |
| AON Corp. | 31,380 | 1,651,843 |
| Assurant, Inc. | 31,825 | 1,293,050 |
| Hanover Insurance Group, Inc. | 66,080 | 3,070,738 |
| Loews Corp. | 42,510 | 1,838,558 |
| Marsh & McLennan Companies, Inc. | 130,065 | 3,959,179 |
| Reinsurance Group of America, Inc. | 40,855 | 2,467,233 |
| Symetra Financial Corp. | 109,455 | 1,565,207 |
| Unum Group | 157,885 | 4,188,689 |
| W.R. Berkley Corp. | 30,625 | 917,219 |
| 12 | Disciplined Value Mid Cap Fund | Semiannual report | See notes to financial statements |
| Shares | Value | |
| Real Estate Investment Trusts 3.43% | ||
| American Assets Trust, Inc. (I) | 41,250 | $889,350 |
| Annaly Capital Management, Inc. | 28,871 | 517,657 |
| Duke Realty Corp. | 78,655 | 1,106,676 |
| Equity Residential | 25,380 | 1,398,692 |
| Kimco Realty Corp. (L) | 123,040 | 2,384,515 |
| Regency Centers Corp. (L) | 23,720 | 1,073,330 |
| Taubman Centers, Inc. | 33,060 | 1,834,169 |
| Ventas, Inc. (L) | 23,010 | 1,275,214 |
| Health Care 8.07% | 24,622,851 | |
| Health Care Equipment & Supplies 1.94% | ||
| CareFusion Corp. (I) | 156,855 | 4,285,279 |
| Hologic, Inc. (I) | 80,350 | 1,621,463 |
| Health Care Providers & Services 5.78% | ||
| Cardinal Health, Inc. | 55,805 | 2,323,720 |
| DaVita, Inc. (I) | 24,930 | 1,978,694 |
| Humana, Inc. (I) | 29,840 | 1,939,898 |
| Laboratory Corp. of America Holdings (I) | 14,830 | 1,336,628 |
| Lincare Holdings, Inc. | 110,900 | 3,253,806 |
| McKesson Corp. | 48,975 | 3,882,738 |
| Omnicare, Inc. (L) | 102,290 | 2,928,563 |
| Pharmaceuticals 0.35% | ||
| Hospira, Inc. (I) | 20,285 | 1,072,062 |
| Industrials 12.14% | 37,058,999 | |
| Electrical Equipment 2.63% | ||
| Cooper Industries PLC | 44,250 | 2,847,488 |
| Thomas & Betts Corp. (I) | 93,460 | 5,176,749 |
| Machinery 2.08% | ||
| Ingersoll-Rand PLC | 69,105 | 3,130,457 |
| Kennametal, Inc. | 84,040 | 3,232,178 |
| Professional Services 5.37% | ||
| Equifax, Inc. | 108,770 | 3,888,528 |
| FTI Consulting, Inc. (I)(L) | 47,905 | 1,580,386 |
| Manpower, Inc. | 63,800 | 4,051,300 |
| Robert Half International, Inc. | 121,140 | 3,864,366 |
| Towers Watson & Company, Class A | 51,185 | 3,009,678 |
| Road & Rail 0.27% | ||
| Norfolk Southern Corp. | 12,420 | 814,504 |
| Trading Companies & Distributors 1.79% | ||
| WESCO International, Inc. (I) | 93,840 | 5,463,365 |
| Information Technology 15.11% | 46,116,788 | |
| Communications Equipment 0.81% | ||
| Harris Corp. | 52,745 | 2,461,082 |
| See notes to financial statements | Semiannual report | Disciplined Value Mid Cap Fund | 13 |
| Shares | Value | |
| Electronic Equipment, Instruments & Components 4.92% | ||
| Aeroflex Holding Corp. (I) | 108,045 | $2,123,084 |
| Arrow Electronics, Inc. (I) | 129,950 | 5,094,040 |
| Avnet, Inc. (I) | 139,685 | 4,778,624 |
| Ingram Micro, Inc., Class A (I) | 151,470 | 3,018,797 |
| Internet Software & Services 0.50% | ||
| Monster Worldwide, Inc. (I)(L) | 88,865 | 1,524,035 |
| IT Services 2.95% | ||
| Alliance Data Systems Corp. (I)(L) | 21,160 | 1,666,138 |
| Amdocs, Ltd. (I) | 45,110 | 1,346,082 |
| Broadridge Financial Solutions, Inc. | 54,040 | 1,238,597 |
| CGI Group, Inc., Class A (I) | 119,225 | 2,378,539 |
| The Western Union Company | 107,940 | 2,373,601 |
| Office Electronics 0.65% | ||
| Xerox Corp. | 185,315 | 1,992,136 |
| Semiconductors & Semiconductor Equipment 2.93% | ||
| Analog Devices, Inc. | 84,680 | 3,377,038 |
| Micron Technology, Inc. (I) | 155,715 | 1,733,108 |
| STMicroelectronics NV (L) | 298,875 | 3,837,555 |
| Software 2.35% | ||
| CA, Inc. | 122,195 | 3,027,992 |
| Electronic Arts, Inc. (I) | 220,550 | 4,146,340 |
| Materials 7.39% | 22,557,376 | |
| Chemicals 3.20% | ||
| Albemarle Corp. | 69,255 | 3,986,318 |
| Ashland, Inc. | 25,380 | 1,428,894 |
| Cytec Industries, Inc. | 36,295 | 2,062,645 |
| PPG Industries, Inc. | 26,090 | 2,305,834 |
| Containers & Packaging 1.67% | ||
| Ball Corp. | 67,860 | 2,449,746 |
| Crown Holdings, Inc. (I) | 68,755 | 2,645,692 |
| Metals & Mining 2.52% | ||
| Allegheny Technologies, Inc. | 20,760 | 1,392,581 |
| Globe Specialty Metals, Inc. | 129,305 | 3,011,513 |
| Reliance Steel & Aluminum Company | 59,175 | 3,274,153 |
| Telecommunication Services 0.74% | 2,255,676 | |
| Diversified Telecommunication Services 0.74% | ||
| CenturyLink, Inc. (L) | 54,776 | 2,255,676 |
| Utilities 5.37% | 16,378,789 | |
| Electric Utilities 3.56% | ||
| American Electric Power Company, Inc. | 19,615 | 701,825 |
| Edison International | 71,925 | 2,669,856 |
| FirstEnergy Corp. | 64,528 | 2,471,422 |
| NV Energy, Inc. | 165,445 | 2,430,387 |
| Westar Energy, Inc. (L) | 99,130 | 2,577,380 |
| 14 | Disciplined Value Mid Cap Fund | Semiannual report | See notes to financial statements |
| Shares | Value | ||
| Multi-Utilities 1.81% | |||
| Alliant Energy Corp. | 61,285 | $2,413,403 | |
| Ameren Corp. | 65,060 | 1,819,078 | |
| PG&E Corp. | 28,125 | 1,295,438 | |
| Yield | Shares | Value | |
| Securities Lending Collateral 6.97% | $21,274,464 | ||
| (Cost $21,273,893) | |||
| John Hancock Collateral Investment Trust (W) | 0.2855% (Y) | 2,125,873 | 21,274,464 |
| Par value | Value | ||
| Short-Term Investments 4.01% | $12,245,000 | ||
| (Cost $12,245,000) | |||
| Repurchase Agreement 4.01% | $12,245,000 | ||
| Repurchase Agreement with State Street Corp. dated 2-28-11 | |||
| at 0.010% to be repurchased at $12,245,003 on 3-1-11, | |||
| collateralized by $12,360,000 U.S. Treasury Notes, 1.000% | |||
| due 4-30-12 (valued at $12,494,155, including interest) | $12,245,000 | 12,245,000 | |
| Total investments (Cost $278,261,294)† 107.79% | $329,019,724 | ||
| Other assets and liabilities, net (7.79%) | ($23,773,199) | ||
| Total net assets 100.00% | $305,246,525 | ||
The percentage shown for each investment category is the total value of the category as a percentage of the net assets of the Fund.
(I) Non-income producing security.
(L) All or a portion of this security is on loan as of 2-28-11.
(W) Investment is an affiliate of the Fund, the adviser and/or subadviser. Also, it represents the investment of securities lending collateral received.
(Y) The rate shown is the annualized seven-day yield as of 2-28-11.
† At 2-28-11, the aggregate cost of investment securities for federal income tax purposes was $278,677,412. Net unrealized appreciation aggregated $50,342,312, of which $50,896,246 related to appreciated investment securities and $553,934 related to depreciated investment securities.
| See notes to financial statements | Semiannual report | Disciplined Value Mid Cap Fund | 15 |
F I N A N C I A L S T A T E M E N T S
Financial statements
Statement of assets and liabilities 2-28-11 (unaudited)
This Statement of Assets and Liabilities is the Fund’s balance sheet. It shows the value of what the Fund owns, is due and owes. You’ll also find the net asset value and the maximum offering price per share.
| Assets | |
| Investments in unaffiliated issuers, at value (Cost $256,987,401) including | |
| $20,942,829 of securities loaned (Note 2) | $307,745,260 |
| Investments in affiliated issuers, at value (Cost $21,273,893) (Note 2) | 21,274,464 |
| Total investments, at value (Cost $278,261,294) | 329,019,724 |
| Cash | 327 |
| Receivable for investments sold | 1,095,560 |
| Receivable for fund shares sold | 4,581,923 |
| Dividends and interest receivable | 268,930 |
| Receivable for securities lending income | 3,462 |
| Receivable due from adviser | 1,018 |
| Other receivables and prepaid expenses | 36,537 |
| Total assets | 335,007,481 |
| Liabilities | |
| Payable for investments purchased | 7,943,197 |
| Payable for fund shares repurchased | 372,252 |
| Payable upon return of securities loaned (Note 2) | 21,277,916 |
| Payable to affiliates | |
| Accounting and legal services fees | 12,996 |
| Transfer agent fees | 51,369 |
| Trustees’ fees | 292 |
| Other liabilities and accrued expenses | 102,934 |
| Total liabilities | 29,760,956 |
| Net assets | |
| Capital paid-in | $253,799,692 |
| Accumulated distributions in excess of net investment income | (49,751) |
| Accumulated net realized gain on investments | 738,154 |
| Net unrealized appreciation (depreciation) on investments | 50,758,430 |
| Net assets | $305,246,525 |
| Net asset value per share | |
| Based on net asset values and shares outstanding — the Fund has an | |
| unlimited number of shares authorized with no par value | |
| Class A ($146,239,306 ÷ 12,409,811 shares) | $11.78 |
| Class I ($158,951,436 ÷ 13,105,469 shares) | $12.13 |
| Class ADV ($55,783 ÷ 4,736 shares) | $11.78 |
| Maximum offering price per share | |
| Class A (net asset value per share ÷ 95%)1 | $12.40 |
1 On single retail sales of less than $50,000. On sales of $50,000 or more and on group sales the offering price is reduced.
| 16 | Disciplined Value Mid Cap Fund | Semiannual report | See notes to financial statements |
F I N A N C I A L S T A T E M E N T S
Statement of operations For the six-month period ended 2-28-11
(unaudited)
This Statement of Operations summarizes the Fund’s investment income earned and expenses incurred in operating the Fund. It also shows net gains (losses) for the period stated.
| Investment income | |
| Dividends | $1,528,918 |
| Securities lending | 20,549 |
| Interest | 390 |
| Less foreign taxes withheld | (6,042) |
| Total investment income | 1,543,815 |
| Expenses | |
| Investment management fees (Note 4) | 891,200 |
| Distribution and service fees (Note 4) | 130,578 |
| Accounting and legal services fees (Note 4) | 23,583 |
| Transfer agent fees (Note 4) | 109,476 |
| Trustees’ fees (Note 4) | 3,193 |
| State registration fees (Note 4) | 18,386 |
| Printing and postage (Note 4) | 9,034 |
| Professional fees | 40,882 |
| Custodian fees | 14,497 |
| Registration and filing fees | 28,892 |
| Other | 2,026 |
| Total expenses | 1,271,747 |
| Less expense reductions (Note 4) | (42,392) |
| Net expenses | 1,229,355 |
| Net investment income | 314,460 |
| Realized and unrealized gain (loss) | |
| Net realized gain (loss) on | |
| Investments in unaffiliated issuers | 5,514,013 |
| Investments in affiliated issuers | (3,889) |
| 5,510,124 | |
| Change in net unrealized appreciation (depreciation) of | |
| Investments in unaffiliated issuers | 59,589,032 |
| Investments in affiliated issuers | 664 |
| 59,589,696 | |
| Net realized and unrealized gain | 65,099,820 |
| Increase in net assets from operations | $65,414,280 |
| See notes to financial statements | Semiannual report | Disciplined Value Mid Cap Fund | 17 |
F I N A N C I A L S T A T E M E N T S
Statements of changes in net assets
These Statements of Changes in Net Assets show how the value of the Fund’s net assets has changed during the last two periods. The difference reflects earnings less expenses, any investment gains and losses, distributions, if any, paid to shareholders and the net of Fund share transactions.
| Six months | ||||
| ended | Year | |||
| 2-28-11 | ended | |||
| (unaudited) | 8-31-10 | |||
| Increase (decrease) in net assets | ||||
| From operations | ||||
| Net investment income | $314,460 | $276,141 | ||
| Net realized gain | 5,510,124 | 2,324,382 | ||
| Change in net unrealized appreciation (depreciation) | 59,589,696 | (8,884,774) | ||
| Increase (decrease) in net assets resulting from operations | 65,414,280 | (6,284,251) | ||
| Distributions to shareholders | ||||
| From net investment income | ||||
| Class A | (100,122) | (92,302) | ||
| Class I | (372,245) | (307,672) | ||
| Class ADV | (26) | — | ||
| Total distributions | (472,393) | (399,974) | ||
| From Fund share transactions (Note 5) | 77,816,302 | 122,565,661 | ||
| Total increase | 142,758,189 | 115,881,436 | ||
| Net assets | ||||
| Beginning of period | 162,488,336 | 46,606,900 | ||
| End of period | $305,246,525 | $162,488,336 | ||
| Undistributed (accumulated distributions in excess of) net | ||||
| investment income | ($49,751) | $108,182 | ||
| 18 | Disciplined Value Mid Cap Fund | Semiannual report | See notes to financial statements |
Financial highlights
The Financial Highlights show how the Fund’s net asset value for a share has changed since the end of the previous period.
| CLASS A SHARES Period ended | 2-28-111 | 8-31-102 | 8-31-093 | 8-31-083 | 8-31-073 | 8-31-06 |
| Per share operating performance | ||||||
| Net asset value, beginning of period | $8.66 | $8.10 | $9.08 | $11.16 | $12.81 | $13.80 |
| Net investment income (loss)4 | 0.01 | 0.015 | 0.07 | 0.06 | 0.02 | (0.01) |
| Net realized and unrealized gain (loss) | ||||||
| on investments | 3.12 | 0.60 | (0.98)6 | (0.74) | 2.39 | 0.87 |
| Total from investment operations | 3.13 | 0.61 | (0.91) | (0.68) | 2.41 | 0.86 |
| Less distributions | ||||||
| From net investment income | (0.01) | (0.05) | (0.07) | (0.04) | — | — |
| From net realized gain | — | — | —7 | (1.36) | (4.06) | (1.85) |
| Total distributions | (0.01) | (0.05) | (0.07) | (1.40) | (4.06) | (1.85) |
| Net asset value, end of period | $11.78 | $8.66 | $8.10 | $9.08 | $11.16 | $12.81 |
| Total return (%)8,9 | 36.1510 | 7.54 | (9.79)6 | (6.62) | 21.02 | 6.59 |
| Ratios and supplemental data | ||||||
| Net assets, end of period (in millions) | $146 | $75 | $14 | $17 | $13 | $5 |
| Ratios (as a percentage of average net assets): | ||||||
| Expenses before reductions | 1.3311 | 1.56 | 1.93 | 1.73 | 1.73 | 1.70 |
| Expenses net of fee waivers and credits | 1.2511 | 1.25 | 1.25 | 1.25 | 1.25 | 1.25 |
| Net investment income (loss) | 0.1311 | 0.09 | 1.09 | 0.55 | 0.14 | (0.04) |
| Portfolio turnover (%) | 22 | 38 | 58 | 64 | 89 | 97 |
1 Semiannual period from 9-1-10 to 2-28-11. Unaudited.
2 After the close of business on 7-9-10, holders of Investor Class Shares of the former Robeco Boston Partners Mid Cap Value Fund (the Predecessor Fund) became owners of an equal number of full and fractional Class A shares of the John Hancock Disciplined Value Mid Cap Fund. These shares were first offered on 7-12-10. Additionally, the accounting and performance history of the Investor Class Shares of the Predecessor Fund was redesignated as that of John Hancock Disciplined Value Mid Cap Fund Class A.
3 Audited by previous independent registered public accounting firm.
4 Based on the average daily shares outstanding.
5 The amount shown for a share outstanding may differ with the distributions from net investment income for the period due to the timing of distributions in relations to fluctuations of shares outstanding during the period.
6 In 2009, the investment advisor fully reimbursed the Fund for a loss on a transaction not meeting the Fund’s investment guidelines, which otherwise would have reduced total return by 0.11% and net realized and unrealized gain/(loss) on investment by $0.01 per share.
7 Less than $0.01 per share.
8 Total returns would have been lower had certain expenses not been reduced during the periods shown.
9 Does not reflect the effect of sales charges, if any.
10 Not annualized.
11 Annualized.
| See notes to financial statements | Semiannual report | Disciplined Value Mid Cap Fund | 19 |
| CLASS I SHARES Period ended | 2-28-111 | 8-31-102 | 8-31-093 | 8-31-083 | 8-31-073 | 8-31-06 |
| Per share operating performance | ||||||
| Net asset value, beginning of period | $8.92 | $8.34 | $9.35 | $11.45 | $13.05 | $14.02 |
| Net investment income4 | 0.02 | 0.045 | 0.09 | 0.08 | 0.05 | 0.04 |
| Net realized and unrealized gain (loss) | ||||||
| on investments | 3.22 | 0.61 | (1.01)6 | (0.76) | 2.44 | 0.86 |
| Total from investment operations | 3.24 | 0.65 | (0.92) | (0.68) | 2.49 | 0.90 |
| Less distributions | ||||||
| From net investment income | (0.03) | (0.07) | (0.09) | (0.06) | (0.03) | (0.02) |
| From net realized gain | — | — | —7 | (1.36) | (4.06) | (1.85) |
| Total distributions | (0.03) | (0.07) | (0.09) | (1.42) | (4.09) | (1.87) |
| Net asset value, end of period | $12.13 | $8.92 | $8.34 | $9.35 | $11.45 | $13.05 |
| Total return (%) | 36.399 | 7.768 | (9.50)6,8 | (6.41)8 | 21.328 | 6.828 |
| Ratios and supplemental data | ||||||
| Net assets, end of period (in millions) | $159 | $87 | $33 | $35 | $36 | $28 |
| Ratios (as a percentage of average net assets): | ||||||
| Expenses before reductions | 0.9710 | 1.28 | 1.69 | 1.48 | 1.48 | 1.38 |
| Expenses net of fee waivers and credits | 0.9710 | 1.00 | 1.00 | 1.00 | 1.00 | 1.00 |
| Net investment income | 0.4110 | 0.41 | 1.33 | 0.80 | 0.38 | 0.28 |
| Portfolio turnover (%) | 22 | 38 | 58 | 64 | 89 | 97 |
1 Semiannual period from 9-1-10 to 2-28-11. Unaudited.
2 After the close of business on 7-9-10, holders of Institutional Class Shares of the former Robeco Boston Partners Mid Cap Value Fund (the Predecessor Fund) became owners of an equal number of full and fractional Class I shares of the John Hancock Disciplined Value Mid Cap Fund. These shares were first offered on 7-12-10. Additionally, the accounting and performance history of the Institutional Class Shares of the Predecessor Fund was redesignated as that of John Hancock Disciplined Value Mid Cap Fund Class I.
3 Audited by previous independent registered public accounting firm.
4 Based on the average daily shares outstanding.
5 The amount shown for a share outstanding may differ with the distributions from net investment income for the period due to the timing of distributions in relations to fluctuations of shares outstanding during the period.
6 In 2009, the investment advisor fully reimbursed the Fund for a loss on a transaction not meeting the Fund’s investment guidelines, which otherwise would have reduced total return by 0.11% and net realized and unrealized gain/(loss) on investment by $0.01 per share.
7 Less than $0.01 per share.
8 Total returns would have been lower had certain expenses not been reduced during the periods shown.
9 Not annualized.
10 Annualized.
| CLASS ADV SHARES Period ended | 2-28-111 | 8-31-102 | ||||
| Per share operating performance | ||||||
| Net asset value, beginning of period | $8.65 | $8.86 | ||||
| Net investment income3 | 0.01 | —4 | ||||
| Net realized and unrealized gain (loss) on investments | 3.13 | (0.21) | ||||
| Total from investment operations | 3.14 | (0.21) | ||||
| Less distributions | ||||||
| From net investment income | (0.01) | — | ||||
| Net asset value, end of period | $11.78 | $8.65 | ||||
| Total return (%)5 | 36.306 | (2.37)6 | ||||
| Ratios and supplemental data | ||||||
| Net assets, end of period (in thousands) | $56 | $24 | ||||
| Ratios (as a percentage of average net assets): | ||||||
| Expenses before reductions | 6.047 | 1.427 | ||||
| Expenses net of fee waivers and credits | 1.257 | 1.257 | ||||
| Net investment income (loss) | 0.197 | (0.37)7 | ||||
| Portfolio turnover (%) | 22 | 388 | ||||
1 Semiannual period from 9-1-10 to 2-28-11. Unaudited.
2 Period from 7-12-10 (inception date) to 8-31-10.
3 Based on the average daily shares outstanding.
4 Less than $0.005 per share.
5 Total returns would have been lower had certain expenses not been reduced during the periods shown.
6 Not annualized.
7 Annualized.
8 Portfolio turnover is shown for the period from 9-1-09 to 8-31-10.
| 20 | Disciplined Value Mid Cap Fund | Semiannual report | See notes to financial statements |
Notes to financial statements
(unaudited)
Note 1 — Organization
John Hancock Disciplined Value Mid Cap Fund (the Fund) is a diversified series of John Hancock Funds III (the Trust), an open-end management investment company organized as a Massachusetts business trust and registered under the Investment Company Act of 1940, as amended (the 1940 Act). The investment objective of the Fund is to seek long-term growth of capital with current income as a secondary objective.
The Fund may offer multiple classes of shares. The shares currently offered are detailed in the Statement of Assets and Liabilities. Class A shares are offered to all investors. Class I shares are offered to institutions and certain investors. Class ADV shares are available to investors who acquired Class A shares as a result of the reorganization of the Robeco Boston Partners Mid Cap Value Fund (the Predecessor Fund) into the Fund and are closed to new investors. Shareholders of each class have exclusive voting rights to matters that affect that class. The distribution and service fees, if any, transfer agent fees, state registration fees and printing and postage, for each class may differ.
As a result of the reorganization, the Fund is the legal survivor, however, the accounting and performance history of the Investor Class and Institutional Class shares of the Predecessor Fund have been redesignated as that of Class A and Class I shares of the Fund, respectively. At the close of business on July 9, 2010, the Fund acquired substantially all the assets and assumed the liabilities of the Predecessor Fund pursuant to an agreement and plan of reorganization, in exchange for Class A and Class I shares of the Fund. Certain prior year amounts have been reclassified to conform with current year presentation.
Note 2 — Significant accounting policies
The financial statements have been prepared in conformity with accounting principles generally accepted in the United States of America, which require management to make certain estimates and assumptions at the date of the financial statements. Actual results could differ from those estimates. Events or transactions occurring after the end of the fiscal period through the date that the financial statements were issued have been evaluated in the preparation of the financial statements. The following summarizes the significant accounting policies of the Fund:
Security valuation. Investments are stated at value as of the close of regular trading on the New York Stock Exchange (NYSE), normally at 4:00 P.M., Eastern Time. The Fund uses a three-tier hierarchy to prioritize the pricing assumptions, referred to as inputs, used in valuation techniques to measure fair value. Level 1 includes securities valued using quoted prices in active markets for identical securities. Level 2 includes securities valued using significant observable inputs. Observable inputs may include quoted prices for similar securities, interest rates, prepayment speeds and credit risk. Prices for securities valued using these inputs are received from independent pricing vendors and brokers and are based on an evaluation of the inputs described. Level 3 includes securities valued using significant unobservable inputs when market prices are not readily available or reliable, including the Fund’s own assumptions in determining the fair value of investments. Factors used in determining value may include market or issuer specific events, changes in interest rates and credit quality. The inputs or methodology used for valuing securities are not necessarily an indication of the risk associated with investing in those securities.
| Semiannual report | Disciplined Value Mid Cap Fund | 21 |
As of February 28, 2011, all investments of the Fund are categorized as Level 1 under the hierarchy described above, except repurchase agreements which are Level 2. Changes in valuation techniques may result in transfers in or out of an assigned level within the disclosure hierarchy. During the six months ended February 28, 2011, there were no significant transfers in or out of Level 1 or Level 2 assets.
In order to value the securities, the Fund uses the following valuation techniques. Equity securities held by the Fund are valued at the last sale price or official closing price on the principal securities exchange on which they trade. In the event there were no sales during the day or closing prices are not available, then securities are valued using the last quoted bid or evaluated price. Investments in open-end mutual funds, including John Hancock Collateral Investment Trust (JHCIT), are valued at their closing net asset values each day. Foreign securities and currencies are valued in U.S. dollars, based on foreign currency exchange rates supplied by an independent pricing service. Certain securities traded only in the over-the-counter market are valued at the last bid price quoted by brokers making markets in the securities at the close of trading. Certain short-term securities are valued at amortized cost. Other portfolio securities and assets, where market quotations are not readily available, are valued at fair value, as determined in good faith by the Fund’s Pricing Committee, following procedures established by the Board of Trustees.
Repurchase agreements. The Fund may enter into repurchase agreements. When a Fund enters into a repurchase agreement, it receives collateral which is held in a segregated account by the Fund’s custodian. The collateral amount is marked-to-market and monitored on a daily basis to ensure that the collateral held is in an amount not less than the principal amount of the repurchase agreement plus any accrued interest. In the event of a default by the counterparty, realization of the collateral proceeds could be delayed, during which time the collateral value may decline.
Security transactions and related investment income. Investment security transactions are accounted for on a trade date plus one basis for daily net asset value calculations. However, for financial reporting purposes, investment transactions are reported on trade date. Interest income is accrued as earned. Gains and losses on securities sold are determined on the basis of identified cost and may include proceeds from litigation. Dividend income is recorded on the ex-date, except for dividends of foreign securities where the dividend may not be known until after the ex-date. In those cases, dividend income is recorded when the Fund becomes aware of the dividends.
Securities lending. The Fund may lend its securities to earn additional income. It receives and maintains cash collateral received from the borrower in an amount not less than the market value of the loaned securities. The Fund will invest its collateral in JHCIT, an affiliate of the Fund, and as a result, the Fund will receive the benefit of any gains and bear any losses generated by JHCIT. Although risk of the loss of the securities lent is mitigated by holding the collateral, the Fund could experience a delay in recovering its securities and a possible loss of income or value if the borrower fails to return the securities or if collateral investments decline in value. The Fund may receive compensation for lending its securities by retaining a portion of the return on the investment of the collateral and compensation from fees earned from borrowers of the securities. Income received from JHCIT is a component of securities lending income as recorded on the Statement of Operations.
Line of credit. The Fund may borrow from banks for temporary or emergency purposes, including meeting redemption requests that otherwise might require the untimely sale of securities. Pursuant to the custodian agreement, the custodian may loan money to a Fund to make properly authorized payments. The Fund is obligated to repay the custodian for any overdraft, including any related costs or expenses. The custodian has a lien, security interest or security entitlement in any Fund property that is not segregated, to the maximum extent permitted by law for any overdraft.
| 22 | Disciplined Value Mid Cap Fund | Semiannual report |
In addition, the Fund and other affiliated funds have entered into an agreement with State Street Bank and Trust Company (SSBT) which enables them to participate in a $100 million unsecured committed line of credit. A commitment fee, payable at the end of each calendar quarter, based on the average daily unused portion of the line of credit, is charged to each participating fund on a pro rata basis and is reflected in other expenses on the Statement of Operations. For the six months ended February 28, 2011, the Fund had no borrowings under the line of credit.
Effective March 30, 2011, the line of credit with SSBT expired and a similar arrangement was established with Citibank N.A.
Expenses. The majority of expenses are directly attributable to an individual fund. Expenses that are not readily attributable to a specific fund are allocated among all funds in an equitable manner, taking into consideration, among other things, the nature and type of expense and the fund’s relative assets. Expense estimates are accrued in the period to which they relate and adjustments are made when actual amounts are known.
Class allocations. Income, common expenses, and realized and unrealized gains (losses) are determined at the fund level and allocated daily to each class of shares based on the net asset value of the class. Class-specific expenses, such as distribution and service fees, if any, transfer agent fees, state registration fees and printing and postage, for all classes, are calculated daily at the class level based on the appropriate net asset value of each class and the specific expense rates applicable to each class.
Federal income taxes. The Fund intends to continue to qualify as a regulated investment company by complying with the applicable provisions of the Internal Revenue Code and will not be subject to federal income tax on taxable income that is distributed to shareholders. Therefore, no federal income tax provision is required.
For federal income tax purposes, the Fund has a capital loss carryforward of $4,366,859 available to offset future net realized capital gains as of August 31, 2010. The loss carryforward expires as follows: August 31, 2017 — $2,550,027 and August 31, 2018 — $1,816,832.
Under the recently enacted Regulated Investment Company Modernization Act of 2010, the Fund will be permitted to carry forward capital losses incurred in taxable years beginning after December 22, 2010 for an unlimited period. However, any losses incurred during those future taxable years will be required to be utilized prior to the losses incurred in pre-enactment taxable years. As a result of this ordering rule, pre-enactment capital loss carryforwards may be more likely to expire unused. Additionally, post-enactment capital losses that are carried forward will retain their character as either short-term or long-term capital losses rather than being considered all short-term as under previous law.
As of August 31, 2010, the Fund had no uncertain tax positions that would require financial statement recognition, de-recognition or disclosure. The Fund’s federal tax return is subject to examination by the Internal Revenue Service for a period of three years.
Distribution of income and gains. Distributions to shareholders from net investment income and net realized gains, if any, are recorded on the ex-date. The Fund generally declares and pays dividends and capital gain distributions, if any, annually.
Distributions paid by the Fund with respect to each class of shares are calculated in the same manner, at the same time and are in the same amount, except for the effect of expenses that may be applied differently to each class.
Such distributions, on a tax basis, are determined in conformity with income tax regulations, which may differ from accounting principles generally accepted in the United States of America.
| Semiannual report | Disciplined Value Mid Cap Fund | 23 |
Capital accounts within financial statements are adjusted for permanent book-tax differences. These adjustments have no impact on net assets or the results of operations. Temporary book-tax differences, if any, will reverse in a subsequent period.
Note 3 — Guarantees and indemnifications
Under the Fund’s organizational documents, its Officers and Trustees are indemnified against certain liabilities arising out of the performance of their duties to the Fund. Additionally, in the normal course of business, the Fund enters into contracts with service providers that contain general indemnification clauses. The Fund’s maximum exposure under these arrangements is unknown, as this would involve future claims that may be made against the Fund that have not yet occurred. The risk of material loss from such claims is considered remote.
Note 4 — Fees and transactions with affiliates
John Hancock Investment Management Services, LLC (the Adviser) serves as investment adviser for the Fund. John Hancock Funds, LLC (the Distributor), an affiliate of the Adviser, serves as principal underwriter of the Trust. The Adviser and the Distributor are indirect wholly owned subsidiaries of Manulife Financial Corporation (MFC).
Management fee. The Fund has an investment management contract with the Adviser under which the Fund pays a daily management fee to the Adviser equivalent, on an annual basis, to the sum of: (a) 0.800% of the first $500,000,000 of the Fund’s average daily net assets; (b) 0.775% of the next $500,000,000; (c) 0.750% of the next $500,000,000; (d) 0.725% of the next $1,000,000,000; and (e) 0.700% of the Fund’s average daily net assets in excess of $2,500,000,000. The Adviser has a subadvisory agreement with Robeco Investment Management, Inc. The Fund is not responsible for payment of the subadvisory fees.
The investment management fees incurred for the six months ended February 28, 2011 were equivalent to an annual effective rate of 0.80% of the Fund’s average daily net assets.
The Adviser has agreed to reimburse or limit certain expenses for each share class of the Fund. This agreement excludes taxes, portfolio brokerage commissions, interest and litigation and indemnification expenses, shareholder services fees and other extraordinary expenses not incurred in the ordinary course of the Fund’s business. The reimbursements and limits are such that these expenses will not exceed 1.25%, 1.00% and 1.25% for Class A, Class I and Class ADV shares, respectively. The expense reimbursements and limits will continue in effect until December 31, 2011 for Class A shares and July 9, 2012 for Class I and Class ADV shares.
Accordingly, these expense reductions amounted to $41,655 and $737 for Class A and Class ADV shares, respectively, for the six months ended February 28, 2011.
Accounting and legal services. Pursuant to the service agreement the Fund reimburses the Adviser for all expenses associated with providing the administrative, financial, legal, accounting and recordkeeping services of the Fund, including the preparation of all tax returns, periodic reports to shareholders and regulatory reports, among other services. These expenses are allocated to each share class based on its relative net assets at the time the expense was incurred. The accounting and legal services fees incurred for the six months ended February 28, 2011 amounted to an annual rate of 0.02% of the Fund’s average daily net assets.
| 24 | Disciplined Value Mid Cap Fund | Semiannual report |
Distribution and service plans. The Fund has a distribution agreement with the Distributor. The Fund has adopted distribution and service plans with respect to Class A and Class ADV shares pursuant to Rule 12b-1 under the 1940 Act, to pay the Distributor for services provided as the distributor of shares of the Fund. The Fund may pay up to 0.30% and 0.25% for Class A and Class ADV shares, respectively, for distribution and service fees under these arrangements, expressed as an annual percentage of average daily net assets. As of February 28, 2011, Class A shares paid 0.25% of average daily net assets.
Sales charges. Class A shares are assessed up-front sales charges, which resulted in payments to the Distributor amounting to $73,061 for the six months ended February 28, 2011. Of this amount, $11,777 was retained and used for printing prospectuses, advertising, sales literature and other purposes, $60,078 was paid as sales commissions to broker-dealers and $1,206 was paid as sales commissions to sales personnel of Signator Investors, Inc. (Signator Investors), a broker-dealer affiliate of the Adviser.
Transfer agent fees. The Fund has a transfer agent agreement with John Hancock Signature Services, Inc. (Signature Services or Transfer Agent), an affiliate of the Adviser. The transfer agent fees paid to Signature Services are determined based on the cost to Signature Services (Signature Services Cost) of providing recordkeeping services. The Signature Services Cost includes a component of allocated John Hancock corporate overhead for providing transfer agent services to the Fund and to all other John Hancock affiliated funds. It also includes out-of-pocket expenses that are comprised of payments made to third-parties for recordkeeping services provided to their clients who invest in one or more John Hancock funds. In addition, Signature Services Cost may be reduced by certain revenues that Signature Services receive in connection with the service they provide to the funds. Signature Services Cost is calculated monthly and allocated, as applicable, to four categories of share classes: Institutional Share Classes, Retirement Share Classes, Municipal Bond Classes and all other Retail Share Classes. Within each of these categories, the applicable costs are allocated to the affected John Hancock affiliated funds and/or classes, based on the relative average daily net assets.
Class level expenses. Class level expenses for the six months ended February 28, 2011 were:
| DISTRIBUTION | TRANSFER | STATE | PRINTING AND | |
| CLASS | AND SERVICE FEES | AGENT FEES | REGISTRATION FEES | POSTAGE |
| Class A | $130,540 | $87,164 | $2,202 | $3,707 |
| Class I | — | 22,284 | 15,539 | 5,248 |
| Class ADV | 38 | 28 | 645 | 79 |
| Total | $130,578 | $109,476 | $18,386 | $9,034 |
Trustee expenses. The Trust compensates each Trustee who is not an employee of the Adviser or its affiliates. These Trustees may, for tax purposes, elect to defer receipt of this compensation under the John Hancock Group of Funds Deferred Compensation Plan (the Plan). Deferred amounts are invested in various John Hancock funds and remain in the funds until distributed in accordance with the Plan. The investment of deferred amounts and the offsetting liability are included within Other receivables and prepaid expenses and Payable to affiliates — Trustees’ fees, respectively, in the accompanying Statement of Assets and Liabilities.
| Semiannual report | Disciplined Value Mid Cap Fund | 25 |
Note 5 — Fund share transactions
Transactions in Fund shares for the six months ended February 28, 2011 and for the year ended August 31, 2010 were as follows:
| Six months ended 2-28-11 | Year ended 8-31-10 | |||||
| Shares | Amount | Shares | Amount | |||
| Class A shares | ||||||
| Sold | 4,836,473 | $52,438,187 | 8,777,014 | $83,785,587 | ||
| Distributions reinvested | 8,933 | 97,188 | 10,325 | 90,650 | ||
| Repurchased | (1,141,822) | (12,054,049) | (1,798,769) | (16,412,636) | ||
| Net increase | 3,703,584 | $40,481,326 | 6,988,570 | $67,463,601 | ||
| Class I shares | ||||||
| Sold | 3,877,395 | $43,152,207 | 6,811,708 | $64,123,319 | ||
| Distributions reinvested | 13,096 | 146,545 | 33,541 | 302,876 | ||
| Repurchased | (550,596) | (5,986,376) | (1,000,633) | (9,349,135) | ||
| Net increase | 3,339,895 | $37,312,376 | 5,844,616 | $55,077,060 | ||
| Class ADV shares | ||||||
| Sold | 1,914 | $22,600 | 2,822 | $25,000 | ||
| Net increase | 1,914 | $22,600 | 2,822 | $25,000 | ||
| Net increase | 7,045,393 | $77,816,302 | 12,836,008 | $122,565,661 | ||
Affiliates of the Fund owned 60% of shares of beneficial interest of Class ADV shares on February 28, 2011.
Note 6 — Purchase and sale of securities
Purchases and sales of securities, other than short-term securities, aggregated $121,042,864 and $47,355,789, respectively, for the six months ended February 28, 2011.
Note 7 — Reorganization
At the close of business on July 9, 2010, the Fund acquired all the assets and liabilities of the Predecessor Fund in exchange for the Class A and Class I shares of the Fund. The Fund had no assets, liabilities or operations prior to the reorganization.
The Agreement provided for (a) the acquisition of all the assets, subject to all of the liabilities, of the Predecessor Fund in exchange for a representative amount of shares of the Fund; (b) the liquidation of the Predecessor Fund; and (c) the distribution to the Predecessor Fund’s shareholders of the Fund’s shares. The reorganization was intended to allow the Fund to be better positioned to increase asset size and achieve additional economies of scale by achieving net prices on securities trades and spread fixed expenses over a larger asset base. As a result of the reorganization, the Fund is the legal survivor, however, the accounting and performance history of the Investor Class and Institutional Class of the Predecessor Fund have been redesignated as that of Class A and Class I of the Fund.
Based on the opinion of tax counsel, the reorganization qualified as a tax-free reorganization for federal income tax purposes with no gain or loss recognized by the Predecessor Fund or its shareholders. In addition, the expenses of the reorganization were borne by the Advisers of both the Predecessor Fund and the Fund. The effective time of the reorganization occurred immediately after the close of regularly scheduled trading on the New York Stock Exchange (NYSE) on July 9, 2010. The following outlines the reorganization:
| 26 | Disciplined Value Mid Cap Fund | Semiannual report |
| ACQUIRED NET ASSET | DEPRECIATION OF | |||
| VALUE OF THE | ACQUIRED FUND’S | SHARES ISSUED | TOTAL NET ASSETS | |
| ACQUIRING FUND | ACQUIRED FUND | INVESTMENTS | BY THE FUND | AFTER COMBINATION |
| Robeco Boston Partners | $154,240,210 | ($5,243,829) | 17,142,708 | $154,240,210 |
| Mid Cap Value Fund | ||||
At the time of the reorganization, certain capital loss carryforward attributable to the Predecessor Fund may be able to be used by the Fund to offset future net realized capital gains. To the extent that such carryforward are used by the Fund, it will reduce the amount of capital gain distributions to be paid. Capital loss carryforward transferred from the Predecessor Fund to the Fund was $2,550,027 and expires on August 31, 2017.
| Semiannual report | Disciplined Value Mid Cap Fund | 27 |
More information
| Trustees | Investment adviser | |
| Steven R. Pruchansky, Chairperson | John Hancock Investment Management | |
| James F. Carlin | Services, LLC | |
| William H. Cunningham | ||
| Deborah C. Jackson* | Subadviser | |
| Charles L. Ladner, Vice Chairperson* | Robeco Investment Management, Inc. | |
| Stanley Martin* | ||
| Hugh McHaffie | Principal distributor | |
| Dr. John A. Moore | John Hancock Funds, LLC | |
| Patti McGill Peterson* | ||
| Gregory A. Russo | Custodian | |
| John G. Vrysen | State Street Bank and Trust Company | |
| Officers | Transfer agent | |
| Keith F. Hartstein | John Hancock Signature Services, Inc. | |
| President and Chief Executive Officer | ||
| Legal counsel | ||
| Andrew G. Arnott | K&L Gates LLP | |
| Senior Vice President and Chief Operating Officer | ||
| Thomas M. Kinzler | The report is certified under the Sarbanes-Oxley | |
| Secretary and Chief Legal Officer | Act, which requires mutual funds and other public | |
| companies to affirm that, to the best of their | ||
| Francis V. Knox, Jr. | knowledge, the information in their financial reports | |
| Chief Compliance Officer | is fairly and accurately stated in all material respects. | |
| Charles A. Rizzo | ||
| Chief Financial Officer | ||
| Salvatore Schiavone | ||
| Treasurer | ||
| *Member of the Audit Committee | ||
The Fund’s proxy voting policies and procedures, as well as the Fund’s proxy voting record for the most recent twelve-month period ended June 30, are available free of charge on the Securities and Exchange Commission (SEC) Web site at www.sec.gov or on our Web site.
The Fund’s complete list of portfolio holdings, for the first and third fiscal quarters, is filed with the SEC on Form N-Q. The Fund’s Form N-Q is available on our Web site and the SEC’s Web site, www.sec.gov, and can be reviewed and copied (for a fee) at the SEC’s Public Reference Room in Washington, DC. Call 1-800-SEC-0330 to receive information on the operation of the SEC’s Public Reference Room.
We make this information on your fund, as well as monthly portfolio holdings, and other fund details available on our Web site www.jhfunds.com or by calling 1-800-225-5291.
| You can also contact us: | ||
| 1-800-225-5291 | Regular mail: | Express mail: |
| jhfunds.com | John Hancock Signature Services, Inc. | John Hancock Signature Services, Inc. |
| P.O. Box 55913 | Mutual Fund Image Operations | |
| Boston, MA 02205-5913 | 30 Dan Road | |
| Canton, MA 02021 |
| 28 | Disciplined Value Mid Cap Fund | Semiannual report |

1-800-225-5291
1-800-554-6713 TDD
1-800-338-8080 EASI-Line
www.jhfunds.com
Now available: electronic delivery
www.jhfunds.com/edelivery
| This report is for the information of the shareholders of John Hancock Disciplined Value Mid Cap Fund. | 363SA 2/11 |
| It is not authorized for distribution to prospective investors unless preceded or accompanied by a prospectus. | 4/11 |
ITEM 2. CODE OF ETHICS.
Not applicable at this time.
ITEM 3. AUDIT COMMITTEE FINANCIAL EXPERT.
Not applicable at this time.
ITEM 4. PRINCIPAL ACCOUNTANT FEES AND SERVICES.
Not applicable at this time.
ITEM 5. AUDIT COMMITTEE OF LISTED REGISTRANTS.
Not applicable at this time.
ITEM 6. SCHEDULE OF INVESTMENTS.
(a) This schedule is included as part of the Report to shareholders filed under Item 1 of this form.
(b) Not applicable.
ITEM 7. DISCLOSURE OF PROXY VOTING POLICIES AND PROCEDURES FOR CLOSED-END MANAGEMENT INVESTMENT COMPANIES.
Not applicable.
ITEM 8. PORTFOLIO MANAGERS OF CLOSED-END MANAGEMENT INVESTMENT COMPANIES.
Not applicable.
ITEM 9. PURCHASES OF EQUITY SECURITIES BY CLOSED-END MANAGEMENT INVESTMENT COMPANY AND AFFILIATED PURCHASERS.
Not applicable.
ITEM 10. SUBMISSION OF MATTERS TO A VOTE OF SECURITY HOLDERS.
Not applicable.
ITEM 11. CONTROLS AND PROCEDURES.
(a) EVALUATION OF DISCLOSURE CONTROLS AND PROCEDURES. The registrant maintains disclosure controls and procedures that are designed to ensure that information required to be disclosed in this Form N-CSR is recorded, processed, summarized and reported within the time periods specified in the rules and forms of the Securities and Exchange Commission. Such disclosure and procedures include controls and procedures designed to ensure that such information is accumulated and communicated to the registrant’s management, including its principal executive officer and principal financial officer, as appropriate, to allow timely decisions regarding required disclosure.
Within 90 days prior to the filing date of this Form N-CSR, the registrant had carried out an evaluation, under the supervision and with the participation of the registrant’s management, including the registrant’s principal executive officer and the registrant’s principal financial officer,
of the effectiveness of the design and operation of the registrant’s disclosure controls and procedures relating to information required to be disclosed on Form N-CSR. Based on such evaluation, the registrant’s principal executive officer and principal financial officer concluded that the registrant’s disclosure controls and procedures are operating effectively to ensure that:
(i) information required to be disclosed in this Form N-CSR is recorded, processed, summarized and reported within the periods specified in the rules and forms of the Securities and Exchange Commission, and
(ii) information is accumulated and communicated to the registrant’s management, including its principal executive officer and principal financial officer, as appropriate, to allow timely decisions regarding required disclosure.
(b) CHANGE IN REGISTRANT’S INTERNAL CONTROL: Not applicable.
ITEM 12. EXHIBITS.
(a) The certification required by Rule 30a-2(a) under the 1940 Act.
(b) The certification required by Rule 30a-2(b) under the 1940 Act.
(c) Contact person at the registrant.
| SIGNATURES |
Pursuant to the requirements of the Securities Exchange Act of 1934 and the Investment Company Act of 1940, the registrant has duly caused this report to be signed on its behalf by the undersigned, thereunto duly authorized.
John Hancock Funds III
By: /s/ Keith F. Hartstein
------------------------------
Keith F. Hartstein
President and
Chief Executive Officer
Date: April 19, 2011
Pursuant to the requirements of the Securities Exchange Act of 1934 and the Investment Company Act of 1940, this report has been signed below by the following persons on behalf of the registrant and in the capacities and on the dates indicated.
By: /s/ Keith F. Hartstein
-------------------------------
Keith F. Hartstein
President and
Chief Executive Officer
Date: April 19, 2011
By: /s/ Charles A. Rizzo
--------------------------------
Charles A. Rizzo
Chief Financial Officer
Date: April 19, 2011