| UNITED STATES | |
| SECURITIES AND EXCHANGE COMMISSION | |
| Washington, D.C. 20549 | |
| FORM N-CSR | |
| CERTIFIED SHAREHOLDER REPORT OF REGISTERED | |
| MANAGEMENT INVESTMENT COMPANIES | |
| Investment Company Act file number 811-21777 | |
| John Hancock Funds III | |
| (Exact name of registrant as specified in charter) | |
| 601 Congress Street, Boston, Massachusetts 02210 | |
| (Address of principal executive offices) (Zip code) | |
| Salvatore Schiavone | |
| Treasurer | |
| 601 Congress Street | |
| Boston, Massachusetts 02210 | |
| (Name and address of agent for service) | |
| Registrant's telephone number, including area code: 617-663-4497 | |
| Date of fiscal year end: | February 28 |
| Date of reporting period: | August 31, 2012 |
ITEM 1. SCHEDULE OF INVESTMENTS
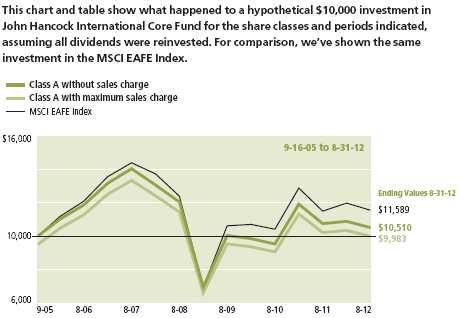
A look at performance
Total returns for the period ended August 31, 2012
| Average annual total returns (%) | Cumulative total returns (%) | ||||||||
| with maximum sales charge | with maximum sales charge | ||||||||
| Since | Since | ||||||||
| 1-year | 5-year | 10-year | inception | 6-months | 1-year | 5-year | 10-year | inception | |
| Class A1 | –7.10 | –6.63 | — | –0.02 | –8.26 | –7.10 | –29.05 | — | –0.17 |
| Class B2 | –7.71 | –6.64 | — | 0.01 | –8.58 | –7.71 | –29.08 | — | 0.05 |
| Class C2 | –3.89 | –6.34 | — | 0.01 | –4.73 | –3.89 | –27.92 | — | 0.05 |
| Class I2,3 | –1.81 | –5.22 | — | 1.20 | –3.20 | –1.81 | –23.50 | — | 8.63 |
| Class R12,3 | –2.50 | –5.86 | — | 0.47 | –3.58 | –2.50 | –26.05 | — | 3.31 |
| Class R22,3 | –2.88 | –6.77 | — | –0.38 | –3.45 | –2.88 | –29.57 | — | –2.63 |
| Class R33,4 | –2.37 | NA | — | 5.55 | –3.49 | –2.37 | NA | — | 19.39 |
| Class R43,4 | –2.10 | NA | — | 5.86 | –3.38 | –2.10 | NA | — | 20.54 |
| Class R53,4 | –1.83 | NA | — | 6.18 | –3.24 | –1.83 | NA | — | 21.74 |
| Class R63 | –1.75 | –5.13 | — | 1.42 | –3.20 | –1.75 | –23.13 | — | 10.28 |
| Class 13,5 | –1.72 | –5.16 | — | –2.03 | –3.16 | –1.72 | –23.27 | — | –11.26 |
| Class NAV 3,6 | –1.69 | –5.11 | — | –1.36 | –3.17 | –1.69 | –23.08 | — | –7.91 |
Performance figures assume all distributions are reinvested. Figures reflect maximum sales charges on Class A shares of 5%, and the applicable contingent deferred sales charge (CDSC) on Class B and Class C shares. The Class B shares’ CDSC declines annually between years 1 to 6 according to the following schedule: 5, 4, 3, 3, 2, 1%. No sales charge will be assessed after the sixth year. Class C shares held for less than one year are subject to a 1% CDSC. Sales charges are not applicable for Class I, Class R1, Class R2, Class R3, Class R4, Class R5, Class R6, Class 1 and Class NAV shares.
The expense ratios of the Fund, both net (including any fee waivers or expense limitations) and gross (excluding any fee waivers or expense limitations), are set forth according to the most recent publicly available prospectuses for the Fund and may differ from those disclosed in the Financial highlights tables in this report. The fee waivers and expense limitations are contractual at least until 6-30-13 for Class A, Class B, Class C, Class R1, Class R2, Class R3, Class R4, Class R5 and Class R6 shares. Had the fee waivers and expense limitations not been in place gross expenses would apply. For all other classes the net expenses equal the gross expenses. The expense ratios are as follows:
| Class A | Class B | Class C | Class I | Class R1 | Class R2 | Class R3 | Class R4 | Class R5 | Class R6 | Class 1 | Class NAV | |
| Net (%) | 1.58 | 2.30 | 2.30 | 1.16 | 1.90 | 1.65 | 1.80 | 1.40 | 1.20 | 1.12 | 1.07 | 1.02 |
| Gross (%) | 1.58 | 2.49 | 2.50 | 1.16 | 7.37 | 2.97 | 45.66 | 42.64 | 20.87 | 16.83 | 1.07 | 1.02 |
The returns reflect past results and should not be considered indicative of future performance. The return and principal value of an investment will fluctuate so that shares, when redeemed, may be worth more or less than their original cost. Due to market volatility, the Fund’s current performance may be higher or lower than the performance shown. For current to the most recent month-end performance data, please call 1-800-225-5291 or visit the Fund’s Web site at www.jhfunds.com.
The performance table above and the chart on the next page do not reflect the deduction of taxes that a shareholder would pay on fund distributions or the redemption of fund shares. The Fund’s performance results reflect any applicable expense reductions, without which the expenses increase and results would have been less favorable.
See the following page for footnotes.
| 6 | International Core Fund | Semiannual report |
| Without | With maximum | |||
| Start date | sales charge | sales charge | Index | |
| Class B 7 | 9-16-05 | $10,005 | $10,005 | $11,589 |
| Class C7 | 9-16-05 | 10,005 | 10,005 | 11,589 |
| Class I 3 | 9-16-05 | 10,863 | 10,863 | 11,589 |
| Class R1 3 | 9-16-05 | 10,331 | 10,331 | 11,589 |
| Class R2 3 | 9-16-05 | 9,737 | 9,737 | 11,589 |
| Class R33 | 5-22-09 | 11,939 | 11,939 | 12,827 |
| Class R4 3 | 5-22-09 | 12,054 | 12,054 | 12,827 |
| Class R5 3 | 5-22-09 | 12,174 | 12,174 | 12,827 |
| Class R6 3 | 9-16-05 | 11,028 | 11,028 | 11,589 |
| Class 1 3 | 11-6-06 | 8,874 | 8,874 | 9,194 |
| Class NAV 3 | 8-29-06 | 9,209 | 9,209 | 9,624 |
MSCI EAFE Index (gross of foreign withholding tax on dividends) (Europe, Australasia, Far East) is a free float-adjusted market capitalization index that is designed to measure developed market equity performance, excluding the U.S. and Canada. It is not possible to invest directly in an index. Index figures do not reflect sales charges, which would have resulted in lower values if they did.
Footnotes related to a look at performance
1 On 6-9-06, through a reorganization, the Fund acquired all of the assets of the GMO International Disciplined Equity Fund (the predecessor fund). The predecessor fund offered its Class III shares, inception date 9-16-05, in exchange for Class A shares, which were first offered on 6-12-06. The predecessor fund’s Class III shares returns have been recalculated to reflect the gross fees and expenses of Class A shares.
2 Class B, Class C, Class I and Class R1 shares were first offered on 6-12-06; Class R6 shares were first offered on 9-1-11; Class R2 shares were first offered on 3-1-12. Returns prior to these dates are those of Class A shares that have been recalculated to apply the gross fees and expenses of Class B, Class C, Class I, Class R1, Class R6 and R2 shares, respectively.
3 For certain types of investors, as described in the Fund’s prospectuses.
4 From 5-22-09.
5 From 11-6-06.
6 From 8-29-06.
7 No contingent deferred sales charge is applicable.
| Semiannual report | International Core Fund | 7 |
Your expenses
These examples are intended to help you understand your ongoing operating expenses of investing in the Fund so you can compare these costs with the ongoing costs of investing in other mutual funds.
Understanding fund expenses
As a shareholder of the Fund, you incur two types of costs:
▪ Transaction costs which include sales charges (loads) on purchases or redemptions (varies by share class), minimum account fee charge, etc.
▪ Ongoing operating expenses including management fees, distribution and service fees (if applicable), and other fund expenses.
We are going to present only your ongoing operating expenses here.
Actual expenses/actual returns
This example is intended to provide information about the Fund’s actual ongoing operating expenses, and is based on the Fund’s actual return. It assumes an account value of $1,000.00 on March 1, 2012 with the same investment held until August 31, 2012.
| Account value | Ending value | Expenses paid during | |
| on 3-1-12 | on 8-31-12 | period ended 8-31-121 | |
| Class A | $1,000.00 | $965.70 | $7.83 |
| Class B | 1,000.00 | 962.33 | 11.38 |
| Class C | 1,000.00 | 962.33 | 11.38 |
| Class I | 1,000.00 | 968.00 | 5.85 |
| Class R1 | 1,000.00 | 964.15 | 9.41 |
| Class R3 | 1,000.00 | 965.11 | 8.92 |
| Class R4 | 1,000.00 | 966.22 | 7.24 |
| Class R5 | 1,000.00 | 967.60 | 5.95 |
| Class R6 | 1,000.00 | 968.40 | 5.56 |
| Class 1 | 1,000.00 | 968.40 | 5.31 |
| Class NAV | 1,000.00 | 968.35 | 5.06 |
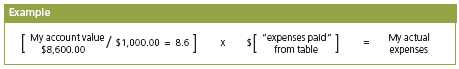
Together with the value of your account, you may use this information to estimate the operating expenses that you paid over the period. Simply divide your account value at August 31, 2012, by $1,000.00, then multiply it by the “expenses paid” for your share class from the table above. For example, for an account value of $8,600.00, the operating expenses should be calculated as follows:
| 8 | International Core Fund | Semiannual report |
Hypothetical example for comparison purposes
This table allows you to compare the Fund’s ongoing operating expenses with those of any other fund. It provides an example of the Fund’s hypothetical account values and hypothetical expenses based on each class’s actual expense ratio and an assumed 5% annualized return before expenses (which is not the Fund’s actual return). It assumes an account value of $1,000.00 on March 1, 2012, with the same investment held until August 31, 2012. Look in any other fund shareholder report to find its hypothetical example and you will be able to compare these expenses.
| Account value | Ending value | Expenses paid during | |
| on 3-1-12 | on 8-31-12 | period ended 8-31-121 | |
| Class A | $1,000.00 | $1,017.20 | $8.03 |
| Class B | 1,000.00 | 1,013.60 | 11.67 |
| Class C | 1,000.00 | 1,013.60 | 11.67 |
| Class I | 1,000.00 | 1,019.30 | 6.01 |
| Class R1 | 1,000.00 | 1,015.60 | 9.65 |
| Class R3 | 1,000.00 | 1,016.10 | 9.15 |
| Class R4 | 1,000.00 | 1,017.80 | 7.43 |
| Class R5 | 1,000.00 | 1,019.20 | 6.11 |
| Class R6 | 1,000.00 | 1,019.60 | 5.70 |
| Class 1 | 1,000.00 | 1,019.80 | 5.45 |
| Class NAV | 1,000.00 | 1,020.10 | 5.19 |
Remember, these examples do not include any transaction costs, therefore, these examples will not help you to determine the relative total costs of owning different funds. If transaction costs were included, your expenses would have been higher. See the prospectus for details regarding transaction costs.
1 Expenses are equal to the Fund’s annualized expense ratio of 1.58%, 2.30%, 2.30%, 1.18%, 1.90%, 1.65%, 1.80%, 1.46%, 1.20%, 1.12%, 1.07% and 1.02% for Class A, Class B, Class C, Class I, Class R1, Class R2, Class R3, Class R4, Class R5, Class R6, Class 1 and Class NAV shares, respectively, multiplied by the average account value over the period, multiplied by 184/365 (to reflect the one-half year period).
| Semiannual report | International Core Fund | 9 |
Portfolio summary
| Top 10 Holdings (20.5% of Net Assets on 8-31-12)1,2 | ||||
| Total SA | 4.0% | BP PLC | 2.0% | |
| Sanofi | 3.3% | ENI SpA | 1.7% | |
| AstraZeneca PLC | 3.0% | Vodafone Group PLC | 1.7% | |
| E.ON AG | 2.3% | Banco Santander SA | 1.6% | |
| GlaxoSmithKline PLC | 2.1% | Telefonica SA | 1.5% | |
| Sector Composition1,3 | ||||
| Health Care | 15.2% | Consumer Staples | 9.1% | |
| Financials | 13.7% | Utilities | 6.4% | |
| Energy | 13.2% | Materials | 4.6% | |
| Telecommunication Services | 10.7% | Information Technology | 3.8% | |
| Industrials | 10.1% | Short-Term Investments & Other | 3.6% | |
| Consumer Discretionary | 9.6% | |||
| Top 10 Countries1,3 | ||||
| Japan | 23.5% | Spain | 5.5% | |
| United Kingdom | 18.7% | Italy | 5.1% | |
| France | 10.4% | Netherlands | 4.5% | |
| Germany | 6.5% | Switzerland | 3.6% | |
| Australia | 5.9% | Canada | 3.2% | |
1 As a percentage of net assets on 8-31-12.
2 Cash and cash equivalents not included.
3 International investing involves special risks such as political, economic and currency risks and differences in accounting standards and financial reporting. Sector investing is subject to greater risks than the market as a whole. Because the Fund may focus on particular sectors of the economy, its performance may depend on the performance of those sectors.
| 10 | International Core Fund | Semiannual report |
Fund’s investments
As of 8-31-12 (unaudited)
| Shares | Value | |
| Common Stocks 95.8% | $1,390,367,175 | |
| (Cost $1,431,888,482) | ||
| Australia 5.9% | 86,092,749 | |
| ALS, Ltd. | 149,800 | 1,280,548 |
| Arrium, Ltd. | 1,881,120 | 1,265,543 |
| Australia & New Zealand Banking Group, Ltd. | 81,447 | 2,095,480 |
| BGP Holdings PLC (I) | 2,714,128 | 3 |
| BHP Billiton, Ltd. | 89,435 | 2,940,087 |
| Billabong International, Ltd. (L) | 526,794 | 737,859 |
| BlueScope Steel, Ltd. (I) | 5,810,717 | 2,021,805 |
| Commonwealth Bank of Australia | 74,634 | 4,233,450 |
| CSL, Ltd. | 63,079 | 2,902,637 |
| David Jones, Ltd. | 33,557 | 84,088 |
| Dexus Property Group | 2,490,105 | 2,464,265 |
| Goodman Fielder, Ltd. | 3,377,565 | 1,818,830 |
| Goodman Group | 576,397 | 2,386,876 |
| GPT Group | 832,161 | 3,019,905 |
| Investa Office Fund | 657,642 | 1,928,150 |
| JB Hi-Fi, Ltd. (L) | 147,524 | 1,395,554 |
| Macquarie Group, Ltd. | 83,601 | 2,331,018 |
| Mirvac Group | 1,642,858 | 2,297,741 |
| Pacific Brands, Ltd. | 837,300 | 531,598 |
| Qantas Airways, Ltd. (I) | 577,543 | 688,618 |
| QBE Insurance Group, Ltd. (L) | 873,312 | 11,790,085 |
| Resolute Mining, Ltd. (I) | 779,004 | 1,189,419 |
| Stockland | 1,283,842 | 4,228,293 |
| TABCORP Holdings, Ltd. | 638,790 | 1,931,694 |
| Tatts Group, Ltd. | 69,403 | 195,453 |
| Telstra Corp., Ltd. | 4,123,395 | 16,431,813 |
| Wesfarmers, Ltd. | 112,873 | 4,037,717 |
| Westpac Banking Corp. | 384,310 | 9,864,220 |
| Austria 0.5% | 7,946,473 | |
| Andritz AG | 24,509 | 1,261,773 |
| OMV AG | 123,179 | 4,082,304 |
| Raiffeisen Bank International AG (L) | 24,267 | 808,371 |
| Voestalpine AG | 62,837 | 1,794,025 |
| See notes to financial statements | Semiannual report | International Core Fund | 11 |
| Shares | Value | |
| Belgium 1.5% | $21,773,203 | |
| Ageas | 123,098 | 2,740,049 |
| Anheuser-Busch InBev NV | 180,361 | 15,168,972 |
| Belgacom SA | 86,231 | 2,553,499 |
| Delhaize Group SA | 33,099 | 1,310,683 |
| Bermuda 0.1% | 1,204,615 | |
| Golden Ocean Group, Ltd. | 36,711 | 25,207 |
| Lancashire Holdings, Ltd. | 92,704 | 1,179,408 |
| Canada 3.2% | 46,026,377 | |
| Alimentation Couche Tard, Inc. | 21,800 | 1,108,853 |
| BCE, Inc. (L) | 99,300 | 4,414,229 |
| Canadian National Railway Company | 52,400 | 4,794,806 |
| Canadian Natural Resources, Ltd. | 183,000 | 5,567,507 |
| Canadian Pacific Railway, Ltd. | 9,800 | 810,047 |
| Enbridge, Inc. | 139,400 | 5,488,323 |
| Encana Corp. (L) | 282,700 | 6,257,686 |
| First Quantum Minerals, Ltd. | 108,700 | 2,094,053 |
| Husky Energy, Inc. | 76,500 | 2,023,185 |
| IGM Financial, Inc. | 26 | 1,000 |
| Methanex Corp. | 8,900 | 265,262 |
| Metro, Inc. (L) | 36,400 | 2,114,394 |
| Research In Motion, Ltd. (I)(L) | 335,700 | 2,237,432 |
| Royal Bank of Canada | 69,400 | 3,884,147 |
| Sherritt International Corp. | 19,500 | 86,843 |
| Sun Life Financial, Inc. | 209,000 | 4,878,610 |
| China 0.1% | 1,091,776 | |
| Yangzijiang Shipbuilding Holdings, Ltd. | 1,378,000 | 1,091,776 |
| Denmark 0.9% | 13,083,076 | |
| Coloplast A/S | 629 | 125,482 |
| GN Store Nord A/S | 11,270 | 152,188 |
| Novo Nordisk A/S | 81,382 | 12,805,406 |
| Finland 0.6% | 8,193,812 | |
| Neste Oil OYJ | 86,945 | 998,962 |
| Nokia OYJ (L) | 2,242,085 | 6,329,665 |
| Nokian Renkaat OYJ | 21,027 | 824,508 |
| Tieto OYJ | 2,376 | 40,677 |
| France 10.4% | 150,225,596 | |
| Air France KLM (I)(L) | 489,576 | 2,460,168 |
| Arkema SA | 41,084 | 3,496,223 |
| Artprice.com (I)(L) | 11,302 | 340,848 |
| AXA SA | 106,877 | 1,540,850 |
| BNP Paribas SA | 82,971 | 3,588,121 |
| Cie Generale d’Optique Essilor International SA | 27,701 | 2,414,880 |
| France Telecom SA | 276,485 | 3,816,968 |
| L’Oreal SA | 8,869 | 1,088,773 |
| Lagardere SCA | 68,431 | 1,916,124 |
| Pernod-Ricard SA | 22,417 | 2,412,014 |
| 12 | International Core Fund | Semiannual report | See notes to financial statements |
| Shares | Value | |
| France (continued) | ||
| Peugeot SA (I)(L) | 484,907 | $3,657,602 |
| Rallye SA | 19,667 | 588,199 |
| Remy Cointreau SA | 1,427 | 162,885 |
| Renault SA | 167,788 | 7,817,047 |
| Safran SA | 15,767 | 551,427 |
| Sanofi | 586,003 | 47,862,168 |
| Total SA | 1,166,270 | 58,115,615 |
| Vivendi SA | 323,685 | 6,334,312 |
| Zodiac Aerospace | 21,659 | 2,061,372 |
| Germany 5.9% | 85,262,369 | |
| Adidas AG | 40,452 | 3,161,229 |
| Aurubis AG | 55,820 | 3,019,269 |
| Bayer AG | 48,171 | 3,736,258 |
| Beiersdorf AG | 6,593 | 472,100 |
| Continental AG | 17,250 | 1,712,245 |
| Deutsche Lufthansa AG | 167,338 | 2,061,037 |
| Deutsche Post AG | 49,472 | 959,233 |
| Duerr AG | 24,372 | 1,601,485 |
| E.ON AG | 1,450,316 | 33,295,592 |
| Fresenius SE & Company KGaA | 34,951 | 3,725,134 |
| GEA Group AG | 75,678 | 1,997,462 |
| Lanxess AG | 29,917 | 2,266,533 |
| Leoni AG | 54,571 | 2,041,175 |
| Muenchener Rueckversicherungs AG | 25,047 | 3,708,012 |
| RWE AG | 224,566 | 9,401,617 |
| Salzgitter AG | 34,281 | 1,259,421 |
| SAP AG | 129,158 | 8,511,376 |
| Suedzucker AG | 69,634 | 2,333,191 |
| Greece 0.2% | 2,559,968 | |
| OPAP SA | 267,253 | 1,848,476 |
| Public Power Corp. SA (I) | 216,317 | 711,492 |
| Hong Kong 0.8% | 11,260,630 | |
| CLP Holdings, Ltd. | 624,699 | 5,212,528 |
| Esprit Holdings, Ltd. (L) | 1,231,851 | 1,895,995 |
| Melco International Development, Ltd. | 348,417 | 283,789 |
| Pacific Basin Shipping, Ltd. | 1,457,121 | 608,678 |
| Power Assets Holdings, Ltd. | 41,207 | 334,474 |
| Sino-Forest Corp. (I) | 26,210 | 0 |
| Swire Pacific, Ltd., Class A | 144,500 | 1,716,138 |
| Swire Properties, Ltd. | 100 | 287 |
| Yue Yuen Industrial Holdings, Ltd. | 416,380 | 1,208,741 |
| Ireland 1.1% | 16,474,422 | |
| C&C Group PLC | 187,004 | 846,910 |
| CRH PLC | 239,977 | 4,231,643 |
| DCC PLC | 45,980 | 1,199,082 |
| Kerry Group PLC | 54,258 | 2,602,401 |
| Paddy Power PLC | 31,708 | 2,234,915 |
| See notes to financial statements | Semiannual report | International Core Fund | 13 |
| Shares | Value | |
| Ireland (continued) | ||
| Shire PLC | 67,520 | $2,038,928 |
| WPP PLC | 256,413 | 3,320,543 |
| Israel 0.2% | 3,524,462 | |
| Africa Israel Investments, Ltd. (I) | 259,944 | 403,447 |
| Mellanox Technologies, Ltd. (I) | 19,173 | 2,265,087 |
| Partner Communications Company, Ltd. | 201,791 | 855,928 |
| Italy 5.1% | 73,717,692 | |
| Azimut Holding SpA | 60,000 | 635,121 |
| Banca Intesa SpA | 91,570 | 115,959 |
| Davide Campari Milano SpA | 12,393 | 85,076 |
| Enel SpA | 6,442,066 | 21,186,616 |
| ENI SpA | 1,097,939 | 24,275,307 |
| Fiat Industrial SpA | 230,571 | 2,314,474 |
| Fiat SpA (I) | 222,179 | 1,206,480 |
| Finmeccanica SpA (I) | 975,454 | 4,320,448 |
| Fondiaria-SAI SpA (I) | 530 | 685 |
| Impregilo SpA (L) | 253,850 | 916,218 |
| Italcementi SpA — RSP | 2,589 | 6,186 |
| Luxottica Group SpA | 16,475 | 599,743 |
| Mediolanum SpA | 332,457 | 1,301,862 |
| Milano Assicurazioni SpA (I) | 297,599 | 115,307 |
| Pirelli & C. SpA (L) | 331,986 | 3,643,477 |
| Recordati SpA | 80,492 | 577,010 |
| Telecom Italia SpA | 6,443,940 | 5,986,273 |
| Telecom Italia SpA, RSP | 5,105,614 | 4,034,560 |
| Terna Rete Elettrica Nazionale SpA | 355,508 | 1,233,411 |
| Tod’s SpA | 10,951 | 1,163,479 |
| Japan 23.5% | 340,364,940 | |
| Accordia Golf Company, Ltd. | 1,095 | 701,901 |
| Advance Residence Investment Corp. | 414 | 835,333 |
| Advantest Corp. | 113,500 | 1,664,627 |
| AEON Company, Ltd. | 481,300 | 5,542,474 |
| Alps Electric Company, Ltd. | 46 | 247 |
| Anritsu Corp. | 227,000 | 2,758,182 |
| Asahi Group Holdings, Ltd. | 99,200 | 2,409,780 |
| Astellas Pharma, Inc. | 192,500 | 9,415,964 |
| CAPCOM Company, Ltd. | 47,900 | 955,637 |
| Credit Saison Company, Ltd. | 95,700 | 2,252,686 |
| Daikyo, Inc. | 906,000 | 2,190,438 |
| Daito Trust Construction Company, Ltd. | 107,000 | 10,478,299 |
| Daiwabo Holdings Company, Ltd. | 233,000 | 412,398 |
| Dena Company, Ltd. (L) | 107,761 | 3,015,520 |
| DIC Corp. | 342,000 | 566,185 |
| East Japan Railway Company | 44,900 | 3,012,918 |
| Eisai Company, Ltd. | 103,380 | 4,724,310 |
| Fast Retailing Company, Ltd. | 19,600 | 4,591,261 |
| Fuji Electric Company, Ltd. | 336,000 | 670,012 |
| 14 | International Core Fund | Semiannual report | See notes to financial statements |
| Shares | Value | |
| Japan (continued) | ||
| Fuji Heavy Industries, Ltd. | 232,116 | $1,871,346 |
| Fuji Oil Company, Ltd. | 47,300 | 632,950 |
| Gunze, Ltd. | 244,000 | 618,919 |
| Hanwa Company, Ltd. | 192,000 | 650,246 |
| Haseko Corp. (I) | 3,272,000 | 2,055,983 |
| Hikari Tsushin, Inc. | 32,100 | 1,611,056 |
| Inpex Corp. | 392 | 2,240,570 |
| Isuzu Motors, Ltd. | 616,000 | 3,164,569 |
| ITOCHU Corp. | 769,300 | 7,843,624 |
| J Trust Co Ltd. | 4,700 | 44,938 |
| Japan Tobacco, Inc. | 286,000 | 8,636,310 |
| JFE Holdings, Inc. | 188,300 | 2,398,658 |
| Juki Corp. (L) | 229,000 | 333,176 |
| JX Holdings, Inc. | 1,950,500 | 10,158,308 |
| K’s Holding Corp. (L) | 95,900 | 2,736,896 |
| Kajima Corp. | 1,435,000 | 3,996,809 |
| Kakaku.com, Inc. | 30,100 | 1,076,234 |
| Kao Corp. | 112,350 | 3,398,498 |
| Kawasaki Kisen Kaisha, Ltd. (I)(L) | 1,706,000 | 2,309,447 |
| KDDI Corp. | 2,011 | 14,410,993 |
| Kinugawa Rubber Industrial Company, Ltd. (L) | 135,000 | 890,385 |
| Kobe Steel, Ltd. | 929,000 | 715,830 |
| Kohnan Shoji Company, Ltd. (L) | 65,500 | 790,763 |
| Konami Corp. | 53,823 | 1,243,463 |
| Lawson, Inc. | 44,300 | 3,393,953 |
| Leopalace21 Corp. (I)(L) | 407,000 | 1,327,652 |
| Look, Inc. (L) | 104,000 | 927,525 |
| Marubeni Corp. | 787,824 | 5,086,963 |
| Mazda Motor Corp. (I) | 1,729,000 | 2,097,950 |
| Mediceo Holdings Company, Ltd. | 107,735 | 1,544,222 |
| MEIJI Holdings Company, Ltd. | 4,100 | 191,448 |
| Misawa Homes Company, Ltd. | 3,400 | 48,965 |
| Mitsubishi Chemical Holdings Corp. | 763,000 | 2,971,317 |
| Mitsubishi Corp. | 422,895 | 7,832,299 |
| Mitsubishi UFJ Lease & Finance Company, Ltd. | 39,070 | 1,686,106 |
| Mitsui & Company, Ltd. | 166,200 | 2,335,571 |
| Mitsui Engineering & Shipbuilding Company, Ltd. | 905,000 | 999,111 |
| Mitsui Mining & Smelting Company, Ltd. | 874,000 | 1,763,099 |
| Mitsui O.S.K. Lines, Ltd. | 1,031,000 | 2,604,420 |
| Mizuho Financial Group, Inc. | 4,203,200 | 6,805,288 |
| Namco Bandai Holdings, Inc. | 131,400 | 2,089,293 |
| NET One Systems Company, Ltd. | 167,200 | 2,219,687 |
| Nichii Gakkan Company, Ltd. | 10,800 | 111,228 |
| Nikon Corp. | 123,900 | 3,434,331 |
| Nintendo Company, Ltd. | 27,100 | 3,047,817 |
| Nippon Light Metal Company, Ltd. | 1,161,000 | 1,166,383 |
| Nippon Paper Group, Inc. (L) | 143,400 | 1,705,033 |
| Nippon Steel Corp. | 1,649,000 | 3,204,625 |
| See notes to financial statements | Semiannual report | International Core Fund | 15 |
| Shares | Value | |
| Japan (continued) | ||
| Nippon Telegraph & Telephone Corp. | 351,700 | $16,277,922 |
| Nippon Yusen Kabushiki Kaisha | 1,375,000 | 2,795,639 |
| Nipro Corp. | 207,400 | 1,233,848 |
| Nitori Holdings Company, Ltd. | 34,650 | 3,474,497 |
| Nitto Boseki Company, Ltd. | 310,000 | 1,070,876 |
| NTT DoCoMo, Inc. | 3,533 | 6,023,624 |
| Obayashi Corp. | 440,000 | 1,921,883 |
| OKI Electric Industry Company, Ltd. (I) | 604,857 | 708,961 |
| Ono Pharmaceutical Company, Ltd. | 8,800 | 547,216 |
| Osaka Gas Company, Ltd. | 120 | 525 |
| Penta-Ocean Construction Company, Ltd. (L) | 628,500 | 1,471,738 |
| Point, Inc. | 53,790 | 1,930,448 |
| Resona Holdings, Inc. | 2,364,600 | 9,283,958 |
| Ricoh Company, Ltd. (L) | 204,000 | 1,619,270 |
| Round One Corp. | 215,600 | 1,051,416 |
| Ryohin Keikaku Company, Ltd. | 33,100 | 2,039,056 |
| Sankyo Company, Ltd. | 53,800 | 2,489,876 |
| Sanrio Company, Ltd. (L) | 33,100 | 1,145,125 |
| Sapporo Hokuyo Holdings, Inc. | 178,000 | 457,552 |
| Seven & I Holdings Company, Ltd. | 123,700 | 3,762,649 |
| Shinko Electric Industries Company, Ltd. (L) | 159,300 | 1,054,653 |
| Softbank Corp. | 81,300 | 3,325,935 |
| Sojitz Corp. | 1,439,200 | 1,941,476 |
| Sumitomo Corp. | 801,600 | 10,668,296 |
| Sumitomo Light Metal Industries, Ltd. | 829,000 | 734,267 |
| Sumitomo Mitsui Company, Ltd. (I) | 56,100 | 34,680 |
| Sumitomo Mitsui Financial Group | 124,700 | 3,877,091 |
| SxL Corp. (I)(L) | 420,000 | 774,493 |
| Taiheiyo Cement Corp. | 2,066,000 | 4,483,892 |
| Taisei Corp. | 1,419,000 | 3,893,638 |
| Taisho Pharmaceutical Holdings Company, Ltd. | 1,600 | 129,201 |
| Taiyo Yuden Company, Ltd. (L) | 125,300 | 1,095,924 |
| Takeda Pharmaceutical Company, Ltd. | 404,689 | 19,006,137 |
| The Daiei, Inc. (I)(L) | 179,558 | 397,684 |
| Tokyo Tatemono Company, Ltd. (I) | 638,000 | 2,130,247 |
| TonenGeneral Sekiyu KK | 154,133 | 1,305,607 |
| Tosoh Corp. | 349,000 | 740,687 |
| Toyota Motor Corp. | 333,700 | 13,270,078 |
| Toyota Tsusho Corp. | 236,100 | 4,849,002 |
| Tsugami Corp. (L) | 143,000 | 1,090,760 |
| Unicharm Corp. | 40,000 | 2,327,001 |
| Unitika, Ltd. (I) | 1,064,000 | 531,205 |
| UNY Company, Ltd. | 291,700 | 2,428,549 |
| USS Company, Ltd. | 18,490 | 1,988,686 |
| Wacom Company, Ltd. | 344 | 777,928 |
| West Japan Railway Company | 33,200 | 1,454,387 |
| Yamada Denki Company, Ltd. (L) | 168,140 | 8,124,928 |
| 16 | International Core Fund | Semiannual report | See notes to financial statements |
| Shares | Value | |
| Jersey, C.I. 0.1% | $2,086,719 | |
| Randgold Resources, Ltd. | 20,449 | 2,086,719 |
| Netherlands 4.5% | 65,398,086 | |
| Aegon NV | 788,633 | 4,032,981 |
| ASML Holding NV | 157,634 | 8,908,823 |
| CSM NV | 48,729 | 820,034 |
| Delta Lloyd NV | 14,441 | 198,255 |
| European Aeronautic Defence & Space Company NV | 199,126 | 7,583,883 |
| Gemalto NV | 13,010 | 1,030,268 |
| ING Groep NV, ADR (I) | 675,031 | 5,137,259 |
| Koninklijke BAM Groep NV (L) | 400,800 | 1,141,207 |
| Koninklijke Vopak NV | 3,858 | 247,097 |
| Royal Dutch Shell PLC, B Shares | 439,698 | 15,866,148 |
| Royal Dutch Shell PLC, Class A (London Stock Exchange) | 427,624 | 14,972,204 |
| SNS REAAL NV (I) | 30,632 | 43,833 |
| Unilever NV | 134,208 | 4,675,915 |
| Wereldhave NV | 14,415 | 740,179 |
| New Zealand 0.6% | 9,337,457 | |
| Chorus, Ltd. (I) | 540,686 | 1,467,082 |
| Fletcher Building, Ltd. | 349,254 | 1,871,344 |
| Telecom Corp. of New Zealand, Ltd. | 3,031,650 | 5,999,031 |
| Norway 0.2% | 3,404,992 | |
| Aker Solutions ASA | 84,915 | 1,549,562 |
| TGS-NOPEC Geophysical Company ASA | 63,506 | 1,855,430 |
| Portugal 0.3% | 4,699,804 | |
| EDP — Energias de Portugal SA | 1,367,415 | 3,327,918 |
| Jeronimo Martins SGPS SA (L) | 82,149 | 1,371,886 |
| Singapore 1.7% | 24,556,160 | |
| Ezra Holdings, Ltd. (I)(L) | 1,465,000 | 1,266,061 |
| Golden Agri-Resources, Ltd. | 11,830,000 | 6,759,329 |
| Jaya Holdings, Ltd. (I) | 778,000 | 343,568 |
| Liongold Corp., Ltd. (I) | 342,000 | 340,319 |
| MobileOne, Ltd. | 36,000 | 73,954 |
| Singapore Exchange, Ltd. | 415,000 | 2,347,028 |
| Singapore Press Holdings, Ltd. | 735,000 | 2,341,898 |
| Singapore Telecommunications, Ltd. | 3,537,350 | 9,627,174 |
| Straits Asia Resources, Ltd. | 658,000 | 990,242 |
| Venture Corp., Ltd. | 74,906 | 466,587 |
| Spain 5.5% | 79,727,499 | |
| Abengoa SA (L) | 80,051 | 1,380,363 |
| Banco Bilbao Vizcaya Argentaria SA | 871,388 | 6,621,742 |
| Banco Santander SA (I) | 3,172,410 | 22,515,341 |
| Distribuidora Internacional de Alimentacion SA | 204,094 | 1,083,013 |
| Fomento de Construcciones y Contratas SA | 53,400 | 669,061 |
| Gas Natural SDG SA | 475,056 | 5,847,094 |
| Grifols SA (I) | 125,299 | 3,526,727 |
| Iberdrola SA | 1,816,739 | 7,186,227 |
| See notes to financial statements | Semiannual report | International Core Fund | 17 |
| Shares | Value | |
| Spain (continued) | ||
| Inditex SA | 36,923 | $4,095,712 |
| Indra Sistemas SA | 14,757 | 141,006 |
| Repsol YPF SA | 271,064 | 4,974,456 |
| Telefonica SA | 1,717,565 | 21,686,757 |
| Sweden 0.6% | 8,951,872 | |
| Boliden AB | 117,525 | 1,721,805 |
| Investor AB, B Shares | 142,534 | 2,947,256 |
| NCC AB, B Shares | 55,170 | 1,006,229 |
| Svenska Handelsbanken AB, Series A | 28,740 | 999,599 |
| Swedbank AB, Class A | 130,122 | 2,276,983 |
| Switzerland 3.6% | 51,857,676 | |
| Nestle SA | 206,344 | 12,821,450 |
| Novartis AG | 273,117 | 16,085,143 |
| Roche Holdings AG | 79,398 | 14,445,198 |
| Swiss Re, Ltd. | 31,710 | 1,985,699 |
| Wolseley PLC | 102,772 | 4,142,737 |
| Zurich Financial Services AG | 9,901 | 2,377,449 |
| United Kingdom 18.7% | 271,544,750 | |
| 3i Group PLC | 407,805 | 1,328,727 |
| Aberdeen Asset Management PLC | 340,903 | 1,505,776 |
| Aegis Group PLC | 122,245 | 460,130 |
| Aggreko PLC | 116,291 | 4,348,327 |
| AstraZeneca PLC | 927,847 | 43,214,668 |
| Aviva PLC (I) | 403,784 | 2,093,042 |
| Babcock International Group PLC | 15,983 | 237,697 |
| BAE Systems PLC | 2,390,653 | 12,064,568 |
| Barclays PLC | 4,957,272 | 14,440,541 |
| BBA Aviation PLC | 1,920 | 5,788 |
| BP PLC | 4,164,918 | 29,128,145 |
| British American Tobacco PLC | 226,706 | 11,868,732 |
| BT Group PLC | 2,136,086 | 7,383,634 |
| Bunzl PLC | 103,028 | 1,835,859 |
| Croda International PLC | 6,611 | 247,463 |
| Diageo PLC | 567,618 | 15,527,789 |
| Dixons Retail PLC (I) | 4,285,952 | 1,190,852 |
| Drax Group PLC | 339,376 | 2,512,120 |
| EasyJet PLC | 14,057 | 118,177 |
| Fenner PLC | 102,002 | 561,711 |
| FirstGroup PLC | 455,076 | 1,769,371 |
| GlaxoSmithKline PLC | 1,339,965 | 30,298,302 |
| Home Retail Group PLC (L) | 1,586,081 | 2,351,635 |
| IMI PLC | 91,318 | 1,245,758 |
| Intercontinental Hotels Group PLC | 34,538 | 878,135 |
| Intertek Group PLC | 5,841 | 260,645 |
| ITV PLC | 1,251,742 | 1,651,381 |
| Jazztel PLC (I) | 845 | 4,735 |
| 18 | International Core Fund | Semiannual report | See notes to financial statements |
| Shares | Value | ||
| United Kingdom (continued) | |||
| Lloyds Banking Group PLC (I) | 13,909,311 | $7,324,440 | |
| Micro Focus International PLC | 5,682 | 48,941 | |
| Next PLC | 140,233 | 7,962,435 | |
| Playtech, Ltd. | 155,132 | 953,257 | |
| Premier Foods PLC (I) | 248,755 | 230,913 | |
| Prudential PLC | 211,172 | 2,641,077 | |
| Punch Taverns PLC (I) | 153,138 | 16,537 | |
| Rio Tinto PLC | 344,426 | 15,066,456 | |
| Rockhopper Exploration PLC (I) | 216,476 | 590,380 | |
| Rolls-Royce Holdings PLC | 562,488 | 7,317,097 | |
| Royal Bank of Scotland Group PLC (I) | 432,574 | 1,552,165 | |
| SABMiller PLC | 84,484 | 3,722,588 | |
| Spectris PLC | 13,190 | 362,402 | |
| SSE PLC | 121,228 | 2,633,857 | |
| Tate & Lyle PLC | 183,718 | 1,911,318 | |
| Telecity Group PLC | 76,959 | 1,063,613 | |
| The Weir Group PLC | 21,486 | 555,760 | |
| Thomas Cook Group PLC (I)(L) | 1,874,040 | 483,128 | |
| Trinity Mirror PLC (I) | 140,795 | 88,921 | |
| Tullett Prebon PLC | 190,017 | 874,292 | |
| Vodafone Group PLC | 8,369,689 | 24,128,544 | |
| WH Smith PLC | 68,950 | 657,695 | |
| William Hill PLC | 592,721 | 2,821,828 | |
| Yell Group PLC (I)(L) | 178,651 | 3,398 | |
| Shares | Value | ||
| Preferred Securities 0.6% | $8,088,041 | ||
| (Cost $8,154,426) | |||
| Germany 0.6% | 8,088,041 | ||
| Henkel AG & Company KGaA | 38,924 | 2,939,095 | |
| Porsche Automobil Holding SE | 99,772 | 5,148,946 | |
| Yield | Shares | Value | |
| Securities Lending Collateral 4.1% | $59,677,617 | ||
| (Cost $59,679,862) | |||
| John Hancock Collateral Investment Trust (W) | 0.3443% (Y) | 5,962,932 | 59,677,617 |
| See notes to financial statements | Semiannual report | International Core Fund | 19 |
| Yield | Shares | Value | |
| Short-Term Investments 2.4% | $34,408,672 | ||
| (Cost $34,408,672) | |||
| Money Market Funds 2.4% | 34,408,672 | ||
| State Street Institutional Treasury Money | |||
| Market Fund (Y) | 0.0000% | 34,408,672 | 34,408,672 |
| Total investments (Cost $1,534,131,442)† 102.9% | $1,492,541,505 | ||
| Other assets and liabilities, net (2.9%) | ($41,396,179) | ||
| Total net assets 100.0% | $1,451,145,326 | ||
The percentage shown for each investment category is the total value of the category as a percentage of the net assets of the Fund.
(I) Non-income producing security.
(L) A portion of this security is on loan as of 8-31-12.
(W) Investment is an affiliate of the Fund, the adviser and/or subadviser. Also, it represents the investment of securities lending collateral received.
(Y) The rate shown is the annualized seven-day yield as of 8-31-12.
† At 8-31-12, the aggregate cost of investment securities for federal income tax purposes was $1,549,227,872. Net unrealized depreciation aggregated $56,686,367, of which $94,818,342 related to appreciated investment securities and $151,504,709 related to depreciated investment securities.
The Fund had the following sector composition as a percentage of net assets on 8-31-12:
| Health Care | 15.2% | |||||
| Financials | 13.7% | |||||
| Energy | 13.2% | |||||
| Telecommunication Services | 10.7% | |||||
| Industrials | 10.1% | |||||
| Consumer Discretionary | 9.6% | |||||
| Consumer Staples | 9.1% | |||||
| Utilities | 6.4% | |||||
| Materials | 4.6% | |||||
| Information Technology | 3.8% | |||||
| Short-Term Investments & Other | 3.6% |
| 20 | International Core Fund | Semiannual report | See notes to financial statements |
F I N A N C I A L S T A T E M E N T S
Financial statements
Statement of assets and liabilities 8-31-12 (unaudited)
This Statement of assets and liabilities is the Fund’s balance sheet. It shows the value of what the Fund owns, is due and owes. You’ll also find the net asset value and the maximum public offering price per share.
| Assets | |
| Investments in unaffiliated issuers, at value (Cost $1,474,451,580) | |
| including $56,456,663 of securities loaned | $1,432,863,888 |
| Investments in affiliated issuers, at value (Cost $59,679,862) | 59,677,617 |
| Total investments, at value (Cost $1,534,131,442) | 1,492,541,505 |
| Foreign currency, at value (Cost $729,771) | 732,647 |
| Cash held at broker for futures contracts | 9,312,405 |
| Receivable for fund shares sold | 3,730,210 |
| Receivable for forward foreign currency exchange contracts | 721,635 |
| Dividends and interest receivable | 6,879,029 |
| Receivable for securities lending income | 88,046 |
| Receivable for futures variation margin | 260,318 |
| Receivable due from adviser | 4,699 |
| Other receivables and prepaid expenses | 196,942 |
| Total assets | 1,514,467,436 |
| Liabilities | |
| Due to custodian | 302,039 |
| Payable for forward foreign currency exchange contracts | 858,904 |
| Payable for fund shares repurchased | 1,837,151 |
| Payable upon return of securities loaned | 59,644,620 |
| Payable to affiliates | |
| Accounting and legal services fees | 53,498 |
| Transfer agent fees | 109,472 |
| Trustees’ fees | 39,320 |
| Other liabilities and accrued expenses | 477,106 |
| Total liabilities | 63,322,110 |
| Net assets | |
| Paid-in capital | $1,736,455,683 |
| Undistributed net investment income | 41,922,586 |
| Accumulated net realized gain (loss) on investments, futures contracts and | |
| foreign currency transactions | (289,104,217) |
| Net unrealized appreciation (depreciation) on investments, futures | |
| contracts and translation of assets and liabilities in foreign currencies | (38,128,726) |
| Net assets | $1,451,145,326 |
| See notes to financial statements | Semiannual report | International Core Fund | 21 |
F I N A N C I A L S T A T E M E N T S
Statement of assets and liabilities (continued)
| Net asset value per share | |
| Based on net asset values and shares outstanding — the Fund has an | |
| unlimited number of shares authorized with no par value | |
| Class A ($389,789,804 ÷ 14,560,364 shares) | $26.77 |
| Class B ($3,289,764 ÷ 123,813 shares)1 | $26.57 |
| Class C ($4,121,452 ÷ 155,098 shares)1 | $26.57 |
| Class I ($459,880,182 ÷ 17,105,418 shares) | $26.89 |
| Class R1 ($256,522 ÷ 9,619 shares) | $26.67 |
| Class R2 ($96,551 ÷ 3,597 shares) | $26.84 |
| Class R3 ($32,359 ÷ 1,206 shares) | $26.83 |
| Class R4 ($35,175 ÷ 1,310 shares) | $26.85 |
| Class R5 ($73,752 ÷ 2,744 shares) | $26.88 |
| Class R6 ($97,625 ÷ 3,625 shares) | $26.93 |
| Class 1 ($35,769,470 ÷ 1,327,687 shares) | $26.94 |
| Class NAV ($557,702,670 ÷ 20,713,192 shares) | $26.92 |
| Maximum offering price per share | |
| Class A (net asset value per share ÷ 95%)2 | $28.18 |
1 Redemption price is equal to net asset value less any applicable contingent deferred sales charge.
2 On single retail sales of less than $50,000. On sales of $50,000 or more and on group sales the offering price is reduced.
| 22 | International Core Fund | Semiannual report | See notes to financial statements |
F I N A N C I A L S T A T E M E N T S
Statement of operations For the six-month period ended 8-31-12 (unaudited)
This Statement of operations summarizes the Fund’s investment income earned and expenses incurred in operating the Fund. It also shows net gains (losses) for the period stated.
| Investment income | |
| Dividends | $41,385,550 |
| Securities lending | 1,835,552 |
| Interest | 409 |
| Less foreign taxes withheld | (3,285,690) |
| Total investment income | 39,935,821 |
| Expenses | |
| Investment management fees | 6,952,252 |
| Distribution and service fees | 609,295 |
| Accounting and legal services fees | 146,882 |
| Transfer agent fees | 602,437 |
| Trustees’ fees | 52,566 |
| State registration fees | 108,821 |
| Printing and postage | 187,378 |
| Professional fees | 71,813 |
| Custodian fees | 779,920 |
| Registration and filing fees | 16,981 |
| Other | 19,159 |
| Total expenses | 9,547,504 |
| Less expense reductions | (71,977) |
| Net expenses | 9,475,527 |
| Net investment income | 30,460,294 |
| Realized and unrealized gain (loss) | |
| Net realized gain (loss) on | |
| Investments in unaffiliated issuers | (67,220,557) |
| Investments in affiliated issuers | (8,838) |
| Futures contracts | (4,326,611) |
| Foreign currency transactions | 1,894,640 |
| (69,661,366) | |
| Change in net unrealized appreciation (depreciation) of | |
| Investments in unaffiliated issuers | (18,316,402) |
| Investments in affiliated issuers | (6,733) |
| Futures contracts | 728,186 |
| Translation of assets and liabilities in foreign currencies | (1,015,220) |
| (18,610,169) | |
| Net realized and unrealized loss | (88,271,535) |
| Decrease in net assets from operations | ($57,811,241) |
| See notes to financial statements | Semiannual report | International Core Fund | 23 |
F I N A N C I A L S T A T E M E N T S
Statements of changes in net assets
These Statements of changes in net assets show how the value of the Fund’s net assets has changed during the last two periods. The difference reflects earnings less expenses, any investment gains and losses, distributions, if any, paid to shareholders and the net of Fund share transactions.
| Six months | ||
| ended | Year | |
| 8-31-12 | ended | |
| (Unaudited) | 2-29-12 | |
| Increase (decrease) in net assets | ||
| From operations | ||
| Net investment income | $30,460,294 | $41,312,921 |
| Net realized loss | (69,661,366) | (1,026,871) |
| Change in net unrealized appreciation (depreciation) | (18,610,169) | (181,194,192) |
| Decrease in net assets resulting from operations | (57,811,241) | (140,908,142) |
| Distributions to shareholders | ||
| From net investment income | ||
| Class A | — | (6,432,365) |
| Class B | — | (26,198) |
| Class C | — | (31,262) |
| Class I | — | (7,098,312) |
| Class R1 | — | (2,560) |
| Class R3 | — | (359) |
| Class R4 | — | (492) |
| Class R5 | — | (1,226) |
| Class R6 | — | (1,923) |
| Class 1 | — | (779,516) |
| Class NAV | — | (15,625,962) |
| Total distributions | — | (30,000,175) |
| From Fund share transactions | (76,818,575) | 154,369,410 |
| Total decrease | (134,629,816) | (16,538,907) |
| Net assets | ||
| Beginning of period | 1,585,775,142 | 1,602,314,049 |
| End of period | $1,451,145,326 | $1,585,775,142 |
| Undistributed net investment income | $41,922,586 | $11,462,292 |
| 24 | International Core Fund | Semiannual report | See notes to financial statements |
Financial highlights
The Financial highlights show how the Fund’s net asset value for a share has changed during the period.
| CLASS A SHARES Period ended | 8-31-121 | 2-29-12 | 2-28-11 | 2-28-10 | 2-28-09 | 2-29-08 |
| Per share operating performance | ||||||
| Net asset value, beginning of period | $27.72 | $30.85 | $25.74 | $18.43 | $39.06 | $43.30 |
| Net investment income2 | 0.45 | 0.58 | 0.33 | 0.24 | 0.76 | 0.35 |
| Net realized and unrealized gain (loss) | ||||||
| on investments | (1.40) | (3.32) | 5.09 | 7.59 | (18.65) | (0.35) |
| Total from investment operations | (0.95) | (2.74) | 5.42 | 7.83 | (17.89) | — |
| Less distributions | ||||||
| From net investment income | — | (0.39) | (0.31) | (0.52) | (1.56) | (0.45) |
| From net realized gain | — | — | — | — | (1.18) | (3.79) |
| Total distributions | — | (0.39) | (0.31) | (0.52) | (2.74) | (4.24) |
| Net asset value, end of period | $26.77 | $27.72 | $30.85 | $25.74 | $18.43 | $39.06 |
| Total return (%)3 | (3.43)4 | (8.73) | 21.135 | 42.335 | (47.16)5 | (0.76)5 |
| Ratios and supplemental data | ||||||
| Net assets, end of period (in millions) | $390 | $374 | $333 | $225 | $54 | $130 |
| Ratios (as a percentage of average net assets): | ||||||
| Expenses before reductions | 1.587 | 1.58 | 1.61 | 1.956 | 1.75 | 1.68 |
| Expenses net of fee waivers | 1.587 | 1.58 | 1.60 | 1.666 | 1.75 | 1.65 |
| Expenses net of fee waivers and credits | 1.587 | 1.58 | 1.60 | 1.626 | 1.70 | 1.65 |
| Net investment income | 3.417 | 2.05 | 1.21 | 0.94 | 2.33 | 0.78 |
| Portfolio turnover (%) | 35 | 42 | 39 | 44 | 54 | 508 |
1 Six months ended 8-31-12. Unaudited.
2 Based on the average daily shares outstanding.
3 Does not reflect the effect of sales charges, if any.
4 Not annualized.
5 Total returns would have been lower had certain expenses not been reduced during the periods shown.
6 Includes the impact of proxy expenses, which amounted to 0.02% of average net assets.
7 Annualized.
8 Excludes merger activity.
| See notes to financial statements | Semiannual report | International Core Fund | 25 |
| CLASS B SHARES Period ended | 8-31-121 | 2-29-12 | 2-28-11 | 2-28-10 | 2-28-09 | 2-29-08 |
| Per share operating performance | ||||||
| Net asset value, beginning of period | $27.61 | $30.70 | $25.62 | $18.36 | $38.80 | $43.08 |
| Net investment income2 | 0.36 | 0.44 | 0.18 | 0.17 | 0.53 | —3 |
| Net realized and unrealized gain (loss) | ||||||
| on investments | (1.40) | (3.34) | 5.01 | 7.44 | (18.49) | (0.33) |
| Total from investment operations | (1.04) | (2.90) | 5.19 | 7.61 | (17.96) | (0.33) |
| Less distributions | ||||||
| From net investment income | — | (0.19) | (0.11) | (0.35) | (1.30) | (0.16) |
| From net realized gain | — | — | — | — | (1.18) | (3.79) |
| Total distributions | — | (0.19) | (0.11) | (0.35) | (2.48) | (3.95) |
| Net asset value, end of period | $26.57 | $27.61 | $30.70 | $25.62 | $18.36 | $38.80 |
| Total return (%)4,5 | (3.77)6 | (9.38) | 20.28 | 41.35 | (47.53) | (1.48) |
| Ratios and supplemental data | ||||||
| Net assets, end of period (in millions) | $3 | $4 | $5 | $6 | $7 | $20 |
| Ratios (as a percentage of average net assets): | ||||||
| Expenses before reductions | 3.117 | 2.49 | 2.36 | 3.078 | 2.75 | 2.48 |
| Expenses net of fee waivers | 2.307 | 2.30 | 2.30 | 2.368 | 2.63 | 2.41 |
| Expenses net of fee waivers and credits | 2.307 | 2.30 | 2.30 | 2.338 | 2.40 | 2.40 |
| Net investment income | 2.737 | 1.58 | 0.65 | 0.69 | 1.64 | —9 |
| Portfolio turnover (%) | 35 | 42 | 39 | 44 | 54 | 5010 |
1 Six months ended 8-31-12. Unaudited.
2 Based on the average daily shares outstanding.
3 Less than $0.005 per share.
4 Does not reflect the effect of sales charges, if any.
5 Total returns would have been lower had certain expenses not been reduced during the periods shown.
6 Not annualized.
7 Annualized.
8 Includes the impact of proxy expenses, which amounted to 0.03% of average net assets.
9 Less than 0.005%
10 Excludes merger activity.
| CLASS C SHARES Period ended | 8-31-121 | 2-29-12 | 2-28-11 | 2-28-10 | 2-28-09 | 2-29-08 |
| Per share operating performance | ||||||
| Net asset value, beginning of period | $27.61 | $30.71 | $25.62 | $18.36 | $38.81 | $43.09 |
| Net investment income2 | 0.36 | 0.43 | 0.17 | 0.15 | 0.55 | 0.13 |
| Net realized and unrealized gain (loss) | ||||||
| on investments | (1.40) | (3.34) | 5.03 | 7.46 | (18.52) | (0.46) |
| Total from investment operations | (1.04) | (2.91) | 5.20 | 7.61 | (17.97) | (0.33) |
| Less distributions | ||||||
| From net investment income | — | (0.19) | (0.11) | (0.35) | (1.30) | (0.16) |
| From net realized gain | — | — | — | — | (1.18) | (3.79) |
| Total distributions | — | (0.19) | (0.11) | (0.35) | (2.48) | (3.95) |
| Net asset value, end of period | $26.57 | $27.61 | $30.71 | $25.62 | $18.36 | $38.81 |
| Total return (%)3,4 | (3.77)5 | (9.41) | 20.32 | 41.35 | (47.55) | (1.48) |
| Ratios and supplemental data | ||||||
| Net assets, end of period (in millions) | $4 | $4 | $5 | $5 | $4 | $15 |
| Ratios (as a percentage of average net assets): | ||||||
| Expenses before reductions | 2.936 | 2.50 | 2.47 | 2.697 | 2.59 | 2.49 |
| Expenses net of fee waivers | 2.306 | 2.30 | 2.30 | 2.367 | 2.43 | 2.40 |
| Expenses net of fee waivers and credits | 2.306 | 2.30 | 2.30 | 2.337 | 2.40 | 2.40 |
| Net investment income | 2.746 | 1.53 | 0.62 | 0.60 | 1.69 | 0.28 |
| Portfolio turnover (%) | 35 | 42 | 39 | 44 | 54 | 508 |
1 Six months ended 8-31-12. Unaudited.
2 Based on the average daily shares outstanding.
3 Does not reflect the effect of sales charges, if any.
4 Total returns would have been lower had certain expenses not been reduced during the periods shown.
5 Not annualized.
6 Annualized.
7 Includes the impact of proxy expenses, which amounted to 0.03% of average net assets.
8 Excludes merger activity.
| 26 | International Core Fund | Semiannual report | See notes to financial statements |
| CLASS I SHARES Period ended | 8-31-121 | 2-29-12 | 2-28-11 | 2-28-10 | 2-28-09 | 2-29-08 |
| Per share operating performance | ||||||
| Net asset value, beginning of period | $27.78 | $30.94 | $25.80 | $18.45 | $39.20 | $43.43 |
| Net investment income2 | 0.50 | 0.72 | 0.45 | 0.35 | 0.94 | 0.55 |
| Net realized and unrealized gain (loss) | ||||||
| on investments | (1.39) | (3.36) | 5.12 | 7.63 | (18.77) | (0.35) |
| Total from investment operations | (0.89) | (2.64) | 5.57 | 7.98 | (17.83) | 0.20 |
| Less distributions | ||||||
| From net investment income | — | (0.52) | (0.43) | (0.63) | (1.74) | (0.64) |
| From net realized gain | — | — | — | — | (1.18) | (3.79) |
| Total distributions | — | (0.52) | (0.43) | (0.63) | (2.92) | (4.43) |
| Net asset value, end of period | $26.89 | $27.78 | $30.94 | $25.80 | $18.45 | $39.20 |
| Total return (%) | (3.20)3 | (8.33) | 21.734 | 43.104 | (46.91)4 | (0.33)4 |
| Ratios and supplemental data | ||||||
| Net assets, end of period (in millions) | $460 | $411 | $291 | $84 | $1 | $3 |
| Ratios (as a percentage of average net assets): | ||||||
| Expenses before reductions | 1.185 | 1.16 | 1.12 | 1.06 | 2.37 | 2.34 |
| Expenses net of fee waivers | 1.185 | 1.16 | 1.12 | 1.06 | 1.18 | 1.18 |
| Expenses net of fee waivers and credits | 1.185 | 1.16 | 1.12 | 1.06 | 1.18 | 1.18 |
| Net investment income | 3.795 | 2.54 | 1.61 | 1.34 | 2.87 | 1.24 |
| Portfolio turnover (%) | 35 | 42 | 39 | 44 | 54 | 506 |
1 Six months ended 8-31-12. Unaudited.
2 Based on the average daily shares outstanding.
3 Not annualized.
4 Total returns would have been lower had certain expenses not been reduced during the periods shown.
5 Annualized.
6 Excludes merger activity.
| CLASS R1 SHARES Period ended | 8-31-121 | 2-29-12 | 2-28-11 | 2-28-10 | 2-28-09 | 2-29-08 |
| Per share operating performance | ||||||
| Net asset value, beginning of period | $27.66 | $30.77 | $25.67 | $18.36 | $38.94 | $43.19 |
| Net investment income2 | 0.41 | 0.53 | 0.24 | 0.23 | 0.69 | 0.66 |
| Net realized and unrealized gain (loss) | ||||||
| on investments | (1.40) | (3.33) | 5.06 | 7.50 | (18.54) | (0.69) |
| Total from investment operations | (0.99) | (2.80) | 5.30 | 7.73 | (17.85) | (0.03) |
| Less distributions | ||||||
| From net investment income | — | (0.31) | (0.20) | (0.42) | (1.55) | (0.43) |
| From net realized gain | — | — | — | — | (1.18) | (3.79) |
| Total distributions | — | (0.31) | (0.20) | (0.42) | (2.73) | (4.22) |
| Net asset value, end of period | $26.67 | $27.66 | $30.77 | $25.67 | $18.36 | $38.94 |
| Total return (%)3 | (3.58)4 | (9.00) | 20.71 | 42.00 | (47.16) | (0.82) |
| Ratios and supplemental data | ||||||
| Net assets, end of period (in millions) | —5 | —5 | —5 | —5 | —5 | —5 |
| Ratios (as a percentage of average net assets): | ||||||
| Expenses before reductions | 7.756 | 7.37 | 6.88 | 8.857 | 15.16 | 13.85 |
| Expenses net of fee waivers | 1.906 | 1.90 | 1.92 | 1.927 | 2.10 | 1.70 |
| Expenses net of fee waivers and credits | 1.906 | 1.90 | 1.92 | 1.927 | 1.70 | 1.70 |
| Net investment income | 3.126 | 1.88 | 0.90 | 0.92 | 2.21 | 1.48 |
| Portfolio turnover (%) | 35 | 42 | 39 | 44 | 54 | 508 |
1 Six months ended 8-31-12. Unaudited.
2 Based on the average daily shares outstanding.
3 Total returns would have been lower had certain expenses not been reduced during the periods shown.
4 Not annualized.
5 Less than $500,000.
6 Annualized.
7 Includes the impact of proxy expenses, which amounted to 0.02% of average net assets.
8 Excludes merger activity.
| See notes to financial statements | Semiannual report | International Core Fund | 27 |
| CLASS R2 SHARES Period ended | 8-31-121 | |||||
| Per share operating performance | ||||||
| Net asset value, beginning of period | $27.80 | |||||
| Net investment income2 | 0.45 | |||||
| Net realized and unrealized gain (loss) on investments | (1.41) | |||||
| Total from investment operations | (0.96) | |||||
| Net asset value, end of period | $26.84 | |||||
| Total return (%)3 | (3.45)4 | |||||
| Ratios and supplemental data | ||||||
| Net assets, end of period (in millions) | —5 | |||||
| Ratios (as a percentage of average net assets): | ||||||
| Expenses before reductions | 17.536 | |||||
| Expenses net of fee waivers | 1.656 | |||||
| Expenses net of fee waivers and credits | 1.656 | |||||
| Net investment income | 3.406 | |||||
| Portfolio turnover (%) | 35 | |||||
1 Period from 3-1-12 (inception date) to 8-31-12.
2 Based on the average daily shares outstanding.
3 Total returns would have been lower had certain expenses not been reduced during the period shown.
4 Not annualized.
5 Less than $500,000.
6 Annualized.
| CLASS R3 SHARES Period ended | 8-31-121 | 2-29-12 | 2-28-11 | 2-28-102 | ||
| Per share operating performance | ||||||
| Net asset value, beginning of period | $27.80 | $30.94 | $25.80 | $23.33 | ||
| Net investment income3 | 0.42 | 0.57 | 0.29 | 0.02 | ||
| Net realized and unrealized gain (loss) on investments | (1.39) | (3.38) | 5.08 | 2.90 | ||
| Total from investment operations | (0.97) | (2.81) | 5.37 | 2.92 | ||
| Less distributions | ||||||
| From net investment income | — | (0.33) | (0.23) | (0.45) | ||
| Net asset value, end of period | $26.83 | $27.80 | $30.94 | $25.80 | ||
| Total return (%)4 | (3.49)5 | (8.95) | 20.87 | 12.405 | ||
| Ratios and supplemental data | ||||||
| Net assets, end of period (in millions) | —6 | —6 | —6 | —6 | ||
| Ratios (as a percentage of average net assets): | ||||||
| Expenses before reductions | 51.417 | 45.66 | 44.55 | 10.977 | ||
| Expenses net of fee waivers | 1.807 | 1.80 | 1.83 | 1.917 | ||
| Expenses net of fee waivers and credits | 1.807 | 1.80 | 1.83 | 1.917 | ||
| Net investment income | 3.147 | 2.01 | 1.05 | 0.107 | ||
| Portfolio turnover (%) | 35 | 42 | 39 | 44 | ||
1 Six months ended 8-31-12. Unaudited.
2 The inception date for Class R3 shares is 5-22-09.
3 Based on the average daily shares outstanding.
4 Total returns would have been lower had certain expenses not been reduced during the periods shown.
5 Not annualized.
6 Less than $500,000.
7 Annualized.
| 28 | International Core Fund | Semiannual report | See notes to financial statements |
| CLASS R4 SHARES Period ended | 8-31-121 | 2-29-12 | 2-28-11 | 2-28-102 | ||
| Per share operating performance | ||||||
| Net asset value, beginning of period | $27.79 | $30.94 | $25.80 | $23.33 | ||
| Net investment income3 | 0.47 | 0.65 | 0.37 | 0.08 | ||
| Net realized and unrealized gain (loss) on investments | (1.41) | (3.38) | 5.08 | 2.91 | ||
| Total from investment operations | (0.94) | (2.73) | 5.45 | 2.99 | ||
| Less distributions | ||||||
| From net investment income | — | (0.42) | (0.31) | (0.52) | ||
| Net asset value, end of period | $26.85 | $27.79 | $30.94 | $25.80 | ||
| Total return (%)4 | (3.38)5 | (8.67) | 21.21 | 12.695 | ||
| Ratios and supplemental data | ||||||
| Net assets, end of period (in millions) | —6 | —6 | —6 | —6 | ||
| Ratios (as a percentage of average net assets): | ||||||
| Expenses before reductions | 46.027 | 42.74 | 44.22 | 10.717 | ||
| Expenses net of fee waivers | 1.467 | 1.50 | 1.53 | 1.617 | ||
| Expenses net of fee waivers and credits | 1.467 | 1.50 | 1.53 | 1.617 | ||
| Net investment income | 3.557 | 2.29 | 1.34 | 0.407 | ||
| Portfolio turnover (%) | 35 | 42 | 39 | 44 | ||
1 Six months ended 8-31-12. Unaudited.
2 The inception date for Class R4 shares is 5-22-09.
3 Based on the average daily shares outstanding.
4 Total returns would have been lower had certain expenses not been reduced during the periods shown.
5 Not annualized.
6 Less than $500,000.
7 Annualized.
| CLASS R5 SHARES Period ended | 8-31-121 | 2-29-12 | 2-28-11 | 2-28-102 | ||
| Per share operating performance | ||||||
| Net asset value, beginning of period | $27.78 | $30.94 | $25.79 | $23.33 | ||
| Net investment income3 | 0.50 | 0.73 | 0.44 | 0.14 | ||
| Net realized and unrealized gain (loss) on investments | (1.40) | (3.38) | 5.10 | 2.91 | ||
| Total from investment operations | (0.90) | (2.65) | 5.54 | 3.05 | ||
| Less distributions | ||||||
| From net investment income | — | (0.51) | (0.39) | (0.59) | ||
| Net asset value, end of period | $26.88 | $27.78 | $30.94 | $25.79 | ||
| Total return (%)4 | (3.24)5 | (8.38) | 21.59 | 12.955 | ||
| Ratios and supplemental data | ||||||
| Net assets, end of period (in millions) | —6 | —6 | —6 | —6 | ||
| Ratios (as a percentage of average net assets): | ||||||
| Expenses before reductions | 22.877 | 20.87 | 31.41 | 10.507 | ||
| Expenses net of fee waivers | 1.207 | 1.20 | 1.22 | 1.317 | ||
| Expenses net of fee waivers and credits | 1.207 | 1.20 | 1.22 | 1.317 | ||
| Net investment income | 3.817 | 2.58 | 1.58 | 0.707 | ||
| Portfolio turnover (%) | 35 | 42 | 39 | 44 | ||
1 Six months ended 8-31-12. Unaudited.
2 The inception date for Class R5 shares is 5-22-09.
3 Based on the average daily shares outstanding.
4 Total returns would have been lower had certain expenses not been reduced during the periods shown.
5 Not annualized.
6 Less than $500,000.
7 Annualized.
| See notes to financial statements | Semiannual report | International Core Fund | 29 |
| CLASS R6 SHARES Period ended | 8-31-121 | 2-29-122 | ||||
| Per share operating performance | ||||||
| Net asset value, beginning of period | $27.82 | $28.00 | ||||
| Net investment income3 | 0.52 | 0.26 | ||||
| Net realized and unrealized gain (loss) on investments | (1.41) | 0.10 | ||||
| Total from investment operations | (0.89) | 0.36 | ||||
| Less distributions | ||||||
| From net investment income | — | (0.54) | ||||
| Net asset value, end of period | $26.93 | $27.82 | ||||
| Total return (%)4 | (3.20)5 | 1.495 | ||||
| Ratios and supplemental data | ||||||
| Net assets, end of period (in millions) | —6 | —6 | ||||
| Ratios (as a percentage of average net assets): | ||||||
| Expenses before reductions | 17.407 | 16.837 | ||||
| Expenses net of fee waivers | 1.127 | 1.127 | ||||
| Expenses net of fee waivers and credits | 1.127 | 1.127 | ||||
| Net investment income | 3.907 | 1.987 | ||||
| Portfolio turnover (%) | 35 | 428 | ||||
1 Six months ended 8-31-12. Unaudited.
2 The inception date for Class R6 shares is 9-1-11.
3 Based on the average daily shares outstanding.
4 Total returns would have been lower had certain expenses not been reduced during the periods shown.
5 Not annualized.
6 Less than $500,000.
7 Annualized.
8 Portfolio turnover is shown for the period from 3-1-11 to 2-29-12.
| CLASS 1 SHARES Period ended | 8-31-121 | 2-29-12 | 2-28-11 | 2-28-10 | 2-28-09 | 2-29-08 |
| Per share operating performance | ||||||
| Net asset value, beginning of period | $27.82 | $30.99 | $25.84 | $18.48 | $39.22 | $43.43 |
| Net investment income2 | 0.53 | 0.79 | 0.50 | 0.46 | 0.93 | 0.95 |
| Net realized and unrealized gain (loss) | ||||||
| on investments | (1.41) | (3.41) | 5.09 | 7.54 | (18.74) | (0.72) |
| Total from investment operations | (0.88) | (2.62) | 5.59 | 8.00 | (17.81) | 0.23 |
| Less distributions | ||||||
| From net investment income | — | (0.55) | (0.44) | (0.64) | (1.75) | (0.65) |
| From net realized gain | — | — | — | — | (1.18) | (3.79) |
| Total distributions | — | (0.55) | (0.44) | (0.64) | (2.93) | (4.44) |
| Net asset value, end of period | $26.94 | $27.82 | $30.99 | $25.84 | $18.48 | $39.22 |
| Total return (%) | (3.16)3,4 | (8.27) | 21.753 | 43.113 | (46.83)3 | (0.25)3 |
| Ratios and supplemental data | ||||||
| Net assets, end of period (in millions) | $36 | $39 | $47 | $44 | $34 | $74 |
| Ratios (as a percentage of average net | ||||||
| assets): | ||||||
| Expenses before reductions | 1.075 | 1.07 | 1.07 | 1.086 | 1.10 | 1.16 |
| Expenses net of fee waivers | 1.075 | 1.07 | 1.07 | 1.076 | 1.10 | 1.14 |
| Expenses net of fee waivers and credits | 1.075 | 1.07 | 1.07 | 1.076 | 1.10 | 1.14 |
| Net investment income | 3.975 | 2.76 | 1.83 | 1.83 | 2.88 | 2.09 |
| Portfolio turnover (%) | 35 | 42 | 39 | 44 | 54 | 507 |
1 Six months ended 8-31-12. Unaudited.
2 Based on the average daily shares outstanding.
3 Total returns would have been lower had certain expenses not been reduced during the periods shown.
4 Not annualized.
5 Annualized.
6 Includes the impact of proxy expenses, which amounted to 0.03% of average net assets.
7 Excludes merger activity.
| 30 | International Core Fund | Semiannual report | See notes to financial statements |
| CLASS NAV SHARES Period ended | 8-31-121 | 2-29-12 | 2-28-11 | 2-28-10 | 2-28-09 | 2-29-08 |
| Per share operating performance | ||||||
| Net asset value, beginning of period | $27.80 | $30.98 | $25.82 | $18.47 | $39.21 | $43.42 |
| Net investment income2 | 0.56 | 0.81 | 0.51 | 0.49 | 0.99 | 0.95 |
| Net realized and unrealized gain (loss) | ||||||
| on investments | (1.44) | (3.43) | 5.10 | 7.51 | (18.78) | (0.70) |
| Total from investment operations | (0.88) | (2.62) | 5.61 | 8.00 | (17.79) | 0.25 |
| Less distributions | ||||||
| From net investment income | — | (0.56) | (0.45) | (0.65) | (1.77) | (0.67) |
| From net realized gain | — | — | — | — | (1.18) | (3.79) |
| Total distributions | — | (0.56) | (0.45) | (0.65) | (2.95) | (4.46) |
| Net asset value, end of period | $26.92 | $27.80 | $30.98 | $25.82 | $18.47 | $39.21 |
| Total return (%) | (3.17)3 | (8.24) | 21.854 | 43.144 | (46.80)4 | (0.20)4 |
| Ratios and supplemental data | ||||||
| Net assets, end of period (in millions) | $558 | $753 | $920 | $800 | $603 | $1,415 |
| Ratios (as a percentage of average net assets): | ||||||
| Expenses before reductions | 1.025 | 1.02 | 1.02 | 1.046 | 1.04 | 1.11 |
| Expenses net of fee waivers | 1.025 | 1.02 | 1.02 | 1.026 | 1.04 | 1.08 |
| Expenses net of fee waivers and credits | 1.025 | 1.02 | 1.02 | 1.026 | 1.04 | 1.08 |
| Net investment income | 4.185 | 2.84 | 1.87 | 1.99 | 3.06 | 2.09 |
| Portfolio turnover (%) | 35 | 42 | 39 | 44 | 54 | 507 |
1 Six months ended 8-31-12. Unaudited.
2 Based on the average daily shares outstanding.
3 Not annualized.
4 Total returns would have been lower had certain expenses not been reduced during the periods shown.
5 Annualized.
6 Includes the impact of proxy expenses, which amounted to 0.03% of average net assets.
7 Excludes merger activity.
| See notes to financial statements | Semiannual report | International Core Fund | 31 |
Notes to financial statements
(unaudited)
Note 1 — Organization
John Hancock International Core Fund (the Fund) is a series of John Hancock Funds III (the Trust), an open-end management investment company organized as a Massachusetts business trust and registered under the Investment Company Act of 1940, as amended (the 1940 Act). The investment objective of the Fund is to seek high total return primarily through capital appreciation.
The Fund may offer multiple classes of shares. The shares currently offered are detailed in the Statement of assets and liabilities. Class A, Class B and Class C shares are offered to all investors. Class I shares are offered to institutions and certain investors. Class R1, Class R2, Class R3, Class R4 and Class R5 shares are available only to certain retirement plans. Class R6 shares are available only to certain retirement plans, institutions and other investors. Class 1 shares are offered only to certain affiliates of Manulife Financial Corporation (MFC). Class NAV shares are offered to John Hancock affiliated funds of funds. Shareholders of each class have exclusive voting rights to matters that affect that class. The distribution and service fees, if any, transfer agent fees, printing and postage and state registration fees for each class may differ. Class B shares convert to Class A shares eight years after purchase. Certain Class I shares may be exchanged for Class R6 shares within one year after the commencement of operations of Class R6 shares.
Note 2 — Significant accounting policies
The financial statements have been prepared in conformity with accounting principles generally accepted in the United States of America, which require management to make certain estimates and assumptions at the date of the financial statements. Actual results could differ from those estimates. Events or transactions occurring after the end of the fiscal period through the date that the financial statements were issued have been evaluated in the preparation of the financial statements. The following summarizes the significant accounting policies of the Fund:
Security valuation. Investments are stated at value as of the close of regular trading on the New York Stock Exchange (NYSE), normally at 4:00 P.M., Eastern Time. In order to value the securities, the Fund uses the following valuation techniques: Equity securities, including exchange traded funds, held by the Fund are valued at the last sale price or official closing price on the principal securities exchange on which they trade. In the event there were no sales during the day or closing prices are not available, then securities are valued using the last quoted bid or evaluated price. Investments by the Funds in open-end mutual funds, including John Hancock Collateral Investment Trust (JHCIT), are valued at their respective net asset values each business day. Futures contracts are valued at the quoted daily settlement prices established by the exchange on which they trade. Foreign securities and currencies, including forward foreign currency contracts, are valued in U.S. dollars, based on foreign currency exchange rates supplied by an independent pricing service. Certain securities and forward foreign currency contracts traded only in the over-the-counter market are valued at the last bid price quoted by brokers making markets in the securities at the close of trading. Certain short-term securities are valued at amortized cost.
Other portfolio securities and assets, where reliable market quotations are not available, are valued at fair value as determined in good faith by the Fund’s Pricing Committee following procedures established by the Board of Trustees, which include price verification procedures. The frequency with which these fair valuation procedures are used cannot be predicted. Generally, trading in non-U.S. securities is substantially completed each day at various times prior to the
| 32 | International Core Fund | Semiannual report |
close of trading on the NYSE. Significant market events that affect the values of non-U.S. securities may occur between the time when the valuation of the securities is generally determined and the close of the NYSE. During significant market events, these securities will be valued at fair value, as determined in good faith, following procedures established by the Board of Trustees. The Fund may use a fair valuation model to value non-U.S. securities in order to adjust for events which may occur between the close of foreign exchanges and the close of the NYSE.
The Fund uses a three-tier hierarchy to prioritize the pricing assumptions, referred to as inputs, used in valuation techniques to measure fair value. Level 1 includes securities valued using quoted prices in active markets for identical securities. Level 2 includes securities valued using significant observable inputs. Observable inputs may include quoted prices for similar securities, interest rates, prepayment speeds and credit risk. Prices for securities valued using these inputs are received from independent pricing vendors and brokers and are based on an evaluation of the inputs described. Level 3 includes securities valued using significant unobservable inputs when market prices are not readily available or reliable, including the Fund’s own assumptions in determining the fair value of investments. Factors used in determining value may include market or issuer specific events or trends, changes in interest rates and credit quality. The inputs or methodology used for valuing securities are not necessarily an indication of the risks associated with investing in those securities. Changes in valuation techniques may result in transfers into or out of an assigned level within the disclosure hierarchy.
The following is a summary of the values by input classification of the Fund’s investments as of August 31, 2012, by major security category or type:
| LEVEL 3 | ||||
| LEVEL 2 | SIGNIFICANT | |||
| TOTAL MARKET | LEVEL 1 | SIGNIFICANT | UNOBSERVABLE | |
| VALUE AT 8-31-12 | QUOTED PRICE | OBSERVABLE INPUTS | INPUTS | |
| Common Stocks | ||||
| Australia | $86,092,749 | — | $86,092,749 | — |
| Austria | 7,946,473 | — | 7,946,473 | — |
| Belgium | 21,773,203 | — | 21,773,203 | — |
| Bermuda | 1,204,615 | — | 1,204,615 | — |
| Canada | 46,026,377 | $46,026,377 | — | — |
| China | 1,091,776 | — | 1,091,776 | — |
| Denmark | 13,083,076 | — | 13,083,076 | — |
| Finland | 8,193,812 | — | 8,193,812 | — |
| France | 150,225,596 | — | 150,225,596 | — |
| Germany | 85,262,369 | — | 85,262,369 | — |
| Greece | 2,559,968 | — | 2,559,968 | — |
| Hong Kong | 11,260,630 | — | 11,260,630 | — |
| Ireland | 16,474,422 | — | 16,474,422 | — |
| Israel | 3,524,462 | — | 3,524,462 | — |
| Italy | 73,717,692 | — | 73,717,692 | — |
| Japan | 340,364,940 | — | 340,364,940 | — |
| Jersey, C.I. | 2,086,719 | — | 2,086,719 | — |
| Netherlands | 65,398,086 | — | 65,398,086 | — |
| New Zealand | 9,337,457 | — | 9,337,457 | — |
| Norway | 3,404,992 | — | 3,404,992 | — |
| Portugal | 4,699,804 | — | 4,699,804 | — |
| Singapore | 24,556,160 | — | 24,556,160 | — |
| Spain | 79,727,499 | — | 79,727,499 | — |
| Sweden | 8,951,872 | — | 8,951,872 | — |
| Semiannual report | International Core Fund | 33 |
| LEVEL 3 | ||||
| LEVEL 2 | SIGNIFICANT | |||
| TOTAL MARKET | LEVEL 1 | SIGNIFICANT | UNOBSERVABLE | |
| VALUE AT 8-31-12 | QUOTED PRICE | OBSERVABLE INPUTS | INPUTS | |
| Common Stocks (continued) | ||||
| Switzerland | $51,857,676 | — | $51,857,676 | — |
| United Kingdom | 271,544,750 | — | 271,544,750 | — |
| Preferred Securities | ||||
| Germany | 8,088,041 | — | 8,088,041 | — |
| Securities Lending | ||||
| Collateral | 59,677,617 | $59,677,617 | — | — |
| Short-Term Investments | 34,408,672 | 34,408,672 | — | — |
| Total Investments | ||||
| in Securities | $1,492,541,505 | $140,112,666 | $1,352,428,839 | — |
| Other Financial | ||||
| Instruments | ||||
| Futures | $3,500,425 | ($1,139,566) | $4,639,991 | — |
| Forward Foreign | ||||
| Currency Contracts | ($137,269) | — | ($137,269) | — |
Security transactions and related investment income. Investment security transactions are accounted for on a trade date plus one basis for daily net asset value calculations. However, for financial reporting purposes, investment transactions are reported on trade date. Interest income is accrued as earned. Dividend income is recorded on the ex-date, except for dividends of foreign securities where the dividend may not be known until after the ex-date. In those cases, dividend income is, net of withholding taxes, recorded when the Fund becomes aware of the dividends. Foreign taxes are provided for based on the Fund’s understanding of the tax rules and rates that exist in the foreign markets in which it invests. Gains and losses on securities sold are determined on the basis of identified cost and may include proceeds from litigation.
Securities lending. The Fund may lend its securities to earn additional income. It receives cash collateral from the borrower in an amount not less than the market value of the loaned securities. The Fund will invest its collateral in JHCIT, an affiliate of the Fund, which has a floating net asset value (NAV) and invests in short term investments as part of the securities lending program, and as a result, the Fund will receive the benefit of any gains and bear any losses generated by JHCIT. Although risk of the loss of the securities lent is mitigated by holding the collateral and through securities lending provider indemnification, the Fund could experience a delay in recovering its securities and a possible loss of income or value if the borrower fails to return the securities or if collateral investments decline in value or possible loss of rights in the collateral should the borrower fail financially. The Fund may receive compensation for lending its securities by retaining a portion of the return on the investment of the collateral and compensation from fees earned from borrowers of the securities. Net income received from JHCIT is a component of securities lending income as recorded on the Statement of operations.
Foreign currency translation. Assets, including investments and liabilities denominated in foreign currencies, are translated into U.S. dollar values each day at the prevailing exchange rate. Purchases and sales of securities, income and expenses are translated into U.S. dollars at the prevailing exchange rate on the date of the transaction. The effect of changes in foreign currency exchange rates on the value of securities is reflected as a component of the realized and unrealized gains (losses) on investments.
Funds that invest internationally generally carry more risk than funds that invest strictly in U.S. securities. Risks can result from differences in economic and political conditions, regulations, market practices (including higher transaction costs) and accounting standards. Foreign
| 34 | International Core Fund | Semiannual report |
investments are also subject to a decline in the value of a foreign currency versus the U.S. dollar, which reduces the dollar value of securities denominated in that currency.
Foreign taxes. The Fund may be subject to withholding tax on income or capital gains or repatriation taxes as imposed by certain countries in which it invests. Taxes are accrued based upon net investment income, net realized gains or net unrealized appreciation.
Line of credit. The Fund may borrow from banks for temporary or emergency purposes, including meeting redemption requests that otherwise might require the untimely sale of securities. Pursuant to the custodian agreement, the custodian may loan money to the Fund to make properly authorized payments. The Fund is obligated to repay the custodian for any overdraft, including any related costs or expenses. The custodian may have a lien, security interest or security entitlement in any Fund property that is not otherwise segregated or pledged, to the maximum extent permitted by law, to the extent of any overdraft.
In addition, the Fund and other affiliated funds have entered into an agreement with Citibank N.A. which enables them to participate in a $100 million unsecured committed line of credit. A commitment fee, payable at the end of each calendar quarter, based on the average daily unused portion of the line of credit, is charged to each participating fund on a pro rata basis and is reflected in other expenses on the Statement of operations. For the six months ended August 31, 2012, the Fund had no borrowings under the line of credit.
Expenses. Within the John Hancock Funds complex, expenses that are directly attributable to an individual fund are allocated to such fund. Expenses that are not readily attributable to a specific fund are allocated among all funds in an equitable manner, taking into consideration, among other things, the nature and type of expense and the fund’s relative net assets. Expense estimates are accrued in the period to which they relate and adjustments are made when actual amounts are known.
Class allocations. Income, common expenses and realized and unrealized gains (losses) are determined at the fund level and allocated daily to each class of shares based on the net assets of the class. Class-specific expenses, such as distribution and service fees, if any, transfer agent fees, state registration fees and printing and postage, for all classes, are calculated daily at the class level based on the appropriate net assets of each class and the specific expense rates applicable to each class.
Federal income taxes. The Fund intends to continue to qualify as a regulated investment company by complying with the applicable provisions of the Internal Revenue Code and will not be subject to federal income tax on taxable income that is distributed to shareholders. Therefore, no federal income tax provision is required.
Under the Regulated Investment Company Modernization Act of 2010, the Fund is permitted to carry forward capital losses incurred in taxable years beginning after December 22, 2010 for an unlimited period. Any losses incurred during those taxable years will be required to be utilized prior to the losses incurred in pre-enactment taxable years. As a result of this ordering rule, pre-enactment capital loss carryforwards may be more likely to expire unused. Additionally, post-enactment capital losses that are carried forward will retain their character as either short-term or long-term capital losses rather than being considered all short-term as under previous law.
For federal income tax purposes, the Fund has a capital loss carryforward of $180,841,491 available to offset future net realized capital gains as of February 29, 2012, which expires as follows: February 28, 2018 — $173,798,079 and February 28, 2019 — $7,043,412.
| Semiannual report | International Core Fund | 35 |
As of February 29, 2012, the Fund had no uncertain tax positions that would require financial statement recognition, derecognition or disclosure. The Fund’s federal tax returns are subject to examination by the Internal Revenue Service for a period of three years.
Distribution of income and gains. Distributions to shareholders from net investment income and net realized gains, if any, are recorded on the ex-date. The Fund generally declares and pays dividends and capital gain distributions, if any, annually.
Distributions paid by the Fund with respect to each class of shares are calculated in the same manner, at the same time and in the same amount, except for the effect of class level expenses that may be applied differently to each class.
Such distributions, on a tax basis, are determined in conformity with income tax regulations, which may differ from accounting principles generally accepted in the United States of America.
Capital accounts within the financial statements are adjusted for permanent book-tax differences. These adjustments have no impact on net assets or the results of operations. Temporary book-tax differences, if any, will reverse in a subsequent period. Book-tax differences are primarily attributable to foreign currency transactions, passive foreign investment companies, wash sale loss deferrals and derivative transactions.
New accounting pronouncement. In December 2011, the Financial Accounting Standards Board issued Accounting Standards Update No. 2011-11 (ASU 2011-11), Disclosures about Offsetting Assets and Liabilities. The update creates new disclosure requirements requiring entities to disclose both gross and net information for derivatives and other financial instruments that are either offset in the Statement of assets and liabilities or subject to an enforceable master netting arrangement or similar agreement. The disclosure requirements are effective for annual reporting periods beginning on or after January 1, 2013 and interim periods within those annual periods. ASU 2011-11 may result in additional disclosure relating to the presentation of derivatives and certain other financial instruments.
Note 3 — Derivative instruments
The Fund may invest in derivatives in order to meet its investment objective. The use of derivatives may involve risks different from, or potentially greater than, the risks associated with investing directly in securities. Specifically, the Fund is exposed to the risk that the counterparty to an over-the-counter (OTC) derivatives contract will be unable or unwilling to make timely settlement payments or otherwise honor its obligations. OTC derivatives transactions typically can only be closed out with the other party to the transaction. If the counterparty defaults, the Fund will have contractual remedies, but there is no assurance that the counterparty will meet its contractual obligations or that the Fund will succeed in enforcing them.
Futures. A futures contract is a contractual agreement to buy or sell a particular currency or financial instrument at a pre-determined price in the future. Risks related to the use of futures contracts include possible illiquidity of the futures markets, contract prices that can be highly volatile and imperfectly correlated to movements in hedged security values and/or interest rates and potential losses in excess of the amounts recognized on the Statement of assets and liabilities.
Upon entering into a futures contract, the Fund is required to deposit initial margin with the broker in the form of cash or securities. The amount of required margin is generally based on a percentage of the contract value; this amount is the initial margin for the trade. The margin deposit must then be maintained at the established level over the life of the contract. Futures collateral receivable / payable is included on the Statement of assets and liabilities. Futures contracts are
| 36 | International Core Fund | Semiannual report |
marked-to-market daily and an appropriate payable or receivable for the change in value (variation margin) and unrealized gain or loss is recorded by the Fund. When the contract is closed, the Fund records a realized gain or loss equal to the difference between the value of the contract at the time it was opened and the value at the time it was closed.
During the six months ended August 31, 2012, the Fund used futures contracts to gain exposure to certain securities markets. The following table summarizes the contracts held at August 31, 2012. During the six months ended August 31, 2012, the Fund held futures contracts with USD notional values ranging from $126.3 million to $135.0 million as measured at each quarter end.
| UNREALIZED | ||||||
| OPEN | NUMBER OF | APPRECIATION | ||||
| CONTRACTS | CONTRACTS | POSITION | EXPIRATION DATE | VALUE | (DEPRECIATION) | |
| TOPIX Index Futures | 235 | Long | Sep 2012 | $21,805,671 | $1,225,922 | |
| FTSE MIB Index | 288 | Long | Sep 2012 | 27,362,280 | 3,278,886 | |
| Futures | ||||||
| DAX Index Futures | 51 | Long | Sep 2012 | 11,176,952 | 1,099,450 | |
| SGX MSCI Singapore | 144 | Long | Sep 2012 | 8,019,639 | (29,774) | |
| Index Futures | ||||||
| FTSE 100 Index | 154 | Long | Sep 2012 | 13,934,488 | 135,183 | |
| Futures | ||||||
| S&P TSE 60 Index | 264 | Short | Sep 2012 | (36,567,649) | (1,775,299) | |
| Futures | ||||||
| ASX SPI 200 Index | ||||||
| Futures | 77 | Short | Sep 2012 | (8,567,807) | (433,943) | |
| Total | $3,500,425 | |||||
Forward foreign currency contracts. A forward foreign currency contract is an agreement between two parties to buy and sell a specific currency at a price that is set on the date of the contract. The forward contract calls for delivery of the currency on a future date that is specified in the contract. Risks related to the use of forwards include the possible failure of counterparties to meet the terms of the forward agreement, the failure of the counterparties to timely post collateral, the risk that currency movements will not occur thereby reducing the Fund’s total return, and the potential for losses in excess of the amounts recognized on the Statement of assets and liabilities.
The market value of a forward foreign currency contract fluctuates with changes in foreign currency exchange rates. Forward foreign currency contracts are marked-to-market daily and the change in value is recorded by the Fund as an unrealized gain or loss. Realized gains or losses, equal to the difference between the value of the contract at the time it was opened and the value at the time it was closed, are recorded upon delivery or receipt of the currency or settlement with the counterparty.
During the six months ended August 31, 2012, the Fund used forward foreign currency contracts to manage against anticipated currency exchange rates. The following table summarizes the contracts held at August 31, 2012. During the six months ended August 31, 2012, the Fund held forward foreign currency contracts with USD notional values ranging from $263.6 million to $284.7 million, as measured at each quarter end.
| Semiannual report | International Core Fund | 37 |
| PRINCIPAL AMOUNT | PRINCIPAL AMOUNT | UNREALIZED | ||||
| COVERED BY | COVERED BY | SETTLEMENT | APPRECIATION | |||
| CURRENCY | CONTRACT | CONTRACT (USD) | COUNTERPARTY | DATE | (DEPRECIATION) | |
| Buys | ||||||
| Pound | 7,249,062 | $11,433,764 | Bank of America | 10-19-12 | $74,870 | |
| Sterling | N.A. | |||||
| Pound | 3,899,895 | 6,143,895 | Brown Brother | 10-19-12 | 47,592 | |
| Sterling | Harriman & | |||||
| Company | ||||||
| Pound | 5,424,577 | 8,551,705 | JPMorgan Chase | 10-19-12 | 60,372 | |
| Sterling | Bank | |||||
| Pound | 10,834,126 | 17,086,825 | Mellon Bank NA | 10-19-12 | 113,469 | |
| Sterling | ||||||
| Pound | 5,351,804 | 8,454,678 | Morgan Stanley | 10-19-12 | 41,863 | |
| Sterling | Capital Services, | |||||
| Inc. | ||||||
| Pound | 5,655,572 | 8,914,805 | Royal Bank of | 10-19-12 | 64,000 | |
| Sterling | Scotland PLC | |||||
| Hong Kong | 41,093,478 | 5,298,467 | Barclays Bank PLC | 10-19-12 | 470 | |
| Dollar | ||||||
| Hong Kong | 86,706,742 | 11,179,456 | Brown Brother | 10-19-12 | 1,236 | |
| Dollar | Harriman & | |||||
| Company | ||||||
| Hong Kong | 24,623,000 | 3,174,792 | JPMorgan Chase | 10-19-12 | 304 | |
| Dollar | Bank | |||||
| Hong Kong | 41,093,478 | 5,298,255 | Morgan Stanley | 10-19-12 | 681 | |
| Dollar | Capital Services, | |||||
| Inc. | ||||||
| Hong Kong | 81,092,551 | 10,455,946 | State Street Bank | 10-19-12 | 805 | |
| Dollar | and Trust Company | |||||
| Swedish | 22,137,987 | 3,326,644 | Bank of America | 10-19-12 | 10,606 | |
| Krona | N.A. | |||||
| Swedish | 25,659,559 | 3,852,972 | Barclays Bank PLC | 10-19-12 | 15,147 | |
| Krona | ||||||
| Swedish | 9,275,289 | 1,392,026 | Brown Brother | 10-19-12 | 6,203 | |
| Krona | Harriman & | |||||
| Company | ||||||
| Swedish | 65,864,325 | 9,900,479 | Deutsche Bank AG | 10-19-12 | 28,414 | |
| Krona | London | |||||
| Singapore | 13,340,186 | 10,679,411 | Bank of America | 10-19-12 | 22,618 | |
| Dollar | N.A. | |||||
| Singapore | 13,331,429 | 10,674,238 | Barclays Bank PLC | 10-19-12 | 20,766 | |
| Dollar | ||||||
| Singapore | 1,942,000 | 1,554,045 | JPMorgan Chase | 10-19-12 | 3,905 | |
| Dollar | Bank | |||||
| Singapore | 3,337,439 | 2,672,217 | Mellon Bank NA | 10-19-12 | 5,209 | |
| Dollar | ||||||
| Singapore | 5,456,946 | 4,367,478 | Morgan Stanley | 10-19-12 | 10,301 | |
| Dollar | Capital Services, | |||||
| Inc. | ||||||
| Singapore | 3,752,879 | 3,003,567 | Royal Bank of | 10-19-12 | 7,142 | |
| Dollar | Scotland PLC | |||||
| Singapore | 2,906,439 | 2,327,348 | State Street | 10-19-12 | 4,313 | |
| Dollar | Bank and Trust | |||||
| Company | ||||||
| Total | $149,743,013 | $540,286 | ||||
| 38 | International Core Fund | Semiannual report |
| PRINCIPAL AMOUNT | PRINCIPAL AMOUNT | UNREALIZED | ||||
| COVERED BY | COVERED BY | SETTLEMENT | APPRECIATION | |||
| CURRENCY | CONTRACT | CONTRACT (USD) | COUNTERPARTY | DATE | (DEPRECIATION) | |
| Sells | ||||||
| Australian | 4,102,760 | $4,285,415 | Bank of America | 10-19-12 | $64,074 | |
| Dollar | N.A. | |||||
| Australian | 1,897,502 | 1,984,076 | Brown Brothers | 10-19-12 | 31,731 | |
| Dollar | Harriman & | |||||
| Company | ||||||
| Australian | 4,700,662 | 4,916,093 | Mellon Bank NA | 10-19-12 | 79,570 | |
| Dollar | ||||||
| Canadian | 9,320,112 | 9,447,933 | Bank of America | 10-19-12 | 1,894 | |
| Dollar | N.A. | |||||
| Canadian | 8,597,508 | 8,714,014 | Barclays Bank PLC | 10-19-12 | 342 | |
| Dollar | ||||||
| Canadian | 6,671,168 | 6,762,633 | JPMorgan Chase | 10-19-12 | 1,328 | |
| Dollar | Bank | |||||
| Canadian | 9,827,877 | 9,963,076 | Morgan Stanley | 10-19-12 | 2,411 | |
| Dollar | Capital Services, | |||||
| Inc. | ||||||
| Canadian | 1,439,388 | 1,458,008 | Royal Bank of | 10-19-12 | (828) | |
| Dollar | Scotland PLC | |||||
| Euro | 8,338,399 | 10,370,050 | Brown Brothers | 10-19-12 | (122,918) | |
| Harriman & | ||||||
| Company | ||||||
| Euro | 4,525,960 | 5,640,482 | JPMorgan Chase | 10-19-12 | (54,946) | |
| Bank | ||||||
| Euro | 4,020,944 | 5,003,848 | Royal Bank of | 10-19-12 | (56,073) | |
| Scotland PLC | ||||||
| Euro | 6,147,461 | 7,671,847 | State Street Bank | 10-19-12 | (64,064) | |
| and Trust Company | ||||||
| Japanese Yen | 661,566,036 | 8,331,699 | Deutsche Bank AG | 10-19-12 | (121,056) | |
| London | ||||||
| Japanese Yen | 2,178,648,508 | 27,424,046 | JPMorgan Chase | 10-19-12 | (412,301) | |
| Bank | ||||||
| Japanese Yen | 152,430,105 | 1,920,863 | Mellon Bank NA | 10-19-12 | (26,719) | |
| Total | $113,894,083 | ($677,555) | ||||
Fair value of derivative instruments by risk category
The table below summarizes the fair value of derivatives held by the Fund at August 31, 2012 by risk category:
| FINANCIAL | ASSET | LIABILITY | ||
| STATEMENT OF ASSET AND | INSTRUMENT | DERIVATIVES | DERIVATIVES | |
| RISK | LIABILITIES LOCATION | LOCATION | FAIR VALUE | FAIR VALUE |
| Equity contracts | Receivable for futures | Futures† | $5,739,441 | ($2,239,016) |
| variation margin; net | ||||
| unrealized appreciation | ||||
| (depreciation) on investments | ||||
| Foreign exchange | Receivable/Payable for | Forward foreign | 721,635 | (858,904) |
| contracts | forward foreign currency | currency | ||
| exchange contracts | contracts | |||
| Total | $6,461,076 | ($3,097,920) | ||
† Reflects cumulative appreciation/depreciation of futures as disclosed herein. Only the period end variation margin is separately disclosed on the Statement of assets and liabilities.
| Semiannual report | International Core Fund | 39 |
Effect of derivative instruments on the Statement of operations
The table below summarizes the net realized gain (loss) included in the net increase (decrease) in net assets from operations, classified by derivative instrument and risk category, for the six months ended August 31, 2012:
| STATEMENT OF | FOREIGN | |||
| OPERATIONS | FUTURES | CURRENCY | ||
| RISK | LOCATION | CONTRACTS | TRANSACTIONS* | TOTAL |
| Equity contracts | Net realized | |||
| gain (loss) | ($4,326,611) | — | ($4,326,611) | |
| Foreign exchange | Net realized | |||
| contracts | gain (loss) | — | $2,337,545 | 2,337,545 |
| Total | ($4,326,611) | $2,337,545 | ($1,989,066) | |
* Realized gain/loss associated with forward foreign currency contracts is included in this caption on the Statement of operations.
The table below summarizes the net change in unrealized appreciation (depreciation) included in the net increase (decrease) in net assets from operations, classified by derivative instrument and risk category, for the six months ended August 31, 2012:
| TRANSLATION | ||||
| OF ASSETS | ||||
| AND LIABILITIES | ||||
| STATEMENT OF | FUTURES | IN FOREIGN | ||
| RISK | OPERATIONS LOCATION | CONTRACTS | CURRENCIES* | TOTAL |
| Equity contracts | Change in unrealized | |||
| appreciation (depreciation) | $728,186 | — | $728,186 | |
| Foreign exchange | Change in unrealized | |||
| contracts | appreciation (depreciation) | — | $954,946 | 954,946 |
| Total | $728,186 | $954,946 | $1,683,132 | |
* Change in unrealized appreciation/depreciaton associated with forward foreign currency contracts is included in this caption on the Statement of operations.
Note 4 — Guarantees and indemnifications
Under the Trust’s organizational documents, its Officers and Trustees are indemnified against certain liabilities arising out of the performance of their duties to the Trust including the Fund. Additionally, in the normal course of business, the Fund enters into contracts with service providers that contain general indemnification clauses. The Fund’s maximum exposure under these arrangements is unknown, as this would involve future claims that may be made against the Fund that have not yet occurred. The risk of material loss from such claims is considered remote.
Note 5 — Fees and transactions with affiliates
John Hancock Investment Management Services, LLC (the Adviser) serves as investment adviser for the Trust. John Hancock Funds, LLC (the Distributor), an affiliate of the Adviser, serves as principal underwriter of the Trust. The Adviser and the Distributor are indirect, wholly owned subsidiaries of MFC.
Management fee. The Fund has an investment management agreement with the Adviser under which the Fund pays a daily management fee to the Adviser equivalent, on an annual basis, to the sum of: a) 0.920% of the first $100,000,000 of the Fund’s average daily net assets; b) 0.895% of the next $900,000,000; c) 0.880% of the next $1,000,000,000; d) 0.850% of the next $1,000,000,000; e) 0.825% of the next $1,000,000,000; and f) 0.800% of the Fund’s average daily net asset in excess of $4,000,000,000. The Adviser has a subadvisory agreement with Grantham, Mayo, Van Otterloo & Co. LLC. The Fund is not responsible for payment of the subadvisory fees.
| 40 | International Core Fund | Semiannual report |
The Adviser has contractually agreed to waive fees and/or reimburse certain expenses for each share class of the Fund. This agreement excludes certain expenses such as taxes, portfolio brokerage commissions, interest expense, litigation and indemnification expenses, and other extraordinary expenses not incurred in the ordinary course of the Fund’s business. The fee waivers and/or reimbursements are such that these expenses will not exceed 1.60%, 2.30%, 2.30%, 1.90%, 1.65% 1.80%, 1.40%, 1.20% and 1.12% for Class A, Class B, Class C, Class R1, Class R2, Class R3, Class R4, Class R5 and Class R6 shares, respectively. The current expense limitation agreement will remain in effect through June 30, 2013, unless renewed by mutual agreement of the Fund and the Adviser based upon a determination that this is appropriate under the circumstances at the time. Prior to July 1, 2012, the fee waivers and/or reimbursements were such that these expenses did not exceed 1.60%, 2.30%, 2.30%, 1.24%, 1.90%, 1.65%, 1.80%, 1.50%, 1.20%, 1.12% and 1.15% for Class A, Class B, Class C, Class I, Class R1, Class R2, Class R3, Class R4, Class R5, Class R6 and Class 1, respectively.
Accordingly, these expense reductions amounted to $13,508, $13,253, $7,236, $7,527, $7,543, $7,551, $7,578 and $7,773 for Class B, Class C, Class R1, Class R2, Class R3, Class R4, Class R5 and Class R6 shares, respectively, for the six months ended August 31, 2012.
The investment management fees, including the impact of the waivers and reimbursements described above, incurred for the six months ended August 31, 2012 were equivalent to the net annual effective rate of 0.88% of the Fund’s average daily net assets.
Accounting and legal services. Pursuant to a service agreement the Fund reimburses the Adviser for all expenses associated with providing the administrative, financial, legal, accounting and recordkeeping services to the Fund, including the preparation of all tax returns, periodic reports to shareholders and regulatory reports, among other services. These expenses are allocated to each share class based on its relative net assets at the time the expense was incurred. These accounting and legal services fees incurred for the six months ended August 31, 2012 amounted to an annual rate of 0.02% of the Fund’s average daily net assets.
Distribution and service plans. The Fund has a distribution agreement with the Distributor. The Fund has adopted distribution and service plans with respect to Class A, Class B, Class C and Class 1 shares pursuant to Rule 12b-1 under the 1940 Act, to pay the Distributor for services provided as the distributor of shares of the Fund. The Fund may pay up to the following contractual rates of distribution and service fees under these arrangements, expressed as an annual percentage of average daily net assets for each class of the Fund’s shares.
| CLASS | 12b–1 FEE | SERVICE FEE | |||||
| Class A | 0.30% | — | |||||
| Class B | 1.00% | — | |||||
| Class C | 1.00% | — | |||||
| Class R1 | 0.50% | 0.25% | |||||
| Class R2 | 0.25% | 0.25% | |||||
| Class R3 | 0.50% | 0.15% | |||||
| Class R41 | 0.25% | 0.10% | |||||
| Class R5 | — | 0.05% | |||||
| Class 1 | 0.05% | — | |||||
1Effective June 1, 2012, the Distributor has contractually agreed to waive 0.10% of 12b-1 fees for Class R4 shares to limit the 12b-1 fees on Class R4 shares to 0.15% of the average daily net assets of Class R4 shares, until at least June 31, 2013, unless renewed by mutual agreement of the Fund and the Distributor based upon a determination that this is appropriate under the circumstances at the time. Accordingly, the fee limitation amounted to $8 for Class R4 shares for the six months ended August 31, 2012.
| Semiannual report | International Core Fund | 41 |
Sales charges. Class A shares are assessed up-front sales charges, which resulted in payments to the Distributor amounting to $32,200 for the six months ended August 31, 2012. Of this amount, $5,308 was retained and used for printing prospectuses, advertising, sales literature and other purposes, $24,572 was paid as sales commissions to broker-dealers and $2,320 was paid as sales commissions to sales personnel of Signator Investors, Inc., a broker-dealer affiliate of the Adviser.
Class B and Class C shares are subject to contingent deferred sales charges (CDSCs). Class B shares that are redeemed within six years of purchase are subject to CDSCs, at declining rates, beginning at 5.00% of the lesser of the current market value at the time of redemption or the original purchase cost of the shares being redeemed. Class C shares that are redeemed within one year of purchase are subject to a 1.00% CDSC on the lesser of the current market value at the time of redemption or the original purchase cost of the shares being redeemed. Proceeds from CDSCs are used to compensate the Distributor for providing distribution-related services in connection with the sale of these shares. During the six months ended August 31, 2012, CDSCs received by the Distributor amounted to $1,982 and $92 for Class B and Class C shares, respectively.
Transfer agent fees. The Fund has a transfer agent agreement with John Hancock Signature Services, Inc. (Signature Services), an affiliate of the Adviser. The transfer agent fees paid to Signature Services are determined based on the cost to Signature Services (Signature Services Cost) of providing recordkeeping services. The Signature Services Cost includes a component of allocated John Hancock corporate overhead for providing transfer agent services to the Fund and to all other John Hancock affiliated funds. It also includes out-of-pocket expenses that are comprised of payments made to third-parties for recordkeeping services provided to their clients who invest in one or more John Hancock funds. In addition, Signature Services Cost may be reduced by certain fees that Signature Services receives in connection with retirement and small accounts. Signature Services Cost is calculated monthly and allocated, as applicable, to four categories of share classes: Institutional Share Classes, Retirement Share Classes, Municipal Bond Classes and all other Retail Share Classes. Within each of these categories, the applicable costs are allocated to the affected John Hancock affiliated funds and/or classes, based on the relative average daily net assets.
Class level expenses. Class level expenses for the six months ended August 31, 2012 were:
| DISTRIBUTION | TRANSFER | STATE | PRINTING AND | |
| CLASS | AND SERVICE FEES | AGENT FEES | REGISTRATION FEES | POSTAGE |
| Class A | $561,706 | $359,727 | $23,425 | $102,641 |
| Class B | 16,609 | 3,178 | 7,830 | 7,101 |
| Class C | 20,976 | 4,020 | 7,810 | 7,231 |
| Class I | — | 235,427 | 24,242 | 70,001 |
| Class R1 | 649 | 37 | 7,477 | 158 |
| Class R2 | 118 | 14 | 7,677 | 14 |
| Class R3 | 76 | 5 | 7,523 | 59 |
| Class R4 | 44 | 5 | 7,523 | 62 |
| Class R5 | 11 | 10 | 7,523 | 97 |
| Class R6 | — | 14 | 7,791 | 14 |
| Class 1 | 9,106 | — | — | — |
| Total | $609,295 | $602,437 | $108,821 | $187,378 |
Trustee expenses. The Fund compensates each Trustee who is not an employee of the Adviser or its affiliates. These Trustees may, for tax purposes, elect to defer receipt of this compensation under the John Hancock Group of Funds Deferred Compensation Plan (the Plan). Deferred amounts are invested in various John Hancock funds and remain in the funds until distributed in accordance with the Plan. The investment of deferred amounts and the offsetting liability are included within Other receivables and prepaid expenses and Payable to affiliates — Trustees’ fees, respectively, in the accompanying Statement of assets and liabilities.
| 42 | International Core Fund | Semiannual report |
Note 6 — Fund share transactions
Transactions in Fund shares for the six months ended August 31, 2012 and the year ended February 29, 2012 were as follows:
| Six months ended 8-31-12 | Year ended 2-29-12 | |||
| Shares | Amount | Shares | Amount | |
| Class A shares | ||||
| Sold | 2,433,635 | $63,541,255 | 9,664,641 | $283,603,855 |
| Distributions reinvested | — | — | 256,155 | 6,396,207 |
| Repurchased | (1,348,982) | (35,420,382) | (7,236,095) | (200,862,649) |
| Net increase | 1,084,653 | $28,120,873 | 2,684,701 | $89,137,413 |
| Class B shares | ||||
| Sold | 10,509 | $270,703 | 19,415 | $552,860 |
| Distributions reinvested | — | — | 1,017 | 25,331 |
| Repurchased | (20,239) | (534,171) | (64,561) | (1,836,330) |
| Net decrease | (9,730) | ($263,468) | (44,129) | ($1,258,139) |
| Class C shares | ||||
| Sold | 10,682 | $282,886 | 20,551 | $588,450 |
| Distributions reinvested | — | — | 1,054 | 26,257 |
| Repurchased | (14,428) | (376,018) | (40,063) | (1,110,406) |
| Net decrease | (3,746) | ($93,132) | (18,458) | ($495,699) |
| Class I shares | ||||
| Sold | 3,893,978 | $101,157,401 | 7,061,327 | $199,845,476 |
| Distributions reinvested | — | — | 280,468 | 7,011,688 |
| Repurchased | (1,594,173) | (41,558,282) | (1,927,978) | (54,524,977) |
| Net increase | 2,299,805 | $59,599,119 | 5,413,817 | $152,332,187 |
| Class R1 shares | ||||
| Sold | 710 | $18,887 | 2,236 | $60,522 |
| Distributions reinvested | — | — | 102 | 2,560 |
| Repurchased | (118) | (3,145) | (757) | (21,279) |
| Net increase | 592 | $15,742 | 1,581 | $41,803 |
| Class R2 shares | ||||
| Sold | 3,597 | $100,000 | — | — |
| Net increase | 3,597 | $100,000 | — | — |
| Class R3 shares | ||||
| Sold | 134 | $3,359 | — | — |
| Net increase | 134 | $3,359 | — | — |
| Class R4 shares | ||||
| Sold | 61 | $1,596 | 160 | $4,313 |
| Distributions reinvested | — | — | 1 | 39 |
| Repurchased | — | — | — | (2) |
| Net increase | 61 | $1,596 | 161 | $4,350 |
| Class R5 shares | ||||
| Sold | 236 | $6,147 | 672 | $18,393 |
| Distributions reinvested | — | — | 27 | 680 |
| Repurchased | (49) | (1,214) | (361) | (9,367) |
| Net increase | 187 | $4,933 | 338 | $9,706 |
| Semiannual report | International Core Fund | 43 |
| Six months ended 8-31-12 | Year ended 2-29-12 | |||
| Shares | Amount | Shares | Amount | |
| Class R6 shares | ||||
| Sold | 48 | $1,254 | 3,577 | $100,148 |
| Net increase | 48 | $1,254 | 3,577 | $100,148 |
| Class 1 shares | ||||
| Sold | 41,703 | $1,093,725 | 96,037 | $2,833,836 |
| Distributions reinvested | — | — | 31,131 | 779,516 |
| Repurchased | (118,998) | (3,151,066) | (242,275) | (6,879,292) |
| Net increase | (77,295) | ($2,057,341) | (115,107) | ($3,265,940) |
| Class NAV shares | ||||
| Sold | 4,123,912 | $109,830,630 | 2,458,509 | $67,970,413 |
| Distributions reinvested | — | — | 624,789 | 15,625,962 |
| Repurchased | (10,506,120) | (272,082,140) | (5,700,418) | (165,832,794) |
| Net decrease | (6,382,208) | ($162,251,510) | (2,617,120) | ($82,236,419) |
| Net increase (decrease) | (3,083,903) | ($76,818,575) | 5,309,361 | $154,369,410 |
Affiliates of the Fund owned 37%, 100%, 89%, 82%, 39%, 100% and 100% of shares of beneficial interest of Class R1, Class R2, Class R3, Class R4, Class R5, Class R6 and Class NAV, respectively, on August 31, 2012.
Note 7 — Purchase and sale of securities
Purchases and sales of securities, other than short-term securities, aggregated $506,167,565 and $528,291,372, respectively, for the six months ended August 31, 2012.
| 44 | International Core Fund | Semiannual report |
Board Consideration of and Continuation of Investment Advisory Agreement and Subadvisory Agreement
The Board of Trustees (the Board, the members of which are referred to as Trustees) of John Hancock International Core Fund (the Fund), a series of John Hancock Funds III, met in-person on May 6–8, and June 3–5, 2012 to consider the approval of the Fund’s investment advisory agreement (the Advisory Agreement) with John Hancock Investment Management Services, LLC (the Adviser), the Fund’s investment adviser. The Board also considered the approval of the investment subadvi-sory agreement (the Subadvisory Agreement) between the Adviser and GMO, LLC (the Subadviser) on behalf of the Fund. The Advisory Agreement and the Subadvisory Agreement are referred to as the Agreements.
Activities and composition of the Board
On June 3–5, 2012, the Board consisted of nine individuals, seven of whom were Independent Trustees. Independent Trustees are generally those individuals who are not employed by or have any significant business or professional relationship with the Adviser or the Subadviser. The Trustees are responsible for the oversight of operations of the Fund and perform various duties required of directors of investment companies by the Investment Company Act of 1940, as amended (the 1940 Act). The Independent Trustees have independent legal counsel to assist them in connection with their duties. The Board has appointed an Independent Trustee as Chairman. On June 3–5, 2012, the Board had four standing committees that were composed entirely of Independent Trustees: the Audit Committee; the Compliance Committee; the Nominating, Governance and Administration Committee; and the Contracts & Operations Committee. Additionally, on June 3–5, 2012, Investment Performance Committees A and B were standing committees of the Board composed of Independent Trustees and one Trustee who is affiliated with the Adviser. Investment Performance Committee B was responsible for overseeing and monitoring matters relating to the investment performance of the Fund. The Board also designated an Independent Trustee as Vice Chairman to serve in the absence of the Chairman. The Board also designates working groups or ad hoc committees as it deems appropriate.
The approval process
Under the 1940 Act, the Board is required to consider the continuation of the Agreements each year. Throughout the year, the Board, acting directly and through its committees, regularly reviews and assesses the quality of the services that the Fund receives under these Agreements. The Board reviews reports of the Adviser at least quarterly, which include Fund performance reports and compliance reports. In addition, the Board meets with portfolio managers and senior investment officers at various times throughout the year. The Board considers at each of its meetings factors that are relevant to its annual consideration of the renewal of the Agreements, including the services and support provided by the Adviser and Subadviser to the Fund and its shareholders.
Prior to the May 6–8, 2012 meeting, the Board requested and received materials specifically relating to the Agreements. The materials provided in connection with the May meeting included information compiled and prepared by Lipper, a Thomson Reuters company (Lipper), on Fund fees and expenses, and the investment performance of the Fund. This Fund information is assembled in a format that permits comparison with similar information from a Category and a subset of the Category referred to as the Expense Group, each as determined by Lipper, and with the Fund’s benchmark index. The Category includes all funds that invest similarly to the way the Fund invests. The Expense Group represents funds of similar size, excluding passively managed funds and funds-of-funds. The Fund’s benchmark index is an unmanaged index of securities that is provided as a basis for comparison with the Fund’s performance. Other material provided for the Fund review included (a) information on the profitability of the Agreements to the Adviser and a discussion of any additional benefits to the Adviser or Subadviser or their affiliates that result from being the Adviser or Subadviser to the Fund; (b) a general analysis provided by the Adviser and the Subadviser concerning investment advisory fees charged to other clients, such as institutional clients and other
| Semiannual report | International Core Fund | 45 |
investment companies, having similar investment mandates, as well as the performance of those other clients and a comparison of the services provided to those other clients and the services provided to the Fund; (c) the impact of economies of scale; (d) a summary of aggregate amounts paid by the Fund to the Adviser; and (e) sales and redemption data regarding the Fund’s shares.
At an in-person meeting held on May 6–8, 2012, the Board reviewed materials relevant to its consideration of the Agreements. As a result of the discussions that occurred during the May 6–8, 2012 meeting, the Board asked the Adviser for additional information on certain matters. The Adviser provided the additional information and the Board also considered this information as part of its consideration of the Agreements.
At an in-person meeting held on June 3–5, 2012, the Board, including the Independent Trustees, formally considered the continuation of the Advisory Agreement and the Subadvisory Agreement, each for an additional one-year term. The Board considered what it believed were key relevant factors that are described under separate headings presented below.
The Board also considered other matters important to the approval process, such as payments made to and by the Adviser or its affiliates relating to the distribution of Fund shares and other services. The Board reviewed services related to the valuation and pricing of Fund portfolio holdings. Other important matters considered by the Board were the direct and indirect benefits to the Adviser, the Subadviser and their affiliates from their relationship with the Fund and advice from independent legal counsel with respect to the review process and materials submitted for the Board’s review.
Nature, extent and quality of services
The Board reviewed the nature, extent and quality of services provided by the Adviser and the Subadviser, including the investment advisory services and the resulting performance of the Fund.
The Board considered the ability of the Adviser and the Subadviser, based on their resources, reputation and other attributes, to attract and retain qualified investment professionals, including research, advisory and supervisory personnel. It considered the background and experience of senior management and investment professionals responsible for managing the Fund. The Board considered the investment philosophy, research and investment decision-making processes of the Subadviser responsible for the daily investment activities of the Fund, including, among other things, portfolio trading capabilities, use of technology, commitment to compliance and approach to training and retaining portfolio managers and other research, advisory and management personnel.
The Board considered the Subadviser’s history and experience providing investment services to the Fund. The Board considered the Adviser’s investment manager analytical capabilities, market and economic knowledge and execution of its Subadviser oversight responsibilities. The Board further considered the culture of compliance, resources dedicated to compliance, compliance programs, record of compliance with applicable laws and regulation, with the Fund’s investment policies and restrictions and with the applicable Code of Ethics, and the responsibilities of the Adviser’s and Subadviser’s compliance departments.
In addition to advisory services, the Board considered the quality of the administrative and non-investment advisory services provided to the Fund by the Adviser under a separate agreement. The Board noted that the Adviser and its affiliates provide the Fund with certain administrative, transfer agency, shareholder and other services (in addition to any such services provided to the Fund by third parties) and officers and other personnel as are necessary for the operations of the Fund. The Board reviewed the structure and duties of the Adviser’s administration, accounting, legal and compliance departments and its affiliate’s transfer agency operations and considered the Adviser’s and its affiliates’ policies and procedures for assuring compliance with applicable laws and regulations.
| 46 | International Core Fund | Semiannual report |
The Board also received information about the nature, extent and quality of services provided by and fee rates charged by the Adviser and Subadviser to their other clients, including other registered investment companies, institutional investors and separate accounts. The Board reviewed a general analysis provided by the Adviser and the Subadviser concerning investment advisory fees charged to other clients having similar investment mandates, the services provided to those other clients as compared to the services provided to the Fund, the performance of those other clients as compared to the performance by the Fund and other factors relating to those other clients. The Board considered the significant differences between the Adviser’s and Subadviser’s services to the Fund and the services they provide to other clients. For other clients that are not mutual funds, the differences in services relate to the greater share purchase and redemption activity in a mutual fund, the generally higher turnover of mutual fund portfolio holdings, the more burdensome regulatory and legal obligations of mutual funds and the higher marketing costs for mutual funds. When compared to all clients including mutual funds, the Adviser has greater oversight and supervisory responsibility for the Fund and undertakes greater entrepreneurial risk as the sponsor of the Fund.
Fund performance
The Board was provided with reports, independently prepared by Lipper, which included a comprehensive analysis of the Fund’s performance. The Board also examined materials discussing Fund performance and the Fund’s investment objective, strategies and outlook. The Board also reviewed a narrative and statistical analysis of the Lipper data that was prepared by the Adviser, which analyzed various factors that may affect the Lipper rankings. The Board reviewed information regarding the investment performance of the Fund as compared to its Lipper Category as well as its benchmark index (see chart below). The Board was provided with a description of the methodology used by Lipper to select the funds in the Category. The Board also considered updated performance information provided by the Adviser at its May and June 2012 meetings. The Board regularly reviews the performance of the Fund throughout the year and attaches more importance to performance over relatively longer periods of time, typically three to five years.
Set forth below is the performance of the Fund over certain time periods ended December 31, 2011 and that of its Category average and benchmark index over the same periods:
| SINCE INCEPTION | ||||
| 1 YEAR | 3 YEAR | 5 YEAR | (9-16-05) | |
| International Core Fund Class A Shares | –10.52% | 4.89% | –4.89% | 0.21% |
| International Large-Cap Core | –12.60% | 7.02% | –4.94% | 0.19% |
| Category Average | ||||
| MSCI EAFE GD Index | –11.73% | 8.16% | –4.26% | 0.97% |
The Board noted that the Fund’s performance compared favorably to the Category’s average performance over all periods shown, other than the three-year period over which the Fund underperformed its Category’s average performance. The Board also noted that the Fund had underperformed its benchmark index’s performance over all periods shown, other than the one-year period over which it had outperformed.
Expenses and fees
The Board, including the Independent Trustees, reviewed the Fund’s contractual advisory fee rate payable by the Fund to the Adviser as compared with the other funds in its Expense Group. The Board also received information about the investment subadvisory fee rate payable by the Adviser to the Subadviser for investment subadvisory services. The Board considered the services provided and the fees charged by the Adviser and the Subadviser to other clients with similar investment mandates, including other registered investment companies, institutional investors and separate accounts.
In addition, the Board considered the cost of the services provided to the Fund by the Adviser. The Board received and considered expense information regarding the Fund’s various components,
| Semiannual report | International Core Fund | 47 |
including advisory fees, distribution fees and fees other than advisory and distribution fees, including transfer agent fees, custodian fees, administration fees and other miscellaneous fees (e.g., fees for accounting and legal services). The Board considered comparisons of these expenses to the Expense Group median. The Board also considered expense information regarding the Fund’s total operating expense ratio (Gross Expense Ratio) and, if different, the Fund’s total operating expense ratio after taking into account any fee waiver or expense waiver agreement by the Adviser (Net Expense Ratio). The Board considered information comparing the Gross Expense Ratio and Net Expense Ratio of the Fund to that of the Expense Group median.
The Board noted that the Fund’s advisory fee ratio was eight basis points above the Expense Group median advisory fee ratio. The Board noted the following information about the Fund’s Gross and Net Expense Ratios for Class A shares contained in the Fund’s 2011 financial statements in relation with the Fund’s Expense Group median provided by Lipper in April 2012:
| FUND — CLASS A | EXPENSE GROUP MEDIAN | |
| Advisory Fee Ratio | 0.88% | 0.80% |
| Gross Expense Ratio | 1.54% | 1.41% |
| Net Expense Ratio | 1.54% | 1.35% |
The Board viewed favorably the Adviser’s contractual agreement to waive all or a portion of its advisory fees and to reimburse or pay operating expenses to the extent necessary to maintain the Fund’s expense ratio at 1.60% for Class A shares (and at varying levels for other classes), excluding certain expenses such as taxes, brokerage commissions, interest, litigation and extraordinary expenses, until June 30, 2013. The Board favorably considered the potential impact of this contractual agreement towards lowering the Fund’s Gross Expense Ratio. The Board was made aware of the higher custody fees associated with investing in foreign securities, which impacted the level of the Fund’s Gross Expense Ratio.
The Board received and reviewed statements relating to the Adviser’s financial condition and was also provided with a profitability analysis that detailed the revenues earned and the expenses incurred by the Adviser for services under the Advisory Agreement, as well as from other relationships between the Fund and the Adviser and its affiliates. The Board reviewed the Adviser’s profitability with respect to the Fund and other funds the Board currently oversees for the year ended December 31, 2011 compared to available aggregate profitability data provided for the year ended December 31, 2010. The Board reviewed the Adviser’s profitability with respect to other fund complexes managed by the Adviser and/or its affiliates. The Board reviewed the Adviser’s assumptions and methodology of allocating expenses in the profitability analysis, noting the inherent limitations in allocating costs among various advisory products.
The Board also considered a comparison of the Adviser’s profitability to that of a limited number of other investment advisers whose profitability information is publicly available. The Board recognized that profitability may be affected by numerous factors including, among other things, fee waivers and expense reimbursements by the Adviser, the types of funds managed, expense allocations and business mix, and therefore comparability of profitability is limited.
The Board did not consider profitability information with respect to the Subadviser, which is not affiliated with the Adviser. The Board considered that the subadvisory fee under the Subadvisory Agreement had been negotiated by the Adviser and the Subadviser on an arm’s length basis. For this reason, the Subadviser’s separate profitability from its relationship with the Fund was not a factor in determining whether to renew the Subadvisory Agreement. In evaluating overall fees for investment management, the Board recognized the inherently higher cost structure of subadvised funds.
| 48 | International Core Fund | Semiannual report |
Economies of scale
The Board, including the Independent Trustees, considered the extent to which economies of scale might be realized as the assets of the Fund increase. Possible changes in the advisory fee rate or structure in order to enable the Fund to participate in these economies of scale (e.g., through the use of breakpoints in the advisory fee at higher asset levels) are periodically discussed. The Board also considered the Adviser’s overall operations and its ongoing investment in its business in order to expand the scale of, and improve the quality of, its operations that benefit the Fund.
The Board recognized the inherent limitations of any analysis of economies of scale, stemming largely from the Board’s understanding that most of the Adviser’s costs are not specific to individual funds, but rather are incurred across a variety of products and services. To ensure that any economies are reasonably shared with the Fund as its assets increase, the Adviser and the Board agreed to continue the existing breakpoints to the contractual advisory fee rate.
Other benefits to the Adviser and the Subadviser
The Board understands that the Adviser, the Subadviser or their affiliates may derive other ancillary benefits from their relationship with the Fund, both tangible and intangible, such as their ability to leverage investment professionals who manage other portfolios, an increase in their profile in the investment advisory community and, in the case of the Adviser, the engagement of its affiliates and/or significant shareholders as service providers to the Fund, including for administrative, transfer agency and distribution services. The Board believes that certain of these benefits are difficult to quantify. The Board also was informed that the Subadviser may use third-party research obtained by soft dollars generated by certain mutual fund transactions to assist itself in managing all or a number of its other client accounts.
Board determination
The Board unanimously approved the continuation of the Advisory Agreement and the Subadvisory Agreement each for an additional one-year term. Based upon its evaluation of relevant factors in their totality, the Board was satisfied that the terms of the Agreements, including the advisory and subadvisory fee rates, were fair and reasonable and in the best interest of the Fund and its shareholders. In arriving at its decision to approve the Agreements, the Board did not identify any single factor or any group of factors as all-important or controlling, but considered all factors together. Different Trustees may have attributed different weights to the various factors considered. The Independent Trustees were also assisted by independent legal counsel in making this determination. The Trustees’ conclusions may be based in part on their consideration of these arrangements in prior years and on their ongoing regular review of Fund performance and operations throughout the year.
| Semiannual report | International Core Fund | 49 |
More information
| Trustees | Investment adviser |
| Steven R. Pruchansky,* Chairman | John Hancock Investment Management |
| William H. Cunningham | Services, LLC |
| Deborah C. Jackson | |
| Hugh McHaffie† | Subadviser |
| Dr. John A. Moore,* Vice Chairman | Grantham, Mayo, Van Otterloo & Co. LLC |
| Gregory A. Russo* | |
| John G. Vrysen† | Principal distributor |
| John Hancock Funds, LLC | |
| Officers | |
| Hugh McHaffie | Custodian |
| President | State Street Bank and Trust Company |
| Andrew G. Arnott | Transfer agent |
| Executive Vice President | John Hancock Signature Services, Inc. |
| Thomas M. Kinzler | Legal counsel |
| Secretary and Chief Legal Officer | K&L Gates LLP |
| Francis V. Knox, Jr. | |
| Chief Compliance Officer | |
| Charles A. Rizzo | |
| Chief Financial Officer | |
| Salvatore Schiavone | |
| Treasurer | |
| *Member of the Audit Committee | |
| †Non-Independent Trustee | |
The Fund’s proxy voting policies and procedures, as well as the Fund’s proxy voting record for the most recent twelve-month period ended June 30, are available free of charge on the Securities and Exchange Commission (SEC) Web site at www.sec.gov or on our Web site.
The Fund’s complete list of portfolio holdings, for the first and third fiscal quarters, is filed with the SEC on Form N-Q. The Fund’s Form N-Q is available on our Web site and the SEC’s Web site, www.sec.gov, and can be reviewed and copied (for a fee) at the SEC’s Public Reference Room in Washington, DC. Call 1-202-551-8090 to receive information on the operation of the SEC’s Public Reference Room.
We make this information on your fund, as well as monthly portfolio holdings, and other fund details available on our Web site at www.jhfunds.com or by calling 1-800-225-5291.
| You can also contact us: | ||
| 1-800-225-5291 | Regular mail: | Express mail: |
| jhfunds.com | John Hancock Signature Services, Inc. | John Hancock Signature Services, Inc. |
| P.O. Box 55913 | Mutual Fund Image Operations | |
| Boston, MA 02205-5913 | 30 Dan Road | |
| Canton, MA 02021 |
| 50 | International Core Fund | Semiannual report |

1-800-225-5291
1-800-554-6713 TDD
1-800-338-8080 EASI-Line
www.jhfunds.com
Now available: electronic delivery
www.jhfunds.com/edelivery
| This report is for the information of the shareholders of John Hancock International Core Fund. | 66SA 8/12 |
| It is not authorized for distribution to prospective investors unless preceded or accompanied by a prospectus. | 10/12 |
A look at performance
Total returns for the period ended August 31, 2012
| Average annual total returns (%) | Cumulative total returns (%) | |||||||||
| with maximum sales charge | with maximum sales charge | |||||||||
| 1-year | 5-year | 10-year | Since inception1 | 6-months | 1-year | 5-year | 10-year | Since inception1 | ||
| Class A | –0.73 | –2.97 | — | 1.82 | –2.95 | –0.73 | –13.99 | — | 11.89 | |
| Class B | –1.25 | –3.06 | — | 1.91 | –3.19 | –1.25 | –14.41 | — | 12.49 | |
| Class C | 2.71 | –2.73 | — | 1.88 | 0.76 | 2.71 | –12.94 | — | 12.28 | |
| Class I2 | 4.78 | –1.56 | — | 3.10 | 2.30 | 4.78 | –7.56 | — | 20.94 | |
| Class 12 | 4.93 | –1.52 | — | 3.14 | 2.35 | 4.93 | –7.39 | — | 21.20 | |
Performance figures assume all distributions are reinvested. Figures reflect maximum sales charges on Class A shares of 5%, and the applicable contingent deferred sales charge (CDSC) on Class B and Class C shares. The Class B shares’ CDSC declines annually between years 1 to 6 according to the following schedule: 5, 4, 3, 3, 2, 1%. No sales charge will be assessed after the sixth year. Class C shares held for less than one year are subject to a 1% CDSC. Sales charges are not applicable for Class I and Class 1 shares.
The expense ratios of the Fund, both net (including any fee waivers or expense limitations) and gross (excluding any fee waivers or expense limitations), are set forth according to the most recent publicly available prospectuses for the Fund and may differ from those disclosed in the Financial highlights tables in this report. The fee waivers and expense limitations are contractual at least until 6-30-13 for Class A, Class B, Class C and Class 1 shares. Had the fee waivers and expense limitations not been in place gross expenses would apply. For all other classes the net expenses equal the gross expenses. The expense ratios are as follows:
| Class A | Class B | Class C | Class I | Class 1 | |
| Net (%) | 1.60 | 2.30 | 2.30 | 1.20 | 1.15 |
| Gross (%) | 1.66 | 4.00 | 3.34 | 1.20 | 1.16 |
The returns reflect past results and should not be considered indicative of future performance. The return and principal value of an investment will fluctuate so that shares, when redeemed, may be worth more or less than their original cost. Due to market volatility, the Fund’s current performance may be higher or lower than the performance shown. For current to the most recent month-end performance data, please call 1-800-225-5291 or visit the Fund’s Web site at www.jhfunds.com.
The performance table above and the chart on the next page do not reflect the deduction of taxes that a shareholder would pay on fund distributions or the redemption of fund shares. The Fund’s performance results reflect any applicable expense reductions, without which the expenses increase and results would have been less favorable.
See the following page for footnotes.
| 6 | International Growth Fund | Semiannual report |
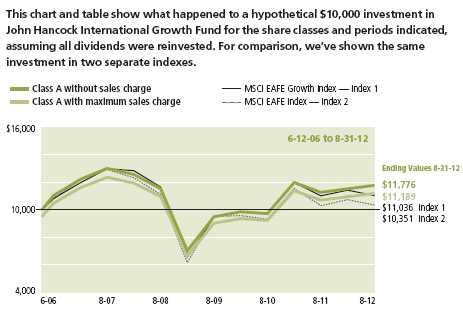
| Without | With maximum | ||||
| Start date | sales charge | sales charge | Index 1 | Index 2 | |
| Class B 3 | 6-12-06 | $11,249 | $11,249 | $11,036 | $10,351 |
| Class C3 | 6-12-06 | 11,228 | 11,228 | 11,036 | 10,351 |
| Class I 2 | 6-12-06 | 12,094 | 12,094 | 11,036 | 10,351 |
| Class 1 2 | 6-12-06 | 12,120 | 12,120 | 11,036 | 10,351 |
MSCI EAFE Growth Index (gross of foreign withholding tax on dividends) is a free float-adjusted market capitalization index that is designed to measure the performance of growth-oriented developed market stocks within Europe, Australasia and the Far East.
MSCI EAFE Index (gross of foreign withholding tax on dividends) is a free float-adjusted market capitalization index that is designed to measure the equity market performance of developed markets, excluding the U.S. and Canada.
It is not possible to invest directly in an index. Index figures do not reflect sales charges, which would have resulted in lower values if they did.
Footnotes related to a look at performance
1 From 6-12-06.
2 For certain types of investors, as described in the Fund’s Class I and Class 1 shares prospectuses.
3 No contingent deferred sales charge is applicable.
| Semiannual report | International Growth Fund | 7 |
Your expenses
These examples are intended to help you understand your ongoing operating expenses of investing in the Fund so you can compare these costs with the ongoing costs of investing in other mutual funds.
Understanding fund expenses
As a shareholder of the Fund, you incur two types of costs:
▪ Transaction costs which include sales charges (loads) on purchases or redemptions (varies by share class), minimum account fee charge, etc.
▪ Ongoing operating expenses including management fees, distribution and service fees (if applicable), and other fund expenses.
We are going to present only your ongoing operating expenses here.
Actual expenses/actual returns
This example is intended to provide information about the Fund’s actual ongoing operating expenses, and is based on the Fund’s actual return. It assumes an account value of $1,000.00 on March 1, 2012 with the same investment held until August 31, 2012.
| Account value | Ending value | Expenses paid during | |
| on 3-1-12 | on 8-31-12 | period ended 8-31-121 | |
| Class A | $1,000.00 | $1,021.50 | $8.20 |
| Class B | 1,000.00 | 1,018.10 | 11.75 |
| Class C | 1,000.00 | 1,017.60 | 11.75 |
| Class I | 1,000.00 | 1,023.00 | 6.37 |
| Class 1 | 1,000.00 | 1,023.50 | 5.92 |
Together with the value of your account, you may use this information to estimate the operating expenses that you paid over the period. Simply divide your account value at August 31, 2012, by $1,000.00, then multiply it by the “expenses paid” for your share class from the table above. For example, for an account value of $8,600.00, the operating expenses should be calculated as follows:
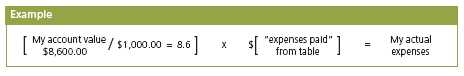
| 8 | International Growth Fund | Semiannual report |
Hypothetical example for comparison purposes
This table allows you to compare the Fund’s ongoing operating expenses with those of any other fund. It provides an example of the Fund’s hypothetical account values and hypothetical expenses based on each class’s actual expense ratio and an assumed 5% annualized return before expenses (which is not the Fund’s actual return). It assumes an account value of $1,000.00 on March 1, 2012, with the same investment held until August 31, 2012. Look in any other fund shareholder report to find its hypothetical example and you will be able to compare these expenses.
| Account value | Ending value | Expenses paid during | |
| on 3-1-12 | on 8-31-12 | period ended 8-31-121 | |
| Class A | $1,000.00 | $1,017.10 | $8.19 |
| Class B | 1,000.00 | 1,013.60 | 11.72 |
| Class C | 1,000.00 | 1,013.60 | 11.72 |
| Class I | 1,000.00 | 1,018.90 | 6.36 |
| Class 1 | 1,000.00 | 1,019.40 | 5.90 |
Remember, these examples do not include any transaction costs, therefore, these examples will not help you to determine the relative total costs of owning different funds. If transaction costs were included, your expenses would have been higher. See the prospectus for details regarding transaction costs.
1 Expenses are equal to the Fund’s annualized expense ratio of 1.61%, 2.31%, 2.31%, 1.25% and 1.16% for Class A, Class B, Class C, Class I and Class 1 shares, respectively, multiplied by the average account value over the period, multiplied by 184/365 (to reflect the one-half year period).
| Semiannual report | International Growth Fund | 9 |
Portfolio summary
| Top 10 Holdings (24.4% of Net Assets on 8-31-12)1,2 | ||||
| Roche Holdings AG | 5.0% | GlaxoSmithKline PLC | 2.4% | |
| Novo Nordisk A/S | 3.1% | SAP AG | 1.6% | |
| British American Tobacco PLC | 2.9% | Anheuser-Busch InBev NV | 1.5% | |
| Nestle SA | 2.7% | Rio Tinto PLC | 1.3% | |
| Diageo PLC | 2.6% | Canadian National Railway Company | 1.3% | |
| Sector Composition1,3 | ||||
| Consumer Staples | 20.3% | Materials | 5.2% | |
| Health Care | 19.1% | Telecommunication Services | 4.6% | |
| Industrials | 13.3% | Energy | 3.0% | |
| Consumer Discretionary | 12.9% | Utilities | 2.7% | |
| Financials | 7.6% | Short-Term Investments & Other | 4.7% | |
| Information Technology | 6.6% | |||
| Top 10 Countries1,2,3 | ||||
| United Kingdom | 22.1% | Australia | 3.7% | |
| Japan | 22.1% | Denmark | 3.4% | |
| Switzerland | 10.5% | Canada | 3.4% | |
| Germany | 6.5% | Netherlands | 3.3% | |
| France | 4.5% | Sweden | 2.8% | |
1 As a percentage of net assets on 8-31-12.
2 Cash and cash equivalents not included.
3 International investing involves special risks such as political, economic and currency risks and differences in accounting standards and financial reporting. Sector investing is subject to greater risks than the market as a whole. Because the Fund may focus on particular sectors of the economy, its performance may depend on the performance of those sectors.
| 10 | International Growth Fund | Semiannual report |
Fund’s investments
As of 8-31-12 (unaudited)
| Shares | Value | |
| Common Stocks 94.7% | $135,254,598 | |
| (Cost $119,624,347) | ||
| Australia 3.7% | 5,234,730 | |
| AGL Energy, Ltd. | 10,422 | 163,551 |
| ALS, Ltd. | 13,555 | 115,873 |
| Australia & New Zealand Banking Group, Ltd. | 7,759 | 199,625 |
| BlueScope Steel, Ltd. (I) | 171,873 | 59,802 |
| Coca-Cola Amatil, Ltd. | 13,870 | 196,406 |
| Cochlear, Ltd. | 1,549 | 108,056 |
| CSL, Ltd. | 26,441 | 1,216,706 |
| Fortescue Metals Group, Ltd. (L) | 12,772 | 47,616 |
| Qantas Airways, Ltd. (I) | 41,408 | 49,372 |
| Telstra Corp., Ltd. | 218,336 | 870,073 |
| Transurban Group | 3 | 19 |
| Wesfarmers, Ltd. | 14,878 | 532,219 |
| Woodside Petroleum, Ltd. | 2 | 71 |
| Woolworths, Ltd. | 54,664 | 1,675,341 |
| Belgium 2.1% | 2,937,433 | |
| Ageas | 4,925 | 109,619 |
| Anheuser-Busch InBev NV | 24,703 | 2,077,606 |
| Bekaert SA | 2,847 | 74,096 |
| Colruyt SA (I) | 5,465 | 259,122 |
| Mobistar SA | 3,858 | 122,086 |
| Telenet Group Holding NV | 1 | 39 |
| UCB SA | 2,262 | 110,882 |
| Umicore SA (L) | 3,887 | 183,983 |
| Bermuda 0.1% | 171,637 | |
| Lancashire Holdings, Ltd. | 13,491 | 171,637 |
| Canada 3.4% | 4,857,360 | |
| BCE, Inc. (L) | 7,600 | 337,846 |
| Canadian National Railway Company | 19,900 | 1,820,928 |
| Canadian Pacific Railway, Ltd. | 5,200 | 429,821 |
| Enbridge, Inc. (L) | 23,800 | 937,031 |
| IGM Financial, Inc. (L) | 2,700 | 103,837 |
| Metro, Inc. (L) | 2,300 | 133,602 |
| Rogers Communications, Inc., Class B (L) | 6,500 | 262,242 |
| Royal Bank of Canada (L) | 10,700 | 598,853 |
| Saputo, Inc. (L) | 3,100 | 130,698 |
| Valeant Pharmaceuticals International, Inc. (I) | 2,002 | 102,502 |
| See notes to financial statements | Semiannual report | International Growth Fund | 11 |
| Shares | Value | |
| China 0.1% | $168,299 | |
| AAC Technologies Holdings, Inc. | 23,500 | 80,355 |
| Yangzijiang Shipbuilding Holdings, Ltd. | 111,000 | 87,944 |
| Denmark 3.4% | 4,887,643 | |
| Coloplast A/S | 1,432 | 285,677 |
| Novo Nordisk A/S | 27,695 | 4,357,791 |
| Novozymes A/S, B shares | 8,820 | 244,175 |
| Finland 0.5% | 683,236 | |
| Fortum OYJ | 11,397 | 210,375 |
| Kone OYJ | 4,133 | 252,444 |
| Neste Oil OYJ | 5,563 | 63,917 |
| Wartsila OYJ | 4,877 | 156,500 |
| France 4.5% | 6,404,724 | |
| Air France KLM (I)(L) | 7,190 | 36,130 |
| Alcatel-Lucent (I)(L) | 63,370 | 71,900 |
| Arkema SA | 1,365 | 116,161 |
| Bureau Veritas SA | 3,529 | 325,178 |
| Carrefour SA | 17,475 | 365,686 |
| Casino Guichard Perrachon SA | 1,683 | 149,314 |
| Cie de Saint-Gobain | 1,554 | 53,161 |
| Cie Generale d’Optique Essilor International SA | 8,051 | 701,859 |
| Danone SA | 4,087 | 254,355 |
| Dassault Systemes SA | 4,004 | 388,065 |
| Eutelsat Communications | 6,048 | 185,407 |
| ICADE | 1,054 | 80,049 |
| Iliad SA | 1,723 | 272,494 |
| L’Oreal SA | 4,900 | 601,546 |
| Neopost SA | 1,309 | 69,794 |
| Pernod-Ricard SA | 2,963 | 318,811 |
| Publicis Groupe SA | 3,392 | 175,772 |
| Remy Cointreau SA | 1,549 | 176,811 |
| Renault SA | 3,187 | 148,479 |
| Sanofi | 9,015 | 736,306 |
| Sodexo | 1,949 | 153,863 |
| Suez Environnement Company | 4,695 | 52,586 |
| Technip SA | 1,052 | 110,478 |
| Total SA | 9,834 | 490,031 |
| Wendel SA | 1,507 | 113,233 |
| Zodiac Aerospace | 2,703 | 257,255 |
| Germany 5.9% | 8,355,644 | |
| Adidas AG | 2,112 | 165,048 |
| Aixtron SE NA | 1 | 15 |
| Aurubis AG | 2,765 | 149,557 |
| BASF SE | 2,770 | 214,973 |
| Bayer AG | 8,301 | 643,845 |
| Bayerische Motoren Werke AG | 1,564 | 113,162 |
| Beiersdorf AG | 3,919 | 280,625 |
| 12 | International Growth Fund | Semiannual report | See notes to financial statements |
| Shares | Value | |
| Germany (continued) | ||
| Bilfinger Berger SE | 1,611 | $135,188 |
| Continental AG | 1,723 | 171,026 |
| Deutsche Lufthansa AG | 9,536 | 117,451 |
| Deutsche Post AG | 15,794 | 306,237 |
| Duerr AG | 1,888 | 124,061 |
| Fielmann AG | 1,685 | 153,095 |
| Freenet AG | 14,485 | 222,064 |
| Fresenius SE & Company KGaA | 1,484 | 158,167 |
| GEA Group AG | 5,965 | 157,442 |
| Hannover Rueckversicherung AG | 3,214 | 196,239 |
| HeidelbergCement AG | 3,260 | 164,362 |
| Henkel AG & Company, KGaA | 2,859 | 177,340 |
| Hugo Boss AG | 1,529 | 141,133 |
| Kabel Deutschland Holding AG (I) | 1,909 | 126,257 |
| Lanxess AG | 2,026 | 153,491 |
| Leoni AG | 1,496 | 55,956 |
| Merck KGaA | 1,325 | 151,469 |
| Metro AG | 6,099 | 183,557 |
| MTU Aero Engines Holding AG | 1,975 | 150,582 |
| Muenchener Rueckversicherungs AG | 3,756 | 556,046 |
| SAP AG | 34,833 | 2,295,458 |
| SGL Carbon SE | 4 | 154 |
| Software AG | 2,230 | 77,054 |
| Stada Arzneimittel AG | 3,742 | 105,162 |
| Suedzucker AG | 7,420 | 248,618 |
| ThyssenKrupp AG | 9,643 | 191,866 |
| TUI AG (I) | 10,526 | 82,199 |
| Volkswagen AG | 844 | 137,287 |
| Wacker Chemie AG | 770 | 49,420 |
| Wincor Nixdorf AG | 1 | 38 |
| Hong Kong 2.5% | 3,562,774 | |
| BOC Hong Kong Holdings, Ltd. | 60,500 | 192,397 |
| Cheung Kong Infrastructure Holdings, Ltd. | 24,000 | 144,801 |
| CLP Holdings, Ltd. | 66,000 | 550,708 |
| Esprit Holdings, Ltd. | 32,800 | 50,484 |
| Galaxy Entertainment Group, Ltd. (I)(L) | 48,000 | 137,076 |
| Hang Seng Bank, Ltd. | 15,800 | 225,470 |
| Hong Kong & China Gas Company, Ltd. | 327,255 | 770,681 |
| Hong Kong Exchanges & Clearing, Ltd. | 10,800 | 144,150 |
| Jardine Matheson Holdings, Ltd. | 1,600 | 86,199 |
| Li & Fung, Ltd. (I) | 84,000 | 137,063 |
| Noble Group, Ltd. | 101,000 | 97,472 |
| Power Assets Holdings, Ltd. | 59,000 | 478,899 |
| Sun Hung Kai Properties, Ltd. | 15,000 | 194,990 |
| The Link REIT | 64,011 | 285,343 |
| Xinyi Glass Holdings Company, Ltd. | 146,000 | 67,041 |
| See notes to financial statements | Semiannual report | International Growth Fund | 13 |
| Shares | Value | |
| Ireland 2.3% | $3,218,082 | |
| CRH PLC | 14,807 | 261,100 |
| DCC PLC | 5,439 | 141,840 |
| Elan Corp. PLC (I) | 21,034 | 240,213 |
| Experian PLC | 30,086 | 479,875 |
| Kerry Group PLC | 10,234 | 490,858 |
| Paddy Power PLC | 8,422 | 593,619 |
| Shire PLC | 15,504 | 468,180 |
| WPP PLC | 41,884 | 542,397 |
| Israel 0.1% | 74,546 | |
| Mellanox Technologies, Ltd. (I) | 631 | 74,546 |
| Italy 0.3% | 485,466 | |
| Assicurazioni Generali SpA | 19,337 | 274,982 |
| Atlantia SpA | 9,232 | 129,433 |
| Fiat SpA (I) | 14,926 | 81,051 |
| Japan 22.1% | 31,589,597 | |
| ABC-MART, Inc. | 2,300 | 96,371 |
| Advantest Corp. | 4,900 | 71,865 |
| Aeon Company, Ltd. (L) | 17,500 | 201,524 |
| Ajinomoto Company, Inc. | 16,000 | 244,126 |
| Anritsu Corp. (L) | 9,000 | 109,355 |
| Asahi Group Holdings, Ltd. | 13,800 | 335,231 |
| Astellas Pharma, Inc. | 16,400 | 802,191 |
| Canon, Inc. | 26,800 | 891,861 |
| Central Japan Railway Company, Ltd. | 37 | 322,671 |
| Chiyoda Corp. | 6,000 | 79,473 |
| Chugai Pharmaceutical Company, Ltd. | 12,700 | 253,462 |
| Credit Saison Company, Ltd. | 6,100 | 143,588 |
| Daihatsu Motor Company, Ltd. | 14,000 | 229,999 |
| Daito Trust Construction Company, Ltd. | 6,200 | 607,154 |
| Dena Company, Ltd. (L) | 6,500 | 181,892 |
| DIC Corp. | 50,000 | 82,776 |
| East Japan Railway Company | 5,500 | 369,066 |
| Eisai Company, Ltd. | 9,600 | 438,706 |
| FANUC Corp. | 2,200 | 362,349 |
| Fast Retailing Company, Ltd. | 3,000 | 702,744 |
| Fuji Heavy Industries, Ltd. | 21,000 | 169,304 |
| Gree, Inc. (L) | 5,300 | 88,544 |
| Hankyu Hanshin Holdings, Inc. | 12,000 | 68,348 |
| Haseko Corp. (I) | 83,500 | 52,468 |
| Hino Motors, Ltd. | 18,000 | 124,974 |
| Hirose Electric Company, Ltd. | 1,000 | 104,031 |
| Hisamitsu Pharmaceutical Company, Inc. (L) | 7,600 | 405,947 |
| Honda Motor Company, Ltd. | 9,900 | 315,430 |
| Hoya Corp. | 17,200 | 389,828 |
| Idemitsu Kosan Company, Ltd. | 600 | 48,388 |
| IHI Corp. | 40,000 | 86,474 |
| Inpex Corp. | 54 | 308,650 |
| Isetan Mitsukoshi Holdings, Ltd. | 14,100 | 147,617 |
| 14 | International Growth Fund | Semiannual report | See notes to financial statements |
| Shares | Value | |
| Japan (continued) | ||
| Isuzu Motors, Ltd. | 49,000 | $251,727 |
| Ito EN, Ltd. | 4,400 | 87,681 |
| ITOCHU Corp. | 61,300 | 625,002 |
| Izumi Company, Ltd. | 5,100 | 98,964 |
| Japan Tobacco, Inc. | 32,200 | 972,340 |
| JFE Holdings, Inc. | 14,200 | 180,887 |
| JGC Corp. | 5,000 | 154,721 |
| K’s Holding Corp. (L) | 4,700 | 134,134 |
| Kakaku.com, Inc. (L) | 3,300 | 117,992 |
| Kao Corp. | 20,600 | 623,134 |
| KDDI Corp. | 123 | 881,428 |
| Keio Corp. | 31,000 | 243,180 |
| Keyence Corp. | 2,100 | 554,756 |
| Kintetsu Corp. (L) | 61,000 | 251,144 |
| Kobe Steel, Ltd. | 82,000 | 63,184 |
| Komatsu, Ltd. | 10,600 | 210,482 |
| Konami Corp. | 6,200 | 143,237 |
| Kubota Corp. | 10,000 | 96,717 |
| Lawson, Inc. (L) | 6,100 | 467,339 |
| Leopalace21 Corp. (I)(L) | 35,800 | 116,781 |
| Makita Corp. | 2,800 | 96,094 |
| Marubeni Corp. | 57,000 | 368,048 |
| Mazda Motor Corp. (I) | 133,000 | 161,381 |
| Medipal Holdings Corp. | 16,000 | 229,336 |
| Mitsubishi Corp. | 19,200 | 355,597 |
| Mitsui Engineering & Shipbuilding Company, Ltd. | 38,000 | 41,952 |
| Mizuho Financial Group, Inc. | 150,000 | 242,861 |
| Namco Bandai Holdings, Inc. | 10,800 | 171,723 |
| NEC Corp. (I)(L) | 61,000 | 87,659 |
| NET One Systems Company, Ltd. | 6,474 | 85,946 |
| Nidec Corp. | 2,300 | 181,857 |
| Nikon Corp. | 11,800 | 327,079 |
| Nintendo Company, Ltd. | 3,900 | 438,616 |
| Nippon Telegraph & Telephone Corp. | 5,400 | 249,931 |
| Nissan Motor Company, Ltd. | 8,200 | 77,031 |
| Nitori Holdings Company, Ltd. | 4,350 | 436,192 |
| Nitto Denko Corp. | 3,800 | 176,688 |
| Nomura Research Institute, Ltd. | 8,300 | 173,761 |
| NTT DoCoMo, Inc. | 306 | 521,718 |
| Odakyu Electric Railway Company, Ltd. | 38,000 | 404,005 |
| OJI Paper Company, Ltd. | 33,000 | 103,794 |
| Ono Pharmaceutical Company, Ltd. | 3,000 | 186,551 |
| Oracle Corp. Japan | 1,600 | 77,565 |
| Oriental Land Company, Ltd. | 3,600 | 486,095 |
| Otsuka Holdings Company, Ltd. | 8,100 | 247,405 |
| Panasonic Corp. | 9,600 | 65,769 |
| Point, Inc. | 1,230 | 44,143 |
| Rakuten, Inc. | 15,700 | 151,864 |
| See notes to financial statements | Semiannual report | International Growth Fund | 15 |
| Shares | Value | |
| Japan (continued) | ||
| Resona Holdings, Inc. | 44,000 | $172,754 |
| Ricoh Company, Ltd. (L) | 10,000 | 79,376 |
| Sankyo Company, Ltd. | 2,000 | 92,560 |
| Sanrio Company, Ltd. (L) | 3,800 | 131,465 |
| Santen Pharmaceutical Company, Ltd. | 6,100 | 266,384 |
| Sawai Pharmaceutical Company, Ltd. | 1,200 | 140,119 |
| Secom Company, Ltd. | 2,600 | 131,743 |
| Sega Sammy Holdings, Inc. | 5,000 | 103,799 |
| Seven & I Holdings Company, Ltd. (L) | 8,600 | 261,591 |
| Seven Bank, Ltd. | 38,600 | 106,949 |
| Shimamura Company, Ltd. | 2,300 | 273,272 |
| Shimano, Inc. | 4,400 | 317,708 |
| Shimizu Corp. | 20,000 | 64,145 |
| Shin-Etsu Chemical Company, Ltd. | 6,000 | 322,502 |
| Shiseido Company, Ltd. | 10,600 | 151,361 |
| SMC Corp. | 1,100 | 173,701 |
| Softbank Corp. | 14,500 | 593,186 |
| Stanley Electric Company, Ltd. | 7,400 | 110,016 |
| Sumitomo Corp. | 11,800 | 157,043 |
| Sumitomo Metal Mining Company, Ltd. | 7,000 | 72,593 |
| Sumitomo Mitsui Financial Group, Inc. | 10,500 | 326,459 |
| Sumitomo Rubber Industries, Ltd. | 12,100 | 148,641 |
| Suzuken Company, Ltd. | 2,600 | 88,208 |
| Sysmex Corp. | 4,300 | 197,773 |
| Takeda Pharmaceutical Company, Ltd. | 11,700 | 549,488 |
| Terumo Corp. | 8,700 | 387,189 |
| The Shizuoka Bank, Ltd. | 11,000 | 114,577 |
| Tobu Railway Company, Ltd. | 45,000 | 250,752 |
| Tokyu Corp. | 39,000 | 192,207 |
| Toray Industries, Inc. | 37,000 | 227,036 |
| Toshiba Corp. | 23,000 | 74,086 |
| Toyo Suisan Kaisha, Ltd. | 6,000 | 149,164 |
| Toyota Motor Corp. | 43,000 | 1,709,959 |
| Toyota Tsusho Corp. | 8,900 | 182,787 |
| Trend Micro, Inc. | 8,900 | 248,299 |
| Tsumura & Company, Ltd. | 6,500 | 200,879 |
| Unicharm Corp. | 6,800 | 395,590 |
| USS Company, Ltd. | 2,050 | 220,487 |
| West Japan Railway Company | 4,800 | 210,273 |
| Yahoo! Japan Corp. | 992 | 342,718 |
| Yamada Denki Company, Ltd. | 5,040 | 243,545 |
| Yamato Kogyo Company, Ltd. | 3,500 | 105,315 |
| Jersey, C.I. 0.1% | 199,294 | |
| Randgold Resources, Ltd. | 1,953 | 199,294 |
| Luxembourg 0.4% | 531,600 | |
| Millicom International Cellular SA, ADR | 2,855 | 245,432 |
| SES SA | 11,134 | 286,168 |
| 16 | International Growth Fund | Semiannual report | See notes to financial statements |
| Shares | Value | |
| Macau 0.2% | $310,922 | |
| Sands China, Ltd. | 87,600 | 310,922 |
| Netherlands 3.3% | 4,744,639 | |
| ASML Holding NV | 20,055 | 1,133,426 |
| European Aeronautic Defence & Space Company NV | 16,170 | 615,848 |
| Gemalto NV (L) | 3,625 | 287,066 |
| Koninklijke (Royal) KPN NV | 37,141 | 318,060 |
| Koninklijke Ahold NV | 23,284 | 287,821 |
| Koninklijke Vopak NV (I) | 2,320 | 148,591 |
| Randstad Holdings NV | 2,919 | 94,776 |
| Reed Elsevier NV | 10,204 | 133,045 |
| Royal Dutch Shell PLC, B Shares | 3,721 | 134,269 |
| Unilever NV | 45,686 | 1,591,737 |
| New Zealand 0.1% | 189,973 | |
| Telecom Corp. of New Zealand, Ltd. | 96,004 | 189,973 |
| Norway 0.6% | 854,504 | |
| Marine Harvest ASA (I) | 112,704 | 87,261 |
| Seadrill, Ltd. | 5,992 | 246,338 |
| Statoil ASA | 4,158 | 106,739 |
| Telenor ASA | 6,987 | 127,662 |
| TGS-NOPEC Geophysical Company ASA | 2,363 | 69,039 |
| Yara International ASA | 4,445 | 217,465 |
| Singapore 2.2% | 3,203,930 | |
| Ezra Holdings, Ltd. (I) | 87,000 | 75,186 |
| Golden Agri-Resources, Ltd. | 547,000 | 312,540 |
| Hyflux, Ltd. (L) | 74,500 | 81,402 |
| Keppel Corp., Ltd. | 18,400 | 165,439 |
| Oversea-Chinese Banking Corp., Ltd. | 6 | 45 |
| Sakari Resources, Ltd. | 31,000 | 46,653 |
| SembCorp Industries, Ltd. | 51,000 | 231,548 |
| Singapore Airport Terminal Services, Ltd. | 60,000 | 125,720 |
| Singapore Exchange, Ltd. | 44,000 | 248,842 |
| Singapore Press Holdings, Ltd. | 116,000 | 369,606 |
| Singapore Technologies Engineering, Ltd. | 127,000 | 347,769 |
| Singapore Telecommunications, Ltd. | 241,000 | 655,900 |
| SMRT Corp., Ltd. | 74,000 | 98,584 |
| StarHub, Ltd. | 66,000 | 191,329 |
| United Overseas Bank, Ltd. | 9,000 | 138,026 |
| Wilmar International, Ltd. | 25,000 | 62,891 |
| Yanlord Land Group, Ltd. (I) | 56,000 | 52,450 |
| Spain 1.4% | 1,961,576 | |
| Enagas SA | 7,582 | 140,554 |
| Iberdrola SA (L) | 66,400 | 262,649 |
| Inditex SA | 8,398 | 931,554 |
| Red Electrica Corp. SA | 4,151 | 179,462 |
| Repsol SA | 24,377 | 447,357 |
| See notes to financial statements | Semiannual report | International Growth Fund | 17 |
| Shares | Value | |
| Sweden 2.8% | $4,023,596 | |
| Assa Abloy AB, Series B | 8,115 | 247,674 |
| Atlas Copco AB, Series A | 7,610 | 169,750 |
| Atlas Copco AB, Series B | 4,204 | 83,043 |
| Electrolux AB, Series B | 3,126 | 75,461 |
| Elekta AB, Series B (L) | 4,078 | 207,635 |
| Getinge AB, Series B | 4,935 | 146,850 |
| Hennes & Mauritz AB, B Shares | 36,149 | 1,305,153 |
| Investor AB, B Shares | 6,470 | 133,784 |
| Kinnevik Investment AB | 8,982 | 181,309 |
| Lundin Petroleum AB (I) | 6,267 | 141,097 |
| Scania AB, Series B | 12,191 | 209,317 |
| Svenska Handelsbanken AB, Series A | 13,283 | 461,993 |
| Swedbank AB, Class A | 19,841 | 347,194 |
| Swedish Match AB | 5,370 | 222,997 |
| Volvo AB, Series B | 7,151 | 90,339 |
| Switzerland 10.5% | 14,972,032 | |
| Actelion, Ltd. | 4,718 | 222,712 |
| Cie Financiere Richemont SA | 3,005 | 183,897 |
| Geberit AG | 1,284 | 270,291 |
| Kuehne & Nagel International AG | 736 | 83,646 |
| Nestle SA | 62,336 | 3,873,328 |
| Nobel Biocare Holding AG | 1 | 9 |
| Novartis AG | 16,954 | 998,501 |
| Partners Group Holding AG | 291 | 56,022 |
| Roche Holdings AG | 39,440 | 7,175,478 |
| SGS SA | 170 | 342,595 |
| Sonova Holding AG | 891 | 82,533 |
| Straumann Holding AG | 371 | 44,048 |
| Swiss Re, Ltd. | 5,571 | 348,859 |
| Swisscom AG | 338 | 135,678 |
| Syngenta AG | 571 | 192,305 |
| The Swatch Group AG | 259 | 105,827 |
| Wolseley PLC | 9,799 | 394,997 |
| Xstrata PLC | 8,816 | 132,819 |
| Zurich Insurance Group AG | 1,368 | 328,487 |
| United Kingdom 22.1% | 31,631,361 | |
| Aberdeen Asset Management PLC | 46,622 | 205,930 |
| Admiral Group PLC | 15,291 | 288,096 |
| Aegis Group PLC | 33,555 | 126,301 |
| Aggreko PLC | 21,692 | 811,102 |
| AMEC PLC | 10,991 | 193,005 |
| Anglo American PLC | 9,957 | 276,946 |
| Ashmore Group PLC | 29,107 | 151,659 |
| Ashtead Group PLC | 14,642 | 65,711 |
| ASOS PLC (I) | 3,058 | 88,557 |
| Associated British Foods PLC (I) | 5,923 | 124,380 |
| AstraZeneca PLC | 16,707 | 778,132 |
| Babcock International Group PLC | 13,140 | 195,416 |
| 18 | International Growth Fund | Semiannual report | See notes to financial statements |
| Shares | Value | |
| United Kingdom (continued) | ||
| BAE Systems PLC | 23,271 | $117,438 |
| Balfour Beatty PLC | 25,151 | 111,727 |
| BG Group PLC | 22,690 | 462,803 |
| BHP Billiton PLC | 16,284 | 473,496 |
| British American Tobacco PLC | 78,428 | 4,105,939 |
| British Sky Broadcasting Group PLC | 29,243 | 352,855 |
| BT Group PLC | 93,208 | 322,184 |
| Bunzl PLC | 25,847 | 460,569 |
| Burberry Group PLC | 13,429 | 287,714 |
| Capita PLC | 22,566 | 258,824 |
| Chemring Group PLC | 13,664 | 71,241 |
| Cobham PLC | 83,462 | 290,086 |
| Compass Group PLC | 11,723 | 132,037 |
| Croda International PLC | 9,580 | 358,598 |
| Debenhams PLC | 52,072 | 79,661 |
| Diageo PLC | 136,151 | 3,724,554 |
| Drax Group PLC | 24,417 | 180,739 |
| easyJet PLC | 7,416 | 62,346 |
| Eurasian Natural Resources Corp. | 10,669 | 51,199 |
| GlaxoSmithKline PLC | 153,635 | 3,473,882 |
| HSBC Holdings PLC | 46,386 | 404,083 |
| ICAP PLC | 10,071 | 50,685 |
| IG Group Holdings PLC | 40,066 | 274,014 |
| IMI PLC | 8,803 | 120,090 |
| Intercontinental Hotels Group PLC | 11,940 | 303,577 |
| Intertek Group PLC | 7,292 | 325,393 |
| ITV PLC | 116,714 | 153,977 |
| John Wood Group PLC | 16,797 | 218,262 |
| Johnson Matthey PLC | 7,358 | 280,738 |
| Kazakhmys PLC | 7,532 | 70,631 |
| Lloyds Banking Group PLC (I) | 1,744,428 | 918,590 |
| Man Group PLC | 56,857 | 64,356 |
| Marks & Spencer Group PLC | 33,207 | 188,755 |
| Micro Focus International PLC | 14,058 | 121,088 |
| National Grid PLC | 27,687 | 300,249 |
| Next PLC | 13,755 | 781,009 |
| Old Mutual PLC | 86,730 | 229,101 |
| Pennon Group PLC | 6,973 | 81,561 |
| Petrofac, Ltd. | 7,918 | 188,349 |
| Playtech, Ltd. | 11,497 | 70,647 |
| Prudential PLC | 44,862 | 561,078 |
| Reckitt Benckiser Group PLC | 17,292 | 977,754 |
| Reed Elsevier PLC | 16,670 | 156,384 |
| Resolution, Ltd. | 32,244 | 110,551 |
| Rexam PLC | 25,772 | 173,121 |
| Rightmove PLC | 10,974 | 279,558 |
| Rio Tinto PLC | 42,562 | 1,861,818 |
| Rolls-Royce Holdings PLC | 59,447 | 773,313 |
| See notes to financial statements | Semiannual report | International Growth Fund | 19 |
| Shares | Value | ||
| United Kingdom (continued) | |||
| SABMiller PLC | 10,728 | $472,704 | |
| Smith & Nephew PLC | 29,528 | 312,383 | |
| Smiths Group PLC | 12,591 | 209,032 | |
| Spectris PLC | 7,253 | 199,280 | |
| SSE PLC | 11,285 | 245,183 | |
| Tate & Lyle PLC | 25,435 | 264,614 | |
| Telecity Group PLC | 12,870 | 177,870 | |
| Tesco PLC | 58,501 | 312,740 | |
| The Sage Group PLC | 37,572 | 176,653 | |
| Tullett Prebon PLC | 18,108 | 83,317 | |
| Whitbread PLC | 2,339 | 78,945 | |
| William Hill PLC | 48,651 | 231,618 | |
| WM Morrison Supermarkets PLC | 32,701 | 145,163 | |
| Preferred Securities 0.6% | $897,428 | ||
| (Cost $880,785) | |||
| Germany 0.6% | 897,428 | ||
| Bayerische Motoren Werke AG | 2,286 | 114,565 | |
| Henkel AG & Company KGaA | 4,810 | 363,196 | |
| Porsche Automobil Holding SE | 2,228 | 114,981 | |
| Volkswagen AG | 1,729 | 304,686 | |
| Warrants (I) 0.0% | $586 | ||
(Cost $5,399) | |||
| Canada 0.0% | 586 | ||
| Kinross Gold Corp. (Expiration Date: 9-17-14, | |||
| Strike Price: $21.30) (I) | 1,133 | 586 | |
| Escrow Shares 0.0% | $0 | ||
| (Cost $0) | |||
| Austria 0.0% | 0 | ||
| Immofinanz AG (I)(L) | 49,581 | 0 | |
| Yield | Shares | Value | |
| Securities Lending Collateral 3.8% | $5,422,549 | ||
| (Cost $5,421,713) | |||
| John Hancock Collateral Investment Trust (W) | 0.3443% (Y) | 541,816 | 5,422,549 |
| 20 | International Growth Fund | Semiannual report | See notes to financial statements |
| Yield | Shares | Value | |
| Short-Term Investments 3.5% | $5,045,891 | ||
| (Cost $5,045,891) | |||
| Money Market Funds 3.5% | 5,045,891 | ||
| State Street Institutional Treasury Money | |||
| Market Fund | 0.0000% (Y) | 5,045,891 | 5,045,891 |
| Total investments (Cost $130,978,135)† 102.6% | $146,621,052 | ||
| Other assets and liabilities, net (2.6%) | ($3,704,884) | ||
| Total net assets 100.0% | $142,916,168 | ||
The percentage shown for each investment category is the total value of the category as a percentage of the net assets of the Fund.
ADR American Depositary Receipts
(I) Non-income producing security.
(L) A portion of this security is on loan as of 8-31-12.
(W) Investment is an affiliate of the Fund, the adviser and/or subadviser. Also, it represents the investment of securities lending collateral received.
(Y) The rate shown is the annualized seven-day yield as of 8-31-12.
† At 8-31-12, the aggregate cost of investment securities for federal income tax purposes was $131,657,761. Net unrealized appreciation aggregated $14,963,291, of which $20,530,840 related to appreciated investment securities and $5,567,549 related to depreciated investment securities.
The Fund had the following sector composition as a percentage of net assets on 8-31-12:
| Consumer Staples | 20.3% | ||
| Health Care | 19.1% | ||
| Industrials | 13.3% | ||
| Consumer Discretionary | 12.9% | ||
| Financials | 7.6% | ||
| Information Technology | 6.6% | ||
| Materials | 5.2% | ||
| Telecommunication Services | 4.6% | ||
| Energy | 3.0% | ||
| Utilities | 2.7% | ||
| Short-Term Investments & Other | 4.7% |
| See notes to financial statements | Semiannual report | International Growth Fund | 21 |
F I N A N C I A L S T A T E M E N T S
Financial statements
Statement of assets and liabilities 8-31-12 (unaudited)
This Statement of assets and liabilities is the Fund’s balance sheet. It shows the value of what the Fund owns, is due and owes. You’ll also find the net asset value and the maximum public offering price per share.
| Assets | |
| Investments in unaffiliated issuers, at value (Cost $125,556,422) including | |
| $5,160,506 of securities loaned | $141,198,503 |
| Investments in affiliated issuers, at value (Cost $5,421,713) | 5,422,549 |
| Total investments, at value (Cost $130,978,135) | 146,621,052 |
| Foreign currency, at value (Cost $77,455) | 77,738 |
| Cash held at broker for futures contracts | 643,640 |
| Receivable for fund shares sold | 882,627 |
| Receivable for forward foreign currency exchange contracts | 67,546 |
| Dividends and interest receivable | 714,831 |
| Receivable for securities lending income | 5,322 |
| Receivable for futures variation margin | 23,605 |
| Receivable due from adviser | 179 |
| Other receivables and prepaid expenses | 43,401 |
| Total assets | 149,079,941 |
| Liabilities | |
| Due to custodian | 45,027 |
| Payable for forward foreign currency exchange contracts | 111,420 |
| Payable for fund shares repurchased | 475,783 |
| Payable upon return of securities loaned | 5,425,308 |
| Payable to affiliates | |
| Accounting and legal services fees | 5,644 |
| Transfer agent fees | 17,086 |
| Trustees’ fees | 3,411 |
| Other liabilities and accrued expenses | 80,094 |
| Total liabilities | 6,163,773 |
| Net assets | |
| Paid-in capital | $119,713,819 |
| Undistributed net investment income | 2,686,606 |
| Accumulated net realized gain (loss) on investments, futures contracts and | |
| foreign currency transactions | 4,667,040 |
| Net unrealized appreciation (depreciation) on investments, futures | |
| contracts and translation of assets and liabilities in foreign currencies | 15,848,703 |
| Net assets | $142,916,168 |
| 22 | International Growth Fund | Semiannual report | See notes to financial statements |
F I N A N C I A L S T A T E M E N T S
Statement of assets and liabilities (continued)
| Net asset value per share | |
| Based on net asset values and shares outstanding — the Fund has an | |
| unlimited number of shares authorized with no par value | |
| Class A ($61,436,774 ÷ 3,010,411 shares) | $20.41 |
| Class B ($1,021,551 ÷ 50,334 shares)1 | $20.30 |
| Class C ($1,639,454 ÷ 80,917 shares)1 | $20.26 |
| Class I ($69,817,408 ÷ 3,410,311 shares) | $20.47 |
| Class 1 ($9,000,981 ÷ 439,767 shares) | $20.47 |
| Maximum offering price per share | |
| Class A (net asset value per share ÷ 95%)2 | $21.48 |
1 Redemption price is equal to net asset value less any applicable contingent deferred sales charge.
2 On single retail sales of less than $50,000. On sales of $50,000 or more and on group sales the offering price is reduced.
| See notes to financial statements | Semiannual report | International Growth Fund | 23 |
F I N A N C I A L S T A T E M E N T S
Statement of operations For the six-month period ended 8-31-12
(unaudited)
This Statement of operations summarizes the Fund’s investment income earned and expenses incurred in operating the Fund. It also shows net gains (losses) for the period stated.
| Investment income | |
| Dividends | $3,694,557 |
| Securities lending | 89,985 |
| Interest | 10 |
| Less foreign taxes withheld | (306,896) |
| Total investment income | 3,477,656 |
| Expenses | |
| Investment management fees | 747,712 |
| Distribution and service fees | 96,094 |
| Accounting and legal services fees | 15,606 |
| Transfer agent fees | 109,432 |
| Trustees’ fees | 7,293 |
| State registration fees | 38,032 |
| Printing and postage | 7,666 |
| Professional fees | 30,710 |
| Custodian fees | 107,816 |
| Registration and filing fees | 11,424 |
| Other | 11,318 |
| Total expenses | 1,183,103 |
| Less expense reductions | (50,733) |
| Net expenses | 1,132,370 |
| Net investment income | 2,345,286 |
| Realized and unrealized gain (loss) | |
| Net realized gain (loss) on | |
| Investments in unaffiliated issuers | 8,582,448 |
| Investments in affiliated issuers | 20 |
| Futures contracts | 135,225 |
| Foreign currency transactions | (45,486) |
| 8,672,207 | |
| Change in net unrealized appreciation (depreciation) of | |
| Investments in unaffiliated issuers | (8,037,587) |
| Investments in affiliated issuers | (1,134) |
| Futures contracts | (229,363) |
| Translation of assets and liabilities in foreign currencies | 62,657 |
| (8,205,427) | |
| Net realized and unrealized gain | 466,780 |
| Increase in net assets from operations | $2,812,066 |
| 24 | International Growth Fund | Semiannual report | See notes to financial statements |
F I N A N C I A L S T A T E M E N T S
Statements of changes in net assets
These Statements of changes in net assets show how the value of the Fund’s net assets has changed during the last two periods. The difference reflects earnings less expenses, any investment gains and losses, distributions, if any, paid to shareholders and the net of Fund share transactions.
| Six months | ||
| ended | Year | |
| 8-31-12 | ended | |
| (Unaudited) | 2-29-12 | |
| Increase (decrease) in net assets | ||
| From operations | ||
| Net investment income | $2,345,286 | $4,479,341 |
| Net realized gain (loss) | 8,672,207 | (1,856,288) |
| Change in net unrealized appreciation (depreciation) | (8,205,427) | (15,386,119) |
| Increase (decrease) in net assets resulting from operations | 2,812,066 | (12,763,066) |
| Distributions to shareholders | ||
| From net investment income | ||
| Class A | — | (431,740) |
| Class B | — | (2,245) |
| Class C | — | (4,082) |
| Class I | — | (2,612,306) |
| Class 1 | — | (126,750) |
| Total distributions | — | (3,177,123) |
| From Fund share transactions | (82,479,648) | (19,513,581) |
| Total decrease | (79,667,582) | (35,453,770) |
| Net assets | ||
| Beginning of period | 222,583,750 | 258,037,520 |
| End of period | $142,916,168 | $222,583,750 |
| Undistributed net investment income | $2,686,606 | $341,320 |
| See notes to financial statements | Semiannual report | International Growth Fund | 25 |
Financial highlights
The Financial highlights show how the Fund’s net asset value for a share has changed during the period.
| CLASS A SHARES Period ended | 8-31-121 | 2-29-12 | 2-28-11 | 2-28-10 | 2-28-09 | 2-29-08 |
| Per share operating performance | ||||||
| Net asset value, beginning of period | $19.98 | $20.99 | $17.36 | $12.46 | $22.86 | $23.94 |
| Net investment income2 | 0.23 | 0.30 | 0.13 | 0.14 | 0.31 | 0.26 |
| Net realized and unrealized gain (loss) | ||||||
| on investments | 0.20 | (1.12) | 3.61 | 4.86 | (10.31) | 0.53 |
| Total from investment operations | 0.43 | (0.82) | 3.74 | 5.00 | (10.00) | 0.79 |
| Less distributions | ||||||
| From net investment income | — | (0.19) | (0.11) | (0.10) | (0.40) | (0.18) |
| From net realized gain | — | — | — | — | — | (1.69) |
| Total distributions | — | (0.19) | (0.11) | (0.10) | (0.40) | (1.87) |
| Net asset value, end of period | $20.41 | $19.98 | $20.99 | $17.36 | $12.46 | $22.86 |
| Total return (%)3,4 | 2.155 | (3.80) | 21.58 | 40.07 | (44.00) | 2.85 |
| Ratios and supplemental data | ||||||
| Net assets, end of period (in millions) | $61 | $49 | $45 | $23 | $13 | $26 |
| Ratios (as a percentage of average net assets): | ||||||
| Expenses before reductions | 1.696 | 1.66 | 1.60 | 1.687 | 1.94 | 2.21 |
| Expenses net of fee waivers | 1.616 | 1.59 | 1.60 | 1.647 | 1.62 | 1.56 |
| Expenses net of fee waivers and credits | 1.616 | 1.59 | 1.60 | 1.637 | 1.62 | 1.56 |
| Net investment income | 2.286 | 1.50 | 0.69 | 0.86 | 1.59 | 1.02 |
| Portfolio turnover (%) | 28 | 55 | 48 | 37 | 59 | 97 |
1 Six months ended 8-31-12. Unaudited.
2 Based on the average daily shares outstanding.
3 Does not reflect the effect of sales charges, if any.
4 Total returns would have been lower had certain expenses not been reduced during the periods shown.
5 Not annualized.
6 Annualized.
7 Includes the impact of proxy expenses, which amounted to 0.03% of average net assets.
| 26 | International Growth Fund | Semiannual report | See notes to financial statements |
| CLASS B SHARES Period ended | 8-31-121 | 2-29-12 | 2-28-11 | 2-28-10 | 2-28-09 | 2-29-08 |
| Per share operating performance | ||||||
| Net asset value, beginning of period | $19.94 | $20.93 | $17.36 | $12.48 | $22.81 | $23.91 |
| Net investment income (loss)2 | 0.16 | 0.12 | 0.01 | 0.05 | 0.15 | (0.01) |
| Net realized and unrealized gain (loss) | ||||||
| on investments | 0.20 | (1.06) | 3.56 | 4.83 | (10.25) | 0.60 |
| Total from investment operations | 0.36 | (0.94) | 3.57 | 4.88 | (10.10) | 0.59 |
| Less distributions | ||||||
| From net investment income | — | (0.05) | — | — | (0.23) | — |
| From net realized gain | — | — | — | — | — | (1.69) |
| Total distributions | — | (0.05) | — | — | (0.23) | (1.69) |
| Net asset value, end of period | $20.30 | $19.94 | $20.93 | $17.36 | $12.48 | $22.81 |
| Total return (%)3,4 | 1.815 | (4.47) | 20.56 | 39.10 | (44.43) | 2.03 |
| Ratios and supplemental data | ||||||
| Net assets, end of period (in millions) | $1 | $1 | $1 | $1 | $1 | $1 |
| Ratios (as a percentage of average net assets): | ||||||
| Expenses before reductions | 4.166 | 4.00 | 4.24 | 4.837 | 4.68 | 4.62 |
| Expenses net of fee waivers | 2.316 | 2.33 | 2.40 | 2.447 | 2.65 | 2.41 |
| Expenses net of fee waivers and credits | 2.316 | 2.33 | 2.40 | 2.407 | 2.40 | 2.40 |
| Net investment income (loss) | 1.666 | 0.63 | 0.04 | 0.29 | 0.80 | (0.03) |
| Portfolio turnover (%) | 28 | 55 | 48 | 37 | 59 | 97 |
1 Six months ended 8-31-12. Unaudited.
2 Based on the average daily shares outstanding.
3 Does not reflect the effect of sales charges, if any.
4 Total returns would have been lower had certain expenses not been reduced during the periods shown.
5 Not annualized.
6 Annualized.
7 Includes the impact of proxy expenses, which amounted to 0.03% of average net assets.
| CLASS C SHARES Period ended | 8-31-121 | 2-29-12 | 2-28-11 | 2-28-10 | 2-28-09 | 2-29-08 |
| Per share operating performance | ||||||
| Net asset value, beginning of period | $19.91 | $20.91 | $17.34 | $12.47 | $22.79 | $23.90 |
| Net investment income (loss)2 | 0.17 | 0.10 | 0.01 | (0.01) | 0.20 | 0.05 |
| Net realized and unrealized gain (loss) | ||||||
| on investments | 0.18 | (1.05) | 3.56 | 4.88 | (10.29) | 0.53 |
| Total from investment operations | 0.35 | (0.95) | 3.57 | 4.87 | (10.09) | 0.58 |
| Less distributions | ||||||
| From net investment income | — | (0.05) | — | — | (0.23) | — |
| From net realized gain | — | — | — | — | — | (1.69) |
| Total distributions | — | (0.05) | — | — | (0.23) | (1.69) |
| Net asset value, end of period | $20.26 | $19.91 | $20.91 | $17.34 | $12.47 | $22.79 |
| Total return (%)3,4 | 1.765 | (4.52) | 20.59 | 39.05 | (44.43) | 1.99 |
| Ratios and supplemental data | ||||||
| Net assets, end of period (in millions) | $2 | $2 | $1 | $1 | $1 | $2 |
| Ratios (as a percentage of average net assets): | ||||||
| Expenses before reductions | 3.476 | 3.34 | 3.45 | 3.957 | 3.81 | 3.73 |
| Expenses net of fee waivers | 2.316 | 2.33 | 2.40 | 2.417 | 2.42 | 2.40 |
| Expenses net of fee waivers and credits | 2.316 | 2.33 | 2.40 | 2.407 | 2.40 | 2.40 |
| Net investment income (loss) | 1.686 | 0.52 | 0.03 | (0.06) | 1.03 | 0.21 |
| Portfolio turnover (%) | 28 | 55 | 48 | 37 | 59 | 97 |
1 Six months ended 8-31-12. Unaudited.
2 Based on the average daily shares outstanding.
3 Does not reflect the effect of sales charges, if any.
4 Total returns would have been lower had certain expenses not been reduced during the periods shown.
5 Not annualized.
6 Annualized.
7 Includes the impact of proxy expenses, which amounted to 0.03% of average net assets.
| See notes to financial statements | Semiannual report | International Growth Fund | 27 |
| CLASS I SHARES Period ended | 8-31-121 | 2-29-12 | 2-28-11 | 2-28-10 | 2-28-09 | 2-29-08 |
| Per share operating performance | ||||||
| Net asset value, beginning of period | $20.01 | $21.04 | $17.40 | $12.48 | $22.90 | $23.97 |
| Net investment income2 | 0.32 | 0.37 | 0.23 | 0.14 | 0.18 | 0.36 |
| Net realized and unrealized gain (loss) | ||||||
| on investments | 0.14 | (1.12) | 3.60 | 4.95 | (10.12) | 0.54 |
| Total from investment operations | 0.46 | (0.75) | 3.83 | 5.09 | (9.94) | 0.90 |
| Less distributions | ||||||
| From net investment income | — | (0.28) | (0.19) | (0.17) | (0.48) | (0.28) |
| From net realized gain | — | — | — | — | — | (1.69) |
| Total distributions | — | (0.28) | (0.19) | (0.17) | (0.48) | (1.97) |
| Net asset value, end of period | $20.47 | $20.01 | $21.04 | $17.40 | $12.48 | $22.90 |
| Total return (%)3 | 2.304 | (3.42) | 22.08 | 40.76 | (43.74) | 3.27 |
| Ratios and supplemental data | ||||||
| Net assets, end of period (in millions) | $70 | $162 | $204 | $134 | $23 | $1 |
| Ratios (as a percentage of average net assets): | ||||||
| Expenses before reductions | 1.275 | 1.20 | 1.14 | 1.236 | 1.67 | 5.07 |
| Expenses net of fee waivers | 1.255 | 1.20 | 1.14 | 1.216 | 1.20 | 1.20 |
| Expenses net of fee waivers and credits | 1.255 | 1.20 | 1.14 | 1.216 | 1.20 | 1.20 |
| Net investment income | 3.215 | 1.88 | 1.21 | 0.84 | 1.16 | 1.43 |
| Portfolio turnover (%) | 28 | 55 | 48 | 37 | 59 | 97 |
1 Six months ended 8-31-12. Unaudited.
2 Based on the average daily shares outstanding.
3 Total returns would have been lower had certain expenses not been reduced during the periods shown.
4 Not annualized.
5 Annualized.
6 Includes the impact of proxy expenses, which amounted to 0.01% of average net assets.
| CLASS 1 SHARES Period ended | 8-31-121 | 2-29-12 | 2-28-11 | 2-28-10 | 2-28-09 | 2-29-08 |
| Per share operating performance | ||||||
| Net asset value, beginning of period | $20.00 | $21.02 | $17.38 | $12.47 | $22.89 | $23.97 |
| Net investment income2 | 0.28 | 0.36 | 0.23 | 0.20 | 0.36 | 0.29 |
| Net realized and unrealized gain (loss) | ||||||
| on investments | 0.19 | (1.09) | 3.60 | 4.89 | (10.29) | 0.61 |
| Total from investment operations | 0.47 | (0.73) | 3.83 | 5.09 | (9.93) | 0.90 |
| Less distributions | ||||||
| From net investment income | — | (0.29) | (0.19) | (0.18) | (0.49) | (0.29) |
| From net realized gain | — | — | — | — | — | (1.69) |
| Total distributions | — | (0.29) | (0.19) | (0.18) | (0.49) | (1.98) |
| Net asset value, end of period | $20.47 | $20.00 | $21.02 | $17.38 | $12.47 | $22.89 |
| Total return (%)3 | 2.354 | (3.33) | 22.11 | 40.73 | (43.72) | 3.28 |
| Ratios and supplemental data | ||||||
| Net assets, end of period (in millions) | $9 | $9 | $8 | $5 | $3 | $3 |
| Ratios (as a percentage of average net assets): | ||||||
| Expenses before reductions | 1.195 | 1.16 | 1.13 | 1.246 | 1.51 | 1.83 |
| Expenses net of fee waivers | 1.165 | 1.14 | 1.13 | 1.196 | 1.15 | 1.15 |
| Expenses net of all fee waivers and credits | 1.165 | 1.14 | 1.13 | 1.196 | 1.15 | 1.15 |
| Net investment income | 2.845 | 1.83 | 1.21 | 1.23 | 1.94 | 1.14 |
| Portfolio turnover (%) | 28 | 55 | 48 | 37 | 59 | 97 |
1 Six months ended 8-31-12. Unaudited.
2 Based on the average daily shares outstanding.
3 Total returns would have been lower had certain expenses not been reduced during the periods shown.
4 Not annualized.
5 Annualized.
6 Includes the impact of proxy expenses, which amounted to 0.02% of average net assets.
| 28 | International Growth Fund | Semiannual report | See notes to financial statements |
Notes to financial statements
(unaudited)
Note 1 — Organization
John Hancock International Growth Fund (the Fund) is a series of John Hancock Funds III (the Trust), an open-end management investment company organized as a Massachusetts business trust and registered under the Investment Company Act of 1940, as amended (the 1940 Act). The investment objective of the Fund is to seek high total return primarily through capital appreciation.
The Fund may offer multiple classes of shares. The shares currently offered are detailed in the Statement of assets and liabilities. Class A, Class B and Class C shares are offered to all investors. Class I shares are offered to institutions and certain investors. Class 1 shares are offered only to certain affiliates of Manulife Financial Corporation (MFC). Shareholders of each class have exclusive voting rights to matters that affect that class. The distribution and service fees, if any, and transfer agent fees for each class may differ. Class B shares convert to Class A shares eight years after purchase.
Note 2 — Significant accounting policies
The financial statements have been prepared in conformity with accounting principles generally accepted in the United States of America, which require management to make certain estimates and assumptions at the date of the financial statements. Actual results could differ from those estimates. Events or transactions occurring after the end of the fiscal period through the date that the financial statements were issued have been evaluated in the preparation of the financial statements. The following summarizes the significant accounting policies of the Fund:
Security valuation. Investments are stated at value as of the close of regular trading on the New York Stock Exchange (NYSE), normally at 4:00 P.M., Eastern Time. In order to value the securities, the Fund uses the following valuation techniques. Equity securities held by the Fund are valued at the last sale price or official closing price on the principal securities exchange on which they trade. In the event there were no sales during the day or closing prices are not available, then securities are valued using the last quoted bid or evaluated price. Investments by the Funds in open-end mutual funds, including John Hancock Collateral Investment Trust (JHCIT), are valued at their respective net asset values each business day. Futures contracts are valued at the quoted daily settlement prices established by the exchange on which they trade. Foreign securities and currencies, including forward foreign currency contracts, are valued in U.S. dollars, based on foreign currency exchange rates supplied by an independent pricing service. Certain securities and forward foreign currency contracts traded only in the over-the-counter market are valued at the last bid price quoted by brokers making markets in the securities at the close of trading. Certain short-term securities are valued at amortized cost.
Other portfolio securities and assets, where reliable market quotations are not available, are valued at fair value as determined in good faith by the Fund’s Pricing Committee following procedures established by the Board of Trustees, which include price verification procedures. The frequency with which these fair valuation procedures are used cannot be predicted. Generally, trading in non-U.S. securities is substantially completed each day at various times prior to the close of trading on the NYSE. Significant market events that affect the values of non-U.S. securities may occur between the time when the valuation of the securities is generally determined and the close of the NYSE. During significant market events, these securities will be valued at fair value, as determined in good faith, following procedures established by the Board of Trustees. The Fund may use a fair valuation model to value non-U.S. securities in order to adjust for events which may occur between the close of foreign exchanges and the close of the NYSE.
| Semiannual report | International Growth Fund | 29 |
The Fund uses a three-tier hierarchy to prioritize the pricing assumptions, referred to as inputs, used in valuation techniques to measure fair value. Level 1 includes securities valued using quoted prices in active markets for identical securities. Level 2 includes securities valued using significant observable inputs. Observable inputs may include quoted prices for similar securities, interest rates, prepayment speeds and credit risk. Prices for securities valued using these inputs are received from independent pricing vendors and brokers and are based on an evaluation of the inputs described. Level 3 includes securities valued using significant unobservable inputs when market prices are not readily available or reliable, including the Fund’s own assumptions in determining the fair value of investments. Factors used in determining value may include market or issuer specific events or trends, changes in interest rates and credit quality. The inputs or methodology used for valuing securities are not necessarily an indication of the risks associated with investing in those securities. Changes in valuation techniques may result in transfers into or out of an assigned level within the disclosure hierarchy.
The following is a summary of the values by input classification of the Fund’s investments as of August 31, 2012, by major security category or type:
| LEVEL 3 | ||||
| LEVEL 2 | SIGNIFICANT | |||
| TOTAL MARKET | LEVEL 1 | SIGNIFICANT | UNOBSERVABLE | |
| VALUE AT 8-31-12 | QUOTED PRICE | OBSERVABLE INPUTS | INPUTS | |
| Common Stocks | ||||
| Australia | $5,234,730 | — | $5,234,730 | — |
| Belgium | 2,937,433 | — | 2,937,433 | — |
| Bermuda | 171,637 | — | 171,637 | — |
| Canada | 4,857,360 | $4,857,360 | — | — |
| China | 168,299 | — | 168,299 | — |
| Denmark | 4,887,643 | — | 4,887,643 | — |
| Finland | 683,236 | — | 683,236 | — |
| France | 6,404,724 | — | 6,404,724 | — |
| Germany | 8,355,644 | — | 8,355,644 | — |
| Hong Kong | 3,562,774 | — | 3,562,774 | — |
| Ireland | 3,218,082 | — | 3,218,082 | — |
| Israel | 74,546 | — | 74,546 | — |
| Italy | 485,466 | — | 485,466 | — |
| Japan | 31,589,597 | — | 31,589,597 | — |
| Jersey, C.I. | 199,294 | — | 199,294 | — |
| Luxembourg | 531,600 | — | 531,600 | — |
| Macau | 310,922 | — | 310,922 | — |
| Netherlands | 4,744,639 | — | 4,744,639 | — |
| New Zealand | 189,973 | — | 189,973 | — |
| Norway | 854,504 | — | 854,504 | — |
| Singapore | 3,203,930 | — | 3,203,930 | — |
| Spain | 1,961,576 | — | 1,961,576 | — |
| Sweden | 4,023,596 | — | 4,023,596 | — |
| Switzerland | 14,972,032 | — | 14,972,032 | — |
| United Kingdom | 31,631,361 | — | 31,631,361 | — |
| Preferred Securities | 897,428 | — | 897,428 | — |
| Warrants | 586 | 586 | — | — |
| Securities Lending | ||||
| Collateral | 5,422,549 | 5,422,549 | — | — |
| Short-Term | ||||
| Investments | 5,045,891 | 5,045,891 | — | — |
| Total Investments | ||||
| in Securities | $146,621,052 | $15,326,386 | $131,294,666 | — |
| 30 | International Growth Fund | Semiannual report |
| LEVEL 3 | ||||
| LEVEL 2 | SIGNIFICANT | |||
| TOTAL MARKET | LEVEL 1 | SIGNIFICANT | UNOBSERVABLE | |
| VALUE AT 8-31-12 | QUOTED PRICE | OBSERVABLE INPUTS | INPUTS | |
| Other Financial | ||||
| Instruments: | ||||
| Futures | $263,742 | $262,304 | $1,438 | — |
| Forward foreign | ||||
| currency contracts | ($43,874) | — | ($43,874) | — |
Security transactions and related investment income. Investment security transactions are accounted for on a trade date plus one basis for daily net asset value calculations. However, for financial reporting purposes, investment transactions are reported on trade date. Interest income is accrued as earned. Dividend income is recorded on the ex-date, except for dividends of foreign securities where the dividend may not be known until after the ex-date. In those cases, dividend income is, net of withholding taxes, recorded when the Fund becomes aware of the dividends. Foreign taxes are provided for based on the Fund’s understanding of the tax rules and rates that exist in the foreign markets in which it invests. Gains and losses on securities sold are determined on the basis of identified cost and may include proceeds from litigation.
Securities lending. The Fund may lend its securities to earn additional income. It receives cash collateral from the borrower in an amount not less than the market value of the loaned securities. The Fund will invest its collateral in JHCIT, an affiliate of the Fund, which has a floating net asset value (NAV) and invests in short term investments as part of the securities lending program, and as a result, the Fund will receive the benefit of any gains and bear any losses generated by JHCIT. Although risk of the loss of the securities lent is mitigated by holding the collateral and through securities lending provider indemnification, the Fund could experience a delay in recovering its securities and a possible loss of income or value if the borrower fails to return the securities or if collateral investments decline in value or possible loss of rights in the collateral should the borrower fail financially. The Fund may receive compensation for lending its securities by retaining a portion of the return on the investment of the collateral and compensation from fees earned from borrowers of the securities. Net income received from JHCIT is a component of securities lending income as recorded on the Statement of operations.
Foreign currency translation. Assets, including investments and liabilities denominated in foreign currencies, are translated into U.S. dollar values each day at the prevailing exchange rate. Purchases and sales of securities, income and expenses are translated into U.S. dollars at the prevailing exchange rate on the date of the transaction. The effect of changes in foreign currency exchange rates on the value of securities is reflected as a component of the realized and unrealized gains (losses) on investments.
Funds that invest internationally generally carry more risk than funds that invest strictly in U.S. securities. Risks can result from differences in economic and political conditions, regulations, market practices (including higher transaction costs) and accounting standards. Foreign investments are also subject to a decline in the value of a foreign currency versus the U.S. dollar, which reduces the dollar value of securities denominated in that currency.
Foreign taxes. The Fund may be subject to withholding tax on income or capital gains or repatriation taxes as imposed by certain countries in which it invests. Taxes are accrued based upon net investment income, net realized gains or net unrealized appreciation.
Line of credit. The Fund may borrow from banks for temporary or emergency purposes, including meeting redemption requests that otherwise might require the untimely sale of securities. Pursuant to the custodian agreement, the custodian may loan money to the Fund to make properly
| Semiannual report | International Growth Fund | 31 |
authorized payments. The Fund is obligated to repay the custodian for any overdraft, including any related costs or expenses. The custodian may have a lien, security interest or security entitlement in any Fund property that is not otherwise segregated or pledged, to the maximum extent permitted by law, to the extent of any overdraft.
In addition, the Fund and other affiliated funds have entered into an agreement with Citibank N.A. which enables them to participate in a $100 million unsecured committed line of credit. A commitment fee, payable at the end of each calendar quarter, based on the average daily unused portion of the line of credit, is charged to each participating fund on a pro rata basis and is reflected in other expenses on the Statement of operations.
During the six months ended August 31, 2012, the average daily loan balance for which loans were outstanding amounted to $33,857,113 and the weighted average interest rate was 1.07%. Interest expense includes $6,952 paid under the line of credit.
Expenses. Within the John Hancock Funds complex, expenses that are directly attributable to an individual fund are allocated to such fund. Expenses that are not readily attributable to a specific fund are allocated among all funds in an equitable manner, taking into consideration, among other things, the nature and type of expense and the fund’s relative net assets. Expense estimates are accrued in the period to which they relate and adjustments are made when actual amounts are known.
Class allocations. Income, common expenses and realized and unrealized gains (losses) are determined at the fund level and allocated daily to each class of shares based on the net assets of the class. Class-specific expenses, such as distribution and service fees, if any, transfer agent fees, state registration fees and printing and postage, for all classes, are calculated daily at the class level based on the appropriate net assets of each class and the specific expense rates applicable to each class.
Federal income taxes. The Fund intends to continue to qualify as a regulated investment company by complying with the applicable provisions of the Internal Revenue Code and will not be subject to federal income tax on taxable income that is distributed to shareholders. Therefore, no federal income tax provision is required.
As of February 29, 2012 the Fund had no uncertain tax positions that would require financial statement recognition, derecognition or disclosure. The Fund’s federal tax returns are subject to examination by the Internal Revenue Service for a period of three years.
Distribution of income and gains. Distributions to shareholders from net investment income and net realized gains, if any, are recorded on the ex-date. The Fund generally declares and pays dividends and capital gain distributions, if any, annually.
Distributions paid by the Fund with respect to each class of shares are calculated in the same manner, at the same time and in the same amount, except for the effect of class level expenses that may be applied differently to each class.
Such distributions, on a tax basis, are determined in conformity with income tax regulations, which may differ from accounting principles generally accepted in the United States of America.
Capital accounts within the financial statements are adjusted for permanent book-tax differences. These adjustments have no impact on net assets or the results of operations. Temporary book-tax differences, if any, will reverse in a subsequent period. Book-tax differences are primarily attributable to foreign currency transactions, passive foreign investment companies, wash sale deferrals and derivative transactions.
| 32 | International Growth Fund | Semiannual report |
New accounting pronouncement. In December 2011, the Financial Accounting Standards Board issued Accounting Standards Update No. 2011-11 (ASU 2011-11), Disclosures about Offsetting Assets and Liabilities. The update creates new disclosure requirements requiring entities to disclose both gross and net information for derivatives and other financial instruments that are either offset in the Statement of assets and liabilities or subject to an enforceable master netting arrangement or similar agreement. The disclosure requirements are effective for annual reporting periods beginning on or after January 1, 2013 and interim periods within those annual periods. ASU 2011-11 may result in additional disclosure relating to the presentation of derivatives and certain other financial instruments.
Note 3 — Derivative instruments
The Fund may invest in derivatives in order to meet its investment objective. The use of derivatives may involve risks different from, or potentially greater than, the risks associated with investing directly in securities. Specifically, the Fund is exposed to the risk that the counterparty to an over-the-counter (OTC) derivatives contract will be unable or unwilling to make timely settlement payments or otherwise honor its obligations. OTC derivatives transactions typically can only be closed out with the other party to the transaction. If the counterparty defaults, the Fund will have contractual remedies, but there is no assurance that the counterparty will meet its contractual obligations or that the Fund will succeed in enforcing them.
The Fund has entered into collateral agreements with certain counterparties to mitigate counterparty risk on over-the-counter derivatives. Subject to established minimum levels, collateral is generally determined based on the net aggregate unrealized gain or loss on contracts with a particular counterparty. Collateral pledged to the Fund is held by the custodian bank for the benefit of the Fund and can be in the form of cash or debt securities issued by the U.S. government or related agencies; collateral posted by the Fund is held in a segregated account at the Fund’s custodian and is noted in the accompanying portfolio of investments, or if cash is posted, on the Statement of assets and liabilities. As of August 31, 2012, no collateral was posted by the Fund for the benefit of counterparties to over-the-counter derivatives transactions.
Futures. A futures contract is a contractual agreement to buy or sell a particular currency or financial instrument at a pre-determined price in the future. Risks related to the use of futures contracts include possible illiquidity of the futures markets, contract prices that can be highly volatile and imperfectly correlated to movements in hedged security values and/or interest rates and potential losses in excess of the amounts recognized on the Statement of assets and liabilities.
Upon entering into a futures contract, the Fund is required to deposit initial margin with the broker in the form of cash or securities. The amount of required margin is generally based on a percentage of the contract value; this amount is the initial margin for the trade. The margin deposit must then be maintained at the established level over the life of the contract. Futures collateral receivable/ payable is included on the Statement of assets of liabilities. Futures contracts are marked-to-market daily and an appropriate payable or receivable for the change in value (variation margin) and unrealized gain or loss is recorded by the Fund. When the contract is closed, the Fund records a realized gain or loss equal to the difference between the value of the contract at the time it was opened and the value at the time it was closed.
During the six months ended August 31, 2012, the Fund used futures contracts to gain exposure to certain securities markets. The following table summarizes the contracts held at August 31, 2012. During the six months ended August 31, 2012, the Fund held futures contracts with USD notional values ranging from $11.9 million to $73.3 million as measured at each quarter end.
| Semiannual report | International Growth Fund | 33 |
| UNREALIZED | |||||
| OPEN | NUMBER OF | APPRECIATION | |||
| CONTRACTS | CONTRACTS | POSITION | EXPIRATION DATE | VALUE | (DEPRECIATION) |
| CAC 40 Index Futures | 30 | Long | Sept 2012 | 1,021,650 | ($12,524) |
| TOPIX Index Futures | 9 | Long | Sept 2012 | 66,015,484 | (23,021) |
| DAX Index Futures | 17 | Long | Sept 2012 | 2,962,037 | 407,294 |
| FTSE 100 Index | 9 | Long | Sept 2012 | 513,450 | 24,458 |
| Futures | |||||
| S&P TSE 60 Index | 16 | Short | Sept 2012 | (2,184,640) | (96,809) |
| Futures | |||||
| ASX SPI 200 Index | 6 | Short | Sept 2012 | (646,200) | (35,656) |
| Futures | |||||
| Total | $263,742 | ||||
Forward foreign currency contracts. A forward foreign currency contract is an agreement between two parties to buy and sell a specific currency at a price that is set on the date of the contract. The forward contract calls for delivery of the currency on a future date that is specified in the contract. Risks related to the use of forwards include the possible failure of counterparties to meet the terms of the forward agreement, the failure of the counterparties to timely post collateral, the risk that currency movements will not occur thereby reducing the Fund’s total return, and the potential for losses in excess of the amounts recognized on the Statement of assets and liabilities.
The market value of a forward foreign currency contract fluctuates with changes in foreign currency exchange rates. Forward foreign currency contracts are marked-to-market daily and the change in value is recorded by the Fund as an unrealized gain or loss. Realized gains or losses, equal to the difference between the value of the contract at the time it was opened and the value at the time it was closed, are recorded upon delivery or receipt of the currency or settlement with the counterparty.
During the six months ended August 31, 2012, the Fund used forward foreign currency contracts to manage against anticipated currency exchange rates. The following table summarizes the contracts held at August 31, 2012. During the six months ended August 31, 2012, the Fund held forward foreign currency contracts with USD notional values ranging from $32.4 million to $78.2 million, as measured at each quarter end.
| PRINCIPAL | ||||||
| PRINCIPAL | AMOUNT | |||||
| AMOUNT | COVERED | UNREALIZED | ||||
| COVERED BY | BY CONTRACT | SETTLEMENT | APPRECIATION | |||
| CURRENCY | CONTRACT | (USD) | COUNTERPARTY | DATE | (DEPRECIATION) | |
| Buys | ||||||
| AUD | 1,390,101 | $1,453,809 | Mellon Bank N.A. | 10-19-12 | ($23,531) | |
| EUR | 460,057 | 573,719 | Bank of America N.A. | 10-19-12 | 5,213 | |
| EUR | 785,679 | 977,110 | Brown Brothers Harriman & | 10-19-12 | 11,582 | |
| Company | ||||||
| EUR | 532,371 | 663,569 | Deutsche Bank AG | 10-19-12 | 6,363 | |
| EUR | 877,107 | 1,093,095 | JPMorgan Chase Bank | 10-19-12 | 10,648 | |
| EUR | 614,621 | 767,692 | Morgan Stanley & Company | 10-19-12 | 5,741 | |
| International PLC | ||||||
| EUR | 103,477 | 128,772 | Royal Bank of Scotland PLC | 10-19-12 | 1,443 | |
| HKD | 1,568,287 | 202,202 | Bank of America N.A. | 10-19-12 | 26 | |
| HKD | 6,988,911 | 901,129 | Barclays Bank PLC | 10-19-12 | 80 | |
| HKD | 24,078,896 | 3,104,591 | Brown Brothers Harriman & | 10-19-12 | 343 | |
| Company | ||||||
| HKD | 4,697,105 | 605,622 | Mellon Bank N.A. | 10-19-12 | 62 | |
| 34 | International Growth Fund | Semiannual report |
| PRINCIPAL | ||||||
| PRINCIPAL | AMOUNT | |||||
| AMOUNT | COVERED | UNREALIZED | ||||
| COVERED BY | BY CONTRACT | SETTLEMENT | APPRECIATION | |||
| CURRENCY | CONTRACT | (USD) | COUNTERPARTY | DATE | (DEPRECIATION) | |
| Buys (continued) | ||||||
| HKD | 5,097,061 | $657,173 | Morgan Stanley & Company | 10-19-12 | $85 | |
| International PLC | ||||||
| HKD | 3,047,597 | 392,952 | State Street Bank & Trust | 10-19-12 | 30 | |
| Company | ||||||
| GBP | 918,163 | 1,448,196 | Bank of America N.A. | 10-19-12 | 9,483 | |
| GBP | 94,291 | 148,725 | Barclays Bank PLC | 10-19-12 | 972 | |
| GBP | 325,658 | 514,468 | Morgan Stanley & Company | 10-19-12 | 2,547 | |
| International PLC | ||||||
| GBP | 103,156 | 162,603 | Royal Bank of Scotland PLC | 10-19-12 | 1,167 | |
| SGD | 568,341 | 454,982 | Bank of America N.A. | 10-19-12 | 964 | |
| SGD | 922,641 | 738,742 | Barclays Bank PLC | 10-19-12 | 1,437 | |
| SGD | 852,564 | 681,751 | Brown Brothers Harriman & | 10-19-12 | 2,210 | |
| Company | ||||||
| SGD | 751,694 | 601,866 | Mellon Bank N.A. | 10-19-12 | 1,173 | |
| SGD | 1,400,398 | 1,120,812 | Morgan Stanley & Company | 10-19-12 | 2,644 | |
| International PLC | ||||||
| SGD | 751,694 | 601,608 | Royal Bank of Scotland PLC | 10-19-12 | 1,431 | |
| SGD | 751,694 | 601,923 | State Street Bank & Trust | 10-19-12 | 1,115 | |
| Company | ||||||
| Total | $18,597,111 | $43,228 | ||||
| Sells | ||||||
| CAD | 1,629,799 | $1,652,151 | Bank of America N.A. | 10-19-12 | $331 | |
| CAD | 488,456 | 495,075 | Barclays Bank PLC | 10-19-12 | 19 | |
| CAD | 933,979 | 946,827 | Morgan Stanley & Company | 10-19-12 | 229 | |
| International PLC | ||||||
| CAD | 1,177,436 | 1,192,668 | Royal Bank of Scotland PLC | 10-19-12 | (677) | |
| CAD | 177,998 | 180,611 | State Street Bank & Trust | 10-19-12 | 208 | |
| Company | ||||||
| JPY | 34,133,230 | 429,657 | JPMorgan Chase Bank | 10-19-12 | (6,460) | |
| JPY | 3,635,083 | 45,766 | Royal Bank of Scotland PLC | 10-19-12 | (679) | |
| NOK | 1,754,214 | 297,735 | JPMorgan Chase Bank | 10-19-12 | (4,468) | |
| NOK | 1,673,672 | 284,318 | Morgan Stanley & Company | 10-19-12 | (4,009) | |
| International PLC | ||||||
| SEK | 1,229,350 | 184,500 | Brown Brothers Harriman & | 10-19-12 | (822) | |
| Company | ||||||
| SEK | 8,092,918 | 1,216,497 | Deutsche Bank AG | 10-19-12 | (3,491) | |
| SEK | 1,526,946 | 229,418 | Mellon Bank N.A. | 10-19-12 | (766) | |
| CHF | 1,273,534 | 1,322,767 | Barclays Bank PLC | 10-19-12 | (12,230) | |
| CHF | 749,562 | 776,165 | Brown Brothers Harriman & | 10-19-12 | (9,572) | |
| Company | ||||||
| CHF | 1,226,249 | 1,273,379 | JPMorgan Chase Bank | 10-19-12 | (12,051) | |
| CHF | 158,000 | 164,288 | Morgan Stanley & Company | 10-19-12 | (1,338) | |
| International PLC | ||||||
| CHF | 2,129,741 | 2,208,475 | Royal Bank of Scotland PLC | 10-19-12 | (24,051) | |
| CHF | 856,284 | 890,335 | State Street Bank & Trust | 10-19-12 | (7,275) | |
| Company | ||||||
| Total | $13,790,632 | ($87,102) | ||||
| Semiannual report | International Growth Fund | 35 |
| Currency Abbreviations | |
| AUD | Australian Dollar |
| CAD | Canadian Dollar |
| CHF | Swiss Franc |
| EUR | Euro |
| GBP | Pound Sterling |
| HKD | Hong Kong Dollar |
| JPY | Japanese Yen |
| NOK | Norwegian Krone |
| SEK | Swedish Krona |
| SGD | Singapore Dollar |
Fair value of derivative instruments by risk category
The table below summarizes the fair value of derivatives held by the Fund at August 31, 2012 by risk category:
| FINANCIAL | ASSET | LIABILITY | |||
| STATEMENT OF ASSET AND | INSTRUMENT | DERIVATIVES | DERIVATIVES | ||
| RISK | LIABILITIES LOCATION | LOCATION | FAIR VALUE | FAIR VALUE | |
| Equity contracts | Receivable/Payable | Future | $431,752† | ($168,010)† | |
| for futures | |||||
| Foreign exchange | Receivable/Payable for | Forward foreign | 67,546 | (111,420) | |
| contracts | forward foreign currency | currency | |||
| exchange contracts | contracts | ||||
| Total | $499,298 | ($279,430) | |||
† Reflects cumulative appreciation/depreciation of futures as disclosed above. Only the period end variation margin is separately disclosed on the Statement of assets and liabilities.
Effect of derivative instruments on the Statement of operations
The table below summarizes the net realized gain (loss) included in the net increase (decrease) in net assets from operations, classified by derivative instrument and risk category, for the six months ended August 31, 2012:
| STATEMENT OF | FOREIGN | |||
| OPERATIONS | FUTURES | CURRENCY | ||
| RISK | LOCATION | CONTRACTS | TRANSACTIONS* | TOTAL |
| Equity contracts | Net realized | $135,225 | — | $135,225 |
| gain (loss) | ||||
| Foreign exchange | Net realized | — | ($9,776) | ($9,776) |
| contracts | gain (loss) | |||
| Total | $135,225 | ($9,776) | $125,449 | |
* Realized gain/loss associated with forward foreign currency contracts is included in this caption on the Statement of operations.
| 36 | International Growth Fund | Semiannual report |
The table below summarizes the net change in unrealized appreciation (depreciation) included in the net increase (decrease) in net assets from operations, classified by derivative instrument and risk category, for the six months ended August 31, 2012:
| TRANSLATION OF | ||||
| ASSETS AND | ||||
| LIABILITIES IN | ||||
| FUTURES | FOREIGN | |||
| RISK | STATEMENT OF OPERATIONS LOCATION | CONTRACTS | TRANSACTIONS* | TOTAL |
| Equity contracts | Change in unrealized | ($229,363) | — | ($229,363) |
| appreciation (depreciation) | ||||
| Foreign exchange | Change in unrealized | — | $81,542 | 81,542 |
| contracts | appreciation (depreciation) | |||
| Total | ($229,363) | $81,542 | ($147,821) | |
* Change in unrealized appreciation/depreciation associated with forward foreign currency contracts is included in this caption on the Statement of operations.
Note 4 — Guarantees and indemnifications
Under the Fund’s organizational documents, its Officers and Trustees are indemnified against certain liabilities arising out of the performance of their duties to the Fund. Additionally, in the normal course of business, the Fund enters into contracts with service providers that contain general indemnification clauses. The Fund’s maximum exposure under these arrangements is unknown, as this would involve future claims that may be made against the Fund that have not yet occurred. The risk of material loss from such claims is considered remote.
Note 5 — Fees and transactions with affiliates
John Hancock Investment Management Services, LLC (the Adviser) serves as investment adviser for the Trust. John Hancock Funds, LLC (the Distributor), an affiliate of the Adviser, serves as principal underwriter of the Trust. The Adviser and the Distributor are indirect, wholly owned subsidiaries of MFC.
Management fee. The Fund has an investment management agreement with the Adviser under which the Fund pays a daily management fee to the Adviser equivalent, on an annual basis, to the sum of: (a) 0.920% of the first $100,000,000 of the Fund’s average daily net assets; (b) 0.895% of the next $900,000,000; (c) 0.880% of the next $1,000,000,000; (d) 0.850% of the next $1,000,000,000; (e) 0.825% of the next $1,000,000,000; and (f) 0.800% of the Fund’s average daily net asset in excess of $4,000,000,000. The Adviser has a subadvisory agreement with Grantham, Mayo, Van Otterloo & Co. LLC. The Fund is not responsible for payment of the subadvisory fees.
The Adviser has contractually agreed to waive fees and/or reimburse certain expenses for each share class of the Fund. This agreement excludes taxes, portfolio brokerage commissions, interest expense, litigation and other extraordinary expenses not incurred in the ordinary course of the Fund’s business. The fee waivers and/or reimbursements are such that these expenses will not exceed 1.60%, 2.30%, 2.30%, 1.24% and 1.15% for Class A, Class B, Class C, Class I and Class 1 shares, respectively. The current expense limitation agreement will remain in effect through June 30, 2013, unless renewed by mutual agreement of the Fund and the adviser based upon a determination that this is appropriate under the circumstances at the time.
Accordingly, these expense reductions amounted to $21,671, $9,050, $9,326, $9,264 and $1,422 for Class A, Class B, Class C, Class I and Class 1 shares, respectively, for the six months ended August 31, 2012.
| Semiannual report | International Growth Fund | 37 |
The investment management fees, including the impact of the waivers and reimbursements described above, incurred for the six months ended August 31, 2012 were equivalent to the net annual effective rate of 0.85% of the Fund’s average daily net assets.
Accounting and legal services. Pursuant to a service agreement the Fund reimburses the Adviser for all expenses associated with providing the administrative, financial, legal, accounting and recordkeeping services to the Fund, including the preparation of all tax returns, periodic reports to shareholders and regulatory reports, among other services. These expenses are allocated to each share class based on its relative net assets at the time the expense was incurred. These accounting and legal services fees incurred for the six months ended August 31, 2012 amounted to an annual rate of 0.02% of the Fund’s average daily net assets.
Distribution and service plans. The Fund has a distribution agreement with the Distributor. The Fund has adopted distribution and service plans with respect to Class A, Class B, Class C and Class 1 shares pursuant to Rule 12b-1 under the 1940 Act, to pay the Distributor for services provided as the distributor of shares of the Fund. The Fund may pay up to the following contractual rates of distribution and service fees under these arrangements, expressed as an annual percentage of average daily net assets for each class of the Fund’s shares.
| CLASS | 12b–1 FEE | |||
| Class A | 0.30% | |||
| Class B | 1.00% | |||
| Class C | 1.00% | |||
| Class 1 | 0.05% | |||
Sales charges. Class A shares are assessed up-front sales charges, which resulted in payments to the Distributor amounting to $30,953 for the six months ended August 31, 2012. Of this amount, $5,369 was retained and used for printing prospectuses, advertising, sales literature and other purposes, $25,451 was paid as sales commissions to broker-dealers and $133 was paid as sales commissions to sales personnel of Signator Investors, Inc., a broker-dealer affiliate of the Adviser.
Class B and Class C shares are subject to contingent deferred sales charges (CDSCs). Class B shares that are redeemed within six years of purchase are subject to CDSCs, at declining rates, beginning at 5.00% of the lesser of the current market value at the time of redemption or the original purchase cost of the shares being redeemed. Class C shares that are redeemed within one year of purchase are subject to a 1.00% CDSC on the lesser of the current market value at the time of redemption or the original purchase cost of the shares being redeemed. Proceeds from CDSCs are used to compensate the Distributor for providing distribution-related services in connection with the sale of these shares. During the six months ended August 31, 2012, CDSCs received by the Distributor amounted to $2,261 and $226 for Class B and Class C shares, respectively.
Transfer agent fees. The Fund has a transfer agent agreement with John Hancock Signature Services, Inc. (Signature Services), an affiliate of the Adviser. The transfer agent fees paid to Signature Services are determined based on the cost to Signature Services (Signature Services Cost) of providing recordkeeping services. The Signature Services Cost includes a component of allocated John Hancock corporate overhead for providing transfer agent services to the Fund and to all other John Hancock affiliated funds. It also includes out-of-pocket expenses that are comprised of payments made to third-parties for recordkeeping services provided to their clients who invest in one or more John Hancock funds. In addition, Signature Services Cost may be reduced by certain fees that Signature Services receives in connection with retirement and small accounts. Signature Services Cost is calculated monthly and allocated, as applicable, to four categories of share classes: Institutional Share Classes, Retirement Share Classes, Municipal Bond Classes and all other Retail Share Classes. Within each of these categories, the applicable costs are allocated to the affected John Hancock affiliated funds and/or classes, based on the relative average daily net assets.
| 38 | International Growth Fund | Semiannual report |
Class level expenses. Class level expenses for the six months ended August 31, 2012 were:
| DISTRIBUTION | TRANSFER | STATE | PRINTING AND | |
| CLASS | AND SERVICE FEES | AGENT FEES | REGISTRATION FEES | POSTAGE |
| Class A | $81,002 | $52,276 | $10,783 | $3,423 |
| Class B | 4,882 | 942 | 8,552 | 373 |
| Class C | 8,000 | 1,539 | 8,727 | 402 |
| Class I | — | 54,675 | 9,970 | 3,468 |
| Class 1 | 2,210 | — | — | — |
| Total | $96,094 | $109,432 | $38,032 | $7,666 |
Trustee expenses. The Fund compensates each Trustee who is not an employee of the Adviser or its affiliates. These Trustees may, for tax purposes, elect to defer receipt of this compensation under the John Hancock Group of Funds Deferred Compensation Plan (the Plan). Deferred amounts are invested in various John Hancock funds and remain in the funds until distributed in accordance with the Plan. The investment of deferred amounts and the offsetting liability are included within Other receivables and prepaid expenses and Payable to affiliates — Trustees’ fees, respectively, in the accompanying Statement of assets and liabilities.
Note 6 — Fund share transactions
Transactions in Fund shares for the six months ended August 31, 2012 and the year ended February 29, 2012 were as follows:
| Six months ended 8-31-12 | Year ended 2-29-12 | |||
| Shares | Amount | Shares | Amount | |
| Class A shares | ||||
| Sold | 709,888 | $13,993,178 | 1,620,299 | $32,324,292 |
| Distributions reinvested | — | — | 23,931 | 428,365 |
| Repurchased | (171,055) | (3,381,289) | (1,304,021) | (27,324,773) |
| Net increase | 538,833 | $10,611,889 | 340,209 | $5,427,884 |
| Class B shares | ||||
| Sold | 7,412 | $147,740 | 25,355 | $511,368 |
| Distributions reinvested | — | — | 117 | 2,099 |
| Repurchased | (5,871) | (115,715) | (14,555) | (291,119) |
| Net increase | 1,541 | $32,025 | 10,917 | $222,348 |
| Class C shares | ||||
| Sold | 8,553 | $168,900 | 41,214 | $820,514 |
| Distributions reinvested | — | — | 185 | 3,306 |
| Repurchased | (9,186) | (181,413) | (13,390) | (262,293) |
| Net increase (decrease) | (633) | ($12,513) | 28,009 | $561,527 |
| Class I shares | ||||
| Sold | 173,408 | $3,402,378 | 2,600,769 | $52,660,106 |
| Distributions reinvested | — | — | 2,431 | 43,561 |
| Repurchased | (4,836,034) | (96,270,265) | (4,208,665) | (80,252,057) |
| Net decrease | (4,662,626) | ($92,867,887) | (1,605,465) | ($27,548,390) |
| Class 1 shares | ||||
| Sold | 56,996 | $1,128,055 | 218,296 | $4,496,153 |
| Distributions reinvested | — | — | 7,081 | 126,750 |
| Repurchased | (69,546) | (1,371,217) | (141,980) | (2,799,853) |
| Net increase (decrease) | (12,550) | ($243,162) | 83,397 | $1,823,050 |
| Net decrease | (4,135,435) | ($82,479,648) | (1,142,933) | ($19,513,581) |
| Semiannual report | International Growth Fund | 39 |
Note 7 — Purchase and sale of securities
Purchases and sales of securities, other than short-term securities, aggregated $43,813,595 and $123,264,199, respectively, for the six months ended August 31, 2012.
| 40 | International Growth Fund | Semiannual report |
Board Consideration of and Continuation of Investment Advisory Agreement and Subadvisory Agreement
The Board of Trustees (the Board, the members of which are referred to as Trustees) of John Hancock International Growth Fund (the Fund), a series of John Hancock Funds III, met in-person on May 6–8, and June 3–5, 2012 to consider the approval of the Fund’s investment advisory agreement (the Advisory Agreement) with John Hancock Investment Management Services, LLC (the Adviser), the Fund’s investment adviser. The Board also considered the approval of the investment subadvisory agreement (the Subadvisory Agreement) between the Adviser and GMO, LLC (the Subadviser) on behalf of the Fund. The Advisory Agreement and the Subadvisory Agreement are referred to as the Agreements.
Activities and composition of the Board
On June 3–5, 2012, the Board consisted of nine individuals, seven of whom were Independent Trustees. Independent Trustees are generally those individuals who are not employed by or have any significant business or professional relationship with the Adviser or the Subadviser. The Trustees are responsible for the oversight of operations of the Fund and perform various duties required of directors of investment companies by the Investment Company Act of 1940, as amended (the 1940 Act). The Independent Trustees have independent legal counsel to assist them in connection with their duties. The Board has appointed an Independent Trustee as Chairman. On June 3–5, 2012, the Board had four standing committees that were composed entirely of Independent Trustees: the Audit Committee; the Compliance Committee; the Nominating, Governance and Administration Committee; and the Contracts & Operations Committee. Additionally, on June 3–5, 2012, Investment Performance Committees A and B were standing committees of the Board composed of Independent Trustees and one Trustee who is affiliated with the Adviser. Investment Performance Committee B was responsible for overseeing and monitoring matters relating to the investment performance of the Fund. The Board also designated an Independent Trustee as Vice Chairman to serve in the absence of the Chairman. The Board also designates working groups or ad hoc committees as it deems appropriate.
The approval process
Under the 1940 Act, the Board is required to consider the continuation of the Agreements each year. Throughout the year, the Board, acting directly and through its committees, regularly reviews and assesses the quality of the services that the Fund receives under these Agreements. The Board reviews reports of the Adviser at least quarterly, which include Fund performance reports and compliance reports. In addition, the Board meets with portfolio managers and senior investment officers at various times throughout the year. The Board considers at each of its meetings factors that are relevant to its annual consideration of the renewal of the Agreements, including the services and support provided by the Adviser and Subadviser to the Fund and its shareholders.
Prior to the May 6–8, 2012 meeting, the Board requested and received materials specifically relating to the Agreements. The materials provided in connection with the May meeting included information compiled and prepared by Lipper, a Thomson Reuters company (Lipper), on Fund fees and expenses, and the investment performance of the Fund. This Fund information is assembled in a format that permits comparison with similar information from a Category and a subset of the Category referred to as the Expense Group, each as determined by Lipper, and with the Fund’s benchmark index. The Category includes all funds that invest similarly to the way the Fund invests. The Expense Group represents funds of similar size, excluding passively managed funds and funds-of-funds. The Fund’s benchmark index is an unmanaged index of securities that is provided as a basis for comparison with the Fund’s performance. Other material provided for the Fund review included (a) information on the profitability of the Agreements to the Adviser and a discussion of any additional benefits to the Adviser or Subadviser or their affiliates that result from being the Adviser or Subadviser to the Fund; (b) a general analysis provided by the Adviser and the Subadviser concerning investment advisory fees charged to other clients, such as
| Semiannual report | International Growth Fund | 41 |
institutional clients and other investment companies, having similar investment mandates, as well as the performance of those other clients and a comparison of the services provided to those other clients and the services provided to the Fund; (c) the impact of economies of scale; (d) a summary of aggregate amounts paid by the Fund to the Adviser; and (e) sales and redemption data regarding the Fund’s shares.
At an in-person meeting held on May 6–8, 2012, the Board reviewed materials relevant to its consideration of the Agreements. As a result of the discussions that occurred during the May 6–8, 2012 meeting, the Board asked the Adviser for additional information on certain matters. The Adviser provided the additional information and the Board also considered this information as part of its consideration of the Agreements.
At an in-person meeting held on June 3–5, 2012, the Board, including the Independent Trustees, formally considered the continuation of the Advisory Agreement and the Subadvisory Agreement, each for an additional one-year term. The Board considered what it believed were key relevant factors that are described under separate headings presented below.
The Board also considered other matters important to the approval process, such as payments made to and by the Adviser or its affiliates relating to the distribution of Fund shares and other services. The Board reviewed services related to the valuation and pricing of Fund portfolio holdings. Other important matters considered by the Board were the direct and indirect benefits to the Adviser, the Subadviser and their affiliates from their relationship with the Fund and advice from independent legal counsel with respect to the review process and materials submitted for the Board’s review.
Nature, extent and quality of services
The Board reviewed the nature, extent and quality of services provided by the Adviser and the Subadviser, including the investment advisory services and the resulting performance of the Fund.
The Board considered the ability of the Adviser and the Subadviser, based on their resources, reputation and other attributes, to attract and retain qualified investment professionals, including research, advisory and supervisory personnel. It considered the background and experience of senior management and investment professionals responsible for managing the Fund. The Board considered the investment philosophy, research and investment decision-making processes of the Subadviser responsible for the daily investment activities of the Fund, including, among other things, portfolio trading capabilities, use of technology, commitment to compliance and approach to training and retaining portfolio managers and other research, advisory and management personnel.
The Board considered the Subadviser’s history and experience providing investment services to the Fund. The Board considered the Adviser’s investment manager analytical capabilities, market and economic knowledge and execution of its Subadviser oversight responsibilities. The Board further considered the culture of compliance, resources dedicated to compliance, compliance programs, record of compliance with applicable laws and regulation, with the Fund’s investment policies and restrictions and with the applicable Code of Ethics, and the responsibilities of the Adviser’s and Subadviser’s compliance departments.
In addition to advisory services, the Board considered the quality of the administrative and non-investment advisory services provided to the Fund by the Adviser under a separate agreement. The Board noted that the Adviser and its affiliates provide the Fund with certain administrative, transfer agency, shareholder and other services (in addition to any such services provided to the Fund by third parties) and officers and other personnel as are necessary for the operations of the Fund. The Board reviewed the structure and duties of the Adviser’s administration, accounting, legal and compliance departments and its affiliate’s transfer agency operations and considered the Adviser’s and its affiliates’ policies and procedures for assuring compliance with applicable laws and regulations.
| 42 | International Growth Fund | Semiannual report |
The Board also received information about the nature, extent and quality of services provided by and fee rates charged by the Adviser and Subadviser to their other clients, including other registered investment companies, institutional investors and separate accounts. The Board reviewed a general analysis provided by the Adviser and the Subadviser concerning investment advisory fees charged to other clients having similar investment mandates, the services provided to those other clients as compared to the services provided to the Fund, the performance of those other clients as compared to the performance by the Fund and other factors relating to those other clients. The Board considered the significant differences between the Adviser’s and Subadviser’s services to the Fund and the services they provide to other clients. For other clients that are not mutual funds, the differences in services relate to the greater share purchase and redemption activity in a mutual fund, the generally higher turnover of mutual fund portfolio holdings, the more burdensome regulatory and legal obligations of mutual funds and the higher marketing costs for mutual funds. When compared to all clients including mutual funds, the Adviser has greater oversight and supervisory responsibility for the Fund and undertakes greater entrepreneurial risk as the sponsor of the Fund.
Fund performance
The Board was provided with reports, independently prepared by Lipper, which included a comprehensive analysis of the Fund’s performance. The Board also examined materials discussing Fund performance and the Fund’s investment objective, strategies and outlook. The Board also reviewed a narrative and statistical analysis of the Lipper data that was prepared by the Adviser, which analyzed various factors that may affect the Lipper rankings. The Board reviewed information regarding the investment performance of the Fund as compared to its Lipper Category as well as its benchmark index (see chart below). The Board was provided with a description of the methodology used by Lipper to select the funds in the Category. The Board also considered updated performance information provided by the Adviser at its May and June 2012 meetings. The Board regularly reviews the performance of the Fund throughout the year and attaches more importance to performance over relatively longer periods of time, typically three to five years.
Set forth below is the performance of the Fund over certain time periods ended December 31, 2011 and that of its Category average and benchmark index over the same periods:
| 1 YEAR | 3 YEAR | 5 YEAR | 10 YEAR | |
| International Growth Fund Class A Shares | –8.61% | 7.81% | –2.61% | –0.11% |
| Intl Large-Cap Growth Category Average | –12.96% | 9.23% | –2.92% | –0.49% |
| MSCI EAFE GD Index | –11.73% | 8.16% | –4.26% | –1.44% |
The Board noted that the Fund’s performance compared favorably to the Category’s average performance and the benchmark index’s performance for all periods shown, other than the three-year period over which the Fund underperformed its Category’s average performance and its benchmark index’s performance.
Expenses and fees
The Board, including the Independent Trustees, reviewed the Fund’s contractual advisory fee rate payable by the Fund to the Adviser as compared with the other funds in its Expense Group. The Board also received information about the investment subadvisory fee rate payable by the Adviser to the Subadviser for investment subadvisory services. The Board considered the services provided and the fees charged by the Adviser and the Subadviser to other clients with similar investment mandates, including other registered investment companies, institutional investors and separate accounts.
In addition, the Board considered the cost of the services provided to the Fund by the Adviser. The Board received and considered expense information regarding the Fund’s various components, including advisory fees, distribution fees and fees other than advisory and distribution fees, including transfer agent fees, custodian fees, administration fees and other miscellaneous fees
| Semiannual report | International Growth Fund | 43 |
(e.g., fees for accounting and legal services). The Board considered comparisons of these expenses to the Expense Group median. The Board also considered expense information regarding the Fund’s total operating expense ratio (Gross Expense Ratio) and, if different, the Fund’s total operating expense ratio after taking into account any fee waiver or expense waiver agreement by the Adviser (Net Expense Ratio). The Board considered information comparing the Gross Expense Ratio and Net Expense Ratio of the Fund to that of the Expense Group median.
The Board noted that the Fund’s advisory fee ratio was five basis points above the Expense Group median advisory fee ratio. The Board noted the following information about the Fund’s Gross and Net Expense Ratios for Class A shares contained in the Fund’s 2011 financial statements in relation with the Fund’s Expense Group median provided by Lipper in April 2012:
| FUND – CLASS A | EXPENSE GROUP MEDIAN | |
| Advisory Fee Ratio | 0.90% | 0.85% |
| Gross Expense Ratio | 1.59% | 1.58% |
| Net Expense Ratio | 1.57% | 1.50% |
The Board viewed favorably the Adviser’s contractual agreement to waive all or a portion of its advisory fees and to reimburse or pay operating expenses to the extent necessary to maintain the Fund’s Net Expense Ratio at 1.60% for Class A shares (and at varying levels for other classes), excluding certain expenses such as taxes, brokerage commissions, interest, litigation and extraordinary expenses, until June 30, 2013. The Board favorably considered the impact of this contractual agreement towards lowering the Fund’s Gross Expense Ratio.
The Board received and reviewed statements relating to the Adviser’s financial condition and was also provided with a profitability analysis that detailed the revenues earned and the expenses incurred by the Adviser for services under the Advisory Agreement, as well as from other relationships between the Fund and the Adviser and its affiliates. The Board reviewed the Adviser’s profitability with respect to the Fund and other funds the Board currently oversees for the year ended December 31, 2011 compared to available aggregate profitability data provided for the year ended December 31, 2010. The Board reviewed the Adviser’s profitability with respect to other fund complexes managed by the Adviser and/or its affiliates. The Board reviewed the Adviser’s assumptions and methodology of allocating expenses in the profitability analysis, noting the inherent limitations in allocating costs among various advisory products.
The Board also considered a comparison of the Adviser’s profitability to that of a limited number of other investment advisers whose profitability information is publicly available. The Board recognized that profitability may be affected by numerous factors including, among other things, fee waivers and expense reimbursements by the Adviser, the types of funds managed, expense allocations and business mix, and therefore comparability of profitability is limited.
The Board did not consider profitability information with respect to the Subadviser, which is not affiliated with the Adviser. The Board considered that the subadvisory fee under the Subadvisory Agreement had been negotiated by the Adviser and the Subadviser on an arm’s length basis. For this reason, the Subadviser’s separate profitability from its relationship with the Fund was not a factor in determining whether to renew the Subadvisory Agreement. In evaluating overall fees for investment management, the Board recognized the inherently higher cost structure of subadvised funds.
Economies of scale
The Board, including the Independent Trustees, considered the extent to which economies of scale might be realized as the assets of the Fund increase. Possible changes in the advisory fee rate or structure in order to enable the Fund to participate in these economies of scale (e.g., through the use of breakpoints in the advisory fee at higher asset levels) are periodically discussed. The Board also
| 44 | International Growth Fund | Semiannual report |
considered the Adviser’s overall operations and its ongoing investment in its business in order to expand the scale of, and improve the quality of, its operations that benefit the Fund.
The Board recognized the inherent limitations of any analysis of economies of scale, stemming largely from the Board’s understanding that most of the Adviser’s costs are not specific to individual funds, but rather are incurred across a variety of products and services. To ensure that any economies are reasonably shared with the Fund as its assets increase, the Adviser and the Board agreed to continue the existing breakpoints to the contractual advisory fee rate.
Other benefits to the Adviser and the Subadviser
The Board understands that the Adviser, the Subadviser or their affiliates may derive other ancillary benefits from their relationship with the Fund, both tangible and intangible, such as their ability to leverage investment professionals who manage other portfolios, an increase in their profile in the investment advisory community and, in the case of the Adviser, the engagement of its affiliates and/or significant shareholders as service providers to the Fund, including for administrative, transfer agency and distribution services. The Board believes that certain of these benefits are difficult to quantify. The Board also was informed that the Subadviser may use third-party research obtained by soft dollars generated by certain mutual fund transactions to assist itself in managing all or a number of its other client accounts.
Board determination
The Board unanimously approved the continuation of the Advisory Agreement and the Subadvisory Agreement each for an additional one-year term. Based upon its evaluation of relevant factors in their totality, the Board was satisfied that the terms of the Agreements, including the advisory and subadvisory fee rates, were fair and reasonable and in the best interest of the Fund and its shareholders. In arriving at its decision to approve the Agreements, the Board did not identify any single factor or any group of factors as all-important or controlling, but considered all factors together. Different Trustees may have attributed different weights to the various factors considered. The Independent Trustees were also assisted by independent legal counsel in making this determination. The Trustees’ conclusions may be based in part on their consideration of these arrangements in prior years and on their ongoing regular review of Fund performance and operations throughout the year.
| Semiannual report | International Growth Fund | 45 |
More information
| Trustees | Investment adviser |
| Steven R. Pruchansky,* Chairman | John Hancock Investment Management |
| William H. Cunningham | Services, LLC |
| Deborah C. Jackson | |
| Hugh McHaffie† | Subadviser |
| Dr. John A. Moore,* Vice Chairman | Grantham, Mayo, Van Otterloo & Co. LLC |
| Gregory A. Russo* | |
| John G. Vrysen† | Principal distributor |
| John Hancock Funds, LLC | |
| Officers | |
| Hugh McHaffie | Custodian |
| President | State Street Bank and Trust Company |
| Andrew G. Arnott | Transfer agent |
| Executive Vice President | John Hancock Signature Services, Inc. |
| Thomas M. Kinzler | Legal counsel |
| Secretary and Chief Legal Officer | K&L Gates LLP |
| Francis V. Knox, Jr. | |
| Chief Compliance Officer | |
| Charles A. Rizzo | |
| Chief Financial Officer | |
| Salvatore Schiavone | |
| Treasurer | |
| *Member of the Audit Committee | |
| †Non-Independent Trustee | |
The Fund’s proxy voting policies and procedures, as well as the Fund’s proxy voting record for the most recent twelve-month period ended June 30, are available free of charge on the Securities and Exchange Commission (SEC) Web site at www.sec.gov or on our Web site.
The Fund’s complete list of portfolio holdings, for the first and third fiscal quarters, is filed with the SEC on Form N-Q. The Fund’s Form N-Q is available on our Web site and the SEC’s Web site, www.sec.gov, and can be reviewed and copied (for a fee) at the SEC’s Public Reference Room in Washington, DC. Call 1-202-551-8090 to receive information on the operation of the SEC’s Public Reference Room.
We make this information on your fund, as well as monthly portfolio holdings, and other fund details available on our Web site at www.jhfunds.com or by calling 1-800-225-5291.
| You can also contact us: | ||
| 1-800-225-5291 | Regular mail: | Express mail: |
| jhfunds.com | John Hancock Signature Services, Inc. | John Hancock Signature Services, Inc. |
| P.O. Box 55913 | Mutual Fund Image Operations | |
| Boston, MA 02205-5913 | 30 Dan Road | |
| Canton, MA 02021 |
| 46 | International Growth Fund | Semiannual report |

1-800-225-5291
1-800-554-6713 TDD
1-800-338-8080 EASI-Line
www.jhfunds.com
Now available: electronic delivery
www.jhfunds.com/edelivery
| This report is for the information of the shareholders of John Hancock International Growth Fund. | 87SA 8/12 |
| It is not authorized for distribution to prospective investors unless preceded or accompanied by a prospectus. | 10/12 |
A look at performance
Total returns for the period ended August 31, 2012
| Average annual total returns (%) | Cumulative total returns (%) | ||||||||
| with maximum sales charge | with maximum sales charge | ||||||||
| Since | Since | ||||||||
| 1-year | 5-year | 10-year | inception 1 | 6-months | 1-year | 5-year | 10-year | inception 1 | |
| Class A | –8.05 | –5.53 | — | –3.82 | –10.45 | –8.05 | –24.76 | — | –19.83 |
| Class B | –8.58 | –5.55 | — | –3.78 | –10.75 | –8.58 | –24.86 | — | –19.63 |
| Class C | –4.75 | –5.21 | — | –3.61 | –6.86 | –4.75 | –23.48 | — | –18.81 |
| Class I2 | –2.77 | –4.13 | — | –2.51 | –5.48 | –2.77 | –19.02 | — | –13.43 |
Performance figures assume all distributions are reinvested. Figures reflect maximum sales charges on Class A shares of 5%, and the applicable contingent deferred sales charge (CDSC) on Class B and Class C shares. The Class B shares’ CDSC declines annually between years 1 to 6 according to the following schedule: 5, 4, 3, 3, 2, 1%. No sales charge will be assessed after the sixth year. Class C shares held for less than one year are subject to a 1% CDSC. Sales charges are not applicable for Class I shares.
The expense ratios of the Portfolio, both net (including any fee waivers or expense limitations) and gross (excluding any fee waivers or expense limitations), are set forth according to the most recent publicly available prospectuses for the Portfolio and may differ from those disclosed in the Financial highlights tables in this report. The fee waivers and expense limitations are contractual at least until 6-30-13. Had the fee waivers and expense limitations not been in place gross expenses would apply. The following expense ratios include expenses of the underlying affiliated funds in which the Portfolio invests. The expense ratios are as follows:
| Class A | Class B | Class C | Class I | |||||||
| Net (%) | 1.61 | 2.31 | 2.31 | 1.25 | ||||||
| Gross (%) | 2.26 | 3.46 | 3.04 | 7.56 |
The returns reflect past results and should not be considered indicative of future performance. The return and principal value of an investment will fluctuate so that shares, when redeemed, may be worth more or less than their original cost. Due to market volatility, the Portfolio’s current performance may be higher or lower than the performance shown. For current to the most recent month-end performance data, please call 1-800-225-5291 or visit the Portfolio’s Web site at www.jhfunds.com.
The performance table above and the chart on the next page do not reflect the deduction of taxes that a shareholder would pay on portfolio distributions or the redemption of portfolio shares. The Portfolio’s performance results reflect any applicable expense reductions, without which the expenses increase and results would have been less favorable.
See the following page for footnotes.
| 6 | International Allocation Portfolio | Semiannual report |
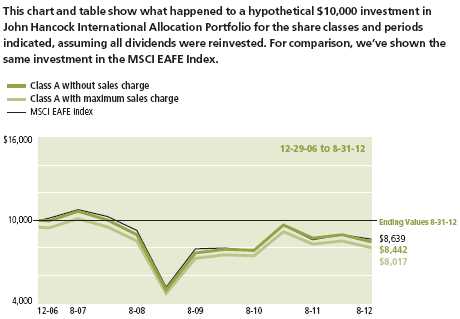
| Without | With maximum | |||
| Start date | sales charge | sales charge | Index | |
| Class B | 12-29-06 | $8,108 | $8,037 | $8,639 |
| Class C3 | 12-29-06 | 8,119 | 8,119 | 8,639 |
| Class I 2 | 12-29-06 | 8,657 | 8,657 | 8,639 |
MSCI EAFE Index (gross of foreign withholding tax on dividends) (Europe, Australasia, Far East) is a free float-adjusted market capitalization index that is designed to measure the equity market performance of developed markets, excluding the U.S. and Canada.
It is not possible to invest directly in an index. Index figures do not reflect sales charges, which would have resulted in lower values if they did.
Footnotes related to a look at performance
1 From 12-29-06.
2 For certain types of investors, as described in the Portfolio’s prospectus.
3 No contingent deferred sales charge is applicable.
| Semiannual report | International Allocation Portfolio | 7 |
Your expenses
These examples are intended to help you understand your ongoing operating expenses of investing in the Fund so you can compare these costs with the ongoing costs of investing in other mutual funds.
Understanding fund expenses
As a shareholder of the Portfolio, you incur two types of costs:
▪ Transaction costs which include sales charges (loads) on purchases or redemptions (varies by share class), minimum account fee charge, etc.
▪ Ongoing operating expenses including management fees, distribution and service fees (if applicable), and other fund expenses.
We are going to present only your ongoing operating expenses here.
Actual expenses/actual returns
This example is intended to provide information about the Portfolio’s actual ongoing operating expenses, and is based on the Portfolio’s actual return. It assumes an account value of $1,000.00 on March 1, 2012 with the same investment held until August 31, 2012.
| Account value | Ending value | Expenses paid during | |
| on 3-1-12 | on 8-31-12 | period ended 8-31-121,2 | |
| Class A | $1,000.00 | $942.40 | $3.08 |
| Class B | 1,000.00 | 939.50 | 6.50 |
| Class C | 1,000.00 | 940.80 | 6.51 |
| Class I | 1,000.00 | 945.20 | 1.32 |
Together with the value of your account, you may use this information to estimate the operating expenses that you paid over the period. Simply divide your account value at August 31, 2012, by $1,000.00, then multiply it by the “expenses paid” for your share class from the table above. For example, for an account value of $8,600.00, the operating expenses should be calculated as follows:
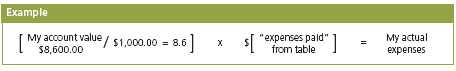
| 8 | International Allocation Portfolio | Semiannual report |
Hypothetical example for comparison purposes
This table allows you to compare the Portfolio’s ongoing operating expenses with those of any other fund. It provides an example of the Portfolio’s hypothetical account values and hypothetical expenses based on each class’s actual expense ratio and an assumed 5% annualized return before expenses (which is not the Portfolio’s actual return). It assumes an account value of $1,000.00 on March 1, 2012, with the same investment held until August 31, 2012. Look in any other fund shareholder report to find its hypothetical example and you will be able to compare these expenses.
| Account value | Ending value | Expenses paid during | |
| on 3-1-12 | on 8-31-12 | period ended 8-31-121,2 | |
| Class A | $1,000.00 | $1,022.00 | $3.21 |
| Class B | 1,000.00 | 1,018.50 | 6.77 |
| Class C | 1,000.00 | 1,018.50 | 6.77 |
| Class I | 1,000.00 | 1,023.80 | 1.38 |
Remember, these examples do not include any transaction costs, therefore, these examples will not help you to determine the relative total costs of owning different funds. If transaction costs were included, your expenses would have been higher. See the prospectus for details regarding transaction costs.
1 Expenses are equal to the Portfolio’s annualized expense ratio of 0.63%, 1.33%, 1.33% and 0.27% for Class A, Class B, Class C and Class I shares, respectively, multiplied by the average account value over the period, multiplied by 184/365 (to reflect the one-half year period).
2 The Portfolio’s expense ratios do not include fees and expenses indirectly incurred by the underlying funds, whose ratios can vary based on the mix of underlying funds. The range of expense ratios of the underlying funds held were 0.86% to 1.34%.
| Semiannual report | International Allocation Portfolio | 9 |
Portfolio summary
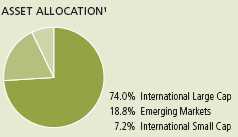
1 As a percentage of net assets on 8-31-12.
| 10 | International Allocation Portfolio | Semiannual report |
Portfolio’s investments
| Investment companies | |
| Underlying Funds’ Subadvisers | |
| Atlantis Investment Management (Hong Kong) Ltd. | (Atlantis) |
| Dimensional Fund Advisors, Inc. | (DFA) |
| Franklin Mutual Advisors, Franklin Templeton Investment Corp., | |
| Templeton Investment Counsel, Inc. | (Franklin) |
| Grantham, Mayo, Van Otterloo & Co. LLC | (GMO) |
| Invesco Advisers, Inc. | (Invesco) |
| John Hancock Asset Management* | (John Hancock) |
*Manulife Asset Management (North America) Limited is doing business as John Hancock Asset Management.
As of 8-31-12 (unaudited)
| Shares | Value | |
| Affiliated Investment Companies 99.5% | $14,801,455 | |
| (Cost $14,090,846) | ||
| EQUITY 99.5% | 14,801,455 | |
| International Large Cap 74.0% | ||
| John Hancock Funds II (G) | ||
| International Growth Stock, Class NAV (Invesco) | 223,236 | 2,431,041 |
| International Opportunities, Class NAV (Invesco) (I) | 96,142 | 1,200,808 |
| International Value, Class NAV (Franklin) | 289,897 | 3,751,262 |
| John Hancock Funds III (G) | ||
| International Core, Class NAV (GMO) | 134,755 | 3,627,609 |
| Emerging Markets 18.8% | ||
| John Hancock Funds II (G) | ||
| China Emerging Leaders, Class NAV (Atlantis) (I) | 39,335 | 372,501 |
| Emerging Markets, Class NAV (DFA) | 188,054 | 1,807,204 |
| John Hancock Investment Trust (G) | ||
| Greater China Opportunities, Class NAV (John Hancock) (A) | 36,858 | 617,747 |
| International Small Cap 6.7% | ||
| John Hancock Funds II (G) | ||
| International Small Company, Class NAV (DFA) | 130,867 | 993,283 |
| See notes to financial statements | Semiannual report | International Allocation Portfolio | 11 |
| Shares | Value | |
| Unaffiliated Investment Companies 0.5% | $69,217 | |
| (Cost $80,839) | ||
| EQUITY 0.5% | 69,217 | |
| WisdomTree Japan Hedged Equity Fund | 2,210 | 69,217 |
| Total investments (Cost $14,171,685)† 100.0% | $14,870,672 | |
| Other assets and liabilities, net 0.0% | $3,670 | |
| Total net assets 100.0% | $14,874,342 | |
The percentage shown for each investment category is the total value of that category as a percentage of the net assets of the Portfolio.
(A) The subadviser is an affiliate of the adviser.
(G) The underlying fund’s subadviser is shown parenthetically.
(I) Non-income producing.
† At 8-31-12, the aggregate cost of investment securities for federal income tax purposes was $16,307,898. Net unrealized depreciation aggregated $1,437,226, of which $0 related to appreciated investment securities.
| 12 | International Allocation Portfolio | Semiannual report | See notes to financial statements |
F I N A N C I A L S T A T E M E N T S
Financial statements
Statement of assets and liabilities 8-31-12 (unaudited)
This Statement of assets and liabilities is the Portfolio’s balance sheet. It shows the value of what the Portfolio owns, is due and owes. You’ll also find the net asset value and the maximum public offering price per share.
| Assets | |
| Investments in unaffiliated issuers, at value (Cost $80,839) | $69,217 |
| Investments in affiliated funds, at value (Cost $14,090,846) | 14,801,455 |
| Total investments, at value (Cost $14,171,685) | 14,870,672 |
| Cash | 20,210 |
| Receivable for fund shares sold | 20,048 |
| Receivable due from adviser | 1,990 |
| Other receivables and prepaid expenses | 21,050 |
| Total assets | 14,933,970 |
| Liabilities | |
| Payable for investments purchased | 6,264 |
| Payable for fund shares repurchased | 12,203 |
| Payable to affiliates | |
| Accounting and legal services fees | 531 |
| Transfer agent fees | 2,467 |
| Trustees’ fees | 684 |
| Other liabilities and accrued expenses | 37,479 |
| Total liabilities | 59,628 |
| Net assets | |
| Paid-in capital | $30,268,603 |
| Undistributed net investment income | 69,251 |
| Accumulated net realized gain (loss) on investments | (16,162,499) |
| Net unrealized appreciation (depreciation) on investments | 698,987 |
| Net assets | $14,874,342 |
| Net asset value per share | |
| Based on net asset values and shares outstanding — the Fund has an | |
| unlimited number of shares authorized with no par value | |
| Class A ($7,685,538 ÷ 1,067,051 shares) | $7.20 |
| Class B ($2,210,307 ÷ 309,449 shares)1 | $7.14 |
| Class C ($4,444,196 ÷ 621,763 shares)1 | $7.15 |
| Class I ($534,301 ÷ 73,734 shares) | $7.25 |
| Maximum offering price per share | |
| Class A (net asset value per share ÷ 95%)2 | $7.58 |
1 Redemption price per share is equal to the net asset value less any applicable contingent deferred sales charge.
2 On single retail sales of less than $50,000. On sales of $50,000 or more and on group sales the offering price is reduced.
| See notes to financial statements | Semiannual report | International Allocation Portfolio | 13 |
F I N A N C I A L S T A T E M E N T S
Statement of operations For the six-month period ended 8-31-12
(unaudited)
This Statement of operations summarizes the Portfolio’s investment income earned and expenses incurred in operating the Portfolio. It also shows net gains (losses) for the period stated.
| Investment income | |
| Dividends | $698 |
| Expenses | |
| Investment management fees | 5,478 |
| Distribution and service fees | 47,701 |
| Accounting and legal services fees | 1,603 |
| Transfer agent fees | 14,617 |
| Trustees’ fees | 528 |
| State registration fees | 34,975 |
| Printing and postage | 6,207 |
| Professional fees | 26,276 |
| Custodian fees | 6,093 |
| Registration and filing fees | 14,963 |
| Other | 1,561 |
| Total expenses | 160,002 |
| Less expense reductions | (87,002) |
| Net expenses | 73,000 |
| Net investment loss | (72,302) |
| Realized and unrealized gain (loss) | |
| Net realized gain (loss) on | |
| Investments in unaffiliated issuers | 7,194 |
| Investments in affiliated issuers | (32,139) |
| (24,945) | |
| Change in net unrealized appreciation (depreciation) of | |
| Investments in unaffiliated issuers | (14,982) |
| Investments in affiliated issuers | (853,862) |
| (868,844) | |
| Net realized and unrealized loss | (893,789) |
| Decrease in net assets from operations | ($966,091) |
| 14 | International Allocation Portfolio | Semiannual report | See notes to financial statements |
F I N A N C I A L S T A T E M E N T S
Statements of changes in net assets
These Statements of changes in net assets show how the value of the Portfolio’s net assets has changed during the last two periods. The difference reflects earnings less expenses, any investment gains and losses, distributions, if any, paid to shareholders and the net of Portfolio share transactions.
| Six months | ||
| ended | Year | |
| 8-31-12 | ended | |
| (Unaudited) | 2-29-12 | |
| Increase (decrease) in net assets | ||
| From operations | ||
| Net investment income (loss) | ($72,302) | $139,498 |
| Net realized loss | (24,945) | (350,628) |
| Change in net unrealized appreciation (depreciation) | (868,844) | (1,463,033) |
| Decrease in net assets resulting from operations | (966,091) | (1,674,163) |
| Distributions to shareholders | ||
| From net investment income | ||
| Class A | — | (96,271) |
| Class B | — | (9,867) |
| Class C | — | (25,766) |
| Class I | — | (3,759) |
| From net realized gain | ||
| Class A | — | (1,275) |
| Class B | — | (330) |
| Class C | — | (862) |
| Class I | — | (38) |
| Total distributions | — | (138,168) |
| From Portfolio share transactions | (571,080) | (1,872,270) |
| Total decrease | (1,537,171) | (3,684,601) |
| Net assets | ||
| Beginning of period | 16,411,513 | 20,096,114 |
| End of period | $14,874,342 | $16,411,513 |
| Undistributed net investment income | $69,251 | $141,553 |
| See notes to financial statements | Semiannual report | International Allocation Portfolio | 15 |
Financial highlights
The Financial highlights show how the Portfolio’s net asset value for a share has changed during the period.
| CLASS A SHARES Period ended | 8-31-121 | 2-29-12 | 2-28-11 | 2-28-10 | 2-28-09 | 2-29-08 |
| Per share operating performance | ||||||
| Net asset value, beginning of period | $7.64 | $8.35 | $6.82 | $4.31 | $9.48 | $9.96 |
| Net investment income (loss)2,3 | (0.02) | 0.08 | 0.05 | 0.02 | 0.12 | 0.13 |
| Net realized and unrealized gain (loss) | ||||||
| on investments | (0.42) | (0.70) | 1.48 | 2.55 | (4.86) | (0.03) |
| Total from investment operations | (0.44) | (0.62) | 1.53 | 2.57 | (4.74) | 0.10 |
| Less distributions | ||||||
| From net investment income | — | (0.09) | — | (0.06) | (0.14) | (0.13) |
| From net realized gain | — | —4 | — | —4 | (0.29) | (0.45) |
| Total distributions | — | (0.09) | — | (0.06) | (0.43) | (0.58) |
| Net asset value, end of period | $7.20 | $7.64 | $8.35 | $6.82 | $4.31 | $9.48 |
| Total return (%)5,6 | (5.76)7 | (7.34) | 22.43 | 59.59 | (50.67) | 0.70 |
| Ratios and supplemental data | ||||||
| Net assets, end of period (in millions) | $8 | $8 | $11 | $10 | $13 | $30 |
| Ratios (as a percentage of average | ||||||
| net assets): | ||||||
| Expenses before reductions | 1.508,9 | 1.289 | 1.159 | 1.069,10 | 0.929 | 1.119 |
| Expenses net of fee waivers | 0.638,9 | 0.639 | 0.659 | 0.679,10 | 0.619 | 0.589 |
| Expenses net of fee waivers and credits | 0.638,9 | 0.639 | 0.659 | 0.669,10 | 0.619 | 0.589 |
| Net investment income (loss)3 | (0.62)8 | 1.01 | 0.62 | 0.29 | 1.56 | 1.21 |
| Portfolio turnover (%) | 9 | 18 | 64 | 41 | 23 | 23 |
1 Six months ended 8-31-12. Unaudited.
2 Based on the average daily shares outstanding.
3 Recognition of net investment income by the Portfolio is affected by the timing and frequency of the declaration of dividends by the underlying funds in which the Portfolio invests.
4 Less than ($0.005) per share.
5 Total returns would have been lower had certain expenses not been reduced during the periods shown.
6 Does not reflect the effect of sales charges, if any.
7 Not annualized.
8 Annualized.
9 Ratios do not include expenses incurred from underlying funds whose annualized expense ratios were 0.86% to 1.34%, 0.48% to 1.35%, 0.91% to 1.11%, 0.91% to 1.17%, 0.99% to 1.17% and 1.02% for the period ended 8-31-12, and the years ended 2-29-12, 2-28-11, 2-28-10, 2-28-09 and 2-29-08, respectively, based on the mix of underlying funds held by the Portfolio.
10 Includes the impact of proxy expenses, which amounted to 0.03% of average net assets.
| 16 | International Allocation Portfolio | Semiannual report | See notes to financial statements |
| CLASS B SHARES Period ended | 8-31-121 | 2-29-12 | 2-28-11 | 2-28-10 | 2-28-09 | 2-29-08 |
| Per share operating performance | ||||||
| Net asset value, beginning of period | $7.60 | $8.30 | $6.84 | $4.32 | $9.46 | $9.95 |
| Net investment income (loss)2,3 | (0.05) | 0.03 | — | 0.03 | 0.06 | 0.07 |
| Net realized and unrealized gain (loss) | ||||||
| on investments | (0.41) | (0.70) | 1.46 | 2.51 | (4.83) | (0.06) |
| Total from investment operations | (0.46) | (0.67) | 1.46 | 2.54 | (4.77) | 0.01 |
| Less distributions | ||||||
| From net investment income | — | (0.03) | — | (0.02) | (0.08) | (0.05) |
| From net realized gain | — | —4 | — | —4 | (0.29) | (0.45) |
| Total distributions | — | (0.03) | — | (0.02) | (0.37) | (0.50) |
| Net asset value, end of period | $7.14 | $7.60 | $8.30 | $6.84 | $4.32 | $9.46 |
| Total return (%)5,6 | (6.05)7 | (7.96) | 21.35 | 58.73 | (51.01) | (0.13) |
| Ratios and supplemental data | ||||||
| Net assets, end of period (in millions) | $2 | $2 | $2 | $1 | $1 | $2 |
| Ratios (as a percentage of average | ||||||
| net assets): | ||||||
| Expenses before reductions | 2.738,9 | 2.489 | 2.339 | 3.069,10 | 3.039 | 4.029 |
| Expenses net of fee waivers | 1.338,9 | 1.339 | 1.349 | 1.449,10 | 1.539 | 1.349 |
| Expenses net of fee waivers and credits | 1.338,9 | 1.339 | 1.349 | 1.379,10 | 1.319 | 1.339 |
| Net investment income (loss)3 | (1.32)8 | 0.43 | 0.05 | 0.48 | 0.80 | 0.70 |
| Portfolio turnover (%) | 9 | 18 | 64 | 41 | 23 | 23 |
1 Six months ended 8-31-12. Unaudited.
2 Based on the average daily shares outstanding.
3 Recognition of net investment income by the Portfolio is affected by the timing and frequency of the declaration of dividends by the underlying funds in which the Portfolio invests.
4 Less than ($0.005) per share.
5 Total returns would have been lower had certain expenses not been reduced during the periods shown.
6 Does not reflect the effect of sales charges, if any.
7 Not annualized.
8 Annualized.
9 Ratios do not include expenses incurred from underlying funds whose annualized expense ratios were 0.86% to 1.34%, 0.48% to 1.35%, 0.91% to 1.11%, 0.91% to 1.17%, 0.99% to 1.17% and 1.02% for the period ended 8-31-12, and the years ended 2-29-12, 2-28-11, 2-28-10, 2-28-09 and 2-29-08, respectively, based on the mix of underlying funds held by the Portfolio.
10 Includes the impact of proxy expenses, which amounted to 0.02% of average net assets.
| See notes to financial statements | Semiannual report | International Allocation Portfolio | 17 |
| CLASS C SHARES Period ended | 8-31-121 | 2-29-12 | 2-28-11 | 2-28-10 | 2-28-09 | 2-29-08 |
| Per share operating performance | ||||||
| Net asset value, beginning of period | $7.60 | $8.31 | $6.84 | $4.32 | $9.46 | $9.95 |
| Net investment income (loss)2,3 | (0.05) | 0.04 | —4 | 0.03 | 0.06 | 0.08 |
| Net realized and unrealized gain (loss) | ||||||
| on investments | (0.40) | (0.72) | 1.47 | 2.51 | (4.83) | (0.07) |
| Total from investment operations | (0.45) | (0.68) | 1.47 | 2.54 | (4.77) | 0.01 |
| Less distributions | ||||||
| From net investment income | — | (0.03) | — | (0.02) | (0.08) | (0.05) |
| From net realized gain | — | — | — | —4 | (0.29) | (0.45) |
| Total distributions | — | (0.03) | — | (0.02) | (0.37) | (0.50) |
| Net asset value, end of period | $7.15 | $7.60 | $8.31 | $6.84 | $4.32 | $9.46 |
| Total return (%)5,6 | (5.92)7 | (8.07) | 21.49 | 58.73 | (51.01) | (0.13) |
| Ratios and supplemental data | ||||||
| Net assets, end of period (in millions) | $4 | $6 | $6 | $5 | $3 | $8 |
| Ratios (as a percentage of average | ||||||
| net assets): | ||||||
| Expenses before reductions | 2.308,9 | 2.068 | 1.968 | 2.118,10 | 1.928 | 2.318 |
| Expenses net of fee waivers | 1.338,9 | 1.338 | 1.358 | 1.408,10 | 1.318 | 1.338 |
| Expenses net of fee waivers and credits | 1.338,9 | 1.338 | 1.358 | 1.378,10 | 1.318 | 1.338 |
| Net investment income (loss)3 | (1.32)8 | 0.52 | (0.06) | 0.44 | 0.76 | 0.79 |
| Portfolio turnover (%) | 9 | 18 | 64 | 41 | 23 | 23 |
1 Six months ended 8-31-2012. Unaudited.
2 Based on the average daily shares outstanding.
3 Recognition of net investment income by the Portfolio is affected by the timing and frequency of the declaration of dividends by the underlying funds in which the Portfolio invests.
4 Less than ($0.005) per share.
5 Total returns would have been lower had certain expenses not been reduced during the periods shown.
6 Does not reflect the effect of sales charges, if any.
7 Not annualized.
8 Ratios do not include expenses incurred from underlying funds whose annualized expense ratios were 0.86% to 1.34%, 0.48% to 1.35%, 0.91% to 1.11%, 0.91% to 1.17%, 0.99% to 1.17% and 1.02% for the period ended 8-31-12, and the years ended 2-29-12, 2-28-11, 2-28-10, 2-28-09 and 2-29-08, respectively, based on the mix of underlying funds held by the Portfolio.
9 Annualized.
10 Includes the impact of proxy expenses, which amounted to 0.03% of average net assets.
| 18 | International Allocation Portfolio | Semiannual report | See notes to financial statements |
| CLASS I SHARES Period ended | 8-31-121 | 2-29-12 | 2-28-11 | 2-28-10 | 2-28-09 | 2-29-08 |
| Per share operating performance | ||||||
| Net asset value, beginning of period | $7.67 | $8.38 | $6.82 | $4.30 | $9.49 | $9.97 |
| Net investment income (loss)2,3 | (0.01) | 0.13 | 0.07 | 0.09 | 0.11 | 0.16 |
| Net realized and unrealized gain (loss) | ||||||
| on investments | (0.41) | (0.73) | 1.49 | 2.52 | (4.84) | (0.03) |
| Total from investment operations | (0.42) | (0.60) | 1.56 | 2.61 | (4.73) | 0.13 |
| Less distributions | ||||||
| From net investment income | — | (0.11) | — | (0.09) | (0.17) | (0.16) |
| From net realized gain | — | —4 | — | —4 | (0.29) | (0.45) |
| Total distributions | — | (0.11) | — | (0.09) | (0.46) | (0.61) |
| Net asset value, end of period | $7.25 | $7.67 | $8.38 | $6.82 | $4.30 | $9.49 |
| Total return (%)5 | (5.48)6 | (6.96) | 22.87 | 60.62 | (50.48) | 1.02 |
| Ratios and supplemental data | ||||||
| Net assets, end of period (in millions) | $1 | —7 | —7 | —7 | —7 | $1 |
| Ratios (as a percentage of average net assets): | ||||||
| Expenses before reductions | 7.128,9 | 6.589 | 5.699 | 4.689,10 | 1.359 | 7.179 |
| Expenses net of fee waivers | 0.278,9 | 0.239 | 0.189 | 0.199,10 | 0.169 | 0.189 |
| Net investment income (loss)3 | (0.26)8 | 1.63 | 0.91 | 1.46 | 1.44 | 1.55 |
| Portfolio turnover (%) | 9 | 18 | 64 | 41 | 23 | 23 |
1 Six months ended 8-31-12. Unaudited.
2 Based on the average daily shares outstanding.
3 Recognition of net investment income by the Portfolio is affected by the timing and frequency of the declaration of dividends by the underlying funds in which the Portfolio invests.
4 Less than ($0.005) per share.
5 Total returns would have been lower had certain expenses not been reduced during the periods shown.
6 Not annualized.
7 Less than $500,000.
8 Annualized.
9 Ratios do not include expenses incurred from underlying funds whose annualized expense ratios were 0.86% to 1.34%, 0.48% to 1.35%, 0.91% to 1.11%, 0.91% to 1.17%, 0.99% to 1.17% and 1.02% for the period ended 8-31-12, and the years ended 2-29-12, 2-28-11, 2-28-10, 2-28-09 and 2-29-08, respectively, based on the mix of underlying funds held by the Portfolio.
10 Includes the impact of proxy expenses, which amounted to 0.03% of average net assets.
| See notes to financial statements | Semiannual report | International Allocation Portfolio | 19 |
Notes to financial statements
(unaudited)
Note 1 — Organization
John Hancock International Allocation Portfolio (the Portfolio) is a series of John Hancock Funds III (JHF III or the Trust), an open-end management investment company organized as a Massachusetts business trust and registered under the Investment Company Act of 1940, as amended (the 1940 Act). The investment objective of the Portfolio is to seek long-term growth of capital. The Portfolio is designed to provide diversification of investments within the international asset class.
The Portfolio operates as a “fund of funds” investing in Class NAV shares of affiliated underlying funds of the Trust, John Hancock Funds II (JHF II) and the John Hancock Funds complex and other permitted investments, including other unaffiliated funds.
The Portfolio may offer multiple classes of shares. The shares currently offered are detailed in the Statement of assets and liabilities. Class A, Class B and Class C shares are offered to all investors. Class I shares are offered to institutions and certain investors. Shareholders of each class have exclusive voting rights to matters that affect that class. The distribution and service fees, if any, transfer agent fees, printing and postage, and registration fees for each class may differ. Class B shares convert to Class A shares eight years after purchase.
The accounting policies of the underlying funds of the Portfolio are outlined in the underlying funds’ shareholder reports, available without charge by calling 1-800-225-5291 and by visiting www.jhfunds.com, on the Securities and Exchange Commission (SEC) Web site at www.sec.gov or at the SEC’s public reference room in Washington, D.C. The underlying funds are not covered by this report.
Note 2 — Significant accounting policies
The financial statements have been prepared in conformity with accounting principles generally accepted in the United States of America, which require management to make certain estimates and assumptions at the date of the financial statements. Actual results could differ from those estimates. Events or transactions occurring after the end of the fiscal period through the date that the financial statements were issued have been evaluated in the preparation of the financial statements. The following summarizes the significant accounting policies of the Portfolio:
Security valuation. Investments are stated at value as of the close of regular trading on the New York Stock Exchange (NYSE), normally at 4:00 P.M., Eastern Time. In order to value the securities, the Portfolio uses the following valuation techniques: Equity securities, including exchange traded funds held by the Portfolio are valued at the last sale price or official closing price on the principal securities exchange on which they trade. In the event there were no sales during the day or closing prices are not available, then securities are valued using the last quoted bid or evaluated price. Investments by the Funds in underlying affiliated funds and/or other open-end management investment companies are valued at their respective net asset values each business day. Other portfolio securities and assets, where reliable market quotations are not available, are valued at fair value as determined in good faith by the Fund’s Pricing Committee following procedures established by the Board of Trustees, which include price verification procedures. The frequency with which these fair valuation procedures are used cannot be predicted.
The Portfolio uses a three-tier hierarchy to prioritize the pricing assumptions, referred to as inputs, used in valuation techniques to measure fair value. Level 1 includes securities valued using quoted prices in active markets for identical securities, including registered investment companies.
| 20 | International Allocation Portfolio | Semiannual report |
Level 2 includes securities valued using significant observable inputs. Observable inputs may include quoted prices for similar securities, interest rates, prepayment speeds and credit risk. Prices for securities valued using these inputs are received from independent pricing vendors and brokers and are based on an evaluation of the inputs described. Level 3 includes securities valued using significant unobservable inputs when market prices are not readily available or reliable, including the Fund’s own assumptions in determining the fair value of investments. Factors used in determining value may include market or issuer specific events or trends, changes in interest rates and credit quality. The inputs or methodology used for valuing securities are not necessarily an indication of the risks associated with investing in those securities. Changes in valuation techniques may result in transfers into or out of an assigned level within the disclosure hierarchy. As of August 31, 2012, all investments are categorized as Level 1 under the hierarchy described above.
Security transactions and related investment income. Investment security transactions are accounted for on a trade date plus one basis for daily net asset value calculations. However, for financial reporting purposes, investment transactions are reported on trade date. Dividend income is recorded on the ex-date, except for dividends of foreign securities where the dividend may not be known until after the ex-date. In those cases, dividend income is recorded when the Portfolio becomes aware of the dividends. Gains and losses on securities sold are determined on the basis of identified cost and may include proceeds from litigation.
Line of credit. The Portfolio may borrow from banks for temporary or emergency purposes, including meeting redemption requests that otherwise might require the untimely sale of securities. Pursuant to the custodian agreement, the custodian may loan money to the Portfolio to make properly authorized payments. The Portfolio is obligated to repay the custodian for any overdraft, including any related costs or expenses. The custodian may have a lien, security interest or security entitlement in any Portfolio property that is not otherwise segregated or pledged, to the maximum extent permitted by law, to the extent of any overdraft.
In addition, the Portfolio and other affiliated funds have entered into an agreement with Citibank N.A. which enables them to participate in a $100 million unsecured committed line of credit. A commitment fee, payable at the end of each calendar quarter, based on the average daily unused portion of the line of credit, is charged to each participating fund on a pro rata basis and is reflected in other expenses on the Statement of operations. For the six months ended August 31, 2012, the Portfolio had no borrowings under the line of credit.
Expenses. Within the John Hancock Funds complex, expenses that are directly attributable to an individual fund are allocated to such fund. Expenses that are not readily attributable to a specific fund are allocated among all funds in an equitable manner, taking into consideration, among other things, the nature and type of expense and the fund’s relative net assets. Expense estimates are accrued in the period to which they relate and adjustments are made when actual amounts are known.
Class allocations. Income, common expenses and realized and unrealized gains (losses) are determined at the fund level and allocated daily to each class of shares based on the net assets of the class. Class-specific expenses, such as distribution and service fees, if any, and transfer agent fees, state registration fees and printing and postage, for all classes, are calculated daily at the class level based on the appropriate net assets of each class and the specific expense rates applicable to each class and the specific expense rates applicable to each class.
Federal income taxes. The Portfolio intends to continue to qualify as a regulated investment company by complying with the applicable provisions of the Internal Revenue Code and will not be subject to federal income tax on taxable income that is distributed to shareholders. Therefore, no federal income tax provision is required.
| Semiannual report | International Allocation Portfolio | 21 |
Under the Regulated Investment Company Modernization Act of 2010, the Portfolio will be permitted to carry forward capital losses incurred in taxable years beginning after December 22, 2010 for an unlimited period. However, any losses incurred during those future taxable years will be required to be utilized prior to the losses incurred in pre-enactment taxable years. As a result of this ordering rule, pre-enactment capital loss carryforwards may be more likely to expire unused. Additionally, post-enactment capital losses that are carried forward will retain their character as either short-term or long-term capital losses rather than being considered all short-term as under previous law.
For federal income tax purposes, the Fund has a capital loss carryforward of $13,723,865 available to offset future net realized capital gains as of February 29, 2012. The following table details the capital loss carryforward available as of February 29, 2012:
| CAPITAL LOSS CARRYFORWARD EXPIRING AT FEBRUARY 28, | NO EXPIRATION DATE | |||
| 2017 | 2018 | 2019 | SHORT-TERM | LONG-TERM |
| $1,965,278 | $6,868,187 | $4,555,665 | — | $334,735 |
As of February 29, 2012, the Fund had no uncertain tax positions that would require financial statement recognition, derecognition or disclosure. The Portfolio’s federal tax returns are subject to examination by the Internal Revenue Service for a period of three years.
Distribution of income and gains. Distributions to shareholders from net investment income and net realized gains, if any, are recorded on the ex-date. The Portfolio generally declares and pays dividends and capital gain distributions, if any, annually.
Distributions paid by the Portfolio with respect to each class of shares are calculated in the same manner, at the same time and in the same amount, except for the effect of class level expenses that may be applied differently to each class.
Such distributions, on a tax basis, are determined in conformity with income tax regulations, which may differ from accounting principles generally accepted in the United States of America.
Capital accounts within the financial statements are adjusted for permanent book-tax differences. These adjustments have no impact on net assets or the results of operations. Temporary book-tax differences, if any, will reverse in a subsequent period. Book-tax differences are primarily attributable to wash sales deferrals.
Note 3 — Guarantees and indemnifications
Under the Trust’s organizational documents, its Officers and Trustees are indemnified against certain liabilities arising out of the performance of their duties to the Trust including the Portfolio. Additionally, in the normal course of business, the Portfolio enters into contracts with service providers that contain general indemnification clauses. The Portfolio’s maximum exposure under these arrangements is unknown, as this would involve future claims that may be made against the Portfolio that have not yet occurred. The risk of material loss from such claims is considered remote.
Note 4 — Fees and transactions with affiliates
John Hancock Investment Management Services, LLC (the Adviser) serves as investment adviser for the Portfolio. John Hancock Funds, LLC (the Distributor), an affiliate of the Adviser, serves as principal underwriter of the Portfolio. The Adviser and the Distributor are indirect, wholly owned subsidiaries of Manulife Financial Corporation (MFC).
Management fee. The Portfolio has an investment management agreement with the Adviser under which the Portfolio pays the Adviser a management fee that has two components: (a) a fee on assets invested in the funds of JHF II and JHF III (Portfolio Assets) and (b) a fee on assets invested in
| 22 | International Allocation Portfolio | Semiannual report |
other permitted investments (other than JHF II and JHF III), including other affiliated funds in the John Hancock Funds complex (Other Assets). The Portfolio pays a daily management fee to the Adviser equivalent, on an annual basis, to the sum of: (a) 0.05% of the first $500,000,000 of the Portfolio Assets; (b) 0.04% of the Portfolio Assets in excess of $500,000,000; (c) 0.50% of the first $500,000,000 of the Other Assets and (d) 0.49% of the Other Assets in excess of $500,000,000. The Adviser has a subadvisory agreement with John Hancock Asset Management a division of Manulife Asset Management (North America) Limited and John Hancock Asset Management, a division of Manulife Asset Management (US) LLC, each an indirectly owned subsidiary of MFC and an affiliate of the Adviser. The Portfolio is not responsible for payment of the subadvisory fees.
The Adviser has contractually agreed to waive fees and/or reimburse certain expenses for each share class of the Portfolio. This agreement excludes certain expenses such as taxes, acquired fund fees, portfolio brokerage commissions, interest expense, litigation and indemnification expenses and other extraordinary expenses not incurred in the ordinary course of the Portfolio’s business. The fee waivers and/or reimbursements are such that these expenses will not exceed 0.63%, 1.33%, 1.33% and 0.27% for Class A, Class B, Class C and Class I shares, respectively. The current expense limitation agreement will remain in effect through June 30, 2013, unless renewed by mutual agreement of the fund and the adviser based upon a determination that this is appropriate under the circumstances at the time.
The Adviser has voluntarily agreed to waive fees and/or reimburse certain other expenses of the Portfolio excluding adviser fees, Rule 12b-1 fees, transfer agent fees, service fees, blue sky fees, printing and postage, litigation and indemnification expenses and other extraordinary expenses not incurred in the ordinary course of business. This voluntary expense reimbursement will continue in effect until terminated at any time by the Adviser on notice to the Portfolio. The fee waivers and/or reimbursements are such that these expenses will not exceed 0.16% of average net assets.
In addition, the Adviser has voluntarily agreed to waive its advisory fees for the Fund so that the amount retained by the Adviser after payment of the subadvisory fees, including Advisor fees collected on the underlying investments after payment of the subadvisory fees, does not exceed 0.50% of the Fund’s average annual net assets.
Accordingly, these expense reductions amounted to $33,819, $15,081, $24,543 and $13,559 for Class A, Class B, Class C and Class I shares, respectively, for the six months ended August 31, 2012.
The investment management fees, including the impact of the waivers and reimbursements described above, incurred for the six months ended August 31, 2012 were equivalent to a net effective rate of 0.00% of the Portfolio’s average daily net assets.
Accounting and legal services. Pursuant to a service agreement, the Portfolio reimburses the Adviser for all expenses associated with providing the administrative, financial, legal, accounting and recordkeeping services to the Fund, including the preparation of all tax returns, periodic reports to shareholders and regulatory reports, among other services. These expenses are allocated to each share class based on its relative net assets at the time the expense was incurred. These accounting and legal services fees incurred for the six months ended August 31, 2012 amounted to an annual rate of 0.02% of the Portfolio’s average daily net assets.
Distribution and service plans. The Portfolio has a distribution agreement with the Distributor. The Portfolio has adopted distribution and service plans with respect to Class A, Class B and Class C shares pursuant to Rule 12b-1 under the 1940 Act, to pay the Distributor for services provided as the distributor of shares of the Portfolio. The Portfolio pays the following contractual rates of distribution and service fees under these arrangements, expressed as an annual percentage of average daily net assets for each class of the Portfolio’s shares.
| Semiannual report | International Allocation Portfolio | 23 |
| CLASS | 12b-1 FEE | |||||||
| Class A | 0.30% | |||||||
| Class B | 1.00% | |||||||
| Class C | 1.00% | |||||||
Sales charges. Class A shares are assessed up-front sales charges, which resulted in payments to the Distributor amounting to $8,080 for the six months ended August 31, 2012. Of this amount, $1,337 was retained and used for printing prospectuses, advertising, sales literature and other purposes, $6,453 was paid as sales commissions to broker-dealers and $290 was paid as sales commissions to sales personnel of Signator Investors, Inc., a broker-dealer affiliate of the Adviser.
Class B and Class C shares are subject to contingent deferred sales charges (CDSCs). Class B shares that are redeemed within six years of purchase are subject to CDSCs, at declining rates, beginning at 5.00% of the lesser of the current market value at the time of redemption or the original purchase cost of the shares being redeemed. Class C shares that are redeemed within one year of purchase are subject to a 1.00% CDSC on the lesser of the current market value at the time of redemption or the original purchase cost of the shares being redeemed. Proceeds from CDSCs are used to reimburse the Distributor for commissions paid in connection with the sale of these shares. During the six months ended August 31, 2012, CDSCs received by the Distributor amounted to $2,754 and $368 for Class B and Class C shares, respectively.
Transfer agent fees. The Portfolio has a transfer agent agreement with John Hancock Signature Services, Inc. (Signature Services), an affiliate of the Adviser. The transfer agent fees paid to Signature Services are determined based on the cost to Signature Services (Signature Services Cost) of providing recordkeeping services. The Signature Services Cost includes a component of allocated John Hancock corporate overhead for providing transfer agent services to the Portfolio and to all other John Hancock affiliated funds. It also includes out-of-pocket expenses that are comprised of payments made to third-parties for recordkeeping services provided to their clients who invest in one or more John Hancock funds. In addition, Signature Services Cost may be reduced by certain fees that Signature Services receives in connection with retirement and small accounts. Signature Services Cost is calculated monthly and allocated, as applicable, to four categories of share classes: Institutional Share Classes, Retirement Share Classes, Municipal Bond Classes and all other Retail Share Classes. Within each of these categories, the applicable costs are allocated to the affected John Hancock affiliated funds and/or classes, based on the relative average daily net assets.
Class level expenses. Class level expenses for the six months ended August 31, 2012 were as follows:
| DISTRIBUTION | TRANSFER | STATE | PRINTING AND | |
| CLASS | AND SERVICE FEES | AGENT FEES | REGISTRATION FEES | POSTAGE |
| Class A | $11,718 | $7,476 | $7,697 | $2,910 |
| Class B | $10,745 | $2,064 | $7,571 | $1,121 |
| Class C | $25,238 | $4,859 | $7,620 | $1,826 |
| Class I | — | $218 | $12,087 | $350 |
| Total | $47,701 | $14,617 | $34,975 | $6,207 |
Trustee expenses. The Portfolio compensates each Trustee who is not an employee of the Adviser or its affiliates. These Trustees may, for tax purposes, elect to defer receipt of this compensation under the John Hancock Group of Funds Deferred Compensation Plan (the Plan). Deferred amounts are invested in various John Hancock funds and remain in the funds until distributed
| 24 | International Allocation Portfolio | Semiannual report |
in accordance with the Plan. The investment of deferred amounts and the offsetting liability are included within Other receivables and prepaid expenses and Payable to affiliates — Trustees’ fees, respectively, in the accompanying Statement of assets and liabilities.
Note 5 — Portfolio share transactions
Transactions in Portfolio shares for the six months ended August 31, 2012 and for the year ended February 29, 2012 were as follows:
| Six months ended 8-31-12 | Year ended 2-29-12 | |||
| Shares | Amount | Shares | Amount | |
| Class A shares | ||||
| Sold | 155,369 | $1,089,096 | 210,670 | $1,670,818 |
| Distributions reinvested | — | — | 13,601 | 92,622 |
| Repurchased | (189,749) | (1,353,448) | (498,441) | (3,784,069) |
| Net decrease | (34,380) | ($264,352) | (274,170) | ($2,020,629) |
| Class B shares | ||||
| Sold | 40,636 | $293,324 | 68,532 | $540,059 |
| Distributions reinvested | — | — | 1,396 | 9,475 |
| Repurchased | (20,743) | (147,191) | (58,582) | (433,759) |
| Net increase | 19,893 | $146,133 | 11,346 | $115,775 |
| Class C shares | ||||
| Sold | 23,720 | $172,523 | 160,969 | $1,211,850 |
| Distributions reinvested | — | — | 3,389 | 23,014 |
| Repurchased | (135,137) | (954,377) | (157,331) | (1,182,384) |
| Net increase (decrease) | (111,417) | ($781,854) | 7,027 | $52,480 |
| Class I shares | ||||
| Sold | 47,988 | $354,196 | 21,746 | $166,343 |
| Distributions reinvested | — | — | 540 | 3,694 |
| Repurchased | (3,705) | (25,203) | (24,949) | (189,933) |
| Net increase (decrease) | 44,283 | $328,993 | (2,663) | ($19,896) |
| Net decrease | (81,621) | ($571,080) | (258,460) | ($1,872,270) |
Note 6 — Purchase and sale of securities
Purchases and sales of securities, other than short-term securities, aggregated $1,414,653 and $2,060,292 respectively, for the six months ended August 31, 2012.
Note 7 — Investment in affiliated underlying funds
The Portfolio invests primarily in affiliated underlying funds that are managed by the Adviser and its affiliates. The Portfolio does not invest in the affiliated underlying funds for the purpose of exercising management or control; however, the Portfolio’s investment may represent a significant portion of each underlying fund’s net assets. For the six months ended August 31, 2012, the Portfolio did not hold 5% or more of any underlying fund’s net assets.
| Semiannual report | International Allocation Portfolio | 25 |
Board Consideration of and Continuation of Investment Advisory Agreement and Subadvisory Agreements
The Board of Trustees (the Board, the members of which are referred to as Trustees) of John Hancock International Allocation Portfolio (the Portfolio), a series of John Hancock Funds III, met in-person on May 6–8, and June 3–5, 2012 to consider the approval of the Portfolio’s investment advisory agreement (the Advisory Agreement) with John Hancock Investment Management Services, LLC (the Adviser), the Portfolio’s investment adviser. The Board also considered the approval of the investment subadvisory agreements (together, the Subadvisory Agreements) among the Adviser, Manulife Asset Management (US) LLC and Manulife Asset Management (North America) Limited (together, the Subadvisers) on behalf of the Portfolio. The Advisory Agreement and the Subadvisory Agreements are referred to as the Agreements.
Activities and composition of the Board
On June 3–5, 2012, the Board consisted of nine individuals, seven of whom were Independent Trustees. Independent Trustees are generally those individuals who are not employed by or have any significant business or professional relationship with the Adviser or the Subadviser. The Trustees are responsible for the oversight of operations of the Portfolio and perform various duties required of directors of investment companies by the Investment Company Act of 1940, as amended (the 1940 Act). The Independent Trustees have independent legal counsel to assist them in connection with their duties. The Board has appointed an Independent Trustee as Chairman. On June 3–5, 2012, the Board had four standing committees that were composed entirely of Independent Trustees: the Audit Committee; the Compliance Committee; the Nominating, Governance and Administration Committee; and the Contracts & Operations Committee. Additionally, on June 3–5, 2012, Investment Performance Committees A and B were standing committees of the Board composed of Independent Trustees and one Trustee who is affiliated with the Adviser. Investment Performance Committee B was responsible for overseeing and monitoring matters relating to the investment performance of the Portfolio. The Board also designated an Independent Trustee as Vice Chairman to serve in the absence of the Chairman. The Board also designates working groups or ad hoc committees as it deems appropriate.
The approval process
Under the 1940 Act, the Board is required to consider the continuation of the Agreements each year. Throughout the year, the Board, acting directly and through its committees, regularly reviews and assesses the quality of the services that the Portfolio receives under these Agreements. The Board reviews reports of the Adviser at least quarterly, which include Portfolio performance reports and compliance reports. In addition, the Board meets with portfolio managers and senior investment officers at various times throughout the year. The Board considers at each of its meetings factors that are relevant to its annual consideration of the renewal of the Agreements, including the services and support provided by the Adviser and Subadvisers to the Portfolio and its shareholders.
Prior to the May 6–8, 2012 meeting, the Board requested and received materials specifically relating to the Agreements. The materials provided in connection with the May meeting included information compiled and prepared by Lipper, a Thomson Reuters company (Lipper), on Portfolio fees and expenses, and the investment performance of the Portfolio. This Portfolio information is assembled in a format that permits comparison with similar information from a Category and a subset of the Category referred to as the Expense Group, each as determined by Lipper, and with the Portfolio’s benchmark index. The Category includes all funds that invest similarly to the way the Portfolio invests. The Expense Group represents funds of similar size, excluding passively managed funds. The Portfolio’s benchmark index is an unmanaged index of securities that is provided as a basis for comparison with the Portfolio’s performance. Other material provided for the Portfolio review included (a) information on the profitability of the Agreements to the Adviser and a discussion of any additional benefits to the Adviser or Subadvisers or their affiliates that result from being the Adviser or Subadvisers to the Portfolio; (b) a general analysis provided by the Adviser and the
| 26 | International Allocation Portfolio | Semiannual report |
Subadvisers concerning investment advisory fees charged to other clients, such as institutional clients and other investment companies, having similar investment mandates, as well as the performance of those other clients and a comparison of the services provided to those other clients and the services provided to the Portfolio; (c) the impact of economies of scale; (d) a summary of aggregate amounts paid by the Portfolio to the Adviser; and (e) sales and redemption data regarding the Portfolio’s shares.
At an in-person meeting held on May 6–8, 2012, the Board reviewed materials relevant to its consideration of the Agreements. As a result of the discussions that occurred during the May 6–8, 2012 meeting, the Board asked the Adviser for additional information on certain matters. The Adviser provided the additional information and the Board also considered this information as part of its consideration of the Agreements.
At an in-person meeting held on June 3–5, 2012, the Board, including the Independent Trustees, formally considered the continuation of the Advisory Agreement and the Subadvisory Agreements, each for an additional one-year term. The Board considered what it believed were key relevant factors that are described under separate headings presented below.
The Board also considered other matters important to the approval process, such as payments made to and by the Adviser or its affiliates relating to the distribution of Portfolio shares and other services. The Board reviewed services related to the valuation and pricing of Portfolio portfolio holdings. Other important matters considered by the Board were the direct and indirect benefits to the Adviser, the Subadvisers and their affiliates from their relationship with the Portfolio and advice from independent legal counsel with respect to the review process and materials submitted for the Board’s review.
Nature, extent and quality of services
The Board reviewed the nature, extent and quality of services provided by the Adviser and the Subadviser, including the investment advisory services and the resulting performance of the Portfolio.
The Board considered the ability of the Adviser and the Subadviser, based on their resources, reputation and other attributes, to attract and retain qualified investment professionals, including research, advisory and supervisory personnel. It considered the background and experience of senior management and investment professionals responsible for managing the Portfolio. The Board considered the investment philosophy, research and investment decision-making processes of the Subadvisers responsible for the daily investment activities of the Portfolio, including, among other things, portfolio trading capabilities, use of technology, commitment to compliance and approach to training and retaining portfolio managers and other research, advisory and management personnel.
The Board considered each Subadviser’s history and experience providing investment services to the Portfolio. The Board considered the Adviser’s investment manager analytical capabilities, market and economic knowledge and execution of its Subadvisers oversight responsibilities. The Board further considered the culture of compliance, resources dedicated to compliance, compliance programs, record of compliance with applicable laws and regulation, with the Portfolio’s investment policies and restrictions and with the applicable Code of Ethics, and the responsibilities of the Adviser’s and Subadvisers’ compliance departments.
In addition to advisory services, the Board considered the quality of the administrative and non-investment advisory services provided to the Portfolio by the Adviser under a separate agreement. The Board noted that the Adviser and its affiliates provide the Portfolio with certain administrative, transfer agency, shareholder and other services (in addition to any such services provided to the Portfolio by third parties) and officers and other personnel as are necessary for the operations of the Portfolio. The Board reviewed the structure and duties of the Adviser’s administration, accounting, legal and compliance departments and its affiliate’s transfer agency operations and considered the
| Semiannual report | International Allocation Portfolio | 27 |
Adviser’s and its affiliates’ policies and procedures for assuring compliance with applicable laws and regulations.
The Board also received information about the nature, extent and quality of services provided by and fee rates charged by the Adviser and Subadvisers to their other clients, including other registered investment companies, institutional investors and separate accounts. The Board reviewed a general analysis provided by the Adviser and the Subadvisers concerning investment advisory fees charged to other clients having similar investment mandates, the services provided to those other clients as compared to the services provided to the Portfolio, the performance of those other clients as compared to the performance by the Portfolio and other factors relating to those other clients. The Board considered the significant differences between the Adviser’s and Subadvisers’ services to the Portfolio and the services they provide to other clients. For other clients that are not mutual funds, the differences in services relate to the greater share purchase and redemption activity in a mutual fund, the generally higher turnover of mutual fund portfolio holdings, the more burdensome regulatory and legal obligations of mutual funds and the higher marketing costs for mutual funds. When compared to all clients including mutual funds, the Adviser has greater oversight and supervisory responsibility for the Portfolio and undertakes greater entrepreneurial risk as the sponsor of the Portfolio.
Portfolio performance
The Board was provided with reports, independently prepared by Lipper, which included a comprehensive analysis of the Portfolio’s performance. The Board also examined materials discussing Portfolio performance and the Portfolio’s investment objective, strategies and outlook. The Board also reviewed a narrative and statistical analysis of the Lipper data that was prepared by the Adviser, which analyzed various factors that may affect the Lipper rankings. The Board reviewed information regarding the investment performance of the Portfolio as compared to its Lipper Category as well as its benchmark index (see chart below). The Board was provided with a description of the methodology used by Lipper to select the funds in the Category. The Board also considered updated performance information provided by the Adviser at its May and June 2012 meetings. The Board regularly reviews the performance of the Portfolio throughout the year and attaches more importance to performance over relatively longer periods of time, typically three to five years.
Set forth below is the performance of the Portfolio over certain time periods ended December 31, 2011 and that of its Category average and benchmark index over the same periods:
| SINCE INCEPTION | ||||
| 1 YEAR | 3 YEAR | 5 YEAR | (12-29-06) | |
| International Allocation Portfolio | –14.61% | 10.01% | –4.36% | –4.36% |
| Class A Shares | ||||
| International Multi-Cap Core | –13.55% | 8.46% | –4.01% | –4.01% |
| Category Average | ||||
| MSCI EAFE GD Index | –11.73% | 8.16% | –4.26% | –4.26% |
The Board noted that the Portfolio underperformed its Category’s average performance and benchmark index’s performance over all periods shown, except that the Portfolio slightly underperformed its benchmark index’s performance over the five-year and since inception periods. However, the Board noted that the Category included stand-alone funds in addition to funds-of-funds like the Portfolio.
Expenses and fees
The Board, including the Independent Trustees, reviewed the Portfolio’s contractual advisory fee rate payable by the Portfolio to the Adviser as compared with the other funds in its Expense Group. The Board also received information about the investment subadvisory fee rate payable by the Adviser to the Subadvisers for investment subadvisory services. The Board considered the services
| 28 | International Allocation Portfolio | Semiannual report |
provided and the fees charged by the Adviser and the Subadvisers to other clients with similar investment mandates, including other registered investment companies, institutional investors and separate accounts.
In addition, the Board considered the cost of the services provided to the Portfolio by the Adviser. The Board received and considered expense information regarding the Portfolio’s various components, including advisory fees, distribution fees and fees other than advisory and distribution fees, including transfer agent fees, custodian fees, administration fees and other miscellaneous fees (e.g., fees for accounting and legal services). The Board considered comparisons of these expenses to the Expense Group median. The Board also considered expense information regarding the Portfolio’s total operating expense ratio (Gross Expense Ratio) and, if different, the Portfolio’s total operating expense ratio including the expenses of the Portfolio’s underlying funds and after taking into account any fee waiver or expense waiver agreement by the Adviser (Net Expense Ratio). The Board considered information comparing the Gross Expense Ratio and Net Expense Ratio of the Portfolio to that of the Expense Group median.
The Board noted that the Portfolio’s advisory fee ratio was two basis points above the Expense Group median advisory fee ratio. The Board noted the following information about the Portfolio’s Gross and Net Expense Ratios for Class A shares contained in the Portfolio’s 2011 financial statements in relation with the Portfolio’s Expense Group median provided by Lipper in April 2012:
| PORTFOLIO — CLASS A | EXPENSE GROUP MEDIAN | |
| Advisory Fee Ratio | 0.07% | 0.05% |
| Gross Expense Ratio | 1.17% | 0.67% |
| Net Expense Ratio | 1.63% | 1.63% |
The Board viewed favorably the Adviser’s contractual agreement to waive all or a portion of its advisory fees and to reimburse or pay operating expenses to the extent necessary to maintain the Portfolio’s Net Expense Ratio at 0.63% for Class A shares (and at varying levels for other classes), excluding certain expenses such as taxes, brokerage commissions, interest, litigation and extraordinary expenses and underlying fund expenses, until June 30, 2013. The Board favorably considered the impact of this contractual agreement towards lowering the Portfolio’s Gross Expense Ratio.
The Board received and reviewed statements relating to the Adviser’s financial condition and was also provided with a profitability analysis that detailed the revenues earned and the expenses incurred by the Adviser for services under the Advisory Agreement, as well as from other relationships between the Portfolio and the Adviser and its affiliates. The Board reviewed the Adviser’s profitability with respect to the Portfolio and other funds the Board currently oversees for the year ended December 31, 2011 compared to available aggregate profitability data provided for the year ended December 31, 2010. The Board reviewed the Adviser’s profitability with respect to other fund complexes managed by the Adviser and/or its affiliates. The Board reviewed the Adviser’s assumptions and methodology of allocating expenses in the profitability analysis, noting the inherent limitations in allocating costs among various advisory products.
The Board also considered a comparison of the Adviser’s profitability to that of a limited number of other investment advisers whose profitability information is publicly available. The Board recognized that profitability may be affected by numerous factors including, among other things, fee waivers and expense reimbursements by the Adviser, the types of funds managed, expense allocations and business mix, and therefore comparability of profitability is limited.
The Board considered limited profitability information with respect to the Subadviser, which is affiliated with the Adviser. In addition, as noted above, the Board considered basic assumptions and methodology for allocating expenses in each Subadviser’s profitability analysis.
| Semiannual report | International Allocation Portfolio | 29 |
Economies of scale
The Board, including the Independent Trustees, considered the extent to which economies of scale might be realized as the assets of the Portfolio increase. Possible changes in the advisory fee rate or structure in order to enable the Portfolio to participate in these economies of scale (e.g., through the use of breakpoints in the advisory fee at higher asset levels) are periodically discussed. The Board also considered the Adviser’s overall operations and its ongoing investment in its business in order to expand the scale of, and improve the quality of, its operations that benefit the Portfolio.
The Board recognized the inherent limitations of any analysis of economies of scale, stemming largely from the Board’s understanding that most of the Adviser’s costs are not specific to individual funds, but rather are incurred across a variety of products and services. To ensure that any economies are reasonably shared with the Portfolio as its assets increase, the Adviser and the Board agreed to continue the existing breakpoints to the contractual advisory fee rate.
Other benefits to the Adviser and the Subadvisers
The Board understands that the Adviser, the Subadvisers or their affiliates may derive other ancillary benefits from their relationship with the Portfolio, both tangible and intangible, such as their ability to leverage investment professionals who manage other portfolios, an increase in their profile in the investment advisory community and the engagement of their affiliates and/or significant shareholders as service providers to the Portfolio, including for administrative, transfer agency and distribution services. The Board believes that certain of these benefits are difficult to quantify. The Board also was informed that the Subadvisers may use third-party research obtained by soft dollars generated by certain mutual fund transactions to assist itself in managing all or a number of its other client accounts.
Board determination
The Board unanimously approved the continuation of the Advisory Agreement and the Subadvisory Agreements each for an additional one-year term. Based upon its evaluation of relevant factors in their totality, the Board was satisfied that the terms of the Agreements, including the advisory and subadvisory fee rates, were fair and reasonable and in the best interest of the Portfolio and its shareholders. In arriving at its decision to approve the Agreements, the Board did not identify any single factor or any group of factors as all-important or controlling, but considered all factors together. Different Trustees may have attributed different weights to the various factors considered. The Independent Trustees were also assisted by independent legal counsel in making this determination. The Trustees’ conclusions may be based in part on their consideration of these arrangements in prior years and on their ongoing regular review of Portfolio performance and operations throughout the year.
| 30 | International Allocation Portfolio | Semiannual report |
More information
| Trustees | Investment adviser |
| Steven R. Pruchansky,* Chairman | John Hancock Investment Management |
| William H. Cunningham | Services, LLC |
| Deborah C. Jackson | |
| Hugh McHaffie† | Subadviser |
| Dr. John A. Moore,* Vice Chairman | John Hancock Asset Management a division of |
| Gregory A. Russo* | Manulife Asset Management (US) LLC |
| John G. Vrysen† | |
| Principal distributor | |
| Officers | John Hancock Funds, LLC |
| Hugh McHaffie | |
| President | Custodian |
| State Street Bank and Trust Company | |
| Andrew G. Arnott | |
| Executive Vice President | Transfer agent |
| John Hancock Signature Services, Inc. | |
| Thomas M. Kinzler | |
| Secretary and Chief Legal Officer | Legal counsel |
| K&L Gates LLP | |
| Francis V. Knox, Jr. | |
| Chief Compliance Officer | |
| Charles A. Rizzo | |
| Chief Financial Officer | |
| Salvatore Schiavone | |
| Treasurer | |
| *Member of the Audit Committee | |
| †Non-Independent Trustee | |
The Fund’s proxy voting policies and procedures, as well as the Fund’s proxy voting record for the most recent twelve-month period ended June 30, are available free of charge on the Securities and Exchange Commission (SEC) Web site at www.sec.gov or on our Web site.
The Fund’s complete list of portfolio holdings, for the first and third fiscal quarters, is filed with the SEC on Form N-Q. The Fund’s Form N-Q is available on our Web site and the SEC’s Web site, www.sec.gov, and can be reviewed and copied (for a fee) at the SEC’s Public Reference Room in Washington, DC. Call 1-202-551-8090 to receive information on the operation of the SEC’s Public Reference Room.
We make this information on your fund, as well as monthly portfolio holdings, and other fund details available on our Web site at www.jhfunds.com or by calling 1-800-225-5291.
| You can also contact us: | ||
| 1-800-225-5291 | Regular mail: | Express mail: |
| jhfunds.com | John Hancock Signature Services, Inc. | John Hancock Signature Services, Inc. |
| P.O. Box 55913 | Mutual Fund Image Operations | |
| Boston, MA 02205-5913 | 30 Dan Road | |
| Canton, MA 02021 |
| Semiannual report | International Allocation Portfolio | 31 |

1-800-225-5291
1-800-554-6713 TDD
1-800-338-8080 EASI-Line
www.jhfunds.com
Now available: electronic delivery
www.jhfunds.com/edelivery
| This report is for the information of the shareholders of John Hancock International Allocation Portfolio. | 318SA 8/12 |
| It is not authorized for distribution to prospective investors unless preceded or accompanied by a prospectus. | 10/12 |
A look at performance
Total returns for the period ended August 31, 2012
| SEC 30-day | SEC 30-day | ||||||||||
| Average annual total returns (%) | Cumulative total returns (%) | yield (%) | yield (%) | ||||||||
| with maximum sales charge | with maximum sales charge | subsidized | unsubsidized1 | ||||||||
| Since | Since | as of | as of | ||||||||
| 1-year | 5-year | 10-year | inception | 6-months | 1-year | 5-year | 10-year | inception | 8-31-12 | 8-31-12 | |
| Class A2 | 4.26 | 0.95 | — | 1.85 | –2.37 | 4.26 | 4.86 | — | 10.59 | 2.70 | 2.70 |
| Class B2 | 4.11 | 0.93 | — | 1.93 | –2.55 | 4.11 | 4.72 | — | 11.12 | 2.20 | 1.87 |
| Class C2 | 8.11 | 1.29 | — | 2.10 | 1.45 | 8.11 | 6.62 | — | 12.11 | 2.20 | 2.12 |
| Class I2,3 | 10.36 | 2.47 | — | 3.29 | 3.03 | 10.36 | 12.95 | — | 19.53 | 3.31 | 3.31 |
| Class R23,4 | 9.01 | 0.72 | — | 1.50 | 2.77 | 9.01 | 3.67 | — | 8.53 | 2.85 | –12.39 |
| Class R63,4 | 10.36 | 2.46 | — | 3.26 | 3.03 | 10.36 | 12.92 | — | 19.30 | 3.34 | –6.07 |
| Class NAV 3,5 | 10.43 | — | — | 4.07 | 3.06 | 10.43 | — | — | 18.91 | 3.45 | 3.45 |
Performance figures assume all distributions are reinvested. Figures reflect maximum sales charges on Class A shares of 5%, and the applicable contingent deferred sales charge (CDSC) on Class B shares and Class C shares. The Class B shares’ CDSC declines annually between years 1 to 6 according to the following schedule: 5, 4, 3, 3, 2, 1%. No sales charge will be assessed after the sixth year. Class C shares held for less than one year are subject to a 1% CDSC. Sales charges are not applicable for Class I, Class R2, Class R6 and Class NAV shares.
The expense ratios of the Fund, both net (including any fee waivers or expense limitations) and gross (excluding any fee waivers or expense limitations), are set forth according to the most recent publicly available prospectuses for the Fund and may differ from those disclosed in the Financial highlights tables in this report. The fee waivers and expense limitations are contractual at least until 6-30-13 for Class A, Class B, Class C, Class R2 and Class R6 shares. Had the fee waivers and expense limitations not been in place gross expenses would apply. For all other classes the net expenses equal the gross expenses. The expense ratios are as follows:
| Class A | Class B | Class C | Class I | Class R2 | Class R6 | Class NAV | ||
| Net (%) | 1.42 | 2.12 | 2.12 | 1.06 | 1.47 | 0.97 | 0.93 | |
| Gross (%) | 1.47 | 2.48 | 2.23 | 1.06 | 2.88 | 15.87 | 0.93 |
The returns reflect past results and should not be considered indicative of future performance. The return and principal value of an investment will fluctuate so that shares, when redeemed, may be worth more or less than their original cost. Due to market volatility, the Fund’s current performance may be higher or lower than the performance shown. For current to the most recent month-end performance data, please call 1-800-225-5291 or visit the Fund’s Web site at www.jhfunds.com.
The performance table above and the chart on the next page do not reflect the deduction of taxes that a shareholder would pay on fund distributions or the redemption of fund shares. The Fund’s performance results reflect any applicable expense reductions, without which the expenses increase and results would have been less favorable.
See the following page for footnotes.
| 6 | Global Shareholder Yield Fund | Semiannual report |
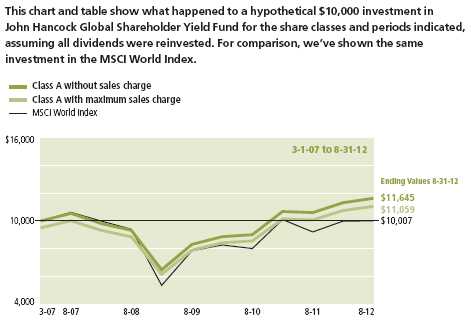
| Without | With maximum | |||
| Start date | sales charge | sales charge | Index | |
| Class B | 3-1-07 | $11,211 | $11,112 | $10,007 |
| Class C6 | 3-1-07 | 11,211 | 11,211 | 10,007 |
| Class I 3 | 3-1-07 | 11,953 | 11,953 | 10,007 |
| Class R2 3 | 3-1-07 | 10,853 | 10,853 | 10,007 |
| Class R63 | 3-1-07 | 11,930 | 11,930 | 10,007 |
| Class NAV 3 | 4-28-08 | 11,891 | 11,891 | 9,536 |
MSCI World Index (gross of foreign withholding tax on dividends) — is a free float-adjusted market capitalization weighted index that is designed to measure the equity market performance of developed markets.
It is not possible to invest directly in an index. Index figures do not reflect sales charges, which would have resulted in lower values if they did.
Footnotes related to a look at performance
1 Unsubsidized yields reflect what the yield would have been without the effect of reimbursements and waivers.
2 From 3-1-07.
3 For certain types of investors, as described in the Fund’s prospectuses.
4 Class R6 shares were first offered on 9-1-11. The returns prior to this date are those of Class A shares that have been recalculated to apply the gross fees and expenses of Class R6 shares. Class R2 shares were first offered on 3-1-12. Because the class has limited operating history, performance is not shown.
5 From 4-28-08.
6 No contingent deferred sales charge is applicable.
| Semiannual report | Global Shareholder Yield Fund | 7 |
Your expenses
These examples are intended to help you understand your ongoing operating expenses of investing in the Fund so you can compare these costs with the ongoing costs of investing in other mutual funds.
Understanding fund expenses
As a shareholder of the Fund, you incur two types of costs:
▪ Transaction costs which include sales charges (loads) on purchases or redemptions (varies by share class), minimum account fee charge, etc.
▪ Ongoing operating expenses including management fees, distribution and service fees (if applicable), and other fund expenses.
We are going to present only your ongoing operating expenses here.
Actual expenses/actual returns
This example is intended to provide information about the Fund’s actual ongoing operating expenses, and is based on the Fund’s actual return. It assumes an account value of $1,000.00 on March 1, 2012 with the same investment held until August 31, 2012.
| Account value | Ending value | Expenses paid during | |
| on 3-1-12 | on 8-31-12 | period ended 8-31-121 | |
| Class A | $1,000.00 | $1,028.10 | $7.26 |
| Class B | 1,000.00 | 1,024.50 | 10.82 |
| Class C | 1,000.00 | 1,024.50 | 10.82 |
| Class I | 1,000.00 | 1,030.30 | 5.12 |
| Class R2 | 1,000.00 | 1,027.70 | 7.51 |
| Class R6 | 1,000.00 | 1,030.30 | 4.96 |
| Class NAV | 1,000.00 | 1,030.60 | 4.50 |
Together with the value of your account, you may use this information to estimate the operating expenses that you paid over the period. Simply divide your account value at August 31, 2012, by $1,000.00, then multiply it by the “expenses paid” for your share class from the table above. For example, for an account value of $8,600.00, the operating expenses should be calculated as follows:
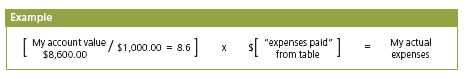
| 8 | Global Shareholder Yield Fund | Semiannual report |
Hypothetical example for comparison purposes
This table allows you to compare the Fund’s ongoing operating expenses with those of any other fund. It provides an example of the Fund’s hypothetical account values and hypothetical expenses based on each class’s actual expense ratio and an assumed 5% annualized return before expenses (which is not the Fund’s actual return). It assumes an account value of $1,000.00 on March 1, 2012, with the same investment held until August 31, 2012. Look in any other fund shareholder report to find its hypothetical example and you will be able to compare these expenses.
| Account value | Ending value | Expenses paid during | |
| on 3-1-12 | on 8-31-12 | period ended 8-31-121 | |
| Class A | $1,000.00 | $1,018.00 | $7.22 |
| Class B | 1,000.00 | 1,014.50 | 10.76 |
| Class C | 1,000.00 | 1,014.50 | 10.76 |
| Class I | 1,000.00 | 1,020.20 | 5.09 |
| Class R2 | 1,000.00 | 1,017.80 | 7.48 |
| Class R6 | 1,000.00 | 1,020.30 | 4.94 |
| Class NAV | 1,000.00 | 1,020.80 | 4.48 |
Remember, these examples do not include any transaction costs, therefore, these examples will not help you to determine the relative total costs of owning different funds. If transaction costs were included, your expenses would have been higher. See the prospectus for details regarding transaction costs.
1 Expenses are equal to the Fund’s annualized expense ratio of 1.42%, 2.12%, 2.12%, 1.00%, 1.47%, 0.97% and 0.88% for Class A, Class B, Class C, Class I, Class R2, Class R6 and Class NAV shares, multiplied by the average account value over the period, multiplied by 184/365 (to reflect the one-half year period).
| Semiannual report | Global Shareholder Yield Fund | 9 |
Portfolio summary
| Top 10 Holdings (17.3% of Net Assets on 8-31-12)1,2 | ||||
| BCE, Inc. | 2.1% | Imperial Tobacco Group PLC | 1.7% | |
| Vodafone Group PLC | 1.9% | Nestle SA | 1.6% | |
| Pearson PLC | 1.8% | Duke Energy Corp. | 1.6% | |
| Swisscom AG | 1.7% | Kimberly-Clark Corp. | 1.6% | |
| Altria Group, Inc. | 1.7% | National Grid PLC | 1.6% | |
| Sector Composition1,3 | ||||
| Consumer Staples | 18.5% | Energy | 7.7% | |
| Telecommunication Services | 15.2% | Financials | 5.9% | |
| Utilities | 12.1% | Information Technology | 5.2% | |
| Consumer Discretionary | 10.4% | Materials | 2.6% | |
| Industrials | 9.7% | Short-Term Investments & Other | 4.3% | |
| Health Care | 8.4% | |||
| Country Composition1,3 | ||||
| United States | 52.5% | Belgium | 1.5% | |
| United Kingdom | 18.8% | Netherlands | 1.4% | |
| France | 6.3% | Australia | 1.3% | |
| Germany | 5.7% | Italy | 0.9% | |
| Switzerland | 5.3% | Other Countries | 2.4% | |
| Canada | 3.9% | |||
1 As a percentage of net assets on 8-31-12.
2 Cash and cash equivalents not included.
3 International investing involves special risks such as political, economic and currency risks and differences in accounting standards and financial reporting. Sector investing is subject to greater risks than the market as a whole. Because the Fund may focus on particular sectors of the economy, its performance may depend on the performance of those sectors.
| 10 | Global Shareholder Yield Fund | Semiannual report |
Fund’s investments
As of 8-31-12 (unaudited)
| Shares | Value | |
| Common Stocks 94.5% | $1,627,664,571 | |
| (Cost $1,473,799,449) | ||
| Australia 1.3% | 22,372,701 | |
| Telstra Corp., Ltd. | 3,040,000 | 12,114,462 |
| Westpac Banking Corp. | 399,661 | 10,258,239 |
| Belgium 1.5% | 25,930,758 | |
| Anheuser-Busch InBev NV | 308,320 | 25,930,758 |
| Brazil 0.1% | 2,511,281 | |
| CPFL Energia SA | 237,100 | 2,511,281 |
| Canada 3.9% | 67,668,425 | |
| BCE, Inc. | 797,200 | 35,438,300 |
| Rogers Communications, Inc., Class B | 372,600 | 15,032,515 |
| Shaw Communications, Inc., Class B | 840,900 | 17,197,610 |
| France 6.3% | 108,067,166 | |
| France Telecom SA | 1,090,700 | 15,057,479 |
| Sanofi | 171,750 | 14,027,790 |
| SCOR SE | 809,700 | 19,875,543 |
| Total SA | 473,500 | 23,594,660 |
| Vinci SA | 411,100 | 17,833,839 |
| Vivendi SA | 903,343 | 17,677,855 |
| Germany 5.1% | 87,658,272 | |
| BASF SE | 299,700 | 23,258,959 |
| Bayer AG | 134,250 | 10,412,751 |
| Daimler AG | 441,300 | 21,606,076 |
| Deutsche Telekom AG | 920,000 | 10,966,187 |
| Muenchener Rueckversicherungs AG | 144,650 | 21,414,299 |
| Hong Kong 0.4% | 7,833,371 | |
| China Mobile, Ltd., ADR | 145,900 | 7,833,371 |
| Italy 0.9% | 15,064,275 | |
| Terna Rete Elettrica Nazionale SpA | 4,342,000 | 15,064,275 |
| Netherlands 1.4% | 23,810,791 | |
| Royal Dutch Shell PLC, ADR | 340,300 | 23,810,791 |
| Norway 0.7% | 11,717,911 | |
| Orkla ASA | 1,586,100 | 11,717,911 |
| See notes to financial statements | Semiannual report | Global Shareholder Yield Fund | 11 |
| Shares | Value | |
| Philippines 0.5% | $8,195,099 | |
| Philippine Long Distance Telephone Company, ADR | 127,451 | 8,195,099 |
| Switzerland 5.3% | 92,178,249 | |
| Nestle SA | 456,900 | 28,390,069 |
| Novartis AG | 287,200 | 16,914,557 |
| Roche Holdings AG | 94,700 | 17,229,153 |
| Swisscom AG | 73,850 | 29,644,470 |
| Taiwan 0.7% | 12,117,284 | |
| Taiwan Semiconductor Manufacturing Company, Ltd., ADR | 824,305 | 12,117,284 |
| United Kingdom 18.8% | 323,417,932 | |
| AstraZeneca PLC, ADR | 454,800 | 21,280,092 |
| BAE Systems PLC | 3,503,100 | 17,678,595 |
| British American Tobacco PLC | 298,700 | 15,637,832 |
| Compass Group PLC | 1,208,300 | 13,609,160 |
| Diageo PLC, ADR | 191,500 | 20,915,630 |
| FirstGroup PLC | 4,665,072 | 18,138,167 |
| GlaxoSmithKline PLC | 703,550 | 15,908,155 |
| Imperial Tobacco Group PLC | 733,700 | 28,580,423 |
| Meggitt PLC | 1,981,600 | 12,442,271 |
| National Grid PLC | 2,548,760 | 27,639,798 |
| Pearson PLC | 1,595,500 | 30,238,480 |
| Reckitt Benckiser Group PLC | 230,000 | 13,005,056 |
| SSE PLC | 804,500 | 17,478,947 |
| Unilever PLC | 267,500 | 9,619,305 |
| United Utilities Group PLC | 1,650,563 | 18,585,658 |
| Vodafone Group PLC | 11,572,000 | 33,360,321 |
| WM Morrison Supermarket PLC | 2,095,050 | 9,300,042 |
| United States 47.6% | 819,121,056 | |
| Abbott Laboratories | 173,800 | 11,390,852 |
| Altria Group, Inc. | 856,500 | 29,086,740 |
| Arthur J. Gallagher & Company | 511,000 | 18,252,920 |
| AT&T, Inc. | 595,300 | 21,811,792 |
| Automatic Data Processing, Inc. | 179,000 | 10,396,320 |
| Bristol-Myers Squibb Company | 367,400 | 12,127,874 |
| CenturyLink, Inc. | 650,500 | 27,490,130 |
| CMS Energy Corp. | 569,300 | 13,133,751 |
| Coca-Cola Enterprises, Inc. | 317,400 | 9,372,822 |
| Comcast Corp., Special Class A | 554,700 | 18,232,989 |
| ConocoPhillips | 225,800 | 12,823,182 |
| Diamond Offshore Drilling, Inc. | 197,700 | 13,249,854 |
| Diebold, Inc. | 391,300 | 12,748,554 |
| Duke Energy Corp. | 434,018 | 28,115,686 |
| E.I. du Pont de Nemours & Company | 428,800 | 21,332,800 |
| Emerson Electric Company | 337,200 | 17,102,784 |
| Enterprise Products Partners LP | 267,500 | 14,284,500 |
| Exxon Mobil Corp. | 110,300 | 9,629,190 |
| 12 | Global Shareholder Yield Fund | Semiannual report | See notes to financial statements |
| Shares | Value | |
| United States (continued) | ||
| Genuine Parts Company | 171,700 | $10,844,572 |
| H.J. Heinz Company | 161,300 | 8,987,636 |
| Honeywell International, Inc. | 287,200 | 16,786,840 |
| Integrys Energy Group, Inc. | 459,050 | 24,784,110 |
| Johnson & Johnson | 190,500 | 12,845,415 |
| Kimberly-Clark Corp. | 335,100 | 28,014,360 |
| Kinder Morgan Energy Partners LP | 222,700 | 18,432,879 |
| Lockheed Martin Corp. | 245,600 | 22,383,984 |
| Lorillard, Inc. | 184,200 | 23,118,942 |
| MarkWest Energy Partners LP | 167,600 | 8,899,560 |
| Mattel, Inc. | 539,100 | 18,943,974 |
| McDonald’s Corp. | 106,200 | 9,503,838 |
| Merck & Company, Inc. | 316,400 | 13,621,020 |
| Microchip Technology, Inc. | 623,400 | 21,663,150 |
| Microsoft Corp. | 492,300 | 15,172,686 |
| NiSource, Inc. | 343,400 | 8,358,356 |
| NYSE Euronext | 441,300 | 11,054,565 |
| Oracle Corp. | 533,900 | 16,897,935 |
| PepsiCo, Inc. | 117,600 | 8,517,768 |
| Philip Morris International, Inc. | 285,200 | 25,468,360 |
| Pitney Bowes, Inc. | 670,200 | 8,953,872 |
| PPL Corp. | 294,500 | 8,637,685 |
| R.R. Donnelley & Sons Company | 1,017,800 | 11,175,444 |
| Regal Entertainment Group, Class A | 1,157,000 | 16,082,300 |
| Reynolds American, Inc. | 531,800 | 24,515,980 |
| SCANA Corp. | 220,600 | 10,447,616 |
| Spectra Energy Corp. | 308,100 | 8,706,906 |
| TECO Energy, Inc. | 784,700 | 13,622,392 |
| The Coca-Cola Company | 260,200 | 9,731,480 |
| The Southern Company | 176,900 | 8,018,877 |
| The Travelers Companies, Inc. | 145,700 | 9,432,618 |
| Time Warner, Inc. | 322,600 | 13,404,030 |
| Vectren Corp. | 403,800 | 11,391,198 |
| Verizon Communications, Inc. | 640,100 | 27,485,894 |
| Waste Management, Inc. | 365,300 | 12,632,074 |
| Preferred Securities 1.2% | $20,543,604 | |
| (Cost $20,460,291) | ||
| Germany 0.6% | 9,814,821 | |
| ProSiebenSat.1 Media AG | 408,000 | 9,814,821 |
| United States 0.6% | 10,728,783 | |
| MetLife, Inc., Series B, 6.500% | 417,300 | 10,728,783 |
| See notes to financial statements | Semiannual report | Global Shareholder Yield Fund | 13 |
| Shares | Value | |
| Short-Term Investments 3.6% | $62,790,254 | |
| (Cost $62,790,254) | ||
| Money Market Funds 3.6% | 62,790,254 | |
| State Street Institutional Treasury Money Market Fund, 0.0000% (Y) | 62,790,254 | 62,790,254 |
| Total investments (Cost $1,557,049,994)† 99.3% | $1,710,998,429 | |
| Other assets and liabilities, net 0.7% | $11,306,365 | |
| Total net assets 100.0% | $1,722,304,794 | |
The percentage shown for each investment category is the total value of the category as a percentage of the net assets of the Fund.
ADR American Depositary Receipts
(Y) The rate shown is the annualized seven-day yield as of 8-31-12.
† At 8-31-12, the aggregate cost of investment securities for federal income tax purposes was $1,559,330,531. Net unrealized appreciation aggregated $151,667,898, of which $177,590,232 related to appreciated investment securities and $25,922,334 related to depreciated investment securities.
The Fund had the following sector composition as a percentage of total net assets on 8-31-12:
| Consumer Staples | 18.5% | |||||
| Telecommunication Services | 15.2% | |||||
| Utilities | 12.1% | |||||
| Consumer Discretionary | 10.4% | |||||
| Industrials | 9.7% | |||||
| Health Care | 8.4% | |||||
| Energy | 7.7% | |||||
| Financials | 5.9% | |||||
| Information Technology | 5.2% | |||||
| Materials | 2.6% | |||||
| Short-Term Investments & Other | 4.3% |
| 14 | Global Shareholder Yield Fund | Semiannual report | See notes to financial statements |
F I N A N C I A L S T A T E M E N T S
Financial statements
Statement of assets and liabilities 8-31-12 (unaudited)
This Statement of assets and liabilities is the Fund’s balance sheet. It shows the value of what the Fund owns, is due and owes. You’ll also find the net asset value and the maximum public offering price per share.
| Assets | |
| Investments, at value (Cost $1,557,049,994) | $1,710,998,429 |
| Foreign currency, at value (Cost $77) | 78 |
| Receivable for investments sold | 662,270 |
| Receivable for fund shares sold | 5,094,935 |
| Dividends and interest receivable | 8,279,760 |
| Receivable due from adviser | 1,690 |
| Other receivables and prepaid expenses | 187,350 |
| Total assets | 1,725,224,512 |
| Liabilities | |
| Payable for fund shares repurchased | 2,465,104 |
| Payable to affiliates | |
| Accounting and legal services fees | 63,557 |
| Transfer agent fees | 98,922 |
| Trustees’ fees | 6,025 |
| Other liabilities and accrued expenses | 286,110 |
| Total liabilities | 2,919,718 |
| Net assets | |
| Paid-in capital | $1,589,268,197 |
| Undistributed net investment income | 7,144,672 |
| Accumulated net realized gain (loss) on investments and foreign | |
| currency transactions | (28,026,331) |
| Net unrealized appreciation (depreciation) on investments and translation | |
| of assets and liabilities in foreign currencies | 153,918,256 |
| Net assets | $1,722,304,794 |
| Net asset value per share | |
| Based on net asset values and shares outstanding — the Fund has an | |
| unlimited number of shares authorized with no par value | |
| Class A ($240,113,690 ÷ 24,226,978 shares) | $9.91 |
| Class B ($9,625,427 ÷ 971,418 shares)1 | $9.91 |
| Class C ($52,905,660 ÷ 5,339,927 shares)1 | $9.91 |
| Class I ($515,617,734 ÷ 51,877,392 shares) | $9.94 |
| Class R2 ($101,000 ÷ 10,163 shares) | $9.94 |
| Class R6 ($146,609 ÷ 14,754 shares) | $9.94 |
| Class NAV ($903,794,674 ÷ 90,948,096 shares) | $9.94 |
| Maximum offering price per share | |
| Class A (net asset value per share ÷ 95%)2 | $10.43 |
1 Redemption price per share is equal to the net asset value less any applicable contingent deferred sales charge.
2 On single retail sales of less than $50,000. On sales of $50,000 or more and on group sales the offering price is reduced.
| See notes to financial statements | Semiannual report | Global Shareholder Yield Fund | 15 |
F I N A N C I A L S T A T E M E N T S
Statement of operations For the six-month period ended 8-31-12
(unaudited)
This Statement of operations summarizes the Fund’s investment income earned and expenses incurred in operating the Fund. It also shows net gains (losses) for the period stated.
| Investment income | |
| Dividends | $44,293,060 |
| Interest | 115 |
| Less foreign taxes withheld | (2,614,801) |
| Total investment income | 41,678,374 |
| Expenses | |
| Investment management fees | 6,724,533 |
| Distribution and service fees | 627,408 |
| Accounting and legal services fees | 152,085 |
| Transfer agent fees | 473,759 |
| Trustees’ fees | 49,388 |
| State registration fees | 77,109 |
| Printing and postage | 66,250 |
| Professional fees | 64,735 |
| Custodian fees | 392,041 |
| Registration and filing fees | 24,850 |
| Other | 13,921 |
| Total expenses | 8,666,079 |
| Less expense reductions | (300,886) |
| Net expenses | 8,365,193 |
| Net investment income | 33,313,181 |
| Realized and unrealized gain (loss) | |
| Net realized gain (loss) on | |
| Investments | (2,066,176) |
| Foreign currency transactions | (249,041) |
| (2,315,217) | |
| Change in net unrealized appreciation (depreciation) of | |
| Investments | 24,662,735 |
| Translation of assets and liabilities in foreign currencies | (24,478) |
| 24,638,257 | |
| Net realized and unrealized gain | 22,323,040 |
| Increase in net assets from operations | $55,636,221 |
| 16 | Global Shareholder Yield Fund | Semiannual report | See notes to financial statements |
F I N A N C I A L S T A T E M E N T S
Statements of changes in net assets
These Statements of changes in net assets show how the value of the Fund’s net assets has changed during the last two periods. The difference reflects earnings less expenses, any investment gains and losses, distributions, if any, paid to shareholders and the net of Fund share transactions.
| Six months | ||
| ended | Year | |
| 8-31-12 | ended | |
| (Unaudited) | 2-29-12 | |
| Increase (decrease) in net assets | ||
| From operations | ||
| Net investment income | $33,313,181 | $24,108,157 |
| Net realized gain (loss) | (2,315,217) | 8,348,730 |
| Change in net unrealized appreciation (depreciation) | 24,638,257 | 72,909,926 |
| Increase in net assets resulting from operations | 55,636,221 | 105,366,813 |
| Distributions to shareholders | ||
| From net investment income | ||
| Class A | (3,889,568) | (2,555,172) |
| Class B | (117,882) | (74,651) |
| Class C | (658,601) | (348,064) |
| Class I | (7,681,042) | (4,826,128) |
| Class R2 | (1,675) | — |
| Class R6 | (2,538) | (1,084) |
| Class NAV | (19,086,450) | (10,611,958) |
| Total distributions | (31,437,756) | (18,417,057) |
| From Fund share transactions | 161,948,270 | 1,095,081,829 |
| Total increase | 186,146,735 | 1,182,031,585 |
| Net assets | ||
| Beginning of period | 1,536,158,059 | 354,126,474 |
| End of period | $1,722,304,794 | $1,536,158,059 |
| Undistributed net investment income | $7,144,672 | $5,269,247 |
| See notes to financial statements | Semiannual report | Global Shareholder Yield Fund | 17 |
Financial highlights
The Financial highlights show how the Fund’s net asset value for a share has changed during the period.
| CLASS A SHARES Period ended | 8-31-121 | 2-29-12 | 2-28-11 | 2-28-10 | 2-28-09 | 2-29-082 |
| Per share operating performance | ||||||
| Net asset value, beginning of period | $9.81 | $9.50 | $8.10 | $6.10 | $9.52 | $10.00 |
| Net investment income3 | 0.18 | 0.26 | 0.24 | 0.25 | 0.36 | 0.35 |
| Net realized and unrealized gain (loss) | ||||||
| on investments | 0.09 | 0.29 | 1.40 | 1.99 | (3.57) | (0.51) |
| Total from investment operations | 0.27 | 0.55 | 1.64 | 2.24 | (3.21) | (0.16) |
| Less distributions | ||||||
| From net investment income | (0.17) | (0.24) | (0.24) | (0.24) | (0.21) | (0.29) |
| From net realized gain | — | — | — | — | — | (0.03) |
| Total distributions | (0.17) | (0.24) | (0.24) | (0.24) | (0.21) | (0.32) |
| Net asset value, end of period | $9.91 | $9.81 | $9.50 | $8.10 | $6.10 | $9.52 |
| Total return (%)4,5 | 2.816 | 5.98 | 20.64 | 37.19 | (34.21) | (1.84) |
| Ratios and supplemental data | ||||||
| Net assets, end of period (in millions) | $240 | $215 | $56 | $22 | $11 | $27 |
| Ratios (as a percentage of average net assets): | ||||||
| Expenses before reductions | 1.447 | 1.53 | 1.55 | 1.668 | 1.72 | 1.79 |
| Expenses net of fee waivers | 1.427 | 1.42 | 1.55 | 1.568 | 1.56 | 1.45 |
| Expenses net of fee waivers and credits | 1.427 | 1.42 | 1.55 | 1.558 | 1.55 | 1.45 |
| Net investment income | 3.727 | 2.78 | 2.80 | 3.34 | 4.28 | 3.31 |
| Portfolio turnover (%) | 9 | 19 | 39 | 53 | 54 | 24 |
1 Six months ended 8-31-12. Unaudited.
2 The inception date for Class A shares is 3-1-07.
3 Based on the average daily shares outstanding.
4 Does not reflect the effect of sales charges, if any.
5 Total returns would have been lower had certain expenses not been reduced during the periods shown.
6 Not annualized.
7 Annualized.
8 Includes the impact of proxy expenses, which amounted to 0.02% of average net assets.
| 18 | Global Shareholder Yield Fund | Semiannual report | See notes to financial statements |
| CLASS B SHARES Period ended | 8-31-121 | 2-29-12 | 2-28-11 | 2-28-10 | 2-28-09 | 2-29-082 |
| Per share operating performance | ||||||
| Net asset value, beginning of period | $9.81 | $9.49 | $8.10 | $6.09 | $9.51 | $10.00 |
| Net investment income3 | 0.15 | 0.20 | 0.19 | 0.20 | 0.29 | 0.22 |
| Net realized and unrealized gain (loss) | ||||||
| on investments | 0.08 | 0.29 | 1.38 | 2.00 | (3.56) | (0.45) |
| Total from investment operations | 0.23 | 0.49 | 1.57 | 2.20 | (3.27) | (0.23) |
| Less distributions | ||||||
| From net investment income | (0.13) | (0.17) | (0.18) | (0.19) | (0.15) | (0.23) |
| From net realized gain | — | — | — | — | — | (0.03) |
| Total distributions | (0.13) | (0.17) | (0.18) | (0.19) | (0.15) | (0.26) |
| Net asset value, end of period | $9.91 | $9.81 | $9.49 | $8.10 | $6.09 | $9.51 |
| Total return (%)4,5 | 2.456 | 5.33 | 19.65 | 36.49 | (34.72) | (2.54) |
| Ratios and supplemental data | ||||||
| Net assets, end of period (in millions) | $10 | $8 | $2 | $1 | $1 | $1 |
| Ratios (as a percentage of average net assets): | ||||||
| Expenses before reductions | 2.367 | 2.54 | 2.91 | 3.548 | 3.94 | 3.89 |
| Expenses net of fee waivers | 2.127 | 2.11 | 2.25 | 2.298 | 2.43 | 2.23 |
| Expenses net of fee waivers and credits | 2.127 | 2.11 | 2.25 | 2.258 | 2.25 | 2.23 |
| Net investment income | 3.017 | 2.17 | 2.18 | 2.68 | 3.50 | 2.11 |
| Portfolio turnover (%) | 9 | 19 | 39 | 53 | 54 | 24 |
1 Six months ended 8-31-12. Unaudited.
2 The inception date for Class B shares is 3-1-07.
3 Based on the average daily shares outstanding.
4 Does not reflect the effect of sales charges, if any.
5 Total returns would have been lower had certain expenses not been reduced during the periods shown.
6 Not annualized.
7 Annualized.
8 Includes the impact of proxy expenses, which amounted to 0.02% of average net assets.
| CLASS C SHARES Period ended | 8-31-121 | 2-29-12 | 2-28-11 | 2-28-10 | 2-28-09 | 2-29-082 |
| Per share operating performance | ||||||
| Net asset value, beginning of period | $9.81 | $9.50 | $8.10 | $6.10 | $9.51 | $10.00 |
| Net investment income3 | 0.15 | 0.20 | 0.18 | 0.20 | 0.29 | 0.22 |
| Net realized and unrealized gain (loss) | ||||||
| on investments | 0.08 | 0.28 | 1.40 | 1.99 | (3.55) | (0.45) |
| Total from investment operations | 0.23 | 0.48 | 1.58 | 2.19 | (3.26) | (0.23) |
| Less distributions | ||||||
| From net investment income | (0.13) | (0.17) | (0.18) | (0.19) | (0.15) | (0.23) |
| From net realized gain | — | — | — | — | — | (0.03) |
| Total distributions | (0.13) | (0.17) | (0.18) | (0.19) | (0.15) | (0.26) |
| Net asset value, end of period | $9.91 | $9.81 | $9.50 | $8.10 | $6.10 | $9.51 |
| Total return (%)4,5 | 2.456 | 5.22 | 19.78 | 36.27 | (34.62) | (2.54) |
| Ratios and supplemental data | ||||||
| Net assets, end of period (in millions) | $53 | $45 | $11 | $4 | $3 | $5 |
| Ratios (as a percentage of average net assets): | ||||||
| Expenses before reductions | 2.177 | 2.29 | 2.39 | 2.638 | 2.72 | 3.00 |
| Expenses net of fee waivers | 2.127 | 2.11 | 2.25 | 2.278 | 2.28 | 2.23 |
| Expenses net of fee waivers and credits | 2.127 | 2.11 | 2.25 | 2.258 | 2.25 | 2.22 |
| Net investment income | 3.027 | 2.13 | 2.10 | 2.66 | 3.50 | 2.08 |
| Portfolio turnover (%) | 9 | 19 | 39 | 53 | 54 | 24 |
1 Six months ended 8-31-12. Unaudited.
2 The inception date for Class C shares is 3-1-07.
3 Based on the average daily shares outstanding.
4 Does not reflect the effect of sales charges, if any.
5 Total returns would have been lower had certain expenses not been reduced during the periods shown.
6 Not annualized.
7 Annualized.
8 Includes the impact of proxy expenses, which amounted to 0.03% of average net assets.
| See notes to financial statements | Semiannual report | Global Shareholder Yield Fund | 19 |
| CLASS I SHARES Period ended | 8-31-121 | 2-29-12 | 2-28-11 | 2-28-10 | 2-28-09 | 2-29-082 |
| Per share operating performance | ||||||
| Net asset value, beginning of period | $9.84 | $9.53 | $8.13 | $6.11 | $9.53 | $10.00 |
| Net investment income3 | 0.18 | 0.32 | 0.29 | 0.30 | 0.29 | 0.33 |
| Net realized and unrealized gain (loss) | ||||||
| on investments | 0.11 | 0.27 | 1.38 | 2.00 | (3.46) | (0.44) |
| Total from investment operations | 0.29 | 0.59 | 1.67 | 2.30 | (3.17) | (0.11) |
| Less distributions | ||||||
| From net investment income | (0.19) | (0.28) | (0.27) | (0.28) | (0.25) | (0.33) |
| From net realized gain | — | — | — | — | — | (0.03) |
| Total distributions | (0.19) | (0.28) | (0.27) | (0.28) | (0.25) | (0.36) |
| Net asset value, end of period | $9.94 | $9.84 | $9.53 | $8.13 | $6.11 | $9.53 |
| Total return (%)4 | 3.035 | 6.45 | 21.09 | 38.08 | (33.87) | (1.43) |
| Ratios and supplemental data | ||||||
| Net assets, end of period (in millions) | $516 | $249 | $123 | $86 | $57 | $3 |
| Ratios (as a percentage of average net assets): | ||||||
| Expenses before reductions | 1.056 | 1.12 | 1.09 | 1.197 | 1.21 | 2.16 |
| Expenses net of fee waivers | 1.006 | 0.97 | 1.08 | 1.087 | 1.10 | 1.09 |
| Expenses net of fee waivers and credits | 1.006 | 0.97 | 1.08 | 1.087 | 1.10 | 1.09 |
| Net investment income | 3.806 | 3.43 | 3.40 | 3.96 | 3.78 | 3.14 |
| Portfolio turnover (%) | 9 | 19 | 39 | 53 | 54 | 24 |
1 Six months ended 8-31-12. Unaudited.
2 The inception date for Class I shares is 3-1-07.
3 Based on the average daily shares outstanding.
4 Total returns would have been lower had certain expenses not been reduced during the periods shown.
5 Not annualized.
6 Annualized.
7 Includes the impact of proxy expenses, which amounted to 0.03% of average net assets.
| CLASS R2 SHARES Period ended | 8-31-121 | |||||
| Per share operating performance | ||||||
| Net asset value, beginning of period | $9.84 | |||||
| Net investment income2 | 0.18 | |||||
| Net realized and unrealized gain on investments | 0.08 | |||||
| Total from investment operations | 0.26 | |||||
| Less distributions | ||||||
| From net investment income | (0.16) | |||||
| Net asset value, end of period | $9.94 | |||||
| Total return (%)3 | 2.774 | |||||
| Ratios and supplemental data | ||||||
| Net assets, end of period (in millions) | —5 | |||||
| Ratios (as a percentage of average net assets): | ||||||
| Expenses before reductions | 16.746 | |||||
| Expenses net of fee waivers | 1.476 | |||||
| Expenses net of fee waivers and credits | 1.476 | |||||
| Net investment income | 3.716 | |||||
| Portfolio turnover (%) | 9 | |||||
1 Period from 3-1-12 (inception date) to 8-31-12.
2 Based on the average daily shares outstanding.
3 Total returns would have been lower had certain expenses not been reduced during the periods shown.
4 Not annualized.
5 Less than $500,000.
6 Annualized.
| 20 | Global Shareholder Yield Fund | Semiannual report | See notes to financial statements |
| CLASS R6 SHARES Period ended | 8-31-121 | 2-29-122 | ||||
| Per share operating performance | ||||||
| Net asset value, beginning of period | $9.84 | $9.29 | ||||
| Net investment income3 | 0.19 | 0.13 | ||||
| Net realized and unrealized gain on investments | 0.10 | 0.52 | ||||
| Total from investment operations | 0.29 | 0.65 | ||||
| Less distributions | ||||||
| From net investment income | (0.19) | (0.10) | ||||
| Net asset value, end of period | $9.94 | $9.84 | ||||
| Total return (%)4 | 3.035 | 7.125 | ||||
| Ratios and supplemental data | ||||||
| Net assets, end of period (in millions) | —6 | —6 | ||||
| Ratios (as a percentage of average net assets): | ||||||
| Expenses before reductions | 13.027 | 15.937 | ||||
| Expenses net of fee waivers | 0.977 | 0.977 | ||||
| Expenses net of fee waivers and credits | 0.977 | 0.977 | ||||
| Net investment income | 4.007 | 2.827 | ||||
| Portfolio turnover (%) | 9 | 198 | ||||
1 Six months ended 8-31-12. Unaudited.
2 The inception date for Class R6 shares is 9-1-11.
3 Based on the average daily shares outstanding.
4 Total returns would have been lower had certain expenses not been reduced during the periods shown.
5 Not annualized.
6 Less than $500,000.
7 Annualized.
8 Portfolio turnover is shown for the period from 3-1-11 to 2-29-12.
| CLASS NAV SHARES Period ended | 8-31-121 | 2-29-12 | 2-28-11 | 2-28-10 | 2-28-092 |
| Per share operating performance | |||||
| Net asset value, beginning of period | $9.84 | $9.53 | $8.13 | $6.11 | $9.71 |
| Net investment income3 | 0.21 | 0.29 | 0.30 | 0.29 | 0.29 |
| Net realized and unrealized gain (loss) on investments | 0.08 | 0.31 | 1.38 | 2.01 | (3.67) |
| Total from investment operations | 0.29 | 0.60 | 1.68 | 2.30 | (3.38) |
| Less distributions | |||||
| From net investment income | (0.19) | (0.29) | (0.28) | (0.28) | (0.22) |
| Net asset value, end of period | $9.94 | $9.84 | $9.53 | $8.13 | $6.11 |
| Total return (%)4 | 3.065 | 6.53 | 21.19 | 38.16 | (35.32)5 |
| Ratios and supplemental data | |||||
| Net assets, end of period (in millions) | $904 | $1,019 | $162 | $129 | $67 |
| Ratios (as a percentage of average net assets): | |||||
| Expenses before reductions | 0.916 | 0.99 | 0.99 | 1.057 | 1.096 |
| Expenses net of fee waivers | 0.886 | 0.94 | 0.99 | 1.007 | 1.056 |
| Expenses net of fee waivers and credits | 0.886 | 0.94 | 0.99 | 1.007 | 1.056 |
| Net investment income | 4.356 | 3.11 | 3.49 | 3.84 | 4.276 |
| Portfolio turnover (%) | 9 | 19 | 39 | 53 | 54 |
1 Six months ended 8-31-12. Unaudited.
2 The inception date for Class NAV shares is 4-28-08.
3 Based on the average daily shares outstanding.
4 Total returns would have been lower had certain expenses not been reduced during the periods shown.
5 Not annualized.
6 Annualized.
7 Includes the impact of proxy expenses, which amounted to 0.02% of average net assets.
| See notes to financial statements | Semiannual report | Global Shareholder Yield Fund | 21 |
Notes to financial statements
(unaudited)
Note 1 — Organization
John Hancock Global Shareholder Yield Fund (the Fund) is a series of John Hancock Funds III (the Trust), an open-end management investment company organized as a Massachusetts business trust and registered under the Investment Company Act of 1940, as amended (the 1940 Act). The investment objective of the Fund is to seek to provide a high level of income. Capital appreciation is a secondary objective.
The Fund may offer multiple classes of shares. The shares currently offered are detailed in the Statement of assets and liabilities. Class A, Class B and Class C shares are offered to all investors. Class I shares are offered to institutions and certain investors. Class R2 shares are available only to certain retirement plans. Class R6 shares are available only to certain retirement plans, institutions and other investors. Class NAV shares are offered to John Hancock affiliated funds of funds. Shareholders of each class have exclusive voting rights to matters that affect that class. The distribution and service fees, if any, transfer agent fees, printing and postage and state registration fees for each class may differ. Class B shares convert to Class A shares eight years after purchase. Certain Class I shares may be exchanged for Class R6 shares within one year after the commencement of operations of Class R6 shares.
Note 2 — Significant accounting policies
The financial statements have been prepared in conformity with accounting principles generally accepted in the United States of America, which require management to make certain estimates and assumptions at the date of the financial statements. Actual results could differ from those estimates. Events or transactions occurring after the end of the fiscal period through the date that the financial statements were issued have been evaluated in the preparation of the financial statements. The following summarizes the significant accounting policies of the Fund:
Security valuation. Investments are stated at value as of the close of regular trading on the New York Stock Exchange (NYSE), normally at 4:00 P.M., Eastern Time. In order to value the securities, the Fund uses the following valuation techniques: Equity securities held by the Fund are valued at the last sale price or official closing price on the principal securities exchange on which they trade. In the event there were no sales during the day or closing prices are not available, then securities are valued using the last quoted bid or evaluated price. Investments by the Fund in open-end mutual funds are valued at their respective net asset values each business day. Foreign securities and currencies are valued in U.S. dollars, based on foreign currency exchange rates supplied by an independent pricing service. Certain securities traded only in the over-the-counter market are valued at the last bid price quoted by brokers making markets in the securities at the close of trading. Certain short-term securities are valued at amortized cost.
Other portfolio securities and assets, where reliable market quotations are not available, are valued at fair value as determined in good faith by the Fund’s Pricing Committee following procedures established by the Board of Trustees, which include price verification procedures. The frequency with which these fair valuation procedures are used cannot be predicted. Generally, trading in non-U.S. securities is substantially completed each day at various times prior to the close of trading on the NYSE. Significant market events that affect the values of non-U.S. securities may occur between the time when the valuation of the securities is generally determined and the close of the NYSE. During significant market events, these securities will be valued at fair value, as determined in good faith, following procedures established by the Board of Trustees. The Fund may use a fair valuation
| 22 | Global Shareholder Yield Fund | Semiannual report |
model to value non-U.S. securities in order to adjust for events which may occur between the close of foreign exchanges and the close of the NYSE.
The Fund uses a three-tier hierarchy to prioritize the pricing assumptions, referred to as inputs, used in valuation techniques to measure fair value. Level 1 includes securities valued using quoted prices in active markets for identical securities. Level 2 includes securities valued using significant observable inputs. Observable inputs may include quoted prices for similar securities, interest rates, prepayment speeds and credit risk. Prices for securities valued using these inputs are received from independent pricing vendors and brokers and are based on an evaluation of the inputs described. Level 3 includes securities valued using significant unobservable inputs when market prices are not readily available or reliable, including the Fund’s own assumptions in determining the fair value of investments. Factors used in determining value may include market or issuer specific events or trends, changes in interest rates and credit quality. The inputs or methodology used for valuing securities are not necessarily an indication of the risks associated with investing in those securities. Changes in valuation techniques may result in transfers into or out of an assigned level within the disclosure hierarchy.
The following is a summary of the values by input classification of the Fund’s investments as of August 31, 2012, by major security category or type:
| LEVEL 3 | ||||
| LEVEL 2 | SIGNIFICANT | |||
| TOTAL MARKET | LEVEL 1 | SIGNIFICANT | UNOBSERVABLE | |
| VALUE AT 8-31-12 | QUOTED PRICE | OBSERVABLE INPUTS | INPUTS | |
| Common Stocks | ||||
| Australia | $22,372,701 | — | $22,372,701 | — |
| Belgium | 25,930,758 | — | 25,930,758 | — |
| Brazil | 2,511,281 | $2,511,281 | — | — |
| Canada | 67,668,425 | 67,668,425 | — | — |
| France | 108,067,166 | — | 108,067,166 | — |
| Germany | 87,658,272 | — | 87,658,272 | — |
| Hong Kong | 7,833,371 | 7,833,371 | — | — |
| Italy | 15,064,275 | — | 15,064,275 | — |
| Netherlands | 23,810,791 | 23,810,791 | — | — |
| Norway | 11,717,911 | — | 11,717,911 | — |
| Philippines | 8,195,099 | 8,195,099 | — | — |
| Switzerland | 92,178,249 | — | 92,178,249 | — |
| Taiwan | 12,117,284 | 12,117,284 | — | — |
| United Kingdom | 323,417,932 | 42,195,722 | 281,222,210 | — |
| United States | 819,121,056 | 819,121,056 | — | — |
| Preferred Securities | ||||
| Germany | 9,814,821 | — | 9,814,821 | — |
| United States | 10,728,783 | 10,728,783 | — | — |
| Short-Term Investments | 62,790,254 | 62,790,254 | — | — |
| Total Investments | ||||
| in Securities | $1,710,998,429 | $1,056,972,066 | $654,026,363 | — |
Security transactions and related investment income. Investment security transactions are accounted for on a trade date plus one basis for daily net asset value calculations. However, for financial reporting purposes, investment transactions are reported on trade date. Interest income is accrued as earned. Dividend income is recorded on the ex-date, except for dividends of foreign securities where the dividend may not be known until after the ex-date. In those cases, dividend income, net of withholding taxes, is recorded when the Fund becomes aware of the dividends. Foreign taxes are provided for based on the Fund’s understanding of the tax rules and rates that
| Semiannual report | Global Shareholder Yield Fund | 23 |
exist in the foreign markets in which it invests. Gains and losses on securities sold are determined on the basis of identified cost and may include proceeds from litigation.
Foreign currency translation. Assets, including investments and liabilities denominated in foreign currencies, are translated into U.S. dollar values each day at the prevailing exchange rate. Purchases and sales of securities, income and expenses are translated into U.S. dollars at the prevailing exchange rate on the date of the transaction. The effect of changes in foreign currency exchange rates on the value of securities is reflected as a component of the realized and unrealized gains (losses) on investments.
Funds that invest internationally generally carry more risk than funds that invest strictly in U.S. securities. Risks can result from differences in economic and political conditions, regulations, market practices (including higher transaction costs) and accounting standards. Foreign investments are also subject to a decline in the value of a foreign currency versus the U.S. dollar, which reduces the dollar value of securities denominated in that currency.
Foreign taxes. The Fund may be subject to withholding tax on income or capital gains or repatriation taxes as imposed by certain countries in which it invests. Taxes are accrued based upon net investment income, net realized gains or net unrealized appreciation.
Line of credit. The Fund may borrow from banks for temporary or emergency purposes, including meeting redemption requests that otherwise might require the untimely sale of securities. Pursuant to the custodian agreement, the custodian may loan money to the Fund to make properly authorized payments. The Fund is obligated to repay the custodian for any overdraft, including any related costs or expenses. The custodian may have a lien, security interest or security entitlement in any Fund property that is not otherwise segregated or pledged, to the maximum extent permitted by law, to the extent of any overdraft.
In addition, the Fund and other affiliated funds have entered into an agreement with Citibank N.A. which enables them to participate in a $100 million unsecured committed line of credit. A commitment fee, payable at the end of each calendar quarter, based on the average daily unused portion of the line of credit, is charged to each participating fund on a pro rata basis and is reflected in other expenses on the Statement of operations. For the six months ended August 31, 2012, the Fund had no borrowings under the line of credit.
Expenses. Within the John Hancock Funds complex, expenses that are directly attributable to an individual fund are allocated to such fund. Expenses that are not readily attributable to a specific fund are allocated among all funds in an equitable manner, taking into consideration, among other things, the nature and type of expense and the fund’s relative net assets. Expense estimates are accrued in the period to which they relate and adjustments are made when actual amounts are known.
Class allocations. Income, common expenses and realized and unrealized gains (losses) are determined at the fund level and allocated daily to each class of shares based on the net assets of the class. Class-specific expenses, such as distribution and service fees, if any, transfer agent fees, state registration fees and printing and postage, for all classes, are calculated daily at the class level based on the appropriate net assets of each class and the specific expense rates applicable to each class.
Federal income taxes. The Fund intends to continue to qualify as a regulated investment company by complying with the applicable provisions of the Internal Revenue Code and will not be subject to federal income tax on taxable income that is distributed to shareholders. Therefore, no federal income tax provision is required.
| 24 | Global Shareholder Yield Fund | Semiannual report |
Under the Regulated Investment Company Modernization Act of 2010, the Fund is permitted to carry forward capital losses incurred in taxable years beginning after December 22, 2010 for an unlimited period. Any losses incurred during those taxable years will be required to be utilized prior to the losses incurred in pre-enactment taxable years. As a result of this ordering rule, pre-enactment capital loss carryforwards may be more likely to expire unused. Additionally, post-enactment capital losses that are carried forward will retain their character as either short-term or long-term capital losses rather than being considered all short-term as under previous law.
For federal income tax purposes, the Fund has a capital loss carryforward of $16,355,664 available to offset future net realized capital gains as of February 29, 2012. The loss carryforward expires on February 28, 2018.
As of February 29, 2012, the Fund had no uncertain tax positions that would require financial statement recognition, derecognition or disclosure. The Fund’s federal tax returns are subject to examination by the Internal Revenue Service for a period of three years.
Distribution of income and gains. Distributions to shareholders from net investment income and net realized gains, if any, are recorded on the ex-date. The Fund generally declares and pays dividends quarterly. Capital gain distributions, if any, are paid annually.
Distributions paid by the Fund with respect to each class of shares are calculated in the same manner, at the same time and in the same amount, except for the effect of class level expenses that may be applied differently to each class.
Such distributions, on a tax basis, are determined in conformity with income tax regulations, which may differ from accounting principles generally accepted in the United States of America.
Capital accounts within the financial statements are adjusted for permanent book-tax differences. These adjustments have no impact on net assets or the results of operations. Temporary book-tax differences, if any, will reverse in a subsequent period. Book-tax differences are primarily attributable to wash sale loss deferrals and partnerships.
Note 3 — Guarantees and indemnifications
Under the Trust’s organizational documents, its Officers and Trustees are indemnified against certain liabilities arising out of the performance of their duties to the Trust including the Fund. Additionally, in the normal course of business, the Fund enters into contracts with service providers that contain general indemnification clauses. The Fund’s maximum exposure under these arrangements is unknown, as this would involve future claims that may be made against the Fund that have not yet occurred. The risk of material loss from such claims is considered remote.
Note 4 — Fees and transactions with affiliates
John Hancock Investment Management Services, LLC (the Adviser) serves as investment adviser for the Trust. John Hancock Funds, LLC (the Distributor), an affiliate of the Adviser, serves as principal underwriter of the Trust. The Adviser and the Distributor are indirect, wholly owned subsidiaries of Manulife Financial Corporation (MFC).
Management fee. The Fund has an investment management agreement with the Adviser under which the Fund pays a daily management fee to the Adviser equivalent, on an annual basis, up to 0.800% of average daily net assets. Prior to July 1, 2012, the Fund paid a daily management fee to the Adviser equivalent, on an annual basis, to the sum of: (a) 0.875% of the first $500,000,000 of the Fund’s average daily net assets; (b) 0.850% of the next $500,000,000; and (c) 0.800% of the Fund’s average daily net assets in excess of $1,000,000,000. The Adviser has a subadvisory agreement with Epoch Investments Partners, Inc. The Fund is not responsible for payment of
| Semiannual report | Global Shareholder Yield Fund | 25 |
the subadvisory fees. The Adviser has contractually agreed to limit the Fund’s management fee to 0.800% of the Fund’s average daily net assets until June 30, 2013.
The Adviser has contractually agreed to waive fees and/or reimburse certain expenses for each share class of the Fund. This agreement excludes certain expenses such as taxes, portfolio brokerage commissions, interest expense, litigation and indemnification expenses and extraordinary expenses not incurred in the ordinary course of the Fund’s business. The fee waivers and/or reimbursements are such that these expenses will not exceed 1.42%, 2.12%, 2.12%, 1.06%, 1.47% and 0.97% for Class A, Class B, Class C, Class I, Class R2 and Class R6 shares, respectively. Prior to July 1, 2012, the fee waivers and/or reimbursement were such that the expenses would not exceed 0.97% for Class I shares. These expense limitations shall remain in effect until June 30, 2013 and thereafter until terminated by the adviser.
Accordingly, these expense reductions amounted to $29,557, $10,171, $13,189, $98,977, $7,539, $7,410 and $134,043 for Class A, Class B, Class C, Class I, Class R2, Class R6 and Class NAV shares, respectively, for the six months ended August 31, 2012.
The investment management fees, including the impact of the waivers and reimbursements described above, incurred for the six months ended August 31, 2012 were equivalent to a net annual effective rate of 0.79% of the Fund’s average daily net assets.
Accounting and legal services. Pursuant to a service agreement, the Fund reimburses the Adviser for all expenses associated with providing the administrative, financial, legal, accounting and recordkeeping services to the Fund, including the preparation of all tax returns, periodic reports to shareholders and regulatory reports, among other services. These expenses are allocated to each share class based on its relative net assets at the time the expense was incurred. These accounting and legal services fees incurred for the six months ended August 31, 2012 amounted to an annual rate of 0.02% of the Fund’s average daily net assets.
Distribution and service plans. The Fund has a distribution agreement with the Distributor. The Fund has adopted distribution and service plans with respect to Class A, Class B, Class C and Class R2 shares pursuant to Rule 12b-1 under the 1940 Act, to pay the Distributor for services provided as the distributor of shares of the Fund. In addition, under a service plan for Class R2 shares, the Fund pays up to 0.25% for certain other services. The Fund pays the following contractual rates of distribution and service fees under these arrangements, expressed as an annual percentage of average daily net assets for each class of the Fund’s shares.
| CLASS | 12b–1 FEE | ||||||
| Class A | 0.30% | ||||||
| Class B | 1.00% | ||||||
| Class C | 1.00% | ||||||
| Class R2 | 0.25% | ||||||
Sales charges. Class A shares are assessed up-front sales charges, which resulted in payments to the Distributor amounting to $377,180 for the six months ended August 31, 2012. Of this amount, $62,746 was retained and used for printing prospectuses, advertising, sales literature and other purposes, $309,973 was paid as sales commissions to broker-dealers and $4,461 was paid as sales commissions to sales personnel of Signator Investors, Inc., a broker-dealer affiliate of the Adviser.
| 26 | Global Shareholder Yield Fund | Semiannual report |
Class B and Class C shares are subject to contingent deferred sales charges (CDSCs). Class B shares that are redeemed within six years of purchase are subject to CDSCs, at declining rates, beginning at 5.00% of the lesser of the current market value at the time of redemption or the original purchase cost of the shares being redeemed. Class C shares that are redeemed within one year of purchase are subject to a 1.00% CDSC on the lesser of the current market value at the time of redemption or the original purchase cost of the shares being redeemed. Proceeds from CDSCs are used to reimburse the Distributor for commissions paid in connection with the sale of these shares. During the six months ended August 31, 2012, CDSCs received by the Distributor amounted to $19,648 and $14,262 for Class B and Class C shares, respectively.
Transfer agent fees. The Fund has a transfer agent agreement with John Hancock Signature Services, Inc. (Signature Services), an affiliate of the Adviser. The transfer agent fees paid to Signature Services are determined based on the cost to Signature Services (Signature Services Cost) of providing recordkeeping services. The Signature Services Cost includes a component of allocated John Hancock corporate overhead for providing transfer agent services to the Fund and to all other John Hancock affiliated funds. It also includes out-of-pocket expenses that are comprised of payments made to third-parties for recordkeeping services provided to their clients who invest in one or more John Hancock funds. In addition, Signature Services Cost may be reduced by certain fees that Signature Services receives in connection with retirement and small accounts. Signature Services Cost is calculated monthly and allocated, as applicable, to four categories of share classes: Institutional Share Classes, Retirement Share Classes, Municipal Bond Classes and all other Retail Share Classes. Within each of these categories, the applicable costs are allocated to the affected John Hancock affiliated funds and/or classes, based on the relative average daily net assets.
Class level expenses. Class level expenses for the six months ended August 31, 2012 were:
| DISTRIBUTION | TRANSFER | STATE | PRINTING AND | |
| CLASS | AND SERVICE FEES | AGENT FEES | REGISTRATION FEES | POSTAGE |
| Class A | $343,166 | $219,749 | $20,776 | $24,640 |
| Class B | 43,265 | 8,425 | 8,729 | 2,043 |
| Class C | 240,854 | 46,968 | 10,825 | 5,559 |
| Class I | — | 198,584 | 21,706 | 33,975 |
| Class R2 | 123 | 15 | 7,663 | 15 |
| Class R6 | — | 18 | 7,410 | 18 |
| Total | $627,408 | $473,759 | $77,109 | $66,250 |
Trustee expenses. The Fund compensates each Trustee who is not an employee of the Adviser or its affiliates. These Trustees may, for tax purposes, elect to defer receipt of this compensation under the John Hancock Group of Funds Deferred Compensation Plan (the Plan). Deferred amounts are invested in various John Hancock funds and remain in the funds until distributed in accordance with the Plan. The investment of deferred amounts and the offsetting liability are included within Other receivables and prepaid expenses and Payable to affiliates — Trustees’ fees, respectively, in the accompanying Statement of assets and liabilities.
| Semiannual report | Global Shareholder Yield Fund | 27 |
Note 5 — Fund share transactions
Transactions in Fund shares for the six months ended August 31, 2012 and for the year ended February 29, 2012 were as follows:
| Six months ended 8-31-12 | Year ended 2-29-12 | |||
| Shares | Amount | Shares | Amount | |
| Class A shares | ||||
| Sold | 7,368,367 | $71,315,435 | 23,923,894 | $222,879,898 |
| Distributions reinvested | 404,750 | 3,839,397 | 264,170 | 2,420,399 |
| Repurchased | (5,481,920) | (52,697,106) | (8,136,254) | (76,349,490) |
| Net increase | 2,291,197 | $22,457,726 | 16,051,810 | $148,950,807 |
| Class B shares | ||||
| Sold | 216,576 | $2,105,160 | 707,569 | $6,681,380 |
| Distributions reinvested | 8,080 | 76,407 | 4,514 | 41,724 |
| Repurchased | (89,062) | (861,367) | (96,598) | (901,603) |
| Net increase | 135,594 | $1,320,200 | 615,485 | $5,821,501 |
| Class C shares | ||||
| Sold | 1,209,204 | $11,760,047 | 3,815,363 | $35,728,262 |
| Distributions reinvested | 58,216 | 550,496 | 30,880 | 284,377 |
| Repurchased | (484,435) | (4,658,188) | (398,328) | (3,718,939) |
| Net increase | 782,985 | $7,652,355 | 3,447,915 | $32,293,700 |
| Class I shares | ||||
| Sold | 31,546,389 | $299,391,058 | 19,098,047 | $180,093,293 |
| Distributions reinvested | 770,734 | 7,289,590 | 468,780 | 4,324,243 |
| Repurchased | (5,729,296) | (54,843,387) | (7,200,716) | (67,155,686) |
| Net increase | 26,587,827 | $251,837,261 | 12,366,111 | $117,261,850 |
| Class R2 shares1 | ||||
| Sold | 10,163 | $100,000 | — | — |
| Net increase | 10,163 | $100,000 | — | — |
| Class R6 shares2 | ||||
| Sold | 3,944 | $36,833 | 10,764 | $100,000 |
| Distributions reinvested | 54 | 507 | — | — |
| Repurchased | (8) | (78) | — | — |
| Net increase | 3,990 | $37,262 | 10,764 | $100,000 |
| Class NAV shares | ||||
| Sold | 2,530,348 | $24,446,475 | 86,174,622 | $787,875,241 |
| Distributions reinvested | 2,004,661 | 19,086,450 | 1,163,218 | 10,611,958 |
| Repurchased | (17,172,792) | (164,989,459) | (808,409) | (7,833,228) |
| Net increase (decrease) | (12,637,783) | ($121,456,534) | 86,529,431 | $790,653,971 |
| Net increase | 17,173,973 | $161,948,270 | 119,021,516 | $1,095,081,829 |
1 Period from 3-1-12 (inception date) to 8-31-12.
2 The inception date for Class R6 shares is 9-1-11.
Affiliates of the Fund owned 100%, 73% and 100% of shares of beneficial interest of Class R2, Class R6 and Class NAV, respectively, on August 31, 2012.
| 28 | Global Shareholder Yield Fund | Semiannual report |
Note 6 — Purchase and sale of securities
Purchases and sales of securities, other than short-term securities, aggregated $268,090,761 and $134,655,432, respectively, for the six months ended August 31, 2012.
Note 7 — Investment by affiliated funds
Certain investors in the Fund are affiliated funds and are managed by the Adviser and its affiliates. The affiliated funds do not invest in the Fund for the purpose of exercising management or control; however, this investment may represent a significant portion of the Fund’s net assets. For the six months ended August 31, 2012, the following funds had an affiliate ownership concentration of 5% or more of the Fund’s net assets:
| AFFILIATED | |||
| FUND | CONCENTRATION | ||
| Lifestyle Balanced Portfolio | 16.5% | ||
| Lifestyle Growth Portfolio | 16.7% | ||
| Semiannual report | Global Shareholder Yield Fund | 29 |
Board Consideration of and Continuation of Investment Advisory Agreement and Subadvisory Agreement
The Board of Trustees (the Board, the members of which are referred to as Trustees) of John Hancock Global Shareholder Yield Fund (the Fund), a series of John Hancock Funds III, met in-person on May 6–8, and June 3–5, 2012 to consider the approval of the Fund’s investment advisory agreement (the Advisory Agreement) with John Hancock Investment Management Services, LLC (the Adviser), the Fund’s investment adviser. The Board also considered the approval of the investment subadvisory agreement (the Subadvisory Agreement) between the Adviser and Epoch Investment Partners, Inc. (the Subadviser) on behalf of the Fund. The Advisory Agreement and the Subadvisory Agreement are referred to as the Agreements.
Activities and composition of the Board
On June 3–5, 2012, the Board consisted of nine individuals, seven of whom were Independent Trustees. Independent Trustees are generally those individuals who are not employed by or have any significant business or professional relationship with the Adviser or the Subadviser. The Trustees are responsible for the oversight of operations of the Fund and perform various duties required of directors of investment companies by the Investment Company Act of 1940, as amended (the 1940 Act). The Independent Trustees have independent legal counsel to assist them in connection with their duties. The Board has appointed an Independent Trustee as Chairman. On June 3–5, 2012, the Board had four standing committees that were composed entirely of Independent Trustees: the Audit Committee; the Compliance Committee; the Nominating, Governance and Administration Committee; and the Contracts & Operations Committee. Additionally, on June 3–5, 2012, Investment Performance Committees A and B were standing committees of the Board composed of Independent Trustees and one Trustee who is affiliated with the Adviser. Investment Performance Committee A was responsible for overseeing and monitoring matters relating to the investment performance of the Fund. The Board also designated an Independent Trustee as Vice Chairman to serve in the absence of the Chairman. The Board also designates working groups or ad hoc committees as it deems appropriate.
The approval process
Under the 1940 Act, the Board is required to consider the continuation of the Agreements each year. Throughout the year, the Board, acting directly and through its committees, regularly reviews and assesses the quality of the services that the Fund receives under these Agreements. The Board reviews reports of the Adviser at least quarterly, which include Fund performance reports and compliance reports. In addition, the Board meets with portfolio managers and senior investment officers at various times throughout the year. The Board considers at each of its meetings factors that are relevant to its annual consideration of the renewal of the Agreements, including the services and support provided by the Adviser and Subadviser to the Fund and its shareholders.
Prior to the May 6–8, 2012 meeting, the Board requested and received materials specifically relating to the Agreements. The materials provided in connection with the May meeting included information compiled and prepared by Lipper, a Thomson Reuters company (Lipper), on Fund fees and expenses, and the investment performance of the Fund. This Fund information is assembled in a format that permits comparison with similar information from a Category and a subset of the Category referred to as the Expense Group, each as determined by Lipper, and with the Fund’s benchmark index. The Category includes all funds that invest similarly to the way the Fund invests. The Expense Group represents funds of similar size, excluding passively managed funds and funds-of-funds. The Fund’s benchmark index is an unmanaged index of securities that is provided as a basis for comparison with the Fund’s performance. Other material provided for the Fund review included (a) information on the profitability of the Agreements to the Adviser and a discussion of any additional benefits to the Adviser or Subadviser or their affiliates that result from being the Adviser or Subadviser to the Fund; (b) a general analysis provided by the Adviser and the Subadviser concerning investment advisory fees charged to other clients, such as
| 30 | Global Shareholder Yield Fund | Semiannual report |
institutional clients and other investment companies, having similar investment mandates, as well as the performance of those other clients and a comparison of the services provided to those other clients and the services provided to the Fund; (c) the impact of economies of scale; (d) a summary of aggregate amounts paid by the Fund to the Adviser; and (e) sales and redemption data regarding the Fund’s shares.
At an in-person meeting held on May 6–8, 2012, the Board reviewed materials relevant to its consideration of the Agreements. As a result of the discussions that occurred during the May 6–8, 2012 meeting, the Board asked the Adviser for additional information on certain matters. The Adviser provided the additional information and the Board also considered this information as part of its consideration of the Agreements.
At an in-person meeting held on June 3–5, 2012, the Board, including the Independent Trustees, formally considered the continuation of the Advisory Agreement and the Subadvisory Agreement, each for an additional one-year term. The Board considered what it believed were key relevant factors that are described under separate headings presented below.
The Board also considered other matters important to the approval process, such as payments made to and by the Adviser or its affiliates relating to the distribution of Fund shares and other services. The Board reviewed services related to the valuation and pricing of Fund portfolio holdings. Other important matters considered by the Board were the direct and indirect benefits to the Adviser, the Subadviser and their affiliates from their relationship with the Fund and advice from independent legal counsel with respect to the review process and materials submitted for the Board’s review.
Nature, extent and quality of services
The Board reviewed the nature, extent and quality of services provided by the Adviser and the Subadviser, including the investment advisory services and the resulting performance of the Fund.
The Board considered the ability of the Adviser and the Subadviser, based on their resources, reputation and other attributes, to attract and retain qualified investment professionals, including research, advisory and supervisory personnel. It considered the background and experience of senior management and investment professionals responsible for managing the Fund. The Board considered the investment philosophy, research and investment decision-making processes of the Subadviser responsible for the daily investment activities of the Fund, including, among other things, portfolio trading capabilities, use of technology, commitment to compliance and approach to training and retaining portfolio managers and other research, advisory and management personnel.
The Board considered the Subadviser’s history and experience providing investment services to the Fund. The Board considered the Adviser’s investment manager analytical capabilities, market and economic knowledge and execution of its Subadviser oversight responsibilities. The Board further considered the culture of compliance, resources dedicated to compliance, compliance programs, record of compliance with applicable laws and regulation, with the Fund’s investment policies and restrictions and with the applicable Code of Ethics, and the responsibilities of the Adviser’s and Subadviser’s compliance departments.
In addition to advisory services, the Board considered the quality of the administrative and non-investment advisory services provided to the Fund by the Adviser under a separate agreement. The Board noted that the Adviser and its affiliates provide the Fund with certain administrative, transfer agency, shareholder and other services (in addition to any such services provided to the Fund by third parties) and officers and other personnel as are necessary for the operations of the Fund. The Board reviewed the structure and duties of the Adviser’s administration, accounting, legal and compliance departments and its affiliate’s transfer agency operations and considered the
| Semiannual report | Global Shareholder Yield Fund | 31 |
Adviser’s and its affiliates’ policies and procedures for assuring compliance with applicable laws and regulations.
The Board also received information about the nature, extent and quality of services provided by and fee rates charged by the Adviser and Subadviser to their other clients, including other registered investment companies, institutional investors and separate accounts. The Board reviewed a general analysis provided by the Adviser and the Subadviser concerning investment advisory fees charged to other clients having similar investment mandates, the services provided to those other clients as compared to the services provided to the Fund, the performance of those other clients as compared to the performance by the Fund and other factors relating to those other clients. The Board considered the significant differences between the Adviser’s and Subadviser’s services to the Fund and the services they provide to other clients. For other clients that are not mutual funds, the differences in services relate to the greater share purchase and redemption activity in a mutual fund, the generally higher turnover of mutual fund portfolio holdings, the more burdensome regulatory and legal obligations of mutual funds and the higher marketing costs for mutual funds. When compared to all clients including mutual funds, the Adviser has greater oversight and supervisory responsibility for the Fund and undertakes greater entrepreneurial risk as the sponsor of the Fund.
Fund performance
The Board was provided with reports, independently prepared by Lipper, which included a comprehensive analysis of the Fund’s performance. The Board also examined materials discussing Fund performance and the Fund’s investment objective, strategies and outlook. The Board also reviewed a narrative and statistical analysis of the Lipper data that was prepared by the Adviser, which analyzed various factors that may affect the Lipper rankings. The Board reviewed information regarding the investment performance of the Fund as compared to its Lipper Category as well as its benchmark index (see chart below). The Board was provided with a description of the methodology used by Lipper to select the funds in the Category. The Board also considered updated performance information provided by the Adviser at its May and June 2012 meetings. The Board regularly reviews the performance of the Fund throughout the year and attaches more importance to performance over relatively longer periods of time, typically three to five years.
Set forth below is the performance of the Fund over certain time periods ended December 31, 2011 and that of its Category average and benchmark index over the same periods:
| SINCE | ||||
| 1 YEAR | 3 YEAR | 5 YEAR | INCEPTION | |
| Global Shareholder Yield Fund | 5.33% | 13.15% | — | 0.89% |
| Class A Shares | ||||
| Global Multi-Cap Core Category Average | –6.59% | 13.34% | — | –2.31% |
| MSCI World GD Index | –5.02% | 11.75% | — | –2.44% |
The Board noted that the Fund’s performance compared favorably to the Category’s average performance and the benchmark index’s performance for all periods shown.
Expenses and fees
The Board, including the Independent Trustees, reviewed the Fund’s contractual advisory fee rate payable by the Fund to the Adviser as compared with the other funds in its Expense Group. The Board also received information about the investment subadvisory fee rate payable by the Adviser to the Subadviser for investment subadvisory services. The Board considered the services provided and the fees charged by the Adviser and the Subadviser to other clients with similar investment mandates, including other registered investment companies, institutional investors and separate accounts.
In addition, the Board considered the cost of the services provided to the Fund by the Adviser. The Board received and considered expense information regarding the Fund’s various components,
| 32 | Global Shareholder Yield Fund | Semiannual report |
including advisory fees, distribution fees and fees other than advisory and distribution fees, including transfer agent fees, custodian fees, administration fees and other miscellaneous fees (e.g., fees for accounting and legal services). The Board considered comparisons of these expenses to the Expense Group median. The Board also considered expense information regarding the Fund’s total operating expense ratio (Gross Expense Ratio) and, if different, the Fund’s total operating expense ratio after taking into account any fee waiver or expense waiver agreement by the Adviser (Net Expense Ratio). The Board considered information comparing the Gross Expense Ratio and Net Expense Ratio of the Fund to that of the Expense Group median.
The Board noted that the Fund’s advisory fee ratio was ten basis points above the Expense Group median advisory fee ratio. The Board noted the following information about the Fund’s Gross and Net Expense Ratios for Class A shares contained in the Fund’s 2011 financial statements in relation with the Fund’s Expense Group median provided by Lipper in April 2012:
| FUND — CLASS A SHARES | EXPENSE GROUP MEDIAN | |
| Advisory Fee Ratio | 0.88% | 0.78% |
| Gross Expense Ratio | 1.48% | 1.47% |
| Net Expense Ratio | 1.41% | 1.40% |
The Board viewed favorably the Adviser’s and Subadviser’s contractual agreement to make certain voluntary fee waivers permanent. The Board favorably considered the impact of this contractual waiver toward lowering the Fund’s Gross Expense Ratio.
The Board received and reviewed statements relating to the Adviser’s financial condition and was also provided with a profitability analysis that detailed the revenues earned and the expenses incurred by the Adviser for services under the Advisory Agreement, as well as from other relationships between the Fund and the Adviser and its affiliates. The Board reviewed the Adviser’s profitability with respect to the Fund and other funds the Board currently oversees for the year ended December 31, 2011 compared to available aggregate profitability data provided for the year ended December 31, 2010. The Board reviewed the Adviser’s profitability with respect to other fund complexes managed by the Adviser and/or its affiliates. The Board reviewed the Adviser’s assumptions and methodology of allocating expenses in the profitability analysis, noting the inherent limitations in allocating costs among various advisory products.
The Board also considered a comparison of the Adviser’s profitability to that of a limited number of other investment advisers whose profitability information is publicly available. The Board recognized that profitability may be affected by numerous factors including, among other things, fee waivers and expense reimbursements by the Adviser, the types of funds managed, expense allocations and business mix, and therefore comparability of profitability is limited.
The Board did not consider profitability information with respect to the Subadviser, which is not affiliated with the Adviser. The Board considered that the subadvisory fee under the Subadvisory Agreement had been negotiated by the Adviser and the Subadviser on an arm’s length basis. For this reason, the Subadviser’s separate profitability from its relationship with the Fund was not a factor in determining whether to renew the Subadvisory Agreement. In evaluating overall fees for investment management, the Board recognized the inherently higher cost structure of subadvised funds.
Economies of scale
The Board, including the Independent Trustees, considered the extent to which economies of scale might be realized as the assets of the Fund increase. Possible changes in the advisory fee rate or structure in order to enable the Fund to participate in these economies of scale (e.g., through the use of breakpoints in the advisory fee at higher asset levels) are periodically discussed. The Board also considered the Adviser’s overall operations and its ongoing investment in its business in order to expand the scale of, and improve the quality of, its operations that benefit the Fund.
| Semiannual report | Global Shareholder Yield Fund | 33 |
The Board recognized the inherent limitations of any analysis of economies of scale, stemming largely from the Board’s understanding that most of the Adviser’s costs are not specific to individual funds, but rather are incurred across a variety of products and services. To ensure that any economies are reasonably shared with the Fund as its assets increase, the Adviser and the Board agreed to continue the existing breakpoints to the contractual advisory fee rate.
Other benefits to the Adviser and the Subadviser
The Board understands that the Adviser, the Subadviser or their affiliates may derive other ancillary benefits from their relationship with the Fund, both tangible and intangible, such as their ability to leverage investment professionals who manage other portfolios, an increase in their profile in the investment advisory community and, in the case of the Adviser, the engagement of its affiliates and/or significant shareholders as service providers to the Fund, including for administrative, transfer agency and distribution services. The Board believes that certain of these benefits are difficult to quantify. The Board also was informed that the Subadviser may use third-party research obtained by soft dollars generated by certain mutual fund transactions to assist itself in managing all or a number of its other client accounts.
Board determination
The Board unanimously approved the continuation of the Advisory Agreement and the Subadvisory Agreement each for an additional one-year term. Based upon its evaluation of relevant factors in their totality, the Board was satisfied that the terms of the Agreements, including the advisory and subadvisory fee rates, were fair and reasonable and in the best interest of the Fund and its shareholders. In arriving at its decision to approve the Agreements, the Board did not identify any single factor or any group of factors as all-important or controlling, but considered all factors together. Different Trustees may have attributed different weights to the various factors considered. The Independent Trustees were also assisted by independent legal counsel in making this determination. The Trustees’ conclusions may be based in part on their consideration of these arrangements in prior years and on their ongoing regular review of Fund performance and operations throughout the year.
| 34 | Global Shareholder Yield Fund | Semiannual report |
More information
| Trustees | Investment adviser |
| Steven R. Pruchansky,* Chairman | John Hancock Investment Management |
| William H. Cunningham | Services, LLC |
| Deborah C. Jackson | |
| Hugh McHaffie† | Subadviser |
| Dr. John A. Moore,* Vice Chairman | Epoch Investment Partners, Inc. |
| Gregory A. Russo* | |
| John G. Vrysen† | Principal distributor |
| John Hancock Funds, LLC | |
| Officers | |
| Hugh McHaffie | Custodian |
| President | State Street Bank and Trust Company |
| Andrew G. Arnott | Transfer agent |
| Executive Vice President | John Hancock Signature Services, Inc. |
| Thomas M. Kinzler | Legal counsel |
| Secretary and Chief Legal Officer | K&L Gates LLP |
| Francis V. Knox, Jr. | |
| Chief Compliance Officer | |
| Charles A. Rizzo | |
| Chief Financial Officer | |
| Salvatore Schiavone | |
| Treasurer | |
| *Member of the Audit Committee | |
| †Non-Independent Trustee | |
The Fund’s proxy voting policies and procedures, as well as the Fund’s proxy voting record for the most recent twelve-month period ended June 30, are available free of charge on the Securities and Exchange Commission (SEC) Web site at www.sec.gov or on our Web site.
The Fund’s complete list of portfolio holdings, for the first and third fiscal quarters, is filed with the SEC on Form N-Q. The Fund’s Form N-Q is available on our Web site and the SEC’s Web site, www.sec.gov, and can be reviewed and copied (for a fee) at the SEC’s Public Reference Room in Washington, DC. Call 1-202-551-8090 to receive information on the operation of the SEC’s Public Reference Room.
We make this information on your fund, as well as monthly portfolio holdings, and other fund details available on our Web site at www.jhfunds.com or by calling 1-800-225-5291.
| You can also contact us: | ||
| 1-800-225-5291 | Regular mail: | Express mail: |
| jhfunds.com | John Hancock Signature Services, Inc. | John Hancock Signature Services, Inc. |
| P.O. Box 55913 | Mutual Fund Image Operations | |
| Boston, MA 02205-5913 | 30 Dan Road | |
| Canton, MA 02021 |
| Semiannual report | Global Shareholder Yield Fund | 35 |

1-800-225-5291
1-800-554-6713 TDD
1-800-338-8080 EASI-Line
www.jhfunds.com
Now available: electronic delivery
www.jhfunds.com/edelivery
| This report is for the information of the shareholders of John Hancock Global Shareholder Yield Fund. | 320SA 8/12 |
| It is not authorized for distribution to prospective investors unless preceded or accompanied by a prospectus. | 10/12 |
ITEM 2. CODE OF ETHICS.
Not applicable at this time.
ITEM 3. AUDIT COMMITTEE FINANCIAL EXPERT.
Not applicable at this time.
ITEM 4. PRINCIPAL ACCOUNTANT FEES AND SERVICES.
Not applicable at this time.
ITEM 5. AUDIT COMMITTEE OF LISTED REGISTRANTS.
Not applicable at this time.
ITEM 6. SCHEDULE OF INVESTMENTS.
(a) This schedule is included as part of the Report to shareholders filed under Item 1 of this form.
(b) Not applicable.
ITEM 7. DISCLOSURE OF PROXY VOTING POLICIES AND PROCEDURES FOR CLOSED-END MANAGEMENT INVESTMENT COMPANIES.
Not applicable.
ITEM 8. PORTFOLIO MANAGERS OF CLOSED-END MANAGEMENT INVESTMENT COMPANIES.
Not applicable.
ITEM 9. PURCHASES OF EQUITY SECURITIES BY CLOSED-END MANAGEMENT INVESTMENT COMPANY AND AFFILIATED PURCHASERS.
Not applicable.
ITEM 10. SUBMISSION OF MATTERS TO A VOTE OF SECURITY HOLDERS.
Not applicable.
ITEM 11. CONTROLS AND PROCEDURES.
(a) EVALUATION OF DISCLOSURE CONTROLS AND PROCEDURES. The registrant maintains disclosure controls and procedures that are designed to ensure that information required to be disclosed in this Form N-CSR is recorded, processed, summarized and reported within the time periods specified in the rules and forms of the Securities and Exchange Commission. Such disclosure and procedures include controls and procedures designed to ensure that such information is accumulated and communicated to the registrant’s management, including its principal executive officer and principal financial officer, as appropriate, to allow timely decisions regarding required disclosure.
Within 90 days prior to the filing date of this Form N-CSR, the registrant had carried out an evaluation, under the supervision and with the participation of the registrant’s management, including the registrant’s principal executive officer and the registrant’s principal financial officer, of the effectiveness of the design and operation of the registrant’s disclosure controls and
procedures relating to information required to be disclosed on Form N-CSR. Based on such evaluation, the registrant’s principal executive officer and principal financial officer concluded that the registrant’s disclosure controls and procedures are operating effectively to ensure that:
(i) information required to be disclosed in this Form N-CSR is recorded, processed, summarized and reported within the periods specified in the rules and forms of the Securities and Exchange Commission, and
(ii) information is accumulated and communicated to the registrant’s management, including its principal executive officer and principal financial officer, as appropriate, to allow timely decisions regarding required disclosure.
(b) CHANGE IN REGISTRANT’S INTERNAL CONTROL: Not applicable.
ITEM 12. EXHIBITS.
(a) The certification required by Rule 30a-2(a) under the 1940 Act.
(b) The certification required by Rule 30a-2(b) under the 1940 Act.
(c) Contact person at the registrant.
| SIGNATURES |
Pursuant to the requirements of the Securities Exchange Act of 1934 and the Investment Company Act of 1940, the registrant has duly caused this report to be signed on its behalf by the undersigned, thereunto duly authorized.
| John Hancock Funds III | |
| By: | /s/ Hugh McHaffie |
| ------------------------------ | |
| Hugh McHaffie | |
| President | |
| Date: | October 19, 2012 |
Pursuant to the requirements of the Securities Exchange Act of 1934 and the Investment Company Act of 1940, this report has been signed below by the following persons on behalf of the registrant and in the capacities and on the dates indicated.
| By: | /s/ Hugh McHaffie |
| ------------------------------- | |
| Hugh McHaffie | |
| President | |
| Date: | October 19, 2012 |
| By: | /s/ Charles A. Rizzo |
| -------------------------------- | |
| Charles A. Rizzo | |
| Chief Financial Officer | |
| Date: | October 19, 2012 |