| UNITED STATES | ||
| SECURITIES AND EXCHANGE COMMISSION | ||
| Washington, D.C. 20549 | ||
| FORM N-CSR | ||
| CERTIFIED SHAREHOLDER REPORT OF REGISTERED | ||
| MANAGEMENT INVESTMENT COMPANIES | ||
| Investment Company Act file number 811-21777 | ||
| John Hancock Funds III | ||
| (Exact name of registrant as specified in charter) | ||
| 601 Congress Street, Boston, Massachusetts 02210 | ||
| (Address of principal executive offices) (Zip code) | ||
| Salvatore Schiavone | ||
| Treasurer | ||
| 601 Congress Street | ||
| Boston, Massachusetts 02210 | ||
| (Name and address of agent for service) | ||
| Registrant's telephone number, including area code: 617-663-4497 | ||
| Date of fiscal year end: | March 31 | |
| Date of reporting period: | September 30, 2010 | |
A look at performance
For the period ended September 30, 2010
| Average annual total returns (%) | Cumulative total returns (%) | |||||||
| with maximum sales charge (POP) | with maximum sales charge (POP) | |||||||
| 1-year | 5-year | 10-year | 6-months | 1-year | 5-year | 10-year | ||
| Class A1 | 6.03 | 0.04 | –4.14 | –5.09 | 6.03 | 0.22 | –34.47 | |
| Class B1 | 5.76 | –0.39 | –4.78 | –5.47 | 5.76 | –1.92 | –38.71 | |
| Class C1 | 9.76 | 0.02 | –4.78 | –1.49 | 9.76 | 0.08 | –38.71 | |
| Class I1,2 | 12.11 | 1.42 | –3.34 | 0.11 | 12.11 | 7.32 | –28.77 | |
| Class R11,2 | 11.13 | 0.40 | –4.40 | –0.33 | 11.13 | 2.01 | –36.26 | |
| Class R31,2 | 11.23 | 0.51 | –4.30 | –0.27 | 11.23 | 2.55 | –35.60 | |
| Class R41,2 | 11.55 | 0.80 | –4.02 | –0.16 | 11.55 | 4.08 | –33.64 | |
| Class R51,2 | 11.93 | 1.12 | –3.72 | 0.05 | 11.93 | 5.70 | –31.59 | |
| Class T1,2 | 5.69 | –0.60 | –4.79 | –5.26 | 5.69 | –2.96 | –38.77 | |
| Class ADV1,2 | 11.84 | 1.16 | –3.58 | –0.05 | 11.84 | 5.96 | –30.55 | |
| Class NAV1,2 | 12.17 | 1.50 | –3.25 | 0.11 | 12.17 | 7.71 | –28.16 | |
Performance figures assume all distributions are reinvested. Public offering price (POP) figures reflect maximum sales charge on Class A and Class T shares of 5%, and the applicable contingent deferred sales charge (CDSC) on Class B and Class C shares. The Class B shares’ CDSC declines annually between years 1 to 6 according to the following schedule: 5, 4, 3, 3, 2, 1%. No sales charge will be assessed after the sixth year. Class C shares held for less than one year are subject to a 1% CDSC. Sales charges are not applicable for Class I, R1, R3, R4, R5, ADV and NAV shares.
The expense ratios of the Fund, both net (including any fee waivers or expense limitations) and gross (excluding any fee waivers or expense limitations), are set forth according to the most recent publicly available prospectuses for the Fund and may differ from the expense ratios disclosed in the Financial Highlights tables in this report. The waivers and expense limitations are contractual at least until 7-31-11. The net expenses are as follows: Class A —1.35%, Class B — 2.10%, Class C — 2.10%, Class R1 — 1.69%, Class R3 — 1.59%, Class R4 — 1.29%, Class R5 — 0.99%, Class T — 1.40% and Class ADV — 1.14%. Had the fee waivers and expense limitations not been in place, the gross expenses would be as follows: Class A — 1.39%, Class B — 2.15%, Class C — 2.27%, Class R1 — 13.21%, Class R3 — 12.58%, Class R4 — 12.23%, Class R5 — 11.87%, Class T — 1.43% and Class ADV & #151; 1.41%. For other classes, the net expenses equal the gross expenses and are as follows: Class I —0.89% and Class NAV — 0.80%.
The returns reflect past results and should not be considered indicative of future performance. The return and principal value of an investment will fluctuate so that shares, when redeemed, may be worth more or less than their original cost. Due to market volatility, the Fund’s current performance may be higher or lower than the performance shown. For performance data current to the most recent month end, please call 1–800–225–5291 or visit the Fund’s Web site at www.jhfunds.com.
The performance table above and the chart on the next page do not reflect the deduction of taxes that a shareholder would pay on fund distributions or the redemption of fund shares. The Fund’s performance results reflect any applicable expense reductions, without which the expenses would increase and results would have been less favorable.
1 On 4-25-08, through a reorganization, the Fund acquired all of the assets of the Rainier Large Cap Growth Equity Portfolio (the predecessor fund). On that date, the predecessor fund offered its Original share class and Institutional share class in exchange for Class A and Class I shares, respectively, of the John Hancock Rainier Growth Fund. The inception date for Class A, B, C, I, R1, R3, R4, R5, ADV and NAV shares of the John Hancock Rainier Growth Fund is 4-28-08. The predecessor fund’s Original share class returns have been recalculated to reflect the gross fees and expenses of Class A shares. The returns for Class B, C, I, R1, R3, R4, R5, ADV and NAV shares prior to 4-28-08 are those of Class A shares that have been recalculated to apply the gross fees and expenses of Class B, C, I, R1, R3, R4, R5, ADV, and NAV shares, respectively. Class T shares were first offered 10-6-08; the returns prio r to this date are those of Class A shares that have been recalculated to apply the gross fees and expenses of Class T shares.
2 For certain types of investors, as described in the Fund’s Class I, R1, R3, R4, R5, T, ADV and NAV shares prospectuses.
| 6 | Rainier Growth Fund | Semiannual report |
| Period | Without | With maximum | |||
| beginning | sales charge | sales charge | Index 1 | Index 2 | |
| Class B1,3 | 9-30-00 | $6,129 | $6,129 | $7,046 | $9,577 |
| Class C1,3 | 9-30-00 | 6,129 | 6,129 | 7,046 | 9,577 |
| Class I1,4 | 9-30-00 | 7,123 | 7,123 | 7,046 | 9,577 |
| Class R11,4 | 9-30-00 | 6,374 | 6,374 | 7,046 | 9,577 |
| Class R31,4 | 9-30-00 | 6,440 | 6,440 | 7,046 | 9,577 |
| Class R41,4 | 9-30-00 | 6,636 | 6,636 | 7,046 | 9,577 |
| Class R51,4 | 9-30-00 | 6,841 | 6,841 | 7,046 | 9,577 |
| Class T1,4 | 9-30-00 | 6,446 | 6,123 | 7,046 | 9,577 |
| Class ADV1,4 | 9-30-00 | 6,945 | 6,945 | 7,046 | 9,577 |
| Class NAV1,4 | 9-30-00 | 7,184 | 7,184 | 7,046 | 9,577 |
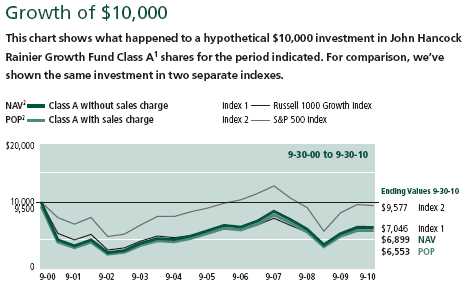
Assuming all distributions were reinvested for the period indicated, the table above shows the value of a $10,000 investment in the Fund’s Class B, C, I, R1, R3, R4, R5, T, ADV and NAV shares, respectively, as of 9-30-10. Performance of the classes will vary based on the difference in sales charges paid by shareholders investing in the different classes and the fee structure of those classes.
Russell 1000 Growth Index — Index 1 — is an unmanaged index containing those securities in the Russell 1000 Index with a greater-than-average growth orientation.
S&P 500 Index — Index 2 — is an unmanaged index that includes 500 widely traded common stocks.
It is not possible to invest directly in an index. Index figures do not reflect sales charges, which would have resulted in lower values if they did.
1 On 4-25-08, through a reorganization, the Fund acquired all of the assets of the Rainier Large Cap Growth Equity Portfolio (the predecessor fund). On that date, the predecessor fund offered its Original share class and Institutional share class in exchange for Class A and Class I shares, respectively, of the John Hancock Rainier Growth Fund. The inception date for Class A, B, C, I, R1, R3, R4, R5, ADV and NAV shares of the John Hancock Rainier Growth Fund is 4-28-08. The predecessor fund’s Original share class returns have been recalculated to reflect the gross fees and expenses of Class A shares. The returns for Class B, C, I, R1, R3, R4, R5, ADV and NAV shares prior to 4-28-08 are those of Class A shares that have been recalculated to apply the gross fees and expenses of Class B, C, I, R1, R3, R4, R5, ADV, and NAV shares, respectively. Class T shares were first offered 10-6-08; the returns prior t o this date are those of Class A shares that have been recalculated to apply the gross fees and expenses of Class T shares.
2 NAV represents net asset value and POP represents public offering price.
3 The contingent deferred sales charge, if any, is not applicable.
4 For certain types of investors, as described in the Fund’s Class I, R1, R3, R4, R5, T, ADV and NAV shares prospectuses.
| Semiannual report | Rainier Growth Fund | 7 |
Your expenses
These examples are intended to help you understand your ongoing operating expenses.
Understanding fund expenses
As a shareholder of the Fund, you incur two types of costs:
▪ Transaction costs which include sales charges (loads) on purchases or redemptions (varies by share class), minimum account fee charge, etc.
▪ Ongoing operating expenses including management fees, distribution and service fees (if applicable), and other fund expenses.
We are going to present only your ongoing operating expenses here.
Actual expenses/actual returns
This example is intended to provide information about your fund’s actual ongoing operating expenses, and is based on your fund’s actual return. It assumes an account value of $1,000.00 on April 1, 2010 with the same investment held until September 30, 2010.
| Account value | Ending value on | Expenses paid during | |
| on 4-1-10 | 9-30-10 | period ended 9-30-101 | |
| Class A | $1,000.00 | $998.90 | $6.76 |
| Class B | 1,000.00 | 995.00 | 10.50 |
| Class C | 1,000.00 | 995.00 | 10.50 |
| Class I | 1,000.00 | 1,001.10 | 4.36 |
| Class R1 | 1,000.00 | 996.70 | 8.76 |
| Class R3 | 1,000.00 | 997.30 | 8.11 |
| Class R4 | 1,000.00 | 998.40 | 6.61 |
| Class R5 | 1,000.00 | 1,000.50 | 5.12 |
| Class T | 1,000.00 | 997.30 | 8.16 |
| Class ADV | 1,000.00 | 999.50 | 5.71 |
| Class NAV | 1,000.00 | 1,001.10 | 4.11 |
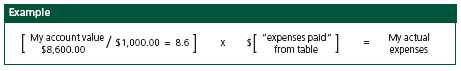
Together with the value of your account, you may use this information to estimate the operating expenses that you paid over the period. Simply divide your account value at September 30, 2010, by $1,000.00, then multiply it by the “expenses paid” for your share class from the table above. For example, for an account value of $8,600.00, the operating expenses should be calculated as follows:
| 8 | Rainier Growth Fund | Semiannual report |
Hypothetical example for comparison purposes
This table allows you to compare your fund’s ongoing operating expenses with those of any other fund. It provides an example of the Fund’s hypothetical account values and hypothetical expenses based on each class’s actual expense ratio and an assumed 5% annualized return before expenses (which is not your fund’s actual return). It assumes an account value of $1,000.00 on April 1, 2010, with the same investment held until September 30, 2010. Look in any other fund shareholder report to find its hypothetical example and you will be able to compare these expenses.
| Account value | Ending value on | Expenses paid during | |
| on 4-1-10 | 9-30-10 | period ended 9-30-101 | |
| Class A | $1,000.00 | $1,018.30 | $6.83 |
| Class B | 1,000.00 | 1,014.50 | 10.61 |
| Class C | 1,000.00 | 1,014.50 | 10.61 |
| Class I | 1,000.00 | 1,020.70 | 4.41 |
| Class R1 | 1,000.00 | 1,016.30 | 8.85 |
| Class R3 | 1,000.00 | 1,016.90 | 8.19 |
| Class R4 | 1,000.00 | 1,018.50 | 6.68 |
| Class R5 | 1,000.00 | 1,020.00 | 5.17 |
| Class T | 1,000.00 | 1,016.90 | 8.24 |
| Class ADV | 1,000.00 | 1,019.40 | 5.77 |
| Class NAV | 1,000.00 | 1,021.00 | 4.15 |
Remember, these examples do not include any transaction costs, therefore, these examples will not help you to determine the relative total costs of owning different funds. If transaction costs were included, your expenses would have been higher. See the prospectus for details regarding transaction costs.
1 Expenses are equal to the Fund’s annualized expense ratio of 1.35%, 2.10%, 2.10%, 0.87%, 1.75%, 1.62%, 1.32%,1.02%, 1.63%, 1.14% and 0.82% for Class A, Class B, Class C, Class I, Class R1, Class R3, Class R4, Class R5, Class T, Class ADV and Class NAV shares, respectively, multiplied by the average account value over the period, multiplied by 183/365 (to reflect the one-half year period).
| Semiannual report | Rainier Growth Fund | 9 |
Portfolio summary
| Top 10 Holdings1 | ||||
| Apple, Inc. | 5.5% | Microsoft Corp. | 2.4% | |
| Amazon.com, Inc. | 3.3% | Deere & Company | 2.3% | |
| Cisco Systems, Inc. | 2.7% | CSX Corp. | 2.2% | |
| Google, Inc., Class A | 2.6% | Oracle Corp. | 2.2% | |
| Cummins, Inc. | 2.4% | Precision Castparts Corp. | 2.1% | |
| Sector Composition2,3 | ||||
| Information Technology | 29% | Financials | 7% | |
| Industrials | 17% | Materials | 3% | |
| Consumer Discretionary | 15% | Telecommunication Services | 2% | |
| Health Care | 10% | Utilities | 1% | |
| Consumer Staples | 8% | Short-Term Investments & Other | 1% | |
| Energy | 7% | |||
1 As a percentage of net assets on 9-30-10. Cash and cash equivalents are not included in Top 10 Holdings.
2 As a percentage of net assets on 9-30-10.
3 Sector investing is subject to greater risks than the market as a whole. Because the Fund may focus on particular sectors of the economy, its performance may depend on the performance of those sectors.
| 10 | Rainier Growth Fund | Semiannual report |
Fund’s investments
As of 9-30-10 (unaudited)
| Shares | Value | |
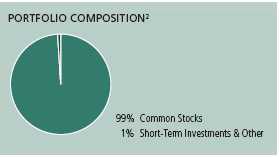
| Common Stocks 98.60% | $1,403,927,394 | |
| (Cost $1,185,948,059) | ||
| Consumer Discretionary 15.27% | 217,460,450 | |
| Hotels, Restaurants & Leisure 3.13% | ||
| Marriott International, Inc., Class A (L) | 734,690 | 26,323,944 |
| McDonald’s Corp. | 245,755 | 18,311,205 |
| Internet & Catalog Retail 4.14% | ||
| Amazon.com, Inc. (I) | 302,230 | 47,468,244 |
| priceline.com, Inc. (I) | 32,960 | 11,481,286 |
| Media 3.04% | ||
| DreamWorks Animation SKG, Inc. (I) | 196,250 | 6,262,338 |
| Scripps Networks Interactive, Inc., Class A | 369,730 | 17,591,753 |
| The Walt Disney Company | 584,690 | 19,359,086 |
| Multiline Retail 2.40% | ||
| Kohl’s Corp. (I) | 294,630 | 15,521,108 |
| Target Corp. | 348,100 | 18,602,464 |
| Specialty Retail 1.30% | ||
| Limited Brands, Inc. | 321,430 | 8,607,895 |
| Tiffany & Company (L) | 211,400 | 9,933,686 |
| Textiles, Apparel & Luxury Goods 1.26% | ||
| NIKE, Inc., Class B | 224,575 | 17,997,441 |
| Consumer Staples 7.81% | 111,233,973 | |
| Beverages 3.34% | ||
| PepsiCo, Inc. | 276,625 | 18,378,965 |
| The Coca-Cola Company | 498,870 | 29,193,872 |
| Food & Staples Retailing 1.39% | ||
| Costco Wholesale Corp. | 307,130 | 19,806,814 |
| Household Products 0.81% | ||
| Church & Dwight Company, Inc. | 178,005 | 11,559,645 |
| Personal Products 0.89% | ||
| Avon Products, Inc. | 396,475 | 12,730,812 |
| Tobacco 1.38% | ||
| Philip Morris International, Inc. | 349,230 | 19,563,865 |
| Energy 7.17% | 102,084,258 | |
| Energy Equipment & Services 3.58% | ||
| Halliburton Company | 854,550 | 28,259,969 |
| Schlumberger, Ltd. | 369,400 | 22,758,734 |
| See notes to financial statements | Semiannual report | Rainier Growth Fund | 11 |
| Shares | Value | |
| Oil, Gas & Consumable Fuels 3.59% | ||
| Concho Resources, Inc. (I) | 191,900 | $12,698,023 |
| Occidental Petroleum Corp. | 342,030 | 26,780,949 |
| Petrohawk Energy Corp. (I) | 717,880 | 11,586,583 |
| Financials 6.63% | 94,416,606 | |
| Capital Markets 2.18% | ||
| BlackRock, Inc. | 71,900 | 12,240,975 |
| Franklin Resources, Inc. | 176,535 | 18,871,592 |
| Consumer Finance 1.41% | ||
| American Express Company | 476,040 | 20,007,961 |
| Diversified Financial Services 3.04% | ||
| IntercontinentalExchange, Inc. (I) | 192,755 | 20,185,304 |
| JPMorgan Chase & Company | 607,060 | 23,110,774 |
| Health Care 10.15% | 144,577,267 | |
| Biotechnology 2.93% | ||
| Alexion Pharmaceuticals, Inc. (I) | 104,320 | 6,714,035 |
| Celgene Corp. (I) | 497,795 | 28,677,970 |
| Vertex Pharmaceuticals, Inc. (I)(L) | 183,510 | 6,343,941 |
| Health Care Equipment & Supplies 0.59% | ||
| ResMed, Inc. (I)(L) | 255,700 | 8,389,517 |
| Health Care Providers & Services 2.38% | ||
| AmerisourceBergen Corp. | 542,000 | 16,617,720 |
| Aveta, Inc. (I)(S) | 97,210 | 534,655 |
| Express Scripts, Inc. (I) | 342,790 | 16,693,873 |
| Pharmaceuticals 4.25% | ||
| Allergan, Inc. | 210,235 | 13,986,935 |
| Merck & Company, Inc. | 393,550 | 14,486,576 |
| Shire PLC, ADR (L) | 188,340 | 12,671,515 |
| Teva Pharmaceutical Industries, Ltd., SADR | 368,920 | 19,460,530 |
| Industrials 17.28% | 246,074,495 | |
| Aerospace & Defense 2.06% | ||
| Precision Castparts Corp. (L) | 229,930 | 29,281,586 |
| Air Freight & Logistics 3.48% | ||
| Expeditors International of Washington, Inc. (L) | 525,280 | 24,283,694 |
| FedEx Corp. (L) | 295,360 | 25,253,280 |
| Electrical Equipment 1.02% | ||
| AMETEK, Inc. | 302,930 | 14,470,966 |
| Industrial Conglomerates 2.01% | ||
| 3M Company | 330,555 | 28,662,424 |
| Machinery 6.53% | ||
| Bucyrus International, Inc. (L) | 221,050 | 15,329,818 |
| Cummins, Inc. | 378,170 | 34,254,639 |
| Danaher Corp. | 137,130 | 5,568,849 |
| Deere & Company | 459,520 | 32,065,306 |
| PACCAR, Inc. | 120,830 | 5,817,965 |
| 12 | Rainier Growth Fund | Semiannual report | See notes to financial statements |
| Shares | Value | |
| Road & Rail 2.18% | ||
| CSX Corp. | 561,930 | $31,085,968 |
| Information Technology 28.47% | 405,321,551 | |
| Communications Equipment 4.60% | ||
| BancTec, Inc. (I)(R) | 197,026 | 1,257,058 |
| Cisco Systems, Inc. (I) | 1,731,080 | 37,910,652 |
| F5 Networks, Inc. (I)(L) | 91,480 | 9,496,539 |
| Juniper Networks, Inc. (I)(L) | 556,405 | 16,886,892 |
| Computers & Peripherals 8.14% | ||
| Apple, Inc. (I) | 274,920 | 78,008,550 |
| EMC Corp. (I) | 1,159,905 | 23,557,671 |
| NetApp, Inc. (I)(L) | 288,240 | 14,351,470 |
| Internet Software & Services 2.61% | ||
| Google, Inc., Class A (I) | 70,690 | 37,168,095 |
| IT Services 2.56% | ||
| Cognizant Technology Solutions Corp., Class A (I) | 200,990 | 12,957,825 |
| Visa, Inc., Class A | 315,995 | 23,465,789 |
| Semiconductors & Semiconductor Equipment 1.69% | ||
| Broadcom Corp., Class A | 263,845 | 9,337,475 |
| Marvell Technology Group, Ltd. (I) | 837,270 | 14,660,598 |
| Software 8.87% | ||
| Adobe Systems, Inc. (I) | 337,720 | 8,831,378 |
| Autodesk, Inc. (I) | 403,410 | 12,897,018 |
| Check Point Software Technologies, Ltd. (I)(L) | 580,050 | 21,421,247 |
| Citrix Systems, Inc. (I) | 270,040 | 18,427,530 |
| Microsoft Corp. | 1,390,930 | 34,063,876 |
| Oracle Corp. | 1,140,480 | 30,621,888 |
| Materials 3.26% | 46,364,420 | |
| Chemicals 1.78% | ||
| FMC Corp. | 143,245 | 9,799,390 |
| Praxair, Inc. | 172,315 | 15,553,144 |
| Metals & Mining 1.48% | ||
| Freeport-McMoRan Copper & Gold, Inc. | 154,165 | 13,164,149 |
| Walter Energy, Inc. (L) | 96,540 | 7,847,737 |
| Telecommunication Services 1.76% | 25,026,157 | |
| Wireless Telecommunication Services 1.76% | ||
| American Tower Corp., Class A (I) | 488,220 | 25,026,157 |
| Utilities 0.80% | 11,368,217 | |
| Independent Power Producers & Energy Traders 0.80% | ||
| The AES Corp. (I) | 1,001,605 | 11,368,217 |
| See notes to financial statements | Semiannual report | Rainier Growth Fund | 13 |
| Par value | Value | ||
| Short-Term Investments 8.91% | $126,809,545 | ||
| (Cost $126,803,512) | |||
| Repurchase Agreement 0.83% | 11,842,000 | ||
| Repurchase Agreement with State Street Corp. dated 9-30-10 | |||
| at 0.010% to be repurchased at $11,842,003 on 10-1-10, | |||
| collateralized by $345,000 Federal Home Loan Bank, 2.000% | |||
| due 9-22-15 (valued at $345,431, including interest), $805,000 | |||
| Federal Home Loan Mortgage Corp., 2.500% due 1-14-16 | |||
| (valued at $813,050, including interest) and $10,910,000 | |||
| Federal National Mortgage Association, 2.000% due 9-21-15 | |||
| (valued at $10,923,638, including interest) | $11,842,000 | 11,842,000 | |
| Shares | Value | ||
| Securities Lending Collateral 8.08% | 114,967,545 | ||
| John Hancock Collateral Investment Trust (W) | 0.2942% (Y) | 11,486,646 | 114,967,545 |
| Total investments (Cost $1,312,751,571)† 107.51% | $1,530,736,939 | ||
| Other assets and liabilities, net (7.51%) | ($106,931,816) | ||
| Total net assets 100.00% | $1,423,805,123 | ||
| The percentage shown for each investment category is the total value of the category as a percentage of the net | |
| assets of the Fund. | |
| ADR | American Depositary Receipts |
| SADR | Sponsored American Depositary Receipts |
| (I) | Non-income producing security. |
| (L) | All or a portion of this security is on loan as of 9-30-10. |
| (R) | Direct placement securities are restricted to resale and the Fund has limited rights to registration under the |
| Securities Act of 1933. |
| Value as a percentage | Value as of | |||
| Issuer, description | Acquisition date | Acquisition cost | of Fund’s net assets | 9-30-10 |
| BancTec, Inc. | ||||
| common stock | 6-20-07 | $4,728,640 | 0.09% | $1,257,058 |
| (S) | These securities are exempt from registration under Rule 144A of the Securities Act of 1933. Such securities may |
| be resold, normally to qualified institutional buyers, in transactions exempt from registration. | |
| (W) | Investment is an affiliate of the Fund, the adviser and/or subadviser. Also, it represents the investment of |
| securities lending collateral received. | |
| (Y) | The rate shown is the annualized seven-day yield as of 9-30-10. |
| † | At 9-30-10, the aggregate cost of investment securities for federal income tax purposes was $1,334,658,956. |
| Net unrealized appreciation aggregated $196,077,983, of which $239,186,034 related to appreciated investment | |
| securities and $43,108,051 related to depreciated investment securities. |
| 14 | Rainier Growth Fund | Semiannual report | See notes to financial statements |
F I N A N C I A L S T A T E M E N T S
Financial statements
Statement of assets and liabilities 9-30-10 (unaudited)
This Statement of Assets and Liabilities is the Fund’s balance sheet. It shows the value of what the Fund owns, is due and owes. You’ll also find the net asset value and the maximum public offering price per share.
| Assets | |
| Investments in unaffiliated issuers, at value (Cost $1,185,948,059) | |
| including $112,056,701 of securities loaned (Note 2) | $1,403,927,394 |
| Investments in affiliated issuers, at value (Cost $114,961,512) (Note 2) | 114,967,545 |
| Repurchase agreements, at value (Cost $11,842,000) (Note 2) | 11,842,000 |
| Total investments, at value (Cost $1,312,751,571) | 1,530,736,939 |
| Cash | 977 |
| Receivable for investments sold | 17,768,467 |
| Receivable for fund shares sold | 665,959 |
| Dividends and interest receivable | 1,204,161 |
| Receivable for securities lending income | 18,353 |
| Other receivables and prepaid assets | 220,324 |
| Total assets | 1,550,615,180 |
| Liabilities | |
| Payable for investments purchased | 10,371,840 |
| Payable for fund shares repurchased | 1,103,557 |
| Payable upon return of securities loaned (Note 2) | 114,987,809 |
| Payable to affiliates | |
| Accounting and legal services fees | 17,884 |
| Transfer agent fees | 95,932 |
| Distribution and service fees | 1,219 |
| Trustees’ fees | 73,280 |
| Payable to adviser | 388 |
| Other liabilities and accrued expenses | 158,148 |
| Total liabilities | 126,810,057 |
| Net assets | |
| Capital paid-in | $1,922,484,923 |
| Undistributed net investment income | 406,199 |
| Accumulated net realized loss on investments | (717,071,752) |
| Net unrealized appreciation on investments and translation of assets and | |
| liabilities in foreign currencies | 217,985,753 |
| Net assets | $1,423,805,123 |
| See notes to financial statements | Semiannual report | Rainier Growth Fund | 15 |
F I N A N C I A L S T A T E M E N T S
Statement of assets and liabilities (continued)
| Net asset value per share | |
| Based on net asset values and shares outstanding — the Fund has an | |
| unlimited number of shares authorized with no par value | |
| Class A ($377,149,471 ÷ 20,624,663 shares) | $18.29 |
| Class B ($30,504,513 ÷ 1,694,078 shares)1 | $18.01 |
| Class C ($20,911,383 ÷ 1,161,418 shares)1 | $18.01 |
| Class I ($196,000,847 ÷ 10,583,002 shares) | $18.52 |
| Class R1 ($177,115 ÷ 9,748 shares) | $18.17 |
| Class R3 ($81,129 ÷ 4,452 shares) | $18.22 |
| Class R4 ($81,722 ÷ 4,452.36 shares) | $18.35 |
| Class R5 ($82,319 ÷ 4,455.66 shares) | $18.48 |
| Class T ($76,090,384 ÷ 4,183,528 shares) | $18.19 |
| Class ADV ($16,337,512 ÷ 887,011 shares) | $18.42 |
| Class NAV ($706,388,728 ÷ 38,120,369 shares) | $18.53 |
| Maximum offering price per share | |
| Class A (net asset value per share ÷ 95%)2 | $19.25 |
| Class T (net asset value per share ÷ 95%)2 | $19.15 |
1 Redemption price per share is equal to the net asset value less any applicable contingent deferred sales charge.
2 On single retail sales of less than $50,000. On sales of $50,000 or more and on group sales the offering price is reduced.
| 16 | Rainier Growth Fund | Semiannual report | See notes to financial statements |
F I N A N C I A L S T A T E M E N T S
Statement of operations For the six-month period ended 9-30-10 (unaudited)
This Statement of Operations summarizes the Fund’s investment income earned and expenses incurred in operating the Fund. It also shows net gains (losses) for the period stated.
| Investment income | |
| Dividends | $6,849,130 |
| Securities lending | 75,459 |
| Interest | 22,703 |
| Less foreign taxes withheld | (6,146) |
| Total investment income | 6,941,146 |
| Expenses | |
| Investment management fees (Note 4) | 5,175,630 |
| Distribution and service fees (Note 4) | 855,646 |
| Accounting and legal services fees (Note 4) | 111,349 |
| Transfer agent fees (Note 4) | 850,483 |
| Trustees’ fees (Note 4) | 58,649 |
| State registration fees (Note 4) | 39,347 |
| Printing and postage (Note 4) | 22,640 |
| Professional fees | 138,559 |
| Custodian fees | 98,394 |
| Registration and filing fees | 20,756 |
| Other | 22,625 |
| Total expenses | 7,394,078 |
| Less expense reductions (Note 4) | (67,524) |
| Net expenses | 7,326,554 |
| Net investment loss | (385,408) |
| Realized and unrealized gain (loss) | |
| Net realized gain (loss) on | |
| Investments in unaffiliated issuers | 31,008,682 |
| Investments in affiliated issuers | (17,871) |
| 30,990,811 | |
| Change in net unrealized appreciation (depreciation) of | |
| Investments in unaffiliated issuers | (31,547,675) |
| Investments in affiliated issuers | 8,048 |
| Translation of assets and liabilities in foreign currencies | 155 |
| (31,539,472) | |
| Net realized and unrealized loss | (548,661) |
| Decrease in net assets from operations | ($934,069) |
| See notes to financial statements | Semiannual report | Rainier Growth Fund | 17 |
F I N A N C I A L S T A T E M E N T S
Statements of changes in net assets
These Statements of Changes in Net Assets show how the value of the Fund’s net assets has changed during the last two periods. The difference reflects earnings less expenses, any investment gains and losses, distributions, if any, paid to shareholders and the net of Fund share transactions.
| Six months | ||||
| ended | Year | |||
| 9-30-10 | ended | |||
| (Unaudited) | 3-31-10 | |||
| Increase (decrease) in net assets | ||||
| From operations | ||||
| Net investment income (loss) | ($385,408) | $837,443 | ||
| Net realized gain (loss) | 30,990,811 | (35,593,479) | ||
| Change in net unrealized appreciation (depreciation) | (31,539,472) | 446,159,707 | ||
| Increase (decrease) in net assets resulting from operations | (934,069) | 411,403,671 | ||
| Distributions to shareholders | ||||
| From net investment income | ||||
| Class I | — | (8,940) | ||
| Class R5 | — | (1) | ||
| Class NAV | — | (33,551) | ||
| Total distributions | — | (42,492) | ||
| From Fund share transactions (Note 5) | (37,746,826) | 194,788,353 | ||
| Total increase (decrease) | (38,680,895) | 606,149,532 | ||
| Net assets | ||||
| Beginning of period | 1,462,486,018 | 856,336,486 | ||
| End of period | $1,423,805,123 | $1,462,486,018 | ||
| Undistributed net investment income | $406,199 | $791,607 | ||
| 18 | Rainier Growth Fund | Semiannual report | See notes to financial statements |
Financial highlights
The Financial Highlights show how the Fund’s net asset value for a share has changed since the end of the previous period.
| CLASS A SHARES Period ended | 9-30-101 | 3-31-10 | 3-31-092 | 3-31-083 | 3-31-073 | 3-31-063 |
| Per share operating performance | ||||||
| Net asset value, beginning of period | $18.31 | $12.84 | $20.91 | $20.44 | $19.07 | $15.64 |
| Net investment loss | (0.03)4 | (0.03)4 | (0.01)4 | (0.02) | (0.04) | (0.07)4 |
| Net realized and unrealized gain (loss) | ||||||
| on investments | 0.01 | 5.50 | (8.06) | 0.49 | 1.41 | 3.50 |
| Total from investment operations | (0.02) | 5.47 | (8.07) | 0.47 | 1.37 | 3.43 |
| Net asset value, end of period | $18.29 | $18.31 | $12.84 | $20.91 | $20.44 | $19.07 |
| Total return (%)5,6 | (0.11)7 | 42.60 | (38.59) | 2.30 | 7.18 | 21.93 |
| Ratios and supplemental data | ||||||
| Net assets, end of period (in millions) | $377 | $384 | $193 | $164 | $33 | $15 |
| Ratios (as a percentage of average | ||||||
| net assets): | ||||||
| Expenses before reductions | 1.358 | 1.45 | 1.47 | 1.179 | 1.30 | 1.72 |
| Expenses net of fee waivers | 1.358 | 1.38 | 1.18 | 1.199 | 1.19 | 1.19 |
| Expenses net of fee waivers and credits | 1.358 | 1.34 | 1.18 | 1.199 | 1.19 | 1.19 |
| Net investment loss | (0.34)8 | (0.18) | (0.04) | (0.27) | (0.38) | (0.42) |
| Portfolio turnover (%) | 39 | 102 | 101 | 86 | 101 | 96 |
1 Semiannual period from 4-1-10 to 9-30-10. Unaudited.
2 After the close of business on 4-25-08, holders of Original Shares of the former Rainier Large Cap Growth Equity Portfolio (the Predecessor Fund) became owners of an equal number of full and fractional Class A shares of the John Hancock Rainier Growth Fund. These shares were first offered on 4-28-08. Additionally, the accounting and performance history of the Original Shares of the Predecessor Fund was redesignated as that of John Hancock Rainier Growth Fund Class A.
3 Audited by previous independent registered public accounting firm.
4 Based on the average daily shares outstanding.
5 Does not reflect the effect of sales charges, if any.
6 Total returns would have been lower had certain expenses not been reduced during the periods shown.
7 Not annualized.
8 Annualized.
9 Prior to the reorganization (Note 7), the Fund was subject to a contractual expense reimbursement and recoupment plan.
| See notes to financial statements | Semiannual report | Rainier Growth Fund | 19 |
| CLASS B SHARES Period ended | 9-30-101 | 3-31-10 | 3-31-092 |
| Per share operating performance | |||
| Net asset value, beginning of period | $18.10 | $12.79 | $22.46 |
| Net investment loss3 | (0.09) | (0.15) | (0.09) |
| Net realized and unrealized gain (loss) on investments | — | 5.46 | (9.58) |
| Total from investment operations | (0.09) | 5.31 | (9.67) |
| Net asset value, end of period | $18.01 | $18.10 | $12.79 |
| Total return (%)4,5 | (0.50)6 | 41.52 | (43.05)6 |
| Ratios and supplemental data | |||
| Net assets, end of period (in millions) | $31 | $37 | $27 |
| Ratios (as a percentage of average net assets): | |||
| Expenses before reductions | 2.207 | 2.45 | 2.827 |
| Expenses net of fee waivers | 2.107 | 2.11 | 2.057 |
| Expenses net of fee waivers and credits | 2.107 | 2.09 | 2.047 |
| Net investment loss | (1.10)7 | (0.94) | (0.75)7 |
| Portfolio turnover (%) | 39 | 102 | 1018 |
1 Semiannual period from 4-1-10 to 9-30-10. Unaudited.
2 The inception date for Class B shares is 4-28-08.
3 Based on the average daily shares outstanding.
4 Total returns would have been lower had certain expenses not been reduced during the periods shown.
5 Does not reflect the effect of sales charges, if any.
6 Not annualized.
7 Annualized.
8 Portfolio turnover is shown for the period from 4-1-08 to 3-31-09.
| CLASS C SHARES Period ended | 9-30-101 | 3-31-10 | 3-31-092 |
| Per share operating performance | |||
| Net asset value, beginning of period | $18.10 | $12.79 | $22.46 |
| Net investment loss3 | (0.09) | (0.15) | (0.09) |
| Net realized and unrealized gain (loss) on investments | — | 5.46 | (9.58) |
| Total from investment operations | (0.09) | 5.31 | (9.67) |
| Net asset value, end of period | $18.01 | $18.10 | $12.79 |
| Total return (%)4,5 | (0.50)6 | 41.52 | (43.05)6 |
| Ratios and supplemental data | |||
| Net assets, end of period (in millions) | $21 | $24 | $15 |
| Ratios (as a percentage of average net assets): | |||
| Expenses before reductions | 2.217 | 2.34 | 2.827 |
| Expenses net of fee waivers | 2.107 | 2.21 | 2.057 |
| Expenses net of fee waivers and credits | 2.107 | 2.09 | 2.047 |
| Net investment loss | (1.10)7 | (0.93) | (0.77)7 |
| Portfolio turnover (%) | 39 | 102 | 1018 |
1 Semiannual period from 4-1-10 to 9-30-10. Unaudited.
2 The inception date for Class C shares is 4-28-08.
3 Based on the average daily shares outstanding.
4 Does not reflect the effect of sales charges, if any.
5 Total returns would have been lower had certain expenses not been reduced during the periods shown.
6 Not annualized.
7 Annualized.
8 Portfolio turnover is shown for the period from 4-1-08 to 3-31-09.
| 20 | Rainier Growth Fund | Semiannual report | See notes to financial statements |
| CLASS I SHARES Period ended | 9-30-101 | 3-31-10 | 3-31-092 | 3-31-083 | 3-31-073,4 |
| Per share operating performance | |||||
| Net asset value, beginning of period | $18.50 | $12.92 | $20.98 | $20.44 | $20.94 |
| Net investment income (loss)5 | 0.01 | 0.04 | 0.04 | —6 | —6 |
| Net realized and unrealized gain (loss) on investments | 0.01 | 5.54 | (8.09) | 0.54 | (0.50) |
| Total from investment operations | 0.02 | 5.58 | (8.05) | 0.54 | (0.50) |
| Less distributions | |||||
| From net investment income | — | —6 | (0.01) | — | — |
| Net asset value, end of period | $18.52 | $18.50 | $12.92 | $20.98 | $20.44 |
| Total return (%) | 0.117 | 43.20 | (38.36) | 2.64 | (2.39)7,8 |
| Ratios and supplemental data | |||||
| Net assets, end of period (in millions) | $196 | $208 | $133 | $136 | $537 |
| Ratios (as a percentage of average net assets): | |||||
| Expenses before reductions | 0.879 | 0.90 | 0.86 | 0.9210 | 1.009 |
| Expenses net of fee waivers | 0.879 | 0.90 | 0.86 | 0.9410 | 0.949 |
| Expenses net of fee waivers and credits | 0.879 | 0.90 | 0.86 | 0.9410 | 0.949 |
| Net investment income (loss) | 0.149 | 0.26 | 0.22 | (0.02) | 0.159 |
| Portfolio turnover (%) | 39 | 102 | 101 | 86 | 10111 |
1 Semiannual period from 4-1-10 to 9-30-10. Unaudited.
2 After the close of business on 4-25-08, holders of Institutional Shares of the former Rainier Large Cap Growth Equity Portfolio (the Predecessor Fund) became owners of an equal number of full and fractional Class I shares of the John Hancock Rainier Growth Fund. These shares were first offered on 4-28-08. Additionally, the accounting and performance history of the Institutional Shares of the Predecessor Fund was redesignated as that of John Hancock Rainier Growth Fund Class I.
3 Audited by previous independent registered public accounting firm.
4 The inception date for Class I shares is 2-20-07.
5 Based on the average daily shares outstanding.
6 Less than ($0.005) per share.
7 Not annualized.
8 Total returns would have been lower had certain expenses not been reduced during the periods shown.
9 Annualized.
10 Prior to the reorganization (Note 7), the Fund was subject to a contractual expense reimbursement and recoupment plan.
11 Annualized based on investments held for a full year.
| CLASS R1 SHARES Period ended | 9-30-101 | 3-31-10 | 3-31-092 |
| Per share operating performance | |||
| Net asset value, beginning of period | $18.23 | $12.84 | $22.46 |
| Net investment loss3 | (0.06) | (0.11) | (0.08) |
| Net realized and unrealized gain (loss) on investments | — | 5.50 | (9.54) |
| Total from investment operations | (0.06) | 5.39 | (9.62) |
| Net asset value, end of period | $18.17 | $18.23 | $12.84 |
| Total return (%)4 | (0.33)5 | 41.98 | (42.83)5 |
| Ratios and supplemental data | |||
| Net assets, end of period (in thousands) | $177 | $177 | $59 |
| Ratios (as a percentage of average net assets): | |||
| Expenses before reductions | 5.626 | 13.91 | 8.706 |
| Expenses net of fee waivers | 1.756 | 1.78 | 1.646 |
| Expenses net of fee waivers and credits | 1.756 | 1.78 | 1.646 |
| Net investment loss | (0.74)6 | (0.65) | (0.50)6 |
| Portfolio turnover (%) | 39 | 102 | 1017 |
1 Semiannual period from 4-1-10 to 9-30-10. Unaudited.
2 The inception date for Class R1 shares is 4-28-08.
3 Based on the average daily shares outstanding.
4 Total returns would have been lower had certain expenses not been reduced during the periods shown.
5 Not annualized.
6 Annualized.
7 Portfolio turnover is shown for the period from 4-1-08 to 3-31-09.
| See notes to financial statements | Semiannual report | Rainier Growth Fund | 21 |
| CLASS R3 SHARES Period ended | 9-30-101 | 3-31-10 | 3-31-092 |
| Per share operating performance | |||
| Net asset value, beginning of period | $18.27 | $12.85 | $22.46 |
| Net investment loss3 | (0.05) | (0.07) | (0.06) |
| Net realized and unrealized gain (loss) on investments | — | 5.49 | (9.55) |
| Total from investment operations | (0.05) | 5.42 | (9.61) |
| Net asset value, end of period | $18.22 | $18.27 | $12.85 |
| Total return (%)4 | (0.27)5 | 42.18 | (42.79)5 |
| Ratios and supplemental data | |||
| Net assets, end of period (in thousands) | $81 | $81 | $57 |
| Ratios (as a percentage of average net assets): | |||
| Expenses before reductions | 8.636 | 13.68 | 8.576 |
| Expenses net of fee waivers | 1.626 | 1.62 | 1.546 |
| Expenses net of fee waivers and credits | 1.626 | 1.62 | 1.546 |
| Net investment loss | (0.62)6 | (0.46) | (0.40)6 |
| Portfolio turnover (%) | 39 | 102 | 1017 |
1 Semiannual period from 4-1-10 to 9-30-10. Unaudited.
2 The inception date for Class R3 shares is 4-28-08.
3 Based on the average daily shares outstanding.
4 Total returns would have been lower had certain expenses not been reduced during the periods shown.
5 Not annualized.
6 Annualized.
7 Portfolio turnover is shown for the period from 4-1-08 to 3-31-09.
| CLASS R4 SHARES Period ended | 9-30-101 | 3-31-10 | 3-31-092 |
| Per share operating performance | |||
| Net asset value, beginning of period | $18.38 | $12.88 | $22.46 |
| Net investment loss3 | (0.03) | (0.03) | (0.02) |
| Net realized and unrealized gain (loss) on investments | — | 5.53 | (9.56) |
| Total from investment operations | (0.03) | 5.50 | (9.58) |
| Net asset value, end of period | $18.35 | $18.38 | $12.88 |
| Total return (%)4 | (0.16)5 | 42.70 | (42.65)5 |
| Ratios and supplemental data | |||
| Net assets, end of period (in thousands) | $82 | $82 | $57 |
| Ratios (as a percentage of average net assets): | |||
| Expenses before reductions | 8.536 | 13.33 | 8.266 |
| Expenses net of fee waivers | 1.326 | 1.32 | 1.246 |
| Expenses net of fee waivers and credits | 1.326 | 1.32 | 1.246 |
| Net investment loss | (0.32)6 | (0.16) | (0.10)6 |
| Portfolio turnover (%) | 39 | 102 | 1017 |
1 Semiannual period from 4-1-10 to 9-30-10. Unaudited.
2 The inception date for Class R4 shares is 4-28-08.
3 Based on the average daily shares outstanding.
4 Total returns would have been lower had certain expenses not been reduced during the periods shown.
5 Not annualized.
6 Annualized.
7 Portfolio turnover is shown for the period from 4-1-08 to 3-31-09.
| 22 | Rainier Growth Fund | Semiannual report | See notes to financial statements |
| CLASS R5 SHARES Period ended | 9-30-101 | 3-31-10 | 3-31-092 |
| Per share operating performance | |||
| Net asset value, beginning of period | $18.47 | $12.91 | $22.46 |
| Net investment income3 | —4 | 0.02 | 0.03 |
| Net realized and unrealized gain (loss) on investments | 0.01 | 5.54 | (9.57) |
| Total from investment operations | 0.01 | 5.56 | (9.54) |
| Less distributions | |||
| From net investment income | — | —4 | (0.01) |
| Net asset value, end of period | $18.48 | $18.47 | $12.91 |
| Total return (%)5 | 0.056 | 43.07 | (42.48)6 |
| Ratios and supplemental data | |||
| Net assets, end of period (in thousands) | $82 | $82 | $58 |
| Ratios (as a percentage of average net assets): | |||
| Expenses before reductions | 8.237 | 12.97 | 7.957 |
| Expenses net of fee waivers | 1.027 | 1.02 | 0.947 |
| Expenses net of fee waivers and credits | 1.027 | 1.02 | 0.947 |
| Net investment income | (0.01)7 | 0.14 | 0.207 |
| Portfolio turnover (%) | 39 | 102 | 1018 |
1 Semiannual period from 4-1-10 to 9-30-10. Unaudited.
2 The inception date for Class R5 shares is 4-28-08.
3 Based on the average daily shares outstanding.
4 Less than ($0.005) per share.
5 Total returns would have been lower had certain expenses not been reduced during the periods shown.
6 Not annualized.
7 Annualized.
8 Portfolio turnover is shown for the period from 4-1-08 to 3-31-09.
| CLASS T SHARES Period ended | 9-30-101 | 3-31-10 | 3-31-092 |
| Per share operating performance | |||
| Net asset value, beginning of period | $18.24 | $12.86 | $16.59 |
| Net investment loss3 | (0.05) | (0.11) | (0.05) |
| Net realized and unrealized gain (loss) on investments | — | 5.49 | (3.68) |
| Total from investment operations | (0.05) | 5.38 | (3.73) |
| Net asset value, end of period | $18.19 | $18.24 | $12.86 |
| Total return (%) | (0.27)5 | 41.84 | (22.48)4,5 |
| Ratios and supplemental data | |||
| Net assets, end of period (in millions) | $76 | $83 | $72 |
| Ratios (as a percentage of average net assets): | |||
| Expenses before reductions | 1.636 | 1.84 | 2.076 |
| Expenses net of fee waivers | 1.636 | 1.84 | 1.996 |
| Expenses net of fee waivers and credits | 1.636 | 1.84 | 1.986 |
| Net investment loss | (0.62)6 | (0.69) | (0.74)6 |
| Portfolio turnover (%) | 39 | 102 | 1017 |
1 Semiannual period from 4-1-10 to 9-30-10. Unaudited.
2 The inception date for Class T shares is 10-6-08.
3 Based on the average daily shares outstanding.
4 Total returns would have been lower had certain expenses not been reduced during the period shown.
5 Not annualized.
6 Annualized.
7 Portfolio turnover is shown for the period from 4-1-08 to 3-31-09.
| See notes to financial statements | Semiannual report | Rainier Growth Fund | 23 |
| CLASS ADV SHARES Period ended | 9-30-101 | 3-31-10 | 3-31-092 |
| Per share operating performance | |||
| Net asset value, beginning of period | $18.43 | $12.90 | $22.46 |
| Net investment income (loss)3 | (0.01) | —4 | (0.01) |
| Net realized and unrealized gain (loss) on investments | — | 5.53 | (9.55) |
| Total from investment operations | (0.01) | 5.53 | (9.56) |
| Net asset value, end of period | $18.42 | $18.43 | $12.90 |
| Total return (%) | (0.05)5,6 | 42.875 | (42.56)6 |
| Ratios and supplemental data | |||
| Net assets, end of period (in millions) | $16 | $18 | $17 |
| Ratios (as a percentage of average net assets): | |||
| Expenses before reductions | 1.377 | 1.25 | 1.147 |
| Expenses net of fee waivers | 1.147 | 1.14 | 1.147 |
| Expenses net of fee waivers and credits | 1.147 | 1.14 | 1.147 |
| Net investment income (loss) | (0.14)7 | 0.01 | (0.04)7 |
| Portfolio turnover (%) | 39 | 102 | 1018 |
1 Semiannual period from 4-1-10 to 9-30-10. Unaudited.
2 The inception date for Class ADV shares is 4-28-08.
3 Based on the average daily shares outstanding.
4 Less than $0.005 per share.
5 Total returns would have been lower had certain expenses not been reduced during the periods shown.
6 Not annualized.
7 Annualized.
8 Portfolio turnover is shown for the period from 4-1-08 to 3-31-09.
| CLASS NAV SHARES Period ended | 9-30-101 | 3-31-10 | 3-31-092 |
| Per share operating performance | |||
| Net asset value, beginning of period | $18.51 | $12.91 | $22.46 |
| Net investment income3 | 0.02 | 0.05 | 0.04 |
| Net realized and unrealized gain (loss) on investments | — | 5.55 | (9.57) |
| Total from investment operations | 0.02 | 5.60 | (9.53) |
| Less distributions | |||
| From net investment income | — | —4 | (0.02) |
| Net asset value, end of period | $18.53 | $18.51 | $12.91 |
| Total return (%) | 0.115 | 43.38 | (42.44)5 |
| Ratios and supplemental data | |||
| Net assets, end of period (in millions) | $706 | $708 | $400 |
| Ratios (as a percentage of average net assets): | |||
| Expenses before reductions | 0.826 | 0.82 | 0.836 |
| Expenses net of fee waivers | 0.826 | 0.82 | 0.836 |
| Expenses net of fee waivers and credits | 0.826 | 0.82 | 0.836 |
| Net investment income | 0.196 | 0.33 | 0.266 |
| Portfolio turnover (%) | 39 | 102 | 1017 |
1 Semiannual period from 4-1-10 to 9-30-10. Unaudited.
2 The inception date for Class NAV shares is 4-28-08.
3 Based on the average daily shares outstanding.
4 Less than ($0.005) per share.
5 Not annualized.
6 Annualized.
7 Portfolio turnover is shown for the period from 4-1-08 to 3-31-09.
| 24 | Rainier Growth Fund | Semiannual report | See notes to financial statements |
Notes to financial statements
(unaudited)
Note 1 — Organization
John Hancock Rainier Growth Fund (the Fund) is a diversified series of John Hancock Funds III (the Trust), an open-end management investment company organized as a Massachusetts business trust and registered under the Investment Company Act of 1940, as amended (the 1940 Act). The investment objective of the Fund is to seek to maximize long-term capital appreciation.
The Fund may offer multiple classes of shares. The shares currently offered are detailed in the Statement of Assets and Liabilities. Class A, Class B and Class C shares are offered to all investors. Class I shares are offered to institutions and certain investors. Class R1, Class R3, Class R4 and Class R5 shares are available only to certain retirement plans. Class T and Class ADV shares are closed to new investors. Class NAV shares are sold to John Hancock affiliated funds of funds, which owned 100% of the shares of beneficial interest. Shareholders of each class have exclusive voting rights to matters that affect that class. The distribution and service fees, transfer agent fees, state registration fees and printing and postage for each class may differ. Class B shares convert to Class A shares eight years after purchase. Effective at the close of business on August 21, 2009, Class R2 converted into Class A and Class R converted into Class R1.
Affiliates of the Fund owned 91%, 100%, 100% and 100% of shares of beneficial interest of Class R1, Class R3, Class R4 and Class R5 shares, respectively, on September 30, 2010.
The Fund is the accounting and performance successor of the Rainier Large Cap Growth Equity Portfolio (the Predecessor Fund). On April 28, 2008, the Fund acquired substantially all the assets and assumed the liabilities of the Predecessor Fund pursuant to an agreement and plan of reorganization, in exchange for Class A and Class I shares of the Fund.
Note 2 — Significant accounting policies
The financial statements have been prepared in conformity with accounting principles generally accepted in the United States of America, which require management to make certain estimates and assumptions at the date of the financial statements. Actual results could differ from those estimates. Events or transactions occurring after the end of the fiscal period through the date that the financial statements were issued have been evaluated in the preparation of the financial statements. The following summarizes the significant accounting policies of the Fund:
Security valuation. Investments are stated at value as of the close of the regular trading on the New York Stock Exchange (NYSE), normally at 4:00 P.M., Eastern Time. The Fund uses a three-tier hierarchy to prioritize the pricing assumptions, referred to as inputs, used in valuation techniques to measure fair value. Level 1 includes quoted prices in active markets for identical securities. Level 2 includes significant observable inputs. Observable inputs may include quoted prices for similar securities, interest rates, prepayment speeds and credit risk. Prices for securities valued using these techniques are received from independent pricing vendors and brokers and are based on an evaluation of the inputs described. Level 3 includes significant unobservable inputs when market prices are not readily available or reliable, including the Fund’s own assumptions in determining the fair value of investments. The inputs or methodology used for valuing securities are not necessarily an indication of the risk associated with investing in those securities.
| Semiannual report | Rainier Growth Fund | 25 |
The following is a summary of the values by input classification of the Fund’s investments as of September 30, 2010, by major security category or type:
| LEVEL 3 | ||||
| LEVEL 2 | SIGNIFICANT | |||
| TOTAL MARKET | LEVEL 1 | SIGNIFICANT | UNOBSERVABLE | |
| VALUE AT 9-30-10 | QUOTED PRICE | OBSERVABLE INPUTS | INPUTS | |
| Common Stocks | ||||
| Consumer Discretionary | $217,460,450 | $217,460,450 | — | — |
| Consumer Staples | 111,233,973 | 111,233,973 | — | — |
| Energy | 102,084,258 | 102,084,258 | — | — |
| Financials | 94,416,606 | 94,416,606 | — | — |
| Health Care | 144,577,267 | 144,042,612 | — | $534,655 |
| Industrials | 246,074,495 | 246,074,495 | — | — |
| Information Technology | 405,321,551 | 404,064,493 | — | 1,257,058 |
| Materials | 46,364,420 | 46,364,420 | — | — |
| Telecommunication | ||||
| Services | 25,026,157 | 25,026,157 | — | — |
| Utilities | 11,368,217 | 11,368,217 | — | — |
| Short-Term Investments | 126,809,545 | 114,967,545 | $11,842,000 | — |
| Total Investments in | ||||
| Securities | $1,530,736,939 | $1,517,103,226 | $11,842,000 | $1,791,713 |
The following is a reconciliation of Level 3 assets for which significant unobservable inputs were used to determine fair value:
| INFORMATION | ||||
| INVESTMENTS IN SECURITIES | HEALTH CARE | TECHNOLOGY | TOTALS | |
| Balance as of March 31, 2010 | $486,050 | $1,293,918 | $1,779,968 | |
| Accrued discounts/premiums | — | — | — | |
| Realized gain (loss) | — | — | — | |
| Change in unrealized appreciation (depreciation) | 48,605 | (36,860) | 11,745 | |
| Net purchases (sales) | — | — | — | |
| Transfers in and/or out of Level 3 | — | — | — | |
| Balance as of September 30, 2010 | $534,655 | $1,257,058 | $1,791,713 | |
During the six-month period ended September 30, 2010, there were no significant transfers in or out of Level 1 or Level 2 assets.
In order to value the securities, the Fund uses the following valuation techniques. Equity securities held by the Fund are valued at the last sale price or official closing price on the principal securities exchange on which they trade. In the event there were no sales during the day or closing prices are not available, then securities are valued using the last quoted bid or evaluated price. Investments in open-end mutual funds, including John Hancock Collateral Investment Trust (JHCIT), are valued at their closing net asset values each day. Foreign securities and currencies are valued in U.S. dollars, based on foreign currency exchange rates supplied by an independent pricing service. Certain securities traded only in the over-the-counter market are valued at the last bid price quoted by brokers making markets in the securities at the close of trading. Certain short-term securities are valued at amortized cost.
Other portfolio securities and assets, where market quotations are not readily available, are valued at fair value, as determined in good faith by the Fund’s Pricing Committee, following procedures established by the Board of Trustees. Generally, trading in non-U.S. securities is substantially completed each day at various times prior to the close of trading on the NYSE. Significant market events that affect the values of non-U.S. securities may occur after the time when the valuation of
| 26 | Rainier Growth Fund | Semiannual report |
the securities is generally determined and the close of the NYSE. During significant market events, these securities will be valued at fair value, as determined in good faith, following procedures established by the Board of Trustees. The Fund may use a fair valuation model to value non-U.S. securities in order to adjust for events which may occur between the close of foreign exchanges and the close of the NYSE.
Repurchase agreements. The Fund may enter into repurchase agreements. When a Fund enters into a repurchase agreement it receives collateral which is held in a segregated account by the Fund’s custodian. The collateral amount is marked-to-market and monitored on a daily basis to ensure that the collateral held is in an amount not less than the principal amount of the repurchase agreement plus any accrued interest. In the event of a default by the counterparty, realization of the collateral proceeds could be delayed, during which time the collateral value may decline.
Security transactions and related investment income. Investment security transactions are accounted for on a trade date plus one basis for daily net asset value calculations. However, for financial reporting purposes, investment transactions are reported on trade date. Interest income is accrued as earned. Gains and losses on securities sold are determined on the basis of identified cost and may include proceeds from litigation. Dividend income is recorded on the ex-date except for certain foreign dividends where the ex-date may have passed, which are recorded when the Fund becomes aware of the dividends.
Securities lending. The Fund may lend its securities to earn additional income. It receives and maintains cash collateral received from the borrower in an amount not less than the market value of the loaned securities. The Fund will invest its collateral in JHCIT. As a result, the Fund will receive the benefit of any gains and bear any losses generated by JHCIT. Although risk of the loss of the securities lent is mitigated by holding the collateral, the Fund could experience a delay in recovering its securities and a possible loss of income or value if the borrower fails to return the securities or if collateral investments decline in value. The Fund may receive compensation for lending its securities by retaining a portion of the return on the investment of the collateral and compensation from fees earned from borrowers of the securities. Income received from JHCIT is a component of securities lending income as re corded on the Statement of Operations.
Line of credit. The Fund may borrow from banks for temporary or emergency purposes, including meeting redemption requests that otherwise might require the untimely sale of securities. Pursuant to the custodian agreement, the custodian may loan money to a Fund to make properly authorized payments. The Fund is obligated to repay the custodian for any overdraft, including any related costs or expenses. The custodian has a lien, security interest or security entitlement in any Fund property that is not segregated, to the maximum extent permitted by law for any overdraft.
In addition, the Fund and other affiliated funds have entered into an agreement with State Street Bank and Trust Company which enables them to participate in a $100 million unsecured committed line of credit. Prior to March 31, 2010, the line of credit was $150 million. A commitment fee, payable at the end of each calendar quarter, based on the average daily unused portion of the line of credit, is charged to each participating fund on a pro rata basis and is reflected in other expenses on the Statement of Operations. For the six months ended September 30, 2010, the Fund had no borrowings under the line of credit.
Expenses. The majority of expenses are directly attributable to an individual Fund. Expenses that are not readily attributable to a specific fund are allocated among all funds in an equitable manner, taking into consideration, among other things, the nature and type of expense and the funds’ relative assets. Expense estimates are accrued in the period to which they relate and adjustments are made when actual amounts are known.
| Semiannual report | Rainier Growth Fund | 27 |
Class allocations. Income, common expenses, and realized and unrealized gains (losses) are determined at the fund level and allocated daily to each class of shares based on the net asset value of the class. Class-specific expenses, such as distribution and service fees, if any, transfer agent fees, state registration fees and printing and postage, for all classes, are calculated daily at the class level based on the appropriate net asset value of each class and the specific expense rates applicable to each class.
Federal income taxes. The Fund intends to qualify as a regulated investment company by complying with the applicable provisions of the Internal Revenue Code and will not be subject to federal income tax on taxable income that is distributed to shareholders. Therefore, no federal income tax provision is required.
For federal income tax purposes, the Fund has a capital loss carryforward of $726,155,178 available to offset future net realized capital gains. Availability of a certain amount of the loss carryforward, which was acquired in a merger, may be limited in a given year. The following table details the capital loss carryforward available as of March 31, 2010.
| CAPITAL LOSS CARRYFORWARD EXPIRING AT MARCH 31 | ||||
| 2011 | 2012 | 2016 | 2017 | 2018 |
| $260,334,070 | $86,800,122 | $25,380,418 | $113,554,715 | $240,085,853 |
It is estimated that $304,466,160 of the loss carryforward, which was acquired on October 3, 2008, in mergers with John Hancock Core Equity Fund, John Hancock Growth Trends Fund, and John Hancock Technology Fund, as well as the carryforward acquired October 2, 2009, in a merger with John Hancock Health Sciences Fund, will likely expire unused because of limitations.
As of March 31, 2010, the Fund had no uncertain tax positions that would require financial statement recognition, de-recognition or disclosure. The Fund’s federal tax return is subject to examination by the Internal Revenue Service for a period of three years.
Distribution of income and gains. Distributions to shareholders from net investment income and net realized gains, if any, are recorded on the ex-dividend date. The Fund generally declares and pays dividends and capital gains distributions, if any, at least annually.
Distributions paid by the Fund with respect to each series of shares are calculated in the same manner, at the same time and in the same amount, except for the effect of expenses that may be applied differently to each class.
Such distributions, on a tax basis, are determined in conformity with income tax regulations, which may differ from accounting principles generally accepted in the United States of America. Material distributions in excess of tax basis earnings and profits, if any, are reported in the Fund’s financial statements as a return of capital.
Capital accounts within financial statements are adjusted for permanent book-tax differences. These adjustments have no impact on net assets or the results of operations. Temporary book-tax differences, if any, will reverse in a subsequent period. Permanent book-tax differences are primarily attributable to expiration of capital loss carryforward and merger related transactions.
Note 3 — Guarantees and indemnifications
Under the Fund’s organizational documents, its Officers and Trustees are indemnified against certain liabilities arising out of the performance of their duties to the Fund. Additionally, in the normal course of business, the Fund enters into contracts with service providers that contain general indemnification clauses. The Fund’s maximum exposure under these arrangements is unknown, as this would involve future claims that may be made against the Fund that have not yet occurred. The risk of material loss from such claims is considered remote.
| 28 | Rainier Growth Fund | Semiannual report |
Note 4 — Fees and transactions with affiliates
John Hancock Investment Management Services, LLC (the Adviser) serves as investment adviser for the Trust. John Hancock Funds, LLC (the Distributor), an affiliate of the Adviser, serves as principal underwriter of the Trust. The Adviser and the Distributor are indirect wholly owned subsidiaries of Manulife Financial Corporation (MFC).
Management fee. The Fund has an investment management contract with the Adviser under which the Fund pays a daily management fee to the Adviser equivalent, on an annual basis, to the sum of: (a) 0.75% of the first $3,000,000,000 of the Fund’s average daily net assets; (b) 0.725% of the next $3,000,000,000; and (c) 0.70% of the Fund’s average daily net assets in excess of $6,000,000,000. The Adviser has a subadvisory agreement with Rainier Investment Management, Inc. The Fund is not responsible for payment of the subadvisory fees.
The investment management fees incurred for the six months ended September 30, 2010 were equivalent to an annual effective rate of 0.75% of the Fund’s average daily net assets.
The Adviser has contractually agreed to reimburse or limit certain expenses for each share class. This agreement excludes taxes, portfolio brokerage commissions, interest, litigation and indemnification expenses and other extraordinary expenses not incurred in the ordinary course of the Fund’s business and shareholder service fees. The reimbursements and limits are such that these expenses will not exceed 1.35% for Class A, 2.10% for Class B, 2.10% for Class C, 0.94% for Class I, 1.69% for Class R1, 1.59% for Class R3, 1.29% for Class R4, 0.99% for Class R5, 1.40% for Class T and 1.14% for Class ADV shares. The expense reimbursements and limits will continue in effect until July 31, 2011.
Prior to July 1, 2010, for Class R1, R3, R4, R5 and T shares, the Adviser had contractually agreed to reimburse or limit certain expenses for each share class. The agreement excluded taxes, portfolio brokerage commissions, interest, litigation and indemnification expenses and other extraordinary expenses not incurred in the ordinary course of the Fund’s business and shareholder service fees. The Adviser had agreed to reimburse and limit these expenses such that these expenses would not exceed 1.80%, 1.65%, 1.35%, 1.05% and 1.98% for Class R1, R3, R4, R5 and T shares, respectively.
Accordingly, the expense reductions or reimbursements related to these agreement were $8,147, $16,603, $12,072, $3,283, $2,783, $2,801, $2,820, and $19,015, for Class A, Class B, Class C, Class R1, Class R3, Class R4, Class R5, and Class ADV shares, respectively, for the six months ended September 30, 2010.
Accounting and legal services. Pursuant to the Service Agreement, the Fund reimburses the Adviser for all expenses associated with providing the administrative, financial, legal, accounting and recordkeeping services of the Fund, including the preparation of all tax returns, periodic reports to shareholders and regulatory reports, among other services. These expenses are allocated to each share class based on its relative net assets at the time the expense was incurred. The accounting and legal services fees incurred for six months ended September 30, 2010, amounted to an annual rate of 0.02% of the Fund’s average daily net assets.
Distribution and service plans. The Fund has a distribution agreement with the Distributor. The Fund has adopted distribution and service plans with respect to Class A, Class B, Class C, Class R1, Class R3, Class R4, Class R5, Class T and Class ADV shares pursuant to Rule 12b-1 under the 1940 Act, to pay the Distributor for services provided as the distributor of shares of the Fund. In addition, under a service plan for Class R1, Class R3, Class R4 and Class R5 shares, the Fund pays for certain other services. The Fund may pay up to the following contractual rates of distribution fees and service fees under these arrangements, expressed as an annual percentage of average daily net assets for each class of the Fund’s shares.
| Semiannual report | Rainier Growth Fund | 29 |
| CLASS | 12b–1 FEES | SERVICE FEES | ||
| Class A | 0.30% | 0.00% | ||
| Class B | 1.00% | 0.00% | ||
| Class C | 1.00% | 0.00% | ||
| Class R1 | 0.50% | 0.25% | ||
| Class R3 | 0.50% | 0.15% | ||
| Class R4 | 0.25% | 0.10% | ||
| Class R5 | 0.00% | 0.05% | ||
| Class T | 0.30% | 0.00% | ||
| Class ADV | 0.25% | 0.00% | ||
For the six months ended September 30, 2010, the Board of Trustees has authorized only 0.25% to be charged to Class A shares for 12b-1 fees.
Sales charges. Class A and Class T shares are assessed up-front sales charges, which resulted in payments to the Distributor amounting to $54,433 and $23,354 for Class A and Class T shares, respectively, for the six months ended September 30, 2010. Of those amounts, $7,642 and $3,528 was retained and used for printing prospectuses, advertising, sales literature and other purposes, $34,440 and $14,183 was paid as sales commissions to broker-dealers and $12,351 and $5,643 was paid as sales commissions to sales personnel of Signator Investors, Inc. (Signator Investors), a broker-dealer affiliate of the Adviser for Class A and T shares, respectively.
Class B and Class C shares are subject to contingent deferred sales charges (CDSC). Class B shares that are redeemed within six years of purchase are subject to CDSC, at declining rates, beginning at 5.00% of the lesser of the current market value at the time of redemption or the original purchase cost of the shares being redeemed. Class C shares that are redeemed within one year of purchase are subject to a 1.00% CDSC on the lesser of the current market value at the time of redemption or the original purchase cost of the shares being redeemed. Proceeds from CDSCs are used to compensate the Distributor for providing distribution-related services in connection with the sale of these shares. During the six months ended September 30, 2010, CDSCs received by the Distributor amounted to $30,257 and $643 for Class B and Class C shares, respectively.
Transfer agent fees. The Fund has a transfer agent agreement with John Hancock Signature Services, Inc. (Signature Services or Transfer Agent), an affiliate of the Adviser. The transfer agent fees paid to Signature Services are determined based on the cost to Signature Services (Signature Services Cost) of providing recordkeeping services. The Signature Services Cost includes a component of allocated John Hancock corporate overhead for providing transfer agent services to the Fund and to all other John Hancock affiliated funds. It also includes out-of-pocket expenses that are comprised of payments made to third-parties for recordkeeping services provided to their clients who invest in one or more John Hancock funds. In addition, Signature Services Cost may be reduced by certain revenues that Signature Services received in connection with the service they provide to the funds. Signature Services Cost is calculated m onthly and allocated, as applicable, to four categories of share classes: Institutional Share Classes, Retirement Share Classes, Municipal Bond Classes and all other Retail Share Classes. Within each of these categories, the applicable costs are allocated to the affected John Hancock affiliated funds and/or classes, based on the relative average daily net assets. Additionally, Class NAV shares do not pay transfer agent fees.
Prior to July 1, 2010, the transfer agent fees were made up of three components:
• The Fund paid a monthly transfer agent fee at an annual rate of 0.05% for Class A, B, C, R1, R3, R4, R5, T and ADV shares and 0.04% for Class I shares, based on each class’s average daily net assets.
| 30 | Rainier Growth Fund | Semiannual report |
• The Fund paid a monthly fee based on an annual rate of $15.00 per shareholder account for Class A, R1, R3, R4 and R5 shares and $16.50 per shareholder account for Class B, C and T shares. During the six months ended September 30, 2010, there were no monthly fees assessed for Class I, ADV and NAV shares.
• In addition, Signature Services was reimbursed for certain out-of-pocket expenses.
• Additionally, Class NAV shares do not pay transfer agent fees.
Class level expenses. Class level expenses for the six months ended September 30, 2010 were:
| DISTRIBUTION | TRANSFER | STATE | PRINTING AND | |
| SHARE CLASS | AND SERVICE FEES | AGENT FEES | REGISTRATION FEES | POSTAGE |
| Class A | $452,899 | $506,465 | $6,406 | $11,137 |
| Class B | 160,678 | 58,174 | 3,510 | 1,103 |
| Class C | 106,793 | 38,429 | 3,490 | 742 |
| Class I | — | 39,978 | 5,741 | 4,705 |
| Class R1 | 536 | 327 | 3,160 | 50 |
| Class R3 | 194 | 263 | 2,577 | 60 |
| Class R4 | 98 | 263 | 2,577 | 60 |
| Class R5 | — | 263 | 2,577 | 60 |
| Class T | 114,170 | 184,749 | 6,330 | 4,130 |
| Class ADV | 20,278 | 21,572 | 2,979 | 593 |
| Total | $855,646 | $850,483 | $39,347 | $22,640 |
Trustee expenses. The Trust compensates each Trustee who is not an employee of the Adviser or its affiliates. These Trustees may, for tax purposes, elect to defer receipt of this compensation under the John Hancock Group of Funds Deferred Compensation Plan (the Plan). Deferred amounts are invested in various John Hancock funds and remain in the funds until distributed in accordance with the Plan. The investment of deferred amounts and the offsetting liability are included within other receivables and prepaid assets and Trustees fees, respectively, in the accompanying Statements of Assets and Liabilities.
Note 5 — Fund share transactions
Transactions in Fund shares for the six months ended September 30, 2010 and the year ended March 31, 2010 were as follows:
| Six months ended 9-30-10 | Year ended 3-31-101 | |||
| Shares | Amount | Shares | Amount | |
| Class A shares | ||||
| Sold | 1,697,686 | $29,350,510 | 4,995,167 | $79,987,175 |
| Issued in reorganization (Note 7) | — | — | 4,832,192 | 76,878,774 |
| Exchanged from Class R2 | — | — | 4,460 | 69,930 |
| Repurchased | (2,046,741) | (35,509,038) | (3,868,875) | (63,049,457) |
| Net increase (decrease) | (349,055) | ($6,158,528) | 5,962,944 | $93,886,422 |
| Class B shares | ||||
| Sold | 67,197 | $1,165,141 | 153,015 | $2,413,612 |
| Issued in reorganization (Note 7) | — | — | 916,109 | 14,459,832 |
| Repurchased | (439,121) | (7,582,102) | (1,145,331) | (18,226,006) |
| Net decrease | (371,924) | ($6,416,961) | (76,207) | ($1,352,562) |
| Semiannual report | Rainier Growth Fund | 31 |
| Six months ended 9-30-10 | Year ended 3-31-101 | |||
| Shares | Amount | Shares | Amount | |
| Class C shares | ||||
| Sold | 24,945 | $431,413 | 81,494 | $1,284,710 |
| Issued in reorganization (Note 7) | — | — | 373,087 | 5,888,163 |
| Repurchased | (171,591) | (2,944,477) | (308,528) | (4,923,072) |
| Net increase (decrease) | (146,646) | ($2,513,064) | 146,053 | $2,249,801 |
| Class I shares | ||||
| Sold | 1,293,511 | $22,747,115 | 3,279,891 | $52,265,579 |
| Distributions reinvested | — | — | 416 | 7,253 |
| Repurchased | (1,969,413) | (34,833,106) | (2,314,726) | (37,707,245) |
| Net increase (decrease) | (675,902) | ($12,085,991) | 965,581 | $14,565,587 |
| Class R shares | ||||
| Exchanged for Class R1 | — | — | (4,669) | ($72,849) |
| Net decrease | — | — | (4,669) | ($72,849) |
| Class R1 shares | ||||
| Sold | 153 | $2,799 | 451 | $7,546 |
| Exchanged from Class R | — | — | 4,654 | 72,849 |
| Repurchased | (111) | (1,878) | (3) | (46) |
| Net increase | 42 | $921 | 5,102 | $80,349 |
| Class R2 shares | ||||
| Exchanged for Class A | — | — | (4,452) | ($69,930) |
| Net decrease | — | — | (4,452) | ($69,930) |
| Class T shares | ||||
| Sold | 48,872 | $848,560 | 143,513 | $2,254,141 |
| Repurchased | (414,120) | (7,195,021) | (1,159,979) | (18,515,245) |
| Net decrease | (365,248) | ($6,346,461) | (1,016,466) | ($16,261,104) |
| Class ADV shares | ||||
| Sold | 156,108 | $2,640,921 | 476,085 | $7,145,887 |
| Repurchased | (233,727) | (4,018,937) | (795,118) | (12,194,104) |
| Net decrease | (77,619) | ($1,378,016) | (319,033) | ($5,048,217) |
| Class NAV shares | ||||
| Sold | 1,003,561 | $16,938,497 | 7,913,853 | $117,933,320 |
| Distributions reinvested | — | — | 1,923 | 33,551 |
| Repurchased | (1,121,594) | (19,787,223) | (650,429) | (11,156,015) |
| Net increase (decrease) | (118,033) | ($2,848,726) | 7,265,347 | $106,810,856 |
| Net increase (decrease) | (2,104,385) | ($37,746,826) | 12,924,200 | $194,788,353 |
1The inception date for Class B, Class C, Class R, Class R1, Class R2, Class R3, Class R4, Class R5, Class ADV and Class NAV shares is 4-28-08 and for Class T shares is 10-6-08.
There were no fund share transactions for Class R3, Class R4 and Class R5 shares for the six months ended September 30, 2010.
Note 6 — Purchase and sale of securities
Purchases and sales of securities, other than short-term securities, aggregated $534,001,124 and $576,385,169, respectively, for the six months ended September 30, 2010.
| 32 | Rainier Growth Fund | Semiannual report |
Note 7 — Reorganization
Fiscal year ended March 31, 2010 mergers. On September 25, 2009, the shareholders of John Hancock Health Sciences Fund (the Acquired Fund) voted to approve an Agreement and Plan of Reorganization (the Agreement) in exchange for a representative amount of shares of John Hancock Rainier Growth Fund (the Acquiring Fund).
The Agreement provided for (a) the acquisition of all the assets, subject to all of the liabilities, of the Acquired Fund in exchange for a representative amount of shares of the Acquiring Fund; (b) the liquidation of the Acquired Fund; and (c) the distribution to the Acquired Fund’s shareholders of such Acquiring Fund’s shares. The reorganization consolidated the Acquired Fund with a fund with a similar objective and the combined fund is better positioned in the market to increase asset size and achieve economies of scale. As a result of the reorganization, the Acquiring Fund is the legal and accounting survivor.
Based on the opinion of tax counsel, the reorganization qualified as a tax-free reorganization for federal income tax purposes with no gain or loss recognized by the Acquired Fund or its shareholders. Thus, the investments were transferred to the Acquiring Fund at the Acquired Fund’s identified cost. All distributable amounts of net income and realized gains from the Acquired Fund were distributed prior to the reorganization. In addition, the expenses of the reorganization were borne by the Acquired Fund. The effective time of the reorganization occurred immediately after the close of regularly scheduled trading on the New York Stock Exchange (NYSE) on October 2, 2009.
The following outlines the reorganization:
| SHARES | SHARES | ||||||
| ACQUIRED NET | DEPRECIATION | REDEEMED | ISSUED | ACQUIRING | ACQUIRING | ||
| ASSET VALUE OF | OF ACQUIRED | BY THE | BY THE | FUND NET | FUND TOTAL NET | ||
| ACQUIRING | ACQUIRED | THE ACQUIRED | FUND’S | ACQUIRED | ACQUIRING | ASSETS PRIOR TO | ASSETS AFTER |
| FUND | FUND | FUND | INVESTMENTS | FUND | FUND | COMBINATION | COMBINATION |
| Rainier | Health | $97,226,769 | $412,956 | 3,813,093 | 6,121,388 | $1,174,437,197 | $1,271,663,966 |
| Growth Fund | Sciences | ||||||
| Fund | |||||||
Because the combined Fund has been managed as a single integrated Fund since the reorganization was completed, it is not practicable to separate the amounts of net investment income and gains attributable to the Acquired Fund that have been included in the Acquiring Fund’s Statement of Operations for the year ended March 31, 2010. See Note 5 for capital shares issued in connection with the above referenced reorganization.
| Semiannual report | Rainier Growth Fund | 33 |
Board Consideration of and Continuation of Investment Advisory Agreement and Subadvisory Agreement
The Board of Trustees (the Board, the members of which are referred to as Trustees) of John Hancock Rainier Growth Fund (the Fund), a series of John Hancock Funds III, met in-person on May 2–4 and June 6–8, 2010 to consider the approval of the Fund’s investment advisory agreement (the Advisory Agreement) with John Hancock Investment Management Services, LLC (the Adviser), the Fund’s investment adviser. The Board also considered the approval of the investment subadvisory agreement (the Subadvisory Agreement) between the Adviser and Rainier Investment Management, Inc. (the Subadviser) on behalf of the Fund. The Advisory Agreement and the Subadvisory Agreement are referred to as the Agreements.
Activities and composition of the Board
The Board consists of eleven individuals, nine of whom are Independent Trustees. Independent Trustees are generally those individuals who are unaffiliated with the Fund, the Adviser and the Subadviser. The Trustees are responsible for the oversight of operations of the Fund and perform the various duties required of directors of investment companies by the Investment Company Act of 1940, as amended (the 1940 Act). The Independent Trustees have retained independent legal counsel to assist them in connection with their duties. The Board has appointed an Independent Trustee as Chairperson. The Board has established four standing committees that are composed entirely of Independent Trustees: the Audit Committee; the Compliance Committee; the Nominating, Governance and Administration Committee; and the Contracts/Operations Committee. Additionally, Investment Performance Committees A and B are standing committees of the Board that are each composed of Independent Trustees and one Trustee who is affiliated with the Adviser. Investment Performance Committee B oversees and monitors matters relating to the investment performance of the Fund. The Board has also designated a Vice Chairperson to serve in the absence of the Chairperson, who also serves as Chairman of the Board’s Nominating, Governance and Administration Committee. The Board also designates working groups or ad hoc committees as it deems appropriate.
The approval process
Pursuant to the 1940 Act, the Board is required to consider the continuation of the Agreements on an annual basis. Throughout the year, the Board, acting directly and through its committees, regularly reviews and assesses the quality of the services that the Fund receives under these Agreements. In this regard, the Board reviews reports of the Adviser at least quarterly, which include, among other things, Fund performance reports and compliance reports. In addition, the Board meets with portfolio managers and senior investment officers at various times throughout the year. The Board considers at each of its meetings factors that are relevant to its annual consideration of the renewal of the Agreements, including the services and support provided by the Adviser and Subadviser to the Fund and its shareholders.
Prior to the May 2-4, 2010 meeting, the Board requested and received materials specifically relating to the Agreements. The materials provided in connection with the May meeting included information independently compiled and prepared by Morningstar, Inc. (Morningstar) on Fund fees and expenses, and the investment performance of the Fund. This Fund information is assembled in a format that permits comparison with similar information from a category of relevant funds (the Category) and a peer group of comparable funds (the Peer Group) as determined by Morningstar, and its benchmark index. Other material provided for the Fund review included (a) information on the profitability of the Agreements to the Adviser and a discussion of any additional benefits to the Adviser and its affiliates that result from being the Adviser to the Fund; (b) a general analysis provided by the Adviser and the Subadviser concerning investment advisory fees charged to other clients, such as institutional clients and other investment companies, under similar investment mandates, as well as the performance of such other clients; (c) the impact of economies of scale;
| 34 | Rainier Growth Fund | Semiannual report |
(d) a summary of aggregate amounts paid by the Fund to the Adviser; and (e) sales and redemption data regarding the Fund’s shares.
At an in-person meeting held on May 2-4, 2010, the Board reviewed materials relating to its consideration of the Agreements. As a result of the discussions that occurred during the May 2-4, 2010 meeting, the Board presented the Adviser and Subadviser with questions and requests for additional information and the Adviser and Subadviser responded to these requests with additional written information in advance of the June 6–8, 2010 Board meeting. The Board also reviewed these additional materials relating to its consideration of the Agreements.
At an in-person meeting held on June 6–8, 2010, the Board, including the Independent Trustees, formally considered the continuation of the Advisory Agreement between the Adviser and the Fund and the Subadvisory Agreement between the Adviser and the Subadviser with respect to the Fund, each for an additional one-year term. The Board considered all factors it believed relevant with respect to the Fund, including, among other factors: (a) the nature, extent and quality of the services provided by the Adviser and the Subadviser; (b) the investment performance of the Fund and portfolio management of the Subadviser; (c) the advisory fees and the cost of the services and profits to be realized by the Adviser and certain affiliates from their relationship with the Fund; (d) economies of scale; and (e) other factors.
The Board also considered other matters important to the approval process, such as payments made to the Adviser or its affiliates relating to the distribution of Fund shares and other services. The Board reviewed services related to the valuation and pricing of Fund portfolio holdings. Other important matters considered by the Board were the direct and indirect benefits to the Adviser, the Subadviser, and their affiliates from their relationship with the Fund and advice from independent legal counsel with respect to the review process and materials submitted for the Board’s review. Each Trustee may have attributed different weights to the various items considered.
The key factors considered by the Board and the conclusions reached are described below.
Nature, extent and quality of services
The Board, including the Independent Trustees, reviewed the nature, extent and quality of services provided by the Adviser and the Subadviser, including the investment advisory services and the resulting performance of the Fund. The Board reviewed the Adviser’s and Subadviser’s senior management personnel responsible for investment operations, including the senior investment officers. The Board also reviewed the materials provided by the Fund’s portfolio management team discussing Fund performance and the Fund’s investment objective, strategies and outlook.
The Board considered the ability of the Adviser and the Subadviser, based on their resources, reputation and other attributes, to attract and retain qualified investment professionals, including research, advisory, and supervisory personnel. It considered the background and experience of senior management and investment professionals responsible for managing the Fund. The Board considered the investment philosophy, research and investment decision-making processes of the Adviser and the Subadviser responsible for the daily investment activities of the Fund, including, among other things, portfolio trading capabilities, use of technology, commitment to compliance and approach to training and retaining portfolio managers and other research, advisory and management personnel.
The Board considered the Subadviser’s history and experience with the Fund. The Board considered the Adviser’s execution of its oversight responsibilities. The Board further considered the culture of compliance, resources dedicated to compliance, compliance programs, record of compliance with applicable laws and regulation, with the Fund’s investment policies and restrictions and with the applicable Code of Ethics, and the responsibilities of the Adviser’s and Subadviser’s compliance departments.
| Semiannual report | Rainier Growth Fund | 35 |
In addition to advisory services, the Board considered the quality of the administrative and non-investment advisory services provided to the Fund by the Adviser under a separate agreement. The Board noted that the Adviser and its affiliates provide the Fund with certain administrative, transfer agency, shareholder and other services (in addition to any such services provided to the Fund by third parties) and officers and other personnel as are necessary for the operations of the Fund. The Board reviewed the structure and duties of the Adviser’s administration, accounting, legal and compliance departments and considered the Adviser’s policies and procedures for assuring compliance with applicable laws and regulations.
The Board also received information about the nature, extent and quality of services and fee rates offered by the Adviser and Subadviser to their other clients, including other registered investment companies, institutional investors and separate accounts. The Board reviewed a general analysis provided by the Adviser and the Subadviser concerning investment advisory fees charged to such other clients under similar investment mandates, the services provided to such other clients as compared to the services provided to the Fund, the performance of such other clients, and other factors relating to such other clients. The Board considered the significant differences between the Adviser’s and Subadviser’s services to the Fund and those services they provide to other clients which, to the extent the other client is not a mutual fund, may generally be attributable to the greater frequency of shareholder redemptions in a mutual fund, the higher turnover o f mutual fund assets, the more burdensome regulatory and legal obligations of mutual funds, and the higher marketing costs for mutual funds.
Fund performance
The Board, including the Independent Trustees, reviewed and considered the performance history of the Fund. The Board was provided with reports, independently prepared by Morningstar, which included a comprehensive analysis of the Fund’s performance. The Board also reviewed a narrative and statistical analysis of the Morningstar data that was prepared by the Adviser, which analyzed various factors that may affect the Morningstar rankings. The Board reviewed information regarding the investment performance of the Fund as compared to its Morningstar Category and Peer Group as well as its benchmark index. The Fund underperformed its Category median, its Peer Group median and the Russell 1000 Growth Index for the 1- and 3-year periods. Its five-year performance is generally comparable to the comparison groups (see chart below). The Board was provided with a description of the methodology used by Morningstar to select the funds in the Category and the Peer Group. The Board also considered updated performance information provided by the Adviser at its May and June 2010 meetings. The Board regularly reviews the performance of the Fund throughout the year and attaches more importance to performance over relatively longer periods of time, typically three to five years.
| 1 YEAR | 3 YEAR | 5 YEAR | 10 YEAR | |
| Rainier Growth Fund | 31.68% | –3.78% | 1.29% | N/A |
| Russell 1000 Growth Index | 37.21% | –1.89% | 1.63% | N/A |
| Large Growth Category Median | 34.36% | –2.70% | 1.35% | N/A |
| Morningstar 15(c) Peer Group Median | 38.44% | –3.38% | 0.56% | N/A |
The Board noted that the Subadviser remained consistent with its investment style and adhered to its investment mandates.
The Board concluded that the Fund’s underperformance was being responsibly addressed by the Adviser and Subadviser.
| 36 | Rainier Growth Fund | Semiannual report |
Expenses and fees
The Board, including the Independent Trustees, reviewed the Fund’s contractual advisory fee rate payable by the Fund to the Adviser as compared with the other funds in its Category and Peer Group. The Board also received information about the investment subadvisory fee rate payable by the Adviser to the Subadviser for investment subadvisory services. The Board considered the services provided and the fees charged by the Adviser and the Subadviser to other types of clients with similar investment mandates, including separately managed institutional accounts.
In addition, the Board considered the cost of the services provided to the Fund by the Adviser. The Board received and considered expense information regarding the Fund’s various components, including advisory fees, distribution fees and fees other than advisory and distribution fees, including transfer agent fees, custodian fees, administration fees and other miscellaneous fees (e.g., fees for accounting and legal services). The Board considered comparisons of these expenses to the Peer Group median. The Board also considered expense information regarding the Fund’s total operating expense ratio (Gross Expense Ratio) and total operating expense ratio after taking the fee waiver arrangement applicable to the Advisory Agreement rate into account (Net Expense Ratio). The Board considered information comparing the Gross Expense Ratio and Net Expense Ratio of the Fund to that of the Peer Group and Category medians. As part of its analysis, the Board reviewed the Adviser’s methodology in allocating its costs to the management of the Fund. The Board considered expenses and fee rates to be higher or lower if they were over or under 10 basis points, respectively; slightly higher or slightly lower if they were above or below 6–10 basis points, respectively, and inline if they were above or below by 5 basis points.
The Board noted that the investment advisory rate was inline with the Category and Peer Group medians. The Board reviewed the Fund’s Gross Expense Ratio of 1.70% for the Fund’s Class A shares. The Board noted that the Fund’s Gross Expense Ratio was higher than the Peer Group and Category medians. The Board also noted that the Fund’s Net Expense Ratio was inline with the Peer Group median and higher than the Category median. The Board favorably considered the impact of fee waivers towards ultimately lowering the Fund’s Gross Expense Ratio. The Board viewed favorably the Adviser’s new contractual agreement to waive all or a portion of its Advisory Agreement rate and reimburse or pay operating expenses to the extent necessary to maintain the Fund’s Net Expense Ratio at 1.35% for Class A shares, excluding certain expenses such as taxes, brokerage commissions, interest, litigation and extraordinary expenses, until July 31, 2011 . The Board also received and considered information relating to the Fund’s Gross Expense Ratio and Net Expense Ratio that reflected a proposed change in the methodology for calculating transfer agent fees.
The Board received and reviewed statements relating to the Adviser’s financial condition and profitability with respect to the services it provides the Fund. The Board was also provided with a profitability analysis that detailed the revenues earned and the expenses incurred by the Adviser for services provided to the Fund. The Board reviewed the Adviser’s profitability with respect to the Fund and other funds the Board currently oversees for the year ended December 31, 2009 compared to available aggregate profitability data provided for the year ended December 31, 2008.
The Board received and considered a detailed profitability analysis of the Adviser based on the Advisory Agreement, as well as on other relationships between the Fund and the Adviser and its affiliates.
The Board did not consider profitability information with respect to the Subadviser, which is not affiliated with the Adviser. The Board considered that the subadvisory fee under the Subadvisory Agreement had been negotiated by the Adviser and the Subadviser on an arm’s length basis and that the Subadviser’s separate profitability from its relationship with the Fund was not a material factor in determining whether to renew the Subadvisory Agreement.
| Semiannual report | Rainier Growth Fund | 37 |
Economies of scale
The Board, including the Independent Trustees, considered the extent to which economies of scale might be realized as the assets of the Fund increase and whether there should be changes in the advisory fee rate or structure in order to enable the Fund to participate in these economies of scale, for example through the use of breakpoints in the advisory fee based upon the assets of the Fund. The Board also considered the Adviser’s overall operations and its efforts to expand the scale of, and improve the quality of, its operations.
The Board recognized the inherent limitations of any analysis of economies of scale, stemming largely from the Board’s understanding that most of the Adviser’s costs are not specific to individual funds, but rather are incurred across a variety of products and services. To ensure that any economies are reasonably shared with the Fund as its assets increase, the Adviser and the Board agreed to continue the existing breakpoints to the Agreement fee rate.
Other benefits to the Adviser and the Subadviser
The Board understands that the Adviser, the Subadviser, or their affiliates may derive other ancillary benefits from their relationship with the Fund, both tangible and intangible, such as their ability to leverage investment professionals who manage other portfolios, an increase in their profile in the investment advisory community, and the engagement of their affiliates and/or significant shareholders as service providers to the Fund, including for administrative, transfer agency and distribution services. The Board believes that certain of these benefits are difficult to quantify. The Board also was informed that the Subadviser may use third party research obtained by soft dollars generated by certain mutual fund transactions to assist itself in managing all or a number of its other client accounts.
Board determination
The Board, including the Independent Trustees, unanimously approved the continuation of the Advisory Agreement between the Adviser and the Fund for an additional one-year term and the Subadvisory Agreement between the Adviser and Subadviser with respect to the Fund for an additional one-year term. Based upon its evaluation of relevant factors in their totality, the Board, including a majority of the Independent Trustees, was satisfied that the terms of the Agreements were fair and reasonable and in the best interest of the Fund and its shareholders. In arriving at a decision to approve the Agreements, the Board did not identify any single factor listed above, or any group of factors listed above, as all-important or controlling, but considered all factors together, and different Board Members may have attributed different weights to the various factors considered. The Independent Trustees were also assisted by the advice of independent legal counsel in maki ng this determination. The Board noted that contractual fee arrangements for the Fund reflect the results of several years of review by the Board and certain predecessor Trustees, and discussions between such Trustees (and predecessor Trustees) and the Adviser. Certain aspects of the arrangements may be the subject of more attention in some years than in others, and the Trustees’ conclusions may be based in part on their consideration of these arrangements in prior years.
| 38 | Rainier Growth Fund | Semiannual report |
More information
| Trustees | Investment adviser | |
| Patti McGill Peterson, Chairperson | John Hancock Investment Management | |
| James F. Carlin | Services, LLC | |
| William H. Cunningham | ||
| Deborah C. Jackson* | Subadviser | |
| Charles L. Ladner | Rainier Investment Management, Inc. | |
| Stanley Martin* | ||
| Hugh McHaffie†** | Principal distributor | |
| Dr. John A. Moore | John Hancock Funds, LLC | |
| Steven R. Pruchansky* | ||
| Gregory A. Russo | Custodian | |
| John G. Vrysen† | State Street Bank and Trust Company | |
| Officers | Transfer agent | |
| Keith F. Hartstein | John Hancock Signature Services, Inc. | |
| President and Chief Executive Officer | ||
| Legal counsel | ||
| Andrew G. Arnott | K&L Gates LLP | |
| Senior Vice President** and Chief Operating Officer | ||
| Thomas M. Kinzler | The report is certified under the Sarbanes-Oxley | |
| Secretary and Chief Legal Officer | Act, which requires mutual funds and other public | |
| companies to affirm that, to the best of their | ||
| Francis V. Knox, Jr. | knowledge, the information in their financial reports | |
| Chief Compliance Officer | is fairly and accurately stated in all material respects. | |
| Charles A. Rizzo | ||
| Chief Financial Officer | ||
| Salvatore Schiavone** | ||
| Treasurer | ||
| *Member of the Audit Committee | ||
| **Effective 8-31-10 | ||
| †Non-Independent Trustee | ||
The Fund’s proxy voting policies and procedures, as well as the Fund’s proxy voting record for the most recent twelve-month period ended June 30, are available free of charge on the Securities and Exchange Commission (SEC) Web site at www.sec.gov or on our Web site.
The Fund’s complete list of portfolio holdings, for the first and third fiscal quarters, is filed with the SEC on Form N-Q. The Fund’s Form N-Q is available on our Web site and the SEC’s Web site, www.sec.gov, and can be reviewed and copied (for a fee) at the SEC’s Public Reference Room in Washington, DC. Call 1-800-SEC-0330 to receive information on the operation of the SEC’s Public Reference Room.
We make this information on your fund, as well as monthly portfolio holdings, and other fund details available on our Web site www.jhfunds.com or by calling 1-800-225-5291.
| You can also contact us: | ||
| 1-800-225-5291 | Regular mail: | Express mail: |
| jhfunds.com | John Hancock Signature Services, Inc. | John Hancock Signature Services, Inc. |
| P.O. Box 55913 | Mutual Fund Image Operations | |
| Boston, MA 02205-5913 | 30 Dan Road | |
| Canton, MA 02021 |
| Semiannual report | Rainier Growth Fund | 39 |

1-800-225-5291
1-800-554-6713 TDD
1-800-338-8080 EASI-Line
www.jhfunds.com
Now available: electronic delivery
www.jhfunds.com/edelivery
| This report is for the information of the shareholders of John Hancock Rainier Growth Fund. | 334SA 9/10 |
| It is not authorized for distribution to prospective investors unless preceded or accompanied by a prospectus. | 11/10 |
| John Hancock | |
| Leveraged Companies Fund | |
| Semiannual Report | |
| 9.30.10 | |
| 1 | |
| John Hancock Leveraged Companies Fund | |
| Table of Contents | |
| Your expenses | Page 3 |
| Portfolio summary | Page 4 |
| Portfolio of investments | Page 5 |
| Financial statements | Page 9 |
| Financial highlights | Page 12 |
| Notes to financial statements | Page 16 |
| More information | Page 27 |
| 2 |
Leveraged Companies Fund
Your expenses
These examples are intended to help you understand your ongoing operating expenses.
Understanding your fund expenses
As a shareholder of the Fund, you incur two types of costs:
• Transaction costs which include sales charges (loads) on purchases or redemptions (varies by share class), minimum account fee charge, etc.
• Ongoing operating expenses including management fees, distribution and service fees (if applicable), and other fund expenses.
We are going to present only your ongoing operating expenses here.
Actual expenses/actual returns
This example is intended to provide information about your fund’s actual ongoing operating expenses, and is based on your fund’s actual return. It assumes an account value of $1,000.00 on April 1, 2010 with the same investment held until September 30, 2010.
| Account value | Ending value | Expenses paid during | |
| on 4-1-10 | on 9-30-10 | period ended 9-30-101 | |
| Class A | $1,000.00 | $990.70 | $6.74 |
| Class B | 1,000.00 | 987.00 | 10.21 |
| Class C | 1,000.00 | 987.00 | 10.21 |
| Class I | 1,000.00 | 992.60 | 4.85 |
Together with the value of your account, you may use this information to estimate the operating expenses that you paid over the period. Simply divide your account value at September 30, 2010, by $1,000.00, then multiply it by the “expenses paid” for your share class from the table above. For example, for an account value of $8,600.00, the operating expenses should be calculated as follows:
Example
[ My account value $8,600.00 / $1,000.00 = 8.6 ] x $[ “expenses paid” from table ] = My actual expenses
Hypothetical example for comparison purposes
This table allows you to compare your fund’s ongoing operating expenses with those of any other fund. It provides an example of the Fund’s hypothetical account values and hypothetical expenses based on each class’s actual expense ratio and an assumed 5% annualized return before expenses (which is not your fund’s actual return). It assumes an account value of $1,000.00 on April 1, 2010, with the same investment held until September 30, 2010. Look in any other fund shareholder report to find its hypothetical example and you will be able to compare these expenses.
| Account value | Ending value | Expenses paid during | |
| on 4-1-10 | on 9-30-10 | period ended 9-30-101 | |
| Class A | $1,000.00 | $1,018.30 | $6.83 |
| Class B | 1,000.00 | 1,014.80 | 10.35 |
| Class C | 1,000.00 | 1,014.80 | 10.35 |
| Class I | 1,000.00 | 1,020.20 | 4.91 |
Remember, these examples do not include any transaction costs, therefore, these examples will not help you to determine the relative total costs of owning different funds. If transaction costs were included, your expenses would have been higher. See the prospectus for details regarding transaction costs.
1 Expenses are equal to the Fund's annualized expense ratio of 1.35%, 2.05%, 2.05% and 0.97% for Class A, Class B, Class C and Class I shares, respectively, multiplied by the average account value over the period, multiplied by 183/365 (to reflect the one-half year period).
| 3 |
| Leveraged Companies Fund | |
| Portfolio Summary | |
| Value as a | |
| percentage of | |
| Top 10 Holdings1 | Fund's net assets |
| Delta Air Lines, Inc. | 13.9% |
| Greektown Superholdings, Inc., Series A | 13.0% |
| US Airways Group, Inc. | 7.7% |
| Sirius XM Radio, Inc. | 5.8% |
| UAL Corp. | 5.7% |
| Charter Communications, Inc., Class A | 5.2% |
| Exide Technologies | 3.7% |
| MBIA Insurance Corp., 14.000%, 1-15-13 | 3.4% |
| Bank of America Corp. | 3.3% |
| Canadian Satellite Radio Holdings, Inc., 12.750%, 2-15-14 | 3.1% |
| Value as a | |
| percentage of | |
| Sector Composition2 | Fund's net assets |
| Common Stocks | 75% |
| Preferred Stocks | 13% |
| Corporate Bonds | 8% |
| Convertible Bonds | 2% |
| Investment Companies | 1% |
| Short-Term Investments and Other | 1% |
| Value as a | |
| percentage of | |
| Portfolio Composition | Fund's net assets |
| Consumer Discretionary | 49% |
| Industrials | 31% |
| Financials | 15% |
| Materials | 2% |
| Investment Companies | 1% |
| Telecommunication Services | 1% |
| Short-Term Investments and Other | 1% |
1 Excludes cash and cash equivalents.
2 Sector investing is subject to greater risks than the market as a whole. Because the Fund may focus on particular sectors of the economy, its performance may depend on the performance of those sectors.
| 4 |
Leveraged Companies Fund
As of 9-30-10 (Unaudited)
| Shares | Value | |
| Common Stocks 74.74% | $992,028 | |
| (Cost $904,117) | ||
| Consumer Discretionary 28.81% | 382,386 | |
| Auto Components 7.52% | ||
| Autoliv, Inc. | 150 | 9,800 |
| Exide Technologies (I) | 10,220 | 48,954 |
| Federal Mogul Corp. (I) | 800 | 15,128 |
| Tenneco, Inc. (I) | 894 | 25,899 |
| Automobiles 2.38% | ||
| Ford Motor Company (I)(L) | 2,580 | 31,579 |
| Hotels, Restaurants & Leisure 1.68% | ||
| Greektown Superholdings, Inc. (I) | 92 | 10,173 |
| Trump Entertainment Resorts, Inc. (I) | 261 | 6,350 |
| Wendy's/Arby's Group, Inc., Class A | 1,285 | 5,821 |
| Media 17.23% | ||
| Cablevision Systems Corp., Class A | 1,495 | 39,154 |
| Canadian Satellite Radio Holdings, Inc., Class A (I) | 5,900 | 16,629 |
| Charter Communications, Inc., Class A (I) | 2,104 | 68,380 |
| Dex One Corp. (I) | 285 | 3,500 |
| Madison Square Garden, Inc., Class A (I) | 373 | 7,863 |
| Sirius XM Radio, Inc. (I) | 64,006 | 76,807 |
| SuperMedia, Inc. (I) | 91 | 962 |
| Time Warner Cable, Inc. | 285 | 15,387 |
| Consumer Staples 0.14% | 1,852 | |
| Food Products 0.14% | ||
| Kraft Foods, Inc., Class A | 60 | 1,852 |
| Energy 0.14% | 1,894 | |
| Oil, Gas & Consumable Fuels 0.14% | ||
| Dominion Petroleum, Ltd., GDR (I) | 33,000 | 1,894 |
| Financials 10.65% | 141,325 | |
| Capital Markets 2.93% | ||
| Janus Capital Group, Inc. | 460 | 5,037 |
| Knight Capital Group, Inc., Class A (I) | 160 | 1,982 |
| Morgan Stanley | 525 | 12,957 |
| The Blackstone Group LP | 350 | 4,442 |
| The Goldman Sachs Group, Inc. | 100 | 14,458 |
| Commercial Banks 0.57% | ||
| Wells Fargo & Company | 300 | 7,539 |
| Consumer Finance 0.27% | ||
| Discover Financial Services | 215 | 3,586 |
| Diversified Financial Services 4.84% | ||
| Bank of America Corp. | 3,320 | 43,525 |
| Citigroup, Inc. (I) | 785 | 3,062 |
| KKR Financial Holdings LLC | 2,010 | 17,648 |
| Insurance 0.29% | ||
| American International Group, Inc. (I) | 100 | 3,910 |
| Real Estate Investment Trusts 1.75% | ||
| Annaly Capital Management, Inc. | 1,317 | 23,179 |
See notes to financial statements
| 5 |
Leveraged Companies Fund
As of 9-30-10 (Unaudited)
| Shares | Value | |
| Industrials 31.19% | $413,934 | |
| Aerospace & Defense 0.44% | ||
| AAR Corp. (I) | 315 | 5,878 |
| Air Freight & Logistics 0.16% | ||
| FedEx Corp. | 25 | 2,138 |
| Airlines 29.78% | ||
| Delta Air Lines, Inc. (I) | 15,843 | 184,413 |
| Pinnacle Airlines Corp. (I) | 6,100 | 33,122 |
| UAL Corp. (I)(L) | 3,215 | 75,970 |
| US Airways Group, Inc. (I)(L) | 11,000 | 101,750 |
| Building Products 0.19% | ||
| USG Corp. (I) | 185 | 2,440 |
| Road & Rail 0.40% | ||
| Union Pacific Corp. | 65 | 5,317 |
| Trading Companies & Distributors 0.22% | ||
| TAL International Group, Inc. | 120 | 2,906 |
| Information Technology 0.53% | 7,102 | |
| Software 0.53% | ||
| Microsoft Corp. | 290 | 7,102 |
| Materials 2.42% | 32,152 | |
| Chemicals 2.19% | ||
| American Pacific Corp. (I) | 5,150 | 22,763 |
| Huntsman Corp. | 550 | 6,358 |
| Paper & Forest Products 0.23% | ||
| Smurfit-Stone Container Corp. (I) | 165 | 3,031 |
| Telecommunication Services 0.86% | 11,383 | |
| Wireless Telecommunication Services 0.86% | ||
| Leap Wireless International, Inc. (I) | 275 | 3,396 |
| Sprint Nextel Corp. (I) | 1,725 | 7,987 |
| Preferred Stocks 13.32% | $176,750 | |
| (Cost $162,034) | ||
| Consumer Discretionary 13.02% | 172,835 | |
| Hotels, Restaurants & Leisure 13.02% | ||
| Greektown Superholdings, Inc., Series A (I) | 1,563 | 172,835 |
| Financials 0.30% | 3,915 | |
| Insurance 0.30% | ||
| Hartford Financial Services Group, Inc., 7.250% | 165 | 3,915 |
See notes to financial statements
| 6 |
Leveraged Companies Fund
As of 9-30-10 (Unaudited)
| Maturity | Par value | |||
| Rate (%) | date | Value | ||
| Corporate Bonds 8.44% | $111,990 | |||
| (Cost $153,019) | ||||
| Consumer Discretionary 5.05% | 66,990 | |||
| Hotels, Restaurants & Leisure 1.98% | ||||
| Fontainebleau Las Vegas Holdings LLC (H)(S) | 10.250 | 06/15/15 | $100,000 | 15 |
| Majestic Star Casino LLC (H) | 9.500 | 10/15/10 | 15,000 | 9,000 |
| Mashantucket Western Pequot Tribe, Series A (H)(S) | 8.500 | 11/15/15 | 115,000 | 17,250 |
| Media 3.07% | ||||
| Canadian Satellite Radio Holdings, Inc. | 12.750 | 02/15/14 | 45,000 | 40,725 |
| SuperMedia, Inc. (Escrow Certificates) (I) | 8.000 | 11/15/16 | 115,000 | 0 |
| Financials 3.39% | 45,000 | |||
| Insurance 3.39% | ||||
| MBIA Insurance Corp. (14.00% to 1-15-13, then 3 month LIBOR | ||||
| + 11.26%) (S) | 14.000 | 01/15/33 | 100,000 | 45,000 |
| Convertible Bonds 2.40% | $31,860 | |||
| (Cost $24,760) | ||||
| Consumer Discretionary 1.97% | 26,160 | |||
| Media 1.97% | ||||
| XM Satellite Radio, Inc. (S) | 7.000 | 12/01/14 | 24,000 | 26,160 |
| Financials 0.43% | 5,700 | |||
| Capital Markets 0.43% | ||||
| Janus Capital Group, Inc. | 3.250 | 07/15/14 | 5,000 | 5,700 |
| Shares | Value | |||
| Investment Companies 1.38% | $18,305 | |||
| (Cost $17,563) | ||||
| Investment Companies 1.38% | 18,305 | |||
| Direxion Daily 10-year Treasury Bear 3X | 85 | 3,509 | ||
| ProShares Ultra Dow30 | 315 | 14,796 | ||
| Warrants 0.04% | $561 | |||
| (Cost $408) | ||||
| Charter Communications, Inc., Class A (Expiration Date: 11-30-14, Strike Price: | ||||
| $46.86) (I) | 102 | 561 | ||
| Short-Term Investments 11.23% | $149,083 | |||
| (Cost $149,089) | ||||
| Shares | Value | |||
| Securities Lending Collateral 11.23% | 149,083 | |||
| John Hancock Collateral Investment Trust (W) | 0.2942% (Y) | 14,895 | 149,083 | |
See notes to financial statements
| 7 |
Leveraged Companies Fund
As of 9-30-10 (Unaudited)
| Total investments (Cost $1,410,990)† 111.55% | $1,480,577 |
| Other assets and liabilities, net (11.55%) | ($153,319) |
| Total net assets 100.00% | $1,327,258 |
The percentage shown for each investment category is the total value that the category as a percentage of the net assets of the Fund.
GDR Global Depositary Receipt
LIBOR London Interbank Offered Rate
(H) Defaulted security. Currently, the issuer is in default with respect to interest payments.
(I) Non-income producing security.
(L) All or a portion of this security is on loan as of 9-30-10.
(S) These securities are exempt from registration under Rule 144A of the Securities Act of 1933. Such securities may be resold, normally to qualified institutional buyers, in transactions exempt from registration.
(W) Investment is an affiliate of the Fund, the adviser and/or subadviser. Also, it represents the investment of securities lending collateral received.
(Y) The rate shown is the annualized seven-day yield as of 9-30-10.
† At 9-30-10, the aggregate cost of investment securities for federal income tax purposes was $1,412,123. Net unrealized appreciation aggregated $68,454, of which $336,821 related to appreciated investment securities and $268,367 related to depreciated investment securities.
See notes to financial statements
| 8 |
Leveraged Companies Fund
Statement of Assets and Liabilities — September 30, 2010 (Unaudited)
| Assets | ||
| Investments in unaffiliated issuers, at value | ||
| (Cost $1,261,901) including $147,438 of securities | ||
| loaned (Note 2) | $1,331,494 | |
| Investments in affiliated issuers, at value | ||
| (Cost $149,089) (Note 2) | 149,083 | |
| Total investments, at value (Cost $1,410,990) | 1,480,577 | |
| Cash | 9,493 | |
| Receivable for investments sold | 3,150 | |
| Dividends and interest receivable | 5,295 | |
| Receivable for securities lending income | 15 | |
| Receivable due from adviser | 152 | |
| Other receivables | 87 | |
| Total assets | 1,498,769 | |
| Liabilities | ||
| Payable upon return of securities loaned (Note 2) | 149,046 | |
| Payable to affiliates | ||
| Accounting and legal services fees | 17 | |
| Transfer agent fees | 169 | |
| Trustees’ fees | 11 | |
| Other liabilities | 22,268 | |
| Total liabilities | 171,511 | |
| Net assets | ||
| Capital paid-in | $1,219,556 | |
| Undistributed net investment income | 12,145 | |
| Accumulated net realized gain on investments and | ||
| foreign currency transactions | 26,215 | |
| Net unrealized appreciation (depreciation) on | ||
| investments and translation of assets and | ||
| liabilities in foreign currencies | 69,342 | |
| Net assets | $1,327,258 | |
| Net asset value per share | ||
| Based on net asset values and shares outstanding | ||
| - the Fund has an unlimited number of shares | ||
| authorized with no par value | ||
| Class A ($302,433 ÷ 28,327 shares) | $10.68 | |
| Class B ($297,362 ÷ 28,010 shares)1 | $10.62 | |
| Class C ($297,348 ÷ 28,011 shares)1 | $10.62 | |
| Class I ($430,115 ÷ 40,159 shares) | $10.71 | |
| Maximum offering price per share | ||
| Class A (net asset value per share ÷ 95%)2 | $11.24 | |
1 Redemption price per share is equal to net asset value less any applicable contingent deferred sales charge.
2 On single retail sales of less than $50,000. On sales of $50,000 or more and on group sales the offering price is reduced.
See notes to financial statements
| 9 |
Leveraged Companies Fund
Statement of Operations — For the six-month period ended 9-30-10 (Unaudited)
| Investment income | ||
| Interest | $11,649 | |
| Dividends | 6,747 | |
| Securities lending | 265 | |
| Less foreign taxes withheld | (71) | |
| Total investment income | 18,590 | |
| Expenses | ||
| Investment management fees (Note 4) | 4,952 | |
| Distribution and service fees (Note 4) | 3,413 | |
| Accounting and legal services fees (Note 4) | 85 | |
| Transfer agent fees (Note 4) | 638 | |
| Trustees' fees (Note 4) | 112 | |
| State registration fees (Note 4) | 88 | |
| Professional fees | 28,180 | |
| Custodian fees | 9,030 | |
| Registration and filing fees | 6,849 | |
| Other | 3,492 | |
| Total expenses | 56,839 | |
| Less expense reductions (Note 4) | (46,662) | |
| Net expenses | 10,177 | |
| Net investment income | 8,413 | |
| Realized and unrealized gain (loss) | ||
| Net realized gain (loss) on | ||
| Investments in unaffiliated issuers | 2,598 | |
| Investments in affiliated issuers | (973) | |
| Foreign currency transactions | (333) | |
| 1,292 | ||
| Change in net unrealized appreciation | ||
| (depreciation) of | ||
| Investments in unaffiliated issuers | (24,060) | |
| Translation of assets and liabilities in foreign | ||
| currencies | 101 | |
| (23,959) | ||
| Net realized and unrealized loss | (22,667) | |
| Decrease in net assets from operations | ($14,254) | |
See notes to financial statements
| 10 |
Leveraged Companies Fund
Statements of Changes in Net Assets
| Six-months | |||
| ended | Year ended | ||
| 9-30-10 | 3-31-10 | ||
| (Unaudited) | |||
| Increase (decrease) in net assets | |||
| From operations | |||
| Net investment income | $8,413 | $28,945 | |
| Net realized gain | 1,292 | 106,434 | |
| Change in net unrealized appreciation | |||
| (depreciation) | (23,959) | 646,527 | |
| Increase (decrease) in net assets resulting | |||
| from operations | (14,254) | 781,906 | |
| Distributions to shareholders | |||
| From net investment income | |||
| Class A | — | (14,079) | |
| Class B | — | (12,806) | |
| Class C | — | (12,807) | |
| Class I | — | (14,628) | |
| From net realized gain | |||
| Class A | — | (4,304) | |
| Class B | — | (4,275) | |
| Class C | — | (4,276) | |
| Class I | — | (4,316) | |
| Total distributions | — | (71,491) | |
| From Fund share transactions (Note 5) | — | 191,393 | |
| Total increase (decrease) | (14,254) | 901,808 | |
| Net assets | |||
| Beginning of period | 1,341,512 | 439,704 | |
| End of period | $1,327,258 | $1,341,512 | |
| Undistributed net investment income | $12,145 | $3,732 | |
See notes to financial statements
| 11 |
Leveraged Companies Fund
Financial Highlights (For a share outstanding throughout the period)
| Class A Shares | ||||
| Period ended | 09/30/20101 | 03/31/2010 | 03/31/20092 | |
| Per share operating performance | ||||
| Net asset value, beginning of period | $10.78 | $4.19 | $10.00 | |
| Net investment income3 | 0.08 | 0.29 | 0.33 | |
| Net realized and unrealized gain (loss) on | ||||
| investments | (0.18) | 7.00 | (5.83) | |
| Total from investment operations | (0.10) | 7.29 | (5.50) | |
| Less distributions | ||||
| From net investment income | — | (0.54) | (0.31) | |
| From net realized gain | — | (0.16) | — | |
| Total distributions | — | (0.70) | (0.31) | |
| Net asset value, end of period | $10.68 | $10.78 | $4.19 | |
| Total return (%)4,5 | (0.93)6 | 177.42 | (55.97)6 | |
| Ratios and supplemental data | ||||
| Net assets, end of period (in thousands) | $302 | $305 | $110 | |
| Ratios (as a percentage of average net assets): | ||||
| Expenses before reductions | 8.427 | 10.56 | 13.917 | |
| Expenses net of fee waivers | 1.357 | 1.41 | 1.217 | |
| Expenses net of fee waivers and credits | 1.357 | 1.35 | 1.217 | |
| Net investment income | 1.477 | 3.63 | 4.877 | |
| Portfolio turnover (%) | 28 | 83 | 18 | |
1 Semiannual period from 4-1-10 to 9-30-10. Unaudited.
2 The inception date for Class A shares is 5-1-08.
3 Based on the average daily shares outstanding.
4 Total returns would have been lower had certain expenses not been reduced during the periods shown.
5 Does not reflect the effect of sales charges, if any.
6 Not annualized.
7 Annualized.
See notes to financial statements
| 12 |
Leveraged Companies Fund
Financial Highlights (For a share outstanding throughout the period)
| Class B Shares | ||||
| Period ended | 09/30/20101 | 03/31/2010 | 03/31/20092 | |
| Per share operating performance | ||||
| Net asset value, beginning of period | $10.76 | $4.19 | $10.00 | |
| Net investment income3 | 0.04 | 0.23 | 0.28 | |
| Net realized and unrealized gain (loss) on | ||||
| investments | (0.18) | 6.99 | (5.82) | |
| Total from investment operations | (0.14) | 7.22 | (5.54) | |
| Less distributions | ||||
| From net investment income | — | (0.49) | (0.27) | |
| From net realized gain | — | (0.16) | — | |
| Total distributions | — | (0.65) | (0.27) | |
| Net asset value, end of period | $10.62 | $10.76 | $4.19 | |
| Total return (%)4,5 | (1.30)6 | 175.60 | (56.26)6 | |
| Ratios and supplemental data | ||||
| Net assets, end of period (in thousands) | $297 | $301 | $109 | |
| Ratios (as a percentage of average net assets): | ||||
| Expenses before reductions | 9.127 | 11.27 | 14.587 | |
| Expenses net of fee waivers | 2.057 | 2.11 | 1.917 | |
| Expenses net of fee waivers and credits | 2.057 | 2.05 | 1.917 | |
| Net investment income | 0.777 | 2.93 | 4.167 | |
| Portfolio turnover (%) | 28 | 83 | 18 | |
1 Semiannual period from 4-1-10 to 9-30-10. Unaudited.
2 The inception date for Class B shares is 5-1-08.
3 Based on the average daily shares outstanding.
4 Total returns would have been lower had certain expenses not been reduced during the periods shown.
5 Does not reflect the effect of sales charges, if any.
6 Not annualized.
7 Annualized.
See notes to financial statements
| 13 |
Leveraged Companies Fund
Financial Highlights (For a share outstanding throughout the period)
| Class C Shares | ||||
| Period ended | 09/30/20101 | 03/31/2010 | 03/31/20092 | |
| Per share operating performance | ||||
| Net asset value, beginning of period | $10.76 | $4.19 | $10.00 | |
| Net investment income3 | 0.04 | 0.23 | 0.28 | |
| Net realized and unrealized gain (loss) on | ||||
| investments | (0.18) | 6.99 | (5.82) | |
| Total from investment operations | (0.14) | 7.22 | (5.54) | |
| Less distributions | ||||
| From net investment income | — | (0.49) | (0.27) | |
| From net realized gain | — | (0.16) | — | |
| Total distributions | — | (0.65) | (0.27) | |
| Net asset value, end of period | $10.62 | $10.76 | $4.19 | |
| Total return (%)4,5 | (1.30)6 | 175.60 | (56.26)6 | |
| Ratios and supplemental data | ||||
| Net assets, end of period (in thousands) | $297 | $301 | $109 | |
| Ratios (as a percentage of average net assets): | ||||
| Expenses before reductions | 9.127 | 11.27 | 14.597 | |
| Expenses net of fee waivers | 2.057 | 2.11 | 1.917 | |
| Expenses net of fee waivers and credits | 2.057 | 2.05 | 1.917 | |
| Net investment income | 0.777 | 2.93 | 4.167 | |
| Portfolio turnover (%) | 28 | 83 | 18 | |
1 Semiannual period from 4-1-10 to 9-30-10. Unaudited.
2 The inception date for Class C shares is 5-1-08.
3 Based on the average daily shares outstanding.
4 Total returns would have been lower had certain expenses not been reduced during the periods shown.
5 Does not reflect the effect of sales charges, if any.
6 Not annualized.
7 Annualized.
See notes to financial statements
| 14 |
Leveraged Companies Fund
Financial Highlights (For a share outstanding throughout the period)
| Class I Shares | ||||
| Period ended | 09/30/20101 | 03/31/2010 | 03/31/20092 | |
| Per share operating performance | ||||
| Net asset value, beginning of period | $10.79 | $4.19 | $10.00 | |
| Net investment income3 | 0.10 | 0.32 | 0.35 | |
| Net realized and unrealized gain (loss) on | ||||
| investments | (0.18) | 7.00 | (5.83) | |
| Total from investment operations | (0.08) | 7.32 | (5.48) | |
| Less distributions | ||||
| From net investment income | — | (0.56) | (0.33) | |
| From net realized gain | — | (0.16) | — | |
| Total distributions | — | (0.72) | (0.33) | |
| Net asset value, end of period | $10.71 | $10.79 | $4.19 | |
| Total return (%)4 | (0.74)5 | 178.23 | (55.85)5 | |
| Ratios and supplemental data | ||||
| Net assets, end of period (in thousands) | $430 | $433 | $111 | |
| Ratios (as a percentage of average net assets): | ||||
| Expenses before reductions | 8.046 | 9.14 | 13.626 | |
| Expenses net of fee waivers | 0.976 | 1.09 | 0.906 | |
| Expenses net of fee waivers and credits | 0.976 | 1.04 | 0.906 | |
| Net investment income | 1.856 | 4.01 | 5.186 | |
| Portfolio turnover (%) | 28 | 83 | 18 | |
1 Semiannual period from 4-1-10 to 9-30-10. Unaudited.
2 The inception date for Class I shares is 5-1-08.
3 Based on the average daily shares outstanding.
4 Total returns would have been lower had certain expenses not been reduced during the periods shown.
5 Not annualized.
6 Annualized.
See notes to financial statements
| 15 |
Leveraged Companies Fund
Notes to financial statements (unaudited)
Note 1 – Organization
John Hancock Leveraged Companies Fund (the Fund) is a diversified series of John Hancock Funds III (the Trust), an open-end management investment company organized as a Massachusetts business trust and registered under the Investment Company Act of 1940, as amended (the 1940 Act). The investment objective of the Fund is to seek capital appreciation.
The Fund may offer multiple classes of shares. The shares currently offered are detailed in the Statement of Assets and Liabilities. Class A, Class B and Class C shares are offered to all investors. Class I shares are offered to institutions and certain investors. Shareholders of each class have exclusive voting rights to matters that affect that class. The distribution and service fees, transfer agent fees, printing and postage and state registration fees for each class may differ. Class B shares convert to Class A shares eight years after purchase.
Affiliates of the Fund owned 100% of the shares of beneficial interest of the Fund on September 30, 2010.
Note 2 – Significant accounting policies
The financial statements have been prepared in conformity with accounting principles generally accepted in the United States of America, which require management to make certain estimates and assumptions at the date of the financial statements. Actual results could differ from those estimates. Events or transactions occurring after the end of the fiscal period through the date that the financial statements were issued have been evaluated in the preparation of the financial statements. The following summarizes the significant accounting policies of the Fund:
Security valuation. Investments are stated at value as of the close of regular trading on the New York Stock Exchange (NYSE), normally at 4:00 P.M., Eastern Time. The Fund uses a three-tier hierarchy to prioritize the pricing assumptions, referred to as inputs, used in valuation techniques to measure fair value. Level 1 includes quoted prices in active markets for identical securities. Level 2 includes significant observable inputs. Observable inputs may include quoted prices for similar securities, interest rates, prepayment speeds and credit risk. Prices for securities valued using these techniques are received from independent pricing vendors and brokers and are based on an evaluation of the inputs described. Level 3 includes significant unobservable inputs when mar ket prices are not readily available or reliable, including the Fund’s own assumptions in determining the fair value of investments. The inputs or methodology used for valuing securities are not necessarily an indication of the risk associated with investing in those securities.
The following is a summary of the values by input classification of the Fund’s investments as of September 30, 2010, by major security category or type:
| Level 2 | Level 3 | ||||
| Significant | Significant | ||||
| Total Market | Level 1 | Observable | Unobservabl | ||
| Value at 9-30-10 | Quoted Price | Inputs | e Inputs | ||
| Common Stocks | $992,028 | $973,611 | $1,894 | $16,523 | |
| Preferred Stocks | 176,750 | 3,915 | - | 172,835 | |
| Corporate Bonds | 111,990 | - | 111,990 | - | |
| Convertible Bonds | 31,860 | - | 31,860 | - | |
| Investment Companies | 18,305 | 18,305 | - | - | |
| Warrants | 561 | 561 | - | - | |
| Short-Term Investments | 149,083 | 149,083 | - | - | |
| Total investments in Securities | $1,480,577 | $1,145,475 | $145,744 | $189,358 | |
| 16 |
The following is a reconciliation of Level 3 assets for which significant unobservable inputs were used to determine fair value:
| Common | Preferred | Corporate | |||
| Stocks | Stocks | Bonds | Total | ||
| Balance as of 3-31-10 | - | $16,983 | $25,571 | $42,554 | |
| Accrued discounts/premiums | - | - | - | - | |
| Realized gain (loss) | - | 9,523 | - | 9,523 | |
| Change in unrealized appreciation | |||||
| (depreciation) | ($1,112) | 4,146 | (2,012) | 1,022 | |
| Net purchases (sales) | 7,462 | 125,375 | - | 132,837 | |
| Transfers in and/or out of Level 3 | 10,173 | 16,808 | (23,559) | 3,422 | |
| Balance as of 9-30-10 | $16,523 | $172,835 | - | $189,358 | |
During the six months ended September 30, 2010, there were no significant transfers in or out of Level 1 or Level 2 assets.
In order to value the securities, the Fund uses the following valuation techniques. Equity securities held by the Fund are valued at the last sale price or official closing price on the principal securities exchange on which they trade. In the event there were no sales during the day or closing prices are not available, then securities are valued using the last quoted bid or evaluated price. Debt obligations are valued based on the evaluated prices provided by an independent pricing service, which utilizes both dealer-supplied and electronic data processing techniques, taking into account factors such as institutional-size trading in similar groups of securities, yield, quality, coupon rate, maturity, type of issue, trading characteristics and other market data. Investments in open-end mutual funds, including John Hancock Collateral Investment Trust (JHCIT), are valued at their closing net asset values each day. Foreign securities and currencies are va lued in U.S. dollars, based on foreign currency exchange rates supplied by an independent pricing service. Certain securities traded only in the over-the-counter market are valued at the last bid price quoted by brokers making markets in the securities at the close of trading. Certain short-term securities are valued at amortized cost.
Other portfolio securities and assets, where market quotations are not readily available, are valued at fair value, as determined in good faith by the Fund’s Pricing Committee, following procedures established by the Board of Trustees. Generally, trading in non-U.S. securities is substantially completed each day at various times prior to the close of trading on the NYSE. Significant market events that affect the values of non-U.S. securities may occur after the time when the valuation of the securities is generally determined and the close of the NYSE. During significant market events, these securities will be valued at fair value, as determined in good faith, following procedures established by the Board of Trustees. The Fund may use a fair valuation model to value non-U.S. securities in order to adjust for events which may occur between the close of foreign exchanges and the close of the NYSE.
Security transactions and related investment income. Investment security transactions are accounted for on a trade date plus one basis for daily net asset value calculations. However, for financial reporting purposes, investment transactions are reported on trade date. Interest income is accrued as earned. Gains and losses on securities sold are determined on the basis of identified cost and may include proceeds from litigation. Dividend income is recorded on the ex-date, except for certain foreign dividends where the ex-date may have passed, which are recorded when the Fund becomes aware of the dividends. Interest income includes coupon interest and amortization/accretion of premiums/discounts on debt securities. Debt obligations may be placed in a non-accrual status and related interest income may be reduced by stopping current accruals and writing off interest receivable when the collection of all or a port ion of interest has become doubtful.
| 17 |
Real estate investment trusts. From time to time, the Fund may invest in real estate investment trusts (REITs) and, as a result, will estimate the components of distributions from these securities. Distributions from REITs received in excess of income are recorded as a reduction of cost of investments and/or as a realized gain.
Securities lending. The Fund may lend its securities to earn additional income. It receives and maintains cash collateral received from the borrower in an amount not less than the market value of the loaned securities. The Fund will invest its collateral in JHCIT, as a result, the Fund will receive the benefit of any gains and bear any losses generated by JHCIT. Although risk of the loss of the securities lent is mitigated by holding the collateral, the Fund could experience a delay in recovering its securities and a possible loss of income or value if the borrower fails to return the securities or if collateral investments decline in value. The Fund may receive compensation for lending its securities by retaining a portion of the return on the investment of the collateral and compensation from fees earned from borrowers of the securities. Income received from JHCIT is a component of securities lending income as recorded on the Statement of Operations.
Foreign currency translation. Assets, including investments and liabilities denominated in foreign currencies, are translated into U.S. dollar values each day at the prevailing exchange rate. Purchases and sales of securities, income, and expenses are translated into U.S. dollars at the prevailing exchange rate on the date of the transaction. The effect of changes in foreign currency exchange rates on securities is reflected as a component of the realized and unrealized gains (losses) on investments.
Line of credit. The Fund may borrow from banks for temporary or emergency purposes, including meeting redemption requests that otherwise might require the untimely sale of securities. Pursuant to the custodian agreement, the custodian may loan money to a Fund to make properly authorized payments. The Fund is obligated to repay the custodian for any overdraft, including any related costs or expenses. The custodian has a lien, security interest or security entitlement in any Fund property that is not segregated, to the maximum extent permitted by law for any overdraft.
In addition, the Fund and other affiliated funds have entered into an agreement with State Street Bank and Trust Company which enables them to participate in a $100 million unsecured committed line of credit. A commitment fee, payable at the end of each calendar quarter, based on the average daily unused portion of the line of credit, is charged to each participating fund on a pro rata basis and is reflected in other expenses on the Statement of Operations. For the six months ended September 30, 2010, the Fund had no borrowings under the line of credit.
Expenses. The majority of expenses are directly attributable to an individual fund. Expenses that are not readily attributable to a specific fund are allocated among all funds in an equitable manner, taking into consideration, among other things, the nature and type of expense and the fund’s relative assets. Expense estimates are accrued in the period to which they relate and adjustments are made when actual amounts are known.
Class allocations. Income, common expenses, and realized and unrealized gains (losses) are determined at the fund level and allocated daily to each class of shares based on the net asset value of the class. Class-specific expenses, such as distribution and service fees, if any, transfer agent fees, state registration fees and printing and postage fees, for all classes are calculated daily at the class level based on the appropriate net asset value of each class and the specific expense rates applicable to each class.
| 18 |
Federal income taxes. The Fund intends to qualify as a regulated investment company by complying with the applicable provisions of the Internal Revenue Code and will not be subject to federal income tax on taxable income that is distributed to shareholders. Therefore, no federal income tax provision is required.
As of March 31, 2010, the Fund had no uncertain tax positions that would require financial statement recognition, de-recognition or disclosure. The Fund’s federal tax return is subject to examination by the Internal Revenue Service for a period of three years.
Distribution of income and gains. Distributions to shareholders from net investment income and net realized gains, if any, are recorded on the ex-date. The Fund generally declares and pays dividends and capital gain distributions, if any, at least annually.
Distributions paid by the Fund with respect to each class of shares are calculated in the same manner, at the same time and are in the same amount, except for the effect of expenses that may be applied differently to each class.
Such distributions, on a tax basis, are determined in conformity with income tax regulations, which may differ from accounting principles generally accepted in the United States of America. Material distributions in excess of tax basis earnings and profits, if any, are reported in the Fund’s financial statements as a return of capital.
Capital accounts within financial statements are adjusted for permanent book/tax differences. These adjustments have no impact on net assets or the results of operations. Temporary book/tax differences, if any, will reverse in a subsequent period. Permanent book/tax differences are primarily attributable to defaulted bonds.
Note 3 – Guarantees and indemnifications
Under the Fund’s organizational documents, its Officers and Trustees are indemnified against certain liabilities arising out of the performance of their duties to the Fund. Additionally, in the normal course of business, the Fund enters into contracts with service providers that contain general indemnification clauses. The Fund’s maximum exposure under these arrangements is unknown, as this would involve future claims that may be made against the Fund that have not yet occurred. The risk of material loss from such claims is considered remote.
Note 4 – Fees and transactions with affiliates
John Hancock Investment Management Services, LLC (the Adviser) serves as investment adviser for the Trust. John Hancock Funds, LLC (the Distributor), an affiliate of the Adviser, serves as principal underwriter of the Trust. The Adviser and the Distributor are indirect wholly owned subsidiaries of Manulife Financial Corporation (MFC).
Management fee. The Fund has an investment management contract with the Adviser under which the Fund pays a daily management fee to the Adviser equivalent, on an annual basis, to the sum of: (a) 0.750% of the first $500,000,000 of the Fund’s average daily net assets; (b) 0.725% of the next $500,000,000 of the Fund’s average daily net assets; and (c) 0.700% of the Fund’s average daily net assets in excess of $1,000,000,000. The Adviser has a subadvisory agreement with MFC Global Investment Management (U.S.), LLC, an indirectly owned subsidiary of MFC and an affiliate of the Adviser. The Fund is not responsible for payment of the subadvisory fees.
The investment management fees incurred for the six months ended September 30, 2010 were equivalent to an annual effective rate of 0.75% of the Fund’s average daily net assets.
| 19 |
Effective July 1, 2010, the Adviser has contractually agreed to waive fees and/or reimburse certain expenses for each share class of the Fund. This agreement excludes taxes, brokerage commissions, interest, litigation and indemnification expenses and other extraordinary expenses not incurred in the ordinary course of the Fund’s business. The fee waivers and/or reimbursements are such that these expenses will not exceed 1.35% for Class A, 2.05% for Class B, 2.05% for Class C and 0.89% for Class I shares. The fee waivers and/or reimbursements will continue in effect until July 31, 2011.
Prior to July 1, 2010, the Adviser had contractually agreed to waive fees and/or reimburse certain expenses for each share class of the Fund. This agreement excluded taxes, brokerage commissions, interest, litigation and indemnification expenses and other extraordinary expenses not incurred in the ordinary course of the Fund’s business. The fee waivers and/or reimbursements were such that these expenses would not exceed 1.35% for Class A, 2.05% for Class B, 2.05% for Class C and 1.05% for Class I shares.
Accordingly, the expense reductions or reimbursements related to these agreements were $10,630, $10,466, $10,466 and $15,100 for Class A, Class B, Class C and Class I shares, respectively, for the six months ended September 30, 2010.
Accounting and legal services. Pursuant to the service agreement, the Fund reimburses the Adviser for all expenses associated with providing the administrative, financial, legal, accounting and recordkeeping services of the Fund, including the preparation of all tax returns, periodic reports to shareholders and regulatory reports, among other services. These expenses are allocated to each share class based on its relative net assets at the time the expense was incurred. The accounting and legal services fees incurred for the six months ended September 30, 2010 amounted to an annual rate of 0.01% of the Fund’s average daily net assets.
Distribution and service plans. The Fund has a distribution agreement with the Distributor. The Fund has adopted distribution and service plans with respect to Class A, Class B and Class C shares pursuant to Rule 12b-1 under the 1940 Act, to pay the Distributor for services provided as the distributor of shares of the Fund. The following table shows the contractual rates of distribution and service fees under these arrangements, expressed as an annual percentage of average daily net assets for each class of the Fund’s shares.
| Class | 12b-1 Fees | ||||||
| Class A | 0.30% | ||||||
| Class B | 1.00% | ||||||
| Class C | 1.00% | ||||||
Sales charges. Class A shares are assessed up-front sales charges. For the six months ended September 30, 2010, there were no up-front sales charges received by the Distributor with regard to sales of Class A shares.
Class B and Class C shares are subject to contingent deferred sales charges (CDSC). Class B shares that are redeemed within six years of purchase are subject to CDSC, at declining rates, beginning at 5.00% of the lesser of the current market value at the time of redemption or the original purchase cost of the shares being redeemed. Class C shares that are redeemed within one year of purchase are subject to a 1.00% CDSC on the lesser of the current market value at the time of redemption or the original purchase cost of the shares being redeemed. Proceeds from CDSCs are used to compensate the Distributor for providing distribution-related services in connection with the sale of these shares. During the six months ended September 30, 2010, there were no CDSCs received by the Distributor for Class B or Class C shares.
| 20 |
Transfer agent fees. The Fund has a transfer agent agreement with John Hancock Signature Services, Inc. (Signature Services or Transfer Agent), an affiliate of the Adviser. The transfer agent fees paid to Signature Services are determined based on the cost to Signature Services (Signature Services Cost) of providing recordkeeping services. The Signature Services Cost includes a component of allocated John Hancock corporate overhead for providing transfer agent services to the Fund and to all other John Hancock affiliated funds. It also includes out-of-pocket expenses that are comprised of payments made to third-parties for recordkeeping services provided to their clients who invest in one or more John Hancock funds. In addition, Signature Services Cost may be reduced by certain revenues that Signature Services received in connection with the service they provide to the funds. Signature Services Cost is calcula ted monthly and allocated, as applicable, to four categories of share classes: Institutional Share Classes, Retirement Share Classes, Municipal Bond Classes and all other Retail Share Classes. Within each of these categories, the applicable costs are allocated to the affected John Hancock affiliated funds and/or classes, based on the relative average daily net assets.
Prior to July 1, 2010, the transfer agent fees were made up of three components:
• The Fund paid a monthly transfer agent fee at an annual rate of 0.05% for Class A, B and C shares and 0.04% for Class I shares, based on each class’s average daily net assets.
• The Fund paid a monthly fee based on an annual rate of $16.50 per shareholder account for all share classes.
• In addition, Signature Services was reimbursed for certain out-of-pocket expenses.
Class level expenses. Class level expenses for the six months ended September 30, 2010 were:
| Class | Distribution and service fees | Transfer agent fees | State registration fees |
| Class A | $451 | $185 | $22 |
| Class B | 1,481 | 181 | 22 |
| Class C | 1,481 | 181 | 22 |
| Class I | - | 91 | 22 |
| Total | $3,413 | $638 | $88 |
Trustee expenses. The Trust compensates each Trustee who is not an employee of the Adviser or its affiliates. These Trustees may, for tax purposes, elect to defer receipt of this compensation under the John Hancock Group of Funds Deferred Compensation Plan (the Plan). Deferred amounts are invested in various John Hancock funds and remain in the funds until distributed in accordance with the Plan. The investment of deferred amounts and the offsetting liability are included within other receivables and prepaid assets and Payable to affiliates - Trustees' fees respectively, in the accompanying Statement of Assets and Liabilities.
Note 5 - Fund share transactions
Transactions in Fund shares for the six months ended September 30, 2010 and year ended March 31, 2010 were as follows:
| 21 |
| Six months ended | Year ended | ||||
| 9/30/10 | 3/31/10 | ||||
| Shares | Amount | Shares | Amount | ||
| Class A shares | |||||
| Distributions reinvested | — | — | 2,056 | $18,382 | |
| Repurchased | — | — | (11) | (91) | |
| Net increase | — | — | 2,045 | $18,291 | |
| Class B shares | |||||
| Distributions reinvested | — | — | 1,911 | $17,081 | |
| Net increase | — | — | 1,911 | $17,081 | |
| Class C shares | |||||
| Distributions reinvested | — | — | 1,911 | $17,082 | |
| Net increase | — | — | 1,911 | $17,082 | |
| Class I shares | |||||
| Sold | — | — | 11,695 | $119,995 | |
| Distributions reinvested | — | — | 2,119 | 18,944 | |
| Net increase | — | — | 13,814 | $138,939 | |
| Net increase | — | — | 19,681 | $191,393 | |
Note 6 - Purchase and sale of securities
Purchases and sales of securities, other than short-term securities, aggregated $424,592 and $365,936, respectively, for the six months ended September 30, 2010.
| 22 |
Board Consideration of and Continuation of Investment Advisory Agreement and Subadvisory Agreement: John Hancock Leveraged Companies Fund
The Board of Trustees (the “Board”, the members of which are referred to as “Trustees”) of John Hancock Leveraged Companies Fund (the “Fund”), a series of John Hancock Funds III, met in-person on May 2-4 and June 6-8, 2010 to consider the approval of the Fund’s investment advisory agreement (the “Advisory Agreement”) with John Hancock Investment Management Services, LLC (the “Adviser”), the Fund’s investment adviser. The Board also considered the approval of the investment subadvisory agreement (the “Subadvisory Agreement”) between the Adviser and MFC Global Investment Management (U.S.), LLC (the “Subadviser”) on behalf of the Fund. The Advisory Agreement and the Subadvisory Agreement are referred to as the “Agreements.”
Activities and Composition of the Board
The Board consists of eleven individuals, nine of whom are Independent Trustees. “Independent Trustees” are generally those individuals who are unaffiliated with the Fund, the Adviser and the Subadviser. The Trustees are responsible for the oversight of operations of the Fund and perform the various duties required of directors of investment companies by the Investment Company Act of 1940, as amended (the “1940 Act”). The Independent Trustees have retained independent legal counsel to assist them in connection with their duties. The Board has appointed an Independent Trustee as Chairperson. The Board has established four standing committees that are composed entirely of Independent Trustees: the Audit Committee; the Compliance Committee; the Nominating, Governance and Administration Committee; and the Contracts/Operations Committee. Additionally, Investment Performance Committees A and B are standing committees of the Board that are each composed of Independent Trustees and one Trustee who is affiliated with the Adviser. Investment Performance Committee A oversees and monitors matters relating to the investment performance of the Fund. The Board has also designated a Vice Chairperson to serve in the absence of the Chairperson, who also serves as Chairman of the Board’s Nominating, Governance and Administration Committee. The Board also designates working groups or ad hoc committees as it deems appropriate.
The Approval Process
Pursuant to the 1940 Act, the Board is required to consider the continuation of the Agreements on an annual basis. Throughout the year, the Board, acting directly and through its committees, regularly reviews and assesses the quality of the services that the Fund receives under these Agreements. In this regard, the Board reviews reports of the Adviser at least quarterly, which include, among other things, Fund performance reports and compliance reports. In addition, the Board meets with portfolio managers and senior investment officers at various times throughout the year. The Board considers at each of its meetings factors that are relevant to its annual consideration of the renewal of the Agreements, including the services and support provided by the Adviser and Subadviser to the Fund and its shareholders.
Prior to the May 2-4, 2010 meeting, the Board requested and received materials specifically relating to the Agreements. The materials provided in connection with the May meeting included information compiled and prepared by the Adviser on Fund fees and expenses as compared with a category of relevant funds selected by the Adviser (the “Category”).
At an in-person meeting held on May 2-4, 2010, the Board reviewed materials relating to its consideration of the Agreements. As a result of the discussions that occurred during the May 2-4, 2010 meeting, the Board presented the Adviser and Subadviser with questions and requests for additional information and the Adviser and Subadviser responded to these requests with additional written information in advance of the June 6-8, 2010 Board meeting. The Board also reviewed these additional materials relating to its consideration of the Agreements.
At an in-person meeting held on June 6-8, 2010, the Board, including the Independent Trustees, formally considered the continuation of the Advisory Agreement between the Adviser and the Fund and the Subadvisory Agreement between the Adviser and the Subadviser with respect to the Fund, each for an
| 23 |
additional one-year term. The Board considered all factors it believed relevant with respect to the Fund, including, among other factors: (a) the nature, extent and quality of the services provided by the Adviser and the Subadviser; (b) the investment performance of the Fund and portfolio management of the Subadviser; (c) the advisory fees and the cost of the services and profits to be realized by the Adviser and certain affiliates from their relationship with the Fund; (d) economies of scale; and (e) other factors.
The Board also considered other matters important to the approval process, such as payments made to the Adviser or its affiliates relating to the distribution of Fund shares and other services. The Board reviewed services related to the valuation and pricing of Fund portfolio holdings. Other important matters considered by the Board were the direct and indirect benefits to the Adviser, the Subadviser, and their affiliates from their relationship with the Fund and advice from independent legal counsel with respect to the review process and materials submitted for the Board’s review. Each Trustee may have attributed different weights to the various items considered.
The key factors considered by the Board and the conclusions reached are described below.
Nature, extent and quality of services
The Board, including the Independent Trustees, reviewed the nature, extent and quality of services provided by the Adviser and the Subadviser, including the investment advisory services and the resulting performance of the Fund. The Board reviewed the Adviser’s and Subadviser’s senior management personnel responsible for investment operations, including the senior investment officers. The Board also reviewed the materials provided by the Fund’s portfolio management team discussing Fund performance and the Fund’s investment objective, strategies and outlook.
The Board considered the ability of the Adviser and the Subadviser, based on their resources, reputation and other attributes, to attract and retain qualified investment professionals, including research, advisory, and supervisory personnel. It considered the background and experience of senior management and investment professionals responsible for managing the Fund. The Board considered the investment philosophy, research and investment decision-making processes of the Adviser and the Subadviser responsible for the daily investment activities of the Fund, including, among other things, portfolio trading capabilities, use of technology, commitment to compliance and approach to training and retaining portfolio managers and other research, advisory and management personnel.
The Board considered the Subadviser’s history and experience with the Fund. The Board considered the Adviser’s execution of its oversight responsibilities. The Board further considered the culture of compliance, resources dedicated to compliance, compliance programs, record of compliance with applicable laws and regulation, with the Fund’s investment policies and restrictions and with the applicable Code of Ethics, and the responsibilities of the Adviser’s and Subadviser’s compliance departments.
In addition to advisory services, the Board considered the quality of the administrative and non-investment advisory services provided to the Fund by the Adviser under a separate agreement. The Board noted that the Adviser and its affiliates provide the Fund with certain administrative, transfer agency, shareholder and other services (in addition to any such services provided to the Fund by third parties) and officers and other personnel as are necessary for the operations of the Fund. The Board reviewed the structure and duties of the Adviser’s administration, accounting, legal and compliance departments and considered the Adviser’s policies and procedures for assuring compliance with applicable laws and regulations.
The Board also received information about the nature, extent and quality of services and fee rates offered by the Adviser and Subadviser to their other clients, including other registered investment companies, institutional investors and separate accounts. The Board reviewed a general analysis provided by the Adviser and the Subadviser concerning investment advisory fees charged to such other clients under similar investment mandates, the services provided to such other clients as compared to the services provided to the Fund, the performance of such other clients, and other factors relating to such other clients. The Board considered the significant differences between the Adviser’s and Subadviser’s services to the Fund and those services they provide to other clients which, to the extent the other client is not a
| 24 |
mutual fund, may generally be attributable to the greater frequency of shareholder redemptions in a mutual fund, the higher turnover of mutual fund assets, the more burdensome regulatory and legal obligations of mutual funds, and the higher marketing costs for mutual funds.
Fund performance
The Board, including the Independent Trustees, had previously received and considered information about the Adviser’s investment performance for other funds. The Board noted that the Fund had limited operational history, and considered the performance results for the Fund presented by the Adviser as of December 31, 2009. The Board noted that the Fund’s performance was higher than the performance of the benchmark index and the Category for the 1 month, 3 month, and since inception periods.
Expenses and fees
The Board, including the Independent Trustees, reviewed the Fund’s contractual advisory fee rate payable by the Fund to the Adviser as compared with the other funds in its Category. The Board also received information about the investment subadvisory fee rate payable by the Adviser to the Subadviser for investment subadvisory services. The Board considered the services provided and the fees charged by the Adviser and the Subadviser to other types of clients with similar investment mandates, including separately managed institutional accounts.
In addition, the Board considered the cost of the services provided to the Fund by the Adviser. The Board received and considered expense information regarding the Fund’s various components, including advisory fees, distribution fees and fees other than advisory and distribution fees, including transfer agent fees, custodian fees, administration fees and other miscellaneous fees (e.g., fees for accounting and legal services). The Board also considered expense information regarding the Fund’s total operating expense ratio (Gross Expense Ratio) and total operating expense ratio after taking the fee waiver arrangement applicable to the Advisory Agreement rate into account (Net Expense Ratio). The Board considered information comparing the Gross Expense Ratio and Net Expense Ratio of the Fund to that of the Category median. As part of its analysis, the Board reviewed t he Adviser’s methodology in allocating its costs to the management of the Fund. The Board considered expenses and fee rates to be higher or lower if they were over or under 10 basis points, respectively; slightly higher or slightly lower if they were above or below 6-10 basis points, respectively; and inline if they were above or below by 5 basis points.
The Board noted that the investment advisory rate was inline with the Category median. The Board reviewed the Fund’s Gross Expense Ratio of 14.28% and Net Expense Ratio of 1.35% for the Fund’s Class A shares. The Board noted that the Fund’s Gross Expense Ratio was higher than the Category median. The Board also noted that the Fund’s Net Expense Ratio was higher than the Category median. The Board favorably considered the impact of fee waivers towards ultimately lowering the Fund’s Gross Expense Ratio.
As the Fund is owned only by the Adviser or its affiliates and has no other shareholders, the Fund is considered “developing” and so the Adviser was not able to provide the Board with specific information concerning the expected profits to be realized by the Adviser and its affiliates from their relationships with the Fund.
Economies of scale
The Board, including the Independent Trustees, considered the extent to which economies of scale might be realized as the assets of the Fund increase and whether there should be changes in the advisory fee rate or structure in order to enable the Fund to participate in these economies of scale, for example through the use of breakpoints in the advisory fee based upon the assets of the Fund. The Board also considered the Adviser’s overall operations and its efforts to expand the scale of, and improve the quality of, its operations.
The Board recognized the inherent limitations of any analysis of economies of scale, stemming largely from the Board’s understanding that most of the Adviser’s costs are not specific to individual funds, but rather are incurred across a variety of products and services. To ensure that any economies are
| 25 |
reasonably shared with the Fund as its assets increase, the Adviser and the Board agreed to continue the existing breakpoints to the Agreement fee rate.
Other benefits to the Adviser and the Subadviser
The Board understands that the Adviser, the Subadviser, or their affiliates may derive other ancillary benefits from their relationship with the Fund, both tangible and intangible, such as their ability to leverage investment professionals who manage other portfolios, an increase in their profile in the investment advisory community, and the engagement of their affiliates and/or significant shareholders as service providers to the Fund, including for administrative, transfer agency and distribution services. The Board believes that certain of these benefits are difficult to quantify. The Board also was informed that the Subadviser may use third party research obtained by soft dollars generated by certain mutual fund transactions to assist itself in managing all or a number of its other client accounts.
Board determination
The Board, including the Independent Trustees, unanimously approved the continuation of the Advisory Agreement between the Adviser and the Fund for an additional one-year term and the Subadvisory Agreement between the Adviser and Subadviser with respect to the Fund for an additional one-year term. Based upon its evaluation of relevant factors in their totality, the Board, including a majority of the Independent Trustees, was satisfied that the terms of the Agreements were fair and reasonable and in the best interest of the Fund and its shareholders. In arriving at a decision to approve the Agreements, the Board did not identify any single factor listed above, or any group of factors listed above, as all-important or controlling, but considered all factors together, and different Board Members may have attributed different weights to the various factors considered. The Independent Trustees were also assisted by the advice of independent legal counsel in making this determination. The Board noted that contractual fee arrangements for the Fund reflect the results of several years of review by the Board and certain predecessor Trustees, and discussions between such Trustees (and predecessor Trustees) and the Adviser. Certain aspects of the arrangements may be the subject of more attention in some years than in others, and the Trustees’ conclusions may be based in part on their consideration of these arrangements in prior years.
| 26 |
| More information |
| Trustees | Investment adviser | |
| Patti McGill Peterson, Chairperson | John Hancock Investment Management Services, LLC | |
| James F. Carlin | ||
| William H. Cunningham | Subadviser | |
| Deborah C. Jackson* | MFC Global Investment Management (U.S.), LLC | |
| Charles L. Ladner | ||
| Stanley Martin* | Principal distributor | |
| Hugh McHaffie†** | John Hancock Funds, LLC | |
| Dr. John A. Moore | ||
| Steven R. Pruchansky* | Custodian | |
| Gregory A. Russo | State Street Bank and Trust Company | |
| John G. Vrysen† | ||
| Transfer agent | ||
| John Hancock Signature Services, Inc. | ||
| Officers | ||
| Keith F. Hartstein | Legal counsel | |
| President and Chief Executive Officer | K&L Gates LLP | |
| Andrew G. Arnott | ||
| Senior Vice President** and Chief Operating Officer | ||
| Thomas M. Kinzler | ||
| Secretary and Chief Legal Officer | ||
| Francis V. Knox, Jr. | The report is certified under the Sarbanes-Oxley Act, which | |
| Chief Compliance Officer | requires mutual funds and other public companies to affirm | |
| Charles A. Rizzo | that, to the best of their knowledge, the information in | |
| Chief Financial Officer | their financial reports is fairly and accurately stated in all | |
| Salvatore Schiavone** | material respects. | |
| Treasurer | ||
| *Member of the Audit Committee | ||
| **Effective 8-31-10 | ||
| †Non-Independent Trustee | ||
The Fund’s proxy voting policies and procedures, as well as the Fund’s proxy voting record, if any, for the most recent twelve-month period ended June 30, are available free of charge on the Securities and Exchange Commission (SEC) Web site at www.sec.gov or on our Web site.
The Fund’s complete list of portfolio holdings, for the first and third fiscal quarters, is filed with the SEC on Form N-Q. The Fund’s Form N-Q is available on our Web site and the SEC’s Web site, www.sec.gov, and can be reviewed and copied (for a fee) at the SEC’s Public Reference Room in Washington, DC. Call 1-800-SEC-0330 to receive information on the operation of the SEC's Public Reference Room.
We make this information on your fund, as well as monthly portfolio holdings, and other fund details available on our Web site www.jhfunds.com or by calling 1-800-225-5291.
| You can also contact us: | ||
| 1-800-225-5291 | Regular mail: | Express mail: |
| www. jhfunds.com | John Hancock Signature Services, Inc. | John Hancock Signature Services, Inc. |
| P.O. Box 55913 | Mutual Fund Image Operations | |
| Boston, MA 02205-5913 | 30 Dan Road | |
| Canton, MA 02021 |
| 27 |
| John Hancock | |
| Small Cap Opportunities Fund | |
| Semiannual Report | |
| 9.30.10 | |
| 1 | |
| John Hancock Small Cap Opportunities Fund | |
| Table of Contents | |
| Your expenses | Page 3 |
| Portfolio summary | Page 4 |
| Portfolio of investments | Page 5 |
| Financial statements | Page 9 |
| Financial highlights | Page 12 |
| Notes to financial statements | Page 16 |
| More information | Page 27 |
| 2 |
Small Cap Opportunities Fund
Your expenses
These examples are intended to help you understand your ongoing operating expenses.
Understanding your fund expenses
As a shareholder of the Fund, you incur two types of costs:
• Transaction costs which include sales charges (loads) on purchases or redemptions (varies by share class), minimum account fee charge, etc.
• Ongoing operating expenses including management fees, distribution and service fees (if applicable), and other fund expenses.
We are going to present only your ongoing operating expenses here.
Actual expenses/actual returns
This example is intended to provide information about your fund’s actual ongoing operating expenses, and is based on your fund’s actual return. It assumes an account value of $1,000.00 on April 1, 2010 with the same investment held until September 30, 2010.
| Account value | Ending value | Expenses paid during | |
| on 4-1-10 | on 9-30-10 | period ended 9-30-101 | |
| Class A | $1,000.00 | $1,004.80 | $7.64 |
| Class B | 1,000.00 | 1,001.40 | 11.14 |
| Class C | 1,000.00 | 1,001.40 | 11.14 |
| Class I | 1,000.00 | 1,006.90 | 5.69 |
Together with the value of your account, you may use this information to estimate the operating expenses that you paid over the period. Simply divide your account value at September 30, 2010, by $1,000.00, then multiply it by the “expenses paid” for your share class from the table above. For example, for an account value of $8,600.00, the operating expenses should be calculated as follows:
Example
[ My account value $8,600.00 / $1,000.00 = 8.6 ] x $[ “expenses paid” from table ] = My actual expenses
Hypothetical example for comparison purposes
This table allows you to compare your fund’s ongoing operating expenses with those of any other fund. It provides an example of the Fund’s hypothetical account values and hypothetical expenses based on each class’s actual expense ratio and an assumed 5% annualized return before expenses (which is not your fund’s actual return). It assumes an account value of $1,000.00 on April 1, 2010, with the same investment held until September 30, 2010. Look in any other fund shareholder report to find its hypothetical example and you will be able to compare these expenses.
| Account value | Ending value | Expenses paid during | |
| on 4-1-10 | on 9-30-10 | period ended 9-30-101 | |
| Class A | $1,000.00 | $1,017.40 | $7.69 |
| Class B | 1,000.00 | 1,013.90 | 11.21 |
| Class C | 1,000.00 | 1,013.90 | 11.21 |
| Class I | 1,000.00 | 1,019.40 | 5.72 |
Remember, these examples do not include any transaction costs, therefore, these examples will not help you to determine the relative total costs of owning different funds. If transaction costs were included, your expenses would have been higher. See the prospectus for details regarding transaction costs.
1 Expenses are equal to the Fund's annualized expense ratio of 1.52%, 2.22%, 2.22% and 1.13% for Class A, Class B, Class C and Class I shares, respectively, multiplied by the average account value over the period, multiplied by 183/365 (to reflect the one-half year period).
| 3 |
| Small Cap Opportunities Fund | |
| Portfolio Summary | |
| Value as a | |
| percentage of | |
| Top 10 Holdings1 | Fund's net assets |
| East West Bancorp, Inc. | 2.4% |
| Bally Technologies, Inc. | 2.4% |
| Atmel Corp. | 2.2% |
| MEDNAX, Inc. | 2.2% |
| Lazard, Ltd., Class A | 2.1% |
| VistaPrint NV | 2.0% |
| Schweitzer-Mauduit International, Inc. | 2.0% |
| Brigham Exploration Company | 1.9% |
| Rex Energy Corp. | 1.9% |
| Evercore Partners, Inc., Class A | 1.9% |
| Value as a | |
| percentage of | |
| Country Concentration2 | Fund's net assets |
| United States | 79% |
| Canada | 8% |
| Netherlands | 3% |
| Panama | 2% |
| Spain | 1% |
| China | 1% |
| Virgin Islands | 1% |
| Short-Term Investments and Other | 5% |
| Value as a | |
| percentage of | |
| Sector Composition2 | Fund’s net assets |
| Information Technology | 20% |
| Health Care | 19% |
| Consumer Discretionary | 16% |
| Materials | 13% |
| Industrials | 12% |
| Financials | 8% |
| Energy | 7% |
| Short-Term Investments and Other | 5% |
1 Excludes cash and cash equivalents.
2 International investing involves special risk such as political, economic and currency risks and differences in accounting standards and financial reporting. Sector investing is subject to greater risks than the market as a whole. Because the Fund may focus on particular sectors of the economy, its performance may depend on the performance of those sectors.
| 4 |
Small Cap Opportunities Fund
As of 9-30-10 (Unaudited)
| Shares | Value | |
| Common Stocks 94.90% | $2,980,139 | |
| (Cost $2,383,810) | ||
| Consumer Discretionary 16.39% | 514,688 | |
| Diversified Consumer Services 0.57% | ||
| American Public Education, Inc. (I) | 545 | 17,909 |
| Hotels, Restaurants & Leisure 3.94% | ||
| Bally Technologies, Inc. (I) | 2,118 | 74,024 |
| WMS Industries, Inc. (I) | 1,304 | 49,643 |
| Household Durables 4.79% | ||
| iRobot Corp. (I)(L) | 1,963 | 36,453 |
| Lennar Corp., Class A | 2,126 | 32,698 |
| Tempur-Pedic International, Inc. (I) | 1,562 | 48,422 |
| Tupperware Brands Corp. | 720 | 32,947 |
| Media 1.54% | ||
| Imax Corp. (I) | 2,877 | 48,506 |
| Specialty Retail 3.05% | ||
| A.C. Moore Arts & Crafts, Inc. (I) | 8,676 | 19,608 |
| CarMax, Inc. (I)(L) | 1,287 | 35,856 |
| DSW, Inc., Class A (I)(L) | 1,401 | 40,209 |
| Textiles, Apparel & Luxury Goods 2.50% | ||
| G-III Apparel Group, Ltd. (I) | 1,876 | 58,869 |
| Skechers U.S.A., Inc., Class A (I) | 832 | 19,544 |
| Energy 6.69% | 210,055 | |
| Oil, Gas & Consumable Fuels 6.69% | ||
| Brigham Exploration Company (I) | 3,258 | 61,088 |
| Kodiak Oil & Gas Corp. (I)(L) | 13,812 | 46,823 |
| Plains Exploration & Production Company (I) | 1,390 | 37,071 |
| Rex Energy Corp. (I) | 4,725 | 60,480 |
| Warren Resources, Inc. (I) | 1,157 | 4,593 |
| Financials 8.06% | 253,277 | |
| Capital Markets 4.32% | ||
| Evercore Partners, Inc., Class A | 2,090 | 59,795 |
| Harris & Harris Group, Inc. (I) | 2,286 | 9,761 |
| Lazard, Ltd., Class A | 1,885 | 66,126 |
| Commercial Banks 2.38% | ||
| East West Bancorp, Inc. | 4,596 | 74,823 |
| Consumer Finance 1.36% | ||
| Cardtronics, Inc. (I) | 2,772 | 42,772 |
| Health Care 18.51% | 581,154 | |
| Biotechnology 2.84% | ||
| BioMarin Pharmaceutical, Inc. (I) | 1,068 | 23,870 |
| Human Genome Sciences, Inc. (I) | 833 | 24,815 |
| Isis Pharmaceuticals, Inc. (I) | 1,785 | 14,994 |
| United Therapeutics Corp. (I) | 453 | 25,373 |
See notes to financial statements
| 5 |
Small Cap Opportunities Fund
As of 9-30-10 (Unaudited)
| Shares | Value | |
| Health Care (continued) | ||
| Health Care Equipment & Supplies 7.30% | ||
| Align Technology, Inc. (I) | 2,858 | $55,960 |
| ArthroCare Corp. (I) | 870 | 23,647 |
| Conceptus, Inc. (I)(L) | 2,152 | 29,590 |
| NuVasive, Inc. (I)(L) | 889 | 31,239 |
| RTI Biologics, Inc. (I) | 11,139 | 29,296 |
| SonoSite, Inc. (I) | 942 | 31,566 |
| Thoratec Corp. (I) | 755 | 27,920 |
| Health Care Providers & Services 3.90% | ||
| MEDNAX, Inc. (I) | 1,284 | 68,437 |
| Sharps Compliance Corp. (I) | 1,750 | 8,838 |
| Sun Healthcare Group, Inc. (I) | 5,352 | 45,331 |
| Pharmaceuticals 4.47% | ||
| Eurand NV (I) | 3,123 | 30,730 |
| Impax Laboratories, Inc. (I) | 1,583 | 31,343 |
| Inspire Pharmaceuticals, Inc. (I) | 5,772 | 34,343 |
| Par Pharmaceutical Companies, Inc. (I) | 1,250 | 36,350 |
| Somaxon Pharmaceuticals, Inc. (I)(L) | 1,931 | 7,512 |
| Industrials 11.97% | 375,974 | |
| Aerospace & Defense 0.47% | ||
| Hexcel Corp. (I) | 832 | 14,801 |
| Air Freight & Logistics 1.73% | ||
| Atlas Air Worldwide Holdings, Inc. (I) | 584 | 29,375 |
| UTi Worldwide, Inc. | 1,562 | 25,117 |
| Airlines 2.31% | ||
| Copa Holdings SA, Class A | 1,064 | 57,360 |
| United Continental Holdings, Inc. | 647 | 15,289 |
| Building Products 1.48% | ||
| Quanex Building Products Corp. | 1,597 | 27,580 |
| Trex Company, Inc. (I)(L) | 989 | 18,860 |
| Commercial Services & Supplies 2.07% | ||
| EnerNOC, Inc. (I)(L) | 986 | 30,970 |
| Steelcase, Inc., Class A | 4,075 | 33,945 |
| Electrical Equipment 0.79% | ||
| Fushi Copperweld, Inc. (I) | 2,854 | 24,801 |
| Machinery 1.94% | ||
| Flow International Corp. (I) | 12,057 | 31,710 |
| Graham Corp. | 1,885 | 29,256 |
| Professional Services 1.18% | ||
| FTI Consulting, Inc. (I)(L) | 1,064 | 36,910 |
| Information Technology 20.13% | 632,063 | |
| Internet Software & Services 6.33% | ||
| Ancestry.com, Inc. (I) | 1,468 | 33,412 |
| Dice Holdings, Inc. (I) | 2,625 | 22,260 |
| TechTarget, Inc. (I) | 5,795 | 30,425 |
See notes to financial statements
| 6 |
Small Cap Opportunities Fund
As of 9-30-10 (Unaudited)
| Shares | Value | ||
| Information Technology (continued) | |||
| The Knot, Inc. (I) | 5,365 | $48,982 | |
| VistaPrint NV (I)(L) | 1,652 | 63,850 | |
| IT Services 1.01% | |||
| Telvent GIT SA (I) | 1,399 | 31,645 | |
| Semiconductors & Semiconductor Equipment 5.62% | |||
| Atmel Corp. (I) | 8,841 | 70,374 | |
| Cypress Semiconductor Corp. (I) | 4,531 | 57,000 | |
| Netlogic Microsystems, Inc. (I) | 1,777 | 49,010 | |
| Software 7.17% | |||
| Chinacache International Holdings, Ltd., ADR | 153 | 2,127 | |
| Concur Technologies, Inc. (I)(L) | 1,104 | 54,582 | |
| Monotype Imaging Holdings, Inc. (I) | 4,735 | 43,325 | |
| NetSuite, Inc. (I) | 1,322 | 31,160 | |
| Rosetta Stone, Inc. (I)(L) | 2,635 | 55,967 | |
| Ultimate Software Group, Inc. (I) | 982 | 37,944 | |
| Materials 12.69% | 398,408 | ||
| Chemicals 3.07% | |||
| LSB Industries, Inc. (I) | 2,399 | 44,549 | |
| Neo Material Technologies, Inc. (I) | 10,827 | 51,773 | |
| Metals & Mining 5.03% | |||
| Avalon Rare Metals, Inc. (I) | 23,289 | 79,674 | |
| Franco-Nevada Corp. | 1,347 | 42,378 | |
| IAMGOLD Corp. | 2,019 | 35,756 | |
| Paper & Forest Products 4.59% | |||
| Buckeye Technologies, Inc. | 2,648 | 38,952 | |
| KapStone Paper and Packaging Corp. (I) | 3,551 | 43,109 | |
| Schweitzer-Mauduit International, Inc. | 1,067 | 62,217 | |
| Utilities 0.46% | 14,520 | ||
| Water Utilities 0.46% | |||
| American Water Works Company, Inc. | 624 | 14,520 | |
| Short-Term Investments 17.28% | $542,567 | ||
| (Cost $542,531) | |||
| Par value | Value | ||
| Repurchase Agreement 4.87% | $153,000 | ||
| Repurchase Agreement with State Street Corp. dated 9-30-10 at 0.010% | |||
| to be repurchased at $153,000 on 10-1-10, collateralized by $160,000 | |||
| Federal National Mortgage Association, 2.000% due 9-21-15 (valued at | |||
| $160,200, including interest) | $153,000 | 153,000 | |
| Shares | Value | ||
| Securities Lending Collateral 12.41% | $389,567 | ||
| John Hancock Collateral Investment Trust (W) | 0.2942%(Y) | 38,922 | 389,567 |
See notes to financial statements
| 7 |
Small Cap Opportunities Fund
As of 9-30-10 (Unaudited)
| Total investments (Cost $2,926,341)† 112.18% | $3,522,706 |
| Other assets and liabilities, net (12.18%) | ($382,501) |
| Total net assets 100.00% | $3,140,205 |
The percentage shown for each investment category is the total value of the category as a percentage of the net assets of the Fund.
ADR American Depositary Receipt
(I) Non-income producing security.
(L) All or a portion of this security is on loan as of 9-30-10.
(W) Investment is an affiliate of the Fund, the adviser and/or subadviser. Also, it represents the investment of securities lending collateral received.
(Y) The rate shown is the annualized seven-day yield as of 9-30-10.
† At 9-30-10, the aggregate cost of investment securities for federal income tax purposes was $2,943,992. Net unrealized appreciation aggregated $578,714, of which $683,442 related to appreciated investment securities and $104,728 related to depreciated investment securities.
The Fund had the following country composition as a percentage of total net assets on 9-30-10:
| United States | 79% | |||||
| Canada | 8% | |||||
| Netherlands | 3% | |||||
| Panama | 2% | |||||
| Spain | 1% | |||||
| China | 1% | |||||
| Virgin Islands | 1% | |||||
| Short-Term Investments and Other | 5% |
See notes to financial statements
| 8 |
Small Cap Opportunities Fund
Statement of Assets and Liabilities — September 30, 2010 (Unaudited)
| Assets | ||
| Investments in unaffiliated issuers, at value | ||
| (Cost $2,536,810) including $380,227 of securities | ||
| loaned (Note 2) | $3,133,139 | |
| Investments in affiliated issuers, at value | ||
| (Cost $389,531) (Note 2) | 389,567 | |
| Total investments, at value (Cost $2,926,341) | 3,522,706 | |
| Cash | 810 | |
| Receivable for investments sold | 53,869 | |
| Dividends and interest receivable | 218 | |
| Receivable for securities lending income | 146 | |
| Receivable due from adviser | 139 | |
| Other receivables and prepaid assets | 188 | |
| Total assets | 3,578,076 | |
| Liabilities | ||
| Payable for investments purchased | 23,804 | |
| Payable upon return of securities loaned (Note 2) | 389,599 | |
| Payable to affiliates | ||
| Accounting and legal services fees | 34 | |
| Transfer agent fees | 415 | |
| Trustees’ fees | 33 | |
| Other liabilities and accrued expenses | 23,986 | |
| Total liabilities | 437,871 | |
| Net assets | ||
| Capital paid-in | $2,214,426 | |
| Accumulated net investment loss | (37,143) | |
| Accumulated net realized gain (loss) on | ||
| investments and foreign currency transactions | 366,553 | |
| Net unrealized appreciation (depreciation) on | ||
| investments and translation of assets and | ||
| liabilities in foreign currencies | 596,369 | |
| Net assets | $3,140,205 | |
| Net asset value per share | ||
| Based on net asset values and shares | ||
| outstanding-the Fund has an unlimited number of | ||
| shares authorized with no par value | ||
| Class A ($788,576 ÷ 54,157 shares) | $14.56 | |
| Class B ($779,022 ÷ 54,186 shares)1 | $14.38 | |
| Class C ($779,018 ÷ 54,186 shares)1 | $14.38 | |
| Class I ($793,589 ÷ 54,139 shares) | $14.66 | |
| Maximum offering price per share | ||
| Class A (net asset value per share ÷ 95%)2 | $15.33 | |
1 Redemption price is equal to net asset value less any applicable contingent deferred sales charge.
2 On single retail sales of less than $50,000. On sales of $50,000 or more and on group sales the offering price is reduced.
See notes to financial statements
| 9 |
Small Cap Opportunities Fund
Statement of Operations — September 30, 2010 (Unaudited)
| Investment income | ||
| Dividends | $3,604 | |
| Securities lending | 719 | |
| Interest | 7 | |
| Less foreign taxes withheld | (12) | |
| Total investment income | 4,318 | |
| Expenses | ||
| Investment management fees (Note 4) | 13,494 | |
| Distribution and service fees (Note 4) | 8,577 | |
| Accounting and legal services fees (Note 4) | 186 | |
| Transfer agent fees (Note 4) | 1,464 | |
| Trustees' fees (Note 4) | 242 | |
| State registration fees (Note 4) | 117 | |
| Professional fees | 21,121 | |
| Custodian fees | 8,260 | |
| Registration and filing fees | 9,845 | |
| Other | 3,475 | |
| Total expenses | 66,781 | |
| Less expense reductions (Note 4) | (40,279) | |
| Net expenses | 26,502 | |
| Net investment loss | (22,184) | |
| Realized and unrealized gain (loss) | ||
| Net realized gain (loss) on | ||
| Investments in unaffiliated issuers | 214,143 | |
| Investments in affiliated issuers | (37) | |
| Foreign currency transactions | 455 | |
| 214,561 | ||
| Change in net unrealized appreciation | ||
| (depreciation) of | ||
| Investments in unaffiliated issuers | (181,978) | |
| Investments in affiliated issuers | 47 | |
| Translation of assets and liabilities in foreign | ||
| currencies | (140) | |
| (182,071) | ||
| Net realized and unrealized gain | 32,490 | |
| Increase in net assets from operations | $10,306 | |
See notes to financial statements
| 10 |
Small Cap Opportunities Fund
Statements of Changes in Net Assets
| Six-months | |||
| ended | Year ended | ||
| 9/30/10 | 3/31/10 | ||
| (Unaudited) | |||
| Increase (decrease) in net assets | |||
| From operations | |||
| Net investment loss | ($22,184) | ($35,438) | |
| Net realized gain | 214,561 | 434,245 | |
| Change in net unrealized appreciation | |||
| (depreciation) | (182,071) | 853,399 | |
| Increase in net assets resulting from | |||
| operations | 10,306 | 1,252,206 | |
| Distributions to shareholders | |||
| From net realized gain | |||
| Class A | — | (55,334) | |
| Class B | — | (55,334) | |
| Class C | — | (55,335) | |
| Class I | — | (55,335) | |
| Total distributions | — | (221,338) | |
| From Fund share transactions (Note 5) | — | 221,338 | |
| Total increase | 10,306 | 1,252,206 | |
| Net assets | |||
| Beginning of period | 3,129,899 | 1,877,693 | |
| End of period | $3,140,205 | $3,129,899 | |
| Accumulated net investment loss | ($37,143) | ($14,959) | |
See notes to financial statements
| 11 |
Small Cap Opportunities Fund
Financial Highlights (For a share outstanding throughout the period)
| Class A Shares | ||||
| Period ended | 09/30/20101 | 03/31/2010 | 03/31/20092 | |
| Per share operating performance | ||||
| Net asset value, beginning of period | $14.49 | $9.39 | $10.00 | |
| Net investment loss3 | (0.09) | (0.14) | (0.03) | |
| Net realized and unrealized gain (loss) on | ||||
| investments | 0.16 | 6.35 | (0.58) | |
| Total from investment operations | 0.07 | 6.21 | (0.61) | |
| Less distributions | ||||
| From net realized gain | — | (1.11) | — | |
| Net asset value, end of period | $14.56 | $14.49 | $9.39 | |
| Total return (%)4,5 | 0.486 | 67.14 | (6.10)6 | |
| Ratios and supplemental data | ||||
| Net assets, end of period (in thousands) | $789 | $785 | $470 | |
| Ratios (as a percentage of average net assets): | ||||
| Expenses before reductions | 4.207 | 4.03 | 12.347 | |
| Expenses net of fee waivers and credits | 1.527 | 1.36 | 1.657 | |
| Net investment loss | (1.23)7 | (1.07) | (1.42)7 | |
| Portfolio turnover (%) | 44 | 101 | 27 | |
1 Semiannual period from 4-1-10 to 9-30-10. Unaudited.
2 Period from 1-2-09 (inception date) to 3-31-09.
3 Based on the average daily shares outstanding.
4 Total returns would have been lower had certain expenses not been reduced during the periods shown.
5 Does not reflect the effect of sales charges, if any.
6 Not annualized.
7 Annualized.
See notes to financial statements
| 12 |
Small Cap Opportunities Fund
Financial Highlights (For a share outstanding throughout the period)
| Class B Shares | ||||
| Period ended | 09/30/20101 | 03/31/2010 | 03/31/20092 | |
| Per share operating performance | ||||
| Net asset value, beginning of period | $14.36 | $9.38 | $10.00 | |
| Net investment loss3 | (0.13) | (0.23) | (0.05) | |
| Net realized and unrealized gain (loss) on | ||||
| investments | 0.15 | 6.32 | (0.57) | |
| Total from investment operations | 0.02 | 6.09 | (0.62) | |
| Less distributions | ||||
| From net realized gain | — | (1.11) | — | |
| Net asset value, end of period | $14.38 | $14.36 | $9.38 | |
| Total return (%)4,5 | 0.146 | 65.91 | (6.20)6 | |
| Ratios and supplemental data | ||||
| Net assets, end of period (in thousands) | $779 | $778 | $469 | |
| Ratios (as a percentage of average net assets): | ||||
| Expenses before reductions | 4.907 | 4.73 | 13.047 | |
| Expenses net of fee waivers and credits | 2.227 | 2.06 | 2.357 | |
| Net investment loss | (1.93)7 | (1.77) | (2.12)7 | |
| Portfolio turnover (%) | 44 | 101 | 27 | |
1 Semiannual period from 4-1-10 to 9-30-10. Unaudited.
2 Period from 1-2-09 (inception date) to 3-31-09.
3 Based on the average daily shares outstanding.
4 Total returns would have been lower had certain expenses not been reduced during the periods shown.
5 Does not reflect the effect of sales charges, if any.
6 Not annualized.
7 Annualized.
See notes to financial statements
| 13 |
Small Cap Opportunities Fund
Financial Highlights (For a share outstanding throughout the period)
| Class C Shares | ||||
| Period ended | 09/30/20101 | 03/31/2010 | 03/31/20092 | |
| Per share operating performance | ||||
| Net asset value, beginning of period | $14.36 | $9.38 | $10.00 | |
| Net investment loss3 | (0.13) | (0.23) | (0.05) | |
| Net realized and unrealized gain (loss) on | ||||
| investments | 0.15 | 6.32 | (0.57) | |
| Total from investment operations | 0.02 | 6.09 | (0.62) | |
| Less distributions | ||||
| From net realized gain | — | (1.11) | — | |
| Net asset value, end of period | $14.38 | $14.36 | $9.38 | |
| Total return (%)4,5 | 0.146 | 65.91 | (6.20)6 | |
| Ratios and supplemental data | ||||
| Net assets, end of period (in thousands) | $779 | $778 | $469 | |
| Ratios (as a percentage of average net assets): | ||||
| Expenses before reductions | 4.907 | 4.73 | 13.047 | |
| Expenses net of fee waivers and credits | 2.227 | 2.06 | 2.357 | |
| Net investment loss | (1.93)7 | (1.77) | (2.12)7 | |
| Portfolio turnover (%) | 44 | 101 | 27 | |
1 Semiannual period from 4-1-10 to 9-30-10. Unaudited.
2 Period from 1-2-09 (inception date) to 3-31-09.
3 Based on the average daily shares outstanding.
4 Total returns would have been lower had certain expenses not been reduced during the periods shown.
5 Does not reflect the effect of sales charges, if any.
6 Not annualized.
7 Annualized.
See notes to financial statements
| 14 |
Small Cap Opportunities Fund
Financial Highlights (For a share outstanding throughout the period)
| Class I Shares | ||||
| Period ended | 09/30/20101 | 03/31/2010 | 03/31/20092 | |
| Per share operating performance | ||||
| Net asset value, beginning of period | $14.56 | $9.41 | $10.00 | |
| Net investment loss3 | (0.06) | (0.10) | (0.02) | |
| Net realized and unrealized gain (loss) on | ||||
| investments | 0.16 | 6.36 | (0.57) | |
| Total from investment operations | 0.10 | 6.26 | (0.59) | |
| Less distributions | ||||
| From net realized gain | — | (1.11) | — | |
| Net asset value, end of period | $14.66 | $14.56 | $9.41 | |
| Total return (%)4 | 0.695 | 67.54 | (5.90)5 | |
| Ratios and supplemental data | ||||
| Net assets, end of period (in thousands) | $794 | $788 | $470 | |
| Ratios (as a percentage of average net assets): | ||||
| Expenses before reductions | 3.826 | 3.72 | 12.046 | |
| Expenses net of fee waivers and credits | 1.136 | 1.06 | 1.106 | |
| Net investment loss | (0.84)6 | (0.77) | (0.87)6 | |
| Portfolio turnover (%) | 44 | 101 | 27 | |
1 Semiannual period from 4-1-10 to 9-30-10. Unaudited.
2 Period from 1-2-09 (inception date) to 3-31-09.
3 Based on the average daily shares outstanding.
4 Total returns would have been lower had certain expenses not been reduced during the periods shown.
5 Not annualized.
6 Annualized.
See notes to financial statements
| 15 |
Small Cap Opportunities Fund
Notes to financial statements (unaudited)
Note 1 - Organization
John Hancock Small Cap Opportunities Fund (the Fund) is a diversified series of John Hancock Funds III (the Trust), an open-end management investment company organized as a Massachusetts business trust and registered under the Investment Company Act of 1940, as amended (the 1940 Act). The investment objective of the Fund is to seek long-term capital appreciation.
The Fund may offer multiple classes of shares. The shares currently offered are detailed in the Statement of Assets and Liabilities. Class A, Class B and Class C shares are offered to all investors. Class I shares are offered to institutions and certain investors. Shareholders of each class have exclusive voting rights to matters that affect that class. The distribution and service fees, transfer agent fees, printing and postage and state registration fees for each class may differ. Class B shares convert to Class A shares eight years after purchase.
Affiliates of the Fund owned 100% of the shares of beneficial interest of Class A, Class B, Class C and Class I, respectively, on September 30, 2010.
Note 2 - Significant accounting policies
The financial statements have been prepared in conformity with accounting principles generally accepted in the United States of America, which require management to make certain estimates and assumptions at the date of the financial statements. Actual results could differ from those estimates. Events or transactions occurring after the end of the fiscal period through the date that the financial statements were issued have been evaluated in the preparation of the financial statements. The following summarizes the significant accounting policies of the Fund:
Security valuation. Investments are stated at value as of the close of the regular trading on the New York Stock Exchange (NYSE), normally at 4:00 P.M., Eastern Time. The Fund uses a three-tier hierarchy to prioritize the pricing assumptions, referred to as inputs, used in valuation techniques to measure fair value. Level 1 includes quoted prices in active markets for identical securities. Level 2 includes significant observable inputs. Observable inputs may include quoted prices for similar securities, interest rates, prepayment speeds and credit risk. Prices for securities valued using these techniques are received from independent pricing vendors and brokers and are based on an evaluation of the inputs described. Level 3 includes significant unobservable inputs when market prices are not readily available or reliable, including the Fund’s own assumptions in determining the fair value of investments. The inputs or methodology used for valuing securities are not necessarily an indication of the risk associated with investing in those securities.
The following is a summary of the values by input classification of the Fund’s investments as of September 30, 2010, by major security category or type:
| Level 2 | Level 3 | ||||
| Significant | Significant | ||||
| Total Market | Level 1 | Observable | Unobservable | ||
| Value at 9-30-10 | Quoted Price | Inputs | Inputs | ||
| Common Stocks | |||||
| Consumer Discretionary | $514,688 | $514,688 | - | - | |
| Energy | 210,055 | 210,055 | - | - | |
| Financials | 253,277 | 253,277 | - | - | |
| Health Care | 581,154 | 581,154 | - | - | |
| Industrials | 375,974 | 375,974 | - | - | |
| Information Technology | 632,063 | 632,063 | - | - | |
| Materials | 398,408 | 398,408 | - | - | |
| 16 |
| Level 2 | Level 3 | ||||
| Significant | Significant | ||||
| Total Market | Level 1 | Observable | Unobservable | ||
| (continued) | Value at 9-30-10 | Quoted Price | Inputs | Inputs | |
| Common Stocks | |||||
| Utilities | $14,520 | $14,520 | - | - | |
| Short-Term Investments | 542,567 | 389,567 | $153,000 | - | |
| Total investments in Securities | $3,522,706 | $3,369,706 | $153,000 | - | |
During the six month period ended September 30, 2010, there were no significant transfers in or out of Level 1 or Level 2 assets.
In order to value the securities, the Fund uses the following valuation techniques. Equity securities held by the Fund are valued at the last sale price or official closing price on the principal securities exchange on which they trade. In the event there were no sales during the day or closing prices are not available, then securities are valued using the last quoted bid or evaluated price. Debt obligations are valued based on the evaluated prices provided by an independent pricing service, which utilizes both dealer-supplied and electronic data processing techniques, taking into account factors such as institutional-size trading in similar groups of securities, yield, quality, coupon rate, maturity, type of issue, trading characteristics and other market data. Investments in open-end mutual funds, including John Hancock Collateral Investment Trust (JHCIT), are valued at their closing net asset values each day. Foreign securities and currencies are va lued in U.S. dollars, based on foreign currency exchange rates supplied by an independent pricing service. Certain securities traded only in the over-the-counter market are valued at the last bid price quoted by brokers making markets in the securities at the close of trading. Certain short-term securities are valued at amortized cost.
Other portfolio securities and assets, where market quotations are not readily available, are valued at fair value, as determined in good faith by the Fund’s Pricing Committee, following procedures established by the Board of Trustees. Generally, trading in non-U.S. securities is substantially completed each day at various times prior to the close of trading on the NYSE. Significant market events that affect the values of non-U.S. securities may occur after the time when the valuation of the securities is generally determined and the close of the NYSE. During significant market events, these securities will be valued at fair value, as determined in good faith, following procedures established by the Board of Trustees. The Fund may use a fair valuation model to value non-U.S. securities in order to adjust for events which may occur between the close of foreign exchanges and the close of the NYSE.
Security transactions and related investment income. Investment security transactions are accounted for on a trade date plus one basis for daily net asset value calculations. However, for financial reporting purposes, investment transactions are reported on trade date. Interest income is accrued as earned. Gains and losses on securities sold are determined on the basis of identified cost and may include proceeds from litigation. Dividend income is recorded on the ex-date, except for certain foreign dividends where the ex-date may have passed, which are recorded when the Fund becomes aware of the dividends.
Securities lending. The Fund may lend its securities to earn additional income. It receives and maintains cash collateral received from the borrower in an amount not less than the market value of the loaned securities. The Fund will invest its collateral in JHCIT, as a result, the Fund will receive the benefit of any gains and bear any losses generated by JHCIT. Although risk of the loss of the securities lent is mitigated by holding the collateral, the Fund could experience a delay in recovering its securities and a possible loss of income or value if the borrower fails to return the securities or if collateral investments decline in value. The Fund may receive compensation for lending its securities by retaining a portion of the return on the investment of the collateral and compensation from fees earned from borrowers of the securities. Income received from JHCIT is a component of securities lending income as recorded on the Statement of Operations.
| 17 |
Foreign currency translation. Assets, including investments and liabilities denominated in foreign currencies, are translated into U.S. dollar values each day at the prevailing exchange rate. Purchases and sales of securities, income and expenses are translated into U.S. dollars at the prevailing exchange rate on the date of the transaction. The effect of changes in foreign currency exchange rates on securities is reflected as a component of the realized and unrealized gains (losses) on investments.
Funds that invest internationally generally carry more risk than funds that invest strictly in U.S. securities. Risks can result from differences in economic and political conditions, regulations, market practices (including higher transaction costs) and accounting standards. Foreign investments are also subject to a decline in the value of a foreign currency versus the U.S. dollar, which reduces the dollar value of securities denominated in that currency.
Line of credit. The Fund may borrow from banks for temporary or emergency purposes, including meeting redemption requests that otherwise might require the untimely sale of securities. Pursuant to the custodian agreement, the custodian may loan money to a Fund to make properly authorized payments. The Fund is obligated to repay the custodian for any overdraft, including any related costs or expenses. The custodian has a lien, security interest or security entitlement in any Fund property that is not segregated, to the maximum extent permitted by law for any overdraft.
In addition, the Fund and other affiliated funds have entered into an agreement with State Street Bank and Trust Company which enables them to participate in a $100 million unsecured committed line of credit. A commitment fee, payable at the end of each calendar quarter, based on the average daily unused portion of the line of credit, is charged to each participating fund on a pro rata basis and is reflected in other expenses on the Statement of Operations. For the six months ended September 30, 2010, the Fund had no borrowings under the line of credit.
Expenses. The majority of expenses are directly attributable to an individual fund. Expenses that are not readily attributable to a specific fund are allocated among all funds in an equitable manner, taking into consideration, among other things, the nature and type of expense and the fund’s relative assets. Expense estimates are accrued in the period to which they relate and adjustments are made when actual amounts are known.
Class allocations. Income, common expenses, and realized and unrealized gains (losses) are determined at the fund level and allocated daily to each class of shares based on the net asset value of the class. Class-specific expenses, such as distribution and service fees, if any, transfer agent fees, state registration fees and printing and postage fees, for all classes are calculated daily at the class level based on the appropriate net asset value of each class and the specific expense rates applicable to each class.
Federal income taxes. The Fund intends to qualify as a regulated investment company by complying with the applicable provisions of the Internal Revenue Code and will not be subject to federal income tax on taxable income that is distributed to shareholders. Therefore, no federal income tax provision is required.
As of March 31, 2010, the Fund had no uncertain tax positions that would require financial statement recognition, de-recognition or disclosure. The Fund’s federal tax return is subject to examination by the Internal Revenue Service for a period of three years.
| 18 |
Distribution of income and gains. Distributions to shareholders from net investment income and net realized gains, if any, are recorded on the ex-date. The Fund generally declares and pays dividends and capital gain distributions, if any, at least annually.
Distributions paid by the Fund with respect to each class of shares are calculated in the same manner, at the same time and are in the same amount, except for the effect of expenses that may be applied differently to each class.
Such distributions, on a tax basis, are determined in conformity with income tax regulations, which may differ from accounting principles generally accepted in the United States of America. Material distributions in excess of tax basis earnings and profits, if any, are reported in the Fund’s financial statements as a return of capital.
Capital accounts within financial statements are adjusted for permanent book/tax differences. These adjustments have no impact on net assets or the results of operations. Temporary book/tax differences, if any, will reverse in a subsequent period. Permanent book/tax differences are primarily attributable to investments in passive foreign investment companies and net operating losses.
Note 3 – Guarantees and indemnifications
Under the Fund’s organizational documents, its Officers and Trustees are indemnified against certain liabilities arising out of the performance of their duties to the Fund. Additionally, in the normal course of business, the Fund enters into contracts with service providers that contain general indemnification clauses. The Fund’s maximum exposure under these arrangements is unknown, as this would involve future claims that may be made against the Fund that have not yet occurred. The risk of material loss from such claims is considered remote.
Note 4 – Fees and transactions with affiliates
John Hancock Investment Management Services, LLC (the Adviser) serves as investment adviser for the Trust. John Hancock Funds, LLC (the Distributor), an affiliate of the Adviser, serves as principal underwriter of the Trust. The Adviser and the Distributor are indirect wholly owned subsidiaries of Manulife Financial Corporation (MFC).
Management fee. The Fund has an investment management contract with the Adviser under which the Fund pays a daily management fee to the Adviser equivalent, on an annual basis, to the sum of: (a) 0.90% of the first $1,000,000,000 of the Fund’s average daily net assets; and (b) 0.85% of the Fund’s average daily net assets in excess of $1,000,000,000. The Adviser has a subadvisory agreement with MFC Global Investment Management (U.S.), LLC, an indirectly owned subsidiary of MFC and an affiliate of the Adviser. The Fund is not responsible for payment of the subadvisory fees.
The investment management fees incurred for the six month period ended September 30, 2010 were equivalent to an annual effective rate of 0.90% of the Fund’s average daily net assets.
Effective April 1, 2010, the Adviser voluntarily agreed to waive fees and/or reimburse certain fund level expenses to 0.19% of the Fund’s average net assets which are allocated pro rata to all share classes of the Fund. This agreement excludes taxes, portfolio brokerage commissions, interest, advisory fees, distribution and service fees, transfer agent fees, state registration fees, printing and postage fees, litigation and indemnification expenses and other extraordinary expenses not incurred in the ordinary course of the Fund’s business.
| 19 |
Effective July 1, 2010, the Adviser has contractually agreed to waive fees and/or reimburse certain expenses for each share class of the Fund. This agreement excludes taxes, brokerage commissions, interest, litigation and indemnification expenses and other extraordinary expenses not incurred in the ordinary course of the Fund’s business. The fee waivers and/or reimbursements are such that these expenses will not exceed 1.65% for Class A, 2.35% for Class B, 2.35% for Class C and 1.19% for Class I shares. The fee waivers and/or reimbursements will continue in effect until July 31, 2011.
Prior to July 1, 2010, the Adviser had contractually agreed to waive fees and/or reimburse certain expenses for each share class of the Fund. This agreement excluded taxes, brokerage commissions, interest, litigation and indemnification expenses and other extraordinary expenses not incurred in the ordinary course of the Fund’s business. The fee waivers and/or reimbursements were such that these expenses would not exceed 1.65% for Class A shares, 2.35% for Class B, 2.35% for Class C and 1.10% for Class I shares.
Accordingly, the expense reductions or reimbursements related to these agreements were $10,111, $10,000, $10,000 and $10,168 for Class A, Class B, Class C and Class I shares, respectively, for the six month period ended September 30, 2010.
Accounting and legal services. Pursuant to the service agreement, the Fund reimburses the Adviser for all expenses associated with providing the administrative, financial, legal, accounting and recordkeeping services of the Fund, including the preparation of all tax returns, periodic reports to shareholders and regulatory reports, among other services. These expenses are allocated to each share class based on its relative net assets at the time the expense was incurred. The accounting and legal services fees incurred for the six month period ended September 30, 2010 amounted to an annual rate of 0.01% of the Fund’s average daily net assets.
Distribution and service plans. The Fund has a distribution agreement with the Distributor. The Fund has adopted distribution and service plans with respect to Class A, Class B and Class C shares pursuant to Rule 12b-1 under the 1940 Act, to pay the Distributor for services provided as the distributor of shares of the Fund. The following table shows the contractual rates of distribution and service fees under these arrangements, expressed as an annual percentage of average daily net assets for each class of the Fund’s shares.
| Class | 12b-1 Fees | ||||||
| Class A | 0.30% | ||||||
| Class B | 1.00% | ||||||
| Class C | 1.00% | ||||||
Sales charges. Class A shares are assessed up-front sales charges. For the six month period ended September 30, 2010, there were no up-front sales charges received by the Distributor with regard to sales of Class A shares.
Class B and Class C shares are subject to contingent deferred sales charges (CDSC). Class B shares that are redeemed within six years of purchase are subject to CDSC, at declining rates, beginning at 5.00% of the lesser of the current market value at the time of redemption or the original purchase cost of the shares being redeemed. Class C shares that are redeemed within one year of purchase are subject to a 1.00% CDSC on the lesser of the current market value at the time of redemption or the original purchase cost of the shares being redeemed. Proceeds from CDSCs are used to compensate the Distributor for providing distribution-related services in connection with the sale of these shares. During the six month period ended September 30, 2010, there were no CDSCs received by the Distributor for Class B or Class C shares.
| 20 |
Transfer agent fees. The Fund has a transfer agent agreement with John Hancock Signature Services, Inc. (Signature Services or Transfer Agent), an affiliate of the Adviser. The transfer agent fees paid to Signature Services are determined based on the cost to Signature Services (Signature Services Cost) of providing recordkeeping services. The Signature Services Cost includes a component of allocated John Hancock corporate overhead for providing transfer agent services to the Fund and to all other John Hancock affiliated funds. It also includes out-of-pocket expenses that are comprised of payments made to third-parties for recordkeeping services provided to their clients who invest in one or more John Hancock funds. In addition, Signature Services Cost may be reduced by certain revenues that Signature Services received in connection with the service they provide to the funds. Signature Services Cost is calcula ted monthly and allocated, as applicable, to four categories of share classes: Institutional Share Classes, Retirement Share Classes, Municipal Bond Classes and all other Retail Share Classes. Within each of these categories, the applicable costs are allocated to the affected John Hancock affiliated funds and/or classes, based on the relative average daily net assets.
Prior to July 1, 2010, the transfer agent fees were made up of three components:
• The Fund paid a monthly transfer agent fee at an annual rate of 0.05% for Class A, B and C shares and 0.04% for Class I shares, based on each class’s average daily net assets.
• The Fund paid a monthly fee based on an annual rate of $16.50 per shareholder account for all share classes.
• In addition, Signature Services was reimbursed for certain out-of-pocket expenses.
Class level expenses. Class level expenses for the six months ended September 30, 2010 were:
| Distribution and | Transfer agent | State registration | ||
| Class | service fees | fees | fees | |
| Class A | $1,129 | $446 | $29 | |
| Class B | 3,724 | 443 | 29 | |
| Class C | 3,724 | 443 | 33 | |
| Class I | - | 132 | 26 | |
| Total | $8,577 | $1,464 | $117 | |
For the six months ended September 30, 2010, the Fund had no printing and postage fees.
Trustee expenses. The Trust compensates each Trustee who is not an employee of the Adviser or its affiliates. These Trustees may, for tax purposes, elect to defer receipt of this compensation under the John Hancock Group of Funds Deferred Compensation Plan (the Plan). Deferred amounts are invested in various John Hancock funds and remain in the funds until distributed in accordance with the Plan. The investment of deferred amounts and the offsetting liability are included within other receivables and prepaid assets and Payable to affiliates - Trustees' fees, respectively, in the accompanying Statement of Assets and Liabilities.
Note 5 - Fund share transactions
Transactions in Fund shares for the six months ended September 30, 2010 and year ended March 31, 2010 were as follows:
| 21 |
| Six months ended | Year ended | |||
| 9/30/10 | 3/31/10 | |||
| Shares | Amount | Shares | Amount | |
| Class A shares | ||||
| Distributions reinvested | — | — | 4,157 | $55,334 |
| Net increase | — | — | 4,157 | $55,334 |
| Class B shares | ||||
| Distributions reinvested | — | — | 4,186 | $55,334 |
| Net increase | — | — | 4,186 | $55,334 |
| Class C shares | ||||
| Distributions reinvested | — | — | 4,186 | $55,335 |
| Net increase | — | — | 4,186 | $55,335 |
| Class I shares | ||||
| Distributions reinvested | — | — | 4,139 | $55,335 |
| Net increase | — | — | 4,139 | $55,335 |
| Net increase | — | — | 16,668 | $221,338 |
Note 6 - Purchase and sale of securities
Purchases and sales of securities, other than short-term securities, aggregated $1,289,958 and $1,509,821, respectively, for the six months ended September 30, 2010.
| 22 |
Board Consideration of and Continuation of Investment Advisory Agreement and Subadvisory Agreement: John Hancock Small Cap Opportunities Fund
The Board of Trustees (the “Board”, the members of which are referred to as “Trustees”) of John Hancock Small Cap Opportunities Fund (the “Fund”), a series of John Hancock Funds III, met in-person on May 2-4 and June 6-8, 2010 to consider the approval of the Fund’s investment advisory agreement (the “Advisory Agreement”) with John Hancock Investment Management Services, LLC (the “Adviser”), the Fund’s investment adviser. The Board also considered the approval of the investment subadvisory agreement (the “Subadvisory Agreement”) between the Adviser and MFC Global Investment Management (U.S.), LLC (the “Subadviser”) on behalf of the Fund. The Advisory Agreement and the Subadvisory Agreement are referred to as the “Agreements.”
Activities and Composition of the Board
The Board consists of eleven individuals, nine of whom are Independent Trustees. “Independent Trustees” are generally those individuals who are unaffiliated with the Fund, the Adviser and the Subadviser. The Trustees are responsible for the oversight of operations of the Fund and perform the various duties required of directors of investment companies by the Investment Company Act of 1940, as amended (the “1940 Act”). The Independent Trustees have retained independent legal counsel to assist them in connection with their duties. The Board has appointed an Independent Trustee as Chairperson. The Board has established four standing committees that are composed entirely of Independent Trustees: the Audit Committee; the Compliance Committee; the Nominating, Governance and Administration Committee; and the Contracts/Operations Committee. Additionally, Investment Performance Committees A and B are standing committees of the Board that are each composed of Independent Trustees and one Trustee who is affiliated with the Adviser. Investment Performance Committee B oversees and monitors matters relating to the investment performance of the Fund. The Board has also designated a Vice Chairperson to serve in the absence of the Chairperson, who also serves as Chairman of the Board’s Nominating, Governance and Administration Committee. The Board also designates working groups or ad hoc committees as it deems appropriate.
The Approval Process
Pursuant to the 1940 Act, the Board is required to consider the continuation of the Agreements on an annual basis. Throughout the year, the Board, acting directly and through its committees, regularly reviews and assesses the quality of the services that the Fund receives under the Agreements. In this regard, the Board reviews reports of the Adviser at least quarterly, which include, among other things, Fund performance reports and compliance reports. In addition, the Board meets with portfolio managers and senior investment officers at various times throughout the year. The Board considers at each of its meetings factors that are relevant to its annual consideration of the renewal of the Agreements, including the services and support provided by the Adviser and Subadviser to the Fund and its shareholders.
Prior to the May 2-4, 2010 meeting, the Board requested and received materials specifically relating to the Agreements. The materials provided in connection with the May meeting included information compiled and prepared by the Adviser on Fund fees and expenses as compared with a category of relevant funds selected by the Adviser (the “Category”).
At an in-person meeting held on May 2-4, 2010, the Board reviewed materials relating to its consideration of the Agreements. As a result of the discussions that occurred during the May 2-4, 2010 meeting, the Board presented the Adviser and Subadviser with questions and requests for additional information and the Adviser and Subadviser responded to these requests with additional written information in advance of the June 6-8, 2010 Board meeting. The Board also reviewed these additional materials relating to its consideration of the Agreements.
At an in-person meeting held on June 6-8, 2010, the Board, including the Independent Trustees, formally considered the continuation of the Advisory Agreement between the Adviser and the Fund and the Subadvisory Agreement between the Adviser and the Subadviser with respect to the Fund, each for an
| 23 |
additional one-year term. The Board considered all factors it believed relevant with respect to the Fund, including, among other factors: (a) the nature, extent and quality of the services provided by the Adviser and the Subadviser; (b) the investment performance of the Fund and portfolio management of the Subadviser; (c) the advisory fees and the cost of the services and profits to be realized by the Adviser and certain affiliates from their relationship with the Fund; (d) economies of scale; and (e) other factors.
The Board also considered other matters important to the approval process, such as payments made to the Adviser or its affiliates relating to the distribution of Fund shares and other services. The Board reviewed services related to the valuation and pricing of Fund portfolio holdings. Other important matters considered by the Board were the direct and indirect benefits to the Adviser, the Subadviser, and their affiliates from their relationship with the Fund, and advice from independent legal counsel with respect to the review process and materials submitted for the Board’s review. Each Trustee may have attributed different weights to the various items considered.
The key factors considered by the Board and the conclusions reached are described below.
Nature, extent and quality of services
The Board, including the Independent Trustees, reviewed the nature, extent and quality of services provided by the Adviser and the Subadviser, including the investment advisory services and the resulting performance of the Fund. The Board reviewed the Adviser’s and Subadviser’s senior management personnel responsible for investment operations, including the senior investment officers. The Board also reviewed the materials provided by the Fund’s portfolio management team discussing Fund performance and the Fund’s investment objective, strategies and outlook.
The Board considered the ability of the Adviser and the Subadviser, based on their resources, reputation and other attributes, to attract and retain qualified investment professionals, including research, advisory, and supervisory personnel. It considered the background and experience of senior management and investment professionals responsible for managing the Fund. The Board considered the investment philosophy, research and investment decision-making processes of the Adviser and the Subadviser responsible for the daily investment activities of the Fund, including, among other things, portfolio trading capabilities, use of technology, commitment to compliance and approach to training and retaining portfolio managers and other research, advisory and management personnel.
The Board considered the Subadviser’s history and experience with the Fund. The Board considered the Adviser’s execution of its oversight responsibilities. The Board further considered the culture of compliance, resources dedicated to compliance, compliance programs, record of compliance with applicable laws and regulation, with the Fund’s investment policies and restrictions and with the applicable Code of Ethics, and the responsibilities of the Adviser’s and Subadviser’s compliance departments.
In addition to advisory services, the Board considered the quality of the administrative and non-investment advisory services provided to the Fund by the Adviser under a separate agreement. The Board noted that the Adviser and its affiliates provide the Fund with certain administrative, transfer agency, shareholder and other services (in addition to any such services provided to the Fund by third parties) and officers and other personnel as are necessary for the operations of the Fund. The Board reviewed the structure and duties of the Adviser’s administration, accounting, legal and compliance departments and considered the Adviser’s policies and procedures for assuring compliance with applicable laws and regulations.
The Board also received information about the nature, extent and quality of services and fee rates offered by the Adviser and Subadviser to their other clients, including other registered investment companies, institutional investors and separate accounts. The Board reviewed a general analysis provided by the Adviser and the Subadviser concerning investment advisory fees charged to such other clients under similar investment mandates, the services provided to such other clients as compared to the services provided to the Fund, the performance of such other clients, and other factors relating to such other clients. The Board considered the significant differences between the Adviser’s and Subadviser’s services to the Fund and those services they provide to other clients which, to the extent the other client is not a
| 24 |
mutual fund, may generally be attributable to the greater frequency of shareholder redemptions in a mutual fund, the higher turnover of mutual fund assets, the more burdensome regulatory and legal obligations of mutual funds, and the higher marketing costs for mutual funds.
Fund performance
The Board, including the Independent Trustees, had previously received and considered information about the Adviser’s investment performance for other funds. The Board noted that the Fund had limited operational history, and considered the performance results for the Fund presented by the Adviser as of December 31, 2009. The Board noted that the Fund’s performance was higher than the performance of the benchmark index and the Category for the 1 month, 3 month and since inception periods.
Expenses and fees
The Board, including the Independent Trustees, reviewed the Fund’s contractual advisory fee rate payable by the Fund to the Adviser as compared with the other funds in its Category. The Board also received information about the investment subadvisory fee rate payable by the Adviser to the Subadviser for investment subadvisory services. The Board considered the services provided and the fees charged by the Adviser and the Subadviser to other types of clients with similar investment mandates, including separately managed institutional accounts.
In addition, the Board considered the cost of the services provided to the Fund by the Adviser. The Board received and considered expense information regarding the Fund’s various components, including advisory fees, distribution fees and fees other than advisory and distribution fees, including transfer agent fees, custodian fees, administration fees and other miscellaneous fees (e.g., fees for accounting and legal services). The Board also considered expense information regarding the Fund’s total operating expense ratio (Gross Expense Ratio) and total operating expense ratio after taking the fee waiver arrangement applicable to the Advisory Agreement rate into account (Net Expense Ratio). The Board considered information comparing the Gross Expense Ratio and Net Expense Ratio of the Fund to that of the Category median. As part of its analysis, the Board reviewed t he Adviser’s methodology in allocating its costs to the management of the Fund. The Board considered expenses and fee rates to be higher or lower if they were over or under 10 basis points, respectively; slightly higher or slightly lower if they were above or below 6-10 basis points, respectively; and inline if they were above or below by 5 basis points.
The Board noted that the investment advisory rate was inline with the Category median. The Board reviewed the Fund’s Gross Expense Ratio of 4.63% and Net Expense Ratio of 1.45% for the Fund’s Class A shares. The Board noted that the Fund’s Gross Expense Ratio was higher than the Category median. The Board also noted that the Fund’s Net Expense Ratio was inline with the Category median. The Board favorably considered the impact of fee waivers towards ultimately lowering the Fund’s Gross Expense Ratio.
As the Fund is owned only by the Adviser or its affiliates and has no other shareholders, the Fund is considered “developing” and so the Adviser was not able to provide the Board with specific information concerning the expected profits to be realized by the Adviser and its affiliates from their relationships with the Fund.
Economies of scale
The Board, including the Independent Trustees, considered the extent to which economies of scale might be realized as the assets of the Fund increase and whether there should be changes in the advisory fee rate or structure in order to enable the Fund to participate in these economies of scale, for example through the use of breakpoints in the advisory fee based upon the assets of the Fund. The Board also considered the Adviser’s overall operations and its efforts to expand the scale of, and improve the quality of, its operations.
The Board recognized the inherent limitations of any analysis of economies of scale, stemming largely from the Board’s understanding that most of the Adviser’s costs are not specific to individual funds, but rather are incurred across a variety of products and services. To ensure that any economies are
| 25 |
reasonably shared with the Fund as its assets increase, the Adviser and the Board agreed to continue the existing breakpoints to the Agreement fee rate.
Other benefits to the Adviser and the Subadviser
The Board understands that the Adviser, the Subadviser, or their affiliates may derive other ancillary benefits from their relationship with the Fund, both tangible and intangible, such as their ability to leverage investment professionals who manage other portfolios, an increase in their profile in the investment advisory community, and the engagement of their affiliates and/or significant shareholders as service providers to the Fund, including for administrative, transfer agency and distribution services. The Board believes that certain of these benefits are difficult to quantify. The Board also was informed that the Subadviser may use third party research obtained by soft dollars generated by certain mutual fund transactions to assist itself in managing all or a number of its other client accounts.
Board determination
The Board, including the Independent Trustees, unanimously approved the continuation of the Advisory Agreement between the Adviser and the Fund for an additional one-year term and the Subadvisory Agreement between the Adviser and Subadviser with respect to the Fund for an additional one-year term. Based upon its evaluation of relevant factors in their totality, the Board, including a majority of the Independent Trustees, was satisfied that the terms of the Agreements were fair and reasonable and in the best interest of the Fund and its shareholders. In arriving at a decision to approve the Agreements, the Board did not identify any single factor listed above, or any group of factors listed above, as all-important or controlling, but considered all factors together, and different Board Members may have attributed different weights to the various factors considered. The Independent Trustees were also assisted by the advice of independent legal counsel in making this determination. The Board noted that contractual fee arrangements for the Fund reflect the results of several years of review by the Board and certain predecessor Trustees, and discussions between such Trustees (and predecessor Trustees) and the Adviser. Certain aspects of the arrangements may be the subject of more attention in some years than in others, and the Trustees’ conclusions may be based in part on their consideration of these arrangements in prior years.
| 26 |
| More information |
| Trustees | Investment adviser | |
| Patti McGill Peterson, Chairperson | John Hancock Investment Management Services, LLC | |
| James F. Carlin | ||
| William H. Cunningham | Subadviser | |
| Deborah C. Jackson* | MFC Global Investment Management (U.S.), LLC | |
| Charles L. Ladner | ||
| Stanley Martin* | Principal distributor | |
| Hugh McHaffie†** | John Hancock Funds, LLC | |
| Dr. John A. Moore | ||
| Steven R. Pruchansky* | Custodian | |
| Gregory A. Russo | State Street Bank and Trust Company | |
| John G. Vrysen† | ||
| Transfer agent | ||
| John Hancock Signature Services, Inc. | ||
| Officers | ||
| Keith F. Hartstein | Legal counsel | |
| President and Chief Executive Officer | K&L Gates LLP | |
| Andrew G. Arnott | ||
| Senior Vice President** and Chief Operating Officer | ||
| Thomas M. Kinzler | ||
| Secretary and Chief Legal Officer | ||
| Francis V. Knox, Jr. | The report is certified under the Sarbanes-Oxley Act, which | |
| Chief Compliance Officer | requires mutual funds and other public companies to affirm | |
| Charles A. Rizzo | that, to the best of their knowledge, the information in | |
| Chief Financial Officer | their financial reports is fairly and accurately stated in all | |
| Salvatore Schiavone** | material respects. | |
| Treasurer | ||
| *Member of the Audit Committee | ||
| **Effective 8-31-10 | ||
| †Non-Independent Trustee | ||
The Fund’s proxy voting policies and procedures, as well as the Fund’s proxy voting record, if any, for the most recent twelve-month period ended June 30, are available free of charge on the Securities and Exchange Commission (SEC) Web site at www.sec.gov or on our Web site.
The Fund’s complete list of portfolio holdings, for the first and third fiscal quarters, is filed with the SEC on Form N-Q. The Fund’s Form N-Q is available on our Web site and the SEC’s Web site, www.sec.gov, and can be reviewed and copied (for a fee) at the SEC’s Public Reference Room in Washington, DC. Call 1-800-SEC-0330 to receive information on the operation of the SEC's Public Reference Room.
We make this information on your fund, as well as monthly portfolio holdings, and other fund details available on our Web site www.jhfunds.com or by calling 1-800-225-5291.
| You can also contact us: | ||
| 1-800-225-5291 | Regular mail: | Express mail: |
| www. jhfunds.com | John Hancock Signature Services, Inc. | John Hancock Signature Services, Inc. |
| P.O. Box 55913 | Mutual Fund Image Operations | |
| Boston, MA 02205-5913 | 30 Dan Road | |
| Canton, MA 02021 |
| 27 |
A look at performance
For the period ended September 30, 2010
| Average annual total returns (%) | Cumulative total returns (%) | |||||||||
| with maximum sales charge (POP) | with maximum sales charge (POP) | |||||||||
| Since | Since | |||||||||
| 1-year | 5-year | 10-year | inception | 6-months | 1-year | 5-year | 10-year | inception | ||
| Class A1 | 1.12 | 0.55 | 3.51 | — | –8.55 | 1.12 | 2.80 | 41.14 | — | |
| Class B1 | 0.55 | 0.28 | 2.98 | — | –8.91 | 0.55 | 1.43 | 34.16 | — | |
| Class C1 | 4.55 | 0.58 | 2.98 | — | –5.07 | 4.55 | 2.94 | 34.16 | — | |
| Class I1,2 | 6.83 | 1.95 | 4.42 | — | –3.57 | 6.83 | 10.11 | 54.18 | — | |
| Class I21,2 | 6.92 | 1.78 | 4.19 | — | –3.57 | 6.92 | 9.22 | 50.81 | — | |
| Class R11,2 | 6.04 | 1.23 | 3.67 | — | –3.90 | 6.04 | 6.31 | 43.33 | — | |
| Class R31,2 | 6.24 | 1.34 | 3.77 | — | –3.82 | 6.24 | 6.87 | 44.81 | — | |
| Class R41,2 | 6.60 | 1.65 | 4.09 | — | –3.65 | 6.60 | 8.51 | 49.24 | — | |
| Class R51,2 | 6.87 | 1.94 | 4.39 | — | –3.57 | 6.87 | 10.08 | 53.68 | — | |
| Class ADV1,2 | 6.70 | 1.44 | 3.81 | — | –3.66 | 6.70 | 7.39 | 45.30 | — | |
| Class NAV2 | 6.91 | — | — | 19.693 | –3.49 | 6.91 | — | — | 27.293 | |
Performance figures assume all distributions are reinvested. Public offering price (POP) figures reflect maximum sales charge on Class A shares of 5%, and the applicable contingent deferred sales charge (CDSC) on Class B and Class C shares. The Class B shares’ CDSC declines annually between years 1 to 6 according to the following schedule: 5, 4, 3, 3, 2, 1%. No sales charge will be assessed after the sixth year. Class C shares held for less than one year are subject to a 1% CDSC. Sales charges are not applicable for Class I, I2, R1, R3, R4, R5, ADV and NAV shares.
The expense ratios of the Fund, both net (including any fee waivers or expense limitations) and gross (excluding any fee waivers or expense limitations), are set forth according to the most recent publicly available prospectuses for the Fund and may differ from the expense ratios disclosed in the Financial Highlights tables in this report. The waivers and expense limitations for Classes A, B, C, I2 and ADV are contractual at least until 6-30-11. The waivers and expense limitations for Classes R1, R3, R4 and R5 are contractual at least until 7-31-11. The net expenses are as follows: Class A — 1.30%, Class B — 2.05%, Class C — 2.05%, Class I2 — 0.85%, Class R1 — 1.64%, Class R3 — 1.54%, Class R4 — 1.24%,Class R5 — 0.94% and Class ADV — 1.00%. Had the fee waivers and expense limitations not been in place, the gross expenses would be as follows: Class A — 1.33%, Class B —2.41%, Class C — 2 .17%, Class I2 — 1.14%, Class R1 – 2.61%, Class R3 – 8.21%, Class R4 – 2.55%, Class R5 —7.75% and Class ADV – 31.96%. For all other classes, the net expenses equal the gross expenses and are as follows: Class I — 0.88% and Class NAV — 0.83%.
The returns reflect past results and should not be considered indicative of future performance. The return and principal value of an investment will fluctuate so that shares, when redeemed, may be worth more or less than their original cost. Due to market volatility, the Fund’s current performance may be higher or lower than the performance shown. For performance data current to the most recent month end, please call 1–800–225–5291 or visit the Fund’s Web site at www.jhfunds.com.
The performance table above and the chart on the next page do not reflect the deduction of taxes that a shareholder would pay on fund distributions or the redemption of fund shares. The Fund’s performance results reflect any applicable expense reductions, without which the expenses would increase and results would have been less favorable.
1 On 12-19-08, through a reorganization, the Fund acquired all of the assets of the Robeco Boston Partners Large Cap Value Fund (the predecessor fund). The predecessor fund offered its Investor share class, in exchange for Class A shares, inception date 12-22-08. The predecessor fund’s Investor share class returns have been recalculated to reflect the gross fees and expenses of Class A shares. The inception date for Class B, C and ADV shares is 12-22-08, the inception date for Class R3, R4 and R5 shares is 5-22-09 and the inception date for Class R1 shares is 7-13-09. The returns prior to these dates are those of Class A shares that have been recalculated to apply the gross fees and expenses of Class B, C, ADV, R1, R3, R4 and R5 shares, respectively. The predecessor fund offered its Institutional share class, in exchange for Class I shares, inception date 12-22-08. The predecessor fund’s Institutional sha re class returns have been recalculated to reflect the gross fees and expenses of Class I shares. The inception date for Class I2 shares is 12-22-08. The returns prior to this date are those of Class I shares that have been recalculated to apply the gross fees and expenses of Class I2.
2 For certain types of investors, as described in the Fund’s Class I, I2, R1, R3, R4, R5, ADV and NAV shares prospectuses.
3 From 5-29-09.
| 6 | Disciplined Value Fund | Semiannual report |
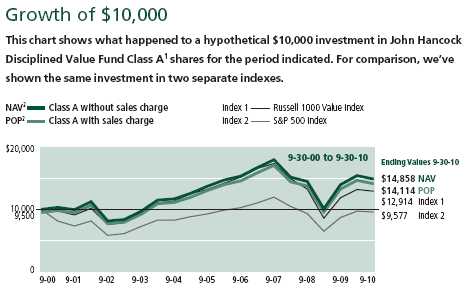
| Period | Without | With maximum | |||
| beginning | sales charge | sales charge | Index 1 | Index 2 | |
| Class B1,3 | 9-30-00 | $13,416 | $13,416 | $12,914 | $9,577 |
| Class C1,3 | 9-30-00 | 13,416 | 13,416 | 12,914 | 9,577 |
| Class I1,4 | 9-30-00 | 15,418 | 15,418 | 12,914 | 9,577 |
| Class I21,4 | 9-30-00 | 15,081 | 15,081 | 12,914 | 9,577 |
| Class R11,4 | 9-30-00 | 14,333 | 14,333 | 12,914 | 9,577 |
| Class R31,4 | 9-30-00 | 14,481 | 14,481 | 12,914 | 9,577 |
| Class R41,4 | 9-30-00 | 14,924 | 14,924 | 12,914 | 9,577 |
| Class R51,4 | 9-30-00 | 15,368 | 15,368 | 12,914 | 9,577 |
| Class ADV1,4 | 9-30-00 | 14,530 | 14,530 | 12,914 | 9,577 |
| Class NAV4 | 5-29-09 | 12,729 | 12,729 | 12,944 | 12,934 |
Assuming all distributions were reinvested for the period indicated, the table above shows the value of a $10,000 investment in the Fund’s Class B, C, I, I2, R1, R3, R4, R5, ADV and NAV shares, respectively, as of 9-30-10. Performance of the classes will vary based on the difference in sales charges paid by shareholders investing in the different classes and the fee structure of those classes.
Russell 1000 Value Index — Index 1 — is an unmanaged index containing those securities in the Russell 1000 Index with a less-than-average growth orientation.
S&P 500 Index — Index 2 — is an unmanaged index that includes 500 widely traded common stocks.
It is not possible to invest directly in an index. Index figures do not reflect sales charges, which would have resulted in lower values if they did.
1 On 12-19-08, through a reorganization, the Fund acquired all of the assets of the Robeco Boston Partners Large Cap Value Fund (the predecessor fund). The predecessor fund offered its Investor share class, in exchange for Class A shares, inception date 12-22-08. The predecessor fund’s Investor share class returns have been recalculated to reflect the gross fees and expenses of Class A shares. The inception date for Class B, C and ADV shares is 12-22-08, the inception date for Class R3, R4 and R5 shares is 5-22-09 and the inception date for Class R1 shares is 7-13-09. The returns prior to these dates are those of Class A shares that have been recalculated to apply the gross fees and expenses of Class B, C, ADV, R1, R3, R4 and R5 shares, respectively. The predecessor fund offered its Institutional share class, in exchange for Class I shares, inception date 12-22-08. The predecessor fund’s Institut ional share class returns have been recalculated to reflect the gross fees and expenses of Class I shares. The inception date for Class I2 shares is 12-22-08. The returns prior to this date are those of Class I shares that have been recalculated to apply the gross fees and expenses of Class I2.
2 NAV represents net asset value and POP represents public offering price.
3 The contingent deferred sales charge, if any, is not applicable.
4 For certain types of investors, as described in the Fund’s Class I, I2, R1, R3, R4, R5, ADV and NAV shares prospectuses.
| Semiannual report | Disciplined Value Fund | 7 |
Your expenses
These examples are intended to help you understand your ongoing operating expenses.
Understanding fund expenses
As a shareholder of the Fund, you incur two types of costs:
▪ Transaction costs which include sales charges (loads) on purchases or redemptions (varies by share class), minimum account fee charge, etc.
▪ Ongoing operating expenses including management fees, distribution and service fees (if applicable), and other fund expenses.
We are going to present only your ongoing operating expenses here.
Actual expenses/actual returns
This example is intended to provide information about your fund’s actual ongoing operating expenses, and is based on your fund’s actual return. It assumes an account value of $1,000.00 on April 1, 2010 with the same investment held until September 30, 2010.
| Account value | Ending value | Expenses paid during | |
| on 4-1-10 | on 9-30-10 | period ended 9-30-101 | |
| Class A | $1,000.00 | $962.60 | $6.20 |
| Class B | 1,000.00 | 958.90 | 10.07 |
| Class C | 1,000.00 | 958.90 | 10.07 |
| Class I | 1,000.00 | 964.30 | 4.23 |
| Class I2 | 1,000.00 | 964.30 | 4.19 |
| Class R1 | 1,000.00 | 961.00 | 7.67 |
| Class R3 | 1,000.00 | 961.80 | 7.13 |
| Class R4 | 1,000.00 | 963.50 | 5.66 |
| Class R5 | 1,000.00 | 964.30 | 4.28 |
| Class ADV | 1,000.00 | 963.40 | 4.92 |
| Class NAV | 1,000.00 | 965.10 | 3.94 |
Together with the value of your account, you may use this information to estimate the operating expenses that you paid over the period. Simply divide your account value at September 30, 2010, by $1,000.00, then multiply it by the “expenses paid” for your share class from the table above. For example, for an account value of $8,600.00, the operating expenses should be calculated as follows:
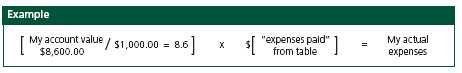
| 8 | Disciplined Value Fund | Semiannual report |
Hypothetical example for comparison purposes
This table allows you to compare your fund’s ongoing operating expenses with those of any other fund. It provides an example of the Fund’s hypothetical account values and hypothetical expenses based on each class’s actual expense ratio and an assumed 5% annualized return before expenses (which is not your fund’s actual return). It assumes an account value of $1,000.00 on April 1, 2010, with the same investment held until September 30, 2010. Look in any other fund shareholder report to find its hypothetical example and you will be able to compare these expenses.
| Account value | Ending value | Expenses paid during | |
| on 4-1-10 | on 9-30-10 | period ended 9-30-101 | |
| Class A | $1,000.00 | $1,018.80 | $6.38 |
| Class B | 1,000.00 | 1,014.80 | 10.35 |
| Class C | 1,000.00 | 1,014.80 | 10.35 |
| Class I | 1,000.00 | 1,020.80 | 4.36 |
| Class I2 | 1,000.00 | 1,020.80 | 4.31 |
| Class R1 | 1,000.00 | 1,017.20 | 7.89 |
| Class R3 | 1,000.00 | 1,017.80 | 7.33 |
| Class R4 | 1,000.00 | 1,019.30 | 5.82 |
| Class R5 | 1,000.00 | 1,020.70 | 4.41 |
| Class ADV | 1,000.00 | 1,020.10 | 5.06 |
| Class NAV | 1,000.00 | 1,021.10 | 4.05 |
Remember, these examples do not include any transaction costs, therefore, these examples will not help you to determine the relative total costs of owning different funds. If transaction costs were included, your expenses would have been higher. See the prospectus for details regarding transaction costs.
1 Expenses are equal to the Fund’s annualized expense ratios of 1.26%, 2.05%, 2.05%, 0.86%, 0.85%, 1.56%, 1.45%, 1.15%, 0.87%, 1.00% and 0.80% for Class A, Class B, Class C, Class I, Class I2, Class R1, Class R3, Class R4, Class R5, Class ADV and Class NAV shares, respectively, multiplied by the average account value over the period, multiplied by 183/365 (to reflect the one-half year period).
| Semiannual report | Disciplined Value Fund | 9 |
Portfolio summary
| Top 10 Holdings1 | ||||
| JPMorgan Chase & Company | 4.0% | Berkshire Hathaway, Inc., Class B | 2.6% | |
| Chevron Corp. | 3.4% | Johnson & Johnson | 2.5% | |
| Pfizer, Inc. | 3.2% | Occidental Petroleum Corp. | 2.5% | |
| Microsoft Corp. | 2.9% | Bank of America Corp. | 2.4% | |
| Wells Fargo & Company | 2.6% | Hewlett-Packard Company | 2.2% | |
| Sector Composition2,3 | ||||
| Financials | 25% | Consumer Staples | 7% | |
| Information Technology | 15% | Materials | 3% | |
| Health Care | 14% | Utilities | 2% | |
| Consumer Discretionary | 12% | Telecommunication Services | 1% | |
| Energy | 11% | Short-Term Investments & Other | 2% | |
| Industrials | 8% | |||
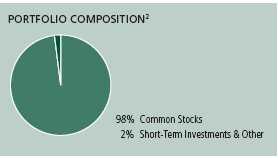
1 As a percentage of net assets on 9-30-10. Cash and cash equivalents are not included in Top 10 Holdings.
2 As a percentage of net assets on 9-30-10.
3 Sector investing is subject to greater risks than the market as a whole. Because the Fund may focus on particular sectors of the economy, its performance may depend on the performance of those sectors.
| 10 | Disciplined Value Fund | Semiannual report |
Fund’s investments
As of 9-30-10 (unaudited)
| Shares | Value | |
| Common Stocks 97.75% | $1,064,888,189 | |
| (Cost $1,003,570,764) | ||
| Consumer Discretionary 12.44% | 135,511,202 | |
| Auto Components 1.55% | ||
| Autoliv, Inc. (L) | 258,435 | 16,883,560 |
| Household Durables 0.53% | ||
| Mohawk Industries, Inc. (I) | 107,855 | 5,748,672 |
| Media 7.10% | ||
| Comcast Corp., Class A (L) | 575,775 | 10,410,012 |
| DIRECTV, Class A (I) | 307,579 | 12,804,514 |
| Liberty Media Corp. — Starz, Series A (I) | 139,257 | 9,034,994 |
| Omnicom Group, Inc. | 302,715 | 11,951,188 |
| Time Warner, Inc. | 353,890 | 10,846,729 |
| Viacom, Inc., Class B | 616,760 | 22,320,544 |
| Multiline Retail 1.56% | ||
| Family Dollar Stores, Inc. (L) | 120,130 | 5,304,941 |
| Macy’s, Inc. | 508,055 | 11,730,990 |
| Specialty Retail 1.70% | ||
| Guess?, Inc. (L) | 298,095 | 12,111,600 |
| Williams-Sonoma, Inc. (L) | 200,740 | 6,363,458 |
| Consumer Staples 7.10% | 77,314,302 | |
| Beverages 2.48% | ||
| Anheuser-Busch InBev NV, ADR (L) | 146,385 | 8,600,119 |
| Dr. Pepper Snapple Group, Inc. | 517,335 | 18,375,739 |
| Food & Staples Retailing 2.13% | ||
| Wal-Mart Stores, Inc. | 320,545 | 17,155,568 |
| Walgreen Company | 181,120 | 6,067,520 |
| Household Products 1.27% | ||
| Clorox Company | 207,430 | 13,848,027 |
| Tobacco 1.22% | ||
| Philip Morris International, Inc. | 236,832 | 13,267,329 |
| Energy 10.86% | 118,306,434 | |
| Energy Equipment & Services 0.60% | ||
| McDermott International, Inc. (I) | 206,815 | 3,056,726 |
| Pride International, Inc. (L) | 119,355 | 3,512,618 |
| See notes to financial statements | Semiannual report | Disciplined Value Fund | 11 |
| Shares | Value | |
| Oil, Gas & Consumable Fuels 10.26% | ||
| Chevron Corp. | 456,760 | $37,020,398 |
| EOG Resources, Inc. (L) | 197,480 | 18,359,716 |
| Exxon Mobil Corp. | 222,594 | 13,754,083 |
| Noble Energy, Inc. (L) | 143,430 | 10,770,159 |
| Occidental Petroleum Corp. | 346,175 | 27,105,503 |
| Petrobakken Energy, Ltd., Class A | 210,660 | 4,727,231 |
| Financials 25.39% | 276,647,915 | |
| Capital Markets 2.72% | ||
| Morgan Stanley | 396,095 | 9,775,625 |
| Raymond James Financial, Inc. (L) | 315,715 | 7,997,061 |
| State Street Corp. | 314,275 | 11,835,597 |
| Commercial Banks 5.17% | ||
| Barclays PLC, SADR (L) | 563,750 | 10,626,688 |
| U.S. Bancorp | 804,120 | 17,385,074 |
| Wells Fargo & Company | 1,129,605 | 28,386,974 |
| Consumer Finance 4.15% | ||
| American Express Company | 293,291 | 12,327,021 |
| Discover Financial Services | 852,875 | 14,225,955 |
| SLM Corp. (I)(L) | 1,615,515 | 18,659,198 |
| Diversified Financial Services 6.45% | ||
| Bank of America Corp. | 2,012,100 | 26,378,631 |
| JPMorgan Chase & Company | 1,151,990 | 43,856,259 |
| Insurance 6.11% | ||
| ACE, Ltd. (L) | 137,574 | 8,013,686 |
| Berkshire Hathaway, Inc., Class B (I) | 338,834 | 28,014,795 |
| Loews Corp. | 244,380 | 9,262,002 |
| Reinsurance Group of America, Inc. | 116,435 | 5,622,646 |
| The Travelers Companies, Inc. | 152,794 | 7,960,567 |
| Validus Holdings, Ltd. | 291,331 | 7,679,485 |
| Real Estate Management & Development 0.79% | ||
| Brookfield Asset Management, Inc., Class A | 304,570 | 8,640,651 |
| Health Care 13.80% | 150,283,930 | |
| Biotechnology 1.39% | ||
| Amgen, Inc. (I) | 273,915 | 15,095,456 |
| Health Care Equipment & Supplies 0.54% | ||
| Hologic, Inc. (I)(L) | 369,405 | 5,914,174 |
| Health Care Providers & Services 5.01% | ||
| DaVita, Inc. (I) | 140,450 | 9,695,264 |
| Humana, Inc. (I) | 332,735 | 16,716,606 |
| McKesson Corp. | 304,600 | 18,818,188 |
| Omnicare, Inc. (L) | 389,525 | 9,301,857 |
| Pharmaceuticals 6.86% | ||
| Abbott Laboratories | 229,415 | 11,984,640 |
| Johnson & Johnson | 446,376 | 27,657,457 |
| Pfizer, Inc. | 2,044,280 | 35,100,288 |
| 12 | Disciplined Value Fund | Semiannual report | See notes to financial statements |
| Shares | Value | |
| Industrials 7.67% | $83,590,574 | |
| Aerospace & Defense 3.11% | ||
| Honeywell International, Inc. | 353,570 | 15,535,866 |
| Northrop Grumman Corp. | 153,625 | 9,314,284 |
| United Technologies Corp. | 127,485 | 9,080,757 |
| Industrial Conglomerates 1.72% | ||
| Siemens AG, SADR (L) | 71,580 | 7,544,532 |
| Tyco International, Ltd. | 304,650 | 11,189,795 |
| Machinery 0.81% | ||
| Illinois Tool Works, Inc. | 186,610 | 8,774,402 |
| Professional Services 2.03% | ||
| Equifax, Inc. | 326,045 | 10,172,604 |
| Manpower, Inc. | 229,470 | 11,978,334 |
| Information Technology 15.22% | 165,857,153 | |
| Communications Equipment 1.71% | ||
| Harris Corp. | 419,830 | 18,594,271 |
| Computers & Peripherals 3.58% | ||
| EMC Corp. (I) | 744,660 | 15,124,045 |
| Hewlett-Packard Company | 568,868 | 23,932,277 |
| Electronic Equipment, Instruments & Components 1.73% | ||
| Avnet, Inc. (I) | 340,945 | 9,208,924 |
| Tyco Electronics, Ltd. | 330,840 | 9,667,145 |
| Internet Software & Services 1.11% | ||
| eBay, Inc. (I) | 493,475 | 12,040,790 |
| IT Services 1.42% | ||
| International Business Machines Corp. | 73,845 | 9,905,568 |
| The Western Union Company | 316,075 | 5,585,045 |
| Office Electronics 0.96% | ||
| Xerox Corp. | 1,014,195 | 10,496,918 |
| Software 4.71% | ||
| Microsoft Corp. | 1,307,614 | 32,023,467 |
| Oracle Corp. | 718,015 | 19,278,703 |
| Materials 3.21% | 34,916,265 | |
| Chemicals 1.32% | ||
| Albemarle Corp. | 129,026 | 6,039,707 |
| Ashland, Inc. | 170,710 | 8,325,527 |
| Containers & Packaging 0.74% | ||
| Crown Holdings, Inc. (I) | 281,110 | 8,056,613 |
| Metals & Mining 1.15% | ||
| Reliance Steel & Aluminum Company | 300,853 | 12,494,418 |
| Telecommunication Services 0.54% | 5,886,594 | |
| Wireless Telecommunication Services 0.54% | ||
| Vodafone Group PLC, SADR (L) | 237,267 | 5,886,594 |
| See notes to financial statements | Semiannual report | Disciplined Value Fund | 13 |
| Shares | Value | |
| Utilities 1.52% | $16,573,820 | |
| Electric Utilities 1.02% | ||
| Edison International | 324,070 | 11,144,767 |
| Multi-Utilities 0.50% | ||
| PG&E Corp. | 119,530 | 5,429,053 |
| Par Value | Value | ||
| Short-Term Investments 13.43% | $146,253,929 | ||
| (Cost $146,245,953) | |||
| Repurchase Agreement 3.86% | 42,034,000 | ||
| Repurchase Agreement with State Street Corp. dated 9-30-10 at 0.010% to | |||
| be repurchased at $42,034,012 on 10-1-10, collateralized by $42,665,000 | |||
| U.S. Treasury Notes, 0.625% due 6-30-12 (valued at $42,878,325, | |||
| Including Interest) | $42,034,000 | 42,034,000 | |
| Shares | Value | ||
| Securities Lending Collateral 9.57% | 104,219,929 | ||
| John Hancock Collateral Investment Trust (W) | 0.2942% (Y) | 10,412,830 | 104,219,929 |
| Total investments (Cost $1,149,816,717)† 111.18% | $1,211,142,118 | ||
| Other assets and liabilities, net (11.18%) | ($121,765,003) | ||
| Total net assets 100.00% | $1,089,377,115 | ||
| The percentage shown for each investment category is the total value of the category as a percentage of the net | |
| assets of the Fund. | |
| ADR | American Depositary Receipts |
| SADR | Sponsored American Depositary Receipts |
| (I) | Non-income producing security. |
| (L) | All or a portion of this security is on loan as of 9-30-10. |
| (W) | Investment is an affiliate of the Fund, the adviser and/or subadviser. Also, it represents the investment of |
| securities lending collateral received. | |
| (Y) | The rate shown is the annualized seven-day yield as of 9-30-10. |
| † | At 9-30-10, the aggregate cost of investment securities for federal income tax purposes was $1,151,272,322. |
| Net unrealized appreciation aggregated $59,869,796, of which $77,254,230 related to appreciated investment | |
| securities and $17,384,434 related to depreciated investment securities. |
| 14 | Disciplined Value Fund | Semiannual report | See notes to financial statements |
F I N A N C I A L S T A T E M E N T S
Financial statements
Statement of assets and liabilities 9-30-10 (unaudited)
This Statement of Assets and Liabilities is the Fund’s balance sheet. It shows the value of what the Fund owns, is due and owes. You’ll also find the net asset value and the maximum public offering price per share.
| Assets | |
| Investments in unaffiliated issuers, at value (Cost $1,003,570,764) | |
| including $101,063,105 of securities loaned (Note 2) | $1,064,888,189 |
| Investments in affiliated issuers, at value (Cost $104,211,953) (Note 2) | 104,219,929 |
| Repurchase agreements, at value (Cost $42,034,000) (Note 2) | 42,034,000 |
| Total investments, at value (Cost $1,149,816,717) | 1,211,142,118 |
| Cash | 354 |
| Receivable for investments sold | 2,263,144 |
| Receivable for fund shares sold | 2,572,675 |
| Dividends and interest receivable | 1,101,800 |
| Receivable for securities lending income | 18,161 |
| Receivable due from adviser | 19,341 |
| Other receivables and prepaid assets | 150,333 |
| Total assets | 1,217,267,926 |
| Liabilities | |
| Payable for investments purchased | 22,713,249 |
| Payable for fund shares repurchased | 765,061 |
| Payable upon return of securities loaned (Note 2) | 104,233,341 |
| Payable to affiliates | |
| Accounting and legal services fees | 10,785 |
| Transfer agent fees | 86,278 |
| Distribution and service fees | 864 |
| Trustees’ fees | 5,187 |
| Other liabilities and accrued expenses | 76,046 |
| Total liabilities | 127,890,811 |
| Net assets | |
| Capital paid-in | $1,089,862,597 |
| Undistributed net investment income | 2,802,718 |
| Accumulated net realized loss on investments and foreign | |
| currency transactions | (64,613,644) |
| Net unrealized appreciation on investments and translation of assets | |
| and liabilities in foreign currencies | 61,325,444 |
| Net assets | $1,089,377,115 |
| See notes to financial statements | Semiannual report | Disciplined Value Fund | 15 |
F I N A N C I A L S T A T E M E N T S
Statement of assets and liabilities (continued)
| Net asset value per share | |
| Based on net asset values and shares outstanding — the Fund has an | |
| unlimited number of shares authorized with no par value | |
| Class A ($420,523,331 ÷ 35,477,456 shares) | $11.85 |
| Class B ($5,764,740 ÷ 504,822 shares)1 | $11.42 |
| Class C ($22,042,122 ÷ 1,930,139 shares)1 | $11.42 |
| Class I ($277,578,298 ÷ 23,920,389 shares) | $11.60 |
| Class I2 ($18,591,592 ÷ 1,601,027 shares) | $11.61 |
| Class R1 ($791,904 ÷ 68,380 shares) | $11.58 |
| Class R3 ($39,877 ÷ 3,444 shares) | $11.58 |
| Class R4 ($849,493 ÷ 73,258 shares) | $11.60 |
| Class R5 ($112,356 ÷ 9,677 shares) | $11.61 |
| Class ADV ($32,967 ÷ 2,844 shares) | $11.59 |
| Class NAV ($343,050,435 ÷ 29,526,138 shares) | $11.62 |
| Maximum offering price per share | |
| Class A (net asset value per share ÷ 95%)2 | $12.47 |
1 Redemption price per share is equal to the net asset value less any applicable contingent deferred sales charge.
2 On single sales of less than $50,000. On sales of $50,000 or more and on group sales the offering price is reduced.
| 16 | Disciplined Value Fund | Semiannual report | See notes to financial statements |
F I N A N C I A L S T A T E M E N T S
Statement of operations For the six-month period ended 9-30-10 (unaudited)
This Statement of Operations summarizes the Fund’s investment income earned and expenses incurred in operating the Fund. It also shows net gains (losses) for the period stated.
| Investment income | |
| Dividends | $6,048,346 |
| Securities lending | 90,245 |
| Interest | 1,493 |
| Less foreign taxes withheld | (56,046) |
| Total investment income | 6,084,038 |
| Expenses | |
| Investment management fees (Note 4) | 2,853,964 |
| Distribution and service fees (Note 4) | 458,352 |
| Accounting and legal services fees (Note 4) | 52,216 |
| Transfer agent fees (Note 4) | 346,111 |
| Trustees’ fees (Note 4) | 25,323 |
| State registration fees (Note 4) | 44,268 |
| Printing and postage (Note 4) | 8,906 |
| Professional fees | 76,986 |
| Custodian fees | 53,355 |
| Registration and filing fees | 14,117 |
| Other | 10,666 |
| Total expenses | 3,944,264 |
| Less expense reductions (Note 4) | (28,386) |
| Net expenses | 3,915,878 |
| Net investment income | 2,168,160 |
| Realized and unrealized gain (loss) | |
| Net realized gain (loss) on | |
| Investments in unaffiliated issuers | 2,028,279 |
| Investments in affiliated issuers | (18,086) |
| Foreign currency transactions | 793 |
| 2,010,986 | |
| Change in net unrealized appreciation (depreciation) of | |
| Investments in unaffiliated issuers | (9,270,656) |
| Investments in affiliated issuers | 10,777 |
| Translation of assets and liabilities in foreign currencies | 10 |
| (9,259,869) | |
| Net realized and unrealized loss | (7,248,883) |
| Decrease in net assets from operations | ($5,080,723) |
| See notes to financial statements | Semiannual report | Disciplined Value Fund | 17 |
F I N A N C I A L S T A T E M E N T S
Statements of changes in net assets
These Statements of Changes in Net Assets show how the value of the Fund’s net assets has changed during the last two periods. The difference reflects earnings less expenses, any investment gains and losses, distributions, if any, paid to shareholders and the net of Fund share transactions.
| Six months | ||||
| ended | Year | |||
| 9-30-10 | ended | |||
| (Unaudited) | 3-31-10 | |||
| Increase (decrease) in net assets | ||||
| From operations | ||||
| Net investment income | $2,168,160 | $2,671,090 | ||
| Net realized gain | 2,010,986 | 5,628,114 | ||
| Change in net unrealized appreciation (depreciation) | (9,259,869) | 84,592,845 | ||
| Increase (decrease) in net assets resulting from operations | (5,080,723) | 92,892,049 | ||
| Distributions to shareholders | ||||
| From net investment income | ||||
| Class A | — | (317,909) | ||
| Class I | — | (734,059) | ||
| Class I2 | — | (422) | ||
| Class R4 | — | (81) | ||
| Class R5 | — | (164) | ||
| Class NAV | — | (1,182,121) | ||
| Class ADV | — | (111) | ||
| Total distributions | — | (2,234,867) | ||
| From Fund share transactions (Note 5) | 502,194,918 | 458,333,062 | ||
| Total increase | 497,114,195 | 548,990,244 | ||
| Net assets | ||||
| Beginning of period | 592,262,920 | 43,272,676 | ||
| End of period | $1,089,377,115 | $592,262,920 | ||
| Undistributed net investment income | $2,802,718 | $634,558 | ||
| 18 | Disciplined Value Fund | Semiannual report | See notes to financial statements |
Financial highlights
The Financial Highlights show how the Fund’s net asset value for a share has changed since the end of the previous period.
| CLASS A SHARES Period ended | 9-30-101 | 3-31-10 | 3-31-092,3 | 8-31-084 | 8-31-074 | 8-31-064 | 8-31-054 |
| Per share operating performance | |||||||
| Net asset value, beginning | |||||||
| of period | $12.31 | $8.09 | $12.32 | $15.62 | $14.77 | $15.22 | $12.86 |
| Net investment income5 | 0.02 | 0.08 | 0.08 | 0.15 | 0.15 | 0.13 | 0.08 |
| Net realized and unrealized gain | |||||||
| (loss) on investments | (0.48) | 4.18 | (4.18) | (1.90) | 2.07 | 1.57 | 2.36 |
| Total from | |||||||
| investment operations | (0.46) | 4.26 | (4.10) | (1.75) | 2.22 | 1.70 | 2.44 |
| Less distributions | |||||||
| From net investment income | — | (0.04) | (0.13) | (0.15) | (0.13) | (0.13) | (0.08) |
| From net realized gain | — | — | — | (1.40) | (1.24) | (2.02) | — |
| Total distributions | — | (0.04) | (0.13) | (1.55) | (1.37) | (2.15) | (0.08) |
| Net asset value, end of period | $11.85 | $12.31 | $8.09 | $12.32 | $15.62 | $14.77 | $15.22 |
| Total return (%)6 | (3.74)7 | 52.688 | (33.33)7,8 | (12.29)8 | 15.458 | 12.148 | 19.048 |
| Ratios and supplemental data | |||||||
| Net assets, end of period | |||||||
| (in millions) | $421 | $162 | $10 | $16 | $23 | $21 | $12 |
| Ratios (as a percentage of average | |||||||
| net assets): | |||||||
| Expenses before reductions | 1.269 | 1.26 | 1.769 | 1.39 | 1.32 | 1.46 | 1.61 |
| Expenses net of fee waivers | 1.269 | 1.06 | 1.009 | 1.00 | 1.00 | 1.11 | 1.25 |
| Expenses net of fee waivers | |||||||
| and credits | 1.269 | 1.05 | 1.009 | 1.00 | 1.00 | 1.11 | 1.25 |
| Net investment income | 0.349 | 0.74 | 1.459 | 1.10 | 0.95 | 0.87 | 0.53 |
| Portfolio turnover (%) | 30 | 59 | 5210 | 78 | 62 | 58 | 77 |
1 Semiannual period from 4-1-10 to 9-30-10. Unaudited.
2 For the seven month period ended 3-31-09. The Fund changed its fiscal year end from August 31 to March 31.
3 After the close of business on 12-19-08, holders of Investor share class of the former Robeco Large Cap Value Fund (the Predecessor Fund) became owners of an equal number of full and fractional Class A shares of the John Hancock Disciplined Value Fund. These shares were first offered on 12-22-08. Additionally, the accounting and performance history of the Investor share class of the Predecessor Fund was redesignated as that of John Hancock Disciplined Value Fund Class A.
4 Audited by previous independent registered public accounting firm.
5 Based on the average daily shares outstanding.
6 Does not reflect the effect of sales charges, if any.
7 Not annualized.
8 Total returns would have been lower had certain expenses not been reduced during the periods shown.
9 Annualized.
10 Portfolio turnover is shown for the period from 9-1-08 to 3-31-09.
| See notes to financial statements | Semiannual report | Disciplined Value Fund | 19 |
| CLASS B SHARES Period ended | 9-30-101 | 3-31-10 | 3-31-092 |
| Per share operating performance | |||
| Net asset value, beginning of period | $11.91 | $7.88 | $8.82 |
| Net investment income (loss)3 | (0.03) | (0.03) | 0.02 |
| Net realized and unrealized gain (loss) on investments | (0.46) | 4.06 | (0.96) |
| Total from investment operations | (0.49) | 4.03 | (0.94) |
| Net asset value, end of period | $11.42 | $11.91 | $7.88 |
| Total return (%)4,5 | (4.11)6 | 51.14 | (10.66)6 |
| Ratios and supplemental data | |||
| Net assets, end of period (in millions) | $6 | $5 | —7 |
| Ratios (as a percentage of average net assets): | |||
| Expenses before reductions | 2.288 | 2.58 | 4.248 |
| Expenses net of fee waivers | 2.058 | 2.12 | 2.078 |
| Expenses net of fee waivers and credits | 2.058 | 2.05 | 2.058 |
| Net investment income (loss) | (0.50)8 | (0.25) | 1.188 |
| Portfolio turnover (%) | 30 | 59 | 529 |
1 Semiannual period from 4-1-10 to 9-30-10. Unaudited.
2 The inception date for Class B shares is 12-22-08.
3 Based on the average daily shares outstanding.
4 Total returns would have been lower had certain expenses not been reduced during the periods shown.
5 Does not reflect the effect of sales charges, if any.
6 Not annualized.
7 Less than $500,000.
8 Annualized.
9 Portfolio turnover is shown for the period from 9-1-08 to 3-31-09.
| CLASS C SHARES Period ended | 9-30-101 | 3-31-10 | 3-31-092 |
| Per share operating performance | |||
| Net asset value, beginning of period | $11.91 | $7.87 | $8.82 |
| Net investment income (loss)3 | (0.03) | (0.03) | 0.02 |
| Net realized and unrealized gain (loss) on investments | (0.46) | 4.07 | (0.97) |
| Total from investment operations | (0.49) | 4.04 | (0.95) |
| Net asset value, end of period | $11.42 | $11.91 | $7.87 |
| Total return (%)4,5 | (4.11)6 | 51.33 | (10.77)6 |
| Ratios and supplemental data | |||
| Net assets, end of period (in millions) | $22 | $19 | —7 |
| Ratios (as a percentage of average net assets): | |||
| Expenses before reductions | 2.088 | 2.24 | 4.418 |
| Expenses net of fee waivers | 2.058 | 2.08 | 2.068 |
| Expenses net of fee waivers and credits | 2.058 | 2.05 | 2.058 |
| Net investment income (loss) | (0.48)8 | (0.27) | 1.268 |
| Portfolio turnover (%) | 30 | 59 | 529 |
1 Semiannual period from 4-1-10 to 9-30-10. Unaudited.
2 The inception date for Class C shares is 12-22-08.
3 Based on the average daily shares outstanding.
4 Does not reflect the effect of sales charges, if any.
5 Total returns would have been lower had certain expenses not been reduced during the periods shown.
6 Not annualized.
7 Less than $500,000.
8 Annualized.
9 Portfolio turnover is shown for the period from 9-1-08 to 3-31-09.
| 20 | Disciplined Value Fund | Semiannual report | See notes to financial statements |
| CLASS I SHARES Period ended | 9-30-101 | 3-31-10 | 3-31-092,3 | 8-31-084 | 8-31-074 | 8-31-064 | 8-31-054 |
| Per share operating performance | |||||||
| Net asset value, beginning | |||||||
| of period | $12.03 | $7.90 | $12.08 | $15.34 | $14.53 | $15.00 | $12.67 |
| Net investment income5 | 0.04 | 0.11 | 0.09 | 0.18 | 0.20 | 0.16 | 0.11 |
| Net realized and unrealized gain | |||||||
| (loss) on investments | (0.47) | 4.08 | (4.10) | (1.84) | 2.02 | 1.55 | 2.33 |
| Total from investment operations | (0.43) | 4.19 | (4.01) | (1.66) | 2.22 | 1.71 | 2.44 |
| Less distributions | |||||||
| From net investment income | — | (0.06) | (0.17) | (0.20) | (0.17) | (0.16) | (0.11) |
| From net realized gain | — | — | — | (1.40) | (1.24) | (2.02) | — |
| Total distributions | — | (0.06) | (0.17) | (1.60) | (1.41) | (2.18) | (0.11) |
| Net asset value, end of period | $11.60 | $12.03 | $7.90 | $12.08 | $15.34 | $14.53 | $15.00 |
| Total return (%)6 | (3.57)7 | 53.14 | (33.33)7 | (11.99) | 15.70 | 12.43 | 19.30 |
| Ratios and supplemental data | |||||||
| Net assets, end of period (in millions) | $278 | $158 | $33 | $44 | $43 | $36 | $27 |
| Ratios (as a percentage of average | |||||||
| net assets): | |||||||
| Expenses before reductions | 0.868 | 0.88 | 1.378 | 1.14 | 1.07 | 1.22 | 1.35 |
| Expenses net of fee waivers | 0.868 | 0.80 | 0.758 | 0.75 | 0.75 | 0.86 | 1.00 |
| Expenses net of fee waivers | |||||||
| and credits | 0.868 | 0.80 | 0.758 | 0.75 | 0.75 | 0.86 | 1.00 |
| Net investment income | 0.708 | 1.01 | 1.728 | 1.37 | 1.20 | 1.11 | 0.83 |
| Portfolio turnover (%) | 30 | 59 | 529 | 78 | 62 | 58 | 77 |
1 Semiannual period from 4-1-10 to 9-30-10. Unaudited.
2 For the seven month period ended 3-31-09. The Fund changed its fiscal year end from August 31 to March 31.
3 After the close of business on 12-19-08, holders of Institutional share class of the former Robeco Large Cap Value Fund (the Predecessor Fund) became owners of an equal number of full and fractional Class I shares of the John Hancock Disciplined Value Fund. These shares were first offered on 12-22-08. Additionally, the accounting and performance history of the Institutional share class of the Predecessor Fund was redesignated as that of John Hancock Disciplined Value Fund Class I.
4 Audited by previous independent registered public accounting firm.
5 Based on the average daily shares outstanding.
6 Total returns would have been lower had certain expenses not been reduced during the periods shown.
7 Not annualized.
8 Annualized.
9 Portfolio turnover is shown for the period from 9-1-08 to 3-31-09.
| See notes to financial statements | Semiannual report | Disciplined Value Fund | 21 |
| CLASS I2 SHARES Period ended | 9-30-101 | 3-31-10 | 3-31-092 |
| Per share operating performance | |||
| Net asset value, beginning of period | $12.04 | $7.90 | $8.82 |
| Net investment income3 | 0.04 | 0.11 | 0.05 |
| Net realized and unrealized gain (loss) on investments | (0.47) | 4.09 | (0.97) |
| Total from investment operations | (0.43) | 4.20 | (0.92) |
| Less distributions | |||
| From net investment income | — | (0.06) | — |
| Net assets value, end of period | $11.61 | $12.04 | $7.90 |
| Total return (%)4 | (3.57)5 | 53.27 | (10.43)5 |
| Ratios and supplemental data | |||
| Net assets, end of period (in millions) | $19 | $19 | —6 |
| Ratios (as a percentage of average net assets): | |||
| Expenses before reductions | 0.917 | 1.13 | 5.087 |
| Expenses net of fee waivers | 0.857 | 0.75 | 0.757 |
| Expenses net of fee waivers and credits | 0.857 | 0.75 | 0.757 |
| Net investment income | 0.707 | 0.99 | 2.237 |
| Portfolio turnover (%) | 30 | 59 | 528 |
1 Semiannual period from 4-1-10 to 9-30-10. Unaudited.
2 The inception date for Class I2 shares is 12-22-08.
3 Based on the average daily shares outstanding.
4 Total returns would have been lower had certain expenses not been reduced during the periods shown.
5 Not annualized.
6 Less than $500,000.
7 Annualized.
8 Portfolio turnover is shown for the period from 9-1-08 to 3-31-09.
| CLASS R1 SHARES Period ended | 9-30-101 | 3-31-102 |
| Per share operating performance | ||
| Net asset value, beginning of period | $12.05 | $9.01 |
| Net investment income3 | — | 0.02 |
| Net realized and unrealized gain (loss) on investments | (0.47) | 3.02 |
| Total from investment operations | (0.47) | 3.04 |
| Net assets value, end of period | $11.58 | $12.05 |
| Total return (%)4 | (3.90)5 | 33.745 |
| Ratios and supplemental data | ||
| Net assets, end of period (in millions) | $1 | —6 |
| Ratios (as a percentage of average net assets): | ||
| Expenses before reductions | 2.307 | 2.967 |
| Expenses net of fee waivers | 1.567 | 1.507 |
| Expenses net of fee waivers and credits | 1.567 | 1.507 |
| Net investment income | 0.017 | 0.297 |
| Portfolio turnover (%) | 30 | 598 |
1 Semiannual period from 4-1-10 to 9-30-10. Unaudited.
2 The inception date for Class R1 shares is 7-13-09.
3 Based on the average daily shares outstanding.
4 Total returns would have been lower had certain expenses not been reduced during the periods shown.
5 Not annualized.
6 Less than $500,000.
7 Annualized.
8 Portfolio turnover is shown for the period from 4-1-09 to 3-31-10.
| 22 | Disciplined Value Fund | Semiannual report | See notes to financial statements |
| CLASS R3 SHARES Period ended | 9-30-101 | 3-31-102 |
| Per share operating performance | ||
| Net asset value, beginning of period | $12.04 | $8.98 |
| Net investment income3 | 0.01 | 0.04 |
| Net realized and unrealized gain (loss) on investments | (0.47) | 3.02 |
| Total from investment operations | (0.46) | 3.06 |
| Net asset value, end of period | $11.58 | $12.04 |
| Total return (%)4 | (3.82)5 | 34.085 |
| Ratios and supplemental data | ||
| Net assets, end of period (in thousands) | $40 | $38 |
| Ratios (as a percentage of average net assets): | ||
| Expenses before reductions | 9.626 | 10.236 |
| Expenses net of fee waivers | 1.456 | 1.406 |
| Expenses net of fee waivers and credits | 1.456 | 1.406 |
| Net investment income | 0.116 | 0.436 |
| Portfolio turnover (%) | 30 | 597 |
1 Semiannual period from 4-1-10 to 9-30-10. Unaudited.
2 The inception date for Class R3 shares is 5-22-09.
3 Based on the average daily shares outstanding.
4 Total returns would have been lower had certain expenses not been reduced during the periods shown.
5 Not annualized.
6 Annualized.
7 Portfolio turnover is shown for the period from 4-1-09 to 3-31-10.
| CLASS R4 SHARES Period ended | 9-30-101 | 3-31-102 |
| Per share operating performance | ||
| Net asset value, beginning of period | $12.04 | $8.98 |
| Net investment income3 | 0.02 | 0.07 |
| Net realized and unrealized gain (loss) on investments | (0.46) | 3.02 |
| Total from investment operations | (0.44) | 3.09 |
| Less distributions | ||
| From net investment income | — | (0.03) |
| Net asset value, end of period | $11.60 | $12.04 |
| Total return (%)4 | (3.65)5 | 34.425 |
| Ratios and supplemental data | ||
| Net assets, end of period (in millions) | $1 | $1 |
| Ratios (as a percentage of average net assets): | ||
| Expenses before reductions | 1.566 | 2.886 |
| Expenses net of fee waivers | 1.156 | 1.106 |
| Expenses net of fee waivers and credits | 1.156 | 1.106 |
| Net investment income | 0.426 | 0.756 |
| Portfolio turnover (%) | 30 | 597 |
1 Semiannual period from 4-1-10 to 9-30-10. Unaudited.
2 The inception date for Class R4 shares is 5-22-09.
3 Based on the average daily shares outstanding.
4 Total returns would have been lower had certain expenses not been reduced during the periods shown.
5 Not annualized.
6 Annualized.
7 Portfolio turnover is shown for the period from 4-1-09 to 3-31-10.
| See notes to financial statements | Semiannual report | Disciplined Value Fund | 23 |
| CLASS R5 SHARES Period ended | 9-30-101 | 3-31-102 |
| Per share operating performance | ||
| Net asset value, beginning of period | $12.04 | $8.98 |
| Net investment income3 | 0.04 | 0.10 |
| Net realized and unrealized gain (loss) on investments | (0.47) | 3.02 |
| Total from investment operations | (0.43) | 3.12 |
| Less distributions | ||
| From net investment income | — | (0.06) |
| Net asset value, end of period | $11.61 | $12.04 |
| Total return (%)4 | (3.57)5 | 34.775 |
| Ratios and supplemental data | ||
| Net assets, end of period (in thousands) | $112 | $38 |
| Ratios (as a percentage of average net assets): | ||
| Expenses before reductions | 6.076 | 9.546 |
| Expenses net of fee waivers | 0.876 | 0.806 |
| Expenses net of fee waivers and credits | 0.876 | 0.806 |
| Net investment income | 0.756 | 1.036 |
| Portfolio turnover (%) | 30 | 597 |
1 Semiannual period from 4-1-10 to 9-30-10. Unaudited.
2 The inception date for Class R5 shares is 5-22-09.
3 Based on the average daily shares outstanding.
4 Total returns would have been lower had certain expenses not been reduced during the periods shown.
5 Not annualized.
6 Annualized.
7 Portfolio turnover is shown for the period from 4-1-09 to 3-31-10.
| CLASS ADV SHARES Period ended | 9-30-101 | 3-31-10 | 3-31-092 |
| Per share operating performance | |||
| Net asset value, beginning of period | $12.03 | $7.90 | $8.82 |
| Net investment income3 | 0.03 | 0.09 | 0.04 |
| Net realized and unrealized gain (loss) on investments | (0.47) | 4.08 | (0.96) |
| Total from investment operations | (0.44) | 4.17 | (0.92) |
| Less distributions | |||
| From net investment income | — | (0.04) | — |
| Net asset value, end of period | $11.59 | $12.03 | $7.90 |
| Total return (%)4 | (3.66)5 | 52.81 | (10.43)5 |
| Ratios and supplemental data | |||
| Net assets, end of period (in thousands) | $33 | $34 | $22 |
| Ratios (as a percentage of average net assets): | |||
| Expenses before reductions | 38.546 | 31.79 | 3.216 |
| Expenses net of fee waivers | 1.006 | 1.00 | 1.006 |
| Expenses net of fee waivers and credits | 1.006 | 1.00 | 1.006 |
| Net investment income | 0.546 | 0.84 | 1.966 |
| Portfolio turnover (%) | 30 | 59 | 527 |
1 Semiannual period from 4-1-10 to 9-30-10. Unaudited.
2 The inception date for Class ADV shares is 12-22-08.
3 Based on the average daily shares outstanding.
4 Total returns would have been lower had certain expenses not been reduced during the periods shown.
5 Not annualized.
6 Annualized.
7 Portfolio turnover is shown for the period from 9-1-08 to 3-31-09.
| 24 | Disciplined Value Fund | Semiannual report | See notes to financial statements |
| CLASS NAV SHARES Period ended | 9-30-101 | 3-31-102 |
| Per share operating performance | ||
| Net asset value, beginning of period | $12.04 | $9.18 |
| Net investment income3 | 0.04 | 0.10 |
| Net realized and unrealized gain (loss) on investments | (0.46) | 2.82 |
| Total from investment operations | (0.42) | 2.92 |
| Less distributions | ||
| From net investment income | — | (0.06) |
| Net asset value, end of period | $11.62 | $12.04 |
| Total return (%) | (3.49)4 | 31.894,5 |
| Ratios and supplemental data | ||
| Net assets, end of period (in millions) | $343 | $228 |
| Ratios (as a percentage of average net assets): | ||
| Expenses before reductions | 0.806 | 0.836 |
| Expenses net of fee waivers | 0.806 | 0.756 |
| Expenses net of fee waivers and credits | 0.806 | 0.756 |
| Net investment income | 0.786 | 1.056 |
| Portfolio turnover (%) | 30 | 597 |
1 Semiannual period from 4-1-10 to 9-30-10. Unaudited.
2 The inception date for Class NAV shares is 5-29-09.
3 Based on the average daily shares outstanding.
4 Not annualized.
5 Total returns would have been lower had certain expenses not been reduced during the periods shown.
6 Annualized.
7 Portfolio turnover is shown for the period from 4-1-09 to 3-31-10.
| See notes to financial statements | Semiannual report | Disciplined Value Fund | 25 |
Notes to financial statements
(unaudited)
Note 1 — Organization
John Hancock Disciplined Value Fund (the Fund) is a diversified series of John Hancock Funds III (the Trust), an open-end management investment company organized as a Massachusetts business trust and registered under the Investment Company Act of 1940, as amended (the 1940 Act). The investment objective of the Fund is to seek to provide long-term growth of capital primarily through investment in equity securities. Current income is a secondary objective.
The Fund may offer multiple classes of shares. The shares currently offered are detailed in the Statement of Assets and Liabilities. Class A, Class B and Class C shares are offered to all investors. Class I shares are offered to institutions and certain investors. Class R1, Class R3, Class R4 and Class R5 shares are available only to certain retirement plans. Class I2 and Class ADV shares are closed to new investors. Class NAV shares are sold to John Hancock affiliated funds of funds, which owned 100% of the shares of beneficial interest. Shareholders of each class have exclusive voting rights to matters that affect that class. The distribution and service fees, transfer agent fees, state registration fees and printing and postage for each class may differ. Class B shares convert to Class A shares eight years after purchase.
The Fund is the accounting and performance successor to the Robeco Boston Partners Large Cap Value Fund (the Predecessor Fund). On December 19, 2008, the Fund acquired substantially all the assets and assumed the liabilities of the Predecessor Fund pursuant to an agreement and plan of reorganization, in exchange for Class A and Class I shares of the Fund.
Affiliates of the Fund owned 100%, 81% and 29% of the shares of beneficial interest of Class ADV, Class R3 and Class R5, respectively, on September 30, 2010.
Note 2 — Significant accounting policies
The financial statements have been prepared in conformity with accounting principles generally accepted in the United States of America, which require management to make certain estimates and assumptions at the date of the financial statements. Actual results could differ from those estimates. Events or transactions occurring after the end of the fiscal period through the date that the financial statements were issued have been evaluated in the preparation of the financial statements. The following summarizes the significant accounting policies of the Fund:
Security valuation. Investments are stated at value as of the close of the regular trading on the New York Stock Exchange (NYSE), normally at 4:00 P.M., Eastern Time. The Fund uses a three-tier hierarchy to prioritize the pricing assumptions, referred to as inputs, used in valuation techniques to measure fair value. Level 1 includes quoted prices in active markets for identical securities. Level 2 includes significant observable inputs. Observable inputs may include quoted prices for similar securities, interest rates, prepayment speeds and credit risk. Prices for securities valued using these techniques are received from independent pricing vendors and brokers and are based on an evaluation of the inputs described. Level 3 includes significant unobservable inputs when market prices are not readily available or reliable, including the Fund’s own assumptions in determining the fair value of investments. The inputs or methodology used for valuing securities are not necessarily an indication of the risk associated with investing in those securities.
| 26 | Disciplined Value Fund | Semiannual report |
The following is a summary of the values by input classification of the Fund’s investments as of September 30, 2010, by major security category or type:
| LEVEL 3 | ||||
| LEVEL 2 | SIGNIFICANT | |||
| TOTAL MARKET | LEVEL 1 | SIGNIFICANT | UNOBSERVABLE | |
| VALUE AT 9-30-10 | QUOTED PRICE | OBSERVABLE INPUTS | INPUTS | |
| Common Stocks | ||||
| Consumer Discretionary | $135,511,202 | $135,511,202 | — | — |
| Consumer Staples | 77,314,302 | 77,314,302 | — | — |
| Energy | 118,306,434 | 118,306,434 | — | — |
| Financials | 276,647,915 | 276,647,915 | — | — |
| Health Care | 150,283,930 | 150,283,930 | — | — |
| Industrials | 83,590,574 | 83,590,574 | — | — |
| Information Technology | 165,857,153 | 165,857,153 | — | — |
| Materials | 34,916,265 | 34,916,265 | — | — |
| Telecommunication | ||||
| Services | 5,886,594 | 5,886,594 | — | — |
| Utilities | 16,573,820 | 16,573,820 | — | — |
| Short-Term Investments | 146,253,929 | 104,219,929 | $42,034,000 | — |
| Total Investments in | ||||
| Securities | $1,211,142,118 | $1,169,108,118 | $42,034,000 | — |
During the six months ended September 30, 2010, there were no significant transfers in or out of Level 1 or Level 2 assets.
In order to value the securities, the Fund uses the following valuation techniques. Equity securities held by the Fund are valued at the last sale price or official closing price on the principal securities exchange on which they trade. In the event there were no sales during the day or closing prices are not available, then securities are valued using the last quoted bid or evaluated price. Investments in open-end mutual funds, including John Hancock Collateral Investment Trust (JHCIT), are valued at their closing net asset values each day. Foreign securities and currencies are valued in U.S. dollars, based on foreign currency exchange rates supplied by an independent pricing service. Certain securities traded only in the over-the-counter market are valued at the last bid price quoted by brokers making markets in the securities at the close of trading. Certain short-term securities are valued at amortized cost.
Other portfolio securities and assets, where market quotations are not readily available, are valued at fair value, as determined in good faith by the Fund’s Pricing Committee, following procedures established by the Board of Trustees.
Repurchase agreements. The Fund may enter into repurchase agreements. When a Fund enters into a repurchase agreement it receives collateral which is held in a segregated account by the Fund’s custodian. The collateral amount is marked-to-market and monitored on a daily basis to ensure that the collateral held is in an amount not less than the principal amount of the repurchase agreement plus any accrued interest. In the event of a default by the counterparty, realization of the collateral proceeds could be delayed, during which time the collateral value may decline.
Security transactions and related investment income. Investment security transactions are accounted for on a trade date plus one basis for daily net asset value calculations. However, for financial reporting purposes, investment transactions are reported on trade date. Interest income is accrued as earned. Gains and losses on securities sold are determined on the basis of identified cost and may include proceeds from litigation. Dividend income is recorded on the ex-date except for certain foreign dividends where the ex-date may have passed, which are recorded when the Fund becomes aware of the dividends.
| Semiannual report | Disciplined Value Fund | 27 |
Securities lending. The Fund may lend its securities to earn additional income. It receives and maintains cash collateral received from the borrower in an amount not less than the market value of the loaned securities. The Fund will invest its collateral in JHCIT. As a result, the Fund will receive the benefit of any gains and bear any losses generated by JHCIT. Although risk of the loss of the securities lent is mitigated by holding the collateral, the Fund could experience a delay in recovering its securities and a possible loss of income or value if the borrower fails to return the securities or if collateral investments decline in value. The Fund may receive compensation for lending its securities by retaining a portion of the return on the investment of the collateral and compensation from fees earned from borrowers of the securities. Income received from JHCIT is a component of securities lending income as re corded on the Statement of Operations.
Line of credit. The Fund may borrow from banks for temporary or emergency purposes, including meeting redemption requests that otherwise might require the untimely sale of securities. Pursuant to the custodian agreement, the custodian may loan money to a Fund to make properly authorized payments. The Fund is obligated to repay the custodian for any overdraft, including any related costs or expenses. The custodian has a lien, security interest or security entitlement in any Fund property that is not segregated, to the maximum extent permitted by law for any overdraft.
In addition, the Fund and other affiliated funds have entered into an agreement with State Street Bank and Trust Company which enables them to participate in a $100 million unsecured committed line of credit. Prior to March 31, 2010, the line of credit was $150 million. A commitment fee, payable at the end of each calendar quarter, based on the average daily unused portion of the line of credit, is charged to each participating fund on a pro rata basis and is reflected in other expenses on the Statement of Operations. For the six months ended September 30, 2010, the Fund had no borrowings under the line of credit.
Expenses. The majority of expenses are directly attributable to an individual fund. Expenses that are not readily attributable to a specific fund are allocated among all funds in an equitable manner, taking into consideration, among other things, the nature and type of expense and the funds’ relative assets. Expense estimates are accrued in the period to which they relate and adjustments are made when actual amounts are known.
Class allocations. Income, common expenses, and realized and unrealized gains (losses) are determined at the fund level and allocated daily to each class of shares based on the net asset value of the class. Class-specific expenses, such as distribution and service fees, if any, transfer agent fees, state registration fees and printing and postage, for all classes, are calculated daily at the class level based on the appropriate net asset value of each class and the specific expense rates applicable to each class.
Federal income taxes. The Fund intends to qualify as a regulated investment company by complying with the applicable provisions of the Internal Revenue Code and will not be subject to federal income tax on taxable income that is distributed to shareholders. Therefore, no federal income tax provision is required.
For federal income tax purposes, the Fund has a capital loss carryforward of $65,169,025 available to offset future net realized capital gains as of March 31, 2010. Availability of a certain amount of the loss carryforward, which was acquired in a merger, may be limited in a given year. The loss carryforward expires as follows: March 31, 2016 — $18,049,677 and March 31, 2017 — $47,119,348.
As of March 31, 2010, the Fund had no uncertain tax positions that would require financial statement recognition, de-recognition or disclosure. The Fund’s federal tax return is subject to examination by the Internal Revenue Service for a period of three years.
| 28 | Disciplined Value Fund | Semiannual report |
Distribution of income and gains. Distributions to shareholders from net investment income and net realized gains, if any, are recorded on the ex-date. The Fund generally declares and pays dividends and capital gains distributions, if any, at least annually.
Distributions paid by the Fund with respect to each series of shares are calculated in the same manner, at the same time and in the same amount, except for the effect of expenses that may be applied differently to each class.
Such distributions, on a tax basis, are determined in conformity with income tax regulations, which may differ from accounting principles generally accepted in the United States of America. Material distributions in excess of tax basis earnings and profits, if any, are reported in the Fund’s financial statements as a return of capital.
Capital accounts within financial statements are adjusted for permanent book/tax differences. These adjustments have no impact on net assets or the results of operations. Temporary book/tax differences, if any, will reverse in a subsequent period. Permanent book/tax differences are primarily attributable to merger related transactions.
Note 3 — Guarantees and indemnifications
Under the Fund’s organizational documents, its Officers and Trustees are indemnified against certain liabilities arising out of the performance of their duties to the Fund. Additionally, in the normal course of business, the Fund enters into contracts with service providers that contain general indemnification clauses. The Fund’s maximum exposure under these arrangements is unknown, as this would involve future claims that may be made against the Fund that have not yet occurred. The risk of material loss from such claims is considered remote.
Note 4 — Fees and transactions with affiliates
John Hancock Investment Management Services, LLC (the Adviser) serves as investment adviser for the Trust. John Hancock Funds, LLC (the Distributor), an affiliate of the Adviser, serves as principal underwriter of the Trust. The Adviser and the Distributor are indirect wholly owned subsidiaries of Manulife Financial Corporation (MFC).
Management fee. The Fund has an investment management contract with the Adviser under which the Fund pays a daily management fee to the Adviser equivalent, on an annual basis, to the sum of: (a) 0.750% of the first $500,000,000 of the Fund’s average daily net assets; (b) 0.725% of the next $500,000,000; (c) 0.700% of the next $500,000,000; (d) 0.675% of the next $1,000,000,000; and (e) 0.650% of the Fund’s average daily net assets in excess of $2,500,000,000. The Adviser has a subadvisory agreement with Robeco Investment Management, Inc. The Fund is not responsible for payment of the subadvisory fees.
The investment management fees incurred for the six months ended September 30, 2010 were equivalent to an annual effective rate of 0.74% of the Fund’s average daily net assets.
The Adviser has contractually agreed to reimburse or limit certain expenses for each share class. This agreement excludes taxes, portfolio brokerage commissions, interest, litigation and indemnification expenses and other extraordinary expenses not incurred in the ordinary course of the Fund’s business and shareholder service fees. The Adviser has agreed to reimburse and limit these expenses such that these expenses will not exceed 1.30%, 2.05%, 2.05%, 0.90%, 0.85%, 1.64%, 1.54%, 1.24%, 0.94% and 1.00% for Class A, B, C, I, I2, R1, R3, R4, R5 and ADV shares, respectively. The expense reimbursements and limits will continue in effect for Class A, B, C, I, I2, and ADV shares until June 30, 2011, and for Class R1, R3, R4 and R5 shares until July 31, 2011.
| Semiannual report | Disciplined Value Fund | 29 |
Prior to April 1, 2010, for Class I2 and August 1, 2010, for Class R1, R3, R4 and R5 shares, the Adviser had contractually agreed to reimburse or limit certain expenses for each share class. The agreement excluded taxes, portfolio brokerage commissions, interest and litigation and indemnification expenses and other extraordinary expenses not incurred in the ordinary course of the Fund’s business and shareholder service fees. The Adviser had agreed to reimburse and limit these expenses such that these expenses would not exceed 0.75%, 1.50%, 1.40%, 1.10% and 0.80% for Class I2, Class R1, R3, R4 and R5 shares, respectively.
Accordingly, the expense reductions or reimbursements related to these agreement were $6,308, $3,133, $5,749, $2,199, $1,523, $1,635, $1,721 and $6,118, for Class B, C, I2, R1, R3, R4, R5 and ADV shares, respectively, for the six months ended September 30, 2010.
Accounting and legal services. Pursuant to the Service Agreement, the Fund reimburses the Adviser for all expenses associated with providing the administrative, financial, legal, accounting and recordkeeping services of the Fund, including the preparation of all tax returns, periodic reports to shareholders and regulatory reports amongst other services. These expenses are allocated to each share class based on relative net assets at the time the expense was incurred. The accounting and legal services fees incurred for six months ended September 30, 2010, amounted to an approximate annual rate of 0.01% of the Fund’s average daily net assets.
Distribution and service plans. The Fund has a distribution agreement with the Distributor. The Fund has adopted distribution plans with respect to Class A, Class B, Class C, Class R1, Class R3, Class R4, Class R5, and Class ADV shares pursuant to Rule 12b-1 of the 1940 Act, to pay the Distributor for services provided as the distributor of shares of the Fund. In addition, under a service plan for Class R1, Class R3, Class R4 and Class R5 shares, the Fund pays for certain other services. The Fund may pay up to the following contractual rates of distribution fees and service fees under these arrangements, expressed as an annual percentage of average daily net assets for each class of the Fund’s shares. As of September 30, 2010, Class A paid 0.25% of average daily assets under these arrangements.
| CLASS | 12b–1 FEES | SERVICE FEE | |||
| Class A | 0.30% | 0.00% | |||
| Class B | 1.00% | 0.00% | |||
| Class C | 1.00% | 0.00% | |||
| Class R1 | 0.50% | 0.25% | |||
| Class R3 | 0.50% | 0.15% | |||
| Class R4 | 0.25% | 0.10% | |||
| Class R5 | 0.00% | 0.05% | |||
| Class ADV | 0.25% | 0.00% | |||
Sales charges. Class A shares are assessed up-front sales charges, which resulted in payments to the Distributor amounting to $215,440 for the six months ended September 30, 2010. Of this amount, $32,708 was retained and used for printing prospectuses, advertising, sales literature and other purposes, $182,107 was paid as sales commissions to broker-dealers and $625 was paid as sales commissions to sales personnel of Signator Investors, Inc. (Signator Investors), a broker-dealer affiliate of the Adviser.
Class B and Class C shares are subject to contingent deferred sales charges (CDSC). Class B shares that are redeemed within six years of purchase are subject to CDSC, at declining rates, beginning at 5.00% of the lesser of the current market value at the time of redemption or the original purchase cost of the shares being redeemed. Class C shares that are redeemed within one year of purchase are subject to a 1.00% CDSC on the lesser of the current market value at the time of redemption or the original purchase cost of the shares being redeemed. Proceeds from CDSCs are used to compensate the Distributor for providing distribution-related services in connection with the sale of
| 30 | Disciplined Value Fund | Semiannual report |
these shares. During the six months ended September 30, 2010, CDSCs received by the Distributor amounted to $4,751 and $6,056 for Class B and Class C shares, respectively.
Transfer agent fees. The Fund has a transfer agent agreement with John Hancock Signature Services, Inc. (Signature Services or Transfer Agent), an affiliate of the Adviser. The transfer agent fees paid to Signature Services are determined based on the cost to Signature Services (Signature Services Cost) of providing recordkeeping services. The Signature Services Cost includes a component of allocated John Hancock corporate overhead for providing transfer agent services to the Fund and to all other John Hancock affiliated funds. It also includes out-of-pocket expenses that are comprised of payments made to third-parties for recordkeeping services provided to their clients who invest in one or more John Hancock funds. In addition, Signature Services Cost may be reduced by certain revenues that Signature Services received in connection with the service they provide to the funds. Signature Services Cost is calculated m onthly and allocated, as applicable, to four categories of share classes: Institutional Share Classes, Retirement Share Classes, Municipal Bond Classes and all other Retail Share Classes. Within each of these categories, the applicable costs are allocated to the affected John Hancock affiliated funds and/or classes, based on the relative average daily net assets. Additionally, Class NAV shares do not pay transfer agent fees.
Prior to July 1, 2010, the transfer agent fees were made up of three components:
• The Fund paid a monthly transfer agent fee at an annual rate of 0.05% for Class A, B, C, R1, R3, R4, R5 and ADV shares and 0.04% for Class I and Class I2 shares, based on each class’s average daily net assets.
• The Fund paid a monthly fee based on an annual rate of $15.00 per shareholder account for Class A, R1, R3, R4 and R5 shares and $16.50 per shareholder account for Class B and C shares. During the six months ended September 30, 2010, there were no monthly fees assessed for Class I, I2 and ADV shares.
• In addition, Signature Services was reimbursed for certain out-of-pocket expenses.
Class level expenses. Class level expenses for the six months ended September 30, 2010 were:
| DISTRIBUTION | TRANSFER | STATE | PRINTING | |
| SHARE CLASS | AND SERVICE FEES | AGENT FEES | REGISTRATION FEES | AND POSTAGE |
| Class A | $325,317 | $260,267 | $7,623 | $3,960 |
| Class B | 27,143 | 7,010 | 6,077 | 150 |
| Class C | 102,516 | 22,531 | 6,264 | 473 |
| Class I | — | 49,461 | 7,516 | 3,537 |
| Class I2 | — | 4,740 | 5,543 | 468 |
| Class R1 | 1,971 | 747 | 1,700 | 55 |
| Class R3 | 93 | 212 | 1,334 | 8 |
| Class R4 | 1,150 | 477 | 1,334 | 63 |
| Class R5 | 121 | 278 | 1,334 | 10 |
| Class ADV | 41 | 388 | 5,543 | 182 |
| Total | $458,352 | $346,111 | $44,268 | $8,906 |
Trustee expenses. The Trust compensates each Trustee who is not an employee of the Adviser or its affiliates. These Trustees may, for tax purposes, elect to defer receipt of this compensation under the John Hancock Group of Funds Deferred Compensation Plan (the Plan). Deferred amounts are invested in various John Hancock funds and remain in the funds until distributed in accordance with the Plan. The investment of deferred amounts and the offsetting liability are included within other receivables and prepaid assets and Trustees’ fees, respectively, in the accompanying Statement of Assets and Liabilities.
| Semiannual report | Disciplined Value Fund | 31 |
Note 5 — Fund share transactions
Transactions in Fund shares for the six months ended September 30, 2010 and the year ended March 31, 2010 were as follows:
| Six months ended 9-30-10 | Year ended 3-31-10 | |||
| Shares | Amount | Shares | Amount | |
| Class A shares | ||||
| Sold | 24,896,461 | $290,888,927 | 11,661,288 | $132,046,024 |
| Issued in reorganization (Note 7) | — | — | 1,765,491 | 16,252,306 |
| Distributions reinvested | — | — | 26,373 | 304,610 |
| Repurchased | (2,608,057) | (29,936,471) | (1,471,480) | (16,576,033) |
| Net increase | 22,288,404 | $260,952,456 | 11,981,672 | $132,026,907 |
| Class B shares | ||||
| Sold | 110,022 | $1,262,311 | 170,090 | $1,774,402 |
| Issued in reorganization (Note 7) | — | — | 301,474 | 2,694,363 |
| Repurchased | (45,262) | (515,772) | (60,848) | (655,998) |
| Net increase | 64,760 | $746,539 | 410,716 | $3,812,767 |
| Class C shares | ||||
| Sold | 528,341 | $6,052,072 | 936,552 | $10,261,715 |
| Issued in reorganization (Note 7) | — | — | 785,159 | 7,017,238 |
| Repurchased | (182,190) | (2,029,923) | (199,589) | (2,167,113) |
| Net increase | 346,151 | $4,022,149 | 1,522,122 | $15,111,840 |
| Class I shares | ||||
| Sold | 12,325,924 | $134,211,857 | 14,153,339 | $142,031,860 |
| Issued in reorganization (Note 7) | — | — | 554,639 | 4,991,870 |
| Distributions reinvested | — | — | 61,516 | 693,903 |
| Repurchased | (1,541,634) | (17,566,971) | (5,776,844) | (59,398,021) |
| Net increase | 10,784,290 | $116,644,886 | 8,992,650 | $88,319,612 |
| Class I2 shares | ||||
| Sold | 59,364 | $666,666 | 1,612,432 | $17,985,940 |
| Distributions reinvested | — | — | 16 | 180 |
| Repurchased | (8,842) | (110,000) | (64,777) | (734,120) |
| Net increase | 50,522 | $556,666 | 1,547,671 | $17,252,000 |
| Class R1 shares | ||||
| Sold | 46,719 | $526,654 | 17,629 | $186,389 |
| Issued in reorganization (Note 7) | — | — | 14,527 | 130,825 |
| Distributions reinvested | — | — | — | — |
| Repurchased | (4,619) | (52,474) | (5,876) | (69,405) |
| Net increase | 42,100 | $474,180 | 26,280 | $247,8091 |
| Class R3 shares | ||||
| Sold | 302 | $3,458 | 3,148 | $28,978 |
| Repurchased | (6) | (70) | — | — |
| Net increase | 296 | $3,388 | 3,148 | $28,9782 |
| 32 | Disciplined Value Fund | Semiannual report |
| Six months ended 9-30-10 | Year ended 3-31-10 | |||
| Shares | Amount | Shares | Amount | |
| Class R4 shares | ||||
| Sold | 23,384 | $269,973 | 66,865 | $724,084 |
| Repurchased | (9,066) | (103,544) | (7,925) | (92,454) |
| Net increase | 14,318 | $166,429 | 58,940 | $631,6302 |
| Class R5 shares | ||||
| Sold | 6,490 | $73,920 | 3,584 | $34,031 |
| Repurchased | — | — | (397) | (4,500) |
| Net increase | 6,490 | $73,920 | 3,187 | $29,5312 |
| Class ADV shares | ||||
| Distributions reinvested | — | — | 10 | 111 |
| Net increase | — | — | 10 | $111 |
| Class NAV shares | ||||
| Sold | 10,602,510 | $118,559,712 | 19,018,330 | $202,006,891 |
| Distributions reinvested | — | — | 104,798 | 1,182,121 |
| Repurchased | (483) | (5,407) | (199,017) | (2,317,135) |
| Net increase | 10,602,027 | $118,554,305 | 18,924,111 | $200,871,8773 |
| Net increase | 44,199,358 | $502,194,918 | 43,470,507 | $458,333,062 |
1Period from 7-13-09 (inception date) to 3-31-10.
2Period from 5-22-09 (inception date) to 3-31-10.
3Period from 5-29-09 (inception date) to 3-31-10.
Note 6 — Purchase and sale of securities
Purchases and sales of securities, other than short-term securities, aggregated $723,592,267 and $228,828,728, respectively, for the six months ended September 30, 2010.
Note 7 — Reorganization
Fiscal year ended March 31, 2010 mergers. On July 1, 2009, the shareholders of John Hancock Classic Value II Fund (the Acquired Fund) voted to approve an Agreement and Plan of Reorganization (the Agreement) in exchange for a representative amount of shares of John Hancock Disciplined Value Fund (the Acquiring Fund).
The Agreement provided for (a) the acquisition of all the assets, subject to all of the liabilities, of the Acquired Fund in exchange for a representative amount of shares of the Acquiring Fund; (b) the liquidation of the Acquired Fund; and (c) the distribution to the Acquired Fund’s shareholders of such Acquiring Fund’s shares. The reorganization consolidated the Acquired Fund with a similar fund and the combined fund is better positioned in the market to increase asset size and achieve economies of scale. As a result of the reorganization, the Acquiring Fund is the legal and accounting survivor.
Based on the opinion of tax counsel, the reorganization qualified as a tax-free reorganization for federal income tax purposes with no gain or loss recognized by the Acquired Fund or its shareholders. Thus, the investments were transferred to the Acquiring Fund at the Acquired Fund’s identified cost. All distributable amounts of net income and realized gains from the Acquired Fund were distributed prior to the reorganization. In addition, the expenses of the reorganization were borne by the Acquired Fund. The effective time of the reorganization occurred immediately after the close of regularly scheduled trading on the New York Stock Exchange (NYSE) on July 10, 2009.
| Semiannual report | Disciplined Value Fund | 33 |
The following outlines the reorganization:
| SHARES | SHARES | ||||||
| ACQUIRED NET | DEPRECIATION | REDEEMED | ISSUED | ACQUIRING | ACQUIRING | ||
| ASSET VALUE OF | OF ACQUIRED | BY THE | BY THE | FUND NET | FUND TOTAL NET | ||
| ACQUIRING | ACQUIRED | THE ACQUIRED | FUND’S | ACQUIRED | ACQUIRING | ASSETS PRIOR TO | ASSETS AFTER |
| FUND | FUND | FUND | INVESTMENTS | FUND | FUND | COMBINATION | COMBINATION |
| Disciplined | Classic | $31,086,602 | $2,067,505 | 6,066,189 | 3,421,290 | $146,891,793 | $177,978,395 |
| Value Fund | Value II | ||||||
| Fund | |||||||
At the time of the reorganization, certain capital loss carryforward attributable to the Acquired Fund may be able to be used by the Acquiring Fund to offset future net realized capital gains. To the extent that such carryforward are used by the Acquiring Fund, it will reduce the amount of capital gain distributions to be paid, though the availability of the capital loss carryforward attributable to the reorganization may be limited in any given year. The table below outlines the capital loss carryforward from the Acquired Fund to the Acquiring Fund.
| ACQUIRING FUND | ACQUIRED FUND | EXPIRES — 10-31-16 | ||
| Disciplined Value Fund | Classic Value II Fund | $18,754,874 | ||
Assuming the acquisition had been completed on April 1, 2009, the beginning of the annual reporting period, the Acquiring Fund’s pro forma results of operations for the year ended March 31, 2010 were as follows:
| Net investment income | $2,747,253 | |
| Net gain/(loss) | (11,990,264) | |
| Increase (decrease) in net assets from Operations | 116,283,569 |
Because the combined Fund has been managed as a single integrated Fund since the reorganization was completed, it is not practicable to separate the amounts of net investment income and gains attributable to the Acquired Fund that have been included in the Acquiring Fund’s Statements of Operations at March 31, 2010. See Note 5 for capital shares issued in connection with the above referenced reorganization.
| 34 | Disciplined Value Fund | Semiannual report |
Board Consideration of and Continuation of Investment Advisory Agreement and Subadvisory Agreement
The Board of Trustees (the Board, the members of which are referred to as Trustees) of John Hancock Disciplined Value Fund (the Fund), a series of John Hancock Funds III, met in-person on May 2–4 and June 6–8, 2010 to consider the approval of the Fund’s investment advisory agreement (the Advisory Agreement) with John Hancock Investment Management Services, LLC (the Adviser), the Fund’s investment adviser. The Board also considered the approval of the investment subadvisory agreement (the Subadvisory Agreement) between the Adviser and Robeco Investment Management, Inc. (the Subadviser) on behalf of the Fund. The Advisory Agreement and the Subadvisory Agreement are referred to as the Agreements.
Activities and composition of the Board
The Board consists of eleven individuals, nine of whom are Independent Trustees. Independent Trustees are generally those individuals who are unaffiliated with the Fund, the Adviser and the Subadviser. The Trustees are responsible for the oversight of operations of the Fund and perform the various duties required of directors of investment companies by the Investment Company Act of 1940, as amended (the 1940 Act). The Independent Trustees have retained independent legal counsel to assist them in connection with their duties. The Board has appointed an Independent Trustee as Chairperson. The Board has established four standing committees that are composed entirely of Independent Trustees: the Audit Committee; the Compliance Committee; the Nominating, Governance and Administration Committee; and the Contracts/Operations Committee. Additionally, Investment Performance Committees A and B are standing committees of the Board that are each composed of Independent Trustees and one Trustee who is affiliated with the Adviser. Investment Performance Committee B oversees and monitors matters relating to the investment performance of the Fund. The Board has also designated a Vice Chairperson to serve in the absence of the Chairperson, who also serves as Chairman of the Board’s Nominating, Governance and Administration Committee. The Board also designates working groups or ad hoc committees as it deems appropriate.
The approval process
Pursuant to the 1940 Act, the Board is required to consider the continuation of the Agreements on an annual basis. Throughout the year, the Board, acting directly and through its committees, regularly reviews and assesses the quality of the services that the Fund receives under these Agreements. In this regard, the Board reviews reports of the Adviser at least quarterly, which include, among other things, Fund performance reports and compliance reports. In addition, the Board meets with portfolio managers and senior investment officers at various times throughout the year. The Board considers at each of its meetings factors that are relevant to its annual consideration of the renewal of the Agreements, including the services and support provided by the Adviser and Subadviser to the Fund and its shareholders.
Prior to the May 2-4, 2010 meeting, the Board requested and received materials specifically relating to the Agreements. The materials provided in connection with the May meeting included information independently compiled and prepared by Morningstar, Inc. (Morningstar) on Fund fees and expenses, and the investment performance of the Fund. This Fund information is assembled in a format that permits comparison with similar information from a category of relevant funds (the Category) and a peer group of comparable funds (the Peer Group) as determined by Morningstar, and its benchmark index. Other material provided for the Fund review included (a) information on the profitability of the Agreements to the Adviser and a discussion of any additional benefits to the Adviser and its affiliates that result from being the Adviser to the Fund; (b) a general analysis provided by the Adviser and the Subadviser concerning investment advisory fees charged to other clients, such as institutional clients and other investment companies, under similar investment mandates, as well as the performance of such other clients; (c) the impact of economies of scale;
| Semiannual report | Disciplined Value Fund | 35 |
(d) a summary of aggregate amounts paid by the Fund to the Adviser; and (e) sales and redemption data regarding the Fund’s shares.
At an in-person meeting held on May 2-4, 2010, the Board reviewed materials relating to its consideration of the Agreements. As a result of the discussions that occurred during the May 2-4, 2010 meeting, the Board presented the Adviser and Subadviser with questions and requests for additional information and the Adviser and Subadviser responded to these requests with additional written information in advance of the June 6–8, 2010 Board meeting. The Board also reviewed these additional materials relating to its consideration of the Agreements.
At an in-person meeting held on June 6–8, 2010, the Board, including the Independent Trustees, formally considered the continuation of the Advisory Agreement between the Adviser and the Fund and the Subadvisory Agreement between the Adviser and the Subadviser with respect to the Fund, each for an additional one-year term. The Board considered all factors it believed relevant with respect to the Fund, including, among other factors: (a) the nature, extent and quality of the services provided by the Adviser and the Subadviser; (b) the investment performance of the Fund and portfolio management of the Subadviser; (c) the advisory fees and the cost of the services and profits to be realized by the Adviser and certain affiliates from their relationship with the Fund; (d) economies of scale; and (e) other factors.
The Board also considered other matters important to the approval process, such as payments made to the Adviser or its affiliates relating to the distribution of Fund shares and other services. The Board reviewed services related to the valuation and pricing of Fund portfolio holdings. Other important matters considered by the Board were the direct and indirect benefits to the Adviser, the Subadviser, and their affiliates from their relationship with the Fund and advice from independent legal counsel with respect to the review process and materials submitted for the Board’s review. Each Trustee may have attributed different weights to the various items considered.
The key factors considered by the Board and the conclusions reached are described below.
Nature, extent and quality of services
The Board, including the Independent Trustees, reviewed the nature, extent and quality of services provided by the Adviser and the Subadviser, including the investment advisory services and the resulting performance of the Fund. The Board reviewed the Adviser’s and Subadviser’s senior management personnel responsible for investment operations, including the senior investment officers. The Board also reviewed the materials provided by the Fund’s portfolio management team discussing Fund performance and the Fund’s investment objective, strategies and outlook.
The Board considered the ability of the Adviser and the Subadviser, based on their resources, reputation and other attributes, to attract and retain qualified investment professionals, including research, advisory, and supervisory personnel. It considered the background and experience of senior management and investment professionals responsible for managing the Fund. The Board considered the investment philosophy, research and investment decision-making processes of the Adviser and the Subadviser responsible for the daily investment activities of the Fund, including, among other things, portfolio trading capabilities, use of technology, commitment to compliance and approach to training and retaining portfolio managers and other research, advisory and management personnel.
The Board considered the Subadviser’s history and experience with the Fund. The Board considered the Adviser’s execution of its oversight responsibilities. The Board further considered the culture of compliance, resources dedicated to compliance, compliance programs, record of compliance with applicable laws and regulation, with the Fund’s investment policies and restrictions and with the applicable Code of Ethics, and the responsibilities of the Adviser’s and Subadviser’s compliance departments.
| 36 | Disciplined Value Fund | Semiannual report |
In addition to advisory services, the Board considered the quality of the administrative and non-investment advisory services provided to the Fund by the Adviser under a separate agreement. The Board noted that the Adviser and its affiliates provide the Fund with certain administrative, transfer agency, shareholder and other services (in addition to any such services provided to the Fund by third parties) and officers and other personnel as are necessary for the operations of the Fund. The Board reviewed the structure and duties of the Adviser’s administration, accounting, legal and compliance departments and considered the Adviser’s policies and procedures for assuring compliance with applicable laws and regulations.
The Board also received information about the nature, extent and quality of services and fee rates offered by the Adviser and Subadviser to their other clients, including other registered investment companies, institutional investors and separate accounts. The Board reviewed a general analysis provided by the Adviser and the Subadviser concerning investment advisory fees charged to such other clients under similar investment mandates, the services provided to such other clients as compared to the services provided to the Fund, the performance of such other clients, and other factors relating to such other clients. The Board considered the significant differences between the Adviser’s and Subadviser’s services to the Fund and those services they provide to other clients which, to the extent the other client is not a mutual fund, may generally be attributable to the greater frequency of shareholder redemptions in a mutual fund, the higher turnover o f mutual fund assets, the more burdensome regulatory and legal obligations of mutual funds, and the higher marketing costs for mutual funds.
Fund performance
The Board, including the Independent Trustees, reviewed and considered the performance history of the Fund. The Board was provided with reports, independently prepared by Morningstar, which included a comprehensive analysis of the Fund’s performance. The Board also reviewed a narrative and statistical analysis of the Morningstar data that was prepared by the Adviser, which analyzed various factors that may affect the Morningstar rankings. The Board reviewed information regarding the investment performance of the Fund as compared to its Morningstar Category and Peer Group as well as its benchmark index. The Fund continues to show superior performance as it outpaced its Category median, its Peer Group median and the Russell Value 1000 Index for each of the 1-, 3-, 5- and 10-year periods (see chart below). The Board was provided with a description of the methodology used by Morningstar to select the funds in the Category and the Peer Group. The Board also considered updated performance information provided by the Adviser at its May and June 2010 meetings. The Board regularly reviews the performance of the Fund throughout the year and attaches more importance to performance over relatively longer periods of time, typically three to five years.
| 1 YEAR | 3 YEAR | 5 YEAR | 10 YEAR | |
| Disciplined Value Fund | 26.05% | –4.29% | 2.95% | 5.22% |
| Russell 1000 Value Index | 19.69% | –8.96% | –0.25% | 2.47% |
| Large Value Category Median | 23.70% | –7.09% | 0.20% | 2.67% |
| Morningstar 15(c) Peer Group Median | 22.60% | –6.16% | 1.24% | 0.86% |
The Board noted that the Subadviser remained consistent with its investment style and adhered to its investment mandates.
Expenses and fees
The Board, including the Independent Trustees, reviewed the Fund’s contractual advisory fee rate payable by the Fund to the Adviser as compared with the other funds in its Category and Peer Group. The Board also received information about the investment subadvisory fee rate payable by the Adviser to the Subadviser for investment subadvisory services. The Board considered the
| Semiannual report | Disciplined Value Fund | 37 |
services provided and the fees charged by the Adviser and the Subadviser to other types of clients with similar investment mandates, including separately managed institutional accounts.
In addition, the Board considered the cost of the services provided to the Fund by the Adviser. The Board received and considered expense information regarding the Fund’s various components, including advisory fees, distribution fees and fees other than advisory and distribution fees, including transfer agent fees, custodian fees, administration fees and other miscellaneous fees (e.g., fees for accounting and legal services). The Board considered comparisons of these expenses to the Peer Group median. The Board also considered expense information regarding the Fund’s total operating expense ratio (Gross Expense Ratio) and total operating expense ratio after taking the fee waiver arrangement applicable to the Advisory Agreement rate into account (Net Expense Ratio). The Board considered information comparing the Gross Expense Ratio and Net Expense Ratio of the Fund to that of the Peer Group and Category medians. As part of its analysis, the Board reviewed the Adviser’s methodology in allocating its costs to the management of the Fund. The Board considered expenses and fee rates to be higher or lower if they were over or under 10 basis points, respectively; slightly higher or slightly lower if they were above or below 6–10 basis points, respectively, and inline if they were above or below by 5 basis points.
The Board noted that the investment advisory rate was inline with the Category median and slightly higher than the Peer Group median. The Board viewed favorably the Adviser’s new contractual agreement to waive all or a portion of its Advisory Agreement Rate and reimburse or pay operating expenses to the extent necessary to maintain the Fund’s Gross Expense Ratio at 1.30% for Class A shares, excluding certain expenses such as taxes, brokerage commissions, interest, litigation and extraordinary expenses, until June 30, 2011.
The Board reviewed the Fund’s Gross Expense Ratio of 1.43% for the Fund’s Class A shares. The Board noted that the Fund’s Gross Expense Ratio was inline with the Peer Group median and higher than the Category median. The Board also noted that the Fund’s Net Expense Ratio was lower than the Peer Group and Category medians. The Board favorably considered the impact of fee waivers towards ultimately lowering the Fund’s Gross Expense Ratio. The Board also received and considered information relating to the Fund’s Gross Expense Ratio and Net Expense Ratio that reflected a proposed change in the methodology for calculating transfer agent fees.
The Board received and reviewed statements relating to the Adviser’s financial condition and profitability with respect to the services it provides the Fund. The Board was also provided with a profitability analysis that detailed the revenues earned and the expenses incurred by the Adviser for services provided to the Fund. The Board reviewed the Adviser’s profitability with respect to the Fund and other funds the Board currently oversees for the year ended December 31, 2009 compared to available aggregate profitability data provided for the year ended December 31, 2008.
The Board received and considered a detailed profitability analysis of the Adviser based on the Advisory Agreement, as well as on other relationships between the Fund and the Adviser and its affiliates. The Board also considered a comparison of the Adviser’s profitability to that of other similar investment advisers whose profitability information is publicly available. The Board reviewed the Adviser’s profitability with respect to other fund complexes managed by the Adviser and/or its affiliates. The Board reviewed the Adviser’s assumptions and methodology of allocating expenses in the profitability analysis, noting the inherent limitations in allocating costs among various advisory products. The Board recognized that profitability may be affected by numerous factors including, among other things, fee waivers and expense reimbursements by the Adviser, the types of funds managed, expense allocations and business mix, and therefore comparabili ty of profitability is somewhat limited.
| 38 | Disciplined Value Fund | Semiannual report |
The Board did not consider profitability information with respect to the Subadviser, which is not affiliated with the Adviser. The Board considered that the subadvisory fee under the Subadvisory Agreement had been negotiated by the Adviser and the Subadviser on an arm’s length basis and that the Subadviser’s separate profitability from its relationship with the Fund was not a material factor in determining whether to renew the Subadvisory Agreement.
Economies of scale
The Board, including the Independent Trustees, considered the extent to which economies of scale might be realized as the assets of the Fund increase and whether there should be changes in the advisory fee rate or structure in order to enable the Fund to participate in these economies of scale, for example through the use of breakpoints in the advisory fee based upon the assets of the Fund. The Board also considered the Adviser’s overall operations and its efforts to expand the scale of, and improve the quality of, its operations.
The Board recognized the inherent limitations of any analysis of economies of scale, stemming largely from the Board’s understanding that most of the Adviser’s costs are not specific to individual funds, but rather are incurred across a variety of products and services. To ensure that any economies are reasonably shared with the Fund as its assets increase, the Adviser and the Board agreed to continue the existing breakpoints to the Agreement fee rate.
Other benefits to the Adviser and the Subadviser
The Board understands that the Adviser, the Subadviser, or their affiliates may derive other ancillary benefits from their relationship with the Fund, both tangible and intangible, such as their ability to leverage investment professionals who manage other portfolios, an increase in their profile in the investment advisory community, and the engagement of their affiliates and/or significant shareholders as service providers to the Fund, including for administrative, transfer agency and distribution services. The Board believes that certain of these benefits are difficult to quantify. The Board also was informed that the Subadviser may use third party research obtained by soft dollars generated by certain mutual fund transactions to assist itself in managing all or a number of its other client accounts.
Board determination
The Board, including the Independent Trustees, unanimously approved the continuation of the Advisory Agreement between the Adviser and the Fund for an additional one-year term and the Subadvisory Agreement between the Adviser and Subadviser with respect to the Fund for an additional one-year term. Based upon its evaluation of relevant factors in their totality, the Board, including a majority of the Independent Trustees, was satisfied that the terms of the Agreements were fair and reasonable and in the best interest of the Fund and its shareholders. In arriving at a decision to approve the Agreements, the Board did not identify any single factor listed above, or any group of factors listed above, as all-important or controlling, but considered all factors together, and different Board Members may have attributed different weights to the various factors considered. The Independent Trustees were also assisted by the advice of independent legal counsel in maki ng this determination. The Board noted that contractual fee arrangements for the Fund reflect the results of several years of review by the Board and certain predecessor Trustees, and discussions between such Trustees (and predecessor Trustees) and the Adviser. Certain aspects of the arrangements may be the subject of more attention in some years than in others, and the Trustees’ conclusions may be based in part on their consideration of these arrangements in prior years.
| Semiannual report | Disciplined Value Fund | 39 |
More information
| Trustees | Investment adviser | |
| Patti McGill Peterson, Chairperson | John Hancock Investment Management | |
| James F. Carlin | Services, LLC | |
| William H. Cunningham | ||
| Deborah C. Jackson* | Subadviser | |
| Charles L. Ladner | Robeco Investment Management, Inc. | |
| Stanley Martin* | ||
| Hugh McHaffie†** | Principal distributor | |
| Dr. John A. Moore | John Hancock Funds, LLC | |
| Steven R. Pruchansky* | ||
| Gregory A. Russo | Custodian | |
| John G. Vrysen† | State Street Bank and Trust Company | |
| Officers | Transfer agent | |
| Keith F. Hartstein | John Hancock Signature Services, Inc. | |
| President and Chief Executive Officer | ||
| Legal counsel | ||
| Andrew G. Arnott | K&L Gates LLP | |
| Senior Vice President** and Chief Operating Officer | ||
| Thomas M. Kinzler | The report is certified under the Sarbanes-Oxley | |
| Secretary and Chief Legal Officer | Act, which requires mutual funds and other public | |
| companies to affirm that, to the best of their | ||
| Francis V. Knox, Jr. | knowledge, the information in their financial reports | |
| Chief Compliance Officer | is fairly and accurately stated in all material respects. | |
| Charles A. Rizzo | ||
| Chief Financial Officer | ||
| Salvatore Schiavone** | ||
| Treasurer | ||
| *Member of the Audit Committee | ||
| **Effective 8-31-10 | ||
| †Non-Independent Trustee | ||
The Fund’s proxy voting policies and procedures, as well as the Fund’s proxy voting record for the most recent twelve-month period ended June 30, are available free of charge on the Securities and Exchange Commission (SEC) Web site at www.sec.gov or on our Web site.
The Fund’s complete list of portfolio holdings, for the first and third fiscal quarters, is filed with the SEC on Form N-Q. The Fund’s Form N-Q is available on our Web site and the SEC’s Web site, www.sec.gov, and can be reviewed and copied (for a fee) at the SEC’s Public Reference Room in Washington, DC. Call 1-800-SEC-0330 to receive information on the operation of the SEC’s Public Reference Room.
We make this information on your fund, as well as monthly portfolio holdings, and other fund details available on our Web site www.jhfunds.com or by calling 1-800-225-5291.
| You can also contact us: | ||
| 1-800-225-5291 | Regular mail: | Express mail: |
| jhfunds.com | John Hancock Signature Services, Inc. | John Hancock Signature Services, Inc. |
| P.O. Box 55913 | Mutual Fund Image Operations | |
| Boston, MA 02205-5913 | 30 Dan Road | |
| Canton, MA 02021 |
| 40 | Disciplined Value Fund | Semiannual report |

1-800-225-5291
1-800-554-6713 TDD
1-800-338-8080 EASI-Line
www.jhfunds.com
Now available: electronic delivery
www.jhfunds.com/edelivery
| This report is for the information of the shareholders of John Hancock Disciplined Value Fund. | 340SA 9/10 |
| It is not authorized for distribution to prospective investors unless preceded or accompanied by a prospectus. | 11/10 |
| John Hancock | |
| Core High Yield Fund | |
| Semiannual Report | |
| 9.30.10 | |
| 1 | |
| Core High Yield Fund | |
| Table of Contents | |
| Your expenses | Page 3 |
| Portfolio summary | Page 4 |
| Portfolio of investments | Page 5 |
| Financial statements | Page 8 |
| Financial highlights | Page 11 |
| Notes to financial statements | Page 13 |
| More information | Page 23 |
| 2 |
Your expenses
These examples are intended to help you understand your ongoing operating expenses.
Understanding your fund expenses
As a shareholder of the Fund, you incur two types of costs:
• Transaction costs which include sales charges (loads) on purchases or redemptions (varies by share class), minimum account fee charge, etc.
• Ongoing operating expenses including management fees, distribution and service fees (if applicable), and other fund expenses.
We are going to present only your ongoing operating expenses here.
Actual expenses/actual returns
This example is intended to provide information about your fund’s actual ongoing operating expenses, and is based on your fund’s actual return. It assumes an account value of $1,000.00 on April 1, 2010 with the same investment held until September 30, 2010.
| Account value | Ending value | Expenses paid during | |
| on 4-1-10 | on 9-30-10 | period ended 9-30-101 | |
| Class A | $1,000.00 | $1,090.50 | $6.34 |
| Class I | 1,000.00 | 1,092.50 | 4.51 |
Together with the value of your account, you may use this information to estimate the operating expenses that you paid over the period. Simply divide your account value at September 30, 2010, by $1,000.00, then multiply it by the “expenses paid” for your share class from the table above. For example, for an account value of $8,600.00, the operating expenses should be calculated as follows:
Example
[ My account value $8,600.00 / $1,000.00 = 8.6 ] x $[ “expenses paid” from table ] = My actual expenses
Hypothetical example for comparison purposes
This table allows you to compare your fund’s ongoing operating expenses with those of any other fund. It provides an example of the Fund’s hypothetical account values and hypothetical expenses based on each class’s actual expense ratio and an assumed 5% annualized return before expenses (which is not your fund’s actual return). It assumes an account value of $1,000.00 on April 1, 2010, with the same investment held until September 30, 2010. Look in any other fund shareholder report to find its hypothetical example and you will be able to compare these expenses.
| Account value | Ending value | Expenses paid during | |
| on 4-1-10 | on 9-30-10 | period ended 9-30-101 | |
| Class A | $1,000.00 | $1,019.00 | $6.12 |
| Class I | 1,000.00 | 1,020.80 | 4.36 |
Remember, these examples do not include any transaction costs, therefore, these examples will not help you to determine the relative total costs of owning different funds. If transaction costs were included, your expenses would have been higher. See the prospectus for details regarding transaction costs.
1 Expenses are equal to the Fund's annualized expense ratio of 1.21% and 0.86% for Class A and Class I shares, respectively, multiplied by the average account value over the period, multiplied by 183/365 (to reflect the one-half year period).
| 3 |
| Core High Yield Fund | |
| Portfolio Summary | |
| Value as a | |
| percentage of | |
| Top 10 Issuers1 | Fund's net assets |
| MTR Gaming Group, Inc., Series B, 9.000%, 6-1-12 | 5.0% |
| Columbus International, Inc., 11.500%, 11-20-14 | 4.6% |
| TMX Finance LLC, 13.250%, 7-15-15 | 4.5% |
| Kratos Defense & Security Solutions, Inc., 10.000%, 6-1-17 | 4.4% |
| Southern States Cooperative, Inc., 11.250%, 5-15-15 | 4.4% |
| Offshore Group Investments, Ltd., 11.500%, 8-1-15 | 4.4% |
| BioScrip, Inc., 10.250%, 10-1-15 | 4.3% |
| Connacher Oil and Gas, Ltd., 10.250%, 12-15-15 | 4.2% |
| Mandalay Resort Group, 7.625%, 7-15-13 | 3.6% |
| CB Richard Ellis Services, Inc., 11.625%, 6-15-17 | 3.2% |
| Value as a | |
| percentage of | |
| Sector Composition2 | Fund's net assets�� |
| Consumer Discretionary | 23 % |
| Financials | 16 % |
| Energy | 15 % |
| Consumer Staples | 12 % |
| Industrials | 9% |
| Health Care | 7% |
| Telecommunication Services | 6% |
| Utilities | 4% |
| Materials | 3% |
| Information Technology | 2% |
| Short-Term Investments & Other | 3% |
| Value as a | |
| percentage of | |
| Portfolio Composition2 | Fund's net assets |
| Corporate Bonds | 97 % |
| Short-Term Investments & Other | 3% |
| Value as a | |
| percentage of | |
| Country Composition2 | Fund's net assets |
| United States | 68 % |
| Canada | 10 % |
| Bermuda | 5% |
| Barbados | 5% |
| Cayman Islands | 4% |
| Finland | 3% |
| Luxembourg | 1% |
| Norway | 1% |
| Short-Term Investments & Other | 3% |
1 Excludes cash and cash equivalents.
2 As a percentage of net assets on 9-30-10.
| 4 |
Core High Yield Fund
As of 9-30-10 (Unaudited)
| Maturity | Par value | |||
| Rate (%) | date | Value | ||
| Corporate Bonds 96.97% | $17,475,994 | |||
| (Cost $16,101,518) | ||||
| Consumer Discretionary 22.80% | 4,109,475 | |||
| Diversified Consumer Services 6.12% | ||||
| Bankrate, Inc. (S) | 11.750 | 07/15/15 | $500,000 | 535,000 |
| Trans Union LLC/TransUnion Financing Corp. (S) | 11.375 | 06/15/18 | 500,000 | 568,750 |
| Hotels, Restaurants & Leisure 10.61% | ||||
| Harrah's Operating Company, Inc. | 11.250 | 06/01/17 | 250,000 | 273,750 |
| Mandalay Resort Group | 7.625 | 07/15/13 | 750,000 | 645,000 |
| Marina District Finance Company, Inc. (S) | 9.875 | 08/15/18 | 100,000 | 96,500 |
| MTR Gaming Group, Inc., Series B | 9.000 | 06/01/12 | 1,000,000 | 897,500 |
| Media 4.60% | ||||
| Columbus International, Inc. (S) | 11.500 | 11/20/14 | 750,000 | 828,600 |
| Specialty Retail 1.47% | ||||
| Freedom Group, Inc. (S) | 10.250 | 08/01/15 | 250,000 | 264,375 |
| Consumer Staples 12.39% | 2,232,500 | |||
| Food & Staples Retailing 2.14% | ||||
| Great Atlantic & Pacific Tea Company (S) | 11.375 | 08/01/15 | 500,000 | 385,000 |
| Food Products 7.25% | ||||
| Reddy Ice Corp. | 11.250 | 03/15/15 | 500,000 | 511,250 |
| Southern States Cooperative, Inc. (S) | 11.250 | 05/15/15 | 750,000 | 795,000 |
| Tobacco 3.00% | ||||
| Alliance One International, Inc. | 10.000 | 07/15/16 | 500,000 | 541,250 |
| Energy 15.09% | 2,720,113 | |||
| Energy Equipment & Services 6.67% | ||||
| Allis-Chalmers Energy, Inc. | 9.000 | 01/15/14 | 500,000 | 505,000 |
| Geokinetics Holdings USA, Inc. (S) | 9.750 | 12/15/14 | 250,000 | 218,750 |
| Pioneer Drilling Company (S) | 9.875 | 03/15/18 | 250,000 | 255,625 |
| Trico Shipping AS (S) | 11.875 | 11/01/14 | 250,000 | 223,125 |
| Oil, Gas & Consumable Fuels 8.42% | ||||
| Atlas Energy Operating Company, LLC | 12.125 | 08/01/17 | 250,000 | 289,063 |
| Connacher Oil and Gas, Ltd. (S) | 10.250 | 12/15/15 | 750,000 | 761,250 |
| Gibson Energy ULC | 11.750 | 05/27/14 | 350,000 | 388,500 |
| Tesoro Corp. | 6.500 | 06/01/17 | 80,000 | 78,800 |
| Financials 16.24% | 2,926,687 | |||
| Diversified Financial Services 8.66% | ||||
| CNG Holdings, Inc. (S) | 12.250 | 02/15/15 | 200,000 | 212,000 |
| Reliance Intermediate Holdings LP (S) | 9.500 | 12/15/19 | 500,000 | 530,000 |
| TMX Finance LLC (S) | 13.250 | 07/15/15 | 750,000 | 818,437 |
| Investment Companies 4.37% | ||||
| Offshore Group Investments, Ltd. (S) | 11.500 | 08/01/15 | 750,000 | 787,500 |
| Real Estate Management & Development 3.21% | ||||
| CB Richard Ellis Services, Inc. | 11.625 | 06/15/17 | 500,000 | 578,750 |
| 5 |
Core High Yield Fund
As of 9-30-10 (Unaudited)
| Maturity | Par value | |||
| Rate (%) | date | Value | ||
| Health Care 7.19% | $1,296,125 | |||
| Health Care Equipment & Supplies 1.54% | ||||
| Apria Healthcare Group, Inc. | 12.375 | 11/01/14 | $250,000 | 278,125 |
| Health Care Providers & Services 5.65% | ||||
| American Renal Holdings (S) | 8.375 | 05/15/18 | 100,000 | 103,000 |
| BioScrip, Inc. | 10.250 | 10/01/15 | 750,000 | 766,875 |
| Radiation Therapy Services, Inc. (S) | 9.875 | 04/15/17 | 150,000 | 148,125 |
| Industrials 8.99% | 1,619,563 | |||
| Aerospace & Defense 4.41% | ||||
| Kratos Defense & Security Solutions, Inc. | 10.000 | 06/01/17 | 750,000 | 795,000 |
| Commercial Services & Supplies 2.11% | ||||
| Casella Waste Systems, Inc. | 11.000 | 07/15/14 | 250,000 | 273,750 |
| Garda World Security Corp. (S) | 9.750 | 03/15/17 | 100,000 | 106,500 |
| Marine 1.53% | ||||
| Commercial Barge Line Company | 12.500 | 07/15/17 | 250,000 | 275,000 |
| Trading Companies & Distributors 0.94% | ||||
| United Rentals North America, Inc. | 10.875 | 06/15/16 | 150,000 | 169,313 |
| Information Technology 1.55% | 278,750 | |||
| IT Services 1.55% | ||||
| Unisys Corp. | 12.500 | 01/15/16 | 250,000 | 278,750 |
| Materials 2.94% | 529,500 | |||
| Paper & Forest Products 2.94% | ||||
| UPM-Kymmene OYJ (S) | 7.450 | 11/26/27 | 600,000 | 529,500 |
| Telecommunication Services 6.20% | 1,117,031 | |||
| Diversified Telecommunication Services 6.20% | ||||
| Global Crossing, Ltd. | 12.000 | 09/15/15 | 500,000 | 565,000 |
| Intelsat Jackson Holdings SA | 11.250 | 06/15/16 | 250,000 | 271,875 |
| Wind Acquisition Finance SA (S) | 11.750 | 07/15/17 | 250,000 | 280,156 |
| Utilities 3.58% | 646,250 | |||
| Electric Utilities 0.91% | ||||
| Texas Competitive Electric Holdings Company LLC, Series A | 10.250 | 11/01/15 | 250,000 | 163,750 |
| Independent Power Producers & Energy Traders 2.67% | ||||
| Dynegy Holdings, Inc. | 8.375 | 05/01/16 | 250,000 | 195,000 |
| The AES Corp. | 9.750 | 04/15/16 | 250,000 | 287,500 |
| Maturity | Par value | |||
| Yield (%)* | date | Value | ||
| Short-Term Investments 0.67% | $119,998 | |||
| (Cost $119,998) | ||||
| Short-Term Securities* 0.67% | 119,998 | |||
| Federal Home Loan Bank Discount Note | 0.050 | 10/13/10 | 120,000 | 119,998 |
| 6 |
Core High Yield Fund
As of 9-30-10 (Unaudited)
| Total investments (Cost $16,221,516)† 97.64% | $17,595,992 |
| Other assets and liabilities, net 2.36% | $425,808 |
| Total net assets 100.00% | $18,021,800 |
The percentage shown for each investment category is the total value of the category as a percentage of the net assets of the Fund.
(S) These securities are exempt from registration under Rule 144A of the Securities Act of 1933. Such securities may be resold, normally to qualified institutional buyers, in transactions exempt from registration. Rule 144A securities amounted to $8,447,193 or 46.87% of the Fund's net assets as of 9-30-10.
* Yield represents either the annualized yield at the date of purchase, the stated coupon rate or, for floating rate securities, the rate at period end.
† At 9-30-10, the aggregate cost of investment securities for federal income tax purposes was $16,222,552. Net unrealized appreciation aggregated $1,373,440, of which $1,563,426 related to appreciated investment securities and $189,986 related to depreciated investment securities.
The portfolio had the following country concentration as a percentage of total net assets on 9-30-10:
| United States | 68% | ||||||
| Canada | 10% | ||||||
| Bermuda | 5% | ||||||
| Barbados | 5% | ||||||
| Cayman Islands | 4% | ||||||
| Finland | 3% | ||||||
| Luxembourg | 1% | ||||||
| Norway | 1% | ||||||
| Short-Term Investments & Other | 3% |
| 7 |
Core High Yield Fund
Statement of Assets and Liabilities — September 30, 2010 (Unaudited)
| Assets | |||
| Investments, at value (Cost $16,221,516) | $ | 17,595,992 | |
| Cash | 2,171 | ||
| Receivable for investments sold | 463,406 | ||
| Interest receivable | 503,427 | ||
| Receivable due from adviser | 145 | ||
| Other receivables and prepaid assets | 452 | ||
| Total assets | 18,565,593 | ||
| Liabilities | |||
| Payable for investments purchased | 350,000 | ||
| Distributions payable | 150,694 | ||
| Payable to affiliates | |||
| Accounting and legal services fees | 216 | ||
| Transfer agent fees | 3,100 | ||
| Trustees' fees | 134 | ||
| Other liabilities and accrued expenses | 39,649 | ||
| Total liabilities | 543,793 | ||
| Net assets | |||
| Capital paid-in | $ | 14,988,504 | |
| Undistributed net investment income | 40,257 | ||
| Accumulated net realized gain on investments | 1,618,563 | ||
| Net unrealized appreciation on investments | 1,374,476 | ||
| Net assets | $ | 18,021,800 | |
| Net asset value per share | |||
| Based on net asset values and shares | |||
| outstanding-the Fund has an unlimited number | |||
| of shares authorized with no par value | |||
| Class A ($17,991,764 ÷ 1,497,500 shares) | $ | 12.01 | |
| Class I ($30,036 ÷ 2,500 shares) | $ | 12.01 | |
| Maximum offering price per share | |||
| Class A (net asset value per share ÷ 95.5%)1 | $ | 12.58 | |
1 On single retail sales of less than $50,000. On sales of $50,000 or more and on group sales the offering price is reduced.
The accompanying notes are an integral part of the financial statements.
| 8 |
Core High Yield Fund
Statement of Operations — September 30, 2010 (Unaudited)
| Investment income | |||
| Interest | $ | 1,026,029 | |
| Total investment income | 1,026,029 | ||
| Expenses | |||
| Investment management fees (Note 4) | 56,836 | ||
| Distribution and service fees (Note 4) | 21,824 | ||
| Accounting and legal services fees (Note 4) | 1,510 | ||
| Transfer agent fees (Note 4) | 9,725 | ||
| Trustees' fees (Note 4) | 924 | ||
| State registration fees (Note 4) | 38 | ||
| Printing and postage (Note 4) | 14 | ||
| Professional fees | 27,714 | ||
| Custodian fees | 7,548 | ||
| Registration and filing fees | 5,792 | ||
| Other | 2,019 | ||
| Total expenses | 133,944 | ||
| Less expense reductions (Note 4) | (28,255) | ||
| Net expenses | 105,689 | ||
| Net investment income | 920,340 | ||
| Realized and unrealized gain (loss) | |||
| Net realized gain on investments | 670,516 | ||
| Change in net unrealized appreciation | |||
| (depreciation) of investments | (62,793) | ||
| Net realized and unrealized gain | 607,723 | ||
| Increase in net assets from operations | $ | 1,528,063 | |
The accompanying notes are an integral part of the financial statements.
| 9 |
Core High Yield Fund
Statements of Changes in Net Assets
| Six months | For the | ||||
| ended | Period ended | ||||
| 9/30/10 | 3/31/101 | ||||
| (Unaudited) | |||||
| Increase (decrease) in net assets | |||||
| From operations | |||||
| Net investment income | $ | 920,340 | $ | 1,481,237 | |
| Net realized gain | 670,516 | 1,893,102 | |||
| Change in net unrealized appreciation | |||||
| (depreciation) | (62,793) | 1,437,269 | |||
| Increase in net assets resulting from | |||||
| operations | 1,528,063 | 4,811,608 | |||
| Distributions to shareholders | |||||
| From net investment income | |||||
| Class A | (896,101) | (1,474,324) | |||
| Class I | (1,551) | (2,530) | |||
| From net realized gain | |||||
| Class A | — | (941,793) | |||
| Class I | — | (1,572) | |||
| Total distributions | (897,652) | (2,420,219) | |||
| From Fund share transactions (Note 5) | — | 15,000,000 | |||
| Total increase | 630,411 | 17,391,389 | |||
| Net assets | |||||
| Beginning of period | 17,391,389 | — | |||
| End of period | $ | 18,021,800 | $ | 17,391,389 | |
| Undistributed net investment income | $ | 40,257 | $ | 17,569 | |
1 Period from 4-30-09 (inception date) to 3-31-10.
The accompanying notes are an integral part of the financial statements.
| 10 |
Core High Yield Fund
Financial Highlights (For a share outstanding throughout the period)
| Class A Shares | |||||
| Period ended | 9/30/20101 | 3/31/20102 | |||
| Per share operating performance | |||||
| Net asset value, beginning of period | $ | 11.59 | $ | 10.00 | |
| Net investment income 3 | 0.61 | 0.99 | |||
| Net realized and unrealized gain on investments | 0.41 | 2.21 | |||
| Total from investment operations | 1.02 | 3.20 | |||
| Less distributions | |||||
| From net investment income | (0.60) | (0.98) | |||
| From net realized gain | — | (0.63) | |||
| Total distributions | (0.60) | (1.61) | |||
| Net asset value, end of period | $ | 12.01 | $ | 11.59 | |
| Total return (%) 4,5,6 | 9.05 | 33.75 | |||
| Ratios and supplemental data | |||||
| Net assets, end of period (in thousands) | $ | 17,992 | $ | 17,362 | |
| Ratios (as a percentage of average net assets): | |||||
| Expenses before reductions | 1.537 | 1.367 | |||
| Expenses net of fee waivers | 1.217 | 1.137 | |||
| Net investment income | 10.527 | 9.827 | |||
| Portfolio turnover (%) | 105 | 389 | |||
1 Semiannual period from 4-1-10 to 9-30-10. Unaudited.
2 Period from 4-30-09 (inception date) to 3-31-10.
3 Based on the average daily shares outstanding.
4 Total returns would have been lower had certain expenses not been reduced during the periods shown.
5 Not annualized.
6 Does not reflect the effect of sales charges, if any.
7 Annualized.
See notes to financial statements
| 11 | Core High Yield |
Core High Yield Fund
Financial Highlights (For a share outstanding throughout the period)
| Class I Shares | |||||
| Period ended | 9/30/20101 | 3/31/20102 | |||
| Per share operating performance | |||||
| Net asset value, beginning of period | $ | 11.59 | $ | 10.00 | |
| Net investment income 3 | 0.63 | 1.02 | |||
| Net realized and unrealized gain on investments | 0.41 | 2.20 | |||
| Total from investment operations | 1.04 | 3.22 | |||
| Less distributions | |||||
| From net investment income | (0.62) | (1.00) | |||
| From net realized gain | — | (0.63) | |||
| Total distributions | (0.62) | (1.63) | |||
| Net asset value, end of period | $ | 12.01 | $ | 11.59 | |
| Total return (%) 4,5 | 9.25 | 34.08 | |||
| Ratios and supplemental data | |||||
| Net assets, end of period (in thousands) | $ | 30 | $ | 29 | |
| Ratios (as a percentage of average net assets): | |||||
| Expenses before reductions | 1.336 | 3.526 | |||
| Expenses net of fee waivers | 0.866 | 0.856 | |||
| Net investment income | ` | 10.886 | 10.106 | ||
| Portfolio turnover (%) | 105 | 389 | |||
1 Semiannual period from 4-1-10 to 9-30-10. Unaudited.
2 Period from 4-30-09 (inception date) to 3-31-10.
3 Based on the average daily shares outstanding.
4 Total returns would have been lower had certain expenses not been reduced during the periods shown.
5 Not annualized.
6 Annualized.
See notes to financial statements
| 12 | Core High Yield |
Core High Yield Fund
Notes to financial statements (unaudited)
Note 1 - Organization
John Hancock Core High Yield Fund (the Fund) is a diversified series of John Hancock Funds III (the Trust), an open-end management investment company organized as a Massachusetts business trust and registered under the Investment Company Act of 1940, as amended (the 1940 Act). The investment objective of the Fund is to seek total return, consisting of a high level of current income and capital appreciation.
The Fund may offer multiple classes of shares. The shares currently offered are detailed in the Statement of Assets and Liabilities. Class A shares are offered to all investors. Class I shares are offered to institutions and certain investors. Shareholders of each class have exclusive voting rights to matters that affect that class. The distribution and service fees, transfer agent fees, printing and postage and state registration fees for each class may differ.
Affiliates of the Fund owned 100% of shares of beneficial interest of the Fund on September 30 , 2010.
Note 2 - Significant accounting policies
The financial statements have been prepared in conformity with accounting principles generally accepted in the United States of America, which require management to make certain estimates and assumptions at the date of the financial statements. Actual results could differ from those estimates. Events or transactions occurring after the end of the fiscal period through the date that the financial statements were issued have been evaluated in the preparation of the financial statements. The following summarizes the significant accounting policies of the Fund:
Security valuation. Investments are stated at value as of the close of regular trading on the New York Stock Exchange (NYSE), normally at 4:00 P.M., Eastern Time. The Fund uses a three-tier hierarchy to prioritize the pricing assumptions, referred to as inputs, used in valuation techniques to measure fair value. Level 1 includes quoted prices in active markets for identical securities. Level 2 includes significant observable inputs. Observable inputs may include quoted prices for similar securities, interest rates, prepayment speeds and credit risk. Prices for securities valued using these techniques are received from independent pricing vendors and brokers and are based on an evaluation of the inputs described. Level 3 includes significant unobservable inputs when mar ket prices are not readily available or reliable, including the Fund’s own assumptions in determining the fair value of investments. The inputs or methodology used for valuing securities are not necessarily an indication of the risk associated with investing in those securities.
At September 30, 2010, all investments are categorized as Level 2 under the hierarchy described above.
During the six months ended September 30, 2010, there were no significant transfers in or out of Level 1 or Level 2 assets.
In order to value the securities, the Fund uses the following valuation techniques. Debt obligations are valued based on the evaluated prices provided by an independent pricing service, which utilizes both dealer-supplied and electronic data processing techniques, taking into account factors such as institutional-size trading in similar groups of securities, yield, quality, coupon rate, maturity, type of issue, trading characteristics and other market data. Certain securities traded only in the over-the-counter market are valued at the last bid price quoted by brokers making markets in the securities at the close of trading. Certain short-term securities are valued at amortized cost.
Other portfolio securities and assets, where market quotations are not readily available, are valued at fair value, as determined in good faith by the Fund’s Pricing Committee, following procedures established by the Board of Trustees. Generally, trading in non-U.S. securities is substantially
| 13 |
completed each day at various times prior to the close of trading on the NYSE. Significant market events that affect the values of non-U.S. securities may occur after the time when the valuation of the securities is generally determined and the close of the NYSE. During significant market events, these securities will be valued at fair value, as determined in good faith, following procedures established by the Board of Trustees. The Fund may use a fair valuation model to value non-U.S. securities in order to adjust for events which may occur between the close of foreign exchanges and the close of the NYSE.
Security transactions and related investment income. Investment security transactions are accounted for on a trade date plus one basis for daily net asset value calculations. However, for financial reporting purposes, investment transactions are reported on trade date. Interest income is accrued as earned. Gains and losses on securities sold are determined on the basis of identified cost and may include proceeds from litigation. Interest income includes coupon interest and amortization/accretion of premiums/discounts on debt securities. Debt obligations may be placed in a non-accrual status and related interest income may be reduced by stopping current accruals and writing off interest receivable when the collection of all or a portion of interest has become doubtful.
Line of credit. The Fund may borrow from banks for temporary or emergency purposes, including meeting redemption requests that otherwise might require the untimely sale of securities. Pursuant to the custodian agreement, the custodian may loan money to a Fund to make properly authorized payments. The Fund is obligated to repay the custodian for any overdraft, including any related costs or expenses. The custodian has a lien, security interest or security entitlement in any Fund property that is not segregated, to the maximum extent permitted by law for any overdraft.
In addition, the Fund and other affiliated funds have entered into an agreement with the custodian which enables them to participate in a $100 million unsecured committed line of credit. A commitment fee, payable at the end of each calendar quarter, based on the average daily unused portion of the line of credit, is charged to each participating fund on a pro rata basis based on their relative average net assets. For the six months ended September 30, 2010, the Fund had no significant borrowings under the line of credit.
Expenses. The majority of expenses are directly attributable to an individual fund. Expenses that are not readily attributable to a specific fund are allocated among all funds in an equitable manner, taking into consideration, among other things, the nature and type of expense and the fund’s relative assets. Expense estimates are accrued in the period to which they relate and adjustments are made when actual amounts are known.
Class allocations. Income, common expenses, and realized and unrealized gains (losses) are determined at the fund level and allocated daily to each class of shares based on the net asset value of the class. Class-specific expenses, such as distribution and service fees, if any, transfer agent fees, state registration fees and printing and postage fees, for all classes are calculated daily at the class level based on the appropriate net asset value of each class and the specific expense rates applicable to each class.
Federal income taxes. The Fund intends to qualify as a regulated investment company by complying with the applicable provisions of the Internal Revenue Code and will not be subject to federal income tax on taxable income that is distributed to shareholders. Therefore, no federal income tax provision is required.
For federal income tax purposes, the Fund had no capital loss carryforward available to offset future net realized capital gains as of March 31, 2010.
| 14 |
As of March 31, 2010, the Fund had no uncertain tax positions that would require financial statement recognition, de-recognition or disclosure. The Fund’s federal tax return is subject to examination by the Internal Revenue Service for a period of three years.
Distribution of income and gains. Distributions to shareholders from net investment income and net realized gains, if any, are recorded on the ex-dividend date. The Fund generally declares dividends daily and pays them monthly. Capital gain distributions, if any, are paid at least annually.
Distributions paid by the Fund with respect to each class of shares are calculated in the same manner, at the same time and are in the same amount, except for the effect of expenses that may be applied differently to each class.
Such distributions, on a tax basis, are determined in conformity with income tax regulations, which may differ from accounting principles generally accepted in the United States of America. Material distributions in excess of tax basis earnings and profits, if any, are reported in the Fund’s financial statements as a return of capital.
Capital accounts within financial statements are adjusted for permanent book/tax differences. These adjustments have no impact on net assets or the results of operations. Temporary book/tax differences, if any, will reverse in a subsequent period. Permanent book/tax differences are primarily attributable to non-deductible start-up costs.
Note 3 – Guarantees and indemnifications
Under the Fund’s organizational documents, its Officers and Trustees are indemnified against certain liabilities arising out of the performance of their duties to the Fund. Additionally, in the normal course of business, the Fund enters into contracts with service providers that contain general indemnification clauses. The Fund’s maximum exposure under these arrangements is unknown, as this would involve future claims that may be made against the Fund that have not yet occurred. The risk of material loss from such claims is considered remote.
Note 4 – Fees and transactions with affiliates
John Hancock Investment Management Services, LLC (the Adviser) serves as investment adviser for the Trust. John Hancock Funds, LLC (the Distributor), an affiliate of the Adviser, serves as principal underwriter of the Trust. The Adviser and the Distributor are indirect wholly owned subsidiaries of Manulife Financial Corporation (MFC).
Management Fee. The Fund has an investment management contract with the Adviser under which the Fund pays a daily management fee to the Adviser equivalent, on an annual basis, to the sum of: (a) 0.650% of the first $250,000,000 of the Fund’s average daily net assets; (b) 0.625% of the next $250,000,000 of the Fund’s average daily net assets; (c) 0.600% of the next $500,000,000 of the Fund’s average daily net assets; (d) 0.550% of the next $1,500,000,000 of the Fund’s average daily net assets; and (e) 0.525% of the Fund’s average daily net assets in excess of $2,500,000,000. The Adviser has a subadvisory agreement with MFC Global Investment Management (U.S.A.) Limited, an indirectly owned subsidiary of MFC and an affiliate of the Adviser. The Fund is not responsible for payment of the subadvisory fees.
The investment management fees incurred for the six months ended September 30, 2010 were equivalent to an annual effective rate of 0.65% of the Fund’s average daily net assets.
Effective July 1, 2010, the Adviser has contractually agreed to waive fees and/or reimburse certain expenses for each share class of the Fund. This agreement excludes taxes, brokerage commissions, interest, litigation and indemnification expenses and other extraordinary expenses not incurred in the ordinary course of the Fund’s business. The fee waivers and/or reimbursements are such that these expenses will not exceed 1.25% for Class A and 0.84% for Class I shares. The fee waivers and/or reimbursements will continue in effect until July 31, 2011.
| 15 |
Prior to July 1, 2010, the Adviser had contractually agreed to waive fees and/or reimburse certain expenses for each share class of the Fund. This agreement excluded taxes, brokerage commissions, interest, litigation and indemnification expenses and other extraordinary expenses not incurred in the ordinary course of the Fund’s business. The fee waivers and/or reimbursements were such that these expenses would not exceed 1.25% for Class A shares and 0.85% for Class I shares.
Accordingly, the expense reductions or reimbursements related to these agreements were $28,186 and $69 for Class A and Class I shares, respectively, for the six months ended September 30, 2010.
Accounting and legal services. Pursuant to the Service Agreement, the Fund reimburses the Adviser for all expenses associated with providing the administrative, financial, legal, accounting and recordkeeping services of the Fund, including the preparation of all tax returns, periodic reports to shareholders and regulatory reports, among other services. These expenses are allocated to each share class based on relative net assets at the time the expense was incurred. The accounting and legal services fees incurred for the six months ended September 30, 2010 amounted to an annual rate of 0.01% of the Fund’s average daily net assets.
Distribution and service plans. The Fund has a distribution agreement with the Distributor. The Fund has adopted distribution and service plans with respect to Class A shares pursuant to Rule 12b-1 under the 1940 Act, to pay the Distributor for services provided as the distributor of shares of the Fund. Accordingly, the Fund may pay up to an annual rate of 0.30% of average daily net assets for Class A shares for distribution and service fees. Currently, only 0.25% is charged to Class A shares for distribution and service fees.
Sales charges. Class A shares are assessed up-front sales charges which result in payments to the Distributor. For the six months ended September 30, 2010, no sales charges were assessed.
Transfer agent fees. The Fund has a transfer agent agreement with John Hancock Signature Services, Inc. (Signature Services or Transfer Agent), an affiliate of the Adviser. The transfer agent fees paid to Signature Services are determined based on the cost to Signature Services (Signature Services Cost) of providing recordkeeping services. The Signature Services Cost includes a component of allocated John Hancock corporate overhead for providing transfer agent services to the Fund and to all other John Hancock affiliated funds. It also includes out-of-pocket expenses that are comprised of payments made to third-parties for recordkeeping services provided to their clients who invest in one or more John Hancock funds. In addition, Signature Services Cost may be reduced by certain revenues that Signature Services received in connection with the service they provide to the funds. Signature Services Cost is calcula ted monthly and allocated, as applicable, to four categories of share classes: Institutional Share Classes, Retirement Share Classes, Municipal Bond Classes and all other Retail Share Classes. Within each of these categories, the applicable costs are allocated to the affected John Hancock affiliated funds and/or classes, based on the relative average daily net assets.
Prior to July 1, 2010, the transfer agent fees were made up of three components:
• The Fund paid a monthly transfer agent fee at an annual rate of 0.015% for Class A and Class I shares, based on each class’s average daily net assets.
• The Fund paid a monthly fee based on an annual rate of $17.50 per shareholder account for all share classes.
• In addition, Signature Services was reimbursed for certain out-of-pocket expenses.
Class level expenses. Class level expenses for the six months ended September 30, 2010 were:
| 16 |
| Distribution and | State registration | Printing and | ||
| Class | service fees | Transfer agent fees | fees | postage |
| A | $21,824 | $9,719 | $19 | $14 |
| I | - | 6 | 19 | - |
| Total | $21,824 | $9,725 | $38 | $14 |
Trustee expenses. The Trust compensates each Trustee who is not an employee of the Adviser or its affiliates. These Trustees may, for tax purposes, elect to defer receipt of this compensation under the John Hancock Group of Funds Deferred Compensation Plan (the Plan). Deferred amounts are invested in various John Hancock Funds and remain in the funds until distributed in accordance with the Plan. The investment of deferred amounts and the offsetting liability are included in the accompanying Statement of Assets and Liabilities.
Note 5 - Fund share transactions
Transactions in Fund shares for the six months ended September 30, 2010 and period ended March 31, 2010 were as follows:
| Six months ended | Period ended | |||||
| 9/30/10 | 3/31/101 | |||||
| Shares | Amount | Shares | Amount | |||
| Class A shares | ||||||
| Sold | — | $ | — | 1,497,500 | $ | 14,975,000 |
| Net increase | — | $ | — | 1,497,500 | $ | 14,975,000 |
| Class I shares | ||||||
| Sold | — | $ | — | 2,500 | $ | 25,000 |
| Net increase | — | $ | — | 2,500 | $ | 25,000 |
| Net increase | — | $ | — | 1,500,000 | $ | 15,000,000 |
1 Period from 4-30-09 (inception date) to 3-31-10.
Note 6 - Purchase and sale of securities
Purchases and sales of securities, other than short-term securities, aggregated $18,622,775 and $20,721,688, respectively, for the six months ended September 30, 2010.
| 17 |
Board Consideration of and Continuation of Investment Advisory Agreement and Subadvisory Agreement: John Hancock Core High Yield Fund
The Board of Trustees (the “Board”, the members of which are referred to as “Trustees”) of John Hancock Core High Yield Fund (the “Fund”), a series of John Hancock Funds III, met in-person on May 2-4 and June 6-8, 2010 to consider the approval of the Fund’s investment advisory agreement (the “Advisory Agreement”) with John Hancock Investment Management Services, LLC (the “Adviser”), the Fund’s investment adviser. The Board also considered the approval of the investment subadvisory agreement (the “Subadvisory Agreement”) between the Adviser and MFC Global Investment Management (U.S.A.) Limited (the “Subadviser”) on behalf of the Fund. The Advisory Agreement and the Subadvisory Agreement are referred to as the “Agreements.”
Activities and Composition of the Board
The Board consists of eleven individuals, nine of whom are Independent Trustees. “Independent Trustees” are generally those individuals who are unaffiliated with the Fund, the Adviser and the Subadviser. The Trustees are responsible for the oversight of operations of the Fund and perform the various duties required of directors of investment companies by the Investment Company Act of 1940, as amended (the “1940 Act”). The Independent Trustees have retained independent legal counsel to assist them in connection with their duties. The Board has appointed an Independent Trustee as Chairperson. The Board has established four standing committees that are composed entirely of Independent Trustees: the Audit Committee; the Compliance Committee; the Nominating, Governance and Administration Committee; and the Contracts/Operations Committee. Additionally, Investment Performance Committees A and B are standing committees of the Board that are each composed of Independent Trustees and one Trustee who is affiliated with the Adviser. Investment Performance Committee A oversees and monitors matters relating to the investment performance of the Fund. The Board has also designated a Vice Chairperson to serve in the absence of the Chairperson, who also serves as Chairman of the Board’s Nominating, Governance and Administration Committee. The Board also designates working groups or ad hoc committees as it deems appropriate.
The Approval Process
Pursuant to the 1940 Act, the Board is required to consider the continuation of the Agreements on an annual basis. Throughout the year, the Board, acting directly and through its committees, regularly reviews and assesses the quality of the services that the Fund receives under these Agreements. In this regard, the Board reviews reports of the Adviser at least quarterly, which include, among other things, Fund performance reports and compliance reports. In addition, the Board meets with portfolio managers and senior investment officers at various times throughout the year. The Board considers at each of its meetings factors that are relevant to its annual consideration of the renewal of the Agreements, including the services and support provided by the Adviser and Subadviser to the Fund and its shareholders.
Prior to the May 2-4, 2010 meeting, the Board requested and received materials specifically relating to the Agreements. The materials provided in connection with the May meeting included
| 18 |
information compiled and prepared by the Adviser on Fund fees and expenses as compared with a category of relevant funds selected by the Adviser (the “Category”).
At an in-person meeting held on May 2-4, 2010, the Board reviewed materials relating to its consideration of the Agreements. As a result of the discussions that occurred during the May 2-4, 2010 meeting, the Board presented the Adviser and Subadviser with questions and requests for additional information and the Adviser and Subadviser responded to these requests with additional written information in advance of the June 6-8, 2010 Board meeting. The Board also reviewed these additional materials relating to its consideration of the Agreements.
At an in-person meeting held on June 6-8, 2010, the Board, including the Independent Trustees, formally considered the continuation of the Advisory Agreement between the Adviser and the Fund and the Subadvisory Agreement between the Adviser and the Subadviser with respect to the Fund, each for an additional one-year term. The Board considered all factors it believed relevant with respect to the Fund, including, among other factors: (a) the nature, extent and quality of the services provided by the Adviser and the Subadviser; (b) the investment performance of the Fund and portfolio management of the Subadviser; (c) the advisory fees and the cost of the services and profits to be realized by the Adviser and certain affiliates from their relationship with the Fund; (d) economies of scale; and (e) other factors.
The Board also considered other matters important to the approval process, such as payments made to the Adviser or its affiliates relating to the distribution of Fund shares and other services. The Board reviewed services related to the valuation and pricing of Fund portfolio holdings. Other important matters considered by the Board were the direct and indirect benefits to the Adviser, the Subadviser, and their affiliates from their relationship with the Fund and advice from independent legal counsel with respect to the review process and materials submitted for the Board’s review. Each Trustee may have attributed different weights to the various items considered.
The key factors considered by the Board and the conclusions reached are described below.
Nature, extent and quality of services
The Board, including the Independent Trustees, reviewed the nature, extent and quality of services provided by the Adviser and the Subadviser, including the investment advisory services and the resulting performance of the Fund. The Board reviewed the Adviser’s and Subadviser’s senior management personnel responsible for investment operations, including the senior investment officers. The Board also reviewed the materials provided by the Fund’s portfolio management team discussing Fund performance and the Fund’s investment objective, strategies and outlook.
The Board considered the ability of the Adviser and the Subadviser, based on their resources, reputation and other attributes, to attract and retain qualified investment professionals, including research, advisory, and supervisory personnel. It considered the background and experience of senior management and investment professionals responsible for managing the Fund. The Board considered the investment philosophy, research and investment decision-making processes of the
| 19 |
Adviser and the Subadviser responsible for the daily investment activities of the Fund, including, among other things, portfolio trading capabilities, use of technology, commitment to compliance and approach to training and retaining portfolio managers and other research, advisory and management personnel.
The Board considered the Subadviser’s history and experience with the Fund. The Board considered the Adviser’s execution of its oversight responsibilities. The Board further considered the culture of compliance, resources dedicated to compliance, compliance programs, record of compliance with applicable laws and regulation, with the Fund’s investment policies and restrictions and with the applicable Code of Ethics, and the responsibilities of the Adviser’s and Subadviser’s compliance departments.
In addition to advisory services, the Board considered the quality of the administrative and non-investment advisory services provided to the Fund by the Adviser under a separate agreement. The Board noted that the Adviser and its affiliates provide the Fund with certain administrative, transfer agency, shareholder and other services (in addition to any such services provided to the Fund by third parties) and officers and other personnel as are necessary for the operations of the Fund. The Board reviewed the structure and duties of the Adviser’s administration, accounting, legal and compliance departments and considered the Adviser’s policies and procedures for assuring compliance with applicable laws and regulations.
The Board also received information about the nature, extent and quality of services and fee rates offered by the Adviser and Subadviser to their other clients, including other registered investment companies, institutional investors and separate accounts. The Board reviewed a general analysis provided by the Adviser and the Subadviser concerning investment advisory fees charged to such other clients under similar investment mandates, the services provided to such other clients as compared to the services provided to the Fund, the performance of such other clients, and other factors relating to such other clients. The Board considered the significant differences between the Adviser’s and Subadviser’s services to the Fund and those services they provide to other clients which, to the extent the other client is not a mutual fund, may generally be attributable to the greater frequency of shareholder redemptions in a mutual fund, the higher turnover o f mutual fund assets, the more burdensome regulatory and legal obligations of mutual funds, and the higher marketing costs for mutual funds.
Fund performance
The Board, including the Independent Trustees, had previously received and considered information about the Adviser’s investment performance for other funds. The Board noted that the Fund had less than one full year of operational history, and considered the performance results for the Fund presented by the Adviser as of December 31, 2009. The Board noted that the Fund’s performance was higher than the performance of the benchmark index and the Category for the 1 month and 3 month periods, but was lower for the period since the Fund’s inception.
Expenses and fees
| 20 |
The Board, including the Independent Trustees, reviewed the Fund’s contractual advisory fee rate payable by the Fund to the Adviser as compared with the other funds in its Category. The Board also received information about the investment subadvisory fee rate payable by the Adviser to the Subadviser for investment subadvisory services. The Board considered the services provided and the fees charged by the Adviser and the Subadviser to other types of clients with similar investment mandates, including separately managed institutional accounts.
In addition, the Board considered the cost of the services provided to the Fund by the Adviser. The Board received and considered expense information regarding the Fund’s various components, including advisory fees, distribution fees and fees other than advisory and distribution fees, including transfer agent fees, custodian fees, administration fees and other miscellaneous fees (e.g., fees for accounting and legal services). The Board considered comparisons of these expenses to the Category Group median. The Board also considered expense information regarding the Fund’s total operating expense ratio (Gross Expense Ratio) and total operating expense ratio after taking the fee waiver arrangement applicable to the Advisory Agreement rate into account (Net Expense Ratio). The Board considered information comparing the Gross Expense Ratio and Net Expense Ratio of the Fund to that of the Category median. As part of its analysis, the Board reviewed the Adviser’s methodology in allocating its costs to the management of the Fund. The Board considered expenses and fee rates to be higher or lower if they were over or under 10 basis points, respectively; slightly higher or slightly lower if they were above or below 6-10 basis points, respectively, and inline if they were above or below by 5 basis points.
The Board noted that the investment advisory rate was inline with the Category median. The Board reviewed the Fund’s Gross Expense Ratio of 1.42% and Net Expense Ratio of 1.14% for the Fund’s Class A shares. The Board noted that the Fund’s Gross Expense Ratio was higher than the Category medians. The Board also noted that the Fund’s Net Expense Ratio was inline with the Category median. The Board favorably considered the impact of fee waivers towards ultimately lowering the Fund’s Gross Expense Ratio.
As the Fund is owned only by the Adviser or its affiliates and has no other shareholders, the Fund is considered “developing” and so the Adviser was not able to provide the Board with specific information concerning the expected profits to be realized by the Adviser and its affiliates from their relationships with the Fund.
Economies of scale
The Board, including the Independent Trustees, considered the extent to which economies of scale might be realized as the assets of the Fund increase and whether there should be changes in the advisory fee rate or structure in order to enable the Fund to participate in these economies of scale, for example through the use of breakpoints in the advisory fee based upon the assets of the Fund. The Board also considered the Adviser’s overall operations and its efforts to expand the scale of, and improve the quality of, its operations.
The Board recognized the inherent limitations of any analysis of economies of scale, stemming largely from the Board’s understanding that most of the Adviser’s costs are not specific to
| 21 |
individual funds, but rather are incurred across a variety of products and services. To ensure that any economies are reasonably shared with the Fund as its assets increase, the Adviser and the Board agreed to continue the existing breakpoints to the Agreement fee rate.
Other benefits to the Adviser and the Subadviser
The Board understands that the Adviser, the Subadviser, or their affiliates may derive other ancillary benefits from their relationship with the Fund, both tangible and intangible, such as their ability to leverage investment professionals who manage other portfolios, an increase in their profile in the investment advisory community, and the engagement of their affiliates and/or significant shareholders as service providers to the Fund, including for administrative, transfer agency and distribution services. The Board believes that certain of these benefits are difficult to quantify. The Board also was informed that the Subadviser may use third party research obtained by soft dollars generated by certain mutual fund transactions to assist itself in managing all or a number of its other client accounts.
Board determination
The Board, including the Independent Trustees, unanimously approved the continuation of the Advisory Agreement between the Adviser and the Fund for an additional one-year term and the Subadvisory Agreement between the Adviser and Subadviser with respect to the Fund for an additional one-year term. Based upon its evaluation of relevant factors in their totality, the Board, including a majority of the Independent Trustees, was satisfied that the terms of the Agreements were fair and reasonable and in the best interest of the Fund and its shareholders. In arriving at a decision to approve the Agreements, the Board did not identify any single factor listed above, or any group of factors listed above, as all-important or controlling, but considered all factors together, and different Board Members may have attributed different weights to the various factors considered. The Independent Trustees were also assisted by the advice of independent legal counsel in maki ng this determination. The Board noted that contractual fee arrangements for the Fund reflect the results of several years of review by the Board and certain predecessor Trustees, and discussions between such Trustees (and predecessor Trustees) and the Adviser. Certain aspects of the arrangements may be the subject of more attention in some years than in others, and the Trustees’ conclusions may be based in part on their consideration of these arrangements in prior years.
| 22 |
| More information |
| Trustees | Investment adviser | |
| Patti McGill Peterson, Chairperson | John Hancock Investment Management Services, LLC | |
| James F. Carlin | ||
| William H. Cunningham | Subadviser | |
| Deborah C. Jackson* | MFC Global Investment Management (U.S.A. Limited) | |
| Charles L. Ladner | ||
| Stanley Martin* | Principal distributor | |
| Hugh McHaffie†** | John Hancock Funds, LLC | |
| Dr. John A. Moore | ||
| Steven R. Pruchansky* | Custodian | |
| Gregory A. Russo | State Street Bank and Trust Company | |
| John G. Vrysen† | ||
| Transfer agent | ||
| John Hancock Signature Services, Inc. | ||
| Officers | ||
| Keith F. Hartstein | Legal counsel | |
| President and Chief Executive Officer | K&L Gates LLP | |
| Andrew G. Arnott | ||
| Senior Vice President ** and Chief Operating Officer | Independent registered public accounting firm | |
| Thomas M. Kinzler | PricewaterhouseCoopers LLP | |
| Secretary and Chief Legal Officer | ||
| Francis V. Knox, Jr. | ||
| Chief Compliance Officer | The report is certified under the Sarbanes-Oxley Act, which | |
| Charles A. Rizzo | requires mutual funds and other public companies to affirm | |
| Chief Financial Officer | that, to the best of their knowledge, the information in | |
| Salvatore Schiavone ** | their financial reports is fairly and accurately stated in all | |
| Treasurer | material respects. | |
| *Member of the Audit Committee | ||
| **Effective 8-31-10 | ||
| †Non-Independent Trustee |
The Fund’s proxy voting policies and procedures, as well as the Fund’s proxy voting record, if any, for the most recent twelve-month period ended June 30, are available free of charge on the Securities and Exchange Commission (SEC) Web site at www.sec.gov or on our Web site.
The Fund’s complete list of portfolio holdings, for the first and third fiscal quarters, is filed with the SEC on Form N-Q. The Fund’s Form N-Q is available on our Web site and the SEC’s Web site, www.sec.gov, and can be reviewed and copied (for a fee) at the SEC’s Public Reference Room in Washington, DC. Call 1-800-SEC-0330 to receive information on the operation of the SEC's Public Reference Room.
We make this information on your fund, as well as monthly portfolio holdings, and other fund details available on our Web site www.jhfunds.com or by calling 1-800-225-5291.
| You can also contact us: | ||
| 1-800-225-5291 | Regular mail: | Express mail: |
| www. jhfunds.com | John Hancock Signature Services, Inc. | John Hancock Signature Services, Inc. |
| P.O. Box 55913 | Mutual Fund Image Operations | |
| Boston, MA 02205-5913 | 30 Dan Road | |
| Canton, MA 02021 |
| 23 |
A look at performance
For the period ended September 30, 2010
| Average annual total returns (%) | Cumulative total returns (%) | |||||||
| with maximum sales charge (POP) | with maximum sales charge (POP) | |||||||
| 1-year | 5-year | 10-year | 6-months | 1-year | 5-year | 10-year | ||
| Class A1 | 10.00 | 1.50 | 5.30 | –6.24 | 10.00 | 7.71 | 67.55 | |
| Class I1,2 | 16.07 | 2.91 | 6.23 | –1.18 | 16.07 | 15.41 | 83.09 | |
| Class R11,2 | 15.26 | 2.10 | 5.39 | –1.54 | 15.26 | 10.97 | 69.09 | |
| Class R31,2 | 15.39 | 2.21 | 5.50 | –1.47 | 15.39 | 11.54 | 70.81 | |
| Class R41,2 | 15.73 | 2.51 | 5.81 | –1.34 | 15.73 | 13.21 | 75.96 | |
| Class R51,2 | 16.13 | 2.83 | 6.13 | –1.15 | 16.13 | 14.96 | 81.37 | |
| Class ADV1,2 | 15.75 | 2.38 | 5.65 | –1.29 | 15.75 | 12.47 | 73.34 | |
Performance figures assume all distributions are reinvested. Public offering price (POP) figures reflect maximum sales charge on Class A shares of 5%. Sales charges are not applicable for Class I, R1, R3, R4, R5 and ADV shares.
The returns reflect past results and should not be considered indicative of future performance. The return and principal value of an investment will fluctuate so that shares, when redeemed, may be worth more or less than their original cost. Due to market volatility, the Fund’s current performance may be higher or lower than the performance shown. For performance data current to the most recent month end, please call 1–800–225–5291 or visit the Fund’s Web site at www.jhfunds.com.
The expense ratios of the Fund, both net (including any fee waivers or expense limitations) and gross (excluding any fee waivers or expense limitations), are set forth according to the most recent publicly available prospectuses for the Fund and may differ from the expense ratios disclosed in the Financial Highlights tables in this report. The waivers and expense limitations for Class A are contractual at least until 7-31-11. The waivers and expense limitations for Class I and ADV shares are contractual at least until 12-11-11. The waivers and expense limitations for Class R1, R3, R4 and R5 shares are contractual at least until 6-30-11. The net expenses are as follows: Class A — 1.34%, Class I — 1.11%, Class R1 — 1.80%, Class R3 — 1.70%, Class R4 — 1.40%, Class R5 — 1.10% and Class ADV —1.34%. Had the fee waivers and expense limitations not been in place, the gross expenses would be as follows: Class A — 1.86% , Class I — 1.12%, Class R1 — 1.92%, Class R3 — 1.82%, Class R4 — 1.52%, Class R5 — 1.22% and Class ADV — 1.81%.
The performance table above and the chart on the next page do not reflect the deduction of taxes that a shareholder would pay on fund distributions or the redemption of fund shares.
The Fund’s performance results reflect any applicable expense reductions, without which the expenses would increase and results would have been less favorable.
1 On 12-11-09, through a reorganization, the Fund acquired all of the assets of the FMA fund (the predecessor fund). The predecessor fund offered its Investor Shares in exchange for Class A shares and the Institutional Shares in exchange for Class I shares. Class A, I and ADV shares were first offered on 12-14-09. The returns prior to this date are those of the FMA fund’s Investor Shares that have been recalculated to apply the gross fees and expenses of Class A, I and ADV shares, respectively. Class R1, R3, R4 and R5 shares were first offered on 4-30-10, the returns prior to this date are those of Class A shares that have been recalculated to apply the gross fees and expenses of Class R1, R3, R4 and R5, respectively.
2 For certain types of investors, as described in the Fund’s Class I, R1, R3, R4, R5 and ADV shares prospectuses.
| 6 | Small Company Fund | Semiannual report |
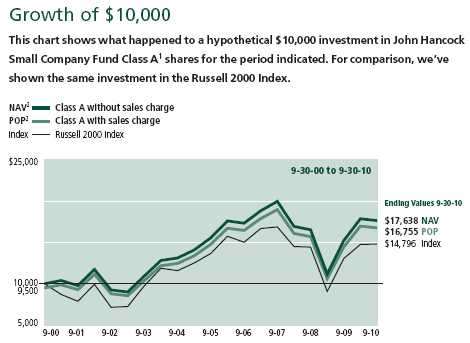
| Period | Without | With maximum | ||
| beginning | sales charge | sales charge | Index | |
| Class I1,3 | 9-30-00 | $18,309 | $18,309 | $14,796 |
| Class R11,3 | 9-30-00 | 16,909 | 16,909 | 14,796 |
| Class R31,3 | 9-30-00 | 17,081 | 17,081 | 14,796 |
| Class R41, 3 | 9-30-00 | 17,596 | 17,596 | 14,796 |
| Class R51,3 | 9-30-00 | 18,137 | 18,137 | 14,796 |
| Class ADV1,3 | 9-30-00 | 17,334 | 17,334 | 14,796 |
Assuming all distributions were reinvested for the period indicated, the table above shows the value of a $10,000 investment in the Fund’s Class I, R1, R3, R4, R5 and ADV shares as of 9-30-10. Performance of the classes will vary based on the difference in sales charges paid by shareholders investing in the different classes and fees structure of those classes.
Russell 2000 Index The Russell 2000 Index measures performance of the 2,000 smallest companies in the Russell 3000 Index, which represents approximately 8% of total market capitalization of the Russell 3000 Index.
1 On 12-11-09, through a reorganization, the Fund acquired all of the assets of the FMA fund (the predecessor fund). The predecessor fund offered its Investor Shares in exchange for Class A shares and the Institutional Shares in exchange for Class I shares. Class A, I and ADV shares were first offered on 12-14-09. The returns prior to this date are those of the FMA fund’s Investor Shares that have been recalculated to apply the gross fees and expenses of Class A, I and ADV shares, respectively. Class R1, R3, R4 and R5 shares were first offered on 4-30-10, the returns prior to this date are those of Class A shares that have been recalculated to apply the gross fees and expenses of Class R1, R3, R4 and R5, respectively.
2 NAV represents net asset value and POP represents public offering price.
3 For certain types of investors, as described in the Fund’s Class I, R1, R3, R4, R5 and ADV shares prospectuses.
| Semiannual report | Small Company Fund | 7 |
Your expenses
These examples are intended to help you understand your ongoing operating expenses.
Understanding fund expenses
As a shareholder of the Fund, you incur two types of costs:
▪ Transaction costs which include sales charges (loads) on purchases or redemptions (varies by share class), minimum account fee charge, etc.
▪ Ongoing operating expenses including management fees, distribution and service fees (if applicable), and other fund expenses.
We are going to present only your ongoing operating expenses here.
Actual expenses/actual returns
This example is intended to provide information about your fund’s actual ongoing operating expenses, and is based on your fund’s actual return. It assumes an account value of $1,000.00 on April 1, 2010 with the same investment held until September 30, 2010.
| Account value | Ending value | Expenses paid during | |
| on 4-1-10 | on 9-30-10 | period ended 9-30-10 | |
| Class A | $1,000.00 | $987.10 | $6.681 |
| Class I | 1,000.00 | 988.20 | 5.481 |
| Class R1 | 1,000.00 | 906.60 | 7.242 |
| Class R3 | 1,000.00 | 907.10 | 6.842 |
| Class R4 | 1,000.00 | 908.20 | 5.642 |
| Class R5 | 1,000.00 | 909.70 | 4.432 |
| Class ADV | 1,000.00 | 987.10 | 6.681 |
Together with the value of your account, you may use this information to estimate the operating expenses that you paid over the period. Simply divide your account value at September 30, 2010, by $1,000.00, then multiply it by the “expenses paid” for your share class from the table above. For example, for an account value of $8,600.00, the operating expenses should be calculated as follows:
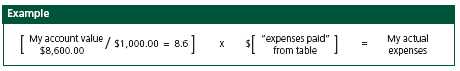
| 8 | Small Company Fund | Semiannual report |
Hypothetical example for comparison purposes
This table allows you to compare your fund’s ongoing operating expenses with those of any other fund. It provides an example of the Fund’s hypothetical account values and hypothetical expenses based on each class’s actual expense ratio and an assumed 5% annualized return before expenses (which is not your fund’s actual return). It assumes an account value of $1,000.00 on April 1, 2010, with the same investment held until September 30, 2010. Look in any other fund shareholder report to find its hypothetical example and you will be able to compare these expenses.
| Account value | Ending value | Expenses paid during | |
| on 4-1-10 | on 9-30-10 | period ended 9-30-103 | |
| Class A | $1,000.00 | $1,018.40 | $6.78 |
| Class I | 1,000.00 | 1,019.60 | 5.57 |
| Class R1 | 1,000.00 | 1,016.00 | 9.10 |
| Class R3 | 1,000.00 | 1,016.50 | 8.59 |
| Class R4 | 1,000.00 | 1,018.00 | 7.08 |
| Class R5 | 1,000.00 | 1,019.60 | 5.57 |
| Class ADV | 1,000.00 | 1,018.40 | 6.78 |
Remember, these examples do not include any transaction costs, therefore, these examples will not help you to determine the relative total costs of owning different funds. If transaction costs were included, your expenses would have been higher. See the prospectus for details regarding transaction costs.
1 Expenses are equal to the Fund’s annualized expense ratio of 1.34%, 1.10% and 1.34% for Class A, Class I and Class ADV shares, respectively, multiplied by the average account value over the period, multiplied by 183/365 (to reflect the one-half year period).
2 Expenses are equal to the Fund’s annualized expense ratio of 1.80%, 1.70%, 1.40% and 1.10% for Class R1, Class R3, Class R4 and Class R5 shares, respectively, multiplied by the average account value over the period, multiplied by 154/365 (to reflect the period).
3 Expenses are equal to the Fund’s annualized expense ratio multiplied by the average account value over the period, multiplied by 183/365 (to reflect the one-half year period).
| Semiannual report | Small Company Fund | 9 |
Portfolio summary
| Top 10 Holdings1 | ||||
| Unisource Energy Corp. | 2.0% | Middleby Corp. | 1.5% | |
| Woodward Governor Company | 1.6% | National Retail Properties, Inc. | 1.5% | |
| Viasat, Inc. | 1.6% | Genesee & Wyoming, Inc., Class A | 1.5% | |
| ACI Worldwide, Inc. | 1.6% | Actuant Corp., Class A | 1.5% | |
| Tractor Supply Company | 1.6% | IDEX Corp. | 1.5% | |
| Sector Composition2,3 | ||||
| Financials | 26% | Materials | 7% | |
| Industrials | 17% | Consumer Staples | 6% | |
| Consumer Discretionary | 13% | Energy | 6% | |
| Information Technology | 13% | Utilities | 3% | |
| Health Care | 7% | Short-Term Investments & Other | 2% | |

1 As a percentage of net assets on 9-30-10. Cash and cash equivalents are not included in Top 10 Holdings.
2 As a percentage of net assets on 9-30-10.
3 Sector investing is subject to greater risks than the market as a whole. Because the Fund may focus on particular
sectors of the economy, its performance may depend on the performance of those sectors.
| 10 | Small Company Fund | Semiannual report |
Fund’s investments
As of 9-30-10 (unaudited)
| Shares | Value | |
| Common Stocks 97.97% | $123,125,371 | |
| (Cost $106,969,255) | ||
| Consumer Discretionary 13.09% | 16,446,955 | |
| Auto Components 0.99% | ||
| Dana Holding Corp. (I) | 101,240 | 1,247,277 |
| Hotels, Restaurants & Leisure 1.98% | ||
| Buffalo Wild Wings, Inc. (I) | 25,370 | 1,214,969 |
| WMS Industries, Inc. (I) | 33,230 | 1,265,066 |
| Household Durables 1.04% | ||
| Ryland Group, Inc. | 73,100 | 1,309,952 |
| Media 3.71% | ||
| Cinemark Holdings, Inc. | 97,100 | 1,563,310 |
| Meredith Corp. | 37,300 | 1,242,463 |
| Valassis Communications, Inc. (I) | 54,700 | 1,853,783 |
| Specialty Retail 4.39% | ||
| Jo-Ann Stores, Inc. (I) | 42,270 | 1,883,128 |
| The Dress Barn, Inc. (I) | 69,848 | 1,658,890 |
| Tractor Supply Company | 49,800 | 1,975,068 |
| Textiles, Apparel & Luxury Goods 0.98% | ||
| Maidenform Brands, Inc. (I) | 42,740 | 1,233,049 |
| Consumer Staples 5.83% | 7,328,164 | |
| Food & Staples Retailing 1.34% | ||
| The Pantry, Inc. (I) | 69,610 | 1,678,297 |
| Food Products 1.97% | ||
| Diamond Foods, Inc. | 30,320 | 1,242,817 |
| J & J Snack Foods Corp. | 29,461 | 1,235,300 |
| Personal Products 2.52% | ||
| Elizabeth Arden, Inc. (I) | 65,020 | 1,299,750 |
| Nu Skin Enterprises, Inc., Class A | 65,000 | 1,872,000 |
| Energy 5.76% | 7,244,535 | |
| Energy Equipment & Services 4.37% | ||
| Complete Production Services, Inc. (I) | 68,500 | 1,400,825 |
| Dresser-Rand Group, Inc. (I) | 31,400 | 1,158,346 |
| Oil States International, Inc. (I) | 34,000 | 1,582,700 |
| T-3 Energy Services, Inc. (I) | 51,860 | 1,356,139 |
| See notes to financial statements | Semiannual report | Small Company Fund | 11 |
| Shares | Value | |
| Oil, Gas & Consumable Fuels 1.39% | ||
| Cloud Peak Energy, Inc. (I) | 95,700 | $1,746,525 |
| Financials 25.93% | 32,588,463 | |
| Capital Markets 2.34% | ||
| Evercore Partners, Inc., Class A | 59,500 | 1,702,295 |
| MF Global Holdings, Ltd. (I) | 171,000 | 1,231,200 |
| Commercial Banks 9.53% | ||
| Bank of the Ozarks, Inc. | 33,000 | 1,223,970 |
| East West Bancorp, Inc. | 78,100 | 1,271,468 |
| First Midwest Bancorp, Inc. | 148,800 | 1,715,664 |
| Prosperity Bancshares, Inc. | 53,600 | 1,740,392 |
| S&T Bancorp, Inc. | 69,400 | 1,208,948 |
| Signature Bank (I) | 46,000 | 1,786,640 |
| TCF Financial Corp. | 112,246 | 1,817,263 |
| Western Alliance Bancorp (I) | 181,800 | 1,218,060 |
| Insurance 4.39% | ||
| Delphi Financial Group, Inc., Class A | 74,300 | 1,856,757 |
| The Hanover Insurance Group, Inc. | 38,900 | 1,828,300 |
| Tower Group, Inc. | 78,670 | 1,836,944 |
| Real Estate Investment Trusts 9.67% | ||
| Entertainment Properties Trust | 41,900 | 1,809,242 |
| Healthcare Realty Trust, Inc. | 52,640 | 1,231,250 |
| Highwoods Properties, Inc. | 56,800 | 1,844,296 |
| LaSalle Hotel Properties | 80,600 | 1,885,234 |
| National Retail Properties, Inc. | 77,500 | 1,946,025 |
| OMEGA Healthcare Investors, Inc. | 67,900 | 1,524,355 |
| Sovran Self Storage, Inc. | 50,400 | 1,910,160 |
| Health Care 7.32% | 9,196,815 | |
| Health Care Equipment & Supplies 2.35% | ||
| Haemonetics Corp. (I) | 32,540 | 1,904,566 |
| Quidel Corp. (I) | 95,600 | 1,050,644 |
| Health Care Providers & Services 1.48% | ||
| Magellan Health Services, Inc. (I) | 39,200 | 1,851,808 |
| Health Care Technology 1.08% | ||
| Medidata Solutions, Inc. (I) | 70,710 | 1,357,632 |
| Pharmaceuticals 2.41% | ||
| Questcor Pharmaceuticals, Inc. (I) | 184,780 | 1,833,018 |
| Salix Pharmaceuticals, Ltd. (I) | 30,190 | 1,199,147 |
| Industrials 16.99% | 21,356,020 | |
| Aerospace & Defense 2.68% | ||
| Moog, Inc., Class A (I) | 53,730 | 1,907,952 |
| Orbital Sciences Corp., Class A (I) | 95,100 | 1,455,030 |
| Electrical Equipment 4.60% | ||
| EnerSys, Inc. (I) | 74,200 | 1,852,774 |
| Thomas & Betts Corp. (I) | 45,500 | 1,866,410 |
| Woodward Governor Company | 63,500 | 2,058,670 |
| 12 | Small Company Fund | Semiannual report | See notes to financial statements |
| Shares | Value | |
| Machinery 6.69% | ||
| Actuant Corp., Class A | 83,430 | $1,915,553 |
| IDEX Corp. | 53,830 | 1,911,503 |
| Middleby Corp. (I) | 30,700 | 1,946,073 |
| Robbins & Myers, Inc. | 48,980 | 1,311,684 |
| Terex Corp. (I) | 57,900 | 1,327,068 |
| Road & Rail 1.54% | ||
| Genesee & Wyoming, Inc., Class A (I) | 44,760 | 1,942,136 |
| Trading Companies & Distributors 1.48% | ||
| WESCO International, Inc. (I) | 47,370 | 1,861,167 |
| Information Technology 12.91% | 16,220,500 | |
| Communications Equipment 4.49% | ||
| Emulex Corp. (I) | 173,300 | 1,809,252 |
| Plantronics, Inc. | 54,110 | 1,827,836 |
| Viasat, Inc. (I) | 48,670 | 2,000,824 |
| Electronic Equipment, Instruments & Components 1.07% | ||
| Anixter International, Inc. | 24,840 | 1,341,112 |
| Semiconductors & Semiconductor Equipment 4.64% | ||
| Applied Micro Circuits Corp. (I) | 139,700 | 1,397,000 |
| Cavium Networks, Inc. (I) | 47,270 | 1,359,485 |
| Entropic Communications, Inc. (I) | 180,910 | 1,736,736 |
| Fairchild Semiconductor International, Inc. (I) | 143,000 | 1,344,200 |
| Software 2.71% | ||
| ACI Worldwide, Inc. (I) | 89,220 | 1,997,636 |
| Progress Software Corp. (I) | 42,490 | 1,406,419 |
| Materials 7.14% | 8,976,039 | |
| Chemicals 2.89% | ||
| Cytec Industries, Inc. | 31,400 | 1,770,332 |
| Rockwood Holdings, Inc. (I) | 59,220 | 1,863,654 |
| Containers & Packaging 2.06% | ||
| Silgan Holdings, Inc. | 38,380 | 1,216,646 |
| Temple-Inland, Inc. | 73,700 | 1,375,242 |
| Metals & Mining 2.19% | ||
| Century Aluminum Company (I) | 98,110 | 1,292,109 |
| Schnitzer Steel Industries, Inc. | 30,200 | 1,458,056 |
| Utilities 3.00% | 3,767,880 | |
| Electric Utilities 3.00% | ||
| Great Plains Energy, Inc. | 66,700 | 1,260,630 |
| Unisource Energy Corp. | 75,000 | 2,507,250 |
| See notes to financial statements | Semiannual report | Small Company Fund | 13 |
| Yield | Shares | Value | |
| Short-Term Investments 2.93% | $3,687,784 | ||
| (Cost $3,687,784) | |||
| Short-Term Securities 2.93% | 3,687,784 | ||
| State Street Institutional Liquid Reserves Fund | 0.2594% (Y) | 2,804,528 | 2,804,528 |
| State Street Institutional U.S. Government | |||
| Money Market Fund | 0.1119 (Y) | 883,256 | 883,256 |
| Total investments (Cost $110,657,039)† 100.90% | $126,813,155 | ||
| Other assets and liabilities, net (0.90%) | ($1,133,011) | ||
| Total net assets 100.00% | $125,680,144 | ||
| The percentage shown for each investment category is the total value of the category as a percentage of the net | |
| assets of the Fund. | |
| (I) | Non-income producing security. |
| (Y) | The rate shown is the annualized seven-day yield as of 9-30-10. |
| † | At 9-30-10, the aggregate cost of investment securities for federal income tax purposes was $112,909,840. |
| Net unrealized appreciation aggregated $13,903,315, of which $17,485,409 related to appreciated investment | |
| securities and $3,582,094 related to depreciated investment securities. |
| 14 | Small Company Fund | Semiannual report | See notes to financial statements |
F I N A N C I A L S T A T E M E N T S
Financial statements
Statement of assets and liabilities 9-30-10 (unaudited)
This Statement of Assets and Liabilities is the Fund’s balance sheet. It shows the value of what the Fund owns, is due and owes. You’ll also find the net asset value and the maximum offering price per share.
| Assets | |
| Investments, at value (Cost $110,657,039) | $126,813,155 |
| Receivable for investments sold | 1,455,341 |
| Receivable for fund shares sold | 400,559 |
| Dividends and interest receivable | 63,637 |
| Receivable due from adviser | 360 |
| Other receivables | 28,600 |
| Total assets | 128,761,652 |
| Liabilities | |
| Payable for investments purchased | 2,965,730 |
| Payable for fund shares repurchased | 67,435 |
| Payable to affiliates | |
| Accounting and legal services fees | 1,487 |
| Transfer agent fees | 15,076 |
| Trustees’ fees | 714 |
| Other liabilities and accrued expenses | 31,066 |
| Total liabilities | 3,081,508 |
| Net assets | |
| Capital paid-in | $145,481,995 |
| Accumulated net investment loss | (106,890) |
| Accumulated net realized loss on investments | (35,851,077) |
| Net unrealized appreciation (depreciation) on investments | 16,156,116 |
| Net assets | $125,680,144 |
| Net asset value per share | |
| Based on net asset values and shares outstanding — the Fund has an | |
| unlimited number of shares authorized with no par value | |
| Class A ($77,551,787 ÷ 4,407,967 shares) | $17.59 |
| Class I ($47,684,011 ÷ 2,704,728 shares) | $17.63 |
| Class R1 ($22,671 ÷ 1,290 shares) | $17.57 |
| Class R3 ($22,680 ÷ 1,290 shares) | $17.58 |
| Class R4 ($22,709 ÷ 1,290 shares) | $17.60 |
| Class R5 ($22,737 ÷ 1,290 shares) | $17.63 |
| Class ADV ($353,549 ÷ 20,095 shares) | $17.59 |
| Maximum offering price per share | |
| Class A (net asset value per share ÷ 95%)1 | $18.52 |
1 On single retail sales of less than $50,000. On sales of $50,000 or more and on group sales the offering price is reduced.
| See notes to financial statements | Semiannual report | Small Company Fund | 15 |
F I N A N C I A L S T A T E M E N T S
Statement of operations For the six-month period ended 9-30-10 (unaudited)
This Statement of Operations summarizes the Fund’s investment income earned and expenses incurred in operating the Fund. It also shows net gains (losses) for the period stated.
| Investment income | |
| Dividends | $669,191 |
| Interest | 4,639 |
| Total investment income | 673,830 |
| Expenses | |
| Investment management fees (Note 4) | 558,421 |
| Distribution and service fees (Note 4) | 123,400 |
| Accounting and legal services fees (Note 4) | 9,627 |
| Transfer agent fees (Note 4) | 52,948 |
| Trustees’ fees (Note 4) | 4,507 |
| Professional fees | 25,922 |
| Custodian fees | 14,069 |
| Registration and filing fees | 23,693 |
| Other | 1,529 |
| Total expenses | 814,116 |
| Less expense reductions (Note 4) | (33,452) |
| Net expenses | 780,664 |
| Net investment loss | (106,834) |
| Realized and unrealized gain (loss) | |
| Net realized gain on | |
| Investments | 4,987,551 |
| 4,987,551 | |
| Change in net unrealized appreciation (depreciation) of | |
| Investments | (6,730,033) |
| (6,730,033) | |
| Net realized and unrealized loss | (1,742,482) |
| Decrease in net assets from operations | ($1,849,316) |
| 16 | Small Company Fund | Semiannual report | See notes to financial statements |
F I N A N C I A L S T A T E M E N T S
Statements of changes in net assets
These Statements of Changes in Net Assets show how the value of the Fund’s net assets has changed during the last three periods. The difference reflects earnings less expenses, any investment gains and losses, distributions, if any, paid to shareholders and the net of Fund share transactions.
| Six months | |||
| ended | Period | Year | |
| 9-30-10 | ended | ended | |
| (Unaudited) | 3-31-101 | 10-31-09 | |
| Increase (decrease) in net assets | |||
| From operations | |||
| Net investment income (loss) | ($106,834) | ($83,476) | $51,853 |
| Net realized gain (loss) | 4,987,551 | 7,017,779 | (22,397,443) |
| Change in net unrealized | |||
| appreciation (depreciation) | (6,730,033) | 15,888,460 | 27,512,072 |
| Increase (decrease) in net assets resulting | |||
| from operations | (1,849,316) | 22,822,763 | 5,166,482 |
| Distributions to shareholders | |||
| From net investment income | |||
| Class A | — | (89,814) | (165,164) |
| Class I | — | (76,915) | (67,134) |
| Total distributions | — | (166,729) | (232,298) |
| From Fund share transactions (Note 5) | 28,400 | (4,491,462) | (25,905,731) |
| Total increase (decrease) | (1,820,916) | 18,164,572 | (20,971,547) |
| Net assets | |||
| Beginning of period | 127,501,060 | 109,336,488 | 130,308,035 |
| End of period | $125,680,144 | $127,501,060 | $109,336,488 |
| (Accumulated net investment loss)/ | |||
| Undistributed net investment income | ($106,890) | ($56) | $166,181 |
1 For the five month period ended 3-31-10. The Fund changed its fiscal year end from October 31 to March 31.
| See notes to financial statements | Semiannual report | Small Company Fund | 17 |
Financial highlights
The Financial Highlights show how the Fund’s net asset value for a share has changed since the end of the previous period.
| CLASS A SHARES | |||||||
| Period ended | 9-30-101 | 3-31-102,3 | 10-31-09 | 10-31-084 | 10-31-07 | 10-31-06 | 10-31-05 |
| Per share operating performance | |||||||
| Net asset value, beginning | |||||||
| of period | $17.82 | $14.68 | $13.83 | $22.55 | $23.04 | $22.40 | $23.77 |
| Net investment income (loss)5 | (0.02) | (0.02) | —6 | 0.05 | (0.04) | (0.05) | 0.03 |
| Net realized and unrealized | |||||||
| gain (loss) on investments | (0.21) | 3.18 | 0.87 | (6.01) | 2.06 | 4.24 | 2.47 |
| Total from | |||||||
| investment operations | (0.23) | 3.16 | 0.87 | (5.96) | 2.02 | 4.19 | 2.50 |
| Less distributions | |||||||
| From net investment income | — | (0.02) | (0.02) | (0.01) | (0.01) | — | (0.01) |
| From net realized gain | — | — | — | (2.75) | (2.50) | (3.55) | (3.86) |
| Total distributions | — | (0.02) | (0.02) | (2.76) | (2.51) | (3.55) | (3.87) |
| Net asset value, end | |||||||
| of period | $17.59 | $17.82 | $14.68 | $13.83 | $22.55 | $23.04 | $22.40 |
| Total return (%)7,8 | (1.29)9 | 21.519 | 6.34 | (29.67) | 9.43 | 21.07 | 11.07 |
| Ratios and supplemental data | |||||||
| Net assets, end of period | |||||||
| (in millions) | $78 | $92 | $87 | $104 | $209 | $212 | $163 |
| Ratios (as a percentage of | |||||||
| average net assets): | |||||||
| Expenses before reductions | 1.4210 | 1.6610 | 1.42 | 1.37 | 1.30 | 1.27 | 1.25 |
| Expenses net of fee waivers | |||||||
| and credits | 1.3410 | 1.3910 | 1.39 | 1.31 | 1.25 | 1.24 | 1.20 |
| Net investment income (loss) | (0.25)10 | (0.23)10 | (0.01) | 0.27 | (0.20) | (0.17) | 0.09 |
| Portfolio turnover (%) | 66 | 4211 | 155 | 177 | 132 | 13512 | 169 |
1 Semiannual period from 4-1-10 to 9-30-10. Unaudited.
2 For the five month period ended 3-31-10. The Fund changed its fiscal year end from October 31 to March 31.
3 After the close of business on 12-11-09, holders of Investor Shares of the former FMA Small Company Portfolio (the
Predecessor Fund) became owners of an equal number of full and fractional Class A shares of the John Hancock
Small Company Fund. These shares were first offered on 12-14-09. Additionally, the accounting and performance
history of the Investor Shares of the Predecessor Fund was redesignated as that of John Hancock Small Company
Fund Class A.
4 Prior to 5-1-08, Investor Shares were offered as Institutional Class Shares.
5 Based on the average daily shares outstanding.
6 Less than ($0.005) per share.
7 Total returns would have been lower had certain expenses not been reduced during the periods shown.
8 Does not reflect the effect of sales charges, if any.
9 Not annualized.
10 Annualized.
11 Portfolio turnover is shown for the period from 11-1-09 to 3-31-10.
12 Includes the effects of in-kind transactions. If the in-kind transactions were not included, the portfolio turnover rate
would have been 127%.
| 18 | Small Company Fund | Semiannual report | See notes to financial statements |
| CLASS I SHARES Period ended | 9-30-101 | 3-31-102,3 | 10-31-09 | 10-31-084 |
| Per share operating performance | ||||
| Net asset value, beginning of period | $17.84 | $14.71 | $13.84 | $17.99 |
| Net investment income5 | —6 | —7 | 0.03 | 0.04 |
| Net realized and unrealized gain (loss) on investments | (0.21) | 3.18 | 0.87 | (4.17) |
| Total from investment operations | (0.21) | 3.18 | 0.90 | (4.13) |
| Less distributions | ||||
| From net investment income | — | (0.05) | (0.03) | (0.02) |
| Net asset value, end of period | $17.63 | $17.84 | $14.71 | $13.84 |
| Total return (%) | (1.18)8 | 21.678,9 | 6.569 | (22.95)8,9 |
| Ratios and supplemental data | ||||
| Net assets, end of period (in millions) | $48 | $36 | $23 | $27 |
| Ratios (as a percentage of average net assets): | ||||
| Expenses before reductions | 1.1010 | 1.1810 | 1.17 | 1.1810 |
| Expenses net of fee waivers and credits | 1.1010 | 1.1410 | 1.14 | 1.0810 |
| Net investment income (loss) | (0.01)10 | 0.0110 | 0.24 | 0.5510 |
| Portfolio turnover (%) | 66 | 4211 | 155 | 177 |
1 Semiannual period from 4-1-10 to 9-30-10. Unaudited.
2 For the five month period ended 3-31-10. The Fund changed its fiscal year end from October 31 to March 31.
3 After the close of business on 12-11-09, holders of Institutional Shares of the former FMA Small Company Portfolio
(the Predecessor Fund) became owners of an equal number of full and fractional Class I shares of the John Hancock
Small Company Fund. These shares were first offered on 12-14-09. Additionally, the accounting and performance
history of the Institutional Shares of the Predecessor Fund was redesignated as that of John Hancock Small Company
Fund Class I.
4 Commencement of operations 5-1-08.
5 Based on the average daily shares outstanding.
6 Less than ($0.005) per share.
7 Less than $0.005 per share.
8 Not annualized.
9 Total returns would have been lower had certain expenses not been reduced during the periods shown.
10 Annualized.
11 Portfolio turnover is shown for the period from 11-1-09 to 3-31-10.
| CLASS R1 SHARES Period ended | 9-30-101 |
| Per share operating performance | |
| Net asset value, beginning of period | $19.38 |
| Net investment loss2 | (0.05) |
| Net realized and unrealized loss on investments | (1.76) |
| Total from investment operations | (1.81) |
| Net asset value, end of period | $17.57 |
| Total return (%)3 | (9.34)4 |
| Ratios and supplemental data | |
| Net assets, end of period (in millions) | —5 |
| Ratios (as a percentage of average net assets): | |
| Expenses before reductions | 2.386 |
| Expenses net of fee waivers and credits | 1.806 |
| Net investment loss | (0.73)6 |
| Portfolio turnover (%) | 66 |
2 Based on the average daily shares outstanding.
3 Total returns would have been lower had certain expenses not been reduced during the periods shown.
4 Not annualized.
5 Less than $500,000.
6 Annualized.
| See notes to financial statements | Semiannual report | Small Company Fund | 19 |
| CLASS R3 SHARES Period ended | 9-30-101 |
| Per share operating performance | |
| Net asset value, end of period | $19.38 |
| Net investment loss2 | (0.05) |
| Net realized and unrealized loss on investments | (1.75) |
| Total from investment operations | (1.80) |
| Net asset value, end of period | $17.58 |
| Total return (%)3 | (9.29)4 |
| Ratios and supplemental data | |
| Net assets, end of period (in millions) | —5 |
| Ratios (as a percentage of average net assets): | |
| Expenses before reductions | 2.386 |
| Expenses net of fee waivers and credits | 1.706 |
| Net investment loss | (0.63)6 |
| Portfolio turnover (%) | 66 |
1 Period from 4-30-10 (inception date) to 9-30-10. Unaudited.
2 Based on the average daily shares outstanding.
3 Total returns would have been lower had certain expenses not been reduced during the periods shown.
4 Not annualized.
5 Less than $500,000.
6 Annualized.
| CLASS R4 SHARES Period ended | 9-30-101 |
| Per share operating performance | |
| Net asset value, beginning of period | $19.38 |
| Net investment loss2 | (0.02) |
| Net realized and unrealized loss on investments | (1.76) |
| Total from investment operations | (1.78) |
| Net asset value, end of period | $17.60 |
| Total return (%)3 | (9.18)4 |
| Ratios and supplemental data | |
| Net assets, end of period (in millions) | —5 |
| Ratios (as a percentage of average net assets): | |
| Expenses before reductions | 2.136 |
| Expenses net of fee waivers and credits | 1.406 |
| Net investment loss | (0.33)6 |
| Portfolio turnover (%) | 66 |
1 Period from 4-30-10 (inception date) to 9-30-10. Unaudited.
2 Based on the average daily shares outstanding.
3 Total returns would have been lower had certain expenses not been reduced during the periods shown.
4 Not annualized.
5 Less than $500,000.
6 Annualized.
| 20 | Small Company Fund | Semiannual report | See notes to financial statements |
| CLASS R5 SHARES Period ended | 9-30-101 |
| Per share operating performance | |
| Net asset value, beginning of period | $19.38 |
| Net investment loss2 | —3 |
| Net realized and unrealized loss on investments | (1.75) |
| Total from investment operations | (1.75) |
| Net asset value, end of period | $17.63 |
| Total return (%)4 | (9.03)5 |
| Ratios and supplemental data | |
| Net assets, end of period (in millions) | —6 |
| Ratios (as a percentage of average net assets): | |
| Expenses before reductions | 1.887 |
| Expenses net of fee waivers and credits | 1.107 |
| Net investment loss | (0.03)7 |
| Portfolio turnover (%) | 66 |
1 Period from 4-30-10 (inception date) to 9-30-10. Unaudited.
2 Based on the average daily shares outstanding.
3 Less than ($0.005) per share.
4 Total returns would have been lower had certain expenses not been reduced during the periods shown.
5 Not annualized.
6 Less than $500,000.
7 Annualized.
| CLASS ADV SHARES Period ended | 9-30-101 | 3-31-102 | ||
| Per share operating performance | ||||
| Net asset value, beginning of period | $17.82 | $15.71 | ||
| Net investment loss3 | (0.02) | (0.01) | ||
| Net realized and unrealized gain (loss) on investments | (0.21) | 2.12 | ||
| Total from investment operations | (0.23) | 2.11 | ||
| Net asset value, end of period | $17.59 | $17.82 | ||
| Total return (%)4 | (1.29)5 | 13.435 | ||
| Ratios and supplemental data | ||||
| Net assets, end of period (in millions) | —6 | —6 | ||
| Ratios (as a percentage of average net assets): | ||||
| Expenses before reductions | 1.747 | 2.767 | ||
| Expenses net of fee waivers and credits | 1.347 | 1.337 | ||
| Net investment loss | (0.19)7 | (0.17)7 | ||
| Portfolio turnover (%) | 66 | 428 | ||
1 Semiannual period from 4-1-10 to 9-30-10. Unaudited.
2 Period from 12-14-09 (inception date) to 3-31-10.
3 Based on the average daily shares outstanding.
4 Total returns would have been lower had certain expenses not been reduced during the periods shown.
5 Not annualized.
6 Less than $500,000.
7 Annualized.
8 Portfolio turnover is shown for the period from 11-1-09 to 3-31-10.
| See notes to financial statements | Semiannual report | Small Company Fund | 21 |
Notes to financial statements
(unaudited)
Note 1 — Organization
John Hancock Small Company Fund (the Fund) is a diversified series of John Hancock Funds III (the Trust), an open-end management investment company organized as a Massachusetts business trust and registered under the Investment Company Act of 1940, as amended (the 1940 Act). The investment objective of the Fund is to seek maximum long-term total return.
The Fund may offer multiple classes of shares. The shares currently offered are detailed in the Statement of Assets and Liabilities. Class A shares are offered to all investors. Class I shares are offered to institutions and certain investors. Class R1, Class R3, Class R4 and Class R5 shares are available only to certain retirement plans. Class ADV shares are available to investors who acquired Class A shares as a result of the reorganization of the FMA Small Company Portfolio (the Predecessor Fund) into the Fund and are closed to new investors. Shareholders of each class have exclusive voting rights to matters that affect that class. The distribution and service fees, transfer agent fees, printing and postage and state registration fees for each class may differ.
The Fund is the accounting and performance successor of the Predecessor Fund. At the close of business on December 11, 2009, the Fund acquired substantially all the assets and assumed the liabilities of the Predecessor Fund pursuant to an agreement and plan on reorganization, in exchange for Class A and Class I shares of the Fund.
Affiliates of the Fund owned 100%, 100%, 100%, 100%, and 8% of the shares of beneficial interest of Class R1, Class R3, Class R4, Class R5 and Class ADV, respectively, on September 30, 2010.
Note 2 — Significant accounting policies
The financial statements have been prepared in conformity with accounting principles generally accepted in the United States of America, which require management to make certain estimates and assumptions at the date of the financial statements. Actual results could differ from those estimates. Events or transactions occurring after the end of the fiscal period through the date that the financial statements were issued have been evaluated in the preparation of the financial statements. The following summarizes the significant accounting policies of the Fund:
Security valuation. Investments are stated at value as of the close of the regular trading on the New York Stock Exchange (NYSE), normally at 4:00 P.M., Eastern Time. The Fund uses a three-tier hierarchy to prioritize the pricing assumptions, referred to as inputs, used in valuation techniques to measure fair value. Level 1 includes quoted prices in active markets for identical securities. Level 2 includes significant observable inputs. Observable inputs may include quoted prices for similar securities, interest rates, prepayment speeds and credit risk. Prices for securities valued using these techniques are received from independent pricing vendors and brokers and are based on an evaluation of the inputs described. Level 3 includes significant unobservable inputs when market prices are not readily available or reliable, including the Fund’s own assumptions in determining the fair value of investments. The inputs or methodology used for valuing securities are not necessarily an indication of the risk associated with investing in those securities.
As of September 30, 2010, all investments are categorized as Level 1 under the hierarchy described above.
During the six month period ended September 30, 2010, there were no significant transfers in or out of Level 1 or Level 2 assets.
| 22 | Small Company Fund | Semiannual report |
In order to value the securities, the Fund uses the following valuation techniques. Equity securities held by the Fund are valued at the last sale price or official closing price on the principal securities exchange on which they trade. In the event there were no sales during the day or closing prices are not available, then securities are valued using the last quoted bid or evaluated price. Investments in open-end mutual funds are valued at their closing net asset values each day. Foreign securities and currencies are valued in U.S. dollars, based on foreign currency exchange rates supplied by an independent pricing service. Certain securities traded only in the over-the-counter market are valued at the last bid price quoted by brokers making markets in the securities at the close of trading. Certain short-term securities are valued at amortized cost.
Other portfolio securities and assets, where market quotations are not readily available, are valued at fair value, as determined in good faith by the Fund’s Pricing Committee, following procedures established by the Board of Trustees. Generally, trading in non-U.S. securities is substantially completed each day at various times prior to the close of trading on the NYSE. Significant market events that affect the values of non-U.S. securities may occur after the time when the valuation of the securities is generally determined and the close of the NYSE. During significant market events, these securities will be valued at fair value, as determined in good faith, following procedures established by the Board of Trustees. The Fund may use a fair valuation model to value non-U.S. securities in order to adjust for events which may occur between the close of foreign exchanges and the close of the NYSE.
Security transactions and related investment income. Investment security transactions are accounted for on a trade date plus one basis for daily net asset value calculations. However, for financial reporting purposes, investment transactions are reported on trade date. Interest income is accrued as earned. Gains and losses on securities sold are determined on the basis of identified cost and may include proceeds from litigation. Dividend income is recorded on the ex-date, except for certain foreign dividends where the ex-date may have passed, which are recorded when the Fund becomes aware of the dividends.
Real estate investment trusts. From time to time, the Fund may invest in real estate investment trusts (REITs) and, as a result, will estimate the components of distributions from these securities. Distributions from REITs received in excess of income are recorded as a reduction of cost of investments and/or as a realized gain.
Line of credit. The Fund may borrow from banks for temporary or emergency purposes, including meeting redemption requests that otherwise might require the untimely sale of securities. Pursuant to the custodian agreement, the custodian may loan money to a Fund to make properly authorized payments. The Fund is obligated to repay the custodian for any overdraft, including any related costs or expenses. The custodian has a lien, security interest or security entitlement in any Fund property that is not segregated, to the maximum extent permitted by law for any overdraft.
In addition, the Fund and other affiliated funds have entered into an agreement with the State Street Bank and Trust Company which enables them to participate in a $100 million unsecured committed line of credit. A commitment fee, payable at the end of each calendar quarter, based on the average daily unused portion of the line of credit, is charged to each participating fund on a pro rata basis and is reflected in other expenses on the Statement of Operations. For the six-month period ended September 30, 2010, the Fund had no borrowings under the line of credit.
Expenses. The majority of expenses are directly attributable to an individual fund. Expenses that are not readily attributable to a specific fund are allocated among all funds in an equitable manner, taking into consideration, among other things, the nature and type of expense and the fund’s relative assets. Expense estimates are accrued in the period to which they relate and adjustments are made when actual amounts are known.
| Semiannual report | Small Company Fund | 23 |
Class allocations. Income, common expenses, and realized and unrealized gains (losses) are determined at the fund level and allocated daily to each class of shares based on the net asset value of the class. Class-specific expenses, such as distribution and service fees, if any, transfer agent fees, state registration fees and printing and postage fees, for all classes are calculated daily at the class level based on the appropriate net asset value of each class and the specific expense rates applicable to each class.
Federal income taxes. The Fund intends to qualify as a regulated investment company by complying with the applicable provisions of the Internal Revenue Code and will not be subject to federal income tax on taxable income that is distributed to shareholders. Therefore, no federal income tax provision is required.
For federal income tax purposes, the Fund had a capital loss carryforward of $38,046,648 available to offset future net realized capital gains as of March 31, 2010. The capital loss carryforward expires as follows: March 31, 2015 — $15,901,391 and March 31, 2016 — $22,145,257.
As of March 31, 2010, the Fund had no uncertain tax positions that would require financial statement recognition, de-recognition or disclosure. The Fund’s federal tax return is subject to examination by the Internal Revenue Service for a period of three years.
Distribution of income and gains. Distributions to shareholders from net investment income and net realized gains, if any, are recorded on the ex-date. The Fund generally declares and pays dividends and capital gain distributions, if any, at least annually.
Distributions paid by the Fund with respect to each class of shares are calculated in the same manner, at the same time and are in the same amount, except for the effect of expenses that may be applied differently to each class.
Such distributions, on a tax basis, are determined in conformity with income tax regulations, which may differ from accounting principles generally accepted in the United States of America. Material distributions in excess of tax basis earnings and profits, if any, are reported in the Fund’s financial statements as a return of capital.
Capital accounts within financial statements are adjusted for permanent book/tax differences. These adjustments have no impact on net assets or the results of operations. Temporary book/tax differences, if any, will reverse in a subsequent period. Permanent book/tax differences are primarily attributable to net operating losses.
Note 3 — Guarantees and indemnifications
Under the Fund’s organizational documents, its Officers and Trustees are indemnified against certain liabilities arising out of the performance of their duties to the Fund. Additionally, in the normal course of business, the Fund enters into contracts with service providers that contain general indemnification clauses. The Fund’s maximum exposure under these arrangements is unknown, as this would involve future claims that may be made against the Fund that have not yet occurred. The risk of material loss from such claims is considered remote.
Note 4 — Fees and transactions with affiliates
John Hancock Investment Management Services, LLC (the Adviser) serves as investment adviser for the Trust. John Hancock Funds, LLC (the Distributor), an affiliate of the Adviser, serves as principal underwriter of the Trust. The Adviser and the Distributor are indirect wholly owned subsidiaries of Manulife Financial Corporation (MFC).
Management fee. The Fund has an investment management contract with the Adviser under which the Fund pays a daily management fee to the Adviser equivalent, on an annual basis, to
| 24 | Small Company Fund | Semiannual report |
the sum of: (a) 0.90% of the first $500,000,000 of the Fund’s average daily net assets; (b) 0.85% of the next $500,000,000; and (c) 0.80% of the Fund’s average daily net assets in excess of $1,000,000,000. The Adviser has a subadvisory agreement with Fiduciary Management Associates, LLC. The Fund is not responsible for payment of the subadvisory fees.
The investment management fees incurred for the six month period ended September 30, 2010 were equivalent to an annual effective rate of 0.90% of the Fund’s average daily net assets.
Effective the entire six month period ended for Class A, Class I and Class ADV shares and effective April 30, 2010 for Class R1, Class R3, Class R4 and Class R5 shares, the Adviser has contractually agreed to waive fees and/or reimburse certain expenses for each share class of the Fund. This agreement excludes taxes, brokerage commissions, interest, litigation and indemnification expenses and other extraordinary expenses not incurred in the ordinary course of the Fund’s business. The fee waivers and/or reimbursements were such that these expenses will not exceed 1.34%, 1.11%, 1.80%, 1.70%, 1.40%, 1.10% and 1.34% for Class A, Class I, Class R1, Class R3, Class R4, Class R5 and Class ADV shares, respectively. The fee waivers and/or reimbursements will continue in effect until July 31, 2011 for Class A, June 30, 2011 for Class R1, Class R3, Class R4 and Class R5 and December 11, 2011 for Class I and Class ADV shares.
Accordingly, the expense reductions or reimbursements related to these agreements were $32,748, $53, $62, $67, $71 and $451 for Class A, Class R1, Class R3, Class R4, Class R5 and Class ADV shares, respectively, for the six months ended September 30, 2010.
Accounting and legal services. Pursuant to the service agreement, the Fund reimburses the Adviser for all expenses associated with providing the administrative, financial, legal, accounting and recordkeeping services of the Fund, including the preparation of all tax returns, periodic reports to shareholders and regulatory reports, among other services. These expenses are allocated to each share class based on its relative net assets at the time the expense was incurred. The accounting and legal services fees incurred for the six months ended September 30, 2010 amounted to an annual rate of 0.02% of the Fund’s average daily net assets.
Distribution and service plans. The Fund has a distribution agreement with the Distributor. The Fund has adopted distribution and service plans with respect to Class A, Class R1, Class R3, Class R4 and Class ADV shares pursuant to Rule 12b-1 under the 1940 Act, to pay the Distributor for services provided as the distributor of shares of the Fund. In addition, under a service plan for Class R1, Class R3, Class R4 and Class R5 shares, the Fund pays for certain other services. The following table shows the contractual rates of distribution and service fees under these arrangements, expressed as an annual percentage of average daily net assets for each class of the Fund’s shares.
| CLASS | 12b–1 FEES | SERVICE FEES | |||
| Class A | 0.30% | — | |||
| Class R1 | 0.50% | 0.25% | |||
| Class R3 | 0.50% | 0.15% | |||
| Class R4 | 0.25% | 0.10% | |||
| Class R5 | — | 0.05% | |||
| Class ADV | 0.25% | — | |||
Sales charges. Class A shares are assessed up-front sales charges, which resulted in payments to the Distributor amounting to $27,895 for the six months ended September 30, 2010. Of this $5,376 was retained and used for printing prospectuses, advertising, sales literature and other purposes, $22,193 was paid as sales commissions to broker-dealers and $326 was paid as sales commissions to sales personnel of Signator Investors, Inc. (Signator Investors), a broker-dealer affiliate of the Adviser.
| Semiannual report | Small Company Fund | 25 |
Transfer agent fees. The Fund has a transfer agent agreement with John Hancock Signature Services, Inc. (Signature Services or Transfer Agent), an affiliate of the Adviser. The transfer agent fees paid to Signature Services are determined based on the cost to Signature Services (Signature Services Cost) of providing recordkeeping services. The Signature Services Cost includes a component of allocated John Hancock corporate overhead for providing transfer agent services to the Fund and to all other John Hancock affiliated funds. It also includes out-of-pocket expenses that are comprised of payments made to third-parties for recordkeeping services provided to their clients who invest in one or more John Hancock funds. In addition, Signature Services Cost may be reduced by certain revenues that Signature Services received in connection with the service they provide to the funds. Signature Services Cost is calculated m onthly and allocated, as applicable, to four categories of share classes: Institutional Share Classes, Retirement Share Classes, Municipal Bond Classes and all other Retail Share Classes. Within each of these categories, the applicable costs are allocated to the affected John Hancock affiliated funds and/or classes, based on the relative average daily net assets.
Prior to July 1, 2010, the transfer agent fees were made up of three components:
• The Fund paid a monthly transfer agent fee at an annual rate of 0.05% for Class A, Class R1, Class R3, Class R4, Class R5 and Class ADV shares and 0.04% for Class I shares, based on each class’s average daily net assets.
• The Fund paid a monthly fee based on an annual rate of $16.50 per shareholder account for all share classes except Class ADV shares.
• In addition, Signature Services was reimbursed for certain out-of-pocket expenses.
Class level expenses. Class level expenses for the six months ended September 30, 2010 were:
| DISTRIBUTION | TRANSFER | ||||
| CLASS | AND SERVICE FEES | AGENT FEES | |||
| Class A | $123,010 | $43,075 | |||
| Class I | — | 9,232 | |||
| Class R1 | 46 | 74 | |||
| Class R3 | 46 | 74 | |||
| Class R4 | 23 | 74 | |||
| Class R5 | — | 74 | |||
| Class ADV | 275 | 345 | |||
| Total | $123,400 | $52,948 | |||
For the six months ended September 30, 2010, the Fund had no state registration or printing and postage expenses.
Trustee expenses. The Trust compensates each Trustee who is not an employee of the Adviser or its affiliates. These Trustees may, for tax purposes, elect to defer receipt of this compensation under the John Hancock Group of Funds Deferred Compensation Plan (the Plan). Deferred amounts are invested in various John Hancock funds and remain in the funds until distributed in accordance with the Plan. The investment of deferred amounts and the offsetting liability are included within other receivables and prepaid assets and Payable to affiliates — Trustees’ fees, respectively, in the accompanying Statement of Assets and Liabilities.
| 26 | Small Company Fund | Semiannual report |
Note 5 — Fund share transactions
Transactions in Fund shares for the six months ended September 30, 2010, period ended March 31, 2010 and year ended October 31, 2010, were as follows:
| Six months ended 9-30-10 | Period ended 3-31-101,3 | Year ended 10-31-09 | ||||
| Shares | Amount | Shares | Amount | Shares | Amount | |
| Class A shares | ||||||
| Sold | 568,067 | $9,764,186 | 436,923 | $7,481,082 | 1,121,281 | $14,394,716 |
| Distributions | ||||||
| reinvested | — | — | 5,373 | 83,872 | 11,880 | 153,251 |
| Repurchased | (1,311,687) | (22,509,727) | (1,190,634) | (19,439,329) | (2,717,492) | (34,890,126) |
| Net decrease | (743,620) | ($12,745,541) | (748,338) | ($11,874,375) | (1,584,331) | ($20,342,159) |
| Class I shares | ||||||
| Sold | 849,099 | $14,804,016 | 580,444 | $9,479,362 | 448,819 | $5,597,754 |
| Distributions | ||||||
| reinvested | — | — | 4,761 | 74,319 | 4,884 | 63,003 |
| Repurchased | (140,925) | (2,412,532) | (135,551) | (2,234,345) | (842,105) | (11,224,329) |
| Net increase | ||||||
| (decrease) | 708,174 | $12,391,484 | 449,654 | $7,319,336 | (388,402) | ($5,563,572) |
| Class R1 shares2 | ||||||
| Sold | 1,290 | $25,000 | — | — | — | — |
| Net increase | 1,290 | $25,000 | — | — | — | — |
| Class R3 shares2 | ||||||
| Sold | 1,290 | $25,000 | — | — | — | — |
| Net increase | 1,290 | $25,000 | — | — | — | — |
| Class R4 shares2 | ||||||
| Sold | 1,290 | $25,000 | — | — | — | — |
| Net increase | 1,290 | $25,000 | — | — | — | — |
| Class R5 shares2 | ||||||
| Sold | 1,290 | $25,000 | — | — | — | — |
| Net increase | 1,290 | $25,000 | — | — | — | — |
| Class ADV shares | ||||||
| Sold | 16,233 | $283,092 | 3,900 | $63,577 | — | — |
| Repurchased | (38) | (635) | — | — | — | — |
| Net increase | 16,195 | $282,457 | 3,900 | $63,577 | — | — |
| Net increase | ||||||
| (decrease) | (14,091) | $28,400 | (294,784) | ($4,491,462) | (1,972,733) | ($25,905,731) |
1 For the five month period ended 3-31-10. The Fund changed its fiscal year end from October 31 to March 31.
2 Period from 4-30-10 (inception date) to 9-30-10.
3 Period from 12-14-09 (inception date) to 3-31-10 for Class ADV shares.
Note 6 — Purchase and sale of securities
Purchases and sales of securities, other than short-term securities, aggregated $82,617,252 and $79,291,925, respectively, for the six months ended September 30, 2010.
Note 7 — Reorganization
At the close of business on December 11, 2009, the Fund acquired all the assets and liabilities of FMA Small Company Portfolio (the Acquired Fund) in exchange for the Class A and Class I shares of the Fund. The Fund had no assets, liabilities or operations prior to the reorganization.
| Semiannual report | Small Company Fund | 27 |
The Agreement provided for (a) the acquisition of all the assets, subject to all of the liabilities, of the Acquired Fund in exchange for a representative amount of shares of the Fund; (b) the liquidation of the Acquired Fund; and (c) the distribution to the Acquired Fund’s shareholders of the Fund’s shares. The reorganization was intended to allow the Fund to be better positioned to increase asset size and achieve additional economies of scale by achieving net prices on securities trades and spread fixed expenses over a larger asset base. As a result of the reorganization, the Fund is the legal survivor, however, the accounting and performance history of the Investor Shares and Institutional Shares of the Acquired Fund have been redesignated as that of Class A and Class I of the Fund.
Based on the opinion of tax counsel, the reorganization qualified as a tax-free reorganization for federal income tax purposes with no gain or loss recognized by the Acquired Fund or its shareholders. Thus, the investments were transferred to the Fund at the Acquired Fund’s identified cost. All distributable amounts of net income and realized gains from the Acquired Fund were distributed prior to the reorganization. In addition, the expenses of the reorganization were borne by the Advisers of both the Acquired Fund and the Fund. The effective time of the reorganization occurred immediately after the close of regularly scheduled trading on the New York Stock Exchange (NYSE) on December 11, 2009. The following outlines the reorganization:
| ACQUIRED NET | APPRECIATION OF | |||
| ASSET VALUE OF THE | ACQUIRED FUND’S | SHARES ISSUED | TOTAL NET ASSETS | |
| ACQUIRED FUND | ACQUIRED FUND | INVESTMENTS | BY THE FUND | AFTER COMBINATION |
| FMA Small Company | ||||
| Portfolio | $114,978,635 | $13,294,586 | 7,316,559* | $114,978,635 |
*The Fund issued 5,788,995 shares of Class A and 1,527,564 shares of Class I as a result of the above reorganization.
At the time of the reorganization, certain capital loss carryforward attributable to the Acquired Fund may be able to be used by the Fund to offset future net realized capital gains. To the extent that such carryforward are used by the Fund, it will reduce the amount of capital gain distributions to be paid, though the availability of the capital loss carryforward attributable to the reorganization may be limited in any given year. Capital loss carryforward transferred from the Acquired Fund to the Fund were $23,032,363 and $22,145,257 and expire on March 31, 2015 and March 31, 2016, respectively.
| 28 | Small Company Fund | Semiannual report |
More information
| Trustees | Investment adviser | |
| Patti McGill Peterson, Chairperson | John Hancock Investment Management | |
| James F. Carlin | Services, LLC | |
| William H. Cunningham | ||
| Deborah C. Jackson* | Subadviser | |
| Charles L. Ladner | Fiduciary Management Associates, LLC | |
| Stanley Martin* | ||
| Hugh McHaffie†** | Principal distributor | |
| Dr. John A. Moore | John Hancock Funds, LLC | |
| Steven R. Pruchansky* | ||
| Gregory A. Russo | Custodian | |
| John G. Vrysen† | State Street Bank and Trust Company | |
| Officers | Transfer agent | |
| Keith F. Hartstein | John Hancock Signature Services, Inc. | |
| President and Chief Executive Officer | ||
| Legal counsel | ||
| Andrew G. Arnott | K&L Gates LLP | |
| Senior Vice President** and Chief Operating Officer | ||
| Thomas M. Kinzler | The report is certified under the Sarbanes-Oxley | |
| Secretary and Chief Legal Officer | Act, which requires mutual funds and other public | |
| companies to affirm that, to the best of their | ||
| Francis V. Knox, Jr. | knowledge, the information in their financial reports | |
| Chief Compliance Officer | is fairly and accurately stated in all material respects. | |
| Charles A. Rizzo | ||
| Chief Financial Officer | ||
| Salvatore Schiavone** | ||
| Treasurer | ||
| *Member of the Audit Committee | ||
| **Effective 8-31-10 | ||
| †Non-Independent Trustee | ||
The Fund’s proxy voting policies and procedures, as well as the Fund’s proxy voting record for the most recent twelve-month period ended June 30, are available free of charge on the Securities and Exchange Commission (SEC) Web site at www.sec.gov or on our Web site.
The Fund’s complete list of portfolio holdings, for the first and third fiscal quarters, is filed with the SEC on Form N-Q. The Fund’s Form N-Q is available on our Web site and the SEC’s Web site, www.sec.gov, and can be reviewed and copied (for a fee) at the SEC’s Public Reference Room in Washington, DC. Call 1-800-SEC-0330 to receive information on the operation of the SEC’s Public Reference Room.
We make this information on your fund, as well as monthly portfolio holdings, and other fund details available on our Web site www.jhfunds.com or by calling 1-800-225-5291.
| You can also contact us: | ||
| 1-800-225-5291 | Regular mail: | Express mail: |
| jhfunds.com | John Hancock Signature Services, Inc. | John Hancock Signature Services, Inc. |
| P.O. Box 55913 | Mutual Fund Image Operations | |
| Boston, MA 02205-5913 | 30 Dan Road | |
| Canton, MA 02021 |
| Semiannual report | Small Company Fund | 29 |

1-800-225-5291
1-800-554-6713 TDD
1-800-338-8080 EASI-Line
www.jhfunds.com
Now available: electronic delivery
www.jhfunds.com/edelivery
| This report is for the information of the shareholders of John Hancock Small Company Fund. | 348SA 9/10 |
| It is not authorized for distribution to prospective investors unless preceded or accompanied by a prospectus. | 11/10 |
ITEM 2. CODE OF ETHICS.
Not applicable at this time.
ITEM 3. AUDIT COMMITTEE FINANCIAL EXPERT.
Not applicable at this time.
ITEM 4. PRINCIPAL ACCOUNTANT FEES AND SERVICES.
Not applicable at this time.
ITEM 5. AUDIT COMMITTEE OF LISTED REGISTRANTS.
Not applicable at this time.
ITEM 6. SCHEDULE OF INVESTMENTS.
Not applicable.
ITEM 7. DISCLOSURE OF PROXY VOTING POLICIES AND PROCEDURES FOR CLOSED-END MANAGEMENT INVESTMENT COMPANIES.
Not applicable.
ITEM 8. PORTFOLIO MANAGERS OF CLOSED-END MANAGEMENT INVESTMENT COMPANIES.
Not applicable.
ITEM 9. PURCHASES OF EQUITY SECURITIES BY CLOSED-END MANAGEMENT INVESTMENT COMPANY AND AFFILIATED PURCHASERS.
Not applicable.
ITEM 10. SUBMISSION OF MATTERS TO A VOTE OF SECURITY HOLDERS.
Not applicable.
ITEM 11. CONTROLS AND PROCEDURES.
(a) EVALUATION OF DISCLOSURE CONTROLS AND PROCEDURES. The registrant maintains disclosure controls and procedures that are designed to ensure that information required to be disclosed in this Form N-CSR is recorded, processed, summarized and reported within the time periods specified in the rules and forms of the Securities and Exchange Commission. Such disclosure and procedures include controls and procedures designed to ensure that such information is accumulated and communicated to the registrant’s management, including its principal executive officer and principal financial officer, as appropriate, to allow timely decisions regarding required disclosure.
Within 90 days prior to the filing date of this Form N-CSR, the registrant had carried out an evaluation, under the supervision and with the participation of the registrant’s management, including the registrant’s principal executive officer and the registrant’s principal financial officer, of the effectiveness of the design and operation of the registrant’s disclosure controls and procedures relating to information required to be disclosed on Form N-CSR. Based on such
evaluation, the registrant’s principal executive officer and principal financial officer concluded that the registrant’s disclosure controls and procedures are operating effectively to ensure that:
(i) information required to be disclosed in this Form N-CSR is recorded, processed, summarized and reported within the periods specified in the rules and forms of the Securities and Exchange Commission, and
(ii) information is accumulated and communicated to the registrant’s management, including its principal executive officer and principal financial officer, as appropriate, to allow timely decisions regarding required disclosure.
(b) CHANGE IN REGISTRANT’S INTERNAL CONTROL: Not applicable.
ITEM 12. EXHIBITS.
(a)(1)(i) CERTIFICATION OF PRINCIPAL EXECUTIVE OFFICER.
(a)(1)(ii) CERTIFICATION OF PRINCIPAL FINANCIAL OFFICER.
(b) CERTIFICATION PURSUANT TO Rule 30a-2(b) OF THE INVESTMENT COMPANY ACT OF 1940.
(c)(1) Contact person at the registrant.
| SIGNATURES |
Pursuant to the requirements of the Securities Exchange Act of 1934 and the Investment Company Act of 1940, the registrant has duly caused this report to be signed on its behalf by the undersigned, thereunto duly authorized.
| John Hancock Funds III | ||
| By: | /s/ Keith F. Hartstein | |
| Keith F. Hartstein | ||
| President and | ||
| Chief Executive Officer | ||
| Date: | November 22, 2010 | |
Pursuant to the requirements of the Securities Exchange Act of 1934 and the Investment Company Act of 1940, this report has been signed below by the following persons on behalf of the registrant and in the capacities and on the dates indicated.
| By: | /s/ Keith F. Hartstein | |
| Keith F. Hartstein | ||
| President and | ||
| Chief Executive Officer | ||
| Date: | November 22, 2010 | |
| By: | /s/ Charles A. Rizzo | |
| Charles A. Rizzo | ||
| Chief Financial Officer | ||
| Date: | November 22, 2010 | |