UNITED STATES
SECURITIES AND EXCHANGE COMMISSION
Washington, D.C. 20549
FORM N-CSR
CERTIFIED SHAREHOLDER REPORT OF REGISTERED
MANAGEMENT INVESTMENT COMPANIES
Investment Company Act file number | 811-21902 |
|
Cohen & Steers Institutional Global Realty Shares, Inc. |
(Exact name of registrant as specified in charter) |
|
280 Park Avenue, New York, NY | | 10017 |
(Address of principal executive offices) | | (Zip code) |
|
Adam M. Derechin
Cohen & Steers Capital Management, Inc.
280 Park Avenue
New York, New York 10017 |
(Name and address of agent for service) |
|
Registrant’s telephone number, including area code: | (212) 832-3232 | |
|
Date of fiscal year end: | December 31 | |
|
Date of reporting period: | June 30, 2007 | |
| | | | | | | | |
Item 1. Reports to Stockholders.
COHEN & STEERS INSTITUTIONAL GLOBAL REALTY SHARES, INC.
August 9, 2007
To Our Shareholders:
We are pleased to submit to you our report for the six months ended June 30, 2007. The net asset value at that date was $28.70 per share. In addition, a regular distribution of $0.219 per share was declared for shareholders of record on June 28, 2007 and was paid on June 29, 2007.a
The total return, including income and change in net asset value, for Cohen & Steers Institutional Global Realty Shares and the comparative benchmarks were:
| | | Six Months Ended
June 30, 2007 | |
| Cohen & Steers Institutional Global Realty Shares | | | –2.17 | % | |
| FTSE EPRA/NAREIT Global Real Estate Indexb | | | 0.01 | % | |
| S&P 500 Indexb | | | 6.96 | % | |
The performance data quoted represent past performance. Past performance is no guarantee of future results. The investment return and the principal value of an investment will fluctuate and shares, if redeemed, may be worth more or less than their original cost. Current performance may be lower or higher than the performance data quoted. Total returns of the fund current to the most recent month-end can be obtained by visiting our Web site at cohenandsteers.com.
Investment Review
Global real estate securities had a slightly positive total return for the first half of 2007, although most markets fell in June due to elevated inflation and interest rate concerns. In addition, while real estate fundamentals are still strong, the prospects for further cap rate compression (increases in valuations due to lower yields) has diminished this year in many markets—that means that extraordinary capital appreciation in property markets is less likely, and growth will more closely track increases in rents and cash flows.
Uncertainty in U.S. market
Performance varied by region. The United States underperformed the FTSE/NAREIT Global Real Estate Index with a –6.0% total return1 in the six-month period. Following four years of double-digit total returns (and seven
a Please note that distributions paid by the fund to shareholders are subject to recharacterization for tax purposes. The final tax treatment of these distributions is reported to shareholders after the close of each fiscal year.
b The FTSE EPRA/NAREIT Global Real Estate Index is an unmanaged portfolio of approximately 314 constituents from 22 countries. The S&P 500 Index is an unmanaged index of common stocks that is frequently used as a general measure of stock market performance.
1 The investment review country returns are in local currency as measured by FTSE EPRA.
1
COHEN & STEERS INSTITUTIONAL GLOBAL REALTY SHARES, INC.
years of positive performance) and a strong start to 2007, REITs were negatively affected by concern over rising interest rates and uncertainty about whether asset pricing would suffer. Expectations for Federal Reserve monetary easing were pushed back as economic growth continued and inflation fears persisted. The possibility that the Fed might in fact raise rates entered the picture, and the yield on the 10-year Treasury bond in June climbed to 5.26%, its highest level in five years; the yield retreated to 5.03% by period end.
Growth rates for U.S. real estate companies have generally stabilized, after accelerating in the past few years. This signaled an end to the stock-multiple expansion phase of the real estate cycle, and set expectations for more normalized (yet solid) returns for REITs.
A trend of large privatization deals in the United States continued, including Archstone-Smith agreeing to be acquired for $22.2 billion by a partnership sponsored by Tishman Speyer and Lehman Brothers. The deal reflected a 22.7% premium to the stock price before a rumor of the deal was published on May 24, 2007. This deal—the largest-ever public-to-private market transaction in the apartment sector—underscored for the market the overall positive prospects for apartment fundamentals and the sustainability of apartment asset pricing.
Global Real Estate Securities Total Returns in Local Currencies
YTD through June 30, 2007
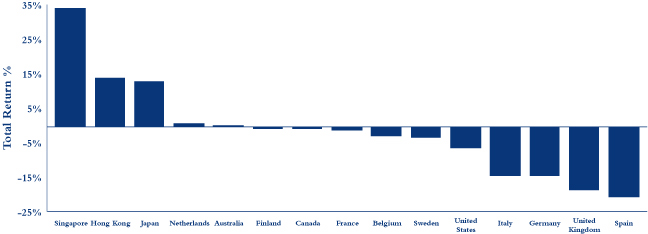
Asia Pacific outperformed
Asia had across-the-board gains, paced by Singapore (with a total return of 32.0%), reflecting strong demand for space and limited new supply, especially in the office sector.
Japan (+13.5%) benefited from optimism that its real estate market has entered a sustained recovery after a long period of deflation, although the market was weak in June due to concerns that the Bank of Japan would continue to raise interest rates. Land prices in Japan are rising for the first time in 16 years. Property fundamentals, especially in Tokyo, are accelerating, and office vacancy rates in the city's main wards have fallen below 3%.
2
COHEN & STEERS INSTITUTIONAL GLOBAL REALTY SHARES, INC.
Hong Kong (+14.5%) benefited from its role as a conduit to business activity in China. This was highlighted in May when China's government designated Hong Kong as the only window for Chinese investment in overseas securities products, including Hong Kong equities. Demand for office space has remained strong and fundamentals are improving in the residential market.
European markets declined
Germany (–15.9%) struggled, despite an improving economy, as restructuring of the residential market proved slower than expected. The country's REIT structure was introduced in March (retroactive to January 1), although the market is unlikely to see its first REITs listed until 2008 due to more advantageous tax treatment for corporate asset sales next year.
The United Kingdom (–17.4%) also declined, hampered by concerns over slowing NAV growth along with rising interest rates. Equity generalists—that is, non-REIT specialists—have been selling real estate securities with the belief that real estate will underperform other equities in the near term. (Generalists represent the majority of U.K. investors). Norway (+10.4%) was an exception, aided by improving demand for office space and limited new supply due to high construction costs.
Global M&A activity
There was also a pickup in mergers involving non-U.S. companies. France's Unibail and the Netherlands' Rodamco Europe announced that they would merge, a deal that created the largest pan-European portfolio of Class A shopping centers. DaVinci Advisors announced that it would launch a tender offer bid for TOC Co., a Japanese office owner listed on the Tokyo Stock Exchange. Other highlights included Morgan Stanley's announcement that it would acquire Investa Property Group, Australia's largest listed office owner.
Performance hurt by U.K and Germany overweights, helped by Hong Kong
The fund underperformed its benchmark in the period, hampered by our overweights in the United Kingdom and Germany, underweights in Japan and Australia and stock selection in Canada, Germany and Australia. Stock selection in the United States was a negative contributor to relative performance, although this was largely offset by our underweight. Factors that helped the fund's performance included strong stock selection in Japan and Hong Kong and our overweight in Hong Kong.
Investment Outlook
We believe the U.S. real estate market has become more attractive based on discounts to underlying net asset values that have widened meaningfully. However, before U.S. REITs can manage a sustainable recovery, investors may require more clarity on inflation and economic growth. If the economy gains momentum, it would benefit real estate companies; however, it might cause the Fed to raise interest rates, unsettling stock prices, including REITs. A cooling economy, on the other hand, would likely prompt the Fed to cut rates, which could lift stocks, as a rate reduction is not currently expected by the market.
3
COHEN & STEERS INSTITUTIONAL GLOBAL REALTY SHARES, INC.
Recent performance notwithstanding, we believe that the United Kingdom, at current valuations, offers some of the best values in the global markets. Many real estate companies are trading at substantial discounts relative to their net asset values, while the quality of these companies is very high. As fundamentals remain sound, we believe that stock prices will revert toward underlying real estate valuations in the United Kingdom. We also expect to see an increase in stock buybacks as companies take advantage of lower valuations.
Germany's economy is improving, and we believe this will translate into increased demand for office space in major cities. The country's new REIT structure should drive a long-term shift toward securitization as Germany's extensive private real estate holdings begin to go public. We favor France, and believe that strong fundamentals for Paris offices will persist.
Strong dynamics in Asia
We believe economic growth in Asia is driving demand for space that will continue to exceed supply growth. As a result, occupancies and rents are likely to accelerate in many markets, especially in Hong Kong, Japan and Singapore, although the last has become more fairly priced. In Japan, we believe supply growth will remain significantly below demand growth for some time—new supply was largely absent throughout the country's long deflationary period.
Overall, we expect global real estate securities to benefit from solid GDP growth, strong property fundamentals and continued acquisition and development opportunities in the U.S. and elsewhere. Of course, there are certain risks that exist when investing in real estate securities, including declining property values or declining rents resulting from legal or economic developments. Foreign securities carry their own risks, such as currency fluctuations, political and economic uncertainties and differences in accounting standards.
We will seek opportunities as securitization activity picks up internationally due to the new REIT structures in Europe and as the model is adopted by more countries over time.
4
COHEN & STEERS INSTITUTIONAL GLOBAL REALTY SHARES, INC.
 | |  | |
|
| MARTIN COHEN | | ROBERT H. STEERS | |
|
| Co-chairman | | Co-chairman | |
|
 | |  | |
|
| JOSEPH M. HARVEY | | JAMES S. CORL | |
|
| Portfolio Manager | | Portfolio Manager | |
|
 | |  | |
|
| W. JOSEPH HOULIHAN | | GERIOS J. M. ROVERS | |
|
| Portfolio Manager | | Portfolio Manager | |
|
| | |  | |
|
| | | DEREK CHEUNG | |
|
| | | Portfolio Manager | |
|
The views and opinions in the preceding commentary are as of the date stated and are subject to change. This material represents an assessment of the market environment at a specific point in time, should not be relied upon as investment advice and is not intended to predict or depict performance of any investment.
Visit Cohen & Steers online at cohenandsteers.com
For more information about any of our funds, visit cohenandsteers.com, where you'll find daily net asset values, fund fact sheets and portfolio highlights. You can also access newsletters, education tools and market updates covering REIT, utility and preferred securities sectors.
In addition, our Web site contains comprehensive information about our firm, including our most recent press releases, profiles of our senior investment professionals, and an overview of our investment approach.
5
COHEN & STEERS INSTITUTIONAL GLOBAL REALTY SHARES, INC.
Expense Example (Unaudited)
As a shareholder of the fund, you incur two types of costs: (1) transaction costs and (2) ongoing costs including management fees and other fund expenses. This example is intended to help you understand your ongoing costs (in dollars) of investing in the fund and to compare these costs with the ongoing costs of investing in other mutual funds.
The example is based on an investment of $1,000 invested at the beginning of the period and held for the entire period 01/01/07 – 06/30/07.
Actual Expenses
The first line of the table below provides information about actual account values and expenses. You may use the information in this line, together with the amount you invested, to estimate the expenses that you paid over the period. Simply divide your account value by $1,000 (for example, an $8,600 account value divided by $1,000 = 8.6), then multiply the result by the number in the first line under the heading entitled "Expenses Paid During Period" to estimate the expenses you paid on your account during this period.
Hypothetical Example for Comparison Purposes
The second line of the table below provides information about hypothetical account values and hypothetical expenses based on the fund's actual expense ratio and an assumed rate of return of 5% per year before expenses, which is not the fund's actual return. The hypothetical account values and expenses may not be used to estimate the actual ending account balance or expenses you paid for the period. You may use this information to compare the ongoing cost of investing in the fund and other funds. To do so, compare this 5% hypothetical example with the 5% hypothetical examples that appear in the shareholder reports of the other funds.
Please note that the expenses shown in the table are meant to highlight your ongoing costs only and do not reflect any transactional costs. Therefore, the second line of the table is useful in comparing ongoing costs only, and will not help you determine the relative total costs of owning different funds. In addition, if these transactional costs were included, your costs would have been higher.
| | | Beginning
Account Value
January 1, 2007 | | Ending
Account Value
June 30, 2007 | | Expenses Paid
During Period*
January 1, 2007 –
June 30, 2007 | |
| Actual (–2.17% return) | | $ | 1,000.00 | | | $ | 978.30 | | | $ | 4.91 | | |
| Hypothetical (5% annual return before expenses) | | $ | 1,000.00 | | | $ | 1,019.84 | | | $ | 5.01 | | |
* Expenses are equal to the Fund's annualized expense ratio of 1.00% multiplied by the average account value over the period, multiplied by 181/365 (to reflect the one-half year period). If the fund had borne all if its expenses that were assumed by the advisor, the annualized expense ratio would have been 1.08%.
6
COHEN & STEERS INSTITUTIONAL GLOBAL REALTY SHARES, INC.
Performance Review (Unaudited)
Average Annual Total Returns—For the Period Ended June 30, 2007
| | | Since Inceptiona | |
| Fund | | | 16.40 | % | |
The performance data quoted represent past performance. Past performance is no guarantee of future results. The investment return and principal value of an investment will fluctuate and shares, when redeemed, may be worth more or less than their original cost. Current performance may be lower or higher than the performance data quoted. Performance information current to the most recent month-end can be obtained by visiting our Web site at cohenandsteers.com. The performance table does not reflect the deduction of taxes that a shareholder would pay on fund distributions or the redemption of fund shares.
The fund's manager has contractually agreed to waive certain fees and/or reimburse the fund for expenses for the life of the fund. Absent such arrangements, returns would have been lower.
a Inception date of August 10, 2006.
7
COHEN & STEERS INSTITUTIONAL GLOBAL REALTY SHARES, INC.
JUNE 30, 2007
Top Ten Long-Term Holdings
(Unaudited)
| Security | | Market
Value | | % of
Net
Assets | |
| Mitsubishi Estate Co., Ltd. | | $ | 11,073,706 | | | | 5.4 | % | |
| Land Securities Group PLC | | | 10,377,679 | | | | 5.0 | | |
| Mitsui Fudosan Co., Ltd. | | | 10,172,751 | | | | 4.9 | | |
| Unibail-Rodamco | | | 8,460,656 | | | | 4.1 | | |
| British Land Co., PLC | | | 7,773,369 | | | | 3.8 | | |
| Public Storage | | | 5,650,418 | | | | 2.7 | | |
| Hongkong Land Holdings Ltd. (USD) | | | 5,287,500 | | | | 2.6 | | |
| Brookfield Properties Corp. | | | 5,267,394 | | | | 2.5 | | |
| Westfield Group | | | 4,846,809 | | | | 2.3 | | |
| Boston Properties | | | 4,693,180 | | | | 2.3 | | |
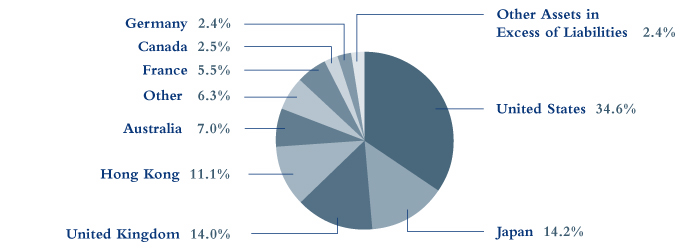
Country Breakdown
(Based on Net Assets)
(Unaudited)
8
COHEN & STEERS INSTITUTIONAL GLOBAL REALTY SHARES, INC.
SCHEDULE OF INVESTMENTS
June 30, 2007 (Unaudited)
| | | | | Number
of Shares | | Value | |
| COMMON STOCK | | | 97.6 | % | | | | | | | | | |
| AUSTRALIA | | | 7.0 | % | | | | | | | | | |
| DIVERSIFIED | | | 2.2 | % | | | | | | | | | |
| GPT Group | | | | | | | 508,358 | | | $ | 2,008,395 | | |
| Mirvac Group | | | | | | | 199,673 | | | | 964,912 | | |
| Stockland | | | | | | | 218,526 | | | | 1,509,922 | | |
| | | | | | | | 4,483,229 | | |
| INDUSTRIAL | | | 0.9 | % | | | | | | | | | |
| Macquarie Goodman Group | | | | | | | 330,264 | | | | 1,881,586 | | |
| OFFICE | | | 1.1 | % | | | |
| Commonwealth Property Office Fund | | | | | | | 385,712 | | | | 547,736 | | |
| ING Office Fund | | | | | | | 697,967 | | | | 1,035,539 | | |
| Tishman Speyer Office Fund | | | | | | | 400,000 | | | | 803,715 | | |
| | | | | | | | 2,386,990 | | |
| SHOPPING CENTER | | | 2.8 | % | | | |
| CFS Gandel Retail Trust | | | | | | | 488,828 | | | | 891,021 | | |
| Westfield Group | | | | | | | 286,419 | | | | 4,846,809 | | |
| | | | | | | | 5,737,830 | | |
| TOTAL AUSTRALIA | | | | | | | | | | | 14,489,635 | | |
| AUSTRIA | | | 0.7 | % | | | | | | | | | |
| DIVERSIFIED | |
| CA Immobilien Anlagen AGa | | | | | | | 50,875 | | | | 1,501,765 | | |
| CANADA | | | 2.5 | % | | | | | | | | | |
| OFFICE | |
| Brookfield Properties Corp. | | | | | | | 216,676 | | | | 5,267,394 | | |
| FINLAND | | | 0.8 | % | | | | | | | | | |
| DIVERSIFIED | |
| Sponda Oyj | | | | | | | 108,750 | | | | 1,585,210 | | |
See accompanying notes to financial statements.
9
COHEN & STEERS INSTITUTIONAL GLOBAL REALTY SHARES, INC.
SCHEDULE OF INVESTMENTS—(Continued)
June 30, 2007 (Unaudited)
| | | | | Number
of Shares | | Value | |
| FRANCE | | | 5.5 | % | | | |
| DIVERSIFIED | |
| Fonciere des Regions | | | | | | | 13,347 | | | $ | 1,960,178 | | |
Societe Immobiliere de Location pour L'Industrie et le
Commerce (Silic) | | | | | | | 6,088 | | | | 984,656 | | |
| Unibail-Rodamco | | | | | | | 32,875 | | | | 8,460,656 | | |
| | | | | | | | 11,405,490 | | |
| GERMANY | | | 2.4 | % | | | | | | | | | |
| APARTMENT | | | 0.9 | % | | | | | | | | | |
| Gagfah SA | | | | | | | 19,973 | | | | 436,574 | | |
| Patrizia Immobilien AG | | | | | | | 82,375 | | | | 1,462,754 | | |
| | | | | | | | 1,899,328 | | |
| DIVERSIFIED | | | 0.4 | % | | | | | | | | | |
| IVG Immobilien AG | | | | | | | 23,100 | | | | 904,487 | | |
| OFFICE | | | 1.1 | % | | | | | | | | | |
| Alstria Office AGa | | | | | | | 68,108 | | | | 1,379,024 | | |
| Eurocastle Investment Ltd. | | | | | | | 18,121 | | | | 839,765 | | |
| | | | | | | | 2,218,789 | | |
| TOTAL GERMANY | | | | | | | | | | | 5,022,604 | | |
| HONG KONG | | | 11.1 | % | | | | | | | | | |
| DIVERSIFIED | | | 7.8 | % | | | | | | | | | |
| Cheung Kong Holdings Ltd. | | | | | | | 77,000 | | | | 1,009,374 | | |
| Great Eagle Holdings Ltd. | | | | | | | 891,389 | | | | 3,123,601 | | |
| Hang Lung Properties Ltd. | | | | | | | 308,000 | | | | 1,061,566 | | |
| Henderson Land Development Company Ltd. | | | | | | | 354,999 | | | | 2,417,600 | | |
| Hysan Development Company Ltd. | | | | | | | 1,112,735 | | | | 2,960,007 | | |
| Kerry Properties Ltd. | | | | | | | 156,348 | | | | 985,773 | | |
| Sun Hung Kai Properties Ltd. | | | | | | | 211,999 | | | | 2,554,009 | | |
| Wharf Holdings Ltd. | | | | | | | 494,992 | | | | 1,978,272 | | |
| | | | | | | | 16,090,202 | | |
| HOTEL | | | 0.8 | % | | | | | | | | | |
| Shangri-La Asia Ltd. | | | | | | | 668,260 | | | | 1,615,269 | | |
See accompanying notes to financial statements.
10
COHEN & STEERS INSTITUTIONAL GLOBAL REALTY SHARES, INC.
SCHEDULE OF INVESTMENTS—(Continued)
June 30, 2007 (Unaudited)
| | | | | Number
of Shares | | Value | |
| OFFICE | | | 2.5 | % | | | | | | | | | |
| Hongkong Land Holdings Ltd. (USD) | | | | | | | 1,175,000 | | | $ | 5,287,500 | | |
| TOTAL HONG KONG | | | | | | | | | | | 22,992,971 | | |
| ITALY | | | 1.0 | % | | | | | | | | | |
| DIVERSIFIED | |
| Beni Stabili S.p.A. | | | | | | | 1,420,977 | | | | 2,079,001 | | |
| JAPAN | | | 14.2 | % | | | | | | | | | |
| DIVERSIFIED | | | 11.9 | % | | | | | | | | | |
| Heiwa Real Estate Co., Ltd. | | | | | | | 175,500 | | | | 1,285,693 | | |
| Kenedix Realty Investment Corp. | | | | | | | 295 | | | | 2,211,452 | | |
| Mitsubishi Estate Co., Ltd. | | | | | | | 407,000 | | | | 11,073,706 | | |
| Mitsui Fudosan Co., Ltd. | | | | | | | 362,000 | | | | 10,172,751 | | |
| | | | | | | | 24,743,602 | | |
| OFFICE | | | 1.1 | % | | | | | | | | | |
| DA Office Investment Corp. | | | | | | | 32 | | | | 210,518 | | |
| Daibiru Corp. | | | | | | | 71,000 | | | | 986,071 | | |
| Nomura Real Estate Office Fund | | | | | | | 98 | | | | 1,058,599 | | |
| | | | | | | | 2,255,188 | | |
| RESIDENTIAL—APARTMENT | | | 0.4 | % | | | | | | | | | |
| New City Residence Investment Corp. | | | | | | | 140 | | | | 778,883 | | |
| SHOPPING CENTER | | | 0.8 | % | | | | | | | | | |
| AEON Mall Co., Ltd. | | | | | | | 53,400 | | | | 1,643,744 | | |
| TOTAL JAPAN | | | | | | | | | | | 29,421,417 | | |
| NETHERLANDS | | | 1.0 | % | | | | | | | | | |
| INDUSTRIAL | | | 0.4 | % | | | | | | | | | |
| ProLogis European Properties | | | | | | | 48,315 | | | | 846,825 | | |
| SHOPPING CENTER | | | 0.6 | % | | | | | | | | | |
| Corio NV | | | | | | | 14,637 | | | | 1,152,571 | | |
| TOTAL NETHERLANDS | | | | | | | | | | | 1,999,396 | | |
See accompanying notes to financial statements.
11
COHEN & STEERS INSTITUTIONAL GLOBAL REALTY SHARES, INC.
SCHEDULE OF INVESTMENTS—(Continued)
June 30, 2007 (Unaudited)
| | | | | Number
of Shares | | Value | |
| NORWAY | | | 0.6 | % | | | | | | | | | |
| REAL ESTATE OPERATIONS/DEVELOPMENT | |
| Norwegian Property ASA | | | | | | | 95,937 | | | $ | 1,199,833 | | |
| SINGAPORE | | | 0.7 | % | | | | | | | | | |
| OFFICE | |
| Capitacommercial Trust | | | | | | | 770,000 | | | | 1,473,853 | | |
| SWEDEN | | | 1.5 | % | | | |
| DIVERSIFIED | |
| Castellum AB | | | | | | | 168,763 | | | | 2,041,926 | | |
| Fabege AB | | | | | | | 92,593 | | | | 1,022,162 | | |
| | | | | | | | 3,064,088 | | |
| UNITED KINGDOM | | | 14.0 | % | | | | | | | | | |
| DIVERSIFIED | | | 10.4 | % | | | | | | | | | |
| British Land Co., PLC | | | | | | | 288,881 | | | | 7,773,369 | | |
| Hammerson PLC | | | | | | | 49,210 | | | | 1,417,059 | | |
| Helical Bar PLC | | | | | | | 93,642 | | | | 870,637 | | |
| Land Securities Group PLC | | | | | | | 296,495 | | | | 10,377,679 | | |
| Quintain Estates & Development PLC | | | | | | | 59,401 | | | | 966,790 | | |
| | | | | | | | 21,405,534 | | |
| INDUSTRIAL | | | 1.2 | % | | | | | | | | | |
| Slough Estates PLC | | | | | | | 196,234 | | | | 2,462,860 | | |
| OFFICE | | | 2.4 | % | | | | | | | | | |
| Derwent London PLC | | | | | | | 110,531 | | | | 4,072,918 | | |
| Great Portland Estates PLC | | | | | | | 70,675 | | | | 940,237 | | |
| | | | | | | | 5,013,155 | | |
| TOTAL UNITED KINGDOM | | | | | | | | | | | 28,881,549 | | |
| UNITED STATES | | | 34.6 | % | | | | | | | | | |
| DIVERSIFIED | | | 2.0 | % | | | | | | | | | |
| Vornado Realty Trust | | | | | | | 37,382 | | | | 4,106,039 | | |
| HEALTH CARE | | | 0.7 | % | | | | | | | | | |
| Ventas | | | | | | | 38,747 | | | | 1,404,579 | | |
See accompanying notes to financial statements.
12
COHEN & STEERS INSTITUTIONAL GLOBAL REALTY SHARES, INC.
SCHEDULE OF INVESTMENTS—(Continued)
June 30, 2007 (Unaudited)
| | | | | Number
of Shares | | Value | |
| HOTEL | | | 3.8 | % | | | | | | | | | |
| Hilton Hotels Corp. | | | | | | | 70,354 | | | $ | 2,354,748 | | |
| Host Hotels & Resorts | | | | | | | 131,338 | | | | 3,036,534 | | |
| Starwood Hotels & Resorts Worldwide | | | | | | | 37,151 | | | | 2,491,718 | | |
| | | | | | | | 7,883,000 | | |
| INDUSTRIAL | | | 2.0 | % | | | | | | | | | |
| ProLogis | | | | | | | 71,418 | | | | 4,063,684 | | |
| OFFICE | | | 8.0 | % | | | | | | | | | |
| BioMed Realty Trust | | | | | | | 81,912 | | | | 2,057,630 | | |
| Boston Properties | | | | | | | 45,953 | | | | 4,693,180 | | |
| Forest City Enterprises | | | | | | | 30,237 | | | | 1,858,971 | | |
| Kilroy Realty Corp. | | | | | | | 28,073 | | | | 1,988,691 | | |
| Mack-Cali Realty Corp. | | | | | | | 35,360 | | | | 1,537,806 | | |
| Maguire Properties | | | | | | | 27,734 | | | | 952,108 | | |
| SL Green Realty Corp. | | | | | | | 28,604 | | | | 3,543,750 | | |
| | | | | | | | 16,632,136 | | |
| OFFICE/INDUSTRIAL | | | 0.7 | % | | | | | | | | | |
| Liberty Property Trust | | | | | | | 35,307 | | | | 1,551,037 | | |
| RESIDENTIAL—APARTMENT | | | 7.5 | % | | | | | | | | | |
| Apartment Investment & Management Co. | | | | | | | 25,258 | | | | 1,273,508 | | |
| AvalonBay Communities | | | | | | | 33,542 | | | | 3,987,473 | | |
| BRE Properties | | | | | | | 40,500 | | | | 2,401,245 | | |
| Equity Residential | | | | | | | 92,313 | | | | 4,212,242 | | |
| Essex Property Trust | | | | | | | 17,505 | | | | 2,035,831 | | |
| UDR | | | | | | | 57,835 | | | | 1,521,061 | | |
| | | | | | | | 15,431,360 | | |
| SELF STORAGE | | | 2.7 | % | | | | | | | | | |
| Public Storage | | | | | | | 73,554 | | | | 5,650,418 | | |
| SHOPPING CENTER | | | 7.2 | % | | | | | | | | | |
| COMMUNITY CENTER | | | 3.0 | % | | | | | | | | | |
| Developers Diversified Realty Corp. | | | | | | | 34,098 | | | | 1,797,306 | | |
| Federal Realty Investment Trust | | | | | | | 55,483 | | | | 4,286,616 | | |
| | | | | | | | 6,083,922 | | |
See accompanying notes to financial statements.
13
COHEN & STEERS INSTITUTIONAL GLOBAL REALTY SHARES, INC.
SCHEDULE OF INVESTMENTS—(Continued)
June 30, 2007 (Unaudited)
| | | | | Number
of Shares | | Value | |
| REGIONAL MALL | | | 4.2 | % | | | | | | | | | |
| Macerich Co. | | | | | | | 50,092 | | | $ | 4,128,583 | | |
| Simon Property Group | | | | | | | 49,430 | | | | 4,598,967 | | |
| | | | | | | | 8,727,550 | | |
| TOTAL SHOPPING CENTER | | | | | | | | | | | 14,811,472 | | |
| TOTAL UNITED STATES | | | | | | | | | | | 71,533,725 | | |
| TOTAL COMMON STOCK (Identified cost—$210,475,393) | | | | | | | | | | | 201,917,931 | | |
| | | | | Principal
Amount | | | |
| COMMERCIAL PAPER | | | 7.6 | % | | | | | | | | | |
| New Center Asset Trust, 4.15%, due 7/2/07 | | | | | | $ | 10,000,000 | | | | 9,998,847 | | |
| San Paolo U.S. Finance Co., 4.15%, due 7/2/07 | | | | | | | 5,613,000 | | | | 5,612,353 | | |
| TOTAL COMMERCIAL PAPER (Identified cost—$15,611,200) | | | | | | | | | | | 15,611,200 | | |
| TOTAL INVESTMENTS (Identified cost—$226,086,593) | | | 105.2 | % | | | | | | | 217,529,131 | | |
| LIABILITIES IN EXCESS OF OTHER ASSETS | | | (5.2 | )% | | | | | | | (10,706,901 | ) | |
NET ASSETS (Equivalent to $28.70 per share based on 7,206,593
shares of capital stock outstanding) | | | 100.0 | % | | | | | | $ | 206,822,230 | | |
Glossary of Portfolio Abbreviation
USD United States Dollar
Note: Percentages indicated are based on the net assets of the fund.
a Non-income producing security.
See accompanying notes to financial statements.
14
COHEN & STEERS INSTITUTIONAL GLOBAL REALTY SHARES, INC.
STATEMENT OF ASSETS AND LIABILITIES
June 30, 2007 (Unaudited)
| ASSETS: | |
| Investments in securities, at value (Identified cost—$226,086,593) | | $ | 217,529,131 | | |
| Foreign currency, at value (Identified cost—$317,729) | | | 317,657 | | |
| Receivable for investment securities sold | | | 4,607,271 | | |
| Dividends receivable | | | 587,569 | | |
| Receivable for fund shares sold | | | 108,122 | | |
| Other assets | | | 25,959 | | |
| Total Assets | | | 223,175,709 | | |
| LIABILITIES: | |
| Payable for investment securities purchased | | | 15,998,705 | | |
| Payable for dividends declared | | | 161,572 | | |
| Payable for investment advisory fees | | | 150,724 | | |
| Payable for fund shares redeemed | | | 31,748 | | |
| Payable for directors' fees | | | 6,326 | | |
| Other liabilities | | | 4,404 | | |
| Total Liabilities | | | 16,353,479 | | |
| NET ASSETS applicable to 7,206,593 shares of $0.001 par value of common stock outstanding | | $ | 206,822,230 | | |
| NET ASSET VALUE PER SHARE: | |
| ($206,822,230 ÷ 7,206,593 shares outstanding) | | $ | 28.70 | | |
| NET ASSETS consist of: | |
| Paid-in-capital | | $ | 213,428,621 | | |
| Dividends in excess of net investment income | | | (868,750 | ) | |
| Accumulated undistributed net realized gain on investments | | | 2,821,532 | | |
| Net unrealized depreciation on investments | | | (8,559,173 | ) | |
| | | $ | 206,822,230 | | |
See accompanying notes to financial statements.
15
COHEN & STEERS INSTITUTIONAL GLOBAL REALTY SHARES, INC.
STATEMENT OF OPERATIONS
For the Six Months Ended June 30, 2007 (Unaudited)
| Investment Income: | |
| Dividend income (net of $175,616 of foreign withholding tax) | | $ | 1,400,834 | | |
| Interest income | | | 144,894 | | |
| Total Income | | | 1,545,728 | | |
| Expenses: | |
| Investment advisory fees | | | 723,384 | | |
| Directors' fees and expenses | | | 31,150 | | |
| Registration and filing fees | | | 24,386 | | |
| Dues and subscriptions | | | 3,916 | | |
| Line of credit fees | | | 890 | | |
| Total Expenses | | | 783,726 | | |
| Reduction of Expenses | | | (60,342 | ) | |
| Net Expenses | | | 723,384 | | |
| Net Investment Income | | | 822,344 | | |
| Net Realized and Unrealized Gain (Loss) on Investments: | |
| Net realized gain (loss) on: | |
| Investments | | | 2,856,387 | | |
| Foreign currency transactions | | | (128,346 | ) | |
| Net realized gain | | | 2,728,041 | | |
| Net change in unrealized appreciation on: | |
| Investments | | | (12,354,549 | ) | |
| Foreign currency translations | | | 12,354 | | |
| Net change in unrealized appreciation | | | (12,342,195 | ) | |
| Net realized and unrealized loss on investments | | | (9,614,154 | ) | |
| Net Decrease in Net Assets Resulting from Operations | | $ | (8,791,810 | ) | |
See accompanying notes to financial statements.
16
COHEN & STEERS INSTITUTIONAL GLOBAL REALTY SHARES, INC.
STATEMENT OF CHANGES IN NET ASSETS (Unaudited)
| | | For the
Six Months Ended
June 30, 2007 | | For the Period
August 10, 2006a
through
December 31, 2006 | |
| Change in Net Assets: | |
| From Operations: | |
| Net investment income | | $ | 822,344 | | | $ | 167,959 | | |
| Net realized gain on investments | | | 2,728,041 | | | | 113,278 | | |
| Net change in unrealized appreciation on investments | | | (12,342,195 | ) | | | 3,783,022 | | |
Net increase (decrease) in net assets resulting from
operations | | | (8,791,810 | ) | | | 4,064,259 | | |
| Dividends and Distributions to Shareholders from: | |
| Net investment income | | | (1,567,198 | ) | | | (289,899 | ) | |
| Net realized gain on investments | | | — | | | | (21,743 | ) | |
| Total dividends and distributions to shareholders | | | (1,567,198 | ) | | | (311,642 | ) | |
| Capital Stock Transactions: | |
| Increase in net assets from fund share transactions | | | 135,743,867 | | | | 77,584,754 | | |
| Total increase in net assets | | | 125,384,859 | | | | 81,337,371 | | |
| Net Assets: | |
| Beginning of period | | | 81,437,371 | | | | 100,000 | | |
| End of periodb | | $ | 206,822,230 | | | $ | 81,437,371 | | |
a Commencement of operations.
b Includes dividends in excess of net investment income of $868,750 and $123,896, respectively.
See accompanying notes to financial statements.
17
COHEN & STEERS INSTITUTIONAL GLOBAL REALTY SHARES, INC.
FINANCIAL HIGHLIGHTS (Unaudited)
The following table includes selected data for a share outstanding throughout each period and other performance information derived from the financial statements. It should be read in conjunction with the financial statements and notes thereto.
| Per Share Operating Performance: | | For the Six
Months Ended
June 30, 2007 | | For the Period
August 10, 2006a
through
December 31, 2006 | |
| Net asset value, beginning of period | | $ | 29.57 | | | $ | 25.00 | | |
| Income from investment operations: | |
| Net investment income | | | 0.14 | | | | 0.12 | | |
| Net realized and unrealized gain (loss) on investments | | | (0.79 | ) | | | 4.62 | | |
| Total income (loss) from investment operations | | | (0.65 | ) | | | 4.74 | | |
| Less dividends and distributions to shareholders from: | |
| Net investment income | | | (0.22 | ) | | | (0.16 | ) | |
| Net realized gain on investments | | | — | | | | (0.01 | ) | |
| Total dividends and distributions to shareholders | | | (0.22 | ) | | | (0.17 | ) | |
| Net increase (decrease) in net asset value | | | (0.87 | ) | | | 4.57 | | |
| Net asset value, end of period | | $ | 28.70 | | | $ | 29.57 | | |
| Total investment return | | | –2.17 | %b | | | 18.98 | %b | |
| Ratios/Supplemental Data: | |
| Net assets, end of period (in millions) | | $ | 206.8 | | | $ | 81.4 | | |
| Ratio of expenses to average daily net assets (before expense reduction) | | | 1.08 | %c | | | 1.47 | %c | |
| Ratio of expenses to average daily net assets (net of expense reduction) | | | 1.00 | %c | | | 1.00 | %c | |
| Ratio of net investment income to average daily net assets (before expense reduction) | | | 1.05 | %c | | | 1.73 | %c | |
| Ratio of net investment income to average daily net assets (net of expense reduction) | | | 1.14 | %c | | | 2.20 | %c | |
| Portfolio turnover rate | | | 36 | %b | | | 8 | %b | |
a Commencement of operations.
b Not annualized.
c Annualized.
See accompanying notes to financial statements.
18
COHEN & STEERS INSTITUTIONAL GLOBAL REALTY SHARES, INC.
NOTES TO FINANCIAL STATEMENTS (Unaudited)
Note 1. Significant Accounting Policies
Cohen & Steers Institutional Global Realty Shares, Inc. (the fund) was incorporated under the laws of the State of Maryland on May 11, 2006 and is registered under the Investment Company Act of 1940, as amended, as a nondiversified, open-end management investment company. The fund's investment objective is total return. The fund had no operations until June 16, 2006 when it sold 4,000 shares for $100,000 to Cohen & Steers Capital Management, Inc. (the advisor). Investment operations commenced on August 10, 2006.
The following is a summary of significant accounting policies consistently followed by the fund in the preparation of its financial statements. The policies are in conformity with accounting principles generally accepted in the United States of America (GAAP). The preparation of the financial statements in accordance with GAAP requires management to make estimates and assumptions that affect the reported amounts of assets and liabilities at the date of the financial statements and the reported amounts of income and expenses during the reporting period. Actual results could differ from those estimates.
Portfolio Valuation: Investments in securities that are listed on the New York Stock Exchange are valued, except as indicated below, at the last sale price reflected at the close of the New York Stock Exchange on the business day as of which such value is being determined. If there has been no sale on such day, the securities are valued at the mean of the closing bid and asked prices for the day or, if no asked price is available, at the bid price.
Securities not listed on the New York Stock Exchange but listed on other domestic or foreign securities exchanges or admitted to trading on the National Association of Securities Dealers Automated Quotations, Inc. (Nasdaq) national market system are valued in a similar manner. Securities traded on more than one securities exchange are valued at the last sale price on the business day as of which such value is being determined as reflected on the tape at the close of the exchange representing the principal market for such securities.
Readily marketable securities traded in the over-the-counter market, including listed securities whose primary market is believed by the advisor to be over-the-counter, but excluding securities admitted to trading on the Nasdaq National List, are valued at the official closing prices as reported by Nasdaq, the National Quotation Bureau, or such other comparable sources as the Board of Directors deems appropriate to reflect their fair market value. If there has been no sale on such day, the securities are valued at the mean of the closing bid and asked prices for the day, or if no asked price is available, at the bid price. Where securities are traded on more than one exchange and also over-the-counter, the securities will generally be valued using the quotations the Board of Directors believes most closely reflect the value of such securities.
Portfolio securities primarily traded on foreign markets are generally valued at the preceding closing values of such securities on their respective exchanges or if after the close of the foreign markets, but prior to the close of business on the day the securities are being valued, market conditions change significantly, certain foreign securities may be fair valued pursuant to procedures established by the Board of Directors.
19
COHEN & STEERS INSTITUTIONAL GLOBAL REALTY SHARES, INC.
NOTES TO FINANCIAL STATEMENTS (Unaudited)—(Continued)
Securities for which market prices are unavailable, or securities for which the advisor determines that bid and/or asked price does not reflect market value, will be valued at fair value pursuant to procedures approved by the fund's Board of Directors. Circumstances in which market prices may be unavailable include, but are not limited to, when trading in a security is suspended, the exchange on which the security is traded is subject to an unscheduled close or disruption or material events occur after the close of the exchange on which the security is principally traded. In these circumstances, the fund determines fair value in a manner that fairly reflects the market value of the security on the valuation date based on consideration of any information or factors it deems appropriate. These may include recent transactions in comparable securities, information relating to the specific security and developments in the markets. In particular, portfolio securities primarily traded on foreign markets are generally valued at the preceding closing values of such securities on their respective exchanges or if after the close of the foreign markets, but prior to the close of trading on the NYSE on the day the securities are being valued, developments occur that are expected to materially affect the value of such securities, such values may be adjusted to reflect the estimated fair value of such securities as of the close of trading on the NYSE using a pricing service and/or procedures approved by the fund's Board of Directors.
The fund's use of fair value pricing may cause the net asset value of fund shares to differ from the net asset value that would be calculated using market quotations. Fair value pricing involves subjective judgments and it is possible that the fair value determined for a security may be materially different than the value that could be realized upon the sale of that security.
Short-term debt securities, which have a maturity date of 60 days or less, are valued at amortized cost, which approximates value.
Security Transactions and Investment Income: Security transactions are recorded on trade date. Realized gains and losses on investments sold are recorded on the basis of identified cost. Interest income is recorded on the accrual basis. Discounts are accreted and premiums are amortized over the life of the respective securities. Dividend income is recorded on the ex-dividend date except for certain dividends on foreign securities, which are recorded as soon as the fund is informed after the ex-dividend date. The fund records distributions received in excess of income from underlying investments as a reduction of cost of investments and/or realized gain. Such amounts are based on estimates if actual amounts are not available and actual amounts of income, realized gain and return of capital may differ from the estimated amounts. The fund adjusts the estimated amount s of the components of distributions (and consequently its net investment income) as an increase to unrealized appreciation/ (depreciation) and realized gain/(loss) on investments as necessary once the issuers provide information about the actual composition of the distributions.
Foreign Currency Translation and Forward Foreign Currency Contracts: The books and records of the fund are maintained in U.S. dollars as follows: (1) the foreign currency market value of investment securities, other assets and liabilities and forward foreign currency contracts (forward contracts) are translated at the exchange rates
20
COHEN & STEERS INSTITUTIONAL GLOBAL REALTY SHARES, INC.
NOTES TO FINANCIAL STATEMENTS (Unaudited)—(Continued)
prevailing at the end of the period; and (2) purchases, sales, income and expenses are translated at the exchange rates prevailing on the respective dates of such transactions. The resultant exchange gains and losses are recorded as realized and unrealized gain/loss on foreign exchange transactions. Pursuant to U.S. federal income tax regulations, certain foreign exchange gains/losses included in realized and unrealized gain/loss are included in or are a reduction of ordinary income for federal income tax purposes. The fund does not isolate that portion of the results of operations arising as a result of changes in the foreign exchange rates from the changes in the market prices of the securities. Forward contracts are valued daily at the appropriate exchange rates. The resultant unrealized exchange gains and losses are recorded as unrealized foreign currency gain or loss. The fund records realized gains or losses on delivery of the currency or at the time the forward contract is extinguished (compensated) by entering into a closing transaction prior to delivery.
Foreign Securities: The fund may directly purchase securities of foreign issuers. Investing in securities of foreign issuers involves special risks not typically associated with investing in securities of U.S. issuers. The risks include possible revaluation of currencies, the ability to repatriate funds, less complete financial information about companies and possible future adverse political and economic developments. Moreover, securities of many foreign issuers and their markets may be less liquid and their prices more volatile than those of securities of comparable U.S. issuers.
Dividends and Distributions to Shareholders: Dividends from net investment income and capital gain distributions are determined in accordance with U.S. federal income tax regulations, which may differ from GAAP. Dividends from net investment income are declared and paid semiannually. Net realized capital gains, unless offset by any available capital loss carryforward, are distributed to shareholders annually. Dividends and distributions to shareholders are recorded on the ex-dividend date and are automatically reinvested in full and fractional shares of the fund based on the net asset value per share at the close of business on the ex-dividend date unless the shareholder has elected to have them paid in cash.
Distributions paid by the fund are subject to recharacterization for tax purposes. Based upon the results of operations for the six months ended June 30, 2007, the advisor considers it likely that a portion of the dividends will be reclassified to return of capital and distributions of net realized capital gains upon the final determination of the fund's taxable income for the year.
Federal Income Taxes: It is the policy of the fund to continue to qualify as a regulated investment company, if such qualification is in the best interest of the shareholders, by complying with the requirements of Subchapter M of the Internal Revenue Code applicable to regulated investment companies, and by distributing substantially all of its taxable earnings to its shareholders. Accordingly, no provision for federal income or excise tax is necessary.
21
COHEN & STEERS INSTITUTIONAL GLOBAL REALTY SHARES, INC.
NOTES TO FINANCIAL STATEMENTS (Unaudited)—(Continued)
Note 2. Investment Advisory Fees and Other Transactions with Affiliates
Investment Advisory Fees: The advisor serves as the fund's investment advisor pursuant to an investment advisory agreement (the advisory agreement). Under the terms of the advisory agreement, the advisor provides the fund with the day-to-day investment decisions and generally manages the fund's investments in accordance with the stated policies of the fund, subject to the supervision of the fund's Board of Directors. For the services provided to the fund, the advisor receives a fee, accrued daily and paid monthly, at the annual rate of 1.00% of the average daily net assets of the fund.
The advisor is also responsible, under the advisory agreement, for the performance of certain administrative functions for the fund. Additionally, the advisor pays all expenses of the fund except for brokerage fees, taxes, interest, fees and expenses of the fund's independent directors (as well as their independent counsel and other independent consultants), trade organization membership dues, federal and state registration fees and extraordinary expenses.
The advisor has contractually agreed to reimburse the fund so that its total annual operating expenses do not exceed 1.00% of the average daily net assets. This commitment will remain in place for the life of the fund.
Under subadvisory agreements between the advisor and Cohen & Steers Asia Limited., Cohen & Steers UK Limited., and Cohen & Steers Europe S.A. (formerly, Houlihan Rovers S.A.) (collectively the subadvisors), affiliates of the advisor, the subadvisors are responsible for managing the fund's investments in certain non-U.S. real estate securities. For their services provided under the subadvisory agreement, the advisor (not the fund) pays the subadvisors 16.3%, 6.3% and 6.3%, respectively, of the advisory fee received by the advisor from the fund, net of operating expenses. For the six months ended June 30, 2007, the advisor paid the subadvisors $102,158, $39,484 and $39,484, respectively.
Directors' and Officers' Fees: Certain directors and officers of the fund are also directors, officers, and/or employees of the advisor. The fund does not pay compensation to any affiliated directors and officers.
Other: At June 30, 2007, the advisor owned 124,051 shares or 1.7% of the fund.
Note 3. Purchases and Sales of Securities
Purchases and sales of securities, excluding short-term investments, for the six months ended June 30, 2007 totaled $187,201,397 and $51,278,473, respectively.
22
COHEN & STEERS INSTITUTIONAL GLOBAL REALTY SHARES, INC.
NOTES TO FINANCIAL STATEMENTS (Unaudited)—(Continued)
Note 4. Income Tax Information
As of June 30, 2007, the federal tax cost and net unrealized depreciation of securities were as follows:
| Cost for federal income tax purposes | | $ | 226,086,593 | | |
| Gross unrealized appreciation | | $ | 4,031,919 | | |
| Gross unrealized depreciation | | | (12,589,381 | ) | |
| Net unrealized depreciation | | $ | (8,557,462 | ) | |
Note 5. Capital Stock
The fund is authorized to issue 100 million shares of capital stock at a par value of $0.001 per share. The Board of Directors of the fund is authorized to reclassify and issue any unissued shares of the fund without shareholder approval. Transactions in fund shares were as follows:
| | | For the
Six Months Ended
June 30, 2007 | | For the
Period August 10, 2006a
through December 31, 2006 | |
| | | Shares | | Amount | | Shares | | Amount | |
| Sold | | | 4,970,694 | | | $ | 150,988,549 | | | | 2,743,068 | | | $ | 77,373,244 | | |
Issued as reinvestment of
dividends and distributions | | | 48,959 | | | | 1,405,626 | | | | 8,178 | | | | 237,082 | | |
| Redeemed | | | (567,366 | ) | | | (16,650,308 | ) | | | (940 | ) | | | (25,572 | ) | |
| Net increase | | | 4,452,287 | | | $ | 135,743,867 | | | | 2,750,306 | | | $ | 77,584,754 | | |
a Commencement of operations.
Note 6. Borrowings
The fund, in conjunction with other Cohen & Steers funds, was made a participant to a $150,000,000 syndicated credit agreement (the credit agreement) with State Street Bank and Trust Company, as administrative agent and operations agent, and the lenders identified in the credit agreement, which expires December 2007. The fund pays a commitment fee of 0.10% per annum on its proportionate share of the unused portion of the credit agreement.
During the six months ended June 30, 2007, the fund did not utilize the line of credit.
23
COHEN & STEERS INSTITUTIONAL GLOBAL REALTY SHARES, INC.
NOTES TO FINANCIAL STATEMENTS (Unaudited)—(Continued)
Note 7. Other
In the normal course of business, the fund enters into contracts that provide general indemnifications. The fund's maximum exposure under these arrangements is dependent on claims that may be made against the fund in the future and, therefore, cannot be estimated; however, based on experience, the risk of material loss from such claims is considered remote.
Note 8. New Accounting Pronouncements
In July 2006, the Financial Accounting Standards Board (FASB) issued Interpretation 48, Accounting for Uncertainty in Income Taxes—an interpretation of FASB Statement 109 (FIN 48). FIN 48 clarifies the accounting for income taxes by prescribing the minimum recognition threshold a tax position must meet before being recognized in the financial statements. FIN 48 is effective for fiscal years beginning after December 15, 2006. An assessment of the fund's tax positions has been made and it has been determined that there is no impact to the fund's financial statements.
In September 2006, Statement of Financial Accounting Standards No. 157, Fair Value Measurements (SFAS 157), was issued and is effective for fiscal years beginning after November 15, 2007. SFAS 157 defines fair value, establishes a framework for measuring fair value and expands disclosures about fair value measurements. Management is currently evaluating the impact the adoption of SFAS 157 will have on the fund's financial statements.
24
COHEN & STEERS INSTITUTIONAL GLOBAL REALTY SHARES, INC.
OTHER INFORMATION
A description of the policies and procedures that the fund uses to determine how to vote proxies relating to portfolio securities is available (i) without charge, upon request, by calling 800-330-7348, (ii) on our Web site at cohenandsteers.com or (iii) on the Securities and Exchange Commission's Web site at http://www.sec.gov. In addition, the fund's proxy voting record for the most recent 12-month period ended June 30 is available (i) without charge, upon request, by calling 800-330-7348 or (ii) on the SEC's Web site at http://www.sec.gov.
The fund files its complete schedule of portfolio holdings with the SEC for the first and third quarters of each fiscal year on Form N-Q. The fund's Forms N-Q are available (i) without charge, upon request by calling 800-330-7348, or (ii) on the SEC's Web site at http://www.sec.gov. In addition, the Forms N-Q may be reviewed and copied at the SEC's Public Reference Room in Washington, DC. Information on the operation of the Public Reference Room may be obtained by calling 800-SEC-0330.
Please note that the distributions paid by the fund to shareholders are subject to recharacterization for tax purposes. The fund may also pay distributions in excess of the fund's net investment company taxable income and this excess would be a tax-free return of capital distributed from the fund's assets. The final tax treatment of all distributions is reported to shareholders on their 1099-DIV forms, which are mailed after the close of each calendar year.
25
COHEN & STEERS INSTITUTIONAL GLOBAL REALTY SHARES, INC.
Meet the Cohen & Steers family of open-end funds:
COHEN & STEERS
REALTY SHARES
• Designed for investors seeking maximum total return, investing primarily in REITs
• Symbol: CSRSX
COHEN & STEERS
REALTY INCOME FUND
• Designed for investors seeking high current income, investing primarily in REITs
• Symbols: CSEIX, CSBIX, CSCIX, CSDIX
COHEN & STEERS
INTERNATIONAL REALTY FUND
• Designed for investors seeking maximum total return, investing primarily in international real estate securities
• Symbols: IRFAX, IRFCX, IRFIX
COHEN & STEERS
DIVIDEND VALUE FUND
• Designed for investors seeking high current income and long-term growth of income and capital appreciation, investing primarily in dividend paying common stocks and preferred stocks
• Symbols: DVFAX, DVFCX, DVFIX
COHEN & STEERS
INSTITUTIONAL GLOBAL REALTY SHARES
• Designed for investors seeking maximum total return, investing primarily in global real estate securities
• Symbol: GRSIX
COHEN & STEERS
INSTITUTIONAL REALTY SHARES
• Designed for institutional investors seeking maximum total return, investing primarily in REITs
• Symbol: CSRIX
COHEN & STEERS
REALTY FOCUS FUND
• Designed for investors seeking maximum capital appreciation, investing in a limited number of REITs and other real estate securities
• Symbols: CSFAX, CSFBX, CSFCX, CSSPX
COHEN & STEERS
UTILITY FUND
• Designed for investors seeking maximum total return, investing primarily in utilities
• Symbols: CSUAX, CSUBX, CSUCX, CSUIX
COHEN & STEERS
ASIA PACIFIC REALTY SHARES
• Designed for investors seeking maximum total return, investing primarily in real estate securities located in the Asia Pacific region
• Symbols: APFAX, APFCX, APFIX
COHEN & STEERS
EUROPEAN REALTY SHARES
• Designed for investors seeking maximum total return, investing primarily in real estate securities located in Europe
• Symbols: EURAX, EURCX, EURIX
Please consider the investment objectives, risks, charges and expenses of the fund carefully before investing. A prospectus containing this and other information can be obtained by calling 800-330-7348 or by visiting cohenandsteers.com. Please read the prospectus carefully before investing.
Cohen & Steers Securities, LLC, Distributor
26
COHEN & STEERS INSTITUTIONAL GLOBAL REALTY SHARES, INC.
OFFICERS AND DIRECTORS
Robert H. Steers
Director and co-chairman
Martin Cohen
Director and co-chairman
Bonnie Cohen
Director
George Grossman
Director
Richard E. Kroon
Director
Richard J. Norman
Director
Frank K. Ross
Director
Willard H. Smith Jr.
Director
C. Edward Ward, Jr.
Director
Adam M. Derechin
President and chief executive officer
Joseph M. Harvey
Vice president
James S. Corl
Vice president
John E. McLean
Secretary
James Giallanza
Treasurer and chief financial officer
Lisa D. Phelan
Chief compliance officer
KEY INFORMATION
Investment Advisor
Cohen & Steers Capital Management, Inc.
280 Park Avenue
New York, NY 10017
(212) 832-3232
Fund Subadministrator and Custodian
State Street Bank and Trust Company
One Lincoln Street
Boston, MA 02111
Transfer Agent
Boston Financial Data Services, Inc.
2 Heritage Drive
North Quincy, MA 02171
(800) 437-9912
Legal Counsel
Stroock & Stroock & Lavan LLP
180 Maiden Lane
New York, NY 10038
Distributor
Cohen & Steers Securities, LLC
280 Park Avenue
New York, NY 10017
Nasdaq Symbol: GRSIX
Web site: cohenandsteers.com
This report is authorized for delivery only to shareholders of Cohen & Steers Institutional Global Realty Shares, Inc. unless accompanied or preceded by the delivery of a currently effective prospectus setting forth details of the fund. Past performance is of course no guarantee of future results and your investment may be worth more or less at the time you sell.
27
COHEN & STEERS
INSTITUTIONAL GLOBAL REALTY SHARES
280 PARK AVENUE
NEW YORK, NY 10017

SEMIANNUAL REPORT
JUNE 30, 2007
Item 2. Code of Ethics.
Not applicable.
Item 3. Audit Committee Financial Expert.
Not applicable.
Item 4. Principal Accountant Fees and Services.
Not applicable.
Item 5. Audit Committee of Listed Registrants.
Not applicable.
Item 6. Schedule of Investments.
Included in Item 1 above.
Item 7. Disclosure of Proxy Voting Policies and Procedures for Closed-End Management Investment Companies.
Not applicable.
Item 8. Portfolio Managers of Closed-End Management Investment Companies.
Not applicable.
Item 9. Purchases of Equity Securities by Closed-End Management Investment Company and Affiliated Purchasers.
None.
Item 10. Submission of Matters to a Vote of Security Holders.
None.
Item 11. Controls and Procedures.
(a) The registrant’s principal executive officer and principal financial officer have concluded, based upon their evaluation of the registrant’s disclosure controls and procedures as conducted within 90 days of the filing date of this report, that these disclosure controls and procedures provide reasonable assurance that material information required to be disclosed by the registrant in the report it files or submits on Form N-CSR is recorded, processed, summarized and reported within the time periods specified in the Securities and Exchange Commission’s rules and forms
and that such material information is accumulated and communicated to the registrant’s management, including its principal executive officer and principal financial officer, as appropriate, in order to allow timely decisions regarding required disclosure.
(b) There were no changes in the registrant’s internal control over financial reporting that occurred during the second fiscal quarter of the period covered by this report that have materially affected, or are reasonably likely to materially affect, the registrant’s internal control over financial reporting.
Item 12. Exhibits.
(a)(1) Not applicable.
(a) (2) Certifications of principal executive officer and principal financial officer as required by Rule 30a-2(a) under the Investment Company Act of 1940.
(a)(3) Not applicable.
(b) Certifications of principal exe cutive officer and principal financial officer as required by Rule 30a- 2(b) under the Investment Company Act of 1940.
SIGNATURES
Pursuant to the requirements of the Securities Exchange Act of 1934 and the Investment Company Act of 1940, the registrant has duly caused this report to be signed on its behalf by the undersigned, thereunto duly authorized.
COHEN & STEERS INSTITUTIONAL GLOBAL REALTY SHARES, INC.
By: | /s/ | Adam M. Derechin | |
| | Name: Adam M. Derechin | |
| | Title: President and Chief Executive Officer | |
| | | |
Date: August 29, 2007 | |
| | | | |
Pursuant to the requirements of the Securities Exchange Act of 1934 and the Investment Company Act of 1940, this report has been signed below by the following persons on behalf of the registrant and in the capacities and on the dates indicated.
By: | /s/ | Adam M. Derechin | |
| | Name: Adam M. Derechin | |
| | Title: President and Chief Executive Officer | |
| | (principal executive officer) | |
| | | | |
By: | /s/ | James Giallanza | |
| | Name: James Giallanza | |
| | Title: Treasurer | |
| | (principal financial officer) | |
| |
| |
Date: August 29, 2007 | |
| | | | |