UNITED STATES
SECURITIES AND EXCHANGE COMMISSION
Washington, D.C. 20549
FORM N-CSR
CERTIFIED SHAREHOLDER REPORT OF REGISTERED
MANAGEMENT INVESTMENT COMPANIES
Investment Company Act file number | 811-21902 |
|
Cohen & Steers Institutional Global Realty Shares, Inc. |
(Exact name of registrant as specified in charter) |
|
280 Park Avenue, New York, NY | | 10017 |
(Address of principal executive offices) | | (Zip code) |
|
Adam M. Derechin Cohen & Steers Capital Management, Inc. 280 Park Avenue New York, New York 10017 |
(Name and address of agent for service) |
|
Registrant’s telephone number, including area code: | (212) 832-3232 | |
|
Date of fiscal year end: | December 31 | |
|
Date of reporting period: | June 30, 2010 | |
| | | | | | | | |
Item 1. Reports to Stockholders.
COHEN & STEERS INSTITUTIONAL GLOBAL REALTY SHARES, INC.
To Our Shareholders:
We would like to share with you our report for the six months ended June 30, 2010. The net asset value (NAV) at that date was $17.15 per share.
The total returns, including income and change in NAV, for the Fund and its comparative benchmarks were:
| | | Six Months Ended
June 30, 2010 | |
| Cohen & Steers Institutional Global Realty Shares | | | –6.24 | % | |
| FTSE EPRA/NAREIT Developed Real Estate Index—(Net)a | | | –4.59 | % | |
| S&P 500 Indexa | | | –6.65 | % | |
The performance data quoted represent past performance. Past performance is no guarantee of future results. The investment return and the principal value of an investment will fluctuate and shares, if redeemed, may be worth more or less than their original cost. Current performance may be lower or higher than the performance data quoted. Current total returns of the Fund can be obtained by visiting our Web site at cohenandsteers.com.
The Fund implements fair value pricing when the daily change in a specific U.S. market index exceeds a predetermined percentage. Fair value pricing adjusts the valuation of non-U.S. holdings to account for such index change following the close of foreign markets. This standard practice has been adopted by a majority of the fund industry to deter investors from arbitraging funds with a large percentage of non-U.S. holdings. In the event fair value pricing is implemented on the first and/or last day of a performance measurement period, the Fund's return may diverge from the relative performance of its benchmark index, which does not use fair value pricing. An investor cannot invest directly in an index.
Please note that the distributions paid by the Fund to shareholders are subject to recharacterization for tax purposes. These recharacterizations could result in the Fund paying distributions in excess of its investment company taxable income and this excess would be a tax free return of capital distributed from the Fund's assets.
Investment Review
Global real estate securities declined in the six-month period, although performance varied by region. North America had a gain, which partly offset weakness elsewhere amid policy tightening in China and a sovereign debt crisis in Europe.
a The FTSE EPRA/NAREIT Developed Real Estate Index is an unmanaged portfolio of approximately 281 constituents from 21 countries and is net of dividend withholding taxes. The S&P 500 Index is an unmanaged index of common stocks that is frequently used as a general measure of stock market performance.
1
COHEN & STEERS INSTITUTIONAL GLOBAL REALTY SHARES, INC.
U.S. real estate stocks had a total return of +5.6% as measured by the FTSE NAREIT Equity REIT Index. The group began to rise in February as fourth-quarter earnings generally met expectations and indicated stabilization in occupancies and rents. The rally continued when first-quarter earnings revealed that conditions were improving faster than expected. REITs gave back some ground when risk factors, such as Europe's sovereign debt crisis, weighed on capital markets. They nonetheless outperformed the broad U.S. equity market by a wide margin; the S&P 500 had a total return of –6.7% for the period.
Within the U.S. hotel sector (which had a return of +10.8% for the period),b revenue per available room began to grow again and signaled that a sustainable recovery might be at hand. The apartment sector (+16.3%) benefited from improved pricing power due to growth in employment that encouraged household formation.
Regional malls (+6.0%) also outperformed, as discretionary consumer spending recovered strongly in the first quarter. Shopping centers (+3.2%), which tend to have more stable anchor tenants such as grocery stores, lagged in the cyclical recovery.
The office sector (+0.8%) had mixed performance. Offices in major city centers have seen a trough in occupancies and fewer rent concessions, and in certain cases have even started to raise rents. Companies in suburban markets generally struggled, primarily due to lack of demand from tenants. The industrial sector (–13.8%) was a poor performer. ProLogis, the largest weight in the sector, continued to suffer from declining rents and was pressured by concerns over exposure to the slowing European economies.
Acquisition activity picked up
There was an acceleration in earnings-accretive acquisition announcements, a development we have been expecting. For example, Ventas, a REIT that operates senior housing and health care properties, acquired a portfolio of 95 medical office buildings and ambulatory facilities at a price between $300 million and $400 million. The transaction gave Ventas a 100% interest in some of the properties and joint venture interests in the others, which could result in significant value creation. The deal also highlights how joint ventures (JVs) are becoming an attractive source of acquisition opportunities, as REITs buy JV partners out at reasonable prices.
In Canada, which had a total return of +8.3%,c property companies in the energy-rich western provinces benefited from job growth and limited supply among most property sectors, particularly residential. The country's sound sovereign balance sheet and strong economic growth have contributed to rising asset prices, including real estate.
b Sector returns in USD as measured by the FTSE NAREIT Equity REIT Index, an unmanaged capitalization-weighted index of all equity real estate investment trusts. Past performance does not guarantee future results. This information is not representative of any Cohen & Steers account and no such account will seek to replicate an index. You cannot invest directly in an index.
c Country returns are in local currencies as measured by the FTSE EPRA/NAREIT Developed Real Estate Index. Past performance does not guarantee future results. This information is not representative of any Cohen & Steers account and no such account will seek to replicate an index. You cannot invest directly in an index.
2
COHEN & STEERS INSTITUTIONAL GLOBAL REALTY SHARES, INC.
Contagion worries hindered European markets
Sovereign debt concerns weighed on European equities. In April, Standard & Poor's downgraded Greece to below investment grade and lowered its ratings on Spain and Portugal, to AA and A–, respectively.
Markets had temporary relief when the European Union and the International Monetary Fund assembled a liquidity facility to ensure that countries such as Greece and Spain could meet their capital needs for the next three years.
The United Kingdom (–13.3%) is potentially vulnerable to shocks from the European sovereign debt crisis, given its own high budget deficit. Most major U.K. REITs reported positive results for the one-year period ended March 31 and revealed strong growth in net asset values (NAV). Recent transactions, however, indicate that the asset value appreciation in London properties may be nearing a peak.
Returns in France (–4.6%) and the Netherlands (–8.5%) reflected worries that the sovereign debt crisis might harm the banks that hold the loans, adversely affecting the availability and cost of capital. Another concern was the potential for austerity measures, which could indirectly harm consumers.
Asia Pacific returns were affected by policies in China
The main drivers of poor sentiment in Asia Pacific markets were the slowing Chinese economy and the government's measures to curb speculation in the luxury residential property market. Hong Kong developers with operations in China saw a sharp selloff and contributed disproportionately to the market's overall 8.9% decline.
Japanese real estate securities (–10.3%) had a positive start to the period, due in part to some good news from Japanese developers with regard to the market value of their leasing assets. The market fell sharply in May, however, amid concerns about the negative effects of the slowing Chinese economy and European debt crisis. The yen soared to an eight-year high against the euro, and investors questioned the sustainability of the recovery for an economy so dependent on exports.
Australia (–2.5%) held up relatively well. In response to economic growth and rising price pressures, its central bank raised short-term interest rates, to 4.5% in May from 3.75% at the start of the year. Although the country is relatively insulated from the crisis in Europe, the prospects for slower global trade—particularly with respect to China—hampered performance in the second quarter of 2010.
In Singapore (–6.2%), the government sought to cool its residential sector, raising the equity requirements for mortgages and imposing a seller's tax on properties sold within a year of purchase. Office occupancies, driven by external demand, improved and rents started to rise in May. Retail and hotel assets also had a strong recovery amid strong gross domestic product growth.
3
COHEN & STEERS INSTITUTIONAL GLOBAL REALTY SHARES, INC.
Global Real Estate Securities Total Returns in Local Currencies
January 1, 2010—June 30, 2010

(1) U.S. return in local currency as measured by the FTSE NAREIT Equity REIT Index.
Fund performance
The Fund had a negative total return and underperformed its benchmark. Factors that hindered relative performance included stock selection in the United States, where we were overweight industrial REIT ProLogis, which declined in part due to concerns over its European land inventory. We are maintaining our position in the company because we believe it is attractively valued and that it still benefits from its build-to-suit activity. An out-of-benchmark allocation to Brookdale Senior Living also detracted from return. Unlike more traditional net lease health care companies, Brookdale's underlying fundamentals are more dependent on a healthy economy—specifically, strong employment and a stable housing market, which have recently slowed.
Our overweight and stock selection in Hong Kong also held back performance, although we continue to have a favorable view of the market because of its growth potential. In the United Kingdom, we were overweight several of the poorer-performing property companies.
Positive contributors to relative return included our underweight in continental Europe; other regions have better fundamentals and rental growth prospects, in our estimation. The Fund also benefited from our underweight in Singapore and a modest, out-of-index allocation to Brazil, which generated positive absolute performance.
The decline of the Australian dollar and the euro against the U.S. dollar were detrimental to U.S. dollar-based portfolios, while the yen's rise against the dollar was beneficial.
4
COHEN & STEERS INSTITUTIONAL GLOBAL REALTY SHARES, INC.
Investment Outlook
We expect the U.S. economy and jobs picture to improve, but the pace of recovery may be somewhat slower than our earlier estimates. There will likely be statistical aberrations, both high and low, with respect to employment and other critical metrics. While this will spark rounds of volatility, we nonetheless believe the cyclical upturn will continue. Even modest economic growth should allow for single-digit earnings growth among REITs and higher rates of dividend growth (as REIT payout ratios move up from historically low levels) into next year at least. Slower economic growth may actually improve REITs' ability to execute on opportunistic acquisitions that are accretive to both earnings and net asset value, in our view.
Europe faces headwinds
The budget measures outlined by the United Kingdom's new administration are for the most part necessary, in our view, although fiscal cutbacks are likely to impede growth in an already fragile economy. While property fundamentals in London are generally stable, new demand take-up is slowing. The next few years will also see an increase in lease expirations, which should provide opportunities for developers to capture tenants and challenges for existing landlords to retain them. Our preference on the continent is for high-quality pan-European mall and shopping center owners with better same-store rental growth prospects and strong balance sheets. On a regional basis, we are most optimistic about Scandinavia, where economic growth and sovereign balance sheets are relatively stronger.
Fundamentals are generally improving within Asia Pacific
In Hong Kong, the recent measures by the government to control speculation in the residential market have led to a retreat in property sales volumes. However, tight near-term supply and strong demand are providing strong support to prices. Longer term, we expect to see steady growth in residential prices as the economy improves, but the pace will likely be slower than before the policy announcement as tighter regulations maintain structural barriers to growth in volume.
Japan's property market is showing signs of recovery in occupancies, as opportunistic tenants have taken advantage of sliding rents. We believe that a stronger recovery in office rents is still 12 to 24 months away. The residential market is benefiting from improved affordability and greater access to capital.
After six interest-rate increases, the Reserve Bank of Australia paused in June. The futures market has been pricing in the probability of a rate cut, but we believe this is unlikely unless inflation begins to track significantly below target.
Singapore's recovery lagged in late 2009, but has accelerated strongly this year. Strong manufacturing data have led us to become more optimistic about the industrial sector, and office and hotel sector fundamentals should continue to improve. We are more positive on developers operating in the high-luxury segment because it is not as affected by government policy measures.
As we move ahead, our focus remains on companies with the best potential for internal growth with solid balance sheets that can also capitalize on the emergence of external growth opportunities.
5
COHEN & STEERS INSTITUTIONAL GLOBAL REALTY SHARES, INC.
Sincerely,
| | |  | |  | |
|
| | | MARTIN COHEN | | ROBERT H. STEERS | |
|
| | | Co-chairman | | Co-chairman | |
|
| | |  | |  | |
|
| | | JOSEPH M. HARVEY | | SCOTT CROWE | |
|
| | | Portfolio Manager | | Portfolio Manager | |
|
 | |  | |  | |
|
| GERIOS J. M. ROVERS | | CHARLES J. MCKINLEY | | LUKE SULLIVAN | |
|
| Portfolio Manager | | Portfolio Manager | | Portfolio Manager | |
|
The views and opinions in the preceding commentary are subject to change. There is no guarantee that any market forecast set forth in the commentary will be realized. This material represents an assessment of the market environment at a specific point in time, should not be relied upon as investment advice and is not intended to predict or depict performance of any investment.
Visit Cohen & Steers online at cohenandsteers.com
For more information about any of our funds, visit cohenandsteers.com, where you will find daily net asset values, fund fact sheets and portfolio highlights. You can also access newsletters, education tools and market updates covering the global real estate, listed infrastructure, utilities, large cap value and preferred securities sectors.
In addition, our Web site contains comprehensive information about our firm, including our most recent press releases, profiles of our senior investment professionals and an overview of our investment approach.
6
COHEN & STEERS INSTITUTIONAL GLOBAL REALTY SHARES, INC.
Performance Review (Unaudited)
Average Annual Total Returns—For Periods Ended June 30, 2010
| | | 1 Year | | Since Inceptiona | |
| Fund | | | 23.78 | % | | | –6.01 | % | |
The performance data quoted represent past performance. Past performance is no guarantee of future results. The investment return and principal value of an investment will fluctuate and shares, when redeemed, may be worth more or less than their original cost. Current performance may be lower or higher than the performance data quoted. Performance information current to the most recent month-end can be obtained by visiting our Web site at cohenandsteers.com. The performance table does not reflect the deduction of taxes that a shareholder would pay on Fund distributions or the redemption of Fund shares.
The gross and net expense ratios were 1.04% and 1.00%, respectively, as disclosed in the May 1, 2010 prospectus. The advisor has contractually agreed to reimburse the Fund so that its annual operating expenses do not exceed 1.00%. This commitment will remain in place for the life of the Fund.
a Inception date of August 10, 2006.
7
COHEN & STEERS INSTITUTIONAL GLOBAL REALTY SHARES, INC.
Expense Example (Unaudited)
As a shareholder of the Fund, you incur two types of costs: (1) transaction costs; and (2) ongoing costs including management fees and other Fund expenses. This example is intended to help you understand your ongoing costs (in dollars) of investing in the Fund and to compare these costs with the ongoing costs of investing in other mutual funds.
The example is based on an investment of $1,000 invested at the beginning of the period and held for the entire period January 1, 2010—June 30, 2010.
Actual Expenses
The first line of the following table provides information about actual account values and expenses. You may use the information in this line, together with the amount you invested, to estimate the expenses that you paid over the period. Simply divide your account value by $1,000 (for example, an $8,600 account value divided by $1,000 = 8.6), then multiply the result by the number in the first line under the heading entitled "Expenses Paid During Period" to estimate the expenses you paid on your account during this period.
Hypothetical Example for Comparison Purposes
The second line of the following table provides information about hypothetical account values and hypothetical expenses based on the Fund's actual expense ratio and an assumed rate of return of 5% per year before expenses, which is not the Fund's actual return. The hypothetical account values and expenses may not be used to estimate the actual ending account balance or expenses you paid for the period. You may use this information to compare the ongoing cost of investing in the Fund and other funds. To do so, compare this 5% hypothetical example with the 5% hypothetical examples that appear in the shareholder reports of other funds.
Please note that the expenses shown in the table are meant to highlight your ongoing costs only and do not reflect any transactional costs. Therefore, the second line of the table is useful in comparing ongoing costs only, and will not help you determine the relative total costs of owning different funds. In addition, if these transactional costs were included, your costs would have been higher.
| | | Beginning
Account Value
January 1, 2010 | | Ending
Account Value
June 30, 2010 | | Expenses Paid
During Perioda
January 1, 2010–
June 30, 2010 | |
| Actual (–6.24% return) | | $ | 1,000.00 | | | $ | 937.60 | | | $ | 4.80 | | |
| Hypothetical (5% annual return before expenses) | | $ | 1,000.00 | | | $ | 1,019.84 | | | $ | 5.01 | | |
a Expenses are equal to the Fund's annualized net expense ratio of 1.00% multiplied by the average account value over the period, multiplied by 181/365 (to reflect the one-half year period). If the Fund had borne all if its expenses that were assumed by the advisor, the annualized expense ratio would have been 1.02%.
8
COHEN & STEERS INSTITUTIONAL GLOBAL REALTY SHARES, INC.
JUNE 30, 2010
Top Ten Holdings
(Unaudited)
| Security | | Value | | % of
Net
Assets | |
| Simon Property Group | | $ | 20,593,188 | | | | 5.3 | % | |
| Sun Hung Kai Properties Ltd. | | | 19,287,648 | | | | 5.0 | | |
| Westfield Group | | | 13,938,379 | | | | 3.6 | | |
| Mitsubishi Estate Co., Ltd. | | | 11,290,468 | | | | 2.9 | | |
| Hongkong Land Holdings Ltd. (USD) | | | 10,946,808 | | | | 2.8 | | |
| Unibail-Rodamco | | | 10,469,480 | | | | 2.7 | | |
| Stockland | | | 9,571,961 | | | | 2.5 | | |
| Mitsui Fudosan Co., Ltd. | | | 9,357,858 | | | | 2.4 | | |
| Wharf Holdings Ltd. | | | 7,851,748 | | | | 2.0 | | |
| Public Storage | | | 7,736,871 | | | | 2.0 | | |
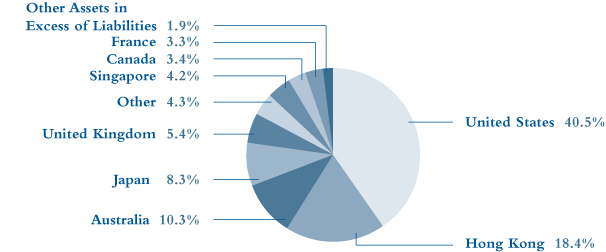
Country Breakdown
(Based on Net Assets)
(Unaudited)
9
COHEN & STEERS INSTITUTIONAL GLOBAL REALTY SHARES, INC.
SCHEDULE OF INVESTMENTS
June 30, 2010 (Unaudited)
| | | | | Number
of Shares | | Value | |
| COMMON STOCK | | | 98.1 | % | | | | | | | | | |
| AUSTRALIA | | | 10.3 | % | | | | | | | | | |
| DIVERSIFIED | | | 5.4 | % | | | | | | | | | |
| BGP Holdings PLC (EUR)a,b,c | | | | | | | 7,741,744 | | | $ | 0 | | |
| Dexus Property Groupc | | | | | | | 5,970,245 | | | | 3,830,980 | | |
| FKP Property Groupc | | | | | | | 1,684,612 | | | | 949,736 | | |
| GPT Groupc | | | | | | | 1,213,672 | | | | 2,833,739 | | |
| Mirvac Groupc | | | | | | | 3,398,443 | | | | 3,711,434 | | |
| Stocklandc | | | | | | | 3,084,131 | | | | 9,571,961 | | |
| | | | | | | | 20,897,850 | | |
| INDUSTRIAL | | | 1.0 | % | | | | | | | | | |
| Goodman Groupc | | | | | | | 7,427,557 | | | | 3,928,512 | | |
| OFFICE | | | 0.3 | % | | | | | | | | | |
| Commonwealth Property Office Fundc | | | | | | | 1,461,929 | | | | 1,135,760 | | |
| RETAIL | | | 3.6 | % | | | |
| Westfield Groupc | | | | | | | 1,371,650 | | | | 13,938,379 | | |
| TOTAL AUSTRALIA | | | | | | | | | | | 39,900,501 | | |
| AUSTRIA | | | 0.3 | % | | | | | | | | | |
| RETAIL | | | | | | | | | | | | | |
| Atrium European Real Estate Ltd.c | | | | | | | 228,249 | | | | 981,933 | | |
| BRAZIL | | | 1.1 | % | | | | | | | | | |
| OFFICE | | | 0.8 | % | | | | | | | | | |
| BR Properties SA | | | | | | | 468,607 | | | | 3,336,066 | | |
| RETAIL | | | 0.3 | % | | | | | | | | | |
| BR Malls Participacoes SA | | | | | | | 78,240 | | | | 1,018,637 | | |
| TOTAL BRAZIL | | | | | | | | | | | 4,354,703 | | |
| CANADA | | | 3.4 | % | | | | | | | | | |
| OFFICE | | | 1.0 | % | | | | | | | | | |
| Brookfield Properties Corp. | | | | | | | 281,143 | | | | 3,947,248 | | |
| RESIDENTIAL | | | 1.5 | % | | | | | | | | | |
| Boardwalk REIT | | | | | | | 152,426 | | | | 5,735,931 | | |
See accompanying notes to financial statements.
10
COHEN & STEERS INSTITUTIONAL GLOBAL REALTY SHARES, INC.
SCHEDULE OF INVESTMENTS—(Continued)
June 30, 2010 (Unaudited)
| | | | | Number
of Shares | | Value | |
| RETAIL | | | 0.9 | % | | | | | | | | | |
| Primaris Retail REIT | | | | | | | 172,720 | | | $ | 2,832,832 | | |
| RioCan REIT | | | | | | | 32,074 | | | | 573,659 | | |
| | | | | | | | 3,406,491 | | |
| TOTAL CANADA | | | | | | | | | | | 13,089,670 | | |
| FINLAND | | | 0.7 | % | | | | | | | | | |
| DIVERSIFIED | | | | | | | | | | | | | |
| Sponda Oyjc | | | | | | | 929,311 | | | | 2,792,633 | | |
| FRANCE | | | 3.3 | % | | | | | | | | | |
| DIVERSIFIED | | | | | | | | | | | | | |
| ICADE SAc | | | | | | | 25,680 | | | | 2,167,390 | | |
| Unibail-Rodamcoc | | | | | | | 64,237 | | | | 10,469,480 | | |
| | | | | | | | 12,636,870 | | |
| GERMANY | | | 0.1 | % | | | | | | | | | |
| DIVERSIFIED | | | 0.1 | % | | | | | | | | | |
| IVG Immobilien AGb,c | | | | | | | 71,776 | | | | 426,734 | | |
| RESIDENTIAL | | | 0.0 | % | | | | | | | | | |
| Deutsche Wohnen AGb,c | | | | | | | 6,313 | | | | 49,285 | | |
| TOTAL GERMANY | | | | | | | | | | | 476,019 | | |
| HONG KONG | | | 18.4 | % | | | | | | | | | |
| DIVERSIFIED | | | 13.4 | % | | | | | | | | | |
| China Resources Land Ltd.c | | | | | | | 996,000 | | | | 1,870,179 | | |
| Glorious Property Holdings Ltd.c | | | | | | | 7,918,689 | | | | 2,254,919 | | |
| Great Eagle Holdings Ltd.c | | | | | | | 294,259 | | | | 748,785 | | |
| Hang Lung Properties Ltd.c | | | | | | | 1,336,600 | | | | 5,137,856 | | |
| Henderson Land Development Company Ltd.c | | | | | | | 355,612 | | | | 2,082,840 | | |
| Hysan Development Company Ltd.c | | | | | | | 738,100 | | | | 2,091,209 | | |
| Kerry Properties Ltd.c | | | | | | | 442,500 | | | | 1,909,207 | | |
| KWG Property Holding Ltd.c | | | | | | | 2,492,663 | | | | 1,532,928 | | |
| New World Development Ltd.c | | | | | | | 4,190,000 | | | | 6,802,249 | | |
| Sun Hung Kai Properties Ltd.c | | | | | | | 1,409,019 | | | | 19,287,648 | | |
| Wharf Holdings Ltd.c | | | | | | | 1,606,000 | | | | 7,851,748 | | |
| | | | | | | | 51,569,568 | | |
See accompanying notes to financial statements.
11
COHEN & STEERS INSTITUTIONAL GLOBAL REALTY SHARES, INC.
SCHEDULE OF INVESTMENTS—(Continued)
June 30, 2010 (Unaudited)
| | | | | Number
of Shares | | Value | |
| HOTEL | | | 1.0 | % | | | | | | | | | |
| Shangri-La Asia Ltd.c | | | | | | | 2,135,785 | | | $ | 3,985,613 | | |
| OFFICE | | | 2.8 | % | | | | | | | | | |
| Hongkong Land Holdings Ltd. (USD)c | | | | | | | 2,214,600 | | | | 10,946,808 | | |
| RESIDENTIAL | | | 1.2 | % | | | | | | | | | |
| China Overseas Land & Investment Ltd.c | | | | | | | 2,437,360 | | | | 4,541,560 | | |
| TOTAL HONG KONG | | | | | | | | | | | 71,043,549 | | |
| JAPAN | | | 8.3 | % | | | | | | | | | |
| DIVERSIFIED | | | 6.4 | % | | | | | | | | | |
| Kenedix Realty Investment Corp.c | | | | | | | 342 | | | | 952,377 | | |
| Mitsubishi Estate Co., Ltd.c | | | | | | | 811,000 | | | | 11,290,468 | | |
| Mitsui Fudosan Co., Ltd.c | | | | | | | 672,334 | | | | 9,357,858 | | |
| Sumitomo Realty & Development Co., Ltd.c | | | | | | | 169,000 | | | | 2,871,634 | | |
| Tokyu Land Corp.c | | | | | | | 110,000 | | | | 384,523 | | |
| | | | | | | | 24,856,860 | | |
| OFFICE | | | 1.7 | % | | | | | | | | | |
| DA Office Investment Corp.c | | | | | | | 309 | | | | 685,906 | | |
| Japan Prime Realty Investment Corp.c | | | | | | | 788 | | | | 1,659,906 | | |
| Japan Real Estate Investment Corp.c | | | | | | | 33 | | | | 268,805 | | |
| Nippon Building Fundc | | | | | | | 467 | | | | 3,705,423 | | |
| ORIX JREITc | | | | | | | 32 | | | | 132,885 | | |
| | | | | | | | 6,452,925 | | |
| RESIDENTIAL | | | 0.2 | % | | | | | | | | | |
| Goldcrest Co., Ltd.c | | | | | | | 52,278 | | | | 903,529 | | |
| TOTAL JAPAN | | | | | | | | | | | 32,213,314 | | |
| NETHERLANDS | | | 0.8 | % | | | | | | | | | |
| RETAIL | |
| Corio NVc | | | | | | | 60,109 | | | | 2,918,952 | | |
| NORWAY | | | 0.3 | % | | | | | | | | | |
| OFFICE | | | | | | | | | | | | | |
| Norwegian Property ASAb,c | | | | | | | 829,762 | | | | 1,083,770 | | |
See accompanying notes to financial statements.
12
COHEN & STEERS INSTITUTIONAL GLOBAL REALTY SHARES, INC.
SCHEDULE OF INVESTMENTS—(Continued)
June 30, 2010 (Unaudited)
| | | | | Number
of Shares | | Value | |
| SINGAPORE | | | 4.2 | % | | | | | | | | | |
| DIVERSIFIED | | | 2.1 | % | | | | | | | | | |
| CapitaLand Ltd.c | | | | | | | 1,938,136 | | | $ | 4,942,132 | | |
| Keppel Land Ltd.c | | | | | | | 1,180,045 | | | | 3,256,283 | | |
| | | | | | | | 8,198,415 | | |
| INDUSTRIAL | | | 0.5 | % | | | | | | | | | |
| Ascendas REITc | | | | | | | 1,510,000 | | | | 1,950,051 | | |
| OFFICE | | | 1.1 | % | | | | | | | | | |
| CapitaCommercial Trustc | | | | | | | 5,026,000 | | | | 4,353,533 | | |
| RETAIL | | | 0.5 | % | | | | | | | | | |
| CapitaMalls Asia Ltd.c | | | | | | | 1,153,000 | | | | 1,723,884 | | |
| TOTAL SINGAPORE | | | | | | | | | | | 16,225,883 | | |
| SWEDEN | | | 1.0 | % | | | | | | | | | |
| DIVERSIFIED | | | 0.8 | % | | | | | | | | | |
| Fabege ABc | | | | | | | 517,816 | | | | 3,066,980 | | |
| OFFICE | | | 0.2 | % | | | | | | | | | |
| Wihlborgs Fastigheter ABc | | | | | | | 42,936 | | | | 813,373 | | |
| TOTAL SWEDEN | | | | | | | | | | | 3,880,353 | | |
| UNITED KINGDOM | | | 5.4 | % | | | | | | | | | |
| DIVERSIFIED | | | 4.2 | % | | | | | | | | | |
| British Land Co., PLCc | | | | | | | 609,251 | | | | 3,935,419 | | |
| Hammerson PLCc | | | | | | | 919,625 | | | | 4,687,987 | | |
| Land Securities Group PLCc | | | | | | | 896,144 | | | | 7,416,271 | | |
| | | | | | | | 16,039,677 | | |
| OFFICE | | | 1.2 | % | | | | | | | | | |
| Derwent London PLCc | | | | | | | 157,047 | | | | 2,920,062 | | |
| Great Portland Estates PLCc | | | | | | | 437,258 | | | | 1,888,593 | | |
| | | | | | | | 4,808,655 | | |
| RESIDENTIAL | | | 0.0 | % | | | | | | | | | |
| Unite Group PLCb,c | | | | | | | 57,296 | | | | 147,978 | | |
| TOTAL UNITED KINGDOM | | | | | | | | | | | 20,996,310 | | |
See accompanying notes to financial statements.
13
COHEN & STEERS INSTITUTIONAL GLOBAL REALTY SHARES, INC.
SCHEDULE OF INVESTMENTS—(Continued)
June 30, 2010 (Unaudited)
| | | | | Number
of Shares | | Value | |
| UNITED STATES | | | 40.5 | % | | | | | | | | | |
| DIVERSIFIED | | | 2.6 | % | | | | | | | | | |
| Cousins Properties | | | | | | | 548 | | | $ | 3,694 | | |
| Forest City Enterprisesb | | | | | | | 244,034 | | | | 2,762,465 | | |
| Vornado Realty Trust | | | | | | | 99,956 | | | | 7,291,790 | | |
| | | | | | | | 10,057,949 | | |
| HEALTH CARE | | | 4.6 | % | | | | | | | | | |
| Brookdale Senior Livingb | | | | | | | 314,039 | | | | 4,710,585 | | |
| HCP | | | | | | | 187,824 | | | | 6,057,324 | | |
| Health Care REIT | | | | | | | 47,925 | | | | 2,018,601 | | |
| Nationwide Health Properties | | | | | | | 143,780 | | | | 5,143,011 | | |
| | | | | | | | 17,929,521 | | |
| HOTEL | | | 3.7 | % | | | | | | | | | |
| Host Hotels & Resorts | | | | | | | 428,013 | | | | 5,769,615 | | |
| Hyatt Hotels Corp.b | | | | | | | 102,753 | | | | 3,811,109 | | |
| Strategic Hotels & Resortsb | | | | | | | 180,866 | | | | 794,002 | | |
| Sunstone Hotel Investorsb | | | | | | | 385,761 | | | | 3,830,606 | | |
| | | | | | | | 14,205,332 | | |
| INDUSTRIAL | | | 1.8 | % | | | | | | | | | |
| ProLogis | | | | | | | 663,701 | | | | 6,723,291 | | |
| OFFICE | | | 5.0 | % | | | | | | | | | |
| BioMed Realty Trust | | | | | | | 174,562 | | | | 2,808,703 | | |
| Boston Properties | | | | | | | 81,060 | | | | 5,782,820 | | |
| DuPont Fabros Technology | | | | | | | 60,098 | | | | 1,476,007 | | |
| Liberty Property Trust | | | | | | | 127,198 | | | | 3,669,662 | | |
| SL Green Realty Corp. | | | | | | | 104,079 | | | | 5,728,508 | | |
| | | | | | | | 19,465,700 | | |
| OFFICE/INDUSTRIAL | | | 1.1 | % | | | | | | | | | |
| PS Business Parks | | | | | | | 73,051 | | | | 4,074,785 | | |
See accompanying notes to financial statements.
14
COHEN & STEERS INSTITUTIONAL GLOBAL REALTY SHARES, INC.
SCHEDULE OF INVESTMENTS—(Continued)
June 30, 2010 (Unaudited)
| | | | | Number
of Shares | | Value | |
| RESIDENTIAL | | | 7.4 | % | | | | | | | | | |
| APARTMENT | | | 6.7 | % | | | | | | | | | |
| Apartment Investment & Management Co. | | | | | | | 176,736 | | | $ | 3,423,376 | | |
| AvalonBay Communities | | | | | | | 50,779 | | | | 4,741,235 | | |
| BRE Properties | | | | | | | 80,780 | | | | 2,983,205 | | |
| Colonial Properties Trust | | | | | | | 140,220 | | | | 2,037,397 | | |
| Equity Residential | | | | | | | 140,113 | | | | 5,834,305 | | |
| Essex Property Trust | | | | | | | 19,181 | | | | 1,870,915 | | |
| Post Properties | | | | | | | 213,128 | | | | 4,844,400 | | |
| | | | | | | | 25,734,833 | | |
| MANUFACTURED HOME | | | 0.7 | % | | | | | | | | | |
| Equity Lifestyle Properties | | | | | | | 57,731 | | | | 2,784,366 | | |
| TOTAL RESIDENTIAL | | | | | | | | | | | 28,519,199 | | |
| SELF STORAGE | | | 2.5 | % | | | | | | | | | |
| Public Storage | | | | | | | 88,009 | | | | 7,736,871 | | |
| Sovran Self Storage | | | | | | | 54,883 | | | | 1,889,622 | | |
| | | | | | | | 9,626,493 | | |
| SHOPPING CENTER | | | 10.8 | % | | | | | | | | | |
| COMMUNITY CENTER | | | 4.1 | % | | | | | | | | | |
| Developers Diversified Realty Corp. | | | | | | | 466,068 | | | | 4,614,073 | | |
| Kimco Realty Corp. | | | | | | | 408,030 | | | | 5,483,923 | | |
| Regency Centers Corp. | | | | | | | 167,989 | | | | 5,778,822 | | |
| | | | | | | | 15,876,818 | | |
| REGIONAL MALL | | | 6.7 | % | | | | | | | | | |
| Macerich Co. | | | | | | | 144,202 | | | | 5,381,619 | | |
| Simon Property Group | | | | | | | 255,024 | | | | 20,593,188 | | |
| | | | | | | | 25,974,807 | | |
| TOTAL SHOPPING CENTER | | | | | | | | | | | 41,851,625 | | |
| SPECIALTY | | | 1.0 | % | | | | | | | | | |
| Digital Realty Trust | | | | | | | 68,393 | | | | 3,944,908 | | |
| TOTAL UNITED STATES | | | | | | | | | | | 156,398,803 | | |
| TOTAL COMMON STOCK (Identified cost—$349,659,658) | | | | | | | | | | | 378,993,263 | | |
See accompanying notes to financial statements.
15
COHEN & STEERS INSTITUTIONAL GLOBAL REALTY SHARES, INC.
SCHEDULE OF INVESTMENTS—(Continued)
June 30, 2010 (Unaudited)
| | | | | Number
of Warrants | | Value | |
| WARRANTS | | | 0.0 | % | | | | | | | | | |
| HONG KONG | |
Henderson Land Development, expire 6/1/2011b
(Identified cost—$0) | | | | | | | 83,122 | | | $ | 14,091 | | |
| | | | | Number
of Shares | | | |
| SHORT-TERM INVESTMENTS | | | 2.1 | % | | | | | | | | | |
| MONEY MARKET FUNDS | | | | | | | | | | | | | |
| Federated Government Obligations Fund, 0.04%d | | | | | | | 4,150,424 | | | | 4,150,424 | | |
| State Street Institutional Liquid Reserves Fund, 0.21%d | | | | | | | 4,152,257 | | | | 4,152,257 | | |
TOTAL SHORT-TERM INVESTMENTS
(Identified cost—$8,302,681) | | | | | | | | | | | 8,302,681 | | |
| TOTAL INVESTMENTS (Identified cost—$357,962,339) | | | 100.2 | % | | | | | | | 387,310,035 | | |
| LIABILITIES IN EXCESS OF OTHER ASSETS | | | (0.2 | ) | | | | | | | (872,720 | ) | |
NET ASSETS (Equivalent to $17.15 per share based on 22,534,754
shares of common stock outstanding) | | | 100.0 | % | | | | | | $ | 386,437,315 | | |
Glossary of Portfolio Abbreviations
EUR Euro Currency
REIT Real Estate Investment Trust
USD United States Dollar
Note: Percentages indicated are based on the net assets of the Fund.
a Illiquid security. Aggregate holdings equal 0% of net assets of the Fund.
b Non-income producing security.
c Fair valued security. This security has been valued at its fair value as determined in good faith under procedures established by and under the general supervision of the Fund's Board of Directors. Aggregate fair value securities represent 53.1% of net assets of the Fund, all of which have been fair valued pursuant to foreign security fair value pricing procedures approved by the Board of Directors.
d Rate quoted represents the seven day yield of the fund.
See accompanying notes to financial statements.
16
COHEN & STEERS INSTITUTIONAL GLOBAL REALTY SHARES, INC.
STATEMENT OF ASSETS AND LIABILITIES
June 30, 2010 (Unaudited)
| ASSETS: | |
| Investments in securities, at value (Identified cost—$357,962,339) | | $ | 387,310,035 | | |
| Cash | | | 51,954 | | |
| Foreign currency, at value (Identified cost—$127,188) | | | 127,267 | | |
| Receivable for: | |
| Investment securities sold | | | 2,644,025 | | |
| Dividends and interest | | | 1,161,454 | | |
| Fund shares sold | | | 164,012 | | |
| Other assets | | | 9,798 | | |
| Total Assets | | | 391,468,545 | | |
| LIABILITIES: | |
| Payable for: | |
| Investment securities purchased | | | 3,771,117 | | |
| Dividends declared | | | 506,121 | | |
| Fund shares redeemed | | | 426,543 | | |
| Investment management fees | | | 321,492 | | |
| Directors' fees | | | 1,480 | | |
| Other liabilities | | | 4,477 | | |
| Total Liabilities | | | 5,031,230 | | |
| NET ASSETS applicable to 22,534,754 shares of $0.001 par value of common stock outstanding | | $ | 386,437,315 | | |
| NET ASSET VALUE PER SHARE: | |
| ($386,437,315 ÷ 22,534,754 shares outstanding) | | $ | 17.15 | | |
| NET ASSETS consist of: | |
| Paid-in-capital | | $ | 539,542,262 | | |
| Dividends in excess of net investment income | | | (9,464,360 | ) | |
| Accumulated net realized loss | | | (172,969,494 | ) | |
| Net unrealized appreciation | | | 29,328,907 | | |
| | | $ | 386,437,315 | | |
See accompanying notes to financial statements.
17
COHEN & STEERS INSTITUTIONAL GLOBAL REALTY SHARES, INC.
STATEMENT OF OPERATIONS
For the Six Months Ended June 30, 2010 (Unaudited)
| Investment Income: | |
| Dividend income (net of $285,936 of foreign withholding tax) | | $ | 5,715,083 | | |
| Expenses: | |
| Investment management fees | | | 1,835,231 | | |
| Directors' fees and expenses | | | 17,605 | | |
| Registration and filing fees | | | 14,868 | | |
| Line of credit fees | | | 8,920 | | |
| Miscellaneous | | | 3,714 | | |
| Total Expenses | | | 1,880,338 | | |
| Reduction of Expenses (See Note 2) | | | (45,107 | ) | |
| Net Expenses | | | 1,835,231 | | |
| Net Investment Income | | | 3,879,852 | | |
| Net Realized and Unrealized Gain: | |
| Net realized gain (loss) on: | |
| Investments | | | 4,473,954 | | |
| Foreign currency transactions | | | (127,357 | ) | |
| Net realized gain | | | 4,346,597 | | |
| Net change in unrealized appreciation (depreciation) on: | |
| Investments | | | (33,186,953 | ) | |
| Foreign currency translations | | | (17,840 | ) | |
| Net change in unrealized appreciation (depreciation) | | | (33,204,793 | ) | |
| Net realized and unrealized loss | | | (28,858,196 | ) | |
| Net Decrease in Net Assets Resulting from Operations | | $ | (24,978,344 | ) | |
See accompanying notes to financial statements.
18
COHEN & STEERS INSTITUTIONAL GLOBAL REALTY SHARES, INC.
STATEMENT OF CHANGES IN NET ASSETS (Unaudited)
| | | For the
Six Months Ended
June 30, 2010 | | For the
Year Ended
December 31, 2009 | |
| Change in Net Assets: | |
| From Operations: | |
| Net investment income | | $ | 3,879,852 | | | $ | 6,471,898 | | |
| Net realized gain (loss) | | | 4,346,597 | | | | (26,183,195 | ) | |
| Net change in unrealized appreciation (depreciation) | | | (33,204,793 | ) | | | 113,220,023 | | |
Net increase (decrease) in net assets resulting
from operations | | | (24,978,344 | ) | | | 93,508,726 | | |
| Dividends to Shareholders from Net Investment Income | | | (4,575,627 | ) | | | (21,339,636 | ) | |
| Capital Stock Transactions: | |
| Increase in net assets from Fund share transactions | | | 65,298,956 | | | | 44,957,609 | | |
| Total increase in net assets | | | 35,744,985 | | | | 117,126,699 | | |
| Net Assets: | |
| Beginning of period | | | 350,692,330 | | | | 233,565,631 | | |
| End of perioda | | $ | 386,437,315 | | | $ | 350,692,330 | | |
a Includes dividends in excess of net investment income of $9,464,360 and $8,768,585, respectively.
See accompanying notes to financial statements.
19
COHEN & STEERS INSTITUTIONAL GLOBAL REALTY SHARES, INC.
FINANCIAL HIGHLIGHTS (Unaudited)
The following table includes selected data for a share outstanding throughout each period and other performance information derived from the financial statements. It should be read in conjunction with the financial statements and notes thereto.
| | | For the Six
Months Ended | | For the Year Ended December 31, | | For the Period
August 10, 2006a
through | |
| Per Share Operating Performance: | | June 30, 2010 | | 2009 | | 2008 | | 2007 | | December 31, 2006 | |
| Net asset value, beginning of period | | $ | 18.51 | | | $ | 14.23 | | | $ | 25.10 | | | $ | 29.57 | | | $ | 25.00 | | |
| Income from investment operations: | |
| Net investment income | | | 0.25 | | | | 0.76 | | | | 0.55 | | | | 0.49 | b | | | 0.12 | | |
| Net realized and unrealized gain (loss) | | | (1.40 | ) | | | 4.65 | | | | (11.02 | ) | | | (4.12 | ) | | | 4.62 | | |
Total income (loss) from investment
operations | | | (1.15 | ) | | | 5.41 | | | | (10.47 | ) | | | (3.63 | ) | | | 4.74 | | |
| Less dividends and distributions to shareholders from: | |
| Net investment income | | | (0.21 | ) | | | (1.13 | ) | | | (0.35 | ) | | | (0.73 | ) | | | (0.16 | ) | |
| Net realized gain | | | — | | | | — | | | | — | | | | (0.01 | ) | | | (0.01 | ) | |
| Tax return of capital | | | — | | | | — | | | | (0.05 | ) | | | (0.10 | ) | | | — | | |
Total dividends and distributions to
shareholders | | | (0.21 | ) | | | (1.13 | ) | | | (0.40 | ) | | | (0.84 | ) | | | (0.17 | ) | |
| Net increase (decrease) in net asset value | | | (1.36 | ) | | | 4.28 | | | | (10.87 | ) | | | (4.47 | ) | | | 4.57 | | |
| Net asset value, end of period | | $ | 17.15 | | | $ | 18.51 | | | $ | 14.23 | | | $ | 25.10 | | | $ | 29.57 | | |
| Total investment return | | | –6.24 | %c | | | 38.68 | % | | | –42.05 | % | | | –12.35 | % | | | –18.98 | %c | |
| Ratios/Supplemental Data: | |
| Net assets, end of period (in millions) | | $ | 386.4 | | | $ | 350.7 | | | $ | 233.6 | | | $ | 280.2 | | | $ | 81.4 | | |
Ratio of expenses to average daily net assets
(before expense reduction) | | | 1.02 | %d | | | 1.04 | % | | | 1.04 | % | | | 1.06 | % | | | 1.47 | %d | |
Ratio of expenses to average daily net assets
(net of expense reduction) | | | 1.00 | %d | | | 1.00 | % | | | 1.00 | % | | | 1.00 | % | | | 1.00 | %d | |
Ratio of net investment income to average daily net assets
(before expense reduction) | | | 2.09 | %d | | | 2.38 | % | | | 2.36 | % | | | 1.62 | % | | | 1.73 | %d | |
Ratio of net investment income to average daily net assets
(net of expense reduction) | | | 2.11 | %d | | | 2.43 | % | | | 2.40 | % | | | 1.68 | % | | | 2.20 | %d | |
| Portfolio turnover rate | | | 46 | %c | | | 186 | % | | | 126 | % | | | 67 | % | | | 8 | %c | |
a Commencement of operations.
b 6.2% of net investment income was attributable to a special dividend paid by Boston Properties, Inc.
c Not annualized.
d Annualized.
See accompanying notes to financial statements.
20
COHEN & STEERS INSTITUTIONAL GLOBAL REALTY SHARES, INC.
NOTES TO FINANCIAL STATEMENTS (Unaudited)
Note 1. Significant Accounting Policies
Cohen & Steers Institutional Global Realty Shares, Inc. (the Fund) was incorporated under the laws of the State of Maryland on May 11, 2006 and is registered under the Investment Company Act of 1940, as amended, as a nondiversified, open-end management investment company. The Fund's investment objective is total return.
The following is a summary of significant accounting policies consistently followed by the Fund in the preparation of its financial statements. The policies are in conformity with accounting principles generally accepted in the United States of America (GAAP). The preparation of the financial statements in accordance with GAAP requires management to make estimates and assumptions that affect the reported amounts of assets and liabilities at the date of the financial statements and the reported amounts of income and expenses during the reporting period. Actual results could differ from those estimates.
Portfolio Valuation: Investments in securities that are listed on the New York Stock Exchange are valued, except as indicated below, at the last sale price reflected at the close of the New York Stock Exchange on the business day as of which such value is being determined. If there has been no sale on such day, the securities are valued at the mean of the closing bid and asked prices for the day or, if no asked price is available, at the bid price.
Securities not listed on the New York Stock Exchange but listed on other domestic or foreign securities exchanges are valued in a similar manner. Securities traded on more than one securities exchange are valued at the last sale price on the business day as of which such value is being determined as reflected on the tape at the close of the exchange representing the principal market for such securities. If after the close of a foreign market, but prior to the close of business on the day the securities are being valued, market conditions change significantly, certain foreign securities may be fair valued pursuant to procedures established by the Board of Directors.
Readily marketable securities traded in the over-the-counter market, including listed securities whose primary market is believed by Cohen & Steers Capital Management, Inc. (the advisor) to be over-the-counter, are valued at the official closing prices as reported by sources as the Board of Directors deem appropriate to reflect their fair market value. If there has been no sale on such day, the securities are valued at the mean of the closing bid and asked prices for the day, or if no asked price is available, at the bid price. However, certain fixed-income securities may be valued on the basis of prices provided by a pricing service when such prices are believed by the Board of Directors to reflect the fair market value of such securities.
Securities for which market prices are unavailable, or securities for which the advisor determines that the bid and/or asked price does not reflect market value, will be valued at fair value pursuant to procedures approved by the Fund's Board of Directors. Circumstances in which market prices may be unavailable include, but are not limited to, when trading in a security is suspended, the exchange on which the security is traded is subject to an unscheduled close or disruption or material events occur after the close of the exchange on which the security is principally traded. In these circumstances, the Fund determines fair value in a manner that fairly reflects the market value of the security on the valuation date based on consideration of any information or factors it deems
21
COHEN & STEERS INSTITUTIONAL GLOBAL REALTY SHARES, INC.
NOTES TO FINANCIAL STATEMENTS (Unaudited)—(Continued)
appropriate. These may include, but are not limited to, recent transactions in comparable securities, information relating to the specific security and developments in the markets.
The Fund's use of fair value pricing may cause the net asset value of Fund shares to differ from the net asset value that would be calculated using market quotations. Fair value pricing involves subjective judgments and it is possible that the fair value determined for a security may be materially different than the value that could be realized upon the sale of that security.
Short-term debt securities with a maturity date of 60 days or less are valued at amortized cost, which approximates value. Investments in open-end mutual funds are valued at their closing net asset value.
Fair value is defined as the price that the Fund would receive to sell an investment or pay to transfer a liability in an orderly transaction with an independent buyer in the principal market, or in the absence of a principal market the most advantageous market for the investment or liability. The hierarchy of inputs that are used in determining the fair value of the Fund's investments is summarized below.
• Level 1—quoted prices in active markets for identical investments
• Level 2—other significant observable inputs (including quoted prices for similar investments, interest rates, credit risk, etc.)
• Level 3—significant unobservable inputs (including the Fund's own assumptions in determining the fair value of investments)
The inputs or methodology used for valuing securities are not necessarily an indication of the risk associated with investing in those securities.
The following is a summary of the inputs used as of June 30, 2010 in valuing the Fund's investments carried at value. 53.1% of net assets of the Fund were fair valued pursuant to foreign fair value pricing procedures approved by the Board of Directors:
| | | Total | | Quoted Prices In
Active Market for
Identical Assets
(Level 1) | | Significant
Other Observable
Inputs
(Level 2) | | Significant
Unobservable
Inputs
(Level 3) | |
| Common Stock—Brazil | | $ | 4,354,703 | | | $ | 4,354,703 | | | $ | — | | | | — | | |
| Common Stock—Canada | | | 13,089,670 | | | | 13,089,670 | | | | — | | | | — | | |
| Common Stock—United States | | | 156,398,803 | | | | 156,398,803 | | | | — | | | | — | | |
| Common Stock—Other Countries | | | 205,150,087 | | | | — | | | | 205,150,087 | | | | — | | |
| Warrants | | | 14,091 | | | | 14,091 | | | | — | | | | — | | |
| Money Market Funds | | | 8,302,681 | | | | — | | | | 8,302,681 | | | | — | | |
| Total Investments | | $ | 387,310,035 | | | $ | 173,857,267 | | | $ | 213,452,768 | | | | — | | |
22
COHEN & STEERS INSTITUTIONAL GLOBAL REALTY SHARES, INC.
NOTES TO FINANCIAL STATEMENTS (Unaudited)—(Continued)
Security Transactions and Investment Income: Security transactions are recorded on trade date. Realized gains and losses on investments sold are recorded on the basis of identified cost. Interest income is recorded on the accrual basis. Discounts are accreted and premiums are amortized over the life of the respective securities. Dividend income is recorded on the ex-dividend date, except for certain dividends on foreign securities, which are recorded as soon as the Fund is informed after the ex-dividend date. The Fund records distributions received in excess of income from underlying investments as a reduction of cost of investments and/or an increase in realized gain. Such amounts are based on estimates if actual amounts are not available, and actual amounts of income, realized gain and return of capital may differ from the estimated amounts. The Fund adjusts the estimated amounts of the components of distributions (and consequently its net investment income) as an increase to unrealized appreciation/(depreciation) and realized gain/(loss) on investments as necessary once the issuers provide information about the actual composition of the distributions.
Foreign Currency Translations: The books and records of the Fund are maintained in U.S. dollars as follows: (1) the foreign currency market value of investment securities, other assets and liabilities and foreign currency contracts are translated at the exchange rates prevailing at the end of the period; and (2) purchases, sales, income and expenses are translated at the exchange rates prevailing on the respective dates of such transactions. The resultant exchange gains and losses are recorded as realized and unrealized gain/loss on foreign exchange transactions. Pursuant to U.S. federal income tax regulations, certain foreign exchange gains/losses included in realized and unrealized gain/loss are included in or are a reduction of ordinary income for federal income tax purposes. The Fund does not isolate that portion of the results of operations arising as a resul t of changes in the foreign exchange rates from the changes in the market prices of the securities.
Foreign Securities: The Fund may directly purchase securities of foreign issuers. Investing in securities of foreign issuers involves special risks not typically associated with investing in securities of U.S. issuers. The risks include possible revaluation of currencies, the ability to repatriate funds, less complete financial information about companies and possible future adverse political and economic developments. Moreover, securities of many foreign issuers and their markets may be less liquid and their prices more volatile than those of securities of comparable U.S. issuers.
Dividends and Distributions to Shareholders: Dividends from net investment income and capital gain distributions are determined in accordance with U.S. federal income tax regulations, which may differ from GAAP. Dividends from net investment income are declared and paid semi-annually. Net realized capital gains, unless offset by any available capital loss carryforward, are distributed to shareholders at least annually. Dividends and distributions to shareholders are recorded on the ex-dividend date and are automatically reinvested in full and fractional shares of the Fund based on the net asset value per share at the close of business on the payable date unless the shareholder has elected to have them paid in cash.
Distributions paid by the Fund are subject to recharacterization for tax purposes. Based upon the results of operations for the six months ended June 30, 2010, the advisor considers it likely that a portion of the dividends will be reclassified to return of capital upon the final determination of the Fund's taxable income for the year.
23
COHEN & STEERS INSTITUTIONAL GLOBAL REALTY SHARES, INC.
NOTES TO FINANCIAL STATEMENTS (Unaudited)—(Continued)
Income Taxes: It is the policy of the Fund to continue to qualify as a regulated investment company, if such qualification is in the best interest of the shareholders, by complying with the requirements of Subchapter M of the Internal Revenue Code applicable to regulated investment companies, and by distributing substantially all of its taxable earnings to its shareholders. Accordingly, no provision for federal income or excise tax is necessary. Management has analyzed the Fund's tax positions taken on federal income tax returns as well as its tax positions in non-U.S. jurisdictions where it trades for all open tax years and has concluded that as of June 30, 2010, no provisions for income tax would be required in the Fund's financial statements. The Fund's tax positions for the tax years for which the applicable statutes of limitations have not expired are subject to examination by the Internal Revenue Service, state departments of revenue and by foreign tax authorities.
Note 2. Investment Management Agreement and Other Transactions with Affiliates
Investment Management Fees: The advisor serves as the Fund's investment advisor pursuant to an investment management agreement (the investment management agreement). Under the terms of the investment management agreement, the advisor provides the Fund with the day-to-day investment decisions and generally manages the Fund's investments in accordance with the stated policies of the Fund, subject to the supervision of the Fund's Board of Directors. For the services provided to the Fund, the advisor receives a fee, accrued daily and paid monthly, at the annual rate of 1.00% of the average daily net assets of the Fund.
The advisor is also responsible, under the investment management agreement, for the performance of certain administrative functions for the Fund. Additionally, the advisor pays all expenses of the Fund except for brokerage fees, taxes, interest, fees and expenses of the Fund's independent directors (as well as their independent counsel and other independent consultants), trade organization membership dues, federal and state registration fees and extraordinary expenses.
The advisor has contractually agreed to reimburse the Fund so that its total annual operating expenses do not exceed 1.00% of the average daily net assets. This commitment will remain in place for the life of the Fund.
Under subadvisory agreements between the advisor and each of Cohen & Steers Asia Limited, Cohen & Steers UK Limited and Cohen & Steers Europe S.A. (collectively the subadvisors), affiliates of the advisor, the subadvisors are responsible for managing the Fund's investments in certain non-U.S. real estate securities. For their services provided under the subadvisory agreement, the advisor (not the Fund) pays the subadvisors. The advisor allocates 50% of the investment management fee received from the Fund among itself and each subadvisor based on the portion of the Fund's average assets managed by the advisor and each subadvisor. The advisor retains the remaining 50% of the investment management fee received from the Fund. For the six months ended June 30, 2010, the advisor paid the subadvisors $335,613, $56,355 and $56,355, respectively.
24
COHEN & STEERS INSTITUTIONAL GLOBAL REALTY SHARES, INC.
NOTES TO FINANCIAL STATEMENTS (Unaudited)—(Continued)
Directors' and Officers' Fees: Certain directors and officers of the Fund are also directors, officers, and/or employees of the manager. The Fund does not pay compensation to any affiliated directors and officers.
Note 3. Purchases and Sales of Securities
Purchases and sales of securities, excluding short-term investments, for the six months ended June 30, 2010, totaled $228,163,597 and $163,900,868, respectively.
Note 4. Income Tax Information
As of June 30, 2010, the federal tax cost and net unrealized appreciation on securities were as follows:
| Gross unrealized appreciation | | $ | 44,419,174 | | |
| Gross unrealized depreciation | | | (15,071,478 | ) | |
| Net unrealized appreciation | | $ | 29,347,696 | | |
| Cost for federal income tax purposes | | $ | 357,962,339 | | |
As of December 31, 2009, the Fund had a net capital loss carryforward of $136,096,123, of which $182,151 will expire on December 31, 2015, $65,478,258 will expire on December 31, 2016 and $70,435,714 will expire on December 31, 2017. This carryforward may be used to offset future capital gains to the extent provided by regulations. In addition, the Fund incurred capital losses of $1,144,625 after October 31, 2009, which are not recognized for tax purposes until 2010.
Note 5. Capital Stock
The Fund is authorized to issue 100 million shares of capital stock, at a par value of $0.001 per share. The Board of Directors of the Fund may increase or decrease the aggregate number of shares of common stock that the Fund has authority to issue. Transactions in Fund shares were as follows:
| | | For the
Six Months Ended
June 30, 2010 | | For the
Year Ended
December 31, 2009 | |
| | | Shares | | Amount | | Shares | | Amount | |
| Sold | | | 5,300,042 | | | $ | 96,690,413 | | | | 7,562,051 | | | $ | 122,112,180 | | |
| Issued as reinvestment of dividends | | | 237,289 | | | | 4,069,506 | | | | 1,038,922 | | | | 18,080,603 | | |
| Redeemed | | | (1,950,961 | ) | | | (35,460,963 | ) | | | (6,060,548 | ) | | | (95,235,174 | ) | |
| Net increase | | | 3,586,370 | | | $ | 65,298,956 | | | | 2,540,425 | | | $ | 44,957,609 | | |
25
COHEN & STEERS INSTITUTIONAL GLOBAL REALTY SHARES, INC.
NOTES TO FINANCIAL STATEMENTS (Unaudited)—(Continued)
Note 6. Borrowings
The Fund, in conjunction with other Cohen & Steers funds, is a party to a $200,000,000 syndicated credit agreement (the credit agreement) with State Street Bank and Trust Company, as administrative agent and operations agent, and the lenders identified in the credit agreement, which expires January 28, 2011. The Fund pays a commitment fee of 0.15% per annum on its proportionate share of the unused portion of the credit agreement.
During the six months ended June 30, 2010, the Fund did not borrow under the credit agreement.
Note 7. Other
In the normal course of business, the Fund enters into contracts that provide general indemnifications. The Fund's maximum exposure under these arrangements is dependent on claims that may be made against the Fund in the future and, therefore, cannot be estimated; however, based on experience, the risk of material loss from such claims is considered remote.
26
COHEN & STEERS INSTITUTIONAL GLOBAL REALTY SHARES, INC.
OTHER INFORMATION
A description of the policies and procedures that the Fund uses to determine how to vote proxies relating to portfolio securities is available (i) without charge, upon request, by calling 800-330-7348, (ii) on our Web site at cohenandsteers.com or (iii) on the Securities and Exchange Commission's Web site at http://www.sec.gov. In addition, the Fund's proxy voting record for the most recent 12-month period ended June 30 is available (i) without charge, upon request, by calling 800-330-7348 or (ii) on the SEC's Web site at http://www.sec.gov.
The Fund files its complete schedule of portfolio holdings with the SEC for the first and third quarters of each fiscal year on Form N-Q. The Fund's Forms N-Q are available (i) without charge, upon request by calling 800-330-7348, or (ii) on the SEC's Web site at http://www.sec.gov. In addition, the Forms N-Q may be reviewed and copied at the SEC's Public Reference Room in Washington, DC. Information on the operation of the Public Reference Room may be obtained by calling 800-SEC-0330.
Please note that the distributions paid by the Fund to shareholders are subject to recharacterization for tax purposes. The Fund may also pay distributions in excess of the Fund's net investment company taxable income and this excess would be a tax-free return of capital distributed from the Fund's assets. The final tax treatment of all distributions is reported to shareholders on their 1099-DIV forms, which are mailed after the close of each calendar year.
APPROVAL OF INVESTMENT MANAGEMENT AGREEMENT
The Board of Directors of the Fund, including a majority of the directors who are not parties to the Fund's investment management and subadvisory agreements (the "Management Agreements"), or interested persons of any such party ("Independent Directors"), has the responsibility under the 1940 Act to approve the Fund's Management Agreements for their initial two year term and their continuation annually thereafter at a meeting of the Board of Directors called for the purpose of voting on the approval or continuation. At a meeting held in person on June 22-23, 2010, the Management Agreements were discussed and were unanimously continued for a term ending June 30, 2011 by the Fund's Board of Directors, including the Independent Directors. The Independent Directors were represented by independent counsel who assisted them in their deliberations during the meeting and executive session.
In considering whether to continue the Management Agreements, the Board of Directors reviewed materials provided by the Fund's investment manager (the "Investment Manager") and Fund counsel which included, among other things, fee, expense and performance information compared to peer funds ("Peer Funds") and performance comparisons to a larger category universe, prepared by an independent data provider; summary information prepared by the Investment Manager; and a memorandum outlining the legal duties of the Board of Directors. The Board of Directors also spoke directly with representatives of the independent data provider and met with investment advisory personnel. In addition, the Board of Directors considered information provided from time to time by the Investment Manager throughout the year at meetings of the Board of Directors, including
27
COHEN & STEERS INSTITUTIONAL GLOBAL REALTY SHARES, INC.
presentations by portfolio managers relating to the investment performance of the Fund and the investment strategies used in pursuing the Fund's objective. In particular, the Board of Directors considered the following:
(i) The nature, extent and quality of services provided by the Investment Manager and the Subadvisors: The Board of Directors reviewed the services that the Investment Manager and the sub-investment advisors (the "Subadvisors") provide to the Fund, including, but not limited to, making the day-to-day investment decisions for the Fund, and, for the Investment Manager, generally managing the Fund's investments in accordance with the stated policies of the Fund. The Board of Directors also discussed with officers and portfolio managers of the Fund the types of transactions that were being done on behalf of the Fund. Additionally, the Board of Directors took into account the services provided by the Investment Manager and the Subadvisors to other funds, including those that have investment objectives and strategies similar to the Fund. The Board of Directors next cons idered the education, background and experience of the Investment Manager's and Subadvisors' personnel, noting particularly that the favorable history and reputation of the portfolio managers for the Fund has had, and would likely continue to have, a favorable impact on the Fund. The Board of Directors further noted the Investment Manager's and Subadvisors' ability to attract qualified and experienced personnel. The Board of Directors then considered the administrative services provided by the Investment Manager, including compliance and accounting services. After consideration of the above factors, among others, the Board of Directors concluded that the nature, extent and quality of services provided by the Investment Manager and the Subadvisors are adequate and appropriate.
(ii) Investment performance of the Fund and the Investment Manager and Subadvisors: The Board of Directors considered the investment performance of the Fund versus Peer Funds and compared to a relevant benchmark. The Board of Directors noted that the Fund outperformed the medians of the Peer Funds for the year-to-date, and one- and three-year periods ended June 30, 2010. The Board of Directors also noted that the Fund had outperformed its benchmark for the year-to-date and one- and three-year periods. The Board of Directors engaged in discussions with the Investment Manager regarding the contributors and detractors to the Fund's performance during the periods. The Board of Directors also considered supplemental information provided by the Investment Manager, including a narrative summary of various factors affecting performance and the Investment Manager's perform ance in managing other real estate funds. The Board of Directors then determined that Fund performance, in light of all the considerations noted above, was satisfactory.
(iii) Cost of the services to be provided and profits to be realized by the Investment Manager from the relationship with the Fund: Next, the Board of Directors considered the advisory fees and administrative fees payable by the Fund, as well as total expense ratios. As part of its analysis, the Board of Directors gave consideration to the fee and expense analyses provided by the independent data provider. The Board of Directors noted that actual advisory fees and contractual advisory fees were higher than the median of the Peer Funds and the net expense ratio was lower than the median for the Peer Funds. The Board of Directors also considered that the Investment Manager charges the Fund a unitary fee over the life of the Fund, causing the Investment Manager to reimburse expenses to limit total expenses. The Board of Directors concluded that the Fund's expense str ucture is satisfactory.
28
COHEN & STEERS INSTITUTIONAL GLOBAL REALTY SHARES, INC.
The Board of Directors also reviewed information regarding the profitability to the Investment Manager of its relationship with the Fund. The Board of Directors considered the level of the Investment Manager's profits and whether the profits were reasonable for the Investment Manager. Since the Subadvisors are paid by the Investment Manager and not by the Fund and are Subadvisors of the Investment Manager, and the Board of Directors considered the profitability of the Investment Manager as a whole, the Board of Directors did not consider the Subadvisors' separate profitability to be relevant to their considerations. The Board of Directors took into consideration other benefits to be derived by the Investment Manager in connection with the Management Agreements, noting particularly the research and related services, within the meaning of Section 28(e) of the Securities Exchange Act of 1934, as amended, that the Investment Manager receives by allocating the Fund's brokerage transactions. The Board of Directors concluded that the profits realized by the Investment Manager from its relationship with the Fund were reasonable and consistent with fiduciary duties.
(iv) The extent to which economies of scale would be realized as the Fund grows and whether fee levels would reflect such economies of scale: The Board of Directors noted that the Investment Manager pays most of the regular operating costs of the Fund and reimburses the Fund to the extent that total expenses exceed the advisory fee rate. The Board of Directors determined that there were not at this time significant economies of scale that were not being shared with shareholders.
(v) Comparison of services rendered and fees paid to those under other investment advisory contracts, such as contracts of the same and other investment advisers or other clients: As discussed above in (iii), the Board of Directors compared the fees paid under the Management Agreements to those under other investment advisory contracts of other investment advisers managing Peer Funds. The Board of Directors also considered the services rendered, fees paid and profitability under the Management Agreements to the Investment Manager's other advisory agreements and advisory contracts with institutional and other clients with similar investment mandates, including subadvised mutual funds and proprietary funds. The Board of Directors also considered the entrepreneurial risk and financial exposure assumed by the Investment Manager in developing and managing the Fund that the Investment Manager does not have with institutional and other clients. The Board of Directors determined that on a comparative basis the fees under the Management Agreements were reasonable in relation to the services provided.
No single factor was cited as determinative to the decision of the Board of Directors. Rather, after weighing all of the considerations and conclusions discussed above, the Board of Directors, including the Independent Directors, unanimously approved the continuation of the Management Agreements.
29
COHEN & STEERS INSTITUTIONAL GLOBAL REALTY SHARES, INC.
Meet the Cohen & Steers family of open-end funds:
COHEN & STEERS
GLOBAL REALTY SHARES
• Designed for investors seeking total return, investing primarily in global real estate equity securities
• Symbols: CSFAX, CSFBX*, CSFCX, CSSPX
COHEN & STEERS
INSTITUTIONAL GLOBAL REALTY SHARES
• Designed for institutional investors seeking total return, investing primarily in global real estate securities
• Symbol: GRSIX
COHEN & STEERS
REALTY SHARES
• Designed for investors seeking total return, investing primarily in REITs
• Symbol: CSRSX
COHEN & STEERS
INSTITUTIONAL REALTY SHARES
• Designed for institutional investors seeking total return, investing primarily in REITs
• Symbol: CSRIX
COHEN & STEERS
REALTY INCOME FUND
• Designed for investors seeking maximum total return, investing primarily in real estate securities with an emphasis on both income and capital appreciation
• Symbols: CSEIX, CSBIX*, CSCIX, CSDIX
COHEN & STEERS
INTERNATIONAL REALTY FUND
• Designed for investors seeking total return, investing primarily in international real estate securities
• Symbols: IRFAX, IRFCX, IRFIX
COHEN & STEERS
ASIA PACIFIC REALTY SHARES
• Designed for investors seeking total return, investing primarily in real estate securities located in the Asia Pacific region
• Symbols: APFAX, APFCX, APFIX
COHEN & STEERS
GLOBAL INFRASTRUCTURE FUND
• Designed for investors seeking total return, investing primarily in global infrastructure securities
• Symbols: CSUAX, CSUBX*, CSUCX, CSUIX
COHEN & STEERS
DIVIDEND VALUE FUND
• Designed for investors seeking high current income and long-term growth of income and capital appreciation, investing primarily in dividend paying common stocks and preferred stocks
• Symbols: DVFAX, DVFCX, DVFIX
COHEN & STEERS
PREFERRED SECURITIES AND INCOME FUND
• Designed for investors seeking total return and high current income and capital appreciation, investing primarily in preferred and debt securities
• Symbols: CPXAX, CPXCX, CPXIX
* Class B shares are no longer offered except through dividend reinvestment and permitted exchanges by existing Class B shareholders.
Please consider the investment objectives, risks, charges and expenses of the fund carefully before investing. A prospectus containing this and other information can be obtained by calling 800-330-7348 or by visiting cohenandsteers.com. Please read the prospectus carefully before investing.
Cohen & Steers Securities, LLC, Distributor
30
COHEN & STEERS INSTITUTIONAL GLOBAL REALTY SHARES, INC.
OFFICERS AND DIRECTORS
Robert H. Steers
Director and co-chairman
Martin Cohen
Director and co-chairman
Bonnie Cohen
Director
George Grossman
Director
Richard E. Kroon
Director
Richard J. Norman
Director
Frank K. Ross
Director
Willard H. Smith Jr.
Director
C. Edward Ward, Jr.
Director
Adam M. Derechin
President and chief executive officer
Joseph M. Harvey
Vice president
Scott Crowe
Vice president
Francis C. Poli
Secretary
James Giallanza
Treasurer and chief financial officer
Lisa D. Phelan
Chief compliance officer
KEY INFORMATION
Investment Advisor
Cohen & Steers Capital Management, Inc.
280 Park Avenue
New York, NY 10017
(212) 832-3232
Fund Subadministrator and Custodian
State Street Bank and Trust Company
One Lincoln Street
Boston, MA 02111
Transfer Agent
Boston Financial Data Services, Inc.
30 Dan Road
Canton, MA 02021
(800) 437-9912
Legal Counsel
Stroock & Stroock & Lavan LLP
180 Maiden Lane
New York, NY 10038
Distributor
Cohen & Steers Securities, LLC
280 Park Avenue
New York, NY 10017
Nasdaq Symbol: GRSIX
Web site: cohenandsteers.com
This report is authorized for delivery only to shareholders of Cohen & Steers Institutional Global Realty Shares, Inc. unless accompanied or preceded by the delivery of a currently effective prospectus setting forth details of the Fund. Past performance is of course no guarantee of future results and your investment may be worth more or less at the time you sell.
31
eDelivery NOW AVAILABLE
Stop traditional mail delivery; receive your shareholder reports and prospectus online.
Sign up at cohenandsteers.com
COHEN & STEERS
INSTITUTIONAL GLOBAL REALTY SHARES
280 PARK AVENUE
NEW YORK, NY 10017


SEMIANNUAL REPORT
JUNE 30, 2010
GRSIXSAR
Item 2. Code of Ethics.
Not applicable.
Item 3. Audit Committee Financial Expert.
Not applicable.
Item 4. Principal Accountant Fees and Services.
Not applicable.
Item 5. Audit Committee of Listed Registrants.
Not applicable.
Item 6. Schedule of Investments.
Included in Item 1 above.
Item 7. Disclosure of Proxy Voting Policies and Procedures for Closed-End Management Investment Companies.
Not applicable.
Item 8. Portfolio Managers of Closed-End Management Investment Companies.
Not applicable.
Item 9. Purchases of Equity Securities by Closed-End Management Investment Company and Affiliated Purchasers.
None.
Item 10. Submission of Matters to a Vote of Security Holders.
None.
Item 11. Controls and Procedures.
(a) The registrant’s principal executive officer and principal financial officer have concluded, based upon their evaluation of the registrant’s disclosure controls and procedures as conducted within 90 days of the filing date of this report, that these disclosure controls and procedures provide reasonable assurance that material information required to be disclosed by the registrant in the report it files or submits on Form N-CSR is recorded, processed, summarized and reported within the time periods specified in the Securities and Exchange Commission’s rules and forms
and that such material information is accumulated and communicated to the registrant’s management, including its principal executive officer and principal financial officer, as appropriate, in order to allow timely decisions regarding required disclosure.
(b) There were no changes in the registrant’s internal control over financial reporting that occurred during the second fiscal quarter of the period covered by this report that have materially affected, or are reasonably likely to materially affect, the registrant’s internal control over financial reporting.
Item 12. Exhibits.
(a)(1) Not applicable.
(a) (2) Certifications of principal executive officer and principal financial officer as required by Rule 30a-2(a) under the Investment Company Act of 1940.
(a)(3) Not applicable.
(b) Certifications of principal executive officer and principal financial officer as required by Rule 30a- 2(b) under the Investment Company Act of 1940.
SIGNATURES
Pursuant to the requirements of the Securities Exchange Act of 1934 and the Investment Company Act of 1940, the registrant has duly caused this report to be signed on its behalf by the undersigned, thereunto duly authorized.
COHEN & STEERS INSTITUTIONAL GLOBAL REALTY SHARES, INC.
By: | /s/ Adam M. Derechin | |
| Name: Adam M. Derechin | |
| Title: President and Chief Executive Officer | |
| | |
Date: | September 3, 2010 | |
Pursuant to the requirements of the Securities Exchange Act of 1934 and the Investment Company Act of 1940, this report has been signed below by the following persons on behalf of the registrant and in the capacities and on the dates indicated.
By: | /s/ Adam M. Derechin | |
| Name: | Adam M. Derechin | |
| Title: | President and Chief Executive Officer | |
| | (principal executive officer) | |
| | | |
By: | /s/ James Giallanza | |
| Name: | James Giallanza | |
| Title: | Treasurer | |
| | (principal financial officer) | |
| | | |
| | | |
Date: | September 3, 2010 | |