UNITED STATES
SECURITIES AND EXCHANGE COMMISSION
Washington, D.C. 20549
FORM N-CSR
CERTIFIED SHAREHOLDER REPORT OF REGISTERED
MANAGEMENT INVESTMENT COMPANIES
Investment Company Act file number | 811-21902 |
|
Cohen & Steers Institutional Global Realty Shares, Inc. |
(Exact name of registrant as specified in charter) |
|
280 Park Avenue, New York, NY | | 10017 |
(Address of principal executive offices) | | (Zip code) |
|
Adam M. Derechin Cohen & Steers Capital Management, Inc. 280 Park Avenue New York, New York 10017 |
(Name and address of agent for service) |
|
Registrant’s telephone number, including area code: | (212) 832-3232 | |
|
Date of fiscal year end: | December 31 | |
|
Date of reporting period: | June 30, 2009 | |
| | | | | | | | |
Item 1. Reports to Stockholders.
COHEN & STEERS INSTITUTIONAL GLOBAL REALTY SHARES, INC.
To Our Shareholders:
We would like to share with you our report for the six months ended June 30, 2009. The net asset value at that date was $14.73 per share.
The total returns, including income and change in net asset value, for the Fund and the comparative benchmarks were:
| | | Six Months Ended
June 30, 2009 | |
| Cohen & Steers Institutional Global Realty Shares | | | 5.05 | % | |
| FTSE EPRA/NAREIT Developed Real Estate Indexa | | | 5.88 | % | |
| S&P 500 Indexa | | | 3.16 | % | |
The performance data quoted represent past performance. Past performance is no guarantee of future results. The investment return and the principal value of an investment will fluctuate and shares, if redeemed, may be worth more or less than their original cost. Current performance may be lower or higher than the performance data quoted. Total returns of the Fund current to the most recent month-end can be obtained by visiting our Web site at cohenandsteers.com.
Investment Review
Global real estate securities had a volatile six months, with a continued economic downturn and deteriorating capital markets driving negative returns for most of the first quarter. Then, after hitting multi-year lows in March, the asset class rallied as monetary and fiscal stimulus efforts began to take hold and the commencement of the inventory cycle began to reverse the contraction in global economies. Asia Pacific was the top-performing region and outdistanced North America and Europe by wide margins. The United States was among the poorest performers, with a total return of –12.2% as measured by the FTSE NAREIT Equity REIT Index. Early in the period, investors reacted unfavorably to the new administration's proposed fiscal budget and were initially disappointed with a lack of specifics on how the government would address the banking crisis.
More clarity on policy lifted U.S. REITs in March
The March rally took hold after the Federal Reserve said it would make substantial purchases of long-term Treasury and mortgage-backed bonds. Equities received another boost when Treasury Secretary Geithner unveiled the details of the Public Private Investment Program rescue plan, which involves working with private investors to purchase assets from banks. Real estate, specifically, benefited from these programs, as they also helped avert
a The FTSE EPRA/NAREIT Developed Real Estate Index (formerly known as the FTSE EPRA/NAREIT Global Real Estate Index) is an unmanaged portfolio of approximately 262 constituents from 19 countries. The S&P 500 Index is an unmanaged index of common stocks that is frequently used as a general measure of stock market performance.
1
COHEN & STEERS INSTITUTIONAL GLOBAL REALTY SHARES, INC.
deflation, which can be particularly damaging to property values. Yield spreads on commercial mortgage-backed securities—a traditional means of real estate financing—narrowed, and U.S. REITs had a strong rally in response to the news.
Recapitalization put global REITs on solid ground
Recapitalization started in Australia before moving to the United Kingdom and the United States. In each country, the goals were similar: to strengthen balance sheets, meet debt maturities and have enough liquidity to take advantage of buying opportunities. Over the six-month period ended June 30, 2009, real estate companies globally raised more than $36 billion in public debt and equity, with $16.8 billion in the U.S. alone. Cohen & Steers was instrumental in several capital raisings, and was a cornerstone investor in many of them.
Canada (which had a total return of +15.0% in the period)1 declined in the first quarter but bounced back, receiving a boost from an interest-rate cut in March, rising oil prices and a healthy banking sector. The market saw some small but meaningful REIT recapitalizations.
Early in the period, U.K. real estate securities (–15.4%) came under pressure as a drop in property values pushed up loan-to-value ratios, putting some companies close to their maximum leverage covenants. In response, four of the largest public property companies recapitalized in February, and others followed suit in the second quarter. The market responded favorably; dilution factors were trumped by REITs' improved financial condition. The rally leveled off in June, with the capitalization story fading as most major REITs' capital needs had been met. Investors refocused on fundamentals, which remained weak.
France (+4.4%) saw a first-quarter sell-off on news of higher-than-forecast unemployment and an unexpected drop in consumption. The market rebounded in the second quarter as the major real estate companies renegotiated leverage covenants, but did not recapitalize. In news, Spain launched its version of the REIT model (SOCIMI) in June. Unlike most REIT structures, it includes a corporate income tax (18%); however, dividends paid to individuals will be tax-exempt.
China's stimulus activity echoed throughout Asia Pacific
Asia Pacific real estate property companies declined in the first quarter as the global economic slowdown reduced demand for the region's exports and pushed most of its economies into recession. China's expansive fiscal and monetary policies, sizable infrastructure spending and relaxed bank lending took hold in the second quarter, however, suggesting that a resumption in the mainland's economic growth may be at hand.
After a steep February sell-off, Hong Kong property stocks (+63.1%) rebounded, despite gross domestic product contracting more than expected. A steady influx of money from mainland China helped support the residential market. Real estate development companies benefited from a combination of low rates and limited existing
1 Country returns are in local currencies as measured by the FTSE EPRA/NAREIT Developed Real Estate Index.
2
COHEN & STEERS INSTITUTIONAL GLOBAL REALTY SHARES, INC.
residential supply. Singapore (+39.0%) surged as its economy performed better than expected and office fundamentals appeared to be stabilizing. The country saw a rebound in residential transactions when developers cut prices and banks offered attractive mortgages.
Japan (+12.8%) rebounded after a poor first quarter. Financially weaker J-REITs trailed the broad market, but rose amid indications that the government was willing to support the group. Property fundamentals remained weak; office vacancy rates within Tokyo's main wards topped 6% for the first time since early 2005. The condominium market showed some signs of stabilization, with a decline in the inventory of unsold units (now below 10,000, a level considered to be a bear market threshold).
Early in the year, Australia (–13.3%) trended down as unemployment rose and office space in Sydney came under pressure from a growing supply of sub-lease space. However, the country appears to have sidestepped a significant recession; gross domestic product grew 0.4% in the first quarter due to government stimulus policies and a recovery in commodity prices. Some of the market's smaller companies rallied on the perception that financing would become more available. Following a second round of recapitalizations, the major real estate companies have largely met their near-term financing needs.
Global Real Estate Securities Total Returns in Local Currencies
January 1, 2009–June 30, 2009
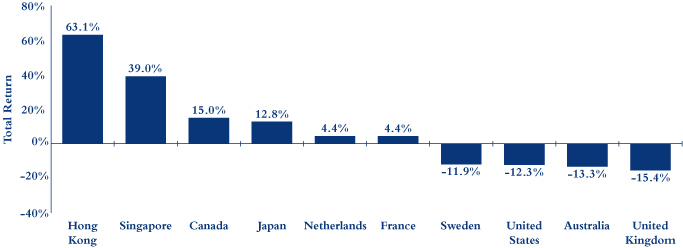
Country returns are in local currencies as measured by the FTSE EPRA/NAREIT Developed Real Estate Index.
Fund performance
The Fund had a positive total return in the six-month period but slightly underperformed its benchmark. Stock selection in the United States detracted from relative performance, although our underweight in the market mitigated the effect. Stock selection in Japan also hindered relative return. We were underweight J-REITs with poorer balance sheets that received a boost from the government's willingness to support debt refinancing.
3
COHEN & STEERS INSTITUTIONAL GLOBAL REALTY SHARES, INC.
Other detractors included our stock selection and overweight in the United Kingdom and our underweight in Singapore, although positive stock selection lessened the full impact in the latter. Likewise, stock selection in Australia was a hindrance, but this was countered by our beneficial underweight there. Relative return received a significant boost from our overweight in Hong Kong due to our allocation to Hong Kong-based companies operating in China. Overall, U.S. dollar-based investors benefited from movements in exchange rates.
Investment Outlook
It is likely that the global economy has bottomed, although the strength and timing of a recovery is uncertain. We believe the United States will surprise to the upside later this year and into 2010, which, along with potential growth in China, could aid a broader global turnaround.
U.S. REIT capital raisings will likely resume again after June's pause, as companies continue to take advantage of a receptive market. We believe that companies with the balance sheet capacity will be in a position to play offense when these buying opportunities appear.
Occupancies and market rents in the United Kingdom still have room to fall, but we believe that property values and cap rates for prime London real estate are stabilizing—especially in the West End, with its diverse tenant base and limited supply. More investors are looking beyond the likelihood of continued weak fundamentals, targeting high-quality properties with dependable income streams and attractive prices.
The efforts to address capital needs have started to spread to continental Europe, although there is still much to be done; a reluctance to recapitalize has clouded many companies' outlook. France's growth had been supported by strong domestic consumer demand, but it has recently leveled off and may remain sluggish into 2010. Similarly, indexation of rents to inflation provided a tailwind for office property owners in recent years but could become a headwind as leases roll over in a low-growth environment.
The recovery in Asia Pacific has been stronger than expected, led by China's initiatives to stimulate the economy, which have encouraged real estate investment and development. China's influence has raised speculation that the recovery in this region might in fact "decouple" from the recoveries in the United States and Europe. In Hong Kong, the economy is likely to remain negative for the rest of 2009, although office rents should bottom by year end. Investors may continue to look beyond this, amid improving residential fundamentals and a flattening unemployment rate. Very low interest rates could spur demand for higher-return investments, including real estate.
Most of the major Australian property trusts have decreased leverage through recapitalization, significantly diminishing the likelihood of distress among high-quality portfolios. Over the next year, we expect them to use this liquidity to acquire properties, or even smaller companies, on attractive terms. We view Japan's developers as more attractive than J-REITs, which are generally expensive and undercapitalized. Japan's economy may take time to recover, as it depends on recoveries in its major trading partners.
4
COHEN & STEERS INSTITUTIONAL GLOBAL REALTY SHARES, INC.
For our part, we favor companies with the balance sheet capacity to take advantage of buying opportunities that arise. These companies and those fundamentally positioned for economic recovery remain our primary focus.
Sincerely,
| | |  | |  | |
|
| | | MARTIN COHEN | | ROBERT H. STEERS | |
|
| | | Co-chairman | | Co-chairman | |
|
| | |  | |  | |
|
| | | JOSEPH M. HARVEY | | SCOTT CROWE | |
|
| | | Portfolio Manager | | Portfolio Manager | |
|
 | |  | |  | |
|
| GERIOS J. M. ROVERS | | CHARLES J. MCKINLEY | | LUKE SULLIVAN | |
|
| Portfolio Manager | | Portfolio Manager | | Portfolio Manager | |
|
The views and opinions in the preceding commentary are subject to change. This material represents an assessment of the market environment at a specific point in time, should not be relied upon as investment advice and is not intended to predict or depict performance of any investment.
Visit Cohen & Steers online at cohenandsteers.com
For more information about any of our funds, visit cohenandsteers.com, where you will find daily net asset values, fund fact sheets and portfolio highlights. You can also access newsletters, education tools and market updates covering the global real estate, listed infrastructure, utilities, large cap value and preferred securities sectors.
In addition, our Web site contains comprehensive information about our firm, including our most recent press releases, profiles of our senior investment professionals and an overview of our investment approach.
5
COHEN & STEERS INSTITUTIONAL GLOBAL REALTY SHARES, INC.
Performance Review (Unaudited)
Average Annual Total Returns—For the Periods Ended June 30, 2009
| | | 1 Year | | Since Inceptiona | |
| Fund | | | –31.38 | % | | | –14.56 | % | |
The performance data quoted represent past performance. Past performance is no guarantee of future results. The investment return and principal value of an investment will fluctuate and shares, when redeemed, may be worth more or less than their original cost. Current performance may be lower or higher than the performance data quoted. Performance information current to the most recent month-end can be obtained by visiting our Web site at cohenandsteers.com. The performance table does not reflect the deduction of taxes that a shareholder would pay on Fund distributions or the redemption of Fund shares.
The gross and net expense ratios were 1.04% and 1.00%, respectively, as disclosed in the May 1, 2009 prospectus. The advisor has contractually agreed to reimburse the Fund so that its annual operating expenses do not exceed 1.00%. This commitment will remain in place for the life of the Fund.
a Inception date of August 10, 2006.
6
COHEN & STEERS INSTITUTIONAL GLOBAL REALTY SHARES, INC.
Expense Example (Unaudited)
As a shareholder of the Fund, you incur two types of costs: (1) transaction costs; and (2) ongoing costs including management fees and other Fund expenses. This example is intended to help you understand your ongoing costs (in dollars) of investing in the Fund and to compare these costs with the ongoing costs of investing in other mutual funds.
The example is based on an investment of $1,000 invested at the beginning of the period and held for the entire period January 1, 2009—June 30, 2009.
Actual Expenses
The first line of the table below provides information about actual account values and expenses. You may use the information in this line, together with the amount you invested, to estimate the expenses that you paid over the period. Simply divide your account value by $1,000 (for example, an $8,600 account value divided by $1,000 = 8.6), then multiply the result by the number in the first line under the heading entitled "Expenses Paid During Period" to estimate the expenses you paid on your account during this period.
Hypothetical Example for Comparison Purposes
The second line of the table below provides information about hypothetical account values and hypothetical expenses based on the Fund's actual expense ratio and an assumed rate of return of 5% per year before expenses, which is not the Fund's actual return. The hypothetical account values and expenses may not be used to estimate the actual ending account balance or expenses you paid for the period. You may use this information to compare the ongoing cost of investing in the Fund and other funds. To do so, compare this 5% hypothetical example with the 5% hypothetical examples that appear in the shareholder reports of other funds.
Please note that the expenses shown in the table are meant to highlight your ongoing costs only and do not reflect any transactional costs. Therefore, the second line of the table is useful in comparing ongoing costs only, and will not help you determine the relative total costs of owning different funds. In addition, if these transactional costs were included, your costs would have been higher.
| | | Beginning
Account Value
January 1, 2009 | | Ending
Account Value
June 30, 2009 | | Expenses Paid
During Period*
January 1, 2009–
June 30, 2009 | |
| Actual (5.05% return) | | $ | 1,000.00 | | | $ | 1,050.50 | | | $ | 5.08 | | |
| Hypothetical (5% annual return before expenses) | | $ | 1,000.00 | | | $ | 1,019.84 | | | $ | 5.01 | | |
* Expenses are equal to the Fund's annualized expense ratio of 1.00% multiplied by the average account value over the period, multiplied by 181/365 (to reflect the one-half year period). If the Fund had borne all of its expenses that were assumed by the advisor, the annualized expense ratio would have been 1.05%.
7
COHEN & STEERS INSTITUTIONAL GLOBAL REALTY SHARES, INC.
JUNE 30, 2009
Top Ten Holdings
(Unaudited)
| Security | | Value | | % of
Net
Assets | |
| Sun Hung Kai Properties Ltd. | | $ | 14,686,195 | | | | 5.8 | % | |
| Simon Property Group | | | 13,182,023 | | | | 5.2 | | |
| Westfield Group | | | 11,164,589 | | | | 4.4 | | |
| Mitsubishi Estate Co., Ltd. | | | 8,998,105 | | | | 3.6 | | |
| Unibail-Rodamco | | | 7,826,869 | | | | 3.1 | | |
| Mitsui Fudosan Co., Ltd. | | | 7,601,941 | | | | 3.0 | | |
| Vornado Realty Trust | | | 6,835,959 | | | | 2.7 | | |
| Public Storage | | | 6,834,344 | | | | 2.7 | | |
| China Overseas Land & Investment Ltd. | | | 6,371,968 | | | | 2.5 | | |
| New World Development Ltd. | | | 5,727,216 | | | | 2.3 | | |
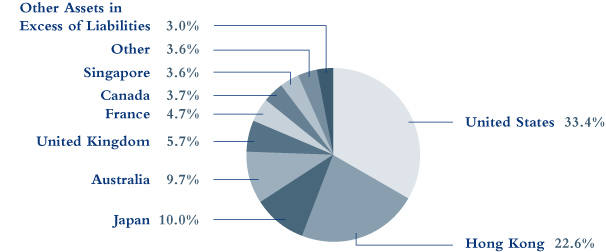
Country Breakdown
(Based on Net Assets)
(Unaudited)
8
COHEN & STEERS INSTITUTIONAL GLOBAL REALTY SHARES, INC.
SCHEDULE OF INVESTMENTS
June 30, 2009 (Unaudited)
| | | | | Number
of Shares | | Value | |
| COMMON STOCK | | | 97.0 | % | | | | | | | | | |
| AUSTRALIA | | | 9.7 | % | | | | | | | | | |
| DIVERSIFIED | | | 4.0 | % | | | | | | | | | |
| Dexus Property Groupa | | | | | | | 5,199,679 | | | $ | 3,128,406 | | |
| GPT Groupa | | | | | | | 5,926,842 | | | | 2,319,290 | | |
| Mirvac Groupa | | | | | | | 1,741,574 | | | | 1,509,127 | | |
| Stocklanda | | | | | | | 1,262,187 | | | | 3,255,839 | | |
| | | | | | | | 10,212,662 | | |
| INDUSTRIAL | | | 0.3 | % | | | | | | | | | |
| Goodman Groupa | | | | | | | 2,093,122 | | | | 619,515 | | |
| OFFICE | | | 1.0 | % | | | | | | | | | |
| Commonwealth Property Office Funda | | | | | | | 1,819,648 | | | | 1,215,243 | | |
| ING Office Funda | | | | | | | 1,555,412 | | | | 574,719 | | |
| Macquarie Office Trusta | | | | | | | 3,959,415 | | | | 665,410 | | |
| | | | | | | | 2,455,372 | | |
| RETAIL | | | 4.4 | % | | | | | | | | | |
| Westfield Groupa | | | | | | | 1,219,869 | | | | 11,164,589 | | |
| TOTAL AUSTRALIA | | | | | | | | | | | 24,452,138 | | |
| BERMUDA | | | 0.3 | % | | | | | | | | | |
| HOTEL | |
| Orient-Express Hotels Ltd | | | | | | | 100,096 | | | | 849,815 | | |
| BRAZIL | | | 0.5 | % | | | | | | | | | |
| DIVERSIFIED | | | 0.2 | % | | | | | | | | | |
| PDG Realty SA Empreendimentos e Participacoes | | | | | | | 51,500 | | | | 559,548 | | |
| RESIDENTIAL | | | 0.3 | % | | | | | | | | | |
| MRV Engenharia e Participacoes SA | | | | | | | 50,790 | | | | 703,725 | | |
| RETAIL | | | 0.0 | % | | | | | | | | | |
| BR Malls Participacoes SAb | | | | | | | 9,900 | | | | 75,279 | | |
| TOTAL BRAZIL | | | | | | | | | | | 1,338,552 | | |
See accompanying notes to financial statements.
9
COHEN & STEERS INSTITUTIONAL GLOBAL REALTY SHARES, INC.
SCHEDULE OF INVESTMENTS—(Continued)
June 30, 2009 (Unaudited)
| | | | | Number
of Shares | | Value | |
| CANADA | | | 3.7 | % | | | | | | | | | |
| DIVERSIFIED | | | 2.5 | % | | | | | | | | | |
| Brookfield Properties Corp. | | | | | | | 373,869 | | | $ | 2,979,736 | | |
| Canadian Real Estate Investment Trust | | | | | | | 162,528 | | | | 3,437,380 | | |
| | | | | | | | 6,417,116 | | |
| RESIDENTIAL | | | 0.5 | % | | | | | | | | | |
| Boardwalk REIT | | | | | | | 45,471 | | | | 1,278,340 | | |
| RETAIL | | | 0.7 | % | | | | | | | | | |
| Primaris Retail REIT | | | | | | | 165,114 | | | | 1,680,738 | | |
| TOTAL CANADA | | | | | | | | | | | 9,376,194 | | |
| FINLAND | | | 0.3 | % | | | | | | | | | |
| DIVERSIFIED | |
| Sponda Oyja,b | | | | | | | 224,385 | | | | 639,310 | | |
| FRANCE | | | 4.7 | % | | | | | | | | | |
| DIVERSIFIED | | | 4.2 | % | | | | | | | | | |
| Gecina SAa | | | | | | | 15,226 | | | | 944,648 | | |
| ICADEa | | | | | | | 21,760 | | | | 1,790,425 | | |
| Unibail-Rodamcoa | | | | | | | 52,349 | | | | 7,826,869 | | |
| | | | | | | | 10,561,942 | | |
| RETAIL | | | 0.5 | % | | | | | | | | | |
| Mercialys Promessea | | | | | | | 38,885 | | | | 1,201,391 | | |
| TOTAL FRANCE | | | | | | | | | | | 11,763,333 | | |
See accompanying notes to financial statements.
10
COHEN & STEERS INSTITUTIONAL GLOBAL REALTY SHARES, INC.
SCHEDULE OF INVESTMENTS—(Continued)
June 30, 2009 (Unaudited)
| | | | | Number
of Shares | | Value | |
| HONG KONG | | | 22.6 | % | | | | | | | | | |
| DIVERSIFIED | | | 17.2 | % | | | | | | | | | |
| Agile Property Holdings Ltd.a | | | | | | | 642,800 | | | $ | 920,734 | | |
| China Resources Land Ltd.a | | | | | | | 1,175,000 | | | | 2,594,124 | | |
| Hang Lung Properties Ltd.a | | | | | | | 952,600 | | | | 3,081,908 | | |
| Henderson Land Development Company Ltd.a | | | | | | | 655,612 | | | | 3,715,816 | | |
| Hysan Development Company Ltd.a | | | | | | | 1,335,303 | | | | 3,402,019 | | |
| Kerry Properties Ltd.a | | | | | | | 501,000 | | | | 2,195,199 | | |
| New World Development Ltda | | | | | | | 3,200,000 | | | | 5,727,216 | | |
| Shimao Property Holdings Ltd.a | | | | | | | 1,840,500 | | | | 3,534,350 | | |
| Shui On Land Ltda | | | | | | | 1,834,700 | | | | 1,250,024 | | |
| Sino Land Co., Ltd.a | | | | | | | 663,500 | | | | 1,092,290 | | |
| Sun Hung Kai Properties Ltd.a | | | | | | | 1,179,019 | | | | 14,686,195 | | |
| Wharf Holdings Ltd.a | | | | | | | 303,000 | | | | 1,279,474 | | |
| | | | | | | | 43,479,349 | | |
| HOTEL | | | 0.6 | % | | | | | | | | | |
| Shangri-La Asia Ltd.a | | | | | | | 1,020,000 | | | | 1,493,408 | | |
| OFFICE | | | 1.6 | % | | | | | | | | | |
| Hongkong Land Holdings Ltd. (USD)a | | | | | | | 1,133,600 | | | | 3,992,505 | | |
| RESIDENTIAL | | | 3.0 | % | | | | | | | | | |
| China Overseas Land & Investment Ltd.a | | | | | | | 2,779,360 | | | | 6,371,968 | | |
| Country Garden Holdings Co.a | | | | | | | 2,761,000 | | | | 1,281,516 | | |
| | | | | | | | 7,653,484 | | |
| RETAIL | | | 0.2 | % | | | | | | | | | |
| Link REITa | | | | | | | 233,479 | | | | 496,215 | | |
| TOTAL HONG KONG | | | | | | | | | | | 57,114,961 | | |
| ITALY | | | 0.2 | % | | | | | | | | | |
| OFFICE | |
| Beni Stabili S.p.A.a | | | | | | | 763,601 | | | | 599,127 | | |
See accompanying notes to financial statements.
11
COHEN & STEERS INSTITUTIONAL GLOBAL REALTY SHARES, INC.
SCHEDULE OF INVESTMENTS—(Continued)
June 30, 2009 (Unaudited)
| | | | | Number
of Shares | | Value | |
| JAPAN | | | 10.0 | % | | | | | | | | | |
| DIVERSIFIED | | | 8.5 | % | | | | | | | | | |
| Kenedix Realty Investment Corp.a | | | | | | | 160 | | | $ | 551,744 | | |
| Mitsubishi Estate Co., Ltd.a | | | | | | | 542,000 | | | | 8,998,105 | | |
| Mitsui Fudosan Co., Ltd.a | | | | | | | 438,300 | | | | 7,601,941 | | |
| NTT Urban Development Corp.a | | | | | | | 1,339 | | | | 1,290,771 | | |
| Tokyo Tatemono Co., Ltd.a | | | | | | | 340,000 | | | | 1,893,413 | | |
| Tokyu Land Corp.a | | | | | | | 285,000 | | | | 1,294,806 | | |
| | | | | | | | 21,630,780 | | |
| OFFICE | | | 0.8 | % | | | | | | | | | |
| Japan Prime Realty Investment Corp.a | | | | | | | 329 | | | | 709,727 | | |
| Nippon Building Funda | | | | | | | 63 | | | | 538,522 | | |
| Nomura Real Estate Office Funda | | | | | | | 107 | | | | 680,251 | | |
| | | | | | | | 1,928,500 | | |
| RETAIL | | | 0.7 | % | | | | | | | | | |
| AEON Mall Co., Ltd.a | | | | | | | 96,000 | | | | 1,821,851 | | |
| TOTAL JAPAN | | | | | | | | | | | 25,381,131 | | |
| NETHERLANDS | | | 2.1 | % | | | | | | | | | |
| INDUSTRIAL | | | 0.7 | % | | | | | | | | | |
| ProLogis European Propertiesa | | | | | | | 450,419 | | | | 1,710,310 | | |
| RETAIL | | | 1.4 | % | | | | | | | | | |
| Corio NVa | | | | | | | 72,356 | | | | 3,528,769 | | |
| TOTAL NETHERLANDS | | | | | | | | | | | 5,239,079 | | |
| SINGAPORE | | | 3.6 | % | | | | | | | | | |
| DIVERSIFIED | | | 3.2 | % | | | | | | | | | |
| Allgreen Properties Ltda | | | | | | | 1,853,000 | | | | 1,288,042 | | |
| CapitaLand Ltd.a | | | | | | | 1,532,000 | | | | 3,895,177 | | |
| Keppel Land Ltd.a | | | | | | | 1,458,000 | | | | 2,210,475 | | |
| Suntec Real Estate Investment Trusta | | | | | | | 932,000 | | | | 551,962 | | |
| | | | | | | | 7,945,656 | | |
| OFFICE | | | 0.4 | % | | | | | | | | | |
| CapitaCommercial Trusta | | | | | | | 1,911,000 | | | | 1,076,617 | | |
| TOTAL SINGAPORE | | | | | | | | | | | 9,022,273 | | |
See accompanying notes to financial statements.
12
COHEN & STEERS INSTITUTIONAL GLOBAL REALTY SHARES, INC.
SCHEDULE OF INVESTMENTS—(Continued)
June 30, 2009 (Unaudited)
| | | | | Number
of Shares | | Value | |
| SWEDEN | | | 0.2 | % | | | | | | | | | |
| DIVERSIFIED | |
| Castellum ABa | | | | | | | 96,471 | | | $ | 616,023 | | |
| UNITED KINGDOM | | | 5.7 | % | | | | | | | | | |
| DIVERSIFIED | | | 3.3 | % | | | | | | | | | |
| British Land Co., PLCa | | | | | | | 878,633 | | | | 5,532,623 | | |
| Hammerson PLCa | | | | | | | 499,081 | | | | 2,530,721 | | |
| Land Securities Group PLCa | | | | | | | 17,822 | | | | 138,594 | | |
| | | | | | | | 8,201,938 | | |
| INDUSTRIAL | | | 0.4 | % | | | | | | | | | |
| Segro PLCa | | | | | | | 2,466,046 | | | | 986,144 | | |
| OFFICE | | | 2.0 | % | | | | | | | | | |
| Derwent London PLCa | | | | | | | 120,376 | | | | 1,854,114 | | |
| Great Portland Estates PLCa | | | | | | | 896,804 | | | | 3,249,932 | | |
| | | | | | | | 5,104,046 | | |
| TOTAL UNITED KINGDOM | | | | | | | | | | | 14,292,128 | | |
| UNITED STATES | | | 33.4 | % | | | | | | | | | |
| DIVERSIFIED | | | 2.7 | % | | | | | | | | | |
| Vornado Realty Trust | | | | | | | 151,809 | | | | 6,835,959 | | |
| HEALTH CARE | | | 2.6 | % | | | | | | | | | |
| Brookdale Senior Living Inc | | | | | | | 168,499 | | | | 1,641,180 | | |
| HCP | | | | | | | 116,237 | | | | 2,463,062 | | |
| Nationwide Health Properties | | | | | | | 47,994 | | | | 1,235,366 | | |
| Ventas | | | | | | | 42,934 | | | | 1,282,009 | | |
| | | | | | | | 6,621,617 | | |
| HOTEL | | | 1.9 | % | | | | | | | | | |
| Host Hotels & Resorts | | | | | | | 562,596 | | | | 4,720,180 | | |
| INDUSTRIAL | | | 2.5 | % | | | | | | | | | |
| AMB Property Corp. | | | | | | | 130,480 | | | | 2,454,329 | | |
| ProLogis | | | | | | | 492,044 | | | | 3,965,874 | | |
| | | | | | | | 6,420,203 | | |
See accompanying notes to financial statements.
13
COHEN & STEERS INSTITUTIONAL GLOBAL REALTY SHARES, INC.
SCHEDULE OF INVESTMENTS—(Continued)
June 30, 2009 (Unaudited)
| | | | | Number
of Shares | | Value | |
| OFFICE | | | 6.7 | % | | | | | | | | | |
| BioMed Realty Trust | | | | | | | 151,434 | | | $ | 1,549,170 | | |
| Boston Properties | | | | | | | 102,447 | | | | 4,886,722 | | |
| Brandywine Realty Trust | | | | | | | 173,491 | | | | 1,292,508 | | |
| Kilroy Realty Corp. | | | | | | | 91,613 | | | | 1,881,731 | | |
| Liberty Property Trust | | | | | | | 157,246 | | | | 3,622,948 | | |
| Mack-Cali Realty Corp. | | | | | | | 31,081 | | | | 708,647 | | |
| SL Green Realty Corp. | | | | | | | 130,441 | | | | 2,992,316 | | |
| | | | | | | | 16,934,042 | | |
| OFFICE/INDUSTRIAL | | | 0.8 | % | | | | | | | | | |
| PS Business Parks | | | | | | | 41,967 | | | | 2,032,882 | | |
| RESIDENTIAL | | | 3.6 | % | | | | | | | | | |
| American Campus Communities | | | | | | | 56,892 | | | | 1,261,864 | | |
| Apartment Investment & Management Co. | | | | | | | 210,913 | | | | 1,866,580 | | |
| AvalonBay Communities | | | | | | | 10,823 | | | | 605,439 | | |
| Equity Lifestyle Properties | | | | | | | 29,865 | | | | 1,110,381 | | |
| Equity Residential | | | | | | | 193,073 | | | | 4,292,013 | | |
| | | | | | | | 9,136,277 | | |
| RETAIL | | | 8.8 | % | | | | | | | | | |
| CBL & Associates Properties | | | | | | | 417,571 | | | | 2,250,708 | | |
| Federal Realty Investment Trust | | | | | | | 11,220 | | | | 578,054 | | |
| Macerich Co. | | | | | | | 95,134 | | | | 1,675,310 | | |
| Regency Centers Corp. | | | | | | | 51,209 | | | | 1,787,706 | | |
| Simon Property Group | | | | | | | 256,310 | | | | 13,182,023 | | |
| Weingarten Realty Investors | | | | | | | 183,650 | | | | 2,664,762 | | |
| | | | | | | | 22,138,563 | | |
| SELF STORAGE | | | 2.7 | % | | | | | | | | | |
| Public Storage | | | | | | | 104,373 | | | | 6,834,344 | | |
See accompanying notes to financial statements.
14
COHEN & STEERS INSTITUTIONAL GLOBAL REALTY SHARES, INC.
SCHEDULE OF INVESTMENTS—(Continued)
June 30, 2009 (Unaudited)
| | | | | Number
of Shares | | Value | |
| SPECIALTY | | | 1.1 | % | | | | | | | | | |
| DuPont Fabros Technology | | | | | | | 167,727 | | | $ | 1,579,989 | | |
| Plum Creek Timber Co. | | | | | | | 37,231 | | | | 1,108,739 | | |
| | | | | | | | 2,688,728 | | |
| TOTAL UNITED STATES | | | | | | | | | | | 84,362,795 | | |
| TOTAL COMMON STOCK (Identified cost—$207,775,061) | | | | | | | | | | | 245,046,859 | | |
| SHORT-TERM INVESTMENTS | | | 3.5 | % | | | | | | | | | |
| MONEY MARKET FUNDS | | | | | | | | | | | | | |
| Dreyfus Treasury Cash Management Fund, 0.001%c | | | | | | | 3,660,309 | | | | 3,660,309 | | |
| Federated U.S. Treasury Cash Reserves Fund, 0.00%c | | | | | | | 5,193,735 | | | | 5,193,735 | | |
TOTAL SHORT-TERM INVESTMENTS
(Identified cost—$8,854,044) | | | | | | | | | | | 8,854,044 | | |
| TOTAL INVESTMENTS (Identified cost—$216,629,105) | | | 100.5 | % | | | | | | | 253,900,903 | | |
| LIABILITIES IN EXCESS OF OTHER ASSETS | | | (0.5 | )% | | | | | | | (1,285,265 | ) | |
NET ASSETS (Equivalent to $14.73 per share based on 17,145,502
shares of common stock outstanding) | | | 100.0 | % | | | | | | $ | 252,615,638 | | |
Glossary of Portfolio Abbreviations
REIT Real Estate Investment Trust
USD United States Dollar
Note: Percentages indicated are based on the net assets of the Fund.
a Fair valued security. This security has been valued at its fair value as determined in good faith under procedures established by and under the general supervision of the Fund's Board of Directors. Aggregate fair value securities represent 59.0% of net assets all of which have been fair valued pursuant to foreign security fair value pricing procedures approved by the Board of Directors.
b Non-income producing security.
c Rate quoted represents the seven day yield of the fund.
See accompanying notes to financial statements.
15
COHEN & STEERS INSTITUTIONAL GLOBAL REALTY SHARES, INC.
STATEMENT OF ASSETS AND LIABILITIES
June 30, 2009 (Unaudited)
| ASSETS: | |
| Investments in securities, at value (Identified cost—$216,629,105) | | $ | 253,900,903 | | |
| Cash | | | 95,462 | | |
| Receivable for: | |
| Investment securities sold | | | 3,596,728 | | |
| Dividends and interest | | | 885,561 | | |
| Fund shares sold | | | 264,597 | | |
| Other assets | | | 1,366 | | |
| Total Assets | | | 258,744,617 | | |
| LIABILITIES: | |
| Payable for: | |
| Investment securities purchased | | | 5,028,758 | | |
| Dividends declared | | | 618,683 | | |
| Fund shares redeemed | | | 258,008 | | |
| Investment management fees | | | 200,664 | | |
| Foreign currency overdraft, at value (Cost—$16,488) | | | 15,971 | | |
| Directors' fees | | | 2,421 | | |
| Other liabilities | | | 4,474 | | |
| Total Liabilities | | | 6,128,979 | | |
| NET ASSETS applicable to 17,145,502 shares of $0.001 par value of common stock outstanding | | $ | 252,615,638 | | |
| NET ASSET VALUE PER SHARE: | |
| ($252,615,638 ÷ 17,145,502 shares outstanding) | | $ | 14.73 | | |
| NET ASSETS consist of: | |
| Paid-in-capital | | $ | 442,428,053 | | |
| Dividends in excess of net investment income | | | (1,655,292 | ) | |
| Accumulated net realized loss | | | (225,433,283 | ) | |
| Net unrealized appreciation | | | 37,276,160 | | |
| | | $ | 252,615,638 | | |
See accompanying notes to financial statements.
16
COHEN & STEERS INSTITUTIONAL GLOBAL REALTY SHARES, INC.
STATEMENT OF OPERATIONS
For the Six Months Ended June 30, 2009 (Unaudited)
| Investment Income: | |
| Dividend income (net of $436,037 of foreign withholding tax) | | $ | 4,549,695 | | |
| Expenses: | |
| Investment management fees | | | 1,042,348 | | |
| Directors' fees and expenses | | | 25,702 | | |
| Registration and filing fees | | | 17,756 | | |
| Line of credit fees | | | 8,161 | | |
| Miscellaneous | | | 2,744 | | |
| Total Expenses | | | 1,096,711 | | |
| Reduction of Expenses (See Note 2) | | | (54,363 | ) | |
| Net Expenses | | | 1,042,348 | | |
| Net Investment Income | | | 3,507,347 | | |
| Net Realized and Unrealized Gain (Loss): | |
| Net realized loss on: | |
| Investments | | | (81,487,126 | ) | |
| Foreign currency transactions | | | (254,449 | ) | |
| Net realized loss | | | (81,741,575 | ) | |
| Net change in unrealized appreciation on: | |
| Investments | | | 87,942,708 | | |
| Foreign currency translations | | | 19,775 | | |
| Net change in unrealized appreciation | | | 87,962,483 | | |
| Net realized and unrealized gain | | | 6,220,908 | | |
| Net Increase in Net Assets Resulting from Operations | | $ | 9,728,255 | | |
See accompanying notes to financial statements.
17
COHEN & STEERS INSTITUTIONAL GLOBAL REALTY SHARES, INC.
STATEMENT OF CHANGES IN NET ASSETS (Unaudited)
| | | For the
Six Months Ended
June 30, 2009 | | For the
Year Ended
December 31, 2008 | |
| Change in Net Assets: | |
| From Operations: | |
| Net investment income | | $ | 3,507,347 | | | $ | 6,951,862 | | |
| Net realized loss | | | (81,741,575 | ) | | | (137,192,401 | ) | |
| Net change in unrealized appreciation (depreciation) | | | 87,962,483 | | | | (17,419,514 | ) | |
Net increase (decrease) in net assets resulting from
operations | | | 9,728,255 | | | | (147,660,053 | ) | |
| Dividends and Distributions to Shareholders from: | |
| Net investment income | | | (3,710,223 | ) | | | (5,154,529 | ) | |
| Tax return of capital | | | — | | | | (752,325 | ) | |
| Total dividends and distributions to shareholders | | | (3,710,223 | ) | | | (5,906,854 | ) | |
| Capital Stock Transactions: | |
| Increase in net assets from Fund share transactions | | | 13,031,975 | | | | 106,884,150 | | |
| Total increase (decrease) in net assets | | | 19,050,007 | | | | (46,682,757 | ) | |
| Net Assets: | |
| Beginning of period | | | 233,565,631 | | | | 280,248,388 | | |
| End of perioda | | $ | 252,615,638 | | | $ | 233,565,631 | | |
a Includes dividends in excess of net investment income of $1,655,292 and $1,452,416, respectively.
See accompanying notes to financial statements.
18
COHEN & STEERS INSTITUTIONAL GLOBAL REALTY SHARES, INC.
FINANCIAL HIGHLIGHTS (Unaudited)
The following table includes selected data for a share outstanding throughout each period and other performance information derived from the financial statements. It should be read in conjunction with the financial statements and notes thereto.
| | | For the
Six Months Ended | | For the Year Ended December 31, | | For the Period
August 10, 2006a
through | |
| Per Share Operating Performance: | | June 30, 2009 | | 2008 | | 2007 | | December 31, 2006 | |
| Net asset value, beginning of period | | $ | 14.23 | | | $ | 25.10 | | | $ | 29.57 | | | $ | 25.00 | | |
| Income from investment operations: | |
| Net investment income | | | 0.21 | | | | 0.55 | | | | 0.49 | b | | | 0.12 | | |
| Net realized and unrealized gain (loss) | | | 0.51 | | | | (11.02 | ) | | | (4.12 | ) | | | 4.62 | | |
| Total income (loss) from investment operations | | | 0.72 | | | | (10.47 | ) | | | (3.63 | ) | | | 4.74 | | |
| Less dividends and distributions to shareholders from: | |
| Net investment income | | | (0.22 | ) | | | (0.35 | ) | | | (0.73 | ) | | | (0.16 | ) | |
| Net realized gain | | | — | | | | — | | | | (0.01 | ) | | | (0.01 | ) | |
| Tax return of capital | | | — | | | | (0.05 | ) | | | (0.10 | ) | | | — | | |
| Total dividends and distributions to shareholders | | | (0.22 | ) | | | (0.40 | ) | | | (0.84 | ) | | | (0.17 | ) | |
| Net increase (decrease) in net asset value | | | 0.50 | | | | (10.87 | ) | | | (4.47 | ) | | | 4.57 | | |
| Net asset value, end of period | | $ | 14.73 | | | $ | 14.23 | | | $ | 25.10 | | | $ | 29.57 | | |
| Total investment return | | | 5.05 | %c | | | –42.05 | % | | | –12.35 | % | | | 18.98 | %c | |
| Ratios/Supplemental Data: | |
| Net assets, end of period (in millions) | | $ | 252.6 | | | $ | 233.6 | | | $ | 280.2 | | | $ | 81.4 | | |
Ratio of expenses to average daily net assets (before expense
reduction) | | | 1.05 | %d | | | 1.04 | % | | | 1.06 | % | | | 1.47 | %d | |
Ratio of expenses to average daily net assets (net of expense
reduction) | | | 1.00 | %d | | | 1.00 | % | | | 1.00 | % | | | 1.00 | %d | |
Ratio of net investment income to average daily net assets
(before expense reduction) | | | 3.31 | %d | | | 2.36 | % | | | 1.62 | % | | | 1.73 | %d | |
Ratio of net investment income to average daily net assets
(net of expense reduction) | | | 3.36 | %d | | | 2.40 | % | | | 1.68 | % | | | 2.20 | %d | |
| Portfolio turnover rate | | | 119 | %c | | | 126 | % | | | 67 | % | | | 8 | %c | |
a Commencement of operations.
b 6.2% of net investment income was attributable to a special dividend paid by Boston Properties, Inc.
c Not annualized.
d Annualized.
See accompanying notes to financial statements.
19
COHEN & STEERS INSTITUTIONAL GLOBAL REALTY SHARES, INC.
NOTES TO FINANCIAL STATEMENTS (Unaudited)
Note 1. Significant Accounting Policies
Cohen & Steers Institutional Global Realty Shares, Inc. (the Fund) was incorporated under the laws of the State of Maryland on May 11, 2006 and is registered under the Investment Company Act of 1940, as amended, as a nondiversified, open-end management investment company. The Fund's investment objective is total return.
The following is a summary of significant accounting policies consistently followed by the Fund in the preparation of its financial statements. The policies are in conformity with accounting principles generally accepted in the United States of America (GAAP). The preparation of the financial statements in accordance with GAAP requires management to make estimates and assumptions that affect the reported amounts of assets and liabilities at the date of the financial statements and the reported amounts of income and expenses during the reporting period. Actual results could differ from those estimates.
Portfolio Valuation: Investments in securities that are listed on the New York Stock Exchange are valued, except as indicated below, at the last sale price reflected at the close of the New York Stock Exchange on the business day as of which such value is being determined. If there has been no sale on such day, the securities are valued at the mean of the closing bid and asked prices for the day or, if no asked price is available, at the bid price.
Securities not listed on the New York Stock Exchange but listed on other domestic or foreign securities exchanges or admitted to trading on the National Association of Securities Dealers Automated Quotations, Inc. (Nasdaq) national market system are valued in a similar manner. Securities traded on more than one securities exchange are valued at the last sale price on the business day as of which such value is being determined as reflected on the tape at the close of the exchange representing the principal market for such securities.
Readily marketable securities traded in the over-the-counter market, including listed securities whose primary market is believed by Cohen & Steers Capital Management, Inc. (the advisor) to be over-the-counter, are valued at the official closing prices as reported by Nasdaq, the Pink Sheets, or such other comparable sources as the Board of Directors deem appropriate to reflect their fair market value. If there has been no sale on such day, the securities are valued at the mean of the closing bid and asked prices for the day, or if no asked price is available, at the bid price. However, certain fixed-income securities may be valued on the basis of prices provided by a pricing service when such prices are believed by the Board of Directors to reflect the fair market value of such securities. Where securities are traded on more than one exchange and also over-the-counter, the securities will generally be valued using the quotations the Boar d of Directors believes most closely reflect the value of such securities.
Portfolio securities primarily traded on foreign markets are generally valued at the closing values of such securities on their respective exchanges or if after the close of the foreign markets, but prior to the close of business on the day the securities are being valued, market conditions change significantly, certain foreign securities may be fair valued pursuant to procedures established by the Board of Directors.
20
COHEN & STEERS INSTITUTIONAL GLOBAL REALTY SHARES, INC.
NOTES TO FINANCIAL STATEMENTS (Unaudited)—(Continued)
Securities for which market prices are unavailable, or securities for which the advisor determines that bid and/or asked price does not reflect market value, will be valued at fair value pursuant to procedures approved by the Fund's Board of Directors. Circumstances in which market prices may be unavailable include, but are not limited to, when trading in a security is suspended, the exchange on which the security is traded is subject to an unscheduled close or disruption or material events occur after the close of the exchange on which the security is principally traded. In these circumstances, the Fund determines fair value in a manner that fairly reflects the market value of the security on the valuation date based on consideration of any information or factors it deems appropriate. These may include recent transactions in comparable securities, information relating to the specific security and developments in the markets.
The Fund's use of fair value pricing may cause the net asset value of Fund shares to differ from the net asset value that would be calculated using market quotations. Fair value pricing involves subjective judgments and it is possible that the fair value determined for a security may be materially different than the value that could be realized upon the sale of that security.
Short-term debt securities, which have a maturity date of 60 days or less, are valued at amortized cost, which approximates value.
The Fund adopted Financial Accounting Standards Board Statement of Financial Accounting Standards No. 157, "Fair Value Measurements" ("FAS 157"), effective January 1, 2008. In accordance with FAS 157, fair value is defined as the price that the Fund would receive to sell an investment or pay to transfer a liability in an orderly transaction with an independent buyer in the principal market, or in the absence of a principal market the most advantageous market for the investment or liability. FAS 157 establishes a single definition of fair value, creates a three-tier hierarchy as a framework for measuring fair value based on inputs used to value the Fund's investments, and requires additional disclosure about fair value. The hierarchy of inputs is summarized below.
• Level 1—quoted prices in active markets for identical investments
• Level 2—other significant observable inputs (including quoted prices for similar investments, interest rates, prepayment speeds, credit risk, etc.)
• Level 3—significant unobservable inputs (including the Fund's own assumptions in determining the fair value of investments)
The Fund adopted Financial Accounting Standards Board Statement of Financial Accounting Standards Staff Position No. 157-4 "Determining Fair Value When the Volume and Level of Activity for the Asset or Liability Have Significantly Decreased and Identifying Transactions That Are Not Orderly" ("FSP 157-4"), effective June 15, 2009. FSP 157-4 provides additional guidance for estimating fair value in accordance with FAS 157, when the volume and level of activity for the asset or liability have significantly decreased as well as guidance on identifying circumstances that indicate a transaction is not orderly.
21
COHEN & STEERS INSTITUTIONAL GLOBAL REALTY SHARES, INC.
NOTES TO FINANCIAL STATEMENTS (Unaudited)—(Continued)
The inputs or methodology used for valuing securities are not necessarily an indication of the risk associated with investing in those securities.
The following is a summary of the inputs used as of June 30, 2009 in valuing the Fund's investments carried at value:
| | | | | Fair Value Measurements at June 30, 2009 Using | |
| | | Total | | Quoted Prices In
Active Market for
Identical Assets
(Level 1) | | Significant
Other Observable
Inputs
(Level 2) | | Significant
Unobservable
Inputs
(Level 3) | |
| Common Stock—Bermuda | | $ | 849,815 | | | $ | 849,815 | | | $ | — | | | | — | | |
| Common Stock—Brazil | | | 1,338,552 | | | | 1,338,552 | | | | — | | | | — | | |
| Common Stock—Canada | | | 9,376,194 | | | | 9,376,194 | | | | — | | | | — | | |
| Common Stock—United States | | | 84,362,795 | | | | 84,362,795 | | | | — | | | | — | | |
| Common Stock—Other Countries | | | 149,119,503 | | | | — | | | | 149,119,503 | | | | — | | |
| Money Market Funds | | | 8,854,044 | | | | — | | | | 8,854,044 | | | | — | | |
| Total Investments | | $ | 253,900,903 | | | $ | 95,927,356 | | | $ | 157,973,547 | | | | — | | |
Security Transactions, Investment Income and Expense Allocations: Security transactions are recorded on trade date. Realized gains and losses on investments sold are recorded on the basis of identified cost. Interest income is recorded on the accrual basis. Discounts are accreted and premiums are amortized over the life of the respective securities. Dividend income is recorded on the ex-dividend date, except for certain dividends on foreign securities, which are recorded as soon as the Fund is informed after the ex-dividend date. The Fund records distributions received in excess of income from underlying investments as a reduction of cost of investments and/or realized gain. Such amounts are based on estimates if actual amounts are not available and actual amounts of income, realized gain and return of capital may differ from the estimated amounts. The Fund adjust s the estimated amounts of the components of distributions (and consequently its net investment income) as an increase to unrealized appreciation/(depreciation) and realized gain/(loss) on investments as necessary once the issuers provide information about the actual composition of the distributions.
Foreign Currency Translations: The books and records of the Fund are maintained in U.S. dollars as follows: (1) the foreign currency market value of investment securities, other assets and liabilities and foreign currency contracts are translated at the exchange rates prevailing at the end of the period; and (2) purchases, sales, income and expenses are translated at the exchange rates prevailing on the respective dates of such transactions. The resultant exchange gains and losses are recorded as realized and unrealized gain/loss on foreign exchange transactions. Pursuant to U.S. federal income tax regulations, certain foreign exchange gains/losses included in realized and unrealized gain/loss are included in or are a reduction of ordinary income for federal income tax
22
COHEN & STEERS INSTITUTIONAL GLOBAL REALTY SHARES, INC.
NOTES TO FINANCIAL STATEMENTS (Unaudited)—(Continued)
purposes. The Fund does not isolate that portion of the results of operations arising as a result of changes in the foreign exchange rates from the changes in the market prices of the securities.
Foreign Securities: The Fund may directly purchase securities of foreign issuers. Investing in securities of foreign issuers involves special risks not typically associated with investing in securities of U.S. issuers. The risks include possible revaluation of currencies, the ability to repatriate funds, less complete financial information about companies and possible future adverse political and economic developments. Moreover, securities of many foreign issuers and their markets may be less liquid and their prices more volatile than those of securities of comparable U.S. issuers.
Dividends and Distributions to Shareholders: Dividends from net investment income and capital gain distributions are determined in accordance with U.S. federal income tax regulations, which may differ from GAAP. Dividends from net investment income are declared and paid semi-annually. Net realized capital gains, unless offset by any available capital loss carryforward, are distributed to shareholders at least annually. Dividends and distributions to shareholders are recorded on the ex-dividend date and are automatically reinvested in full and fractional shares of the Fund based on the net asset value per share at the close of business on the payable date unless the shareholder has elected to have them paid in cash.
Distributions paid by the Fund are subject to recharacterization for tax purposes. Based upon the results of operations for the six months ended June 30, 2009, the advisor considers it likely that a portion of the dividends will be reclassified to return of capital upon the final determination of the Fund's taxable income for the year.
Income Taxes: It is the policy of the Fund to continue to qualify as a regulated investment company, if such qualification is in the best interest of the shareholders, by complying with the requirements of Subchapter M of the Internal Revenue Code applicable to regulated investment companies, and by distributing substantially all of its taxable earnings to its shareholders. Accordingly, no provision for federal income or excise tax is necessary. The Fund has adopted the provisions of FASB Interpretation No. 48, Accounting for Uncertainty in Income Taxes (FIN 48). FIN 48 clarifies the accounting for income taxes by prescribing the minimum recognition threshold a tax position must meet before being recognized in the financial statements. An assessment of the Fund's tax positions has been made and it has been determined that there is no impact to the Fund's financial statements. Each of the Fund's federal tax returns for the prior three fiscal years remains subject to examination by the Internal Revenue Service.
Note 2. Investment Management Agreement and Other Transactions with Affiliates
Investment Management Fees: The advisor serves as the Fund's investment advisor pursuant to an investment management agreement (the investment management agreement). Under the terms of the investment management agreement, the advisor provides the Fund with the day-to-day investment decisions and generally manages the Fund's investments in accordance with the stated policies of the Fund, subject to the supervision of
23
COHEN & STEERS INSTITUTIONAL GLOBAL REALTY SHARES, INC.
NOTES TO FINANCIAL STATEMENTS (Unaudited)—(Continued)
the Fund's Board of Directors. For the services provided to the Fund, the advisor receives a fee, accrued daily and paid monthly, at the annual rate of 1.00% of the average daily net assets of the Fund.
The advisor is also responsible, under the investment management agreement, for the performance of certain administrative functions for the Fund. Additionally, the advisor pays all expenses of the Fund except for brokerage fees, taxes, interest, fees and expenses of the Fund's independent directors (as well as their independent counsel and other independent consultants), trade organization membership dues, federal and state registration fees and extraordinary expenses.
The advisor has contractually agreed to reimburse the Fund so that its total annual operating expenses do not exceed 1.00% of the average daily net assets. This commitment will remain in place for the life of the Fund.
Under subadvisory agreements between the advisor and each of Cohen & Steers Asia Limited, Cohen & Steers UK Limited and Cohen & Steers Europe S.A. (collectively the subadvisors), affiliates of the advisor, the subadvisors are responsible for managing the Fund's investments in certain non-U.S. real estate securities. For their services provided under the subadvisory agreement, the advisor (not the Fund) pays the subadvisors 16.3%, 6.3% and 6.3%, respectively, of the advisory fee received by the advisor from the Fund. For the six months ended June 30, 2009, the advisor paid the subadvisors $144,417, $55,818 and $55,818, respectively.
Directors' and Officers' Fees: Certain directors and officers of the Fund are also directors, officers, and/or employees of the advisor. The Fund does not pay compensation to any affiliated directors and officers.
Note 3. Purchases and Sales of Securities
Purchases and sales of securities, excluding short-term investments, for the six months ended June 30, 2009, totaled $259,993,973 and $247,760,757, respectively.
Note 4. Income Tax Information
As of June 30, 2009, the federal tax cost and net unrealized appreciation on securities were as follows:
| Gross unrealized appreciation | | $ | 41,846,356 | | |
| Gross unrealized depreciation | | | (4,574,558 | ) | |
| Net unrealized appreciation | | $ | 37,271,798 | | |
| Cost for federal income tax purposes | | $ | 216,629,105 | | |
As of December 31, 2008, the Fund had a net capital loss carryforward of $65,693,655, of which $182,151 will expire on December 31, 2015 and $65,511,504 will expire on December 31, 2016. This carryforward may be used to offset future capital gains to the extent provided by regulations. In addition, the Fund incurred capital and
24
COHEN & STEERS INSTITUTIONAL GLOBAL REALTY SHARES, INC.
NOTES TO FINANCIAL STATEMENTS (Unaudited)—(Continued)
currency losses of $19,731,001 and $38,811, respectively, after October 31, 2008, which are not recognized until 2009.
Note 5. Capital Stock
The Fund is authorized to issue 100 million shares of capital stock, at a par value of $0.001 per share. The Board of Directors of the Fund may increase or decrease the aggregate number of shares of common stock that the Fund has authority to issue. Transactions in Fund shares were as follows:
| | | For the
Six Months Ended
June 30, 2009 | | For the
Year Ended
December 31, 2008 | |
| | | Shares | | Amount | | Shares | | Amount | |
| Sold | | | 2,961,818 | | | $ | 38,495,368 | | | | 8,185,232 | | | $ | 156,150,711 | | |
Issued as reinvestment of dividends
and distributions | | | 209,881 | | | | 3,091,540 | | | | 287,706 | | | | 5,222,649 | | |
| Redeemed | | | (2,434,156 | ) | | | (28,554,933 | ) | | | (3,228,927 | ) | | | (54,489,210 | ) | |
| Net increase | | | 737,543 | | | $ | 13,031,975 | | | | 5,244,011 | | | $ | 106,884,150 | | |
Note 6. Borrowings
The Fund, in conjunction with other Cohen & Steers funds, is a party to a $200,000,000 syndicated credit agreement (the credit agreement) with State Street Bank and Trust Company, as administrative agent and operations agent, and the lenders identified in the credit agreement, which expires December 2009. The Fund pays a commitment fee of 0.15% per annum on its proportionate share of the unused portion of the credit agreement.
During the six months ended June 30, 2009, the Fund did not utilize the line of credit.
Note 7. Other
In the normal course of business, the Fund enters into contracts that provide general indemnifications. The Fund's maximum exposure under these arrangements is dependent on claims that may be made against the Fund in the future and, therefore, cannot be estimated; however, based on experience, the risk of material loss from such claims is considered remote.
25
COHEN & STEERS INSTITUTIONAL GLOBAL REALTY SHARES, INC.
NOTES TO FINANCIAL STATEMENTS (Unaudited)—(Continued)
Note 8. Subsequent Events
In May 2009, the Financial Accounting Standards Board (FASB) issued Statement of Financial Accounting Standards No. 165, Subsequent Events (FAS 165), effective for interim or annual periods ending after June 15, 2009. The FASB has established general standards of accounting for and disclosure of events that occur after the balance sheet date but before financial statements are issued or are available to be issued.
With regard to the Fund's financial statements, subsequent to June 30, 2009 and through August 18, 2009, there have been no recognized subsequent events (subsequent events that provide additional evidence about conditions that existed at the date of the balance sheet) nor have there been any nonrecognized subsequent events (subsequent events that provide evidence about conditions that did not exist at the date of the balance sheet but arose after the balance sheet but before the financial statements are issued or are available to be issued).
26
COHEN & STEERS INSTITUTIONAL GLOBAL REALTY SHARES, INC.
OTHER INFORMATION
A description of the policies and procedures that the Fund uses to determine how to vote proxies relating to portfolio securities is available (i) without charge, upon request, by calling 800-330-7348, (ii) on our Web site at cohenandsteers.com or (iii) on the Securities and Exchange Commission's Web site at http://www.sec.gov. In addition, the Fund's proxy voting record for the most recent 12-month period ended June 30 is available (i) without charge, upon request, by calling 800-330-7348 or (ii) on the SEC's Web site at http://www.sec.gov.
The Fund files its complete schedule of portfolio holdings with the SEC for the first and third quarters of each fiscal year on Form N-Q. The Fund's Forms N-Q are available (i) without charge, upon request by calling 800-330-7348, or (ii) on the SEC's Web site at http://www.sec.gov. In addition, the Forms N-Q may be reviewed and copied at the SEC's Public Reference Room in Washington, DC. Information on the operation of the Public Reference Room may be obtained by calling 800-SEC-0330.
Please note that the distributions paid by the Fund to shareholders are subject to recharacterization for tax purposes. The Fund may also pay distributions in excess of the Fund's net investment company taxable income and this excess would be a tax-free return of capital distributed from the Fund's assets. The final tax treatment of all distributions is reported to shareholders on their 1099-DIV forms, which are mailed after the close of each calendar year.
APPROVAL OF INVESTMENT MANAGEMENT AGREEMENT
The Board of Directors of the Fund, including a majority of the directors who are not parties to the Fund's investment management agreement and subadvisory agreements (collectively, the "Management Agreements"), or interested persons of any such party ("Independent Directors"), has the responsibility under the 1940 Act to approve the Fund's Management Agreements for their initial two year term and their continuation annually thereafter at a meeting of the Board of Directors called for the purpose of voting on the approval or continuation. At meetings held in person on June 9-10, 2009, the Management Agreements were discussed and were unanimously continued for a one-year term by the Fund's Board of Directors, including the Independent Directors. The Independent Directors were represented by independent counsel who assisted them in their deliberations during the meeting and executive session.
In considering whether to continue the Management Agreements, the Board of Directors reviewed materials provided by the Fund's investment manager (the "Investment Manager") and Fund counsel which included, among other things, fee, expense and performance information compared to peer funds ("Peer Funds") prepared by an independent data provider; supplemental performance and summary information prepared by the Investment Manager; and memoranda outlining the legal duties of the Board of Directors. The Board of Directors also spoke directly with representatives of the independent data provider and met with investment management personnel. In addition, the Board of Directors considered information provided from time to time by the Investment Manager throughout the year at meetings of the Board of Directors, including presentations by portfolio managers relating
27
COHEN & STEERS INSTITUTIONAL GLOBAL REALTY SHARES, INC.
to the investment performance of the Fund and the investment strategies used in pursuing the Fund's objective. In particular, the Board of Directors considered the following:
(i) The nature, extent and quality of services to be provided by the Investment Manager: The Board of Directors reviewed the services that the Investment Manager provides to the Fund, including, but not limited to, making the day-to-day investment decisions for the Fund, and generally managing the Fund's investments in accordance with the stated policies of the Fund. The Board of Directors also discussed with officers and portfolio managers of the Fund the amount of time the Investment Manager dedicates to the Fund and the types of transactions that were being done on behalf of the Fund. Additionally, the Board of Directors took into account the services provided by the Investment Manager to its other funds, including those that invest substantially in real estate securities and have investment objectives and strategies similar to the Fund.
The Board of Directors next considered the education, background and experience of the Investment Manager's personnel, noting particularly that the favorable history and reputation of the portfolio managers for the Fund, has had, and would likely continue to have, a favorable impact on the Fund. The Board of Directors further noted the Investment Manager's ability to attract quality and experienced personnel. After consideration of the above factors, among others, the Board of Directors concluded that the nature, quality and extent of services provided by the Investment Manager are adequate and appropriate.
(ii) Investment performance of the Fund and the Investment Manager: The Board of Directors considered the investment performance of the Fund compared to Peer Funds and compared to a relevant benchmark. The Board of Directors noted that the Fund underperformed the median of the Peer Funds and the benchmark during the year-to-date period ended March 31, 2009, but outperformed the median of the Peer Funds and the benchmark during the one-year period, ranking the Fund in the fifth and second quintiles respectively. The Board of Directors engaged in discussions with the Investment Manager regarding the Fund's most recent absolute performance, which was hampered by extreme market volatility during 2008 as a result of the recession and credit crisis. The Board of Directors also considered supplemental performance data provided by the Advisor, including a narrative summar y of various factors affecting performance, and the Investment Advisor's performance in managing other real estate funds. The Board of Directors then determined that Fund performance, in light of all considerations noted above, was satisfactory.
(iii) Cost of the services to be provided and profits to be realized by the Investment Manager from the relationship with the Fund: Next, the Board of Directors considered the management fees payable by the Fund, as well as total expense ratios. As part of their analysis, the Board of Directors gave substantial consideration to the fee and expense analyses provided by the independent data provider. The Board of Directors noted that the actual and contractual management fees were higher than the Peer Funds' median, ranking the Fund in the fifth quintile. The Board of Directors also noted that the expense ratio was lower than the median of the Peer Funds, ranking the Fund in the second quintile. The Board of Directors also considered that the Investment Manager is currently waiving a portion of its management fees and/or reimbursing expenses to limit total expenses over the life of the Fund. In light of the considerations above, the Board of Directors concluded that the Fund's expense structure was competitive in the peer group.
28
COHEN & STEERS INSTITUTIONAL GLOBAL REALTY SHARES, INC.
The Board of Directors also reviewed information regarding the profitability to the Investment Manager of its relationship with the Fund. The Board of Directors considered the level of the Investment Manager's profits and whether the profits were reasonable for the Investment Manager. The Board of Directors took into consideration other benefits to be derived by the Investment Manager in connection with the Management Agreements, noting particularly the research and related services, within the meaning of Section 28(e) of the Securities Exchange Act of 1934, as amended, that the Investment Manager receives by allocating the Fund's brokerage transactions. The Board of Directors also considered the fees received by the Investment Manager under the Management Agreements, noted the administrative services received, such as operational services and furnishing office space and facilities for the Fund, and providing persons satisfactory to the Boar d of Directors to serve as officers of the Fund, and that these services were beneficial to the Fund. The Board of Directors concluded that the profits realized by the Investment Manager under the Management Agreement from its administrative relationship with the Fund were reasonable and consistent with fiduciary duties.
(iv) The extent to which economies of scale would be realized as the Fund grows and whether fee levels would reflect such economies of scale: The Board of Directors noted that the Investment Manager pays certain operating costs of the Fund and reimburses the Fund to the extent that total expenses exceed the advisory fee rate; thus, the shareholders only incur the advisory fee costs. The Board of Directors determined that shareholders appropriately benefited from economies of scale.
(v) Comparison of services rendered and fees paid to those under other investment management contracts, such as contracts of the same and other investment advisers or other clients: As discussed above in (i) and (iii), the Board of Directors compared both the services rendered and the fees paid under the Management Agreements to those under other investment management contracts of other investment advisers managing Peer Funds. The Board of Directors also compared both the services rendered and the fees paid under the Management Agreements to the Investment Manager's other fund management agreements as well as the profitability under the Management Agreements to the Investment Manager's other management contracts with institutional and other clients with similar investment mandates. The Board of Directors determined that on a comparative basis the fees under the Ma nagement Agreements were reasonable in relation to the services provided.
No single factor was cited as determinative to the decision of the Board of Directors. Rather, after weighing all of the considerations and conclusions discussed above, the Board of Directors, including the Independent Directors, unanimously approved the continuation of the Management Agreements.
29
COHEN & STEERS INSTITUTIONAL GLOBAL REALTY SHARES, INC.
Meet the Cohen & Steers family of open-end funds:
COHEN & STEERS
GLOBAL REALTY SHARES
• Designed for investors seeking total return, investing primarily in global real estate equity securities
• Symbols: CSFAX, CSFBX, CSFCX, CSSPX
COHEN & STEERS
INSTITUTIONAL GLOBAL REALTY SHARES
• Designed for institutional investors seeking total return, investing primarily in global real estate securities
• Symbol: GRSIX
COHEN & STEERS
REALTY SHARES
• Designed for investors seeking total return, investing primarily in REITs
• Symbol: CSRSX
COHEN & STEERS
INSTITUTIONAL REALTY SHARES
• Designed for institutional investors seeking total return, investing primarily in REITs
• Symbol: CSRIX
COHEN & STEERS
REALTY INCOME FUND
• Designed for investors seeking maximum total return, investing primarily in real estate securities with an emphasis on both income and capital appreciation
• Symbols: CSEIX, CSBIX, CSCIX, CSDIX
COHEN & STEERS
INTERNATIONAL REALTY FUND
• Designed for investors seeking total return, investing primarily in international real estate securities
• Symbols: IRFAX, IRFCX, IRFIX
COHEN & STEERS
ASIA PACIFIC REALTY SHARES
• Designed for investors seeking total return, investing primarily in real estate securities located in the Asia Pacific region
• Symbols: APFAX, APFCX, APFIX
COHEN & STEERS
GLOBAL INFRASTRUCTURE FUND
• Designed for investors seeking total return, investing primarily in global infrastructure securities
• Symbols: CSUAX, CSUBX, CSUCX, CSUIX
COHEN & STEERS
DIVIDEND VALUE FUND
• Designed for investors seeking high current income and long-term growth of income and capital appreciation, investing primarily in dividend paying common stocks and preferred stocks
• Symbols: DVFAX, DVFCX, DVFIX
Please consider the investment objectives, risks, charges and expenses of the fund carefully before investing. A prospectus containing this and other information can be obtained by calling 800-330-7348 or by visiting cohenandsteers.com. Please read the prospectus carefully before investing.
Cohen & Steers Securities, LLC, Distributor
30
COHEN & STEERS INSTITUTIONAL GLOBAL REALTY SHARES, INC.
OFFICERS AND DIRECTORS
Robert H. Steers
Director and co-chairman
Martin Cohen
Director and co-chairman
Bonnie Cohen
Director
George Grossman
Director
Richard E. Kroon
Director
Richard J. Norman
Director
Frank K. Ross
Director
Willard H. Smith Jr.
Director
C. Edward Ward, Jr.
Director
Adam M. Derechin
President and chief executive officer
Joseph M. Harvey
Vice president
Scott Crowe
Vice president
Francis C. Poli
Secretary
James Giallanza
Treasurer and chief financial officer
Lisa D. Phelan
Chief compliance officer
KEY INFORMATION
Investment Advisor
Cohen & Steers Capital Management, Inc.
280 Park Avenue
New York, NY 10017
(212) 832-3232
Fund Subadministrator and Custodian
State Street Bank and Trust Company
One Lincoln Street
Boston, MA 02111
Transfer Agent
Boston Financial Data Services, Inc.
30 Dan Road
Canton, MA 02021
(800) 437-9912
Legal Counsel
Stroock & Stroock & Lavan LLP
180 Maiden Lane
New York, NY 10038
Distributor
Cohen & Steers Securities, LLC
280 Park Avenue
New York, NY 10017
Nasdaq Symbol: GRSIX
Web site: cohenandsteers.com
This report is authorized for delivery only to shareholders of Cohen & Steers Institutional Global Realty Shares, Inc. unless accompanied or preceded by the delivery of a currently effective prospectus setting forth details of the Fund. Past performance is of course no guarantee of future results and your investment may be worth more or less at the time you sell.
31

SEMIANNUAL REPORT
JUNE 30, 2009
COHEN & STEERS
INSTITUTIONAL GLOBAL REALTY SHARES
280 PARK AVENUE
NEW YORK, NY 10017
eDelivery NOW AVAILABLE
Stop traditional mail delivery; receive your shareholder reports and prospectus online.
Sign up at cohenandsteers.com
GRSIXSAR
Item 2. Code of Ethics.
Not applicable.
Item 3. Audit Committee Financial Expert.
Not applicable.
Item 4. Principal Accountant Fees and Services.
Not applicable.
Item 5. Audit Committee of Listed Registrants.
Not applicable.
Item 6. Schedule of Investments.
Included in Item 1 above.
Item 7. Disclosure of Proxy Voting Policies and Procedures for Closed-End Management Investment Companies.
Not applicable.
Item 8. Portfolio Managers of Closed-End Management Investment Companies.
Not applicable.
Item 9. Purchases of Equity Securities by Closed-End Management Investment Company and Affiliated Purchasers.
None.
Item 10. Submission of Matters to a Vote of Security Holders.
None.
Item 11. Controls and Procedures.
(a) The registrant’s principal executive officer and principal financial officer have concluded, based upon their evaluation of the registrant’s disclosure controls and procedures as conducted within 90 days of the filing date of this report, that these disclosure controls and procedures provide reasonable assurance that material information required to be disclosed by the registrant in the report it files or submits on Form N-CSR is recorded, processed, summarized and reported within the time periods specified in the Securities and Exchange Commission’s rules and forms
and that such material information is accumulated and communicated to the registrant’s management, including its principal executive officer and principal financial officer, as appropriate, in order to allow timely decisions regarding required disclosure.
(b) There were no changes in the registrant’s internal control over financial reporting that occurred during the second fiscal quarter of the period covered by this report that have materially affected, or are reasonably likely to materially affect, the registrant’s internal control over financial reporting.
Item 12. Exhibits.
(a)(1) Not applicable.
(a) (2) Certifications of principal executive officer and principal financial officer as required by Rule 30a-2(a) under the Investment Company Act of 1940.
(a)(3) Not applicable.
(b) Certifications of principal executive officer and principal financial officer as required by Rule 30a- 2(b) under the Investment Company Act of 1940.
SIGNATURES
Pursuant to the requirements of the Securities Exchange Act of 1934 and the Investment Company Act of 1940, the registrant has duly caused this report to be signed on its behalf by the undersigned, thereunto duly authorized.
COHEN & STEERS INSTITUTIONAL GLOBAL REALTY SHARES, INC.
By: | /s/ Adam M. Derechin | |
| Name: Adam M. Derechin | |
| Title: President and Chief Executive Officer | |
| | |
Date: August 28, 2009 | |
Pursuant to the requirements of the Securities Exchange Act of 1934 and the Investment Company Act of 1940, this report has been signed below by the following persons on behalf of the registrant and in the capacities and on the dates indicated.
By: | /s/ Adam M. Derechin | |
| Name: | Adam M. Derechin | |
| Title: | President and Chief Executive Officer | |
| | (principal executive officer) | |
By: | /s/ James Giallanza | |
| Name: | James Giallanza | |
| Title: | Treasurer | |
| | (principal financial officer) | |
| | | |
| | |
Date: August 28, 2009 | |