UNITED STATES
SECURITIES AND EXCHANGE COMMISSION
Washington, D.C. 20549
FORM N-CSR
CERTIFIED SHAREHOLDER REPORT OF REGISTERED
MANAGEMENT INVESTMENT COMPANIES
Investment Company Act file number | 811-21902 |
|
Cohen & Steers Institutional Global Realty Shares, Inc. |
(Exact name of registrant as specified in charter) |
|
280 Park Avenue, New York, NY | | 10017 |
(Address of principal executive offices) | | (Zip code) |
|
Adam M. Derechin Cohen & Steers Capital Management, Inc. 280 Park Avenue New York, New York 10017 |
(Name and address of agent for service) |
|
Registrant’s telephone number, including area code: | (212) 832-3232 | |
|
Date of fiscal year end: | December 31 | |
|
Date of reporting period: | June 30, 2008 | |
| | | | | | | |
Item 1. Reports to Stockholders.
COHEN & STEERS INSTITUTIONAL GLOBAL REALTY SHARES, INC.
August 8, 2008
To Our Shareholders:
We are pleased to submit to you our report for the six months ended June 30, 2008. The net asset value at that date was $22.01 per share. In addition, a regular distribution of $0.255 per share was declared for shareholders of record on June 27, 2008 and was paid on June 30, 2008a.
The total returns, including income and change in net asset value, for the fund and the comparative benchmarks were:
| | | Six Months Ended
June 30, 2008 | |
| Cohen & Steers Institutional Global Realty Shares | | | –11.29 | % | |
| FTSE EPRA/NAREIT Global Real Estate Indexb | | | –13.71 | % | |
| S&P 500 Indexb | | | –11.91 | % | |
The performance data quoted represent past performance. Past performance is no guarantee of future results. The investment return and the principal value of an investment will fluctuate and shares, if redeemed, may be worth more or less than their original cost. Current performance may be lower or higher than the performance data quoted. Total returns of the fund current to the most recent month-end can be obtained by visiting our Web site at cohenandsteers.com.
Investment Review
Global real estate securities, and stocks generally, reported negative returns in the period due to concerns about the global economy and the ongoing credit crunch. While stocks performed well in March and April—investors' risk aversion had moderated somewhat after the U.S. Federal Reserve announced it would help JPMorgan Chase acquire Bear Stearns—this was quickly reversed. Surging oil prices in early June contributed to fears of global stagflation, an unwelcome mix of inflation and slowing economic growth.
U.S. real estate securities (which had a total return of –4.1% in the period)c outperformed the broader U.S. stock market by a wide margin. Fundamentals remained supportive (demand softened only modestly amid limited new supply), while reported earnings were in line with expectations.
a Please note that distributions paid by the fund to shareholders are subject to recharacterization for tax purposes. The final tax treatment of these distributions is reported to shareholders after the close of the calendar year.
b The FTSE EPRA/NAREIT Global Real Estate Index is an unmanaged portfolio of approximately 286 constituents from 22 countries. The S&P 500 Index is an unmanaged index of common stocks that is frequently used as a general measure of stock market performance.
c Country returns are in local currency as measured by the FTSE EPRA/NAREIT Global Real Estate Index.
1
COHEN & STEERS INSTITUTIONAL GLOBAL REALTY SHARES, INC.
The U.S. Federal Reserve left interest rates unchanged at 2% at its June meeting, after lowering rates from 5.25% beginning in September 2007. The ability of the Fed to lower interest rates explains much of the United States' outperformance in the period; the market nonetheless ended weaker amid inflation worries and renewed concerns over the financial sector.
Asia Pacific declined as the region re-coupled
Asia Pacific real estate securities underperformed in the six-month period. Hong Kong (–32.5%) was a poor performer, reflecting concerns over economic tightening measures in China and the end of interest-rate cuts in the United States (Hong Kong's currency is linked to the U.S. dollar). The possibility of interest-rate increases weighed heavily on the market's property development companies, as investors discounted their weaker growth potential.
Japan (–15.7%) struggled amid an uncertain U.S. economic outlook and a stronger yen, which hindered exports. Real estate fundamentals were mixed; central Tokyo's office market remained firm, but condominium markets weakened.
Singapore (–17.3%) declined as inflation rose to a 26-year high (7.5%) and as the economy showed signs of softening. Non-oil domestic exports data, which tend to be volatile, declined late in the period, although domestic demand remained healthy.
Australia (–30.3%) underperformed, at first due to the lingering effect of Centro Property Group's inability to refinance debt in late 2007. The market remained under pressure amid concerns over rising cap rates, restrictive monetary policy and the potential for more dividend cuts as real estate companies deleverage.
The Bank of England focused on inflation
After posting one of its best months on record in January, the United Kingdom (–21.7%) sold off amid concerns about inflation, financial sector layoffs, a deteriorating housing market and a pullback in bank lending. The Bank of England (BOE) lowered the base interest rate by 0.25% in February and April, to 5.0%, before signaling in May that additional reductions were unlikely until inflation moderates back toward the 2% target level. Property stocks, which had already turned down by March—largely on the negative outlook for financial services industry employment and its impact on demand for central London office space—sold off sharply following the BOE announcement.
Inflation pressures rose on the continent
Germany (–31.2%) retreated on concerns about highly leveraged companies. Nevertheless, the German economy exceeded expectations; first-quarter GDP increased 1.5%, more than double the forecast.
Sweden (–20.3%) was a top performer early in the period, but sold off following a 25-basis-point increase in its benchmark interest rate, to 4.25%, in late February. Most Swedish property companies have variable-rate debt in their capital structure and are vulnerable to rate increases.
2
COHEN & STEERS INSTITUTIONAL GLOBAL REALTY SHARES, INC.
Switzerland (+7.5%) was Europe's best performer during the period as defensive-minded investors bid up share prices.
France (–5.5%) declined but outperformed the benchmark, largely due to strength within retail real estate securities; investors were attracted to mall owners' relatively low debt levels and well-regarded management teams.
The Netherlands (–9.1%) also outperformed as investors were initially attracted to its mall companies for their defensive characteristics: minimal development, high occupancies, rising rents and conservative financing. A strong performer for most of the period, Dutch property stocks sold off over the last two months after IEF Capital NV withdrew its bid for VastNed Retail NV in May, citing difficult market conditions.
Global Real Estate Securities: Total Returns in Local Currencies
June 30, 2008
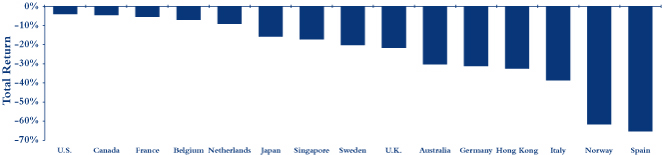
Country returns are in local currencies as measured by the FTSE EPRA/NAREIT Global Real Estate Index. Source: Wilshire
The fund outperformed in a negative environment
The fund declined in the period, although it outperformed its benchmark, due in part to favorable stock selection in Hong Kong. We reduced exposure to Hong Kong and Chinese developers in anticipation of a more difficult environment for these companies in the face of tight Chinese policies and higher interest rates. Our overweight and stock selection in France and Japan also helped the fund's relative return, as did our underweight and stock selection in Australia; we did not own Centro Properties, whose stock declined more than 70% in the period. Our U.K. and U.S. holdings performed relatively well.
Factors that hindered performance included stock selection in Germany (the only country where our stock selection was a significant detractor in the period), our underweights in Canada and the Netherlands and our lack of investment in Switzerland, a market we view as expensive relative to its total return prospects.
3
COHEN & STEERS INSTITUTIONAL GLOBAL REALTY SHARES, INC.
Investment Outlook
The risks posed by global inflation took center stage in the second quarter, broadening the range of possible economic outcomes. While we believe that much of the associated risk has been factored into stock prices, volatility surrounding the credit crisis is likely to persist through 2008.
Compelling global valuations
Global real estate securities are trading at compelling discounts to our estimates of their underlying asset values. The U.S. market finished the period at an 11.9% discount to net asset value, with even greater discounts available in Asia Pacific (a 23% discount to NAV) and Europe (27.4%, including the U.K.).
We expect U.S. REITs to generate earnings growth in the 4% to 6% range this year and in 2009, with demand and supply for commercial real estate remaining largely in balance. We view them as attractive, given their discounts to NAV, moderate growth, relatively stable earnings and compelling yields. Similarly, European real estate securities are likely to see earnings growth in the 5% to 7% range, and Asia Pacific in the 7% to 8% range.
Asia Pacific could face new headwinds
The end of the easing cycle in the United States means that Hong Kong's interest rates have also stopped declining, removing what had been a catalyst for its strong property market. Decelerating growth in China is another concern. We believe that Japanese developers' stocks and certain J-REITs offer attractive valuations.
We remain generally cautious toward Singapore and Australia. As a small market that is dependent on exports as a growth engine, Singapore is vulnerable to a global economic slowdown and inflation. Australia faces headwinds in the form of rising inflation, slowing economic growth and declining property valuations.
Pressure on Europe persists
U.K. property fundamentals are trending down, as evidenced by landlords offering incentives to tenants, and are not likely to rebound soon. London's West End office market, which had been more resilient than the City because of its diverse tenant base, is softening.
Germany's economy has slowed, but it will likely outperform in 2008 due to its low reliance on external financing and low and stable household debt levels. The country's office market is one of Europe's most solid, although the tight credit environment will be difficult for companies with higher leverage.
France alone is likely to enjoy a fiscal boost in 2008. A €9 billion tax cut, expected later this year, was designed to put more cash in the hands of French consumers.
Global companies we favor include retail property companies, which typically have inflation pass-through provisions in their leases, and self storage companies, whose short-term leases allow for frequent mark-to-market rent increases. Our focus remains on financially stronger companies whose business models, in our view, can be sustained despite a challenging environment.
4
COHEN & STEERS INSTITUTIONAL GLOBAL REALTY SHARES, INC.
Sincerely,
 | |  | |
|
| MARTIN COHEN | | ROBERT H. STEERS | |
|
| Co-chairman | | Co-chairman | |
|
 | |  | |
|
| JOSEPH M. HARVEY | | SCOTT CROWE | |
|
| Portfolio Manager | | Portfolio Manager | |
|
 | |  | |
|
| W. JOSEPH HOULIHAN | | GERIOS J. M. ROVERS | |
|
| Portfolio Manager | | Portfolio Manager | |
|
 | |  | |
|
| DEREK CHEUNG | | CHARLES J. MCKINLEY | |
|
| Portfolio Manager | | Portfolio Manager | |
|
The views and opinions in the preceding commentary are as of the date stated and are subject to change. This material represents an assessment of the market environment at a specific point in time, should not be relied upon as investment advice and is not intended to predict or depict performance of any investment.
Visit Cohen & Steers online at cohenandsteers.com
For more information about any of our funds, visit cohenandsteers.com, where you will find daily net asset values, fund fact sheets and portfolio highlights. You can also access newsletters, education tools and market updates covering the global real estate, listed infrastructure, utilities, large cap value and preferred securities sectors.
In addition, our Web site contains comprehensive information about our firm, including our most recent press releases, profiles of our senior investment professionals and an overview of our investment approach.
5
COHEN & STEERS INSTITUTIONAL GLOBAL REALTY SHARES, INC.
Performance Review (Unaudited)
Average Annual Total Returns—For the Periods Ended June 30, 2008
| | | 1 Year | | Since Inceptiona | |
| Fund | | | –20.52 | % | | | –4.04 | % | |
The performance data quoted represent past performance. Past performance is no guarantee of future results. The investment return and principal value of an investment will fluctuate and shares, when redeemed, may be worth more or less than their original cost. Current performance may be lower or higher than the performance data quoted. Performance information current to the most recent month-end can be obtained by visiting our Web site at cohenandsteers.com. The performance table does not reflect the deduction of taxes that a shareholder would pay on fund distributions or the redemption of fund shares.
The annulized gross and net expense ratios were 1.06% and 1.00% respectively, as disclosed in the May 1, 2008 prospectus. The advisor has contractually agreed to reimburse the fund so that its annual operating expenses do not exceed 1.00%. This commitment will remain in place for the life of the fund.
a Inception date of August 10, 2006
6
COHEN & STEERS INSTITUTIONAL GLOBAL REALTY SHARES, INC.
Expense Example
(Unaudited)
As a shareholder of the fund, you incur two types of costs: (1) transaction costs; and (2) ongoing costs including management fees and other fund expenses. This example is intended to help you understand your ongoing costs (in dollars) of investing in the fund and to compare these costs with the ongoing costs of investing in other mutual funds.
The example is based on an investment of $1,000 invested at the beginning of the period and held for the entire period January 1, 2008—June 30, 2008.
Actual Expenses
The first line of the table below provides information about actual account values and expenses. You may use the information in this line, together with the amount you invested, to estimate the expenses that you paid over the period. Simply divide your account value by $1,000 (for example, an $8,600 account value divided by $1,000 = 8.6), then multiply the result by the number in the first line under the heading entitled "Expenses Paid During Period" to estimate the expenses you paid on your account during this period.
Hypothetical Example for Comparison Purposes
The second line of the table below provides information about hypothetical account values and hypothetical expenses based on the fund's actual expense ratio and an assumed rate of return of 5% per year before expenses, which is not the fund's actual return. The hypothetical account values and expenses may not be used to estimate the actual ending account balance or expenses you paid for the period. You may use this information to compare the ongoing cost of investing in the fund and other funds. To do so, compare this 5% hypothetical example with the 5% hypothetical examples that appear in the shareholder reports of other funds.
Please note that the expenses shown in the table are meant to highlight your ongoing costs only and do not reflect any transactional costs, Therefore, the second line of the table is useful in comparing ongoing costs only, and will not help you determine the relative total costs of owning different funds. In addition, if these transactional costs were included, your costs would have been higher.
| | | Beginning
Account Value
January 1, 2008 | | Ending
Account Value
June 30, 2008 | | Expenses Paid
During Period*
January 1, 2008–
June 30, 2008 | |
| Actual (–11.29% return) | | $ | 1,000.00 | | | $ | 887.10 | | | $ | 4.69 | | |
| Hypothetical (5% annual return before expenses) | | $ | 1,000.00 | | | $ | 1,019.89 | | | $ | 5.02 | | |
* Expenses are equal to the Fund's annualized expense ratio of 1.00% multiplied by the average account value over the period, multiplied by 182/366 (to reflect the one-half year period). If the fund had borne all of its expenses that were assumed by the advisor, the annualized expense ratios would have been 1.05%
7
COHEN & STEERS INSTITUTIONAL GLOBAL REALTY SHARES, INC.
JUNE 30, 2008
Top Ten Long-Term Holdings
(Unaudited)
| Security | | Market
Value | | % of
Net Assets | |
| Mitsubishi Estate Co., Ltd. | | $ | 20,596,130 | | | | 6.8 | % | |
| Mitsui Fudosan Co., Ltd. | | | 19,336,206 | | | | 6.4 | | |
| Unibail-Rodamco | | | 15,084,964 | | | | 5.0 | | |
| Westfield Group | | | 11,558,236 | | | | 3.8 | | |
| Macerich Co. | | | 11,209,246 | | | | 3.7 | | |
| Sun Hung Kai Properties Ltd. | | | 10,467,935 | | | | 3.4 | | |
| Land Securities Group PLC | | | 10,257,497 | | | | 3.4 | | |
| Hongkong Land Holdings Ltd. | | | 9,599,360 | | | | 3.2 | | |
| Public Storage | | | 7,497,958 | | | | 2.5 | | |
| Vornado Realty Trust | | | 7,429,664 | | | | 2.4 | | |
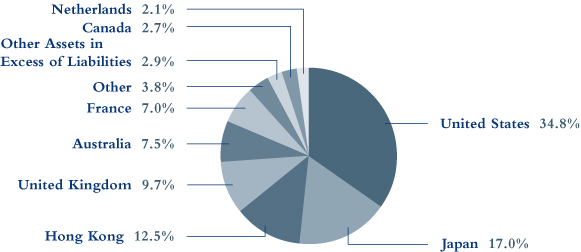
Country Breakdown
(Based on Net Assets)
(Unaudited)
8
COHEN & STEERS INSTITUTIONAL GLOBAL REALTY SHARES, INC.
SCHEDULE OF INVESTMENTS
June 30, 2008 (Unaudited)
| | | | | Number
of Shares | | Value | |
| COMMON STOCK | | | 97.1 | % | | | | | | | | | |
| AUSTRALIA | | | 7.5 | % | | | | | | | | | |
| DIVERSIFIED | | | 2.6 | % | | | | | | | | | |
| Dexus Property Group | | | | | | | 1,570,280 | | | $ | 2,077,381 | | |
| GPT Group | | | | | | | 422,551 | | | | 899,274 | | |
| Mirvac Group | | | | | | | 968,187 | | | | 2,747,330 | | |
| Stockland | | | | | | | 405,779 | | | | 2,096,709 | | |
| | | | | | | | 7,820,694 | | |
| INDUSTRIAL | | | 0.3 | % | | | | | | | | | |
| Macquarie Goodman Group | | | | | | | 347,552 | | | | 1,029,528 | | |
| OFFICE | | | 0.8 | % | | | | | | | | | |
| Commonwealth Property Office Fund | | | | | | | 1,075,763 | | | | 1,273,630 | | |
| Tishman Speyer Office Fund | | | | | | | 809,468 | | | | 1,063,115 | | |
| | | | | | | | 2,336,745 | | |
| RETAIL | | | 3.8 | % | | | | | | | | | |
| Westfield Group | | | | | | | 740,589 | | | | 11,558,236 | | |
| TOTAL AUSTRALIA | | | | | | | | | | | 22,745,203 | | |
| CANADA | | | 2.7 | % | | | | | | | | | |
| DIVERSIFIED | | | 0.5 | % | | | | | | | | | |
| Canadian REIT | | | | | | | 58,805 | | | | 1,687,969 | | |
| OFFICE | | | 1.0 | % | | | |
| Brookfield Properties Corp. | | | | | | | 168,435 | | | | 2,996,459 | | |
| RESIDENTIAL | | | 0.9 | % | | | | | | | | | |
| Boardwalk REIT | | | | | | | 75,665 | | | | 2,830,852 | | |
| RETAIL | | | 0.3 | % | | | | | | | | | |
| Primaris Retail REIT | | | | | | | 46,024 | | | | 826,419 | | |
| TOTAL CANADA | | | | | | | | | | | 8,341,699 | | |
| CHINA | | | 0.9 | % | | | | | | | | | |
| DIVERSIFIED | | | 0.5 | % | | | | | | | | | |
| New World China Land Ltd. | | | | | | | 2,553,706 | | | | 1,323,155 | | |
See accompanying notes to financial statements.
9
COHEN & STEERS INSTITUTIONAL GLOBAL REALTY SHARES, INC.
SCHEDULE OF INVESTMENTS—(Continued)
June 30, 2008 (Unaudited)
| | | | | Number
of Shares | | Value | |
| RESIDENTIAL | | | 0.4 | % | | | | | | | | | |
| Country Garden Holdings Co. | | | | | | | 2,008,317 | | | $ | 1,303,291 | | |
| TOTAL CHINA | | | | | | | | | | | 2,626,446 | | |
| FINLAND | | | 0.2 | % | | | | | | | | | |
| OFFICE | | | 0.0 | % | | | | | | | | | |
| Sponda Oyj | | | | | | | 13,272 | | | | 115,556 | | |
| RETAIL | | | 0.2 | % | | | | | | | | | |
| Citycon Oyj | | | | | | | 122,700 | | | | 620,124 | | |
| TOTAL FINLAND | | | | | | | | | | | 735,680 | | |
| FRANCE | | | 7.0 | % | | | | | | | | | |
| DIVERSIFIED | | | 6.1 | % | | | | | | | | | |
| ICADE | | | | | | | 29,560 | | | | 3,450,067 | | |
| Unibail-Rodamco | | | | | | | 65,213 | | | | 15,084,964 | | |
| | | | | | | | 18,535,031 | | |
| OFFICE | | | 0.2 | % | | | | | | | | | |
Societe Immobiliere de Location pour L'Industrie et le
Commerce (Silic) | | | | | | | 5,400 | | | | 678,463 | | |
| RETAIL | | | 0.7 | % | | | | | | | | | |
| Klepierre | | | | | | | 10,885 | | | | 548,413 | | |
| Mercialys Promesse | | | | | | | 32,065 | | | | 1,410,544 | | |
| | | | | | | | 1,958,957 | | |
| TOTAL FRANCE | | | | | | | | | | | 21,172,451 | | |
| GERMANY | | | 0.2 | % | | | | | | | | | |
| RESIDENTIAL | | | | | | | | | | | | | |
| Deutsche Wohnen AGa | | | | | | | 45,078 | | | | 679,213 | | |
| HONG KONG | | | 12.5 | % | | | | | | | | | |
| DIVERSIFIED | | | 9.1 | % | | | | | | | | | |
| Great Eagle Holdings Ltd. | | | | | | | 1,540,733 | | | | 4,544,789 | | |
| Henderson Land Development Company Ltd. | | | | | | | 1,015,612 | | | | 6,330,276 | | |
| Hysan Development Company Ltd. | | | | | | | 821,357 | | | | 2,254,261 | | |
| Kerry Properties Ltd. | | | | | | | 262,221 | | | | 1,377,146 | | |
See accompanying notes to financial statements.
10
COHEN & STEERS INSTITUTIONAL GLOBAL REALTY SHARES, INC.
SCHEDULE OF INVESTMENTS—(Continued)
June 30, 2008 (Unaudited)
| | | | | Number
of Shares | | Value | |
| Sino Land Co., Ltd. | | | | | | | 634,768 | | | $ | 1,261,843 | | |
| Sun Hung Kai Properties Ltd. | | | | | | | 771,466 | | | | 10,467,935 | | |
| Wharf Holdings Ltd. | | | | | | | 348,065 | | | | 1,457,478 | | |
| | | | | | | | 27,693,728 | | |
| HOTEL | | | 0.2 | % | | | | | | | | | |
| Shangri-La Asia Ltd. | | | | | | | 294,319 | | | | 686,987 | | |
| OFFICE | | | 3.2 | % | | | | | | | | | |
| Hongkong Land Holdings Ltd. (USD) | | | | | | | 2,264,000 | | | | 9,599,360 | | |
| TOTAL HONG KONG | | | | | | | | | | | 37,980,075 | | |
| ITALY | | | 0.2 | % | | | | | | | | | |
| DIVERSIFIED | | | | | | | | | | | | | |
| Beni Stabili S.p.A. | | | | | | | 671,052 | | | | 665,619 | | |
| JAPAN | | | 17.0 | % | | | | | | | | | |
| DIVERSIFIED | | | 16.2 | % | | | | | | | | | |
| Kenedix Realty Investment Corp. | | | | | | | 154 | | | | 913,688 | | |
| Mitsubishi Estate Co., Ltd. | | | | | | | 900,000 | | | | 20,596,130 | | |
| Mitsui Fudosan Co., Ltd. | | | | | | | 904,500 | | | | 19,336,206 | | |
| NTT Urban Development Corp. | | | | | | | 1,200 | | | | 1,570,843 | | |
| Sumitomo Realty & Development Co., Ltd. | | | | | | | 257,000 | | | | 5,106,842 | | |
| Tokyo Tatemono Co., Ltd. | | | | | | | 245,000 | | | | 1,585,111 | | |
| | | | | | | | 49,108,820 | | |
| OFFICE | | | 0.8 | % | | | | | | | | | |
| Japan Real Estate Investment Corp. | | | | | | | 142 | | | | 1,497,763 | | |
| Nomura Real Estate Office Fund | | | | | | | 126 | | | | 948,100 | | |
| | | | | | | | 2,445,863 | | |
| TOTAL JAPAN | | | | | | | | | | | 51,554,683 | | |
| NETHERLANDS | | | 2.1 | % | | | | | | | | | |
| RETAIL | | | | | | | | | | | | | |
| Corio NV | | | | | | | 62,489 | | | | 4,882,891 | | |
| Eurocommercial Properties NV | | | | | | | 28,092 | | | | 1,338,826 | | |
| | | | | | | | 6,221,717 | | |
See accompanying notes to financial statements.
11
COHEN & STEERS INSTITUTIONAL GLOBAL REALTY SHARES, INC.
SCHEDULE OF INVESTMENTS—(Continued)
June 30, 2008 (Unaudited)
| | | | | Number
of Shares | | Value | |
| NORWAY | | | 0.1 | % | | | | | | | | | |
| OFFICE | | | | | | | |
| Norwegian Property ASA | | | | | | | 55,559 | | | $ | 258,531 | | |
| SINGAPORE | | | 2.0 | % | | | | | | | | | |
| DIVERSIFIED | | | 1.2 | % | | | | | | | | | |
| CapitaLand Ltd. | | | | | | | 633,000 | | | | 2,651,942 | | |
| Keppel Land Ltd. | | | | | | | 125,000 | | | | 455,698 | | |
| Suntec Real Estate Investment Trust | | | | | | | 743,000 | | | | 742,700 | | |
| | | | | | | | 3,850,340 | | |
| OFFICE | | | 0.8 | % | | | | | | | | | |
| CapitaCommercial Trust | | | | | | | 1,664,000 | | | | 2,335,996 | | |
| TOTAL SINGAPORE | | | | | | | | | | | 6,186,336 | | |
| SWEDEN | | | 0.2 | % | | | | | | | | | |
| DIVERSIFIED | | | | | | | | | | | | | |
| Castellum AB | | | | | | | 64,037 | | | | 611,400 | | |
| UNITED KINGDOM | | | 9.7 | % | | | | | | | | | |
| DIVERSIFIED | | | 4.3 | % | | | | | | | | | |
| British Land Co., PLC | | | | | | | 195,889 | | | | 2,764,435 | | |
| Land Securities Group PLC | | | | | | | 417,998 | | | | 10,257,497 | | |
| | | | | | | | 13,021,932 | | |
| INDUSTRIAL | | | 0.5 | % | | | | | | | | | |
| Segro PLC | | | | | | | 208,559 | | | | 1,634,670 | | |
| OFFICE | | | 2.6 | % | | | | | | | | | |
| Derwent London PLC | | | | | | | 172,387 | | | | 3,461,159 | | |
| Great Portland Estates PLC | | | | | | | 651,027 | | | | 4,386,249 | | |
| | | | | | | | 7,847,408 | | |
| RETAIL | | | 2.1 | % | | | | | | | | | |
| Hammerson PLC | | | | | | | 258,345 | | | | 4,592,665 | | |
| Liberty International PLC | | | | | | | 98,510 | | | | 1,691,391 | | |
| | | | | | | | 6,284,056 | | |
See accompanying notes to financial statements.
12
COHEN & STEERS INSTITUTIONAL GLOBAL REALTY SHARES, INC.
SCHEDULE OF INVESTMENTS—(Continued)
June 30, 2008 (Unaudited)
| | | | | Number
of Shares | | Value | |
| SELF STORAGE | | | 0.2 | % | | | | | | | | | |
| Safestore Holdings Ltd. | | | | | | | 235,212 | | | $ | 694,562 | | |
| TOTAL UNITED KINGDOM | | | | | | | | | | | 29,482,628 | | |
| UNITED STATES | | | 34.8 | % | | | | | | | | | |
| DIVERSIFIED | | | 4.0 | % | | | | | | | | | |
| Boston Properties | | | | | | | 40,767 | | | | 3,677,999 | | |
| Forest City Enterprises | | | | | | | 31,644 | | | | 1,019,570 | | |
| Vornado Realty Trust | | | | | | | 84,428 | | | | 7,429,664 | | |
| | | | | | | | 12,127,233 | | |
| HEALTH CARE | | | 1.8 | % | | | | | | | | | |
| Omega Healthcare Investors | | | | | | | 174,210 | | | | 2,900,596 | | |
| Ventas | | | | | | | 62,073 | | | | 2,642,448 | | |
| | | | | | | | 5,543,044 | | |
| HOTEL | | | 2.3 | % | | | | | | | | | |
| Host Hotels & Resorts | | | | | | | 303,338 | | | | 4,140,564 | | |
| Starwood Hotels & Resorts Worldwide | | | | | | | 54,105 | | | | 2,167,987 | | |
| Sunstone Hotel Investors | | | | | | | 35,545 | | | | 590,047 | | |
| | | | | | | | 6,898,598 | | |
| INDUSTRIAL | | | 1.7 | % | | | | | | | | | |
| EastGroup Properties | | | | | | | 70,941 | | | | 3,043,369 | | |
| ProLogis | | | | | | | 40,657 | | | | 2,209,708 | | |
| | | | | | | | 5,253,077 | | |
| OFFICE | | | 3.0 | % | | | | | | | | | |
| Douglas Emmett | | | | | | | 108,084 | | | | 2,374,606 | | |
| Maguire Properties | | | | | | | 56,582 | | | | 688,603 | | |
| SL Green Realty Corp. | | | | | | | 71,675 | | | | 5,928,956 | | |
| | | | | | | | 8,992,165 | | |
| OFFICE/INDUSTRIAL | | | 1.0 | % | | | | | | | | | |
| Liberty Property Trust | | | | | | | 47,390 | | | | 1,570,978 | | |
| PS Business Parks | | | | | | | 28,438 | | | | 1,467,401 | | |
| | | | | | | | 3,038,379 | | |
See accompanying notes to financial statements.
13
COHEN & STEERS INSTITUTIONAL GLOBAL REALTY SHARES, INC.
SCHEDULE OF INVESTMENTS—(Continued)
June 30, 2008 (Unaudited)
| | | | | Number
of Shares | | Value | |
| RESIDENTIAL | | | 5.7 | % | | | | | | | | | |
| APARTMENT | | | 5.2 | % | | | | | | | | | |
| American Campus Communities | | | | | | | 27,474 | | | $ | 764,876 | | |
| Apartment Investment & Management Co. | | | | | | | 76,462 | | | | 2,604,296 | | |
| AvalonBay Communities | | | | | | | 59,956 | | | | 5,345,677 | | |
| BRE Properties | | | | | | | 37,426 | | | | 1,619,797 | | |
| Equity Residential | | | | | | | 60,956 | | | | 2,332,786 | | |
| UDR | | | | | | | 139,214 | | | | 3,115,610 | | |
| | | | | | | | 15,783,042 | | |
| MANUFACTURED HOME | | | 0.5 | % | | | | | | | | | |
| Equity Lifestyle Properties | | | | | | | 33,780 | | | | 1,486,320 | | |
| TOTAL RESIDENTIAL | | | | | | | | | | | 17,269,362 | | |
| RETAIL | | | 11.3 | % | | | | | | | | | |
| Acadia Realty Trust | | | | | | | 35,666 | | | | 825,668 | | |
| Federal Realty Investment Trust | | | | | | | 83,552 | | | | 5,765,088 | | |
| General Growth Properties | | | | | | | 172,283 | | | | 6,035,073 | | |
| Macerich Co. | | | | | | | 180,416 | | | | 11,209,246 | | |
| Regency Centers Corp. | | | | | | | 50,474 | | | | 2,984,023 | | |
| Simon Property Group | | | | | | | 81,309 | | | | 7,308,866 | | |
| | | | | | | | 34,127,964 | | |
| SELF STORAGE | | | 2.5 | % | | | | | | | | | |
| Public Storage | | | | | | | 92,808 | | | | 7,497,958 | | |
| SPECIALTY | | | 1.5 | % | | | | | | | | | |
| Digital Realty Trust | | | | | | | 41,885 | | | | 1,713,515 | | |
| Plum Creek Timber Co. | | | | | | | 53,421 | | | | 2,281,611 | | |
| Rayonier | | | | | | | 17,598 | | | | 747,211 | | |
| | | | | | | | 4,742,337 | | |
| TOTAL UNITED STATES | | | | | | | | | | | 105,490,117 | | |
| TOTAL COMMON STOCK (Identified cost—$336,404,043) | | | | | | | | | | | 294,751,798 | | |
See accompanying notes to financial statements.
14
COHEN & STEERS INSTITUTIONAL GLOBAL REALTY SHARES, INC.
SCHEDULE OF INVESTMENTS—(Continued)
June 30, 2008 (Unaudited)
| | | | | Number
of Rights | | Value | |
| RIGHTS | | | 0.0 | % | | | | | | | |
| NORWAY | | | | | | | | | | | |
Norwegian Property ASA, expire 7/10/08a
(Identified cost—$0) | | | | | | | 53,369 | | | $ | 839 | | |
| | | | | Principal
Amount | | | |
| COMMERCIAL PAPER | | | 3.0 | % | | | | | | | |
Prudential Funding LLC, 1.05%, due 7/1/08
(Identified cost—$8,991,000) | | | | | | $ | 8,991,000 | | | | 8,991,000 | | |
| TOTAL INVESTMENTS (Identified cost—$345,395,043) | | | 100.1 | % | | | | | 303,743,637 | | |
| LIABILITIES IN EXCESS OF OTHER ASSETS | | | (0.1 | )% | | | | | (302,018 | ) | |
NET ASSETS (Equivalent to $22.01 per share based on 13,786,982
shares of common stock outstanding) | | | 100.0 | % | | | | $ | 303,441,619 | | |
Glossary of Portfolio Abbreviations
REIT Real Estate Investment Trust
USD United States Dollar
Note: Percentages indicated are based on the net assets of the fund.
a Non-income producing security.
See accompanying notes to financial statements.
15
COHEN & STEERS INSTITUTIONAL GLOBAL REALTY SHARES, INC.
STATEMENT OF ASSETS AND LIABILITIES
June 30, 2008 (Unaudited)
| ASSETS: | |
| Investments in securities, at value (Identified cost—$345,395,043) | | $ | 303,743,637 | | |
| Foreign currency, at value (Identified cost—$198,940) | | | 199,564 | | |
| Receivable for investment securities sold | | | 3,839,144 | | |
| Dividends receivable | | | 945,297 | | |
| Receivable for fund shares sold | | | 173,521 | | |
| Other assets | | | 1,098 | | |
| Total Assets | | | 308,902,261 | | |
| LIABILITIES: | |
| Payable for investment securities purchased | | | 4,714,869 | | |
| Payable for dividends declared | | | 259,328 | | |
| Payable for investment advisory fees | | | 249,732 | | |
| Payable for fund shares redeemed | | | 211,913 | | |
| Payable for directors' fees | | | 4,768 | | |
| Other liabilities | | | 20,032 | | |
| Total Liabilities | | | 5,460,642 | | |
| NET ASSETS applicable to 13,786,982 shares of $0.001 par value of common stock outstanding | | $ | 303,441,619 | | |
| NET ASSET VALUE PER SHARE: | |
| ($303,441,619 ÷ 13,786,982 shares outstanding) | | $ | 22.01 | | |
| NET ASSETS consist of: | |
| Paid-in-capital | | $ | 385,964,632 | | |
| Dividends in excess of net investment income | | | (4,151,985 | ) | |
| Accumulated net realized loss | | | (36,724,813 | ) | |
| Net unrealized depreciation | | | (41,646,215 | ) | |
| | | $ | 303,441,619 | | |
See accompanying notes to financial statements.
16
COHEN & STEERS INSTITUTIONAL GLOBAL REALTY SHARES, INC.
STATEMENT OF OPERATIONS
For the Six Months Ended June 30, 2008 (Unaudited)
| Investment Income: | |
| Dividend income (net of $384,724 of foreign withholding tax) | | $ | 4,014,812 | | |
| Interest income | | | 91,162 | | |
| Total Income | | | 4,105,974 | | |
| Expenses: | |
| Investment advisory fees | | | 1,557,736 | | |
| Registration and filing fees | | | 40,052 | | |
| Directors' fees and expenses | | | 26,188 | | |
| Line of credit fees | | | 3,089 | | |
| Miscellaneous | | | 1,221 | | |
| Total Expenses | | | 1,628,286 | | |
| Reduction of Expenses (See Note 2) | | | (70,550 | ) | |
| Net Expenses | | | 1,557,736 | | |
| Net Investment Income | | | 2,548,238 | | |
| Net Realized and Unrealized Gain (Loss): | |
| Net realized loss on: | |
| Investments | | | (30,025,092 | ) | |
| Foreign currency transactions | | | (147,381 | ) | |
| Net realized loss | | | (30,172,473 | ) | |
| Net change in unrealized depreciation on: | |
| Investments | | | (8,387,944 | ) | |
| Foreign currency translations | | | 8,538 | | |
| Net change in unrealized depreciation | | | (8,379,406 | ) | |
| Net realized and unrealized loss | | | (38,551,879 | ) | |
| Net Decrease in Net Assets Resulting from Operations | | $ | (36,003,641 | ) | |
See accompanying notes to financial statements.
17
COHEN & STEERS INSTITUTIONAL GLOBAL REALTY SHARES, INC.
STATEMENT OF CHANGES IN NET ASSETS (Unaudited)
| | | For the
Six Months Ended
June 30, 2008 | | For the
Year Ended
December 31, 2007 | |
| Change in Net Assets: | |
| From Operations: | |
| Net investment income | | $ | 2,548,238 | | | $ | 3,397,745 | | |
| Net realized loss | | | (30,172,473 | ) | | | (5,742,996 | ) | |
| Net change in unrealized depreciation | | | (8,379,406 | ) | | | (37,049,831 | ) | |
| Net decrease in net assets resulting from operations | | | (36,003,641 | ) | | | (39,395,082 | ) | |
| Dividends and Distributions to Shareholders from: | |
| Net investment income | | | (3,480,162 | ) | | | (7,288,118 | ) | |
| Net realized gain on investments | | | — | | | | (108,627 | ) | |
| Tax return of capital | | | — | | | | (963,594 | ) | |
| Total dividends and distributions to shareholders | | | (3,480,162 | ) | | | (8,360,339 | ) | |
| Capital Stock Transactions: | |
| Increase in net assets from fund share transactions | | | 62,677,034 | | | | 246,566,438 | | |
| Total increase in net assets | | | 23,193,231 | | | | 198,811,017 | | |
| Net Assets: | |
| Beginning of period | | | 280,248,388 | | | | 81,437,371 | | |
| End of perioda | | $ | 303,441,619 | | | $ | 280,248,388 | | |
a Includes dividends in excess of net investment income of $4,151,985 and $3,220,061, respectively.
See accompanying notes to financial statements.
18
COHEN & STEERS INSTITUTIONAL GLOBAL REALTY SHARES, INC.
FINANCIAL HIGHLIGHTS (Unaudited)
The following table includes selected data for a share outstanding throughout each period and other performance information derived from the financial statements. It should be read in conjunction with the financial statements and notes thereto.
| Per Share Operating Performance: | | For the Six
Months Ended
June 30, 2008 | | For the
Year Ended
December 31, 2007 | | For the Period
August 10, 2006a
through
December 31, 2006 | |
| Net asset value, beginning of period | | $ | 25.10 | | | $ | 29.57 | | | $ | 25.00 | | |
| Income from investment operations: | |
| Net investment income | | | 0.24 | | | | 0.49 | b | | | 0.12 | | |
| Net realized and unrealized gain (loss) on investments | | | (3.07 | ) | | | (4.12 | ) | | | 4.62 | | |
| Total income (loss) from investment operations | | | (2.83 | ) | | | (3.63 | ) | | | 4.74 | | |
| Less dividends and distributions to shareholders from: | |
| Net investment income | | | (0.26 | ) | | | (0.73 | ) | | | (0.16 | ) | |
| Net realized gain on investments | | | — | | | | (0.01 | ) | | | (0.01 | ) | |
| Tax return of capital | | | — | | | | (0.10 | ) | | | — | | |
| Total dividends and distributions to shareholders | | | (0.26 | ) | | | (0.84 | ) | | | (0.17 | ) | |
| Net increase (decrease) in net asset value | | | (3.09 | ) | | | (4.47 | ) | | | 4.57 | | |
| Net asset value, end of period | | $ | 22.01 | | | $ | 25.10 | | | $ | 29.57 | | |
| Total investment return | | | –11.29 | %c | | | –12.35 | % | | | 18.98 | %c | |
| Ratios/Supplemental Data: | |
| Net assets, end of period (in millions) | | $ | 303.4 | | | $ | 280.2 | | | $ | 81.4 | | |
| Ratio of expenses to average daily net assets (before expense reduction) | | | 1.05 | %d | | | 1.06 | % | | | 1.47 | %d | |
| Ratio of expenses to average daily net assets (net of expense reduction) | | | 1.00 | %d | | | 1.00 | % | | | 1.00 | %d | |
| Ratio of net investment income to average daily net assets (before expense reduction) | | | 1.59 | %d | | | 1.62 | % | | | 1.73 | %d | |
| Ratio of net investment income to average daily net assets (net of expense reduction) | | | 1.64 | %d | | | 1.68 | % | | | 2.20 | %d | |
| Portfolio turnover rate | | | 45 | %c | | | 67 | % | | | 8 | %c | |
a Commencement of operations.
b 6.2% of net investment income was attributable to a special dividend paid by Boston Properties, Inc.
c Not annualized.
d Annualized.
See accompanying notes to financial statements.
19
COHEN & STEERS INSTITUTIONAL GLOBAL REALTY SHARES, INC.
NOTES TO FINANCIAL STATEMENTS (Unaudited)
Note 1. Significant Accounting Policies
Cohen & Steers Institutional Global Realty Shares, Inc. (the fund) was incorporated under the laws of the State of Maryland on May 11, 2006 and is registered under the Investment Company Act of 1940, as amended, as a nondiversified, open-end management investment company. The fund's investment objective is total return.
The following is a summary of significant accounting policies consistently followed by the fund in the preparation of its financial statements. The policies are in conformity with accounting principles generally accepted in the United States of America (GAAP). The preparation of the financial statements in accordance with GAAP requires management to make estimates and assumptions that affect the reported amounts of assets and liabilities at the date of the financial statements and the reported amounts of income and expenses during the reporting period. Actual results could differ from those estimates.
Portfolio Valuation: Investments in securities that are listed on the New York Stock Exchange are valued, except as indicated below, at the last sale price reflected at the close of the New York Stock Exchange on the business day as of which such value is being determined. If there has been no sale on such day, the securities are valued at the mean of the closing bid and asked prices for the day or, if no asked price is available, at the bid price.
Securities not listed on the New York Stock Exchange but listed on other domestic or foreign securities exchanges or admitted to trading on the National Association of Securities Dealers Automated Quotations, Inc. (Nasdaq) national market system are valued in a similar manner. Securities traded on more than one securities exchange are valued at the last sale price on the business day as of which such value is being determined as reflected on the tape at the close of the exchange representing the principal market for such securities.
Readily marketable securities traded in the over-the-counter market, including listed securities whose primary market is believed by Cohen & Steers Capital Management, Inc. (the advisor) to be over-the-counter, but excluding securities admitted to trading on the Nasdaq National List, are valued at the official closing prices as reported by Nasdaq, the National Quotation Bureau, or such other comparable sources as the Board of Directors deems appropriate to reflect their fair market value. If there has been no sale on such day, the securities are valued at the mean of the closing bid and asked prices for the day, or if no asked price is available, at the bid price. Where securities are traded on more than one exchange and also over-the-counter, the securities will generally be valued using the quotations the Board of Directors believes most closely reflect the value of such securities.
Portfolio securities primarily traded on foreign markets are generally valued at the closing values of such securities on their respective exchanges or if after the close of the foreign markets, but prior to the close of business on the day the securities are being valued, market conditions change significantly, certain foreign securities may be fair valued pursuant to procedures established by the Board of Directors.
Securities for which market prices are unavailable, or securities for which the advisor determines that bid and/or asked price does not reflect market value, will be valued at fair value pursuant to procedures approved by
20
COHEN & STEERS INSTITUTIONAL GLOBAL REALTY SHARES, INC.
NOTES TO FINANCIAL STATEMENTS (Unaudited)—(Continued)
the fund's Board of Directors. Circumstances in which market prices may be unavailable include, but are not limited to, when trading in a security is suspended, the exchange on which the security is traded is subject to an unscheduled close or disruption or material events occur after the close of the exchange on which the security is principally traded. In these circumstances, the fund determines fair value in a manner that fairly reflects the market value of the security on the valuation date based on consideration of any information or factors it deems appropriate. These may include recent transactions in comparable securities, information relating to the specific security and developments in the markets. In particular, portfolio securities primarily traded on foreign markets are generally valued at the closing values of such securities on their respective exchanges or if after the close of the foreign markets, but prior to the close of trading on the NYSE on the day the securities are being valued, developments occur that are expected to materially affect the value of such securities, such values may be adjusted to reflect the estimated fair value of such securities as of the close of trading on the NYSE using a pricing service and/or procedures approved by the fund's Board of Directors.
The fund's use of fair value pricing may cause the net asset value of fund shares to differ from the net asset value that would be calculated using market quotations. Fair value pricing involves subjective judgments and it is possible that the fair value determined for a security may be materially different than the value that could be realized upon the sale of that security.
Short-term debt securities, which have a maturity date of 60 days or less, are valued at amortized cost, which approximates value.
The fund adopted Financial Accounting Standards Board Statement of Financial Accounting Standards No. 157, "Fair Value Measurements" ("FAS 157"), effective January 1, 2008. In accordance with FAS 157, fair value is defined as the price that the fund would receive to sell an investment or pay to transfer a liability in a timely transaction with an independent buyer in the principal market, or in the absence of a principal market the most advantageous market for the investment or liability. FAS 157 establishes a single definition of fair value, creates a three-tier hierarchy as a framework for measuring fair value based on inputs used to value the fund's investments, and requires additional disclosure about fair value. The hierarchy of inputs is summarized below.
• Level 1—quoted prices in active markets for identical investments
• Level 2—other significant observable inputs (including quoted prices for similar investments, interest rates, prepayment speeds, credit risk, etc.)
• Level 3—significant unobservable inputs (including the fund's own assumptions in determining the fair value of investments)
The inputs or methodology used for valuing securities are not necessarily an indication of the risk associated with investing in those securities.
21
COHEN & STEERS INSTITUTIONAL GLOBAL REALTY SHARES, INC.
NOTES TO FINANCIAL STATEMENTS (Unaudited)—(Continued)
The following is a summary of the inputs used as of June 30, 2008 in valuing the fund's investments carried at value:
| | | | | Fair Value Measurements at June 30, 2008 Using | |
| | | Total | | Quoted Prices In
Active Market for
Identical Assets
(Level 1) | | Significant
Other Observable
Inputs
(Level 2) | | Significant
Unobservable
Inputs
(Level 3) | |
| Investments in Securities | | $ | 303,743,637 | | | $ | 294,752,637 | | | $ | 8,991,000 | | | $ | — | | |
Security Transactions and Investment Income: Security transactions are recorded on trade date. Realized gains and losses on investments sold are recorded on the basis of identified cost. Interest income is recorded on the accrual basis. Discounts are accreted and premiums are amortized over the life of the respective securities. Dividend income is recorded on the ex-dividend date except for certain dividends on foreign securities, which are recorded as soon as the fund is informed after the ex-dividend date. The fund records distributions received in excess of income from underlying investments as a reduction of cost of investments and/or realized gain. Such amounts are based on estimates if actual amounts are not available and actual amounts of income, realized gain and return of capital may differ from the estimated amounts. The fund adjusts the estimated amount s of the components of distributions (and consequently its net investment income) as an increase to unrealized appreciation/(depreciation) and realized gain/(loss) on investments as necessary once the issuers provide information about the actual composition of the distributions.
Foreign Currency Translations: The books and records of the fund are maintained in U.S. dollars as follows: (1) the foreign currency market value of investment securities, other assets and liabilities and foreign currency contracts are translated at the exchange rates prevailing at the end of the period; and (2) purchases, sales, income and expenses are translated at the exchange rates prevailing on the respective dates of such transactions. The resultant exchange gains and losses are recorded as realized and unrealized gain/loss on foreign exchange transactions. Pursuant to U.S. federal income tax regulations, certain foreign exchange gains/losses included in realized and unrealized gain/loss are included in or are a reduction of ordinary income for federal income tax purposes. The fund does not isolate that portion of the results of operations arising as a resul t of changes in the foreign exchange rates from the changes in the market prices of the securities.
Foreign Securities: The fund may directly purchase securities of foreign issuers. Investing in securities of foreign issuers involves special risks not typically associated with investing in securities of U.S. issuers. The risks include possible revaluation of currencies, the ability to repatriate funds, less complete financial information about companies and possible future adverse political and economic developments. Moreover, securities of many foreign issuers and their markets may be less liquid and their prices more volatile than those of securities of comparable U.S. issuers.
22
COHEN & STEERS INSTITUTIONAL GLOBAL REALTY SHARES, INC.
NOTES TO FINANCIAL STATEMENTS (Unaudited)—(Continued)
Dividends and Distributions to Shareholders: Dividends from net investment income and capital gain distributions are determined in accordance with U.S. federal income tax regulations, which may differ from GAAP. Dividends from net investment income are declared and paid semiannually. Net realized capital gains, unless offset by any available capital loss carryforward, are typically distributed to shareholders at least annually. Dividends and distributions to shareholders are recorded on the ex-dividend date and are automatically reinvested in full and fractional shares of the fund based on the net asset value per share at the close of business on the payable date unless the shareholder has elected to have them paid in cash.
Distributions paid by the fund are subject to recharacterization for tax purposes. Based upon the results of operations for the six months ended June 30, 2008, the advisor considers it likely that a portion of the dividends will be reclassified to return of capital and distributions of net realized capital gains upon the final determination of the fund's taxable income for the year.
Income Taxes: It is the policy of the fund to continue to qualify as a regulated investment company, if such qualification is in the best interest of the shareholders, by complying with the requirements of Subchapter M of the Internal Revenue Code applicable to regulated investment companies, and by distributing substantially all of its taxable earnings to its shareholders. Accordingly, no provision for federal income or excise tax is necessary. The fund has adopted the provisions of FASB Interpretation No. 48, Accounting for Uncertainties in Income Taxes (FIN 48). FIN 48 clarifies the accounting for income taxes by prescribing the minimum recognition threshold a tax position must meet before being recognized in the financial statements. An assessment of the fund's tax positions has been made and it has been determined that there is no impact to the fund's financi al statements. Each of the fund's federal tax returns for the prior three fiscal years remains subject to examination by the Internal Revenue Service.
Note 2. Investment Advisory Fees and Other Transactions with Affiliates
Investment Advisory Fees: The advisor serves as the fund's investment advisor pursuant to an investment advisory agreement (the advisory agreement). Under the terms of the advisory agreement, the advisor provides the fund with the day-to-day investment decisions and generally manages the fund's investments in accordance with the stated policies of the fund, subject to the supervision of the fund's Board of Directors. For the services provided to the fund, the advisor receives a fee, accrued daily and paid monthly, at the annual rate of 1.00% of the average daily net assets of the fund.
The advisor is also responsible, under the advisory agreement, for the performance of certain administrative functions for the fund. Additionally, the advisor pays all expenses of the fund except for brokerage fees, taxes, interest, fees and expenses of the fund's independent directors (as well as their independent counsel and other independent consultants), trade organization membership dues, federal and state registration fees and extraordinary expenses.
The advisor has contractually agreed to reimburse the fund so that its total annual operating expenses do not exceed 1.00% of the average daily net assets. This commitment will remain in place for the life of the fund.
23
COHEN & STEERS INSTITUTIONAL GLOBAL REALTY SHARES, INC.
NOTES TO FINANCIAL STATEMENTS (Unaudited)—(Continued)
Under subadvisory agreements between the advisor and Cohen & Steers Asia Limited., Cohen & Steers UK Limited., and Cohen & Steers Europe S.A. (collectively the subadvisors), affiliates of the advisor, the subadvisors are responsible for managing the fund's investments in certain non-U.S. real estate securities. For their services provided under the subadvisory agreement, the advisor (not the fund) pays the subadvisors 16.3%, 6.3% and 6.3%, respectively, of the advisory fee received by the advisor from the fund, net of operating expenses. For the six months ended June 30, 2008, the advisor paid the subadvisors $215,824, $83,417 and $83,417, respectively.
Directors' and Officers' Fees: Certain directors and officers of the fund are also directors, officers, and/or employees of the advisor. The fund does not pay compensation to any affiliated directors and officers.
Note 3. Purchases and Sales of Securities
Purchases and sales of securities, excluding short-term investments, for the six months ended June 30, 2008 totaled $195,624,804 and $136,526,245 respectively.
Note 4. Income Tax Information
As of June 30, 2008, the federal tax cost and net unrealized depreciation on securities were as follows:
| Gross unrealized appreciation | | $ | 2,647,218 | | |
| Gross unrealized depreciation | | | (44,298,624 | ) | |
| Net unrealized depreciation | | $ | (41,651,406 | ) | |
| Cost for federal income tax purposes | | $ | 345,395,043 | | |
Note 5. Capital Stock
The fund is authorized to issue 100 million shares of capital stock at a par value of $0.001 per share. The Board of Directors of the fund is authorized to reclassify and issue any unissued shares of the fund without shareholder approval. Transactions in fund shares were as follows:
| | | For the
Six Months Ended
June 30, 2008 | | For the
Year Ended
December 31, 2007 | |
| | | Shares | | Amount | | Shares | | Amount | |
| Sold | | | 2,967,310 | | | $ | 71,310,247 | | | | 9,216,358 | | | $ | 270,272,278 | | |
Issued as reinvestment of
dividends and distributions | | | 146,335 | | | | 3,220,834 | | | | 298,514 | | | | 7,669,435 | | |
| Redeemed | | | (490,611) | | | | (11,854,047 | ) | | | (1,105,230 | ) | | | (31,375,275 | ) | |
| Net increase | | | 2,623,034 | | | $ | 62,677,034 | | | | 8,409,642 | | | $ | 246,566,438 | | |
24
COHEN & STEERS INSTITUTIONAL GLOBAL REALTY SHARES, INC.
NOTES TO FINANCIAL STATEMENTS (Unaudited)—(Continued)
Note 6. Borrowings
The fund, in conjunction with other Cohen & Steers funds, is a party to a $200,000,000 syndicated credit agreement (the credit agreement) with State Street Bank and Trust Company, as administrative agent and operations agent, and the lenders identified in the credit agreement, which expires December 2008. The fund pays a commitment fee of 0.10% per annum on its proportionate share of the unused portion of the credit agreement.
During the six months ended June 30, 2008, the fund did not utilize the line of credit.
Note 7. Other
In the normal course of business, the fund enters into contracts that provide general indemnifications. The fund's maximum exposure under these arrangements is dependent on claims that may be made against the fund in the future and, therefore, cannot be estimated; however, based on experience, the risk of material loss from such claims is considered remote.
Note 8. New Accounting Pronouncement
In March 2008, the Financial Accounting Standards Board issued Statement of Financial Accounting Standards No. 161, Disclosures about Derivative Instruments and Hedging Activities ("FAS 161"), an amendment of FASB Statement No. 133. FAS 161 requires enhanced disclosures about (a) how and why an entity uses derivative instruments, (b) how derivative instruments and related hedged items are accounted for, and (c) how derivative instruments and related hedged items affect the fund's financial position, financial performance, and cash flows. Management is currently evaluating the impact the adoption of this pronouncement will have on the fund's financial statements. FAS 161 is effective for fiscal years beginning after November 15, 2008.
25
COHEN & STEERS INSTITUTIONAL GLOBAL REALTY SHARES, INC.
OTHER INFORMATION
A description of the policies and procedures that the fund uses to determine how to vote proxies relating to portfolio securities is available (i) without charge, upon request, by calling 800-330-7348, (ii) on our Web site at cohenandsteers.com or (iii) on the Securities and Exchange Commission's Web site at http://www.sec.gov. In addition, the fund's proxy voting record for the most recent 12-month period ended June 30 is available (i) without charge, upon request, by calling 800-330-7348 or (ii) on the SEC's Web site at http://www.sec.gov.
The fund files its complete schedule of portfolio holdings with the SEC for the first and third quarters of each fiscal year on Form N-Q. The fund's Forms N-Q are available (i) without charge, upon request by calling 800-330-7348, or (ii) on the SEC's Web site at http://www.sec.gov. In addition, the Forms N-Q may be reviewed and copied at the SEC's Public Reference Room in Washington, DC. Information on the operation of the Public Reference Room may be obtained by calling 800-SEC-0330.
Please note that the distributions paid by the fund to shareholders are subject to recharacterization for tax purposes. The fund may also pay distributions in excess of the fund's net investment company taxable income and this excess would be a tax-free return of capital distributed from the fund's assets. The final tax treatment of all distributions is reported to shareholders on their 1099-DIV forms, which are mailed after the close of each calendar year.
26
COHEN & STEERS INSTITUTIONAL GLOBAL REALTY SHARES, INC.
APPROVAL OF INVESTMENT ADVISORY AGREEMENT
The board of directors of the fund, including a majority of the directors who are not parties to the fund's Investment Advisory Agreement, or interested persons of any such party ("Independent Directors"), has the responsibility under the 1940 Act to approve the fund's Investment Advisory Agreement for its initial two year term and its continuation annually thereafter at a meeting of the board called for the purpose of voting on the approval or continuation. At meetings held in person on June 11-12, 2008, the Investment Advisory Agreement was discussed and was unanimously continued for a one-year term by the fund's board, including the Independent Directors. The Independent Directors were represented by independent counsel who assisted them in their deliberations during the meeting and executive session.
In considering whether to continue the Investment Advisory Agreement, the board reviewed materials provided by the fund's investment advisor (the "Advisor") and fund counsel which included, among other things, fee, expense and performance information compared to peer funds ("Peer Funds") prepared by an independent data provider, supplemental performance and summary information prepared by the Advisor, sales and redemption data for the fund and memoranda outlining the legal duties of the board. The board also spoke directly with representatives of the independent data provider and met with investment advisory personnel. In addition, the board considered information provided from time to time by the Advisor throughout the year at meetings of the board, including presentations by portfolio managers relating to the investment performance of the fund and the investment strategies used in pursuing the fund's objective. In particular, the board con sidered the following:
(i) The nature, extent and quality of services to be provided by the Advisor: The board reviewed the services that the Advisor provides to the fund, including, but not limited to, making the day-to-day investment decisions for the fund, and generally managing the fund's investments in accordance with the stated policies of the fund. The board also discussed with officers and portfolio managers of the fund the amount of time the Advisor dedicates to the fund and the types of transactions that were being done on behalf of the fund. Additionally, the board took into account the services provided by the Advisor to its other funds, including those that invest substantially in real estate securities and have investment objectives and strategies similar to the fund.
The board next considered the education, background and experience of the Advisor's personnel, noting particularly that the favorable history and reputation of the portfolio managers for the fund, has had, and would likely continue to have, a favorable impact on the success of the fund. The board further noted the Advisor's ability to attract quality and experienced personnel. After consideration of the above factors, among others, the board concluded that the nature, quality and extent of services provided by the Advisor are adequate and appropriate.
(ii) Investment performance of the fund and the Advisor: The board considered the investment performance of the fund compared to Peer Funds and compared to a relevant benchmark. The board noted that the fund underperformed the median of the Peer Funds and the benchmark during the one-year period. The board also considered the Advisor's performance in managing other real estate funds and reviewed supplemental performance data provided by the Advisor. The board engaged in discussions with the Advisor regarding the fund's relative and absolute performance. The board then determined that fund performance, in light of all considerations noted above, was satisfactory.
27
COHEN & STEERS INSTITUTIONAL GLOBAL REALTY SHARES, INC.
(iii) Cost of the services to be provided and profits to be realized by the Advisor from the relationship with the fund: Next, the board considered the advisory fees and administrative fees payable by the fund, as well as total expense ratios. As part of their analysis, the board gave substantial consideration to the fee and expense analyses provided by the independent data provider. The board noted that the advisory fee and total expense ratio (on a gross and net basis) were above the median versus the Peer Funds. The board also considered that the Advisor is currently waiving a portion of its advisory fees and/or reimbursing expenses to limit total expenses of the fund. In light of the considerations above, the board concluded that the fund's expense structure was competitive in the peer group.
The board also reviewed information regarding the profitability to the Advisor of its relationship with the fund. The board considered the level of the Advisor's profits and whether the profits were reasonable for the Advisor. The board took into consideration other benefits to be derived by the Advisor in connection with the Advisory Agreement, noting particularly the research and related services, within the meaning of Section 28(e) of the Securities Exchange Act of 1934, as amended, that the Advisor receives by allocating the fund's brokerage transactions. The board also considered the fees received by the Advisor under the Administration Agreement, but noted the significant services received, such as operational services and furnishing office space and facilities for the fund, and providing persons satisfactory to the board to serve as officers of the fund, and that these services were beneficial to the fund. The directors concluded that the profits realized by the Advisor from its administrative relationship with the fund were reasonable and consistent with fiduciary duties.
(iv) The extent to which economies of scale would be realized as the fund grows and whether fee levels would reflect such economies of scale: The board noted that the fund's advisory fee schedule does not contain any breakpoints. The board considered the fund's asset size and determined that there were not at this time significant economies of scale that were not being shared with stockholders.
(v) Comparison of services rendered and fees paid to those under other investment advisory contracts, such as contracts of the same and other investment advisers or other clients: As discussed above in (i) and (iii), the board compared both the services rendered and the fees paid under the Advisory Agreement to those under other investment advisory contracts of other investment advisers managing Peer Funds. The board also compared both the services rendered and the fees paid under the Advisory Agreement to the Advisor's other fund advisory agreements as well as the profitability under the Advisory Agreement to the Advisor's other advisory contracts with institutional and other clients with similar investment mandates. The board determined that on a comparative basis the fees under the Advisory Agreement were reasonable in relation to the services provided.
No single factor was cited as determinative to the decision of the board. Rather, after weighing all of the considerations and conclusions discussed above, the board, including the Independent Directors, unanimously approved the continuation of the Advisory Agreement.
28
COHEN & STEERS INSTITUTIONAL GLOBAL REALTY SHARES, INC.
Meet the Cohen & Steers family of open-end funds:
COHEN & STEERS
REALTY SHARES
• Designed for investors seeking total return, investing primarily in REITs
• Symbol: CSRSX
COHEN & STEERS
REALTY INCOME FUND
• Designed for investors seeking maximum total return, investing primarily in real estate securities with an emphasis on both income and capital appreciation
• Symbols: CSEIX, CSBIX, CSCIX, CSDIX
COHEN & STEERS
INTERNATIONAL REALTY FUND
• Designed for investors seeking total return, investing primarily in international real estate securities
• Symbols: IRFAX, IRFCX, IRFIX
COHEN & STEERS
DIVIDEND VALUE FUND
• Designed for investors seeking high current income and long-term growth of income and capital appreciation, investing primarily in dividend paying common stocks and preferred stocks
• Symbols: DVFAX, DVFCX, DVFIX
COHEN & STEERS
INSTITUTIONAL GLOBAL REALTY SHARES
• Designed for institutional investors seeking total return, investing primarily in global real estate securities
• Symbol: GRSIX
COHEN & STEERS
INSTITUTIONAL REALTY SHARES
• Designed for institutional investors seeking total return, investing primarily in REITs
• Symbol: CSRIX
COHEN & STEERS
GLOBAL REALTY SHARES
• Designed for investors seeking total return, investing primarily in global real estate equity securities
• Symbols: CSFAX, CSFBX, CSFCX, CSSPX
COHEN & STEERS
GLOBAL INFRASTRUCTURE FUND
• Designed for investors seeking total return, investing primarily in global infrastructure securities
• Symbols: CSUAX, CSUBX, CSUCX, CSUIX
COHEN & STEERS
ASIA PACIFIC REALTY SHARES
• Designed for investors seeking total return, investing primarily in real estate securities located in the Asia Pacific region
• Symbols: APFAX, APFCX, APFIX
COHEN & STEERS
EUROPEAN REALTY SHARES
• Designed for investors seeking total return, investing primarily in real estate securities located in Europe
• Symbols: EURAX, EURCX, EURIX
Please consider the investment objectives, risks, charges and expenses of the fund carefully before investing. A prospectus containing this and other information can be obtained by calling 800-330-7348 or by visiting cohenandsteers.com. Please read the prospectus carefully before investing.
Cohen & Steers Securities, LLC, Distributor
29
COHEN & STEERS INSTITUTIONAL GLOBAL REALTY SHARES, INC.
OFFICERS AND DIRECTORS
Robert H. Steers
Director and co-chairman
Martin Cohen
Director and co-chairman
Bonnie Cohen
Director
George Grossman
Director
Richard E. Kroon
Director
Richard J. Norman
Director
Frank K. Ross
Director
Willard H. Smith Jr.
Director
C. Edward Ward, Jr.
Director
Adam M. Derechin
President and chief executive officer
Joseph M. Harvey
Vice president
Francis C. Poli
Secretary
James Giallanza
Treasurer and chief financial officer
Lisa D. Phelan
Chief compliance officer
KEY INFORMATION
Investment Advisor
Cohen & Steers Capital Management, Inc.
280 Park Avenue
New York, NY 10017
(212) 832-3232
Fund Subadministrator and Custodian
State Street Bank and Trust Company
One Lincoln Street
Boston, MA 02111
Transfer Agent
Boston Financial Data Services, Inc.
2 Heritage Drive
North Quincy, MA 02171
(800) 437-9912
Legal Counsel
Stroock & Stroock & Lavan LLP
180 Maiden Lane
New York, NY 10038
Distributor
Cohen & Steers Securities, LLC
280 Park Avenue
New York, NY 10017
Nasdaq Symbol: GRSIX
Web site: cohenandsteers.com
This report is authorized for delivery only to shareholders of Cohen & Steers Institutional Global Realty Shares, Inc. unless accompanied or preceded by the delivery of a currently effective prospectus setting forth details of the fund. Past performance is of course no guarantee of future results and your investment may be worth more or less at the time you sell.
30

eDelivery NOW AVAILABLE
Stop traditional mail delivery; receive your shareholder reports and prospectus online.
Sign up at cohenandsteers.com
COHEN & STEERS
INSTITUTIONAL GLOBAL REALTY SHARES
280 PARK AVENUE
NEW YORK, NY 10017
GRSIXSAR
SEMIANNUAL REPORT
JUNE 30, 2008
Item 2. Code of Ethics.
Not applicable.
Item 3. Audit Committee Financial Expert.
Not applicable.
Item 4. Principal Accountant Fees and Services.
Not applicable.
Item 5. Audit Committee of Listed Registrants.
Not applicable.
Item 6. Schedule of Investments.
Included in Item 1 above.
Item 7. Disclosure of Proxy Voting Policies and Procedures for Closed-End Management Investment Companies.
Not applicable.
Item 8. Portfolio Managers of Closed-End Management Investment Companies.
Not applicable.
Item 9. Purchases of Equity Securities by Closed-End Management Investment Company and Affiliated Purchasers.
None.
Item 10. Submission of Matters to a Vote of Security Holders.
None.
Item 11. Controls and Procedures.
(a) The registrant’s principal executive officer and principal financial officer have concluded, based upon their evaluation of the registrant’s disclosure controls and procedures as conducted within 90 days of the filing date of this report, that these disclosure controls and procedures provide reasonable assurance that material information required to be disclosed by the registrant in the report it files or submits on Form N-CSR is recorded, processed, summarized and reported within the time periods specified in the Securities and Exchange Commission’s rules and forms and that such material information is accumulated and communicated to the registrant’s management, including its principal executive officer and principal financial officer, as appropriate, in order to allow timely decisions regarding required disclosure.
(b) There were no changes in the registrant’s internal control over financial reporting that occurred during the second fiscal quarter of the period covered by this report that have materially affected, or are reasonably likely to materially affect, the registrant’s internal control over financial reporting.
Item 12. Exhibits.
(a)(1) Not applicable.
(a) (2) Certifications of principal executive officer and principal financial officer as required by Rule 30a-2(a) under the Investment Company Act of 1940.
(a)(3) Not applicable.
(b) Certifications of principal executive officer and principal financial officer as required by Rule 30a- 2(b) under the Investment Company Act of 1940.
SIGNATURES
Pursuant to the requirements of the Securities Exchange Act of 1934 and the Investment Company Act of 1940, the registrant has duly caused this report to be signed on its behalf by the undersigned, thereunto duly authorized.
COHEN & STEERS INSTITUTIONAL GLOBAL REALTY SHARES, INC.
By: | /s/ Adam M. Derechin | |
| | Name: Adam M. Derechin |
| | Title: President and Chief Executive Officer |
| | |
Date: August 27, 2008 |
| | | |
Pursuant to the requirements of the Securities Exchange Act of 1934 and the Investment Company Act of 1940, this report has been signed below by the following persons on behalf of the registrant and in the capacities and on the dates indicated.
By: | /s/ Adam M. Derechin | |
| | Name: | Adam M. Derechin |
| | Title: | President and Chief Executive Officer |
| | | (principal executive officer) |
| | | | |
By: | /s/ James Giallanza | |
| | Name: | James Giallanza |
| | Title: | Treasurer |
| | | (principal financial officer) |
| | | |
| | | |
Date: August 27, 2008 |
| | | | |