UNITED STATES
SECURITIES AND EXCHANGE COMMISSION
Washington, D.C. 20549
FORM N-CSR
CERTIFIED SHAREHOLDER REPORT OF REGISTERED
MANAGEMENT INVESTMENT COMPANIES
Investment Company Act file number | 811-21902 |
|
Cohen & Steers Institutional Global Realty Shares, Inc. |
(Exact name of registrant as specified in charter) |
|
280 Park Avenue, New York, NY | | 10017 |
(Address of principal executive offices) | | (Zip code) |
|
Tina M. Payne Cohen & Steers Capital Management, Inc. 280 Park Avenue New York, New York 10017 |
(Name and address of agent for service) |
|
Registrant’s telephone number, including area code: | (212) 832-3232 | |
|
Date of fiscal year end: | December 31 | |
|
Date of reporting period: | June 30, 2012 | |
| | | | | | | | |
Item 1. Reports to Stockholders.
COHEN & STEERS INSTITUTIONAL GLOBAL REALTY SHARES, INC.
To Our Shareholders:
We would like to share with you our report for the six months ended June 30, 2012. The net asset value (NAV) at that date was $20.63 per share.
The total returns, including income and change in NAV, for the Fund and its comparative benchmarks were:
| | | Six Months Ended
June 30, 2012 | |
| Cohen & Steers Institutional Global Realty Shares | | | 12.74 | % | |
| FTSE EPRA/NAREIT Developed Real Estate Index—neta | | | 14.81 | % | |
| S&P 500 Indexa | | | 9.49 | % | |
The performance data quoted represent past performance. Past performance is no guarantee of future results. The investment return and the principal value of an investment will fluctuate and shares, if redeemed, may be worth more or less than their original cost. Current performance may be lower or higher than the performance data quoted. Current total returns of the Fund can be obtained by visiting our Web site at cohenandsteers.com. The Fund's return assumes the reinvestment of all dividends and distributions at NAV. Fund performance reflects fee waivers and/or expense reimbursements, without which the performance would have been lower. Performance figures for periods shorter than one year are not annualized.
The Fund implements fair value pricing when the daily change in a specific U.S. market index exceeds a predetermined percentage. Fair value pricing adjusts the valuation of certain non-U.S. holdings to account for such index change following the close of foreign markets. This standard practice has been adopted by a majority of the fund industry. In the event fair value pricing is implemented on the first and/or last day of a performance measurement period, the Fund's return may diverge from the relative performance of its benchmark index, which does not use fair value pricing. An investor cannot invest directly in an index.
Please note that distributions paid by the Fund to shareholders are subject to recharacterization for tax purposes and are taxable up to the amount of the Fund's investment company taxable income and net realized gains. Distributions in excess of the Fund's investment company taxable income and realized gains are a return of capital distributed from the Fund's assets.
Investment Review
Global real estate securities generated strong returns in the first half of 2012, as fears of a global downturn moderated despite continued uncertainty in Europe. All regions gained, with Asia Pacific leading North America and Europe. The group also outperformed the broad equity market by a wide margin, demonstrating stable cash flow growth amid an attractive combination of modest economic expansion, policy easing and very little new supply coming to market.
a The FTSE EPRA/NAREIT Developed Real Estate Index is an unmanaged portfolio of approximately 287 constituents from 20 countries and is net of dividend withholding taxes. The S&P 500 Index is an unmanaged index of common stocks that is frequently used as a general measure of stock market performance.
1
COHEN & STEERS INSTITUTIONAL GLOBAL REALTY SHARES, INC.
The year started with a sharp rally, due in large part to surprisingly strong economic data from the United States. Europe also offered positive news early in the year, as authorities negotiated a controlled restructuring of Greek debt and provided liquidity to the region's banks. Financial markets turned volatile in the second quarter amid rising uncertainty about the fate of the Eurozone and signs of a sharp slowdown in the global economy. Equities rallied into the end of the period, as Eurozone officials took steps toward creating a centralized banking supervisor, reducing the risk of a liquidity crisis and potentially easing the strain on sovereign balance sheets.
North America continued to see strong property fundamentals
U.S. REITs had a total return of (+14.9%) based on the FTSE NAREIT Equity REIT Index. Demand for commercial space strengthened overall, and REITs continued to benefit from access to capital on historically inexpensive terms. All property sectors advanced, led by owners of regional malls (+22.7%)b and shopping centers (+19.3%). Retail landlords generally benefited from improving consumer sentiment and continued sales growth from mall tenants. Office REITs (+13.7%) saw stronger-than-expected demand on the West Coast and in Manhattan. SL Green Realty Corp. was a standout, announcing one of the largest lease deals in New York City history with media tenant Viacom.
The typically cyclical hotel sector (+12.8%) performed broadly in line with the typically defensive health care property sector (+12.7%), alternating leadership in the first and second quarters, respectively. Apartment REITs (+9.5%) underperformed, as improving sentiment in the single-family housing market prompted concerns of slower cash flow growth in the rental market.
Canada (+12.4%)c had solid returns, benefiting from a relatively healthy banking system and strong fundamentals. Companies focused on the Western territories did particularly well amid robust demand across all property types, driven by the boom in natural resources.
Europe gained despite worsening economic and fiscal conditions
The U.K. (+14.2%) technically entered a recession in the first quarter, but investment demand for prime office and retail assets in London remained very strong, as international investors sought the relative safety of high-quality, income-producing assets and a stable currency. The government announced positive amendments to U.K. REIT legislation as part of the draft for Finance Bill 2012. Among other things, the amendments would abolish the 2% entry charge on companies converting to a REIT, eliminating one of the obstacles in the advancement of the REIT structure.
In France (+12.5%), Klépierre outperformed significantly on news that U.S.-based Simon Property Group (SPG) had acquired a 29% stake in the company from majority owner BNP Paribas. Following the announcement, Klépierre was able to issue debt at a meaningfully lower cost, benefiting by association with SPG's strong balance sheet.
Germany (+20.9%) led all of Europe, benefiting from an economy that was largely resistant to the euro crisis, although economic trends showed marked deceleration in June. Switzerland (+12.4%) also did well, as slowing inflation and accommodative policies were generally supportive of real estate values. The Netherlands (+6.0%) was more subdued, as REIT shares retreated in the second quarter due to worries about their exposure to southern Europe.
b Sector returns as measured by the FTSE NAREIT Equity REIT Index.
c Country returns are in local currencies as measured by the FTSE EPRA/NAREIT Developed Real Estate Index.
2
COHEN & STEERS INSTITUTIONAL GLOBAL REALTY SHARES, INC.
Asia Pacific benefited from policy easing and a rebound in Japan
Japan (+26.6%) led all developed property markets during the period. The return was also remarkable in relation to Japan's broad equity market, as the Nikkei 225 Index had a total return of just +7.7%. The Bank of Japan continued to buy J-REITs as part of its asset-purchase program, and attempted to shift the country away from its persistent deflation, announcing an explicit target of a 1% rise in consumer prices. Developers also benefited from better-than-expected vacancy rates, as well as the market's growing expectation for further quantitative easing.
In Hong Kong (+12.7%), shares of lower-quality developers rallied on speculation that the government might limit its directed policies on residential development. Property stocks also responded to changing sentiment regarding the slowing Chinese economy. Sun Hung Kai Properties Ltd. was the only index component in Hong Kong that declined, weighed down by concerns surrounding the company's co-chairmen, who were detained in March on suspicion of bribery related to a land acquisition in 2003.
Australia (+16.6%) had strong gains, with property stocks outperforming local equities by a substantial margin (the S&P ASX had a return of +3.3%). Real estate securities were direct beneficiaries of the Reserve Bank of Australia's continued interest-rate cuts, which put downward pressure on cap rates. Investors also took a favorable view of the generally stable earnings, defensive balance sheets and inflation-linked cash flows offered by many Australian REITs.
Singapore (+25.4%) was a large beneficiary of the first-quarter rally. The gains were paced by development companies, which had previously been under pressure from government regulatory actions to push down residential property prices.
Fund performance
The Fund had a positive total return during the period, but underperformed its benchmark, due largely to our stock selection and overweight in Hong Kong. In particular, we had a meaningful position in Sun Hung Kai, as we viewed it as attractively valued, with a strong market position and high-quality assets. We moderated our allocation to the shares and continue to monitor long-term risks related to the corruption scandal discussed above. However, we believe the company's near-term prospects are unlikely to be affected. Other detractors included our stock selection and underweights in Australia, Singapore and the United States.
Our allocation to China developers contributed to performance on an absolute and relative basis. These stocks rallied sharply in response to China's monetary policy easing and recent stimulus measures designed to promote infrastructure development. Stock selection in Germany also helped, as we had a meaningful position in Deutsche Wohnen AG. Additionally, our out-of-index allocation to the Philippines had a positive effect on returns.
Investment Outlook
We expect the U.S. to continue on a slow recovery path
Notwithstanding recent disappointments in employment reports, we expect the U.S. economy to maintain a slow but steady recovery, allowing for incremental gains in demand for real estate and continued low financing costs. Fundamentals in most sectors should also be supported by only gradual additions to supply, likely benefiting property-level cash flow growth.
3
COHEN & STEERS INSTITUTIONAL GLOBAL REALTY SHARES, INC.
We maintain a favorable view of key office markets, including life sciences, technology and media, as well as New York offices broadly. We also see good value in certain hotel and industrial REITs that have been heavily discounted despite their solid operating fundamentals. We continue to favor owners of high-quality malls, as we believe they provide attractive defensive qualities along with better growth potential than the traditionally defensive health care property sector. Although we see some attractive opportunities in the apartment sector, we have broad concerns based on valuations and the prospect of decelerating earnings growth.
Europe's economic and financing risks keep us focused on high-quality names
The uncertainties surrounding Europe's banking and fiscal crisis, combined with diminished economic growth expectations, continue to make for a challenging investment outlook over the near term. Our base-case scenario is one of moderate recession in the Eurozone, with more severe contractions in the southern peripheral countries and slow-to-moderate expansion in the north.
We remain positioned generally defensively on the continent, with a focus on high-quality assets that we believe are able to weather the effects of consumer and government deleveraging. We favor prime retail owners, as well as the German residential market. We continue to underweight Switzerland despite its strong property fundamentals, as we believe Sweden and Norway offer defensive qualities at a better relative value.
The U.K. appears in better shape relative to the Eurozone, in our view. We see further quantitative easing as increasingly likely, while austerity measures have reduced sovereign risk, albeit at a cost to economic growth. We see London-focused companies with prime office and retail assets as particularly attractive, as we believe competition for acquisitions in this desirable and supply-constrained market is likely to provide support for property values.
Hong Kong still the favorite in Asia Pacific, but others are looking increasingly attractive
Hong Kong remains among the world's most undervalued property markets relative to our NAV estimates, even taking into account the potential for slower economic growth. We view offices as increasingly attractive, as we believe they will begin to see a recovery in rents in the second half of 2012. In the residential market, we believe positive demand-side factors are likely to be offset by policy and supply risks in the near term given the transition to a new administration this year.
We retain our cautious view of Japan, which continues to see challenging economic conditions and property fundamentals. However, while tenant demand for offices remains tepid, we are seeing evidence of a bottom and have taken a constructive stance toward developers. We are also seeing resilience in the residential market, with condo sales buoyed by government incentives and low interest rates.
We continue to underweight Australia, as we expect rent growth to remain challenged due to the cooling economy, struggling home prices and an array of issues facing retail landlords. We have adjusted our estimates to reflect lower financing costs and a weaker currency, as well as recent property transactions that have provided confirmation to book values. When combined with the recent run-up in share prices, we continue to see better value elsewhere, despite the high quality of Australian assets. On a policy level, we believe there is still room for interest-rate cuts, but in a slow global recovery scenario, cuts may fall short of market expectations.
We have recently become more constructive regarding Singapore, favoring commercial property owners that stand to benefit from the country's growing role in global trade. We view hotels as particularly attractive given tight supply conditions and growth in intra-regional travel. Among developers, we remain positive on names with strong mass-market residential operations, as they are less at risk to policy tightening due to the government's support for more public housing.
4
COHEN & STEERS INSTITUTIONAL GLOBAL REALTY SHARES, INC.
Sincerely,
 | |  | |
|
| MARTIN COHEN | | ROBERT H. STEERS | |
|
| Co-chairman | | Co-chairman | |
|
 | |  | |
|
| JOSEPH M. HARVEY | | JON CHEIGH | |
|
| Portfolio Manager | | Portfolio Manager | |
|
 | |  | |
|
| GERIOS J.M. ROVERS | | CHARLES J. MCKINLEY | |
|
| Portfolio Manager | | Portfolio Manager | |
|
 | |  | |
|
| LUKE SULLIVAN | | ROGIER QUIRIJNS | |
|
| Portfolio Manager | | Portfolio Manager | |
|
The views and opinions in the preceding commentary are subject to change. There is no guarantee that any market forecast set forth in the commentary will be realized. This material represents an assessment of the market environment at a specific point in time, should not be relied upon as investment advice and is not intended to predict or depict performance of any investment.
Visit Cohen & Steers online at cohenandsteers.com
For more information about any of our funds, visit cohenandsteers.com, where you will find daily net asset values, fund fact sheets and portfolio highlights. You can also access newsletters, education tools and market updates covering the global real estate, commodities, global natural resource equities, listed infrastructure, utilities, large cap value and preferred securities sectors.
In addition, our Web site contains comprehensive information about our firm, including our most recent press releases, profiles of our senior investment professionals and an overview of our investment approach.
5
COHEN & STEERS INSTITUTIONAL GLOBAL REALTY SHARES, INC.
Performance Review (Unaudited)
Average Annual Total Returns—For Periods Ended June 30, 2012
| | | 1 Year | | 5 Years | | Since Inceptiona | |
| Fund | | | –2.22 | % | | | –2.81 | % | | | 0.16 | % | |
The performance data quoted represent past performance. Past performance is no guarantee of future results. The investment return and principal value of an investment will fluctuate and shares, if redeemed, may be worth more or less than their original cost. Current performance may be lower or higher than the performance data quoted. Performance information current to the most recent month end can be obtained by visiting our Web site at cohenandsteers.com. Total return assumes the reinvestment of all dividends and distributions at NAV. The performance table does not reflect the deduction of taxes that a shareholder would pay on Fund distributions or the redemption of Fund shares. During the periods presented above, the advisor waived fees and/or reimbursed expenses. Without this arrangement, performance would have been lower.
The annualized gross and net expense ratios were 1.03% and 1.00%, respectively, as disclosed in the May 1, 2012 prospectus. The advisor has contractually agreed to waive its fee and/or reimburse the Fund so that the Fund's total annual operating expenses (excluding brokerage fees and commissions, taxes and, upon approval of the Board of Directors, extraordinary expenses) do not exceed 1.00% of average daily net assets. This commitment will remain in place for the life of the Fund.
a Inception date of August 10, 2006.
6
COHEN & STEERS INSTITUTIONAL GLOBAL REALTY SHARES, INC.
Expense Example
(Unaudited)
As a shareholder of the Fund, you incur two types of costs: (1) transaction costs and (2) ongoing costs, including management fees and other Fund expenses. This example is intended to help you understand your ongoing costs (in dollars) of investing in the Fund and to compare these costs with the ongoing costs of investing in other mutual funds.
The example is based on an investment of $1,000 invested at the beginning of the period and held for the entire period January 1, 2012—June 30, 2012.
Actual Expenses
The first line of the following table provides information about actual account values and expenses. You may use the information in this line, together with the amount you invested, to estimate the expenses that you paid over the period. Simply divide your account value by $1,000 (for example, an $8,600 account value divided by $1,000 = 8.6), then multiply the result by the number in the first line under the heading entitled "Expenses Paid During Period" to estimate the expenses you paid on your account during this period.
Hypothetical Example for Comparison Purposes
The second line of the following table provides information about hypothetical account values and hypothetical expenses based on the Fund's actual expense ratio and an assumed rate of return of 5% per year before expenses, which is not the Fund's actual return. The hypothetical account values and expenses may not be used to estimate the actual ending account balance or expenses you paid for the period. You may use this information to compare the ongoing cost of investing in the Fund and other funds. To do so, compare this 5% hypothetical example with the 5% hypothetical examples that appear in the shareholder reports of other funds.
Please note that the expenses shown in the table are meant to highlight your ongoing costs only and do not reflect any transactional costs. Therefore, the second line of the table is useful in comparing ongoing costs only, and will not help you determine the relative total costs of owning different funds. In addition, if these transactional costs were included, your costs would have been higher.
| | | Beginning
Account Value
January 1, 2012 | | Ending
Account Value
June 30, 2012 | | Expenses Paid
During Perioda
January 1, 2012–
June 30, 2012 | |
| Actual (12.74% return) | | $ | 1,000.00 | | | $ | 1,127.40 | | | $ | 5.29 | | |
| Hypothetical (5% annual return before expenses) | | $ | 1,000.00 | | | $ | 1,019.89 | | | $ | 5.02 | | |
a Expenses are equal to the Fund's annualized expense ratio of 1.00% multiplied by the average account value over the period, multiplied by 182/366 (to reflect the one-half year period). If the Fund had borne all of its expenses that were assumed by the advisor, the annualized expense ratio would have been 1.03%.
7
COHEN & STEERS INSTITUTIONAL GLOBAL REALTY SHARES, INC.
June 30, 2012
Top Ten Holdings
(Unaudited)
| Security | | Value | | % of
Net
Assets | |
| Simon Property Group | | $ | 32,297,738 | | | | 5.7 | | |
| Vornado Realty Trust | | | 21,228,800 | | | | 3.8 | | |
| Mitsubishi Estate Co., Ltd. | | | 19,698,989 | | | | 3.5 | | |
| Unibail-Rodamco | | | 19,099,083 | | | | 3.4 | | |
| Sun Hung Kai Properties Ltd. | | | 18,536,793 | | | | 3.3 | | |
| Prologis | | | 16,344,408 | | | | 2.9 | | |
| Equity Residential | | | 15,949,630 | | | | 2.8 | | |
| Hang Lung Properties Ltd. | | | 13,932,177 | | | | 2.5 | | |
| Public Storage | | | 13,001,232 | | | | 2.3 | | |
| Brookfield Office Properties (USD) | | | 12,827,914 | | | | 2.3 | | |
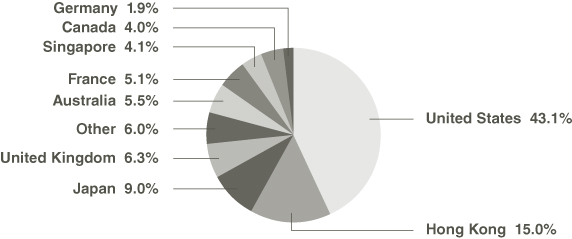
Country Breakdown
(Based on Net Assets)
(Unaudited)
8
COHEN & STEERS INSTITUTIONAL GLOBAL REALTY SHARES, INC.
SCHEDULE OF INVESTMENTS
June 30, 2012 (Unaudited)
| | | | | Number
of Shares | | Value | |
| COMMON STOCK | | 99.5% | | | | | | | | | |
| AUSTRALIA | | 5.5% | | | | | | | | | |
| REAL ESTATE | | | | | | | | | | | |
| DIVERSIFIED | | 4.0% | | | | | | | | | |
| BGP Holdings PLC (EUR)a,b,c | | | | | 7,741,744 | | | $ | 0 | | |
| Dexus Property Groupb | | | | | 5,884,303 | | | | 5,630,710 | | |
| GPT Groupb | | | | | 2,174,627 | | | | 7,355,799 | | |
| Mirvac Groupb | | | | | 1,877,079 | | | | 2,466,444 | | |
| Stocklandb | | | | | 2,120,758 | | | | 6,731,073 | | |
| | | | | | | | 22,184,026 | | |
| RETAIL | | 1.5% | | | | | | | | | |
| Westfield Groupb | | | | | 879,147 | | | | 8,608,059 | | |
| TOTAL AUSTRALIA | | | | | | | 30,792,085 | | |
| BERMUDA | | 0.7% | | | | | | | | | |
| REAL ESTATE—HOTEL | |
| Orient-Express Hotels Ltd., Class A (USD)c | | | | | 479,780 | | | | 4,015,759 | | |
| BRAZIL | | 0.3% | | | | | | | | | |
| REAL ESTATE—RESIDENTIAL | |
| MRV Engenharia e Participacoes SA | | | | | 277,414 | | | | 1,284,516 | | |
| PDG Realty SA Empreendimentos e Participacoes | | | | | 300,112 | | | | 524,468 | | |
| | | | | | | | 1,808,984 | | |
| CANADA | | 4.0% | | | | | | | | | |
| REAL ESTATE | | | | | | | | | | | |
| OFFICE | | 2.3% | | | | | | | | | |
| Brookfield Office Properties (USD) | | | | | 736,390 | | | | 12,827,914 | | |
| RESIDENTIAL | | 0.2% | | | | | | | | | |
| Boardwalk REIT | | | | | 18,908 | | | | 1,088,496 | | |
| RETAIL | | 1.5% | | | | | | | | | |
| Primaris Retail REIT | | | | | 181,543 | | | | 4,201,113 | | |
| RioCan REIT | | | | | 162,869 | | | | 4,431,265 | | |
| | | | | | | | 8,632,378 | | |
| TOTAL CANADA | | | | | | | 22,548,788 | | |
See accompanying notes to financial statements.
9
COHEN & STEERS INSTITUTIONAL GLOBAL REALTY SHARES, INC.
SCHEDULE OF INVESTMENTS—(Continued)
June 30, 2012 (Unaudited)
| | | | | Number
of Shares | | Value | |
| CHINA | | 0.2% | | | | | | | | | |
| REAL ESTATE—DIVERSIFIED | |
| Guangzhou R&F Properties Co., Ltd. Class H (HKD)b | | | | | 1,006,600 | | | $ | 1,348,289 | | |
| FRANCE | | 5.1% | | | | | | | | | |
| REAL ESTATE | | | | | | | | | | | |
| DIVERSIFIED | | 0.3% | | | | | | | | | |
| Gecina SAb | | | | | 3,321 | | | | 296,057 | | |
| ICADEb | | | | | 22,093 | | | | 1,670,902 | | |
| | | | | | | | 1,966,959 | | |
| RETAIL | | 4.8% | | | | | | | | | |
| Klepierreb | | | | | 235,250 | | | | 7,731,212 | | |
| Unibail-Rodamcob | | | | | 103,681 | | | | 19,099,083 | | |
| | | | | | | | 26,830,295 | | |
| TOTAL FRANCE | | | | | | | 28,797,254 | | |
| GERMANY | | 1.9% | | | | | | | | | |
| REAL ESTATE—RESIDENTIAL | |
| Deutsche Wohnen AGb | | | | | 627,950 | | | | 10,559,111 | | |
| HONG KONG | | 15.0% | | | | | | | | | |
| REAL ESTATE | | | | | | | | | | | |
| DIVERSIFIED | | 10.7% | | | | | | | | | |
| Agile Property Holdings Ltd.b | | | | | 3,519,000 | | | | 4,604,162 | | |
| China Resources Land Ltd.b | | | | | 993 | | | | 2,058 | | |
| Hang Lung Properties Ltd.b | | | | | 4,073,000 | | | | 13,932,177 | | |
| Hysan Development Co., Ltd.b | | | | | 911,000 | | | | 3,472,554 | | |
| Kerry Properties Ltd.b | | | | | 189,998 | | | | 812,646 | | |
| Sino Land Co., Ltd.b | | | | | 5,901,400 | | | | 8,945,659 | | |
| Sun Hung Kai Properties Ltd.b | | | | | 1,560,019 | | | | 18,536,793 | | |
| Wharf Holdings Ltd.b | | | | | 1,829,629 | | | | 10,186,441 | | |
| | | | | | | | 60,492,490 | | |
See accompanying notes to financial statements.
10
COHEN & STEERS INSTITUTIONAL GLOBAL REALTY SHARES, INC.
SCHEDULE OF INVESTMENTS—(Continued)
June 30, 2012 (Unaudited)
| | | | | Number
of Shares | | Value | |
| HOTEL | | 0.4% | | | | | | | | | |
| Shangri-La Asia Ltd.b | | | | | 1,305,992 | | | $ | 2,495,000 | | |
| OFFICE | | 1.9% | | | | | | | | | |
| Hongkong Land Holdings Ltd. (USD)b | | | | | 1,820,600 | | | | 10,502,606 | | |
| RESIDENTIAL | | 1.9% | | | | | | | | | |
| China Overseas Land & Investment Ltd.b | | | | | 1,767,341 | | | | 4,162,123 | | |
| Country Garden Holdings Co.b,c | | | | | 15,712,436 | | | | 6,259,761 | | |
| | | | | | | | 10,421,884 | | |
| RETAIL | | 0.1% | | | | | | | | | |
| Link REITb | | | | | 100,500 | | | | 411,285 | | |
| TOTAL HONG KONG | | | | | | | 84,323,265 | | |
| INDIA | | 0.3% | | | | | | | | | |
| REAL ESTATE—RETAIL | | | | | | | | | | | |
| Phoenix Mills Ltd.b | | | | | 478,735 | | | | 1,526,146 | | |
| INDONESIA | | 0.2% | | | | | | | | | |
| REAL ESTATE—RETAIL | | | | | | | | | | | |
| Ciputra Development Tbk PTb | | | | | 18,198,000 | | | | 1,271,413 | | |
| JAPAN | | 9.0% | | | | | | | | | |
| REAL ESTATE | | | | | | | | | | | |
| DIVERSIFIED | | 7.7% | | | | | | | | | |
| Mitsubishi Estate Co., Ltd.b | | | | | 1,098,000 | | | | 19,698,989 | | |
| Mitsui Fudosan Co., Ltd.b | | | | | 593,334 | | | | 11,512,361 | | |
| Nomura Real Estate Holdingsb | | | | | 253,500 | | | | 4,642,178 | | |
| Sumitomo Realty & Development Co., Ltd.b | | | | | 303,000 | | | | 7,452,700 | | |
| | | | | | | | 43,306,228 | | |
| OFFICE | | 0.8% | | | | | | | | | |
| Nippon Building Fundb | | | | | 457 | | | | 4,418,582 | | |
| RESIDENTIAL | | 0.5% | | | | | | | | | |
| Advance Residence Investmentb | | | | | 1,380 | | | | 2,682,696 | | |
| TOTAL JAPAN | | | | | | | 50,407,506 | | |
See accompanying notes to financial statements.
11
COHEN & STEERS INSTITUTIONAL GLOBAL REALTY SHARES, INC.
SCHEDULE OF INVESTMENTS—(Continued)
June 30, 2012 (Unaudited)
| | | | | Number
of Shares | | Value | |
| NETHERLANDS | | 1.4% | | | | | | | | | |
| REAL ESTATE—RETAIL | | | | | | | | | | | |
| Corio NVb | | | | | 67,419 | | | $ | 2,968,281 | | |
| Eurocommercial Properties NVb | | | | | 147,504 | | | | 5,103,195 | | |
| | | | | | | | 8,071,476 | | |
| NORWAY | | 0.5% | | | | | | | | | |
| REAL ESTATE—OFFICE | | | | | | | | | | | |
| Norwegian Property ASAb | | | | | 1,948,228 | | | | 2,669,932 | | |
| PHILIPPINES | | 0.8% | | | | | | | | | |
| REAL ESTATE—RETAIL | | | | | | | | | | | |
| SM Prime Holdingsb | | | | | 13,944,891 | | | | 4,322,376 | | |
| SINGAPORE | | 4.1% | | | | | | | | | |
| REAL ESTATE | | | | | | | | | | | |
| DIVERSIFIED | | 0.2% | | | | | | | | | |
| Capitaland Ltd.b | | | | | 468,000 | | | | 1,009,079 | | |
| HOTEL | | 0.7% | | | | | | | | | |
| City Developments Ltd.b | | | | | 451,000 | | | | 4,020,173 | | |
| INDUSTRIAL | | 1.4% | | | | | | | | | |
| Global Logistic Properties Ltd.b,c | | | | | 4,570,000 | | | | 7,607,954 | | |
| OFFICE | | 0.3% | | | | | | | | | |
| CapitaCommercial Trustb | | | | | 1,905,000 | | | | 1,916,005 | | |
| RETAIL | | 1.5% | | | | | | | | | |
| CapitaMall Trustb | | | | | 3,000,000 | | | | 4,544,067 | | |
| CapitaMalls Asia Ltd.b | | | | | 3,316,999 | | | | 4,137,444 | | |
| | | | | | | | 8,681,511 | | |
| TOTAL SINGAPORE | | | | | | | 23,234,722 | | |
| SWEDEN | | 1.1% | | | | | | | | | |
| REAL ESTATE—OFFICE | | | | | | | | | | | |
| Fabege ABb | | | | | 804,752 | | | | 6,313,612 | | |
See accompanying notes to financial statements.
12
COHEN & STEERS INSTITUTIONAL GLOBAL REALTY SHARES, INC.
SCHEDULE OF INVESTMENTS—(Continued)
June 30, 2012 (Unaudited)
| | | | | Number
of Shares | | Value | |
| UNITED KINGDOM | | 6.3% | | | | | | | | | |
| REAL ESTATE | | | | | | | | | | | |
| DIVERSIFIED | | 5.0% | | | | | | | | | |
| British Land Co., PLCb | | | | | 1,417,318 | | | $ | 11,349,170 | | |
| Hammerson PLCb | | | | | 639,186 | | | | 4,439,254 | | |
| Land Securities Group PLCb | | | | | 1,083,028 | | | | 12,547,912 | | |
| | | | | | | | 28,336,336 | | |
| INDUSTRIAL | | 0.2% | | | | | | | | | |
| Segro PLCb | | | | | 396,757 | | | | 1,351,748 | | |
| OFFICE | | 1.1% | | | | | | | | | |
| Derwent London PLCb | | | | | 208,142 | | | | 6,051,448 | | |
| TOTAL UNITED KINGDOM | | | | | | | 35,739,532 | | |
| UNITED STATES | | 43.1% | | | | | | | | | |
| COMMUNICATIONS—TOWERS | | 0.5% | | | | | | | | | |
| American Tower Corp. | | | | | 40,473 | | | | 2,829,468 | | |
| REAL ESTATE | | 42.6% | | | | | | | | | |
| DIVERSIFIED | | 4.3% | | | | | | | | | |
| American Assets Trust | | | | | 119,923 | | | | 2,908,133 | | |
| Vornado Realty Trust | | | | | 252,784 | | | | 21,228,800 | | |
| | | | | | | | 24,136,933 | | |
| HEALTH CARE | | 3.1% | | | | | | | | | |
| HCP | | | | | 142,275 | | | | 6,281,441 | | |
| Ventas | | | | | 174,965 | | | | 11,043,791 | | |
| | | | | | | | 17,325,232 | | |
| HOTEL | | 2.7% | | | | | | | | | |
| Hersha Hospitality Trust | | | | | 624,344 | | | | 3,296,536 | | |
| Host Hotels & Resorts | | | | | 180,995 | | | | 2,863,341 | | |
| Hyatt Hotels Corp., Class Ac | | | | | 167,568 | | | | 6,226,827 | | |
| Strategic Hotels & Resorts Worldwidec | | | | | 440,229 | | | | 2,843,879 | | |
| | | | | | | | 15,230,583 | | |
See accompanying notes to financial statements.
13
COHEN & STEERS INSTITUTIONAL GLOBAL REALTY SHARES, INC.
SCHEDULE OF INVESTMENTS—(Continued)
June 30, 2012 (Unaudited)
| | | | | Number
of Shares | | Value | |
| INDUSTRIAL | | 3.6% | | | | | | | | | |
| First Industrial Realty Trustc | | | | | 322,391 | | | $ | 4,068,575 | | |
| Prologis | | | | | 491,857 | | | | 16,344,408 | | |
| | | | | | | | 20,412,983 | | |
| OFFICE | | 5.3% | | | | | | | | | |
| Alexandria Real Estate Equities | | | | | 59,687 | | | | 4,340,439 | | |
| Boston Properties | | | | | 63,198 | | | | 6,848,767 | | |
| Corporate Office Properties Trust | | | | | 185,687 | | | | 4,365,501 | | |
| Kilroy Realty Corp. | | | | | 115,345 | | | | 5,583,852 | | |
| Liberty Property Trust | | | | | 109,009 | | | | 4,015,892 | | |
| SL Green Realty Corp. | | | | | 54,489 | | | | 4,372,197 | | |
| | | | | | | | 29,526,648 | | |
| RESIDENTIAL | | 7.6% | | | | | | | | | |
| APARTMENT | | 6.9% | | | | | | | | | |
| Apartment Investment & Management Co. | | | | | 309,289 | | | | 8,360,082 | | |
| AvalonBay Communities | | | | | 41,880 | | | | 5,925,182 | | |
| Colonial Properties Trust | | | | | 186,695 | | | | 4,133,427 | | |
| Education Realty Trust | | | | | 386,709 | | | | 4,284,736 | | |
| Equity Residential | | | | | 255,767 | | | | 15,949,630 | | |
| | | | | | | | 38,653,057 | | |
| MANUFACTURED HOME | | 0.7% | | | | | | | | | |
| Equity Lifestyle Properties | | | | | 61,391 | | | | 4,234,137 | | |
| TOTAL RESIDENTIAL | | | | | | | 42,887,194 | | |
| SELF STORAGE | | 2.9% | | | | | | | | | |
| CubeSmart | | | | | 278,301 | | | | 3,247,773 | | |
| Public Storage | | | | | 90,030 | | | | 13,001,232 | | |
| | | | | | | | 16,249,005 | | |
| SHOPPING CENTER | | 11.2% | | | | | | | | | |
| COMMUNITY CENTER | | 2.1% | | | | | | | | | |
| Regency Centers Corp. | | | | | 157,109 | | | | 7,473,675 | | |
| Weingarten Realty Investors | | | | | 173,156 | | | | 4,560,929 | | |
| | | | | | | | 12,034,604 | | |
See accompanying notes to financial statements.
14
COHEN & STEERS INSTITUTIONAL GLOBAL REALTY SHARES, INC.
SCHEDULE OF INVESTMENTS—(Continued)
June 30, 2012 (Unaudited)
| | | | | Number
of Shares | | Value | |
| REGIONAL MALL | | | 9.1% | | | | | | | | | | |
| CBL & Associates Properties | | | | | 154,158 | | | $ | 3,012,247 | | |
| General Growth Properties | | | | | 705,164 | | | | 12,756,417 | | |
| Simon Property Group | | | | | 207,489 | | | | 32,297,738 | | |
| Taubman Centers | | | | | 36,566 | | | | 2,821,433 | | |
| | | | | | | | 50,887,835 | | |
| TOTAL SHOPPING CENTER | | | | | | | 62,922,439 | | |
| SPECIALTY | | | 1.9% | | | | | | | | | | |
| Digital Realty Trust | | | | | 86,502 | | | | 6,493,705 | | |
| DuPont Fabros Technology | | | | | 151,545 | | | | 4,328,125 | | |
| | | | | | | | 10,821,830 | | |
| TOTAL REAL ESTATE | | | | | | | 239,512,847 | | |
| TOTAL UNITED STATES | | | | | | | 242,342,315 | | |
TOTAL COMMON STOCK
(Identified cost—$472,119,389) | | | | | | | 560,092,565 | | |
| SHORT-TERM INVESTMENTS | | | 0.9% | | | | | | | | | | |
| MONEY MARKET FUNDS | | | | | | | | | | | | | |
| BlackRock Liquidity Funds: FedFund, 0.01%d | | | | | 2,400,019 | | | | 2,400,019 | | |
| Federated Government Obligations Fund, 0.01%d | | | | | 2,400,018 | | | | 2,400,018 | | |
TOTAL SHORT-TERM INVESTMENTS
(Identified cost—$4,800,037) | | | | | | | 4,800,037 | | |
TOTAL INVESTMENTS
(Identified cost—$476,919,426) | | | 100.4 | % | | | | | | | 564,892,602 | | |
| LIABILITIES IN EXCESS OF OTHER ASSETS | | | (0.4 | )% | | | | | | | (2,245,815 | ) | |
NET ASSETS (Equivalent to $20.63 per share
based on 27,277,579 shares of common
stock outstanding) | | | 100.0 | % | | | | | | $ | 562,646,787 | | |
See accompanying notes to financial statements.
15
COHEN & STEERS INSTITUTIONAL GLOBAL REALTY SHARES, INC.
SCHEDULE OF INVESTMENTS—(Continued)
June 30, 2012 (Unaudited)
Glossary of Portfolio Abbreviations
EUR Euro Currency
HKD Hong Kong Dollar
REIT Real Estate Investment Trust
USD United States Dollar
| Sector Summary | | % of
Net Assets | |
| Diversified | | | 32.4 | | |
| Office | | | 13.3 | | |
| Residential | | | 12.4 | | |
| Retail | | | 12.1 | | |
| Shopping Center | | | 11.2 | | |
| Industrial | | | 5.2 | | |
| Hotel | | | 4.5 | | |
| Health Care | | | 3.1 | | |
| Self Storage | | | 2.9 | | |
| Specialty | | | 1.9 | | |
| Towers | | | 0.5 | | |
| Other | | | 0.5 | | |
| | | | 100.0 | | |
Note: Percentages indicated are based on the net assets of the Fund.
a Illiquid security. Aggregate holdings equal 0.0% of the net assets of the Fund.
b Fair valued security. This security has been valued at its fair value as determined in good faith under procedures established by and under the general supervision of the Fund's Board of Directors. Aggregate fair value securities represent 51.4% of the net assets of the Fund, all of which have been fair valued pursuant to foreign fair value pricing procedures approved by the Board of Directors.
c Non-income producing security.
d Rate quoted represents the seven-day yield of the fund.
See accompanying notes to financial statements.
16
COHEN & STEERS INSTITUTIONAL GLOBAL REALTY SHARES, INC.
STATEMENT OF ASSETS AND LIABILITIES
June 30, 2012 (Unaudited)
| ASSETS: | |
| Investments in securities, at value (Identified cost—$476,919,426) | | $ | 564,892,602 | | |
| Cash | | | 74,130 | | |
| Foreign currency, at value (Identified cost—$349,115) | | | 348,042 | | |
| Receivable for: | |
| Investment securities sold | | | 10,949,580 | | |
| Fund shares sold | | | 2,462,312 | | |
| Dividends | | | 1,165,015 | | |
| Other assets | | | 2,851 | | |
| Total Assets | | | 579,894,532 | | |
| LIABILITIES: | |
| Payable for: | |
| Fund shares redeemed | | | 8,531,537 | | |
| Investment securities purchased | | | 7,513,274 | | |
| Dividends declared | | | 740,232 | | |
| Investment management fees | | | 432,630 | | |
| Directors' fees | | | 761 | | |
| Other liabilities | | | 29,311 | | |
| Total Liabilities | | | 17,247,745 | | |
NET ASSETS applicable to 27,277,579 shares of $0.001 par value of common
stock outstanding | | $ | 562,646,787 | | |
| NET ASSET VALUE PER SHARE: | |
| ($562,646,787 ÷ 27,277,579 shares outstanding) | | $ | 20.63 | | |
| NET ASSETS consist of: | |
| Paid-in capital | | $ | 636,287,491 | | |
| Dividends in excess of net investment income | | | (8,748,333 | ) | |
| Accumulated net realized loss | | | (152,887,994 | ) | |
| Net unrealized appreciation | | | 87,995,623 | | |
| | | $ | 562,646,787 | | |
See accompanying notes to financial statements.
17
COHEN & STEERS INSTITUTIONAL GLOBAL REALTY SHARES, INC.
STATEMENT OF OPERATIONS
For the Six Months Ended June 30, 2012 (Unaudited)
| Investment Income: | |
| Dividend income (net of $373,318 of foreign withholding tax) | | $ | 8,616,408 | | |
| Expenses: | |
| Investment management fees | | | 2,758,890 | | |
| Registration and filing fees | | | 37,310 | | |
| Directors' fees and expenses | | | 20,102 | | |
| Line of credit fees | | | 9,181 | | |
| Miscellaneous | | | 5,640 | | |
| Total Expenses | | | 2,831,123 | | |
| Reduction of Expenses (See Note 2) | | | (72,233 | ) | |
| Net Expenses | | | 2,758,890 | | |
| Net Investment Income | | | 5,857,518 | | |
| Net Realized and Unrealized Gain (Loss): | |
| Net realized gain (loss) on: | |
| Investments | | | 16,262,304 | | |
| Foreign currency transactions | | | (151,177 | ) | |
| Net realized gain | | | 16,111,127 | | |
| Net change in unrealized appreciation on: | |
| Investments | | | 42,283,232 | | |
| Foreign currency translations | | | 17,134 | | |
| Net change in unrealized appreciation | | | 42,300,366 | | |
| Net realized and unrealized gain | | | 58,411,493 | | |
| Net Increase in Net Assets Resulting from Operations | | $ | 64,269,011 | | |
See accompanying notes to financial statements.
18
COHEN & STEERS INSTITUTIONAL GLOBAL REALTY SHARES, INC.
STATEMENT OF CHANGES IN NET ASSETS (Unaudited)
| | | For the
Six Months Ended
June 30, 2012 | | For the
Year Ended
December 31, 2011 | |
| Change in Net Assets: | |
| From Operations: | |
| Net investment income | | $ | 5,857,518 | | | $ | 9,534,656 | | |
| Net realized gain (loss) | | | 16,111,127 | | | | (8,971,224 | ) | |
| Net change in unrealized appreciation | | | 42,300,366 | | | | (54,273,349 | ) | |
Net increase (decrease) in net assets
resulting from operations | | | 64,269,011 | | | | (53,709,917 | ) | |
| Dividends and Distributions to Shareholders from: | | | | | | | | | |
| Net investment income | | | (6,821,367 | ) | | | (7,205,657 | ) | |
| Tax return of capital | | | — | | | | (1,956,287 | ) | |
Total dividends and distributions
to shareholders | | | (6,821,367 | ) | | | (9,161,944 | ) | |
| Capital Stock Transactions: | |
Increase in net assets from Fund share
transactions | | | 1,680,753 | | | | 40,626,776 | | |
| Total increase (decrease) in net assets | | | 59,128,397 | | | | (22,245,085 | ) | |
| Net Assets: | |
| Beginning of period | | | 503,518,390 | | | | 525,763,475 | | |
| End of perioda | | $ | 562,646,787 | | | $ | 503,518,390 | | |
a Includes dividends in excess of net investment income of $8,748,333 and $7,784,484, respectively.
See accompanying notes to financial statements.
19
COHEN & STEERS INSTITUTIONAL GLOBAL REALTY SHARES, INC.
FINANCIAL HIGHLIGHTS (Unaudited)—(Continued)
The following table includes selected data for a share outstanding throughout each period and other performance information derived from the financial statements. It should be read in conjunction with the financial statements and notes thereto.
| | | For the Six
Months Ended | | For the Year Ended December 31, | |
| Per Share Operating Performance: | | June 30, 2012 | | 2011 | | 2010 | | 2009 | | 2008 | | 2007 | |
Net asset value, beginning of
period | | $ | 18.52 | | | $ | 20.72 | | | $ | 18.51 | | | $ | 14.23 | | | $ | 25.10 | | | $ | 29.57 | | |
Income from investment
operations: | |
| Net investment income | | | 0.22 | | | | 0.56 | | | | 0.84 | a | | | 0.76 | | | | 0.55 | | | | 0.49 | b | |
Net realized and unrealized
gain (loss) | | | 2.14 | | | | (2.43 | ) | | | 2.33 | | | | 4.65 | | | | (11.02 | ) | | | (4.12 | ) | |
Total income (loss) from
investment operations | | | 2.36 | | | | (1.87 | ) | | | 3.17 | | | | 5.41 | | | | (10.47 | ) | | | (3.63 | ) | |
Less dividends and distributions
to shareholders from: | |
| Net investment income | | | (0.25 | ) | | | (0.26 | ) | | | (0.96 | ) | | | (1.13 | ) | | | (0.35 | ) | | | (0.73 | ) | |
| Net realized gain | | | — | | | | — | | | | — | | | | — | | | | — | | | | (0.01 | ) | |
| Tax return of capital | | | — | | | | (0.07 | ) | | | — | | | | — | | | | (0.05 | ) | | | (0.10 | ) | |
Total dividends and
distributions to
shareholders | | | (0.25 | ) | | | (0.33 | ) | | | (0.96 | ) | | | (1.13 | ) | | | (0.40 | ) | | | (0.84 | ) | |
Net increase (decrease) in net
asset value | | | 2.11 | | | | (2.20 | ) | | | 2.21 | | | | 4.28 | | | | (10.87 | ) | | | (4.47 | ) | |
| Net asset value, end of period | | $ | 20.63 | | | $ | 18.52 | | | $ | 20.72 | | | $ | 18.51 | | | $ | 14.23 | | | $ | 25.10 | | |
| Total investment returnc | | | 12.74 | %d | | | –9.15 | % | | | 17.56 | % | | | 38.68 | % | | | –42.05 | % | | | –12.35 | % | |
See accompanying notes to financial statements.
20
COHEN & STEERS INSTITUTIONAL GLOBAL REALTY SHARES, INC.
FINANCIAL HIGHLIGHTS (Unaudited)—(Continued)
| | | For the Six
Months Ended | | For the Year Ended December 31, | |
| Ratios/Supplemental Data: | | June 30, 2012 | | 2011 | | 2010 | | 2009 | | 2008 | | 2007 | |
Net assets, end of period
(in millions) | | $ | 562.6 | | | $ | 503.5 | | | $ | 525.8 | | | $ | 350.7 | | | $ | 233.6 | | | $ | 280.2 | | |
Ratio of expenses to average daily
net assets (before expense
reduction) | | | 1.03 | %e | | | 1.03 | % | | | 1.03 | % | | | 1.04 | % | | | 1.04 | % | | | 1.06 | % | |
Ratio of expenses to average daily
net assets (net of expense
reduction) | | | 1.00 | %e | | | 1.00 | % | | | 1.00 | % | | | 1.00 | % | | | 1.00 | % | | | 1.00 | % | |
Ratio of net investment income
to average daily net assets
(before expense reduction) | | | 2.10 | %e | | | 1.68 | % | | | 2.07 | % | | | 2.38 | % | | | 2.36 | % | | | 1.62 | % | |
Ratio of net investment income
to average daily net assets
(net of expense reduction) | | | 2.12 | %e | | | 1.71 | % | | | 2.10 | % | | | 2.43 | % | | | 2.40 | % | | | 1.68 | % | |
| Portfolio turnover rate | | | 51 | %d | | | 101 | % | | | 111 | % | | | 186 | % | | | 126 | % | | | 67 | % | |
a 20.6% of gross income was attributable to dividends paid by Unibail-Rodamco.
b 6.2% of net investment income was attributable to a special dividend paid by Boston Properties.
c Return assumes the reinvestment of all dividends and distributions at NAV.
d Not annualized.
e Annualized.
See accompanying notes to financial statements.
21
COHEN & STEERS INSTITUTIONAL GLOBAL REALTY SHARES, INC.
NOTES TO FINANCIAL STATEMENTS (Unaudited)
Note 1. Significant Accounting Policies
Cohen & Steers Institutional Global Realty Shares, Inc. (the Fund) was incorporated under the laws of the State of Maryland on May 11, 2006 and is registered under the Investment Company Act of 1940, as amended, as a diversified, open-end management investment company. The Fund's investment objective is total return.
The following is a summary of significant accounting policies consistently followed by the Fund in the preparation of its financial statements. The policies are in conformity with accounting principles generally accepted in the United States of America (GAAP). The preparation of the financial statements in accordance with GAAP requires management to make estimates and assumptions that affect the reported amounts of assets and liabilities at the date of the financial statements and the reported amounts of income and expenses during the reporting period. Actual results could differ from those estimates.
Portfolio Valuation: Investments in securities that are listed on the New York Stock Exchange are valued, except as indicated below, at the last sale price reflected at the close of the New York Stock Exchange on the business day as of which such value is being determined. If there has been no sale on such day, the securities are valued at the mean of the closing bid and asked prices on such day or, if no asked price is available, at the bid price.
Securities not listed on the New York Stock Exchange but listed on other domestic or foreign securities exchanges are valued in a similar manner. Securities traded on more than one securities exchange are valued at the last sale price reflected at the close of the exchange representing the principal market for such securities on the business day as of which such value is being determined. If after the close of a foreign market, but prior to the close of business on the day the securities are being valued, market conditions change significantly, certain foreign securities may be fair valued pursuant to procedures established by the Board of Directors.
Readily marketable securities traded in the over-the-counter market, including listed securities whose primary market is believed by Cohen & Steers Capital Management, Inc. (the advisor) to be over-the-counter, are valued at the last sale price on the valuation date as reported by sources deemed appropriate by the Board of Directors to reflect their fair market value. If there has been no sale on such day, the securities are valued at the mean of the closing bid and asked prices on such day or, if no asked price is available, at the bid price.
Short-term debt securities with a maturity date of 60 days or less are valued at amortized cost, which approximates value. Investments in open-end mutual funds are valued at their closing net asset value.
The policies and procedures approved by the Fund's Board of Directors delegate authority to make fair value determinations to the advisor, subject to the oversight of the Board of Directors. The advisor has established a valuation committee (Valuation Committee) to administer, implement and oversee the fair valuation process according to the policies and procedures approved annually by the Board of Directors. Among other things, these procedures allow the Fund to utilize independent pricing services, quotations from securities and financial instrument dealers and other market sources to determine fair value.
22
COHEN & STEERS INSTITUTIONAL GLOBAL REALTY SHARES, INC.
NOTES TO FINANCIAL STATEMENTS (Unaudited)—(Continued)
Securities for which market prices are unavailable will be valued at fair value, as determined in good faith by the Valuation Committee, pursuant to procedures approved by the Fund's Board of Directors. Circumstances in which market prices may be unavailable include, but are not limited to, when trading in a security is suspended, the exchange on which the security is traded is subject to an unscheduled close or disruption or material events occur after the close of the exchange on which the security is principally traded. In these circumstances, the Fund determines fair value in a manner that fairly reflects the market value of the security on the valuation date based on consideration of any information or factors it deems appropriate. These may include, but are not limited to, recent transactions in comparable securities, information relating to the specific security and developments in the markets.
The Fund's use of fair value pricing may cause the net asset value of Fund shares to differ from the net asset value that would be calculated using market quotations. Fair value pricing involves subjective judgments and it is possible that the fair value determined for a security may be materially different than the value that could be realized upon the sale of that security.
Fair value is defined as the price that the Fund would expect to receive upon the sale of an investment or expect to pay to transfer a liability in an orderly transaction with an independent buyer in the principal market or, in the absence of a principal market, the most advantageous market for the investment or liability. The hierarchy of inputs that are used in determining the fair value of the Fund's investments is summarized below.
• Level 1—quoted prices in active markets for identical investments
• Level 2—other significant observable inputs (including quoted prices for similar investments, interest rates, credit risk, etc.)
• Level 3—significant unobservable inputs (including the Fund's own assumptions in determining the fair value of investments)
The inputs or methodology used for valuing securities are not necessarily an indication of the risk associated with investing in those securities.
For movements between the levels within the fair value hierarchy, the Fund has adopted a policy of recognizing the transfer at the end of the period in which the underlying event causing the movement occurred. Changes in valuation techniques may result in transfers into or out of an assigned level within the disclosure hierarchy. During the six months ended June 30, 2012, transfers between Level 1 and Level 2 securities totaled $236,013,680, which were the result of foreign fair value procedures utilized by the Fund.
23
COHEN & STEERS INSTITUTIONAL GLOBAL REALTY SHARES, INC.
NOTES TO FINANCIAL STATEMENTS (Unaudited)—(Continued)
The following is a summary of the inputs used as of June 30, 2012 in valuing the Fund's investments carried at value:
| | | Total | | Quoted Prices
In Active
Markets for
Identical
Investments
(Level 1) | | Other
Significant
Observable
Inputs
(Level 2) | | Significant
Unobservable
Inputs
(Level 3) | |
| Common Stock—Bermuda | | $ | 4,015,759 | | | $ | 4,015,759 | | | $ | — | | | $ | — | | |
| Common Stock—Brazil | | | 1,808,984 | | | | 1,808,984 | | | | — | | | | — | | |
| Common Stock—Canada | | | 22,548,788 | | | | 22,548,788 | | | | — | | | | — | | |
| Common Stock—United States | | | 242,342,315 | | | | 242,342,315 | | | | — | | | | — | | |
Common Stock—
Other Countries | | | 289,376,719 | | | | — | | | | 289,376,719 | | | | — | a | |
| Money Market Funds | | | 4,800,037 | | | | — | | | | 4,800,037 | | | | — | | |
| Total Investmentsb | | $ | 564,892,602 | | | $ | 270,715,846 | | | $ | 294,176,756 | | | $ | — | | |
a BGP Holdings PLC was acquired via a spinoff and has been fair valued, by the Valuation Committee, at zero pursuant to the Fund's fair value procedures and classified as a Level 3 security. Its likelihood of having value in the future is remote.
b Portfolio holdings are disclosed individually on the Schedule of Investments.
Security Transactions and Investment Income: Security transactions are recorded on trade date. Realized gains and losses on investments sold are recorded on the basis of identified cost. Interest income is recorded on the accrual basis. Discounts are accreted and premiums are amortized over the life of the respective securities. Dividend income is recorded on the ex-dividend date, except for certain dividends on foreign securities, which are recorded as soon as the Fund is informed after the ex-dividend date. Distributions from Real Estate Investment Trusts ("REITs") are recorded as ordinary income, net realized capital gain or return of capital based on information reported by the REITs and management's estimates of such amounts based on historical information. These estimates are adjusted when the actual source of distributions is disclosed by the REITs and may differ from the estimated amounts.
Foreign Currency Translation: The books and records of the Fund are maintained in U.S. dollars as follows: (1) the foreign currency market value of investment securities, other assets and liabilities and foreign currency contracts are translated at the exchange rates prevailing on the date of valuation; and (2) purchases, sales, income and expenses are translated at the exchange rates prevailing on the respective dates of such transactions. The resultant exchange gains and losses are recorded as realized and unrealized gain/loss on foreign exchange transactions. Pursuant to U.S. federal income tax regulations, certain foreign exchange gains/losses included in realized and unrealized gain/loss are included in or are a reduction of ordinary income for federal income tax purposes. The Fund does not isolate that portion of the results of operations arising as a result of changes in foreign exchange rates on investments from the changes in market prices of securities.
24
COHEN & STEERS INSTITUTIONAL GLOBAL REALTY SHARES, INC.
NOTES TO FINANCIAL STATEMENTS (Unaudited)—(Continued)
Foreign Securities: The Fund may directly purchase securities of foreign issuers. Investing in securities of foreign issuers involves special risks not typically associated with investing in securities of U.S. issuers. The risks include possible revaluation of currencies, the ability to repatriate funds, less complete financial information about companies and possible future adverse political and economic developments. Moreover, securities of many foreign issuers and their markets may be less liquid and their prices more volatile than those of securities of comparable U.S. issuers.
Dividends and Distributions to Shareholders: Dividends from net investment income and capital gain distributions are determined in accordance with U.S. federal income tax regulations, which may differ from GAAP. Dividends from net investment income, if any, are declared and paid semi-annually. Net realized capital gains, unless offset by any available capital loss carryforward, are typically distributed to shareholders at least annually. Dividends and distributions to shareholders are recorded on the ex-dividend date and are automatically reinvested in full and fractional shares of the Fund based on the net asset value per share at the close of business on the payable date, unless the shareholder has elected to have them paid in cash. Distributions paid by the Fund are subject to recharacterization for tax purposes.
Income Taxes: It is the policy of the Fund to continue to qualify as a regulated investment company, if such qualification is in the best interest of the shareholders, by complying with the requirements of Subchapter M of the Internal Revenue Code applicable to regulated investment companies, and by distributing substantially all of its taxable earnings to its shareholders. Accordingly, no provision for federal income or excise tax is necessary. Dividend and interest income from holdings in non-U.S. securities is recorded net of non-U.S. taxes paid. Security and foreign currency transactions and any gains realized by the Fund on the sale of securities in certain non-U.S. markets are subject to non-U.S. taxes. The Fund records a liability based on any unrealized gains on securities held in these markets in order to estimate the potential non-U.S. taxes due upon the sale of these securities. Management has analyzed the Fund's tax positions taken on federal income tax returns as well as its tax positions in non-U.S. jurisdictions in which it trades for all open tax years and has concluded that as of June 30, 2012, no additional provisions for income tax are required in the Fund's financial statements. The Fund's tax positions for the tax years for which the applicable statutes of limitations have not expired are subject to examination by the Internal Revenue Service, state departments of revenue and by foreign tax authorities.
Note 2. Investment Management Agreement and Other Transactions with Affiliates
Investment Management Fees: The advisor serves as the Fund's investment advisor pursuant to an investment management agreement (the investment management agreement). Under the terms of the investment management agreement, the advisor provides the Fund with day-to-day investment decisions and generally manages the Fund's investments in accordance with the stated policies of the Fund, subject to the supervision of the Board of Directors.
For the services provided to the Fund, the advisor receives a fee, accrued daily and paid monthly, at the annual rate of 1.00% of the average daily net assets of the Fund.
25
COHEN & STEERS INSTITUTIONAL GLOBAL REALTY SHARES, INC.
NOTES TO FINANCIAL STATEMENTS (Unaudited)—(Continued)
The advisor is also responsible, under the investment management agreement, for the performance of certain administrative functions for the Fund.
The advisor has contractually agreed to waive its fees and/or reimburse the Fund so that the Fund's total annual operating expenses (excluding brokerage fees and commissions, taxes and, upon approval of the Board of Directors, extraordinary expenses) do not exceed 1.00% of the average daily net assets. This commitment will remain in place for the life of the Fund. For the six months ended June 30, 2012, fees waived and/or expenses reimbursed totaled $72,233.
Under subadvisory agreements between the advisor and each of Cohen & Steers Asia Limited, Cohen & Steers UK Limited and Cohen & Steers Europe S.A. (collectively, the subadvisors), affiliates of the advisor, the subadvisors are responsible for managing the Fund's investments in certain non-U.S. real estate securities. For their services provided under the subadvisory agreements, the advisor (not the Fund) pays the subadvisors. The advisor allocates 50% of the investment management fee received from the Fund among itself and each subadvisor based on the portion of the Fund's average assets managed by the advisor and each subadvisor.
Directors' and Officers' Fees: Certain directors and officers of the Fund are also directors, officers and/or employees of the advisor. The Fund does not pay compensation to directors and officers affiliated with the advisor.
Note 3. Purchases and Sales of Securities
Purchases and sales of securities, excluding short-term investments, for the six months ended June 30, 2012, totaled $282,062,653 and $275,108,654, respectively.
Note 4. Income Tax Information
As of June 30, 2012, the federal tax cost and unrealized appreciation and depreciation in value of securities held were as follows:
| Cost for federal income tax purposes | | $ | 476,919,426 | | |
| Gross unrealized appreciation | | $ | 93,409,971 | | |
| Gross unrealized depreciation | | | (5,436,795 | ) | |
| Net unrealized appreciation | | $ | 87,973,176 | | |
As of December 31, 2011, the Fund had a net capital loss carryforward of $133,767,577 which may be used to offset future capital gains. These losses are comprised of a short-term capital loss carryover of $10,711,478 recognized during the year ended December 31, 2011 which under current Federal income tax rules may offset capital gains recognized in any future period but must be utilized prior to using the balance of its short-term capital loss carryovers of which $52,715,488 will expire on December 31, 2016 and $70,340,611 will expire on December 31, 2017. In addition, the Fund incurred short-term capital losses of $4,392,385 and net ordinary losses of $1,376,391 after October 31, 2011, that it has elected to treat as arising in the following fiscal year.
26
COHEN & STEERS INSTITUTIONAL GLOBAL REALTY SHARES, INC.
NOTES TO FINANCIAL STATEMENTS (Unaudited)—(Continued)
Note 5. Capital Stock
The Fund is authorized to issue 100 million shares of capital stock, at a par value of $0.001 per share. The Board of Directors of the Fund may increase or decrease the aggregate number of shares of common stock that the Fund has authority to issue. Transactions in Fund shares were as follows:
| | | For the
Six Months Ended
June 30, 2012 | | For the
Year Ended
December 31, 2011 | |
| | | Shares | | Amount | | Shares | | Amount | |
| Sold | | | 2,529,739 | | | $ | 51,102,226 | | | | 9,630,841 | | | $ | 195,028,076 | | |
Issued as reinvestment of
dividends and distributions | | | 294,771 | | | | 6,081,135 | | | | 414,107 | | | | 8,399,474 | | |
| Redeemed | | | (2,739,799 | ) | | | (55,502,608 | ) | | | (8,226,739 | ) | | | (162,800,774 | ) | |
| Net increase | | | 84,711 | | | $ | 1,680,753 | | | | 1,818,209 | | | $ | 40,626,776 | | |
Note 6. Borrowings
The Fund, in conjunction with other Cohen & Steers funds, is a party to a $200,000,000 syndicated credit agreement (the credit agreement) with State Street Bank and Trust Company, as administrative agent and operations agent, and the lenders identified in the credit agreement, which expires January 25, 2013. The Fund pays a commitment fee of 0.10% per annum on its proportionate share of the unused portion of the credit agreement. For the period January 1, 2012 through January 27, 2012, the commitment fee was 0.125% per annum on the Fund's proportionate share of the unused portion of the credit agreement.
During the six months ended June 30, 2012, the Fund did not borrow under the credit agreement.
Note 7. Other
In the normal course of business, the Fund enters into contracts that provide general indemnifications. The Fund's maximum exposure under these arrangements is dependent on claims that may be made against the Fund in the future and, therefore, cannot be estimated; however, based on experience, the risk of material loss from such claims is considered remote.
Note 8. Subsequent Events
Management has evaluated events and transactions occurring after June 30, 2012 through the date that the financial statements were issued, and has determined that no additional disclosure in the financial statements is required.
27
COHEN & STEERS INSTITUTIONAL GLOBAL REALTY SHARES, INC.
OTHER INFORMATION
A description of the policies and procedures that the Fund uses to determine how to vote proxies relating to portfolio securities is available (i) without charge, upon request, by calling 800-330-7348, (ii) on our Web site at cohenandsteers.com or (iii) on the Securities and Exchange Commission's Web site at http://www.sec.gov. In addition, the Fund's proxy voting record for the most recent 12-month period ended June 30 is available by August 31 of each year (i) without charge, upon request, by calling 800-330-7348 or (ii) on the SEC's Web site at http://www.sec.gov.
The Fund files its complete schedule of portfolio holdings with the SEC for the first and third quarters of each fiscal year on Form N-Q. The Fund's Forms N-Q are available (i) without charge, upon request by calling 800-330-7348 or (ii) on the SEC's Web site at http://www.sec.gov. In addition, the Forms N-Q may be reviewed and copied at the SEC's Public Reference Room in Washington, DC. Information on the operation of the Public Reference Room may be obtained by calling 800-SEC-0330.
Please note that the distributions paid by the Fund to shareholders are subject to recharacterization for tax purposes. The Fund may also pay distributions in excess of the Fund's net investment company taxable income and this excess could be a tax free return of capital distributed from the Fund's assets. The final tax treatment of all distributions is reported to shareholders on their 1099-DIV forms, which are mailed after the close of each calendar year.
APPROVAL OF INVESTMENT MANAGEMENT AND SUBADVISORY AGREEMENTS
The Board of Directors of the Fund, including a majority of the directors who are not parties to the Fund's investment management and subadvisory agreements (the "Management Agreements"), or interested persons of any such party ("Independent Directors"), has the responsibility under the 1940 Act to approve the Fund's Management Agreements for their initial two year term and their continuation annually thereafter at a meeting of the Board of Directors called for the purpose of voting on the approval or continuation. At a telephonic meeting held on June 12, 2012 and at a meeting held in person on June 19, 2012, the Management Agreements were discussed and were unanimously continued for a term ending June 30, 2013 by the Fund's Board of Directors, including the Independent Directors. The Independent Directors were represented by independent counsel who assisted them in their deliberations during the meeting and executive session.
In considering whether to continue the Management Agreements, the Board of Directors reviewed materials provided by the Fund's investment manager (the "Investment Manager") and Fund counsel which included, among other things, fee, expense and performance information compared to peer funds ("Peer Funds") and performance comparisons to a larger category universe, prepared by an independent data provider; summary information prepared by the Investment Manager; and a memorandum outlining the legal duties of the Board of Directors. The Board of Directors also spoke directly with representatives of the independent data provider and met with investment advisory personnel. In addition, the Board of Directors considered information provided from time to time by the Investment Manager throughout the year at meetings of the Board of Directors, including presentations by portfolio managers relating to the investment performance of the Fund and the investment strategies used in pursuing the Fund's objective. In particular, the Board of Directors considered the following:
(i) The nature, extent and quality of services to be provided by the Investment Manager and the Subadvisors: The Board of Directors reviewed the services that the Investment Manager and the
28
COHEN & STEERS INSTITUTIONAL GLOBAL REALTY SHARES, INC.
sub-investment advisors (the "Subadvisors") provide to the Fund, including, but not limited to, making the day-to-day investment decisions for the Fund, and, for the Investment Manager, generally managing the Fund's investments in accordance with the stated policies of the Fund. The Board of Directors also discussed with officers and portfolio managers of the Fund the types of transactions that were being done on behalf of the Fund. Additionally, the Board of Directors took into account the services provided by the Investment Manager and the Subadvisors to other funds, including those that have investment objectives and strategies similar to the Fund. The Board of Directors next considered the education, background and experience of the Investment Manager's and Subadvisors' personnel, noting particularly that the favorable history and reputation of the portfolio managers for the Fund has had, and would likely continue to have, a favorable impact on the Fund. The Board of Directors further noted the Investment Manager's and Subadvisors' ability to attract qualified and experienced personnel, noting the recent leadership changes to the global real estate investment team. The Board of Directors also considered the administrative services provided by the Investment Manager, including compliance and accounting services. After consideration of the above factors, among others, the Board of Directors concluded that the nature, extent and quality of services provided by the Investment Manager and the Subadvisors are adequate and appropriate.
(ii) Investment performance of the Fund and the Investment Manager and Subadvisors: The Board of Directors considered the investment performance of the Fund versus Peer Funds and compared to a relevant benchmark. The Board of Directors noted that the Fund underperformed the median of the Peer Funds for the one- and five-year period and outperformed the median of the Peer Funds for the three-year period ended March 31, 2012. The Board of Directors also noted that the Fund had underperformed its benchmark for the one- and three-year periods and outperformed its benchmark for the five-year period. The Board of Directors engaged in discussions with the Investment Manager regarding the contributors and detractors to the Fund's performance during the periods. The Board of Directors also considered supplemental information provided by the Investment Manager, including a narrative summary of various factors affecting performance, recent changes to the global real estate investment team, and the Investment Manager's performance in managing other real estate funds. The Board of Directors then determined to closely monitor the Fund's performance and requested that the Investment Manager provide updates for this purpose.
(iii) Cost of the services to be provided and profits to be realized by the Investment Manager from the relationship with the Fund: Next, the Board of Directors considered the advisory fees and administrative fees payable by the Fund, as well as total expense ratios. As part of its analysis, the Board of Directors gave consideration to the fee and expense analyses provided by the independent data provider. The Board of Directors noted that actual advisory fees and contractual advisory fees were higher than the median of the Peer Funds and the net expense ratio was lower than the median for the Peer Funds. The Board of Directors also considered that the Investment Manager charges the Fund a unitary fee over the life of the Fund, causing the Investment Manager to reimburse expenses to limit total expenses. The Board of Directors concluded that the Fund's expense structure was satisfactory.
The Board of Directors also reviewed information regarding the profitability to the Investment Manager of its relationship with the Fund. The Board of Directors considered the level of the Investment Manager's profits and whether the profits were reasonable for the Investment Manager. Since the Subadvisors are paid by the Investment Manager and not by the Fund and are affiliates of the Investment
29
COHEN & STEERS INSTITUTIONAL GLOBAL REALTY SHARES, INC.
Manager, and the Board of Directors considered the profitability of the Investment Manager as a whole, the Board of Directors did not consider the Subadvisors' separate profitability to be relevant to their considerations. The Board of Directors took into consideration other benefits to be derived by the Investment Manager in connection with the Management Agreements, noting particularly the research and related services, within the meaning of Section 28(e) of the Securities Exchange Act of 1934, as amended, that the Investment Manager receives by allocating the Fund's brokerage transactions. The Board of Directors concluded that the profits realized by the Investment Manager from its relationship with the Fund were reasonable and consistent with the Investment Manager's fiduciary duties.
(iv) The extent to which economies of scale would be realized as the Fund grows and whether fee levels would reflect such economies of scale: The Board of Directors noted that the Investment Manager pays most of the regular operating costs of the Fund and reimburses the Fund to the extent that total expenses exceed the advisory fee rate. The Board of Directors determined that there were not at this time significant economies of scale that were not being shared with shareholders.
(v) Comparison of services rendered and fees paid to those under other investment advisory contracts, such as contracts of the same and other investment advisers or other clients: As discussed above in (iii), the Board of Directors compared the fees paid under the Management Agreements to those under other investment advisory contracts of other investment advisers managing Peer Funds. The Board of Directors also considered the services rendered, fees paid and profitability under the Management Agreements to those under the Investment Manager's other advisory agreements and advisory contracts with institutional and other clients with similar investment mandates. The Board of Directors also considered the entrepreneurial risk and financial exposure assumed by the Investment Manager in developing and managing the Fund that the Investment Manager does not have with institutional and other clients. The Board of Directors determined that on a comparative basis the fees under the Management Agreements were reasonable in relation to the services provided.
No single factor was cited as determinative to the decision of the Board of Directors. Rather, after weighing all of the considerations and conclusions discussed above, the Board of Directors, including the Independent Directors, unanimously approved the continuation of the Management Agreements.
30
COHEN & STEERS INSTITUTIONAL GLOBAL REALTY SHARES, INC.
Cohen & Steers Privacy Policy
| Facts | | What Does Cohen & Steers Do With Your Personal Information? | |
|
| Why? | | Financial companies choose how they share your personal information. Federal law gives consumers the right to limit some but not all sharing. Federal law also requires us to tell you how we collect, share, and protect your personal information. Please read this notice carefully to understand what we do. | |
|
| What? | | The types of personal information we collect and share depend on the product or service you have with us. This information can include:
• Social Security number and account balances
• Transaction history and account transactions
• Purchase history and wire transfer instructions | |
|
| How? | | All financial companies need to share customers' personal information to run their everyday business. In the section below, we list the reasons financial companies can share their customers' personal information; the reasons Cohen & Steers chooses to share; and whether you can limit this sharing. | |
|
| Reasons we can share your personal information | | Does Cohen & Steers
share? | | Can you limit this
sharing? | |
For our everyday business purposes—
such as to process your transactions, maintain your account(s), respond to court orders and legal investigations, or reports to credit bureaus | | Yes | | No | |
|
For our marketing purposes—
to offer our products and services to you | | Yes | | No | |
|
| For joint marketing with other financial companies— | | No | | We don't share | |
|
For our affiliates' everyday business purposes—
information about your transactions and experiences | | No | | We don't share | |
|
For our affiliates' everyday business purposes—
information about your creditworthiness | | No | | We don't share | |
|
| For our affiliates to market to you— | | No | | We don't share | |
|
| For non-affiliates to market to you— | | No | | We don't share | |
|
Questions? Call 800.330.7348
31
COHEN & STEERS INSTITUTIONAL GLOBAL REALTY SHARES, INC.
Cohen & Steers Privacy Policy—(Continued)
| Who we are | | | |
| Who is providing this notice? | | Cohen & Steers Capital Management, Inc., Cohen & Steers Asia Limited, Cohen & Steers UK Limited, Cohen & Steers Europe SA, Cohen & Steers Securities, LLC, Cohen & Steers Private Funds and Cohen & Steers Open and Closed-End Funds (collectively, "Cohen & Steers"). | |
|
| What we do | | | |
| How does Cohen & Steers protect my personal information? | | To protect your personal information from unauthorized access and use, we use security measures that comply with federal law. These measures include computer safeguards and secured files and buildings. We restrict access to your information to those employees who need it to perform their jobs, and also require companies that provide services on our behalf to protect your information. | |
|
| How does Cohen & Steers collect my personal information? | | We collect your personal information, for example, when you:
• Open an account or buy securities from us
• Provide account information or give us your contact information
• Make deposits or withdrawals from your account
We also collect your personal information from other companies. | |
|
| Why can't I limit all sharing? | | Federal law gives you the right to limit only:
• sharing for affiliates' everyday business purposes—information about your creditworthiness
• affiliates from using your information to market to you
• sharing for non-affiliates to market to you
State law and individual companies may give you additional rights to limit sharing. | |
|
| Definitions | | | |
| Affiliates | | Companies related by common ownership or control. They can be financial and nonfinancial companies.
• Cohen & Steers does not share with affiliates. | |
|
| Non-affiliates | | Companies not related by common ownership or control. They can be financial and nonfinancial companies.
• Cohen & Steers does not share with non-affiliates. | |
|
| Joint marketing | | A formal agreement between non-affiliated financial companies that together market financial products or services to you.
• Cohen & Steers does not jointly market. | |
|
32
COHEN & STEERS INSTITUTIONAL GLOBAL REALTY SHARES, INC.
Cohen & Steers Investment Solutions
COHEN & STEERS GLOBAL REALTY SHARES
• Designed for investors seeking total return, investing primarily in global real estate equity securities
• Symbols: CSFAX, CSFBX*, CSFCX, CSSPX
COHEN & STEERS INSTITUTIONAL REALTY SHARES
• Designed for institutional investors seeking total return, investing primarily in REITs
• Symbol: CSRIX
COHEN & STEERS REALTY INCOME FUND
• Designed for investors seeking total return, investing primarily in real estate securities with an emphasis on both income and capital appreciation
• Symbols: CSEIX, CSBIX*, CSCIX, CSDIX
COHEN & STEERS INTERNATIONAL REALTY FUND
• Designed for investors seeking total return, investing primarily in international real estate securities
• Symbols: IRFAX, IRFCX, IRFIX
COHEN & STEERS
EMERGING MARKETS REAL ESTATE FUND
• Designed for investors seeking total return, investing primarily in emerging market real estate securities
• Symbols: APFAX, APFCX, APFIX
COHEN & STEERS REALTY SHARES
• Designed for investors seeking total return, investing primarily in REITs
• Symbol: CSRSX
COHEN & STEERS
INSTITUTIONAL GLOBAL REALTY SHARES
• Designed for institutional investors seeking total return, investing primarily in global real estate securities
• Symbol: GRSIX
COHEN & STEERS GLOBAL INFRASTRUCTURE FUND
• Designed for investors seeking total return, investing primarily in global infrastructure securities
• Symbols: CSUAX, CSUBX*, CSUCX, CSUIX
COHEN & STEERS DIVIDEND VALUE FUND
• Designed for investors seeking high income and long-term growth of income and capital appreciation, investing primarily in dividend paying common stocks and preferred stocks
• Symbols: DVFAX, DVFCX, DVFIX
COHEN & STEERS
PREFERRED SECURITIES AND INCOME FUND
• Designed for investors seeking total return (high current income and capital appreciation), investing primarily in preferred and debt securities
• Symbols: CPXAX, CPXCX, CPXIX
COHEN & STEERS REAL ASSETS FUND
• Designed for investors seeking total return and the maximization of real returns during inflationary environments by investing primarily in real assets
• Symbols: RAPAX, RAPCX, RAPIX, RAPRX, RAPZX
Distributed by Cohen & Steers Securities, LLC.
COHEN & STEERS GLOBAL REALTY MAJORS ETF
• Designed for investors who seek a relatively low-cost "passive" approach for investing in a portfolio of real estate equity securities of companies in a specified index
• Symbol: GRI
Distributed by ALPS Distributors, Inc.
ISHARES COHEN & STEERS
REALTY MAJORS INDEX FUND
• Designed for investors who seek a relatively low-cost "passive" approach for investing in a portfolio of real estate equity securities of companies in a specified index
• Symbol: ICF
Distributed by SEI Investments Distribution Co.
* Class B shares are no longer offered except through dividend reinvestment and permitted exchanges by existing Class B shareholders.
Please consider the investment objectives, risks, charges and expenses of the fund carefully before investing. A summary prospectus and prospectus containing this and other information can be obtained by calling 800-330-7348 or by visiting cohenandsteers.com. Please read the prospectus carefully before investing.
33
COHEN & STEERS INSTITUTIONAL GLOBAL REALTY SHARES, INC.
OFFICERS AND DIRECTORS
Robert H. Steers
Director and co-chairman
Martin Cohen
Director and co-chairman
Michael G. Clark
Director
Bonnie Cohen
Director
George Grossman
Director
Richard E. Kroon
Director
Richard J. Norman
Director
Frank K. Ross
Director
C. Edward Ward, Jr.
Director
Adam M. Derechin
President and chief executive officer
Joseph M. Harvey
Vice president
Jon Cheigh
Vice president
Francis C. Poli
Secretary
James Giallanza
Treasurer and chief financial officer
Lisa D. Phelan
Chief compliance officer
KEY INFORMATION
Investment Advisor
Cohen & Steers Capital Management, Inc.
280 Park Avenue
New York, NY 10017
(212) 832-3232
Fund Co-administrator and Custodian
State Street Bank and Trust Company
One Lincoln Street
Boston, MA 02111
Transfer Agent
Boston Financial Data Services, Inc.
30 Dan Road
Canton, MA 02021
(800) 437-9912
Legal Counsel
Ropes & Gray LLC
1211 Avenue of the Americas
New York, NY 10036
Distributor
Cohen & Steers Securities, LLC
280 Park Avenue
New York, NY 10017
Nasdaq Symbol: GRSIX
Web site: cohenandsteers.com
This report is authorized for delivery only to shareholders of Cohen & Steers Institutional Global Realty Shares, Inc. unless accompanied or preceded by the delivery of a currently effective prospectus setting forth details of the Fund. Past performance is no guarantee of future results and your investment may be worth more or less at the time you sell.
34

eDelivery NOW AVAILABLE
Stop traditional mail delivery; receive your shareholder reports and prospectus online.
Sign up at cohenandsteers.com
COHEN & STEERS
INSTITUTIONAL GLOBAL REALTY SHARES
280 PARK AVENUE
NEW YORK, NY 10017
Semiannual Report June 30, 2012
Cohen & Steers Institutional Global Realty Shares
GRSIXSAR
Item 2. Code of Ethics.
Not applicable.
Item 3. Audit Committee Financial Expert.
Not applicable.
Item 4. Principal Accountant Fees and Services.
Not applicable.
Item 5. Audit Committee of Listed Registrants.
Not applicable.
Item 6. Schedule of Investments.
Included in Item 1 above.
Item 7. Disclosure of Proxy Voting Policies and Procedures for Closed-End Management Investment Companies.
Not applicable.
Item 8. Portfolio Managers of Closed-End Investment Companies.
Not applicable.
Item 9. Purchases of Equity Securities by Closed-End Management Investment Company and Affiliated Purchasers.
Not applicable.
Item 10. Submission of Matters to a Vote of Security Holders.
Not applicable.
Item 11. Controls and Procedures.
(a) The registrant’s principal executive officer and principal financial officer have concluded that the registrant’s disclosure controls and procedures are reasonably designed to ensure that information required to be disclosed by the registrant in this Form N-CSR was recorded, processed, summarized and reported within the time periods specified in the Securities and Exchange Commission’s rules and forms, based upon such officers’ evaluation of these controls and procedures as of a date within 90 days of the filing date of this report.
(b) There were no changes in the registrant’s internal control over financial reporting that occurred during the second fiscal quarter of the period covered by this report that have materially affected, or are reasonably likely to materially affect, the registrant’s internal control over financial reporting.
Item 12. Exhibits.
(a)(1) Not applicable.
(a)(2) Certifications of principal executive officer and principal financial officer as required by Rule 30a-2(a) under the Investment Company Act of 1940.
(a)(3) Not applicable.
(b) Certifications of chief executive officer and chief financial officer as required by Rule 30a- 2(b) under the Investment Company Act of 1940.
SIGNATURES
Pursuant to the requirements of the Securities Exchange Act of 1934 and the Investment Company Act of 1940, the registrant has duly caused this report to be signed on its behalf by the undersigned, thereunto duly authorized.
COHEN & STEERS INSITUTIONAL GLOBAL REALTY SHARES, INC.
| By: | /s/ Adam M. Derechin | |
| | Name: Adam M. Derechin | |
| | Title: President and Chief Executive Officer | |
| | |
| Date: September 4, 2012 | |
Pursuant to the requirements of the Securities Exchange Act of 1934 and the Investment Company Act of 1940, this report has been signed below by the following persons on behalf of the registrant and in the capacities and on the dates indicated.
| By: | /s/ Adam M. Derechin | |
| | Name: | Adam M. Derechin | |
| | Title: | President and Chief Executive Officer | |
| | | (Principal Executive Officer) | |
| By: | /s/ James Giallanza | |
| | Name: | James Giallanza | |
| | Title: | Treasurer and Chief Financial Officer | |
| | | (Principal Financial Officer) | |
| | | | |
| | | | |
| Date: September 4, 2012 | |