First Eagle Private Credit (NEWS) Inactive
Filed: 27 Nov 17, 12:00am
Exhibit (c)(7)
PRELIMINARY | SUBJECT TO FURTHER REVIEW & REVISION Project Osprey Board of Directors discussion materials Confidential October 7, 2017 PRELIMINARY | SUBJECT TO FURTHER REVIEW AND EVALUATION These materials may not be used or relied upon for any purpose other than as specifically contemplated by a written agreement with Credit Suisse Group AG and/or its Affiliates (hereafter “Credit Suisse”).
PRELIMINARY | SUBJECT TO FURTHER REVIEW & REVISION Table of contents 1. Executive summary 2. Public market perspectives 3. Preliminary financial projections 4. Preliminary financial analysis framework 5. Preliminary financial analysis Appendix Confidential 1 © Credit Suisse Group AG and/or its affiliates. All rights reserved.
PRELIMINARY | SUBJECT TO FURTHER REVIEW & REVISION 1. Executive summary Confidential 2
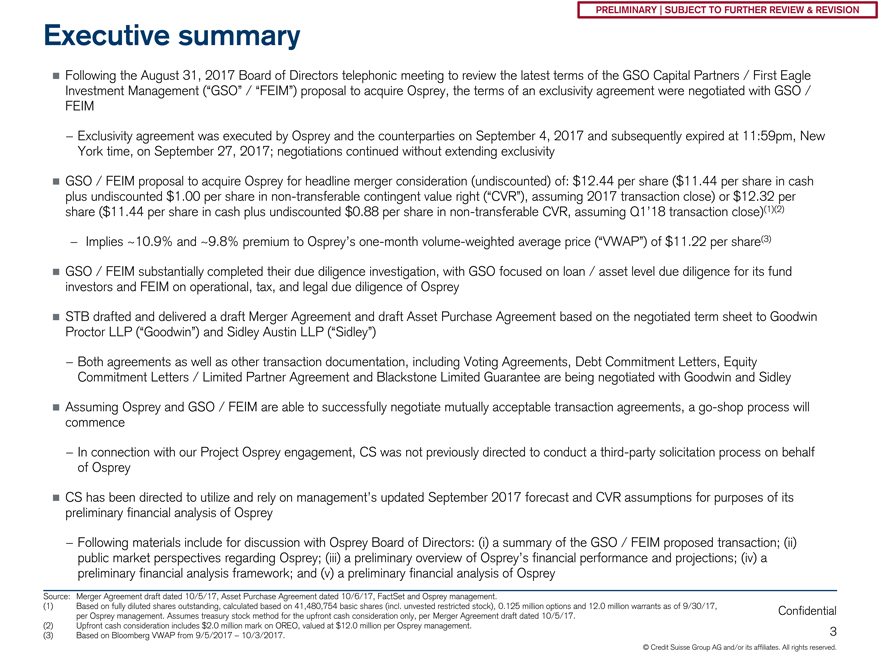
PRELIMINARY | SUBJECT TO FURTHER REVIEW & REVISION Executive summary ï® Following the August 31, 2017 Board of Directors telephonic meeting to review the latest terms of the GSO Capital Partners / First Eagle Investment Management (“GSO” / “FEIM”) proposal to acquire Osprey, the terms of an exclusivity agreement were negotiated with GSO / FEIM —Exclusivity agreement was executed by Osprey and the counterparties on September 4, 2017 and subsequently expired at 11:59pm, New York time, on September 27, 2017; negotiations continued without extending exclusivity ï® GSO / FEIM proposal to acquire Osprey for headline merger consideration (undiscounted) of: $12.44 per share ($11.44 per share in cash plus undiscounted $1.00 per share innon-transferable contingent value right (“CVR”), assuming 2017 transaction close) or $12.32 per share ($11.44 per share in cash plus undiscounted $0.88 per share innon-transferable CVR, assuming Q1’18 transaction close)(1)(2) —Implies ~10.9% and ~9.8% premium to Osprey’sone-month volume-weighted average price (“VWAP”) of $11.22 per share(3) ï® GSO / FEIM substantially completed their due diligence investigation, with GSO focused on loan / asset level due diligence for its fund investors and FEIM on operational, tax, and legal due diligence of Osprey ï® STB drafted and delivered a draft Merger Agreement and draft Asset Purchase Agreement based on the negotiated term sheet to Goodwin Proctor LLP (“Goodwin”) and Sidley Austin LLP (“Sidley”) —Both agreements as well as other transaction documentation, including Voting Agreements, Debt Commitment Letters, Equity Commitment Letters / Limited Partner Agreement and Blackstone Limited Guarantee are being negotiated with Goodwin and Sidley ï® Assuming Osprey and GSO / FEIM are able to successfully negotiate mutually acceptable transaction agreements, ago-shop process will commence —In connection with our Project Osprey engagement, CS was not previously directed to conduct a third-party solicitation process on behalf of Osprey ï® CS has been directed to utilize and rely on management’s updated September 2017 forecast and CVR assumptions for purposes of its preliminary financial analysis of Osprey —Following materials include for discussion with Osprey Board of Directors: (i) a summary of the GSO / FEIM proposed transaction; (ii) public market perspectives regarding Osprey; (iii) a preliminary overview of Osprey’s financial performance and projections; (iv) a preliminary financial analysis framework; and (v) a preliminary financial analysis of Osprey Source: Merger Agreement draft dated 10/5/17, Asset Purchase Agreement dated 10/6/17, FactSet and Osprey management. (1) Based on fully diluted shares outstanding, calculated based on 41,480,754 basic shares (incl. unvested restricted stock), 0.125 million options and 12.0 million warrants as of 9/30/17, Confidential per Osprey management. Assumes treasury stock method for the upfront cash consideration only, per Merger Agreement draft dated 10/5/17. (2) Upfront cash consideration includes $2.0 million mark on OREO, valued at $12.0 million per Osprey management. (3) Based on Bloomberg VWAP from 9/5/2017 – 10/3/2017. 3 © Credit Suisse Group AG and/or its affiliates. All rights reserved.
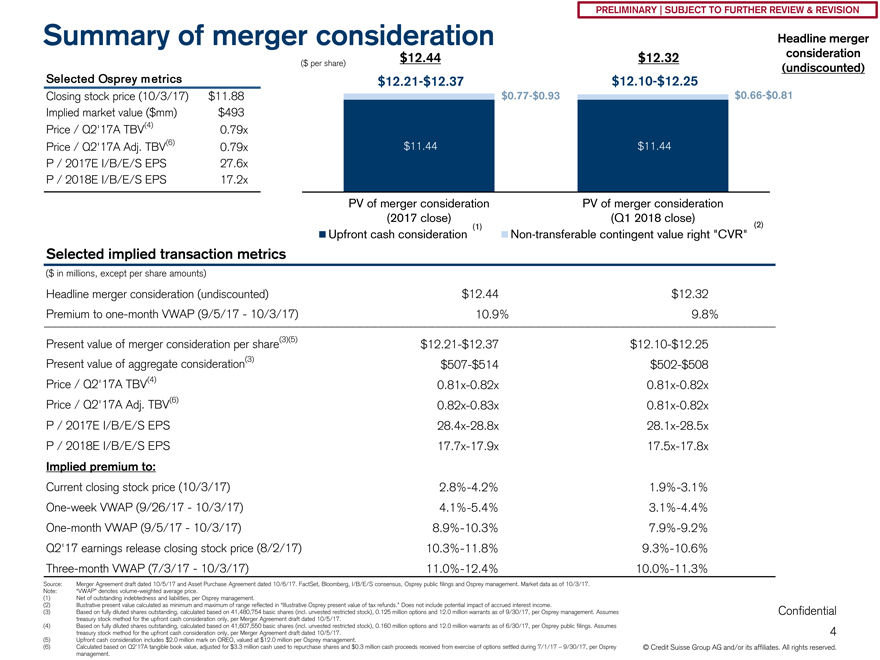
PRELIMINARY | SUBJECT TO FURTHER REVIEW & REVISION Summary of merger consideration Headline merger $12.44 $12.32 consideration ($ per share) (undiscounted) Selected Osprey m etrics$12.21-$12.37$12.10-$12.25 Closing stock price (10/3/17) $11.88$0.77-$0.93$0.66-$0.81 Implied market value ($mm) $493 Price / Q2’17A TBV(4) 0.79x Price / Q2’17A Adj. TBV(6) 0.79x $11.44 $11.44 P / 2017E I/B/E/S EPS 27.6x P / 2018E I/B/E/S EPS 17.2x PV of merger consideration PV of merger consideration (2017 close) (Q1 2018 close) Upfront cash consideration(1) Non-transferable contingent value right “CVR” (2) Selected implied transaction metrics ($ in millions, except per share amounts) Headline merger consideration (undiscounted) $12.44 $12.32 Premium toone-month VWAP (9/5/17—10/3/17) 10.9% 9.8% Present value of merger consideration per share(3)(5)$12.21-$12.37$12.10-$12.25 Present value of aggregate consideration(3)$507-$514$502-$508 Price / Q2’17A TBV(4)0.81x-0.82x0.81x-0.82x Price / Q2’17A Adj. TBV(6)0.82x-0.83x0.81x-0.82x P / 2017E I/B/E/S EPS28.4x-28.8x28.1x-28.5x P / 2018E I/B/E/S EPS17.7x-17.9x17.5x-17.8x Implied premium to: Current closing stock price (10/3/17)2.8%-4.2%1.9%-3.1%One-week VWAP (9/26/17—10/3/17)4.1%-5.4%3.1%-4.4%One-month VWAP (9/5/17—10/3/17)8.9%-10.3%7.9%-9.2% Q2’17 earnings release closing stock price (8/2/17)10.3%-11.8%9.3%-10.6% Three-month VWAP (7/3/17—10/3/17)11.0%-12.4%10.0%-11.3% Source: Merger Agreement draft dated 10/5/17 and Asset Purchase Agreement dated 10/6/17. FactSet, Bloomberg, I/B/E/S consensus, Osprey public filings and Osprey management. Market data as of 10/3/17. Note: “VWAP” denotes volume-weighted average price. (1) Net of outstanding indebtedness and liabilities, per Osprey management. (2) Illustrative present value calculated as minimum and maximum of range reflected in “Illustrative Osprey present value of tax refunds.” Does not include potential impact of accrued interest income. (3) Based on fully diluted shares outstanding, calculated based on 41,480,754 basic shares (incl. unvested restricted stock), 0.125 million options and 12.0 million warrants as of 9/30/17, per Osprey management. Assumes Confidential treasury stock method for the upfront cash consideration only, per Merger Agreement draft dated 10/5/17. (4) Based on fully diluted shares outstanding, calculated based on 41,607,550 basic shares (incl. unvested restricted stock), 0.160 million options and 12.0 million warrants as of 6/30/17, per Osprey public filings. Assumes treasury stock method for the upfront cash consideration only, per Merger Agreement draft dated 10/5/17. 4 (5) Upfront cash consideration includes $2.0 million mark on OREO, valued at $12.0 million per Osprey management. (6) Calculated based on Q2’17A tangible book value, adjusted for $3.3 million cash used to repurchase shares and $0.3 million cash proceeds received from exercise of options settled during 7/1/17 – 9/30/17, per Osprey © Credit Suisse Group AG and/or its affiliates. All rights reserved. management.
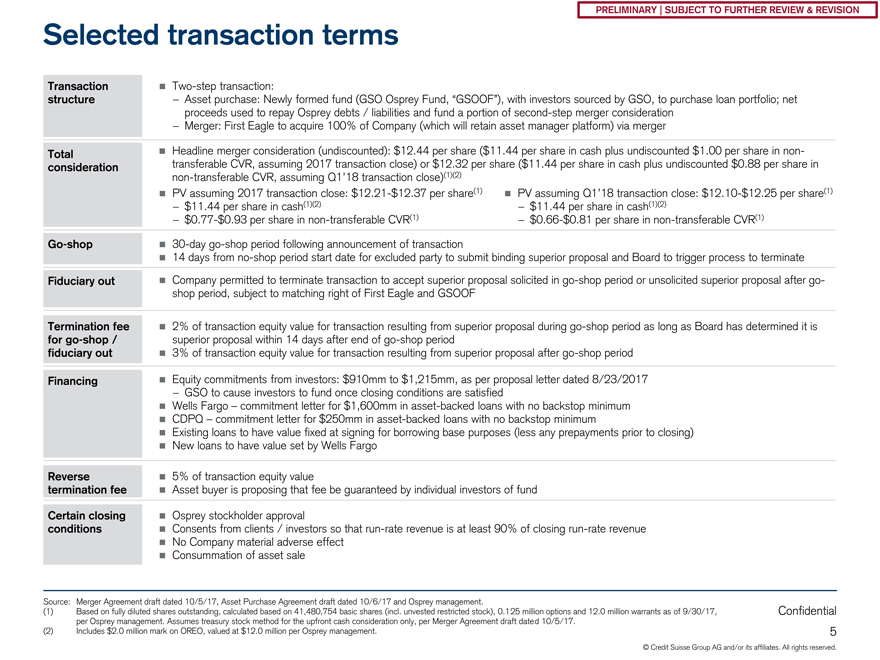
PRELIMINARY | SUBJECT TO FURTHER REVIEW & REVISION Selected transaction terms Transaction ï®Two-step transaction: structure—Asset purchase: Newly formed fund (GSO Osprey Fund, “GSOOF”), with investors sourced by GSO, to purchase loan portfolio; net proceeds used to repay Osprey debts / liabilities and fund a portion of second-step merger consideration —Merger: First Eagle to acquire 100% of Company (which will retain asset manager platform) via merger Total ï® Headline merger consideration (undiscounted): $12.44 per share ($11.44 per share in cash plus undiscounted $1.00 per share innon-consideration transferable CVR, assuming 2017 transaction close) or $12.32 per share ($11.44 per share in cash plus undiscounted $0.88 per share innon-transferable CVR, assuming Q1’18 transaction close)(1)(2) ï® PV assuming 2017 transaction close:$12.21-$12.37 per share(1) ï® PV assuming Q1’18 transaction close:$12.10-$12.25 per share(1) —$11.44 per share in cash(1)(2)—$11.44 per share in cash(1)(2)—$0.77-$0.93 per share innon-transferableCVR(1)—$0.66-$0.81 per share innon-transferable CVR(1)Go-shop ï®30-daygo-shop period following announcement of transaction ï® 14 days fromno-shop period start date for excluded party to submit binding superior proposal and Board to trigger process to terminate Fiduciary out ï® Company permitted to terminate transaction to accept superior proposal solicited ingo-shop period or unsolicited superior proposal aftergo-shop period, subject to matching right of First Eagle and GSOOF Termination fee ï® 2% of transaction equity value for transaction resulting from superior proposal duringgo-shop period as long as Board has determined it is forgo-shop / superior proposal within 14 days after end ofgo-shop period fiduciary out ï® 3% of transaction equity value for transaction resulting from superior proposal aftergo-shop period Financing ï® Equity commitments from investors: $910mm to $1,215mm, as per proposal letter dated 8/23/2017 —GSO to cause investors to fund once closing conditions are satisfied ï® Wells Fargo – commitment letter for $1,600mm in asset-backed loans with no backstop minimum ï® CDPQ – commitment letter for $250mm in asset-backed loans with no backstop minimum ï® Existing loans to have value fixed at signing for borrowing base purposes (less any prepayments prior to closing) ï® New loans to have value set by Wells Fargo Reverse ï® 5% of transaction equity value termination fee ï® Asset buyer is proposing that fee be guaranteed by individual investors of fund Certain closing ï® Osprey stockholder approval conditions ï® Consents from clients / investors so thatrun-rate revenue is at least 90% of closingrun-rate revenue ï® No Company material adverse effect ï® Consummation of asset sale Source: Merger Agreement draft dated 10/5/17, Asset Purchase Agreement draft dated 10/6/17 and Osprey management. (1) Based on fully diluted shares outstanding, calculated based on 41,480,754 basic shares (incl. unvested restricted stock), 0.125 million options and 12.0 million warrants as of 9/30/17, Confidential per Osprey management. Assumes treasury stock method for the upfront cash consideration only, per Merger Agreement draft dated 10/5/17. (2) Includes $2.0 million mark on OREO, valued at $12.0 million per Osprey management. 5 © Credit Suisse Group AG and/or its affiliates. All rights reserved.
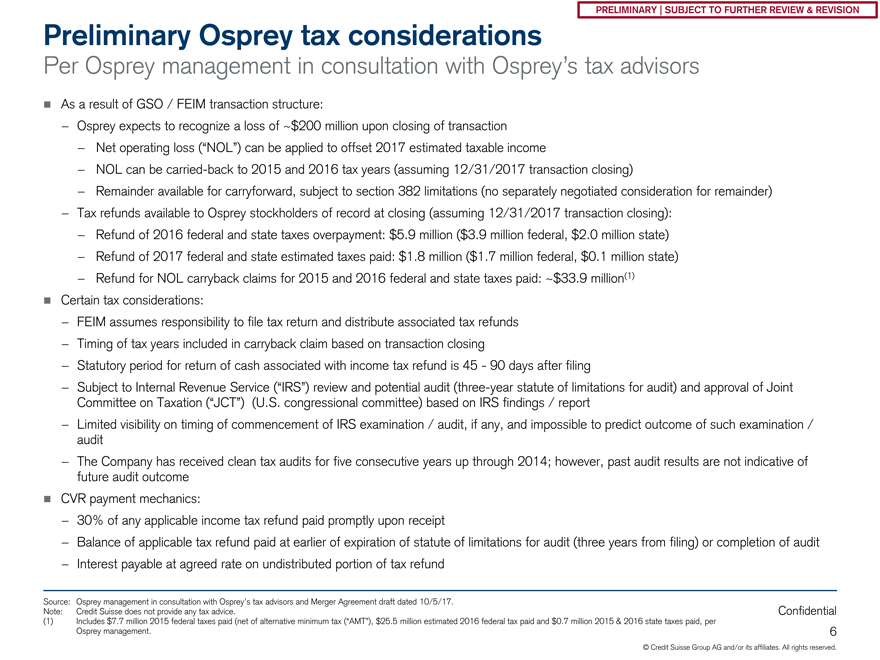
PRELIMINARY | SUBJECT TO FURTHER REVIEW & REVISION Preliminary Osprey tax considerations Per Osprey management in consultation with Osprey’s tax advisors ï® As a result of GSO / FEIM transaction structure: —Osprey expects to recognize a loss of ~$200 million upon closing of transaction —Net operating loss (“NOL”) can be applied to offset 2017 estimated taxable income —NOL can be carried-back to 2015 and 2016 tax years (assuming 12/31/2017 transaction closing) —Remainder available for carryforward, subject to section 382 limitations (no separately negotiated consideration for remainder) —Tax refunds available to Osprey stockholders of record at closing (assuming 12/31/2017 transaction closing): —Refund of 2016 federal and state taxes overpayment: $5.9 million ($3.9 million federal, $2.0 million state) —Refund of 2017 federal and state estimated taxes paid: $1.8 million ($1.7 million federal, $0.1 million state) —Refund for NOL carryback claims for 2015 and 2016 federal and state taxes paid: ~$33.9 million(1) ï® Certain tax considerations: —FEIM assumes responsibility to file tax return and distribute associated tax refunds —Timing of tax years included in carryback claim based on transaction closing —Statutory period for return of cash associated with income tax refund is 45—90 days after filing —Subject to Internal Revenue Service (“IRS”) review and potential audit (three-year statute of limitations for audit) and approval of Joint Committee on Taxation (“JCT”) (U.S. congressional committee) based on IRS findings / report —Limited visibility on timing of commencement of IRS examination / audit, if any, and impossible to predict outcome of such examination / audit —The Company has received clean tax audits for five consecutive years up through 2014; however, past audit results are not indicative of future audit outcome ï® CVR payment mechanics: —30% of any applicable income tax refund paid promptly upon receipt —Balance of applicable tax refund paid at earlier of expiration of statute of limitations for audit (three years from filing) or completion of audit —Interest payable at agreed rate on undistributed portion of tax refund Source: Osprey management in consultation with Osprey’s tax advisors and Merger Agreement draft dated 10/5/17. Note: Credit Suisse does not provide any tax advice. Confidential (1) Includes $7.7 million 2015 federal taxes paid (net of alternative minimum tax (“AMT”), $25.5 million estimated 2016 federal tax paid and $0.7 million 2015 & 2016 state taxes paid, per Osprey management. 6 © Credit Suisse Group AG and/or its affiliates. All rights reserved.
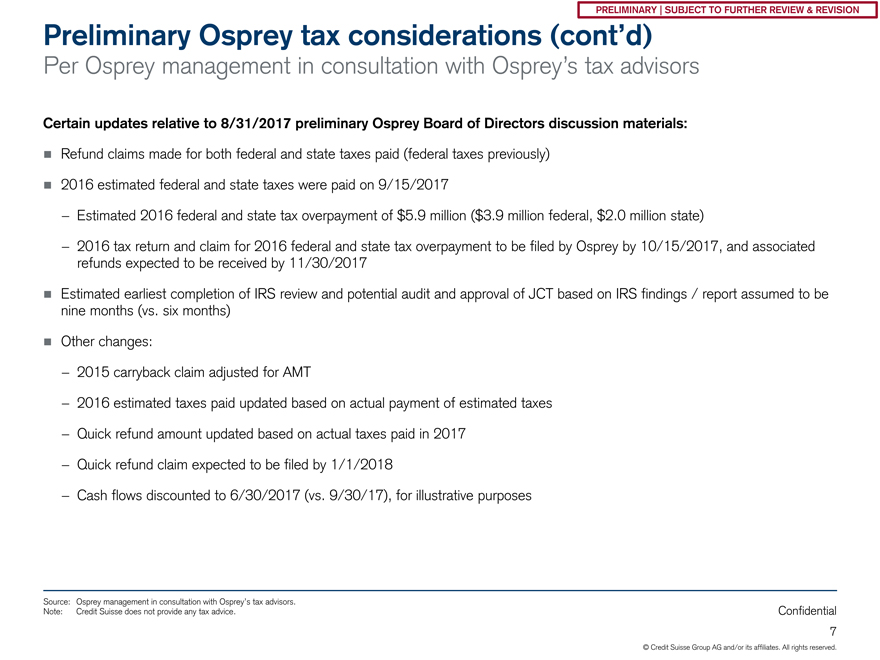
PRELIMINARY | SUBJECT TO FURTHER REVIEW & REVISION Preliminary Osprey tax considerations (cont’d) Per Osprey management in consultation with Osprey’s tax advisors Certain updates relative to 8/31/2017 preliminary Osprey Board of Directors discussion materials: ï® Refund claims made for both federal and state taxes paid (federal taxes previously) ï® 2016 estimated federal and state taxes were paid on 9/15/2017 —Estimated 2016 federal and state tax overpayment of $5.9 million ($3.9 million federal, $2.0 million state) —2016 tax return and claim for 2016 federal and state tax overpayment to be filed by Osprey by 10/15/2017, and associated refunds expected to be received by 11/30/2017 ï® Estimated earliest completion of IRS review and potential audit and approval of JCT based on IRS findings / report assumed to be nine months (vs. six months) ï® Other changes: —2015 carryback claim adjusted for AMT —2016 estimated taxes paid updated based on actual payment of estimated taxes —Quick refund amount updated based on actual taxes paid in 2017 —Quick refund claim expected to be filed by 1/1/2018 —Cash flows discounted to 6/30/2017 (vs. 9/30/17), for illustrative purposes Source: Osprey management in consultation with Osprey’s tax advisors. Note: Credit Suisse does not provide any tax advice. Confidential 7 © Credit Suisse Group AG and/or its affiliates. All rights reserved.
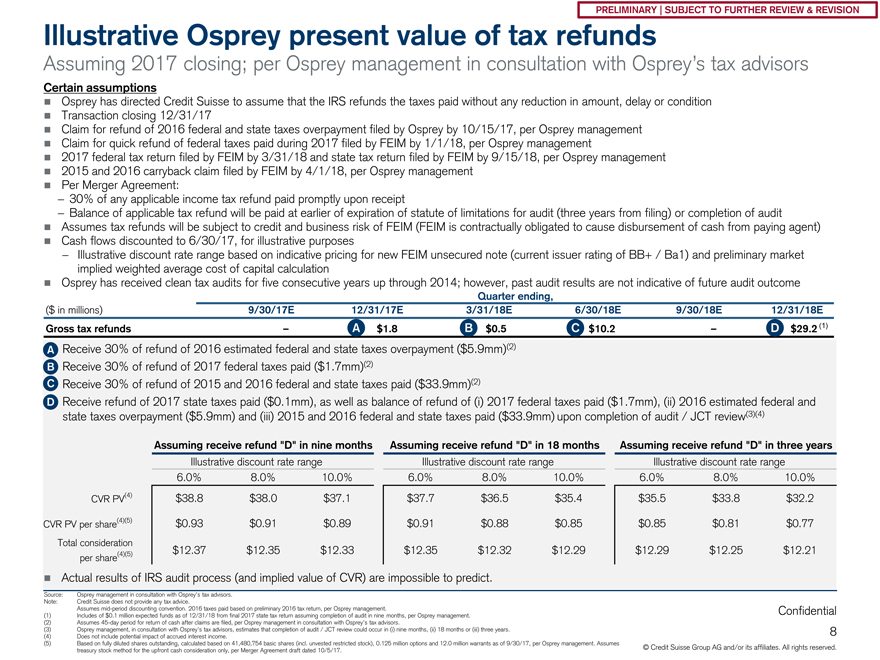
PRELIMINARY | SUBJECT TO FURTHER REVIEW & REVISION Illustrative Osprey present value of tax refunds Assuming 2017 closing; per Osprey management in consultation with Osprey’s tax advisors Certain assumptions ï® Osprey has directed Credit Suisse to assume that the IRS refunds the taxes paid without any reduction in amount, delay or condition ï® Transaction closing 12/31/17 ï® Claim for refund of 2016 federal and state taxes overpayment filed by Osprey by 10/15/17, per Osprey management ï® Claim for quick refund of federal taxes paid during 2017 filed by FEIM by 1/1/18, per Osprey management ï® 2017 federal tax return filed by FEIM by 3/31/18 and state tax return filed by FEIM by 9/15/18, per Osprey management ï® 2015 and 2016 carryback claim filed by FEIM by 4/1/18, per Osprey management ï® Per Merger Agreement: —30% of any applicable income tax refund paid promptly upon receipt —Balance of applicable tax refund will be paid at earlier of expiration of statute of limitations for audit (three years from filing) or completion of audit ï® Assumes tax refunds will be subject to credit and business risk of FEIM (FEIM is contractually obligated to cause disbursement of cash from paying agent) ï® Cash flows discounted to 6/30/17, for illustrative purposes —Illustrative discount rate range based on indicative pricing for new FEIM unsecured note (current issuer rating of BB+ / Ba1) and preliminary market implied weighted average cost of capital calculation ï® Osprey has received clean tax audits for five consecutive years up through 2014; however, past audit results are not indicative of future audit outcome Quarter ending, ($ in millions) 9/30/17E 12/31/17E 3/31/18E 6/30/18E 9/30/18E 12/31/18E Gross tax refunds – A $1.8 B $0.5 C $10.2 – D $29.2 (1) ï® A Receive 30% of refund of 2016 estimated federal and state taxes overpayment ($5.9mm)(2) ï® B Receive 30% of refund of 2017 federal taxes paid ($1.7mm)(2) ï® C Receive 30% of refund of 2015 and 2016 federal and state taxes paid ($33.9mm)(2) ï® D Receive refund of 2017 state taxes paid ($0.1mm), as well as balance of refund of (i) 2017 federal taxes paid ($1.7mm), (ii) 2016 estimated federal and state taxes overpayment ($5.9mm) and (iii) 2015 and 2016 federal and state taxes paid ($33.9mm) upon completion of audit / JCT review(3)(4) Assuming receive refund “D” in nine months Assuming receive refund “D” in 18 months Assuming receive refund “D” in three years Illustrative discount rate range Illustrative discount rate range Illustrative discount rate range 6.0% 8.0% 10.0% 6.0% 8.0% 10.0% 6.0% 8.0% 10.0% CVR PV(4) $38.8 $38.0 $37.1 $37.7 $36.5 $35.4 $35.5 $33.8 $32.2 CVR PV per share(4)(5) $0.93 $0.91 $0.89 $0.91 $0.88 $0.85 $0.85 $0.81 $0.77 Total consideration (4)(5) $12.37 $12.35 $12.33 $12.35 $12.32 $12.29 $12.29 $12.25 $12.21 per share ï® Actual results of IRS audit process (and implied value of CVR) are impossible to predict. Source: Osprey management in consultation with Osprey’s tax advisors. Note: Credit Suisse does not provide any tax advice. Assumesmid-period discounting convention. 2016 taxes paid based on preliminary 2016 tax return, per Osprey management. Confidential (1) Includes of $0.1 million expected funds as of 12/31/18 from final 2017 state tax return assuming completion of audit in nine months, per Osprey management. (2) Assumes45-day period for return of cash after claims are filed, per Osprey management in consultation with Osprey’s tax advisors. (3) Osprey management, in consultation with Osprey’s tax advisors, estimates that completion of audit / JCT review could occur in (i) nine months, (ii) 18 months or (iii) three years. 8 (4) Does not include potential impact of accrued interest income. (5) Based on fully diluted shares outstanding, calculated based on 41,480,754 basic shares (incl. unvested restricted stock), 0.125 million options and 12.0 million warrants as of 9/30/17, per Osprey management. Assumes treasury stock method for the upfront cash consideration only, per Merger Agreement draft dated 10/5/17. © Credit Suisse Group AG and/or its affiliates. All rights reserved.

PRELIMINARY | SUBJECT TO FURTHER REVIEW & REVISION Illustrative Osprey present value of tax refunds Assuming 2018 closing; per Osprey management in consultation with Osprey’s tax advisors Certain assumptions ï® Osprey has directed Credit Suisse to assume that the IRS refunds the taxes paid without any reduction in amount, delay or condition ï® Transaction closing 3/31/18 ï® Osprey does not expect to make a federal or state tax payment in Q1 2018 given transaction timing and magnitude of loss generated ï® 2018 short year federal tax return filed by FEIM by 6/30/18, per Osprey management ï® 2016 federal and state carryback as well as 2017 federal carryback claims filed by FEIM by 7/1/18, per Osprey management ï® 2017 state carryback claim filed by FEIM by 9/15/18, per Osprey management ï® Per Merger Agreement: —30% of any applicable income tax refund shall be paid promptly upon receipt —Balance of applicable tax refund shall be paid at earlier of expiration of statute of limitations for audit (three years from filing) or completion of audit ï® Assumes tax refunds will be subject to credit and business risk of FEIM (FEIM is contractually obligated to cause disbursement of cash from paying agent) ï® Illustrative discount rate range based on indicative pricing for new FEIM unsecured note (current issuer rating of BB+ / Ba1) and preliminary market implied weighted average cost of capital calculation —Cash flows discounted to 6/30/17, for illustrative purposes ï® Osprey has received clean tax audits for five consecutive years up through 2014; however, past audit results are not indicative of future audit outcome Quarter ending, ($ in millions) 9/30/17E 12/31/17E 3/31/18E 6/30/18E 9/30/18E 12/31/18E 3/31/19E Gross tax refunds – – – – A $10.4 B $0.6 C $25.6 ï® A Receive 30% of refund of (i) 2016 federal taxes paid ($25.5mm), (ii) 2016 state taxes paid ($0.6mm), and (iii) 2017 federal taxes paid, net of AMT ($8.5mm)(1) ï® B Receive 30% of refund of 2017 state taxes paid ($2.1mm)(1) ï® C Receive balance of refund of (i) 2016 federal and state taxes paid ($26.1mm) and (ii) 2017 federal and taxes paid ($10.6mm) upon completion of audit / JCT review(2)(3) Assuming receive refund “C” in nine months Assuming receive refund “C” in 18 months Assuming receive refund “C” in three years Illustrative discount rate range Illustrative discount rate range Illustrative discount rate range 6.0% 8.0% 10.0% 6.0% 8.0% 10.0% 6.0% 8.0% 10.0% CVR PV(3) $33.6 $32.7 $31.8 $32.6 $31.4 $30.3 $30.7 $29.1 $27.6 CVR PV per share(3)(4) $0.81 $0.79 $0.77 $0.78 $0.76 $0.73 $0.74 $0.70 $0.66 Total consideration (3)(4) $12.25 $12.23 $12.21 $12.22 $12.20 $12.17 $12.18 $12.14 $12.10 per share ï® Actual results of IRS audit process (and implied value of CVR) are impossible to predict. Source: Osprey management in consultation with Osprey’s tax advisors. Note: Credit Suisse does not provide any tax advice. Assumesmid-period discounting convention. 2016 taxes paid based on preliminary 2016 tax return, per Osprey management. Confidential (1) Assumes45-day period for return of cash after claims are filed, per Osprey management in consultation with Osprey’s tax advisors. (2) Osprey management, in consultation with Osprey’s tax advisors, estimates that completion of audit / JCT review could occur in (i) nine months, (ii) 18 months or (iii) three years. (3) Does not include potential impact of accrued interest income. 9 (4) Based on fully diluted shares outstanding, calculated based on 41,480,754 basic shares (incl. unvested restricted stock), 0.125 million options and 12.0 million warrants as of 9/30/17, per Osprey management. Assumes treasury stock method for the upfront cash consideration only, per Merger Agreement draft dated 10/5/17. © Credit Suisse Group AG and/or its affiliates. All rights reserved.
PRELIMINARY | SUBJECT TO FURTHER REVIEW & REVISION 2. Public market perspectives Confidential 10
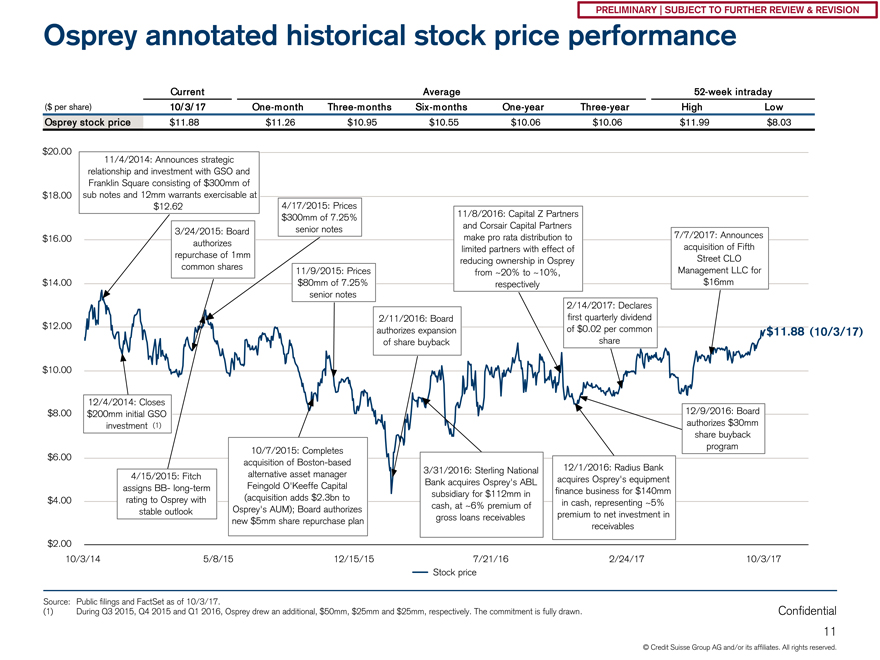
PRELIMINARY | SUBJECT TO FURTHER REVIEW & REVISION Osprey annotated historical stock price performance Current Average52-week intraday ($ per share) 10/ 3/ 17One-m onthThree-m onthsSix-m onthsOne-year Three-year High Low Osprey stock price $11.88 $11.26 $10.95 $10.55 $10.06 $10.06 $11.99 $8.03 (10/3/17) (1) Source: Public filings and FactSet as of 10/3/17. (1) During Q3 2015, Q4 2015 and Q1 2016, Osprey drew an additional, $50mm, $25mm and $25mm, respectively. The commitment is fully drawn. Confidential 11 © Credit Suisse Group AG and/or its affiliates. All rights reserved.
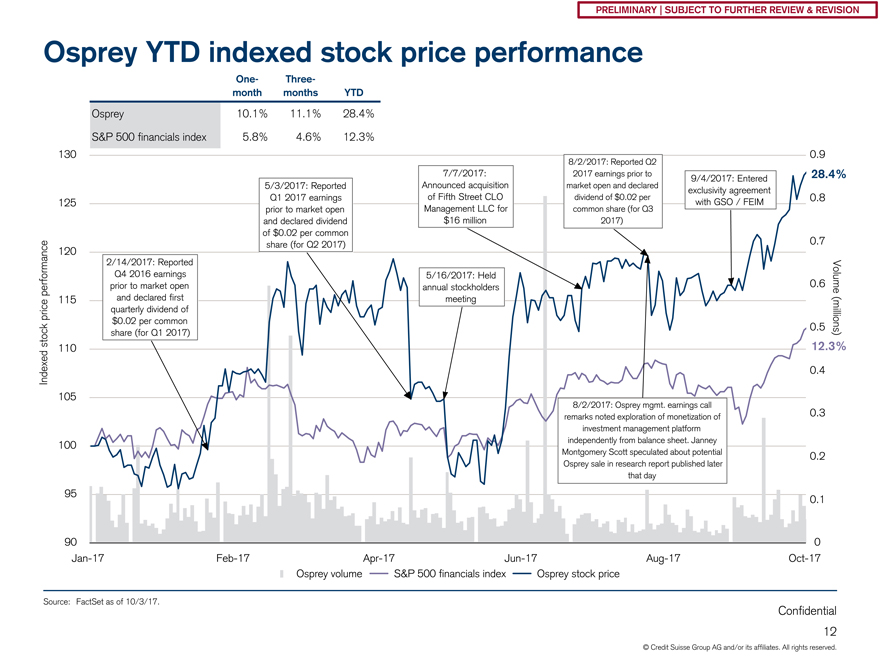
PRELIMINARY | SUBJECT TO FURTHER REVIEW & REVISION Osprey YTD indexed stock price performanceOne- Three-month months YTD Osprey 10.1% 11.1% 28.4% S&P 500 financials index 5.8% 4.6% 12.3% 28.4% performanceVolume price (millions) stock 12.3% Indexed Source: FactSet as of 10/3/17. Confidential 12 © Credit Suisse Group AG and/or its affiliates. All rights reserved.
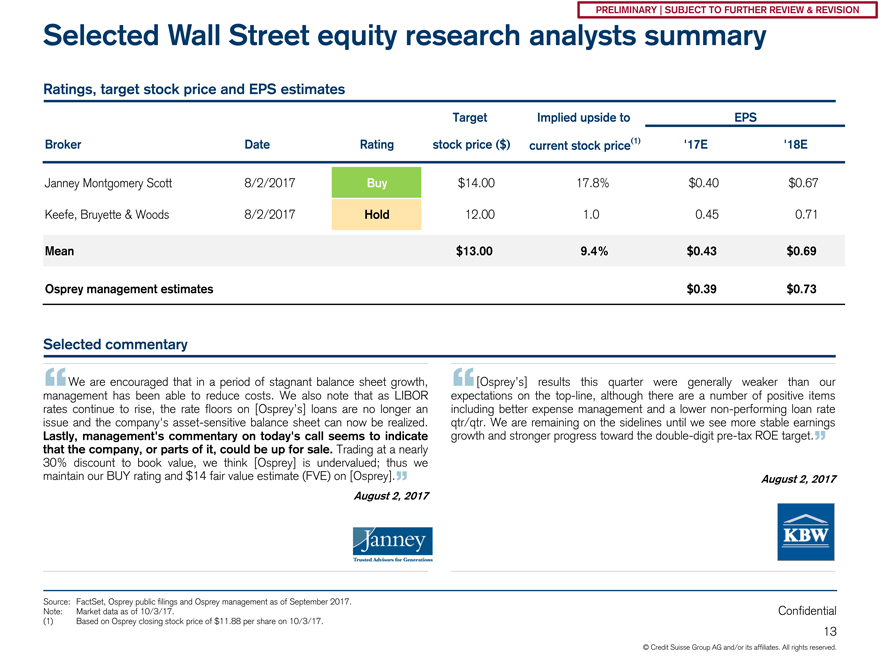
PRELIMINARY | SUBJECT TO FURTHER REVIEW & REVISION Selected Wall Street equity research analysts summary Ratings, target stock price and EPS estimates Target Implied upside to EPS Broker Date Rating stock price ($) current stock price(1) ‘17E ‘18E Janney Montgomery Scott 8/2/2017 Buy $14.00 17.8% $0.40 $0.67 Keefe, Bruyette & Woods 8/2/2017 Hold 12.00 1.0 0.45 0.71 Mean $13.00 9.4% $0.43 $0.69 Osprey management estimates $0.39 $0.73 Selected commentary We are encouraged that in a period of stagnant balance sheet growth, [Osprey’s] results this quarter were generally weaker than our management has been able to reduce costs. We also note that as LIBOR expectations on thetop-line, although there are a number of positive items rates “ continue to rise, the rate floors on [Osprey’s] loans are no longer an including “ better expense management and a lowernon-performing loan rate issue and the company’s asset-sensitive balance sheet can now be realized. qtr/qtr. We are remaining on the sidelines until we see more stable earnings Lastly, management’s commentary on today’s call seems to indicate growth and stronger progress toward the double-digitpre-tax ROE target. that the company, or parts of it, could be up for sale. Trading at a nearly ” 30% discount to book value, we think [Osprey] is undervalued; thus we maintain our BUY rating and $14 fair value estimate (FVE) on [Osprey].” August 2, 2017 August 2, 2017 Source: FactSet, Osprey public filings and Osprey management as of September 2017. Note: Market data as of 10/3/17. Confidential (1) Based on Osprey closing stock price of $11.88 per share on 10/3/17. 13 © Credit Suisse Group AG and/or its affiliates. All rights reserved.
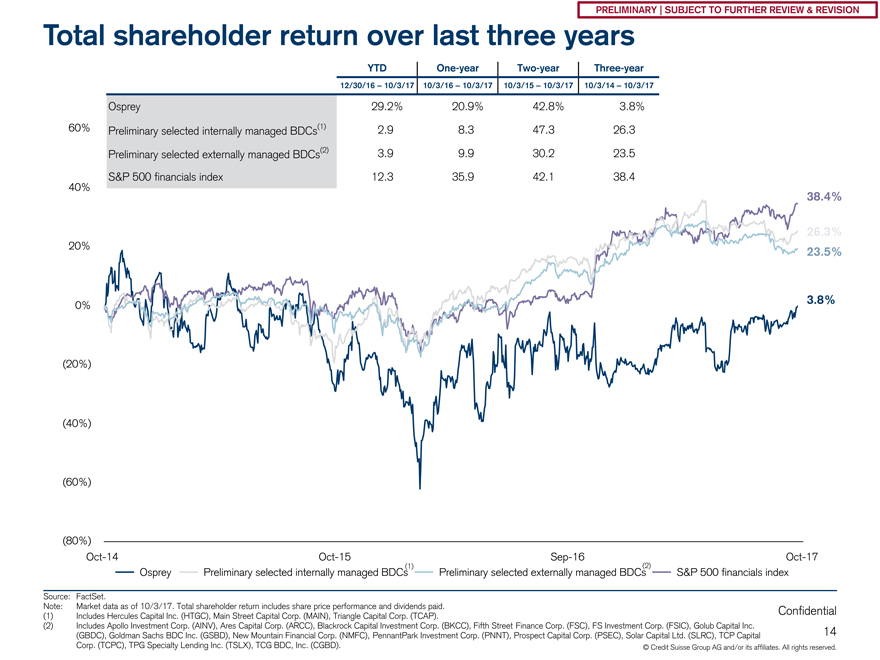
PRELIMINARY | SUBJECT TO FURTHER REVIEW & REVISION Total shareholder return over last three years YTDOne-yearTwo-year Three-year 12/30/16 – 10/3/17 10/3/16 – 10/3/17 10/3/15 – 10/3/17 10/3/14 – 10/3/17 Osprey 29.2% 20.9% 42.8% 3.8% Preliminary selected internally managed BDCs(1) 2.9 8.3 47.3 26.3 Preliminary selected externally managed BDCs(2) 3.9 9.9 30.2 23.5 S&P 500 financials index 12.3 35.9 42.1 38.4 38.4% 26.3% 23.5% 3.8% (1) (2) Source: FactSet. Note: Market data as of 10/3/17. Total shareholder return includes share price performance and dividends paid. Confidential (1) Includes Hercules Capital Inc. (HTGC), Main Street Capital Corp. (MAIN), Triangle Capital Corp. (TCAP). (2) Includes Apollo Investment Corp. (AINV), Ares Capital Corp. (ARCC), Blackrock Capital Investment Corp. (BKCC), Fifth Street Finance Corp. (FSC), FS Investment Corp. (FSIC), Golub Capital Inc. 14 (GBDC), Goldman Sachs BDC Inc. (GSBD), New Mountain Financial Corp. (NMFC), PennantPark Investment Corp. (PNNT), Prospect Capital Corp. (PSEC), Solar Capital Ltd. (SLRC), TCP Capital Corp. (TCPC), TPG Specialty Lending Inc. (TSLX), TCG BDC, Inc. (CGBD). © Credit Suisse Group AG and/or its affiliates. All rights reserved.
PRELIMINARY | SUBJECT TO FURTHER REVIEW & REVISION 3. Preliminary financial projections Confidential 15
PRELIMINARY | SUBJECT TO FURTHER REVIEW & REVISION A. Osprey management standalone financial performance and projections Confidential 16
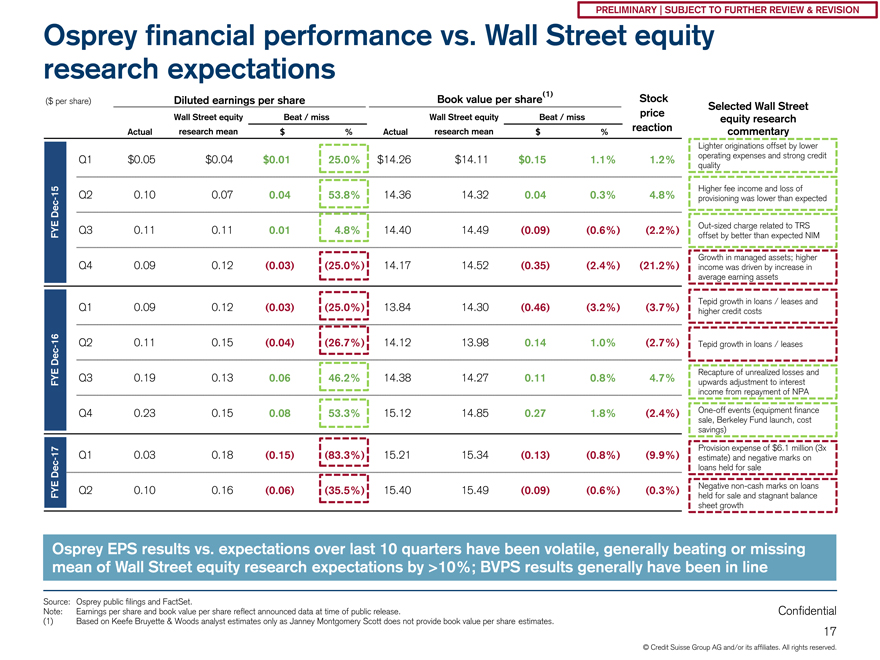
PRELIMINARY | SUBJECT TO FURTHER REVIEW & REVISION Osprey financial performance vs. Wall Street equity research expectations (1) Stock ($ per share) Diluted earnings per share Book value per share Selected Wall Street Wall Street equity Beat / miss Wall Street equity Beat / miss price equity research Actual research mean $ % Actual research mean $ % reaction commentary Lighter originations offset by lower Q1 $0.05 $0.04 $0.01 25.0% $14.26 $14.11 $0.15 1.1% 1.2% operating expenses and strong credit quality 15 Higher fee income and loss of Q2 0.10 0.07 0.04 53.8% 14.36 14.32 0.04 0.3% 4.8%—Dec provisioning was lower than expected EOut-sized charge related to TRS Q3 0.11 0.11 0.01 4.8% 14.40 14.49 (0.09) (0.6%) (2.2%) FY offset by better than expected NIM Growth in managed assets; higher Q4 0.09 0.12 (0.03) (25.0%) 14.17 14.52 (0.35) (2.4%) (21.2%) income was driven by increase in average earning assets Tepid growth in loans / leases and Q1 0.09 0.12 (0.03) (25.0%) 13.84 14.30 (0.46) (3.2%) (3.7%) higher credit costs 16—Q2 0.11 0.15 (0.04) (26.7%) 14.12 13.98 0.14 1.0% (2.7%) Tepid growth in loans / leases Dec Recapture of unrealized losses and FYE Q3 0.19 0.13 0.06 46.2% 14.38 14.27 0.11 0.8% 4.7% upwards adjustment to interest income from repayment of NPA Q4 0.23 0.15 0.08 53.3% 15.12 14.85 0.27 1.8% (2.4%)One-off events (equipment finance sale, Berkeley Fund launch, cost savings) 17 Provision expense of $6.1 million (3x Q1 0.03 0.18 (0.15) (83.3%) 15.21 15.34 (0.13) (0.8%) (9.9%)—estimate) and negative marks on Dec loans held for sale Negativenon-cash marks on loans Q2 0.10 0.16 (0.06) (35.5%) 15.40 15.49 (0.09) (0.6%) (0.3%) FYE held for sale and stagnant balance sheet growth Osprey EPS results vs. expectations over last 10 quarters have been volatile, generally beating or missing mean of Wall Street equity research expectations by >10%; BVPS results generally have been in line Source: Osprey public filings and FactSet. Note: Earnings per share and book value per share reflect announced data at time of public release. Confidential (1) Based on Keefe Bruyette & Woods analyst estimates only as Janney Montgomery Scott does not provide book value per share estimates. 17 © Credit Suisse Group AG and/or its affiliates. All rights reserved.
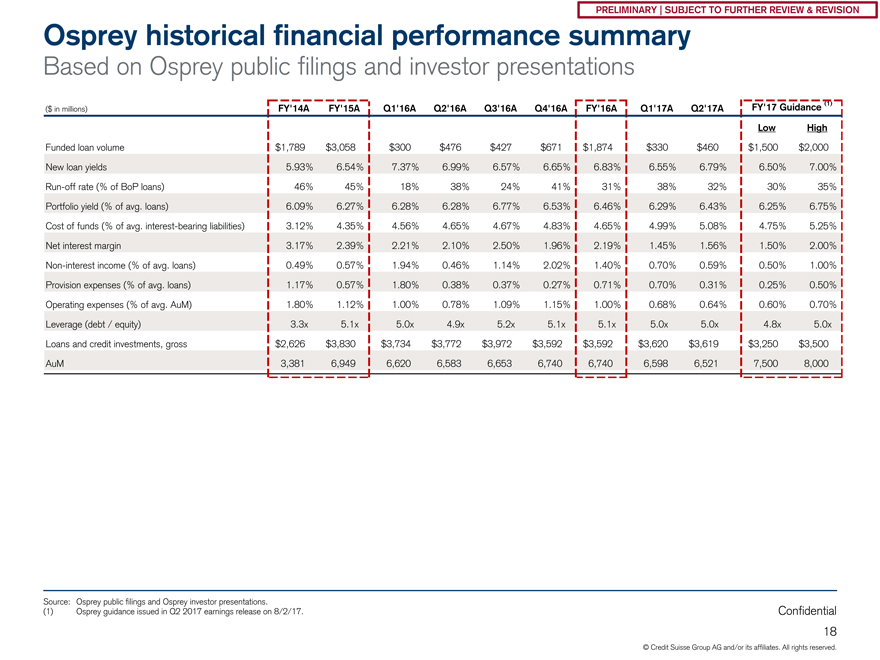
PRELIMINARY | SUBJECT TO FURTHER REVIEW & REVISION Osprey historical financial performance summary Based on Osprey public filings and investor presentations FY’17 Guidance (1) ($ in millions) FY’14A FY’15A Q1’16A Q2’16A Q3’16A Q4’16A FY’16A Q1’17A Q2’17A Low High Funded loan volume $1,789 $3,058 $300 $476 $427 $671 $1,874 $330 $460 $1,500 $2,000 New loan yields 5.93% 6.54% 7.37% 6.99% 6.57% 6.65% 6.83% 6.55% 6.79% 6.50% 7.00%Run-off rate (% of BoP loans) 46% 45% 18% 38% 24% 41% 31% 38% 32% 30% 35% Portfolio yield (% of avg. loans) 6.09% 6.27% 6.28% 6.28% 6.77% 6.53% 6.46% 6.29% 6.43% 6.25% 6.75% Cost of funds (% of avg. interest-bearing liabilities) 3.12% 4.35% 4.56% 4.65% 4.67% 4.83% 4.65% 4.99% 5.08% 4.75% 5.25% Net interest margin 3.17% 2.39% 2.21% 2.10% 2.50% 1.96% 2.19% 1.45% 1.56% 1.50% 2.00%Non-interest income (% of avg. loans) 0.49% 0.57% 1.94% 0.46% 1.14% 2.02% 1.40% 0.70% 0.59% 0.50% 1.00% Provision expenses (% of avg. loans) 1.17% 0.57% 1.80% 0.38% 0.37% 0.27% 0.71% 0.70% 0.31% 0.25% 0.50% Operating expenses (% of avg. AuM) 1.80% 1.12% 1.00% 0.78% 1.09% 1.15% 1.00% 0.68% 0.64% 0.60% 0.70% Leverage (debt / equity) 3.3x 5.1x 5.0x 4.9x 5.2x 5.1x 5.1x 5.0x 5.0x 4.8x 5.0x Loans and credit investments, gross $2,626 $3,830 $3,734 $3,772 $3,972 $3,592 $3,592 $3,620 $3,619 $3,250 $3,500 AuM 3,381 6,949 6,620 6,583 6,653 6,740 6,740 6,598 6,521 7,500 8,000 Source: Osprey public filings and Osprey investor presentations. (1) Osprey guidance issued in Q2 2017 earnings release on 8/2/17. Confidential 18 © Credit Suisse Group AG and/or its affiliates. All rights reserved.
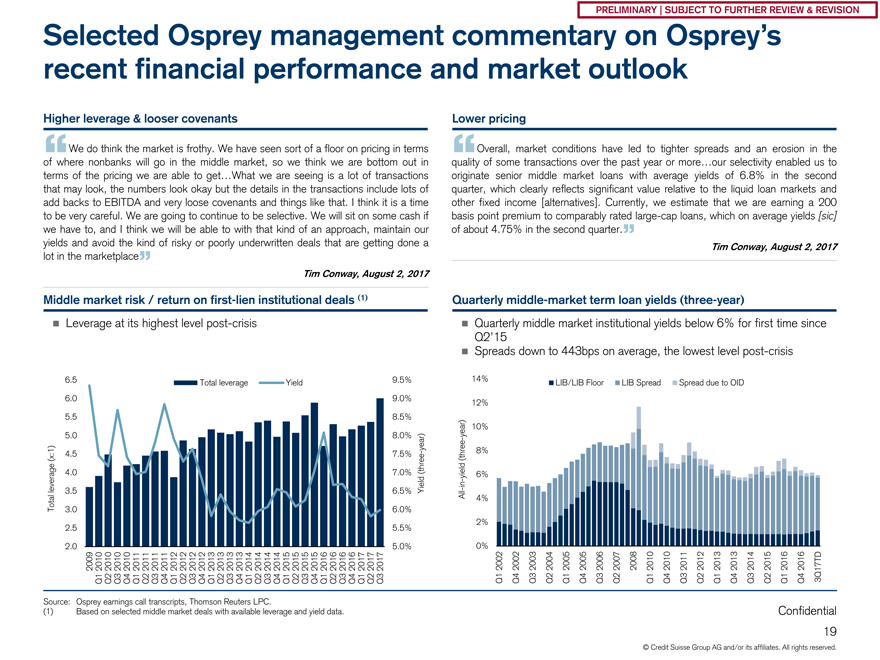
PRELIMINARY | SUBJECT TO FURTHER REVIEW & REVISION Selected Osprey management commentary on Osprey’s recent financial performance and market outlook Higher leverage & looser covenants Lower pricing We do think the market is frothy. We have seen sort of a floor on pricing in terms Overall, market conditions have led to tighter spreads and an erosion in the of where nonbanks will go in the middle market, so we think we are bottom out in quality of some transactions over the past year or more…our selectivity enabled us to “ terms of the pricing we are able to get…What we are seeing is a lot of transactions originate “ senior middle market loans with average yields of 6.8% in the second that may look, the numbers look okay but the details in the transactions include lots of quarter, which clearly reflects significant value relative to the liquid loan markets and add backs to EBITDA and very loose covenants and things like that. I think it is a time other fixed income [alternatives]. Currently, we estimate that we are earning a 200 to be very careful. We are going to continue to be selective. We will sit on some cash if basis point premium to comparably ratedlarge-cap loans, which on average yields [sic] we have to, and I think we will be able to with that kind of an approach, maintain our of about 4.75% in the second quarter. yields and avoid the kind of risky or poorly underwritten deals that are getting done a ” Tim Conway, August 2, 2017 lot in the marketplace” Tim Conway, August 2, 2017 Middle market risk / return on first-lien institutional deals (1) Quarterly middle-market term loan yields (three-year) ï® Leverage at its highest level post-crisis ï® Quarterly middle market institutional yields below 6% for first time since Q2’15 ï® Spreads down to 443bps on average, the lowest level post-crisis 6.5 Total leverage Yield 9.5% 14% LIB/LIB Floor LIB Spread Spread due to OID 6.0 9.0% 12% 5.5 8.5% 10% 5.0 8.0% year)—year) 8% (x:1) 4.5 7.5%—(three (three 4.0 7.0% yield 6% in -leverage 3.5 6.5% Yield -Total All 4% 3.0 6.0% 2% 2.5 5.5% 2.0 5.0% 0% 2009 2010 2010 2010 2010 2011 2011 2011 2011 2012 201220122012 2013 2013 20132013201420142014 2014 201520152015201520162016 2016 2016 2017 2017 2017 2002 2002 2003 2004 2005 2005 20062007 2008 2010 2010 201120122013 2013 2014 2015 20162016 3Q17TD Q1 Q2 Q3 Q4 Q1 Q2 Q3 Q4 Q1 Q2 Q3 Q4 Q1 Q2 Q3 Q4 Q1 Q2 Q3 Q4 Q1 Q2 Q3 Q4 Q1 Q2 Q3 Q4 Q1 Q2 Q3 Q1 Q4 Q3 Q2 Q1 Q4 Q3 Q2 Q1 Q4 Q3 Q2 Q1 Q4 Q3 Q2 Q1 Q4 Source: Osprey earnings call transcripts, Thomson Reuters LPC. (1) Based on selected middle market deals with available leverage and yield data. Confidential 19 © Credit Suisse Group AG and/or its affiliates. All rights reserved.
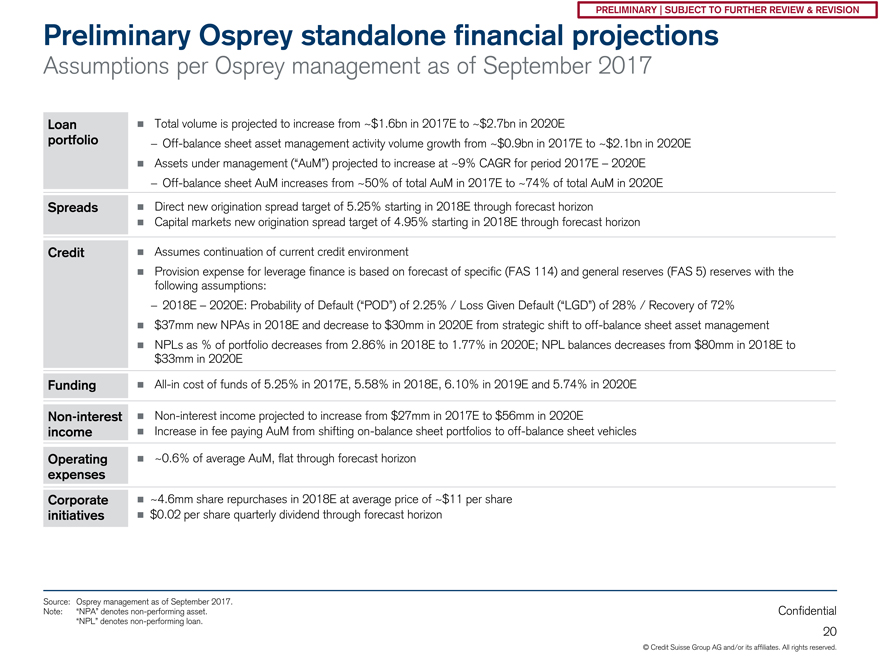
PRELIMINARY | SUBJECT TO FURTHER REVIEW & REVISION Preliminary Osprey standalone financial projections Assumptions per Osprey management as of September 2017 Loan ï® Total volume is projected to increase from ~$1.6bn in 2017E to ~$2.7bn in 2020Eportfolio—Off-balance sheet asset management activity volume growth from ~$0.9bn in 2017E to ~$2.1bn in 2020E ï® Assets under management (“AuM”) projected to increase at ~9% CAGR for period 2017E – 2020E—Off-balance sheet AuM increases from ~50% of total AuM in 2017E to ~74% of total AuM in 2020E Spreads ï® Direct new origination spread target of 5.25% starting in 2018E through forecast horizon ï® Capital markets new origination spread target of 4.95% starting in 2018E through forecast horizon Credit ï® Assumes continuation of current credit environment ï® Provision expense for leverage finance is based on forecast of specific (FAS 114) and general reserves (FAS 5) reserves with the following assumptions: —2018E – 2020E: Probability of Default (“POD”) of 2.25% / Loss Given Default (“LGD”) of 28% / Recovery of 72% ï® $37mm new NPAs in 2018E and decrease to $30mm in 2020E from strategic shift tooff-balance sheet asset management ï® NPLs as % of portfolio decreases from 2.86% in 2018E to 1.77% in 2020E; NPL balances decreases from $80mm in 2018E to $33mm in 2020E Funding ï®All-in cost of funds of 5.25% in 2017E, 5.58% in 2018E, 6.10% in 2019E and 5.74% in 2020ENon-interest ï®Non-interest income projected to increase from $27mm in 2017E to $56mm in 2020E income ï® Increase in fee paying AuM from shiftingon-balance sheet portfolios tooff-balance sheet vehicles Operating ï® ~0.6% of average AuM, flat through forecast horizon expenses Corporate ï® ~4.6mm share repurchases in 2018E at average price of ~$11 per share initiatives ï® $0.02 per share quarterly dividend through forecast horizon Source: Osprey management as of September 2017. Note: “NPA” denotesnon-performing asset. Confidential “NPL” denotesnon-performing loan. 20 © Credit Suisse Group AG and/or its affiliates. All rights reserved.
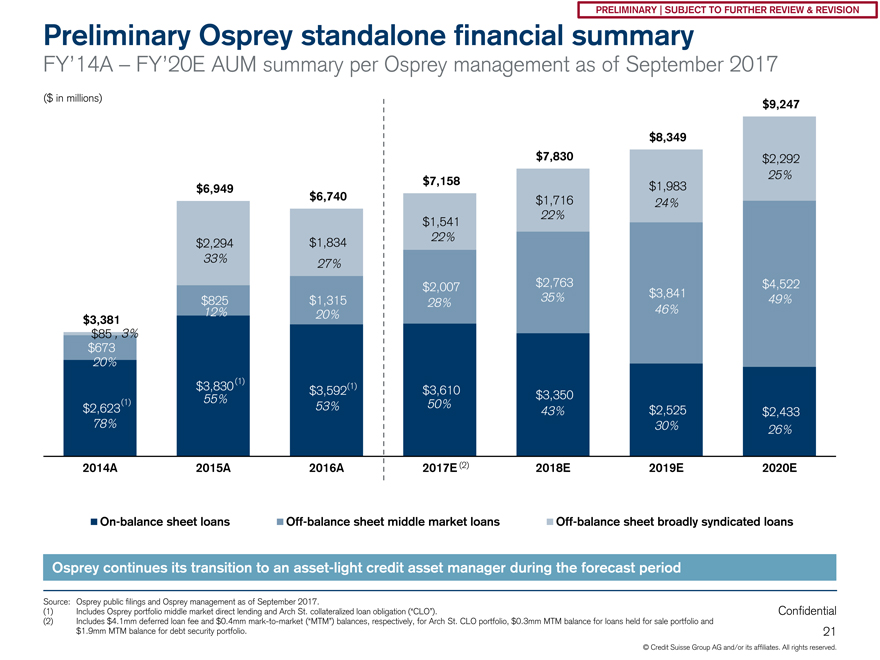
PRELIMINARY | SUBJECT TO FURTHER REVIEW & REVISION Preliminary Osprey standalone financial summary FY’14A – FY’20E AUM summary per Osprey management as of September 2017 ($ in millions) $9,247 $8,349 $7,830 $2,292 25% $7,158 $1,983 $6,949 $6,740 $1,716 24% 22% $1,541 22% $2,294 $1,834 33% 27% $2,007 $2,763 $3,841 $4,522 $825 $1,315 28% 35% 49% 12% 20% 46% $3,381 $85 , 3% $673 20% (1) $3,830 $3,592(1) $3,610 55% $3,350 (1) 53% 50% $2,623 43% $2,525 $2,433 78% 30% 26% 2014A 2015A 2016A 2017E (2) 2018E 2019E 2020EOn-balance sheet loansOff-balance sheet middle market loansOff-balance sheet broadly syndicated loans Osprey continues its transition to an asset-light credit asset manager during the forecast period Source: Osprey public filings and Osprey management as of September 2017. (1) Includes Osprey portfolio middle market direct lending and Arch St. collateralized loan obligation (“CLO”). Confidential (2) Includes $4.1mm deferred loan fee and $0.4mmmark-to-market (“MTM”) balances, respectively, for Arch St. CLO portfolio, $0.3mm MTM balance for loans held for sale portfolio and $1.9mm MTM balance for debt security portfolio. 21 © Credit Suisse Group AG and/or its affiliates. All rights reserved.
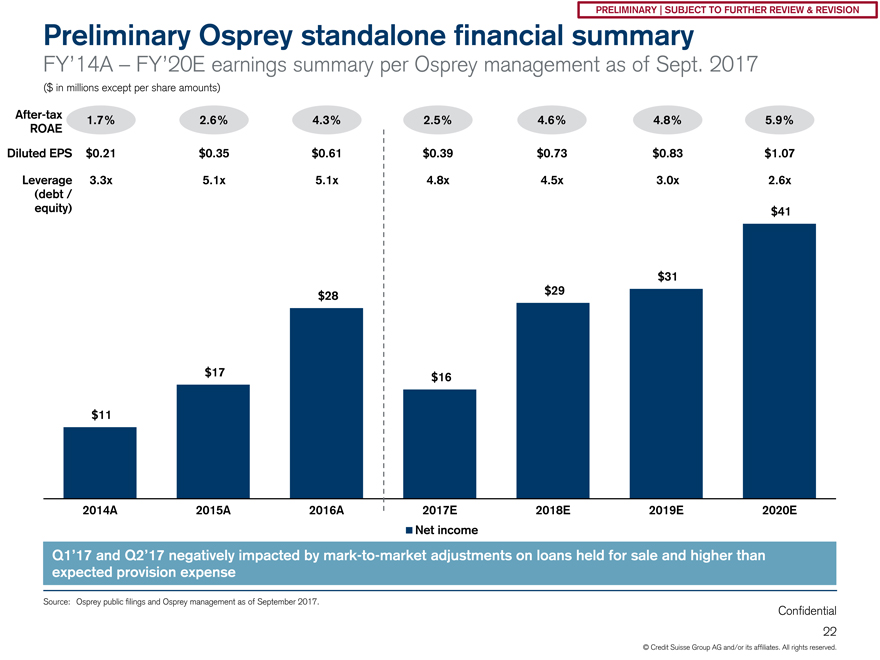
PRELIMINARY | SUBJECT TO FURTHER REVIEW & REVISION Preliminary Osprey standalone financial summary FY’14A – FY’20E earnings summary per Osprey management as of Sept. 2017 ($ in millions except per share amounts)After-tax 1.7% 2.6% 4.3% 2.5% 4.6% 4.8% 5.9% ROAE Diluted EPS $0.21 $0.35 $0.61 $0.39 $0.73 $0.83 $1.07 Leverage 3.3x 5.1x 5.1x 4.8x 4.5x 3.0x 2.6x (debt / equity) $41 $31 $28 $29 $17 $16 $11 2014A 2015A 2016A 2017E 2018E 2019E 2020E Net income Q1’17 and Q2’17 negatively impacted bymark-to-market adjustments on loans held for sale and higher than expected provision expense Source: Osprey public filings and Osprey management as of September 2017. Confidential 22 © Credit Suisse Group AG and/or its affiliates. All rights reserved.
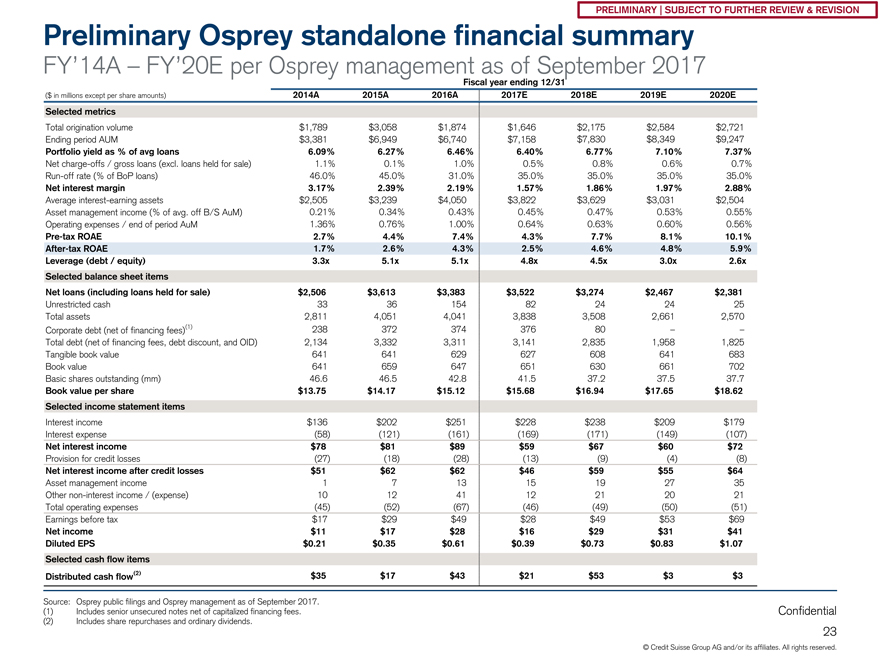
PRELIMINARY | SUBJECT TO FURTHER REVIEW & REVISION Preliminary Osprey standalone financial summary FY’14A – FY’20E per Osprey management as of September 2017 Fiscal year ending 12/31 ($ in millions except per share amounts) 2014A 2015A 2016A 2017E 2018E 2019E 2020E Selected metrics Total origination volume $1,789 $3,058 $1,874 $1,646 $2,175 $2,584 $2,721 Ending period AUM $3,381 $6,949 $6,740 $7,158 $7,830 $8,349 $9,247 Portfolio yield as % of avg loans 6.09% 6.27% 6.46% 6.40% 6.77% 7.10% 7.37% Net charge-offs / gross loans (excl. loans held for sale) 1.1% 0.1% 1.0% 0.5% 0.8% 0.6% 0.7%Run-off rate (% of BoP loans) 46.0% 45.0% 31.0% 35.0% 35.0% 35.0% 35.0% Net interest margin 3.17% 2.39% 2.19% 1.57% 1.86% 1.97% 2.88% Average interest-earning assets $2,505 $3,239 $4,050 $3,822 $3,629 $3,031 $2,504 Asset management income (% of avg. off B/S AuM) 0.21% 0.34% 0.43% 0.45% 0.47% 0.53% 0.55% Operating expenses / end of period AuM 1.36% 0.76% 1.00% 0.64% 0.63% 0.60% 0.56%Pre-tax ROAE 2.7% 4.4% 7.4% 4.3% 7.7% 8.1% 10.1%After-tax ROAE 1.7% 2.6% 4.3% 2.5% 4.6% 4.8% 5.9% Leverage (debt / equity) 3.3x 5.1x 5.1x 4.8x 4.5x 3.0x 2.6x Selected balance sheet items Net loans (including loans held for sale) $2,506 $3,613 $3,383 $3,522 $3,274 $2,467 $2,381 Unrestricted cash 33 36 154 82 24 24 25 Total assets 2,811 4,051 4,041 3,838 3,508 2,661 2,570 Corporate debt (net of financing fees)(1) 238 372 374 376 80 – –Total debt (net of financing fees, debt discount, and OID) 2,134 3,332 3,311 3,141 2,835 1,958 1,825 Tangible book value 641 641 629 627 608 641 683 Book value 641 659 647 651 630 661 702 Basic shares outstanding (mm) 46.6 46.5 42.8 41.5 37.2 37.5 37.7 Book value per share $13.75 $14.17 $15.12 $15.68 $16.94 $17.65 $18.62 Selected income statement items Interest income $136 $202 $251 $228 $238 $209 $179 Interest expense (58) (121) (161) (169) (171) (149) (107) Net interest income $78 $81 $89 $59 $67 $60 $72 Provision for credit losses (27) (18) (28) (13) (9) (4) (8) Net interest income after credit losses $51 $62 $62 $46 $59 $55 $64 Asset management income 1 7 13 15 19 27 35 Othernon-interest income / (expense) 10 12 41 12 21 20 21 Total operating expenses (45) (52) (67) (46) (49) (50) (51) Earnings before tax $17 $29 $49 $28 $49 $53 $69 Net income $11 $17 $28 $16 $29 $31 $41 Diluted EPS $0.21 $0.35 $0.61 $0.39 $0.73 $0.83 $1.07 Selected cash flow items Distributed cash flow(2) $35 $17 $43 $21 $53 $3 $3 Source: Osprey public filings and Osprey management as of September 2017. (1) Includes senior unsecured notes net of capitalized financing fees. Confidential (2) Includes share repurchases and ordinary dividends. 23 © Credit Suisse Group AG and/or its affiliates. All rights reserved.

PRELIMINARY | SUBJECT TO FURTHER REVIEW & REVISION Preliminary Osprey standalone financial summary Cash flow statement per Osprey management as of September 2017 ($ in millions) Cash flow statement 2H 2017E 2018E 2019E 2020E Beginning unrestricted cash $50 $82 $24 $24 Cash generated from operations Interest income 110 228 200 172 Interest expense (51) (108) (93) (77) Corporate & subordinated debt interest expense (27) (48) (27) (14) Other income 16 40 47 56 Cash operating expenses (15) (31) (32) (33) Incentive compensation 0 (14) (14) (15) Tax payments (7) (10) (9) (20) Miscellaneous (7) (0) (1) 0 Total cash generated from operations $20 $56 $72 $71 Cash generated from investing & financing Net investment in leveraged finance 14 251 83 23 New NS Capital activity 3 (11) 28 (9) Corporate debt open market purchases – (300) (180) (80) Share buyback program & dividend program (4) (53) (3) (3) Total cash generated from investing & financing $12 ($113) ($72) ($69) Total change in cash 32 (58) (0) 1 Ending cash balance $82 $24 $24 $25 Source: Osprey management as of September 2017. Confidential 24 © Credit Suisse Group AG and/or its affiliates. All rights reserved.
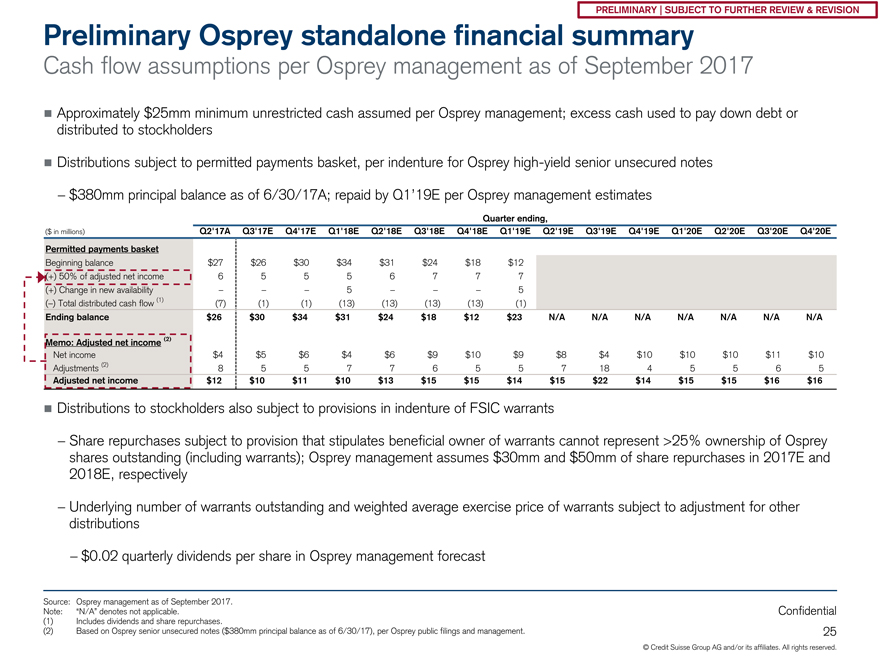
PRELIMINARY | SUBJECT TO FURTHER REVIEW & REVISION Preliminary Osprey standalone financial summary Cash flow assumptions per Osprey management as of September 2017 ï® Approximately $25mm minimum unrestricted cash assumed per Osprey management; excess cash used to pay down debt or distributed to stockholders ï® Distributions subject to permitted payments basket, per indenture for Osprey high-yield senior unsecured notes —$380mm principal balance as of 6/30/17A; repaid by Q1’19E per Osprey management estimates Quarter ending, ($ in millions) Q2’17A Q3’17E Q4’17E Q1’18E Q2’18E Q3’18E Q4’18E Q1’19E Q2’19E Q3’19E Q4’19E Q1’20E Q2’20E Q3’20E Q4’20E Permitted payments basket Beginning balance $27 $26 $30 $34 $31 $24 $18 $12 (+) 50% of adjusted net income 6 5 5 5 6 7 7 7 (+) Change in new availability – – – 5 – – – 5 (–) Total distributed cash flow (1) (7) (1) (1) (13) (13) (13) (13) (1) Ending balance $26 $30 $34 $31 $24 $18 $12 $23 N/A N/A N/A N/A N/A N/A N/A Memo: Adjusted net income (2) Net income $4 $5 $6 $4 $6 $9 $10 $9 $8 $4 $10 $10 $10 $11 $10 Adjustments (2) 8 5 5 7 7 6 5 5 7 18 4 5 5 6 5 Adjusted net income $12 $10 $11 $10 $13 $15 $15 $14 $15 $22 $14 $15 $15 $16 $16 ï® Distributions to stockholders also subject to provisions in indenture of FSIC warrants —Share repurchases subject to provision that stipulates beneficial owner of warrants cannot represent >25% ownership of Osprey shares outstanding (including warrants); Osprey management assumes $30mm and $50mm of share repurchases in 2017E and 2018E, respectively —Underlying number of warrants outstanding and weighted average exercise price of warrants subject to adjustment for other distributions —$0.02 quarterly dividends per share in Osprey management forecast Source: Osprey management as of September 2017. Note: “N/A” denotes not applicable. Confidential (1) Includes dividends and share repurchases. (2) Based on Osprey senior unsecured notes ($380mm principal balance as of 6/30/17), per Osprey public filings and management. 25 © Credit Suisse Group AG and/or its affiliates. All rights reserved.
PRELIMINARY | SUBJECT TO FURTHER REVIEW & REVISION B. Comparisons of updated September 2017 versus February 2017 management projections Confidential 26
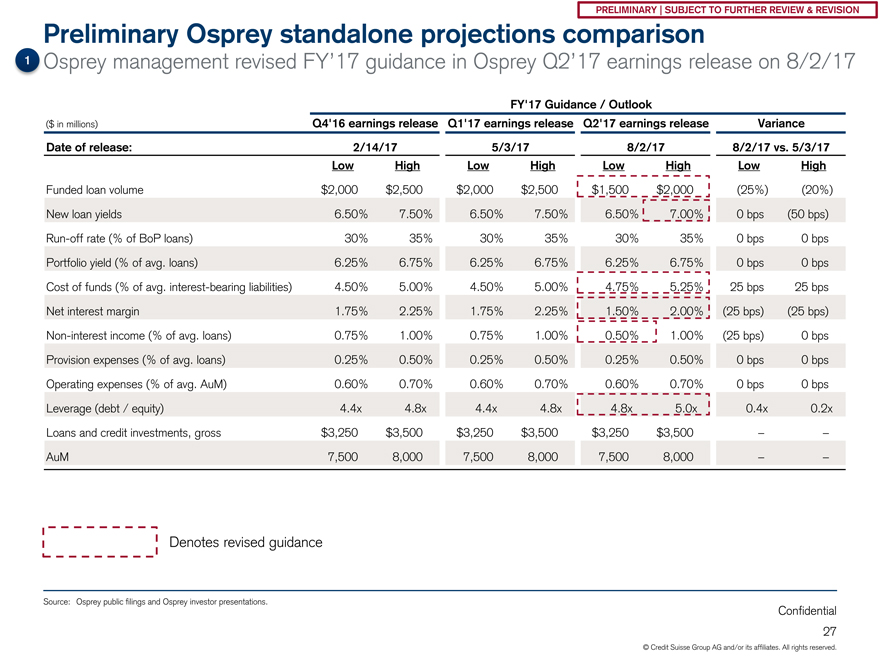
PRELIMINARY | SUBJECT TO FURTHER REVIEW & REVISION Preliminary Osprey standalone projections comparison 1 Osprey management revised FY’17 guidance in Osprey Q2’17 earnings release on 8/2/17 FY’17 Guidance / Outlook ($ in millions) Q4’16 earnings release Q1’17 earnings release Q2’17 earnings release Variance Date of release: 2/14/17 5/3/17 8/2/17 8/2/17 vs. 5/3/17 Low High Low High Low High Low High Funded loan volume $2,000 $2,500 $2,000 $2,500 $1,500 $2,000 (25%) (20%) New loan yields 6.50% 7.50% 6.50% 7.50% 6.50% 7.00% 0 bps (50 bps)Run-off rate (% of BoP loans) 30% 35% 30% 35% 30% 35% 0 bps 0 bps Portfolio yield (% of avg. loans) 6.25% 6.75% 6.25% 6.75% 6.25% 6.75% 0 bps 0 bps Cost of funds (% of avg. interest-bearing liabilities) 4.50% 5.00% 4.50% 5.00% 4.75% 5.25% 25 bps 25 bps Net interest margin 1.75% 2.25% 1.75% 2.25% 1.50% 2.00% (25 bps) (25 bps)Non-interest income (% of avg. loans) 0.75% 1.00% 0.75% 1.00% 0.50% 1.00% (25 bps) 0 bps Provision expenses (% of avg. loans) 0.25% 0.50% 0.25% 0.50% 0.25% 0.50% 0 bps 0 bps Operating expenses (% of avg. AuM) 0.60% 0.70% 0.60% 0.70% 0.60% 0.70% 0 bps 0 bps Leverage (debt / equity) 4.4x 4.8x 4.4x 4.8x 4.8x 5.0x 0.4x 0.2x Loans and credit investments, gross $3,250 $3,500 $3,250 $3,500 $3,250 $3,500 – –AuM 7,500 8,000 7,500 8,000 7,500 8,000 – – Denotes revised guidance Source: Osprey public filings and Osprey investor presentations. Confidential 27 © Credit Suisse Group AG and/or its affiliates. All rights reserved.
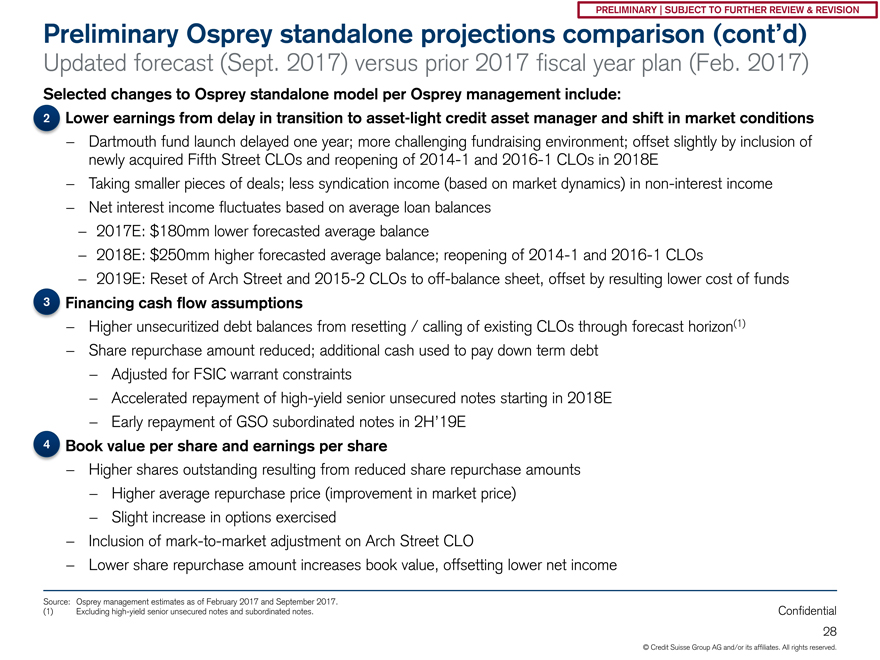
PRELIMINARY | SUBJECT TO FURTHER REVIEW & REVISION Preliminary Osprey standalone projections comparison (cont’d) Updated forecast (Sept. 2017) versus prior 2017 fiscal year plan (Feb. 2017) Selected changes to Osprey standalone model per Osprey management include: 2 Lower earnings from delay in transition to asset-light credit asset manager and shift in market conditions —Dartmouth fund launch delayed one year; more challenging fundraising environment; offset slightly by inclusion of newly acquired Fifth Street CLOs and reopening of2014-1 and2016-1 CLOs in 2018E —Taking smaller pieces of deals; less syndication income (based on market dynamics) innon-interest income —Net interest income fluctuates based on average loan balances —2017E: $180mm lower forecasted average balance —2018E: $250mm higher forecasted average balance; reopening of2014-1 and2016-1 CLOs —2019E: Reset of Arch Street and2015-2 CLOs tooff-balance sheet, offset by resulting lower cost of funds 3 Financing cash flow assumptions —Higher unsecuritized debt balances from resetting / calling of existing CLOs through forecast horizon(1) —Share repurchase amount reduced; additional cash used to pay down term debt —Adjusted for FSIC warrant constraints —Accelerated repayment of high-yield senior unsecured notes starting in 2018E —Early repayment of GSO subordinated notes in 2H’19E 4 Book value per share and earnings per share —Higher shares outstanding resulting from reduced share repurchase amounts —Higher average repurchase price (improvement in market price) —Slight increase in options exercised —Inclusion ofmark-to-market adjustment on Arch Street CLO —Lower share repurchase amount increases book value, offsetting lower net income Source: Osprey management estimates as of February 2017 and September 2017. (1) Excluding high-yield senior unsecured notes and subordinated notes. Confidential 28 © Credit Suisse Group AG and/or its affiliates. All rights reserved.
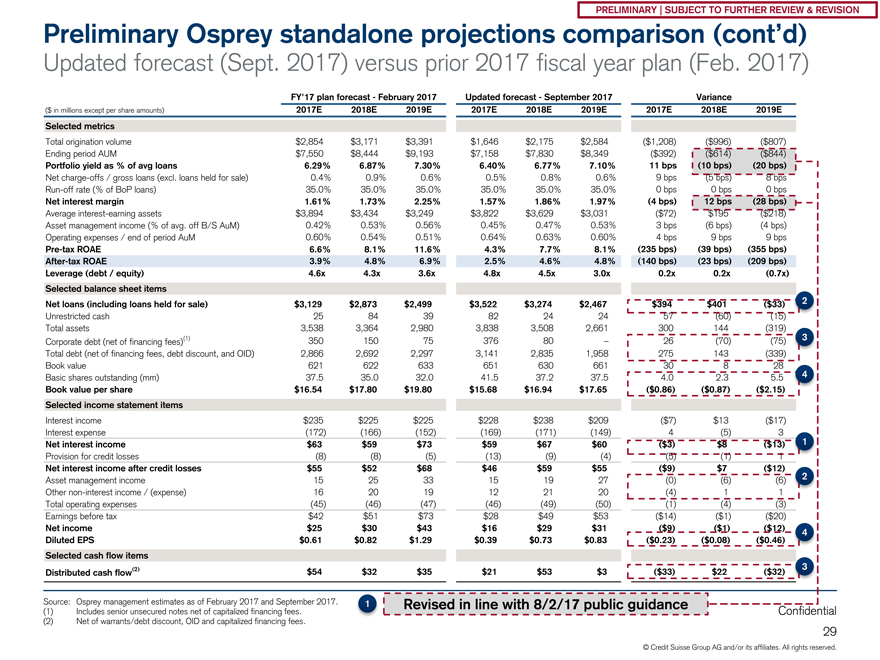
PRELIMINARY | SUBJECT TO FURTHER REVIEW & REVISION Preliminary Osprey standalone projections comparison (cont’d) Updated forecast (Sept. 2017) versus prior 2017 fiscal year plan (Feb. 2017) FY’17 plan forecast—February 2017 Updated forecast—September 2017 Variance ($ in millions except per share amounts) 2017E 2018E 2019E 2017E 2018E 2019E 2017E 2018E 2019E Selected metrics Total origination volume $2,854 $3,171 $3,391 $1,646 $2,175 $2,584 ($1,208) ($996) ($807) Ending period AUM $7,550 $8,444 $9,193 $7,158 $7,830 $8,349 ($392) ($614) ($844) Portfolio yield as % of avg loans 6.29% 6.87% 7.30% 6.40% 6.77% 7.10% 11 bps (10 bps) (20 bps) Net charge-offs / gross loans (excl. loans held for sale) 0.4% 0.9% 0.6% 0.5% 0.8% 0.6% 9 bps (5 bps) 8 bpsRun-off rate (% of BoP loans) 35.0% 35.0% 35.0% 35.0% 35.0% 35.0% 0 bps 0 bps 0 bps Net interest margin 1.61% 1.73% 2.25% 1.57% 1.86% 1.97% (4 bps) 12 bps (28 bps) Average interest-earning assets $3,894 $3,434 $3,249 $3,822 $3,629 $3,031 ($72) $195 ($218) Asset management income (% of avg. off B/S AuM) 0.42% 0.53% 0.56% 0.45% 0.47% 0.53% 3 bps (6 bps) (4 bps) Operating expenses / end of period AuM 0.60% 0.54% 0.51% 0.64% 0.63% 0.60% 4 bps 9 bps 9 bpsPre-tax ROAE 6.6% 8.1% 11.6% 4.3% 7.7% 8.1% (235 bps) (39 bps) (355 bps)After-tax ROAE 3.9% 4.8% 6.9% 2.5% 4.6% 4.8% (140 bps) (23 bps) (209 bps) Leverage (debt / equity) 4.6x 4.3x 3.6x 4.8x 4.5x 3.0x 0.2x 0.2x (0.7x) Selected balance sheet items Net loans (including loans held for sale) $3,129 $2,873 $2,499 $3,522 $3,274 $2,467 $394 $401 ($33) 2 Unrestricted cash 25 84 39 82 24 24 57 (60) (15) Total assets 3,538 3,364 2,980 3,838 3,508 2,661 300 144 (319) Corporate debt (net of financing fees)(1) 350 150 75 376 80 – 26 (70) (75) 3 Total debt (net of financing fees, debt discount, and OID) 2,866 2,692 2,297 3,141 2,835 1,958 275 143 (339) Book value 621 622 633 651 630 661 30 8 28 4 Basic shares outstanding (mm) 37.5 35.0 32.0 41.5 37.2 37.5 4.0 2.3 5.5 Book value per share $16.54 $17.80 $19.80 $15.68 $16.94 $17.65 ($0.86) ($0.87) ($2.15) Selected income statement items Interest income $235 $225 $225 $228 $238 $209 ($7) $13 ($17) Interest expense (172) (166) (152) (169) (171) (149) 4 (5) 3 1 Net interest income $63 $59 $73 $59 $67 $60 ($3) $8 ($13) Provision for credit losses (8) (8) (5) (13) (9) (4) (5) (1) 1 Net interest income after credit losses $55 $52 $68 $46 $59 $55 ($9) $7 ($12) Asset management income 15 25 33 15 19 27 (0) (6) (6) 2 Othernon-interest income / (expense) 16 20 19 12 21 20 (4) 1 1 Total operating expenses (45) (46) (47) (46) (49) (50) (1) (4) (3) Earnings before tax $42 $51 $73 $28 $49 $53 ($14) ($1) ($20) Net income $25 $30 $43 $16 $29 $31 ($9) ($1) ($12) 4 Diluted EPS $0.61 $0.82 $1.29 $0.39 $0.73 $0.83 ($0.23) ($0.08) ($0.46) Selected cash flow items (2) 3 Distributed cash flow $54 $32 $35 $21 $53 $3 ($33) $22 ($32) Source: Osprey management estimates as of February 2017 and September 2017. 1 Revised in line with 8/2/17 public guidance (1) Includes senior unsecured notes net of capitalized financing fees. Confidential (2) Net of warrants/debt discount, OID and capitalized financing fees. 29 © Credit Suisse Group AG and/or its affiliates. All rights reserved.
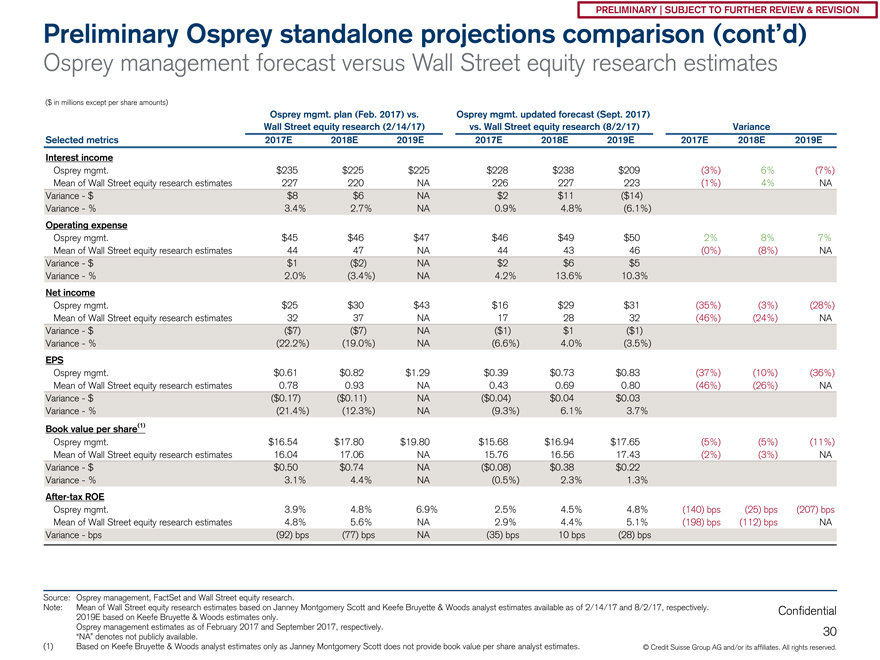
PRELIMINARY | SUBJECT TO FURTHER REVIEW & REVISION Preliminary Osprey standalone projections comparison (cont’d) Osprey management forecast versus Wall Street equity research estimates ($ in millions except per share amounts) Osprey mgmt. plan (Feb. 2017) vs. Osprey mgmt. updated forecast (Sept. 2017) Wall Street equity research (2/14/17) vs. Wall Street equity research (8/2/17) Variance Selected metrics 2017E 2018E 2019E 2017E 2018E 2019E 2017E 2018E 2019E Interest income Osprey mgmt. $235 $225 $225 $228 $238 $209 (3%) 6% (7%) Mean of Wall Street equity research estimates 227 220 NA 226 227 223 (1%) 4% NA Variance—$ $8 $6 NA $2 $11 ($14) Variance—% 3.4% 2.7% NA 0.9% 4.8% (6.1%) Operating expense Osprey mgmt. $45 $46 $47 $46 $49 $50 2% 8% 7% Mean of Wall Street equity research estimates 44 47 NA 44 43 46 (0%) (8%) NA Variance—$ $1 ($2) NA $2 $6 $5 Variance—% 2.0% (3.4%) NA 4.2% 13.6% 10.3% Net income Osprey mgmt. $25 $30 $43 $16 $29 $31 (35%) (3%) (28%) Mean of Wall Street equity research estimates 32 37 NA 17 28 32 (46%) (24%) NA Variance—$ ($7) ($7) NA ($1) $1 ($1) Variance—% (22.2%) (19.0%) NA (6.6%) 4.0% (3.5%) EPS Osprey mgmt. $0.61 $0.82 $1.29 $0.39 $0.73 $0.83 (37%) (10%) (36%) Mean of Wall Street equity research estimates 0.78 0.93 NA 0.43 0.69 0.80 (46%) (26%) NA Variance—$ ($0.17) ($0.11) NA ($0.04) $0.04 $0.03 Variance—% (21.4%) (12.3%) NA (9.3%) 6.1% 3.7% Book value per share(1) Osprey mgmt. $16.54 $17.80 $19.80 $15.68 $16.94 $17.65 (5%) (5%) (11%) Mean of Wall Street equity research estimates 16.04 17.06 NA 15.76 16.56 17.43 (2%) (3%) NA Variance—$ $0.50 $0.74 NA ($0.08) $0.38 $0.22 Variance—% 3.1% 4.4% NA (0.5%) 2.3% 1.3%After-tax ROE Osprey mgmt. 3.9% 4.8% 6.9% 2.5% 4.5% 4.8% (140) bps (25) bps (207) bps Mean of Wall Street equity research estimates 4.8% 5.6% NA 2.9% 4.4% 5.1% (198) bps (112) bps NA Variance—bps (92) bps (77) bps NA (35) bps 10 bps (28) bps Source: Osprey management, FactSet and Wall Street equity research. Note: Mean of Wall Street equity research estimates based on Janney Montgomery Scott and Keefe Bruyette & Woods analyst estimates available as of 2/14/17 and 8/2/17, respectively. Confidential 2019E based on Keefe Bruyette & Woods estimates only. Osprey management estimates as of February 2017 and September 2017, respectively. 30 “NA” denotes not publicly available. (1) Based on Keefe Bruyette & Woods analyst estimates only as Janney Montgomery Scott does not provide book value per share analyst estimates. © Credit Suisse Group AG and/or its affiliates. All rights reserved.
PRELIMINARY | SUBJECT TO FURTHER REVIEW & REVISION 4. Preliminary financial analysis framework Confidential 31
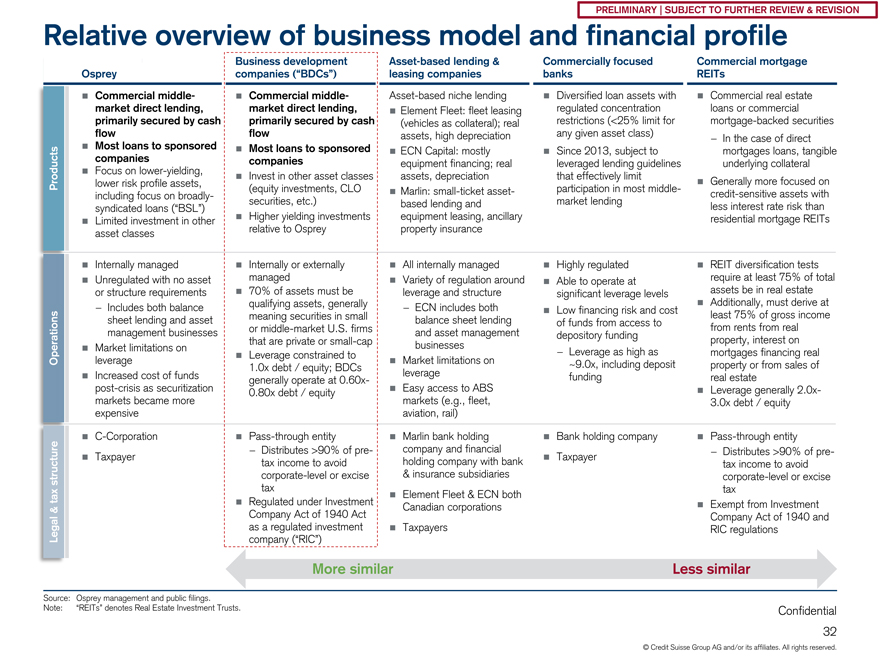
PRELIMINARY | SUBJECT TO FURTHER REVIEW & REVISION Relative overview of business model and financial profile Business development Asset-based lending & Commercially focused Commercial mortgage Osprey companies (“BDCs”) leasing companies banks REITs ï® Commercial middle-ï® Commercial middle- Asset-based niche lending ï® Diversified loan assets with ï® Commercial real estate market direct lending, market direct lending, ï® Element Fleet: fleet leasing regulated concentration loans or commercial primarily secured by cash primarily secured by cash (vehicles as collateral); real restrictions (<25% limit for mortgage-backed securities flow flow assets, high depreciation any given asset class) —In the case of direct ï® Most loans to sponsored ï® Most loans to sponsored ï® ECN Capital: mostly ï® Since 2013, subject to mortgages loans, tangible companies companies equipment financing; real leveraged lending guidelines underlying collateral ï® Focus on lower-yielding, ï® Invest in other asset classes assets, depreciation that effectively limit Products lower risk profile assets, ï® Generally more focused on (equity investments, CLO ï® Marlin: small-ticket asset- participation in most middle-including focus on broadly- credit-sensitive assets with securities, etc.) based lending and market lending syndicated loans (“BSL”) Higher yielding investments equipment leasing, ancillary less interest rate risk than ï® residential mortgage REITs ï® Limited investment in other asset classes relative to Osprey property insurance ï® Internally managed ï® Internally or externally ï® All internally managed ï® Highly regulated ï® REIT diversification tests ï® Unregulated with no asset managed ï® Variety of regulation around Able to operate at require at least 75% of total ï® or structure requirements ï® 70% of assets must be leverage and structure significant leverage levels assets be in real estate qualifying assets, generally ï® Additionally, must derive at —Includes both balance—ECN includes both ï® Low financing risk and cost least 75% of gross income sheet lending and asset meaning securities in small balance sheet lending of funds from access to from rents from real management businesses or middle-market U.S. firms and asset management depository funding property, interest on that are private orsmall-cap businesses ï® Market limitations on—Leverage as high as mortgages financing real ï® Leverage constrained to Operations leverage ï® Market limitations on ~9.0x, including deposit property or from sales of 1.0x debt / equity; BDCs ï® Increased cost of funds leverage funding real estate generally operate at0.60x-post-crisis as securitization 0.80x debt / equity ï® Easy access to ABS ï® Leverage generally2.0x-markets became more markets (e.g., fleet, 3.0x debt / equity expensive aviation, rail) ï®C-Corporation ï® Pass-through entity ï® Marlin bank holding ï® Bank holding company ï® Pass-through entity —Distributes >90% ofpre- company and financial ï®—Distributes >90% of pre-ï® Taxpayer holding company with bank Taxpayer tax income to avoid tax income to avoid structure corporate-level or excise & insurance subsidiaries corporate-level or excise tax tax taxï® Element Fleet & ECN both ï® Regulated under Investment Canadian corporations ï® Exempt from Investment & Company Act of 1940 Act as a regulated investment Taxpayers Company Act of 1940 and ï® RIC regulations Legal company (“RIC”) More similar Less similar Source: Osprey management and public filings. Note: “REITs” denotes Real Estate Investment Trusts. Confidential 32 © Credit Suisse Group AG and/or its affiliates. All rights reserved.
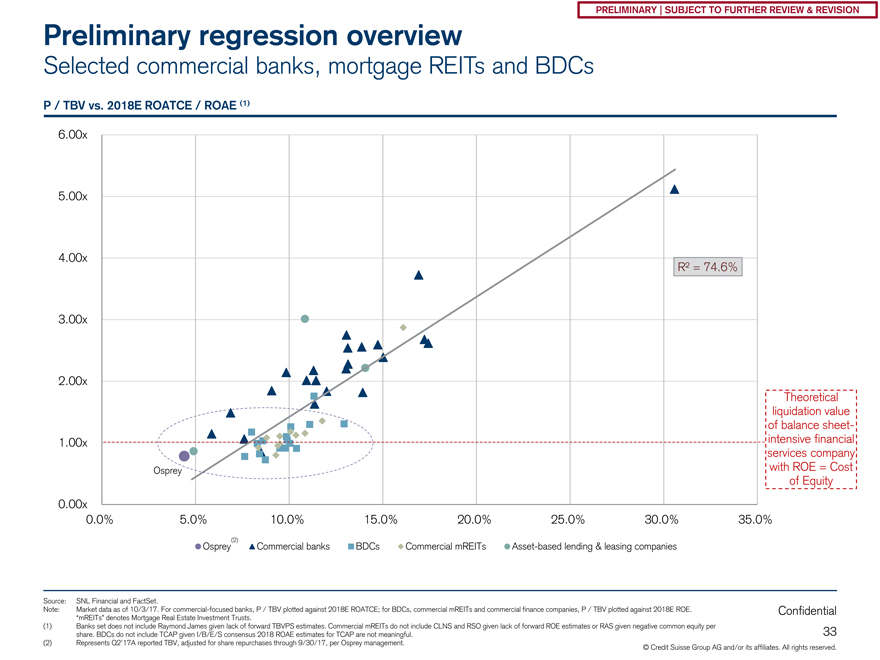
PRELIMINARY | SUBJECT TO FURTHER REVIEW & REVISION Preliminary regression overview Selected commercial banks, mortgage REITs and BDCs P / TBV vs. 2018E ROATCE / ROAE (1) 6.00x 5.00x 4.00x R² = 74.6% 3.00x 2.00x Theoretical liquidation value of balance sheet- 1.00x intensive financial services company Osprey with ROE = Cost of Equity 0.00x 0.0% 5.0% 10.0% 15.0% 20.0% 25.0% 30.0% 35.0% (2) Osprey Commercial banks BDCs Commercial mREITs Asset-based lending & leasing companies Source: SNL Financial and FactSet. Note: Market data as of 10/3/17. For commercial-focused banks, P / TBV plotted against 2018E ROATCE; for BDCs, commercial mREITs and commercial finance companies, P / TBV plotted against 2018E ROE. Confidential “mREITs” denotes Mortgage Real Estate Investment Trusts. (1) Banks set does not include Raymond James given lack of forward TBVPS estimates. Commercial mREITs do not include CLNS and RSO given lack of forward ROE estimates or RAS given negative common equity per 33 share. BDCs do not include TCAP given I/B/E/S consensus 2018 ROAE estimates for TCAP are not meaningful. (2) Represents Q2’17A reported TBV, adjusted for share repurchases through 9/30/17, per Osprey management. © Credit Suisse Group AG and/or its affiliates. All rights reserved.
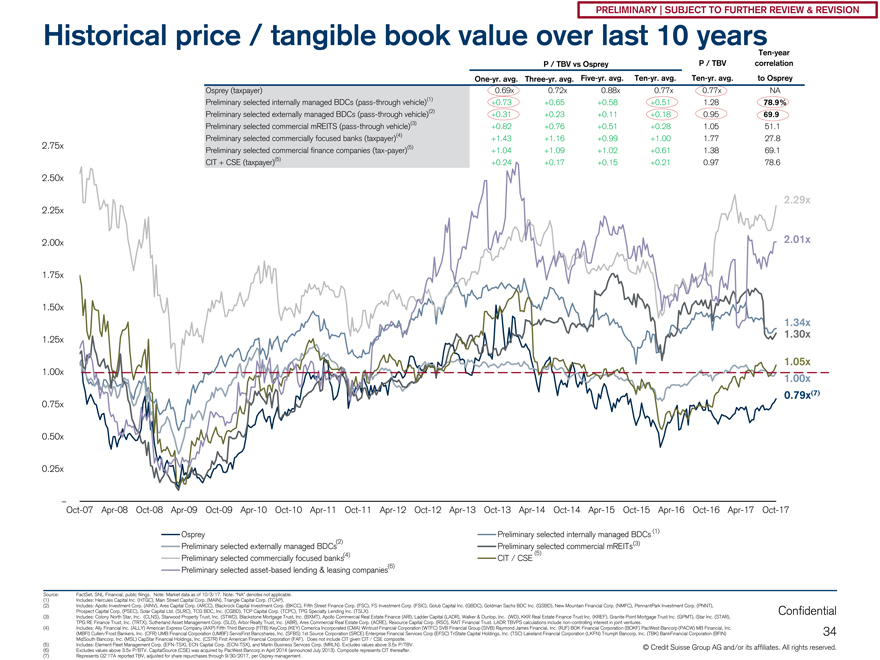
PRELIMINARY | SUBJECT TO FURTHER REVIEW & REVISION Historical price / tangible book value over last 10 yearsTen-year P / TBV vs Osprey P / TBV correlationOne-yr. avg.Three-yr. avg.Five-yr. avg.Ten-yr. avg.Ten-yr. avg. to Osprey Osprey (taxpayer) 0.69x 0.72x 0.88x 0.77x 0.77x NA Preliminary selected internally managed BDCs (pass-through vehicle)(1) +0.73 +0.65 +0.58 +0.51 1.28 78.9% Preliminary selected externally managed BDCs (pass-through vehicle)(2) +0.31 +0.23 +0.11 +0.18 0.95 69.9 Preliminary selected commercial mREITS (pass-through vehicle)(3) +0.82 +0.76 +0.51 +0.28 1.05 51.1 Preliminary selected commercially focused banks (taxpayer)(4) +1.43 +1.16 +0.99 +1.00 1.77 27.8 2.75x (5) Preliminary selected commercial finance companies(tax-payer) +1.04 +1.09 +1.02 +0.61 1.38 69.1 CIT + CSE (taxpayer)(5) +0.24 +0.17 +0.15 +0.21 0.97 78.6 2.50x 2.29x 2.25x 2.00x 2.01x 1.75x 1.50x 1.34x 1.30x 1.25x 1.05x 1.00x 1.00x 0.79x(7) 0.75x 0.50x 0.25x–Oct-07Apr-08Oct-08Apr-09Oct-09Apr-10Oct-10Apr-11Oct-11Apr-12Oct-12Apr-13Oct-13Apr-14Oct-14Apr-15Oct-15Apr-16Oct-16Apr-17Oct-17 Osprey Preliminary selected internally managed BDCs (1) (2) (3) Preliminary selected externally managed BDCs Preliminary(5) selected commercial mREITs Preliminary selected commercially focused banks(4) CIT / CSE Preliminary selected asset-based lending & leasing companies(6) Source: FactSet, SNL Financial, public filings. Note: Market data as of 10/3/17. Note: “NA” denotes not applicable. (1) Includes: Hercules Capital Inc. (HTGC), Main Street Capital Corp. (MAIN), Triangle Capital Corp. (TCAP). (2) Includes: Apollo Investment Corp. (AINV), Ares Capital Corp. (ARCC), Blackrock Capital Investment Corp. (BKCC), Fifth Street Finance Corp. (FSC), FS Investment Corp. (FSIC), Golub Capital Inc. (GBDC), Goldman Sachs BDC Inc. (GSBD), New Mountain Financial Corp. (NMFC), PennantPark Investment Corp. (PNNT), Prospect Capital Corp. (PSEC), Solar Capital Ltd. (SLRC), TCG BDC, Inc. (CGBD), TCP Capital Corp. (TCPC), TPG Specialty Lending Inc. (TSLX). Confidential (3) Includes: Colony North Star, Inc. (CLNS), Starwood Property Trust, Inc. (STWD), Blackstone Mortgage Trust, Inc. (BXMT), Apollo Commercial Real Estate Finance (ARI), Ladder Capital (LADR), Walker & Dunlop, Inc. (WD), KKR Real Estate Finance Trust Inc. (KREF), Granite Point Mortgage Trust Inc. (GPMT), iStar Inc. (STAR), TPG RE Finance Trust, Inc. (TRTX), Sutherland Asset Management Corp. (SLD), Arbor Realty Trust, Inc. (ABR), Ares Commercial Real Estate Corp. (ACRE), Resource Capital Corp. (RSO), RAIT Financial Trust. LADR TBVPS calculations includenon-controlling interest in joint ventures. (4) Includes: Ally Financial Inc. (ALLY) American Express Company (AXP) Fifth Third Bancorp (FITB) KeyCorp (KEY) Comerica Incorporated (CMA) Wintrust Financial Corporation (WTFC) SVB Financial Group (SIVB) Raymond James Financial, Inc. (RJF) BOK Financial Corporation (BOKF) PacWest Bancorp (PACW) MB Financial, Inc. (MBFI) Cullen/Frost Bankers, Inc. (CFR) UMB Financial Corporation (UMBF) ServisFirst Bancshares, Inc. (SFBS) 1st Source Corporation (SRCE) Enterprise Financial Services Corp (EFSC) TriState Capital Holdings, Inc. (TSC) Lakeland Financial Corporation (LKFN) Triumph Bancorp, Inc. (TBK) BankFinancial Corporation (BFIN) 34 MidSouth Bancorp, Inc. (MSL) CapStar Financial Holdings, Inc. (CSTR) First American Financial Corporation (FAF). Does not include CIT given CIT / CSE composite. (5) Includes: Element Fleet Management Corp.(EFN-TSX), ECN Capital Corp.(ECN-TSX), and Marlin Business Services Corp. (MRLN). Excludes values above 3.5x P/TBV. © Credit Suisse Group AG and/or its affiliates. All rights reserved. (6) Excludes values above 3.5x P/BTV. CapitalSource (CSE) was acquired by PacWest Bancorp in April 2014 (announced July 2013). Composite represents CIT thereafter. (7) Represents Q2’17A reported TBV, adjusted for share repurchases through 9/30/2017, per Osprey management.
PRELIMINARY | SUBJECT TO FURTHER REVIEW & REVISION 5. Preliminary financial analysis Confidential 35
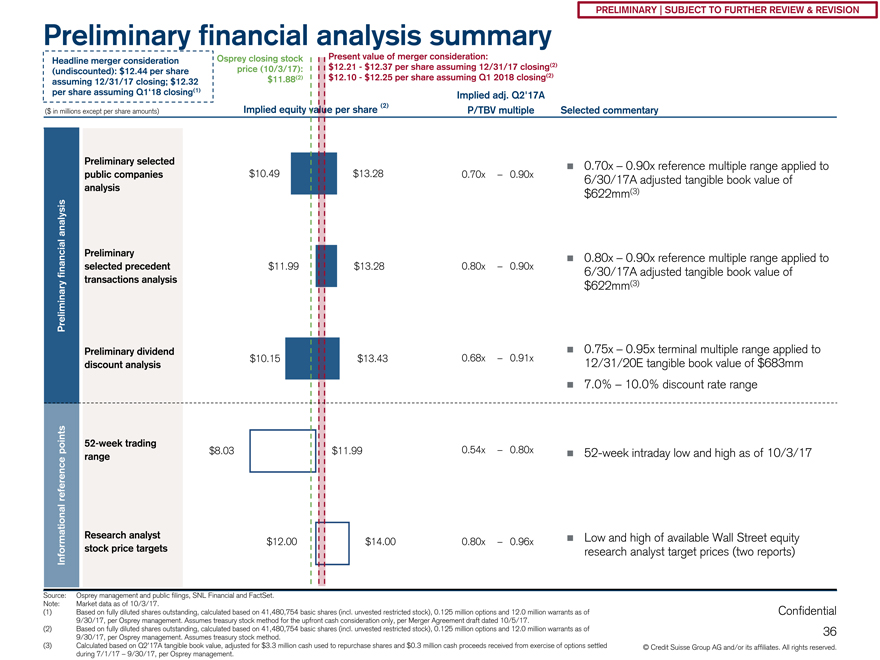
PRELIMINARY | SUBJECT TO FURTHER REVIEW & REVISION Preliminary financial analysis summary Osprey closing stock Present value of merger consideration: Headline merger consideration price (10/3/17): $12.21—$12.37 per share assuming 12/31/17 closing(2) (undiscounted): $12.44 per share $11.88(2) $12.10—$12.25 per share assuming Q1 2018 closing(2) assuming 12/31/17 closing; $12.32 per share assuming Q1‘18 closing(1) Implied adj. Q2’17A Implied equity value per share (2) ($ in millions except per share amounts) P/TBV multiple Selected commentary Preliminary selected 0.70x – 0.90x reference multiple range applied to ï® public companies $10.49 $13.28 0.70x – 0.90x 6/30/17A adjusted tangible book value of analysis (3) $622mm analysis Preliminary ï® 0.80x – 0.90x reference multiple range applied to financial selected precedent $11.99 $13.28 0.80x – 0.90x 6/30/17A adjusted tangible book value of minary transactions analysis $622mm(3) Preli Preliminary dividend ï® 0.75x – 0.95x terminal multiple range applied to $10.15 $13.43 0.68x – 0.91x 12/31/20E tangible book value of $683mm discount analysis ï® 7.0% – 10.0% discount rate range52-week trading points $8.03 $11.99 0.54x – 0.80x ce rangeï®52-week intraday low and high as of 10/3/17 referen ati onal Research analyst ï® Low and high of available Wall Street equity $12.00 $14.00 0.80x – 0.96x Inform stock price targets research analyst target prices (two reports) Source: Osprey management and public filings, SNL Financial and FactSet. Note: Market data as of 10/3/17. (1) Based on fully diluted shares outstanding, calculated based on 41,480,754 basic shares (incl. unvested restricted stock), 0.125 million options and 12.0 million warrants as of Confidential 9/30/17, per Osprey management. Assumes treasury stock method for the upfront cash consideration only, per Merger Agreement draft dated 10/5/17. (2) Based on fully diluted shares outstanding, calculated based on 41,480,754 basic shares (incl. unvested restricted stock), 0.125 million options and 12.0 million warrants as of 36 9/30/17, per Osprey management. Assumes treasury stock method. (3) Calculated based on Q2’17A tangible book value, adjusted for $3.3 million cash used to repurchase shares and $0.3 million cash proceeds received from exercise of options settled © Credit Suisse Group AG and/or its affiliates. All rights reserved. during 7/1/17 – 9/30/17, per Osprey management.
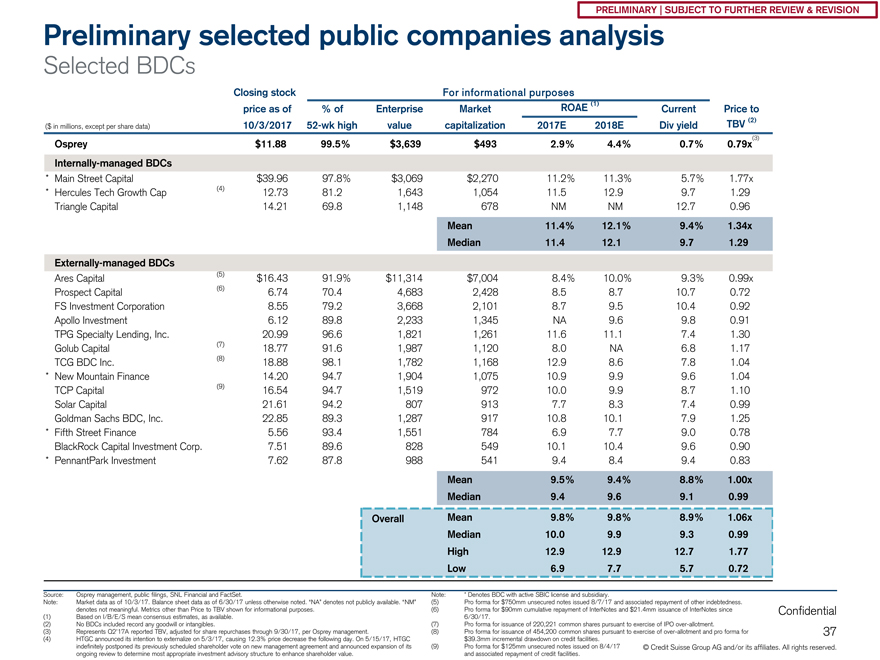
PRELIMINARY | SUBJECT TO FURTHER REVIEW & REVISION Preliminary selected public companies analysis Selected BDCs Closing stock For inform ational purposes ROAE (1) price as of % of Enterprise Market Current Price to millions, per data) TBV (2) ($ in except share 10/3/201752-wk high value capitalization 2017E 2018E Div yield (3) Osprey $11.88 99.5% $3,639 $493 2.9% 4.4% 0.7% 0.79x Internally-managed BDCs * Main Street Capital $39.96 97.8% $3,069 $2,270 11.2% 11.3% 5.7% 1.77x * Hercules Tech Growth Cap (4) 12.73 81.2 1,643 1,054 11.5 12.9 9.7 1.29 Triangle Capital 14.21 69.8 1,148 678 NM NM 12.7 0.96 Mean 11.4% 12.1% 9.4% 1.34x Median 11.4 12.1 9.7 1.29 Externally-managed BDCs Ares Capital (5) $16.43 91.9% $11,314 $7,004 8.4% 10.0% 9.3% 0.99x Prospect Capital (6) 6.74 70.4 4,683 2,428 8.5 8.7 10.7 0.72 FS Investment Corporation 8.55 79.2 3,668 2,101 8.7 9.5 10.4 0.92 Apollo Investment 6.12 89.8 2,233 1,345 NA 9.6 9.8 0.91 TPG Specialty Lending, Inc. 20.99 96.6 1,821 1,261 11.6 11.1 7.4 1.30 Golub Capital (7) 18.77 91.6 1,987 1,120 8.0 NA 6.8 1.17 TCG BDC Inc. (8) 18.88 98.1 1,782 1,168 12.9 8.6 7.8 1.04 * New Mountain Finance 14.20 94.7 1,904 1,075 10.9 9.9 9.6 1.04 TCP Capital (9) 16.54 94.7 1,519 972 10.0 9.9 8.7 1.10 Solar Capital 21.61 94.2 807 913 7.7 8.3 7.4 0.99 Goldman Sachs BDC, Inc. 22.85 89.3 1,287 917 10.8 10.1 7.9 1.25 * Fifth Street Finance 5.56 93.4 1,551 784 6.9 7.7 9.0 0.78 BlackRock Capital Investment Corp. 7.51 89.6 828 549 10.1 10.4 9.6 0.90 * PennantPark Investment 7.62 87.8 988 541 9.4 8.4 9.4 0.83 Mean 9.5% 9.4% 8.8% 1.00x Median 9.4 9.6 9.1 0.99 Overall Mean 9.8% 9.8% 8.9% 1.06x Median 10.0 9.9 9.3 0.99 High 12.9 12.9 12.7 1.77 Low 6.9 7.7 5.7 0.72 Source: Osprey management, public filings, SNL Financial and FactSet. Note: * Denotes BDC with active SBIC license and subsidiary. Note: Market data as of 10/3/17. Balance sheet data as of 6/30/17 unless otherwise noted. “NA” denotes not publicly available. “NM” (5) Pro forma for $750mm unsecured notes issued 8/7/17 and associated repayment of other indebtedness. denotes not meaningful. Metrics other than Price to TBV shown for informational purposes. (6) Pro forma for $90mm cumulative repayment of InterNotes and $21.4mm issuance of InterNotes since Confidential (1) Based on I/B/E/S mean consensus estimates, as available. 6/30/17. (2) No BDCs included record any goodwill or intangibles. (7) Pro forma for issuance of 220,221 common shares pursuant to exercise of IPO over-allotment. (3) Represents Q2’17A reported TBV, adjusted for share repurchases through 9/30/17, per Osprey management. (8) Pro forma for issuance of 454,200 common shares pursuant to exercise of over-allotment and pro forma for 37 (4) HTGC announced its intention to externalize on 5/3/17, causing 12.3% price decrease the following day. On 5/15/17, HTGC $39.3mm incremental drawdown on credit facilities. indefinitely postponed its previously scheduled shareholder vote on new management agreement and announced expansion of its (9) Pro forma for $125mm unsecured notes issued on 8/4/17 © Credit Suisse Group AG and/or its affiliates. All rights reserved. ongoing review to determine most appropriate investment advisory structure to enhance shareholder value. and associated repayment of credit facilities.
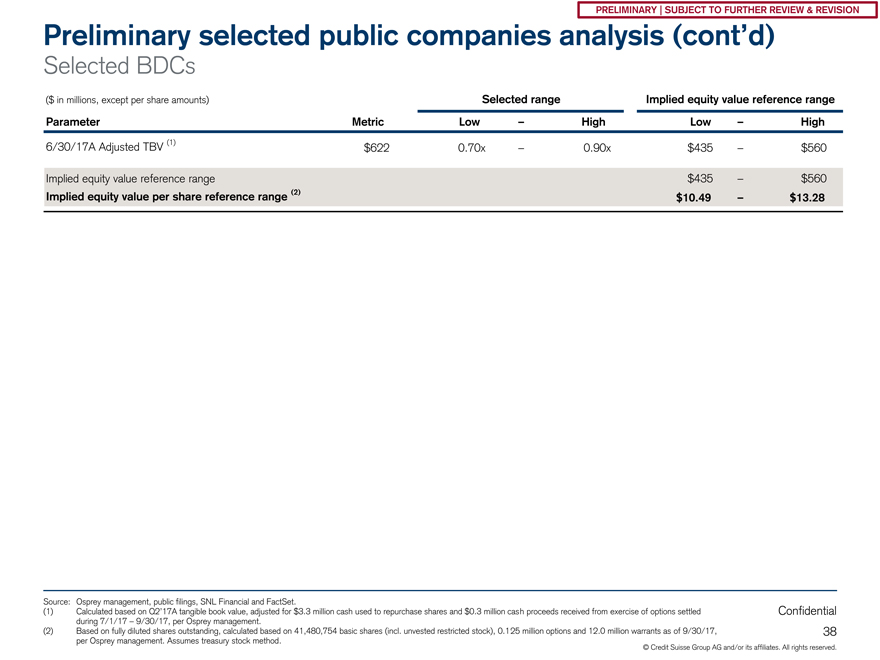
PRELIMINARY | SUBJECT TO FURTHER REVIEW & REVISION Preliminary selected public companies analysis (cont’d) Selected BDCs ($ in millions, except per share amounts) Selected range Implied equity value reference range Parameter Metric Low – High Low – High 6/30/17A Adjusted TBV (1) $622 0.70x – 0.90x $435 – $560 Implied equity value reference range $435 – $560 Implied equity value per share reference range (2) $10.49 – $13.28 Source: Osprey management, public filings, SNL Financial and FactSet. (1) Calculated based on Q2’17A tangible book value, adjusted for $3.3 million cash used to repurchase shares and $0.3 million cash proceeds received from exercise of options settled Confidential during 7/1/17 – 9/30/17, per Osprey management. (2) Based on fully diluted shares outstanding, calculated based on 41,480,754 basic shares (incl. unvested restricted stock), 0.125 million options and 12.0 million warrants as of 9/30/17, 38 per Osprey management. Assumes treasury stock method. © Credit Suisse Group AG and/or its affiliates. All rights reserved.
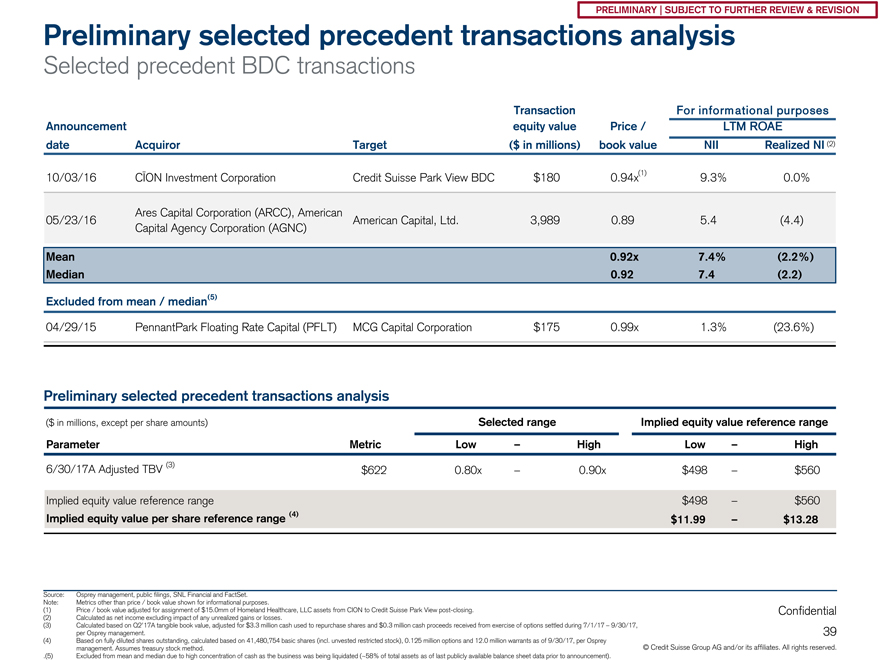
PRELIMINARY | SUBJECT TO FURTHER REVIEW & REVISION Preliminary selected precedent transactions analysis Selected precedent BDC transactions Transaction For inform ational purposes Announcement equity value Price / LTM ROAE date Acquiror Target ($ in millions) book value NII Realized NI (2) 10/03/16 CĪON Investment Corporation Credit Suisse Park View BDC $180 0.94x(1) 9.3% 0.0% Ares Capital Corporation (ARCC), American 05/23/16 American Capital, Ltd. 3,989 0.89 5.4 (4.4) Capital Agency Corporation (AGNC) Mean 0.92x 7.4% (2.2%) Median 0.92 7.4 (2.2) Excluded from mean / median(5) 04/29/15 PennantPark Floating Rate Capital (PFLT) MCG Capital Corporation $175 0.99x 1.3% (23.6%) Preliminary selected precedent transactions analysis ($ in millions, except per share amounts) Selected range Implied equity value reference range Parameter Metric Low – High Low – High 6/30/17A Adjusted TBV (3) $622 0.80x – 0.90x $498 – $560 Implied equity value reference range $498 – $560 Implied equity value per share reference range (4) $11.99 – $13.28 Source: Osprey management, public filings, SNL Financial and FactSet. Note: Metrics other than price / book value shown for informational purposes. (1) Price / book value adjusted for assignment of $15.0mm of Homeland Healthcare, LLC assets from CION to Credit Suisse Park View post-closing. Confidential (2) Calculated as net income excluding impact of any unrealized gains or losses. (3) Calculated based on Q2’17A tangible book value, adjusted for $3.3 million cash used to repurchase shares and $0.3 million cash proceeds received from exercise of options settled during 7/1/17 – 9/30/17, per Osprey management. 39 (4) Based on fully diluted shares outstanding, calculated based on 41,480,754 basic shares (incl. unvested restricted stock), 0.125 million options and 12.0 million warrants as of 9/30/17, per Osprey © Credit Suisse Group AG and/or its affiliates. All rights reserved. management. Assumes treasury stock method. .(5) Excluded from mean and median due to high concentration of cash as the business was being liquidated (~58% of total assets as of last publicly available balance sheet data prior to announcement).
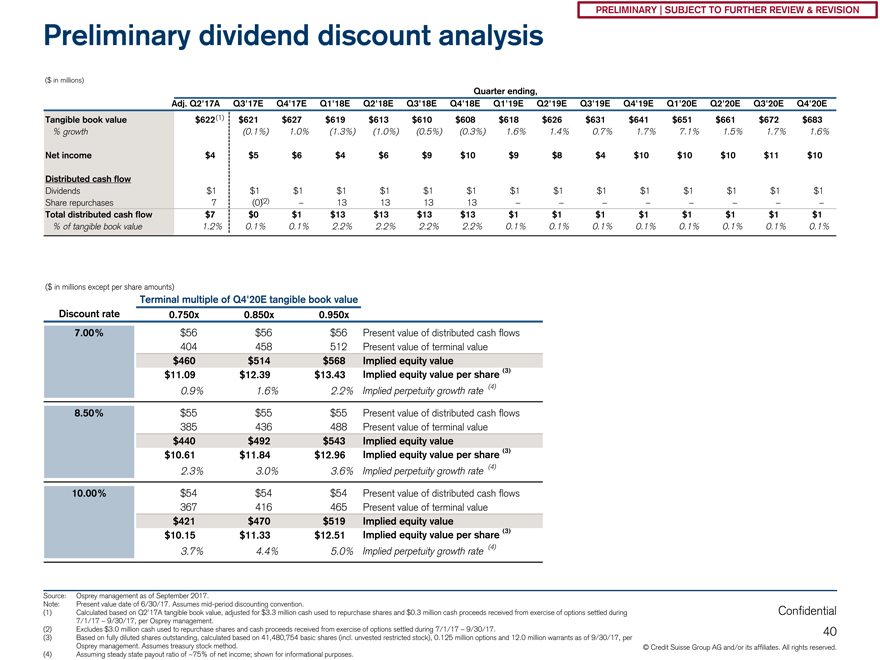
PRELIMINARY | SUBJECT TO FURTHER REVIEW & REVISION Preliminary dividend discount analysis ($ in millions) Quarter ending, Adj. Q2’17A Q3’17E Q4’17E Q1’18E Q2’18E Q3’18E Q4’18E Q1’19E Q2’19E Q3’19E Q4’19E Q1’20E Q2’20E Q3’20E Q4’20E Tangible book value $622(1) $621 $627 $619 $613 $610 $608 $618 $626 $631 $641 $651 $661 $672 $683 % growth (0.1%) 1.0% (1.3%) (1.0%) (0.5%) (0.3%) 1.6% 1.4% 0.7% 1.7% 7.1% 1.5% 1.7% 1.6% Net income $4 $5 $6 $4 $6 $9 $10 $9 $8 $4 $10 $10 $10 $11 $10 Distributed cash flow Dividends $1 $1 $1 $1 $1 $1 $1 $1 $1 $1 $1 $1 $1 $1 $1 Share repurchases 7 (0)(2) – 13 13 13 13 – – – – – – – – Total distributed cash flow $7 $0 $1 $13 $13 $13 $13 $1 $1 $1 $1 $1 $1 $1 $1 % of tangible book value 1.2% 0.1% 0.1% 2.2% 2.2% 2.2% 2.2% 0.1% 0.1% 0.1% 0.1% 0.1% 0.1% 0.1% 0.1% ($ in millions except per share amounts) Terminal multiple of Q4’20E tangible book value Discount rate 0.750x 0.850x 0.950x 7.00% $56 $56 $56 Present value of distributed cash flows 404 458 512 Present value of terminal value $460 $514 $568 Implied equity value $11.09 $12.39 $13.43 Implied equity value per share (3) 0.9% 1.6% 2.2% Implied perpetuity growth rate (4) 8.50% $55 $55 $55 Present value of distributed cash flows 385 436 488 Present value of terminal value $440 $492 $543 Implied equity value $10.61 $11.84 $12.96 Implied equity value per share (3) 2.3% 3.0% 3.6% Implied perpetuity growth rate (4) 10.00% $54 $54 $54 Present value of distributed cash flows 367 416 465 Present value of terminal value $421 $470 $519 Implied equity value $10.15 $11.33 $12.51 Implied equity value per share (3) 3.7% 4.4% 5.0% Implied perpetuity growth rate (4) Source: Osprey management as of September 2017. Note: Present value date of 6/30/17. Assumesmid-period discounting convention. (1) Calculated based on Q2’17A tangible book value, adjusted for $3.3 million cash used to repurchase shares and $0.3 million cash proceeds received from exercise of options settled during Confidential 7/1/17 – 9/30/17, per Osprey management. (2) Excludes $3.0 million cash used to repurchase shares and cash proceeds received from exercise of options settled during 7/1/17 – 9/30/17. 40 (3) Based on fully diluted shares outstanding, calculated based on 41,480,754 basic shares (incl. unvested restricted stock), 0.125 million options and 12.0 million warrants as of 9/30/17, per Osprey management. Assumes treasury stock method. © Credit Suisse Group AG and/or its affiliates. All rights reserved. (4) Assuming steady state payout ratio of ~75% of net income; shown for informational purposes.
PRELIMINARY | SUBJECT TO FURTHER REVIEW & REVISION Appendix (Informational) Confidential 41
PRELIMINARY | SUBJECT TO FURTHER REVIEW & REVISION A. Supplemental supporting information Confidential 42
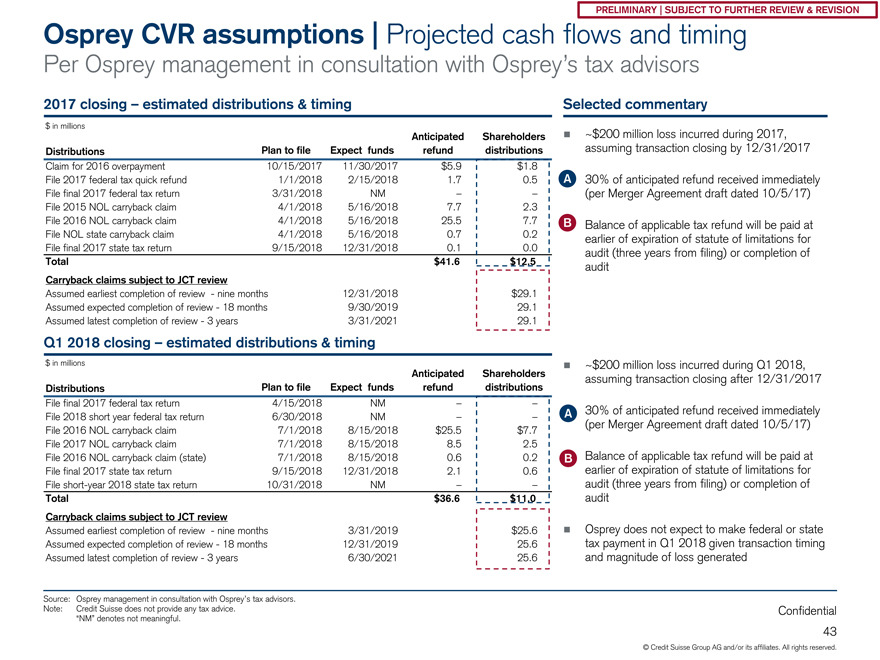
PRELIMINARY | SUBJECT TO FURTHER REVIEW & REVISION Osprey CVR assumptions | Projected cash flows and timing Per Osprey management in consultation with Osprey’s tax advisors 2017 closing – estimated distributions & timing Selected commentary $ in millions Anticipated Shareholders ï® ~$200 million loss incurred during 2017, Distributions Plan to file Expect funds refund distributions assuming transaction closing by 12/31/2017 Claim for 2016 overpayment 10/15/2017 11/30/2017 $5.9 $1.8 File 2017 federal tax quick refund 1/1/2018 2/15/2018 1.7 0.5ï® A 30% of anticipated refund received immediately File final 2017 federal tax return 3/31/2018 NM – – (per Merger Agreement draft dated 10/5/17) File 2015 NOL carryback claim 4/1/2018 5/16/2018 7.7 2.3 File 2016 NOL carryback claim 4/1/2018 5/16/2018 25.5 7.7 B Balance of applicable refund will be paid at File NOL state carryback claim 4/1/2018 5/16/2018 0.7 0.2ï® tax earlier of expiration of statute of limitations for File final 2017 state tax return 9/15/2018 12/31/2018 0.1 0.0 audit (three years from filing) or completion of Total $41.6 $12.5 audit Carryback claims subject to JCT review Assumed earliest completion of review —nine months 12/31/2018 $29.1 Assumed expected completion of review—18 months 9/30/2019 29.1 Assumed latest completion of review—3 years 3/31/2021 29.1 Q1 2018 closing – estimated distributions & timing $ in millionsï® ~$200 million loss incurred during Q1 2018, Anticipated Shareholders assuming transaction closing after 12/31/2017 Distributions Plan to file Expect funds refund distributions File final 2017 federal tax return 4/15/2018 NM – – ï® A 30% of anticipated refund received immediately File 2018 short year federal tax return 6/30/2018 NM – – (per Merger Agreement draft dated 10/5/17) File 2016 NOL carryback claim 7/1/2018 8/15/2018 $25.5 $7.7 File 2017 NOL carryback claim 7/1/2018 8/15/2018 8.5 2.5 File 2016 NOL carryback claim (state) 7/1/2018 8/15/2018 0.6 0.2ï® B Balance of applicable tax refund will be paid at File final 2017 state tax return 9/15/2018 12/31/2018 2.1 0.6 earlier of expiration of statute of limitations for File short-year 2018 state tax return 10/31/2018 NM – – audit (three years from filing) or completion of Total $36.6 $11.0 audit Carryback claims subject to JCT review Assumed earliest completion of review —nine months 3/31/2019 $25.6ï® Osprey does not expect to make federal or state Assumed expected completion of review—18 months 12/31/2019 25.6 tax payment in Q1 2018 given transaction timing Assumed latest completion of review—3 years 6/30/2021 25.6 and magnitude of loss generated Source: Osprey management in consultation with Osprey’s tax advisors. Note: Credit Suisse does not provide any tax advice. Confidential “NM” denotes not meaningful. 43 © Credit Suisse Group AG and/or its affiliates. All rights reserved.
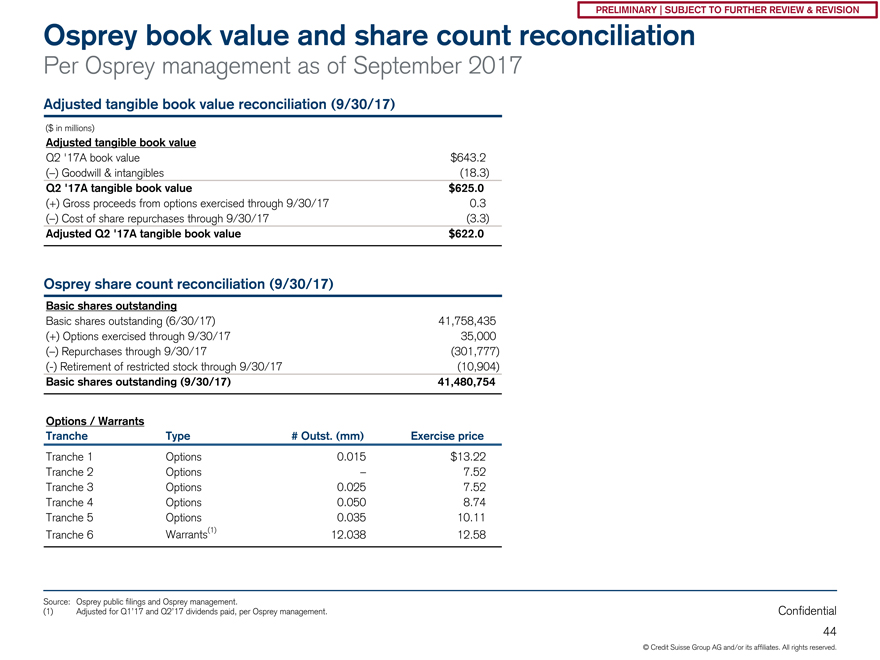
PRELIMINARY | SUBJECT TO FURTHER REVIEW & REVISION Osprey book value and share count reconciliation Per Osprey management as of September 2017 Adjusted tangible book value reconciliation (9/30/17) ($ in millions) Adjusted tangible book value Q2 ‘17A book value $643.2 (–) Goodwill & intangibles (18.3) Q2 ‘17A tangible book value $625.0 (+) Gross proceeds from options exercised through 9/30/17 0.3 (–) Cost of share repurchases through 9/30/17 (3.3) Adjusted Q2 ‘17A tangible book value $622.0 Osprey share count reconciliation (9/30/17) Basic shares outstanding Basic shares outstanding (6/30/17) 41,758,435 (+) Options exercised through 9/30/17 35,000 (–) Repurchases through 9/30/17 (301,777) (-) Retirement of restricted stock through 9/30/17 (10,904) Basic shares outstanding (9/30/17) 41,480,754 Options / Warrants Tranche Type # Outst. (mm) Exercise price Tranche 1 Options 0.015 $13.22 Tranche 2 Options – 7.52 Tranche 3 Options 0.025 7.52 Tranche 4 Options 0.050 8.74 Tranche 5 Options 0.035 10.11 Tranche 6 Warrants(1) 12.038 12.58 Source: Osprey public filings and Osprey management. (1) Adjusted for Q1’17 and Q2’17 dividends paid, per Osprey management. Confidential 44 © Credit Suisse Group AG and/or its affiliates. All rights reserved.
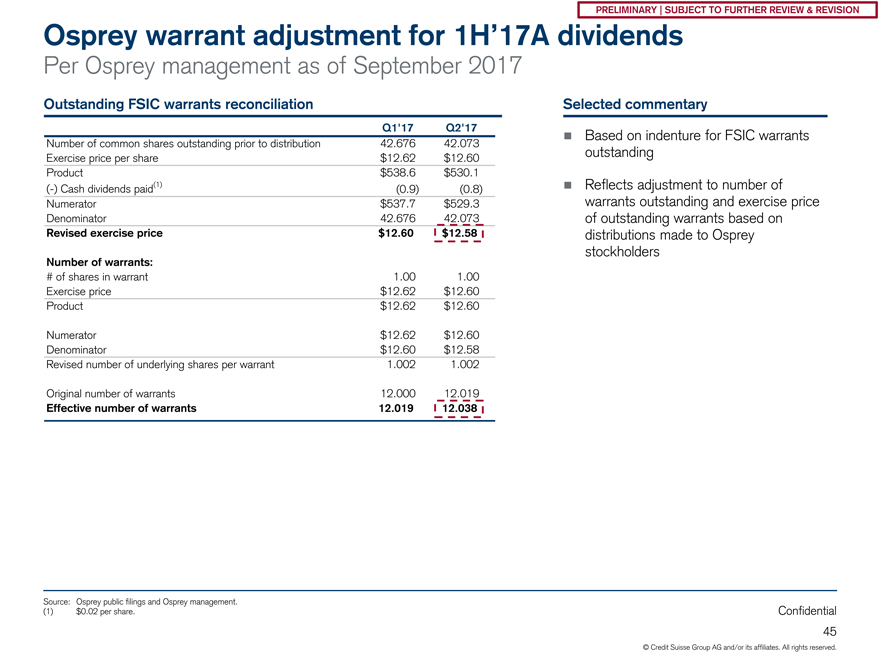
PRELIMINARY | SUBJECT TO FURTHER REVIEW & REVISION Osprey warrant adjustment for 1H’17A dividends Per Osprey management as of September 2017 Outstanding FSIC warrants reconciliation Selected commentary Q1’17 Q2’17 ï® Based on indenture for FSIC warrants Number of common shares outstanding prior to distribution 42.676 42.073 Exercise price per share $12.62 $12.60 outstanding Product $538.6 $530.1 (-) Cash dividends paid(1) (0.9) (0.8)ï® Reflects adjustment to number of Numerator $537.7 $529.3 warrants outstanding and exercise price Denominator 42.676 42.073 of outstanding warrants based on Revised exercise price $12.60 $12.58 distributions made to Osprey stockholders Number of warrants: # of shares in warrant 1.00 1.00 Exercise price $12.62 $12.60 Product $12.62 $12.60 Numerator $12.62 $12.60 Denominator $12.60 $12.58 Revised number of underlying shares per warrant 1.002 1.002 Original number of warrants 12.000 12.019 Effective number of warrants 12.019 12.038 Source: Osprey public filings and Osprey management. (1) $0.02 per share. Confidential 45 © Credit Suisse Group AG and/or its affiliates. All rights reserved.
PRELIMINARY | SUBJECT TO FURTHER REVIEW & REVISION B. Supplemental information Confidential 46
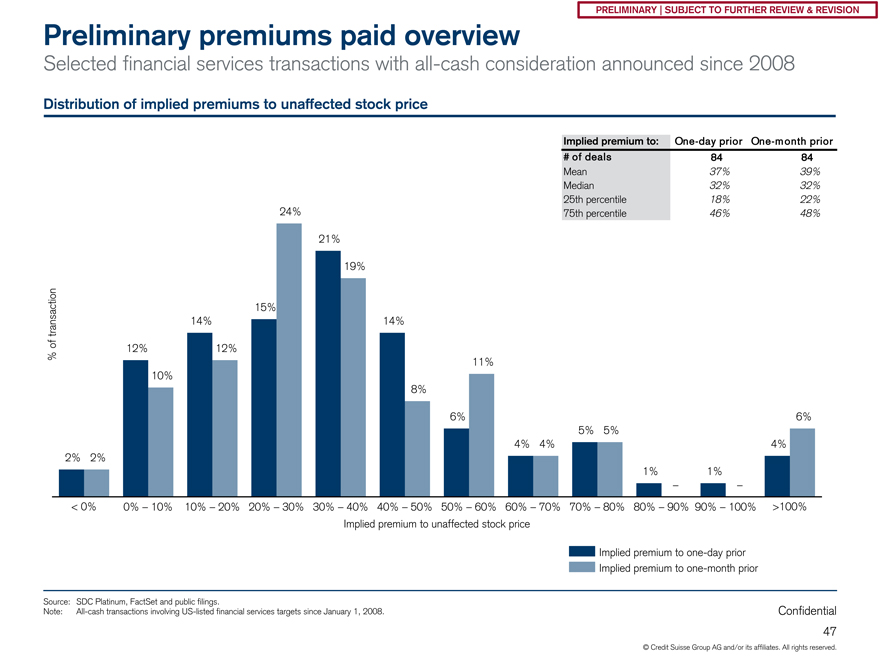
PRELIMINARY | SUBJECT TO FURTHER REVIEW & REVISION Preliminary premiums paid overview Selected financial services transactions withall-cash consideration announced since 2008 Distribution of implied premiums to unaffected stock price Implied premium to:One-day priorOne-m onth prior # of deals 84 84 Mean 37% 39% Median 32% 32% 25th percentile 18% 22% 24% 75th percentile 46% 48% 21% 19% 15% transaction 14% 14% of % 12% 12% 11% 10% 8% 6% 6% 5% 5% 4% 4% 4% 2% 2% 1% 1% – – < 0% 0% – 10% 10% – 20% 20% – 30% 30% – 40% 40% – 50% 50% – 60% 60% – 70% 70% – 80% 80% – 90% 90% – 100% >100% Implied premium to unaffected stock price Implied premium toone-day prior Implied premium toone-month prior Source: SDC Platinum, FactSet and public filings. Note:All-cash transactions involvingUS-listed financial services targets since January 1, 2008. Confidential 47 © Credit Suisse Group AG and/or its affiliates. All rights reserved.
PRELIMINARY | SUBJECT TO FURTHER REVIEW & REVISION Credit Suisse does not provide any tax advice. Any tax statement herein regarding any U.S. federal tax is not intended or written to be used, and cannot be used, by any taxpayer for the purpose of avoiding any penalties. Any such statement herein was written to support the marketing or promotion of the transaction(s) or matter(s) to which the statement relates. Each taxpayer should seek advice based on the taxpayer’s particular circumstances from an independent tax advisor. These materials have been provided to you by Credit Suisse in connection with an actual or potential mandate or engagement and may not be used or relied upon for any purpose other than as specifically contemplated by a written agreement with Credit Suisse. In addition, these materials may not be disclosed, in whole or in part, or summarized or otherwise referred to except as agreed in writing by Credit Suisse. The information used in preparing these materials was obtained from or through you or your representatives or from public sources. Credit Suisse assumes no responsibility for independent verification of such information and has relied on such information being complete and accurate in all material respects. To the extent such information includes estimates and forecasts of future financial performance (including estimates of potential cost savings and synergies) prepared by or reviewed or discussed with the managements of your company and/or other potential transaction participants or obtained from public sources, we have assumed that such estimates and forecasts have been reasonably prepared on bases reflecting the best currently available estimates and judgments of such managements (or, with respect to estimates and forecasts obtained from public sources, represent reasonable estimates). These materials were designed for use by specific persons familiar with the business and the affairs of your company and Credit Suisse assumes no obligation to update or otherwise revise these materials. Nothing contained herein should be construed as tax, accounting or legal advice. You (and each of your employees, representatives or other agents) may disclose to any and all persons, without limitation of any kind, the tax treatment and tax structure of the transactions contemplated by these materials and all materials of any kind (including opinions or other tax analyses) that are provided to you relating to such tax treatment and structure. For this purpose, the tax treatment of a transaction is the purported or claimed U.S. federal income tax treatment of the transaction and the tax structure of a transaction is any fact that may be relevant to understanding the purported or claimed U.S. federal income tax treatment of the transaction. These materials have been prepared by Credit Suisse (“CS”) and its affiliates for use by CS. Accordingly, any information reflected or incorporated herein, or in related materials or in ensuing transactions, may be shared in good faith by CS and its affiliates with employees of CS, its affiliates and agents in any location. Credit Suisse has adopted policies and guidelines designed to preserve the independence of its research analysts. Credit Suisse’s policies prohibit employees from directly or indirectly offering a favorable research rating or specific price target, or offering to change a research rating or price target, as consideration for or an inducement to obtain business or other compensation. Credit Suisse’s policies prohibit research analysts from being compensated for their involvement in investment banking transactions. CREDIT SUISSE SECURITIES (USA) LLC Eleven Madison Avenue New York, NY 10010-3629 +1 212 325 2000 www.credit-suisse.com Confidential 48 Copyright © 2017 Credit Suisse Group AG and/or its affiliates. All rights reserved.