First Eagle Private Credit (NEWS) Inactive
Filed: 27 Nov 17, 12:00am
Exhibit (c)(11)

DRAFT Project Osprey DISCUSSION MATERIALS FOR THE BOARD OF DIRECTORS OCTOBER 16, 2017 CONFIDENTIAL Preliminary—Subject to Further Review
Table of Contents Page 1. Transaction Background 3 2. Public Market Observations 7 3. Financial Analyses 11 4. Contingent Value Right 17 5. Appendix 23 Historical and Projected Financial Information 24 6. Disclaimer 28 2
Page 1. Transaction Background 3 2. Public Market Observations 7 3. Financial Analyses 11 4. Contingent Value Right 17 5. Appendix 23 6. Disclaimer 28
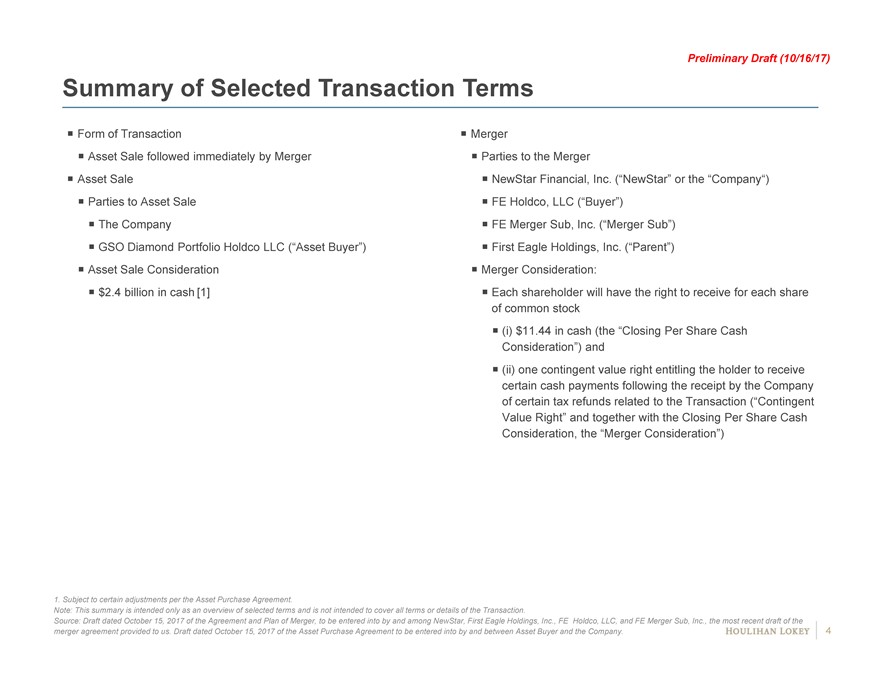
Preliminary Draft (10/16/17) Summary of Selected Transaction Terms Form of Transaction Merger Asset Sale followed immediately by Merger Parties to the Merger Asset Sale NewStar Financial, Inc. (“NewStar” or the “Company“) Parties to Asset Sale FE Holdco, LLC (“Buyer”) The Company FE Merger Sub, Inc. (“Merger Sub”) GSO Diamond Portfolio Holdco LLC (“Asset Buyer”) First Eagle Holdings, Inc. (“Parent”) Asset Sale Consideration Merger Consideration: $2.4 billion in cash [1] Each shareholder will have the right to receive for each share of common stock (i) $11.44 in cash (the “Closing Per Share Cash Consideration”) and (ii) one contingent value right entitling the holder to receive certain cash payments following the receipt by the Company of certain tax refunds related to the Transaction (“Contingent Value Right” and together with the Closing Per Share Cash Consideration, the “Merger Consideration”) 1. Subject to certain adjustments per the Asset Purchase Agreement. Note: This summary is intended only as an overview of selected terms and is not intended to cover all terms or details of the Transaction. Source: Draft dated October 15, 2017 of the Agreement and Plan of Merger, to be entered into by and among NewStar, First Eagle Holdings, Inc., FE Holdco, LLC, and FE Merger Sub, Inc., the most recent draft of the merger agreement provided to us. Draft dated October 15, 2017 of the Asset Purchase Agreement to be entered into by and between Asset Buyer and the Company. 4

Preliminary Draft (10/16/17) Implied Illustrative Premiums to Historical Stock Trading Prices The chart below illustrates the premium implied by the Merger Consideration to the Company’s stock price. Merger Consideration of $12.32 per share [1] represents an 11.0% premium over the share price on 8/1/17, prior to NewStar’s Q2 2017 earnings call, as well as a range of premiums of 3.3% to 23.8% based on the VWAPs of the Company’s common stock over the periods set forth in the chart below. Illustrative Merger Consideration (dollars and shares in millions, except per share values) Merger Consideration Closing Per Share Cash Consideration $11.44 Illustrative Contingent Value Right per Share [1] $0.88 Illustrative Merger Consideration $12.32 Premium of Illustrative Merger Consideration (dollars per share) 50.0% 47.4%Pre-Q2 As of 10/13/17 45.0% Earnings Announcement 40.0% ($11.10) 35.0% 30.0% 23.8% 25.0% 20.0% 17.7% 15.0% 11.0% 10.6% 8.7% 10.0% 3.3% 2.8% 3.5% 5.0% 0.4% 0.0% Share Price1-Day5-Day10-Day30-Day60-Day180-Day1-Year52-Week52-Week as of VWAP VWAP VWAP VWAP VWAP VWAP VWAP High Low 8/1/17 ($11.93) ($11.99) ($11.91) ($11.33) ($11.14) ($10.47) ($9.95) ($12.27) ($8.36) ($11.10) 1. For illustrative purpose, based on the midpoint of the implied Contingent Value Right reference range. Refer to the “Contingent Value Right” section for further details. VWAP refers to Volume Weighted Average Price. Source: Bloomberg as of 10/13/17, Company management. 5
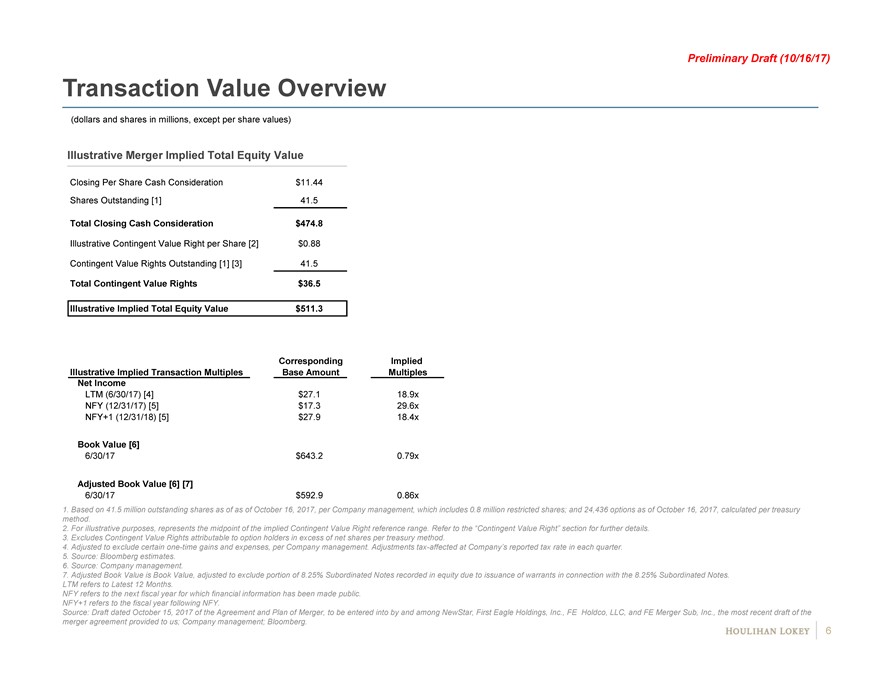
Preliminary Draft (10/16/17) Transaction Value Overview (dollars and shares in millions, except per share values) Illustrative Merger Implied Total Equity Value Closing Per Share Cash Consideration $11.44 Shares Outstanding [1] 41.5 Total Closing Cash Consideration $474.8 Illustrative Contingent Value Right per Share [2] $0.88 Contingent Value Rights Outstanding [1] [3] 41.5 Total Contingent Value Rights $36.5 Illustrative Implied Total Equity Value $511.3 Corresponding Implied Illustrative Implied Transaction Multiples Base Amount Multiples Net Income LTM (6/30/17) [4] $27.1 18.9x NFY (12/31/17) [5] $17.3 29.6x NFY+1 (12/31/18) [5] $27.9 18.4x Book Value [6] 6/30/17 $643.2 0.79x Adjusted Book Value [6] [7] 6/30/17 $592.9 0.86x 1. Based on 41.5 million outstanding shares as of as of October 16, 2017, per Company management, which includes 0.8 million restricted shares; and 24,436 options as of October 16, 2017, calculated per treasury method. 2. For illustrative purposes, represents the midpoint of the implied Contingent Value Right reference range. Refer to the “Contingent Value Right” section for further details. 3. Excludes Contingent Value Rights attributable to option holders in excess of net shares per treasury method. 4. Adjusted to exclude certainone-time gains and expenses, per Company management. Adjustmentstax-affected at Company’s reported tax rate in each quarter. 5. Source: Bloomberg estimates. 6. Source: Company management. 7. Adjusted Book Value is Book Value, adjusted to exclude portion of 8.25% Subordinated Notes recorded in equity due to issuance of warrants in connection with the 8.25% Subordinated Notes. LTM refers to Latest 12 Months. NFY refers to the next fiscal year for which financial information has been made public. NFY+1 refers to the fiscal year following NFY. Source: Draft dated October 15, 2017 of the Agreement and Plan of Merger, to be entered into by and among NewStar, First Eagle Holdings, Inc., FE Holdco, LLC, and FE Merger Sub, Inc., the most recent draft of the merger agreement provided to us; Company management; Bloomberg. 6
Page 1. Transaction Background 3 2. Public Market Observations 7 3. Financial Analyses 11 4. Contingent Value Right 17 5. Appendix 23 6. Disclaimer 28
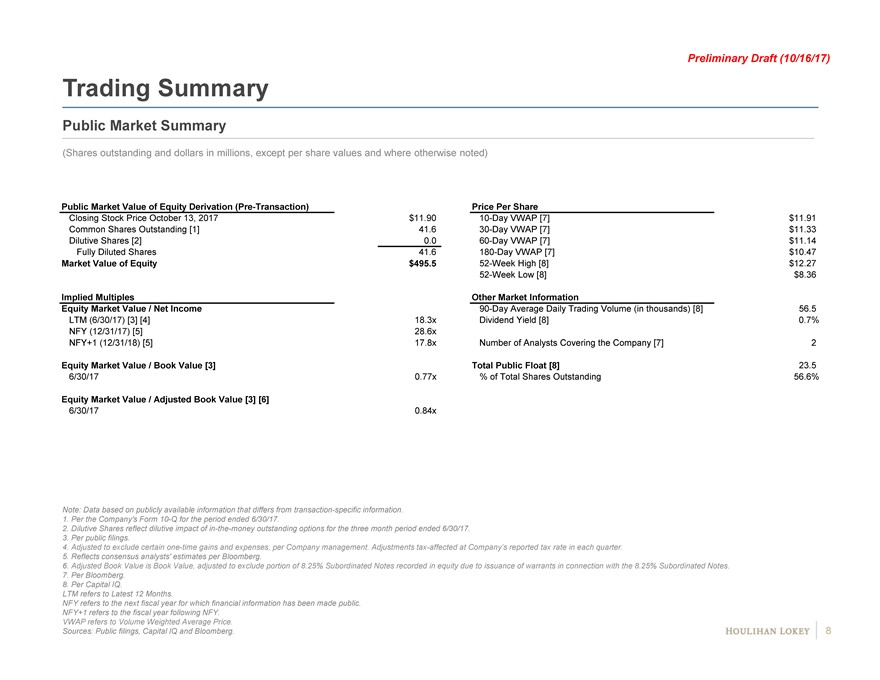
Preliminary Draft (10/16/17) Trading Summary Public Market Summary (Shares outstanding and dollars in millions, except per share values and where otherwise noted) Public Market Value of Equity Derivation(Pre-Transaction) Price Per Share Closing Stock Price October 13, 2017 $11.9010-Day VWAP [7] $11.91 Common Shares Outstanding [1] 41.630-Day VWAP [7] $11.33 Dilutive Shares [2] 0.060-Day VWAP [7] $11.14 Fully Diluted Shares 41.6180-Day VWAP [7] $10.47 Market Value of Equity $495.552-Week High [8] $12.2752-Week Low [8] $8.36 Implied Multiples Other Market Information Equity Market Value / Net Income90-Day Average Daily Trading Volume (in thousands) [8] 56.5 LTM (6/30/17) [3] [4] 18.3x Dividend Yield [8] 0.7% NFY (12/31/17) [5] 28.6x NFY+1 (12/31/18) [5] 17.8x Number of Analysts Covering the Company [7] 2 Equity Market Value / Book Value [3] Total Public Float [8] 23.5 6/30/17 0.77x % of Total Shares Outstanding 56.6% Equity Market Value / Adjusted Book Value [3] [6] 6/30/17 0.84x Note: Data based on publicly available information that differs from transaction-specific information. 1. Per the Company’s Form10-Q for the period ended 6/30/17. 2. Dilutive Shares reflect dilutive impact ofin-the-money outstanding options for the three month period ended 6/30/17. 3. Per public filings. 4. Adjusted to exclude certainone-time gains and expenses, per Company management. Adjustmentstax-affected at Company’s reported tax rate in each quarter. 5. Reflects consensus analysts’ estimates per Bloomberg. 6. Adjusted Book Value is Book Value, adjusted to exclude portion of 8.25% Subordinated Notes recorded in equity due to issuance of warrants in connection with the 8.25% Subordinated Notes. 7. Per Bloomberg. 8. Per Capital IQ. LTM refers to Latest 12 Months. NFY refers to the next fiscal year for which financial information has been made public. NFY+1 refers to the fiscal year following NFY. VWAP refers to Volume Weighted Average Price. Sources: Public filings, Capital IQ and Bloomberg. 8
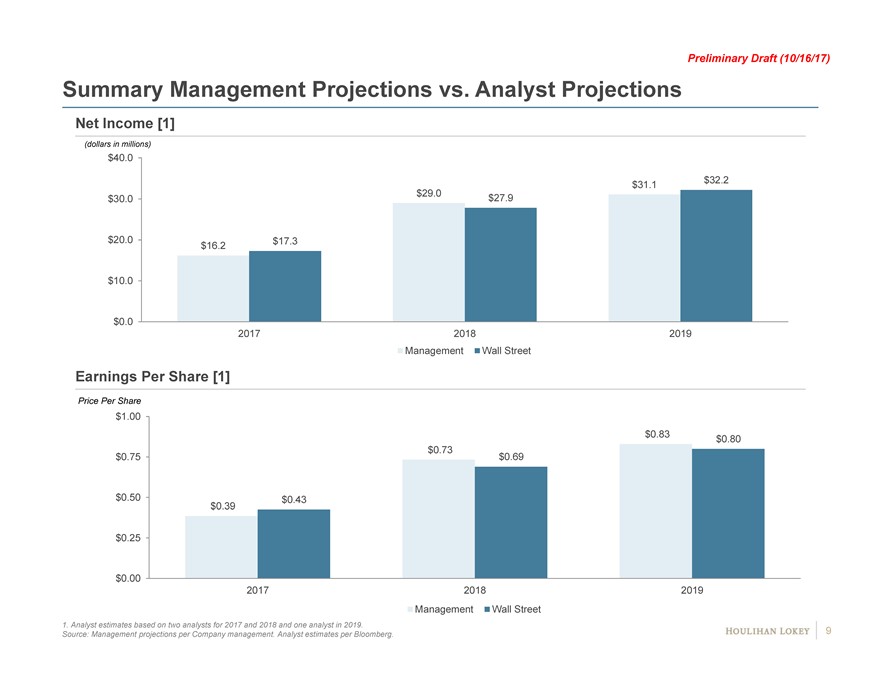
Preliminary Draft (10/16/17) Summary Management Projections vs. Analyst Projections Net Income [1] (dollars in millions) $40.0 $32.2 $29.0 $31.1 $30.0 $27.9 $20.0 $17.3 $16.2 $10.0 $0.0 2017 2018 2019 Management Wall Street Earnings Per Share [1] Price Per Share $1.00 $0.83 $0.80 $0.73 $0.75 $0.69 $0.50 $0.39 $0.43 $0.25 $0.00 2017 2018 2019 Management Wall Street 1. Analyst estimates based on two analysts for 2017 and 2018 and one analyst in 2019. Source: Management projections per Company management. Analyst estimates per Bloomberg. 9
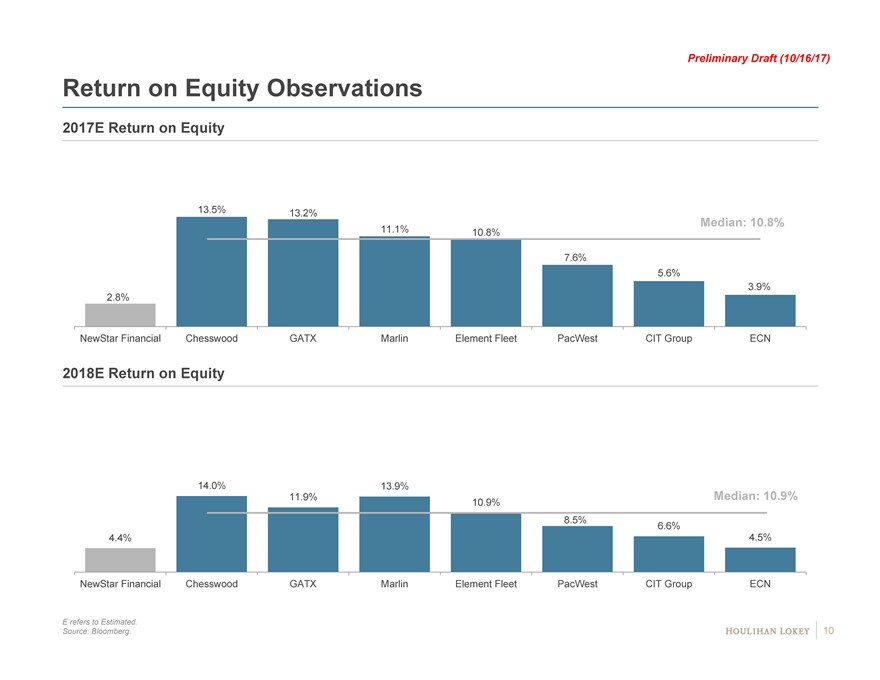
Preliminary Draft (10/16/17) Return on Equity Observations 2017E Return on Equity 13.5% 13.2% Median: 10.8% 11.1% 10.8% 7.6% 5.6% 3.9% 2.8% NewStar Financial Chesswood GATX Marlin Element Fleet PacWest CIT Group ECN 2018E Return on Equity 14.0% 13.9% Median: 10.9% 11.9% 10.9% 8.5% 6.6% 4.4% 4.5% NewStar Financial Chesswood GATX Marlin Element Fleet PacWest CIT Group ECN E refers to Estimated. Source: Bloomberg. 10
Page 1. Transaction Background 3 2. Public Market Observations 7 3. Financial Analyses 11 4. Contingent Value Right 17 5. Appendix 23 6. Disclaimer 28
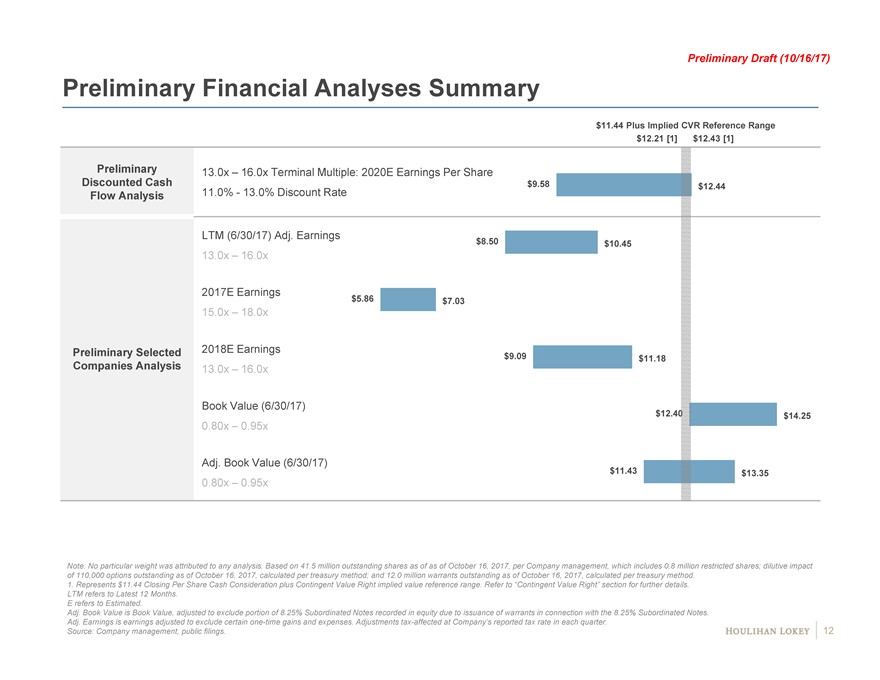
Preliminary Draft (10/16/17) Preliminary Financial Analyses Summary $11.44 Plus Implied CVR Reference Range $12.21 [1] $12.43 [1] Preliminary 13.0x—16.0x Terminal Multiple: 2020E Earnings Per Share Discounted Cash 11.0%—13.0% Discount Rate $9.58 $12.44 Flow Analysis LTM (6/30/17) Adj. Earnings $8.50 $10.45 13.0x—16.0x 2017E Earnings $5.86 $7.03 15.0x—18.0x Preliminary Selected 2018E Earnings Companies Analysis $9.09 $11.18 13.0x—16.0x Book Value (6/30/17) $12.40 $14.25 0.80x—0.95x Adj. Book Value (6/30/17) $11.43 $13.35 0.80x—0.95x Note: No particular weight was attributed to any analysis. Based on 41.5 million outstanding shares as of as of October 16, 2017, per Company management, which includes 0.8 million restricted shares; dilutive impact of 110,000 options outstanding as of October 16, 2017, calculated per treasury method; and 12.0 million warrants outstanding as of October 16, 2017, calculated per treasury method. 1. Represents $11.44 Closing Per Share Cash Consideration plus Contingent Value Right implied value reference range. Refer to “Contingent Value Right” section for further details. LTM refers to Latest 12 Months. E refers to Estimated. Adj. Book Value is Book Value, adjusted to exclude portion of 8.25% Subordinated Notes recorded in equity due to issuance of warrants in connection with the 8.25% Subordinated Notes. Adj. Earnings is earnings adjusted to exclude certainone-time gains and expenses. Adjustmentstax-affected at Company’s reported tax rate in each quarter. Source: Company management, public filings. 12
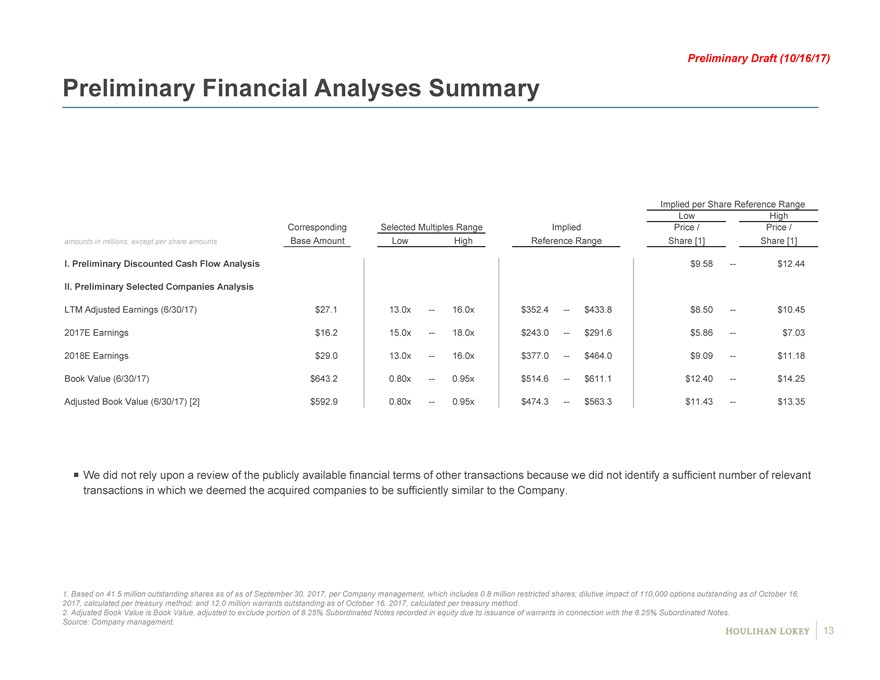
Preliminary Draft (10/16/17) Preliminary Financial Analyses Summary Implied per Share Reference Range Low High Corresponding Selected Multiples Range Implied Price / Price / amounts in millions, except per share amounts Base Amount Low High Reference Range Share [1] Share [1] I. Preliminary Discounted Cash Flow Analysis $9.58—$12.44 II. Preliminary Selected Companies Analysis LTM Adjusted Earnings (6/30/17) $27.1 13.0x—16.0x $352.4—$433.8 $8.50—$10.45 2017E Earnings $16.2 15.0x—18.0x $243.0—$291.6 $5.86—$7.03 2018E Earnings $29.0 13.0x—16.0x $377.0—$464.0 $9.09—$11.18 Book Value (6/30/17) $643.2 0.80x—0.95x $514.6—$611.1 $12.40—$14.25 Adjusted Book Value (6/30/17) [2] $592.9 0.80x—0.95x $474.3—$563.3 $11.43—$13.35 We did not rely upon a review of the publicly available financial terms of other transactions because we did not identify a sufficient number of relevant transactions in which we deemed the acquired companies to be sufficiently similar to the Company. 1. Based on 41.5 million outstanding shares as of as of September 30, 2017, per Company management, which includes 0.8 million restricted shares; dilutive impact of 110,000 options outstanding as of October 16, 2017, calculated per treasury method; and 12.0 million warrants outstanding as of October 16, 2017, calculated per treasury method. 2. Adjusted Book Value is Book Value, adjusted to exclude portion of 8.25% Subordinated Notes recorded in equity due to issuance of warrants in connection with the 8.25% Subordinated Notes. Source: Company management. 13
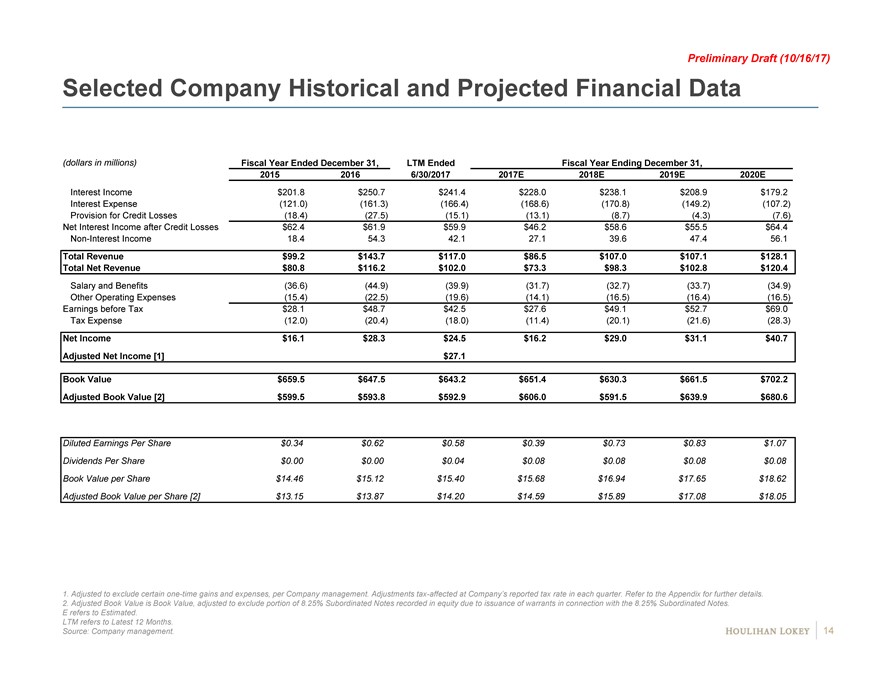
Preliminary Draft (10/16/17) Selected Company Historical and Projected Financial Data (dollars in millions) Fiscal Year Ended December 31, LTM Ended Fiscal Year Ending December 31, 2015 2016 6/30/2017 2017E 2018E 2019E 2020E Interest Income $201.8 $250.7 $241.4 $228.0 $238.1 $208.9 $179.2 Interest Expense (121.0) (161.3) (166.4) (168.6) (170.8) (149.2) (107.2) Provision for Credit Losses (18.4) (27.5) (15.1) (13.1) (8.7) (4.3) (7.6) Net Interest Income after Credit Losses $62.4 $61.9 $59.9 $46.2 $58.6 $55.5 $64.4Non-Interest Income 18.4 54.3 42.1 27.1 39.6 47.4 56.1 Total Revenue $99.2 $143.7 $117.0 $86.5 $107.0 $107.1 $128.1 Total Net Revenue $80.8 $116.2 $102.0 $73.3 $98.3 $102.8 $120.4 Salary and Benefits (36.6) (44.9) (39.9) (31.7) (32.7) (33.7) (34.9) Other Operating Expenses (15.4) (22.5) (19.6) (14.1) (16.5) (16.4) (16.5) Earnings before Tax $28.1 $48.7 $42.5 $27.6 $49.1 $52.7 $69.0 Tax Expense (12.0) (20.4) (18.0) (11.4) (20.1) (21.6) (28.3) Net Income $16.1 $28.3 $24.5 $16.2 $29.0 $31.1 $40.7 Adjusted Net Income [1] $27.1 Book Value $659.5 $647.5 $643.2 $651.4 $630.3 $661.5 $702.2 Adjusted Book Value [2] $599.5 $593.8 $592.9 $606.0 $591.5 $639.9 $680.6 Diluted Earnings Per Share $0.34 $0.62 $0.58 $0.39 $0.73 $0.83 $1.07 Dividends Per Share $0.00 $0.00 $0.04 $0.08 $0.08 $0.08 $0.08 Book Value per Share $14.46 $15.12 $15.40 $15.68 $16.94 $17.65 $18.62 Adjusted Book Value per Share [2] $13.15 $13.87 $14.20 $14.59 $15.89 $17.08 $18.05 1. Adjusted to exclude certainone-time gains and expenses, per Company management. Adjustmentstax-affected at Company’s reported tax rate in each quarter. Refer to the Appendix for further details. 2. Adjusted Book Value is Book Value, adjusted to exclude portion of 8.25% Subordinated Notes recorded in equity due to issuance of warrants in connection with the 8.25% Subordinated Notes. E refers to Estimated. LTM refers to Latest 12 Months. Source: Company management. 14
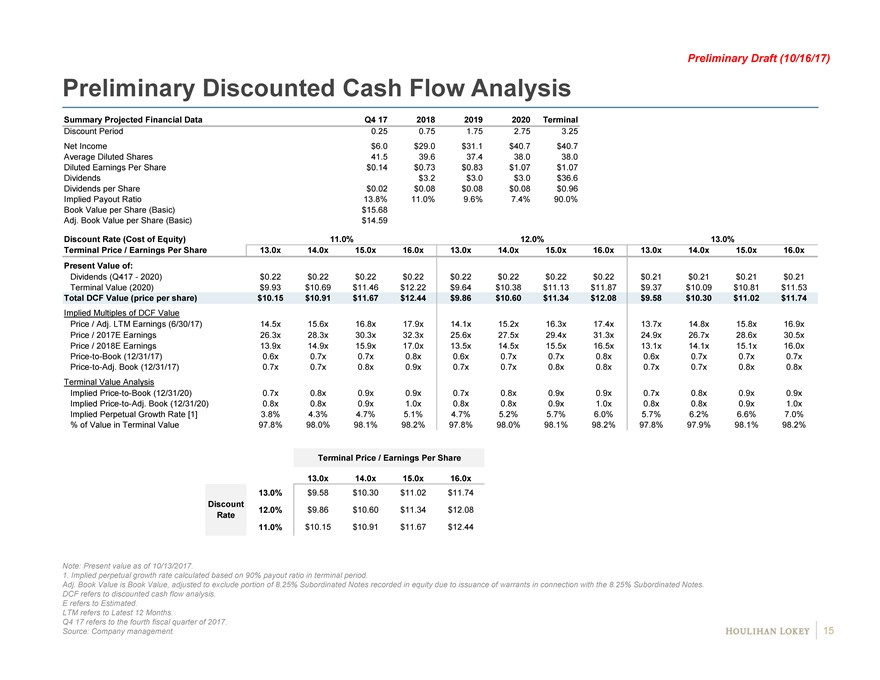
Preliminary Draft (10/16/17) Preliminary Discounted Cash Flow Analysis Summary Projected Financial Data Q4 17 2018 2019 2020 Terminal Discount Period 0.25 0.75 1.75 2.75 3.25 Net Income $6.0 $29.0 $31.1 $40.7 $40.7 Average Diluted Shares 41.5 39.6 37.4 38.0 38.0 Diluted Earnings Per Share $0.14 $0.73 $0.83 $1.07 $1.07 Dividends $3.2 $3.0 $3.0 $36.6 Dividends per Share $0.02 $0.08 $0.08 $0.08 $0.96 Implied Payout Ratio 13.8% 11.0% 9.6% 7.4% 90.0% Book Value per Share (Basic) $15.68 Adj. Book Value per Share (Basic) $14.59 Discount Rate (Cost of Equity) 11.0% 12.0% 13.0% Terminal Price / Earnings Per Share 13.0x 14.0x 15.0x 16.0x 13.0x 14.0x 15.0x 16.0x 13.0x 14.0x 15.0x 16.0x Present Value of: Dividends (Q417—2020) $0.22 $0.22 $0.22 $0.22 $0.22 $0.22 $0.22 $0.22 $0.21 $0.21 $0.21 $0.21 Terminal Value (2020) $9.93 $10.69 $11.46 $12.22 $9.64 $10.38 $11.13 $11.87 $9.37 $10.09 $10.81 $11.53 Total DCF Value (price per share) $10.15 $10.91 $11.67 $12.44 $9.86 $10.60 $11.34 $12.08 $9.58 $10.30 $11.02 $11.74 Implied Multiples of DCF Value Price / Adj. LTM Earnings (6/30/17) 14.5x 15.6x 16.8x 17.9x 14.1x 15.2x 16.3x 17.4x 13.7x 14.8x 15.8x 16.9x Price / 2017E Earnings 26.3x 28.3x 30.3x 32.3x 25.6x 27.5x 29.4x 31.3x 24.9x 26.7x 28.6x 30.5x Price / 2018E Earnings 13.9x 14.9x 15.9x 17.0x 13.5x 14.5x 15.5x 16.5x 13.1x 14.1x 15.1x 16.0xPrice-to-Book (12/31/17) 0.6x 0.7x 0.7x 0.8x 0.6x 0.7x 0.7x 0.8x 0.6x 0.7x 0.7x 0.7xPrice-to-Adj. Book (12/31/17) 0.7x 0.7x 0.8x 0.9x 0.7x 0.7x 0.8x 0.8x 0.7x 0.7x 0.8x 0.8x Terminal Value Analysis ImpliedPrice-to-Book (12/31/20) 0.7x 0.8x 0.9x 0.9x 0.7x 0.8x 0.9x 0.9x 0.7x 0.8x 0.9x 0.9x ImpliedPrice-to-Adj. Book (12/31/20) 0.8x 0.8x 0.9x 1.0x 0.8x 0.8x 0.9x 1.0x 0.8x 0.8x 0.9x 1.0x Implied Perpetual Growth Rate [1] 3.8% 4.3% 4.7% 5.1% 4.7% 5.2% 5.7% 6.0% 5.7% 6.2% 6.6% 7.0% % of Value in Terminal Value 97.8% 98.0% 98.1% 98.2% 97.8% 98.0% 98.1% 98.2% 97.8% 97.9% 98.1% 98.2% Terminal Price / Earnings Per Share 13.0x 14.0x 15.0x 16.0x 13.0% $9.58 $10.30 $11.02 $11.74 Discount 12.0% $9.86 $10.60 $11.34 $12.08 Rate 11.0% $10.15 $10.91 $11.67 $12.44 Note: Present value as of 10/13/2017. 1. Implied perpetual growth rate calculated based on 90% payout ratio in terminal period. Adj. Book Value is Book Value, adjusted to exclude portion of 8.25% Subordinated Notes recorded in equity due to issuance of warrants in connection with the 8.25% Subordinated Notes. DCF refers to discounted cash flow analysis. E refers to Estimated. LTM refers to Latest 12 Months. Q4 17 refers to the fourth fiscal quarter of 2017. Source: Company management. 15
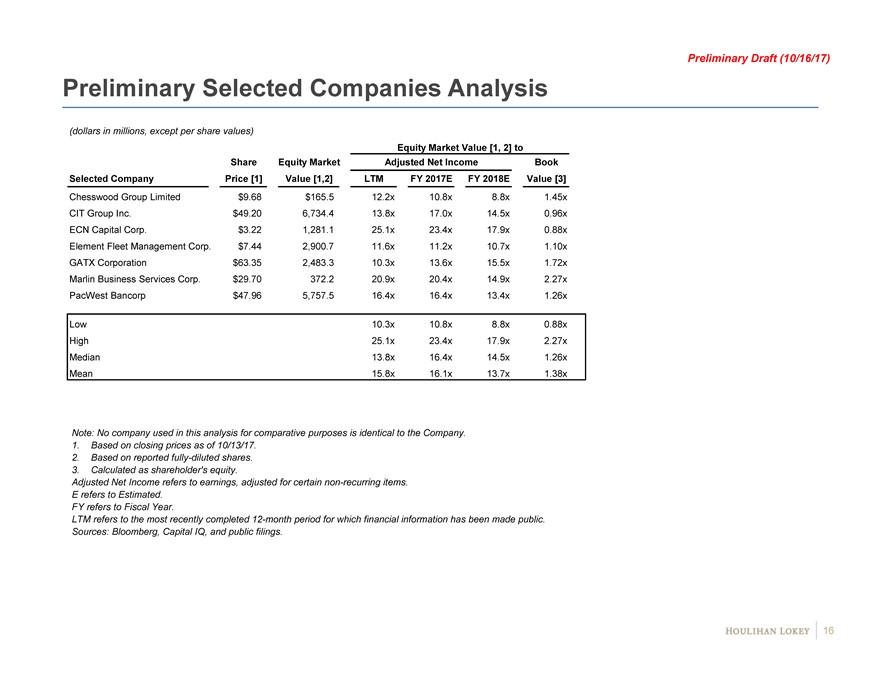
Preliminary Draft (10/16/17) Preliminary Selected Companies Analysis (dollars in millions, except per share values) Equity Market Value [1, 2] to Share Equity Market Adjusted Net Income Book Selected Company Price [1] Value [1,2] LTM FY 2017E FY 2018E Value [3] Chesswood Group Limited $9.68 $165.5 12.2x # 10.8x # 8.8x # 1.45x ## CIT Group Inc. $49.20 6,734.4 13.8x # 17.0x # 14.5x # 0.96x ## ECN Capital Corp. $3.22 1,281.1 25.1x # 23.4x # 17.9x # 0.88x ## Element Fleet Management Corp. $7.44 2,900.7 11.6x # 11.2x # 10.7x # 1.10x ## GATX Corporation $63.35 2,483.3 10.3x # 13.6x # 15.5x # 1.72x ## Marlin Business Services Corp. $29.70 372.2 20.9x # 20.4x # 14.9x # 2.27x ## PacWest Bancorp $47.96 5,757.5 16.4x # 16.4x # 13.4x # 1.26x ## Low 10.3x 10.8x 8.8x 0.88x High 25.1x 23.4x 17.9x 2.27x Median 13.8x 16.4x 14.5x 1.26x Mean 15.8x 16.1x 13.7x 1.38x Note: No company used in this analysis for comparative purposes is identical to the Company. 1. Based on closing prices as of 10/13/17. 2. Based on reported fully-diluted shares. 3. Calculated as shareholder’s equity. Adjusted Net Income refers to earnings, adjusted for certainnon-recurring items. E refers to Estimated. FY refers to Fiscal Year. LTM refers to the most recently completed12-month period for which financial information has been made public. Sources: Bloomberg, Capital IQ, and public filings. 16

Page 1. Transaction Background 3 2. Public Market Observations 7 3. Financial Analyses 11 4. Contingent Value Right 17 5. Appendix 23 6. Disclaimer 28
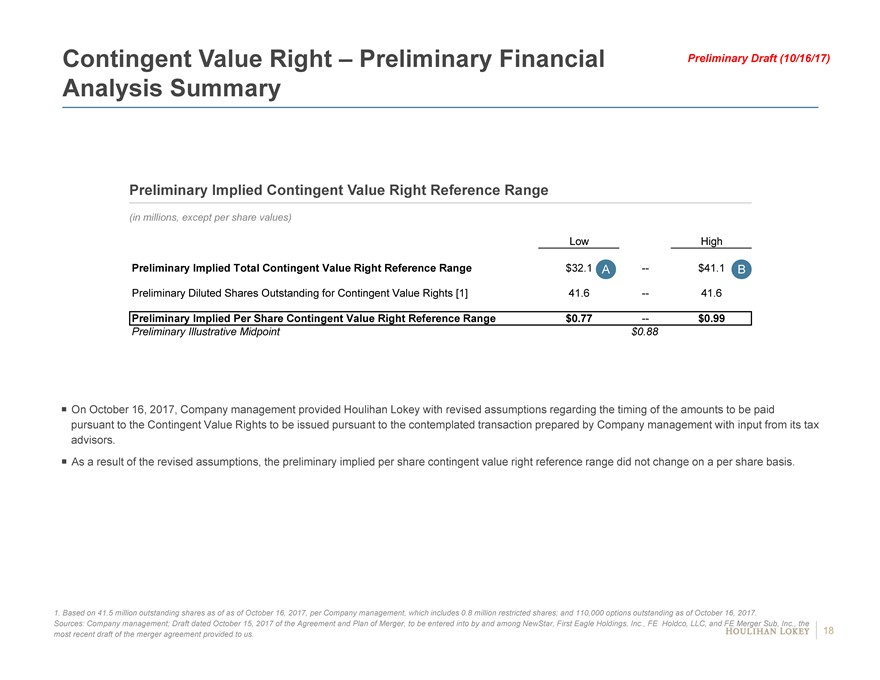
Contingent Value Right—Preliminary Financial Preliminary Draft (10/16/17) Analysis Summary Preliminary Implied Contingent Value Right Reference Range (in millions, except per share values) Low High Preliminary Implied Total Contingent Value Right Reference Range $32.1 A—$41.1 B Preliminary Diluted Shares Outstanding for Contingent Value Rights [1] 41.6—41.6 Preliminary Implied Per Share Contingent Value Right Reference Range $0.77—$0.99 Preliminary Illustrative Midpoint $0.88 On October 16, 2017, Company management provided Houlihan Lokey with revised assumptions regarding the timing of the amounts to be paid pursuant to the Contingent Value Rights to be issued pursuant to the contemplated transaction prepared by Company management with input from its tax advisors. As a result of the revised assumptions, the preliminary implied per share contingent value right reference range did not change on a per share basis. 1. Based on 41.5 million outstanding shares as of as of October 16, 2017, per Company management, which includes 0.8 million restricted shares; and 110,000 options outstanding as of October 16, 2017. Sources: Company management; Draft dated October 15, 2017 of the Agreement and Plan of Merger, to be entered into by and among NewStar, First Eagle Holdings, Inc., FE Holdco, LLC, and FE Merger Sub, Inc., the most recent draft of the merger agreement provided to us. 18
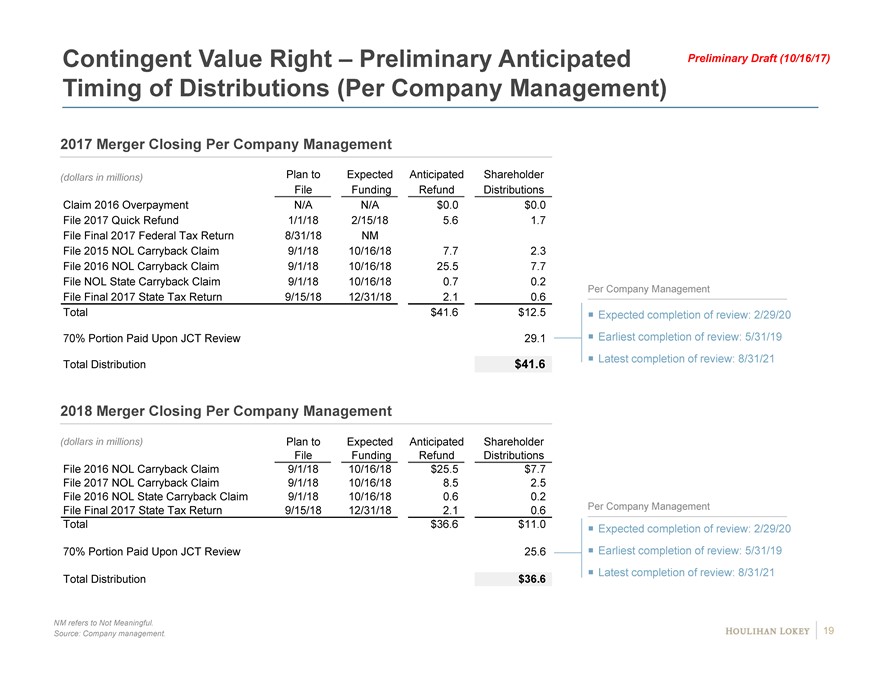
Contingent Value Right—Preliminary Anticipated Preliminary Draft (10/16/17) Timing of Distributions (Per Company Management) 2017 Merger Closing Per Company Management (dollars in millions) Plan to Expected Anticipated Shareholder File Funding Refund Distributions Claim 2016 Overpayment N/A N/A $0.0 $0.0 File 2017 Quick Refund 1/1/18 2/15/18 5.6 1.7 File Final 2017 Federal Tax Return 8/31/18 NM File 2015 NOL Carryback Claim 9/1/18 10/16/18 7.7 2.3 File 2016 NOL Carryback Claim 9/1/18 10/16/18 25.5 7.7 File NOL State Carryback Claim 9/1/18 10/16/18 0.7 0.2 Per Company Management File Final 2017 State Tax Return 9/15/18 12/31/18 2.1 0.6 Total $41.6 $12.5 Expected completion of review: 2/29/20 70% Portion Paid Upon JCT Review 29.1 Earliest completion of review: 5/31/19 $41.6 Latest completion of review: 8/31/21 Total Distribution 2018 Merger Closing Per Company Management (dollars in millions) Plan to Expected Anticipated Shareholder File Funding Refund Distributions File 2016 NOL Carryback Claim 9/1/18 10/16/18 $25.5 $7.7 File 2017 NOL Carryback Claim 9/1/18 10/16/18 8.5 2.5 File 2016 NOL State Carryback Claim 9/1/18 10/16/18 0.6 0.2 Per Company Management File Final 2017 State Tax Return 9/15/18 12/31/18 2.1 0.6 Total $36.6 $11.0 Expected completion of review: 2/29/20 70% Portion Paid Upon JCT Review 25.6 Earliest completion of review: 5/31/19 Latest completion of review: 8/31/21 Total Distribution $36.6 NM refers to Not Meaningful. 19 Source: Company management.
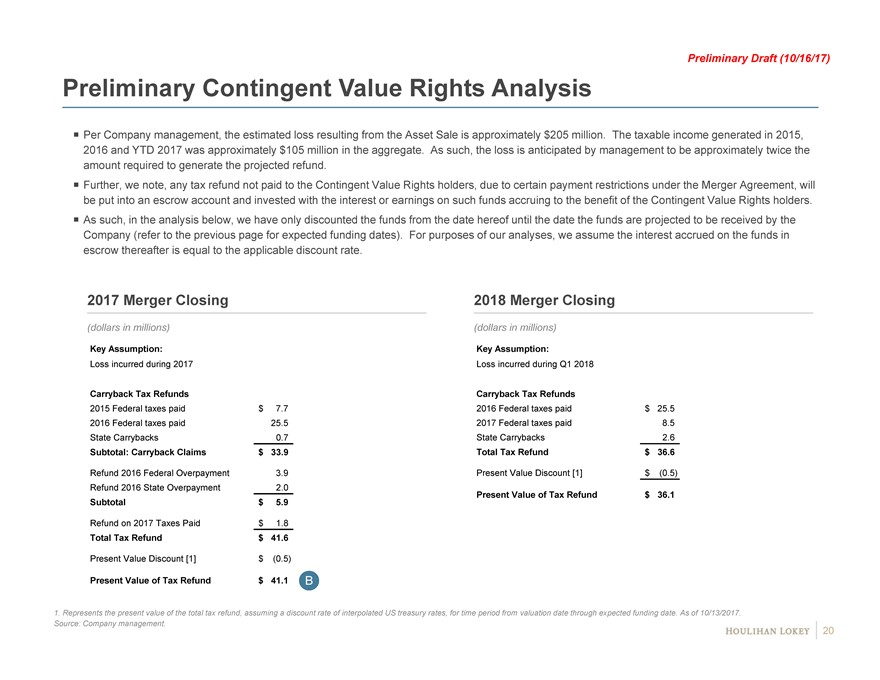
Preliminary Draft (10/16/17) Preliminary Contingent Value Rights Analysis Per Company management, the estimated loss resulting from the Asset Sale is approximately $205 million. The taxable income generated in 2015, 2016 and YTD 2017 was approximately $105 million in the aggregate. As such, the loss is anticipated by management to be approximately twice the amount required to generate the projected refund. Further, we note, any tax refund not paid to the Contingent Value Rights holders, due to certain payment restrictions under the Merger Agreement, will be put into an escrow account and invested with the interest or earnings on such funds accruing to the benefit of the Contingent Value Rights holders. As such, in the analysis below, we have only discounted the funds from the date hereof until the date the funds are projected to be received by the Company (refer to the previous page for expected funding dates). For purposes of our analyses, we assume the interest accrued on the funds in escrow thereafter is equal to the applicable discount rate. 2017 Merger Closing 2018 Merger Closing (dollars in millions) (dollars in millions) Key Assumption: Key Assumption: Loss incurred during 2017 Loss incurred during Q1 2018 Carryback Tax Refunds Carryback Tax Refunds 2015 Federal taxes paid $ 7.7 2016 Federal taxes paid $ 25.5 2016 Federal taxes paid 25.5 2017 Federal taxes paid 8.5 State Carrybacks 0.7 State Carrybacks 2.6 Subtotal: Carryback Claims $ 33.9 Total Tax Refund $ 36.6 Refund 2016 Federal Overpayment 3.9 Present Value Discount [1] $ (0.5) Refund 2016 State Overpayment 2.0 Present Value of Tax Refund $ 36.1 Subtotal $ 5.9 Refund on 2017 Taxes Paid $ 1.8 Total Tax Refund $ 41.6 Present Value Discount [1] $ (0.5) Present Value of Tax Refund $ 41.1 B 1. Represents the present value of the total tax refund, assuming a discount rate of interpolated US treasury rates, for time period from valuation date through expected funding date. As of 10/13/2017. Source: Company management. 20
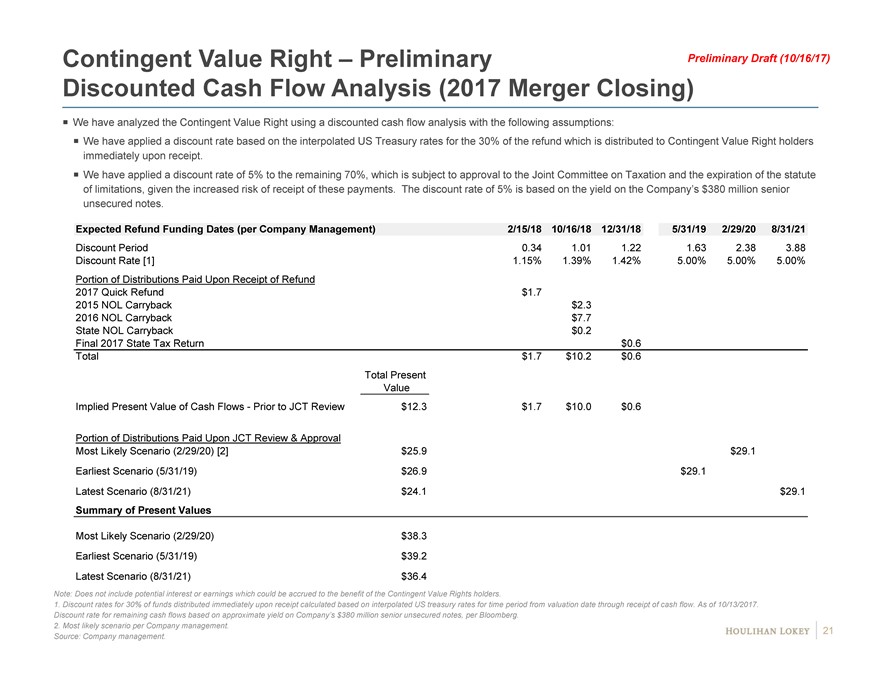
Contingent Value Right—Preliminary Preliminary Draft (10/16/17) Discounted Cash Flow Analysis (2017 Merger Closing) We have analyzed the Contingent Value Right using a discounted cash flow analysis with the following assumptions: We have applied a discount rate based on the interpolated US Treasury rates for the 30% of the refund which is distributed to Contingent Value Right holders immediately upon receipt. We have applied a discount rate of 5% to the remaining 70%, which is subject to approval to the Joint Committee on Taxation and the expiration of the statute of limitations, given the increased risk of receipt of these payments. The discount rate of 5% is based on the yield on the Company’s $380 million senior unsecured notes. Expected Refund Funding Dates (per Company Management) 2/15/18 10/16/18 12/31/18 5/31/19 2/29/20 8/31/21 Discount Period 0.34 1.01 1.22 1.63 2.38 3.88 Discount Rate [1] 1.15% 1.39% 1.42% 5.00% 5.00% 5.00% Portion of Distributions Paid Upon Receipt of Refund 2017 Quick Refund $1.7 2015 NOL Carryback $2.3 2016 NOL Carryback $7.7 State NOL Carryback $0.2 Final 2017 State Tax Return $0.6 Total $1.7 $10.2 $0.6 Total Present Value Implied Present Value of Cash Flows—Prior to JCT Review $12.3 $1.7 $10.0 $0.6 Portion of Distributions Paid Upon JCT Review & Approval Most Likely Scenario (2/29/20) [2] $25.9 $29.1 Earliest Scenario (5/31/19) $26.9 $29.1 Latest Scenario (8/31/21) $24.1 $29.1 Summary of Present Values Most Likely Scenario (2/29/20) $38.3 Earliest Scenario (5/31/19) $39.2 Latest Scenario (8/31/21) $36.4 Note: Does not include potential interest or earnings which could be accrued to the benefit of the Contingent Value Rights holders. 1. Discount rates for 30% of funds distributed immediately upon receipt calculated based on interpolated US treasury rates for time period from valuation date through receipt of cash flow. As of 10/13/2017. Discount rate for remaining cash flows based on approximate yield on Company’s $380 million senior unsecured notes, per Bloomberg. 2. Most likely scenario per Company management. 21 Source: Company management.
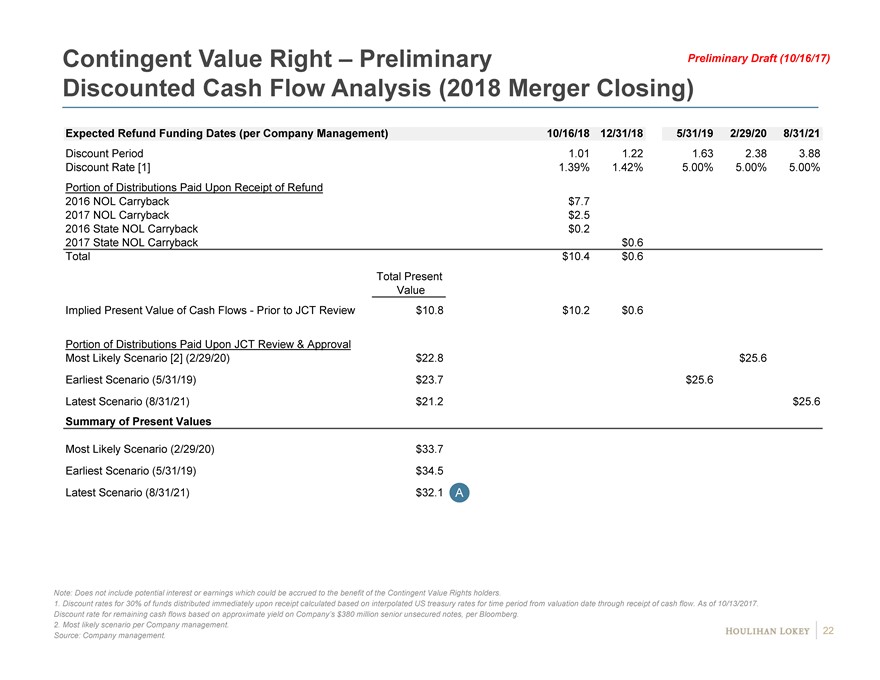
Contingent Value Right—Preliminary Preliminary Draft (10/16/17) Discounted Cash Flow Analysis (2018 Merger Closing) Expected Refund Funding Dates (per Company Management) 10/16/18 12/31/18 5/31/19 2/29/20 8/31/21 Discount Period 1.01 1.22 1.63 2.38 3.88 Discount Rate [1] 1.39% 1.42% 5.00% 5.00% 5.00% Portion of Distributions Paid Upon Receipt of Refund 2016 NOL Carryback $7.7 2017 NOL Carryback $2.5 2016 State NOL Carryback $0.2 2017 State NOL Carryback $0.6 Total $10.4 $0.6 Total Present Value Implied Present Value of Cash Flows—Prior to JCT Review $10.8 $10.2 $0.6 Portion of Distributions Paid Upon JCT Review & Approval Most Likely Scenario [2] (2/29/20) $22.8 $25.6 Earliest Scenario (5/31/19) $23.7 $25.6 Latest Scenario (8/31/21) $21.2 $25.6 Summary of Present Values Most Likely Scenario (2/29/20) $33.7 Earliest Scenario (5/31/19) $34.5 Latest Scenario (8/31/21) $32.1 A Note: Does not include potential interest or earnings which could be accrued to the benefit of the Contingent Value Rights holders. 1. Discount rates for 30% of funds distributed immediately upon receipt calculated based on interpolated US treasury rates for time period from valuation date through receipt of cash flow. As of 10/13/2017. Discount rate for remaining cash flows based on approximate yield on Company’s $380 million senior unsecured notes, per Bloomberg. 2. Most likely scenario per Company management. 22 Source: Company management.
Page 1. Transaction Background 3 2. Public Market Observations 7 3. Financial Analyses 11 4. Contingent Value Right 17 5. Appendix 23 Historical and Projected Financial Information 24 6. Disclaimer 28
Page 1. Transaction Background 3 2. Public Market Observations 7 3. Financial Analyses 11 4. Contingent Value Right 17 5. Appendix 23 Historical and Projected Financial Information 24 6. Disclaimer 28
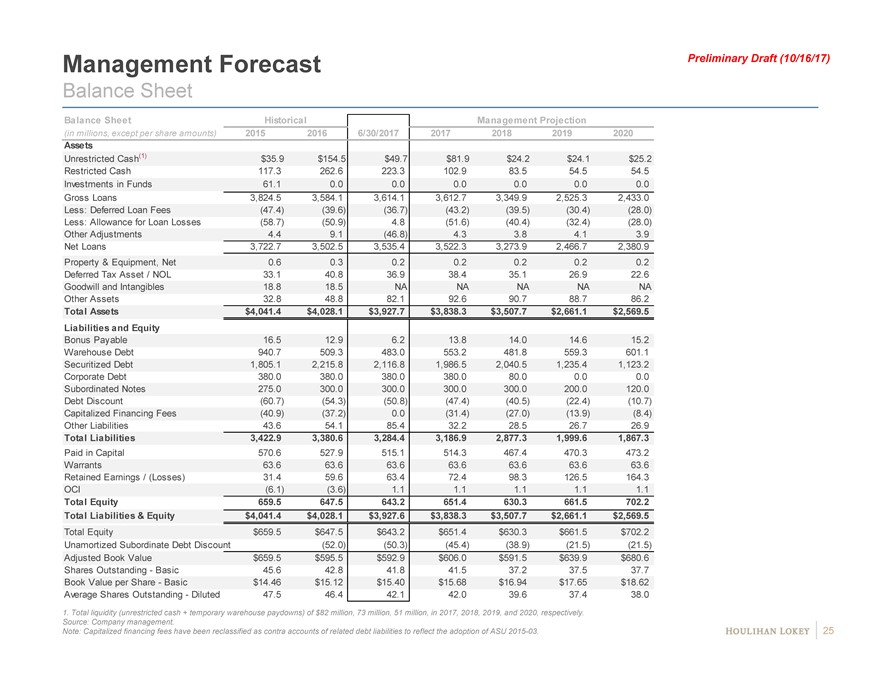
Management Forecast Preliminary Draft (10/16/17) Balance Sheet Balance Sheet Historical Management Projection (in millions, except per share amounts) 2015 2016 6/30/2017 2017 2018 2019 2020 Assets Unrestricted Cash(1) $35.9 $154.5 $49.7 $81.9 $24.2 $24.1 $25.2 Restricted Cash 117.3 262.6 223.3 102.9 83.5 54.5 54.5 Investments in Funds 61.1 0.0 0.0 0.0 0.0 0.0 0.0 Gross Loans 3,824.5 3,584.1 3,614.1 3,612.7 3,349.9 2,525.3 2,433.0 Less: Deferred Loan Fees (47.4) (39.6) (36.7) (43.2) (39.5) (30.4) (28.0) Less: Allowance for Loan Losses (58.7) (50.9) 4.8 (51.6) (40.4) (32.4) (28.0) Other Adjustments 4.4 9.1 (46.8) 4.3 3.8 4.1 3.9 Net Loans 3,722.7 3,502.5 3,535.4 3,522.3 3,273.9 2,466.7 2,380.9 Property & Equipment, Net 0.6 0.3 0.2 0.2 0.2 0.2 0.2 Deferred Tax Asset / NOL 33.1 40.8 36.9 38.4 35.1 26.9 22.6 Goodwill and Intangibles 18.8 18.5 NA NA NA NA NA Other Assets 32.8 48.8 82.1 92.6 90.7 88.7 86.2 Total Assets $4,041.4 $4,028.1 $3,927.7 $3,838.3 $3,507.7 $2,661.1 $2,569.5 Liabilities and Equity Bonus Payable 16.5 12.9 6.2 13.8 14.0 14.6 15.2 Warehouse Debt 940.7 509.3 483.0 553.2 481.8 559.3 601.1 Securitized Debt 1,805.1 2,215.8 2,116.8 1,986.5 2,040.5 1,235.4 1,123.2 Corporate Debt 380.0 380.0 380.0 380.0 80.0 0.0 0.0 Subordinated Notes 275.0 300.0 300.0 300.0 300.0 200.0 120.0 Debt Discount (60.7) (54.3) (50.8) (47.4) (40.5) (22.4) (10.7) Capitalized Financing Fees (40.9) (37.2) 0.0 (31.4) (27.0) (13.9) (8.4) Other Liabilities 43.6 54.1 85.4 32.2 28.5 26.7 26.9 Total Liabilities 3,422.9 3,380.6 3,284.4 3,186.9 2,877.3 1,999.6 1,867.3 Paid in Capital 570.6 527.9 515.1 514.3 467.4 470.3 473.2 Warrants 63.6 63.6 63.6 63.6 63.6 63.6 63.6 Retained Earnings / (Losses) 31.4 59.6 63.4 72.4 98.3 126.5 164.3 OCI (6.1) (3.6) 1.1 1.1 1.1 1.1 1.1 Total Equity 659.5 647.5 643.2 651.4 630.3 661.5 702.2 Total Liabilities & Equity $4,041.4 $4,028.1 $3,927.6 $3,838.3 $3,507.7 $2,661.1 $2,569.5 Total Equity $659.5 $647.5 $643.2 $651.4 $630.3 $661.5 $702.2 Unamortized Subordinate Debt Discount (52.0) (50.3) (45.4) (38.9) (21.5) (21.5) Adjusted Book Value $659.5 $595.5 $592.9 $606.0 $591.5 $639.9 $680.6 Shares Outstanding—Basic 45.6 42.8 41.8 41.5 37.2 37.5 37.7 Book Value per Share—Basic $14.46 $15.12 $15.40 $15.68 $16.94 $17.65 $18.62 Average Shares Outstanding—Diluted 47.5 46.4 42.1 42.0 39.6 37.4 38.0 1. Total liquidity (unrestricted cash + temporary warehouse paydowns) of $82 million, 73 million, 51 million, in 2017, 2018, 2019, and 2020, respectively. Source: Company management. Note: Capitalized financing fees have been reclassified as contra accounts of related debt liabilities to reflect the adoption of ASU2015-03. 25
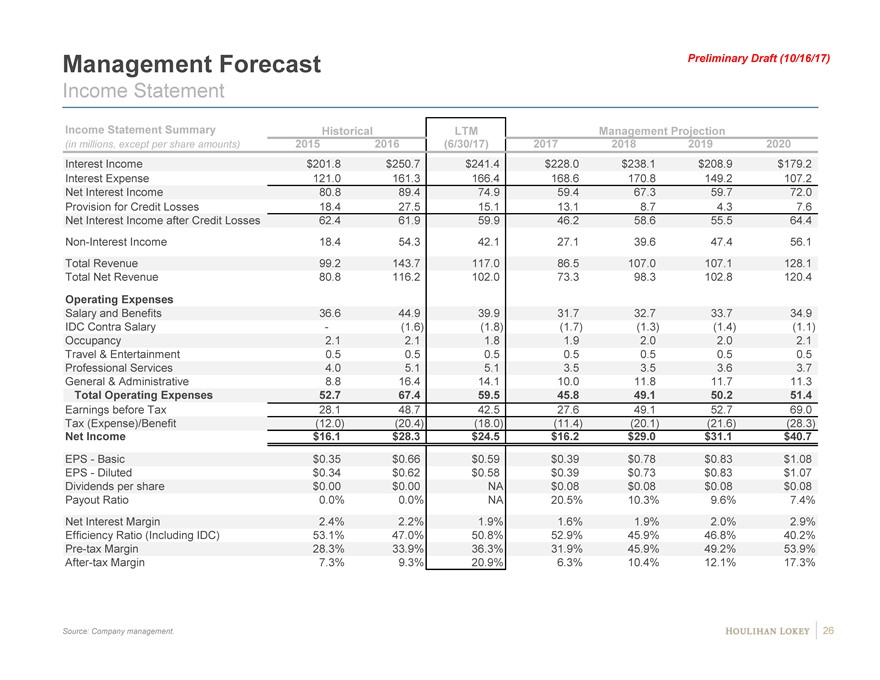
Management Forecast Preliminary Draft (10/16/17) Income Statement Income Statement Summary Historical LTM Management Projection (in millions, except per share amounts) 2015 2016 (6/30/17) 2017 2018 2019 2020 Interest Income $201.8 $250.7 $241.4 $228.0 $238.1 $208.9 $179.2 Interest Expense 121.0 161.3 166.4 168.6 170.8 149.2 107.2 Net Interest Income 80.8 89.4 74.9 59.4 67.3 59.7 72.0 Provision for Credit Losses 18.4 27.5 15.1 13.1 8.7 4.3 7.6 Net Interest Income after Credit Losses 62.4 61.9 59.9 46.2 58.6 55.5 64.4Non-Interest Income 18.4 54.3 42.1 27.1 39.6 47.4 56.1 Total Revenue 99.2 143.7 117.0 86.5 107.0 107.1 128.1 Total Net Revenue 80.8 116.2 102.0 73.3 98.3 102.8 120.4 Operating Expenses Salary and Benefits 36.6 44.9 39.9 31.7 32.7 33.7 34.9 IDC Contra Salary—(1.6) (1.8) (1.7) (1.3) (1.4) (1.1) Occupancy 2.1 2.1 1.8 1.9 2.0 2.0 2.1 Travel & Entertainment 0.5 0.5 0.5 0.5 0.5 0.5 0.5 Professional Services 4.0 5.1 5.1 3.5 3.5 3.6 3.7 General & Administrative 8.8 16.4 14.1 10.0 11.8 11.7 11.3 Total Operating Expenses 52.7 67.4 59.5 45.8 49.1 50.2 51.4 Earnings before Tax 28.1 48.7 42.5 27.6 49.1 52.7 69.0 Tax (Expense)/Benefit (12.0) (20.4) (18.0) (11.4) (20.1) (21.6) (28.3) Net Income $16.1 $28.3 $24.5 $16.2 $29.0 $31.1 $40.7 EPS—Basic $0.35 $0.66 $0.59 $0.39 $0.78 $0.83 $1.08 EPS—Diluted $0.34 $0.62 $0.58 $0.39 $0.73 $0.83 $1.07 Dividends per share $0.00 $0.00 NA $0.08 $0.08 $0.08 $0.08 Payout Ratio 0.0% 0.0% NA 20.5% 10.3% 9.6% 7.4% Net Interest Margin 2.4% 2.2% 1.9% 1.6% 1.9% 2.0% 2.9% Efficiency Ratio (Including IDC) 53.1% 47.0% 50.8% 52.9% 45.9% 46.8% 40.2%Pre-tax Margin 28.3% 33.9% 36.3% 31.9% 45.9% 49.2% 53.9%After-tax Margin 7.3% 9.3% 20.9% 6.3% 10.4% 12.1% 17.3% Source: Company management. 26
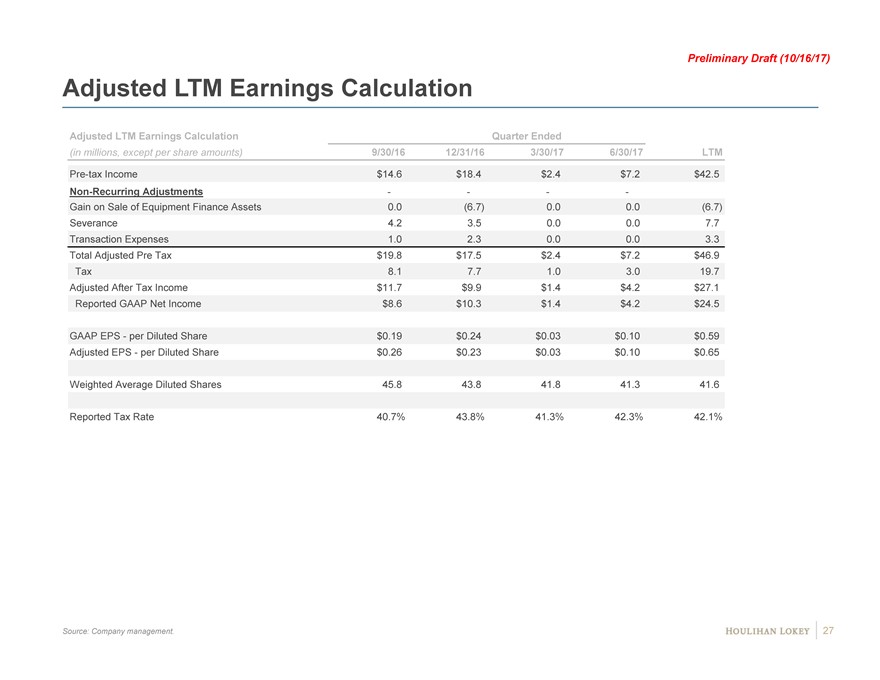
Preliminary Draft (10/16/17) Adjusted LTM Earnings Calculation Adjusted LTM Earnings Calculation Quarter Ended (in millions, except per share amounts) 9/30/16 12/31/16 3/30/17 6/30/17 LTMPre-tax Income $14.6 $18.4 $2.4 $7.2 $42.5Non-Recurring Adjustments — — Gain on Sale of Equipment Finance Assets 0.0 (6.7) 0.0 0.0 (6.7) Severance 4.2 3.5 0.0 0.0 7.7 Transaction Expenses 1.0 2.3 0.0 0.0 3.3 Total Adjusted Pre Tax $19.8 $17.5 $2.4 $7.2 $46.9 Tax 8.1 7.7 1.0 3.0 19.7 Adjusted After Tax Income $11.7 $9.9 $1.4 $4.2 $27.1 Reported GAAP Net Income $8.6 $10.3 $1.4 $4.2 $24.5 GAAP EPS—per Diluted Share $0.19 $0.24 $0.03 $0.10 $0.59 Adjusted EPS—per Diluted Share $0.26 $0.23 $0.03 $0.10 $0.65 Weighted Average Diluted Shares 45.8 43.8 41.8 41.3 41.6 Reported Tax Rate 40.7% 43.8% 41.3% 42.3% 42.1% Source: Company management. 27
Page 1. Transaction Background 3 2. Public Market Observations 7 3. Financial Analyses 11 4. Contingent Value Right 17 5. Appendix 23 6. Disclaimer 28
Preliminary Draft (10/16/17) Disclaimer This presentation, and any supplemental information (written or oral) or other documents provided in connection therewith (collectively, the “materials”), are provided solely for the information of the Board of Directors (the “Board”) of NewStar Financial, Inc. (the “Company”) by Houlihan Lokey in connection with the Board’s consideration of a potential transaction (the “Transaction”) involving the Company. This presentation is incomplete without reference to, and should be considered in conjunction with, any supplemental information provided by and discussions with Houlihan Lokey in connection therewith. Any defined terms used herein shall have the meanings set forth herein, even if such defined terms have been given different meanings elsewhere in the materials. The materials are for discussion purposes only. Houlihan Lokey expressly disclaims any and all liability which may be based on the materials and any errors therein or omissions therefrom. The materials were prepared for specific persons familiar with the business and affairs of the Company for use in a specific context and were not prepared with a view to public disclosure or to conform with any disclosure standards under any state, federal or international securities laws or other laws, rules or regulations, and none of the Board, the Company or Houlihan Lokey takes any responsibility for the use of the materials by persons other than the Board. The materials are provided on a confidential basis solely for the information of the Board and may not be disclosed, summarized, reproduced, disseminated or quoted or otherwise referred to, in whole or in part, without Houlihan Lokey’s express prior written consent. Notwithstanding any other provision herein, the Company (and each employee, representative or other agent of the Company) may disclose to any and all persons without limitation of any kind, the tax treatment and tax structure of any transaction and all materials of any kind (including opinions or other tax analyses, if any) that are provided to the Company relating to such tax treatment and structure. However, any information relating to the tax treatment and tax structure shall remain confidential (and the foregoing sentence shall not apply) to the extent necessary to enable any person to comply with securities laws. For this purpose, the tax treatment of a transaction is the purported or claimed U.S. income or franchise tax treatment of the transaction and the tax structure of a transaction is any fact that may be relevant to understanding the purported or claimed U.S. income or franchise tax treatment of the transaction. If the Company plans to disclose information pursuant to the first sentence of this paragraph, the Company shall inform those to whom it discloses any such information that they may not rely upon such information for any purpose without Houlihan Lokey’s prior written consent. Houlihan Lokey is not an expert on, and nothing contained in the materials should be construed as advice with regard to, legal, accounting, regulatory, insurance, tax or other specialist matters. Houlihan Lokey’s role in reviewing any information was limited solely to performing such a review as it deemed necessary to support its own advice and analysis and was not on behalf of the Board. The materials necessarily are based on financial, economic, market and other conditions as in effect on, and the information available to Houlihan Lokey as of, the date of the materials. Although subsequent developments may affect the contents of the materials, Houlihan Lokey has not undertaken, and is under no obligation, to update, revise or reaffirm the materials, except as may be expressly contemplated by Houlihan Lokey’s engagement letter. The materials are not intended to provide the sole basis for evaluation of the Transaction and do not purport to contain all information that may be required. The materials do not address the underlying business decision of the Company or any other party to proceed with or effect the Transaction, or the relative merits of the Transaction as compared to any alternative business strategies or transactions that might be available for the Company or any other party. The materials do not constitute any opinion, nor do the materials constitute a recommendation to the Board, the Company, any security holder of the Company or any other party as to how to vote or act with respect to any matter relating to the Transaction or otherwise or whether to buy or sell any assets or securities of any company. Houlihan Lokey’s only opinion is the opinion, if any, that is actually delivered to the Board. The materials may not reflect information known to other professionals in other business areas of Houlihan Lokey and its affiliates. The preparation of the materials was a complex process involving quantitative and qualitative judgments and determinations with respect to the financial, comparative and other analytic methods employed and the adaption and application of these methods to the unique facts and circumstances presented and, therefore, is not readily susceptible to partial analysis or summary description. Furthermore, Houlihan Lokey did not attribute any particular weight to any analysis or factor considered by it, but rather made qualitative judgments as to the significance and relevance of each analysis and factor. Each analytical technique has inherent strengths and weaknesses, and the nature of the available information may further affect the value of particular techniques. Accordingly, the analyses contained in the materials must be considered as a whole. Selecting portions of the analyses, analytic methods and factors without considering all analyses and factors could create a misleading or incomplete view. The materials reflect judgments and assumptions with regard to industry performance, general business, economic, regulatory, market and financial conditions and other matters, many of which are beyond the control of the participants in the Transaction. Any estimates of value contained in the materials are not necessarily indicative of actual value or predictive of future results or values, which may be significantly more or less favorable. Any analyses relating to the value of assets, businesses or securities do not purport to be appraisals or to reflect the prices at which any assets, businesses or securities may actually be sold. The materials do not constitute a valuation opinion or credit rating. In preparing the materials, Houlihan Lokey has not conducted any physical inspection or independent appraisal or evaluation of any of the assets, properties or liabilities (contingent or otherwise) of the Company or any other party and has no obligation to evaluate the solvency of the Company or any other party under any law. All budgets, projections, estimates, financial analyses, reports and other information with respect to operations (including estimates of potential cost savings and expenses) reflected in the materials have been prepared by management of the relevant party or are derived from such budgets, projections, estimates, financial analyses, reports and other information or from other sources, which involve numerous and significant subjective determinations made by management of the relevant party and/or which such management has reviewed and found reasonable. The budgets, projections and estimates contained in the materials may or may not be achieved and differences between projected results and those actually achieved may be material. Houlihan Lokey has relied upon representations made by management of the Company and other participants in the Transaction that such budgets, projections and estimates have been reasonably prepared in good faith on bases reflecting the best currently available estimates and judgments of such management (or, with respect to information obtained from public sources, represent reasonable estimates), and Houlihan Lokey expresses no opinion with respect to such budgets, projections or estimates or the assumptions on which they are based. The scope of the financial analysis contained herein is based on discussions with the Company (including, without limitation, regarding the methodologies to be utilized), and Houlihan Lokey does not make any representation, express or implied, as to the sufficiency or adequacy of such financial analysis or the scope thereof for any particular purpose. Houlihan Lokey has assumed and relied upon the accuracy and completeness of the financial and other information provided to, discussed with or reviewed by it without (and without assuming responsibility for) independent verification of such information, makes no representation or warranty (express or implied) in respect of the accuracy or completeness of such information and has further relied upon the assurances of the Company and other participants in the Transaction that they are not aware of any facts or circumstances that would make such information inaccurate or misleading. In addition, Houlihan Lokey has relied upon and assumed, without independent verification, that there has been no change in the business, assets, liabilities, financial condition, results of operations, cash flows or prospects of the Company or any other participant in the Transaction since the respective dates of the most recent financial statements and other information, financial or otherwise, provided to, discussed with or reviewed by Houlihan Lokey that would be material to its analyses, and that the final forms of any draft documents reviewed by Houlihan Lokey will not differ in any material respect from such draft documents. The materials are not an offer to sell or a solicitation of an indication of interest to purchase any security, option, commodity, future, loan or currency. The materials do not constitute a commitment by Houlihan Lokey or any of its affiliates to underwrite, subscribe for or place any securities, to extend or arrange credit, or to provide any other services. In the ordinary course of business, certain of Houlihan Lokey’s affiliates and employees, as well as investment funds in which they may have financial interests or with which they mayco-invest, may acquire, hold or sell, long or short positions, or trade or otherwise effect transactions, in debt, equity, and other securities and financial instruments (including loans and other obligations) of, or investments in, the Company, any Transaction counterparty, any other Transaction participant, any other financially interested party with respect to any transaction, other entities or parties that are mentioned in the materials, or any of the foregoing entities’ or parties’ respective affiliates, subsidiaries, investment funds, portfolio companies and representatives (collectively, the “Interested Parties”), or any currency or commodity that may be involved in the Transaction. Houlihan Lokey provides mergers and acquisitions, restructuring and other advisory and consulting services to clients, which may have in the past included, or may currently or in the future include, one or more Interested Parties, for which services Houlihan Lokey has received, and may receive, compensation. Although Houlihan Lokey in the course of such activities and relationships or otherwise may have acquired, or may in the future acquire, information about one or more Interested Parties or the Transaction, or that otherwise may be of interest to the Company, Houlihan Lokey shall have no obligation to, and may not be contractually permitted to, disclose such information, or the fact that Houlihan Lokey is in possession of such information, to the Company or to use such information on the Company’s behalf. Houlihan Lokey’s personnel may make statements or provide advice that is contrary to information contained in the materials. 29

CORPORATEFINANCE FINANCIALADVISORYSERVICES FINANCIALRESTRUCTURING STRATEGICCONSULTING HL.com