First Eagle Private Credit (NEWS) Inactive
Filed: 27 Nov 17, 12:00am
Exhibit (c)(1)
|
Project Osprey Presentation to the Board of Directors Confidential / Draft April 13, 2017 PRELIMINARY | SUBJECT TO FURTHER REVIEW AND EVALUATION These materials may not be used or relied upon for any purpose other than as specifically contemplated by a written agreement with Credit Suisse AG or its Affiliates (hereafter “Credit Suisse”).
|
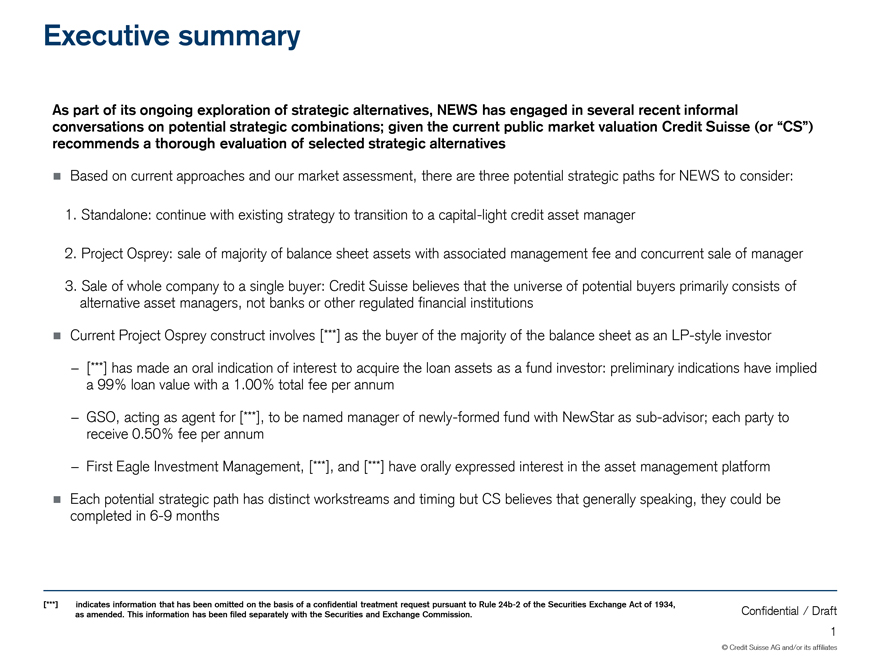
Executive summary As part of its ongoing exploration of strategic alternatives, NEWS has engaged in several recent informal conversations on potential strategic combinations; given the current public market valuation Credit Suisse (or “CS”) recommends a thorough evaluation of selected strategic alternatives Based on current approaches and our market assessment, there are three potential strategic paths for NEWS to consider: 1. Standalone: continue with existing strategy to transition to a capital-light credit asset manager 2. Project Osprey: sale of majority of balance sheet assets with associated management fee and concurrent sale of manager 3. Sale of whole company to a single buyer: Credit Suisse believes that the universe of potential buyers primarily consists of alternative asset managers, not banks or other regulated financial institutions Current Project Osprey construct involves [***] as the buyer of the majority of the balance sheet as an LP-style investor [***] has made an oral indication of interest to acquire the loan assets as a fund investor: preliminary indications have implied a 99% loan value with a 1.00% total fee per annum GSO, acting as agent for [***], to be named manager of newly-formed fund with NewStar as sub-advisor; each party to receive 0.50% fee per annum First Eagle Investment Management, [***], and [***] have orally expressed interest in the asset management platform Each potential strategic path has distinct workstreams and timing but CS believes that generally speaking, they could be completed in 6-9 months[***] indicates information that has been omitted on the basis of a confidential treatment request pursuant to Rule 24b-2 of the Securities Exchange Act of 1934, as amended. This information has been filed separately with the Securities and Exchange Commission.
 |
Preliminary assessment of NEWS standalone Confidential / Draft 2
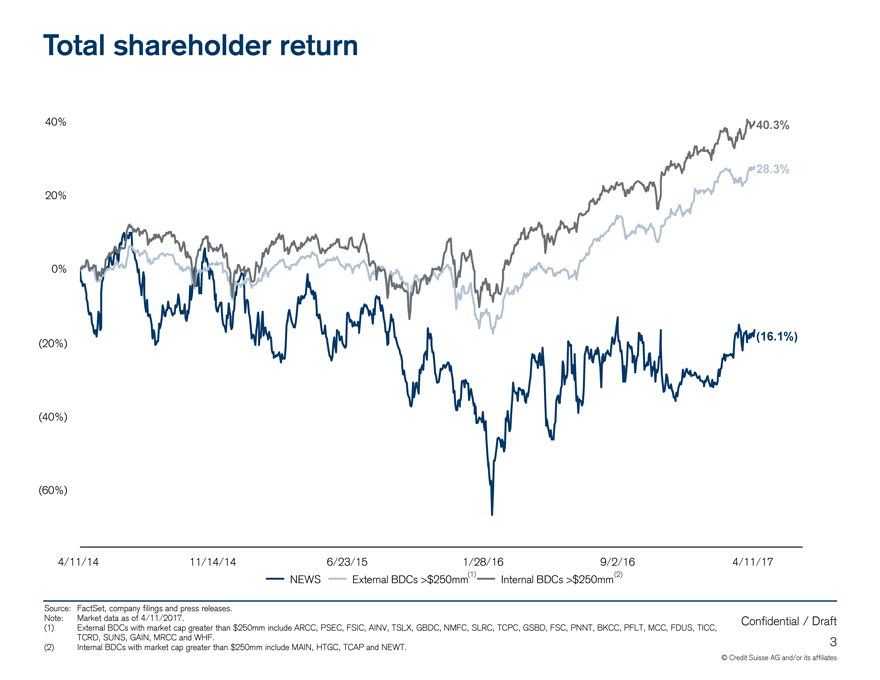 |
Total shareholder return 40%40.3% 28.3% 20% 0% (20%)(16.1%) (40%) (60%) 4/11/1411/14/146/23/151/28/169/2/164/11/17 NEWSExternal BDCs >$250mm(1)Internal BDCs >$250mm(2) Source:FactSet, company filings and press releases. Note:Market data as of 4/11/2017.Confidential / Draft (1)External BDCs with market cap greater than $250mm include ARCC, PSEC, FSIC, AINV, TSLX, GBDC, NMFC, SLRC, TCPC, GSBD, FSC, PNNT, BKCC, PFLT, MCC, FDUS, TICC, TCRD, SUNS, GAIN, MRCC and WHF.3 (2)Internal BDCs with market cap greater than $250mm include MAIN, HTGC, TCAP and NEWT. © Credit Suisse AG and/or its affiliates
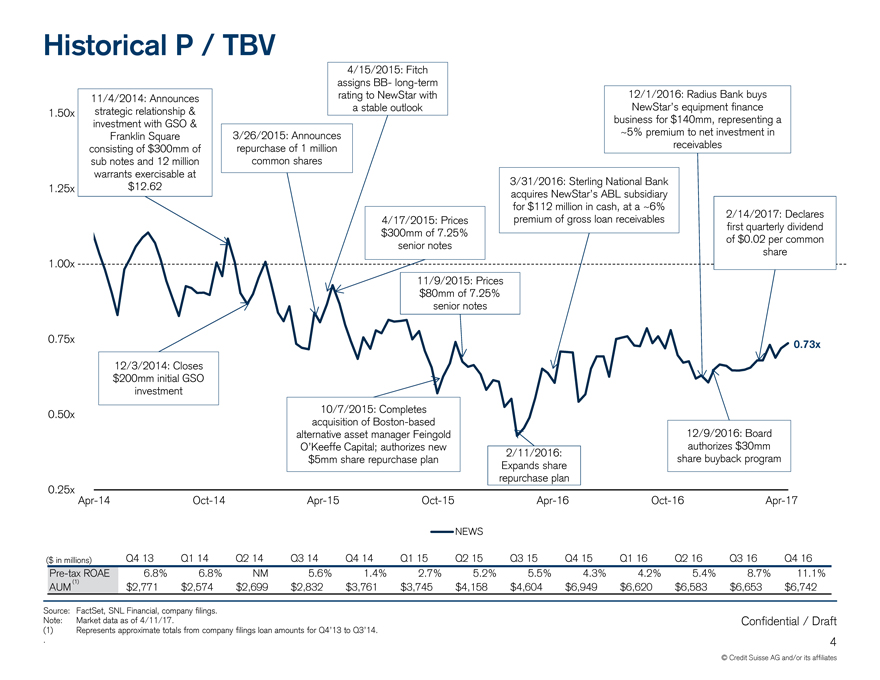 |
Historical P / TBV 4/15/2015: Fitch assigns BB long term 11/4/2014: Announcesrating to NewStar with12/1/2016: Radius Bank buys 1.50xstrategic relationship &a stable outlookNewStar’s equipment finance investment with GSO &business for $140mm, representing a Franklin Square3/26/2015: Announces~5% premium to net investment in consisting of $300mm ofrepurchase of 1 millionreceivables sub notes and 12 millioncommon shares warrants exercisable at 1.25x$12.623/31/2016: Sterling National Bank acquires NewStar’s ABL subsidiary for $112 million in cash, at a ~6% 4/17/2015: Pricespremium of gross loan receivables2/14/2017: Declares $300mm of 7.25%first quarterly dividend senior notesof $0.02 per common share 1.00x 11/9/2015: Prices $80mm of 7.25% senior notes 0.75x0.73x 12/3/2014: Closes $200mm initial GSO investment 0.50x10/7/2015: Completes acquisition of Boston based alternative asset manager Feingold12/9/2016: Board O’Keeffe Capital; authorizes newauthorizes $30mm 2/11/2016: $5mm share repurchase planshare buyback program Expands share repurchase plan 0.25x Apr 14Oct 14Apr 15Oct 15Apr 16Oct 16Apr 17 NEWS ($ in millions)Q4 13Q1 14Q2 14Q3 14Q4 14Q1 15Q2 15Q3 15Q4 15Q1 16Q2 16Q3 16Q4 16 Pre tax ROAE6.8%6.8%NM5.6%1.4%2.7%5.2%5.5%4.3%4.2%5.4%8.7%11.1% AUM (1)$2,771$2,574$2,699$2,832$3,761$3,745$4,158$4,604$6,949$6,620$6,583$6,653$6,742 Source:FactSet, SNL Financial, company filings. Note:Market data as of 4/11/17.Confidential / Draft (1)Represents approximate totals from company filings loan amounts for Q4’13 to Q3’14. .4 © Credit Suisse AG and/or its affiliates
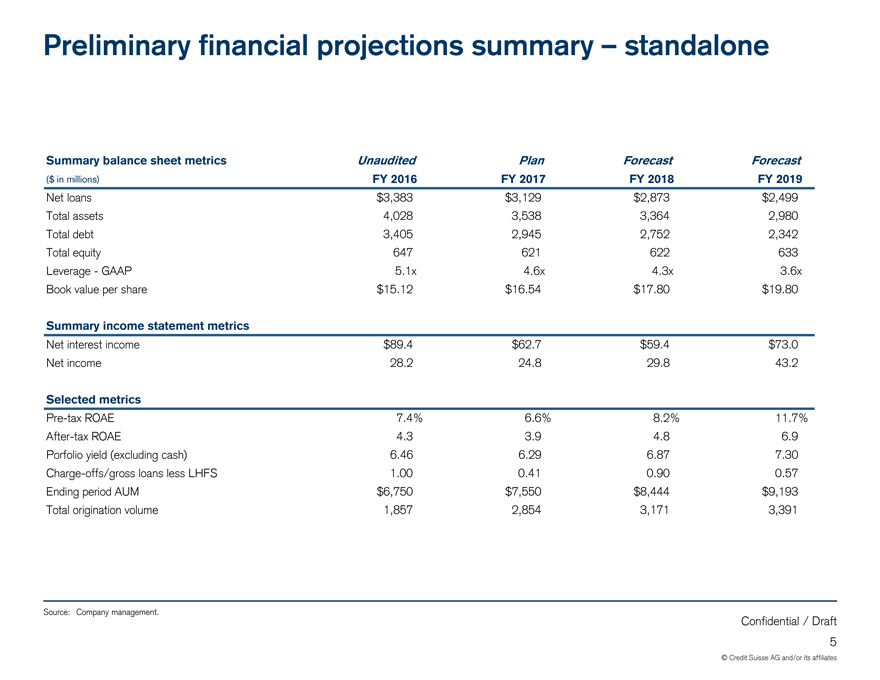 |
Preliminary financial projections summary – standalone Summary balance sheet metrics Unaudited PlanForecastForecast ($ in millions)FY 2016FY 2017FY 2018FY 2019 Net loans$3,383$3,129$2,873$2,499 Total assets4,0283,5383,3642,980 Total debt3,4052,9452,7522,342 Total equity647621622633 Leverage—GAAP5.1x4.6x4.3x3.6x Book value per share$15.12$16.54$17.80$19.80 Summary income statement metrics Net interest income$89.4$62.7$59.4$73.0 Net income28.224.829.843.2 Selected metricsPre-tax ROAE7.4%6.6%8.2%11.7%After-tax ROAE4.33.94.86.9 Porfolio yield (excluding cash)6.466.296.877.30 Charge-offs/gross loans less LHFS1.000.410.900.57 Ending period AUM$6,750$7,550$8,444$9,193 Total origination volume1,8572,8543,1713,391 Source: Company management. Confidential / Draft 5 © Credit Suisse AG and/or its affiliates
 |
Project Osprey overview Confidential / Draft 6
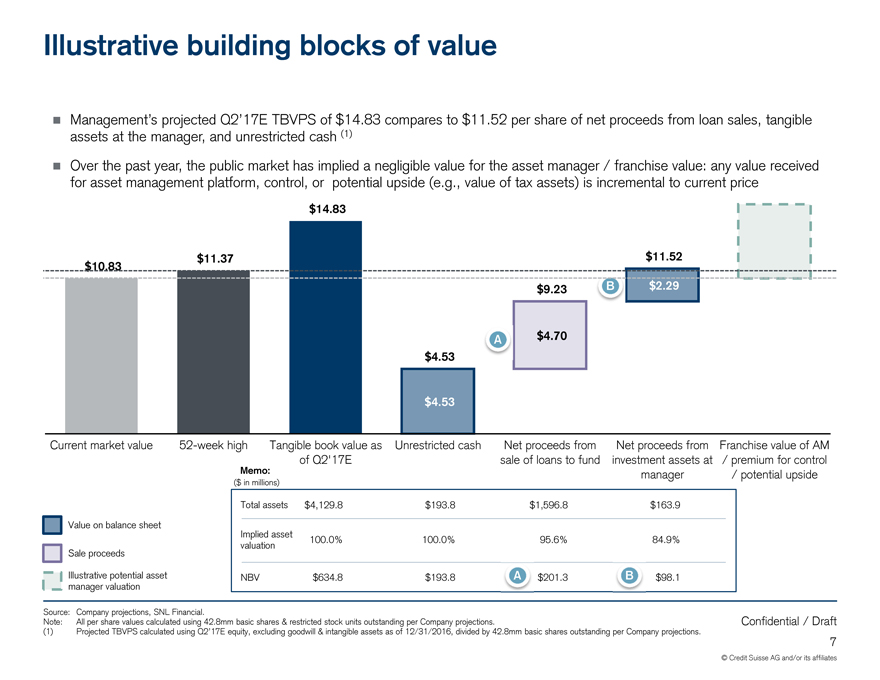 |
Illustrative building blocks of value Management’s projected Q2’17E TBVPS of $14.83 compares to $11.52 per share of net proceeds from loan sales, tangible assets at the manager, and unrestricted cash (1) Over the past year, the public market has implied a negligible value for the asset manager / franchise value: any value received for asset management platform, control, or potential upside (e.g., value of tax assets) is incremental to current price $14.83 $10.83$11.37$11.52 $9.23B$2.29 A$4.70 $4.53 $4.53 Current marketvalue52-week highTangible book value asUnrestricted cashNet proceeds fromNet proceeds fromFranchise value of AM of Q2’17Esale of loans to fundinvestment assets at/ premium for control Memo:manager/ potential upside ($ in millions) Total assets$4,129.8$193.8$1,596.8$163.9 Value on balance sheet Implied asset100.0%100.0%95.6%84.9% valuation Sale proceeds Illustrative potential assetNBV$634.8$193.8A $201.3B$98.1 manager valuation Source:Company projections, SNL Financial. Note:All per share values calculated using 42.8mm basic shares & restricted stock units outstanding per Company projections.Confidential / Draft (1)Projected TBVPS calculated using Q2’17E equity, excluding goodwill & intangible assets as of 12/31/2016, divided by 42.8mm basic shares outstanding per Company projections. 7 © Credit Suisse AG and/or its affiliates
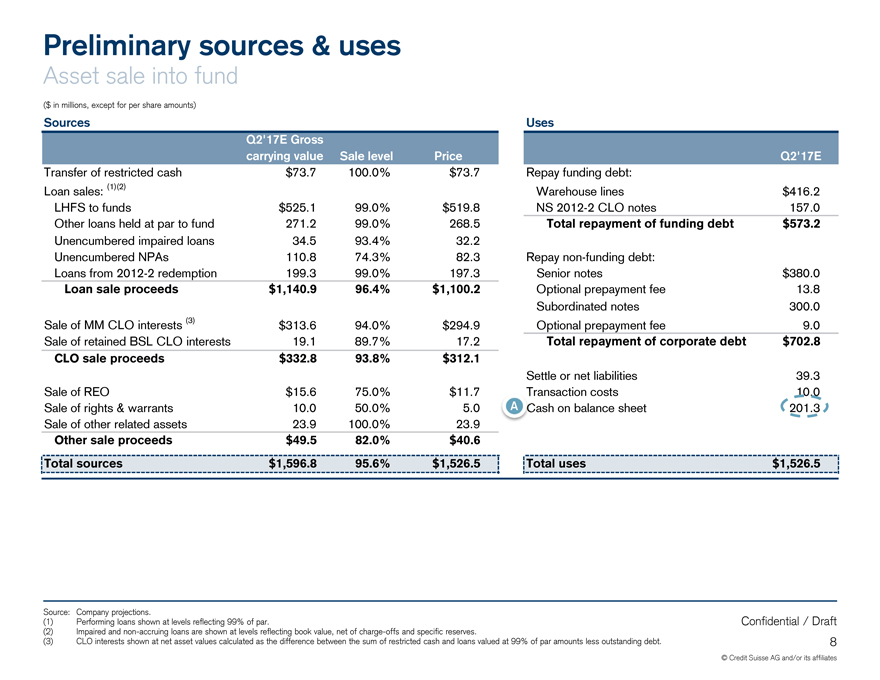 |
Preliminary sources & uses Asset sale into fund ($ in millions, except for per share amounts) Sources Q2’17E Gross carrying valueSale levelPrice Transfer of restricted cash$73.7100.0%$73.7 Loan sales: (1)(2) LHFS to funds$525.199.0%$519.8 Other loans held at par to fund271.299.0%268.5 Unencumbered impaired loans34.593.4%32.2 Unencumbered NPAs110.874.3%82.3 Loans from2012-2 redemption199.399.0%197.3 Loan sale proceeds$1,140.996.4%$1,100.2 Sale of MM CLO interests (3)$313.694.0%$294.9 Sale of retained BSL CLO interests19.189.7%17.2 CLO sale proceeds$332.893.8%$312.1 Sale of REO$15.675.0%$11.7 Sale of rights & warrants10.050.0%5.0 Sale of other related assets23.9100.0%23.9 Other sale proceeds$49.582.0%$40.6 Total sources$1,596.895.6%$1,526.5 Uses Q2’17E Repay funding debt: Warehouse lines$416.2 NS2012-2 CLO notes157.0 Total repayment of funding debt$573.2 Repaynon-funding debt: Senior notes$380.0 Optional prepayment fee13.8 Subordinated notes300.0 Optional prepayment fee9.0 Total repayment of corporate debt$702.8 Settle or net liabilities39.3 Transaction costs10.0 Aash on balance sheet201.3 Total uses$1,526.5 Source: Company projections. (1) Performing loans shown at levels reflecting 99% of par. Confidential / Draft (2) Impaired andnon-accruing loans are shown at levels reflecting book value, net of charge-offs and specific reserves. (3) CLO interests shown at net asset values calculated as the difference between the sum of restricted cash and loans valued at 99% of par amounts less outstanding debt. 8 © Credit Suisse AG and/or its affiliates
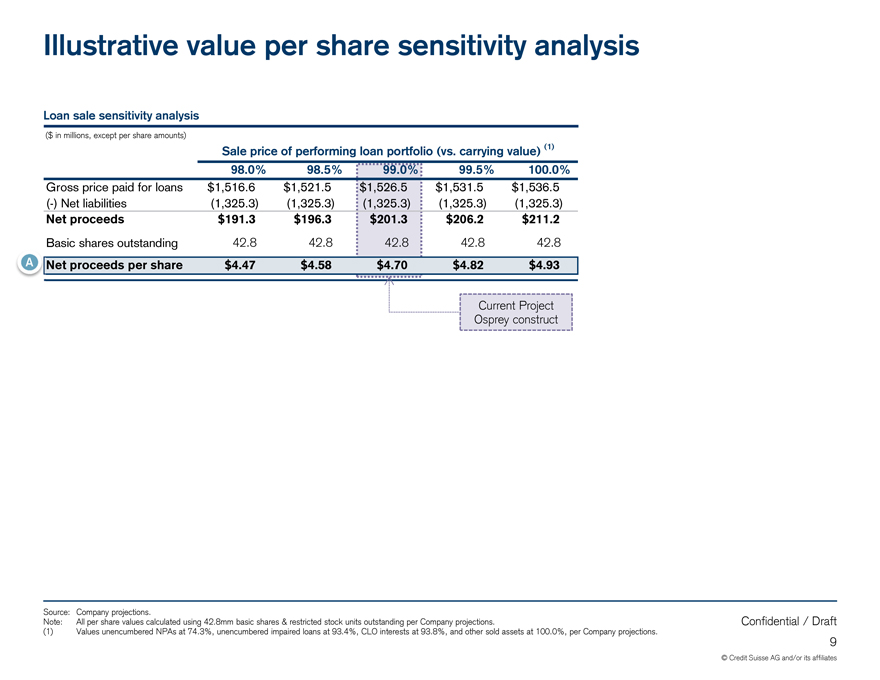 |
Illustrative value per share sensitivity analysis Loan sale sensitivity analysis ($ in millions, except per share amounts) Sale price of performing loan portfolio (vs. carrying value) (1) 98.0%98.5%99.0%99.5%100.0% Gross price paid for loans$1,516.6$1,521.5$1,526.5$1,531.5$1,536.5 (-) Net liabilities(1,325.3)(1,325.3)(1,325.3)(1,325.3)(1,325.3) Net proceeds$191.3$196.3$201.3$206.2$211.2 Basic shares outstanding42.842.842.842.842.8 ANet proceeds per share$4.47$4.58$4.70$4.82$4.93 Current Project Osprey construct Source: Company projections. Note: All per share values calculated using 42.8mm basic shares & restricted stock units outstanding per Company projections. Confidential / Draft (1) Values unencumbered NPAs at 74.3%, unencumbered impaired loans at 93.4%, CLO interests at 93.8%, and other sold assets at 100.0%, per Company projections. 9 © Credit Suisse AG and/or its affiliates
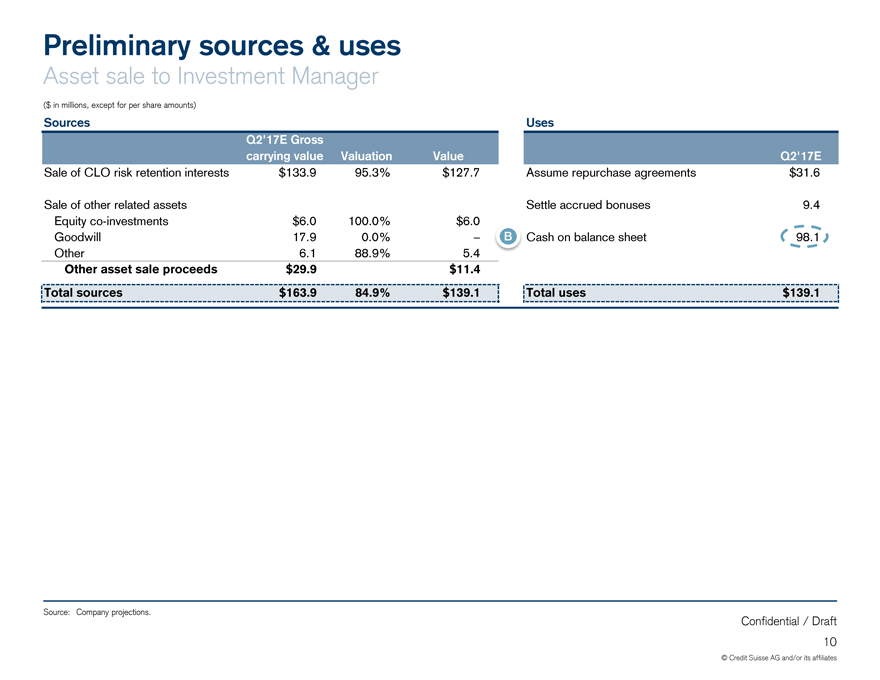 |
Preliminary sources & uses Asset sale to Investment Manager ($ in millions, except for per share amounts) SourcesUses Q2’17E Gross carrying valueValuationValueQ2’17E Sale of CLO risk retention interests$133.995.3%$127.7Assume repurchase agreements$31.6 Sale of other related assetsSettle accrued bonuses9.4 Equityco-investments$6.0100.0%$6.0 Goodwill17.90.0%–BCash on balance sheet98.1 Other6.188.9%5.4 Other asset sale proceeds$29.9$11.4 Total sources$163.984.9%$139.1Total uses$139.1 Source: Company projections. Confidential / Draft 10 © Credit Suisse AG and/or its affiliates
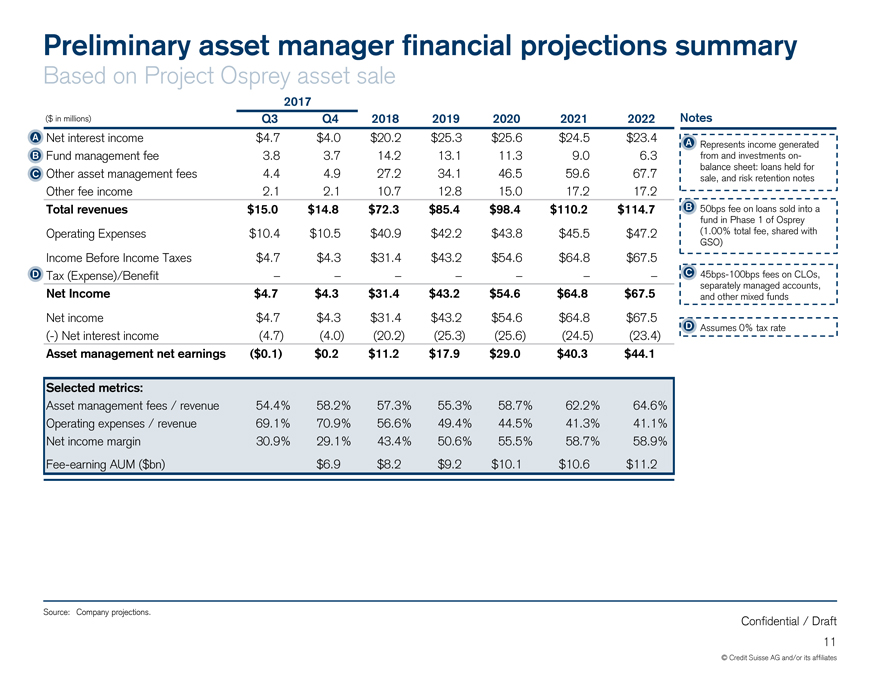 |
Preliminary asset manager financial projections summary Based on Project Osprey asset sale 2017 ($ in millions)Q3Q420182019202020212022Notes A Net interest income$4.7$4.0$20.2$25.3$25.6$24.5$23.4ARepresents income generated B Fund management fee3.83.714.213.111.39.06.3from and investmentson- balance sheet: loans held for C Other asset management fees4.44.927.234.146.559.667.7sale, and risk retention notes Other fee income2.12.110.712.815.017.217.2 Total revenues$15.0$14.8$72.3$85.4$98.4$110.2$114.7B50bps fee on loans sold into a fund in Phase 1 of Osprey Operating Expenses$10.4$10.5$40.9$42.2$43.8$45.5$47.2(1.00% total fee, shared with GSO) Income Before Income Taxes$4.7$4.3$31.4$43.2$54.6$64.8$67.5 D Tax (Expense)/Benefit–––––––C45bps-100bps fees on CLOs, separately managed accounts, Net Income$4.7$4.3$31.4$43.2$54.6$64.8$67.5and other mixed funds Net income$4.7$4.3$31.4$43.2$54.6$64.8$67.5 DAssumes 0% tax rate (-) Net interest income(4.7)(4.0)(20.2)(25.3)(25.6)(24.5)(23.4) Asset management net earnings($0.1)$0.2$11.2$17.9$29.0$40.3$44.1 Selected metrics: Asset management fees / revenue54.4%58.2%57.3%55.3%58.7%62.2%64.6% Operating expenses / revenue69.1%70.9%56.6%49.4%44.5%41.3%41.1% Net income margin30.9%29.1%43.4%50.6%55.5%58.7%58.9%Fee-earning AUM ($bn)$6.9$8.2$9.2$10.1$10.6$11.2 Source: Company projections. Confidential / Draft 11 © Credit Suisse AG and/or its affiliates
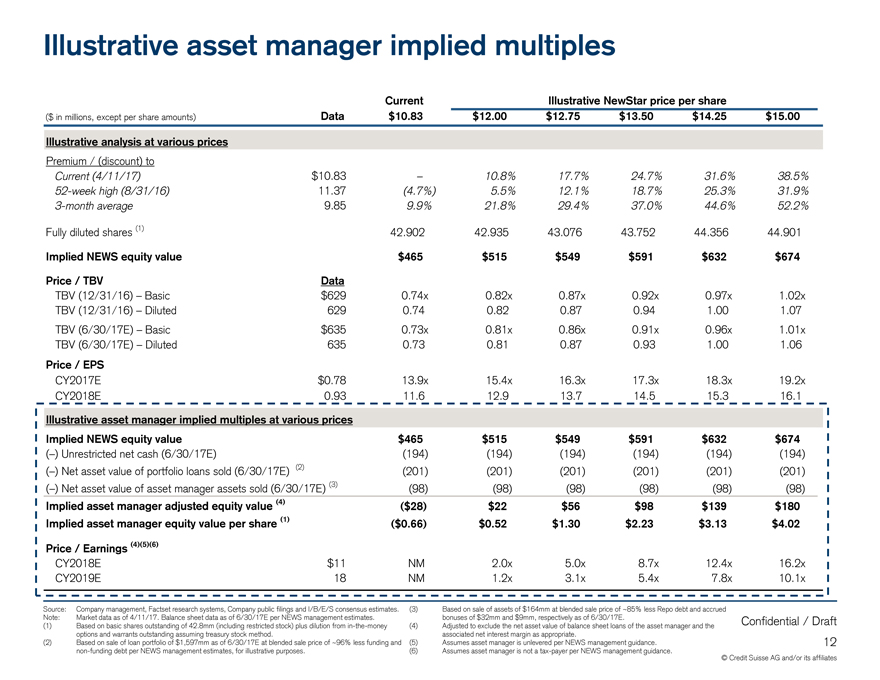 |
Illustrative asset manager implied multiples CurrentIllustrative NewStar price per share ($ in millions, except per share amounts)Data$10.83$12.00$12.75$13.50$14.25$15.00 Illustrative analysis at various prices Premium / (discount) to Current (4/11/17)$10.83–10.8%17.7%24.7%31.6%38.5%52-week high (8/31/16)11.37(4.7%)5.5%12.1%18.7%25.3%31.9%3-month average9.859.9%21.8%29.4%37.0%44.6%52.2% Fully diluted shares (1)42.90242.93543.07643.75244.35644.901 Implied NEWS equity value$465$515$549$591$632$674 Price / TBVData TBV (12/31/16) – Basic$6290.74x0.82x0.87x0.92x0.97x1.02x TBV (12/31/16) – Diluted6290.740.820.870.941.001.07 TBV (6/30/17E) – Basic$6350.73x0.81x0.86x0.91x0.96x1.01x TBV (6/30/17E) – Diluted6350.730.810.870.931.001.06 Price / EPS CY2017E$0.7813.9x15.4x16.3x17.3x18.3x19.2x CY2018E0.9311.612.913.714.515.316.1 Illustrative asset manager implied multiples at various prices Implied NEWS equity value$465$515$549$591$632$674 (–) Unrestricted net cash (6/30/17E)(194)(194)(194)(194)(194)(194) (–) Net asset value of portfolio loans sold (6/30/17E)(2)(201)(201)(201)(201)(201)(201) (–) Net asset value of asset manager assets sold (6/30/17E) (3)(98)(98)(98)(98)(98)(98) Implied asset manager adjusted equity value (4)($28)$22$56$98$139$180 Implied asset manager equity value per share (1)($0.66)$0.52$1.30$2.23$3.13$4.02 Price / Earnings (4)(5)(6) CY2018E$11NM2.0x5.0x8.7x12.4x16.2x CY2019E18NM1.2x3.1x5.4x7.8x10.1x Source:Company management, Factset research systems, Company public filings and I/B/E/S consensus estimates.(3)Based on sale of assets of $164mm at blended sale price of ~85% less Repo debt and accrued (1) Note:Based Market on data basic as of shares 4/11/17. outstanding Balance of sheet 42.8mm data (including as of 6/30/17E restricted per stock) NEWS plus management dilution from estimates.in-the-money(4)Adjusted bonuses of to $ exclude 32mm the and net $9mm, asset respectively value of balance as of 6/30/17E. sheet loans of the asset manager and theConfidential / Draft options and warrants outstanding assuming treasury stock method.associated net interest margin as appropriate. (2)Based on sale of loan portfolio of $1,597mm as of 6/30/17E at blended sale price of ~96% less funding and(5)Assumes asset manager is unlevered per NEWS management guidance.12non-funding debt per NEWS management estimates, for illustrative purposes.(6)Assumes asset manager is not atax-payer per NEWS management guidance. © Credit Suisse AG and/or its affiliates
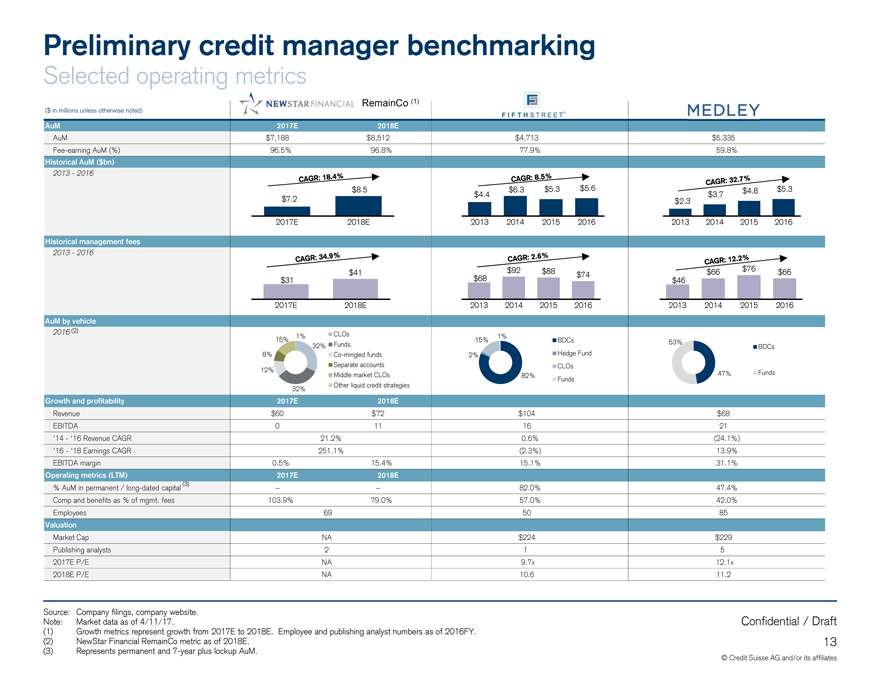 |
Preliminary credit manager benchmarking Selected operating metrics RemainCo (1) ($ in millions unless otherwise noted) AuM2017E2018E AuM$7,188$8,512$4,713$5,335Fee-earning AuM (%)96.5%96.8%77.9%59.8% Historical AuM ($bn) 2013—2016 $8.5$4.4$6.3$5.3$5.6$3.7$4.8$5.3 $7.2$2.3 2017E2018E20132014201520162013201420152016 Historical management fees 2013—2016 $41$92$88$74$66$76$66 $31$68$46 2017E2018E20132014201520162013201420152016 AuM by vehicle 2016 (2)1%CLOs1% 15%15%BDCs53% 32% FundsBDCs8%Co-mingled funds2%Hedge Fund Separate accountsCLOs 12%Middle market CLOs82%47%Funds Funds 32%Other liquid credit strategies Growth and profitability2017E2018E Revenue$60$72$104$68 EBITDA0111621 ‘14—‘16 Revenue CAGR21.2%0.6%(24.1%) ‘16—‘18 Earnings CAGR251.1%(2.3%)13.9% EBITDA margin0.5%15.4%15.1%31.1% Operating metrics (LTM)2017E2018E % AuM in permanent / long-dated capital (3)––82.0%47.4% Comp and benefits as % of mgmt. fees103.9%79.0%57.0%42.0% Employees695085 Valuation Market CapNA$224$229 Publishing analysts215 2017E P/ENA9.7x12.1x 2018E P/ENA10.611.2 Source:Company filings, company website. Note:Market data as of 4/11/17.Confidential / Draft (1)Growth metrics represent growth from 2017E to 2018E. Employee and publishing analyst numbers as of 2016FY. (2)NewStar Financial RemainCo metric as of 2018E.13 (3)Represents permanent and7-year plus lockup AuM. © Credit Suisse AG and/or its affiliates
 |
Appendix Confidential / Draft 14
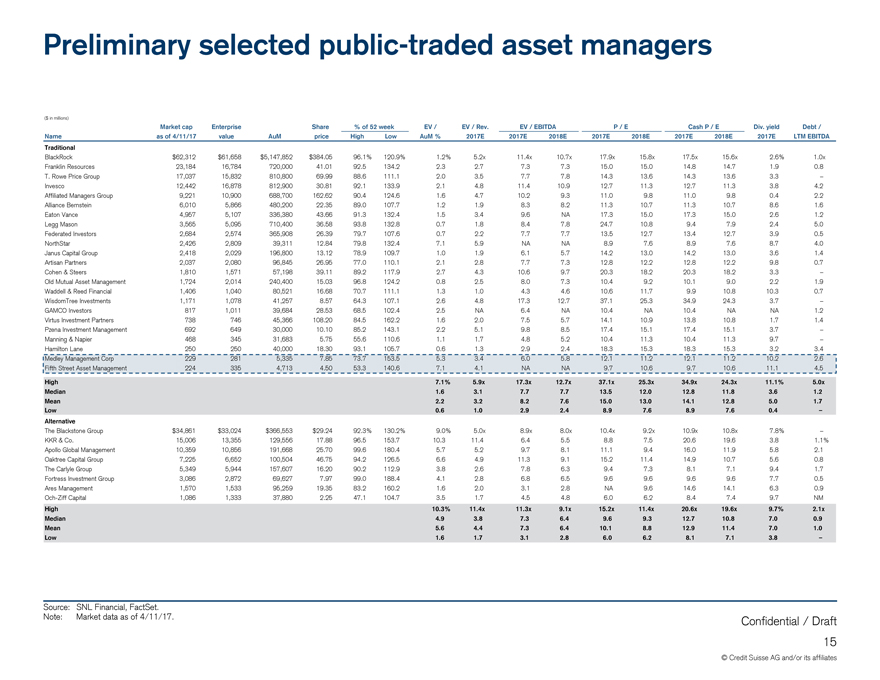 |
Preliminary selected public-traded asset managers ($ in millions) Market capEnterpriseShare% of 52 weekEV /EV / Rev.EV / EBITDAP / ECash P / EDiv. yieldDebt / Nameas of 4/11/17valueAuMpriceHighLowAuM %2017E2017E2018E2017E2018E2017E2018E2017ELTM EBITDA Traditional BlackRock$62,312$61,658$5,147,852$384.0596.1%120.9%1.2%5.2x11.4x10.7x17.9x15.8x17.5x15.6x2.6%1.0x Franklin Resources23,18416,784720,00041.0192.5134.22.32.77.37.315.015.014.814.71.90.8 T. Rowe Price Group17,03715,832810,80069.9988.6111.12.03.57.77.814.313.614.313.63.3– Invesco12,44216,878812,90030.8192.1133.92.14.811.410.912.711.312.711.33.84.2 Affiliated Managers Group9,22110,900688,700162.6290.4124.61.64.710.29.311.09.811.09.80.42.2 Alliance Bernstein6,0105,866480,20022.3589.0107.71.21.98.38.211.310.711.310.78.61.6 Eaton Vance4,9575,107336,38043.6691.3132.41.53.49.6NA17.315.017.315.02.61.2 Legg Mason3,5655,095710,40036.5893.8132.80.71.88.47.824.710.89.47.92.45.0 Federated Investors2,6842,574365,90826.3979.7107.60.72.27.77.713.512.713.412.73.90.5 NorthStar2,4262,80939,31112.8479.8132.47.15.9NANA8.97.68.97.68.74.0 Janus Capital Group2,4182,029196,80013.1278.9109.71.01.96.15.714.213.014.213.03.61.4 Artisan Partners2,0372,08096,84526.9577.0110.12.12.87.77.312.812.212.812.29.80.7 Cohen & Steers1,8101,57157,19839.1189.2117.92.74.310.69.720.318.220.318.23.3– Old Mutual Asset Management1,7242,014240,40015.0396.8124.20.82.58.07.310.49.210.19.02.21.9 Waddell & Reed Financial1,4061,04080,52116.6870.7111.11.31.04.34.610.611.79.910.810.30.7 WisdomTree Investments1,1711,07841,2578.5764.3107.12.64.817.312.737.125.334.924.33.7– GAMCO Investors8171,01139,68428.5368.5102.42.5NA6.4NA10.4NA10.4NANA1.2 Virtus Investment Partners73874645,366108.2084.5162.21.62.07.55.714.110.913.810.81.71.4 Pzena Investment Management69264930,00010.1085.2143.12.25.19.88.517.415.117.415.13.7– Manning & Napier46834531,6835.7555.6110.61.11.74.85.210.411.310.411.39.7– Hamilton Lane25025040,00018.3093.1105.70.61.32.92.418.315.318.315.33.23.4 Medley Management Corp2292815,3357.8573.7153.55.33.46.05.812.111.212.111.210.22.6 Fifth Street Asset Management2243354,7134.5053.3140.67.14.1NANA9.710.69.710.611.14.5 High7.1%5.9x17.3x12.7x37.1x25.3x34.9x24.3x11.1%5.0x Median1.63.17.77.713.512.012.811.83.61.2 Mean2.23.28.27.615.013.014.112.85.01.7 Low0.61.02.92.48.97.68.97.60.4– Alternative The Blackstone Group$34,861$33,024$366,553$29.2492.3%130.2%9.0%5.0x8.9x8.0x10.4x9.2x10.9x10.8x7.8%– KKR & Co.15,00613,355129,55617.8896.5153.710.311.46.45.58.87.520.619.63.81.1% Apollo Global Management10,35910,856191,66825.7099.6180.45.75.29.78.111.19.416.011.95.82.1 Oaktree Capital Group7,2256,652100,50446.7594.2126.56.64.911.39.115.211.414.910.75.60.8 The Carlyle Group5,3495,944157,60716.2090.2112.93.82.67.86.39.47.38.17.19.41.7 Fortress Investment Group3,0862,87269,6277.9799.0188.44.12.86.86.59.69.69.69.67.70.5 Ares Management1,5701,53395,25919.3583.2160.21.62.03.12.8NA9.614.614.16.30.9Och-Ziff Capital1,0861,33337,8802.2547.1104.73.51.74.54.86.06.28.47.49.7NM High10.3%11.4x11.3x9.1x15.2x11.4x20.6x19.6x9.7%2.1x Median4.93.87.36.49.69.312.710.87.00.9 Mean5.64.47.36.410.18.812.911.47.01.0 Low1.61.73.12.86.06.28.17.13.8– Source:SNL Financial, FactSet. Note:Market data as of 4/11/17.Confidential / Draft 15 © Credit Suisse AG and/or its affiliates
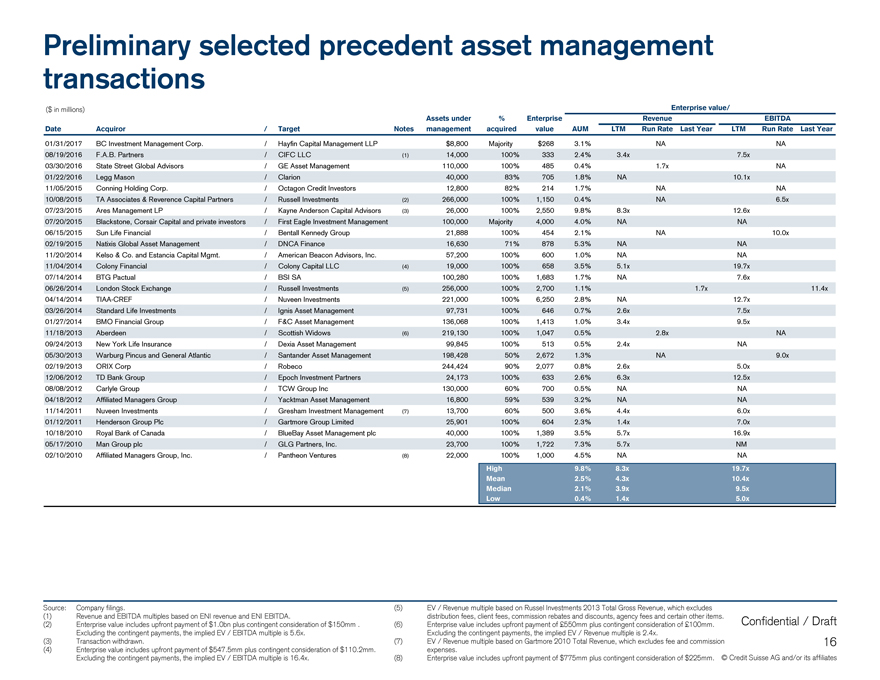 |
Preliminary selected precedent asset management transactions ($ in millions)Enterprise value/ Assets under%EnterpriseRevenueEBITDA DateAcquiror/TargetNotes managementacquiredvalueAUMLTM Run Rate Last YearLTM Run Rate Last Year 01/31/2017BC Investment Management Corp./Hayfin Capital Management LLP$8,800Majority$2683.1%NANA 08/19/2016F.A.B. Partners/CIFC LLC(1)14,000100%3332.4%3.4x7.5x 03/30/2016State Street Global Advisors/GE Asset Management110,000100%4850.4%1.7xNA 01/22/2016Legg Mason/Clarion40,00083%7051.8%NA10.1x 11/05/2015Conning Holding Corp./Octagon Credit Investors12,80082%2141.7%NANA 10/08/2015TA Associates & Reverence Capital Partners/Russell Investments(2)266,000100%1,1500.4%NA6.5x 07/23/2015Ares Management LP/Kayne Anderson Capital Advisors(3)26,000100%2,5509.8%8.3x12.6x 07/20/2015Blackstone, Corsair Capital and private investors/First Eagle Investment Management100,000Majority4,0004.0%NANA 06/15/2015Sun Life Financial/Bentall Kennedy Group21,888100%4542.1%NA10.0x 02/19/2015Natixis Global Asset Management/DNCA Finance16,63071%8785.3%NANA 11/20/2014Kelso & Co. and Estancia Capital Mgmt./American Beacon Advisors, Inc.57,200100%6001.0%NANA 11/04/2014Colony Financial/Colony Capital LLC(4)19,000100%6583.5%5.1x19.7x 07/14/2014BTG Pactual/BSI SA100,280100%1,6831.7%NA7.6x 06/26/2014London Stock Exchange/Russell Investments(5)256,000100%2,7001.1%1.7x11.4x 04/14/2014TIAA-CREF/Nuveen Investments221,000100%6,2502.8%NA12.7x 03/26/2014Standard Life Investments/Ignis Asset Management97,731100%6460.7%2.6x7.5x 01/27/2014BMO Financial Group/F&C Asset Management136,068100%1,4131.0%3.4x9.5x 11/18/2013Aberdeen/Scottish Widows(6)219,130100%1,0470.5%2.8xNA 09/24/2013New York Life Insurance/Dexia Asset Management99,845100%5130.5%2.4xNA 05/30/2013Warburg Pincus and General Atlantic/Santander Asset Management198,42850%2,6721.3%NA9.0x 02/19/2013ORIX Corp/Robeco244,42490%2,0770.8%2.6x5.0x 12/06/2012TD Bank Group/Epoch Investment Partners24,173100%6332.6%6.3x12.5x 08/08/2012Carlyle Group/TCW Group Inc130,00060%7000.5%NANA 04/18/2012Affiliated Managers Group/Yacktman Asset Management16,80059%5393.2%NANA 11/14/2011Nuveen Investments/Gresham Investment Management(7)13,70060%5003.6%4.4x6.0x 01/12/2011Henderson Group Plc/Gartmore Group Limited25,901100%6042.3%1.4x7.0x 10/18/2010Royal Bank of Canada/BlueBay Asset Management plc40,000100%1,3893.5%5.7x16.9x 05/17/2010Man Group plc/GLG Partners, Inc.23,700100%1,7227.3%5.7xNM 02/10/2010Affiliated Managers Group, Inc./Pantheon Ventures(8)22,000100%1,0004.5%NANA High9.8%8.3x19.7x Mean2.5%4.3x10.4x Median2.1%3.9x9.5x Low0.4%1.4x5.0x Source:Company filings.(5)EV / Revenue multiple based on Russel Investments 2013 Total Gross Revenue, which excludes (2) (1)Revenue and EBITDA multiples based on ENI revenue and ENI EBITDA.distribution fees, client fees, commission rebates and discounts, agency fees and certain other items.Confidential / Draft Enterprise value includes upfront payment of $1.0bn plus contingent consideration of $150mm .(6)Enterprise value includes upfront payment of £550mm plus contingent consideration of £100mm. Excluding the contingent payments, the implied EV / EBITDA multiple is 5.6x.Excluding the contingent payments, the implied EV / Revenue multiple is 2.4x. (3)Transaction withdrawn.(7)EV / Revenue multiple based on Gartmore 2010 Total Revenue, which excludes fee and commission16 (4)Enterprise value includes upfront payment of $547.5mm plus contingent consideration of $110.2mm.expenses. Excluding the contingent payments, the implied EV / EBITDA multiple is 16.4x.(8)Enterprise value includes upfront payment of $775mm plus contingent consideration of $225mm. © Credit Suisse AG and/or its affiliates
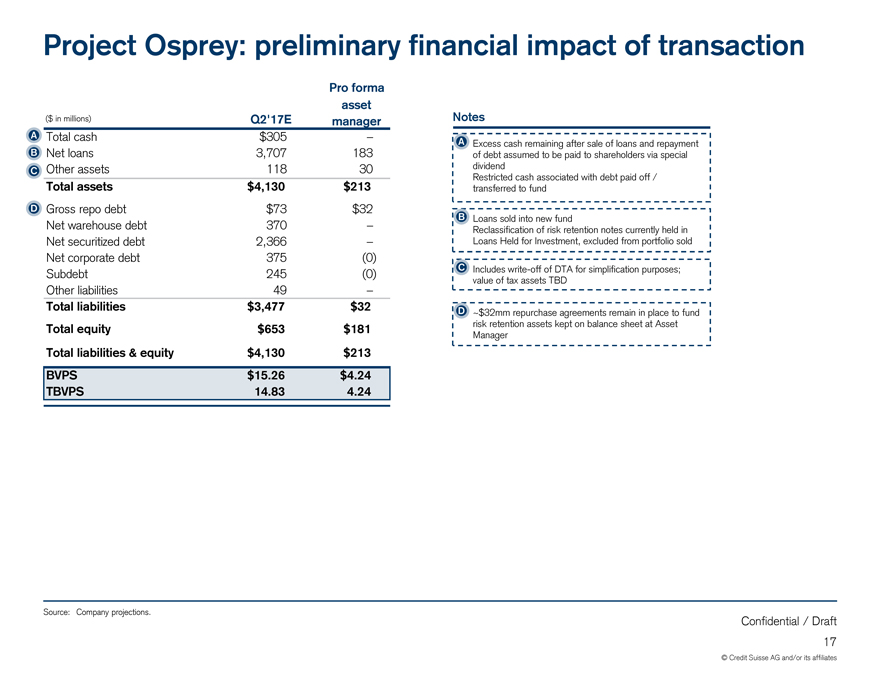 |
Project Osprey: preliminary financial impact of transaction Pro forma asset ($ in millions)Q2’17EmanagerNotes A Total cash$305–AExcess cash remaining after sale of loans and repayment B Netloans3,707183of debt assumed to be paid to shareholders via special C Other assets11830dividend Restricted cash associated with debt paid off / Total assets$4,130$213transferred to fund D Gross repo debt$73$32 BLoans sold into new fund Netwarehouse debt370–Reclassification of risk retention notes currently held in Netsecuritized debt2,366–Loans Held for Investment, excluded from portfolio sold Net corporate debt375(0) Subdebt245(0)CIncludeswrite-off of DTA for simplification purposes; value of tax assets TBD Other liabilities49– Totalliabilities$3,477$32D~$32mm repurchase agreements remain in place to fund Totalequity$653$181risk retention assets kept on balance sheet at Asset Manager Total liabilities & equity$4,130$213 BVPS$15.26$4.24 TBVPS14.834.24 Source:Company projections. Confidential / Draft 17 © Credit Suisse AG and/or its affiliates
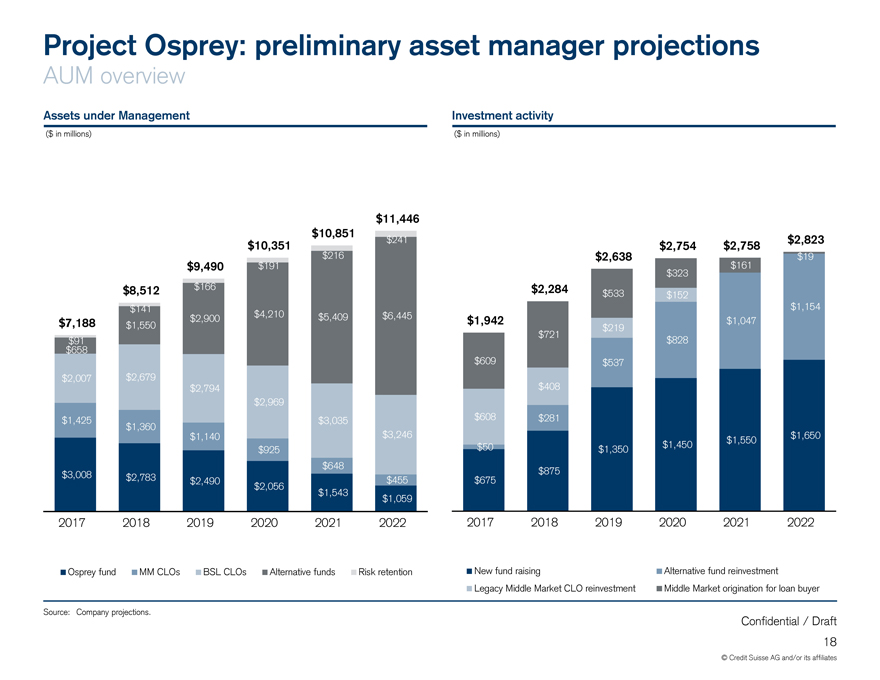 |
Project Osprey: preliminary asset manager projections AUM overview Assets under ManagementInvestment activity ($ in millions)($ in millions) $11,446 $10,851$241$2,823 $10,351$2,754$2,758 $216$2,638$19 $9,490$191$161 $323 $8,512$166$2,284$533$152 $141$1,154 $7,188$2,900$4,210$5,409$6,445$1,942$1,047 $1,550$219 $721 $91$828 $658 $609$537 $2,007$2,679 $2,794$408 $2,969 $1,425$3,035$608$281 $1,360 $1,140$3,246$1,550$1,650 $925$50$1,350$1,450 $648 $3,008$2,783$2,490$455$675$875 $2,056 $1,543$1,059 201720182019202020212022201720182019202020212022 Osprey fundMM CLOsBSL CLOsAlternative fundsRisk retentionNew fund raisingAlternative fund reinvestment Legacy Middle Market CLO reinvestmentMiddle Market origination for loan buyer Source: Company projections. Confidential / Draft 18 © Credit Suisse AG and/or its affiliates
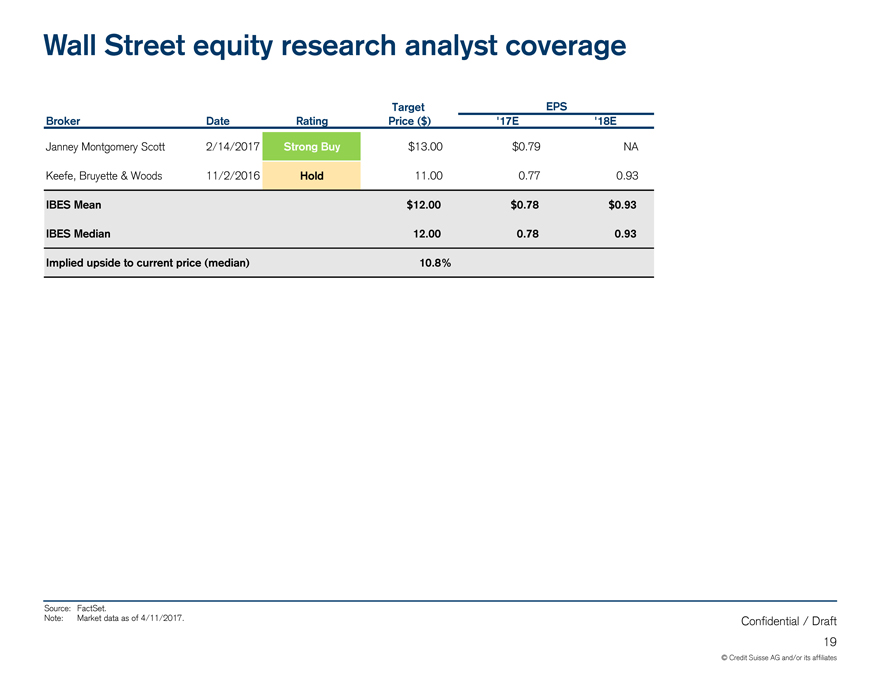 |
Wall Street equity research analyst coverage TargetEPS BrokerDateRatingPrice ($)‘17E’18E Janney Montgomery Scott2/14/2017Strong Buy$13.00$0.79NA Keefe, Bruyette & Woods11/2/2016Hold11.000.770.93 IBES Mean$12.00$0.78$0.93 IBES Median12.000.780.93 Implied upside to current price (median)10.8% Source: FactSet. Note: Market data as of 4/11/2017.Confidential / Draft 19 © Credit Suisse AG and/or its affiliates
 |
Credit Suisse does not provide any tax advice. Any tax statement herein regarding any U.S. federal tax is not intended or written to be used, and cannot be used, by any taxpayer for the purpose of avoiding any penalties. Any such statement herein was written to support the marketing or promotion of the transaction(s) or matter(s) to which the statement relates. Each taxpayer should seek advice based on the taxpayer’s particular circumstances from an independent tax advisor. These materials have been provided to you by Credit Suisse in connection with an actual or potential mandate or engagement and may not be used or relied upon for any purpose other than as specifically contemplated by a written agreement with Credit Suisse. In addition, these materials may not be disclosed, in whole or in part, or summarized or otherwise referred to except as agreed in writing by Credit Suisse. The information used in preparing these materials was obtained from or through you or your representatives or from public sources. Credit Suisse assumes no responsibility for independent verification of such information and has relied on such information being complete and accurate in all material respects. To the extent such information includes estimates and forecasts of future financial performance (including estimates of potential cost savings and synergies) prepared by or reviewed or discussed with the managements of your company and/or other potential transaction participants or obtained from public sources, we have assumed that such estimates and forecasts have been reasonably prepared on bases reflecting the best currently available estimates and judgments of such managements (or, with respect to estimates and forecasts obtained from public sources, represent reasonable estimates). These materials were designed for use by specific persons familiar with the business and the affairs of your company and Credit Suisse assumes no obligation to update or otherwise revise these materials. Nothing contained herein should be construed as tax, accounting or legal advice. You (and each of your employees, representatives or other agents) may disclose to any and all persons, without limitation of any kind, the tax treatment and tax structure of the transactions contemplated by these materials and all materials of any kind (including opinions or other tax analyses) that are provided to you relating to such tax treatment and structure. For this purpose, the tax treatment of a transaction is the purported or claimed U.S. federal income tax treatment of the transaction and the tax structure of a transaction is any fact that may be relevant to understanding the purported or claimed U.S. federal income tax treatment of the transaction. These materials have been prepared by Credit Suisse (“CS”) and its affiliates for use by CS. Accordingly, any information reflected or incorporated herein, or in related materials or in ensuing transactions, may be shared in good faith by CS and its affiliates with employees of CS, its affiliates and agents in any location. Credit Suisse has adopted policies and guidelines designed to preserve the independence of its research analysts. Credit Suisse’s policies prohibit employees from directly or indirectly offering a favorable research rating or specific price target, or offering to change a research rating or price target, as consideration for or an inducement to obtain business or other compensation. Credit Suisse’s policies prohibit research analysts from being compensated for their involvement in investment banking transactions. Confidential / Draft 20 © Credit Suisse AG and/or its affiliates
 |
CREDIT SUISSE SECURITIES (USA) LLC Eleven Madison Avenue New York, NY 10010-3629 +1 212 325 2000 www.credit-suisse.com Confidential / Draft 21 © Credit Suisse AG and/or its affiliates