Table of Contents
UNITED STATES
SECURITIES AND EXCHANGE COMMISSION
Washington, D.C. 20549
FORM N-CSR
CERTIFIED SHAREHOLDER REPORT OF REGISTERED
MANAGEMENT INVESTMENT COMPANIES
Investment Company Act file number: 811-22037
Stone Harbor Investment Funds
(Exact name of registrant as specified in charter)
1290 Broadway, Suite 1100
Denver, CO 80203
(Address of principal executive offices) (Zip code)
Adam J. Shapiro, Esq.
c/o Stone Harbor Investment Partners LP
31 West 52nd Street, 16th Floor
New York, NY 10019
(Name and address of agent for service)
With copies To:
Michael G. Doherty, Esq.
Ropes & Gray LLP
1211 Avenue of the Americas
New York, NY 10036
Registrant’s telephone number, including area code: (303) 623-2577
Date of fiscal year end: May 31
Date of reporting period: June 1, 2015 - November 30, 2015
Table of Contents
Item 1. Report to Stockholders.
Table of Contents

Table of Contents
| Table of Contents | ||
| 2 | ||||
| 11 | ||||
| 12 | ||||
Growth of $10,000 Investment | ||||
| 15 | ||||
| 16 | ||||
| 17 | ||||
| 18 | ||||
| 19 | ||||
| 20 | ||||
| 21 | ||||
Statements of Investments | ||||
| 22 | ||||
| 34 | ||||
| 44 | ||||
| 50 | ||||
| 56 | ||||
| 62 | ||||
| 64 | ||||
| 65 | ||||
| 67 | ||||
| 69 | ||||
Financial Highlights | ||||
| 73 | ||||
| 74 | ||||
| 75 | ||||
| 76 | ||||
| 77 | ||||
| 78 | ||||
| 79 | ||||
| 80 | ||||
| 100 | ||||
| 102 | ||||
Stone Harbor Investment Funds Semi-Annual Report | November 30, 2015 | 1 |
Table of Contents
| Stone Harbor Investment Funds | Shareholder Letter | |
| November 30, 2015 (Unaudited) |
Dear Shareholder,
The six month period ended November 30, 2015 presented a challenging environment for credit and equity markets worldwide. The underlying macroeconomic themes from earlier in the year seemed to grow in importance during the current review period, and continued to pressure global financial markets. Weak commodity prices, divergent global monetary and fiscal policies, and deepening concerns around global growth all converged to further erode already unsettled market sentiment. Growth recovery efforts, particularly in emerging markets, were hampered by the impact of the stronger US dollar, as well as ongoing geopolitical risks in Eastern Europe and the Middle East. While market and asset price volatility increased during the period, our outlook for credit markets remains highly dependent on the future path of economic growth.
The decline in commodity prices, oil prices in particular, continued to exert significant influence on the investment outlook during the period. The broad impact of low oil prices was especially felt in the high yield and emerging markets. Default rates began to rise in the US high yield market while oil exporters in emerging markets suffered. Oil importing countries in the emerging and developed world began to see the benefits of lower oil prices. This fundamental weakness combined with tighter bank trading regulations led to a significant decline in market liquidity, particularly in the more volatile asset classes, causing spreads to widen. We expect this increase in volatility to continue over the intermediate term, especially in light of the ongoing uncertainty surrounding global growth.
Divergent global monetary and fiscal policies aimed at promoting growth and reducing deflationary risks were also important factors during the reporting period. The US experienced moderate economic growth during the period and, after deferring a rate increase for several meetings, the Federal Reserve (the “Fed”) increased rates in December. In Asia, China experienced slowing economic growth and implemented a number of dramatic stimulus measures including currency devaluation, interest rate cuts, stock market intervention, and increased fiscal spending. With Europe experiencing steady slow economic growth and weak inflation, the European Central Bank (“ECB”) cut interest rates and indicated that it will do more as necessary.
We believe that credit markets will continue to experience market volatility as questions about global growth continue to dominate investor concerns. As was the case six months ago, our current view is that market performance will be uneven and heavily influenced by the macroeconomic forces described above. This seems to be an environment where security selection will have an extremely important impact on future performance.
At Stone Harbor, we continue to focus on capturing excess return from stable and improving credit situations in corporate and sovereign markets worldwide. As we continue to monitor developments in these markets, please follow our progress throughout the year by visiting our website at www.shiplp.com. There you will find updates on our view of credit markets, as well as related news and research. We appreciate the confidence you have placed in Stone Harbor Investment Partners LP and look forward to providing you with another update in six months.
Market Review: Emerging Markets Debt
The six months ended November 30, 2015 was a volatile period for emerging markets (“EM”) as sentiments around growth expectations, market technicals, and returns deteriorated throughout most of the period on several adverse macroeconomic drivers. The Chinese stock market crash that rippled across global equity markets, the continued slide in oil prices, and concerns around US monetary policy and the preoccupation with the timing of the initial interest rate hike, coincided to create a challenging investment landscape for credit and equity markets alike. The move by the People’s Bank of China (“PBOC”) to devalue the currency exacerbated the negative sentiment as global investors speculated on deeper economic issues in China. Notably, the volatility index (“VIX”) spiked to a post 2009-high of mid-40 at the end of August.
In addition to these broad macroeconomic factors, idiosyncratic problems in several large economies, including the political crisis in Brazil and the related Standard & Poor’s Financial Services LLC (“S&P”) downgrade of Brazil sovereign debt from BBB- to BB+, the political turmoil in Turkey, as well as geopolitical tensions in the Russia-Ukraine border, negatively impacted flows into EM debt. Portfolio outflows from local currency assets accelerated in reaction to market volatility and continued concerns around EM growth.
By the end of the review period, the macroeconomic picture appeared to be improving. The Fed left rates unchanged in September, global equity markets - including China - regained footing and produced better economic results, the geopolitical situation in Russia and Ukraine subsided, and overall market volatility receded.
While these market dynamics had varying degrees of impact across EM sectors, countries, currencies, and EM industries during the period, EM debt broadly posted negative returns; and, in the particular case of local markets, most emerging markets currencies depreciated during the review period. The J.P. Morgan Government Bond Index – Emerging Markets Global Diversified (“GBI-EM Global Diversified”) returned -9.63%, all of which was driven by foreign exchange rate (“FX”) weakness. The J.P. Morgan Emerging Markets Bond Index Global Diversified (“EMBI Global Diversified”) returned -0.64%, and the J.P. Morgan Corporate Emerging Markets Broad Diversified (“CEMBI Broad Diversified”) returned -1.99%.
| 2 | www.shiplp.com |
Table of Contents
| Stone Harbor Investment Funds | Shareholder Letter | |
| November 30, 2015 (Unaudited) |
Stone Harbor Emerging Markets Debt Fund
The total return of the Stone Harbor Emerging Markets Debt Fund (the “Fund” or “portfolio”) for the six month period ended November 30, 2015 was -2.36% (net of expenses) and -2.02% (gross of expenses). This performance compares to a benchmark return of -0.64% for the EMBI Global Diversified. For the period, external sovereign bond credit spreads over comparable maturity US Treasury securities widened by 46 basis points, ending the period at 390 basis points.
The Fund underperformed its benchmark primarily as a result of country selection within the hard currency sovereign debt allocation, which detracted 88 basis points from relative returns. Local currency debt allocation detracted 18 basis points – the majority of the underperformance attributed to FX exposure – and hard currency corporate debt allocation detracted 16 basis points. The largest detractor from relative returns was an underweight in Ukraine. Ukraine sub-index outperformed during the period on news of a sovereign debt restructuring. Key components of the agreement reached during the third quarter included a 20% principal haircut, a four-year maturity extension, an increase in the average coupon, no haircut on accrued interest, and additional GDP warrants with payouts during 2021-2040, subject to GDP triggers. The result and the market’s response to it were better than expected. Nevertheless, we believe that the restructuring terms were too optimistic. Economic depression continues to deepen in Ukraine and geopolitical tensions with Russia remain high. In addition, we believe Ukraine is unlikely to pay $3 billion owed to Russia in December 2015. As a result of our view, the portfolio continues to hold no exposure to Ukraine.
Another detractor was an overweight and issue selection in Brazil. The fundamental story has been deteriorating, but in our view, the country’s ability and willingness to service debt obligations remains strong. S&P downgraded Brazil debt from BBB- to BB+ in early September, citing the perceived lack of willingness of congress to support fiscal reforms. Brazil’s sovereign bond spreads widened in response to the downgrade and the Brazil real sharply depreciated in August and September 2015. We believed that credit spreads had already factored in a macroeconomic outlook consistent with valuations for a single-B rated credit and that the market was overstating Brazil default risk. Other detractors within the hard currency debt allocation included overweights and issue selection decisions in Chile and Costa Rica, an overweight in Iraq, an underweight in Russia, and issue selection in South Africa.
The largest positive contributor to relative returns was an overweight and issue selection in Venezuela. In our view, deeply discounted prices of Venezuela bonds overstated default risk. We maintained an overweight position in Venezuela based on our assessments of the sovereign’s ability and willingness to service its external debt, particularly in the near term. Our judgement is that Venezuela’s policy makers are keenly aware of the importance of avoiding default. In October and November, Venezuela’s government paid over $5 billion to bond holders in the form of coupons, amortizations and maturities, supporting this view. Importantly, these payments have already reduced our exposure in Venezuela. Other positive contributors included an overweight and issue selection in Ecuador and Kazakhstan. An overweight in Kazakhstan enhanced relative returns as its sovereign bonds outperformed following the government’s tender for $3.4 billion of existing quasi-sovereign debt. Ecuador also outperformed as the government prepared market participants for the first full repayment at maturity of sovereign international debt in over 160 years. Corporate exposure in Russia also enhanced returns during the period.
The largest relative exposure changes during the review period included reducing the Fund’s positions in Indonesia, Kazakhstan, Russia, and Venezuela based on outperformance and valuations. On the other hand, we increased the Fund’s positions in select countries in Latin America, including Brazil, Costa Rica, Ecuador, and El Salvador, where spreads have widened. As of the end of November, the Fund’s relative position in Brazil was the largest overweight in the Fund. We are cognizant of ongoing political concerns over the corruption scandals at the state-sponsored oil and gas producer Petroleo Brasiliero SA (“Petrobras”) and the related news at BTG Pactual (BTG’s former chairman and CEO Esteves has been arrested and has resigned from the bank). We also recognize that rating agencies may downgrade Brazil sovereign debt further. However, the prospects for repayment of Brazil sovereign bonds remain strong, in our view. In addition, we reduced our underweights in Croatia, Malaysia, and Turkey during the review period. At the end of the period, the portfolio was modestly underweight duration, with much of the underweight concentrated in Central and Eastern Europe and Asia, including Hungary, Lebanon, Poland, Ukraine, China, and Philippines. In the case of Lebanon and Ukraine, we held zero exposure based on our assessment of relative valuation and fundamentals.
The Fund uses various derivative instruments to implement its strategies. These derivatives are utilized to manage the Fund’s credit risk, interest rate risk and foreign exchange risk. These derivative positions may increase or decrease the Fund’s exposure to these risks. At the end of the reporting period the Fund had net exposure to these derivatives of approximately $2.0 million. Over the course of the reporting period these derivative positions generated a net realized gain of approximately $1.3 million and $4.0 million in unrealized appreciation, for an increase in operations of $5.3 million. We plan to continue to utilize derivative instruments to implement our strategies related to credit risk, interest rate risk and foreign exchange risk.
Stone Harbor Local Markets Fund
The total return of the Stone Harbor Local Markets Fund (the “Fund” or “portfolio”) for the six month period ended November 30, 2015 was -10.86% (net of expenses) and -10.42% (gross of expenses). This performance compares to a benchmark return of -9.63% for the GBI-EM Global Diversified, with FX accounting for all of the negative return. The largest underperformers for the period at the index level were Colombia
(-22.30%), Brazil (-20.12%) and South Africa (-14.49%).
Stone Harbor Investment Funds Semi-Annual Report | November 30, 2015 | 3 |
Table of Contents
| Stone Harbor Investment Funds | Shareholder Letter | |
| November 30, 2015 (Unaudited) |
The largest source of underperformance was Colombia (FX and duration overweight). The Fund’s overweight duration positioning in Colombia was based on what we believed were attractive valuations and a steep local bond yield curve that favored longer duration exposure. Colombia bond yields rose as inflation climbed above its target range – largely due to the oil-related weakness in the currency – limiting the scope for rate cuts.
Other significant detractors included Hungary (FX and duration underweight), Nigeria (FX underweight), and Poland (overweight FX and issue selection). We continue to view Hungary as one of the most challenged credits in Central Europe with a weak balance sheet (high debt/GDP) in a small, open economy with a ruling political party that has pursued populist policies at the expense of structural reforms that may generate sustainable growth. In this environment, we believe that the Hungarian forint has low appreciation potential and bond yields are low relative to the credit risk. However, during the period, the Hungary sub-index outperformed the benchmark, returning -2.02% versus -9.63%. In Nigeria, capital controls and a fixed exchange rate allowed for the reported outperformance of the Nigeria sub-index in FX and rates during the period. However, Nigeria will be removed from the GBI-EM Global Diversified given the constraints on liquidity. In light of this prospect, we held a zero weight in the country’s currency and local fixed income, which resulted in relative underperformance.
The top positive contributors to performance during the period included Indonesia (FX overweight), Russia (FX underweight, duration overweight), and issue selection in off-benchmark, short duration hard currency bonds in Venezuela. Indonesia remained one of our favorites in the Asia region, as shown by our continued overweight position since September 2013. Despite lower growth this year, the central bank remained focused on financial stability and will maintain a relatively tight policy, in our view. We also believe a cabinet reshuffle over the summer reaffirmed the government’s commitment to conservative fiscal policies. During the period, the Indonesia rupiah was among the best performing currencies. We moved the Russia FX exposure to neutral in the second quarter as we felt the rebound in the ruble had outpaced the rebound in oil prices. Late in July, we moved to an outright underweight in the ruble as oil prices continued to fall. The ruble stabilized relative to the US dollar toward the end of the review period but remained at weaker levels compared to its peak in May 2015. An off-benchmark position in short duration Venezuela hard currency debt was the largest positive contributor, enhancing relative returns by 29 basis points during the period.
The largest relative changes in the Fund included adding to our position in Brazil real and Indonesia rupiah. While we remain cautious in Brazil given the economic and political challenges, we tactically reduced our underweight in the real over the last several months due to cheap valuations and renewed intervention by Brazil’s central bank, which has been selling US dollars. We also increased our exposure in the Polish zloty. We reduced our underweight in the beginning of 2015 and increased our position in the zloty to an overweight in August to express our view of reduced downside for the euro. Our investment thesis was based on Poland’s improving economic activity and the view that Poland would benefit from better economic strength in the Eurozone, particularly relative to other Central and Eastern European (“CEE”) countries. Our positioning worked well, especially in the third quarter, as it was helped by the rally of the euro versus the US dollar and signs of improving economic activity in the region. To fund these positions, we reduced FX exposure in Colombia, Malaysia, and South Africa.
The Fund’s positioning at the end of the period reflects our expectations of modestly better growth in emerging markets in 2016. Currency weakness over the past several years has allowed for adjustments in the external balances of many emerging markets; the depreciation of EM currencies relative to the US dollar is beginning to help reduce current account deficits. Many EM economies now boast surpluses in their current accounts. While it remains difficult to predict the path of oil prices, many energy exporters are adjusting to a lower oil price environment through fiscal adjustments or increases in domestic gas prices, which lower fiscal pressures. Finally, while we believe China’s growth trajectory is very likely to be lower in the year ahead, we see no imminent crash in China’s economy but rather a long process of deleveraging.
The Fund uses various derivative instruments to implement its strategies. These derivatives are utilized to manage the Fund’s credit risk, interest rate risk and foreign exchange risk. These derivative positions may increase or decrease the Fund’s exposure to these risks. At the end of the reporting period the Fund had a net exposure to these derivatives of approximately -$589,000. Over the course of the reporting period these derivative positions generated a net realized gain of approximately $9.4 million partially offset by $4.6 million in unrealized depreciation, for a net increase in operations of approximately $4.8 million. We plan to continue to utilize derivative instruments to implement our strategies related to credit risk, interest rate risk and foreign exchange risk.
Stone Harbor Emerging Markets Corporate Debt Fund
The total return of the Stone Harbor Emerging Markets Corporate Debt Fund (the “Fund” or “portfolio”) for the six month period ended November 30, 2015 was -2.86% (net of expenses) and -2.36% (gross of expenses). This performance compares to a benchmark return of -1.99% for the CEMBI Broad Diversified. The index spread over comparable maturity US Treasury securities widened by 72 basis points, ending the period at 406 basis points. Contributions to the index total return from each of the major EM regions (i.e., Africa, Asia, Eastern Europe, Latin America, and the Middle East) were negative for the period with the exception of Eastern Europe which was up 3.09% for the period. Specific top country performers included Bangladesh (+4.90%), Russia (+5.74%), and Ukraine (+11.16%); the bottom performers included Brazil (-13.88%), Mongolia (-42.88%), and Zambia (-31.83%). The negative performance of the EM corporate sector was driven primarily by depressed oil prices and sovereign downgrades.
The Fund underperformed its benchmark largely as a result of issue selection decisions in several countries including Brazil, Chile, India, and Kazakhstan. Regionally, corporates from Latin America detracted the most, while corporates from Eastern Europe, Middle East, Africa in aggregate enhanced relative returns. In Brazil, the Fund’s performance suffered from exposure to corporate issuers impacted by the ongoing political scandal
| 4 | www.shiplp.com |
Table of Contents
| Stone Harbor Investment Funds | Shareholder Letter | |
| November 30, 2015 (Unaudited) |
at the state-sponsored oil and gas producer Petroleo Brasileiro SA (“Petrobas”). Petrobras bonds were negatively impacted as a result of the company being downgraded by S&P in early September to below investment grade (BB). This rating downgrade, coupled with an earlier Moody’s Investors Service (“Moody’s”) downgrade, had resulted in the bond being ineligible for most Investment Grade (“IG”) indices. As a consequence, the entire Petrobras curve came under significant pressure as certain IG investors were required to sell the bonds. The depreciation of the Brazilian real also exacerbated Petrobras’ leveraged balance sheet and added to negative sentiment surrounding the company. We held our position based on the view that the company’s prospects would improve over the course of the next year as they begin to manage leverage through lower capital expenditures, reduced operating costs and asset sales.
Positioning in Russia and China enhanced returns, as did issue selection decisions in Indonesia. In the case of Russian corporates, the Fund’s positioning in Russia moved from an underweight in the fourth quarter of 2014 to an overweight in January 2015, and this overweight was maintained even as Russian corporates were downgraded in February and throughout the remainder of the review period. This positioning eventually improved relative performance as Russian corporate bond prices recovered during the third quarter from the oil price-induced drawdown in late 2014, enhanced by investor demand to reduce underweight positions versus the CEMBI Broad Diversified. As part of the re-positioning of the Russia exposure, we focused on non-cyclical businesses such as the Mobile Telecommunications sector (Vimpelcom and MTS Telecom) and hard currency generating companies in the Oil & Gas sector (Lukoil and SIBNEFT). These issue selection decisions also enhanced relative performance during the period.
Looking ahead to 2016, we expect continued pressure on commodity producing companies, those exposed to local currency depreciation, and issuers from split-investment grade countries that are at risk of further downgrade, specifically Brazil, South Africa, and Turkey. Based on these expectations, we have marginally reduced exposure to certain Mining and Oil and Gas credits and increased exposure to companies that generate hard currency. In the case of South Africa, we hold an off-benchmark position in hard currency quasi-sovereign debt. Regionally, we hold the largest relative underweight in Asia, given the multitude of low spread opportunities across a number of the stronger investment grade countries.
We believe the most attractive investment opportunities for 2016 will be in those countries that experienced political and economic challenges in 2015, and where corporate bond prices have fallen as a result. We expect that in Brazil, credit selection will remain a key driver of excess returns and that the country, despite current political crises related to the ongoing Presidential impeachment process, still provides one of the largest opportunity sets in 2016. Once the political noise has bottomed, Russian corporates are also attractive versus sovereign bonds, in our view. We see more limited upside in China and Mexico IG credits. In addition, we believe an improved political environment will result in spread compression for corporates in Argentina. At the end of the review period, the Fund’s largest positions were in Indonesia, Mexico and Russia.
In broad terms, our strategy in corporates focuses on identifying companies that are market leaders in their industries. We favor exporters that generate US dollar revenues and companies that benefit from the growth of middle classes. At the sector level, we favor Consumer Goods, Wireless Telecommunications, and Food and Beverage companies, among others. In addition, we look for companies that are growing, reducing debt and, as a result, are candidates for rating agency upgrades over the next 18 to 24 months.
The Fund uses various derivative instruments to implement its strategies. These derivatives are utilized to manage the Fund’s credit risk, interest rate risk and foreign exchange risk. These derivative positions may increase or decrease the Fund’s exposure to these risks. At the end of the reporting period the Fund had net exposure to these derivatives of approximately $25,000. Over the course of the reporting period these derivative positions generated a net realized gain of approximately $5,000 and $22,000 in unrealized appreciation, for a net increase in operations of approximately $27,000. We plan to continue to utilize derivative instruments to implement our strategies related to credit risk, interest rate risk and foreign exchange risk.
Stone Harbor Emerging Markets Debt Allocation Fund
The Stone Harbor Emerging Markets Debt Allocation Fund’s (the “Fund” or “portfolio”) performance for the six month period ended November 30, 2015 was -6.73% (net of expenses) and -6.31% (gross of expenses). This compares to a blended benchmark (50% EMBI Global Diversified / 50% GBI-EM Global Diversified) return of -5.19%. At the close of the reporting period, the Fund allocated approximately 48.5% to local currency debt, 46.6% to external sovereign debt, and 3.4% to hard currency corporate debt, with cash representing 1.5% of the Fund. The Fund’s asset allocation mix varied throughout the review period, driven by tactical asset allocation decisions based on portfolio management’s assessment of relative value opportunities and global market risks. The portfolio’s local currency debt allocation detracted 69 basis points in aggregate, driven primarily by negative attribution from issue selection. The allocation to hard currency debt detracted 34 basis points, almost entirely driven by country selection. Hard currency corporate debt allocation detracted 7 basis points. Tactical asset allocation decisions, including the decision to reduce local currency exposure in August 2015 in light of the unexpected Chinese devaluation and then to increase it later in the reporting period, detracted 4 basis points. Treasury attribution, a result of holding modestly lower US Treasury duration than that of the blended benchmark, enhanced returns by 7 basis points, and miscellaneous differences detracted 5 basis points from relative total returns.
Within the hard currency sovereign debt allocation, an underweight in Ukraine was the largest detractor from relative performance. The Ukraine sub-index outperformed during the period on news of a sovereign debt restructuring. Key components of the agreement reached during the third quarter included a 20% principal haircut, a four-year maturity extension, an increase in the average coupon, no haircut on accrued interest, and
Stone Harbor Investment Funds Semi-Annual Report | November 30, 2015 | 5 |
Table of Contents
| Stone Harbor Investment Funds | Shareholder Letter | |
| November 30, 2015 (Unaudited) |
additional GDP warrants with payouts during 2021-2040, subject to GDP triggers. The result and the market’s response to it were better than expected. Nevertheless, we believe that the restructuring terms were too optimistic. In our view, economic depression continues to deepen in Ukraine and geopolitical tensions with Russia remain high. In addition, Ukraine is unlikely to pay $3 billion owed to Russia in December 2015. As a result of our view, the portfolio continues to hold no exposure to Ukraine.
Other detractors from performance included overweights and issue selection decisions in Brazil, Chile, and Costa Rica. In Brazil, the fundamental story has been deteriorating, but in our view, the country’s ability and willingness to service debt obligations remains strong. S&P downgraded Brazil debt from BBB- to BB+ on September 9th, citing the perceived lack of willingness of Brazil’s congress to support fiscal reforms. Brazil’s sovereign bond spreads widened in response to the downgrade and the Brazil real sharply depreciated in August and September 2015. We believed that credit spreads had already factored in a macroeconomic outlook consistent with valuations for a single-B rated credit and that the market was overstating Brazil default risk. An underweight in Russia and issue selection decisions in South Africa also detracted from relative performance.
The biggest positive contributor to relative returns within the hard currency allocation was an overweight and issue selection in Venezuela. In our view, deeply discounted prices of Venezuela bonds overstated default risk. We maintained an overweight position in Venezuela based on our assessments of the sovereign’s ability and willingness to service its external debt, particularly in the near term. Our judgment is that Venezuela’s policy makers are keenly aware of the importance of avoiding default. In October and November, Venezuela’s government paid over $5 billion to bond holders in the form of coupons, amortizations and maturities, supporting this view. Importantly, these payments have already reduced our exposure in Venezuela.
Top detractors within the local currency debt allocation included Brazil (issue selection), Colombia (FX and duration overweight, issue selection), Hungary (FX and duration underweight), and Thailand (FX underweight). The Fund’s overweight duration positioning in Colombia was based on what we believed were attractive valuations and a steep local bond yield curve that favored longer duration exposure. Colombia bond yields rose as inflation climbed above its target range – largely due to the oil-related weakness in the currency – limiting the scope for rate cuts. In Hungary, we maintain the view that it is one of the most challenged credits in Central Europe with a weak balance sheet (high debt/GDP) in a small, open economy with a ruling political party that has pursued populist policies at the expense of structural reforms that may generate sustainable growth. In this environment, we believe that the Hungarian forint has low appreciation potential and bond yields are low relative to the credit risk. However, during the period, the Hungary sub-index outperformed the benchmark. In Thailand, our decision to underweight the Thai baht was based on our expectations that currencies in Asia, with the exception of Indonesia, would underperform the market due to weaker economic activity in China. Our decision to underweight the Thai baht also arose from political uncertainty and the central bank’s intention to allow the baht to depreciate.
The Fund’s exposure in Mexico (FX and duration overweight) enhanced returns, as did overweight FX exposure in Brazil. In Mexico, the Fund’s overweight position reflected our view that the Mexican economy will continue to perform well and that growth will accelerate into 2016. A weaker peso has enhanced Mexico’s competitiveness. We also view Mexico’s close economic ties to a growing US economy as a strong support for Mexico’s local economy.
At the end of September, the Fund began reducing its tactical underweight allocation to local currency debt. For the first four months of the reporting period, this underweight enhanced relative performance as the total return of the local currency benchmark underperformed the hard currency index by over 8%. Given this underperformance in local currency debt and the more attractive valuations in local markets, we began adding EM FX and local interest rate exposure in September. By the end of November, the portfolio’s position in local debt markets had increased to a more modest underweight relative to the 50% weighting in the blended benchmark.
The Fund uses various derivative instruments to implement its strategies. These derivatives are utilized to manage the Fund’s credit risk, interest rate risk and foreign exchange risk. These derivative positions may increase or decrease the Fund’s exposure to these risks. At the end of the reporting period the Fund had no net exposure to these derivatives. We plan to continue to utilize derivative instruments to implement our strategies related to credit risk, interest rate risk and foreign exchange risk.
Stone Harbor High Yield Bond Fund
The Stone Harbor High Yield Bond Fund (the “Fund” or “portfolio”) return for the six months ended November 30, 2015 was -5.89% (net of expenses) and -5.58% (gross of expenses). This compares to a benchmark return of -6.63% for the Citigroup High Yield Market Capped Index.
Global growth concerns were primarily to blame for a weak high yield market over the review period, as commodity prices plummeted to multi-year lows. The drawdown in oil prices in particular had a disproportionate negative impact on overall market performance, given that energy represents the largest industry within the US high yield benchmark. An increase in market volatility led by thin trading liquidity and increased company–specific operational disappointments led to further credit spread widening. Given global economic growth uncertainty and as the Fed prepares for “lift off”, we expect this increase in volatility to persist over the intermediate term. The market is also encountering a step up in idiosyncratic events that have had a negative impact on a growing number of industries.
| 6 | www.shiplp.com |
Table of Contents
| Stone Harbor Investment Funds | Shareholder Letter | |
| November 30, 2015 (Unaudited) |
High yield new issuance languished during the period due to a decline in refinancing activity. A rise in M&A transactions and a number of issuer-unfriendly and non-opportunistic deals also put downside pressure on the market. From a technical perspective, high yield issuers continue to have access to capital; however, in our view, CCC issuers could see tighter borrowing conditions in the future as risk aversion gains traction in the market. Retail flows over the period were negative but comparatively better than the same period last year. High yield spreads, as represented by the Citigroup High Yield Market Capped Index, widened 171 basis points to end the period at 644 basis points, and the average yield rose 2.04% to 8.03%.
Top performing sectors during the period under review included the Containers and Food/Beverage industries which benefit from stable operations, strong cash flows and solid asset values. Predictably, the bottom performers included Energy, driven by lower oil prices, and Metals/Mining, led by the underperformance of coal companies due to the rising abundance of cheaper natural gas in the US, diminished demand globally and tightening environmental regulations. Market volatility and a decline in investor risk appetite drove BB-rated bonds to outperform both B and CCC securities (S&P ratings), as represented by the Citigroup High Yield Market Capped Index. Longer duration securities, which tend to be higher in credit quality, significantly outperformed shorter duration bonds.
From a fundamental standpoint, we believe overall company financials are deteriorating. Default rates remain below long term averages but have been pressured by increasing defaults in the Energy and Metals/Mining sectors. We anticipate an increase in defaults as low commodity prices continue to pressure high yield issuers, and believe that the low in defaults has most likely been achieved for this cycle. The US market had more companies downgraded to high yield than companies upgraded to investment grade, and there were a greater number of ratings downgrades than upgrades on both a volume and issuer basis. Default rates in the leveraged loan and European high yield markets, however, have remained low helped in part by lower commodity exposure. In Europe, high yield fundamentals also remain broadly healthy with leverage ratios declining as European economic growth increased.
The portfolio outperformed its benchmark due to industry selection. Positive excess returns were driven by underweights to the Energy and Metals/Mining sectors, and an overweight to the Food/Beverage industry. Issue selection decisions within Energy, and to a lesser extent the Utilities sector, were the primary detractors from performance, although these losses were partially offset by issue selection in the Chemicals and Cable/Media industries. Continued volatility in oil prices driven by a supply/demand imbalance put pressure on our holdings in Energy, particularly in Exploration & Production and Oil Field Services companies. Depressed natural gas prices, which pushed power prices lower, adversely affected the portfolio’s power generation holdings in the Utilities sector. In the Chemical industry, positions in specialty chemical manufacturers and a zero weighting to producers of titanium dioxide – which experienced a slump in prices due to a lack of global demand – contributed positively to returns. Issue selection in the B-rated sector and an underweight to the CCC-rated sector enhanced performance while an underweight to BB-rated issuers detracted from returns.
With market volatility expected to continue, and the credit cycle in its later stages, we are taking a defensive posture in portfolio positioning. We have been increasing our exposure to leveraged loans and reducing our underweight in the BB sector, as well as paring down exposure to CCC-rated issues. We remain overweight B-rated bonds on attractive valuations. From an industry standpoint, the portfolio is overweight in several defensive sectors such as Cable/Media, Food/Beverage and Consumer Products, as these sectors benefit from stable operations, strong cash flows and solid asset values. We are notably underweight in both the Energy and Metals/Mining industries, as we believe oversupply, coupled with slower than expected global growth, has led to accelerated commodity price declines.
The Fund uses various derivative instruments to implement its strategies. These derivatives are utilized to manage the Fund’s credit risk, interest rate risk and foreign exchange risk. These derivative positions may increase or decrease the Fund’s exposure to these risks. At the end of the reporting period the Fund had net exposure to these derivatives of approximately $216,000. Over the course of the reporting period these derivative positions generated a net realized loss of approximately $27,000 partially offset by $121,000 in unrealized appreciation, for a net increase in operations of approximately $94,000. We plan to continue to utilize derivative instruments to implement our strategies related to credit risk, interest rate risk and foreign exchange risk.
Stone Harbor Investment Grade Fund
The total return of the Stone Harbor Investment Grade Fund (the “Fund” or “portfolio”) for the six months ended November 30, 2015 was -0.48% (net of expenses) and -0.23% (gross of expenses). This performance compares to a benchmark return of -0.12% for the Barclays US Aggregate Index. The Fund’s modest underperformance relative to its benchmark is primarily the result of certain asset allocation decisions. In terms of asset allocation, the Fund’s underperformance relative to the benchmark can be explained by an overweight to corporate bonds, during a period where credit spreads were generally wider. Security selection was a positive contributor to the Fund’s performance relative to the benchmark. Securitized assets accounted for most of the security selection alpha.
Over the past six months, the Chinese devalued their currency, the ECB introduced further quantitative easing, only for the expectation of and clamor for more to grow, and in September, the Fed reached the point of tightening, only to step back and then to step forward again. Copper prices declined by a third with a similar move in Chinese equity markets. Underlying this, Chinese growth has averaged around low 6% levels according to most commentators; US growth was 3.9% in the second quarter and 2.1% in the third quarter. Europe recorded 1.4% growth annualized over the second and third quarters. Core US inflation has edged up to 1.9% year-over-year while Eurozone inflation has remained
| Stone Harbor Investment Funds Semi-Annual Report | November 30, 2015 | 7 |
Table of Contents
| Stone Harbor Investment Funds | Shareholder Letter | |
| November 30, 2015 (Unaudited) |
subdued. Credit markets performed poorly, especially the high yield sector, which underperformed equal duration US Treasuries by approximately 6.5%, despite little change in ten year yields. The trade-weighted US dollar rallied by about 4% over the past six months.
Looking ahead, we are focusing on a number of issues. The August Chinese currency devaluation, which came as a shock to many, contributed to policy uncertainty which we believe will likely remain as the authorities navigate their way through a rebalancing of the economy. While a positive contribution is anticipated from the devaluation, we believe the impact on the overall economy will likely be modest. Given the strength in the trade-weighted renminbi and ongoing economic softness, we expect more periodic devaluations. We anticipate a period of stable or even improving growth after each devaluation and before pressure re-appears, as the economy weakens under the pressure to rebalance away from investment and recognize the constraints of credit-driven growth. In our view, it appears we have entered a near term period of stability which may help calm concerns about emerging markets more broadly and permit the markets a period of reflection. We believe the key component of the outlook for emerging markets more generally is the demand for commodities, which may be influenced by Chinese growth. Growth in the primary and secondary sectors of the Chinese economy has already collapsed, suggesting that we may have seen the worst of the decline in demand for commodities and other emerging markets’ product more generally. In our view, demand will continue to decline; Brazil and Russia, for example, face their own challenges as they overcome a burst bubble, which revealed a lack of market reform. However, we believe that the challenges for emerging markets going forward will likely be predominantly endogenous. The one exogenous consideration outstanding, however, is Fed policy going forward.
At the time of this writing, it seems probable that the Fed will raise rates in December. It appears that the Fed has lowered the hurdle rate for growth to trigger a tightening. As such, we expect to see a move of 25 basis points per quarter, absent a material softening of growth. We continue to believe that the yield curve does not reflect this likely path of rates and that ten year yields represent fair values closer to a 3% yield than the current 2.25% yield. However, we think messaging from the Fed reflects a compromise between the dovish members of the Committee and the remaining members. This suggests that the range of market expectations is likely to oscillate between 25 basis point tightening per half year (current pricing) and 25 basis points per quarter (our more pessimistic expectation). Our longer term expectation for the terminal Fed Funds rate is still 3.5%, reflecting an economy that has not materially deleveraged and a growing challenge from demographic changes, although the changes may be at their least intensive in the US.
Arguably, Europe has been growing above trend for some time, albeit modestly. Though the Eurozone unemployment rate has declined, inflation has remained subdued with headline inflation slightly above zero and core inflation around 1%. While there are signs that bank lending channels are loosening, there is little in the data to suggest that the ECB will reach its 2% inflation target in the near future. With some tentative signs of a slowdown in Germany, it seems likely that the European output gap will remain elevated, resulting in a long period of underlying disinflationary impulse. The risks of a second-round effect of low inflation will increase the longer inflation remains low. In our view, the recent moves from the ECB were disappointing and we expect further action in 2016, and it is important to recognize that the ECB is close to the end of its easing cycle. We believe yield differentials with the US should continue to widen, reducing support for the euro. While investor positions have increased, they do not yet appear to be at a level which represents a warning sign.
An initial move higher in the yield curve often goes hand in hand with a tightening of credit spreads. Both events are indicators of a strong economy. Over the past twelve months, the US high yield sector has been the standout credit underperformer, especially when compared to the progress that the economy has made and the performance of equity markets. Until recently, the sector’s underperformance could be attributed to lower oil prices and the subsequent broader collapse in commodity prices. While longer term valuations are slightly more attractive, in our opinion, we believe this sectoral behavior is masking some worrisome underlying trends. For example, M&A activity is running at very elevated levels, which has led to a sharp increase in acquisition-related issuance. Though the credit quality of issuers and the term structure of issuance are not as poor as in 2006 and 2007 and issuance is more acquisition focused than leverage buyout oriented, there is clearly a heavy increase in issuance and the corresponding event risk. Additionally, particularly in the Health Care and Technology sectors, there is growing evidence of bottom line sensitivity to wage pressures. In some cases, this sensitivity arises from minimum wage increases and in others, from a dearth of skilled workers causing wages to be bid upward. While we do not believe this to be at a level that may be easily picked up in broad economy level data, it does suggest a growing sensitivity of corporate profits to the employment level. With the Fed wishing to move slowly, this sensitivity may become a longstanding concern. A final later cycle concern is that of recovery rates. As bond prices increase, the recovery rates decrease. In previous cycles, bonds were acquired with prices around 80, which meant a real recovery rate of 50%. With today’s low yields, many bonds are priced significantly higher than 80. For example, a bond priced at 120 has a recovery rate of approximately 33%. From a security selection and an asset allocation perspective, we believe investors should consider these later cycle concerns as we continue into the credit cycle.
The Fund uses various derivative instruments to implement its strategies. These derivatives are utilized to manage the Fund’s credit risk, interest rate risk and foreign exchange risk. These derivative positions may increase or decrease the Fund’s exposure to these risks. At the end of the reporting period the Fund had no net exposure to these derivatives. We plan to continue to utilize derivative instruments to implement our strategies related to credit risk, interest rate risk and foreign exchange risk.
| 8 | www.shiplp.com |
Table of Contents
| Stone Harbor Investment Funds | Shareholder Letter | |
| November 30, 2015 (Unaudited) |
Stone Harbor Strategic Income Fund
The total return of the Strategic Income Fund (the “Fund” or “portfolio”) for the six month period ended November 30, 2015 was -3.08% (net of expenses) and -2.73% (gross of expenses). This performance compares to a benchmark return of -1.05% for the Barclays Global Credit Index (Hedged into USD). The Fund underperformed its benchmark as a result of certain asset allocation and individual credit decisions. Approximately 85% of the Fund’s underperformance (155 basis points out of 179 basis points) was the result of broad asset allocation, with a large portion of that coming from the Fund’s relative overweight position in the US high yield market. The US high yield market was one of the weaker performers in global fixed income markets over the period. Issue selection accounted for the balance of the underperformance. The Fund’s US high yield holdings provided positive alpha over the period, relative to the high yield market. This positive contribution was completely offset by the Fund’s emerging debt holdings, which underperformed relative to the EM debt benchmark.
Over the past six months, the Chinese devalued their currency, the ECB introduced further quantitative easing, only for the expectation of and clamor for more to grow, and in September, the Fed reached the point of tightening, only to step back and then to step forward again. Copper prices declined by a third with a similar move in Chinese equity markets. Underlying this, Chinese growth has averaged around low 6% levels according to most commentators; US growth was 3.9% in the second quarter and 2.1% in the third quarter. Europe recorded 1.4% growth annualized over the second and third quarters. Core US inflation has edged up to 1.9% year-over-year while Eurozone inflation has remained subdued. Credit markets performed poorly, especially the high yield sector, which underperformed equal duration US Treasuries by approximately 6.5%, despite little change in ten year yields. The trade-weighted US dollar rallied by about 4% over the past six months.
Looking ahead, we are focusing on a number of issues. The August Chinese currency devaluation, which came as a shock to many, contributed to policy uncertainty which we believe will likely remain as the authorities navigate their way through a rebalancing of the economy. While a positive contribution is anticipated from the devaluation, we believe the impact on the overall economy will likely be modest. Given the strength in the trade-weighted renminbi and ongoing economic softness, we expect more periodic devaluations. We anticipate a period of stable or even improving growth after each devaluation and before pressure re-appears, as the economy weakens under the pressure to rebalance away from investment and recognize the constraints of credit-driven growth. In our view, it appears we have entered a near term period of stability which may help calm concerns about emerging markets more broadly and permit the markets a period of reflection. We believe the key component of the outlook for emerging markets more generally is the demand for commodities, which may be influenced by Chinese growth. Growth in the primary and secondary sectors of the Chinese economy has already collapsed, suggesting that we may have seen the worst of the decline in demand for commodities and other emerging markets’ product more generally. In our view, demand will continue to decline; Brazil and Russia, for example, face their own challenges as they overcome a burst bubble, which revealed a lack of market reform. However, we believe that the challenges for emerging markets going forward will likely be predominantly endogenous. The one exogenous consideration outstanding, however, is Fed policy going forward.
At the time of this writing, it seems probable that the Fed will raise rates in December. It appears the Fed has lowered the hurdle rate for growth to trigger a tightening. As such, we expect to see a move of 25 basis points per quarter, absent a material softening of growth. We continue to believe that the yield curve does not reflect this likely path of rates and that ten year yields represent fair values closer to a 3% yield than the current 2.25% yield. However, we think messaging from the Fed reflects a compromise between the dovish members of the Committee and the remaining members. This suggests that the range of market expectations is likely to oscillate between 25 basis points tightening per half year (current pricing) and 25 basis points per quarter (our more pessimistic expectation). Our longer term expectation for the terminal Fed Funds rate is still 3.5%, reflecting an economy that has not materially deleveraged and a growing challenge from demographic changes, although the changes may be at their least intensive in the US.
Arguably, Europe has been growing above trend for some time, albeit modestly. Though the Eurozone unemployment rate has declined, inflation has remained subdued with headline inflation slightly above zero and core inflation around 1%. While there are signs that bank lending channels are loosening, there is little in the data to suggest that the ECB will reach its 2% inflation target in the near future. With some tentative signs of a slowdown in Germany, we believe it seems likely that the European output gap will remain elevated, resulting in a long period of underlying disinflationary impulse. We further believe the risks of a second-round effect of low inflation will increase the longer inflation remains low. In our view, the recent moves from the ECB were disappointing and we expect further action in 2016, and it is important to recognize that the ECB is close to the end of its easing cycle. In our view, yield differentials with the US should continue to widen, reducing support for the euro. While investor positions have increased, they do not yet appear to be at a level which represents a warning sign.
An initial move higher in the yield curve often goes hand in hand with a tightening of credit spreads. Both events are indicators of a strong economy. Over the past twelve months, the US high yield sector has been the standout credit underperformer, especially when compared to the progress that the economy has made and the performance of equity markets. Until recently, the sector’s underperformance could be attributed to lower oil prices and the subsequent broader collapse in commodity prices. While longer term valuations are slightly more attractive, in our opinion, we believe this sectoral behavior is masking some worrisome underlying trends. For example, M&A activity is running at very elevated levels, which has led to a sharp increase in acquisition-related issuance. Though the credit quality of issuers and the term structure of issuance are not as poor as in 2006 and 2007 and issuance is more acquisition focused than LBO oriented, there is clearly a heavy increase in issuance and the corresponding event risk. Additionally, particularly in the Health Care and Technology sectors, there is growing evidence of bottom line sensitivity to wage
Stone Harbor Investment Funds Semi-Annual Report | November 30, 2015 | 9 |
Table of Contents
| Stone Harbor Investment Funds | Shareholder Letter | |
| November 30, 2015 (Unaudited) |
pressures. In some cases, this sensitivity arises from minimum wage increases and in others, from a dearth of skilled workers causing wages to be bid upward. While we do not believe this to be at a level that may be easily picked up in broad economy level data, it does suggest a growing sensitivity of corporate profits to the employment level. With the Fed wishing to move slowly, this sensitivity may become a longstanding concern. A final later cycle concern is that of recovery rates. As bond prices increase, the recovery rates decrease. In previous cycles, bonds were acquired with prices around 80, which meant a real recovery rate of 50%. With today’s low yields, many bonds are priced significantly higher than 80. For example, a bond priced at 120 has a recovery rate of approximately 33%. From a security selection and an asset allocation perspective, we believe investors should consider these later cycle concerns as we continue into the credit cycle.
The Fund uses various derivative instruments to implement its strategies. These derivatives are utilized to manage the Fund’s credit risk, interest rate risk and foreign exchange risk. These derivative positions may increase or decrease the Fund’s exposure to these risks. At the end of the reporting period the Fund had net exposure to these derivatives of approximately $418,000. Over the course of the reporting period these derivative positions generated a net realized loss of approximately $116,000 offset by $151,000 in unrealized appreciation, for a net increase in operations of approximately $35,000. We plan to continue to utilize derivative instruments to implement our strategies related to credit risk, interest rate risk and foreign exchange risk.
Sincerely,

Thomas K. Flanagan
Chairman of the Board of Trustees
| 10 | www.shiplp.com |
Table of Contents
| Stone Harbor Investment Funds | Disclosure of Fund Expenses | |
| November 30, 2015 (Unaudited) |
Example. As a shareholder of a Fund, you incur two types of costs: (1) transaction costs, including sales charges (loads) on purchase payments and/or redemption fees (if applicable) and (2) ongoing costs, including management fees and other Fund expenses. The below examples are intended to help you understand your ongoing costs (in dollars) of investing in a Fund and to compare these costs with the ongoing costs of investing in other mutual funds. The examples are based on an investment of $1,000 invested on June 1, 2015 and held until November 30, 2015.
Actual Expenses. The first table below provides information about actual account values and actual expenses. You may use the information in this table, together with the amount you invested, to estimate the expenses that you paid over the period. Simply divide your account value by $1,000 (for example, an $8,600 account value divided by $1,000 = 8.6), then multiply the result by the number in the first line under the heading “Expenses Paid During Period” to estimate the expenses you paid on your account during this period.
Hypothetical Example for Comparison Purposes. The second table below provides information about hypothetical account values and hypothetical expenses based on the Fund’s actual expense ratio and an assumed rate of return of 5% per year before expenses, which is not the Fund’s actual return. The hypothetical account values and expenses may not be used to estimate the actual ending account balance or expenses you paid for the period. You may use this information to compare the ongoing costs of investing in a Fund and other mutual funds. To do so, compare this 5% hypothetical example with the 5% hypothetical examples that appear in the shareholder reports of the other funds.
Please note that the expenses shown in the tables are meant to highlight your ongoing costs only and do not reflect transactional costs, such as redemption fees, sales charges (loads) or exchange fees. Therefore, the second line of the table is useful in comparing ongoing costs only, and will not help you determine the relative total costs of owning different funds. In addition, if these transactional costs were included, your costs would have been higher.
BASED ON ACTUAL TOTAL RETURN
Actual Total Return | Beginning Account Value June 1, 2015 | Ending Account Value | Expense Ratio(1) | Expenses Paid During Period(2) | ||||||||||||||||||
|
| |||||||||||||||||||||
STONE HARBOR EMERGING MARKETS DEBT FUND | -2.36% | $ 1,000.00 | $ 976.40 | 0.68% | $ 3.36 | |||||||||||||||||
STONE HARBOR HIGH YIELD BOND FUND | -5.89 | 1,000.00 | 941.10 | 0.63 | 3.06 | |||||||||||||||||
STONE HARBOR LOCAL MARKETS FUND | -10.86 | 1,000.00 | 891.40 | 0.89 | 4.21 | |||||||||||||||||
STONE HARBOR EMERGING MARKETS CORPORATE DEBT FUND | -2.86 | 1,000.00 | 971.40 | 1.00 | 4.93 | |||||||||||||||||
STONE HARBOR INVESTMENT GRADE FUND | -0.48 | 1,000.00 | 995.20 | 0.50 | 2.49 | |||||||||||||||||
STONE HARBOR STRATEGIC INCOME FUND | -3.08 | 1,000.00 | 969.20 | 0.12 | 0.59 | |||||||||||||||||
STONE HARBOR EMERGING MARKETS DEBT ALLOCATION FUND | -6.73 | 1,000.00 | 932.70 | 0.07 | 0.34 | |||||||||||||||||
BASED ON HYPOTHETICAL TOTAL RETURN
Hypothetical Annualized Total Return | Beginning Account Value | Ending Account Value November 30, 2015 | Expense Ratio(1) | Expenses Paid During Period(2) | ||||||||||||||||
| ||||||||||||||||||||
STONE HARBOR EMERGING MARKETS DEBT FUND | 5.00% | $ 1,000.00 | $ 1,021.60 | 0.68% | $ 3.44 | |||||||||||||||
STONE HARBOR HIGH YIELD BOND FUND | 5.00 | 1,000.00 | 1,021.85 | 0.63 | 3.18 | |||||||||||||||
STONE HARBOR LOCAL MARKETS FUND | 5.00 | 1,000.00 | 1,020.55 | 0.89 | 4.50 | |||||||||||||||
STONE HARBOR EMERGING MARKETS CORPORATE DEBT FUND | 5.00 | 1,000.00 | 1,020.00 | 1.00 | 5.05 | |||||||||||||||
STONE HARBOR INVESTMENT GRADE FUND | 5.00 | 1,000.00 | 1,022.50 | 0.50 | 2.53 | |||||||||||||||
STONE HARBOR STRATEGIC INCOME FUND | 5.00 | 1,000.00 | 1,024.40 | 0.12 | 0.61 | |||||||||||||||
STONE HARBOR EMERGING MARKETS DEBT ALLOCATION FUND | 5.00 | 1,000.00 | 1,024.65 | 0.07 | 0.35 | |||||||||||||||
| (1) | Annualized, based on the Fund’s most recent fiscal half-year expenses. |
| (2) | Expenses are equal to the Fund’s annualized expense ratio multiplied by the average account value over the period, multiplied by the number of days in the most recent fiscal half year (183), divided by 366. Note this expense example is typically based on a six-month period. |
Stone Harbor Investment Funds Semi-Annual Report | November 30, 2015 | 11 |
Table of Contents
| Stone Harbor Investment Funds | Summaries of Portfolio Holdings | |
| November 30, 2015 (Unaudited) |
Under SEC Rules, all funds are required to include in their annual and semi-annual shareholder reports a presentation of portfolio holdings in a table, chart or graph by reasonably identifiable categories. The following tables, which present holdings as a percent of total net assets, are provided in compliance with such requirements.
STONE HARBOR EMERGING MARKETS DEBT FUND(1) Country Breakdown | % | |||
| ||||
Brazil | 7.24% | |||
Mexico | 6.45% | |||
Argentina | 5.45% | |||
Kazakhstan | 5.18% | |||
Colombia | 4.70% | |||
Turkey | 4.30% | |||
Chile | 4.27% | |||
Venezuela | 4.19% | |||
Russia | 3.87% | |||
Dominican Republic | 3.20% | |||
Costa Rica | 3.16% | |||
South Africa | 3.08% | |||
Ivory Coast | 2.93% | |||
Indonesia | 2.84% | |||
Croatia | 2.29% | |||
China | 2.26% | |||
Peru | 2.23% | |||
Uruguay | 2.22% | |||
El Salvador | 2.12% | |||
Malaysia | 2.10% | |||
Panama | 2.01% | |||
Azerbaijan | 1.70% | |||
Ecuador | 1.63% | |||
Jamaica | 1.49% | |||
Iraq | 1.27% | |||
Ghana | 1.15% | |||
Paraguay | 1.15% | |||
Nigeria | 1.10% | |||
Philippines | 1.07% | |||
Sri Lanka | 1.04% | |||
Zambia | 1.00% | |||
Kenya | 0.88% | |||
Romania | 0.82% | |||
Egypt | 0.73% | |||
Hungary | 0.66% | |||
Gabon | 0.61% | |||
Morocco | 0.53% | |||
Serbia | 0.49% | |||
Trinidad | 0.43% | |||
Angola | 0.41% | |||
India | 0.29% | |||
Bahrain | 0.27% | |||
Ethiopia | 0.24% | |||
Poland | 0.22% | |||
Honduras | 0.21% | |||
Mozambique | 0.19% | |||
Lithuania | 0.10% | |||
Namibia | 0.08% | |||
| ||||
Total | 95.85% | |||
| ||||
Short Term Investments | 1.66% | |||
| ||||
Other Assets in Excess of Liabilities | 2.49% | |||
| ||||
Total Net Assets | 100.00% | |||
| ||||
| ||||
STONE HARBOR HIGH YIELD BOND FUND Industry Breakdown | % | |||
Media Cable | 9.11% | |||
Healthcare | 6.63% | |||
Food & Beverage | 6.48% | |||
Wirelines | 6.47% | |||
Media Other | 6.13% | |||
Exploration & Production | 5.55% | |||
Electric | 5.47% | |||
Chemicals | 5.39% | |||
Wireless | 4.05% | |||
Building Products | 3.98% | |||
Technology | 3.57% | |||
Consumer Products | 3.41% | |||
Industrial Other | 3.32% | |||
Gaming | 2.73% | |||
Retail Non Food/Drug | 2.71% | |||
Containers/Packaging | 2.28% | |||
Paper/Forest Products | 1.87% | |||
Automotive | 1.86% | |||
Textile/Apparel | 1.66% | |||
Pharmaceuticals | 1.64% | |||
Retail Food/Drug | 1.60% | |||
Drillers/Services | 1.32% | |||
Leisure | 1.30% | |||
Lodging | 1.25% | |||
Restaurants | 0.99% | |||
Home Builders | 0.97% | |||
Services Other | 0.89% | |||
Metals/Mining/Steel | 0.82% | |||
Refining | 0.70% | |||
Financial Other | 0.69% | |||
Aerospace/Defense | 0.68% | |||
Environmental Services | 0.63% | |||
Transportation Non Air/Rail | 0.53% | |||
| ||||
Total | 96.68% | |||
| ||||
Short Term Investments | 2.84% | |||
| ||||
Other Assets in Excess of Liabilities | 0.48% | |||
| ||||
Total Net Assets | 100.00% | |||
| ||||
| ||||
| (1) | Country refers to country of primary risk exposure, as determined by Stone Harbor. In certain instances, a security’s country of incorporation may be different from its country of risk. |
| 12 | www.shiplp.com |
Table of Contents
| Stone Harbor Investment Funds | Summaries of Portfolio Holdings | |
| November 30, 2015 (Unaudited) |
STONE HARBOR LOCAL MARKETS FUND(1) Country Breakdown | % | |||
| ||||
Brazil | 12.40% | |||
Indonesia | 11.87% | |||
Turkey | 10.04% | |||
Russia | 8.38% | |||
Colombia | 7.88% | |||
Mexico | 7.01% | |||
Malaysia | 4.86% | |||
Poland | 4.81% | |||
South Africa | 4.76% | |||
Thailand | 3.13% | |||
Venezuela | 1.94% | |||
Romania | 0.12% | |||
Peru | 0.11% | |||
| ||||
Total | 77.31% | |||
| ||||
Short Term Investments | 0.77% | |||
| ||||
Other Assets in Excess of Liabilities | 21.92% | |||
| ||||
Total Net Assets | 100.00% | |||
| ||||
| ||||
| (1) | Country refers to country of primary risk exposure, as determined by Stone Harbor. In certain instances, a security’s country of incorporation may be different from its country of risk. |
STONE EMERGING MARKETS CORPORATE DEBT FUND(1) Country Breakdown | % | |||
| ||||
Russia | 9.24% | |||
China | 7.66% | |||
Brazil | 7.36% | |||
Mexico | 7.04% | |||
Hong Kong | 6.01% | |||
United Arab Emirates | 5.60% | |||
India | 5.38% | |||
Colombia | 5.13% | |||
Israel | 5.13% | |||
Chile | 3.95% | |||
Turkey | 3.86% | |||
Thailand | 3.75% | |||
Singapore | 3.10% | |||
South Africa | 2.60% | |||
South Korea | 2.39% | |||
Indonesia | 2.21% | |||
Kazakhstan | 2.18% | |||
Morocco | 2.13% | |||
Jamaica | 2.04% | |||
Macau | 1.93% | |||
Philippines | 1.71% | |||
Peru | 1.46% | |||
Argentina | 1.36% | |||
Guatemala | 1.10% | |||
Angola | 1.09% | |||
Canada | 0.95% | |||
Oman | 0.84% | |||
Malaysia | 0.53% | |||
Venezuela | 0.28% | |||
Qatar | 0.26% | |||
Saudi Arabia | 0.08% | |||
| ||||
Total | 98.35% | |||
| ||||
Short Term Investments | 0.24% | |||
| ||||
Other Assets in Excess of Liabilities | 1.41% | |||
| ||||
Total Net Assets | 100.00% | |||
| ||||
| ||||
Stone Harbor Investment Funds Semi-Annual Report | November 30, 2015 | 13 |
Table of Contents
| Stone Harbor Investment Funds | Summaries of Portfolio Holdings | |
| November 30, 2015 (Unaudited) |
STONE HARBOR INVESTMENT GRADE FUND Industry Breakdown | % | |||
| ||||
U.S. Government Agency Mortgage Backed | 23.28% | |||
U.S. Treasury Bonds/Notes | 20.36% | |||
Asset Backed/Commercial Mortgage Backed | 9.77% | |||
Banking | 7.45% | |||
Electric | 2.57% | |||
Gas Pipelines | 2.29% | |||
Real Estate Investment Trust (REITs) | 1.74% | |||
Media Cable | 1.66% | |||
Non Captive Finance | 1.51% | |||
Food and Beverage | 1.50% | |||
Media Other | 1.45% | |||
Pharmaceuticals | 1.45% | |||
Exploration & Production | 1.42% | |||
Healthcare | 1.15% | |||
Automotive | 1.14% | |||
Technology | 1.10% | |||
Retail Food/Drug | 1.05% | |||
Wirelines | 0.90% | |||
Transportation Non Air/Rail | 0.83% | |||
Chemicals | 0.64% | |||
Retail Non Food/Drug | 0.64% | |||
Lodging | 0.49% | |||
Refining | 0.48% | |||
Healthcare Insurance | 0.47% | |||
Life Insurance | 0.46% | |||
Metals/Mining/Steel | 0.41% | |||
Wireless | 0.35% | |||
Consumer Products | 0.33% | |||
Diversified Manufacturing | 0.33% | |||
Environmental Services | 0.33% | |||
Aerospace/Defense | 0.32% | |||
Leisure | 0.32% | |||
Railroads | 0.31% | |||
Drillers/Services | 0.24% | |||
| ||||
Total | 88.74% | |||
| ||||
Short Term Investments | 8.51% | |||
| ||||
Other Assets in Excess of Liabilities | 2.75% | |||
| ||||
Total Net Assets | 100.00% | |||
| ||||
| ||||
STONE HARBOR STRATEGIC INCOME FUND
| % | ||||
| ||||
Stone Harbor Emerging Markets Debt Fund | 20.05% | |||
Stone Harbor High Yield Bond Fund | 34.72% | |||
Stone Harbor Investment Grade Fund | 43.61% | |||
| ||||
Total | 98.38% | |||
| ||||
Other Assets in Excess of Liabilities | 1.62% | |||
| ||||
Total Net Assets | 100.00% | |||
| ||||
| ||||
STONE HARBOR EMERGING MARKETS DEBT ALLOCATION FUND
| % | ||||
| ||||
Stone Harbor Emerging Markets Debt Fund | 49.81% | |||
Stone Harbor Local Markets Fund | 50.16% | |||
| ||||
Total | 99.97% | |||
| ||||
Other Assets in Excess of Liabilities | 0.03% | |||
| ||||
Total Net Assets | 100.00% | |||
| ||||
| ||||
| 14 | www.shiplp.com |
Table of Contents
| Stone Harbor Investment Funds | Growth of $10,000 Investment | |
| November 30, 2015 (Unaudited) |
STONE HARBOR EMERGING MARKETS DEBT FUND
Comparison of Change in Value of $10,000 Investment in Stone Harbor Emerging Markets Debt Fund and the J.P. Morgan Emerging Markets Bond Index Global Diversified (J.P. Morgan EMBI Global Diversified). Please refer to page 100 for detailed benchmark descriptions.
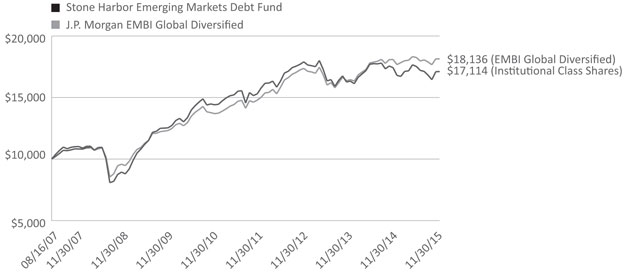
Average Annual Total Returns (Inception Date, August 16, 2007)
| 6 Months | 1 Year | 3 Years | 5 Years | Since Inception | ||||||
Stone Harbor Emerging Markets Debt Fund | -2.36% | -1.82% | -1.11% | 3.53% | 6.70% | |||||
J.P. Morgan EMBI Global Diversified | -0.64% | 0.24% | 1.70% | 5.56% | 7.45% |
The performance data quoted represents past performance and does not guarantee future results. Current performance may be lower or higher than the performance quoted. Average annual total returns reflect the reinvestment of dividends and capital gains distributions and include all fee waivers and expense reimbursements. Without the fee waivers and expense reimbursements, total return figures would have been lower. The performance data quoted does not reflect the deduction of taxes that a shareholder would pay on Fund distributions or the redemption of Fund shares. Investment return and principal value will vary, and shares, when redeemed, may be worth more or less than their original cost. Index returns do not include the effects of sales charges, management fees or transaction costs. It is not possible to invest directly in an index.
Stone Harbor Investment Funds Semi-Annual Report | November 30, 2015 | 15 |
Table of Contents
| Stone Harbor Investment Funds | Growth of $10,000 Investment | |
| November 30, 2015 (Unaudited) |
STONE HARBOR HIGH YIELD BOND FUND
Comparison of Change in Value of $10,000 Investment in Stone Harbor High Yield Bond Fund and the Citigroup High Yield Market Capped Index. Please refer to page 100 for detailed benchmark descriptions.
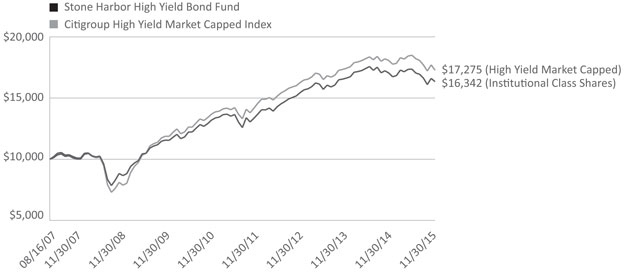
Average Annual Total Returns (Inception Date, August 16, 2007)
| 6 Months | 1 Year | 3 Years | 5 Years | Since Inception | ||||||
Stone Harbor High Yield Bond Fund | -5.89% | -4.11% | 2.50% | 5.19% | 6.10% | |||||
Citigroup High Yield Market Capped Index | -6.63% | -4.38% | 2.57% | 5.58% | 6.82% |
The performance data quoted represents past performance and does not guarantee future results. Current performance may be lower or higher than the performance quoted. Average annual total returns reflect the reinvestment of dividends and capital gains distributions and include all fee waivers and expense reimbursements. Without the fee waivers and expense reimbursements, total return figures would have been lower. The performance data quoted does not reflect the deduction of taxes that a shareholder would pay on Fund distributions or the redemption of Fund shares. Investment return and principal value will vary, and shares, when redeemed, may be worth more or less than their original cost. Index returns do not include the effects of sales charges, management fees or transaction costs. It is not possible to invest directly in an index.
| 16 | www.shiplp.com |
Table of Contents
| Stone Harbor Investment Funds | Growth of $10,000 Investment | |
| November 30, 2015 (Unaudited) |
STONE HARBOR LOCAL MARKETS FUND
Comparison of Change in Value of $10,000 Investment in Stone Harbor Local Markets Fund and the J.P. Morgan Global Bond Index – Emerging Markets Global Diversified (J.P. Morgan GBI-EM Global Diversified). Please refer to page 100 for detailed benchmark descriptions.
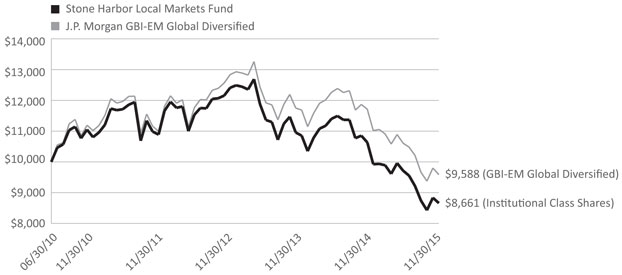
Average Annual Total Returns (Inception Date, June 30, 2010)
| 6 Months | 1 Year | 3 Years | 5 Years | Since Inception | ||||||
Stone Harbor Local Markets Fund | -10.86% | -18.56% | -10.68% | -4.26% | -2.62% | |||||
J.P. Morgan GBI-EM Global Diversified | -9.63% | -18.14% | -8.62% | -2.45% | -0.77% |
The performance data quoted represents past performance and does not guarantee future results. Current performance may be lower or higher than the performance quoted. Average annual total returns reflect the reinvestment of dividends and capital gains distributions and include all fee waivers and expense reimbursements. Without the fee waivers and expense reimbursements, total return figures would have been lower. The performance data quoted does not reflect the deduction of taxes that a shareholder would pay on Fund distributions or the redemption of Fund shares. Investment return and principal value will vary, and shares, when redeemed, may be worth more or less than their original cost. Index returns do not include the effects of sales charges, management fees or transaction costs. It is not possible to invest directly in an index.
Stone Harbor Investment Funds Semi-Annual Report | November 30, 2015 | 17 |
Table of Contents
| Stone Harbor Investment Funds | Growth of $10,000 Investment | |
| November 30, 2015 (Unaudited) |
STONE HARBOR EMERGING MARKETS CORPORATE DEBT FUND
Comparison of Change in Value of $10,000 Investment in Stone Harbor Emerging Market Corporate Debt Fund and the J.P. Morgan Corporate Emerging Market Bond Index – Broad Diversified (J.P. Morgan CEMBI Broad Diversified). Please refer to page 100 for detailed benchmark descriptions.
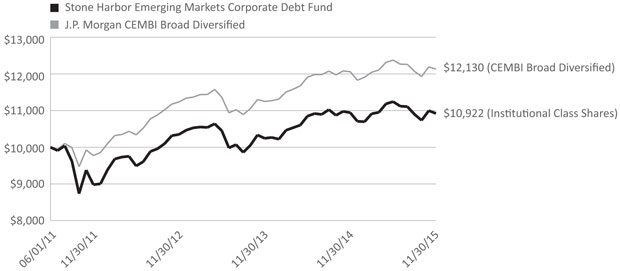
Average Annual Total Returns (Inception Date, June 1, 2011)
| 6 Months | 1 Year | 3 Year | Since Inception | |||||
Stone Harbor Emerging Markets Corporate Debt Fund | -2.86% | -0.19% | 1.81% | 1.98% | ||||
J.P. Morgan CEMBI Broad Diversified | -1.99% | 0.58% | 2.58% | 4.39% |
The performance data quoted represents past performance and does not guarantee future results. Current performance may be lower or higher than the performance quoted. Average annual total returns reflect the reinvestment of dividends and capital gains distributions and include all fee waivers and expense reimbursements. Without the fee waivers and expense reimbursements, total return figures would have been lower. The performance data quoted does not reflect the deduction of taxes that a shareholder would pay on Fund distributions or the redemption of Fund shares. Investment return and principal value will vary, and shares, when redeemed, may be worth more or less than their original cost. Index returns do not include the effects of sales charges, management fees or transaction costs. It is not possible to invest directly in an index.
| 18 | www.shiplp.com |
Table of Contents
| Stone Harbor Investment Funds | Growth of $10,000 Investment | |
| November 30, 2015 (Unaudited) |
STONE HARBOR INVESTMENT GRADE FUND
Comparison of Change in Value of $10,000 Investment in Stone Harbor Investment Grade Fund and the Barclays Capital U.S. Aggregate Index. Please refer to page 100 for detailed benchmark descriptions.
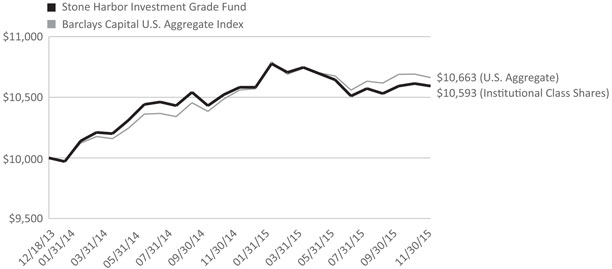
Cumulative Returns (Inception Date, December 18, 2013)
| 6 Months | 1 Year | Since Inception | ||||
Stone Harbor Investment Grade Fund | -0.48% | 0.10% | 3.00% | |||
Barclays Capital U.S. Aggregate Index | -0.12% | 0.97% | 3.34% |
The performance data quoted represents past performance and does not guarantee future results. Current performance may be lower or higher than the performance quoted. Average annual total returns reflect the reinvestment of dividends and capital gains distributions and include all fee waivers and expense reimbursements. Without the fee waivers and expense reimbursements, total return figures would have been lower. The performance data quoted does not reflect the deduction of taxes that a shareholder would pay on Fund distributions or the redemption of Fund shares. Investment return and principal value will vary, and shares, when redeemed, may be worth more or less than their original cost. Index returns do not include the effects of sales charges, management fees or transaction costs. It is not possible to invest directly in an index.
Stone Harbor Investment Funds Semi-Annual Report | November 30, 2015 | 19 |
Table of Contents
| Stone Harbor Investment Funds | Growth of $10,000 Investment | |
| November 30, 2015 (Unaudited) |
STONE HARBOR STRATEGIC INCOME FUND
Comparison of Change in Value of $10,000 Investment in Stone Harbor Strategic Income Fund and the Barclays Global Credit Index (Hedged USD). Please refer to page 100 for detailed benchmark descriptions.
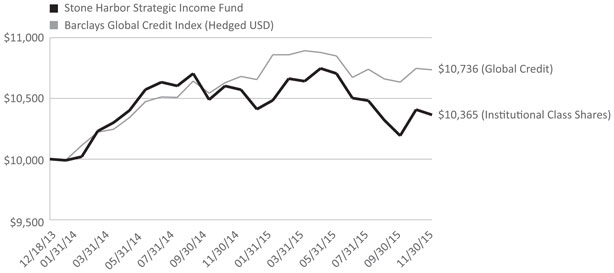
Cumulative Returns (Inception Date, December 18, 2013)
| 6 Months | 1 Year | Since Inception | ||||
Stone Harbor Strategic Income Fund | -3.08% | -1.96% | 1.85% | |||
Barclays Global Credit Index (Hedged USD) | -1.05% | 0.51% | 3.71% |
The performance data quoted represents past performance and does not guarantee future results. Current performance may be lower or higher than the performance quoted. Average annual total returns reflect the reinvestment of dividends and capital gains distributions and include all fee waivers and expense reimbursements. Without the fee waivers and expense reimbursements, total return figures would have been lower. The performance data quoted does not reflect the deduction of taxes that a shareholder would pay on Fund distributions or the redemption of Fund shares. Investment return and principal value will vary, and shares, when redeemed, may be worth more or less than their original cost. Index returns do not include the effects of sales charges, management fees or transaction costs. It is not possible to invest directly in an index.
| 20 | www.shiplp.com |
Table of Contents
| Stone Harbor Investment Funds | Growth of $10,000 Investment | |
| November 30, 2015 (Unaudited) |
STONE HARBOR EMERGING MARKETS DEBT ALLOCATION FUND
Comparison of Change in Value of $10,000 Investment in Stone Harbor Emerging Markets Debt Allocation Fund, the J.P. Morgan EMBI Global Diversified Index TR and the Blend Index (50% J.P. Morgan EMBI Global Diversified Index and 50% J.P. Morgan GBI-EM Global Diversified Index). Please refer to page 100 for detailed benchmark descriptions.
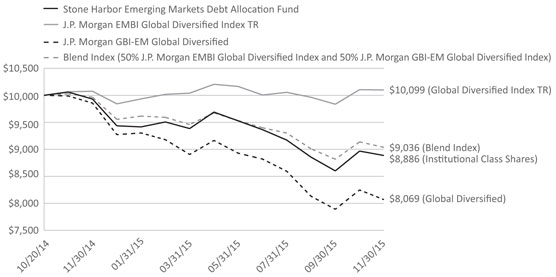
Cumulative Returns (Inception Date, October 20, 2014)
| 6 Months | 1 Year | Since Inception | ||||
Stone Harbor Emerging Markets Debt Allocation Fund | -6.73% | -10.52% | -10.08% | |||
J.P. Morgan EMBI Global Diversified | -0.64% | 0.24% | 0.89% | |||
J.P. Morgan GBI-EM Global Diversified | -9.63% | -18.14% | -17.55% | |||
Blend Index (50% J.P. Morgan EMBI Global Diversified Index and 50% J.P. Morgan GBI-EM Global Diversified Index) | -5.19% | -9.33% | -8.71% |
The performance data quoted represents past performance and does not guarantee future results. Current performance may be lower or higher than the performance quoted. Average annual total returns reflect the reinvestment of dividends and capital gains distributions and include all fee waivers and expense reimbursements. Without the fee waivers and expense reimbursements, total return figures would have been lower. The performance data quoted does not reflect the deduction of taxes that a shareholder would pay on Fund distributions or the redemption of Fund shares. Investment return and principal value will vary, and shares, when redeemed, may be worth more or less than their original cost. Index returns do not include the effects of sales charges, management fees or transaction costs. It is not possible to invest directly in an index.
Stone Harbor Investment Funds Semi-Annual Report | November 30, 2015 | 21 |
Table of Contents
| Stone Harbor Emerging Markets Debt Fund | Statements of Investments | |||
| November 30, 2015 (Unaudited) |
Currency | Rate | Maturity Date | Principal | Market Value Expressed (in U.S. $) | ||||||||||||||
SOVEREIGN DEBT OBLIGATIONS - 64.34% | ||||||||||||||||||
Angola - 0.41% | ||||||||||||||||||
Republic of Angola: | ||||||||||||||||||
| USD | 7.000 | % | 08/16/2019 | 5,490,938 | $ | 5,456,619(1) | ||||||||||||
| USD | 9.500 | % | 11/12/2025 | 1,824,000 | 1,833,120(2) | |||||||||||||
|
| |||||||||||||||||
| 7,289,739 | ||||||||||||||||||
|
| |||||||||||||||||
Argentina - 4.36% | ||||||||||||||||||
Republic of Argentina: | ||||||||||||||||||
| EUR | 0.000 | % | 03/31/2023 | 270,000 | 180,864(3) | |||||||||||||
| EUR | 0.000 | % | 11/26/2003 | 100,000 | 116,220(3) | |||||||||||||
| EUR | 0.000 | % | 01/07/2005 | 164,000 | 190,602(3) | |||||||||||||
| USD | 7.000 | % | 04/17/2017 | 24,609,140 | 24,142,935 | |||||||||||||
| EUR | 5.870 | % | 03/31/2023 | 11,055,000 | 7,405,356(3) | |||||||||||||
| USD | 0.000 | % | 03/31/2023 | 310,000 | 384,400(3) | |||||||||||||
| USD | 6.000 | % | 03/31/2023 | 7,841,000 | 9,722,840(3) | |||||||||||||
| EUR | 7.820 | % | 12/31/2033 | 3,132,012 | 3,391,854(3) | |||||||||||||
| EUR | 7.820 | % | 12/31/2033 | 20,858,930 | 22,754,748(3) | |||||||||||||
| EUR | 0.000 | % | 12/15/2035 | 32,777,740 | 3,541,052 | |||||||||||||
| USD | 0.000 | % | 12/15/2035 | 2,922,000 | 299,505 | |||||||||||||
| USD | 0.000 | % | 12/15/2035 | 16,590,841 | 1,713,004 | |||||||||||||
| EUR | 2.260 | % | 12/31/2038 | 3,773,216 | 2,222,524(3) | |||||||||||||
| EUR | 8.500 | % | 07/01/2004 | 700,000 | 813,543(3) | |||||||||||||
|
| |||||||||||||||||
| 76,879,447 | ||||||||||||||||||
|
| |||||||||||||||||
Azerbaijan - 0.65% | ||||||||||||||||||
Republic of Azerbaijan | USD | 4.750 | % | 03/18/2024 | 11,967,000 | 11,398,567(2) | ||||||||||||
|
| |||||||||||||||||
Bahrain - 0.27% | ||||||||||||||||||
Bahrain Government International Bond | USD | 7.000 | % | 01/26/2026 | 4,664,000 | 4,670,996(2) | ||||||||||||
|
| |||||||||||||||||
Brazil - 6.33% | ||||||||||||||||||
Brazil Loan Trust 1 | USD | 5.477 | % | 07/24/2023 | 18,232,938 | 16,272,898(2) | ||||||||||||
Brazil Minas SPE via State of Minas Gerais: | ||||||||||||||||||
| USD | 5.333 | % | 02/15/2028 | 496,000 | 404,240(2) | |||||||||||||
| USD | 5.333 | % | 02/15/2028 | 1,479,000 | 1,205,385(1) | |||||||||||||
Republic of Brazil: | ||||||||||||||||||
| USD | 4.250 | % | 01/07/2025 | 57,583,000 | 49,809,295 | |||||||||||||
| USD | 8.750 | % | 02/04/2025 | 834,000 | 982,035 | |||||||||||||
| USD | 8.250 | % | 01/20/2034 | 12,755,000 | 13,424,637 | |||||||||||||
| USD | 7.125 | % | 01/20/2037 | 25,654,000 | 24,563,705 | |||||||||||||
| USD | 5.000 | % | 01/27/2045 | 6,719,000 | 4,904,870 | |||||||||||||
|
| |||||||||||||||||
| �� | 111,567,065 | |||||||||||||||||
|
| |||||||||||||||||
Colombia - 4.28% | ||||||||||||||||||
Bogota Distrio Capital | COP | 9.750 | % | 07/26/2028 | 7,870,000,000 | 2,724,943(1) | ||||||||||||
Republic of Colombia: | ||||||||||||||||||
| COP | 7.750 | % | 04/14/2021 | 5,210,000,000 | 1,691,535 | |||||||||||||
| USD | 4.375 | % | 07/12/2021 | 19,523,000 | 19,991,552 | |||||||||||||
| USD | 2.625 | % | 03/15/2023 | 814,000 | 734,635 | |||||||||||||
| USD | 4.000 | % | 02/26/2024 | 17,449,000 | 17,100,020 | |||||||||||||
| USD | 8.125 | % | 05/21/2024 | 25,000 | 30,875 | |||||||||||||
| COP | 10.000 | % | 07/24/2024 | 565,000,000 | 199,814 | |||||||||||||
| COP | 9.850 | % | 06/28/2027 | 8,281,000,000 | 3,022,094 | |||||||||||||
| COP | 7.750 | % | 09/18/2030 | 9,209,500,000 | 2,649,261 | |||||||||||||
| USD | 10.375 | % | 01/28/2033 | 2,006,000 | 2,783,325 | |||||||||||||
| 22 | www.shiplp.com |
Table of Contents
| Stone Harbor Emerging Markets Debt Fund | Statements of Investments | |
| November 30, 2015 (Unaudited) |
Currency | Rate | Maturity Date | Principal | Market Value | ||||||||||||||
Colombia (continued) | ||||||||||||||||||
Republic of Colombia: (continued) | ||||||||||||||||||
| USD | 7.375 | % | 09/18/2037 | 13,959,000 | $ | 16,087,747 | ||||||||||||
| USD | 6.125 | % | 01/18/2041 | 387,000 | 394,740 | |||||||||||||
| USD | 5.625 | % | 02/26/2044 | 8,366,000 | 8,010,445 | |||||||||||||
|
| |||||||||||||||||
| 75,420,986 | ||||||||||||||||||
|
| |||||||||||||||||
Costa Rica - 3.16% | ||||||||||||||||||
Republic of Costa Rica: | ||||||||||||||||||
| USD | 4.250 | % | 01/26/2023 | 19,942,000 | 17,710,989(1) | |||||||||||||
| USD | 4.375 | % | 04/30/2025 | 4,745,000 | 4,030,284(1) | |||||||||||||
| USD | 4.375 | % | 04/30/2025 | 5,728,000 | 4,865,220(2) | |||||||||||||
| USD | 7.000 | % | 04/04/2044 | 20,745,000 | 18,112,978(2) | |||||||||||||
| USD | 7.158 | % | 03/12/2045 | 12,531,000 | 10,980,289(1) | |||||||||||||
|
| |||||||||||||||||
| 55,699,760 | ||||||||||||||||||
|
| |||||||||||||||||
Croatia - 2.29% | ||||||||||||||||||
Croatian Government: | ||||||||||||||||||
| USD | 6.625 | % | 07/14/2020 | 6,726,000 | 7,319,569(1) | |||||||||||||
| USD | 6.375 | % | 03/24/2021 | 4,148,000 | 4,474,655(2) | |||||||||||||
| USD | 5.500 | % | 04/04/2023 | 4,392,000 | 4,547,916(2) | |||||||||||||
| USD | 5.500 | % | 04/04/2023 | 15,458,000 | 16,006,759(1) | |||||||||||||
| USD | 6.000 | % | 01/26/2024 | 7,571,000 | 8,063,115(2) | |||||||||||||
|
| |||||||||||||||||
| 40,412,014 | ||||||||||||||||||
|
| |||||||||||||||||
Dominican Republic - 3.20% | ||||||||||||||||||
Dominican Republic: | ||||||||||||||||||
| USD | 9.040 | % | 01/23/2018 | 5,253,940 | 5,602,014(1) | |||||||||||||
| USD | 7.500 | % | 05/06/2021 | 28,957,000 | 31,418,345(1) | |||||||||||||
| USD | 6.600 | % | 01/28/2024 | 7,818,000 | 8,247,990(1) | |||||||||||||
| USD | 5.875 | % | 04/18/2024 | 6,265,000 | 6,343,312(2) | |||||||||||||
| USD | 7.450 | % | 04/30/2044 | 4,704,000 | 4,903,920(2) | |||||||||||||
|
| |||||||||||||||||
| 56,515,581 | ||||||||||||||||||
|
| |||||||||||||||||
Ecuador - 0.52% | ||||||||||||||||||
Ecuador Government International Bond USD | 10.500 | % | 03/24/2020 | 10,859,000 | 9,135,134(1) | |||||||||||||
|
| |||||||||||||||||
Egypt - 0.73% | ||||||||||||||||||
Egypt Government International Bond: | ||||||||||||||||||
| USD | 5.875 | % | 06/11/2025 | 12,758,000 | 11,019,722(2) | |||||||||||||
| USD | 6.875 | % | 04/30/2040 | 2,350,000 | 1,921,125(2) | |||||||||||||
|
| |||||||||||||||||
| 12,940,847 | ||||||||||||||||||
|
| |||||||||||||||||
El Salvador - 2.12% | ||||||||||||||||||
Republic of El Salvador: | ||||||||||||||||||
| USD | 7.375 | % | 12/01/2019 | 220,000 | 223,162(2) | |||||||||||||
| USD | 7.375 | % | 12/01/2019 | 2,068,000 | 2,097,728(1) | |||||||||||||
| USD | 7.750 | % | 01/24/2023 | 6,735,000 | 6,772,884(1) | |||||||||||||
| USD | 6.375 | % | 01/18/2027 | 3,267,000 | 2,874,960(2) | |||||||||||||
| USD | 8.250 | % | 04/10/2032 | 1,178,000 | 1,150,023(1) | |||||||||||||
| USD | 7.650 | % | 06/15/2035 | 25,933,000 | 23,388,324(1) | |||||||||||||
| USD | 7.625 | % | 02/01/2041 | 1,000,000 | 890,625(1) | |||||||||||||
|
| |||||||||||||||||
| 37,397,706 | ||||||||||||||||||
|
| |||||||||||||||||
Ethiopia - 0.24% | ||||||||||||||||||
Federal Democratic Republic of Ethiopia | USD | 6.625 | % | 12/11/2024 | 4,562,000 | 4,258,627(2) | ||||||||||||
|
| |||||||||||||||||
Stone Harbor Investment Funds Semi-Annual Report | November 30, 2015 | 23 |
Table of Contents
| Stone Harbor Emerging Markets Debt Fund | Statements of Investments | |
| November 30, 2015 (Unaudited) |
Currency | Rate | Maturity Date | Principal | Market Value | ||||||||||||||
Gabon - 0.61% | ||||||||||||||||||
Republic of Gabon: | ||||||||||||||||||
| USD | 8.200 | % | 12/12/2017 | 50,000 | $ | 51,637(2) | ||||||||||||
| USD | 6.375 | % | 12/12/2024 | 9,674,347 | 8,305,427(2) | |||||||||||||
| USD | 6.950 | % | 06/16/2025 | 2,861,000 | 2,471,904(2) | |||||||||||||
|
| |||||||||||||||||
| 10,828,968 | ||||||||||||||||||
|
| |||||||||||||||||
Ghana - 1.15% | ||||||||||||||||||
Republic of Ghana: | ||||||||||||||||||
| USD | 8.500 | % | 10/04/2017 | 2,641,000 | 2,670,051(1) | |||||||||||||
| USD | 7.875 | % | 08/07/2023 | 200,000 | 171,000(1) | |||||||||||||
| USD | 7.875 | % | 08/07/2023 | 6,267,000 | 5,358,285(2) | |||||||||||||
| USD | 8.125 | % | 01/18/2026 | 6,435,000 | 5,469,750(2) | |||||||||||||
| USD | 10.750 | % | 10/14/2030 | 6,285,000 | 6,621,247(2) | |||||||||||||
|
| |||||||||||||||||
| 20,290,333 | ||||||||||||||||||
|
| |||||||||||||||||
Honduras - 0.21% | ||||||||||||||||||
Republic of Honduras | USD | 8.750 | % | 12/16/2020 | 3,268,000 | 3,668,330(1) | ||||||||||||
|
| |||||||||||||||||
Hungary - 0.66% | ||||||||||||||||||
Republic of Hungary: | ||||||||||||||||||
| GBP | 5.000 | % | 03/30/2016 | 670,000 | 1,021,348 | |||||||||||||
| USD | 5.375 | % | 02/21/2023 | 7,734,000 | 8,501,600 | |||||||||||||
| USD | 5.750 | % | 11/22/2023 | 1,910,000 | 2,151,080 | |||||||||||||
|
| |||||||||||||||||
| 11,674,028 | ||||||||||||||||||
|
| |||||||||||||||||
Indonesia - 2.71% | ||||||||||||||||||
Republic of Indonesia: | ||||||||||||||||||
| USD | 3.375 | % | 04/15/2023 | 10,543,000 | 9,865,612(2) | |||||||||||||
| USD | 5.375 | % | 10/17/2023 | 7,084,000 | 7,477,162(1) | |||||||||||||
| USD | 5.875 | % | 01/15/2024 | 5,972,000 | 6,481,113(2) | |||||||||||||
| USD | 8.500 | % | 10/12/2035 | 9,681,000 | 12,338,434(1) | |||||||||||||
| USD | 6.625 | % | 02/17/2037 | 4,759,000 | 5,075,474(1) | |||||||||||||
| USD | 7.750 | % | 01/17/2038 | 5,510,000 | 6,570,675(1) | |||||||||||||
|
| |||||||||||||||||
| 47,808,470 | ||||||||||||||||||
|
| |||||||||||||||||
Iraq - 0.94% | ||||||||||||||||||
Republic of Iraq | USD | 5.800 | % | 01/15/2028 | 22,679,000 | 16,555,670(1) | ||||||||||||
|
| |||||||||||||||||
Ivory Coast - 2.93% | ||||||||||||||||||
Ivory Coast Government: | ||||||||||||||||||
| USD | 5.375 | % | 07/23/2024 | 3,119,000 | 2,822,695(2) | |||||||||||||
| USD | 6.375 | % | 03/03/2028 | 9,122,000 | 8,501,704(2) | |||||||||||||
| USD | 5.750 | % | 12/31/2032 | 44,705,000 | 40,279,205(1)(4) | |||||||||||||
|
| |||||||||||||||||
| 51,603,604 | ||||||||||||||||||
|
| |||||||||||||||||
Jamaica - 1.13% | ||||||||||||||||||
Jamaican Government: | ||||||||||||||||||
| USD | 10.625 | % | 06/20/2017 | 2,278,000 | 2,497,258 | |||||||||||||
| USD | 7.625 | % | 07/09/2025 | 8,273,000 | 9,027,911 | |||||||||||||
| USD | 6.750 | % | 04/28/2028 | 8,340,000 | 8,485,950 | |||||||||||||
|
| |||||||||||||||||
| 20,011,119 | ||||||||||||||||||
|
| |||||||||||||||||
Kazakhstan - 0.13% | ||||||||||||||||||
Republic of Kazakhstan | USD | 5.125 | % | 07/21/2025 | 2,284,000 | 2,321,686(2) | ||||||||||||
|
| |||||||||||||||||
| 24 | www.shiplp.com |
Table of Contents
| Stone Harbor Emerging Markets Debt Fund | Statements of Investments | |
| November 30, 2015 (Unaudited) |
Currency | Rate | Maturity Date | Principal | Market Value | ||||||||||||||
Kenya - 0.88% | ||||||||||||||||||
Republic of Kenya: | ||||||||||||||||||
| USD | 6.875 | % | 06/24/2024 | 1,934,000 | $ | 1,766,709(1) | ||||||||||||
| USD | 6.875 | % | 06/24/2024 | 15,047,000 | 13,745,434(2) | |||||||||||||
|
| |||||||||||||||||
| 15,512,143 | ||||||||||||||||||
|
| |||||||||||||||||
Lithuania - 0.10% | ||||||||||||||||||
Republic of Lithuania | USD | 7.375 | % | 02/11/2020 | 1,413,000 | 1,686,797(2) | ||||||||||||
|
| |||||||||||||||||
Malaysia - 0.53% | ||||||||||||||||||
1MDB Global Investments Ltd. | USD | 4.400 | % | 03/09/2023 | 10,500,000 | 9,358,125(1) | ||||||||||||
|
| |||||||||||||||||
Mexico - 3.08% | ||||||||||||||||||
United Mexican States: | ||||||||||||||||||
| USD | 4.000 | % | 10/02/2023 | 7,961,000 | 8,140,122 | |||||||||||||
| USD | 3.600 | % | 01/30/2025 | 7,507,000 | 7,428,177 | |||||||||||||
| USD | 6.050 | % | 01/11/2040 | 10,119,000 | 11,396,524 | |||||||||||||
| USD | 4.750 | % | 03/08/2044 | 8,464,000 | 7,987,900 | |||||||||||||
| USD | 5.550 | % | 01/21/2045 | 18,388,000 | 19,376,355 | |||||||||||||
|
| |||||||||||||||||
| 54,329,078 | ||||||||||||||||||
|
| |||||||||||||||||
Morocco - 0.14% | ||||||||||||||||||
Moroccan Government | USD | 4.250 | % | 12/11/2022 | 2,545,000 | 2,510,006(2) | ||||||||||||
|
| |||||||||||||||||
Mozambique - 0.19% | ||||||||||||||||||
Republic of Mozambique | USD | 6.305 | % | 09/11/2020 | 3,832,920 | 3,300,144(1) | ||||||||||||
|
| |||||||||||||||||
Namibia - 0.08% | ||||||||||||||||||
Namibia International Bonds | USD | 5.250 | % | 10/29/2025 | 1,486,000 | 1,450,708(2) | ||||||||||||
|
| |||||||||||||||||
Nigeria - 1.10% | ||||||||||||||||||
Republic of Nigeria: | ||||||||||||||||||
| USD | 5.125 | % | 07/12/2018 | 5,664,000 | 5,560,632(1) | |||||||||||||
| USD | 6.750 | % | 01/28/2021 | 11,638,000 | 11,419,788(1) | |||||||||||||
| USD | 6.375 | % | 07/12/2023 | 2,636,000 | 2,481,135(1) | |||||||||||||
|
| |||||||||||||||||
| 19,461,555 | ||||||||||||||||||
|
| |||||||||||||||||
Panama - 2.01% | ||||||||||||||||||
Republic of Panama: | ||||||||||||||||||
| USD | 8.875 | % | 09/30/2027 | 3,493,000 | 4,885,834 | |||||||||||||
| USD | 9.375 | % | 04/01/2029 | 19,063,000 | 27,855,809 | |||||||||||||
| USD | 8.125 | % | 04/28/2034 | 2,063,000 | 2,748,947 | |||||||||||||
|
| |||||||||||||||||
| 35,490,590 | ||||||||||||||||||
|
| |||||||||||||||||
Paraguay - 1.15% | ||||||||||||||||||
Republic of Paraguay: | ||||||||||||||||||
| USD | 4.625 | % | 01/25/2023 | 1,753,000 | 1,731,088(2) | |||||||||||||
| USD | 4.625 | % | 01/25/2023 | 4,242,000 | 4,188,975(1) | |||||||||||||
| USD | 6.100 | % | 08/11/2044 | 14,580,000 | 14,379,525(2) | |||||||||||||
|
| |||||||||||||||||
| 20,299,588 | ||||||||||||||||||
|
| |||||||||||||||||
Peru - 2.02% | ||||||||||||||||||
Republic of Peru: | ||||||||||||||||||
| USD | 4.125 | % | 08/25/2027 | 10,910,000 | 10,882,725 | |||||||||||||
| USD | 8.750 | % | 11/21/2033 | 8,539,000 | 12,296,160 | |||||||||||||
| USD | 6.550 | % | 03/14/2037 | 5,762,000 | 6,863,983 | |||||||||||||
Stone Harbor Investment Funds Semi-Annual Report | November 30, 2015 | 25 |
Table of Contents
| Stone Harbor Emerging Markets Debt Fund | Statements of Investments | |
| November 30, 2015 (Unaudited) |
Currency | Rate | Maturity Date | Principal | Market Value | ||||||||||||||
Peru (continued) | ||||||||||||||||||
Republic of Peru: (continued) | ||||||||||||||||||
| USD | 5.625 | % | 11/18/2050 | 5,299,000 | $ | 5,623,590 | ||||||||||||
|
| |||||||||||||||||
| 35,666,458 | ||||||||||||||||||
|
| |||||||||||||||||
Philippines - 1.07% | ||||||||||||||||||
Republic of Philippines: | ||||||||||||||||||
| USD | 9.500 | % | 02/02/2030 | 9,716,000 | 15,441,153 | |||||||||||||
| USD | 6.375 | % | 01/15/2032 | 2,597,000 | 3,351,429 | |||||||||||||
|
| |||||||||||||||||
| 18,792,582 | ||||||||||||||||||
|
| |||||||||||||||||
Poland - 0.22% | ||||||||||||||||||
Republic of Poland: | ||||||||||||||||||
| USD | 5.000 | % | 03/23/2022 | 1,000 | 1,118 | |||||||||||||
| USD | 3.000 | % | 03/17/2023 | 2,100,000 | 2,101,008 | |||||||||||||
| USD | 4.000 | % | 01/22/2024 | 1,738,000 | 1,844,800 | |||||||||||||
|
| |||||||||||||||||
| 3,946,926 | ||||||||||||||||||
|
| |||||||||||||||||
Romania - 0.82% | ||||||||||||||||||
Romanian Government International Bond: | ||||||||||||||||||
| USD | 6.750 | % | 02/07/2022 | 8,755,000 | 10,387,808(1) | |||||||||||||
| USD | 4.375 | % | 08/22/2023 | 3,860,000 | 4,075,195(2) | |||||||||||||
|
| |||||||||||||||||
| 14,463,003 | ||||||||||||||||||
|
| |||||||||||||||||
Russia - 1.61% | ||||||||||||||||||
Russian Federation: | ||||||||||||||||||
| USD | 4.875 | % | 09/16/2023 | 9,400,000 | 9,827,700(1) | |||||||||||||
| USD | 12.750 | % | 06/24/2028 | 430,000 | 701,975(1) | |||||||||||||
| USD | 5.625 | % | 04/04/2042 | 14,600,000 | 14,618,250(1) | |||||||||||||
Russian Foreign Bond - Eurobond | USD | 5.875 | % | 09/16/2043 | 3,200,000 | 3,279,200(1) | ||||||||||||
|
| |||||||||||||||||
| 28,427,125 | ||||||||||||||||||
|
| |||||||||||||||||
Serbia - 0.49% | ||||||||||||||||||
Republic of Serbia: | ||||||||||||||||||
| USD | 5.875 | % | 12/03/2018 | 1,505,000 | 1,601,884(1) | |||||||||||||
| USD | 4.875 | % | 02/25/2020 | 6,772,000 | 6,992,090(1) | |||||||||||||
|
| |||||||||||||||||
| 8,593,974 | ||||||||||||||||||
|
| |||||||||||||||||
South Africa - 0.59% | ||||||||||||||||||
Republic of South Africa: | ||||||||||||||||||
| USD | 5.875 | % | 05/30/2022 | 4,000,000 | 4,378,000 | |||||||||||||
| USD | 5.875 | % | 09/16/2025 | 5,595,000 | 6,050,993 | |||||||||||||
|
| |||||||||||||||||
| 10,428,993 | ||||||||||||||||||
|
| |||||||||||||||||
Sri Lanka - 1.04% | ||||||||||||||||||
Republic of Sri Lanka: | ||||||||||||||||||
| USD | 5.125 | % | 04/11/2019 | 484,000 | 473,148(2) | |||||||||||||
| USD | 6.250 | % | 07/27/2021 | 6,600,000 | 6,510,900(1) | |||||||||||||
| USD | 5.875 | % | 07/25/2022 | 5,493,000 | 5,241,695(2) | |||||||||||||
| USD | 6.125 | % | 06/03/2025 | 6,566,000 | 6,150,701(2) | |||||||||||||
|
| |||||||||||||||||
| 18,376,444 | ||||||||||||||||||
|
| |||||||||||||||||
Trinidad - 0.43% | ||||||||||||||||||
Republic of Trinidad & Tobago | USD | 4.375 | % | 01/16/2024 | 7,174,000 | 7,631,343(2) | ||||||||||||
|
| |||||||||||||||||
Turkey - 4.30% | ||||||||||||||||||
Republic of Turkey: | ||||||||||||||||||
| USD | 7.500 | % | 07/14/2017 | 7,869,000 | 8,474,913 | |||||||||||||
| 26 | www.shiplp.com |
Table of Contents
| Stone Harbor Emerging Markets Debt Fund | Statements of Investments | |
| November 30, 2015 (Unaudited) |
Currency | Rate | Maturity Date | Principal | Market Value | ||||||||||||||
Turkey (continued) | ||||||||||||||||||
Republic of Turkey: (continued) | ||||||||||||||||||
| USD | 7.500 | % | 11/07/2019 | 3,542,000 | $ | 4,019,284 | ||||||||||||
| USD | 7.000 | % | 06/05/2020 | 4,293,000 | 4,831,772 | |||||||||||||
| USD | 5.125 | % | 03/25/2022 | 6,809,000 | 7,071,147 | |||||||||||||
| USD | 6.250 | % | 09/26/2022 | 11,921,000 | 13,125,021 | |||||||||||||
| USD | 3.250 | % | 03/23/2023 | 6,345,000 | 5,846,918 | |||||||||||||
| USD | 5.750 | % | 03/22/2024 | 12,215,000 | 13,039,512 | |||||||||||||
| USD | 7.375 | % | 02/05/2025 | 824,000 | 974,586 | |||||||||||||
| USD | 6.875 | % | 03/17/2036 | 958,000 | 1,078,947 | |||||||||||||
| USD | 6.750 | % | 05/30/2040 | 4,378,000 | 4,891,320 | |||||||||||||
| USD | 6.000 | % | 01/14/2041 | 3,102,000 | 3,184,979 | |||||||||||||
| USD | 4.875 | % | 04/16/2043 | 10,459,000 | 9,214,379 | |||||||||||||
|
| |||||||||||||||||
| 75,752,778 | ||||||||||||||||||
|
| |||||||||||||||||
Uruguay - 2.22% | ||||||||||||||||||
Republic of Uruguay: | ||||||||||||||||||
| USD | 4.500 | % | 08/14/2024 | 2,172,262 | 2,237,430 | |||||||||||||
| USD | 5.100 | % | 06/18/2050 | 29,920,079 | 26,778,471 | |||||||||||||
Uruguay Government International Bond | USD | 4.375 | % | 10/27/2027 | 10,174,000 | 10,097,695 | ||||||||||||
|
| |||||||||||||||||
| 39,113,596 | ||||||||||||||||||
|
| |||||||||||||||||
Venezuela - 0.24% | ||||||||||||||||||
Republic of Venezuela | USD | 13.625 | % | 08/15/2018 | 6,704,000 | 4,168,904(1) | ||||||||||||
|
| |||||||||||||||||
Zambia - 1.00% | ||||||||||||||||||
Republic of Zambia: | ||||||||||||||||||
| USD | 5.375 | % | 09/20/2022 | 3,274,000 | 2,525,891(1) | |||||||||||||
| USD | 8.500 | % | 04/14/2024 | 4,488,000 | 3,897,828(2) | |||||||||||||
| USD | 8.970 | % | 07/30/2027 | 11,377,000 | 9,841,105(2) | |||||||||||||
Zambia Government International Bond | USD | 8.970 | % | 07/30/2027 | 1,549,000 | 1,339,885(1) | ||||||||||||
|
| |||||||||||||||||
| 17,604,709 | ||||||||||||||||||
|
| |||||||||||||||||
TOTAL SOVEREIGN DEBT OBLIGATIONS | 1,134,714,246 | |||||||||||||||||
|
| |||||||||||||||||
(Cost $1,183,117,035) | ||||||||||||||||||
BANK LOANS - 0.01% | ||||||||||||||||||
Indonesia - 0.01% | ||||||||||||||||||
PT Bakrie & Brothers TBK | USD | 0.000 | % | 11/25/2014 | 624,912 | 156,228(3) | ||||||||||||
|
| |||||||||||||||||
TOTAL BANK LOANS | 156,228 | |||||||||||||||||
|
| |||||||||||||||||
(Cost $249,965) | ||||||||||||||||||
CORPORATE BONDS - 30.16% | ||||||||||||||||||
Argentina - 1.09% | ||||||||||||||||||
YPF SA: | ||||||||||||||||||
| USD | 8.750 | % | 04/04/2024 | 5,635,000 | 5,571,606(2) | |||||||||||||
| USD | 8.500 | % | 07/28/2025 | 4,325,000 | 4,195,250(1) | |||||||||||||
| USD | 8.500 | % | 07/28/2025 | 9,694,000 | 9,403,180(2) | |||||||||||||
|
| |||||||||||||||||
| 19,170,036 | ||||||||||||||||||
|
| |||||||||||||||||
Azerbaijan - 1.05% | ||||||||||||||||||
State Oil Co. of the Azerbaijan Republic | USD | 6.950 | % | 03/18/2030 | 2,955,000 | 2,774,006 | ||||||||||||
State Oil Company: | ||||||||||||||||||
| USD | 5.450 | % | 02/09/2017 | 6,323,000 | 6,441,556 | |||||||||||||
Stone Harbor Investment Funds Semi-Annual Report | November 30, 2015 | 27 |
Table of Contents
| Stone Harbor Emerging Markets Debt Fund | Statements of Investments | |
| November 30, 2015 (Unaudited) |
Currency | Rate | Maturity Date | Principal | Market Value | ||||||||||||||
Azerbaijan (continued) | ||||||||||||||||||
State Oil Company: (continued) | ||||||||||||||||||
| USD | 4.750 | % | 03/13/2023 | 10,470,000 | $ | 9,292,125 | ||||||||||||
|
| |||||||||||||||||
| 18,507,687 | ||||||||||||||||||
|
| |||||||||||||||||
Brazil - 0.91% | ||||||||||||||||||
CIMPOR Financial Operations BV | USD | 5.750 | % | 07/17/2024 | 1,908,000 | 1,268,718(2) | ||||||||||||
Cosan Luxembourg SA | USD | 5.000 | % | 03/14/2023 | 5,052,000 | 4,445,760(2) | ||||||||||||
ESAL GmbH | USD | 6.250 | % | 02/05/2023 | 5,793,000 | 5,590,245(2) | ||||||||||||
GTL Trade Finance, Inc. | USD | 5.893 | % | 04/29/2024 | 4,919,000 | 4,021,282(2) | ||||||||||||
Samarco Mineracao SA | USD | 4.125 | % | 11/01/2022 | 1,946,000 | 715,155(2) | ||||||||||||
|
| |||||||||||||||||
| 16,041,160 | ||||||||||||||||||
|
| |||||||||||||||||
Chile - 4.27% | ||||||||||||||||||
Banco del Estado de Chile | USD | 3.875 | % | 02/08/2022 | 3,277,000 | 3,293,385(2) | ||||||||||||
Codelco, Inc.: | ||||||||||||||||||
| USD | 3.875 | % | 11/03/2021 | 5,000,000 | 4,923,050(1) | |||||||||||||
| USD | 3.000 | % | 07/17/2022 | 22,668,000 | 20,781,229(2) | |||||||||||||
| USD | 4.500 | % | 08/13/2023 | 8,054,000 | 7,965,406(2) | |||||||||||||
| USD | 4.500 | % | 09/16/2025 | 8,500,000 | 8,178,700(2) | |||||||||||||
| USD | 6.150 | % | 10/24/2036 | 14,132,000 | 14,590,654(1) | |||||||||||||
| USD | 4.250 | % | 07/17/2042 | 7,321,000 | 5,668,650(2) | |||||||||||||
| USD | 4.875 | % | 11/04/2044 | 2,928,000 | 2,460,223(2) | |||||||||||||
VTR Finance BV | USD | 6.875 | % | 01/15/2024 | 7,828,000 | 7,540,712(2) | ||||||||||||
|
| |||||||||||||||||
| 75,402,009 | ||||||||||||||||||
|
| |||||||||||||||||
China - 2.26% | ||||||||||||||||||
CNOOC Finance 2015 USA LLC | USD | 3.500 | % | 05/05/2025 | 1,731,000 | 1,671,774 | ||||||||||||
Sinochem Offshore Capital Co. Ltd. | USD | 3.250 | % | 04/29/2019 | 1,835,000 | 1,857,089(2) | ||||||||||||
Sinochem Overseas Capital Co. Ltd.: | ||||||||||||||||||
| USD | 4.500 | % | 11/12/2020 | 5,534,000 | 5,844,458(1) | |||||||||||||
| USD | 4.500 | % | 11/12/2020 | 19,913,000 | 21,030,119(2) | |||||||||||||
| USD | 6.300 | % | 11/12/2040 | 4,353,000 | 5,347,225(1) | |||||||||||||
Sinopec Capital 2013 Ltd. | USD | 3.125 | % | 04/24/2023 | 4,284,000 | 4,118,688(2) | ||||||||||||
|
| |||||||||||||||||
| 39,869,353 | ||||||||||||||||||
|
| |||||||||||||||||
Colombia - 0.35% | ||||||||||||||||||
Ecopetrol SA: | ||||||||||||||||||
| USD | 4.125 | % | 01/16/2025 | 647,000 | 556,420 | |||||||||||||
| USD | 5.375 | % | 06/26/2026 | 926,000 | 842,660 | |||||||||||||
| USD | 7.375 | % | 09/18/2043 | 1,440,000 | 1,331,597 | |||||||||||||
| USD | 5.875 | % | 05/28/2045 | 4,334,000 | 3,402,190 | |||||||||||||
Pacific Exploration and Production Corp. | USD | 5.125 | % | 03/28/2023 | 397,000 | 121,085(2) | ||||||||||||
|
| |||||||||||||||||
| 6,253,952 | ||||||||||||||||||
|
| |||||||||||||||||
Ecuador - 1.11% | ||||||||||||||||||
EP PetroEcuador via Noble Sovereign Funding I Ltd. | USD | 5.957 | % | 09/24/2019 | 23,818,947 | 19,650,632(1)(5) | ||||||||||||
|
| |||||||||||||||||
India - 0.29% | ||||||||||||||||||
ABJA Investment Co. Pte Ltd.: | ||||||||||||||||||
| USD | 4.850 | % | 01/31/2020 | 800,000 | 772,280 | |||||||||||||
| USD | 5.950 | % | 07/31/2024 | 2,954,000 | 2,591,101 | |||||||||||||
Vedanta Resources PLC: | ||||||||||||||||||
| USD | 6.000 | % | 01/31/2019 | 1,111,000 | 848,516(2) | |||||||||||||
| USD | 8.250 | % | 06/07/2021 | 1,329,000 | 986,543(2) | |||||||||||||
|
| |||||||||||||||||
| 5,198,440 | ||||||||||||||||||
|
| |||||||||||||||||
| 28 | www.shiplp.com |
Table of Contents
| Stone Harbor Emerging Markets Debt Fund | Statements of Investments | |
| November 30, 2015 (Unaudited) |
Currency | Rate | Maturity Date | Principal | Market Value | ||||||||||||||
Indonesia - 0.12% | ||||||||||||||||||
Pertamina Persero PT | USD | 6.000 | % | 05/03/2042 | 2,529,000 | $ | 2,159,248(1) | |||||||||||
|
| |||||||||||||||||
Jamaica - 0.36% | ||||||||||||||||||
Digicel Group Ltd. | USD | 7.125 | % | 04/01/2022 | 7,632,000 | 6,266,373(2) | ||||||||||||
|
| |||||||||||||||||
Kazakhstan - 5.05% | ||||||||||||||||||
KazMunayGas National Co. JSC: | ||||||||||||||||||
| USD | 9.125 | % | 07/02/2018 | 1,906,000 | 2,120,425(1) | |||||||||||||
| USD | 9.125 | % | 07/02/2018 | 8,532,000 | 9,491,850(2) | |||||||||||||
| USD | 7.000 | % | 05/05/2020 | 8,387,000 | 8,900,704(2) | |||||||||||||
| USD | 7.000 | % | 05/05/2020 | 9,199,000 | 9,762,439(1) | |||||||||||||
| USD | 6.375 | % | 04/09/2021 | 11,190,000 | 11,498,285(1) | |||||||||||||
| USD | 6.375 | % | 04/09/2021 | 20,328,000 | 20,888,036(2) | |||||||||||||
| USD | 4.400 | % | 04/30/2023 | 2,738,000 | 2,574,404(1) | |||||||||||||
| USD | 4.400 | % | 04/30/2023 | 10,403,000 | 9,781,421(2) | |||||||||||||
| USD | 4.875 | % | 05/07/2025 | 8,110,000 | 7,582,850(2) | |||||||||||||
Zhaikmunai LLP: | ||||||||||||||||||
| USD | 6.375 | % | 02/14/2019 | 3,544,000 | 3,025,690(2) | |||||||||||||
| USD | 7.125 | % | 11/13/2019 | 3,958,000 | 3,384,090(2) | |||||||||||||
|
| |||||||||||||||||
| 89,010,194 | ||||||||||||||||||
|
| |||||||||||||||||
Malaysia - 1.57% | ||||||||||||||||||
Petronas Capital Ltd.: | ||||||||||||||||||
| USD | 3.500 | % | 03/18/2025 | 22,386,000 | 21,843,391(2) | |||||||||||||
| USD | 4.500 | % | 03/18/2045 | 6,025,000 | 5,876,541(2) | |||||||||||||
|
| |||||||||||||||||
| 27,719,932 | ||||||||||||||||||
|
| |||||||||||||||||
Mexico - 3.37% | ||||||||||||||||||
Comision Federal de Electricidad | USD | 4.875 | % | 01/15/2024 | 1,784,000 | 1,815,220(2) | ||||||||||||
Petroleos Mexicanos: | ||||||||||||||||||
| USD | 5.500 | % | 01/21/2021 | 10,698,000 | 11,246,272 | |||||||||||||
| USD | 4.875 | % | 01/18/2024 | 3,582,000 | 3,518,240 | |||||||||||||
| EUR | 5.500 | % | 02/24/2025 | 2,275,000 | 2,677,102(1) | |||||||||||||
| USD | 4.500 | % | 01/23/2026 | 2,206,000 | 2,085,332(2) | |||||||||||||
| USD | 9.500 | % | 09/15/2027 | 1,231,000 | 1,511,052 | |||||||||||||
| USD | 6.500 | % | 06/02/2041 | 8,189,000 | 7,765,629 | |||||||||||||
| USD | 5.500 | % | 06/27/2044 | 1,194,000 | 985,050 | |||||||||||||
| USD | 5.500 | % | 06/27/2044 | 3,187,000 | 2,629,275(1) | |||||||||||||
| USD | 6.375 | % | 01/23/2045 | 18,229,000 | 16,907,398 | |||||||||||||
| USD | 5.625 | % | 01/23/2046 | 9,173,000 | 7,682,388(2) | |||||||||||||
Sixsigma Networks Mexico SA de CV | USD | 8.250 | % | 11/07/2021 | 657,000 | 629,899(2) | ||||||||||||
|
| |||||||||||||||||
| 59,452,857 | ||||||||||||||||||
|
| |||||||||||||||||
Morocco - 0.39% | ||||||||||||||||||
OCP SA: | ||||||||||||||||||
| USD | 5.625 | % | 04/25/2024 | 2,190,000 | 2,227,777(2) | |||||||||||||
| USD | 4.500 | % | 10/22/2025 | 4,899,000 | 4,592,813(2) | |||||||||||||
|
| |||||||||||||||||
| 6,820,590 | ||||||||||||||||||
|
| |||||||||||||||||
Peru - 0.21% | ||||||||||||||||||
Peru Payroll Deduction Finance Ltd. | USD | 0.000 | % | 11/01/2029 | 4,980,537 | 3,678,126(1)(6) | ||||||||||||
|
| |||||||||||||||||
Russia - 2.26% | ||||||||||||||||||
Gazprom OAO Via Gaz Capital SA: | ||||||||||||||||||
| USD | 8.146 | % | 04/11/2018 | 2,500,000 | 2,715,000(2) | |||||||||||||
| USD | 9.250 | % | 04/23/2019 | 3,106,000 | 3,513,662(2) | |||||||||||||
| USD | 5.999 | % | 01/23/2021 | 2,235,000 | 2,251,763(2) | |||||||||||||
Stone Harbor Investment Funds Semi-Annual Report | November 30, 2015 | 29 |
Table of Contents
| Stone Harbor Emerging Markets Debt Fund | Statements of Investments | |
| November 30, 2015 (Unaudited) |
Counterparty | Currency | Rate | Maturity Date | Principal | Market Value Expressed (in U.S. $) | |||||||||||||||
Russia (continued) | ||||||||||||||||||||
Gazprom OAO Via Gaz Capital SA: (continued) | ||||||||||||||||||||
| USD | 6.510 | % | 03/07/2022 | 1,785,000 | $ | 1,845,244(2) | ||||||||||||||
| USD | 6.510 | % | 03/07/2022 | 5,160,000 | 5,334,150(1) | |||||||||||||||
| USD | 4.375 | % | 09/19/2022 | 1,669,000 | 1,518,790(2) | |||||||||||||||
| USD | 7.288 | % | 08/16/2037 | 12,000,000 | 12,318,000(1) | |||||||||||||||
Rosneft Oil Co. via Rosneft International Finance Ltd. | USD | 4.199 | % | 03/06/2022 | 11,440,000 | 10,410,400(2) | ||||||||||||||
|
| |||||||||||||||||||
| 39,907,009 | ||||||||||||||||||||
|
| |||||||||||||||||||
South Africa - 2.49% | ||||||||||||||||||||
Eskom Holdings SOC Ltd.: | ||||||||||||||||||||
| USD | 5.750 | % | 01/26/2021 | 3,382,000 | 3,225,075(1) | |||||||||||||||
| USD | 6.750 | % | 08/06/2023 | 7,174,000 | 6,824,268(2) | |||||||||||||||
| USD | 7.125 | % | 02/11/2025 | 1,000,000 | 952,250(1) | |||||||||||||||
| USD | 7.125 | % | 02/11/2025 | 34,561,000 | 32,910,712(2) | |||||||||||||||
|
| |||||||||||||||||||
| 43,912,305 | ||||||||||||||||||||
|
| |||||||||||||||||||
Venezuela - 3.01% | ||||||||||||||||||||
Petroleos de Venezuela SA: | ||||||||||||||||||||
| USD | 5.125 | % | 10/28/2016 | 12,006,939 | 9,425,447 | |||||||||||||||
| USD | 5.250 | % | 04/12/2017 | 17,845,400 | 10,350,332 | |||||||||||||||
| USD | 8.500 | % | 11/02/2017 | 52,955,000 | 33,242,501(1) | |||||||||||||||
|
| |||||||||||||||||||
| 53,018,280 | ||||||||||||||||||||
|
| |||||||||||||||||||
TOTAL CORPORATE BONDS | 532,038,183 | |||||||||||||||||||
|
| |||||||||||||||||||
(Cost $553,207,893) | ||||||||||||||||||||
CREDIT LINKED NOTES - 1.34% | ||||||||||||||||||||
Colombia - 0.07% | ||||||||||||||||||||
Titulos de Tesoreria - Series B | Citigroup Global Markets | COP | 11.000 | % | 07/27/2020 | 3,500,000,000 | 1,265,472 | |||||||||||||
|
| |||||||||||||||||||
Iraq - 0.33% | ||||||||||||||||||||
Republic of Iraq: | ||||||||||||||||||||
Bank of America - Merrill Lynch | JPY | 2.582 | % | 01/01/2028 | 809,656,116 | 4,028,549(5) | ||||||||||||||
Bank of America - Merrill Lynch | JPY | 2.816 | % | 01/01/2028 | 370,070,031 | 1,841,331(5) | ||||||||||||||
|
| |||||||||||||||||||
| 5,869,880 | ||||||||||||||||||||
|
| |||||||||||||||||||
Venezuela - 0.94% | ||||||||||||||||||||
Petroleos De Venezuela | Credit Suisse First Boston | USD | 5.319 | % | 12/20/2016 | 29,200,000 | 16,525,203(5) | |||||||||||||
|
| |||||||||||||||||||
TOTAL CREDIT LINKED NOTES | 23,660,555 | |||||||||||||||||||
|
| |||||||||||||||||||
(Cost $37,472,499) | ||||||||||||||||||||
| 30 | www.shiplp.com |
Table of Contents
| Stone Harbor Emerging Markets Debt Fund | Statements of Investments | |
| November 30, 2015 (Unaudited) |
| Currency | Rate | Maturity | Principal Amount/Shares* | Market Value Expressed (in U.S. $) | ||||||||||||
SHORT TERM INVESTMENTS - 1.66% | ||||||||||||||||
Money Market Mutual Funds - 1.66% | ||||||||||||||||
Dreyfus Institutional Cash Advantage | USD | 0.11517 | % | N/A | 29,225,209 | $ | 29,225,209 | |||||||||
|
| |||||||||||||||
TOTAL SHORT TERM INVESTMENTS | 29,225,209 | |||||||||||||||
|
| |||||||||||||||
(Cost $29,225,209) | ||||||||||||||||
Total Investments - 97.51% | 1,719,794,421 | |||||||||||||||
(Cost $1,803,272,601) | ||||||||||||||||
Other Assets In Excess of Liabilities - 2.49% | 43,962,570(7) | |||||||||||||||
|
| |||||||||||||||
Net Assets - 100.00% | $ | 1,763,756,991 | ||||||||||||||
|
| |||||||||||||||
* The principal amount/shares of each security is stated in the currency in which the security is denominated.
Currency Abbreviations:
| COP | - Colombian Peso |
| EUR | - Euro Currency |
| GBP | - Great Britain Pound |
| IDR | - Indonesian Rupiah |
| JPY | - Japanese Yen |
| USD | - United States Dollar |
| (1) | Securities were originally issued pursuant to Regulation S under the Securities Act of 1933, which exempts securities offered and sold outside of the United States from registration. Such securities cannot be sold in the United States without either an effective registration statement filed pursuant to the Securities Act of 1933, or pursuant to an exemption from registration. As of November 30, 2015, the aggregate market value of those securities was $495,696,449, which represents approximately 28.10% of net assets. |
| (2) | Security exempt from registration under Rule 144A of the Securities Act of 1933. Such securities may normally be sold to qualified institutional buyers in transactions exempt from registration. Total market value of Rule 144A securities amounts to $531,204,671, which represents approximately 30.12% of net assets as of November 30, 2015. |
| (3) | Security is in default and therefore is non-income producing. |
| (4) | Floating or variable rate security. Interest rate disclosed is that which is in effect as of November 30, 2015. |
| (5) | Step bond. Coupon changes periodically based upon a predetermined schedule. Interest rate disclosed is that which is in effect as of November 30, 2015. |
| (6) | Issued with a zero coupon. Income is recognized through the accretion of discount. |
| (7) | Includes cash which is being held as collateral for derivatives. |
Stone Harbor Investment Funds Semi-Annual Report | November 30, 2015 | 31 |
Table of Contents
| Stone Harbor Emerging Markets Debt Fund | Statements of Investments | |
| November 30, 2015 (Unaudited) |
Common Abbreviations:
BV | - | Besloten Vennootschap is the Dutch term for private limited liability company. | ||
GmbH | - | Gesellschaft mit beschrankter Haftung is the German term for a company with limited liability. | ||
JSC | - | Joint Stock Company. | ||
L | - | LIBOR (London Interbank Offered Rate). | ||
LLC | - | Limited Liability Corporation. | ||
LLP | - | Limited Liability Partnership. | ||
Ltd. | - | Limited. | ||
OAO | - | Otkrytoe Aktsionernoe Obschestvo is the Russian term for Open Joint Stock Company. | ||
OJSC | - | Open Joint Stock Company. | ||
PLC | - | Public Limited Company. | ||
PT | - | Perseroan terbuka is an Indonesian term for limited liability company. | ||
Pte | - | Private. | ||
SA | - | Generally designates corporations in various countries, mostly those employing the civil law. | ||
SA de CV | - | Publicly Traded Company in Mexico. | ||
SAB de CV | - | A variable capital company. | ||
SOC | - | State owned Company. | ||
SPE | - | Special Purpose Entity. | ||
TBK | - | Perseroan terbuka is an Indonesian term for limited liability company. |
OUTSTANDING FORWARD FOREIGN CURRENCY CONTRACTS
| Counterparty | Foreign Currency | Contracted Amount** | Purchase/Sale Contract | Settlement Date | Current Value | Unrealized Appreciation/ (Depreciation) | ||||||||||||||||
Citigroup Global Market | COP | 38,229,820,000 | Sale | 12/14/2015 | $ | 12,150,521 | $ | 445,795 | ||||||||||||||
J.P. Morgan Chase | EUR | 41,531,543 | Sale | 12/08/2015 | 43,893,026 | 1,308,202 | ||||||||||||||||
J.P. Morgan Chase | GBP | 699,900 | Sale | 12/08/2015 | 1,054,171 | 25,929 | ||||||||||||||||
J.P. Morgan Chase | IDR | 227,543,798,000 | Sale | 12/14/2015 | 16,391,678 | 181,068 | ||||||||||||||||
J.P. Morgan Chase | JPY | 749,554,000 | Sale | 12/08/2015 | 6,091,090 | 122,237 | ||||||||||||||||
|
| |||||||||||||||||||||
| $ | 2,083,231 | |||||||||||||||||||||
|
| |||||||||||||||||||||
Citigroup Global Market | IDR | 73,306,219,000 | Purchase | 12/14/2015 | $ | 5,280,794 | $ | (62,225 | ) | |||||||||||||
J.P. Morgan Chase | EUR | 1,169,334 | Purchase | 12/08/2015 | 1,235,822 | (21,121 | ) | |||||||||||||||
J.P. Morgan Chase | IDR | 154,237,579,000 | Purchase | 12/14/2015 | 11,110,883 | (129,579 | ) | |||||||||||||||
|
| |||||||||||||||||||||
| $ | (212,925 | ) | ||||||||||||||||||||
|
| |||||||||||||||||||||
| ** | The contracted amount is stated in the currency in which the contract is denominated. |
CREDIT DEFAULT SWAP CONTRACTS ON SOVEREIGN DEBT OBLIGATIONS ISSUE - SELL PROTECTION(8)
Reference Obligations | Counterparty | Fixed Deal Receive Rate | Maturity Date | Implied Credit Spread at | Notional Amount(10) | Market Value | Upfront Premiums Received | Unrealized Appreciation | ||||||||||||||||||||
Petroleos de | | Credit Suisse First Boston | | 5.000% | 06/20/2016 | 37.659% | $ | 27,50,000 | $ | 4,425,418 | $ | 8,318,750 | $ | 3,893,332 | ||||||||||||||
|
| |||||||||||||||||||||||||||
| $ | 4,425,418 | $ | 8,318,750 | $ | 3,893,332 | |||||||||||||||||||||||
|
| |||||||||||||||||||||||||||
| (8) | If the Fund is a seller of protection and a credit event occurs, as defined under the terms of that particular swap agreement, the Fund will either (i) pay to the buyer of protection an amount equal to the notional amount of the swap and take delivery of the referenced obligation or underlying securities comprising the referenced index or (ii) pay a net settlement amount in the form of cash or securities equal to the notional amount of the swap less the recovery value of the referenced obligation or underlying securities comprising the referenced index. |
| 32 | www.shiplp.com |
Table of Contents
| Stone Harbor Emerging Markets Debt Fund | Statements of Investments | |
| November 30, 2015 (Unaudited) |
| (9) | Implied credit spreads, represented in absolute terms, utilized in determining the market value of credit default swap agreements on sovereign issues of an emerging country as of period end serve as an indicator of the current status of the payment/performance risk and represent the likelihood or risk of default for the credit derivative. The implied credit spread of a particular referenced entity reflects the cost of buying/selling protection and may include upfront payments required to be made to enter into the agreement. Wider credit spreads represent a deterioration of the referenced entity’s credit soundness and a greater likelihood or risk of default or other credit event occurring as defined under the terms of the agreement. |
| (10) | The maximum potential amount the Fund could be required to pay as a seller of credit protection or receive as a buyer of credit protection if a credit event occurs as defined under the terms of that particular swap agreement. |
INTEREST RATE SWAP CONTRACTS
Pay/Receive Floating Rate | Clearing House | Floating Rate | Expiration Date | Notional Amount | Fixed Rate | Market Value | Unrealized Appreciation/(Depreciation) | |||||||||||||||
Receive | Chicago Mercantile Exchange | 3 month LIBOR | 02/06/2045 | $ | 5,700,000 | 2.343% | $ | 283,388 | $ | 283,388 | ||||||||||||
|
| |||||||||||||||||||||
| $ | 283,388 | $ | 283,388 | |||||||||||||||||||
|
| |||||||||||||||||||||
Receive | Chicago Mercantile Exchange | 3 month LIBOR | 01/12/2025 | $ | 31,570,000 | 2.140% | $ | (268,079 | ) | $ | (268,079) | |||||||||||
Receive | Chicago Mercantile Exchange | 3 month LIBOR | 01/13/2025 | 15,490,300 | 2.077% | (48,582 | ) | (48,582) | ||||||||||||||
|
| |||||||||||||||||||||
| $ | (316,661 | ) | $ | (316,661) | ||||||||||||||||||
|
| |||||||||||||||||||||
See Notes to Financial Statements.
Stone Harbor Investment Funds Semi-Annual Report | November 30, 2015 | 33 |
Table of Contents
| Stone Harbor High Yield Bond Fund | Statements of Investments | |
| November 30, 2015 (Unaudited) |
| Currency | Rate | Maturity Date | Principal Amount* | Market Value (Expressed in U.S. $) | ||||||||||||||||||||||
CORPORATE BONDS - 89.13% | ||||||||||||||||||||||||||
Aerospace/Defense - 0.38% | ||||||||||||||||||||||||||
Erickson, Inc., Series WI | USD | 8.250 | % | 05/01/2020 | 900,000 | $ | 567,000 | |||||||||||||||||||
Huntington Ingalls Industries, Inc. | USD | 5.000 | % | 11/15/2025 | 420,000 | 427,350 | (1) | |||||||||||||||||||
|
| |||||||||||||||||||||||||
| 994,350 | ||||||||||||||||||||||||||
|
| |||||||||||||||||||||||||
Automotive - 1.86% | ||||||||||||||||||||||||||
Fiat Chrysler Automobiles NV | USD | 5.250 | % | 04/15/2023 | 1,010,000 | 1,004,950 | ||||||||||||||||||||
Goodyear Tire & Rubber Co. | USD | 5.125 | % | 11/15/2023 | 670,000 | 688,425 | ||||||||||||||||||||
MPG Holdco I, Inc. | USD | 7.375 | % | 10/15/2022 | 1,200,000 | 1,266,000 | ||||||||||||||||||||
Schaeffler Holding Finance BV | USD | 6.250 | % | 11/15/2019 | 620,000 | 657,975 | (1)(2) | |||||||||||||||||||
ZF North America Capital, Inc. | USD | 4.750 | % | 04/29/2025 | 1,325,000 | 1,284,839 | (1) | |||||||||||||||||||
|
| |||||||||||||||||||||||||
| 4,902,189 | ||||||||||||||||||||||||||
|
| |||||||||||||||||||||||||
Building Products - 3.38% | ||||||||||||||||||||||||||
Building Materials Corp. of America | USD | 5.375 | % | 11/15/2024 | 1,145,000 | 1,159,312 | (1) | |||||||||||||||||||
Griffon Corp. | USD | 5.250 | % | 03/01/2022 | 2,490,000 | 2,399,737 | ||||||||||||||||||||
Masonite International Corp. | USD | 5.625 | % | 03/15/2023 | 825,000 | 866,250 | (1) | |||||||||||||||||||
NCI Building Systems, Inc. | USD | 8.250 | % | 01/15/2023 | 920,000 | 975,200 | (1) | |||||||||||||||||||
Norbord, Inc. | USD | 5.375 | % | 12/01/2020 | 1,985,000 | 2,009,813 | (1) | |||||||||||||||||||
RSI Home Products, Inc. | USD | 6.500 | % | 03/15/2023 | 1,475,000 | 1,534,000 | (1) | |||||||||||||||||||
|
| |||||||||||||||||||||||||
| 8,944,312 | ||||||||||||||||||||||||||
|
| |||||||||||||||||||||||||
Chemicals - 4.13% | ||||||||||||||||||||||||||
CeramTec Group GmbH | EUR | 8.250 | % | 08/15/2021 | 1,000,000 | 1,146,599 | (3) | |||||||||||||||||||
Chemtura Corp. | USD | 5.750 | % | 07/15/2021 | 3,377,000 | 3,410,770 | ||||||||||||||||||||
INEOS Group Holdings SA | USD | 5.875 | % | 02/15/2019 | 2,425,000 | 2,421,969 | (1) | |||||||||||||||||||
Lyond Basel Escrow | USD | 0.000 | % | 08/15/2015 | 25,000 | 0 | (4) | |||||||||||||||||||
Lyondell Chemical Co. | USD | 0.000 | % | 08/15/2015 | 945,000 | 0 | (4) | |||||||||||||||||||
Platform Specialty Products Corp. | USD | 6.500 | % | 02/01/2022 | 1,290,000 | 1,128,750 | (1) | |||||||||||||||||||
PSPC Escrow II Corp. | USD | 10.375 | % | 05/01/2021 | 350,000 | 357,875 | (1) | |||||||||||||||||||
SPCM SA | USD | 6.000 | % | 01/15/2022 | 926,000 | 939,890 | (1) | |||||||||||||||||||
Trinseo Materials Operating SCA / Trinseo | USD | 6.750 | % | 05/01/2022 | 1,500,000 | 1,498,125 | (1) | |||||||||||||||||||
|
| |||||||||||||||||||||||||
| 10,903,978 | ||||||||||||||||||||||||||
|
| |||||||||||||||||||||||||
Consumer Products - 3.41% | ||||||||||||||||||||||||||
ACCO Brands Corp. | USD | 6.750 | % | 04/30/2020 | 2,318,000 | 2,433,900 | ||||||||||||||||||||
Energizer SpinCo, Inc. | USD | 5.500 | % | 06/15/2025 | 1,345,000 | 1,308,013 | (1) | |||||||||||||||||||
Jarden Corp. | USD | 5.000 | % | 11/15/2023 | 975,000 | 1,005,347 | (1) | |||||||||||||||||||
Revlon Consumer Products Corp., Series WI | USD | 5.750 | % | 02/15/2021 | 530,000 | 527,350 | ||||||||||||||||||||
Spectrum Brands, Inc.: | ||||||||||||||||||||||||||
| USD | 6.125 | % | 12/15/2024 | 980,000 | 1,026,550 | (1) | ||||||||||||||||||||
| USD | 5.750 | % | 07/15/2025 | 1,580,000 | 1,637,275 | (1) | ||||||||||||||||||||
Sun Products Corp. | USD | 7.750 | % | 03/15/2021 | 1,201,000 | 1,080,149 | (1) | |||||||||||||||||||
|
| |||||||||||||||||||||||||
| 9,018,584 | ||||||||||||||||||||||||||
|
| |||||||||||||||||||||||||
| 34 | www.shiplp.com |
Table of Contents
| Stone Harbor High Yield Bond Fund | Statements of Investments | |
| November 30, 2015 (Unaudited) |
| Currency | Rate | Maturity Date | Principal Amount* | Market Value (Expressed in U.S. $) | ||||||||||||||||||||||
Containers/Packaging - 1.94% | ||||||||||||||||||||||||||
Albea Beauty Holdings SA | USD | 8.375 | % | 11/01/2019 | 1,116,000 | $ | 1,177,380 | (1) | ||||||||||||||||||
Ardagh Packaging Finance PLC/Ardagh Holdings USA, Inc. | USD | 6.000 | % | 06/30/2021 | 700,000 | 693,000 | (1) | |||||||||||||||||||
Berry Plastics Corp. | USD | 6.000 | % | 10/15/2022 | 1,005,000 | 1,042,688 | (1) | |||||||||||||||||||
Owens-Brockway Glass Container, Inc. | USD | 5.875 | % | 08/15/2023 | 710,000 | 739,731 | (1) | |||||||||||||||||||
Reynolds Group Issuer LLC | USD | 8.250 | % | 02/15/2021 | 440,000 | 441,650 | ||||||||||||||||||||
Signode Industrial Group Lux SA/Signode | USD | 6.375 | % | 05/01/2022 | 1,115,000 | 1,025,800 | (1) | |||||||||||||||||||
|
| |||||||||||||||||||||||||
| 5,120,249 | ||||||||||||||||||||||||||
|
| |||||||||||||||||||||||||
Drillers/Services - 1.32% | ||||||||||||||||||||||||||
FTS International, Inc. | USD | 6.250 | % | 05/01/2022 | 1,625,000 | 495,625 | ||||||||||||||||||||
Hornbeck Offshore Services, Inc.: | ||||||||||||||||||||||||||
| USD | 5.875 | % | 04/01/2020 | 827,000 | 661,600 | |||||||||||||||||||||
| USD | 5.000 | % | 03/01/2021 | 1,107,000 | 856,541 | |||||||||||||||||||||
Offshore Group Investment Ltd. | USD | 7.125 | % | 04/01/2023 | 1,440,000 | 410,400 | ||||||||||||||||||||
Parker Drilling Co. | USD | 6.750 | % | 07/15/2022 | 1,455,000 | 1,054,875 | ||||||||||||||||||||
|
| |||||||||||||||||||||||||
| 3,479,041 | ||||||||||||||||||||||||||
|
| |||||||||||||||||||||||||
Electric - 4.81% | ||||||||||||||||||||||||||
Calpine Corp. | USD | 5.750 | % | 01/15/2025 | 2,330,000 | 2,190,200 | ||||||||||||||||||||
Dynegy, Inc.: | ||||||||||||||||||||||||||
| USD | 6.750 | % | 11/01/2019 | 1,800,000 | 1,767,384 | |||||||||||||||||||||
| USD | 7.625 | % | 11/01/2024 | 800,000 | 764,000 | |||||||||||||||||||||
GenOn Energy, Inc. | USD | 9.500 | % | 10/15/2018 | 4,287,000 | 3,815,430 | ||||||||||||||||||||
NRG Energy, Inc. | USD | 6.250 | % | 07/15/2022 | 2,330,000 | 2,166,900 | ||||||||||||||||||||
Talen Energy Supply LLC: | ||||||||||||||||||||||||||
| USD | 6.500 | % | 06/01/2025 | 665,000 | 569,406 | (1) | ||||||||||||||||||||
| USD | 5.125 | % | 07/15/2019 | 1,575,000 | 1,429,313 | (1) | ||||||||||||||||||||
|
| |||||||||||||||||||||||||
| 12,702,633 | ||||||||||||||||||||||||||
|
| |||||||||||||||||||||||||
Environmental Services - 0.63% | ||||||||||||||||||||||||||
Clean Harbors, Inc. | USD | 5.250 | % | 08/01/2020 | 1,641,000 | 1,672,015 | ||||||||||||||||||||
|
| |||||||||||||||||||||||||
Exploration & Production - 5.55% | ||||||||||||||||||||||||||
Bonanza Creek Energy, Inc.: | ||||||||||||||||||||||||||
| USD | 6.750 | % | 04/15/2021 | 2,198,000 | 1,736,420 | |||||||||||||||||||||
| USD | 5.750 | % | 02/01/2023 | 250,000 | 171,250 | |||||||||||||||||||||
Calumet Specialty Products Partners LP / | ||||||||||||||||||||||||||
| USD | 7.625 | % | 01/15/2022 | 650,000 | 617,500 | |||||||||||||||||||||
| USD | 7.750 | % | 04/15/2023 | 215,000 | 202,638 | (1) | ||||||||||||||||||||
Chesapeake Energy Corp. | USD | 5.750 | % | 03/15/2023 | 2,440,000 | 1,049,200 | ||||||||||||||||||||
Denbury Resources, Inc. | USD | 5.500 | % | 05/01/2022 | 1,770,000 | 1,106,250 | ||||||||||||||||||||
EP Energy LLC / Everest Acquisition Finance, Inc. | USD | 6.375 | % | 06/15/2023 | 1,100,000 | 847,000 | ||||||||||||||||||||
EP Energy LLC/EP Energy Finance, Inc., Series WI | USD | 9.375 | % | 05/01/2020 | 1,228,000 | 1,049,940 | ||||||||||||||||||||
Halcon Resources Corp.: | ||||||||||||||||||||||||||
| USD | 8.625 | % | 02/01/2020 | 385,000 | 304,631 | (1) | ||||||||||||||||||||
| USD | 9.750 | % | 07/15/2020 | 1,658,000 | 530,560 | |||||||||||||||||||||
Laredo Petroleum, Inc.: | ||||||||||||||||||||||||||
| USD | 5.625 | % | 01/15/2022 | 1,100,000 | 1,034,000 | |||||||||||||||||||||
| USD | 7.375 | % | 05/01/2022 | 1,243,000 | 1,218,140 | |||||||||||||||||||||
Stone Harbor Investment Funds Semi-Annual Report | November 30, 2015 | 35 |
Table of Contents
| Stone Harbor High Yield Bond Fund | Statements of Investments | |
| November 30, 2015 (Unaudited) |
| Currency | Rate | Maturity Date | Principal Amount* | Market Value (Expressed in U.S. $) | ||||||||||||||||||||||
Exploration & Production (continued) | ||||||||||||||||||||||||||
Linn Energy LLC/Linn Energy Finance Corp.: | ||||||||||||||||||||||||||
| USD | 7.750 | % | 02/01/2021 | 2,119,000 | $ | 455,585 | ||||||||||||||||||||
| USD | 6.500 | % | 09/15/2021 | 705,000 | 137,038 | |||||||||||||||||||||
Midstates Petroleum Co., Inc. | USD | 10.750 | % | 10/01/2020 | 981,000 | 161,865 | ||||||||||||||||||||
Oasis Petroleum, Inc. | USD | 7.250 | % | 02/01/2019 | 2,376,000 | 2,263,140 | ||||||||||||||||||||
QEP Resources, Inc. | USD | 5.375 | % | 10/01/2022 | 1,977,000 | 1,789,185 | ||||||||||||||||||||
|
| |||||||||||||||||||||||||
| 14,674,342 | ||||||||||||||||||||||||||
|
| |||||||||||||||||||||||||
Financial Other - 0.69% | ||||||||||||||||||||||||||
Aircastle Ltd. | USD | 5.500 | % | 02/15/2022 | 640,000 | 672,000 | ||||||||||||||||||||
Quicken Loans, Inc. | USD | 5.750 | % | 05/01/2025 | 1,180,000 | 1,144,600 | (1) | |||||||||||||||||||
|
| |||||||||||||||||||||||||
| 1,816,600 | ||||||||||||||||||||||||||
|
| |||||||||||||||||||||||||
Food & Beverage - 5.92% | ||||||||||||||||||||||||||
Bakkavor Finance 2 PLC | GBP | 8.250 | % | 02/15/2018 | 419,204 | 653,461 | (3) | |||||||||||||||||||
Boparan Finance PLC | GBP | 5.500 | % | 07/15/2021 | 1,725,000 | 2,364,203 | (3) | |||||||||||||||||||
Chiquita Brands International, Inc./Chiquita Brands LLC | USD | 7.875 | % | 02/01/2021 | 1,152,000 | 1,222,560 | ||||||||||||||||||||
Constellation Brands, Inc. | USD | 4.750 | % | 12/01/2025 | 620,000 | 632,400 | ||||||||||||||||||||
Dean Foods Co. | USD | 6.500 | % | 03/15/2023 | 1,855,000 | 1,915,288 | (1) | |||||||||||||||||||
Pilgrim’s Pride Corp. | USD | 5.750 | % | 03/15/2025 | 1,440,000 | 1,422,000 | (1) | |||||||||||||||||||
Post Holdings, Inc. | USD | 7.375 | % | 02/15/2022 | 2,415,000 | 2,522,926 | ||||||||||||||||||||
Premier Foods Finance PLC | GBP | 6.500 | % | 03/15/2021 | 1,000,000 | 1,467,507 | (3) | |||||||||||||||||||
R&R PLC | EUR | 9.250 | % | 05/15/2018 | 1,100,000 | 1,186,222 | (2)(3) | |||||||||||||||||||
Smithfield Foods, Inc. | USD | 6.625 | % | 08/15/2022 | 2,131,000 | 2,266,851 | ||||||||||||||||||||
|
| |||||||||||||||||||||||||
| 15,653,418 | ||||||||||||||||||||||||||
|
| |||||||||||||||||||||||||
Gaming - 2.73% | ||||||||||||||||||||||||||
GLP Capital LP / GLP Financing II, Inc. | USD | 5.375 | % | 11/01/2023 | 830,000 | 827,925 | ||||||||||||||||||||
Isle of Capri Casinos, Inc. | USD | 5.875 | % | 03/15/2021 | 2,325,000 | 2,435,437 | ||||||||||||||||||||
MGM Resorts International | USD | 6.625 | % | 12/15/2021 | 1,838,000 | 1,925,305 | ||||||||||||||||||||
Pinnacle Entertainment, Inc. | USD | 6.375 | % | 08/01/2021 | 1,910,000 | 2,034,150 | ||||||||||||||||||||
|
| |||||||||||||||||||||||||
| 7,222,817 | ||||||||||||||||||||||||||
|
| |||||||||||||||||||||||||
Healthcare - 6.63% | ||||||||||||||||||||||||||
Amsurg Corp. | USD | 5.625 | % | 07/15/2022 | 1,230,000 | 1,214,625 | ||||||||||||||||||||
Community Health Systems, Inc.: | ||||||||||||||||||||||||||
| USD | 8.000 | % | 11/15/2019 | 967,000 | 983,922 | |||||||||||||||||||||
| USD | 6.875 | % | 02/01/2022 | 1,645,000 | 1,599,763 | |||||||||||||||||||||
DaVita HealthCare Partners, Inc. | USD | 5.125 | % | 07/15/2024 | 1,265,000 | 1,264,209 | ||||||||||||||||||||
HCA, Inc.: | ||||||||||||||||||||||||||
| USD | 5.375 | % | 02/01/2025 | 2,550,000 | 2,526,094 | |||||||||||||||||||||
| USD | 5.250 | % | 04/15/2025 | 690,000 | 700,350 | |||||||||||||||||||||
HealthSouth Corp. | USD | 5.750 | % | 11/01/2024 | 1,800,000 | 1,746,000 | ||||||||||||||||||||
IASIS Healthcare LLC | USD | 8.375 | % | 05/15/2019 | 1,187,000 | 1,121,715 | ||||||||||||||||||||
Kinetic Concepts, Inc./KCI USA, Inc.: | ||||||||||||||||||||||||||
| USD | 10.500 | % | 11/01/2018 | 1,264,000 | 1,230,504 | |||||||||||||||||||||
| USD | 12.500 | % | 11/01/2019 | 845,000 | 819,650 | |||||||||||||||||||||
| 36 | www.shiplp.com |
Table of Contents
| Stone Harbor High Yield Bond Fund | Statements of Investments | |
| November 30, 2015 (Unaudited) |
| Currency | Rate | Maturity Date | Principal Amount* | Market Value (Expressed in U.S. $) | |||||||||||||||||||||||||
Healthcare (continued) | |||||||||||||||||||||||||||||
LifePoint Health, Inc. | USD | 5.500 | % | 12/01/2021 | 1,760,000 | $ | 1,764,400 | ||||||||||||||||||||||
Quintiles Transnational Corp. | USD | 4.875 | % | 05/15/2023 | 515,000 | 518,863 | (1) | ||||||||||||||||||||||
Team Health, Inc. | USD | 7.250 | % | 12/15/2023 | 1,450,000 | 1,497,125 | (1) | ||||||||||||||||||||||
Tenet Healthcare Corp. | USD | 6.000 | % | 10/01/2020 | 498,000 | 531,615 | |||||||||||||||||||||||
|
| ||||||||||||||||||||||||||||
| 17,518,835 | |||||||||||||||||||||||||||||
|
| ||||||||||||||||||||||||||||
Home Builders - 0.97% | |||||||||||||||||||||||||||||
Lennar Corp. | USD | 4.750 | % | 11/15/2022 | 939,000 | 941,348 | |||||||||||||||||||||||
Shea Homes LP / Shea Homes Funding Corp. | USD | 5.875 | % | 04/01/2023 | 710,000 | 736,625 | (1) | ||||||||||||||||||||||
Standard Pacific Corp. | USD | 5.875 | % | 11/15/2024 | 847,000 | 889,350 | |||||||||||||||||||||||
|
| ||||||||||||||||||||||||||||
| 2,567,323 | |||||||||||||||||||||||||||||
|
| ||||||||||||||||||||||||||||
Industrial Other - 2.82% | |||||||||||||||||||||||||||||
AECOM | USD | 5.750 | % | 10/15/2022 | 1,415,000 | 1,465,402 | |||||||||||||||||||||||
Cleaver-Brooks, Inc. | USD | 8.750 | % | 12/15/2019 | 1,661,000 | 1,619,475 | (1) | ||||||||||||||||||||||
EnerSys | USD | 5.000 | % | 04/30/2023 | 1,025,000 | 1,027,563 | (1) | ||||||||||||||||||||||
MasTec, Inc. | USD | 4.875 | % | 03/15/2023 | 2,833,000 | 2,408,050 | |||||||||||||||||||||||
WESCO Distribution, Inc. | USD | 5.375 | % | 12/15/2021 | 970,000 | 936,050 | |||||||||||||||||||||||
|
| ||||||||||||||||||||||||||||
| 7,456,540 | |||||||||||||||||||||||||||||
|
| ||||||||||||||||||||||||||||
Leisure - 1.30% | |||||||||||||||||||||||||||||
AMC Entertainment, Inc. | USD | 5.750 | % | 06/15/2025 | 2,290,000 | 2,312,900 | |||||||||||||||||||||||
Cinemark USA, Inc.: | |||||||||||||||||||||||||||||
| USD | 5.125 | % | 12/15/2022 | 740,000 | 742,775 | ||||||||||||||||||||||||
| USD | 4.875 | % | 06/01/2023 | 375,000 | 368,906 | ||||||||||||||||||||||||
|
| ||||||||||||||||||||||||||||
| 3,424,581 | |||||||||||||||||||||||||||||
|
| ||||||||||||||||||||||||||||
Lodging - 0.77% | |||||||||||||||||||||||||||||
RHP Hotel Properties LP/RHP Finance Corp. | USD | 5.000 | % | 04/15/2021 | 1,978,000 | 2,022,505 | |||||||||||||||||||||||
|
| ||||||||||||||||||||||||||||
Media Cable - 9.11% | |||||||||||||||||||||||||||||
Altice US Finance I Corp | USD | 5.375 | % | 07/15/2023 | 640,000 | 641,600 | (1) | ||||||||||||||||||||||
Cable One, Inc. | USD | 5.750 | % | 06/15/2022 | 1,405,000 | 1,412,025 | (1) | ||||||||||||||||||||||
Cablevision Systems Corp.: | |||||||||||||||||||||||||||||
| USD | 8.000 | % | 04/15/2020 | 864,000 | 818,640 | ||||||||||||||||||||||||
| USD | 5.875 | % | 09/15/2022 | 3,595,000 | 2,867,012 | ||||||||||||||||||||||||
CCO Holdings LLC | USD | 6.625 | % | 01/31/2022 | 1,487,000 | 1,573,261 | |||||||||||||||||||||||
Cequel Communications Holdings I LLC/Cequel Capital Corp. | USD | 5.125 | % | 12/15/2021 | 1,541,000 | 1,429,277 | (1) | ||||||||||||||||||||||
DISH DBS Corp., Series WI | USD | 5.000 | % | 03/15/2023 | 4,523,000 | 3,923,702 | |||||||||||||||||||||||
Mediacom LLC | USD | 7.250 | % | 02/15/2022 | 2,432,000 | 2,447,200 | |||||||||||||||||||||||
Numericable-SFR SAS: | |||||||||||||||||||||||||||||
| USD | 6.000 | % | 05/15/2022 | 1,270,000 | 1,257,300 | (1) | |||||||||||||||||||||||
| USD | 6.250 | % | 05/15/2024 | 660,000 | 651,750 | (1) | |||||||||||||||||||||||
Quebecor Media, Inc. | USD | 5.750 | % | 01/15/2023 | 1,566,000 | 1,583,618 | |||||||||||||||||||||||
Unitymedia GmbH | USD | 6.125 | % | 01/15/2025 | 715,000 | 723,044 | (1) | ||||||||||||||||||||||
Unitymedia Hessen GmbH & Co. KG | USD | 5.000 | % | 01/15/2025 | 1,040,000 | 1,016,600 | (1) | ||||||||||||||||||||||
UPCB Finance IV Ltd. | USD | 5.375 | % | 01/15/2025 | 1,030,000 | 1,001,675 | (1) | ||||||||||||||||||||||
Virgin Media Finance PLC | USD | 6.000 | % | 10/15/2024 | 1,475,000 | 1,473,156 | (1) | ||||||||||||||||||||||
Virgin Media Secured Finance PLC | USD | 5.250 | % | 01/15/2026 | 1,275,000 | 1,252,688 | (1) | ||||||||||||||||||||||
|
| ||||||||||||||||||||||||||||
| 24,072,548 | |||||||||||||||||||||||||||||
|
| ||||||||||||||||||||||||||||
Stone Harbor Investment Funds Semi-Annual Report | November 30, 2015 | 37 |
Table of Contents
| Stone Harbor High Yield Bond Fund | Statements of Investments | |
| November 30, 2015 (Unaudited) |
Currency | Rate | Maturity Date | Principal Amount* | Market Value (Expressed in U.S. $) | ||||||||||||||||
Media Other - 5.56% | ||||||||||||||||||||
Gray Television, Inc. | USD | 7.500 | % | 10/01/2020 | 2,240,000 | $ | 2,332,400 | |||||||||||||
Interep National Radio Sales, Inc., Series B | USD | 0.000 | % | 07/01/2008 | 27,318 | 3 | (4) | |||||||||||||
LIN Television Corp. | USD | 5.875 | % | 11/15/2022 | 2,075,000 | 2,085,375 | (1) | |||||||||||||
Nexstar Broadcasting, Inc., Series WI | USD | 6.875 | % | 11/15/2020 | 2,020,000 | 2,065,450 | ||||||||||||||
Outfront Media Capital LLC / Outfront Media Capital Corp. | USD | 5.250 | % | 02/15/2022 | 955,000 | 983,650 | ||||||||||||||
Sinclair Television Group, Inc., Series WI | USD | 6.125 | % | 10/01/2022 | 2,780,000 | 2,870,350 | ||||||||||||||
TEGNA, Inc. | USD | 6.375 | % | 10/15/2023 | 1,714,000 | 1,816,840 | ||||||||||||||
Tribune Media Co. | USD | 5.875 | % | 07/15/2022 | 2,530,000 | 2,536,325 | (1) | |||||||||||||
|
| |||||||||||||||||||
| 14,690,393 | ||||||||||||||||||||
|
| |||||||||||||||||||
Metals/Mining/Steel - 0.65% | ||||||||||||||||||||
ArcelorMittal: | ||||||||||||||||||||
| USD | 7.250 | % | 02/25/2022 | 601,000 | 533,015 | (5) | ||||||||||||||
| USD | 8.000 | % | 10/15/2039 | 1,050,000 | 798,136 | (5) | ||||||||||||||
Cloud Peak Energy Resources LLC | USD | 6.375 | % | 03/15/2024 | 835,000 | 379,925 | ||||||||||||||
|
| |||||||||||||||||||
| 1,711,076 | ||||||||||||||||||||
|
| |||||||||||||||||||
Paper/Forest Products - 1.87% | ||||||||||||||||||||
Cascades, Inc. | USD | 5.500 | % | 07/15/2022 | 735,000 | 713,869 | (1) | |||||||||||||
Louisiana-Pacific Corp. | USD | 7.500 | % | 06/01/2020 | 1,293,000 | 1,351,185 | ||||||||||||||
Mercer International, Inc. | USD | 7.750 | % | 12/01/2022 | 1,685,000 | 1,760,825 | ||||||||||||||
Xerium Technologies, Inc. | USD | 8.875 | % | 06/15/2018 | 1,119,000 | 1,126,693 | ||||||||||||||
|
| |||||||||||||||||||
| 4,952,572 | ||||||||||||||||||||
|
| |||||||||||||||||||
Pharmaceuticals - 1.64% | ||||||||||||||||||||
Endo Finance LLC / Endo Ltd. / Endo Finco, Inc. | USD | 6.000 | % | 02/01/2025 | 1,595,000 | 1,523,225 | (1) | |||||||||||||
Mallinckrodt International Finance SA / Mallinckrodt CB LLC: | ||||||||||||||||||||
| USD | 5.625 | % | 10/15/2023 | 1,125,000 | 975,937 | (1) | ||||||||||||||
| USD | 5.750 | % | 08/01/2022 | 215,000 | 191,350 | (1) | ||||||||||||||
Valeant Pharmaceuticals International, Inc. | USD | 5.875 | % | 05/15/2023 | 1,895,000 | 1,648,650 | (1) | |||||||||||||
|
| |||||||||||||||||||
| 4,339,162 | ||||||||||||||||||||
|
| |||||||||||||||||||
Refining - 0.70% | ||||||||||||||||||||
Tesoro Logistics LP/Tesoro Logistics Finance Corp.: | ||||||||||||||||||||
| USD | 5.875 | % | 10/01/2020 | 776,000 | 801,220 | |||||||||||||||
| USD | 6.125 | % | 10/15/2021 | 1,003,000 | 1,035,598 | |||||||||||||||
|
| |||||||||||||||||||
| 1,836,818 | ||||||||||||||||||||
|
| |||||||||||||||||||
Restaurants - 0.99% | ||||||||||||||||||||
Landry’s, Inc. | USD | 9.375 | % | 05/01/2020 | 1,742,000 | 1,857,408 | (1) | |||||||||||||
Ruby Tuesday, Inc. | USD | 7.625 | % | 05/15/2020 | 740,000 | 752,950 | ||||||||||||||
|
| |||||||||||||||||||
| 2,610,358 | ||||||||||||||||||||
|
| |||||||||||||||||||
Retail Food/Drug - 0.59% | ||||||||||||||||||||
Tops Holding II | USD | 8.000 | % | 6/15/2022 | 1,540,000 | 1,547,700 | (1) | |||||||||||||
|
| |||||||||||||||||||
| 38 | www.shiplp.com |
Table of Contents
| Stone Harbor High Yield Bond Fund | Statements of Investments | |
| November 30, 2015 (Unaudited) |
| Currency | Rate | Maturity Date | Principal Amount* | Market Value (Expressed in U.S. $) | |||||||||||||||||||||||||
Retail Non Food/Drug - 2.71% | |||||||||||||||||||||||||||||
Argos Merger Sub, Inc. | USD | 7.125 | % | 03/15/2023 | 1,840,000 | $ | 1,858,400 | (1) | |||||||||||||||||||||
Bon-Ton Department Stores, Inc. | USD | 8.000 | % | 06/15/2021 | 828,000 | 240,120 | |||||||||||||||||||||||
Hot Topic, Inc. | USD | 9.250 | % | 06/15/2021 | 1,625,000 | 1,434,062 | (1) | ||||||||||||||||||||||
L Brands, Inc. | USD | 6.875 | % | 11/01/2035 | 1,335,000 | 1,371,713 | (1) | ||||||||||||||||||||||
Petco Holdings, Inc. | USD | 8.500 | % | 10/15/2017 | 1,201,000 | 1,226,521 | (1)(2) | ||||||||||||||||||||||
Sally Holdings LLC/ Sally Capital, Inc. | USD | 5.625 | % | 12/01/2025 | 1,015,000 | 1,034,031 | |||||||||||||||||||||||
|
| ||||||||||||||||||||||||||||
| 7,164,847 | |||||||||||||||||||||||||||||
|
| ||||||||||||||||||||||||||||
Services Other - 0.58% | |||||||||||||||||||||||||||||
Outerwall, Inc. | USD | 6.000 | % | 03/15/2019 | 1,540,000 | 1,536,150 | |||||||||||||||||||||||
Technology - 2.78% | |||||||||||||||||||||||||||||
Alcatel-Lucent USA, Inc. | USD | 6.750 | % | 11/15/2020 | 1,230,000 | 1,306,248 | (1) | ||||||||||||||||||||||
Artesyn Embedded Technologies, Inc. | USD | 9.750 | % | 10/15/2020 | 1,275,000 | 1,208,062 | (1) | ||||||||||||||||||||||
CommScope Technologies Finance LLC | USD | 6.000 | % | 06/15/2025 | 980,000 | 940,800 | (1) | ||||||||||||||||||||||
First Data Corp. | USD | 7.000 | % | 12/01/2023 | 1,270,000 | 1,290,638 | (1) | ||||||||||||||||||||||
NCR Corp. | USD | 5.000 | % | 07/15/2022 | 944,000 | 918,040 | |||||||||||||||||||||||
Nuance Communications, Inc. | USD | 5.375 | % | 08/15/2020 | 1,657,000 | 1,690,140 | (1) | ||||||||||||||||||||||
|
| ||||||||||||||||||||||||||||
| 7,353,928 | |||||||||||||||||||||||||||||
|
| ||||||||||||||||||||||||||||
Textile/Apparel - 1.66% | |||||||||||||||||||||||||||||
Levi Strauss & Co.: | |||||||||||||||||||||||||||||
| USD | 6.875 | % | 05/01/2022 | 1,525,000 | 1,654,625 | ||||||||||||||||||||||||
| USD | 5.000 | % | 05/01/2025 | 853,000 | 855,132 | ||||||||||||||||||||||||
Quiksilver, Inc.: | |||||||||||||||||||||||||||||
| USD | 10.000 | % | 08/01/2020 | 521,000 | 18,235 | (4) | |||||||||||||||||||||||
| USD | 7.875 | % | 08/01/2018 | 1,117,000 | 793,070 | (1)(4) | |||||||||||||||||||||||
William Carter Co. | USD | 5.250 | % | 08/15/2021 | 1,025,000 | 1,058,313 | |||||||||||||||||||||||
|
| ||||||||||||||||||||||||||||
| 4,379,375 | |||||||||||||||||||||||||||||
|
| ||||||||||||||||||||||||||||
Transportation Non Air/Rail - 0.53% | |||||||||||||||||||||||||||||
XPO Logistics, Inc. | USD | 6.500 | % | 06/15/2022 | 1,535,000 | 1,410,281 | (1) | ||||||||||||||||||||||
|
| ||||||||||||||||||||||||||||
Wireless - 4.05% | |||||||||||||||||||||||||||||
Altice SA | USD | 7.750 | % | 05/15/2022 | 1,860,000 | 1,743,750 | (1) | ||||||||||||||||||||||
Sprint Capital Corp. | USD | 8.750 | % | 03/15/2032 | 4,225,000 | 3,274,375 | |||||||||||||||||||||||
T-Mobile USA, Inc.: | |||||||||||||||||||||||||||||
| USD | 6.731 | % | 04/28/2022 | 2,511,000 | 2,605,162 | ||||||||||||||||||||||||
| USD | 6.500 | % | 01/15/2026 | 1,675,000 | 1,677,094 | ||||||||||||||||||||||||
Wind Acquisition Finance SA: | |||||||||||||||||||||||||||||
| USD | 4.750 | % | 07/15/2020 | 730,000 | 730,000 | (1) | |||||||||||||||||||||||
| USD | 7.375 | % | 04/23/2021 | 690,000 | 667,575 | (1) | |||||||||||||||||||||||
|
| ||||||||||||||||||||||||||||
| 10,697,956 | |||||||||||||||||||||||||||||
|
| ||||||||||||||||||||||||||||
Wirelines - 6.47% | |||||||||||||||||||||||||||||
CenturyLink, Inc.: | |||||||||||||||||||||||||||||
| USD | 5.800 | % | 03/15/2022 | 641,000 | 596,931 | ||||||||||||||||||||||||
| USD | 7.650 | % | 03/15/2042 | 1,350,000 | 1,093,500 | ||||||||||||||||||||||||
Stone Harbor Investment Funds Semi-Annual Report | November 30, 2015 | 39 |
Table of Contents
| Stone Harbor High Yield Bond Fund | Statements of Investments | |
| November 30, 2015 (Unaudited) |
| Currency | Rate | Maturity Date | Principal Amount* | Market Value (Expressed in U.S. $) | |||||||||||||||||||||||||
Wirelines (continued) | |||||||||||||||||||||||||||||
Cincinnati Bell, Inc. | USD | 8.375 | % | 10/15/2020 | 1,273,000 | $ | 1,317,555 | ||||||||||||||||||||||
Citizens Communications Co. | USD | 9.000 | % | 08/15/2031 | 1,870,000 | 1,594,175 | |||||||||||||||||||||||
Cogent Communications Group, Inc. | USD | 5.375 | % | 03/01/2022 | 775,000 | 761,437 | (1) | ||||||||||||||||||||||
CyrusOne LP / CyrusOne Finance Corp.: | |||||||||||||||||||||||||||||
| USD | 6.375 | % | 11/15/2022 | 400,000 | 418,000 | (1) | |||||||||||||||||||||||
| USD | 6.375 | % | 11/15/2022 | 1,940,000 | 2,027,300 | ||||||||||||||||||||||||
Frontier Communications Corp.: | |||||||||||||||||||||||||||||
| USD | 6.250 | % | 09/15/2021 | 1,490,000 | 1,277,675 | ||||||||||||||||||||||||
| USD | 11.000 | % | 09/15/2025 | 400,000 | 393,000 | (1) | |||||||||||||||||||||||
GCI, Inc. | USD | 6.875 | % | 04/15/2025 | 1,486,000 | 1,545,440 | |||||||||||||||||||||||
Level 3 Communications, Inc. | USD | 5.750 | % | 12/01/2022 | 1,215,000 | 1,230,188 | |||||||||||||||||||||||
Level 3 Financing, Inc., Series WI | USD | 5.375 | % | 08/15/2022 | 1,865,000 | 1,884,592 | |||||||||||||||||||||||
Telecom Italia SpA | USD | 5.303 | % | 05/30/2024 | 1,233,000 | 1,258,893 | (1) | ||||||||||||||||||||||
Windstream Services LLC | USD | 7.500 | % | 04/01/2023 | 2,226,000 | 1,708,455 | |||||||||||||||||||||||
|
| ||||||||||||||||||||||||||||
| 17,107,141 | |||||||||||||||||||||||||||||
|
| ||||||||||||||||||||||||||||
TOTAL CORPORATE BONDS | 235,504,617 | ||||||||||||||||||||||||||||
|
| ||||||||||||||||||||||||||||
(Cost $253,415,029) | |||||||||||||||||||||||||||||
CONVERTIBLE CORPORATE BONDS - 0.17% | |||||||||||||||||||||||||||||
Metals/Mining/Steel - 0.17% | |||||||||||||||||||||||||||||
RTI International Metals, Inc.: | |||||||||||||||||||||||||||||
| USD | 3.000 | % | 12/01/2015 | 353,000 | 353,000 | ||||||||||||||||||||||||
| USD | 1.625 | % | 10/15/2019 | 99,400 | 102,941 | ||||||||||||||||||||||||
|
| ||||||||||||||||||||||||||||
| 455,941 | |||||||||||||||||||||||||||||
|
| ||||||||||||||||||||||||||||
TOTAL CONVERTIBLE CORPORATE BONDS | 455,941 | ||||||||||||||||||||||||||||
|
| ||||||||||||||||||||||||||||
(Cost $450,210) | |||||||||||||||||||||||||||||
BANK LOANS - 7.33%(6) | |||||||||||||||||||||||||||||
Aerospace/Defense - 0.30% | |||||||||||||||||||||||||||||
Accudyne Industries Borrower SCA (aka Hamilton Sundstrand) - Refinancing Term Loan (L+3.000) | USD | 4.000 | % | 12/13/2019 | 885,000 | 783,225 | |||||||||||||||||||||||
|
| ||||||||||||||||||||||||||||
Building Products - 0.60% | |||||||||||||||||||||||||||||
Beacon Roofing Supply, Inc. - Initial Term Loan (L+3.000) | USD | 4.000 | % | 09/25/2022 | 780,000 | 776,587 | |||||||||||||||||||||||
Summit Materials LLC - Restatement Effective | |||||||||||||||||||||||||||||
Date Term Loan (L+3.250) | USD | 4.250 | % | 06/26/2022 | 817,950 | 814,883 | |||||||||||||||||||||||
|
| ||||||||||||||||||||||||||||
| 1,591,470 | |||||||||||||||||||||||||||||
|
| ||||||||||||||||||||||||||||
Chemicals - 1.26% | |||||||||||||||||||||||||||||
Axalta Coating Systems Dutch Holding B BV - Refinanced Term B Loan (L+2.750) | USD | 3.750 | % | 02/01/2020 | 657,881 | 653,182 | |||||||||||||||||||||||
MacDermid, Inc. Term B-3 Loan | USD | L+4.500 | % | 06/05/2020 | 930,000 | 906,653 | |||||||||||||||||||||||
Styrolution Group Gmbh - Tranche B1 Term Loan (L+5.500) | USD | 6.500 | % | 10/31/2019 | 1,746,800 | 1,761,356 | |||||||||||||||||||||||
|
| ||||||||||||||||||||||||||||
| 3,321,191 | |||||||||||||||||||||||||||||
|
| ||||||||||||||||||||||||||||
Containers/Packaging - 0.34% | |||||||||||||||||||||||||||||
Berry Plastics Group, Inc. - Term F Loan (L+3.000) | USD | 4.000 | % | 09/17/2022 | 910,000 | 906,132 | |||||||||||||||||||||||
|
| ||||||||||||||||||||||||||||
| 40 | www.shiplp.com |
Table of Contents
| Stone Harbor High Yield Bond Fund | Statements of Investments | |
| November 30, 2015 (Unaudited) |
| Currency | Rate | Maturity Date | Principal Amount/Shares* | Market Value (Expressed in U.S. $) | ||||||||||||||||
Electric - 0.61% | ||||||||||||||||||||
Texas Competitive Electric Holdings Co. LLC - | USD | 4.670 | % | 10/10/2017 | 4,540,167 | $ | 1,553,591 | |||||||||||||
Texas Competitive Electric Holdings Company, | USD | 4.670 | % | 05/01/2016 | 46,597 | 46,597 | ||||||||||||||
|
| |||||||||||||||||||
| 1,600,188 | ||||||||||||||||||||
|
| |||||||||||||||||||
Food & Beverage - 0.56% | ||||||||||||||||||||
Hostess Brands LLC - Term B Loan (First Lien) (L+3.500) | USD | 4.500 | % | 07/29/2022 | 1,490,000 | 1,487,896 | ||||||||||||||
|
| |||||||||||||||||||
Industrial Other - 0.50% | ||||||||||||||||||||
Gates Global LLC - Initial Term Loan (L+3.250) | USD | 4.250 | % | 06/12/2021 | 1,429,041 | 1,326,508 | ||||||||||||||
|
| |||||||||||||||||||
Lodging - 0.48% | ||||||||||||||||||||
La Quinta Intermediate Holdings LLC - Initial | USD | 3.750 | % | 02/10/2021 | 1,287,334 | 1,268,829 | ||||||||||||||
|
| |||||||||||||||||||
Media Other - 0.57% | ||||||||||||||||||||
Univision Communications, Inc. - Replacement | USD | 4.000 | % | 03/01/2020 | 1,522,788 | 1,505,300 | ||||||||||||||
|
| |||||||||||||||||||
Retail Food/Drug - 1.01% | ||||||||||||||||||||
Albertson’s Holdings LLC - Term B-4 Loan (L+4.500) | USD | 5.500 | % | 08/08/2021 | 2,652,937 | 2,654,136 | ||||||||||||||
|
| |||||||||||||||||||
Services Other - 0.31% | ||||||||||||||||||||
HD Supply, Inc. - Incremental Term Loan | USD | L+2.750 | % | 08/13/2021 | 830,000 | 824,640 | ||||||||||||||
|
| |||||||||||||||||||
Technology - 0.79% | ||||||||||||||||||||
Avago Technologies Cayman Finance Ltd. - Term B Loan | USD | L+3.500 | % | 11/11/2022 | 1,440,000 | 1,426,500 | ||||||||||||||
MA Financeco. - LLC - Initial Tranche B Term Loan (L+4.250) | USD | 5.250 | % | 10/07/2021 | 666,788 | 665,419 | ||||||||||||||
|
| |||||||||||||||||||
| 2,091,919 | ||||||||||||||||||||
|
| |||||||||||||||||||
TOTAL BANK LOANS | 19,361,434 | |||||||||||||||||||
|
| |||||||||||||||||||
(Cost $21,690,159) | ||||||||||||||||||||
COMMON/PREFERRED STOCKS - 0.05% | ||||||||||||||||||||
EME Reorganization Trust | USD | 3,059,892 | 12,240 | |||||||||||||||||
NRG Energy, Inc. | USD | 10,061 | 124,354 | |||||||||||||||||
|
| |||||||||||||||||||
| 136,594 | ||||||||||||||||||||
|
| |||||||||||||||||||
TOTAL COMMON/PREFERRED STOCKS | 136,594 | |||||||||||||||||||
|
| |||||||||||||||||||
(Cost $764,841) | ||||||||||||||||||||
Stone Harbor Investment Funds Semi-Annual Report | November 30, 2015 | 41 |
Table of Contents
| Stone Harbor High Yield Bond Fund | Statements of Investments | |
| November 30, 2015 (Unaudited) |
| Currency | Rate | Maturity Date | Principal Amount/Shares* | Market Value (Expressed in U.S. $) | ||||||||||||||||
SHORT TERM INVESTMENTS - 2.84% | ||||||||||||||||||||
Money Market Mutual Funds - 2.84% | ||||||||||||||||||||
Dreyfus Institutional Cash Advantage Fund - Institutional Advantage Class (7-Day Yield) | USD | 0.11517 | % | N/A | 7,513,195 | $ | 7,513,195 | |||||||||||||
|
| |||||||||||||||||||
TOTAL SHORT TERM INVESTMENTS | ||||||||||||||||||||
(Cost $7,513,195) | 7,513,195 | |||||||||||||||||||
|
| |||||||||||||||||||
Total Investments - 99.52% (Cost $283,833,434) | 262,971,781 | |||||||||||||||||||
Other Assets in Excess of Liabilities - 0.48% | 1,265,967 | |||||||||||||||||||
|
| |||||||||||||||||||
Net Assets - 100.00% | $ | 264,237,748 | ||||||||||||||||||
|
| |||||||||||||||||||
| * | The principal amount/shares of each security is stated in the currency in which the security is denominated. |
Currency Abbreviations:
EUR - Euro Currency
GBP - Great British Pound
USD - United States Dollar
| (1) | Security exempt from registration under Rule 144A of the Securities Act of 1933. Such securities may normally be sold to qualified institutional buyers in transactions exempt from registration. Total market value of Rule 144A securities amounts to $82,826,352, which represents approximately 31.35% of net assets as of November 30, 2015. |
| (2) | Payment-in-kind securities. |
| (3) | Securities were originally issued pursuant to Regulation S under the Securities Act of 1933, which exempts securities offered and sold outside of the United States from registration. Such securities cannot be sold in the United States without either an effective registration statement filed pursuant to the Securities Act of 1933, or pursuant to an exemption from registration. As of November 30, 2015, the aggregate market value of those securities was $6,817,992, which represents approximately 2.58% of net assets. |
| (4) | Security is in default and therefore is non-income producing. |
| (5) | Floating or variable rate security. Interest rate disclosed is that which is in effect as of November 30, 2015. |
| (6) | Bank loans generally pay interest at rates which are periodically determined by reference to a base lending rate plus a premium. All loans carry a variable rate of interest. These base lending rates are generally (i) the Prime Rate offered by one or more major United States banks, (ii) the lending rate offered by one or more European banks such as the London Interbank Offered Rate (“LIBOR”) or (iii) the Certificate of Deposit rate. Bank Loans, while exempt from registration, under the Securities Act of 1933, contain certain restrictions on resale and cannot be sold publicly. Floating rate bank loans often require prepayments from excess cash flow or permit the borrower to repay at its election. The degree to which borrowers repay, whether as a contractual requirement or at their election, cannot be predicted with accuracy. |
Common Abbreviations:
BV | - | Besloten Vennootschap is the Dutch term for private limited liability company. | ||||
GmbH | - | Gesellschaft mit beschrankter Haftung is the German term for a company with limited liability. | ||||
KG | - | A Kommanditgesellschaft is the German name for a limited partnership business entity. | ||||
LLC | - | Limited Liability Corporation. | ||||
L | - | LIBOR (London Interbank Offered Rate). | ||||
LP | - | Limited Partnership. | ||||
Ltd. | - | Limited. | ||||
NV | - | Naamloze Vennootshap is the Dutch term for a Public Limited Liability Corporation. | ||||
PLC | - | Public Limited Company. | ||||
SA | - | Generally designates corporations in various countries, mostly those employing the civil law. | ||||
SAS | - | Société par actions simplifiée (French: Joint Stock Company). | ||||
SCA | - | Société en commandite par actions is a term from Luxembourg meaning partnership by limited shares. | ||||
SpA | - | Società per Azioni is the Italian term for Limited share company. |
| 42 | www.shiplp.com |
Table of Contents
| Stone Harbor High Yield Bond Fund | Statements of Investments | |
| November 30, 2015 (Unaudited) |
OUTSTANDING FORWARD FOREIGN CURRENCY CONTRACTS
Counterparty | Foreign Currency | Contracted Amount** | Purchase/Sale Contract | Settlement Date | | Current Value | | | Unrealized Appreciation/ (Depreciation) | | ||||||
J.P. Morgan Chase | EUR | 2,270,000 | Sale | 12/08/2015 | $ | 2,399,072 | $ | 106,667 | ||||||||
J.P. Morgan Chase | GBP | 3,050,105 | Sale | 12/08/2015 | 4,593,990 | 111,074 | ||||||||||
|
| |||||||||||||||
| $ | 217,741 | |||||||||||||||
|
| |||||||||||||||
J.P. Morgan Chase | EUR | 64,306 | Purchase | 12/08/2015 | $ | 67,962 | $ | (957) | ||||||||
J.P. Morgan Chase | GBP | 18,574 | Purchase | 12/08/2015 | 27,976 | (662) | ||||||||||
|
| |||||||||||||||
| $ | (1,619) | |||||||||||||||
|
|
| ** | The contracted amount is stated in the currency in which the contract is denominated. |
See Notes to Financial Statements.
Stone Harbor Investment Funds Semi-Annual Report | November 30, 2015 | 43 |
Table of Contents
| Stone Harbor Local Markets Fund | Statements of Investments | |
| November 30, 2015 (Unaudited) |
| Maturity | Principal | Market Value | ||||||||||||||||
Currency | Rate | Date | Amount* | Expressed (in U.S. $) | ||||||||||||||
SOVEREIGN DEBT OBLIGATIONS - 72.88% | ||||||||||||||||||
Brazil - 12.40% | ||||||||||||||||||
Brazil Letras do Tesouro Nacional: | ||||||||||||||||||
| BRL | 0.000 | % | 01/01/2018 | 144,848,000 | $ | 27,449,613(1) | ||||||||||||
| BRL | 0.000 | % | 07/01/2018 | 159,815,000 | 28,100,839(1) | |||||||||||||
| BRL | 0.000 | % | 01/01/2019 | 142,272,000 | 23,214,348(1) | |||||||||||||
| BRL | 0.000 | % | 07/01/2019 | 34,450,000 | 5,230,274(1) | |||||||||||||
Nota Do Tesouro Nacional: | ||||||||||||||||||
| BRL | 10.000 | % | 01/01/2017 | 43,368,000 | 10,617,036 | |||||||||||||
| BRL | 10.000 | % | 01/01/2021 | 48,528,000 | 10,156,891 | |||||||||||||
| BRL | 10.000 | % | 01/01/2023 | 18,412,000 | 3,655,180 | |||||||||||||
| BRL | 10.000 | % | 01/01/2025 | 64,732,000 | 12,315,312 | |||||||||||||
|
| |||||||||||||||||
| 120,739,493 | ||||||||||||||||||
|
| |||||||||||||||||
Colombia - 6.51% | ||||||||||||||||||
Bogota Distrio Capital | COP | 9.750 | % | 07/26/2028 | 65,141,000,000 | 22,554,704(2) | ||||||||||||
International Bank for Reconstruction & Development Republic of Colombia: | COP | 8.000 | % | 03/02/2020 | 1,020,000,000 | 346,456 | ||||||||||||
| COP | 7.750 | % | 04/14/2021 | 20,892,000,000 | 6,783,024 | |||||||||||||
| COP | 4.375 | % | 03/21/2023 | 18,986,000,000 | 5,048,201 | |||||||||||||
| COP | 10.000 | % | 07/24/2024 | 13,121,100,000 | 4,640,307 | |||||||||||||
| COP | 9.850 | % | 06/28/2027 | 39,589,000,000 | 14,447,732 | |||||||||||||
| COP | 7.750 | % | 09/18/2030 | 33,182,000,000 | 9,545,338 | |||||||||||||
|
| |||||||||||||||||
| 63,365,762 | ||||||||||||||||||
|
| |||||||||||||||||
Indonesia - 11.87% | ||||||||||||||||||
European Bank for Reconstruction & Development Indonesia Government: | IDR | 7.200 | % | 06/08/2016 | 37,740,000,000 | 2,693,084 | ||||||||||||
| IDR | 11.000 | % | 09/15/2025 | 109,942,000,000 | 9,106,829 | |||||||||||||
| IDR | 6.125 | % | 05/15/2028 | 149,010,000,000 | 8,630,410 | |||||||||||||
| IDR | 8.250 | % | 06/15/2032 | 232,400,000,000 | 15,935,400 | |||||||||||||
| IDR | 6.625 | % | 05/15/2033 | 220,002,000,000 | 12,800,984 | |||||||||||||
| IDR | 8.375 | % | 03/15/2034 | 141,460,000,000 | 9,828,888 | |||||||||||||
Republic of Indonesia: | ||||||||||||||||||
| IDR | 12.800 | % | 06/15/2021 | 2,980,000,000 | 254,975 | |||||||||||||
| IDR | 7.000 | % | 05/15/2022 | 383,170,000,000 | 25,537,096 | |||||||||||||
| IDR | 5.625 | % | 05/15/2023 | 36,052,000,000 | 2,182,169 | |||||||||||||
| IDR | 8.375 | % | 03/15/2024 | 84,775,000,000 | 6,057,966 | |||||||||||||
| IDR | 9.000 | % | 03/15/2029 | 305,160,000,000 | 22,567,282 | |||||||||||||
|
| |||||||||||||||||
| 115,595,083 | ||||||||||||||||||
|
| |||||||||||||||||
Malaysia - 4.86% | ||||||||||||||||||
Malaysian Government: | ||||||||||||||||||
| MYR | 3.418 | % | 08/15/2022 | 34,450,000 | 7,736,142 | |||||||||||||
| MYR | 3.480 | % | 03/15/2023 | 72,280,000 | 16,179,922 | |||||||||||||
| MYR | 4.181 | % | 07/15/2024 | 54,930,000 | 12,849,923 | |||||||||||||
| MYR | 4.392 | % | 04/15/2026 | 16,370,000 | 3,854,517 | |||||||||||||
| MYR | 4.498 | % | 04/15/2030 | 11,870,000 | 2,793,453 | |||||||||||||
| MYR | 3.844 | % | 04/15/2033 | 18,480,000 | 3,935,364 | |||||||||||||
|
| |||||||||||||||||
| 47,349,321 | ||||||||||||||||||
|
| |||||||||||||||||
Mexico - 4.75% | ||||||||||||||||||
Mexican Bonos: | ||||||||||||||||||
| MXN | 10.000 | % | 12/05/2024 | 69,343,400 | 5,323,860 | |||||||||||||
| MXN | 8.500 | % | 05/31/2029 | 58,535,000 | 4,168,020 | |||||||||||||
| MXN | 7.750 | % | 05/29/2031 | 209,386,000 | 14,030,296 | |||||||||||||
| 44 | www.shiplp.com |
Table of Contents
| Stone Harbor Local Markets Fund | Statements of Investments | |
| November 30, 2015 (Unaudited) |
| Maturity | Principal | Market Value | ||||||||||||||||
Currency | Rate | Date | Amount* | Expressed (in U.S. $) | ||||||||||||||
Mexico (continued) | ||||||||||||||||||
Mexican Bonos: (continued) | ||||||||||||||||||
| MXN | 8.500 | % | 11/18/2038 | 142,092,000 | $ | 10,219,821 | ||||||||||||
| MXN | 7.750 | % | 11/13/2042 | 186,513,000 | 12,471,147 | |||||||||||||
|
| |||||||||||||||||
| 46,213,144 | ||||||||||||||||||
|
| |||||||||||||||||
Peru - 0.11% | ||||||||||||||||||
Republic of Peru | PEN | 5.200 | % | 09/12/2023 | 3,930,000 | 1,070,856(2) | ||||||||||||
|
| |||||||||||||||||
Poland - 4.81% | ||||||||||||||||||
Republic of Poland: | ||||||||||||||||||
| PLN | 3.000 | % | 08/24/2016 | 15,792,941 | 3,969,095 | |||||||||||||
| PLN | 2.750 | % | 08/25/2023 | 16,331,587 | 4,485,978 | |||||||||||||
| PLN | 3.250 | % | 07/25/2025 | 130,885,000 | 33,975,913 | |||||||||||||
| PLN | 2.500 | % | 07/25/2026 | 18,470,000 | 4,428,906 | |||||||||||||
|
| |||||||||||||||||
| 46,859,892 | ||||||||||||||||||
|
| |||||||||||||||||
Romania - 0.12% | ||||||||||||||||||
Romania Government | RON | 5.950 | % | 06/11/2021 | 4,060,000 | 1,125,658 | ||||||||||||
|
| |||||||||||||||||
Russia - 8.38% | ||||||||||||||||||
Russian Federation: | ||||||||||||||||||
| RUB | 7.400 | % | 06/14/2017 | 276,636,000 | 4,017,502 | |||||||||||||
| RUB | 7.850 | % | 03/10/2018 | 500,000,000 | 7,205,882(2) | |||||||||||||
| RUB | 6.800 | % | 12/11/2019 | 467,990,000 | 6,342,253 | |||||||||||||
| EUR | 3.625 | % | 09/16/2020 | 4,800,000 | 5,229,921(2) | |||||||||||||
| RUB | 7.600 | % | 04/14/2021 | 715,870,000 | 9,847,261 | |||||||||||||
| RUB | 6.500 | % | 11/24/2021 | 288,490,000 | 3,785,615(3) | |||||||||||||
| RUB | 7.600 | % | 07/20/2022 | 1,143,582,000 | 15,489,327 | |||||||||||||
| RUB | 7.000 | % | 01/25/2023 | 679,600,000 | 8,897,327 | |||||||||||||
| RUB | 7.000 | % | 08/16/2023 | 554,690,000 | 7,199,257 | |||||||||||||
| RUB | 8.150 | % | 02/03/2027 | 376,180,000 | 5,205,838 | |||||||||||||
| RUB | 7.050 | % | 01/19/2028 | 666,980,000 | 8,408,274 | |||||||||||||
|
| |||||||||||||||||
| 81,628,457 | ||||||||||||||||||
|
| |||||||||||||||||
South Africa - 4.76% | ||||||||||||||||||
Republic of South Africa: | ||||||||||||||||||
| ZAR | 7.000 | % | 02/28/2031 | 205,994,000 | 11,858,925 | |||||||||||||
| ZAR | 6.250 | % | 03/31/2036 | 304,170,000 | 15,458,181 | |||||||||||||
| ZAR | 6.500 | % | 02/28/2041 | 234,390,000 | 11,933,986 | |||||||||||||
| ZAR | 8.750 | % | 02/28/2048 | 107,519,000 | 7,042,479 | |||||||||||||
|
| |||||||||||||||||
| 46,293,571 | ||||||||||||||||||
|
| |||||||||||||||||
Thailand - 3.13% | ||||||||||||||||||
Thailand Government: | ||||||||||||||||||
| THB | 1.200 | % | 07/14/2021 | 453,639,563 | 12,059,332 | |||||||||||||
| THB | 3.625 | % | 06/16/2023 | 83,235,000 | 2,484,769 | |||||||||||||
| THB | 3.580 | % | 12/17/2027 | 261,770,000 | 7,835,050 | |||||||||||||
| THB | 4.875 | % | 06/22/2029 | 132,351,000 | 4,482,017 | |||||||||||||
| THB | 4.675 | % | 06/29/2044 | 109,231,000 | 3,622,036 | |||||||||||||
|
| |||||||||||||||||
| 30,483,204 | ||||||||||||||||||
|
| |||||||||||||||||
Turkey - 10.04% | ||||||||||||||||||
Republic of Turkey: | ||||||||||||||||||
| TRY | 8.200 | % | 07/13/2016 | 23,153,000 | 7,836,216 | |||||||||||||
| TRY | 9.000 | % | 03/08/2017 | 26,580,000 | 8,976,937 | |||||||||||||
| TRY | 10.400 | % | 03/27/2019 | 8,400,000 | 2,894,334 | |||||||||||||
Stone Harbor Investment Funds Semi-Annual Report | November 30, 2015 | 45 |
Table of Contents
| Stone Harbor Local Markets Fund | Statements of Investments | |
| November 30, 2015 (Unaudited) |
Counterparty | Currency | Rate | Maturity | Principal | Market Value | |||||||||||||||||
Turkey (continued) | ||||||||||||||||||||||
Republic of Turkey: (continued) | ||||||||||||||||||||||
| TRY | 10.500 | % | 01/15/2020 | 43,700,000 | $ | 15,217,935 | ||||||||||||||||
| TRY | 9.500 | % | 01/12/2022 | 63,490,000 | 21,139,724 | |||||||||||||||||
| TRY | 8.500 | % | 09/14/2022 | 51,360,000 | 16,228,755 | |||||||||||||||||
| TRY | 7.100 | % | 03/08/2023 | 32,760,000 | 9,535,907 | |||||||||||||||||
| TRY | 10.400 | % | 03/20/2024 | 25,200,000 | 8,788,103 | |||||||||||||||||
| TRY | 9.000 | % | 07/24/2024 | 22,150,000 | 7,120,390 | |||||||||||||||||
|
| |||||||||||||||||||||
| 97,738,301 | ||||||||||||||||||||||
|
| |||||||||||||||||||||
Venezuela - 1.14% | ||||||||||||||||||||||
Republic of Venezuela | USD | 5.750 | % | 02/26/2016 | 12,069,500 | 11,103,940(2) | ||||||||||||||||
|
| |||||||||||||||||||||
TOTAL SOVEREIGN DEBT OBLIGATIONS |
| 709,566,682 | ||||||||||||||||||||
|
| |||||||||||||||||||||
(Cost $958,371,453) | ||||||||||||||||||||||
CORPORATE BONDS - 4.21% | ||||||||||||||||||||||
Colombia - 1.15% | ||||||||||||||||||||||
Emgesa SA ESP: | COP | |||||||||||||||||||||
| COP | 8.750 | % | 01/25/2021 | 616,000,000 | 199,199(4) | |||||||||||||||||
| 8.750 | % | 01/25/2021 | 16,739,000,000 | 5,412,974(2) | ||||||||||||||||||
Empresas Publicas de Medellin ESP: |
| |||||||||||||||||||||
| COP | 8.375 | % | 02/01/2021 | 776,000,000 | 247,261(4) | |||||||||||||||||
| COP | 8.375 | % | 02/01/2021 | 3,338,000,000 | 1,063,604(2) | |||||||||||||||||
| COP | 7.625 | % | 09/10/2024 | 9,444,000,000 | 2,627,970(4) | |||||||||||||||||
Financiera de Desarrollo Territorial SA Findeter |
| COP | 7.875 | % | 08/12/2024 | 5,687,000,000 | 1,630,892(4) | |||||||||||||||
|
| |||||||||||||||||||||
| 11,181,900 | ||||||||||||||||||||||
|
| |||||||||||||||||||||
Mexico - 2.26% | ||||||||||||||||||||||
America Movil SAB de CV | MXN | 6.000 | % | 06/09/2019 | 242,900,000 | 14,704,254 | ||||||||||||||||
Petroleos Mexicanos: | ||||||||||||||||||||||
| MXN | 7.650 | % | 11/24/2021 | 91,160,000 | 5,534,634(4) | |||||||||||||||||
| MXN | 7.470 | % | 11/12/2026 | 31,840,000 | 1,745,344 | |||||||||||||||||
|
| |||||||||||||||||||||
| 21,984,232 | ||||||||||||||||||||||
|
| |||||||||||||||||||||
Venezuela - 0.80% | ||||||||||||||||||||||
Petroleos de Venezuela SA | USD | 8.500 | % | 11/02/2017 | 12,422,800 | 7,798,413(2) | ||||||||||||||||
|
| |||||||||||||||||||||
TOTAL CORPORATE BONDS | 40,964,545 | |||||||||||||||||||||
|
| |||||||||||||||||||||
(Cost $57,021,082) | ||||||||||||||||||||||
CREDIT LINKED NOTES - 0.22% | ||||||||||||||||||||||
Colombia - 0.22% | ||||||||||||||||||||||
Titulos de Tesoreria - Series B | Citigroup Global Markets | COP | 10.000 | % | 07/24/2024 | 6,000,000,000 | 2,123,457 | |||||||||||||||
|
| |||||||||||||||||||||
TOTAL CREDIT LINKED NOTES | 2,123,457 | |||||||||||||||||||||
|
| |||||||||||||||||||||
(Cost $4,039,864) | ||||||||||||||||||||||
| 46 | www.shiplp.com |
Table of Contents
| Stone Harbor Local Markets Fund | Statements of Investments | |
| November 30, 2015 (Unaudited) |
Currency | Rate | Maturity | Principal | Market Value | ||||||||||||||
SHORT TERM INVESTMENTS - 0.77% | ||||||||||||||||||
Money Market Mutual Funds - 0.77% | ||||||||||||||||||
Dreyfus Institutional Cash Advantage Fund - Institutional Advantage Class (7-Day Yield) | USD | 0.11517 | % | N/A | 7,511,076 | $ | 7,511,076 | |||||||||||
|
| |||||||||||||||||
TOTAL SHORT TERM INVESTMENTS | 7,511,076 | |||||||||||||||||
|
| |||||||||||||||||
(Cost $7,511,076) | ||||||||||||||||||
Total Investments - 78.08% | 760,165,760 | |||||||||||||||||
(Cost $1,026,943,475) | ||||||||||||||||||
Other Assets In Excess of Liabilities - 21.92% | 213,417,703(5) | |||||||||||||||||
|
| |||||||||||||||||
Net Assets - 100.00% | $ | 973,583,463 | ||||||||||||||||
|
| |||||||||||||||||
| * | The principal amount/shares of each security is stated in the currency in which the security is denominated. |
Currency Abbreviations:
BRL | - | Brazilian Real | ||
COP | - | Colombian Peso | ||
EUR | - | Euro Currency | ||
IDR | - | Indonesian Rupiah | ||
INR | - | Indian Rupee | ||
MXN | - | Mexican Peso | ||
MYR | - | Malaysian Ringgit | ||
PEN | - | Peruvian Nuevo Sol | ||
PLN | - | Polish Zloty | ||
RON | - | Romanian Leu | ||
RUB | - | Russian Ruble | ||
THB | - | Thai Baht | ||
TRY | - | Turkish Lira | ||
USD | - | United States Dollar | ||
ZAR | - | South African Rand |
| (1) | Issued with a zero coupon. Income is recognized through the accretion of discount. |
| (2) | Securities were originally issued pursuant to Regulation S under the Securities Act of 1933, which exempts securities offered and sold outside of the United States from registration. Such securities cannot be sold in the United States without either an effective registration statement filed pursuant to the Securities Act of 1933, or pursuant to an exemption from registration. As of November 30, 2015, the aggregate market value of those securities was $61,440,294, which represents approximately 6.31% of net assets. |
| (3) | Step bond. Coupon changes periodically based upon a predetermined schedule. Interest rate disclosed is that which is in effect as of November30, 2015. |
| (4) | Security exempt from registration under Rule 144A of the Securities Act of 1933. Such securities may normally be sold to qualified institutional buyers in transactions exempt from registration. Total market value of Rule 144A securities amounts to $10,239,956, which represents approximately 1.05% of net assets as of November 30, 2015. |
| (5) | Includes cash which is being held as collateral for foward foreign currency contracts. |
Common Abbreviations:
ESP | - | Empresa de Servicios Publicos is the Colombian term for Public Service Company. | ||
SA | - | Generally designates corporations in various countries mostly employing civil law. | ||
SAB de CV | - | A Variable Capital Company. |
Stone Harbor Investment Funds Semi-Annual Report | November 30, 2015 | 47 |
Table of Contents
| Stone Harbor Local Markets Fund | Statements of Investments | |
| November 30, 2015 (Unaudited) |
OUTSTANDING FORWARD FOREIGN CURRENCY CONTRACTS
| Counterparty | Foreign Currency | Contracted Amount** | Purchase/Sale Contract | Settlement Date | Current Value | Unrealized Appreciation/ (Depreciation) | ||||||||||
Citigroup Global Markets | BRL | 3,547,757 | Sale | 01/05/2016 | $ | 906,219 | $ | 38,992 | ||||||||
Citigroup Global Markets | COP | 8,753,998,740 | Sale | 12/14/2015 | 2,782,269 | 102,080 | ||||||||||
Citigroup Global Markets | EUR | 8,878,000 | Sale | 12/18/2015 | 9,386,248 | 90,763 | ||||||||||
Citigroup Global Markets | EUR | 3,470,080 | Sale | 01/08/2016 | 3,670,817 | 57,455 | ||||||||||
Citigroup Global Markets | IDR | 149,535,900,000 | Sale | 12/14/2015 | 10,772,186 | 28,529 | ||||||||||
Citigroup Global Markets | IDR | 56,240,000,000 | Sale | 03/17/2016 | 3,959,448 | 40,552 | ||||||||||
Citigroup Global Markets | IDR | 148,174,500,000 | Purchase | 03/17/2016 | 10,431,885 | 847,506 | ||||||||||
Citigroup Global Markets | MXN | 182,674,000 | Purchase | 12/17/2015 | 11,005,165 | 117,455 | ||||||||||
Citigroup Global Markets | PLN | 13,600,000 | Sale | 12/04/2015 | 3,365,034 | 43,744 | ||||||||||
Citigroup Global Markets | RUB | 1,678,687,976 | Sale | 01/15/2016 | 24,966,266 | 122,480 | ||||||||||
Citigroup Global Markets | ZAR | 733,686,931 | Purchase | 12/10/2015 | 50,649,515 | 6,759 | ||||||||||
Citigroup Global Markets | ZAR | 93,490,318 | Sale | 12/23/2015 | 6,436,952 | 143,907 | ||||||||||
J.P. Morgan Chase & Co. | BRL | 76,221,489 | Sale | 01/05/2016 | 19,469,588 | 822,593 | ||||||||||
J.P. Morgan Chase & Co. | PLN | 13,087,792 | Sale | 12/04/2015 | 3,238,299 | 56,797 | ||||||||||
J.P. Morgan Chase & Co. | PLN | 70,928,210 | Purchase | 12/09/2015 | 17,548,200 | 48,672 | ||||||||||
|
| |||||||||||||||
| $ | 2,568,284 | |||||||||||||||
|
| |||||||||||||||
| 48 | www.shiplp.com |
Table of Contents
| Stone Harbor Local Markets Fund | Statements of Investments | |
| November 30, 2015 (Unaudited) |
| Counterparty | Foreign Currency | Contracted Amount** | Purchase/Sale Contract | Settlement Date | Current Value | Appreciation/ (Depreciation) | ||||||||||
Citigroup Global Markets | BRL | 44,715,923 | Purchase | 12/02/2015 | $ | 11,549,940 | $ | (194,400) | ||||||||
Citigroup Global Markets | BRL | 44,715,923 | Sale | 12/02/2015 | 11,549,940 | (230,886) | ||||||||||
Citigroup Global Markets | COP | 3,171,180,000 | Purchase | 12/21/2015 | 1,007,610 | (12,390) | ||||||||||
Citigroup Global Markets | EUR | 12,173,000 | Purchase | 12/18/2015 | 12,869,881 | (114,267) | ||||||||||
Citigroup Global Markets | MXN | 892,447,840 | Purchase | 12/09/2015 | 53,796,918 | (4,865) | ||||||||||
Citigroup Global Markets | MXN | 8,766,071 | Sale | 12/17/2015 | 528,110 | (6,110) | ||||||||||
Citigroup Global Markets | MYR | 20,404,876 | Purchase | 12/09/2015 | 4,782,170 | (13,335) | ||||||||||
Citigroup Global Markets | MYR | 23,697,235 | Sale | 12/14/2015 | 5,551,710 | (164,750) | ||||||||||
Citigroup Global Markets | PEN | 30,551,435 | Purchase | 01/08/2016 | 8,999,348 | (58,842) | ||||||||||
Citigroup Global Markets | PLN | 51,746,760 | Purchase | 12/04/2015 | 12,803,646 | (562,775) | ||||||||||
Citigroup Global Markets | PLN | 183,500,510 | Purchase | 12/09/2015 | 45,399,477 | (11,887) | ||||||||||
Citigroup Global Markets | RON | 51,670,234 | Purchase | 12/04/2015 | 12,249,149 | (563,506) | ||||||||||
Citigroup Global Markets | ZAR | 22,530,000 | Purchase | 12/23/2015 | 1,551,225 | (44,181) | ||||||||||
Goldman Sachs & Co. | INR | 1,365,128,517 | Purchase | 12/18/2015 | 20,411,611 | (108,923) | ||||||||||
J.P. Morgan Chase & Co. | BRL | 76,221,489 | Sale | 12/02/2015 | 19,687,699 | (415,027) | ||||||||||
J.P. Morgan Chase & Co. | BRL | 76,221,489 | Purchase | 12/02/2015 | 19,687,699 | (801,949) | ||||||||||
J.P. Morgan Chase & Co. | MYR | 8,409,629 | Purchase | 12/09/2015 | 1,970,915 | (6,425) | ||||||||||
J.P. Morgan Chase & Co. | PLN | 13,087,792 | Purchase | 12/04/2015 | 3,238,299 | (143,232) | ||||||||||
J.P. Morgan Chase & Co. | RON | 111,804,725 | Purchase | 12/04/2015 | 26,504,867 | (1,222,416) | ||||||||||
|
| |||||||||||||||
| $ | (4,680,166) | |||||||||||||||
|
| |||||||||||||||
| ** | The contracted amount is stated in the currency in which the contract is denominated. |
See Notes to Financial Statements.
Stone Harbor Investment Funds Semi-Annual Report | November 30, 2015 | 49 |
Table of Contents
| Stone Harbor Emerging Markets Corporate Debt Fund | Statements of Investments | |
| November 30, 2015 (Unaudited) |
Currency | Rate | Maturity Date | Principal | Market Value | ||||||||||||
CORPORATE BONDS - 98.35% | ||||||||||||||||
Angola - 1.09% | ||||||||||||||||
Puma International Financing SA | USD | 6.750 | % | 02/01/2021 | 455,000 | $ | 457,275(1) | |||||||||
|
| |||||||||||||||
Argentina - 1.36% | ||||||||||||||||
YPF SA: | ||||||||||||||||
| USD | 8.875 | % | 12/19/2018 | 106,000 | 109,842(1) | |||||||||||
| USD | 8.750 | % | 04/04/2024 | 465,000 | 459,769(1) | |||||||||||
|
| |||||||||||||||
| 569,611 | ||||||||||||||||
|
| |||||||||||||||
Brazil - 7.36% | ||||||||||||||||
Braskem America Finance Co. | USD | 7.125 | % | 07/22/2041 | 162,000 | 131,625(1) | ||||||||||
Braskem Finance Ltd. | USD | 5.750 | % | 04/15/2021 | 86,000 | 81,915(2) | ||||||||||
Cia Brasileira de Aluminio | USD | 4.750 | % | 06/17/2024 | 312,000 | 272,220(1) | ||||||||||
CIMPOR Financial Operations BV | USD | 5.750 | % | 07/17/2024 | 93,000 | 61,840(1) | ||||||||||
Cosan Luxembourg SA | USD | 5.000 | % | 03/14/2023 | 200,000 | 176,000(1) | ||||||||||
ESAL GmbH | USD | 6.250 | % | 02/05/2023 | 362,000 | 349,330(1) | ||||||||||
GTL Trade Finance, Inc. | USD | 5.893 | % | 04/29/2024 | 133,000 | 108,727(1) | ||||||||||
Itau Unibanco Holding SA | USD | 5.650 | % | 03/19/2022 | 286,000 | 275,632(1) | ||||||||||
Marfrig Overseas Ltd. | USD | 9.500 | % | 05/04/2020 | 217,000 | 221,340(2) | ||||||||||
Minerva Luxembourg SA | USD | 7.750 | % | 01/31/2023 | 426,000 | 425,489(1) | ||||||||||
Petrobras Global Finance BV: | ||||||||||||||||
| USD | 2.000 | % | 05/20/2016 | 219,000 | 215,835 | |||||||||||
| USD | 5.375 | % | 01/27/2021 | 444,000 | 352,492 | |||||||||||
QGOG Atlantic/Alaskan Rigs Ltd. | USD | 5.250 | % | 07/30/2018 | 45,719 | 34,747(1) | ||||||||||
Samarco Mineracao SA: | ||||||||||||||||
| USD | 4.125 | % | 11/01/2022 | 239,000 | 87,833(1) | |||||||||||
| USD | 5.750 | % | 10/24/2023 | 184,000 | 64,400(1) | |||||||||||
Vale Overseas Ltd.: | ||||||||||||||||
| USD | 4.625 | % | 09/15/2020 | 225,000 | 206,118 | |||||||||||
| USD | 6.875 | % | 11/10/2039 | 19,000 | 14,084 | |||||||||||
|
| |||||||||||||||
| 3,079,627 | ||||||||||||||||
|
| |||||||||||||||
Canada - 0.95% | ||||||||||||||||
Harvest Operations Corp. | USD | 2.125 | % | 05/14/2018 | 400,000 | 399,412(2) | ||||||||||
|
| |||||||||||||||
Chile - 3.95% | ||||||||||||||||
Cencosud SA: | ||||||||||||||||
| USD | 4.875 | % | 01/20/2023 | 183,000 | 178,654(1) | |||||||||||
| USD | 6.625 | % | 02/12/2045 | 194,000 | 177,025(1) | |||||||||||
Empresa Electrica Angamos SA | USD | 4.875 | % | 05/25/2029 | 349,000 | 313,646(1) | ||||||||||
Empresa Nacional de Electricidad SA | USD | 4.250 | % | 04/15/2024 | 133,000 | 133,665 | ||||||||||
Empresa Nacional de Telecomunicaciones SA | USD | 4.875 | % | 10/30/2024 | 290,000 | 284,925(1) | ||||||||||
GeoPark Latin America Ltd. Agencia en Chile | USD | 7.500 | % | 02/11/2020 | 206,000 | 146,030(1) | ||||||||||
VTR Finance BV | USD | 6.875 | % | 01/15/2024 | 436,000 | 419,999(1) | ||||||||||
|
| |||||||||||||||
| 1,653,944 | ||||||||||||||||
|
| |||||||||||||||
China - 7.66% | ||||||||||||||||
China Life Insurance | USD | 4.000 | % | 07/03/2075 | 700,000 | 689,500(3) | ||||||||||
China Overseas Finance Cayman V Ltd. | USD | 3.950 | % | 11/15/2022 | 500,000 | 499,490 | ||||||||||
CITIC Ltd.: | ||||||||||||||||
| USD | 6.800 | % | 01/17/2023 | 425,000 | 494,920 | |||||||||||
| USD | 8.625 | % | Perpetual | 500,000 | 568,176(3) | |||||||||||
| 50 | www.shiplp.com |
Table of Contents
| Stone Harbor Emerging Markets Corporate Debt Fund | Statements of Investments | |
| November 30, 2015 (Unaudited) |
Currency | Rate | Maturity Date | Principal | Market Value | ||||||||||||
China (continued) | ||||||||||||||||
Industrial & Commercial Bank of China Ltd. | USD | 6.000 | % | Perpetual | 200,000 | $ | 212,000(2)(3) | |||||||||
Lenovo Group Ltd. | USD | 4.700 | % | 05/08/2019 | 350,000 | 363,631 | ||||||||||
Longfor Properties Co. Ltd. | USD | 6.875 | % | 10/18/2019 | 358,000 | 378,413 | ||||||||||
|
| |||||||||||||||
| 3,206,130 | ||||||||||||||||
|
| |||||||||||||||
Colombia - 5.13% | ||||||||||||||||
Bancolombia SA | USD | 5.125 | % | 09/11/2022 | 300,000 | 294,750 | ||||||||||
Ecopetrol SA: | ||||||||||||||||
| USD | 5.875 | % | 09/18/2023 | 327,000 | 323,730 | |||||||||||
| USD | 5.375 | % | 06/26/2026 | 278,000 | 252,980 | |||||||||||
Empresa de Energia de Bogota SA ESP | USD | 6.125 | % | 11/10/2021 | 146,000 | 151,840(1) | ||||||||||
Grupo Aval Ltd. | USD | 4.750 | % | 09/26/2022 | 237,000 | 222,187(1) | ||||||||||
GrupoSura Finance SA | USD | 5.700 | % | 05/18/2021 | 104,000 | 109,720(1) | ||||||||||
Millicom International Cellular SA | USD | 6.625 | % | 10/15/2021 | 167,000 | 161,957(1) | ||||||||||
Oleoducto Central SA | USD | 4.000 | % | 05/07/2021 | 348,000 | 339,300(1) | ||||||||||
Pacific Exploration and Production Corp. | USD | 5.125 | % | 03/28/2023 | 219,000 | 66,795(1) | ||||||||||
SUAM Finance BV | USD | 4.875 | % | 04/17/2024 | 220,000 | 225,500(1) | ||||||||||
|
| |||||||||||||||
| 2,148,759 | ||||||||||||||||
|
| |||||||||||||||
Guatemala - 1.10% | ||||||||||||||||
Comcel Trust via Comunicaciones Celulares SA | USD | 6.875 | % | 02/06/2024 | 550,000 | 460,735(1) | ||||||||||
Hong Kong - 6.01% | ||||||||||||||||
Goodman HK Finance | USD | 4.375 | % | 06/19/2024 | 300,000 | 305,246 | ||||||||||
HKT Capital No. 2 Ltd. | USD | 3.625 | % | 04/02/2025 | 400,000 | 395,740 | ||||||||||
Hutchison Whampoa International 12 Ltd. | USD | 6.000 | % | Perpetual | 540,000 | 565,110(2)(3) | ||||||||||
Li & Fung Ltd. | USD | 6.000 | % | Perpetual | 200,000 | 208,000(2)(3) | ||||||||||
Towngas Finance Ltd | USD | 4.750 | % | Perpetual | 1,000,000 | 1,039,819(3) | ||||||||||
|
| |||||||||||||||
| 2,513,915 | ||||||||||||||||
|
| |||||||||||||||
India - 5.38% | ||||||||||||||||
ABJA Investment Co. Pte Ltd. | USD | 5.950 | % | 07/31/2024 | 400,000 | 350,860 | ||||||||||
Bharti Airtel International Netherlands BV: | ||||||||||||||||
| USD | 5.125 | % | 03/11/2023 | 417,000 | 437,023(1) | |||||||||||
| USD | 5.350 | % | 05/20/2024 | 100,000 | 106,094(2) | |||||||||||
Greenko Dutch BV | USD | 8.000 | % | 08/01/2019 | 296,000 | 313,889(2) | ||||||||||
ICICI Bank Ltd. | USD | 6.375 | % | 04/30/2022 | 300,000 | 309,738(2)(3) | ||||||||||
Reliance Holding USA, Inc. | USD | 5.400 | % | 02/14/2022 | 450,000 | 492,081(1) | ||||||||||
Reliance Industries Ltd. | USD | 4.125 | % | 01/28/2025 | 99,000 | 98,053(1) | ||||||||||
Vedanta Resources PLC: | ||||||||||||||||
| USD | 6.000 | % | 01/31/2019 | 32,000 | 24,440(1) | |||||||||||
| USD | 8.250 | % | 06/07/2021 | 49,000 | 36,373(1) | |||||||||||
| USD | 7.125 | % | 05/31/2023 | 120,000 | 81,600(1) | |||||||||||
|
| |||||||||||||||
| 2,250,151 | ||||||||||||||||
|
| |||||||||||||||
Indonesia - 2.21% | ||||||||||||||||
Listrindo Capital BV | USD | 6.950 | % | 02/21/2019 | 605,000 | 626,931(1) | ||||||||||
TBG Global Pte Ltd. | USD | 4.625 | % | 04/03/2018 | 300,000 | 296,787(1) | ||||||||||
|
| |||||||||||||||
| 923,718 | ||||||||||||||||
|
| |||||||||||||||
Israel - 5.13% | ||||||||||||||||
B Communications Ltd. | USD | 7.375 | % | 02/15/2021 | 548,000 | 598,005(1) | ||||||||||
Delek & Avner Tamar Bond Ltd.: | ||||||||||||||||
| USD | 3.839 | % | 12/30/2018 | 77,000 | 78,251(1) | |||||||||||
Stone Harbor Investment Funds Semi-Annual Report | November 30, 2015 | 51 |
Table of Contents
| Stone Harbor Emerging Markets Corporate Debt Fund | Statements of Investments | |
| November 30, 2015 (Unaudited) |
Currency | Rate | Maturity | Principal | Market Value | ||||||||||||
Israel (continued) | ||||||||||||||||
Delek & Avner Tamar Bond Ltd.: (continued) | ||||||||||||||||
| USD | 5.082 | % | 12/30/2023 | 1,433,000 | $ | 1,472,408(1) | ||||||||||
|
| |||||||||||||||
| 2,148,664 | ||||||||||||||||
|
| |||||||||||||||
Jamaica - 2.04% | ||||||||||||||||
Digicel Group Ltd.: | ||||||||||||||||
| USD | 8.250 | % | 09/30/2020 | 382,000 | 333,772(1) | |||||||||||
| USD | 7.125 | % | 04/01/2022 | 633,000 | 519,735(2) | |||||||||||
|
| |||||||||||||||
| 853,507 | ||||||||||||||||
|
| |||||||||||||||
Kazakhstan - 2.18% | ||||||||||||||||
Zhaikmunai LLP: | ||||||||||||||||
| USD | 6.375 | % | 02/14/2019 | 625,000 | 533,594(1) | |||||||||||
| USD | 7.125 | % | 11/13/2019 | 445,000 | 380,475(1) | |||||||||||
|
| |||||||||||||||
| 914,069 | ||||||||||||||||
|
| |||||||||||||||
Macau - 1.93% | ||||||||||||||||
MCE Finance Ltd. | USD | 5.000 | % | 02/15/2021 | 655,000 | 609,150(1) | ||||||||||
Studio City Finance Ltd. | USD | 8.500 | % | 12/01/2020 | 200,000 | 198,770(1) | ||||||||||
|
| |||||||||||||||
| 807,920 | ||||||||||||||||
|
| |||||||||||||||
Malaysia - 0.53% | ||||||||||||||||
Malayan Banking Bhd | USD | 3.250 | % | 09/20/2022 | 220,000 | 220,312(3) | ||||||||||
|
| |||||||||||||||
Mexico - 7.04% | ||||||||||||||||
Alfa SAB de CV | USD | 5.250 | % | 03/25/2024 | 150,000 | 155,250(1) | ||||||||||
BBVA Bancomer SA | USD | 6.750 | % | 09/30/2022 | 304,000 | 336,376(1) | ||||||||||
Cemex SAB de CV: | ||||||||||||||||
| USD | 9.500 | % | 06/15/2018 | 240,000 | 256,800(1) | |||||||||||
| USD | 7.250 | % | 01/15/2021 | 120,000 | 121,500(1) | |||||||||||
| USD | 5.700 | % | 01/11/2025 | 376,000 | 333,700(1) | |||||||||||
| USD | 6.125 | % | 05/05/2025 | 455,000 | 418,054(1) | |||||||||||
Metalsa SA de CV | USD | 4.900 | % | 04/24/2023 | 331,000 | 292,303(1) | ||||||||||
Mexico Generadora De Energia | USD | 5.500 | % | 12/06/2032 | 157,459 | 144,665(1) | ||||||||||
Nemak SAB de CV | USD | 5.500 | % | 02/28/2023 | 154,000 | 156,772(1) | ||||||||||
Sixsigma Networks Mexico SA de CV | USD | 8.250 | % | 11/07/2021 | 437,000 | 418,974(1) | ||||||||||
Southern Copper Corp. | USD | 5.250 | % | 11/08/2042 | 412,000 | 311,307 | ||||||||||
|
| |||||||||||||||
| 2,945,701 | ||||||||||||||||
|
| |||||||||||||||
Morocco - 2.13% | ||||||||||||||||
OCP SA: | ||||||||||||||||
| USD | 5.625 | % | 04/25/2024 | 112,000 | 113,932(1) | |||||||||||
| USD | 4.500 | % | 10/22/2025 | 753,000 | 705,938(1) | |||||||||||
| USD | 6.875 | % | 04/25/2044 | 70,000 | 70,262(1) | |||||||||||
|
| |||||||||||||||
| 890,132 | ||||||||||||||||
|
| |||||||||||||||
Oman - 0.84% | ||||||||||||||||
Lamar Funding Ltd. | USD | 3.958 | % | 05/07/2025 | 392,000 | 352,310(1) | ||||||||||
|
| |||||||||||||||
Peru - 1.46% | ||||||||||||||||
BBVA Banco Continental SA | USD | 5.000 | % | 08/26/2022 | 107,000 | 111,815(1) | ||||||||||
Cia Minera Ares SAC | USD | 7.750 | % | 01/23/2021 | 157,000 | 154,645(1) | ||||||||||
Cia Minera Milpo SAA | USD | 4.625 | % | 03/28/2023 | 378,000 | 344,620(1) | ||||||||||
|
| |||||||||||||||
| 611,080 | ||||||||||||||||
|
| |||||||||||||||
| 52 | www.shiplp.com |
Table of Contents
| Stone Harbor Emerging Markets Corporate Debt Fund | Statements of Investments | |
| November 30, 2015 (Unaudited) |
Currency | Rate | Maturity Date | Principal | Market Value | ||||||||||||||
Philippines - 1.71% | ||||||||||||||||||
FPT Finance Ltd. | USD | 6.375 | % | 09/28/2020 | 650,000 | $ | 713,593 | |||||||||||
|
| |||||||||||||||||
Qatar - 0.26% | ||||||||||||||||||
Ras Laffan Liquefied Natural Gas Co. Ltd. III | USD | 6.750 | % | 09/30/2019 | 93,000 | 108,322(2) | ||||||||||||
|
| |||||||||||||||||
Russia - 9.24% | ||||||||||||||||||
Evraz Group SA | USD | 6.750 | % | 04/27/2018 | 1,008,000 | 1,023,725(1) | ||||||||||||
Gazprom OAO Via Gaz Capital SA: | ||||||||||||||||||
| USD | 8.146 | % | 04/11/2018 | 613,000 | 665,718(1) | |||||||||||||
| USD | 9.250 | % | 04/23/2019 | 52,000 | 58,825(1) | |||||||||||||
| USD | 6.510 | % | 03/07/2022 | 104,000 | 107,510(1) | |||||||||||||
Rosneft Finance SA | USD | 7.875 | % | 03/13/2018 | 439,000 | 474,120(1) | ||||||||||||
Rosneft Oil Co. via Rosneft International Finance Ltd.: | ||||||||||||||||||
| USD | 3.149 | % | 03/06/2017 | 580,000 | 577,100(1) | |||||||||||||
| USD | 4.199 | % | 03/06/2022 | 575,000 | 523,250(1) | |||||||||||||
Vimpel Communications Holdings BV | USD | 7.504 | % | 03/01/2022 | 382,000 | 395,848(2) | ||||||||||||
Vimpel Communications Via VIP Finance Ireland Ltd. OJSC | USD | 7.748 | % | 02/02/2021 | 38,000 | 39,852(1) | ||||||||||||
|
| |||||||||||||||||
| 3,865,948 | ||||||||||||||||||
|
| |||||||||||||||||
Saudi Arabia - 0.08% | ||||||||||||||||||
Saudi Electricity Global Sukuk Co. 3 | USD | 5.500 | % | 04/08/2044 | 36,000 | 33,435(1) | ||||||||||||
|
| |||||||||||||||||
Singapore - 3.10% | ||||||||||||||||||
DBS Bank Ltd. | USD | 3.625 | % | 09/21/2022 | 80,000 | 81,833(2)(3) | ||||||||||||
Oversea-Chinese Banking Corp. Ltd.: | ||||||||||||||||||
| USD | 3.150 | % | 03/11/2023 | 400,000 | 403,783(1)(3) | |||||||||||||
| USD | 4.000 | % | 10/15/2024 | 61,000 | 62,548(1)(3) | |||||||||||||
Pratama Agung Pte Ltd. | USD | 6.250 | % | 2/24/2020 | 350,000 | 340,704 | ||||||||||||
United Overseas Bank Ltd. | USD | 3.750 | % | 09/19/2024 | 400,000 | 406,572(3) | ||||||||||||
|
| |||||||||||||||||
| 1,295,440 | ||||||||||||||||||
|
| |||||||||||||||||
South Africa - 2.60% | ||||||||||||||||||
Eskom Holdings SOC Ltd.: | ||||||||||||||||||
| USD | 5.750 | % | 01/26/2021 | 98,000 | 93,453(1) | |||||||||||||
| USD | 6.750 | % | 08/06/2023 | 274,000 | 260,642(1) | |||||||||||||
| USD | 7.125 | % | 02/11/2025 | 162,000 | 154,265(1) | |||||||||||||
Myriad International Holdings BV: | ||||||||||||||||||
| USD | 6.000 | % | 07/18/2020 | 14,000 | 15,120(1) | |||||||||||||
| USD | 5.500 | % | 07/21/2025 | 559,000 | 562,494(1) | |||||||||||||
|
| |||||||||||||||||
| 1,085,974 | ||||||||||||||||||
|
| |||||||||||||||||
South Korea - 2.39% | ||||||||||||||||||
Korea Gas Corp. | USD | 3.875 | % | 02/12/2024 | 150,000 | 157,830(1) | ||||||||||||
Korea Midland Power Co. Ltd. | USD | 2.750 | % | 02/11/2019 | 700,000 | 708,853 | ||||||||||||
Korea National Oil Corp. | USD | 3.250 | % | 07/10/2024 | 134,000 | 135,034(1) | ||||||||||||
|
| |||||||||||||||||
| 1,001,717 | ||||||||||||||||||
|
| |||||||||||||||||
Thailand - 3.75% | ||||||||||||||||||
Bangkok Bank PCL: | ||||||||||||||||||
| USD | 3.300 | % | 10/03/2018 | 64,000 | 65,485(1) | |||||||||||||
| USD | 3.875 | % | 09/27/2022 | 136,000 | 139,590(1) | |||||||||||||
PTT Exploration & Production PCL | USD | 4.875 | % | Perpetual | 873,000 | 866,452(1)(3) | ||||||||||||
PTT Global Chemical PCL | USD | 4.250 | % | 09/19/2022 | 380,000 | 392,283(1) | ||||||||||||
PTTEP Canada International Finance Ltd. | USD | 5.692 | % | 04/05/2021 | 94,000 | 105,527(2) | ||||||||||||
|
| |||||||||||||||||
| 1,569,337 | ||||||||||||||||||
|
| |||||||||||||||||
Stone Harbor Investment Funds Semi-Annual Report | November 30, 2015 | 53 |
Table of Contents
| Stone Harbor Emerging Markets Corporate Debt Fund | Statements of Investments | |
| November 30, 2015 (Unaudited) |
Currency | Rate | Maturity Date | Principal | Market Value | ||||||||||||||
Turkey - 3.86% | ||||||||||||||||||
Akbank TAS | USD | 4.000 | % | 01/24/2020 | 352,000 | $ | 342,320(1) | |||||||||||
Turk Telekomunikasyon AS | USD | 4.875 | % | 06/19/2024 | 501,000 | 479,708(1) | ||||||||||||
Turkiye Garanti Bankasi AS: | ||||||||||||||||||
| USD | 4.750 | % | 10/17/2019 | 24,000 | 24,000(1) | |||||||||||||
| USD | 5.250 | % | 09/13/2022 | 101,000 | 101,000(1) | |||||||||||||
Turkiye Vakiflar Bankasi | USD | 6.875 | % | 02/03/2025 | 680,000 | 666,400(1)(3) | ||||||||||||
|
| |||||||||||||||||
| 1,613,428 | ||||||||||||||||||
|
| |||||||||||||||||
United Arab Emirates - 5.60% | ||||||||||||||||||
DP World Ltd. | USD | 3.250 | % | 05/18/2020 | 100,000 | 99,250(1) | ||||||||||||
Dubai Holding Commercial Operations MTN Ltd. | GBP | 6.000 | % | 02/01/2017 | 650,000 | 994,140 | ||||||||||||
MAF Global Securities Ltd. | USD | 7.125 | % | Perpetual | 1,212,000 | 1,249,875(3) | ||||||||||||
|
| |||||||||||||||||
| 2,343,265 | ||||||||||||||||||
|
| |||||||||||||||||
Venezuela - 0.28% | ||||||||||||||||||
Petroleos de Venezuela SA | USD | 8.500 | % | 11/02/2017 | 187,133 | 117,473(2) | ||||||||||||
|
| |||||||||||||||||
TOTAL CORPORATE BONDS | 41,154,904 | |||||||||||||||||
|
| |||||||||||||||||
(Cost $42,076,518) | ||||||||||||||||||
SHORT TERM INVESTMENTS - 0.24% | ||||||||||||||||||
Money Market Mutual Funds - 0.24% | ||||||||||||||||||
Dreyfus Institutional Cash Advantage | USD | 0.11517 | % | N/A | 101,243 | 101,243 | ||||||||||||
|
| |||||||||||||||||
TOTAL SHORT TERM INVESTMENTS | 101,243 | |||||||||||||||||
|
| |||||||||||||||||
(Cost $101,243) | ||||||||||||||||||
Total Investments - 98.59% | 41,256,147 | |||||||||||||||||
(Cost $42,177,761) | ||||||||||||||||||
Other Assets In Excess of Liabilities - 1.41% | 589,392 | |||||||||||||||||
|
| |||||||||||||||||
Net Assets - 100.00% | $ | 41,845,539 | ||||||||||||||||
|
| |||||||||||||||||
| * | The principal amount/shares of each security is stated in the currency in which the security is denominated. |
Currency Abbreviations:
GBP | - | Great Britain Pound | ||
USD | - | United States Dollar |
| (1) | Security exempt from registration under Rule 144A of the Securities Act of 1933. Such securities may normally be sold to qualified institutional buyers in transactions exempt from registration. Total market value of Rule 144A securities amounts to $25,583,863, which represents approximately 61.14% of net assets as of November 30, 2015. |
| (2) | Securities were originally issued pursuant to Regulation S under the Securities Act of 1933, which exempts securities offered and sold outside of the United States from registration. Such securities cannot be sold in the United States without either an effective registration statement filed pursuant to the Securities Act of 1933, or pursuant to an exemption from registration. As of November 30, 2015, the aggregate market value of those securities was $3,746,236, which represents approximately 8.95% of net assets. |
| (3) | Floating or variable rate security. Interest rate disclosed is that which is in effect as of November 30, 2015. |
Common Abbreviations:
AS | - | Anonim Sirket is the Turkish term for Incorporation. | ||
Bhd | - | Berhad is the Malaysian term for public limited company. | ||
BV | - | Besloten Vennootschap is the Dutch term for private limited liability company. | ||
ESP | - | Empresa de Servicios Publicos is the Colombian term for Public Service Company. |
| 54 | www.shiplp.com |
Table of Contents
| Stone Harbor Emerging Markets Corporate Debt Fund | Statements of Investments | |
| November 30, 2015 (Unaudited) |
GmbH | - | Gesellschaft mit beschrankter Haftung is the German term for a company with limited liability. | ||
LLP | - | Limited Liability Partnership. | ||
Ltd. | - | Limited. | ||
MTN | - | Medium Term Note. | ||
OAO | - | Otkrytoe Aktsionernoe Obschestvo is the Russian term for Open Joint Stock Company. | ||
OJSC | - | Open Joint Stock Company. | ||
PCL | - | A rearrangement of the letters for Public Limited Company, used in Thailand. | ||
PLC | - | Public Limited Company. | ||
Pte | - | Private. | ||
SA | - | Generally designates corporations in various countries, mostly those employing the civil law. | ||
SA de CV | - | A Variable Capital Company. | ||
SAA | - | Sociedad Anonima Abierta is the Peruvian term used for companies with 20 or more shareholders. | ||
SAB de CV | - | A Variable Capital Company. | ||
SAC | - | Sociedad Anonima Abierta is the Peruvian term used for a publicly traded corporation. | ||
SOC | - | State Owned Company | ||
TAS | - | TüRk Anonim Sirketi is the Turkish term for Joint Stock Company. |
OUTSTANDING FORWARD FOREIGN CURRENCY CONTRACTS
| Foreign | Contracted | Sale | Settlement | Current | Unrealized | |||||||||||||||
| Counterparty | Currency | Amount** | Contract | Date | Value | Appreciation | ||||||||||||||
J.P. Morgan Chase & Co. | GBP | 686,000 | Sale | 12/08/2015 | $ | 1,033,236 | $ | 25,413 | ||||||||||||
|
| |||||||||||||||||||
| $ | 25,413 | |||||||||||||||||||
|
| |||||||||||||||||||
| ** The | contracted amount is stated in the currency in which the contract is denominated. |
See Notes to Financial Statements.
Stone Harbor Investment Funds Semi-Annual Report | November 30, 2015 | 55 |
Table of Contents
| Stone Harbor Investment Grade Fund | Statements of Investments | |
| November 30, 2015 (Unaudited) |
| Currency | Rate | Maturity Date | Principal Amount* | Market Value (Expressed in U.S. $) | ||||||||||||||
CORPORATE BONDS - 35.33% | ||||||||||||||||||
Aerospace/Defense - 0.32% | ||||||||||||||||||
Lockheed Martin Corp. | USD | 2.500 | % | 11/23/2020 | 50,000 | $ | 50,154 | |||||||||||
|
| |||||||||||||||||
Automotive - 1.14% | ||||||||||||||||||
Ford Motor Credit Co. LLC | USD | 4.250 | % | 09/20/2022 | 50,000 | 51,996 | ||||||||||||
General Motors Financial Co., Inc. | USD | 3.700 | % | 11/24/2020 | 50,000 | 50,151 | ||||||||||||
Hyundai Capital America | USD | 2.550 | % | 02/06/2019 | 75,000 | 74,716(1) | ||||||||||||
|
| |||||||||||||||||
| 176,863 | ||||||||||||||||||
|
| |||||||||||||||||
Banking - 7.45% | ||||||||||||||||||
American Express Co. | USD | 3.625 | % | 12/05/2024 | 50,000 | 49,701 | ||||||||||||
ANZ New Zealand Int’l Ltd. | USD | 1.750 | % | 03/29/2018 | 25,000 | 24,922(1) | ||||||||||||
Bank of America Corp.: | ||||||||||||||||||
| USD | 6.050 | % | 05/16/2016 | 25,000 | 25,556 | |||||||||||||
| USD | 3.300 | % | 01/11/2023 | 175,000 | 175,172 | |||||||||||||
| USD | 3.950 | % | 04/21/2025 | 25,000 | 24,777 | |||||||||||||
BPCE SA | USD | 5.700 | % | 10/22/2023 | 50,000 | 53,556(1) | ||||||||||||
Capital One Bank USA NA | USD | 3.375 | % | 02/15/2023 | 50,000 | 49,478 | ||||||||||||
Capital One Financial Corp. | USD | 6.750 | % | 09/15/2017 | 50,000 | 54,217 | ||||||||||||
Citigroup, Inc.: | ||||||||||||||||||
| USD | 3.500 | % | 05/15/2023 | 100,000 | 98,953 | |||||||||||||
| USD | 3.875 | % | 03/26/2025 | 75,000 | 73,871 | |||||||||||||
Goldman Sachs Capital I | USD | 6.345 | % | 02/15/2034 | 50,000 | 58,878 | ||||||||||||
Intesa Sanpaolo SpA, Series GMTN | USD | 3.125 | % | 01/15/2016 | 50,000 | 50,132 | ||||||||||||
Mizuho Bank Ltd. | USD | 3.600 | % | 09/25/2024 | 75,000 | 76,324(1) | ||||||||||||
Morgan Stanley | USD | 4.875 | % | 11/01/2022 | 50,000 | 54,158 | ||||||||||||
The PNC Financial Services Group, Inc. | USD | 3.900 | % | 04/29/2024 | 100,000 | 102,279 | ||||||||||||
Santander UK PLC | USD | 5.000 | % | 11/07/2023 | 50,000 | 52,261(1) | ||||||||||||
US Bancorp | USD | 3.600 | % | 09/11/2024 | 75,000 | 76,519 | ||||||||||||
Wells Fargo & Co., Series M | USD | 3.450 | % | 02/13/2023 | 50,000 | 50,323 | ||||||||||||
|
| |||||||||||||||||
| 1,151,077 | ||||||||||||||||||
|
| |||||||||||||||||
Chemicals - 0.64% | ||||||||||||||||||
Eastman Chemical Co. | USD | 4.650 | % | 10/15/2044 | 25,000 | 23,368 | ||||||||||||
The Mosaic Co. | USD | 4.250 | % | 11/15/2023 | 75,000 | 75,377 | ||||||||||||
|
| |||||||||||||||||
| 98,745 | ||||||||||||||||||
|
| |||||||||||||||||
Consumer Products - 0.33% | ||||||||||||||||||
Newell Rubbermaid, Inc. | USD | 4.000 | % | 06/15/2022 | 50,000 | 51,279 | ||||||||||||
|
| |||||||||||||||||
Diversified Manufacturing - 0.33% | ||||||||||||||||||
Siemens Financieringsmaatschappij NV | USD | 3.250 | % | 05/27/2025 | 50,000 | 50,399(1) | ||||||||||||
|
| |||||||||||||||||
Drillers/Services - 0.24% | ||||||||||||||||||
Transocean, Inc. | USD | 6.875 | % | 12/15/2021 | 50,000 | 37,675 | ||||||||||||
|
| |||||||||||||||||
Electric - 2.57% | ||||||||||||||||||
Ameren Corp. | USD | 2.700 | % | 11/15/2020 | 75,000 | 75,188 | ||||||||||||
DTE Energy Co., Series F | USD | 3.850 | % | 12/01/2023 | 75,000 | 77,547 | ||||||||||||
Exelon Generation Co. LLC | USD | 5.600 | % | 06/15/2042 | 75,000 | 72,542 | ||||||||||||
Georgia Power Co. | USD | 4.300 | % | 03/15/2042 | 50,000 | 46,366 | ||||||||||||
| 56 | www.shiplp.com |
Table of Contents
| Stone Harbor Investment Grade Fund | Statements of Investments | |
| November 30, 2015 (Unaudited) |
| Currency | Rate | Maturity Date | Principal Amount* | Market Value (Expressed in U.S. $) | ||||||||||||||
Electric (continued) | ||||||||||||||||||
Oncor Electric Delivery Co. LLC | USD | 2.150 | % | 06/01/2019 | 50,000 | $ | 49,462 | |||||||||||
Wisconsin Energy Corp. | USD | 2.450 | % | 06/15/2020 | 75,000 | 75,057 | ||||||||||||
|
| |||||||||||||||||
| 396,162 | ||||||||||||||||||
|
| |||||||||||||||||
Environmental Services - 0.33% | ||||||||||||||||||
Republic Service, Inc. | USD | 3.550 | % | 06/01/2022 | 50,000 | 51,357 | ||||||||||||
|
| |||||||||||||||||
Exploration & Production - 1.42% | ||||||||||||||||||
Anadarko Petroleum Corp. | USD | 6.450 | % | 09/15/2036 | 75,000 | 82,630 | ||||||||||||
Apache Corp. | USD | 5.100 | % | 09/01/2040 | 75,000 | 73,042 | ||||||||||||
Continental Resources, Inc. | USD | 4.500 | % | 04/15/2023 | 75,000 | 65,404 | ||||||||||||
|
| |||||||||||||||||
| 221,076 | ||||||||||||||||||
|
| |||||||||||||||||
Food and Beverage - 1.50% | ||||||||||||||||||
Kraft Heinz Foods Co.: | ||||||||||||||||||
| USD | 4.875 | % | 02/15/2025 | 50,000 | 53,343(1) | |||||||||||||
| USD | 5.200 | % | 07/15/2045 | 25,000 | 26,312(1) | |||||||||||||
PepsiCo, Inc. | USD | 4.250 | % | 10/22/2044 | 50,000 | 50,218 | ||||||||||||
Whole Foods Market, Inc. | USD | 5.200 | % | 12/03/2025 | 100,000 | 99,861(1) | ||||||||||||
|
| |||||||||||||||||
| 229,734 | ||||||||||||||||||
|
| |||||||||||||||||
Gas Pipelines - 2.29% | ||||||||||||||||||
Boardwalk Pipelines LP | USD | 3.375 | % | 02/01/2023 | 50,000 | 42,708 | ||||||||||||
Dominion Gas Holdings LLC | USD | 4.800 | % | 11/01/2043 | 25,000 | 24,345 | ||||||||||||
Dominion Resources, Inc. | USD | 7.500 | % | 06/30/2066 | 25,000 | 21,785(2) | ||||||||||||
EQT Midstream Partners LP | USD | 4.000 | % | 08/01/2024 | 50,000 | 43,689 | ||||||||||||
Kinder Morgan, Inc. | USD | 5.550 | % | 06/01/2045 | 75,000 | 57,416 | ||||||||||||
Plains All American Pipeline LP / PAA Finance Corp. | USD | 3.600 | % | 11/01/2024 | 50,000 | 43,508 | ||||||||||||
Spectra Energy Partners LP | USD | 3.500 | % | 03/15/2025 | 50,000 | 46,031 | ||||||||||||
TransCanada PipeLines Ltd. | USD | 5.000 | % | 10/16/2043 | 75,000 | 73,956 | ||||||||||||
|
| |||||||||||||||||
| 353,438 | ||||||||||||||||||
|
| |||||||||||||||||
Healthcare - 1.15% | ||||||||||||||||||
Medtronic, Inc.: | ||||||||||||||||||
| USD | 3.150 | % | 03/15/2022 | 50,000 | 50,821 | |||||||||||||
| USD | 4.625 | % | 03/15/2045 | 25,000 | 25,937 | |||||||||||||
Thermo Fisher Scientific, Inc. | USD | 1.300 | % | 02/01/2017 | 25,000 | 24,955 | ||||||||||||
Zimmer Biomet Holdings, Inc. | USD | 2.700 | % | 04/01/2020 | 75,000 | 75,012 | ||||||||||||
|
| |||||||||||||||||
| 176,725 | ||||||||||||||||||
|
| |||||||||||||||||
Healthcare Insurance - 0.47% | ||||||||||||||||||
Humana, Inc. | USD | 4.625 | % | 12/01/2042 | 75,000 | 72,914 | ||||||||||||
|
| |||||||||||||||||
Leisure - 0.32% | ||||||||||||||||||
Time Warner, Inc. | USD | 3.600 | % | 07/15/2025 | 50,000 | 49,596 | ||||||||||||
|
| |||||||||||||||||
Life Insurance - 0.46% | ||||||||||||||||||
American International Group, Inc. | USD | 3.875 | % | 01/15/2035 | 50,000 | 45,261 | ||||||||||||
Nippon Life Insurance Co. | USD | 5.100 | % | 10/16/2044 | 25,000 | 26,094(1)(2) | ||||||||||||
|
| |||||||||||||||||
| 71,355 | ||||||||||||||||||
|
| |||||||||||||||||
Stone Harbor Investment Funds Semi-Annual Report | November 30, 2015 | 57 |
Table of Contents
| Stone Harbor Investment Grade Fund | Statements of Investments | |
| November 30, 2015 (Unaudited) |
| Currency | Rate | Maturity Date | Principal Amount* | Market Value (Expressed in U.S. $) | ||||||||||||||
Lodging - 0.49% | ||||||||||||||||||
Marriott International, Inc. | USD | 3.000 | % | 03/01/2019 | 75,000 | $ | 76,468 | |||||||||||
|
| |||||||||||||||||
Media Cable - 1.66% | ||||||||||||||||||
CCO Safari II LLC: | ||||||||||||||||||
| USD | 3.579 | % | 07/23/2020 | 50,000 | 50,300(1) | |||||||||||||
| USD | 6.484 | % | 10/23/2045 | 50,000 | 52,221(1) | |||||||||||||
Comcast Corp. | USD | 4.250 | % | 01/15/2033 | 75,000 | 75,222 | ||||||||||||
DIRECTV Holdings LLC / DIRECTV Financing Co., Inc | USD | 6.000 | % | 08/15/2040 | 75,000 | 78,842 | ||||||||||||
|
| |||||||||||||||||
| 256,585 | ||||||||||||||||||
|
| |||||||||||||||||
Media Other - 1.45% | ||||||||||||||||||
21st Century Fox America, Inc. | USD | 6.650 | % | 11/15/2037 | 25,000 | 30,101 | ||||||||||||
CBS Corp. | USD | 4.850 | % | 07/01/2042 | 75,000 | 69,627 | ||||||||||||
The Interpublic Group of Cos, Inc. | USD | 3.750 | % | 02/15/2023 | 75,000 | 73,658 | ||||||||||||
Omnicom Group, Inc. | USD | 3.650 | % | 11/01/2024 | 50,000 | 49,634 | ||||||||||||
|
| |||||||||||||||||
| 223,020 | ||||||||||||||||||
|
| |||||||||||||||||
Metals/Mining/Steel - 0.41% | ||||||||||||||||||
Newmont Mining Corp. | USD | 6.250 | % | 10/01/2039 | 75,000 | 63,778 | ||||||||||||
|
| |||||||||||||||||
Non Captive Finance - 1.51% | ||||||||||||||||||
Air Lease Corp. | USD | 3.875 | % | 04/01/2021 | 75,000 | 75,937 | ||||||||||||
Aviation Capital Group Corp. | USD | 6.750 | % | 04/06/2021 | 50,000 | 56,437(1) | ||||||||||||
Discover Bank | USD | 4.250 | % | 03/13/2026 | 50,000 | 50,815 | ||||||||||||
Synchrony Financial | USD | 4.250 | % | 08/15/2024 | 50,000 | 50,075 | ||||||||||||
|
| |||||||||||||||||
| 233,264 | ||||||||||||||||||
|
| |||||||||||||||||
Pharmaceuticals - 1.45% | ||||||||||||||||||
Actavis Funding SCS | USD | 4.550 | % | 03/15/2035 | 25,000 | 24,671 | ||||||||||||
Actavis, Inc. | USD | 1.875 | % | 10/01/2017 | 50,000 | 50,096 | ||||||||||||
Amgen, Inc. | USD | 3.625 | % | 05/22/2024 | 75,000 | 75,428 | ||||||||||||
Gilead Sciences, Inc. | USD | 4.500 | % | 02/01/2045 | 75,000 | 73,776 | ||||||||||||
|
| |||||||||||||||||
| 223,971 | ||||||||||||||||||
|
| |||||||||||||||||
Railroads - 0.31% | ||||||||||||||||||
Burlington Northern Sante Fe LLC | USD | 4.400 | % | 03/15/2042 | 50,000 | 48,379 | ||||||||||||
|
| |||||||||||||||||
Real Estate Investment Trust (REITs) - 1.74% | ||||||||||||||||||
Avalonbay Communties, Inc., Series GMTN | USD | 3.450 | % | 06/01/2025 | 25,000 | 24,909 | ||||||||||||
Corporate Office Properties LP | USD | 3.600 | % | 05/15/2023 | 50,000 | 46,158 | ||||||||||||
DDR Corp. | USD | 3.375 | % | 05/15/2023 | 75,000 | 71,500 | ||||||||||||
Digital Delta Holdings LLC | USD | 4.750 | % | 10/01/2025 | 75,000 | 76,006(1) | ||||||||||||
Kimco Realty Corp. | USD | 3.200 | % | 05/01/2021 | 50,000 | 50,412 | ||||||||||||
|
| |||||||||||||||||
| 268,985 | ||||||||||||||||||
|
| |||||||||||||||||
Refining - 0.48% | ||||||||||||||||||
Phillips 66 | USD | 4.650 | % | 11/15/2034 | 75,000 | 74,602 | ||||||||||||
|
| |||||||||||||||||
Retail Food/Drug - 1.05% | ||||||||||||||||||
CVS Pass-Through Trust | USD | 6.036 | % | 12/10/2028 | 55,527 | 61,761 | ||||||||||||
JB y Co. SA de CV | USD | 3.750 | % | 05/13/2025 | 50,000 | 48,505(1) | ||||||||||||
| 58 | www.shiplp.com |
Table of Contents
| Stone Harbor Investment Grade Fund | Statements of Investments | |
| November 30, 2015 (Unaudited) |
Currency | Rate | Maturity Date | Principal | Market Value | ||||||||||||||
Retail Food/Drug (continued) | ||||||||||||||||||
The Kroger Co. | USD | 5.150% | 08/01/2043 | 50,000 | $ | 53,081 | ||||||||||||
|
| |||||||||||||||||
| 163,347 | ||||||||||||||||||
|
| |||||||||||||||||
Retail Non Food/Drug - 0.64% | ||||||||||||||||||
The Home Depot, Inc. | USD | 2.625% | 06/01/2022 | 50,000 | 50,095 | |||||||||||||
Macy’s Retail Holdings, Inc. | USD | 3.875% | 01/15/2022 | 50,000 | 50,183 | |||||||||||||
|
| |||||||||||||||||
| 100,278 | ||||||||||||||||||
|
| |||||||||||||||||
Technology - 1.10% | ||||||||||||||||||
Apple, Inc. | USD | 3.850% | 05/04/2043 | 75,000 | 69,936 | |||||||||||||
Ingram Micro, Inc. | USD | 4.950% | 12/15/2024 | 50,000 | 50,192 | |||||||||||||
Tencent Holdings Ltd. | USD | 3.800% | 02/11/2025 | 50,000 | 49,511(1) | |||||||||||||
|
| |||||||||||||||||
| 169,639 | ||||||||||||||||||
|
| |||||||||||||||||
Transportation Non Air/Rail - 0.83% | ||||||||||||||||||
ERAC USA Finance LLC | USD | 3.850% | 11/15/2024 | 50,000 | 50,512(1) | |||||||||||||
FedEx Corp. | USD | 5.100% | 01/15/2044 | 75,000 | 78,007 | |||||||||||||
|
| |||||||||||||||||
| 128,519 | ||||||||||||||||||
|
| |||||||||||||||||
Wireless - 0.35% | ||||||||||||||||||
Rogers Communications, Inc. | USD | 5.450% | 10/01/2043 | 50,000 | 54,087 | |||||||||||||
|
| |||||||||||||||||
Wirelines - 0.90% | ||||||||||||||||||
AT&T, Inc. | USD | 2.450% | 06/30/2020 | 25,000 | 24,616 | |||||||||||||
Verizon Communications, Inc.: | ||||||||||||||||||
| USD | 5.150% | 09/15/2023 | 50,000 | 56,000 | ||||||||||||||
| USD | 6.400% | 09/15/2033 | 50,000 | 58,548 | ||||||||||||||
|
| |||||||||||||||||
| 139,164 | ||||||||||||||||||
|
| |||||||||||||||||
TOTAL CORPORATE BONDS | ||||||||||||||||||
(Cost $5,574,612) | 5,462,635 | |||||||||||||||||
|
| |||||||||||||||||
ASSET BACKED/COMMERCIAL MORTGAGE BACKED SECURITIES - 9.77% | ||||||||||||||||||
1211 Avenue of the Americas Trust, Series 2015-1211 | USD | 3.901% | 08/10/2035 | 25,000 | 26,085(1) | |||||||||||||
AMPLIT Trust, Series 2015-A | USD | 5.000% | 09/15/2021 | 25,000 | 25,000(1)(2) | |||||||||||||
ARLP Securitization Trust, Series 2015-1 | USD | 3.967% | 05/25/2055 | 24,777 | 24,374(1)(3) | |||||||||||||
Banc of America Funding Corp., Series 2012-R6 | USD | 0.387% | 07/26/2036 | 33,234 | 32,259(1)(2) | |||||||||||||
BHMS Mortgage Trust, Series 2014-ATLS | USD | 1.693% | 07/05/2033 | 25,000 | 25,085(1)(2) | |||||||||||||
CDGJ Commercial Mortgage Trust, Series 2014-BXCH | USD | 1.597% | 12/15/2027 | 50,000 | 49,888(1)(2) | |||||||||||||
Citigroup Mortgage Loan Trust, Series 2012-1 | USD | 0.567% | 06/25/2035 | 13,566 | 13,384(1)(2) | |||||||||||||
COMM Mortgage Trust, Series 2006-C8 | USD | 5.306% | 12/10/2046 | 95,206 | 97,248 | |||||||||||||
Ellington Loan Acquisition Trust, Series 2007-1 | USD | 1.097% | 05/28/2037 | 27,281 | 27,011(1)(2) | |||||||||||||
Financial Asset Securities Corp. AAA Trust, Series 2005-2 | USD | 0.497% | 11/26/2035 | 36,620 | 33,896(1)(2) | |||||||||||||
Freddie Mac Whole Loan Securities Trust, Series 2015-SC02 | USD | 3.000% | 09/25/2045 | 100,000 | 98,672 | |||||||||||||
GAHR Commercial Mortgage Trust, Series 2015-NRF | USD | 1.497% | 12/15/2016 | 100,000 | 99,998(1)(2) | |||||||||||||
Hyatt Hotel Portfolio Trust, Series 2015-HYT | USD | 1.447% | 11/15/2029 | 100,000 | 100,222(1)(2) | |||||||||||||
Invitation Homes Trust, Series 2013-SFR1
| USD | 1.400% | 12/17/2030 | 48,353 | 48,011(1)(2) | |||||||||||||
Stone Harbor Investment Funds Semi-Annual Report | November 30, 2015 | 59 |
Table of Contents
| Stone Harbor Investment Grade Fund | Statements of Investments | |
| November 30, 2015 (Unaudited) |
| Currency | Rate | Maturity Date | Principal Amount* | Market Value (Expressed in U.S. $) | ||||||||||||||
ASSET BACKED/COMMERCIAL MORTGAGE BACKED SECURITIES (continued) |
| |||||||||||||||||
JP Morgan Chase Commercial Mortgage Securities Trust, Series 2007-CB18 | USD | 5.440 | % | 06/12/2047 | 46,893 | $ | 48,287 | |||||||||||
LSTAR Securities Investment Trust: | ||||||||||||||||||
Series 2015-10 | USD | 2.203 | % | 11/02/2020 | 100,000 | 98,269(1)(2) | ||||||||||||
Series 2015-9 | USD | 2.193 | % | 10/01/2020 | 98,840 | 97,110(1)(2) | ||||||||||||
ML-CFC Commercial Mortgage Trust, Series 2007-8 | USD | 6.073 | % | 08/12/2049 | 25,000 | 25,779(2) | ||||||||||||
Oak Hill Advisors Residential Loan Trust, Series 2015-NPL1 | USD | 3.475 | % | 01/25/2055 | 13,191 | 13,188(1)(3) | ||||||||||||
RBSSP Resecuritization Trust: | ||||||||||||||||||
Series 2012-6 | USD | 0.537 | % | 11/26/2035 | 49,425 | 46,484(1)(2) | ||||||||||||
Series 2012-6 | USD | 0.527 | % | 01/26/2036 | 49,637 | 47,059(1)(2) | ||||||||||||
Series 2012-6 | USD | 0.347 | % | 08/26/2036 | 42,425 | 40,846(1)(2) | ||||||||||||
Series 2013-1 | USD | 0.367 | % | 01/26/2037 | 49,668 | 46,137(1)(2) | ||||||||||||
TAL Advantage V LLC, Series 2013-2A | USD | 3.550 | % | 11/20/2038 | 20,000 | 19,925(1) | ||||||||||||
Towd Point Mortgage Trust: | ||||||||||||||||||
Series 2015-3 | USD | 3.000 | % | 03/25/2054 | 91,446 | 91,807(1)(2) | ||||||||||||
Series 2015-5 | USD | 2.750 | % | 05/25/2055 | 49,400 | 49,269(1)(2) | ||||||||||||
US Residential Opportunity Fund III Trust, Series 2015-1III | USD | 3.721 | % | 01/27/2035 | 37,917 | 37,862(1) | ||||||||||||
VOLT XXII LLC, Series 2015-NPL4 | USD | 3.500 | % | 02/25/2055 | 32,396 | 32,184(1)(3) | ||||||||||||
VOLT XXV LLC, Series 2015-NPL8 | USD | 3.500 | % | 06/26/2045 | 44,399 | 43,916(1)(3) | ||||||||||||
VOLT XXXIII LLC, Series 2015-NPL5 | USD | 3.500 | % | 03/25/2055 | 21,974 | 21,815(1)(3) | ||||||||||||
VOLT XXXIX LLC, Series 2015-NP13 | USD | 4.125 | % | 10/25/2045 | 49,844 | 49,881(1)(3) | ||||||||||||
|
| |||||||||||||||||
TOTAL ASSET BACKED/COMMERCIAL MORTGAGE BACKED SECURITIES | 1,510,951 | |||||||||||||||||
|
| |||||||||||||||||
(Cost $1,502,295) | ||||||||||||||||||
U.S. TREASURY BONDS/NOTES - 20.36% | ||||||||||||||||||
U.S. Treasury Notes: | ||||||||||||||||||
| USD | 0.250 | % | 12/15/2015 | 425,000 | 425,017 | |||||||||||||
| USD | 2.000 | % | 01/31/2016 | 450,000 | 451,345 | |||||||||||||
| USD | 1.625 | % | 04/30/2019 | 150,000 | 151,359 | |||||||||||||
| USD | 1.375 | % | 09/30/2020 | 400,000 | 394,836 | |||||||||||||
| USD | 2.000 | % | 11/15/2021 | 925,000 | 932,208 | |||||||||||||
| USD | 2.750 | % | 02/15/2024 | 100,000 | 104,846 | |||||||||||||
| USD | 2.250 | % | 11/15/2024 | 100,000 | 100,533 | |||||||||||||
| USD | 2.000 | % | 08/15/2025 | 600,000 | 588,387 | |||||||||||||
|
| |||||||||||||||||
TOTAL U.S. TREASURY BONDS/NOTES | 3,148,531 | |||||||||||||||||
|
| |||||||||||||||||
(Cost $3,133,319) | ||||||||||||||||||
U.S. GOVERNMENT AGENCY MORTGAGE BACKED SECURITIES - 23.28% | ||||||||||||||||||
FHLMC TBA | USD | 3.000 | % | 12/10/2015 | 100,000 | 100,336(4) | ||||||||||||
FNMA TBA: | ||||||||||||||||||
| USD | 3.000 | % | 12/10/2015 | 500,000 | 502,305(4) | |||||||||||||
| USD | 3.500 | % | 12/10/2015 | 1,250,000 | 1,295,020(4) | |||||||||||||
| USD | 4.000 | % | 12/10/2015 | 525,000 | 557,082(4) | |||||||||||||
| USD | 4.500 | % | 12/10/2015 | 375,000 | 405,425(4) | |||||||||||||
| USD | 5.000 | % | 12/10/2015 | 250,000 | 275,785(4) | |||||||||||||
| USD | 2.500 | % | 12/16/2015 | 100,000 | 101,320(4) | |||||||||||||
| USD | 3.000 | % | 12/16/2015 | 300,000 | 310,629(4) | |||||||||||||
| 60 | www.shiplp.com |
Table of Contents
| Stone Harbor Investment Grade Fund | Statements of Investments | |
| November 30, 2015 (Unaudited) |
Currency | Rate | Maturity Date | Principal Amount/Shares* | Market Value (Expressed in U.S. $) | ||||||||||||||
U.S. GOVERNMENT AGENCY MORTGAGE BACKED SECURITIES (continued) | ||||||||||||||||||
GNMA TBA | USD | 3.500 | % | 12/17/2015 | 50,000 | $ | 52,160(4) | |||||||||||
|
| |||||||||||||||||
TOTAL U.S. GOVERNMENT AGENCY MORTGAGE BACKED SECURITIES | 3,600,062 | |||||||||||||||||
|
| |||||||||||||||||
(Cost $3,581,968) | ||||||||||||||||||
SHORT TERM INVESTMENTS - 8.51% | ||||||||||||||||||
Money Market Mutual Funds - 8.51% | ||||||||||||||||||
Dreyfus Institutional Cash Advantage Fund - Institutional Advantage Class (7-Day Yield) | USD | 0.11517 | % | N/A | 1,314,977 | 1,314,977 | ||||||||||||
|
| |||||||||||||||||
TOTAL SHORT TERM INVESTMENTS | 1,314,977 | |||||||||||||||||
|
| |||||||||||||||||
(Cost $1,314,977) | ||||||||||||||||||
Total Investments - 97.25% | 15,037,156 | |||||||||||||||||
(Cost $15,107,171) | ||||||||||||||||||
Other Assets in Excess of Liabilities - 2.75% | 425,335 | |||||||||||||||||
|
| |||||||||||||||||
Net Assets - 100.00% | $ | 15,462,491 | ||||||||||||||||
|
| |||||||||||||||||
| * | The principal amount/shares of each security is stated in the currency in which the security is denominated. |
Currency Abbreviations:
| USD | - United States Dollar |
| (1) | Security exempt from registration under Rule 144A of the Securities Act of 1933. Such securities may normally be sold to qualified institutional buyers in transactions exempt from registration. Total market value of Rule 144A securities amounts to $2,162,245, which represents approximately 13.98% of net assets as of November 30, 2015. |
| (2) | Floating or variable rate security. Interest rate disclosed is that which is in effect as of November 30, 2015. |
| (3) | Step bond. Coupon changes periodically based upon a predetermined schedule. Interest rate disclosed is that which is in effect as of November 30, 2015. |
| (4) | Investment purchased on a delayed delivery basis. |
Common Abbreviations:
| FNMA | - | Fannie Mae. | ||
| FHLMC | - | Freddie Mac. | ||
| GMTN | - | Global Medium Term Note | ||
| GNMA | - | Government National Mortgage Association. | ||
| LLC | - | Lmited Liability Corporation. | ||
| LP | - | Limited Partnership. | ||
| Ltd | - | Limited. | ||
| NA | - | National Association. | ||
| NV | - | Naamloze Vennootshap is the Dutch term for a Public Limited Liability Corporation. | ||
| PLC | - | Public Limited Company. | ||
| SA de CV | - | A Variable Capital Company. | ||
| SCS | - | Societe en Commandite Simple is the French term for limited partnership. | ||
| SpA | - | Societa per Azione. | ||
| TBA | - | To Be Annoucned. | ||
| UK | - | United Kingdom. |
See Notes to Financial Statements.
Stone Harbor Investment Funds Semi-Annual Report | November 30, 2015 | 61 |
Table of Contents
| Stone Harbor Strategic Income Fund | Statements of Investments | |
| November 30, 2015 (Unaudited) |
| Currency | Rate | Shares* | Market Value (Expressed in U.S. $) | |||||||||||
OPEN-END FUNDS - 98.38% | ||||||||||||||
Stone Harbor Emerging Markets Debt Fund | USD | N/A | 717,569 | $ | 7,103,932(1) | |||||||||
Stone Harbor High Yield Bond Fund | USD | N/A | 1,553,187 | 12,301,243(1) | ||||||||||
Stone Harbor Investment Grade Fund | USD | N/A | 1,507,630 | 15,453,210(1) | ||||||||||
|
| |||||||||||||
| 34,858,385 | ||||||||||||||
|
| |||||||||||||
TOTAL OPEN-END FUNDS | 34,858,385 | |||||||||||||
|
| |||||||||||||
(Cost $37,160,346) | ||||||||||||||
Total Investments - 98.38% | 34,858,385 | |||||||||||||
(Cost $37,160,346) | ||||||||||||||
Other Assets In Excess of Liabilities - 1.62% | 572,502(2) | |||||||||||||
|
| |||||||||||||
Net Assets - 100.00% | $ | 35,430,887 | ||||||||||||
|
| |||||||||||||
| * | The shares of each security is stated in the currency in which the security is denominated. |
Currency Abbreviations:
| CAD | - | Canadian Dollar | ||
| EUR | - | Euro Currency | ||
| GBP | - | Great Britain Pound | ||
| MXN | - | Mexican Peso | ||
| USD | - | United States Dollar |
| (1) | Affiliated with the Fund, as each is a series of Stone Harbor Investment Funds and has the same investment adviser. |
| (2) | Includes cash which is being held as collateral for futures contracts. |
OUTSTANDING FORWARD FOREIGN CURRENCY CONTRACTS
| Counterparty | Foreign Currency | Contracted Amount** | Purchase/Sale Contract | Settlement Date | Current Value | Unrealized Appreciation/ (Depreciation) | ||||||||||
Citigroup Global Market | EUR | 108,000 | Sale | 12/08/2015 | $ | 114,141 | $ | 5,197 | ||||||||
Citigroup Global Market | GBP | 14,900 | Sale | 12/08/2015 | 22,442 | 604 | ||||||||||
Citigroup Global Market | MXN | 2,943,200 | Purchase | 12/07/2015 | 177,448 | 2,270 | ||||||||||
J.P. Morgan Chase | CAD | 625,000 | Purchase | 01/25/2016 | 468,000 | 665 | ||||||||||
|
| |||||||||||||||
| $ | 8,736 | |||||||||||||||
|
| |||||||||||||||
Citigroup Global Market | MXN | 11,571,300 | Purchase | 12/07/2015 | $ | 697,647 | $ | (2,460) | ||||||||
|
| |||||||||||||||
| $ | (2,460) | |||||||||||||||
|
| |||||||||||||||
| ** | The contracted amount is stated in the currency in which the contract is denominated. |
FUTURES CONTRACTS
| Description | Position | Contracts | Currency | Expiration Date | Notional Amount* | Unrealized Appreciation/(Depreciation) | ||||||||||||
Euro-Bund Future | Long | 25 | EUR | 12/08/15 | 4,181,560 | $ | 115,692 | |||||||||||
Long Gilt Future | Long | 6 | GBP | 3/29/16 | 1,063,873 | 3,434 | ||||||||||||
US 10Yr Note Future | Short | (71) | USD | 3/21/16 | (8,977,063 | ) | 1,110 | |||||||||||
US Ultra T-Bond | Long | 2 | USD | 3/21/16 | 316,875 | 969 | ||||||||||||
| * | The notional amount of each security is stated in the currency in which the security is denominated. |
| 62 | www.shiplp.com |
Table of Contents
| Stone Harbor Strategic Income Fund | Statements of Investments | |
| November 30, 2015 (Unaudited) |
CREDIT DEFAULT SWAP CONTRACTS ON CREDIT INDICES ISSUE - BUY PROTECTION(3)
Reference Obligations | Clearinghouse | Fixed Deal Receive Rate | Maturity Date | Implied Credit Spread at | Notional Amount(5) | Market Value | Upfront Premiums Received | Unrealized Depreciation | ||||||||||||||||
CDX HY NA 25 5Y | Intercontinental Exchange | 5.000% | 12/20/2020 | 4.499% | $ | 5,050,000 | $ | 106,712 | $ | 100,788 | $ | (5,924) | ||||||||||||
|
| |||||||||||||||||||||||
| $ | 106,712 | $ | 100,788 | $ | (5,924) | |||||||||||||||||||
|
| |||||||||||||||||||||||
| (3) | If the Fund is a buyer of protection and a credit event occurs, as defined under the terms of that particular swap agreement, the Fund will either (i) receive from the seller of protection an amount equal to the notional amount of the swap and deliver the referenced obligation or (ii) receive a net settlement amount in the form of cash or securities equal to the notional amount of the swap less the recovery value of the referenced obligation. |
| (4) | Implied credit spreads, represented in absolute terms, utilized in determining the market value of credit default swap agreements on sovereign issues of an emerging country as of period end serve as an indicator of the current status of the payment/performance risk and represent the likelihood or risk of default for the credit derivative. The implied credit spread of a particular referenced entity reflects the cost of buying/selling protection and may include upfront payments required to be made to enter into the agreement. Wider credit spreads represent a deterioration of the referenced entity’s credit soundness and a greater likelihood or risk of default or other credit event occurring as defined under the terms of the agreement. |
| (5) | The maximum potential amount the Fund could be required to pay as a seller of credit protection or receive as a buyer of credit protection if a credit event occurs as defined under the terms of that particular swap agreement. |
See Notes to Financial Statements.
Stone Harbor Investment Funds Semi-Annual Report | November 30, 2015 | 63 |
Table of Contents
| Stone Harbor Emerging Markets Debt Allocation Fund | Statements of Investments | |
| November 30, 2015 (Unaudited) |
| Currency | Rate | Shares* | Market Value (Expressed in U.S. $) | |||||||||||
OPEN-END FUNDS - 99.97% | ||||||||||||||
Stone Harbor Emerging Markets Debt Fund | USD | N/A | 4,823,020 | $ | 47,747,894(1) | |||||||||
Stone Harbor Local Markets Fund | USD | N/A | 6,435,992 | 48,076,858(1) | ||||||||||
|
| |||||||||||||
| 95,824,752 | ||||||||||||||
|
| |||||||||||||
TOTAL OPEN-END FUNDS | 95,824,752 | |||||||||||||
|
| |||||||||||||
(Cost $106,380,829) | ||||||||||||||
Total Investments - 99.97% | ||||||||||||||
(Cost $106,380,829) | 95,824,752 | |||||||||||||
Other Assets In Excess of Liabilities - 0.03% | 27,729 | |||||||||||||
|
| |||||||||||||
Net Assets - 100.00% | $ | 95,852,481 | ||||||||||||
|
| |||||||||||||
| * | The shares of each security is stated in the currency in which the security is denominated. |
Currency Abbreviations:
| USD | - | United States Dollar |
| (1) | Affiliated with the Fund, as each is a series of Stone Harbor Investment Funds and has the same investment adviser. |
See Notes to Financial Statements.
| 64 | www.shiplp.com |
Table of Contents
| Stone Harbor Investment Funds | Statements of Assets and Liabilities | |
| November 30, 2015 (Unaudited) |
| Stone Harbor Emerging Markets Debt Fund | Stone Harbor High Yield Bond Fund | Stone Harbor Local Markets Fund | Stone Harbor Emerging Markets Corporate Debt Fund | |||||||||||||
ASSETS: | ||||||||||||||||
Investments, at value(1) | $ | 1,719,794,421 | $ | 262,971,781 | $ | 760,165,760 | $ | 41,256,147 | ||||||||
Cash | 29,404,857 | 32,693 | 2,348 | 24,181 | ||||||||||||
Foreign currency, at value | – | – | 5,580 | – | ||||||||||||
Unrealized appreciation on credit default swap contracts | 3,893,332 | – | – | – | ||||||||||||
Unrealized appreciation on forward foreign currency contracts | 2,083,231 | 217,741 | 2,568,284 | 25,413 | ||||||||||||
Deposits with brokers for credit default swap contracts | 4,180,000 | – | – | – | ||||||||||||
Deposits with brokers for forward foreign currency contracts | – | – | 2,160,000 | – | ||||||||||||
Deposits with brokers for interest rate swap contracts | 2,179,894 | – | – | – | ||||||||||||
Receivable for investments sold | 6,607,668 | 943,323 | 203,466,375 | – | ||||||||||||
Receivable for fund shares sold | 244,969 | 375,755 | 10,260 | – | ||||||||||||
Interest receivable | 27,411,819 | 4,021,089 | 16,286,176 | 594,402 | ||||||||||||
Prepaid and other assets | 60,028 | 20,257 | 44,384 | 15,106 | ||||||||||||
| ||||||||||||||||
Total Assets | 1,795,860,219 | 268,582,639 | 984,709,167 | 41,915,249 | ||||||||||||
| ||||||||||||||||
LIABILITIES: | ||||||||||||||||
Payable due to brokers for forward foreign currency contracts | 1,610,000 | – | 637,000 | – | ||||||||||||
Payable for investments purchased | 17,249,555 | 4,148,388 | 2,010,468 | 9,780 | ||||||||||||
Payable for fund shares redeemed | 3,421,341 | – | 2,917,472 | – | ||||||||||||
Swap premium received | 8,318,750 | – | – | – | ||||||||||||
Unrealized depreciation on forward foreign currency contracts | 212,925 | 1,619 | 4,680,166 | – | ||||||||||||
Variation margin payable on interest rate swap contracts | 90,275 | – | – | – | ||||||||||||
Interest payable on credit default swap contracts | 137,306 | – | – | – | ||||||||||||
Payable to adviser | 885,231 | 111,117 | 646,788 | 21,656 | ||||||||||||
Payable to administrator | 94,696 | 25,959 | 60,201 | 4,285 | ||||||||||||
Other payables | 83,149 | 57,808 | 173,609 | 33,989 | ||||||||||||
| ||||||||||||||||
Total Liabilities | 32,103,228 | 4,344,891 | 11,125,704 | 69,710 | ||||||||||||
| ||||||||||||||||
Net Assets | $ | 1,763,756,991 | $ | 264,237,748 | $ | 973,583,463 | $ | 41,845,539 | ||||||||
| ||||||||||||||||
NET ASSETS CONSIST OF: | ||||||||||||||||
Paid-in capital | $ | 1,999,257,312 | $ | 295,223,676 | $ | 1,697,433,648 | $ | 46,445,334 | ||||||||
Undistributed/(overdistributed) net investment income | 11,372,892 | 216,435 | (130,053,583) | 52,105 | ||||||||||||
Accumulated net realized loss on investments, forward foreign currency contracts, credit default swap contracts, interest rate swap contracts and foreign currency transactions | (169,087,794) | (10,554,171) | (323,969,245) | (3,754,789) | ||||||||||||
Net unrealized depreciation on investments, forward foreign currency contracts, credit default swap contracts, interest rate swap contracts and translation of assets and liabilities denominated in foreign currencies | (77,785,419) | (20,648,192) | (269,827,357) | (897,111) | ||||||||||||
| ||||||||||||||||
Net Assets | $ | 1,763,756,991 | $ | 264,237,748 | $ | 973,583,463 | $ | 41,845,539 | ||||||||
| ||||||||||||||||
PRICING OF SHARES: | ||||||||||||||||
Institutional Class | ||||||||||||||||
Net Assets | $ | 1,763,756,991 | $ | 264,237,748 | $ | 973,583,463 | $ | 41,845,539 | ||||||||
Shares of beneficial interest outstanding (unlimited number of shares, par value of $0.001 per share authorized) | 178,147,998 | 33,346,891 | 130,390,181 | 4,849,574 | ||||||||||||
| ||||||||||||||||
Net assets value, offering and redemption price per share | $ | 9.90 | $ | 7.92 | $ | 7.47 | $ | 8.63 | ||||||||
| ||||||||||||||||
(1)Cost of Investments | $ | 1,803,272,601 | $ | 283,833,434 | $ | 1,026,943,475 | $ | 42,177,761 | ||||||||
| See Notes to Financial Statements. | ||
Stone Harbor Investment Funds Semi-Annual Report | November 30, 2015 | 65 |
Table of Contents
| Stone Harbor Investment Funds | Statements of Assets and Liabilities | |
| November 30, 2015 (Unaudited) |
| Stone Harbor Investment Grade Fund | Stone Harbor Strategic Income Fund | Stone Harbor Emerging Markets Debt Allocation Fund | ||||||||||
ASSETS: | ||||||||||||
Investments, at value(1) | $ | 15,037,156 | $ | – | $ | – | ||||||
Investments in affiliates, at value(2) | – | 34,858,385 | 95,824,752 | |||||||||
Foreign currency, at value | – | 58,643 | – | |||||||||
Unrealized appreciation on forward foreign currency contracts | – | 8,736 | – | |||||||||
Deposits with brokers for credit default swap contracts | – | 389,470 | – | |||||||||
Cash pledged as collateral for forward commitments | 3,552,393 | – | – | |||||||||
Deposits with brokers for futures contracts collateral | – | 179,651 | – | |||||||||
Receivable for investments sold | 123,881 | 200,000 | 12,960 | |||||||||
Receivable for fund shares sold | 440,000 | 1,000,000 | – | |||||||||
Receivable from adviser | 50,020 | 74,936 | 36,138 | |||||||||
Interest receivable | 67,925 | 7 | – | |||||||||
Prepaid and other assets | 9,696 | 10,364 | 15,852 | |||||||||
| ||||||||||||
Total Assets | 19,281,071 | 36,780,192 | 95,889,702 | |||||||||
| ||||||||||||
LIABILITIES: | ||||||||||||
Bank Overdraft | – | 170,551 | 12,960 | |||||||||
Payable for investments purchased | 3,784,858 | 990,000 | – | |||||||||
Swap premium received | – | 100,788 | – | |||||||||
Unrealized depreciation on forward foreign currency contracts | – | 2,460 | – | |||||||||
Variation margin payable on credit default swap contracts | – | 4,445 | – | |||||||||
Variation margin payable on futures contracts | – | 2,775 | – | |||||||||
Interest payable on credit default swap contracts | – | 49,799 | – | |||||||||
Payable to administrator | 6,734 | 1,522 | 3,845 | |||||||||
Other payables | 26,988 | 26,965 | 20,416 | |||||||||
| ||||||||||||
Total Liabilities | 3,818,580 | 1,349,305 | 37,221 | |||||||||
| ||||||||||||
Net Assets | $ | 15,462,491 | $ | 35,430,887 | $ | 95,852,481 | ||||||
| ||||||||||||
NET ASSETS CONSIST OF: | ||||||||||||
Paid-in capital | $ | 15,431,062 | $ | 37,499,066 | $ | 106,146,020 | ||||||
Undistributed net investment income | 2,304 | 123,037 | 2,045,328 | |||||||||
Accumulated net realized gain/(loss) on investments, forward foreign currency contracts, credit default swap contracts, interest rate swap contracts and foreign currency transactions | 99,140 | (7,208) | (1,782,790) | |||||||||
Net unrealized depreciation on investments, forward foreign currency contracts, credit default swap contracts, interest rate swap contracts and translation of assets and liabilities denominated in foreign currencies | (70,015) | (2,184,008) | (10,556,077) | |||||||||
| ||||||||||||
Net Assets | $ | 15,462,491 | $ | 35,430,887 | $ | 95,852,481 | ||||||
| ||||||||||||
PRICING OF SHARES: | ||||||||||||
Institutional Class | ||||||||||||
Net Assets | $ | 15,462,491 | $ | 35,430,887 | $ | 95,852,481 | ||||||
Shares of beneficial interest outstanding (unlimited number of shares, par value of $0.001 per share authorized) | 1,508,653 | 3,697,937 | 10,980,251 | |||||||||
| ||||||||||||
Net assets value, offering and redemption price per share | $ | 10.25 | $ | 9.58 | $ | 8.73 | ||||||
| ||||||||||||
(1)Cost of Investments | $ | 15,107,171 | $ | – | $ | – | ||||||
(2)Cost of Investments in affiliates | $ | – | $ | 37,160,346 | $ | 106,380,829 | ||||||
| See Notes to Financial Statements. | ||
| 66 | www.shiplp.com |
Table of Contents
| Stone Harbor Investment Funds | Statements of Operations | |
| For the Six Months Ended November 30, 2015 (Unaudited) |
| Stone Harbor Emerging Markets Debt Fund | Stone Harbor High Yield Bond Fund | Stone Harbor Local Markets Fund | Stone Harbor Emerging Markets Corporate Debt Fund | |||||||||||||
INVESTMENT INCOME: | ||||||||||||||||
Interest(1) | $ | 73,736,297 | $ | 9,122,709 | $ | 45,306,535 | $ | 961,514 | ||||||||
Dividends | 14,673 | 39,039 | 12,158 | 339 | ||||||||||||
| ||||||||||||||||
Total Investment Income | 73,750,970 | 9,161,748 | 45,318,693 | 961,853 | ||||||||||||
| ||||||||||||||||
EXPENSES: | ||||||||||||||||
Operational: | ||||||||||||||||
Investment advisory fee | 5,514,351 | 695,614 | 4,555,706 | 141,940 | ||||||||||||
Administration fees | 479,517 | 86,489 | 320,322 | 11,312 | ||||||||||||
Custodian fees | 55,569 | 15,807 | 356,706 | 5,350 | ||||||||||||
Printing fees | 3,084 | 2,748 | 5,396 | 2,244 | ||||||||||||
Professional fees | 38,755 | 38,755 | 35,633 | 33,722 | ||||||||||||
Trustee fees | 75,937 | 11,366 | 58,793 | 945 | ||||||||||||
Transfer agent fees | 16,571 | 11,405 | 15,894 | 10,764 | ||||||||||||
Registration fees | 16,414 | 12,872 | 12,441 | 12,059 | ||||||||||||
Insurance fees | 13,745 | 1,879 | 14,560 | 171 | ||||||||||||
Other | 7,407 | 2,144 | 6,618 | 1,486 | ||||||||||||
| ||||||||||||||||
Total expenses before waiver/reimbursement | 6,221,350 | 879,079 | 5,382,069 | 219,993 | ||||||||||||
Less fees waived by investment adviser | – | – | – | (53,005) | ||||||||||||
| ||||||||||||||||
Total Net Expenses | 6,221,350 | 879,079 | 5,382,069 | 166,988 | ||||||||||||
| ||||||||||||||||
Net Investment Income | 67,529,620 | 8,282,669 | 39,936,624 | 794,865 | ||||||||||||
| ||||||||||||||||
REALIZED AND UNREALIZED GAIN/(LOSS) ON INVESTMENTS: |
| |||||||||||||||
Net realized gain/(loss) on: | ||||||||||||||||
Investments | (28,530,854) | (7,173,304) | (199,786,221) | (91,067) | ||||||||||||
Credit default swap contracts | 691,316 | – | – | – | ||||||||||||
Interest rate swap contracts | (478,664) | – | – | – | ||||||||||||
Forward foreign currency contracts | 1,149,297 | (27,209) | 9,444,652 | 4,906 | ||||||||||||
Foreign currency transactions | (379,641) | 2,922 | (4,440,908) | (16,652) | ||||||||||||
| ||||||||||||||||
Net realized loss | (27,548,546) | (7,197,591) | (194,782,477) | (102,813) | ||||||||||||
| ||||||||||||||||
Change in unrealized appreciation/(depreciation) on: | ||||||||||||||||
Investments | (88,720,698) | (18,123,611) | 10,920,315 | (1,344,999) | ||||||||||||
Credit default swap contracts | 3,390,303 | – | – | – | ||||||||||||
Interest rate swap contracts | (528,406) | – | – | – | ||||||||||||
Forward foreign currency contracts | 1,104,788 | 121,018 | (4,602,238) | 22,028 | ||||||||||||
Translation of assets and liabilities denominated in foreign currencies | 50,359 | (848) | 640,427 | (970) | ||||||||||||
| ||||||||||||||||
Net change in unrealized appreciation/(depreciation) | (84,703,654) | (18,003,441) | 6,958,504 | (1,323,941) | ||||||||||||
| ||||||||||||||||
Net Realized and Unrealized Loss | (112,252,200) | (25,201,032) | (187,823,973) | (1,426,754) | ||||||||||||
| ||||||||||||||||
Net Decrease in Net Assets Resulting from Operations | $ | (44,722,580) | $ | (16,918,363) | $ | (147,887,349) | $ | (631,889) | ||||||||
| ||||||||||||||||
(1)Including Foreign Tax Withholding | $ | 89,353 | $ | – | $ | 371,336 | $ | – | ||||||||
| See Notes to Financial Statements. | ||
Stone Harbor Investment Funds Semi-Annual Report | November 30, 2015 | 67 |
Table of Contents
| Stone Harbor Investment Funds | Statements of Operations | |
| For the Six Months Ended November 30, 2015 (Unaudited) |
| Stone Harbor Investment Grade Fund | Stone Harbor Strategic Income Fund | Stone Harbor Emerging Markets Debt Allocation Fund | ||||||||||
INVESTMENT INCOME: | ||||||||||||
Interest | $ | 118,669 | $ | – | $ | – | ||||||
Dividends | 536 | 18 | – | |||||||||
Dividends from affiliated investment companies | – | 671,283 | 1,511,004 | |||||||||
| ||||||||||||
Total Investment Income | 119,205 | 671,301 | 1,511,004 | |||||||||
| ||||||||||||
EXPENSES: | ||||||||||||
Operational: | ||||||||||||
Investment advisory fee | 22,650 | 93,956 | 324,505 | |||||||||
Administration fees | 11,799 | 9,014 | 22,835 | |||||||||
Custodian fees | 6,261 | 8,399 | 2,910 | |||||||||
Printing fees | 2,201 | 2,224 | 2,184 | |||||||||
Professional fees | 25,972 | 25,972 | 20,595 | |||||||||
Trustee fees | 452 | 1,361 | 3,546 | |||||||||
Transfer agent fees | 10,249 | 10,498 | 10,494 | |||||||||
Registration fees | 10,619 | 10,796 | 6,267 | |||||||||
Insurance fees | 67 | 219 | 438 | |||||||||
Other | 1,448 | 1,510 | 1,636 | |||||||||
| ||||||||||||
Total expenses before waiver/reimbursement | 91,718 | 163,949 | 395,410 | |||||||||
Less fees waived by investment adviser | (22,650) | (93,956) | (324,505) | |||||||||
Less expenses reimbursed by investment adviser | (36,711) | (49,673) | (36,138) | |||||||||
| ||||||||||||
Total Net Expenses | 32,357 | 20,320 | 34,767 | |||||||||
| ||||||||||||
Net Investment Income | 86,848 | 650,981 | 1,476,237 | |||||||||
| ||||||||||||
REALIZED AND UNREALIZED GAIN/(LOSS) ON INVESTMENTS: | ||||||||||||
Net realized gain/(loss) on: | ||||||||||||
Investments | (22,159) | – | – | |||||||||
Investments - affiliated investment companies | – | (435,618) | (1,508,254) | |||||||||
Credit default swap contracts | – | 965 | – | |||||||||
Futures contracts | – | (57,846) | – | |||||||||
Forward foreign currency contracts | – | (59,354) | – | |||||||||
Foreign currency transactions | – | (9,324) | – | |||||||||
| ||||||||||||
Net realized loss | (22,159) | (561,177) | (1,508,254) | |||||||||
| ||||||||||||
Change in unrealized appreciation/(depreciation) on: | ||||||||||||
Investments | (95,181) | (1,314,656) | (6,348,652) | |||||||||
Credit default swap contracts | – | (31,864) | – | |||||||||
Futures contracts | – | 178,115 | – | |||||||||
Forward foreign currency contracts | – | 5,213 | – | |||||||||
Translation of assets and liabilities denominated in foreign currencies | – | 6,244 | – | |||||||||
| ||||||||||||
Net change in unrealized depreciation | (95,181) | (1,156,948) | (6,348,652) | |||||||||
| ||||||||||||
Net Realized and Unrealized Loss | (117,340) | (1,718,125) | (7,856,906) | |||||||||
| ||||||||||||
Net Decrease in Net Assets Resulting from Operations | $ | (30,492) | $ | (1,067,144) | $ | (6,380,669) | ||||||
| ||||||||||||
| See Notes to Financial Statements. | ||
| 68 | www.shiplp.com |
Table of Contents
| Stone Harbor Investment Funds | Statements of Changes in Net Assets | |
| Stone Harbor Emerging Markets Debt Fund | Stone Harbor High Yield Bond Fund | |||||||||||||||
For the Six Months Ended | For the Year Ended | For the Six Months Ended | For the Year Ended | |||||||||||||
OPERATIONS: | ||||||||||||||||
Net investment income | $ | 67,529,620 | $ | 116,699,852 | $ | 8,282,669 | $ | 17,041,253 | ||||||||
Net realized gain/(loss) on investments, credit default swap contracts, futures contracts, interest rate swap contracts, forward foreign currency contracts and foreign currency transactions | (27,548,546 | ) | (83,285,428 | ) | (7,197,591 | ) | 357,724 | |||||||||
Net change in unrealized depreciation on investments, credit default swap contracts, interest rate swap contracts, futures contracts, forward foreign currency contracts and foreign currency transactions | (84,703,654 | ) | (65,214,960 | ) | (18,003,441 | ) | (17,293,072 | ) | ||||||||
Net increase/(decrease) in net assets resulting from operations | (44,722,580 | ) | (31,800,536 | ) | (16,918,363 | ) | 105,905 | |||||||||
DISTRIBUTIONS TO SHAREHOLDERS: | ||||||||||||||||
Institutional Class | ||||||||||||||||
From net investment income | (57,134,662 | ) | (104,263,472 | ) | (8,384,566 | ) | (18,987,355 | ) | ||||||||
From net realized gains | – | – | – | (9,517,441 | ) | |||||||||||
Net decrease in net assets from distributions to shareholders | (57,134,662 | ) | (104,263,472 | ) | (8,384,566 | ) | (28,504,796 | ) | ||||||||
CAPITAL SHARE TRANSACTIONS: | ||||||||||||||||
Institutional Class | ||||||||||||||||
Proceeds from sale of shares | 127,728,554 | 476,079,373 | 2,817,494 | 54,566,778 | ||||||||||||
Issued to shareholders in reinvestment of distributions | 53,080,382 | 98,614,208 | 7,314,015 | 25,193,090 | ||||||||||||
Cost of shares redeemed | (251,535,217 | ) | (680,253,445 | ) | (10,305,172 | ) | (64,502,568 | ) | ||||||||
Net increase/(decrease) in net assets from capital share transactions | (70,726,281 | ) | (105,559,864 | ) | (173,663 | ) | 15,257,300 | |||||||||
Net Decrease in Net Assets | (172,583,523 | ) | (241,623,872 | ) | (25,476,592 | ) | (13,141,591 | ) | ||||||||
NET ASSETS: | ||||||||||||||||
Beginning of period | 1,936,340,514 | 2,177,964,386 | 289,714,340 | 302,855,931 | ||||||||||||
End of period | $ | 1,763,756,991 | $ | 1,936,340,514 | $ | 264,237,748 | $ | 289,714,340 | ||||||||
Includes undistributed net investment income of: | $ | 11,372,892 | $ | 977,934 | $ | 216,435 | $ | 318,332 | ||||||||
OTHER INFORMATION: | ||||||||||||||||
Share Transactions: | ||||||||||||||||
Institutional Class | ||||||||||||||||
Beginning shares | 185,010,068 | 196,069,405 | 33,382,621 | 31,455,233 | ||||||||||||
Shares sold | 12,766,726 | 44,694,384 | 340,842 | 5,947,727 | ||||||||||||
Shares reinvested | 5,371,552 | 9,292,443 | 911,762 | 2,858,107 | ||||||||||||
Shares redeemed | (25,000,348 | ) | (65,046,164 | ) | (1,288,334 | ) | (6,878,446 | ) | ||||||||
Shares outstanding - end of period | 178,147,998 | 185,010,068 | 33,346,891 | 33,382,621 | ||||||||||||
See Notes to Financial Statements.
Stone Harbor Investment Funds Semi-Annual Report | November 30, 2015 | 69 |
Table of Contents
| Stone Harbor Investment Funds | Statements of Changes in Net Assets | |
| Stone Harbor Emerging Markets Corporate | ||||||||||||||||
| Stone Harbor Local Markets Fund | Debt Fund | |||||||||||||||
For the Six Months Ended | For the Year Ended May 31, 2015 | For the Six Months Ended November 30, 2015 | For the Year Ended | |||||||||||||
OPERATIONS: | ||||||||||||||||
Net investment income | $ | 39,936,624 | $ | 115,420,109 | $ | 794,865 | $ | 1,134,569 | ||||||||
Net realized gain/(loss) on investments, credit default swap contracts, futures contracts, interest rate swap contracts, forward foreign currency contracts and foreign currency transactions | (194,782,477) | (262,316,954) | (102,813) | 363,555 | ||||||||||||
Net change in unrealized appreciation/(depreciation) on investments, credit default swap contracts, interest rate swap contracts, futures contracts, forward foreign currency contracts and foreign currency transactions | 6,958,504 | (196,330,586) | (1,323,941) | (619,142) | ||||||||||||
Net increase/(decrease) in net assets resulting from operations | (147,887,349) | (343,227,431) | (631,889) | 878,982 | ||||||||||||
DISTRIBUTIONS TO SHAREHOLDERS: | ||||||||||||||||
Institutional Class | ||||||||||||||||
From net investment income | – | (27,499,281) | (806,595) | (1,215,887) | ||||||||||||
Net decrease in net assets from distributions to shareholders | – | (27,499,281) | (806,595) | (1,215,887) | ||||||||||||
CAPITAL SHARE TRANSACTIONS: | ||||||||||||||||
Institutional Class | ||||||||||||||||
Proceeds from sale of shares | 118,548,327 | 371,721,098 | 25,000,000 | 2,938,306 | ||||||||||||
Issued to shareholders in reinvestment of distributions | – | 26,635,265 | 519,898 | 1,215,887 | ||||||||||||
Cost of shares redeemed | (560,025,223) | (955,466,079) | (6,237,300) | (6,102,931) | ||||||||||||
Net increase/(decrease) in net assets from capital share transactions | (441,476,896) | (557,109,716) | 19,282,598 | (1,948,738) | ||||||||||||
Net Increase/(Decrease) in Net Assets | (589,364,245) | (927,836,428) | 17,844,114 | (2,285,643) | ||||||||||||
NET ASSETS: | ||||||||||||||||
Beginning of period | 1,562,947,708 | 2,490,784,136 | 24,001,425 | 26,287,068 | ||||||||||||
End of period | $ | 973,583,463 | $ | 1,562,947,708 | $ | 41,845,539 | $ | 24,001,425 | ||||||||
Includes undistributed/(overdistributed) net investment income of: | $ | (130,053,583) | $ | (169,990,207) | $ | 52,105 | $ | 63,835 | ||||||||
OTHER INFORMATION: | ||||||||||||||||
Share Transactions: | ||||||||||||||||
Institutional Class | ||||||||||||||||
Beginning shares | 186,605,612 | 249,984,702 | 2,634,743 | 2,847,399 | ||||||||||||
Shares sold | 15,259,573 | 40,488,906 | 2,866,973 | 318,097 | ||||||||||||
Shares reinvested | – | 3,068,946 | 59,718 | 134,222 | ||||||||||||
Shares redeemed | (71,475,004) | (106,936,942) | (711,860) | (664,975) | ||||||||||||
Shares outstanding - end of period | 130,390,181 | 186,605,612 | 4,849,574 | 2,634,743 | ||||||||||||
See Notes to Financial Statements.
| 70 | www.shiplp.com |
Table of Contents
| Stone Harbor Investment Funds | Statements of Changes in Net Assets | |
| Stone Harbor Investment Grade Fund | Stone Harbor Strategic Income Fund | |||||||||||||||
For the Six Months Ended | For the Year Ended | For the Six Months Ended | For the Year Ended | |||||||||||||
OPERATIONS: | ||||||||||||||||
Net investment income | $ | 86,848 | $ | 96,786 | $ | 650,981 | $ | 1,270,579 | ||||||||
Net realized gain/(loss) on investments, credit default swap contracts, futures contracts, interest rate swap contracts, forward foreign currency contracts and foreign currency transactions | (22,159 | ) | 165,207 | (125,559 | ) | 283,251 | ||||||||||
Net realized loss on investments - affiliated investment companies | – | – | (435,618 | ) | (14,796 | ) | ||||||||||
Distributions from affiliated investment companies | – | – | – | 418,657 | ||||||||||||
Net change in unrealized depreciation on investments, credit default swap contracts, interest rate swap contracts, futures contracts, forward foreign currency contracts and foreign currency transactions | (95,181 | ) | (54,936 | ) | (1,156,948 | ) | (1,490,326 | ) | ||||||||
Net increase/(decrease) in net assets resulting from operations | (30,492 | ) | 207,057 | (1,067,144 | ) | 467,365 | ||||||||||
DISTRIBUTIONS TO SHAREHOLDERS: | ||||||||||||||||
Institutional Class | ||||||||||||||||
From net investment income | (87,753 | ) | (98,558 | ) | (566,055 | ) | (1,268,494 | ) | ||||||||
From net realized gains | – | (73,570 | ) | – | (80,720 | ) | ||||||||||
Net decrease in net assets from distributions to shareholders | (87,753 | ) | (172,128 | ) | (566,055 | ) | (1,349,214 | ) | ||||||||
CAPITAL SHARE TRANSACTIONS: | ||||||||||||||||
Institutional Class | ||||||||||||||||
Proceeds from sale of shares | 5,960,832 | 6,913,138 | 2,802,571 | 23,081,037 | ||||||||||||
Issued to shareholders in reinvestment of distributions | 87,753 | 172,128 | 171,135 | 1,306,521 | ||||||||||||
Cost of shares redeemed | (345,000 | ) | (365,300 | ) | – | – | ||||||||||
Net increase in net assets from capital share transactions | 5,703,585 | 6,719,966 | 2,973,706 | 24,387,558 | ||||||||||||
Net Increase in Net Assets | 5,585,340 | 6,754,895 | 1,340,507 | 23,505,709 | ||||||||||||
NET ASSETS: | ||||||||||||||||
Beginning of period | 9,877,151 | 3,122,256 | 34,090,380 | 10,584,671 | ||||||||||||
End of period | $ | 15,462,491 | $ | 9,877,151 | $ | 35,430,887 | $ | 34,090,380 | ||||||||
Includes undistributed net investment income of: | $ | 2,304 | $ | 3,209 | $ | 123,037 | $ | 38,111 | ||||||||
OTHER INFORMATION: | ||||||||||||||||
Share Transactions: | ||||||||||||||||
Institutional Class | ||||||||||||||||
Beginning shares | 953,189 | 300,737 | 3,390,417 | 1,013,714 | ||||||||||||
Shares sold | 580,575 | 670,830 | 289,702 | 2,247,267 | ||||||||||||
Shares reinvested | 8,561 | 16,631 | 17,818 | 129,436 | ||||||||||||
Shares redeemed | (33,672 | ) | (35,009 | ) | – | – | ||||||||||
Shares outstanding - end of period | 1,508,653 | 953,189 | 3,697,937 | 3,390,417 | ||||||||||||
See Notes to Financial Statements.
Stone Harbor Investment Funds Semi-Annual Report | November 30, 2015 | 71 |
Table of Contents
| Stone Harbor Investment Funds | Statements of Changes in Net Assets | |
| Stone Harbor Emerging Markets Debt Allocation Fund | ||||||||
For the Six Months Ended | For the Period October 20, 2014 (Inception) to May 31, 2015 | |||||||
OPERATIONS: | ||||||||
Net investment income | $ | 1,476,237 | $ | 1,615,277 | ||||
Net realized loss on investments - affiliated securities | (1,508,254 | ) | (274,536) | |||||
Net change in unrealized depreciation on investments - affiliated securities | (6,348,652 | ) | (4,207,425) | |||||
Net decrease in net assets resulting from operations | (6,380,669 | ) | (2,866,684) | |||||
DISTRIBUTIONS TO SHAREHOLDERS: | ||||||||
Institutional Class | ||||||||
From net investment income | – | (1,049,102) | ||||||
Net decrease in net assets from distributions to shareholders | – | (1,049,102) | ||||||
CAPITAL SHARE TRANSACTIONS: | ||||||||
Institutional Class | ||||||||
Proceeds from sale of shares | 27,708,700 | 88,266,192 | ||||||
Issued to shareholders in reinvestment of distributions | – | 1,049,102 | ||||||
Cost of shares redeemed | (10,875,058 | ) | – | |||||
Net increase in net assets from capital share transactions | 16,833,642 | 89,315,294 | ||||||
Net Increase in Net Assets | 10,452,973 | 85,399,508 | ||||||
NET ASSETS: | ||||||||
Beginning of period | 85,399,508 | – | ||||||
End of period | $ | 95,852,481 | $ | 85,399,508 | ||||
Includes undistributed net investment income of: | $ | 2,045,328 | $ | 569,091 | ||||
OTHER INFORMATION: | ||||||||
Share Transactions: | ||||||||
Institutional Class Beginning shares | 9,124,028 | – | ||||||
Shares sold | 3,041,123 | 9,010,734 | ||||||
Shares reinvested | – | 113,294 | ||||||
Shares redeemed | (1,184,900 | ) | – | |||||
Shares outstanding - end of period | 10,980,251 | 9,124,028 | ||||||
See Notes to Financial Statements.
| 72 | www.shiplp.com |
Table of Contents
| Stone Harbor Emerging Markets Debt Fund | Financial Highlights | |
| For a share outstanding through the periods presented. |
| Institutional Class | For the Six Months November 30, (Unaudited) | For the 2015 | For the 2014 | For the Year Ended May 31, 2013 | For the 2012 | For the 2011 | ||||||||||||||||||
Net asset value - beginning of period | $ | 10.47 | $ | 11.11 | $ | 11.34 | $ | 10.93 | $ | 11.20 | $ | 10.48 | ||||||||||||
Income/(loss) from investment operations: |
| |||||||||||||||||||||||
Net investment income(1) | 0.37 | 0.59 | 0.55 | 0.55 | 0.65 | 0.67 | ||||||||||||||||||
Net realized and unrealized gain/(loss) on investments | (0.62) | (0.70) | (0.31) | 0.45 | (0.15) | 1.00 | ||||||||||||||||||
Total income/(loss) from investment operations | (0.25) | (0.11) | 0.24 | 1.00 | 0.50 | 1.67 | ||||||||||||||||||
Less distributions to common shareholders: |
| |||||||||||||||||||||||
From net investment income | (0.32) | (0.53) | (0.47) | (0.54) | (0.67) | (0.63) | ||||||||||||||||||
From net realized gains | – | – | – | (0.05) | (0.10) | (0.32) | ||||||||||||||||||
Total distributions | (0.32) | (0.53) | (0.47) | (0.59) | (0.77) | (0.95) | ||||||||||||||||||
Net Increase/(Decrease) in Net Asset Value | (0.57) | (0.64) | (0.23) | 0.41 | (0.27) | 0.72 | ||||||||||||||||||
Net asset value - end of period | $ | 9.90 | $ | 10.47 | $ | 11.11 | $ | 11.34 | $ | 10.93 | $ | 11.20 | ||||||||||||
Total Return(2)(3) | (2.36)% | (1.01)% | 2.45% | 9.05% | 4.61% | 16.30% | ||||||||||||||||||
Ratios/Supplemental Data: | ||||||||||||||||||||||||
Net assets, end of period (in millions) | $ | 1,764 | $ | 1,936 | $ | 2,178 | $ | 1,837 | $ | 1,184 | $ | 749 | ||||||||||||
Ratio of expenses to average net assets without fee waivers/reimbursements/repayment of previously waived fees | 0.68%(4) | 0.68% | 0.70% | 0.68% | 0.72% | 0.77% | ||||||||||||||||||
Ratio of expenses to average net assets with fee waivers/reimbursements/repayment of previously waived fees | 0.68%(4) | 0.68% | 0.70% | 0.68% | 0.72% | 0.75% | ||||||||||||||||||
Ratio of net investment income to average net assets with fee waivers/reimbursements/repayment of previously waived fees | 7.35%(4) | 5.54% | 5.21% | 4.68% | 5.78% | 6.02% | ||||||||||||||||||
Portfolio turnover rate | 39% | 75% | 68% | 68% | 60% | 82% | ||||||||||||||||||
| (1) | Calculated using average shares throughout the period. |
| (2) | Total returns would have been lower in 2011 had various fees and expenses not been waived and reimbursed during the period. The total returns in the table represent the rate that an investor would have earned (or lost) on an investment in a Fund (assuming reinvestment of all dividends and distributions). |
| (3) | Total returns for periods of less than one year are not annualized. |
| (4) | Annualized. |
See Notes to Financial Statements.
Stone Harbor Investment Funds Semi-Annual Report | November 30, 2015 | 73 |
Table of Contents
| Stone Harbor High Yield Bond Fund | Financial Highlights | |
| For a share outstanding through the periods presented. |
| Institutional Class | For the Six Months November 30, (Unaudited) | For the 2015 | For the 2014 | For the 2013 | For the 2012 | For the 2011 | ||||||||||||||||||
Net asset value - beginning of period | $ | 8.68 | $ | 9.63 | $ | 9.83 | $ | 9.13 | $ | 10.00 | $ | 9.36 | ||||||||||||
Income/(loss) from investment operations: |
| |||||||||||||||||||||||
Net investment income(1) | 0.25 | 0.54 | 0.60 | 0.70 | 0.72 | 0.77 | ||||||||||||||||||
Net realized and unrealized gain/(loss) on investments | (0.76) | (0.58) | 0.13 | 0.72 | (0.59) | 0.78 | ||||||||||||||||||
Total income/(loss) from investment operations | (0.51) | (0.04) | 0.73 | 1.42 | 0.13 | 1.55 | ||||||||||||||||||
Less distributions to common shareholders: |
| |||||||||||||||||||||||
From net investment income | (0.25) | (0.60) | (0.64) | (0.68) | (0.70) | (0.76) | ||||||||||||||||||
From net realized gains | – | (0.31) | (0.29) | (0.04) | (0.30) | (0.15) | ||||||||||||||||||
Total distributions | (0.25) | (0.91) | (0.93) | (0.72) | (1.00) | (0.91) | ||||||||||||||||||
Net Increase/(Decrease) in Net Asset Value | (0.76) | (0.95) | (0.20) | 0.70 | (0.87) | 0.64 | ||||||||||||||||||
Net asset value - end of period | $ | 7.92 | $ | 8.68 | $ | 9.63 | $ | 9.83 | $ | 9.13 | $ | 10.00 | ||||||||||||
Total Return(2)(3) | (5.89)% | (0.27)% | 7.90% | 15.87% | 1.77% | 17.14% | ||||||||||||||||||
Ratios/Supplemental Data: | ||||||||||||||||||||||||
Net assets, end of period (in millions) | $ | 264 | $ | 290 | $ | 303 | $ | 387 | $ | 520 | $ | 488 | ||||||||||||
Ratio of expenses to average net assets without fee waivers/reimbursements/repayment of previously waived fees | 0.63%(4) | 0.62%(5) | 0.62% | 0.60% | 0.62% | 0.65% | ||||||||||||||||||
Ratio of expenses to average net assets with fee waivers/reimbursements/repayment of previously waived fees | 0.63%(4) | 0.60%(5) | 0.55% | 0.55% | 0.55% | 0.55% | ||||||||||||||||||
Ratio of net investment income to average net assets with fee waivers/reimbursements/repayment of previously waived fees | 5.95%(4) | 5.98% | 6.23% | 7.27% | 7.67% | 7.78% | ||||||||||||||||||
Portfolio turnover rate | 23% | 52% | 54% | 59% | 46% | 60% | ||||||||||||||||||
| (1) | Calculated using average shares throughout the period. |
| (2) | Total returns would have been lower in May 2011 through May 2015 had various fees and expenses not been waived and reimbursed during the period. The total returns in the table represent the rate that an investor would have earned (or lost) on an investment in a Fund (assuming reinvestment of all dividends and distributions). |
| (3) | Total returns for periods of less than one year are not annualized. |
| (4) | Annualized. |
| (5) | Effective October 1, 2014, the expense limitation rate changed from 0.55% to 0.65%. |
See Notes to Financial Statements.
| 74 | www.shiplp.com |
Table of Contents
| Stone Harbor Local Markets Fund | Financial Highlights | |
| For a share outstanding through the periods presented. |
| Institutional Class | For the Six Months November 30, (Unaudited) | For the Year 2015 | For the 2014 | For the 2013 | For the 2012 | For the (Inception) | ||||||||||||||||||
Net asset value - beginning of period | $ | 8.38 | $ | 9.96 | $ | 10.51 | $ | 10.10 | $ | 11.21 | $ | 10.00 | ||||||||||||
Income/(loss) from investment operations: |
| |||||||||||||||||||||||
Net investment income(1) | 0.26 | 0.52 | 0.53 | 0.49 | 0.57 | 0.51 | ||||||||||||||||||
Net realized and unrealized gain/(loss) on investments | (1.17) | (1.98) | (0.96) | 0.33 | (1.21) | 1.14 | ||||||||||||||||||
Total income/(loss) from investment operations | (0.91) | (1.46) | (0.43) | 0.82 | (0.64) | 1.65 | ||||||||||||||||||
Less distributions to common shareholders: |
| |||||||||||||||||||||||
From net investment income | – | (0.12) | (0.07) | (0.39) | (0.45) | (0.39) | ||||||||||||||||||
From net realized gains | – | – | (0.05) | (0.02) | – | (0.05) | ||||||||||||||||||
From tax return of capital | – | – | – | – | (0.02) | – | ||||||||||||||||||
Total distributions | – | (0.12) | (0.12) | (0.41) | (0.47) | (0.44) | ||||||||||||||||||
Net Increase/(Decrease) in Net Asset Value | (0.91) | (1.58) | (0.55) | 0.41 | (1.11) | 1.21 | ||||||||||||||||||
Net asset value - end of period | $ | 7.47 | $ | 8.38 | $ | 9.96 | $ | 10.51 | $ | 10.10 | $ | 11.21 | ||||||||||||
Total Return(2)(3) | (10.86)% | (14.70)% | (4.04)% | 7.92% | (5.84)% | 16.82% | ||||||||||||||||||
Ratios/Supplemental Data: | ||||||||||||||||||||||||
Net assets, end of period (in millions) | $ | 974 | $ | 1,563 | $ | 2,491 | $ | 2,464 | $ | 1,563 | $ | 606 | ||||||||||||
Ratio of expenses to average net assets without fee waivers/reimbursements/repayment of previously waived fees | 0.89%(4) | 0.87% | 0.88% | 0.86% | 0.89% | 1.01%(4) | ||||||||||||||||||
Ratio of expenses to average net assets with fee waivers/reimbursements/repayment of previously waived fees | 0.89%(4) | 0.87% | 0.88% | 0.86% | 0.89% | 1.00%(4) | ||||||||||||||||||
Ratio of net investment income to average net assets with fee waivers/reimbursements/repayment of previously waived fees | 6.57%(4) | 5.62% | 5.41% | 4.45% | 5.35% | 5.13%(4) | ||||||||||||||||||
Portfolio turnover rate | 91% | 145% | 181% | 191% | 161% | 102% | ||||||||||||||||||
| (1) | Calculated using average shares throughout the period. |
| (2) | Total returns would have been lower in 2011 had various fees and expenses not been waived and reimbursed during the period. The total returns in the table represent the rate that an investor would have earned (or lost) on an investment in a Fund (assuming reinvestment of all dividends and distributions). |
| (3) | Total returns for periods of less than one year are not annualized. |
| (4) | Annualized. |
See Notes to Financial Statements.
Stone Harbor Investment Funds Semi-Annual Report | November 30, 2015 | 75 |
Table of Contents
| Stone Harbor Emerging Markets Corporate Debt Fund | Financial Highlights |
| For a share outstanding through the periods presented. |
| Institutional Class | For the Six Months Ended November 30, 2015 (Unaudited) | For the Year Ended May 31, 2015 | For the Year Ended May 31, 2014 | For the Year Ended May 31, 2013 | For the Period June 1, 2011 | |||||||||||||||
Net asset value - beginning of period | $ | 9.11 | $ | 9.23 | $ | 9.37 | $ | 8.89 | $ | 10.00 | ||||||||||
Income/(loss) from investment operations: |
| |||||||||||||||||||
Net investment | 0.21 | 0.41 | 0.41 | 0.44 | 0.59 | |||||||||||||||
Net realized and unrealized gain/(loss) on investments | (0.47) | (0.08) | (0.08) | 0.46 | (1.11) | |||||||||||||||
Total income/(loss) from investment operations | (0.26) | 0.33 | 0.33 | 0.90 | (0.52) | |||||||||||||||
Less distributions to common shareholders: |
| |||||||||||||||||||
From net investment income | (0.22) | (0.45) | (0.47) | (0.42) | (0.59) | |||||||||||||||
Total distributions | (0.22) | (0.45) | (0.47) | (0.42) | (0.59) | |||||||||||||||
Net Increase/(Decrease) in Net Asset Value | (0.48) | (0.12) | (0.14) | 0.48 | (1.11) | |||||||||||||||
Net asset value - end of period | $ | 8.63 | $ | 9.11 | $ | 9.23 | $ | 9.37 | $ | 8.89 | ||||||||||
Total Return(2) | (2.86)% | 3.64% | 3.80% | 10.13% | (5.10)% | |||||||||||||||
Ratios/Supplemental Data: |
| |||||||||||||||||||
Net assets, end of period (in millions) | $ | 42 | $ | 24 | $ | 26 | $ | 68 | $ | 35 | ||||||||||
Ratio of expenses to average net assets without fee waivers/reimbursements | 1.32%(3) | 1.40% | 1.22% | 1.16% | 1.32% | |||||||||||||||
Ratio of expenses to average net assets with fee waivers/reimbursements | 1.00%(3) | 1.00% | 1.00% | 1.00% | 1.00% | |||||||||||||||
Ratio of net investment income to average net assets with fee waivers/reimbursements | 4.76%(3) | 4.52% | 4.58% | 4.68% | 6.41% | |||||||||||||||
Portfolio turnover rate | 35% | 62% | 78% | 78% | 51% | |||||||||||||||
| (1) | Calculated using average shares throughout the period. |
| (2) | Total returns would have been lower had various fees and expenses not been waived and reimbursed during the period. The total returns in the table represent the rate that an investor would have earned (or lost) on an investment in a Fund (assuming reinvestment of all dividends and distributions). |
| (3) | Annualized. |
See Notes to Financial Statements.
| 76 | www.shiplp.com |
Table of Contents
| Stone Harbor Investment Grade Fund | Financial Highlights | |
| For a share outstanding through the periods presented. |
| Institutional Class | For the Six Months Ended November 30, 2015 (Unaudited) | For the Year Ended May 31, 2015 | For the Period December 18, 2013 (Inception) to May 31, 2014 | |||||||||
Net asset value - beginning of period | $ | 10.36 | $ | 10.38 | $ | 10.00 | ||||||
Income/(loss) from investment operations: |
| |||||||||||
Net investment income(1) | 0.07 | 0.13 | 0.07 | |||||||||
Net realized and unrealized gain/(loss) on investments | (0.12) | 0.07 | 0.37 | |||||||||
Total income/(loss) from investment operations | (0.05) | 0.20 | 0.44 | |||||||||
Less distributions to common shareholders: |
| |||||||||||
From net investment income | (0.06) | (0.14) | (0.06) | |||||||||
From net realized gains | – | (0.08) | – | |||||||||
Total distributions | (0.06) | (0.22) | (0.06) | |||||||||
Net Increase/(Decrease) in Net Asset Value | (0.11) | (0.02) | 0.38 | |||||||||
Net asset value - end of period | $ | 10.25 | $ | 10.36 | $ | 10.38 | ||||||
Total Return(2)(3) | (0.48%) | 1.94% | 4.41% | |||||||||
Ratios/Supplemental Data: | ||||||||||||
Net assets, end of period (in millions) | $ | 15 | $ | 10 | $ | 3 | ||||||
Ratio of expenses to average net assets without fees waived by investment adviser and expenses reimbursed by investment adviser | 1.42 | %(4) | 2.07% | 4.14%(4) | ||||||||
Ratio of expenses to average net assets with fees waived by investment adviser and expenses reimbursed by investment adviser | 0.50 | %(4) | 0.50% | 0.50%(4) | ||||||||
Ratio of net investment income to average net assets with fee waivers/reimbursements | 1.34 | %(4) | 1.26% | 1.62%(4) | ||||||||
Portfolio turnover rate | 16 | % | 51% | 27% | ||||||||
| (1) | Calculated using average shares throughout the period. |
| (2) | Total returns would have been lower had various fees and expenses not been waived and reimbursed during the period. The total returns in the table represent the rate that an investor would have earned (or lost) on an investment in a Fund (assuming reinvestment of all dividends and distributions). |
| (3) | Total returns for periods of less than one year are not annualized. |
| (4) | Annualized. |
See Notes to Financial Statements.
Stone Harbor Investment Funds Semi-Annual Report | November 30, 2015 | 77 |
Table of Contents
| Stone Harbor Strategic Income Fund | Financial Highlights | |
| For a share outstanding through the periods presented. |
| Institutional Class | For the Six Months Ended November 30, 2015 (Unaudited) | For the Year Ended May 31, 2015 | For the Period December 18, 2013 (Inception) to May 31, 2014 | |||||||||
| ||||||||||||
Net asset value - beginning of period | $ | 10.05 | $ | 10.44 | $ | 10.00 | ||||||
Income/(loss) from investment operations: | ||||||||||||
Net investment income(1) | 0.19 | 0.49 | 0.15 | |||||||||
Net realized and unrealized gain/(loss) on investments | (0.50 | ) | (0.37 | ) | 0.42 | |||||||
| ||||||||||||
Total income/(loss) from investment operations | (0.31 | ) | 0.12 | 0.57 | ||||||||
| ||||||||||||
Less distributions to common shareholders: | ||||||||||||
From net investment income | (0.16 | ) | (0.48 | ) | (0.13) | |||||||
From net realized gains | – | (0.03 | ) | – | ||||||||
| ||||||||||||
Total distributions | (0.16 | ) | (0.51 | ) | (0.13) | |||||||
| ||||||||||||
Net Increase/(Decrease) in Net Asset Value | (0.47 | ) | (0.39 | ) | 0.44 | |||||||
| ||||||||||||
Net asset value - end of period | $ | 9.58 | $ | 10.05 | $ | 10.44 | ||||||
| ||||||||||||
Total Return(2)(3) | (3.08%) | 1.15% | 5.73% | |||||||||
Ratios/Supplemental Data: | ||||||||||||
Net assets, end of period (in millions) | $ | 35 | $ | 34 | $ | 11 | ||||||
Ratio of expenses to average net assets without fees waived by investment adviser and expenses reimbursed by investment adviser | 0.96 | %(4)(5) | 1.06 | %(5) | 1.46%(4)(5) | |||||||
Ratio of expenses to average net assets with fees waived by investment adviser and expenses reimbursed by investment adviser | 0.12 | %(4)(5) | 0.11 | %(5) | 0.12%(4)(5) | |||||||
Ratio of net investment income to average net assets with fee waivers/reimbursements | 3.81 | %(4)(5) | 4.88 | %(5) | 3.38%(4)(5) | |||||||
Portfolio turnover rate | 16 | % | 8 | % | 0%(6) | |||||||
| (1) | Calculated using average shares throughout the period. |
| (2) | Total returns would have been lower had various fees and expenses not been waived and reimbursed during the period. The total returns in the table represent the rate that an investor would have earned (or lost) on an investment in a Fund (assuming reinvestment of all dividends and distributions). |
| (3) | Total returns for periods of less than one year are not annualized. |
| (4) | Annualized. |
| (5) | Ratio does not include expenses of the mutual funds held in the investment portfolio. |
| (6) | Less than 0.5%. |
See Notes to Financial Statements.
| 78 | www.shiplp.com |
Table of Contents
| Stone Harbor Emerging Markets Debt Allocation Fund | Financial Highlights |
| For a share outstanding through the periods presented. |
| Institutional Class | For the Six Months Ended | For the Period October 20, 2014 (Inception) to May 31, 2015 | ||||||
| ||||||||
Net asset value - beginning of period | $ | 9.36 | $ | 10.00 | ||||
Income/(loss) from investment operations: | ||||||||
Net investment income(1) | 0.14 | 0.23 | ||||||
Net realized and unrealized loss on investments | (0.77 | ) | (0.70) | |||||
| ||||||||
Total loss from investment operations | (0.63 | ) | (0.47) | |||||
| ||||||||
Less distributions to common shareholders: | ||||||||
From net investment income | – | (0.17) | ||||||
| ||||||||
Total distributions | – | (0.17) | ||||||
| ||||||||
Net Decrease in Net Asset Value | (0.63 | ) | (0.64) | |||||
| ||||||||
Net asset value - end of period | $ | 8.73 | $ | 9.36 | ||||
| ||||||||
Total Return(2)(3) | (6.73%) | (4.73%) | ||||||
Ratios/Supplemental Data: | ||||||||
Net assets, end of period (in millions) | $ | 96 | $ | 85 | ||||
Ratio of expenses to average net assets without fees waived by investment adviser and expenses reimbursed by investment adviser | 0.85 | %(4)(5) | 0.97%(4)(5) | |||||
Ratio of expenses to average net assets with fees waived by investment adviser and expenses reimbursed by investment adviser | 0.07 | %(4)(5) | 0.10%(4)(5) | |||||
Ratio of net investment income to average net assets with fee waivers/reimbursements | 3.18 | %(4)(5) | 3.68%(4)(5) | |||||
Portfolio turnover rate | 15 | % | 11% | |||||
| (1) | Calculated using average shares throughout the period. |
| (2) | Total returns would have been lower in 2015 had various fees and expenses not been waived and reimbursed during the period. The total returns in the table represent the rate that an investor would have earned (or lost) on an investment in a Fund (assuming reinvestment of all dividends and distributions). |
| (3) | Total returns for periods of less than one year are not annualized. |
| (4) | Annualized. |
| (5) | Ratio does not include expenses of the mutual funds held in the investment portfolio. |
See Notes to Financial Statements.
Stone Harbor Investment Funds Semi-Annual Report | November 30, 2015 | 79 |
Table of Contents
| Stone Harbor Investment Funds | Notes to Financial Statements | |
| November 30, 2015 (Unaudited) |
1. ORGANIZATION AND SIGNIFICANT ACCOUNTING POLICIES
Stone Harbor Investment Funds, which consists of Stone Harbor Emerging Markets Debt Fund, Stone Harbor High Yield Bond Fund, Stone Harbor Local Markets Fund, Stone Harbor Emerging Markets Corporate Debt Fund, Stone Harbor Investment Grade Fund, Stone Harbor Strategic Income Fund, and Stone Harbor Emerging Markets Debt Allocation Fund (each, a “Fund” and together, the “Funds”) is a Massachusetts business trust (the “Trust”), organized on February 20, 2007 and registered under the Investment Company Act of 1940, as amended (the “1940 Act”), as an open-end management investment company. Shares of each Fund are currently divided into two classes, designated Institutional Class Shares and Distributor Class Shares. As of the date of this report, Distributor Class shares were not offered for sale in each Fund. The Trust’s Declaration of Trust permits the Trustees to create additional funds and share classes.
The Emerging Markets Debt Fund’s investment objective is to maximize total return. The Fund normally will invest at least 80% of its net assets (plus any borrowings made for investment purposes) in Emerging Markets Fixed Income Securities. “Emerging Markets Fixed Income Securities” include fixed income securities and derivative instruments (including, but not limited to, spot and currency contracts, futures, options and swaps) that economically are tied to countries with emerging securities markets or whose performance is linked to those countries’ markets, economies or ability to repay loans. Emerging Markets Fixed Income Securities may be denominated in non-U.S. currencies or the U.S. dollar. A security or instrument is economically tied to an emerging market country if it is principally traded on the country’s securities markets or the issuer is organized or principally operates in the country, derives a majority of its income from its operations within the country or has a majority of its assets within the country. Emerging Markets Fixed Income Securities also include derivatives and other instruments used to hedge or gain exposure to emerging securities markets (for example, futures or other derivatives whose return is based on specific emerging markets securities or indices).
The High Yield Bond Fund’s investment objective is to maximize total return. The Fund will normally invest at least 80% of its net assets (plus any borrowings made for investment purposes) in High Yield Debt Securities. “High Yield Debt Securities” include fixed income securities and derivative instruments (including, but not limited to, spot and currency contracts, futures, options and swaps) rated below investment grade (or, if unrated, of comparable quality as determined by Stone Harbor Investment Partners LP (the “Adviser” or “Stone Harbor”). These types of securities and instruments are commonly referred to as “high yield” securities or “junk bonds,” and may include, among other things, bonds, debentures, notes, equipment trust certificates, commercial paper, commercial loans, preferred stock and other obligations of U.S. and non-U.S. issuers. High Yield Debt Securities also include securities or other instruments whose return is based on the return of high yield securities, including derivative instruments and instruments created to hedge or gain exposure to the high yield markets.
The Local Markets Fund’s investment objective is to maximize total return. The Fund normally will invest at least 80% of its net assets (plus any borrowings made for investment purposes) in Emerging Markets Investments. “Emerging Markets Investments” include fixed income securities and derivative instruments (including, but not limited to, spot and currency contracts, futures, options and swaps) that economically are tied to an emerging market country, which are denominated in the predominant currency of the local market of an emerging market country (an “Emerging Markets Currency”) or whose performance is linked to those countries’ currencies, markets, economies or ability to repay loans. Although under normal circumstances a significant portion of the Fund’s investments will be denominated in Emerging Markets Currencies, Emerging Markets Investments may be denominated in non-Emerging Markets Currencies, including the U.S. dollar. A security or instrument is economically tied to an emerging market country if it is principally traded on the country’s securities markets or the issuer is organized or principally operates in the country, derives a majority of its income from its operations within the country or has a majority of its assets within the country. Emerging Markets Investments also include Emerging Markets Currencies and derivatives and other instruments used to hedge or gain exposure to emerging securities markets or Emerging Markets Currencies (for example, futures or other derivatives whose return is based on specific emerging markets securities, emerging markets indices or Emerging Markets Currencies).
The Emerging Markets Corporate Debt Fund’s investment objective is to maximize total return. The Fund normally will invest at least 80% of its net assets (plus any borrowings made for investment purposes) in Emerging Markets Corporate Debt Investments. “Emerging Markets Corporate Debt Investments” are debt instruments, including loans, issued by corporations or other business organizations that are economically tied to an emerging market country. A corporation or other business organization is economically tied to an emerging market country if it issues securities that are principally traded on the country’s securities markets or if it is organized or principally operates in the country, derives a majority of its income from its operations within the country or has a majority of its assets within the country. Emerging Markets Corporate Debt Investments also include derivative instruments used for hedging purposes or to otherwise gain or reduce long or short exposure to Emerging Markets Corporate Debt Investments.
The Investment Grade Fund’s investment objective is to maximize total return. The Fund invests in various types of fixed income securities and under normal market conditions will invest at least 80% of its net assets (plus any borrowings made for investment purposes) in Investment Grade Debt Securities. “Investment Grade Debt Securities” include fixed income securities that are rated investment grade by any of Moody’s Investors Services, Inc., Standard & Poor’s Rating Services, Fitch Ratings Limited, DBRS or other qualified rating agencies or, if unrated, are determined by the Adviser to be of comparable quality, and derivative instruments related to those securities.
| 80 | www.shiplp.com |
Table of Contents
| Stone Harbor Investment Funds | Notes to Financial Statements | |
| November 30, 2015 (Unaudited) |
The Strategic Income Fund’s investment objective is to maximize total return. The Fund is intended to provide broad exposure to global credit markets. The Fund, either directly or through investment in the underlying funds (defined below), may invest in a broad variety of fixed income and other income producing securities and instruments (including derivatives), and will not be limited in terms of type of instrument, geography, credit rating or duration. The Fund may invest all or a significant portion of its assets in Stone Harbor Investment Grade Fund, Stone Harbor High Yield Bond Fund, Stone Harbor Emerging Markets Debt Fund, Stone Harbor Local Markets Fund and Stone Harbor Emerging Markets Corporate Debt Fund and other funds sponsored or advised by the Adviser (together, the “underlying funds”). The Fund is not required to invest in the underlying funds, and from time to time may not be invested in any underlying fund. In addition to investing in the underlying funds, the Fund may invest directly in fixed income securities and in other instruments and transactions.
The Emerging Markets Debt Allocation Fund’s investment objective is to maximize total return. The Fund, either directly or through investment in the underlying funds (defined below), will invest at least 80% of its net assets (plus any borrowings made for investment purposes) in Emerging Markets Investments. Emerging Markets Investments include fixed income securities and other income producing securities and derivative instruments (including, but not limited to, spot and currency contracts, futures, options and swaps), that economically are tied to an emerging market country or whose performance is linked to those countries’ currencies, markets, economies or ability to repay loans. The Fund may invest all or a significant portion of its assets in Stone Harbor Emerging Markets Debt Fund and Stone Harbor Local Markets Fund (together, the “underlying funds”). The Fund is not required to invest in the underlying funds, and from time to time may not be invested in any underlying fund. In addition to investing in the underlying funds, the Fund may invest directly in fixed income securities and in other instruments and transactions.
The Emerging Markets Debt Fund and Local Markets Fund are each classified as “non-diversified” under the 1940 Act. As a result, the Funds can invest a greater portion of the Funds’ assets in obligations of a single issuer than a “diversified” fund. The Funds may therefore be more susceptible than a diversified fund to being adversely affected by any single corporate, economic, political or regulatory occurrence. The High Yield Bond Fund, Emerging Markets Corporate Debt Fund, Investment Grade Fund, Strategic Income Fund, and Emerging Markets Debt Allocation Fund are diversified funds. The Emerging Markets Corporate Debt Fund was previously classified as a non-diversified investment company for purposes of the 1940 Act. As a result of ongoing operations, the Emerging Markets Corporate Debt Fund is now classified as a diversified company.
The following is a summary of significant accounting policies consistently followed by the Funds in the preparation of their financial statements. Each Fund is considered an investment company for financial reporting purposes under generally accepted accounting principles in the United States of America (“GAAP”). The policies are in conformity with GAAP. The preparation of the financial statements in accordance with GAAP requires management to make estimates and assumptions that affect the reported amounts of assets and liabilities at the date of the financial statements and the reported amounts of income and expenses during the reporting period. Actual results could differ from those estimates.
Investment Valuation: Debt securities, including bank loans and linked notes, are generally valued at the mean between the closing bid and asked prices provided by independent pricing services or brokers that are based on transactions in debt obligations, quotations from dealers, market transactions in comparable securities and various other relationships between securities. Equity securities for which market quotations are available are generally valued at the last sale price or official closing price on the primary market or exchange on which they trade. Publicly traded foreign government debt securities are typically traded internationally in the over-the-counter market, and are valued at the mean between the bid and asked prices as of the close of business of that market. When prices are not readily available, or are determined not to reflect fair value, such as when the value of a security has been significantly affected by events after the close of the exchange or market on which the security is principally traded, but before the Funds calculate their net asset value, the Funds may value these investments at fair value as determined in accordance with the procedures approved by the Funds’ Board of Trustees (the “Board”). Short-term obligations with maturities of 60 days or less are valued at amortized cost, which approximates market value. Open end funds and money market mutual funds are valued at their net asset value. Futures contracts are ordinarily valued at the last sales price on the securities or commodities exchange on which they are traded. Credit default swaps are priced by an independent pricing service based off of the underlying terms of the swap. Over-the-counter traded derivatives (primarily swaps) are priced by an independent pricing service. Derivatives which are cleared by an exchange are priced by such exchange. Foreign currency positions including forward currency contracts are priced at the mean between the closing bid and asked prices at 4:00 p.m. Eastern time.
A three-tier hierarchy has been established to measure fair value based on the extent of use of “observable inputs” as compared to “unobservable inputs” for disclosure purposes and requires additional disclosures about these valuations measurements. Inputs refer broadly to the assumptions that market participants would use in pricing a security. Observable inputs are inputs that reflect the assumptions market participants would use in pricing the security developed based on market data obtained from sources independent of the reporting entity. Unobservable inputs are inputs that reflect the reporting entity’s own assumptions about the assumptions market participants would use in pricing the security developed based on the best information available in the circumstances.
Stone Harbor Investment Funds Semi-Annual Report | November 30, 2015 | 81 |
Table of Contents
| Stone Harbor Investment Funds | Notes to Financial Statements | |
| November 30, 2015 (Unaudited) |
The three-tier hierarchy is summarized as follows:
Level 1 — | Unadjusted quoted prices in active markets for identical assets or liabilities that the Fund has the ability to access. | |
Level 2 — | Observable inputs other than quoted prices included in level 1 that are observable for the asset or liability, either directly or indirectly. These inputs may include quoted prices for the identical instrument on an inactive market, prices for similar instruments, interest rates, prepayment speeds, credit risk, yield curve, rates, and similar data. | |
Level 3 — | Unobservable inputs for the asset or liability, to the extent relevant observable inputs are not available, representing the Fund’s own assumptions about the assumptions a market participant would use in valuing the asset or liability, and would be based on the best information available. |
The following is a summary of each Fund’s investments and financial instruments based on the three-tier hierarchy as of November 30, 2015:
| Investments in Securities at Value* | Level 1 - Quoted and Unadjusted Prices | Level 2 - Other Significant Observable Inputs | Level 3 - Significant Unobservable Inputs | Total | ||||||||||||
Stone Harbor Emerging Markets Debt Fund | ||||||||||||||||
Sovereign Debt Obligations | $ | – | $ | 1,134,714,246 | $ | – | $1,134,714,246 | |||||||||
Bank Loans | – | – | 156,228 | 156,228 | ||||||||||||
Corporate Bonds | – | 532,038,183 | – | 532,038,183 | ||||||||||||
Credit Linked Notes | ||||||||||||||||
Colombia | – | 1,265,472 | – | 1,265,472 | ||||||||||||
Iraq | – | – | 5,869,880 | 5,869,880 | ||||||||||||
Venezuela | – | – | 16,525,203 | 16,525,203 | ||||||||||||
Short Term Investments | 29,225,209 | – | – | 29,225,209 | ||||||||||||
| ||||||||||||||||
Total | $ | 29,225,209 | $ | 1,668,017,901 | $ | 22,551,311 | $1,719,794,421 | |||||||||
| ||||||||||||||||
| ||||||||||||||||
Other Financial Instruments** | ||||||||||||||||
| ||||||||||||||||
Assets | ||||||||||||||||
Forward Foreign Currency Contracts | $ | – | $ | 2,083,231 | $ | – | $2,083,231 | |||||||||
Credit Default Swap Contracts | – | 3,893,332 | – | 3,893,332 | ||||||||||||
Interest Rate Swap Contracts | – | 283,388 | – | 283,388 | ||||||||||||
Liabilities | ||||||||||||||||
Forward Foreign Currency Contracts | – | (212,925 | ) | – | (212,925) | |||||||||||
Interest Rate Swap Contracts | – | (316,661 | ) | – | (316,661) | |||||||||||
| ||||||||||||||||
Total | $ | – | $ | 5,730,365 | $ | – | $ | 5,730,365 | ||||||||
| ||||||||||||||||
| Investments in Securities at Value* | Level 1 -Quoted and Unadjusted Prices | Level 2 - Other Significant Observable Inputs | Level 3 -Significant Unobservable Inputs | Total | ||||||||||||
Stone Harbor High Yield Bond Fund | ||||||||||||||||
Corporate Bonds | $ | – | $ | 235,504,617 | $ | – | $ | 235,504,617 | ||||||||
Convertible Corporate Bonds | – | 455,941 | – | 455,941 | ||||||||||||
Bank Loans | – | 19,361,434 | – | 19,361,434 | ||||||||||||
Common/Preferred Stocks | 136,594 | – | – | 136,594 | ||||||||||||
Short Term Investments | 7,513,195 | – | – | 7,513,195 | ||||||||||||
| ||||||||||||||||
Total | $ | 7,649,789 | $ | 255,321,992 | $ | – | $ | 262,971,781 | ||||||||
| ||||||||||||||||
| ||||||||||||||||
Other Financial Instruments** | ||||||||||||||||
| ||||||||||||||||
Assets | ||||||||||||||||
Forward Foreign Currency Contracts | $ | – | $ | 217,741 | $ | – | $ | 217,741 | ||||||||
Liabilities | ||||||||||||||||
Forward Foreign Currency Contracts | – | (1,619 | ) | – | (1,619) | |||||||||||
| ||||||||||||||||
Total | $ | – | $ | 216,122 | $ | – | $ | 216,122 | ||||||||
| ||||||||||||||||
| 82 | www.shiplp.com |
Table of Contents
| Stone Harbor Investment Funds | Notes to Financial Statements | |
| November 30, 2015 (Unaudited) |
| Investments in Securities at Value* | Level 1 - Quoted and Unadjusted Prices | Level 2 - Other Significant Observable Inputs | Level 3 - Significant Unobservable | Total | ||||||||||||
Stone Harbor Local Markets Fund | ||||||||||||||||
Sovereign Debt Obligations | $ | – | $ | 709,566,682 | $ | – | $ | 709,566,682 | ||||||||
Corporate Bonds | – | 40,964,545 | – | 40,964,545 | ||||||||||||
Credit Linked Notes | – | 2,123,457 | – | 2,123,457 | ||||||||||||
Short Term Investments | 7,511,076 | – | – | 7,511,076 | ||||||||||||
| ||||||||||||||||
Total | $ | 7,511,076 | $ | 752,654,684 | $ | – | $ | 760,165,760 | ||||||||
| ||||||||||||||||
| ||||||||||||||||
Other Financial Instruments** | ||||||||||||||||
| ||||||||||||||||
Assets | ||||||||||||||||
Forward Foreign Currency Contracts | $ | – | $ | 2,568,284 | $ | – | $2,568,284 | |||||||||
Liabilities | ||||||||||||||||
Forward Foreign Currency Contracts | – | (4,680,166 | ) | – | (4,680,166) | |||||||||||
| ||||||||||||||||
Total | $ | – | $ | (2,111,882 | ) | $ | – | $ (2,111,882) | ||||||||
| ||||||||||||||||
| Investments in Securities at Value* | Level 1 - Quoted and Unadjusted Prices | Level 2 - Other Significant Observable Inputs | Level 3 - Significant Unobservable | Total | ||||||||||||
Stone Harbor Emerging Markets Corporate Debt Fund | ||||||||||||||||
Corporate Bonds | $ | – | $ | 41,154,904 | $ | – | $ | 41,154,904 | ||||||||
Short Term Investments | 101,243 | – | – | 101,243 | ||||||||||||
| ||||||||||||||||
Total | $ | 101,243 | $ | 41,154,904 | $ | – | $ | 41,256,147 | ||||||||
| ||||||||||||||||
| ||||||||||||||||
Other Financial Instruments** | ||||||||||||||||
| ||||||||||||||||
Assets | ||||||||||||||||
Forward Foreign Currency Contracts | $ | – | $ | 25,413 | $ | – | $ | 25,413 | ||||||||
| ||||||||||||||||
Total | $ | – | $ | 25,413 | $ | – | $ | 25,413 | ||||||||
| ||||||||||||||||
| Investments in Securities at Value* | Level 1 - Quoted and Unadjusted Prices | Level 2 - Other Significant Observable Inputs | Level 3 - Significant Unobservable | Total | ||||||||||||
Stone Harbor Investment Grade Fund | ||||||||||||||||
Corporate Bonds | $ | – | $ | 5,462,635 | $ | – | $ | 5,462,635 | ||||||||
Asset Backed/Commercial Mortgage Backed Securities | – | 1,510,951 | – | 1,510,951 | ||||||||||||
U.S. Treasury Bonds/Notes | – | 3,148,531 | – | 3,148,531 | ||||||||||||
U.S. Government Agency Mortgage Backed Securities | – | 3,600,062 | – | 3,600,062 | ||||||||||||
Short Term Investments | 1,314,977 | – | – | 1,314,977 | ||||||||||||
| ||||||||||||||||
Total | $ | 1,314,977 | $ | 13,722,179 | $ | – | $ | 15,037,156 | ||||||||
| ||||||||||||||||
| Investments in Securities at Value* | Level 1 - Quoted and Unadjusted Prices | Level 2 - Other Significant Observable Inputs | Level 3 - Significant Unobservable Inputs | Total | ||||||||||||
Stone Harbor Strategic Income Fund | ||||||||||||||||
Open-End Funds | $ | 34,858,385 | $ | – | $ | – | $ | 34,858,385 | ||||||||
| ||||||||||||||||
Total | $ | 34,858,385 | $ | – | $ | – | $ | 34,858,385 | ||||||||
| ||||||||||||||||
| ||||||||||||||||
Stone Harbor Investment Funds Semi-Annual Report | November 30, 2015 | 83 |
Table of Contents
| Stone Harbor Investment Funds | Notes to Financial Statements | |
| November 30, 2015 (Unaudited) |
| Investments in Securities at Value* | Level 1 - Quoted and Unadjusted Prices | Level 2 - Other Significant Observable Inputs | Level 3 - Significant Unobservable Inputs | Total | ||||||||||||
Stone Harbor Strategic Income Fund (continued) | ||||||||||||||||
Other Financial Instruments** | ||||||||||||||||
| ||||||||||||||||
Assets | ||||||||||||||||
Forward Foreign Currency Contracts | $ | – | $ | 8,737 | $ | – | $ | 8,737 | ||||||||
Futures Contracts | 121,205 | – | – | 121,205 | ||||||||||||
Liabilities | ||||||||||||||||
Forward Foreign Currency Contracts | – | (2,460 | ) | – | (2,460 | ) | ||||||||||
Credit Default Swap Contracts | – | (5,924 | ) | – | (5,924 | ) | ||||||||||
| ||||||||||||||||
Total | $ | 121,205 | $ | 353 | $ | – | $ | 121,558 | ||||||||
| ||||||||||||||||
| Investments in Securities at Value* | Level 1 - Quoted and Unadjusted Prices | Level 2 - Other Significant Observable Inputs | Level 3 - Significant Unobservable Inputs | Total | ||||||||||||
Stone Harbor Emerging Markets Debt Allocation Fund | ||||||||||||||||
Open-End Funds | $ | 95,824,752 | $ | – | $ | – | $ | 95,824,752 | ||||||||
| ||||||||||||||||
Total | $ | 95,824,752 | $ | – | $ | – | $ | 95,824,752 | ||||||||
| ||||||||||||||||
| * | For detailed Industry/Country descriptions, see accompanying Statements of Investments. |
| ** | Other financial instruments are derivative instruments not reflected in the Statements of Investments. The derivatives shown in this table are reported at their unrealized appreciation/(depreciation) at measurement date, which represents the change in the contract’s value. |
There were no transfers between Levels 1 and 2 during the period ended November 30, 2015. It is the Funds’ policy to recognize transfers into and out of all levels at the end of the reporting period.
The following is a reconciliation of assets in which significant unobservable inputs (Level 3) were used in determining fair value:
Investments in Securities | Balance as of May 31, 2015 | Accrued discount/ premium | Return of Capital | Realized Gain/(Loss) | Change in Unrealized Appreciation/ (Depreciation) | Purchases | Sales Proceeds | Transfer into Level 3 | Transfer out of Level 3 | Balance as of November 30, 2015 | Net change in unrealized appreciation/ (depreciation) still held at November 30, 2015 | |||||||||||||||||||||||||||||||||
| ||||||||||||||||||||||||||||||||||||||||||||
Stone Harbor | ||||||||||||||||||||||||||||||||||||||||||||
Emerging | ||||||||||||||||||||||||||||||||||||||||||||
Markets | ||||||||||||||||||||||||||||||||||||||||||||
Debt Fund | ||||||||||||||||||||||||||||||||||||||||||||
Bank Loans | $ | 218,719 | $ | – | $ | – | $ | – | $ | (62,491 | ) | $ | – | $ | – | $ | – | $ | – | $ | 156,228 | $ | (62,491 | ) | ||||||||||||||||||||
Credit Linked Notes | 22,967,945 | 1,871,451 | – | (41,945 | ) | (2,008,014 | ) | – | (394,354 | ) | – | – | 22,395,083 | (2,008,014 | ) | |||||||||||||||||||||||||||||
| ||||||||||||||||||||||||||||||||||||||||||||
Total | $ | 23,186,664 | $ | 1,871,451 | $ | – | $ | (41,945 | ) | $ | (2,070,505 | ) | $ | – | $ | (394,354 | ) | $ | – | $ | – | $ | 22,551,311 | $ | (2,070,505 | ) | ||||||||||||||||||
| ||||||||||||||||||||||||||||||||||||||||||||
All level 3 investments have values determined utilizing third party pricing information without adjustment.
The inputs or methodology used for valuing securities are not necessarily an indication of the risk associated with investing in those securities.
In the event a Board approved independent pricing service is unable to provide an evaluated price for a security or the Adviser believes the price provided is not reliable, securities of the Funds may be valued at fair value as described above. In these instances the Adviser may seek to find an alternative independent source, such as a broker/dealer to provide a price quote, or by using evaluated pricing models similar to the techniques and models used by the independent pricing service. These fair value measurement techniques may utilize unobservable inputs (Level 3). On at least a quarterly basis, the Adviser presents the factors considered in determining the fair value measurements and presents that information to the Board which meets at least quarterly.
| 84 | www.shiplp.com |
Table of Contents
| Stone Harbor Investment Funds | Notes to Financial Statements | |
| November 30, 2015 (Unaudited) |
Security Transactions and Investment Income: Security transactions are accounted for on a trade date basis. Interest income, adjusted for amortization of premium and accretion of discount, is recorded on the accrual basis. Dividend income is recorded on the ex-dividend date. Foreign dividend income is recorded on the ex-dividend date or as soon as practical after the Funds determine the existence of a dividend declaration after exercising reasonable due diligence. Dividend income received from underlying affiliated funds is generally reinvested back into the underlying fund. If applicable, any foreign capital gains taxes are accrued, net of unrealized gains, and are payable upon the sale of such investments. The cost of investments sold is determined by use of the specific identification method. To the extent any issuer defaults on an expected interest payment, the Funds’ policy is to generally halt any additional interest income accruals and consider the realizability of interest accrued up to the date of default.
Foreign Currency Translation: The books and records of the Funds are maintained in U.S. dollars. Investment valuations and other assets and liabilities initially expressed in foreign currencies are converted each business day into U.S. dollars based upon current exchange rates. Prevailing foreign exchange rates may generally be obtained at the close of the NYSE (normally, 4:00 p.m. Eastern time). The portion of realized and unrealized gains or losses on investments due to fluctuations in foreign currency exchange rates is not separately disclosed and is included in realized and unrealized gains or losses on investments, when applicable.
Foreign Securities: The Funds may directly purchase securities of foreign issuers. Investing in securities of foreign issuers involves special risks not typically associated with investing in securities of U.S. issuers. The risks include possible revaluation of currencies, the ability to repatriate funds, less complete financial information about companies and possible future adverse political and economic developments. Moreover, securities of many foreign issuers and their markets may be less liquid and their prices more volatile than those of securities of comparable U.S. issuers.
Credit Linked Notes: The Funds may invest in credit linked notes to obtain economic exposure to high yield, emerging markets or other securities. Investments in a credit linked note typically provide the holder with a return based on the return of an underlying reference instrument, such as an emerging market bond. Like an investment in a bond, investments in credit-linked securities represent the right to receive periodic income payments (in the form of distributions) and payment of principal at the end of the term of the security. In addition to the risks associated with the underlying reference instrument, an investment in a credit linked note is also subject to liquidity risk, market risk, interest rate risk and the risk that the counterparty will be unwilling or unable to meet its obligations under the note.
Segregation and Collateralization: In cases in which the 1940 Act and the interpretive positions of the Securities and Exchange Commission (“SEC”) require that the Fund either delivers collateral or segregate assets in connection with certain investments (e.g., foreign currency exchange contracts, securities with extended settlement periods, and swaps) or certain borrowings (e.g., reverse repurchase agreements), the Fund will segregate collateral or designate on its books and records cash or other liquid securities having a value at least equal to the amount that is required to be physically segregated for the benefit of the counterparty. Furthermore, based on requirements and agreements with certain exchanges and third party broker-dealers, each party has requirements to deliver/deposit cash or securities as collateral for certain investments. Cash collateral that has been pledged to cover obligations of the Funds and cash collateral received from the counterparty, if any, is reported separately on the Statements of Assets and Liabilities as “Deposits with brokers” or “Payable due to brokers”, respectively. Securities collateral pledged for the same purpose is noted on the Statement of Investments.
Loan Participations and Assignments: The Funds may invest in loans arranged through private negotiation between one or more financial institutions. The Funds’ investment in any such loan may be in the form of a participation in or an assignment of the loan. In connection with purchasing participations, the Funds generally will have no right to enforce compliance by the borrower with the terms of the loan agreement relating to the loan, nor any rights of set-off against the borrower and the Funds may not benefit directly from any collateral supporting the loan in which they have purchased the participation.
While some loans are collateralized and senior to an issuer’s other debt securities, other loans may be unsecured and/or subordinated to other securities. Some senior loans, such as bank loans, may be illiquid and generally tend to be less liquid than many other debt securities.
The Funds may also invest in unfunded loan commitments, which are contractual obligations for future funding. Information regarding unfunded commitments is included at the end of the Funds’ Schedules of Investments.
The Funds assume the credit risk of the borrower, the lender that is selling the participation and any other persons interpositioned between the Funds and the borrower. In the event of the insolvency of the lender selling the participation, the Funds may be treated as a general creditor of the lender and may not benefit from any set-off between the lender and the borrower. Loans may not be considered “securities,” and purchasers, such as the Funds, therefore may not be entitled to rely on the anti-fraud protections of the federal securities laws.
Inflation-Indexed Bonds: Certain Funds may invest in inflation indexed bonds. Inflation-indexed bonds are fixed-income securities whose principal value is periodically adjusted to the rate of inflation. The interest rate on these bonds is generally fixed at issuance at a rate lower than typical bonds. Over the life of an inflation-indexed bond, however, interest will be paid based on a principal value which is adjusted for inflation.
Stone Harbor Investment Funds Semi-Annual Report | November 30, 2015 | 85 |
Table of Contents
| Stone Harbor Investment Funds | Notes to Financial Statements | |
| November 30, 2015 (Unaudited) |
Any increase or decrease in the principal amount of an inflation-indexed bond will be included as interest income on the Statements of Operations, even though investors do not receive their principal until maturity.
Mortgage-Related and Other Asset-Backed Securities: Certain Funds may invest in mortgage-related and other asset-backed securities. These securities include mortgage pass-through securities, collateralized mortgage obligations, commercial mortgage-backed securities, stripped mortgage-backed securities, asset-backed securities, collateralized debt obligations and other securities that directly or indirectly represent a participation in, or are secured by and payable from, mortgage loans on real property. Mortgage-related and other asset-backed securities are interests in pools of loans or other receivables. Mortgage-related securities are created from pools of residential or commercial mortgage loans, including mortgage loans made by savings and loan institutions, mortgage bankers, commercial banks and others. Asset-backed securities are created from many types of assets, including auto loans, credit card receivables, home equity loans, and student loans. These securities provide a monthly payment which consists of both interest and principal payments. Interest payments may be determined by fixed or adjustable rates. The rate of prepayments on underlying mortgages will affect the price and volatility of a mortgage-related security, and may have the effect of shortening or extending the effective duration of the security relative to what was anticipated at the time of purchase. The timely payment of principal and interest of certain mortgage-related securities is guaranteed with the full faith and credit of the U.S. Government. Pools created and guaranteed by non-governmental issuers, including government sponsored corporations, may be supported by various forms of insurance or guarantees, but there can be no assurance that the private insurers or guarantors can meet their obligations under the insurance policies or guarantee arrangements.
U.S. Government Agencies or Government-Sponsored Enterprises: Certain Funds may invest in securities of U.S. Government agencies or government-sponsored enterprises. U.S. Government securities are obligations of and, in certain cases, guaranteed by, the U.S. Government, its agencies or instrumentalities. Some U.S. Government securities, such as Treasury bills, notes and bonds, and securities guaranteed by the Government National Mortgage Association (“GNMA” or “Ginnie Mae”), are supported by the full faith and credit of the U.S. Government; others, such as those of the Federal Home Loan Banks, are supported by the right of the issuer to borrow from the U.S. Department of the Treasury (the “U.S. Treasury”); others, such as those of the Federal National Mortgage Association (“FNMA” or “Fannie Mae”), are supported by the discretionary authority of the U.S. Government to purchase the agency’s obligations. U.S. Government securities may include zero coupon securities, which do not distribute interest on a current basis and tend to be subject to greater risk than interest-paying securities of similar maturities.
Government-related guarantors (i.e., not backed by the full faith and credit of the U.S. Government) include FNMA and the Federal Home Loan Mortgage Corporation (“FHLMC” or “Freddie Mac”). FNMA is a government-sponsored corporation. FNMA purchases conventional (i.e., not insured or guaranteed by any government agency) residential mortgages from a list of approved seller/servicers which include state and federally chartered savings and loan associations, mutual savings banks, commercial banks and credit unions and mortgage bankers. Pass-through securities issued by FNMA are guaranteed as to timely payment of principal and interest by FNMA, but are not backed by the full faith and credit of the U.S. Government. FHLMC issues Participation Certificates (“PCs”), which are pass-through securities, each representing an undivided interest in a pool of residential mortgages. FHLMC guarantees the timely payment of interest and ultimate collection of principal, but PCs are not backed by the full faith and credit of the U.S. Government.
Forward Commitments: Certain Funds may contract to purchase securities for a fixed price at a transaction date beyond the customary settlement period (i.e., “when-issued,” “delayed-delivery,” “forward commitment,” or “To Be Announced (“TBA”) transactions”) consistent with a Fund’s ability to manage its investment portfolio and meet redemption requests. These transactions involve a commitment by a Fund to purchase securities for a predetermined price or yield with payment and delivery taking place more than three days in the future or after a period longer than the customary settlement period for that type of security. No interest will be earned by a Fund on such purchases until the securities are delivered; however, the market value may change prior to delivery. A Fund will not engage in these transactions for investment leverage.
When-issued securities involve the risk that the yield obtained in the transaction will be less than that available in the market when delivery takes place. Securities purchased on a when-issued basis are recorded as an asset and are subject to changes in value based upon changes in the value of the security or general level of interest rates. In when-issued and delayed-delivery transactions, a Fund relies on the seller to complete the transaction; the seller’s failure to do so may cause a Fund to miss an advantageous price or yield.
The Funds may enter into TBA commitments. TBA commitments are forward agreements for the purchase or sale of mortgage-backed securities for a fixed price, with payment and delivery on an agreed upon future settlement date. The specific securities to be delivered are not identified at the trade date. However, delivered securities must meet specified terms, including issuer, rate and mortgage terms. The Funds generally enter into TBA commitments with the intent to take possession of or deliver the underlying mortgage-backed securities but can extend the settlement or roll the transaction. Regulatory developments may limit the ability of a Fund to engage in TBA transactions to the extent desired.
Unsettled TBA sale (purchase) commitments are valued at the current market value of the underlying securities. The contract is adjusted to market value daily, and the change in market value is recorded by the Fund as an unrealized gain or loss. Outstanding TBA commitments and related
| 86 | www.shiplp.com |
Table of Contents
| Stone Harbor Investment Funds | Notes to Financial Statements | |
| November 30, 2015 (Unaudited) |
deliverables are reflected on the State of Assets and Liabilities in Payable for investments purchased and Receivable for investments sold, respectively. If the TBA sale (purchase) commitment is closed through the acquisition of an offsetting purchase (sale) commitment, the Fund realizes a gain or loss from the sale of the securities based upon the unit price established at the date the commitment was entered into. These gain/loss amounts are reflected in the Accumulated net realized gain/loss on investments and Net unrealized appreciation on investments on the Statement of Assets and Liabilities.
Credit and Market Risk: The Funds invest in high yield and emerging market instruments that are subject to certain credit and market risks. The yields of high yield and emerging market debt obligations reflect, among other things, perceived credit and market risks. The Funds’ investment in securities rated below investment grade typically involves risks not associated with higher rated securities including, among others, greater risk related to timely and ultimate payment of interest and principal, greater market price volatility and less liquid secondary market trading. The consequences of political, social, economic or diplomatic changes may have disruptive effects on the market prices of investments held by the Funds. The Funds’ investment in non-U.S. dollar denominated securities may also result in foreign currency losses caused by devaluations and exchange rate fluctuations. Investments in derivatives are also subject to credit and market risks.
Distributions to Shareholders: Dividends and distributions to shareholders, which are determined in accordance with income tax regulations, are recorded on the ex-date. Income distributions, if any, are generally declared and paid on a quarterly basis, except for any distributions paid by Local Markets Fund and Emerging Markets Debt Allocation Fund. Capital gain distributions, if any, are declared and paid at least annually. A portion of the Fund’s distributions made for a taxable year may be recharacterized as a return of capital to shareholders. This may occur, for example, if the Fund’s distributions exceed its “earnings and profits” for the taxable year or because certain foreign currency losses may reduce the Fund’s income. This recharacterization may be retroactive. A return of capital will generally not be taxable, but will reduce a shareholder’s basis in his or her Fund shares and therefore result in a higher gain or lower loss when the shareholder sells the shares.
Expenses: Direct expenses are charged to each Fund; expenses of the Trust are generally allocated to the Funds based on each Fund’s relative net assets.
Federal and Other Taxes: No provision for income taxes is included in the accompanying financial statements, as the Funds intend to distribute to shareholders all taxable investment income and realized gains and otherwise comply with Subchapter M of the Internal Revenue Code of 1986, as amended, applicable to regulated investment companies.
The Funds evaluate tax positions taken (or expected to be taken) in the course of preparing the Funds’ tax provisions to determine whether these positions meet a “more-likely-than-not” standard that, based on the technical merits, have a more than fifty percent likelihood of being sustained by a taxing authority upon examination. A tax position that meets the “more-likely-than-not” recognition threshold is measured to determine the amount of benefit to recognize in the financial statements.
As of and during the period ended November 30, 2015, the Funds did not have a liability for any unrecognized tax benefits. The Funds file U.S. federal, state, and local tax returns as required. The Funds’ tax returns are subject to examination by the relevant tax authorities until expiration of the applicable statute of limitations which is generally three years after the filing of the tax return for federal purposes and four years for most state returns. Tax returns for open years have incorporated no uncertain tax positions that require a provision for income taxes.
Statement of Changes in Net Assets for the year ended May 31, 2015: Subsequent to the issuance of the Funds’ 2015 financial statements, an error was identified in the presentation of the Strategic Income Fund’s Statement of Changes in Net Assets for the year ended May 31, 2015. This error resulted in the overstatement of “Net Realized gain/loss on investments” presented by $418,657 as well as the corresponding overstatement of the totals “Net increase/decrease in net assets resulting from operations”, “Net increase in net assets”, and “Net Assets” by that same amount. These balances within the Statement of Changes in Net Assets for the year ended May 31, 2015 have been revised to reflect the correct amounts. The previously issued Statement of Assets and Liabilities as of May 31, 2015, and the related Statement of Operations and Financial Highlights for the year then ended were properly stated and were not impacted by this error.
2. DERIVATIVE INSTRUMENTS
Risk Exposure and the Use of Derivative Instruments: The Funds’ investment objectives not only permit the Funds to purchase investment securities, they also allow the Funds to enter in various types of derivatives contracts. In doing so, the Funds employ strategies in differing combinations to permit them to increase, decrease, or change the level or types of exposure to market factors. Central to those strategies are features inherent to derivatives that may make them more attractive for this purpose than equity or debt securities; they require little or no initial cash investment, they can focus exposure on only certain selected risk factors, and they may not require the ultimate receipt or delivery of the underlying security (or securities) to the contract. This may allow the Funds to pursue their objectives more quickly and efficiently than if they were to make direct purchases or sales of securities capable of affecting a similar response to market factors.
Stone Harbor Investment Funds Semi-Annual Report | November 30, 2015 | 87 |
Table of Contents
| Stone Harbor Investment Funds | Notes to Financial Statements | |
| November 30, 2015 (Unaudited) |
Market Risk Factors. In pursuit of their investment objectives, the Funds may seek to use derivatives to increase or decrease their exposure to the following market risk factors, among others:
Interest Rate Risk. Interest rate risk refers to the fluctuations in value of fixed-income securities resulting from the inverse relationship between price and yield. For example, an increase in general interest rates will tend to reduce the market value of already issued fixed-income investments, and a decline in general interest rates will tend to increase their value. In addition, debt securities with longer maturities, which tend to have higher yields, are subject to potentially greater fluctuations in value from changes in interest rates than obligations with shorter maturities.
Credit Risk. Credit risk relates to the ability of the issuer to meet interest and principal payments, or both, as they come due. In general, lower-grade, higher-yield bonds are subject to credit risk to a greater extent than lower-yield, higher-quality bonds.
Foreign Exchange Rate Risk. Foreign exchange risk relates to the change in the U.S. dollar value of a security held that is denominated in a foreign currency. The U.S. dollar value of a foreign currency denominated security will decrease as the dollar appreciates against the currency, while the U.S. dollar value will increase as the dollar depreciates against the currency.
Equity Risk. Equity risk relates to the change in value of equity securities as they relate to increases or decreases in the general market.
The Funds’ use of derivatives can result in losses due to unanticipated changes in these risk factors and the overall market. In instances where the Funds are using derivatives to decrease, or hedge, exposures to market risk factors for securities held by the Funds, there are also risks that those derivatives may not perform as expected resulting in losses for the combined or hedged positions.
Derivatives may have little or no initial cash investment relative to their market value exposure and therefore can produce significant gains or losses in excess of their cost. This use of embedded leverage allows each Fund to increase its market value exposure relative to its net assets and can substantially increase the volatility of the Funds’ performance.
Additional associated risks from investing in derivatives also exist and potentially could have significant effects on the valuation of the derivative and the Funds. Typically, the associated risks are not the risks that the Funds are attempting to increase or decrease exposure to, per their investment objectives, but are the additional risks from investing in derivatives.
Examples of these associated risks are liquidity risk, which is the risk that the Funds will not be able to sell or close out the derivative in a timely manner, and counterparty credit risk, which is the risk that the counterparty will not fulfill its obligation to the Funds. Associated risks can be different for each type of derivative and are discussed by each derivative type below in the notes that follow.
Derivatives are also subject to the risk of possible regulatory changes, which could adversely affect the availability and performance of derivative securities, make them more costly and limit or restrict their use by the Fund, which could prevent the Fund from implementing its investment strategies and adversely affect returns.
Forward Foreign Currency Contracts: The Funds may engage in currency transactions with counterparties to hedge the value of portfolio securities denominated in particular currencies against fluctuations in relative value, to gain or reduce exposure to certain currencies, or to generate income or gains. A forward foreign currency contract is an agreement between two parties to buy and sell a currency at a set price on a future date. The contract is marked-to-market daily and the change in value is recorded by the Funds as an unrealized gain or loss. When a forward foreign currency contract is extinguished, through either delivery or offset by entering into another forward foreign currency contract, the Funds record a realized gain or loss equal to the difference between the value of the contract at the time it was opened and the value of the contract at the time it was extinguished.
Forward foreign currency contracts involve elements of market risk in excess of the amounts reflected in the Statements of Assets and Liabilities. The Funds bear the risk of an unfavorable change in the foreign exchange rate underlying the forward foreign currency contract. Risks may also arise upon entering into these contracts from the potential inability of the counterparties to meet the terms of their contracts.
Futures Contracts: Certain Funds may invest in futures contracts in accordance with their investment objectives. Each Fund does so for a variety of reasons including for cash management, hedging or non-hedging purposes in an attempt to achieve investment returns consistent with the Fund’s investment objective. A futures contract provides for the future sale by one party and purchase by another party of a specified quantity of the security or other financial instrument at a specified price and time. A futures contract on an index is an agreement pursuant to which two parties agree to take or make delivery of an amount of cash equal to the difference between the value of the index at the close of the last trading day of the contract and the price at which the index contract was originally written. Futures contract transactions may result in losses in excess of
| 88 | www.shiplp.com |
Table of Contents
| Stone Harbor Investment Funds | Notes to Financial Statements | |
| November 30, 2015 (Unaudited) |
the amount invested in the futures contract. There can be no guarantee that there will be a correlation between price movements in the hedging vehicle and in the portfolio securities being hedged. An incorrect correlation could result in a loss on both the hedged securities in a Fund and the hedging vehicle so that the portfolio return might have been greater had hedging not been attempted. There can be no assurance that a liquid market will exist at a time when a Fund seeks to close out a futures contract or a futures option position. Lack of a liquid market for any reason may prevent a Fund from liquidating an unfavorable position, and the Fund would remain obligated to meet margin requirements until the position is closed. In addition, a Fund could be exposed to risk if the counterparties to the contracts are unable to meet the terms of their contracts. With exchange-traded futures contracts, there is minimal counterparty credit risk to the Funds since futures contracts are exchange-traded and the exchange’s clearinghouse, as counterparty to all exchange-traded futures contracts, guarantees the futures contracts against default.
When a purchase or sale of a futures contract is made by a Fund, the Fund is required to deposit with its broker a specified amount of liquid assets (“initial margin”). The margin required for a futures contract is set by the exchange on which the contract is traded and may be modified during the term of the contract. The initial margin is in the nature of a performance bond or good faith deposit on the futures contract that is returned to a Fund upon termination of the contract, assuming all contractual obligations have been satisfied. Each day a Fund may pay or receive cash, called “variation margin,” equal to the daily change in value of the futures contract. Such payments or receipts are recorded for financial statement purposes as unrealized gains or losses by a Fund. Variation margin does not represent a borrowing or loan by a Fund but is instead a settlement between a Fund and the broker of the amount one would owe the other if the futures contract expired. When the contract is closed, a Fund records a realized gain or loss equal to the difference between the value of the contract at the time it was opened and the value at the time it was closed.
Swap Agreements: The Funds may invest in swap agreements. Swap agreements are bilaterally negotiated agreements between a Fund and a counterparty to exchange or swap investment cash flows, assets, or market-linked returns at specified, future intervals. Swap agreements are privately negotiated in the over the counter market (“OTC swaps”) or may be executed in a multilateral or other trade facility platform, such as a registered exchange (“centrally cleared swaps”). In a centrally cleared swap, immediately following execution of the swap agreement, the swap agreement is novated to a central counterparty (the “CCP”) and the Fund’s counterparty on the swap agreement becomes the CCP. The Fund may enter into credit default swaps, interest rate swaps, total return swaps on individual securities or groups or indices of securities for hedging, investment or leverage purposes. In connection with these agreements, securities or cash may be identified as collateral or margin in accordance with the terms of the respective swap agreements to provide assets of value and recourse in the event of default or bankruptcy/insolvency.
Swaps are marked-to-market daily and changes in value, including the accrual of periodic amounts of interest, are recorded daily. Daily changes in valuation of centrally cleared swaps, if any, are recorded as a receivable or payable for the change in value as appropriate (“variation margin”). Each day the Fund may pay or receive cash, equal to the variation margin of the centrally cleared swap. OTC swap payments received or paid at the beginning of the measurement period represent premiums paid or received upon entering into the swap agreement to compensate for differences between the stated terms of the swap agreement and prevailing market conditions (credit spreads, interest rates, and other relevant factors). Generally, the basis of the OTC swaps is the unamortized premium received or paid. The periodic swap payments received or made by the Fund are recorded as realized gains or losses, respectively. Any upfront fees paid are recorded as assets and any upfront fees received are recorded as liabilities. When the swap is terminated, the Fund will record a realized gain or loss equal to the difference between the proceeds from (or cost of) the closing transaction and the Fund’s basis in the contract, if any.
Credit Default Swap Contracts: The Funds may enter into credit default swap contracts for hedging purposes to gain market exposure or to add leverage to its portfolio. When used for hedging purposes, a Fund would be the buyer of a credit default swap contract. In that case, the Fund would be entitled to receive the par (or other agreed upon) value of a referenced debt obligation, index or other investment from the counterparty to the contract in the event of a default by a third party, such as a U.S. or foreign issuer, on the referenced debt obligation. In return, the Fund would pay to the counterparty a periodic stream of payments over the term of the contract provided that no event of default has occurred. If no event of default occurs, the Fund would have spent the stream of payments and received no benefit from the contract. When the Fund is the seller of a credit default swap contract, it receives the stream of payments but is obligated to pay upon default of the referenced debt obligation. As the seller, the Fund would effectively add leverage to its portfolio because, in addition to its total assets, the Fund would be subject to investment exposure on the notional amount of the swap.
In addition to the risks applicable to derivatives generally, credit default swaps involve special risks because they may be difficult to value, are highly susceptible to liquidity and credit risk and generally pay a return to the counterparty only in the event of an actual default by the issuer of the underlying obligation, as opposed to a credit downgrade or other indication of financial difficulty.
Interest Rate Swap Contracts: Interest rate swap contracts involve the exchange by a Fund with another party for their respective commitment to pay or receive interest on the notional amount of principal. Certain forms of interest rate swap agreements may include: (i) interest rate caps, under which, in return for a premium, one party agrees to make payments to the other to the extent that interest rates exceed a specified rate, or “cap”, (ii) interest rate floors, under which, in return for a premium, one party agrees to make payments to the other to the extent that interest
Stone Harbor Investment Funds Semi-Annual Report | November 30, 2015 | 89 |
Table of Contents
| Stone Harbor Investment Funds | Notes to Financial Statements | |
| November 30, 2015 (Unaudited) |
rates fall below a specified rate, or “floor”, (iii) interest rate collars, under which a party sells a cap and purchases a floor or vice versa in an attempt to protect itself against interest rate movements exceeding given minimum or maximum levels, (iv) callable interest rate swaps, under which the buyer pays an upfront fee in consideration for the right to early terminate the swap transaction in whole, at zero costs and at a predetermined date and time prior to the maturity date, (v) spreadlocks, which allow the interest rate swap users to lock in the forward differential (or spread) between the interest rate swap rate and a specified benchmark, or (vi) basis swaps, under which two parties can exchange variable interest rates based on different segments of money markets.
The tables below are a summary of the fair valuations of derivative instruments categorized by risk exposure.
Fair values of forward foreign currency contracts, credit default swaps, interest rate swaps, and future contracts on the Statements of Assets and Liabilities as of November 30, 2015:
| Risk Exposure | Statement of Assets and Liabilities Location | Fair Value | Statement of Assets and Liabilities Location | Fair Value | ||||||||
Stone Harbor Emerging Markets Debt Fund |
| |||||||||||
Credit Risk (Swap Contracts) | Unrealized appreciation on credit default swap contracts | $ | 3,893,332 | Unrealized depreciation on credit default swap contracts | $ | – | ||||||
Interest Rate Risk (Swap Contracts)* | Unrealized appreciation on interest rate swap contracts | 283,388 | Unrealized depreciation on interest rate swap contracts | (316,661) | ||||||||
Foreign Exchange Rate Risk (Forward Foreign Currency Contracts) | Unrealized appreciation on forward foreign currency contracts | 2,083,231 | Unrealized depreciation on forward foreign currency contracts | (212,925) | ||||||||
Total | $ | 6,259,951 | $ | (529,586) | ||||||||
Stone Harbor High Yield Bond Fund |
| |||||||||||
Foreign Exchange Rate Risk (Forward Foreign Currency Contracts) | Unrealized appreciation on forward foreign currency contracts | $ | 217,741 | Unrealized depreciation on forward foreign currency contracts | $ | (1,619) | ||||||
Total | $ | 217,741 | $ | (1,619) | ||||||||
Stone Harbor Local Markets Fund |
| |||||||||||
Foreign Exchange Rate Risk (Forward Foreign Currency Contracts) | Unrealized appreciation on forward foreign currency contracts | $ | 2,568,284 | Unrealized depreciation on forward foreign currency contracts | $ | (4,680,166) | ||||||
Total | $ | 2,568,284 | $ | (4,680,166) | ||||||||
Stone Harbor Emerging Markets Corporate Debt Fund |
| |||||||||||
Foreign Exchange Rate Risk (Forward Foreign Currency Contracts) | Unrealized appreciation on forward foreign currency contracts | $ | 25,413 | Unrealized depreciation on forward foreign currency contracts | $ | – | ||||||
Total | $ | 25,413 | $ | – | ||||||||
Stone Harbor Strategic Income Fund |
| |||||||||||
Credit Risk (Swap Contracts)* | Unrealized appreciation on credit default swap contracts | $ | – | Unrealized depreciation on credit default swap contracts | $ | (5,924) | ||||||
Interest Rate Risk (Futures Contracts)* | Unrealized appreciation on futures contracts | 121,205 | Unrealized depreciation on futures contracts | – | ||||||||
Foreign Exchange Rate Risk (Forward Foreign Currency Contracts) | Unrealized appreciation on forward foreign currency contracts | 8,736 | Unrealized depreciation on forward foreign currency contracts | (2,460) | ||||||||
Total | $ | 129,941 | $ | (8,384) | ||||||||
| * | The value presented includes cumulative gain/(loss) on open futures contracts, interest rate swap contracts, and credit default swap contracts; however, the value reflected on the accompanying Statement of Assets and Liabilities is only the unsettled variation margin receivable/(payable) as of November 30, 2015. |
| 90 | www.shiplp.com |
Table of Contents
| Stone Harbor Investment Funds | Notes to Financial Statements | |
| November 30, 2015 (Unaudited) |
The number of forward foreign currency contracts, credit default swap contracts, interest rate swap contracts, and futures contracts held at November 30, 2015 is representative of activity during the periods ended November 30, 2015.
The effect of forward foreign currency contracts, credit default swaps, interest rate swaps, and futures contracts on the Statements of Operations for the period ended November 30, 2015:
| Risk Exposure | Statement of Operations Location | Realized Gain/(Loss) on Derivatives | Location | Change in Unrealized Appreciation/(Depreciation) on Derivatives Recognized in Income | ||||||||||
Stone Harbor Emerging Markets Debt Fund | ||||||||||||||
Credit Risk (Swap Contracts) | Net realized gain/(loss) on credit default swap contracts | $ | 691,316 | Change in unrealized appreciation/(depreciation) on credit default swap contracts | $ | 3,390,303 | ||||||||
Interest Rate Risk (Swap Contracts) | Net realized gain/(loss) on interest rate swap contracts | (478,664) | Change in unrealized appreciation/(depreciation) on interest rate swap contracts | (528,406 | ) | |||||||||
Foreign Exchange Rate Risk (Forward Foreign Currency Contracts) | Net realized gain/(loss) on forward foreign currency contracts | 1,149,297 | Change in unrealized appreciation/(depreciation) on forward foreign currency contracts | 1,104,788 | ||||||||||
Total | $ | 1,361,949 | $ | 3,966,685 | ||||||||||
Stone Harbor High Yield Bond Fund | ||||||||||||||
Foreign Exchange Rate Risk (Forward Foreign Currency Contracts) | Net realized gain/(loss) on forward foreign currency contracts | $ | (27,209) | Change in unrealized appreciation/(depreciation) on forward foreign currency contracts | $ | 121,018 | ||||||||
Total | $ | (27,209) | $ | 121,018 | ||||||||||
Stone Harbor Local Markets Fund | ||||||||||||||
Foreign Exchange Rate Risk (Forward Foreign Currency Contracts) | Net realized gain/(loss) on forward foreign currency contracts | $ | 9,444,652 | Change in unrealized appreciation/(depreciation) on forward foreign currency contracts | $ | (4,602,238 | ) | |||||||
Total | $ | 9,444,652 | $ | (4,602,238 | ) | |||||||||
Stone Harbor Emerging Markets Corporate Debt Fund | ||||||||||||||
Foreign Exchange Rate Risk (Forward Foreign Currency Contracts) | Net realized gain/(loss) on forward foreign currency contracts | $ | 4,906 | Change in unrealized appreciation/(depreciation) on forward foreign currency contracts | $ | 22,028 | ||||||||
Total | $ | 4,906 | $ | 22,028 | ||||||||||
Stone Harbor Strategic Income Fund | ||||||||||||||
Credit Risk (Swap Contracts) | Net realized gain/(loss) on credit default swap contracts | $ | 965 | Change in unrealized appreciation/(depreciation) on credit default swap contracts | $ | (31,864 | ) | |||||||
Interest Rate Risk (Futures Contracts) | Net realized gain/(loss) on futures contracts | (57,846) | Change in unrealized appreciation/(depreciation) on futures contracts | 178,115 | ||||||||||
Foreign Exchange Rate Risk (Forward Foreign Currency Contracts) | Net realized gain/(loss) on forward foreign currency contracts | (59,354) | Change in unrealized appreciation/(depreciation) on forward foreign currency contracts | 5,213 | ||||||||||
Total | $ | (116,235) | $ | 151,464 | ||||||||||
Stone Harbor Investment Funds Semi-Annual Report | November 30, 2015 | 91 |
Table of Contents
| Stone Harbor Investment Funds | Notes to Financial Statements | |
| November 30, 2015 (Unaudited) |
Offsetting Arrangements: Certain derivative contracts are executed under standardized netting agreements. A derivative netting arrangement creates an enforceable right of set-off that becomes effective, and affects the realization of settlement on individual assets, liabilities and collateral amounts, only following a specified event of default or early termination. Default events may include the failure to make payments or deliver securities timely, material adverse changes in financial condition or insolvency, the breach of minimum regulatory capital requirements, or loss of license, charter or other legal authorization necessary to perform under the contract. These agreements mitigate counterparty credit risk by providing for a single net settlement with a counterparty of all financial transactions covered by the agreement in an event of default as defined under such agreement.
The following table presents derivative financial instruments that are subject to enforceable netting arrangements, collateral arrangements or other similar agreements as of November 30, 2015.
| Offsetting of Derivatives Assets | ||||||||||||||||||||||||
| November 30, 2015 | ||||||||||||||||||||||||
| Gross Amounts Not Offset in the Statements of Assets and Liabilities | ||||||||||||||||||||||||
| Description | Gross Amounts of Recognized | Gross Amounts Offset in the Statements of Assets and Liabilities | Net Amounts Presented in the Statements of Assets and Liabilities Available for Offset | Financial Instruments Available for Offset(a) | Cash Collateral Received(a) | Net Amount Receivable | ||||||||||||||||||
Stone Harbor Emerging Markets Debt Fund |
| |||||||||||||||||||||||
Forward Foreign | ||||||||||||||||||||||||
Currency Contracts | $ | 2,083,231 | $ | – | $ | 2,083,231 | $ | (212,925) | $ | (1,610,000) | $ | 260,306 | ||||||||||||
Credit Default Swap Contract | 3,893,332 | – | 3,893,332 | – | – | 3,893,332 | ||||||||||||||||||
Total | $ | 5,976,563 | $ | – | $ | 5,976,563 | $ | (212,925) | $ | – | $ | 4,153,638 | ||||||||||||
Stone Harbor High Yield Bond Fund |
| |||||||||||||||||||||||
Forward Foreign | ||||||||||||||||||||||||
Currency Contracts | $ | 217,741 | $ | – | $ | 217,741 | $ | (1,619) | $ | – | $ | 216,122 | ||||||||||||
Total | $ | 217,741 | $ | – | $ | 217,741 | $ | (1,619) | $ | – | $ | 216,122 | ||||||||||||
Stone Harbor Local Markets Fund |
| |||||||||||||||||||||||
Forward Foreign | ||||||||||||||||||||||||
Currency Contracts | $ | 2,568,284 | $ | – | $ | 2,568,284 | $ | (2,568,284) | $ | – | $ | – | ||||||||||||
Total | $ | 2,568,284 | $ | – | $ | 2,568,284 | $ | (2,568,284) | $ | – | $ | – | ||||||||||||
Stone Harbor Emerging Markets Corporate Debt Fund |
| |||||||||||||||||||||||
Forward Foreign | ||||||||||||||||||||||||
Currency Contracts | $ | 25,413 | $ | – | $ | 25,413 | $ | – | $ | – | $ | 25,413 | ||||||||||||
Total | $ | 25,413 | $ | – | $ | 25,413 | $ | – | $ | – | $ | 25,413 | ||||||||||||
Stone Harbor Strategic Income Fund |
| |||||||||||||||||||||||
Forward Foreign | ||||||||||||||||||||||||
Currency Contracts | $ | 8,736 | $ | – | $ | 8,736 | $ | (2,460) | $ | – | $ | 6,276 | ||||||||||||
Total | $ | 8,736 | $ | – | $ | 8,736 | $ | (2,460) | $ | – | $ | 6,276 | ||||||||||||
| 92 | www.shiplp.com |
Table of Contents
| Stone Harbor Investment Funds | Notes to Financial Statements | |
| November 30, 2015 (Unaudited) |
| Offsetting of Derivatives Liabilities | ||||||||||||||||||||||||
| November 30, 2015 | ||||||||||||||||||||||||
| Gross Amounts Not Offset in the Statements of Assets and Liabilities | ||||||||||||||||||||||||
| Description | Gross Amounts of Recognized | Gross Amounts Offset in the Statements of Assets and Liabilities | Net Amounts Presented in the Statements of Assets and Liabilities Available for Offset | Financial Instruments Available for Offset(a) | Cash Collateral Pledged(a) | Net Amount Payable | ||||||||||||||||||
Stone Harbor Emerging Markets Debt Fund |
| |||||||||||||||||||||||
Forward Foreign | ||||||||||||||||||||||||
Currency Contracts | $ | 212,925 | $ | – | $ | 212,925 | $ | (212,925) | $ | – | $ | – | ||||||||||||
Total | $ | 212,925 | $ | – | $ | 212,925 | $ | (212,925) | $ | – | $ | – | ||||||||||||
Stone Harbor High Yield Bond Fund |
| |||||||||||||||||||||||
Forward Foreign | ||||||||||||||||||||||||
Currency Contracts | $ | 1,619 | $ | – | $ | 1,619 | $ | (1,619) | $ | – | $ | – | ||||||||||||
Total | $ | 1,619 | $ | – | $ | 1,619 | $ | (1,619) | $ | – | $ | – | ||||||||||||
Stone Harbor Local Markets Fund |
| |||||||||||||||||||||||
Forward Foreign | ||||||||||||||||||||||||
Currency Contracts | $ | 4,680,166 | $ | – | $ | 4,680,166 | $ | (2,568,284) | $ | (1,690,987) | $ | 420,895 | ||||||||||||
Total | $ | 4,680,166 | $ | – | $ | 4,680,166 | $ | (2,568,284) | $ | (1,690,987) | $ | 420,895 | ||||||||||||
Stone Harbor Strategic Income Fund |
| |||||||||||||||||||||||
Forward Foreign | ||||||||||||||||||||||||
Currency Contracts | $ | 2,460 | $ | – | $ | 2,460 | $ | (2,460) | $ | – | $ | – | ||||||||||||
Total | $ | 2,460 | $ | – | $ | 2,460 | $ | (2,460) | $ | – | $ | – | ||||||||||||
| (a) | These amounts are limited to the derivatives asset/liability balance and, accordingly, do not include excess collateral received/pledged. |
3. TAX BASIS INFORMATION
Tax Basis of Distributions to Shareholders: Net investment income/ (loss) and net realized gain/ (loss) may differ for financial statement and tax purposes. The character of distributions made during the year from net investment income or net realized gains may differ from its ultimate characterization for federal income tax purposes. Also, due to the timing of dividend distributions, the fiscal year in which amounts are distributed may differ from the fiscal year in which the income or realized gain was recorded by a Fund.
The amounts and characteristics of tax basis distributions and composition of distributable earnings/(accumulated losses) are finalized at fiscal year end: accordingly, tax basis balances have not been determined as of November 30, 2015.
The tax character of the distributions paid by the Funds during the periods ended May 31, 2015 were as follows:
Stone Harbor Emerging Markets Debt Fund | ||||
Ordinary Income | $ | 104,263,472 | ||
| ||||
Total | $ | 104,263,472 | ||
| ||||
Stone Harbor High Yield Bond Fund | ||||
Ordinary Income | $ | 19,455,425 | ||
Long-Term Capital Gain | 9,049,371 | |||
| ||||
Total | $ | 28,504,796 | ||
| ||||
Stone Harbor Local Markets Fund | ||||
Ordinary Income | $ | 27,499,281 | ||
| ||||
Total | $ | 27,499,281 | ||
| ||||
Stone Harbor Investment Funds Semi-Annual Report | November 30, 2015 | 93 |
Table of Contents
| Stone Harbor Investment Funds | Notes to Financial Statements | |
| November 30, 2015 (Unaudited) |
Stone Harbor Emerging Markets Corporate Debt Fund | ||||
Ordinary Income | $ | 1,215,887 | ||
| ||||
Total | $ | 1,215,887 | ||
| ||||
Stone Harbor Investment Grade Fund | ||||
Ordinary Income | $ | 172,128 | ||
| ||||
Total | $ | 172,128 | ||
| ||||
Stone Harbor Strategic Income Fund | ||||
Ordinary Income | $ | 1,316,926 | ||
Long-Term Capital Gain | 32,288 | |||
| ||||
Total | $ | 1,349,214 | ||
| ||||
Stone Harbor Emerging Markets Debt Allocation Fund | ||||
Ordinary Income | $ | 1,049,102 | ||
| ||||
Total | $ | 1,049,102 | ||
| ||||
As of May 31, 2015, the components of distributable earnings on a tax basis were as follows: | ||||
Stone Harbor Emerging Markets Debt Fund | ||||
Undistributed Ordinary Income | $ | 4,476,156 | ||
Accumulated Capital Loss | (132,337,679) | |||
Unrealized Depreciation | (2,479,492) | |||
Cumulative Effect of Other Timing Difference* | (3,302,064) | |||
| ||||
Total | $ | (133,643,079) | ||
| ||||
Stone Harbor High Yield Bond Fund | ||||
Undistributed Ordinary Income | $ | 413,436 | ||
Accumulated Capital Loss | (3,173,432) | |||
Unrealized Depreciation | (2,827,899) | |||
Cumulative Effect of Other Timing Difference* | (95,104) | |||
| ||||
Total | $ | (5,682,999) | ||
| ||||
Stone Harbor Local Markets Fund | ||||
Accumulated Capital Loss | $ | (121,225,776) | ||
Unrealized Depreciation | (317,983,923) | |||
Cumulative Effect of Other Timing Difference* | (136,753,137) | |||
| ||||
Total | $ | (575,962,836) | ||
| ||||
Stone Harbor Emerging Markets Corporate Debt Fund | ||||
Undistributed Ordinary Income | $ | 76,312 | ||
Accumulated Capital Loss | (3,617,629) | |||
Unrealized Appreciation | 392,483 | |||
Cumulative Effect of Other Timing Difference* | (12,477) | |||
| ||||
Total | $ | (3,161,311) | ||
| ||||
Stone Harbor Investment Grade Fund | ||||
Undistributed Ordinary Income | $ | 103,491 | ||
Accumulated Capital Gain | 21,781 | |||
Unrealized Appreciation | 24,402 | |||
| ||||
Total | $ | 149,674 | ||
| ||||
| 94 | www.shiplp.com |
Table of Contents
| Stone Harbor Investment Funds | Notes to Financial Statements | |
| November 30, 2015 (Unaudited) |
Stone Harbor Strategic Income Fund | ||||
Undistributed Ordinary Income | $ | 88,467 | ||
Accumulated Capital Gain | 489,931 | |||
Unrealized Depreciation | (1,043,285) | |||
Cumulative Effect of Other Timing Difference* | 29,907 | |||
Total | $ | (434,980) | ||
Stone Harbor Emerging Markets Debt Allocation Fund | ||||
Undistributed Ordinary Income | $ | 569,091 | ||
Accumulated Capital Loss | (28,021) | |||
Unrealized Depreciation | (4,453,940) | |||
Total | $ | (3,912,870) | ||
| * | Other temporary differences due to timing, consist primarily of mark-to-market on forward foreign currency contracts. |
The tax components of distributable earnings are determined in accordance with income tax regulations which may differ from the composition of net assets reported under GAAP. Accordingly, for the year ended May 31, 2015, certain differences were reclassified. These differences were primarily attributed to the differing tax treatment of foreign currencies and certain other investments. The amounts reclassified did not affect net assets.
The reclassifications were as follows:
| Fund | Paid-in Capital | Accumulated Net Investment Income/(Loss) | Accumulated Net Realized Gain/(Loss) on Investments | |||||||||
Stone Harbor Emerging Markets Debt Fund | $ | – | $ | (13,006,475) | $ | 13,006,475 | ||||||
Stone Harbor High Yield Bond Fund | – | 1,540,778 | (1,540,778) | |||||||||
Stone Harbor Local Markets Fund | (1) | (235,485,550) | 235,485,551 | |||||||||
Stone Harbor Emerging Markets Corporate Debt Fund | – | 111,177 | (111,177) | |||||||||
Stone Harbor Investment Grade Fund | (423) | 745 | (322) | |||||||||
Stone Harbor Strategic Income Fund | (2,726) | 10,260 | (7,534) | |||||||||
Stone Harbor Emerging Markets Debt Allocation Fund | (2,916) | 2,916 | – | |||||||||
Capital Losses: As of May 31, 2015 the following Funds had capital loss carryforwards which may reduce the Funds’ taxable income arising from future net realized gains on investments, if any, to the extent permitted by the Code and thus may reduce the amount of the distributions to shareholders which would otherwise be necessary to relieve the Funds of any liability for federal tax pursuant to the Code.
Capital losses carried forward were as follows:
| Fund | Short-Term |
| Long-Term | |||||||
Stone Harbor Emerging Markets Debt Fund | $ | 47,841,364 | $ | 17,042,098 | ||||||
Stone Harbor Local Markets Fund | 84,978,042 | 4,728,953 | ||||||||
Stone Harbor Emerging Markets Corporate Debt Fund | 1,359,129 | 2,251,674 | ||||||||
The following Funds elect to defer to the year ending May 31, 2016 the following capital losses recognized during the period November 1, 2014 through May 31, 2015:
| Fund | Amount | |||||||
Stone Harbor Emerging Markets Debt Fund | $ | 67,454,217 | ||||||
Stone Harbor High Yield Bond Fund | 3,173,432 | |||||||
Stone Harbor Local Markets Fund | 31,518,781 | |||||||
Stone Harbor Emerging Markets Corporate Debt Fund | 6,826 | |||||||
Stone Harbor Emerging Markets Debt Allocation Fund | 28,021 | |||||||
Stone Harbor Investment Funds Semi-Annual Report | November 30, 2015 | 95 |
Table of Contents
| Stone Harbor Investment Funds | Notes to Financial Statements | |
| November 30, 2015 (Unaudited) |
The following Fund elects to defer to the period ending May 31, 2016, late year ordinary losses in the amount of:
| Fund | Amount | |||
| ||||
Stone Harbor Local Markets Fund | $ | 133,045,763 | ||
Unrealized Appreciation and Depreciation on Investments: At November 30, 2015, the aggregate gross unrealized appreciation and depreciation of investments for federal income purposes were as follows:
Stone Harbor Emerging Markets Debt Fund | ||||
Gross appreciation on investments (excess of value over tax cost) | $ | 10,899,570 | ||
Gross depreciation on investments (excess of tax cost over value) | (107,033,704) | |||
| ||||
Net unrealized depreciation | $ | (96,134,134) | ||
| ||||
Cost of investments for income tax purposes | $ | 1,815,928,555 | ||
| ||||
Stone Harbor High Yield Bond Fund | ||||
Gross appreciation on investments (excess of value over tax cost) | $ | 2,882,290 | ||
Gross depreciation on investments (excess of tax cost over value) | (23,924,113) | |||
| ||||
Net unrealized depreciation | $ | (21,041,823) | ||
| ||||
Cost of investments for income tax purposes | $ | 284,013,604 | ||
| ||||
Stone Harbor Local Markets Fund | ||||
Gross appreciation on investments (excess of value over tax cost) | $ | (46,942,890) | ||
Gross depreciation on investments (excess of tax cost over value) | (270,495,236) | |||
| ||||
Net unrealized depreciation | $ | (317,438,126) | ||
| ||||
Cost of investments for income tax purposes | $ | 1,077,603,886 | ||
| ||||
Stone Harbor Emerging Markets Corporate Debt Fund | ||||
Gross appreciation on investments (excess of value over tax cost) | $ | 436,107 | ||
Gross depreciation on investments (excess of tax cost over value) | (1,401,736) | |||
| ||||
Net unrealized depreciation | $ | (965,629) | ||
| ||||
Cost of investments for income tax purposes | $ | 42,221,776 | ||
| ||||
Stone Harbor Investment Grade Fund | ||||
Gross appreciation on investments (excess of value over tax cost) | $ | 95,763 | ||
Gross depreciation on investments (excess of tax cost over value) | (166,559) | |||
| ||||
Net unrealized depreciation | $ | (70,796) | ||
| ||||
Cost of investments for income tax purposes | $ | 15,107,952 | ||
| ||||
Stone Harbor Strategic Income Fund | ||||
Gross appreciation on investments (excess of value over tax cost) | $ | 29,857 | ||
Gross depreciation on investments (excess of tax cost over value) | (2,381,316) | |||
| ||||
Net unrealized depreciation | $ | (2,351,459) | ||
| ||||
Cost of investments for income tax purposes | $ | 37,209,844 | ||
| ||||
| 96 | www.shiplp.com |
Table of Contents
| Stone Harbor Investment Funds | Notes to Financial Statements | |
| November 30, 2015 (Unaudited) |
Stone Harbor Emerging Markets Debt Allocation Fund | ||||
Gross appreciation on investments (excess of value over tax cost) | $ | (1,207,712) | ||
Gross depreciation on investments (excess of tax cost over value) | (10,615,094) | |||
| ||||
Net unrealized depreciation | $ | (11,822,806) | ||
| ||||
Cost of investments for income tax purposes | $ | 107,647,558 | ||
| ||||
4. ADVISORY FEES
Stone Harbor Investment Partners LP is the Trust’s investment adviser. Under the investment advisory agreement the Trust pays an investment advisory fee calculated daily and paid monthly of 0.60%, 0.50%, 0.75%, 0.85%, 0.35%, 0.55%, and 0.70% of the average daily net assets for Stone Harbor Emerging Markets Debt Fund, Stone Harbor High Yield Bond Fund, Stone Harbor Local Markets Fund, Stone Harbor Emerging Markets Corporate Debt Fund, Stone Harbor Investment Grade Fund, Stone Harbor Strategic Income Fund, and Stone Harbor Emerging Markets Debt Allocation Fund, respectively.
The Adviser has contractually agreed to waive fees and reimburse expenses with respect to each of the Funds so that the Net Annual Operating Expenses (exclusive of acquired Fund fees and expenses, brokerage expenses, interest expense, taxes and extraordinary expenses) of the Stone Harbor Emerging Markets Debt Fund Institutional Class, Stone Harbor High Yield Bond Fund Institutional Class, Stone Harbor Local Markets Fund Institutional Class, Stone Harbor Emerging Markets Corporate Debt Fund Institutional Class, and Stone Harbor Investment Grade Fund Institutional Class will not exceed 0.75%, 0.65%, 1.00%, 1.00%, and 0.50%, respectively. The Adviser has contractually agreed to waive fees and reimburse expenses with respect to the Stone Harbor Strategic Income Fund Institutional Class and Stone Harbor Emerging Markets Debt Allocation Fund Institutional Class, so that the Net Annual Operating Expenses (inclusive of acquired fund fees and expenses but exclusive of brokerage expenses, interest expense, taxes and extraordinary expenses) will not exceed 0.70% and 0.85%, respectively. The fee waiver agreements are in effect through September 30, 2016 and are reevaluated on an annual basis.
The Adviser will be permitted to recover, on a class by class basis, expenses it has borne through the undertakings described above to the extent that a Fund’s expenses in later periods fall below the annual rates set forth in the relevant undertaking. A Fund will not be obligated to pay any such deferred fees and expenses more than three years after the end of the fiscal year in which the fee and expense was deferred. At May 31, 2015, deferred fees and expenses eligible to be recovered will expire as follows:
| 2016 | 2017 | 2018 | Total | |||||||||||||
Stone Harbor High Yield Bond Fund | $ | 256,488 | $ | 231,918 | $ | 65,578 | $ | 533,984 | ||||||||
Stone Harbor Emerging Markets Corporate Debt Fund | $ | 99,115 | $ | 97,636 | $ | 100,868 | $ | 297,619 | ||||||||
Stone Harbor Investment Grade Fund | N/A | $ | 49,712 | $ | 120,267 | $ | 169,979 | |||||||||
Stone Harbor Strategic Income Fund | N/A | $ | 61,917 | $ | 248,095 | $ | 310,012 | |||||||||
Stone Harbor Debt Allocation Fund | N/A | N/A | $ | 379,648 | $ | 379,648 | ||||||||||
5. INVESTMENTS
For the period ended November 30, 2015, the aggregate cost of purchases and proceeds from sales of investments (excluding short-term investments and U.S. Government Obligations) were as follows:
| Purchases | Sales | |||||||
Stone Harbor Emerging Markets Debt Fund | $ | 696,296,572 | $ | 727,447,850 | ||||
Stone Harbor High Yield Bond Fund | 62,063,003 | 59,710,739 | ||||||
Stone Harbor Local Markets Fund | 974,271,583 | 1,255,114,511 | ||||||
Stone Harbor Emerging Markets Corporate Debt Fund | 31,823,830 | 11,986,949 | ||||||
Stone Harbor Investment Grade Fund | 3,593,827 | 1,271,914 | ||||||
Stone Harbor Strategic Income Fund | 8,346,029 | 5,370,200 | ||||||
Stone Harbor Emerging Markets Debt Allocation Fund | 32,639,823 | 14,400,781 | ||||||
Stone Harbor Investment Funds Semi-Annual Report | November 30, 2015 | 97 |
Table of Contents
| Stone Harbor Investment Funds | Notes to Financial Statements | |
| November 30, 2015 (Unaudited) |
For the period ended November 30, 2015, the aggregate cost of purchases and proceeds from sales of U.S. Government Obligations were as follows:
| Purchases | Sales | ||||||
| Stone Harbor Investment Grade Fund | $ | 997,887 | $ | – | ||||
6. AFFILIATED COMPANIES
Funds may invest in certain securities that are considered securities issued by affiliated companies. As defined by the 1940 Act, an affiliated person, including an affiliated company, is one in which a Fund owns 5% or more of the outstanding voting securities, or a company which is under common ownership or control with the Fund. The purchases, sales, dividend income, capital gains, return of capital distributions received, shares and value of investments in affiliated companies for the period ended November 30, 2015 were as follows:
Stone Harbor Strategic Income Fund
| Security Name | Share Balance May 31, 2015 | Purchases | Sales | Share Balance November 30, 2015 | Dividend Income | Realized Loss | Market Value November 30, 2015 | |||||||||||||||||||||
Stone Harbor Emerging Markets Debt Fund | 969,132 | 89,496 | 341,059 | 717,569 | $ | 219,292 | $ | (231,029 | ) | $ | 7,103,932 | |||||||||||||||||
Stone Harbor High Yield Bond Fund | 1,569,300 | 172,429 | 188,542 | 1,553,187 | 364,299 | (196,688 | ) | 12,301,243 | ||||||||||||||||||||
Stone Harbor Investment Grade Fund | 952,172 | 589,130 | 33,672 | 1,507,630 | 87,692 | (7,901 | ) | 15,453,210 | ||||||||||||||||||||
| 3,490,604 | 851,055 | 563,273 | 3,778,386 | $ | 671,283 | $ | (435,618 | ) | $ | 34,858,385 | ||||||||||||||||||
Stone Harbor Emerging Markets Debt Allocation Fund
| Security Name | Share Balance May 31, 2015 | Purchases | Sales | Share Balance November 30, 2015 | Dividend Income | Realized Loss | Market Value 2015 | |||||||||||||||||||||
Stone Harbor Emerging Markets Debt Fund | 3,994,289 | 1,584,303 | 755,572 | 4,823,020 | $ | 1,511,004 | $ | (403,341 | ) | $ | 47,747,894 | |||||||||||||||||
Stone Harbor Local Markets Fund | 5,205,538 | 2,051,829 | 821,375 | 6,435,992 | – | (1,104,913 | ) | 48,076,858 | ||||||||||||||||||||
| 9,199,827 | 3,636,132 | 1,576,947 | 11,259,012 | $ | 1,511,004 | $ | (1,508,254 | ) | $ | 95,824,752 | ||||||||||||||||||
The Emerging Markets Debt Fund engaged in cross trades with an affiliate of the Fund during the period ended November 30, 2015 pursuant to Rule 17a-7 under the 1940 Act. Cross trading is the buying or selling of portfolio securities between funds to which the Adviser serves as the investment adviser. The Board of Trustees previously adopted procedures that apply to transactions between the Portfolios pursuant to Rule 17a-7. At its regularly scheduled meetings, the Trustees review such transactions as of the most current calendar quarter for compliance with the requirements set forth by Rule 17a-7 and the Emerging Markets Debt Fund’s procedures. The procedures require that the transactions be a purchase or sale for no consideration other than cash payment against prompt delivery of a security for which market quotations are readily available, and be consistent with the investment policies of the Fund. During the period ended November 30, 2015 the Emerging Markets Debt Fund purchased a security from another fund for which the Adviser is the investment adviser in the amount of $1,412,337.
7. SHARES OF BENEFICIAL INTEREST
At November 30, 2015, the Trust had an unlimited number of shares of beneficial interest authorized with a par value of $0.001 per share. The Funds have the ability to issue multiple classes of shares. Each share of a class represents an identical interest and has the same rights, except that each class bears certain direct expenses, including those specifically related to the distribution of its shares. Transactions in shares of the Institutional Class can be found on the Statements of Changes in Net Assets.
8. BENEFICIAL OWNERSHIP
As of November 30, 2015 IMF Retired Staff Benefits owned beneficially 43.73% of the Stone Harbor High Yield Bond Fund’s outstanding shares, an individual shareholder owned beneficially 98.89% of the Stone Harbor Emerging Markets Debt Allocation Fund’s outstanding shares, the Stone Harbor Strategic Income Fund owned beneficially 99.93% of the Stone Harbor Investment Grade Fund’s outstanding shares, an individual shareholder owned 61.76% of the Stone Harbor Strategic Income Fund’s outstanding shares and two separate shareholders held 30.74% and 28.38% of the of the Stone Harbor Emerging Markets Corporate Bond Fund’s outstanding shares.
| 98 | www.shiplp.com |
Table of Contents
| Stone Harbor Investment Funds | Notes to Financial Statements | |
| November 30, 2015 (Unaudited) |
9. INDEMNIFICATIONS
Under the Trust’s organizational documents, its officers and Trustees are indemnified against certain liability arising out of the performance of their duties to the Trust. Additionally, in the normal course of business, the Trust enters into contracts with service providers that may contain general indemnification clauses. The Trust’s maximum exposure under these arrangements is unknown, as this would involve future claims that may be made against the Trust that have not yet occurred.
10. OTHER
The Funds, along with the Stone Harbor Emerging Markets Total Income Fund and the Stone Harbor Emerging Markets Income Fund (the “Stone Harbor Fund Complex”) paid each Trustee who is not an interested person, of the Investment Adviser or any of its affiliates an aggregate fee of $84,000 per year. These fees were allocated over the Stone Harbor Fund Complex based on the average net assets of each fund. Interested Trustees of the Trust are not compensated by the Stone Harbor Fund Complex. All Trustees are reimbursed for reasonable travel and out-of-pocket expenses incurred to attend such meetings. Officers of the Funds do not receive compensation for performing the duties of their office.
11. RECENT ACCOUNTING PRONOUNCEMENTS
In May 2015, the Financial Accounting Standards Board (“FASB”) issued Accounting Standards Update (“ASU”) 2015-07, “Disclosures for Investments in Certain Entities that Calculate Net Asset Value Per Share (or its Equivalent).” This is an update to Accounting Standards Codification Topic 820, Fair Value Measurement. ASU 2015-07 removes the requirement to categorize within the fair value hierarchy investments for which fair value is measured at net asset value per share (or its equivalent) using the practical expedient.
ASU 2015-17 is effective for annual reporting periods beginning on or after December 15, 2015, and interim periods within those annual periods, with retrospective application for all periods presented. Management does not believe the adoption of ASU 2015-07 will have a material effect on the financial statements or disclosures of the Funds.
Stone Harbor Investment Funds Semi-Annual Report | November 30, 2015 | 99 |
Table of Contents
| Stone Harbor Investment Funds | Additional Information | |
| November 30, 2015 (Unaudited) |
FUND PORTFOLIO HOLDINGS
The SEC has adopted the requirement that all registered investment companies file a complete schedule of portfolio holdings with the SEC for their first and third fiscal quarters on Form N-Q. For the Funds, this would be for the fiscal quarters ending August 31 and February 28. The Form N-Q filing must be made within 60 days of the end of the quarter. The Funds’ Forms N-Q will be available on the SEC’s website at http://www.sec.gov., or they may be reviewed and copied at the SEC’s Public Reference Room in Washington, DC (call 1-800-732-0330 for information on the operation of the Public Reference Room).
PROXY VOTING
A description of the policies and procedures that the Funds use to determine how to vote proxies relating to portfolio securities and information regarding how the Funds voted proxies relating to portfolio securities for the 12-month period ended June 30, 2015 are available without a charge, upon request, by contacting Stone Harbor Investment Funds at 1-866-699-8158 or on the SEC website at http://www.sec.gov.
BENCHMARK DESCRIPTIONS
| Index | Description | |
| J.P. Morgan EMBI Global Diversified | The J.P. Morgan EMBI Global Diversified (EMBI Global Diversified) tracks total returns for U.S. dollar-denominated debt instruments issued by emerging markets sovereign and quasi-sovereign entities: Brady bonds, loans, and Eurobonds. The index limits the weights of those index countries with larger debt stocks by only including specified portions of these countries’ eligible current face amounts outstanding. The countries covered in the EMBI Global Diversified are identical to those covered by the EMBI Global. | |
| Citigroup High Yield Market Capped | The Citigroup High Yield Market Capped Index represents a modified version of the High Yield Market Index by delaying the entry of “fallen angel” issues and capping the par value of individual issuers at US $10 billion par amount outstanding. The index is a total rate of return index which captures the performance of below investment grade debt issued by corporations domiciled in the United States or Canada. | |
| J.P. Morgan GBI-EM Global Diversified | The J.P. Morgan GBI-EM Global Diversified consists of regularly traded, liquid fixed-rate, domestic currency government bonds to which international investors can gain exposure. The weightings among the countries are more evenly distributed within this index. | |
| J.P. Morgan CEMBI Broad Diversified | The J.P. Morgan CEMBI Broad Diversified tracks total returns of U.S. dollar-denominated debt instruments issued by corporate entities in emerging market countries and consists of an investable universe of corporate bonds. The minimum amount outstanding required is $350 mm for the CEMBI Broad Diversified. The CEMBI Broad Diversified limits the weights of those index countries with larger corporate debt stocks by only including a specified portion of these countries’ eligible current face amounts of debt outstanding. | |
| Barclays Capital U.S. Aggregate Index | The Barclays Capital U.S. Aggregate Index represents securities that are SEC-registered, taxable, and dollar denominated. The index covers the U.S. investment grade fixed rate bond market, with index components for government and corporate securities, mortgage pass-through securities, and asset-backed securities. These major sectors are subdivided into more specific indices that are calculated and reported on a regular basis. | |
| Barclays Global Credit Index (Hedged USD) | Barclays Global Credit Total Return Index is a subset of the Global Aggregate Index and is subject to the same quality, liquidity, and maturity requirements and exclusion rules of the latter. Constituents must be rated investment grade by at least two of the three major ratings agencies. Constituents must have a remaining maturity of at least one year. The index does not include convertibles, floating-rate notes, fixed-rate perpetuals, warrants, linked bonds, and structured products. |
DEFINITIONS
Broad-based securities indices are unmanaged and are not subject to fees and expenses typically associated with managed accounts or investment funds. Investments cannot be made directly in a broad-based securities index.
Standard and Poor’s ratings are measured on a scale that generally ranges from AAA (highest) to D (lowest). A security that has not been given a credit rating by Standard and Poor’s is listed as “not rated”. For additional information please go to the Understanding Ratings section at www.standardpoors.com.
Alpha – A measure of performance on a risk-adjusted basis. The excess return of the fund relative to the return of the benchmark index is a fund’s alpha.
Basis Point – a unit equal to one hundredth of a percentage point.
Duration – A measure of the sensitivity of the price (the value of principal) of a fixed-income investment to a change in interest rates. Duration is expressed as a number of years.
Investment Grade – Refers to bonds that are considered to have a relatively low risk of default, ranging from highest credit quality to good credit quality. Bonds rated below investment grade are considered to have significant speculative characteristics.
| 100 | www.shiplp.com |
Table of Contents
| Stone Harbor Investment Funds | Additional Information | |
| November 30, 2015 (Unaudited) |
Quantitative Easing (QE) – is an unconventional monetary policy used by central banks to stimulate the national economy when standard monetary policy has become ineffective. A central bank implements quantitative easing by buying financial assets from commercial banks and other private institutions, thus increasing the monetary base. This is distinguished from the more usual policy of buying or selling government bonds in order to keep market interest rates at a specified target value.
Sovereign Debt – Refers to bonds issued by a national government in order to finance the issuing country’s growth. Sovereign debt described as external is denominated in U.S. dollar, while sovereign debt described as local is issued in a foreign currency.
Spread – The difference between the bid and ask price of a security or asset.
The S&P 500 – is a stock market index based on the market capitalizations of 500 leading companies publicly traded in the U.S. stock market, as determined by Standard & Poor’s. It differs from other U.S. stock market indices such as the Dow Jones Industrial Average and the Nasdaq due to its diverse constituency and weighting methodology.
Stone Harbor Investment Funds Semi-Annual Report | November 30, 2015 | 101 |
Table of Contents
| Stone Harbor Investment Funds | Trustees & Officers | |
| November 30, 2015 (Unaudited) |
The business and affairs of each Fund are managed under the direction of its Board of Trustees. The Board of Trustees approves all significant agreements between a Fund and the persons or companies that furnish services to the Fund, including agreements with its distributor, investment adviser, administrator, custodian and transfer agent. The day-to-day operations of the Fund are delegated to the Fund’s Adviser and administrator.
The name, age and principal occupations for the past five years of the Trustees and officers of the Funds are listed below, along with the number of portfolios in the Fund Complex overseen by and the other directorships held by each Trustee. Except as otherwise noted, the address of each Trustee and officer is c/o Stone Harbor Investment Partners LP, 31 W. 52nd Street, 16th Floor, New York, New York 10019. The Trust’s Statement of Additional Information includes additional information about the Trustees and is available without a charge, upon request, by calling 1-866-699-8158.
INDEPENDENT TRUSTEES
Name and Year of Birth(1) | Position with the Trust | Term of Office and Length of Time Served(2) | Principal Occupation(s) During Past 5 Years | Number of Portfolios in Fund by Trustee(3) | Other Directorships Held by Trustee | |||||
| Alan Brott 1942 | Chairman of Audit Committee; Trustee | Since June 21, 2007 | Columbia University Associate Professor, 2000-Present; Consultant, 1991-Present. | 10 | Stone Harbor Emerging Markets Income Fund, Stone Harbor Emerging Markets Total Income Fund, Grosvenor Registered Multi-Strategy Fund, Man FRM Alternative Multi-Strategy Fund, Excelsior Private Markets Fund II, Excelsior Private Markets Fund III and Excelsior Venture Partners III and UST Global Private Markets. | |||||
| Heath B. McLendon 1933 | Trustee | Since June 21, 2007 | Retired; formerly Citigroup – Chairman of Equity Research Oversight Committee (retired December 31, 2006). | 10 | Stone Harbor Emerging Markets Income Fund, Stone Harbor Emerging Markets Total Income Fund | |||||
| Patrick Sheehan 1947 | Trustee | Since June 21, 2007 | Retired; formerly, Citigroup Asset Management-Managing Director and Fixed Income Portfolio Manager, 1991-2002. | 10 | Stone Harbor Emerging Markets Income Fund, Stone Harbor Emerging Markets Total Income Fund | |||||
| Glenn Marchak 1956 | Trustee | Since April 2, 2015 | Chairman of Audit Committee, Apollo Tactical Income Fund Inc. (February 2013 to Present), Chairman of Audit Committee, Apollo Senior Floating Rate Fund Inc. (December 2010 –Present); Chairman of Audit Committee, Atlanta Equity Advisors/Resolvion (January 2010 – September 2014) | 10 | Stone Harbor Emerging Markets Income Fund, Stone Harbor Emerging Markets Total Income Fund, Apollo Tactical Income Fund Inc. and Apollo Senior Floating Rate Fund Inc. |
| 102 | www.shiplp.com |
Table of Contents
| Stone Harbor Investment Funds | Trustees & Officers | |
| November 30, 2015 (Unaudited) |
INDEPENDENT TRUSTEES
Name and Year of Birth(1) | Position with the Trust | Term of Office and Length of Time Served(2) | Principal Occupation(s) During Past 5 Years | Number of Portfolios in Fund | Other Directorships Held by Trustee | |||||
Thomas K. Flanagan* 1953 | Chairman; Trustee | Since October 17, 2012 | Since April 2006, Portfolio Manager of Stone Harbor; prior to April 2006, Managing Director and Senior Portfolio Manager for emerging markets debt portfolios at Salomon Brothers Asset Management Inc.; joined Salomon Brothers Asset Management Inc. in 1991. | 10 | Stone Harbor Emerging Markets Income Fund, Stone Harbor Emerging Markets Total Income Fund | |||||
OFFICERS
Name and Year of Birth(1) | Position with the Trust | Term of Office and Length of Time Served(2) | Principal Occupation(s) During Past 5 Years | |||
Peter J. Wilby 1958 | President | Since June 21, 2007 | Co-portfolio manager of the Funds; since April 2006, Chief Investment Officer of Stone Harbor; prior to April 2006, Chief Investment Officer – North American Fixed Income at Citigroup Asset Management; joined Citigroup or its predecessor firms in 1989. | |||
Jeffrey S. Scott 1959 | Chief Compliance Officer | Since June 21, 2007 | Since April 2006, Chief Compliance Officer of Stone Harbor; from October 2005 to March 2006, Director of Compliance, New York Life Investment Management LLC; from July 1998 to September 2005, Chief Compliance Officer, Salomon Brothers Asset Management Inc. | |||
Thomas M. Reynolds 1960 | Principal Financial and Accounting Officer | Since April 16, 2014 | Since February 2008, Controller of Stone Harbor; from February 2006 to February 2008, Vice President of Portfolio Administration for Goldman Sachs Asset Management; from 1991 to 2006, Citigroup Asset Management. | |||
Amanda Suss 1969 | Treasurer | Since April 16, 2014 | Since July 2011, Senior Finance Associate of Stone Harbor; from 2000 to July 2006, Director of Business Operations at Citigroup Asset Management; From April 1994 to April 2000, Mutual Fund Accounting Manager at Smith Barney Asset Management. | |||
Adam J. Shapiro 1963 | Secretary/ Anti-Money Laundering Officer | Since June 21, 2007 | Since April 2006, General Counsel of Stone Harbor; from April 2004 to March 2006, General Counsel, North American Fixed Income, Salomon Brothers Asset Management Inc.; from August 1999 to March 2004, Director of Product and Business Development, Citigroup Asset Management. | |||
Vilma V. DeVooght 1977 | Assistant Secretary | Since January 21, 2015 | Vice President, Senior Counsel, ALPS, since 2014; Associate Counsel, First Data Corporation 2012 to 2014; Legal Counsel, Invesco 2009 to 2011; Secretary Centaur Funds. | |||
Gina Meyer 1980 | Assistant Treasurer | Since July 17, 2013 | Since November 2012, Fund Controller for ALPS Fund Services, Inc.; from January 2011 to October 2012, Manager of Fund Accounting for Jackson National Asset Management; from August 2008 to January 2011, Supervisor of Fund Accounting for Jackson National Asset Management. | |||
| * | Mr. Flanagan is an interested person of the Trust (as defined in the 1940 Act) (an “Interested Trustee”) because of his position with the Adviser. |
| (1) | The business address of each Trustee and Officer of the Trust is c/o Stone Harbor Investment Partners LP, 31 West 52nd Street, 16th Floor, New York, NY 10019. |
| (2) | Each Trustee serves until retirement, resignation or removal from the Board. Officers are typically elected every year, unless an officer earlier retires, resigns or is removed from office. |
| (3) | The term “Fund Complex” as used in this table includes each series of the Trust, and Stone Harbor Emerging Markets Income Fund and Stone Harbor Emerging Markets Total Income Fund, two closed-end funds advised by the Adviser. As of November 30, 2015 the Stone Harbor Emerging Markets Debt Blend Fund had not commenced operations. |
Stone Harbor Investment Funds Semi-Annual Report | November 30, 2015 | 103 |
Table of Contents

INVESTMENT ADVISER
Stone Harbor Investment Partners LP
31 W. 52nd Street 16th Floor
New York, New York 10019
ADMINISTRATOR & FUND ACCOUNTANT
ALPS Fund Services, Inc.
1290 Broadway, Suite 1100
Denver, Colorado 80203
DISTRIBUTOR
ALPS Distributors, Inc.
1290 Broadway, Suite 1100
Denver, Colorado 80203
TRANSFER AGENT
ALPS Fund Services, Inc.
1290 Broadway, Suite 1100
Denver, Colorado 80203
CUSTODIAN
State Street Bank and Trust Company
One Iron Street Boston,
MA 02210
LEGAL COUNSEL
Ropes & Gray LLP
1211 Avenue of the Americas
New York, New York 10036
INDEPENDENT REGISTERED PUBLIC ACCOUNTING FIRM
Deloitte & Touche LLP
555 17th Street, Suite 3600
Denver, Colorado 80202
This report and its financial statements are submitted for the general information of the shareholders of the Funds. The report is not authorized for distribution to prospective investors in the Funds unless preceded or accompanied by a prospectus. Investors should carefully consider the investment objectives, risks, charges, and expenses of a Fund, which are described in its prospectus. For this and other information or to request a prospectus or summary prospectus, call 1-866-699-8125 toll free. Please read the prospectus carefully before investing. The Funds’ Statement of Additional Information contains additional information about the Funds’ Trustees and is available without charge upon request by calling 1-866-699-8125. |
SHF000798 exp. 01/31/17
Table of Contents
| Item 2. | Code of Ethics. |
Not applicable to this Report.
| Item 3. | Audit Committee Financial Expert. |
Not applicable to this Report.
| Item 4. | Principal Accountant Fees and Services. |
Not applicable to this Report.
| Item 5. | Audit Committee of Listed Registrants. |
Not applicable to Registrant.
| Item 6. | Investments. |
| (a) | Schedule of Investments in securities of unaffiliated issuers as of the close of the reporting period is included as part of the Report to Stockholders filed under Item 1 of this Form N-CSR. |
| (b) | Not applicable. |
| Item 7. | Disclosure of Proxy Voting Policies and Procedures for Closed-End Management Investment Companies. |
Not applicable to Registrant.
| Item 8. | Portfolio Managers of Closed-End Management Investment Companies. |
Not applicable to Registrant.
2
Table of Contents
| Item 9. | Purchases of Equity Securities by Closed-End Management Investment Companies and Affiliated Purchasers. |
Not applicable to Registrant.
| Item 10. | Submission of Matters to a Vote of Security Holders. |
| There have been no material changes to the procedures by which shareholders may recommend nominees to the Registrant’s Board of Trustees, where those changes were implemented after the Registrant last provided disclosure in response to the requirements of Item 407(c)(2) of Regulation S-K, or this Item. |
| Item 11. | Controls and Procedures. |
| (a) | The Registrant’s principal executive officer and principal financial officer have concluded that the Registrant’s disclosure controls and procedures (as defined in Rule 30a-3(c) under the Investment Company Act of 1940, as amended) are effective based on their evaluation of these controls and procedures as of a date within 90 days of the filing date of this report. |
| (b) | There was no change in the Registrant’s internal control over financial reporting (as defined in Rule 30a-3(d) under the Investment Company Act of 1940, as amended) during the second fiscal quarter of the period covered by this report that has materially affected, or is reasonably likely to materially affect, the Registrant’s internal control over financial reporting. |
| Item 12. | Exhibits. |
| (a)(1) | Not applicable to this Report. |
| (a)(2) | The certifications required by Rule 30a-2(a) of the Investment Company Act of 1940, as amended, and Section 302 of the Sarbanes-Oxley Act of 2002 are attached hereto as Exhibit 99.Cert. |
| (a)(3) | None. |
| (b) | The certifications by the Registrant’s principal executive officer and principal financial officer, as required by Rule 30a-2(b) of the Investment Company Act of 1940, as amended, and Section 906 of the Sarbanes-Oxley Act of 2002 are attached hereto as Exhibit 99.906Cert. |
3
Table of Contents
SIGNATURES
Pursuant to the requirements of the Securities Exchange Act of 1934 and the Investment Company Act of 1940, the Registrant has duly caused this Report to be signed on its behalf by the undersigned, thereunto duly authorized.
| Stone Harbor Investment Funds | ||
| By: | /s/ Peter J. Wilby | |
| Peter J. Wilby | ||
President and Chief Executive Officer/Principal Executive Officer | ||
| Date: | February 8, 2016 | |
Pursuant to the requirements of the Securities Exchange Act of 1934 and the Investment Company Act of 1940, this Report has been signed below by the following persons on behalf of the Registrant and in the capacities and on the dates indicated.
| Stone Harbor Investment Funds | ||
| By: | /s/ Peter J. Wilby | |
| Peter J. Wilby | ||
President and Chief Executive Officer/Principal Executive Officer | ||
| Date: | February 8, 2016 | |
| By: | /s/ Thomas M. Reynolds | |
| Thomas M. Reynolds | ||
| Principal Financial Officer/ Principal Accounting Officer | ||
| Date: | February 8, 2016 | |
4