Table of Contents
UNITED STATES
SECURITIES AND EXCHANGE COMMISSION
Washington, D.C. 20549
FORM N-CSR
CERTIFIED SHAREHOLDER REPORT OF REGISTERED
MANAGEMENT INVESTMENT COMPANIES
Investment Company Act file number: 811-22037
Stone Harbor Investment Funds
(Exact name of registrant as specified in charter)
1290 Broadway, Suite 1100
Denver, CO 80203
(Address of principal executive offices) (Zip code)
Adam J. Shapiro, Esq.
c/o Stone Harbor Investment Partners LP
31 West 52nd Street, 16th Floor
New York, NY 10019
(Name and address of agent for service)
With copies To:
Michael G. Doherty, Esq.
Ropes & Gray LLP
1211 Avenue of the Americas
New York, NY 10036
Registrant’s telephone number, including area code: (303) 623-2577
Date of fiscal year end: May 31
Date of reporting period: June 1, 2014 - November 30, 2014
Table of Contents
Item 1. Report to Stockholders.
Table of Contents

Table of Contents
| Table of Contents | ||
| ||
| 2 | ||||
| 10 | ||||
| 12 | ||||
| 15 | ||||
| 16 | ||||
| 17 | ||||
| 18 | ||||
| 19 | ||||
| 20 | ||||
| 21 | ||||
| 22 | ||||
| 33 | ||||
| 42 | ||||
| 48 | ||||
| 54 | ||||
| 59 | ||||
| 61 | ||||
| 62 | ||||
| 64 | ||||
| 66 | ||||
| 70 | ||||
| 71 | ||||
| 72 | ||||
| 73 | ||||
| 74 | ||||
| 75 | ||||
| 76 | ||||
| 77 | ||||
| 97 | ||||
Stone Harbor Investment Funds Semi-Annual Report | November 30, 2014 |
1 |
Table of Contents
| Stone Harbor Investment Funds | Shareholder Letter | |
|
November 30, 2014 (Unaudited) | |
Dear Shareholder,
During the six month period ending November 30, 2014, credit market performance was impacted by weak global economic growth outside the U.S., a significant decline in oil prices, the Federal Reserve’s (FED’s) wind down of its asset purchase program, and increased geopolitical risk in Eastern Europe. In general, these factors had disparate impact across credit markets, and in the case of emerging markets, varying effects across regions and countries.
Weaker-than-expected growth outside the U.S. gave rise to divergent monetary policy aimed at supporting growth and reducing deflationary risks. The European Central Bank (ECB) cut interest rates and instituted its anticipated asset purchase program; the People’s Bank of China (PBOC) cut its benchmark rate for the first time since 2012; and the Bank of Japan (BOJ) surprised the markets with the large scale of its asset purchase program. On the other hand, the U.S. Federal Reserve completed its asset purchase program during the period on evidence of better-than-expected growth but remained sensitive to the fragility of the recovery and maintained its pledge to keep low rates for a considerable time.
Asset price volatility increased during the period, particularly in the emerging markets and high yield markets as oil prices declined precipitously. The strengthening US dollar has supported U.S. growth but emerging markets currencies have suffered as a consequence of that dollar strength. As of the date of this report, we expect markets to remain volatile until oil prices reach a new equilibrium level. As we look ahead to 2015, we believe the key market drivers of the past 6 months are still very much in place. There appears to be a growing consensus on the direction of some of those drivers including the likelihood of the ECB’s launch of a quantitative easing program and the Federal Reserve’s rate increase by mid-2015. A great deal of uncertainty continues to surround other drivers including oil prices, non-US growth and geopolitical risk in Russia/Ukraine and in the Middle East.
At Stone Harbor, we will continue to focus on seeking to capture excess return from stable and improving credit situations in corporate and sovereign markets worldwide. As we continue to monitor these developments, please follow our progress throughout the year by visiting our website at www.shiplp.com. There you will find updates on our view of credit markets, as well as related news and research. We appreciate the confidence you have placed in Stone Harbor Investment Partners LP and look forward to providing you with another update in the next six months.
Emerging Markets Debt Market Review
During the six month period ended November 30, 2014, emerging markets were broadly driven by three main themes: falling core fixed income yields and flattening yield curves, U.S. dollar strength, and falling oil prices. Asset price volatility increased at the end of the period from very low levels. While there were initial signs of market recovery during the first half of the review period – as suggested by improving global growth primarily led by a rebound in the U.S., and low volatility – demand for risk assets waned as several persistent macroeconomic factors again brought to focus EM vulnerabilities. These factors included weaker-than-expected growth in Europe, an uneven economic recovery in emerging markets, and increasing geopolitical risks. On the other hand, results of presidential elections in four major EM countries—Brazil, India, Indonesia and Turkey – provided some support for EM markets, in our view, as policy makers in these countries had a freer hand to implement better policies that may have been politically difficult to propose prior to the elections. These market dynamics ultimately produced divergent results across EM asset classes for the review period, as falling core fixed income yields supported returns for hard currency debt, while a strong U.S. dollar and falling oil prices, combined with a continuation of weak global growth outside of the U.S., weighed against returns of local currency bonds and local currencies. Returns on emerging market corporate debt trailed behind U.S. dollar sovereign debt, but remained positive.
Stone Harbor Emerging Markets Debt Fund
The total return of the Emerging Markets Debt Fund (the “Fund” or “portfolio”) for the 6 month period ended November 30, 2014 was
-1.55% (net of expenses) and -1.21% (gross of expenses). This performance compares to a benchmark return of 1.56% for the J.P. Morgan EMBI Global Diversified. For the period, external sovereign bond credit spreads over comparable maturity U.S. Treasury securities widened by 37 basis points, ending the period at 310 basis points.
The Fund underperformed its benchmark primarily as a result of country selection within the hard currency sovereign debt allocation, which detracted 214 basis points overall to excess returns. Specifically, overweight in Venezuela was a significant detractor. We have based our rationale for investing in Venezuela external sovereign U.S. dollar debt on fundamental credit assessments and what we believe are very attractive valuations in the current market environment. We view Venezuela’s near term payment obligations as manageable absent a more significant and sustained decline in oil prices. The key issue remains whether Venezuela’s government will continue to prioritize cash receipts from oil sales to pay debt. In our view, Venezuela will continue to do so to maintain joint venture partnerships and foreign investment in the energy sector and to protect oil shipments and foreign assets from attachment in foreign jurisdictions. At current spread and bond price levels, we believe Venezuela’s external sovereign debt is an attractive tactical opportunity. We fully recognize the volatility that is inherent in this exposure but believe current
2 |
www.shiplp.com |
Table of Contents
| Stone Harbor Investment Funds | Shareholder Letter | |
|
November 30, 2014 (Unaudited) | |
valuations combined with cash flow support from oil exports and the pragmatic reasons supporting the government’s ongoing willingness to fulfill its debt obligations support our overweight.
Issue selection in Argentina also detracted from relative returns during the period. Positions in Argentina hard currency debt reflected our view that local law, US-dollar denominated debt is one of the most attractive opportunities in the Emerging Markets (EM) universe. However, this position did not fare well during the latter part of the review period as defaulted bonds outperformed. Other sources of underperformance included local rates and foreign exchange (FX) exposure in Russia and Colombia, and FX exposure in Mexico and Indonesia.
Issue selection, particularly an allocation to short duration securities in Venezuela, enhanced excess returns. Overweight in Argentina, Dominican Republic, and Indonesia, as well as issue selection in Russia within the hard currency sovereign allocation, also enhanced relative returns. Hard currency corporate allocation in Argentina, China, and Thailand also enhanced performance.
As of the end of the period, overweight positions in the Fund were concentrated in country exposures where the portfolio management team identified attractive spread premiums relative to the team’s fundamental assessments of sovereign and corporate credit quality, including both non-investment grade and investment grade countries. The Fund reduced exposure to local debt markets over the course of the review period, particularly in countries in which local debt and currencies had outperformed the market since the end of January. Finally, our exposure to off-benchmark corporate debt remained constrained by current valuations relative to sovereign debt. We believe sovereign debt is more attractive in aggregate. However, we continue to find opportunities in the corporate sector selectively and, over the review period, have further concentrated our exposures into our highest conviction credits.
We are interpreting the current market environment as an opportunity to maintain or increase our existing positions in credits that we believe will benefit from country specific developments over the next 12 months. Our key overweights in external sovereign debt are in Argentina, Dominican Republic, Indonesia, Russia and Venezuela. In each case, we believe significant spread compression is possible in the near term. We have retained our overweight in Venezuela despite the recent drawdown on the view that policy makers are aware of the necessity of devaluation in the near term. While the recent decline in oil prices reduces Venezuela’s revenue from oil sales, we believe repayment of external obligations is Venezuela’s only practical alternative in the next 12 months for reasons highlighted earlier. We have added to exposure in Russia as external and local debt valuations already account for very negative scenarios for Russia’s credit profile. Russia’s sovereign spread trades at a level that exceeds spreads for bonds from many countries with single B ratings. In addition, we have continued to add to some existing overweights in countries where we believe fundamental credit improvements are not fully appreciated by markets. Dominican Republic is a good example. In our view, Dominican Republic benefits from strong U.S. growth as tourism and remittance revenues increase and institutional improvements to monetary and fiscal policy should be supportive. We believe Dominican Republic bonds are attractive in the current environment.
To fund these purchases, we reduced our exposure in Poland and Colombia over the course of the last 6 months and more recently reduced our overweight in Turkey that has performed well, benefiting from the decline in oil prices. We also began reducing exposure in Brazil external sovereign debt beginning in July as Brazil outperformed throughout much of 3Q 2014 until September, with spreads at below 150 basis points for ten-year and shorter maturity bonds. Brazil sovereign bonds, like other relatively low volatility debt in emerging markets, hit turbulence in September due to external factors, but Brazil’s presidential election was also a key source of volatility. Lastly, we have avoided investments in many of the newer entrants in our benchmark, particularly smaller countries from sub-Sahara Africa that may come under further selling pressure if terms of trade weaken due to falling commodity prices. Nevertheless, as valuations become more attractive to us on some of these countries, we may look for opportunities to selectively add exposure to this region.
As we head into 2015, EM growth continues to face headwinds with leverage still rising in most EMs, fiscal and monetary policies that are generally no longer supportive, and falling commodity prices. However, these risk factors are balanced with supportive external factors that are poised to aid EM growth – namely, better U.S. growth, record high global savings and low core rates that support capital flows to EMs, and commodity prices that are benefitting importers, such as China, India, Korea, and Thailand, among others.
Stone Harbor Local Markets Fund
The total return of the Stone Harbor Local Markets Fund (the “Fund” or “portfolio”) for the 6 month period ended November 30, 2014
was -6.63% (net of expenses) and -6.19% (gross of expenses). This performance compares to a benchmark return of -4.50% for the J.P. Morgan GBI-EM Global Diversified.
The Fund underperformed its benchmark as a result of both country and issue selection decisions. The largest source of underperformance came from overweights in Russia and Venezuela. We held an underweight in Russia until July when the ruble began to weaken as the conflict with Ukraine escalated. Local bond yields rose sharply. We gradually increased our position to an overweight in August based on our view that there would be no further meaningful increase in western financial sanctions, particularly for sovereign assets. During the reporting period, oil prices fell
Stone Harbor Investment Funds Semi-Annual Report | November 30, 2014 |
3 |
Table of Contents
| Stone Harbor Investment Funds | Shareholder Letter | |
|
November 30, 2014 (Unaudited) | |
over 45%, reducing Russia’s fiscal revenues. While the devaluation of the ruble neutralized the impact on both the fiscal accounts and balance of payments, it had a direct implication on portfolio performance. However, given the positive external adjustment taking place and the very high level of real yields, we maintained the Russia overweight through the end of the period. The other main detractor was our position in Venezuela, which suffered this year due to the decline in oil prices and because of a delay in an expected devaluation of the bolivar that has in turn caused concerns that Venezuela will lose international reserves. The market grew impatient waiting for devaluation and the bonds suffered accordingly. Notwithstanding the decline in oil prices, we maintained our view that Venezuela has the means and the strong desire to service its external debt stock and believe the government understands that the cost to default is higher than the cost to service the debt.
In addition, underweights in South Africa and Thailand, as well as the Fund’s overall duration underweight detracted from relative performance. The underweight position in South Africa reflected our view that the weak growth profile should lead to a steady deterioration of credit-worthiness. However, this position detracted from excess returns as South Africa outperformed due to an increase in economic activity after the cessation of platinum strikes in July and as the general decline in global interest rates supported this long duration fixed income market. We maintained duration underweight positions in several countries including Indonesia, Malaysia, Mexico, Nigeria, Philippines, Poland, Thailand, and Turkey; all of which detracted from performance.
Positions that enhanced returns during the period included an overweight in Argentina, Indonesia, and Turkey. In Indonesia, we have held an overweight position since the start of the year based on our view that Indonesia is rebalancing, growing and has a tailwind of support from a new government. We believe that this story is still intact with the recent election of Joko Widodo as the new President. President Widodo faces challenges in implementing reforms with an opposition parliament, but we believe fuel subsidy cuts remain an important policy change, and will support market sentiment toward the rupiah.
The divergence between the U.S. and European monetary policy continues to be a key theme at a global level as the ECB moves towards further easing at a time when the Fed is slowly moving towards the exit. We are concerned that with poor growth, the Euro will continue to weaken and central European markets might underperform further. This problem is compounded by the very low yields available in the region, with Poland, Hungary and Romania representing three of the four lowest-yielding countries in the index. Given the poor risk-reward of investment in the Eurozone in our view, we have reduced our central European position by reducing Poland and Romania to underweights. Hungary remains the largest underweight in the portfolio. The offsets to this exposure are our positions in Russia and Turkey where much higher yields are still available. Elsewhere, the adjustment has just begun and we maintain Colombia at neutral and have increased our underweight in Nigeria. We retain the off-index position in Venezuela as we expect market-positive reforms in 2015 and valuations remain compelling, in our view. For oil exporters, the benefits are less tangible, but Turkey should likely benefit from lower inflation and smaller current account deficit. We therefore increased the overweight to near 3% in November.
Stone Harbor Emerging Markets Corporate Debt Fund
The total return of the Stone Harbor Emerging Markets Corporate Debt Fund (the “Fund” or “portfolio”) for the twelve month period ended November 30, 2014 was 0.87% (net of expenses) and 1.37% (gross of expenses). This performance compares to a benchmark return of 1.28% for the J.P. Morgan Corporate Emerging Markets Bond Index Broad Diversified (CEMBI Broad Diversified). Corporate bond credit spreads over comparable maturity U.S. Treasury securities tightened by 25 basis points, ending the period at 318 basis points. Contributions to the index total return by corporate debt from each of the major EM were mixed for the period. Asia, Latin America and Middle East enhanced overall index returns, while Africa and Central Europe detracted. Returns varied considerably at the index country level, from approximately -25% for Ukraine’s sub index to positive 30% for Mongolia’s. Performance of the EM corporate sector weakened along with the downturn in oil prices during the period; commodity and oil producers continued to underperform. We believe that cross over high yield fund selling contributed to the decline.
The Fund outperformed its benchmark largely as a result of issue selection decisions in several countries including Indonesia, Brazil, and Russia, despite a broad based decline in the EM sector that seemed to suggest that markets were focused more on macroeconomic and technical factors, rather than company and country fundamentals. Corporate bonds in Indonesia were supported by election results that secured the presidency for the market favorite candidate Joko Widodo. Likewise, the key driver of Brazil corporate debt returns was the presidential election; however, the re-election of incumbent Dilma Rousseff, in our view, is a negative for Brazilian asset prices. Central and Eastern European corporates, particularly Russian corporates, were under pressure as oil prices declined precipitously throughout the latter half of the review period. Another significant contributor to returns was the underweight exposure to Ukraine corporate debt. The weakness in Ukraine corporate debt resulted from ongoing hostilities in Ukraine’s Donbass region as well as expectations of continuing decline in Ukraine’s economic activity. In addition, issue selection in food & beverage and metals/mining/steel industries enhanced performance.
Primary detractors from performance were overweight corporate positions in Venezuela, Indonesia, Brazil, and Ghana. Oil-related credits in Venezuela and Brazil, as well as an independent oil and gas producer from Ghana, suffered as oil price continued to decline during the latter half of
4 |
www.shiplp.com |
Table of Contents
| Stone Harbor Investment Funds | Shareholder Letter | |
|
November 30, 2014 (Unaudited) | |
the period. Issue selection in Mexico and Kazakhstan also detracted from performance. Issue selection within the Exploration & Production (E&P) industry and among property developers/real estate managers also detracted from relative returns during the period.
Despite recent return volatility, many sectors of the EM corporate debt market remained resilient. We took advantage of recent market movements to modestly realign the portfolio, favoring higher yielding non-investment grade positions that had lagged the broader market. The largest relative change came in the BBB sector. We reduced overall exposure to BBB rated corporate debt across a variety of countries and industries as a result of case by case review of relative value at the company level. At the industry level, we made the largest changes in banking where we reduced exposure. The credit specific valuation assessments have been the drivers of these decisions but also our heightened concern about the impact of currency weakness on these companies’ balance sheets. These sales have funded increases in exposure in the Building Products, E&P, Food and Beverage, and Media Cable industries. We continue to hold an overweight in Brazil corporates relative to benchmark but at a materially reduced level compared to the start of 2014. We also hold relative overweights in Argentina and Trinidad. Most recently, we’ve added to electricity credits in Chile, Israel and South Korea. By coincidence, all three countries are net oil importers and may benefit from the recent oil price decline.
Stone Harbor Emerging Markets Debt Allocation Fund
The Emerging Markets Debt Allocation Portfolio (the “Fund”) performance since inception through November 30, 2014 was -0.70% (net of expenses) and -0.60% (gross of expenses). This compares to a blended benchmark (50% J.P. Morgan EMBI Global Diversified / 50% J.P. Morgan GBI-EM Global Diversified) return of -0.35%. At the close of the reporting period, the Fund allocated approximately 44.9% to local currency debt, 51.8% to external sovereign debt, and 2.3% to hard currency corporate debt, with cash representing 0.9% of the Fund. The Fund’s asset allocation mix varied throughout the review period, driven by tactical asset allocation decisions based on portfolio management’s assessment of relative value opportunities and global market risks. Relative to the benchmark, local currency allocation decisions detracted 43 basis points from excess returns. The largest contributor to this result was an overweight in the Russian ruble, which depreciated by approximately 30% over the period. Hard currency corporate allocations reduced relative returns by 1 basis point. Hard currency sovereign allocations, and tactical asset allocation decisions, on the other hand, contributed 19 basis points and 15 basis points, respectively. Miscellaneous differences, a result of holding modestly lower U.S. Treasury duration than that of the blended benchmark, detracted 16 basis points from relative total returns.
Within the hard currency sovereign allocation, our overweights in Venezuela and Russia detracted most from performance. We have based our rationale for investing in Venezuela external sovereign U.S. dollar debt on fundamental credit assessments and what we believe are very attractive valuations in the current market environment. We view Venezuela’s near term payment obligations as manageable absent a more significant and sustained decline in oil prices. The key issue remains whether Venezuela’s government will continue to prioritize cash receipts from oil sales to pay debt. In our view, Venezuela will continue to do so to maintain joint venture partnerships and foreign investment in the energy sector and to protect oil shipments and foreign assets from attachment in foreign jurisdictions. At current spread and bond price levels, we believe Venezuela’s external sovereign debt is an attractive tactical opportunity. We fully recognize the volatility that is inherent in this exposure but believe current valuations combined with cash flow support from oil exports and the pragmatic reasons supporting the government’s ongoing willingness to fulfill its debt obligations support our overweight. The Fund’s positioning in Russia reflects our view that the country’s ability and willingness to repay debt obligations remains strong despite the recent declines in oil prices and depreciation of the ruble. In addition, while the U.S. and Europe may tighten existing measures against Russia, we believe the risk of a significant acceleration in western financial sanctions remains low as the situation in Ukraine appears to be stabilizing. In addition, as we see it, Russia’s high levels of international reserves and low levels of outstanding public debt supports Russia’s creditworthiness and our overweight. However, the significant fall in oil prices worked against us during the review period. Other detractors from excess returns included underweights in Pakistan, Philippines, and Sri Lanka, and allocations in hard currency corporate debt in Brazil and Colombia.
On the other hand, the biggest contributors within the hard currency allocation included an overweight and issue selection in Argentina, and issue selection in Venezuela and Russia. Positions in Argentina hard currency debt reflected our view that local law, US-dollar denominated debt was attractive. Other contributors included overweights in Dominican Republic, Ivory Coast, and Indonesia. An underweight in Poland and issue selection in Brazil and Kazakhstan also enhanced relative performance.
Within the local currency allocation, an overweight in the Russian ruble and an underweight in South African rand detracted from performance. While the devaluation of the ruble neutralized the impact on both the fiscal accounts and balance of payments, it had a direct implication on portfolio performance. However, given the positive external adjustment taking place and the very high level of real yields, we maintained the Russia overweight through the end of the period. Issue selection in Indonesia and Turkey also detracted from relative returns during the period. The Fund’s overweight in the Indonesian ringgit and the Turkish lira, as well as an underweight in the Nigerian naira enhanced performance. In Indonesia, we have held an overweight position since the start of the year based on our view that Indonesia is rebalancing, growing, and has a tailwind of support from potential policy reforms. We believe that this story is still intact with the recent election of Joko Widodo as the new
Stone Harbor Investment Funds Semi-Annual Report | November 30, 2014 |
5 |
Table of Contents
| Stone Harbor Investment Funds | Shareholder Letter | |
|
November 30, 2014 (Unaudited) | |
President. President Widodo faces challenges in implementing reforms with an opposition parliament, but we believe fuel subsidy cuts remain an important policy change, and will support market sentiment toward the rupiah.
We are interpreting the current market environment as an opportunity to maintain or increase our existing positions in credits that we believe will benefit from country specific developments over the next 12 months. Our key overweights in external sovereign debt are in Argentina, Dominican Republic, Indonesia, Russia and Venezuela. In each case, we believe significant spread compression is possible in the near term. To fund these purchases, we reduced our exposure in Poland and Hungary over the course of the last 6 months. We have also made adjustments within the local currency allocation. Given the poor risk-reward of investment in the Euro-area, in our view, we have reduced our central European position by reducing Poland and Romania to an underweight. Poland remains the largest underweight in the portfolio. The offsets to this exposure are our positions in Russia and Turkey where we believe much higher yields are still available. At the end of the review period, the Fund remained overweight hard currency sovereign debt. While our total return projections for each of the three sectors of emerging market debt favor local currency over the next 12 months, the key constraint for reducing our underweight in local debt remains evidence of more rapid growth. We believe that improving growth in the U.S. and weaker currencies in emerging market countries may eventually support developed country growth, but this effect seems more likely in the latter part of the coming year.
Stone Harbor High Yield Bond Fund
The Stone Harbor High Yield Bond Fund (the “Fund” or “portfolio”) return for the six months ended November 30, 2014 was -2.12% (net of expenses) and -1.85% (gross of expenses). This compares to a benchmark return of -0.84% for the Citigroup High Yield Market Capped Index. The high yield market was pressured by tight valuations entering the period, a significant decline in oil prices, the timing and magnitude of the Federal Reserve’s wind down of its asset purchase program, increasing geopolitical risks, and weak market technicals including record mutual fund outflows.
At the start of the review period, U.S. economic growth appeared to be accelerating with 2Q and 3Q 2014 reporting the strongest back-to-back growth since 2003. Europe, however, appeared to be weakening. Concern over the European economic outlook and deflation risk prompted the ECB to lower rates and institute an asset purchase program with indications of future more aggressive action. The decline in oil prices had a significant negative impact on the energy sector and the market as a whole, as the sector represented 18% of the index and 19% of total new issuance during the period. Underlying credit quality for the market in general remained healthy. High yield spreads, as represented by the Citigroup High Yield Market Capped Index, widened 97 basis points to end the period at 492 basis points, and the average yield rose 1.14% to end the period at 6.22%.
Top performing industries included Auto, Transportation-other, and Airlines due to the positive effects of lower oil prices. The bottom performers included Gaming, from increased competition and structural changes in the industry; Energy, driven by lower oil prices; and Metals/Mining, primarily from the impact on coal companies from lower prices and additional regulations. Interest rate-sensitive BB rated bonds outperformed both B and CCC securities (S&P ratings), according to the Citigroup High Yield Market Capped index due to increased market volatility and a decline in interest rates. Longer duration securities, which tend to be higher quality, significantly outperformed shorter duration bonds due to the decline in interest rates. Credit trends continued to be positive in the high yield market. The par-weighted default rate declined to 1.92% from 2.11% at the beginning of the period, well below the long term average of 3.81%; and recovery rates at 51% remain above the long term average of 41% according to J.P. Morgan. We believe default rates will continue to remain low over the intermediate term as healthy capital markets conditions enable companies to extend maturities and company fundamentals remain solid. However, if oil prices remain at current levels or decline further, we would expect to see an increase in defaults due to deteriorating fundamentals in the Energy sector. The market had more companies upgraded to investment grade (rising stars) than companies downgraded to high yield (fallen angels) and there were more companies with ratings upgrades than downgrades on both a volume and issuer basis. The new issue market remained robust with slightly less issuance than last year’s record setting volume. The majority of funds continue to be used for refinancing outstanding debt; however, the amount of funds used for acquisition purposes has significantly increased.
The portfolio underperformed its benchmark primarily as a result of issue selection decisions. Issue selection within the Energy, Textile, and Food sectors were the main detractors from performance. However, these were partially offset by issue selection in the Gaming industry. Industry selection also slightly detracted from performance due to an underweight in Finance and Services-other. This was almost completely offset by an underweight in the Energy and an overweight to the Cable & Media and Utilities sectors. An underweight to the BB sector detracted from performance but was offset by the underweight to CCC securities, which enhanced performance.
Leveraged markets continue to be supported by, in our view, positive underlying fundamentals with healthy earnings, a worldwide accommodative monetary policy, accelerating U.S. economic growth, and a stabilizing, although weak, European economy. Default rates remain low, although we expect an increase if oil prices remain or decline from current levels for an extended period of time. Overall company balance sheets are solid, in our view, with reasonable leverage, high cash balances, and fewer near term maturities. We remain overweight B rated securities relative to BB
6 |
www.shiplp.com |
Table of Contents
| Stone Harbor Investment Funds | Shareholder Letter | |
|
November 30, 2014 (Unaudited) | |
rated bonds, as we believe the quality sector should outperform on attractive valuations and lower interest rate sensitivities. Our current expectations are that the market should experience more positive events than negative events. The largest portfolio industry overweights currently include Telecommunications, due to its strong cash flow characteristics; Food/Beverage/Bottling sectors, due to its strong cash flow characteristics and brand value, and Cable & Media, as it is our view that the industry is consolidating and our holdings will benefit from M&A activity. The largest portfolio industry underweights include Services-Other, as it consists of a large number of asset-light companies; Finance-other, as we believe highly leveraged financial companies are at a competitive disadvantage to investment grade companies with their lower cost of capital; and Energy, with the decline in oil prices and the potential effect from reduced drilling activity .
Leveraged markets, particularly the U.S. market, have been negatively impacted by the decline in oil prices. We expect this volatility to continue until prices reach a level that is supported by supply/demand and the uncertainty of longer term fundamentals can be better evaluated by the market. While we currently expect market volatility to continue, we are constructive on the overall market fundamentals and valuations. In our view, market risks include the impact of lower energy prices on the Energy sector’s access to capital, increased geopolitical risk, a slowdown in global growth, and the impact of higher mortgage rates on housing.
Stone Harbor Investment Grade Fund
The total return of the Stone Harbor Investment Grade Fund (the “Fund” or “portfolio”) for the six months ended November 30, 2014 was 1.35% (net of expenses) and 1.60% (gross of expenses). This performance compares to a benchmark return of 1.92% for the Barclays Capital U.S. Aggregate Index. The Fund underperformed its benchmark as a result of certain asset allocation and individual credit decisions. The Fund’s underperformance was primarily driven by a decision to maintain a shorter duration relative to its benchmark. With government yields well below levels from the beginning at 2014, the bigger risk appeared to be for higher rates. A shorter duration position under those circumstances would have benefitted the Fund. There was also some underperformance caused by the Fund’s exposure to energy-related issuers, although most of it was offset by favorable performance in other corporate sectors as well as securitized assets.
The past six months have been dominated by two main themes, the growing risk of deflation in the Eurozone and the more recent sharp decline in the price of oil. Overall government bond yields have declined with U.S. Treasury 10-year yields declining to 2.2% from 2.45%, German 10-year yield to 0.7% from 1.36%, and UK 10-year Gilts declining to 1.93% from 2.57%. Despite the positive environment for government bonds, credit has performed poorly with U.S. investment grade corporate spreads widening 23 bps, translating into an underperformance relative to U.S. Treasuries of 1.25%. U.S. High Yield Spreads widened by 98 bps, an underperformance relative to U.S. Treasuries of 2.09%. Emerging market USD bond spreads widened some 43 bps translating into an underperformance relative to U.S. Treasuries of 1.83%. In USD terms, Emerging Market Local Currency debt fell 4.32% over the past six months, which compares to a positive return for the U.S. Treasury market of 1.54%.
At the beginning of the period under review, headline Consumer Price Index (CPI) inflation stood at 0.7% over the previous reported twelve months. Over the subsequent six months, this fell to 0.3% year-over-year (yoy). Over the same period, core inflation has fallen to 0.7% from 1.0%. With the recent declines in the oil price, it is likely that there will be further falls in inflation. Indeed, it is likely that all European countries will report negative yoy inflation in early 2015. While there has been some improvement in the growth profile of peripheral countries, the output gaps remain large and many of these countries are currently experiencing deflation. It is the growth profile of the major economies that continues to deteriorate. France has just avoided a technical recession; Germany has done so by little more than a statistical rounding error; and Italy is in recession. Faced with a continued underperformance of its inflation mandate, the European Central Bank (ECB) has responded by inching towards full scale quantitative easing. Over the last six months, they have announced the introduction of the Targeted Long Term Refinancing Operations (TLTRO’s) together with the resumption the Asset Backed Securities (ABS) and Covered Bond purchases. Perhaps most importantly, the stated intention of these has moved from one of improving the flow of credit to end borrowers to a large expansion of the ECB’s balance sheet. So far, the TLTRO’s and asset purchases have failed to expand the ECB’s balance sheet forcing it to consider further unconventional measures. The specter of ECB quantitative easing, together with an extension of the Bank of Japan’s (BoJ’s) program has been a major force behind the decline in global government bond yields.
At the end of May, West Texas Intermediate (WTI) oil traded at $100. It closed November at $66. Most markedly, the oil price decline has been exponential with larger percentage declines occurring as the price has declines. Data suggests that an excess supply of 2 million barrels per day exists. In addition, there have been very substantial position liquidations in the futures market. So far, despite clear stress in a number of oil producing markets, such as Russia and Venezuela, there has been no response from OPEC with production cuts ruled out. The various explanation of this range from market orientated considerations through to conspiratorial theories including: (i) Opec may not have cut production at this juncture for fear that a failure to succeed will damage their credibility, in other words it is better to intervene once the market has found a bottom; (ii) Saudi Arabia is targeting a reduction in shale gas production in the U.S. and understands that this will take time and is willing to live with low prices in the interim; or (iii) that Saudi is also concerned to put pressure on Russia as punishment for supporting Assad in Syria. Whatever the truth, and only time will tell, the fall in oil prices has put pressure on credit markets. Oil producers have led the decline in emerging market performance,
Stone Harbor Investment Funds Semi-Annual Report | November 30, 2014 |
7 |
Table of Contents
| Stone Harbor Investment Funds | Shareholder Letter | |
|
November 30, 2014 (Unaudited) | |
both local and hard currency, and oil companies have far and away accounted for the majority of the spread widening in the high yield market. Our positioning in both these asset classes has been negatively impacted by the decline in oil prices.
Looking ahead to the next twelve months, we are focusing on three key issues. The decline in oil prices should likely have a positive impact on growth prospects in developed markets and a number of the emerging economies, while at the same time lowering reported inflation. We expect that the ECB will focus on the risks of lower inflation expectations as a consequence of this. Conversely, the Fed, with growth already strong, will likely focus on the risk of rising wage pressure as a result of stronger employment. The ECB is likely to launch a program of quantitative easing in early 2015, whereas we believe the Fed will start the drumbeat of higher rates with a view to raising rates in mid 2015. Government bond yields are expected to rise. Corporate credit markets should ultimately perform well, in our view, benefitting from stronger growth and lower input prices, suggesting improved profit margins. Ultimately, stronger developed market growth should raise the demand for oil. At the same time, we think production cuts from U.S. shale fields are likely as we move through mid-year 2015. While near term clarity is limited, we expect that more balanced supply and demand metrics will help the oil price improve during the second half of 2015. Emerging market debt will likely benefit from this, in our view.
Stone Harbor Strategic Income Fund
The total return of the Strategic Income Fund (the “Fund” or “portfolio”) for the 6 month period ended November 30, 2014 was -0.01% (net of expenses) and 0.34% (gross of expenses). This performance compares to a benchmark return of 1.98% for the Barclays Global Credit Total Return Index (Hedged into USD). The Fund underperformed its benchmark as a result of certain asset allocation and individual credit decisions. The Fund’s investments in the high yield and emerging debt sectors were negative contributors to performance, as both markets underperformed the investment grade sector. The market weight of the Fund’s investments in high yield and emerging debt exceeded the weight of those sectors represented in the benchmark. This asset allocation effect accounted for less than half of the Fund’s total relative underperformance. In addition to the negative impact of asset allocation, the Fund’s investments in high yield and emerging debt also underperformed benchmarks for their respective sectors. These negative security selection effects accounted for much of the Fund’s underperformance beyond the asset allocation effects discussed earlier.
The past six months have been dominated by two main themes, the growing risk of deflation in the Eurozone and the more recent sharp decline in the price of oil. Overall government bond yields have declined with U.S. Treasury 10-year yields declining to 2.2% from 2.45%, German 10-year yield to 0.7% from 1.36%, and UK 10-year Gilts declining to 1.93% from 2.57%. Despite the positive environment for government bonds, credit has performed poorly with U.S. investment grade corporate spreads widening 23 bps, translating into an underperformance relative to U.S. Treasuries of 1.25%. U.S. High Yield Spreads widened by 98 bps, an underperformance relative to U.S. Treasuries of 2.09%. Emerging market USD bond spreads widened some 43 bps translating into an underperformance relative to U.S. Treasuries of 1.83%. In USD terms, Emerging Market Local Currency debt fell 4.32% over the past six months, which compares to a positive return for the U.S. Treasury market of 1.54%.
At the beginning of the period under review, headline CPI inflation stood at 0.7% over the previous reported twelve months. Over the subsequent six months, this fell to 0.3% year-over-year (yoy). Over the same period, core inflation has fallen to 0.7% from 1.0%. With the recent declines in the oil price, it is likely that there will be further falls in inflation. Indeed it is likely that all European countries will report negative yoy inflation in early 2015. While there has been some improvement in the growth profile of peripheral countries, the output gaps remain large and many of these countries are currently experiencing deflation. It is the growth profile of the major economies that continues to deteriorate. France has just avoided a technical recession; Germany has done so by little more than a statistical rounding error; and Italy is in recession. Faced with a continued underperformance of its inflation mandate, the European Central Bank (ECB) has responded by inching towards full scale quantitative easing. Over the last six months, they have announced the introduction of the Targeted Long Term Refinancing Operations (TLTRO’s) together with the resumption the ABS and Covered Bond purchases. Perhaps most importantly, the stated intention of these has moved from one of improving the flow of credit to end borrowers to a large expansion of the ECB’s balance sheet. So far, the TLTRO’s and asset purchases have failed to expand the ECB’s balance sheet forcing it to consider further unconventional measures. The specter of ECB quantitative easing, together with an extension of the Bank of Japan’s (BoJ’s) program has been a major force behind the decline in global government bond yields.
At the end of May, WTI oil traded at $100. It closed November at $66. Most markedly, the oil price decline has been exponential with larger percentage declines occurring as the price has declines. Data suggests that an excess supply of 2 million barrels per day exists. In addition, there have been very substantial position liquidations in the futures market. So far, despite clear stress in a number of oil producing markets, such as Russia and Venezuela, there has been no response from OPEC with production cuts ruled out. The various explanation of this range from market orientated considerations through to conspiratorial theories including: (i) Opec may not have cut production at this juncture for fear that a failure to succeed will damage their credibility, in other words it is better to intervene once the market has found a bottom; (ii) Saudi Arabia is targeting a reduction in shale gas production in the U.S. and understands that this will take time and is willing to live with low prices in the interim; or (iii) that Saudi is also concerned to put pressure on Russia as punishment for supporting Assad in Syria. Whatever the truth, and only time will tell, the fall in oil prices has put pressure on credit markets. Oil producers have led the decline in emerging market performance, both local and hard currency,
8 |
www.shiplp.com |
Table of Contents
| Stone Harbor Investment Funds | Shareholder Letter | |
|
November 30, 2014 (Unaudited) | |
and oil companies have far and away accounted for the majority of the spread widening in the high yield market. Our positioning in both these asset classes has been negatively impacted by the decline in oil prices.
Looking ahead to the next twelve months, we are focusing on three key issues. The decline in oil prices should likely have a positive impact on growth prospects in developed markets and a number of the emerging economies, while at the same time lowering reported inflation. We expect that the ECB will focus on the risks of lower inflation expectations as a consequence of this. Conversely, the Fed, with growth already strong, will likely focus on the risk of rising wage pressure as a result of stronger employment. The ECB is likely to launch a program of quantitative easing in early 2015, whereas we believe the Fed will start the drumbeat of higher rates with a view to raising rates in mid 2015. Government bond yields are expected to rise. Corporate credit markets should ultimately perform well, in our view, benefitting from stronger growth and lower input prices, suggesting improved profit margins. Ultimately, stronger developed market growth should raise the demand for oil. At the same time, we think production cuts from U.S. shale fields are likely as we move through mid-year 2015. While near term clarity is limited, we expect that more balanced supply and demand metrics will help the oil price improve during the second half of 2015. Emerging market debt will likely benefit from this, in our view.
Sincerely,

Thomas K. Flanagan
Chairman of the Board of Trustees
Stone Harbor Investment Funds Semi-Annual Report | November 30, 2014 |
9 |
Table of Contents
| Stone Harbor Investment Funds | Disclosure of Fund Expenses | |
|
November 30, 2014 (Unaudited) | |
Example. As a shareholder of a Fund, you incur two types of costs: (1) transaction costs, including sales charges (loads) on purchase payments and/or redemption fees (if applicable) and (2) ongoing costs, including management fees and other Fund expenses. The below examples are intended to help you understand your ongoing costs (in dollars) of investing in a Fund and to compare these costs with the ongoing costs of investing in other mutual funds. The examples are based on an investment of $1,000 invested on June 1, 2014 and held until November 30, 2014.
Actual Expenses. The first line of each table below provides information about actual account values and actual expenses. You may use the information in this line, together with the amount you invested, to estimate the expenses that you paid over the period. Simply divide your account value by $1,000 (for example, an $8,600 account value divided by $1,000 = 8.6), then multiply the result by the number in the first line under the heading “Expenses Paid During Period” to estimate the expenses you paid on your account during this period.
Hypothetical Example for Comparison Purposes. The second line of each table below provides information about hypothetical account values and hypothetical expenses based on the Fund’s actual expense ratio and an assumed rate of return of 5% per year before expenses, which is not the Fund’s actual return. The hypothetical account values and expenses may not be used to estimate the actual ending account balance or expenses you paid for the period. You may use this information to compare the ongoing costs of investing in a Fund and other mutual funds. To do so, compare this 5% hypothetical example with the 5% hypothetical examples that appear in the shareholder reports of the other funds.
Please note that the expenses shown in the table are meant to highlight your ongoing costs only and do not reflect transactional costs, such as redemption fees, sales charges (loads) or exchange fees. Therefore, the second line of the table is useful in comparing ongoing costs only, and will not help you determine the relative total costs of owning different funds. In addition, if these transactional costs were included, your costs would have been higher.
10 |
www.shiplp.com |
Table of Contents
| Stone Harbor Investment Funds | Disclosure of Fund Expenses | |
|
November 30, 2014 (Unaudited) | |
| Beginning Account Value June 1, 2014 | Ending Account Value November 30, 2014 | Expense Ratio(1) | Expenses Paid During Period(2) | |||||
STONE HARBOR EMERGING MARKETS DEBT FUND | ||||||||
Institutional Class | ||||||||
Actual | $ 1,000.00 | $ 984.50 | 0.69% | $ 3.43 | ||||
Hypothetical (5% return before expenses) | $ 1,000.00 | $ 1,021.61 | 0.69% | $ 3.50 | ||||
STONE HARBOR HIGH YIELD BOND FUND | ||||||||
Institutional Class | ||||||||
Actual | $ 1,000.00 | $ 978.80 | 0.57% | $ 2.83 | ||||
Hypothetical (5% return before expenses) | $ 1,000.00 | $ 1,022.21 | 0.57% | $ 2.89 | ||||
STONE HARBOR LOCAL MARKETS FUND | ||||||||
Institutional Class | ||||||||
Actual | $ 1,000.00 | $ 933.70 | 0.88% | $ 4.27 | ||||
Hypothetical (5% return before expenses) | $ 1,000.00 | $ 1,020.66 | 0.88% | $ 4.46 | ||||
STONE HARBOR EMERGING MARKETS CORPORATE DEBT FUND | ||||||||
Institutional Class | ||||||||
Actual | $ 1,000.00 | $ 1,008.70 | 1.00% | $ 5.04 | ||||
Hypothetical (5% return before expenses) | $ 1,000.00 | $ 1,020.05 | 1.00% | $ 5.06 | ||||
STONE HARBOR INVESTMENT GRADE FUND | ||||||||
Institutional Class | ||||||||
Actual | $ 1,000.00 | $ 1,013.50 | 0.50% | $ 2.52 | ||||
Hypothetical (5% return before expenses) | $ 1,000.00 | $ 1,022.56 | 0.50% | $ 2.54 | ||||
STONE HARBOR STRATEGIC INCOME FUND | ||||||||
Institutional Class | ||||||||
Actual | $ 1,000.00 | $ 999.90 | 0.11% | $ 0.55 | ||||
Hypothetical (5% return before expenses) | $ 1,000.00 | $ 1,024.52 | 0.11% | $ 0.56 | ||||
STONE HARBOR EMERGING MARKETS DEBT ALLOCATION FUND(3) | ||||||||
Institutional Class | ||||||||
Actual | $ 1,000.00 | $ 993.00 | 0.10% | $ 0.11 | ||||
Hypothetical (5% return before expenses) | $ 1,000.00 | $ 1,024.57 | 0.10% | $ 0.51 | ||||
| (1) | Annualized, based on the Fund’s most recent fiscal half-year expenses. |
| (2) | Expenses are equal to the Fund’s annualized ratio multiplied by the average account value over the period, multiplied by the number of days in the most recent fiscal half year (183), divided by 365. Note this expense example is typically based on a six-month period. |
| (3) | Stone Harbor Emerging Markets Debt Allocation Fund commenced operations on October 21, 2014. For purposes of calculating the “Actual” figures, actual number of days from commencement of operations through November 30, 2014 were used (41 days). |
Stone Harbor Investment Funds Semi-Annual Report | November 30, 2014 |
11 |
Table of Contents
| Stone Harbor Investment Funds | Summaries of Portfolio Holdings | |
|
November 30, 2014 (Unaudited) | |
Under SEC Rules, all funds are required to include in their annual and semi-annual shareholder reports a presentation of portfolio holdings in a table, chart or graph by reasonably identifiable categories. The following tables, which present holdings as a percent of total net assets (“TNA”), are provided in compliance with such requirements.
STONE HARBOR EMERGING MARKETS DEBT FUND
| Country Breakdown | % of TNA | |
| ||
Russia | 8.87% | |
Indonesia | 7.24% | |
Venezuela | 6.96% | |
Mexico | 6.23% | |
Turkey | 5.34% | |
Kazakhstan | 5.00% | |
Brazil | 4.83% | |
Argentina | 4.64% | |
Colombia | 4.23% | |
Dominican Republic | 3.78% | |
Chile | 3.33% | |
China | 2.67% | |
South Africa | 2.57% | |
Ukraine | 2.15% | |
Panama | 2.11% | |
Peru | 2.02% | |
Costa Rica | 1.92% | |
Romania | 1.83% | |
El Salvador | 1.74% | |
Philippines | 1.59% | |
Ivory Coast | 1.51% | |
Uruguay | 1.51% | |
Croatia | 1.44% | |
Azerbaijan | 1.38% | |
Hungary | 1.33% | |
Slovenia | 1.11% | |
Serbia | 1.10% | |
Paraguay | 0.99% | |
Jamaica | 0.93% | |
Honduras | 0.80% | |
Nigeria | 0.70% | |
Iraq | 0.69% | |
Morocco | 0.65% | |
Trinidad | 0.64% | |
Ghana | 0.62% | |
Ecuador | 0.47% | |
Gabon | 0.46% | |
Kenya | 0.36% | |
India | 0.35% | |
Lithuania | 0.31% | |
Mozambique | 0.29% | |
Sri Lanka | 0.24% | |
Thailand | 0.16% | |
Poland | 0.08% | |
Macau | 0.07% | |
United Arab Emirates | 0.04% | |
| ||
Total | 97.28% | |
| ||
Short Term Investments | 1.11% | |
| ||
Other Assets in Excess of Liabilities | 1.61% | |
| ||
Total Net Assets | 100.00% | |
| ||
STONE HARBOR HIGH YIELD BOND FUND
| Industry Breakdown | % of TNA | |
| ||
Exploration & Production | 9.84% | |
Media Cable | 7.85% | |
Healthcare | 6.38% | |
Electric | 5.84% | |
Food/Beverage/Tobacco | 5.46% | |
Wirelines | 5.06% | |
Metals/Mining/Steel | 4.91% | |
Technology | 4.85% | |
Media Other | 4.84% | |
Chemicals | 4.62% | |
Wireless | 4.53% | |
Drillers/Services | 3.58% | |
Paper/Forest Products | 2.84% | |
Industrial Other | 2.76% | |
Gaming | 2.51% | |
Building Products | 2.49% | |
Consumer Products | 2.25% | |
Containers/Packaging | 2.21% | |
Automotive | 1.97% | |
Lodging | 1.73% | |
Textile/Apparel | 1.69% | |
Retail Non Food/Drug | 1.28% | |
Aerospace/Defense | 1.06% | |
Retail Food/Drug | 0.83% | |
Leisure | 0.70% | |
Restaurants | 0.69% | |
Home Builders | 0.68% | |
Financial Other | 0.66% | |
Refining | 0.64% | |
Environmental Services | 0.59% | |
Services Other | 0.50% | |
Non Captive Finance | 0.49% | |
Pharmaceuticals | 0.42% | |
Gas Pipelines | 0.41% | |
Airlines | 0.22% | |
Publishing/Printing | 0.00%* | |
| ||
Total | 97.38% | |
| ||
Common/Preferred Stocks | 0.29% | |
| ||
Money Market Fund | 1.66% | |
| ||
Other Assets in Excess of Liabilities | 0.67% | |
| ||
Total Net Assets | 100.00% | |
| ||
| * | Amount represents less than 0.005% of net assets. |
12 |
www.shiplp.com |
Table of Contents
| Stone Harbor Investment Funds | Summaries of Portfolio Holdings | |
|
November 30, 2014 (Unaudited) | |
STONE HARBOR LOCAL MARKETS FUND
| Country Breakdown | % of TNA | |
| ||
Mexico | 12.75% | |
Indonesia | 11.22% | |
Brazil | 9.97% | |
Russia | 8.02% | |
Malaysia | 7.71% | |
Colombia | 6.52% | |
Poland | 4.92% | |
Turkey | 4.92% | |
South Africa | 4.89% | |
Thailand | 4.85% | |
Venezuela | 2.14% | |
Argentina | 1.96% | |
| ||
Total | 79.87% | |
| ||
Short Term Investments | 6.13% | |
| ||
Other Assets in Excess of Liabilities | 14.00% | |
| ||
Total Net Assets | 100.00% | |
| ||
STONE EMERGING MARKETS CORPORATE DEBT FUND
| Country Breakdown | % of TNA | |
| ||
Mexico | 10.82% | |
Brazil | 7.37% | |
United Arab Emirates | 5.94% | |
China | 5.49% | |
Colombia | 5.35% | |
India | 5.01% | |
Turkey | 4.96% | |
Hong Kong | 4.47% | |
Russia | 4.33% | |
Indonesia | 4.04% | |
Peru | 4.04% | |
Thailand | 3.62% | |
Israel | 3.40% | |
Qatar | 3.39% | |
South Korea | 3.33% | |
Chile | 2.95% | |
Singapore | 2.32% | |
Kazakhstan | 2.28% | |
Morocco | 1.97% | |
Argentina | 1.60% | |
Philippines | 1.58% | |
Macau | 1.55% | |
Jamaica | 1.41% | |
Ghana | 1.31% | |
Venezuela | 0.94% | |
Malaysia | 0.92% | |
Saudi Arabia | 0.89% | |
Guatemala | 0.88% | |
Luxembourg | 0.85% | |
South Africa | 0.83% | |
Trinidad | 0.78% | |
| ||
Total | 98.62% | |
| ||
Short Term Investments | 1.31% | |
| ||
Other Assets in Excess of Liabilities | 0.07% | |
| ||
Total Net Assets | 100.00% | |
| ||
Stone Harbor Investment Funds Semi-Annual Report | November 30, 2014 |
13 |
Table of Contents
| Stone Harbor Investment Funds | Summaries of Portfolio Holdings | |
|
November 30, 2014 (Unaudited) | |
STONE HARBOR INVESTMENT GRADE FUND
| Industry Breakdown | % of TNA | |
| ||
U.S. Government Agency Mortgage Backed | 26.71% | |
U.S. Treasury Bonds/Notes | 23.96% | |
Banking | 8.45% | |
Asset Backed/Commercial Mortgage Backed | 4.55% | |
Pipelines | 2.91% | |
Retail Non Food/Drug | 1.92% | |
Exploration & Production | 1.89% | |
Real Estate Investment Trust (REITs) | 1.83% | |
Media Non Cable | 1.40% | |
Life Insurance | 1.34% | |
Automotive | 1.11% | |
Healthcare | 1.07% | |
Retail Food/Drug | 1.06% | |
Food and Beverage | 0.81% | |
Electric | 0.57% | |
Health Insurance | 0.56% | |
Paper/Forest Products | 0.56% | |
Media Cable | 0.55% | |
Non Captive Finance | 0.54% | |
Pharmaceuticals | 0.54% | |
Wirelines | 0.54% | |
Brokerage | 0.53% | |
Property & Casualty Insurance | 0.53% | |
Metals/Mining/Steel | 0.52% | |
Technology | 0.51% | |
Aerospace/Defense | 0.26% | |
Oil Field Services | 0.26% | |
Wireless | 0.26% | |
| ||
Total | 85.74% | |
| ||
Money Market Fund | 15.82% | |
| ||
Liabilities in Excess of Other Assets | -1.56% | |
| ||
Total Net Assets | 100.00% | |
| ||
STONE HARBOR STRATEGIC INCOME FUND
| % of TNA | ||
| ||
Stone Harbor Emerging Markets Debt Fund | 29.90% | |
Stone Harbor High Yield Bond Fund | 39.97% | |
Stone Harbor Investment Grade Fund | 29.15% | |
| ||
Total | 99.02% | |
| ||
Money Market Fund | 0.12% | |
| ||
Other Assets in Excess of Liabilities | 0.86% | |
| ||
Total Net Assets | 100.00% | |
| ||
| STONE HARBOR EMERGING MARKETS DEBT ALLOCATION FUND | ||
| % of TNA | ||
| ||
Stone Harbor Emerging Markets Debt Fund | 55.05% | |
Stone Harbor Local Markets Fund | 44.96% | |
| ||
Total | 100.01% | |
| ||
Liabilities in Excess of Other Assets | -0.01% | |
| ||
Total Net Assets | 100.00% | |
| ||
14 |
www.shiplp.com |
Table of Contents
| Stone Harbor Investment Funds | Growth of $10,000 Investment | |
|
November 30, 2014 (Unaudited) | |
STONE HARBOR EMERGING MARKETS DEBT FUND
Comparison of Change in Value of $10,000 Investment in Stone Harbor Emerging Markets Debt Fund and the J.P. Morgan Emerging Markets Bond Index Global Diversified (J.P. Morgan EMBI Global Diversified). Please refer to page 98 for detailed benchmark descriptions.
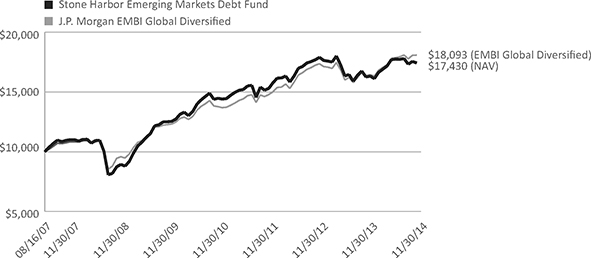
Average Annual Total Returns (Commencement of Operations, August 16, 2007)
| 6 Months | 1 Year | 3 Years | 5 Years | Since Inception | ||||||
Stone Harbor Emerging Markets Debt Fund | -1.55% | 7.18% | 4.76% | 6.88% | 7.92% | |||||
J.P. Morgan EMBI Global Diversified | 1.56% | 10.53% | 7.36% | 8.15% | 8.47% |
The performance data quoted represents past performance and does not guarantee future results. Current performance may be lower or higher than the performance quoted. Average annual total returns reflect the reinvestment of dividends and capital gains distributions and include all fee waivers and expense reimbursements. Without the fee waivers and expense reimbursements, total return figures would have been lower. The performance data quoted does not reflect the deduction of taxes that a shareholder would pay on Fund distributions or the redemption of Fund shares. Investment return and principal value will vary, and shares, when redeemed, may be worth more or less than their original cost. Index returns do not include the effects of sales charges, management fees or transaction costs. It is not possible to invest directly in an index.
Stone Harbor Investment Funds Semi-Annual Report | November 30, 2014 |
15 |
Table of Contents
| Stone Harbor Investment Funds | Growth of $10,000 Investment | |
|
November 30, 2014 (Unaudited) | |
STONE HARBOR HIGH YIELD BOND FUND
Comparison of Change in Value of $10,000 Investment in Stone Harbor High Yield Bond Fund and the Citigroup High Yield Market Capped Index. Please refer to page 98 for detailed benchmark descriptions.
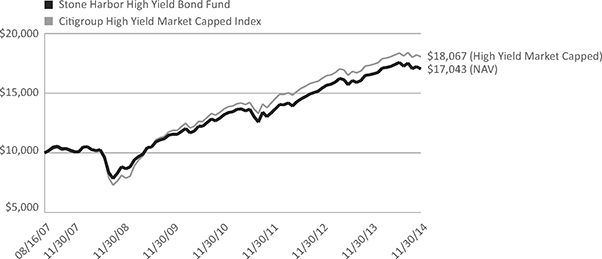
Average Annual Total Returns (Commencement of Operations, August 16, 2007)
| 6 Months | 1 Year | 3 Years | 5 Years | Since Inception | ||||||
Stone Harbor High Yield Bond Fund | -2.12% | 3.01% | 9.32% | 8.79% | 7.59% | |||||
Citigroup High Yield Market Capped Index | -0.84% | 4.21% | 9.41% | 9.67% | 8.50% |
The performance data quoted represents past performance and does not guarantee future results. Current performance may be lower or higher than the performance quoted. Average annual total returns reflect the reinvestment of dividends and capital gains distributions and include all fee waivers and expense reimbursements. Without the fee waivers and expense reimbursements, total return figures would have been lower. The performance data quoted does not reflect the deduction of taxes that a shareholder would pay on Fund distributions or the redemption of Fund shares. Investment return and principal value will vary, and shares, when redeemed, may be worth more or less than their original cost. Index returns do not include the effects of sales charges, management fees or transaction costs. It is not possible to invest directly in an index.
16 |
www.shiplp.com |
Table of Contents
| Stone Harbor Investment Funds | Growth of $10,000 Investment | |
|
November 30, 2014 (Unaudited) | |
STONE HARBOR LOCAL MARKETS FUND
Comparison of Change in Value of $10,000 Investment in Stone Harbor Local Markets Fund and the J.P. Morgan Global Bond Index – Emerging Markets Global Diversified (J.P. Morgan GBI-EM Global Diversified). Please refer to page 98 for detailed benchmark descriptions.
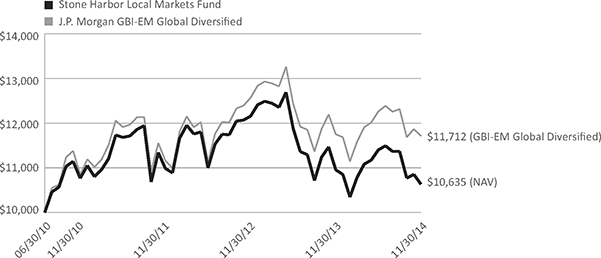
Average Annual Total Returns (Commencement of Operations, June 30, 2010)
| 6 Months | 1 Year | 3 Years | Since Inception | |||||
Stone Harbor Local Markets Fund | -6.63% | -2.93% | -1.07% | 1.40% | ||||
J.P. Morgan GBI-EM Global Diversified | -4.50% | -0.33% | 1.62% | 3.64% |
The performance data quoted represents past performance and does not guarantee future results. Current performance may be lower or higher than the performance quoted. Average annual total returns reflect the reinvestment of dividends and capital gains distributions and include all fee waivers and expense reimbursements. Without the fee waivers and expense reimbursements, total return figures would have been lower. The performance data quoted does not reflect the deduction of taxes that a shareholder would pay on Fund distributions or the redemption of Fund shares. Investment return and principal value will vary, and shares, when redeemed, may be worth more or less than their original cost. Index returns do not include the effects of sales charges, management fees or transaction costs. It is not possible to invest directly in an index.
Stone Harbor Investment Funds Semi-Annual Report | November 30, 2014 |
17 |
Table of Contents
| Stone Harbor Investment Funds | Growth of $10,000 Investment | |
|
November 30, 2014 (Unaudited) | |
STONE HARBOR EMERGING MARKETS CORPORATE DEBT FUND
Comparison of Change in Value of $10,000 Investment in Stone Harbor Emerging Market Corporate Debt Fund and the J.P. Morgan Corporate Emerging Market Bond Index – Broad Diversified (J.P. Morgan CEMBI Broad Diversified). Please refer to page 98 for detailed benchmark descriptions.
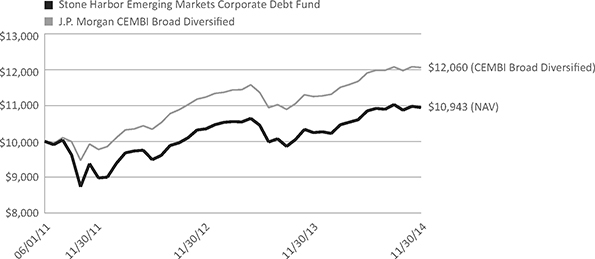
Average Annual Total Returns (Commencement of Operations, June 1, 2011)
| 6 Months | 1 Year | 3 Year | Since Inception | |||||
Stone Harbor Emerging Markets Corporate Debt Fund | 0.87% | 6.82% | 6.81% | 2.61% | ||||
J.P. Morgan CEMBI Broad Diversified | 1.28% | 7.20% | 7.25% | 5.50% |
The performance data quoted represents past performance and does not guarantee future results. Current performance may be lower or higher than the performance quoted. Average annual total returns reflect the reinvestment of dividends and capital gains distributions and include all fee waivers and expense reimbursements. Without the fee waivers and expense reimbursements, total return figures would have been lower. The performance data quoted does not reflect the deduction of taxes that a shareholder would pay on Fund distributions or the redemption of Fund shares. Investment return and principal value will vary, and shares, when redeemed, may be worth more or less than their original cost. Index returns do not include the effects of sales charges, management fees or transaction costs. It is not possible to invest directly in an index.
18 |
www.shiplp.com |
Table of Contents
| Stone Harbor Investment Funds | Growth of $10,000 Investment | |
|
November 30, 2014 (Unaudited) | |
STONE HARBOR INVESTMENT GRADE FUND
Comparison of Change in Value of $10,000 Investment in Stone Harbor Investment Grade Fund and the Barclays Capital U.S. Aggregate Index. Please refer to page 98 for detailed benchmark descriptions.
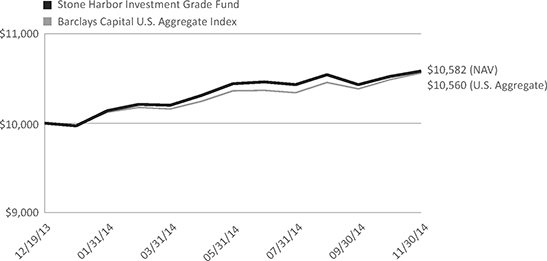
Cumulative Returns (Commencement of Operations, December 19, 2013)
| 3 Months | 6 Months | Since Inception | ||||
Stone Harbor Investment Grade Fund | 0.38% | 1.35% | 5.82% | |||
Barclays Capital U.S. Aggregate Index | 1.01% | 1.92% | 5.60% |
The performance data quoted represents past performance and does not guarantee future results. Current performance may be lower or higher than the performance quoted. Average annual total returns reflect the reinvestment of dividends and capital gains distributions and include all fee waivers and expense reimbursements. Without the fee waivers and expense reimbursements, total return figures would have been lower. The performance data quoted does not reflect the deduction of taxes that a shareholder would pay on Fund distributions or the redemption of Fund shares. Investment return and principal value will vary, and shares, when redeemed, may be worth more or less than their original cost. Index returns do not include the effects of sales charges, management fees or transaction costs. It is not possible to invest directly in an index.
Stone Harbor Investment Funds Semi-Annual Report | November 30, 2014 |
19 |
Table of Contents
| Stone Harbor Investment Funds | Growth of $10,000 Investment | |
|
November 30, 2014 (Unaudited) | |
STONE HARBOR STRATEGIC INCOME FUND
Comparison of Change in Value of $10,000 Investment in Stone Harbor Strategic Income Fund and the Barclays Global Credit Total Return Index (Hedged USD). Please refer to page 98 for detailed benchmark descriptions.
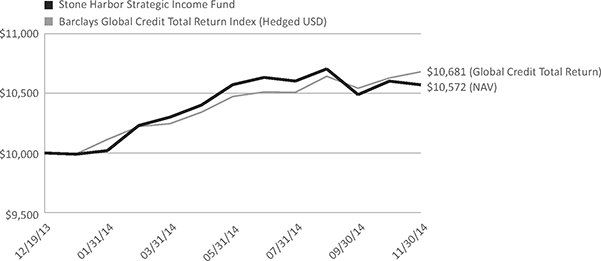
Cumulative Returns (Commencement of Operations, December 19, 2013)
| 3 Months | 6 Months | Since Inception | ||||||
Stone Harbor Strategic Income Fund | -1.24% | -0.01% | 5.72% | |||||
Barclays Global Credit Total Return Index (Hedged USD) | 0.36% | 1.98% | 6.81% | |||||
The performance data quoted represents past performance and does not guarantee future results. Current performance may be lower or higher than the performance quoted. Average annual total returns reflect the reinvestment of dividends and capital gains distributions and include all fee waivers and expense reimbursements. Without the fee waivers and expense reimbursements, total return figures would have been lower. The performance data quoted does not reflect the deduction of taxes that a shareholder would pay on Fund distributions or the redemption of Fund shares. Investment return and principal value will vary, and shares, when redeemed, may be worth more or less than their original cost. Index returns do not include the effects of sales charges, management fees or transaction costs. It is not possible to invest directly in an index.
20 |
www.shiplp.com |
Table of Contents
| Stone Harbor Investment Funds | Growth of $10,000 Investment | |
|
November 30, 2014 (Unaudited) | |
STONE HARBOR EMERGING MARKETS DEBT ALLOCATION FUND
Comparison of Change in Value of $10,000 Investment in Stone Harbor Emerging Markets Debt Allocation Fund and the Blend Index (50% J.P. Morgan EMBI Global Diversified Index and 50% J.P. Morgan GBI-EM Global Diversified Index). Please refer to page 98 for detailed benchmark descriptions.
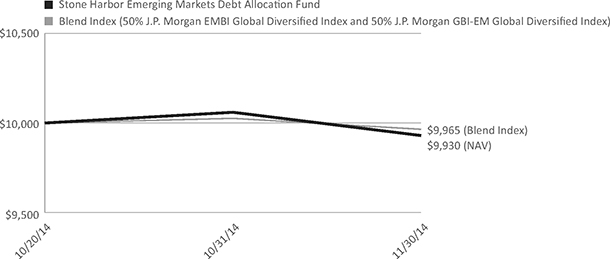
Cumulative Returns (Commencement of Operations, October 21, 2014)
| 1 Month | Since Inception | |||
Stone Harbor Emerging Markets Debt Allocation Fund | -1.29% | -0.70% | ||
Blend Index (50% J.P. Morgan EMBI Global Diversified Index and 50% J.P. Morgan GBI-EM Global Diversified Index) | -0.61% | -0.35% |
The performance data quoted represents past performance and does not guarantee future results. Current performance may be lower or higher than the performance quoted. Average annual total returns reflect the reinvestment of dividends and capital gains distributions and include all fee waivers and expense reimbursements. Without the fee waivers and expense reimbursements, total return figures would have been lower. The performance data quoted does not reflect the deduction of taxes that a shareholder would pay on Fund distributions or the redemption of Fund shares. Investment return and principal value will vary, and shares, when redeemed, may be worth more or less than their original cost. Index returns do not include the effects of sales charges, management fees or transaction costs. It is not possible to invest directly in an index.
Stone Harbor Investment Funds Semi-Annual Report | November 30, 2014 |
21 |
Table of Contents
| Stone Harbor Emerging Markets Debt Fund | Statements of Investments | |
|
November 30, 2014 (Unaudited) | |
Currency | Rate | Maturity Date | Principal Amount* | Market Value (Expressed in U.S. $) | ||||||||||||||
| SOVEREIGN DEBT OBLIGATIONS - 76.61% | ||||||||||||||||||
Argentina - 4.44% | ||||||||||||||||||
Republic of Argentina: | ||||||||||||||||||
| USD | 7.000 | % | 10/03/2015 | 36,244,708 | $ | 35,126,156 | ||||||||||||
| USD | 7.000 | % | 04/17/2017 | 54,459,205 | 50,421,659 | |||||||||||||
| EUR | 5.870 | % | 03/31/2023 | 1,540,000 | 1,150,442(1) | |||||||||||||
| USD | 0.000 | % | 03/31/2023 | 184,000 | 212,520(1) | |||||||||||||
| USD | 6.000 | % | 03/31/2023 | 7,841,000 | 9,056,355(1) | |||||||||||||
| EUR | 8.500 | % | 07/01/2049 | 700,000 | 918,293(1) | |||||||||||||
|
| |||||||||||||||||
| 96,885,425 | ||||||||||||||||||
|
| |||||||||||||||||
Azerbaijan - 0.75% | ||||||||||||||||||
Republic of Azerbaijan | USD | 4.750 | % | 03/18/2024 | 16,005,000 | 16,345,106(2) | ||||||||||||
|
| |||||||||||||||||
Brazil - 4.13% | ||||||||||||||||||
Brazil Loan Trust 1 | USD | 5.477 | % | 07/24/2023 | 19,576,715 | 20,335,313(2) | ||||||||||||
Brazil Minas SPE via State of Minas Gerais | USD | 5.333 | % | 02/15/2028 | 1,479,000 | 1,490,092(3) | ||||||||||||
Republic of Brazil: | ||||||||||||||||||
| USD | 2.625 | % | 01/05/2023 | 3,729,000 | 3,448,393 | |||||||||||||
| USD | 4.250 | % | 01/07/2025 | 17,402,000 | 17,828,349 | |||||||||||||
| USD | 8.750 | % | 02/04/2025 | 834,000 | 1,160,302 | |||||||||||||
| USD | 8.250 | % | 01/20/2034 | 12,755,000 | 17,841,056 | |||||||||||||
| USD | 7.125 | % | 01/20/2037 | 21,858,000 | 27,950,918 | |||||||||||||
|
| |||||||||||||||||
| 90,054,423 | ||||||||||||||||||
|
| |||||||||||||||||
Colombia - 3.79% | ||||||||||||||||||
Bogota Distrio Capital | COP | 9.750 | % | 07/26/2028 | 7,870,000,000 | 4,369,866(3) | ||||||||||||
Republic of Colombia: | ||||||||||||||||||
| COP | 12.000 | % | 10/22/2015 | 4,798,000,000 | 2,291,341 | |||||||||||||
| USD | 7.375 | % | 01/27/2017 | 1,838,000 | 2,070,507 | |||||||||||||
| USD | 7.375 | % | 03/18/2019 | 6,147,000 | 7,367,179 | |||||||||||||
| USD | 11.750 | % | 02/25/2020 | 4,338,000 | 6,208,762 | |||||||||||||
| COP | 7.750 | % | 04/14/2021 | 5,210,000,000 | 2,652,833 | |||||||||||||
| USD | 4.375 | % | 07/12/2021 | 12,912,000 | 13,851,348 | |||||||||||||
| USD | 2.625 | % | 03/15/2023 | 814,000 | 768,620 | |||||||||||||
| USD | 4.000 | % | 02/26/2024 | 8,519,000 | 8,812,906 | |||||||||||||
| USD | 8.125 | % | 05/21/2024 | 25,000 | 33,562 | |||||||||||||
| COP | 9.850 | % | 06/28/2027 | 8,281,000,000 | 4,908,424 | |||||||||||||
| USD | 10.375 | % | 01/28/2033 | 2,006,000 | 3,184,525 | |||||||||||||
| USD | 7.375 | % | 09/18/2037 | 13,959,000 | 18,984,240 | |||||||||||||
| USD | 6.125 | % | 01/18/2041 | 387,000 | 467,786 | |||||||||||||
| USD | 5.625 | % | 02/26/2044 | 5,930,000 | 6,752,788 | |||||||||||||
|
| |||||||||||||||||
| 82,724,687 | ||||||||||||||||||
|
| |||||||||||||||||
Costa Rica - 1.92% | ||||||||||||||||||
Republic of Costa Rica: | ||||||||||||||||||
| USD | 4.250 | % | 01/26/2023 | 19,119,000 | 18,151,101(3) | |||||||||||||
| USD | 4.375 | % | 04/30/2025 | 4,745,000 | 4,403,953(3) | |||||||||||||
| USD | 4.375 | % | 04/30/2025 | 5,728,000 | 5,316,300(2) | |||||||||||||
| USD | 7.000 | % | 04/04/2044 | 13,630,000 | 13,979,269(2) | |||||||||||||
|
| |||||||||||||||||
| 41,850,623 | ||||||||||||||||||
| �� |
|
| ||||||||||||||||
Croatia - 1.44% | ||||||||||||||||||
Croatian Government: | ||||||||||||||||||
| USD | 6.750 | % | 11/05/2019 | 3,746,000 | 4,186,155(3) | |||||||||||||
| USD | 5.500 | % | 04/04/2023 | 14,955,000 | 15,777,525(3) | |||||||||||||
22 |
www.shiplp.com |
Table of Contents
| Stone Harbor Emerging Markets Debt Fund | Statements of Investments | |
|
November 30, 2014 (Unaudited) | |
Currency | Rate | Maturity Date | Principal Amount* | Market Value (Expressed in U.S. $) | ||||||||||||||
Croatia (continued) | ||||||||||||||||||
Croatian Government: (continued) | ||||||||||||||||||
| USD | 6.000 | % | 01/26/2024 | 10,520,000 | $ | 11,453,650(2) | ||||||||||||
|
| |||||||||||||||||
| 31,417,330 | ||||||||||||||||||
|
| |||||||||||||||||
Dominican Republic - 3.78% | ||||||||||||||||||
Dominican Republic: | ||||||||||||||||||
| USD | 9.040 | % | 01/23/2018 | 11,110,546 | 12,082,719(3) | |||||||||||||
| USD | 7.500 | % | 05/06/2021 | 36,382,000 | 41,202,615(3) | |||||||||||||
| USD | 6.600 | % | 01/28/2024 | 12,823,000 | 14,105,300(3) | |||||||||||||
| USD | 5.875 | % | 04/18/2024 | 9,929,000 | 10,425,450(2) | |||||||||||||
| USD | 7.450 | % | 04/30/2044 | 4,091,000 | 4,622,830(2) | |||||||||||||
|
| |||||||||||||||||
| 82,438,914 | ||||||||||||||||||
|
| |||||||||||||||||
El Salvador - 1.74% | ||||||||||||||||||
Republic of El Salvador: | ||||||||||||||||||
| USD | 7.375 | % | 12/01/2019 | 220,000 | 245,437(2) | |||||||||||||
| USD | 7.375 | % | 12/01/2019 | 2,068,000 | 2,307,113(3) | |||||||||||||
| USD | 7.750 | % | 01/24/2023 | 4,320,000 | 4,927,500(3) | |||||||||||||
| USD | 5.875 | % | 01/30/2025 | 4,407,000 | 4,453,824(2) | |||||||||||||
| USD | 6.375 | % | 01/18/2027 | 6,844,000 | 7,100,650(2) | |||||||||||||
| USD | 8.250 | % | 04/10/2032 | 4,000,000 | 4,720,000(3) | |||||||||||||
| USD | 7.650 | % | 06/15/2035 | 12,924,000 | 14,305,253(3) | |||||||||||||
|
| |||||||||||||||||
| 38,059,777 | ||||||||||||||||||
|
| |||||||||||||||||
Gabon - 0.46% | ||||||||||||||||||
Republic of Gabon: | ||||||||||||||||||
| USD | 8.200 | % | 12/12/2017 | 50,000 | 55,750(2) | |||||||||||||
| USD | 6.375 | % | 12/12/2024 | 9,674,347 | 9,964,577(2) | |||||||||||||
|
| |||||||||||||||||
| 10,020,327 | ||||||||||||||||||
|
| |||||||||||||||||
Ghana - 0.52% | ||||||||||||||||||
Republic of Ghana: | ||||||||||||||||||
| USD | 8.500 | % | 10/04/2017 | 2,641,000 | 2,779,653(3) | |||||||||||||
| USD | 7.875 | % | 08/07/2023 | 6,267,000 | 6,235,665(2) | |||||||||||||
| USD | 8.125 | % | 01/18/2026 | 2,379,000 | 2,373,052(2) | |||||||||||||
|
| |||||||||||||||||
| 11,388,370 | ||||||||||||||||||
|
| |||||||||||||||||
Honduras - 0.80% | ||||||||||||||||||
Republic of Honduras | USD | 8.750 | % | 12/16/2020 | 15,358,000 | 17,508,120(3) | ||||||||||||
|
| |||||||||||||||||
Hungary - 1.33% | ||||||||||||||||||
Republic of Hungary: | ||||||||||||||||||
| GBP | 5.000 | % | 03/30/2016 | 670,000 | 1,085,992 | |||||||||||||
| USD | 6.375 | % | 03/29/2021 | 15,182,000 | 17,458,403 | |||||||||||||
| USD | 5.750 | % | 11/22/2023 | 9,410,000 | 10,445,269 | |||||||||||||
|
| |||||||||||||||||
| 28,989,664 | ||||||||||||||||||
|
| |||||||||||||||||
Indonesia - 7.05% | ||||||||||||||||||
Republic of Indonesia: | ||||||||||||||||||
| USD | 6.875 | % | 01/17/2018 | 9,123,000 | 10,363,728(3) | |||||||||||||
| USD | 11.625 | % | 03/04/2019 | 2,170,000 | 2,926,787(2) | |||||||||||||
| USD | 11.625 | % | 03/04/2019 | 18,110,000 | 24,425,863(3) | |||||||||||||
| IDR | 7.875 | % | 04/15/2019 | 59,940,000,000 | 4,967,987 | |||||||||||||
| USD | 5.875 | % | 03/13/2020 | 2,977,000 | 3,345,404(3) | |||||||||||||
| USD | 4.875 | % | 05/05/2021 | 8,484,000 | 9,120,300(3) | |||||||||||||
| USD | 3.750 | % | 04/25/2022 | 418,000 | 421,135(3) | |||||||||||||
Stone Harbor Investment Funds Semi-Annual Report | November 30, 2014 |
23 |
Table of Contents
| Stone Harbor Emerging Markets Debt Fund | Statements of Investments | |
|
November 30, 2014 (Unaudited) | |
Currency | Rate | Maturity Date | Principal Amount* | Market Value (Expressed in U.S. $) | ||||||||||||||
Indonesia (continued) | ||||||||||||||||||
Republic of Indonesia: (continued) | ||||||||||||||||||
| IDR | 7.000 | % | 05/15/2022 | 16,100,000,000 | $ | 1,266,470 | ||||||||||||
| USD | 3.375 | % | 04/15/2023 | 22,727,000 | 21,931,555(2) | |||||||||||||
| USD | 5.375 | % | 10/17/2023 | 10,731,000 | 11,884,582(3) | |||||||||||||
| IDR | 8.375 | % | 03/15/2024 | 70,009,000,000 | 6,014,785 | |||||||||||||
| IDR | 9.000 | % | 03/15/2029 | 46,100,000,000 | 4,121,198 | |||||||||||||
| USD | 8.500 | % | 10/12/2035 | 12,260,000 | 17,301,925(3) | |||||||||||||
| USD | 6.625 | % | 02/17/2037 | 10,764,000 | 12,836,070(3) | |||||||||||||
| USD | 7.750 | % | 01/17/2038 | 17,156,000 | 22,860,370(3) | |||||||||||||
|
| |||||||||||||||||
| 153,788,159 | ||||||||||||||||||
|
| |||||||||||||||||
Iraq - 0.34% | ||||||||||||||||||
Republic of Iraq | USD | 5.800 | % | 01/15/2028 | 8,331,000 | 7,310,453(3) | ||||||||||||
|
| |||||||||||||||||
Ivory Coast - 1.51% | ||||||||||||||||||
Ivory Coast Government: | ||||||||||||||||||
| USD | 5.375 | % | 07/23/2024 | 3,119,000 | 3,025,430(2) | |||||||||||||
| USD | 7.774 | % | 12/31/2032 | 30,799,000 | 29,952,027(3)(4) | |||||||||||||
|
| |||||||||||||||||
| 32,977,457 | ||||||||||||||||||
|
| |||||||||||||||||
Jamaica - 0.93% | ||||||||||||||||||
Jamaican Government: | ||||||||||||||||||
| USD | 10.625 | % | 06/20/2017 | 2,278,000 | 2,642,480 | |||||||||||||
| USD | 7.625 | % | 07/09/2025 | 16,497,000 | 17,734,275 | |||||||||||||
|
| |||||||||||||||||
| 20,376,755 | ||||||||||||||||||
|
| |||||||||||||||||
Kazakhstan - 0.38% | ||||||||||||||||||
Republic of Kazakhstan | USD | 3.875 | % | 10/14/2024 | 8,543,000 | 8,345,443(2) | ||||||||||||
|
| |||||||||||||||||
Kenya - 0.36% | ||||||||||||||||||
Republic of Kenya | USD | 6.875 | % | 06/24/2024 | 7,252,000 | 7,786,835(2) | ||||||||||||
|
| |||||||||||||||||
Lithuania - 0.31% | ||||||||||||||||||
Republic of Lithuania | USD | 6.625 | % | 02/01/2022 | 5,448,000 | 6,681,836(3) | ||||||||||||
|
| |||||||||||||||||
Mexico - 5.71% | ||||||||||||||||||
Mexican Bonos: | ||||||||||||||||||
| MXN | 9.500 | % | 12/18/2014 | 19,143,000 | 1,379,723 | |||||||||||||
| MXN | 6.250 | % | 06/16/2016 | 137,165,000 | 10,280,313 | |||||||||||||
| MXN | 8.000 | % | 12/07/2023 | 219,919,000 | 18,325,413 | |||||||||||||
United Mexican States: | ||||||||||||||||||
| USD | 5.950 | % | 03/19/2019 | 42,000 | 48,090 | |||||||||||||
| USD | 4.000 | % | 10/02/2023 | 30,844,000 | 32,578,975 | |||||||||||||
| USD | 6.050 | % | 01/11/2040 | 13,130,000 | 16,035,012 | |||||||||||||
| USD | 4.750 | % | 03/08/2044 | 19,308,000 | 19,983,780 | |||||||||||||
| USD | 5.550 | % | 01/21/2045 | 22,480,000 | 25,964,400 | |||||||||||||
|
| |||||||||||||||||
| 124,595,706 | ||||||||||||||||||
|
| |||||||||||||||||
Morocco - 0.48% | ||||||||||||||||||
Moroccan Government | USD | 4.250 | % | 12/11/2022 | 10,204,000 | 10,497,365(2) | ||||||||||||
|
| |||||||||||||||||
Mozambique - 0.29% | ||||||||||||||||||
Republic of Mozambique | USD | 6.305 | % | 09/11/2020 | 6,214,000 | 6,229,535(3) | ||||||||||||
|
| |||||||||||||||||
Nigeria - 0.70% | ||||||||||||||||||
Republic of Nigeria: | ||||||||||||||||||
| USD | 6.750 | % | 01/28/2021 | 11,638,000 | 12,438,113(3) | |||||||||||||
24 |
www.shiplp.com |
Table of Contents
| Stone Harbor Emerging Markets Debt Fund | Statements of Investments | |
|
November 30, 2014 (Unaudited) | |
Currency | Rate | Maturity Date | Principal Amount* | Market Value (Expressed in U.S. $) | ||||||||||||||
Nigeria (continued) | ||||||||||||||||||
Republic of Nigeria: (continued) | ||||||||||||||||||
| USD | 6.375 | % | 07/12/2023 | 2,636,000 | $ | 2,748,030(3) | ||||||||||||
|
| |||||||||||||||||
| 15,186,143 | ||||||||||||||||||
|
| |||||||||||||||||
Panama - 2.11% | ||||||||||||||||||
Republic of Panama: | ||||||||||||||||||
| USD | 5.200 | % | 01/30/2020 | 7,121,000 | 7,890,068 | |||||||||||||
| USD | 9.375 | % | 01/16/2023 | 450,000 | 621,562 | |||||||||||||
| USD | 8.875 | % | 09/30/2027 | 3,493,000 | 5,043,019 | |||||||||||||
| USD | 9.375 | % | 04/01/2029 | 19,723,000 | 29,707,769 | |||||||||||||
| USD | 8.125 | % | 04/28/2034 | 2,063,000 | 2,846,940 | |||||||||||||
| USD | 6.700 | % | 01/26/2036 | 12,000 | 15,270 | |||||||||||||
|
| |||||||||||||||||
| 46,124,628 | ||||||||||||||||||
|
| |||||||||||||||||
Paraguay - 0.99% | ||||||||||||||||||
Republic of Paraguay: | ||||||||||||||||||
| USD | 4.625 | % | 01/25/2023 | 4,242,000 | 4,358,655(3) | |||||||||||||
| USD | 4.625 | % | 01/25/2023 | 4,578,000 | 4,703,895(2) | |||||||||||||
| USD | 6.100 | % | 08/11/2044 | 11,733,000 | 12,554,310(2) | |||||||||||||
|
| |||||||||||||||||
| 21,616,860 | ||||||||||||||||||
|
| |||||||||||||||||
Peru - 1.96% | ||||||||||||||||||
Republic of Peru: | ||||||||||||||||||
| USD | 7.350 | % | 07/21/2025 | 12,342,000 | 16,491,997 | |||||||||||||
| USD | 8.750 | % | 11/21/2033 | 10,945,000 | 17,128,925 | |||||||||||||
| USD | 6.550 | % | 03/14/2037 | 1,970,000 | 2,561,000 | |||||||||||||
| USD | 5.625 | % | 11/18/2050 | 5,578,000 | 6,554,150 | |||||||||||||
|
| |||||||||||||||||
| 42,736,072 | ||||||||||||||||||
|
| |||||||||||||||||
Philippines - 1.59% | ||||||||||||||||||
Republic of Philippines: | ||||||||||||||||||
| USD | 9.500 | % | 02/02/2030 | 9,716,000 | 15,667,050 | |||||||||||||
| USD | 7.750 | % | 01/14/2031 | 12,895,000 | 18,488,206 | |||||||||||||
| USD | 6.375 | % | 01/15/2032 | 366,000 | 473,284 | |||||||||||||
|
| |||||||||||||||||
| 34,628,540 | ||||||||||||||||||
|
| |||||||||||||||||
Poland - 0.08% | ||||||||||||||||||
Republic of Poland: | ||||||||||||||||||
| USD | 5.000 | % | 03/23/2022 | 1,000 | 1,131 | |||||||||||||
| USD | 4.000 | % | 01/22/2024 | 1,738,000 | 1,842,314 | |||||||||||||
|
| |||||||||||||||||
| 1,843,445 | ||||||||||||||||||
|
| |||||||||||||||||
Romania - 1.83% | ||||||||||||||||||
Romanian Government International Bond: | ||||||||||||||||||
| USD | 6.750 | % | 02/07/2022 | 13,020,000 | 15,689,100(3) | |||||||||||||
| USD | 4.375 | % | 08/22/2023 | 8,126,000 | 8,572,727(3) | |||||||||||||
| USD | 4.875 | % | 01/22/2024 | 14,268,000 | 15,578,872(2) | |||||||||||||
|
| |||||||||||||||||
| 39,840,699 | ||||||||||||||||||
|
| |||||||||||||||||
Russia - 8.35% | ||||||||||||||||||
Russian Federation: | ||||||||||||||||||
| RUB | 7.500 | % | 02/27/2019 | 123,470,000 | 2,228,485 | |||||||||||||
| RUB | 6.700 | % | 05/15/2019 | 153,120,000 | 2,668,839 | |||||||||||||
| RUB | 6.800 | % | 12/11/2019 | 107,180,000 | 1,845,530 | |||||||||||||
| RUB | 6.400 | % | 05/27/2020 | 74,080,000 | 1,236,742 | |||||||||||||
| RUB | 7.600 | % | 04/14/2021 | 61,760,000 | 1,080,800 | |||||||||||||
Stone Harbor Investment Funds Semi-Annual Report | November 30, 2014 |
25 |
Table of Contents
| Stone Harbor Emerging Markets Debt Fund | Statements of Investments | |
|
November 30, 2014 (Unaudited) | |
Currency | Rate | Maturity Date | Principal Amount* | Market Value (Expressed in U.S. $) | ||||||||||||||
Russia (continued) | ||||||||||||||||||
Russian Federation: (continued) | ||||||||||||||||||
| RUB | 7.000 | % | 08/16/2023 | 882,200,000 | $ | 14,375,608 | ||||||||||||
| USD | 12.750 | % | 06/24/2028 | 8,749,000 | 13,801,547(3) | |||||||||||||
| USD | 7.500 | % | 03/31/2030 | 131,995,321 | 144,963,861(3)(4) | |||||||||||||
|
| |||||||||||||||||
| 182,201,412 | ||||||||||||||||||
|
| |||||||||||||||||
Serbia - 1.10% | ||||||||||||||||||
Republic of Serbia: | ||||||||||||||||||
| USD | 5.875 | % | 12/03/2018 | 1,505,000 | 1,599,138(3) | |||||||||||||
| USD | 7.250 | % | 09/28/2021 | 19,554,000 | 22,438,215(3) | |||||||||||||
|
| |||||||||||||||||
| 24,037,353 | ||||||||||||||||||
|
| |||||||||||||||||
Slovenia - 1.11% | ||||||||||||||||||
Republic of Slovenia: | ||||||||||||||||||
| USD | 5.850 | % | 05/10/2023 | 9,796,000 | 11,191,129(3) | |||||||||||||
| USD | 5.250 | % | 02/18/2024 | 11,879,000 | 13,035,766(2) | |||||||||||||
|
| |||||||||||||||||
| 24,226,895 | ||||||||||||||||||
|
| |||||||||||||||||
South Africa - 2.21% | ||||||||||||||||||
Republic of South Africa: | ||||||||||||||||||
| USD | 5.500 | % | 03/09/2020 | 1,914,000 | 2,114,970 | |||||||||||||
| USD | 5.875 | % | 05/30/2022 | 5,256,000 | 5,985,270 | |||||||||||||
| USD | 4.665 | % | 01/17/2024 | 5,250,000 | 5,532,188 | |||||||||||||
| USD | 5.875 | % | 09/16/2025 | 30,244,000 | 34,667,185 | |||||||||||||
|
| |||||||||||||||||
| 48,299,613 | ||||||||||||||||||
|
| |||||||||||||||||
Sri Lanka - 0.24% | ||||||||||||||||||
Republic of Sri Lanka: | ||||||||||||||||||
| USD | 5.125 | % | 04/11/2019 | 1,379,000 | 1,427,265(2) | |||||||||||||
| USD | 6.250 | % | 07/27/2021 | 3,600,000 | 3,865,500(3) | |||||||||||||
|
| |||||||||||||||||
| 5,292,765 | ||||||||||||||||||
|
| |||||||||||||||||
Trinidad - 0.45% | ||||||||||||||||||
Republic of Trinidad & Tobago | USD | 4.375 | % | 01/16/2024 | 8,957,000 | 9,763,130(2) | ||||||||||||
|
| |||||||||||||||||
Turkey - 5.34% | ||||||||||||||||||
Republic of Turkey: | ||||||||||||||||||
| USD | 7.250 | % | 03/15/2015 | 30,000 | 30,525 | |||||||||||||
| USD | 7.000 | % | 09/26/2016 | 2,884,000 | 3,157,980 | |||||||||||||
| USD | 7.500 | % | 07/14/2017 | 7,869,000 | 8,882,134 | |||||||||||||
| USD | 6.750 | % | 04/03/2018 | 4,450,000 | 5,022,937 | |||||||||||||
| USD | 7.000 | % | 03/11/2019 | 3,305,000 | 3,829,669 | |||||||||||||
| USD | 7.500 | % | 11/07/2019 | 5,407,000 | 6,454,606 | |||||||||||||
| USD | 7.000 | % | 06/05/2020 | 4,293,000 | 5,071,106 | |||||||||||||
| USD | 5.125 | % | 03/25/2022 | 12,582,000 | 13,667,198 | |||||||||||||
| USD | 6.250 | % | 09/26/2022 | 14,127,000 | 16,387,320 | |||||||||||||
| USD | 3.250 | % | 03/23/2023 | 8,817,000 | 8,442,278 | |||||||||||||
| USD | 5.750 | % | 03/22/2024 | 1,485,000 | 1,678,050 | |||||||||||||
| TRY | 9.000 | % | 07/24/2024 | 22,330,000 | 10,997,128 | |||||||||||||
| USD | 7.375 | % | 02/05/2025 | 22,769,000 | 28,688,940 | |||||||||||||
| USD | 6.875 | % | 03/17/2036 | 958,000 | 1,208,277 | |||||||||||||
| USD | 6.000 | % | 01/14/2041 | 1,120,000 | 1,290,800 | |||||||||||||
| USD | 6.625 | % | 02/17/2045 | 1,383,000 | 1,727,021 | |||||||||||||
|
| |||||||||||||||||
| 116,535,969 | ||||||||||||||||||
|
| |||||||||||||||||
26 |
www.shiplp.com |
Table of Contents
| Stone Harbor Emerging Markets Debt Fund | Statements of Investments | |
|
November 30, 2014 (Unaudited) | |
Currency | Rate | Maturity Date | Principal Amount* | Market Value (Expressed in U.S. $) | ||||||||||||||
Ukraine - 2.15% | ||||||||||||||||||
Financing of Infrastrucural Projects State Enterprise | USD | 9.000 | % | 12/07/2017 | 11,276,000 | $ | 8,406,266(3) | |||||||||||
Ukraine Government: | ||||||||||||||||||
| USD | 6.875 | % | 09/23/2015 | 208,000 | 175,760(3) | |||||||||||||
| USD | 6.875 | % | 09/23/2015 | 1,854,000 | 1,566,630(2) | |||||||||||||
| EUR | 4.950 | % | 10/13/2015 | 6,532,000 | 6,822,696(3) | |||||||||||||
| USD | 6.250 | % | 06/17/2016 | 18,945,000 | 14,966,550(3) | |||||||||||||
| USD | 6.580 | % | 11/21/2016 | 14,196,000 | 11,001,900(3)�� | |||||||||||||
| USD | 9.250 | % | 07/24/2017 | 196,000 | 155,330(3) | |||||||||||||
| USD | 6.750 | % | 11/14/2017 | 4,950,000 | 3,836,250(3) | |||||||||||||
|
| |||||||||||||||||
| 46,931,382 | ||||||||||||||||||
|
| |||||||||||||||||
Uruguay - 1.51% | ||||||||||||||||||
Republic of Uruguay: | ||||||||||||||||||
| USD | 4.500 | % | 08/14/2024 | 10,276,613 | 10,918,901 | |||||||||||||
| USD | 5.100 | % | 06/18/2050 | 21,820,991 | 21,984,649 | |||||||||||||
|
| |||||||||||||||||
| 32,903,550 | ||||||||||||||||||
|
| |||||||||||||||||
Venezuela - 2.43% | ||||||||||||||||||
Republic of Venezuela: | ||||||||||||||||||
| USD | 5.750 | % | 02/26/2016 | 20,121,000 | 16,147,102(3) | |||||||||||||
| USD | 13.625 | % | 08/15/2018 | 1,704,000 | 1,290,695(3) | |||||||||||||
| USD | 7.750 | % | 10/13/2019 | 27,209,900 | 15,237,544(3) | |||||||||||||
| USD | 9.000 | % | 05/07/2023 | 5,074,900 | 2,765,821(3) | |||||||||||||
| USD | 8.250 | % | 10/13/2024 | 4,713,500 | 2,451,020(3) | |||||||||||||
| USD | 11.750 | % | 10/21/2026 | 123,000 | 76,260(3) | |||||||||||||
| USD | 9.250 | % | 05/07/2028 | 1,353,000 | 723,855(3) | |||||||||||||
| USD | 11.950 | % | 08/05/2031 | 23,644,000 | 14,422,840(3) | |||||||||||||
|
| |||||||||||||||||
| 53,115,137 | ||||||||||||||||||
|
| |||||||||||||||||
| TOTAL SOVEREIGN DEBT OBLIGATIONS | 1,671,555,903 | |||||||||||||||||
|
| |||||||||||||||||
(Cost $1,662,139,484) | ||||||||||||||||||
| BANK LOANS - 0.01%(5) | ||||||||||||||||||
Indonesia - 0.01% | ||||||||||||||||||
PT Bakrie & Brothers TBK | USD | 6.151 | % | 11/25/2014 | 624,912 | 187,474(1) | ||||||||||||
|
| |||||||||||||||||
| TOTAL BANK LOANS | 187,474 | |||||||||||||||||
|
| |||||||||||||||||
(Cost $249,965) | ||||||||||||||||||
| CORPORATE BONDS - 19.44% | ||||||||||||||||||
Argentina - 0.20% | ||||||||||||||||||
YPF SA | USD | 8.750 | % | 04/04/2024 | 4,224,000 | 4,414,080(2) | ||||||||||||
|
| |||||||||||||||||
Azerbaijan - 0.63% | ||||||||||||||||||
State Oil Company: | ||||||||||||||||||
| USD | 5.450 | % | 02/09/2017 | 6,323,000 | 6,591,727 | |||||||||||||
| USD | 4.750 | % | 03/13/2023 | 7,270,000 | 7,088,250 | |||||||||||||
|
| |||||||||||||||||
| 13,679,977 | ||||||||||||||||||
|
| |||||||||||||||||
Brazil - 0.70% | ||||||||||||||||||
CIMPOR Financial Operations BV | USD | 5.750 | % | 07/17/2024 | 5,812,000 | 5,448,750(2) | ||||||||||||
Cosan Luxembourg SA | USD | 5.000 | % | 03/14/2023 | 4,870,000 | 4,559,830(2) | ||||||||||||
ESAL GmbH | USD | 6.250 | % | 02/05/2023 | 5,126,000 | 5,222,112(2) | ||||||||||||
|
| |||||||||||||||||
| 15,230,692 | ||||||||||||||||||
|
| |||||||||||||||||
Stone Harbor Investment Funds Semi-Annual Report | November 30, 2014 |
27 |
Table of Contents
| Stone Harbor Emerging Markets Debt Fund | Statements of Investments | |
|
November 30, 2014 (Unaudited) | |
Currency | Rate | Maturity Date | Principal Amount* | Market Value (Expressed in U.S. $) | ||||||||||||||
Chile - 3.33% | ||||||||||||||||||
Banco del Estado de Chile | USD | 3.875 | % | 02/08/2022 | 3,277,000 | $ | 3,334,347(2) | |||||||||||
Codelco, Inc.: | ||||||||||||||||||
| USD | 7.500 | % | 01/15/2019 | 3,216,000 | 3,876,888(3) | |||||||||||||
| USD | 3.875 | % | 11/03/2021 | 6,970,000 | 7,234,128(3) | |||||||||||||
| USD | 3.000 | % | 07/17/2022 | 22,668,000 | 22,080,332(2) | |||||||||||||
| USD | 4.500 | % | 08/13/2023 | 8,054,000 | 8,645,164(2) | |||||||||||||
| USD | 6.150 | % | 10/24/2036 | 12,512,000 | 14,959,472(3) | |||||||||||||
| USD | 4.250 | % | 07/17/2042 | 7,321,000 | 6,769,253(2) | |||||||||||||
Corp. Nacional del Cobre de Chile | USD | 4.875 | % | 11/04/2044 | 283,000 | 287,783(2) | ||||||||||||
ENTEL Chile SA | USD | 4.875 | % | 10/30/2024 | 500,000 | 510,000(2) | ||||||||||||
VTR Finance BV | USD | 6.875 | % | 01/15/2024 | 4,763,000 | 4,972,810(2) | ||||||||||||
|
| |||||||||||||||||
| 72,670,177 | ||||||||||||||||||
|
| |||||||||||||||||
China - 2.67% | ||||||||||||||||||
CITIC Ltd.: | ||||||||||||||||||
| USD | 7.875 | % | Perpetual | 1,800,000 | 1,899,000(6) | |||||||||||||
| USD | 8.625 | % | Perpetual | 350,000 | 402,500(3)(6) | |||||||||||||
Country Garden Holdings Co. Ltd. | USD | 11.125 | % | 02/23/2018 | 1,793,000 | 1,914,924(3) | ||||||||||||
Kaisa Group Holdings Ltd. | USD | 8.875 | % | 03/19/2018 | 1,904,000 | 1,937,320(2) | ||||||||||||
Sinochem Offshore Capital Co. Ltd. | USD | 3.250 | % | 04/29/2019 | 10,303,000 | 10,536,665(2) | ||||||||||||
Sinochem Overseas Capital Co. Ltd.: | ||||||||||||||||||
| USD | 4.500 | % | 11/12/2020 | 5,534,000 | 5,943,635(3) | |||||||||||||
| USD | 4.500 | % | 11/12/2020 | 19,392,000 | 20,827,428(2) | |||||||||||||
| USD | 6.300 | % | 11/12/2040 | 4,353,000 | 5,528,702(3) | |||||||||||||
Sinopec Capital 2013 Ltd. | USD | 3.125 | % | 04/24/2023 | 4,584,000 | 4,443,078(2) | ||||||||||||
Sinopec Group Overseas Development 2012 Ltd. | USD | 3.900 | % | 05/17/2022 | 1,071,000 | 1,102,321(3) | ||||||||||||
Sinopec Group Overseas Development 2014 Ltd. | USD | 4.375 | % | 04/10/2024 | 3,460,000 | 3,676,413(2) | ||||||||||||
|
| |||||||||||||||||
| 58,211,986 | ||||||||||||||||||
|
| |||||||||||||||||
Colombia - 0.35% | ||||||||||||||||||
Ecopetrol SA | USD | 5.875 | % | 05/28/2045 | 4,334,000 | 4,323,165 | ||||||||||||
Pacific Rubiales Energy Corp. | USD | 5.125 | % | 03/28/2023 | 2,886,000 | 2,698,410(2) | ||||||||||||
SUAM Finance BV | USD | 4.875 | % | 04/17/2024 | 548,000 | 560,330(2) | ||||||||||||
|
| |||||||||||||||||
| 7,581,905 | ||||||||||||||||||
|
| |||||||||||||||||
Ecuador - 0.47% | ||||||||||||||||||
EP PetroEcuador via Noble Sovereign Funding I Ltd. | USD | 5.866 | % | 09/24/2019 | 10,468,000 | 10,297,895(3) | ||||||||||||
|
| |||||||||||||||||
Ghana - 0.10% | ||||||||||||||||||
Tullow Oil PLC | USD | 6.000 | % | 11/01/2020 | 2,411,000 | 2,073,460(2) | ||||||||||||
|
| |||||||||||||||||
India - 0.35% | ||||||||||||||||||
ABJA Investment Co. Pte Ltd.: | ||||||||||||||||||
| USD | 4.850 | % | 01/31/2020 | 1,000,000 | 1,025,200 | |||||||||||||
| USD | 5.950 | % | 07/31/2024 | 2,496,000 | 2,527,150 | |||||||||||||
Vedanta Resources PLC: | ||||||||||||||||||
| USD | 6.750 | % | 06/07/2016 | 650,000 | 673,563(3) | |||||||||||||
| USD | 6.000 | % | 01/31/2019 | 2,346,000 | 2,269,755(2) | |||||||||||||
| USD | 8.250 | % | 06/07/2021 | 1,052,000 | 1,062,520(2) | |||||||||||||
|
| |||||||||||||||||
| 7,558,188 | ||||||||||||||||||
|
| |||||||||||||||||
Indonesia - 0.18% | ||||||||||||||||||
Listrindo Capital BV | USD | 6.950 | % | 02/21/2019 | 1,319,000 | 1,408,428(2) | ||||||||||||
Pertamina Persero PT | USD | 6.000 | % | 05/03/2042 | 2,529,000 | 2,580,339(3) | ||||||||||||
|
| |||||||||||||||||
| 3,988,767 | ||||||||||||||||||
|
| |||||||||||||||||
28 |
www.shiplp.com |
Table of Contents
| Stone Harbor Emerging Markets Debt Fund | Statements of Investments | |
|
November 30, 2014 (Unaudited) | |
Currency | Rate | Maturity Date | Principal Amount* | Market Value (Expressed in U.S. $) | ||||||||||||||
Kazakhstan - 4.62% | ||||||||||||||||||
KazMunayGas National Co. JSC: | ||||||||||||||||||
| USD | 11.750 | % | 01/23/2015 | 13,611,000 | $ | 13,857,699(3) | ||||||||||||
| USD | 9.125 | % | 07/02/2018 | 1,449,000 | 1,688,085(3) | |||||||||||||
| USD | 9.125 | % | 07/02/2018 | 10,692,000 | 12,456,180(2) | |||||||||||||
| USD | 7.000 | % | 05/05/2020 | 739,000 | 823,061(2) | |||||||||||||
| USD | 7.000 | % | 05/05/2020 | 10,197,000 | 11,356,909(3) | |||||||||||||
| USD | 6.375 | % | 04/09/2021 | 3,945,000 | 4,280,325(2) | |||||||||||||
| USD | 6.375 | % | 04/09/2021 | 18,920,000 | 20,528,200(3) | |||||||||||||
| USD | 4.400 | % | 04/30/2023 | 2,738,000 | 2,645,592(3) | |||||||||||||
| USD | 4.400 | % | 04/30/2023 | 6,792,000 | 6,562,770(2) | |||||||||||||
| USD | 4.875 | % | 05/07/2025 | 3,138,000 | 3,087,008(2) | |||||||||||||
| USD | 5.750 | % | 04/30/2043 | 6,861,000 | 6,442,753(3) | |||||||||||||
| USD | 5.750 | % | 04/30/2043 | 15,265,000 | 14,334,446(2) | |||||||||||||
Zhaikmunai LP | USD | 7.125 | % | 11/13/2019 | 2,948,000 | 2,822,710(2) | ||||||||||||
|
| |||||||||||||||||
| 100,885,738 | ||||||||||||||||||
|
| |||||||||||||||||
Macau - 0.07% | ||||||||||||||||||
MCE Finance Ltd.: | ||||||||||||||||||
| USD | 5.000 | % | 02/15/2021 | 127,000 | 123,507(2) | |||||||||||||
| USD | 5.000 | % | 02/15/2021 | 1,491,000 | 1,449,998(3) | |||||||||||||
|
| |||||||||||||||||
| 1,573,505 | ||||||||||||||||||
|
| |||||||||||||||||
Mexico - 0.52% | ||||||||||||||||||
Cemex Finance LLC | USD | 9.375 | % | 10/12/2022 | 1,883,000 | 2,165,450(2) | ||||||||||||
Cemex SAB de CV: | ||||||||||||||||||
| USD | 9.500 | % | 06/15/2018 | 2,448,000 | 2,726,460(2) | |||||||||||||
| USD | 7.250 | % | 01/15/2021 | 849,000 | 899,940(2) | |||||||||||||
Comision Federal de Electricidad | USD | 4.875 | % | 01/15/2024 | 1,784,000 | 1,891,040(2) | ||||||||||||
Petroleos Mexicanos | EUR | 5.500 | % | 02/24/2025 | 2,275,000 | 3,556,956(3) | ||||||||||||
|
| |||||||||||||||||
| 11,239,846 | ||||||||||||||||||
|
| |||||||||||||||||
Morocco - 0.17% | ||||||||||||||||||
OCP SA | USD | 5.625 | % | 04/25/2024 | 3,556,000 | 3,773,805(2) | ||||||||||||
|
| |||||||||||||||||
Peru - 0.06% | ||||||||||||||||||
Cementos Pacasmayo SAA | USD | 4.500 | % | 02/08/2023 | 1,032,000 | 972,660(2) | ||||||||||||
Inkia Energy Ltd. | USD | 8.375 | % | 04/04/2021 | 416,000 | 442,000(2) | ||||||||||||
|
| |||||||||||||||||
| 1,414,660 | ||||||||||||||||||
|
| |||||||||||||||||
Russia - 0.52% | ||||||||||||||||||
Gazprom OAO Via Gaz Capital SA | USD | 4.300 | % | 11/12/2015 | 4,286,000 | 4,303,144(2) | ||||||||||||
Vimpel Communications Holdings BV: | ||||||||||||||||||
| USD | 7.504 | % | 03/01/2022 | 300,000 | 279,375(3) | |||||||||||||
| USD | 5.950 | % | 02/13/2023 | 1,420,000 | 1,187,475(2) | |||||||||||||
Vimpel Communications Via VIP Finance Ireland | USD | 7.748 | % | 02/02/2021 | 1,372,000 | 1,313,690(2) | ||||||||||||
Wind Acquisition Finance SA: | ||||||||||||||||||
| EUR | 4.000 | % | 07/15/2020 | 3,088,000 | 3,849,393(2) | |||||||||||||
| USD | 4.750 | % | 07/15/2020 | 419,000 | 404,335(2) | |||||||||||||
|
| |||||||||||||||||
| 11,337,412 | ||||||||||||||||||
|
| |||||||||||||||||
South Africa - 0.36% | ||||||||||||||||||
Eskom Holdings SOC Ltd. | USD | 6.750 | % | 08/06/2023 | 7,174,000 | 7,830,421(2) | ||||||||||||
|
| |||||||||||||||||
Thailand - 0.16% | ||||||||||||||||||
PTT Exploration & Production PCL | USD | 4.875 | % | Perpetual | 3,407,000 | 3,471,733(2)(6) | ||||||||||||
|
| |||||||||||||||||
Stone Harbor Investment Funds Semi-Annual Report | November 30, 2014 |
29 |
Table of Contents
| Stone Harbor Emerging Markets Debt Fund | Statements of Investments | |
|
November 30, 2014 (Unaudited) | |
Counterparty | Currency | Rate | Maturity Date | Principal Amount/Shares* | Market Value (Expressed in U.S. $) | |||||||||||||||
Trinidad - 0.19% | ||||||||||||||||||||
Columbus International Inc. | USD | 7.375 | % | 03/30/2021 | 3,937,000 | $ | 4,251,960(2) | |||||||||||||
|
| |||||||||||||||||||
United Arab Emirates - 0.04% | ||||||||||||||||||||
MAF Global Securities Ltd. | USD | 7.125 | % | Perpetual | 700,000 | 768,250(6) | ||||||||||||||
|
| |||||||||||||||||||
Venezuela - 3.75% | ||||||||||||||||||||
Petroleos de Venezuela SA: | ||||||||||||||||||||
| USD | 5.250 | % | 04/12/2017 | 20,190,600 | 12,619,125(3) | |||||||||||||||
| USD | 8.500 | % | 11/02/2017 | 61,998,700 | 45,181,553(3) | |||||||||||||||
| USD | 9.000 | % | 11/17/2021 | 17,411,177 | 9,576,147(3) | |||||||||||||||
| USD | 6.000 | % | 05/16/2024 | 16,405,200 | 7,525,886(3) | |||||||||||||||
| USD | 6.000 | % | 11/15/2026 | 3,063,791 | 1,286,792(3) | |||||||||||||||
| USD | 9.750 | % | 05/17/2035 | 10,409,499 | 5,647,153(3) | |||||||||||||||
|
| |||||||||||||||||||
| 81,836,656 | ||||||||||||||||||||
|
| |||||||||||||||||||
| TOTAL CORPORATE BONDS | 424,091,113 | |||||||||||||||||||
|
| |||||||||||||||||||
(Cost $440,988,781) | ||||||||||||||||||||
| CREDIT LINKED NOTES - 1.22% | ||||||||||||||||||||
Colombia - 0.09% | ||||||||||||||||||||
Titulos de Tesoreria - Series B | Citigroup Global Markets | COP | 11.000 | % | 07/27/2020 | 3,500,000,000 | 1,970,704(2) | |||||||||||||
|
| |||||||||||||||||||
Iraq - 0.35% | ||||||||||||||||||||
Republic of Iraq: | ||||||||||||||||||||
| Bank of America - Merrill Lynch | JPY | 2.534 | % | 01/01/2028 | 877,806,828 | 5,175,966(6) | ||||||||||||||
| Bank of America - Merrill Lynch | JPY | 2.765 | % | 01/01/2028 | 399,816,233 | 2,357,506(6) | ||||||||||||||
|
| |||||||||||||||||||
| 7,533,472 | ||||||||||||||||||||
|
| |||||||||||||||||||
Venezuela - 0.78% | ||||||||||||||||||||
Petroleos De Venezuela | Credit Suisse First Boston | USD | 5.233 | % | 12/20/2016 | 29,200,000 | 17,054,976 | |||||||||||||
|
| |||||||||||||||||||
| TOTAL CREDIT LINKED NOTES | 26,559,152 | |||||||||||||||||||
|
| |||||||||||||||||||
(Cost $34,814,922) | ||||||||||||||||||||
| SHORT TERM INVESTMENTS - 1.11% | ||||||||||||||||||||
Money Market Mutual Funds - 1.11% | ||||||||||||||||||||
Dreyfus Institutional Cash Advantage | USD | 0.06001 | % | N/A | 24,307,740 | 24,307,740 | ||||||||||||||
|
| |||||||||||||||||||
| TOTAL SHORT TERM INVESTMENTS | 24,307,740 | |||||||||||||||||||
|
| |||||||||||||||||||
(Cost $24,307,740) | ||||||||||||||||||||
| Total Investments - 98.39% | 2,146,701,382 | |||||||||||||||||||
(Cost $2,162,500,892) | ||||||||||||||||||||
Other Assets In Excess of Liabilities - 1.61% | 35,031,053 | |||||||||||||||||||
|
| |||||||||||||||||||
| Net Assets - 100.00% | $ | 2,181,732,435 | ||||||||||||||||||
|
| |||||||||||||||||||
|
| |||||||||||||||||||
* The principal amount/shares of each security is stated in the currency in which the security is denominated.
30 |
www.shiplp.com |
Table of Contents
| Stone Harbor Emerging Markets Debt Fund | Statements of Investments | |
|
November 30, 2014 (Unaudited) | |
Currency Abbreviations:
| COP | - | Colombian Peso | ||
| EUR | - | Euro Currency | ||
| GBP | - | Great Britain Pound | ||
| IDR | - | Indonesian Rupiah | ||
| JPY | - | Japanese Yen | ||
| MXN | - | Mexican Peso | ||
| RUB | - | Russian Ruble | ||
| TRY | - | Turkish Lira | ||
| USD | - | United States Dollar |
| (1) | Security is in default and therefore is non-income producing. |
| (2) | Security exempt from registration under Rule 144A of the Securities Act of 1933. Such securities may normally be sold to qualified institutional buyers in transactions exempt from registration. Total market value of Rule 144A securities amounts to $429,732,643, which represents approximately 19.70% of net assets as of November 30, 2014. |
| (3) | Securities were originally issued pursuant to Regulation S under the Securities Act of 1933, which exempts securities offered and sold outside of the United States from registration. Such securities cannot be sold in the United States without either an effective registration statement filed pursuant to teh Securities Act of 1933, or pursuant to an exemption from registration. As of November 30, 2014, the aggregate market value of those securities was $863,352,685, which represents approximately 39.57% of net assets. |
| (4) | Step bond. Coupon changes periodically based upon a predetermined schedule. Interest rate disclosed is that which is in effect as of November 30, 2014. |
| (5) | Bank loans generally pay interest at rates which are periodically determined by reference to a base lending rate plus a premium. All loans carry a variable rate of interest. These base lending rates are generally (i) the Prime Rate offered by one or more major United States banks, (ii) the lending rate offered by one or more European banks such as the London Interbank Offered Rate (“LIBOR”) or (iii) the Certificate of Deposit rate. Bank loans, while exempt from registration, under the Securities Act of 1933, contain certain restrictions on resale and cannot be sold publicly. Floating rate bank loans often require prepayments from excess cash flow or permit the borrower to repay at its election. The degree to which borrowers repay, whether as a contractual requirement or at their election, cannot be predicted with accuracy. The loan matured on November 25, 2014, due to a default, final payments were not received. The security is shown to represent future expected payments. |
| (6) | Floating or variable rate security. Interest rate disclosed is that which is in effect as of November 30, 2014. |
Common Abbreviations:
| BV | - | Besloten Vennootschap is the Dutch term for private limited liability company. | ||
| GmbH | - | Gesellschaft mit beschrankter Haftung is the German term for a company with limited liability. | ||
| JSC | - | Joint Stock Company. | ||
| LLC | - | Lmited Liability Corporation. | ||
| LP | - | Limited Partnership. | ||
| Ltd. | - | Limited. | ||
| OAO | - | Otkrytoe Aktsionernoe Obschestvo is the Russian term for Open Joint Stock Company | ||
| OJSC | - | Open Joint Stock Company. | ||
| PCL | - | A rearrangement of the letters for Public Limited Company, used in Thailand. | ||
| PLC | - | Public Limited Company. | ||
| PT | - | Perseroan terbuka is an Indonesian term for limited liability company. | ||
| Pte | - | Private | ||
| SA | - | Generally designates corporations in various countries, mostly those employing the civil law. | ||
| SAA | - | Sociedad Anonima Abierta is the Peruvian term used for companies with 20 or more shareholders. | ||
| SAB de CV | - | A variable capital company. | ||
| SOC | - | State owned Company. | ||
| SPE | - | Special Purpose Entity. | ||
| TBK | - | Perseroan terbuka is an Indonesian term for limited liability company. |
Stone Harbor Investment Funds Semi-Annual Report | November 30, 2014 |
31 |
Table of Contents
| Stone Harbor Emerging Markets Debt Fund | Statements of Investments | |
|
November 30, 2014 (Unaudited) | |
OUTSTANDING FORWARD FOREIGN CURRENCY CONTRACTS
| Counterparty | Foreign Currency | Contracted Amount** | Purchase/Sale Contract | Settlement Date | Current Value | Unrealized Appreciation/ (Depreciation) | ||||||||||
| ||||||||||||||||
J.P Morgan Chase & Co. | EUR | 13,149,500 | Sale | 01/08/2015 | $ | 16,355,554 | $ | 97,495 | ||||||||
J.P Morgan Chase & Co. | GBP | 716,600 | Sale | 01/08/2015 | 1,119,027 | 2,490 | ||||||||||
J.P Morgan Chase & Co. | JPY | 903,471,000 | Sale | 01/08/2015 | 7,614,845 | 135,501 | ||||||||||
|
| |||||||||||||||
| $ | 235,486 | |||||||||||||||
|
| |||||||||||||||
** The contracted amount is stated in the currency in which the contract is denominated.
CREDIT DEFAULT SWAP CONTRACTS ON SOVEREIGN DEBT OBLIGATIONS ISSUE - SELL PROTECTION(7)
| Reference Entity | Counterparty | Fixed Deal Receive Rate | Maturity Date | Implied Credit Spread at November 30, 2014(8) | Notional Amount(9) | Market Value | Upfront Premiums Received | Unrealized Depreciation | ||||||||||||||
| ||||||||||||||||||||||
Petroleos de Venezuela | Credit Suisse First Boston | 5.000% | 06/20/2016 | 33.960% | $ 27,500,000 | $ | 9,024,213 | $ | 8,318,750 | $ | (705,463) | |||||||||||
|
| |||||||||||||||||||||
| $ | 9,024,213 | $ | 8,318,750 | $ | (705,463) | |||||||||||||||||
|
| |||||||||||||||||||||
| (7) | If the Fund is a seller of protection and a credit event occurs, as defined under the terms of that particular swap agreement, the Fund will either (i) pay to the buyer of protection an amount equal to the notional amount of the swap and take delivery of the referenced obligation or underlying securities comprising the referenced index or (ii) pay a net settlement amount in the form of cash or securities equal to the notional amount of the swap less the recovery value of the referenced obligation or underlying securities comprising the referenced index. |
| (8) | Implied credit spreads, represented in absolute terms, utilized in determining the market value of credit default swap agreements on sovereign issues of an emerging country as of period end serve as an indicator of the current status of the payment/performance risk and represent the likelihood or risk of default for the credit derivative. The implied credit spread of a particular referenced entity reflects the cost of buying/selling protection and may include upfront payments required to be made to enter into the agreement. Wider credit spreads represent a deterioration of the referenced entity’s credit soundness and a greater likelihood or risk of default or other credit event occurring as defined under the terms of the agreement. |
| (9) | The maximum potential amount the Fund could be required to pay as a seller of credit protection or receive as a buyer of credit protection if a credit event occurs as defined under the terms of that particular swap agreement. |
See Notes to Financial Statements.
32 |
www.shiplp.com |
Table of Contents
| Stone Harbor High Yield Bond Fund | Statements of Investments | |
|
November 30, 2014 (Unaudited) | |
Currency | Rate | Maturity Date | Principal | Market Value | ||||||||||||||
| CORPORATE BONDS - 89.97% | ||||||||||||||||||
Aerospace/Defense - 1.06% | ||||||||||||||||||
Bombardier, Inc. | USD | 6.000 | % | 10/15/2022 | 1,245,000 | $ | 1,267,036(1) | |||||||||||
CPI International, Inc. | USD | 8.750 | % | 02/15/2018 | 880,000 | 910,800(2) | ||||||||||||
Erickson, Inc., Series WI | USD | 8.250 | % | 05/01/2020 | 900,000 | 850,500 | ||||||||||||
|
| |||||||||||||||||
| 3,028,336 | ||||||||||||||||||
|
| |||||||||||||||||
Airlines - 0.22% | ||||||||||||||||||
Allegiant Travel Co. | USD | 5.500 | % | 07/15/2019 | 620,000 | 636,662 | ||||||||||||
|
| |||||||||||||||||
Automotive - 1.97% | ||||||||||||||||||
Chrysler Group LLC | USD | 8.250 | % | 06/15/2021 | 1,585,000 | 1,775,200 | ||||||||||||
Goodyear Tire & Rubber Co. | USD | 6.500 | % | 03/01/2021 | 1,528,000 | 1,631,140 | ||||||||||||
MPG Holdco I, Inc. | USD | 7.375 | % | 10/15/2022 | 1,200,000 | 1,254,000(1) | ||||||||||||
Schaeffler Holding Finance BV: | ||||||||||||||||||
| USD | 6.250 | % | 11/15/2019 | 620,000 | 651,775(1)(3) | |||||||||||||
| USD | 6.750 | % | 11/15/2022 | 265,000 | 280,900(1)(3) | |||||||||||||
|
| |||||||||||||||||
| 5,593,015 | ||||||||||||||||||
|
| |||||||||||||||||
Building Products - 2.49% | ||||||||||||||||||
American Builders & Contractors Supply Co., Inc. | USD | 5.625 | % | 04/15/2021 | 1,245,000 | 1,260,563(1) | ||||||||||||
Building Materials Corp. of America | USD | 5.375 | % | 11/15/2024 | 935,000 | 939,675(1) | ||||||||||||
Griffon Corp. | USD | 5.250 | % | 03/01/2022 | 2,490,000 | 2,390,400 | ||||||||||||
Norbord, Inc. | USD | 5.375 | % | 12/01/2020 | 1,985,000 | 1,945,300(1) | ||||||||||||
RSI Home Products, Inc. | USD | 6.875 | % | 03/01/2018 | 521,000 | 548,415(1) | ||||||||||||
|
| |||||||||||||||||
| 7,084,353 | ||||||||||||||||||
|
| |||||||||||||||||
Chemicals - 4.25% | ||||||||||||||||||
CeramTec Group GmbH | EUR | 8.250 | % | 08/15/2021 | 1,000,000 | 1,349,150(4) | ||||||||||||
Chemtura Corp. | USD | 5.750 | % | 07/15/2021 | 2,957,000 | 2,942,215 | ||||||||||||
Huntsman International LLC | USD | 5.125 | % | 11/15/2022 | 705,000 | 706,762(1) | ||||||||||||
INEOS Group Holdings SA | USD | 5.875 | % | 02/01/2019 | 2,310,000 | 2,252,250(1) | ||||||||||||
Lyond Basel Escrow | USD | 8.375 | % | 08/15/2015 | 25,000 | 0(5) | ||||||||||||
Lyondell Chemical Co. | USD | 8.375 | % | 08/15/2015 | 945,000 | 0(5) | ||||||||||||
NOVA Chemicals Corp. | USD | 5.000 | % | 05/01/2025 | 450,000 | 466,313(1) | ||||||||||||
SPCM SA | USD | 6.000 | % | 01/15/2022 | 1,424,000 | 1,502,320(1) | ||||||||||||
Trinseo Materials Operating SCA/Trinseo Materials Finance, Inc., Series WI | USD | 8.750 | % | 02/01/2019 | 2,761,000 | 2,850,733 | ||||||||||||
|
| |||||||||||||||||
| 12,069,743 | ||||||||||||||||||
|
| |||||||||||||||||
Consumer Products - 2.16% | ||||||||||||||||||
ACCO Brands Corp. | USD | 6.750 | % | 04/30/2020 | 2,123,000 | 2,276,917 | ||||||||||||
Prestige Brands, Inc. | USD | 5.375 | % | 12/15/2021 | 880,000 | 871,200(1) | ||||||||||||
Spectrum Brands, Inc., Series WI | USD | 6.375 | % | 11/15/2020 | 1,455,000 | 1,545,938 | ||||||||||||
Sun Products Corp. | USD | 7.750 | % | 03/15/2021 | 1,711,000 | 1,454,350(1) | ||||||||||||
|
| |||||||||||||||||
| 6,148,405 | ||||||||||||||||||
|
| |||||||||||||||||
Containers/Packaging - 2.21% | ||||||||||||||||||
Albea Beauty Holdings SA | USD | 8.375 | % | 11/01/2019 | 816,000 | 864,960(1) | ||||||||||||
Ardagh Finance Holdings SA | USD | 8.625 | % | 06/15/2019 | 705,000 | 729,675(1)(3) | ||||||||||||
Ardagh Packaging Finance PLC/Ardagh Holdings USA, Inc. | USD | 6.000 | % | 06/30/2021 | 700,000 | 694,750(1) | ||||||||||||
Stone Harbor Investment Funds Semi-Annual Report | November 30, 2014 |
33 |
Table of Contents
| Stone Harbor High Yield Bond Fund | Statements of Investments | |
|
November 30, 2014 (Unaudited) | |
Currency | Rate | Maturity Date | Principal | Market Value | ||||||||||||||
Containers/Packaging (continued) | ||||||||||||||||||
Reynolds Group Issuer LLC | USD | 8.250 | % | 02/15/2021 | 2,235,000 | $ | 2,343,956 | |||||||||||
Sealed Air Corp. | USD | 5.125 | % | 12/01/2024 | 560,000 | 562,800(1) | ||||||||||||
Signode Industrial Group Lux SA/Signode Industrial Group US, Inc. | USD | 6.375 | % | 05/01/2022 | 1,115,000 | 1,095,488(1) | ||||||||||||
|
| |||||||||||||||||
| 6,291,629 | ||||||||||||||||||
|
| |||||||||||||||||
Drillers/Services - 3.45% | ||||||||||||||||||
FTS International, Inc. | USD | 6.250 | % | 05/01/2022 | 1,625,000 | 1,348,750(1) | ||||||||||||
Hornbeck Offshore Services, Inc.: | ||||||||||||||||||
| USD | 5.875 | % | 04/01/2020 | 827,000 | 736,030 | |||||||||||||
| USD | 5.000 | % | 03/01/2021 | 1,107,000 | 918,810 | |||||||||||||
Offshore Group Investment Ltd. | USD | 7.125 | % | 04/01/2023 | 2,360,000 | 1,675,600 | ||||||||||||
Pacific Drilling SA | USD | 5.375 | % | 06/01/2020 | 1,967,000 | 1,573,600(1) | ||||||||||||
Parker Drilling Co. | USD | 6.750 | % | 07/15/2022 | 1,980,000 | 1,564,200 | ||||||||||||
Trinidad Drilling Ltd. | USD | 7.875 | % | 01/15/2019 | 1,975,000 | 1,994,750(1) | ||||||||||||
|
| |||||||||||||||||
| 9,811,740 | ||||||||||||||||||
|
| |||||||||||||||||
Electric - 4.85% | ||||||||||||||||||
The AES Corp. | USD | 7.375 | % | 07/01/2021 | 1,105,000 | 1,270,750 | ||||||||||||
Calpine Corp. | USD | 5.750 | % | 01/15/2025 | 2,285,000 | 2,327,844 | ||||||||||||
Dynegy Finance I, Inc. / Dynegy Finance II Inc: | ||||||||||||||||||
| USD | 6.750 | % | 11/01/2019 | 1,355,000 | 1,410,894(1) | |||||||||||||
| USD | 7.625 | % | 11/01/2024 | 800,000 | 847,000(1) | |||||||||||||
GenOn Energy, Inc. | USD | 9.500 | % | 10/15/2018 | 3,887,000 | 4,061,915 | ||||||||||||
NRG Energy, Inc. | USD | 6.250 | % | 07/15/2022 | 2,330,000 | 2,405,725 | ||||||||||||
RJS Power Holdings LLC | USD | 5.125 | % | 07/15/2019 | 1,455,000 | 1,451,362(1) | ||||||||||||
|
| |||||||||||||||||
| 13,775,490 | ||||||||||||||||||
|
| |||||||||||||||||
Environmental Services - 0.59% | ||||||||||||||||||
Clean Harbors, Inc. | USD | 5.250 | % | 08/01/2020 | 1,641,000 | 1,665,615 | ||||||||||||
|
| |||||||||||||||||
Exploration & Production - 9.61% | ||||||||||||||||||
Atlas Pipeline Partners LP/Atlas Pipeline Finance Corp., Series WI | USD | 4.750 | % | 11/15/2021 | 1,494,000 | 1,471,590 | ||||||||||||
Bonanza Creek Energy, Inc. | USD | 6.750 | % | 04/15/2021 | 2,198,000 | 2,099,090 | ||||||||||||
Calumet Specialty Products Partners LP/Calumet Finance Corp.: | ||||||||||||||||||
| USD | 9.625 | % | 08/01/2020 | 935,000 | 1,021,487 | |||||||||||||
| USD | 6.500 | % | 04/15/2021 | 795,000 | 767,175(1) | |||||||||||||
Chesapeake Energy Corp. | USD | 5.750 | % | 03/15/2023 | 2,040,000 | 2,172,600 | ||||||||||||
Denbury Resources, Inc. | USD | 5.500 | % | 05/01/2022 | 1,770,000 | 1,668,225 | ||||||||||||
EP Energy LLC/EP Energy Finance, Inc., Series WI | USD | 9.375 | % | 05/01/2020 | 1,033,000 | 1,133,717 | ||||||||||||
Halcon Resources Corp. | USD | 9.750 | % | 07/15/2020 | 2,138,000 | 1,646,260 | ||||||||||||
Kodiak Oil & Gas Corp. | USD | 5.500 | % | 01/15/2021 | 1,165,000 | 1,179,563 | ||||||||||||
Laredo Petroleum, Inc.: | ||||||||||||||||||
| USD | 5.625 | % | 01/15/2022 | 1,100,000 | 1,045,000 | |||||||||||||
| USD | 7.375 | % | 05/01/2022 | 1,243,000 | 1,261,645 | |||||||||||||
Linn Energy LLC | USD | 7.750 | % | 02/01/2021 | 1,219,000 | 1,091,005 | ||||||||||||
Linn Energy LLC / Linn Energy Finance Corp. | USD | 6.500 | % | 09/15/2021 | 705,000 | 613,350 | ||||||||||||
MEG Energy Corp.: | ||||||||||||||||||
| USD | 6.500 | % | 03/15/2021 | 1,305,000 | 1,207,125(1) | |||||||||||||
| USD | 7.000 | % | 03/31/2024 | 662,000 | 602,420(1) | |||||||||||||
34 |
www.shiplp.com |
Table of Contents
| Stone Harbor High Yield Bond Fund | Statements of Investments | |
|
November 30, 2014 (Unaudited) | |
Currency | Rate | Maturity Date | Principal | Market Value | ||||||||||||||
Exploration & Production (continued) | ||||||||||||||||||
MEG Energy Corp.: (continued) | ||||||||||||||||||
Midstates Petroleum Co., Inc. | USD | 10.750 | % | 10/01/2020 | 1,476,000 | $ | 1,284,120 | |||||||||||
Oasis Petroleum, Inc.: | ||||||||||||||||||
| USD | 7.250 | % | 02/01/2019 | 1,531,000 | 1,454,450 | |||||||||||||
| USD | 6.875 | % | 03/15/2022 | 773,000 | 730,485 | |||||||||||||
QEP Resources, Inc. | USD | 5.375 | % | 10/01/2022 | 1,427,000 | 1,362,785 | ||||||||||||
Samson Investment Co. | USD | 9.750 | % | 02/15/2020 | 1,991,000 | 1,159,758(2) | ||||||||||||
SandRidge Energy, Inc. | USD | 7.500 | % | 03/15/2021 | 1,832,000 | 1,483,920 | ||||||||||||
Venoco, Inc. | USD | 8.875 | % | 02/15/2019 | 1,186,000 | 847,990 | ||||||||||||
|
| |||||||||||||||||
| 27,303,760 | ||||||||||||||||||
|
| |||||||||||||||||
Financial Other - 0.66% | ||||||||||||||||||
Aircastle Ltd. | USD | 6.750 | % | 04/15/2017 | 1,087,000 | 1,171,242 | ||||||||||||
Springleaf Finance Corp. | USD | 5.250 | % | 12/15/2019 | 705,000 | 708,525 | ||||||||||||
|
| |||||||||||||||||
| 1,879,767 | ||||||||||||||||||
|
| |||||||||||||||||
Food/Beverage/Tobacco - 4.53% | ||||||||||||||||||
Bakkavor Finance 2 PLC | GBP | 8.250 | % | 02/15/2018 | 725,000 | 1,180,112(4) | ||||||||||||
Big Heart Pet Brands | USD | 7.625 | % | 02/15/2019 | 1,455,000 | 1,428,628 | ||||||||||||
Boparan Finance PLC | GBP | 5.500 | % | 07/15/2021 | 980,000 | 1,331,924(4) | ||||||||||||
Chiquita Brands International, Inc./Chiquita Brands LLC | USD | 7.875 | % | 02/01/2021 | 1,870,000 | 2,035,963 | ||||||||||||
Post Holdings, Inc. | USD | 7.375 | % | 02/15/2022 | 2,165,000 | 2,192,063 | ||||||||||||
Premier Foods Finance PLC | GBP | 6.500 | % | 03/15/2021 | 1,000,000 | 1,400,687(4) | ||||||||||||
R&R PLC | EUR | 9.250 | % | 05/15/2018 | 1,100,000 | 1,390,070(3)(4) | ||||||||||||
Smithfield Foods, Inc. | USD | 6.625 | % | 08/15/2022 | 1,756,000 | 1,909,650 | ||||||||||||
|
| |||||||||||||||||
| 12,869,097 | ||||||||||||||||||
|
| |||||||||||||||||
Gaming - 2.51% | ||||||||||||||||||
Isle of Capri Casinos, Inc. | USD | 5.875 | % | 03/15/2021 | 2,325,000 | 2,388,937 | ||||||||||||
MGM Resorts International | USD | 6.625 | % | 12/15/2021 | 2,333,000 | 2,502,143 | ||||||||||||
Pinnacle Entertainment, Inc. | USD | 6.375 | % | 08/01/2021 | 2,135,000 | 2,236,413 | ||||||||||||
|
| |||||||||||||||||
| 7,127,493 | ||||||||||||||||||
|
| |||||||||||||||||
Gas Pipelines - 0.41% | ||||||||||||||||||
Sabine Pass Liquefaction LLC | USD | 5.625 | % | 02/01/2021 | 1,124,000 | 1,154,910 | ||||||||||||
|
| |||||||||||||||||
Healthcare - 6.38% | ||||||||||||||||||
Community Health Systems, Inc. | USD | 8.000 | % | 11/15/2019 | 1,552,000 | 1,664,520 | ||||||||||||
DaVita HealthCare Partners, Inc. | USD | 5.125 | % | 07/15/2024 | 1,530,000 | 1,572,075 | ||||||||||||
Fresenius Medical Care US Finance, Inc. | USD | 5.750 | % | 02/15/2021 | 650,000 | 698,750(1) | ||||||||||||
Grifols Worldwide Operations Ltd. | USD | 5.250 | % | 04/01/2022 | 1,270,000 | 1,311,275(1) | ||||||||||||
HCA, Inc. | USD | 4.250 | % | 10/15/2019 | 1,525,000 | 1,534,531 | ||||||||||||
HealthSouth Corp. | USD | 5.750 | % | 11/01/2024 | 1,475,000 | 1,541,375 | ||||||||||||
Hologic, Inc. | USD | 6.250 | % | 08/01/2020 | 1,759,000 | 1,830,459 | ||||||||||||
IASIS Healthcare LLC | USD | 8.375 | % | 05/15/2019 | 1,487,000 | 1,565,068 | ||||||||||||
Kinetic Concepts, Inc./KCI USA, Inc.: | ||||||||||||||||||
| USD | 10.500 | % | 11/01/2018 | 1,064,000 | 1,181,040 | |||||||||||||
| USD | 12.500 | % | 11/01/2019 | 795,000 | 882,450 | |||||||||||||
LifePoint Hospitals, Inc. | USD | 5.500 | % | 12/01/2021 | 2,170,000 | 2,262,225 | ||||||||||||
Tenet Healthcare Corp.: | ||||||||||||||||||
| USD | 6.000 | % | 10/01/2020 | 718,000 | 765,568 | |||||||||||||
Stone Harbor Investment Funds Semi-Annual Report | November 30, 2014 |
35 |
Table of Contents
| Stone Harbor High Yield Bond Fund | Statements of Investments | |
|
November 30, 2014 (Unaudited) | |
Currency | Rate | Maturity Date | Principal | Market Value | ||||||||||||||
Healthcare (continued) | ||||||||||||||||||
Tenet Healthcare Corp.: (continued) | ||||||||||||||||||
| USD | 8.125 | % | 04/01/2022 | 1,173,000 | $ | 1,313,760 | ||||||||||||
|
| |||||||||||||||||
| 18,123,096 | ||||||||||||||||||
|
| |||||||||||||||||
Home Builders - 0.68% | ||||||||||||||||||
Lennar Corp. | USD | 4.750 | % | 11/15/2022 | 1,234,000 | 1,200,065 | ||||||||||||
Standard Pacific Corp. | USD | 5.875 | % | 11/15/2024 | 727,000 | 734,270 | ||||||||||||
|
| |||||||||||||||||
| 1,934,335 | ||||||||||||||||||
|
| |||||||||||||||||
Industrial Other - 2.34% | ||||||||||||||||||
AECOM Technology Corp. | USD | 5.750 | % | 10/15/2022 | 1,415,000 | 1,485,750(1) | ||||||||||||
Cleaver-Brooks, Inc. | USD | 8.750 | % | 12/15/2019 | 1,461,000 | 1,585,185(1) | ||||||||||||
MasTec, Inc. | USD | 4.875 | % | 03/15/2023 | 2,688,000 | 2,587,200 | ||||||||||||
WESCO Distribution, Inc. | USD | 5.375 | % | 12/15/2021 | 970,000 | 993,037 | ||||||||||||
|
| |||||||||||||||||
| 6,651,172 | ||||||||||||||||||
|
| |||||||||||||||||
Leisure - 0.70% | ||||||||||||||||||
AMC Entertainment, Inc. | USD | 5.875 | % | 02/15/2022 | 1,925,000 | 1,982,750 | ||||||||||||
|
| |||||||||||||||||
Lodging - 1.23% | ||||||||||||||||||
Hilton Worldwide Finance LLC | USD | 5.625 | % | 10/15/2021 | 1,446,000 | 1,521,011(1) | ||||||||||||
RHP Hotel Properties LP/RHP Finance Corp. | USD | 5.000 | % | 04/15/2021 | 1,978,000 | 1,973,055 | ||||||||||||
|
| |||||||||||||||||
| 3,494,066 | ||||||||||||||||||
|
| |||||||||||||||||
Media Cable - 7.85% | ||||||||||||||||||
Cablevision Systems Corp.: | ||||||||||||||||||
| USD | 8.000 | % | 04/15/2020 | 864,000 | 996,840 | |||||||||||||
| USD | 5.875 | % | 09/15/2022 | 2,755,000 | 2,813,544 | |||||||||||||
CCO Holdings LLC: | ||||||||||||||||||
| USD | 6.625 | % | 01/31/2022 | 1,487,000 | 1,587,372 | |||||||||||||
| USD | 5.125 | % | 02/15/2023 | 750,000 | 737,813 | |||||||||||||
Cequel Communications Holdings I LLC/Cequel Capital Corp. | USD | 5.125 | % | 12/15/2021 | 2,236,000 | 2,168,920(1) | ||||||||||||
DISH DBS Corp., Series WI | USD | 5.000 | % | 03/15/2023 | 4,978,000 | 4,844,216 | ||||||||||||
Mediacom LLC | USD | 7.250 | % | 02/15/2022 | 2,371,000 | 2,542,898 | ||||||||||||
Numericable-SFR: | ||||||||||||||||||
| USD | 6.000 | % | 05/15/2022 | 1,270,000 | 1,291,615(1) | |||||||||||||
| USD | 6.250 | % | 05/15/2024 | 660,000 | 673,200(1) | |||||||||||||
Quebecor Media, Inc. | USD | 5.750 | % | 01/15/2023 | 1,296,000 | 1,334,880 | ||||||||||||
UPC Holding BV | EUR | 6.375 | % | 09/15/2022 | 1,300,000 | 1,757,936(4) | ||||||||||||
Virgin Media Finance PLC | USD | 6.000 | % | 10/15/2024 | 1,475,000 | 1,550,594(1) | ||||||||||||
|
| |||||||||||||||||
| 22,299,828 | ||||||||||||||||||
|
| |||||||||||||||||
Media Other - 4.05% | ||||||||||||||||||
CBS Outdoor Americas Capital LLC/CBS Outdoor Americas Capital Corp. | USD | 5.250 | % | 02/15/2022 | 955,000 | 981,262(1) | ||||||||||||
Gannett Co. Inc | USD | 6.375 | % | 10/15/2023 | 1,714,000 | 1,853,263 | ||||||||||||
Gray Television, Inc. | USD | 7.500 | % | 10/01/2020 | 2,115,000 | 2,199,600 | ||||||||||||
Interep National Radio Sales, Inc., Series B | USD | 10.000 | % | 07/01/2008 | 27,318 | 3(5) | ||||||||||||
Media General Financing Sub, Inc. | USD | 5.875 | % | 11/15/2022 | 1,510,000 | 1,521,325(1) | ||||||||||||
Nexstar Broadcasting, Inc., Series WI | USD | 6.875 | % | 11/15/2020 | 1,990,000 | 2,079,550 | ||||||||||||
36 |
www.shiplp.com |
Table of Contents
| Stone Harbor High Yield Bond Fund | Statements of Investments | |
|
November 30, 2014 (Unaudited) | |
Currency | Rate | Maturity Date | Principal | Market Value (Expressed in U.S. $) | ||||||||||||||
Media Other (continued) | ||||||||||||||||||
Sinclair Television Group, Inc., Series WI | USD | 6.125 | % | 10/01/2022 | 2,780,000 | $ | 2,877,300 | |||||||||||
|
| |||||||||||||||||
| 11,512,303 | ||||||||||||||||||
|
| |||||||||||||||||
Metals/Mining/Steel - 4.49% | ||||||||||||||||||
Alcoa, Inc. | USD | 5.125 | % | 10/01/2024 | 655,000 | 691,570 | ||||||||||||
APERAM SA | USD | 7.750 | % | 04/01/2018 | 1,195,000 | 1,238,797(1) | ||||||||||||
ArcelorMittal: | ||||||||||||||||||
| USD | 6.750 | % | 02/25/2022 | 1,546,000 | 1,688,039 | |||||||||||||
| USD | 7.500 | % | 10/15/2039 | 1,255,000 | 1,305,200 | |||||||||||||
Arch Coal, Inc. | USD | 7.250 | % | 06/15/2021 | 1,823,000 | 674,510 | ||||||||||||
Cloud Peak Energy Resources LLC: | ||||||||||||||||||
| USD | 8.500 | % | 12/15/2019 | 615,000 | 638,677 | |||||||||||||
| USD | 6.375 | % | 03/15/2024 | 1,580,000 | 1,552,350 | |||||||||||||
CONSOL Energy, Inc. | USD | 8.250 | % | 04/01/2020 | 1,301,000 | 1,374,181 | ||||||||||||
Constellium NV | USD | 5.750 | % | 05/15/2024 | 1,015,000 | 979,475(1) | ||||||||||||
Peabody Energy Corp., Series WI | USD | 6.250 | % | 11/15/2021 | 2,792,000 | 2,627,970 | ||||||||||||
|
| |||||||||||||||||
| 12,770,769 | ||||||||||||||||||
|
| |||||||||||||||||
Non Captive Finance - 0.49% | ||||||||||||||||||
International Lease Finance Corp. | USD | 8.250 | % | 12/15/2020 | 1,152,000 | 1,399,680 | ||||||||||||
|
| |||||||||||||||||
Paper/Forest Products - 2.84% | ||||||||||||||||||
Cascades, Inc.: | ||||||||||||||||||
| USD | 7.875 | % | 01/15/2020 | 1,075,000 | 1,126,062 | |||||||||||||
| USD | 5.500 | % | 07/15/2022 | 735,000 | 730,406(1) | |||||||||||||
Louisiana-Pacific Corp. | USD | 7.500 | % | 06/01/2020 | 1,578,000 | 1,704,240 | ||||||||||||
Mercer International, Inc. | USD | 7.750 | % | 12/01/2022 | 1,470,000 | 1,499,400(1) | ||||||||||||
Rayonier AM Products, Inc. | USD | 5.500 | % | 06/01/2024 | 1,900,000 | 1,776,500(1) | ||||||||||||
Xerium Technologies, Inc. | USD | 8.875 | % | 06/15/2018 | 1,154,000 | 1,222,519 | ||||||||||||
|
| |||||||||||||||||
| 8,059,127 | ||||||||||||||||||
|
| |||||||||||||||||
Pharmaceuticals - 0.42% | ||||||||||||||||||
Mallinckrodt International Finance SA / Mallinckrodt CB LLC | USD | 5.750 | % | 08/01/2022 | 1,155,000 | 1,182,431(1) | ||||||||||||
|
| |||||||||||||||||
Publishing/Printing - 0.00% | ||||||||||||||||||
IDEARC, Inc. | USD | 8.000 | % | 11/15/2016 | 1,345,000 | 0(5) | ||||||||||||
|
| |||||||||||||||||
Refining - 0.64% | ||||||||||||||||||
Tesoro Logistics LP/Tesoro Logistics Finance Corp.: | ||||||||||||||||||
| USD | 5.875 | % | 10/01/2020 | 776,000 | 791,520 | |||||||||||||
| USD | 6.125 | % | 10/15/2021 | 1,003,000 | 1,028,075 | |||||||||||||
|
| |||||||||||||||||
| 1,819,595 | ||||||||||||||||||
|
| |||||||||||||||||
Restaurants - 0.69% | ||||||||||||||||||
Landry’s, Inc. | USD | 9.375 | % | 05/01/2020 | 1,842,000 | 1,968,638(1) | ||||||||||||
|
| |||||||||||||||||
Retail Non Food/Drug - 1.28% | ||||||||||||||||||
Bon-Ton Department Stores, Inc. | USD | 8.000 | % | 06/15/2021 | 692,000 | 570,900 | ||||||||||||
Hot Topic, Inc. | USD | 9.250 | % | 06/15/2021 | 1,515,000 | 1,632,412(1) | ||||||||||||
JC Penney Corp. Inc | USD | 5.650 | % | 06/01/2020 | 490,000 | 400,575 | ||||||||||||
Stone Harbor Investment Funds Semi-Annual Report | November 30, 2014 |
37 |
Table of Contents
| Stone Harbor High Yield Bond Fund | Statements of Investments | |
|
November 30, 2014 (Unaudited) | |
Currency | Rate | Maturity Date | Principal | Market Value | ||||||||||||||
Retail Non Food/Drug (continued) | ||||||||||||||||||
Petco Holdings, Inc. | USD | 8.500 | % | 10/15/2017 | 1,026,000 | $ | 1,038,825(1)(3) | |||||||||||
|
| |||||||||||||||||
| 3,642,712 | ||||||||||||||||||
|
| |||||||||||||||||
Services Other - 0.50% | ||||||||||||||||||
Outerwall, Inc. | USD | 6.000 | % | 03/15/2019 | 1,430,000 | 1,415,700 | ||||||||||||
|
| |||||||||||||||||
Technology - 3.14% | ||||||||||||||||||
Alcatel-Lucent USA, Inc. | USD | 6.750 | % | 11/15/2020 | 1,230,000 | 1,282,275(1) | ||||||||||||
Artesyn Embedded Technologies, Inc. | USD | 9.750 | % | 10/15/2020 | 1,275,000 | 1,268,625(1) | ||||||||||||
BMC Software Finance, Inc. | USD | 8.125 | % | 07/15/2021 | 650,000 | 612,625(1) | ||||||||||||
First Data Corp. | USD | 12.625 | % | 01/15/2021 | 1,637,000 | 1,952,122 | ||||||||||||
Magnachip Semiconductor Corp. | USD | 6.625 | % | 07/15/2021 | 422,000 | 388,240 | ||||||||||||
NCR Corp. | USD | 5.000 | % | 07/15/2022 | 1,784,000 | 1,748,320 | ||||||||||||
Nuance Communications, Inc. | USD | 5.375 | % | 08/15/2020 | 1,657,000 | 1,677,713(1) | ||||||||||||
|
| |||||||||||||||||
| 8,929,920 | ||||||||||||||||||
|
| |||||||||||||||||
Textile/Apparel - 1.69% | ||||||||||||||||||
Levi Strauss & Co. | USD | 6.875 | % | 05/01/2022 | 2,225,000 | 2,430,812 | ||||||||||||
Quiksilver, Inc.: | ||||||||||||||||||
| USD | 10.000 | % | 08/01/2020 | 521,000 | 302,180 | |||||||||||||
| USD | 7.875 | % | 08/01/2018 | 1,117,000 | 999,715(1) | |||||||||||||
William Carter Co. | USD | 5.250 | % | 08/15/2021 | 1,025,000 | 1,068,563 | ||||||||||||
|
| |||||||||||||||||
| 4,801,270 | ||||||||||||||||||
|
| |||||||||||||||||
Wireless - 4.53% | ||||||||||||||||||
Altice SA | USD | 7.750 | % | 05/15/2022 | 1,510,000 | 1,564,738(1) | ||||||||||||
Matterhorn Mobile Holdings SA | EUR | 8.250 | % | 02/15/2020 | 900,000 | 1,197,448(4) | ||||||||||||
Mobile Challenger Intermediate Group SA | EUR | 8.750 | % | 03/15/2019 | 800,000 | 1,014,660(3)(4) | ||||||||||||
Sprint Capital Corp. | USD | 8.750 | % | 03/15/2032 | 3,725,000 | 3,934,531 | ||||||||||||
T-Mobile USA, Inc.: | ||||||||||||||||||
| USD | 6.731 | % | 04/28/2022 | 2,545,000 | 2,643,619 | |||||||||||||
| USD | 6.500 | % | 01/15/2024 | 965,000 | 989,125 | |||||||||||||
Wind Acquisition Finance SA: | ||||||||||||||||||
| USD | 6.500 | % | 04/30/2020 | 1,122,000 | 1,165,478(1) | |||||||||||||
| USD | 7.375 | % | 04/23/2021 | 375,000 | 361,875(1) | |||||||||||||
|
| |||||||||||||||||
| 12,871,474 | ||||||||||||||||||
|
| |||||||||||||||||
Wirelines - 5.06% | ||||||||||||||||||
CenturyLink, Inc.: | ||||||||||||||||||
| USD | 5.800 | % | 03/15/2022 | 641,000 | 676,255 | |||||||||||||
| USD | 7.650 | % | 03/15/2042 | 700,000 | 707,000 | |||||||||||||
Cincinnati Bell, Inc. | USD | 8.375 | % | 10/15/2020 | 558,000 | 597,757 | ||||||||||||
Citizens Communications Co. | USD | 9.000 | % | 08/15/2031 | 1,485,000 | 1,607,512 | ||||||||||||
CyrusOne LP/CyrusOne Finance Corp. | USD | 6.375 | % | 11/15/2022 | 1,810,000 | 1,968,375 | ||||||||||||
Frontier Communications Corp. | USD | 6.250 | % | 09/15/2021 | 995,000 | 1,018,681 | ||||||||||||
Level 3 Communications, Inc. | USD | 5.750 | % | 12/01/2022 | 485,000 | 489,850(1) | ||||||||||||
Level 3 Escrow II, Inc. | USD | 5.375 | % | 08/15/2022 | 1,865,000 | 1,888,313(1) | ||||||||||||
Level 3 Financing, Inc., Series WI | USD | 7.000 | % | 06/01/2020 | 1,804,000 | 1,937,045 | ||||||||||||
Telecom Italia SpA | USD | 5.303 | % | 05/30/2024 | 1,233,000 | 1,262,284(1) | ||||||||||||
38 |
www.shiplp.com |
Table of Contents
| Stone Harbor High Yield Bond Fund | Statements of Investments | |
|
November 30, 2014 (Unaudited) | |
Currency | Rate | Maturity Date | Principal | Market Value (Expressed in U.S. $) | ||||||||||||||
Wirelines (continued) | ||||||||||||||||||
CenturyLink, Inc.: (continued) | ||||||||||||||||||
Windstream Corp. | USD | 7.500 | % | 04/01/2023 | 2,191,000 | $ | 2,240,298 | |||||||||||
|
| |||||||||||||||||
| 14,393,370 | ||||||||||||||||||
|
| |||||||||||||||||
| TOTAL CORPORATE BONDS | 255,692,251 | |||||||||||||||||
|
| |||||||||||||||||
(Cost $257,087,381) | ||||||||||||||||||
| CONVERTIBLE CORPORATE BONDS - 1.03% | ||||||||||||||||||
Consumer Products - 0.09% | ||||||||||||||||||
Jarden Corp. | USD | 1.125 | % | 03/15/2034 | 226,000 | 240,407(1) | ||||||||||||
|
| |||||||||||||||||
Drillers/Services - 0.13% | ||||||||||||||||||
Hornbeck Offshore Services, Inc. | USD | 1.500 | % | 09/01/2019 | 397,000 | 359,037 | ||||||||||||
|
| |||||||||||||||||
Exploration & Production - 0.23% | ||||||||||||||||||
Energy XXI Ltd. | USD | 3.000 | % | 12/15/2018 | 540,000 | 353,700(1) | ||||||||||||
Stone Energy Corp. | USD | 1.750 | % | 03/01/2017 | 347,000 | 302,541 | ||||||||||||
|
| |||||||||||||||||
| 656,241 | ||||||||||||||||||
|
| |||||||||||||||||
Industrial Other - 0.08% | ||||||||||||||||||
Altra Industrial Motion Corp. | USD | 2.750 | % | 03/01/2031 | 182,000 | 228,410 | ||||||||||||
|
| |||||||||||||||||
Metals/Mining/Steel - 0.16% | ||||||||||||||||||
RTI International Metals, Inc.: | ||||||||||||||||||
| USD | 3.000 | % | 12/01/2015 | 353,000 | 361,825 | |||||||||||||
| USD | 1.625 | % | 10/15/2019 | 99,400 | 94,865 | |||||||||||||
|
| |||||||||||||||||
| 456,690 | ||||||||||||||||||
|
| |||||||||||||||||
Technology - 0.34% | ||||||||||||||||||
Ciena Corp. | USD | 4.000 | % | 03/15/2015 | 331,000 | 340,516(1) | ||||||||||||
SanDisk Corp. | USD | 0.500 | % | 10/15/2020 | 339,000 | 423,750 | ||||||||||||
ServiceNow, Inc. | USD | 0.000 | % | 11/01/2018 | 189,000 | 209,790(6) | ||||||||||||
|
| |||||||||||||||||
| 974,056 | ||||||||||||||||||
|
| |||||||||||||||||
| TOTAL CONVERTIBLE CORPORATE BONDS | 2,914,841 | |||||||||||||||||
|
| |||||||||||||||||
(Cost $2,998,714) | ||||||||||||||||||
| BANK LOANS - 6.38%(7) | ||||||||||||||||||
Chemicals - 0.37% | ||||||||||||||||||
Styrolution Group Gmbh - Tranche B1 Term Loan | USD | 6.500 | % | 10/31/2019 | 1,050,000 | 1,051,969(8) | ||||||||||||
|
| |||||||||||||||||
Electric - 0.99% | ||||||||||||||||||
Texas Competitive Electric Holdings Co. LLC - 2017 Term Loan | USD | 4.652 | % | 10/10/2017 | 3,880,167 | 2,821,204(5) | ||||||||||||
|
| |||||||||||||||||
Food/Beverage/Tobacco - 0.93% | ||||||||||||||||||
Del Monte Foods Inc. - Initial Term Loan | USD | 8.250 | % | 05/26/2021 | 1,305,000 | 1,138,613 | ||||||||||||
New HB Acquisition LLC - Term B Loan | USD | 6.750 | % | 03/12/2020 | 1,467,700 | 1,503,475 | ||||||||||||
|
| |||||||||||||||||
| 2,642,088 | ||||||||||||||||||
|
| |||||||||||||||||
Stone Harbor Investment Funds Semi-Annual Report | November 30, 2014 |
39 |
Table of Contents
| Stone Harbor High Yield Bond Fund | Statements of Investments | |
|
November 30, 2014 (Unaudited) | |
Currency | Rate | Maturity Date | Principal Amount/Shares* | Market Value (Expressed in U.S. $) | ||||||||||||||
Industrial Other - 0.34% | ||||||||||||||||||
Gates Global LLC - Initial Term Loan | USD | 4.250 | % | 06/12/2021 | 980,000 | $ | 971,775 | |||||||||||
|
| |||||||||||||||||
Lodging - 0.50% | ||||||||||||||||||
La Quinta Intermediate Holdings LLC - Initial Term Loan | USD | 4.000 | % | 02/12/2021 | 1,429,619 | 1,425,866 | ||||||||||||
|
| |||||||||||||||||
Media Other - 0.79% | ||||||||||||||||||
Tribune Company - Initial Term Loan | USD | 4.000 | % | 11/20/2020 | 2,254,568 | 2,248,932 | ||||||||||||
|
| |||||||||||||||||
Metals/Mining/Steel - 0.26% | ||||||||||||||||||
Arch Coal, Inc., - Term Loan | USD | 6.250 | % | 05/01/2018 | 839,425 | 744,465 | ||||||||||||
|
| |||||||||||||||||
Retail Food/Drug - 0.83% | ||||||||||||||||||
Albertson’s Holdings LLC - Term B-4 Loan | USD | 4.500 | % | 08/08/2021 | 2,330,000 | 2,340,375 | ||||||||||||
|
| |||||||||||||||||
Technology - 1.37% | ||||||||||||||||||
Dell International LLC - Term B Loan | USD | 4.500 | % | 03/24/2020 | 3,128,400 | 3,137,109 | ||||||||||||
MA Financeco., LLC - Initial Tranche B Term Loan | USD | 5.250 | % | 10/07/2021 | 760,000 | 744,563 | ||||||||||||
|
| |||||||||||||||||
| 3,881,672 | ||||||||||||||||||
|
| |||||||||||||||||
| TOTAL BANK LOANS | 18,128,346 | |||||||||||||||||
|
| |||||||||||||||||
(Cost $18,439,889) | ||||||||||||||||||
| COMMON/PREFERRED STOCKS - 0.29% | ||||||||||||||||||
EME Reorganization Trust | USD | 3,059,892 | 107,096 | |||||||||||||||
General Maritime | USD | 1,929 | 19 | |||||||||||||||
NRG Energy, Inc. | USD | 10,061 | 314,507 | |||||||||||||||
SandRidge Energy, Inc. | USD | 3,451 | 274,355 | |||||||||||||||
Subsea 7 SA | NOK | 14,306 | 142,542 | |||||||||||||||
|
| |||||||||||||||||
| 838,519 | ||||||||||||||||||
|
| |||||||||||||||||
| TOTAL COMMON/PREFERRED STOCKS | 838,519 | |||||||||||||||||
|
| |||||||||||||||||
(Cost $1,416,334) | ||||||||||||||||||
| SHORT TERM INVESTMENTS - 1.66% | ||||||||||||||||||
Money Market Mutual Funds - 1.66% | ||||||||||||||||||
Dreyfus Institutional Cash Advantage Fund - Institutional Advantage Class | USD | 0.06001 | % | N/A | 4,726,849 | 4,726,849 | ||||||||||||
|
| |||||||||||||||||
| TOTAL SHORT TERM INVESTMENTS | 4,726,849 | |||||||||||||||||
|
| |||||||||||||||||
(Cost $4,726,849) | ||||||||||||||||||
Total Investments - 99.33% | 282,300,806 | |||||||||||||||||
(Cost $284,669,167) | ||||||||||||||||||
Other Assets in Excess of | 1,895,972 | |||||||||||||||||
|
| |||||||||||||||||
| Net Assets - 100.00% | $ | 284,196,778 | ||||||||||||||||
|
| |||||||||||||||||
* The principal amount/shares of each security is stated in the currency in which the security is denominated.
40 |
www.shiplp.com |
Table of Contents
| Stone Harbor High Yield Bond Fund | Statements of Investments | |
|
November 30, 2014 (Unaudited) | |
Currency Abbreviations:
| EUR | - | Euro Currency | ||
| GBP | - | Great British Pound | ||
| NOK | - | Norwegian Krone | ||
| USD | - | United States Dollar |
| (1) | Security exempt from registration under Rule 144A of the Securities Act of 1933. Such securities may normally be sold to qualified institutional buyers in transactions exempt from registration. Total market value of Rule 144A securities amounts to $70,895,493, which represents approximately 24.95% of net assets as of November 30, 2014. |
| (2) | Floating or variable rate security. Interest rate disclosed is that which is in effect as of November 30, 2014. |
| (3) | Payment-in-kind securities. |
| (4) | Securities were originally issued pursuant to Regulation S under the Securities Act of 1933, which exempts securities offered and sold outside of the United States from registration. Such securities cannot be sold in the United States without either an effective registration statement filed pursuant to teh Securities Act of 1933, or pursuant to an exemption from registration. As of November 30, 2014, the aggregate market value of those securities was $10,621,987, which represents approximately 3.74% of net assets. |
| (5) | Security is in default and therefore is non-income producing. |
| (6) | Issued with a zero coupon. Income is recognized through the accretion of discount. |
| (7) | Bank loans generally pay interest at rates which are periodically determined by reference to a base lending rate plus a premium. All loans carry a variable rate of interest. These base lending rates are generally (i) the Prime Rate offered by one or more major United States banks, (ii) the lending rate offered by one or more European banks such as the London Interbank Offered Rate (“LIBOR”) or (iii) the Certificate of Deposit rate. Bank Loans, while exempt from registration, under the Securities Act of 1933, contain certain restrictions on resale and cannot be sold publicly. Floating rate bank loans often require prepayments from excess cash flow or permit the borrower to repay at its election. The degree to which borrowers repay, whether as a contractual requirement or at their election, cannot be predicted with accuracy. |
| (8) | All or a portion of this position has not settled. Contract rates do not take effect until settlement date. |
Common Abbreviations:
| BV | - | Besloten Vennootschap is the Dutch term for private limited liability company. | ||
| GmbH | - | Gesellschaft mit beschrankter Haftung is the German term for a company with limited liability. | ||
| LLC | - | Limited Liability Corporation. | ||
| LP | - | Limited Partnership. | ||
| Ltd. | - | Limited. | ||
| NV | - | Naamloze Vennootschap is the Dutch term used for a public limited liability company. | ||
| PLC | - | Public Limited Company. | ||
| SA | - | Generally designates corporations in various countries, mostly those employing the civil law. | ||
| SCA | - | Société en commandite par actions is a term from Luxembourg meaning partnership by limited shares. | ||
| SpA | - | Società per Azioni is the Italian term for Limited share company. |
OUTSTANDING FORWARD FOREIGN CURRENCY CONTRACTS
| Counterparty | Foreign Currency | Contracted Amount** | Purchase/Sale Contract | Settlement Date | Current Value | Unrealized Appreciation/ (Depreciation) | ||||||||||
| ||||||||||||||||
J.P Morgan Chase & Co. | EUR | 5,465,400 | Sale | 01/08/2015 | $ | 6,797,950 | $ | 40,522 | ||||||||
J.P Morgan Chase & Co. | GBP | 2,551,700 | Sale | 01/08/2015 | 3,984,680 | 8,866 | ||||||||||
|
| |||||||||||||||
| $ | 49,388 | |||||||||||||||
|
| |||||||||||||||
J.P Morgan Chase & Co. | GBP | 38,667 | Purchase | 01/08/2015 | $ | 60,382 | $ | (183) | ||||||||
|
| |||||||||||||||
| $ | (183) | |||||||||||||||
|
| |||||||||||||||
** The contracted amount is stated in the currency in which the contract is denominated.
See Notes to Financial Statements.
Stone Harbor Investment Funds Semi-Annual Report | November 30, 2014 |
41 |
Table of Contents
| Stone Harbor Local Markets Fund | Statements of Investments | |
|
November 30, 2014 (Unaudited) | |
Currency | Rate | Maturity Date | Principal Amount* | Market Value | ||||||||||||||
| SOVEREIGN DEBT OBLIGATIONS - 70.84% | ||||||||||||||||||
Argentina - 1.96% | ||||||||||||||||||
Republic of Argentina: | ||||||||||||||||||
| USD | 7.000 | % | 10/03/2015 | 22,301,732 | $ | 21,613,476 | ||||||||||||
| USD | 7.000 | % | 04/17/2017 | 22,852,600 | 21,158,334 | |||||||||||||
|
| |||||||||||||||||
| 42,771,810 | ||||||||||||||||||
|
| |||||||||||||||||
Brazil - 9.97% | ||||||||||||||||||
Brazil Letras do Tesouro Nacional: | ||||||||||||||||||
| BRL | 0.000 | % | 01/01/2016 | 33,600,000 | 11,489,378(1) | |||||||||||||
| BRL | 0.000 | % | 01/01/2017 | 35,349,000 | 10,800,549(1) | |||||||||||||
| BRL | 0.000 | % | 01/01/2018 | 435,727,000 | 119,453,326(1) | |||||||||||||
| BRL | 0.000 | % | 07/01/2018 | 227,179,000 | 58,846,934(1) | |||||||||||||
Nota Do Tesouro Nacional | BRL | 10.000 | % | 01/01/2021 | 48,528,000 | 17,448,559 | ||||||||||||
|
| |||||||||||||||||
| 218,038,746 | ||||||||||||||||||
|
| |||||||||||||||||
Colombia - 4.07% | ||||||||||||||||||
Bogota Distrio Capital | COP | 9.750 | % | 07/26/2028 | 62,441,000,000 | 34,670,749(2) | ||||||||||||
International Bank for Reconstruction & | COP | 8.000 | % | 03/02/2020 | 1,020,000,000 | 531,141 | ||||||||||||
Republic of Colombia: | ||||||||||||||||||
| COP | 12.000 | % | 10/22/2015 | 19,735,000,000 | 9,424,679 | |||||||||||||
| COP | 7.750 | % | 04/14/2021 | 16,137,000,000 | 8,216,653 | |||||||||||||
| COP | 4.375 | % | 03/21/2023 | 17,400,000,000 | 7,181,707 | |||||||||||||
| COP | 9.850 | % | 06/28/2027 | 48,881,000,000 | 28,973,392 | |||||||||||||
|
| |||||||||||||||||
| 88,998,321 | ||||||||||||||||||
|
| |||||||||||||||||
Indonesia - 7.11% | ||||||||||||||||||
European Bank for Reconstruction & Development | IDR | 7.200 | % | 06/08/2016 | 37,740,000,000 | 3,112,993 | ||||||||||||
Indonesia Government: | ||||||||||||||||||
| IDR | 5.625 | % | 05/15/2023 | 271,052,000,000 | 19,433,833 | |||||||||||||
| IDR | 6.125 | % | 05/15/2028 | 132,110,000,000 | 9,241,963 | |||||||||||||
| IDR | 8.250 | % | 06/15/2032 | 56,400,000,000 | 4,673,427 | |||||||||||||
| IDR | 6.625 | % | 05/15/2033 | 184,000,000,000 | 13,000,164 | |||||||||||||
| IDR | 8.375 | % | 03/15/2034 | 19,020,000,000 | 1,606,819 | |||||||||||||
Inter-American Development Bank | IDR | 0.000 | % | 08/20/2015 | 286,830,000,000 | 22,480,571(1) | ||||||||||||
Republic of Indonesia: | ||||||||||||||||||
| IDR | 7.875 | % | 04/15/2019 | 159,200,000,000 | 13,194,920 | |||||||||||||
| IDR | 12.800 | % | 06/15/2021 | 2,980,000,000 | 307,364 | |||||||||||||
| IDR | 7.000 | % | 05/15/2022 | 132,570,000,000 | 10,428,319 | |||||||||||||
| IDR | 8.375 | % | 03/15/2024 | 237,330,000,000 | 20,390,077 | |||||||||||||
| IDR | 9.000 | % | 03/15/2029 | 420,070,000,000 | 37,552,964 | |||||||||||||
|
| |||||||||||||||||
| 155,423,414 | ||||||||||||||||||
|
| |||||||||||||||||
Malaysia - 7.71% | ||||||||||||||||||
Malaysian Government: | ||||||||||||||||||
| MYR | 4.012 | % | 09/15/2017 | 72,080,000 | 21,517,452 | |||||||||||||
| MYR | 3.314 | % | 10/31/2017 | 23,870,000 | 6,987,894 | |||||||||||||
| MYR | 3.580 | % | 09/28/2018 | 28,110,000 | 8,277,180 | |||||||||||||
| MYR | 3.654 | % | 10/31/2019 | 33,940,000 | 9,992,056 | |||||||||||||
| MYR | 3.492 | % | 03/31/2020 | 88,290,000 | 25,814,874 | |||||||||||||
| MYR | 3.889 | % | 07/31/2020 | 21,990,000 | 6,549,867 | |||||||||||||
| MYR | 4.160 | % | 07/15/2021 | 26,730,000 | 8,080,244 | |||||||||||||
| MYR | 4.048 | % | 09/30/2021 | 45,270,000 | 13,591,974 | |||||||||||||
| MYR | 3.418 | % | 08/15/2022 | 73,150,000 | 21,045,790 | |||||||||||||
| MYR | 3.480 | % | 03/15/2023 | 72,280,000 | 20,814,289 | |||||||||||||
| MYR | 4.181 | % | 07/15/2024 | 52,220,000 | 15,836,130 | |||||||||||||
42 |
www.shiplp.com |
Table of Contents
| Stone Harbor Local Markets Fund | Statements of Investments | |
|
November 30, 2014 (Unaudited) | |
Currency | Rate | Maturity Date | Principal | Market Value | ||||||||||||||
Malaysia (continued) | ||||||||||||||||||
Malaysian Government: (continued) | ||||||||||||||||||
| MYR | 4.392 | % | 04/15/2026 | 16,370,000 | $ | 5,008,760 | ||||||||||||
| MYR | 3.844 | % | 04/15/2033 | 18,480,000 | 5,195,735 | |||||||||||||
|
| |||||||||||||||||
| 168,712,245 | ||||||||||||||||||
|
| |||||||||||||||||
Mexico - 11.98% | ||||||||||||||||||
Mexican Bonos: | ||||||||||||||||||
| MXN | 6.000 | % | 06/18/2015 | 97,660,000 | 7,129,680 | |||||||||||||
| MXN | 6.250 | % | 06/16/2016 | 138,763,000 | 10,400,081 | |||||||||||||
| MXN | 7.250 | % | 12/15/2016 | 403,962,000 | 31,125,389 | |||||||||||||
| MXN | 5.000 | % | 06/15/2017 | 148,103,000 | 10,941,388 | |||||||||||||
| MXN | 7.750 | % | 12/14/2017 | 386,121,000 | 30,588,135 | |||||||||||||
| MXN | 8.500 | % | 12/13/2018 | 135,950,000 | 11,191,958 | |||||||||||||
| MXN | 8.000 | % | 06/11/2020 | 397,474,000 | 32,605,950 | |||||||||||||
| MXN | 6.500 | % | 06/10/2021 | 479,861,000 | 36,623,982 | |||||||||||||
| MXN | 6.500 | % | 06/09/2022 | �� | 334,818,000 | 25,469,303 | ||||||||||||
| MXN | 8.000 | % | 12/07/2023 | 105,551,000 | 8,795,355 | |||||||||||||
| MXN | 8.500 | % | 05/31/2029 | 58,535,000 | 5,097,190 | |||||||||||||
| MXN | 7.750 | % | 05/29/2031 | 209,386,000 | 17,057,488 | |||||||||||||
Mexican Udibonos: | ||||||||||||||||||
| MXN | 2.000 | % | 06/09/2022 | 86,159,837 | 6,108,709 | |||||||||||||
| MXN | 4.500 | % | 11/22/2035 | 336,798,546 | 28,811,786 | |||||||||||||
|
| |||||||||||||||||
| 261,946,394 | ||||||||||||||||||
|
| |||||||||||||||||
Poland - 4.92% | ||||||||||||||||||
Republic of Poland: | ||||||||||||||||||
| PLN | 5.000 | % | 04/25/2016 | 52,930,000 | 16,426,443 | |||||||||||||
| PLN | 0.000 | % | 07/25/2016 | 102,100,000 | 29,486,319(1) | |||||||||||||
| PLN | 3.000 | % | 08/24/2016 | 135,707,596 | 41,847,696 | |||||||||||||
| PLN | 4.750 | % | 04/25/2017 | 2,180,000 | 692,872 | |||||||||||||
| PLN | 5.250 | % | 10/25/2017 | 4,190,000 | 1,366,327 | |||||||||||||
| PLN | 2.750 | % | 08/25/2023 | 40,722,005 | 13,764,997 | |||||||||||||
| PLN | 3.250 | % | 07/25/2025 | 12,236,000 | 3,932,981 | |||||||||||||
|
| |||||||||||||||||
| 107,517,635 | ||||||||||||||||||
|
| |||||||||||||||||
Russia - 8.02% | ||||||||||||||||||
Russian Federation: | ||||||||||||||||||
| RUB | 7.400 | % | 04/19/2017 | 45,630,000 | 858,540 | |||||||||||||
| RUB | 7.400 | % | 06/14/2017 | 234,890,000 | 4,401,381 | |||||||||||||
| RUB | 6.200 | % | 01/31/2018 | 173,950,000 | 3,094,581 | |||||||||||||
| RUB | 7.850 | % | 03/10/2018 | 60,000,000 | 1,116,867(3) | |||||||||||||
| RUB | 7.850 | % | 03/10/2018 | 585,000,000 | 10,889,458(2) | |||||||||||||
| RUB | 7.500 | % | 03/15/2018 | 91,250,000 | 1,680,420 | |||||||||||||
| RUB | 7.500 | % | 02/27/2019 | 123,140,000 | 2,222,529 | |||||||||||||
| RUB | 6.700 | % | 05/15/2019 | 243,149,000 | 4,238,019 | |||||||||||||
| RUB | 6.800 | % | 12/11/2019 | 80,830,000 | 1,391,810 | |||||||||||||
| RUB | 6.400 | % | 05/27/2020 | 193,400,000 | 3,228,751 | |||||||||||||
| RUB | 7.600 | % | 04/14/2021 | 1,658,080,000 | 29,016,400 | |||||||||||||
| RUB | 7.000 | % | 11/24/2021 | 288,490,000 | 4,918,233(4) | |||||||||||||
| RUB | 7.600 | % | 07/20/2022 | 1,876,990,000 | 32,225,619 | |||||||||||||
| RUB | 7.000 | % | 01/25/2023 | 1,065,920,000 | 17,497,783 | |||||||||||||
| RUB | 7.000 | % | 08/16/2023 | 538,630,000 | 8,777,073 | |||||||||||||
| RUB | 8.150 | % | 02/03/2027 | 954,960,000 | 16,404,986 | |||||||||||||
| RUB | 7.050 | % | 01/19/2028 | 2,171,316,000 | 33,420,172 | |||||||||||||
|
| |||||||||||||||||
| 175,382,622 | ||||||||||||||||||
|
| |||||||||||||||||
Stone Harbor Investment Funds Semi-Annual Report | November 30, 2014 |
43 |
Table of Contents
| Stone Harbor Local Markets Fund | Statements of Investments | |
|
November 30, 2014 (Unaudited) | |
Currency | Rate | Maturity Date | Principal | Market Value | ||||||||||
South Africa - 4.89% | ||||||||||||||
Asian Development Bank | ZAR | 6.500% | 09/15/2015 | 4,500,000 | $ | 404,546 | ||||||||
Republic of South Africa: | ||||||||||||||
| ZAR | 7.250% | 01/15/2020 | 97,930,000 | 8,963,605 | ||||||||||
| ZAR | 7.000% | 02/28/2031 | 190,300,000 | 15,491,967 | ||||||||||
| ZAR | 6.250% | 03/31/2036 | 390,650,000 | 28,140,142 | ||||||||||
| ZAR | 6.500% | 02/28/2041 | 260,160,000 | 18,811,154 | ||||||||||
| ZAR | 8.750% | 01/31/2044 | 229,260,000 | 21,292,595 | ||||||||||
| ZAR | 8.750% | 02/28/2048 | 149,110,000 | 13,857,395 | ||||||||||
|
| |||||||||||||
| 106,961,404 | ||||||||||||||
|
| |||||||||||||
Thailand - 4.85% | ||||||||||||||
Thailand Government: | ||||||||||||||
| THB | 3.580% | 12/17/2017 | 293,730,000 | 9,315,155 | ||||||||||
| THB | 3.875% | 06/13/2019 | 876,240,000 | 28,429,685 | ||||||||||
| THB | 1.200% | 07/14/2021 | 829,637,359 | 24,369,962 | ||||||||||
| THB | 3.650% | 12/17/2021 | 191,610,000 | 6,203,933 | ||||||||||
| THB | 3.625% | 06/16/2023 | 1,166,310,000 | 37,757,879 | ||||||||||
|
| |||||||||||||
| 106,076,614 | ||||||||||||||
|
| |||||||||||||
Turkey - 4.92% | ||||||||||||||
Republic of Turkey: | ||||||||||||||
| TRY | 9.500% | 01/12/2022 | 67,290,000 | 33,314,305 | ||||||||||
| TRY | 8.500% | 09/14/2022 | 51,360,000 | 24,269,660 | ||||||||||
| TRY | 7.100% | 03/08/2023 | 59,460,000 | 25,792,192 | ||||||||||
| TRY | 10.400% | 03/20/2024 | 25,200,000 | 13,369,137 | ||||||||||
| TRY | 9.000% | 07/24/2024 | 22,160,000 | 10,913,406 | ||||||||||
|
| |||||||||||||
| 107,658,700 | ||||||||||||||
|
| |||||||||||||
Venezuela - 0.44% | ||||||||||||||
Republic of Venezuela | USD | 5.750% | 02/26/2016 | 12,069,500 | 9,685,774(2) | |||||||||
|
| |||||||||||||
| TOTAL SOVEREIGN DEBT OBLIGATIONS | 1,549,173,679 | |||||||||||||
|
| |||||||||||||
(Cost $1,754,958,981) | ||||||||||||||
| CORPORATE BONDS - 3.27% | ||||||||||||||
Colombia - 0.80% | ||||||||||||||
Emgesa SA ESP: | ||||||||||||||
| COP | 8.750% | 01/25/2021 | 616,000,000 | 301,311(3) | ||||||||||
| COP | 8.750% | 01/25/2021 | 16,739,000,000 | 8,187,737(2) | ||||||||||
Empresas Publicas de Medellin ESP: | ||||||||||||||
| COP | 8.375% | 02/01/2021 | 776,000,000 | 372,312(3) | ||||||||||
| COP | 8.375% | 02/01/2021 | 3,338,000,000 | 1,601,516(2) | ||||||||||
| COP | 7.625% | 09/10/2024 | 9,444,000,000 | 4,327,275(3) | ||||||||||
Findeter | COP | 7.875% | 08/12/2024 | 5,687,000,000 | 2,639,146(3) | |||||||||
|
| |||||||||||||
| 17,429,297 | ||||||||||||||
|
| |||||||||||||
Mexico - 0.77% | ||||||||||||||
America Movil SAB de CV | MXN | 6.000% | 06/09/2019 | 134,900,000 | 9,882,890 | |||||||||
Petroleos Mexicanos | MXN | 7.650% | 11/24/2021 | 91,160,000 | 7,075,231(3) | |||||||||
|
| |||||||||||||
| 16,958,121 | ||||||||||||||
|
| |||||||||||||
Venezuela - 1.70% | ||||||||||||||
Petroleos de Venezuela SA: | ||||||||||||||
| USD | 8.500% | 11/02/2017 | 42,791,600 | 31,184,378(2) | ||||||||||
44 |
www.shiplp.com |
Table of Contents
| Stone Harbor Local Markets Fund | Statements of Investments | |
|
November 30, 2014 (Unaudited) | |
Counterparty | Currency | Rate | Maturity Date | Principal | Market Value | |||||||||||||||
Venezuela (continued) | ||||||||||||||||||||
Petroleos de Venezuela SA: (continued) | ||||||||||||||||||||
| USD | 6.000 | % | 05/16/2024 | 12,878,519 | $ | 5,908,021(2) | ||||||||||||||
|
| |||||||||||||||||||
| 37,092,399 | ||||||||||||||||||||
|
| |||||||||||||||||||
| TOTAL CORPORATE BONDS | 71,479,817 | |||||||||||||||||||
|
| |||||||||||||||||||
(Cost $82,516,332) | ||||||||||||||||||||
| CREDIT LINKED NOTES - 5.76% | ||||||||||||||||||||
Colombia - 1.65% | ||||||||||||||||||||
Titulos de Tesoreria - Series B: | ||||||||||||||||||||
| Citigroup Global Markets | COP | 7.000 | % | 02/26/2015 | 11,165,310,000 | 5,184,970 | ||||||||||||||
| Citigroup Global Markets | COP | 7.250 | % | 06/16/2016 | 2,200,000,000 | 1,028,884 | ||||||||||||||
| Citigroup Global Markets | COP | 7.250 | % | 06/16/2016 | 9,678,000,000 | 4,526,152 | ||||||||||||||
| Citigroup Global Markets | COP | 11.000 | % | 07/27/2020 | 4,500,000,000 | 2,533,762 | ||||||||||||||
| Citigroup Global Markets | COP | 11.000 | % | 07/27/2020 | 4,570,000,000 | 2,573,176 | ||||||||||||||
| Citigroup Global Markets | COP | 11.000 | % | 07/27/2020 | 6,546,000,000 | 3,685,780(3) | ||||||||||||||
| Citigroup Global Markets | COP | 7.000 | % | 05/05/2022 | 5,200,000,000 | 2,427,920 | ||||||||||||||
| Citigroup Global Markets | COP | 7.000 | % | 05/05/2022 | 10,113,510,000 | 4,722,075 | ||||||||||||||
| J.P. Morgan Chase & Co. | COP | 7.000 | % | 05/06/2022 | 12,970,000,000 | 6,053,452 | ||||||||||||||
| Citigroup Global Markets | COP | 10.000 | % | 07/25/2024 | 6,000,000,000 | 3,352,643 | ||||||||||||||
|
| |||||||||||||||||||
| 36,088,814 | ||||||||||||||||||||
|
| |||||||||||||||||||
Indonesia - 4.11% | ||||||||||||||||||||
Republic of Indonesia: | ||||||||||||||||||||
| Deutsche Bank AG London | IDR | 8.250 | % | 07/19/2021 | 111,500,000,000 | 9,421,677 | ||||||||||||||
| J.P. Morgan Chase & Co. | IDR | 7.000 | % | 05/15/2022 | 105,974,000,000 | 8,292,787 | ||||||||||||||
| Deutsche Bank AG London | IDR | 7.000 | % | 05/17/2022 | 60,000,000,000 | 4,733,088 | ||||||||||||||
| Deutsche Bank AG London | IDR | 7.000 | % | 05/17/2022 | 240,900,000,000 | 19,003,346 | ||||||||||||||
| Deutsche Bank AG London | IDR | 5.625 | % | 05/17/2023 | 15,000,000,000 | 1,075,172 | ||||||||||||||
| J.P. Morgan Chase & Co. | IDR | 5.625 | % | 05/17/2023 | 180,398,000,000 | 12,860,231 | ||||||||||||||
| HSBC Bank | IDR | 11.000 | % | 09/15/2025 | 49,455,000,000 | 4,945,905 | ||||||||||||||
| HSBC Bank | IDR | 11.000 | % | 09/15/2025 | 60,487,000,000 | 6,049,196 | ||||||||||||||
| Deutsche Bank AG London | IDR | 11.000 | % | 09/17/2025 | 32,500,000,000 | 3,249,760 | ||||||||||||||
| Deutsche Bank AG London | IDR | 7.000 | % | 05/18/2027 | 25,400,000,000 | 1,924,585 | ||||||||||||||
| J.P. Morgan Chase & Co. | IDR | 6.125 | % | 05/17/2028 | 16,900,000,000 | 1,182,197 | ||||||||||||||
| Deutsche Bank AG London | IDR | 8.250 | % | 06/17/2032 | 176,000,000,000 | 14,560,091 | ||||||||||||||
| J.P. Morgan Chase & Co. | IDR | 6.625 | % | 05/15/2033 | 36,002,000,000 | 2,525,214 | ||||||||||||||
|
| |||||||||||||||||||
| 89,823,249 | ||||||||||||||||||||
|
| |||||||||||||||||||
| TOTAL CREDIT LINKED NOTES | 125,912,063 | |||||||||||||||||||
|
| |||||||||||||||||||
(Cost $169,288,545) | ||||||||||||||||||||
Stone Harbor Investment Funds Semi-Annual Report | November 30, 2014 |
45 |
Table of Contents
| Stone Harbor Local Markets Fund | Statements of Investments | |
|
November 30, 2014 (Unaudited) | |
Currency | Rate | Maturity Date | Principal | Market Value | ||||||||||||
SHORT TERM INVESTMENTS - 6.13% | ||||||||||||||||
Money Market Mutual Funds - 6.13% | ||||||||||||||||
Dreyfus Institutional Cash | USD | 0.06001 | % | N/A | 133,951,527 | $ | 133,951,527 | |||||||||
|
| |||||||||||||||
| TOTAL SHORT TERM INVESTMENTS | 133,951,527 | |||||||||||||||
|
| |||||||||||||||
(Cost $133,951,527) | ||||||||||||||||
| Total Investments - 86.00% | 1,880,517,086 | |||||||||||||||
(Cost $2,140,715,385) | ||||||||||||||||
Other Assets In Excess of Liabilities - 14.00% | 306,188,552 | |||||||||||||||
|
| |||||||||||||||
| Net Assets - 100.00% | $ | 2,186,705,638 | ||||||||||||||
|
| |||||||||||||||
* The principal amount/shares of each security is stated in the currency in which the security is denominated.
| Currency Abbreviations: | ||||
| BRL | - | Brazilian Real | ||
| CLP | - | Chilean Peso | ||
| COP | - | Colombian Peso | ||
| IDR | - | Indonesian Rupiah | ||
| MXN | - | Mexican Peso | ||
| MYR | - | Malaysian Ringgit | ||
| PLN | - | Polish Zloty | ||
| RUB | - | Russian Ruble | ||
| THB | - | Thai Baht | ||
| TRY | - | Turkish Lira | ||
| USD | - | United States Dollar | ||
| ZAR | - | South African Rand | ||
| (1) | Issued with a zero coupon. Income is recognized through the accretion of discount. |
| (2) | Securities were originally issued pursuant to Regulation S under the Securities Act of 1933, which exempts securities offered and sold outside of the United States from registration. Such securities cannot be sold in the United States without either an effective registration statement filed pursuant to teh Securities Act of 1933, or pursuant to an exemption from registration. As of November 30, 2014, the aggregate market value of those securities was $102,127,633, which represents approximately 4.67% of net assets. |
| (3) | Security exempt from registration under Rule 144A of the Securities Act of 1933. Such securities may normally be sold to qualified institutional buyers in transactions exempt from registration. Total market value of Rule 144A securities amounts to $19,517,922, which represents approximately 0.89% of net assets as of November 30, 2014. |
| (4) | Step bond. Coupon changes periodically based upon a predetermined schedule. Interest rate disclosed is that which is in effect as of November 30, 2014. |
| Common Abbreviations: | ||||
| ESP | - | Empresa de Servicios Publicos is the Colombian term for Public Service Company. | ||
| SA | - | Generally designates corporations in various countries mostly employing civil law. | ||
| SAB de CV | - | A variable capital company. | ||
46 |
www.shiplp.com |
Table of Contents
| Stone Harbor Local Markets Fund | Statements of Investments | |
|
November 30, 2014 (Unaudited) | |
OUTSTANDING FORWARD FOREIGN CURRENCY CONTRACTS
| Counterparty | Foreign Currency | Contracted Amount** | Purchase/Sale Contract | Settlement Date | Current Value | Unrealized Appreciation/ (Depreciation) | ||||||||||
| ||||||||||||||||
Citigroup Global Markets | BRL | 58,085,895 | Sale | 12/02/2014 | $ | 22,542,121 | $ | 1,383,198 | ||||||||
Citigroup Global Markets | CLP | 8,830,019,640 | Sale | 12/11/2014 | 14,492,691 | 277,921 | ||||||||||
|
| |||||||||||||||
| $ | 1,661,119 | |||||||||||||||
|
| |||||||||||||||
Citigroup Global Markets | BRL | 58,085,895 | Purchase | 12/02/2014 | $ | 22,542,121 | $ | (101,771) | ||||||||
Citigroup Global Markets | CLP | 8,830,019,640 | Purchase | 12/11/2014 | 14,492,691 | (317,372) | ||||||||||
Citigroup Global Markets | COP | 13,316,270,000 | Purchase | 01/09/2015 | 5,981,870 | (517,042) | ||||||||||
Citigroup Global Markets | COP | 33,364,990,300 | Purchase | 02/25/2015 | 14,927,372 | (526,537) | ||||||||||
Citigroup Global Markets | MYR | 126,178,269 | Purchase | 01/12/2015 | 37,167,280 | (1,025,934) | ||||||||||
Citigroup Global Markets | THB | 1,192,476,850 | Purchase | 01/16/2015 | 36,232,988 | (241,048) | ||||||||||
Citigroup Global Markets | TRY | 177,190,334 | Purchase | 12/15/2014 | 79,505,763 | (432,130) | ||||||||||
Citigroup Global Markets | ZAR | 475,345,254 | Purchase | 12/17/2014 | 42,775,495 | (265,156) | ||||||||||
Goldman Sachs & Co. | PLN | 25,788,720 | Purchase | 12/12/2014 | 7,658,392 | (30,094) | ||||||||||
Goldman Sachs & Co. | ZAR | 245,291,158 | Purchase | 12/17/2014 | 22,073,326 | (117,940) | ||||||||||
J.P. Morgan Chase & Co. | MYR | 147,158,545 | Purchase | 12/12/2014 | 43,456,390 | (394,304) | ||||||||||
J.P. Morgan Chase & Co. | TRY | 205,055,584 | Purchase | 12/15/2014 | 92,008,973 | (437,527) | ||||||||||
|
| |||||||||||||||
| $ | (4,406,855) | |||||||||||||||
|
| |||||||||||||||
** The contracted amount is stated in the currency in which the contract is denominated.
See Notes to Financial Statements.
Stone Harbor Investment Funds Semi-Annual Report | November 30, 2014 |
47 |
Table of Contents
| Stone Harbor Emerging Markets Corporate Debt Fund | Statements of Investments | |
|
November 30, 2014 (Unaudited) | |
Currency | Rate | Maturity Date | Principal | Market Value | ||||||||||||||
| CORPORATE BONDS - 98.62% | ||||||||||||||||||
Angola - 0.85% | ||||||||||||||||||
Puma International Financing SA | USD | 6.750 | % | 02/01/2021 | 205,000 | $ | 206,025(1) | |||||||||||
|
| |||||||||||||||||
Argentina - 1.60% | ||||||||||||||||||
Arcos Dorados Holdings, Inc. | USD | 6.625 | % | 09/27/2023 | 100,000 | 102,750(2) | ||||||||||||
YPF SA | USD | 8.750 | % | 04/04/2024 | 275,000 | 287,375(1) | ||||||||||||
|
| |||||||||||||||||
| 390,125 | ||||||||||||||||||
|
| |||||||||||||||||
Brazil - 7.37% | ||||||||||||||||||
CIMPOR Financial Operations BV | USD | 5.750 | % | 07/17/2024 | 361,000 | 338,437(1) | ||||||||||||
Cosan Luxembourg SA | USD | 5.000 | % | 03/14/2023 | 200,000 | 187,262(1) | ||||||||||||
ESAL GmbH | USD | 6.250 | % | 02/05/2023 | 670,000 | 682,562(1) | ||||||||||||
Fibria Overseas Finance Ltd. | USD | 5.250 | % | 05/12/2024 | 125,000 | 125,938 | ||||||||||||
Itau Unibanco Holding SA | USD | 5.650 | % | 03/19/2022 | 98,000 | 100,695(1) | ||||||||||||
Odebrecht Drilling Norbe VIII/IX Ltd. | USD | 6.350 | % | 06/30/2021 | 175,875 | 177,634(2) | ||||||||||||
QGOG Atlantic/Alaskan Rigs Ltd. | USD | 5.250 | % | 07/30/2018 | 74,637 | 74,637(1) | ||||||||||||
Samarco Mineracao SA | USD | 4.125 | % | 11/01/2022 | 40,000 | 36,540(1) | ||||||||||||
Schahin II Finance Co. SPV Ltd. | USD | 5.875 | % | 09/25/2022 | 76,443 | 68,799(1) | ||||||||||||
|
| |||||||||||||||||
| 1,792,504 | ||||||||||||||||||
|
| |||||||||||||||||
Chile - 2.95% | ||||||||||||||||||
Cencosud SA | USD | 4.875 | % | 01/20/2023 | 180,000 | 180,000(1) | ||||||||||||
Colbun SA | USD | 4.500 | % | 07/10/2024 | 200,000 | 201,500(1) | ||||||||||||
Empresa Nacional de Electricidad SA | USD | 4.250 | % | 04/15/2024 | 89,000 | 90,557 | ||||||||||||
VTR Finance BV | USD | 6.875 | % | 01/15/2024 | 236,000 | 246,396(1) | ||||||||||||
|
| |||||||||||||||||
| 718,453 �� | ||||||||||||||||||
|
| |||||||||||||||||
China - 5.49% | ||||||||||||||||||
Bestgain Real Estate Ltd. | USD | 2.625 | % | 03/13/2018 | 200,000 | 196,137(2) | ||||||||||||
CITIC Ltd.: | ||||||||||||||||||
| USD | 7.875 | % | Perpetual | 200,000 | 211,000(3) | |||||||||||||
| USD | 8.625 | % | Perpetual | 200,000 | 230,000(2)(3) | |||||||||||||
Country Garden Holdings Co. Ltd. | USD | 11.125 | % | 02/23/2018 | 165,000 | 176,220(2) | ||||||||||||
Kaisa Group Holdings Ltd. | USD | 8.875 | % | 03/19/2018 | 150,000 | 152,625(1) | ||||||||||||
Lenovo Group Ltd. | USD | 4.700 | % | 05/08/2019 | 350,000 | 368,189 | ||||||||||||
|
| |||||||||||||||||
| 1,334,171 | ||||||||||||||||||
|
| |||||||||||||||||
Colombia - 5.35% | ||||||||||||||||||
Bancolombia SA | USD | 5.125 | % | 09/11/2022 | 200,000 | 203,000 | ||||||||||||
Empresa de Energia de Bogota SA ESP | USD | 6.125 | % | 11/10/2021 | 175,000 | 189,875(1) | ||||||||||||
Grupo Aval Ltd. | USD | 5.250 | % | 02/01/2017 | 130,000 | 138,125(1) | ||||||||||||
GrupoSura Finance SA | USD | 5.700 | % | 05/18/2021 | 157,000 | 171,130(1) | ||||||||||||
Millicom International Cellular SA | USD | 6.625 | % | 10/15/2021 | 124,000 | 130,510(1) | ||||||||||||
Pacific Rubiales Energy Corp. | USD | 5.125 | % | 03/28/2023 | 340,000 | 317,900(1) | ||||||||||||
SUAM Finance BV | USD | 4.875 | % | 04/17/2024 | 148,000 | 151,330(1) | ||||||||||||
|
| |||||||||||||||||
| 1,301,870 | ||||||||||||||||||
|
| |||||||||||||||||
Ghana - 1.31% | ||||||||||||||||||
Tullow Oil PLC | USD | 6.000 | % | 11/01/2020 | 370,000 | 318,200(1) | ||||||||||||
|
| |||||||||||||||||
Guatemala - 0.88% | ||||||||||||||||||
Comcel Trust | USD | 6.875 | % | 02/06/2024 | 200,000 | 214,000(1) | ||||||||||||
|
| |||||||||||||||||
48 |
www.shiplp.com |
Table of Contents
| Stone Harbor Emerging Markets Corporate Debt Fund | Statements of Investments | |
|
November 30, 2014 (Unaudited) | |
Currency | Rate | Maturity Date | Principal | Market Value | ||||||||||||||
Hong Kong - 4.47% | ||||||||||||||||||
Goodman HK Finance | USD | 4.375 | % | 06/19/2024 | 300,000 | $ | 305,830 | |||||||||||
Hutchison Whampoa International 09 Ltd. | USD | 7.625 | % | 04/09/2019 | 42,000 | 51,173(1) | ||||||||||||
Hutchison Whampoa International 10 Ltd. | USD | 6.000 | % | Perpetual | 210,000 | 217,350(2)(3) | ||||||||||||
Hutchison Whampoa International 11 Ltd. | USD | 4.625 | % | 01/13/2022 | 37,000 | 40,269(1) | ||||||||||||
Hutchison Whampoa International 12 Ltd. | USD | 6.000 | % | Perpetual | 140,000 | 149,883(2)(3) | ||||||||||||
Li & Fung Ltd.: | ||||||||||||||||||
| USD | 5.500 | % | 05/16/2017 | 100,000 | 108,451(2) | |||||||||||||
| USD | 6.000 | % | Perpetual | 200,000 | 213,000(2)(3) | |||||||||||||
|
| |||||||||||||||||
| 1,085,956 | ||||||||||||||||||
|
| |||||||||||||||||
India - 5.01% | ||||||||||||||||||
Bharti Airtel International Netherlands BV: | ||||||||||||||||||
| USD | 5.125 | % | 03/11/2023 | 256,000 | 275,136(1) | |||||||||||||
| USD | 5.350 | % | 05/20/2024 | 200,000 | 218,516(2) | |||||||||||||
ICICI Bank Ltd. | USD | 5.750 | % | 11/16/2020 | 114,000 | 128,129(2) | ||||||||||||
Reliance Holding USA, Inc. | USD | 5.400 | % | 02/14/2022 | 200,000 | 222,213(1) | ||||||||||||
Vedanta Resources PLC: | ||||||||||||||||||
| USD | 6.750 | % | 06/07/2016 | 75,000 | 77,719(2) | |||||||||||||
| USD | 6.000 | % | 01/31/2019 | 130,000 | 125,775(1) | |||||||||||||
| USD | 8.250 | % | 06/07/2021 | 54,000 | 54,540(1) | |||||||||||||
| USD | 7.125 | % | 05/31/2023 | 120,000 | 115,800(1) | |||||||||||||
|
| |||||||||||||||||
| 1,217,828 | ||||||||||||||||||
|
| |||||||||||||||||
Indonesia - 4.04% | ||||||||||||||||||
Indosat Palapa Co. BV | USD | 7.375 | % | 07/29/2020 | 250,000 | 265,938(2) | ||||||||||||
Listrindo Capital BV | USD | 6.950 | % | 02/21/2019 | 320,000 | 341,696(1) | ||||||||||||
Pelabuhan Indonesia III PT | USD | 4.875 | % | 10/01/2024 | 162,000 | 167,062(1) | ||||||||||||
Perusahaan Gas Negara Persero Tbk PT | USD | 5.125 | % | 05/16/2024 | 200,000 | 208,125(1) | ||||||||||||
|
| |||||||||||||||||
| 982,821 | ||||||||||||||||||
|
| |||||||||||||||||
Israel - 3.40% | ||||||||||||||||||
B Communications Ltd. | USD | 7.375 | % | 02/15/2021 | 348,000 | 374,970(1) | ||||||||||||
Delek & Avner Tamar Bond Ltd.: | ||||||||||||||||||
| USD | 3.839 | % | 12/30/2018 | 122,000 | 124,745(1) | |||||||||||||
| USD | 5.082 | % | 12/30/2023 | 119,000 | 122,867(1) | |||||||||||||
Israel Electric Corp. Ltd. | USD | 5.000 | % | 11/12/2024 | 200,000 | 204,250 | ||||||||||||
|
| |||||||||||||||||
| 826,832 | ||||||||||||||||||
|
| |||||||||||||||||
Jamaica - 1.41% | ||||||||||||||||||
Digicel Group Ltd. | USD | 7.125 | % | 04/01/2022 | 350,000 | 343,875(2) | ||||||||||||
|
| |||||||||||||||||
Kazakhstan - 2.28% | ||||||||||||||||||
Nostrum Oil & Gas Finance BV | USD | 6.375 | % | 02/14/2019 | 153,000 | 147,239(1) | ||||||||||||
Zhaikmunai LP | USD | 7.125 | % | 11/13/2019 | 425,000 | 406,938(1) | ||||||||||||
|
| |||||||||||||||||
| 554,177 | ||||||||||||||||||
|
| |||||||||||||||||
Macau - 1.55% | ||||||||||||||||||
MCE Finance Ltd. | USD | 5.000 | % | 02/15/2021 | 388,000 | 377,330(1) | ||||||||||||
|
| |||||||||||||||||
Malaysia - 0.92% | ||||||||||||||||||
Malayan Banking Bhd | USD | 3.250 | % | 09/20/2022 | 220,000 | 222,768(3) | ||||||||||||
|
| |||||||||||||||||
Mexico - 10.82% | ||||||||||||||||||
BBVA Bancomer SA | USD | 6.750 | % | 09/30/2022 | 480,000 | 541,824(1) | ||||||||||||
Cemex Finance LLC | USD | 9.375 | % | 10/12/2022 | 118,000 | 135,700(1) | ||||||||||||
Cemex SAB de CV: | ||||||||||||||||||
| USD | 9.500 | % | 06/15/2018 | 190,000 | 211,612(1) | |||||||||||||
Stone Harbor Investment Funds Semi-Annual Report | November 30, 2014 |
49 |
Table of Contents
| Stone Harbor Emerging Markets Corporate Debt Fund | Statements of Investments | |
|
November 30, 2014 (Unaudited) | |
Currency | Rate | Maturity Date | Principal | Market Value | ||||||||||||||
Mexico (continued) | ||||||||||||||||||
Cemex SAB de CV: (continued) | ||||||||||||||||||
| USD | 7.250 | % | 01/15/2021 | 120,000 | $ | 127,200(1) | ||||||||||||
Fresnillo PLC | USD | 5.500 | % | 11/13/2023 | 125,000 | 129,688(1) | ||||||||||||
Gruma SAB de CV | USD | 4.875 | % | 12/01/2024 | 200,000 | 205,450(1) | ||||||||||||
Metalsa SAB de CV | USD | 4.900 | % | 04/24/2023 | 406,000 | 377,580(1) | ||||||||||||
Mexichem SAB de CV | USD | 4.875 | % | 09/19/2022 | 110,000 | 114,675(1) | ||||||||||||
Mexico Generadora De Energia | USD | 5.500 | % | 12/06/2032 | 160,000 | 164,000(1) | ||||||||||||
Sixsigma Networks Mexico SA de CV | USD | 8.250 | % | 11/07/2021 | 203,000 | 211,120(1) | ||||||||||||
Tenedora Nemak SAB de CV | USD | 5.500 | % | 02/28/2023 | 400,000 | 412,000(1) | ||||||||||||
|
| |||||||||||||||||
| 2,630,849 | ||||||||||||||||||
|
| |||||||||||||||||
Morocco - 1.97% | ||||||||||||||||||
OCP SA: | ||||||||||||||||||
| USD | 5.625 | % | 04/25/2024 | 378,000 | 401,152(1) | |||||||||||||
| USD | 6.875 | % | 04/25/2044 | 70,000 | 77,263(1) | |||||||||||||
|
| |||||||||||||||||
| 478,415 | ||||||||||||||||||
|
| |||||||||||||||||
Peru - 4.04% | ||||||||||||||||||
Banco de Credito del Peru | USD | 5.375 | % | 09/16/2020 | 62,000 | 67,657(2) | ||||||||||||
Cementos Pacasmayo SAA | USD | 4.500 | % | 02/08/2023 | 60,000 | 56,550(1) | ||||||||||||
Cia Minera Ares SAC | USD | 7.750 | % | 01/23/2021 | 200,000 | 210,500(1) | ||||||||||||
Cia Minera Milpo SAA | USD | 4.625 | % | 03/28/2023 | 192,000 | 191,040(1) | ||||||||||||
Consorcio Transmantaro SA | USD | 4.375 | % | 05/07/2023 | 254,000 | 250,825(1) | ||||||||||||
Inkia Energy Ltd. | USD | 8.375 | % | 04/04/2021 | 140,000 | 148,750(1) | ||||||||||||
Volcan Cia Minera SAA | USD | 5.375 | % | 02/02/2022 | 57,000 | 56,430(1) | ||||||||||||
|
| |||||||||||||||||
| 981,752 | ||||||||||||||||||
|
| |||||||||||||||||
Philippines - 1.58% | ||||||||||||||||||
FPT Finance Ltd. | USD | 6.375 | % | 09/28/2020 | 350,000 | 383,250 | ||||||||||||
|
| |||||||||||||||||
Qatar - 3.39% | ||||||||||||||||||
Ooredoo International Finance Ltd. | USD | 4.750 | % | 02/16/2021 | 434,000 | 475,230(2) | ||||||||||||
Ras Laffan Liquefied Natural Gas Co. Ltd. II | USD | 5.298 | % | 09/30/2020 | 219,887 | 239,127(2) | ||||||||||||
Ras Laffan Liquefied Natural Gas Co. Ltd. III | USD | 6.750 | % | 09/30/2019 | 93,000 | 110,554(2) | ||||||||||||
|
| |||||||||||||||||
| 824,911 | ||||||||||||||||||
|
| |||||||||||||||||
Russia - 4.33% | ||||||||||||||||||
Evraz Group SA | USD | 6.500 | % | 04/22/2020 | 200,000 | 165,000(2) | ||||||||||||
Vimpel Communications Holdings BV: | ||||||||||||||||||
| USD | 6.255 | % | 03/01/2017 | 200,000 | 197,000(2) | |||||||||||||
| USD | 7.504 | % | 03/01/2022 | 200,000 | 186,250(2) | |||||||||||||
| USD | 5.950 | % | 02/13/2023 | 126,000 | 105,368(1) | |||||||||||||
Vimpel Communications Via VIP Finance Ireland Ltd. OJSC | USD | 7.748 | % | 02/02/2021 | 148,000 | 141,710(1) | ||||||||||||
Wind Acquisition Finance SA | EUR | 4.000 | % | 07/15/2020 | 206,000 | 256,792(1) | ||||||||||||
|
| |||||||||||||||||
| 1,052,120 | ||||||||||||||||||
|
| |||||||||||||||||
Saudi Arabia - 0.89% | ||||||||||||||||||
Saudi Electricity Global Sukuk Co. 3: | ||||||||||||||||||
| USD | 4.000 | % | 04/08/2024 | 130,000 | 136,825(1) | |||||||||||||
| USD | 5.500 | % | 04/08/2044 | 72,000 | 78,930(1) | |||||||||||||
|
| |||||||||||||||||
| 215,755 | ||||||||||||||||||
|
| |||||||||||||||||
50 |
www.shiplp.com |
Table of Contents
| Stone Harbor Emerging Markets Corporate Debt Fund | Statements of Investments | |
|
November 30, 2014 (Unaudited) | |
Currency | Rate | Maturity Date | Principal | Market Value | ||||||||||||||
Singapore - 2.32% | ||||||||||||||||||
DBS Bank Ltd. | USD | 3.625 | % | 09/21/2022 | 80,000 | $ | 82,727(2) | |||||||||||
Olam International Ltd. | USD | 5.750 | % | 09/20/2017 | 400,000 | 419,500 | ||||||||||||
Oversea-Chinese Banking Corp. Ltd. | USD | 4.000 | % | 10/15/2024 | 61,000 | 62,861(1)(3) | ||||||||||||
|
| |||||||||||||||||
| 565,088 | ||||||||||||||||||
|
| |||||||||||||||||
South Africa - 0.83% | ||||||||||||||||||
Myriad International Holdings BV | USD | 6.000 | % | 07/18/2020 | 183,000 | 201,757(1) | ||||||||||||
|
| |||||||||||||||||
South Korea - 3.33% | ||||||||||||||||||
Korea Gas Corp.: | ||||||||||||||||||
| USD | 2.875 | % | 07/29/2018 | 30,000 | 30,861(1) | |||||||||||||
| USD | 3.875 | % | 02/12/2024 | 150,000 | 159,336(1) | |||||||||||||
Korea Hydro & Nuclear Power Co. Ltd. | USD | 4.750 | % | 07/13/2021 | 160,000 | 178,896(2) | ||||||||||||
Korea Midland Power Co. Ltd. | USD | 2.750 | % | 02/11/2019 | 300,000 | 305,896(2) | ||||||||||||
Korea National Oil Corp. | USD | 3.250 | % | 07/10/2024 | 134,000 | 135,416(1) | ||||||||||||
|
| |||||||||||||||||
| 810,405 | ||||||||||||||||||
|
| |||||||||||||||||
Thailand - 3.62% | ||||||||||||||||||
Bangkok Bank PCL: | ||||||||||||||||||
| USD | 3.300 | % | 10/03/2018 | 64,000 | 66,167(1) | |||||||||||||
| USD | 3.875 | % | 09/27/2022 | 136,000 | 141,234(1) | |||||||||||||
PTT Exploration & Production PCL | USD | 4.875 | % | Perpetual | 473,000 | 481,987(1)(3) | ||||||||||||
PTT Global Chemical PCL | USD | 4.250 | % | 09/19/2022 | 80,000 | 82,944(1) | ||||||||||||
PTTEP Canada International Finance Ltd. | USD | �� | 5.692 | % | 04/05/2021 | 94,000 | 107,388(2) | |||||||||||
|
| |||||||||||||||||
| 879,720 | ||||||||||||||||||
|
| |||||||||||||||||
Trinidad - 0.78% | ||||||||||||||||||
Columbus International Inc. | USD | 7.375 | % | 03/30/2021 | 175,000 | 189,000(1) | ||||||||||||
|
| |||||||||||||||||
Turkey - 4.96% | ||||||||||||||||||
Turk Telekomunikasyon AS | USD | 4.875 | % | 06/19/2024 | 430,000 | 439,137(1) | ||||||||||||
Turkiye Garanti Bankasi AS: | ||||||||||||||||||
| USD | 4.000 | % | 09/13/2017 | 156,000 | 160,485(1) | |||||||||||||
| USD | 4.750 | % | 10/17/2019 | 140,000 | 145,425(1) | |||||||||||||
| USD | 5.250 | % | 09/13/2022 | 101,000 | 105,899(1) | |||||||||||||
Turkiye Is Bankasi: | ||||||||||||||||||
| USD | 5.500 | % | 04/21/2019 | 133,000 | 141,811(1) | |||||||||||||
| USD | 6.000 | % | 10/24/2022 | 209,000 | 213,703(1) | |||||||||||||
|
| |||||||||||||||||
| 1,206,460 | ||||||||||||||||||
|
| |||||||||||||||||
United Arab Emirates - 5.94% | ||||||||||||||||||
DP World Sukuk Ltd. | USD | 6.250 | % | 07/02/2017 | 120,000 | 131,682(2) | ||||||||||||
Dubai Holding Commercial Operations MTN Ltd. | GBP | 6.000 | % | 02/01/2017 | 400,000 | 639,800 | ||||||||||||
MAF Global Securities Ltd. | USD | 7.125 | % | Perpetual | 612,000 | 671,670(3) | ||||||||||||
|
| |||||||||||||||||
| 1,443,152 | ||||||||||||||||||
|
| |||||||||||||||||
Venezuela - 0.94% | ||||||||||||||||||
Petroleos de Venezuela SA | USD | 8.500 | % | 11/02/2017 | 312,700 | 227,880(2) | ||||||||||||
|
| |||||||||||||||||
| TOTAL CORPORATE BONDS (Cost $23,597,436) | 23,977,449 | |||||||||||||||||
|
| |||||||||||||||||
Stone Harbor Investment Funds Semi-Annual Report | November 30, 2014 |
51 |
Table of Contents
| Stone Harbor Emerging Markets Corporate Debt Fund | Statements of Investments | |
|
November 30, 2014 (Unaudited) | |
Currency | Rate | Maturity Date | Principal | Market Value | ||||||||||||
| SHORT TERM INVESTMENTS - 1.31% | ||||||||||||||||
Money Market Mutual Funds - 1.31% | ||||||||||||||||
Dreyfus Institutional Cash Advantage Fund - Institutional Advantage Class | USD | 0.06001 | % | N/A | 317,963 | $ | 317,963 | |||||||||
|
| |||||||||||||||
| TOTAL SHORT TERM INVESTMENTS | 317,963 | |||||||||||||||
|
| |||||||||||||||
(Cost $317,963) | ||||||||||||||||
| Total Investments - 99.93% | 24,295,412 | |||||||||||||||
(Cost $23,915,399) | ||||||||||||||||
| Other Assets In Excess of Liabilities - 0.07% | 17,358 | |||||||||||||||
|
| |||||||||||||||
| Net Assets - 100.00% | $ | 24,312,770 | ||||||||||||||
|
| |||||||||||||||
* The principal amount/shares of each security is stated in the currency in which the security is denominated.
| Currency Abbreviations: | ||||
| EUR | - | Euro Currency | ||
| GBP | - | Great Britain Pound | ||
| USD | - | United States Dollar | ||
| (1) | Security exempt from registration under Rule 144A of the Securities Act of 1933. Such securities may normally be sold to qualified institutional buyers in transactions exempt from registration. Total market value of Rule 144A securities amounts to $15,050,810, which represents approximately 61.90% of net assets as of November 30, 2014. |
| (2) | Securities were originally issued pursuant to Regulation S under the Securities Act of 1933, which exempts securities offered and sold outside of the United States from registration. Such securities cannot be sold in the United States without either an effective registration statement filed pursuant to teh Securities Act of 1933, or pursuant to an exemption from registration. As of November 30, 2014, the aggregate market value of those securities was $5,080,888, which represents approximately 20.90% of net assets. |
| (3) | Floating or variable rate security. Interest rate disclosed is that which is in effect as of November 30, 2014. |
| Common Abbreviations: | ||||
| AS | - | Anonim Sirket is the Turkish term for Incorporation. | ||
| Bhd | - | Berhad is the Malaysian term for public limited company. | ||
| BV | - | Besloten Vennootschap is the Dutch term for private limited liability company. | ||
| ESP | - | Empresa de Servicios Publicos is the Colombian term for Public Service Company. | ||
| GmbH | - | Gesellschaft mit beschrankter Haftung is the German term for a company wtih limited liability. | ||
| LLC | - | Limited Liability Corporation. | ||
| LP | - | Limited Partnership. | ||
| Ltd. | - | Limited. | ||
| MTN | - | Medium Term Note. | ||
| OJSC | - | Open Joint Stock Company. | ||
| PCL | - | A rearrangement of the letters for Public Limited Company, used in Thailand. | ||
| PLC | - | Public Limited Company. | ||
| PT | - | Perseroan terbuka is an Indonesian term for limited liability company. | ||
| SA | - | Generally designates corporations in various countries, mostly those employing the civil law. | ||
| SA de CV | - | A Variable Capital Company | ||
| SAA | - | Sociedad Anonima Abierta is the Peruvian term used for companies with 20 or more shareholders. | ||
| SAB de CV | - | A Variable Capital Company. | ||
| SAC | - | Sociedad Anonima Abierta is the Peruvian term used for a publicly traded corporation. | ||
| SPV | - | Special Purpose Vehicle. | ||
| Tbk PT | - | Terbuka is the Indonesian term for Limited Liability Company. | ||
52 |
www.shiplp.com |
Table of Contents
| Stone Harbor Emerging Markets Corporate Debt Fund | Statements of Investments | |
|
November 30, 2014 (Unaudited) | |
OUTSTANDING FORWARD FOREIGN CURRENCY CONTRACTS
| Counterparty | Foreign Currency | Contracted Amount** | Purchase/Sale Contract | Settlement Date | Current Value | Unrealized Appreciation | ||||||||||||
| ||||||||||||||||||
J.P Morgan Chase & Co. | EUR | 203,800 | Sale | 01/08/2015 | $ | 253,490 | $ | 1,511 | ||||||||||
J.P Morgan Chase & Co. | GBP | 428,800 | Sale | 01/08/2015 | 669,605 | 1,490 | ||||||||||||
|
| |||||||||||||||||
| $ | 3,001 | |||||||||||||||||
|
| |||||||||||||||||
** The contracted amount is stated in the currency in which the contract is denominated.
See Notes to Financial Statements.
Stone Harbor Investment Funds Semi-Annual Report | November 30, 2014 |
53 |
Table of Contents
| Stone Harbor Investment Grade Fund | Statements of Investments | |
|
November 30, 2014 (Unaudited) | |
Currency | Rate | Maturity Date | Principal | Market Value | ||||||||||||||
| CORPORATE BONDS - 30.52% | ||||||||||||||||||
Aerospace/Defense - 0.26% | ||||||||||||||||||
Northrop Grumman Corp. | USD | 1.750 | % | 06/01/2018 | 25,000 | $ | 24,910 | |||||||||||
|
| |||||||||||||||||
Automotive - 1.11% | ||||||||||||||||||
Ford Motor Credit Co. LLC | USD | 4.250 | % | 09/20/2022 | 50,000 | 52,997 | ||||||||||||
Hyundai Capital America | USD | 4.000 | % | 06/08/2017 | 50,000 | 52,727(1) | ||||||||||||
|
| |||||||||||||||||
| 105,724 | ||||||||||||||||||
|
| |||||||||||||||||
Banking - 8.45% | ||||||||||||||||||
Bank of America Corp.: | ||||||||||||||||||
| USD | 6.050 | % | 05/16/2016 | 25,000 | 26,696 | |||||||||||||
| USD | 3.300 | % | 01/11/2023 | 125,000 | 125,229 | |||||||||||||
| USD | 4.200 | % | 08/26/2024 | 25,000 | 25,543 | |||||||||||||
BPCE SA | USD | 5.700 | % | 10/22/2023 | 75,000 | 80,646(1) | ||||||||||||
Capital One Bank USA NA | USD | 3.375 | % | 02/15/2023 | 25,000 | 24,842 | ||||||||||||
Capital One Financial Corp. | USD | 6.750 | % | 09/15/2017 | 50,000 | 56,941 | ||||||||||||
Citigroup, Inc.: | ||||||||||||||||||
| USD | 4.050 | % | 07/30/2022 | 100,000 | 104,184 | |||||||||||||
| USD | 5.500 | % | 09/13/2025 | 25,000 | 28,002 | |||||||||||||
Intesa Sanpaolo SpA | USD | 3.125 | % | 01/15/2016 | 75,000 | 76,506 | ||||||||||||
Mizuho Bank Ltd. | USD | 3.600 | % | 09/25/2024 | 75,000 | 76,468(1) | ||||||||||||
PNC Financial Services Group, Inc. | USD | 3.900 | % | 04/29/2024 | 25,000 | 25,532 | ||||||||||||
Santander UK PLC | USD | 5.000 | % | 11/07/2023 | 50,000 | 53,266(1) | ||||||||||||
Sumitomo Mitsui Banking Corp. | USD | 2.450 | % | 01/10/2019 | 50,000 | 50,632 | ||||||||||||
Wells Fargo & Co., Series M | USD | 3.450 | % | 02/13/2023 | 50,000 | 50,287 | ||||||||||||
|
| |||||||||||||||||
| 804,774 | ||||||||||||||||||
|
| |||||||||||||||||
Brokerage - 0.53% | ||||||||||||||||||
Nomura Holdings, Inc., Series GMTN | USD | 2.750 | % | 03/19/2019 | 50,000 | 50,919 | ||||||||||||
|
| |||||||||||||||||
Electric - 0.57% | ||||||||||||||||||
Oncor Electric Delivery Co. LLC | USD | 4.100 | % | 06/01/2022 | 50,000 | 54,125 | ||||||||||||
|
| |||||||||||||||||
Exploration & Production - 1.89% | ||||||||||||||||||
Anadarko Petroleum Corp. | USD | 6.450 | % | 09/15/2036 | 25,000 | 30,558 | ||||||||||||
Apache Corp. | USD | 4.750 | % | 04/15/2043 | 50,000 | 48,307 | ||||||||||||
BP Capital Markets PLC | USD | 2.750 | % | 05/10/2023 | 25,000 | 23,925 | ||||||||||||
Continental Resources, Inc. | USD | 3.800 | % | 06/01/2024 | 25,000 | 23,999 | ||||||||||||
Phillips 66 | USD | 4.300 | % | 04/01/2022 | 50,000 | 53,502 | ||||||||||||
|
| |||||||||||||||||
| 180,291 | ||||||||||||||||||
|
| |||||||||||||||||
Food and Beverage - 0.81% | ||||||||||||||||||
PepsiCo, Inc. | USD | 4.250 | % | 10/22/2044 | 50,000 | 50,897 | ||||||||||||
SABMiller Holdings, Inc. | USD | 3.750 | % | 01/15/2022 | 25,000 | 26,248(1) | ||||||||||||
|
| |||||||||||||||||
| 77,145 | ||||||||||||||||||
|
| |||||||||||||||||
Health Insurance - 0.56% | ||||||||||||||||||
UnitedHealth Group, Inc. | USD | 4.625 | % | 11/15/2041 | 50,000 | 53,426 | ||||||||||||
|
| |||||||||||||||||
Healthcare - 1.07% | ||||||||||||||||||
McKesson Corp. | USD | 3.796 | % | 03/15/2024 | 50,000 | 51,259 | ||||||||||||
54 |
www.shiplp.com |
Table of Contents
| Stone Harbor Investment Grade Fund | Statements of Investments | |
|
November 30, 2014 (Unaudited) | |
Currency | Rate | Maturity Date | Principal | Market Value | ||||||||||||||
Healthcare (continued) | ||||||||||||||||||
Thermo Fisher Scientific, Inc. | USD | 1.300 | % | 02/01/2017 | 50,000 | $ | 49,987 | |||||||||||
|
| |||||||||||||||||
| 101,246 | ||||||||||||||||||
|
| |||||||||||||||||
Life Insurance - 1.34% | ||||||||||||||||||
ING Bank NV | USD | 2.500 | % | 10/01/2019 | 50,000 | 50,731(1) | ||||||||||||
Nippon Life Insurance Co. | USD | 5.100 | % | 10/16/2044 | 25,000 | 25,993(1)(2) | ||||||||||||
Voya Financial, Inc. | USD | 2.900 | % | 02/15/2018 | 50,000 | 51,471(2) | ||||||||||||
|
| |||||||||||||||||
| 128,195 | ||||||||||||||||||
|
| |||||||||||||||||
Media Cable - 0.55% | ||||||||||||||||||
Comcast Corp. | USD | 4.250 | % | 01/15/2033 | 50,000 | 52,040 | ||||||||||||
|
| |||||||||||||||||
Media Non Cable - 1.40% | ||||||||||||||||||
21st Century Fox America, Inc. | USD | 6.650 | % | 11/15/2037 | 25,000 | 32,885 | ||||||||||||
Discovery Communications LLC | USD | 3.300 | % | 05/15/2022 | 50,000 | 49,514 | ||||||||||||
Omnicom Group, Inc. | USD | 3.650 | % | 11/01/2024 | 50,000 | 50,330 | ||||||||||||
|
| |||||||||||||||||
| 132,729 | ||||||||||||||||||
|
| |||||||||||||||||
Metals/Mining/Steel - 0.52% | ||||||||||||||||||
Newmont Mining Corp. | USD | 6.250 | % | 10/01/2039 | 50,000 | 49,352 | ||||||||||||
|
| |||||||||||||||||
Non Captive Finance - 0.54% | ||||||||||||||||||
Synchrony Financial | USD | 3.750 | % | 08/15/2021 | 50,000 | 51,322 | ||||||||||||
|
| |||||||||||||||||
Oil Field Services - 0.26% | ||||||||||||||||||
Transocean, Inc. | USD | 6.375 | % | 12/15/2021 | 25,000 | 24,938 | ||||||||||||
|
| |||||||||||||||||
Paper/Forest Products - 0.56% | ||||||||||||||||||
Packaging Corp. of America | USD | 4.500 | % | 11/01/2023 | 50,000 | 53,060 | ||||||||||||
|
| |||||||||||||||||
Pharmaceuticals - 0.54% | ||||||||||||||||||
Gilead Sciences, Inc. | USD | 3.500 | % | 02/01/2025 | 50,000 | 51,611 | ||||||||||||
|
| |||||||||||||||||
Pipelines - 2.91% | ||||||||||||||||||
Boardwalk Pipelines LP | USD | 3.375 | % | 02/01/2023 | 50,000 | 46,688 | ||||||||||||
Dominion Gas Holdings LLC | USD | 4.800 | % | 11/01/2043 | 50,000 | 53,735 | ||||||||||||
Enterprise Products Operating LLC | USD | 2.550 | % | 10/15/2019 | 25,000 | 25,065 | ||||||||||||
EQT Midstream Partners LP | USD | 4.000 | % | 08/01/2024 | 50,000 | 49,765 | ||||||||||||
Plains All American Pipeline LP / PAA Finance Corp. | USD | 3.600 | % | 11/01/2024 | 50,000 | 50,062 | ||||||||||||
Williams Partners LP | USD | 4.500 | % | 11/15/2023 | 50,000 | 52,833 | ||||||||||||
|
| |||||||||||||||||
| 278,148 | ||||||||||||||||||
|
| |||||||||||||||||
Property & Casualty Insurance - 0.53% | ||||||||||||||||||
Berkshire Hathaway Energy Co. | USD | 2.000 | % | 11/15/2018 | 50,000 | 50,329 | ||||||||||||
|
| |||||||||||||||||
Real Estate Investment Trust (REITs) - 1.83% | ||||||||||||||||||
Boston Properties LP | USD | 3.850 | % | 02/01/2023 | 25,000 | 25,970 | ||||||||||||
Corporate Office Properties LP | USD | 3.600 | % | 05/15/2023 | 50,000 | 48,447 | ||||||||||||
DDR Corp. | USD | 3.500 | % | 01/15/2021 | 45,000 | 45,636 | ||||||||||||
Stone Harbor Investment Funds Semi-Annual Report | November 30, 2014 |
55 |
Table of Contents
| Stone Harbor Investment Grade Fund | Statements of Investments | |
|
November 30, 2014 (Unaudited) | |
Currency | Rate | Maturity Date | Principal | Market Value | ||||||||||||||
Real Estate Investment Trust (REITs) (continued) | ||||||||||||||||||
Kimco Realty Corp. | USD | 4.300 | % | 02/01/2018 | 50,000 | $ | 53,877 | |||||||||||
|
| |||||||||||||||||
| 173,930 | ||||||||||||||||||
|
| |||||||||||||||||
Retail Food/Drug - 1.06% | ||||||||||||||||||
CVS Pass-Through Trust | USD | 6.036 | % | 12/10/2028 | 38,848 | 45,917 | ||||||||||||
Kroger Co. | USD | 5.150 | % | 08/01/2043 | 50,000 | 55,425 | ||||||||||||
|
| |||||||||||||||||
| 101,342 | ||||||||||||||||||
|
| |||||||||||||||||
Retail Non Food/Drug - 1.92% | ||||||||||||||||||
Advance Auto Parts, Inc. | USD | 4.500 | % | 12/01/2023 | 50,000 | 53,362 | ||||||||||||
Macy’s Retail Holdings, Inc. | USD | 3.875 | % | 01/15/2022 | 75,000 | 78,718 | ||||||||||||
The TJX Cos., Inc. | USD | 2.750 | % | 06/15/2021 | 50,000 | 50,447 | ||||||||||||
|
| |||||||||||||||||
| 182,527 | ||||||||||||||||||
|
| |||||||||||||||||
Technology - 0.51% | ||||||||||||||||||
Apple, Inc. | USD | 3.850 | % | 05/04/2043 | 50,000 | 48,743 | ||||||||||||
|
| |||||||||||||||||
Wireless - 0.26% | ||||||||||||||||||
America Movil SAB de CV | USD | 3.125 | % | 07/16/2022 | 25,000 | 24,845 | ||||||||||||
|
| |||||||||||||||||
Wirelines - 0.54% | ||||||||||||||||||
Telefonica Emisiones SAU | USD | 5.134 | % | 04/27/2020 | 25,000 | 27,956 | ||||||||||||
Verizon Communications, Inc. | USD | 2.450 | % | 11/01/2022 | 25,000 | 23,717 | ||||||||||||
|
| |||||||||||||||||
| 51,673 | ||||||||||||||||||
|
| |||||||||||||||||
| TOTAL CORPORATE BONDS (Cost $2,848,333) | 2,907,344 | |||||||||||||||||
|
| |||||||||||||||||
| ASSET BACKED/COMMERCIAL MORTGAGE BACKED SECURITIES - 4.55% | ||||||||||||||||||
CDGJ Commercial Mortgage Trust 2014-BXCH A | USD | 1.550 | % | 11/15/2016 | 50,000 | 50,000(1)(2) | ||||||||||||
Ellington Loan Acquisition Trust 2007-1 A2B | USD | 1.055 | % | 05/28/2037 | 46,057 | 45,504(1)(2) | ||||||||||||
Financial Asset Securities Corp. AAA Trust, Series 2005-2 | USD | 0.457 | % | 11/26/2035 | 49,811 | 48,288(1)(2) | ||||||||||||
GSAA Home Equity Trust 2004-11 2A1 | USD | 0.815 | % | 12/25/2034 | 40,997 | 40,105(2) | ||||||||||||
GSAMP Trust 2002-WF M1 | USD | 1.355 | % | 10/20/2032 | 28,636 | 27,683(2) | ||||||||||||
HLSS Servicer Advance Receivables Backed Notes 2014-T1 BT1 | USD | 1.542 | % | 01/15/2015 | 100,000 | 100,001(1) | ||||||||||||
Invitation Homes Trust 2013-SFR1 A | USD | 1.400 | % | 12/17/2015 | 49,212 | 49,101(1)(2) | ||||||||||||
ML-CFC Commercial Mortgage Trust 2007-8 AMA | USD | 6.078 | % | 07/12/2017 | 25,000 | 25,468(2) | ||||||||||||
Rialto Real Estate Fund 2012 LT1 LLC, Series 2014-LT5 | USD | 2.850 | % | 12/15/2015 | 12,638 | 12,637(1) | ||||||||||||
TAL Advantage V LLC, Series 2013-2A | USD | 3.550 | % | 11/20/2023 | 22,500 | 22,885(1) | ||||||||||||
Vericrest Opportunity Loan Transferee 2013-NPL6 A1 | USD | 3.625 | % | 03/25/2054 | 11,388 | 11,457(1)(3) | ||||||||||||
|
| |||||||||||||||||
| TOTAL ASSET BACKED/COMMERCIAL MORTGAGE BACKED SECURITIES | 433,129 | |||||||||||||||||
|
| |||||||||||||||||
(Cost $430,361) | ||||||||||||||||||
| U.S. TREASURY BONDS/NOTES - 23.96% | ||||||||||||||||||
U.S. Treasury Bonds | USD | 2.000 | % | 11/15/2021 | 925,000 | 931,359 | ||||||||||||
56 |
www.shiplp.com |
Table of Contents
| Stone Harbor Investment Grade Fund | Statements of Investments | |
|
November 30, 2014 (Unaudited) | |
Currency | Rate | Maturity Date | Principal | Market Value | ||||||||||||||||
U.S. TREASURY BONDS/NOTES (continued) | ||||||||||||||||||||
U.S. Treasury Notes: | ||||||||||||||||||||
| USD | 0.250 | % | 12/15/2015 | 425,000 | $ | 425,432 | ||||||||||||||
| USD | 2.000 | % | 01/31/2016 | 450,000 | 459,422 | |||||||||||||||
| USD | 1.625 | % | 04/30/2019 | 150,000 | 151,559 | |||||||||||||||
| USD | 2.750 | % | 02/15/2024 | 300,000 | 315,187 | |||||||||||||||
|
| |||||||||||||||||||
| TOTAL U.S. TREASURY BONDS/NOTES | 2,282,959 | |||||||||||||||||||
|
| |||||||||||||||||||
(Cost $2,238,875) | ||||||||||||||||||||
U.S. GOVERNMENT AGENCY MORTGAGE BACKED SECURITIES - 26.71% | ||||||||||||||||||||
FNMA TBA: | ||||||||||||||||||||
| USD | 3.000 | % | 12/11/2014 | 250,000 | 252,715(4) | |||||||||||||||
| USD | 3.500 | % | 12/11/2014 | 450,000 | 469,055(4) | |||||||||||||||
| USD | 4.000 | % | 12/11/2014 | 625,000 | 667,334(4) | |||||||||||||||
| USD | 4.500 | % | 12/11/2014 | 375,000 | 407,607(4) | |||||||||||||||
| USD | 5.000 | % | 12/11/2014 | 250,000 | 277,226(4) | |||||||||||||||
| USD | 3.000 | % | 12/16/2014 | 300,000 | 312,422(4) | |||||||||||||||
| USD | 3.500 | % | 12/16/2014 | 100,000 | 105,941(4) | |||||||||||||||
GNMA TBA | USD | 3.500 | % | 12/18/2014 | 50,000 | 52,481(4) | ||||||||||||||
|
| |||||||||||||||||||
TOTAL U.S. GOVERNMENT AGENCY MORTGAGE BACKED SECURITIES | 2,544,781 | |||||||||||||||||||
|
| |||||||||||||||||||
(Cost $2,526,438) | ||||||||||||||||||||
| SHORT TERM INVESTMENTS - 15.82% | ||||||||||||||||||||
Money Market Mutual Funds - 15.82% | ||||||||||||||||||||
Dreyfus Institutional Cash Advantage Fund - Institutional Advantage Class (7-Day Yield) | USD | 0.06001 | % | N/A | 1,507,422 | 1,507,422 | ||||||||||||||
|
| |||||||||||||||||||
| TOTAL SHORT TERM INVESTMENTS | 1,507,422 | |||||||||||||||||||
|
| |||||||||||||||||||
(Cost $1,507,422) | ||||||||||||||||||||
| Total Investments - 101.56% | 9,675,635 | |||||||||||||||||||
(Cost $9,551,429) | ||||||||||||||||||||
Liabilities in Excess of Other Assets - (1.56)% | (148,916) | |||||||||||||||||||
|
| |||||||||||||||||||
| Net Assets - 100.00% | $ | 9,526,719 | ||||||||||||||||||
|
| |||||||||||||||||||
* The principal amount/shares of each security is stated in the currency in which the security is denominated.
Currency Abbreviations:
| USD | - | United States Dollar |
| (1) | Security exempt from registration under Rule 144A of the Securities Act of 1933. Such securities may normally be sold to qualified institutional buyers in transactions exempt from registration. Total market value of Rule 144A securities amounts to $705,952, which represents approximately 7.41% of net assets as of November 30, 2014. |
| (2) | Floating or variable rate security. Interest rate disclosed is that which is in effect as of November 30, 2014. |
| (3) | Step bond. Coupon changes periodically based upon a predetermined schedule. Interest rate disclosed is that which is in effect as of November 30, 2014. |
| (4) | Investment purchased on a delayed delivery basis. |
Stone Harbor Investment Funds Semi-Annual Report | November 30, 2014 |
57 |
Table of Contents
| Stone Harbor Investment Grade Fund | Statements of Investments | |
|
November 30, 2014 (Unaudited) | |
| Common Abbreviations: | ||||
| FNMA | - | Fannie Mae. | ||
| GNMA | - | Government National Mortgage Association. | ||
| GMTN | - | Global Medium Term Note | ||
| LLC | - | Lmited Liability Corporation. | ||
| LP | - | Limited Partnership. | ||
| NA | - | National Association. | ||
| NV | - | Naamloze Vennootshap is the Dutch term for a Public Limited Liability Corporation | ||
| PLC | - | Public Limited Company. | ||
| Sab de CV | - | A Variable Capital Company | ||
| SAU | - | Sociedad Anónima Unipersonal is the Spanish term for Single Shareholder Corporartion. | ||
| SpA | - | Società per Azioni is the Italian term for Limited share company. | ||
| TBA | - | To Be Announced | ||
| UK | - | United Kingdom | ||
See Notes to Financial Statements.
58 |
www.shiplp.com |
Table of Contents
| Stone Harbor Strategic Income Fund | Statements of Investments | |
|
November 30, 2014 (Unaudited) | |
Currency | Rate | Shares* | Market Value | |||||||||||
| OPEN-END FUNDS - 99.02% | ||||||||||||||
Stone Harbor Emerging Markets Debt Fund | USD | N/A | 917,605 | $ | 9,763,313(1) | |||||||||
Stone Harbor High Yield Bond Fund | USD | N/A | 1,432,241 | 13,047,712(1) | ||||||||||
Stone Harbor Investment Grade Fund | USD | N/A | 911,656 | 9,517,684(1) | ||||||||||
|
| |||||||||||||
| 32,328,709 | ||||||||||||||
|
| |||||||||||||
| TOTAL OPEN-END FUNDS | 32,328,709 | |||||||||||||
|
| |||||||||||||
(Cost $32,490,738) | ||||||||||||||
| SHORT TERM INVESTMENTS - 0.12% | ||||||||||||||
Money Market Mutual Funds - 0.12% | ||||||||||||||
Dreyfus Institutional Cash Advantage Fund - Institutional Advantage Class (7-Day Yield) | USD | 0.06001 | % | 38,354 | 38,354 | |||||||||
|
| |||||||||||||
| TOTAL SHORT TERM INVESTMENTS | 38,354 | |||||||||||||
|
| |||||||||||||
(Cost $38,354) | ||||||||||||||
| Total Investments - 99.14% | 32,367,063 | |||||||||||||
(Cost $32,529,092) | ||||||||||||||
Other Assets In Excess of Liabilities - 0.86% | 279,244 | |||||||||||||
|
| |||||||||||||
| Net Assets - 100.00% | $ | 32,646,307 | ||||||||||||
|
| |||||||||||||
* The shares of each security is stated in the currency in which the security is denominated.
| Currency Abbreviations: | ||||
| AUD | - | Australian Dollar | ||
| EUR | - | Euro Currency | ||
| USD | - | United States Dollar | ||
| (1) | Affiliated with the Fund, as each is a series of Stone Harbor Investment Funds and has the same investment adviser. |
OUTSTANDING FORWARD FOREIGN CURRENCY CONTRACTS
| Counterparty | Foreign Currency | Contracted Amount** | Purchase/Sale Contract | Settlement Date | Current Value | Unrealized Appreciation/ (Depreciation) | ||||||||||
| ||||||||||||||||
Citigroup Global Markets | EUR | 76,300 | Sale | 01/08/2015 | $ | 94,903 | $ | 699 | ||||||||
Citigroup Global Markets | GBP | 39,100 | Sale | 01/08/2015 | 61,058 | 153 | ||||||||||
|
| |||||||||||||||
| $ | 852 | |||||||||||||||
|
| |||||||||||||||
Citigroup Global Markets | AUD | 90,000 | Purchase | 01/28/2015 | $ | 76,246 | $ | (614) | ||||||||
|
| |||||||||||||||
| $ | (614) | |||||||||||||||
|
| |||||||||||||||
** The contracted amount is stated in the currency in which the contract is denominated.
Stone Harbor Investment Funds Semi-Annual Report | November 30, 2014 |
59 |
Table of Contents
| Stone Harbor Strategic Income Fund | Statements of Investments | |
|
November 30, 2014 (Unaudited) | |
FUTURES CONTRACTS
| Description | Position | Contracts | Expiration Date | Notional Amount, | Unrealized Appreciation | |||||||||
| ||||||||||||||
Euro-Bund Future | Long | 22 | 12/09/14 | $ | 3,362,700 | $ | 105,470 | |||||||
Long Gilt Future | Long | 10 | 3/30/15 | 1,175,400 | 11,246 | |||||||||
US Ultra T-Bond | Long | 2 | 12/22/14 | 321,750 | 10,344 | |||||||||
|
| |||||||||||||
| $ | 4,859,850 | $ | 127,060 | |||||||||||
|
| |||||||||||||
| Description | Position | Contracts | Expiration Date | Notional Amount, | Unrealized Depreciation | |||||||||
| ||||||||||||||
US 10 Yr Note Future | Short | (38) | 12/22/14 | $ | (4,850,939) | $ | (94,219) | |||||||
|
| |||||||||||||
| $ | (4,850,939) | $ | (94,219) | |||||||||||
|
| |||||||||||||
See Notes to Financial Statements.
60 |
www.shiplp.com |
Table of Contents
| Stone Harbor Emerging Markets Debt Allocation Fund | Statements of Investments | |
|
November 30, 2014 (Unaudited) | |
Currency | Rate | Shares* | Market Value | |||||||||||
| OPEN-END FUNDS - 100.01% | ||||||||||||||
Stone Harbor Emerging Markets Debt Fund | USD | N/A | 3,266,861 | $ | 34,759,405(1) | |||||||||
Stone Harbor Local Markets Fund | USD | N/A | 3,055,848 | 28,388,827(1) | ||||||||||
|
| |||||||||||||
| 63,148,232 | ||||||||||||||
|
| |||||||||||||
| TOTAL OPEN-END FUNDS | 63,148,232 | |||||||||||||
|
| |||||||||||||
(Cost $64,064,325) | ||||||||||||||
| Total Investments - 100.01% | 63,148,232 | |||||||||||||
(Cost $64,064,325) | ||||||||||||||
Liabilities in Excess of Other Assets - (0.01)% | (6,048) | |||||||||||||
|
| |||||||||||||
| Net Assets - 100.00% | $ | 63,142,184 | ||||||||||||
|
| |||||||||||||
* The shares of each security is stated in the currency in which the security is denominated.
Currency Abbreviations:
| USD | - | United States Dollar |
| (1) | Affiliated with the Fund, as each is a series of Stone Harbor Investment Funds and has the same investment adviser. |
See Notes to Financial Statements.
Stone Harbor Investment Funds Semi-Annual Report | November 30, 2014 |
61 |
Table of Contents
| Stone Harbor Investment Funds | Statements of Assets and Liabilities | |
|
November 30, 2014 (Unaudited) | |
Stone Harbor Emerging Markets Debt Fund | Stone Harbor High Yield Bond Fund | Stone Harbor Local Markets Fund | Stone Harbor Emerging Markets Corporate Debt Fund | |||||||||||||
| ||||||||||||||||
ASSETS: | ||||||||||||||||
Investments, at value(1) | $ | 2,146,701,382 | $ | 282,300,806 | $ | 1,880,517,086 | $ | 24,295,412 | ||||||||
Cash | 9,884,846 | – | 1,692,967 | – | ||||||||||||
Foreign currency, at value | – | 63,261 | 11,506 | – | ||||||||||||
Unrealized appreciation on forward foreign currency contracts | 235,486 | 49,388 | 1,661,119 | 3,001 | ||||||||||||
Deposits with brokers for credit default swap contracts | 8,730,000 | – | – | – | ||||||||||||
Deposits with brokers for forward foreign currency contracts | – | – | 1,825,000 | – | ||||||||||||
Receivable for investments sold | 8,577,820 | 184,642 | 283,165,680 | 145,247 | ||||||||||||
Receivable for fund shares sold | 61,284 | 2,183 | 404,682 | – | ||||||||||||
Interest receivable | 33,168,156 | 4,363,060 | 31,179,677 | 335,029 | ||||||||||||
Prepaid and other assets | 46,594 | 16,136 | 44,030 | 25,399 | ||||||||||||
| ||||||||||||||||
| Total Assets | 2,207,405,568 | 286,979,476 | 2,200,501,747 | 24,804,088 | ||||||||||||
| ||||||||||||||||
LIABILITIES: | ||||||||||||||||
Foreign currency, at value due to custodian | 230,127 | – | – | – | ||||||||||||
Swap Premiums Received | 8,318,750 | – | – | – | ||||||||||||
Payable due to brokers for forward foreign currency contracts | 870,000 | 260,000 | – | – | ||||||||||||
Payable for investments purchased | 14,035,187 | 2,281,253 | 1,692,967 | 414,790 | ||||||||||||
Payable for fund shares redeemed | – | – | 5,595,723 | – | ||||||||||||
Unrealized depreciation on forward foreign currency contracts | – | 183 | 4,406,855 | – | ||||||||||||
Unrealized depreciation on credit default swap contracts | 705,463 | – | – | – | ||||||||||||
Payable to adviser | 1,082,521 | 117,942 | 1,373,828 | 17,020 | ||||||||||||
Payable to administrator | 181,141 | 30,355 | 181,007 | 2,827 | ||||||||||||
Other payables | 249,944 | 92,965 | 545,729 | 56,681 | ||||||||||||
| ||||||||||||||||
| Total Liabilities | 25,673,133 | 2,782,698 | 13,796,109 | 491,318 | ||||||||||||
| ||||||||||||||||
| Net Assets | $ | 2,181,732,435 | $ | 284,196,778 | $ | 2,186,705,638 | $ | 24,312,770 | ||||||||
| ||||||||||||||||
NET ASSETS CONSIST OF: | ||||||||||||||||
Paid-in capital | $ | 2,275,484,374 | $ | 276,729,446 | $ | 2,552,933,892 | $ | 27,533,279 | ||||||||
Undistributed/(overdistributed) net investment income | (2,174,620) | (708,714) | 39,387,244 | (37,025) | ||||||||||||
Accumulated net realized gain/(loss) on investments, | (75,070,098) | 10,315,640 | (139,146,076) | (3,564,586) | ||||||||||||
Net unrealized appreciation/(depreciation) on investments, | (16,507,221) | (2,139,594) | (266,469,422) | 381,102 | ||||||||||||
| ||||||||||||||||
| Net Assets | $ | 2,181,732,435 | $ | 284,196,778 | $ | 2,186,705,638 | $ | 24,312,770 | ||||||||
| ||||||||||||||||
PRICING OF SHARES: | ||||||||||||||||
Institutional Class | ||||||||||||||||
Net Assets | $ | 2,181,732,435 | $ | 284,196,778 | $ | 2,186,705,638 | $ | 24,312,770 | ||||||||
Shares of beneficial interest outstanding (unlimited number | 205,030,801 | 31,211,915 | 235,444,769 | 2,676,426 | ||||||||||||
| ||||||||||||||||
Net assets value, offering and redemption price per share | $ | 10.64 | $ | 9.11 | $ | 9.29 | $ | 9.08 | ||||||||
| ||||||||||||||||
(1)Cost of Investments | $ | 2,162,500,892 | $ | 284,669,167 | $ | 2,140,715,385 | $ | 23,915,399 | ||||||||
See Notes to Financial Statements. | ||
62 |
www.shiplp.com |
Table of Contents
| Stone Harbor Investment Funds | Statements of Assets and Liabilities | |
|
November 30, 2014 (Unaudited) | |
Stone Harbor Investment Grade Fund | Stone Harbor Strategic Income Fund | Stone Harbor Emerging Markets Debt Allocation Fund | ||||||||||
| ||||||||||||
ASSETS: | ||||||||||||
Investments, at value(1) | $ | 9,675,635 | $ | 38,354 | $ | – | ||||||
Investments in affiliates, at value(2) | – | 32,328,709 | 63,148,232 | |||||||||
Foreign currency, at value | – | 93,135 | – | |||||||||
Unrealized appreciation on forward foreign currency contracts | – | 852 | – | |||||||||
Deposits with brokers for credit default swap contracts | – | 8,686 | – | |||||||||
Cash pledged as collateral for forward commitments | 2,400,423 | – | – | |||||||||
Deposits with brokers for futures contracts collateral | – | 120,281 | – | |||||||||
Receivable for variation margin | – | 127,060 | – | |||||||||
Receivable from adviser | 57,389 | 102,819 | 55,837 | |||||||||
Interest receivable | 36,291 | – | – | |||||||||
Prepaid and other assets | 9,055 | 9,331 | 807 | |||||||||
| ||||||||||||
| Total Assets | 12,178,793 | 32,829,227 | 63,204,876 | |||||||||
| ||||||||||||
LIABILITIES: | ||||||||||||
Payable for investments purchased | 2,604,812 | – | – | |||||||||
Payable for variation margin | – | 94,219 | – | |||||||||
Unrealized depreciation on forward foreign currency contracts | – | 614 | – | |||||||||
Payable to adviser | 10,705 | 57,165 | 49,860 | |||||||||
Payable to administrator | 2,456 | 2,506 | 3,402 | |||||||||
Other payables | 34,101 | 28,416 | 9,430 | |||||||||
| ||||||||||||
| Total Liabilities | 2,652,074 | 182,920 | 62,692 | |||||||||
| ||||||||||||
| Net Assets | $ | 9,526,719 | $ | 32,646,307 | $ | 63,142,184 | ||||||
| ||||||||||||
NET ASSETS CONSIST OF: | ||||||||||||
Paid-in capital | $ | 9,304,327 | $ | 32,647,705 | $ | 63,581,942 | ||||||
Undistributed/(overdistributed) net investment income | (7,496) | 16,927 | 476,351 | |||||||||
Accumulated net realized gain/(loss) on investments, forward foreign currency contracts, credit default swaps and | 105,682 | 115,844 | (16) | |||||||||
Net unrealized appreciation/(depreciation) on investments, forward foreign currency contracts credit default swaps | 124,206 | (134,169) | (916,093) | |||||||||
| ||||||||||||
| Net Assets | $ | 9,526,719 | $ | 32,646,307 | $ | 63,142,184 | ||||||
| ||||||||||||
PRICING OF SHARES: | ||||||||||||
Institutional Class | ||||||||||||
Net Assets | $ | 9,526,719 | $ | 32,646,307 | $ | 63,142,184 | ||||||
Shares of beneficial interest outstanding (unlimited number of shares, par value of $0.001 per share authorized) | 912,659 | 3,203,426 | 6,358,194 | |||||||||
| ||||||||||||
Net assets value, offering and redemption price per share | $ | 10.44 | $ | 10.19 | $ | 9.93 | ||||||
| ||||||||||||
(1)Cost of Investments | $ | 9,551,429 | $ | 38,354 | $ | – | ||||||
(2)Cost of Investments in affiliates | $ | – | $ | 32,490,738 | $ | 64,064,325 | ||||||
See Notes to Financial Statements. | ||
Stone Harbor Investment Funds Semi-Annual Report | November 30, 2014 |
63 |
Table of Contents
| Stone Harbor Investment Funds | Statements of Operations | |
|
For the Six Months Ended November 30, 2014 (Unaudited) | |
Stone Harbor Emerging Markets Debt Fund | Stone Harbor High Yield Bond Fund | Stone Harbor Local Markets Fund | Stone Harbor Emerging Markets Corporate Debt Fund | |||||||||||||
| ||||||||||||||||
INVESTMENT INCOME: | ||||||||||||||||
Interest | $ | 64,959,973 | $ | 8,892,358 | $ | 74,481,950 | $ | 707,429 | ||||||||
Dividends | 16,561 | 418,625 | 55,305 | 176 | ||||||||||||
| ||||||||||||||||
| Total Investment Income | 64,976,534 | 9,310,983 | 74,537,255 | 707,605 | ||||||||||||
| ||||||||||||||||
EXPENSES: | ||||||||||||||||
Investment advisory fee | 6,637,207 | 720,493 | 8,812,659 | 112,267 | ||||||||||||
Administration fees | 537,048 | 84,639 | 568,734 | 8,855 | ||||||||||||
Custodian fees | 297,292 | 15,404 | 864,975 | 3,061 | ||||||||||||
Printing fees | 2,548 | 2,592 | 5,390 | 2,199 | ||||||||||||
Professional fees | 33,163 | 33,182 | 33,147 | 32,525 | ||||||||||||
Trustee fees | 36,975 | 4,995 | 40,098 | 477 | ||||||||||||
Transfer agent fees | 20,727 | 12,191 | 22,388 | 11,110 | ||||||||||||
Registration fees | 22,363 | 13,384 | 13,186 | 11,306 | ||||||||||||
Insurance fees | 15,612 | 1,380 | 15,798 | 133 | ||||||||||||
Other | 6,026 | 1,839 | 6,767 | 1,479 | ||||||||||||
| ||||||||||||||||
Total expenses before waiver/reimbursement | 7,608,961 | 890,099 | 10,383,142 | 183,412 | ||||||||||||
Less fees waived by investment adviser | – | (65,578) | – | (51,332) | ||||||||||||
| ||||||||||||||||
| Total Net Expenses | 7,608,961 | 824,521 | 10,383,142 | 132,080 | ||||||||||||
| ||||||||||||||||
| Net Investment Income | 57,367,573 | 8,486,462 | 64,154,113 | 575,525 | ||||||||||||
| ||||||||||||||||
REALIZED AND UNREALIZED GAIN/(LOSS) ON INVESTMENTS: |
| |||||||||||||||
Net realized gain/(loss) on: | ||||||||||||||||
Investments | (7,301,058) | 2,137,727 | (26,964,364) | 270,992 | ||||||||||||
Credit default swap contracts | 87,847 | – | – | – | ||||||||||||
Forward foreign currency contracts | 1,114,693 | 534,699 | (4,553,750) | 21,134 | ||||||||||||
Foreign currency transactions | 2,288,715 | 299,299 | (5,272,597) | 47,642 | ||||||||||||
| ||||||||||||||||
Net realized gain/(loss) | (3,809,803) | 2,971,725 | (36,790,711) | 339,768 | ||||||||||||
| ||||||||||||||||
Change in unrealized appreciation/(depreciation) on: | ||||||||||||||||
Investments | (87,948,778) | (16,956,779) | (181,004,591) | (664,094) | ||||||||||||
Credit default swap contracts | (705,463) | – | – | – | ||||||||||||
Forward foreign currency contracts | 127,372 | (12,947) | (1,337,848) | 1,170 | ||||||||||||
Translation of assets and liabilities denominated in | (113,547) | 181,811 | (3,671,708) | (1,946) | ||||||||||||
| ||||||||||||||||
Net change in unrealized depreciation | (88,640,416) | (16,787,915) | (186,014,147) | (664,870) | ||||||||||||
| ||||||||||||||||
| Net Realized and Unrealized Loss | (92,450,219) | (13,816,190) | (222,804,858) | (325,102) | ||||||||||||
| ||||||||||||||||
Net Increase/(Decrease) in Net Assets Resulting from Operations | $ | (35,082,646) | $ | (5,329,728) | $ | (158,650,745) | $ | 250,423 | ||||||||
| ||||||||||||||||
See Notes to Financial Statements. | ||
64 |
www.shiplp.com |
Table of Contents
| Stone Harbor Investment Funds | Statements of Operations | |
|
For the Six Months Ended November 30, 2014 (Unaudited) | |
Stone Harbor Investment Grade Fund | Stone Harbor Strategic Income Fund | Stone Harbor Emerging Markets Debt Allocation Fund | ||||||||||
| ||||||||||||
INVESTMENT INCOME: | ||||||||||||
Interest | $ | 43,708 | $ | – | $ | – | ||||||
Dividends | 666 | 13 | – | |||||||||
Dividends from affiliated securities | – | 510,899 | 483,217 | |||||||||
| ||||||||||||
| Total Investment Income | 44,374 | 510,912 | 483,217 | |||||||||
| ||||||||||||
EXPENSES: | ||||||||||||
Investment advisory fee | 9,783 | 52,266 | 49,860 | |||||||||
Administration fees | 6,133 | 4,876 | 3,402 | |||||||||
Custodian fees | 1,171 | 1,097 | 219 | |||||||||
Printing fees | 2,345 | 2,345 | 392 | |||||||||
Professional fees | 24,455 | 19,461 | 23,189 | |||||||||
Trustee fees | 53 | 179 | 67 | |||||||||
Transfer agent fees | 10,321 | 10,520 | 2,418 | |||||||||
Registration fees | 10,140 | 10,542 | 24,618 | |||||||||
Insurance fees | 26 | 85 | 12 | |||||||||
Other | 3,368 | 3,413 | 341 | |||||||||
| ||||||||||||
Total expenses before waiver/reimbursement | 67,795 | 104,784 | 104,518 | |||||||||
Less fees waived by investment adviser | (9,783) | (52,266) | (49,860) | |||||||||
Less expenses reimbursed by investment adviser | (44,036) | (41,711) | (47,792) | |||||||||
| ||||||||||||
| Total Net Expenses | 13,976 | 10,807 | 6,866 | |||||||||
| ||||||||||||
| Net Investment Income | 30,398 | 500,105 | 476,351 | |||||||||
| ||||||||||||
REALIZED AND UNREALIZED GAIN/(LOSS) ON INVESTMENTS: |
| |||||||||||
Net realized gain/(loss) on: | ||||||||||||
Investments | 63,705 | – | – | |||||||||
Investments - affiliated securities | – | (4,629) | (16) | |||||||||
Credit default swap contracts | – | (3,664) | – | |||||||||
Futures contracts | 11,993 | 167,052 | – | |||||||||
Forward foreign currency contracts | – | 2,002 | – | |||||||||
Foreign currency transactions | – | (28) | – | |||||||||
| ||||||||||||
Net realized gain/(loss) | 75,698 | 160,733 | (16) | |||||||||
�� | ||||||||||||
Change in unrealized appreciation/(depreciation) on: | ||||||||||||
Investments | 44,104 | (589,953) | (916,093) | |||||||||
Credit default swap contracts | – | – | – | |||||||||
Futures contracts | – | (2,155) | – | |||||||||
Forward foreign currency contracts | – | (7) | – | |||||||||
Translation of assets and liabilities denominated in foreign currencies | – | (5,320) | – | |||||||||
| ||||||||||||
Net change in unrealized appreciation/(depreciation) | 44,104 | (597,435) | (916,093) | |||||||||
| ||||||||||||
| Net Realized and Unrealized Gain/(Loss) | 119,802 | (436,702) | (916,109) | |||||||||
| ||||||||||||
Net Increase/(Decrease) in Net Assets Resulting from Operations | $ | 150,200 | $ | 63,403 | $ | (439,758) | ||||||
| ||||||||||||
See Notes to Financial Statements. | ||
Stone Harbor Investment Funds Semi-Annual Report | November 30, 2014 |
65 |
Table of Contents
| Stone Harbor Investment Funds | Statements of Changes in Net Assets | |
| ||
| Stone Harbor Emerging Markets Debt Fund | Stone Harbor High Yield Bond Fund | |||||||||||||||
|
| |||||||||||||||
For the Six Months Ended November 30, 2014 (Unaudited) | For the Year Ended May 31, 2014 | For the Six Months Ended November 30, 2014 (Unaudited) | For the Year Ended May 31, 2014 | |||||||||||||
| ||||||||||||||||
OPERATIONS: | ||||||||||||||||
Net investment income | $ | 57,367,573 | $ | 99,624,975 | $ | 8,486,462 | $ | 21,690,768 | ||||||||
Net realized gain/(loss) on investments, credit default | (3,809,803) | (75,846,274) | 2,971,725 | 8,405,472 | ||||||||||||
Net realized gain on investments - affiliated securities | – | 343,748 | – | – | ||||||||||||
Net change in unrealized appreciation/(depreciation) on investments, credit default swap contracts, forward | (88,640,416) | 41,237,853 | (16,787,915) | (4,854,203) | ||||||||||||
| ||||||||||||||||
Net increase/(decrease) in net assets resulting from operations | (35,082,646) | 65,360,302 | (5,329,728) | 25,242,037 | ||||||||||||
| ||||||||||||||||
DISTRIBUTIONS TO SHAREHOLDERS: |
| |||||||||||||||
Institutional Class | ||||||||||||||||
From net investment income | (61,090,222) | (86,019,842) | (9,918,832) | (22,390,532) | ||||||||||||
From net realized gains | – | – | – | (10,114,843) | ||||||||||||
| ||||||||||||||||
Net decrease in net assets from distributions to shareholders | (61,090,222) | (86,019,842) | (9,918,832) | (32,505,375) | ||||||||||||
| ||||||||||||||||
CAPITAL SHARE TRANSACTIONS: |
| |||||||||||||||
Institutional Class | ||||||||||||||||
Proceeds from sale of shares | 301,157,784 | 589,771,294 | 45,366,043 | 18,366,132 | ||||||||||||
Issued to shareholders in reinvestment of distributions | 57,815,093 | 82,361,287 | 8,334,955 | 30,458,281 | ||||||||||||
Cost of shares redeemed | (259,031,960) | (310,280,824) | (57,111,591) | (125,687,444) | ||||||||||||
| ||||||||||||||||
Net increase/(decrease) in net assets from capital | 99,940,917 | 361,851,757 | (3,410,593) | (76,863,031) | ||||||||||||
| ||||||||||||||||
Net Increase/(Decrease) in Net Assets | 3,768,049 | 341,192,217 | (18,659,153) | (84,126,369) | ||||||||||||
| ||||||||||||||||
NET ASSETS: |
| |||||||||||||||
Beginning of period | 2,177,964,386 | 1,836,772,169 | 302,855,931 | 386,982,300 | ||||||||||||
| ||||||||||||||||
End of period | $ | 2,181,732,435 | $ | 2,177,964,386 | $ | 284,196,778 | $ | 302,855,931 | ||||||||
| ||||||||||||||||
Includes undistributed/(overdistributed) net investment | $ | (2,174,620) | $ | 1,548,029 | $ | (708,714) | $ | 723,656 | ||||||||
OTHER INFORMATION: |
| |||||||||||||||
Share Transactions: | ||||||||||||||||
Institutional Class | ||||||||||||||||
Beginning shares | 196,069,405 | 162,037,118 | 31,455,233 | 39,368,510 | ||||||||||||
Shares sold | 27,578,409 | 55,561,421 | 4,886,714 | 1,918,497 | ||||||||||||
Shares reinvested | 5,348,503 | 7,802,599 | 895,188 | 3,203,877 | ||||||||||||
Shares redeemed | (23,965,516) | (29,331,733) | (6,025,220) | (13,035,651) | ||||||||||||
| ||||||||||||||||
Shares outstanding - end of period | 205,030,801 | 196,069,405 | 31,211,915 | 31,455,233 | ||||||||||||
| ||||||||||||||||
See Notes to Financial Statements. | ||
66 |
www.shiplp.com |
Table of Contents
| Stone Harbor Investment Funds | Statements of Changes in Net Assets | |
| ||
| Stone Harbor Local Markets Fund | Stone Harbor Emerging Markets Corporate Debt Fund | |||||||||||||||
|
| |||||||||||||||
| For the Six Months Ended November 30, 2014 (Unaudited) | For the Year Ended May 31, 2014 | For the Six Months Ended November 30, 2014 (Unaudited) | For the Year Ended | |||||||||||||
| ||||||||||||||||
OPERATIONS: | ||||||||||||||||
Net investment income | $ | 64,154,113 | $ | 132,011,677 | $ | 575,525 | $ | 2,005,319 | ||||||||
Net realized gain/(loss) on investments, credit default swap contracts, forward foreign currency contracts and foreign currency transactions | (36,790,711) | (253,220,413) | 339,768 | (2,602,601) | ||||||||||||
Net change in unrealized appreciation/(depreciation) on investments, credit default swap contracts, forward foreign currency contracts and foreign currency translations | (186,014,147) | 16,126,803 | (664,870) | 487,117 | ||||||||||||
| ||||||||||||||||
Net increase/(decrease) in net assets resulting from operations | (158,650,745) | (105,081,933) | 250,423 | (110,165) | ||||||||||||
| ||||||||||||||||
DISTRIBUTIONS TO SHAREHOLDERS: |
| |||||||||||||||
Institutional Class | ||||||||||||||||
From net investment income | (2,341,384) | (17,612,618) | (646,526) | (2,080,114) | ||||||||||||
From net realized gains | – | (12,318,762) | – | – | ||||||||||||
| ||||||||||||||||
Net decrease in net assets from distributions to shareholders | (2,341,384) | (29,931,380) | (646,526) | (2,080,114) | ||||||||||||
| ||||||||||||||||
CAPITAL SHARE TRANSACTIONS: |
| |||||||||||||||
Institutional Class | ||||||||||||||||
Proceeds from sale of shares | 206,350,280 | 1,007,385,023 | 2,214,000 | 26,904,350 | ||||||||||||
Issued to shareholders in reinvestment of distributions | 2,277,846 | 29,494,620 | 646,526 | 2,080,114 | ||||||||||||
Cost of shares redeemed | (351,714,495) | (875,509,273) | (4,438,721) | (68,683,365) | ||||||||||||
| ||||||||||||||||
Net increase/(decrease) in net assets from capital share transactions | (143,086,369) | 161,370,370 | (1,578,195) | (39,698,901) | ||||||||||||
| ||||||||||||||||
Net Increase/(Decrease) in Net Assets | (304,078,498) | 26,357,057 | (1,974,298) | (41,889,180) | ||||||||||||
| ||||||||||||||||
NET ASSETS: |
| |||||||||||||||
Beginning of period | 2,490,784,136 | 2,464,427,079 | 26,287,068 | 68,176,248 | ||||||||||||
| ||||||||||||||||
End of period | $ | 2,186,705,638 | $ | 2,490,784,136 | $ | 24,312,770 | $ | 26,287,068 | ||||||||
| ||||||||||||||||
Includes undistributed/(overdistributed) net investment income of: | $ | 39,387,244 | $ | (22,425,485) | $ | (37,025) | $ | 33,976 | ||||||||
OTHER INFORMATION: |
| |||||||||||||||
Share Transactions: | ||||||||||||||||
Institutional Class | ||||||||||||||||
Beginning shares | 249,984,702 | 234,568,603 | 2,847,399 | 7,278,681 | ||||||||||||
Shares sold | 21,272,778 | 102,260,030 | 239,122 | 2,959,490 | ||||||||||||
Shares reinvested | 230,085 | 3,069,429 | 70,785 | 234,122 | ||||||||||||
Shares redeemed | (36,042,796) | (89,913,360) | (480,880)�� | (7,624,894) | ||||||||||||
| ||||||||||||||||
Shares outstanding - end of period | 235,444,769 | 249,984,702 | 2,676,426 | 2,847,399 | ||||||||||||
| ||||||||||||||||
See Notes to Financial Statements. | ||
Stone Harbor Investment Funds Semi-Annual Report | November 30, 2014 |
67 |
Table of Contents
| Stone Harbor Investment Funds | Statements of Changes in Net Assets | |
| ||
| Stone Harbor Investment Grade Fund | Stone Harbor Strategic Income Fund | |||||||||||||||
|
| |||||||||||||||
| For the Six Months Ended November 30, 2014 (Unaudited) | For the Period December 19, 2013 (Commencment of Operations) to May 31, 2014 | For the Six Months Ended November 30, 2014 (Unaudited) | For the Period December 19, 2013 (Commencment of Operations) to May 31, 2014 | |||||||||||||
| ||||||||||||||||
OPERATIONS: | ||||||||||||||||
Net investment income | $ | 30,398 | $ | 22,162 | $ | 500,105 | $ | 155,131 | ||||||||
Net realized gain/(loss) on investments, credit default swap contracts, forward foreign currency contracts and foreign currency transactions | 75,698 | 29,993 | 165,362 | (45,067) | ||||||||||||
Net realized gain/(loss) on investments - affiliated securities | – | – | (4,629) | 1,340 | ||||||||||||
Net change in unrealized appreciation/(depreciation) on investments, credit default swap contracts, forward foreign currency contracts and foreign currency translations | 44,104 | 80,102 | (597,435) | 463,266 | ||||||||||||
| ||||||||||||||||
Net increase in net assets resulting from operations | 150,200 | 132,257 | 63,403 | 574,670 | ||||||||||||
| ||||||||||||||||
DISTRIBUTIONS TO SHAREHOLDERS: |
| |||||||||||||||
Institutional Class | ||||||||||||||||
From net investment income | (42,130) | (17,965) | (508,944) | (130,527) | ||||||||||||
| ||||||||||||||||
Net decrease in net assets from distributions to shareholders | (42,130) | (17,965) | (508,944) | (130,527) | ||||||||||||
| ||||||||||||||||
CAPITAL SHARE TRANSACTIONS: |
| |||||||||||||||
Institutional Class | ||||||||||||||||
Proceeds from sale of shares | 6,602,507 | 2,989,999 | 22,009,894 | 10,010,001 | ||||||||||||
Issued to shareholders in reinvestment of distributions | 42,130 | 17,965 | 497,283 | 130,527 | ||||||||||||
Cost of shares redeemed | (348,244) | – | – | – | ||||||||||||
| ||||||||||||||||
Net increase in net assets from capital share transactions | 6,296,393 | 3,007,964 | 22,507,177 | 10,140,528 | ||||||||||||
| ||||||||||||||||
Net Increase in Net Assets | 6,404,463 | 3,122,256 | 22,061,636 | 10,584,671 | ||||||||||||
| ||||||||||||||||
NET ASSETS: |
| |||||||||||||||
Beginning of period | 3,122,256 | – | 10,584,671 | – | ||||||||||||
| ||||||||||||||||
End of period | $ | 9,526,719 | $ | 3,122,256 | $ | 32,646,307 | $ | 10,584,671 | ||||||||
| ||||||||||||||||
Includes undistributed/(overdistributed) net investment income of: | $ | (7,496) | $ | 4,236 | $ | 16,927 | $ | 25,766 | ||||||||
OTHER INFORMATION: |
| |||||||||||||||
Share Transactions: | ||||||||||||||||
Institutional Class | ||||||||||||||||
Beginning shares | 300,737 | – | 1,013,714 | – | ||||||||||||
Shares sold | 641,230 | 298,981 | 2,141,137 | 1,000,996 | ||||||||||||
Shares reinvested | 4,055 | 1,756 | 48,575 | 12,718 | ||||||||||||
Shares redeemed | (33,363) | – | – | – | ||||||||||||
| ||||||||||||||||
Shares outstanding - end of period | 912,659 | 300,737 | 3,203,426 | 1,013,714 | ||||||||||||
| ||||||||||||||||
See Notes to Financial Statements. | ||
68 |
www.shiplp.com |
Table of Contents
| Stone Harbor Investment Funds | Statements of Changes in Net Assets | |
| ||
| Stone Harbor Emerging Markets Debt Allocation Fund | ||||
| For the Period October 21, 2014 (Commencement of Operations) to November 30, 2014 (Unaudited) | ||||
| ||||
OPERATIONS: | ||||
Net investment income | $ | 476,351 | ||
Net realized loss on investments - affiliated securities | (16) | |||
Net change in unrealized depreciation on investments - affiliated securities, forward foreign currency contracts and foreign currency translations | (916,093) | |||
| ||||
| Net decrease in net assets resulting from operations | (439,758) | |||
| ||||
CAPITAL SHARE TRANSACTIONS: | ||||
Institutional Class | ||||
Proceeds from sale of shares | 63,581,942 | |||
| ||||
| Net increase in net assets from capital share transactions | 63,581,942 | |||
| ||||
| Net Increase in Net Assets | 63,142,184 | |||
| ||||
NET ASSETS: | ||||
Beginning of period | – | |||
| ||||
End of period | $ | 63,142,184 | ||
| ||||
Includes undistributed net investment income of: | $ | 476,351 | ||
OTHER INFORMATION: | ||||
| Share Transactions: | ||||
| Institutional Class | ||||
Beginning shares | – | |||
Shares sold | 6,358,194 | |||
| ||||
Shares outstanding - end of period | 6,358,194 | |||
| ||||
See Notes to Financial Statements. | ||
Stone Harbor Investment Funds Semi-Annual Report | November 30, 2014 |
69 |
Table of Contents
| Stone Harbor Emerging Markets Debt Fund | Financial Highlights | |
For a share outstanding through the periods presented. | ||
| Institutional Class | For the Six Months Ended November 30, 2014 (Unaudited) | For the Year Ended May 31, 2014 | For the Year Ended May 31, 2013 | For the Year Ended May 31, 2012 | For the Year Ended May 31, 2011 | For the Year Ended May 31, 2010 | ||||||||||||||||||
| ||||||||||||||||||||||||
Net asset value - beginning of period | $ | 11.11 | $ | 11.34 | $ | 10.93 | $ | 11.20 | $ | 10.48 | $ | 9.22 | ||||||||||||
Income/(loss) from investment operations: |
| |||||||||||||||||||||||
Net investment income | 0.28(1) | 0.55(1) | 0.55(1) | 0.65(1) | 0.67(1) | 0.75 | ||||||||||||||||||
Net realized and unrealized gain/(loss) on investments | (0.45) | (0.31) | 0.45 | (0.15) | 1.00 | 1.44 | ||||||||||||||||||
| ||||||||||||||||||||||||
Total income/(loss) from investment operations | (0.17) | 0.24 | 1.00 | 0.50 | 1.67 | 2.19 | ||||||||||||||||||
| ||||||||||||||||||||||||
Less distributions to common shareholders: |
| |||||||||||||||||||||||
From net investment income | (0.30) | (0.47) | (0.54) | (0.67) | (0.63) | (0.79) | ||||||||||||||||||
From net realized gains | – | – | (0.05) | (0.10) | (0.32) | (0.14) | ||||||||||||||||||
| ||||||||||||||||||||||||
Total distributions | (0.30) | (0.47) | (0.59) | (0.77) | (0.95) | (0.93) | ||||||||||||||||||
| ||||||||||||||||||||||||
Net Increase/(Decrease) in Net Asset Value | (0.47) | (0.23) | 0.41 | (0.27) | 0.72 | 1.26 | ||||||||||||||||||
| ||||||||||||||||||||||||
Net asset value - end of period | $ | 10.64 | $ | 11.11 | $ | 11.34 | $ | 10.93 | $ | 11.20 | $ | 10.48 | ||||||||||||
| ||||||||||||||||||||||||
Total Return(2) | (1.55)%(3) | 2.45% | 9.05% | 4.61% | 16.30% | 24.25% | ||||||||||||||||||
Ratios/Supplemental Data: |
| |||||||||||||||||||||||
Net assets, end of period (in millions) | $ | 2,182 | $ | 2,178 | $ | 1,837 | $ | 1,184 | $ | 749 | $ | 178 | ||||||||||||
Ratio of expenses to average net assets without fee waivers/reimbursements/ repayment of previously waived fees | 0.69%(4) | 0.70% | 0.68% | 0.72% | 0.77% | 0.91% | ||||||||||||||||||
Ratio of expenses to average net assets with fee waivers/reimbursements/ repayment of previously waived fees | 0.69%(4) | 0.70% | 0.68% | 0.72% | 0.75% | 0.75% | ||||||||||||||||||
Ratio of net investment income to average net assets with fee waivers/ reimbursements/repayment of previously waived fees | 5.19%(4) | 5.21% | 4.68% | 5.78% | 6.02% | 6.80% | ||||||||||||||||||
Portfolio turnover rate | 35%(3) | 68% | 68% | 60% | 82% | 125% | ||||||||||||||||||
| (1) | Calculated using average shares throughout the period. |
| (2) | Total returns would have been lower in 2010 and 2011 had various fees and expenses not been waived and reimbursed during the period. The total returns in the table represent the rate that an investor would have earned (or lost) on an investment in a Fund (assuming reinvestment of all dividends and distributions). |
| (3) | Not-Annualized |
| (4) | Annualized. |
See Notes to Financial Statements. | ||
70 |
www.shiplp.com |
Table of Contents
| Stone Harbor High Yield Bond Fund | Financial Highlights | |
For a share outstanding through the periods presented. | ||
| Institutional Class | For the Six Months November 30, | For the Year Ended May 31, 2014 | For the Year Ended May 31, 2013 | For the Year Ended May 31, 2012 | For the Year Ended May 31, 2011 | For the Year Ended May 31, 2010 | ||||||||||||||||||
| ||||||||||||||||||||||||
Net asset value - beginning of period | $ | 9.63 | $ | 9.83 | $ | 9.13 | $ | 10.00 | $ | 9.36 | $ | 8.39 | ||||||||||||
Income/(loss) from investment operations: |
| |||||||||||||||||||||||
Net investment income | 0.28(1) | 0.60(1) | 0.70(1) | 0.72(1) | 0.77(1) | 0.73 | ||||||||||||||||||
Net realized and unrealized gain/(loss) on investments | (0.48) | 0.13 | 0.72 | (0.59) | 0.78 | 0.96 | ||||||||||||||||||
| ||||||||||||||||||||||||
Total income/(loss) from investment operations | (0.20) | 0.73 | 1.42 | 0.13 | 1.55 | 1.69 | ||||||||||||||||||
| ||||||||||||||||||||||||
Less distributions to common shareholders: |
| |||||||||||||||||||||||
From net investment income | (0.32) | (0.64) | (0.68) | (0.70) | (0.76) | (0.72) | ||||||||||||||||||
From net realized gains | – | (0.29) | (0.04) | (0.30) | (0.15) | – | ||||||||||||||||||
| ||||||||||||||||||||||||
Total distributions | (0.32) | (0.93) | (0.72) | (1.00) | (0.91) | (0.72) | ||||||||||||||||||
| ||||||||||||||||||||||||
Net Increase/(Decrease) in Net Asset Value | (0.52) | (0.20) | 0.70 | (0.87) | 0.64 | 0.97 | ||||||||||||||||||
| ||||||||||||||||||||||||
Net asset value - end of period | $ | 9.11 | $ | 9.63 | $ | 9.83 | $ | 9.13 | $ | 10.00 | $ | 9.36 | ||||||||||||
| ||||||||||||||||||||||||
Total Return(2) | (2.12)%(3) | 7.90% | 15.87% | 1.77% | 17.14% | 20.53% | ||||||||||||||||||
Ratios/Supplemental Data: |
| |||||||||||||||||||||||
Net assets, end of period (in millions) | $ | 284 | $ | 303 | $ | 387 | $ | 520 | $ | 488 | $ | 408 | ||||||||||||
Ratio of expenses to average net assets without fee waivers/reimbursements/ repayment of previously waived fees | 0.62%(4)(5) | 0.62% | 0.60% | 0.62% | 0.65% | 0.67% | ||||||||||||||||||
Ratio of expenses to average net assets with fee waivers/reimbursements/ repayment of previously waived fees | 0.57%(4)(5) | 0.55% | 0.55% | 0.55% | 0.55% | 0.55% | ||||||||||||||||||
Ratio of net investment income to average net assets with fee waivers/ reimbursements/repayment of previously waived fees | 5.89%(4) | 6.23% | 7.27% | 7.67% | 7.78% | 8.13% | ||||||||||||||||||
Portfolio turnover rate | 34%(3) | 54% | 59% | 46% | 60% | 36% | ||||||||||||||||||
| (1) | Calculated using average shares throughout the period. |
| (2) | Total returns would have been lower had various fees and expenses not been waived and reimbursed during the period. The total returns in the table represent the rate that an investor would have earned (or lost) on an investment in a Fund (assuming reinvestment of all dividends and distributions). |
| (3) | Not-Annualized |
| (4) | Annualized. |
| (5) | Effective October 1, 2014, the expense limitation rate changed from 0.55% to 0.65%. |
See Notes to Financial Statements. | ||
Stone Harbor Investment Funds Semi-Annual Report | November 30, 2014 |
71 |
Table of Contents
| Stone Harbor Local Markets Fund | Financial Highlights | |
For a share outstanding through the periods presented. | ||
| Institutional Class | For the Six Months Ended | For the Year Ended May 31, 2014 | For the Year Ended May 31, 2013 | For the Year Ended May 31, 2012 | For the Period June 30, 2010 (Commencement of Operations) to May 31, 2011 | |||||||||||||||
| ||||||||||||||||||||
Net asset value - beginning of period | $ | 9.96 | $ | 10.51 | $ | 10.10 | $ | 11.21 | $ | 10.00 | ||||||||||
Income/(loss) from investment operations: |
| |||||||||||||||||||
Net investment income(1) | 0.27 | 0.53 | 0.49 | 0.57 | 0.51 | |||||||||||||||
Net realized and unrealized gain/(loss) on investments | (0.93) | (0.96) | 0.33 | (1.21) | 1.14 | |||||||||||||||
| ||||||||||||||||||||
Total income/(loss) from investment operations | (0.66) | (0.43) | 0.82 | (0.64) | 1.65 | |||||||||||||||
| ||||||||||||||||||||
Less distributions to common shareholders: |
| |||||||||||||||||||
From net investment income | (0.01) | (0.07) | (0.39) | (0.45) | (0.39) | |||||||||||||||
From net realized gains | – | (0.05) | (0.02) | – | (0.05) | |||||||||||||||
From tax return of capital | – | – | – | (0.02) | – | |||||||||||||||
| ||||||||||||||||||||
Total distributions | (0.01) | (0.12) | (0.41) | (0.47) | (0.44) | |||||||||||||||
| ||||||||||||||||||||
Net Increase/(Decrease) in Net Asset | (0.67) | (0.55) | 0.41 | (1.11) | 1.21 | |||||||||||||||
| ||||||||||||||||||||
Net asset value - end of period | $ | 9.29 | $ | 9.96 | $ | 10.51 | $ | 10.10 | $ | 11.21 | ||||||||||
| ||||||||||||||||||||
Total Return(2) | (6.63)%(3) | (4.04)% | 7.92% | (5.84)% | 16.82% | |||||||||||||||
Ratios/Supplemental Data: | ||||||||||||||||||||
Net assets, end of period (in millions) | $ | 2,187 | $ | 2,491 | $ | 2,464 | $ | 1,563 | $ | 606 | ||||||||||
Ratio of expenses to average net assets without fee waivers/reimbursements/repayment of previously waived fees | 0.88%(4) | 0.88% | 0.86% | 0.89% | 1.01%(4) | |||||||||||||||
Ratio of expenses to average net assets with fee waivers/reimbursements/repayment of previously waived fees | 0.88%(4) | 0.88% | 0.86% | 0.89% | 1.00%(4) | |||||||||||||||
Ratio of net investment income to average net assets with fee waivers/reimbursements/repayment of previously waived fees | 5.46%(4) | 5.41% | 4.45% | 5.35% | 5.13%(4) | |||||||||||||||
Portfolio turnover rate | 76%(3) | 181% | 191% | 161% | 102% | |||||||||||||||
| (1) | Calculated using average shares throughout the period. |
| (2) | Total returns would have been lower in 2011 had various fees and expenses not been waived and reimbursed during the period. The total returns in the table represent the rate that an investor would have earned (or lost) on an investment in a Fund (assuming reinvestment of all dividends and distributions). |
| (3) | Not-Annualized |
| (4) | Annualized. |
See Notes to Financial Statements. | ||
72 |
www.shiplp.com |
Table of Contents
| Stone Harbor Emerging Markets Corporate Debt Fund | Financial Highlights | |
For a share outstanding through the periods presented. | ||
| Institutional Class | For the Six Months Ended | For the Year Ended May 31, 2014 | For the Year Ended May 31, 2013 | For the Period June 1, 2011 (Commencement of Operations) to May 31, 2012 | ||||||||||||
| ||||||||||||||||
Net asset value - beginning of period | $ | 9.23 | $ | 9.37 | $ | 8.89 | $ | 10.00 | ||||||||
Income/(loss) from investment operations: | ||||||||||||||||
Net investment income(1) | 0.20 | 0.41 | 0.44 | 0.59 | ||||||||||||
Net realized and unrealized gain/(loss) on investments | (0.12) | (0.08) | 0.46 | (1.11) | ||||||||||||
| ||||||||||||||||
Total income/(loss) from investment operations | 0.08 | 0.33 | 0.90 | (0.52) | ||||||||||||
| ||||||||||||||||
Less distributions to common shareholders: | ||||||||||||||||
From net investment income | (0.23) | (0.47) | (0.42) | (0.59) | ||||||||||||
| ||||||||||||||||
Total distributions | (0.23) | (0.47) | (0.42) | (0.59) | ||||||||||||
| ||||||||||||||||
Net Increase/(Decrease) in Net Asset | (0.15) | (0.14) | 0.48 | (1.11) | ||||||||||||
| ||||||||||||||||
Net asset value - end of period | $ | 9.08 | $ | 9.23 | $ | 9.37 | $ | 8.89 | ||||||||
| ||||||||||||||||
Total Return(2) | 0.87%(3) | 3.80% | 10.13% | (5.10)% | ||||||||||||
Ratios/Supplemental Data: | ||||||||||||||||
Net assets, end of period (in millions) | $ | 24 | $ | 26 | $ | 68 | $ | 35 | ||||||||
Ratio of expenses to average net assets without fee waivers/reimbursements | 1.39%(4) | 1.22% | 1.16% | 1.32% | ||||||||||||
Ratio of expenses to average net assets with fee waivers/reimbursements | 1.00%(4) | 1.00% | 1.00% | 1.00% | ||||||||||||
Ratio of net investment income to average net assets with fee waivers/reimbursements | 4.36%(4) | 4.58% | 4.68% | 6.41% | ||||||||||||
Portfolio turnover rate | 34%(3) | 78% | 78% | 51% | ||||||||||||
| (1) | Calculated using average shares throughout the period. |
| (2) | Total returns would have been lower had various fees and expenses not been waived and reimbursed during the period. The total returns in the table represent the rate that an investor would have earned (or lost) on an investment in a Fund (assuming reinvestment of all dividends and distributions). |
| (3) | Not-Annualized |
| (4) | Annualized. |
See Notes to Financial Statements. | ||
Stone Harbor Investment Funds Semi-Annual Report | November 30, 2014 |
73 |
Table of Contents
| Stone Harbor Investment Grade Fund | Financial Highlights | |
For a share outstanding through the periods presented. | ||
| Institutional Class | For the Six Months Ended | For the Period December 19, 2013 (Commencement of Operations) to May 31, 2014 | ||||||
| ||||||||
Net asset value - beginning of period | $ | 10.38 | $ | 10.00 | ||||
Income/(loss) from investment operations: | ||||||||
Net investment income(1) | 0.06 | 0.07 | ||||||
Net realized and unrealized gain on investments | 0.08 | 0.37 | ||||||
| ||||||||
Total income from investment operations | 0.14 | 0.44 | ||||||
| ||||||||
Less distributions to common shareholders: | ||||||||
From net investment income | (0.08) | (0.06) | ||||||
| ||||||||
Total distributions | (0.08) | (0.06) | ||||||
| ||||||||
Net Increase in Net Asset Value | 0.06 | 0.38 | ||||||
| ||||||||
Net asset value - end of period | $ | 10.44 | $ | 10.38 | ||||
| ||||||||
Total Return(2) | 1.35%(3) | 4.41% | ||||||
Ratios/Supplemental Data: | ||||||||
Net assets, end of period (in millions) | $ | 10 | $ | 3 | ||||
Ratio of expenses to average net assets without fees waived by investment adviser and expenses reimbursed by investment adviser | 2.43%(4) | 4.14%(4) | ||||||
Ratio of expenses to average net assets with fees waived by investment adviser and expenses reimbursed by investment adviser | 0.50%(4) | 0.50%(4) | ||||||
Ratio of net investment income to average net assets with fee waivers/reimbursements | 1.09%(4) | 1.62%(4) | ||||||
Portfolio turnover rate | 20%(3) | 27% | ||||||
| (1) | Calculated using average shares throughout the period. |
| (2) | Total returns would have been lower in 2014 had various fees and expenses not been waived and reimbursed during the period. The total returns in the table represent the rate that an investor would have earned (or lost) on an investment in a Fund (assuming reinvestment of all dividends and distributions). |
| (3) | Not-Annualized |
| (4) | Annualized. |
See Notes to Financial Statements. | ||
74 |
www.shiplp.com |
Table of Contents
| Stone Harbor Strategic Income Fund | Financial Highlights | |
For a share outstanding through the periods presented. | ||
| Institutional Class | For the Six Months Ended | For the Period December 19, 2013 (Commencement of Operations) to May 31, 2014 | ||||||
| ||||||||
Net asset value - beginning of period | $ | 10.44 | $ | 10.00 | ||||
Income/(loss) from investment operations: |
| |||||||
Net investment income(1) | 0.27 | 0.15 | ||||||
Net realized and unrealized gain/(loss) on investments | (0.27) | 0.42 | ||||||
| ||||||||
Total income from investment operations | – | 0.57 | ||||||
| ||||||||
Less distributions to common shareholders: |
| |||||||
From net investment income | (0.25) | (0.13) | ||||||
| ||||||||
Total distributions | (0.25) | (0.13) | ||||||
| ||||||||
Net Increase/(Decrease) in Net Asset Value | (0.25) | 0.44 | ||||||
| ||||||||
Net asset value - end of period | $ | 10.19 | $ | 10.44 | ||||
| ||||||||
Total Return(2) | (0.01%)(3) | 5.73% | ||||||
Ratios/Supplemental Data: | ||||||||
Net assets, end of period (in millions) | $ | 33 | $ | 11 | ||||
Ratio of expenses to average net assets without fees waived by investment adviser and expenses reimbursed by investment adviser | 1.10%(4)(5) | 1.46%(4)(5) | ||||||
Ratio of expenses to average net assets with fees waived by investment adviser and expenses reimbursed by investment adviser | 0.11%(4)(5) | 0.12%(4)(5) | ||||||
Ratio of net investment income to average net assets with fee waivers/reimbursements | 5.26%(4)(5) | 3.38%(4)(5) | ||||||
Portfolio turnover rate | 10%(3) | 0%(6) | ||||||
| (1) | Calculated using average shares throughout the period. |
| (2) | Total returns would have been lower in 2014 had various fees and expenses not been waived and reimbursed during the period. The total returns in the table represent the rate that an investor would have earned (or lost) on an investment in a Fund (assuming reinvestment of all dividends and distributions). |
| (3) | Not-Annualized |
| (4) | Annualized. |
| (5) | Ratio does not include expenses of the mutual funds held in the investment portfolio. |
| (6) | Less than 0.5%. |
See Notes to Financial Statements. | ||
Stone Harbor Investment Funds Semi-Annual Report | November 30, 2014 |
75 |
Table of Contents
| Stone Harbor Emerging Markets Debt Allocation Fund | Financial Highlights | |
For a share outstanding through the periods presented. | ||
| Institutional Class | For the Period October 21, 2014 (Commencement of Operations) to November 30, 2014 (Unaudited) | |||
| ||||
Net asset value - beginning of period | $ | 10.00 | ||
Income/(loss) from investment operations: | ||||
Net investment income(1) | 0.07 | |||
Net realized and unrealized loss on investments | (0.14) | |||
| ||||
Total loss from investment operations | (0.07) | |||
| ||||
Net Decrease in Net Asset Value | (0.07) | |||
| ||||
Net asset value - end of period | $ | 9.93 | ||
| ||||
Total Return(2) | (0.70%)(3) | |||
Ratios/Supplemental Data: | ||||
Net assets, end of period (in millions) | $ | 63 | ||
Ratio of expenses to average net assets without fees waived by investment adviser and expenses reimbursed by investment adviser | 1.47%(4)(5) | |||
Ratio of expenses to average net assets with fees waived by investment adviser and expenses reimbursed by investment adviser | 0.10%(4)(5) | |||
Ratio of net investment income to average net assets with fee waivers/reimbursements | 6.69%(4)(5) | |||
Portfolio turnover rate | 2%(3) | |||
| (1) | Calculated using average shares throughout the period. |
| (2) | Total returns would have been lower in 2014 had various fees and expenses not been waived and reimbursed during the period. The total returns in the table represent the rate that an investor would have earned (or lost) on an investment in a Fund (assuming reinvestment of all dividends and distributions). |
| (3) | Not-Annualized |
| (4) | Annualized. |
| (5) | Ratio does not include expenses of the mutual funds held in the investment portfolio. |
See Notes to Financial Statements. | ||
76 |
www.shiplp.com |
Table of Contents
Stone Harbor Investment Funds | Notes to Financial Statements | |
|
November 30, 2014 (Unaudited) | |
1. ORGANIZATION AND SIGNIFICANT ACCOUNTING POLICIES
Stone Harbor Investment Funds, which consists of Stone Harbor Emerging Markets Debt Fund, Stone Harbor High Yield Bond Fund, Stone Harbor Local Markets Fund, Stone Harbor Emerging Markets Corporate Debt Fund, Stone Harbor Investment Grade Fund, Stone Harbor Strategic Income Fund, and Stone Harbor Emerging Markets Debt Allocation Fund (each, a “Fund” and together, the “Funds”) is a Massachusetts business trust (the “Trust”), organized on February 20, 2007 and registered under the Investment Company Act of 1940, as amended (the “1940 Act”), as an open-end management investment company. The Stone Harbor Emerging Markets Debt Allocation Fund was added to the Trust on September 5, 2014. The Stone Harbor Emerging Markets Debt Allocation Fund commenced operations on October 21, 2014. Shares of each Fund are currently divided into two classes, designated Institutional Class Shares and Distributor Class Shares. As of the date of this report, there were no outstanding shares for the Distributor Class of each Fund. The Trust’s Declaration of Trust permits the Trustees to create additional funds and share classes.
The Emerging Markets Debt Fund’s investment objective is to maximize total return. The Fund normally will invest at least 80% of its net assets (plus any borrowings made for investment purposes) in Emerging Markets Fixed Income Securities. “Emerging Markets Fixed Income Securities” include fixed income securities and derivative instruments (including, but not limited to, spot and currency contracts, futures, options and swaps) that economically are tied to countries with emerging securities markets or whose performance is linked to those countries’ markets, economies or ability to repay loans. Emerging Markets Fixed Income Securities may be denominated in non-U.S. currencies or the U.S. dollar. A security or instrument is economically tied to an emerging market country if it is principally traded on the country’s securities markets or the issuer is organized or principally operates in the country, derives a majority of its income from its operations within the country or has a majority of its assets within the country. Emerging Markets Fixed Income Securities also include derivatives and other instruments used to hedge or gain exposure to emerging securities markets (for example, futures or other derivatives whose return is based on specific emerging markets securities or indices).
The High Yield Bond Fund’s investment objective is to maximize total return. The Fund will normally invest at least 80% of its net assets (plus any borrowings made for investment purposes) in High Yield Debt Securities. “High Yield Debt Securities” include fixed income securities and derivative instruments (including, but not limited to, spot and currency contracts, futures, options and swaps) rated below investment grade (or, if unrated, of comparable quality as determined by Stone Harbor Investment Partners LP (the “Adviser” or “Stone Harbor”). These types of securities and instruments are commonly referred to as “high yield” securities or “junk bonds,” and may include, among other things, bonds, debentures, notes, equipment trust certificates, commercial paper, commercial loans, preferred stock and other obligations of U.S. and non-U.S. issuers. High Yield Debt Securities also include securities or other instruments whose return is based on the return of high yield securities, including derivative instruments and instruments created to hedge or gain exposure to the high yield markets.
The Local Markets Fund’s investment objective is to maximize total return. The Fund normally will invest at least 80% of its net assets (plus any borrowings made for investment purposes) in Emerging Markets Investments. “Emerging Markets Investments” include fixed income securities and derivative instruments (including, but not limited to, spot and currency contracts, futures, options and swaps) that economically are tied to an emerging market country, which are denominated in the predominant currency of the local market of an emerging market country (an “Emerging Markets Currency”) or whose performance is linked to those countries’ currencies, markets, economies or ability to repay loans. Although under normal circumstances a significant portion of the Fund’s investments will be denominated in Emerging Markets Currencies, Emerging Markets Investments may be denominated in non-Emerging Markets Currencies, including the U.S. dollar. A security or instrument is economically tied to an emerging market country if it is principally traded on the country’s securities markets or the issuer is organized or principally operates in the country, derives a majority of its income from its operations within the country or has a majority of its assets within the country. Emerging Markets Investments also include Emerging Markets Currencies and derivatives and other instruments used to hedge or gain exposure to emerging securities markets or Emerging Markets Currencies (for example, futures or other derivatives whose return is based on specific emerging markets securities, emerging markets indices or Emerging Markets Currencies).
The Emerging Markets Corporate Debt Fund’s investment objective is to maximize total return. The Fund normally will invest at least 80% of its net assets (plus any borrowings made for investment purposes) in Emerging Markets Corporate Debt Investments. “Emerging Markets Corporate Debt Investments” are debt instruments, including loans, issued by corporations or other business organizations that are economically tied to an emerging market country. A corporation or other business organization is economically tied to an emerging market country if it issues securities that are principally traded on the country’s securities markets or if it is organized or principally operates in the country, derives a majority of its income from its operations within the country or has a majority of its assets within the country. Emerging Markets Corporate Debt Investments also include derivative instruments used for hedging purposes or to otherwise gain or reduce long or short exposure to Emerging Markets Corporate Debt Investments.
The Investment Grade Fund’s investment objective is to maximize total return. The Fund invests in various types of fixed income securities and under normal market conditions will invest at least 80% of its net assets (plus any borrowings made for investment purposes) in Investment Grade Debt Securities. “Investment Grade Debt Securities” include fixed income securities that are rated investment grade by any of Moody’s Investors Services, Inc., Standard & Poor’s Rating Services, Fitch Ratings Limited, DBRS or other qualified rating agencies or, if unrated, are determined by the Adviser to be of comparable quality, and derivative instruments related to those securities.
Stone Harbor Investment Funds Semi-Annual Report | November 30, 2014 |
77 |
Table of Contents
| Stone Harbor Investment Funds | Notes to Financial Statements | |
|
November 30, 2014 (Unaudited) | |
The Strategic Income Fund’s investment objective is to maximize total return. The Fund is intended to provide broad exposure to global credit markets. The Fund, either directly or through investment in the underlying funds, may invest in a broad variety of fixed income and other income producing securities and instruments (including derivatives), and will not be limited in terms of type of instrument, geography, credit rating or duration. The Fund may invest all or a significant portion of its assets in Stone Harbor Investment Grade Fund, Stone Harbor High Yield Bond Fund, Stone Harbor Emerging Markets Debt Fund, Stone Harbor Local Markets Fund and Stone Harbor Emerging Markets Corporate Debt Fund and other funds sponsored or advised by the Adviser (together, the “underlying funds”). The Fund is not required to invest in the underlying funds, and from time to time may not be invested in any underlying fund. In addition to investing in the underlying funds, the Fund may invest directly in fixed income securities and in other instruments and transactions.
The Emerging Markets Debt Allocation Fund’s investment objective is to maximize total return. The Fund, either directly or through investment in the underlying funds, will invest at least 80% of its net assets (plus any borrowings made for investment purposes) in a broad variety of fixed income and other income producing securities and instruments (including derivatives), that economically are tied to an emerging market country or whose performance is linked to those countries’ currencies, markets, economies or ability to repay loans. The Fund may invest all or a significant portion of its assets in Stone Harbor Emerging Markets Debt Fund and Stone Harbor Local Markets Fund (together, the “underlying funds”). The Fund is not required to invest in the underlying funds, and from time to time may not be invested in any underlying fund. In addition to investing in the underlying funds, the Fund may invest directly in fixed income securities and in other instruments and transactions.
The Emerging Markets Debt Fund and Local Markets Fund are each classified as “non-diversified” under the 1940 Act. As a result, the Funds can invest a greater portion of the Funds’ assets in obligations of a single issuer than a “diversified” fund. The Funds may therefore be more susceptible than a diversified fund to being adversely affected by any single corporate, economic, political or regulatory occurrence. The High Yield Bond Fund, Emerging Markets Corporate Debt Fund, Investment Grade Fund, Strategic Income Fund, and Emerging Markets Debt Allocation Fund are diversified funds.
The following is a summary of significant accounting policies consistently followed by the Funds in the preparation of their financial statements. The Funds are considered an investment company for financial reporting purposes under generally accepted accounting principles in the United States of America (“GAAP”). The policies are in conformity with GAAP. The preparation of the financial statements in accordance with GAAP requires management to make estimates and assumptions that affect the reported amounts of assets and liabilities at the date of the financial statements and the reported amounts of income and expenses during the reporting period. Actual results could differ from those estimates.
Investment Valuation: Debt securities, including bank loans and linked notes, are generally valued at the mean between the closing bid and asked prices provided by independent pricing services or brokers that are based on transactions in debt obligations, quotations from dealers, market transactions in comparable securities and various other relationships between securities. Equity securities for which market quotations are available are generally valued at the last sale price or official closing price on the primary market or exchange on which they trade. Publicly traded foreign government debt securities are typically traded internationally in the over-the-counter market, and are valued at the mean between the bid and asked prices as of the close of business of that market. When prices are not readily available, or are determined not to reflect fair value, such as when the value of a security has been significantly affected by events after the close of the exchange or market on which the security is principally traded, but before the Funds calculate their net asset value, the Funds may value these investments at fair value as determined in accordance with the procedures approved by the Funds’ Board of Trustees (the “Board”). Short-term obligations with maturities of 60 days or less are valued at amortized cost, which approximates market value. Open end funds and money market mutual funds are valued at their net asset value. Futures contracts are ordinarily valued at the last sales price on the securities or commodities exchange on which they are traded. Credit default swaps are priced by an independent pricing service based off of the underlying terms of the swap. Foreign currency positions including forward currency contracts are priced at the mean between the closing bid and asked prices at 4:00 p.m. Eastern time.
A three-tier hierarchy has been established to measure fair value based on the extent of use of “observable inputs” as compared to “unobservable inputs” for disclosure purposes and requires additional disclosures about these valuations measurements. Inputs refer broadly to the assumptions that market participants would use in pricing a security. Observable inputs are inputs that reflect the assumptions market participants would use in pricing the security developed based on market data obtained from sources independent of the reporting entity. Unobservable inputs are inputs that reflect the reporting entity’s own assumptions about the assumptions market participants would use in pricing the security developed based on the best information available in the circumstances.
78 |
www.shiplp.com |
Table of Contents
| Stone Harbor Investment Funds | Notes to Financial Statements | |
|
November 30, 2014 (Unaudited) | |
The three-tier hierarchy is summarized as follows:
| Level 1— | Unadjusted quoted prices in active markets for identical assets or liabilities that the Fund has the ability to access. | |
| Level 2— | Observable inputs other than quoted prices included in level 1 that are observable for the asset or liability, either directly or indirectly. These inputs may include quoted prices for the identical instrument on an inactive market, prices for similar instruments, interest rates, prepayment speeds, credit risk, yield curve, rates, and similar data. | |
| Level 3— | Unobservable inputs for the asset or liability, to the extent relevant observable inputs are not available, representing the Fund’s own assumptions about the assumptions a market participant would use in valuing the asset or liability, and would be based on the best information available. | |
The following is a summary of each Fund’s investments and financial instruments based on the three-tier hierarchy as of November 30, 2014:
| Investments in Securities at Value* | Level 1 - Quoted and Unadjusted Prices | Level 2 - Other Significant Observable Inputs | Level 3 - Significant Unobservable Inputs | Total | ||||||||||||
| ||||||||||||||||
Stone Harbor Emerging Markets Debt Fund | ||||||||||||||||
Sovereign Debt Obligations | $ | – | $ | 1,671,555,903 | $ | – | $ | 1,671,555,903 | ||||||||
Bank Loans | – | – | 187,474 | 187,474 | ||||||||||||
Corporate Bonds | – | 424,091,113 | – | 424,091,113 | ||||||||||||
Credit Linked Notes | ||||||||||||||||
Colombia | – | 1,970,704 | – | 1,970,704 | ||||||||||||
Iraq | – | – | 7,533,472 | 7,533,472 | ||||||||||||
Venezuela | – | 17,054,976 | – | 17,054,976 | ||||||||||||
Short Term Investments | 24,307,740 | – | – | 24,307,740 | ||||||||||||
| ||||||||||||||||
Total | $ | 24,307,740 | $ | 2,114,672,696 | $ | 7,720,946 | $ | 2,146,701,382 | ||||||||
| ||||||||||||||||
| ||||||||||||||||
Other Financial Instruments** | ||||||||||||||||
| ||||||||||||||||
Assets | ||||||||||||||||
Forward Foreign Currency Contracts | $ | – | $ | 235,486 | $ | – | $ | 235,486 | ||||||||
Liabilities | ||||||||||||||||
Credit Default Swap Contracts | – | (705,463) | – | (705,463) | ||||||||||||
| ||||||||||||||||
Total | $ | – | $ | (469,977) | $ | – | $ | (469,977) | ||||||||
| ||||||||||||||||
| Investments in Securities at Value* | Level 1 - Quoted and Unadjusted Prices | Level 2 - Other Significant Observable Inputs | Level 3 - Significant Unobservable Inputs | Total | ||||||||||||
| ||||||||||||||||
Stone Harbor High Yield Bond Fund | ||||||||||||||||
Corporate Bonds | $ | – | $ | 255,692,251 | $ | – | $ | 255,692,251 | ||||||||
Convertible Corporate Bonds | – | 2,914,841 | – | 2,914,841 | ||||||||||||
Bank Loans | – | 18,128,346 | – | 18,128,346 | ||||||||||||
Common/Preferred Stocks | 838,500 | 19 | – | 838,519 | ||||||||||||
Short Term Investments | 4,726,849 | – | – | 4,726,849 | ||||||||||||
| ||||||||||||||||
Total | $ | 5,565,349 | $ | 276,735,457 | $ | – | $ | 282,300,806 | ||||||||
| ||||||||||||||||
| ||||||||||||||||
Other Financial Instruments** | ||||||||||||||||
| ||||||||||||||||
Assets | ||||||||||||||||
Forward Foreign Currency Contracts | $ | – | $ | 49,388 | $ | – | $ | 49,388 | ||||||||
Liabilities | ||||||||||||||||
Forward Foreign Currency Contracts | – | (183) | – | (183) | ||||||||||||
| ||||||||||||||||
Total | $ | – | $ | 49,205 | $ | – | $ | 49,205 | ||||||||
| ||||||||||||||||
Stone Harbor Investment Funds Semi-Annual Report | November 30, 2014 |
79 |
Table of Contents
| Stone Harbor Investment Funds | Notes to Financial Statements | |
|
November 30, 2014 (Unaudited) | |
| Investments in Securities at Value* | Level 1 - Quoted and Unadjusted Prices | Level 2 - Other Significant Observable Inputs | Level 3 - Significant Unobservable Inputs | Total | ||||||||||||
| ||||||||||||||||
Stone Harbor Local Markets Fund | ||||||||||||||||
Sovereign Debt Obligations | $ | – | $ | 1,549,173,679 | $ | – | $ | 1,549,173,679 | ||||||||
Corporate Bonds | – | 71,479,817 | – | 71,479,817 | ||||||||||||
Credit Linked Notes | – | 125,912,063 | – | 125,912,063 | ||||||||||||
Short Term Investments | 133,951,527 | – | – | 133,951,527 | ||||||||||||
| ||||||||||||||||
Total | $ | 133,951,527 | $ | 1,746,565,559 | $ | – | $ | 1,880,517,086 | ||||||||
| ||||||||||||||||
| ||||||||||||||||
Other Financial Instruments** | ||||||||||||||||
| ||||||||||||||||
Assets | ||||||||||||||||
Forward Foreign Currency Contracts | $ | – | $ | 1,661,119 | $ | – | $ | 1,661,119 | ||||||||
Liabilities | ||||||||||||||||
Forward Foreign Currency Contracts | – | (4,406,855) | – | (4,406,855) | ||||||||||||
| ||||||||||||||||
Total | $ | – | $ | (2,745,736) | $ | – | $ | (2,745,736) | ||||||||
| ||||||||||||||||
| Investments in Securities at Value* | Level 1 - Quoted and Unadjusted Prices | Level 2 - Other Significant Observable Inputs | Level 3 - Significant Unobservable Inputs | Total | ||||||||||||
| ||||||||||||||||
Stone Harbor Emerging Markets Corporate Debt Fund | ||||||||||||||||
Corporate Bonds | $ | – | $ | 23,977,449 | $ | – | $ | 23,977,449 | ||||||||
Short Term Investments | 317,963 | – | – | 317,963 | ||||||||||||
| ||||||||||||||||
Total | $ | 317,963 | $ | 23,977,449 | $ | – | $ | 24,295,412 | ||||||||
| ||||||||||||||||
| ||||||||||||||||
Other Financial Instruments** | ||||||||||||||||
| ||||||||||||||||
Assets | ||||||||||||||||
Forward Foreign Currency Contracts | $ | – | $ | 3,001 | $ | – | $ | 3,001 | ||||||||
| ||||||||||||||||
Total | $ | – | $ | 3,001 | $ | – | $ | 3,001 | ||||||||
| ||||||||||||||||
| Investments in Securities at Value* | Level 1 - Quoted and Unadjusted Prices | Level 2 - Other Significant Observable Inputs | Level 3 - Significant Unobservable Inputs | Total | ||||||||||||
| ||||||||||||||||
Stone Harbor Investment Grade Fund | ||||||||||||||||
Corporate Bonds | $ | – | $ | 2,907,344 | $ | – | $ | 2,907,344 | ||||||||
Asset Backed/Commercial Mortgage Backed Securities | – | 433,129 | – | 433,129 | ||||||||||||
U.S. Treasury Bonds/Notes | – | 2,282,959 | – | 2,282,959 | ||||||||||||
U.S. Government Agency Mortgage Backed Securities | – | 2,544,781 | – | 2,544,781 | ||||||||||||
Short Term Investments | 1,507,422 | – | – | 1,507,422 | ||||||||||||
| ||||||||||||||||
Total | $ | 1,507,422 | $ | 8,168,213 | $ | – | $ | 9,675,635 | ||||||||
| ||||||||||||||||
| Investments in Securities at Value* | Level 1 - Quoted and Unadjusted Prices | Level 2 - Other Significant Observable Inputs | Level 3 - Significant Unobservable Inputs | Total | ||||||||||||
| ||||||||||||||||
Stone Harbor Strategic Income Fund | ||||||||||||||||
Open-End Funds | $ | 32,328,709 | $ | – | $ | – | $ | 32,328,709 | ||||||||
Short Term Investments | 38,354 | – | – | 38,354 | ||||||||||||
| ||||||||||||||||
Total | $ | 32,367,063 | $ | – | $ | – | $ | 32,367,063 | ||||||||
| ||||||||||||||||
80 |
www.shiplp.com |
Table of Contents
| Stone Harbor Investment Funds | Notes to Financial Statements | |
|
November 30, 2014 (Unaudited) | |
| Investments in Securities at Value* | Level 1 - Quoted and Unadjusted Prices | Level 2 - Other Significant Observable Inputs | Level 3 - Significant Unobservable Inputs | Total | ||||||||||||
| ||||||||||||||||
Stone Harbor Strategic Income Fund (continued) | ||||||||||||||||
Other Financial Instruments** | ||||||||||||||||
| ||||||||||||||||
Assets | ||||||||||||||||
Forward Foreign Currency Contracts | $ | – | $ | 852 | $ | – | $ | 852 | ||||||||
Futures Contracts | 127,060 | – | – | 127,060 | ||||||||||||
Liabilities | ||||||||||||||||
Forward Foreign Currency Contracts | – | (614) | – | (614) | ||||||||||||
Futures Contracts | (94,219) | – | – | (94,219) | ||||||||||||
| ||||||||||||||||
Total | $ | 32,841 | $ | 238 | $ | – | $ | 33,079 | ||||||||
| ||||||||||||||||
| Investments in Securities at Value* | Level 1 - Quoted and Unadjusted Prices | Level 2 - Other Significant Observable Inputs | Level 3 - Significant Unobservable Inputs | Total | ||||||||||||
| ||||||||||||||||
Stone Harbor Emerging Markets Debt Allocation Fund | ||||||||||||||||
Open-End Funds | $ | 63,148,232 | $ | – | $ | – | $ | 63,148,232 | ||||||||
| ||||||||||||||||
Total | $ | 63,148,232 | $ | – | $ | – | $ | 63,148,232 | ||||||||
| ||||||||||||||||
| * | For detailed Industry/Country descriptions, see accompanying Statements of Investments. |
| ** | Other financial instruments are derivative instruments not reflected in the Statements of Investments. The derivatives shown in this table are reported at their unrealized appreciation/ (depreciation) at measurement date, which represents the change in the contract’s value. |
There were no transfers between Levels 1 and 2 during the period ended November 30, 2014. It is the Funds’ policy to recognize transfers into and out of all levels at the end of the reporting period. Other financial assets were moved from Level 2 to Level 3 as observable inputs were not available for purposes of valuing those assets.
Stone Harbor Investment Funds Semi-Annual Report | November 30, 2014 |
81 |
Table of Contents
| Stone Harbor Investment Funds | Notes to Financial Statements | |
|
November 30, 2014 (Unaudited) | |
The following is a reconciliation of assets in which significant unobservable inputs (Level 3) were used in determining fair value:
| Investments in Securities | Balance as of May 31, 2014 | Accrued discount/ premium | Realized Gain/ (Loss) | Change in (Depreciation) | Purchases | Sales Proceeds | Transfer into Level 3 | Transfer out of Level 3 | Balance as of November | Net change in unrealized appreciation/ (depreciation) included in the Statements of Operations attributable to Level 3 investments held at November 30, 2014 | ||||||||||||||||||||||||||||||
| ||||||||||||||||||||||||||||||||||||||||
Stone Harbor Emerging Market Debt Fund | ||||||||||||||||||||||||||||||||||||||||
Bank Loans | $ | 249,965 | $ | – | $ | – | $ | (62,491) | $ | – | $ | – | $ | – | $ | – | $ | 187,474 | $ | (62,491) | ||||||||||||||||||||
Credit Linked Notes | 9,778,779 | 88,734 | 49,199 | (1,893,966) | – | (489,274) | – | – | 7,533,472 | (1,893,966) | ||||||||||||||||||||||||||||||
| ||||||||||||||||||||||||||||||||||||||||
Total | $ | 10,028,744 | $ | 88,734 | $ | 49,199 | $ | (1,956,457) | $ | – | $ | (489,274) | $ | – | $ | – | $ | 7,720,946 | $ | (1,956,457) | ||||||||||||||||||||
| ||||||||||||||||||||||||||||||||||||||||
| * | Realized gain/ (loss) and change in unrealized appreciation/ (depreciation) are included in the related amounts on the investment in the Statements of Operations. |
All level 3 investments have values determined utilizing third party pricing information without adjustment.
The inputs or methodology used for valuing securities are not necessarily an indication of the risk associated with investing in those securities.
In the event a Board approved independent pricing service is unable to provide an evaluated price for a security or the Adviser believes the price provided is not reliable, securities of the Funds may be valued at fair value as described above. In these instances the Adviser may seek to find an alternative independent source, such as a broker/dealer to provide a price quote, or by using evaluated pricing models similar to the techniques and models used by the independent pricing service. These fair value measurement techniques may utilize unobservable inputs (Level 3).
On at least a quarterly basis, the Adviser presents the factors considered in determining the fair value measurements and presents that information to the Board which meets at least quarterly.
Security Transactions and Investment Income: Security transactions are accounted for on a trade date basis. Interest income, adjusted for amortization of premium and accretion of discount, is recorded on the accrual basis. Dividend income is recorded on the ex-dividend date. Foreign dividend income is recorded on the ex-dividend date or as soon as practical after the Funds determine the existence of a dividend declaration after exercising reasonable due diligence. If applicable, any foreign capital gains taxes are accrued, net of unrealized gains, and are payable upon the sale of such investments. The cost of investments sold is determined by use of the specific identification method. To the extent any issuer defaults on an expected interest payment, the Funds’ policy is to generally halt any additional interest income accruals and consider the realizability of interest accrued up to the date of default.
Foreign Currency Translation: The books and records of the Funds are maintained in U.S. dollars. Investment valuations and other assets and liabilities initially expressed in foreign currencies are converted each business day into U.S. dollars based upon current exchange rates. Prevailing foreign exchange rates may generally be obtained at the close of the NYSE (normally, 4:00 p.m. Eastern time). The portion of realized and unrealized gains or losses on investments due to fluctuations in foreign currency exchange rates is not separately disclosed and is included in realized and unrealized gains or losses on investments, when applicable.
Foreign Securities: The Funds may directly purchase securities of foreign issuers. Investing in securities of foreign issuers involves special risks not typically associated with investing in securities of U.S. issuers. The risks include possible revaluation of currencies, the ability to repatriate funds, less complete financial information about companies and possible future adverse political and economic developments. Moreover, securities of many foreign issuers and their markets may be less liquid and their prices more volatile than those of securities of comparable U.S. issuers.
82 |
www.shiplp.com |
Table of Contents
| Stone Harbor Investment Funds | Notes to Financial Statements | |
|
November 30, 2014 (Unaudited) | |
Credit Linked Notes: The Funds may invest in credit linked notes to obtain economic exposure to high yield, emerging markets or other securities. Investments in a credit linked note typically provide the holder with a return based on the return of an underlying reference instrument, such as an emerging market bond. Like an investment in a bond, investments in credit-linked securities represent the right to receive periodic income payments (in the form of distributions) and payment of principal at the end of the term of the security. In addition to the risks associated with the underlying reference instrument, an investment in a credit linked note is also subject to the risk that the counterparty will be unwilling or unable to meet its obligations under the note.
Segregation and Collateralization: In cases in which the 1940 Act and the interpretive positions of the Securities and Exchange Commission (“SEC”) require that the Fund either delivers collateral or segregate assets in connection with certain investments (e.g., foreign currency exchange contracts, securities with extended settlement periods, and swaps) or certain borrowings (e.g., reverse repurchase agreements), the Fund will segregate collateral or designate on its books and records cash or other liquid securities having a value at least equal to the amount that is required to be physically segregated for the benefit of the counterparty. Furthermore, based on requirements and agreements with certain exchanges and third party broker-dealers, each party has requirements to deliver/deposit cash or securities as collateral for certain investments. Cash collateral that has been pledged to cover obligations of the Funds and cash collateral received from the counterparty, if any, is reported separately on the Statements of Assets and Liabilities as “Deposits with brokers” or “Payable due to brokers”, respectively. Securities collateral pledged for the same purpose is noted on the Statement of Investments.
Loan Participations and Assignments: The Funds may invest in loans arranged through private negotiation between one or more financial institutions. The Funds’ investment in any such loan may be in the form of a participation in or an assignment of the loan. In connection with purchasing participations, the Funds generally will have no right to enforce compliance by the borrower with the terms of the loan agreement relating to the loan, nor any rights of set-off against the borrower and the Funds may not benefit directly from any collateral supporting the loan in which they have purchased the participation.
The Funds may also invest in unfunded loan commitments, which are contractual obligations for future funding. Information regarding unfunded commitments is included at the end of the Funds’ Schedules of Investments.
The Funds assume the credit risk of the borrower, the lender that is selling the participation and any other persons interpositioned between the Funds and the borrower. In the event of the insolvency of the lender selling the participation, the Funds may be treated as a general creditor of the lender and may not benefit from any set-off between the lender and the borrower.
Inflation-Indexed Bonds: Certain Funds may invest in inflation indexed bonds. Inflation-indexed bonds are fixed-income securities whose principal value is periodically adjusted to the rate of inflation. The interest rate on these bonds is generally fixed at issuance at a rate lower than typical bonds. Over the life of an inflation-indexed bond, however, interest will be paid based on a principal value which is adjusted for inflation. Any increase or decrease in the principal amount of an inflation-indexed bond will be included as interest income on the Statements of Operations, even though investors do not receive their principal until maturity.
Mortgage-Related and Other Asset-Backed Securities: Certain Funds may invest in mortgage-related and other asset-backed securities. These securities include mortgage pass-through securities, collateralized mortgage obligations, commercial mortgage-backed securities, stripped mortgage-backed securities, asset-backed securities, collateralized debt obligations and other securities that directly or indirectly represent a participation in, or are secured by and payable from, mortgage loans on real property. Mortgage-related and other asset-backed securities are interests in pools of loans or other receivables. Mortgage-related securities are created from pools of residential or commercial mortgage loans, including mortgage loans made by savings and loan institutions, mortgage bankers, commercial banks and others. Asset-backed securities are created from many types of assets, including auto loans, credit card receivables, home equity loans, and student loans. These securities provide a monthly payment which consists of both interest and principal payments. Interest payments may be determined by fixed or adjustable rates. The rate of prepayments on underlying mortgages will affect the price and volatility of a mortgage-related security, and may have the effect of shortening or extending the effective duration of the security relative to what was anticipated at the time of purchase. The timely payment of principal and interest of certain mortgage-related securities is guaranteed with the full faith and credit of the U.S. Government. Pools created and guaranteed by non-governmental issuers, including government sponsored corporations, may be supported by various forms of insurance or guarantees, but there can be no assurance that the private insurers or guarantors can meet their obligations under the insurance policies or guarantee arrangements.
U.S. Government Agencies or Government-Sponsored Enterprises: Certain Funds may invest in securities of U.S. Government agencies or government-sponsored enterprises. U.S. Government securities are obligations of and, in certain cases, guaranteed by, the U.S. Government, its agencies or instrumentalities. Some U.S. Government securities, such as Treasury bills, notes and bonds, and securities guaranteed by the Government National Mortgage Association (“GNMA” or “Ginnie Mae”), are supported by the full faith and credit of the U.S. Government; others, such as those of the Federal Home Loan Banks, are supported by the right of the issuer to borrow from the U.S. Department of the Treasury (the
Stone Harbor Investment Funds Semi-Annual Report | November 30, 2014 |
83 |
Table of Contents
| Stone Harbor Investment Funds | Notes to Financial Statements | |
|
November 30, 2014 (Unaudited) | |
“U.S. Treasury”); others, such as those of the Federal National Mortgage Association (“FNMA” or “Fannie Mae”), are supported by the discretionary authority of the U.S. Government to purchase the agency’s obligations. U.S. Government securities may include zero coupon securities, which do not distribute interest on a current basis and tend to be subject to greater risk than interest-paying securities of similar maturities.
Government-related guarantors (i.e., not backed by the full faith and credit of the U.S. Government) include FNMA and the Federal Home Loan Mortgage Corporation (“FHLMC” or “Freddie Mac”). FNMA is a government-sponsored corporation. FNMA purchases conventional (i.e., not insured or guaranteed by any government agency) residential mortgages from a list of approved seller/servicers which include state and federally chartered savings and loan associations, mutual savings banks, commercial banks and credit unions and mortgage bankers. Pass-through securities issued by FNMA are guaranteed as to timely payment of principal and interest by FNMA, but are not backed by the full faith and credit of the U.S. Government. FHLMC issues Participation Certificates (“PCs”), which are pass-through securities, each representing an undivided interest in a pool of residential mortgages. FHLMC guarantees the timely payment of interest and ultimate collection of principal, but PCs are not backed by the full faith and credit of the U.S. Government.
Forward Commitments: Certain Funds may contract to purchase securities for a fixed price at a transaction date beyond the customary settlement period (i.e., “when-issued,” “delayed-delivery,” “forward commitment,” or “To Be Announced (“TBA”) transactions”) consistent with a Fund’s ability to manage its investment portfolio and meet redemption requests. These transactions involve a commitment by a Fund to purchase securities for a predetermined price or yield with payment and delivery taking place more than three days in the future or after a period longer than the customary settlement period for that type of security. No interest will be earned by a Fund on such purchases until the securities are delivered; however, the market value may change prior to delivery. A Fund will not engage in these transactions for investment leverage.
When-issued securities involve the risk that the yield obtained in the transaction will be less than that available in the market when delivery takes place. Securities purchased on a when-issued basis are recorded as an asset and are subject to changes in value based upon changes in the value of the security or general level of interest rates. In when-issued and delayed-delivery transactions, a Fund relies on the seller to complete the transaction; the seller’s failure to do so may cause a Fund to miss an advantageous price or yield.
The Funds may enter into TBA commitments. TBA commitments are forward agreements for the purchase or sale of mortgage-backed securities for a fixed price, with payment and delivery on an agreed upon future settlement date. The specific securities to be delivered are not identified at the trade date. However, delivered securities must meet specified terms, including issuer, rate and mortgage terms. The Funds generally enter into TBA commitments with the intent to take possession of or deliver the underlying mortgage-backed securities but can extend the settlement or roll the transaction.
Unsettled TBA sale (purchase) commitments are valued at the current market value of the underlying securities. The contract is adjusted to market value daily, and the change in market value is recorded by the Fund as an unrealized gain or loss. Outstanding TBA commitments and related deliverables are reflected on the State of Assets and Liabilities in Payable for investments purchased and Receivable for investments sold, respectively. If the TBA sale (purchase) commitment is closed through the acquisition of an offsetting purchase (sale) commitment, the Fund realizes a gain or loss from the sale of the securities based upon the unit price established at the date the commitment was entered into. These gain/loss amounts are reflected in the Accumulated net realized gain/loss on investments and Net unrealized appreciation on investments on the Statement of Assets and Liabilities.
Credit and Market Risk: The Funds invest in high yield and emerging market instruments that are subject to certain credit and market risks. The yields of high yield and emerging market debt obligations reflect, among other things, perceived credit and market risks. The Funds’ investment in securities rated below investment grade typically involves risks not associated with higher rated securities including, among others, greater risk related to timely and ultimate payment of interest and principal, greater market price volatility and less liquid secondary market trading. The consequences of political, social, economic or diplomatic changes may have disruptive effects on the market prices of investments held by the Funds. The Funds’ investment in non-U.S. dollar denominated securities may also result in foreign currency losses caused by devaluations and exchange rate fluctuations. Investments in derivatives are also subject to credit and market risks.
Distributions to Shareholders: Dividends and distributions to shareholders, which are determined in accordance with income tax regulations, are recorded on the ex-date. Income distributions, if any are generally declared and paid on a quarterly basis. Capital gain distributions, if any, are declared and paid at least annually.
Expenses: Direct expenses are charged to each Fund; expenses of the Trust are generally allocated to the Funds based on each Fund’s relative net assets.
84 |
www.shiplp.com |
Table of Contents
| Stone Harbor Investment Funds | Notes to Financial Statements | |
|
November 30, 2014 (Unaudited) | |
Federal and Other Taxes: No provision for income taxes is included in the accompanying financial statements, as the Funds intend to distribute to shareholders all taxable investment income and realized gains and otherwise comply with Subchapter M of the Internal Revenue Code of 1986, as amended, applicable to regulated investment companies.
The Funds evaluate tax positions taken (or expected to be taken) in the course of preparing the Funds’ tax provisions to determine whether these positions meet a “more-likely-than-not” standard that, based on the technical merits, have a more than fifty percent likelihood of being sustained by a taxing authority upon examination. A tax position that meets the “more-likely-than-not” recognition threshold is measured to determine the amount of benefit to recognize in the financial statements.
As of and during the period ended November 30, 2014, the Funds did not have a liability for any unrecognized tax benefits. The Funds file U.S. federal, state, and local tax returns as required. The Funds’ tax returns are subject to examination by the relevant tax authorities until expiration of the applicable statute of limitations which is generally three years after the filing of the tax return for federal purposes and four years for most state returns. Tax returns for open years have incorporated no uncertain tax positions that require a provision for income taxes.
2. DERIVATIVE INSTRUMENTS
Risk Exposure and the Use of Derivative Instruments: The Funds’ investment objectives not only permit the Funds to purchase investment securities, they also allow the Funds to enter in various types of derivatives contracts. In doing so, the Funds employ strategies in differing combinations to permit them to increase, decrease, or change the level or types of exposure to market factors. Central to those strategies are features inherent to derivatives that may make them more attractive for this purpose than equity or debt securities; they require little or no initial cash investment, they can focus exposure on only certain selected risk factors, and they may not require the ultimate receipt or delivery of the underlying security (or securities) to the contract. This may allow the Funds to pursue their objectives more quickly and efficiently than if they were to make direct purchases or sales of securities capable of affecting a similar response to market factors.
Market Risk Factors. In pursuit of their investment objectives, the Funds may seek to use derivatives to increase or decrease their exposure to the following market risk factors, among others:
Interest Rate Risk. Interest rate risk refers to the fluctuations in value of fixed-income securities resulting from the inverse relationship between price and yield. For example, an increase in general interest rates will tend to reduce the market value of already issued fixed-income investments, and a decline in general interest rates will tend to increase their value. In addition, debt securities with longer maturities, which tend to have higher yields, are subject to potentially greater fluctuations in value from changes in interest rates than obligations with shorter maturities.
Credit Risk. Credit risk relates to the ability of the issuer to meet interest and principal payments, or both, as they come due. In general, lower-grade, higher-yield bonds are subject to credit risk to a greater extent than lower-yield, higher-quality bonds.
Foreign Exchange Rate Risk. Foreign exchange risk relates to the change in the U.S. dollar value of a security held that is denominated in a foreign currency. The U.S. dollar value of a foreign currency denominated security will decrease as the dollar appreciates against the currency, while the U.S. dollar value will increase as the dollar depreciates against the currency.
Equity Risk. Equity risk relates to the change in value of equity securities as they relate to increases or decreases in the general market.
The Funds’ use of derivatives can result in losses due to unanticipated changes in these risk factors and the overall market. In instances where the Funds are using derivatives to decrease, or hedge, exposures to market risk factors for securities held by the Funds, there are also risks that those derivatives may not perform as expected resulting in losses for the combined or hedged positions.
Derivatives may have little or no initial cash investment relative to their market value exposure and therefore can produce significant gains or losses in excess of their cost. This use of embedded leverage allows each Fund to increase its market value exposure relative to its net assets and can substantially increase the volatility of the Funds’ performance.
Additional associated risks from investing in derivatives also exist and potentially could have significant effects on the valuation of the derivative and the Funds. Typically, the associated risks are not the risks that the Funds are attempting to increase or decrease exposure to, per their investment objectives, but are the additional risks from investing in derivatives.
Stone Harbor Investment Funds Semi-Annual Report | November 30, 2014 |
85 |
Table of Contents
| Stone Harbor Investment Funds | Notes to Financial Statements | |
|
November 30, 2014 (Unaudited) | |
Examples of these associated risks are liquidity risk, which is the risk that the Funds will not be able to sell or close out the derivative in a timely manner, and counterparty credit risk, which is the risk that the counterparty will not fulfill its obligation to the Funds. Associated risks can be different for each type of derivative and are discussed by each derivative type below in the notes that follow.
Forward Foreign Currency Contracts: The Funds may engage in currency transactions with counterparties to hedge the value of portfolio securities denominated in particular currencies against fluctuations in relative value, to gain or reduce exposure to certain currencies, or to generate income or gains. A forward foreign currency contract is an agreement between two parties to buy and sell a currency at a set price on a future date. The contract is marked-to-market daily and the change in value is recorded by the Funds as an unrealized gain or loss. When a forward foreign currency contract is extinguished, through either delivery or offset by entering into another forward foreign currency contract, the Funds record a realized gain or loss equal to the difference between the value of the contract at the time it was opened and the value of the contract at the time it was extinguished.
Forward foreign currency contracts involve elements of market risk in excess of the amounts reflected in the Statements of Assets and Liabilities. The Funds bear the risk of an unfavorable change in the foreign exchange rate underlying the forward foreign currency contract. Risks may also arise upon entering into these contracts from the potential inability of the counterparties to meet the terms of their contracts.
Futures Contracts: Certain Funds may invest in futures contracts in accordance with their investment objectives. Each Fund does so for a variety of reasons including for cash management, hedging or non-hedging purposes in an attempt to achieve investment returns consistent with the Fund’s investment objective. A futures contract provides for the future sale by one party and purchase by another party of a specified quantity of the security or other financial instrument at a specified price and time. A futures contract on an index is an agreement pursuant to which two parties agree to take or make delivery of an amount of cash equal to the difference between the value of the index at the close of the last trading day of the contract and the price at which the index contract was originally written. Futures contract transactions may result in losses in excess of the amount invested in the futures contract. There can be no guarantee that there will be a correlation between price movements in the hedging vehicle and in the portfolio securities being hedged. An incorrect correlation could result in a loss on both the hedged securities in a Fund and the hedging vehicle so that the portfolio return might have been greater had hedging not been attempted. There can be no assurance that a liquid market will exist at a time when a Fund seeks to close out a futures contract or a futures option position. Lack of a liquid market for any reason may prevent a Fund from liquidating an unfavorable position, and the Fund would remain obligated to meet margin requirements until the position is closed. In addition, a Fund could be exposed to risk if the counterparties to the contracts are unable to meet the terms of their contracts. With exchange-traded futures contracts, there is minimal counterparty credit risk to the Funds since futures contracts are exchange-traded and the exchange’s clearinghouse, as counterparty to all exchange-traded futures contracts, guarantees the futures contracts against default.
When a purchase or sale of a futures contract is made by a Fund, the Fund is required to deposit with its broker a specified amount of liquid assets (“initial margin”). The margin required for a futures contract is set by the exchange on which the contract is traded and may be modified during the term of the contract. The initial margin is in the nature of a performance bond or good faith deposit on the futures contract that is returned to a Fund upon termination of the contract, assuming all contractual obligations have been satisfied. Each day a Fund may pay or receive cash, called “variation margin,” equal to the daily change in value of the futures contract. Such payments or receipts are recorded for financial statement purposes as unrealized gains or losses by a Fund. Variation margin does not represent a borrowing or loan by a Fund but is instead a settlement between a Fund and the broker of the amount one would owe the other if the futures contract expired. When the contract is closed, a Fund records a realized gain or loss equal to the difference between the value of the contract at the time it was opened and the value at the time it was closed. As of November 30, 2014, the Strategic Income Fund held futures contracts outstanding with an unrealized gain of $238. No other Funds held futures contracts at November 30, 2014.
Credit Default Swap Contracts: The Funds may enter into credit default swap contracts for hedging purposes or to add leverage to its portfolio. When used for hedging purposes, the Funds would be the buyer of a credit default swap contract. In that case, the Funds would be entitled to receive the par (or other agreed upon) value of a referenced debt obligation, index or other investment from the counterparty to the contract in the event of a default by a third party, such as a U.S. or foreign issuer, on the referenced debt obligation. In return, the Funds would pay to the counterparty a periodic stream of payments over the term of the contract provided that no event of default has occurred. If no event of default occurs, the Fund would have spent the stream of payments and received no benefit from the contract. When the Funds are the seller of a credit default swap contract, it receives the stream of payments but is obligated to pay upon default of the referenced debt obligation. As the seller, the Funds would effectively add leverage to its portfolio because, in addition to its total assets, the Fund would be subject to investment exposure on the notional amount of the swap.
86 |
www.shiplp.com |
Table of Contents
| Stone Harbor Investment Funds | Notes to Financial Statements | |
|
November 30, 2014 (Unaudited) | |
The tables below are a summary of the fair valuations of derivative instruments categorized by risk exposure.
Fair values of forward foreign currency contracts and future contracts on the Statements of Assets and Liabilities as of November 30, 2014:
| Risk Exposure | Statement of Assets and Liabilities Location | Fair Value | Statement of Assets and Liabilities Location | Fair Value | ||||||||
| ||||||||||||
Stone Harbor Emerging Markets Debt Fund | ||||||||||||
Credit Risk | Unrealized appreciation on credit default swap contracts | – | Unrealized depreciation on credit default swap contracts | (705,463) | ||||||||
Foreign Exchange Rate Risk | Unrealized appreciation on forward foreign currency contracts | $ | 235,486 | Unrealized depreciation on forward foreign currency contracts | $ | – | ||||||
| ||||||||||||
Total | $ | 235,486 | $ | (705,463) | ||||||||
| ||||||||||||
Stone Harbor High Yield Bond Fund | ||||||||||||
Foreign Exchange Rate Risk | Unrealized appreciation on forward foreign currency contracts | $ | 49,388 | Unrealized depreciation on forward foreign currency contracts | $ | (183) | ||||||
| ||||||||||||
Total | $ | 49,388 | $ | (183) | ||||||||
| ||||||||||||
Stone Harbor Local Markets Fund | ||||||||||||
Foreign Exchange Rate Risk | Unrealized appreciation on forward foreign currency contracts | $ | 1,661,119 | Unrealized depreciation on forward foreign currency contracts | $ | (4,406,855) | ||||||
| ||||||||||||
Total | $ | 1,661,119 | $ | (4,406,855) | ||||||||
| ||||||||||||
Stone Harbor Emerging Markets Corporate Debt Fund | ||||||||||||
Foreign Exchange Rate Risk | Unrealized appreciation on forward foreign currency contracts | $ | 3,001 | Unrealized depreciation on forward foreign currency contracts | $ | – | ||||||
| ||||||||||||
Total | $ | 3,001 | $ | – | ||||||||
| ||||||||||||
Stone Harbor Strategic Income Fund | ||||||||||||
Interest Rate Risk (Futures Contracts) | Receivable for variation margin | 127,060 | Payable for variation margin | (94,219) | ||||||||
Foreign Exchange Rate Risk | Unrealized appreciation on forward foreign currency contracts | $ | 852 | Unrealized depreciation on forward foreign currency contracts | $ | (614) | ||||||
| ||||||||||||
Total | $ | 127,912 | $ | (94,833) | ||||||||
| ||||||||||||
The number of forward foreign currency contracts, credit default swap contracts, and futures contracts held at November 30, 2014 is representative of activity during the period ended November 30, 2014.
Stone Harbor Investment Funds Semi-Annual Report | November 30, 2014 |
87 |
Table of Contents
| Stone Harbor Investment Funds | Notes to Financial Statements | |
|
November 30, 2014 (Unaudited) | |
The effect of forward foreign currency contracts and futures contracts on the Statements of Operations for the period ended November 30, 2014:
| Risk Exposure | Statement of Operations Location | Realized Gain/(Loss) on | Location | Change in Unrealized Appreciation/(Depreciation) on Derivatives Recognized in Income | ||||||||||
| ||||||||||||||
Stone Harbor Emerging Markets Debt Fund | ||||||||||||||
Credit Risk | Net realized gain/(loss) on credit default swap contracts | 87,847 | Change in unrealized appreciation/(depreciation) on credit default swap contracts | (705,463) | ||||||||||
Forward Exchange Rate Risk | Net realized gain/(loss) on forward foreign currency contracts | $ | 1,114,693 | Change in unrealized appreciation/(depreciation) on forward foreign currency contracts | $ | 127,372 | ||||||||
| ||||||||||||||
Total | $ | 1,202,540 | $ | (578,091) | ||||||||||
| ||||||||||||||
Stone Harbor High Yield Bond Fund | ||||||||||||||
Forward Exchange Rate Risk | Net realized gain/(loss) on forward foreign currency contracts | $ | 534,699 | Change in unrealized appreciation/(depreciation) on forward foreign currency contracts | $ | (12,947) | ||||||||
| ||||||||||||||
Total | $ | 534,699 | $ | (12,947) | ||||||||||
| ||||||||||||||
Stone Harbor Local Markets Fund | ||||||||||||||
Forward Exchange Rate Risk | Net realized gain/(loss) on forward foreign currency contracts | $ | (4,553,750) | Change in unrealized appreciation/(depreciation) on forward foreign currency contracts | $ | (1,337,848) | ||||||||
| ||||||||||||||
Total | $ | (4,553,750) | $ | (1,337,848) | ||||||||||
| ||||||||||||||
Stone Harbor Emerging Markets Corporate Debt Fund | ||||||||||||||
Forward Exchange Rate Risk | Net realized gain/(loss) on forward foreign currency contracts | $ | 21,134 | Change in unrealized appreciation/(depreciation) on forward foreign currency contracts | $ | 1,170 | ||||||||
| ||||||||||||||
Total | $ | 21,134 | $ | 1,170 | ||||||||||
| ||||||||||||||
Stone Harbor Investment Grade Fund | ||||||||||||||
Interest Rate Risk (Futures Contracts) | Net realized gain/(loss) on futures contracts | $ | 11,993 | Change in unrealized appreciation/(depreciation) on futures contracts | $ | – | ||||||||
| ||||||||||||||
Total | $ | 11,993 | $ | – | ||||||||||
| ||||||||||||||
Stone Harbor Strategic Income Fund | ||||||||||||||
Credit Risk | Net realized gain/(loss) on credit default swap contracts | (3,664) | Change in unrealized appreciation/(depreciation) on credit default swap contracts | – | ||||||||||
Interest Rate Risk (Futures Contracts) | Net realized gain/(loss) on futures contracts | 167,052 | Change in unrealized appreciation/(depreciation) on futures contracts | (2,155) | ||||||||||
Forward Exchange Rate Risk | Net realized gain/(loss) on forward foreign currency contracts | $ | 2,002 | Change in unrealized appreciation/(depreciation) on forward foreign currency contracts | $ | (7) | ||||||||
| ||||||||||||||
Total | $ | 165,390 | $ | (2,162) | ||||||||||
| ||||||||||||||
88 |
www.shiplp.com |
Table of Contents
| Stone Harbor Investment Funds | Notes to Financial Statements | |
|
November 30, 2014 (Unaudited) | |
Offsetting Arrangements: Certain derivative contracts are executed under standardized netting agreements. A derivative netting arrangement creates an enforceable right of set-off that becomes effective, and affects the realization of settlement on individual assets, liabilities and collateral amounts, only following a specified event of default or early termination. Default events may include the failure to make payments or deliver securities timely, material adverse changes in financial condition or insolvency, the breach of minimum regulatory capital requirements, or loss of license, charter or other legal authorization necessary to perform under the contract. These agreements mitigate counterparty credit risk by providing for a single net settlement with a counterparty of all financial transactions covered by the agreement in an event of default as defined under such agreement.
The following table presents derivative financial instruments that are subject to enforceable netting arrangements, collateral arrangements or other similar agreements as of November 30, 2014.
Offsetting of Derivatives Assets
November 30, 2014
| Gross Amounts Not Offset in the Statements of Assets and Liabilities | ||||||||||||||||||||||||
| Description | Gross Amounts of Recognized Assets | Gross Amounts Offset in the Statements of Assets and Liabilities | Net Amounts Presented in the Statements of Assets and Liabilities | Financial Instruments Available for Offset (a) | Cash Collateral Received(a) | Net Amount Receivable | ||||||||||||||||||
| ||||||||||||||||||||||||
Stone Harbor Emerging Markets Debt Fund |
| |||||||||||||||||||||||
| Forward foreign currency contracts | $ | 235,486 | $ | – | $ | 235,486 | $ | – | $ | (235,486) | $ | – | ||||||||||||
| ||||||||||||||||||||||||
Total | $ | 235,486 | $ | – | $ | 235,486 | $ | – | $ | (235,486) | $ | – | ||||||||||||
| ||||||||||||||||||||||||
Stone Harbor High Yield Bond Fund |
| |||||||||||||||||||||||
| Forward foreign currency contracts | $ | 49,388 | $ | – | $ | 49,388 | $ | (183) | $ | (49,205) | $ | – | ||||||||||||
| ||||||||||||||||||||||||
Total | $ | 49,388 | $ | – | $ | 49,388 | $ | (183) | $ | (49,205) | $ | – | ||||||||||||
| ||||||||||||||||||||||||
Stone Harbor Local Markets Fund |
| |||||||||||||||||||||||
| Forward foreign currency contracts | $ | 1,661,119 | $ | – | $ | 1,661,119 | $ | (1,661,119) | $ | – | $ | – | ||||||||||||
| ||||||||||||||||||||||||
Total | $ | 1,661,119 | $ | – | $ | 1,661,119 | $ | (1,661,119) | $ | – | $ | – | ||||||||||||
| ||||||||||||||||||||||||
Stone Harbor Emerging Markets Corporate Debt Fund |
| |||||||||||||||||||||||
| Forward foreign currency contracts | $ | 3,001 | $ | – | $ | 3,001 | $ | – | $ | – | $ | (3,001) | ||||||||||||
| ||||||||||||||||||||||||
Total | $ | 3,001 | $ | – | $ | 3,001 | $ | – | $ | – | $ | (3,001) | ||||||||||||
| ||||||||||||||||||||||||
Stone Harbor Strategic Income Fund |
| |||||||||||||||||||||||
| Forward foreign currency contracts | $ | 852 | $ | – | $ | 852 | $ | (614) | $ | – | $ | (238) | ||||||||||||
| ||||||||||||||||||||||||
Total | $ | 852 | $ | – | $ | 852 | $ | (614) | $ | – | $ | (238) | ||||||||||||
| ||||||||||||||||||||||||
Stone Harbor Investment Funds Semi-Annual Report | November 30, 2014 |
89 |
Table of Contents
| Stone Harbor Investment Funds | Notes to Financial Statements | |
|
November 30, 2014 (Unaudited) | |
Offsetting of Derivatives Liabilities
November 30, 2014
| Gross Amounts Not Offset in the Statements of Assets and Liabilities | ||||||||||||||||||||||||
| Description | Gross Amounts of Recognized Liabilities | Gross Amounts Offset in the Statements of Assets and Liabilities | Net Amounts Presented in the Statements of Assets and Liabilities | Financial Offset (a) | Cash Collateral Pledged(a) | Net Amount Payable | ||||||||||||||||||
| ||||||||||||||||||||||||
Stone Harbor Emerging Markets Debt Fund |
| |||||||||||||||||||||||
| Credit default swap contracts | 705,463 | – | 705,463 | – | (705,463) | – | ||||||||||||||||||
| ||||||||||||||||||||||||
Total | $ | 705,463 | $ | – | $ | 705,463 | $ | – | $ | (705,463) | $ | – | ||||||||||||
| ||||||||||||||||||||||||
Stone Harbor High Yield Bond Fund |
| |||||||||||||||||||||||
| Forward foreign currency contracts | $ | 183 | $ | – | $ | 183 | $ | (183) | $ | – | $ | – | ||||||||||||
| ||||||||||||||||||||||||
Total | $ | 183 | $ | – | $ | 183 | $ | (183) | $ | – | $ | – | ||||||||||||
| ||||||||||||||||||||||||
Stone Harbor Local Markets Fund |
| |||||||||||||||||||||||
| Forward foreign currency contracts | $ | 4,406,855 | $ | – | $ | 4,406,855 | $ | (1,661,119) | $ | (1,765,868) | $ | (979,868) | ||||||||||||
| ||||||||||||||||||||||||
Total | $ | 4,406,855 | $ | – | $ | 4,406,855 | $ | (1,661,119) | $ | (1,765,868) | $ | (979,868) | ||||||||||||
| ||||||||||||||||||||||||
Stone Harbor Strategic Income Fund |
| |||||||||||||||||||||||
| Forward foreign currency contracts | $ | 614 | $ | – | $ | 614 | $ | (614) | $ | – | $ | – | ||||||||||||
| ||||||||||||||||||||||||
Total | $ | 614 | $ | – | $ | 614 | $ | (614) | $ | – | $ | – | ||||||||||||
| ||||||||||||||||||||||||
| (a) | These amounts are limited to the derivatives asset/liability balance and, accordingly, do not include excess collateral received/pledged. |
3. TAX BASIS INFORMATION
Tax Basis of Distributions to Shareholders: Net investment income/ (loss) and net realized gain/ (loss) may differ for financial statement and tax purposes. The character of distributions made during the year from net investment income or net realized gains may differ from its ultimate characterization for federal income tax purposes. Also, due to the timing of dividend distributions, the fiscal year in which amounts are distributed may differ from the fiscal year in which the income or realized gain was recorded by a Fund.
The amounts and characteristics of tax basis distributions and composition of distributable earnings/(accumulated losses) are finalized at fiscal year end: accordingly, tax basis balances have not been determined as of November 30, 2014.
The tax character of the distributions paid by the Funds during the period ended May 31, 2014 was as follows:
| Stone Harbor Emerging Markets Debt Fund | For the Year Ended May 31, 2014 | |||
Ordinary Income | $ | 85,919,272 | ||
Long-Term Capital Gain | 100,570 | |||
| ||||
Total | $ | 86,019,842 | ||
| ||||
| Stone Harbor High Yield Bond Fund | For the Year Ended May 31, 2014 | |||
Ordinary Income | $ | 23,884,719 | ||
Long-Term Capital Gain | 8,620,656 | |||
| ||||
Total | $ | 32,505,375 | ||
| ||||
90 |
www.shiplp.com |
Table of Contents
| Stone Harbor Investment Funds | Notes to Financial Statements | |
|
November 30, 2014 (Unaudited) | |
| For the Year Ended May 31, 2014 | ||||
Stone Harbor Local Markets Fund | ||||
Ordinary Income | $ | 25,186,122 | ||
Long-Term Capital Gain | 4,745,258 | |||
| ||||
Total | $ | 29,931,380 | ||
| ||||
| Stone Harbor Emerging Markets Corporate Debt Fund | For the Year Ended May 31, 2014 | |||
Ordinary Income | $ | 2,080,114 | ||
| ||||
Total | $ | 2,080,114 | ||
| ||||
| Stone Harbor Investment Grade Fund | For the Period Ended May 31, 2014 | |||
Ordinary Income | $ | 17,965 | ||
| ||||
Total | $ | 17,965 | ||
| ||||
| Stone Harbor Strategic Income Fund | For the Period Ended May 31, 2014 | |||
Ordinary Income | $ | 130,527 | ||
| ||||
Total | $ | 130,527 | ||
| ||||
As of May 31, 2014, the components of distributable earnings on a tax basis were as follows:
|
| |||
Stone Harbor Emerging Markets Debt Fund | ||||
Undistributed Ordinary Income | $ | 2,746,820 | ||
Accumulated Capital Loss | (65,679,587) | |||
Unrealized Appreciation | 65,638,517 | |||
Cumulative Effect of Other Timing Difference* | (284,821) | |||
| ||||
Total | $ | 2,420,929 | ||
| ||||
Stone Harbor High Yield Bond Fund | ||||
Undistributed Ordinary Income | $ | 1,129,696 | ||
Accumulated Capital Gain | 7,113,965 | |||
Unrealized Appreciation | 14,534,383 | |||
Cumulative Effect of Other Timing Difference* | (62,152) | |||
| ||||
Total | $ | 22,715,892 | ||
| ||||
Stone Harbor Local Markets Fund | ||||
Undistributed Ordinary Income | $ | 2,515,479 | ||
Accumulated Capital Loss | (93,903,742) | |||
Unrealized Depreciation | (99,004,350) | |||
Cumulative Effect of Other Timing Difference* | (14,843,512) | |||
| ||||
Total | $ | (205,236,125) | ||
| ||||
Stone Harbor Emerging Markets Corporate Debt Fund | ||||
Undistributed Ordinary Income | $ | 37,668 | ||
Accumulated Capital Loss | (3,847,595) | |||
Unrealized Appreciation | 989,213 | |||
Cumulative Effect of Other Timing Difference* | (3,692) | |||
| ||||
Total | $ | (2,824,406) | ||
| ||||
Stone Harbor Investment Funds Semi-Annual Report | November 30, 2014 |
91 |
Table of Contents
| Stone Harbor Investment Funds | Notes to Financial Statements | |
|
November 30, 2014 (Unaudited) | |
Stone Harbor Investment Grade Fund | ||||
Undistributed Ordinary Income | $ | 34,220 | ||
Unrealized Appreciation | 80,102 | |||
Cumulative Effect of Other Timing Difference* | – | |||
| ||||
Total | $ | 114,322 | ||
| ||||
Stone Harbor Strategic Income Fund | ||||
Undistributed Ordinary Income | $ | 26,011 | ||
Accumulated Capital Loss | (9,893) | |||
Unrealized Appreciation | 463,266 | |||
Cumulative Effect of Other Timing Difference* | (35,241) | |||
| ||||
Total | $ | 444,143 | ||
| ||||
| * | Other temporary differences due to timing, consist primarily of mark-to-market on forward foreign currency contracts. |
The tax components of distributable earnings are determined in accordance with income tax regulations which may differ from the composition of net assets reported under GAAP. Accordingly, for the year ended May 31, 2014, certain differences were reclassified. These differences were primarily attributed to the differing tax treatment of foreign currencies, in kind transactions and certain other investments and the amounts reclassified did not affect net assets.
The reclassifications were as follows:
| Fund | Paid-in Capital | Accumulated Net Investment Income/(Loss) | Accumulated Net Realized Gain/(Loss) on Investments | |||||||||
| ||||||||||||
Stone Harbor Emerging Markets Debt Fund | $ | 1 | $ | (12,384,954) | $ | 12,384,953 | ||||||
Stone Harbor High Yield Bond Fund | (414,886) | (183,334) | 598,220 | |||||||||
Stone Harbor Local Markets Fund | (8,852,339) | (146,278,310) | 155,130,649 | |||||||||
Stone Harbor Emerging Markets Corporate Debt Fund | (410,072) | (43,531) | 453,603 | |||||||||
Stone Harbor Investment Grade Fund | (30) | 39 | (9) | |||||||||
Stone Harbor Strategic Income Fund | – | 1,162 | (1,162) | |||||||||
Capital Losses: As of May 31, 2014 the following Funds had capital loss carryforwards which may reduce the Funds’ taxable income arising from future net realized gains on investments, if any, to the extent permitted by the Code and thus may reduce the amount of the distributions to shareholders which would otherwise be necessary to relieve the Funds of any liability for federal tax pursuant to the Code.
Capital losses carried forward were as follows:
| Fund | Short-Term | Long-Term | ||||||
| ||||||||
Stone Harbor Emerging Markets Debt Fund | $ | 20,814,999 | $ | 1,295,535 | ||||
Stone Harbor Local Markets Fund | 24,947,473 | 311,722 | ||||||
Stone Harbor Emerging Markets Corporate Debt Fund | 1,353,221 | 2,269,613 | ||||||
The following Funds elect to defer to the year ending May 31, 2015 the following capital losses recognized during the period November 1, 2013 through May 31, 2014:
| Fund | Amount | |||
| ||||
Stone Harbor Emerging Markets Debt Fund | $ | 43,569,053 | ||
Stone Harbor Local Markets Fund | 68,644,547 | |||
Stone Harbor Emerging Markets Corporate Debt Fund | 224,761 | |||
Stone Harbor Strategic Income Fund | 9,893 | |||
92 |
www.shiplp.com |
Table of Contents
| Stone Harbor Investment Funds | Notes to Financial Statements | |
|
November 30, 2014 (Unaudited) | |
The following Fund elects to defer to the period ending May 31, 2015, late year ordinary losses in the amount of:
| Fund | Amount | |||
| ||||
Stone Harbor Local Markets Fund | $ 16,110,677 | |||
Unrealized Appreciation and Depreciation on Investments: At November 30, 2014 the aggregate gross unrealized appreciation and depreciation of investments for federal income purposes were as follows:
Stone Harbor Emerging Markets Debt Fund | ||||
Gross appreciation on investments (excess of value over tax cost) | $ | 59,940,481 | ||
Gross depreciation on investments (excess of tax cost over value) | (86,402,839) | |||
| ||||
Net unrealized depreciation | $ | (26,462,358) | ||
| ||||
Cost of investments for income tax purposes | $ | 2,173,163,740 | ||
| ||||
Stone Harbor High Yield Bond Fund | ||||
Gross appreciation on investments (excess of value over tax cost) | $ | 7,480,703 | ||
Gross depreciation on investments (excess of tax cost over value) | (10,032,201) | |||
| ||||
Net unrealized depreciation | $ | (2,551,498) | ||
| ||||
Cost of investments for income tax purposes | $ | 284,852,304 | ||
| ||||
Stone Harbor Local Markets Fund | ||||
Gross appreciation on investments (excess of value over tax cost) | $ | – | ||
Gross depreciation on investments (excess of tax cost over value) | (273,427,394) | |||
| ||||
Net unrealized depreciation | $ | (273,427,394) | ||
| ||||
Cost of investments for income tax purposes | $ | 2,153,944,480 | ||
| ||||
Stone Harbor Emerging Markets Corporate Debt Fund | ||||
Gross appreciation on investments (excess of value over tax cost) | $ | 710,880 | ||
Gross depreciation on investments (excess of tax cost over value) | (368,015) | |||
| ||||
Net unrealized appreciation | $ | 342,865 | ||
| ||||
Cost of investments for income tax purposes | $ | 23,952,547 | ||
| ||||
Stone Harbor Investment Grade Fund | ||||
Gross appreciation on investments (excess of value over tax cost) | $ | 130,841 | ||
Gross depreciation on investments (excess of tax cost over value) | (6,636) | |||
| ||||
Net unrealized appreciation | $ | 124,205 | ||
| ||||
Cost of investments for income tax purposes | $ | 9,551,430 | ||
| ||||
Stone Harbor Strategic Income Fund | ||||
Gross appreciation on investments (excess of value over tax cost) | $ | 289,652 | ||
Gross depreciation on investments (excess of tax cost over value) | (457,739) | |||
| ||||
Net unrealized depreciation | $ | (168,087) | ||
| ||||
Cost of investments for income tax purposes | $ | 32,535,150 | ||
| ||||
Stone Harbor Investment Funds Semi-Annual Report | November 30, 2014 |
93 |
Table of Contents
| Stone Harbor Investment Funds | Notes to Financial Statements | |
|
November 30, 2014 (Unaudited) | |
Stone Harbor Emerging Markets Debt Allocation Fund | ||||
Gross appreciation on investments (excess of value over tax cost) | $ | (17) | ||
Gross depreciation on investments (excess of tax cost over value) | (916,092) | |||
Net unrealized depreciation | $ | (916,109) | ||
Cost of investments for income tax purposes | $ | 64,064,341 | ||
4. ADVISORY FEES
Stone Harbor Investment Partners LP is the Trust’s investment adviser. Under the investment advisory agreement the Trust pays an investment advisory fee calculated daily and paid monthly of 0.60%, 0.50%, 0.75%, 0.85%, 0.35%, 0.55%, and 0.70% of the average daily net assets for Stone Harbor Emerging Markets Debt Fund, Stone Harbor High Yield Bond Fund, Stone Harbor Local Markets Fund, Stone Harbor Emerging Markets Corporate Debt Fund, Stone Harbor Investment Grade Fund, Stone Harbor Strategic Income Fund, and Stone Harbor Emerging Markets Debt Allocation Fund, respectively.
The Adviser has contractually agreed to waive fees and reimburse expenses with respect to each of the Funds so that the Net Annual Operating Expenses (exclusive of acquired Fund fees and expenses, brokerage expenses, interest expense, taxes and extraordinary expenses) of the Stone Harbor Emerging Markets Debt Fund Institutional Class, Stone Harbor Local Markets Fund Institutional Class, Stone Harbor Emerging Markets Corporate Debt Fund Institutional Class, and Stone Harbor Investment Grade Fund Institutional Class will not exceed 0.75%, 1.00%, 1.00%, and 0.50%, respectively. The Net Annual Operating Expenses (exclusive of acquired Fund fees and expenses, brokerage expenses, interest expense, taxes and extraordinary expenses) of the Stone Harbor High Yield Bond Fund Institutional Class were limited to 0.55% through September 30, 2014, at which point the agreement expired. Effective October 1, 2014, the Adviser contractually agreed to waive fees and reimburse expenses with respect to the Stone Harbor High Yield Bond Fund Institutional Class so that the Net Annual Operating Expenses (exclusive of acquired Fund fees and expenses, brokerage expenses, interest expense, taxes and extraordinary expenses) will not exceed 0.65%. The Adviser has contractually agreed to waive fees and reimburse expenses with respect to the Stone Harbor Strategic Income Fund Institutional Class and Stone Harbor Emerging Markets Debt Allocation Fund Institutional Class, so that the Net Annual Operating Expenses (inclusive of acquired fund fees and expenses but exclusive of brokerage expenses, interest expense, taxes and extraordinary expenses) will not exceed 0.70% and 0.85%, respectively. The fee waiver agreements are in effect through September 30, 2015 and are reevaluated on an annual basis.
The Adviser will be permitted to recover, on a class by class basis, expenses it has borne through the undertakings described above to the extent that a Fund’s expenses in later periods fall below the annual rates set forth in the relevant undertaking. A Fund will not be obligated to pay any such deferred fees and expenses more than three years after the end of the fiscal year in which the fee and expense was deferred. At May 31, 2014, deferred fees and expenses eligible to be recovered will expire as follows:
| 2015 | 2016 | 2017 | Total | |||||||||||||
Stone Harbor High Yield Bond Fund | $ | 324,939 | $ | 256,488 | $ | 231,918 | $ | 813,345 | ||||||||
Stone Harbor Emerging Markets Corporate Debt Fund | $ | 97,840 | $ | 99,115 | $ | 97,636 | $ | 294,591 | ||||||||
Stone Harbor Investment Grade Fund | N/A | N/A | $ | 49,712 | $ | 49,712 | ||||||||||
Stone Harbor Strategic Income Fund | N/A | N/A | $ | 61,917 | $ | 61,917 | ||||||||||
5. INVESTMENTS
For the period ended November 30, 2014, the aggregate cost of purchases and proceeds from sales of investments (excluding short-term investments and U.S. Government Obligations) were as follows:
| Purchases | Sales | |||||||||
Stone Harbor Emerging Markets Debt Fund | $ | 227,582,411 | $ | 196,284,576 | ||||||
Stone Harbor High Yield Bond Fund | 94,925,603 | 93,384,582 | ||||||||
Stone Harbor Local Markets Fund | 36,787,518 | 33,348,959 | ||||||||
Stone Harbor Emerging Markets Corporate Debt Fund | 8,741,100 | 10,304,867 | ||||||||
Stone Harbor Investment Grade Fund | 2,295,126 | 698,281 | ||||||||
Stone Harbor Strategic Income Fund | 24,348,930 | 1,931,907 | ||||||||
Stone Harbor Emerging Markets Debt Allocation Fund | 65,040,500 | 976,159 | ||||||||
94 |
www.shiplp.com |
Table of Contents
| Stone Harbor Investment Funds | Notes to Financial Statements | |
|
November 30, 2014 (Unaudited) | |
For the period ended November 30, 2014 the aggregate cost of purchases and proceeds from sales of U.S. Government Obligations were as follows:
| Purchases | Sales | |||||||||||
| ||||||||||||
Stone Harbor Emerging Markets Debt Fund | $ | 610,370,447 | $ | 554,098,858 | ||||||||
Stone Harbor Local Markets Fund | 1,523,676,248 | 1,525,615,655 | ||||||||||
Stone Harbor Investment Grade Fund | 1,668,845 | 0 | ||||||||||
6. AFFILIATED COMPANIES
Funds may invest in certain securities that are considered securities issued by affiliated companies. As defined by the Investment Company Act of 1940, an affiliated person, including an affiliated company, is one in which a Fund owns 5% or more of the outstanding voting securities, or a company which is under common ownership or control with the Fund. The purchases, sales, dividend income, capital gains, return of capital distributions received, shares and value of investments in affiliated companies for the period ended November 30, 2014 were as follows:
Stone Harbor Strategic Income Fund
| Security Name | Share Balance June 1, 2014 | Purchases | Sales | Share Balance November 30, 2014 | Dividend Income | Realized Gain | Market Value November 30, 2014 | |||||||||||||||||||
| ||||||||||||||||||||||||||
Stone Harbor Emerging Markets Debt Fund | 335,330 | 726,988 | 144,714 | 917,605 | $ | 184,582 | $ | (9,233) | $ | 9,763,313 | ||||||||||||||||
Stone Harbor High Yield Bond Fund | 381,043 | 1,054,294 | 3,096 | 1,432,241 | 284,268 | (153) | 13,047,712 | |||||||||||||||||||
Stone Harbor Investment Grade Fund | 299,741 | 645,277 | 33,362 | 911,656 | 42,050 | 4,757 | 9,517,684 | |||||||||||||||||||
| ||||||||||||||||||||||||||
| $ | 510,899 | $ | (4,629) | $ | 32,328,709 | |||||||||||||||||||||
| ||||||||||||||||||||||||||
Stone Harbor Emerging Markets Debt Allocation Fund
| Security Name | Share Balance June 1, 2014 | Purchases | Sales | Share Balance November 30, 2014 | Dividend Income | Realized Loss | Market Value November 30, 2014 | |||||||||||||||||||||
| ||||||||||||||||||||||||||||
Stone Harbor Emerging Markets Debt Fund | – | 3,357,591 | 90,729 | 3,266,861 | $ | 483,217 | $ | – | $ | 34,759,405 | ||||||||||||||||||
Stone Harbor Local Markets Fund | – | 3,055,936 | 88 | 3,055,848 | – | (16) | 28,388,827 | |||||||||||||||||||||
| ||||||||||||||||||||||||||||
| $ | 483,217 | $ | (16) | $ | 63,148,232 | |||||||||||||||||||||||
| ||||||||||||||||||||||||||||
The Emerging Markets Debt Fund engaged in cross trades with an affiliate of the Fund during the six months ended November 30, 2014 pursuant to Rule 17a-7 under the 1940 Act. Cross trading is the buying or selling of portfolio securities between funds to which the Adviser serves as the investment adviser. The Board of trustees previously adopted procedures that apply to transactions between the Portfolios pursuant to Rule 17a-7. At its regularly scheduled meetings, the Trustees review such transactions as of the most current calendar quarter for compliance with the requirements set forth by Rule 17a-7 and the Emerging Markets Debt Fund’s procedures. The procedures require that the transactions be a purchase or sale for no consideration other than cash payment against prompt delivery of a security for which market quotations are readily available, and be consistent with the investment policies of each Emerging Markets Debt Fund. During the six months ended November 30, 2014 the Emerging Markets Corporate Debt Fund purchased a security from another fund for which the Adviser is the investment adviser in the amount of $164,063, and the Emerging Markets Debt Fund sold securities to another fund for which the Adviser is the investment adviser in the amount of $2,210,798 and a realized gain of $71,277.
7. SHARES OF BENEFICIAL INTEREST
At November 30, 2014, the Trust had an unlimited number of shares of beneficial interest authorized with a par value of $0.001 per share. The Funds have the ability to issue multiple classes of shares. Each share of a class represents an identical interest and has the same rights, except that each class bears certain direct expenses, including those specifically related to the distribution of its shares. Transactions in shares of the Institutional Class can be found on the Statements of Changes in Net Assets.
8. BENEFICIAL OWNERSHIP
As of November 30, 2014 IMF Retired Staff Benefits owned beneficially 42.30% of the Stone Harbor High Yield Bond Fund’s outstanding shares, an individual shareholder owned beneficially 25.28% of the Stone Harbor Emerging Markets Corporate Debt Fund’s outstanding shares, the Stone
Stone Harbor Investment Funds Semi-Annual Report | November 30, 2014 |
95 |
Table of Contents
| Stone Harbor Investment Funds | Notes to Financial Statements | |
|
November 30, 2014 (Unaudited) | |
Harbor Strategic Income Fund owned beneficially 99.89% of the Stone Harbor Investment Grade Fund’s outstanding shares and an individual shareholder owned 63.78% of the Stone Harbor Strategic Income Fund’s outstanding shares.
9. INDEMNIFICATIONS
Under the Trust’s organizational documents, its officers and Trustees are indemnified against certain liability arising out of the performance of their duties to the Trust. Additionally, in the normal course of business, the Trust enters into contracts with service providers that may contain general indemnification clauses. The Trust’s maximum exposure under these arrangements is unknown, as this would involve future claims that may be made against the Trust that have not yet occurred.
10. OTHER
Board of Trustees Compensation: No officer, trustee or employee of the Adviser or any of its affiliates receives any compensation from the Funds for serving as an officer or trustee of the Funds. The Trust will pay each Trustee who is not an interested person an annual fee of $54,000. All Trustees are reimbursed for reasonable travel and out-of-pocket expenses incurred to attend such meetings.
11. SUBSEQUENT EVENT
On December 8, 2014 the Fund’s custodian was changed from the Bank of New York Mellon to State Street Bank and Trust Company.
96 |
www.shiplp.com |
Table of Contents
| Stone Harbor Investment Funds | Additional Information | |
|
November 30, 2014 (Unaudited) | |
FUND PORTFOLIO HOLDINGS
The SEC has adopted the requirement that all registered investment companies file a complete schedule of portfolio holdings with the SEC for their first and third fiscal quarters on Form N-Q. For the Funds, this would be for the fiscal quarters ending August 31 and February 28. The Form N-Q filing must be made within 60 days of the end of the quarter. The Funds’ Forms N-Q will be available on the SEC’s website at http://www.sec.gov., or they may be reviewed and copied at the SEC’s Public Reference Room in Washington, DC (call 1-800-732-0330 for information on the operation of the Public Reference Room).
PROXY VOTING
A description of the policies and procedures that the Funds use to determine how to vote proxies relating to portfolio securities and information regarding how the Funds voted proxies relating to portfolio securities for the 12-month period ended June 30, 2014 are available without a charge, upon request, by contacting Stone Harbor Investment Funds at 1-866-699-8158 or on the SEC website at http://www.sec.gov.
Stone Harbor Investment Funds Semi-Annual Report | November 30, 2014 |
97 |
Table of Contents
| Stone Harbor Investment Funds | Additional Information | |
|
November 30, 2014 (Unaudited) | |
Benchmark Descriptions
| Index | Description | |
| ||
| J.P. Morgan EMBI Global Diversified | The J.P. Morgan EMBI Global Diversified (EMBI Global Diversified) tracks total returns for U.S. dollar-denominated debt instruments issued by emerging markets sovereign and quasi-sovereign entities: Brady bonds, loans, and Eurobonds. The index limits the weights of those index countries with larger debt stocks by only including specified portions of these countries’ eligible current face amounts outstanding. The countries covered in the EMBI Global Diversified are identical to those covered by the EMBI Global. | |
| ||
| Citigroup High Yield Market Capped | The Citigroup High Yield Market Capped Index represents a modified version of the High Yield Market Index by delaying the entry of “fallen angel” issues and capping the par value of individual issuers at US $10 billion par amount outstanding. The index is a total rate of return index which captures the performance of below investment grade debt issued by corporations domiciled in the United States or Canada. | |
| ||
| J.P. Morgan GBI-EM Global Diversified | The J.P. Morgan GBI-EM Global Diversified consists of regularly traded, liquid fixed-rate, domestic currency government bonds to which international investors can gain exposure. The weightings among the countries are more evenly distributed within this index. | |
| ||
| J.P. Morgan CEMBI Broad Diversified | The J.P. Morgan CEMBI Broad Diversified tracks total returns of U.S. dollar-denominated debt instruments issued by corporate entities in emerging market countries and consists of an investable universe of corporate bonds. The CEMBI Broad Diversified limits the weights of those index countries with larger corporate debt stocks by only including a specified portion of these countries’ eligible current face amounts of debt outstanding. | |
| ||
| Barclays Capital U.S. Aggregate Index | The Barclays Capital U.S. Aggregate Index represents securities that are SEC-registered, taxable, and dollar denominated. The index covers the U.S. investment grade fixed rate bond market, with index components for government and corporate securities, mortgage pass-through securities, and asset-backed securities. These major sectors are subdivided into more specific indices that are calculated and reported on a regular basis. | |
| ||
Barclays Global Credit Total Return Index (Hedged USD) | Barclays Global Credit Total Return Index is a subset of the Global Aggregate Index and is subject to the same quality, liquidity, and maturity requirements and exclusion rules of the latter. Constituents must be rated investment grade by at least two of the three major ratings agencies. Constituents must have a remaining maturity of at least one year. The index does not include convertibles, floating-rate notes, fixed-rate perpetuals, warrants, linked bonds, and structured products. | |
| ||
Definitions
Broad-based securities indices are unmanaged and are not subject to fees and expenses typically associated with managed accounts or investment funds. Investments cannot be made directly in a broad-based securities index.
Standard and Poor’s ratings are measured on a scale that generally ranges from AAA (highest) to D (lowest). A security that has not been given a credit rating by Standard and Poor’s is listed as “not rated”. For additional information please go to the Understanding Ratings section at www.standardpoors.com.
Basis Point – a unit equal to one hundredth of a percentage point.
Sovereign Debt – Refers to bonds issued by a national government in order to finance the issuing country’s growth. Sovereign debt described as external is denominated in U.S. dollar, while sovereign debt described as local is issued in a foreign currency.
Investment Grade – Refers to bonds that are considered to have a relatively low risk of default, ranging from highest credit quality to good credit quality. Bonds rated below investment grade are considered to have significant speculative characteristics.
The S&P 500 – is a stock market index based on the market capitalizations of 500 leading companies publicly traded in the U.S. stock market, as determined by Standard & Poor’s. It differs from other U.S. stock market indices such as the Dow Jones Industrial Average and the Nasdaq due to its diverse constituency and weighting methodology.
Quantitative Easing (QE) – is an unconventional monetary policy used by central banks to stimulate the national economy when standard monetary policy has become ineffective. A central bank implements quantitative easing by buying financial assets from commercial banks and other private institutions, thus increasing the monetary base. This is distinguished from the more usual policy of buying or selling government bonds in order to keep market interest rates at a specified target value.
98 |
www.shiplp.com |
Table of Contents
Intentionally Left Blank
Table of Contents

INVESTMENT ADVISER
Stone Harbor Investment Partners LP
31 W. 52nd Street 16th Floor
New York, New York 10019
ADMINISTRATOR & FUND ACCOUNTANT
ALPS Fund Services, Inc.
1290 Broadway, Suite 1100
Denver, Colorado 80203
DISTRIBUTOR
ALPS Distributors, Inc.
1290 Broadway, Suite 1100
Denver, Colorado 80203
TRANSFER AGENT
ALPS Fund Services, Inc.
1290 Broadway, Suite 1100
Denver, Colorado 80203
CUSTODIAN
The Bank of New York Mellon
One Wall Street
New York, New York 10286
LEGAL COUNSEL
Ropes & Gray LLP
1211 Avenue of the Americas
New York, New York 10036
INDEPENDENT REGISTERED PUBLIC ACCOUNTING FIRM
Deloitte & Touche LLP
555 17th Street, Suite 3600
Denver, Colorado 80202
This report and its financial statements are submitted for the general information of the shareholders of the Funds. The report is not authorized for distribution to prospective investors in the Funds unless preceded or accompanied by a prospectus.
SHF000748 exp. 01/31/16
Table of Contents
| Item 2. | Code of Ethics. |
Not applicable to this Report.
| Item 3. | Audit Committee Financial Expert. |
Not applicable to this Report.
| Item 4. | Principal Accountant Fees and Services. |
Not applicable to this Report.
| Item 5. | Audit Committee of Listed Registrants. |
Not applicable to Registrant.
| Item 6. | Investments. |
| (a) | Schedule of Investments in securities of unaffiliated issuers as of the close of the reporting period is included as part of the Report to Stockholders filed under Item 1 of this Form N-CSR. |
| (b) | Not applicable. |
| Item 7. | Disclosure of Proxy Voting Policies and Procedures for Closed-End Management Investment Companies. |
Not applicable to Registrant.
| Item 8. | Portfolio Managers of Closed-End Management Investment Companies. |
Not applicable to Registrant.
2
Table of Contents
| Item 9. | Purchases of Equity Securities by Closed-End Management Investment Companies and Affiliated Purchasers. |
Not applicable to Registrant.
| Item 10. | Submission of Matters to a Vote of Security Holders. |
There have been no material changes to the procedures by which shareholders may recommend nominees to the Registrant’s Board of Trustees, where those changes were implemented after the Registrant last provided disclosure in response to the requirements of Item 407(c)(2) of Regulation S-K, or this Item.
| Item 11. | Controls and Procedures. |
| (a) | The Registrant’s principal executive officer and principal financial officer have concluded that the Registrant’s disclosure controls and procedures (as defined in Rule 30a-3(c) under the Investment Company Act of 1940, as amended) are effective as of a date within 90 days of the filing date of this Report, based on their evaluation of these controls and procedures required by Rule 30a-3(b) under the Investment Company Act of 1940, as amended, and Rule 15d-15(b) under the Securities Exchange Act of 1934, as amended. |
| (b) | There was no change in the Registrant’s internal control over financial reporting (as defined in Rule 30a-3(d) under the Investment Company Act of 1940, as amended) during the second fiscal quarter of the period covered by this Report that has materially affected, or is reasonably likely to materially affect, the Registrant’s internal control over financial reporting. |
| Item 12. | Exhibits. |
| (a)(1) | Not applicable to this Report. |
| (a)(2) | The certifications required by Rule 30a-2(a) of the Investment Company Act of 1940, as amended, and Section 302 of the Sarbanes-Oxley Act of 2002 are attached hereto as Exhibit 99.Cert. |
| (a)(3) | None. |
| (b) | The certifications by the Registrant’s principal executive officer and principal financial officer, as required by Rule 30a-2(b) of the Investment Company Act of 1940, as amended, and Section 906 of the Sarbanes-Oxley Act of 2002 are attached hereto as Exhibit 99.906Cert. |
3
Table of Contents
SIGNATURES
Pursuant to the requirements of the Securities Exchange Act of 1934 and the Investment Company Act of 1940, the Registrant has duly caused this Report to be signed on its behalf by the undersigned, thereunto duly authorized.
| Stone Harbor Investment Funds | ||
| By: | /s/ Peter J. Wilby | |
| Peter J. Wilby | ||
President and Chief Executive Officer/Principal Executive Officer | ||
| Date: | February 6, 2015 | |
Pursuant to the requirements of the Securities Exchange Act of 1934 and the Investment Company Act of 1940, this Report has been signed below by the following persons on behalf of the Registrant and in the capacities and on the dates indicated.
| Stone Harbor Investment Funds | ||
| By: | /s/ Peter J. Wilby | |
| Peter J. Wilby | ||
| President and Chief Executive Officer/Principal Executive Officer | ||
| Date: | February 6, 2015 | |
| By: | /s/ Thomas M. Reynolds | |
| Thomas M. Reynolds | ||
| Principal Financial Officer/ Principal Accounting Officer | ||
| Date: | February 6, 2015 | |
4