Table of Contents
UNITED STATES
SECURITIES AND EXCHANGE COMMISSION
Washington, D.C. 20549
FORM N-CSR
CERTIFIED SHAREHOLDER REPORT OF REGISTERED
MANAGEMENT INVESTMENT COMPANIES
Investment Company Act file number: 811-22037
Stone Harbor Investment Funds
(Exact name of registrant as specified in charter)
1290 Broadway, Suite 1100
Denver, CO 80203
(Address of principal executive offices) (Zip code)
Adam J. Shapiro, Esq.
c/o Stone Harbor Investment Partners LP
31 West 52nd Street, 16th Floor
New York, NY 10019
(Name and address of agent for service)
With copies To:
Michael G. Doherty, Esq.
Ropes & Gray LLP
1211 Avenue of the Americas
New York, NY 10036
Registrant’s telephone number, including area code: (303) 623-2577
Date of fiscal year end: May 31
Date of reporting period: June 1, 2013 - November 30, 2013
Table of Contents
| Item 1. | Report to Stockholders. |
Table of Contents

Table of Contents
| Table of Contents | ||
| 2 | ||||
| 7 | ||||
| 8 | ||||
| 10 | ||||
| 11 | ||||
| 12 | ||||
| 13 | ||||
| 14 | ||||
| 26 | ||||
| 36 | ||||
| 42 | ||||
| 48 | ||||
| 49 | ||||
| 50 | ||||
| 52 | ||||
| 53 | ||||
| 54 | ||||
| 55 | ||||
| 56 | ||||
| 68 | ||||
| Stone Harbor Investment Funds Semi-Annual Report | November 30, 2013 | 1 |
Table of Contents
| Stone Harbor Investment Funds | Shareholder Letter | |
| November 30, 2013 (Unaudited) |
Dear Shareholder,
The six month period ending November 30, 2013 proved to be challenging for fixed income investors as returns were significantly impacted by movements in interest rates. Investors in credit sectors of the fixed income markets were further challenged by a volatile and uncertain outlook for global gross domestic product (GDP) growth. In our opinion, the single largest influence on fixed income markets throughout the period was the impact of U.S. Federal Reserve (FED) Chairman Bernanke’s comments about the FED’s plans to “taper” its purchases of U.S. Government securities. The comments created a dynamic whereby every U.S. economic data release was judged by its impact on the timing and pace of future tapering. Retail investors, particularly those in credit oriented fixed income mutual funds reacted to this uncertainty over the future direction of interest rates by selling their fund investments. This retail mutual fund selling impacted a wide range of fixed income mutual funds and was particularly severe in the emerging markets (EM) debt sector.
Implicit in any analysis of a Fed “tapering” program is the likelihood that U.S. economic growth is accelerating, a clear positive for credit investors. This trade-off between the positive impact of economic growth and the negative impact of rising rates will likely influence fixed income investors for many months to come.
While we continue to see signs of global economic recovery, we remain aware of the major challenges that will affect the financial markets. We believe these include, among other factors, a disorderly response to changes in the Federal Reserve’s asset purchase program, the inability of the U.S. to reach agreement on fiscal policy, a U.S. and/or global economic slowdown, as well as the turmoil in the Middle East.
At Stone Harbor Investment Partners LP, we will continue to focus on seeking to capture excess return from stable and improving credit situations in corporate and sovereign markets worldwide. We remain vigilant to the credit risks associated with a slowdown in global growth. As we continue to monitor these developments, please follow our progress throughout the year by visiting our website at www.shiplp.com. There, you will find updates on our view of credit markets, as well as related news and research. We appreciate the confidence you have placed in Stone Harbor and look forward to providing you with another update in the next six months.
Stone Harbor Emerging Markets Debt Fund
The total return of the Emerging Markets Debt Fund (the “Fund” or “portfolio”) for the six month period ended November 30, 2013 was -5.90% (net of expenses) and -5.56% (gross of expenses). This performance compares to a benchmark return of -2.81% for the J.P. Morgan EMBI Global Diversified. At the end of the reporting period, EM appeared to be stabilizing as evidenced by slowing retail investor outflows and better economic data. The selloff that occurred in the preceding months, however, resulted in negative market performance, with external sovereign bond credit spreads over comparable maturity U.S. Treasury securities widening by 39 basis points1. Total returns on all country sub indices were also negative for the period.
In our view, the fundamental driver of the market downturn, which lasted from late May through August, was uncertainty about the continuation of the FED’s bond buying program. Market response to the suggestion of an earlier tapering was further exacerbated by slower-than-expected growth in developing countries. As U.S. Treasury yields moved higher over fears of tapering, a liquidity-driven sell off severely impacted the most liquid, large capitalization sovereign assets with high sensitivity to U.S. Treasuries. The pull-back in EM debt was more substantial than in other risk assets. In our view, the liquidity-driven decline was more symptomatic of investor positioning and retail mutual fund redemptions than EM fundamentals, which we believe remain strong. The end of the period brought some relief as EM debt returns stabilized due to a temporary delay in Fed tapering expectations in September and improvement in Chinese growth data. Technical factors improved somewhat as retail outflows slowed and turned into inflows in September. Throughout the reporting period, institutional flows remained constant and positive. Notwithstanding these and other signs of improvement in EM growth, capital flows to EMs continued to be critical for market sentiment, particularly for those countries with current account deficits.
In our view, the May-August sell-off created value in all sectors of the market, particularly in the more liquid sectors, including external U.S. dollar-denominated and local currency sovereign debt, where the decline was most pronounced. The Fund used the market weakness resulting from the sell-off as an opportunity to increase risk, focusing primarily on assets that had been sold off most aggressively during the downturn. Widening spreads during the third quarter, in our view, created an opportunity to add to external sovereign positions at better levels in several countries. However, we sold U.S. dollar-denominated bonds from countries that outperformed, for example, Hungary, Poland, and Lithuania, to fund the tactical additions of local currency debt in Brazil, Mexico, Peru, Turkey and South Africa. Country positioning reflects our expectation of stabilization in EM growth and a normalization of portfolio flows; our largest overweights are in many of the countries that came under market wide scrutiny in August due to their current account deficits (Brazil, Indonesia, South Africa, and Turkey). The Fund reduced its exposure to corporate debt due to recent outperformance, while increasing the exposure to local currency debt until September 30, 2013. Since then, modest reductions in local currency positions were made.
The Fund underperformed its benchmark as a result of a country overweight in Venezuela and an underweight in Argentina within our hard currency sovereign allocation. Markets questioned Venezuela’s capacity to repay foreign debt, citing the rapid decline in reported foreign currency reserves and short term liquidity. Our view supporting Venezuela bonds is that the current government has strong capacity to repay debt based on generation of oil
| 1 | J.P. Morgan EMBI Global Diversified spreads. |
2 | www.shiplp.com |
Table of Contents
| Stone Harbor Investment Funds | Shareholder Letter | |
| November 30, 2013 (Unaudited) |
revenues in a country with some of the largest proven oil revenues. Furthermore, we believe Venezuela’s administration is willing to honor debt obligations in order to continue attracting international investors to the energy sector and to protect foreign assets from liquidating. In addition, we believe the current spreads provide meaningful cushion against our base case expectation of gradually rising U.S. Treasury yields. Other sources of underperformance included local rates and foreign exchange (FX) exposure in Brazil and Indonesia within the local currency allocation. In Brazil, concerns over social unrest in the early summer sparked significant underperformance of the real. We view recent actions by the Central Bank of Brazil that lifted restrictions on capital inflows and an intervention program to stabilize the currency as positive signals, along with continued foreign direct investments (FDI), which finance a significant portion of Brazil’s current account deficit. Country selection decisions in the hard currency corporate allocation, particularly in Russia, Mexico and Argentina, contributed to returns, as did issue selection in Venezuela hard currency sovereign debt.
We view the recent moves in EM debt prices, currencies, and local interest rates as part of an early stage adjustment to the normalization in monetary policies in developed markets and to an ongoing recovery of the U.S. economy. While the timing of the Fed’s tapering remains uncertain as of the date of this report and a focal point for investors, it seems to us that monetary policy in the developed world is likely to remain accommodative for at least the next twelve months. Risks related to potential policy mistakes both by advanced economy central banks, as well as those from EM countries, may increase, and therefore, in our view, EM debt markets are likely to remain volatile in the coming months. We are also cognizant of the underlying concern that mounted throughout the period - the narrowing of the gap between actual and expected growth of emerging countries and whether or not capital inflows in EM would be impeded by the perceived narrowing growth gap. Our view is that improving credit quality fundamentals combined with substantially improved valuations will outweigh these headwinds.
Stone Harbor High Yield Bond Fund
The Stone Harbor High Yield Bond Fund (the “Fund” or “portfolio”) return for the six months ended November 30, 2013 was 2.52% (net of expenses) and 2.80% (gross of expenses). This compares to a benchmark return of 2.27% for the Citigroup High Yield Market Capped Index. The high yield market benefited from moderate U.S. economic growth, a stabilizing European economy, global monetary easing, healthy market fundamentals, and positive event risk. Market volatility during the period was primarily due to concern over the timing of the Fed’s tapering and its effect on interest rates. This concern led to record mutual fund outflows early in the period before recovering a significant portion of the outflows during the remaining months. The 10-year Treasury reached a yield of 3.00% before ending the period at 2.75%, an increase of 62 basis points from end of May. High yield spreads, as represented by the Citigroup High Yield Market Capped Index, tightened 29 basis points to end the period at 440 basis points, with the average yield virtually unchanged at 5.66%.
Top performing industries included Transportation-other, Publishing, and Airlines while the bottom performers included Homebuilders, Retail Stores, and Towers. CCC rated bonds outperformed both BB and B securities (S&P ratings), according to the Citigroup High Yield Market Capped index, and shorter duration securities significantly outperformed longer duration bonds. With significant refinancing and an improving economic environment, the par-weighted default rate declined from 1.02% to 0.69%, the lowest level since December 2007, and well below the long term average of 4% according to J.P. Morgan. We believe default rates will continue to remain low over the intermediate term as healthy capital markets conditions enable companies to extend maturities and company fundamentals remain solid. The market had more companies upgraded to investment grade (rising stars) than companies downgraded to high yield (fallen angels). However, the number of issuer downgrades slightly exceeded the number of upgrades for the period. On a par basis there were more upgrades than downgrades. The new issue market remains robust with slightly less issuance than last year’s record setting volume. The majority of funds continue to be used for refinancing outstanding debt.
The portfolio outperformed its benchmark as a result of issue selection decisions. Issue selection within the Energy, Utilities, and Healthcare sectors were the main drivers of performance. Industry selection slightly detracted from performance due to an overweight in Telecommunications, Food/Beverage/Bottling and an underweight in the Services-other sector. This was partially offset by an underweight to the Home Builders sector. All rating categories, except a small overweight to the BBB sector, contributed to performance particularly an underweight to BB rated bonds. Our issue selection in CCC rated bonds was a significant contributor to performance.
We believe the portfolio remains positioned for moderate U.S. economic growth. Relative to BB rated bonds, we remain overweight B rated securities as we believe this sector should outperform on attractive valuations and lower interest rate sensitivities. The largest portfolio industry overweights currently include the Technology, Healthcare, and Food/Beverage/Bottling sectors, while the largest industry underweights include Services-Other, Energy, and Home Builders. Additionally, we observed positive event risk through merger and acquisition activity and deleveraging through public equity offerings during the period. Risk factors include a disorderly response to the removal of quantitative easing (QE) and/or the inability to agree on fiscal policy in the U.S., a slowdown in global growth, a potential releveraging of corporate balance sheets, and geopolitical problems.
Stone Harbor Local Markets Fund
The total return of the Stone Harbor Local Markets Fund (the “Fund” or “portfolio”) for the six month period ended November 30, 2013 was -7.71% (net of expenses) and -7.28% (gross of expenses). This performance compares to a benchmark return of -5.49% for the J.P. Morgan GBI-EM Global Diversified. At the end of the reporting period, EM appeared to be stabilizing as evidenced by slowing retail investor outflows and better economic
| Stone Harbor Investment Funds Semi-Annual Report | November 30, 2013 | 3 |
Table of Contents
| Stone Harbor Investment Funds | Shareholder Letter | |
| November 30, 2013 (Unaudited) |
data. The selloff that occurred in the preceding months, however, resulted in negative market performance,2 primarily as movements in FX relative to the U.S. dollar detracted from total returns. Rising interest rates in many countries also detracted from the sector’s returns during the period.
In our view, the fundamental driver of the market downturn, which lasted from late May through August, was uncertainty about the continuation of the FED’s bond buying program. Market response to the suggestion of an earlier tapering was further exacerbated by slower-than-expected growth in developing countries. As U.S. Treasury yields moved higher over fears of tapering, a liquidity-driven sell off severely impacted the most liquid, large capitalization sovereign assets with high sensitivity to U.S. Treasuries. The pull-back in EM debt was more substantial than in other risk assets. In our view, the liquidity-driven decline was more symptomatic of investor positioning and retail mutual fund redemptions than EM fundamentals, which we believe remain strong. The end of the period brought some relief as EM debt returns stabilized due to a temporary delay in Fed tapering expectations in September and improvement in Chinese growth data. Technical factors improved somewhat as retail outflows slowed and turned into inflows in September. Throughout the reporting period, institutional flows remained constant and positive. Notwithstanding these and other signs of improvement in EM growth, capital flows to EMs continued to be critical for market sentiment, particularly for those countries with current account deficits.
In our view, the May-August sell-off created value in all sectors of the market, particularly in the more liquid sectors, including local currency sovereign debt, where the decline was most pronounced. Currency depreciation relative to the U.S. dollar was a significant driver of the local currency markets. During the period, we took advantage of weakness in Brazil, Mexico and South Africa to increase our FX and duration exposure in the Fund. Local debt markets in Peru and Philippines have underperformed this year, and we used this weakness to increase FX exposure at, what we believe are, attractive levels. We funded these increases through sales of bonds that have outperformed, particularly from Thailand, Hungary and Nigeria. Overall duration of the Fund remains a modest overweight with the largest sensitivity to interest rates in Latin America (Brazil, Mexico and Colombia) partially offset by duration underweights in Asia (Malaysia, Thailand). We believe valuations remain attractive in local currency debt markets.
The Fund underperformed its benchmark as a result of a country overweight and issue selection in Brazil and an underweight in Hungary. In Brazil, concerns over social unrest in the early summer sparked significant underperformance of the real. We view recent actions by the Central Bank of Brazil that lifted restrictions on capital inflows and an intervention program to stabilize the currency as positive signals, along with continued FDI, which finance a significant part of Brazil’s current account deficit. In Hungary, we feel a cyclical upswing disguises underlying fiscal and external weakness and maintain our view that Hungary’s credit fundamentals are among the weakest in the local currency universe.
Issue selection in Turkey and Indonesia contributed to the Fund’s overall returns. These two countries, which have fallen under the general category of “current account deficit countries” and have attracted much negative market sentiment over the course of the year, are now poised to be among the biggest beneficiaries of global growth. In our view, stabilization of external demand will benefit these countries through a better composition of their trade balance and also the capital accounts.
We view the recent moves in EM debt prices, currencies, and local interest rates as part of an early stage adjustment to the normalization in monetary policies in developed markets and to an ongoing recovery of the U.S. economy. While the timing of the Fed’s tapering remains uncertain as of the date of this report and a focal point for investors, it seems to us that monetary policy in the developed world is likely to remain accommodative for at least the next twelve months. Risks related to potential policy mistakes both by advanced economy central banks, as well as those from EM countries, may increase, and therefore, in our view, EM debt markets are likely to remain volatile in the coming months. We are also cognizant of the underlying concern that mounted throughout the period - the narrowing of the gap between actual and expected growth of emerging countries and whether or not capital inflows in EM would be impeded by the perceived narrowing growth gap. Our view is that improving credit quality fundamentals combined with substantially improved valuations will outweigh these headwinds.
Stone Harbor Emerging Markets Corporate Debt Fund
The total return of the Stone Harbor Emerging Markets Corporate Debt Fund (the “Fund” or “portfolio”) for the six months ended November 30, 2013 was -1.98% (net of expenses) and -1.48% (gross of expenses). This performance compares to a benchmark return of -1.00% for the J.P. Morgan Corporate Emerging Markets Bond Index Broad Diversified (CEMBI Broad Diversified). Market performance was negative with corporate bond credit spreads over comparable maturity U.S. Treasury securities widening by 14 basis points, ending the period at 337 basis points. While absolute returns for the period were negative, emerging market corporate bonds outperformed both hard and local currency sovereign debt. In our view, this relative outperformance was a function of the generally lower liquidity and shorter duration of corporate bonds than sovereign debt, hence the lower sensitivity to rising U.S. interest rates, as well as generally higher liquidity in sovereign debt.
In our view, the fundamental driver of the market downturn, which lasted from late May through August, was uncertainty about the continuation of the FED’s bond buying program. Market response to the suggestion of an earlier tapering was further exacerbated by slower-than-expected growth in developing countries. As U.S. Treasury yields moved higher over fears of tapering, a liquidity-driven sell-off impacted the most liquid, large capitalization sovereign assets with high sensitivity to U.S. Treasuries. The pull-back in EM debt was more substantial than in other risk assets. In our view, the liquidity-driven decline was more symptomatic of investor positioning and retail mutual fund redemptions rather than EM fundamentals, which we believe remain strong. These fund outflows were concentrated in hard currency and local currency denominated sovereign debt. EM
| 2 | J.P. Morgan GBI-EM Global Diversified. |
4 | www.shiplp.com |
Table of Contents
| Stone Harbor Investment Funds | Shareholder Letter | |
| November 30, 2013 (Unaudited) |
corporate debt as a result was not subject to the consistent selling pressure that drove negative returns in sovereign debt. The end of the period brought some relief as EM debt returns stabilized due to a temporary delay in Fed tapering expectations in September and improvement in Chinese growth data. Technical factors also improved somewhat as retail outflows slowed and turned into inflows in September. Throughout the reporting period, institutional flows remained constant and positive.
Despite the uncertainly around U.S. monetary policy during the reporting period, supply of new corporate debt expanded at an elevated level. While we do expect issuance in the coming months to slow seasonally, the pipeline for new deals in 2014 remains very strong. Notwithstanding these and other signs of improvement in EM debt markets, capital flows to EMs continued to be critical for market sentiment, particularly for those countries with current account deficits. These flows only indirectly impact the corporate sector but will nonetheless reflect investor sentiment toward all sectors of emerging markets.
During the review period, the Fund increased market exposure in corporate bonds that we believe continue to have attractive valuations, including energy and electric utility companies in Brazil, a telecommunications provider from Qatar and a gaming company in Macau. In anticipation of potential further volatility, the Fund also reduced exposure to bonds that performed well during the period including Argentina, Peru, Russia, Thailand and the Ukraine. In terms of credit quality, the Fund’s exposure to the investment grade sector increased over the reporting period; however, relative to the benchmark, the Fund continued to hold an overweight to non-investment grade debt. At the index level, we believe that EM corporate spreads have moved to fair levels and that, given the sharper recent widening of sovereign external debt, sovereign debt spreads will likely catch up with corporates over the next 6-12 months. In our view, the current investment landscape for EM corporates necessitates an active positioning at the country, industry, and issue selection level to generate excess returns. The Fund continues to focus on companies that will likely benefit from the rise of the middle class in emerging economies. As such, we have maintained exposure to companies in sectors that may benefit most from this trend, including banks in Russia and Turkey, real estate companies in China, and food or beverage companies in Brazil.
The Fund underperformed its benchmark due to country selection, largely as a result of the performance of our corporate positions in Brazil and Venezuela, both overweights. In Brazil, concerns over social unrest in the early summer sparked significant underperformance of the real and a weakening of Brazilian asset prices. These macro factors influenced returns in the corporate sector during the period. In addition, our corporate investment in the oil sector of Venezuela was negatively impacted by political volatility in the country. We view recent actions by the Central Bank of Brazil that lifted restrictions on capital inflows and the recent pick-up in economic activity as positive signals, along with continued FDI, which finance a significant part of Brazil’s current account deficit. Issue selection in Argentina and an overweight in Russia helped performance during the period.
From an industry standpoint, an overweight to the real estate development sector enhanced returns, although issue selection within the industry detracted. The Fund maintained an underweight exposure to the banking sector, which also detracted from returns, but the more important negative impact on relative returns in this sector came from issue selection. Allocation decisions to media and cable companies enhanced returns, with particular success in Argentina.
We view the recent moves in EM debt prices, currencies, and local interest rates as part of an early stage adjustment to the normalization in monetary policies in developed markets and to an ongoing recovery of the U.S. economy. While the timing of the Fed’s tapering remains uncertain as of the date of this report and a focal point for investors, it seems to us that monetary policy in the developed world is likely to remain accommodative for at least the next twelve months. These macro factors tend to have an indirect impact on the operation of most corporations in their respective countries. They do, however, have a direct impact on investor sentiment and will positively influence the environment for EM corporate investments, in our view. More importantly, we believe that fundamental credit quality of the Fund’s portfolio companies will remain the key driver of returns over the medium to long term.
Sincerely,

Thomas K. Flanagan
Chairman of the Board of Trustees
| Stone Harbor Investment Funds Semi-Annual Report | November 30, 2013 | 5 |
Table of Contents
| Stone Harbor Investment Funds | Shareholder Letter | |
| November 30, 2013 (Unaudited) |
The Citigroup High Yield Market Index (previously the Salomon Smith Barney High Yield Market Index) is a total rate-of-return index which captures the performance of below investment-grade debt issued by corporations domiciled in the United States or Canada. This index comprises Citigroup’s broadest market measure and includes cash-pay and deferred-interest securities. All the bonds in the high-yield indices are publicly placed, have a fixed coupon and are nonconvertible.
The JP Morgan Emerging Markets Bond Index (EMBI) Global Diversified tracks total returns for U.S. dollar-denominated debt instruments issued by emerging markets sovereign and quasi-sovereign entities: Brady bonds, loans, and Eurobonds. Source: JP Morgan Chase.
The JP Morgan Government Bond Index – Emerging Markets (GBI-EM) Global Diversified consists of regularly traded, liquid fixed-rate, domestic currency government bonds to which international investors can gain exposure. The weightings among the countries are more evenly distributed within this index. Although not expected to be a principal investment tool, the Portfolio may make use of derivative securities (including futures and options on securities, securities indices or currencies, options on futures, forward currency contracts, and interest rate, currency or credit default) for the purposes of reducing risk and/or obtaining efficient investment exposure. Source: JP Morgan Chase.
Emerging markets corporate debt is represented by JP Morgan Corporate Emerging Markets Bond Index (CEMBI) Broad Diversified. The CEMBI tracks total returns of U.S. dollar-denominated debt instruments issued by corporate entities in Emerging Markets countries. Two variations are available: CEMBI Broad and CEMBI. The CEMBI Broad is the most comprehensive corporate benchmark followed by the CEMBI, which consists of an Investable universe of corporate bonds. Both indices are also available in Diversified version. The JPMorgan CEMBI Broad Diversified limits the current face amount allocations of the bonds. Both indices are also available in outstanding countries with larger debt stocks. Qualifying corporate bonds have a face amount greater than USD 300 million, maturity greater than 5 years, verifiable prices and cash flows, and from countries within Asia ex-Japan, Latin America, Eastern Europe, Middle East, and Africa.
It is not possible to invest directly in an index.
Standard and Poor’s ratings are measured on a scale that generally ranges from AAA (highest) to D (lowest). A security that has not been given a credit rating by Standard and Poor’s is listed as “not rated”.
Basis Point – a unit equal to one hundredth of a percentage point.
Sovereign Debt – Refers to bonds issued by a national government in order to finance the issuing country’s growth. Sovereign debt described as external is denominated in U.S. dollar, while sovereign debt described as local is issued in a foreign currency.
Investment Grade – Refers to bonds that are considered to have a relatively low risk of default, ranging from highest credit quality to good credit quality. Bonds rated below investment grade are considered to have significant speculative characteristics.
The S&P 500 – is a stock market index based on the market capitalizations of 500 leading companies publicly traded in the U.S. stock market, as determined by Standard & Poor’s. It differs from other U.S. stock market indices such as the Dow Jones Industrial Average and the Nasdaq due to its diverse constituency and weighting methodology.
Quantitative Easing (QE) – is an unconventional monetary policy used by central banks to stimulate the national economy when standard monetary policy has become ineffective. A central bank implements quantitative easing by buying financial assets from commercial banks and other private institutions, thus increasing the monetary base. This is distinguished from the more usual policy of buying or selling government bonds in order to keep market interest rates at a specified target value.
6 | www.shiplp.com |
Table of Contents
| Stone Harbor Investment Funds | Disclosure of Fund Expenses | |
| November 30, 2013 (Unaudited) |
Example. As a shareholder of a Fund, you incur two types of costs: (1) transaction costs, including sales charges (loads) on purchase payments and/or redemption fees (if applicable) and (2) ongoing costs, including management fees and other Fund expenses. The below examples are intended to help you understand your ongoing costs (in dollars) of investing in a Fund and to compare these costs with the ongoing costs of investing in other mutual funds. The examples are based on an investment of $1,000 invested on June 1, 2013 and held until November 30, 2013.
Actual Expenses. The first line of each table below provides information about actual account values and actual expenses. You may use the information in this line, together with the amount you invested, to estimate the expenses that you paid over the period. Simply divide your account value by $1,000 (for example, an $8,600 account value divided by $1,000 = 8.6), then multiply the result by the number in the first line under the heading “Expenses Paid During Period” to estimate the expenses you paid on your account during this period.
Hypothetical Example for Comparison Purposes. The second line of each table below provides information about hypothetical account values and hypothetical expenses based on the Fund’s actual expense ratio and an assumed rate of return of 5% per year before expenses, which is not the Fund’s actual return. The hypothetical account values and expenses may not be used to estimate the actual ending account balance or expenses you paid for the period. You may use this information to compare the ongoing costs of investing in a Fund and other mutual funds. To do so, compare this 5% hypothetical example with the 5% hypothetical examples that appear in the shareholder reports of the other funds.
Please note that the expenses shown in the table are meant to highlight your ongoing costs only and do not reflect transactional costs, such as redemption fees, sales charges (loads) or exchange fees. Therefore, the second line of the table is useful in comparing ongoing costs only, and will not help you determine the relative total costs of owning different funds. In addition, if these transactional costs were included, your costs would have been higher.
Beginning Account Value June 1, 2013 | Ending Account Value November 30, 2013 | Expense Ratio(1) | Expenses Paid During Period(2) | |||||||||||||
STONE HARBOR EMERGING MARKETS DEBT FUND |
| |||||||||||||||
Institutional Class | ||||||||||||||||
Actual | $ | 1,000.00 | $ | 941.00 | 0.68 | % | $ | 3.31 | ||||||||
Hypothetical (5% return before expenses) | $ | 1,000.00 | $ | 1,021.66 | 0.68 | % | $ | 3.45 | ||||||||
STONE HARBOR HIGH YIELD BOND FUND | ||||||||||||||||
Institutional Class | ||||||||||||||||
Actual | $ | 1,000.00 | $ | 1,025.20 | 0.55 | % | $ | 2.79 | ||||||||
Hypothetical (5% return before expenses) | $ | 1,000.00 | $ | 1,022.31 | 0.55 | % | $ | 2.79 | ||||||||
STONE HARBOR LOCAL MARKETS FUND | ||||||||||||||||
Institutional Class | ||||||||||||||||
Actual | $ | 1,000.00 | $ | 922.90 | 0.86 | % | $ | 4.15 | ||||||||
Hypothetical (5% return before expenses) | $ | 1,000.00 | $ | 1,020.76 | 0.86 | % | $ | 4.36 | ||||||||
STONE HARBOR EMERGING MARKETS CORPORATE DEBT FUND |
| |||||||||||||||
Institutional Class | ||||||||||||||||
Actual | $ | 1,000.00 | $ | 980.20 | 1.00 | % | $ | 4.96 | ||||||||
Hypothetical (5% return before expenses) | $ | 1,000.00 | $ | 1,020.05 | 1.00 | % | $ | 5.06 | ||||||||
| (1) | Annualized, based on the Fund’s most recent fiscal half-year expenses. |
| (2) | Expenses are equal to the Fund’s annualized ratio multiplied by the average account value over the period, multiplied by the number of days in the most recent fiscal half year (183), divided by 365. Note this expense example is typically based on a six-month period. |
| Stone Harbor Investment Funds Semi-Annual Report | November 30, 2013 | 7 |
Table of Contents
| Stone Harbor Investment Funds | Summaries of Portfolio Holdings | |
| November 30, 2013 (Unaudited) |
Under SEC Rules, all funds are required to include in their annual and semi-annual shareholder reports a presentation of portfolio holdings in a table, chart or graph by reasonably identifiable categories. The following tables, which present holdings as a percent of total net assets (“TNA”), are provided in compliance with such requirements.
| STONE HARBOR EMERGING MARKETS DEBT FUND | ||||
| Country Breakdown | % of TNA | |||
Venezuela | 9.43% | |||
Brazil | 9.24% | |||
Indonesia | 8.75% | |||
Turkey | 8.69% | |||
Mexico | 7.33% | |||
Russia | 6.45% | |||
South Africa | 5.99% | |||
Colombia | 5.31% | |||
Kazakhstan | 3.74% | |||
Chile | 3.23% | |||
China | 2.27% | |||
Peru | 2.24% | |||
Ukraine | 2.23% | |||
Panama | 2.17% | |||
Dominican Republic | 1.84% | |||
Philippines | 1.63% | |||
Poland | 1.46% | |||
Hungary | 1.12% | |||
Iraq | 1.03% | |||
Croatia | 0.99% | |||
Romania | 0.95% | |||
El Salvador | 0.90% | |||
Malaysia | 0.77% | |||
Uruguay | 0.76% | |||
Ghana | 0.72% | |||
Azerbaijan | 0.64% | |||
India | 0.56% | |||
Mozambique | 0.50% | |||
Slovakia | 0.48% | |||
United Arab Emirates | 0.47% | |||
Nigeria | 0.30% | |||
Ivory Coast | 0.29% | |||
Morocco | 0.27% | |||
Macau | 0.13% | |||
Singapore | 0.12% | |||
Argentina | 0.03% | |||
Honduras | 0.02% | |||
Gabon | 0.00% | * | ||
Stone Harbor Emerging Markets Corporate Debt Fund | 0.78% | |||
Total | 93.82% | |||
Short Term Investments | 4.85% | |||
Other Assets in Excess of Liabilities | 1.33% | |||
Total Net Assets | 100.00% | |||
| STONE HARBOR HIGH YIELD BOND FUND | ||||
| Industry Breakdown | % of TNA | |||
Exploration & Production | 9.72% | |||
Healthcare | 8.79% | |||
Technology | 8.41% | |||
Media Cable | 6.19% | |||
Food/Beverage/Tobacco | 5.01% | |||
Electric | 4.59% | |||
Wirelines | 4.27% | |||
Metals/Mining/Steel | 4.16% | |||
Chemicals | 3.82% | |||
Wireless | 3.61% | |||
Gaming | 3.33% | |||
Drillers/Services | 3.25% | |||
Paper/Forest Products | 3.04% | |||
Media Other | 2.65% | |||
Services Other | 2.51% | |||
Consumer Products | 2.02% | |||
Containers/Packaging | 1.95% | |||
Publishing/Printing | 1.83% | |||
Industrial Other | 1.68% | |||
Building Products | 1.64% | |||
Lodging | 1.44% | |||
Retail Non Food/Drug | 1.31% | |||
Non Captive Finance | 1.23% | |||
Automotive | 1.22% | |||
Textile/Apparel | 1.22% | |||
Aerospace/Defense | 1.08% | |||
Banking | 0.95% | |||
Gas Pipelines | 0.90% | |||
Pharmaceuticals | 0.84% | |||
Financial - Other | 0.59% | |||
Home Builders | 0.58% | |||
Restaurants | 0.51% | |||
Environmental Services | 0.49% | |||
Refining | 0.45% | |||
Leisure | 0.39% | |||
Satellite | 0.35% | |||
Life Insurance | 0.33% | |||
Retail Food/Drug | 0.28% | |||
Railroads | 0.05% | |||
Airlines | 0.04% | |||
Transportation Non Air/Rail | 0.00% | * | ||
Total | 96.73% | |||
Short Term Investments | 3.35% | |||
Other Assets in Excess of Liabilities | -0.08% | |||
Total Net Assets | 100.00% | |||
| *Amount | represents less than 0.005% of net assets. |
8 | www.shiplp.com |
Table of Contents
| Stone Harbor Investment Funds | Summaries of Portfolio Holdings | |
| November 30, 2013 (Unaudited) |
| STONE HARBOR LOCAL MARKETS FUND | ||||
| Country Breakdown | % of TNA | |||
Brazil | 12.94% | |||
Mexico | 12.26% | |||
South Africa | 12.15% | |||
Indonesia | 8.77% | |||
Malaysia | 4.97% | |||
Turkey | 4.89% | |||
Russia | 4.85% | |||
Poland | 4.94% | |||
Colombia | 4.54% | |||
Thailand | 4.35% | |||
Hungary | 2.33% | |||
Peru | 1.59% | |||
Venezuela | 1.51% | |||
Chile | 0.13% | |||
Total | 80.22% | |||
Short Term Investments | 15.10% | |||
Other Assets in Excess of Liabilities | 4.68% | |||
Total Net Assets | 100.00% | |||
| STONE HARBOR EMERGING MARKETS CORPORATE DEBT FUND | ||||
| Country Breakdown | % of TNA | |||
Brazil | 15.48% | |||
Russia | 9.84% | |||
Mexico | 6.77% | |||
United Arab Emirates | 6.47% | |||
Turkey | 6.09% | |||
China | 5.43% | |||
Colombia | 5.34% | |||
Indonesia | 5.07% | |||
India | 4.83% | |||
Peru | 4.73% | |||
Hong Kong | 4.17% | |||
Chile | 3.44% | |||
Qatar | 3.15% | |||
South Korea | 2.46% | |||
South Africa | 1.85% | |||
Venezuela | 1.74% | |||
Kazakhstan | 1.64% | |||
Macau | 1.42% | |||
Thailand | 1.34% | |||
Jamaica | 1.29% | |||
Singapore | 1.28% | |||
Ukraine | 1.22% | |||
Ghana | 0.95% | |||
Malaysia | 0.51% | |||
Philippines | 0.24% | |||
Total | 96.75% | |||
Short Term Investments | 2.34% | |||
Other Assets in Excess of Liabilities | 0.91% | |||
Total Net Assets | 100.00% | |||
| Stone Harbor Investment Funds Semi-Annual Report | November 30, 2013 | 9 |
Table of Contents
| Stone Harbor Investment Funds | Growth of $10,000 Investment | |
| November 30, 2013 (Unaudited) |
STONE HARBOR EMERGING MARKETS DEBT FUND
Comparison of Change in Value of $10,000 Investment in Stone Harbor Emerging Markets Debt Fund and the JP Morgan Emerging Market Bond Index Global Diversified (JP Morgan EMBI Global Diversified).
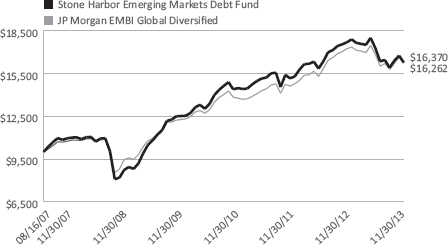
The JP Morgan EMBI Global Diversified limits the weights of those index countries with larger debt stocks by only including specified portions of these countries’ eligible current face amounts outstanding. The countries covered in the EMBI Global Diversified are identical to those covered by the EMBI Global.
Average Annual Total Returns (Inception, August 16, 2007)
| 6 Months | 1 Year | 3 Years | 5 Years | Since Inception | ||||||||
Stone Harbor Emerging Markets Debt Fund | -5.90% | -8.10% | 4.16% | 14.71% | 8.04% | |||||||
JP Morgan EMBI Global Diversified | -2.81% | -5.06% | 5.76% | 13.22% | 8.15% |
The performance data quoted represents past performance and does not guarantee future results. Current performance may be lower or higher than the performance quoted. Average annual total returns reflect the reinvestment of dividends and capital gains distributions and include all fee waivers and expense reimbursements. Without the fee waivers and expense reimbursements, total return figures would have been lower. The performance data quoted does not reflect the deduction of taxes that a shareholder would pay on Fund distributions or the redemption of Fund shares. Investment return and principal value will vary, and shares, when redeemed, may be worth more or less than their original cost. Index returns do not include the effects of sales charges, management fees or transaction costs. It is not possible to invest directly in an index.
10 | www.shiplp.com |
Table of Contents
| Stone Harbor Investment Funds | Growth of $10,000 Investment | |
| November 30, 2013 (Unaudited) |
STONE HARBOR HIGH YIELD BOND FUND
Comparison of Change in Value of $10,000 Investment in Stone Harbor High Yield Bond Fund and the Citigroup High Yield Market Capped Index.
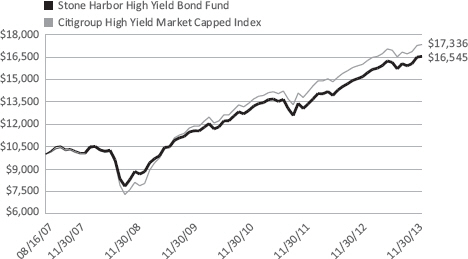
The Citigroup High Yield Market Capped Index represents a modified version of the High Yield Market Index by delaying the entry of “fallen angel” issues (corporate bonds that were previously investment-grade rated but have recently been downgraded) and capping the par value of individual issuers at US $10 billion par amount outstanding.
Average Annual Total Returns (Inception, August 16, 2007)
| 6 Months | 1 Year | 3 Years | 5 Years | Since Inception | ||||||||
Stone Harbor High Yield Bond Fund | 2.52% | 9.03% | 9.25% | 16.09% | 8.33% | |||||||
Citigroup High Yield Market Capped Index | 2.27% | 8.30% | 9.61% | 18.90% | 8.95% |
The performance data quoted represents past performance and does not guarantee future results. Current performance may be lower or higher than the performance quoted. Average annual total returns reflect the reinvestment of dividends and capital gains distributions and include all fee waivers and expense reimbursements. Without the fee waivers and expense reimbursements, total return figures would have been lower. The performance data quoted does not reflect the deduction of taxes that a shareholder would pay on Fund distributions or the redemption of Fund shares. Investment return and principal value will vary, and shares, when redeemed, may be worth more or less than their original cost. Index returns do not include the effects of sales charges, management fees or transaction costs. It is not possible to invest directly in an index.
| Stone Harbor Investment Funds Semi-Annual Report | November 30, 2013 | 11 |
Table of Contents
| Stone Harbor Investment Funds | Growth of $10,000 Investment | |
| November 30, 2013 (Unaudited) |
STONE HARBOR LOCAL MARKETS FUND
Comparison of Change in Value of $10,000 Investment in Stone Harbor Local Markets Fund and the JP Morgan Global Bond Index – Emerging Markets Global Diversified (JP Morgan GBI-EM Global Diversified).
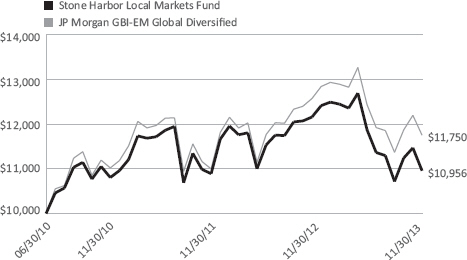
The JP Morgan GBI-EM Global Diversified consists of regularly traded, liquid fixed-rate, domestic currency government bonds to which international investors can gain exposure. The weightings among the countries are more evenly distributed within this index.
Average Annual Total Returns (Inception, June 30, 2010)
| 6 Months | 1 Year | 3 Years | Since Inception | |||||||
Stone Harbor Local Markets Fund | -7.71% | -9.87% | 0.57% | 2.71% | ||||||
JP Morgan GBI-EM Global Diversified | -5.49% | -6.50% | 2.69% | 4.83% |
The performance data quoted represents past performance and does not guarantee future results. Current performance may be lower or higher than the performance quoted. Average annual total returns reflect the reinvestment of dividends and capital gains distributions and include all fee waivers and expense reimbursements. Without the fee waivers and expense reimbursements, total return figures would have been lower. The performance data quoted does not reflect the deduction of taxes that a shareholder would pay on Fund distributions or the redemption of Fund shares. Investment return and principal value will vary, and shares, when redeemed, may be worth more or less than their original cost. Index returns do not include the effects of sales charges, management fees or transaction costs. It is not possible to invest directly in an index.
12 | www.shiplp.com |
Table of Contents
| Stone Harbor Investment Funds | Growth of $10,000 Investment | |
| November 30, 2013 (Unaudited) |
STONE HARBOR EMERGING MARKETS CORPORATE DEBT FUND
Comparison of Change in Value of $10,000 Investment in Stone Harbor Emerging Market Corporate Debt Fund and the JP Morgan Corporate Emerging Market Bond Index – Broad Diversified (JP Morgan CEMBI Broad Diversified).
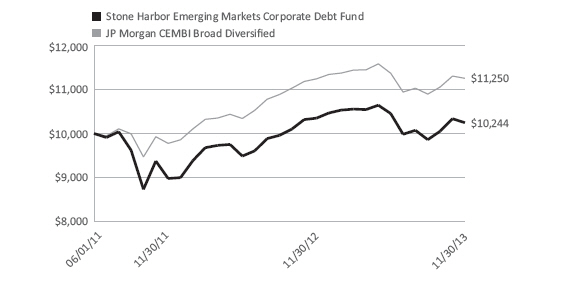
The JP Morgan CEMBI Broad is a market capitalization weighted index that tracks total returns of US dollar-denominated debt instruments issued by corporate entities in Emerging Markets countries. The CEMBI Broad Diversified limits the current face amount allocations of the bonds in the CEMBI Broad by constraining the total face amount outstanding for countries with larger debt stocks.
Average Annual Total Returns (Inception, June 1, 2011)
| 6 Months | 1 Year | Since Inception | ||||||
Stone Harbor Emerging Markets Corporate Debt Fund | -1.98% | -1.02% | 0.97% | |||||
JP Morgan CEMBI Broad Diversified | -1.00% | 0.12% | 4.83% |
The performance data quoted represents past performance and does not guarantee future results. Current performance may be lower or higher than the performance quoted. Average annual total returns reflect the reinvestment of dividends and capital gains distributions and include all fee waivers and expense reimbursements. Without the fee waivers and expense reimbursements, total return figures would have been lower. The performance data quoted does not reflect the deduction of taxes that a shareholder would pay on Fund distributions or the redemption of Fund shares. Investment return and principal value will vary, and shares, when redeemed, may be worth more or less than their original cost. Index returns do not include the effects of sales charges, management fees or transaction costs. It is not possible to invest directly in an index.
| Stone Harbor Investment Funds Semi-Annual Report | November 30, 2013 | 13 |
Table of Contents
| Stone Harbor Emerging Markets Debt Fund | Statements of Investments | |
| November 30, 2013 (Unaudited) |
Currency | Rate | Maturity Date | Principal | Market Value | ||||||||||||||||||||||
SOVEREIGN DEBT OBLIGATIONS - 67.17% | ||||||||||||||||||||||||||
Argentina - 0.03% | ||||||||||||||||||||||||||
Republic of Argentina: | ||||||||||||||||||||||||||
| USD | 0.000 | % | 03/31/2023 | 184,000 | $ | 134,320 | (1) | |||||||||||||||||||
| USD | 6.000 | % | 03/31/2023 | 480,000 | 367,200 | (1) | ||||||||||||||||||||
|
| |||||||||||||||||||||||||
| 501,520 | ||||||||||||||||||||||||||
|
| |||||||||||||||||||||||||
Brazil - 7.75% | ||||||||||||||||||||||||||
Brazil Loan Trust 1 | USD | 5.477 | % | 07/24/2023 | 19,576,715 | 19,743,117 | (2) | |||||||||||||||||||
Nota Do Tesouro Nacional | BRL | 10.000 | % | 01/01/2023 | 134,472,000 | 49,330,400 | ||||||||||||||||||||
Republic of Brazil: | ||||||||||||||||||||||||||
| USD | 4.875 | % | 01/22/2021 | 4,097,000 | 4,353,063 | |||||||||||||||||||||
| USD | 2.625 | % | 01/05/2023 | 17,855,000 | 15,368,691 | |||||||||||||||||||||
| USD | 4.250 | % | 01/07/2025 | 9,972,000 | 9,403,596 | |||||||||||||||||||||
| USD | 8.750 | % | 02/04/2025 | 834,000 | 1,121,730 | |||||||||||||||||||||
| USD | 8.250 | % | 01/20/2034 | 16,529,000 | 20,867,862 | |||||||||||||||||||||
| USD | 7.125 | % | 01/20/2037 | 23,747,000 | 27,071,580 | |||||||||||||||||||||
|
| |||||||||||||||||||||||||
| 147,260,039 | ||||||||||||||||||||||||||
|
| |||||||||||||||||||||||||
Colombia - 3.60% | ||||||||||||||||||||||||||
Bogota Distrio Capital | COP | 9.750 | % | 07/26/2028 | 7,800,000,000 | 5,118,205 | (3) | |||||||||||||||||||
Republic of Colombia: | ||||||||||||||||||||||||||
| COP | 12.000 | % | 10/22/2015 | 4,798,000,000 | 2,803,896 | |||||||||||||||||||||
| USD | 7.375 | % | 01/27/2017 | 1,838,000 | 2,132,080 | |||||||||||||||||||||
| USD | 7.375 | % | 03/18/2019 | 2,808,000 | 3,394,170 | |||||||||||||||||||||
| USD | 11.750 | % | 02/25/2020 | 3,851,000 | 5,593,577 | |||||||||||||||||||||
| USD | 4.375 | % | 07/12/2021 | 3,520,000 | 3,643,200 | |||||||||||||||||||||
| USD | 2.625 | % | 03/15/2023 | 3,539,000 | 3,123,168 | |||||||||||||||||||||
| USD | 4.000 | % | 02/26/2024 | 3,694,000 | 3,576,716 | |||||||||||||||||||||
| USD | 8.125 | % | 05/21/2024 | 25,000 | 32,437 | |||||||||||||||||||||
| COP | 9.850 | % | 06/28/2027 | 4,740,000,000 | 3,054,304 | |||||||||||||||||||||
| USD | 10.375 | % | 01/28/2033 | 2,006,000 | 2,973,895 | |||||||||||||||||||||
| USD | 7.375 | % | 09/18/2037 | 26,572,000 | 32,484,270 | |||||||||||||||||||||
| USD | 6.125 | % | 01/18/2041 | 387,000 | 411,188 | |||||||||||||||||||||
|
| |||||||||||||||||||||||||
| 68,341,106 | ||||||||||||||||||||||||||
|
| |||||||||||||||||||||||||
Croatia - 0.99% | ||||||||||||||||||||||||||
Croatia Government International Bond: | ||||||||||||||||||||||||||
| USD | 5.500 | % | 04/04/2023 | 10,139,000 | 9,741,044 | (3) | ||||||||||||||||||||
| USD | 6.000 | % | 01/26/2024 | 9,334,000 | 9,142,653 | (2) | ||||||||||||||||||||
|
| |||||||||||||||||||||||||
| 18,883,697 | ||||||||||||||||||||||||||
|
| |||||||||||||||||||||||||
Dominican Republic - 1.84% | ||||||||||||||||||||||||||
Dominican Republic International Bond: | ||||||||||||||||||||||||||
| USD | 9.040 | % | 01/23/2018 | 7,919,601 | 8,572,968 | (3) | ||||||||||||||||||||
| USD | 7.500 | % | 05/06/2021 | 21,665,000 | 23,452,363 | (3) | ||||||||||||||||||||
| USD | 5.875 | % | 04/18/2024 | 3,178,000 | 2,979,375 | (2) | ||||||||||||||||||||
|
| |||||||||||||||||||||||||
| 35,004,706 | ||||||||||||||||||||||||||
|
| |||||||||||||||||||||||||
El Salvador - 0.90% | ||||||||||||||||||||||||||
Republic of El Salvador: | ||||||||||||||||||||||||||
| USD | 7.375 | % | 12/01/2019 | 220,000 | 237,600 | (2) | ||||||||||||||||||||
| USD | 7.375 | % | 12/01/2019 | 2,068,000 | 2,233,440 | (3) | ||||||||||||||||||||
| USD | 7.750 | % | 01/24/2023 | 1,014,000 | 1,100,190 | (3) | ||||||||||||||||||||
| USD | 8.250 | % | 04/10/2032 | 1,000,000 | 1,100,000 | (3) | ||||||||||||||||||||
14 | www.shiplp.com |
Table of Contents
| Stone Harbor Emerging Markets Debt Fund | Statements of Investments | |
| November 30, 2013 (Unaudited) |
Currency | Rate | Maturity Date | Principal Amount* | Market Value (Expressed in U.S. $) | ||||||||||||||||||||||
El Salvador (continued) | ||||||||||||||||||||||||||
Republic of El Salvador: (continued) | ||||||||||||||||||||||||||
| USD | 7.650 | % | 06/15/2035 | 12,326,000 | $ | 12,510,890 | (3) | |||||||||||||||||||
|
| |||||||||||||||||||||||||
| 17,182,120 | ||||||||||||||||||||||||||
|
| |||||||||||||||||||||||||
Gabon - 0.00%(4) | ||||||||||||||||||||||||||
Republic of Gabon | USD | 8.200 | % | 12/12/2017 | 50,000 | 58,500 | (2) | |||||||||||||||||||
|
| |||||||||||||||||||||||||
Ghana - 0.65% | ||||||||||||||||||||||||||
Republic of Ghana: | ||||||||||||||||||||||||||
| USD | 8.500 | % | 10/04/2017 | 7,766,000 | 8,406,695 | (3) | ||||||||||||||||||||
| USD | 7.875 | % | 08/07/2023 | 4,079,000 | 4,012,716 | (3) | ||||||||||||||||||||
|
| |||||||||||||||||||||||||
| 12,419,411 | ||||||||||||||||||||||||||
|
| |||||||||||||||||||||||||
Honduras - 0.02% | ||||||||||||||||||||||||||
Honduras Government International Bond | USD | 7.500 | % | 03/15/2024 | 460,000 | 427,800 | (3) | |||||||||||||||||||
|
| |||||||||||||||||||||||||
Hungary - 1.12% | ||||||||||||||||||||||||||
Republic of Hungary: | ||||||||||||||||||||||||||
| GBP | 5.000 | % | 03/30/2016 | 668,000 | 1,139,512 | |||||||||||||||||||||
| USD | 6.250 | % | 01/29/2020 | 2,444,000 | 2,635,293 | |||||||||||||||||||||
| USD | 6.375 | % | 03/29/2021 | 13,042,000 | 14,023,546 | |||||||||||||||||||||
| USD | 5.750 | % | 11/22/2023 | 3,470,000 | 3,447,187 | |||||||||||||||||||||
|
| |||||||||||||||||||||||||
| 21,245,538 | ||||||||||||||||||||||||||
|
| |||||||||||||||||||||||||
Indonesia - 8.10% | ||||||||||||||||||||||||||
Republic of Indonesia: | ||||||||||||||||||||||||||
| USD | 6.875 | % | 01/17/2018 | 6,424,000 | 7,206,925 | (3) | ||||||||||||||||||||
| USD | 11.625 | % | 03/04/2019 | 2,170,000 | 2,918,650 | (2) | ||||||||||||||||||||
| USD | 11.625 | % | 03/04/2019 | 18,110,000 | 24,357,950 | (3) | ||||||||||||||||||||
| IDR | 7.875 | % | 04/15/2019 | 59,940,000,000 | 4,941,762 | |||||||||||||||||||||
| USD | 5.875 | % | 03/13/2020 | 2,977,000 | 3,203,996 | (3) | ||||||||||||||||||||
| USD | 4.875 | % | 05/05/2021 | 10,421,000 | 10,466,592 | (3) | ||||||||||||||||||||
| USD | 3.750 | % | 04/25/2022 | 6,093,000 | 5,521,781 | (3) | ||||||||||||||||||||
| IDR | 7.000 | % | 05/15/2022 | 16,100,000,000 | 1,216,332 | |||||||||||||||||||||
| USD | 3.375 | % | 04/15/2023 | 22,727,000 | 19,616,242 | (2) | ||||||||||||||||||||
| IDR | 8.375 | % | 03/15/2024 | 171,249,000,000 | 14,082,859 | |||||||||||||||||||||
| IDR | 9.000 | % | 03/15/2029 | 46,100,000,000 | 3,791,087 | |||||||||||||||||||||
| USD | 8.500 | % | 10/12/2035 | 24,788,000 | 30,101,928 | (3) | ||||||||||||||||||||
| USD | 6.625 | % | 02/17/2037 | 2,597,000 | 2,613,231 | (2) | ||||||||||||||||||||
| USD | 6.625 | % | 02/17/2037 | 6,286,000 | 6,325,288 | (3) | ||||||||||||||||||||
| USD | 7.750 | % | 01/17/2038 | 15,431,000 | 17,668,495 | (3) | ||||||||||||||||||||
|
| |||||||||||||||||||||||||
| 154,033,118 | ||||||||||||||||||||||||||
|
| |||||||||||||||||||||||||
Iraq - 0.62% | ||||||||||||||||||||||||||
Republic of Iraq | USD | 5.800 | % | 01/15/2028 | 13,894,000 | 11,757,798 | (3) | |||||||||||||||||||
|
| |||||||||||||||||||||||||
Ivory Coast - 0.29% | ||||||||||||||||||||||||||
Ivory Coast Government International Bond | USD | 5.750 | % | 12/31/2032 | 6,102,000 | 5,476,545 | (3)(5) | |||||||||||||||||||
|
| |||||||||||||||||||||||||
Mexico - 6.31% | ||||||||||||||||||||||||||
Mexican Bonos: | ||||||||||||||||||||||||||
| MXN | 8.000 | % | 12/07/2023 | 350,022,000 | 30,187,886 | |||||||||||||||||||||
| MXN | 10.000 | % | 12/05/2024 | 249,849,000 | 24,851,556 | |||||||||||||||||||||
| Stone Harbor Investment Funds Semi-Annual Report | November 30, 2013 | 15 |
Table of Contents
| Stone Harbor Emerging Markets Debt Fund | Statements of Investments | |
| November 30, 2013 (Unaudited) |
Currency | Rate | Maturity Date | Principal | Market Value (Expressed in U.S. $) | ||||||||||||||||||||||
Mexico (continued) | ||||||||||||||||||||||||||
United Mexican States: | ||||||||||||||||||||||||||
| USD | 5.950 | % | 03/19/2019 | 4,442,000 | $ | 5,141,615 | ||||||||||||||||||||
| USD | 4.000 | % | 10/02/2023 | 20,948,000 | 20,811,838 | |||||||||||||||||||||
| USD | 8.300 | % | 08/15/2031 | 479,000 | 647,848 | |||||||||||||||||||||
| USD | 6.750 | % | 09/27/2034 | 10,351,000 | 12,007,160 | |||||||||||||||||||||
| USD | 6.050 | % | 01/11/2040 | 17,540,000 | 18,811,650 | |||||||||||||||||||||
| USD | 4.750 | % | 03/08/2044 | 8,566,000 | 7,559,495 | |||||||||||||||||||||
|
| |||||||||||||||||||||||||
| 120,019,048 | ||||||||||||||||||||||||||
|
| |||||||||||||||||||||||||
Morocco - 0.27% | ||||||||||||||||||||||||||
Moroccan Government | USD | 4.250 | % | 12/11/2022 | 5,560,000 | 5,143,000 | (2) | |||||||||||||||||||
|
| |||||||||||||||||||||||||
Mozambique - 0.50% | ||||||||||||||||||||||||||
Mozambique EMATUM Finance 2020 BV | USD | 6.305 | % | 09/11/2020 | 9,997,000 | 9,484,654 | ||||||||||||||||||||
|
| |||||||||||||||||||||||||
Nigeria - 0.30% | ||||||||||||||||||||||||||
Republic of Nigeria | USD | 6.375 | % | 07/12/2023 | 5,479,000 | 5,691,311 | (2) | |||||||||||||||||||
|
| |||||||||||||||||||||||||
Panama - 2.17% | ||||||||||||||||||||||||||
Republic of Panama: | ||||||||||||||||||||||||||
| USD | 5.200 | % | 01/30/2020 | 1,445,000 | 1,571,437 | |||||||||||||||||||||
| USD | 9.375 | % | 01/16/2023 | 450,000 | 603,000 | |||||||||||||||||||||
| USD | 8.875 | % | 09/30/2027 | 6,661,000 | 8,992,350 | |||||||||||||||||||||
| USD | 9.375 | % | 04/01/2029 | 19,652,000 | 27,414,540 | |||||||||||||||||||||
| USD | 8.125 | % | 04/28/2034 | 2,059,000 | 2,645,815 | |||||||||||||||||||||
|
| |||||||||||||||||||||||||
| 41,227,142 | ||||||||||||||||||||||||||
|
| |||||||||||||||||||||||||
Peru - 1.78% | ||||||||||||||||||||||||||
Republic of Peru: | ||||||||||||||||||||||||||
| USD | 7.350 | % | 07/21/2025 | 4,165,000 | 5,273,931 | |||||||||||||||||||||
| USD | 8.750 | % | 11/21/2033 | 10,379,000 | 14,556,548 | |||||||||||||||||||||
| USD | 6.550 | % | 03/14/2037 | 1,970,000 | �� | 2,235,950 | ||||||||||||||||||||
| USD | 5.625 | % | 11/18/2050 | 11,897,000 | 11,837,515 | |||||||||||||||||||||
|
| |||||||||||||||||||||||||
| 33,903,944 | ||||||||||||||||||||||||||
|
| |||||||||||||||||||||||||
Philippines - 1.63% | ||||||||||||||||||||||||||
Republic of Philippines: | ||||||||||||||||||||||||||
| USD | 9.500 | % | 02/02/2030 | 8,226,000 | 12,369,848 | |||||||||||||||||||||
| USD | 7.750 | % | 01/14/2031 | 13,764,000 | 18,237,300 | |||||||||||||||||||||
| USD | 6.375 | % | 01/15/2032 | 366,000 | 430,736 | |||||||||||||||||||||
|
| |||||||||||||||||||||||||
| 31,037,884 | ||||||||||||||||||||||||||
|
| |||||||||||||||||||||||||
Poland - 1.46% | ||||||||||||||||||||||||||
Republic of Poland: | ||||||||||||||||||||||||||
| USD | 6.375 | % | 07/15/2019 | 12,669,000 | 14,849,294 | |||||||||||||||||||||
| USD | 5.125 | % | 04/21/2021 | 11,809,000 | 12,899,716 | |||||||||||||||||||||
|
| |||||||||||||||||||||||||
| 27,749,010 | ||||||||||||||||||||||||||
|
| |||||||||||||||||||||||||
Romania - 0.95% | ||||||||||||||||||||||||||
Romanian Government International Bond | USD | 6.750 | % | 02/07/2022 | 15,932,000 | 18,046,973 | (3) | |||||||||||||||||||
|
| |||||||||||||||||||||||||
Russia - 4.46% | ||||||||||||||||||||||||||
Russian Federation: | ||||||||||||||||||||||||||
| USD | 4.875 | % | 09/16/2023 | 6,200,000 | 6,355,000 | (2) | ||||||||||||||||||||
16 | www.shiplp.com |
Table of Contents
| Stone Harbor Emerging Markets Debt Fund | Statements of Investments | |
| November 30, 2013 (Unaudited) |
Currency | Rate | Maturity Date | Principal Amount* | Market Value (Expressed in U.S. $) | ||||||||||||||||||||||
Russia (continued) | ||||||||||||||||||||||||||
Russian Federation: (continued) | ||||||||||||||||||||||||||
| USD | 12.750 | % | 06/24/2028 | 8,739,000 | $ | 14,976,461 | (3) | |||||||||||||||||||
| USD | 7.500 | % | 03/31/2030 | 54,162,031 | 63,518,523 | (3)(5) | ||||||||||||||||||||
|
| |||||||||||||||||||||||||
| 84,849,984 | ||||||||||||||||||||||||||
|
| |||||||||||||||||||||||||
Slovakia - 0.48% | ||||||||||||||||||||||||||
Republic of Slovakia | USD | 4.375 | % | 05/21/2022 | 8,831,000 | 9,132,839 | (2) | |||||||||||||||||||
|
| |||||||||||||||||||||||||
South Africa - 5.57% | ||||||||||||||||||||||||||
Republic of South Africa: | ||||||||||||||||||||||||||
| ZAR | 13.500 | % | 09/15/2015 | 72,930,000 | 8,027,005 | |||||||||||||||||||||
| ZAR | 8.250 | % | 09/15/2017 | 10,270,000 | 1,048,873 | |||||||||||||||||||||
| ZAR | 8.000 | % | 12/21/2018 | 276,080,000 | 27,916,871 | |||||||||||||||||||||
| USD | 6.875 | % | 05/27/2019 | 8,113,000 | 9,360,374 | |||||||||||||||||||||
| USD | 5.500 | % | 03/09/2020 | 7,679,000 | 8,254,925 | |||||||||||||||||||||
| USD | 5.875 | % | 05/30/2022 | 5,256,000 | 5,676,480 | |||||||||||||||||||||
| USD | 4.665 | % | 01/17/2024 | 11,503,000 | 11,114,774 | |||||||||||||||||||||
| USD | 5.875 | % | 09/16/2025 | 33,077,000 | 34,482,773 | |||||||||||||||||||||
|
| |||||||||||||||||||||||||
| 105,882,075 | ||||||||||||||||||||||||||
|
| |||||||||||||||||||||||||
Turkey - 8.16% | ||||||||||||||||||||||||||
Republic of Turkey: | ||||||||||||||||||||||||||
| TRY | 6.500 | % | 01/07/2015 | 7,173,000 | 3,467,642 | |||||||||||||||||||||
| USD | 7.000 | % | 09/26/2016 | 2,884,000 | 3,204,845 | |||||||||||||||||||||
| USD | 7.500 | % | 07/14/2017 | 7,869,000 | 8,950,987 | |||||||||||||||||||||
| TRY | 6.300 | % | 02/14/2018 | 20,640,000 | 9,308,902 | |||||||||||||||||||||
| USD | 6.750 | % | 04/03/2018 | 8,441,000 | 9,432,817 | |||||||||||||||||||||
| TRY | 8.300 | % | 06/20/2018 | 18,960,000 | 9,140,838 | |||||||||||||||||||||
| USD | 7.000 | % | 03/11/2019 | 3,305,000 | 3,730,519 | |||||||||||||||||||||
| USD | 7.500 | % | 11/07/2019 | 19,865,000 | 22,993,738 | |||||||||||||||||||||
| USD | 7.000 | % | 06/05/2020 | 4,272,000 | 4,827,360 | |||||||||||||||||||||
| USD | 5.625 | % | 03/30/2021 | 1,053,000 | 1,095,120 | |||||||||||||||||||||
| USD | 5.125 | % | 03/25/2022 | 9,201,000 | 9,154,995 | |||||||||||||||||||||
| USD | 6.250 | % | 09/26/2022 | 12,872,000 | 13,756,950 | |||||||||||||||||||||
| TRY | 7.100 | % | 03/08/2023 | 13,182,000 | 5,691,308 | |||||||||||||||||||||
| USD | 3.250 | % | 03/23/2023 | 16,673,000 | 14,297,098 | |||||||||||||||||||||
| USD | 7.375 | % | 02/05/2025 | 7,264,000 | 8,135,680 | |||||||||||||||||||||
| USD | 8.000 | % | 02/14/2034 | 11,685,000 | 13,700,662 | |||||||||||||||||||||
| USD | 6.875 | % | 03/17/2036 | 12,403,000 | 12,945,631 | |||||||||||||||||||||
| USD | 7.250 | % | 03/05/2038 | 1,285,000 | 1,399,044 | |||||||||||||||||||||
|
| |||||||||||||||||||||||||
| 155,234,136 | ||||||||||||||||||||||||||
|
| |||||||||||||||||||||||||
Ukraine - 1.71% | ||||||||||||||||||||||||||
Ukraine Government: | ||||||||||||||||||||||||||
| USD | 6.875 | % | 09/23/2015 | 208,000 | 195,000 | (3) | ||||||||||||||||||||
| USD | 6.875 | % | 09/23/2015 | 1,723,000 | 1,615,312 | (2) | ||||||||||||||||||||
| EUR | 4.950 | % | 10/13/2015 | 6,482,000 | 8,147,199 | (3) | ||||||||||||||||||||
| USD | 6.250 | % | 06/17/2016 | 2,600,000 | 2,320,500 | (2) | ||||||||||||||||||||
| USD | 6.250 | % | 06/17/2016 | 14,090,000 | 12,575,325 | (3) | ||||||||||||||||||||
| USD | 6.580 | % | 11/21/2016 | 2,053,000 | 1,832,303 | (3) | ||||||||||||||||||||
| USD | 9.250 | % | 07/24/2017 | 1,594,000 | 1,482,420 | (3) | ||||||||||||||||||||
| USD | 6.750 | % | 11/14/2017 | 4,950,000 | 4,356,000 | (3) | ||||||||||||||||||||
|
| |||||||||||||||||||||||||
| 32,524,059 | ||||||||||||||||||||||||||
|
| |||||||||||||||||||||||||
| Stone Harbor Investment Funds Semi-Annual Report | November 30, 2013 | 17 |
Table of Contents
| Stone Harbor Emerging Markets Debt Fund | Statements of Investments | |
| November 30, 2013 (Unaudited) |
Currency | Rate | Maturity Date | Principal Amount* | Market Value (Expressed in U.S. $) | ||||||||||||||||||||||
Uruguay - 0.76% | ||||||||||||||||||||||||||
Republic of Uruguay: | ||||||||||||||||||||||||||
| USD | 8.000 | % | 11/18/2022 | 2,598,310 | $ | 3,208,913 | ||||||||||||||||||||
| USD | 6.875 | % | 09/28/2025 | 1,148,125 | 1,331,825 | (6) | ||||||||||||||||||||
| USD | 7.875 | % | 01/15/2033 | 1,125,800 | 1,407,250 | |||||||||||||||||||||
| USD | 7.625 | % | 03/21/2036 | 6,979,404 | 8,532,321 | |||||||||||||||||||||
|
| |||||||||||||||||||||||||
| 14,480,309 | ||||||||||||||||||||||||||
|
| |||||||||||||||||||||||||
Venezuela - 4.75% | ||||||||||||||||||||||||||
Republic of Venezuela: | ||||||||||||||||||||||||||
| USD | 5.750 | % | 02/26/2016 | 3,475,000 | 2,897,281 | (3) | ||||||||||||||||||||
| USD | 13.625 | % | 08/15/2018 | 1,051,000 | 1,024,725 | (3) | ||||||||||||||||||||
| USD | 13.625 | % | 08/15/2018 | 1,669,000 | 1,585,550 | |||||||||||||||||||||
| USD | 7.000 | % | 12/01/2018 | 3,370,000 | 2,527,500 | (3) | ||||||||||||||||||||
| USD | 7.750 | % | 10/13/2019 | 14,121,100 | 10,449,614 | (3) | ||||||||||||||||||||
| USD | 6.000 | % | 12/09/2020 | 4,600,000 | 3,013,000 | (3) | ||||||||||||||||||||
| USD | 12.750 | % | 08/23/2022 | 40,405,700 | 36,870,201 | (3) | ||||||||||||||||||||
| USD | 9.000 | % | 05/07/2023 | 6,908,700 | 4,974,264 | (3) | ||||||||||||||||||||
| USD | 8.250 | % | 10/13/2024 | 27,802,200 | 18,905,496 | (3) | ||||||||||||||||||||
| USD | 7.650 | % | 04/21/2025 | 4,497,000 | 2,934,292 | (3) | ||||||||||||||||||||
| USD | 11.950 | % | 08/05/2031 | 5,395,000 | 4,437,388 | |||||||||||||||||||||
| USD | 9.375 | % | 01/13/2034 | 928,000 | 663,520 | |||||||||||||||||||||
|
| |||||||||||||||||||||||||
| 90,282,831 | ||||||||||||||||||||||||||
|
| |||||||||||||||||||||||||
TOTAL SOVEREIGN DEBT OBLIGATIONS | 1,277,281,097 | |||||||||||||||||||||||||
|
| |||||||||||||||||||||||||
(Cost $1,356,517,195) | ||||||||||||||||||||||||||
BANK LOANS - 0.06%(7) | ||||||||||||||||||||||||||
Indonesia - 0.06% | ||||||||||||||||||||||||||
PT Bumi Resources | USD | 11.177 | % | 08/07/2013 | 1,181,017 | 767,661 | ||||||||||||||||||||
PT Bumi Tranche A | USD | 15.000 | % | 01/18/2014 | 577,486 | 230,995 | ||||||||||||||||||||
PT Bumi Tranche B | USD | 15.000 | % | 01/18/2014 | 460,908 | 184,363 | ||||||||||||||||||||
|
| |||||||||||||||||||||||||
| 1,183,019 | ||||||||||||||||||||||||||
|
| |||||||||||||||||||||||||
TOTAL BANK LOANS | 1,183,019 | |||||||||||||||||||||||||
|
| |||||||||||||||||||||||||
(Cost $2,219,410) | ||||||||||||||||||||||||||
CORPORATE BONDS - 23.86% | ||||||||||||||||||||||||||
Azerbaijan - 0.64% | ||||||||||||||||||||||||||
State Oil Co. of the Azerbaijan Republic | USD | 4.750 | % | 03/13/2023 | 5,705,000 | 5,362,700 | ||||||||||||||||||||
State Oil Company | USD | 5.450 | % | 02/09/2017 | 6,323,000 | 6,726,091 | ||||||||||||||||||||
|
| |||||||||||||||||||||||||
| 12,088,791 | ||||||||||||||||||||||||||
|
| |||||||||||||||||||||||||
Brazil - 1.49% | ||||||||||||||||||||||||||
Andrade Gutierrez International SA | USD | 4.000 | % | 04/30/2018 | 1,500,000 | 1,455,000 | (2) | |||||||||||||||||||
Banco do Brasil SA | USD | 3.875 | % | 10/10/2022 | 1,494,000 | 1,311,545 | ||||||||||||||||||||
BR Malls International Finance Ltd.: | ||||||||||||||||||||||||||
| USD | 8.500 | % | 01/21/2049 | 225,000 | 230,625 | (3) | ||||||||||||||||||||
| USD | 8.500 | % | 01/21/2049 | 1,443,000 | 1,479,075 | (2) | ||||||||||||||||||||
18 | www.shiplp.com |
Table of Contents
| Stone Harbor Emerging Markets Debt Fund | Statements of Investments | |
| November 30, 2013 (Unaudited) |
Currency | Rate | Maturity Date | Principal Amount* | Market Value (Expressed in U.S. $) | ||||||||||||||||||||||
Brazil (continued) | ||||||||||||||||||||||||||
Centrais Eletricas Brasileiras SA | USD | 5.750 | % | 10/27/2021 | 2,319,000 | $ | 2,266,823 | (3) | ||||||||||||||||||
Cosan Luxembourg SA | USD | 5.000 | % | 03/14/2023 | 2,639,000 | 2,427,880 | (2) | |||||||||||||||||||
ESAL GmbH | USD | 6.250 | % | 02/05/2023 | 2,466,000 | 2,237,895 | (2) | |||||||||||||||||||
General Shopping Finance Ltd. | USD | 10.000 | % | 11/09/2015 | 660,000 | 598,950 | (2) | |||||||||||||||||||
Globo Comunicacao e Participacoes SA | USD | 6.250 | % | 07/20/2049 | 825,000 | 864,188 | (3)(5) | |||||||||||||||||||
Hypermarcas SA | USD | 6.500 | % | 04/20/2021 | 978,000 | 1,029,345 | (2) | |||||||||||||||||||
Itau Unibanco Holding SA | USD | 5.650 | % | 03/19/2022 | 658,000 | 639,905 | (2) | |||||||||||||||||||
Minerva Luxembourg SA | USD | 7.750 | % | 01/31/2023 | 1,396,000 | 1,378,550 | (2) | |||||||||||||||||||
NET Servicos de Comunicacao SA | USD | 7.500 | % | 01/27/2020 | 1,588,000 | 1,722,980 | ||||||||||||||||||||
Odebrecht Drilling Norbe VIII/IX Ltd.: | ||||||||||||||||||||||||||
| USD | 6.350 | % | 06/30/2021 | 360,750 | 367,965 | (3) | ||||||||||||||||||||
| USD | 6.350 | % | 06/30/2021 | 648,425 | 661,393 | (2) | ||||||||||||||||||||
Odebrecht Offshore Drilling Finance Ltd. | USD | 6.750 | % | 10/01/2022 | 1,803,000 | 1,843,567 | (2) | |||||||||||||||||||
QGOG Atlantic/Alaskan Rigs Ltd. | USD | 5.250 | % | 07/30/2018 | 1,735,957 | 1,779,356 | (2) | |||||||||||||||||||
Samarco Mineracao SA | USD | 4.125 | % | 11/01/2022 | 4,097,000 | 3,687,300 | (2) | |||||||||||||||||||
Schahin II Finance Co. SPV Ltd. | USD | 5.875 | % | 09/25/2022 | 1,389,100 | 1,337,009 | (2) | |||||||||||||||||||
Tonon Bioenergia SA | USD | 9.250 | % | 01/24/2020 | 1,200,000 | 1,110,000 | (2) | |||||||||||||||||||
|
| |||||||||||||||||||||||||
| 28,429,351 | ||||||||||||||||||||||||||
|
| |||||||||||||||||||||||||
Chile - 3.23% | ||||||||||||||||||||||||||
Banco del Estado de Chile | USD | 3.875 | % | 02/08/2022 | 3,277,000 | 3,231,941 | (2) | |||||||||||||||||||
Cencosud SA: | ||||||||||||||||||||||||||
| USD | 5.500 | % | 01/20/2021 | 2,000,000 | 2,060,000 | (2) | ||||||||||||||||||||
| USD | 4.875 | % | 01/20/2023 | 1,908,000 | 1,817,370 | (2) | ||||||||||||||||||||
CFR International SpA | USD | 5.125 | % | 12/06/2022 | 500,000 | 465,312 | (2) | |||||||||||||||||||
Codelco, Inc.: | ||||||||||||||||||||||||||
| USD | 7.500 | % | 01/15/2019 | 3,216,000 | 3,887,748 | (3) | ||||||||||||||||||||
| USD | 3.875 | % | 11/03/2021 | 6,970,000 | 6,876,277 | (3) | ||||||||||||||||||||
| USD | 3.000 | % | 07/17/2022 | 14,167,000 | 12,879,550 | (2) | ||||||||||||||||||||
| USD | 4.500 | % | 08/13/2023 | 7,856,000 | 7,898,375 | (2) | ||||||||||||||||||||
| USD | 6.150 | % | 10/24/2036 | 12,412,000 | 13,248,422 | (3) | ||||||||||||||||||||
| USD | 4.250 | % | 07/17/2042 | 7,321,000 | 5,943,447 | (2) | ||||||||||||||||||||
ENTEL Chile SA | USD | 4.875 | % | 10/30/2024 | 1,150,000 | 1,133,469 | (2) | |||||||||||||||||||
GeoPark Latin America Ltd. Agencia en Chile | USD | 7.500 | % | 02/11/2020 | 1,497,000 | 1,530,683 | (2) | |||||||||||||||||||
Telefonica Chile SA | USD | 3.875 | % | 10/12/2022 | 488,000 | 454,450 | (2) | |||||||||||||||||||
|
| |||||||||||||||||||||||||
| 61,427,044 | ||||||||||||||||||||||||||
|
| |||||||||||||||||||||||||
China - 2.27% | ||||||||||||||||||||||||||
Bestgain Real Estate Ltd. | USD | 2.625 | % | 03/13/2018 | 900,000 | 847,719 | (3) | |||||||||||||||||||
China Overseas Finance Cayman V Ltd. | USD | 3.950 | % | 11/15/2022 | 1,250,000 | 1,124,074 | ||||||||||||||||||||
Country Garden Holdings Co. Ltd.: | ||||||||||||||||||||||||||
| USD | 11.125 | % | 02/23/2018 | 500,000 | 560,625 | (3) | ||||||||||||||||||||
| USD | 7.250 | % | 04/04/2021 | 1,400,000 | 1,394,750 | (2) | ||||||||||||||||||||
Kaisa Group Holdings Ltd. | USD | 8.875 | % | 03/19/2018 | 1,928,000 | 1,981,020 | (2) | |||||||||||||||||||
Longfor Properties Co. Ltd. | USD | 6.875 | % | 10/18/2019 | 1,397,000 | 1,428,432 | ||||||||||||||||||||
Mega Advance Investments Ltd. | USD | 5.000 | % | 05/12/2021 | 200,000 | 209,096 | (2) | |||||||||||||||||||
Sinochem Overseas Capital Co. Ltd.: | ||||||||||||||||||||||||||
| USD | 4.500 | % | 11/12/2020 | 5,534,000 | 5,648,250 | (3) | ||||||||||||||||||||
| USD | 4.500 | % | 11/12/2020 | 18,617,000 | 19,001,348 | (2) | ||||||||||||||||||||
| USD | 6.300 | % | 11/12/2040 | 4,685,000 | 4,918,664 | (3) | ||||||||||||||||||||
| Stone Harbor Investment Funds Semi-Annual Report | November 30, 2013 | 19 |
Table of Contents
| Stone Harbor Emerging Markets Debt Fund | Statements of Investments | |
| November 30, 2013 (Unaudited) |
Currency | Rate | Maturity Date | Principal Amount* | Market Value (Expressed in U.S. $) | ||||||||||||||||||||||
China (continued) | ||||||||||||||||||||||||||
Sinopec Capital 2013 Ltd. | USD | 3.125 | % | 04/24/2023 | 4,584,000 | $ | 4,194,979 | (2) | ||||||||||||||||||
Sinopec Group Overseas Development 2012 Ltd. | USD | 3.900 | % | 05/17/2022 | 1,071,000 | 1,053,612 | (3) | |||||||||||||||||||
Texhong Textile Group Ltd.: | ||||||||||||||||||||||||||
| USD | 7.625 | % | 01/19/2016 | 343,000 | 361,007 | (2) | ||||||||||||||||||||
| USD | 7.625 | % | 01/19/2016 | 439,000 | 462,048 | (3) | ||||||||||||||||||||
|
| |||||||||||||||||||||||||
| 43,185,624 | ||||||||||||||||||||||||||
|
| |||||||||||||||||||||||||
Colombia - 0.48% | ||||||||||||||||||||||||||
Bancolombia SA | USD | 5.125 | % | 09/11/2022 | 1,739,000 | 1,608,575 | ||||||||||||||||||||
Empresa de Energia de Bogota SA | USD | 6.125 | % | 11/10/2021 | 1,392,000 | 1,437,240 | (2) | |||||||||||||||||||
Grupo Aval Ltd.: | ||||||||||||||||||||||||||
| USD | 5.250 | % | 02/01/2017 | 550,000 | 574,750 | (2) | ||||||||||||||||||||
| USD | 4.750 | % | 09/26/2022 | 974,000 | 894,862 | (2) | ||||||||||||||||||||
Gruposura Finance | USD | 5.700 | % | 05/18/2021 | 491,000 | 506,957 | (2) | |||||||||||||||||||
Millicom International Cellular SA | USD | 6.625 | % | 10/15/2021 | 786,000 | 804,471 | (2) | |||||||||||||||||||
Pacific Rubiales Energy Corp. | USD | 5.125 | % | 03/28/2023 | 2,417,000 | 2,193,428 | (2) | |||||||||||||||||||
Transportadora de Gas Internacional SA ESP | USD | 5.700 | % | 03/20/2022 | 1,000,000 | 1,033,875 | (2) | |||||||||||||||||||
|
| |||||||||||||||||||||||||
| 9,054,158 | ||||||||||||||||||||||||||
|
| |||||||||||||||||||||||||
Ghana - 0.07% | ||||||||||||||||||||||||||
Tullow Oil PLC | USD | 6.000 | % | 11/01/2020 | 1,300,000 | 1,314,625 | (2) | |||||||||||||||||||
|
| |||||||||||||||||||||||||
India - 0.56% | ||||||||||||||||||||||||||
Bharti Airtel International Netherlands BV | USD | 5.125 | % | 03/11/2023 | 1,692,000 | 1,552,410 | (2) | |||||||||||||||||||
ICICI Bank Ltd. | USD | 5.750 | % | 11/16/2020 | 508,000 | 519,526 | (2) | |||||||||||||||||||
ICICI Bank Ltd./Hong Kong | USD | 5.750 | % | 11/16/2020 | 877,000 | 896,899 | (3) | |||||||||||||||||||
Reliance Holdings USA, Inc. | USD | 5.400 | % | 02/14/2022 | 1,710,000 | 1,731,948 | (2) | |||||||||||||||||||
Vedanta Resources PLC: | ||||||||||||||||||||||||||
| USD | 6.000 | % | 01/31/2019 | 4,044,000 | 3,902,460 | (2) | ||||||||||||||||||||
| USD | 8.250 | % | 06/07/2021 | 902,000 | 908,765 | (2) | ||||||||||||||||||||
| USD | 7.125 | % | 05/31/2023 | 1,194,000 | 1,104,450 | (2) | ||||||||||||||||||||
|
| |||||||||||||||||||||||||
| 10,616,458 | ||||||||||||||||||||||||||
|
| |||||||||||||||||||||||||
Indonesia - 0.58% | ||||||||||||||||||||||||||
Berau Capital Resources Pte Ltd. | USD | 12.500 | % | 07/08/2015 | 200,000 | 211,750 | (3) | |||||||||||||||||||
Indo Energy Finance BV | USD | 7.000 | % | 05/07/2018 | 500,000 | 505,000 | (2) | |||||||||||||||||||
Indo Energy Finance II BV | USD | 6.375 | % | 01/24/2023 | 1,214,000 | 1,028,865 | (2) | |||||||||||||||||||
Indosat Palapa Co. BV: | ||||||||||||||||||||||||||
| USD | 7.375 | % | 07/29/2020 | 241,000 | 261,214 | (2) | ||||||||||||||||||||
| USD | 7.375 | % | 07/29/2020 | 1,850,000 | 2,005,169 | (3) | ||||||||||||||||||||
Listrindo Capital BV | USD | 6.950 | % | 02/21/2019 | 1,361,000 | 1,415,440 | (2) | |||||||||||||||||||
Pertamina Persero PT | USD | 6.000 | % | 05/03/2042 | 2,529,000 | 2,051,651 | (3) | |||||||||||||||||||
PT Adaro Indonesia | USD | 7.625 | % | 10/22/2019 | 2,447,000 | 2,584,644 | (3) | |||||||||||||||||||
TBG Global Pte Ltd. | USD | 4.625 | % | 04/03/2018 | 1,117,000 | 1,066,735 | (2) | |||||||||||||||||||
|
| |||||||||||||||||||||||||
| 11,130,468 | ||||||||||||||||||||||||||
|
| |||||||||||||||||||||||||
Kazakhstan - 3.74% | ||||||||||||||||||||||||||
KazMunayGas National Co. JSC: | ||||||||||||||||||||||||||
| USD | 11.750 | % | 01/23/2015 | 13,511,000 | 14,971,877 | (3) | ||||||||||||||||||||
| USD | 9.125 | % | 07/02/2018 | 1,449,000 | 1,760,535 | (3) | ||||||||||||||||||||
| USD | 9.125 | % | 07/02/2018 | 9,516,000 | 11,561,940 | (2) | ||||||||||||||||||||
| USD | 7.000 | % | 05/05/2020 | 739,000 | 833,223 | (2) | ||||||||||||||||||||
20 | www.shiplp.com |
Table of Contents
| Stone Harbor Emerging Markets Debt Fund | Statements of Investments | |
| November 30, 2013 (Unaudited) |
Currency | Rate | Maturity Date | Principal Amount* | Market Value (Expressed in U.S. $) | ||||||||||||||||||||||
Kazakhstan (continued) | ||||||||||||||||||||||||||
KazMunayGas National Co. JSC: (continued) | ||||||||||||||||||||||||||
| USD | 7.000 | % | 05/05/2020 | 6,662,000 | $ | 7,511,405 | (3) | |||||||||||||||||||
| USD | 6.375 | % | 04/09/2021 | 3,945,000 | 4,290,188 | (2) | ||||||||||||||||||||
| USD | 6.375 | % | 04/09/2021 | 17,538,000 | 19,072,575 | (3) | ||||||||||||||||||||
| USD | 4.400 | % | 04/30/2023 | 5,426,000 | 5,039,397 | (2) | ||||||||||||||||||||
| USD | 5.750 | % | 04/30/2043 | 3,065,000 | 2,658,887 | (2) | ||||||||||||||||||||
Zhaikmunai LP | USD | 7.125 | % | 11/13/2019 | 3,275,000 | 3,430,562 | (2) | |||||||||||||||||||
|
| |||||||||||||||||||||||||
| 71,130,589 | ||||||||||||||||||||||||||
|
| |||||||||||||||||||||||||
Macau - 0.13% | ||||||||||||||||||||||||||
MCE Finance Ltd. | USD | 5.000 | % | 02/15/2021 | 921,000 | 895,673 | (2) | |||||||||||||||||||
Wynn Macau Ltd. | USD | 5.250 | % | 10/15/2021 | 1,500,000 | 1,518,750 | (2) | |||||||||||||||||||
|
| |||||||||||||||||||||||||
| 2,414,423 | ||||||||||||||||||||||||||
|
| |||||||||||||||||||||||||
Malaysia - 0.77% | ||||||||||||||||||||||||||
IOI Investment L BHD | USD | 4.375 | % | 06/27/2022 | 225,000 | 213,735 | ||||||||||||||||||||
Penerbangan Malaysia BHD | USD | 5.625 | % | 03/15/2016 | 1,195,000 | 1,311,718 | (3) | |||||||||||||||||||
Petroliam Nasional BHD | USD | 7.625 | % | 10/15/2026 | 2,742,000 | 3,491,680 | (3) | |||||||||||||||||||
Petronas Capital Ltd. | USD | 7.875 | % | 05/22/2022 | 7,567,000 | 9,634,450 | (3) | |||||||||||||||||||
|
| |||||||||||||||||||||||||
| 14,651,583 | ||||||||||||||||||||||||||
|
| |||||||||||||||||||||||||
Mexico - 1.02% | ||||||||||||||||||||||||||
BBVA Bancomer SA | USD | 6.750 | % | 09/30/2022 | 920,000 | 978,650 | (2) | |||||||||||||||||||
Cemex Finance LLC | USD | 9.375 | % | 10/12/2022 | 1,823,000 | 2,028,087 | (2) | |||||||||||||||||||
Cemex SAB de CV: | ||||||||||||||||||||||||||
| USD | 9.500 | % | 06/15/2018 | 2,338,000 | 2,630,250 | (2) | ||||||||||||||||||||
| USD | 7.250 | % | 01/15/2021 | 779,000 | 793,606 | (2) | ||||||||||||||||||||
Comision Federal de Electricidad | USD | 4.875 | % | 01/15/2024 | 1,784,000 | 1,777,028 | (2) | |||||||||||||||||||
Grupo Bimbo SAB de CV: | ||||||||||||||||||||||||||
| USD | 4.875 | % | 06/30/2020 | 400,000 | 420,291 | (2) | ||||||||||||||||||||
| USD | 4.500 | % | 01/25/2022 | 800,000 | 803,198 | (2) | ||||||||||||||||||||
Metalsa SAB de CV | USD | 4.900 | % | 04/24/2023 | 1,726,000 | 1,600,865 | (2) | |||||||||||||||||||
Mexico Generadora De Energia | USD | 5.500 | % | 12/06/2032 | 2,861,000 | 2,696,493 | (2) | |||||||||||||||||||
Pemex Project Funding Master Trust | EUR | 5.500 | % | 02/24/2025 | 2,275,000 | 3,524,064 | (3) | |||||||||||||||||||
Petroleos Mexicanos | USD | 6.500 | % | 06/02/2041 | 2,129,000 | 2,155,613 | ||||||||||||||||||||
|
| |||||||||||||||||||||||||
| 19,408,145 | ||||||||||||||||||||||||||
|
| |||||||||||||||||||||||||
Peru - 0.46% | ||||||||||||||||||||||||||
Ajecorp BV | USD | 6.500 | % | 05/14/2022 | 973,000 | 975,432 | (2) | |||||||||||||||||||
Banco de Credito del Peru: | ||||||||||||||||||||||||||
| USD | 5.375 | % | 09/16/2020 | 526,000 | 545,725 | (2) | ||||||||||||||||||||
| USD | 5.375 | % | 09/16/2020 | 1,465,000 | 1,519,938 | (3) | ||||||||||||||||||||
BBVA Banco Continental SA | USD | 5.000 | % | 08/26/2022 | 778,000 | 767,302 | (2) | |||||||||||||||||||
Cementos Pacasmayo SAA | USD | 4.500 | % | 02/08/2023 | 1,506,000 | 1,385,520 | (2) | |||||||||||||||||||
Inkia Energy Ltd. | USD | 8.375 | % | 04/04/2021 | 785,000 | 847,800 | (2) | |||||||||||||||||||
Southern Copper Corp.: | ||||||||||||||||||||||||||
| USD | 6.750 | % | 04/16/2040 | 1,167,000 | 1,110,130 | |||||||||||||||||||||
| USD | 5.250 | % | 11/08/2042 | 962,000 | 778,176 | |||||||||||||||||||||
Volcan Cia Minera SAA | USD | 5.375 | % | 02/02/2022 | 836,000 | 785,840 | (2) | |||||||||||||||||||
|
| |||||||||||||||||||||||||
| 8,715,863 | ||||||||||||||||||||||||||
|
| |||||||||||||||||||||||||
| Stone Harbor Investment Funds Semi-Annual Report | November 30, 2013 | 21 |
Table of Contents
| Stone Harbor Emerging Markets Debt Fund | Statements of Investments | |
| November 30, 2013 (Unaudited) |
Currency | Rate | Maturity Date | Principal Amount* | Market Value (Expressed in U.S. $) | ||||||||||||||||||||||
Russia - 1.99% | ||||||||||||||||||||||||||
Alfa Bank OJSC Via Alfa Bond Issuance PLC | USD | 7.500 | % | 09/26/2019 | 2,750,000 | $ | 2,908,125 | (2) | ||||||||||||||||||
EDC Finance Ltd. | USD | 4.875 | % | 04/17/2020 | 975,000 | 953,062 | (2) | |||||||||||||||||||
EuroChem Mineral & Chemical Co. OJSC via EuroChem GI Ltd. | USD | 5.125 | % | 12/12/2017 | 1,230,000 | 1,245,375 | (2) | |||||||||||||||||||
Far East Capital Ltd. SA | USD | 8.000 | % | 05/02/2018 | 948,000 | 852,015 | (2) | |||||||||||||||||||
Gazprom OAO Via Gaz Capital SA: | ||||||||||||||||||||||||||
| USD | 9.250 | % | 04/23/2019 | 7,874,000 | 9,753,917 | (3) | ||||||||||||||||||||
| USD | 4.950 | % | 02/06/2028 | 6,070,000 | 5,341,600 | (2) | ||||||||||||||||||||
| USD | 7.288 | % | 08/16/2037 | 1,642,000 | 1,740,520 | (3) | ||||||||||||||||||||
Metalloinvest Finance Ltd.: | ||||||||||||||||||||||||||
| USD | 6.500 | % | 07/21/2016 | 1,137,000 | 1,205,220 | (2) | ||||||||||||||||||||
| USD | 5.625 | % | 04/17/2020 | 335,000 | 327,881 | (2) | ||||||||||||||||||||
Mobile Telesystems OJSC via MTS International Funding Ltd. | USD | 5.000 | % | 05/30/2023 | 1,650,000 | 1,544,813 | (2) | |||||||||||||||||||
Russian Agricultural Bank OJSC Via RSHB Capital SA: | ||||||||||||||||||||||||||
| USD | 5.298 | % | 12/27/2017 | 1,320,000 | 1,369,500 | (3) | ||||||||||||||||||||
| USD | 6.000 | % | 06/03/2021 | 2,342,000 | 2,412,260 | (3)(8) | ||||||||||||||||||||
Severstal OAO Via Steel Capital SA | USD | 5.900 | % | 10/17/2022 | 1,000,000 | 970,000 | (2) | |||||||||||||||||||
Vimpel Communications Via VIP Finance Ireland Ltd. OJSC | USD | 7.748 | % | 02/02/2021 | 1,266,000 | 1,360,950 | (2) | |||||||||||||||||||
VTB Bank OJSC Via VTB Capital SA: | ||||||||||||||||||||||||||
| USD | 6.315 | % | 02/22/2018 | 2,317,000 | 2,484,983 | (3) | ||||||||||||||||||||
| USD | 6.950 | % | 10/17/2022 | 1,500,000 | 1,533,750 | (3) | ||||||||||||||||||||
| USD | 6.250 | % | 06/30/2035 | 1,085,000 | 1,156,881 | (3) | ||||||||||||||||||||
Wind Acquisition Finance SA | USD | 12.250 | % | 07/15/2017 | 700,000 | 726,250 | (2)(6) | |||||||||||||||||||
|
| |||||||||||||||||||||||||
| 37,887,102 | ||||||||||||||||||||||||||
|
| |||||||||||||||||||||||||
Singapore - 0.12% | ||||||||||||||||||||||||||
STATS ChipPAC Ltd.: | ||||||||||||||||||||||||||
| USD | 5.375 | % | 03/31/2016 | 153,000 | 158,164 | (3) | ||||||||||||||||||||
| USD | 4.500 | % | 03/20/2018 | 2,096,000 | 2,103,860 | (2) | ||||||||||||||||||||
|
| |||||||||||||||||||||||||
| 2,262,024 | ||||||||||||||||||||||||||
|
| |||||||||||||||||||||||||
South Africa - 0.42% | ||||||||||||||||||||||||||
Eskom Holdings SOC Ltd. | USD | 6.750 | % | 08/06/2023 | 7,174,000 | 7,281,610 | (2) | |||||||||||||||||||
Gold Fields Orogen Holding BVI Ltd. | USD | 4.875 | % | 10/07/2020 | 900,000 | 753,750 | (3) | |||||||||||||||||||
|
| |||||||||||||||||||||||||
| 8,035,360 | ||||||||||||||||||||||||||
|
| |||||||||||||||||||||||||
Turkey - 0.53% | ||||||||||||||||||||||||||
Akbank TAS: | ||||||||||||||||||||||||||
| USD | 3.875 | % | 10/24/2017 | 2,050,000 | 2,034,625 | (2) | ||||||||||||||||||||
| USD | 5.000 | % | 10/24/2022 | 750,000 | 691,875 | (3) | ||||||||||||||||||||
KOC Holding AS | USD | 3.500 | % | 04/24/2020 | 2,500,000 | 2,212,500 | (2) | |||||||||||||||||||
Turkiye Garanti Bankasi AS: | ||||||||||||||||||||||||||
| USD | 4.000 | % | 09/13/2017 | 1,000,000 | 1,001,250 | (2) | ||||||||||||||||||||
| USD | 5.250 | % | 09/13/2022 | 3,122,000 | 2,911,265 | (2) | ||||||||||||||||||||
Turkiye Is Bankasi | USD | 5.500 | % | 04/21/2019 | 1,200,000 | 1,215,000 | (2) | |||||||||||||||||||
|
| |||||||||||||||||||||||||
| 10,066,515 | ||||||||||||||||||||||||||
|
| |||||||||||||||||||||||||
22 | www.shiplp.com |
Table of Contents
| Stone Harbor Emerging Markets Debt Fund | Statements of Investments | |
| November 30, 2013 (Unaudited) |
Currency | Rate | Maturity Date | Principal Amount* | Market Value (Expressed in U.S. $) | ||||||||||||||||||||||||
Ukraine - 0.21% | ||||||||||||||||||||||||||||
Ferrexpo Finance PLC | USD | 7.875 | % | 04/07/2016 | 2,115,000 | $ | 2,009,250 | (2) | ||||||||||||||||||||
Metinvest BV | USD | 8.750 | % | 02/14/2018 | 1,437,000 | 1,278,930 | (2) | |||||||||||||||||||||
Mriya Agro Holding PLC | USD | 9.450 | % | 04/19/2018 | 864,000 | 738,720 | (2) | |||||||||||||||||||||
|
| |||||||||||||||||||||||||||
| 4,026,900 | ||||||||||||||||||||||||||||
|
| |||||||||||||||||||||||||||
United Arab Emirates - 0.47% | ||||||||||||||||||||||||||||
Dubai Holding Commercial Operations MTN Ltd. | GBP | 6.000 | % | 02/01/2017 | 3,350,000 | 5,680,359 | ||||||||||||||||||||||
Emaar Sukuk Ltd. | USD | 6.400 | % | 07/18/2019 | 3,000,000 | 3,255,750 | ||||||||||||||||||||||
|
| |||||||||||||||||||||||||||
| 8,936,109 | ||||||||||||||||||||||||||||
|
| |||||||||||||||||||||||||||
Venezuela - 4.68% | ||||||||||||||||||||||||||||
Petroleos de Venezuela SA: | ||||||||||||||||||||||||||||
| USD | 4.900 | % | 10/28/2014 | 19,549,747 | 17,741,395 | |||||||||||||||||||||||
| USD | 5.000 | % | 10/28/2015 | 42,018,707 | 34,231,590 | |||||||||||||||||||||||
| USD | 5.250 | % | 04/12/2017 | 510,800 | 356,922 | (3) | ||||||||||||||||||||||
| USD | 8.500 | % | 11/02/2017 | 45,840,200 | 36,614,860 | (3) | ||||||||||||||||||||||
|
| |||||||||||||||||||||||||||
| 88,944,767 | ||||||||||||||||||||||||||||
|
| |||||||||||||||||||||||||||
TOTAL CORPORATE BONDS | 453,725,899 | |||||||||||||||||||||||||||
|
| |||||||||||||||||||||||||||
(Cost $471,172,213) | ||||||||||||||||||||||||||||
PARTICIPATION NOTES - 0.31% | ||||||||||||||||||||||||||||
Ukraine - 0.31% | ||||||||||||||||||||||||||||
Ukreximbank Biz Finance PLC | USD | 8.375 | % | 04/27/2015 | 6,358,000 | 5,785,780 | (3) | |||||||||||||||||||||
|
| |||||||||||||||||||||||||||
TOTAL PARTICIPATION NOTES | 5,785,780 | |||||||||||||||||||||||||||
|
| |||||||||||||||||||||||||||
(Cost $6,120,723) | ||||||||||||||||||||||||||||
CREDIT LINKED NOTES - 1.64% | ||||||||||||||||||||||||||||
Colombia - 1.23% | ||||||||||||||||||||||||||||
Titulos de Tesoreria - Series B: | ||||||||||||||||||||||||||||
Citigroup Global Markets | COP | 11.000 | % | 07/24/2020 | 3,000,000,000 | 1,887,112 | ||||||||||||||||||||||
Citigroup Global Markets | COP | 11.000 | % | 07/24/2020 | 3,500,000,000 | 2,201,631 | (2) | |||||||||||||||||||||
Citigroup Global Markets | COP | 11.000 | % | 07/24/2020 | 4,000,000,000 | 2,516,149 | ||||||||||||||||||||||
Citigroup Global Markets | COP | 11.000 | % | 07/24/2020 | 5,700,000,000 | 3,585,512 | ||||||||||||||||||||||
Citigroup Global Markets | COP | 11.000 | % | 07/27/2020 | 1,960,000,000 | 1,232,913 | ||||||||||||||||||||||
Citigroup Global Markets | COP | 7.000 | % | 05/04/2022 | 7,130,000,000 | 3,700,440 | ||||||||||||||||||||||
JPMorgan Chase & Co. | COP | 7.000 | % | 05/04/2022 | 16,010,000,000 | 8,307,632 | ||||||||||||||||||||||
|
| |||||||||||||||||||||||||||
| 23,431,389 | ||||||||||||||||||||||||||||
|
| |||||||||||||||||||||||||||
Iraq - 0.41% | ||||||||||||||||||||||||||||
Republic of Iraq: | ||||||||||||||||||||||||||||
Bank of America - Merrill Lynch | JPY | 2.520 | % | 01/01/2028 | 430,974,362 | 2,439,994 | (8) | |||||||||||||||||||||
Bank of America - Merrill Lynch | JPY | 2.520 | % | 01/01/2028 | 947,870,488 | 5,366,439 | (8) | |||||||||||||||||||||
|
| |||||||||||||||||||||||||||
| 7,806,433 | ||||||||||||||||||||||||||||
|
| |||||||||||||||||||||||||||
TOTAL CREDIT LINKED NOTES | 31,237,822 | |||||||||||||||||||||||||||
|
| |||||||||||||||||||||||||||
(Cost $37,031,530) | ||||||||||||||||||||||||||||
| Stone Harbor Investment Funds Semi-Annual Report | November 30, 2013 | 23 |
Table of Contents
| Stone Harbor Emerging Markets Debt Fund | Statements of Investments | |
| November 30, 2013 (Unaudited) |
Currency | Rate | Maturity Date | Principal | Market Value | ||||||||||||||||||||||
OPEN-END FUNDS - 0.78% | ||||||||||||||||||||||||||
United States - 0.78% | ||||||||||||||||||||||||||
Stone Harbor Emerging Markets Corporate Debt Fund | USD | N/A | N/A | 1,665,074 | $ | 14,869,110 | (9) | |||||||||||||||||||
|
| |||||||||||||||||||||||||
TOTAL OPEN-END FUNDS | 14,869,110 | |||||||||||||||||||||||||
|
| |||||||||||||||||||||||||
(Cost $15,229,508) | ||||||||||||||||||||||||||
SHORT TERM INVESTMENTS - 4.85% | ||||||||||||||||||||||||||
Money Market Mutual Funds - 4.85% | ||||||||||||||||||||||||||
Dreyfus Institutional Cash Advantage Fund - Institutional Advantage Class (7-Day Yield) | USD | 0.07715 | % | N/A | 92,134,481 | 92,134,481 | ||||||||||||||||||||
|
| |||||||||||||||||||||||||
TOTAL SHORT TERM INVESTMENTS | 92,134,481 | |||||||||||||||||||||||||
|
| |||||||||||||||||||||||||
(Cost $92,134,481) | ||||||||||||||||||||||||||
Total Investments - 98.67% | 1,876,217,208 | |||||||||||||||||||||||||
(Cost $1,980,425,060) | ||||||||||||||||||||||||||
Other Assets In Excess of Liabilities - 1.33% | 25,349,532 | |||||||||||||||||||||||||
|
| |||||||||||||||||||||||||
Net Assets - 100.00% | $ | 1,901,566,740 | ||||||||||||||||||||||||
|
| |||||||||||||||||||||||||
* The principal amount/shares of each security is stated in the currency in which the security is denominated. See below.
BRL | - | Brazilian Real | ||||
COP | - | Colombian Peso | ||||
EUR | - | Euro Currency | ||||
GBP | - | Great Britain Pound | ||||
IDR | - | Indonesian Rupiah | ||||
JPY | - | Japanese Yen | ||||
MXN | - | Mexican Peso | ||||
PEN | - | Peruvian Nuevo Sol | ||||
PHP | - | Phillipine Peso | ||||
TRY | - | Turkish Lira | ||||
USD | - | United States Dollar | ||||
ZAR | - | South African Rand |
| (1) | Security is currently in default/non-income producing. |
| (2) | Security exempt from registration under Rule 144A of the Securities Act of 1933. Such securities may normally be sold to qualified institutional buyers in transactions exempt from registration. Total market value of Rule 144A securities amounts to $288,235,012, which represents approximately 15.16% of net assets as of November 30, 2013. |
| (3) | Securities were originally issued pursuant to Regulation S under the Securities Act of 1933, which exempts securities offered and sold outside of the United States from registration. Such securities cannot be sold in the United States without either an effective registration statement filed pursuant to the Securities Act of 1933, or pursuant to an exemption from registration. As of November 30, 2013, the aggregate market value of those securities was $586,148,590, which represents approximately 30.82% of net assets. |
| (4) | Amount represents less than 0.005% of net assets. |
| (5) | Step bond. Coupon increases periodically based upon a predetermined schedule. Interest rate disclosed is that which is in effect as of November 30, 2013. |
| (6) | Pay-in-kind securities. |
| (7) | Bank loans generally pay interest at rates which are periodically determined by reference to a base lending rate plus a premium. All loans carry a variable rate of interest. These base lending rates are generally (i) the Prime Rate offered by one or more major United States banks, (ii) the lending rate offered by one or more European banks such as the London Interbank Offered Rate (“LIBOR”) or (iii) the Certificate of Deposit rate. Rate shown represents the weighted average rate at November 30, 2013. Bank loans, while exempt from registration, under the Securities Act of 1933, contain certain restrictions on resale and cannot be sold publicly. Floating rate bank loans often require prepayments from excess cash flow or permit the borrower to repay at its election. The degree to which borrowers repay, whether as a contractual requirement or at their election, cannot be predicted with accuracy. As a result, the actual remaining maturity may be substantially less than the stated maturity shown. |
| (8) | Floating or variable rate security. Interest rate disclosed is that which is in effect as of November 30, 2013. |
| (9) | Affiliated with the Fund, as each is a series of Stone Harbor Investment Partners LP and have the same investment adviser. |
24 | www.shiplp.com |
Table of Contents
| Stone Harbor Emerging Markets Debt Fund | Statements of Investments | |
| November 30, 2013 (Unaudited) |
Common Abbreviations:
AS | - | Anonim Sirket is the Turkish term for Incorporation. | ||||
Bhd | - | Berhad is the Malaysian term for public limited company. | ||||
BV | - | Besloten Vennootschap is the Dutch term for private limited liability company. | ||||
BVI | - | British Virgin Islands. | ||||
ESP | - | Empresa de Servicios Publicos is the Colombian term for Public Service Company. | ||||
GmbH | - | Gesellschaft mit beschrankter Haftung is the German term for a company with limited liability. | ||||
JSC | - | Joint Stock Company. | ||||
LLC | - | Lmited Liability Corporation. | ||||
LP | - | Limited Partnership. | ||||
Ltd. | - | Limited. | ||||
MTN | - | Medium Term Note. | ||||
OAO | - | Otkrytoe Aktsionernoe Obschestvo is the Russian term for Open Joint Stock Company. | ||||
OJSC | - | Open Joint Stock Company. | ||||
PLC | - | Public Limited Company. | ||||
PT | - | Perseroan terbuka is an Indonesian term for limited liability company. | ||||
Pte | - | Private. | ||||
SA | - | Generally designates corporations in various countries, mostly those employing the civil law. | ||||
SAA | - | Sociedad Anonima Abierta is the Peruvian term used for companies with 20 or more shareholders. | ||||
SAB | - | Sociedad Anonima Bursatil is the Spanish term used for publicly held company. | ||||
SAB de CV | - | A variable capital company. | ||||
SpA | - | Societa per Azioni. | ||||
SPV | - | Special Purpose Vehicle. | ||||
TAS | - | TüRk Anonim Sirketi is the Turkish term for Joint Stock Company. |
OUTSTANDING FORWARD FOREIGN CURRENCY CONTRACTS
| Counterparty | Foreign Currency | Contracted Amount** | Purchase/Sale Contract | Settlement Date | Current Value | Unrealized Appreciation/ (Depreciation) | ||||||||||
Citigroup Global Markets | BRL | 20,503,662 | Sale | 12/03/2013 | $ | 8,773,631 | $ | 534,369 | ||||||||
JPMorgan Chase & Co. | JPY | 850,592,000 | Sale | 12/27/2013 | 8,305,244 | 307,910 | ||||||||||
Citigroup Global Markets | PHP | 795,126,860 | Sale | 12/12/2013 | 18,177,895 | 185,312 | ||||||||||
|
| |||||||||||||||
| $ | 1,027,591 | |||||||||||||||
|
| |||||||||||||||
Citigroup Global Markets | BRL | 20,503,662 | Purchase | 12/03/2013 | $ | 8,773,631 | $ | (153,036 | ) | |||||||
JPMorgan Chase & Co. | EUR | 8,720,000 | Sale | 12/27/2013 | 11,848,642 | (88,806 | ) | |||||||||
JPMorgan Chase & Co. | GBP | 4,328,700 | Sale | 12/27/2013 | 7,081,594 | (194,806 | ) | |||||||||
Citigroup Global Markets | PEN | 107,611,891 | Purchase | 12/20/2013 | 38,337,659 | (235,227 | ) | |||||||||
Citigroup Global Markets | PHP | 795,126,860 | Purchase | 12/12/2013 | 18,177,895 | (475,027 | ) | |||||||||
|
| |||||||||||||||
| $ | (1,146,902 | ) | ||||||||||||||
|
| |||||||||||||||
| ** | The contracted amount is stated in the currency in which the security is denominated. |
See Notes to Financial Statements.
| Stone Harbor Investment Funds Semi-Annual Report | November 30, 2013 | 25 |
Table of Contents
| Stone Harbor High Yield Bond Fund | Statements of Investments | |
| November 30, 2013 (Unaudited) |
Currency | Rate | Maturity Date | Principal | Market Value | ||||||||||||||||||||||
CORPORATE BONDS - 90.57% | ||||||||||||||||||||||||||
Aerospace/Defense - 0.96% | ||||||||||||||||||||||||||
CPI International, Inc. | USD | 8.000 | % | 02/15/2018 | 1,575,000 | $ | 1,638,000 | |||||||||||||||||||
Erickson Air-Crane, Inc. | USD | 8.250 | % | 05/01/2020 | 1,587,000 | 1,624,691 | (1) | |||||||||||||||||||
|
| |||||||||||||||||||||||||
| 3,262,691 | ||||||||||||||||||||||||||
|
| |||||||||||||||||||||||||
Automotive - 1.15% | ||||||||||||||||||||||||||
Chrysler Group LLC | USD | 8.000 | % | 06/15/2019 | 1,515,000 | 1,689,225 | ||||||||||||||||||||
The Goodyear Tire & Rubber Co.: | ||||||||||||||||||||||||||
| USD | 6.500 | % | 03/01/2021 | 1,488,000 | 1,584,720 | |||||||||||||||||||||
| USD | 7.000 | % | 05/15/2022 | 608,000 | 658,160 | |||||||||||||||||||||
|
| |||||||||||||||||||||||||
| 3,932,105 | ||||||||||||||||||||||||||
|
| |||||||||||||||||||||||||
Banking - 0.95% | ||||||||||||||||||||||||||
LBG Capital No. 1 PLC, Series 15 | EUR | 6.439 | % | 05/23/2020 | 1,213,000 | 1,727,347 | ||||||||||||||||||||
Provident Funding Associates LP: | ||||||||||||||||||||||||||
| USD | 10.125 | % | 02/15/2019 | 864,000 | 956,880 | (1) | ||||||||||||||||||||
| USD | 6.750 | % | 06/15/2021 | 555,000 | 566,100 | (1) | ||||||||||||||||||||
|
| |||||||||||||||||||||||||
| 3,250,327 | ||||||||||||||||||||||||||
|
| |||||||||||||||||||||||||
Building Products - 1.64% | ||||||||||||||||||||||||||
American Builders & Contractors Supply Co., Inc. | USD | 5.625 | % | 04/15/2021 | 1,140,000 | 1,157,100 | (1) | |||||||||||||||||||
Griffon Corp. | USD | 7.125 | % | 04/01/2018 | 844,000 | 905,190 | ||||||||||||||||||||
Norbord, Inc. | USD | 5.375 | % | 12/01/2020 | 930,000 | 933,487 | (1) | |||||||||||||||||||
Norcraft Cos. LP | USD | 10.500 | % | 12/15/2015 | 1,216,000 | 1,252,230 | ||||||||||||||||||||
RSI Home Products, Inc. | USD | 6.875 | % | 03/01/2018 | 1,261,000 | 1,327,203 | (1) | |||||||||||||||||||
|
| |||||||||||||||||||||||||
| 5,575,210 | ||||||||||||||||||||||||||
|
| |||||||||||||||||||||||||
Chemicals - 3.82% | ||||||||||||||||||||||||||
CeramTec Group GmbH | EUR | 8.250 | % | 08/15/2021 | 1,225,000 | 1,797,701 | (2) | |||||||||||||||||||
Chemtura Corp. | USD | 5.750 | % | 07/15/2021 | 2,527,000 | 2,571,222 | ||||||||||||||||||||
Hexion US Finance Corp. | USD | 6.625 | % | 04/15/2020 | 2,212,000 | 2,264,535 | ||||||||||||||||||||
Ineos Finance PLC | USD | 8.375 | % | 02/15/2019 | 1,867,000 | 2,081,705 | (1) | |||||||||||||||||||
Lyondell Chemical Co. | USD | 8.375 | % | 08/15/2015 | 945,000 | 0 | (3) | |||||||||||||||||||
SPCM SA | USD | 6.000 | % | 01/15/2022 | 1,274,000 | 1,337,700 | (1) | |||||||||||||||||||
Trinseo Materials Operating SCA/Trinseo Materials Finance, Inc. | USD | 8.750 | % | 02/01/2019 | 2,880,000 | 2,952,000 | (1) | |||||||||||||||||||
|
| |||||||||||||||||||||||||
| 13,004,863 | ||||||||||||||||||||||||||
|
| |||||||||||||||||||||||||
Consumer Products - 2.02% | ||||||||||||||||||||||||||
ACCO Brands Corp. | USD | 6.750 | % | 04/30/2020 | 2,166,000 | 2,168,708 | ||||||||||||||||||||
Alphabet Holding Co., Inc. | USD | 7.750 | % | 11/01/2017 | 1,286,000 | 1,330,206 | (4) | |||||||||||||||||||
Spectrum Brands Escrow Corp. | USD | 6.375 | % | 11/15/2020 | 1,678,000 | 1,791,265 | (1) | |||||||||||||||||||
The Sun Products Corp. | USD | 7.750 | % | 03/15/2021 | 1,821,000 | 1,575,165 | (1) | |||||||||||||||||||
|
| |||||||||||||||||||||||||
| 6,865,344 | ||||||||||||||||||||||||||
|
| |||||||||||||||||||||||||
Containers/Packaging - 1.95% | ||||||||||||||||||||||||||
ARD Finance SA | USD | 11.125 | % | 06/01/2018 | 1,486,001 | 1,597,451 | (1)(4) | |||||||||||||||||||
Ardagh Packaging Finance PLC | USD | 9.125 | % | 10/15/2020 | 1,348,000 | 1,462,580 | (1) | |||||||||||||||||||
Reynolds Group Issuer LLC | USD | 9.875 | % | 08/15/2019 | 2,292,000 | 2,555,580 | ||||||||||||||||||||
Sealed Air Corp. | USD | 8.375 | % | 09/15/2021 | 894,000 | 1,028,100 | (1) | |||||||||||||||||||
|
| |||||||||||||||||||||||||
| 6,643,711 | ||||||||||||||||||||||||||
|
| |||||||||||||||||||||||||
26 | www.shiplp.com |
Table of Contents
| Stone Harbor High Yield Bond Fund | Statements of Investments | |
| November 30, 2013 (Unaudited) |
Currency | Rate | Maturity Date | Principal | Market Value | ||||||||||||||||||||||
Drillers/Services - 3.14% | ||||||||||||||||||||||||||
Hornbeck Offshore Services, Inc.: | ||||||||||||||||||||||||||
| USD | 5.875 | % | 04/01/2020 | 827,000 | $ | 855,945 | ||||||||||||||||||||
| USD | 5.000 | % | 03/01/2021 | 1,077,000 | 1,066,230 | |||||||||||||||||||||
Offshore Group Investment Ltd. | USD | 7.125 | % | 04/01/2023 | 2,425,000 | 2,509,875 | ||||||||||||||||||||
Pacific Drilling SA | USD | 5.375 | % | 06/01/2020 | 1,647,000 | 1,671,705 | (1) | |||||||||||||||||||
Parker Drilling Co. | USD | 9.125 | % | 04/01/2018 | 2,032,000 | 2,181,860 | ||||||||||||||||||||
Trinidad Drilling Ltd. | USD | 7.875 | % | 01/15/2019 | 2,257,000 | 2,409,348 | (1) | |||||||||||||||||||
|
| |||||||||||||||||||||||||
| 10,694,963 | ||||||||||||||||||||||||||
|
| |||||||||||||||||||||||||
Electric - 3.49% | ||||||||||||||||||||||||||
The AES Corp. | USD | 7.375 | % | 07/01/2021 | 1,825,000 | 2,071,375 | ||||||||||||||||||||
Calpine Corp. | USD | 7.875 | % | 01/15/2023 | 1,550,000 | 1,705,000 | (1) | |||||||||||||||||||
Edison Mission Energy: | ||||||||||||||||||||||||||
| USD | 7.750 | % | 06/15/2016 | 1,402,000 | 1,055,005 | (3) | ||||||||||||||||||||
| USD | 7.200 | % | 05/15/2019 | 1,488,000 | 1,123,440 | (3) | ||||||||||||||||||||
GenOn Energy, Inc. | USD | 9.500 | % | 10/15/2018 | 3,502,000 | 4,053,565 | ||||||||||||||||||||
NRG Energy, Inc. | USD | 7.875 | % | 05/15/2021 | 1,690,000 | 1,892,800 | ||||||||||||||||||||
|
| |||||||||||||||||||||||||
| 11,901,185 | ||||||||||||||||||||||||||
|
| |||||||||||||||||||||||||
Environmental Services - 0.49% | ||||||||||||||||||||||||||
Clean Harbors, Inc. | USD | 5.250 | % | 08/01/2020 | 1,606,000 | 1,658,195 | ||||||||||||||||||||
|
| |||||||||||||||||||||||||
Exploration & Production - 9.56% | ||||||||||||||||||||||||||
Antero Resources Finance Corp. | USD | 5.375 | % | 11/01/2021 | 753,000 | 761,001 | (1) | |||||||||||||||||||
Atlas Pipeline Partners LP/Atlas Pipeline Finance Corp. | USD | 4.750 | % | 11/15/2021 | 1,454,000 | 1,352,220 | (1) | |||||||||||||||||||
Bonanza Creek Energy, Inc. | USD | 6.750 | % | 04/15/2021 | 2,048,000 | 2,176,000 | ||||||||||||||||||||
Calumet Specialty Products Partners LP/Calumet Finance Corp.: | ||||||||||||||||||||||||||
| USD | 9.625 | % | 08/01/2020 | 910,000 | 1,016,925 | |||||||||||||||||||||
| USD | 7.625 | % | 01/15/2022 | 1,340,000 | 1,353,400 | (1) | ||||||||||||||||||||
EP Energy LLC/EP Energy Finance, Inc., Series WI | USD | 9.375 | % | 05/01/2020 | 1,498,000 | 1,730,190 | ||||||||||||||||||||
EP Energy LLC/Everest Acquisition Finance, Inc., Series WI | USD | 6.875 | % | 05/01/2019 | 1,494,000 | 1,617,255 | ||||||||||||||||||||
Forest Oil Corp. | USD | 7.250 | % | 06/15/2019 | 887,000 | 884,782 | ||||||||||||||||||||
Kodiak Oil & Gas Corp. | USD | 5.500 | % | 01/15/2021 | 1,135,000 | 1,140,675 | (1) | |||||||||||||||||||
Laredo Petroleum, Inc. | USD | 7.375 | % | 05/01/2022 | 1,018,000 | 1,107,075 | ||||||||||||||||||||
Linn Energy LLC | USD | 7.750 | % | 02/01/2021 | 2,314,000 | 2,412,345 | ||||||||||||||||||||
MEG Energy Corp.: | ||||||||||||||||||||||||||
| USD | 6.500 | % | 03/15/2021 | 1,440,000 | 1,504,800 | (1) | ||||||||||||||||||||
| USD | 7.000 | % | 03/31/2024 | 647,000 | 661,557 | (1) | ||||||||||||||||||||
Midstates Petroleum Co., Inc. | USD | 10.750 | % | 10/01/2020 | 1,876,000 | 2,054,220 | ||||||||||||||||||||
Oasis Petroleum, Inc.: | ||||||||||||||||||||||||||
| USD | 7.250 | % | 02/01/2019 | 2,566,000 | 2,777,695 | |||||||||||||||||||||
| USD | 6.875 | % | 03/15/2022 | 773,000 | 834,840 | (1) | ||||||||||||||||||||
QEP Resources, Inc. | USD | 5.375 | % | 10/01/2022 | 1,680,000 | 1,629,600 | ||||||||||||||||||||
Samson Investment Co. | USD | 10.250 | % | 02/15/2020 | 2,436,000 | 2,646,105 | (1) | |||||||||||||||||||
SandRidge Energy, Inc.: | ||||||||||||||||||||||||||
| USD | 8.750 | % | 01/15/2020 | 1,364,000 | 1,479,940 | |||||||||||||||||||||
| USD | 7.500 | % | 03/15/2021 | 1,537,000 | 1,617,693 | |||||||||||||||||||||
Venoco, Inc. | USD | 8.875 | % | 02/15/2019 | 1,799,000 | 1,803,498 | ||||||||||||||||||||
|
| |||||||||||||||||||||||||
| 32,561,816 | ||||||||||||||||||||||||||
|
| |||||||||||||||||||||||||
| Stone Harbor Investment Funds Semi-Annual Report | November 30, 2013 | 27 |
Table of Contents
| Stone Harbor High Yield Bond Fund | Statements of Investments | |
| November 30, 2013 (Unaudited) |
Currency | Rate | Maturity Date | Principal | Market Value | ||||||||||||||||||||||
Financial - Other - 0.59% | ||||||||||||||||||||||||||
Aircastle Ltd. | USD | 6.750 | % | 04/15/2017 | 1,817,000 | $ | 2,025,955 | |||||||||||||||||||
|
| |||||||||||||||||||||||||
Food/Beverage/Tobacco - 4.58% | ||||||||||||||||||||||||||
Bakkavor Finance 2 PLC | GBP | 8.250 | % | 02/15/2018 | 350,000 | 614,231 | (2) | |||||||||||||||||||
Boparan Finance PLC | EUR | 9.750 | % | 04/30/2018 | 831,000 | 1,244,908 | (2) | |||||||||||||||||||
Chiquita Brands International, Inc./Chiquita | ||||||||||||||||||||||||||
Brands LLC | USD | 7.875 | % | 02/01/2021 | 2,400,000 | 2,577,000 | (1) | |||||||||||||||||||
Del Monte Corp. | USD | 7.625 | % | 02/15/2019 | 1,432,000 | 1,496,440 | ||||||||||||||||||||
Hawk Acquisition Sub, Inc. | USD | 4.250 | % | 10/15/2020 | 1,821,000 | 1,757,265 | (1) | |||||||||||||||||||
Pilgrim’s Pride Corp. | USD | 7.875 | % | 12/15/2018 | 1,691,000 | 1,851,645 | ||||||||||||||||||||
Post Holdings, Inc. | USD | 7.375 | % | 02/15/2022 | 1,580,000 | 1,682,700 | ||||||||||||||||||||
R&R PLC | EUR | 9.250 | % | 05/15/2018 | 1,450,000 | 2,039,229 | (2)(4) | |||||||||||||||||||
Smithfield Foods, Inc. | USD | 6.625 | % | 08/15/2022 | 2,206,000 | 2,341,117 | ||||||||||||||||||||
|
| |||||||||||||||||||||||||
| 15,604,535 | ||||||||||||||||||||||||||
|
| |||||||||||||||||||||||||
Gaming - 2.85% | ||||||||||||||||||||||||||
Isle of Capri Casinos, Inc. | USD | 5.875 | % | 03/15/2021 | 2,130,000 | 2,076,750 | ||||||||||||||||||||
MGM Resorts International | USD | 6.625 | % | 12/15/2021 | 3,178,000 | 3,348,817 | ||||||||||||||||||||
Pinnacle Entertainment, Inc. | USD | 8.750 | % | 05/15/2020 | 447,000 | 496,170 | ||||||||||||||||||||
PNK Finance Corp. | USD | 6.375 | % | 08/01/2021 | 2,030,000 | 2,106,125 | (1) | |||||||||||||||||||
Wynn Macau Ltd. | USD | 5.250 | % | 10/15/2021 | 1,671,000 | 1,691,888 | (1) | |||||||||||||||||||
|
| |||||||||||||||||||||||||
| 9,719,750 | ||||||||||||||||||||||||||
|
| |||||||||||||||||||||||||
Gas Pipelines - 0.90% | ||||||||||||||||||||||||||
Access Midstream Partners LP/ACMP Finance Corp. | USD | 4.875 | % | 05/15/2023 | 1,526,000 | 1,503,110 | ||||||||||||||||||||
Sabine Pass Liquefaction LLC | USD | 5.625 | % | 02/01/2021 | 1,579,000 | 1,567,158 | (1) | |||||||||||||||||||
|
| |||||||||||||||||||||||||
| 3,070,268 | ||||||||||||||||||||||||||
|
| |||||||||||||||||||||||||
Healthcare - 8.79% | ||||||||||||||||||||||||||
Biomet, Inc. | USD | 6.500 | % | 08/01/2020 | 2,797,000 | 2,978,805 | ||||||||||||||||||||
Community Health Systems, Inc. | USD | 8.000 | % | 11/15/2019 | 1,517,000 | 1,657,322 | ||||||||||||||||||||
Envision Healthcare Corp., Series WI | USD | 8.125 | % | 06/01/2019 | 1,802,000 | 1,961,927 | ||||||||||||||||||||
Fresenius Medical Care US Finance II, Inc. | USD | 5.875 | % | 01/31/2022 | 1,373,000 | 1,472,543 | (1) | |||||||||||||||||||
HCA Holdings, Inc.: | ||||||||||||||||||||||||||
| USD | 7.750 | % | 05/15/2021 | 1,337,000 | 1,465,686 | |||||||||||||||||||||
| USD | 5.875 | % | 03/15/2022 | 1,687,000 | 1,754,480 | |||||||||||||||||||||
Health Management Associates, Inc. | USD | 7.375 | % | 01/15/2020 | 345,000 | 388,125 | ||||||||||||||||||||
HealthSouth Corp. | USD | 8.125 | % | 02/15/2020 | 1,862,000 | 2,057,510 | ||||||||||||||||||||
Hologic, Inc. | USD | 6.250 | % | 08/01/2020 | 1,379,000 | 1,461,740 | ||||||||||||||||||||
IASIS Healthcare LLC | USD | 8.375 | % | 05/15/2019 | 2,022,000 | 2,148,375 | ||||||||||||||||||||
Kinetic Concepts, Inc./KCI USA, Inc.: | ||||||||||||||||||||||||||
| USD | 10.500 | % | 11/01/2018 | 1,504,000 | 1,725,840 | |||||||||||||||||||||
| USD | 12.500 | % | 11/01/2019 | 1,610,000 | 1,795,150 | |||||||||||||||||||||
LifePoint Hospitals, Inc. | USD | 5.500 | % | 12/01/2021 | 1,510,000 | 1,521,325 | (1) | |||||||||||||||||||
Prospect Medical Holdings, Inc. | USD | 8.375 | % | 05/01/2019 | 2,367,000 | 2,556,360 | (1) | |||||||||||||||||||
Tenet Healthcare Corp.: | ||||||||||||||||||||||||||
| USD | 8.125 | % | 04/01/2022 | 1,393,000 | 1,514,888 | |||||||||||||||||||||
| USD | 6.000 | % | 10/01/2020 | 1,048,000 | 1,097,125 | (1) | ||||||||||||||||||||
United Surgical Partners International, Inc., Series WI | USD | 9.000 | % | 04/01/2020 | 2,113,000 | 2,377,125 | ||||||||||||||||||||
|
| |||||||||||||||||||||||||
| 29,934,326 | ||||||||||||||||||||||||||
|
| |||||||||||||||||||||||||
28 | www.shiplp.com |
Table of Contents
| Stone Harbor High Yield Bond Fund | Statements of Investments | |
| November 30, 2013 (Unaudited) |
Currency | Rate | Maturity Date | Principal | Market Value | ||||||||||||||||||||||
Home Builders - 0.46% | ||||||||||||||||||||||||||
Lennar Corp. | USD | 4.750 | % | 11/15/2022 | 1,694,000 | $ | 1,579,655 | |||||||||||||||||||
|
| |||||||||||||||||||||||||
Industrial Other - 1.59% | ||||||||||||||||||||||||||
Cleaver-Brooks, Inc. | USD | 8.750 | % | 12/15/2019 | 1,671,000 | 1,833,922 | (1) | |||||||||||||||||||
MasTec, Inc. | USD | 4.875 | % | 03/15/2023 | 2,328,000 | 2,217,420 | ||||||||||||||||||||
Park-Ohio Industries, Inc. | USD | 8.125 | % | 04/01/2021 | 477,000 | 528,278 | ||||||||||||||||||||
WESCO Distribution, Inc. | USD | 5.375 | % | 12/15/2021 | 825,000 | 833,250 | (1) | |||||||||||||||||||
|
| |||||||||||||||||||||||||
| 5,412,870 | ||||||||||||||||||||||||||
|
| |||||||||||||||||||||||||
Leisure - 0.39% | ||||||||||||||||||||||||||
AMC Entertainment, Inc. | USD | 9.750 | % | 12/01/2020 | 1,151,000 | 1,320,772 | ||||||||||||||||||||
|
| |||||||||||||||||||||||||
Life Insurance - 0.33% | ||||||||||||||||||||||||||
American Equity Investment Life Holding Co. | USD | 6.625 | % | 07/15/2021 | 1,072,000 | 1,118,900 | ||||||||||||||||||||
|
| |||||||||||||||||||||||||
Lodging - 1.43% | ||||||||||||||||||||||||||
Choice Hotels International, Inc. | USD | 5.750 | % | 07/01/2022 | 1,141,000 | 1,200,902 | ||||||||||||||||||||
Hilton Worldwide Finance LLC | USD | 5.625 | % | 10/15/2021 | 1,906,000 | 1,947,694 | (1) | |||||||||||||||||||
RHP Hotel Properties LP / RHP Finance Corp. | USD | 5.000 | % | 04/15/2021 | 1,753,000 | 1,726,705 | ||||||||||||||||||||
|
| |||||||||||||||||||||||||
| 4,875,301 | ||||||||||||||||||||||||||
|
| |||||||||||||||||||||||||
Media Cable - 6.19% | ||||||||||||||||||||||||||
Cablevision Systems Corp.: | ||||||||||||||||||||||||||
| USD | 8.000 | % | 04/15/2020 | 2,659,000 | 2,978,080 | |||||||||||||||||||||
| USD | 5.875 | % | 09/15/2022 | 2,160,000 | 2,100,600 | |||||||||||||||||||||
CCO Holdings LLC | USD | 6.625 | % | 01/31/2022 | 2,167,000 | 2,264,515 | ||||||||||||||||||||
DISH DBS Corp., Series WI | USD | 5.000 | % | 03/15/2023 | 4,178,000 | 4,000,435 | ||||||||||||||||||||
Mediacom LLC | USD | 7.250 | % | 02/15/2022 | 1,936,000 | 2,071,520 | ||||||||||||||||||||
Nara Cable Funding Ltd. | USD | 8.875 | % | 12/01/2018 | 1,828,000 | 1,969,670 | (1) | |||||||||||||||||||
Unitymedia KabelBW GmbH | EUR | 9.500 | % | 03/15/2021 | 1,305,000 | 2,063,451 | (2) | |||||||||||||||||||
UPC Holding BV | EUR | 6.375 | % | 09/15/2022 | 2,625,000 | 3,633,746 | (2) | |||||||||||||||||||
|
| |||||||||||||||||||||||||
| 21,082,017 | ||||||||||||||||||||||||||
|
| |||||||||||||||||||||||||
Media Other - 2.65% | ||||||||||||||||||||||||||
AMC Networks, Inc. | USD | 7.750 | % | 07/15/2021 | 764,000 | 863,320 | ||||||||||||||||||||
Gray Television, Inc. | USD | 7.500 | % | 10/01/2020 | 1,875,000 | 1,982,812 | ||||||||||||||||||||
Interep National Radio Sales, Inc., Series B | USD | 10.000 | % | 07/01/2008 | 3,768 | 0 | (3) | |||||||||||||||||||
Nexstar Broadcasting, Inc., Series WI | USD | 6.875 | % | 11/15/2020 | 2,190,000 | 2,326,875 | ||||||||||||||||||||
Sinclair Television Group, Inc., Series WI | USD | 6.125 | % | 10/01/2022 | 1,785,000 | 1,818,469 | ||||||||||||||||||||
Univision Communications, Inc. | USD | 7.875 | % | 11/01/2020 | 1,829,000 | 2,043,908 | (1) | |||||||||||||||||||
|
| |||||||||||||||||||||||||
| 9,035,384 | ||||||||||||||||||||||||||
|
| |||||||||||||||||||||||||
Metals/Mining/Steel - 3.80% | ||||||||||||||||||||||||||
APERAM | USD | 7.750 | % | 04/01/2018 | 1,710,000 | 1,774,125 | (1) | |||||||||||||||||||
ArcelorMittal | USD | 6.750 | % | 02/25/2022 | 2,806,000 | 3,055,033 | ||||||||||||||||||||
Arch Coal, Inc. | USD | 7.250 | % | 06/15/2021 | 2,013,000 | 1,534,912 | ||||||||||||||||||||
Cloud Peak Energy Resources LLC | USD | 8.500 | % | 12/15/2019 | 1,080,000 | 1,174,500 | ||||||||||||||||||||
CONSOL Energy, Inc. | USD | 8.250 | % | 04/01/2020 | 2,581,000 | 2,819,743 | ||||||||||||||||||||
Peabody Energy Corp., Series WI | USD | 6.250 | % | 11/15/2021 | 2,502,000 | 2,570,805 | ||||||||||||||||||||
|
| |||||||||||||||||||||||||
| 12,929,118 | ||||||||||||||||||||||||||
|
| |||||||||||||||||||||||||
Non Captive Finance - 1.23% | ||||||||||||||||||||||||||
CIT Group, Inc. | USD | 5.250 | % | 03/15/2018 | 2,017,000 | 2,180,881 | ||||||||||||||||||||
| Stone Harbor Investment Funds Semi-Annual Report | November 30, 2013 | 29 |
Table of Contents
| Stone Harbor High Yield Bond Fund | Statements of Investments | |
| November 30, 2013 (Unaudited) |
Currency | Rate | Maturity Date | Principal Amount* | Market Value (Expressed in U.S. $) | ||||||||||||||||||||||
Non Captive Finance (continued) | ||||||||||||||||||||||||||
International Lease Finance Corp. | USD | 8.250 | % | 12/15/2020 | 1,677,000 | $ | 1,995,630 | |||||||||||||||||||
|
| |||||||||||||||||||||||||
| 4,176,511 | ||||||||||||||||||||||||||
|
| |||||||||||||||||||||||||
Paper/Forest Products - 2.92% | ||||||||||||||||||||||||||
Ainsworth Lumber Co. Ltd. | USD | 7.500 | % | 12/15/2017 | 1,470,000 | 1,591,275 | (1) | |||||||||||||||||||
Cascades, Inc.: | ||||||||||||||||||||||||||
| USD | 7.750 | % | 12/15/2017 | 1,345,000 | 1,403,844 | |||||||||||||||||||||
| USD | 7.875 | % | 01/15/2020 | 1,075,000 | 1,158,312 | |||||||||||||||||||||
Louisiana-Pacific Corp. | USD | 7.500 | % | 06/01/2020 | 2,293,000 | 2,545,230 | ||||||||||||||||||||
Mercer International, Inc. | USD | 9.500 | % | 12/01/2017 | 1,639,000 | 1,802,900 | ||||||||||||||||||||
Xerium Technologies, Inc. | USD | 8.875 | % | 06/15/2018 | 1,364,000 | 1,439,020 | ||||||||||||||||||||
|
| |||||||||||||||||||||||||
| 9,940,581 | ||||||||||||||||||||||||||
|
| |||||||||||||||||||||||||
Pharmaceuticals - 0.85% | ||||||||||||||||||||||||||
Valeant Pharmaceuticals International: | ||||||||||||||||||||||||||
| USD | 6.750 | % | 08/15/2018 | 869,000 | 961,331 | (1) | ||||||||||||||||||||
| USD | 7.500 | % | 07/15/2021 | 1,734,000 | 1,916,070 | (1) | ||||||||||||||||||||
|
| |||||||||||||||||||||||||
| 2,877,401 | ||||||||||||||||||||||||||
|
| |||||||||||||||||||||||||
Publishing/Printing - 1.08% | ||||||||||||||||||||||||||
Gannett Co., Inc.: | ||||||||||||||||||||||||||
| USD | 5.125 | % | 10/15/2019 | 666,000 | 688,478 | (1) | ||||||||||||||||||||
| USD | 6.375 | % | 10/15/2023 | 1,594,000 | 1,665,730 | (1) | ||||||||||||||||||||
IDEARC, Inc. | USD | 8.000 | % | 11/15/2016 | 1,265,000 | 0 | (3) | |||||||||||||||||||
Quebecor Media, Inc. | USD | 5.750 | % | 01/15/2023 | 1,356,000 | 1,322,100 | ||||||||||||||||||||
|
| |||||||||||||||||||||||||
| 3,676,308 | ||||||||||||||||||||||||||
|
| |||||||||||||||||||||||||
Refining - 0.45% | ||||||||||||||||||||||||||
Tesoro Logistics LP / Tesoro Logistics Finance Corp., Series WI | USD | 6.125 | % | 10/15/2021 | 1,468,000 | 1,523,050 | ||||||||||||||||||||
|
| |||||||||||||||||||||||||
Restaurants - 0.51% | ||||||||||||||||||||||||||
Landry’s, Inc. | USD | 9.375 | % | 05/01/2020 | 1,597,000 | 1,748,715 | (1) | |||||||||||||||||||
|
| |||||||||||||||||||||||||
Retail Food/Drug - 0.28% | ||||||||||||||||||||||||||
Albertsons, Inc. | USD | 8.000 | % | 05/01/2031 | 1,152,000 | 964,800 | ||||||||||||||||||||
|
| |||||||||||||||||||||||||
Retail Non Food/Drug - 1.31% | ||||||||||||||||||||||||||
The Bon-Ton Department Stores, Inc. | USD | 8.000 | % | 06/15/2021 | 892,000 | 898,690 | ||||||||||||||||||||
Burlington Holdings LLC/Burlington Holding Finance, Inc. | USD | 9.000 | % | 02/15/2018 | 337,000 | 348,795 | (1)(4) | |||||||||||||||||||
Limited Brands, Inc.: | ||||||||||||||||||||||||||
| USD | 6.950 | % | 03/01/2033 | 1,106,000 | 1,100,470 | |||||||||||||||||||||
| USD | 7.600 | % | 07/15/2037 | 1,075,000 | 1,093,812 | |||||||||||||||||||||
Petco Holdings, Inc. | USD | 8.500 | % | 10/15/2017 | 986,000 | 1,008,195 | (1)(4) | |||||||||||||||||||
|
| |||||||||||||||||||||||||
| 4,449,962 | ||||||||||||||||||||||||||
|
| |||||||||||||||||||||||||
Satellite - 0.35% | ||||||||||||||||||||||||||
Intelsat Jackson Holdings SA | USD | 7.250 | % | 04/01/2019 | 1,111,000 | 1,206,824 | ||||||||||||||||||||
|
| |||||||||||||||||||||||||
Services Other - 2.51% | ||||||||||||||||||||||||||
Brickman Group Holdings, Inc. | USD | 9.125 | % | 11/01/2018 | 966,000 | 1,037,329 | (1) | |||||||||||||||||||
HD Supply, Inc., Series WI | USD | 7.500 | % | 07/15/2020 | 1,623,000 | 1,728,495 | ||||||||||||||||||||
30 | www.shiplp.com |
Table of Contents
| Stone Harbor High Yield Bond Fund | Statements of Investments | |
| November 30, 2013 (Unaudited) |
Currency | Rate | Maturity Date | Principal Amount* | Market Value (Expressed in U.S. $) | ||||||||||||||||||||||
Services Other (continued) | ||||||||||||||||||||||||||
Outerwall, Inc. | USD | 6.000 | % | 03/15/2019 | 1,855,000 | $ | 1,859,638 | |||||||||||||||||||
ServiceMaster Co.: | ||||||||||||||||||||||||||
| USD | 8.000 | % | 02/15/2020 | 1,083,000 | 1,088,415 | |||||||||||||||||||||
| USD | 7.000 | % | 08/15/2020 | 1,231,000 | 1,183,299 | |||||||||||||||||||||
| USD | 7.450 | % | 08/15/2027 | 249,000 | 206,047 | |||||||||||||||||||||
TransUnion Holding Co., Inc.: | ||||||||||||||||||||||||||
| USD | 8.125 | % | 06/15/2018 | 750,000 | 800,625 | |||||||||||||||||||||
| USD | 9.625 | % | 06/15/2018 | 595,000 | 644,831 | |||||||||||||||||||||
|
| |||||||||||||||||||||||||
| 8,548,679 | ||||||||||||||||||||||||||
|
| |||||||||||||||||||||||||
Technology - 6.26% | ||||||||||||||||||||||||||
Alcatel-Lucent USA, Inc. | USD | 6.750 | % | 11/15/2020 | 1,205,000 | 1,218,556 | (1) | |||||||||||||||||||
Amkor Technology, Inc. | USD | 6.375 | % | 10/01/2022 | 2,244,000 | 2,277,660 | ||||||||||||||||||||
Artesyn Escrow, Inc. | USD | 9.750 | % | 10/15/2020 | 980,000 | 1,024,100 | (1) | |||||||||||||||||||
BMC Software Finance, Inc. | USD | 8.125 | % | 07/15/2021 | 1,405,000 | 1,496,325 | (1) | |||||||||||||||||||
CommScope, Inc. | USD | 8.250 | % | 01/15/2019 | 768,000 | 848,640 | (1) | |||||||||||||||||||
CyrusOne LP / CyrusOne Finance Corp. | USD | 6.375 | % | 11/15/2022 | 1,520,000 | 1,565,600 | ||||||||||||||||||||
First Data Corp.: | ||||||||||||||||||||||||||
| USD | 12.625 | % | 01/15/2021 | 1,250,000 | 1,471,875 | |||||||||||||||||||||
| USD | 7.375 | % | 06/15/2019 | 1,373,000 | 1,475,975 | (1) | ||||||||||||||||||||
iGATE Corp. | USD | 9.000 | % | 05/01/2016 | 1,690,000 | 1,814,637 | ||||||||||||||||||||
Infor US, Inc. | USD | 11.500 | % | 07/15/2018 | 1,535,000 | 1,780,600 | ||||||||||||||||||||
Magnachip Semiconductor Corp. | USD | 6.625 | % | 07/15/2021 | 1,657,000 | 1,690,140 | ||||||||||||||||||||
NCR Corp. | USD | 5.000 | % | 07/15/2022 | 1,644,000 | 1,607,010 | ||||||||||||||||||||
Nuance Communications, Inc. | USD | 5.375 | % | 08/15/2020 | 1,617,000 | 1,532,108 | (1) | |||||||||||||||||||
SSI Investments II | USD | 11.125 | % | 06/01/2018 | 1,391,000 | 1,519,668 | ||||||||||||||||||||
|
| |||||||||||||||||||||||||
| 21,322,894 | ||||||||||||||||||||||||||
|
| |||||||||||||||||||||||||
Textile/Apparel - 1.22% | ||||||||||||||||||||||||||
Levi Strauss & Co. | USD | 6.875 | % | 05/01/2022 | 1,865,000 | 2,046,838 | ||||||||||||||||||||
Quiksilver, Inc.: | ||||||||||||||||||||||||||
| USD | 10.000 | % | 08/01/2020 | 816,000 | 909,840 | |||||||||||||||||||||
| USD | 7.875 | % | 08/01/2018 | 1,092,000 | 1,182,090 | (1) | ||||||||||||||||||||
|
| |||||||||||||||||||||||||
| 4,138,768 | ||||||||||||||||||||||||||
|
| |||||||||||||||||||||||||
Wireless - 3.61% | ||||||||||||||||||||||||||
Cricket Communications, Inc. | USD | 7.750 | % | 10/15/2020 | 1,101,000 | 1,266,150 | ||||||||||||||||||||
Matterhorn Mobile Holdings SA | EUR | 8.250 | % | 02/15/2020 | 1,248,000 | 1,856,891 | (2) | |||||||||||||||||||
Mobile Challenger Intermediate Group SA | EUR | 8.750 | % | 03/15/2019 | 1,200,000 | 1,675,408 | (2)(4) | |||||||||||||||||||
NII International Telecom SCA | USD | 11.375 | % | 08/15/2019 | 920,000 | 740,600 | (1) | |||||||||||||||||||
Sprint Capital Corp. | USD | 8.750 | % | 03/15/2032 | 2,965,000 | 3,202,200 | ||||||||||||||||||||
T-Mobile USA, Inc.: | ||||||||||||||||||||||||||
| USD | 6.125 | % | 01/15/2022 | 400,000 | 408,500 | |||||||||||||||||||||
| USD | 6.731 | % | 04/28/2022 | 1,600,000 | 1,674,000 | |||||||||||||||||||||
Wind Acquisition Finance SA | USD | 6.500 | % | 04/30/2020 | 1,372,000 | 1,454,320 | (1) | |||||||||||||||||||
|
| |||||||||||||||||||||||||
| 12,278,069 | ||||||||||||||||||||||||||
|
| |||||||||||||||||||||||||
Wirelines - 4.27% | ||||||||||||||||||||||||||
CenturyLink, Inc.: | ||||||||||||||||||||||||||
Series T | USD | 5.800 | % | 03/15/2022 | 1,806,000 | 1,792,455 | ||||||||||||||||||||
Series U | USD | 7.650 | % | 03/15/2042 | 965,000 | 875,737 | ||||||||||||||||||||
Series W | USD | 6.750 | % | 12/01/2023 | 680,000 | 696,575 | ||||||||||||||||||||
| Stone Harbor Investment Funds Semi-Annual Report | November 30, 2013 | 31 |
Table of Contents
| Stone Harbor High Yield Bond Fund | Statements of Investments | |
| November 30, 2013 (Unaudited) |
Currency | Rate | Maturity Date | Principal Amount* | Market Value (Expressed in U.S. $) | ||||||||||||||||||||||
Wirelines (continued) | ||||||||||||||||||||||||||
Cincinnati Bell, Inc.: | ||||||||||||||||||||||||||
| USD | 8.750 | % | 03/15/2018 | 1,609,000 | $ | 1,707,551 | ||||||||||||||||||||
| USD | 8.375 | % | 10/15/2020 | 1,753,000 | 1,906,388 | |||||||||||||||||||||
Citizens Communications Co. | USD | 9.000 | % | 08/15/2031 | 3,064,000 | 3,102,300 | ||||||||||||||||||||
Level 3 Financing, Inc., Series WI | USD | 7.000 | % | 06/01/2020 | 1,719,000 | 1,830,735 | ||||||||||||||||||||
Windstream Corp. | USD | 7.500 | % | 04/01/2023 | 2,541,000 | 2,614,054 | ||||||||||||||||||||
|
| |||||||||||||||||||||||||
| 14,525,795 | ||||||||||||||||||||||||||
|
| |||||||||||||||||||||||||
TOTAL CORPORATE BONDS | 308,437,618 | |||||||||||||||||||||||||
|
| |||||||||||||||||||||||||
(Cost $293,768,107) | ||||||||||||||||||||||||||
CONVERTIBLE CORPORATE BONDS - 1.38% | ||||||||||||||||||||||||||
Aerospace/Defense - 0.12% | ||||||||||||||||||||||||||
Triumph Group, Inc. | USD | 2.625 | % | 10/01/2026 | 145,000 | 397,300 | ||||||||||||||||||||
|
| |||||||||||||||||||||||||
Airlines - 0.04% | ||||||||||||||||||||||||||
AirTran Holdings, Inc. | USD | 5.250 | % | 11/01/2016 | 84,000 | 141,802 | ||||||||||||||||||||
|
| |||||||||||||||||||||||||
Automotive - 0.07% | ||||||||||||||||||||||||||
TRW Automotive, Inc. | USD | 3.500 | % | 12/01/2015 | 90,000 | 238,556 | ||||||||||||||||||||
|
| |||||||||||||||||||||||||
Drillers/Services - 0.03% | ||||||||||||||||||||||||||
Hornbeck Offshore Services, Inc. | USD | 1.500 | % | 09/01/2019 | 74,000 | 89,632 | ||||||||||||||||||||
|
| |||||||||||||||||||||||||
Exploration & Production - 0.05% | ||||||||||||||||||||||||||
Stone Energy Corp. | USD | 1.750 | % | 03/01/2017 | 156,000 | 169,163 | ||||||||||||||||||||
|
| |||||||||||||||||||||||||
Home Builders - 0.12% | ||||||||||||||||||||||||||
The Ryland Group, Inc. | USD | 0.250 | % | 06/01/2019 | 446,000 | 406,139 | ||||||||||||||||||||
|
| |||||||||||||||||||||||||
Industrial Other - 0.09% | ||||||||||||||||||||||||||
Altra Holdings, Inc. | USD | 2.750 | % | 03/01/2031 | 232,000 | 301,310 | ||||||||||||||||||||
|
| |||||||||||||||||||||||||
Lodging - 0.01% | ||||||||||||||||||||||||||
Home Inns & Hotels Management, Inc. | USD | 2.000 | % | 12/15/2015 | 43,000 | 43,941 | ||||||||||||||||||||
|
| |||||||||||||||||||||||||
Metals/Mining/Steel - 0.14% | ||||||||||||||||||||||||||
RTI International Metals, Inc.: | ||||||||||||||||||||||||||
| USD | 3.000 | % | 12/01/2015 | 308,000 | 355,933 | |||||||||||||||||||||
| USD | 1.625 | % | 10/15/2019 | 99,400 | 106,979 | |||||||||||||||||||||
|
| |||||||||||||||||||||||||
| 462,912 | ||||||||||||||||||||||||||
|
| |||||||||||||||||||||||||
Railroads - 0.05% | ||||||||||||||||||||||||||
Greenbrier Cos., Inc. | USD | 3.500 | % | 04/01/2018 | 160,000 | 186,200 | ||||||||||||||||||||
|
| |||||||||||||||||||||||||
Services Other - 0.00% | ||||||||||||||||||||||||||
Cardtronics, Inc. | USD | 1.000 | % | 12/01/2020 | 17,000 | 16,883 | (1) | |||||||||||||||||||
|
| |||||||||||||||||||||||||
Technology - 0.66% | ||||||||||||||||||||||||||
Alcatel-Lucent USA, Inc., Series A | USD | 2.875 | % | 06/15/2023 | 253,000 | 251,735 | ||||||||||||||||||||
Ciena Corp.: | ||||||||||||||||||||||||||
| USD | 0.875 | % | 06/15/2017 | 87,000 | 86,728 | |||||||||||||||||||||
| USD | 4.000 | % | 03/15/2015 | 273,000 | 346,540 | (1) | ||||||||||||||||||||
32 | www.shiplp.com |
Table of Contents
| Stone Harbor High Yield Bond Fund | Statements of Investments | |
| November 30, 2013 (Unaudited) |
Currency | Rate | Maturity Date | Principal Amount/Shares* | Market Value (Expressed in U.S. $) | ||||||||||||||||||||||
Technology (continued) | ||||||||||||||||||||||||||
Ciena Corp. (continued) | ||||||||||||||||||||||||||
Comtech Telecommunications Corp. | USD | 3.000 | % | 05/01/2029 | 567,000 | $ | 602,437 | |||||||||||||||||||
Intel Corp. | USD | 2.950 | % | 12/15/2035 | 258,000 | 280,575 | ||||||||||||||||||||
NetSuite, Inc. | USD | 0.250 | % | 06/01/2018 | 169,000 | 180,619 | (1) | |||||||||||||||||||
Nuance Communications, Inc. | USD | 2.750 | % | 11/01/2031 | 407,000 | 390,720 | ||||||||||||||||||||
Spansion LLC | USD | 2.000 | % | 09/01/2020 | 85,000 | 92,756 | (1) | |||||||||||||||||||
|
| |||||||||||||||||||||||||
| 2,232,110 | ||||||||||||||||||||||||||
|
| |||||||||||||||||||||||||
TOTAL CONVERTIBLE CORPORATE BONDS | 4,685,948 | |||||||||||||||||||||||||
|
| |||||||||||||||||||||||||
(Cost $4,260,184) | ||||||||||||||||||||||||||
BANK LOANS - 4.42%(5) | ||||||||||||||||||||||||||
Electric - 1.10% | ||||||||||||||||||||||||||
Texas Competitive Electric Holdings Co. LLC - 2017 Term Loan: | ||||||||||||||||||||||||||
| USD | 4.668 | % | 12/09/2013 | 671,990 | 466,529 | |||||||||||||||||||||
| USD | 4.739 | % | 02/10/2014 | 2,949,495 | 2,047,687 | |||||||||||||||||||||
| USD | 4.739 | % | 02/10/2014 | 1,771,124 | 1,229,603 | |||||||||||||||||||||
|
| |||||||||||||||||||||||||
| 3,743,819 | ||||||||||||||||||||||||||
|
| |||||||||||||||||||||||||
Food/Beverage/Tobacco - 0.43% | ||||||||||||||||||||||||||
New HB Acquisition LLC - Term B Loan: | ||||||||||||||||||||||||||
| USD | 6.750 | % | 12/31/2013 | 113,200 | 116,879 | |||||||||||||||||||||
| USD | 6.750 | % | 12/31/2013 | 1,301,800 | 1,344,109 | |||||||||||||||||||||
|
| |||||||||||||||||||||||||
| 1,460,988 | ||||||||||||||||||||||||||
|
| |||||||||||||||||||||||||
Gaming - 0.48% | ||||||||||||||||||||||||||
Caesars Entertainment Operating Co., Inc. - Term B-6 Loan | USD | 5.488 | % | 01/27/2014 | 1,720,971 | 1,638,610 | ||||||||||||||||||||
|
| |||||||||||||||||||||||||
Metals/Mining/Steel - 0.22% | ||||||||||||||||||||||||||
Arch Coal Inc., - Term Loan | USD | 5.750 | % | 12/31/2013 | 778,031 | 761,692 | ||||||||||||||||||||
|
| |||||||||||||||||||||||||
Publishing/Printing - 0.70% | ||||||||||||||||||||||||||
Gardner Denver, Inc. - Initial Dollar Term Loan | USD | 4.250 | % | 12/31/2013 | 2,390,000 | 2,382,531 | ||||||||||||||||||||
|
| |||||||||||||||||||||||||
Technology - 1.49% | ||||||||||||||||||||||||||
Alcatel-Lucent USA, Inc. - Term Loan | USD | 5.750 | % | 12/31/2013 | 1,530,788 | 1,548,391 | ||||||||||||||||||||
Dell International LLC - Term B Loan | USD | 4.500 | % | 01/29/2014 | 2,110,000 | 2,093,213 | ||||||||||||||||||||
Freescale Semiconductor, Inc. - Tranche B-5 Term Loan | USD | 5.000 | % | 12/02/2013 | 590,000 | 597,446 | ||||||||||||||||||||
Freescale Semicondutor, Inc. - Tranche B-4 Term Loan | USD | 5.000 | % | 12/02/2013 | 815,464 | 826,252 | ||||||||||||||||||||
|
| |||||||||||||||||||||||||
| 5,065,302 | ||||||||||||||||||||||||||
|
| |||||||||||||||||||||||||
TOTAL BANK LOANS | 15,052,942 | |||||||||||||||||||||||||
|
| |||||||||||||||||||||||||
(Cost $15,364,673) | ||||||||||||||||||||||||||
COMMON/PREFERRED STOCKS - 0.36% | ||||||||||||||||||||||||||
General Maritime | USD | 1,887 | 19 | |||||||||||||||||||||||
NewPage Corp. | USD | 4,860 | 413,100 | |||||||||||||||||||||||
SandRidge Energy, Inc. | USD | 8.500 | % | 12/31/2049 | 3,701 | 383,054 | ||||||||||||||||||||
Subsea 7 SA | NOK | 14,306 | 278,564 | |||||||||||||||||||||||
| Stone Harbor Investment Funds Semi-Annual Report | November 30, 2013 | 33 |
Table of Contents
| Stone Harbor High Yield Bond Fund | Statements of Investments | |
| November 30, 2013 (Unaudited) |
Currency | Rate | Maturity Date | Principal Amount/Shares* | Market Value (Expressed in U.S. $) | ||||||||||||||||||||||
COMMON/PREFERRED STOCKS (continued) | ||||||||||||||||||||||||||
Tribune Co. | USD | 2,226 | $ | 165,837 | ||||||||||||||||||||||
| 1,240,574 | ||||||||||||||||||||||||||
TOTAL COMMON/PREFERRED STOCKS | 1,240,574 | |||||||||||||||||||||||||
|
| |||||||||||||||||||||||||
(Cost $1,200,794) | ||||||||||||||||||||||||||
SHORT TERM INVESTMENTS - 3.35% | ||||||||||||||||||||||||||
Money Market Mutual Funds - 3.35% | ||||||||||||||||||||||||||
Dreyfus Institutional Cash Advantage Fund - | ||||||||||||||||||||||||||
Institutional Advantage Class (7-Day Yield) | USD | 0.07715 | % | N/A | 11,426,995 | 11,426,995 | ||||||||||||||||||||
|
| |||||||||||||||||||||||||
TOTAL SHORT TERM INVESTMENTS | 11,426,995 | |||||||||||||||||||||||||
|
| |||||||||||||||||||||||||
(Cost $11,426,995) | ||||||||||||||||||||||||||
Total Investments - 100.08% | 340,844,077 | |||||||||||||||||||||||||
(Cost $326,020,753) | ||||||||||||||||||||||||||
Liabilities in Excess of Other Assets - (0.08)% | (288,865 | ) | ||||||||||||||||||||||||
|
| |||||||||||||||||||||||||
Net Assets - 100.00% | $ | 340,555,212 | ||||||||||||||||||||||||
|
| |||||||||||||||||||||||||
* The principal amount/shares of each security is stated in the currency in which the security is denominated. See below.
EUR | - | Euro Currency | ||||
GBP | - | Great British Pound | ||||
NOK | - | Norwegian Krone | ||||
USD | - | United States Dollar |
| (1) | Security exempt from registration under Rule 144A of the Securities Act of 1933. Such securities may normally be sold to qualified institutional buyers in transactions exempt from registration. Total market value of Rule 144A securities amounts to $85,756,865, which represents approximately 25.18% of net assets as of November 30, 2013. |
| (2) | Securities were originally issued pursuant to Regulation S under the Securities Act of 1933, which exempts securities offered and sold outside of the United States from registration. Such securities cannot be sold in the United States without either an effective registration statement filed pursuant to the Securities Act of 1933, or pursuant to an exemption from registration. As of November 30, 2013, the aggregate market value of those securities was $14,925,565, which represents approximately 4.38% of net assets. |
| (3) | Security is currently in default/non-income producing. |
| (4) | Pay-in-kind securities. |
| (5) | Bank loans generally pay interest at rates which are periodically determined by reference to a base lending rate plus a premium. All loans carry a variable rate of interest. These base lending rates are generally (i) the Prime Rate offered by one or more major United States banks, (ii) the lending rate offered by one or more European banks such as the London Interbank Offered Rate (“LIBOR”) or (iii) the Certificate of Deposit rate. Rate shown represents the weighted average rate at November 30, 2013. Bank loans, while exempt from registration, under the Securities Act of 1933, contain certain restrictions on resale and cannot be sold publicly. Floating rate bank loans often require prepayments from excess cash flow or permit the borrower to repay at its election. The degree to which borrowers repay, whether as a contractual requirement or at their election, cannot be predicted with accuracy. As a result, the actual remaining maturity may be substantially less than the stated maturity shown. |
| (6) | Amount represents less than 0.005% of net assets. |
| (7) | Non-income producing security. |
Common Abbreviations:
BV | - | Besloten Vennootschap is the Dutch term for private limited liability company. | ||||
GmbH | - | Gesellschaft mit beschrankter Haftung is the German term for a company wtih limited liability. | ||||
LLC | - | Limited Liability Corporation. | ||||
LP | - | Limited Partnership. | ||||
Ltd. | - | Limited. | ||||
PLC | - | Public Limited Company. | ||||
SA | - | Generally designates corporations in various countries, mostly those employing the civil law. | ||||
SCA | - | Societe en commandite pe actiuni is the Romanian term for limited liability partnership. |
34 | www.shiplp.com |
Table of Contents
| Stone Harbor High Yield Bond Fund | Statements of Investments | |
| November 30, 2013 (Unaudited) |
OUTSTANDING FORWARD FOREIGN CURRENCY CONTRACTS
| Counterparty | Foreign Currency | Contracted Amount** | Purchase/Sale Contract | Settlement Date | Current Value | Unrealized Appreciation/ (Depreciation) | ||||||||||||
JPMorgan Chase & Co. | EUR | 61,331 | Purchase | 12/27/2013 | $ | 83,336 | $ | 784 | ||||||||||
|
| |||||||||||||||||
| $ | 784 | |||||||||||||||||
|
| |||||||||||||||||
JPMorgan Chase & Co. | EUR | 11,968,700 | Sale | 12/27/2013 | $ | 16,262,940 | $ | (121,892 | ) | |||||||||
JPMorgan Chase & Co. | GBP | 382,100 | Sale | 12/27/2013 | 625,102 | (17,196 | ) | |||||||||||
|
| |||||||||||||||||
| $ | (139,088 | ) | ||||||||||||||||
|
| |||||||||||||||||
** The contracted amount is stated in the currency in which the security is denominated.
See Notes to Financial Statements.
| Stone Harbor Investment Funds Semi-Annual Report | November 30, 2013 | 35 |
Table of Contents
| Stone Harbor Local Markets Fund | Statements of Investments | |
| November 30, 2013 (Unaudited) |
Currency | Rate | Maturity Date | Principal Amount* | Market Value | ||||||||||||||||||||||
SOVEREIGN DEBT OBLIGATIONS - 73.55% | ||||||||||||||||||||||||||
Brazil - 12.94% | ||||||||||||||||||||||||||
Brazil Letras do Tesouro Nacional | BRL | 0.000 | % | 01/01/2017 | 198,241,000 | $ | 59,302,786 | (1) | ||||||||||||||||||
Nota Do Tesouro Nacional: | ||||||||||||||||||||||||||
| BRL | 10.000 | % | 01/01/2021 | 289,210,000 | 109,121,094 | |||||||||||||||||||||
| BRL | 10.000 | % | 01/01/2023 | 387,721,000 | 142,233,566 | |||||||||||||||||||||
|
| |||||||||||||||||||||||||
| 310,657,446 | ||||||||||||||||||||||||||
|
| |||||||||||||||||||||||||
Chile - 0.13% | ||||||||||||||||||||||||||
Republic of Chile: | ||||||||||||||||||||||||||
| CLP | 5.500 | % | 08/05/2020 | 890,000,000 | 1,712,821 | |||||||||||||||||||||
| CLP | 6.000 | % | 01/01/2022 | 745,000,000 | 1,491,679 | (2) | ||||||||||||||||||||
|
| |||||||||||||||||||||||||
| 3,204,500 | ||||||||||||||||||||||||||
|
| |||||||||||||||||||||||||
Colombia - 2.74% | ||||||||||||||||||||||||||
Bogota Distrio Capital | COP | 9.750 | % | 07/26/2028 | 54,446,000,000 | 35,726,383 | (3) | |||||||||||||||||||
International Bank for Reconstruction & Development | COP | 8.000 | % | 03/02/2020 | 1,020,000,000 | 601,782 | ||||||||||||||||||||
Republic of Colombia: | ||||||||||||||||||||||||||
| COP | 12.000 | % | 10/22/2015 | 6,878,000,000 | 4,019,425 | |||||||||||||||||||||
| COP | 7.750 | % | 04/14/2021 | 24,696,000,000 | 14,259,349 | |||||||||||||||||||||
| COP | 4.375 | % | 03/21/2023 | 10,437,000,000 | 4,824,492 | |||||||||||||||||||||
| COP | 9.850 | % | 06/28/2027 | 9,767,000,000 | 6,293,541 | |||||||||||||||||||||
|
| |||||||||||||||||||||||||
| 65,724,972 | ||||||||||||||||||||||||||
|
| |||||||||||||||||||||||||
Hungary - 2.33% | ||||||||||||||||||||||||||
Hungarian Government: | ||||||||||||||||||||||||||
| HUF | 5.500 | % | 12/22/2016 | 1,031,950,000 | 4,823,400 | |||||||||||||||||||||
| HUF | 6.750 | % | 02/24/2017 | 1,146,060,000 | 5,525,408 | |||||||||||||||||||||
| HUF | 6.750 | % | 11/24/2017 | 1,285,860,000 | 6,236,853 | |||||||||||||||||||||
| HUF | 5.500 | % | 12/20/2018 | 3,455,360,000 | 15,878,968 | |||||||||||||||||||||
| HUF | 6.500 | % | 06/24/2019 | 579,810,000 | 2,772,709 | |||||||||||||||||||||
| HUF | 7.000 | % | 06/24/2022 | 3,515,050,000 | 16,850,982 | |||||||||||||||||||||
| HUF | 6.000 | % | 11/24/2023 | 844,170,000 | 3,793,761 | |||||||||||||||||||||
|
| |||||||||||||||||||||||||
| 55,882,081 | ||||||||||||||||||||||||||
|
| |||||||||||||||||||||||||
Indonesia - 5.41% | ||||||||||||||||||||||||||
European Bank for Reconstruction & Development | IDR | 7.200 | % | 06/08/2016 | 37,740,000,000 | 3,041,757 | ||||||||||||||||||||
European Investment Bank | IDR | 6.000 | % | 04/22/2014 | 10,650,000,000 | 872,833 | ||||||||||||||||||||
Indonesia Government: | ||||||||||||||||||||||||||
| IDR | 5.625 | % | 05/15/2023 | 313,632,000,000 | 21,203,752 | |||||||||||||||||||||
| IDR | 6.125 | % | 05/15/2028 | 132,110,000,000 | 8,379,391 | |||||||||||||||||||||
| IDR | 8.250 | % | 06/15/2032 | 56,400,000,000 | 4,325,768 | |||||||||||||||||||||
| IDR | 6.625 | % | 05/15/2033 | 184,000,000,000 | 11,843,678 | |||||||||||||||||||||
Inter-American Development Bank: | ||||||||||||||||||||||||||
| IDR | 6.500 | % | 03/10/2014 | 14,520,000,000 | 1,202,991 | |||||||||||||||||||||
| IDR | 6.500 | % | 06/04/2014 | 15,480,000,000 | 1,261,628 | |||||||||||||||||||||
| IDR | 0.000 | % | 08/20/2015 | 286,830,000,000 | 20,630,180 | (1) | ||||||||||||||||||||
Republic of Indonesia: | ||||||||||||||||||||||||||
| IDR | 7.000 | % | 05/15/2022 | 157,440,000,000 | 11,894,370 | |||||||||||||||||||||
| IDR | 8.375 | % | 03/15/2024 | 161,560,000,000 | 13,286,073 | |||||||||||||||||||||
| IDR | 9.000 | % | 03/15/2029 | 388,060,000,000 | 31,912,562 | |||||||||||||||||||||
|
| |||||||||||||||||||||||||
| 129,854,983 | ||||||||||||||||||||||||||
|
| |||||||||||||||||||||||||
36 | www.shiplp.com |
Table of Contents
| Stone Harbor Local Markets Fund | Statements of Investments | |
| November 30, 2013 (Unaudited) |
| Currency | Rate | Maturity Date | Principal Amount* | Market Value (Expressed in U.S. $) | ||||||||||||||||||||||
Malaysia - 4.97% | ||||||||||||||||||||||||||
Malaysian Government: | ||||||||||||||||||||||||||
| MYR | 3.314 | % | 10/31/2017 | 44,340,000 | $ | 13,650,749 | ||||||||||||||||||||
| MYR | 3.260 | % | 03/01/2018 | 50,520,000 | 15,471,064 | |||||||||||||||||||||
| MYR | 3.580 | % | 09/28/2018 | 28,110,000 | 8,682,440 | |||||||||||||||||||||
| MYR | 3.492 | % | 03/31/2020 | 54,490,000 | 16,416,317 | |||||||||||||||||||||
| MYR | 3.889 | % | 07/31/2020 | 10,820,000 | 3,330,264 | |||||||||||||||||||||
| MYR | 4.160 | % | 07/15/2021 | 26,730,000 | 8,301,809 | |||||||||||||||||||||
| MYR | 3.418 | % | 08/15/2022 | 66,270,000 | 19,440,982 | |||||||||||||||||||||
| MYR | 3.480 | % | 03/15/2023 | 79,940,000 | 23,711,648 | |||||||||||||||||||||
| MYR | 4.392 | % | 04/15/2026 | 16,370,000 | 5,039,756 | |||||||||||||||||||||
| MYR | 3.844 | % | 04/15/2033 | 18,480,000 | 5,230,648 | |||||||||||||||||||||
|
| |||||||||||||||||||||||||
| 119,275,677 | ||||||||||||||||||||||||||
|
| |||||||||||||||||||||||||
Mexico - 11.96% | ||||||||||||||||||||||||||
Mexican Bonos: | ||||||||||||||||||||||||||
| MXN | 5.000 | % | 06/15/2017 | 98,263,000 | 7,593,850 | |||||||||||||||||||||
| MXN | 7.750 | % | 12/14/2017 | 26,570,000 | 2,250,009 | |||||||||||||||||||||
| MXN | 8.000 | % | 06/11/2020 | 349,514,000 | 30,197,192 | |||||||||||||||||||||
| MXN | 6.500 | % | 06/10/2021 | 582,039,000 | 46,184,288 | |||||||||||||||||||||
| MXN | 6.500 | % | 06/09/2022 | 395,315,000 | 30,950,382 | |||||||||||||||||||||
| MXN | 8.000 | % | 12/07/2023 | 1,005,657,000 | 86,733,572 | |||||||||||||||||||||
| MXN | 10.000 | % | 12/05/2024 | 170,212,000 | 16,930,358 | |||||||||||||||||||||
| MXN | 7.500 | % | 06/03/2027 | 215,567,000 | 17,647,199 | |||||||||||||||||||||
| MXN | 8.500 | % | 05/31/2029 | 115,336,000 | 9,947,982 | |||||||||||||||||||||
| MXN | 7.750 | % | 05/29/2031 | 486,752,000 | 38,701,619 | |||||||||||||||||||||
|
| |||||||||||||||||||||||||
| 287,136,451 | ||||||||||||||||||||||||||
|
| |||||||||||||||||||||||||
Peru - 1.59% | ||||||||||||||||||||||||||
Republic of Peru: | ||||||||||||||||||||||||||
| PEN | 7.840 | % | 08/12/2020 | 23,470,000 | 9,683,136 | (3) | ||||||||||||||||||||
| PEN | 5.200 | % | 09/12/2023 | 28,860,000 | 10,131,552 | (3) | ||||||||||||||||||||
| PEN | 8.200 | % | 08/12/2026 | 13,990,000 | 6,008,224 | (3) | ||||||||||||||||||||
| PEN | 6.950 | % | 08/12/2031 | 18,630,000 | 6,868,978 | (3) | ||||||||||||||||||||
| PEN | 6.900 | % | 08/12/2037 | 6,580,000 | 2,386,464 | (3) | ||||||||||||||||||||
| PEN | 6.850 | % | 02/12/2042 | 8,460,000 | 3,010,513 | (3) | ||||||||||||||||||||
|
| |||||||||||||||||||||||||
| 38,088,867 | ||||||||||||||||||||||||||
|
| |||||||||||||||||||||||||
Poland - 4.94% | ||||||||||||||||||||||||||
Republic of Poland: | ||||||||||||||||||||||||||
| PLN | 3.000 | % | 08/24/2016 | 141,099,834 | 47,904,518 | |||||||||||||||||||||
| PLN | 2.500 | % | 07/25/2018 | 6,560,000 | 2,009,905 | |||||||||||||||||||||
| PLN | 5.750 | % | 09/23/2022 | 26,490,000 | 9,387,495 | |||||||||||||||||||||
| PLN | 4.000 | % | 10/25/2023 | 191,610,000 | 59,465,813 | |||||||||||||||||||||
|
| |||||||||||||||||||||||||
| 118,767,731 | ||||||||||||||||||||||||||
|
| |||||||||||||||||||||||||
Russia - 4.85% | ||||||||||||||||||||||||||
Russian Federation: | ||||||||||||||||||||||||||
| RUB | 7.850 | % | 03/10/2018 | 60,000,000 | 1,859,934 | (2) | ||||||||||||||||||||
| RUB | 7.850 | % | 03/10/2018 | 855,000,000 | 26,504,058 | (3) | ||||||||||||||||||||
| RUB | 7.600 | % | 04/14/2021 | 370,450,000 | 11,271,140 | |||||||||||||||||||||
| RUB | 7.000 | % | 11/24/2021 | 341,370,000 | 9,783,884 | (4) | ||||||||||||||||||||
| RUB | 7.600 | % | 07/20/2022 | 1,189,110,000 | 35,856,439 | |||||||||||||||||||||
| RUB | 7.000 | % | 01/25/2023 | 1,083,130,000 | 31,304,782 | |||||||||||||||||||||
|
| |||||||||||||||||||||||||
| 116,580,237 | ||||||||||||||||||||||||||
|
| |||||||||||||||||||||||||
| Stone Harbor Investment Funds Semi-Annual Report | November 30, 2013 | 37 |
Table of Contents
| Stone Harbor Local Markets Fund | Statements of Investments | |
| November 30, 2013 (Unaudited) |
Currency | Rate | Maturity Date | Principal | Market Value | ||||||||||||||||||||||
South Africa - 12.15% | ||||||||||||||||||||||||||
Asian Development Bank | ZAR | 6.500 | % | 09/15/2015 | 4,500,000 | $ | 438,794 | |||||||||||||||||||
European Investment Bank: | ||||||||||||||||||||||||||
| ZAR | 9.000 | % | 12/21/2018 | 134,520,000 | 14,050,578 | |||||||||||||||||||||
| ZAR | 0.000 | % | 12/31/2018 | 5,110,000 | 341,341 | (1) | ||||||||||||||||||||
Republic of South Africa: | ||||||||||||||||||||||||||
| ZAR | 13.500 | % | 09/15/2015 | 53,740,000 | 5,914,867 | |||||||||||||||||||||
| ZAR | 8.250 | % | 09/15/2017 | 671,050,000 | 68,534,230 | |||||||||||||||||||||
| ZAR | 8.000 | % | 12/21/2018 | 643,680,000 | 65,088,132 | |||||||||||||||||||||
| ZAR | 7.250 | % | 01/15/2020 | 139,390,000 | 13,458,988 | |||||||||||||||||||||
| ZAR | 6.750 | % | 03/31/2021 | 117,070,000 | 10,853,380 | |||||||||||||||||||||
| ZAR | 10.500 | % | 12/21/2026 | 790,920,000 | 90,863,373 | |||||||||||||||||||||
| ZAR | 7.000 | % | 02/28/2031 | 117,800,000 | 9,639,345 | |||||||||||||||||||||
| ZAR | 6.250 | % | 03/31/2036 | 176,350,000 | 12,629,672 | |||||||||||||||||||||
|
| |||||||||||||||||||||||||
| 291,812,700 | ||||||||||||||||||||||||||
|
| |||||||||||||||||||||||||
Thailand - 4.35% | ||||||||||||||||||||||||||
Thailand Government: | ||||||||||||||||||||||||||
| THB | 3.250 | % | 06/16/2017 | 246,890,000 | 7,730,667 | |||||||||||||||||||||
| THB | 2.800 | % | 10/10/2017 | 245,470,000 | 7,529,381 | |||||||||||||||||||||
| THB | 3.580 | % | 12/17/2017 | 293,730,000 | 8,504,193 | |||||||||||||||||||||
| THB | 3.875 | % | 06/13/2019 | 4,625,000 | 146,622 | |||||||||||||||||||||
| THB | 1.200 | % | 07/14/2021 | 817,506,928 | 23,896,853 | |||||||||||||||||||||
| THB | 3.650 | % | 12/17/2021 | 1,050,060,000 | 32,085,121 | |||||||||||||||||||||
| THB | 3.625 | % | 06/16/2023 | 823,290,000 | 24,665,292 | |||||||||||||||||||||
|
| |||||||||||||||||||||||||
| 104,558,129 | ||||||||||||||||||||||||||
|
| |||||||||||||||||||||||||
Turkey - 4.89% | ||||||||||||||||||||||||||
Republic of Turkey: | ||||||||||||||||||||||||||
| TRY | 4.500 | % | 02/11/2015 | 19,888,011 | 10,128,446 | |||||||||||||||||||||
| TRY | 4.000 | % | 04/29/2015 | 34,770,641 | 17,594,839 | |||||||||||||||||||||
| TRY | 9.500 | % | 01/12/2022 | 60,480,000 | 30,472,157 | |||||||||||||||||||||
| TRY | 8.500 | % | 09/14/2022 | 51,360,000 | 24,426,541 | |||||||||||||||||||||
| TRY | 7.100 | % | 03/08/2023 | 80,640,000 | 34,816,195 | |||||||||||||||||||||
|
| |||||||||||||||||||||||||
| 117,438,178 | ||||||||||||||||||||||||||
|
| |||||||||||||||||||||||||
Venezuela - 0.30% | ||||||||||||||||||||||||||
Republic of Venezuela | USD | 12.750 | % | 08/23/2022 | 7,850,000 | 7,163,125 | (3) | |||||||||||||||||||
|
| |||||||||||||||||||||||||
TOTAL SOVEREIGN DEBT OBLIGATIONS | 1,766,145,077 | |||||||||||||||||||||||||
|
| |||||||||||||||||||||||||
(Cost $1,933,621,793) | ||||||||||||||||||||||||||
CORPORATE BONDS - 1.85% | ||||||||||||||||||||||||||
Colombia - 0.34% | ||||||||||||||||||||||||||
Emgesa SA ESP: | ||||||||||||||||||||||||||
| COP | 8.750 | % | 01/25/2021 | 616,000,000 | 337,174 | (2) | ||||||||||||||||||||
| COP | 8.750 | % | 01/25/2021 | 10,204,000,000 | 5,585,264 | (3) | ||||||||||||||||||||
Empresas Publicas de Medellin ESP: | ||||||||||||||||||||||||||
| COP | 8.375 | % | 02/01/2021 | 776,000,000 | 416,718 | (2) | ||||||||||||||||||||
| COP | 8.375 | % | 02/01/2021 | 3,338,000,000 | 1,792,534 | (3) | ||||||||||||||||||||
|
| |||||||||||||||||||||||||
| 8,131,690 | ||||||||||||||||||||||||||
|
| |||||||||||||||||||||||||
Mexico - 0.30% | ||||||||||||||||||||||||||
Petroleos Mexicanos | MXN | 7.650 | % | 11/24/2021 | 91,160,000 | 7,336,603 | (2) | |||||||||||||||||||
|
| |||||||||||||||||||||||||
38 | www.shiplp.com |
Table of Contents
| Stone Harbor Local Markets Fund | Statements of Investments | |
| November 30, 2013 (Unaudited) |
| Currency | Rate | Maturity Date | Principal | Market Value | ||||||||||||||||||||||||
Venezuela - 1.21% | ||||||||||||||||||||||||||||
Petroleos de Venezuela SA | USD | 8.500 | % | 11/02/2017 | 36,365,000 | $ | 29,046,544 | (3) | ||||||||||||||||||||
|
| |||||||||||||||||||||||||||
TOTAL CORPORATE BONDS | 44,514,837 | |||||||||||||||||||||||||||
|
| |||||||||||||||||||||||||||
(Cost $48,730,986) | ||||||||||||||||||||||||||||
CREDIT LINKED NOTES - 4.82% | ||||||||||||||||||||||||||||
Colombia - 1.46% | ||||||||||||||||||||||||||||
Titulos de Tesoreria - Series B: | ||||||||||||||||||||||||||||
| Citigroup Global Markets | COP | 7.000 | % | 02/25/2015 | 10,833,966,000 | 5,964,850 | (3) | |||||||||||||||||||||
| Citigroup Global Markets | COP | 7.250 | % | 06/15/2016 | 2,200,000,000 | 1,197,132 | ||||||||||||||||||||||
| Citigroup Global Markets | COP | 7.250 | % | 06/15/2016 | 9,678,000,000 | 5,266,295 | ||||||||||||||||||||||
| Citigroup Global Markets | COP | 11.000 | % | 07/24/2020 | 4,570,000,000 | 2,874,700 | ||||||||||||||||||||||
| Citigroup Global Markets | COP | 11.000 | % | 07/24/2020 | 6,366,000,000 | 4,004,451 | (2) | |||||||||||||||||||||
| Citigroup Global Markets | COP | 11.000 | % | 07/27/2020 | 4,500,000,000 | 2,830,668 | ||||||||||||||||||||||
| JPMorgan Chase & Co. | COP | 7.000 | % | 05/04/2022 | 2,000,000,000 | 1,037,805 | ||||||||||||||||||||||
| Citigroup Global Markets | COP | 7.000 | % | 05/04/2022 | 5,200,000,000 | 2,698,779 | ||||||||||||||||||||||
| Citigroup Global Markets | COP | 7.000 | % | 05/04/2022 | 10,113,510,000 | 5,248,870 | ||||||||||||||||||||||
| Citigroup Global Markets | COP | 10.000 | % | 07/24/2024 | 6,000,000,000 | 3,854,037 | ||||||||||||||||||||||
|
| |||||||||||||||||||||||||||
| 34,977,587 | ||||||||||||||||||||||||||||
|
| |||||||||||||||||||||||||||
Indonesia - 3.36% | ||||||||||||||||||||||||||||
Republic of Indonesia: | ||||||||||||||||||||||||||||
| Deutsche Bank AG London | IDR | 8.250 | % | 07/15/2021 | 111,500,000,000 | 9,159,544 | ||||||||||||||||||||||
| JPMorgan Chase & Co. | IDR | 7.000 | % | 05/15/2022 | 105,974,000,000 | 8,006,186 | ||||||||||||||||||||||
| Deutsche Bank AG London | IDR | 7.000 | % | 05/15/2022 | 240,900,000,000 | 18,240,334 | ||||||||||||||||||||||
| Deutsche Bank AG London | IDR | 5.625 | % | 05/15/2023 | 15,000,000,000 | 1,015,862 | ||||||||||||||||||||||
| JPMorgan Chase & Co. | IDR | 5.625 | % | 05/15/2023 | 180,398,000,000 | 12,195,433 | ||||||||||||||||||||||
| HSBC Bank | IDR | 11.000 | % | 09/15/2025 | 49,455,000,000 | 4,757,602 | ||||||||||||||||||||||
| HSBC Bank | IDR | 11.000 | % | 09/15/2025 | 60,487,000,000 | 5,818,887 | ||||||||||||||||||||||
| Deutsche Bank AG London | IDR | 11.000 | % | 09/17/2025 | 32,500,000,000 | 3,090,360 | ||||||||||||||||||||||
| Deutsche Bank AG London | IDR | 7.000 | % | 05/15/2027 | 25,400,000,000 | 1,772,044 | ||||||||||||||||||||||
| JPMorgan Chase & Co. | IDR | 6.125 | % | 05/15/2028 | 16,900,000,000 | 1,071,852 | ||||||||||||||||||||||
| Deutsche Bank AG London | IDR | 8.250 | % | 06/15/2032 | 176,000,000,000 | 13,354,520 | ||||||||||||||||||||||
| JPMorgan Chase & Co. | IDR | 6.625 | % | 05/15/2033 | 36,002,000,000 | 2,317,370 | ||||||||||||||||||||||
|
| |||||||||||||||||||||||||||
| 80,799,994 | ||||||||||||||||||||||||||||
|
| |||||||||||||||||||||||||||
TOTAL CREDIT LINKED NOTES | 115,777,581 | |||||||||||||||||||||||||||
|
| |||||||||||||||||||||||||||
(Cost $159,132,576) | ||||||||||||||||||||||||||||
| Stone Harbor Investment Funds Semi-Annual Report | November 30, 2013 | 39 |
Table of Contents
| Stone Harbor Local Markets Fund | Statements of Investments | |
| November 30, 2013 (Unaudited) |
Currency | Rate | Maturity Date | Principal | Market Value | ||||||||||||||||||||||
SHORT TERM INVESTMENTS - 15.10% | ||||||||||||||||||||||||||
Money Market Mutual Funds - 15.10% | ||||||||||||||||||||||||||
Dreyfus Institutional Cash Advantage | USD | 0.07715 | % | N/A | 362,612,554 | $ | 362,612,554 | |||||||||||||||||||
|
| |||||||||||||||||||||||||
TOTAL SHORT TERM INVESTMENTS | 362,612,554 | |||||||||||||||||||||||||
|
| |||||||||||||||||||||||||
(Cost $362,612,554) | ||||||||||||||||||||||||||
Total Investments - 95.32% (Cost $2,504,097,909) | 2,289,050,049 | |||||||||||||||||||||||||
Other Assets In Excess of Liabilities - 4.68% | 112,352,626 | |||||||||||||||||||||||||
|
| |||||||||||||||||||||||||
Net Assets - 100.00% | $ | 2,401,402,675 | ||||||||||||||||||||||||
|
| |||||||||||||||||||||||||
* The principal amount/shares of each security is stated in the currency in which the security is denominated. See below.
BRL | - | Brazilian Real | ||||
CLP | - | Chilean Peso | ||||
COP | - | Colombian Peso | ||||
HUF | - | Hungarian Forint | ||||
IDR | - | Indonesian Rupiah | ||||
MXN | - | Mexican Peso | ||||
MYR | - | Malaysian Ringgit | ||||
PEN | - | Peruvian Nuevo Sol | ||||
PHP | - | Philippine Peso | ||||
PLN | - | Polish Zloty | ||||
RUB | - | Russian Ruble | ||||
THB | - | Thai Baht | ||||
TRY | - | Turkish Lira | ||||
USD | - | United States Dollar | ||||
ZAR | - | South African Rand |
| (1) | Issued with a zero coupon. Income is recognized through the accretion of discount. |
| (2) | Security exempt from registration under Rule 144A of the Securities Act of 1933. Such securities may normally be sold to qualified institutional buyers in transactions exempt from registration. Total market value of Rule 144A securities amounts to $15,446,559, which represents approximately 0.64% of net assets as of November 30, 2013. |
| (3) | Securities were originally issued pursuant to Regulation S under the Securities Act of 1933, which exempts securities offered and sold outside of the United States from registration. Such securities cannot be sold in the United States without either an effective registration statement filed pursuant to the Securities Act of 1933, or pursuant to an exemption from registration. As of November 30, 2013, the aggregate market value of those securities was $149,871,625, which represents approximately 6.24% of net assets. |
| (4) | Step bond. Coupon increases periodically based upon a predetermined schedule. Interest rate disclosed is that which is in effect as of November 30, 2013. |
Common Abbreviations:
AG | - | Aktiengesellschaft is a German term that refers to a corporation that is limited by shares, i.e. owned by shareholders. | ||||
ESP | - | Empresa de Servicios Publicos is the Colombian term for Public Service Company. | ||||
SA | - | Generally designates corporations in various countries mostly employing civil law. |
40 | www.shiplp.com |
Table of Contents
| Stone Harbor Local Markets Fund | Statements of Investments | |
| November 30, 2013 (Unaudited) |
OUTSTANDING FORWARD FOREIGN CURRENCY CONTRACTS
| Counterparty | Foreign Currency | Contracted Amount** | Purchase/Sale Contract | Settlement Date | Current Value | Unrealized Appreciation/ (Depreciation) | ||||||||||||
Citigroup Global Markets | BRL | 56,689,000 | Sale | 12/03/2013 | $ | 24,257,538 | $ | 1,587,655 | ||||||||||
Citigroup Global Markets | BRL | 28,220,000 | Sale | 02/04/2014 | 11,896,793 | 253,842 | ||||||||||||
Citigroup Global Markets | MXN | 165,848,939 | Sale | 12/03/2013 | 12,635,216 | 101,690 | ||||||||||||
JPMorgan Chase & Co. | MYR | 187,808,250 | Purchase | 12/06/2013 | 58,247,759 | 147,759 | ||||||||||||
Citigroup Global Markets | PEN | 13,995,493 | Sale | 12/20/2013 | 4,986,014 | 9,986 | ||||||||||||
Citigroup Global Markets | PHP | 38,316,240 | Sale | 12/12/2013 | 875,972 | 28 | ||||||||||||
Citigroup Global Markets | RUB | 417,653,039 | Sale | 12/03/2013 | 12,591,261 | 222,730 | ||||||||||||
JPMorgan Chase & Co. | TRY | 282,402,890 | Purchase | 12/06/2013 | 139,543,666 | 243,666 | ||||||||||||
|
| |||||||||||||||||
| $ | 2,567,356 | |||||||||||||||||
|
| |||||||||||||||||
Citigroup Global Markets | BRL | 56,689,000 | Purchase | 12/03/2013 | $ | 24,257,538 | $ | (481,767 | ) | |||||||||
Citigroup Global Markets | MXN | 165,848,940 | Purchase | 12/03/2013 | 12,635,216 | (195,431 | ) | |||||||||||
Citigroup Global Markets | MXN | 158,559,714 | Purchase | 02/04/2014 | 12,022,913 | (127,722 | ) | |||||||||||
Citigroup Global Markets | PEN | 61,636,727 | Purchase | 12/20/2013 | 21,958,613 | (256,039 | ) | |||||||||||
Citigroup Global Markets | PHP | 1,244,627,980 | Purchase | 12/12/2013 | 28,454,222 | (350,778 | ) | |||||||||||
Citigroup Global Markets | PHP | 167,953,500 | Purchase | 02/03/2014 | 3,841,571 | (19,429 | ) | |||||||||||
Goldman Sachs | PLN | 352,636,200 | Purchase | 12/06/2013 | 113,948,796 | (51,204 | ) | |||||||||||
Citigroup Global Markets | RUB | 417,653,041 | Purchase | 12/03/2013 | 12,591,261 | (423,285 | ) | |||||||||||
Credit Suisse First Boston | RUB | 2,385,140,100 | Purchase | 12/06/2013 | 71,868,087 | (231,913 | ) | |||||||||||
|
| |||||||||||||||||
| $ | (2,137,568 | ) | ||||||||||||||||
|
| |||||||||||||||||
** The contracted amount is stated in the currency in which the security is denominated.
See Notes to Financial Statements.
| Stone Harbor Investment Funds Semi-Annual Report | November 30, 2013 | 41 |
Table of Contents
Corporate Debt Fund | Statements of Investments | |
| November 30, 2013 (Unaudited) |
Currency | Rate | Maturity Date | Principal | Market Value (Expressed in U.S. $) | ||||||||||||||||||||||
CORPORATE BONDS - 96.75% | ||||||||||||||||||||||||||
Brazil - 15.48% | ||||||||||||||||||||||||||
Andrade Gutierrez International SA | USD | 4.000 | % | 04/30/2018 | 304,000 | $ | 294,880 | (1) | ||||||||||||||||||
BM&FBovespa SA | USD | 5.500 | % | 07/16/2020 | 100,000 | 105,125 | (2) | |||||||||||||||||||
BR Malls International Finance Ltd.: | ||||||||||||||||||||||||||
| USD | 8.500 | % | 01/21/2049 | 14,000 | 14,350 | (1) | ||||||||||||||||||||
| USD | 8.500 | % | 01/21/2049 | 89,000 | 91,225 | (2) | ||||||||||||||||||||
Braskem Finance Ltd. | USD | 7.375 | % | 10/29/2049 | 130,000 | 122,850 | (1) | |||||||||||||||||||
Centrais Eletricas Brasileiras SA | USD | 5.750 | % | 10/27/2021 | 1,034,000 | 1,010,735 | (2) | |||||||||||||||||||
Cosan Luxembourg SA | USD | 5.000 | % | 03/14/2023 | 994,000 | 914,480 | (1) | |||||||||||||||||||
ESAL GmbH | USD | 6.250 | % | 02/05/2023 | 548,000 | 497,310 | (1) | |||||||||||||||||||
Globo Comunicacao e Participacoes SA | USD | 6.250 | % | 07/20/2049 | 130,000 | 136,175 | (2)(3) | |||||||||||||||||||
Hypermarcas SA | USD | 6.500 | % | 04/20/2021 | 100,000 | 105,250 | (1) | |||||||||||||||||||
Itau Unibanco Holding SA | USD | 5.650 | % | 03/19/2022 | 148,000 | 143,930 | (1) | |||||||||||||||||||
Minerva Luxembourg SA | USD | 7.750 | % | 01/31/2023 | 442,000 | 436,475 | (1) | |||||||||||||||||||
Odebrecht Drilling Norbe VIII/IX Ltd. | USD | 6.350 | % | 06/30/2021 | 481,000 | 490,620 | (2) | |||||||||||||||||||
Odebrecht Finance Ltd. | USD | 5.125 | % | 06/26/2022 | 190,000 | 185,250 | (1) | |||||||||||||||||||
Odebrecht Offshore Drilling Finance Ltd. | USD | 6.750 | % | 10/01/2022 | 747,000 | 763,807 | (1) | |||||||||||||||||||
QGOG Atlantic/Alaskan Rigs Ltd. | USD | 5.250 | % | 07/30/2018 | 371,130 | 380,409 | (1) | |||||||||||||||||||
Samarco Mineracao SA | USD | 4.125 | % | 11/01/2022 | 385,000 | 346,500 | (1) | |||||||||||||||||||
Schahin II Finance Co. SPV Ltd. | USD | 5.875 | % | 09/25/2022 | 229,920 | 221,298 | (1) | |||||||||||||||||||
Tonon Bioenergia SA | USD | 9.250 | % | 01/24/2020 | 250,000 | 231,250 | (1) | |||||||||||||||||||
Voto-Votorantim Overseas Trading Operations V Ltd. | USD | 6.625 | % | 09/25/2019 | 103,000 | 115,360 | (1) | |||||||||||||||||||
|
| |||||||||||||||||||||||||
| 6,607,279 | ||||||||||||||||||||||||||
|
| |||||||||||||||||||||||||
Chile - 3.44% | ||||||||||||||||||||||||||
Cencosud SA: | ||||||||||||||||||||||||||
| USD | 5.500 | % | 01/20/2021 | 370,000 | 381,100 | (1) | ||||||||||||||||||||
| USD | 4.875 | % | 01/20/2023 | 130,000 | 123,825 | (1) | ||||||||||||||||||||
CFR International SpA | USD | 5.125 | % | 12/06/2022 | 400,000 | 372,250 | (1) | |||||||||||||||||||
ENTEL Chile SA | USD | 4.875 | % | 10/30/2024 | 600,000 | 591,375 | (1) | |||||||||||||||||||
|
| |||||||||||||||||||||||||
| 1,468,550 | ||||||||||||||||||||||||||
|
| |||||||||||||||||||||||||
China - 5.43% | ||||||||||||||||||||||||||
Baidu, Inc. | USD | 3.250 | % | 08/06/2018 | 170,000 | 173,632 | ||||||||||||||||||||
Bestgain Real Estate Ltd. | USD | 2.625 | % | 03/13/2018 | 200,000 | 188,382 | (2) | |||||||||||||||||||
China Overseas Finance Cayman V Ltd. | USD | 3.950 | % | 11/15/2022 | 300,000 | 269,778 | ||||||||||||||||||||
CNOOC Finance 2012 Ltd. | USD | 3.875 | % | 05/02/2022 | 175,000 | 172,472 | (2) | |||||||||||||||||||
Country Garden Holdings Co. Ltd. | USD | 7.250 | % | 04/04/2021 | 250,000 | 249,063 | (1) | |||||||||||||||||||
Kaisa Group Holdings Ltd. | USD | 8.875 | % | 03/19/2018 | 410,000 | 421,275 | (1) | |||||||||||||||||||
Longfor Properties Co. Ltd. | USD | 6.875 | % | 10/18/2019 | 203,000 | 207,568 | ||||||||||||||||||||
Mega Advance Investments Ltd. | USD | 5.000 | % | 05/12/2021 | 130,000 | 135,912 | (1) | |||||||||||||||||||
Tencent Holdings Ltd. | USD | 3.375 | % | 03/05/2018 | 490,000 | 501,799 | (1) | |||||||||||||||||||
|
| |||||||||||||||||||||||||
| 2,319,881 | ||||||||||||||||||||||||||
|
| |||||||||||||||||||||||||
Colombia - 5.34% | ||||||||||||||||||||||||||
Bancolombia SA | USD | 5.125 | % | 09/11/2022 | 471,000 | 435,675 | ||||||||||||||||||||
Empresa de Energia de Bogota SA | USD | 6.125 | % | 11/10/2021 | 275,000 | 283,937 | (1) | |||||||||||||||||||
Grupo Aval Ltd.: | ||||||||||||||||||||||||||
| USD | 5.250 | % | 02/01/2017 | 200,000 | 209,000 | (1) | ||||||||||||||||||||
| USD | 4.750 | % | 09/26/2022 | 226,000 | 207,638 | (1) | ||||||||||||||||||||
42 | www.shiplp.com |
Table of Contents
Stone Harbor Emerging Markets Corporate Debt Fund | Statements of Investments | |
| November 30, 2013 (Unaudited) |
Currency | Rate | Maturity Date | Principal | Market Value (Expressed in U.S. $) | ||||||||||||||||||||||
Colombia (continued) | ||||||||||||||||||||||||||
Gruposura Finance | USD | 5.700 | % | 05/18/2021 | 247,000 | $ | 255,028 | (1) | ||||||||||||||||||
Millicom International Cellular SA | USD | 6.625 | % | 10/15/2021 | 194,000 | 198,559 | (1) | |||||||||||||||||||
Pacific Rubiales Energy Corp. | USD | 5.125 | % | 03/28/2023 | 530,000 | 480,975 | (1) | |||||||||||||||||||
Transportadora de Gas Internacional SA ESP | USD | 5.700 | % | 03/20/2022 | 200,000 | 206,775 | (1) | |||||||||||||||||||
|
| |||||||||||||||||||||||||
| 2,277,587 | ||||||||||||||||||||||||||
|
| |||||||||||||||||||||||||
Ghana - 0.95% | ||||||||||||||||||||||||||
Tullow Oil PLC | USD | 6.000 | % | 11/01/2020 | 400,000 | 404,500 | (1) | |||||||||||||||||||
|
| |||||||||||||||||||||||||
Hong Kong - 4.17% | ||||||||||||||||||||||||||
Hutchison Whampoa International 09 Ltd. | USD | 7.625 | % | 04/09/2019 | 72,000 | 88,254 | (1) | |||||||||||||||||||
Hutchison Whampoa International 10 Ltd. | USD | 6.000 | % | 10/28/2049 | 250,000 | 264,375 | (2)(4) | |||||||||||||||||||
Hutchison Whampoa International 11 Ltd. | USD | 4.625 | % | 01/13/2022 | 295,000 | 304,978 | (1) | |||||||||||||||||||
Hutchison Whampoa International 12 II Ltd. | USD | 2.000 | % | 11/08/2017 | 300,000 | 299,621 | (1) | |||||||||||||||||||
PCCW-HKT Capital No. 4 Ltd. | USD | 4.250 | % | 02/24/2016 | 200,000 | 211,224 | ||||||||||||||||||||
PCCW-HKT Capital No. 5 Ltd. | USD | 3.750 | % | 03/08/2023 | 385,000 | 352,225 | (2) | |||||||||||||||||||
Sun Hung Kai Properties Capital Market Ltd. | USD | 4.500 | % | 02/14/2022 | 256,000 | 259,419 | ||||||||||||||||||||
|
| |||||||||||||||||||||||||
| 1,780,096 | ||||||||||||||||||||||||||
|
| |||||||||||||||||||||||||
India - 4.83% | ||||||||||||||||||||||||||
Bharti Airtel International Netherlands BV | USD | 5.125 | % | 03/11/2023 | 546,000 | 500,955 | (1) | |||||||||||||||||||
ICICI Bank Ltd./Hong Kong | USD | 5.750 | % | 11/16/2020 | 174,000 | 177,948 | (2) | |||||||||||||||||||
NTPC Ltd. | USD | 5.625 | % | 07/14/2021 | 500,000 | 497,552 | ||||||||||||||||||||
Reliance Holdings USA, Inc. | USD | 5.400 | % | 02/14/2022 | 310,000 | 313,979 | (1) | |||||||||||||||||||
Vedanta Resources PLC: | ||||||||||||||||||||||||||
| USD | 6.000 | % | 01/31/2019 | 260,000 | 250,900 | (1) | ||||||||||||||||||||
| USD | 8.250 | % | 06/07/2021 | 152,000 | 153,140 | (1) | ||||||||||||||||||||
| USD | 7.125 | % | 05/31/2023 | 180,000 | 166,500 | (1) | ||||||||||||||||||||
|
| |||||||||||||||||||||||||
| 2,060,974 | ||||||||||||||||||||||||||
|
| |||||||||||||||||||||||||
Indonesia - 5.07% | ||||||||||||||||||||||||||
Berau Capital Resources Pte Ltd. | USD | 12.500 | % | 07/08/2015 | 200,000 | 211,750 | (2) | |||||||||||||||||||
Indo Energy Finance II BV | USD | 6.375 | % | 01/24/2023 | 277,000 | 234,757 | (1) | |||||||||||||||||||
Indosat Palapa Co. BV | USD | 7.375 | % | 07/29/2020 | 380,000 | 411,873 | (2) | |||||||||||||||||||
Listrindo Capital BV | USD | 6.950 | % | 02/21/2019 | 410,000 | 426,400 | (1) | |||||||||||||||||||
PT Adaro Indonesia | USD | 7.625 | % | 10/22/2019 | 676,000 | 714,025 | (2) | |||||||||||||||||||
TBG Global Pte Ltd. | USD | 4.625 | % | 04/03/2018 | 175,000 | 167,125 | (1) | |||||||||||||||||||
|
| |||||||||||||||||||||||||
| 2,165,930 | ||||||||||||||||||||||||||
|
| |||||||||||||||||||||||||
Jamaica - 1.29% | ||||||||||||||||||||||||||
Digicel Group Ltd. | USD | 10.500 | % | 04/15/2018 | 510,000 | 552,075 | (2) | |||||||||||||||||||
|
| |||||||||||||||||||||||||
Kazakhstan - 1.64% | ||||||||||||||||||||||||||
Zhaikmunai LP | USD | 7.125 | % | 11/13/2019 | 670,000 | 701,825 | (1) | |||||||||||||||||||
|
| |||||||||||||||||||||||||
| Stone Harbor Investment Funds Semi-Annual Report | November 30, 2013 | 43 |
Table of Contents
Stone Harbor Emerging Markets Corporate Debt Fund | Statements of Investments | |
| November 30, 2013 (Unaudited) |
Currency | Rate | Maturity Date | Principal Amount* | Market Value (Expressed in U.S. $) | ||||||||||||||||||||||
Macau - 1.42% | ||||||||||||||||||||||||||
MCE Finance Ltd. | USD | 5.000 | % | 02/15/2021 | 218,000 | $ | 212,005 | (1) | ||||||||||||||||||
Wynn Macau Ltd. | USD | 5.250 | % | 10/15/2021 | 390,000 | 394,875 | (1) | |||||||||||||||||||
|
| |||||||||||||||||||||||||
| 606,880 | ||||||||||||||||||||||||||
|
| |||||||||||||||||||||||||
Malaysia - 0.51% | ||||||||||||||||||||||||||
Malayan Banking Bhd | USD | 3.250 | % | 09/20/2022 | 220,000 | 219,146 | (4) | |||||||||||||||||||
|
| |||||||||||||||||||||||||
Mexico - 6.77% | ||||||||||||||||||||||||||
America Movil SAB de CV | USD | 3.125 | % | 07/16/2022 | 219,000 | 204,979 | ||||||||||||||||||||
BBVA Bancomer SA | USD | 6.750 | % | 09/30/2022 | 740,000 | 787,175 | (1) | |||||||||||||||||||
Cemex Finance LLC | USD | 9.375 | % | 10/12/2022 | 178,000 | 198,025 | (1) | |||||||||||||||||||
Cemex SAB de CV: | ||||||||||||||||||||||||||
| USD | 9.500 | % | 06/15/2018 | 300,000 | 337,500 | (1) | ||||||||||||||||||||
| USD | 7.250 | % | 01/15/2021 | 190,000 | 193,563 | (1) | ||||||||||||||||||||
Grupo Bimbo SAB de CV | USD | 4.875 | % | 06/30/2020 | 352,000 | 369,856 | (1) | |||||||||||||||||||
Metalsa SAB de CV | USD | 4.900 | % | 04/24/2023 | 130,000 | 120,575 | (1) | |||||||||||||||||||
Mexichem SAB de CV | USD | 4.875 | % | 09/19/2022 | 250,000 | 241,250 | (1) | |||||||||||||||||||
Mexico Generadora De Energia | USD | 5.500 | % | 12/06/2032 | 240,000 | 226,200 | (1) | |||||||||||||||||||
Telefonos de Mexico SAB de CV | USD | 5.500 | % | 11/15/2019 | 190,000 | 210,960 | ||||||||||||||||||||
|
| |||||||||||||||||||||||||
| 2,890,083 | ||||||||||||||||||||||||||
|
| |||||||||||||||||||||||||
Peru - 4.73% | ||||||||||||||||||||||||||
Alicorp SAA | USD | 3.875 | % | 03/20/2023 | 629,000 | 578,680 | (1) | |||||||||||||||||||
Banco de Credito del Peru | USD | 5.375 | % | 09/16/2020 | 207,000 | 214,762 | (2) | |||||||||||||||||||
BBVA Banco Continental SA | USD | 5.000 | % | 08/26/2022 | 175,000 | 172,594 | (1) | |||||||||||||||||||
Cementos Pacasmayo SAA | USD | 4.500 | % | 02/08/2023 | 100,000 | 92,000 | (1) | |||||||||||||||||||
Cia Minera Milpo SAA | USD | 4.625 | % | 03/28/2023 | 302,000 | 277,085 | (1) | |||||||||||||||||||
Consorcio Transmantaro SA | USD | 4.375 | % | 05/07/2023 | 384,000 | 348,480 | (1) | |||||||||||||||||||
Inkia Energy Ltd. | USD | 8.375 | % | 04/04/2021 | 220,000 | 237,600 | (1) | |||||||||||||||||||
Volcan Cia Minera SAA | USD | 5.375 | % | 02/02/2022 | 103,000 | 96,820 | (1) | |||||||||||||||||||
|
| |||||||||||||||||||||||||
| 2,018,021 | ||||||||||||||||||||||||||
|
| |||||||||||||||||||||||||
Philippines - 0.24% | ||||||||||||||||||||||||||
FPT Finance Ltd. | USD | 6.375 | % | 09/28/2020 | 100,000 | 103,025 | (2) | |||||||||||||||||||
|
| |||||||||||||||||||||||||
Qatar - 3.15% | ||||||||||||||||||||||||||
Qtel International Finance Ltd. | USD | 4.750 | % | 02/16/2021 | 434,000 | 459,497 | (2) | |||||||||||||||||||
Ras Laffan Liquefied Natural Gas Co. Ltd. II | USD | 5.298 | % | 09/30/2020 | 362,202 | 390,273 | (2) | |||||||||||||||||||
Ras Laffan Liquefied Natural Gas Co. Ltd. III: | ||||||||||||||||||||||||||
| USD | 5.832 | % | 09/30/2016 | 103,400 | 110,638 | (2) | ||||||||||||||||||||
| USD | 6.750 | % | 09/30/2019 | 325,000 | 384,719 | (2) | ||||||||||||||||||||
|
| |||||||||||||||||||||||||
| 1,345,127 | ||||||||||||||||||||||||||
|
| |||||||||||||||||||||||||
44 | www.shiplp.com |
Table of Contents
Stone Harbor Emerging Markets Corporate Debt Fund | Statements of Investments | |
| November 30, 2013 (Unaudited) |
Currency | Rate | Maturity Date | Principal Amount* | Market Value (Expressed in U.S. $) | ||||||||||||||||||||||
Russia - 9.84% | ||||||||||||||||||||||||||
Alfa Bank OJSC Via Alfa Bond Issuance PLC | USD | 7.500 | % | 09/26/2019 | 475,000 | $ | 502,312 | (1) | ||||||||||||||||||
EDC Finance Ltd. | USD | 4.875 | % | 04/17/2020 | 252,000 | 246,330 | (1) | |||||||||||||||||||
EuroChem Mineral & Chemical Co. OJSC via EuroChem GI Ltd. | USD | 5.125 | % | 12/12/2017 | 375,000 | 379,687 | (1) | |||||||||||||||||||
Far East Capital Ltd. SA | USD | 8.000 | % | 05/02/2018 | 130,000 | 116,838 | (1) | |||||||||||||||||||
Gazprom OAO Via Gaz Capital SA | USD | 3.850 | % | 02/06/2020 | 350,000 | 339,281 | (1) | |||||||||||||||||||
Metalloinvest Finance Ltd. | USD | 6.500 | % | 07/21/2016 | 130,000 | 137,800 | (1) | |||||||||||||||||||
Mobile Telesystems OJSC via MTS International Funding Ltd. | USD | 5.000 | % | 05/30/2023 | 435,000 | 407,269 | (1) | |||||||||||||||||||
Sberbank of Russia Via SB Capital SA: | ||||||||||||||||||||||||||
| USD | 6.125 | % | 02/07/2022 | 130,000 | 137,637 | (1) | ||||||||||||||||||||
| USD | 5.125 | % | 10/29/2022 | 190,000 | 180,738 | (1) | ||||||||||||||||||||
Severstal OAO Via Steel Capital SA | USD | 5.900 | % | 10/17/2022 | 196,000 | 190,120 | (1) | |||||||||||||||||||
Vimpel Communications Holdings BV | USD | 6.255 | % | 03/01/2017 | 200,000 | 213,500 | (2) | |||||||||||||||||||
Vimpel Communications Via VIP Finance Ireland Ltd. OJSC | USD | 7.748 | % | 02/02/2021 | 500,000 | 537,500 | (2) | |||||||||||||||||||
VTB Bank OJSC Via VTB Capital SA | USD | 6.950 | % | 10/17/2022 | 509,000 | 520,453 | (2) | |||||||||||||||||||
Wind Acquisition Finance SA | USD | 12.250 | % | 07/15/2017 | 282,312 | 292,899 | (1)(5) | |||||||||||||||||||
|
| |||||||||||||||||||||||||
| 4,202,364 | ||||||||||||||||||||||||||
|
| |||||||||||||||||||||||||
Singapore - 1.28% | ||||||||||||||||||||||||||
DBS Bank Ltd. | USD | 3.625 | % | 09/21/2022 | 130,000 | 134,647 | (2)(4) | |||||||||||||||||||
STATS ChipPAC Ltd.: | ||||||||||||||||||||||||||
| USD | 5.375 | % | 03/31/2016 | 103,000 | 106,476 | (2) | ||||||||||||||||||||
| USD | 4.500 | % | 03/20/2018 | 303,000 | 304,137 | (1) | ||||||||||||||||||||
|
| |||||||||||||||||||||||||
| 545,260 | ||||||||||||||||||||||||||
|
| |||||||||||||||||||||||||
South Africa - 1.85% | ||||||||||||||||||||||||||
Gold Fields Orogen Holding BVI Ltd. | USD | 4.875 | % | 10/07/2020 | 200,000 | 167,500 | (2) | |||||||||||||||||||
Myriad International Holdings BV | USD | 6.000 | % | 07/18/2020 | 583,000 | 623,810 | (1) | |||||||||||||||||||
|
| |||||||||||||||||||||||||
| 791,310 | ||||||||||||||||||||||||||
|
| |||||||||||||||||||||||||
South Korea - 2.46% | ||||||||||||||||||||||||||
Korea Gas Corp. | USD | 2.875 | % | 07/29/2018 | 200,000 | 202,972 | (1) | |||||||||||||||||||
Korea Hydro & Nuclear Power Co. Ltd. | USD | 4.750 | % | 07/13/2021 | 250,000 | 265,909 | (2) | |||||||||||||||||||
Korea Western Power Co. Ltd. | USD | 2.875 | % | 10/10/2018 | 160,000 | 161,378 | (1) | |||||||||||||||||||
KT Corp. | USD | 3.875 | % | 01/20/2017 | 400,000 | 421,267 | ||||||||||||||||||||
|
| |||||||||||||||||||||||||
| 1,051,526 | ||||||||||||||||||||||||||
|
| |||||||||||||||||||||||||
Thailand - 1.34% | ||||||||||||||||||||||||||
Bangkok Bank PCL: | ||||||||||||||||||||||||||
| USD | 3.300 | % | 10/03/2018 | 94,000 | 95,334 | (1) | ||||||||||||||||||||
| USD | 3.875 | % | 09/27/2022 | 223,000 | 212,483 | (1) | ||||||||||||||||||||
PTT Global Chemical PCL | USD | 4.250 | % | 09/19/2022 | 130,000 | 124,201 | (1) | |||||||||||||||||||
PTTEP Canada International Finance Ltd. | USD | 5.692 | % | 04/05/2021 | 130,000 | 140,601 | (2) | |||||||||||||||||||
|
| |||||||||||||||||||||||||
| 572,619 | ||||||||||||||||||||||||||
|
| |||||||||||||||||||||||||
Turkey - 6.09% | ||||||||||||||||||||||||||
Akbank TAS: | ||||||||||||||||||||||||||
| USD | 3.875 | % | 10/24/2017 | 264,000 | 262,020 | (1) | ||||||||||||||||||||
| USD | 5.000 | % | 10/24/2022 | 246,000 | 226,935 | (2) | ||||||||||||||||||||
| Stone Harbor Investment Funds Semi-Annual Report | November 30, 2013 | 45 |
Table of Contents
Stone Harbor Emerging Markets Corporate Debt Fund | Statements of Investments | |
| November 30, 2013 (Unaudited) |
Currency | Rate | Maturity Date | Principal Amount* | Market Value (Expressed in U.S. $) | ||||||||||||||||||||||
Turkey (continued) | ||||||||||||||||||||||||||
KOC Holding AS | USD | 3.500 | % | 04/24/2020 | 773,000 | $ | 684,105 | (1) | ||||||||||||||||||
Turkiye Garanti Bankasi AS: | ||||||||||||||||||||||||||
| USD | 4.000 | % | 09/13/2017 | 246,000 | 246,307 | (1) | ||||||||||||||||||||
| USD | 5.250 | % | 09/13/2022 | 280,000 | 261,100 | (1) | ||||||||||||||||||||
Turkiye Is Bankasi: | ||||||||||||||||||||||||||
| USD | 3.750 | % | 10/10/2018 | 600,000 | 573,750 | (2) | ||||||||||||||||||||
| USD | 5.500 | % | 04/21/2019 | 341,000 | 345,263 | (1) | ||||||||||||||||||||
|
| |||||||||||||||||||||||||
| 2,599,480 | ||||||||||||||||||||||||||
|
| |||||||||||||||||||||||||
Ukraine - 1.22% | ||||||||||||||||||||||||||
Ferrexpo Finance PLC | USD | 7.875 | % | 04/07/2016 | 370,000 | 351,500 | (1) | |||||||||||||||||||
Mriya Agro Holding PLC | USD | 9.450 | % | 04/19/2018 | 200,000 | 171,000 | (1) | |||||||||||||||||||
|
| |||||||||||||||||||||||||
| 522,500 | ||||||||||||||||||||||||||
|
| |||||||||||||||||||||||||
United Arab Emirates - 6.47% | ||||||||||||||||||||||||||
DP World Sukuk Ltd. | USD | 6.250 | % | 07/02/2017 | 340,000 | 374,085 | (2) | |||||||||||||||||||
Dubai Holding Commercial Operations MTN Ltd. | GBP | 6.000 | % | 02/01/2017 | 450,000 | 763,033 | ||||||||||||||||||||
Emaar Sukuk Ltd. | USD | 6.400 | % | 07/18/2019 | 830,000 | 900,757 | ||||||||||||||||||||
MAF Global Securities Ltd. | USD | 5.250 | % | 07/05/2019 | 690,000 | 722,603 | ||||||||||||||||||||
|
| |||||||||||||||||||||||||
| 2,760,478 | ||||||||||||||||||||||||||
|
| |||||||||||||||||||||||||
Venezuela - 1.74% | ||||||||||||||||||||||||||
Petroleos de Venezuela SA | USD | 8.500 | % | 11/02/2017 | 927,700 | 741,000 | (2) | |||||||||||||||||||
|
| |||||||||||||||||||||||||
TOTAL CORPORATE BONDS | 41,307,516 | |||||||||||||||||||||||||
|
| |||||||||||||||||||||||||
(Cost $41,567,819) | ||||||||||||||||||||||||||
SHORT TERM INVESTMENTS - 2.34% | ||||||||||||||||||||||||||
Money Market Mutual Funds - 2.34% | ||||||||||||||||||||||||||
Dreyfus Institutional Cash Advantage Fund - Institutional Advantage Class (7-Day Yield) | USD | 0.07715 | % | N/A | 998,185 | 998,185 | ||||||||||||||||||||
|
| |||||||||||||||||||||||||
TOTAL SHORT TERM INVESTMENTS | 998,185 | |||||||||||||||||||||||||
|
| |||||||||||||||||||||||||
(Cost $998,185) | ||||||||||||||||||||||||||
Total Investments - 99.09% | 42,305,701 | |||||||||||||||||||||||||
(Cost $42,566,004) | ||||||||||||||||||||||||||
Other Assets In Excess of Liabilities - 0.91% | 386,559 | |||||||||||||||||||||||||
|
| |||||||||||||||||||||||||
Net Assets - 100.00% | $ | 42,692,260 | ||||||||||||||||||||||||
|
| |||||||||||||||||||||||||
* The principal amount/shares of each security is stated in the currency in which the security is denominated. See below.
GBP | - | Great Britain Pound | ||
USD | - | United States Dollar |
| (1) | Security exempt from registration under Rule 144A of the Securities Act of 1933. Such securities may normally be sold to qualified institutional buyers in transactions exempt from registration. Total market value of Rule 144A securities amounts to $25,265,648, which represents approximately 59.18% of net assets as of November 30, 2013. |
46 | www.shiplp.com |
Table of Contents
Stone Harbor Emerging Markets Corporate Debt Fund | Statements of Investments | |
| November 30, 2013 (Unaudited) |
| (2) | Securities were originally issued pursuant to Regulation S under the Securities Act of 1933, which exempts securities offered and sold outside of the United States from registration. Such securities cannot be sold in the United States without either an effective registration statement filed pursuant to the Securities Act of 1933, or pursuant to an exemption from registration. As of November 30, 2013, the aggregate market value of those securities was $10,544,275, which represents approximately 24.70% of net assets. |
| (3) | Step bond. Coupon increases periodically based upon a predetermined schedule. Interest rate disclosed is that which is in effect as of November 30, 2013. |
| (4) | Floating or variable rate security. Interest rate disclosed is that which is in effect as of November 30, 2013. |
| (5) | Pay-in-kind securities. |
Common Abbreviations:
| AS | - Anonim Sirket is the Turkish term for Incorporation. | |
| Bhd | - Berhad is the Malaysian term for public limited company. | |
| BV | - Besloten Vennootschap is the Dutch term for private limited liability company. | |
| BVI | - British Virgin Islands. | |
| ESP | - Empresa de Servicios Publicos is the Colombian term for Public Service Company. | |
| LLC | - Limited Liability Corporation. | |
| LP | - Limited Partnership. | |
| Ltd. | - Limited. | |
| MTN | - Medium Term Note. | |
| OAO | - Otkrytoe Aktsionernoe Obschestvo is the Russian term for Open Joint Stock Company. | |
| OJSC | - Open Joint Stock Company. | |
| PCL | - A rearrangement of the letters for Public Limited Company, used in Thailand. | |
| PLC | - Public Limited Company. | |
| PT | - Perseroan terbuka is an Indonesian term for limited liability company. | |
| Pte | - Private. | |
| SA | - Generally designates corporations in various countries, mostly those employing the civil law. | |
| SAA | - Sociedad Anonima Abierta is the Peruvian term used for companies with 20 or more shareholders. | |
| SAB de CV | - A variable capital company. | |
| SpA | - Societa per Azioni. | |
| SPV | - Special Purpose Vehicle. | |
| TAS | - TüRk Anonim Sirketi is the Turkish term for Joint Stock Company. |
OUTSTANDING FORWARD FOREIGN CURRENCY CONTRACTS
| Counterparty | Foreign Currency | Contracted Amount** | Purchase/Sale Contract | Settlement Date | Current Value | Unrealized Appreciation | ||||||||
JPMorgan Chase & Co. | GBP | 216,000 | Purchase | 12/27/2013 | $ 353,368 | $ | 8,427 | |||||||
|
| |||||||||||||
| $ | 8,427 | |||||||||||||
|
| |||||||||||||
JPMorgan Chase & Co. | GBP | 702,200 | Sale | 12/27/2013 | $ 1,148,773 | $ | (31,601) | |||||||
|
| |||||||||||||
| $ | (31,601) | |||||||||||||
|
| |||||||||||||
** The contracted amount is stated in the currency in which the security is denominated.
See Notes to Financial Statements.
| Stone Harbor Investment Funds Semi-Annual Report | November 30, 2013 | 47 |
Table of Contents
| Stone Harbor Investment Funds | Statements of Assets and Liabilities | |
| November 30, 2013 (Unaudited) |
Stone Harbor Emerging Markets Debt Fund | Stone Harbor High Yield Bond Fund | Stone Harbor Local Markets Fund | Stone Harbor Emerging Markets Corporate Debt Fund | |||||||||||||||||
ASSETS: | ||||||||||||||||||||
Investments , at value(1) | $ | 1,861,348,098 | $ | 340,844,077 | $ | 2,289,050,049 | $ | 42,305,701 | ||||||||||||
Investments in affiliates, at value(2) | 14,869,110 | – | – | – | ||||||||||||||||
Cash | 191,025 | – | – | 216,437 | ||||||||||||||||
Foreign currency, at value | 247,976 | – | 25,565 | – | ||||||||||||||||
Unrealized appreciation on forward foreign currency contracts | 1,027,591 | 784 | 2,567,356 | 8,427 | ||||||||||||||||
Receivable for investments sold | 7,755,026 | 1,796,494 | 72,414,500 | – | ||||||||||||||||
Receivable for fund shares sold | 12,046 | – | 665,121 | – | ||||||||||||||||
Interest receivable | 30,445,768 | 5,660,746 | 49,680,201 | 583,635 | ||||||||||||||||
Prepaid and other assets | 17,901 | 42,141 | 16,595 | 17,555 | ||||||||||||||||
Total Assets | 1,915,914,541 | 348,344,242 | 2,414,419,387 | 43,131,755 | ||||||||||||||||
LIABILITIES: | ||||||||||||||||||||
Bank Overdraft | – | 19,204 | – | – | ||||||||||||||||
Payable due to brokers for forward foreign currency contracts | 290,000 | – | 360,000 | – | ||||||||||||||||
Payable for investments purchased | 9,814,086 | 7,351,121 | – | 303,638 | ||||||||||||||||
Payable for fund shares redeemed | 2,000,000 | – | 8,526,348 | – | ||||||||||||||||
Unrealized depreciation on forward foreign currency contracts | 1,146,902 | 139,088 | 2,137,568 | 31,601 | ||||||||||||||||
Payable to adviser | 940,049 | 139,291 | 1,544,276 | 29,428 | ||||||||||||||||
Payable to administrator | 83,762 | 25,233 | 107,797 | 2,911 | ||||||||||||||||
Other payables | 73,002 | 115,093 | 340,723 | 71,917 | ||||||||||||||||
Total Liabilities | 14,347,801 | 7,789,030 | 13,016,712 | 439,495 | ||||||||||||||||
Net Assets | $ | 1,901,566,740 | $ | 340,555,212 | $ | 2,401,402,675 | $ | 42,692,260 | ||||||||||||
NET ASSETS CONSIST OF: | ||||||||||||||||||||
Paid-in capital | $ | 2,033,435,618 | $ | 315,192,221 | $ | 2,697,414,818 | $ | 46,810,579 | ||||||||||||
Undistributed net investment income | 4,203,790 | 839,994 | 61,605,803 | 81,357 | ||||||||||||||||
Accumulated net realized gain/(loss) on investments, forward foreign currency contracts and foreign currency transactions | (31,480,421) | 9,774,765 | (141,607,433) | (3,917,869) | ||||||||||||||||
Net unrealized appreciation/(depreciation) on investments, forward foreign currency contracts and translation of assets and liabilities denominated in foreign currencies | (104,592,247) | 14,748,232 | (216,010,513) | (281,807) | ||||||||||||||||
Net Assets | $ | 1,901,566,740 | $ | 340,555,212 | $ | 2,401,402,675 | $ | 42,692,260 | ||||||||||||
PRICING OF SHARES: | ||||||||||||||||||||
Institutional Class | ||||||||||||||||||||
Net Assets | $ | 1,901,566,740 | $ | 340,555,212 | $ | 2,401,402,675 | $ | 42,692,260 | ||||||||||||
Shares of beneficial interest outstanding (unlimited number of shares, par value of $0.001 per share authorized) | 182,522,148 | 34,993,135 | 249,195,206 | 4,782,614 | ||||||||||||||||
Net assets value, offering and redemption price per share | $ | 10.42 | $ | 9.73 | $ | 9.64 | $ | 8.93 | ||||||||||||
(1)Cost of Investments |
$ |
1,965,195,552 |
|
$ |
326,020,753 |
|
$ |
2,504,097,909 |
|
$ |
42,566,004 |
| ||||||||
(2)Cost of Investments in affiliates | $ | 15,229,508 | $ | – | $ | – | $ | – | ||||||||||||
See Notes to Financial Statements.
48 | www.shiplp.com |
Table of Contents
| Stone Harbor Investment Funds | Statements of Operations | |
| For the Six Months Ended November 30, 2013 (Unaudited) |
Stone Harbor Emerging Markets Debt Fund | Stone Harbor High Yield Bond Fund | Stone Harbor Local Markets Fund | Stone Harbor Emerging Markets Corporate Debt Fund | |||||||||||||||||
INVESTMENT INCOME: | ||||||||||||||||||||
Interest | $ | 53,061,919 | $ | 12,648,844 | $ | 78,256,795 | $ | 1,673,409 | ||||||||||||
Dividends | 20,406 | 19,809 | 18,029 | 542 | ||||||||||||||||
Dividends from affiliated securities | 229,508 | – | – | – | ||||||||||||||||
Total Investment Income | 53,311,833 | 12,668,653 | 78,274,824 | 1,673,951 | ||||||||||||||||
EXPENSES: | ||||||||||||||||||||
Investment advisory fee | 5,415,636 | 906,499 | 9,477,081 | 257,363 | ||||||||||||||||
Administration fees | 431,567 | 106,679 | 598,743 | 16,937 | ||||||||||||||||
Custodian fees | 170,630 | 20,808 | 612,293 | 4,963 | ||||||||||||||||
Audit fees | 34,482 | 33,460 | 35,344 | 32,475 | ||||||||||||||||
Printing fees | 4,807 | 4,419 | 7,301 | 4,641 | ||||||||||||||||
Legal fees | 12,838 | 12,838 | 12,838 | 12,867 | ||||||||||||||||
Trustee fees | 32,190 | 11,840 | 43,455 | 1,591 | ||||||||||||||||
Transfer agent fees | 20,447 | 12,189 | 21,814 | 10,767 | ||||||||||||||||
Registration fees | 36,843 | 13,278 | 68,872 | 12,966 | ||||||||||||||||
Insurance fees | 10,825 | 2,657 | 14,394 | 463 | ||||||||||||||||
Other | 5,892 | 6,012 | 14,904 | 1,299 | ||||||||||||||||
Total expenses before waiver | 6,176,157 | 1,130,679 | 10,907,039 | 356,332 | ||||||||||||||||
Less fees waived by investment adviser | – | (133,535) | – | (53,552) | ||||||||||||||||
Total Net Expenses | 6,176,157 | 997,144 | 10,907,039 | 302,780 | ||||||||||||||||
Net Investment Income | 47,135,676 | 11,671,509 | 67,367,785 | 1,371,171 | ||||||||||||||||
REALIZED AND UNREALIZED GAIN/(LOSS) ON INVESTMENTS: |
| |||||||||||||||||||
Net realized gain/(loss) on: | ||||||||||||||||||||
Investments | (22,684,927) | 1,699,139 | (144,910,296) | (2,149,300) | ||||||||||||||||
Forward foreign currency contracts | (249,488) | (403,106) | (934,493) | (40,001) | ||||||||||||||||
Foreign currency transactions | (403,284) | 23,666 | (3,815,805) | 26,788 | ||||||||||||||||
Net realized gain/(loss) | (23,337,699) | 1,319,699 | (149,660,594) | (2,162,513) | ||||||||||||||||
Change in unrealized appreciation/(depreciation) on: | ||||||||||||||||||||
Investments | (133,434,166) | (4,436,203) | (120,899,095) | (803,216) | ||||||||||||||||
Forward foreign currency contracts | (1,354,492) | (381,069) | 2,917,307 | (39,200) | ||||||||||||||||
Translation of assets and liabilities denominated in foreign currencies | (698,931) | 62,980 | (1,446,647) | 1,754 | ||||||||||||||||
Net change | (135,487,589) | (4,754,292) | (119,428,435) | (840,662) | ||||||||||||||||
Net Realized and Unrealized Loss on Investments | (158,825,288) | (3,434,593) | (269,089,029) | (3,003,175) | ||||||||||||||||
Net Increase/(Decrease) in Net Assets Resulting from Operations | $ | (111,689,612) | $ | 8,236,916 | $ | (201,721,244) | $ | (1,632,004) | ||||||||||||
See Notes to Financial Statements.
| Stone Harbor Investment Funds Semi-Annual Report | November 30, 2013 | 49 |
Table of Contents
| Stone Harbor Investment Funds | Statements of Changes in Net Assets | |
| Stone Harbor Emerging Markets Debt Fund | Stone Harbor High Yield Bond Fund | |||||||||||||||||||
For the Six Months Ended November 30, 2013 (Unaudited) | For the Year Ended May 31, 2013 | For the Six Months Ended November 30, 2013 (Unaudited) | For the Year Ended May 31, 2013 | |||||||||||||||||
OPERATIONS: | ||||||||||||||||||||
Net investment income | $ | 47,135,676 | $ | 74,806,955 | $ | 11,671,509 | $ | 34,158,305 | ||||||||||||
Net realized gain/(loss) on investments, forward foreign currency contracts and foreign currency transactions | (23,337,699) | (1,611,503) | 1,319,699 | 14,454,436 | ||||||||||||||||
Net change in unrealized appreciation/(depreciation) on investments, forward foreign currency contracts and foreign currency translations | (135,487,589) | 30,426,237 | (4,754,292) | 21,808,228 | ||||||||||||||||
Net increase/(decrease) in net assets resulting from operations | (111,689,612) | 103,621,689 | 8,236,916 | 70,420,969 | ||||||||||||||||
DISTRIBUTIONS TO SHAREHOLDERS: | ||||||||||||||||||||
Institutional Class | ||||||||||||||||||||
From net investment income | (43,259,736) | (74,212,098) | (12,438,269) | (33,469,548) | ||||||||||||||||
From net realized gains | – | (7,462,387) | – | (1,484,074) | ||||||||||||||||
Net decrease in net assets from distributions to shareholders | (43,259,736) | (81,674,485) | (12,438,269) | (34,953,622) | ||||||||||||||||
CAPITAL SHARE TRANSACTIONS: | ||||||||||||||||||||
Institutional Class | ||||||||||||||||||||
Proceeds from sale of shares | 320,966,467 | 701,645,400 | 2,411,694 | 70,255,935 | ||||||||||||||||
Issued to shareholders in reinvestment of distributions | 41,923,053 | 78,161,464 | 11,519,116 | 31,890,743 | ||||||||||||||||
Cost of shares redeemed | (143,145,601) | (148,710,236) | (56,156,545) | (270,312,084) | ||||||||||||||||
Net increase/(decrease) in net assets from capital share transactions | 219,743,919 | 631,096,628 | (42,225,735) | (168,165,406) | ||||||||||||||||
Net Increase/(Decrease) in Net Assets | 64,794,571 | 653,043,832 | (46,427,088) | (132,698,059) | ||||||||||||||||
NET ASSETS: | ||||||||||||||||||||
Beginning of period | 1,836,772,169 | 1,183,728,337 | 386,982,300 | 519,680,359 | ||||||||||||||||
End of period | $ | 1,901,566,740 | $ | 1,836,772,169 | $ | 340,555,212 | $ | 386,982,300 | ||||||||||||
Includes undistributed net investment income of: | $ | 4,203,790 | $ | 327,850 | $ | 839,994 | $ | 1,606,754 | ||||||||||||
OTHER INFORMATION: | ||||||||||||||||||||
Share Transactions: | ||||||||||||||||||||
Institutional Class | ||||||||||||||||||||
Beginning shares | 162,037,118 | 108,310,075 | 39,368,510 | 56,889,085 | ||||||||||||||||
Shares sold | 29,845,157 | 59,623,123 | 251,248 | 7,368,911 | ||||||||||||||||
Shares reinvested | 4,019,625 | 6,675,662 | 1,202,222 | 3,323,302 | ||||||||||||||||
Shares redeemed | (13,379,752) | (12,571,742) | (5,828,845) | (28,212,788) | ||||||||||||||||
Shares outstanding - end of period | 182,522,148 | 162,037,118 | 34,993,135 | 39,368,510 | ||||||||||||||||
See Notes to Financial Statements.
50 | www.shiplp.com |
Table of Contents
| Stone Harbor Investment Funds | Statements of Changes in Net Assets | |
| Stone Harbor Local Markets Fund | Stone Harbor Emerging Markets Corporate Debt Fund | |||||||||||||||||||
For the Six Months Ended November 30, 2013 (Unaudited) | For the Year Ended May 31, 2013 | For the Six Months Ended November 30, 2013 (Unaudited) | For the Year Ended May 31, 2013 | |||||||||||||||||
OPERATIONS: | ||||||||||||||||||||
Net investment income | $ | 67,367,785 | $ | 95,341,510 | $ | 1,371,171 | $ | 2,831,461 | ||||||||||||
Net realized gain/(loss) on investments, forward foreign currency contracts and foreign currency transactions | (149,660,594) | 24,204,534 | (2,162,513) | (1,372,927) | ||||||||||||||||
Net change in unrealized appreciation/(depreciation) on investments, forward foreign currency contracts and foreign currency translations | (119,428,435) | (11,735,106) | (840,662) | 3,498,202 | ||||||||||||||||
Net increase/(decrease) in net assets resulting from operations | (201,721,244) | 107,810,938 | (1,632,004) | 4,956,736 | ||||||||||||||||
DISTRIBUTIONS TO SHAREHOLDERS: | ||||||||||||||||||||
Institutional Class | ||||||||||||||||||||
From net investment income | (15,215,748) | (80,332,640) | (1,442,116) | (2,733,381) | ||||||||||||||||
From net realized gains | – | (3,257,825) | – | – | ||||||||||||||||
Net decrease in net assets from distributions to shareholders | (15,215,748) | (83,590,465) | (1,442,116) | (2,733,381) | ||||||||||||||||
CAPITAL SHARE TRANSACTIONS: | ||||||||||||||||||||
Institutional Class | ||||||||||||||||||||
Proceeds from sale of shares | 641,700,229 | 960,952,241 | 25,500,080 | 30,480,000 | ||||||||||||||||
Issued to shareholders in reinvestment of distributions | 14,980,856 | 82,497,686 | 1,442,116 | 2,733,381 | ||||||||||||||||
Cost of shares redeemed | (502,768,497) | (166,738,410) | (49,352,064) | (1,890,000) | ||||||||||||||||
Net increase/(decrease) in net assets from capital share transactions | 153,912,588 | 876,711,517 | (22,409,868) | 31,323,381 | ||||||||||||||||
Net Increase/(Decrease) in Net Assets | (63,024,404) | 900,931,990 | (25,483,988) | 33,546,736 | ||||||||||||||||
NET ASSETS: | ||||||||||||||||||||
Beginning of period | 2,464,427,079 | 1,563,495,089 | 68,176,248 | 34,629,512 | ||||||||||||||||
End of period | $ | 2,401,402,675 | $ | 2,464,427,079 | $ | 42,692,260 | $ | 68,176,248 | ||||||||||||
Includes undistributed net investment income of: | $ | 61,605,803 | $ | 9,453,766 | $ | 81,357 | $ | 152,302 | ||||||||||||
OTHER INFORMATION: | ||||||||||||||||||||
Share Transactions: | ||||||||||||||||||||
Institutional Class | ||||||||||||||||||||
Beginning shares | 234,568,603 | 154,809,668 | 7,278,681 | 3,896,019 | ||||||||||||||||
Shares sold | 63,712,332 | 87,325,840 | 2,801,474 | 3,290,911 | ||||||||||||||||
Shares reinvested | 1,554,175 | 7,514,090 | 163,377 | 289,977 | ||||||||||||||||
Shares redeemed | (50,639,904) | (15,080,995) | (5,460,918) | (198,226) | ||||||||||||||||
Shares outstanding - end of period | 249,195,206 | 234,568,603 | 4,782,614 | 7,278,681 | ||||||||||||||||
See Notes to Financial Statements.
| Stone Harbor Investment Funds Semi-Annual Report | November 30, 2013 | 51 |
Table of Contents
| Stone Harbor Emerging Markets Debt Fund | Financial Highlights | |
| For a share outstanding through the periods presented. |
| Institutional Class | For the Six Months Ended November 30, 2013 (Unaudited) | For the Year Ended May 31, 2013 | For the Year Ended May 31, 2012 | For the Year Ended May 31, 2011 | For the Year Ended May 31, 2010 | For the Year Ended May 31, 2009 | ||||||||||||||||||||||||
Net asset value - beginning of period | $ | 11.34 | $ | 10.93 | $ | 11.20 | $ | 10.48 | $ | 9.22 | $ | 10.34 | ||||||||||||||||||
Income/(loss) from investment operations: |
| |||||||||||||||||||||||||||||
Net investment income | 0.28(1) | 0.55(1) | 0.65(1) | 0.67(1) | 0.75 | 0.59 | ||||||||||||||||||||||||
Net realized and unrealized gain/(loss) on investments | (0.95) | 0.45 | (0.15) | 1.00 | 1.44 | (1.18) | ||||||||||||||||||||||||
Total income/(loss) from investment operations | (0.67) | 1.00 | 0.50 | 1.67 | 2.19 | (0.59) | ||||||||||||||||||||||||
Less distributions to common shareholders: |
| |||||||||||||||||||||||||||||
From net investment income | (0.25) | (0.54) | (0.67) | (0.63) | (0.79) | (0.53) | ||||||||||||||||||||||||
From net realized gains | – | (0.05) | (0.10) | (0.32) | (0.14) | – | ||||||||||||||||||||||||
Total distributions | (0.25) | (0.59) | (0.77) | (0.95) | (0.93) | (0.53) | ||||||||||||||||||||||||
Net Increase/(Decrease) in Net Asset Value | (0.92) | 0.41 | (0.27) | 0.72 | 1.26 | (1.12) | ||||||||||||||||||||||||
Net asset value - end of period | $ | 10.42 | $ | 11.34 | $ | 10.93 | $ | 11.20 | $ | 10.48 | $ | 9.22 | ||||||||||||||||||
Total Return(2) | (5.90)% | 9.05% | 4.61% | 16.30% | 24.25% | (5.10)% | ||||||||||||||||||||||||
Ratios/Supplemental Data: | ||||||||||||||||||||||||||||||
Net assets, end of period (in millions) | $ | 1,902 | $ | 1,837 | $ | 1,184 | $ | 749 | $ | 178 | $ | 92 | ||||||||||||||||||
Ratio of expenses to average net assets without fee waivers/reimbursements/repayment of previously waived fees | 0.68%(3) | 0.68% | 0.72% | 0.77% | 0.91% | 1.33% | ||||||||||||||||||||||||
Ratio of expenses to average net assets with fee waivers/reimbursements/repayment of previously waived fees | 0.68%(3) | 0.68% | 0.72% | 0.75% | 0.75% | 0.75% | ||||||||||||||||||||||||
Ratio of net investment income to average net assets with fee waivers/reimbursements/repayment of previously waived fees | 5.22%(3) | 4.68% | 5.78% | 6.02% | 6.80% | 9.32% | ||||||||||||||||||||||||
Portfolio turnover rate | 35% | 68% | 60% | 82% | 125% | 84% | ||||||||||||||||||||||||
| (1) | Calculated using average shares throughout the period. |
| (2) | Total returns would have been lower had various fees and expenses not been waived and reimbursed during the period. The total returns in the table represent the rate that an investor would have earned (or lost) on an investment in a Fund (assuming reinvestment of all dividends and distributions). |
| (3) | Annualized. |
See Notes to Financial Statements.
52 | www.shiplp.com |
Table of Contents
| Stone Harbor High Yield Bond Fund | Financial Highlights | |
| For a share outstanding through the periods presented. |
| Institutional Class | For the Six Months Ended November 30, 2013 (Unaudited) | For the Year Ended May 31, 2013 | For the Year Ended May 31, 2012 | For the Year Ended May 31, 2011 | For the Year Ended May 31, 2010 | For the Year Ended May 31, 2009 | ||||||||||||||||||
| ||||||||||||||||||||||||
Net asset value - beginning of period | $ | 9.83 | $ | 9.13 | $ | 10.00 | $ | 9.36 | $ | 8.39 | $ | 9.92 | ||||||||||||
Income/(loss) from investment operations: | ||||||||||||||||||||||||
Net investment income | 0.31(1) | 0.70(1) | 0.72(1) | 0.77(1) | 0.73 | 0.70 | ||||||||||||||||||
Net realized and unrealized gain/(loss) on investments | (0.07) | 0.72 | (0.59) | 0.78 | 0.96 | (1.53) | ||||||||||||||||||
| ||||||||||||||||||||||||
Total income/(loss) from investment operations | 0.24 | 1.42 | 0.13 | 1.55 | 1.69 | (0.83) | ||||||||||||||||||
| ||||||||||||||||||||||||
Less distributions to common shareholders: | ||||||||||||||||||||||||
From net investment income | (0.34) | (0.68) | (0.70) | (0.76) | (0.72) | (0.70) | ||||||||||||||||||
From net realized gains | – | (0.04) | (0.30) | (0.15) | – | – | ||||||||||||||||||
| ||||||||||||||||||||||||
Total distributions | (0.34) | (0.72) | (1.00) | (0.91) | (0.72) | (0.70) | ||||||||||||||||||
| ||||||||||||||||||||||||
Net Increase/(Decrease) in Net Asset Value | (0.10) | 0.70 | (0.87) | 0.64 | 0.97 | (1.53) | ||||||||||||||||||
| ||||||||||||||||||||||||
Net asset value - end of period | $ | 9.73 | $ | 9.83 | $ | 9.13 | $ | 10.00 | $ | 9.36 | $ | 8.39 | ||||||||||||
| ||||||||||||||||||||||||
Total Return(2) | 2.52% | 15.87% | 1.77% | 17.14% | 20.53% | (7.77)% | ||||||||||||||||||
Ratios/Supplemental Data: | ||||||||||||||||||||||||
Net assets, end of period (in millions) | $ | 341 | $ | 387 | $ | 520 | $ | 488 | $ | 408 | $ | 223 | ||||||||||||
Ratio of expenses to average net assets without fee waivers/reimbursements/repayment of previously waived fees | 0.62%(3) | 0.60% | 0.62% | 0.65% | 0.67% | 0.88% | ||||||||||||||||||
Ratio of expenses to average net assets with fee waivers/reimbursements/repayment of previously waived fees | 0.55%(3) | 0.55% | 0.55% | 0.55% | 0.55% | 0.55% | ||||||||||||||||||
Ratio of net investment income to average net assets with fee waivers/reimbursements/repayment of previously waived fees | 6.44%(3) | 7.27% | 7.67% | 7.78% | 8.13% | 9.07% | ||||||||||||||||||
Portfolio turnover rate | 24% | 59% | 46% | 60% | 36% | 16% | ||||||||||||||||||
| (1) | Calculated using average shares throughout the period. |
| (2) | Total returns would have been lower had various fees and expenses not been waived and reimbursed during the period. The total returns in the table represent the rate that an investor would have earned (or lost) on an investment in a Fund (assuming reinvestment of all dividends and distributions). |
| (3) | Annualized. |
See Notes to Financial Statements.
| ||
| Stone Harbor Investment Funds Semi-Annual Report | November 30, 2013 | 53 |
Table of Contents
| Stone Harbor Local Markets Fund | Financial Highlights | |
| For a share outstanding through the periods presented. |
| Institutional Class | For the Six Months Ended November 30, 2013 (Unaudited) | For the Year Ended May 31, 2013 | For the Year Ended May 31, 2012 | For the Period June 30, 2010 (Inception) to May 31, 2011 | ||||||||||||
| ||||||||||||||||
Net asset value - beginning of period | $ | 10.51 | $ | 10.10 | $ | 11.21 | $ | 10.00 | ||||||||
Income/(loss) from investment operations: | ||||||||||||||||
Net investment income(1) | 0.27 | 0.49 | 0.57 | 0.51 | ||||||||||||
Net realized and unrealized gain/(loss) on investments | (1.08) | 0.33 | (1.21) | 1.14 | ||||||||||||
| ||||||||||||||||
Total income/(loss) from investment operations | (0.81) | 0.82 | (0.64) | 1.65 | ||||||||||||
| ||||||||||||||||
Less distributions to common shareholders: | ||||||||||||||||
From net investment income | (0.06) | (0.39) | (0.45) | (0.39) | ||||||||||||
From net realized gains | – | (0.02) | – | (0.05) | ||||||||||||
From tax return of capital | – | – | (0.02) | – | ||||||||||||
| ||||||||||||||||
Total distributions | (0.06) | (0.41) | (0.47) | (0.44) | ||||||||||||
| ||||||||||||||||
Net Increase/(Decrease) in Net Asset Value | (0.87) | 0.41 | (1.11) | 1.21 | ||||||||||||
| ||||||||||||||||
Net asset value - end of period | $ | 9.64 | $ | 10.51 | $ | 10.10 | $ | 11.21 | ||||||||
| ||||||||||||||||
Total Return(2)(3) | (7.71)% | 7.92% | (5.84)% | 16.82% | ||||||||||||
Ratios/Supplemental Data: | ||||||||||||||||
Net assets, end of period (in millions) | $ | 2,401 | $ | 2,464 | $ | 1,563 | $ | 606 | ||||||||
Ratio of expenses to average net assets without fee waivers/reimbursements/repayment of previously waived fees | 0.86%(4) | 0.86% | 0.89% | 1.01%(4) | ||||||||||||
Ratio of expenses to average net assets with fee waivers/reimbursements/repayment of previously waived fees | 0.86%(4) | 0.86% | 0.89% | 1.00%(4) | ||||||||||||
Ratio of net investment income to average net assets with fee waivers/reimbursements/repayment of previously waived fees | 5.33%(4) | 4.45% | 5.35% | 5.13%(4) | ||||||||||||
Portfolio turnover rate | 89% | 191% | 161% | 102% | ||||||||||||
| (1) | Calculated using average shares throughout the period. |
| (2) | Total returns would have been lower had various fees and expenses not been waived and reimbursed during the period. The total returns in the table represent the rate that an investor would have earned (or lost) on an investment in a Fund (assuming reinvestment of all dividends and distributions). |
| (3) | Total returns for periods of less than one year are not annualized. |
| (4) | Annualized. |
See Notes to Financial Statements.
| ||
54 | www.shiplp.com | |
Table of Contents
Corporate Debt Fund | Financial Highlights | |
For a share outstanding through the periods presented. | ||
For the Six Months Ended November 30, 2013 (Unaudited) | For the Year Ended May 31, 2013 | For the Year Ended May 31, 2012(1) | ||||||||||
Net asset value - beginning of period | $ | 9.37 | $ | 8.89 | $ | 10.00 | ||||||
Income/(loss) from investment operations: | $(0.19) | $0.90 | $(0.52) | |||||||||
Net investment income(2) | 0.20 | 0.44 | 0.59 | |||||||||
Net realized and unrealized gain/(loss) on investments | (0.39) | 0.46 | (1.11) | |||||||||
Total income/(loss) from investment operations | (0.19) | 0.90 | (0.52) | |||||||||
Less distributions to common shareholders: | ||||||||||||
From net investment income | (0.25) | (0.42) | (0.59) | |||||||||
Total distributions | (0.25) | (0.42) | (0.59) | |||||||||
Net Increase/(Decrease) in Net Asset Value | (0.44) | 0.48 | (1.11) | |||||||||
Net asset value - end of period | $ | 8.93 | $ | 9.37 | $ | 8.89 | ||||||
Total Return(3) | (1.98)% | 10.13% | (5.10)% | |||||||||
Ratios/Supplemental Data: | ||||||||||||
Net assets, end of period (in millions) | $ | 43 | $ | 68 | $ | 35 | ||||||
Ratio of expenses to average net assets without fee waivers/reimbursements | 1.18%(4) | 1.16% | 1.32% | |||||||||
Ratio of expenses to average net assets with fee waivers/reimbursements | 1.00%(4) | 1.00% | 1.00% | |||||||||
Ratio of net investment income to average net assets with fee waivers/reimbursements | 4.53%(4) | 4.68% | 6.41% | |||||||||
Portfolio turnover rate | 42% | 78% | 51% | |||||||||
| (1) | The Fund commenced operations on June 1, 2011. |
| (2) | Calculated using average shares throughout the period. |
| (3) | Total returns would have been lower had various fees and expenses not been waived and reimbursed during the period. The total returns in the table represent the rate that an investor would have earned (or lost) on an investment in a Fund (assuming reinvestment of all dividends and distributions). |
| (4) | Annualized. |
See Notes to Financial Statements.
| ||
| Stone Harbor Investment Funds Semi-Annual Report | November 30, 2013 | 55 |
Table of Contents
| Stone Harbor Investment Funds | Notes to Financial Statements | |
| November 30, 2013 (Unaudited) |
1. ORGANIZATION AND SIGNIFICANT ACCOUNTING POLICIES
Stone Harbor Investment Funds, which consists of Stone Harbor Emerging Markets Debt Fund, Stone Harbor High Yield Bond Fund, Stone Harbor Local Markets Fund and Stone Harbor Emerging Markets Corporate Debt Fund (each, a “Fund” and together, the “Funds”) is a Massachusetts business trust (the “Trust”), organized on February 20, 2007 and registered under the Investment Company Act of 1940, as amended (the “1940 Act”), as an open-end management investment company. Shares of each Fund are currently divided into two classes, designated Institutional Class Shares and Distributor Class Shares. As of the date of this report, there were no outstanding shares for the Distributor Class of each Fund. The Trust’s Declaration of Trust permits the Trustees to create additional funds and share classes.
The Emerging Markets Debt Fund’s investment objective is to maximize total return. The Fund normally will invest at least 80% of its net assets (plus any borrowings made for investment purposes) in Emerging Markets Fixed Income Securities. “Emerging Markets Fixed Income Securities” include fixed income securities and derivative instruments (including, but not limited to, spot and currency contracts, futures, options and swaps) that economically are tied to countries with emerging securities markets or whose performance is linked to those countries’ markets, economies or ability to repay loans. Emerging Markets Fixed Income Securities may be denominated in non-U.S. currencies or the U.S. dollar. A security or instrument is economically tied to an emerging market country if it is principally traded on the country’s securities markets or the issuer is organized or principally operates in the country, derives a majority of its income from its operations within the country or has a majority of its assets within the country. Emerging Markets Fixed Income Securities also include derivatives and other instruments used to hedge or gain exposure to emerging securities markets (for example, futures or other derivatives whose return is based on specific emerging markets securities or indices).
The High Yield Bond Fund’s investment objective is to maximize total return. The Fund will normally invest at least 80% of its net assets (plus any borrowings made for investment purposes) in High Yield Debt Securities. “High Yield Debt Securities” include fixed income securities and derivative instruments (including, but not limited to, spot and currency contracts, futures, options and swaps) rated below investment grade (or, if unrated, of comparable quality as determined by Stone Harbor Investment Partners LP (the “Adviser” or “Stone Harbor”). These securities and instruments are commonly referred to as “high yield” securities or “junk bonds,” and may include, among other things, bonds, debentures, notes, equipment trust certificates, commercial paper, commercial loans, preferred stock and other obligations of U.S. and non-U.S. issuers. High Yield Debt Securities also include securities or other instruments whose return is based on the return of high yield securities, including derivative instruments and instruments created to hedge or gain exposure to the high yield markets.
The Local Markets Fund’s investment objective is to maximize total return. The Fund normally will invest at least 80% of its net assets (plus any borrowings made for investment purposes) in Emerging Markets Investments. “Emerging Markets Investments” include fixed income securities and derivative instruments (including, but not limited to, spot and currency contracts, futures, options and swaps) that economically are tied to an emerging market country, which are denominated in the predominant currency of the local market of an emerging market country (an “Emerging Markets Currency”) or whose performance is linked to those countries’ currencies, markets, economies or ability to repay loans. Although under normal circumstances a significant portion of the Fund’s investments will be denominated in Emerging Markets Currencies, Emerging Markets Investments may be denominated in non-Emerging Markets Currencies, including the U.S. dollar. A security or instrument is economically tied to an emerging market country if it is principally traded on the country’s securities markets or the issuer is organized or principally operates in the country, derives a majority of its income from its operations within the country or has a majority of its assets within the country. Emerging Markets Investments also include Emerging Markets Currencies and derivatives and other instruments used to hedge or gain exposure to emerging securities markets or Emerging Markets Currencies (for example, futures or other derivatives whose return is based on specific emerging markets securities, emerging markets indices or Emerging Markets Currencies).
The Emerging Markets Corporate Debt Fund’s investment objective is to maximize total return. The Fund normally will invest at least 80% of its net assets (plus any borrowings made for investment purposes) in Emerging Markets Corporate Debt Investments. “Emerging Markets Corporate Debt Investments” are debt instruments, including loans, issued by corporations or other business organizations that are economically tied to an emerging market country. A corporation or other business organization is economically tied to an emerging market country if it issues securities that are principally traded on the country’s securities markets or if it is organized or principally operates in the country, derives a majority of its income from its operations within the country or has a majority of its assets within the country. Emerging Markets Corporate Debt Investments also include derivative instruments used for hedging purposes or to otherwise gain or reduce long or short exposure to Emerging Markets Corporate Debt Investments.
The Emerging Markets Debt Fund, Local Markets Fund and Emerging Markets Corporate Debt Fund are each classified as “non-diversified” under the 1940 Act. As a result, the Funds can invest a greater portion of the Funds’ assets in obligations of a single issuer than a “diversified” fund. The Funds may therefore be more susceptible than a diversified fund to being adversely affected by any single corporate, economic, political or regulatory occurrence. The High Yield Bond Fund is a diversified fund.
The following is a summary of significant accounting policies consistently followed by the Funds in the preparation of their financial statements. The policies are in conformity with accounting principles generally accepted in the United States of America (“GAAP”). The preparation of the financial statements in accordance with GAAP requires management to make estimates and assumptions that affect the reported amounts of assets and
56 | www.shiplp.com |
Table of Contents
| Stone Harbor Investment Funds | Notes to Financial Statements | |
| November 30, 2013 (Unaudited) |
liabilities at the date of the financial statements and the reported amounts of income and expenses during the reporting period. Actual results could differ from those estimates.
Investment Valuation: Debt securities, including bank loans and linked notes, are generally valued at the mean between the bid and asked prices provided by independent pricing services or brokers that are based on transactions in debt obligations, quotations from dealers, market transactions in comparable securities and various other relationships between securities. Equity securities for which market quotations are available are generally valued at the last sale price or official closing price on the primary market or exchange on which they trade. Publicly traded foreign government debt securities are typically traded internationally in the over-the-counter market, and are valued at the mean between the bid and asked prices as of the close of business of that market. When prices are not readily available, or are determined not to reflect fair value, such as when the value of a security has been significantly affected by events after the close of the exchange or market on which the security is principally traded, but before the Funds calculate their net asset value, the Funds may value these investments at fair value as determined in accordance with the procedures approved by the Funds’ Board of Trustees. Short-term obligations with maturities of 60 days or less are valued at amortized cost, which approximates market value. Money market mutual funds are valued at their net asset value. Foreign Currency positions including forward currency contracts are priced at the mean between the closing bid and asked prices at 4:00 p.m. Eastern time.
A three-tier hierarchy has been established to measure fair value based on the extent of use of “observable inputs” as compared to “unobservable inputs” for disclosure purposes and requires additional disclosures about these valuations measurements. Inputs refer broadly to the assumptions that market participants would use in pricing a security. Observable inputs are inputs that reflect the assumptions market participants would use in pricing the security developed based on market data obtained from sources independent of the reporting entity. Unobservable inputs are inputs that reflect the reporting entity’s own assumptions about the assumptions market participants would use in pricing the security developed based on the best information available in the circumstances.
The three-tier hierarchy is summarized as follows:
Level 1— | Unadjusted quoted prices in active markets for identical assets or liabilities that the Fund has the ability to access. | |
Level 2— | Observable inputs other than quoted prices included in level 1 that are observable for the asset or liability, either directly or indirectly. These inputs may include quoted prices for the identical instrument on an inactive market, prices for similar instruments, interest rates, prepayment speeds, credit risk, yield curve, rates, and similar data. | |
Level 3— | Unobservable inputs for the asset or liability, to the extent relevant observable inputs are not available, representing the Fund’s own assumptions about the assumptions a market participant would use in valuing the asset or liability, and would be based on the best information available. | |
The following is a summary of each Fund’s investments and financial instruments based on the three-tier hierarchy as of November 30, 2013:
| Investments in Securities at Value* | Level 1 - Quoted and Unadjusted Prices | Level 2 - Other Significant Observable Inputs | Level 3 - Significant Unobservable Inputs | Total | ||||||||||||
Stone Harbor Emerging Markets Debt Fund | ||||||||||||||||
Sovereign Debt Obligations | $ | – | $ | 1,277,281,097 | $ | – | $ | 1,277,281,097 | ||||||||
Bank Loans | – | – | 1,183,019 | 1,183,019 | ||||||||||||
Corporate Bonds | – | 453,725,899 | – | 453,725,899 | ||||||||||||
Participation Notes | – | 5,785,780 | – | 5,785,780 | ||||||||||||
Credit Linked Notes | ||||||||||||||||
Colombia | – | 23,431,389 | – | 23,431,389 | ||||||||||||
Iraq | – | – | 7,806,433 | 7,806,433 | ||||||||||||
Open-End Funds | 14,869,110 | – | – | 14,869,110 | ||||||||||||
Short Term Investments | 92,134,481 | – | – | 92,134,481 | ||||||||||||
Total | $ | 107,003,591 | $ | 1,760,224,165 | $ | 8,989,452 | $ | 1,876,217,208 | ||||||||
Other Financial Instruments** | ||||||||||||||||
Assets | ||||||||||||||||
Forward Foreign Currency Contracts | $ | – | $ | 1,027,591 | $ | – | $ | 1,027,591 | ||||||||
Liabilities | ||||||||||||||||
Forward Foreign Currency Contracts | – | (1,146,900 | ) | – | (1,146,900 | ) | ||||||||||
Total | $ | – | $ | (119,309 | ) | $ | – | $ | (119,309 | ) | ||||||
| Stone Harbor Investment Funds Semi-Annual Report | November 30, 2013 | 57 |
Table of Contents
| Stone Harbor Investment Funds | Notes to Financial Statements | |
| November 30, 2013 (Unaudited) |
| Investments in Securities at Value* | Level 1 - Quoted and Unadjusted Prices | Level 2 - Other Significant Observable Inputs | Level 3 - Significant Unobservable Inputs | Total | ||||||||||||
Stone Harbor High Yield Bond Fund | ||||||||||||||||
Corporate Bonds | $ | – | $ | 308,437,618 | $ | – | $ | 308,437,618 | ||||||||
Convertible Corporate Bonds | – | 4,685,948 | – | 4,685,948 | ||||||||||||
Bank Loans | – | 15,052,942 | – | 15,052,942 | ||||||||||||
Common/Preferred Stocks | 827,455 | 413,100 | 19 | 1,240,574 | ||||||||||||
Short Term Investments | 11,426,995 | – | – | 11,426,995 | ||||||||||||
Total | $ | 12,254,450 | $ | 328,589,608 | $ | 19 | $ | 340,844,077 | ||||||||
| ||||||||||||||||
Other Financial Instruments** | ||||||||||||||||
Assets | ||||||||||||||||
Forward Foreign Currency Contracts | $ | – | $ | 784 | $ | – | $ | 784 | ||||||||
Liabilities | ||||||||||||||||
Forward Foreign Currency Contracts | – | (139,087) | – | (139,087) | ||||||||||||
Total | $ | – | $ | (138,303) | $ | – | $ | (138,303) | ||||||||
| ||||||||||||||||
| Investments in Securities at Value * | Level 1 - Quoted and Unadjusted Prices | Level 2 - Other Significant | Level 3 - Significant Unobservable Inputs | Total | ||||||||||||
Stone Harbor Local Markets Fund | ||||||||||||||||
Sovereign Debt Obligations | $ | – | $ | 1,766,145,077 | $ | – | $ | 1,766,145,077 | ||||||||
Corporate Bonds | – | 44,514,837 | – | 44,514,837 | ||||||||||||
Credit Linked Notes | – | 115,777,581 | – | 115,777,581 | ||||||||||||
Short Term Investments | 362,612,554 | – | – | 362,612,554 | ||||||||||||
Total | $ | 362,612,554 | $ | 1,926,437,495 | $ | – | $ | 2,289,050,049 | ||||||||
| ||||||||||||||||
Other Financial Instruments** | ||||||||||||||||
Assets | ||||||||||||||||
Forward Foreign Currency Contracts | $ | – | $ | 2,567,356 | $ | – | $ | 2,567,356 | ||||||||
Liabilities | ||||||||||||||||
Forward Foreign Currency Contracts | – | (2,137,569) | – | (2,137,569) | ||||||||||||
Total | $ | – | $ | 429,787 | $ | – | $ | 429,787 | ||||||||
| ||||||||||||||||
| Investments in Securities at Value* | Level 1 - Quoted and Unadjusted Prices | Level 2 - Other Significant Observable Inputs | Level 3 - Significant Unobservable Inputs | Total | ||||||||||||
Stone Harbor Emerging Markets Corporate Debt Fund | ||||||||||||||||
Corporate Bonds | $ | – | $ | 41,307,516 | $ | – | $ | 41,307,516 | ||||||||
Short Term Investments | 998,185 | – | – | 998,185 | ||||||||||||
Total | $ | 998,185 | $ | 41,307,516 | $ | – | $ | 42,305,701 | ||||||||
| ||||||||||||||||
Other Financial Instruments** | ||||||||||||||||
Assets | ||||||||||||||||
Forward Foreign Currency Contracts | $ | – | $ | 8,427 | $ | – | $ | 8,427 | ||||||||
Liabilities | ||||||||||||||||
Forward Foreign Currency Contracts | – | (31,601) | – | (31,601) | ||||||||||||
Total | $ | – | $ | (23,174) | $ | – | $ | (23,174) | ||||||||
| * | For detailed Industry/Country descriptions, see accompanying Statements of Investments. |
| ** | Other financial instruments are derivative instruments not reflected in the Statements of Investments. The derivatives shown in this table are reported at their unrealized appreciation/(depreciation) at measurement date, which represents the change in the contract’s value from trade date. |
58 | www.shiplp.com |
Table of Contents
| Stone Harbor Investment Funds | Notes to Financial Statements | |
| November 30, 2013 (Unaudited) |
There were no transfers between Levels 1 and 2 during the year ended November 30, 2013. It is the Funds’ policy to recognize transfers into and out of all levels at the end of the reporting period. Other financial assets were moved from Level 2 to Level 3 as observable inputs were not available for purposes of valuing those assets.
The following is a reconciliation of assets in which significant unobservable inputs (Level 3) were used in determining fair value:
| Investments in Securities | Balance as of May 31, 2013 | Accrued discount/ premium | Realized Gain/(Loss)* | Change in (Depreciation)* | Sales Proceeds | Transfer into Level 3 | Balance as of November 30, 2013 | Net change in unrealized | ||||||||||||||||||||||||
| ||||||||||||||||||||||||||||||||
Stone Harbor Emerging Markets Debt Fund |
| |||||||||||||||||||||||||||||||
Bank Loan | $ | 560,733 | $ | – | $ | – | $ | (145,375) | $ | – | $ | 767,661 | $ | 1,183,019 | $ | (558,731) | ||||||||||||||||
Credit Linked Notes | 11,419,038 | 92,511 | (339,388) | (763,867) | (2,601,861) | – | 7,806,433 | (1,439,106) | ||||||||||||||||||||||||
| ||||||||||||||||||||||||||||||||
TOTAL | $ | 11,979,771 | $ | 92,511 | $ | (339,388) | $ | (909,242) | $ | (2,601,861) | $ | 767,661 | $ | 8,989,452 | $ | (1,997,837) | ||||||||||||||||
| ||||||||||||||||||||||||||||||||
| ||||||||||||||||||||||||||||||||
Stone Harbor High Yield Bond Fund |
| |||||||||||||||||||||||||||||||
Common Stock | $ | – | $ | – | $ | – | $ | – | $ | – | $ | 19 | $ | 19 | $ | 18 | ||||||||||||||||
| ||||||||||||||||||||||||||||||||
TOTAL | $ | – | $ | – | $ | – | $ | – | $ | – | $ | 19 | $ | 19 | $ | 18 | ||||||||||||||||
| ||||||||||||||||||||||||||||||||
| ||||||||||||||||||||||||||||||||
Stone Harbor Emerging Markets Corporate Debt Fund |
| |||||||||||||||||||||||||||||||
Credit Linked Notes | $ | 313,925 | $ | (84) | $ | (73,680) | $ | 120,182 | $ | (360,343) | $ | – | $ | – | $ | – | ||||||||||||||||
| ||||||||||||||||||||||||||||||||
TOTAL | $ | 313,925 | $ | (84) | $ | (73,680) | $ | 120,182 | $ | (360,343) | $ | – | $ | – | $ | – | ||||||||||||||||
| ||||||||||||||||||||||||||||||||
| ||||||||||||||||||||||||||||||||
| * | Realized gain/(loss) and change in unrealized appreciation/(depreciation) are included in the related amounts on the investment in the Statements of Operations. |
All level 3 investments have values determined utilizing third party pricing information without adjustment.
The inputs or methodology used for valuing securities are not necessarily an indication of the risk associated with investing in those securities.
In the event a board approved independent pricing service is unable to provide an evaluated price for a security or the Adviser believes the price provided is not reliable, securities of the Funds may be valued at fair value as described above. In these instances the Adviser may seek to find an alternative independent source, such as a broker/dealer to provide a price quote, or by using evaluated pricing models similar to the techniques and models used by the independent pricing service. These fair value measurement techniques may utilize unobservable inputs (Level 3).
On at least a quarterly basis, the Adviser presents the factors considered in determining the fair value measurements and presents that information to the Board which meets at least quarterly.
Security Transactions and Investment Income: Security transactions are accounted for on a trade date basis. Interest income, adjusted for amortization of premium and accretion of discount, is recorded on the accrual basis. Dividend income is recorded on the ex-dividend date. Foreign dividend income is recorded on the ex-dividend date or as soon as practical after the Funds determine the existence of a dividend declaration after exercising reasonable due diligence. If applicable, any foreign capital gains taxes are accrued, net of unrealized gains, and are payable upon the sale of such investments. The cost of investments sold is determined by use of the specific identification method. To the extent any issuer defaults on an expected interest payment, the Funds’ policy is to generally halt any additional interest income accruals and consider the realizability of interest accrued up to the date of default.
Foreign Currency Translation: The books and records of the Funds are maintained in U.S. dollars. Investment valuations and other assets and liabilities initially expressed in foreign currencies are converted each business day into U.S. dollars based upon current exchange rates. Prevailing foreign exchange rates may generally be obtained at the close of the NYSE (normally, 4:00 p.m. Eastern time). The portion of realized and unrealized gains or losses on investments due to fluctuations in foreign currency exchange rates is not separately disclosed and is included in realized and unrealized gains or losses on investments, when applicable.
| Stone Harbor Investment Funds Semi-Annual Report | November 30, 2013 | 59 |
Table of Contents
| Stone Harbor Investment Funds | Notes to Financial Statements | |
| November 30, 2013 (Unaudited) |
Foreign Securities: The Funds may directly purchase securities of foreign issuers. Investing in securities of foreign issuers involves special risks not typically associated with investing in securities of U.S. issuers. The risks include possible revaluation of currencies, the ability to repatriate funds, less complete financial information about companies and possible future adverse political and economic developments. Moreover, securities of many foreign issuers and their markets may be less liquid and their prices more volatile than those of securities of comparable U.S. issuers.
Credit Linked Notes: The Funds may invest in credit linked notes to obtain economic exposure to high yield, emerging markets or other securities. Investments in a credit linked note typically provide the holder with a return based on the return of an underlying reference instrument, such as an emerging market bond. Like an investment in a bond, investments in credit-linked securities represent the right to receive periodic income payments (in the form of distributions) and payment of principal at the end of the term of the security. In addition to the risks associated with the underlying reference instrument, an investment in a credit linked note is also subject to the risk that the counterparty will be unwilling or unable to meet its obligations under the note.
Segregation and Collateralization: In cases in which the 1940 Act and the interpretive positions of the Securities and Exchange Commission (“SEC”) require that the Fund either delivers collateral or segregate assets in connection with certain investments (e.g., foreign currency exchange contracts, securities with extended settlement periods, and swaps) or certain borrowings (e.g., reverse repurchase agreements), the Fund will segregate collateral or designate on its books and records cash or other liquid securities having a value at least equal to the amount that is required to be physically segregated for the benefit of the counterparty. Furthermore, based on requirements and agreements with certain exchanges and third party broker-dealers, each party has requirements to deliver/deposit cash or securities as collateral for certain investments. Cash collateral that has been pledged to cover obligations of the Fund is reported separately on the Statement of Assets and Liabilities as “Deposits with brokers.” Securities collateral pledged for the same purpose is noted on the Statement of Investments.
Loan Participations and Assignments: The Funds may invest in loans arranged through private negotiation between one or more financial institutions. The Funds’ investment in any such loan may be in the form of a participation in or an assignment of the loan. In connection with purchasing participations, the Funds generally will have no right to enforce compliance by the borrower with the terms of the loan agreement relating to the loan, nor any rights of set-off against the borrower and the Funds may not benefit directly from any collateral supporting the loan in which they have purchased the participation.
The Funds may also invest in unfunded loan commitments, which are contractual obligations for future funding. Information regarding unfunded commitments is included at the end of the Funds’ Schedules of Investments.
The Funds assume the credit risk of the borrower, the lender that is selling the participation and any other persons interpositioned between the Funds and the borrower. In the event of the insolvency of the lender selling the participation, the Funds may be treated as a general creditor of the lender and may not benefit from any set-off between the lender and the borrower.
Inflation-Indexed Bonds: Certain Funds may invest in inflation indexed bonds. Inflation-indexed bonds are fixed-income securities whose principal value is periodically adjusted to the rate of inflation. The interest rate on these bonds is generally fixed at issuance at a rate lower than typical bonds. Over the life of an inflation-indexed bond, however, interest will be paid based on a principal value which is adjusted for inflation. Any increase or decrease in the principal amount of an inflation-indexed bond will be included as interest income on the Statements of Operations, even though investors do not receive their principal until maturity.
Credit and Market Risk: The Funds invest in high yield and emerging market instruments that are subject to certain credit and market risks. The yields of high yield and emerging market debt obligations reflect, among other things, perceived credit and market risks. The Funds’ investment in securities rated below investment grade typically involves risks not associated with higher rated securities including, among others, greater risk related to timely and ultimate payment of interest and principal, greater market price volatility and less liquid secondary market trading. The consequences of political, social, economic or diplomatic changes may have disruptive effects on the market prices of investments held by the Funds. The Funds’ investment in non-U.S. dollar denominated securities may also result in foreign currency losses caused by devaluations and exchange rate fluctuations. Investments in derivatives are also subject to credit and market risks.
Distributions to Shareholders: Dividends and distributions to shareholders, which are determined in accordance with income tax regulations, are recorded on the ex-date. Income distributions, if any are generally declared and paid on a quarterly basis. Capital gain distributions, if any, are declared and paid at least annually.
Expenses: Direct expenses are charged to each Fund; expenses of the Trust are generally allocated to the Funds based on each Fund’s relative net assets.
60 | www.shiplp.com |
Table of Contents
| Stone Harbor Investment Funds | Notes to Financial Statements | |
| November 30, 2013 (Unaudited) |
Federal and Other Taxes: No provision for income taxes is included in the accompanying financial statements, as the Funds intend to distribute to shareholders all taxable investment income and realized gains and otherwise comply with Subchapter M of the Internal Revenue Code of 1986, as amended, applicable to regulated investment companies.
The Funds evaluate tax positions taken (or expected to be taken) in the course of preparing the Funds’ tax provisions to determine whether these positions meet a “more-likely-than-not” standard that, based on the technical merits, have a more than fifty percent likelihood of being sustained by a taxing authority upon examination. A tax position that meets the “more-likely-than-not” recognition threshold is measured to determine the amount of benefit to recognize in the financial statements.
As of and during the period ended November 30, 2013, the Funds did not have a liability for any unrecognized tax benefits. The Funds file U.S. federal, state, and local tax returns as required. The Funds’ tax returns are subject to examination by the relevant tax authorities until expiration of the applicable statute of limitations which is generally three years after the filing of the tax return for federal purposes and four years for most state returns. Tax returns for open years have incorporated no uncertain tax positions that require a provision for income taxes.
2. DERIVATIVE INSTRUMENTS
Risk Exposure and the Use of Derivative Instruments: The Funds’ investment objectives not only permit the Funds to purchase investment securities, they also allow the Funds to enter in various types of derivatives contracts. In doing so, the Funds employ strategies in differing combinations to permit them to increase, decrease, or change the level or types of exposure to market factors. Central to those strategies are features inherent to derivatives that may make them more attractive for this purpose than equity or debt securities; they require little or no initial cash investment, they can focus exposure on only certain selected risk factors, and they may not require the ultimate receipt or delivery of the underlying security (or securities) to the contract. This may allow the Funds to pursue their objectives more quickly and efficiently than if they were to make direct purchases or sales of securities capable of affecting a similar response to market factors.
Market Risk Factors. In pursuit of their investment objectives, the Funds may seek to use derivatives to increase or decrease their exposure to the following market risk factors, among others:
Interest Rate Risk. Interest rate risk refers to the fluctuations in value of fixed-income securities resulting from the inverse relationship between price and yield. For example, an increase in general interest rates will tend to reduce the market value of already issued fixed-income investments, and a decline in general interest rates will tend to increase their value. In addition, debt securities with longer maturities, which tend to have higher yields, are subject to potentially greater fluctuations in value from changes in interest rates than obligations with shorter maturities.
Credit Risk. Credit risk relates to the ability of the issuer to meet interest and principal payments, or both, as they come due. In general, lower-grade, higher-yield bonds are subject to credit risk to a greater extent than lower-yield, higher-quality bonds.
Foreign Exchange Rate Risk. Foreign exchange risk relates to the change in the U.S. dollar value of a security held that is denominated in a foreign currency. The U.S. dollar value of a foreign currency denominated security will decrease as the dollar appreciates against the currency, while the U.S. dollar value will increase as the dollar depreciates against the currency.
Equity Risk. Equity risk relates to the change in value of equity securities as they relate to increases or decreases in the general market.
The Funds’ use of derivatives can result in losses due to unanticipated changes in these risk factors and the overall market. In instances where the Funds are using derivatives to decrease, or hedge, exposures to market risk factors for securities held by the Funds, there are also risks that those derivatives may not perform as expected resulting in losses for the combined or hedged positions.
Derivatives may have little or no initial cash investment relative to their market value exposure and therefore can produce significant gains or losses in excess of their cost. This use of embedded leverage allows each Fund to increase its market value exposure relative to its net assets and can substantially increase the volatility of the Funds’ performance.
Additional associated risks from investing in derivatives also exist and potentially could have significant effects on the valuation of the derivative and the Funds. Typically, the associated risks are not the risks that the Funds are attempting to increase or decrease exposure to, per their investment objectives, but are the additional risks from investing in derivatives.
Examples of these associated risks are liquidity risk, which is the risk that the Funds will not be able to sell or close out the derivative in a timely manner, and counterparty credit risk, which is the risk that the counterparty will not fulfill its obligation to the Funds. Associated risks can be different for each type of derivative and are discussed by each derivative type below in the notes that follow.
| Stone Harbor Investment Funds Semi-Annual Report | November 30, 2013 | 61 |
Table of Contents
| Stone Harbor Investment Funds | Notes to Financial Statements | |
| November 30, 2013 (Unaudited) |
Forward Foreign Currency Contracts. The Funds may engage in currency transactions with counterparties to hedge the value of portfolio securities denominated in particular currencies against fluctuations in relative value, to gain or reduce exposure to certain currencies, or to generate income or gains. A forward foreign currency contract is an agreement between two parties to buy and sell a currency at a set price on a future date. The contract is marked-to-market daily and the change in value is recorded by the Funds as an unrealized gain or loss. When a forward foreign currency contract is extinguished, through either delivery or offset by entering into another forward foreign currency contract, the Funds record a realized gain or loss equal to the difference between the value of the contract at the time it was opened and the value of the contract at the time it was extinguished.
Forward foreign currency contracts involve elements of market risk in excess of the amounts reflected in the Statements of Assets and Liabilities. The Funds bear the risk of an unfavorable change in the foreign exchange rate underlying the forward foreign currency contract. Risks may also arise upon entering into these contracts from the potential inability of the counterparties to meet the terms of their contracts.
The tables below are a summary of the fair valuations of derivative instruments categorized by risk exposure.
Fair values of forward foreign currency contracts on the Statements of Assets and Liabilities as of November 30, 2013:
| Location | Fair Value of Asset Derivatives | Location | Fair Value of Liability Derivatives | |||||||||
Stone Harbor Emerging Markets Debt Fund | Unrealized appreciation on forward foreign currency contracts | $ | 1,027,591 | Unrealized depreciation on forward foreign currency contracts | $ | (1,146,902) | ||||||
|
|
|
| |||||||||
| $ | 1,027,591 | $ | (1,146,902) | |||||||||
|
|
|
| |||||||||
Stone Harbor High Yield Fund | Unrealized appreciation on forward foreign currency contracts | $ | 784 | Unrealized depreciation on forward foreign currency contracts | $ | (139,088) | ||||||
|
|
|
| |||||||||
| $ | 784 | $ | (139,088) | |||||||||
|
|
|
| |||||||||
Stone Harbor Local Markets Fund | Unrealized appreciation on forward foreign currency contracts | $ | 2,567,356 | Unrealized depreciation on forward foreign currency contracts | $ | (2,137,568) | ||||||
|
|
|
| |||||||||
| $ | 2,567,356 | $ | (2,137,568) | |||||||||
|
|
|
| |||||||||
Stone Harbor Emerging Markets Corporate Debt Fund | Unrealized appreciation on forward foreign currency contracts | $ | 8,427 | Unrealized depreciation on forward foreign currency contracts | $ | (31,601) | ||||||
|
|
|
| |||||||||
| $ | 8,427 | $ | (31,601) | |||||||||
|
|
|
| |||||||||
The number of forward foreign currency contracts held at November 30, 2013 is representative of activity during the period ended November 30, 2013.
62 | www.shiplp.com |
Table of Contents
| Stone Harbor Investment Funds | Notes to Financial Statements | |
| November 30, 2013 (Unaudited) |
The effect of forward foreign currency contracts on the Statements of Operations for the period ended November 30, 2013:
| Location | Realized Gain/(Loss) | Location | Unrealized Gain/(Loss) | |||||||||
| Stone Harbor Emerging Markets Debt Fund | Net realized gain/(loss) on forward foreign currency contracts | $ | (249,488) | Change in unrealized appreciation/(depreciation) on forward foreign currency contracts | $ | (1,354,492) | ||||||
|
|
|
| |||||||||
| $ | (249,488) | $ | (1,354,492) | |||||||||
|
|
|
| |||||||||
| Location | Realized Gain/(Loss) | Location | Unrealized Gain/(Loss) | |||||||||
| Stone Harbor High Yield Fund | Net realized gain/(loss) on forward foreign currency contracts | $ | (403,106) | Change in unrealized appreciation/(depreciation) on forward foreign currency contracts | $ | (381,069) | ||||||
|
|
|
| |||||||||
| $ | (403,106) | $ | (381,069) | |||||||||
|
|
|
| |||||||||
| Location | Realized Gain/(Loss) | Location | Unrealized Gain/(Loss) | |||||||||
Stone Harbor Local Markets Fund | Net realized gain/(loss) on forward foreign currency contracts | $ | (934,493) | Change in unrealized appreciation/(depreciation) on forward foreign currency contracts | $ | 2,917,307 | ||||||
|
|
|
| |||||||||
| $ | (934,493) | $ | 2,917,307 | |||||||||
|
|
|
| |||||||||
| Location | Realized Gain/(Loss) | Location | Unrealized Gain/(Loss) | |||||||||
Stone Harbor Emerging Markets Corporate Debt Fund | Net realized gain/(loss) on forward foreign currency contracts | $ | (40,001) | Change in unrealized appreciation/(depreciation) on forward foreign currency contracts | $ | (39,200) | ||||||
|
|
|
| |||||||||
| $ | (40,001) | $ | (39,200) | |||||||||
|
|
|
| |||||||||
3. TAX BASIS INFORMATION
Tax Basis of Distributions to Shareholders: Net investment income/(loss) and net realized gain/(loss) may differ for financial statement and tax purposes. The character of distributions made during the year from net investment income or net realized gains may differ from its ultimate characterization for federal income tax purposes. Also, due to the timing of dividend distributions, the fiscal year in which amounts are distributed may differ from the fiscal year in which the income or realized gain was recorded by a Fund.
The amounts and characteristics of tax basis distributions and composition of distributable earnings/(accumulated losses) are finalized at fiscal year end; accordingly, tax basis balances have not been determined as of November 30, 2013.
The tax character of the distributions paid by the Funds during the years ended May 31, 2013 and May 31, 2012 , was as follows:
Stone Harbor Emerging Markets Debt Fund | ||||||||
| For the Year Ended May 31, | ||||||||
| 2013 | 2012 | |||||||
Ordinary Income | $ | 78,804,336 | $ | 69,336,608 | ||||
Long-Term Capital Gain | 2,870,149 | 1,804,387 | ||||||
Total | $ | 81,674,485 | $ | 71,140,995 | ||||
| Stone Harbor Investment Funds Semi-Annual Report | November 30, 2013 | 63 |
Table of Contents
| Stone Harbor Investment Funds | Notes to Financial Statements | |
| November 30, 2013 (Unaudited) |
Stone Harbor High Yield Bond Fund | ||||||||
| For the Year Ended May 31, | ||||||||
| 2013 | 2012 | |||||||
Ordinary Income | $ | 33,469,548 | $ | 38,131,521 | ||||
Long-Term Capital Gain | 1,484,074 | 12,255,940 | ||||||
Total | $ | 34,953,622 | $ | 50,387,461 | ||||
Stone Harbor Local Markets Fund | ||||||||
| For the Year Ended May 31, | ||||||||
| 2013 | 2012 | |||||||
Ordinary Income | $ | 82,687,694 | $ | 44,750,817 | ||||
Long-Term Capital Gain | 902,771 | 1,784,323 | ||||||
Return of Capital | – | 2,731,631 | ||||||
Total | $ | 83,590,465 | $ | 49,266,771 | ||||
Stone Harbor Emerging Markets Corporate Debt Fund | ||||||||
| For the Year Ended May 31, | ||||||||
| 2013 | 2012 | |||||||
Ordinary Income | $ | 2,733,381 | $ | 1,965,171 | ||||
Total | $ | 2,733,381 | $ | 1,965,171 | ||||
As of May 31, 2013, the components of distributable earnings on a tax basis were as follows: | ||||||||
Stone Harbor Emerging Markets Debt Fund | ||||||||
Undistributed Ordinary Income | $ | 1,934,150 | ||||||
Accumulated Capital Loss | (4,854,935) | |||||||
Unrealized Appreciation | 26,952,947 | |||||||
Cumulative Effect of Other Timing Difference* | (951,692) | |||||||
Total | $ | 23,080,470 | ||||||
Stone Harbor High Yield Bond Fund | ||||||||
Undistributed Ordinary Income | $ | 3,340,388 | ||||||
Accumulated Capital Gain | 7,048,548 | |||||||
Unrealized Appreciation | 19,420,537 | |||||||
Cumulative Effect of Other Timing Difference* | (245,129) | |||||||
Total | $ | 29,564,344 | ||||||
Stone Harbor Local Markets Fund | ||||||||
Undistributed Ordinary Income | $ | 21,946,932 | ||||||
Accumulated Capital Gain | 4,745,258 | |||||||
Unrealized Depreciation | (106,582,261) | |||||||
Cumulative Effect of Other Timing Difference* | 814,920 | |||||||
Total | $ | (79,075,151) | ||||||
Stone Harbor Emerging Markets Corporate Debt Fund | ||||||||
Undistributed Ordinary Income | $ | 168,327 | ||||||
Accumulated Capital Loss | (1,734,721) | |||||||
Unrealized Appreciation | 538,220 | |||||||
Cumulative Effect of Other Timing Difference* | (16,025) | |||||||
Total | $ | (1,044,199) | ||||||
| * | Other temporary differences due to timing, consist primarily of mark-to-market on forward foreign currency contracts. |
64 | www.shiplp.com |
Table of Contents
| Stone Harbor Investment Funds | Notes to Financial Statements | |
| November 30, 2013 (Unaudited) |
The tax components of distributable earnings are determined in accordance with income tax regulations which may differ from the composition of net assets reported under GAAP. Accordingly, for the year ended May 31, 2013, certain differences were reclassified. These differences were primarily attributed to the differing tax treatment of foreign currencies, in kind transactions and certain other investments and the amounts reclassified did not affect net assets.
The reclassifications were as follows:
| Fund | Paid-in Capital | Accumulated Net Investment Income/(Loss) | Accumulated Net Realized Gain/(Loss) on Investments | |||||||||
Stone Harbor Emerging Markets Debt Fund | $ | – | $ | (1,351,367) | $ | 1,351,367 | ||||||
Stone Harbor High Yield Bond Fund | 1,849,556 | (782,039) | (1,067,517) | |||||||||
Stone Harbor Local Markets Fund | – | (3,500,290) | 3,500,290 | |||||||||
Stone Harbor Emerging Markets Corporate Debt Fund | (105) | 24,809 | (24,704) | |||||||||
Capital Losses: As of May 31, 2013 the following Funds had capital loss carryforwards which may reduce the Funds’ taxable income arising from future net realized gains on investments, if any, to the extent permitted by the Code and thus may reduce the amount of the distributions to shareholders which would otherwise be necessary to relieve the Funds of any liability for federal tax pursuant to the Code.
Capital losses deferred to next tax year were as follows:
| Fund | Long-Term | |||
Stone Harbor Emerging Markets Corporate Debt Fund | $ | 362,605 | ||
Under the recently enacted Regulated Investment Company Modernization Act of 2010, capital losses incurred by each Fund after January 1, 2011 will not be subject to expiration. | ||||
The following Funds elect to defer to the year ending May 31, 2014 the following losses recognized during the period November 1, 2012 through May 31, 2013: | ||||
| Capital | ||||
Stone Harbor Emerging Markets Debt Fund | $ | 4,955,505 | ||
Stone Harbor Emerging Markets Corporate Debt Fund | $ | 1,372,116 | ||
Unrealized Appreciation and Depreciation on Investments: At November 30, 2013 the aggregate gross unrealized appreciation and depreciation of investments for federal income purposes were as follows: | ||||
Stone Harbor Emerging Markets Debt Fund | ||||
Gross appreciation on investments (excess of value over tax cost) | $ | 16,145,741 | ||
Gross depreciation on investments (excess of tax cost over value) | (126,145,545) | |||
Net unrealized depreciation | $ | (109,999,804) | ||
Cost of investments for income tax purposes | $ | 1,986,217,012 | ||
Stone Harbor High Yield Bond Fund | ||||
Gross appreciation on investments (excess of value over tax cost) | $ | 17,907,358 | ||
Gross depreciation on investments (excess of tax cost over value) | (3,151,267) | |||
Net unrealized appreciation | $ | 14,756,091 | ||
Cost of investments for income tax purposes | $ | 326,087,986 | ||
Stone Harbor Local Markets Fund | ||||
Gross appreciation on investments (excess of value over tax cost) | $ | – | ||
Gross depreciation on investments (excess of tax cost over value) | (235,012,430) | |||
Net unrealized depreciation | $ | (235,012,430) | ||
Cost of investments for income tax purposes | $ | 2,524,062,479 | ||
| Stone Harbor Investment Funds Semi-Annual Report | November 30, 2013 | 65 |
Table of Contents
| Stone Harbor Investment Funds | Notes to Financial Statements | |
| November 30, 2013 (Unaudited) |
Stone Harbor Emerging Markets Corporate Debt Fund | ||||
Gross appreciation on investments (excess of value over tax cost) | $ | 665,043 | ||
Gross depreciation on investments (excess of tax cost over value) | (989,614) | |||
| ||||
Net unrealized depreciation | $ | (324,571) | ||
| ||||
Cost of investments for income tax purposes | $ | 42,630,272 | ||
| ||||
4. ADVISORY FEES
Stone Harbor Investment Partners LP is the Trust’s investment adviser. Under the investment advisory agreement the Trust pays an investment advisory fee calculated daily and paid monthly of 0.60%, 0.50%, 0.75% and 0.85% of the average daily net assets for Stone Harbor Emerging Markets Debt Fund, Stone Harbor High Yield Bond Fund, Stone Harbor Local Markets Fund, and Stone Harbor Emerging Markets Corporate Debt Fund, respectively.
The Adviser has contractually agreed to waive fees and reimburse expenses with respect to each of the Funds so that the Net Annual Operating Expenses (exclusive of acquired Fund fees and expenses, brokerage expenses, interest expense, taxes and extraordinary expenses) of the Stone Harbor Emerging Markets Debt Fund Institutional Class, Stone Harbor High Yield Bond Fund Institutional Class, Stone Harbor Local Markets Fund Institutional Class and Stone Harbor Emerging Markets Corporate Debt Fund Institutional Class will not exceed 0.75%, 0.55%, 1.00% and 1.00%, respectively. This undertaking is in effect through September 30, 2014 and is reevaluated on an annual basis.
The Adviser will be permitted to recover, on a class by class basis, expenses it has borne through the undertakings described above to the extent that a Fund’s expenses in later periods fall below the annual rates set forth in the relevant undertaking. A Fund will not be obligated to pay any such deferred fees and expenses more than three years after the end of the fiscal year in which the fee and expense was deferred. At May 31, 2013, deferred fees and expenses eligible to be recovered will expire as follows:
| 2014 | 2015 | 2016 | Total | |||||||||||||
Stone Harbor High Yield Bond Fund | $ | 423,643 | $ | 324,939 | $ | 256,488 | $ | 581,427 | ||||||||
Stone Harbor Emerging Markets Corporate Debt Fund | N/A | $ | 97,840 | $ | 99,115 | $ | 196,955 | |||||||||
5. INVESTMENTS
During the period ended November 30, 2013, common stock holdings were redeemed in-kind. The intent of the transfers was to save on equity transaction costs both for the redeeming shareholder at the institution they transferred to and for Stone Harbor High Yield Bond Fund, Stone Harbor Local Markets Fund and the Stone Harbor Emerging Markets Corporate Debt Fund on the sale of assets. The assets of one separate account in Stone Harbor High Yield Bond Fund, Stone Harbor Local Markets Fund and the Stone Harbor Emerging Markets Corporate Debt Fund were redeemed-in-kind out of each Fund in the amount of $10,440,611, $63,146,083 and $15,963,069.54 with a realized gain/(loss) of $306,685, $(8,084,066) and $(198,482), respectively.
For the period ended November 30, 2013, the aggregate cost of purchases and proceeds from sales of investments (excluding short-term investments and transfer-in-kinds) were as follows:
| Purchases | Sales | |||||||
Stone Harbor Emerging Markets Debt Fund | $ | 819,755,292 | $ | 602,282,849 | ||||
Stone Harbor High Yield Bond Fund | 85,560,992 | 121,778,872 | ||||||
Stone Harbor Local Markets Fund | 2,297,506,086 | 1,961,510,541 | ||||||
Stone Harbor Emerging Markets Corporate Debt Fund | 23,865,525 | 30,417,276 | ||||||
66 | www.shiplp.com |
Table of Contents
| Stone Harbor Investment Funds | Notes to Financial Statements | |
| November 30, 2013 (Unaudited) |
6. AFFILIATED COMPANIES
The Stone Harbor Emerging Markets Corporate Debt Fund may invest in certain securities that are considered securities issued by affiliated companies. As defined by the 1940 Act, an affiliated person, including an affiliated company, is one in which a Fund owns 5% or more of the outstanding voting securities, or a company which is under common ownership or control with the Fund. The purchases, sales, dividend income, capital gains, return of capital distributions received, shares and value of investments in affiliated companies for the year ended November 30, 2013 were as follows:
| Security Name | Share Balance May 31, 2013 | Purchases | Sales | Share Balance 2013 | Dividend Income | Realized Gain/(Loss) | Market Value 2013 | |||||||||||||||||||||
| ||||||||||||||||||||||||||||
Stone Harbor Emerging Markets Corporate Debt Fund | – | 1,665,074 | – | 1,665,074 | $ | 229,508 | $ | – | $ | 14,869,110 | ||||||||||||||||||
| ||||||||||||||||||||||||||||
TOTAL | $ | 229,508 | $ | – | $ | 14,869,110 | ||||||||||||||||||||||
| ||||||||||||||||||||||||||||
7. APPLICATION OF RECENT ACCOUNTING PRONOUNCEMENTS
In June 2013, the Financial Accounting Standards Board (FASB) issued Accounting Standards Update (ASU) No. 2013-08, Financial Services- Investment Companies (Topic 946): Amendments to the Scope, Measurement, and Disclosure Requirements. The FASB standard identifies characteristics a company must assess to determine whether it is considered an investment company for financial reporting purposes. This ASU is effective for fiscal years beginning after December 15, 2013. The Fund believes the adoption of this ASU will not have a material impact on its financial statements.
8. SHARES OF BENEFICIAL INTEREST
At November 30, 2013, the Trust had an unlimited number of shares of beneficial interest authorized with a par value of $0.001 per share. The Funds have the ability to issue multiple classes of shares. Each share of a class represents an identical interest and has the same rights, except that each class bears certain direct expenses, including those specifically related to the distribution of its shares. Transactions in shares of the Institutional Class can be found on the Statements of Changes in Net Assets.
9. BENEFICIAL OWNERSHIP
As of November 30, 2013 IMF Retired Staff Benefits owned beneficially 34.30% of the Stone Harbor High Yield Bond Fund’s outstanding shares and the Stone Harbor Emerging Markets Debt Fund owned beneficially 34.82% of the Stone Harbor Emerging Markets Corporate Debt Fund’s outstanding shares.
10. INDEMNIFICATIONS
Under the Trust’s organizational documents, its officers and Trustees are indemnified against certain liability arising out of the performance of their duties to the Trust. Additionally, in the normal course of business, the Trust enters into contracts with service providers that may contain general indemnification clauses. The Trust’s maximum exposure under these arrangements is unknown, as this would involve future claims that may be made against the Trust that have not yet occurred.
11. OTHER
Board of Trustees Compensation: No officer, trustee or employee of the Adviser or any of its affiliates receives any compensation from the Funds for serving as an officer or trustee of the Funds. The Trust will pay each Trustee who is not an interested person an annual fee of $54,000. All Trustees are reimbursed for reasonable travel and out-of-pocket expenses incurred to attend such meetings.
12. SUBSEQUENT EVENTS
The Stone Harbor Investment Grade Fund and the Stone Harbor Strategic Income Fund were added to the Trust. Both Funds have completed registration with the Securities and Exchange Commission and commenced operations on December 18, 2013.
| Stone Harbor Investment Funds Semi-Annual Report | November 30, 2013 | 67 |
Table of Contents
| Stone Harbor Investment Funds | Additional Information | |
| November 30, 2013 (Unaudited) |
FUND PORTFOLIO HOLDINGS
The SEC has adopted the requirement that all registered investment companies file a complete schedule of portfolio holdings with the SEC for their first and third fiscal quarters on Form N-Q. For the Funds, this would be for the fiscal quarters ending August 31 and February 28. The Form N-Q filing must be made within 60 days of the end of the quarter. The Funds’ Forms N-Q will be available on the SEC’s website at http://www.sec.gov., or they may be reviewed and copied at the SEC’s Public Reference Room in Washington, DC (call 1-800-732-0330 for information on the operation of the Public Reference Room).
PROXY VOTING
A description of the policies and procedures that the Funds use to determine how to vote proxies relating to portfolio securities and information regarding how the Funds voted proxies relating to portfolio securities for the 12-month period ended June 30, 2013 are available without a charge, upon request, by contacting Stone Harbor Investment Funds at 1-866-699-8158 or on the SEC website at http://www.sec.gov.
68 | www.shiplp.com |
Table of Contents

INVESTMENT ADVISER
Stone Harbor Investment Partners LP
31 W. 52nd Street 16th Floor
New York, New York 10019
ADMINISTRATOR & FUND ACCOUNTANT
ALPS Fund Services, Inc.
1290 Broadway, Suite 1100
Denver, Colorado 80203
DISTRIBUTOR
ALPS Distributors, Inc.
1290 Broadway, Suite 1100
Denver, Colorado 80203
TRANSFER AGENT
ALPS Fund Services, Inc.
1290 Broadway, Suite 1100
Denver, Colorado 80203
CUSTODIAN
The Bank of New York Mellon
One Wall Street
New York, New York 10286
LEGAL COUNSEL
Ropes & Gray LLP
1211 Avenue of the Americas
New York, New York 10036
INDEPENDENT REGISTERED PUBLIC ACCOUNTING FIRM
Deloitte & Touche LLP
555 17th Street, Suite 3600
Denver, Colorado 80202
This report and its financial statements are submitted for the general information of the shareholders of the Funds. The report is not authorized for distribution to prospective investors in the Funds unless preceded or accompanied by a prospectus.
SHF000678 exp. 01/31/15
Table of Contents
| Item 2. | Code of Ethics. |
Not applicable to this Report.
| Item 3. | Audit Committee Financial Expert. |
Not applicable to this Report.
| Item 4. | Principal Accountant Fees and Services. |
Not applicable to this Report.
| Item 5. | Audit Committee of Listed Registrants. |
Not applicable to Registrant.
| Item 6. | Investments. |
| (a) | Schedule of Investments in securities of unaffiliated issuers as of the close of the reporting period is included as part of the Report to Stockholders filed under Item 1 of this Form N-CSR. |
| (b) | Not applicable. |
| Item 7. | Disclosure of Proxy Voting Policies and Procedures for Closed-End Management Investment Companies. |
Not applicable to Registrant.
| Item 8. | Portfolio Managers of Closed-End Management Investment Companies. |
Not applicable to Registrant.
Table of Contents
| Item 9. | Purchases of Equity Securities by Closed-End Management Investment Companies and Affiliated Purchasers. |
Not applicable to Registrant.
| Item 10. | Submission of Matters to a Vote of Security Holders. |
There have been no material changes to the procedures by which shareholders may recommend nominees to the Registrant’s Board of Trustees, where those changes were implemented after the Registrant last provided disclosure in response to the requirements of Item 407(c)(2) of Regulation S-K, or this Item.
| Item 11. | Controls and Procedures. |
| (a) | The Registrant’s principal executive officer and principal financial officer have concluded that the Registrant’s disclosure controls and procedures (as defined in Rule 30a-3(c) under the Investment Company Act of 1940, as amended) are effective as of a date within 90 days of the filing date of this Report, based on their evaluation of these controls and procedures required by Rule 30a-3(b) under the Investment Company Act of 1940, as amended, and Rule 15d-15(b) under the Securities Exchange Act of 1934, as amended. |
| (b) | There was no change in the Registrant’s internal control over financial reporting (as defined in Rule 30a-3(d) under the Investment Company Act of 1940, as amended) during the second fiscal quarter of the period covered by this Report that has materially affected, or is reasonably likely to materially affect, the Registrant’s internal control over financial reporting. |
| Item 12. | Exhibits. |
| (a)(1) | Not applicable to this Report. |
| (a)(2) | The certifications required by Rule 30a-2(a) of the Investment Company Act of 1940, as amended, and Section 302 of the Sarbanes-Oxley Act of 2002 are attached hereto as Exhibit 99.Cert. |
| (a)(3) | None. |
| (b) | The certifications by the Registrant’s principal executive officer and principal financial officer, as required by Rule 30a-2(b) of the Investment Company Act of 1940, as amended, and Section 906 of the Sarbanes-Oxley Act of 2002 are attached hereto as Exhibit 99.906Cert. |
Table of Contents
SIGNATURES
Pursuant to the requirements of the Securities Exchange Act of 1934 and the Investment Company Act of 1940, the Registrant has duly caused this Report to be signed on its behalf by the undersigned, thereunto duly authorized.
| Stone Harbor Investment Funds | ||
| By: | /s/ Peter J. Wilby | |
| Peter J. Wilby | ||
President and Chief Executive Officer/Principal Executive Officer | ||
| Date: | February 7, 2014 | |
Pursuant to the requirements of the Securities Exchange Act of 1934 and the Investment Company Act of 1940, this Report has been signed below by the following persons on behalf of the Registrant and in the capacities and on the dates indicated.
| Stone Harbor Investment Funds | ||
| By: | /s/ Peter J. Wilby | |
| Peter J. Wilby | ||
President and Chief Executive Officer/Principal Executive Officer | ||
| Date: | February 7, 2014 | |
| By: | /s/ James J. Dooley | |
| James J. Dooley | ||
Treasurer and Chief Financial Officer/Principal Financial Officer | ||
| Date: | February 7, 2014 | |