Table of Contents
UNITED STATES
SECURITIES AND EXCHANGE COMMISSION
Washington, D.C. 20549
FORM N-CSR
CERTIFIED SHAREHOLDER REPORT OF REGISTERED
MANAGEMENT INVESTMENT COMPANIES
Investment Company Act file number: 811-22037
Stone Harbor Investment Funds
(Exact name of registrant as specified in charter)
1290 Broadway, Suite 1100
Denver, CO 80203
(Address of principal executive offices) (Zip code)
Adam J. Shapiro, Esq.
c/o Stone Harbor Investment Partners LP
31 West 52nd Street, 16th Floor
New York, NY 10019
(Name and address of agent for service)
With copies To:
Michael G. Doherty, Esq.
Ropes & Gray LLP
1211 Avenue of the Americas
New York, NY 10036
Registrant’s telephone number, including area code: (303) 623-2577
Date of fiscal year end: May 31
Date of reporting period: June 1, 2012 - November 30, 2012
Table of Contents
| Item 1. | Report to Stockholders. |
Table of Contents

Table of Contents
| Table of Contents | ||
| 2 | ||||
| 7 | ||||
| 8 | ||||
| 10 | ||||
| 11 | ||||
| 12 | ||||
| 13 | ||||
| 14 | ||||
| 30 | ||||
| 42 | ||||
| 48 | ||||
| 55 | ||||
| 56 | ||||
| 57 | ||||
| 59 | ||||
| 60 | ||||
| 61 | ||||
| 62 | ||||
| 63 | ||||
| 74 | ||||
| Stone Harbor Investment Funds Semi-Annual Report | November 30, 2012 | 1 |
Table of Contents
| Stone Harbor Investment Funds | Shareholder Letter | |
| November 30, 2012 (Unaudited) |
Dear Shareholder,
The six months ended November 30, 2012 can be characterized by cautious and measured optimism, globally. Coordinated efforts in the Euro zone to contain and mitigate the sovereign debt crisis, as well as positive indicators signaling improvements in the economic conditions in the U.S. and China alleviated much of the concerns the financial markets had been grappling with since the earlier part of the year. In general, the credit environment has improved over the course of the last six months, and steps taken by European policy makers have been supportive of risk assets.
While improvements in both the financial markets and the global economy are not insignificant, there remain major challenges that must be carefully addressed in the coming months. Politics will continue to play a critical role in the European markets and economy. In addition to 2013 general elections in Italy and Germany, further progress towards a deeper economic and monetary union will be key in securing market participants’ confidence in the sustainability of the single currency. Likewise, the political situation in the U.S. will need to be closely monitored as the recent concerns around the Fiscal Cliff can potentially engender a large fiscal tightening and threaten to sidetrack the gradual improvement of the U.S. economy. In Japan, the outlook for monetary policy is likely to be one of more significant quantitative easing by the Bank of Japan. Lastly, while China’s growth levels are unlikely to return to the double digit pace of Gross Domestic Product (“GDP”) growth experienced in recent years, the economy appears to have stabilized.
As we continue to monitor these developments, please follow our progress throughout the year by visiting our website at www.shiplp.com. There, you will find updates on our view of credit markets, as well as related news and research. We appreciate the confidence you have placed in Stone Harbor Investment Partners and look forward providing you with another update in the next six months.
Semiannual (2012) Market Review
Risk appetite and asset prices were up during the 6-month period ending November 30, 2012 on three main drivers: the European Central Bank (“ECB”) and the Federal Open Market Committee (“FOMC”) response to the European debt crisis and weakening global growth; stabilizing economic growth in China; and an improving U.S. economy. Fixed income investments reported consistent positive monthly returns throughout the period, and equities reached levels not seen since December 2007 before ending the period up 9.32%. Market volatility still played a role, however, as European sovereign debt concerns had the 10-year Treasury reaching a low yield of 1.39% in July before ending the period at 1.62% and remaining virtually unchanged for the period.
At the start of the review period, questions shaping the market continued to focus on the ability of Greece to form a government, the financial viability of the Spanish banking system, and weak global economic growth. Although Greek elections ultimately showed support for a pro Euro government, Spain was forced to request a bailout from the European Union (“EU”) for it banks. As sovereign spreads widened, the EU Leaders Summit surprised the market with a plan that would allow for direct bank recapitalization and the utilization of the firewalls (European Financial Stability Facility/European Stability Mechanism) to “stabilize markets for member states”. Officials also committed to break the “vicious” link between sovereign and bank balance sheets.
Despite this support, Europe continued to struggle as GDP contracted more, with weakness especially in the peripheral countries, and unemployment reached its highest level in decades. Concerns over the European sovereign debt crisis peaked as Spain announced that it would require additional funds to finance regional governments after receiving bank bailout aid earlier in the year. The International Monetary Fund (“IMF”) was rumored to be questioning further aid to Greece, while credit rating agency S&P warned that Greece’s ratings may be cut on the likelihood that it will need additional support. Italy was downgraded by credit rating agency Moody’s, and Portugal warned that they would not reach their deficit goals because of weaker-than-expected growth. As sovereign debt fears spread, the Spanish and Italian 10-year rates reached unsustainable levels. Although the ECB cut rates to a record low, it was not until ECB President Draghi stated that the ECB would do whatever it takes to preserve the Euro that the market took notice. As the ECB revised down its economic forecast, it announced plans to purchase an unlimited amount of sovereign bonds through a new program Outright Monetary Transactions (“OMT”), focusing on short maturities, after the affected countries officially request aid. This program reduced risk levels in sovereign debt causing a significant rally in peripheral bonds even in the face of a weak European economy. Greece ended the period reaching agreement with the IMF and EU for additional aid disbursement.
The Fed initiated a number of actions during the period to address concerns over weakening trends and to boost growth. As it lowered its estimate for GDP growth, the Federal Reserve (“Fed”) expanded its “Operation Twist” and stated that it is “prepared to take further action” as necessary. This would prove not to be the only stimulus during the period, and while market anticipation of additional stimulus kept risk assets from declining, the domestic economy continued to exhibit muted growth during the period.
One week after the ECB enacted its new bond purchase program, the Federal Reserve took very aggressive policy actions, committing to open-ended and unlimited asset purchase programs until the labor market substantially strengthens, and vowing to maintain near-zero rates for a considerable time even after the recovery strengthens. This combined with the ECB program gave a significant lift to risk assets. These actions helped the market until November when Washington and fiscal cliff concerns caused additional volatility in credit markets. However, the month ended on a positive note with a sense of optimism that a fiscal compromise would be reached. Housing is leading the economic recovery as housing starts surged to their highest level in four years, new home sales rose to the highest level in more than two years, and housing prices are showing a firming trend. Corporate profits met reduced expectations in the second quarter, and managements spoke of weakening business
2 | www.shiplp.com |
Table of Contents
| Stone Harbor Investment Funds | Shareholder Letter | |
| November 30, 2012 (Unaudited) |
conditions as the third quarter progressed. After growing at 2% during the first quarter, second quarter US GDP growth came in at an anemic 1.3% before reporting a more respectable 2.7% in the third quarter.
In spite of continued concern over slowing global growth and the European debt crisis, credit market performance was surprisingly consistent during the period with all months reporting positive returns. As represented by the Citigroup High Yield Index, high yield spreads tightened over 100 basis points, ending the period at 564 basis points and the average yield declined from 7.66% to 6.32%. Although corporate earnings retreated from their prior higher growth rates, CCC- rated bonds outperformed both BB-and B- rated securities. Default rates remain at historically low levels and with a record amount of new issuance, refinancing risk has been significantly reduced.
In emerging markets (“EM”), external sovereign bond credit spreads over comparable maturity U.S. Treasury securities tightened during the reporting period and total returns in all but one of the countries in the index were positive. Despite concerns regarding global growth and Europe’s debt crisis that plagued markets during the first half of the year, strong inflows into the asset class, solid balance sheets, and low interest rates supported EM debt performance during the period. Returns for the emerging local currency debt markets were driven by local interest rate movements and carry, as well as movements in foreign exchange relative to the U.S. dollar. While global growth showed signs of stabilization, expectations for both growth and inflation remained low, supporting local rates. Additionally, strong investor flows into the asset class due to still wide yield differentials relative to domestic debt from developed countries further supported local rates, particularly in long duration instruments. Emerging markets corporate debt asset class posted strong returns benefitting from central bank policy action by the ECB and Fed, which were generally supportive of a rally in risk assets. The asset class benefitted from record issuance, which has increased the stock of EM corporate debt to over $1 trillion.
At Stone Harbor, we will continue to focus on seeking to capture excess return from stable and improving credit situations in corporate and sovereign markets worldwide. We remain vigilant to the credit risks associated with the systematic banking problems in Europe, as well as the slowdown in global growth.
Stone Harbor Emerging Markets Debt Fund
The total return of the Stone Harbor Emerging Markets Debt Fund (the “Fund” or “portfolio”) for the six months ended November 30, 2012 was 11.67% (net of expenses) and 12.02% (gross of expenses). This performance compares to a benchmark return of 12.68% for the JP Morgan EMBI Global Diversified. External sovereign bond credit spreads over comparable maturity U.S. Treasury securities tightened during the reporting period and total returns in all but one of the countries in the index- Belize- were positive. Despite concerns regarding global growth and Europe’s debt crisis that plagued markets during the first half of the year, strong inflows into the asset class, solid balance sheets, and low interest rates supported EM debt performance during the 6 month period ending November 30th . After a volatile April and May, foreign exchange markets began a slow recovery that accelerated after the European Central Bank (ECB) and the U.S. Federal Reserve announced bond purchasing plans at the end of August and early September. Signs of a rebound in Chinese economic activity, in our view, also helped to buoy returns.
Technical factors also supported returns. Investor demand for emerging markets external debt remained strong. According to JP Morgan, new allocations to emerging markets from institutional fixed income investors set a new record in 2012 with inflows exceeding $80 billion. Of this amount, over 75% was allocated to US dollar- denominated sovereign and corporate bonds; the remainder went to local currency investments. In addition, many emerging market governments took advantage of demand for emerging markets debt to fulfill a majority financing needs for 2012 and 2013. As a result, the remaining calendar of debt issuance remained manageable, in our view, particularly in comparison to the large funding needs of advanced economies including Spain, Italy, Japan, the United Kingdom and the United States.
Throughout the period, the portfolio was positioned to seek to take advantage of the portfolio management team’s country views and assessments of global risks and relative value. The Fund retained its exposure to corporate debt, but continued to shift into more defensive investment grade positions, selling higher yielding bonds as the markets rallied. The Fund’s corporate market value exposure at the end of the reporting period was 14.66%. After reducing local markets exposure 1 during the first quarter, the portfolio management team increased the Fund’s exposure to local currencies and local interest rates from 4.6%1 to 9.7% on early signs of stabilization in economic activity in China and other key emerging markets. Despite strong absolute performance, the Fund underperformed its benchmark primarily as a result of 1) allocations to corporate debt in Indonesia and Brazil and 2) selection of short maturity securities in Venezuela. Corporate debt owned by the Fund in Indonesia and Brazil underperformed sovereign debt in each country. In Indonesia, the holdings of coal companies in particular came under pressure as coal prices fell on fears of a hard landing for the Chinese economy. The rapid slowdown of the Brazilian economy weighed on prices of corporate bonds, particularly banks. Decisions to underweight Hungary and Ivory Coast also detracted from performance as did an overweight in Mexico. However, overweights in Venezuela, Iraq and Argentina enhanced excess returns as did underweights in Lebanon, Chile, China and Brazil.
Short duration securities in Venezuela underperformed as markets speculated in favor of a regime change following the October 7th Presidential election in which Hugo Chavez, the President for the past 14 years, was running for- re election despite reports of his poor health. Chavez eventually won the re-election and markets quickly reversed some of its bets on longer dated bonds. Issue selection decisions that enhanced performance included allocations to long duration external debt in Mexico, as well as exposure to the Mexican Peso.
| Stone Harbor Investment Funds Semi-Annual Report | November 30, 2012 | 3 |
Table of Contents
| Stone Harbor Investment Funds | Shareholder Letter | |
| November 30, 2012 (Unaudited) |
Stone Harbor High Yield Bond Fund
The Stone Harbor High Yield Bond Fund (the “Fund” or “portfolio”) return for the six months ended November 30, 2012 was 8.95% (net of expenses) and 9.23% (gross of expenses). This compares to a benchmark return of 7.87% for the Citigroup High Yield Market Capped Index. The high yield market benefitted from the ECB’s response to the European debt crisis, the Federal Reserve’s aggressive policy actions, global monetary easing, and an improving U.S. economy. High yield spreads, as represented by the Citigroup High Yield Capped Index, tightened over 100 basis points to end the period at 567 basis points with the average yield declining from 7.67% to 6.34%. Returns were fairly consistent throughout the period, however, the market was also influenced by continuing developments regarding the European debt crisis, as well as the more recent concern over the looming fiscal cliff. Sovereign debt concerns contributed to the 10-year Treasury reaching a low yield of 1.39% in July before ending the period at 1.62% versus 1.56% at the beginning of the period.
Non-cyclical industries slightly outperformed both the Cyclical and the Energy sectors. Specifically, Housing-related industries, Media, and Financials were the best performing sectors during the period, while Transportation and the Manufacturing sectors were the weakest. Due to the economic recovery, CCC-rated bonds outperformed both BB-rated and B-rated securities (S&P ratings). The par-weighted default rate decreased from 2.21% to 1.31%, its lowest level since October 2011 and well below its long term average of 4.06%, according to J.P. Morgan. The market had more companies returning to investment grade than companies downgraded to high yield. However, the number of credit agency downgrades exceeded the number of upgrades for the period. Market technicals were robust with record new issuance and record amounts flowing into high yield mutual funds. Refinancing risk was significantly reduced during the period as over 50% of new issuance was used to refinance outstanding debt.
The portfolio outperformed its benchmark as a result of issue selection decisions. Issue selection decisions within the Telecommunications, Cable & Media, and Publishing sectors were the main drivers of performance. Industry selection detracted from performance due to an underweight in the Home Building sector and an overweight in the Chemicals sector, which was partially offset by an overweight to the Telecom sector. In terms of ratings, an underweight to BB-rated bonds also contributed to performance.
We believe the portfolio is positioned for continuing, slow but steady U.S. economic growth. The portfolio is overweight B-rated securities relative to BB-rated bonds, as we believe the sector should outperform as valuations remain attractive. The largest portfolio industry overweights include the Telecommunications, Cable/Media, and Food/Beverage sectors, while the largest industry underweights include Energy, Services-Other, and Home Builders. We believe the high yield market may experience positive event risk such as mergers and acquisitions activity, and that equity markets could remain open to initial offerings of highly leveraged companies. Risk factors for credit markets continue to be primarily macro issues, in particular, the European sovereign debt/banking problems, the U.S. fiscal cliff, and the magnitude of the global economic slowdown.
Stone Harbor Local Markets Fund
The Stone Harbor Local Markets Fund (the “Fund” or “portfolio”) performance for the six months ended November 30, 2012 was 10.51% (net of expenses) and 10.94% (gross of expenses). This compares to a benchmark total return 12.78% for the JP Morgan GBI-EM Global Diversified. During the period, movements in foreign exchange (“FX”) relative to the U.S. dollar contributed 4.25% to the index total returns. Local interest rate movements and carry contributed 8.19%. While global growth showed signs of stabilization, expectations for both growth and inflation remained low, supporting local rates. Additionally, strong investor flows into the asset class due to still wide yield differentials relative to domestic debt from developed countries further supported local rates, particularly in long duration instruments.
FX volatility spiked in May 2012 as a result of a variety of factors. While currency weakness accompanies most periods of volatility within emerging markets, weaker currencies resulted at these times from heightened concerns over banking and sovereign debt crises in Europe and lower global growth. Additionally, the highly liquid nature of foreign exchange facilitated its use as a risk reduction instrument, putting further pressure on currencies. However, foreign exchange markets began to recover after bond buying announcements from the European Central Bank and the U.S. Federal Reserve, which in our view, reduced the near term “tail” risk in the market. Signs of a tentative rebound in global growth, particularly economic activity figures from China, also helped to boost currencies.
Throughout the reporting period, the portfolio favored faster growing economies in Latin America and Asia, with overweight allocations in Brazil, Colombia, Mexico and Malaysia. The portfolio’s underweight positions have been concentrated in Central and Eastern Europe, where a mix of more limited growth prospects, short-term policymaking, and contagion effects from an increasingly unstable Euro zone have reduced the attractiveness of local debt markets, in our view. We maintained a country overweight in Brazil in the portfolio, but continued to reduce the size of the overweight as the Brazilian Central Bank intervened aggressively to weaken its currency. Given our more constructive view of risk appetite, we removed a partial hedge from the Colombian Peso at the end of August. In light of signs of a tentative rebound in Chinese economic activity, we reduced the portfolio’s underweight to the Asian region through purchases of Indonesian and Malaysian bonds. We have funded these purchases by reducing the portfolio’s exposure in Poland. Given the aggressive move lower in long duration yields, and our view that most EM central banks have reached the end of their easing cycles, we have moved to underweight duration in all but a few credits. While inflation does not appear to be a significant problem in the short term, we added inflation linked bonds when we can buy breakeven rates that are at or below current inflation levels.
4 | www.shiplp.com |
Table of Contents
| Stone Harbor Investment Funds | Shareholder Letter | |
| November 30, 2012 (Unaudited) |
The Fund underperformed its benchmark as a result of country selection and issue selection decisions. The country decision that most detracted from performance was an underweight in Hungary, as it outperformed along with other credits linked to the Euro. Overweights in Brazil and South Africa and an underweight in Peru also detracted from performance. Overweights to Mexico and Russia and undereweights to Indonesia and Thailand enhanced performance. Decisions to allocate to short duration bonds in Poland, Russia and Turkey detracted from excess returns, while allocations to long duration local debt in South Africa and Colombia enhanced performance.
Stone Harbor Emerging Markets Corporate Debt Fund
The total return of the Stone Harbor Emerging Markets Corporate Debt Fund (the “Fund” or “portfolio”) for the six months ending November 30, 2012 was 9.05% (net of expenses) and 9.55% (gross of expenses). This performance compares to a benchmark return of 8.69% for the JP Morgan Corporate Emerging Markets Bond Index Broad Diversified (CEMBI Broad Diversified).
Despite continued uncertainty in Europe, the asset class posted strong returns benefitting from central bank policy action from the ECB and Fed, which were generally supportive of risk assets. The asset class benefitted from record issuance, which has increased the stock of EM corporate debt to over $1 trillion. Year-to-date, issuance has exceeded $310 billion. With the majority of issuance weighted towards Quasi-Sovereign and Investment Grade credit (approximately 78% of total Year-to-date issuance), the limited supply of High Yield credit coupled with strong inflows into the asset class resulted in significant outperformance of High Yield relative to Investment Grade. The CEMBI Broad Diversified High Yield Sub Index returned 11.21% during the six-month period ending November 30, 2012; the Investment Grade component of the index returned 7.75%.
The Fund maintained an overweight (“OW”) to High Yield relative to the index during this period, which generated excess returns. However, during the period, the Fund increased exposure to Investment Grade credit by 12.44%, reducing the underweight (“UW”) relative to the index from 18.07% to 7.93%, principally by taking profits in B-rated credits in favor of adding exposure to BBB-rated companies.
From a regional perspective, the Fund is OW Latin America and Emerging Europe while UW Asia and the Middle East. The biggest regional shift in the portfolio was an 8.6% increase in exposure to the Asia region funded principally through a reduction in exposure to Latin America and Emerging Europe. The Fund reduced its UW in Asia to 8.7% from 17.4%. The increase in Asia exposure was largely driven by increased exposure to Hong Kong, Malaysia, Singapore, South Korea and Thailand in defensive sectors.
Emerging Europe and Middle East were the largest contributors to outperformance during the period, contributing 1.02% and 0.66% in excess returns, respectively. The OW to Latin America detracted -0.94% from relative performance, driven primarily by Brazil exposure (-0.92%). The UW to Asia also enhanced relative performance, adding 0.31%. The outperformance in Asia was partially a result of the UW to the region, but largely a result of issue selection. Our OW in China contributed most significantly towards the Fund’s outperformance relative to the index in Asia with Chinese High Yield credit outperforming during the period.
From a country perspective, the Fund’s largest OW exposures were Brazil, Argentina, China, and Mexico. While we reduced our exposure to Brazil, Argentina and Mexico during the period, the Fund remained OW. The biggest country shifts in the portfolio were increases in exposure to Singapore and Qatar, 2.21% and 2.68%, respectively. In both countries, we reduced the portfolio’s UWs relative to the index by increasing exposure to more defensive Investment Grade companies in the Wireless Telecom and Utilities sectors.
Kazakhstan was the largest contributor to the Fund’s performance during the period, contributing 0.76% in excess returns compared to the index. The positive performance is attributable to both our exposure to High Yield Oil & Gas and positive price action following the announcement of the restructuring of the Kazakhstan banking sector. Other notable contributors to the Fund’s outperformance relative to the index includes Russia, which benefitted from strong performance of High Yield credit in the Metals/Mining/Steel and Wireless sectors. The Fund’s OW to Brazil contributed -0.92% towards underperformance relative to the index, driven by credit specific issues in the Banking sector. Argentina continues to have a negative impact on performance, reducing relative performance by -0.24% due to weakness in Argentina’s sovereign debt.
The Fund increased exposure to defensive industries such as electric utilities and Investment Grade banks in well regulated Asian Investment Grade countries. While the Banking sector remains an 18.18% UW relative to the index, the Fund increased its exposure from 5.77% to 13.72%, the largest increase in industry exposure during the period. The Fund’s UW to the Banking sector contributed +0.15% towards relative returns, despite the negative impact from its exposure to the Brazilian banking sector. The increase in exposure to the Banking sector was followed by a 2.80% increase in the Real Estate Development/Management industry and 1.67% increase in exposure to Electric utilities.
Sincerely,

Thomas K. Flanagan
Chairman of the Board of Trustees
| Stone Harbor Investment Funds Semi-Annual Report | November 30, 2012 | 5 |
Table of Contents
| Stone Harbor Investment Funds | Shareholder Letter | |
| November 30, 2012 (Unaudited) |
| 1 | Net of a hedge in the Colombian peso. |
Past performance does not guarantee future results.
The Citigroup High Yield Market Index (previously the Salomon Smith Barney High Yield Market Index) is a total rate-of-return index which captures the performance of below investment-grade debt issued by corporations domiciled in the United States or Canada. This index comprises Citigroup’s broadest market measure and includes cash-pay and deferred-interest securities. All the bonds in the high-yield indices are publicly placed, have a fixed coupon and are nonconvertible.
The JP Morgan Emerging Markets Bond Index (EMBI) Global Diversified tracks total returns for U.S. dollar-denominated debt instruments issued by emerging markets sovereign and quasi-sovereign entities: Brady bonds, loans, and Eurobonds. Source: JP Morgan Chase.
The JP Morgan Government Bond Index – Emerging Markets (GBI-EM) Global Diversified consists of regularly traded, liquid fixed-rate, domestic currency government bonds to which international investors can gain exposure. The weightings among the countries are more evenly distributed within this index. Although not expected to be a principal investment tool, the Portfolio may make use of derivative securities (including futures and options on securities, securities indices or currencies, options on futures, forward currency contracts, and interest rate, currency or credit default) for the purposes of reducing risk and/or obtaining efficient investment exposure. Source: JP Morgan Chase.
Emerging markets corporate debt is represented by JP Morgan Corporate Emerging Markets Bond Index (CEMBI) Broad Diversified. The CEMBI tracks total returns of US dollar-denominated debt instruments issued by corporate entities in Emerging Markets countries. Two variations are available: CEMBI Broad and CEMBI. The CEMBI Broad is the most comprehensive corporate benchmark followed by the CEMBI, which consists of an Investable universe of corporate bonds. Both indices are also available in Diversified version. The JPMorgan CEMBI Broad Diversified limits the current face amount allocations of the bonds. Both indices are also available in outstanding countries with larger debt stocks. Qualifying corporate bonds have a face amount greater than USD 300 million, maturity greater than 5 years, verifiable prices and cash flows, and from countries within Asia ex-Japan, Latin America, Eastern Europe, Middle East, and Africa.
It is not possible to invest directly in an index.
Standard and Poor’s ratings are measured on a scale that generally ranges from AAA (highest) to D (lowest). A security that has not been given a credit rating by Standard and Poor’s is listed as “not rated”.
Basis Point – a unit equal to one hundredth of a percentage point.
The Fiscal Cliff – the sharp decline in the budget deficit that could have occurred beginning in 2013 due to increased taxes and reduced spending as required by previously enacted laws.
Operational Twist – a policy, originally from the 1960’s but revived in September 2011 and implemented by the Federal Reserve. The policy involves the selling of short-term Treasuries by the central bank in exchange for the same amount in longer-term bonds, thereby lowering longer-term interest rates.
Sovereign Debt – Refers to bonds issued by a national government in order to finance the issuing country’s growth. Sovereign debt described as external is denominated in US dollar, while sovereign debt described as local is issued in a foreign currency.
Tail Risk – the risk of an asset or portfolio of assets moving more than 3 standard deviations (i.e., variation or dispersion from the average) from its current price.
The Citigroup High Yield Market Capped Index – represents a modified version of the High Yield Market Index by delaying the entry of fallen angel issues and capping the par value of individual issuers at US $10 billion par amount outstanding. The Citigroup High Yield Market Index includes cash-pay, deferred-interest and Rule 144A bonds. The bonds must have a remaining maturity of at least one year, a minimum amount outstanding of $100 million (subject to an entry criteria of $200 million per issue or $400 million per issuer), and a speculative grade rating by both Moody’s Investor Service and Standard & Poor’s. When an issuer misses or expects to miss an interest payment or enters Chapter 11, the bonds exit the index at month-end. The returns are adjusted for the loss of a coupon payment or accrued interest.
Investment Grade – Refers to bonds that have a relatively low risk of default, ranging from highest credit quality to good credit quality. Bonds rated below investment grade are considered to have significant speculative characteristics.
6 | www.shiplp.com |
Table of Contents
| Stone Harbor Investment Funds | Disclosure of Fund Expenses | |
| November 30, 2012 (Unaudited) |
Example. As a shareholder of a Fund, you incur two types of costs: (1) transaction costs, including sales charges (loads) on purchase payments and/or redemption fees (if applicable) and (2) ongoing costs, including management fees and other Fund expenses. The below examples are intended to help you understand your ongoing costs (in dollars) of investing in a Fund and to compare these costs with the ongoing costs of investing in other mutual funds. The examples are based on an investment of $1,000 invested on June 1, 2012 and held until November 30, 2012.
Actual Expenses. The first line of each table below provides information about actual account values and actual expenses. You may use the information in this line, together with the amount you invested, to estimate the expenses that you paid over the period. Simply divide your account value by $1,000 (for example, an $8,600 account value divided by $1,000 = 8.6), then multiply the result by the number in the first line under the heading “Expenses Paid During Period” to estimate the expenses you paid on your account during this period.
Hypothetical Example for Comparison Purposes. The second line of each table below provides information about hypothetical account values and hypothetical expenses based on the Fund’s actual expense ratio and an assumed rate of return of 5% per year before expenses, which is not the Fund’s actual return. The hypothetical account values and expenses may not be used to estimate the actual ending account balance or expenses you paid for the period. You may use this information to compare the ongoing costs of investing in a Fund and other mutual funds. To do so, compare this 5% hypothetical example with the 5% hypothetical examples that appear in the shareholder reports of the other funds.
Please note that the expenses shown in the table are meant to highlight your ongoing costs only and do not reflect transactional costs, such as redemption fees, sales charges (loads) or exchange fees. Therefore, the second line of the table is useful in comparing ongoing costs only, and will not help you determine the relative total costs of owning different funds. In addition, if these transactional costs were included, your costs would have been higher.
| Beginning Account Value 06/01/2012 | Ending Account Value 11/30/2012 | Expense Ratio(1) | Expenses Paid During Period(2) | |||||||||||||
STONE HARBOR EMERGING MARKETS DEBT FUND |
| |||||||||||||||
Institutional Class | ||||||||||||||||
Actual | $ | 1,000.00 | $ | 1,116.70 | 0.69 | % | $ | 3.66 | ||||||||
Hypothetical (5% return before expenses) | $ | 1,000.00 | $ | 1,021.61 | 0.69 | % | $ | 3.50 | ||||||||
STONE HARBOR HIGH YIELD BOND FUND | ||||||||||||||||
Institutional Class | ||||||||||||||||
Actual | $ | 1,000.00 | $ | 1,089.50 | 0.55 | % | $ | 2.88 | ||||||||
Hypothetical (5% return before expenses) | $ | 1,000.00 | $ | 1,022.31 | 0.55 | % | $ | 2.79 | ||||||||
STONE HARBOR LOCAL MARKETS FUND |
| |||||||||||||||
Institutional Class | ||||||||||||||||
Actual | $ | 1,000.00 | $ | 1,105.10 | 0.85 | % | $ | 4.49 | ||||||||
Hypothetical (5% return before expenses) | $ | 1,000.00 | $ | 1,020.81 | 0.85 | % | $ | 4.31 | ||||||||
STONE HARBOR EMERGING MARKETS CORPORATE DEBT FUND |
| |||||||||||||||
Institutional Class | ||||||||||||||||
Actual | $ | 1,000.00 | $ | 1,090.50 | 1.00 | % | $ | 5.24 | ||||||||
Hypothetical (5% return before expenses) | $ | 1,000.00 | $ | 1,020.05 | 1.00 | % | $ | 5.06 | ||||||||
| (1) | Annualized, based on the Fund’s most recent fiscal half-year expenses. |
| (2) | Expenses are equal to the Fund’s annualized ratio multiplied by the average account value over the period, multiplied by the number of days in the most recent fiscal half year (183), divided by 365. Note this expense example is typically based on a six-month period. |
| Stone Harbor Investment Funds Semi-Annual Report | November 30, 2012 | 7 |
Table of Contents
| Stone Harbor Investment Funds | Summaries of Portfolio Holdings | |
| November 30, 2012 (Unaudited) |
Under SEC Rules, all funds are required to include in their annual and semi-annual shareholder reports a presentation of portfolio holdings in a table, chart or graph by reasonably identifiable categories. The following tables, which present holdings as a percent of total net assets (“TNA”), are provided in compliance with such requirements.
STONE HARBOR EMERGING MARKETS DEBT FUND
| Country Breakdown | % of TNA | |
Mexico | 8.85% | |
Russia | 8.77% | |
Venezuela | 6.87% | |
Colombia | 5.58% | |
Brazil | 5.29% | |
South Africa | 4.87% | |
Turkey | 4.74% | |
Indonesia | 4.30% | |
Poland | 3.50% | |
Panama | 3.28% | |
Ukraine | 3.02% | |
Malaysia | 2.65% | |
Qatar | 2.61% | |
Philippines | 2.60% | |
Lithuania | 2.51% | |
Kazakhstan | 2.26% | |
Peru | 2.23% | |
Hungary | 2.15% | |
Chile | 2.09% | |
Argentina | 2.05% | |
China | 1.54% | |
Iraq | 1.34% | |
United Arab Emirates | 0.99% | |
South Korea | 0.90% | |
Croatia | 0.87% | |
Uruguay | 0.82% | |
Hong Kong | 0.69% | |
Romania | 0.66% | |
Dominican Republic | 0.65% | |
El Salvador | 0.63% | |
Slovakia | 0.57% | |
Thailand | 0.44% | |
Singapore | 0.39% | |
British Virgin Islands | 0.35% | |
Saudi Arabia | 0.34% | |
India | 0.31% | |
Jamaica | 0.21% | |
Ghana | 0.21% | |
Azerbaijan | 0.13% | |
Mongolia | 0.11% | |
Nigeria | 0.07% | |
Gabon | 0.00%* | |
Total | 92.44% | |
Money Market Mutual Funds | 6.89% | |
Other Assets in Excess of Liabilities | 0.67% | |
Total Net Assets | 100.00% | |
| * | Amount represents less than 0.005% of net assets. |
STONE HARBOR HIGH YIELD BOND FUND
| Industry Breakdown | % of TNA | |
Healthcare | 9.23% | |
Exploration & Production | 7.07% | |
Wirelines | 5.98% | |
Media Cable | 5.56% | |
Media Other | 5.21% | |
Drillers/Services | 5.13% | |
Food & Beverage | 4.91% | |
Technology | 4.75% | |
Electric | 4.63% | |
Chemicals | 3.86% | |
Gaming | 3.49% | |
Metals/Mining/Steel | 3.42% | |
Wireless | 3.26% | |
Containers/Packaging | 3.25% | |
Retail Non Food/Drug | 2.95% | |
Paper/Forest Products | 2.88% | |
Services Other | 2.78% | |
Non Captive Finance | 2.05% | |
Consumer Products | 1.85% | |
Publishing/Printing | 1.74% | |
Automotive | 1.57% | |
Leisure | 1.47% | |
Building Products | 1.32% | |
Aerospace/Defense | 1.23% | |
Textile/Apparel | 1.18% | |
Industrial Other | 0.90% | |
Banking | 0.86% | |
Financial Other | 0.74% | |
Life | 0.64% | |
Gas Pipelines | 0.62% | |
Retail Food/Drug | 0.62% | |
Restaurants | 0.56% | |
Satellite | 0.53% | |
Construction Machinery | 0.47% | |
Environmental Services | 0.43% | |
Home Builders | 0.42% | |
Lodging | 0.34% | |
Gas Distributors | 0.34% | |
Railroads | 0.06% | |
Airlines | 0.03% | |
Transportation Non Air/Rail | 0.00%* | |
Total | 98.33% | |
Money Market Mutual Funds | 0.47% | |
Other Assets in Excess of Liabilities | 1.20% | |
Total Net Assets | 100.00% | |
8 | www.shiplp.com |
Table of Contents
| Stone Harbor Investment Funds | Summaries of Portfolio Holdings | |
| November 30, 2012 (Unaudited) |
| STONE HARBOR LOCAL MARKETS FUND | ||||
| Country Breakdown | % of TNA | |||
Mexico | 11.28% | |||
South Africa | 9.69% | |||
Poland | 9.06% | |||
Indonesia | 6.96% | |||
Brazil | 6.45% | |||
Colombia | 4.95% | |||
Russia | 4.79% | |||
Malaysia | 4.64% | |||
Turkey | 4.61% | |||
Thailand | 4.58% | |||
Hungary | 2.98% | |||
European Union | 2.72% | |||
Romania | 0.38% | |||
Chile | 0.10% | |||
Argentina | 0.02% | |||
Total | 73.21% | |||
Money Market Mutual Funds | 10.41% | |||
Other Assets in Excess of Liabilities | 16.38% | |||
Total Net Assets | 100.00% | |||
| STONE HARBOR EMERGING MARKETS CORPORATE DEBT FUND | ||||
| Country Breakdown | % of TNA | |||
Brazil | 14.01% | |||
Mexico | 8.14% | |||
Russia | 8.05% | |||
South Korea | 6.48% | |||
United Arab Emirates | 6.41% | |||
Hong Kong | 5.40% | |||
Qatar | 5.11% | |||
China | 4.09% | |||
Colombia | 4.00% | |||
Peru | 3.75% | |||
Indonesia | 3.44% | |||
South Africa | 3.19% | |||
Thailand | 2.85% | |||
Turkey | 2.78% | |||
Singapore | 2.60% | |||
Chile | 2.49% | |||
Saudi Arabia | 2.31% | |||
India | 2.15% | |||
Ukraine | 1.86% | |||
Argentina | 1.85% | |||
Jamaica | 1.76% | |||
Kazakhstan | 1.61% | |||
Malaysia | 1.52% | |||
Mongolia | 0.95% | |||
Nigeria | 0.68% | |||
Dominican Republic | 0.29% | |||
Total | 97.77% | |||
Money Market Mutual Funds | 2.53% | |||
Liabilities in Excess of Other Assets | -0.30% | |||
Total Net Assets | 100.00% | |||
| Stone Harbor Investment Funds Semi-Annual Report | November 30, 2012 | 9 |
Table of Contents
| Stone Harbor Investment Funds | Growth of $10,000 Investment | |
| November 30, 2012 (Unaudited) |
STONE HARBOR EMERGING MARKETS DEBT FUND
Comparison of Change in Value of $10,000 Investment in Stone Harbor Emerging Markets Debt Fund and the JP Morgan Emerging Market Bond Index Global Diversified (JP Morgan EMBI Global Diversified).
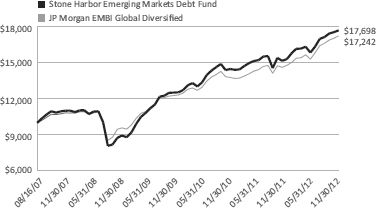
The JP Morgan EMBI Global Diversified limits the weights of those index countries with larger debt stocks by only including specified portions of these countries’ eligible current face amounts outstanding. The countries covered in the EMBI Global Diversified are identical to those covered by the EMBI Global.
Average Annual Total Returns
| 6 Months | 1 Year | 3 Years | 5 Years | Since Inception | Inception Date | |||||||
Stone Harbor Emerging Markets Debt Fund | 11.67% | 16.73% | 12.29% | 10.30% | 11.39% | 08/16/07 | ||||||
JP Morgan EMBI Global Diversified | 12.68% | 17.93% | 12.14% | 10.05% | 10.85% |
The performance data quoted represents past performance and does not guarantee future results. Current performance may be lower or higher than the performance quoted. Average annual total returns reflect the reinvestment of dividends and capital gains distributions and include all fee waivers and expense reimbursements. Without the fee waivers and expense reimbursements, total return figures would have been lower. The performance data quoted does not reflect the deduction of taxes that a shareholder would pay on Fund distributions or the redemption of Fund shares. Investment return and principal value will vary, and shares, when redeemed, may be worth more or less than their original cost. Index returns do not include the effects of sales charges, management fees or transaction costs. It is not possible to invest directly in an index.
10 | www.shiplp.com |
Table of Contents
| Stone Harbor Investment Funds | Growth of $10,000 Investment | |
| November 30, 2012 (Unaudited) |
STONE HARBOR HIGH YIELD BOND FUND
Comparison of Change in Value of $10,000 Investment in Stone Harbor High Yield Bond Fund and the Citigroup High Yield Market Capped Index.
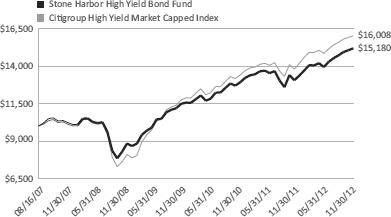
The Citigroup High Yield Market Capped Index represents a modified version of the High Yield Market Index by delaying the entry of “fallen angel” issues (corporate or municipal bonds that were investment-grade when issued but have since been downgraded) and capping the par value of individual issuers at US $5 billion par amount outstanding.
Average Annual Total Returns
| 6 Months | 1 Year | 3 Years | 5 Years | Since Inception | Inception Date | |||||||
Stone Harbor High Yield Bond Fund | 8.95% | 16.31% | 10.71% | 7.97% | 8.20% | 08/16/07 | ||||||
Citigroup High Yield Market Capped Index | 7.87% | 16.05% | 12.01% | 9.37% | 9.30% |
The performance data quoted represents past performance and does not guarantee future results. Current performance may be lower or higher than the performance quoted. Average annual total returns reflect the reinvestment of dividends and capital gains distributions and include all fee waivers and expense reimbursements. Without the fee waivers and expense reimbursements, total return figures would have been lower. The performance data quoted does not reflect the deduction of taxes that a shareholder would pay on Fund distributions or the redemption of Fund shares. Investment return and principal value will vary, and shares, when redeemed, may be worth more or less than their original cost. Index returns do not include the effects of sales charges, management fees or transaction costs. It is not possible to invest directly in an index.
| Stone Harbor Investment Funds Semi-Annual Report | November 30, 2012 | 11 |
Table of Contents
| Stone Harbor Investment Funds | Growth of $10,000 Investment | |
| November 30, 2012 (Unaudited) |
STONE HARBOR LOCAL MARKETS FUND
Comparison of Change in Value of $10,000 Investment in Stone Harbor Local Markets Fund and the JP Morgan Global Bond Index – Emerging Markets Global Diversified (JP Morgan GBI-EM Global Diversified).
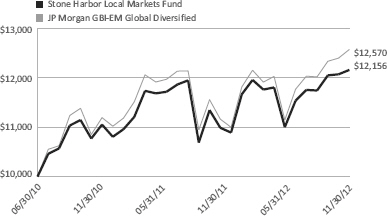
The JP Morgan GBI-EM Global Diversified consists of regularly traded, liquid fixed-rate, domestic currency government bonds to which international investors can gain exposure. The weightings among the countries are more evenly distributed within this index.
Average Annual Total Return
| 6 Months | 1 Year | Since Inception | Inception Date | |||||
Stone Harbor Local Markets Fund | 10.51% | 10.66% | 8.40% | 06/30/10 | ||||
JP Morgan GBI-EM Global Diversified | 12.78% | 12.61% | 9.90% |
The performance data quoted represents past performance and does not guarantee future results. Current performance may be lower or higher than the performance quoted. Average annual total returns reflect the reinvestment of dividends and capital gains distributions and include all fee waivers and expense reimbursements. Without the fee waivers and expense reimbursements, total return figures would have been lower. The performance data quoted does not reflect the deduction of taxes that a shareholder would pay on Fund distributions or the redemption of Fund shares. Investment return and principal value will vary, and shares, when redeemed, may be worth more or less than their original cost. Index returns do not include the effects of sales charges, management fees or transaction costs. It is not possible to invest directly in an index.
12 | www.shiplp.com |
Table of Contents
| Stone Harbor Investment Funds | Growth of $10,000 Investment | |
| November 30, 2012 (Unaudited) |
STONE HARBOR EMERGING MARKETS CORPORATE DEBT FUND
Comparison of Change in Value of $10,000 Investment in Stone Harbor Emerging Market Corporate Debt Fund and the JP Morgan Corporate Emerging Market Bond Index – Broad Diversified (JP Morgan CEMBI Broad Diversified).
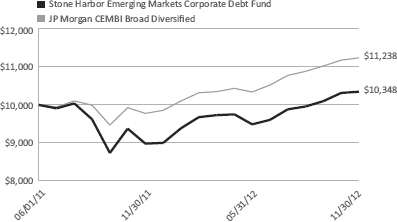
The JP Morgan CEMBI Broad is a market capitalization weighted index that tracks total returns of US dollar-denominated debt instruments issued by corporate entities in Emerging Markets countries. The CEMBI Broad Diversified limits the current face amount allocations of the bonds in the CEMBI Broad by constraining the total face amount outstanding for countries with larger debt stocks.
Average Annual Total Returns
| 6 Months | 1 Year | Since Inception | Inception Date | |||||
Stone Harbor Emerging Markets Corporate Debt Fund | 9.05% | 15.23% | 2.32% | 06/01/11 | ||||
JP Morgan CEMBI Broad Diversified | 8.69% | 14.96% | 8.09% |
The performance data quoted represents past performance and does not guarantee future results. Current performance may be lower or higher than the performance quoted. Average annual total returns reflect the reinvestment of dividends and capital gains distributions and include all fee waivers and expense reimbursements. Without the fee waivers and expense reimbursements, total return figures would have been lower. The performance data quoted does not reflect the deduction of taxes that a shareholder would pay on Fund distributions or the redemption of Fund shares. Investment return and principal value will vary, and shares, when redeemed, may be worth more or less than their original cost. Index returns do not include the effects of sales charges, management fees or transaction costs. It is not possible to invest directly in an index.
| Stone Harbor Investment Funds Semi-Annual Report | November 30, 2012 | 13 |
Table of Contents
| Stone Harbor Emerging Markets Debt Fund | Statements of Investments | |
| November 30, 2012 (Unaudited) |
Currency | Rate | Maturity Date | Principal Amount* | Market Value (Expressed in U.S. $) | ||||||||||||||||||||||
SOVEREIGN DEBT OBLIGATIONS - 63.19% | ||||||||||||||||||||||||||
Argentina - 1.68% | ||||||||||||||||||||||||||
City of Buenos Aires Argentina | USD | 9.950 | % | 03/01/2017 | 1,655,000 | $ | 1,406,750 | (1) | ||||||||||||||||||
Republic of Argentina: | ||||||||||||||||||||||||||
| USD | 0.000 | % | 03/31/2023 | 184,000 | 144,440 | (2)(3) | ||||||||||||||||||||
| USD | 6.000 | % | 03/31/2023 | 480,000 | 391,200 | (2) | ||||||||||||||||||||
| EUR | 6.734 | % | 12/31/2033 | 32,808,802 | 23,308,070 | |||||||||||||||||||||
| EUR | 6.742 | % | 12/31/2033 | 3,935,266 | 2,814,889 | |||||||||||||||||||||
|
| |||||||||||||||||||||||||
| 28,065,349 | ||||||||||||||||||||||||||
|
| |||||||||||||||||||||||||
Brazil - 2.41% | ||||||||||||||||||||||||||
Nota Do Tesouro Nacional | BRL | 6.000 | % | 05/15/2015 | 13,697,456 | 7,023,395 | ||||||||||||||||||||
Republic of Brazil: | ||||||||||||||||||||||||||
| USD | 8.000 | % | 01/15/2018 | 3,916,000 | 4,581,720 | |||||||||||||||||||||
| USD | 8.750 | % | 02/04/2025 | 1,680,000 | 2,751,000 | |||||||||||||||||||||
| USD | 10.125 | % | 05/15/2027 | 3,402,000 | 6,276,690 | |||||||||||||||||||||
| USD | 8.250 | % | 01/20/2034 | 4,576,000 | 7,733,440 | |||||||||||||||||||||
| USD | 7.125 | % | 01/20/2037 | 7,734,000 | 11,958,697 | |||||||||||||||||||||
|
| |||||||||||||||||||||||||
| 40,324,942 | ||||||||||||||||||||||||||
|
| |||||||||||||||||||||||||
Chile - 0.17% | ||||||||||||||||||||||||||
Republic of Chile | USD | 3.250 | % | 09/14/2021 | 2,550,000 | 2,792,250 | ||||||||||||||||||||
|
| |||||||||||||||||||||||||
Colombia - 4.14% | ||||||||||||||||||||||||||
Bogota Distrio Capital | COP | 9.750 | % | 07/26/2028 | 7,800,000,000 | 6,597,342 | (4) | |||||||||||||||||||
Republic of Colombia: | ||||||||||||||||||||||||||
| COP | 12.000 | % | 10/22/2015 | 4,798,000,000 | 3,246,406 | |||||||||||||||||||||
| USD | 7.375 | % | 01/27/2017 | 1,838,000 | 2,279,120 | |||||||||||||||||||||
| USD | 11.750 | % | 02/25/2020 | 2,702,000 | 4,390,750 | |||||||||||||||||||||
| USD | 8.125 | % | 05/21/2024 | 25,000 | 37,625 | |||||||||||||||||||||
| COP | 9.850 | % | 06/28/2027 | 2,240,000,000 | 1,936,482 | |||||||||||||||||||||
| USD | 10.375 | % | 01/28/2033 | 2,006,000 | 3,711,100 | |||||||||||||||||||||
| USD | 7.375 | % | 09/18/2037 | 27,836,000 | 43,424,160 | |||||||||||||||||||||
| USD | 6.125 | % | 01/18/2041 | 2,577,000 | 3,556,260 | |||||||||||||||||||||
|
| |||||||||||||||||||||||||
| 69,179,245 | ||||||||||||||||||||||||||
|
| |||||||||||||||||||||||||
Croatia - 0.87% | ||||||||||||||||||||||||||
Croatian Government: | ||||||||||||||||||||||||||
| USD | 6.250 | % | 04/27/2017 | 1,704,000 | 1,878,660 | (1) | ||||||||||||||||||||
| USD | 6.750 | % | 11/05/2019 | 2,250,000 | 2,604,488 | (4) | ||||||||||||||||||||
| USD | 6.625 | % | 07/14/2020 | 1,299,000 | 1,503,592 | (4) | ||||||||||||||||||||
| USD | 6.375 | % | 03/24/2021 | 7,428,000 | 8,505,060 | (1) | ||||||||||||||||||||
|
| |||||||||||||||||||||||||
| 14,491,800 | ||||||||||||||||||||||||||
|
| |||||||||||||||||||||||||
Dominican Republic - 0.62% | ||||||||||||||||||||||||||
Dominican Republic International Bond: | ||||||||||||||||||||||||||
| USD | 9.040 | % | 01/23/2018 | 2,753,209 | 3,138,658 | (4) | ||||||||||||||||||||
See Notes to Financial Statements.
14 | www.shiplp.com |
Table of Contents
| Stone Harbor Emerging Markets Debt Fund | Statements of Investments | |
| November 30, 2012 (Unaudited) |
Currency | Rate | Maturity Date | Principal | Market Value | ||||||||||||||||||||||
Dominican Republic (continued) | ||||||||||||||||||||||||||
Dominican Republic International Bond (continued) | ||||||||||||||||||||||||||
| USD | 7.500 | % | 05/06/2021 | 6,148,000 | $ | 7,193,160 | (4) | |||||||||||||||||||
|
| |||||||||||||||||||||||||
| 10,331,818 | ||||||||||||||||||||||||||
|
| |||||||||||||||||||||||||
El Salvador - 0.63% | ||||||||||||||||||||||||||
Republic of El Salvador: | ||||||||||||||||||||||||||
| USD | 7.375 | % | 12/01/2019 | 220,000 | 251,900 | (1) | ||||||||||||||||||||
| USD | 7.375 | % | 12/01/2019 | 2,068,000 | 2,367,860 | (4) | ||||||||||||||||||||
| USD | 7.750 | % | 01/24/2023 | 1,014,000 | 1,196,520 | (4) | ||||||||||||||||||||
| USD | 8.250 | % | 04/10/2032 | 1,000,000 | 1,185,000 | (4) | ||||||||||||||||||||
| USD | 7.650 | % | 06/15/2035 | 4,931,000 | 5,522,720 | (4) | ||||||||||||||||||||
|
| |||||||||||||||||||||||||
| 10,524,000 | ||||||||||||||||||||||||||
|
| |||||||||||||||||||||||||
Gabon - 0.00%(5) | ||||||||||||||||||||||||||
Republic of Gabon | USD | 8.200 | % | 12/12/2017 | 50,000 | 60,750 | (1) | |||||||||||||||||||
|
| |||||||||||||||||||||||||
Ghana - 0.21% | ||||||||||||||||||||||||||
Republic of Ghana | USD | 8.500 | % | 10/04/2017 | 3,037,000 | 3,500,143 | (4) | |||||||||||||||||||
|
| |||||||||||||||||||||||||
Hungary - 2.15% | ||||||||||||||||||||||||||
Republic of Hungary: | ||||||||||||||||||||||||||
| EUR | 4.500 | % | 01/29/2014 | 2,326,000 | 3,070,437 | |||||||||||||||||||||
| GBP | 5.500 | % | 05/06/2014 | 194,000 | 315,869 | |||||||||||||||||||||
| USD | 4.750 | % | 02/03/2015 | 2,585,000 | 2,652,856 | |||||||||||||||||||||
| GBP | 5.000 | % | 03/30/2016 | 668,000 | 1,070,774 | |||||||||||||||||||||
| EUR | 3.500 | % | 07/18/2016 | 7,569,000 | 9,480,815 | |||||||||||||||||||||
| EUR | 4.375 | % | 07/04/2017 | 2,798,000 | 3,559,316 | |||||||||||||||||||||
| EUR | 5.750 | % | 06/11/2018 | 961,000 | 1,276,380 | |||||||||||||||||||||
| USD | 6.375 | % | 03/29/2021 | 13,042,000 | 14,460,317 | |||||||||||||||||||||
|
| |||||||||||||||||||||||||
| 35,886,764 | ||||||||||||||||||||||||||
|
| |||||||||||||||||||||||||
Indonesia - 3.69% | ||||||||||||||||||||||||||
Republic of Indonesia: | ||||||||||||||||||||||||||
| USD | 6.875 | % | 01/17/2018 | 3,338,000 | 4,093,222 | (4) | ||||||||||||||||||||
| USD | 11.625 | % | 03/04/2019 | 2,170,000 | 3,309,250 | (1) | ||||||||||||||||||||
| USD | 11.625 | % | 03/04/2019 | 11,260,000 | 17,171,500 | (4) | ||||||||||||||||||||
| USD | 5.875 | % | 03/13/2020 | 2,977,000 | 3,624,498 | (4) | ||||||||||||||||||||
| USD | 4.875 | % | 05/05/2021 | 2,800,000 | 3,237,500 | (4) | ||||||||||||||||||||
| USD | 3.750 | % | 04/25/2022 | 3,093,000 | 3,332,708 | (4) | ||||||||||||||||||||
| USD | 8.500 | % | 10/12/2035 | 4,630,000 | 7,489,025 | (4) | ||||||||||||||||||||
| USD | 6.625 | % | 02/17/2037 | 2,597,000 | 3,528,674 | (1) | ||||||||||||||||||||
| USD | 6.625 | % | 02/17/2037 | 6,286,000 | 8,541,102 | (4) | ||||||||||||||||||||
| USD | 7.750 | % | 01/17/2038 | 4,807,000 | 7,342,692 | (4) | ||||||||||||||||||||
|
| |||||||||||||||||||||||||
| 61,670,171 | ||||||||||||||||||||||||||
|
| |||||||||||||||||||||||||
See Notes to Financial Statements.
| Stone Harbor Investment Funds Semi-Annual Report | November 30, 2012 | 15 |
Table of Contents
| Stone Harbor Emerging Markets Debt Fund | Statements of Investments | |
| November 30, 2012 (Unaudited) |
Currency | Rate | Maturity Date | Principal | Market Value | ||||||||||||||||||||||
Iraq - 0.59% | ||||||||||||||||||||||||||
Republic of Iraq | USD | 5.800 | % | 01/15/2028 | 10,342,000 | $ | 9,760,263 | (4) | ||||||||||||||||||
|
| |||||||||||||||||||||||||
Lithuania - 2.51% | ||||||||||||||||||||||||||
Republic of Lithuania: | ||||||||||||||||||||||||||
| USD | 7.375 | % | 02/11/2020 | 2,662,000 | 3,443,962 | (4) | ||||||||||||||||||||
| USD | 6.125 | % | 03/09/2021 | 21,343,000 | 26,145,175 | (4) | ||||||||||||||||||||
| USD | 6.625 | % | 02/01/2022 | 2,622,000 | 3,343,050 | (1) | ||||||||||||||||||||
| USD | 6.625 | % | 02/01/2022 | 7,014,000 | 8,942,850 | (4) | ||||||||||||||||||||
|
| |||||||||||||||||||||||||
| 41,875,037 | ||||||||||||||||||||||||||
|
| |||||||||||||||||||||||||
Malaysia - 0.99% | ||||||||||||||||||||||||||
Malaysian Government | MYR | 3.197 | % | 10/15/2015 | 50,350,000 | 16,601,131 | ||||||||||||||||||||
|
| |||||||||||||||||||||||||
Mexico - 7.01% | ||||||||||||||||||||||||||
Mexican Bonos: | ||||||||||||||||||||||||||
| MXN | 8.000 | % | 12/17/2015 | 80,700,000 | 6,788,169 | |||||||||||||||||||||
| MXN | 6.250 | % | 06/16/2016 | 124,853,000 | 10,065,119 | |||||||||||||||||||||
| MXN | 7.750 | % | 12/14/2017 | 34,840,000 | 3,013,122 | |||||||||||||||||||||
Mexican Udibonos | MXN | 2.500 | % | 12/10/2020 | 145,884,787 | 12,158,768 | ||||||||||||||||||||
United Mexican States: | ||||||||||||||||||||||||||
| USD | 5.125 | % | 01/15/2020 | 8,292,000 | 9,929,670 | |||||||||||||||||||||
| USD | 8.300 | % | 08/15/2031 | 479,000 | 781,968 | |||||||||||||||||||||
| USD | 6.750 | % | 09/27/2034 | 9,940,000 | 14,263,900 | |||||||||||||||||||||
| USD | 6.050 | % | 01/11/2040 | 9,418,000 | 12,690,755 | |||||||||||||||||||||
| USD | 4.750 | % | 03/08/2044 | 6,326,000 | 7,219,547 | |||||||||||||||||||||
| USD | 5.750 | % | 10/12/2110 | 33,218,000 | 40,110,735 | |||||||||||||||||||||
|
| |||||||||||||||||||||||||
| 117,021,753 | ||||||||||||||||||||||||||
|
| |||||||||||||||||||||||||
Panama - 3.28% | ||||||||||||||||||||||||||
Republic of Panama: | ||||||||||||||||||||||||||
| USD | 5.200 | % | 01/30/2020 | 6,883,000 | 8,311,223 | |||||||||||||||||||||
| USD | 9.375 | % | 01/16/2023 | 25,000 | 36,750 | |||||||||||||||||||||
| USD | 7.125 | % | 01/29/2026 | 967,000 | 1,380,392 | |||||||||||||||||||||
| USD | 8.875 | % | 09/30/2027 | 6,661,000 | 10,840,777 | |||||||||||||||||||||
| USD | 9.375 | % | 04/01/2029 | 15,678,000 | 26,864,253 | |||||||||||||||||||||
| USD | 8.125 | % | 04/28/2034 | 764,000 | 1,111,620 | |||||||||||||||||||||
| USD | 6.700 | % | 01/26/2036 | 4,397,000 | 6,287,710 | |||||||||||||||||||||
|
| |||||||||||||||||||||||||
| 54,832,725 | ||||||||||||||||||||||||||
|
| |||||||||||||||||||||||||
Peru - 1.36% | ||||||||||||||||||||||||||
Republic of Peru: | ||||||||||||||||||||||||||
| USD | 8.750 | % | 11/21/2033 | 3,980,000 | 6,994,850 | |||||||||||||||||||||
| USD | 5.625 | % | 11/18/2050 | 11,897,000 | 15,674,298 | |||||||||||||||||||||
|
| |||||||||||||||||||||||||
| 22,669,148 | ||||||||||||||||||||||||||
|
| |||||||||||||||||||||||||
See Notes to Financial Statements.
16 | www.shiplp.com |
Table of Contents
| Stone Harbor Emerging Markets Debt Fund | Statements of Investments | |
| November 30, 2012 (Unaudited) |
Currency | Rate | Maturity Date | Principal Amount* | Market Value (Expressed in U.S. $) | ||||||||||||||||||||||
Philippines - 2.60% | ||||||||||||||||||||||||||
Republic of Philippines: | ||||||||||||||||||||||||||
| USD | 6.500 | % | 01/20/2020 | 1,349,000 | $ | 1,747,798 | ||||||||||||||||||||
| USD | 10.625 | % | 03/16/2025 | 1,109,000 | 1,961,544 | |||||||||||||||||||||
| USD | 5.500 | % | 03/30/2026 | 2,002,000 | 2,562,560 | |||||||||||||||||||||
| USD | 9.500 | % | 02/02/2030 | 8,226,000 | 14,416,065 | |||||||||||||||||||||
| USD | 7.750 | % | 01/14/2031 | 11,314,000 | 17,536,700 | |||||||||||||||||||||
| USD | 6.375 | % | 01/15/2032 | 1,636,000 | 2,267,905 | |||||||||||||||||||||
| USD | 6.375 | % | 10/23/2034 | 2,086,000 | 2,951,690 | |||||||||||||||||||||
|
| |||||||||||||||||||||||||
| 43,444,262 | ||||||||||||||||||||||||||
|
| |||||||||||||||||||||||||
Poland - 3.50% | ||||||||||||||||||||||||||
Republic of Poland: | ||||||||||||||||||||||||||
| USD | 6.375 | % | 07/15/2019 | 27,558,000 | 34,550,843 | |||||||||||||||||||||
| EUR | 4.200 | % | 04/15/2020 | 6,630,000 | 9,757,286 | |||||||||||||||||||||
| EUR | 4.000 | % | 03/23/2021 | 665,000 | 963,325 | |||||||||||||||||||||
| USD | 5.125 | % | 04/21/2021 | 8,058,000 | 9,568,875 | |||||||||||||||||||||
| USD | 5.000 | % | 03/23/2022 | 3,033,000 | 3,597,896 | |||||||||||||||||||||
|
| |||||||||||||||||||||||||
| 58,438,225 | ||||||||||||||||||||||||||
|
| |||||||||||||||||||||||||
Qatar - 1.89% | ||||||||||||||||||||||||||
State of Qatar: | ||||||||||||||||||||||||||
| USD | 6.550 | % | 04/09/2019 | 9,087,000 | 11,438,261 | (4) | ||||||||||||||||||||
| USD | 5.250 | % | 01/20/2020 | 10,716,000 | 12,832,410 | (4) | ||||||||||||||||||||
| USD | 6.400 | % | 01/20/2040 | 1,687,000 | 2,361,800 | (4) | ||||||||||||||||||||
| USD | 5.750 | % | 01/20/2042 | 3,758,000 | 4,913,585 | (4) | ||||||||||||||||||||
|
| |||||||||||||||||||||||||
| 31,546,056 | ||||||||||||||||||||||||||
|
| |||||||||||||||||||||||||
Romania - 0.66% | ||||||||||||||||||||||||||
Romania: | ||||||||||||||||||||||||||
| USD | 6.750 | % | 02/07/2022 | 1,110,000 | 1,315,350 | (1) | ||||||||||||||||||||
| USD | 6.750 | % | 02/07/2022 | 8,156,000 | 9,664,860 | (4) | ||||||||||||||||||||
|
| |||||||||||||||||||||||||
| 10,980,210 | ||||||||||||||||||||||||||
|
| |||||||||||||||||||||||||
Russia - 6.97% | ||||||||||||||||||||||||||
Russian Federation: | ||||||||||||||||||||||||||
| USD | 12.750 | % | 06/24/2028 | 8,739,000 | 17,488,924 | (4) | ||||||||||||||||||||
| USD | 7.500 | % | 03/31/2030 | 78,033,150 | 99,004,558 | (4)(6) | ||||||||||||||||||||
|
| |||||||||||||||||||||||||
| 116,493,482 | ||||||||||||||||||||||||||
|
| |||||||||||||||||||||||||
Slovakia - 0.57% | ||||||||||||||||||||||||||
Republic of Slovakia | USD | 4.375 | % | 05/21/2022 | 8,831,000 | 9,515,226 | (1) | |||||||||||||||||||
|
| |||||||||||||||||||||||||
South Africa - 4.49% | ||||||||||||||||||||||||||
Republic of South Africa: | ||||||||||||||||||||||||||
| ZAR | 8.000 | % | 12/21/2018 | 119,630,000 | 14,652,558 | |||||||||||||||||||||
| USD | 6.875 | % | 05/27/2019 | 9,506,000 | 12,036,973 | |||||||||||||||||||||
| USD | 5.500 | % | 03/09/2020 | 14,580,000 | 17,423,100 | |||||||||||||||||||||
See Notes to Financial Statements.
| Stone Harbor Investment Funds Semi-Annual Report | November 30, 2012 | 17 |
Table of Contents
| Stone Harbor Emerging Markets Debt Fund | Statements of Investments | |
| November 30, 2012 (Unaudited) |
Currency | Rate | Maturity Date | Principal | Market Value (Expressed in U.S. $) | ||||||||||||||||||||||
South Africa (continued) | ||||||||||||||||||||||||||
Republic of South Africa (continued) | ||||||||||||||||||||||||||
| USD | 5.875 | % | 05/30/2022 | 8,140,000 | $ | 10,113,950 | ||||||||||||||||||||
| USD | 4.665 | % | 01/17/2024 | 7,999,000 | 9,128,859 | |||||||||||||||||||||
| ZAR | 10.500 | % | 12/21/2026 | 54,270,000 | 7,627,445 | |||||||||||||||||||||
| USD | 6.250 | % | 03/08/2041 | 3,031,000 | 4,088,061 | |||||||||||||||||||||
|
| |||||||||||||||||||||||||
| 75,070,946 | ||||||||||||||||||||||||||
|
| |||||||||||||||||||||||||
Turkey - 4.32% | ||||||||||||||||||||||||||
Republic of Turkey: | ||||||||||||||||||||||||||
| USD | 6.750 | % | 04/03/2018 | 5,293,000 | 6,430,995 | |||||||||||||||||||||
| USD | 7.000 | % | 03/11/2019 | 3,305,000 | 4,151,906 | |||||||||||||||||||||
| USD | 7.500 | % | 11/07/2019 | 16,848,000 | 21,965,580 | |||||||||||||||||||||
| USD | 7.000 | % | 06/05/2020 | 4,272,000 | 5,500,200 | |||||||||||||||||||||
| USD | 5.625 | % | 03/30/2021 | 1,053,000 | 1,266,233 | |||||||||||||||||||||
| USD | 5.125 | % | 03/25/2022 | 9,201,000 | 10,765,170 | |||||||||||||||||||||
| USD | 6.250 | % | 09/26/2022 | 7,981,000 | 10,105,941 | |||||||||||||||||||||
| USD | 7.375 | % | 02/05/2025 | 1,820,000 | 2,522,975 | |||||||||||||||||||||
| USD | 6.875 | % | 03/17/2036 | 5,520,000 | 7,659,000 | |||||||||||||||||||||
| USD | 7.250 | % | 03/05/2038 | 1,285,000 | 1,871,281 | |||||||||||||||||||||
|
| |||||||||||||||||||||||||
| 72,239,281 | ||||||||||||||||||||||||||
|
| |||||||||||||||||||||||||
Ukraine - 1.98% | ||||||||||||||||||||||||||
Financing of Infrastructure | USD | 9.000 | % | 12/07/2017 | 3,002,000 | 3,002,000 | (1) | |||||||||||||||||||
Ukraine Government: | ||||||||||||||||||||||||||
| USD | 7.650 | % | 06/11/2013 | 2,951,000 | 2,991,576 | (4) | ||||||||||||||||||||
| USD | 6.875 | % | 09/23/2015 | 208,000 | 210,600 | (4) | ||||||||||||||||||||
| USD | 6.875 | % | 09/23/2015 | 1,723,000 | 1,744,537 | (1) | ||||||||||||||||||||
| USD | 6.250 | % | 06/17/2016 | 2,600,000 | 2,587,000 | (1) | ||||||||||||||||||||
| USD | 6.250 | % | 06/17/2016 | 9,615,000 | 9,566,925 | (4) | ||||||||||||||||||||
| USD | 6.580 | % | 11/21/2016 | 1,460,000 | 1,456,350 | (4) | ||||||||||||||||||||
| USD | 6.750 | % | 11/14/2017 | 4,950,000 | 4,937,625 | (4) | ||||||||||||||||||||
| USD | 7.800 | % | 11/28/2022 | 6,493,000 | 6,647,209 | (1) | ||||||||||||||||||||
|
| |||||||||||||||||||||||||
| 33,143,822 | ||||||||||||||||||||||||||
|
| |||||||||||||||||||||||||
Uruguay - 0.82% | ||||||||||||||||||||||||||
Republic of Uruguay: | ||||||||||||||||||||||||||
| USD | 8.000 | % | 11/18/2022 | 2,598,310 | 3,800,028 | |||||||||||||||||||||
| USD | 6.875 | % | 09/28/2025 | 1,148,125 | 1,613,116 | |||||||||||||||||||||
| USD | 7.875 | % | 01/15/2033 | 1,390,800 | 2,155,740 | (7) | ||||||||||||||||||||
| USD | 7.625 | % | 03/21/2036 | 3,979,404 | 6,182,999 | |||||||||||||||||||||
|
| |||||||||||||||||||||||||
| 13,751,883 | ||||||||||||||||||||||||||
|
| |||||||||||||||||||||||||
Venezuela - 3.08% | ||||||||||||||||||||||||||
Republic of Venezuela: | ||||||||||||||||||||||||||
| USD | 13.625 | % | 08/15/2018 | 1,051,000 | 1,198,140 | |||||||||||||||||||||
| USD | 13.625 | % | 08/15/2018 | 1,669,000 | 1,835,900 | (4) | ||||||||||||||||||||
| USD | 7.000 | % | 12/01/2018 | 3,370,000 | 3,016,150 | (4) | ||||||||||||||||||||
| USD | 7.750 | % | 10/13/2019 | 10,500,000 | 9,581,250 | (4) | ||||||||||||||||||||
| USD | 6.000 | % | 12/09/2020 | 4,600,000 | 3,657,000 | (4) | ||||||||||||||||||||
| USD | 12.750 | % | 08/23/2022 | 15,794,800 | 17,709,920 | (4) | ||||||||||||||||||||
See Notes to Financial Statements.
18 | www.shiplp.com |
Table of Contents
| Stone Harbor Emerging Markets Debt Fund | Statements of Investments | |
| November 30, 2012 (Unaudited) |
Currency | Rate | Maturity Date | Principal Amount* | Market Value (Expressed in U.S. $) | ||||||||||||||||||||||
Venezuela (continued) | ||||||||||||||||||||||||||
Republic of Venezuela (continued) | ||||||||||||||||||||||||||
| USD | 9.000 | % | 05/07/2023 | 4,206,700 | $ | 3,843,872 | (4) | |||||||||||||||||||
| USD | 9.250 | % | 09/15/2027 | 7,565,000 | 7,120,556 | |||||||||||||||||||||
| USD | 11.950 | % | 08/05/2031 | 3,357,000 | 3,558,420 | (4) | ||||||||||||||||||||
|
| |||||||||||||||||||||||||
| 51,521,208 | ||||||||||||||||||||||||||
|
| |||||||||||||||||||||||||
TOTAL SOVEREIGN DEBT OBLIGATIONS (Cost $959,956,630) | 1,055,731,890 | |||||||||||||||||||||||||
|
| |||||||||||||||||||||||||
BANK LOANS - 0.15%(8) | ||||||||||||||||||||||||||
Brazil - 0.04% | ||||||||||||||||||||||||||
Virgolino de Oliveira - GVO Loan | USD | 5.273 | % | 03/11/2015 | 705,882 | 691,184 | ||||||||||||||||||||
|
| |||||||||||||||||||||||||
Indonesia - 0.11% | ||||||||||||||||||||||||||
PT Bumi Resources | USD | 11.250 | % | 08/07/2013 | 1,337,000 | 1,306,249 | ||||||||||||||||||||
PT Bumi Tranche A | USD | 15.000 | % | 01/18/2013 | 577,486 | 271,419 | ||||||||||||||||||||
PT Bumi Tranche B | USD | 15.000 | % | 01/18/2013 | 460,908 | 216,627 | ||||||||||||||||||||
|
| |||||||||||||||||||||||||
| 1,794,295 | ||||||||||||||||||||||||||
|
| |||||||||||||||||||||||||
TOTAL BANK LOANS (Cost $3,081,275) | 2,485,479 | |||||||||||||||||||||||||
|
| |||||||||||||||||||||||||
CORPORATE BONDS - 25.88% | ||||||||||||||||||||||||||
Argentina - 0.15% | ||||||||||||||||||||||||||
Capex SA | USD | 10.000 | % | 03/10/2018 | 1,642,000 | 1,059,090 | (1) | |||||||||||||||||||
Empresa Distribuidora Y Comercializadora Norte: | ||||||||||||||||||||||||||
| USD | 9.750 | % | 10/25/2022 | 500,000 | 227,500 | (4) | ||||||||||||||||||||
| USD | 9.750 | % | 10/25/2022 | 1,362,000 | 619,710 | (1) | ||||||||||||||||||||
Inversiones y Representaciones SA | USD | 11.500 | % | 07/20/2020 | 636,000 | 562,860 | (1) | |||||||||||||||||||
|
| |||||||||||||||||||||||||
| 2,469,160 | ||||||||||||||||||||||||||
|
| |||||||||||||||||||||||||
Azerbaijan - 0.13% | ||||||||||||||||||||||||||
State Oil Company | USD | 5.450 | % | 02/09/2017 | 1,966,000 | 2,152,770 | ||||||||||||||||||||
|
| |||||||||||||||||||||||||
Brazil - 2.33% | ||||||||||||||||||||||||||
Banco Cruzeiro do Sul SA: | ||||||||||||||||||||||||||
| USD | 8.875 | % | 09/22/2020 | 170,000 | 85 | (2)(4) | ||||||||||||||||||||
| USD | 8.875 | % | 09/22/2020 | 1,184,000 | 592 | (1)(2) | ||||||||||||||||||||
Banco do Brasil SA | USD | 3.875 | % | 10/10/2022 | 1,494,000 | 1,501,470 | ||||||||||||||||||||
BM&FBovespa SA: | ||||||||||||||||||||||||||
| USD | 5.500 | % | 07/16/2020 | 800,000 | 909,000 | (4) | ||||||||||||||||||||
| USD | 5.500 | % | 07/16/2020 | 842,000 | 956,722 | (1) | ||||||||||||||||||||
BR Malls International Finance Ltd.: | ||||||||||||||||||||||||||
| USD | 8.500 | % | 01/21/2049 | 260,000 | 284,050 | (4) | ||||||||||||||||||||
| USD | 8.500 | % | 01/21/2049 | 2,482,000 | 2,711,585 | (1) | ||||||||||||||||||||
See Notes to Financial Statements.
| Stone Harbor Investment Funds Semi-Annual Report | November 30, 2012 | 19 |
Table of Contents
| Stone Harbor Emerging Markets Debt Fund | Statements of Investments | |
| November 30, 2012 (Unaudited) |
Currency | Rate | Maturity Date | Principal Amount* | Market Value (Expressed in U.S. $) | ||||||||||||||||||||||
Brazil (continued) | ||||||||||||||||||||||||||
BR Properties SA | USD | 9.000 | % | 10/07/2015 | 310,000 | $ | 338,675 | (1) | ||||||||||||||||||
Braskem Finance Ltd. | USD | 7.375 | % | 10/29/2049 | 1,200,000 | 1,254,000 | (1) | |||||||||||||||||||
Caixa Economica Federal: | ||||||||||||||||||||||||||
| USD | 2.375 | % | 11/06/2017 | 5,000,000 | 4,968,750 | (1) | ||||||||||||||||||||
| USD | 3.500 | % | 11/07/2022 | 1,000,000 | 1,010,000 | (1) | ||||||||||||||||||||
General Shopping Finance Ltd.: | ||||||||||||||||||||||||||
| USD | 10.000 | % | 11/09/2015 | 1,824,000 | 1,801,200 | (1) | ||||||||||||||||||||
| USD | 10.000 | % | 11/09/2049 | 246,000 | 242,925 | (4) | ||||||||||||||||||||
Globo Comunicacao e Participacoes SA | USD | 6.250 | % | 07/20/2049 | 825,000 | 893,063 | (4)(6) | |||||||||||||||||||
Hypermarcas SA | USD | 6.500 | % | 04/20/2021 | 730,000 | 792,050 | (1) | |||||||||||||||||||
Itau Unibanco Holding SA | USD | 5.650 | % | 03/19/2022 | 1,158,000 | 1,221,690 | (1) | |||||||||||||||||||
Minerva Overseas II Ltd.: | ||||||||||||||||||||||||||
| USD | 10.875 | % | 11/15/2019 | 538,000 | 601,215 | (4) | ||||||||||||||||||||
| USD | 10.875 | % | 11/15/2019 | 633,000 | 707,377 | (1) | ||||||||||||||||||||
NET Servicos de Comunicacao SA | USD | 7.500 | % | 01/27/2020 | 2,802,000 | 3,264,330 | ||||||||||||||||||||
Odebrecht Drilling Norbe VIII/IX Ltd.: | ||||||||||||||||||||||||||
| USD | 6.350 | % | 06/30/2021 | 378,300 | 425,588 | (4) | ||||||||||||||||||||
| USD | 6.350 | % | 06/30/2021 | 679,970 | 764,966 | (1) | ||||||||||||||||||||
Odebrecht Finance Ltd. | USD | 5.125 | % | 06/26/2022 | 1,000,000 | 1,077,500 | (1) | |||||||||||||||||||
OGX Austria GmbH | USD | 8.500 | % | 06/01/2018 | 5,100,000 | 4,456,125 | (1) | |||||||||||||||||||
Petrobras International Finance Co.: | ||||||||||||||||||||||||||
| USD | 2.875 | % | 02/06/2015 | 700,000 | 720,153 | |||||||||||||||||||||
| USD | 5.375 | % | 01/27/2021 | 430,000 | 485,438 | |||||||||||||||||||||
QGOG Atlantic / Alaskan Rigs Ltd. | USD | 5.250 | % | 07/30/2018 | 1,897,838 | 1,973,752 | (1) | |||||||||||||||||||
Samarco Mineracao SA | USD | 4.125 | % | 11/01/2022 | 1,638,000 | 1,642,095 | (1) | |||||||||||||||||||
Schahin II Finance Co. SPV Ltd. | USD | 5.875 | % | 09/25/2022 | 1,450,000 | 1,522,500 | (1) | |||||||||||||||||||
Telemar Norte Leste SA | USD | 5.500 | % | 10/23/2020 | 1,712,000 | 1,774,060 | (1) | |||||||||||||||||||
Votorantim Cimentos SA | USD | 7.250 | % | 04/05/2041 | 500,000 | 552,500 | (1) | |||||||||||||||||||
|
| |||||||||||||||||||||||||
| 38,853,456 | ||||||||||||||||||||||||||
|
| |||||||||||||||||||||||||
British Virgin Islands - 0.35% | ||||||||||||||||||||||||||
Sinochem Overseas Capital Co. Ltd. | USD | 6.300 | % | 11/12/2040 | 4,685,000 | 5,790,959 | (4) | |||||||||||||||||||
|
| |||||||||||||||||||||||||
Chile - 1.92% | ||||||||||||||||||||||||||
Banco del Estado de Chile | USD | 3.875 | % | 02/08/2022 | 3,277,000 | 3,498,197 | (1) | |||||||||||||||||||
Cencosud SA: | ||||||||||||||||||||||||||
| USD | 5.500 | % | 01/20/2021 | 2,000,000 | 2,120,000 | (1) | ||||||||||||||||||||
| USD | 4.875 | % | 01/20/2023 | 1,908,000 | 1,890,103 | (1) | ||||||||||||||||||||
Codelco, Inc.: | ||||||||||||||||||||||||||
| USD | 7.500 | % | 01/15/2019 | 450,000 | 581,875 | (4) | ||||||||||||||||||||
| USD | 3.875 | % | 11/03/2021 | 2,798,000 | 3,057,165 | (4) | ||||||||||||||||||||
| USD | 3.000 | % | 07/17/2022 | 5,823,000 | 5,916,139 | (1) | ||||||||||||||||||||
| USD | 6.150 | % | 10/24/2036 | 4,905,000 | 6,365,218 | (4) | ||||||||||||||||||||
| USD | 4.250 | % | 07/17/2042 | 7,321,000 | 7,420,199 | (1) | ||||||||||||||||||||
Telefonica Chile SA | USD | 3.875 | % | 10/12/2022 | 1,245,000 | 1,229,438 | (1) | |||||||||||||||||||
|
| |||||||||||||||||||||||||
| 32,078,334 | ||||||||||||||||||||||||||
|
| |||||||||||||||||||||||||
See Notes to Financial Statements.
20 | www.shiplp.com |
Table of Contents
| Stone Harbor Emerging Markets Debt Fund | Statements of Investments | |
| November 30, 2012 (Unaudited) |
Currency | Rate | Maturity Date | Principal Amount* | Market Value (Expressed in U.S. $) | ||||||||||||||||||||||
China - 1.54% | ||||||||||||||||||||||||||
China Liansu Group Holdings Ltd. | USD | 7.875 | % | 05/13/2016 | 593,000 | $ | 621,167 | (1) | ||||||||||||||||||
China Overseas Finance Cayman II Ltd. | USD | 5.500 | % | 11/10/2020 | 300,000 | 335,892 | ||||||||||||||||||||
China Overseas Finance Cayman IV Ltd. | USD | 4.875 | % | 02/15/2017 | 500,000 | 542,625 | ||||||||||||||||||||
Mega Advance Investments Ltd. | USD | 5.000 | % | 05/12/2021 | 1,661,000 | 1,881,527 | (1) | |||||||||||||||||||
MIE Holdings Corp. | USD | 9.750 | % | 05/12/2016 | 805,000 | 877,450 | (1) | |||||||||||||||||||
Sinochem Overseas Capital Co. Ltd.: | ||||||||||||||||||||||||||
| USD | 4.500 | % | 11/12/2020 | 5,534,000 | 6,017,576 | (4) | ||||||||||||||||||||
| USD | 4.500 | % | 11/12/2020 | 6,499,000 | 7,066,901 | (1) | ||||||||||||||||||||
Sinopec Group Overseas Development 2012 Ltd. | USD | 4.875 | % | 05/17/2042 | 2,250,000 | 2,646,562 | (1) | |||||||||||||||||||
Tencent Holdings Ltd.: | ||||||||||||||||||||||||||
| USD | 4.625 | % | 12/12/2016 | 1,200,000 | 1,292,424 | (1) | ||||||||||||||||||||
| USD | 3.375 | % | 03/05/2018 | 1,629,000 | 1,681,617 | (1) | ||||||||||||||||||||
Texhong Textile Group Ltd.: | ||||||||||||||||||||||||||
| USD | 7.625 | % | 01/19/2016 | 343,000 | 345,573 | (1) | ||||||||||||||||||||
| USD | 7.625 | % | 01/19/2016 | 658,000 | 662,935 | (4) | ||||||||||||||||||||
Yancoal International Resources Development Co. Ltd. | USD | 5.730 | % | 05/16/2022 | 1,711,000 | 1,762,073 | (1) | |||||||||||||||||||
|
| |||||||||||||||||||||||||
| 25,734,322 | ||||||||||||||||||||||||||
|
| |||||||||||||||||||||||||
Colombia - 0.65% | ||||||||||||||||||||||||||
Bancolombia SA | USD | 5.125 | % | 09/11/2022 | 1,139,000 | 1,144,695 | ||||||||||||||||||||
Colombia Telecomunicaciones SA ESP | USD | 5.375 | % | 09/27/2022 | 1,500,000 | 1,515,000 | (1) | |||||||||||||||||||
Empresa de Energia de Bogota SA | USD | 6.125 | % | 11/10/2021 | 1,392,000 | 1,572,960 | (1) | |||||||||||||||||||
Grupo Aval Ltd.: | ||||||||||||||||||||||||||
| USD | 5.250 | % | 02/01/2017 | 1,000,000 | 1,066,250 | (1) | ||||||||||||||||||||
| USD | 4.750 | % | 09/26/2022 | 1,474,000 | 1,488,740 | (1) | ||||||||||||||||||||
Gruposura Finance | USD | 5.700 | % | 05/18/2021 | 2,100,000 | 2,338,875 | (1) | |||||||||||||||||||
Transportadora de Gas Internacional SA ESP | USD | 5.700 | % | 03/20/2022 | 1,500,000 | 1,668,750 | (1) | |||||||||||||||||||
|
| |||||||||||||||||||||||||
| 10,795,270 | ||||||||||||||||||||||||||
|
| |||||||||||||||||||||||||
Dominican Republic - 0.03% | ||||||||||||||||||||||||||
Cap Cana SA: | ||||||||||||||||||||||||||
| USD | 10.000 | % | 04/30/2016 | 1,103,320 | 275,830 | (2)(4)(9) | ||||||||||||||||||||
| USD | 10.000 | % | 04/30/2016 | 1,343,373 | 201,506 | (2)(4)(9) | ||||||||||||||||||||
|
| |||||||||||||||||||||||||
| 477,336 | ||||||||||||||||||||||||||
|
| |||||||||||||||||||||||||
Hong Kong - 0.69% | ||||||||||||||||||||||||||
Hutchison Whampoa International 10 Ltd. | USD | 6.000 | % | 10/28/2049 | 1,757,000 | 1,851,439 | (4)(10) | |||||||||||||||||||
Hutchison Whampoa International 11 Ltd. | USD | 4.625 | % | 01/13/2022 | 1,500,000 | 1,689,456 | (1) | |||||||||||||||||||
Hutchison Whampoa International 12 II Ltd.: | ||||||||||||||||||||||||||
| USD | 2.000 | % | 11/08/2017 | 1,500,000 | 1,507,738 | (1) | ||||||||||||||||||||
| USD | 3.250 | % | 11/08/2022 | 1,500,000 | 1,527,675 | (1) | ||||||||||||||||||||
PCCW-HKT Capital No. 4 Ltd. | USD | 4.250 | % | 02/24/2016 | 2,299,000 | 2,458,666 | ||||||||||||||||||||
Swire Pacific MTN Financing Ltd. | USD | 4.500 | % | 02/28/2022 | 2,200,000 | 2,433,805 | ||||||||||||||||||||
|
| |||||||||||||||||||||||||
| 11,468,779 | ||||||||||||||||||||||||||
|
| |||||||||||||||||||||||||
India - 0.31% | ||||||||||||||||||||||||||
ICICI Bank Ltd.: | ||||||||||||||||||||||||||
| USD | 5.750 | % | 11/16/2020 | 508,000 | 551,840 | (1) | ||||||||||||||||||||
| USD | 5.750 | % | 11/16/2020 | 1,200,000 | 1,303,560 | (4) | ||||||||||||||||||||
See Notes to Financial Statements.
| Stone Harbor Investment Funds Semi-Annual Report | November 30, 2012 | 21 |
Table of Contents
| Stone Harbor Emerging Markets Debt Fund | Statements of Investments | |
| November 30, 2012 (Unaudited) |
Currency | Rate | Maturity Date | Principal Amount* | Market Value (Expressed in U.S. $) | ||||||||||||||||||||||
India (continued) | ||||||||||||||||||||||||||
Reliance Holdings USA, Inc. | USD | 5.400 | % | 02/14/2022 | 2,000,000 | $ | 2,213,700 | (1) | ||||||||||||||||||
Vedanta Resources PLC | USD | 8.250 | % | 06/07/2021 | 1,063,000 | 1,153,355 | (1) | |||||||||||||||||||
|
| |||||||||||||||||||||||||
| 5,222,455 | ||||||||||||||||||||||||||
|
| |||||||||||||||||||||||||
Indonesia - 0.50% | ||||||||||||||||||||||||||
Bakrie Telecom Pte Ltd. | USD | 11.500 | % | 05/07/2015 | 1,805,000 | 780,663 | (4) | |||||||||||||||||||
Berau Capital Resources Pte Ltd. | USD | 12.500 | % | 07/08/2015 | 200,000 | 211,000 | (4) | |||||||||||||||||||
Berau Coal Energy Tbk PT | USD | 7.250 | % | 03/13/2017 | 650,000 | 602,875 | (4) | |||||||||||||||||||
BLT Finance BV | USD | 7.500 | % | 05/15/2014 | 644,000 | 115,920 | (2)(4) | |||||||||||||||||||
Indosat Palapa Co. BV: | ||||||||||||||||||||||||||
| USD | 7.375 | % | 07/29/2020 | 241,000 | 272,933 | (1) | ||||||||||||||||||||
| USD | 7.375 | % | 07/29/2020 | 550,000 | 622,875 | (4) | ||||||||||||||||||||
Listrindo Capital BV | USD | 6.950 | % | 02/21/2019 | 861,000 | 960,015 | (1) | |||||||||||||||||||
Pertamina Persero PT | USD | 6.000 | % | 05/03/2042 | 2,529,000 | 2,867,127 | (4) | |||||||||||||||||||
PT Adaro Indonesia | USD | 7.625 | % | 10/22/2019 | 1,717,000 | 1,908,016 | (4) | |||||||||||||||||||
|
| |||||||||||||||||||||||||
| 8,341,424 | ||||||||||||||||||||||||||
|
| |||||||||||||||||||||||||
Jamaica - 0.21% | ||||||||||||||||||||||||||
Digicel Group Ltd.: | ||||||||||||||||||||||||||
| USD | 10.500 | % | 04/15/2018 | 1,450,000 | 1,598,625 | (4) | ||||||||||||||||||||
| USD | 8.250 | % | 09/30/2020 | 1,800,000 | 1,917,567 | (1) | ||||||||||||||||||||
|
| |||||||||||||||||||||||||
| 3,516,192 | ||||||||||||||||||||||||||
|
| |||||||||||||||||||||||||
Kazakhstan - 2.26% | ||||||||||||||||||||||||||
BTA Bank JSC: | ||||||||||||||||||||||||||
| USD | 10.750 | % | 07/01/2018 | 3,480,237 | 1,431,247 | (2)(4) | ||||||||||||||||||||
| USD | 0.000 | % | 07/01/2020 | 500,000 | 61,250 | (2)(3)(4) | ||||||||||||||||||||
| USD | 0.000 | % | 07/01/2020 | 2,515,532 | 301,864 | (1)(2)(3) | ||||||||||||||||||||
KazMunayGas National Co. JSC: | ||||||||||||||||||||||||||
| USD | 11.750 | % | 01/23/2015 | 10,428,000 | 12,578,775 | (4) | ||||||||||||||||||||
| USD | 9.125 | % | 07/02/2018 | 1,158,000 | 1,532,903 | (1) | ||||||||||||||||||||
| USD | 7.000 | % | 05/05/2020 | 739,000 | 918,207 | (1) | ||||||||||||||||||||
| USD | 7.000 | % | 05/05/2020 | 3,925,000 | 4,876,813 | (4) | ||||||||||||||||||||
| USD | 6.375 | % | 04/09/2021 | 2,538,000 | 3,105,877 | (1) | ||||||||||||||||||||
| USD | 6.375 | % | 04/09/2021 | 8,410,000 | 10,291,738 | (4) | ||||||||||||||||||||
Zhaikmunai LLP | USD | 7.125 | % | 11/13/2019 | 2,500,000 | 2,581,250 | (1) | |||||||||||||||||||
|
| |||||||||||||||||||||||||
| 37,679,924 | ||||||||||||||||||||||||||
|
| |||||||||||||||||||||||||
Malaysia - 1.66% | ||||||||||||||||||||||||||
IOI Investment L BHD | USD | 4.375 | % | 06/27/2022 | 3,000,000 | 3,125,550 | ||||||||||||||||||||
Penerbangan Malaysia BHD | USD | 5.625 | % | 03/15/2016 | 1,195,000 | 1,350,649 | (4) | |||||||||||||||||||
Petroliam Nasional BHD: | ||||||||||||||||||||||||||
| USD | 7.750 | % | 08/15/2015 | 335,000 | 393,675 | (1) | ||||||||||||||||||||
| USD | 7.625 | % | 10/15/2026 | 840,000 | 1,272,012 | (4) | ||||||||||||||||||||
Petronas Capital Ltd. | USD | 7.875 | % | 05/22/2022 | 13,315,000 | 19,316,070 | (4) | |||||||||||||||||||
Petronas Global Sukuk Ltd. | USD | 4.250 | % | 08/12/2014 | 2,240,000 | 2,356,368 | (1) | |||||||||||||||||||
|
| |||||||||||||||||||||||||
| 27,814,324 | ||||||||||||||||||||||||||
|
| |||||||||||||||||||||||||
See Notes to Financial Statements.
22 | www.shiplp.com |
Table of Contents
| Stone Harbor Emerging Markets Debt Fund | Statements of Investments | |
| November 30, 2012 (Unaudited) |
Currency | Rate | Maturity Date | Principal Amount* | Market Value (Expressed in U.S. $) | |||||||||||||||||||||
Mexico - 1.84% | |||||||||||||||||||||||||
America Movil SAB de CV: | |||||||||||||||||||||||||
| USD | 2.375 | % | 09/08/2016 | 1,369,000 | $ | 1,430,482 | |||||||||||||||||||
| USD | 3.125 | % | 07/16/2022 | 1,800,000 | 1,850,688 | ||||||||||||||||||||
Axtel SAB de CV | USD | 7.625 | % | 02/01/2017 | 347,000 | 149,210 | (1) | ||||||||||||||||||
Cemex Finance LLC | USD | 9.375 | % | 10/12/2022 | 601,000 | 651,523 | (1) | ||||||||||||||||||
Cemex SAB de CV | USD | 9.500 | % | 06/15/2018 | 2,000,000 | 2,157,500 | (1) | ||||||||||||||||||
Geo Maquinaria | USD | 9.625 | % | 05/02/2021 | 3,746,758 | 3,550,053 | (1) | ||||||||||||||||||
Grupo Bimbo SAB de CV: | |||||||||||||||||||||||||
| USD | 4.875 | % | 06/30/2020 | 183,000 | 207,160 | (1) | |||||||||||||||||||
| USD | 4.500 | % | 01/25/2022 | 800,000 | 880,588 | (1) | |||||||||||||||||||
Grupo Televisa SAB | USD | 6.000 | % | 05/12/2018 | 300,000 | 357,349 | |||||||||||||||||||
Mexichem SAB de CV | USD | 4.875 | % | 09/19/2022 | 653,000 | 693,812 | (1) | ||||||||||||||||||
Mexico Generadora De En | USD | 5.500 | % | 12/06/2032 | 2,000,000 | 2,000,00 | (1) | ||||||||||||||||||
Pemex Finance Ltd. | USD | 9.150 | % | 11/15/2018 | 1,250,000 | 1,548,876 | |||||||||||||||||||
Pemex Project Funding Master Trust: | |||||||||||||||||||||||||
| EUR | 5.500 | % | 02/24/2025 | 2,275,000 | 3,387,943 | (4) | |||||||||||||||||||
| USD | 6.625 | % | 06/15/2035 | 3,034,000 | 3,838,010 | ||||||||||||||||||||
Petroleos Mexicanos | USD | 6.500 | % | 06/02/2041 | 2,129,000 | 2,682,540 | |||||||||||||||||||
Telefonos de Mexico SAB de CV | USD | 5.500 | % | 11/15/2019 | 1,100,000 | 1,297,807 | |||||||||||||||||||
Urbi Desarrollos Urbanos SAB de CV: | |||||||||||||||||||||||||
| USD | 10.576 | % | 12/22/2012 | 1,700,000 | 1,716,660 | (1)(10) | |||||||||||||||||||
| USD | 9.750 | % | 02/03/2022 | 2,700,000 | 2,409,750 | (1) | |||||||||||||||||||
|
| ||||||||||||||||||||||||
| 30,809,951 | |||||||||||||||||||||||||
|
| ||||||||||||||||||||||||
Mongolia - 0.11% | |||||||||||||||||||||||||
Mongolian Mining Corp. | USD | 8.875 | % | 03/29/2017 | 1,795,000 | 1,898,213 | (1) | ||||||||||||||||||
|
| ||||||||||||||||||||||||
Nigeria - 0.07% | |||||||||||||||||||||||||
Afren PLC | USD | 10.250 | % | 04/08/2019 | 964,000 | 1,127,880 | (1) | ||||||||||||||||||
|
| ||||||||||||||||||||||||
Peru - 0.87% | |||||||||||||||||||||||||
Ajecorp BV | USD | 6.500 | % | 05/14/2022 | 2,875,000 | 3,119,375 | (1) | ||||||||||||||||||
Banco de Credito del Peru: | |||||||||||||||||||||||||
| USD | 4.750 | % | 03/16/2016 | 300,000 | 320,250 | (1) | |||||||||||||||||||
| USD | 5.375 | % | 09/16/2020 | 526,000 | 586,490 | (1) | |||||||||||||||||||
| USD | 5.375 | % | 09/16/2020 | 1,465,000 | 1,633,475 | (4) | |||||||||||||||||||
BBVA Banco Continental SA | USD | 5.000 | % | 08/26/2022 | 1,176,000 | 1,270,080 | (1) | ||||||||||||||||||
Corp. Azucarera del Peru SA | USD | 6.375 | % | 08/02/2022 | 631,000 | 679,902 | (1) | ||||||||||||||||||
Inkia Energy Ltd. | USD | 8.375 | % | 04/04/2021 | 785,000 | 875,275 | (1) | ||||||||||||||||||
Maestro Peru SA | USD | 6.750 | % | 09/26/2019 | 800,000 | 832,000 | (1) | ||||||||||||||||||
Southern Copper Corp.: | |||||||||||||||||||||||||
| USD | 6.750 | % | 04/16/2040 | 1,167,000 | 1,381,390 | ||||||||||||||||||||
| USD | 5.250 | % | 11/08/2042 | 3,000,000 | 3,015,000 | ||||||||||||||||||||
Volcan Cia Minera SAA | USD | 5.375 | % | 02/02/2022 | 836,000 | 909,150 | (1) | ||||||||||||||||||
|
| ||||||||||||||||||||||||
| 14,622,387 | |||||||||||||||||||||||||
|
| ||||||||||||||||||||||||
See Notes to Financial Statements.
| Stone Harbor Investment Funds Semi-Annual Report | November 30, 2012 | 23 |
Table of Contents
| Stone Harbor Emerging Markets Debt Fund | Statements of Investments | |
| November 30, 2012 (Unaudited) |
Currency | Rate | Maturity Date | Principal Amount* | Market Value (Expressed in U.S. $) | |||||||||||||||||||||
Qatar - 0.72% | |||||||||||||||||||||||||
Doha Finance Ltd. | USD | 3.500 | % | 03/14/2017 | 800,000 | $ | 828,000 | ||||||||||||||||||
Nakilat, Inc. | USD | 6.067 | % | 12/31/2033 | 400,000 | 492,000 | (4) | ||||||||||||||||||
Qtel International Finance Ltd.: | |||||||||||||||||||||||||
| USD | 3.375 | % | 10/14/2016 | 500,000 | 523,750 | (4) | |||||||||||||||||||
| USD | 4.750 | % | 02/16/2021 | 567,000 | 637,166 | (1) | |||||||||||||||||||
| USD | 4.750 | % | 02/16/2021 | 2,040,000 | 2,292,450 | (4) | |||||||||||||||||||
| USD | 5.000 | % | 10/19/2025 | 1,856,000 | 2,081,040 | (4) | |||||||||||||||||||
Ras Laffan Liquefied Natural Gas Co. Ltd. II | USD | 5.298 | % | 09/30/2020 | 1,395,625 | 1,578,801 | (4) | ||||||||||||||||||
Ras Laffan Liquefied Natural Gas Co. Ltd. III: | |||||||||||||||||||||||||
| USD | 5.832 | % | 09/30/2016 | 484,800 | 533,888 | (4) | |||||||||||||||||||
| USD | 6.750 | % | 09/30/2019 | 2,500,000 | 3,146,875 | (4) | |||||||||||||||||||
|
| ||||||||||||||||||||||||
| 12,113,970 | |||||||||||||||||||||||||
|
| ||||||||||||||||||||||||
Russia - 1.46% | |||||||||||||||||||||||||
Alfa Bank OJSC Via Alfa Bond Issuance PLC | USD | 7.500 | % | 09/26/2019 | 1,750,000 | 1,833,125 | (1) | ||||||||||||||||||
Evraz Group SA | USD | 6.750 | % | 04/27/2018 | 1,184,000 | 1,186,960 | (1) | ||||||||||||||||||
Gazprom Neft OAO Via GPN Capital SA | USD | 4.375 | % | 09/19/2022 | 2,183,000 | 2,210,287 | (1) | ||||||||||||||||||
Gazprom OAO Via Gaz Capital SA | USD | 4.950 | % | 07/19/2022 | 860,000 | 916,975 | (1) | ||||||||||||||||||
Metalloinvest Finance Ltd. | USD | 6.500 | % | 07/21/2016 | 1,137,000 | 1,173,952 | (1) | ||||||||||||||||||
Novatek OAO via Novatek Finance Ltd.: | |||||||||||||||||||||||||
| USD | 5.326 | % | 02/03/2016 | 1,700,000 | 1,823,250 | (4) | |||||||||||||||||||
| USD | 6.604 | % | 02/03/2021 | 976,000 | 1,149,240 | (1) | |||||||||||||||||||
Rosneft Oil Co. | USD | 4.199 | % | 03/06/2022 | 1,814,000 | 1,814,000 | (1) | ||||||||||||||||||
Russian Agricultural Bank OJSC Via RSHB Capital SA | USD | 5.298 | % | 12/27/2017 | 1,320,000 | 1,400,890 | (4) | ||||||||||||||||||
Sberbank of Russia Via SB Capital SA: | |||||||||||||||||||||||||
| USD | 6.125 | % | 02/07/2022 | 1,300,000 | 1,456,813 | (1) | |||||||||||||||||||
| USD | 5.125 | % | 10/29/2022 | 1,739,000 | 1,756,390 | (1) | |||||||||||||||||||
Severstal OAO Via Steel Capital SA: | |||||||||||||||||||||||||
| USD | 6.700 | % | 10/25/2017 | 649,000 | 691,185 | (4) | |||||||||||||||||||
| USD | 5.900 | % | 10/17/2022 | 1,000,000 | 992,500 | (1) | |||||||||||||||||||
Vimpel Communications Holdings BV | USD | 6.255 | % | 03/01/2017 | 830,000 | 869,425 | (4) | ||||||||||||||||||
Vimpel Communications Via VIP Finance Ireland Ltd. OJSC | USD | 7.748 | % | 02/02/2021 | 1,266,000 | 1,403,678 | (1) | ||||||||||||||||||
VTB Bank OJSC Via VTB Capital SA: | |||||||||||||||||||||||||
| USD | 6.315 | % | 02/22/2018 | 2,317,000 | 2,482,086 | (4) | |||||||||||||||||||
| USD | 6.250 | % | 06/30/2035 | 1,085,000 | 1,159,594 | (4) | |||||||||||||||||||
|
| ||||||||||||||||||||||||
| 24,320,350 | |||||||||||||||||||||||||
|
| ||||||||||||||||||||||||
Saudi Arabia��- 0.34% | |||||||||||||||||||||||||
Saudi Electricity Global Sukuk Co.: | |||||||||||||||||||||||||
| USD | 2.665 | % | 04/03/2017 | 2,089,000 | 2,159,504 | (4) | |||||||||||||||||||
| USD | 4.211 | % | 04/03/2022 | 3,268,000 | 3,545,780 | (4) | |||||||||||||||||||
|
| ||||||||||||||||||||||||
| 5,705,284 | |||||||||||||||||||||||||
|
| ||||||||||||||||||||||||
See Notes to Financial Statements.
24 | www.shiplp.com |
Table of Contents
| Stone Harbor Emerging Markets Debt Fund | Statements of Investments | |
| November 30, 2012 (Unaudited) |
Currency | Rate | Maturity Date | Principal Amount* | Market Value (Expressed in U.S. $) | ||||||||||||||||||||||
Singapore - 0.39% | ||||||||||||||||||||||||||
DBS Bank Ltd. | USD | 3.625 | % | 09/21/2022 | 900,000 | $ | 944,415 | (4)(10) | ||||||||||||||||||
Oversea-Chinese Banking Corp. Ltd. | USD | 3.150 | % | 03/11/2023 | 1,517,000 | 1,541,887 | (1)(10) | |||||||||||||||||||
PSA International Pte Ltd. | USD | 3.875 | % | 02/11/2021 | 850,000 | 934,448 | ||||||||||||||||||||
SingTel Group Treasury Pte Ltd. | USD | 4.500 | % | 09/08/2021 | 1,000,000 | 1,150,200 | ||||||||||||||||||||
SP PowerAssets Ltd. | USD | 2.700 | % | 09/14/2022 | 2,000,000 | 1,987,500 | (4) | |||||||||||||||||||
|
| |||||||||||||||||||||||||
| 6,558,450 | ||||||||||||||||||||||||||
|
| |||||||||||||||||||||||||
South Africa - 0.38% | ||||||||||||||||||||||||||
Gold Fields Orogen Holding BVI Ltd. | USD | 4.875 | % | 10/07/2020 | 3,400,000 | 3,276,750 | (4) | |||||||||||||||||||
Myriad International Holding BV | USD | 6.375 | % | 07/28/2017 | 2,700,000 | 3,081,375 | (4) | |||||||||||||||||||
|
| |||||||||||||||||||||||||
| 6,358,125 | ||||||||||||||||||||||||||
|
| |||||||||||||||||||||||||
South Korea - 0.90% | ||||||||||||||||||||||||||
Industrial Bank of Korea | USD | 2.375 | % | 07/17/2017 | 2,000,000 | 2,042,200 | (1) | |||||||||||||||||||
Korea East-West Power Co. Ltd. | USD | 2.500 | % | 07/16/2017 | 1,000,000 | 1,022,550 | (1) | |||||||||||||||||||
Korea Electric Power Corp. | USD | 3.000 | % | 10/05/2015 | 1,000,000 | 1,045,550 | (1) | |||||||||||||||||||
Korea Exchange Bank | USD | 3.125 | % | 06/26/2017 | 700,000 | 731,465 | (1) | |||||||||||||||||||
Korea Expressway Corp. | USD | 1.875 | % | 10/22/2017 | 900,000 | 891,385 | (1) | |||||||||||||||||||
Korea Hydro & Nuclear Power Co. Ltd.: | ||||||||||||||||||||||||||
| USD | 4.750 | % | 07/13/2021 | 1,200,000 | 1,373,100 | (4) | ||||||||||||||||||||
| USD | 3.000 | % | 09/19/2022 | 2,000,000 | 2,004,400 | (1) | ||||||||||||||||||||
Korea Western Power Co. Ltd. | USD | 3.125 | % | 05/10/2017 | 3,001,000 | 3,138,746 | (1) | |||||||||||||||||||
KT Corp. | USD | 3.875 | % | 01/20/2017 | 1,450,000 | 1,560,649 | ||||||||||||||||||||
SK Telecom Co. Ltd. | USD | 2.125 | % | 05/01/2018 | 1,207,000 | 1,215,570 | (1) | |||||||||||||||||||
|
| |||||||||||||||||||||||||
| 15,025,615 | ||||||||||||||||||||||||||
|
| |||||||||||||||||||||||||
Thailand - 0.44% | ||||||||||||||||||||||||||
Bangkok Bank PCL: | ||||||||||||||||||||||||||
| USD | 2.750 | % | 03/27/2018 | 1,180,000 | 1,190,148 | (1) | ||||||||||||||||||||
| USD | 3.875 | % | 09/27/2022 | 1,537,000 | 1,591,871 | (1) | ||||||||||||||||||||
PTT Global Chemical PCL | USD | 4.250 | % | 09/19/2022 | 1,007,000 | 1,050,111 | (1) | |||||||||||||||||||
PTT PCL | USD | 4.500 | % | 10/25/2042 | 1,032,000 | 1,037,573 | (1) | |||||||||||||||||||
PTTEP Canada International Finance Ltd.: | ||||||||||||||||||||||||||
| USD | 5.692 | % | 04/05/2021 | 1,032,000 | 1,190,360 | (4) | ||||||||||||||||||||
| USD | 6.350 | % | 06/12/2042 | 1,000,000 | 1,282,550 | (4) | ||||||||||||||||||||
|
| |||||||||||||||||||||||||
| 7,342,613 | ||||||||||||||||||||||||||
|
| |||||||||||||||||||||||||
Turkey - 0.42% | ||||||||||||||||||||||||||
Akbank TAS | USD | 3.875 | % | 10/24/2017 | 800,000 | 828,000 | (1) | |||||||||||||||||||
Anadolu Efes Biracilik Ve Malt Sanayii AS | USD | 3.375 | % | 11/01/2022 | 2,300,000 | 2,288,500 | (1) | |||||||||||||||||||
Turkiye Garanti Bankasi AS | USD | 5.250 | % | 09/13/2022 | 1,200,000 | 1,312,500 | (1) | |||||||||||||||||||
Yuksel Insaat AS | USD | 9.500 | % | 11/10/2015 | 3,237,000 | 2,573,415 | (4) | |||||||||||||||||||
|
| |||||||||||||||||||||||||
| 7,002,415 | ||||||||||||||||||||||||||
|
| |||||||||||||||||||||||||
See Notes to Financial Statements.
| Stone Harbor Investment Funds Semi-Annual Report | November 30, 2012 | 25 |
Table of Contents
| Stone Harbor Emerging Markets Debt Fund | Statements of Investments | |
| November 30, 2012 (Unaudited) |
Counterparty | Currency | Rate | Maturity Date | Principal Amount* | Market Value (Expressed in U.S. $) | ||||||||||||||||||||||||||
Ukraine - 0.43% | |||||||||||||||||||||||||||||||
Ferrexpo Finance PLC | USD | 7.875 | % | 04/07/2016 | 2,115,000 | $ | 2,072,700 | (1) | |||||||||||||||||||||||
Metinvest BV | USD | 8.750 | % | 02/14/2018 | 1,737,000 | 1,676,205 | (1) | ||||||||||||||||||||||||
Mriya Agro Holding PLC | USD | 10.950 | % | 03/30/2016 | 1,168,000 | 1,159,240 | (1) | ||||||||||||||||||||||||
National JSC Naftogaz of Ukraine | USD | 9.500 | % | 09/30/2014 | 2,189,000 | 2,249,197 | |||||||||||||||||||||||||
|
| ||||||||||||||||||||||||||||||
| 7,157,342 | |||||||||||||||||||||||||||||||
|
| ||||||||||||||||||||||||||||||
United Arab Emirates - 0.99% | |||||||||||||||||||||||||||||||
Dolphin Energy Ltd. | USD | 5.888 | % | 06/15/2019 | 1,520,760 | 1,717,698 | (4) | ||||||||||||||||||||||||
DP World Ltd. | USD | 6.850 | % | 07/02/2037 | 910,000 | 1,015,788 | (4) | ||||||||||||||||||||||||
DP World Sukuk Ltd. | USD | 6.250 | % | 07/02/2017 | 2,690,000 | 3,032,975 | (4) | ||||||||||||||||||||||||
Dubai Holding Commercial Operations MTN Ltd. | GBP | 6.000 | % | 02/01/2017 | 900,000 | 1,391,470 | |||||||||||||||||||||||||
Emaar Sukuk Ltd. | USD | 6.400 | % | 07/18/2019 | 3,000,000 | 3,262,500 | |||||||||||||||||||||||||
IPIC GMTN Ltd. | USD | 3.750 | % | 03/01/2017 | 1,690,000 | 1,801,962 | (1) | ||||||||||||||||||||||||
MAF Global Securities Ltd. | USD | 5.250 | % | 07/05/2019 | 1,500,000 | 1,582,500 | |||||||||||||||||||||||||
MAF Sukuk Ltd. | USD | 5.850 | % | 02/07/2017 | 2,547,000 | 2,795,333 | |||||||||||||||||||||||||
|
| ||||||||||||||||||||||||||||||
| 16,600,226 | |||||||||||||||||||||||||||||||
|
| ||||||||||||||||||||||||||||||
Venezuela - 3.79% | |||||||||||||||||||||||||||||||
Petroleos de Venezuela SA: | |||||||||||||||||||||||||||||||
| USD | 4.900 | % | 10/28/2014 | 58,271,818 | 55,256,251 | ||||||||||||||||||||||||||
| USD | 5.000 | % | 10/28/2015 | 4,959,924 | 4,439,132 | ||||||||||||||||||||||||||
| USD | 5.250 | % | 04/12/2017 | 4,331,000 | 3,621,799 | (4) | |||||||||||||||||||||||||
|
| ||||||||||||||||||||||||||||||
| 63,317,182 | |||||||||||||||||||||||||||||||
|
| ||||||||||||||||||||||||||||||
TOTAL CORPORATE BONDS | 432,354,708 | ||||||||||||||||||||||||||||||
|
| ||||||||||||||||||||||||||||||
(Cost $413,282,409) | |||||||||||||||||||||||||||||||
PARTICIPATION NOTES - 0.66% | |||||||||||||||||||||||||||||||
Argentina - 0.05% | |||||||||||||||||||||||||||||||
Hidroelec el Chocon SA | USD | 8.061 | % | 03/01/2015 | 846,154 | 846,154 | |||||||||||||||||||||||||
|
| ||||||||||||||||||||||||||||||
Ukraine - 0.61% | |||||||||||||||||||||||||||||||
Ukreximbank Biz Finance PLC | USD | 8.375 | % | 04/27/2015 | 10,324,000 | 10,169,140 | (4) | ||||||||||||||||||||||||
|
| ||||||||||||||||||||||||||||||
TOTAL PARTICIPATION NOTES | 11,015,294 | ||||||||||||||||||||||||||||||
|
| ||||||||||||||||||||||||||||||
(Cost $10,910,902) | |||||||||||||||||||||||||||||||
CREDIT LINKED NOTES - 2.56% | |||||||||||||||||||||||||||||||
Argentina - 0.17% | |||||||||||||||||||||||||||||||
Cablevision SA | Deutsche Bank AG London | USD | 9.375 | % | 02/12/2018 | 3,618,000 | 2,803,950 | ||||||||||||||||||||||||
|
| ||||||||||||||||||||||||||||||
Brazil - 0.51% | |||||||||||||||||||||||||||||||
Nota Do Tesouro Nacional: | |||||||||||||||||||||||||||||||
| Barclays Bank PLC | BRL | 6.000 | % | 05/15/2015 | 3,564,049 | 1,827,517 | |||||||||||||||||||||||||
See Notes to Financial Statements.
26 | www.shiplp.com |
Table of Contents
| Stone Harbor Emerging Markets Debt Fund | Statements of Investments | |
| November 30, 2012 (Unaudited) |
Counterparty | Currency | Rate | Maturity Date | Principal Amount/Shares* | Market Value (Expressed in U.S. $) | ||||||||||||||||||||||||||
Brazil (continued) | |||||||||||||||||||||||||||||||
Nota Do Tesouro Nacional (continued) | |||||||||||||||||||||||||||||||
| Citigroup Global Markets | BRL | 6.000 | % | 05/15/2015 | 5,288,042 | $ | 2,696,115 | ||||||||||||||||||||||||
| JPMorganChase &Co. | BRL | 6.000 | % | 05/15/2015 | 7,722,105 | 3,959,620 | |||||||||||||||||||||||||
|
| ||||||||||||||||||||||||||||||
| 8,483,252 | |||||||||||||||||||||||||||||||
|
| ||||||||||||||||||||||||||||||
Colombia - 0.79% | |||||||||||||||||||||||||||||||
Titulos de Tesoreria - Series B: | |||||||||||||||||||||||||||||||
| Citigroup Global Markets | COP | 11.000 | % | 07/24/2020 | 3,000,000,000 | 2,186,205 | |||||||||||||||||||||||||
| Citigroup Global Markets | COP | 11.000 | % | 07/24/2020 | 3,500,000,000 | 2,550,573 | |||||||||||||||||||||||||
| Citigroup Global Markets | COP | 11.000 | % | 07/24/2020 | 4,000,000,000 | 2,914,941 | |||||||||||||||||||||||||
| Citigroup Global Markets | COP | 11.000 | % | 07/24/2020 | 5,700,000,000 | 4,153,790 | |||||||||||||||||||||||||
| Citigroup Global Markets | COP | 10.000 | % | 07/24/2024 | 1,952,000,000 | 1,430,018 | |||||||||||||||||||||||||
|
| ||||||||||||||||||||||||||||||
| 13,235,527 | |||||||||||||||||||||||||||||||
|
| ||||||||||||||||||||||||||||||
Iraq - 0.75% | |||||||||||||||||||||||||||||||
Republic of Iraq: | |||||||||||||||||||||||||||||||
| Merrill Lynch | JPY | 2.510 | % | 01/01/2028 | 1,035,000,000 | 8,663,189 | |||||||||||||||||||||||||
| Merrill Lynch | JPY | 2.548 | % | 01/01/2028 | 475,424,246 | 3,979,411 | (10) | ||||||||||||||||||||||||
|
| ||||||||||||||||||||||||||||||
| 12,642,600 | |||||||||||||||||||||||||||||||
|
| ||||||||||||||||||||||||||||||
Russia - 0.34% | |||||||||||||||||||||||||||||||
Russian Government | Credit Suisse First Boston | RUB | 7.600 | % | 04/14/2021 | 167,100,000 | 5,685,479 | ||||||||||||||||||||||||
|
| ||||||||||||||||||||||||||||||
TOTAL CREDIT LINKED NOTES | 42,850,808 | ||||||||||||||||||||||||||||||
|
| ||||||||||||||||||||||||||||||
(Cost $43,052,035) | |||||||||||||||||||||||||||||||
SHORT TERM INVESTMENTS - 6.89% | |||||||||||||||||||||||||||||||
Money Market Mutual Funds - 6.89% | |||||||||||||||||||||||||||||||
Dreyfus Institutional Cash Advantage Fund - Institutional Advantage Shares (7-Day Yield) | USD | 0.06959 | % | N/A | 115,163,413 | 115,163,413 | |||||||||||||||||||||||||
|
| ||||||||||||||||||||||||||||||
TOTAL SHORT TERM INVESTMENTS | 115,163,413 | ||||||||||||||||||||||||||||||
|
| ||||||||||||||||||||||||||||||
(Cost $115,163,413) | |||||||||||||||||||||||||||||||
Total Investments - 99.33% | 1,659,601,592 | ||||||||||||||||||||||||||||||
(Cost $1,545,446,664) | |||||||||||||||||||||||||||||||
Other Assets In Excess of Liabilities - 0.67% | 11,134,811 | ||||||||||||||||||||||||||||||
|
| ||||||||||||||||||||||||||||||
Net Assets - 100.00% | $ | 1,670,736,403 | |||||||||||||||||||||||||||||
|
| ||||||||||||||||||||||||||||||
See Notes to Financial Statements.
| Stone Harbor Investment Funds Semi-Annual Report | November 30, 2012 | 27 |
Table of Contents
| Stone Harbor Emerging Markets Debt Fund | Statements of Investments | |
| November 30, 2012 (Unaudited) |
* The contract/principal amount of each security is stated in the currency in which the security is denominated. See below.
BRL | - | Brazilian Real | ||||
COP | - | Colombian Peso | ||||
EUR | - | Euro Currency | ||||
GBP | - | Great Britain Pound | ||||
JPY | - | Japanese Yen | ||||
MXN | - | Mexican Peso | ||||
MYR | - | Malaysian Ringgit | ||||
RON | - | Romanian Leu | ||||
RUB | - | Russian Ruble | ||||
USD | - | United States Dollar | ||||
ZAR | - | South African Rand |
| (1) | Security exempt from registration under Rule 144A of the Securities Act of 1933. Such securities may normally be sold to qualified institutional buyers in transactions exempt from registration. Total market value of Rule 144A securities amounts to $223,956,103 which represents approximately 13.40% of net assets as of November 30, 2012. |
| (2) | Security is currently in default/non-income producing. |
| (3) | Issued with a zero coupon. Income is recognized through the accretion of discount. |
| (4) | Securities were originally issued pursuant to Regulation S under the Securities Act of 1933, which exempts securities offered and sold outside of the United States from registration. Such securities cannot be sold in the United States without either an effective registration statement filed pursuant to the Securities Act of 1933, or pursuant to an exemption from registration. As of November 30, 2012, the aggregate market value of those securities was $512,649,911, which represents approximately 30.68% of net assets. |
| (5) | Amount represents less than 0.005% of net assets. |
| (6) | Step bond. Coupon increases periodically based upon a predetermined schedule. Interest rate disclosed is that which is in effect at November 30, 2012. |
| (7) | Pay-in-kind securities. |
| (8) | Bank loans generally pay interest at rates which are periodically determined by reference to a base lending rate plus a premium. All loans carry a variable rate of interest. These base lending rates are generally (i) the Prime Rate offered by one or more major United States banks, (ii) the lending rate offered by one or more European banks such as the London Interbank Offered Rate (“LIBOR”) or (iii) the Certificate of Deposit rate. Rate shown represents the weighted average rate at November 30, 2012. Bank Loans, while exempt from registration, under the Securities Act of 1933, contain certain restrictions on resale and cannot be sold publicly. Floating rate bank loans often require prepayments from excess cash flow or permit the borrower to repay at its election. The degree to which borrowers repay, whether as a contractual requirement or at their election, cannot be predicted with accuracy. As a result, the actual remaining maturity may be substantially less than the stated maturity shown. |
| (9) | This security is considered illiquid. On November 30, 2012, the total market values of these securities were $447,336, representing 0.03% of net assets. |
| (10) | Floating or variable rate security. Interest rate disclosed is that which is in effect at November 30, 2012. |
Common Abbreviations:
AS | - | Anonim Sirket is the Turkish term for Incorporation. | ||||
BHD | - | Berhad is the Malaysian term for public limited company. | ||||
BVI | - | British Virgin Islands. | ||||
BV | - | Besloten Vennootschap is the Dutch term for private limited liability company. | ||||
ESP | - | Empresa de Servicios Publicos is the Colombian term for Public Service Company. | ||||
GmbH | - | Gesellschaft mit beschrankter Haftung is the German term for a company with limited liability. | ||||
GMTN | - | Global Medium Term Note. | ||||
JSC | - | Joint Stock Company. | ||||
LLC | - | Lmited Liability Corporation. | ||||
LLP | - | Limited Liability Partnership. | ||||
Ltd. | - | Limited. | ||||
MTN | - | Medium Term Note. | ||||
OAO | - | Otkrytoe Aktsionernoe Obschestvo is the Russian term for Open Joint Stock Company. | ||||
OJSC | - | Open Joint Stock Company. | ||||
PCL | - | A rearrangement of the letters for Public Limited Company, used in Thailand. | ||||
PLC | - | Public Limited Company. | ||||
PT | - | Perseroan terbuka is an Indonesian term for limited liability company. | ||||
Pte | - | Private. | ||||
SA | - | Generally designates corporations in various countries, mostly those employing the civil law. | ||||
SAA | - | Sociedad Anonima Abierta is the Peruvian term used for companies with 20 or more shareholders. | ||||
SAB | - | Sociedad Anonima Bursatil is the Spanish term used for publicly held company. | ||||
SAB de CV | - | A variable capital company. | ||||
SPV | - | Special Purpose Vehicle. | ||||
TAS | - | TüRk Anonim Sirketi is the Turkish term for Joint Stock Company. | ||||
Tbk | - | Terbuka is the Indonesian term for limited liability company. |
See Notes to Financial Statements.
28 | www.shiplp.com |
Table of Contents
| Stone Harbor Emerging Markets Debt Fund | Statements of Investments | |
| November 30, 2012 (Unaudited) |
OUTSTANDING FORWARD FOREIGN CURRENCY CONTRACTS
Counterparty | Foreign | Contracted Amount* | Purchase/Sale | Settlement Date | Current Value | Unrealized Appreciation/ (Depreciation) | ||||||||||
Citigroup Global Markets | COP | 7,609,517,600 | Purchase | 12/03/2012 | $ | 4,190,675 | $ | 54,303 | ||||||||
Citigroup Global Markets | COP | 7,609,517,601 | Purchase | 01/29/2013 | 4,164,293 | 21,255 | ||||||||||
JPMorgan Chase & Co. | EUR | 2,073,428 | Purchase | 12/31/2012 | 2,697,469 | 40,033 | ||||||||||
JPMorgan Chase & Co. | EUR | 8,105,536 | Purchase | 12/31/2012 | 10,545,064 | 35,832 | ||||||||||
JPMorgan Chase & Co. | EUR | 4,158,653 | Purchase | 12/31/2012 | 5,410,286 | 12,059 | ||||||||||
JPMorgan Chase & Co. | EUR | 353,000 | Purchase | 12/31/2012 | 459,243 | 9,232 | ||||||||||
JPMorgan Chase & Co. | EUR | 1,685,792 | Purchase | 12/31/2012 | 2,193,165 | 6,154 | ||||||||||
JPMorgan Chase & Co. | EUR | 354,474 | Purchase | 12/31/2012 | 461,160 | 1,613 | ||||||||||
JPMorgan Chase & Co. | JPY | 1,055,091,000 | Sale | 01/04/2013 | 12,803,773 | 484,025 | ||||||||||
Citigroup Global Markets | RUB | 272,840,750 | Purchase | 12/19/2012 | 8,811,188 | 101,188 | ||||||||||
Citigroup Global Markets | RUB | 117,509,180 | Purchase | 12/19/2012 | 3,794,871 | 73,871 | ||||||||||
Citigroup Global Markets | RUB | 438,654,880 | Purchase | 02/01/2013 | 14,077,100 | 258,369 | ||||||||||
|
| |||||||||||||||
| $ | 1,097,934 | |||||||||||||||
|
| |||||||||||||||
Citigroup Global Markets | BRL | 17,190,062 | Purchase | 01/03/2013 | $ | 8,004,014 | $ | (152,986) | ||||||||
Citigroup Global Markets | COP | 7,609,517,598 | Sale | 12/03/2012 | 4,190,675 | (21,076) | ||||||||||
JPMorgan Chase & Co. | EUR | 2,582,699 | Sale | 12/31/2012 | 3,360,016 | (286) | ||||||||||
JPMorgan Chase & Co. | EUR | 58,190,000 | Sale | 12/31/2012 | 75,703,484 | (1,662,529) | ||||||||||
JPMorgan Chase & Co. | EUR | 353,000 | Sale | 12/31/2012 | 459,243 | (10,085) | ||||||||||
JPMorgan Chase & Co. | GBP | 857,000 | Sale | 12/31/2012 | 1,372,943 | (10,879) | ||||||||||
JPMorgan Chase & Co. | GBP | 904,000 | Sale | 12/31/2012 | 1,448,239 | (11,475) | ||||||||||
Citigroup Global Markets | RON | 12,485,820 | Purchase | 12/18/2012 | 3,582,948 | (16,827) | ||||||||||
|
| |||||||||||||||
| $ | (1,886,143) | |||||||||||||||
|
| |||||||||||||||
| * | The contracted amount is stated in the currency in which the security is denominated. |
Securities determined to be illiquid under the procedures approved by the Funds’ Board of Trustees. Information related to the illiquid securities is as follows:
| Date(s) of Purchase | Security | Cost | Market Value | % of Net Assets | ||||||||
08/10/2010 – 02/23/2011 | Cap Cana SA | $ 894,380 | $ 275,830 | 0.02% | ||||||||
08/10/2010 – 11/01/2011 | Cap Cana SA | 837,337 | 201,506 | 0.01% | ||||||||
|
| |||||||||||
| $ 477,336 | 0.03% | |||||||||||
|
| |||||||||||
See Notes to Financial Statements.
| Stone Harbor Investment Funds Semi-Annual Report | November 30, 2012 | 29 |
Table of Contents
| Stone Harbor High Yield Bond Fund | Statements of Investments | |
| November 30, 2012 (Unaudited) |
Currency | Rate | Maturity Date | Principal | Market Value | ||||||||||||||||||||||
CORPORATE BONDS - 94.47% | ||||||||||||||||||||||||||
Aerospace/Defense - 1.23% | ||||||||||||||||||||||||||
CPI International, Inc. | USD | 8.000 | % | 02/15/2018 | 1,631,000 | $ | 1,559,644 | |||||||||||||||||||
TransDigm, Inc.: | ||||||||||||||||||||||||||
| USD | 7.750 | % | 12/15/2018 | 795,000 | 882,450 | |||||||||||||||||||||
| USD | 5.500 | % | 10/15/2020 | 994,000 | 1,017,607 | (1) | ||||||||||||||||||||
Triumph Group, Inc. | USD | 8.625 | % | 07/15/2018 | 1,253,000 | 1,403,360 | ||||||||||||||||||||
|
| |||||||||||||||||||||||||
| 4,863,061 | ||||||||||||||||||||||||||
|
| |||||||||||||||||||||||||
Automotive - 1.48% | ||||||||||||||||||||||||||
Allison Transmission, Inc. | USD | 7.125 | % | 05/15/2019 | 1,034,000 | 1,106,380 | (1) | |||||||||||||||||||
Chrysler Group LLC | USD | 8.000 | % | 06/15/2019 | 1,818,000 | 1,992,982 | ||||||||||||||||||||
The Goodyear Tire & Rubber Co. | USD | 7.000 | % | 05/15/2022 | 1,309,000 | 1,403,903 | ||||||||||||||||||||
Tomkins LLC | USD | 9.000 | % | 10/01/2018 | 507,000 | 570,375 | ||||||||||||||||||||
UCI International, Inc. | USD | 8.625 | % | 02/15/2019 | 795,000 | 772,144 | ||||||||||||||||||||
|
| |||||||||||||||||||||||||
| 5,845,784 | ||||||||||||||||||||||||||
|
| |||||||||||||||||||||||||
Banking - 0.86% | ||||||||||||||||||||||||||
LBG Capital No.1 PLC, Series | EUR | 6.439 | % | 05/23/2020 | 1,213,000 | 1,557,901 | ||||||||||||||||||||
Provident Funding Associates LP | ||||||||||||||||||||||||||
| USD | 10.250 | % | 04/15/2017 | 815,000 | 900,575 | (1) | ||||||||||||||||||||
| USD | 10.125 | % | 02/15/2019 | 894,000 | 943,170 | (1) | ||||||||||||||||||||
|
| |||||||||||||||||||||||||
| 3,401,646 | ||||||||||||||||||||||||||
|
| |||||||||||||||||||||||||
Building Products - 1.32% | ||||||||||||||||||||||||||
American Standard Americas | USD | 10.750 | % | 01/15/2016 | 569,000 | 555,486 | (1) | |||||||||||||||||||
Griffon Corp. | USD | 7.125 | % | 04/01/2018 | 2,744,000 | 2,918,930 | ||||||||||||||||||||
Norcraft Cos. LP | USD | 10.500 | % | 12/15/2015 | 1,734,000 | 1,742,670 | ||||||||||||||||||||
|
| |||||||||||||||||||||||||
| 5,217,086 | ||||||||||||||||||||||||||
|
| |||||||||||||||||||||||||
Chemicals - 3.06% | ||||||||||||||||||||||||||
Hexion US Finance Corp. | USD | 6.625 | % | 04/15/2020 | 2,490,000 | 2,496,225 | ||||||||||||||||||||
Ineos Finance PLC | USD | 8.375 | % | 02/15/2019 | 1,933,000 | 2,068,310 | (1) | |||||||||||||||||||
Ineos Group Holdings Ltd. | USD | 8.500 | % | 02/15/2016 | 1,853,000 | 1,825,205 | (1) | |||||||||||||||||||
Koppers, Inc. | USD | 7.875 | % | 12/01/2019 | 1,265,000 | 1,396,244 | ||||||||||||||||||||
Lyondell Chemical Co. | USD | 8.375 | % | 08/15/2015 | 945,000 | 0 | (2) | |||||||||||||||||||
LyondellBasell Industries NV | USD | 6.000 | % | 11/15/2021 | 2,203,000 | 2,640,846 | ||||||||||||||||||||
Momentive Performance Materials, Inc.: | ||||||||||||||||||||||||||
| USD | 8.875 | % | 10/15/2020 | 811,000 | 807,959 | (1) | ||||||||||||||||||||
| USD | 9.000 | % | 01/15/2021 | 1,265,000 | 894,987 | |||||||||||||||||||||
|
| |||||||||||||||||||||||||
| 12,129,776 | ||||||||||||||||||||||||||
|
| |||||||||||||||||||||||||
Construction Machinery - 0.47% | ||||||||||||||||||||||||||
The Manitowoc Co., Inc. | USD | 9.500 | % | 02/15/2018 | 1,670,000 | 1,874,575 | ||||||||||||||||||||
|
| |||||||||||||||||||||||||
Consumer Products - 1.85% | ||||||||||||||||||||||||||
Alphabet Holding Co. Inc | USD | 7.750 | % | 11/01/2017 | 1,006,000 | 1,028,635 | (1)(3) | |||||||||||||||||||
Armored Autogroup, Inc. | USD | 9.250 | % | 11/01/2018 | 517,000 | 411,661 | ||||||||||||||||||||
Elizabeth Arden, Inc. | USD | 7.375 | % | 03/15/2021 | 1,432,000 | 1,600,260 | ||||||||||||||||||||
Mead Products LLC | USD | 6.750 | % | 04/30/2020 | 1,392,000 | 1,451,160 | (1) | |||||||||||||||||||
NBTY, Inc. | USD | 9.000 | % | 10/01/2018 | 1,050,000 | 1,186,500 | ||||||||||||||||||||
See Notes to Financial Statements.
30 | www.shiplp.com |
Table of Contents
| Stone Harbor High Yield Bond Fund | Statements of Investments | |
| November 30, 2012 (Unaudited) |
Currency | Rate | Maturity Date | Principal | Market Value | ||||||||||||||||||||||
Consumer Products (continued) | ||||||||||||||||||||||||||
Spectrum Brands Escrow Corp. | USD | 6.375 | % | 11/15/2020 | 1,587,000 | $ 1,650,480 | (1) | |||||||||||||||||||
|
| |||||||||||||||||||||||||
| 7,328,696 | ||||||||||||||||||||||||||
|
| |||||||||||||||||||||||||
Containers/Packaging - 3.25% | ||||||||||||||||||||||||||
Albea Beauty Holdings SA | EUR | 8.750 | % | 11/01/2019 | 1,812,000 | 2,433,172 | (1) | |||||||||||||||||||
ARD Finance SA | USD | 11.125 | % | 06/01/2018 | 1,845,075 | 1,932,716 | (1)(3) | |||||||||||||||||||
Ardagh Packaging Finance PLC | USD | 9.125 | % | 10/15/2020 | 1,821,000 | 1,975,785 | (1) | |||||||||||||||||||
Reynolds Group Issuer LLC | USD | 9.875 | % | 08/15/2019 | 3,873,000 | 4,124,745 | ||||||||||||||||||||
Sealed Air Corp. | USD | 8.375 | % | 09/15/2021 | 2,136,000 | 2,413,680 | (1) | |||||||||||||||||||
|
| |||||||||||||||||||||||||
| 12,880,098 | ||||||||||||||||||||||||||
|
| |||||||||||||||||||||||||
Drillers/Services - 4.96% | ||||||||||||||||||||||||||
Basic Energy Services, Inc. | USD | 7.750 | % | 10/15/2022 | 1,989,000 | 1,914,412 | (1) | |||||||||||||||||||
CHC Helicopter SA | USD | 9.250 | % | 10/15/2020 | 1,547,000 | 1,577,940 | ||||||||||||||||||||
Gulfmark Offshore, Inc. | USD | 6.375 | % | 03/15/2022 | 1,889,000 | 1,931,502 | (1) | |||||||||||||||||||
Hercules Offshore LLC | USD | 10.500 | % | 10/15/2017 | 2,107,000 | 2,249,222 | (1) | |||||||||||||||||||
Hornbeck Offshore Services, Inc.: | ||||||||||||||||||||||||||
| USD | 8.000 | % | 09/01/2017 | 1,491,000 | 1,610,280 | |||||||||||||||||||||
| USD | 5.875 | % | 04/01/2020 | 1,086,000 | 1,118,580 | |||||||||||||||||||||
Offshore Group Investment Ltd. | USD | 11.500 | % | 08/01/2015 | 2,533,000 | 2,792,633 | ||||||||||||||||||||
Parker Drilling Co. | USD | 9.125 | % | 04/01/2018 | 2,104,000 | 2,251,280 | ||||||||||||||||||||
SESI LLC: | ||||||||||||||||||||||||||
| USD | 6.375 | % | 05/01/2019 | 1,633,000 | 1,747,310 | |||||||||||||||||||||
| USD | 7.125 | % | 12/15/2021 | 795,000 | 888,413 | |||||||||||||||||||||
Trinidad Drilling Ltd. | USD | 7.875 | % | 01/15/2019 | 1,487,000 | 1,579,938 | (1) | |||||||||||||||||||
|
| |||||||||||||||||||||||||
| 19,661,510 | ||||||||||||||||||||||||||
|
| |||||||||||||||||||||||||
Electric - 3.75% | ||||||||||||||||||||||||||
The AES Corp. | USD | 7.375 | % | 07/01/2021 | 1,889,000 | 2,101,512 | ||||||||||||||||||||
Calpine Corp.: | ||||||||||||||||||||||||||
| USD | 7.500 | % | 02/15/2021 | 606,000 | 672,660 | (1) | ||||||||||||||||||||
| USD | 7.875 | % | 01/15/2023 | 1,605,000 | 1,797,600 | (1) | ||||||||||||||||||||
DPL, Inc. | USD | 7.250 | % | 10/15/2021 | 1,169,000 | 1,239,140 | ||||||||||||||||||||
Edison Mission Energy: | ||||||||||||||||||||||||||
| USD | 7.750 | % | 06/15/2016 | 1,451,000 | 722,598 | |||||||||||||||||||||
| USD | 7.000 | % | 05/15/2017 | 150,000 | 76,125 | |||||||||||||||||||||
| USD | 7.200 | % | 05/15/2019 | 1,540,000 | 783,475 | |||||||||||||||||||||
| USD | 7.625 | % | 05/15/2027 | 1,135,000 | 576,012 | |||||||||||||||||||||
GenOn Energy, Inc. | USD | 9.500 | % | 10/15/2018 | 2,127,000 | 2,472,638 | ||||||||||||||||||||
NRG Energy, Inc.: | ||||||||||||||||||||||||||
| USD | 8.500 | % | 06/15/2019 | 1,034,000 | 1,134,815 | |||||||||||||||||||||
| USD | 8.250 | % | 09/01/2020 | 1,181,000 | 1,316,815 | |||||||||||||||||||||
| USD | 7.875 | % | 05/15/2021 | 1,750,000 | 1,942,500 | |||||||||||||||||||||
|
| |||||||||||||||||||||||||
| 14,835,890 | ||||||||||||||||||||||||||
|
| |||||||||||||||||||||||||
Environmental Services - 0.43% | ||||||||||||||||||||||||||
Clean Harbors, Inc. | USD | 5.250 | % | 08/01/2020 | 1,663,000 | 1,717,048 | ||||||||||||||||||||
|
| |||||||||||||||||||||||||
Exploration & Production - 6.97% | ||||||||||||||||||||||||||
Calumet Specialty Products Partners LP/Calumet Finance Corp.: | ||||||||||||||||||||||||||
| USD | 9.375 | % | 05/01/2019 | 870,000 | 941,775 | |||||||||||||||||||||
See Notes to Financial Statements.
| Stone Harbor Investment Funds Semi-Annual Report | November 30, 2012 | 31 |
Table of Contents
| Stone Harbor High Yield Bond Fund | Statements of Investments | |
| November 30, 2012 (Unaudited) |
Currency | Rate | Maturity Date | Principal | Market Value (Expressed in U.S. $) | |||||||||||||||||||||
Exploration & Production (continued) | |||||||||||||||||||||||||
Calumet Specialty Products Partners LP/Calumet Finance Corp. (continued) | |||||||||||||||||||||||||
| USD | 9.625 | % | 08/01/2020 | 942,000 | $ 1,026,780 | (1) | |||||||||||||||||||
EP Energy LLC /EP Energy Finance, Inc., Series WI | USD | 9.375 | % | 05/01/2020 | 1,551,000 | 1,725,487 | |||||||||||||||||||
EP Energy LLC /Everest Acquisition Finance, Inc., Series WI | USD | 6.875 | % | 05/01/2019 | 1,547,000 | 1,682,362 | |||||||||||||||||||
EPL Oil & Gas, Inc. | USD | 8.250 | % | 02/15/2018 | 1,046,000 | 1,043,385 | (1) | ||||||||||||||||||
Forest Oil Corp. | USD | 7.250 | % | 06/15/2019 | 2,219,000 | 2,230,095 | |||||||||||||||||||
Kodiak Oil & Gas Corp. | USD | 8.125 | % | 12/01/2019 | 1,285,000 | 1,407,075 | |||||||||||||||||||
Laredo Petroleum, Inc. | USD | 7.375 | % | 05/01/2022 | 1,054,000 | 1,146,225 | |||||||||||||||||||
Linn Energy LLC | USD | 7.750 | % | 02/01/2021 | 2,566,000 | 2,719,960 | |||||||||||||||||||
MEG Energy Corp. | USD | 6.500 | % | 03/15/2021 | 1,491,000 | 1,563,686 | (1) | ||||||||||||||||||
Midstates Petroleum Co., Inc. /Midstates Petroleum Co. LLC | USD | 10.750 | % | 10/01/2020 | 867,000 | 919,020 | (1) | ||||||||||||||||||
Oasis Petroleum, Inc. | USD | 7.250 | % | 02/01/2019 | 2,656,000 | 2,841,920 | |||||||||||||||||||
Plains Exploration & Production Co.: | |||||||||||||||||||||||||
| USD | 7.625 | % | 04/01/2020 | 835,000 | 889,275 | ||||||||||||||||||||
| USD | 6.500 | % | 11/15/2020 | 994,000 | 1,015,123 | ||||||||||||||||||||
QEP Resources, Inc. | USD | 5.375 | % | 10/01/2022 | 1,989,000 | 2,108,340 | |||||||||||||||||||
SandRidge Energy, Inc.: | |||||||||||||||||||||||||
| USD | 8.750 | % | 01/15/2020 | 1,412,000 | 1,535,550 | ||||||||||||||||||||
| USD | 7.500 | % | 03/15/2021 | 1,591,000 | 1,666,573 | ||||||||||||||||||||
Venoco, Inc. | USD | 8.875 | % | 02/15/2019 | 1,272,000 | 1,128,900 | |||||||||||||||||||
|
| ||||||||||||||||||||||||
| 27,591,531 | |||||||||||||||||||||||||
|
| ||||||||||||||||||||||||
Financial Other - 0.74% | |||||||||||||||||||||||||
Aircastle Ltd. | USD | 6.750 | % | 04/15/2017 | 2,756,000 | 2,928,250 | |||||||||||||||||||
|
| ||||||||||||||||||||||||
Food & Beverage - 4.86% | |||||||||||||||||||||||||
Boparan Finance PLC | EUR | 9.750 | % | 04/30/2018 | 831,000 | 1,205,037 | (4) | ||||||||||||||||||
Campofrio Food Group SA | EUR | 8.250 | % | 10/31/2016 | 831,000 | 1,146,676 | (4) | ||||||||||||||||||
Dean Foods Co. | USD | 9.750 | % | 12/15/2018 | 2,494,000 | 2,824,455 | |||||||||||||||||||
Del Monte Corp. | USD | 7.625 | % | 02/15/2019 | 3,917,000 | 4,044,303 | |||||||||||||||||||
Pilgrim’s Pride Corp. | USD | 7.875 | % | 12/15/2018 | 1,416,000 | 1,423,080 | |||||||||||||||||||
Pinnacle Foods Finance LLC | USD | 8.250 | % | 09/01/2017 | 1,233,000 | 1,300,815 | |||||||||||||||||||
Post Holdings, Inc. | USD | 7.375 | % | 02/15/2022 | 2,636,000 | 2,830,405 | (1) | ||||||||||||||||||
Shearer’s Foods LLC / Chip Fin Corp. | USD | 9.000 | % | 11/01/2019 | 1,221,000 | 1,257,630 | (1) | ||||||||||||||||||
Smithfield Foods, Inc. | USD | 6.625 | % | 08/15/2022 | 3,034,000 | 3,223,625 | |||||||||||||||||||
|
| ||||||||||||||||||||||||
| 19,256,026 | |||||||||||||||||||||||||
|
| ||||||||||||||||||||||||
Gaming - 2.92% | |||||||||||||||||||||||||
American Casino & Entertainment Properties LLC | USD | 11.000 | % | 06/15/2014 | 818,000 | 845,096 | |||||||||||||||||||
Boyd Gaming Corp. | USD | 9.125 | % | 12/01/2018 | 1,881,000 | 1,904,513 | |||||||||||||||||||
Caesars Entertainment Operating Co., Inc. | USD | 12.750 | % | 04/15/2018 | 389,000 | 283,970 | |||||||||||||||||||
Isle of Capri Casinos, Inc.: | |||||||||||||||||||||||||
| USD | 7.750 | % | 03/15/2019 | 1,134,000 | 1,219,050 | ||||||||||||||||||||
| USD | 8.875 | % | 06/15/2020 | 1,360,000 | 1,443,300 | ||||||||||||||||||||
MGM Resorts International: | |||||||||||||||||||||||||
| USD | 7.500 | % | 06/01/2016 | 2,478,000 | 2,645,265 | ||||||||||||||||||||
| USD | 8.625 | % | 02/01/2019 | 1,082,000 | 1,190,200 | (1) | |||||||||||||||||||
See Notes to Financial Statements.
32 | www.shiplp.com |
Table of Contents
| Stone Harbor High Yield Bond Fund | Statements of Investments | |
| November 30, 2012 (Unaudited) |
Currency | Rate | Maturity Date | Principal | Market Value | ||||||||||||||||||||||
Gaming (continued) | ||||||||||||||||||||||||||
Pinnacle Entertainment, Inc. | USD | 8.750 | % | 05/15/2020 | 1,853,000 | $ 2,029,035 | ||||||||||||||||||||
|
| |||||||||||||||||||||||||
| 11,560,429 | ||||||||||||||||||||||||||
|
| |||||||||||||||||||||||||
Gas Distributors - 0.34% | ||||||||||||||||||||||||||
Suburban Propane Partners LP | USD | 7.375 | % | 08/01/2021 | 1,243,000 | 1,336,225 | (1) | |||||||||||||||||||
|
| |||||||||||||||||||||||||
Gas Pipelines - 0.62% | ||||||||||||||||||||||||||
Copano Energy LLC | USD | 7.125 | % | 04/01/2021 | 1,412,000 | 1,494,955 | ||||||||||||||||||||
MarkWest Energy Partners LP | USD | 6.250 | % | 06/15/2022 | 875,000 | 955,938 | ||||||||||||||||||||
|
| |||||||||||||||||||||||||
| 2,450,893 | ||||||||||||||||||||||||||
|
| |||||||||||||||||||||||||
Healthcare - 9.20% | ||||||||||||||||||||||||||
American Renal Holdings, Inc. | USD | 8.375 | % | 05/15/2018 | 1,491,000 | 1,584,187 | ||||||||||||||||||||
Amsurg Corp. | USD | 5.625 | % | 11/30/2020 | 914,000 | 927,710 | (1) | |||||||||||||||||||
Biomet, Inc. | USD | 6.500 | % | 08/01/2020 | 2,350,000 | 2,464,562 | (1) | |||||||||||||||||||
CHS/Community Health Systems, Inc. | USD | 8.000 | % | 11/15/2019 | 1,376,000 | 1,505,000 | ||||||||||||||||||||
ConvaTec Healthcare E SA | USD | 10.500 | % | 12/15/2018 | 1,877,000 | 2,055,315 | (1) | |||||||||||||||||||
Emergency Medical Services Corp., Series WI | USD | 8.125 | % | 06/01/2019 | 1,865,000 | 2,000,212 | ||||||||||||||||||||
Fresenius Medical Care US Finance II, Inc. | USD | 5.875 | % | 01/31/2022 | 1,921,000 | 2,069,877 | (1) | |||||||||||||||||||
HCA Holdings, Inc. | USD | 7.750 | % | 05/15/2021 | 859,000 | 936,310 | ||||||||||||||||||||
HCA, Inc.: | ||||||||||||||||||||||||||
| USD | 7.500 | % | 02/15/2022 | 970,000 | 1,108,225 | |||||||||||||||||||||
| USD | 5.875 | % | 03/15/2022 | 1,746,000 | 1,907,505 | |||||||||||||||||||||
Health Management Associates, Inc. | USD | 7.375 | % | 01/15/2020 | 1,797,000 | 1,949,745 | ||||||||||||||||||||
HealthSouth Corp. | USD | 8.125 | % | 02/15/2020 | 1,928,000 | 2,130,440 | ||||||||||||||||||||
Hologic, Inc. | USD | 6.250 | % | 08/01/2020 | 1,428,000 | 1,524,390 | (1) | |||||||||||||||||||
IASIS Healthcare LLC | USD | 8.375 | % | 05/15/2019 | 2,009,000 | 1,908,550 | ||||||||||||||||||||
Kinetic Concepts, Inc.: | ||||||||||||||||||||||||||
| USD | 10.500 | % | 11/01/2018 | 1,607,000 | 1,679,315 | (1) | ||||||||||||||||||||
| USD | 12.500 | % | 11/01/2019 | 1,121,000 | 1,064,950 | (1) | ||||||||||||||||||||
Prospect Medical Holdings, Inc. | USD | 8.375 | % | 05/01/2019 | 1,797,000 | 1,882,358 | (1) | |||||||||||||||||||
Radiation Therapy Services, Inc. | USD | 9.875 | % | 04/15/2017 | 1,810,000 | 1,330,350 | ||||||||||||||||||||
Surgical Care Affiliates, Inc.: | ||||||||||||||||||||||||||
| USD | 8.875 | % | 07/15/2015 | 782,000 | 799,595 | (1) | ||||||||||||||||||||
| USD | 10.000 | % | 07/15/2017 | 1,054,000 | 1,098,795 | (1) | ||||||||||||||||||||
United Surgical Partners International, Inc., Series WI | USD | 9.000 | % | 04/01/2020 | 2,187,000 | 2,422,103 | ||||||||||||||||||||
Universal Hospital Services, Inc. | USD | 7.625 | % | 08/15/2020 | 1,989,000 | 2,073,533 | (1) | |||||||||||||||||||
|
| |||||||||||||||||||||||||
| 36,423,027 | ||||||||||||||||||||||||||
|
| |||||||||||||||||||||||||
Home Builders - 0.42% | ||||||||||||||||||||||||||
Lennar Corp. | USD | 4.750 | % | 11/15/2022 | 1,714,000 | 1,662,580 | (1) | |||||||||||||||||||
|
| |||||||||||||||||||||||||
Industrial Other - 0.84% | ||||||||||||||||||||||||||
Park-Ohio Industries, Inc. | USD | 8.125 | % | 04/01/2021 | 994,000 | 1,051,155 | ||||||||||||||||||||
RBS Global, Inc. | USD | 8.500 | % | 05/01/2018 | 2,088,000 | 2,275,920 | ||||||||||||||||||||
|
| |||||||||||||||||||||||||
| 3,327,075 | ||||||||||||||||||||||||||
|
| |||||||||||||||||||||||||
Leisure - 1.47% | ||||||||||||||||||||||||||
AMC Entertainment, Inc. | USD | 9.750 | % | 12/01/2020 | 2,566,000 | 2,899,580 | ||||||||||||||||||||
Cinemark USA, Inc. | USD | 7.375 | % | 06/15/2021 | 935,000 | 1,028,500 | ||||||||||||||||||||
Regal Cinemas Corp. | USD | 8.625 | % | 07/15/2019 | 1,353,000 | 1,491,682 | ||||||||||||||||||||
See Notes to Financial Statements.
| Stone Harbor Investment Funds Semi-Annual Report | November 30, 2012 | 33 |
Table of Contents
| Stone Harbor High Yield Bond Fund | Statements of Investments | |
| November 30, 2012 (Unaudited) |
Currency | Rate | Maturity Date | Principal | Market Value | ||||||||||||||||||||||
Leisure (continued) | ||||||||||||||||||||||||||
Regal Entertainment Group | USD | 9.125 | % | 08/15/2018 | 378,000 | $ 420,525 | ||||||||||||||||||||
|
| |||||||||||||||||||||||||
| 5,840,287 | ||||||||||||||||||||||||||
|
| |||||||||||||||||||||||||
Life - 0.64% | ||||||||||||||||||||||||||
Genworth Financial, Inc. | USD | 7.625 | % | 09/24/2021 | 2,347,000 | 2,539,365 | ||||||||||||||||||||
|
| |||||||||||||||||||||||||
Lodging - 0.33% | ||||||||||||||||||||||||||
Choice Hotels International, Inc. | USD | 5.750 | % | 07/01/2022 | 1,181,000 | 1,299,100 | ||||||||||||||||||||
|
| |||||||||||||||||||||||||
Media Cable - 5.56% | ||||||||||||||||||||||||||
Cablevision Systems Corp. | USD | 8.000 | % | 04/15/2020 | 1,213,000 | 1,346,430 | ||||||||||||||||||||
CCO Holdings LLC | USD | 6.625 | % | 01/31/2022 | 2,243,000 | 2,450,478 | ||||||||||||||||||||
DISH DBS Corp. | USD | 5.875 | % | 07/15/2022 | 3,512,000 | 3,779,790 | ||||||||||||||||||||
Mediacom LLC | USD | 7.250 | % | 02/15/2022 | 2,004,000 | 2,159,310 | ||||||||||||||||||||
Nara Cable Funding Ltd. | USD | 8.875 | % | 12/01/2018 | 3,547,000 | 3,405,120 | (1) | |||||||||||||||||||
Ono Finance II PLC | USD | 10.875 | % | 07/15/2019 | 640,000 | 566,400 | (1) | |||||||||||||||||||
Starz LLC / Starz Finance Corp. | USD | 5.000 | % | 09/15/2019 | 883,000 | 908,386 | (1) | |||||||||||||||||||
Unitymedia KabelBW GmbH | EUR | 9.500 | % | 03/15/2021 | 1,205,000 | 1,802,383 | (4) | |||||||||||||||||||
UPC Holding BV: | ||||||||||||||||||||||||||
| USD | 9.875 | % | 04/15/2018 | 1,292,000 | 1,451,885 | (1) | ||||||||||||||||||||
| EUR | 6.375 | % | 09/15/2022 | 2,625,000 | 3,345,645 | (1) | ||||||||||||||||||||
Virgin Media Finance PLC | USD | 4.875 | % | 02/15/2022 | 791,000 | 816,708 | ||||||||||||||||||||
|
| |||||||||||||||||||||||||
| 22,032,535 | ||||||||||||||||||||||||||
|
| |||||||||||||||||||||||||
Media Other - 5.20% | ||||||||||||||||||||||||||
Allbritton Communications Co. | USD | 8.000 | % | 05/15/2018 | 1,786,000 | 1,951,205 | ||||||||||||||||||||
AMC Networks, Inc. | USD | 7.750 | % | 07/15/2021 | 791,000 | 901,740 | ||||||||||||||||||||
Bonten Media Acquisition Co. | USD | 9.000 | % | 06/01/2015 | 429,195 | 360,524 | (1)(3)(5) | |||||||||||||||||||
Entravision Communications Corp. | USD | 8.750 | % | 08/01/2017 | 3,672,000 | 3,993,300 | ||||||||||||||||||||
Gray Television, Inc. | USD | 7.500 | % | 10/01/2020 | 2,446,000 | 2,458,230 | (1) | |||||||||||||||||||
Interep National Radio Sales, Inc., Series B | USD | 10.000 | % | 07/01/2008 | 4,000 | 0 | (2) | |||||||||||||||||||
Local TV Finance LLC | USD | 9.250 | % | 06/15/2015 | 1,292,000 | 1,314,610 | (1) | |||||||||||||||||||
Nexstar Broadcasting, Inc. | USD | 6.875 | % | 11/15/2020 | 1,917,000 | 1,936,170 | (1) | |||||||||||||||||||
Radio One, Inc. | USD | 12.500 | % | 05/24/2016 | 2,248,001 | 2,023,201 | ||||||||||||||||||||
Sinclair Television Group, Inc. | USD | 6.125 | % | 10/01/2022 | 3,003,000 | 3,145,642 | (1) | |||||||||||||||||||
Univision Communications, Inc.: | ||||||||||||||||||||||||||
| USD | 7.875 | % | 11/01/2020 | 1,893,000 | 2,030,243 | (1) | ||||||||||||||||||||
| USD | 8.500 | % | 05/15/2021 | 465,000 | 481,275 | (1) | ||||||||||||||||||||
|
| |||||||||||||||||||||||||
| 20,596,140 | ||||||||||||||||||||||||||
|
| |||||||||||||||||||||||||
Metals/Mining/Steel - 3.38% | ||||||||||||||||||||||||||
APERAM | USD | 7.750 | % | 04/01/2018 | 1,770,000 | 1,522,200 | (1) | |||||||||||||||||||
Arch Coal, Inc. | USD | 7.250 | % | 06/15/2021 | 1,579,000 | 1,421,100 | ||||||||||||||||||||
Cloud Peak Energy Resources LLC | USD | 8.500 | % | 12/15/2019 | 1,368,000 | 1,491,120 | ||||||||||||||||||||
CONSOL Energy, Inc. | USD | 8.250 | % | 04/01/2020 | 2,227,000 | 2,388,457 | ||||||||||||||||||||
Novelis, Inc. | USD | 8.375 | % | 12/15/2017 | 1,451,000 | 1,603,355 | ||||||||||||||||||||
Peabody Energy Corp., Series WI | USD | 6.250 | % | 11/15/2021 | 2,975,000 | 3,101,438 | ||||||||||||||||||||
Taseko Mines Ltd. | USD | 7.750 | % | 04/15/2019 | 1,941,000 | 1,853,655 | ||||||||||||||||||||
|
| |||||||||||||||||||||||||
| 13,381,325 | ||||||||||||||||||||||||||
|
| |||||||||||||||||||||||||
See Notes to Financial Statements.
34 | www.shiplp.com |
Table of Contents
| Stone Harbor High Yield Bond Fund | Statements of Investments | |
| November 30, 2012 (Unaudited) |
Currency | Rate | Maturity Date | Principal | Market Value | ||||||||||||||||||||||
Non Captive Finance - 1.45% | ||||||||||||||||||||||||||
Ally Financial, Inc.: | ||||||||||||||||||||||||||
| USD | 6.250 | % | 12/01/2017 | 628,000 | $ 696,003 | |||||||||||||||||||||
| USD | 8.000 | % | 11/01/2031 | 645,000 | 818,117 | |||||||||||||||||||||
CIT Group, Inc. | USD | 5.250 | % | 03/15/2018 | 2,088,000 | 2,226,330 | ||||||||||||||||||||
International Lease Finance Corp. | USD | 8.250 | % | 12/15/2020 | 1,736,000 | 2,025,221 | ||||||||||||||||||||
|
| |||||||||||||||||||||||||
| 5,765,671 | ||||||||||||||||||||||||||
|
| |||||||||||||||||||||||||
Paper/Forest Products - 2.88% | ||||||||||||||||||||||||||
Ainsworth Lumber Co. Ltd. | USD | 7.500 | % | 12/15/2017 | 1,972,000 | 2,038,555 | (1) | |||||||||||||||||||
Cascades, Inc.: | ||||||||||||||||||||||||||
| USD | 7.750 | % | 12/15/2017 | 1,392,000 | 1,465,080 | |||||||||||||||||||||
| USD | 7.875 | % | 01/15/2020 | 1,113,000 | 1,179,780 | |||||||||||||||||||||
Catalyst Paper Corp. | USD | 11.000 | % | 10/30/2017 | 795,450 | 600,565 | (3) | |||||||||||||||||||
Louisiana-Pacific Corp. | USD | 7.500 | % | 06/01/2020 | 2,374,000 | 2,658,880 | ||||||||||||||||||||
Mercer International, Inc. | USD | 9.500 | % | 12/01/2017 | 1,547,000 | 1,647,555 | ||||||||||||||||||||
NewPage Corp. | USD | 11.375 | % | 12/31/2014 | 1,215,000 | 592,312 | (2) | |||||||||||||||||||
Xerium Technologies, Inc. | USD | 8.875 | % | 06/15/2018 | 1,412,000 | 1,214,320 | ||||||||||||||||||||
|
| |||||||||||||||||||||||||
| 11,397,047 | ||||||||||||||||||||||||||
|
| |||||||||||||||||||||||||
Publishing/Printing - 1.66% | ||||||||||||||||||||||||||
Baker & Taylor Acquisitions Corp. | USD | 15.000 | % | 04/01/2017 | 1,030,000 | 782,800 | (1) | |||||||||||||||||||
IDEARC, Inc. | USD | 8.000 | % | 11/15/2016 | 1,265,000 | 0 | (2) | |||||||||||||||||||
The McClatchy Co. | USD | 11.500 | % | 02/15/2017 | 3,305,000 | 3,660,287 | ||||||||||||||||||||
Nielsen Finance LLC /Nielsen Finance Co. | USD | 4.500 | % | 10/01/2020 | 660,000 | 661,650 | (1) | |||||||||||||||||||
Quebecor Media, Inc. | USD | 5.750 | % | 01/15/2023 | 1,404,000 | 1,463,670 | (1) | |||||||||||||||||||
|
| |||||||||||||||||||||||||
| 6,568,407 | ||||||||||||||||||||||||||
|
| |||||||||||||||||||||||||
Restaurants - 0.56% | ||||||||||||||||||||||||||
Landry’s, Inc. | USD | 9.375 | % | 05/01/2020 | 2,068,000 | 2,202,420 | (1) | |||||||||||||||||||
|
| |||||||||||||||||||||||||
Retail Food/Drug - 0.62% | ||||||||||||||||||||||||||
Albertsons, Inc.: | ||||||||||||||||||||||||||
| USD | 8.700 | % | 05/01/2030 | 577,000 | 334,660 | |||||||||||||||||||||
| USD | 8.000 | % | 05/01/2031 | 1,193,000 | 682,992 | |||||||||||||||||||||
American Stores Co.: | ||||||||||||||||||||||||||
| USD | 7.900 | % | 05/01/2017 | 437,000 | 408,595 | |||||||||||||||||||||
| USD | 8.000 | % | 06/01/2026 | 1,165,000 | 1,016,463 | |||||||||||||||||||||
|
| |||||||||||||||||||||||||
| 2,442,710 | ||||||||||||||||||||||||||
|
| |||||||||||||||||||||||||
Retail Non Food/Drug - 2.94% | ||||||||||||||||||||||||||
Claire’s Stores, Inc.: | ||||||||||||||||||||||||||
| USD | 9.250 | % | 06/01/2015 | 437,000 | 405,317 | |||||||||||||||||||||
| USD | 9.625 | % | 06/01/2015 | 762,282 | 701,300 | (3) | ||||||||||||||||||||
| USD | 8.875 | % | 03/15/2019 | 914,000 | 856,875 | |||||||||||||||||||||
Express LLC | USD | 8.750 | % | 03/01/2018 | 1,782,000 | 1,935,698 | ||||||||||||||||||||
GRD Holdings III Corp. | USD | 10.750 | % | 06/01/2019 | 1,050,000 | 1,078,875 | (1) | |||||||||||||||||||
Limited Brands, Inc.: | ||||||||||||||||||||||||||
| USD | 6.950 | % | 03/01/2033 | 1,145,000 | 1,159,312 | |||||||||||||||||||||
| USD | 7.600 | % | 07/15/2037 | 1,113,000 | 1,165,868 | |||||||||||||||||||||
Michaels Stores, Inc. | USD | 7.750 | % | 11/01/2018 | 975,000 | 1,061,531 | ||||||||||||||||||||
Party City Holdings, Inc. | USD | 8.875 | % | 08/01/2020 | 1,030,000 | 1,096,950 | (1) | |||||||||||||||||||
Petco Holdings, Inc. | USD | 8.500 | % | 10/15/2017 | 756,000 | 776,790 | (1)(3) | |||||||||||||||||||
See Notes to Financial Statements.
| Stone Harbor Investment Funds Semi-Annual Report | November 30, 2012 | 35 |
Table of Contents
| Stone Harbor High Yield Bond Fund | Statements of Investments | |
| November 30, 2012 (Unaudited) |
Currency | Rate | Maturity Date | Principal | Market Value | ||||||||||||||||||||||
Retail Non Food/Drug (continued) | ||||||||||||||||||||||||||
RadioShack Corp. | USD | 6.750 | % | 05/15/2019 | 2,247,000 | $ 1,418,419 | ||||||||||||||||||||
|
| |||||||||||||||||||||||||
| 11,656,935 | ||||||||||||||||||||||||||
|
| |||||||||||||||||||||||||
Satellite - 0.53% | ||||||||||||||||||||||||||
Intelsat Jackson Holdings SA | USD | 7.250 | % | 04/01/2019 | 1,956,000 | 2,097,810 | ||||||||||||||||||||
|
| |||||||||||||||||||||||||
Services Other - 2.78% | ||||||||||||||||||||||||||
American Residential Services LLC | USD | 12.000 | % | 04/15/2015 | 855,000 | 816,525 | (1) | |||||||||||||||||||
Brickman Group Holdings, Inc. | USD | 9.125 | % | 11/01/2018 | 1,865,000 | 1,920,950 | (1) | |||||||||||||||||||
GXS Worldwide, Inc. | USD | 9.750 | % | 06/15/2015 | 946,000 | 990,935 | ||||||||||||||||||||
Nuance Communications, Inc. | USD | 5.375 | % | 08/15/2020 | 1,074,000 | 1,111,590 | (1) | |||||||||||||||||||
ServiceMaster Co.: | ||||||||||||||||||||||||||
| USD | 8.000 | % | 02/15/2020 | 1,121,000 | 1,146,223 | |||||||||||||||||||||
| USD | 7.000 | % | 08/15/2020 | 1,611,000 | 1,584,821 | (1) | ||||||||||||||||||||
| USD | 7.450 | % | 08/15/2027 | 258,000 | 207,690 | |||||||||||||||||||||
Trans Union LLC | USD | 11.375 | % | 06/15/2018 | 1,532,000 | 1,784,780 | ||||||||||||||||||||
TransUnion Holding Co., Inc.: | ||||||||||||||||||||||||||
| USD | 8.125 | % | 06/15/2018 | 776,000 | 787,640 | (1)(3) | ||||||||||||||||||||
| USD | 9.625 | % | 06/15/2018 | 616,000 | 652,960 | |||||||||||||||||||||
|
| |||||||||||||||||||||||||
| 11,004,114 | ||||||||||||||||||||||||||
|
| |||||||||||||||||||||||||
Technology - 4.48% | ||||||||||||||||||||||||||
Amkor Technology, Inc. | USD | 6.375 | % | 10/01/2022 | 843,000 | 811,387 | (1) | |||||||||||||||||||
CommScope, Inc. | USD | 8.250 | % | 01/15/2019 | 2,127,000 | 2,323,748 | (1) | |||||||||||||||||||
CyrusOne LP /CyrusOne Finance Corp. | USD | 6.375 | % | 11/15/2022 | 1,734,000 | 1,803,360 | (1) | |||||||||||||||||||
First Data Corp.: | ||||||||||||||||||||||||||
| USD | 7.375 | % | 06/15/2019 | 1,917,000 | 1,979,303 | (1) | ||||||||||||||||||||
| USD | 12.625 | % | 01/15/2021 | 1,869,000 | 1,976,467 | |||||||||||||||||||||
iGATE Corp. | USD | 9.000 | % | 05/01/2016 | 1,750,000 | 1,911,875 | ||||||||||||||||||||
Infor US, Inc. | USD | 11.500 | % | 07/15/2018 | 2,339,000 | 2,724,935 | ||||||||||||||||||||
Legend Acquisition Sub, Inc. | USD | 10.750 | % | 08/15/2020 | 1,054,000 | 1,006,570 | (1) | |||||||||||||||||||
NCR Corp. | USD | 5.000 | % | 07/15/2022 | 1,602,000 | 1,630,035 | (1) | |||||||||||||||||||
SSI Investments II | USD | 11.125 | % | 06/01/2018 | 1,440,000 | 1,598,400 | ||||||||||||||||||||
|
| |||||||||||||||||||||||||
| 17,766,080 | ||||||||||||||||||||||||||
|
| |||||||||||||||||||||||||
Textile/Apparel - 1.18% | ||||||||||||||||||||||||||
Levi Strauss & Co.: | ||||||||||||||||||||||||||
| USD | 7.625 | % | 05/15/2020 | 1,333,000 | 1,454,637 | |||||||||||||||||||||
| USD | 6.875 | % | 05/01/2022 | 676,000 | 712,335 | |||||||||||||||||||||
Quiksilver, Inc. | USD | 6.875 | % | 04/15/2015 | 2,533,000 | 2,498,171 | ||||||||||||||||||||
|
| |||||||||||||||||||||||||
| 4,665,143 | ||||||||||||||||||||||||||
|
| |||||||||||||||||||||||||
Wireless - 3.26% | ||||||||||||||||||||||||||
Crown Castle International Corp. | USD | 5.250 | % | 01/15/2023 | 1,806,000 | 1,894,042 | (1) | |||||||||||||||||||
Matterhorn Midco & Cy S.C.A. | EUR | 7.750 | % | 02/15/2020 | 519,000 | 680,044 | (1) | |||||||||||||||||||
Matterhorn Mobile Holdings SA | EUR | 8.250 | % | 02/15/2020 | 748,000 | 1,055,981 | (4) | |||||||||||||||||||
Sprint Capital Corp. | USD | 8.750 | % | 03/15/2032 | 4,459,000 | 5,317,358 | ||||||||||||||||||||
Wind Acquisition Finance SA: | ||||||||||||||||||||||||||
| USD | 12.250 | % | 07/15/2017 | 2,822,782 | 2,801,611 | (1)(3) | ||||||||||||||||||||
See Notes to Financial Statements.
36 | www.shiplp.com |
Table of Contents
| Stone Harbor High Yield Bond Fund | Statements of Investments | |
| November 30, 2012 (Unaudited) |
Currency | Rate | Maturity Date | Principal | Market Value | ||||||||||||||||||||||
Wireless (continued) | ||||||||||||||||||||||||||
Wind Acquisition Finance SA (continued) | ||||||||||||||||||||||||||
| USD | 7.250 | % | 02/15/2018 | 1,154,000 | $ 1,148,230 | (1) | ||||||||||||||||||||
|
| |||||||||||||||||||||||||
| 12,897,266 | ||||||||||||||||||||||||||
|
| |||||||||||||||||||||||||
Wirelines - 5.98% | ||||||||||||||||||||||||||
CenturyLink, Inc.: | ||||||||||||||||||||||||||
Series T | USD | 5.800 | % | 03/15/2022 | 2,370,000 | 2,508,994 | ||||||||||||||||||||
Series U | USD | 7.650 | % | 03/15/2042 | 1,659,000 | 1,735,755 | ||||||||||||||||||||
Cincinnati Bell, Inc.: | ||||||||||||||||||||||||||
| USD | 8.250 | % | 10/15/2017 | 2,271,000 | 2,435,647 | |||||||||||||||||||||
| USD | 8.750 | % | 03/15/2018 | 1,666,000 | 1,690,990 | |||||||||||||||||||||
Citizens Communications Co. | USD | 9.000 | % | 08/15/2031 | 4,647,000 | 4,960,672 | ||||||||||||||||||||
ITC Deltacom, Inc. | USD | 10.500 | % | 04/01/2016 | 2,000,000 | 2,150,000 | ||||||||||||||||||||
Level 3 Financing, Inc. | USD | 10.000 | % | 02/01/2018 | 2,551,000 | 2,847,554 | ||||||||||||||||||||
Syniverse Holdings, Inc. | USD | 9.125 | % | 01/15/2019 | 1,006,000 | 1,078,935 | ||||||||||||||||||||
Windstream Corp. | USD | 7.500 | % | 04/01/2023 | 4,131,000 | 4,285,913 | ||||||||||||||||||||
|
| |||||||||||||||||||||||||
| 23,694,460 | ||||||||||||||||||||||||||
|
| |||||||||||||||||||||||||
TOTAL CORPORATE BONDS | 374,138,021 | |||||||||||||||||||||||||
|
| |||||||||||||||||||||||||
(Cost $357,218,739) | ||||||||||||||||||||||||||
CONVERTIBLE CORPORATE BONDS - 0.85% | ||||||||||||||||||||||||||
Airlines - 0.03% | ||||||||||||||||||||||||||
AirTran Holdings, Inc. | USD | 5.250 | % | 11/01/2016 | 87,000 | 111,795 | ||||||||||||||||||||
|
| |||||||||||||||||||||||||
Automotive - 0.09% | ||||||||||||||||||||||||||
TRW Automotive, Inc. | USD | 3.500 | % | 12/01/2015 | 202,000 | 367,640 | ||||||||||||||||||||
|
| |||||||||||||||||||||||||
Drillers/Services - 0.17% | ||||||||||||||||||||||||||
Hornbeck Offshore Services, Inc.: | ||||||||||||||||||||||||||
| USD | 1.500 | % | 09/01/2019 | 77,000 | 79,647 | (1) | ||||||||||||||||||||
| USD | 1.625 | % | 11/15/2026 | 99,000 | 102,000 | (6) | ||||||||||||||||||||
Newpark Resources, Inc. | USD | 4.000 | % | 10/01/2017 | 130,000 | 138,937 | ||||||||||||||||||||
Subsea 7 SA, Series ACY | USD | 2.250 | % | 10/11/2013 | 300,000 | 341,100 | ||||||||||||||||||||
|
| |||||||||||||||||||||||||
| 661,684 | ||||||||||||||||||||||||||
|
| |||||||||||||||||||||||||
Exploration & Production - 0.03% | ||||||||||||||||||||||||||
Stone Energy Corp. | USD | 1.750 | % | 03/01/2017 | 132,000 | 119,460 | (1) | |||||||||||||||||||
|
| |||||||||||||||||||||||||
Food & Beverage - 0.05% | ||||||||||||||||||||||||||
Smithfield Foods, Inc. | USD | 4.000 | % | 06/30/2013 | 34,000 | 37,209 | ||||||||||||||||||||
Tyson Foods, Inc. | USD | 3.250 | % | 10/15/2013 | 147,000 | 176,951 | ||||||||||||||||||||
|
| |||||||||||||||||||||||||
| 214,160 | ||||||||||||||||||||||||||
|
| |||||||||||||||||||||||||
Healthcare - 0.03% | ||||||||||||||||||||||||||
Dendreon Corp. | USD | 2.875 | % | 01/15/2016 | 187,000 | 126,342 | ||||||||||||||||||||
|
| |||||||||||||||||||||||||
Industrial Other - 0.06% | ||||||||||||||||||||||||||
Altra Holdings, Inc. | USD | 2.750 | % | 03/01/2031 | 235,000 | 243,959 | ||||||||||||||||||||
|
| |||||||||||||||||||||||||
See Notes to Financial Statements.
| Stone Harbor Investment Funds Semi-Annual Report | November 30, 2012 | 37 |
Table of Contents
| Stone Harbor High Yield Bond Fund | Statements of Investments | |
| November 30, 2012 (Unaudited) |
Currency | Rate | Maturity Date | Principal | Market Value | ||||||||||||||||||||||
Lodging - 0.01% | ||||||||||||||||||||||||||
Home Inns & Hotels Management, Inc. | USD | 2.000 | % | 12/15/2015 | 45,000 | $ 40,247 | ||||||||||||||||||||
|
| |||||||||||||||||||||||||
Metals/Mining/Steel - 0.04% | ||||||||||||||||||||||||||
RTI International Metals, Inc. | USD | 3.000 | % | 12/01/2015 | 133,000 | 140,814 | ||||||||||||||||||||
|
| |||||||||||||||||||||||||
Railroads - 0.06% | ||||||||||||||||||||||||||
Greenbrier Cos., Inc. | USD | 3.500 | % | 04/01/2018 | 237,000 | 226,335 | ||||||||||||||||||||
|
| |||||||||||||||||||||||||
Retail Non Food/Drug - 0.01% | ||||||||||||||||||||||||||
RadioShack Corp. | USD | 2.500 | % | 08/01/2013 | 61,000 | 56,196 | (1) | |||||||||||||||||||
|
| |||||||||||||||||||||||||
Technology - 0.27% | ||||||||||||||||||||||||||
Alcatel-Lucent, Series ALU | EUR | 5.000 | % | 01/01/2015 | 2,000,000 | 74,218 | ||||||||||||||||||||
Alcatel-Lucent USA, Inc., Series A | USD | 2.875 | % | 06/15/2023 | 262,000 | 210,910 | ||||||||||||||||||||
Callidus Software, Inc. | USD | 4.750 | % | 06/01/2016 | 157,000 | 150,328 | ||||||||||||||||||||
Ciena Corp. | USD | 4.000 | % | 03/15/2015 | 60,000 | 66,263 | (1) | |||||||||||||||||||
Comtech Telecommunications Corp. | USD | 3.000 | % | 05/01/2029 | 12,000 | 12,390 | ||||||||||||||||||||
Micron Technology, Inc.: | ||||||||||||||||||||||||||
| USD | 1.875 | % | 06/01/2027 | 97,000 | 86,997 | |||||||||||||||||||||
Series A | USD | 1.500 | % | 08/01/2031 | 113,000 | 100,146 | ||||||||||||||||||||
NetApp, Inc. | USD | 1.750 | % | 06/01/2013 | 116,000 | 127,165 | ||||||||||||||||||||
ON Semiconductor Corp. | USD | 2.625 | % | 12/15/2026 | 42,000 | 42,840 | ||||||||||||||||||||
Symantec Corp., Series B | USD | 1.000 | % | 06/15/2013 | 55,000 | 60,053 | ||||||||||||||||||||
WebMD Health Corp. | USD | 2.500 | % | 01/31/2018 | 161,000 | 134,938 | ||||||||||||||||||||
|
| |||||||||||||||||||||||||
| 1,066,248 | ||||||||||||||||||||||||||
|
| |||||||||||||||||||||||||
TOTAL CONVERTIBLE CORPORATE BONDS | 3,374,880 | |||||||||||||||||||||||||
|
| |||||||||||||||||||||||||
(Cost $3,517,638) | ||||||||||||||||||||||||||
BANK LOANS - 2.93%(7) | ||||||||||||||||||||||||||
Chemicals - 0.80% | ||||||||||||||||||||||||||
Trinseo Materials Operating S.C.A. | USD | 8.000 | % | 01/31/2013 | 3,319,124 | 3,188,663 | ||||||||||||||||||||
|
| |||||||||||||||||||||||||
Electric - 0.88% | ||||||||||||||||||||||||||
Texas Competitive Electric Holdings Co. LLC - 2017 | ||||||||||||||||||||||||||
Term Loan: | ||||||||||||||||||||||||||
| USD | 4.709 | % | 12/10/2012 | 3,527,400 | 2,296,728 | |||||||||||||||||||||
| USD | 4.810 | % | 02/11/2013 | 1,066,977 | 694,720 | |||||||||||||||||||||
| USD | 4.810 | % | 02/11/2013 | 738,232 | 480,672 | |||||||||||||||||||||
|
| |||||||||||||||||||||||||
| 3,472,120 | ||||||||||||||||||||||||||
|
| |||||||||||||||||||||||||
Gaming - 0.57% | ||||||||||||||||||||||||||
Caesars Entertainment Operating Co., Inc. -Term B-6 Loan | USD | 5.458 | % | 12/27/2012 | 2,500,000 | 2,239,235 | ||||||||||||||||||||
|
| |||||||||||||||||||||||||
Non Captive Finance - 0.60% | ||||||||||||||||||||||||||
IStar Financial, Inc.: | ||||||||||||||||||||||||||
| USD | 5.750 | % | 12/06/2012 | 1,202,308 | 1,204,750 | |||||||||||||||||||||
| USD | 5.750 | % | 12/20/2012 | 1,187,778 | 1,190,191 | |||||||||||||||||||||
|
| |||||||||||||||||||||||||
| 2,394,941 | ||||||||||||||||||||||||||
|
| |||||||||||||||||||||||||
See Notes to Financial Statements.
38 | www.shiplp.com |
Table of Contents
| Stone Harbor High Yield Bond Fund | Statements of Investments | |
| November 30, 2012 (Unaudited) |
| Currency | Rate | Maturity Date | Principal Amount/Shares* | Market Value (Expressed in U.S. $) | ||||||||||||
Publishing/Printing - 0.08% | ||||||||||||||||
Merrill Communications LLC - Term Loan 2L - Second Lien: | ||||||||||||||||
| USD | 16.000 | % | 12/31/2012 | 150,000 | $ | 146,250 | ||||||||||
| USD | 16.000 | % | 01/31/2013 | 13,471 | 13,134 | |||||||||||
Tribune Co. - Tranche X Advance | USD | 5.000 | % | 12/31/2012 | 192,000 | 149,616 | (2) | |||||||||
|
| |||||||||||||||
| 309,000 | ||||||||||||||||
|
| |||||||||||||||
TOTAL BANK LOANS (Cost $12,324,133) | 11,603,959 | |||||||||||||||
|
| |||||||||||||||
COMMON STOCKS - 0.00%(8) | ||||||||||||||||
Transportation Non Air/Rail - 0.00%(8) | ||||||||||||||||
General Maritime | 1,887 | 19 | ||||||||||||||
|
| |||||||||||||||
TOTAL COMMON STOCKS (Cost $1) | 19 | |||||||||||||||
|
| |||||||||||||||
PREFERRED STOCKS - 0.07% | ||||||||||||||||
Exploration & Production - 0.07% | ||||||||||||||||
Apache Corp. | 6.000 | % | 08/01/2013 | 2,802 | 124,493 | |||||||||||
SandRidge Energy, Inc. | 8.500 | % | 12/31/2049 | 1,551 | 155,953 | |||||||||||
|
| |||||||||||||||
| 280,446 | ||||||||||||||||
|
| |||||||||||||||
Metals/Mining/Steel - 0.00%(8) | ||||||||||||||||
Molycorp, Inc. | 5.500 | % | 03/01/2014 | 540 | 13,824 | |||||||||||
|
| |||||||||||||||
TOTAL PREFERRED STOCKS (Cost $365,031) | 294,270 | |||||||||||||||
|
| |||||||||||||||
WARRANTS - 0.01%(9) | ||||||||||||||||
Media Other - 0.01% | ||||||||||||||||
Cumulus Media, Inc. | ||||||||||||||||
expires 06/03/2030, strike price $0.010 | 12,989 | 31,498 | ||||||||||||||
|
| |||||||||||||||
Publishing/Printing - 0.00%(8) | ||||||||||||||||
Readers Digest | ||||||||||||||||
expires 02/19/2014, strike price $0.010 | 1,498 | 0 | ||||||||||||||
|
| |||||||||||||||
Transportation Non Air/Rail - 0.00%(8) | ||||||||||||||||
General Maritime | ||||||||||||||||
expires 05/17/2017, strike price $42.500 | 2,919 | 0 | ||||||||||||||
|
| |||||||||||||||
TOTAL WARRANTS (Cost $490,671) | 31,498 | |||||||||||||||
|
| |||||||||||||||
See Notes to Financial Statements.
| Stone Harbor Investment Funds Semi-Annual Report | November 30, 2012 | 39 |
Table of Contents
| Stone Harbor High Yield Bond Fund | Statements of Investments | |
| November 30, 2012 (Unaudited) |
| Currency | Rate | Maturity Date | Shares | Market Value (Expressed in U.S. $) | ||||||||||||||||||||||
SHORT TERM INVESTMENTS - 0.47% | ||||||||||||||||||||||||||
Money Market Mutual Funds - 0.47% | ||||||||||||||||||||||||||
Dreyfus Institutional Cash Advantage Fund - Institutional Advantage Shares (7 - Day Yield) | USD | 0.06959 | % | N/A | 1,868,368 | $ | 1,868,368 | |||||||||||||||||||
|
| |||||||||||||||||||||||||
TOTAL SHORT TERM INVESTMENTS (Cost $1,868,368) | 1,868,368 | |||||||||||||||||||||||||
|
| |||||||||||||||||||||||||
Total Investments - 98.80% (Cost $375,784,581) | 391,311,015 | |||||||||||||||||||||||||
Other Assets in Excess of Liabilities - 1.20% | 4,749,140 | |||||||||||||||||||||||||
|
| |||||||||||||||||||||||||
Net Assets - 100.00% | $ | 396,060,155 | ||||||||||||||||||||||||
|
| |||||||||||||||||||||||||
| * | The contract/principal amount of each security is stated in the currency in which the security is denominated. See below. |
EUR | - | Euro Currency | ||
USD | - | United States Dollar |
| (1) | Security exempt from registration under Rule 144A of the Securities Act of 1933. Such securities may normally be sold to qualified institutional buyers in transactions exempt from registration. Total market value of Rule 144A securities amounts to $118,375,427, which represents approximately 29.89% of net assets as of November 30, 2012. |
| (2) | Security is currently in default/non-income producing. |
| (3) | Pay-in-kind securities. |
| (4) | Securities were originally issued pursuant to Regulation S under the Securities Act of 1933, which exempts securities offered and sold outside of the United States from registration. Such securities cannot be sold in the United States without either an effective registration statement filed pursuant to the Securities Act of 1933, or pursuant to an exemption from registration. As of November 30, 2012, the aggregate market value of those securities was $5,210,077, which represents approximately 1.32% of net assets. |
| (5) | Floating or variable rate security. Interest rate disclosed is that which is in effect at November 30, 2012. |
| (6) | Step bond. Coupon increases periodically based upon a predetermined schedule. Interest rate disclosed is that which is in effect at November 30, 2012. |
| (7) | Bank loans generally pay interest at rates which are periodically determined by reference to a base lending rate plus a premium. All loans carry a variable rate of interest. These base lending rates are generally (i) the Prime Rate offered by one or more major United States banks, (ii) the lending rate offered by one or more European banks such as the London Interbank Offered Rate (“LIBOR”) or (iii) the Certificate of Deposit rate. Rate shown represents the weighted average rate at November 30, 2012. Bank Loans, while exempt from registration, under the Securities Act of 1933, contain certain restrictions on resale and cannot be sold publicly. Floating rate bank loans often require prepayments from excess cash flow or permit the borrower to repay at its election. The degree to which borrowers repay, whether as a contractual requirement or at their election, cannot be predicted with accuracy. As a result, the actual remaining maturity may be substantially less than the stated maturity shown. |
| (8) | Amount represents less than 0.005% of net assets. |
| (9) | Non-income producing security. |
Common Abbreviations:
BV | - | Besloten Vennootschap is the Dutch term for private limited liability company. | ||||
GmbH | - | Gesellschaft mit beschrankter Haftung is the German term for a company with limited liability. | ||||
LLC | - | Limited Liability Corporation. | ||||
LP | - | Limited Partnership. | ||||
Ltd. | - | Limited. | ||||
NV | - | Naamloze Vennootschap is the Dutch term for a public limited liability corporation. | ||||
PLC | - | Public Limited Company. | ||||
SA | - | Generally designates corporations in various countries, mostly those employing the civil law. | ||||
S.C.A. | - | Societe en commandite pe actiuni is the Romanian term for limited liability partnership. |
See Notes to Financial Statements.
40 | www.shiplp.com |
Table of Contents
| Stone Harbor High Yield Bond Fund | Statements of Investments | |
| November 30, 2012 (Unaudited) |
OUTSTANDING FORWARD FOREIGN CURRENCY CONTRACTS
Counterparty | Foreign | Contracted Amount* | Purchase/Sale | Settlement | Current Value | Unrealized Appreciation/ (Depreciation) | ||||||||||
JPMorgan Chase & Co. | EUR | 2,298,206 | Purchase | 12/31/2012 | $ | 2,989,899 | $ | 18,594 | ||||||||
|
| |||||||||||||||
| $ | 18,594 | |||||||||||||||
|
| |||||||||||||||
JPMorgan Chase & Co. | EUR | 14,293,000 | Sale | 12/31/2012 | $ | 18,594,774 | $ | (408,361 | ) | |||||||
JPMorgan Chase & Co. | EUR | 281,904 | Sale | 12/31/2012 | 366,748 | (8,581 | ) | |||||||||
JPMorgan Chase & Co. | EUR | 310,385 | Sale | 12/31/2012 | 403,802 | (7,859 | ) | |||||||||
JPMorgan Chase & Co. | EUR | 52,000 | Sale | 12/31/2012 | 67,650 | (1,486 | ) | |||||||||
|
| |||||||||||||||
| $ | (426,287 | ) | ||||||||||||||
|
| |||||||||||||||
| * | The contracted amount is stated in the currency in which the security is denominated. |
See Notes to Financial Statements.
| Stone Harbor Investment Funds Semi-Annual Report | November 30, 2012 | 41 |
Table of Contents
| Stone Harbor Local Markets Fund | Statements of Investments | |
| November 30, 2012 (Unaudited) |
| Currency | Rate | Maturity Date | Principal Amount* | Market Value (Expressed in U.S. $) | ||||||||||||
SOVEREIGN DEBT OBLIGATIONS - 52.90% | ||||||||||||||||
Argentina - 0.02% | ||||||||||||||||
Republic of Argentina | EUR | 6.734 | % | 12/31/2033 | 664,011 | $ | 471,728 | |||||||||
|
| |||||||||||||||
Brazil - 2.40% | ||||||||||||||||
Nota Do Tesouro Nacional: | ||||||||||||||||
| BRL | 6.000 | % | 05/15/2015 | 61,931,155 | 31,755,312 | |||||||||||
| BRL | 6.000 | % | 08/15/2020 | 33,247,691 | 18,328,691 | |||||||||||
| BRL | 10.000 | % | 01/01/2023 | 3,200,000 | 1,550,231 | |||||||||||
|
| |||||||||||||||
| 51,634,234 | ||||||||||||||||
|
| |||||||||||||||
Chile - 0.10% | ||||||||||||||||
Republic of Chile | CLP | 5.500 | % | 08/05/2020 | 890,000,000 | 2,038,387 | ||||||||||
|
| |||||||||||||||
Colombia - 3.07% | ||||||||||||||||
Bogota Distrio Capital | COP | 9.750 | % | 07/26/2028 | 42,957,000,000 | 36,333,595 | (1) | |||||||||
Republic of Colombia: | ||||||||||||||||
| COP | 12.000 | % | 10/22/2015 | 14,340,000,000 | 9,702,680 | |||||||||||
| COP | 7.750 | % | 04/14/2021 | 22,433,000,000 | 15,845,098 | |||||||||||
| COP | 9.850 | % | 06/28/2027 | 4,692,000,000 | 4,056,238 | |||||||||||
|
| |||||||||||||||
| 65,937,611 | ||||||||||||||||
|
| |||||||||||||||
Hungary - 2.98% | ||||||||||||||||
Hungarian Government: | ||||||||||||||||
| HUF | 6.750 | % | 02/12/2013 | 1,312,080,000 | 6,076,692 | |||||||||||
| HUF | 7.500 | % | 10/24/2013 | 700,100,000 | 3,285,093 | |||||||||||
| HUF | 5.500 | % | 02/12/2014 | 1,204,890,000 | 5,559,752 | |||||||||||
| HUF | 6.750 | % | 08/22/2014 | 414,880,000 | 1,950,664 | |||||||||||
| HUF | 8.000 | % | 02/12/2015 | 4,238,700,000 | 20,484,677 | |||||||||||
| HUF | 7.750 | % | 08/24/2015 | 3,610,350,000 | 17,428,635 | |||||||||||
| HUF | 6.750 | % | 02/24/2017 | 358,100,000 | 1,683,648 | |||||||||||
| HUF | 6.750 | % | 11/24/2017 | 1,058,000,000 | 4,984,315 | |||||||||||
| HUF | 7.000 | % | 06/24/2022 | 554,740,000 | 2,602,864 | |||||||||||
|
| |||||||||||||||
| 64,056,340 | ||||||||||||||||
|
| |||||||||||||||
Malaysia - 4.64% | ||||||||||||||||
Malaysian Government: | ||||||||||||||||
| MYR | 5.094 | % | 04/30/2014 | 25,000,000 | 8,452,587 | |||||||||||
| MYR | 3.741 | % | 02/27/2015 | 14,000,000 | 4,663,903 | |||||||||||
| MYR | 3.835 | % | 08/12/2015 | 8,650,000 | 2,895,570 | |||||||||||
| MYR | 4.012 | % | 09/15/2017 | 85,800,000 | 29,165,931 | |||||||||||
| MYR | 3.314 | % | 10/31/2017 | 94,740,000 | 31,249,631 | |||||||||||
| MYR | 4.160 | % | 07/15/2021 | 17,550,000 | 6,062,176 | |||||||||||
| MYR | 3.418 | % | 08/15/2022 | 40,980,000 | 13,400,484 | |||||||||||
| MYR | 4.392 | % | 04/15/2026 | 10,350,000 | 3,670,466 | |||||||||||
|
| |||||||||||||||
| 99,560,748 | ||||||||||||||||
|
| |||||||||||||||
See Notes to Financial Statements.
42 | www.shiplp.com |
Table of Contents
| Stone Harbor Local Markets Fund | Statements of Investments | |
| November 30, 2012 (Unaudited) |
| Currency | Rate | Maturity Date | Principal Amount* | Market Value (Expressed in U.S. $) | ||||||||||||||||
Mexico - 10.92% | ||||||||||||||||||||
Mexican Bonos: | ||||||||||||||||||||
| MXN | 7.000 | % | 06/19/2014 | 72,306,000 | $ | 5,779,243 | ||||||||||||||
| MXN | 6.000 | % | 06/18/2015 | 247,400,000 | 19,664,767 | |||||||||||||||
| MXN | 8.000 | % | 12/17/2015 | 13,441,000 | 1,130,605 | |||||||||||||||
| MXN | 6.250 | % | 06/16/2016 | 119,910,000 | 9,666,636 | |||||||||||||||
| MXN | 5.000 | % | 06/15/2017 | 64,470,000 | 4,970,681 | |||||||||||||||
| MXN | 7.750 | % | 12/14/2017 | 58,030,000 | 5,018,699 | |||||||||||||||
| MXN | 8.000 | % | 06/11/2020 | 417,668,000 | 37,845,884 | |||||||||||||||
| MXN | 6.500 | % | 06/10/2021 | 483,349,000 | 40,355,464 | |||||||||||||||
| MXN | 6.500 | % | 06/09/2022 | 395,255,000 | 32,997,560 | |||||||||||||||
| MXN | 8.500 | % | 05/31/2029 | 62,000,000 | 5,980,465 | |||||||||||||||
| MXN | 7.750 | % | 05/29/2031 | 163,760,000 | 14,668,945 | |||||||||||||||
Mexican Udibonos: | ||||||||||||||||||||
| MXN | 3.500 | % | 12/14/2017 | 3,688,371 | 318,342 | |||||||||||||||
| MXN | 4.000 | % | 06/13/2019 | 24,799,443 | 2,245,105 | |||||||||||||||
| MXN | 2.500 | % | 12/10/2020 | 648,284,623 | 54,031,282 | |||||||||||||||
|
| |||||||||||||||||||
| 234,673,678 | ||||||||||||||||||||
|
| |||||||||||||||||||
Poland - 9.06% | ||||||||||||||||||||
Republic of Poland: | ||||||||||||||||||||
| PLN | 5.000 | % | 10/24/2013 | 33,240,000 | 10,678,716 | |||||||||||||||
| PLN | 0.000 | % | 01/25/2014 | 322,320,000 | 98,364,645 | (2) | ||||||||||||||
| PLN | 5.750 | % | 04/25/2014 | 14,980,000 | 4,901,197 | |||||||||||||||
| PLN | 0.000 | % | 07/25/2014 | 18,410,000 | 5,533,310 | (2) | ||||||||||||||
| PLN | 5.500 | % | 04/25/2015 | 65,240,000 | 21,696,293 | |||||||||||||||
| PLN | 6.250 | % | 10/24/2015 | 5,580,000 | 1,907,482 | |||||||||||||||
| PLN | 3.000 | % | 08/24/2016 | 82,231,625 | 27,789,329 | |||||||||||||||
| PLN | 5.250 | % | 10/25/2017 | 22,062,000 | 7,553,983 | |||||||||||||||
| PLN | 5.250 | % | 10/25/2020 | 24,980,000 | 8,714,405 | |||||||||||||||
| PLN | 5.750 | % | 10/25/2021 | 20,480,000 | 7,395,402 | |||||||||||||||
|
| |||||||||||||||||||
| 194,534,762 | ||||||||||||||||||||
|
| |||||||||||||||||||
Romania - 0.38% | ||||||||||||||||||||
Romania Government Bond: | ||||||||||||||||||||
| RON | 6.000 | % | 10/19/2013 | 17,190,000 | 4,957,374 | |||||||||||||||
| RON | 5.850 | % | 07/28/2014 | 11,010,000 | 3,153,591 | |||||||||||||||
|
| |||||||||||||||||||
| 8,110,965 | ||||||||||||||||||||
|
| |||||||||||||||||||
Russia - 0.45% | ||||||||||||||||||||
Russian Federation | RUB | 7.850 | % | 03/10/2018 | 275,000,000 | 9,673,210 | (1) | |||||||||||||
|
| |||||||||||||||||||
South Africa - 9.69% | ||||||||||||||||||||
Republic of South Africa: | ||||||||||||||||||||
| ZAR | 13.500 | % | 09/15/2015 | 197,005,000 | 26,670,090 | |||||||||||||||
| ZAR | 8.250 | % | 09/15/2017 | 25,950,000 | 3,193,205 | |||||||||||||||
| ZAR | 8.000 | % | 12/21/2018 | 310,705,000 | 38,055,865 | |||||||||||||||
| ZAR | 7.250 | % | 01/15/2020 | 27,990,000 | 3,279,155 | |||||||||||||||
| ZAR | 6.750 | % | 03/31/2021 | 975,790,000 | 110,405,342 | |||||||||||||||
See Notes to Financial Statements.
| Stone Harbor Investment Funds Semi-Annual Report | November 30, 2012 | 43 |
Table of Contents
| Stone Harbor Local Markets Fund | Statements of Investments | |
| November 30, 2012 (Unaudited) |
| Currency | Rate | Maturity Date | Principal Amount* | Market Value (Expressed in U.S. $) | ||||||||||||
South Africa (continued) | ||||||||||||||||
Republic of South Africa (continued) | ||||||||||||||||
| ZAR | 10.500 | % | 12/21/2026 | 189,250,000 | $ | 26,598,377 | ||||||||||
|
| |||||||||||||||
| 208,202,034 | ||||||||||||||||
|
| |||||||||||||||
Thailand - 4.58% | ||||||||||||||||
Thailand Government: | ||||||||||||||||
| THB | 5.250 | % | 05/12/2014 | 11,120,000 | 374,476 | |||||||||||
| THB | 3.625 | % | 05/22/2015 | 535,220,000 | 17,736,311 | |||||||||||
| THB | 3.250 | % | 06/16/2017 | 1,138,400,000 | 37,325,189 | |||||||||||
| THB | 2.800 | % | 10/10/2017 | 324,480,000 | 10,410,154 | |||||||||||
| THB | 3.875 | % | 06/13/2019 | 4,775,000 | 160,849 | |||||||||||
| THB | 1.200 | % | 07/14/2021 | 733,797,127 | 24,532,018 | |||||||||||
| THB | 3.650 | % | 12/17/2021 | 240,690,000 | 7,935,637 | |||||||||||
|
| |||||||||||||||
| 98,474,634 | ||||||||||||||||
|
| |||||||||||||||
Turkey - 4.61% | ||||||||||||||||
Republic of Turkey: | ||||||||||||||||
| TRY | 4.500 | % | 02/11/2015 | 42,925,529 | 26,602,270 | |||||||||||
| TRY | 4.000 | % | 04/29/2015 | 42,406,325 | 26,030,071 | |||||||||||
| TRY | 10.000 | % | 06/17/2015 | 1,760,000 | 1,077,561 | |||||||||||
| TRY | 9.000 | % | 01/27/2016 | 51,490,000 | 31,178,991 | |||||||||||
| TRY | 9.000 | % | 03/08/2017 | 22,990,000 | 14,191,437 | |||||||||||
|
| |||||||||||||||
| 99,080,330 | ||||||||||||||||
|
| |||||||||||||||
TOTAL SOVEREIGN DEBT OBLIGATIONS (Cost $1,096,941,897) | 1,136,448,661 | |||||||||||||||
|
| |||||||||||||||
CORPORATE BONDS - 3.53% | ||||||||||||||||
Colombia - 0.45% | ||||||||||||||||
Emgesa SA ESP: | ||||||||||||||||
| COP | 8.750 | % | 01/25/2021 | 636,000,000 | 400,969 | (3) | ||||||||||
| COP | 8.750 | % | 01/25/2021 | 10,543,000,000 | 6,646,876 | (1) | ||||||||||
Empresas Publicas de Medellin ESP: | ||||||||||||||||
| COP | 8.375 | % | 02/01/2021 | 802,000,000 | 501,294 | (3) | ||||||||||
| COP | 8.375 | % | 02/01/2021 | 3,450,000,000 | 2,156,440 | (1) | ||||||||||
|
| |||||||||||||||
| 9,705,579 | ||||||||||||||||
|
| |||||||||||||||
European Union - 2.72% | ||||||||||||||||
Asian Development Bank | ZAR | 6.500 | % | 09/15/2015 | 4,650,000 | 530,824 | ||||||||||
European Bank for Reconstruction & Development: | ||||||||||||||||
| MXN | 7.300 | % | 05/23/2013 | 8,500,000 | 666,188 | |||||||||||
| IDR | 7.200 | % | 06/08/2016 | 39,000,000,000 | 4,437,223 | |||||||||||
European Investment Bank: | ||||||||||||||||
| ZAR | 8.000 | % | 10/21/2013 | 3,810,000 | 438,730 | |||||||||||
| IDR | 6.000 | % | 04/22/2014 | 11,000,000,000 | 1,153,489 | |||||||||||
| ZAR | 9.000 | % | 12/21/2018 | 139,000,000 | 17,753,520 | |||||||||||
| ZAR | 0.000 | % | 12/31/2018 | 5,280,000 | 408,912 | (2) | ||||||||||
Inter - American Development Bank: | ||||||||||||||||
| IDR | 6.500 | % | 03/10/2014 | 15,000,000,000 | 1,597,644 | |||||||||||
See Notes to Financial Statements.
44 | www.shiplp.com |
Table of Contents
| Stone Harbor Local Markets Fund | Statements of Investments | |
| November 30, 2012 (Unaudited) |
Counterparty | Currency | Rate | Maturity Date | Principal Amount* | Market Value (Expressed in U.S. $) | |||||||||||||||
European Union (continued) | ||||||||||||||||||||
Inter-American Development Bank (continued) | ||||||||||||||||||||
| IDR | 6.500 | % | 06/04/2014 | 16,000,000,000 | $ | 1,709,324 | ||||||||||||||
| IDR | 0.000 | % | 08/20/2015 | 314,250,000,000 | 29,030,496 | (2) | ||||||||||||||
International Bank for Reconstruction & Development | COP | 8.000 | % | 03/02/2020 | 1,050,000,000 | 701,924 | ||||||||||||||
|
| |||||||||||||||||||
| 58,428,274 | ||||||||||||||||||||
|
| |||||||||||||||||||
Mexico - 0.36% | ||||||||||||||||||||
Petroleos Mexicanos | MXN | 7.650 | % | 11/24/2021 | 94,160,000 | 7,827,825 | (3) | |||||||||||||
|
| |||||||||||||||||||
TOTAL CORPORATE BONDS | 75,961,678 | |||||||||||||||||||
|
| |||||||||||||||||||
(Cost $76,426,392) | ||||||||||||||||||||
CREDIT LINKED NOTES - 16.78% | ||||||||||||||||||||
Brazil - 4.05% | ||||||||||||||||||||
Nota Do Tesouro Nacional: | ||||||||||||||||||||
| Barclays Bank PLC | BRL | 6.000 | % | 05/15/2015 | 3,344,046 | 1,714,707 | ||||||||||||||
| Barclays Bank PLC | BRL | 6.000 | % | 05/15/2015 | 3,960,054 | 2,030,575 | ||||||||||||||
| JPMorgan Chase & Co. | BRL | 6.000 | % | 05/15/2015 | 22,044,301 | 11,303,531 | ||||||||||||||
| Barclays Bank PLC | BRL | 6.000 | % | 05/15/2015 | 27,368,373 | 14,033,526 | ||||||||||||||
| Barclays Bank PLC | BRL | 6.000 | % | 08/15/2016 | 2,783,050 | 1,453,469 | ||||||||||||||
| JPMorgan Chase & Co. | BRL | 6.000 | % | 08/15/2020 | 18,188,547 | 10,026,930 | ||||||||||||||
| Citigroup Global Markets | BRL | 10.000 | % | 01/01/2021 | 2,600,000 | 1,267,761 | ||||||||||||||
| Citigroup Global Markets | BRL | 10.000 | % | 01/01/2021 | 5,400,000 | 2,630,756 | ||||||||||||||
| Barclays Bank PLC | BRL | 10.000 | % | 01/01/2021 | 6,800,000 | 3,315,681 | ||||||||||||||
| JPMorgan Chase & Co. | BRL | 10.000 | % | 01/01/2021 | 7,000,000 | 3,413,202 | ||||||||||||||
| Citigroup Global Markets | BRL | 10.000 | % | 01/01/2021 | 7,000,000 | 3,410,240 | ||||||||||||||
| JPMorgan Chase & Co. | BRL | 10.000 | % | 01/01/2021 | 11,240,000 | 5,480,626 | ||||||||||||||
| Citigroup Global Markets | BRL | 10.000 | % | 01/01/2021 | 17,000,000 | 8,282,010 | ||||||||||||||
| Barclays Bank PLC | BRL | 10.000 | % | 01/01/2021 | 38,460,000 | 18,753,105 | ||||||||||||||
|
| |||||||||||||||||||
| 87,116,119 | ||||||||||||||||||||
|
| |||||||||||||||||||
Colombia - 1.43% | ||||||||||||||||||||
Titulos de Tesoreria - Series B: | ||||||||||||||||||||
| Citigroup Global Markets | COP | 7.000 | % | 02/25/2015 | 10,617,682,400 | 6,291,527 | ||||||||||||||
| Citigroup Global Markets | COP | 7.250 | % | 06/15/2016 | 2,200,000,000 | 1,287,131 | ||||||||||||||
| Citigroup Global Markets | COP | 7.250 | % | 06/15/2016 | 10,000,000,000 | 5,850,595 | ||||||||||||||
| Citigroup Global Markets | COP | 4.250 | % | 05/17/2017 | 6,329,772,200 | 3,770,245 | ||||||||||||||
| Citigroup Global Markets | COP | 11.000 | % | 07/24/2020 | 2,800,000,000 | 2,040,458 | ||||||||||||||
| Citigroup Global Markets | COP | 11.000 | % | 07/24/2020 | 4,570,000,000 | 3,330,319 | ||||||||||||||
| Citigroup Global Markets | COP | 11.000 | % | 07/24/2020 | 6,578,000,000 | 4,793,620 | ||||||||||||||
| Citigroup Global Markets | COP | 11.000 | % | 07/27/2020 | 4,500,000,000 | 3,280,077 | ||||||||||||||
|
| |||||||||||||||||||
| 30,643,972 | ||||||||||||||||||||
|
| |||||||||||||||||||
Indonesia - 6.96% | ||||||||||||||||||||
Republic of Indonesia: | ||||||||||||||||||||
| JPMorgan Chase & Co. | IDR | 5.250 | % | 05/15/2018 | 155,400,000,000 | 16,520,315 | ||||||||||||||
| Deutsche Bank AG London | IDR | 12.800 | % | 06/15/2021 | 3,000,000,000 | 470,165 | ||||||||||||||
| JPMorgan Chase & Co. | IDR | 8.250 | % | 07/15/2021 | 90,200,000,000 | 11,350,805 | ||||||||||||||
See Notes to Financial Statements.
| Stone Harbor Investment Funds Semi-Annual Report | November 30, 2012 | 45 |
Table of Contents
| Stone Harbor Local Markets Fund | Statements of Investments | |
| November 30, 2012 (Unaudited) |
Counterparty | Currency | Rate | Maturity | Principal | Market Value | ||||||||||||||||||||||||||
Indonesia - 6.96% (continued) | |||||||||||||||||||||||||||||||
Republic of Indonesia (continued) | |||||||||||||||||||||||||||||||
| Deutsche Bank AG London | IDR | 8.250 | % | 07/15/2021 | 144,100,000,000 | $ | 17,927,821 | ||||||||||||||||||||||||
| JPMorgan Chase & Co. | IDR | 7.000 | % | 05/15/2022 | 39,200,000,000 | 4,574,389 | |||||||||||||||||||||||||
| Deutsche Bank AG London | IDR | 7.000 | % | 05/15/2022 | 248,900,000,000 | 29,252,594 | |||||||||||||||||||||||||
| Deutsche Bank AG London | IDR | 5.625 | % | 05/15/2023 | 33,500,000,000 | 3,579,246 | |||||||||||||||||||||||||
| JPMorgan Chase & Co. | IDR | 5.625 | % | 05/15/2023 | 118,700,000,000 | 12,682,285 | |||||||||||||||||||||||||
| HSBC Bank | IDR | 11.000 | % | 09/15/2025 | 51,100,000,000 | 7,851,295 | |||||||||||||||||||||||||
| HSBC Bank | IDR | 11.000 | % | 09/15/2025 | 62,500,000,000 | 9,602,856 | |||||||||||||||||||||||||
| Deutsche Bank AG London | IDR | 11.000 | % | 09/17/2025 | 33,600,000,000 | 5,106,493 | |||||||||||||||||||||||||
| JPMorgan Chase & Co. | IDR | 8.250 | % | 06/15/2032 | 44,400,000,000 | 5,681,497 | |||||||||||||||||||||||||
| Deutsche Bank AG London | IDR | 8.250 | % | 06/15/2032 | 193,700,000,000 | 24,915,392 | |||||||||||||||||||||||||
|
| ||||||||||||||||||||||||||||||
| 149,515,153 | |||||||||||||||||||||||||||||||
|
| ||||||||||||||||||||||||||||||
Russia - 4.34% | |||||||||||||||||||||||||||||||
Russian Federation: | |||||||||||||||||||||||||||||||
| JPMorgan Chase & Co. | RUB | 6.880 | % | 07/15/2015 | 88,300,000 | 2,886,987 | |||||||||||||||||||||||||
| JPMorgan Chase & Co. | RUB | 7.350 | % | 01/20/2016 | 100,000,000 | 3,310,045 | |||||||||||||||||||||||||
| Credit Suisse First Boston | RUB | 7.400 | % | 06/14/2017 | 304,200,000 | 10,148,054 | |||||||||||||||||||||||||
| JPMorgan Chase & Co. | RUB | 7.500 | % | 03/15/2018 | 116,600,000 | 3,931,335 | |||||||||||||||||||||||||
| Credit Suisse First Boston | RUB | 7.500 | % | 03/15/2018 | 338,500,000 | 11,407,523 | |||||||||||||||||||||||||
| Credit Suisse First Boston | RUB | 7.500 | % | 02/27/2019 | 102,500,000 | 3,449,288 | |||||||||||||||||||||||||
| JPMorgan Chase & Co. | RUB | 7.600 | % | 04/14/2021 | 319,000,000 | 10,858,958 | |||||||||||||||||||||||||
| Deutsche Bank AG London | RUB | 7.600 | % | 04/14/2021 | 470,000,000 | 15,999,092 | |||||||||||||||||||||||||
| Credit Suisse First Boston | RUB | 7.600 | % | 04/14/2021 | 818,100,000 | 27,835,372 | |||||||||||||||||||||||||
| Deutsche Bank AG London | RUB | 7.600 | % | 07/20/2022 | 99,000,000 | 3,388,955 | |||||||||||||||||||||||||
|
| ||||||||||||||||||||||||||||||
| 93,215,609 | |||||||||||||||||||||||||||||||
|
| ||||||||||||||||||||||||||||||
TOTAL CREDIT LINKED NOTES | 360,490,853 | ||||||||||||||||||||||||||||||
|
| ||||||||||||||||||||||||||||||
(Cost $352,259,310) | |||||||||||||||||||||||||||||||
SHORT TERM INVESTMENTS - 10.41% | |||||||||||||||||||||||||||||||
Money Market Mutual Funds - 10.41% | |||||||||||||||||||||||||||||||
Dreyfus Institutional Cash Advantage Fund - Institutional Advantage Shares (7-Day Yield) | USD | 0.06959 | % | N/A | 223,610,701 | 223,610,701 | |||||||||||||||||||||||||
|
| ||||||||||||||||||||||||||||||
TOTAL SHORT TERM INVESTMENTS | 223,610,701 | ||||||||||||||||||||||||||||||
|
| ||||||||||||||||||||||||||||||
(Cost $223,610,701) | |||||||||||||||||||||||||||||||
Total Investments - 83.62% | 1,796,511,893 | ||||||||||||||||||||||||||||||
(Cost $1,749,238,300) | |||||||||||||||||||||||||||||||
Other Assets In Excess of Liabilities - 16.38% | 351,798,098 | ||||||||||||||||||||||||||||||
|
| ||||||||||||||||||||||||||||||
Net Assets - 100.00% | $ | 2,148,309,991 | |||||||||||||||||||||||||||||
|
| ||||||||||||||||||||||||||||||
See Notes to Financial Statements.
46 | www.shiplp.com |
Table of Contents
| Stone Harbor Local Markets Fund | Statements of Investments | |
| November 30, 2012 (Unaudited) |
| * | The contract/principal amount of each security is stated in the currency in which the security is denominated. See below. |
BRL | - | Brazilian Real | ||
CLP | - | Chilean Peso | ||
COP | - | Colombian Peso | ||
EUR | - | Euro Currency | ||
HUF | - | Hungarian Forint | ||
IDR | - | Indonesian Rupiah | ||
MXN | - | Mexican Peso | ||
MYR | - | Malaysian Ringgit | ||
PHP | - | Philippine Peso | ||
PLN | - | Polish Zloty | ||
RON | - | Romanian Leu | ||
RUB | - | Russian Ruble | ||
THB | - | Thai Baht | ||
TRY | - | Turkish Lira | ||
ZAR | - | South African Rand |
| (1) | Securities were originally issued pursuant to Regulation S under the Securities Act of 1933, which exempts securities offered and sold outside of the United States from registration. Such securities cannot be sold in the United States without either an effective registration statement filed pursuant to the Securities Act of 1933, or pursuant to an exemption from registration. As of November 30, 2012, the aggregate market value of those securities was $54,810,121, which represents approximately 2.55% of net assets. |
| (2) | Issued with a zero coupon. Income is recognized through the accretion of discount. |
| (3) | Security exempt from registration under Rule 144A of the Securities Act of 1933. Such securities may normally be sold to qualified institutional buyers in transactions exempt from registration. Total market value of Rule 144A securities amounts to $8,730,088, which represents approximately 0.41% of net assets as of November 30, 2012. |
Common Abbreviations:
ESP | - | Empresa de Servicios Publicos is the Colombian term for Public Service Company. | ||
SA | - | Generally designates corporations in various countries mostly employing civil law. |
OUTSTANDING FORWARD FOREIGN CURRENCY CONTRACTS
Counterparty | Foreign Currency | Contracted Amount* | Purchase/Sale Contract | Settlement Date | Current Value | Unrealized Appreciation/ (Depreciation) | ||||||||||||||
Citigroup Global Markets | BRL | 181,987,378 | Sale | 12/04/2012 | $ | 85,112,193 | $ | 2,297,691 | ||||||||||||
JPMorgan Chase & Co. | MYR | 406,353,388 | Purchase | 12/07/2012 | 133,608,226 | 106,226 | ||||||||||||||
Citigroup Global Markets | PHP | 202,530,420 | Purchase | 12/05/2012 | 4,954,829 | 125,777 | ||||||||||||||
Citigroup Global Markets | RON | 27,658,536 | Purchase | 01/28/2013 | 7,891,314 | 144,910 | ||||||||||||||
Citigroup Global Markets | RUB | 149,289,750 | Purchase | 01/16/2013 | 4,801,214 | 67,867 | ||||||||||||||
Citigroup Global Markets | RUB | 162,302,640 | Purchase | 01/16/2013 | 5,219,713 | 59,713 | ||||||||||||||
Citigroup Global Markets | RUB | 72,433,700 | Purchase | 01/16/2013 | 2,329,495 | 53,495 | ||||||||||||||
Citigroup Global Markets | RUB | 44,267,430 | Purchase | 01/16/2013 | 1,423,657 | 34,657 | ||||||||||||||
Citigroup Global Markets | RUB | 2,751,950,051 | Purchase | 02/01/2013 | 88,314,246 | 1,620,906 | ||||||||||||||
Citigroup Global Markets | RUB | 73,221,120 | Purchase | 02/01/2013 | 2,349,777 | 45,777 | ||||||||||||||
Citigroup Global Markets | RUB | 51,426,000 | Purchase | 02/01/2013 | 1,650,338 | 30,264 | ||||||||||||||
|
| |||||||||||||||||||
| $ | 4,587,283 | |||||||||||||||||||
|
| |||||||||||||||||||
Citigroup Global Markets | BRL | 8,692,155 | Purchase | 12/04/2012 | $ | 4,065,163 | $ | (124,837 | ) | |||||||||||
Citigroup Global Markets | BRL | 173,295,223 | Purchase | 12/04/2012 | 81,047,030 | (3,970,373 | ) | |||||||||||||
Citigroup Global Markets | BRL | 181,987,378 | Purchase | 01/03/2013 | 84,736,729 | (2,334,405 | ) | |||||||||||||
Citigroup Global Markets | BRL | 22,342,655 | Purchase | 01/03/2013 | 10,403,158 | (198,842 | ) | |||||||||||||
Citigroup Global Markets | PHP | 202,530,420 | Sale | 12/05/2012 | 4,954,829 | (93,321 | ) | |||||||||||||
Credit Suisse First Boston | RUB | 1,014,965,000 | Purchase | 12/07/2012 | 32,866,760 | (33,240 | ) | |||||||||||||
Citigroup Global Markets | RUB | 107,546,240 | Sale | 02/01/2013 | 3,451,322 | (39,322 | ) | |||||||||||||
JPMorgan Chase & Co. | THB | 1,051,475,000 | Purchase | 12/07/2012 | 34,245,538 | (4,462 | ) | |||||||||||||
JPMorgan Chase & Co. | TRY | 173,769,043 | Purchase | 12/07/2012 | 97,153,121 | (146,879 | ) | |||||||||||||
|
| |||||||||||||||||||
| $ | (6,945,681 | ) | ||||||||||||||||||
|
| |||||||||||||||||||
| * | The contracted amount is stated in the currency in which the security is denominated. |
See Notes to Financial Statements.
| Stone Harbor Investment Funds Semi-Annual Report | November 30, 2012 | 47 |
Table of Contents
| Stone Harbor Emerging Markets Corporate Debt Fund | Statements of Investments | |
| November 30, 2012 (Unaudited) |
| Currency | Rate | Maturity Date | Principal Amount* | Market Value (Expressed in U.S. $) | ||||||||||||
CORPORATE BONDS - 96.97% | ||||||||||||||||
Argentina - 1.05% | ||||||||||||||||
Alto Palermo SA | USD | 7.875 | % | 05/11/2017 | 258,000 | $ | 223,170 | (1) | ||||||||
Capex SA | USD | 10.000 | % | 03/10/2018 | 550,000 | 354,750 | (2) | |||||||||
Empresa Distribuidora Y Comercializadora Norte | USD | 9.750 | % | 10/25/2022 | 300,000 | 136,500 | (1) | |||||||||
|
| |||||||||||||||
| 714,420 | ||||||||||||||||
|
| |||||||||||||||
Brazil - 14.01% | ||||||||||||||||
Banco Cruzeiro do Sul SA: | ||||||||||||||||
| USD | 8.875 | % | 09/22/2020 | 125,000 | 63 | (1)(3) | ||||||||||
| USD | 8.875 | % | 09/22/2020 | 200,000 | 100 | (2)(3) | ||||||||||
Banco do Brasil SA | USD | 3.875 | % | 10/10/2022 | 423,000 | 425,115 | ||||||||||
BM&FBovespa SA | USD | 5.500 | % | 07/16/2020 | 450,000 | 511,312 | (1) | |||||||||
BR Malls International Finance Ltd.: | ||||||||||||||||
| USD | 8.500 | % | 01/21/2049 | 300,000 | 327,750 | (1) | ||||||||||
| USD | 8.500 | % | 01/21/2049 | 346,000 | 378,005 | (2) | ||||||||||
BR Properties SA | USD | 9.000 | % | 10/07/2049 | 200,000 | 218,500 | (1) | |||||||||
Braskem Finance Ltd. | USD | 7.375 | % | 10/29/2049 | 200,000 | 209,000 | (2) | |||||||||
Caixa Economica Federal: | ||||||||||||||||
| USD | 2.375 | % | 11/06/2017 | 500,000 | 496,875 | (2) | ||||||||||
| USD | 3.500 | % | 11/07/2022 | 288,000 | 290,880 | (2) | ||||||||||
General Shopping Finance Ltd. | USD | 10.000 | % | 11/09/2015 | 294,000 | 290,325 | (2) | |||||||||
Globo Comunicacao e Participacoes SA | USD | 6.250 | % | 07/20/2049 | 200,000 | 216,500 | (1)(4) | |||||||||
Itau Unibanco Holding SA | USD | 5.650 | % | 03/19/2022 | 228,000 | 240,540 | (2) | |||||||||
Minerva Overseas II Ltd. | USD | 10.875 | % | 11/15/2019 | 575,000 | 642,562 | (1) | |||||||||
NET Servicos de Comunicacao SA | USD | 7.500 | % | 01/27/2020 | 711,000 | 828,315 | ||||||||||
Odebrecht Drilling Norbe VIII/IX Ltd. | USD | 6.350 | % | 06/30/2021 | 727,500 | 818,437 | (1) | |||||||||
Odebrecht Finance Ltd. | USD | 5.125 | % | 06/26/2022 | 210,000 | 226,275 | (2) | |||||||||
OGX Austria GmbH | USD | 8.500 | % | 06/01/2018 | 1,283,000 | 1,121,021 | (2) | |||||||||
Petrobras International Finance Co.: | ||||||||||||||||
| USD | 2.875 | % | 02/06/2015 | 116,000 | 119,340 | |||||||||||
| USD | 5.375 | % | 01/27/2021 | 267,000 | 301,423 | |||||||||||
QGOG Atlantic / Alaskan Rigs Ltd. | USD | 5.250 | % | 07/30/2018 | 570,339 | 593,153 | (2) | |||||||||
Samarco Mineracao SA | USD | 4.125 | % | 11/01/2022 | 468,000 | 469,170 | (2) | |||||||||
Schahin II Finance Co. SPV Ltd. | USD | 5.875 | % | 09/25/2022 | 380,000 | 399,000 | (2) | |||||||||
Telemar Norte Leste SA | USD | 5.500 | % | 10/23/2020 | 223,000 | 231,084 | (1) | |||||||||
Votorantim Cimentos SA | USD | 7.250 | % | 04/05/2041 | 200,000 | 221,000 | (2) | |||||||||
|
| |||||||||||||||
| 9,575,745 | ||||||||||||||||
|
| |||||||||||||||
Chile - 2.49% | ||||||||||||||||
Cencosud SA: | ||||||||||||||||
| USD | 5.500 | % | 01/20/2021 | 600,000 | 636,000 | (2) | ||||||||||
| USD | 4.875 | % | 01/20/2023 | 419,000 | 415,070 | (2) | ||||||||||
CFR International SA | USD | 5.125 | % | 12/06/2022 | 300,000 | 300,000 | (2) | |||||||||
Telefonica Chile SA | USD | 3.875 | % | 10/12/2022 | 353,000 | 348,587 | (2) | |||||||||
|
| |||||||||||||||
| 1,699,657 | ||||||||||||||||
|
| |||||||||||||||
See Notes to Financial Statements.
48 | www.shiplp.com |
Table of Contents
| Stone Harbor Emerging Markets Corporate Debt Fund | Statements of Investments | |
| November 30, 2012 (Unaudited) |
Currency | Rate | Maturity Date | Principal | Market Value | ||||||||||||||||||||||
China - 4.09% | ||||||||||||||||||||||||||
China Liansu Group Holdings Ltd. | USD | 7.875 | % | 05/13/2016 | 200,000 | $ 209,500 | (2) | |||||||||||||||||||
China Overseas Finance Cayman IV Ltd. | USD | 4.875 | % | 02/15/2017 | 200,000 | 217,050 | ||||||||||||||||||||
Mega Advance Investments Ltd. | USD | 5.000 | % | 05/12/2021 | 505,000 | 572,047 | (2) | |||||||||||||||||||
MIE Holdings Corp. | USD | 9.750 | % | 05/12/2016 | 249,000 | 271,410 | (2) | |||||||||||||||||||
Tencent Holdings Ltd.: | ||||||||||||||||||||||||||
| USD | 4.625 | % | 12/12/2016 | 200,000 | 215,404 | (2) | ||||||||||||||||||||
| USD | 3.375 | % | 03/05/2018 | 600,000 | 619,380 | (2) | ||||||||||||||||||||
Texhong Textile Group Ltd. | USD | 7.625 | % | 01/19/2016 | 250,000 | 251,875 | (1) | |||||||||||||||||||
Yancoal International Resources Development Co. Ltd. | USD | 5.730 | % | 05/16/2022 | 423,000 | 435,627 | (2) | |||||||||||||||||||
|
| |||||||||||||||||||||||||
| 2,792,293 | ||||||||||||||||||||||||||
|
| |||||||||||||||||||||||||
Colombia - 4.00% | ||||||||||||||||||||||||||
Bancolombia SA | USD | 5.125 | % | 09/11/2022 | 407,000 | 409,035 | ||||||||||||||||||||
Colombia Telecomunicaciones SA ESP | USD | 5.375 | % | 09/27/2022 | 400,000 | 404,000 | (2) | |||||||||||||||||||
Empresa de Energia de Bogota SA | USD | 6.125 | % | 11/10/2021 | 400,000 | 452,000 | (2) | |||||||||||||||||||
Grupo Aval Ltd.: | ||||||||||||||||||||||||||
| USD | 5.250 | % | 02/01/2017 | 200,000 | 213,250 | (2) | ||||||||||||||||||||
| USD | 4.750 | % | 09/26/2022 | 366,000 | 369,660 | (2) | ||||||||||||||||||||
Gruposura Finance | USD | 5.700 | % | 05/18/2021 | 397,000 | 442,159 | (2) | |||||||||||||||||||
Transportadora de Gas Internacional SA ESP | USD | 5.700 | % | 03/20/2022 | 400,000 | 445,000 | (2) | |||||||||||||||||||
|
| |||||||||||||||||||||||||
| 2,735,104 | ||||||||||||||||||||||||||
|
| |||||||||||||||||||||||||
Dominican Republic - 0.29% | ||||||||||||||||||||||||||
Cap Cana SA: | ||||||||||||||||||||||||||
| USD | 10.000% | 04/30/2016 | 500,000 | 125,000 | (1)(3)(5) | |||||||||||||||||||||
| USD | 10.000% | 04/30/2016 | 509,432 | 76,415 | (1)(3)(5) | |||||||||||||||||||||
|
| |||||||||||||||||||||||||
| 201,415 | ||||||||||||||||||||||||||
|
| |||||||||||||||||||||||||
Hong Kong - 5.40% | ||||||||||||||||||||||||||
Hutchison Whampoa International 10 Ltd. | USD | 6.000 | % | 10/28/2049 | 400,000 | 421,500 | (1)(6) | |||||||||||||||||||
Hutchison Whampoa International 11 Ltd. | USD | 4.625 | % | 01/13/2022 | 400,000 | 450,522 | (2) | |||||||||||||||||||
Hutchison Whampoa International 12 II Ltd.: | ||||||||||||||||||||||||||
| USD | 2.000 | % | 11/08/2017 | 750,000 | 753,869 | (2) | ||||||||||||||||||||
| USD | 3.250 | % | 11/08/2022 | 750,000 | 763,838 | (2) | ||||||||||||||||||||
PCCW?HKT Capital No. 4 Ltd. | USD | 4.250 | % | 02/24/2016 | 700,000 | 748,615 | ||||||||||||||||||||
Swire Pacific MTN Financing Ltd. | USD | 4.500 | % | 02/28/2022 | 500,000 | 553,137 | ||||||||||||||||||||
|
| |||||||||||||||||||||||||
| 3,691,481 | ||||||||||||||||||||||||||
|
| |||||||||||||||||||||||||
India - 2.15% | ||||||||||||||||||||||||||
ICICI Bank Ltd. | USD | 5.750 | % | 11/16/2020 | 400,000 | 434,520 | (1) | |||||||||||||||||||
Reliance Holdings USA, Inc. | USD | 5.400 | % | 02/14/2022 | 500,000 | 553,425 | (2) | |||||||||||||||||||
Vedanta Resources PLC | USD | 8.250 | % | 06/07/2021 | 445,000 | 482,825 | (2) | |||||||||||||||||||
|
| |||||||||||||||||||||||||
| 1,470,770 | ||||||||||||||||||||||||||
|
| |||||||||||||||||||||||||
See Notes to Financial Statements.
| Stone Harbor Investment Funds Semi-Annual Report | November 30, 2012 | 49 |
Table of Contents
| Stone Harbor Emerging Markets Corporate Debt Fund | Statements of Investments | |
| November 30, 2012 (Unaudited) |
Currency | Rate | Maturity Date | Principal Amount* | Market Value (Expressed in U.S. $) | ||||||||||||||||||||||
Indonesia - 3.44% | ||||||||||||||||||||||||||
Bakrie Telecom Pte Ltd. | USD | 11.500 | % | 05/07/2015 | 303,000 | $ 131,048 | (1) | |||||||||||||||||||
Berau Capital Resources Pte Ltd. | USD | 12.500 | % | 07/08/2015 | 200,000 | 211,000 | (1) | |||||||||||||||||||
Berau Coal Energy Tbk PT | USD | 7.250 | % | 03/13/2017 | 700,000 | 649,250 | (1) | |||||||||||||||||||
BLT Finance BV | USD | 7.500 | % | 05/15/2014 | 100,000 | 18,000 | (1)(3) | |||||||||||||||||||
Indosat Palapa Co. BV | USD | 7.375 | % | 07/29/2020 | 400,000 | 453,000 | (1) | |||||||||||||||||||
Listrindo Capital BV | USD | 6.950 | % | 02/21/2019 | 200,000 | 223,000 | (2) | |||||||||||||||||||
PT Adaro Indonesia | USD | 7.625 | % | 10/22/2019 | 601,000 | 667,861 | (1) | |||||||||||||||||||
|
| |||||||||||||||||||||||||
| 2,353,159 | ||||||||||||||||||||||||||
|
| |||||||||||||||||||||||||
Jamaica - 1.76% | ||||||||||||||||||||||||||
Digicel Group Ltd.: | ||||||||||||||||||||||||||
| USD | 10.500 | % | 04/15/2018 | 900,000 | 992,250 | (1) | ||||||||||||||||||||
| USD | 8.250 | % | 09/30/2020 | 200,000 | 213,063 | (2) | ||||||||||||||||||||
|
| |||||||||||||||||||||||||
| 1,205,313 | ||||||||||||||||||||||||||
|
| |||||||||||||||||||||||||
Kazakhstan - 1.61% | ||||||||||||||||||||||||||
BTA Bank JSC: | ||||||||||||||||||||||||||
| USD | 10.750 | % | 07/01/2018 | 613,572 | 252,331 | (1)(3) | ||||||||||||||||||||
| USD | 0.000 | % | 07/01/2020 | 1,000,000 | 122,500 | (1)(3)(7) | ||||||||||||||||||||
Zhaikmunai LLP | USD | 7.125 | % | 11/13/2019 | 700,000 | 722,750 | (2) | |||||||||||||||||||
|
| |||||||||||||||||||||||||
| 1,097,581 | ||||||||||||||||||||||||||
|
| |||||||||||||||||||||||||
Malaysia - 1.52% | ||||||||||||||||||||||||||
IOI Investment L BHD | USD | 4.375 | % | 06/27/2022 | 1,000,000 | 1,041,850 | ||||||||||||||||||||
|
| |||||||||||||||||||||||||
Mexico - 8.14% | ||||||||||||||||||||||||||
America Movil SAB de CV: | ||||||||||||||||||||||||||
| USD | 2.375 | % | 09/08/2016 | 300,000 | 313,473 | |||||||||||||||||||||
| USD | 3.125 | % | 07/16/2022 | 600,000 | 616,896 | |||||||||||||||||||||
Axtel SAB de CV | USD | 7.625 | % | 02/01/2017 | 80,000 | 34,400 | (2) | |||||||||||||||||||
Cemex Finance LLC | USD | 9.375 | % | 10/12/2022 | 288,000 | 312,211 | (2) | |||||||||||||||||||
Cemex SAB de CV | USD | 9.500 | % | 06/15/2018 | 1,000,000 | 1,078,750 | (2) | |||||||||||||||||||
Geo Maquinaria | USD | 9.625 | % | 05/02/2021 | 635,375 | 602,018 | (2) | |||||||||||||||||||
Grupo Bimbo SAB de CV | USD | 4.875 | % | 06/30/2020 | 202,000 | 228,668 | (2) | |||||||||||||||||||
Grupo Televisa SAB | USD | 6.000 | % | 05/12/2018 | 400,000 | 476,466 | ||||||||||||||||||||
Mexichem SAB de CV | USD | 4.875 | % | 09/19/2022 | 200,000 | 212,500 | (2) | |||||||||||||||||||
Mexico Generadora De En | USD | 5.500 | % | 12/06/2032 | 240,000 | 240,000 | (2) | |||||||||||||||||||
Telefonos de Mexico SAB de CV | USD | 5.500 | % | 11/15/2019 | 300,000 | 353,947 | ||||||||||||||||||||
Urbi Desarrollos Urbanos SAB de CV: | ||||||||||||||||||||||||||
| USD | 10.576 | % | 12/22/2012 | 200,000 | 201,960 | (2)(6) | ||||||||||||||||||||
| USD | 9.750 | % | 02/03/2022 | 1,000,000 | 892,500 | (2) | ||||||||||||||||||||
|
| |||||||||||||||||||||||||
| 5,563,789 | ||||||||||||||||||||||||||
|
| |||||||||||||||||||||||||
Mongolia - 0.95% | ||||||||||||||||||||||||||
Mongolian Mining Corp. | USD | 8.875 | % | 03/29/2017 | 612,000 | 647,190 | (2) | |||||||||||||||||||
|
| |||||||||||||||||||||||||
See Notes to Financial Statements.
50 | www.shiplp.com |
Table of Contents
| Stone Harbor Emerging Markets Corporate Debt Fund | Statements of Investments | |
| November 30, 2012 (Unaudited) |
Currency | Rate | Maturity Date | Principal Amount* | Market Value (Expressed in U.S. $) | ||||||||||||||||||||||
Nigeria - 0.68% | ||||||||||||||||||||||||||
Afren PLC | USD | 10.250 | % | 04/08/2019 | 400,000 | $ 468,000 | (2) | |||||||||||||||||||
|
| |||||||||||||||||||||||||
Peru - 3.75% | ||||||||||||||||||||||||||
Banco de Credito del Peru | USD | 5.375 | % | 09/16/2020 | 577,000 | 643,355 | (1) | |||||||||||||||||||
BBVA Banco Continental SA | USD | 5.000 | % | 08/26/2022 | 335,000 | 361,800 | (2) | |||||||||||||||||||
Corp. Azucarera del Peru SA | USD | 6.375 | % | 08/02/2022 | 378,000 | 407,295 | (2) | |||||||||||||||||||
Inkia Energy Ltd. | USD | 8.375 | % | 04/04/2021 | 350,000 | 390,250 | (2) | |||||||||||||||||||
Maestro Peru SA | USD | 6.750 | % | 09/26/2019 | 200,000 | 208,000 | (2) | |||||||||||||||||||
Southern Copper Corp.: | ||||||||||||||||||||||||||
| USD | 6.750 | % | 04/16/2040 | 145,000 | 171,638 | |||||||||||||||||||||
| USD | 5.250 | % | 11/08/2042 | 200,000 | 201,000 | |||||||||||||||||||||
Volcan Cia Minera SAA | USD | 5.375 | % | 02/02/2022 | 163,000 | 177,262 | (2) | |||||||||||||||||||
|
| |||||||||||||||||||||||||
| 2,560,600 | ||||||||||||||||||||||||||
|
| |||||||||||||||||||||||||
Qatar - 5.11% | ||||||||||||||||||||||||||
Doha Finance Ltd. | USD | 3.500 | % | 03/14/2017 | 200,000 | 207,000 | ||||||||||||||||||||
Nakilat, Inc. | USD | 6.067 | % | 12/31/2033 | 100,000 | 123,000 | (1) | |||||||||||||||||||
Qtel International Finance Ltd.: | ||||||||||||||||||||||||||
| USD | 4.750 | % | 02/16/2021 | 494,000 | 555,133 | (1) | ||||||||||||||||||||
| USD | 5.000 | % | 10/19/2025 | 600,000 | 672,750 | (1) | ||||||||||||||||||||
Ras Laffan Liquefied Natural Gas Co. Ltd. II | USD | 5.298 | % | 09/30/2020 | 717,750 | 811,955 | (1) | |||||||||||||||||||
Ras Laffan Liquefied Natural Gas Co. Ltd. III: | ||||||||||||||||||||||||||
| USD | 5.832 | % | 09/30/2016 | 161,600 | 177,963 | (1) | ||||||||||||||||||||
| USD | 6.750 | % | 09/30/2019 | 750,000 | 944,062 | (1) | ||||||||||||||||||||
|
| |||||||||||||||||||||||||
| 3,491,863 | ||||||||||||||||||||||||||
|
| |||||||||||||||||||||||||
Russia - 8.05% | ||||||||||||||||||||||||||
Alfa Bank OJSC Via Alfa Bond Issuance PLC | USD | 7.500 | % | 09/26/2019 | 435,000 | 455,662 | (2) | |||||||||||||||||||
Evraz Group SA | USD | 6.750 | % | 04/27/2018 | 400,000 | 401,000 | (2) | |||||||||||||||||||
Gazprom Neft OAO Via GPN Capital SA | USD | 4.375 | % | 09/19/2022 | 500,000 | 506,250 | (2) | |||||||||||||||||||
Gazprom OAO Via Gaz Capital SA | USD | 4.950 | % | 07/19/2022 | 254,000 | 270,828 | (2) | |||||||||||||||||||
Metalloinvest Finance Ltd. | USD | 6.500 | % | 07/21/2016 | 200,000 | 206,500 | (2) | |||||||||||||||||||
Novatek OAO via Novatek Finance Ltd. | USD | 5.326 | % | 02/03/2016 | 500,000 | 536,250 | (1) | |||||||||||||||||||
Rosneft Oil Co. | USD | 4.199 | % | 03/06/2022 | 496,000 | 496,000 | (2) | |||||||||||||||||||
Sberbank of Russia Via SB Capital SA: | ||||||||||||||||||||||||||
| USD | 6.125 | % | 02/07/2022 | 400,000 | 448,250 | (2) | ||||||||||||||||||||
| USD | 5.125 | % | 10/29/2022 | 500,000 | 505,000 | (2) | ||||||||||||||||||||
Severstal OAO Via Steel Capital SA: | ||||||||||||||||||||||||||
| USD | 6.700 | % | 10/25/2017 | 162,000 | 172,530 | (1) | ||||||||||||||||||||
| USD | 5.900 | % | 10/17/2022 | 316,000 | 313,630 | (2) | ||||||||||||||||||||
Vimpel Communications Holdings BV | USD | 6.255 | % | 03/01/2017 | 200,000 | 209,500 | (1) | |||||||||||||||||||
Vimpel Communications Via VIP Finance Ireland Ltd. OJSC | USD | 7.748 | % | 02/02/2021 | 400,000 | 443,500 | (1) | |||||||||||||||||||
VTB Bank OJSC Via VTB Capital SA | USD | 6.315 | % | 02/22/2018 | 500,000 | 535,625 | (1) | |||||||||||||||||||
|
| |||||||||||||||||||||||||
| 5,500,525 | ||||||||||||||||||||||||||
|
| |||||||||||||||||||||||||
Saudi Arabia - 2.31% | ||||||||||||||||||||||||||
Saudi Electricity Global Sukuk Co.: | ||||||||||||||||||||||||||
| USD | 2.665 | % | 04/03/2017 | 595,000 | 615,081 | (1) | ||||||||||||||||||||
See Notes to Financial Statements.
| Stone Harbor Investment Funds Semi-Annual Report | November 30, 2012 | 51 |
Table of Contents
| Stone Harbor Emerging Markets Corporate Debt Fund | Statements of Investments | |
| November 30, 2012 (Unaudited) |
Currency | Rate | Maturity Date | Principal Amount* | Market Value (Expressed in U.S. $) | ||||||||||||||||||||||
Saudi Arabia (continued) | ||||||||||||||||||||||||||
Saudi Electricity Global Sukuk Co. (continued) | ||||||||||||||||||||||||||
| USD | 4.211 | % | 04/03/2022 | 888,000 | $ 963,480 | (1) | ||||||||||||||||||||
|
| |||||||||||||||||||||||||
| 1,578,561 | ||||||||||||||||||||||||||
|
| |||||||||||||||||||||||||
Singapore - 2.60% | ||||||||||||||||||||||||||
DBS Bank Ltd. | USD | 3.625 | % | 09/21/2022 | 400,000 | 419,740 | (1)(6) | |||||||||||||||||||
Oversea-Chinese Banking Corp. Ltd. | USD | 3.150 | % | 03/11/2023 | 550,000 | 559,023 | (2)(6) | |||||||||||||||||||
PSA International Pte Ltd. | USD | 3.875 | % | 02/11/2021 | 200,000 | 219,870 | ||||||||||||||||||||
SingTel Group Treasury Pte Ltd. | USD | 4.500 | % | 09/08/2021 | 500,000 | 575,100 | ||||||||||||||||||||
|
| |||||||||||||||||||||||||
| 1,773,733 | ||||||||||||||||||||||||||
|
| |||||||||||||||||||||||||
South Africa - 3.19% | ||||||||||||||||||||||||||
Gold Fields Orogen��Holding BVI Ltd. | USD | 4.875 | % | 10/07/2020 | 1,400,000 | 1,349,250 | (1) | |||||||||||||||||||
Myriad International Holding BV | USD | 6.375 | % | 07/28/2017 | 730,000 | 833,113 | (1) | |||||||||||||||||||
|
| |||||||||||||||||||||||||
| 2,182,363 | ||||||||||||||||||||||||||
|
| |||||||||||||||||||||||||
South Korea - 6.48% | ||||||||||||||||||||||||||
Industrial Bank of Korea | USD | 2.375 | % | 07/17/2017 | 500,000 | 510,550 | (2) | |||||||||||||||||||
Korea East-West Power Co. Ltd. | USD | 2.500 | % | 07/16/2017 | 400,000 | 409,020 | (2) | |||||||||||||||||||
Korea Electric Power Corp. | USD | 3.000 | % | 10/05/2015 | 200,000 | 209,110 | (2) | |||||||||||||||||||
Korea Exchange Bank | USD | 3.125 | % | 06/26/2017 | 200,000 | 208,990 | (2) | |||||||||||||||||||
Korea Expressway Corp. | USD | 1.875 | % | 10/22/2017 | 250,000 | 247,607 | (2) | |||||||||||||||||||
Korea Hydro & Nuclear Power Co. Ltd.: | ||||||||||||||||||||||||||
| USD | 4.750 | % | 07/13/2021 | 400,000 | 457,700 | (1) | ||||||||||||||||||||
| USD | 3.000 | % | 09/19/2022 | 659,000 | 660,450 | (2) | ||||||||||||||||||||
Korea Western Power Co. Ltd. | USD | 3.125 | % | 05/10/2017 | 904,000 | 945,493 | (2) | |||||||||||||||||||
KT Corp. | USD | 3.875 | % | 01/20/2017 | 400,000 | 430,524 | ||||||||||||||||||||
SK Telecom Co. Ltd. | USD | 2.125 | % | 05/01/2018 | 347,000 | 349,464 | (2) | |||||||||||||||||||
|
| |||||||||||||||||||||||||
| 4,428,908 | ||||||||||||||||||||||||||
|
| |||||||||||||||||||||||||
Thailand - 2.85% | ||||||||||||||||||||||||||
Bangkok Bank PCL: | ||||||||||||||||||||||||||
| USD | 2.750 | % | 03/27/2018 | 294,000 | 296,528 | (2) | ||||||||||||||||||||
| USD | 3.875 | % | 09/27/2022 | 353,000 | 365,602 | (2) | ||||||||||||||||||||
PTT Global Chemical PCL | USD | 4.250 | % | 09/19/2022 | 500,000 | 521,406 | (2) | |||||||||||||||||||
PTT PCL | USD | 4.500 | % | 10/25/2042 | 299,000 | 300,615 | (2) | |||||||||||||||||||
PTTEP Canada International Finance Ltd. | USD | 5.692 | % | 04/05/2021 | 400,000 | 461,380 | (1) | |||||||||||||||||||
|
| |||||||||||||||||||||||||
| 1,945,531 | ||||||||||||||||||||||||||
|
| |||||||||||||||||||||||||
Turkey - 2.78% | ||||||||||||||||||||||||||
Akbank TAS | USD | 3.875 | % | 10/24/2017 | 250,000 | 258,750 | (2) | |||||||||||||||||||
Anadolu Efes Biracilik Ve Malt Sanayii AS | USD | 3.375 | % | 11/01/2022 | 550,000 | 547,250 | (2) | |||||||||||||||||||
Turkiye Garanti Bankasi AS | USD | 5.250 | % | 09/13/2022 | 600,000 | 656,250 | (2) | |||||||||||||||||||
Yuksel Insaat AS | USD | 9.500 | % | 11/10/2015 | 550,000 | 437,250 | (1) | |||||||||||||||||||
|
| |||||||||||||||||||||||||
| 1,899,500 | ||||||||||||||||||||||||||
|
| |||||||||||||||||||||||||
See Notes to Financial Statements.
52 | www.shiplp.com |
Table of Contents
| Stone Harbor Emerging Markets Corporate Debt Fund | Statements of Investments | |
| November 30, 2012 (Unaudited) |
Counterparty | Currency | Rate | Maturity Date | Principal Amount/Shares* | Market Value (Expressed in U.S. $) | ||||||||||||||||||||||||||
Ukraine - 1.86% | |||||||||||||||||||||||||||||||
Ferrexpo Finance PLC | USD | 7.875 | % | 04/07/2016 | 600,000 | $ 588,000 | (2) | ||||||||||||||||||||||||
Metinvest BV | USD | 8.750 | % | 02/14/2018 | 500,000 | 482,500 | (2) | ||||||||||||||||||||||||
Mriya Agro Holding PLC | USD | 10.950 | % | 03/30/2016 | 200,000 | 198,500 | (2) | ||||||||||||||||||||||||
|
| ||||||||||||||||||||||||||||||
| 1,269,000 | |||||||||||||||||||||||||||||||
|
| ||||||||||||||||||||||||||||||
United Arab Emirates - 6.41% | |||||||||||||||||||||||||||||||
Dolphin Energy Ltd. | USD | 5.888 | % | 06/15/2019 | 360,180 | 406,823 | (1) | ||||||||||||||||||||||||
DP World Sukuk Ltd. | USD | 6.250 | % | 07/02/2017 | 590,000 | 665,225 | (1) | ||||||||||||||||||||||||
Dubai Holding Commercial Operations MTN Ltd. | GBP | 6.000 | % | 02/01/2017 | 400,000 | 618,431 | |||||||||||||||||||||||||
Emaar Sukuk Ltd. | USD | 6.400 | % | 07/18/2019 | 900,000 | 978,750 | |||||||||||||||||||||||||
IPIC GMTN Ltd. | USD | 3.750 | % | 03/01/2017 | 300,000 | 319,875 | (2) | ||||||||||||||||||||||||
MAF Global Securities Ltd. | USD | 5.250 | % | 07/05/2019 | 800,000 | 844,000 | |||||||||||||||||||||||||
MAF Sukuk Ltd. | USD | 5.850 | % | 02/07/2017 | 500,000 | 548,750 | |||||||||||||||||||||||||
|
| ||||||||||||||||||||||||||||||
| 4,381,854 | |||||||||||||||||||||||||||||||
|
| ||||||||||||||||||||||||||||||
TOTAL CORPORATE BONDS (Cost $66,028,682) | 66,270,205 | ||||||||||||||||||||||||||||||
|
| ||||||||||||||||||||||||||||||
CREDIT LINKED NOTES - 0.80% | |||||||||||||||||||||||||||||||
Argentina - 0.80% | |||||||||||||||||||||||||||||||
Cablevision SA | Deutsche Bank AG London | USD | 9.375 | % | 02/12/2018 | 700,000 | 542,500 | ||||||||||||||||||||||||
|
| ||||||||||||||||||||||||||||||
TOTAL CREDIT LINKED NOTES (Cost $702,303) | 542,500 | ||||||||||||||||||||||||||||||
|
| ||||||||||||||||||||||||||||||
SHORT TERM INVESTMENTS - 2.53% | |||||||||||||||||||||||||||||||
Money Market Mutual Funds - 2.53% | |||||||||||||||||||||||||||||||
Dreyfus Institutional Cash Advantage Fund - Institutional Advantage Shares (7-Day Yield) | USD | 0.06959 | % | N/A | 1,730,436 | 1,730,436 | |||||||||||||||||||||||||
|
| ||||||||||||||||||||||||||||||
TOTAL SHORT TERM INVESTMENTS (Cost $1,730,436) | 1,730,436 | ||||||||||||||||||||||||||||||
|
| ||||||||||||||||||||||||||||||
Total Investments - 100.30% (Cost $68,461,421) | 68,543,141 | ||||||||||||||||||||||||||||||
Liabilities in Excess of Other Assets - (0.30)% | (203,731 | ) | |||||||||||||||||||||||||||||
|
| ||||||||||||||||||||||||||||||
Net Assets - 100.00% | $ 68,339,410 | ||||||||||||||||||||||||||||||
|
| ||||||||||||||||||||||||||||||
* The contract/principal amount of each security is stated in the currency in which the security is denominated. See below.
EUR | - | Euro | ||||
GBP | - | Great Britain Pound | ||||
USD | - | United States Dollar |
See Notes to Financial Statements.
| Stone Harbor Investment Funds Semi-Annual Report | November 30, 2012 | 53 |
Table of Contents
| Stone Harbor Emerging Markets Corporate Debt Fund | Statements of Investments | |
| November 30, 2012 (Unaudited) |
| (1) | Securities were originally issued pursuant to Regulation S under the Securities Act of 1933, which exempts securities offered and sold outside of the United States from registration. Such securities cannot be sold in the United States without either an effective registration statement filed pursuant to the Securities Act of 1933, or pursuant to an exemption from registration. As of November 30, 2012, the aggregate market value of those securities was $20,567,093, which represents approximately 30.10% of net assets. |
| (2) | Security exempt from registration under Rule 144A of the Securities Act of 1933. Such securities may normally be sold to qualified institutional buyers in transactions exempt from registration. Total market value of Rule 144A securities amounts to $34,503,387, which represents approximately 50.49% of net assets as of November 30, 2012. |
| (3) | Security is currently in default/non-income producing. |
| (4) | Step bond. Coupon increases periodically based upon a predetermined schedule. Interest rate disclosed is that which is in effect at November 30, 2012. |
| (5) | This security is considered illiquid. On November 30, 2012, the total market values of these securities were $201,415, representing 0.29% of net assets. |
| (6) | Floating or variable rate security. Interest rate disclosed is that which is in effect at November 30, 2012. |
| (7) | Issued with a zero coupon. Income is recognized through the accretion of discount. |
Common Abbreviations:
AS | - | Anonim Sirket is the Turkish term for Incorporation. | ||||
BHD | - | Berhad is a Malaysian term for public limited company. | ||||
BV | - | Besloten Vennootschap is the Dutch term for private limited liability company. | ||||
BVI | - | British Virgin Islands. | ||||
ESP | - | Empresa de Servicios Publicos is the Colombian term for Public Service Company. | ||||
GmbH | - | Gesellschaft mit beschrankter Haftung is the German term for a company with limited liability. | ||||
GMTN | - | Global Medium Term Note. | ||||
JSC | - | Joing Stock Company. | ||||
LLC | - | Limited Liability Corporation. | ||||
LLP | - | Limited Liability Partnership. | ||||
Ltd. | - | Limited. | ||||
MTN | - | Medium Term Note. | ||||
OAO | - | Otkrytoe Aktsionernoe Obschestvo is the Russian term for Open Joint Stock Company. | ||||
OJSC | - | Open Joint Stock Company. | ||||
PCL | - | A rearrangement of the letters for Public Limited Company, used in Thailand. | ||||
PLC | - | Public Limited Company. | ||||
PT | - | Perseroan terbuka is an Indonesian term for limited liability company. | ||||
Pte | - | Private. | ||||
SA | - | Generally designates corporations in various countries, mostly those employing the civil law. | ||||
SAA | - | Sociedad Anonima Abierta is the Peruvian term used for companies with 20 or more shareholders. | ||||
SAB | - | Sociedad Anonima Bursatil is the Spanish term used for publicly held company. | ||||
SAB de CV | - | A variable capital company. | ||||
SPV | - | Special Purpose Vehicle. | ||||
TAS | - | TüRk Anonim Sirketi is the Turkish term for Joint Stock Company. | ||||
Tbk | - | Terbuka is the Indonesian term for limited liability company. |
OUTSTANDING FORWARD FOREIGN CURRENCY CONTRACTS
Counterparty | Foreign Currency | Contracted Amount* | Purchase/Sale Contract | Settlement Date | Current Value | Unrealized Appreciation/ (Depreciation) | ||||||||||||||||||||||||
JPMorgan Chase & Co. | EUR | 101,000 | Purchase | 12/31/2012 | $ | 131,398 | $ | 2,641 | ||||||||||||||||||||||
|
| |||||||||||||||||||||||||||||
| $ | 2,641 | |||||||||||||||||||||||||||||
|
| |||||||||||||||||||||||||||||
JPMorgan Chase & Co. | EUR | 101,000 | Sale | 12/31/2012 | $ | 131,398 | $ | (2,885) | ||||||||||||||||||||||
JPMorgan Chase & Co. | GBP | 402,000 | Sale | 12/31/2012 | 644,018 | (5,103) | ||||||||||||||||||||||||
|
| |||||||||||||||||||||||||||||
| $ | (7,988) | |||||||||||||||||||||||||||||
|
| |||||||||||||||||||||||||||||
* The contracted amount is stated in the currency in which the security is denominated.
Securities determined to be illiquid under the procedures approved by the Funds’ Board of Trustees. Information related to the illiquid securities is as follows:
| Date(s) of Purchase | Security | Cost | Market Value | % of Net��Assets | ||||||||
06/01/2011 | Cap Cana SA | $ | 388,075 | $ | 125,000 | 0.18% | ||||||
06/01/2011 – 11/01/2011 | Cap Cana SA | 305,893 | 76,415 | 0.11% | ||||||||
|
| |||||||||||
| $ | 201,415 | 0.29% | ||||||||||
|
| |||||||||||
See Notes to Financial Statements.
54 | www.shiplp.com |
Table of Contents
| Stone Harbor Investment Funds | Statements of Assets and Liabilities | |
| November 30, 2012 (Unaudited) |
Stone Harbor Debt Fund | Stone Harbor High Yield Bond Fund | Stone Harbor Local Markets Fund | Stone Harbor Emerging Markets Corporate Debt Fund | |||||||||||||||||
ASSETS: | ||||||||||||||||||||
Investments , at value(1) | $ | 1,659,601,592 | $ | 391,311,015 | $ | 1,796,511,893 | $ | 68,543,141 | ||||||||||||
Cash | 1,668,865 | – | 1,206,536 | – | ||||||||||||||||
Foreign currency, at value | 554,068 | – | 2,016,216 | – | ||||||||||||||||
Unrealized appreciation on forward foreign currency contracts | 1,097,934 | 18,594 | 4,587,283 | 2,641 | ||||||||||||||||
Receivable due from broker | – | – | 1,320,000 | – | ||||||||||||||||
Receivable for investments sold | 12,320,128 | 6,680,338 | 314,293,901 | 935,519 | ||||||||||||||||
Receivable for fund shares sold | 13,524,694 | – | 38,437,874 | – | ||||||||||||||||
Interest receivable | 21,364,127 | 7,837,123 | 29,767,063 | 834,618 | ||||||||||||||||
Dividends receivable | – | 932 | – | – | ||||||||||||||||
Prepaid offering costs | – | – | 1,360 | – | ||||||||||||||||
Prepaid and other assets | 39,873 | 50,026 | 54,295 | 42,825 | ||||||||||||||||
Total Assets | 1,710,171,281 | 405,898,028 | 2,188,196,421 | 70,358,744 | ||||||||||||||||
LIABILITIES: | ||||||||||||||||||||
Payable to custodian due to overdraft | – | 6,112,544 | – | – | ||||||||||||||||
Foreign currency, at value due to custodian | – | 344,936 | – | – | ||||||||||||||||
Payable due to broker | 1,050,000 | 40,000 | – | – | ||||||||||||||||
Payable for investments purchased | 34,600,388 | 517,790 | 10,339,828 | 1,903,587 | ||||||||||||||||
Payable for fund shares redeemed | 857,353 | 1,000,000 | 21,031,219 | – | ||||||||||||||||
Unrealized depreciation on forward foreign currency contracts | 1,886,143 | 426,287 | 6,945,681 | 7,988 | ||||||||||||||||
Payable for distributions | – | 1,031,609 | – | – | ||||||||||||||||
Payable to advisor | 800,579 | 222,502 | 1,297,574 | 47,499 | ||||||||||||||||
Payable to administrator | 62,689 | 32,272 | 81,224 | 2,645 | ||||||||||||||||
Payable for trustee fees | 13,257 | 6,892 | 3,742 | 351 | ||||||||||||||||
Other payables | 164,469 | 103,041 | 187,162 | 57,264 | ||||||||||||||||
Total Liabilities | 39,434,878 | 9,837,873 | 39,886,430 | 2,019,334 | ||||||||||||||||
Net Assets | $ | 1,670,736,403 | $ | 396,060,155 | $ | 2,148,309,991 | $ | 68,339,410 | ||||||||||||
NET ASSETS CONSIST OF: | ||||||||||||||||||||
Paid-in capital | $ | 1,558,371,977 | $ | 374,903,432 | $ | 2,095,086,333 | $ | 68,554,819 | ||||||||||||
Undistributed/(overdistributed) net investment income | (1,439,010) | 222,577 | 18,416,655 | 84,120 | ||||||||||||||||
Accumulated net realized gain/(loss) on investments, forward foreign currency contracts and foreign currency transactions | 434,992 | 5,813,537 | (10,190,939) | (386,668) | ||||||||||||||||
Net unrealized appreciation on investments, forward foreign currency contracts and translation of assets and liabilities denominated in foreign currencies | 113,368,444 | 15,120,609 | 44,997,942 | 87,139 | ||||||||||||||||
Net Assets | $ | 1,670,736,403 | $ | 396,060,155 | $ | 2,148,309,991 | $ | 68,339,410 | ||||||||||||
PRICING OF SHARES: | ||||||||||||||||||||
Institutional Class | ||||||||||||||||||||
Net Assets | $ | 1,670,736,403 | $ | 396,060,155 | $ | 2,148,309,991 | $ | 68,339,410 | ||||||||||||
Shares of beneficial interest outstanding (unlimited number of shares, par value of $0.001 per share authorized) | 140,415,341 | 41,331,134 | 194,634,323 | 7,207,953 | ||||||||||||||||
Net assets value, offering and redemption price per share | $ | 11.90 | $ | 9.58 | $ | 11.04 | $ | 9.48 | ||||||||||||
Cost of Investments(1) | $ | 1,545,446,664 | $ | 375,784,581 | $ | 1,749,238,300 | $ | 68,461,421 | ||||||||||||
See Notes to Financial Statements.
| ||
| Stone Harbor Investment Funds Semi-Annual Report | November 30, 2012 | 55 |
Table of Contents
| Stone Harbor Investment Funds | Statements of Operations | |
| For the Six Months Ended November 30, 2012 (Unaudited) |
| Stone Harbor Emerging Markets Debt Fund | Stone Harbor High Yield Bond Fund | Stone Harbor Local Markets Fund | Stone Harbor Emerging Markets Corporate Debt Fund | |||||||||||||||||
INVESTMENT INCOME: | ||||||||||||||||||||
Interest | $ | 40,319,138 | $ | 20,731,771 | $ | 50,463,295 | $ | 1,571,899 | ||||||||||||
Dividends | 37,913 | 30,309 | 136,415 | 970 | ||||||||||||||||
Total Investment Income | 40,357,051 | 20,762,080 | 50,599,710 | 1,572,869 | ||||||||||||||||
EXPENSES: | ||||||||||||||||||||
Investment advisory fee | 4,277,624 | 1,352,185 | 7,160,102 | 221,437 | ||||||||||||||||
Administration fee | 346,484 | 159,347 | 458,464 | 14,792 | ||||||||||||||||
Custodian fees | 133,639 | 19,478 | 324,095 | 2,594 | ||||||||||||||||
Audit fees | 33,838 | 36,794 | 33,848 | 32,396 | ||||||||||||||||
Printing fees | 4,712 | 4,109 | 7,666 | 4,271 | ||||||||||||||||
Legal fees | 18,270 | 18,270 | 18,270 | 18,210 | ||||||||||||||||
Trustee fee | 22,951 | 11,048 | 24,607 | 800 | ||||||||||||||||
Transfer agent fees | 19,600 | 12,963 | 15,992 | 10,400 | ||||||||||||||||
Registration fees | 36,853 | 16,822 | 80,347 | 5,945 | ||||||||||||||||
Insurance fees | 9,662 | 4,443 | 11,250 | 268 | ||||||||||||||||
Other | 4,998 | 2,941 | 4,911 | 1,473 | ||||||||||||||||
Total expenses before waiver | 4,908,631 | 1,638,400 | 8,139,552 | 312,586 | ||||||||||||||||
Less fees waived by investment advisor | – | (150,997) | – | (52,072) | ||||||||||||||||
Total Net Expenses | 4,908,631 | 1,487,403 | 8,139,552 | 260,514 | ||||||||||||||||
Net Investment Income | 35,448,420 | 19,274,677 | 42,460,158 | 1,312,355 | ||||||||||||||||
REALIZED AND UNREALIZED GAIN/(LOSS) ON INVESTMENTS: |
| |||||||||||||||||||
Net realized gain/(loss) on: | ||||||||||||||||||||
Investments | 23,892 | 9,058,265 | 7,823,239 | (16,780) | ||||||||||||||||
Forward foreign currency contracts | 1,025,375 | 156,267 | (1,608,383) | (12,433) | ||||||||||||||||
Forward currency transactions | (194,076) | 46,784 | (11,957) | 270 | ||||||||||||||||
Net realized gain/(loss) | 855,191 | 9,261,316 | 6,202,899 | (28,943) | ||||||||||||||||
Change in unrealized appreciation/(depreciation) on: | ||||||||||||||||||||
Investments | 115,943,066 | 18,130,449 | 121,038,088 | 3,043,558 | ||||||||||||||||
Forward foreign currency contracts | (3,326,462) | (713,141) | 7,134,205 | (28,483) | ||||||||||||||||
Translation of assets and liabilities dominated in foreign currencies | 282,735 | 9,005 | 1,672,621 | 11,411 | ||||||||||||||||
Net change | 112,899,339 | 17,426,313 | 129,844,914 | 3,026,486 | ||||||||||||||||
Net Realized and Unrealized Gain on Investments | 113,754,530 | 26,687,629 | 136,047,813 | 2,997,543 | ||||||||||||||||
Net Increase in Net Assets Resulting from Operations | $ | 149,202,950 | $ | 45,962,306 | $ | 178,507,971 | $ | 4,309,898 | ||||||||||||
See Notes to Financial Statements.
| ||
56 | www.shiplp.com | |
Table of Contents
| Stone Harbor Investment Funds | Statements of Changes in Net Assets | |
| Stone Harbor Emerging Markets Debt Fund | Stone Harbor High Yield Bond Fund | |||||||||||||||||||
For the Six Months Ended | For the Year Ended | For the Six Months Ended November 30, 2012 | For the Year Ended | |||||||||||||||||
OPERATIONS: | ||||||||||||||||||||
Net investment income | $ | 35,448,420 | $ | 57,940,014 | $ | 19,274,677 | $ | 36,881,426 | ||||||||||||
Net realized gain on investments, forward foreign currency contracts and foreign currency transactions | 855,191 | 12,428,756 | 9,261,316 | 405,445 | ||||||||||||||||
Net change in unrealized appreciation/(depreciation) on investments, forward foreign currency contracts and foreign currency translations | 112,899,339 | (24,488,836) | 17,426,313 | (30,819,198) | ||||||||||||||||
Net increase in net assets resulting from operations | 149,202,950 | 45,879,934 | 45,962,306 | 6,467,673 | ||||||||||||||||
DISTRIBUTIONS TO SHAREHOLDERS: | ||||||||||||||||||||
Institutional Class | ||||||||||||||||||||
From net investment income | (37,971,790) | (62,119,059) | (20,752,136) | (35,520,684) | ||||||||||||||||
From net realized gains | – | (9,021,936) | – | (14,866,777) | ||||||||||||||||
Net decrease in net assets from distributions to shareholders | (37,971,790) | (71,140,995) | (20,752,136) | (50,387,461) | ||||||||||||||||
CAPITAL SHARE TRANSACTIONS: | ||||||||||||||||||||
Institutional Class | ||||||||||||||||||||
Proceeds from sale of shares | 388,720,944 | 509,808,699 | 68,366,160 | 111,505,627 | ||||||||||||||||
Issued to shareholders in reinvestment of distributions | 36,124,425 | 67,065,948 | 18,607,730 | 48,229,973 | ||||||||||||||||
Cost of shares redeemed | (49,068,463) | (117,232,918) | (235,804,264) | (84,560,710) | ||||||||||||||||
Net increase/(decrease) in net assets from capital share transactions | 375,776,906 | 459,641,729 | (148,830,374) | 75,174,890 | ||||||||||||||||
Net Increase/(Decrease) in Net Assets | 487,008,066 | 434,380,668 | (123,620,204) | 31,255,102 | ||||||||||||||||
NET ASSETS: | ||||||||||||||||||||
Beginning of period | 1,183,728,337 | 749,347,669 | 519,680,359 | 488,425,257 | ||||||||||||||||
End of period | $ | 1,670,736,403 | $ | 1,183,728,337 | $ | 396,060,155 | $ | 519,680,359 | ||||||||||||
Includes undistributed/(overdistributed) net investment | $ | (1,439,010) | $ | 1,084,360 | $ | 222,577 | $ | 1,700,036 | ||||||||||||
OTHER INFORMATION: | ||||||||||||||||||||
Share Transactions: | ||||||||||||||||||||
Institutional Class | ||||||||||||||||||||
Beginning shares | 108,310,075 | 66,925,355 | 56,889,085 | 48,832,904 | ||||||||||||||||
Shares sold | 33,169,236 | 45,737,532 | 7,175,972 | 11,902,013 | ||||||||||||||||
Shares reinvested | 3,073,821 | 6,095,861 | 1,964,403 | 5,307,792 | ||||||||||||||||
Shares redeemed | (4,137,791) | (10,448,673) | (24,698,326) | (9,153,624) | ||||||||||||||||
Shares outstanding - end of period | 140,415,341 | 108,310,075 | 41,331,134 | 56,889,085 | ||||||||||||||||
See Notes to Financial Statements.
| ||
| Stone Harbor Investment Funds Semi-Annual Report | November 30, 2012 | 57 |
Table of Contents
| Stone Harbor Investment Funds | Statements of Changes in Net Assets | |
Stone Harbor Local Markets Fund | Stone Harbor Emerging Markets Corporate Debt Fund | |||||||||||||||||||
For the Six Months Ended November 30, 2012 | For the Year Ended May 31, 2012 | For the Six Months Ended | For the Year Ended | |||||||||||||||||
OPERATIONS: | ||||||||||||||||||||
Net investment income | $ | 42,460,158 | $ | 59,803,238 | $ | 1,312,355 | $ | 1,969,621 | ||||||||||||
Net realized gain/(loss) on investments, forward foreign currency contracts and foreign currency transactions | 6,202,899 | (31,033,518) | (28,943) | (332,762) | ||||||||||||||||
Net change in unrealized appreciation/(depreciation) on investments, forward foreign currency contracts and foreign currency translations | 129,844,914 | (102,407,376) | 3,026,486 | (2,939,347) | ||||||||||||||||
Net increase/(decrease) in net assets resulting from operations | 178,507,971 | (73,637,656) | 4,309,898 | (1,302,488) | ||||||||||||||||
DISTRIBUTIONS TO SHAREHOLDERS: | ||||||||||||||||||||
Institutional Class | ||||||||||||||||||||
From net investment income | (21,988,689) | (46,535,140) | (1,257,648) | (1,965,171) | ||||||||||||||||
From tax return of capital | – | (2,731,631) | – | – | ||||||||||||||||
Net decrease in net assets from distributions to shareholders | (21,988,689) | (49,266,771) | (1,257,648) | (1,965,171) | ||||||||||||||||
CAPITAL SHARE TRANSACTIONS: | ||||||||||||||||||||
Institutional Class | ||||||||||||||||||||
Proceeds from sale of shares | 454,648,985 | 1,147,925,382 | 29,400,000 | 35,932,000 | ||||||||||||||||
Issued to shareholders in reinvestment of distributions | 21,798,154 | 48,814,517 | 1,257,648 | 1,965,171 | ||||||||||||||||
Cost of shares redeemed | (48,151,519) | (116,133,532) | – | – | ||||||||||||||||
Net increase in net assets from capital share transactions | 428,295,620 | 1,080,606,367 | 30,657,648 | 37,897,171 | ||||||||||||||||
Net Increase in Net Assets | 584,814,902 | 957,701,940 | 33,709,898 | 34,629,512 | ||||||||||||||||
NET ASSETS: | ||||||||||||||||||||
Beginning of period | 1,563,495,089 | 605,793,149 | 34,629,512 | – | ||||||||||||||||
End of period | $ | 2,148,309,991 | $ | 1,563,495,089 | $ | 68,339,410 | $ | 34,629,512 | ||||||||||||
Includes undistributed/(overdistributed) net investment income of: | $ | 18,416,655 | $ | (2,054,814) | $ | 84,120 | $ | 29,413 | ||||||||||||
OTHER INFORMATION: | ||||||||||||||||||||
Share Transactions: | ||||||||||||||||||||
Institutional Class | ||||||||||||||||||||
Beginning shares | 154,809,668 | 54,032,190 | 3,896,019 | – | ||||||||||||||||
Shares sold | 42,215,683 | 106,956,969 | 3,177,226 | 3,676,780 | ||||||||||||||||
Shares reinvested | 1,999,032 | 4,632,478 | 134,708 | 219,239 | ||||||||||||||||
Shares redeemed | (4,390,060) | (10,811,969) | – | – | ||||||||||||||||
Shares outstanding - end of period | 194,634,323 | 154,809,668 | 7,207,953 | 3,896,019 | ||||||||||||||||
See Notes to Financial Statements.
| ||
58 | www.shiplp.com | |
Table of Contents
| Stone Harbor Emerging Markets Debt Fund | Financial Highlights | |
| For a share outstanding through the periods presented. |
| Institutional Class | For the Six Months Ended November 30, 2012 (Unaudited) | For the Year Ended | For the Year Ended May 31, 2011 | For the Year Ended May 31, 2010 | For the Year Ended May 31, 2009 | For the Period August 16, 2007 (Inception) to May 31, 2008 | ||||||||||||||||||||||||||||
Net asset value - beginning of period | $ | 10.93 | $ | 11.20 | $ | 10.48 | $ | 9.22 | $ | 10.34 | $ | 10.00 | ||||||||||||||||||||||
Income/(loss) from investment operations: |
| |||||||||||||||||||||||||||||||||
Net investment income | 0.29(1) | 0.65(1) | 0.67(1) | 0.75 | 0.59 | 0.46 | ||||||||||||||||||||||||||||
Net realized and unrealized gain/(loss) on investments | 0.98 | (0.15) | 1.00 | 1.44 | (1.18) | 0.58 | ||||||||||||||||||||||||||||
Total income/(loss) from investment operations | 1.27 | 0.50 | 1.67 | 2.19 | (0.59) | 1.04 | ||||||||||||||||||||||||||||
Less distributions to common shareholders: |
| |||||||||||||||||||||||||||||||||
From net investment income | (0.30) | (0.67) | (0.63) | (0.79) | (0.53) | (0.54) | ||||||||||||||||||||||||||||
From net realized gains | – | (0.10) | (0.32) | (0.14) | – | (0.16) | ||||||||||||||||||||||||||||
From tax return of capital | – | – | – | – | – | (0.00)(2) | ||||||||||||||||||||||||||||
Total distributions | (0.30) | (0.77) | (0.95) | (0.93) | (0.53) | (0.70) | ||||||||||||||||||||||||||||
Net Increase/(Decrease) in Net Asset Value | 0.97 | (0.27) | 0.72 | 1.26 | (1.12) | 0.34 | ||||||||||||||||||||||||||||
Net asset value - end of period | $ | 11.90 | $ | 10.93 | $ | 11.20 | $ | 10.48 | $ | 9.22 | $ | 10.34 | ||||||||||||||||||||||
Total Return(3)(4) | 11.67% | 4.61% | 16.30% | 24.25% | (5.10)% | 10.46% | ||||||||||||||||||||||||||||
Ratios/Supplemental Data: | ||||||||||||||||||||||||||||||||||
Net assets, end of period (in thousands) | $ | 1,670,736 | $ | 1,183,728 | $ | 749,348 | $ | 178,026 | $ | 91,753 | $ | 19,587 | ||||||||||||||||||||||
Ratio of expenses to average net assets without fee waivers/reimbursements/ repayment of previously waived fees | 0.69%(5) | 0.72% | 0.77% | 0.91% | 1.33% | 2.27%(5) | ||||||||||||||||||||||||||||
Ratio of expenses to average net assets with fee waivers/reimbursements/ repayment of previously waived fees | 0.69%(5) | 0.72% | 0.75% | 0.75% | 0.75% | 0.75%(5) | ||||||||||||||||||||||||||||
Ratio of net investment income to average net assets with fee waivers/reimbursements/repayment of previously waived fees | 4.97%(5) | 5.78% | 6.02% | 6.80% | 9.32% | 5.91%(5) | ||||||||||||||||||||||||||||
Portfolio turnover rate | 29% | 60% | 82% | 125% | 84% | 143% | ||||||||||||||||||||||||||||
| (1) | Calculated using average shares throughout the period. |
| (2) | Less than $(0.005) per share. |
| (3) | Total returns would have been lower had various fees and expenses not been waived and reimbursed during the period. The total returns in the table represent the rate that an investor would have earned (or lost) on an investment in a Fund (assuming reinvestment of all dividends and distributions). |
| (4) | Total returns for periods of less than one year are not annualized. |
| (5) | Annualized. |
See Notes to Financial Statements.
| ||
| Stone Harbor Investment Funds Semi-Annual Report | November 30, 2012 | 59 |
Table of Contents
| Stone Harbor High Yield Bond Fund | Financial Highlights | |
| For a share outstanding through the periods presented. |
| Institutional Class | For the Six Months Ended | For the Year Ended May 31, 2012 | For the Year Ended May 31, 2011 | For the Year Ended May 31, 2010 | For the Year Ended May 31, 2009 | For the Period May 31, 2008 | ||||||||||||||||||||||||||||
Net asset value - beginning of period | $ | 9.13 | $ | 10.00 | $ | 9.36 | $ | 8.39 | $ | 9.92 | $ | 10.00 | ||||||||||||||||||||||
Income/(loss) from investment operations: |
| |||||||||||||||||||||||||||||||||
Net investment income | 0.34(1) | 0.72(1) | 0.77(1) | 0.73 | 0.70 | 0.58 | ||||||||||||||||||||||||||||
Net realized and unrealized gain/(loss) on investment | 0.47 | (0.59) | 0.78 | 0.96 | (1.53) | (0.08) | ||||||||||||||||||||||||||||
Total income/(loss) from investment operations | 0.81 | 0.13 | 1.55 | 1.69 | (0.83) | 0.50 | ||||||||||||||||||||||||||||
Less distributions to common shareholders: |
| |||||||||||||||||||||||||||||||||
From net investment income | (0.36) | (0.70) | (0.76) | (0.72) | (0.70) | (0.57) | ||||||||||||||||||||||||||||
From net realized gains | – | (0.30) | (0.15) | – | – | (0.01) | ||||||||||||||||||||||||||||
From tax return of capital | – | – | – | – | – | (0.00)(2) | ||||||||||||||||||||||||||||
Total distributions | (0.36) | (1.00) | (0.91) | (0.72) | (0.70) | (0.58) | ||||||||||||||||||||||||||||
Net Increase/(Decrease) in Net Asset Value | 0.45 | (0.87) | 0.64 | 0.97 | (1.53) | (0.08) | ||||||||||||||||||||||||||||
Net asset value - end of period | $ | 9.58 | $ | 9.13 | $ | 10.00 | $ | 9.36 | $ | 8.39 | $ | 9.92 | ||||||||||||||||||||||
Total Return(3)(4) | 8.95% | 1.77% | 17.14% | 20.53% | (7.77)% | 5.09% | ||||||||||||||||||||||||||||
Ratios/Supplemental Data: | ||||||||||||||||||||||||||||||||||
Net assets, end of period (in thousands) | $ | 396,060 | $ | 519,680 | $ | 488,425 | $ | 407,964 | $ | 223,210 | $ | 106,912 | ||||||||||||||||||||||
Ratio of expenses to average net assets without fee waivers/reimbursements | 0.61%(5) | 0.62% | 0.65% | 0.67% | 0.88% | 1.21%(5) | ||||||||||||||||||||||||||||
Ratio of expenses to average net assets with fee waivers/reimbursements | 0.55%(5) | 0.55% | 0.55% | 0.55% | 0.55% | 0.55%(5) | ||||||||||||||||||||||||||||
Ratio of net investment income to average net assets with fee waivers/reimbursements | 7.13%(5) | 7.67% | 7.78% | 8.13% | 9.07% | 7.81%(5) | ||||||||||||||||||||||||||||
Portfolio turnover rate | 30% | 46% | 60% | 36% | 16% | 11% | ||||||||||||||||||||||||||||
| (1) | Calculated using average shares throughout the period. |
| (2) | Less than $(0.005) per share. |
| (3) | Total returns would have been lower had various fees and expenses not been waived and reimbursed during the period. The total returns in the table represent the rate that an investor would have earned (or lost) on an investment in a Fund (assuming reinvestment of all dividends and distributions). |
| (4) | Total returns for periods of less than one year are not annualized. |
| (5) | Annualized. |
See Notes to Financial Statements.
| ||
60 | www.shiplp.com | |
Table of Contents
| Stone Harbor Local Markets Fund | Financial Highlights | |
| For a share outstanding through the period presented. |
| Institutional Class | For the Six Months Ended | For the Year Ended May 31, 2012 | For the Period June 30, 2010 (Inception) to May 31, 2011 | ||||||||||||
Net asset value - beginning of period | $ | 10.10 | $ | 11.21 | $ | 10.00 | |||||||||
Income/(loss) from investment operations: | |||||||||||||||
Net investment income | 0.24(1) | 0.57(1) | 0.51(1) | ||||||||||||
Net realized and unrealized gain/(loss) on investments | 0.82 | (1.21) | 1.14 | ||||||||||||
Total income/(loss) from investment operations | 1.06 | (0.64) | 1.65 | ||||||||||||
Less distributions to common shareholders: | |||||||||||||||
From net investment income | (0.12) | (0.45) | (0.39) | ||||||||||||
From net realized gains | – | – | (0.05) | ||||||||||||
From tax return of capital | – | (0.02) | – | ||||||||||||
Total distributions | (0.12) | (0.47) | (0.44) | ||||||||||||
Net Increase/(Decrease) in Net Asset Value | 0.94 | (1.11) | 1.21 | ||||||||||||
Net asset value - end of period | $ | 11.04 | $ | 10.10 | $ | 11.21 | |||||||||
Total Return(2)(3) | 10.51% | (5.84)% | 16.82% | ||||||||||||
Ratios/Supplemental Data: | |||||||||||||||
Net assets, end of period (in thousands) | $ | 2,148,310 | $ | 1,563,495 | $ | 605,793 | |||||||||
Ratio of expenses to average net assets without fee waivers/reimbursements/repayment of previously waived fees | 0.85%(4) | 0.89% | 1.01%(4) | ||||||||||||
Ratio of expenses to average net assets with fee waivers/reimbursements/repayment of previously waived fees | 0.85%(4) | 0.89% | 1.00%(4) | ||||||||||||
Ratio of net investment income to average net assets with fee waivers/reimbursements/repayment of previously waived fees | 4.45%(4) | 5.35% | 5.13%(4) | ||||||||||||
Portfolio turnover rate | 78% | 161% | 102% | ||||||||||||
| (1) | Calculated using average shares throughout the period. |
| (2) | Total returns would have been lower had various fees and expenses not been waived and reimbursed during the period. The total returns in the table represent the rate that an investor would have earned (or lost) on an investment in a Fund (assuming reinvestment of all dividends and distributions). |
| (3) | Total returns for periods of less than one year are not annualized. |
| (4) | Annualized. |
See Notes to Financial Statements.
| ||
| Stone Harbor Investment Funds Semi-Annual Report | November 30, 2012 | 61 |
Table of Contents
Corporate Debt Fund | Financial Highlights | |
| For a share outstanding through the periods presented. | ||
| Institutional Class | For the Six Months Ended | For the Year Ended May 31, 2012 | ||||||||
Net asset value -beginning of period | $ | 8.89 | $ | 10.00 | ||||||
Income/(loss) from investment operations: | ||||||||||
Net investment income | 0.23(1) | 0.59(1) | ||||||||
Net realized and unrealized gain/(loss) on investments | 0.57 | (1.11) | ||||||||
Total income/(loss) from investment operations | 0.80 | (0.52) | ||||||||
Less distributions to common shareholders: | ||||||||||
From net investment income | (0.21) | (0.59) | ||||||||
Total distributions | (0.21) | (0.59) | ||||||||
Net Increase/(Decrease) in Net Asset Value | 0.59 | (1.11) | ||||||||
Net asset value - end of period | $ | 9.48 | $ | 8.89 | ||||||
Total Return(2)(3) | 9.05% | (5.10)% | ||||||||
Ratios/Supplemental Data: | ||||||||||
Net assets, end of period (in thousands) | $ | 68,339 | $ | 34,630 | ||||||
Ratio of expenses to average net assets without fee waivers/reimbursements | 1.20%(4) | 1.32% | ||||||||
Ratio of expenses to average net assets with fee waivers/reimbursements | 1.00%(4) | 1.00% | ||||||||
Ratio of net investment income to average net assets with fee waivers/reimbursements | 5.04%(4) | 6.41% | ||||||||
Portfolio turnover rate | 39% | 51% | ||||||||
| (1) | Calculated using average shares throughout the period. |
| (2) | Total returns would have been lower had various fees and expenses not been waived and reimbursed during the period. The total returns in the table represent the rate that an investor would have earned (or lost) on an investment in a Fund (assuming reinvestment of all dividends and distributions). |
| (3) | Total returns for periods of less than one year are not annualized. |
| (4) | Annualized. |
See Notes to Financial Statements.
| ||
62 | www.shiplp.com | |
Table of Contents
| Stone Harbor Investment Funds | Notes to Financial Statements | |
| November 30, 2012 (Unaudited) |
1. ORGANIZATION AND SIGNIFICANT ACCOUNTING POLICIES
Stone Harbor Investment Funds, which consists of Stone Harbor Emerging Markets Debt Fund, Stone Harbor High Yield Bond Fund, Stone Harbor Local Markets Fund and Stone Harbor Emerging Markets Corporate Debt Fund (each, a “Fund” and together, the “Funds”) is a Massachusetts business trust (the “Trust”), organized on February 20, 2007 and registered under the Investment Company Act of 1940, as amended (the “1940 Act”), as an open-end management investment company. The Stone Harbor Emerging Markets Corporate Debt Fund commenced operations on June 1, 2011. Each Fund is a non-diversified portfolio with an investment objective to maximize total return. Shares of each Fund are currently divided into two classes, designated Institutional Class Shares and Distributor Class Shares. As of the date of this report, there were no outstanding shares for the Distributor Class of each Fund. The Declaration of Trust permits the Trustees to create additional funds and share classes.
The following is a summary of significant accounting policies consistently followed by the Funds in the preparation of their financial statements. The policies are in conformity with accounting principles generally accepted in the United States of America (“GAAP”). The preparation of the financial statements in accordance with GAAP requires management to make estimates and assumptions that affect the reported amounts of assets and liabilities at the date of the financial statements and the reported amounts of income and expenses during the reporting period. Actual results could differ from those estimates.
Investment Valuation: Debt securities, including bank loans and linked notes, are generally valued at the mean between the bid and asked prices provided by independent pricing services or brokers that are based on transactions in debt obligations, quotations from dealers, market transactions in comparable securities and various other relationships between securities. Equity securities for which market quotations are available are generally valued at the last sale price or official closing price on the primary market or exchange on which they trade. Publicly traded foreign government debt securities are typically traded internationally in the over-the-counter market, and are valued at the mean between the bid and asked prices as of the close of business of that market. When prices are not readily available, or are determined not to reflect fair value, such as when the value of a security has been significantly affected by events after the close of the exchange or market on which the security is principally traded, but before the Funds calculate their net asset value, the Funds may value these investments at fair value as determined in accordance with the procedures approved by the Funds’ Board of Trustees. Short-term obligations with maturities of 60 days or less are valued at amortized cost, which approximates market value. Money market mutual funds are valued at their net asset value.
A three-tier hierarchy has been established to measure fair value based on the extent of use of “observable inputs” as compared to “unobservable inputs” for disclosure purposes and requires additional disclosures about these valuations measurements. Inputs refer broadly to the assumptions that market participants would use in pricing a security. Observable inputs are inputs that reflect the assumptions market participants would use in pricing the security developed based on market data obtained from sources independent of the reporting entity. Unobservable inputs are inputs that reflect the reporting entity’s own assumptions about the assumptions market participants would use in pricing the security developed based on the best information available in the circumstances.
The three-tier hierarchy is summarized as follows:
Level 1— | Unadjusted quoted prices in active markets for identical assets or liabilities that the Fund has the ability to access. | |
Level 2— | Observable inputs other than quoted prices included in level 1 that are observable for the asset or liability, either directly or indirectly. These inputs may include quoted prices for the identical instrument on an inactive market, prices for similar instruments, interest rates, prepayment speeds, credit risk, yield curve, rates, and similar data. | |
Level 3— | Unobservable inputs for the asset or liability, to the extent relevant observable inputs are not available, representing the Fund’s own assumptions about the assumptions a market participant would use in valuing the asset or liability, and would be based on the best information available. | |
| Stone Harbor Investment Funds Semi-Annual Report | November 30, 2012 | 63 |
Table of Contents
| Stone Harbor Investment funds | Notes to Financial Statements | |
| November 30, 2012 (Unaudited) |
The following is a summary of each Fund’s investments and financial instruments based on the three-tier hierarchy as of November 30, 2012:
| Investments in Securities at Value* | Level 1 - Quoted and Unadjusted Prices | Level 2 - Other Significant Observable Inputs | Level 3 - Significant Unobservable Inputs | Total | ||||||||||||||||
Stone Harbor Emerging Markets Debt Fund |
| |||||||||||||||||||
Sovereign Debt Obligations | $ | – | $ | 1,055,731,890 | $ | – | $ | 1,055,731,890 | ||||||||||||
Bank Loans | ||||||||||||||||||||
Brazil | – | – | 691,184 | 691,184 | ||||||||||||||||
Indonesia | – | 1,306,249 | 488,046 | 1,794,295 | ||||||||||||||||
Corporate Bonds | ||||||||||||||||||||
Dominican Republic | – | – | 477,336 | 477,336 | ||||||||||||||||
Other | – | 431,877,372 | – | 431,877,372 | ||||||||||||||||
Participation Notes | – | 11,015,294 | – | 11,015,294 | ||||||||||||||||
Credit Linked Notes | ||||||||||||||||||||
Argentina | – | – | 2,803,950 | 2,803,950 | ||||||||||||||||
Iraq | – | 8,663,189 | 3,979,411 | 12,642,600 | ||||||||||||||||
Other | – | 27,404,258 | – | 27,404,258 | ||||||||||||||||
Short Term Investments | 115,163,413 | – | – | 115,163,413 | ||||||||||||||||
Total | $ | 115,163,413 | $ | 1,535,998,252 | $ | 8,439,927 | $ | 1,659,601,592 | ||||||||||||
| ||||||||||||||||||||
Other Financial Instruments** | ||||||||||||||||||||
Assets | ||||||||||||||||||||
Forward Foreign Currency Contracts | $ | – | $ | 1,097,934 | $ | – | $ | 1,097,934 | ||||||||||||
Liabilities | ||||||||||||||||||||
Forward Foreign Currency Contracts | – | (1,886,143) | – | (1,886,143) | ||||||||||||||||
Total | $ | – | $ | (788,209) | $ | – | $ | (788,209) | ||||||||||||
| Investments in Securities at Value* | Level 1 - Quoted and Unadjusted Prices | Level 2 - Other Significant Observable Inputs | Level 3 - Significant Unobservable Inputs | Total | ||||||||||||||||
Stone Harbor High Yield Bond Fund |
| |||||||||||||||||||
Corporate Bonds | $ | – | $ | 374,138,021 | $ | – | $ | 374,138,021 | ||||||||||||
Convertible Corporate Bonds | – | 3,374,880 | – | 3,374,880 | ||||||||||||||||
Bank Loans | – | 11,603,959 | – | 11,603,959 | ||||||||||||||||
Common Stocks | – | 19 | – | 19 | ||||||||||||||||
Preferred Stocks | 294,270 | – | – | 294,270 | ||||||||||||||||
Warrants | 31,498 | – | – | 31,498 | ||||||||||||||||
Short Term Investments | 1,868,368 | – | – | 1,868,368 | ||||||||||||||||
Total | $ | 2,194,136 | $ | 389,116,879 | $ | – | $ | 391,311,015 | ||||||||||||
| ||||||||||||||||||||
Other Financial Instruments** | ||||||||||||||||||||
Assets | ||||||||||||||||||||
Forward Foreign Currency Contracts | $ | – | $ | 18,594 | $ | – | $ | 18,594 | ||||||||||||
Liabilities | ||||||||||||||||||||
Forward Foreign Currency Contracts | – | (426,287) | – | (426,287) | ||||||||||||||||
Total | $ | – | $ | (407,693) | $ | – | $ | (407,693) | ||||||||||||
64 | www.shiplp.com |
Table of Contents
| Stone Harbor Investment Funds | Notes to Financial Statements | |
| November 30, 2012 (Unaudited) |
| Investments in Securities at Value* | Level 1 - Quoted and Unadjusted Prices | Level 2 - Other Significant Observable Inputs | Level 3 - Significant Unobservable Inputs | Total | ||||||||||||||||
Stone Harbor Local Markets Fund | ||||||||||||||||||||
Sovereign Debt Obligations | $ | – | $ | 1,136,448,661 | $ | – | $ | 1,136,448,661 | ||||||||||||
Corporate Bonds | – | 75,961,678 | – | 75,961,678 | ||||||||||||||||
Credit Linked Notes | – | 360,490,853 | – | 360,490,853 | ||||||||||||||||
Short Term Investments | 223,610,701 | – | – | 223,610,701 | ||||||||||||||||
Total | $ | 223,610,701 | $ | 1,572,901,192 | $ | – | $ | 1,796,511,893 | ||||||||||||
| ||||||||||||||||||||
Other Financial Instruments** | ||||||||||||||||||||
Assets | ||||||||||||||||||||
Forward Foreign Currency Contracts | $ | – | $ | 4,587,283 | $ | – | $ | 4,587,283 | ||||||||||||
Liabilities | ||||||||||||||||||||
Forward Foreign Currency Contracts | – | (6,945,681) | – | (6,945,681) | ||||||||||||||||
Total | $ | – | $ | (2,358,398) | $ | – | $ | (2,358,398) | ||||||||||||
| Investments in Securities at Value* | Level 1 - Quoted and Unadjusted Prices | Level 2 - Other Significant Observable Inputs | Level 3 - Significant Unobservable Inputs | Total | ||||||||||||||||
Stone Harbor Emerging Markets Corporate Debt Fund |
| |||||||||||||||||||
Corporate Bonds | ||||||||||||||||||||
Dominican Republic | $ | – | $ | – | $ | 201,415 | $ | 201,415 | ||||||||||||
Other | – | 66,068,790 | – | 66,068,790 | ||||||||||||||||
Credit Linked Notes | – | – | 542,500 | 542,500 | ||||||||||||||||
Short Term Investments | 1,730,436 | – | – | 1,730,436 | ||||||||||||||||
Total | $ | 1,730,436 | $ | 66,068,790 | $ | 743,915 | $ | 68,543,141 | ||||||||||||
| Investments in Securities at Value* | Level 1 - Quoted and Unadjusted Prices | Level 2 - Other Significant Observable Inputs | Level 3 - Significant Unobservable Inputs | Total | ||||||||||||||||
Other Financial Instruments** | ||||||||||||||||||||
Assets | ||||||||||||||||||||
Forward Foreign Currency Contracts | $ | – | $ | 2,641 | $ | – | $ | 2,641 | ||||||||||||
Liabilities | ||||||||||||||||||||
Forward Foreign Currency Contracts | – | (7,988) | – | (7,988) | ||||||||||||||||
Total | $ | – | $ | (5,347) | $ | – | $ | (5,347) | ||||||||||||
| * | For detailed Industry/Country descriptions, see accompanying Statement of Investments. |
| ** | Other financial instruments are derivative instruments not reflected in the Statement of Investments. The derivatives shown in this table are reported at their unrealized appreciation/(depreciation) at measurement date, which represents the change in the contract’s value from trade date. |
There were no transfers between Levels 1 and 2 during the period. It is the Funds’ policy to recognize transfers into and out of all levels at the end of the reporting period.
| Stone Harbor Investment Funds Semi-Annual Report | November 30, 2012 | 65 |
Table of Contents
| Stone Harbor Investment Funds | Notes to Financial Statements | |
| November 30, 2012 (Unaudited) |
The following is a reconciliation of assets in which significant unobservable inputs (Level 3) were used in determining fair value:
Investments in Securities | Balance as of May 31, 2012 | Accrued discount/ premium | Realized gain/(loss)* | Change in unrealized depreciation* | Transfer into Level 3 | Transfer out of Level 3 | Balance as of November 30, 2012 | Net change in Operations attributable to Level 3 investments held at November 30, 2012 | ||||||||||||||||||||||||||||||||
| Stone Harbor Emerging Markets Debt Fund | ||||||||||||||||||||||||||||||||||||||||
Bank Loans | $ | 934,554 | $ | – | $ | – | $ | (446,508) | $ | 691,184 | $ | – | $ | 1,179,230 | $ | (426,206) | ||||||||||||||||||||||||
Corporate Bonds | 477,336 | 118,264 | – | (118,264) | – | – | 477,336 | (118,266) | ||||||||||||||||||||||||||||||||
Credit Linked Notes | – | – | – | – | 6,783,361 | – | 6,783,361 | (324,065) | ||||||||||||||||||||||||||||||||
TOTAL | $ | 1,411,890 | $ | 118,264 | $ | – | $ | (564,772) | $ | 7,474,545 | $ | – | $ | 8,439,927 | $ | (868,537) | ||||||||||||||||||||||||
Investments in Securities | Balance as of May 31, 2012 | Accrued discount/ premium | Realized gain/(loss)* | Change in unrealized depreciation* | Transfer into Level 3 | Transfer out of Level 3 | Balance as of November 30, 2012 | Net change in Level 3 investments held at November 30, 2012 | ||||||||||||||||||||||||||||||||
| Stone Harbor Emerging Markets Corporate Debt Fund | ||||||||||||||||||||||||||||||||||||||||
Corporate Bonds | $ | 201,415 | $ | 47,499 | $ | – | $ | (47,499) | $ | – | $ | – | $ | 201,415 | $ | (47,500) | ||||||||||||||||||||||||
Credit Linked Notes | – | – | – | – | 542,500 | – | 542,500 | (73,301) | ||||||||||||||||||||||||||||||||
TOTAL | $ | 201,415 | $ | 47,499 | $ | – | $ | (47,499) | $ | 542,500 | $ | – | $ | 743,915 | $ | (120,801) | ||||||||||||||||||||||||
| * | Realized gain/(loss) and change in unrealized depreciation are included in the related amounts on the investment in the Statements of Operations. |
The inputs or methodology used for valuing securities are not necessarily an indication of the risk associated with investing in those securities.
In the event a board approved independent pricing service is unable to provide an evaluated price for a security or Stone Harbor Investment Partners LP (the “advisor”) believes the price provided is not reliable, securities of the Funds may be valued at fair value as described above. In these instances the advisor may seek to find an alternative independent source, such as a broker/dealer to provide a price quote, or by using evaluated pricing models similar to the techniques and models used by the independent pricing service. These fair value measurement techniques may utilize unobservable inputs (Level 3).
On at least a quarterly basis, the advisor presents the factors considered in determining the fair value measurements and presents that information to the Audit Committee which meets at least quarterly. The Audit Committee then will provide a recommendation to the Board for approval of the fair value measurements.
The table below provides additional information about the Level 3 Fair Value Measurements as of November 30, 2012:
Fair Value at November 30, 2012 | Valuation Methodology | Unobservable Inputs | Range of Inputs | |||||||||||||||||
Stone Harbor Emerging Markets Debt Fund | ||||||||||||||||||||
Bank Loans | $ | 1,179,230 | Broker Quote | Broker Quote | N/A | |||||||||||||||
Corporate Bonds | 477,336 | Broker Quote | Broker Quote | N/A | ||||||||||||||||
Credit Linked Notes | 6,783,361 | Broker Quote | Broker Quote | N/A | ||||||||||||||||
TOTAL | $ | 8,439,927 | ||||||||||||||||||
66 | www.shiplp.com |
Table of Contents
| Stone Harbor Investment Funds | Notes to Financial Statements | |
| November 30, 2012 (Unaudited) |
| Fair Value at November 30, 2012 | Valuation Methodology | Unobservable Inputs | Range of Inputs | |||||||
Stone Harbor Emerging Markets Corporate Debt Fund | ||||||||||
Corporate Bonds | $ | 201,415 | Broker Quote | Broker Quote | N/A | |||||
Credit Linked Notes | 542,500 | Broker Quote | Broker Quote | N/A | ||||||
TOTAL | $ | 743,915 | ||||||||
Security Transactions and Investment Income: Security transactions are accounted for on a trade date basis. Interest income, adjusted for amortization of premium and accretion of discount, is recorded on the accrual basis. Dividend income is recorded on the ex-dividend date. Foreign dividend income is recorded on the ex-dividend date or as soon as practical after the Funds determine the existence of a dividend declaration after exercising reasonable due diligence. If applicable, any foreign capital gains taxes are accrued, net of unrealized gains, and are payable upon the sale of such investments. The cost of investments sold is determined by use of the specific identification method. To the extent any issuer defaults on an expected interest payment, the Funds’ policy is to generally halt any additional interest income accruals and consider the realizability of interest accrued up to the date of default.
Foreign Currency Translation: The books and records of the Funds are maintained in U.S. dollars. Investment valuations and other assets and liabilities initially expressed in foreign currencies are converted each business day into U.S. dollars based upon current exchange rates. Prevailing foreign exchange rates may generally be obtained at the close of the NYSE (normally, 4:00 p.m. Eastern time). The portion of realized and unrealized gains or losses on investments due to fluctuations in foreign currency exchange rates is not separately disclosed and is included in realized and unrealized gains or losses on investments, when applicable.
Foreign Securities: The Funds may directly purchase securities of foreign issuers. Investing in securities of foreign issuers involves special risks not typically associated with investing in securities of U.S. issuers. The risks include possible revaluation of currencies, the ability to repatriate funds, less complete financial information about companies and possible future adverse political and economic developments. Moreover, securities of many foreign issuers and their markets may be less liquid and their prices more volatile than those of securities of comparable U.S. issuers.
Credit Linked Notes: The Funds may invest in credit linked notes to obtain economic exposure to high yield, emerging markets or other securities. Investments in a credit linked note typically provide the holder with a return based on the return of an underlying reference instrument, such as an emerging market bond. Like an investment in a bond, investments in credit-linked securities represent the right to receive periodic income payments (in the form of distributions) and payment of principal at the end of the term of the security. In addition to the risks associated with the underlying reference instrument, an investment in a credit linked note is also subject to the risk that the counterparty will be unwilling or unable to meet its obligations under the note.
Loan Participations and Assignments: The Funds may invest in loans arranged through private negotiation between one or more financial institutions. The Funds’ investment in any such loan may be in the form of a participation in or an assignment of the loan. In connection with purchasing participations, the Funds generally will have no right to enforce compliance by the borrower with the terms of the loan agreement relating to the loan, nor any rights of set-off against the borrower and the Funds may not benefit directly from any collateral supporting the loan in which they have purchased the participation.
The Funds assume the credit risk of the borrower, the lender that is selling the participation and any other persons interpositioned between the Funds and the borrower. In the event of the insolvency of the lender selling the participation, the Funds may be treated as a general creditor of the lender and may not benefit from any set-off between the lender and the borrower.
Credit and Market Risk: The Funds invest in high yield and emerging market instruments that are subject to certain credit and market risks. The yields of high yield and emerging market debt obligations reflect, among other things, perceived credit and market risks. The Funds’ investment in securities rated below investment grade typically involves risks not associated with higher rated securities including, among others, greater risk related to timely and ultimate payment of interest and principal, greater market price volatility and less liquid secondary market trading. The consequences of political, social, economic or diplomatic changes may have disruptive effects on the market prices of investments held by the Funds. The Funds’ investment in non-U.S. dollar denominated securities may also result in foreign currency losses caused by devaluations and exchange rate fluctuations. Investments in derivatives are also subject to credit and market risks.
Distributions to Shareholders: Dividends and distributions to shareholders, which are determined in accordance with income tax regulations, are recorded on the ex-date. Income distributions, if any are generally declared and paid on a quarterly basis. Capital gain distributions, if any, are declared and paid at least annually.
Expenses: Direct expenses are charged to the Funds; general expenses of the Trust are allocated to the Funds based on each Fund’s relative net assets.
| Stone Harbor Investment Funds Semi-Annual Report | November 30, 2012 | 67 |
Table of Contents
| Stone Harbor Investment Funds | Notes to Financial Statements | |
| November 30, 2012 (Unaudited) |
Federal and Other Taxes: No provision for income taxes is included in the accompanying financial statements, as the Funds intend to distribute to shareholders all taxable investment income and realized gains and otherwise comply with Subchapter M of the Internal Revenue Code of 1986, as amended, applicable to regulated investment companies.
The Funds evaluate tax positions taken (or expected to be taken) in the course of preparing the Funds’ tax returns to determine whether these positions meet a “more-likely-than-not” standard that, based on the technical merits, have a more than fifty percent likelihood of being sustained by a taxing authority upon examination. A tax position that meets the “more-likely-than-not” recognition threshold is measured to determine the amount of benefit to recognize in the financial statements.
Management of the Funds analyzes all open tax years, as defined by the Statute of Limitations, for all major jurisdictions, including federal tax authorities and certain state tax authorities. As of and during the fiscal year ended May 31, 2012, the Funds did not have a liability for any unrecognized tax benefits. The Funds’ federal and state income and federal excise tax returns for all tax years since inception are subject to examination by the Internal Revenue Service and state departments of revenue.
2. DERIVATIVE INSTRUMENTS
Risk Exposure and the Use of Derivative Instruments: The Funds’ investment objectives not only permit the Funds to purchase investment securities, they also allow the Funds to enter in various types of derivatives contracts. In doing so, the Funds employ strategies in differing combinations to permit them to increase, decrease, or change the level or types of exposure to market factors. Central to those strategies are features inherent to derivatives that may make them more attractive for this purpose than equity or debt securities; they require little or no initial cash investment, they can focus exposure on only certain selected risk factors, and they may not require the ultimate receipt or delivery of the underlying security (or securities) to the contract. This may allow the Funds to pursue their objectives more quickly and efficiently than if they were to make direct purchases or sales of securities capable of affecting a similar response to market factors.
Market Risk Factors. In pursuit of their investment objectives, the Funds may seek to use derivatives to increase or decrease their exposure to the following market risk factors, among others:
Interest Rate Risk. Interest rate risk refers to the fluctuations in value of fixed-income securities resulting from the inverse relationship between price and yield. For example, an increase in general interest rates will tend to reduce the market value of already issued fixed-income investments, and a decline in general interest rates will tend to increase their value. In addition, debt securities with longer maturities, which tend to have higher yields, are subject to potentially greater fluctuations in value from changes in interest rates than obligations with shorter maturities.
Credit Risk. Credit risk relates to the ability of the issuer to meet interest and principal payments, or both, as they come due. In general, lower-grade, higher-yield bonds are subject to credit risk to a greater extent than lower-yield, higher-quality bonds.
Foreign Exchange Rate Risk. Foreign exchange risk relates to the change in the U.S. dollar value of a security held that is denominated in a foreign currency. The U.S. dollar value of a foreign currency denominated security will decrease as the dollar appreciates against the currency, while the U.S. dollar value will increase as the dollar depreciates against the currency.
Equity Risk. Equity risk relates to the change in value of equity securities as they relate to increases or decreases in the general market.
The Funds’ use of derivatives can result in losses due to unanticipated changes in these risk factors and the overall market. In instances where the Funds are using derivatives to decrease, or hedge, exposures to market risk factors for securities held by the Funds, there are also risks that those derivatives may not perform as expected resulting in losses for the combined or hedged positions.
Derivatives may have little or no initial cash investment relative to their market value exposure and therefore can produce significant gains or losses in excess of their cost. This use of embedded leverage allows the Fund to increase its market value exposure relative to it net assets and can substantially increase the volatility of the Funds’ performance.
Additional associated risks from investing in derivatives also exist and potentially could have significant effects on the valuation of the derivative and the Funds. Typically, the associated risks are not the risks that the Funds are attempting to increase or decrease exposure to, per their investment objectives, but are the additional risks from investing in derivatives.
Examples of these associated risks are liquidity risk, which is the risk that the Funds will not be able to sell or close out the derivative in a timely manner, and counterparty credit risk, which is the risk that the counterparty will not fulfill its obligation to the Funds. Associated risks can be different for each type of derivative and are discussed by each derivative type bellow in the notes that follow.
68 | www.shiplp.com |
Table of Contents
| Stone Harbor Investment Funds | Notes to Financial Statements | |
| November 30, 2012 (Unaudited) |
Forward Foreign Currency Contracts. The Funds may engage in currency transactions with counterparties to hedge the value of portfolio securities denominated in particular currencies against fluctuations in relative value, to gain or reduce exposure to certain currencies, or to generate income or gains. A forward foreign currency contract is an agreement between two parties to buy and sell a currency at a set price on a future date. The contract is marked-to-market daily and the change in value is recorded by the Funds as an unrealized gain or loss. When a forward foreign currency contract is extinguished, through either delivery or offset by entering into another forward foreign currency contract, the Funds record a realized gain or loss equal to the difference between the value of the contract at the time it was opened and the value of the contract at the time it was extinguished.
Forward foreign currency contracts involve elements of market risk in excess of the amounts reflected in the Statements of Assets and Liabilities. The Funds bear the risk of an unfavorable change in the foreign exchange rate underlying the forward foreign currency contract. Risks may also arise upon entering into these contracts from the potential inability of the counterparties to meet the terms of their contracts.
The tables below are a summary of the fair valuations of derivative instruments categorized by risk exposure.
Fair values of derivative instruments on the Statements of Assets and Liabilities as of November 30, 2012:
| Foreign Exchange Contracts | ||||||||
Stone Harbor Emerging Markets Debt Fund | ||||||||
Assets: | ||||||||
Unrealized appreciation on forward foreign currency contracts | $ | 1,097,934 | ||||||
Liabilities: | ||||||||
Unrealized depreciation on forward foreign currency contracts | $ | (1,886,143) | ||||||
Stone Harbor High Yield Bond Fund | ||||||||
Assets: | ||||||||
Unrealized appreciation on forward foreign currency contracts | $ | 18,594 | ||||||
Liabilities: | ||||||||
Unrealized depreciation on forward foreign currency contracts | $ | (426,287) | ||||||
Stone Harbor Local Markets Fund | ||||||||
Assets: | ||||||||
Unrealized appreciation on forward foreign currency contracts | $ | 4,587,283 | ||||||
Liabilities: | ||||||||
Unrealized depreciation on forward foreign currency contracts | $ | (6,945,681) | ||||||
Stone Harbor Emerging Markets Corporate Debt Fund | ||||||||
Assets: | ||||||||
Unrealized appreciation on forward foreign currency contracts | $ | 2,641 | ||||||
Liabilities: | ||||||||
Unrealized depreciation on forward foreign currency contracts | $ | (7,988) | ||||||
The number of forward foreign currency contracts held at November 30, 2012 is representative of activity during the six months ended November 30, 2012.
| Stone Harbor Investment Funds Semi-Annual Report | November 30, 2012 | 69 |
Table of Contents
| Stone Harbor Investment Funds | Notes to Financial Statements | |
| November 30, 2012 (Unaudited) |
The effect of derivative instruments on the Statements of Operations for the six months ended November 30, 2012:
| Foreign Exchange Contracts | ||||||||
Stone Harbor Emerging Markets Debt Fund | ||||||||
Net Realized Gain on: | ||||||||
Forward foreign currency contracts | $ | 1,025,375 | ||||||
Change in Unrealized Depreciation on: | ||||||||
Forward foreign currency contracts | $ | (3,326,462) | ||||||
Stone Harbor High Yield Bond Fund | ||||||||
Net Realized Gain on: | ||||||||
Forward foreign currency contracts | $ | 156,267 | ||||||
Change in Unrealized Depreciation on: | ||||||||
Forward foreign currency contracts | $ | (713,141) | ||||||
Stone Harbor Local Markets Fund | ||||||||
Net Realized Loss on: | ||||||||
Forward foreign currency contracts | $ | (1,608,383) | ||||||
Change in Unrealized Appreciation on: | ||||||||
Forward foreign currency contracts | $ | 7,134,205 | ||||||
Stone Harbor Emerging Markets Corporate Debt Fund | ||||||||
Net Realized Loss on: | ||||||||
Forward foreign currency contracts | $ | (12,433) | ||||||
Change in Unrealized Depreciation on: | ||||||||
Forward foreign currency contracts | $ | (28,483) | ||||||
3. TAX BASIS INFORMATION
Tax Basis of Distributions to Shareholders: Net investment income/(loss) and net realized gain/(loss) may differ for financial statement and tax purposes. The character of distributions made during the year from net investment income or net realized gains may differ from its ultimate characterization for federal income tax purposes. Also, due to the timing of dividend distributions, the fiscal year in which amounts are distributed may differ from the fiscal year in which the income or realized gain was recorded by a Fund.
The tax character of the distributions paid by the Funds during the year ended May 31, 2012, was as follows:
| Stone Harbor Emerging Markets Debt Fund | ||||||||
For the Year Ended May 31, 2012 | For the Year Ended May 31, 2011 | |||||||
Ordinary Income | $ 69,336,608 | $ 30,268,192 | ||||||
Long-Term Capital Gain | 1,804,387 | 3,751,322 | ||||||
Total | $ 71,140,995 | $ 34,019,514 | ||||||
| Stone Harbor High Yield Bond Fund | ||||||||
For the Year Ended May 31, 2012 | For the Year Ended May 31, 2011 | |||||||
Ordinary Income | $ 38,131,521 | $ 37,432,474 | ||||||
Long-Term Capital Gain | 12,255,940 | 3,833,489 | ||||||
Total | $ 50,387,461 | $ 41,265,963 | ||||||
| Stone Harbor Local Markets Fund | ||||||||
For the Year Ended May 31, 2012 | For the Period June 30, 2010 (Inception) to May 31, 2011 | |||||||
Ordinary Income | $ 44,750,817 | $ 10,697,812 | ||||||
Long-Term Capital Gain | 1,784,323 | – | ||||||
Tax Return of Capital | 2,731,631 | – | ||||||
Total | $ 49,266,771 | $ 10,697,812 | ||||||
70 | www.shiplp.com |
Table of Contents
| Stone Harbor Investment Funds | Notes to Financial Statements | |
| November 30, 2012 (Unaudited) |
| Stone Harbor Emerging Markets Corporate Debt Fund | ||||
For the Year Ended May 31, 2012 | ||||
Ordinary Income | $ 1,965,171 | |||
Total | $ 1,965,171 | |||
Capital Losses: As of May 31, 2012 the following Funds had capital loss carryforwards which may reduce the Funds’ taxable income arising from future net realized gains on investments, if any, to the extent permitted by the Code and thus may reduce the amount of the distributions to shareholders which would otherwise be necessary to relieve the Funds of any liability for federal tax pursuant to the Code.
Capital losses deferred to next tax year were as follows:
| Fund | Short-Term | |||
Stone Harbor Emerging Markets Corporate Debt Fund | $ | 173,100 | ||
Under the recently enacted Regulated Investment Company Modernization Act of 2010, capital losses incurred by each Fund after January 1, 2011 will not be subject to expiration.
The following Funds elect to defer to the period ending May 31, 2013 the following losses recognized during the period November 1, 2011 through May 31, 2012:
| Capital | ||||
Stone Harbor High Yield Bond Fund | $ | 3,386,948 | ||
Stone Harbor Emerging Markets Corporate Debt Fund | 184,056 | |||
The following Fund elects to defer to the period ending May 31, 2013, late year ordinary losses in the amount of:
| Fund | ||||
Stone Harbor Local Markets Fund | $ | 10,822,361 | ||
Unrealized Appreciation and Depreciation on Investments: At November 30, 2012 the aggregate gross unrealized appreciation and depreciation of investments for federal income purposes were as follows:
| Stone Harbor Emerging Markets Debt Fund | ||||
Gross appreciation on investments (excess of value over tax cost) | $ | 128,462,727 | ||
Gross depreciation on investments (excess of tax cost over value) | (16,409,745) | |||
Net unrealized appreciation | 112,052,982 | |||
Cost of investments for income tax purposes | $ | 1,547,548,610 | ||
Stone Harbor High Yield Bond Fund | ||||
Gross appreciation on investments (excess of value over tax cost) | $ | 23,712,418 | ||
Gross depreciation on investments (excess of tax cost over value) | (8,282,304) | |||
Net unrealized appreciation | 15,430,114 | |||
Cost of investments for income tax purposes | $ | 375,880,901 | ||
Stone Harbor Local Markets Fund | ||||
Gross appreciation on investments (excess of value over tax cost) | $ | 63,479,129 | ||
Gross depreciation on investments (excess of tax cost over value) | (24,690,623) | |||
Net unrealized appreciation | 38,788,506 | |||
Cost of investments for income tax purposes | $ | 1,757,723,387 | ||
| Stone Harbor Investment Funds Semi-Annual Report | November 30, 2012 | 71 |
Table of Contents
| Stone Harbor Investment Funds | Notes to Financial Statements | |
| November 30, 2012 (Unaudited) |
| Stone Harbor Emerging Markets Corporate Debt Fund | ||||
Gross appreciation on investments (excess of value over tax cost) | $ | 2,299,723 | ||
Gross depreciation on investments (excess of tax cost over value) | (2,246,027) | |||
Net unrealized appreciation | 53,696 | |||
Cost of investments for income tax purposes | $ | 68,489,445 | ||
4. ADVISORY FEES
Stone Harbor Investment Partners LP is the Trust’s investment adviser. Under the investment advisory agreement the Trust pays an investment advisory fee calculated daily and paid monthly of 0.60%, 0.50%, 0.75% and 0.85% of the average daily net assets for Stone Harbor Emerging Markets Debt Fund, Stone Harbor High Yield Bond Fund, Stone Harbor Local Markets Fund, and Stone Harbor Emerging Markets Corporate Debt Fund, respectively.
The Adviser has contractually agreed to waive fees and reimburse expenses with respect to each of the Funds so that the Net Annual Operating Expenses (exclusive of acquired Fund fees and expenses, brokerage expenses, interest expense, taxes and extraordinary expenses) of the Stone Harbor Emerging Markets Debt Fund Institutional Class, Stone Harbor High Yield Bond Fund Institutional Class, Stone Harbor Local Markets Fund Institutional Class and Stone Harbor Emerging Markets Corporate Debt Fund Institutional Class will not exceed 0.75%, 0.55%, 1.00% and 1.00%, respectively. This undertaking is in effect through September 30, 2013 and is reevaluated on an annual basis.
The Adviser will be permitted to recover, on a class by class basis, expenses it has borne through the undertakings described above to the extent that a Fund’s expenses in later periods fall below the annual rates set forth in the relevant undertaking. A Fund will not be obligated to pay any such deferred fees and expenses more than three years after the end of the fiscal year in which the fee and expense was deferred. Prior to 2011, the recovery period was limited to one year for the Stone Harbor Emerging Markets Debt Fund and Stone Harbor High Yield Bond Fund and as such, amounts waived and reimbursed through 2010 are not eligible to be recovered. At May 31, 2012, deferred fees and expenses that were eligible to be recovered by the Adviser were as follows:
| Expires 2015 | Expires 2016 | Total | ||||||||||||||||||||||
Stone Harbor High Yield Bond Fund | $ | 324,939 | $ | 150,997 | $ | 475,936 | ||||||||||||||||||
Stone Harbor Emerging Markets Corporate Debt Fund | 97,840 | 52,072 | 149,912 | |||||||||||||||||||||
The Stone Harbor Emerging Markets Debt Fund and Stone Harbor Local Markets Fund did not have any recoverable amounts outstanding as of November 30, 2012.
5. INVESTMENTS
During the six months ended November 30, 2012 the aggregate cost of purchases and proceeds from sales of investments (excluding short-term investments) were as follows:
| Purchases of investments | Sales of investments | |||||||||||||||
Stone Harbor Emerging Markets Debt Fund | $ | 713,874,281 | $ | 379,627,116 | ||||||||||||
Stone Harbor High Yield Bond Fund | 148,202,730 | 296,594,261 | ||||||||||||||
Stone Harbor Local Markets Fund | 1,547,275,261 | 1,226,823,896 | ||||||||||||||
Stone Harbor Emerging Markets Corporate Debt Fund | 49,378,300 | 19,305,152 | ||||||||||||||
6. APPLICATION OF RECENT ACCOUNTING PRONOUNCEMENTS
In December 2011, the FASB issued ASU No. 2011-11 “Disclosures about Offsetting Assets and Liabilities” to expand current disclosure requirements on the offsetting of certain assets and liabilities. The new disclosures will be required for investments and derivative financial instruments subject to master netting or similar agreements which are eligible for offset in the Statements of Assets and Liabilities and will require an entity to disclose both gross and net information about such investments and transactions in the financial statements. The guidance is effective for financial statements with fiscal years beginning on or after January 1, 2013, and interim periods within those fiscal years. Management is evaluating the impact of this guidance on the Funds’ financial statement disclosures.
7. SHARES OF BENEFICIAL INTEREST
At November 30, 2012, the Trust had an unlimited number of shares of beneficial interest authorized with a par value of $0.001 per share. The Funds have the ability to issue multiple classes of shares. Each share of a class represents an identical interest and has the same rights, except that each class bears certain direct expenses, including those specifically related to the distribution of its shares. Transactions in shares of the Institutional Class can be found on the Statements of Changes in Net Assets.
72 | www.shiplp.com |
Table of Contents
| Stone Harbor Investment Funds | Notes to Financial Statements | |
| November 30, 2012 (Unaudited) |
8. BENEFICIAL OWNERSHIP
The beneficial ownership, either directly or indirectly, of more than 25% of the voting securities of any class of the Fund creates a presumption of control of the Fund under Section 2(a)(9) of the 1940 Act. As of November 30, 2012, the following entities owned beneficially 25% or greater of the Fund’s outstanding shares. The shares are held under omnibus accounts (whereby the transactions of two or more shareholders are combined and carried in the name of the originating broker rather than designated separately).
9. INDEMNIFICATIONS
Under the Trust’s organizational documents, its officers and Trustees are indemnified against certain liability arising out of the performance of their duties to the Trust. Additionally, in the normal course of business, the Trust enters into contracts with service providers that may contain general indemnification clauses. The Trust’s maximum exposure under these arrangements is unknown, as this would involve future claims that may be made against the Trust that have not yet occurred.
10. OTHER
Board of Trustees Compensation: No officer, trustee or employee of the Adviser or any of its affiliates receives any compensation from the Funds for serving as an officer or trustee of the Funds. The Trust will pay each Trustee who is not an interested person an annual fee of $54,000. All Trustees are reimbursed for reasonable travel and out-of-pocket expenses incurred to attend such meetings.
| Stone Harbor Investment Funds Semi-Annual Report | November 30, 2012 | 73 |
Table of Contents
| Stone Harbor Investment Funds | Additional Information | |
| November 30, 2012 (Unaudited) |
FUND PORTFOLIO HOLDINGS
The SEC has adopted the requirement that all registered investment companies file a complete schedule of portfolio holdings with the SEC for their first and third fiscal quarters on Form N-Q. For the Funds, this would be for the fiscal quarters ending August 31 and February 28. The Form N-Q filing must be made within 60 days of the end of the quarter. The Funds’ Forms N-Q will be available on the SEC’s website at http://www.sec.gov., or they may be reviewed and copied at the SEC’s Public Reference Room in Washington, DC (call 1-800-732-0330 for information on the operation of the Public Reference Room).
PROXY VOTING
A description of the policies and procedures that the Funds use to determine how to vote proxies relating to portfolio securities and information regarding how the Funds voted proxies relating to portfolio securities for the period ending June 30, 2012 will be available without a charge, upon request, by contacting Stone Harbor Investment Funds at 1-866-699-8158 or on the SEC website at http://www.sec.gov.
74 | www.shiplp.com |
Table of Contents
| Stone Harbor Investment Funds | Notes | |
Table of Contents
| Stone Harbor Investment Funds | Notes | |
Table of Contents

INVESTMENT ADVISER
Stone Harbor Investment Partners LP
31 W. 52nd Street 16th Floor
New York, New York 10019
ADMINISTRATOR & FUND ACCOUNTANT
ALPS Fund Services, Inc.
1290 Broadway, Suite 1100
Denver, Colorado 80203
DISTRIBUTOR
ALPS Distributors, Inc.
1290 Broadway, Suite 1100
Denver, Colorado 80203
TRANSFER AGENT
ALPS Fund Services, Inc.
1290 Broadway, Suite 1100
Denver, Colorado 80203
CUSTODIAN
The Bank of New York Mellon
One Wall Street
New York, New York 10286
LEGAL COUNSEL
Ropes & Gray LLP
1211 Avenue of the Americas
New York, New York 10036
INDEPENDENT REGISTERED PUBLIC ACCOUNTING FIRM
Deloitte & Touche LLP
555 17th Street, Suite 3600
Denver, Colorado 80202
This report and its financial statements are submitted for the general information of the shareholders of the Funds. The report is not authorized for distribution to prospective investors in the Funds unless preceded or accompanied by a prospectus.
SHF000623 exp. 01/31/14
Table of Contents
| Item 2. | Code of Ethics. |
Not applicable to this Report.
| Item 3. | Audit Committee Financial Expert. |
Not applicable to this Report.
| Item 4. | Principal Accountant Fees and Services. |
Not applicable to this Report.
| Item 5. | Audit Committee of Listed Registrants. |
Not applicable.
| Item 6. | Investments. |
(a) | Schedule of Investments is included as part of the Report to Stockholders filed under Item 1 of this Form N-CSR. | |||
(b) | Not applicable. | |||
| Item 7. | Disclosure of Proxy Voting Policies and Procedures for Closed-End Management Investment Companies. |
Not applicable to Registrant.
| Item 8. | Portfolio Managers of Closed-End Management Investment Companies. |
Not applicable to Registrant.
Table of Contents
| Item 9. | Purchases of Equity Securities by Closed-End Management Investment Companies and Affiliated Purchasers. |
Not applicable to Registrant.
| Item 10. | Submission of Matters to a Vote of Security Holders. |
There have been no material changes to the procedures by which shareholders may recommend nominees to the Registrant’s Board of Trustees, where those changes were implemented after the Registrant last provided disclosure in response to the requirements of Item 407(c)(2) of Regulation S-K, or this Item.
| Item 11. | Controls and Procedures. |
| (a) | The Registrant’s principal executive officer and principal financial officer have concluded that the Registrant’s disclosure controls and procedures (as defined in Rule 30a-3(c) under the Investment Company Act of 1940, as amended) are effective based on their evaluation of these controls and procedures as of a date within 90 days of the filing date of this report. | |
| (b) | There was no change in the Registrant’s internal control over financial reporting (as defined in Rule 30a-3(d) under the Investment Company Act of 1940, as amended) during the second fiscal quarter of the period covered by this report that has materially affected, or is reasonably likely to materially affect, the Registrant’s internal control over financial reporting. | |
| Item 12. | Exhibits. |
| (a)(1) | Not applicable to this Report. | |
| (a)(2) | The certifications required by Rule 30a-2(a) of the Investment Company Act of 1940, as amended, and Section 302 of the Sarbanes-Oxley Act of 2002 are attached hereto as Exhibit 99.Cert. | |
(a)(3) Not applicable to Registrant. | ||
| (b) | The certifications by the Registrant’s principal executive officer and principal financial officer, as required by Rule 30a-2(b) of the Investment Company Act of 1940, as amended, and Section 906 of the Sarbanes-Oxley Act of 2002 are attached hereto as Exhibit 99.906Cert. | |
Table of Contents
SIGNATURES
Pursuant to the requirements of the Securities Exchange Act of 1934 and the Investment Company Act of 1940, the Registrant has duly caused this Report to be signed on its behalf by the undersigned, thereunto duly authorized.
| Stone Harbor Investment Funds | ||
| By: | /s/ Peter J. Wilby | |
| Peter J. Wilby | ||
| President/Principal Executive Officer | ||
Date: | February 7, 2013 | |
Pursuant to the requirements of the Securities Exchange Act of 1934 and the Investment Company Act of 1940, this Report has been signed below by the following persons on behalf of the Registrant and in the capacities and on the dates indicated.
| By: | /s/ Peter J. Wilby | |
| Peter J. Wilby | ||
| President/Principal Executive Officer | ||
| Date: | February 7, 2013 | |
| By: | /s/ James J. Dooley | |
| James J. Dooley | ||
| Treasurer, Chief Financial Officer/ Principal Financial Officer | ||
| Date: | February 7, 2013 | |