UNITED STATES
SECURITIES AND EXCHANGE COMMISSION
Washington, D.C. 20549
FORM N-CSR
CERTIFIED SHAREHOLDER REPORT OF REGISTERED
MANAGEMENT INVESTMENT COMPANIES
Investment Company Act file number | 811-22037 | |||||||
| ||||||||
Stone Harbor Investment Funds | ||||||||
(Exact name of registrant as specified in charter) | ||||||||
| ||||||||
1290 Broadway, Suite 1100 |
| 80203 | ||||||
(Address of principal executive offices) |
| (Zip code) | ||||||
| ||||||||
Adam J. Shapiro, Esq. c/o Stone Harbor Investment Partners LP 31 West 52nd Street, 16th Floor New York, NY 10019 | ||||||||
(Name and address of agent for service) | ||||||||
| ||||||||
With copies To:
John M. Loder, Esq. Ropes & Gray LLP One International Place Boston, MA 02110-2624 | ||||||||
| ||||||||
Registrant’s telephone number, including area code: | (303) 623-2577 |
| ||||||
| ||||||||
Date of fiscal year end: | May 31 |
| ||||||
| ||||||||
Date of reporting period: | June 1, 2009 - November 30, 2009 |
| ||||||
Item 1. Report to Stockholders.

Table of Contents
Letter to Shareholders |
| 2 |
Disclosure of Fund Expenses |
| 4 |
Summary of Portfolio Holdings |
| 5 |
Growth of a $10,000 Investment |
| 6 |
Statement of Investments |
|
|
Emerging Markets Debt Fund |
| 8 |
High Yield Bond Fund |
| 15 |
Statement of Assets & Liabilities |
| 36 |
Statement of Operations |
| 37 |
Statements of Changes in Net Assets |
|
|
Emerging Markets Debt Fund |
| 38 |
High Yield Bond Fund |
| 39 |
Financial Highlights |
|
|
Emerging Markets Debt Fund |
| 40 |
High Yield Bond Fund |
| 41 |
Notes to Financial Statements |
| 42 |
Additional Information |
| 52 |
Trustees and Officers |
| 54 |
Letter to Shareholders
January 15, 2010
Dear Shareholder,
Just a year ago, financial markets and investor sentiment reached their nadir as credit spreads hit some of their widest levels in history. With global capital markets in seizure, the economic picture was bleak. Large financial institutions were under tremendous pressure, and consumer and business spending severely slowed. Through unprecedented government support and the injection of record amounts of liquidity, in 2009 the economy began to emerge from its longest and deepest downturn since the 1930s. By the end of the year, spreads across most major fixed income asset classes returned to pre-Lehman levels and in many cases to pre-credit crisis levels.
MARKET OVERVIEW
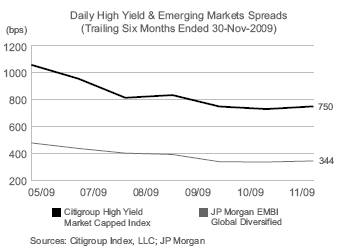
For the six month period ending November 30, 2009, risk assets like emerging debt and high yield bonds experienced an impressive rally as efforts to curtail the global economic downturn gained traction. With credit markets re-opening, high yield debt and bank loan markets performed well, driven by low-dollar priced and lower-rated issues. Credit spreads continued to contract during the summer as liability restructurings, deeply discounted debt repurchases, and debt for equity exchanges slowed the rate of default. Additional support came from corporate earnings improvements, and government programs such as securitized markets purchase packages, “cash for clunkers”, and first-time home buyer tax credits. As the summer concluded, signs of a housing bottom and improving equity markets fueled the rally within fixed income markets.
During the review period, inflows to credit asset classes revived the new issue market and provided desperately needed liquidity to companies with looming maturities. This resurgence in demand amid limited supply pushed spreads inexorably tighter. As the fourth calendar quarter progressed, credit markets took a breather and even experienced a brief setback when Dubai corporate debt faced potential default. With assistance from Abu Dhabi, the Dubai repayment fears were quelled and credit markets finished the year on a strong note. Yield spreads finished the reporting period with an improvement of 309 basis points in high yield and 134 basis points in emerging debt.
As we begin 2010, some uncertainty lingers over the eventual impact of the government’s exit strategy (the stimulus and liquidity “unwind”). We believe that the Fed will be reluctant to move too quickly, favoring solid evidence of a recovery before acting. Therefore, it is unlikely that we will see restrictive policy actions until the second half of 2010 at the earliest. We view current spread levels constructively as compared to long-term averages, and continue to believe that the credit markets will provide us with favorable opportunities over the coming months.
Sincerely,
![]()
Thomas W. Brock
Chairman of the Board of Trustees
PERFORMANCE REVIEW
Stone Harbor Emerging Markets Debt Fund
Fund performance over the six months ended November 30, 2009 was 19.24% (net of expenses) and 19.62% (gross of expenses) relative to a benchmark return of 13.39% on the JP Morgan Emerging Market Global Diversified Index. Country selection decisions accounted for approximately two-thirds of excess returns; the remainder came from issue selection. Treasury attribution was negative, primarily due to rolling yield effects and a steepening US Treasury yield curve. Key country decisions during the period included an overweight in Argentina, both in its US-dollar performing debt and bonds that were not submitted into the 2005 Argentina debt exchange (untendered debt). The untendered debt had been purchased in default based on the manager’s assessment of strong return potential. During the 6 month period, other high beta credits such as Iraq, Ukraine and Venezuela, outperformed. The portfolio’s overweight in these credits enhanced performance. Key issue selection decisions included an allocation to short dated US dollar debt from Argentina and local currency bonds in Colombia. As increasing evidence of a global economic recovery took root in the period, the manager increased the portfolio’s exposure to local currency debt in Brazil, Colombia, Mexico, Indonesia and Malaysia. In addition, given the significant compression of spreads during the period, the manager reduced duration in the high beta credits mentioned earlier and rotated into high quality credits such as Mexico and Russia that had lagged the market’s rally.
Stone Harbor High Yield Bond Fund
The fund returned 15.39% (net of expenses) and 15.67% (gross of expenses) for the six months ended November 30, 2009, 555 basis points below the return of its benchmark, the Citigroup High Yield Market Capped Index, which returned 20.94%. Positive momentum within the high yield market that began earlier in the year picked up speed throughout the six month period driving significant spread, or risk premia, contraction, as the US and global economy showed signs of stabilization. Better than expected economic indicators, most consistently in housing and manufacturing, as well as continued monetary and fiscal stimulus out of Washington buoyed investor sentiment. This renewed demand for risky assets helped to foster a robust new issue market for high yield bonds and a subsequent notable decline in levels of distressed debt. Mitigated default risk fueled greater demand still and established a positive feedback loop that persisted through November. Strong inflows into the asset class led to further broadening of high yield capital markets and a shift in investor appetite towards economically-sensitive industries, which had been the most fundamentally challenged during the credit crunch. Performance was bifurcated from a ratings perspective, as the rally for high yield debt focused on lower quality CCC-rated bonds. We believe strong GDP growth and the Fed’s commitment to low-for-long rates reassured investors that the worst economic pain may be behind us. Heading into the holiday season, the market showed signs of performance fatigue amid more mixed economic data, suggesting as it had before that while the US economy recovers, it will do so in a circuitous path. Stone Harbor’s high yield strategy during the six month period was to maintain a slight overweight in defensive sectors and to focus on mid to better quality companies, which detracted from performance.
Disclosure of Fund Expenses (Unaudited)
Example. As a shareholder of a Fund, you incur two types of costs: (1) transaction costs, including sales charges (loads) on purchase payments and/or redemption fees (if applicable) and (2) ongoing costs, including management fees and other Fund expenses. The below examples are intended to help you understand your ongoing costs (in dollars) of investing in a Fund and to compare these costs with the ongoing costs of investing in other mutual funds. The examples are based on an investment of $1,000 invested on June 1, 2009 and held until November 30, 2009.
Actual Expenses. The first line of the table below provides information about actual account values and actual expenses. You may use the information in this line, together with the amount you invested, to estimate the expenses that you paid over the period. Simply divide your account value by $1,000 (for example, an $8,600 account value divided by $1,000 = 8.6), then multiply the result by the number in the first line under the heading “Expenses Paid During Period” to estimate the expenses you paid on your account during this period.
Hypothetical Example for Comparison Purposes. The second line of the table below provides information about hypothetical account values and hypothetical expenses based on the Fund’s actual expense ratio and an assumed rate of return of 5% per year before expenses, which is not the Fund’s actual return. The hypothetical account values and expenses may not be used to estimate the actual ending account balance or expenses you paid for the period. You may use this information to compare the ongoing costs of investing in a Fund and other mutual funds. To do so, compare this 5% hypothetical example with the 5% hypothetical examples that appear in the shareholder reports of the other funds.
Please note that the expenses shown in the table are meant to highlight your ongoing costs only and do not reflect transactional costs, such as redemption fees, sales charges (loads) or exchange fees. Therefore, the second line of the table is useful in comparing ongoing costs only, and will not help you determine the relative total costs of owning different funds. In addition, if these transactional costs were included, your costs would have been higher.
|
| Beginning |
| Ending |
|
|
| Expenses |
| |||
|
| Account Value |
| Account Value |
| Expense |
| Paid During |
| |||
|
| 06/01/2009 |
| 11/30/2009 |
| Ratio(1) |
| Period(2) |
| |||
|
|
|
|
|
|
|
|
|
| |||
STONE HARBOR EMERGING MARKETS DEBT FUND |
|
|
|
|
|
|
|
|
| |||
Actual |
| $ | 1,000.00 |
| $ | 1,192.40 |
| 0.75 | % | $ | 4.12 |
|
Hypothetical (5% return before expenses) |
| $ | 1,000.00 |
| $ | 1,021.31 |
| 0.75 | % | $ | 3.80 |
|
|
|
|
|
|
|
|
|
|
| |||
STONE HARBOR HIGH YIELD BOND FUND |
|
|
|
|
|
|
|
|
| |||
Actual |
| $ | 1,000.00 |
| $ | 1,153.90 |
| 0.55 | % | $ | 2.97 |
|
Hypothetical (5% return before expenses) |
| $ | 1,000.00 |
| $ | 1,022.31 |
| 0.55 | % | $ | 2.79 |
|
(1) Annualized, based on the Fund’s most recent fiscal half-year expenses.
(2) Expenses are equal to the Fund’s annualized expense ratio multiplied by the average account value over the period, multiplied by the number of days in the most recent fiscal half year (183), divided by 365. Note this expense example is typically based on a six-month period.
Summary of Portfolio Holdings
November 30, 2009 (Unaudited)
Under SEC Rules, all funds are required to include in their annual and semi-annual shareholder reports a presentation of portfolio holdings in a table, chart or graph by reasonably identifiable categories. The following tables which present holdings as a percent of total net assets (“TNA”) are provided in compliance with such requirements.
EMERGING MARKETS DEBT FUND
Country Breakdown |
| % of TNA |
|
Mexico |
| 10.43 | % |
Russia |
| 10.20 | % |
Brazil |
| 7.80 | % |
Venezuela |
| 7.14 | % |
Argentina |
| 7.11 | % |
Indonesia |
| 6.80 | % |
Colombia |
| 6.01 | % |
Philippines |
| 4.85 | % |
Turkey |
| 4.83 | % |
Malaysia |
| 4.69 | % |
Panama |
| 3.79 | % |
Peru |
| 3.01 | % |
Uruguay |
| 2.59 | % |
Poland |
| 2.52 | % |
Ukraine |
| 2.08 | % |
Iraq |
| 2.07 | % |
El Salvador |
| 1.77 | % |
Qatar |
| 1.37 | % |
South Africa |
| 1.08 | % |
Tunisia |
| 0.58 | % |
India |
| 0.44 | % |
Kazakhstan |
| 0.44 | % |
Gabon |
| 0.43 | % |
South Korea |
| 0.41 | % |
Singapore |
| 0.38 | % |
Vietnam |
| 0.31 | % |
Pakistan |
| 0.12 | % |
Total |
| 93.25 | % |
Other Assets in Excess of Liabilities |
| 6.75 | % |
Total Net Assets |
| 100.00 | % |
HIGH YIELD BOND FUND
Industry Breakdown |
| % of TNA |
|
Telecommunications |
| 11.22 | % |
Oil & Gas |
| 7.19 | % |
Diversified Financial Services |
| 6.51 | % |
Healthcare - Services |
| 6.27 | % |
Media |
| 5.89 | % |
Retail |
| 5.61 | % |
Pipelines |
| 4.99 | % |
Electric |
| 4.69 | % |
Commercial Services |
| 4.64 | % |
Entertainment |
| 3.27 | % |
Packaging & Containers |
| 3.27 | % |
Food |
| 3.20 | % |
Chemicals |
| 2.85 | % |
Coal |
| 2.25 | % |
Miscellaneous Manufacturers |
| 1.96 | % |
Lodging |
| 1.93 | % |
Gaming |
| 1.58 | % |
Healthcare - Products |
| 1.54 | % |
Oil & Gas Services |
| 1.36 | % |
Forest Products & Paper |
| 1.21 | % |
Agriculture |
| 1.10 | % |
Beverages |
| 1.10 | % |
Aerospace - Defense |
| 1.06 | % |
Gas |
| 0.94 | % |
Office - Business Equipment |
| 0.92 | % |
Transportation |
| 0.89 | % |
Apparel |
| 0.88 | % |
Building Products |
| 0.87 | % |
Advertising |
| 0.82 | % |
Environmental Control |
| 0.82 | % |
Mining |
| 0.81 | % |
Communications |
| 0.72 | % |
Holding Companies - Diversified |
| 0.56 | % |
Auto Manufacturers |
| 0.55 | % |
Real Estate |
| 0.45 | % |
Office Furnishings |
| 0.26 | % |
Building Materials |
| 0.21 | % |
Machinery - Construction & Mining |
| 0.21 | % |
Distribution - Wholesale |
| 0.18 | % |
Auto Parts & Equipment |
| 0.15 | % |
Research Services |
| 0.09 | % |
Home Furnishings |
| 0.09 | % |
Radio & TV/Other |
| 0.07 | % |
Internet |
| 0.06 | % |
Hotels & Motels |
| 0.03 | % |
Total |
| 95.27 | % |
Other Assets in Excess of Liabilities |
| 4.73 | % |
Total Net Assets |
| 100.00 | % |
Growth of a $10,000 Investment
November 30, 2009 (Unaudited)
STONE HARBOR EMERGING MARKETS DEBT FUND
Comparison of Change in Value of $10,000 Investment in Stone Harbor Emerging Markets Debt Fund and the JP Morgan Emerging Market Bond Index Global Diversified
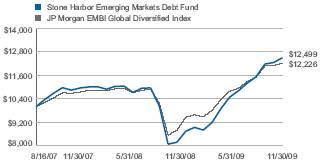
The JP Morgan Emerging Market Bond Index Global Diversified is a uniquely-weighted version of the EMBI Global Index, which tracks total returns for U.S. dollar-denominated debt instruments issued by emerging market sovereign and quasi-sovereign entities such as: Brady bonds, loans and Eurobonds. Currently, the EMBI Global Index covers 196 instruments across 28 countries. It limits the weights of those index countries with larger debt stocks by only including specified portions of these countries’ eligible debt outstanding. The countries covered in the EMBI Global Diversified are identical to those covered by the EMBI Global Index.
AVERAGE ANNUAL TOTAL RETURNS
|
|
|
|
|
|
|
|
|
| Since |
| Inception |
|
|
| 1 Year |
| 3 Years |
| 5 Years |
| 10 Years |
| Inception |
| Date |
|
Stone Harbor Emerging Markets Debt Fund |
| 52.64 | % | N/A |
| N/A |
| N/A |
| 10.23 | % | 8/16/07 |
|
JP Morgan Emerging Market Bond Index Global Diversified |
| 38.98 | % | N/A |
| N/A |
| N/A |
| 9.16 | % |
|
|
The performance data quoted represents past performance and does not guarantee future results. Current performance may be lower or higher than the performance quoted. Average annual total returns reflect the reinvestment of dividends and capital gains distributions and include all fee waivers and expense reimbursements. Without the fee waivers and expense reimbursements, total return figures would have been lower. The performance data quoted does not reflect the deduction of taxes that a shareholder would pay on Fund distributions or the redemption of Fund shares. Investment return and principal value will vary, and shares, when redeemed, may be worth more or less than their original cost.
STONE HARBOR HIGH YIELD BOND FUND
Comparison of Change in Value of $10,000 Investment in Stone Harbor High Yield Bond Fund and the Citigroup High Yield Market Capped Index
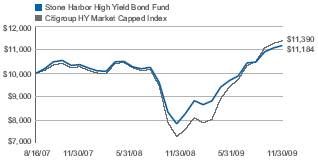
The Citigroup High Yield Market Capped Index represents a modified version of the High Yield Market Index by delaying the entry of “fallen angel” issues (corporate or municipal bonds that were investment-grade when issued but have since been downgraded) and capping the par value of individual issuers at US $5 billion par amount outstanding.
AVERAGE ANNUAL TOTAL RETURNS
|
|
|
|
|
|
|
|
|
| Since |
| Inception |
|
|
| 1 Year |
| 3 Years |
| 5 Years |
| 10 Years |
| Inception |
| Date |
|
Stone Harbor High Yield Bond Fund |
| 42.51 | % | N/A |
| N/A |
| N/A |
| 5.01 | % | 8/16/07 |
|
Citigroup High Yield Market Capped Index |
| 56.10 | % | N/A |
| N/A |
| N/A |
| 5.84 | % |
|
|
The performance data quoted represents past performance and does not guarantee future results. Current performance may be lower or higher than the performance quoted. Average annual total returns reflect the reinvestment of dividends and capital gains distributions and include all fee waivers and expense reimbursements. Without the fee waivers and expense reimbursements, total return figures would have been lower. The performance data quoted does not reflect the deduction of taxes that a shareholder would pay on Fund distributions or the redemption of Fund shares. Investment return and principal value will vary, and shares, when redeemed, may be worth more or less than their original cost.
Statement of Investments |
|
November 30, 2009 (Unaudited) | Emerging Markets Debt Fund |
|
|
|
| Principal |
| Market Value |
| ||
Interest Rate/Maturity Date |
| Currency |
| Amount* |
| (Expressed in U.S. $) |
| ||
|
|
|
|
|
|
|
| ||
SOVEREIGN DEBT OBLIGATIONS - 84.72% |
|
|
|
|
|
|
| ||
Argentina - 7.11% |
|
|
|
|
|
|
| ||
Republic of Argentina |
|
|
|
|
|
|
| ||
10.500%, 11/14/2002(1) |
| EUR |
| $ | 2,165,000 |
| $ | 644,073 |
|
7.000%, 03/18/2004(1) |
| EUR |
| 30,000 |
| 18,131 |
| ||
7.000%, 03/18/2004(1) |
| EUR |
| 58,000 |
| 17,923 |
| ||
10.000%, 01/07/2005(1) |
| EUR |
| 1,035,000 |
| 648,837 |
| ||
0.000%, 03/29/2005(1) |
|
|
| 154,000 |
| 66,990 |
| ||
9.000%, 05/24/2005(1) |
| EUR |
| 191,000 |
| 115,077 |
| ||
9.000%, 04/26/2006(1) |
| EUR |
| 58,000 |
| 35,271 |
| ||
10.000%, 01/03/2007(1) |
| ITL |
| 140,000,000 |
| 44,513 |
| ||
10.250%, 01/26/2007(1) |
| EUR |
| 661,000 |
| 413,137 |
| ||
8.000%, 02/26/2008(1) |
| EUR |
| 243,000 |
| 148,231 |
| ||
15.500%, 12/19/2008(1) |
|
|
| 755,000 |
| 328,425 |
| ||
11.750%, 04/07/2009(1) |
|
|
| 1,840,000 |
| 800,400 |
| ||
9.000%, 07/06/2010(1) |
| EUR |
| 420,000 |
| 249,895 |
| ||
7.000%, 10/03/2015 |
|
|
| 1,980,000 |
| 1,511,400 |
| ||
0.000%, 03/31/2023(1) |
|
|
| 184,000 |
| 105,800 |
| ||
6.000%, 03/31/2023(1) |
|
|
| 480,000 |
| 276,000 |
| ||
|
|
|
|
|
| 5,424,103 |
| ||
Brazil - 7.80% |
|
|
|
|
|
|
| ||
Nota Do Tesouro Nacional |
|
|
|
|
|
|
| ||
Series F, 10.000%, 01/01/2017 |
| BRL |
| 6,610,000 |
| 3,222,712 |
| ||
Republic of Brazil |
|
|
|
|
|
|
| ||
6.000%, 01/17/2017 |
|
|
| 100,000 |
| 110,000 |
| ||
8.875%, 04/15/2024 |
|
|
| 150,000 |
| 199,125 |
| ||
8.750%, 02/04/2025 |
|
|
| 450,000 |
| 590,625 |
| ||
10.125%, 05/15/2027 |
|
|
| 25,000 |
| 37,375 |
| ||
12.250%, 03/06/2030 |
|
|
| 20,000 |
| 35,300 |
| ||
8.250%, 01/20/2034 |
|
|
| 130,000 |
| 169,650 |
| ||
11.000%, 08/17/2040 |
|
|
| 1,170,000 |
| 1,592,662 |
| ||
|
|
|
|
|
| 5,957,449 |
| ||
Colombia - 6.01% |
|
|
|
|
|
|
| ||
Bogota Distrio Capital |
|
|
|
|
|
|
| ||
9.750%, 07/26/2028 |
| COP |
| 2,188,000,000 |
| 1,202,985 |
| ||
Republic of Colombia |
|
|
|
|
|
|
| ||
7.375%, 03/18/2019 |
|
|
| 1,415,000 |
| 1,650,244 |
| ||
9.850%, 06/28/2027 |
| COP |
| 460,000,000 |
| 274,796 |
| ||
7.375%, 09/18/2037 |
|
|
| 1,015,000 |
| 1,162,175 |
| ||
6.125%, 01/18/2041 |
|
|
| 305,000 |
| 298,137 |
| ||
|
|
|
|
|
| 4,588,337 |
| ||
|
|
|
| Principal |
| Market Value |
| ||
Interest Rate/Maturity Date |
| Currency |
| Amount* |
| (Expressed in U.S. $) |
| ||
|
|
|
|
|
|
|
| ||
El Salvador - 1.77% |
|
|
|
|
|
|
| ||
Republic of El Salvador |
|
|
|
|
|
|
| ||
7.375%, 12/01/2019(2) |
|
|
| $ | 220,000 |
| $ | 227,150 |
|
7.650%, 06/15/2035 |
|
|
| 1,133,000 |
| 1,127,335 |
| ||
|
|
|
|
|
| 1,354,485 |
| ||
Gabon - 0.43% |
|
|
|
|
|
|
| ||
Republic of Gabonese |
|
|
|
|
|
|
| ||
8.200%, 12/12/2017 |
|
|
| 140,000 |
| 144,725 |
| ||
8.200%, 12/12/2017(2) |
|
|
| 180,000 |
| 186,075 |
| ||
|
|
|
|
|
| 330,800 |
| ||
Indonesia - 5.07% |
|
|
|
|
|
|
| ||
Republic of Indonesia |
|
|
|
|
|
|
| ||
11.625%, 03/04/2019 |
|
|
| 305,000 |
| 431,758 |
| ||
11.625%, 03/04/2019(2) |
|
|
| 2,070,000 |
| 2,930,292 |
| ||
7.750%, 01/17/2038 |
|
|
| 465,000 |
| 511,500 |
| ||
|
|
|
|
|
| 3,873,550 |
| ||
Iraq - 2.07% |
|
|
|
|
|
|
| ||
Republic of Iraq |
|
|
|
|
|
|
| ||
5.800%, 01/15/2028 |
|
|
| 2,100,000 |
| 1,577,625 |
| ||
|
|
|
|
|
|
|
| ||
Malaysia - 0.88% |
|
|
|
|
|
|
| ||
Malaysian Government |
|
|
|
|
|
|
| ||
4.378%, 11/29/2019 |
| MYR |
| 2,240,000 |
| 669,194 |
| ||
|
|
|
|
|
|
|
| ||
Mexico - 10.43% |
|
|
|
|
|
|
| ||
Mexican Bonos |
|
|
|
|
|
|
| ||
7.500%, 06/03/2027 |
| MXN |
| 15,340,000 |
| 1,099,344 |
| ||
8.500%, 05/31/2029 |
| MXN |
| 4,980,000 |
| 391,371 |
| ||
United Mexican States |
|
|
|
|
|
|
| ||
11.375%, 09/15/2016 |
|
|
| 600,000 |
| 842,250 |
| ||
5.950%, 03/19/2019 |
|
|
| 618,000 |
| 670,993 |
| ||
8.125%, 12/30/2019 |
|
|
| 935,000 |
| 1,167,628 |
| ||
8.000%, 09/24/2022 |
|
|
| 445,000 |
| 551,800 |
| ||
8.300%, 08/15/2031 |
|
|
| 1,810,000 |
| 2,343,950 |
| ||
6.750%, 09/27/2034 |
|
|
| 560,000 |
| 624,400 |
| ||
6.050%, 01/11/2040 |
|
|
| 264,000 |
| 269,940 |
| ||
|
|
|
|
|
| 7,961,676 |
| ||
Pakistan - 0.12% |
|
|
|
|
|
|
| ||
Islamic Republic of Pakistan |
|
|
|
|
|
|
| ||
7.125%, 03/31/2016 |
|
|
| 100,000 |
| 92,000 |
| ||
|
| Principal |
| Market Value |
| ||
Interest Rate/Maturity Date |
| Amount* |
| (Expressed in U.S. $) |
| ||
|
|
|
|
|
| ||
Panama - 3.79% |
|
|
|
|
| ||
Republic of Panama |
|
|
|
|
| ||
7.250%, 03/15/2015 |
| $ | 505,000 |
| $ | 580,750 |
|
5.200%, 01/30/2020 |
| 445,000 |
| 453,900 |
| ||
9.375%, 01/16/2023 |
| 25,000 |
| 33,500 |
| ||
9.375%, 04/01/2029 |
| 1,310,000 |
| 1,827,450 |
| ||
|
|
|
| 2,895,600 |
| ||
Peru - 3.01 % |
|
|
|
|
| ||
Republic of Peru |
|
|
|
|
| ||
9.875%, 02/06/2015 |
| 5,000 |
| 6,390 |
| ||
7.125%, 03/30/2019 |
| 605,000 |
| 709,816 |
| ||
7.350%, 07/21/2025 |
| 815,000 |
| 967,813 |
| ||
8.750%, 11/21/2033 |
| 320,000 |
| 431,200 |
| ||
6.550%, 03/14/2037 |
| 170,000 |
| 183,175 |
| ||
|
|
|
| 2,298,394 |
| ||
Philippines - 4.85% |
|
|
|
|
| ||
Republic of Philippines |
|
|
|
|
| ||
8.000%, 01/15/2016 |
| 120,000 |
| 139,050 |
| ||
8.375%, 06/17/2019 |
| 1,055,000 |
| 1,275,179 |
| ||
7.500%, 09/25/2024 |
| 965,000 |
| 1,073,562 |
| ||
10.625%, 03/16/2025 |
| 70,000 |
| 98,525 |
| ||
7.750%, 01/14/2031 |
| 905,000 |
| 1,016,994 |
| ||
6.375%, 01/15/2032 |
| 100,000 |
| 97,750 |
| ||
|
|
|
| 3,701,060 |
| ||
Poland - 2.52% |
|
|
|
|
| ||
Republic of Poland |
|
|
|
|
| ||
6.375%, 07/15/2019 |
| 1,730,000 |
| 1,920,300 |
| ||
|
|
|
|
|
| ||
Qatar - 1.37% |
|
|
|
|
| ||
State of Qatar |
|
|
|
|
| ||
5.250%, 01/20/2020(2) |
| 1,035,000 |
| 1,047,937 |
| ||
|
|
|
|
|
| ||
Russia - 9.83% |
|
|
|
|
| ||
Russian Federation |
|
|
|
|
| ||
7.500%, 03/31/2030 |
| 6,640,160 |
| 7,503,381 |
| ||
|
|
|
|
|
| ||
South Africa - 1.08% |
|
|
|
|
| ||
Republic of South Africa |
|
|
|
|
| ||
8.500%, 06/23/2017 |
| 20,000 |
| 24,700 |
| ||
6.875%, 05/27/2019 |
| 205,000 |
| 228,831 |
| ||
5.875%, 05/30/2022 |
| 560,000 |
| 569,800 |
| ||
|
|
|
| 823,331 |
| ||
|
|
|
| Principal |
| Market Value |
| ||
Interest Rate/Maturity Date |
| Currency |
| Amount* |
| (Expressed in U.S. $) |
| ||
|
|
|
|
|
|
|
| ||
Turkey - 4.83% |
|
|
|
|
|
|
| ||
Republic of Turkey |
|
|
|
|
|
|
| ||
7.375%, 02/05/2025 |
|
|
| $ | 550,000 |
| $ | 610,500 |
|
6.875%, 03/17/2036 |
|
|
| 1,305,000 |
| 1,332,731 |
| ||
7.250%, 03/05/2038 |
|
|
| 1,640,000 |
| 1,746,600 |
| ||
|
|
|
|
|
| 3,689,831 |
| ||
Ukraine - 2.08% |
|
|
|
|
|
|
| ||
Ukraine Government |
|
|
|
|
|
|
| ||
3.200%, 12/19/2010 |
| JPY |
| 120,000,000 |
| 1,159,186 |
| ||
6.875%, 03/04/2011(2) |
|
|
| 110,000 |
| 97,625 |
| ||
6.875%, 03/04/2011 |
|
|
| 370,000 |
| 328,375 |
| ||
|
|
|
|
|
| 1,585,186 |
| ||
Uruguay - 2.59% |
|
|
|
|
|
|
| ||
Republic of Uruguay |
|
|
|
|
|
|
| ||
8.000%, 11/18/2022 |
|
|
| 350,000 |
| 410,375 |
| ||
7.875%, 01/15/2033(3) |
|
|
| 800 |
| 908 |
| ||
7.625%, 03/21/2036 |
|
|
| 1,400,000 |
| 1,568,000 |
| ||
|
|
|
|
|
| 1,979,283 |
| ||
Venezuela - 6.77% |
|
|
|
|
|
|
| ||
Republic of Venezuela |
|
|
|
|
|
|
| ||
1.283%, 04/20/2011(4) |
|
|
| 5,940,000 |
| 5,167,800 |
| ||
|
|
|
|
|
|
|
| ||
Vietnam - 0.31% |
|
|
|
|
|
|
| ||
Republic of Vietnam |
|
|
|
|
|
|
| ||
6.875%, 01/15/2016 |
|
|
| 230,000 |
| 236,900 |
| ||
|
|
|
|
| �� |
|
| ||
TOTAL SOVEREIGN DEBT OBLIGATIONS |
|
|
|
|
| 64,678,222 |
| ||
|
|
|
|
|
|
|
| ||
CORPORATE BONDS - 6.80% |
|
|
|
|
|
|
| ||
India- 0.44 % |
|
|
|
|
|
|
| ||
Vedanta Resources PLC |
|
|
|
|
|
|
| ||
9.500%, 07/18/2018(2) |
|
|
| 340,000 |
| 339,150 |
| ||
|
|
|
|
|
|
|
| ||
Kazakhstan - 0.44% |
|
|
|
|
|
|
| ||
HSBK Europe BV |
|
|
|
|
|
|
| ||
9.250%, 10/16/2013(2) |
|
|
| 110,000 |
| 108,900 |
| ||
KazMunaiGaz Finance Sub BV |
|
|
|
|
|
|
| ||
9.125%, 07/02/2018(2) |
|
|
| 205,000 |
| 225,244 |
| ||
|
|
|
|
|
| 334,144 |
| ||
|
|
|
| Principal |
| Market Value |
| ||
Interest Rate/Maturity Date |
|
|
| Amount* |
| (Expressed in U.S. $) |
| ||
|
|
|
|
|
|
|
| ||
Malaysia - 3.81% |
|
|
|
|
|
|
| ||
Penerbangan Malaysia BHD |
|
|
|
|
|
|
| ||
5.625%, 03/15/2016 |
|
|
| $ | 820,000 |
| $ | 888,516 |
|
Petroliam Nasional BHD |
|
|
|
|
|
|
| ||
7.750%, 08/15/2015(2) |
|
|
| 335,000 |
| 399,264 |
| ||
Petronas Capital Ltd. |
|
|
|
|
|
|
| ||
5.250%, 08/12/2019(2) |
|
|
| 530,000 |
| 545,416 |
| ||
7.875%, 05/22/2022 |
|
|
| 850,000 |
| 1,072,532 |
| ||
|
|
|
|
|
| 2,905,728 |
| ||
Russia - 0.37% |
|
|
|
|
|
|
| ||
TransCapitalInvest Ltd. for OJSC AK Transneft |
|
|
|
|
|
|
| ||
8.700%, 08/07/2018(2) |
|
|
| 160,000 |
| 181,200 |
| ||
VIP Finance Ireland Ltd. for OJSC Vimpel Communications |
|
|
|
|
|
|
| ||
8.375%, 04/30/2013(2) |
|
|
| 100,000 |
| 104,500 |
| ||
|
|
|
|
|
| 285,700 |
| ||
Singapore - 0.38% |
|
|
|
|
|
|
| ||
Adaro Indonesia PT |
|
|
|
|
|
|
| ||
7.625%, 10/22/2019(2) |
|
|
| 295,000 |
| 288,363 |
| ||
|
|
|
|
|
|
|
| ||
South Korea - 0.41% |
|
|
|
|
|
|
| ||
Export-Import Bank of Korea |
|
|
|
|
|
|
| ||
8.125%, 01/21/2014 |
|
|
| 265,000 |
| 311,375 |
| ||
|
|
|
|
|
|
|
| ||
Tunisia - 0.58% |
|
|
|
|
|
|
| ||
Banque Centrale de Tunisie |
|
|
|
|
|
|
| ||
7.375%, 04/25/2012 |
|
|
| 400,000 |
| 440,500 |
| ||
|
|
|
|
|
|
|
| ||
Venezuela - 0.37% |
|
|
|
|
|
|
| ||
Petroleos de Venezuela SA |
|
|
|
|
|
|
| ||
5.250%, 04/12/2017 |
|
|
| 555,000 |
| 287,212 |
| ||
|
|
|
|
|
|
|
| ||
TOTAL CORPORATE BONDS |
|
|
|
|
| 5,192,172 |
| ||
|
|
|
|
|
|
|
| ||
CREDIT LINKED NOTES - 1.73% |
|
|
|
|
|
|
| ||
Indonesia - 1.73% |
|
|
|
|
|
|
| ||
Republic of Indonesia |
|
|
|
|
|
|
| ||
11.000%, 11/16/2020(5)(7) |
| IDR |
| 3,100,000,000 |
| 341,804 |
| ||
12.800%, 06/15/2021(6)(7) |
| IDR |
| 2,600,000,000 |
| 317,610 |
| ||
12.800%, 06/17/2021(6)(7) |
| IDR |
| 5,400,000,000 |
| 659,651 |
| ||
|
|
|
|
|
|
|
| ||
TOTAL CREDIT LINKED NOTES |
|
|
|
|
| 1,319,065 |
| ||
|
|
|
| Market Value |
| ||
Interest Rate/Maturity Date |
| Shares |
| (Expressed in U.S. $) |
| ||
|
|
|
|
|
| ||
MONEY MARKET MUTUAL FUNDS - 4.26% |
|
|
|
|
| ||
Dreyfus Cash Advantage Plus Fund |
| $ | 3,249,810 |
| $ | 3,249,810 |
|
|
|
|
|
|
| ||
TOTAL MONEY MARKET MUTUAL FUNDS |
|
|
| 3,249,810 |
| ||
|
|
|
|
|
| ||
Total Investments - 97.51% |
|
|
| $ | 74,439,269 |
| |
|
|
|
|
|
| ||
Other Assets In Excess of Liabilities - 2.49% |
|
|
| 1,901,067 |
| ||
|
|
|
|
|
| ||
Net Assets - 100% |
|
|
| $ | 76,340,336 |
| |
* |
| The principal/contract amount of each security is stated in the currency in which the bond is denominated (U.S. Dollar unless otherwise notated). See below. | |
|
|
| |
|
| BRL | Brazilian Real |
|
| COP | Colombian Peso |
|
| EUR | Euro Currency |
|
| IDR | Indonesian Rupiah |
|
| ITL | Italian Lira |
|
| JPY | Japanese Yen |
|
| MXN | Mexican Peso |
|
| MYR | Malaysian Ringgit |
|
|
| |
(1) |
| Security is currently in default/non-income producing. | |
(2) |
| Security exempt from registration under Rule 144A of the Securities Act of 1933. Under procedures approved by the Board of Trustees, such securities have been determined to be liquid by the Investment Advisor and may be resold, normally to qualified buyers in transactions exempt from registration. Total market value of Rule 144A securities amounts to $6,681,116, which represents approximately 8.75% of net assets as of November 30, 2009. | |
(3) |
| Pay-in-kind securities. | |
(4) |
| Floating or variable rate security. Interest rate disclosed is that which is in effect at November 30, 2009. | |
(5) |
| The underlying security is issued by HSBC Bank | |
(6) |
| The underlying security is issued by JP Morgan Chase. | |
(7) |
| This security has been valued at its fair value determined in good faith by or under the direction of the Board of Trustees. | |
Common Abbreviations:
BHD - Berhad is the Malaysian term for public limited company.
BV - Besloten Vennootschap a Dutch private limited liability company.
OJSC - Open Joint Stock Company.
PLC - Public Limited Co.
PT - Perseroan Terbatas an Indonesian limited liability company.
SA - Generally designates corporations in various countries, mostly those employing the civil law.
OUTSTANDING FORWARD FOREIGN CURRENCY CONTRACTS
Contract |
| Contracted |
| Purchase/Sale |
| Expiration |
| Value on |
| Current |
| Unrealized |
| |||
Description |
| Amount |
| Contract |
| Date |
| Settlement Date |
| Value |
| Depreciation |
| |||
EUR |
| 1,485,419 (EUR) |
| Sale |
| 12/18/2009 |
| $ | 2,223,999 |
| $ | 2,230,285 |
| $ | (6,286 | ) |
JPY |
| 102,389,333 (JPY) |
| Sale |
| 12/18/2009 |
| 1,143,261 |
| 1,184,637 |
| (41,376 | ) | |||
|
|
|
|
|
|
|
|
|
| $ | 3,414,922 |
| $ | (47,662 | ) | |
See Notes to Financial Statements
Statement of Investments |
|
November 30, 2009 (Unaudited) | High Yield Bond Fund |
|
| Principal |
|
|
| ||
Interest Rate/Maturity Date |
| Amount |
| Market Value |
| ||
|
|
|
|
|
| ||
CORPORATE BONDS - 92.54% |
|
|
|
|
| ||
Advertising - 0.73% |
|
|
|
|
| ||
Interep National Radio Sales, Inc. |
|
|
|
|
| ||
Series B, 10.000%, 07/01/2008(1)(2) |
| $ | 4,000 |
| $ | — |
|
Lamar Media Corp. |
|
|
|
|
| ||
6.625%, 08/15/2015 |
| 710,000 |
| 678,050 |
| ||
Series B, 6.625%, 08/15/2015 |
| 1,680,000 |
| 1,587,600 |
| ||
Series C, 6.625%, 08/15/2015 |
| 200,000 |
| 189,000 |
| ||
RH Donnelley Corp. |
|
|
|
|
| ||
Series A-1, 6.875%, 01/15/2013 |
| 250,000 |
| 23,750 |
| ||
Series A-2, 6.875%, 01/15/2013 |
| 25,000 |
| 2,375 |
| ||
Series A-3, 8.875%, 01/15/2016 |
| 380,000 |
| 36,100 |
| ||
Series A-4, 8.875%, 10/15/2017 |
| 1,800,000 |
| 171,000 |
| ||
|
|
|
| 2,687,875 |
| ||
Aerospace - Defense - 0.98% |
|
|
|
|
| ||
Alliant Techsystems, Inc. |
|
|
|
|
| ||
6.750%, 04/01/2016 |
| 915,000 |
| 908,138 |
| ||
L-3 Communications Corp. |
|
|
|
|
| ||
6.125%, 07/15/2013 |
| 100,000 |
| 101,250 |
| ||
6.125%, 01/15/2014 |
| 475,000 |
| 475,000 |
| ||
5.875%, 01/15/2015 |
| 1,100,000 |
| 1,083,499 |
| ||
Series B, 6.375%, 10/15/2015 |
| 400,000 |
| 395,500 |
| ||
TransDigm, Inc. |
|
|
|
|
| ||
7.750%, 07/15/2014 |
| 625,000 |
| 635,938 |
| ||
|
|
|
| 3,599,325 |
| ||
Agriculture - 1.10% |
|
|
|
|
| ||
Altria Group, Inc. |
|
|
|
|
| ||
9.250%, 08/06/2019 |
| 825,000 |
| 1,008,951 |
| ||
Reynolds American, Inc. |
|
|
|
|
| ||
7.250%, 06/01/2013 |
| 625,000 |
| 690,898 |
| ||
7.625%, 06/01/2016 |
| 2,155,000 |
| 2,345,178 |
| ||
|
|
|
| 4,045,027 |
| ||
Apparel - 0.88% |
|
|
|
|
| ||
Levi Strauss & Co. |
|
|
|
|
| ||
9.750%, 01/15/2015 |
| 1,870,000 |
| 1,968,175 |
| ||
8.875%, 04/01/2016 |
| 1,200,000 |
| 1,245,000 |
| ||
|
|
|
| 3,213,175 |
| ||
|
| Principal |
|
|
| ||
Interest Rate/Maturity Date |
| Amount |
| Market Value |
| ||
|
|
|
|
|
| ||
Auto Manufacturers - 0.30% |
|
|
|
|
| ||
Ford Motor Co. |
|
|
|
|
| ||
7.450%, 07/16/2031 |
| $ | 1,260,000 |
| $ | 1,078,875 |
|
8.900%, 01/15/2032 |
| 25,000 |
| 21,375 |
| ||
|
|
|
| 1,100,250 |
| ||
Auto Parts & Equipment - 0.15% |
|
|
|
|
| ||
TRW Automotive, Inc. |
|
|
|
|
| ||
8.875%, 12/01/2017(3) |
| 550,000 |
| 551,375 |
| ||
|
|
|
|
|
| ||
Beverages - 1.10% |
|
|
|
|
| ||
Constellation Brands, Inc. |
|
|
|
|
| ||
8.375%, 12/15/2014 |
| 1,500,000 |
| 1,597,500 |
| ||
7.250%, 09/01/2016 |
| 1,995,000 |
| 2,029,913 |
| ||
7.250%, 05/15/2017 |
| 400,000 |
| 406,000 |
| ||
|
|
|
| 4,033,413 |
| ||
Building Materials - 0.21% |
|
|
|
|
| ||
Associated Materials LLC |
|
|
|
|
| ||
9.875%, 11/15/2016(3) |
| 175,000 |
| 183,750 |
| ||
Interline Brands, Inc. |
|
|
|
|
| ||
8.125%, 06/15/2014 |
| 600,000 |
| 595,500 |
| ||
NTK Holdings, Inc. |
|
|
|
|
| ||
10.750%, 03/01/2014(1)(4) |
| 75,000 |
| 3,375 |
| ||
|
|
|
| 782,625 |
| ||
Chemicals - 2.73% |
|
|
|
|
| ||
Airgas, Inc. |
|
|
|
|
| ||
7.125%, 10/01/2018(3) |
| 375,000 |
| 390,000 |
| ||
Ashland, Inc. |
|
|
|
|
| ||
9.125%, 06/01/2017(3) |
| 1,100,000 |
| 1,185,250 |
| ||
Lyondell Chemical Co. |
|
|
|
|
| ||
8.375%, 08/15/2015(1)(3) |
| 945,000 |
| 240,975 |
| ||
MacDermid, Inc. |
|
|
|
|
| ||
9.500%, 04/15/2017(3) |
| 1,650,000 |
| 1,641,750 |
| ||
Nalco Co. |
|
|
|
|
| ||
7.750%, 11/15/2011 |
| 75,000 |
| 75,000 |
| ||
8.875%, 11/15/2013 |
| 530,000 |
| 545,900 |
| ||
8.250%, 05/15/2017(3) |
| 1,050,000 |
| 1,099,875 |
| ||
NewMarket Corp. |
|
|
|
|
| ||
7.125%, 12/15/2016 |
| 1,405,000 |
| 1,366,363 |
| ||
Nova Chemicals Corp. |
|
|
|
|
| ||
6.500%, 01/15/2012 |
| 1,045,000 |
| 1,039,775 |
| ||
8.375%, 11/01/2016(3) |
| 2,375,000 |
| 2,416,562 |
| ||
|
|
|
| 10,001,450 |
| ||
Interest Rate/Maturity Date |
| Principal |
| Market Value |
| ||
|
|
|
|
|
| ||
Coal - 2.25% |
|
|
|
|
| ||
Arch Coal, Inc. |
|
|
|
|
| ||
8.750%, 08/01/2016(3) |
| $ | 750,000 |
| $ | 776,250 |
|
Arch Western Finance LLC |
|
|
|
|
| ||
6.750%, 07/01/2013(5) |
| 1,275,000 |
| 1,275,000 |
| ||
Cloud Peak Energy Resources LLC |
|
|
|
|
| ||
8.250%, 12/15/2017(3) |
| 400,000 |
| 396,000 |
| ||
8.500%, 12/15/2019(3) |
| 1,450,000 |
| 1,442,750 |
| ||
Drummond Co., Inc. |
|
|
|
|
| ||
7.375%, 02/15/2016(3) |
| 1,475,000 |
| 1,397,563 |
| ||
Peabody Energy Corp. |
|
|
|
|
| ||
Series B, 6.875%, 03/15/2013 |
| 1,650,000 |
| 1,674,750 |
| ||
5.875%, 04/15/2016 |
| 900,000 |
| 877,500 |
| ||
7.875%, 11/01/2026 |
| 425,000 |
| 420,750 |
| ||
|
|
|
| 8,260,563 |
| ||
Commercial Services - 4.64% |
|
|
|
|
| ||
ARAMARK Corp. |
|
|
|
|
| ||
3.781%, 02/01/2015(5) |
| 65,000 |
| 58,175 |
| ||
3.781%, 02/01/2015 |
| 3,355,000 |
| 3,380,162 |
| ||
Cenveo Corp. |
|
|
|
|
| ||
7.875%, 12/01/2013 |
| 1,025,000 |
| 944,281 |
| ||
8.375%, 06/15/2014 |
| 650,000 |
| 541,125 |
| ||
10.500%, 08/15/2016(3) |
| 350,000 |
| 350,875 |
| ||
Corrections Corp. of America |
|
|
|
|
| ||
6.250%, 03/15/2013 |
| 999,000 |
| 1,005,244 |
| ||
6.750%, 01/31/2014 |
| 1,450,000 |
| 1,453,625 |
| ||
7.750%, 06/01/2017 |
| 1,725,000 |
| 1,802,625 |
| ||
Deluxe Corp. |
|
|
|
|
| ||
7.375%, 06/01/2015 |
| 870,000 |
| 843,900 |
| ||
Education Management LLC |
|
|
|
|
| ||
8.750%, 06/01/2014 |
| 1,200,000 |
| 1,239,000 |
| ||
10.250%, 06/01/2016 |
| 215,000 |
| 228,975 |
| ||
The Geo Group, Inc. |
|
|
|
|
| ||
7.750%, 10/15/2017(3) |
| 1,700,000 |
| 1,734,000 |
| ||
Iron Mountain, Inc. |
|
|
|
|
| ||
7.750%, 01/15/2015 |
| 1,000,000 |
| 1,007,500 |
| ||
8.750%, 07/15/2018 |
| 1,635,000 |
| 1,702,444 |
| ||
8.000%, 06/15/2020 |
| 375,000 |
| 378,750 |
| ||
8.375%, 08/15/2021 |
| 325,000 |
| 333,938 |
| ||
|
|
|
| 17,004,619 |
| ||
|
| Principal |
|
|
| ||
Interest Rate/Maturity Date |
| Amount |
| Market Value |
| ||
|
|
|
|
|
| ||
Communications - 0.72% |
|
|
|
|
| ||
Intelsat Jackson Holdings Ltd. |
|
|
|
|
| ||
9.500%, 06/15/2016(3) |
| $ | 900,000 |
| $ | 946,125 |
|
11.250%, 06/15/2016 |
| 600,000 |
| 643,500 |
| ||
8.500%, 11/01/2019(3) |
| 1,025,000 |
| 1,030,125 |
| ||
|
|
|
| 2,619,750 |
| ||
Distribution - Wholesale - 0.18% |
|
|
|
|
| ||
Baker & Taylor, Inc. |
|
|
|
|
| ||
11.500%, 07/01/2013(3) |
| 1,295,000 |
| 666,925 |
| ||
|
|
|
|
|
| ||
Diversified Financial Services - 6.44% |
|
|
|
|
| ||
E*Trade Financial Corp. |
|
|
|
|
| ||
12.500%, 11/30/2017(2)(6) |
| 1,525,000 |
| 1,722,720 |
| ||
Ford Motor Credit Co. LLC |
|
|
|
|
| ||
9.875%, 08/10/2011 |
| 1,775,000 |
| 1,842,813 |
| ||
3.034%, 01/13/2012(5) |
| 2,850,000 |
| 2,587,087 |
| ||
7.800%, 06/01/2012 |
| 900,000 |
| 899,800 |
| ||
7.500%, 08/01/2012 |
| 875,000 |
| 867,640 |
| ||
8.700%, 10/01/2014 |
| 575,000 |
| 591,329 |
| ||
8.000%, 12/15/2016 |
| 1,385,000 |
| 1,381,208 |
| ||
Fox Acquisition Sub LLC |
|
|
|
|
| ||
13.375%, 07/15/2016(3) |
| 540,000 |
| 408,375 |
| ||
Global Cash Access LLC |
|
|
|
|
| ||
8.750%, 03/15/2012 |
| 925,000 |
| 909,969 |
| ||
GMAC LLC |
|
|
|
|
| ||
7.250%, 03/02/2011(3) |
| 79,000 |
| 78,013 |
| ||
6.875%, 09/15/2011(3) |
| 237,000 |
| 230,483 |
| ||
6.000%, 12/15/2011(3) |
| 244,000 |
| 232,105 |
| ||
7.000%, 02/01/2012(3) |
| 1,004,000 |
| 966,350 |
| ||
6.625%, 05/15/2012(3) |
| 66,000 |
| 63,113 |
| ||
8.000%, 11/01/2031(3) |
| 550,000 |
| 477,125 |
| ||
Hughes Network Systems LLC |
|
|
|
|
| ||
9.500%, 04/15/2014 |
| 1,560,000 |
| 1,583,400 |
| ||
Petroplus Finance Ltd. |
|
|
|
|
| ||
6.750%, 05/01/2014(3) |
| 1,585,000 |
| 1,497,825 |
| ||
7.000%, 05/01/2017(3) |
| 925,000 |
| 832,500 |
| ||
9.375%, 09/15/2019(3) |
| 300,000 |
| 298,500 |
| ||
Pinnacle Foods Finance LLC |
|
|
|
|
| ||
9.250%, 04/01/2015 |
| 1,550,000 |
| 1,608,668 |
| ||
10.625%, 04/01/2017 |
| 400,000 |
| 420,000 |
| ||
Rainbow National Services LLC |
|
|
|
|
| ||
8.750%, 09/01/2012(3) |
| 200,000 |
| 204,000 |
| ||
|
| Principal |
|
|
| ||
Interest Rate/Maturity Date |
| Amount |
| Market Value |
| ||
|
|
|
|
|
| ||
Sensus Metering Systems, Inc. |
|
|
|
|
| ||
8.625%, 12/15/2013 |
| $ | 600,000 |
| $ | 610,500 |
|
Southern Star Central Corp. |
|
|
|
|
| ||
6.750%, 03/01/2016 |
| 75,000 |
| 72,000 |
| ||
6.750%, 03/01/2016(3) |
| 575,000 |
| 552,000 |
| ||
UPC Germany GMBH |
|
|
|
|
| ||
8.125%, 12/01/2017(3) |
| 125,000 |
| 125,625 |
| ||
Vanguard Health Holding Co. I LLC |
|
|
|
|
| ||
11.250%, 10/01/2015(4) |
| 1,550,000 |
| 1,635,249 |
| ||
Vanguard Health Holding Co. II LLC |
|
|
|
|
| ||
9.000%, 10/01/2014 |
| 890,000 |
| 921,150 |
| ||
|
|
|
| 23,619,547 |
| ||
Electric - 4.69% |
|
|
|
|
| ||
The AES Corp. |
|
|
|
|
| ||
8.750%, 05/15/2013(3) |
| 275,000 |
| 281,187 |
| ||
7.750%, 03/01/2014 |
| 650,000 |
| 654,875 |
| ||
7.750%, 10/15/2015 |
| 850,000 |
| 856,375 |
| ||
9.750%, 04/15/2016(3) |
| 725,000 |
| 784,813 |
| ||
8.000%, 10/15/2017 |
| 1,125,000 |
| 1,127,813 |
| ||
Edison Mission Energy |
|
|
|
|
| ||
7.500%, 06/15/2013 |
| 55,000 |
| 50,325 |
| ||
7.750%, 06/15/2016 |
| 1,200,000 |
| 984,000 |
| ||
7.000%, 05/15/2017 |
| 150,000 |
| 110,250 |
| ||
7.200%, 05/15/2019 |
| 1,540,000 |
| 1,124,200 |
| ||
7.625%, 05/15/2027 |
| 1,135,000 |
| 754,775 |
| ||
Mirant Americas Generation LLC |
|
|
|
|
| ||
8.300%, 05/01/2011 |
| 275,000 |
| 281,188 |
| ||
8.500%, 10/01/2021 |
| 1,150,000 |
| 1,046,500 |
| ||
Mirant North America LLC |
|
|
|
|
| ||
7.375%, 12/31/2013 |
| 2,190,000 |
| 2,168,099 |
| ||
NRG Energy, Inc. |
|
|
|
|
| ||
7.250%, 02/01/2014 |
| 800,000 |
| 809,000 |
| ||
7.375%, 02/01/2016 |
| 1,715,000 |
| 1,710,713 |
| ||
8.500%, 06/15/2019 |
| 1,925,000 |
| 1,953,875 |
| ||
Texas Competitive Electric Holdings Co. LLC |
|
|
|
|
| ||
Series A, 10.250%, 11/01/2015(4) |
| 3,500,000 |
| 2,502,500 |
| ||
|
|
|
| 17,200,488 |
| ||
Entertainment - 3.22% |
|
|
|
|
| ||
AMC Entertainment, Inc. |
|
|
|
|
| ||
8.000%, 03/01/2014 |
| 50,000 |
| 47,375 |
| ||
11.000%, 02/01/2016 |
| 565,000 |
| 590,425 |
| ||
|
| Principal |
|
|
| ||
Interest Rate/Maturity Date |
| Amount |
| Market Value |
| ||
|
|
|
|
|
| ||
Cinemark, Inc. |
|
|
|
|
| ||
8.625%, 06/15/2019(3) |
| $ | 1,775,000 |
| $ | 1,837,125 |
|
Great Canadian Gaming Corp. |
|
|
|
|
| ||
7.250%, 02/15/2015(3) |
| 1,230,000 |
| 1,197,713 |
| ||
Marquee Holdings, Inc. |
|
|
|
|
| ||
9.505%, 08/15/2014(4) |
| 2,490,000 |
| 2,054,250 |
| ||
Pinnacle Entertainment, Inc. |
|
|
|
|
| ||
8.250%, 03/15/2012 |
| 275,000 |
| 276,375 |
| ||
7.500%, 06/15/2015 |
| 2,605,000 |
| 2,331,475 |
| ||
8.625%, 08/01/2017(3) |
| 775,000 |
| 775,000 |
| ||
Regal Cinemas Corp. |
|
|
|
|
| ||
8.625%, 07/15/2019(3) |
| 1,325,000 |
| 1,364,750 |
| ||
Seneca Gaming Corp. |
|
|
|
|
| ||
7.250%, 05/01/2012 |
| 720,000 |
| 709,200 |
| ||
Series B, 7.250%, 05/01/2012 |
| 630,000 |
| 620,550 |
| ||
|
|
|
| 11,804,238 |
| ||
Environmental Control - 0.82% |
|
|
|
|
| ||
Allied Waste North America, Inc. |
|
|
|
|
| ||
7.250%, 03/15/2015 |
| 900,000 |
| 943,781 |
| ||
Series B, 7.125%, 05/15/2016 |
| 200,000 |
| 212,274 |
| ||
Browning-Ferris Industries, Inc. |
|
|
|
|
| ||
9.250%, 05/01/2021 |
| 35,000 |
| 43,551 |
| ||
Clean Harbors, Inc. |
|
|
|
|
| ||
7.625%, 08/15/2016(3) |
| 1,775,000 |
| 1,794,969 |
| ||
Safety-Kleen Services, Inc. |
|
|
|
|
| ||
9.250%, 06/01/2008(1)(2) |
| 50,000 |
| 100 |
| ||
|
|
|
| 2,994,675 |
| ||
Food - 3.13% |
|
|
|
|
| ||
Ahold Lease USA, Inc. |
|
|
|
|
| ||
Series A-1, 7.820%, 01/02/2020(4) |
| 454,418 |
| 475,435 |
| ||
Series A-2, 8.620%, 01/02/2025(4) |
| 831,908 |
| 836,068 |
| ||
American Stores Co. |
|
|
|
|
| ||
7.900%, 05/01/2017 |
| 550,000 |
| 521,125 |
| ||
8.000%, 06/01/2026 |
| 1,465,000 |
| 1,351,462 |
| ||
Series MTNB, 7.100%, 03/20/2028 |
| 600,000 |
| 492,000 |
| ||
Dean Foods Co. |
|
|
|
|
| ||
7.000%, 06/01/2016 |
| 1,800,000 |
| 1,745,999 |
| ||
Del Monte Corp. |
|
|
|
|
| ||
6.750%, 02/15/2015 |
| 100,000 |
| 101,000 |
| ||
7.500%, 10/15/2019(3) |
| 1,225,000 |
| 1,243,375 |
| ||
Dole Food Co., Inc. |
|
|
|
|
| ||
8.750%, 07/15/2013 |
| 1,125,000 |
| 1,147,500 |
| ||
13.875%, 03/15/2014(3) |
| 691,000 |
| 815,380 |
| ||
|
| Principal |
|
|
| ||
Interest Rate/Maturity Date |
| Amount |
| Market Value |
| ||
|
|
|
|
|
| ||
Great Atlantic & Pacific Tea Co. |
|
|
|
|
| ||
11.375%, 08/01/2015(3) |
| $ | 475,000 |
| $ | 495,188 |
|
Pilgrim’s Pride Corp. |
|
|
|
|
| ||
9.250%, 11/15/2013(1)(2)(7) |
| 100,000 |
| 104,250 |
| ||
Smithfield Foods, Inc. |
|
|
|
|
| ||
10.000%, 07/15/2014(3) |
| 1,225,000 |
| 1,289,313 |
| ||
SUPERVALU, Inc. |
|
|
|
|
| ||
7.500%, 11/15/2014 |
| 350,000 |
| 356,125 |
| ||
8.000%, 05/01/2016 |
| 500,000 |
| 512,500 |
| ||
|
|
|
| 11,486,720 |
| ||
Forest Products & Paper - 1.21% |
|
|
|
|
| ||
Buckeye Technologies, Inc. |
|
|
|
|
| ||
8.500%, 10/01/2013 |
| 800,000 |
| 822,000 |
| ||
Georgia-Pacific LLC |
|
|
|
|
| ||
9.500%, 12/01/2011 |
| 775,000 |
| 842,812 |
| ||
8.250%, 05/01/2016(3) |
| 50,000 |
| 53,250 |
| ||
7.125%, 01/15/2017(3) |
| 575,000 |
| 585,063 |
| ||
International Paper Co. |
|
|
|
|
| ||
7.950%, 06/15/2018 |
| 600,000 |
| 695,707 |
| ||
9.375%, 05/15/2019 |
| 450,000 |
| 559,239 |
| ||
NewPage Corp. |
|
|
|
|
| ||
11.375%, 12/31/2014(3) |
| 900,000 |
| 890,999 |
| ||
|
|
|
| 4,449,070 |
| ||
Gaming - 1.58% |
|
|
|
|
| ||
Ameristar Casinos, Inc. |
|
|
|
|
| ||
9.250%, 06/01/2014(3) |
| 1,625,000 |
| 1,665,625 |
| ||
Harrah’s Operating Escrow LLC |
|
|
|
|
| ||
11.250%, 06/01/2017(3) |
| 1,425,000 |
| 1,460,625 |
| ||
MGM Mirage |
|
|
|
|
| ||
8.500%, 09/15/2010 |
| 1,800,000 |
| 1,795,500 |
| ||
11.125%, 11/15/2017(3) |
| 800,000 |
| 880,000 |
| ||
|
|
|
| 5,801,750 |
| ||
Gas - 0.94% |
|
|
|
|
| ||
Southern Star Central Gas Pipeline, Inc. |
|
|
|
|
| ||
6.000%, 06/01/2016(3) |
| 500,000 |
| 475,000 |
| ||
Southern Union Co. |
|
|
|
|
| ||
7.600%, 02/01/2024 |
| 1,025,000 |
| 1,101,089 |
| ||
8.250%, 11/15/2029 |
| 1,625,000 |
| 1,855,870 |
| ||
|
|
|
| 3,431,959 |
| ||
|
| Principal |
|
|
| ||
Interest Rate/Maturity Date |
| Amount |
| Market Value |
| ||
|
|
|
|
|
| ||
Healthcare - Products - 1.54% |
|
|
|
|
| ||
Accellent, Inc. |
|
|
|
|
| ||
10.500%, 12/01/2013 |
| $ | 1,205,000 |
| $ | 1,165,838 |
|
Boston Scientific Corp. |
|
|
|
|
| ||
6.000%, 06/15/2011 |
| 900,000 |
| 931,500 |
| ||
5.450%, 06/15/2014 |
| 450,000 |
| 457,875 |
| ||
6.400%, 06/15/2016 |
| 575,000 |
| 592,250 |
| ||
7.000%, 11/15/2035 |
| 625,000 |
| 621,875 |
| ||
Inverness Medical Innovations, Inc. |
|
|
|
|
| ||
9.000%, 05/15/2016 |
| 1,825,000 |
| 1,856,937 |
| ||
|
|
|
| 5,626,275 |
| ||
Healthcare - Services - 5.94% |
|
|
|
|
| ||
Community Health Systems, Inc. |
|
|
|
|
| ||
8.875%, 07/15/2015 |
| 3,250,000 |
| 3,323,125 |
| ||
DaVita, Inc. |
|
|
|
|
| ||
7.250%, 03/15/2015 |
| 4,620,000 |
| 4,619,999 |
| ||
HCA, Inc. |
|
|
|
|
| ||
6.300%, 10/01/2012 |
| 1,250,000 |
| 1,225,000 |
| ||
6.750%, 07/15/2013 |
| 875,000 |
| 848,750 |
| ||
9.125%, 11/15/2014 |
| 210,000 |
| 219,975 |
| ||
9.250%, 11/15/2016 |
| 2,200,000 |
| 2,332,000 |
| ||
9.625%, 11/15/2016(6) |
| 1,438,000 |
| 1,536,863 |
| ||
Healthsouth Corp. |
|
|
|
|
| ||
10.750%, 06/15/2016 |
| 600,000 |
| 657,000 |
| ||
8.125%, 02/15/2020 |
| 1,600,000 |
| 1,576,000 |
| ||
IASIS Healthcare LLC |
|
|
|
|
| ||
8.750%, 06/15/2014 |
| 1,650,000 |
| 1,687,125 |
| ||
Psychiatric Solutions, Inc. |
|
|
|
|
| ||
7.750%, 07/15/2015 |
| 1,105,000 |
| 1,071,850 |
| ||
7.750%, 07/15/2015(3) |
| 1,375,000 |
| 1,299,375 |
| ||
United Surgical Partners International, Inc. |
|
|
|
|
| ||
8.875%, 05/01/2017 |
| 125,000 |
| 128,125 |
| ||
9.250%, 05/01/2017(6) |
| 1,220,000 |
| 1,238,300 |
| ||
|
|
|
| 21,763,487 |
| ||
Holding Companies - Diversified - 0.56% |
|
|
|
|
| ||
AMH Holdings, Inc. |
|
|
|
|
| ||
11.250%, 03/01/2014(4) |
| 360,000 |
| 339,300 |
| ||
Atlantic Broadband Finance LLC |
|
|
|
|
| ||
9.375%, 01/15/2014 |
| 985,000 |
| 985,000 |
| ||
Reynolds Group DL Escrow, Inc. |
|
|
|
|
| ||
7.750%, 10/15/2016(3) |
| 700,000 |
| 710,500 |
| ||
|
|
|
| 2,034,800 |
| ||
|
| Principal |
|
|
| ||
Interest Rate/Maturity Date |
| Amount |
| Market Value |
| ||
|
|
|
|
|
| ||
Home Furnishings - 0.09% |
|
|
|
|
| ||
Norcraft Cos LP |
|
|
|
|
| ||
9.000%, 11/01/2011 |
| $ | 35,000 |
| $ | 35,175 |
|
Norcraft Holdings LP |
|
|
|
|
| ||
9.750%, 09/01/2012(4) |
| 300,000 |
| 286,500 |
| ||
|
|
|
| 321,675 |
| ||
Lodging - 1.93% |
|
|
|
|
| ||
Harrah’s Operating Co., Inc. |
|
|
|
|
| ||
11.250%, 06/01/2017(3) |
| 50,000 |
| 51,375 |
| ||
Host Hotels & Resorts LP - REIT |
|
|
|
|
| ||
Series M, 7.000%, 08/15/2012 |
| 275,000 |
| 279,813 |
| ||
7.125%, 11/01/2013 |
| 950,000 |
| 947,625 |
| ||
Series O, 6.375%, 03/15/2015 |
| 75,000 |
| 71,063 |
| ||
Series Q, 6.750%, 06/01/2016 |
| 625,000 |
| 595,313 |
| ||
9.000%, 05/15/2017(3) |
| 1,000,000 |
| 1,057,500 |
| ||
Las Vegas Sands Corp. |
|
|
|
|
| ||
6.375%, 02/15/2015 |
| 1,675,000 |
| 1,490,750 |
| ||
Starwood Hotels & Resorts Worldwide, Inc. |
|
|
|
|
| ||
6.250%, 02/15/2013 |
| 1,450,000 |
| 1,482,625 |
| ||
7.875%, 10/15/2014 |
| 250,000 |
| 264,687 |
| ||
Wynn Las Vegas LLC |
|
|
|
|
| ||
7.875%, 11/01/2017(3) |
| 825,000 |
| 825,000 |
| ||
|
|
|
| 7,065,751 |
| ||
Machinery - Construction & Mining - 0.21% |
|
|
|
|
| ||
Terex Corp. |
|
|
|
|
| ||
8.000%, 11/15/2017 |
| 825,000 |
| 759,000 |
| ||
|
|
|
|
|
| ||
Media - 5.80% |
|
|
|
|
| ||
Bonten Media Acquisition Co. |
|
|
|
|
| ||
9.000%, 06/01/2015(3)(6) |
| 445,718 |
| 154,330 |
| ||
Cablevision Systems Corp. |
|
|
|
|
| ||
8.625%, 09/15/2017(3) |
| 925,000 |
| 952,750 |
| ||
CanWest MediaWorks, Inc. |
|
|
|
|
| ||
8.000%, 09/15/2012 |
| 361,654 |
| 298,816 |
| ||
CCH I Holdings LLC |
|
|
|
|
| ||
9.920%, 04/01/2014(1) |
| 275,000 |
| 5,500 |
| ||
10.000%, 05/15/2014(1) |
| 25,000 |
| 500 |
| ||
11.750%, 05/15/2014(1)(4) |
| 230,000 |
| 4,600 |
| ||
12.125%, 01/15/2015(1)(4) |
| 25,000 |
| 500 |
| ||
CCO Holdings LLC |
|
|
|
|
| ||
8.750%, 11/15/2013(1) |
| 200,000 |
| 221,250 |
| ||
|
| Principal |
|
|
| ||
Interest Rate/Maturity Date |
| Amount |
| Market Value |
| ||
|
|
|
|
|
| ||
Charter Communications Operating LLC |
|
|
|
|
| ||
10.000%, 04/30/2012(1)(3) |
| $ | 475,000 |
| $ | 485,688 |
|
CSC Holdings, Inc. |
|
|
|
|
| ||
6.750%, 04/15/2012 |
| 45,000 |
| 46,688 |
| ||
8.500%, 04/15/2014(3) |
| 200,000 |
| 211,250 |
| ||
8.500%, 06/15/2015(3) |
| 1,700,000 |
| 1,795,624 |
| ||
7.625%, 07/15/2018 |
| 325,000 |
| 330,688 |
| ||
8.625%, 02/15/2019(3) |
| 475,000 |
| 505,875 |
| ||
Dex Media, Inc. |
|
|
|
|
| ||
8.000%, 11/15/2013 |
| 20,000 |
| 5,000 |
| ||
9.000%, 11/15/2013(1)(4) |
| 150,000 |
| 37,500 |
| ||
9.000%, 11/15/2013(1)(4) |
| 225,000 |
| 56,250 |
| ||
Dex Media West LLC |
|
|
|
|
| ||
Series B, 8.500%, 08/15/2010 |
| 20,000 |
| 20,800 |
| ||
Series B, 9.875%, 08/15/2013 |
| 44,000 |
| 13,970 |
| ||
DirecTV Holdings LLC |
|
|
|
|
| ||
7.625%, 05/15/2016 |
| 2,600,000 |
| 2,805,079 |
| ||
DISH DBS Corp. |
|
|
|
|
| ||
7.000%, 10/01/2013 |
| 475,000 |
| 477,375 |
| ||
6.625%, 10/01/2014 |
| 650,000 |
| 638,625 |
| ||
7.750%, 05/31/2015 |
| 1,450,000 |
| 1,479,000 |
| ||
7.125%, 02/01/2016 |
| 960,000 |
| 955,200 |
| ||
7.875%, 09/01/2019 |
| 1,700,000 |
| 1,721,249 |
| ||
Idearc, Inc. |
|
|
|
|
| ||
8.000%, 11/15/2016(1) |
| 1,265,000 |
| 82,225 |
| ||
Mediacom LLC |
|
|
|
|
| ||
9.125%, 08/15/2019(3) |
| 500,000 |
| 510,000 |
| ||
Radio One, Inc. |
|
|
|
|
| ||
Series B, 8.875%, 07/01/2011 |
| 865,000 |
| 685,513 |
| ||
The Reader’s Digest Association, Inc. |
|
|
|
|
| ||
9.000%, 02/15/2017(1) |
| 470,000 |
| 9,988 |
| ||
Salem Communications Holding Corp. |
|
|
|
|
| ||
7.750%, 12/15/2010 |
| 445,000 |
| 446,113 |
| ||
Sinclair Television Group, Inc. |
|
|
|
|
| ||
8.000%, 03/15/2012 |
| 1,825,000 |
| 1,758,843 |
| ||
UPC Holding BV |
|
|
|
|
| ||
9.875%, 04/15/2018(3) |
| 1,050,000 |
| 1,097,250 |
| ||
Videotron Ltee |
|
|
|
|
| ||
6.875%, 01/15/2014 |
| 1,495,000 |
| 1,465,100 |
| ||
6.375%, 12/15/2015 |
| 685,000 |
| 653,319 |
| ||
9.125%, 04/15/2018 |
| 500,000 |
| 537,500 |
| ||
9.125%, 04/15/2018(3) |
| 725,000 |
| 779,374 |
| ||
|
|
|
| 21,249,332 |
| ||
|
| Principal |
|
|
| ||
Interest Rate/Maturity Date |
| Amount |
| Market Value |
| ||
|
|
|
|
|
| ||
Mining - 0.81% |
|
|
|
|
| ||
Alcoa, Inc. |
|
|
|
|
| ||
6.750%, 07/15/2018 |
| $ | 1,675,000 |
| $ | 1,727,183 |
|
5.720%, 02/23/2019 |
| 25,000 |
| 24,378 |
| ||
Teck Resources Ltd. |
|
|
|
|
| ||
9.750%, 05/15/2014 |
| 250,000 |
| 282,188 |
| ||
10.750%, 05/15/2019 |
| 800,000 |
| 938,000 |
| ||
|
|
|
| 2,971,749 |
| ||
Miscellaneous Manufacturers - 1.96% |
|
|
|
|
| ||
Freedom Group, Inc. |
|
|
|
|
| ||
10.250%, 08/01/2015(3) |
| 200,000 |
| 214,750 |
| ||
10.250%, 08/01/2015(3) |
| 1,450,000 |
| 1,556,938 |
| ||
Koppers Holdings, Inc. |
|
|
|
|
| ||
9.875%, 11/15/2014(4) |
| 925,000 |
| 971,250 |
| ||
Koppers, Inc. |
|
|
|
|
| ||
7.875%, 12/01/2019(3) |
| 1,875,000 |
| 1,884,375 |
| ||
RBS Global, Inc. |
|
|
|
|
| ||
9.500%, 08/01/2014 |
| 1,710,000 |
| 1,710,000 |
| ||
SPX Corp. |
|
|
|
|
| ||
7.625%, 12/15/2014 |
| 825,000 |
| 845,625 |
| ||
|
|
|
| 7,182,938 |
| ||
Office - Business Equipment - 0.92% |
|
|
|
|
| ||
Xerox Capital Trust I |
|
|
|
|
| ||
8.000%, 02/01/2027 |
| 3,445,000 |
| 3,383,851 |
| ||
|
|
|
|
|
| ||
Office Furnishings - 0.21% |
|
|
|
|
| ||
Interface, Inc. |
|
|
|
|
| ||
Series B, 11.375%, 11/01/2013 |
| 475,000 |
| 521,906 |
| ||
9.500%, 02/01/2014 |
| 265,000 |
| 264,006 |
| ||
|
|
|
| 785,912 |
| ||
Oil & Gas - 7.04% |
|
|
|
|
| ||
Atlas Energy Operating Co. LLC |
|
|
|
|
| ||
12.125%, 08/01/2017 |
| 1,325,000 |
| 1,487,313 |
| ||
Chesapeake Energy Corp. |
|
|
|
|
| ||
7.625%, 07/15/2013 |
| 1,250,000 |
| 1,271,875 |
| ||
7.000%, 08/15/2014 |
| 50,000 |
| 50,000 |
| ||
9.500%, 02/15/2015 |
| 275,000 |
| 289,438 |
| ||
6.375%, 06/15/2015 |
| 275,000 |
| 257,125 |
| ||
6.875%, 01/15/2016 |
| 1,275,000 |
| 1,230,375 |
| ||
6.250%, 01/15/2018 |
| 585,000 |
| 529,425 |
| ||
7.250%, 12/15/2018 |
| 550,000 |
| 532,125 |
| ||
|
| Principal |
|
|
| ||
Interest Rate/Maturity Date |
| Amount |
| Market Value |
| ||
|
|
|
|
|
| ||
Comstock Resources, Inc. |
|
|
|
|
| ||
8.375%, 10/15/2017 |
| $ | 1,500,000 |
| $ | 1,511,250 |
|
Encore Acquisition Co. |
|
|
|
|
| ||
6.250%, 04/15/2014 |
| 525,000 |
| 526,313 |
| ||
9.500%, 05/01/2016 |
| 1,000,000 |
| 1,060,000 |
| ||
EXCO Resources, Inc. |
|
|
|
|
| ||
7.250%, 01/15/2011 |
| 2,150,000 |
| 2,149,999 |
| ||
Hercules Offshore LLC |
|
|
|
|
| ||
10.500%, 10/15/2017(3) |
| 1,750,000 |
| 1,776,249 |
| ||
Hilcorp Energy I LP |
|
|
|
|
| ||
7.750%, 11/01/2015(3) |
| 95,000 |
| 91,913 |
| ||
9.000%, 06/01/2016(3) |
| 334,000 |
| 336,505 |
| ||
Mariner Energy, Inc. |
|
|
|
|
| ||
11.750%, 06/30/2016 |
| 1,375,000 |
| 1,522,813 |
| ||
Newfield Exploration Co. |
|
|
|
|
| ||
7.125%, 05/15/2018 |
| 875,000 |
| 881,563 |
| ||
Penn Virginia Corp. |
|
|
|
|
| ||
10.375%, 06/15/2016 |
| 1,325,000 |
| 1,434,313 |
| ||
Pioneer Natural Resources Co. |
|
|
|
|
| ||
6.650%, 03/15/2017 |
| 3,650,000 |
| 3,555,267 |
| ||
Quicksilver Resources, Inc. |
|
|
|
|
| ||
8.250%, 08/01/2015 |
| 850,000 |
| 850,000 |
| ||
11.750%, 01/01/2016 |
| 700,000 |
| 781,375 |
| ||
Sabine Pass LNG LP |
|
|
|
|
| ||
7.250%, 11/30/2013 |
| 1,750,000 |
| 1,561,874 |
| ||
SandRidge Energy, Inc. |
|
|
|
|
| ||
8.625%, 04/01/2015(6) |
| 1,625,000 |
| 1,566,093 |
| ||
8.000%, 06/01/2018(3) |
| 575,000 |
| 544,813 |
| ||
|
|
|
| 25,798,016 |
| ||
Oil & Gas Services - 1.36% |
|
|
|
|
| ||
Complete Production Services, Inc. |
|
|
|
|
| ||
8.000%, 12/15/2016 |
| 1,825,000 |
| 1,797,625 |
| ||
Dresser-Rand Group, Inc. |
|
|
|
|
| ||
7.375%, 11/01/2014 |
| 2,230,000 |
| 2,207,700 |
| ||
Hornbeck Offshore Services, Inc. |
|
|
|
|
| ||
8.000%, 09/01/2017(3) |
| 1,000,000 |
| 995,000 |
| ||
|
|
|
| 5,000,325 |
| ||
Packaging & Containers - 3.27% |
|
|
|
|
| ||
Crown Americas LLC |
|
|
|
|
| ||
7.625%, 11/15/2013 |
| 475,000 |
| 488,656 |
| ||
7.750%, 11/15/2015 |
| 605,000 |
| 620,125 |
| ||
7.625%, 05/15/2017(3) |
| 700,000 |
| 717,500 |
| ||
|
| Principal |
|
|
| ||
Interest Rate/Maturity Date |
| Amount |
| Market Value |
| ||
|
|
|
|
|
| ||
Graphic Packaging International, Inc. |
|
|
|
|
| ||
9.500%, 08/15/2013 |
| $ | 1,160,000 |
| $ | 1,194,800 |
|
9.500%, 06/15/2017 |
| 2,055,000 |
| 2,178,299 |
| ||
Greif, Inc. |
|
|
|
|
| ||
7.750%, 08/01/2019(3) |
| 1,625,000 |
| 1,653,438 |
| ||
Owens-Brockway Glass Container, Inc. |
|
|
|
|
| ||
8.250%, 05/15/2013 |
| 1,132,000 |
| 1,160,300 |
| ||
6.750%, 12/01/2014 |
| 425,000 |
| 431,375 |
| ||
7.375%, 05/15/2016 |
| 400,000 |
| 407,000 |
| ||
Owens-Illinois, Inc. |
|
|
|
|
| ||
7.800%, 05/15/2018 |
| 1,675,000 |
| 1,687,563 |
| ||
Radnor Holdings Corp. |
|
|
|
|
| ||
11.000%, 03/15/2010(1)(2) |
| 25,000 |
| 3 |
| ||
Silgan Holdings, Inc. |
|
|
|
|
| ||
7.250%, 08/15/2016 |
| 1,425,000 |
| 1,448,156 |
| ||
|
|
|
| 11,987,215 |
| ||
Pipelines - 4.99% |
|
|
|
|
| ||
ANR Pipeline Co. |
|
|
|
|
| ||
7.375%, 02/15/2024 |
| 60,000 |
| 66,735 |
| ||
7.000%, 06/01/2025 |
| 10,000 |
| 10,815 |
| ||
Atlas Pipeline Partners LP |
|
|
|
|
| ||
8.125%, 12/15/2015 |
| 1,750,000 |
| 1,443,750 |
| ||
8.750%, 06/15/2018 |
| 200,000 |
| 163,000 |
| ||
Copano Energy LLC |
|
|
|
|
| ||
8.125%, 03/01/2016 |
| 350,000 |
| 351,750 |
| ||
7.750%, 06/01/2018 |
| 675,000 |
| 675,000 |
| ||
Dynegy Holdings, Inc. |
|
|
|
|
| ||
8.375%, 05/01/2016 |
| 3,070,000 |
| 2,832,075 |
| ||
7.125%, 05/15/2018 |
| 500,000 |
| 377,500 |
| ||
7.750%, 06/01/2019 |
| 460,000 |
| 378,350 |
| ||
7.625%, 10/15/2026 |
| 25,000 |
| 16,375 |
| ||
El Paso Corp. |
|
|
|
|
| ||
7.750%, 06/15/2010 |
| 300,000 |
| 304,542 |
| ||
7.000%, 05/15/2011 |
| 100,000 |
| 101,304 |
| ||
Series GMTN, 7.375%, 12/15/2012 |
| 125,000 |
| 128,015 |
| ||
8.250%, 02/15/2016 |
| 125,000 |
| 130,000 |
| ||
7.250%, 06/01/2018 |
| 175,000 |
| 175,863 |
| ||
Series GMTN, 7.800%, 08/01/2031 |
| 2,025,000 |
| 1,895,481 |
| ||
Series GMTN, 7.750%, 01/15/2032 |
| 150,000 |
| 139,593 |
| ||
Kinder Morgan Finance Co. ULC |
|
|
|
|
| ||
5.350%, 01/05/2011 |
| 1,050,000 |
| 1,060,500 |
| ||
|
| Principal |
|
|
| ||
Interest Rate/Maturity Date |
| Amount |
| Market Value |
| ||
|
|
|
|
|
| ||
MarkWest Energy Partners LP |
|
|
|
|
| ||
Series B, 6.875%, 11/01/2014 |
| $ | 175,000 |
| $ | 163,625 |
|
Series B, 8.500%, 07/15/2016 |
| 600,000 |
| 607,500 |
| ||
Series B, 8.750%, 04/15/2018 |
| 950,000 |
| 961,875 |
| ||
Regency Energy Partners LP |
|
|
|
|
| ||
9.375%, 06/01/2016(3) |
| 1,125,000 |
| 1,195,313 |
| ||
Sonat, Inc. |
|
|
|
|
| ||
7.625%, 07/15/2011 |
| 375,000 |
| 382,826 |
| ||
Targa Resources, Inc. |
|
|
|
|
| ||
8.500%, 11/01/2013 |
| 1,455,000 |
| 1,433,175 |
| ||
Targa Resources Partners LP |
|
|
|
|
| ||
11.250%, 07/15/2017(3) |
| 625,000 |
| 671,875 |
| ||
Tennessee Gas Pipeline Co. |
|
|
|
|
| ||
8.375%, 06/15/2032 |
| 150,000 |
| 181,746 |
| ||
Transcontinental Gas Pipe Line Co. LLC |
|
|
|
|
| ||
6.400%, 04/15/2016 |
| 50,000 |
| 56,187 |
| ||
The Williams Cos, Inc. |
|
|
|
|
| ||
7.875%, 09/01/2021 |
| 1,650,000 |
| 1,844,789 |
| ||
8.750%, 03/15/2032 |
| 473,000 |
| 555,156 |
| ||
|
|
|
| 18,304,715 |
| ||
Real Estate - 0.45% |
|
|
|
|
| ||
CB Richard Ellis Services, Inc. |
|
|
|
|
| ||
11.625%, 06/15/2017 |
| 1,500,000 |
| 1,665,000 |
| ||
|
|
|
|
|
| ||
Retail - 5.37% |
|
|
|
|
| ||
Claire’s Stores, Inc. |
|
|
|
|
| ||
9.625%, 06/01/2015(6) |
| 1,565,761 |
| 1,189,978 |
| ||
10.500%, 06/01/2017 |
| 425,000 |
| 320,875 |
| ||
Inergy LP |
|
|
|
|
| ||
6.875%, 12/15/2014 |
| 50,000 |
| 48,625 |
| ||
8.750%, 03/01/2015 |
| 900,000 |
| 922,500 |
| ||
8.250%, 03/01/2016 |
| 750,000 |
| 759,375 |
| ||
JC Penney Corp. Inc. |
|
|
|
|
| ||
7.400%, 04/01/2037 |
| 1,475,000 |
| 1,408,625 |
| ||
Limited Brands, Inc. |
|
|
|
|
| ||
8.500%, 06/15/2019(3) |
| 1,175,000 |
| 1,245,500 |
| ||
6.950%, 03/01/2033 |
| 1,350,000 |
| 1,117,125 |
| ||
7.600%, 07/15/2037 |
| 100,000 |
| 87,000 |
| ||
|
| Principal |
|
|
| ||
Interest Rate/Maturity Date |
| Amount |
| Market Value |
| ||
|
|
|
|
|
| ||
Macy’s Retail Holdings, Inc. |
|
|
|
|
| ||
5.350%, 03/15/2012 |
| $ | 2,540,000 |
| $ | 2,552,700 |
|
5.875%, 01/15/2013 |
| 425,000 |
| 427,125 |
| ||
6.900%, 01/15/2032 |
| 175,000 |
| 147,875 |
| ||
7.875%, 08/15/2036 |
| 525,000 |
| 462,000 |
| ||
Michaels Stores, Inc. |
|
|
|
|
| ||
10.000%, 11/01/2014 |
| 1,600,000 |
| 1,640,000 |
| ||
11.375%, 11/01/2016 |
| 1,000,000 |
| 1,000,000 |
| ||
Neiman-Marcus Group, Inc. |
|
|
|
|
| ||
9.000%, 10/15/2015(6) |
| 1,352,116 |
| 1,227,045 |
| ||
10.375%, 10/15/2015 |
| 500,000 |
| 453,750 |
| ||
Quiksilver, Inc. |
|
|
|
|
| ||
6.875%, 04/15/2015 |
| 1,125,000 |
| 866,250 |
| ||
QVC, Inc. |
|
|
|
|
| ||
7.500%, 10/01/2019(3) |
| 1,400,000 |
| 1,407,000 |
| ||
Sbarro, Inc. |
|
|
|
|
| ||
10.375%, 02/01/2015 |
| 225,000 |
| 178,875 |
| ||
Toys R Us Property Co. I LLC |
|
|
|
|
| ||
10.750%, 07/15/2017(3) |
| 2,075,000 |
| 2,225,438 |
| ||
|
|
|
| 19,687,661 |
| ||
Telecommunications - 11.20% |
|
|
|
|
| ||
American Tower Corp. |
|
|
|
|
| ||
7.000%, 10/15/2017 |
| 575,000 |
| 635,375 |
| ||
CC Holdings GS V LLC |
|
|
|
|
| ||
7.750%, 05/01/2017(3) |
| 1,575,000 |
| 1,673,438 |
| ||
Centennial Communications Corp. |
|
|
|
|
| ||
6.040%, 01/01/2013(5) |
| 575,000 |
| 576,438 |
| ||
Citizens Communications Co. |
|
|
|
|
| ||
7.875%, 01/15/2027 |
| 125,000 |
| 113,750 |
| ||
9.000%, 08/15/2031 |
| 3,455,000 |
| 3,394,537 |
| ||
Crown Castle International Corp. |
|
|
|
|
| ||
9.000%, 01/15/2015 |
| 1,325,000 |
| 1,407,813 |
| ||
7.125%, 11/01/2019 |
| 100,000 |
| 99,250 |
| ||
DigitalGlobe, Inc. |
|
|
|
|
| ||
10.500%, 05/01/2014(3) |
| 950,000 |
| 1,021,250 |
| ||
Embarq Corp. |
|
|
|
|
| ||
7.082%, 06/01/2016 |
| 1,035,000 |
| 1,151,670 |
| ||
7.995%, 06/01/2036 |
| 1,975,000 |
| 2,080,913 |
| ||
GeoEye, Inc. |
|
|
|
|
| ||
9.625%, 10/01/2015(3) |
| 1,675,000 |
| 1,746,188 |
| ||
Hughes Network Systems LLC |
|
|
|
|
| ||
9.500%, 04/15/2014 |
| 75,000 |
| 75,375 |
| ||
|
| Principal |
|
|
| ||
Interest Rate/Maturity Date |
| Amount |
| Market Value |
| ||
|
|
|
|
|
| ||
Intelsat Corp. |
|
|
|
|
| ||
9.250%, 06/15/2016(3) |
| $ | 500,000 |
| $ | 507,500 |
|
Intelsat Intermediate Holding Co. Ltd. |
|
|
|
|
| ||
9.500%, 02/01/2015(3)(8) |
| 275,000 |
| 277,750 |
| ||
Level 3 Financing, Inc. |
|
|
|
|
| ||
12.250%, 03/15/2013 |
| 1,795,000 |
| 1,882,506 |
| ||
9.250%, 11/01/2014 |
| 1,040,000 |
| 923,000 |
| ||
4.601%, 02/15/2015(5) |
| 350,000 |
| 253,750 |
| ||
MetroPCS Wireless, Inc. |
|
|
|
|
| ||
9.250%, 11/01/2014 |
| 175,000 |
| 176,313 |
| ||
9.250%, 11/01/2014 |
| 2,690,000 |
| 2,710,174 |
| ||
Nextel Communications, Inc. |
|
|
|
|
| ||
Series F, 5.950%, 03/15/2014 |
| 350,000 |
| 318,500 |
| ||
Series D, 7.375%, 08/01/2015 |
| 3,125,000 |
| 2,906,250 |
| ||
Qwest Communications International, Inc. |
|
|
|
|
| ||
Series B, 7.500%, 02/15/2014 |
| 875,000 |
| 870,625 |
| ||
Qwest Corp. |
|
|
|
|
| ||
8.875%, 03/15/2012 |
| 750,000 |
| 799,687 |
| ||
7.500%, 10/01/2014 |
| 1,050,000 |
| 1,078,875 |
| ||
7.500%, 06/15/2023 |
| 425,000 |
| 391,000 |
| ||
6.875%, 09/15/2033 |
| 2,550,000 |
| 2,180,250 |
| ||
Rogers Communications, Inc. |
|
|
|
|
| ||
7.250%, 12/15/2012 |
| 30,000 |
| 34,405 |
| ||
8.000%, 12/15/2012 |
| 1,545,000 |
| 1,579,270 |
| ||
8.750%, 05/01/2032 |
| 175,000 |
| 231,888 |
| ||
SBA Telecommunications, Inc. |
|
|
|
|
| ||
8.000%, 08/15/2016(3) |
| 625,000 |
| 646,875 |
| ||
8.250%, 08/15/2019(3) |
| 700,000 |
| 731,500 |
| ||
Sprint Capital Corp. |
|
|
|
|
| ||
8.750%, 03/15/2032 |
| 2,775,000 |
| 2,389,968 |
| ||
Virgin Media Finance PLC |
|
|
|
|
| ||
Series $, 8.750%, 04/15/2014 |
| 450,000 |
| 468,000 |
| ||
9.125%, 08/15/2016 |
| 2,125,000 |
| 2,194,063 |
| ||
Series 1, 9.500%, 08/15/2016 |
| 650,000 |
| 685,750 |
| ||
8.375%, 10/15/2019 |
| 200,000 |
| 201,000 |
| ||
Wind Acquisition Finance SA |
|
|
|
|
| ||
11.750%, 07/15/2014(3) |
| 1,325,000 |
| 1,477,375 |
| ||
Windstream Corp. |
|
|
|
|
| ||
8.625%, 08/01/2016 |
| 1,150,000 |
| 1,164,375 |
| ||
|
|
|
| 41,056,646 |
| ||
Transportation - 0.89% |
|
|
|
|
| ||
Bristow Group, Inc. |
|
|
|
|
| ||
7.500%, 09/15/2017 |
| 830,000 |
| 806,760 |
| ||
|
| Principal |
|
|
| ||
Interest Rate/Maturity Date |
| Amount |
| Market Value |
| ||
|
|
|
|
|
| ||
General Maritime Corp. |
|
|
|
|
| ||
12.000%, 11/15/2017(3) |
| $ | 725,000 |
| $ | 755,813 |
|
Navios Maritime Holdings, Inc. |
|
|
|
|
| ||
9.500%, 12/15/2014 |
| 630,000 |
| 622,913 |
| ||
8.875%, 11/01/2017(3) |
| 1,050,000 |
| 1,081,500 |
| ||
|
|
|
| 3,266,986 |
| ||
TOTAL CORPORATE BONDS |
|
|
| 339,266,153 |
| ||
|
|
|
|
|
| ||
CONVERTIBLE CORPORATE BONDS - 0.00%(9) |
|
|
|
|
| ||
Aerospace - Defense - 0.00%(9) |
|
|
|
|
| ||
L-3 Communications Holdings, Inc. |
|
|
|
|
| ||
3.000%, 08/01/2035(3) |
| 15,000 |
| 15,413 |
| ||
|
|
|
|
|
| ||
TOTAL CONVERTIBLE CORPORATE BONDS |
|
|
| 15,413 |
| ||
|
|
|
|
|
| ||
BANK LOANS - 2.71%(10) |
|
|
|
|
| ||
Advertising - 0.09% |
|
|
|
|
| ||
RH Donnelley, Inc. - Tranche D-2 Term Loan |
|
|
|
|
| ||
6.750%, 12/31/2009 |
| 377,477 |
| 339,493 |
| ||
|
|
|
|
|
| ||
Aerospace - Defense - 0.08% |
|
|
|
|
| ||
Sequa Corp. - Term Loan |
|
|
|
|
| ||
3.580%, 12/08/2009 |
| 11,385 |
| 9,941 |
| ||
3.940%, 03/15/2010 |
| 9,828 |
| 8,581 |
| ||
3.890%, 04/01/2010 |
| 316,382 |
| 276,242 |
| ||
|
|
|
| 294,764 |
| ||
Auto Manufacturers - 0.25% |
|
|
|
|
| ||
Ford Motor Co. - Tranche B-1 Term Loan |
|
|
|
|
| ||
3.240%, 12/15/2009 |
| 65,036 |
| 57,394 |
| ||
3.290%, 01/15/2010 |
| 993,257 |
| 876,550 |
| ||
|
|
|
| 933,944 |
| ||
Building Products - 0.87% |
|
|
|
|
| ||
Texas Competitive Electric Holdings Co. LLC - Initial Tranche B-2 Term Loan |
|
|
|
|
| ||
3.742%, 12/09/2009 |
| 4,221,275 |
| 3,163,318 |
| ||
3.783%, 12/31/2009 |
| 21,815 |
| 16,348 |
| ||
3.753%, 12/31/2009 |
| 32,723 |
| 24,522 |
| ||
|
|
|
| 3,204,188 |
| ||
|
| Principal |
|
|
| ||
Interest Rate/Maturity Date |
| Amount |
| Market Value |
| ||
|
|
|
|
|
| ||
Chemicals - 0.12% |
|
|
|
|
| ||
Lyondell Chemical Co. |
|
|
|
|
| ||
- Dutch Revolving Credit Loan |
|
|
|
|
| ||
3.736%, 12/29/2009 |
| $ | 4,812 |
| $ | 3,533 |
|
Lyondell Chemical Co. |
|
|
|
|
| ||
- Dutch Tranche A Dollar Term Loan |
|
|
|
|
| ||
3.736%, 12/29/2009 |
| 11,036 |
| 8,101 |
| ||
Lyondell Chemical Co. |
|
|
|
|
| ||
- German Tranche B-1 Euro Term Loan |
|
|
|
|
| ||
3.986%, 12/29/2009 |
| 13,816 |
| 10,142 |
| ||
Lyondell Chemical Co. |
|
|
|
|
| ||
- German Tranche B-2 Euro Term Loan |
|
|
|
|
| ||
3.986%, 12/29/2009 |
| 13,816 |
| 10,142 |
| ||
Lyondell Chemical Co. |
|
|
|
|
| ||
- German Tranche B-3 Euro Term Loan |
|
|
|
|
| ||
3.986%, 12/29/2009 |
| 13,816 |
| 10,142 |
| ||
Lyondell Chemical Co. - Initial New Money Loan |
|
|
|
|
| ||
1.500%, 12/31/2009(11) |
| 35,653 |
| 37,052 |
| ||
13.000%, 12/31/2009 |
| 71,338 |
| 74,137 |
| ||
Lyondell Chemical Co. - Primary Revolving Credit Loan |
|
|
|
|
| ||
3.736%, 12/29/2009 |
| 18,046 |
| 13,247 |
| ||
Lyondell Chemical Co. - Roll-Up Loan |
|
|
|
|
| ||
5.795%, 12/29/2009 |
| 106,826 |
| 104,287 |
| ||
6.560%, 12/31/2009 |
| 7 |
| 7 |
| ||
Lyondell Chemical Co. - U.S. Tranche A Dollar Term Loan |
|
|
|
|
| ||
3.736%, 12/29/2009 |
| 34,383 |
| 25,240 |
| ||
Lyondell Chemical Co. - U.S. Tranche B-1 Dollar Term Loan |
|
|
|
|
| ||
7.000%, 12/29/2009 |
| 59,951 |
| 44,008 |
| ||
Lyondell Chemical Co. - U.S. Tranche B-2 Dollar Term Loan |
|
|
|
|
| ||
7.000%, 12/29/2009 |
| 59,951 |
| 44,008 |
| ||
Lyondell Chemical Co. - U.S. Tranche B-3 Dollar Term Loan |
|
|
|
|
| ||
7.000%, 12/29/2009 |
| 59,951 |
| 44,008 |
| ||
|
|
|
| 428,054 |
| ||
Diversified Financial Services - 0.07% |
|
|
|
|
| ||
First Data Corp. - Initial Tranche B-1 Term Loan |
|
|
|
|
| ||
2.986%, 12/24/2009 |
| 270,379 |
| 225,954 |
| ||
3.036%, 12/24/2009 |
| 8,220 |
| 6,869 |
| ||
3.033%, 12/31/2009 |
| 15,401 |
| 12,871 |
| ||
|
|
|
| 245,694 |
| ||
Entertainment - 0.05% |
|
|
|
|
| ||
Las Vegas Sands LLC - Delayed Draw I Term Loan |
|
|
|
|
| ||
2.040%, 12/31/2009 |
| 44,438 |
| 37,105 |
| ||
|
| Principal |
|
|
| ||
Interest Rate/Maturity Date |
| Amount |
| Market Value |
| ||
|
|
|
|
|
| ||
Las Vegas Sands LLC - Tranche B Term Loan |
|
|
|
|
| ||
2.040%, 12/31/2009 |
| $ | 175,950 |
| $ | 146,919 |
|
|
|
|
| 184,024 |
| ||
Food - 0.07% |
|
|
|
|
| ||
Pinnacle Foods |
|
|
|
|
| ||
2.994%, 12/02/2009 |
| 273,601 |
| 249,934 |
| ||
|
|
|
|
|
| ||
Healthcare - Services - 0.33% |
|
|
|
|
| ||
Community Health Systems, Inc. - Delayed Draw Term Loan |
|
|
|
|
| ||
2.506%, 02/26/2010 |
| 29,136 |
| 26,702 |
| ||
Community Health Systems, Inc. - Funded Term Loan |
|
|
|
|
| ||
2.484%, 12/31/2009 |
| 1,077 |
| 987 |
| ||
2.506%, 02/26/2010 |
| 570,034 |
| 522,412 |
| ||
HCA, Inc. - Tranche B-1 Term Loan |
|
|
|
|
| ||
2.533%, 12/31/2009 |
| 725,279 |
| 675,280 |
| ||
|
|
|
| 1,225,381 |
| ||
Hotels & Motels - 0.03% |
|
|
|
|
| ||
Tribune Co. - Tranche X Advance |
|
|
|
|
| ||
5.000%, 06/30/2009(1) |
| 192,000 |
| 96,400 |
| ||
|
|
|
|
|
| ||
Internet - 0.06% |
|
|
|
|
| ||
Level 3 Financing, Inc. - Tranche A Term Loan |
|
|
|
|
| ||
2.530%, 01/13/2010 |
| 250,000 |
| 212,604 |
| ||
|
|
|
|
|
| ||
Media- 0.09% |
|
|
|
|
| ||
Charter Communications Operating LLC - New Term Loan |
|
|
|
|
| ||
4.240%, 12/31/2009 |
| 313 |
| 290 |
| ||
4.260%, 02/26/2010 |
| 122,500 |
| 113,670 |
| ||
Merrill Communications LLC - Loan (Second Lien) |
|
|
|
|
| ||
14.750%, 12/31/2009 |
| 150,000 |
| 86,250 |
| ||
15.000%, 02/02/2010 |
| 939 |
| 540 |
| ||
Univision Communications, Inc. - Initial Term Loan |
|
|
|
|
| ||
2.533%, 12/31/2009 |
| 150,000 |
| 123,703 |
| ||
|
|
|
| 324,453 |
| ||
Office Furnishings - 0.05% |
|
|
|
|
| ||
Collins & Aikman Floorcoverings, Inc. - Loan |
|
|
|
|
| ||
2.802%, 12/10/2009 |
| 101,021 |
| 79,301 |
| ||
3.783%, 12/10/2009 |
| 45,918 |
| 36,046 |
| ||
2.784%, 01/13/2010 |
| 31,095 |
| 24,410 |
| ||
2.784%, 01/14/2010 |
| 15,046 |
| 11,811 |
| ||
2.784%, 01/19/2010 |
| 18,367 |
| 14,418 |
| ||
|
|
|
| 165,986 |
| ||
|
| Principal |
|
|
| ||
Interest Rate/Maturity Date |
| Amount/Shares |
| Market Value |
| ||
|
|
|
|
|
| ||
Oil & Gas - 0.15% |
|
|
|
|
| ||
Dresser, Inc. - Term B Loan |
|
|
|
|
| ||
2.521%, 02/18/2010 |
| $ | 600,000 |
| $ | 553,714 |
|
|
|
|
|
|
| ||
Radio & TV/Other - 0.07% |
|
|
|
|
| ||
Citadel Broadcasting Corp. - Tranche B Term Loan |
|
|
|
|
| ||
2.040%, 12/31/2009 |
| 229,383 |
| 157,988 |
| ||
2.040%, 01/05/2010 |
| 170,617 |
| 117,512 |
| ||
|
|
|
| 275,500 |
| ||
Research Services - 0.09% |
|
|
|
|
| ||
Nielsen Finance LLC - Class A Dollar Term Loan |
|
|
|
|
| ||
2.242%, 12/09/2009 |
| 366,749 |
| 331,515 |
| ||
|
|
|
|
|
| ||
Retail - 0.24% |
|
|
|
|
| ||
Claire’s Stores, Inc. - Term B Loan |
|
|
|
|
| ||
3.033%, 12/31/2009 |
| 348,219 |
| 273,497 |
| ||
Michaels Stores, Inc. - B-1 Term Loan |
|
|
|
|
| ||
2.563%, 02/08/2010 |
| 216,295 |
| 187,185 |
| ||
2.563%, 02/12/2010 |
| 7,261 |
| 6,284 |
| ||
2.563%, 02/12/2010 |
| 174,503 |
| 151,018 |
| ||
2.563%, 02/26/2010 |
| 21,535 |
| 18,637 |
| ||
2.563%, 02/26/2010 |
| 33,514 |
| 29,003 |
| ||
2.563%, 02/16/2010 |
| 93,625 |
| 81,025 |
| ||
2.563%, 02/26/2010 |
| 157,615 |
| 136,403 |
| ||
|
|
|
| 883,052 |
| ||
|
|
|
|
|
| ||
TOTAL BANK LOANS |
|
|
| 9,948,700 |
| ||
|
|
|
|
|
| ||
COMMON STOCKS - 0.02% |
|
|
|
|
| ||
Telecommunications - 0.02% |
|
|
|
|
| ||
Virgin Media, Inc. |
| 3,372 |
| 55,503 |
| ||
|
|
|
|
|
| ||
TOTAL COMMON STOCKS |
|
|
| 55,503 |
| ||
|
|
|
|
|
| ||
MONEY MARKET MUTUAL FUNDS - 3.43% |
|
|
|
|
| ||
Dreyfus Cash Advantage Plus Fund |
|
|
|
|
| ||
(0.132% 7-Day Yield) |
| 12,570,276 |
| 12,570,276 |
| ||
|
|
|
|
|
| ||
TOTAL MONEY MARKET MUTUAL FUNDS |
|
|
| 12,570,276 |
| ||
|
| Market Value |
| |
Total Investments - 98.70% |
| $ | 361,856,045 |
|
|
|
|
| |
Other Assets in Excess of Liabilities - 1.30% |
| 4,776,492 |
| |
|
|
|
| |
Net Assets - 100.00% |
| $ | 366,632,537 |
|
(1) | Security is currently in default/non-income producing. |
(2) | This security has been valued at its fair value determined in good faith by or under the direction of the Board of Trustees. |
(3) | Security exempt from registration under Rule 144A of the Securities Act of 1933. Under procedures approved by the Board of Trustees, such securities have been determined to be liquid by the Investment Advisor and may be resold, normally to qualified buyers in transactions exempt from registration. Total market value of Rule 144A securities amounts to $77,192,637, which represents approximately 21.05% of net assets as of November 30, 2009. |
(4) | Step bond. Coupon increases periodically based upon a predetermined schedule. Interest rate disclosed is that which is in effect at November 30, 2009. |
(5) | Floating or variable rate security. Interest rate disclosed is that which is in effect at November 30, 2009. |
(6) | Pay-in-kind securities. |
(7) | This security is considered illiquid by the Investment Advisor. |
(8) | Step bond. Coupon increases periodically based upon a predetermined schedule. Interest rate disclosed is the stated rate at a set date in the future. |
(9) | Amount represents less than 0.005% of net assets. |
(10) | Bank loans generally pay interest at rates which are periodically determined by reference to a base lending rate plus a premium. All loans carry a variable rate of interest. These base lending rates are generally (i) the Prime Rate offered by one or more major United States banks, (ii) the lending rate offered by one or more European banks such as the London Interbank Offered Rate (“LIBOR”) or (iii) the Certificate of Deposit rate. Rate shown represents the weighted average rate at November 30, 2009. Bank Loans, while exempt from registration, under the Securities Act of 1933 (the “1933 Act”), contain certain restrictions on resale and cannot be sold publicly. Floating rate bank loans often require prepayments from excess cash flow or permit the borrower to repay at its election. The degree to which borrowers repay, whether as a contractual requirement or at their election, cannot be predicted with accuracy. As a result, the actual remaining maturity may be substantially less than the stated maturity shown. |
(11) | All or a portion of this position has not settled. Contract rates do not take effect until settlement date. |
See Notes to Financial Statements
Statement of Assets & Liabilities
November 30, 2009 (Unaudited)
|
| Stone Harbor |
| Stone Harbor |
| ||
|
| Emerging Markets |
| High Yield |
| ||
|
| Debt Fund |
| Bond Fund |
| ||
ASSETS: |
|
|
|
|
| ||
Investments, at value(1) |
| $ | 74,439,269 |
| $ | 361,856,045 |
|
Foreign currency, at value (Cost $14,437) |
| 14,453 |
| — |
| ||
Receivable for investments sold |
| 2,799,075 |
| 1,313,437 |
| ||
Receivable for Fund shares sold |
| 945,000 |
| 211,580 |
| ||
Interest receivable |
| 1,199,543 |
| 7,765,966 |
| ||
Prepaids and other assets |
| 2,263 |
| 585,741 |
| ||
Total Assets |
| 79,399,603 |
| 371,732,769 |
| ||
|
|
|
|
|
| ||
LIABILITIES: |
|
|
|
|
| ||
Payable for investments purchased |
| 2,927,587 |
| 3,947,887 |
| ||
Payable for Fund shares redeemed |
| — |
| 945,000 |
| ||
Unrealized depreciation on forward foreign currency contracts |
| 47,662 |
| — |
| ||
Payable to advisor |
| 16,851 |
| 117,028 |
| ||
Payable to administrator |
| 5,272 |
| 28,215 |
| ||
Payable for trustee fees |
| 5,283 |
| 5,283 |
| ||
Other payables |
| 56,612 |
| 56,819 |
| ||
Total Liabilities |
| 3,059,267 |
| 5,100,232 |
| ||
Net Assets |
| $ | 76,340,336 |
| $ | 366,632,537 |
|
|
|
|
|
|
| ||
NET ASSETS CONSIST OF: |
|
|
|
|
| ||
Paid-in capital |
| $ | 64,272,127 |
| $ | 354,609,297 |
|
Undistributed/(overdistributed) net investment income |
| (71,728 | ) | 10,834 |
| ||
Accumulated net realized gain/(loss) on investments and translation of assets and liabilities denominated in foreign currency |
| 2,127,348 |
| (3,838,387 | ) | ||
Net unrealized appreciation on investments and translation of assets and liabilities denominated in foreign currency |
| 10,012,589 |
| 15,850,793 |
| ||
Net Assets |
| $ | 76,340,336 |
| $ | 366,632,537 |
|
|
|
|
|
|
| ||
PRICING OF SHARES: |
|
|
|
|
| ||
Institutional Class Shares |
|
|
|
|
| ||
Net Assets |
| $ | 76,340,336 |
| $ | 366,632,537 |
|
Shares of beneficial interest outstanding (unlimited number of shares, par value of $0.001 per share authorized) |
| 7,246,062 |
| 39,291,795 |
| ||
Net asset value, offering and redemption price per share |
| $ | 10.54 |
| $ | 9.33 |
|
(1) Cost of Investments |
| $ | 64,389,683 |
| $ | 346,005,252 |
|
See Notes to Financial Statements
Statement of Operations
For the Six Months Ended November 30, 2009 (Unaudited)
|
| Stone Harbor |
| Stone Harbor |
| ||
|
| Emerging Markets |
| High Yield |
| ||
|
| Debt Fund |
| Bond Fund |
| ||
INVESTMENT INCOME |
|
|
|
|
| ||
Interest (net of foreign withholding tax of $961 on Stone Harbor Emerging Markets Debt Fund) |
| $ | 3,648,891 |
| $ | 13,443,569 |
|
Other income |
| — |
| 159,880 |
| ||
Total Investment Income |
| 3,648,891 |
| 13,603,449 |
| ||
|
|
|
|
|
| ||
EXPENSES |
|
|
|
|
| ||
Investment advisory fee |
| 269,777 |
| 777,845 |
| ||
Administrative fee |
| 41,389 |
| 140,887 |
| ||
Custodian fees |
| 16,715 |
| 12,653 |
| ||
Audit fees |
| 35,391 |
| 35,391 |
| ||
Printing fees |
| 5,351 |
| 5,317 |
| ||
Legal fees |
| 25,355 |
| 25,244 |
| ||
Trustee fees |
| 8,674 |
| 8,674 |
| ||
Transfer agent fees |
| 11,175 |
| 11,812 |
| ||
Registration fees |
| 2,812 |
| 6,838 |
| ||
Insurance fees |
| 3,482 |
| 12,288 |
| ||
Other |
| 1,482 |
| 2,489 |
| ||
Total expenses before waiver |
| 421,603 |
| 1,039,438 |
| ||
Less fees waived by investment advisor |
| (84,381 | ) | (183,808 | ) | ||
Total Net Expenses |
| 337,222 |
| 855,630 |
| ||
Net Investment Income |
| 3,311,669 |
| 12,747,819 |
| ||
|
|
|
|
|
| ||
REALIZED AND UNREALIZED GAIN ON INVESTMENTS |
|
|
|
|
| ||
Net realized gain on: |
|
|
|
|
| ||
Investments |
| 6,459,415 |
| 256,008 |
| ||
Foreign currency transactions |
| 187,921 |
| — |
| ||
Net realized gain |
| 6,647,336 |
| 256,008 |
| ||
Change in unrealized appreciation on: |
|
|
|
|
| ||
Investments |
| 6,184,571 |
| 29,817,283 |
| ||
Translation of assets and liabilities denominated in foreign currencies |
| 16,710 |
| — |
| ||
Net change |
| 6,201,281 |
| 29,817,283 |
| ||
Net Realized and Unrealized Gain on Investments |
| 12,848,617 |
| 30,073,291 |
| ||
Net Increase in Net Assets Resulting from Operations |
| $ | 16,160,286 |
| $ | 42,821,110 |
|
See Notes to Financial Statements
Statements of Changes in Net Assets
STONE HARBOR EMERGING MARKETS DEBT FUND
|
| For the |
|
|
| ||
|
| Six Months Ended |
| For the |
| ||
|
| November 30, 2009 |
| Year Ended |
| ||
|
| (Unaudited) |
| May 31, 2009 |
| ||
OPERATIONS |
|
|
|
|
| ||
Net investment income |
| $ | 3,311,669 |
| $ | 3,740,570 |
|
Net realized gain/(loss) on investments |
| 6,647,336 |
| (5,220,508 | ) | ||
Net change in unrealized appreciation on investments and foreign currency translations |
| 6,201,281 |
| 3,631,081 |
| ||
Net increase in net assets resulting from operations |
| 16,160,286 |
| 2,151,143 |
| ||
|
|
|
|
|
| ||
DISTRIBUTIONS TO SHAREHOLDERS |
|
|
|
|
| ||
From net investment income |
| (3,446,854 | ) | (3,008,908 | ) | ||
Net decrease in net assets from distributions to shareholders |
| (3,446,854 | ) | (3,008,908 | ) | ||
|
|
|
|
|
| ||
CAPITAL SHARE TRANSACTIONS |
|
|
|
|
| ||
Institutional Class Shares |
|
|
|
|
| ||
Proceeds from sale of shares |
| 19,371,250 |
| 72,248,655 |
| ||
Issued to shareholders in reinvestment of distributions |
| 3,295,093 |
| 2,948,631 |
| ||
Cost of shares redeemed |
| (50,792,439 | ) | (2,173,927 | ) | ||
Net increase/(decrease) in net assets from capital share transactions |
| (28,126,096 | ) | 73,023,359 |
| ||
Net Increase/(Decrease) in Net Assets |
| (15,412,664 | ) | 72,165,594 |
| ||
Net Assets |
|
|
|
|
| ||
Beginning of period |
| 91,753,000 |
| 19,587,406 |
| ||
End of period (including (overdistributed)/undistributed net investment income of $(71,728) and $63,457, respectively) |
| $ | 76,340,336 |
| $ | 91,753,000 |
|
|
|
|
|
|
| ||
OTHER INFORMATION: |
|
|
|
|
| ||
Share Transactions: |
|
|
|
|
| ||
Institutional Class Shares |
|
|
|
|
| ||
Beginning shares |
| 9,952,470 |
| 1,894,363 |
| ||
Shares sold |
| 1,833,168 |
| 7,950,246 |
| ||
Shares reinvested |
| 322,064 |
| 344,206 |
| ||
Shares redeemed |
| (4,861,640 | ) | (236,345 | ) | ||
Shares outstanding |
| 7,246,062 |
| 9,952,470 |
| ||
See Notes to Financial Statements
Statements of Changes in Net Assets
STONE HARBOR HIGH YIELD BOND FUND
|
| For the |
|
|
| ||
|
| Six Months Ended |
| For the |
| ||
|
| November 30, 2009 |
| Year Ended |
| ||
|
| (Unaudited) |
| May 31, 2009 |
| ||
OPERATIONS |
|
|
|
|
| ||
Net investment income |
| $ | 12,747,819 |
| $ | 11,528,807 |
|
Net realized gain/(loss) on investments |
| 256,008 |
| (3,443,983 | ) | ||
Net change in unrealized appreciation/(depreciation) on investments |
| 29,817,283 |
| (12,603,307 | ) | ||
Net increase/(decrease) in net assets resulting from operations |
| 42,821,110 |
| (4,518,483 | ) | ||
|
|
|
|
|
| ||
DISTRIBUTIONS TO SHAREHOLDERS |
|
|
|
|
| ||
From net investment income |
| (12,601,941 | ) | (11,426,115 | ) | ||
Net decrease in net assets from distributions to shareholders |
| (12,601,941 | ) | (11,426,115 | ) | ||
|
|
|
|
|
| ||
CAPITAL SHARE TRANSACTIONS |
|
|
|
|
| ||
Institutional Class Shares |
|
|
|
|
| ||
Proceeds from sales of shares |
| 118,384,695 |
| 131,188,255 |
| ||
Issued to shareholders in reinvestment of distributions |
| 11,858,215 |
| 9,950,073 |
| ||
Cost of shares redeemed |
| (17,039,376 | ) | (8,895,972 | ) | ||
Net increase in net assets from capital share transactions |
| 113,203,534 |
| 132,242,356 |
| ||
Net Increase in Net Assets |
| 143,422,703 |
| 116,297,758 |
| ||
Net Assets |
|
|
|
|
| ||
Beginning of period |
| 223,209,834 |
| 106,912,076 |
| ||
End of period (including undistributed/(overdistributed) net investment income of $10,834 and $(135,044), respectively) |
| $ | 366,632,537 |
| $ | 223,209,834 |
|
|
|
|
|
|
| ||
OTHER INFORMATION: |
|
|
|
|
| ||
Share Transactions: |
|
|
|
|
| ||
Institutional Class Shares |
|
|
|
|
| ||
Beginning shares |
| 26,613,415 |
| 10,776,299 |
| ||
Shares sold |
| 13,236,795 |
| 15,634,751 |
| ||
Shares reinvested |
| 1,296,824 |
| 1,246,011 |
| ||
Shares redeemed |
| (1,855,239 | ) | (1,043,646 | ) | ||
Shares outstanding |
| 39,291,795 |
| 26,613,415 |
| ||
See Notes to Financial Statements
Financial Highlights*
For a share outstanding through the periods presented
|
| For the |
|
|
| For the Period |
| |||
|
| Six Months Ended |
| For the |
| August 16, 2007 |
| |||
Emerging Markets Debt Fund |
| November 30, 2009 |
| Year Ended |
| (Inception) to |
| |||
Institutional Class Shares |
| (Unaudited) |
| May 31, 2009 |
| May 31, 2008 |
| |||
Net asset value - beginning of the period |
| $ | 9.22 |
| $ | 10.34 |
| $ | 10.00 |
|
Income/(loss) from investment operations |
|
|
|
|
|
|
| |||
Net investment income |
| 0.42 |
| 0.59 |
| 0.46 |
| |||
Net realized and unrealized gain/(loss) on investments |
| 1.34 |
| (1.18 | ) | 0.58 |
| |||
Total income/(loss) from investment operations |
| 1.76 |
| (0.59 | ) | 1.04 |
| |||
|
|
|
|
|
|
|
| |||
Less distributions to common shareholders |
|
|
|
|
|
|
| |||
From net investment income |
| (0.44 | ) | (0.53 | ) | (0.54 | ) | |||
From net realized gain on investments |
| — |
| — |
| (0.16 | ) | |||
From tax return of capital |
| — |
| — |
| (0.00 | )(1) | |||
Total distributions |
| (0.44 | ) | (0.53 | ) | (0.70 | ) | |||
|
|
|
|
|
|
|
| |||
Net Increase/(Decrease) in Net Asset Value |
| 1.32 |
| (1.12 | ) | 0.34 |
| |||
Net asset value - end of period |
| $ | 10.54 |
| $ | 9.22 |
| $ | 10.34 |
|
|
|
|
|
|
|
|
| |||
Total Return (2)(3) |
| 19.24 | % | (5.10 | )% | 10.46 | % | |||
|
|
|
|
|
|
|
| |||
RATIOS/SUPPLEMENTAL DATA: |
|
|
|
|
|
|
| |||
Net assets, end of period (in thousands) |
| $ | 76,340 |
| $ | 91,753 |
| $ | 19,587 |
|
Ratio of expenses to average net assets with fee waivers/reimbursements |
| 0.75 | %** | 0.75 | % | 0.75 | %** | |||
Ratio of expenses to average net assets without fee waivers/reimbursements |
| 0.94 | %** | 1.33 | % | 2.27 | %** | |||
Ratio of net investment income to average net assets with fee waivers/reimbursements |
| 7.37 | %** | 9.32 | % | 5.91 | %** | |||
|
|
|
|
|
|
|
| |||
Portfolio Turnover Rate |
| 70 | % | 84 | % | 143 | % | |||
* The amount shown for a share outstanding throughout the period may not correlate with the Statement of Operations for the period due to the timing of sales and repurchase of the Fund Shares in relation to income earned and/or fluctuating market value of the investment of the Fund.
** Annualized.
(1) Less than $(0.005) per share.
(2) Total returns would have been lower had various fees and expenses not been waived and reimbursed during the period.
(3) Total returns for periods of less than one year are not annualized.
See Notes to Financial Statements
Financial Highlights
For a share outstanding through the periods presented
|
| For the |
|
|
| For the Period |
| |||
|
| Six Months Ended |
| For the |
| August 16, 2007 |
| |||
High Yield Bond Fund |
| November 30, 2009 |
| Year Ended |
| (Inception) to |
| |||
Institutional Class Shares |
| (Unaudited) |
| May 31, 2009 |
| May 31, 2008 |
| |||
Net asset value - beginning of the period |
| $ | 8.39 |
| $ | 9.92 |
| $ | 10.00 |
|
Income/(loss) from investment operations |
|
|
|
|
|
|
| |||
Net investment income |
| 0.35 |
| 0.70 |
| 0.58 |
| |||
Net realized and unrealized gain/(loss) on investments |
| 0.93 |
| (1.53 | ) | (0.08 | ) | |||
Total income/(loss) from investment operations |
| 1.28 |
| (0.83 | ) | 0.50 |
| |||
|
|
|
|
|
|
|
| |||
Less distributions to common shareholders |
|
|
|
|
|
|
| |||
From net investment income |
| (0.34 | ) | (0.70 | ) | (0.57 | ) | |||
From net realized gain on investments |
| — |
| — |
| (0.01 | ) | |||
From tax return of capital |
| — |
| — |
| (0.00 | )(1) | |||
Total distributions |
| (0.34 | ) | (0.70 | ) | (0.58 | ) | |||
|
|
|
|
|
|
|
| |||
Net Increase/(Decrease) in Net Asset Value |
| 0.94 |
| (1.53 | ) | (0.08 | ) | |||
Net asset value - end of period |
| $ | 9.33 |
| $ | 8.39 |
| $ | 9.92 |
|
|
|
|
|
|
|
|
| |||
Total Return (2)(3) |
| 15.39 | % | (7.77 | )% | 5.09 | % | |||
|
|
|
|
|
|
|
| |||
RATIOS/SUPPLEMENTAL DATA: |
|
|
|
|
|
|
| |||
Net assets, end of period (in thousands) |
| $ | 366,633 |
| $ | 223,210 |
| $ | 106,912 |
|
Ratio of expenses to average net assets with fee waivers/reimbursements |
| 0.55 | %** | 0.55 | % | 0.55 | %** | |||
Ratio of expenses to average net assets without fee waivers/reimbursements |
| 0.67 | %** | 0.88 | % | 1.21 | %** | |||
Ratio of net investment income to average net assets with fee waivers/reimbursements |
| 8.20 | %** | 9.07 | % | 7.81 | %** | |||
|
|
|
|
|
|
|
| |||
Portfolio Turnover Rate |
| 13 | % | 16 | % | 11 | % | |||
** | Annualized. |
(1) | Less than $(0.005) per share. |
(2) | Total returns would have been lower had various fees and expenses not been waived and reimbursed during the period. |
(3) | Total returns for periods of less than one year are not annualized. |
See Notes to Financial Statements
Notes to Financial Statements
November 30, 2009 (Unaudited)
1. ORGANIZATION AND SIGNIFICANT ACCOUNTING POLICIES
Stone Harbor Investment Funds, which consist of Stone Harbor Emerging Markets Debt Fund and Stone Harbor High Yield Bond Fund (each, a “Fund” and together, the “Funds”) is a Massachusetts business trust (the “Trust”), organized on February 20, 2007 and registered under the Investment Company Act of 1940, as amended (the “1940 Act”), as an open-end management investment company. Each Fund is a non-diversified portfolio with an investment objective to maximize total return. Shares of each Fund are currently divided into two classes, designated Institutional Class Shares and Distributor Class Shares. As of the date of this report, there were no outstanding shares for the Distributor Class of each Fund. The Declaration of Trust permits the Trustees to create additional funds and share classes.
The following is a summary of significant accounting policies consistently followed by the Funds in the preparation of their financial statements. The policies are in conformity with accounting principles generally accepted in the United States of America (GAAP). The preparation of the financial statements in accordance with GAAP requires management to make estimates and assumptions that affect the reported amounts of assets and liabilities at the date of the financial statements and the reported amounts of income and expenses during the reporting period. Actual results could differ from those estimates.
(a) Investment Valuation: Debt securities, bank loans and linked notes are valued at the mean between the bid and asked prices provided by an independent pricing service that are based on transactions in debt obligations, quotations from dealers, market transactions in comparable securities and various other relationships between securities. Equity securities for which market quotations are available are valued at the last sale price or official closing price on the primary market or exchange on which they trade. Publicly traded foreign government debt securities are typically traded internationally in the over-the-counter market, and are valued at the mean between the bid and asked prices as of the close of business of that market. When prices are not readily available, or are determined not to reflect fair value, such as when the value of a security has been significantly affected by events after the close of the exchange or market on which the security is principally traded, but before the Funds calculate their net asset value, the Funds may value these investments at fair value as determined in accordance with the procedures approved by the Funds’ Board of Trustees. Short-term obligations with maturities of 60 days or less are valued at amortized cost, which approximates market value. Available cash is generally invested into a money market fund by the custodian, and is valued at the latest net asset value per share as reported by the fund’s administrator.
The Funds have adopted Financial Accounting Standards Board Codification Topic 820 (formerly Statement of Financial Accounting Standards No. 157) (“ASC Topic 820”). In accordance with ASC 820, fair value is defined as the price that the Funds would receive to sell an investment or pay to transfer a liability in a timely transaction with an independent buyer in the principal market, or in the absence of a principal market the most advantageous market for the investment or liability. ASC 820 establishes a single definition of fair value, creates a three-tier hierarchy as a framework for measuring fair value based on inputs used to value the Funds’ investments, and requires additional disclosure about fair value. The hierarchy of inputs is summarized below.
Level 1 – quoted prices in active markets for identical investments
Level 2 – other significant observable inputs (including quoted prices for similar investments, interest rates, prepayment speeds, credit risk, etc.)
Level 3 – significant unobservable inputs (including the Funds’ own assumptions in determining the fair value of investments)
The inputs or methodology used for valuing securities are not necessarily an indication of the risk associated with investing in those securities.
Notes to Financial Statements (continued)
November 30, 2009 (Unaudited)
The following is a summary of the inputs used as of November 30, 2009 in valuing the Funds’ investments carried at value:
Stone Harbor Emerging Markets Debt Fund
Assets:
|
| Level 1 - Quoted |
| Level 2 - |
| Level 3 - |
|
|
| ||||
Investments in |
| Prices in Active |
| Other |
| Significant |
|
|
| ||||
Securities at |
| Market for |
| Significant |
| Unobservable |
|
|
| ||||
Value |
| Identical Assets |
| Observable Inputs |
| Inputs |
| Total |
| ||||
Sovereign Debt Obligations |
| $ | — |
| $ | 64,678,222 |
| $ | — |
| $ | 64,678,222 |
|
Corporate Bonds |
| — |
| 5,192,172 |
| — |
| 5,192,172 |
| ||||
Credit Linked Notes |
| — |
| — |
| 1,319,065 |
| 1,319,065 |
| ||||
Money Market Mutual Funds |
| — |
| 3,249,810 |
| — |
| 3,249,810 |
| ||||
TOTAL |
| $ | — |
| $ | 73,120,204 |
| $ | 1,319,065 |
| $ | 74,439,269 |
|
Liabilities:
Other Financial |
|
|
|
|
|
|
|
|
| ||||
Instruments |
|
|
|
|
|
|
|
|
| ||||
at Value |
|
|
|
|
|
|
|
|
| ||||
Derivative Instruments* |
| $ | — |
| $ | 47,662 |
| $ | — |
| $ | 47,662 |
|
TOTAL |
| $ | — |
| $ | 47,662 |
| $ | — |
| $ | 47,662 |
|
* Derivative instruments are forward foreign currency contracts held at November 30, 2009.
Stone Harbor High Yield Bond Fund
Assets:
|
| Level 1 - Quoted |
| Level 2 - |
| Level 3 - |
|
|
| ||||
Investments in |
| Prices in Active |
| Other |
| Significant |
|
|
| ||||
Securities at |
| Market for |
| Significant |
| Unobservable |
|
|
| ||||
Value |
| Identical Assets |
| Observable Inputs |
| Inputs |
| Total |
| ||||
Corporate Bonds |
| $ | — |
| $ | 335,760,843 |
| $ | 3,505,310 |
| $ | 339,266,153 |
|
Convertible Corporate Bonds |
| — |
| 15,413 |
| — |
| 15,413 |
| ||||
Bank Loans |
| — |
| 9,609,207 |
| 339,493 |
| 9,948,700 |
| ||||
Common Stocks |
| 55,503 |
| — |
| — |
| 55,503 |
| ||||
Money Market Mutual Funds |
| — |
| 12,570,276 |
| — |
| 12,570,276 |
| ||||
TOTAL |
| $ | 55,503 |
| $ | 357,955,739 |
| $ | 3,844,803 |
| $ | 361,856,045 |
|
Notes to Financial Statements (continued)
November 30, 2009 (Unaudited)
The following is a reconciliation of assets in which significant unobservable inputs (Level 3) were used in determining fair value:
Stone Harbor Emerging Markets Debt Fund
|
|
|
|
|
| Change In |
| Net |
| Transfers in |
| Balance as |
| ||||||
Investments |
| Balance as of |
| Realized |
| Unrealized |
| Purchases/ |
| and/or (out) |
| of November |
| ||||||
in Securities |
| May 31, 2009 |
| Gain** |
| Appreciation** |
| (Sales) |
| of Level 3 |
| 30, 2009 |
| ||||||
Credit Linked Notes |
| $ | — |
| $ | 7,795 |
| $ | 15,161 |
| $ | 1,296,109 |
| $ | — |
| $ | 1,319,065 |
|
TOTAL |
| $ | — |
| $ | 7,795 |
| $ | 15,161 |
| $ | 1,296,109 |
| $ | — |
| $ | 1,319,065 |
|
Stone Harbor High Yield Bond Fund
|
|
|
|
|
| Change In |
| Net |
| Transfers in |
| Balance as |
| ||||||
Investments |
| Balance as of |
| Realized |
| Unrealized |
| Purchases/ |
| and/or (out) |
| of November |
| ||||||
in Securities |
| May 31, 2009 |
| Gain** |
| Appreciation** |
| (Sales) |
| of Level 3 |
| 30, 2009 |
| ||||||
Corporate Bonds |
| $ | 1,042,064 |
| $ | 19,032 |
| $ | 656,593 |
| $ | 954,167 |
| $ | 833,454 |
| $ | 3,505,310 |
|
Bank Loans |
| 312,000 |
| 7,322 |
| 42,359 |
| (22,188 | ) | — |
| 339,493 |
| ||||||
TOTAL |
| $ | 1,354,064 |
| $ | 26,354 |
| $ | 698,952 |
| $ | 931,979 |
| $ | 833,454 |
| $ | 3,844,803 |
|
** Realized gain and change in unrealized appreciation are included in the related amounts on investments in the statement of operations.
(b) Security Transactions and Investment Income: Security transactions are accounted for on a trade date basis. Interest income, adjusted for amortization of premium and accretion of discount, is recorded on the accrual basis. Dividend income is recorded on the ex-dividend date. Foreign dividend income is recorded on the ex-dividend date or as soon as practical after the Funds determine the existence of a dividend declaration after exercising reasonable due diligence. The cost of investments sold is determined by use of the specific identification method. To the extent any issuer defaults on an expected interest payment, the Funds’ policy is to generally halt any additional interest income accruals and consider the realizability of interest accrued up to the date of default.
(c) Foreign Currency Translation: The books and records of the Fund are maintained in U.S. dollars as follows: (1) the foreign currency market value of investment securities, other assets and liabilities and foreign currency contracts are translated at the exchange rates prevailing at the end of the period; and (2) purchases, sales, income and expenses are translated at the exchange rates prevailing on the respective date of such transactions.
The resultant exchange gains and losses are recorded as realized and unrealized gain/loss on foreign exchange transactions. Pursuant to U.S. federal income tax regulations, certain foreign exchange gains/losses included in realized and unrealized gain/loss are included in or are a reduction of ordinary income for federal income tax purposes. The Funds do not isolate that portion of the results of operations arising as a result of changes in the foreign exchange rates from the changes in the market prices of the securities.
(d) Foreign Securities: The Funds may directly purchase securities of foreign issuers. Investing in securities of foreign issuers involves special risks not typically associated with investing in securities of U.S. issuers. The risks include, among other things, possible revaluation of currencies, the
Notes to Financial Statements (continued)
November 30, 2009 (Unaudited)
ability to repatriate funds, less complete financial information about companies and possible future adverse political and economic developments. Moreover, securities of many foreign issuers and their markets may be less liquid and their prices more volatile than those of securities of comparable U.S. issuers.
(e) Risk Exposure and the Use of Derivative Instruments: The Funds’ investment objectives not only permit the Funds to purchase investment securities, they also allow the Funds to enter in various types of derivatives contracts. In doing so, the Funds will employ strategies in differing combinations to permit them to increase, decrease, or change the level or types of exposure to market factors. Central to those strategies are features inherent to derivatives that make them more attractive for this purpose than equity or debt securities; they require little or no initial cash investment, they can focus exposure on only certain selected risk factors, and they may not require the ultimate receipt or delivery of the underlying security (or securities) to the contract. This may allow the Funds to pursue their objectives more quickly and efficiently than if they were to make direct purchases or sales of securities capable of effecting a similar response to market factors.
Market Risk Factors. In pursuit of its investment objects, the Fund’s may seek to use derivatives to increase or decrease its exposure to the following market risk factors:
Interest Rate Risk. Interest rate risk refers to the fluctuations in value of fixed-income securities resulting from the inverse relationship between price and yield. For example, an increase in general interest rates will tend to reduce the make value of already issued fixed-income investments, and a decline in general interest rates will tend to increase their value. In addition, debt securities with longer maturities, which tend to have higher yields, are subject to potentially greater fluctuations in value from changes in interest rates than obligations with shorter maturities.
Credit Risk. Credit risk relates to the ability of the issuer to meet interest and principal payments, or both, as they come due. In general, lower-grade, higher-yield bonds are subject to credit risk to a greater extent than lower-yield, higher-quality bonds.
Foreign Exchange Rate Risk. Foreign exchange rate risk relates to the change in the U.S. dollar value of a security held that is denominated in a foreign currency. The U.S. dollar value of a foreign currency denominated security will decrease as the dollar appreciates against the currency, while the U.S. dollar value will decrease as the dollar depreciates against the currency.
Equity Risk. Equity risk relates to the change in value of equity securities as they relate to increases or decreases in the general market.
Risk of Investing in Derivatives. The Funds’ use of derivatives can result in losses due to unanticipated changes in the market risk factors and the overall market. In instances where the Funds are using derivatives to decrease, or hedge, exposures to market risk factors for securities held by the Funds, there are also risks that those derivatives may not perform as expected resulting in losses for the combined or hedged positions.
Derivatives may have little or no initial cash investment relative to their market value exposure and therefore can produce significant gains or losses in excess of their cost. This use of embedded leverage allows the Fund to increase its market value exposure relative to it net assets and can substantially increase the volatility of the Funds’ performance.
Notes to Financial Statements (continued)
November 30, 2009 (Unaudited)
Additional associated risks from investing in derivatives also exist and potentially could have significant effects on the valuation of the derivative and the Funds. Typically, the associated risks are not the risks that the Funds is attempting to increase or decrease exposure to, per their investment objectives, but are the additional risks from investing in derivatives.
Example of these associated risks are liquidity risk, which is the risk that the Funds will not be able to sell the derivative in the open market in a timely manner, and counterparty credit risk, which is the risk that the counterparty will not fulfill its obligation to the Funds. Associated risks can be different for each type of derivative and are discussed by each derivative type in the notes that follow.
Forward Foreign Currency Contracts: The Funds may engage in currency transactions with counterparties to hedge the value of portfolio securities denominated in particular currencies against fluctuations in relative value, to gain or reduce exposure to certain currencies, or to generate income or gains. A forward foreign currency contract is an agreement between two parties to buy and sell a currency at a set price on a future date. The contract is marked-to-market daily and the change in value is recorded by the Funds as an unrealized gain or loss. When a forward foreign currency contract is extinguished, through either delivery or offset by entering into another forward foreign currency contract, the Funds record a realized gain or loss equal to the difference between the value of the contract at the time it was opened and the value of the contract at the time it was extinguished.
Forward foreign currency contracts involve elements of market risk in excess of the amounts reflected in the Statements of Assets and Liabilities. The Funds bear the risk of an unfavorable change in the foreign exchange rate underlying the forward foreign currency contract. Risks may also arise upon entering into these contracts from the potential inability of the counterparties to meet the terms of their contracts.
Credit Default Swaps: The Funds may enter into credit default swap contracts for hedging purposes, to gain market exposure or to add leverage to their portfolios. When used for hedging purposes, a Fund would be the buyer of a credit default swap contract. In that case, the Fund would be entitled to receive the par (or other agreed-upon) value of a referenced debt obligation, index or other investment from the counterparty to the contract in the event of a default by a third party, such as a U.S. or foreign issuer, on the referenced debt obligation. In return, the Fund would pay to the counterparty a periodic stream of payments over the term of the contract provided that no event of default has occurred. If no default occurs, the Fund would have spent the stream of payments and received no benefit from the contract. When the Fund is the seller of a credit default swap contract, it receives the stream of payments but is obligated to pay upon default of the referenced debt obligation. As the seller, the Fund would effectively add leverage to its portfolio because, in addition to its total assets, the Fund would be subject to investment exposure on the notional amount of the swap.
In addition to the risks applicable to derivatives generally, credit default swaps involve special risks because they are difficult to value, are highly susceptible to liquidity and credit risk, and generally pay a return to the party that has paid the premium only in the event of an actual default by the issuer of the underlying obligation, as opposed to a credit downgrade or other indication of financial difficulty.
No swaps were held in the Funds as of November 30, 2009.
Notes to Financial Statements (continued)
November 30, 2009 (Unaudited)
The effect of derivative instruments on the Balance Sheet as of November 30, 2009:
Stone Harbor Emerging Markets Debt Fund
Derivatives not accounted for |
| Asset Derivatives |
| Liability Derivatives |
| |||||
as hedging instruments under |
| Balance |
|
|
| Balance |
|
|
| |
Statement ASC 815 |
| Sheet Location |
| Fair Value |
| Sheet Location |
| Fair Value |
| |
Foreign Exchange Contracts |
| — |
| — |
| Unrealized depreciation on forward foreign currency contracts |
| $ | 47,662 |
|
Total |
| — |
| — |
|
|
| $ | 47,662 |
|
The effect of derivatives instruments on the Statement of Operations for the period ended November 30, 2009:
Derivatives not |
|
|
|
|
| Change in Unrealized |
| ||
accounted for as |
| Location of Gain/ |
| Realized Gain/ |
| Gain/(Loss) |
| ||
hedging instruments |
| (Loss) On Derivatives |
| (Loss) On Derivatives |
| On Derivatives |
| ||
under ASC 815 |
| Recognized in Income |
| Recognized in Income |
| Recognized in Income |
| ||
Foreign Exchange Contracts |
| Net realized loss on Foreign currency transactions/Change in unrealized appreciation on translation of assets and liabilities denominated in foreign currencies |
| $ | (211,007 | ) | $ | 33,272 |
|
Total |
|
|
| $ | (211,007 | ) | $ | 33,272 |
|
(f) Loan Participations: The High Yield Bond Fund may invest in loans arranged through private negotiation between one or more financial institutions. The Fund’s investment in any such loan may be in the form of a participation in or an assignment of the loan. In connection with purchasing participations, the Fund generally will have no right to enforce compliance by the borrower with the terms of the loan agreement relating to the loan, nor any rights of set-off against the borrower and the Fund may not benefit directly from any collateral supporting the loan in which it has purchased the participation.
The Fund assumes the credit risk of the borrower, the lender that is selling the participation and any other persons interpositioned between the Fund and the borrower. In the event of the insolvency of the lender selling the participation, the Fund may be treated as a general creditor of the lender and may not benefit from any set-off between the lender and the borrower.
(g) Credit and Market Risk: The Funds invest in high yield and emerging market instruments that are subject to certain credit and market risks. The yields of high yield and emerging market debt obligations reflect, among other things, perceived credit and market risks. The Funds’ investment in securities rated below investment grade typically involves risks not associated with higher rated
Notes to Financial Statements (continued)
November 30, 2009 (Unaudited)
securities including, among others, greater risk related to timely and ultimate payment of interest and principal, greater market price volatility and less liquid secondary market trading. The consequences of political, social, economic or diplomatic changes may have disruptive effects on the market prices of investments held by the Funds. The Funds’ investment in non-dollar denominated securities may also result in foreign currency losses caused by devaluations and exchange rate fluctuations.
(h) Distributions to Shareholders: Dividends and distributions to shareholders, which are determined in accordance with income tax regulations, are recorded on the ex-date. Income distributions, if any, are declared and paid on a quarterly basis. Capital gain distributions, if any, are declared and paid at least annually.
(i) Classifications of Distributions: Net investment income (loss) and net realized gain (loss) may differ for financial statement and tax purposes. The character of distributions made during the year from net investment income or net realized gains may differ from its ultimate characterization for federal income tax purposes. Also, due to the timing of dividend distributions, the fiscal year in which amounts are distributed may differ from the fiscal year in which the income or realized gain was recorded by a Fund.
The tax character of the distributions paid by the Funds during the year ended May 31, 2009, was as follows:
|
| Stone Harbor |
| Stone Harbor |
| ||
|
| Emerging Markets |
| High Yield |
| ||
|
| Debt Fund |
| Bond Fund |
| ||
Ordinary Income |
| $ | 3,008,908 |
| $ | 11,426,115 |
|
As of May 31, 2009, the components of distributable earnings on a tax basis were as follows:
|
| Stone Harbor |
| Stone Harbor |
| ||
|
| Emerging Markets |
| High Yield |
| ||
|
| Debt Fund |
| Bond Fund |
| ||
Undistributed Ordinary Income |
| $ | 259,541 |
| $ | 172,616 |
|
Accumulated Capital Losses |
| $ | (4,051,127 | ) | $ | (4,089,660 | ) |
Unrealized Appreciation/(Depreciation) |
| $ | 3,342,447 |
| $ | (15,316,280 | ) |
Cumulative Effect of Other Timing Differences* |
| $ | (196,084 | ) | $ | (307,660 | ) |
|
| $ | (645,223 | ) | $ | (19,540,984 | ) |
* | Other temporary differences due to timing consist primarily of mark-to-market under section 1256 of the Internal Revenue Code, dividends payable, and post-October foreign currency losses. |
At May 31, 2009, each Fund had available for federal income tax purposes unused capital loss carryforwards as follows:
|
| Stone Harbor |
| Stone Harbor |
| ||
|
| Emerging Markets |
| High Yield |
| ||
Expiring |
| Debt Fund |
| Bond Fund |
| ||
May 31, 2017 |
| $ | 899,017 |
| $ | 651,342 |
|
The tax components of distributable earnings are determined in accordance with income tax regulations which may differ from the composition of net assets reported under accounting principles generally accepted in the United States. Accordingly, for the period ended May 31, 2009, certain differences were reclassified. These differences were primarily due to the differing tax treatment of certain investments
Notes to Financial Statements (continued)
November 30, 2009 (Unaudited)
and the amounts reclassified did not affect net assets. For Stone Harbor High Yield Bond Fund, the differences were primarily due to the differing tax treatment of the securities contributed to the Fund’s portfolio at the time of inception.
The reclassifications were as follows:
|
| Stone Harbor |
| Stone Harbor |
| ||
|
| Emerging Markets |
| High Yield |
| ||
|
| Debt Fund |
| Bond Fund |
| ||
Paid-in capital |
| $ | 6,303 |
| $ | 1,004,884 |
|
Overdistributed Net Investment Income |
| $ | (716,321 | ) | $ | (181,551 | ) |
Accumulated Net Realized Gain/(Loss) |
| $ | 710,018 |
| $ | (823,333 | ) |
(j) Expenses: Direct expenses are charged to the Funds; general expenses of the Trust are allocated to the Funds based on each Fund’s relative net assets or any other reasonable basis.
(k) Federal and Other Taxes: It is the Funds’ policy to comply with the federal income and excise tax requirements of the Internal Revenue Code of 1986, as amended, applicable to regulated investment companies. Accordingly, the Funds intend to distribute substantially all of their income and net realized gains on investments, if any, to shareholders each year. Therefore, no federal income tax provision is required in the Funds’ financial statements.
The Fund follows ASC 740 “Income Taxes” (“ASC 740”), which requires that the financial statement effects of a tax position taken or expected to be taken in a tax return be recognized in the financial statements when it is more likely than not, based on the technical merits, that the position will be sustained upon examination.
Management has analyzed the Funds’ tax positions taken on federal income tax returns for all open tax years and has concluded that as of May 31, 2009, no provision for income tax is required in the Funds’ financial statements. The Funds’ federal and state income and federal excise tax returns for tax years since inception are subject to examination by the Internal Revenue Service and state departments of revenue.
2. Advisory Fees
Stone Harbor Investment Partners LP is the Trust’s investment adviser (the “Adviser”). Under the investment advisory agreement the Trust pays an investment advisory fee calculated daily and paid monthly of 0.50% and 0.60% of the average daily net assets for Stone Harbor High Yield Bond Fund and Stone Harbor Emerging Markets Debt Fund, respectively.
The Adviser has contractually agreed to waive fees and reimburse expenses with respect to each of the Funds so that the Net Annual Operating Expenses (exclusive of acquired fund fees and expenses, brokerage expenses, interest expense, taxes and extraordinary expenses) of the Stone Harbor High Yield Bond Fund Institutional Class, Stone Harbor High Yield Bond Fund Distributor Class, Stone Harbor Emerging Markets Debt Fund Institutional Class and Stone Harbor Emerging Markets Debt Fund Distributor Class will not exceed 0.55%, 0.80%, 0.75% and 1.00%, respectively. This undertaking is in effect through September 30, 2010 and is reevaluated on an annual basis.
The Adviser will be permitted to recover, on a class by class basis, expenses it has borne through the undertakings described above to the extent that a Fund’s expenses in later periods fall below the annual rates set forth in the relevant undertaking. A Fund will not be obligated to pay any such deferred fees and expenses more than one year after the end of the fiscal year in which the fee and expense was deferred.
Notes to Financial Statements (continued)
November 30, 2009 (Unaudited)
3. Federal Income Taxes
Income and capital gains distributions are determined in accordance with income tax regulations that may differ from accounting principles generally accepted in the United States of America. These differences are due to differing treatments for items such as net short-term gains, deferral of wash sale losses, foreign currency transactions, net investment losses and capital loss carryovers. The Funds have elected to treat gains and losses on forward foreign currency contracts as capital gains and losses. Other foreign currency gains and losses on debt instruments are treated as ordinary income for federal income tax purposes pursuant to Section 988 of the Internal Revenue Code.
The aggregate cost of investments and proceeds from sales of investments (excluding short-term investments), as well as the composition of unrealized appreciation and depreciation of investment securities, for federal income tax purposes for the six months ended November 30, 2009 are noted below:
|
| Stone Harbor |
| Stone Harbor |
| ||
|
| Emerging Markets Debt Fund |
| High Yield Bond Fund |
| ||
Purchases of investments |
| $ | 57,559,780 |
| $ | 150,975,044 |
|
Sales of investments |
| $ | 79,925,497 |
| $ | 37,333,451 |
|
Unrealized appreciation and unrealized depreciation in the table below exclude appreciation/depreciation on foreign currency translations. The primary difference between book and tax appreciation or depreciation of investments is wash sale loss deferrals and passive foreign investment companies.
|
| Stone Harbor |
| Stone Harbor |
| ||
|
| Emerging Markets Debt Fund |
| High Yield Bond Fund |
| ||
Gross appreciation |
|
|
|
|
| ||
(excess of value over tax cost) |
| $ | 9,864,250 |
| $ | 25,145,719 |
|
Gross depreciation |
|
|
|
|
| ||
(excess of tax cost over value) |
| $ | (71,519 | ) | $ | (8,206,827 | ) |
Net unrealized appreciation |
| $ | 9,792,731 |
| $ | 16,938,892 |
|
Cost of investments for income tax purposes |
| $ | 64,646,538 |
| $ | 344,917,153 |
|
Stone Harbor Emerging Markets Debt Fund and Stone Harbor High Yield Bond Fund elect to defer to the fiscal year ending May 31, 2010, approximately $ 3,152,110 and $ 3,438,318, respectively, of capital losses recognized during the period from November 1, 2008 to May 31, 2009. Additionally, Stone Harbor Emerging Markets Debt Fund elects to defer to its fiscal year ending May 31, 2010, approximately $ 259,507 of foreign currency losses recognized during the period from November 1,2008 to May 31, 2009.
4. Shares of Beneficial Interest
At November 30, 2009, the Trust had an unlimited number of shares of beneficial interest authorized with a par value of $0.001 per share. The Funds have the ability to issue multiple classes of shares. Each share of a class represents an identical interest and has the same rights, except that each class bears certain direct expenses, including those specifically related to the distribution of its shares.
Notes to Financial Statements (continued)
November 30, 2009 (Unaudited)
Transactions in shares of the Institutional Class were as follows:
|
| Stone Harbor |
| Stone Harbor |
| ||||
|
| Emerging Markets Debt Fund |
| High Yield Bond Fund |
| ||||
|
| Six Months |
| Year Ended |
| Six Months |
| Year Ended |
|
|
| Ended 11/30/09 |
| 5/31/09 |
| Ended 11/30/09 |
| 5/31/09 |
|
Shares sold |
| 1,833,168 |
| 7,950,246 |
| 13,236,795 |
| 15,634,751 |
|
Shares reinvested |
| 322,064 |
| 344,206 |
| 1,296,824 |
| 1,246,011 |
|
Shares redeemed |
| (4,861,640 | ) | (236,345 | ) | (1,855,239 | ) | (1,043,646 | ) |
Net increase/(decrease) in shares outstanding |
| (2,706,408 | ) | 8,058,107 |
| 12,678,380 |
| 15,837,116 |
|
5. Subsequent Events
In May 2009, the FASB issued “Subsequent Events” (the “Subsequent Events Statement” or “ASC 855.10,” formerly FAS 165), a statement outlining disclosure requirements related to certain events occurring after the date of financial statements. The Subsequent Events Statement is effective for interim and annual periods after June 15, 2009. The Funds adopted the Subsequent Events Statement in the current reporting period.
Management has performed a review for subsequent events through January 27, 2010, the date this report was issued. There were no reportable events for the Fund as a result of their review.
6. Recent Accounting Pronouncements
Recent Accounting Pronouncements: In June 2009, FASB issued FASB ASC 105 (formerly FASB Statement 168), Generally Accepted Accounting Principles, establishing FASB Accounting Standards CodificationTM (ASC) as the source of authoritative generally accepted accounting principles (GAAP) to be applied by nongovernmental entities. FASB ASC 105 is effective for annual and interim periods ending after September 15, 2009, and the Fund has updated its references to GAAP in this report in accordance with the provisions of this pronouncement. The implementation of FASB ASC 105 did not have a material effect on its financial position or results of operation.
In April 2009, FASB issued FASB ASC 820-10-65 (formerly FASB Staff Position No. FAS 157-4), Determining Fair Value When the Volume and Level of Activity for the Asset or Liability Have Significantly Decreased and Identifying Transactions That Are Not Orderly. This standard applies to all assets and liabilities within the scope of accounting pronouncements that require or permit fair value measurements, with certain defined exceptions, and provides additional guidance for estimating fair value when the volume and level of activity for the asset or liability have significantly decreased. ASC 820-10-65 is effective for interim reporting periods ending after June 15, 2009. The implementation of ASC 820-10-65 did not have a material effect on the Fund’s financial position or results of operation.
Additional Information
November 30, 2009 (Unaudited)
Fund Portfolio Holdings
The SEC has adopted the requirement that all funds file a complete schedule of portfolio holdings with the SEC for their first and third fiscal quarters on Form N-Q. For the Funds, this would be for the fiscal quarters ending August 31 and February 28. The Form N-Q filing must be made within 60 days of the end of the quarter. The Funds’ Forms N-Q are available without change, upon request, by contacting the Funds at 1-866-699-8158, on the SEC’s website at http://www.sec.gov., or they may be reviewed and copied at the SEC’s Public Reference Room in Washington, DC (call 1-800-732-0330 for information on the operation of the Public Reference Room).
Proxy Voting
A description of the policies and procedures that the Funds use to determine how to vote proxies relating to portfolio securities and information regarding how the Funds voted proxies relating to portfolio securities for the 12 month period ended June 30, 2009 is available without a charge, upon request, by contacting Stone Harbor Investment Funds at 1-866-699-8158 and on the SEC’s Web site at http://www.sec.gov.
Trustees and Officers
November 30, 2009 (Unaudited)
The business and affairs of each Fund are managed under the direction of its Board of Trustees. The Board of Trustees approves all significant agreements between a Fund and the persons or companies that furnish services to the Fund, including agreements with its distributor, investment adviser, administrator, custodian and transfer agent. The day-to-day operations of the Fund are delegated to the Fund’s Adviser and administrator.
The name, age and principal occupations for the past five years of the Trustees and officers of the Funds are listed below, along with the number of portfolios in the Fund complex overseen by and the other directorships held by each Trustee. Except as otherwise noted, the address of each Trustee and officer is c/o Stone Harbor Investment Partners LP, 31 W. 52nd Street, 16th Floor, New York, New York 10019. The Trust’s Statement of Additional Information includes additional information about the Trustees and is available without a charge, upon request, by calling 1-866-699-8158.
INDEPENDENT TRUSTEES
Name and Age |
| Position with the Trust |
| Term of Office and Length |
Alan Brott |
| Chairman of Audit Committee; Trustee |
| Since June 21, 2007 |
Age: 66 |
|
|
|
|
Heath B. McLendon |
| Trustee |
| Since June 21, 2007 |
Age: 76 |
|
|
|
|
Patrick Sheehan |
| Trustee |
| Since June 21, 2007 |
Age: 61 |
|
|
|
|
INTERESTED TRUSTEE
|
|
|
| Term of Office and Length |
Name and Age |
| Position with the Trust |
| of Time Served(1) |
Thomas W. Brock* |
| Chairman; Trustee |
| Since June 21, 2007 |
Age: 63 |
|
|
|
|
* Mr. Brock is an interested Trustee because of his position with Stone Harbor.
|
| Number of |
|
|
|
| Portfolios in |
|
|
|
| Fund Complex |
|
|
|
| Overseen by |
| Other Directorships |
Principal Occupation(s) During Past 5 Years |
| Trustee |
| by Trustee |
Columbia University Graduate School of Business - Associate Professor, 2000-Present; Consultant, 1991-Present. |
| 2 |
| Bank of America– two closed-end registered hedge funds. |
Citigroup – Chairman of Equity Research Oversight Committee (retired December 31, 2006). |
| 2 |
| None |
Retired; formerly, Citigroup Asset Management-Managing Director and Fixed Income Portfolio Manager, 1991-2002. |
| 2 |
| None |
|
| Number of |
|
|
|
| Portfolios in |
|
|
|
| Fund Complex |
|
|
|
| Overseen by |
| Other Directorships |
Principal Occupation(s) During Past 5 Years |
| Trustee |
| by Trustee |
Stone Harbor Investment Partners LP – Chief Executive Officer, 2006-Present; Columbia University Graduate School of Business - Associate Professor, 1998-2006. |
| 2 |
| Bank of America – two closed-end registered hedge funds; Liberty All Star Funds – two closed-end funds. |
OFFICERS
Name and Age |
| Position with the Trust |
| Term of Office and Length |
Peter J. Wilby Age: 51 |
| President |
| Since June 21, 2007 |
Pablo Cisilino Age: 42 |
| Executive Vice President |
| Since June 21, 2007 |
James E. Craige Age: 42 |
| Executive Vice President |
| Since June 21, 2007 |
Thomas K. Flanagan Age: 57 |
| Executive Vice President |
| Since June 21, 2007 |
David Oliver Age: 50 |
| Executive Vice President |
| Since September 29, 2008 |
(1) Officers are typically elected every year, unless an officer early retires, resigns or is removed from office. The current retirement age is 80.
|
| Number of |
|
|
|
| Portfolios in |
|
|
|
| Fund Complex |
|
|
|
| Overseen by |
| Other Directorships |
Principal Occupation(s) During Past 5 Years |
| Trustee |
| by Trustee |
Co-portfolio manager of the Funds; since April 3, 2006, Chief Investment Officer of Stone Harbor Investment Partners LP; prior to April 3, 2006, Chief Investment Officer – North American Fixed Income; joined Citigroup or its predecessor firms in 1989. |
| N/A |
| N/A |
Co-portfolio manager of Emerging Markets Debt Fund; since July 1, 2006, Senior Portfolio Manager of Stone Harbor Investment Partners LP; from June 1, 2004 to July 1, 2006, Executive Director for Sales and Trading in Emerging Markets at Morgan Stanley Inc; prior to June 1, 2004, Vice President for local markets and FX sales and trading, Goldman Sachs; joined Goldman Sachs in 1994. |
| N/A |
| N/A |
Co-portfolio manager of Emerging Markets Debt Fund; since April 3, 2006, Senior Portfolio Manager of Stone Harbor Investment Partners LP; prior to April 3, 2006, Managing Director and Senior Portfolio Manager at Salomon Brothers Asset Management Inc.; joined Salomon Brothers Asset Management Inc. in 1992. |
| N/A |
| N/A |
Co-portfolio manager of Emerging Markets Debt Fund; since April 3, 2006, Senior Portfolio Manager of Stone Harbor Investment Partners LP; prior to April 3, 2006, Managing Director and Senior Portfolio Manager at Salomon Brothers Asset Management Inc.; joined Salomon Brothers Asset Management Inc. in 1991. |
| N/A |
| N/A |
Co-portfolio manager of Emerging Markets Debt Fund; since June 1, 2008 Senior Portfolio Manager of Stone Harbor, from 1986 to June 1, 2008 Managing Director in Emerging Market sales and trading Citigroup. |
| N/A |
| N/A |
Name and Age |
| Position with |
| Term of Office and Length |
Beth A. Semmel Age: 49 |
| Executive Vice President |
| Since June 21, 2007 |
Jeffrey S. Scott Age: 50 |
| Chief Compliance Officer |
| Since June 21, 2007 |
James J. Dooley Age: 54 |
| Treasurer |
| Since June 21, 2007 |
Adam J. Shapiro Age: 45 |
| Secretary; Anti-Money Laundering Officer |
| Since June 21, 2007 Since June 21, 2007 |
Patrick D. Buchanan |
| Assistant Treasurer |
| Since April 23, 2008 |
(1) Officers are typically elected every year, unless an officer early retires, resigns or is removed from office. The current retirement age is 80.
|
| Number of |
|
|
|
| Portfolios in |
|
|
|
| Fund Complex |
|
|
|
| Overseen by |
| Other Directorships |
Principal Occupation(s) During Past 5 Years |
| Trustee |
| by Trustee |
Co-portfolio manager of High Yield Bond Fund; since April 3, 2006, Senior Portfolio Manager of Stone Harbor Investment Partners LP; Prior to April 3, 2006, Managing Director, Senior Portfolio Manager and Senior Trader for all high yield securities portfolios at Salomon Brothers Asset Management Inc.; joined Salomon Brothers Asset Management Inc. in 1993. |
| N/A |
| N/A |
Since April 3, 2006, Chief Compliance Officer of Stone Harbor Investment Partners LP; from October 2006 to March 2007, Director of Compliance, New York Life Investment Management LLC; from July 1998 to September 2006, Chief Compliance Officer, Salomon Brothers Asset Management Inc. |
| N/A |
| N/A |
Since April 3, 2006, Head of Operations, Technology and Finance of Stone Harbor Investment Partners LP; from August 2004 to March 2006, Senior Operations Manager of Institutional Asset Management, Citigroup Asset Management; from October 2002 to August 2004, Managing Director, Global Operations & Application Development, AIG Global Investment Group; from May 2001 to September 2002, President and Chief Operating Officer, Financial Technologies International. |
| N/A |
| N/A |
Since April 3, 2006, General Counsel of Stone Harbor Investment Partners LP; from April 2004 to March 2006, General Counsel, North American Fixed Income, Salomon Brothers Asset Management Inc.; from August 1999 to March 2004, Director of Product and Business Development, Citigroup Asset Management. |
| N/A |
| N/A |
Since October 15, 2007, Senior Fund Controller for ALPS Fund Services, Inc; from February 2005 to October 2007, Director of Accounting for Madison Capital Management LLC; from August 2003 to February, 2005, Manager of Fund Accounting for Janus Capital Group. |
| N/A |
| N/A |

OFFICERS AND TRUSTEES
Alan Brott, Trustee
Heath B. McLendon, Trustee
Patrick Sheehan, Trustee
Thomas W. Brock, Chairman
Peter J. Wilby, President
Pablo Cisilino, Exec. Vice President
James E. Craige, Exec. Vice President
Thomas K. Flanagan, Exec. Vice President
David Oliver, Exec. Vice President
Beth A. Semmel, Exec. Vice President
Jeffrey S. Scott, Chief Compliance Officer
Adam Shapiro, Secretary/Anti-Money Laundering Officer
James J. Dooley, Treasurer
Patrick Buchanan, Assistant Treasurer
INVESTMENT ADVISER
Stone Harbor Investment Partners LP
31 W. 52nd Street 16th Floor
New York, New York 10019
ADMINISTRATOR & FUND ACCOUNTANT
ALPS Fund Services, Inc.
1290 Broadway, Suite 1100
Denver, Colorado 80203
DISTRIBUTOR
ALPS Distributors, Inc.
1290 Broadway, Suite 1100
Denver, Colorado 80203
TRANSFER AGENT
ALPS Fund Services, Inc.
1290 Broadway, Suite 1100
Denver, Colorado 80203
CUSTODIAN
The Bank of New York Mellon
One Wall Street
New York, New York 10286
LEGAL COUNSEL
Ropes & Gray LLP
1211 Avenue of the Americas
New York, New York 10036
INDEPENDENT REGISTERED
PUBLIC ACCOUNTING FIRM
Deloitte & Touche LLP
555 17th Street, Suite 3600
Denver, Colorado 80202
This report and its financial statements are submitted for the general information of the shareholders of the Funds. The report is not authorized for distribution to prospective investors in the Funds unless preceded or accompanied by a prospectus.
SHF000117 06/10
Item 2. Code of Ethics.
Not applicable to this Report.
Item 3. Audit Committee Financial Expert.
Not applicable to this Report.
Item 4. Principal Accountant Fees and Services.
Not applicable to this Report.
Item 5. Audit Committee of Listed Registrants.
Not applicable.
Item 6. Investments.
(a) Schedule of Investments is included as part of the Report to Stockholders filed under Item 1 of this Form N-CSR.
(b) Not applicable.
Item 7. Disclosure of Proxy Voting Policies and Procedures for Closed-End Management Investment Companies.
Not applicable to Registrant.
Item 8. Portfolio Managers of Closed-End Management Investment Companies.
Not applicable to Registrant.
Item 9. Purchases of Equity Securities by Closed-End Management Investment Companies and Affiliated Purchasers.
Not applicable to Registrant.
Item 10. Submission of Matters to a Vote of Security Holders.
There have been no material changes to the procedures by which shareholders may recommend nominees to the Registrant’s Board of Trustees, where those changes were implemented after the Registrant last provided disclosure in response to the requirements of Item 407(c)(2) of Regulation S-K, or this Item.
Item 11. Controls and Procedures.
(a) The Registrant’s principal executive officer and principal financial officer have concluded that the Registrant’s disclosure controls and procedures (as defined in Rule 30a-3(c) under the Investment Company Act of 1940, as amended) are effective based on their evaluation of these controls and procedures as of a date within 90 days of the filing date of this report.
(b) There was no change in the Registrant’s internal control over financial reporting (as defined in Rule 30a-3(d) under the Investment Company Act of 1940, as amended) during the second fiscal quarter of the period covered by this report that has materially affected, or is reasonably likely to materially affect, the Registrant’s internal control over financial reporting.
Item 12. Exhibits.
(a)(1) Not applicable to this Report.
(a)(2) The certifications required by Rule 30a-2(a) of the Investment Company Act of 1940, as amended, and Section 302 of the Sarbanes-Oxley Act of 2002 are attached hereto as Exhibit 99.Cert.
(a)(3) Not applicable to Registrant.
(b) The certifications by the Registrant’s principal executive officer and principal financial officer, as required by Rule 30a-2(b) of the Investment Company Act of 1940, as amended, and Section 906 of the Sarbanes-Oxley Act of 2002 are attached hereto as Exhibit 99.906Cert.
SIGNATURES
Pursuant to the requirements of the Securities Exchange Act of 1934 and the Investment Company Act of 1940, the Registrant has duly caused this Report to be signed on its behalf by the undersigned, thereunto duly authorized.
|
| Stone Harbor Investment Funds | |
|
|
|
|
|
| By: | /s/ Peter J. Wilby |
|
|
| Peter J. Wilby |
|
|
| President/Principal Executive Officer |
|
|
|
|
|
| Date: | February 5, 2010 |
Pursuant to the requirements of the Securities Exchange Act of 1934 and the Investment Company Act of 1940, this Report has been signed below by the following persons on behalf of the Registrant and in the capacities and on the dates indicated.
|
| By: | /s/ Peter J. Wilby |
|
|
| Peter J. Wilby |
|
|
| President/Principal Executive Officer |
|
|
|
|
|
| Date: | February 5, 2010 |
|
|
|
|
|
|
|
|
|
| By: | /s/ James J. Dooley |
|
|
| James J. Dooley |
|
|
| Treasurer, Chief Financial Officer/Principal Financial Officer |
|
|
|
|
|
| Date: | February 5, 2010 |