Table of Contents
UNITED STATES
SECURITIES AND EXCHANGE COMMISSION
Washington, D.C. 20549
FORM N-CSR
CERTIFIED SHAREHOLDER REPORT OF REGISTERED
MANAGEMENT INVESTMENT COMPANIES
Investment Company Act file number: 811-22037
Stone Harbor Investment Funds
(Exact name of registrant as specified in charter)
1290 Broadway, Suite 1100
Denver, CO 80203
(Address of principal executive offices) (Zip code)
Adam J. Shapiro, Esq.
c/o Stone Harbor Investment Partners LP
31 West 52nd Street, 16th Floor
New York, NY 10019
(Name and address of agent for service)
With copies To:
John M. Loder, Esq.
Ropes & Gray LLP
One International Place
Boston, MA 02110-2624
Registrant’s telephone number, including area code: (303) 623-2577
Date of fiscal year end: May 31
Date of reporting period: June 1, 2010 - November 30, 2010
Table of Contents
Item 1. Report to Stockholders.
Table of Contents
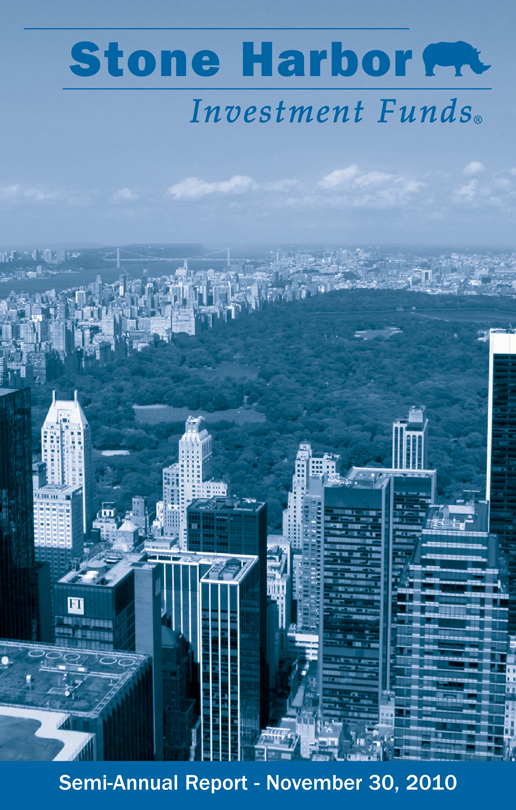
Table of Contents
| 1 | |||||
| 5 | |||||
Summaries of Portfolio Holdings
| 6 | |||||
Growth of a $10,000 Investment
| 8 | |||||
Statements of Investments
| ||||||
| 11 | |||||
| 26 | |||||
| 50 | |||||
Statements of Assets & Liabilities
| 57 | |||||
| 59 | |||||
Statements of Changes in Net Assets
| ||||||
| 60 | |||||
| 61 | |||||
| 62 | |||||
Financial Highlights
| ||||||
| 64 | ||||||
| 66 | ||||||
| 68 | |||||
| 69 | |||||
| 81 | |||||
| 82 | |||||
Table of Contents
Stone Harbor Investment Funds | Shareholder Letter | |
| November 30, 2010 (Unaudited) |
Dear Shareholder,
After just a year of moderate recovery from the deep global recession and financial crisis, global growth sputtered somewhat in the second half of 2010. Euro area economic and fiscal uncertainty amid weakening fundamentals and downward revisions to growth expectations weighed globally on market sentiment in the early summer and stoked fears of a double-dip recession and deflationary pressures in developed markets. As events unfolded, strong profit reporting and better corporate credit metrics, as well as a tentative stabilization of the European banking system, helped foster a greater tolerance for credit risk as broad fixed income credit markets remained relatively resilient notwithstanding equity instability and declining Treasury yields. In the US, a surge in imports and the failure of corporate hiring to build on momentum that looked to be gathering earlier in the year, despite the most expansive monetary stance seen in a generation, prompted the Federal Reserve to announce a second round of large scale asset purchases, a policy known as quantitative easing, or QE2. As the central bank kicked off its buyback program, investor response turned mixed, and Treasury yields unexpectedly rose sharply higher, with intermediate maturity yields retracing more than half of their decline from April peaks. Volatility in risk assets spiked briefly as lingering disquiet in the eurozone periphery, this time in Ireland, resurfaced and credit-tightening concerns in China returned to the fore. Despite the late retrenchment, fixed income asset classes headed into the last month of the year having achieved double-digit returns and substantive compression in credit spreads.
Market Overview
For the six month period ending November 30, 2010, market momentum was patchy, highlighting the uneven trajectory which the economic recovery has taken. The credit markets witnessed moderate improvement, although below the substantial gains seen in 2009 in the initial stages of the recovery. As represented by the Citigroup High Yield Market Index, high yield spreads began the reporting period at 703 basis points (“bps”) and contracted to a tight level of 589 bps on November 9, although subsequently widening to 618 bps by the end of the reporting period, driven largely by mixed response to Federal Reserve policy action and uncertainty in the global markets. Emerging markets debt trended similarly but sustained steeper losses in November, further weakened by a stronger dollar. Spread levels remained range-bound due to sharply rising Treasury yields. The JP Morgan Emerging Markets Bond Index Global spread levels contracted from 343 bps to 322 bps in the six months ended November 30, although they had narrowed tighter, to 268 bps, on November 9. Investment grade credit had a more muted reaction to event risk. As represented by Barclay’s US Corporate Index, spreads over Treasuries ground tighter by 16 bps, from 187 bps to 171 bps, reaching a low level within the period of 162 bps in early November.
Looking ahead, we remain optimistic that the recovery in the US will accelerate into 2011, sustained by an improving macroeconomic backdrop, a benign inflationary environment and positive demand/supply technicals. While employment levels and the housing market have remained stubbornly depressed, we are encouraged by strong corporate profitability and the recent rebound in consumer spending. Given the Federal Reserve’s commitment to its dual mandate – full employment and price stability – we believe that the central bank will likely continue asset purchases until it sees a shift to convincingly above-trend growth. Beyond that, we remain cautious of the visible downside risks that threaten to undercut upward momentum, including fiscal drag from the inevitable government stimulus unwind, sovereign stress in the eurozone periphery, the stability of growth in China and global trade imbalances, among others. With this in mind, we view current spread levels constructively as compared to underlying credit
Semi-Annual Report (Unaudited) | November 30, 2010 | 1 |
Table of Contents
Stone Harbor Investment Funds | Shareholder Letter | |
| November 30, 2010 (Unaudited) |
risk, and continue to believe Stone Harbor Funds appear to be well-positioned to provide us with favorable opportunities over the coming months.
Performance Review
Stone Harbor Emerging Markets Debt Fund
Fund performance for the six months ended November 30, 2010 was 10.38% (net of expenses) and 10.75% (gross of expenses). This compares to a benchmark return of 8.89% for the JP Morgan Emerging Market Bond Index Global Diversified. Emerging debt markets turned higher following May’s sell off as investors marked down the probability of a US double-dip recession and China reported strong industrial production and retail sales. Gains were also boosted by falling US Treasury yields, though the increase in yields in the final month of the period reduced these gains.
Key economic developments during the period included a continuation of a strong fundamental credit backdrop for emerging markets (EM). While growth in most EM countries continued to moderate as the initial rebound from 2008 and 2009 waned, the growth differential between EM countries and advanced economies remained large. Domestic consumption expanded in all regions. Credit growth rebounded but remained below pre-crisis levels. While headline inflation measures picked up measurably in response to commodity price gains, core inflation remained below targets in most EMs. Throughout the period, gradual policy rate tightening continued, but rates remained accommodative in most countries.
Despite a positive fundamental backdrop for EM economies, global risks increased. The potential for contagion from the fiscal crisis in peripheral European countries escalated over the summer; the issues remained unresolved at the end of the reporting period. Food price inflation and rapid credit growth in China led authorities to call for additional measures to slow the Chinese economy. China hiked rates unexpectedly in October, by 25 basis points. Investors worried that this move and other measures designed to cool property price speculation would lead to a hard landing for China, an expectation that was not realized. The weakening of the US dollar as the US Federal Reserve embarked on another leg of quantitative easing also raised discussion of a global currency war, prompting several EM central banks to intervene more aggressively to slow down the inflow of foreign capital, and reduce the appreciation of EM currencies relative to the US dollar.
These events as well as assessments of fundamental credit—both sovereign and corporate—and analysis of current market valuations led to important shifts in the positioning of the fund. Spread duration was reduced in several countries as yield curves flattened and spreads tightened. Positioning in local currency markets was reduced from 18.6% of the portfolio in market weight terms to 12.1% at the end of the period. Corporate debt exposure was increased from 3.0% to 13.1%, reflecting attractive valuations and improving underlying credit quality, liquidity and transparency in the EM corporate bond sector.
Country selection decisions, including sovereign and corporate credits, accounted for approximately 35% of portfolio returns in excess of the benchmark rate of return; the remainder came from issue selection and a flattening US Treasury yield curve. Key country decisions during the period included an overweight to Argentina sovereign and corporate debt, the largest contributor to returns. Argentina’s debt markets were supported in an environment that favored high yielding debt but positive country developments. During the reporting period, Argentina benefited from the completion of the debt exchange, strong growth numbers and a rating upgrade by Standard & Poor’s. In October, the unexpected death of Nestor Kirchner, Argentina’s former
2 | www.shiplp.com |
Table of Contents
Stone Harbor Investment Funds | Shareholder Letter | |
| November 30, 2010 (Unaudited) |
president and husband of current president Cristina Fernandez, also drove spread compression as his demise was viewed as increasing the likelihood of a centralist policy shift leading to 2012 presidential elections. Finally, news that the Argentine government would negotiate to repay the country’s defaulted debt with the Paris Club was looked upon favorably by investors. A portfolio overweight to high beta Venezuela also outperformed, largely driven by the failure of the Chavez administration to clinch a majority necessary to implement constitutional changes and thus aggressively pursue his populist political agenda. Allocations to local currency debt in Brazil, Colombia, Indonesia, Malaysia, Mexico and South Africa enhanced performance. Exposure to long duration debt in each of these countries was also a key source of excess returns.
Stone Harbor Emerging Markets Local Currency Debt Fund
Fund performance for the six months ended November 30, 2010 was 7.70% (net of expenses) and 8.11% (gross of expenses). This compares to a benchmark return of 8.52% for the JP Morgan Government Bond Index - Emerging Markets Global Diversified. Emerging local currency debt markets trended upward following May’s sell off as investors marked down the probability of a US double-dip recession and China reported strong industrial production and retail sales figures. While lower long term interest rates contributed positively to returns of local bonds, foreign exchange rate (EMFX) appreciation relative to the US dollar was the primary source of the rally. On the downside, concerns over lack of export competitiveness due to rising currency values heightened pressures for competitive valuations.
Key economic developments during the period included a continuation of a strong fundamental credit backdrop for emerging markets (EM). While growth in most EM countries moderated from the fast pace of the first half of the year, the growth differential between EM countries and advanced economies remained large. Domestic consumption expanded in all regions. Credit growth rebounded but remained below pre-crisis levels. Headline inflation measures picked up measurably in response to commodity price gains, but core inflation remained below targets in most EMs. Many EM country central banks gradually began to normalize policy rates, though interest rates remained accommodative in most countries.
Despite a positive fundamental backdrop for EM economies, global risks increased. The potential for contagion from the fiscal crisis in peripheral European countries escalated over the summer; the issues remained unresolved at the end of the reporting period. Food price inflation and rapid credit growth in China led authorities to call for additional measures to slow the Chinese economy. China hiked rates unexpectedly in October, by 25 basis points. Investors worried that this move and other measures designed to cool property price speculation would lead to a hard landing for China, an expectation that was not realized. The weakening of the US dollar as the US Federal Reserve embarked on another leg of quantitative easing also raised discussion of a global currency war, prompting several EM central banks to intervene more aggressively to slow down the inflow of foreign capital, and reduce the appreciation of EM currencies relative to the US dollar.
Stone Harbor High Yield Bond Fund
Fund performance for the six months ended November 30, 2010 was 8.62% (net of expenses) and 8.89% (gross of expenses). This compares to a benchmark return of 8.96% for the Citigroup High Yield Market Capped Index. The high yield market recovered lost ground in the trailing six months in the wake of a pullback in May and June as foreign concerns receded and market participants returned to the domestic economic landscape for impetus. Broad-based fundamentals substantiating concerns of a slowdown in growth were largely dismissed as strong corporate
Semi-Annual Report (Unaudited) | November 30, 2010 | 3 |
Table of Contents
Stone Harbor Investment Funds | Shareholder Letter | |
| November 30, 2010 (Unaudited) |
earnings, low Treasury yields and the expectation of further stimulus by the Federal Reserve boosted market sentiment.
An improving tone in economic data, including signs of a stabilizing housing market and small but consistent decreases in initial jobless claims renewed demand for risk assets. New issue activity reached record highs, including three consecutive months in excess of $30 billion. On the demand side, positive high yield mutual fund flows were reported in all but November. Risk appetite ultimately remained healthy as market participants continued to reach for yield.
The high yield market gave back some gains in November as base Treasury rates rose sharply and volatility spiked. Signs of accelerating economic growth and mixed response to Federal Reserve policy exerted upward pressure on bond yields. Market focus then shifted overseas as sovereign debt concerns in the eurozone periphery, this time in Ireland, as well as military tensions in the Korean peninsula and the threat of an overheated Chinese economy sidelined investors. The technical landscape weakened somewhat, with three consecutive weeks of outflows, totaling $1.5 billion, from weekly reporting high yield mutual funds.
Nevertheless, against a backdrop of improving growth, little threat of inflation and continued diminishing refinance and maturity risk, we remain constructive on high yield and believe credit risk assets have room to tighten. Despite potential exogenous shocks and the impact of fiscal policy down the road, we believe the economy is nearing a threshold for self-sustaining growth.
Our investment style has been to focus on industries and companies poised to benefit from a continued moderate economic recovery while properly financed to resist financial stress should growth continue to lag. As a result, we have focused on mid to better quality investments within our universe, which despite strong returns over the past six months, trailed the broader market indices. As investors recede from indiscriminate buying within high yield to focusing on companies that can thrive in a more subdued economic recovery, we believe that more differentiation will take place in the market.
Sincerely,

Thomas W. Brock
Chairman of the Board of Trustees
4 | www.shiplp.com |
Table of Contents
| Stone Harbor Investment Funds | Disclosure of Fund Expenses | |
November 30, 2010 (Unaudited) |
Example. As a shareholder of a Fund, you incur two types of costs: (1) transaction costs, including sales charges (loads) on purchase payments and/or redemption fees (if applicable) and (2) ongoing costs, including management fees and other Fund expenses. The below examples are intended to help you understand your ongoing costs (in dollars) of investing in a Fund and to compare these costs with the ongoing costs of investing in other mutual funds. The examples are based on an investment of $1,000 invested on June 1, 2010 and held until November 30, 2010.
Actual Expenses. The first line of each table below provides information about actual account values and actual expenses. You may use the information in this line, together with the amount you invested, to estimate the expenses that you paid over the period. Simply divide your account value by $1,000 (for example, an $8,600 account value divided by $1,000 = 8.6), then multiply the result by the number in the first line under the heading “Expenses Paid During Period” to estimate the expenses you paid on your account during this period.
Hypothetical Example for Comparison Purposes. The second line of each table below provides information about hypothetical account values and hypothetical expenses based on the Fund’s actual expense ratio and an assumed rate of return of 5% per year before expenses, which is not the Fund’s actual return. The hypothetical account values and expenses may not be used to estimate the actual ending account balance or expenses you paid for the period. You may use this information to compare the ongoing costs of investing in a Fund and other mutual funds. To do so, compare this 5% hypothetical example with the 5% hypothetical examples that appear in the shareholder reports of the other funds.
Please note that the expenses shown in the table are meant to highlight your ongoing costs only and do not reflect transactional costs, such as redemption fees, sales charges (loads) or exchange fees. Therefore, the second line of the table is useful in comparing ongoing costs only, and will not help you determine the relative total costs of owning different funds. In addition, if these transactional costs were included, your costs would have been higher.
Beginning Account Value 06/01/2010 | Ending Account Value 11/30/2010 | Expense Ratio(1) | Expenses Paid During Period(2) | |||||||||||||
STONE HARBOR EMERGING MARKETS DEBT FUND | ||||||||||||||||
Institutional Class shares | ||||||||||||||||
Actual | $1,000.00 | $1,103.80 | 0.75% | $3.96 | ||||||||||||
Hypothetical (5% return before expenses) | $1,000.00 | $1,021.31 | 0.75% | $3.80 | ||||||||||||
STONE HARBOR HIGH YIELD BOND FUND | ||||||||||||||||
Institutional Class shares | ||||||||||||||||
Actual | $1,000.00 | $1,086.20 | 0.55% | $2.88 | ||||||||||||
Hypothetical (5% return before expenses) | $1,000.00 | $1,022.31 | 0.55% | $2.79 | ||||||||||||
STONE HARBOR LOCAL MARKETS FUND | ||||||||||||||||
Institutional Class shares | ||||||||||||||||
Actual | $1,000.00 | $1,077.00 | 1.00% | $4.35(3) | ||||||||||||
Hypothetical (5% return before expenses) | $1,000.00 | $1,016.77 | 1.00% | $5.06 | ||||||||||||
| (1) | Annualized, based on the Fund’s most recent fiscal half-year expenses. |
| (2) | Expenses are equal to the Fund’s annualized ratio multiplied by the average account value over the period, multiplied by the number of days in the most recent fiscal half year (183), divided by 365. Note this expense example is typically based on a six-month period. |
| (3) | The Fund’s expense ratios have been based on the Fund’s inception date of June 30, 2010 through November 30, 2010. |
Semi-Annual Report (Unaudited) | November 30, 2010 | 5 |
Table of Contents
| Stone Harbor Investment Funds | Summaries of Portfolio Holdings | |
November 30, 2010 (Unaudited) |
Under SEC Rules, all funds are required to include in their annual and semi-annual shareholder reports a presentation of portfolio holdings in a table, chart or graph by reasonably identifiable categories. The following tables, which present holdings as a percent of total net assets (“TNA”), are provided in compliance with such requirements.
| EMERGING MARKETS DEBT FUND | ||
| Country Breakdown | % of TNA | |
Mexico | 10.78% | |
Russia | 9.08% | |
Venezuela | 7.49% | |
Brazil | 7.31% | |
Colombia | 5.75% | |
Indonesia | 5.56% | |
Philippines | 5.25% | |
Malaysia | 5.23% | |
Argentina | 4.44% | |
Ukraine | 3.65% | |
Iraq | 3.33% | |
Panama | 3.33% | |
Poland | 2.96% | |
Peru | 2.76% | |
Turkey | 2.61% | |
Kazakhstan | 2.44% | |
Uruguay | 2.15% | |
Qatar | 2.13% | |
El Salvador | 1.50% | |
South Africa | 1.45% | |
China | 1.13% | |
United Arab Emirates | 0.83% | |
Croatia | 0.71% | |
Tunisia | 0.65% | |
Chile | 0.56% | |
India | 0.46% | |
Pakistan | 0.37% | |
South Korea | 0.35% | |
Barbados | 0.19% | |
Dominican Republic | 0.17% | |
Egypt | 0.15% | |
Jamaica | 0.15% | |
Singapore | 0.13% | |
Gabon | 0.02% | |
Total | 95.07% | |
Money Market Mutual Funds | 3.01% | |
Other Assets in Excess of Liabilities | 1.92% | |
Total Net Assets | 100.00% | |
| HIGH YIELD BOND FUND | ||||
| Industry Breakdown | % of TNA | |||
Healthcare | 7.92% | |||
Electric | 7.28% | |||
Exploration & Production | 6.89% | |||
Retail Non Food/Drug | 5.50% | |||
Wirelines | 4.99% | |||
Media Cable | 4.92% | |||
Services Other | 4.86% | |||
Gaming | 3.92% | |||
Food and Beverage | 3.89% | |||
Wireless | 3.68% | |||
Drillers/Services | 3.59% | |||
Gas Pipelines | 3.38% | |||
Chemicals | 3.15% | |||
Technology | 2.73% | |||
Paper/Forest Products | 2.50% | |||
Media Other | 2.38% | |||
Automotive | 2.30% | |||
Containers/Packaging | 2.25% | |||
Metals/Mining/Steel | 2.21% | |||
Consumer Products | 1.99% | |||
Leisure | 1.59% | |||
Publishing/Printing | 1.26% | |||
Satellite | 1.19% | |||
Building Products | 1.16% | |||
Industrial Other | 1.03% | |||
Gas Distributors | 0.96% | |||
Aerospace/Defense | 0.91% | |||
Textile/Apparel | 0.88% | |||
Construction Machinery | 0.84% | |||
Banking | 0.77% | |||
Retail Food/Drug | 0.73% | |||
Non Captive Finance | 0.59% | |||
Refining | 0.58% | |||
Transportation - Non Air/Rail | 0.54% | |||
Restaurants | 0.47% | |||
REITS | 0.45% | |||
Lodging | 0.42% | |||
Environmental Services | 0.40% | |||
6 | www.shiplp.com |
Table of Contents
Stone Harbor Investment Funds | Summaries of Portfolio Holdings | |
| November 30, 2010 (Unaudited) |
HIGH YIELD BOND FUND (CONTINUED) |
| |||
Industry Breakdown | % of TNA | |||
Pharmaceuticals | 0.37 | % | ||
Diversified Manufacturing | 0.24 | % | ||
Life | 0.04 | % | ||
Insurance* | 0.00 | % | ||
Total | 95.75 | % | ||
Money Market Mutual Funds | 2.56 | % | ||
Other Assets in Excess of Liabilities | 1.69 | % | ||
Total Net Assets | 100.00 | % | ||
LOCAL MARKETS FUND | ||||
Country Breakdown | % of TNA | |||
Brazil | 12.93 | % | ||
Indonesia | 11.73 | % | ||
Mexico | 11.11 | % | ||
Poland | 7.89 | % | ||
European Union | 7.66 | % | ||
Colombia | 5.42 | % | ||
South Africa | 4.75 | % | ||
Turkey | 4.72 | % | ||
Malaysia | 4.52 | % | ||
Thailand | 3.67 | % | ||
Hungary | 2.50 | % | ||
Russia | 1.14 | % | ||
Venezuela | 1.01 | % | ||
Peru | 0.43 | % | ||
Total | 79.48 | % | ||
Money Market Mutual Funds | 21.25 | % | ||
Liabilities in Excess of Other Assets | -0.73 | % | ||
Total Net Assets | 100.00 | % | ||
| * | Less than 0.005% |
Semi-Annual Report (Unaudited) | November 30, 2010 | 7 |
Table of Contents
Stone Harbor Investment Funds | Growth of $10,000 Investment | |
| November 30, 2010 (Unaudited) |
STONE HARBOR EMERGING MARKETS DEBT FUND
Comparison of Change in Value of $10,000 Investment in Stone Harbor Emerging Markets Debt Fund and the JP Morgan Emerging Market Bond Index Global Diversified
The JP Morgan Emerging Market Bond Index Global Diversified is a uniquely-weighted version of the EMBI Global Index, which tracks total returns for U.S. dollar-denominated debt instruments issued by emerging market sovereign and quasi-sovereign entities such as: Brady bonds, loans and Eurobonds. Currently, the EMBI Global Index covers 196 instruments across 28 countries. It limits the weights of those index countries with larger debt stocks by only including specified portions of these countries’ eligible debt outstanding. The countries covered in the EMBI Global Diversified are identical to those covered by the EMBI Global Index.
Average Annual Total Returns
| 1 Year | 3 Years | 5 Years | 10 Years | Since Inception | Inception Date | |||||||||
Stone Harbor Emerging Markets Debt Fund | 15.02% | 9.87% | N/A | N/A | 11.66% | 8/16/07 | ||||||||
JP Morgan EMBI Global Diversified Index | 13.17% | 9.01% | N/A | N/A | 10.36% | |||||||||
The performance data quoted represents past performance and does not guarantee future results. Current performance may be lower or higher than the performance quoted. Average annual total returns reflect the reinvestment of dividends and capital gains distributions and include all fee waivers and expense reimbursements. Without the fee waivers and expense reimbursements, total return figures would have been lower. The performance data quoted does not reflect the deduction of taxes that a shareholder would pay on Fund distributions or the redemption of Fund shares. Investment return and principal value will vary, and shares, when redeemed, may be worth more or less than their original cost.
8 | www.shiplp.com |
Table of Contents
| Stone Harbor Investment Funds | Growth of $10,000 Investment | |
November 30, 2010 (Unaudited) |
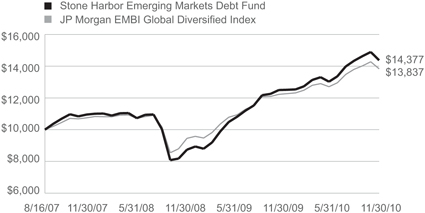
STONE HARBOR HIGH YIELD BOND FUND
Comparison of Change in Value of $10,000 Investment in Stone Harbor High Yield Bond Fund and the Citigroup High Yield Market Capped Index
The Citigroup High Yield Market Capped Index represents a modified version of the High Yield Market Index by delaying the entry of “fallen angel” issues (corporate or municipal bonds that were investment-grade when issued but have since been downgraded) and capping the par value of individual issuers at US $5 billion par amount outstanding.
Average Annual Total Returns
| 1 Year | 3 Years | 5 Years | 10 Years | Since Inception | Inception Date | |||||||||
Stone Harbor High Yield Bond Fund | 13.46% | 7.06% | N/A | N/A | 7.51% | 8/16/07 | ||||||||
Citigroup High Yield Markets Capped Index | 15.59% | 8.77% | N/A | N/A | 8.71% | |||||||||
The performance data quoted represents past performance and does not guarantee future results. Current performance may be lower or higher than the performance quoted. Average annual total returns reflect the reinvestment of dividends and capital gains distributions and include all fee waivers and expense reimbursements. Without the fee waivers and expense reimbursements, total return figures would have been lower. The performance data quoted does not reflect the deduction of taxes that a shareholder would pay on Fund distributions or the redemption of Fund shares. Investment return and principal value will vary, and shares, when redeemed, may be worth more or less than their original cost.
Semi-Annual Report (Unaudited) | November 30, 2010 | 9 |
Table of Contents
Stone Harbor Investment Funds | Growth of $10,000 Investment | |
| November 30, 2010 (Unaudited) |
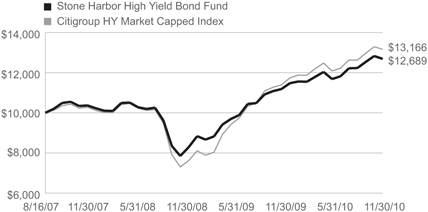
STONE HARBOR LOCAL MARKETS FUND
Comparison of Change in Value of $10,000 Investment in Stone Harbor Local Markets Fund and the JP Morgan EM Global Diversified Index.
The JPMorgan Emerging Markets Bond Index Global Diversified (EMBI Global Diversified is one our most comprehensive US-dollar emerging markets debt benchmarks). Included in the EMBI Global Diversified is US-dollar-denominated Brady bonds, Eurobonds, and traded loans issued by sovereign and quasi-sovereign entities. The EMBI Global Diversified expands upon the composition of its predecessor, the Emerging Markets Bond Index Plus (EMBI+), by using a different country selection process and instrument selection process. The EMBI Diversified defines emerging markets countries with a combination of World-Bank-defined per capita income brackets and each country’s debt-restructuring history. These two criteria allow the EMBI Diversified to include a number of higher-rated countries that international investors have nevertheless considered part of the emerging markets universe.
Average Annual Total Returns
| 1 Year | 3 Years | 5 Years | 10 Years | Since Inception | Inception Date | |||||||||
Stone Harbor Local Markets Fund | N/A | N/A | N/A | N/A | 7.70% | 6/30/10 | ||||||||
JP Morgan EM Global Diversified Index | N/A | N/A | N/A | N/A | 8.52% | |||||||||
The performance data quoted represents past performance and does not guarantee future results. Current performance may be lower or higher than the performance quoted. Average annual total returns reflect the reinvestment of dividends and capital gains distributions and include all fee waivers and expense reimbursements. Without the fee waivers and expense reimbursements, total return figures would have been lower. The performance data quoted does not reflect the deduction of taxes that a shareholder would pay on Fund distributions or the redemption of Fund shares. Investment return and principal value will vary, and shares, when redeemed, may be worth more or less than their original cost.
10 | www.shiplp.com |
Table of Contents
Markets Debt Fund | Statements of Investments | |
November 30, 2010 (Unaudited) |
Interest Rate/Maturity Date | Currency | Principal Amount * | Market Value (Expressed in U.S. $) | |||||||||
SOVEREIGN DEBT OBLIGATIONS - 67.87% | ||||||||||||
Argentina - 3.57% | ||||||||||||
Republic of Argentina | ||||||||||||
7.000%, 09/12/2013 | $1,766,000 | $1,707,281 | ||||||||||
7.000%, 10/03/2015 | 5,528,078 | 4,946,709 | ||||||||||
7.000%, 04/17/2017 | 434,550 | 368,305 | ||||||||||
8.750%, 06/02/2017 | 841,922 | 841,080 | ||||||||||
0.000%, 03/31/2023(1) | 184,000 | 110,400 | ||||||||||
6.000%, 03/31/2023(1) | 480,000 | 336,000 | ||||||||||
5.820%, 12/31/2033(3) | ARS | 526,544 | 202,240 | |||||||||
7.820%, 12/31/2033 | EUR | 666,568 | 629,458 | |||||||||
7.820%, 12/31/2033 | EUR | 736,972 | 693,551 | |||||||||
8.280%, 12/31/2033 | 1,912,223 | 1,668,414 | ||||||||||
| 11,503,438 | ||||||||||||
Brazil - 3.88% | ||||||||||||
Nota Do Tesouro Nacional | ||||||||||||
10.000%, 01/01/2021 | BRL | 5,800,000 | 2,939,014 | |||||||||
Republic of Brazil | ||||||||||||
6.000%, 01/17/2017 | 3,839,000 | 4,443,643 | ||||||||||
5.875%, 01/15/2019 | 3,169,000 | 3,648,311 | ||||||||||
8.875%, 10/14/2019 | 100,000 | 137,250 | ||||||||||
4.875%, 01/22/2021 | 1,235,000 | 1,309,100 | ||||||||||
10.125%, 05/15/2027 | 32,000 | 50,560 | ||||||||||
| 12,527,878 | ||||||||||||
Colombia - 5.75% | ||||||||||||
Bogota Distrio Capital | ||||||||||||
9.750%, 07/26/2028(4) | COP | 4,954,000,000 | 3,459,080 | |||||||||
Republic of Colombia | ||||||||||||
7.375%, 01/27/2017 | 500,000 | 605,000 | ||||||||||
7.375%, 03/18/2019 | 2,764,000 | 3,399,720 | ||||||||||
11.750%, 02/25/2020 | 1,045,000 | 1,614,525 | ||||||||||
8.375%, 02/15/2027 | 25,000 | 31,500 | ||||||||||
9.850%, 06/28/2027 | COP | 3,873,000,000 | 2,681,858 | |||||||||
7.375%, 09/18/2037 | 4,783,000 | 5,907,005 | ||||||||||
6.125%, 01/18/2041 | 790,000 | 841,350 | ||||||||||
| 18,540,038 | ||||||||||||
See Notes to Financial Statements.
Semi-Annual Report (Unaudited) | November 30, 2010 | 11 |
Table of Contents
Stone Harbor Emerging | ||
Markets Debt Fund | Statements of Investments | |
| November 30, 2010 (Unaudited) |
Interest Rate/Maturity Date | Currency | Principal Amount * | Market Value (Expressed in U.S. $) | |||||||||
Croatia - 0.71% | ||||||||||||
Croatian Government | ||||||||||||
6.750%, 11/05/2019(4) | $ | 240,000 | $255,300 | |||||||||
6.625%, 07/14/2020(5) | 1,906,000 | 2,026,983 | ||||||||||
| 2,282,283 | ||||||||||||
El Salvador - 1.50% | ||||||||||||
Republic of El Salvador | ||||||||||||
7.375%, 12/01/2019(5) | 220,000 | 244,200 | ||||||||||
7.375%, 12/01/2019(4) | 2,068,000 | 2,295,480 | ||||||||||
8.250%, 04/10/2032(4) | 1,000,000 | 1,140,000 | ||||||||||
7.650%, 06/15/2035(4) | 1,077,000 | 1,168,545 | ||||||||||
| 4,848,225 | ||||||||||||
Gabon - 0.02% | ||||||||||||
Republic of Gabon | ||||||||||||
8.200%, 12/12/2017(5) | 50,000 | 58,875 | ||||||||||
Indonesia - 3.44% | ||||||||||||
Republic of Indonesia | ||||||||||||
6.875%, 01/17/2018(4) | 1,278,000 | 1,512,833 | ||||||||||
11.625%, 03/04/2019(4) | 875,000 | 1,322,343 | ||||||||||
11.625%, 03/04/2019(5) | 2,070,000 | 3,128,288 | ||||||||||
5.875%, 03/13/2020(4) | 189,000 | 212,153 | ||||||||||
7.750%, 01/17/2038(4) | 3,918,000 | 4,926,884 | ||||||||||
| 11,102,501 | ||||||||||||
Iraq - 3.33% | ||||||||||||
Republic of Iraq | ||||||||||||
5.800%, 01/15/2028(4) | 12,130,000 | 10,735,050 | ||||||||||
Malaysia - 2.09% | ||||||||||||
Malaysian Government | ||||||||||||
7.500%, 07/15/2011 | 495,000 | 508,219 | ||||||||||
3.741%, 02/27/2015 | MYR | 7,745,000 | 2,475,710 | |||||||||
3.835%, 08/12/2015 | MYR | 11,639,000 | 3,759,020 | |||||||||
| 6,742,949 | ||||||||||||
See Notes to Financial Statements.
12 | www.shiplp.com |
Table of Contents
Stone Harbor Emerging | ||
Markets Debt Fund | Statements of Investments | |
| November 30, 2010 (Unaudited) |
Interest Rate/Maturity Date | Currency | Principal | Market Value (Expressed in U.S. $) | |||||||
Mexico - 7.62% | ||||||||||
Mexican Bonos | ||||||||||
7.500%, 06/03/2027 | MXN | $ | 10,000,000 | $811,243 | ||||||
Mexican Udibonos | ||||||||||
5.000%, 06/16/2016 | MXN | 30,032,575 | 2,881,459 | |||||||
4.000%, 06/13/2019 | MXN | 31,034,197 | 2,856,508 | |||||||
United Mexican States | ||||||||||
5.625%, 01/15/2017 | 2,122,000 | 2,392,555 | ||||||||
5.950%, 03/19/2019 | 2,732,000 | 3,124,042 | ||||||||
5.125%, 01/15/2020 | 1,692,000 | 1,821,015 | ||||||||
8.000%, 09/24/2022 | 3,829,000 | 5,264,875 | ||||||||
8.300%, 08/15/2031 | 1,903,000 | 2,588,080 | ||||||||
6.750%, 09/27/2034 | 1,445,000 | 1,683,425 | ||||||||
6.050%, 01/11/2040 | 1,084,000 | 1,154,460 | ||||||||
| 24,577,662 | ||||||||||
Pakistan - 0.37% | ||||||||||
Islamic Republic of Pakistan | ||||||||||
7.125%, 03/31/2016(4) | 1,300,000 | 1,183,000 | ||||||||
Panama - 3.33% | ||||||||||
Republic of Panama | ||||||||||
7.250%, 03/15/2015 | 278,000 | 329,430 | ||||||||
5.200%, 01/30/2020 | 4,527,000 | 4,934,430 | ||||||||
9.375%, 01/16/2023 | 25,000 | 34,750 | ||||||||
7.125%, 01/29/2026 | 600,000 | 744,000 | ||||||||
8.875%, 09/30/2027 | 603,000 | 855,506 | ||||||||
9.375%, 04/01/2029 | 2,522,000 | 3,719,950 | ||||||||
6.700%, 01/26/2036 | 100,000 | 116,875 | ||||||||
| 10,734,941 | ||||||||||
Peru - 2.31% | ||||||||||
Republic of Peru | ||||||||||
7.125%, 03/30/2019 | 151,000 | 184,220 | ||||||||
7.350%, 07/21/2025 | 2,209,000 | 2,755,728 | ||||||||
8.750%, 11/21/2033 | 3,165,000 | 4,510,125 | ||||||||
| 7,450,073 | ||||||||||
See Notes to Financial Statements.
Semi-Annual Report (Unaudited) | November 30, 2010 | 13 |
Table of Contents
Stone Harbor Emerging | ||
Markets Debt Fund | Statements of Investments | |
| November 30, 2010 (Unaudited) |
Interest Rate/Maturity Date | Currency | Principal | Market Value (Expressed in U.S. $) | |||||||
Philippines - 5.25% | ||||||||||
Republic of Philippines | ||||||||||
4.000%, 01/15/2021 | $563,000 | $550,333 | ||||||||
7.500%, 09/25/2024 | 2,620,000 | 3,320,850 | ||||||||
10.625%, 03/16/2025 | 70,000 | 110,863 | ||||||||
9.500%, 02/02/2030 | 3,633,000 | 5,404,087 | ||||||||
7.750%, 01/14/2031 | 3,215,000 | 4,099,125 | ||||||||
6.375%, 01/15/2032 | 520,000 | 574,600 | ||||||||
6.375%, 10/23/2034 | 2,599,000 | 2,858,900 | ||||||||
| 16,918,758 | ||||||||||
Poland - 2.96% | ||||||||||
Republic of Poland | ||||||||||
6.375%, 07/15/2019 | 7,857,000 | 8,721,270 | ||||||||
4.000%, 03/23/2021 | EUR | 665,000 | 822,542 | |||||||
| 9,543,812 | ||||||||||
Qatar - 1.76% | ||||||||||
State of Qatar | ||||||||||
5.250%, 01/20/2020(5) | 2,619,000 | 2,818,044 | ||||||||
5.250%, 01/20/2020(4) | 2,647,000 | 2,848,172 | ||||||||
| 5,666,216 | ||||||||||
Russia - 6.85% | ||||||||||
Russian Federation | ||||||||||
3.625%, 04/29/2015(5) | 500,000 | 498,375 | ||||||||
5.000%, 04/29/2020(4) | 500,000 | 497,875 | ||||||||
5.000%, 04/29/2020(5) | 800,000 | 796,600 | ||||||||
7.500%, 03/31/2030(4) | 17,601,222 | 20,289,809 | ||||||||
| 22,082,659 | ||||||||||
South Africa - 1.24% | ||||||||||
Republic of South Africa | ||||||||||
8.500%, 06/23/2017 | 45,000 | 57,600 | ||||||||
6.875%, 05/27/2019 | 975,000 | 1,163,906 | ||||||||
6.750%, 03/31/2021 | ZAR | 12,370,000 | 1,555,459 | |||||||
5.875%, 05/30/2022 | 1,109,000 | 1,226,831 | ||||||||
| 4,003,796 | ||||||||||
See Notes to Financial Statements.
14 | www.shiplp.com |
Table of Contents
Stone Harbor Emerging | ||
Markets Debt Fund | Statements of Investments | |
| November 30, 2010 (Unaudited) |
Interest Rate/Maturity Date | Currency | Principal Amount * | Market Value (Expressed in U.S. $) | |||
Turkey - 2.37% | ||||||
Republic of Turkey | ||||||
7.000%, 09/26/2016 | $159,000 | $187,024 | ||||
7.000%, 03/11/2019 | 135,000 | 160,819 | ||||
7.500%, 11/07/2019 | 1,305,000 | 1,605,149 | ||||
7.000%, 06/05/2020 | 359,000 | 426,313 | ||||
7.375%, 02/05/2025 | 1,820,000 | 2,218,124 | ||||
6.875%, 03/17/2036 | 1,305,000 | 1,497,488 | ||||
7.250%, 03/05/2038 | 1,285,000 | 1,551,638 | ||||
| 7,646,555 | ||||||
Ukraine - 3.34% | ||||||
Ukraine Government | ||||||
3.200%, 12/19/2010 | JPY | 340,000,000 | 4,058,891 | |||
6.385%, 06/26/2012(4) | 5,205,000 | 5,188,734 | ||||
6.875%, 09/23/2015(5) | 1,559,000 | 1,515,153 | ||||
| 10,762,778 | ||||||
Uruguay - 2.15% | ||||||
Republic of Uruguay | ||||||
8.000%, 11/18/2022 | 1,008,499 | 1,300,964 | ||||
6.875%, 09/28/2025 | 1,313,650 | 1,576,380 | ||||
7.875%, 01/15/2033(6) | 1,710,800 | 2,206,932 | ||||
7.625%, 03/21/2036 | 1,465,000 | 1,853,225 | ||||
| 6,937,501 | ||||||
Venezuela - 4.03% | ||||||
Republic of Venezuela | ||||||
8.500%, 10/08/2014 | 3,013,000 | 2,463,128 | ||||
5.750%, 02/26/2016(4) | 2,176,000 | 1,457,920 | ||||
13.625%, 08/15/2018(4) | 1,601,000 | 1,504,940 | ||||
7.000%, 12/01/2018(4) | 120,000 | 75,000 | ||||
7.750%, 10/13/2019(4) | 4,526,000 | 2,828,750 | ||||
12.750%, 08/23/2022 | 1,742,000 | 1,434,973 | ||||
9.000%, 05/07/2023(4) | 4,514,300 | 2,849,651 | ||||
8.250%, 10/13/2024(4) | 505,000 | 303,000 | ||||
9.250%, 05/07/2028(4) | 120,000 | 75,300 | ||||
| 12,992,662 | ||||||
| TOTAL SOVEREIGN DEBT OBLIGATIONS | 218,841,650 | |||||
(Amortized Cost $207,681,420) | ||||||
| See Notes to Financial Statements. | ||
Semi-Annual Report (Unaudited) | November 30, 2010 | 15 |
Table of Contents
Stone Harbor Emerging Markets Debt Fund | Statements of Investments | |
November 30, 2010 (Unaudited) |
Interest Rate/Maturity Date | Principal Amount * | Market Value (Expressed in U.S. $) | ||
BANK LOANS - 0.77% | ||||
Argentina - 0.35% | ||||
Capex SA | ||||
10.394%, 09/26/2014(2)(5) | $1,118,000 | $1,118,000 | ||
Indonesia - 0.42% | ||||
PT Bumi Resources | ||||
11.256%, 08/07/2013 | 1,337,000 | 1,363,740 | ||
TOTAL BANK LOANS | 2,481,740 | |||
(Amortized Cost $2,433,462) | ||||
CONVERTIBLE CORPORATE BONDS - 0.43% | ||||
United Arab Emirates - 0.43% | ||||
Aldar Funding Ltd. | ||||
5.767%, 11/10/2011 | 1,447,000 | 1,399,973 | ||
TOTAL CONVERTIBLE CORPORATE BONDS | 1,399,973 | |||
(Amortized Cost $1,404,550) | ||||
CORPORATE BONDS - 22.89% | ||||
Argentina - 0.52% | ||||
Arcor | ||||
7.250%, 11/09/2017(2)(5) | 380,000 | 398,050 | ||
Empresa Distribuidora Y Comercializadora Norte | ||||
9.750%, 10/25/2022(5) | 577,000 | 609,929 | ||
Inversiones y Representaciones SA | ||||
11.500%, 07/20/2020(5) | 608,000 | 677,823 | ||
| 1,685,802 | ||||
Barbados - 0.19% | ||||
Columbus International, Inc. | ||||
11.500%, 11/20/2014(4) | 545,000 | 604,950 | ||
See Notes to Financial Statements.
16 | www.shiplp.com |
Table of Contents
Stone Harbor Emerging | ||
Markets Debt Fund | Statements of Investments | |
| November 30, 2010 (Unaudited) |
Interest Rate/Maturity Date | Principal Amount * | Market Value (Expressed in U.S. $) | ||||||
Brazil - 2.38% | ||||||||
Banco Cruzeiro do Sul SA | ||||||||
8.875%, 09/22/2020(5) | $841,000 | $828,385 | ||||||
BM&FBovespa SA | ||||||||
5.500%, 07/16/2020(5) | 842,000 | 879,302 | ||||||
BR Properties SA | ||||||||
9.000%, 10/07/2015(5) | 579,000 | 583,343 | ||||||
CSN Resources SA | ||||||||
6.500%, 07/21/2020(5) | 611,000 | 647,660 | ||||||
General Shopping Finance Ltd. | ||||||||
10.000%, 11/09/2015(5) | 857,000 | 822,720 | ||||||
Gerdau Trade, Inc. | ||||||||
5.750%, 01/30/2021(5) | 424,000 | 428,749 | ||||||
Minerva Overseas II Ltd. | ||||||||
10.875%, 11/15/2019(4) | 238,000 | 251,602 | ||||||
10.875%, 11/15/2019(5) | 633,000 | 661,485 | ||||||
Odebrecht Drilling Norbe VIII/IX Ltd. | ||||||||
6.350%, 06/30/2021(5) | 1,227,000 | 1,251,540 | ||||||
Telemar Norte Leste SA | ||||||||
5.500%, 10/23/2020(5) | 666,000 | 664,335 | ||||||
Vale Overseas Ltd. | ||||||||
4.625%, 09/15/2020 | 642,000 | 649,441 | ||||||
| 7,668,562 | ||||||||
Chile - 0.56% | ||||||||
Celulosa Arauco y Constitucion SA | ||||||||
5.000%, 01/21/2021(5) | 438,000 | 440,396 | ||||||
Codelco, Inc. | ||||||||
7.500%, 01/15/2019(4) | 450,000 | 560,516 | ||||||
6.150%, 10/24/2036(4) | 705,000 | 793,247 | ||||||
| 1,794,159 | ||||||||
See Notes to Financial Statements.
Semi-Annual Report (Unaudited) | November 30, 2010 | 17 |
Table of Contents
Stone Harbor Emerging Markets Debt Fund | Statements of Investments | |
November 30, 2010 (Unaudited) |
Interest Rate/Maturity Date | Principal Amount * | Market Value (Expressed in U.S. $) | ||||||
China - 1.13% | ||||||||
Central China Real Estate Ltd. | ||||||||
12.250%, 10/20/2015(5) | $412,000 | $429,510 | ||||||
China Oriental Group Co. Ltd. | ||||||||
8.000%, 08/18/2015(5) | 1,221,000 | 1,245,419 | ||||||
Evergrande Real Estate Group Ltd. | ||||||||
13.000%, 01/27/2015(4) | 102,000 | 107,100 | ||||||
13.000%, 01/27/2015(5) | 106,000 | 110,770 | ||||||
Kaisa Group Holdings Ltd. | ||||||||
13.500%, 04/28/2015(4) | 223,000 | 225,788 | ||||||
Sinochem Overseas Capital Co. Ltd. | ||||||||
4.500%, 11/12/2020(5) | 1,150,000 | 1,138,086 | ||||||
Sino-Forest Corp. | ||||||||
6.250%, 10/21/2017(5) | 400,000 | 393,250 | ||||||
| 3,649,923 | ||||||||
Dominican Republic - 0.17% | ||||||||
Cap Cana SA | ||||||||
10.000%, 04/30/2016(4) | 420,900 | 298,839 | ||||||
10.000%, 04/30/2016(4) | 486,213 | 247,969 | ||||||
| 546,808 | ||||||||
Egypt - 0.15% | ||||||||
Orascom Telecom Finance SCA | ||||||||
7.875%, 02/08/2014(4) | 512,000 | 483,840 | ||||||
India - 0.46% | ||||||||
Axis Bank Ltd. | ||||||||
4.750%, 05/02/2016(5) | 588,000 | 587,588 | ||||||
ICICI Bank Ltd. | ||||||||
5.750%, 11/16/2020(5) | 820,000 | 812,027 | ||||||
Vedanta Resources PLC | ||||||||
9.500%, 07/18/2018(5) | 75,000 | 79,125 | ||||||
| 1,478,740 | ||||||||
See Notes to Financial Statements.
18 | www.shiplp.com |
Table of Contents
Stone Harbor Emerging | ||
Markets Debt Fund | Statements of Investments | |
| November 30, 2010 (Unaudited) |
Interest Rate/Maturity Date | Principal Amount * | Market Value (Expressed in U.S. $) | ||||
Indonesia - 0.37% | ||||||
Bakrie Telecom Pte Ltd. | ||||||
11.500%, 05/07/2015(4) | $100,000 | $106,500 | ||||
Bumi Investment Pte Ltd. | ||||||
10.750%, 10/06/2017(5) | 625,000 | 651,562 | ||||
Indo Integrated Energy II BV | ||||||
9.750%, 11/05/2016(4) | 151,000 | 168,365 | ||||
Indosat Palapa Co. BV | ||||||
7.375%, 07/29/2020(5) | 241,000 | 264,799 | ||||
| 1,191,226 | ||||||
Jamaica - 0.15% | ||||||
Digicel Group Ltd. | ||||||
9.125%, 01/15/2015(5) | 308,000 | 312,620 | ||||
10.500%, 04/15/2018(4) | 150,000 | 165,750 | ||||
| 478,370 | ||||||
Kazakhstan - 2.44% | ||||||
BTA Bank JSC | ||||||
10.750%, 07/01/2018(4)(7) | 242,577 | 254,706 | ||||
10.750%, 07/01/2018(5)(7) | 1,121,283 | 1,170,339 | ||||
0.000%, 07/01/2020(3)(5) | 2,431,514 | 141,028 | ||||
KazMunayGas National Co. | ||||||
7.000%, 05/05/2020(5) | 1,088,000 | 1,104,320 | ||||
7.000%, 05/05/2020(4) | 3,125,000 | 3,171,874 | ||||
6.375%, 04/09/2021(5) | 1,071,000 | 1,038,870 | ||||
Zhaikmunai Finance BV | ||||||
10.500%, 10/19/2015(5) | 1,037,000 | 982,558 | ||||
| 7,863,695 | ||||||
Malaysia - 3.14% | ||||||
Penerbangan Malaysia BHD | ||||||
5.625%, 03/15/2016(4) | 1,195,000 | 1,355,838 | ||||
Petroliam Nasional BHD | ||||||
7.750%, 08/15/2015(5) | 335,000 | 413,362 | ||||
7.625%, 10/15/2026(4) | 840,000 | 1,111,561 | ||||
Petronas Capital Ltd. | ||||||
5.250%, 08/12/2019(5) | 530,000 | 587,194 | ||||
7.875%, 05/22/2022(4) | 5,000,000 | 6,669,202 | ||||
| 10,137,157 | ||||||
See Notes to Financial Statements.
Semi-Annual Report (Unaudited) | November 30, 2010 | 19 |
Table of Contents
Stone Harbor Emerging | ||
Markets Debt Fund | Statements of Investments | |
| November 30, 2010 (Unaudited) |
Interest Rate/Maturity Date | Currency | Principal | Market Value (Expressed in U.S. $) | |||||||
Mexico - 3.16% | ||||||||||
Alestra SA | ||||||||||
11.750%, 08/11/2014 | $487,000 | $555,180 | ||||||||
Axtel SAB de CV | ||||||||||
7.625%, 02/01/2017(5) | �� | 13,000 | 11,765 | |||||||
9.000%, 09/22/2019(4) | 514,000 | 475,450 | ||||||||
Cemex Espana Luxembourg | ||||||||||
9.250%, 05/12/2020(5) | 71,000 | 68,338 | ||||||||
9.250%, 05/12/2020(4) | 519,000 | 495,645 | ||||||||
Cemex Finance Europe BV | ||||||||||
4.750%, 03/05/2014 | EUR | 380,000 | 408,786 | |||||||
Desarrolla Homex SAB de CV | ||||||||||
7.500%, 09/28/2015 | 207,000 | 215,280 | ||||||||
Hipotecaria Su Casita SA de CV | ||||||||||
8.500%, 10/04/2016(4) | 63,000 | 25,232 | ||||||||
8.500%, 10/04/2016(5) | 182,000 | 72,891 | ||||||||
Pemex Finance Ltd. | ||||||||||
9.150%, 11/15/2018 | 1,200,000 | 1,429,867 | ||||||||
Pemex Project Funding Master Trust | ||||||||||
5.500%, 02/24/2025(4) | EUR | 2,275,000 | 2,916,137 | |||||||
6.625%, 06/15/2035 | 3,034,000 | 3,155,360 | ||||||||
Urbi Desarrollos Urbanos SAB de CV | ||||||||||
9.500%, 01/21/2020(4) | 308,000 | 354,200 | ||||||||
| 10,184,131 | ||||||||||
Peru - 0.45% | ||||||||||
Banco de Credito del Peru | ||||||||||
5.375%, 09/16/2020(5) | 735,000 | 736,837 | ||||||||
Continental Senior Trustees Cayman Ltd. | ||||||||||
5.500%, 11/18/2020(5) | 716,000 | 710,183 | ||||||||
| 1,447,020 | ||||||||||
Qatar - 0.37% | ||||||||||
Qtel International Finance Ltd. | ||||||||||
7.875%, 06/10/2019(4) | 429,000 | 513,728 | ||||||||
4.750%, 02/16/2021(5) | 367,000 | 342,686 | ||||||||
5.000%, 10/19/2025(5) | 379,000 | 346,311 | ||||||||
| 1,202,725 | ||||||||||
See Notes to Financial Statements.
20 | www.shiplp.com |
Table of Contents
Stone Harbor Emerging | ||
Markets Debt Fund | Statements of Investments | |
| November 30, 2010 (Unaudited) |
Interest Rate/Maturity Date | Currency | Principal Amount * | Market Value in U.S. $) | |||||
Russia - 1.50% | ||||||||
Alfa Bank OJSC Via Alfa Bond Issuance PLC | ||||||||
7.875%, 09/25/2017(5) | $658,000 | $654,710 | ||||||
ALROSA Finance SA | ||||||||
7.750%, 11/03/2020(5) | 578,000 | 582,335 | ||||||
Gazpram Via Gaz Capital SA | ||||||||
6.510%, 03/07/2022(5) | 710,000 | 717,988 | ||||||
MTS International Funding Ltd. | ||||||||
8.625%, 06/22/2020(5) | 660,000 | 732,600 | ||||||
Severstal OAO Via Steel Capital SA | ||||||||
6.700%, 10/25/2017(5) | 613,000 | 594,610 | ||||||
TNK-BP Finance SA | ||||||||
6.250%, 02/02/2015(5) | 160,000 | 169,200 | ||||||
7.500%, 07/18/2016(5) | 525,000 | 582,750 | ||||||
7.250%, 02/02/2020(5) | 100,000 | 108,000 | ||||||
VIP Finance Ireland Ltd. for OJSC Vimpel Communications | ||||||||
8.375%, 04/30/2013(5) | 650,000 | 702,406 | ||||||
| 4,844,599 | ||||||||
Singapore - 0.13% | ||||||||
STATS ChipPAC Ltd. | ||||||||
7.500%, 08/12/2015(5) | 389,000 | 413,799 | ||||||
South Africa - 0.21% | ||||||||
Myriad International Holding BV | ||||||||
6.375%, 07/28/2017(5) | 650,000 | 676,000 | ||||||
South Korea - 0.35% | ||||||||
Export-Import Bank of Korea | ||||||||
8.125%, 01/21/2014 | 985,000 | 1,137,590 | ||||||
Tunisia - 0.65% | ||||||||
Banque Centrale de Tunisie SA | ||||||||
7.375%, 04/25/2012 | 545,000 | 589,182 | ||||||
6.250%, 02/20/2013 | EUR | 1,084,000 | 1,513,893 | |||||
| 2,103,075 | ||||||||
Turkey - 0.24% | ||||||||
Akbank TAS | ||||||||
5.125%, 07/22/2015(5) | 786,000 | 786,000 | ||||||
See Notes to Financial Statements.
Semi-Annual Report (Unaudited) | November 30, 2010 | 21 |
Table of Contents
Stone Harbor Emerging | ||
Markets Debt Fund | Statements of Investments | |
| November 30, 2010 (Unaudited) |
Interest Rate/Maturity Date | Currency | Principal Amount * | Market Value (Expressed in U.S. $) | |||||
Ukraine - 0.31% | ||||||||
Avangardco Investments Public Ltd. | ||||||||
10.000%, 10/29/2015 | $446,000 | $418,125 | ||||||
DTEK Finance BV | ||||||||
9.500%, 04/28/2015(4) | 310,000 | 322,400 | ||||||
Metinvest BV | ||||||||
10.250%, 05/20/2015(4) | 100,000 | 102,750 | ||||||
MHP SA | ||||||||
10.250%, 04/29/2015(4) | 154,000 | 159,968 | ||||||
| 1,003,243 | ||||||||
United Arab Emirates - 0.40% | ||||||||
DP World Ltd. | ||||||||
6.850%, 07/02/2037(4) | 1,000,000 | 887,500 | ||||||
DP World Sukuk Ltd. | ||||||||
6.250%, 07/02/2017(4) | 410,000 | 391,345 | ||||||
| 1,278,845 | ||||||||
Venezuela - 3.46% | ||||||||
Petroleos de Venezuela SA | ||||||||
4.900%, 10/28/2014 | 12,724,487 | 7,682,409 | ||||||
5.000%, 10/28/2015 | 345,000 | 188,025 | ||||||
5.250%, 04/12/2017 | 5,844,100 | 3,144,126 | ||||||
5.375%, 04/12/2027 | 323,300 | 146,051 | ||||||
| 11,160,611 | ||||||||
TOTAL CORPORATE BONDS | 73,820,870 | |||||||
(Amortized Cost $74,468,871) | ||||||||
CREDIT LINKED NOTES - 3.11% | ||||||||
Brazil - 1.05% | ||||||||
Nota Do Tesouro Nacional | ||||||||
10.000%, 01/01/2017(2)(8) | BRL | 600,000 | 318,024 | |||||
10.000%, 01/01/2017(2)(9) | BRL | 2,000,000 | 1,051,907 | |||||
10.000%, 01/01/2021(2)(9) | BRL | 4,000,000 | 2,006,532 | |||||
| 3,376,463 | ||||||||
| See Notes to Financial Statements. | ||
22 | www.shiplp.com |
Table of Contents
Stone Harbor Emerging | ||
Markets Debt Fund | Statements of Investments | |
| November 30, 2010 (Unaudited) |
Interest Rate/Maturity Date | Currency | Principal Amount*/Shares | Market Value (Expressed in U.S. $) | |||||
Indonesia - 1.33% | ||||||||
Republic of Indonesia | ||||||||
9.500%, 06/15/2015(2)(8) | IDR | $5,892,000,000 | $724,532 | |||||
11.500%, 09/18/2019(2)(10) | IDR | 3,900,000,000 | 539,412 | |||||
11.000%, 11/16/2020(2)(11) | IDR | 4,600,000,000 | 628,236 | |||||
11.000%, 09/17/2025(2)(10) | IDR | 6,300,000,000 | 826,099 | |||||
10.000%, 02/15/2028(2)(12) | IDR | 13,000,000,000 | 1,560,605 | |||||
| 4,278,884 | ||||||||
Russia - 0.73% | ||||||||
Russian Federation | ||||||||
10.550%, 07/06/2011(2)(9) | RUB | 41,700,000 | 1,368,470 | |||||
11.200%, 12/17/2014(2)(10) | RUB | 27,000,000 | 985,795 | |||||
| 2,354,265 | ||||||||
TOTAL CREDIT LINKED NOTES | 10,009,612 | |||||||
(Cost $10,102,954) | ||||||||
MONEY MARKET MUTUAL FUNDS -3.01% | ||||||||
Dreyfus Cash Advantage Plus Fund | ||||||||
(0.100% 7-Day Yield) | 9,698,097 | 9,698,097 | ||||||
TOTAL MONEY MARKET MUTUAL FUNDS | 9,698,097 | |||||||
(Cost $9,698,097) | ||||||||
Total Investments - 98.08% | $316,251,942 | |||||||
(Cost $305,789,354) | ||||||||
Other Assets In Excess of Liabilities -1.92% | 6,195,660 | |||||||
Net Assets - 100.00% | $322,447,602 | |||||||
* | The principal/contract amount of each security is stated in the currency in which the bond is denominated (U.S. Dollar unless otherwise notated). See below. | |||
| ARS | Argentine Peso | |||
| BRL | Brazilian Real | |||
| CNY | Chinese Yuan | |||
| COP | Colombian Peso | |||
| EUR | Euro Currency | |||
| IDR | Indonesian Rupiah | |||
| JPY | Japanese Yen | |||
| See Notes to Financial Statements. | ||
Semi-Annual Report (Unaudited) | November 30, 2010 | 23 |
Table of Contents
Stone Harbor Emerging Markets Debt Fund | Statements of Investments | |
November 30, 2010 (Unaudited) |
MXN | Mexican Peso | |
MYR | Malaysian Ringgit | |
RUB | Russian Ruble | |
ZAR | South African Rand |
| (1) | Security is currently in default/non-income producing. |
| (2) | This security has been valued at its fair value determined in good faith pursuant to procedures approved by the Board of Trustees. Total market value of fair valued securities amounts to $11,525,662, which represents approximately 3.57% of net assets as of November 30, 2010. |
| (3) | Floating or variable rate security. Interest rate disclosed is that which is in effect at November 30, 2010. |
| (4) | Securities were purchased pursuant to Regulation S under the Securities Act of 1933, which exempts securities offered and sold outside of the United States from registration. Such securities cannot be sold in the United States without either an effective registration statement filed pursuant to the Securities Act of 1933, or pursuant to an exemption from registration. These securities have been deemed liquid under guidelines approved by the Fund’s Board of Trustees. As of November 30, 2010, the aggregate market value of those securities was $89,351,821, representing 27.71% of net assets. |
| (5) | Security exempt from registration under Rule 144A of the Securities Act of 1933. Under procedures approved by the Board of Trustees, such securities have been determined to be liquid by the Investment Advisor and may normally be sold to qualified institutional buyers in transactions exempt from registration. Total market value of Rule 144A securities amounts to $41,570,071, which represents approximately 12.89% of net assets as of November 30, 2010. |
| (6) | Pay-in-kind securities. |
| (7) | Step bond. Coupon increases periodically based upon a predetermined schedule. Interest rate disclosed is that which is in effect at November 30, 2010. |
| (8) | The underlying security is issued by Citigroup Global Markets. |
| (9) | The underlying security is issued by JP Morgan Chase. |
| (10) | The underlying security is issued by Barclays Bank PLC. |
| (11) | The underlying security is issued by HSBC Bank. |
| (12) | The underlying security is issued by Deutsche Bank AG London. |
Common Abbreviations:
BHD - Berhad is the Malaysian term for public limited company.
BV - Besloten Vennootschap a Dutch private limited liability company.
Ltd. - Limited.
OJSC - Open Joint Stock Company.
PLC - Public Limited Co.
PT - Perseroan Terbatas an Indonesian limited liability company.
Pte - private.
SA - Generally designates corporations in various countries, mostly those employing the civil law.
SA de CV - A variable capital company.
SAB de CV - A variable capital company.
SCA - Soceite en Commandite par actions is the French equivalent of a limited partnership.
TAS - TüRk Anonim Sirketi.
24 | www.shiplp.com |
Table of Contents
Stone Harbor Emerging Markets Debt Fund | Statements of Investments | |
November 30, 2010 (Unaudited) |
OUTSTANDING FORWARD FOREIGN CURRENCY CONTRACTS
Contract Description | Contracted Amount | Purchase/Sale Contract | Expiration Date | Value On Settlement Date | Current Value | Unrealized Appreciation/ (Depreciation) | ||||||
BRL | 11,531,000 (BRL) | Purchase | 12/02/2010 | $6,719,304 | $6,722,439 | $3,135 | ||||||
BRL | 11,531,000 (BRL) | Sale | 12/02/2010 | 6,757,897 | 6,722,439 | 35,458 | ||||||
CNY | 8,000,000 (CNY) | Purchase | 05/20/2011 | 1,191,842 | 1,204,230 | 12,388 | ||||||
CNY | 14,149,000 (CNY) | Purchase | 08/09/2011 | 2,117,955 | 2,133,443 | 15,488 | ||||||
CNY | 4,000,000 (CNY) | Purchase | 08/09/2011 | 598,355 | 603,136 | 4,781 | ||||||
COP | 8,229,000,000 (COP) | Sale | 01/26/2011 | 4,444,504 | 4,247,664 | 196,840 | ||||||
EUR | 5,325,000 (EUR) | Sale | 12/30/2010 | 7,090,131 | 6,911,455 | 178,676 | ||||||
EUR | 327,000 (EUR) | Sale | 12/30/2010 | 435,394 | 424,422 | 10,972 | ||||||
JPY | 342,805,000 (JPY) | Sale | 12/30/2010 | 4,103,189 | 4,098,136 | 5,053 | ||||||
| $462,791 | ||||||||||||
CNY | 8,000,000 (CNY) | Sale | 05/20/2011 | $1,192,251 | $1,204,230 | $(11,979) | ||||||
COP | 8,229,000,000 (COP) | Purchase | 01/26/2011 | 4,275,916 | 4,247,664 | (28,252) | ||||||
| $(40,231) | ||||||||||||
See Notes to Financial Statements.
Semi-Annual Report (Unaudited) | November 30, 2010 | 25 |
Table of Contents
| Stone Harbor High Yield Bond Fund | Statements of Investments | |
November 30, 2010 (Unaudited) |
Interest Rate/Maturity Date | Principal Amount* | Market Value | ||||||
CORPORATE BONDS - 91.15% | ||||||||
Aerospace/Defense - 0.84% | ||||||||
TransDigm, Inc. | ||||||||
7.750%, 07/15/2014 | $1,875,000 | $1,935,938 | ||||||
Triumph Group, Inc. | ||||||||
8.625%, 07/15/2018 | 1,575,000 | 1,718,718 | ||||||
| 3,654,656 | ||||||||
Automotive - 1.91% | ||||||||
Allison Transmission, Inc. | ||||||||
11.000%, 11/01/2015(1) | 925,000 | 1,005,938 | ||||||
11.250%, 11/01/2015(1)(2) | 425,000 | 465,375 | ||||||
American Tire Distributors, Inc. | ||||||||
9.750%, 06/01/2017(1) | 950,000 | 1,009,375 | ||||||
Ford Motor Co. | ||||||||
7.450%, 07/16/2031 | 910,000 | 982,800 | ||||||
8.900%, 01/15/2032 | 25,000 | 29,125 | ||||||
Ford Motor Credit Co. LLC | ||||||||
8.700%, 10/01/2014 | 575,000 | 639,635 | ||||||
8.000%, 12/15/2016 | 1,385,000 | 1,523,460 | ||||||
Pinafore LLC | ||||||||
9.000%, 10/01/2018(1) | 1,975,000 | 2,093,499 | ||||||
TRW Automotive, Inc. | ||||||||
8.875%, 12/01/2017(1) | 550,000 | 616,000 | ||||||
| 8,365,207 | ||||||||
Banking - 0.69% | ||||||||
E*Trade Financial Corp. | ||||||||
12.500%, 11/30/2017(2) | 1,670,000 | 1,933,025 | ||||||
Provident Funding Associates LP | ||||||||
10.250%, 04/15/2017(1) | 1,025,000 | 1,063,438 | ||||||
| 2,996,463 | ||||||||
Building Products - 1.12% | ||||||||
Associated Materials LLC | ||||||||
9.125%, 11/01/2017(1) | 250,000 | 255,625 | ||||||
Interface, Inc. | ||||||||
Series B, 11.375%, 11/01/2013 | 475,000 | 585,438 | ||||||
9.500%, 02/01/2014 | 211,000 | 217,858 | ||||||
7.625%, 12/01/2018(1) | 1,225,000 | 1,255,624 | ||||||
Interline Brands, Inc. | ||||||||
7.000%, 11/15/2018(1) | 550,000 | 554,813 | ||||||
See Notes to Financial Statements.
26 | www.shiplp.com |
Table of Contents
| Stone Harbor High Yield Bond Fund | Statements of Investments | |
November 30, 2010 (Unaudited) |
Interest Rate/Maturity Date | Principal | Market Value | ||||||
Norcraft Cos. LP | ||||||||
10.500%, 12/15/2015 | $1,125,000 | $1,198,125 | ||||||
Norcraft Holdings LP | ||||||||
9.750%, 09/01/2012 | 812,000 | 809,970 | ||||||
| 4,877,453 | ||||||||
Chemicals - 3.12% | ||||||||
Ineos Group Holdings PLC | ||||||||
8.500%, 02/15/2016(1) | 1,815,000 | 1,583,588 | ||||||
Koppers, Inc. | ||||||||
7.875%, 12/01/2019 | 1,875,000 | 2,029,687 | ||||||
Lyondell Chemical Co. | ||||||||
8.375%, 08/15/2015(1)(3)(4) | 945,000 | 0 | ||||||
8.000%, 11/01/2017(1) | 500,000 | 540,625 | ||||||
MacDermid, Inc. | ||||||||
9.500%, 04/15/2017(1) | 1,875,000 | 1,973,438 | ||||||
Momentive Performance Materials, Inc. | ||||||||
9.000%, 01/15/2021(1) | 1,825,000 | 1,820,438 | ||||||
Nalco Co. | ||||||||
8.875%, 11/15/2013 | 530,000 | 541,925 | ||||||
8.250%, 05/15/2017 | 1,050,000 | 1,149,750 | ||||||
NewMarket Corp. | ||||||||
7.125%, 12/15/2016 | 1,405,000 | 1,440,125 | ||||||
Nova Chemicals Corp. | ||||||||
8.375%, 11/01/2016 | 2,375,000 | 2,529,375 | ||||||
| 13,608,951 | ||||||||
Construction Machinery - 0.84% | ||||||||
Case New Holland, Inc. | ||||||||
7.875%, 12/01/2017(1) | 950,000 | 1,052,125 | ||||||
The Manitowoc Co., Inc. | ||||||||
9.500%, 02/15/2018 | 1,875,000 | 2,015,625 | ||||||
8.500%, 11/01/2020 | 100,000 | 102,750 | ||||||
Maxim Crane Works LP | ||||||||
12.250%, 04/15/2015(1) | 550,000 | 520,438 | ||||||
| 3,690,938 | ||||||||
Consumer Products - 1.99% | ||||||||
American Achievement Corp. | ||||||||
10.875%, 04/15/2016(1) | 660,000 | 655,050 | ||||||
Central Garden and Pet Co. | ||||||||
8.250%, 03/01/2018 | 1,875,000 | 1,926,562 | ||||||
| See Notes to Financial Statements. | ||
Semi-Annual Report (Unaudited) | November 30, 2010 | 27 |
Table of Contents
| Stone Harbor High Yield Bond Fund | Statements of Investments | |
November 30, 2010 (Unaudited) |
Interest Rate/Maturity Date | Principal Amount* | Market Value | ||||||
Elizabeth Arden, Inc. | ||||||||
7.750%, 01/15/2014 | $1,611,000 | $1,645,234 | ||||||
FGI Holding Co., Inc. | ||||||||
11.250%, 10/01/2015(1)(2) | 565,617 | 540,164 | ||||||
Libbey Glass, Inc. | ||||||||
10.000%, 02/15/2015(1) | 1,125,000 | 1,209,375 | ||||||
NBTY, Inc. | ||||||||
9.000%, 10/01/2018(1) | 800,000 | 844,000 | ||||||
Viking Acquisition, Inc. | ||||||||
9.250%, 11/01/2018(1) | 1,025,000 | 1,027,563 | ||||||
Visant Corp. | ||||||||
10.000%, 10/01/2017(1) | 800,000 | 828,000 | ||||||
| 8,675,948 | ||||||||
Containers/Packaging - 2.17% | ||||||||
Ardagh Packaging Finance PLC | ||||||||
9.125%, 10/15/2020(1) | 2,050,000 | 2,121,750 | ||||||
BWAY Holding Co. | ||||||||
10.000%, 06/15/2018(1) | 975,000 | 1,053,000 | ||||||
Greif, Inc. | ||||||||
7.750%, 08/01/2019 | 1,625,000 | 1,796,640 | ||||||
Owens-Illinois, Inc. | ||||||||
7.800%, 05/15/2018 | 325,000 | 351,813 | ||||||
Radnor Holdings Corp. | ||||||||
11.000%, 03/15/2010(3)(4) | 25,000 | 3 | ||||||
Reynolds Group DL Escrow, Inc. | ||||||||
7.750%, 10/15/2016(1) | 1,850,000 | 1,937,874 | ||||||
Reynolds Group Issuer, Inc. | ||||||||
9.000%, 04/15/2019(1) | 1,225,000 | 1,252,563 | ||||||
Reynolds Group, Inc. | ||||||||
8.500%, 05/15/2018(1) | 975,000 | 975,000 | ||||||
| 9,488,643 | ||||||||
Diversified Manufacturing - 0.24% | ||||||||
SPX Corp. | ||||||||
7.625%, 12/15/2014 | 825,000 | 900,281 | ||||||
6.875%, 09/01/2017(1) | 150,000 | 158,250 | ||||||
| 1,058,531 | ||||||||
Drillers/Services - 3.43% | ||||||||
Bristow Group, Inc. | ||||||||
7.500%, 09/15/2017 | 1,205,000 | 1,271,275 | ||||||
| See Notes to Financial Statements. | ||
28 | www.shiplp.com |
Table of Contents
| Stone Harbor High Yield Bond Fund | Statements of Investments | |
November 30, 2010 (Unaudited) |
Interest Rate/Maturity Date | Principal Amount* | Market Value | ||||||
CHC Helicopter SA | ||||||||
9.250%, 10/15/2020(1) | $2,025,000 | $2,085,750 | ||||||
Complete Production Services, Inc. | ||||||||
8.000%, 12/15/2016 | 1,975,000 | 2,034,250 | ||||||
Dresser-Rand Group, Inc. | ||||||||
7.375%, 11/01/2014 | 2,230,000 | 2,252,299 | ||||||
Exterran Holdings, Inc. | ||||||||
7.250%, 12/01/2018(1) | 1,125,000 | 1,127,813 | ||||||
Hercules Offshore LLC | ||||||||
10.500%, 10/15/2017(1) | 2,330,000 | 1,864,000 | ||||||
Hornbeck Offshore Services, Inc. | ||||||||
8.000%, 09/01/2017 | 1,875,000 | 1,898,438 | ||||||
Offshore Group Investments Ltd. | ||||||||
11.500%, 08/01/2015(1) | 400,000 | 424,000 | ||||||
PHI, Inc. | ||||||||
8.625%, 10/15/2018(1) | 800,000 | 810,000 | ||||||
Precision Drilling Corp. | ||||||||
6.625%, 11/15/2020(1) | 500,000 | 506,250 | ||||||
Stallion Oilfield Holdings Ltd. | ||||||||
10.500%, 02/15/2015(1) | 686,000 | 720,300 | ||||||
| 14,994,375 | ||||||||
Electric - 6.34% | ||||||||
The AES Corp. | ||||||||
7.750%, 03/01/2014 | 650,000 | 692,250 | ||||||
7.750%, 10/15/2015 | 850,000 | 905,250 | ||||||
9.750%, 04/15/2016 | 725,000 | 808,375 | ||||||
8.000%, 10/15/2017 | 2,225,000 | 2,325,124 | ||||||
8.000%, 06/01/2020 | 325,000 | 341,250 | ||||||
Calpine Corp. | ||||||||
7.875%, 07/31/2020(1) | 2,250,000 | 2,283,750 | ||||||
7.500%, 02/15/2021(1) | 1,925,000 | 1,900,938 | ||||||
Dynegy Holdings, Inc. | ||||||||
8.375%, 05/01/2016 | 3,070,000 | 2,256,450 | ||||||
7.125%, 05/15/2018 | 500,000 | 322,500 | ||||||
7.750%, 06/01/2019 | 460,000 | 302,450 | ||||||
7.625%, 10/15/2026 | 25,000 | 15,125 | ||||||
Edison Mission Energy | ||||||||
7.500%, 06/15/2013 | 55,000 | 53,350 | ||||||
7.750%, 06/15/2016 | 1,825,000 | 1,569,500 | ||||||
7.000%, 05/15/2017 | 150,000 | 118,500 | ||||||
7.200%, 05/15/2019 | 1,540,000 | 1,193,500 | ||||||
7.625%, 05/15/2027 | 1,135,000 | 822,875 | ||||||
| See Notes to Financial Statements. | ||
Semi-Annual Report (Unaudited) | November 30, 2010 | 29 |
Table of Contents
| Stone Harbor High Yield Bond Fund | Statements of Investments | |
November 30, 2010 (Unaudited) |
Interest Rate/Maturity Date | Principal Amount* | Market Value | ||||||
Genon Energy, Inc. | ||||||||
9.500%, 10/15/2018(1) | $1,650,000 | $1,575,750 | ||||||
9.875%, 10/15/2020(1) | 1,875,000 | 1,795,313 | ||||||
NRG Energy, Inc. | ||||||||
7.375%, 02/01/2016 | 1,990,000 | 2,004,925 | ||||||
8.500%, 06/15/2019 | 3,075,000 | 3,136,499 | ||||||
8.250%, 09/01/2020(1) | 1,175,000 | 1,183,813 | ||||||
Texas Competitive Electric Holdings Co. LLC | ||||||||
Series A, 10.250%, 11/01/2015 | 3,500,000 | 2,100,000 | ||||||
| 27,707,487 | ||||||||
Environmental Services - 0.40% | ||||||||
Browning-Ferris Industries, Inc. | ||||||||
9.250%, 05/01/2021 | 35,000 | 45,720 | ||||||
Clean Harbors, Inc. | ||||||||
7.625%, 08/15/2016 | 1,591,000 | 1,686,460 | ||||||
| 1,732,180 | ||||||||
Exploration & Production - 6.78% | ||||||||
Atlas Energy Operating Co. LLC | ||||||||
12.125%, 08/01/2017 | 1,600,000 | 2,104,000 | ||||||
Atlas Pipeline Partners LP | ||||||||
8.125%, 12/15/2015 | 1,850,000 | 1,914,750 | ||||||
8.750%, 06/15/2018 | 200,000 | 219,000 | ||||||
Denbury Resources, Inc. | ||||||||
8.250%, 02/15/2020 | 1,346,000 | 1,473,870 | ||||||
Encore Acquisition Co. | ||||||||
9.500%, 05/01/2016 | 1,000,000 | 1,105,000 | ||||||
Gibson Energy ULC | ||||||||
10.000%, 01/15/2018 | 975,000 | 979,875 | ||||||
Linn Energy LLC | ||||||||
7.750%, 02/01/2021(1) | 2,000,000 | 2,040,000 | ||||||
Mariner Energy, Inc. | ||||||||
11.750%, 06/30/2016 | 1,375,000 | 1,711,875 | ||||||
MarkWest Energy Partners LP | ||||||||
Series B, 8.500%, 07/15/2016 | 600,000 | 628,500 | ||||||
Series B, 8.750%, 04/15/2018 | 850,000 | 918,000 | ||||||
Newfield Exploration Co. | ||||||||
7.125%, 05/15/2018 | 875,000 | 923,125 | ||||||
6.875%, 02/01/2020 | 1,190,000 | 1,249,500 | ||||||
NFR Energy LLC | ||||||||
9.750%, 02/15/2017(1) | 225,000 | 223,313 | ||||||
9.750%, 02/15/2017(1) | 1,075,000 | 1,066,938 | ||||||
See Notes to Financial Statements.
30 | www.shiplp.com |
Table of Contents
| Stone Harbor High Yield Bond Fund | Statements of Investments | |
November 30, 2010 (Unaudited) |
Interest Rate/Maturity Date | Principal Amount* | Market Value | ||||
Penn Virginia Corp. | ||||||
10.375%, 06/15/2016 | $1,450,000 | $1,602,250 | ||||
Pioneer Natural Resources Co. | ||||||
6.650%, 03/15/2017 | 3,650,000 | 3,889,308 | ||||
Plains Exploration & Production Co. | ||||||
7.625%, 06/01/2018 | 800,000 | 850,040 | ||||
7.625%, 04/01/2020 | 1,050,000 | 1,115,625 | ||||
Quicksilver Resources, Inc. | ||||||
8.250%, 08/01/2015 | 850,000 | 873,375 | ||||
11.750%, 01/01/2016 | 700,000 | 806,750 | ||||
SandRidge Energy, Inc. | ||||||
8.625%, 04/01/2015(2) | 2,650,000 | 2,596,999 | ||||
8.000%, 06/01/2018(1) | 575,000 | 549,125 | ||||
8.750%, 01/15/2020 | 700,000 | 710,500 | ||||
Southern Star Central Corp. | ||||||
6.750%, 03/01/2016 | 75,000 | 75,375 | ||||
| 29,627,093 | ||||||
Food and Beverage - 3.73% | ||||||
Constellation Brands, Inc. | ||||||
8.375%, 12/15/2014 | 1,000,000 | 1,106,250 | ||||
7.250%, 09/01/2016 | 1,995,000 | 2,149,612 | ||||
7.250%, 05/15/2017 | 400,000 | 432,000 | ||||
Cott Beverages, Inc. | ||||||
8.375%, 11/15/2017 | 900,000 | 960,750 | ||||
Dean Foods Co. | ||||||
7.000%, 06/01/2016 | 2,225,000 | 2,052,562 | ||||
Del Monte Corp. | ||||||
6.750%, 02/15/2015 | 100,000 | 103,125 | ||||
7.500%, 10/15/2019 | 1,225,000 | 1,393,438 | ||||
Dole Food Co., Inc. | ||||||
8.750%, 07/15/2013 | 1,125,000 | 1,192,500 | ||||
13.875%, 03/15/2014 | 691,000 | 841,293 | ||||
Michael Foods, Inc. | ||||||
9.750%, 07/15/2018(1) | 725,000 | 786,625 | ||||
Pinnacle Foods Finance LLC | ||||||
9.250%, 04/01/2015 | 1,825,000 | 1,886,594 | ||||
10.625%, 04/01/2017 | 400,000 | 427,500 | ||||
8.250%, 09/01/2017 | 1,550,000 | 1,577,125 | ||||
Smithfield Foods, Inc. | ||||||
10.000%, 07/15/2014(1) | 1,225,000 | 1,390,375 | ||||
| 16,299,749 | ||||||
See Notes to Financial Statements.
Semi-Annual Report (Unaudited) | November 30, 2010 | 31 |
Table of Contents
| Stone Harbor High Yield Bond Fund | Statements of Investments | |
November 30, 2010 (Unaudited) |
Interest Rate/Maturity Date | Principal Amount* | Market Value | ||||||
Gaming - 3.42% | ||||||||
American Casino & Entertainment Properties LLC | ||||||||
11.000%, 06/15/2014 | $500,000 | $497,500 | ||||||
Ameristar Casinos, Inc. | ||||||||
9.250%, 06/01/2014 | 1,625,000 | 1,746,875 | ||||||
Boyd Gaming Corp. | ||||||||
9.125%, 12/01/2018(1) | 900,000 | 850,500 | ||||||
CCM Merger, Inc. | ||||||||
8.000%, 08/01/2013(1) | 295,000 | 284,675 | ||||||
Harrah’s Operating Co., Inc. | ||||||||
5.375%, 12/15/2013 | 1,100,000 | 1,017,500 | ||||||
Isle of Capri Casinos, Inc. | ||||||||
7.000%, 03/01/2014 | 1,725,000 | 1,645,219 | ||||||
MGM Resorts International | ||||||||
6.750%, 04/01/2013 | 550,000 | 526,625 | ||||||
5.875%, 02/27/2014 | 1,375,000 | 1,203,125 | ||||||
10.000%, 11/01/2016(1) | 1,025,000 | 986,563 | ||||||
11.125%, 11/15/2017 | 800,000 | 908,000 | ||||||
9.000%, 03/15/2020(1) | 875,000 | 958,125 | ||||||
Pinnacle Entertainment, Inc. | ||||||||
7.500%, 06/15/2015 | 2,605,000 | 2,582,206 | ||||||
8.625%, 08/01/2017 | 775,000 | 837,969 | ||||||
Wynn Las Vegas LLC | ||||||||
7.875%, 11/01/2017 | 825,000 | 879,656 | ||||||
| 14,924,538 | ||||||||
Gas Distributors - 0.96% | ||||||||
Inergy LP | ||||||||
6.875%, 12/15/2014 | 50,000 | 50,875 | ||||||
8.750%, 03/01/2015 | 900,000 | 963,000 | ||||||
8.250%, 03/01/2016 | 750,000 | 783,750 | ||||||
Niska Gas Storage Partners LLC | ||||||||
8.875%, 03/15/2018(1) | 1,900,000 | 2,004,500 | ||||||
Regency Energy Partners LP | ||||||||
6.875%, 12/01/2018 | 400,000 | 406,000 | ||||||
| 4,208,125 | ||||||||
Gas Pipelines - 3.30% | ||||||||
ANR Pipeline Co. | ||||||||
7.375%, 02/15/2024 | 60,000 | 76,884 | ||||||
7.000%, 06/01/2025 | 10,000 | 11,293 | ||||||
Copano Energy LLC | ||||||||
8.125%, 03/01/2016 | 1,225,000 | 1,243,375 | ||||||
See Notes to Financial Statements.
32 | www.shiplp.com |
Table of Contents
| Stone Harbor High Yield Bond Fund | Statements of Investments | |
November 30, 2010 (Unaudited) |
Interest Rate/Maturity Date | Principal Amount* | Market Value | ||||||
7.750%, 06/01/2018 | $675,000 | $678,375 | ||||||
Crosstex Energy, Inc. | ||||||||
8.875%, 02/15/2018 | 1,950,000 | 2,042,625 | ||||||
El Paso Corp. | ||||||||
Series GMTN, 7.375%, 12/15/2012 | 125,000 | 133,881 | ||||||
7.250%, 06/01/2018 | 1,675,000 | 1,793,201 | ||||||
Series GMTN, 7.800%, 08/01/2031 | 2,025,000 | 2,119,002 | ||||||
Series GMTN, 7.750%, 01/15/2032 | 150,000 | 157,051 | ||||||
MarkWest Energy Partners LP | ||||||||
6.750%, 11/01/2020 | 475,000 | 476,188 | ||||||
Sabine Pass LNG LP | ||||||||
7.250%, 11/30/2013 | 2,175,000 | 2,104,313 | ||||||
Southern Union Co. | ||||||||
8.250%, 11/15/2029 | 1,625,000 | 1,803,623 | ||||||
Targa Resources Partners LP | ||||||||
11.250%, 07/15/2017 | 850,000 | 973,250 | ||||||
7.875%, 10/15/2018(1) | 775,000 | 802,125 | ||||||
| 14,415,186 | ||||||||
Healthcare - 7.67% | ||||||||
Alere, Inc. | ||||||||
7.875%, 02/01/2016 | 1,350,000 | 1,368,563 | ||||||
9.000%, 05/15/2016 | 1,625,000 | 1,665,625 | ||||||
American Renal Holdings, Inc. | ||||||||
8.375%, 05/15/2018(1) | 900,000 | 936,000 | ||||||
Community Health Systems, Inc. | ||||||||
8.875%, 07/15/2015 | 3,525,000 | 3,696,843 | ||||||
DaVita, Inc. | ||||||||
6.625%, 11/01/2020 | 2,225,000 | 2,211,094 | ||||||
HCA Holdings, Inc. | ||||||||
7.750%, 05/15/2021(1) | 275,000 | 271,219 | ||||||
HCA, Inc. | ||||||||
6.750%, 07/15/2013 | 700,000 | 719,250 | ||||||
9.125%, 11/15/2014 | 210,000 | 219,450 | ||||||
6.375%, 01/15/2015 | 1,100,000 | 1,086,250 | ||||||
9.250%, 11/15/2016 | 2,200,000 | 2,359,500 | ||||||
9.625%, 11/15/2016(2) | 2,013,000 | 2,156,426 | ||||||
HealthSouth Corp. | ||||||||
10.750%, 06/15/2016 | 650,000 | 710,125 | ||||||
8.125%, 02/15/2020 | 3,425,000 | 3,728,968 | ||||||
IASIS Healthcare LLC | ||||||||
8.750%, 06/15/2014 | 1,900,000 | 1,933,250 | ||||||
See Notes to Financial Statements.
Semi-Annual Report (Unaudited) | November 30, 2010 | 33 |
Table of Contents
| Stone Harbor High Yield Bond Fund | Statements of Investments | |
November 30, 2010 (Unaudited) |
Interest Rate/Maturity Date | Principal Amount* | Market Value | ||||||
Multiplan, Inc. | ||||||||
9.875%, 09/01/2018(1) | $850,000 | $905,250 | ||||||
Radiation Therapy Services, Inc. | ||||||||
9.875%, 04/15/2017(1) | 2,075,000 | 2,038,688 | ||||||
Surgical Care Affiliates, Inc. | ||||||||
8.875%, 07/15/2015(1)(2) | 984,000 | 998,760 | ||||||
10.000%, 07/15/2017(1) | 1,000,000 | 1,020,000 | ||||||
United Surgical Partners International, Inc. | ||||||||
8.875%, 05/01/2017 | 125,000 | 129,063 | ||||||
9.250%, 05/01/2017(2) | 1,220,000 | 1,265,750 | ||||||
Vanguard Health Holding Co. II LLC | ||||||||
8.000%, 02/01/2018 | 4,025,000 | 4,085,374 | ||||||
| 33,505,448 | ||||||||
Industrial Other - 1.03% | ||||||||
Aquilex Holdings LLC | ||||||||
11.125%, 12/15/2016 | 220,000 | 222,200 | ||||||
RBS Global, Inc. | ||||||||
8.500%, 05/01/2018 | 3,550,000 | 3,656,500 | ||||||
Sensus Metering Systems, Inc. | ||||||||
8.625%, 12/15/2013 | 600,000 | 612,000 | ||||||
| 4,490,700 | ||||||||
Leisure - 1.59% | ||||||||
AMC Entertainment, Inc. | ||||||||
8.000%, 03/01/2014 | 550,000 | 554,125 | ||||||
11.000%, 02/01/2016 | 565,000 | 601,725 | ||||||
Cinemark USA, Inc. | ||||||||
8.625%, 06/15/2019 | 1,775,000 | 1,912,563 | ||||||
Marquee Holdings, Inc. | ||||||||
9.505%, 08/15/2014(5) | 2,490,000 | 2,060,475 | ||||||
Regal Cinemas Corp. | ||||||||
8.625%, 07/15/2019 | 1,700,000 | 1,802,000 | ||||||
| 6,930,888 | ||||||||
Lodging - 0.42% | ||||||||
Host Hotels & Resorts LP - REIT | ||||||||
Series O, 6.375%, 03/15/2015 | 75,000 | 76,688 | ||||||
Series Q, 6.750%, 06/01/2016 | 625,000 | 643,750 | ||||||
9.000%, 05/15/2017 | 1,000,000 | 1,117,500 | ||||||
| 1,837,938 | ||||||||
See Notes to Financial Statements.
34 | www.shiplp.com |
Table of Contents
| Stone Harbor High Yield Bond Fund | Statements of Investments | |
November 30, 2010 (Unaudited) |
Interest Rate/Maturity Date | Principal Amount* | Market Value | ||||||
Media Cable - 4.68% | ||||||||
Atlantic Broadband Finance LLC | ||||||||
9.375%, 01/15/2014 | $1,710,000 | $1,748,475 | ||||||
Cablevision Systems Corp. | ||||||||
8.625%, 09/15/2017 | 925,000 | 1,010,563 | ||||||
7.750%, 04/15/2018 | 525,000 | 559,125 | ||||||
8.000%, 04/15/2020 | 750,000 | 808,125 | ||||||
Cequel Communications Holdings I, LLC | ||||||||
8.625%, 11/15/2017(1) | 1,175,000 | 1,210,250 | ||||||
CSC Holdings LLC | ||||||||
8.500%, 06/15/2015 | 1,700,000 | 1,853,000 | ||||||
8.625%, 02/15/2019 | 475,000 | 545,063 | ||||||
CSC Holdings, Inc. | ||||||||
7.625%, 07/15/2018 | 325,000 | 355,875 | ||||||
DISH DBS Corp. | ||||||||
7.750%, 05/31/2015 | 1,100,000 | 1,172,875 | ||||||
7.125%, 02/01/2016 | 960,000 | 991,200 | ||||||
7.875%, 09/01/2019 | 1,700,000 | 1,793,500 | ||||||
Insight Communications Co., Inc. | ||||||||
9.375%, 07/15/2018(1) | 650,000 | 708,500 | ||||||
Mediacom LLC | ||||||||
9.125%, 08/15/2019 | 500,000 | 507,500 | ||||||
Unitymedia Hesson GmbH & Co. | ||||||||
8.125%, 12/01/2017(1) | 125,000 | 130,625 | ||||||
UPC Holding BV | ||||||||
9.875%, 04/15/2018(1) | 1,750,000 | 1,889,999 | ||||||
Videotron Ltee | ||||||||
9.125%, 04/15/2018 | 1,225,000 | 1,362,813 | ||||||
Virgin Media Finance PLC | ||||||||
9.125%, 08/15/2016 | 2,125,000 | 2,268,437 | ||||||
Series 1, 9.500%, 08/15/2016 | 1,100,000 | 1,234,750 | ||||||
8.375%, 10/15/2019 | 275,000 | 303,188 | ||||||
| 20,453,863 | ||||||||
Media Other - 2.27% | ||||||||
Bonten Media Acquisition Co. | ||||||||
9.000%, 06/01/2015(1)(2) | 490,233 | 264,726 | ||||||
Fox Acquisition Sub LLC | ||||||||
13.375%, 07/15/2016(1) | 1,115,000 | 1,223,713 | ||||||
Interep National Radio Sales, Inc. | ||||||||
Series B, 10.000%, 07/01/2008(3)(4) | 4,000 | 0 | ||||||
Lamar Media Corp. | ||||||||
6.625%, 08/15/2015 | 710,000 | 725,975 | ||||||
See Notes to Financial Statements.
Semi-Annual Report (Unaudited) | November 30, 2010 | 35 |
Table of Contents
| Stone Harbor High Yield Bond Fund | Statements of Investments | |
November 30, 2010 (Unaudited) |
Interest Rate/Maturity Date | Principal Amount* | Market Value | ||||||
Series B, 6.625%, 08/15/2015 | $1,680,000 | $1,701,000 | ||||||
Series C, 6.625%, 08/15/2015 | 200,000 | 202,500 | ||||||
Radio One, Inc. | ||||||||
12.500%, 05/11/2016(1)(2)(3) | 2,341,661 | 2,212,869 | ||||||
Sinclair Television Group, Inc. | ||||||||
9.250%, 11/01/2017(1) | 800,000 | 870,000 | ||||||
8.375%, 10/15/2018(1) | 750,000 | 772,500 | ||||||
Univision Communications, Inc. | ||||||||
7.875%, 11/01/2010(1) | 1,900,000 | 1,952,250 | ||||||
| 9,925,533 | ||||||||
Metals/Mining/Steel - 2.20% | ||||||||
Arch Coal, Inc. | ||||||||
8.750%, 08/01/2016 | 725,000 | 799,313 | ||||||
7.250%, 10/01/2020 | 400,000 | 440,000 | ||||||
Cloud Peak Energy Resources LLC | ||||||||
8.250%, 12/15/2017 | 400,000 | 438,000 | ||||||
8.500%, 12/15/2019 | 1,450,000 | 1,602,250 | ||||||
Consol Energy, Inc. | ||||||||
8.000%, 04/01/2017(1) | 1,175,000 | 1,269,000 | ||||||
8.250%, 04/01/2020(1) | 800,000 | 870,000 | ||||||
Drummond Co., Inc. | ||||||||
9.000%, 10/15/2014(1) | 325,000 | 344,500 | ||||||
7.375%, 02/15/2016 | 1,475,000 | 1,511,875 | ||||||
FMG Resources August 2006 Pty Ltd. | ||||||||
7.000%, 11/01/2015(1) | 1,175,000 | 1,195,563 | ||||||
Penn Virginia Resource Partners LP | ||||||||
8.250%, 04/15/2018 | 1,130,000 | 1,155,425 | ||||||
| 9,625,926 | ||||||||
Non Captive Finance - 0.38% | ||||||||
Ally Financial, Inc. | ||||||||
6.250%, 12/01/2017(1) | 830,000 | 797,838 | ||||||
GMAC LLC | ||||||||
8.000%, 11/01/2031 | 400,000 | 416,000 | ||||||
PHH Corp. | ||||||||
9.250%, 03/01/2016(1) | 450,000 | 463,500 | ||||||
| 1,677,338 | ||||||||
Paper/Forest Products - 2.50% | ||||||||
Ainsworth Lumber Co. Ltd. | ||||||||
11.000%, 07/29/2015(1)(2) | 950,000 | 855,000 | ||||||
See Notes to Financial Statements.
36 | www.shiplp.com |
Table of Contents
| Stone Harbor High Yield Bond Fund | Statements of Investments | |
November 30, 2010 (Unaudited) |
Interest Rate/Maturity Date | Principal | Market Value | ||||||
Boise Paper Holdings LLC | ||||||||
8.000%, 04/01/2020 | $2,000,000 | $2,175,000 | ||||||
Cascades, Inc. | ||||||||
7.750%, 12/15/2017 | 1,750,000 | 1,841,874 | ||||||
7.875%, 01/15/2020 | 225,000 | 237,375 | ||||||
Catalyst Paper Corp. | ||||||||
11.000%, 12/15/2016(1) | 330,000 | 298,650 | ||||||
Graphic Packaging International, Inc. | ||||||||
9.500%, 06/15/2017 | 2,155,000 | 2,348,950 | ||||||
Mercer International, Inc. | ||||||||
9.500%, 12/01/2017(1) | 1,050,000 | 1,055,250 | ||||||
Millar Western Forest Products Ltd. | ||||||||
7.750%, 11/15/2013 | 810,000 | 765,450 | ||||||
NewPage Corp. | ||||||||
11.375%, 12/31/2014 | 990,000 | 900,900 | ||||||
Verso Paper Holdings LLC | ||||||||
Series B, 11.375%, 08/01/2016 | 465,000 | 456,281 | ||||||
| 10,934,730 | ||||||||
Publishing/Printing - 1.14% | ||||||||
Baker & Taylor, Inc. | ||||||||
11.500%, 07/01/2013(1) | 1,295,000 | 1,029,525 | ||||||
Cenveo Corp. | ||||||||
7.875%, 12/01/2013 | 1,025,000 | 1,007,063 | ||||||
8.375%, 06/15/2014 | 650,000 | 562,250 | ||||||
10.500%, 08/15/2016(1) | 350,000 | 361,375 | ||||||
8.875%, 02/01/2018 | 500,000 | 498,750 | ||||||
Dex One Corp. | ||||||||
12.000%, 01/29/2017(2) | 15,236 | 8,608 | ||||||
IDEARC, Inc. | ||||||||
8.000%, 11/15/2016(3)(4) | 1,265,000 | 0 | ||||||
The McClatchy Co. | ||||||||
11.500%, 02/15/2017 | 1,010,000 | 1,063,025 | ||||||
Nielsen Finance LLC | ||||||||
7.750%, 10/15/2018(1) | 450,000 | 460,125 | ||||||
| 4,990,721 | ||||||||
Refining - 0.58% | ||||||||
Petroplus Finance Ltd. | ||||||||
6.750%, 05/01/2014(1) | 1,585,000 | 1,442,350 | ||||||
7.000%, 05/01/2017(1) | 925,000 | 800,125 | ||||||
9.375%, 09/15/2019(1) | 300,000 | 277,500 | ||||||
| 2,519,975 | ||||||||
See Notes to Financial Statements.
Semi-Annual Report (Unaudited) | November 30, 2010 | 37 |
Table of Contents
| Stone Harbor High Yield Bond Fund | Statements of Investments | |
November 30, 2010 (Unaudited) |
Interest Rate/Maturity Date | Principal | Market Value | ||||||
REITS - 0.45% | ||||||||
CB Richard Ellis Services, Inc. | ||||||||
11.625%, 06/15/2017 | $1,675,000 | $1,949,281 | ||||||
Restaurants - 0.47% | ||||||||
DineEquity, Inc. | ||||||||
9.500%, 10/30/2018(1) | 975,000 | 1,014,000 | ||||||
Dunkin Finance Corp. | ||||||||
9.625%, 12/01/2018(1) | 925,000 | 935,406 | ||||||
Sbarro, Inc. | ||||||||
10.375%, 02/01/2015 | 225,000 | 109,125 | ||||||
| 2,058,531 | ||||||||
Retail Food/Drug - 0.72% | ||||||||
Albertsons, Inc. | ||||||||
8.000%, 05/01/2031 | 50,000 | 39,000 | ||||||
American Stores Co. | ||||||||
7.900%, 05/01/2017 | 550,000 | 532,125 | ||||||
8.000%, 06/01/2026 | 1,465,000 | 1,259,900 | ||||||
Series MTNB, 7.100%, 03/20/2028 | 600,000 | 459,000 | ||||||
SUPERVALU, Inc. | ||||||||
7.500%, 11/15/2014 | 350,000 | 349,125 | ||||||
8.000%, 05/01/2016 | 500,000 | 493,750 | ||||||
| 3,132,900 | ||||||||
Retail Non Food/Drug - 5.43% | ||||||||
The Bon-Ton Department Stores, Inc. | ||||||||
10.250%, 03/15/2014 | 1,250,000 | 1,262,500 | ||||||
Claire’s Stores, Inc. | ||||||||
9.250%, 06/01/2015 | 550,000 | 514,250 | ||||||
9.625%, 06/01/2015(2) | 1,182,424 | 1,129,215 | ||||||
10.500%, 06/01/2017 | 425,000 | 382,500 | ||||||
Express LLC | ||||||||
8.750%, 03/01/2018 | 1,300,000 | 1,384,500 | ||||||
JC Penney Corp., Inc. | ||||||||
7.400%, 04/01/2037 | 1,475,000 | 1,390,188 | ||||||
Limited Brands, Inc. | ||||||||
8.500%, 06/15/2019 | 1,175,000 | 1,360,063 | ||||||
7.000%, 05/01/2020 | 1,075,000 | 1,150,250 | ||||||
6.950%, 03/01/2033 | 1,350,000 | 1,269,000 | ||||||
7.600%, 07/15/2037 | 400,000 | 394,000 | ||||||
See Notes to Financial Statements.
38 | www.shiplp.com |
Table of Contents
| Stone Harbor High Yield Bond Fund | Statements of Investments | |
November 30, 2010 (Unaudited) |
Interest Rate/Maturity Date | Principal Amount* | Market Value | ||||||
Macy’s Retail Holdings, Inc. | ||||||||
6.900%, 01/15/2032 | $175,000 | $174,125 | ||||||
7.875%, 08/15/2036 | 525,000 | 542,063 | ||||||
Michaels Stores, Inc. | ||||||||
11.375%, 11/01/2016 | 1,800,000 | 1,955,249 | ||||||
7.750%, 11/01/2018(1) | 725,000 | 708,688 | ||||||
Neiman-Marcus Group, Inc. | ||||||||
9.000%, 10/15/2015(2) | 1,652,116 | 1,726,460 | ||||||
10.375%, 10/15/2015 | 1,200,000 | 1,269,000 | ||||||
Petco Animal Supplies, Inc. | ||||||||
9.250%, 12/01/2018(1) | 1,200,000 | 1,215,000 | ||||||
QVC, Inc. | ||||||||
7.125%, 04/15/2017(1) | 500,000 | 527,500 | ||||||
7.500%, 10/01/2019(1) | 1,150,000 | 1,213,250 | ||||||
Toys R Us Delaware, Inc. | ||||||||
7.375%, 09/01/2016(1) | 1,275,000 | 1,337,156 | ||||||
Toys R Us Property Co. I LLC | ||||||||
10.750%, 07/15/2017 | 2,500,000 | 2,824,999 | ||||||
| 23,729,956 | ||||||||
Satellite - 1.19% | ||||||||
Hughes Network Systems LLC | ||||||||
9.500%, 04/15/2014 | 75,000 | 77,250 | ||||||
9.500%, 04/15/2014 | 1,560,000 | 1,606,800 | ||||||
Intelsat Corp. | ||||||||
9.250%, 06/15/2016 | 500,000 | 528,750 | ||||||
Intelsat Intermediate Holding Co. SA | ||||||||
9.500%, 02/01/2015 | 275,000 | 284,625 | ||||||
Intelsat Jackson Holdings SA | ||||||||
9.500%, 06/15/2016 | 900,000 | 954,000 | ||||||
11.250%, 06/15/2016 | 600,000 | 644,250 | ||||||
8.500%, 11/01/2019(1) | 1,025,000 | 1,107,000 | ||||||
| 5,202,675 | ||||||||
Services Other - 4.86% | ||||||||
American Residential Services LLC | ||||||||
12.000%, 04/15/2015(1) | 1,075,000 | 1,120,688 | ||||||
ARAMARK Corp. | ||||||||
8.500%, 02/01/2015 | 3,870,000 | 4,024,800 | ||||||
Corrections Corp. of America | ||||||||
7.750%, 06/01/2017 | 1,725,000 | 1,888,875 | ||||||
Education Management LLC | ||||||||
8.750%, 06/01/2014 | 1,200,000 | 1,228,500 | ||||||
See Notes to Financial Statements.
Semi-Annual Report (Unaudited) | November 30, 2010 | 39 |
Table of Contents
| Stone Harbor High Yield Bond Fund | Statements of Investments | |
November 30, 2010 (Unaudited) |
Interest Rate/Maturity Date | Principal Amount* | Market Value | ||||
10.250%, 06/01/2016 | $215,000 | $220,375 | ||||
The Geo Group, Inc. | ||||||
7.750%, 10/15/2017 | 2,300,000 | 2,449,500 | ||||
GXS Worldwide, Inc. | ||||||
9.750%, 06/15/2015 | 1,900,000 | 1,885,750 | ||||
Iron Mountain, Inc. | ||||||
7.750%, 01/15/2015 | 536,000 | 541,360 | ||||
8.750%, 07/15/2018 | 1,710,000 | 1,804,050 | ||||
8.000%, 06/15/2020 | 375,000 | 403,125 | ||||
8.375%, 08/15/2021 | 325,000 | 357,500 | ||||
Mobile Mini, Inc. | ||||||
7.875%, 12/01/2020(1) | 275,000 | 282,906 | ||||
Old West Corp. | ||||||
8.625%, 10/01/2018(1) | 350,000 | 365,750 | ||||
7.875%, 01/15/2019(1) | 1,350,000 | 1,336,500 | ||||
The ServiceMaster Co. | ||||||
10.750%, 07/15/2015(1)(2) | 1,800,000 | 1,939,500 | ||||
7.450%, 08/15/2027 | 175,000 | 138,250 | ||||
Trans Union LLC | ||||||
11.375%, 06/15/2018(1) | 1,100,000 | 1,237,500 | ||||
| 21,224,929 | ||||||
Technology - 2.27% | ||||||
Fidelity National Information Services, Inc. | ||||||
7.875%, 07/15/2020(1) | 575,000 | 616,688 | ||||
NXP BV | ||||||
9.750%, 08/01/2018(1) | 2,125,000 | 2,305,625 | ||||
SSI Investments II | ||||||
11.125%, 06/01/2018(1) | 1,700,000 | 1,865,750 | ||||
SunGard Data Systems, Inc. | ||||||
7.375%, 11/15/2018(1) | 1,625,000 | 1,616,875 | ||||
Xerox Capital Trust I | ||||||
8.000%, 02/01/2027 | 3,445,000 | 3,508,911 | ||||
| 9,913,849 | ||||||
Textile/Apparel - 0.88% | ||||||
Levi Strauss & Co. | ||||||
8.875%, 04/01/2016 | 1,200,000 | 1,266,000 | ||||
7.625%, 05/15/2020 | 925,000 | 952,750 | ||||
Quiksilver, Inc. | ||||||
6.875%, 04/15/2015 | 1,700,000 | 1,623,500 | ||||
| 3,842,250 | ||||||
See Notes to Financial Statements.
40 | www.shiplp.com |
Table of Contents
| Stone Harbor High Yield Bond Fund | Statements of Investments | |
November 30, 2010 (Unaudited) |
Interest Rate/Maturity Date | Principal | Market Value | ||||||
Transportation - Non Air/Rail - 0.54% | ||||||||
General Maritime Corp. | ||||||||
12.000%, 11/15/2017 | $1,775,000 | $1,783,875 | ||||||
Navios Maritime Holdings, Inc. | ||||||||
8.875%, 11/01/2017 | 525,000 | 563,063 | ||||||
| 2,346,938 | ||||||||
Wireless - 3.68% | ||||||||
Crown Castle International Corp. | ||||||||
9.000%, 01/15/2015 | 3,650,000 | 4,042,375 | ||||||
7.125%, 11/01/2019 | 100,000 | 108,750 | ||||||
MetroPCS Wireless, Inc. | �� | |||||||
7.875%, 09/01/2018 | 1,450,000 | 1,509,813 | ||||||
6.625%, 11/15/2020 | 975,000 | 931,125 | ||||||
Nextel Communications, Inc. | ||||||||
Series D, 7.375%, 08/01/2015 | 2,325,000 | 2,255,250 | ||||||
SBA Telecommunications, Inc. | ||||||||
8.000%, 08/15/2016 | 625,000 | 678,125 | ||||||
8.250%, 08/15/2019 | 700,000 | 770,000 | ||||||
Sprint Capital Corp. | ||||||||
8.750%, 03/15/2032 | 3,825,000 | 3,805,875 | ||||||
Wind Acquisition Finance SA | ||||||||
11.750%, 07/15/2014(1) | 975,000 | 1,087,125 | ||||||
12.250%, 07/15/2017(1)(2) | 767,885 | 871,549 | ||||||
| 16,059,987 | ||||||||
Wirelines - 4.92% | ||||||||
Cincinnati Bell, Inc. | ||||||||
8.250%, 10/15/2017 | 975,000 | 950,625 | ||||||
Citizens Communications Co. | ||||||||
7.875%, 01/15/2027 | 125,000 | 123,125 | ||||||
9.000%, 08/15/2031 | 3,880,000 | 4,083,699 | ||||||
Embarq Corp. | ||||||||
7.995%, 06/01/2036 | 1,975,000 | 2,150,026 | ||||||
ITC Deltacom, Inc. | ||||||||
10.500%, 04/01/2016 | 2,025,000 | 2,181,938 | ||||||
Level 3 Financing, Inc. | ||||||||
9.250%, 11/01/2014 | 1,040,000 | 1,008,800 | ||||||
4.344%, 02/15/2015(6) | 350,000 | 295,750 | ||||||
10.000%, 02/01/2018 | 2,550,000 | 2,358,750 | ||||||
Qwest Communications International, Inc. | ||||||||
Series B, 7.500%, 02/15/2014 | 875,000 | 888,125 | ||||||
7.125%, 04/01/2018(1) | 1,975,000 | 2,063,875 | ||||||
See Notes to Financial Statements.
Semi-Annual Report (Unaudited) | November 30, 2010 | 41 |
Table of Contents
| Stone Harbor High Yield Bond Fund | Statements of Investments | |
November 30, 2010 (Unaudited) |
Interest Rate/Maturity Date | Currency | Principal Amount* | Market Value | |||||
Qwest Corp. | ||||||||
7.500%, 06/15/2023 | $425,000 | $422,875 | ||||||
6.875%, 09/15/2033 | 2,550,000 | 2,524,500 | ||||||
Windstream Corp. | ||||||||
8.625%, 08/01/2016 | 1,000,000 | 1,042,500 | ||||||
7.875%, 11/01/2017 | 1,325,000 | 1,397,875 | ||||||
| 21,492,463 | ||||||||
TOTAL CORPORATE BONDS | 398,172,342 | |||||||
(Amortized Cost $373,548,127) | ||||||||
CONVERTIBLE CORPORATE BONDS - 1.71% | ||||||||
Automotive - 0.16% | ||||||||
ArvinMeritor, Inc. | ||||||||
4.625%, 03/01/2026(5) | 125,000 | 147,031 | ||||||
Cie Generale des Etablissements Michelin | ||||||||
Series ML, 3.402%, 01/01/2017(7) | EUR | 166,631 | 234,418 | |||||
Suzuki Motor Corp. | ||||||||
Series 4, 0.000%, 03/29/2013(1)(7) | JPY | 25,000,000 | 304,042 | |||||
| 685,491 | ||||||||
Containers/Packaging - 0.08% | ||||||||
Owens - Brockway Glass Container, Inc. | ||||||||
3.000%, 06/01/2015(1) | 363,000 | 356,648 | ||||||
Drillers/Services - 0.16% | ||||||||
Acergy SA | ||||||||
Series ACY, 2.250%, 10/11/2013 | 200,000 | 225,900 | ||||||
Newpark Resources, Inc. | ||||||||
4.000%, 10/01/2017 | 290,000 | 258,825 | ||||||
Transocean, Inc. | ||||||||
Series A, 1.625%, 12/15/2037 | 205,000 | 203,463 | ||||||
| 688,188 | ||||||||
Exploration & Production - 0.04% | ||||||||
InterOil Corp. | ||||||||
2.750%, 11/15/2015 | 9,000 | 9,090 | ||||||
Quicksilver Resources, Inc. | ||||||||
1.875%, 11/01/2024 | 138,000 | 149,558 | ||||||
| 158,648 | ||||||||
| See Notes to Financial Statements. | ||
42 | www.shiplp.com |
Table of Contents
| Stone Harbor High Yield Bond Fund | Statements of Investments | |
November 30, 2010 (Unaudited) |
Interest Rate/Maturity Date | Principal Amount* | Market Value | ||||||
Food and Beverage - 0.11% | ||||||||
Smithfield Foods, Inc. | ||||||||
4.000%, 06/30/2013 | $95,000 | $103,669 | ||||||
Tyson Foods, Inc. | ||||||||
3.250%, 10/15/2013 | 330,000 | 386,925 | ||||||
| 490,594 | ||||||||
Healthcare - 0.25% | ||||||||
Amylin Pharmaceuticals, Inc. | ||||||||
3.000%, 06/15/2014 | 360,000 | 311,850 | ||||||
Beckman Coulter, Inc. | ||||||||
2.500%, 12/15/2036 | 39,000 | 41,340 | ||||||
Hologic, Inc. | ||||||||
2.000%, 12/15/2037(5) | 192,000 | 179,040 | ||||||
Life Technologies Corp. | ||||||||
3.250%, 06/15/2025 | 498,000 | 563,363 | ||||||
| 1,095,593 | ||||||||
Insurance - 0.00%(8) | ||||||||
Radian Group, Inc. | ||||||||
3.000%, 11/15/2017 | 18,000 | 16,515 | ||||||
Pharmaceuticals - 0.37% | ||||||||
Amgen, Inc. | ||||||||
Series A, 0.125%, 02/01/2011 | 275,000 | 275,687 | ||||||
Gilead Sciences, Inc. | ||||||||
Series A, 0.500%, 05/01/2011 | 520,000 | 536,900 | ||||||
1.000%, 05/01/2014(1) | 85,000 | 88,081 | ||||||
PDL BioPharma, Inc. | ||||||||
2.000%, 02/15/2012 | 230,000 | 227,700 | ||||||
Shire PLC | ||||||||
Series SHP, 2.750%, 05/09/2014 | 475,000 | 491,030 | ||||||
| 1,619,398 | ||||||||
Retail Food/Drug - 0.01% | ||||||||
Great Atlantic & Pacific Tea Co. | ||||||||
5.125%, 06/15/2011(4) | 65,000 | 52,975 | ||||||
Technology - 0.46% | ||||||||
Alcatel-Lucent USA, Inc. | ||||||||
Series B, 2.750%, 06/15/2025 | 90,000 | 85,837 | ||||||
Comtech Telecommunications Corp. | ||||||||
3.000%, 05/01/2029 | 215,000 | 232,738 | ||||||
| See Notes to Financial Statements. | ||
Semi-Annual Report (Unaudited) | November 30, 2010 | 43 |
Table of Contents
| Stone Harbor High Yield Bond Fund | Statements of Investments | |
November 30, 2010 (Unaudited) |
Interest Rate/Maturity Date | Principal | Market Value | ||||||
Digital River, Inc. | ||||||||
2.000%, 11/01/2030(1) | $65,000 | $65,081 | ||||||
Hon Hai Precision Industry Co. Ltd. | ||||||||
0.000%, 10/12/2013(7) | 100,000 | 99,038 | ||||||
Hutchinson Technology, Inc. | ||||||||
3.250%, 01/15/2026 | 145,000 | 102,225 | ||||||
Micron Technology, Inc. | ||||||||
1.875%, 06/01/2014 | 102,000 | 93,968 | ||||||
ON Semiconductor Corp. | ||||||||
Series B, 2.280%, 04/15/2024(7) | 275,000 | 286,000 | ||||||
2.625%, 12/15/2026 | 265,000 | 284,874 | ||||||
RightNow Technologies, Inc. | ||||||||
2.500%, 11/15/2030(1) | 67,000 | 69,010 | ||||||
SanDisk Corp. | ||||||||
1.500%, 08/15/2017 | 157,000 | 168,579 | ||||||
Xilinx, Inc. | ||||||||
3.125%, 03/15/2037 | 513,000 | 512,357 | ||||||
| 1,999,707 | ||||||||
Wirelines - 0.07% | ||||||||
Earthlink, Inc. | ||||||||
3.250%, 11/15/2026(5) | 252,000 | 289,170 | ||||||
TOTAL CONVERTIBLE CORPORATE BONDS | 7,452,927 | |||||||
(Amortized Cost $7,272,275) | ||||||||
BANK LOANS - 2.21%(9) | ||||||||
Aerospace/Defense - 0.07% | ||||||||
Sequa Corp. - Term Loan | ||||||||
3.550%, 12/08/2010 | 11,385 | 10,854 | ||||||
3.550%, 12/15/2010 | 9,731 | 9,276 | ||||||
3.540%, 01/03/2011 | 316,381 | 301,617 | ||||||
| 321,747 | ||||||||
Automotive - 0.22% | ||||||||
Ford Motor Co. - Tranche B-1 Term Loan | ||||||||
3.010%, 12/15/2010 | 246,239 | 244,220 | ||||||
3.050%, 12/15/2010 | 496,629 | 492,557 | ||||||
3.040%, 01/18/2011 | 232,272 | 230,367 | ||||||
| 967,144 | ||||||||
See Notes to Financial Statements.
44 | www.shiplp.com |
Table of Contents
| Stone Harbor High Yield Bond Fund | Statements of Investments | |
November 30, 2010 (Unaudited) |
Interest Rate/Maturity Date | Principal Amount* | Market Value | ||||||
Building Products - 0.04% | ||||||||
Collins & Aikman Floorcoverings, Inc. - Loan | ||||||||
2.794%, 12/07/2010 | $3,569 | $3,252 | ||||||
2.793%, 12/13/2010 | 178,034 | 162,234 | ||||||
2.791%, 12/20/2010 | 18,367 | 16,737 | ||||||
| 182,223 | ||||||||
Electric - 0.93% | ||||||||
Texas Competitive Holdings Co. LLC - Initial Tranche B-2 Term Loan | ||||||||
3.753%, 12/09/2010 | 4,714,999 | 4,038,834 | ||||||
3.789%, 12/31/2010 | 12,183 | 10,436 | ||||||
| 4,049,270 | ||||||||
Gaming - 0.50% | ||||||||
Harrah’s Operating Co., Inc. - Term B-2 Loan | ||||||||
3.288%, 01/26/2011 | 2,475,000 | 2,172,897 | ||||||
Media Other - 0.06% | ||||||||
Citadel Broadcasting Corp. - Loan | ||||||||
11.000%, 12/30/2010 | 146,093 | 154,327 | ||||||
Univision Communications, Inc. - Extended First- Lien Term Loan | ||||||||
4.506%, 12/31/2010 | 132,383 | 123,633 | ||||||
| 277,960 | ||||||||
Non Captive Finance - 0.21% | ||||||||
American General Finance Co. - Loan | ||||||||
7.250%, 12/29/2010 | 925,000 | 933,961 | ||||||
Publishing/Printing - 0.11% | ||||||||
Merrill Communications LLC - Loan (Second Lien) | ||||||||
14.750%, 12/31/2010 | 150,000 | 142,500 | ||||||
15.000%, 02/01/2011 | 4,295 | 4,081 | ||||||
R.H. Donnelley, Inc. - Loan | ||||||||
9.000%, 12/31/2010 | 14,746 | 10,626 | ||||||
9.000%, 01/31/2011 | 127,533 | 91,903 | ||||||
9.000%, 02/28/2011 | 129,628 | 93,413 | ||||||
Tribune Co. - Tranche X Advance | ||||||||
5.000%, 12/31/2010 | 192,000 | 120,686 | ||||||
| 463,209 | ||||||||
Retail Non Food/Drug - 0.07% | ||||||||
Claire’s Stores, Inc. - Term B Loan | ||||||||
3.044%, 02/28/2010 | 294,630 | 258,313 | ||||||
See Notes to Financial Statements.
Semi-Annual Report (Unaudited) | November 30, 2010 | 45 |
Table of Contents
| Stone Harbor High Yield Bond Fund | Statements of Investments | |
November 30, 2010 (Unaudited) |
Interest Rate/Maturity Date | Principal Amount*/Shares | Market Value | ||||||
3.006%, 12/31/2010 | $891 | $781 | ||||||
3.038%, 01/31/2011 | 49,136 | 43,079 | ||||||
| 302,173 | ||||||||
TOTAL BANK LOANS | 9,670,584 | |||||||
(Amortized Cost $9,423,079) | ||||||||
COMMON STOCKS - 0.28% | ||||||||
Chemicals - 0.03% | ||||||||
LyondellBasell Industries NV(10) | 4,658 | 136,060 | ||||||
Media Cable - 0.24% | ||||||||
Charter Communications, Inc.(10) | 31,035 | 1,040,293 | ||||||
Publishing/Printing - 0.01% | ||||||||
Dex One Corp.(10) | 12,498 | 59,366 | ||||||
SuperMedia, Inc.(10) | 998 | 4,511 | ||||||
| 63,877 | ||||||||
TOTAL COMMON STOCKS | 1,240,230 | |||||||
(Cost $4,147,172) | ||||||||
PREFERRED STOCKS - 0.35% | ||||||||
Automotive - 0.01% | ||||||||
General Motors Co. | ||||||||
4.750%, 12/01/2013 | 1,050 | 53,235 | ||||||
Banking - 0.08% | ||||||||
Wells Fargo & Co. | ||||||||
7.500%, 12/31/2049 | 350 | 345,450 | ||||||
Electric - 0.01% | ||||||||
AES Trust III | ||||||||
6.750%, 10/15/2029 | 600 | 28,950 | ||||||
Exploration & Production - 0.07% | ||||||||
Apache Corp. | ||||||||
6.000%, 08/01/2013 | 4,610 | 279,597 | ||||||
See Notes to Financial Statements.
46 | www.shiplp.com |
Table of Contents
| Stone Harbor High Yield Bond Fund | Statements of Investments | |
November 30, 2010 (Unaudited) |
Interest Rate/Maturity Date | Principal Amount*/Shares | Market Value | ||||||
Food and Beverage - 0.05% | ||||||||
Archer-Daniels-Midland Co. | ||||||||
6.250%, 06/01/2011 | $5,700 | $215,061 | ||||||
Gas Pipelines - 0.08% | ||||||||
El Paso Corp. | ||||||||
4.990%, 12/31/2049 | 301 | 351,035 | ||||||
Life - 0.04% | ||||||||
Hartford Financial Services Group, Inc. | ||||||||
7.250%, 04/01/2013 | 8,100 | 187,353 | ||||||
Metals/Mining/Steel - 0.01% | ||||||||
AngloGold Ashanti Ltd. | ||||||||
6.000%, 09/15/2013 | 950 | 50,711 | ||||||
TOTAL PREFERRED STOCKS | 1,511,392 | |||||||
(Cost $1,472,084) | ||||||||
RIGHTS AND WARRANTS - 0.05% | ||||||||
Media Other - 0.05% | ||||||||
Citadel Broadcasting Corp. | �� | |||||||
expires 6/3/2030(10) | 8,540 | 230,580 | ||||||
Publishing/Printing - 0.00% | ||||||||
Readers Digest | ||||||||
expires 2/19/2014 (3)(10) | 1,498 | 0 | ||||||
TOTAL RIGHTS AND WARRANTS | 230,580 | |||||||
(Cost $576,017) | ||||||||
MONEY MARKET MUTUAL FUNDS - 2.56% | ||||||||
Dreyfus Cash Advantage Plus Fund | ||||||||
(0.100% 7-Day Yield) | 11,177,477 | 11,177,477 | ||||||
TOTAL MONEY MARKET MUTUAL FUNDS | 11,177,477 | |||||||
(Cost $11,177,477) | ||||||||
| See Notes to Financial Statements. | ||
Semi-Annual Report (Unaudited) | November 30, 2010 | 47 |
Table of Contents
| Stone Harbor High Yield Bond Fund | Statements of Investments | |
November 30, 2010 (Unaudited) |
| Market Value | ||||
Total Investments - 98.31% (Cost $407,616,231) | $ | 429,455,532 | ||
Other Assets in Excess of Liabilities - 1.69% | 7,393,127 | |||
Net Assets - 100.00% | $ | 436,848,659 | ||
| * | The principal/contract amount of each security is stated in the currency in which the bond is denominated (U.S. Dollar unless otherwise notated). See below. |
| EUR | Euro Currency | |
| JPY | Japanese Yen |
Common Abbreviations:
BV - Besloten Vennootschap a Dutch private limited liability company.
GmbH - Gesellschaft mit bescharankter Haftung is the German term for limited liability company.
LLC - Limited Liability Corp.
LP - Limited Partnership.
Ltd. - Limited.
NV - Naamloze Vennootschap is the Dutch term for a public limited liability corporation.
PLC - Public Limited Co.
Pty Ltd. - Propriety Limited
REIT - Real Estate Investment Trust.
SA - Generally designates corporations in various countries, mostly those employing the civil law.
ULC - Unlimited Liability Corp.
| (1) | Security exempt from registration under Rule 144A of the Securities Act of 1933. Under procedures approved by the Board of Trustees, such securities have been determined to be liquid by the Investment Advisor and may normally be sold to qualified institutional buyers in transactions exempt from registration. Total market value of Rule 144A securities amounts to $111,210,312, which represents approximately 25.46% of net assets as of November 30, 2010. |
| (2) | Pay-in-kind securities. |
| (3) | This security has been valued at its fair value determined in good faith pursuant to procedures approved by the Board of Trustees. Total market value of fair valued securities amounts to $2,212,872, which represents approximately 0.51% of net assets as of November 30, 2010. |
| (4) | Security is currently in default/non-income producing. |
| (5) | Step bond. Coupon increases periodically based upon a predetermined schedule. Interest rate disclosed is that which is in effect at November 30, 2010. |
| (6) | Floating or variable rate security. Interest rate disclosed is that which is in effect at November 30, 2010. |
| (7) | Zero coupon bond reflects effective yield on the date of purchase. |
| (8) | Amount represents less than 0.005% of net assets. |
See Notes to Financial Statements.
48 | www.shiplp.com |
Table of Contents
| Stone Harbor High Yield Bond Fund | Statements of Investments | |
November 30, 2010 (Unaudited) |
| (9) | Bank loans generally pay interest at rates which are periodically determined by reference to a base lending rate plus a premium. All loans carry a variable rate of interest. These base lending rates are generally (i) the Prime Rate offered by one or more major United States banks, (ii) the lending rate offered by one or more European banks such as the London Interbank Offered Rate (“LIBOR”) or (iii) the Certificate of Deposit rate. Rate shown represents the weighted average rate at November 30, 2010. Bank Loans, while exempt from registration, under the Securities Act of 1933 (the “1933 Act”), contain certain restrictions on resale and cannot be sold publicly. Floating rate bank loans often require prepayments from excess cash flow or permit the borrower to repay at its election. The degree to which borrowers repay, whether as a contractual requirement or at their election, cannot be predicted with accuracy. As a result, the actual remaining maturity may be substantially less than the stated maturity shown. |
| (10) | Non-income producing security. |
OUTSTANDING FORWARD FOREIGN CURRENCY CONTRACTS
Contract | Contracted Amount | Purchase/Sale Contract | Expiration Date | Value On Date | Current Value | Unrealized | ||||||
EUR | 182,000 (EUR) | Sale | 01/21/2011 | $247,136 | $236,199 | $10,937 | ||||||
JPY | 25,637,000 (JPY) | Sale | 01/21/2011 | 307,409 | 306,570 | 839 | ||||||
| $11,776 | ||||||||||||
| See Notes to Financial Statements. | ||
Semi-Annual Report (Unaudited) | November 30, 2010 | 49 |
Table of Contents
| Stone Harbor Local Markets Fund | Statements of Investments | |
November 30, 2010 (Unaudited) |
Interest Rate/Maturity Date | Currency | Principal Amount * | Market Value (Expressed in U.S. $) | |||||||||
SOVEREIGN DEBT OBLIGATIONS - 50.81% | ||||||||||||
Brazil - 7.88% | ||||||||||||
Nota Do Tesouro Nacional | ||||||||||||
10.000%, 01/01/2014 | BRL | $8,360,000 | $4,604,667 | |||||||||
10.000%, 01/01/2021 | BRL | 15,700,000 | 7,955,607 | |||||||||
| 12,560,274 | ||||||||||||
Colombia - 2.57% | ||||||||||||
Bogota Distrio Capital | ||||||||||||
9.750%, 07/26/2028(1) | COP | 5,030,000,000 | 3,512,146 | |||||||||
Republic of Colombia | ||||||||||||
7.750%, 04/14/2021 | COP | 800,000,000 | 465,948 | |||||||||
9.850%, 06/28/2027 | COP | 182,000,000 | 126,026 | |||||||||
| 4,104,120 | ||||||||||||
Hungary - 2.50% | ||||||||||||
Hungarian Government | ||||||||||||
7.500%, 10/24/2013 | HUF | 56,000,000 | 256,845 | |||||||||
8.000%, 02/12/2015 | HUF | 812,850,000 | 3,727,538 | |||||||||
| 3,984,383 | ||||||||||||
Malaysia - 4.52% | ||||||||||||
Malaysian Government | ||||||||||||
3.835%, 08/12/2015 | MYR | 2,895,000 | 934,991 | |||||||||
4.012%, 09/15/2017 | MYR | 18,810,000 | 6,077,991 | |||||||||
4.378%, 11/29/2019 | MYR | 580,000 | 190,983 | |||||||||
| 7,203,965 | ||||||||||||
Mexico - 11.11% | ||||||||||||
Mexican Bonos | ||||||||||||
7.750%, 12/14/2017 | MXN | 11,170,000 | 963,244 | |||||||||
8.000%, 06/11/2020 | MXN | 119,110,000 | 10,323,668 | |||||||||
8.500%, 05/31/2029 | MXN | 19,120,000 | 1,689,197 | |||||||||
Mexican Udibonos | ||||||||||||
5.000%, 06/16/2016 | MXN | 35,722,461 | 3,427,372 | |||||||||
3.500%, 12/14/2017 | MXN | 3,391,799 | 301,187 | |||||||||
4.000%, 06/13/2019 | MXN | 10,925,371 | 1,005,614 | |||||||||
| 17,710,282 | ||||||||||||
Peru - 0.43% | ||||||||||||
Republic of Peru | ||||||||||||
6.950%, 08/12/2031(1) | PEN | 1,910,000 | 690,713 | |||||||||
See Notes to Financial Statements.
50 | www.shiplp.com |
Table of Contents
| Stone Harbor Local Markets Fund | Statements of Investments | |
November 30, 2010 (Unaudited) |
Interest Rate/Maturity Date | Currency | Principal | Market Value (Expressed in U.S. $) | |||||||||
Poland - 7.89% | ||||||||||||
Republic of Poland | ||||||||||||
5.500%, 04/25/2015 | PLN | $ | 24,845,000 | $ | 8,039,455 | |||||||
3.000%, 08/24/2016 | PLN | 11,189,459 | 3,669,264 | |||||||||
5.500%, 10/25/2019 | PLN | 2,755,000 | 862,603 | |||||||||
| 12,571,322 | ||||||||||||
South Africa - 4.75% | ||||||||||||
Republic of South Africa | ||||||||||||
2.500%, 01/31/2017 | ZAR | 6,605,650 | 928,602 | |||||||||
8.250%, 09/15/2017 | ZAR | 4,225,000 | 599,625 | |||||||||
8.000%, 12/21/2018 | ZAR | 23,230,000 | 3,227,142 | |||||||||
6.750%, 03/31/2021 | ZAR | 22,380,000 | 2,814,161 | |||||||||
| 7,569,530 | ||||||||||||
Thailand - 3.67% | ||||||||||||
Thailand Government | ||||||||||||
3.625%, 05/22/2015 | THB | 99,050,000 | 3,369,659 | |||||||||
3.125%, 12/11/2015 | THB | 69,600,000 | 2,317,301 | |||||||||
3.875%, 06/13/2019 | THB | 4,775,000 | 163,343 | |||||||||
| 5,850,303 | ||||||||||||
Turkey - 4.72% | ||||||||||||
Republic of Turkey | ||||||||||||
10.000%, 02/15/2012 | TRY | 9,109,580 | 6,766,009 | |||||||||
0.000%, 08/08/2012(2) | TRY | 1,300,000 | 761,329 | |||||||||
| 7,527,338 | ||||||||||||
Venezuela - 0.77% | ||||||||||||
Republic of Venezuela | ||||||||||||
12.750%, 08/23/2022 | 1,400,000 | 1,153,250 | ||||||||||
9.000%, 05/07/2023(1) | 115,000 | 72,594 | ||||||||||
| 1,225,844 | ||||||||||||
TOTAL SOVEREIGN DEBT OBLIGATIONS | 80,998,074 | |||||||||||
(Amortized Cost $82,189,339) | ||||||||||||
See Notes to Financial Statements.
Semi-Annual Report (Unaudited) | November 30, 2010 | 51 |
Table of Contents
| Stone Harbor Local Markets Fund | Statements of Investments | |
November 30, 2010 (Unaudited) |
Interest Rate/Maturity Date | Currency | Principal | Market Value (Expressed in U.S. $) | |||||||
CORPORATE BONDS - 7.90% | ||||||||||
European Union - 7.66% | ||||||||||
Asian Development Bank | ||||||||||
6.500%, 09/15/2015 | ZAR | $4,650,000 | $610,428 | |||||||
European Bank for Reconstruction & Development | ||||||||||
9.250%, 09/10/2012 | BRL | 2,500,000 | 1,471,816 | |||||||
7.300%, 05/23/2013 | MXN | 8,500,000 | 709,317 | |||||||
European Investment Bank | ||||||||||
6.250%, 03/11/2013 | RUB | 57,000,000 | 1,825,207 | |||||||
8.000%, 10/21/2013 | ZAR | 12,510,000 | 1,829,055 | |||||||
6.500%, 12/15/2015 | RUB | 42,000,000 | 1,312,463 | |||||||
9.000%, 12/21/2018 | ZAR | 10,000,000 | 1,468,996 | |||||||
International Bank for Reconstruction & Development | ||||||||||
10.000%, 04/05/2012 | RUB | 39,350,000 | 1,323,185 | |||||||
0.000%, 05/14/2012(2) | ZAR | 6,500,000 | 834,925 | |||||||
6.000%, 11/29/2012 | RUB | 21,500,000 | 679,525 | |||||||
7.500%, 03/02/2017 | RUB | 4,500,000 | 149,419 | |||||||
| 12,214,336 | ||||||||||
Venezuela - 0.24% | ||||||||||
Petroleos de Venezuela SA | ||||||||||
4.900%, 10/28/2014 | 620,000 | 374,325 | ||||||||
TOTAL CORPORATE BONDS | 12,588,661 | |||||||||
(Amortized Cost $12,680,064) | ||||||||||
CREDIT LINKED NOTES - 20.77% | ||||||||||
Brazil - 5.05% | ||||||||||
Nota Do Tesouro Nacional | ||||||||||
10.000%, 01/01/2014(3)(4) | BRL | 5,100,000 | 2,796,285 | |||||||
10.000%, 01/01/2021(3)(5) | BRL | 1,100,000 | 557,057 | |||||||
10.000%, 01/01/2021(3)(5) | BRL | 2,600,000 | 1,316,680 | |||||||
10.000%, 01/01/2021(3)(6) | BRL | 3,000,000 | 1,520,180 | |||||||
10.000%, 01/01/2021(3)(4) | BRL | 3,700,000 | 1,856,042 | |||||||
| 8,046,244 | ||||||||||
See Notes to Financial Statements.
52 | www.shiplp.com |
Table of Contents
| Stone Harbor Local Markets Fund | Statements of Investments | |
November 30, 2010 (Unaudited) |
Interest Rate/Maturity Date | Currency | Principal Amount * | Market Value (Expressed in U.S. $) | |||||||
Colombia - 2.85% | ||||||||||
Colombia CGM | ||||||||||
11.000%, 07/24/2020(3)(5) | COP | $300,000,000 | $188,909 | |||||||
11.000%, 07/24/2020(3)(5) | COP | 550,000,000 | 346,333 | |||||||
11.000%, 07/24/2020(3)(5) | COP | 983,000,000 | 618,992 | |||||||
10.000%, 07/24/2024(3)(5) | COP | 185,000,000 | 110,524 | |||||||
10.000%, 07/24/2024(3)(5) | COP | 903,000,000 | 539,476 | |||||||
11.000%, 07/24/2024(3)(5) | COP | 1,850,000,000 | 1,164,938 | |||||||
Colombia Tes | ||||||||||
11.000%, 07/24/2020(3)(5) | COP | 1,000,000,000 | 629,696 | |||||||
11.000%, 07/24/2020(3)(5) | COP | 1,500,000,000 | 944,545 | |||||||
| 4,543,413 | ||||||||||
Indonesia - 11.73% | ||||||||||
Republic of Indonesia | ||||||||||
9.500%, 06/15/2015(3)(4) | IDR | 4,400,000,000 | 541,063 | |||||||
9.500%, 06/15/2015(3)(7) | IDR | 7,500,000,000 | 928,492 | |||||||
9.500%, 06/15/2015(3)(6) | IDR | 8,500,000,000 | 1,048,528 | |||||||
9.500%, 06/15/2015(3)(8) | IDR | 18,500,000,000 | 2,381,880 | |||||||
10.000%, 07/15/2017(3)(9) | IDR | 12,000,000,000 | 1,514,279 | |||||||
11.500%, 09/15/2019(3)(4) | IDR | 13,254,000,000 | 1,829,504 | |||||||
12.800%, 06/15/2021(3)(8) | IDR | 5,800,000,000 | 931,332 | |||||||
12.800%, 06/15/2021(3)(7) | IDR | 5,800,000,000 | 875,072 | |||||||
12.800%, 06/15/2021(3)(7) | IDR | 8,000,000,000 | 1,206,996 | |||||||
12.800%, 06/15/2021(3)(7) | IDR | 8,300,000,000 | 1,252,258 | |||||||
12.800%, 06/15/2021(3)(6) | IDR | 19,800,000,000 | 2,957,726 | |||||||
12.800%, 06/15/2021(3)(8) | IDR | 19,800,000,000 | 3,231,428 | |||||||
| 18,698,558 | ||||||||||
Russia - 1.14% | ||||||||||
Russian Federation | ||||||||||
10.550%, 07/06/2011(3)(4) | RUB | 6,000,000 | 196,902 | |||||||
10.550%, 07/06/2011(3)(6) | RUB | 27,800,000 | 910,992 | |||||||
6.100%, 07/11/2012(3)(8) | RUB | 22,400,000 | 710,598 | |||||||
| 1,818,492 | ||||||||||
TOTAL CREDIT LINKED NOTES | 33,106,707 | |||||||||
(Amortized Cost $34,210,851) | ||||||||||
See Notes to Financial Statements.
Semi-Annual Report (Unaudited) | November 30, 2010 | 53 |
Table of Contents
| Stone Harbor Local Markets Fund | Statements of Investments | |
November 30, 2010 (Unaudited) |
| Shares | Market Value (Expressed in U.S. $) | |||||||
| MONEY MARKET MUTUAL FUNDS - 21.25% | ||||||||
Dreyfus Cash Advantage Plus Fund | ||||||||
(0.100% 7-Day Yield) | 33,875,658 | $33,875,658 | ||||||
TOTAL MONEY MARKET MUTUAL FUNDS (Cost $33,875,658) | 33,875,658 | |||||||
Total Investments - 100.73% (Cost $162,955,912) | $160,569,100 | |||||||
Liabilities in Excess of Other Assets - (0.73)% | (1,155,773 | ) | ||||||
Net Assets - 100.00% | $159,413,327 | |||||||
| * | The principal/contract amount of each security is stated in the currency in which the bond is denominated (U.S. Dollar unless otherwise notated). See below. |
| BRL | Brazilian Real | |
| CNY | Chinese Yuan | |
| COP | Colombian Peso | |
| HUF | Hungarian Forint | |
| IDR | Indonesian Rupiah | |
| INR | Indian Rupee | |
| MXN | Mexican Peso | |
| MYR | Malaysian Ringgit | |
| PEN | Peruvian Nuevo | |
| PHP | Philippine Peso | |
| PLN | Polish Zloty | |
| RUB | Russian Ruble | |
| THB | Thai Baht | |
| TRY | Turkish Lira | |
| ZAR | South African Rand |
| (1) | Securities were purchased pursuant to Regulation S under the Securities Act of 1933, which exempts securities offered and sold outside of the United States from registration. Such securities cannot be sold in the United States without either an effective registration statement filed pursuant to the Securities Act of 1933, or pursuant to an exemption from registration. These securities have been deemed liquid under procedures approved by the Fund’s Board of Trustees. As of November 30, 2010, the aggregate market value of those securities was $4,275,453, representing 2.68% of net assets. |
| (2) | These securities are issued with a zero coupon or interest rate. |
| (3) | This security has been valued at its fair value determined in good faith pursuant to procedures approved by the Board of Trustees. Total market value of fair valued securities amounts to $33,106,707, which represents approximately 20.77% of net assets as of November 30, 2010. |
| (4) | The underlying security is issued by JP Morgan Chase. |
| (5) | The underlying security is issued by Citigroup Global Markets. |
| (6) | The underlying security is issued by Barclays Bank PLC. |
See Notes to Financial Statements.
54 | www.shiplp.com |
Table of Contents
| Stone Harbor Local Markets Fund | Statements of Investments | |
November 30, 2010 (Unaudited) |
| (7) | The underlying security is issued by HSBC Bank. |
| (8) | The underlying security is issued by Deutsche Bank AG London. |
| (9) | The underlying security is issued by Credit Suisse First Boston. |
Common Abbreviations:
CGM - Citigroup Global Markets
SA - Generally designates corporations in various countries mostly employing civil law.
OUTSTANDING FORWARD FOREIGN CURRENCY CONTRACTS
Contract Description | Contracted Amount | Purchase/Sale Contract | Expiration Date | Value On Settlement Date | Current Value | Unrealized | ||||||||||||||
BRL | 8,114,000 (BRL) | Purchase | 12/02/2010 | $4,728,163 | $4,730,368 | $2,205 | ||||||||||||||
BRL | 8,114,000 (BRL) | Sale | 12/02/2010 | 4,755,319 | 4,730,368 | 24,951 | ||||||||||||||
CNY | 2,031,000 (CNY) | Purchase | 08/09/2011 | 303,974 | 306,242 | 2,268 | ||||||||||||||
CNY | 2,025,900 (CNY) | Purchase | 12/16/2010 | 300,000 | 303,819 | 3,819 | ||||||||||||||
CNY | 1,336,000 (CNY) | Purchase | 08/09/2011 | 200,000 | 201,448 | 1,448 | ||||||||||||||
INR | 11,354,400 (INR) | Purchase | 12/27/2010 | 240,000 | 246,210 | 6,210 | ||||||||||||||
INR | 4,968,600 (INR) | Purchase | 12/27/2010 | 105,000 | 107,740 | 2,740 | ||||||||||||||
MYR | 4,897,500 (MYR) | Purchase | 07/05/2011 | 1,500,000 | 1,525,989 | 25,989 | ||||||||||||||
MYR | 3,864,000 (MYR) | Purchase | 07/05/2011 | 1,200,000 | 1,203,966 | 3,966 | ||||||||||||||
PHP | 3,300,500 (PHP) | Purchase | 01/24/2011 | 70,000 | 74,924 | 4,924 | ||||||||||||||
PHP | 15,582,000 (PHP) | Purchase | 01/24/2011 | 350,000 | 353,724 | 3,724 | ||||||||||||||
ZAR | 5,729,200 (ZAR) | Purchase | 12/24/2010 | 800,000 | 804,528 | 4,528 | ||||||||||||||
| $86,772 | ||||||||||||||||||||
CNY | 6,519,500 (CNY) | Purchase | 08/09/2011 | $1,000,000 | $983,037 | $(16,963) | ||||||||||||||
CNY | 1,423,515 (CNY) | Purchase | 08/09/2011 | 215,000 | 214,643 | (357) | ||||||||||||||
CNY | 1,251,910 (CNY) | Purchase | 08/09/2011 | 190,000 | 188,768 | (1,232) | ||||||||||||||
CNY | 2,630,000 (CNY) | Purchase | 08/09/2011 | 400,000 | 396,562 | (3,438) | ||||||||||||||
CNY | 2,025,900 (CNY) | Sale | 12/16/2010 | 300,022 | 303,818 | (3,796) | ||||||||||||||
CNY | 2,331,000 (CNY) | Purchase | 08/09/2011 | 360,000 | 351,478 | (8,522) | ||||||||||||||
CNY | 6,487,000 (CNY) | Purchase | 08/09/2011 | 1,000,000 | 978,136 | (21,864) | ||||||||||||||
CNY | 785,400 (CNY) | Purchase | 08/09/2011 | 120,000 | 118,426 | (1,574) | ||||||||||||||
INR | 30,348,400 (INR) | Purchase | 12/27/2010 | 680,000 | 658,078 | (21,922) | ||||||||||||||
MYR | 3,127,500 (MYR) | Purchase | 07/05/2011 | 1,000,000 | 974,483 | (25,517) | ||||||||||||||
MYR | 18,693,000 (MYR) | Purchase | 12/24/2010 | 6,000,000 | 5,892,272 | (107,728) | ||||||||||||||
MYR | 881,100 (MYR) | Purchase | 07/05/2011 | 275,000 | 274,538 | (462) | ||||||||||||||
MYR | 2,600,000 (MYR) | Purchase | 07/05/2011 | 816,839 | 810,122 | (6,717) | ||||||||||||||
PHP | 10,562,400 (PHP) | Purchase | 01/24/2011 | 240,000 | 239,775 | (225) | ||||||||||||||
PLN | 2,806,200 (PLN) | Purchase | 12/17/2010 | 972,012 | 903,890 | (68,122) | ||||||||||||||
THB | 35,047,350 (THB) | Purchase | 01/19/2011 | 1,170,000 | 1,158,574 | (11,426) | ||||||||||||||
THB | 30,240,000 (THB) | Purchase | 01/19/2011 | 1,000,000 | 999,656 | (344) | ||||||||||||||
THB | 47,408,000 (THB) | Purchase | 01/19/2011 | 1,600,000 | 1,567,185 | (32,815) | ||||||||||||||
ZAR | 21,819,350 (ZAR) | Purchase | 12/24/2010 | 3,100,000 | 3,064,003 | (35,997) | ||||||||||||||
| $(369,021) | ||||||||||||||||||||
See Notes to Financial Statements.
Semi-Annual Report (Unaudited) | November 30, 2010 | 55 |
Table of Contents
| Stone Harbor Investment Funds | ||
| Stone Harbor | Stone Harbor | |||||||
| Emerging Markets | High Yield | |||||||
| Debt Fund | Bond Fund | |||||||
ASSETS: | ||||||||
Investments , at value(1) | $ | 316,251,942 | $ | 429,455,532 | ||||
Cash | 478,146 | 67,992 | ||||||
Foreign currency, at value (Cost $47,021, $0 and $74,541, respectively) | 47,196 | – | ||||||
Unrealized appreciation on forward foreign currency contracts | 462,791 | 11,776 | ||||||
Receivable for investments sold | – | 887,080 | ||||||
Receivable for fund shares sold | 2,400,000 | 95,007 | ||||||
Interest receivable | 5,249,934 | 8,875,844 | ||||||
Dividends receivable | – | 10,891 | ||||||
Prepaid offering costs | – | – | ||||||
Prepaid and other assets | 25,700 | 27,658 | ||||||
Total Assets | 324,915,709 | 439,431,780 | ||||||
LIABILITIES: | ||||||||
Payable for investments purchased | 2,211,974 | 2,122,744 | ||||||
Payable for fund shares redeemed | – | 230,000 | ||||||
Unrealized depreciation on forward foreign currency contracts | 40,231 | – | ||||||
Payable to advisor | 126,160 | 143,382 | ||||||
Payable to administrator | 20,614 | 29,315 | ||||||
Payable for trustee fees | 7,443 | 7,443 | ||||||
Other payables | 61,685 | 50,237 | ||||||
Total Liabilities | 2,468,107 | 2,583,121 | ||||||
Net Assets | $ | 322,447,602 | $ | 436,848,659 | ||||
NET ASSETS CONSIST OF: | ||||||||
Paid-in capital | $ | 301,076,302 | $ | 406,705,632 | ||||
Undistributed/(overdistributed) net investment income | (527,260 | ) | 87,366 | |||||
Accumulated net realized gain on investments and translation of assets and liabilities denominated in foreign currency | 11,042,490 | 8,204,584 | ||||||
Net unrealized appreciation/(depreciation) on investments and translation of assets and liabilities denominated in foreign currency | 10,856,070 | 21,851,077 | ||||||
Net Assets | $ | 322,447,602 | $ | 436,848,659 | ||||
PRICING OF SHARES: | ||||||||
Institutional Class Shares | ||||||||
Net Assets | $ | 322,447,602 | $ | 436,848,659 | ||||
Shares of beneficial interest outstanding (unlimited number of shares, par value of $0.001 per share authorized) | 28,675,858 | 44,654,809 | ||||||
Net assets value, offering and redemption price per share | $ | 11.24 | $ | 9.78 | ||||
(1)Cost of Investments | $ | 305,789,354 | $ | 407,616,231 | ||||
See Notes to Financial Statements.
56 | www.shiplp.com |
Table of Contents
| Statements of Assets & Liabilities | ||
November 30, 2010 (Unaudited) |
|
| Stone Harbor Local Markets Fund |
|
| $ | 160,569,100 | |
| 2,653,782 | ||
| 74,696 | ||
| 86,772 | ||
| 2,729,662 | ||
| 678,660 | ||
| 3,946,772 | ||
| – | ||
| 1,360 | ||
| 33,450 | ||
| 170,774,254 | ||
| 10,837,946 | ||
| – | ||
| 369,021 | ||
| 83,539 | ||
| 10,108 | ||
| 6,823 | ||
| 53,490 | ||
| 11,360,927 | ||
| $ | 159,413,327 | |
| $ | 161,190,748 | |
| (173,475) | ||
| 1,096,941 | ||
| (2,700,887) | ||
| $ | 159,413,327 | |
| $ | 159,413,327 | |
| 15,021,198 | ||
| $ | 10.61 | |
| $ | 162,955,912 | |
See Notes to Financial Statements.
Semi-Annual Report (Unaudited) | November 30, 2010 | 57 |
Table of Contents
| Stone Harbor Investment Funds | ||
| Stone Harbor Emerging Markets Debt Fund | Stone Harbor High Yield Bond Fund | |||||||
INVESTMENT INCOME: | ||||||||
Interest (net of foreign withholding tax of $0, $0 and $15,807, respectively) | $ | 8,825,590 | $ | 17,330,412 | ||||
Dividends | – | 35,906 | ||||||
Other Income | – | 224,278 | ||||||
Total Investment Income | 8,825,590 | 17,590,596 | ||||||
EXPENSES: | ||||||||
Investment advisory fee | 774,622 | 1,047,796 | ||||||
Administration fee | 103,301 | 169,994 | ||||||
Custodian fees | 35,095 | 14,326 | ||||||
Audit fees | 33,876 | 33,876 | ||||||
Printing fees | 2,734 | 2,734 | ||||||
Legal fees | 34,244 | 34,244 | ||||||
Trustee fee | 12,646 | 12,646 | ||||||
Transfer agent fees | 17,224 | 14,283 | ||||||
Registration fees | 24,151 | 8,478 | ||||||
Insurance fees | 7,495 | 27,236 | ||||||
Other | 1,278 | 1,947 | ||||||
Total expenses before waiver | 1,046,666 | 1,367,560 | ||||||
Less fees waived by investment advisor | (78,388) | (214,988) | ||||||
Total Net Expenses | 968,278 | 1,152,572 | ||||||
Net Investment Income | 7,857,312 | 16,438,024 | ||||||
REALIZED AND UNREALIZED GAIN/(LOSS) ON INVESTMENTS: | ||||||||
Net realized gain/(loss) on: | ||||||||
Investments | 5,326,250 | 6,734,862 | ||||||
Foreign currency transactions | 1,181,011 | (10,112) | ||||||
Net realized gain | 6,507,261 | 6,724,750 | ||||||
Change in unrealized appreciation/(depreciation) on: | ||||||||
Investments | 4,737,282 | 10,766,186 | ||||||
Translation of assets and liabilities denominated in foreign currencies | 417,727 | 11,776 | ||||||
Net change | 5,155,009 | 10,777,962 | ||||||
Net Realized and Unrealized Gain/(Loss) on Investments | 11,662,270 | 17,502,712 | ||||||
Net Increase/(Decrease) in Net Assets Resulting from Operations | $ | 19,519,582 | $ | 33,940,736 | ||||
| (1) | For the period June 30, 2010 (Inception) to November 30, 2010. |
See Notes to Financial Statements.
58 | www.shiplp.com |
Table of Contents
| Statements of Operations | ||
For the Six Months Ended November 30, 2010 (Unaudited) |
| Stone Harbor Local Markets Fund (1) | ||
| $ | 1,885,501 | |
| – | ||
| – | ||
| 1,885,501 | ||
| 248,158 | ||
| 26,462 | ||
| 24,751 | ||
| 30,661 | ||
| 2,788 | ||
| 19,711 | ||
| 13,270 | ||
| 11,637 | ||
| 5,908 | ||
| 151 | ||
| 1,039 | ||
| 384,536 | ||
| (53,656) | ||
| 330,880 | ||
| 1,554,621 | ||
| 880,291 | ||
| 216,650 | ||
| 1,096,941 | ||
|
(2,386,812) |
|
| (314,075) | ||
| (2,700,887) | ||
| (1,603,946) | ||
$ |
(49,325) |
|
See Notes to Financial Statements.
Semi-Annual Report (Unaudited) | November 30, 2010 | 59 |
Table of Contents
Markets Debt Fund | Statements of Changes in Net Assets | |
| For the Six Months Ended November 30, 2010 (Unaudited) | For the Year Ended May 31, 2010 | |||||||
OPERATIONS: | ||||||||
Net investment income | $ | 7,857,312 | $ | 7,972,731 | ||||
Net realized gain on investments | 6,507,261 | 11,619,476 | ||||||
Net change in unrealized appreciation on investments and foreign currency translations | 5,155,009 | 1,889,753 | ||||||
Net increase in net assets resulting from operations | 19,519,582 | 21,481,960 | ||||||
DISTRIBUTIONS TO SHAREHOLDERS: | ||||||||
From net investment income | (8,663,185 | ) | (8,618,487) | |||||
From net realized gains on investments | – | (1,703,347) | ||||||
Net decrease in net assets from distributions to shareholders | (8,663,185 | ) | (10,321,834) | |||||
CAPITAL SHARE TRANSACTIONS: | ||||||||
Institutional Class Shares | ||||||||
Proceeds from sale of shares | 185,057,982 | 120,511,062 | ||||||
Issued to shareholders in reinvestment of distributions | 8,171,502 | 9,893,837 | ||||||
Cost of shares redeemed | (59,664,309 | ) | (55,291,995) | |||||
Net increase in net assets from capital share transactions | 133,565,175 | 75,112,904 | ||||||
Net Increase in Net Assets | 144,421,572 | 86,273,030 | ||||||
NET ASSETS: | ||||||||
Beginning of period | 178,026,030 | 91,753,000 | ||||||
End of period (including undistributed/(overdistributed) net investment income of $(527,260) and $278,613, respectively) | $ | 322,447,602 | $ | 178,026,030 | ||||
OTHER INFORMATION: | ||||||||
Share Transactions: | ||||||||
Institutional Class Shares | ||||||||
Beginning shares | 16,992,367 | 9,952,470 | ||||||
Shares sold | 16,140,488 | 11,360,440 | ||||||
Shares reinvested | 717,428 | 955,219 | ||||||
Shares redeemed | (5,174,425 | ) | (5,275,762) | |||||
Shares outstanding - end of period | 28,675,858 | 16,992,367 | ||||||
See Notes to Financial Statements.
60 | www.shiplp.com |
Table of Contents
High Yield Bond Fund | Statements of Changes in Net Assets | |
For the Six Months Ended November 30, 2010 (Unaudited) | For the Year Ended May 31, 2010 | |||||
OPERATIONS: | ||||||
Net investment income | $ | 16,438,024 | $ 28,652,485 | |||
Net realized gain on investments | 6,724,750 | 5,807,602 | ||||
Net change in unrealized appreciation on investments and foreign currency translations | 10,777,962 | 25,039,605 | ||||
Net increase in net assets resulting from operations | 33,940,736 | 59,499,692 | ||||
DISTRIBUTIONS TO SHAREHOLDERS: | ||||||
From net investment income | (16,255,523) | (28,484,852) | ||||
Net decrease in net assets from distributions to shareholders | (16,255,523) | (28,484,852) | ||||
CAPITAL SHARE TRANSACTIONS: | ||||||
Institutional Class Shares | ||||||
Proceeds from sale of shares | 34,577,185 | 168,548,608 | ||||
Issued to shareholders in reinvestment of distributions | 7,496,229 | 26,880,125 | ||||
Cost of shares redeemed | (30,874,428) | (41,688,947) | ||||
Net increase in net assets from capital share transactions | 11,198,986 | 153,739,786 | ||||
Net Increase in Net Assets | 28,884,199 | 184,754,626 | ||||
NET ASSETS: | ||||||
Beginning of period | 407,964,460 | 223,209,834 | ||||
End of period (including undistributed/(overdistributed) net investment income of $87,366 and $(95,135), respectively) | $ | 436,848,659 | $ 407,964,460 | |||
OTHER INFORMATION: | ||||||
Share Transactions: | ||||||
Institutional Class Shares | ||||||
Beginning shares | 43,581,412 | 26,613,415 | ||||
Shares sold | 3,511,906 | 18,456,848 | ||||
Shares reinvested | 780,045 | 2,893,977 | ||||
Shares redeemed | (3,218,554) | (4,382,828) | ||||
Shares outstanding - end of period | 44,654,809 | 43,581,412 | ||||
See Notes to Financial Statements.
Semi-Annual Report (Unaudited) | November 30, 2010 | 61 |
Table of Contents
Stone Harbor | Statements of Changes in Net Assets |
For the Period June 30, 2010 (Inception) to November 30, 2010 (Unaudited) | ||||
OPERATIONS: | ||||
Net investment income | $ | 1,554,621 | ||
Net realized gain on investments | 1,096,941 | |||
Net change in unrealized depreciation on investments and foreign currency translations | (2,700,887) | |||
Net decrease in net assets resulting from operations | (49,325) | |||
DISTRIBUTIONS TO SHAREHOLDERS: | ||||
From net investment income | (1,728,096) | |||
Net decrease in net assets from distributions to shareholders | (1,728,096) | |||
CAPITAL SHARE TRANSACTIONS: | ||||
Institutional Class Shares | ||||
Proceeds from sale of shares | 160,315,898 | |||
Issued to shareholders in reinvestment of distributions | 1,720,049 | |||
Cost of shares redeemed | (845,199) | |||
Net increase in net assets from capital share transactions | 161,190,748 | |||
Net Increase in Net Assets | 159,413,327 | |||
NET ASSETS: | ||||
Beginning of period | – | |||
End of period (including overdistributed net investment income of $(173,475), respectively) | $ | 159,413,327 | ||
OTHER INFORMATION: | ||||
Share Transactions: | ||||
Institutional Class Shares | ||||
Beginning shares | – | |||
Shares sold | 14,937,883 | |||
Shares reinvested | 160,394 | |||
Shares redeemed | (77,079) | |||
Shares outstanding - end of period | 15,021,198 | |||
See Notes to Financial Statements.
62 | www.shiplp.com |
Table of Contents
Intentionally Left Blank
Table of Contents
| Stone Harbor Emerging Markets Debt Fund | ||
| For a share outstanding through the periods presented |
The financial highlights table is intended to help you understand each Fund’s financial performance for the six-months ended November 30, 2010 and the most recent preceding fiscal years. Certain information reflects financial results for a single Fund share. The total returns in the table represent the rate that an investor would have earned (or lost) on an investment in a Fund (assuming reinvestment of all dividends and distributions).
| Institutional Class Shares |
Net asset value - beginning of period |
Income/(loss) from investment operations: |
Net investment income |
Net realized and unrealized gain/(loss) on investments |
Total income/(loss) from investment operations |
Less distributions to common shareholders: |
From net investment income |
From net realized gain on investments |
From tax return of capital |
Total distributions |
Net Increase/(Decrease) in Net Asset Value |
Net asset value - end of period |
Total Return(2)(3)
Ratios/Supplemental Data:
Net assets, end of period (in thousands)
Ratio of expenses to average net assets with fee waivers/reimbursements
Ratio of expenses to average net assets without fee waivers/reimbursements
Ratio of net investment income to average net assets with fee waivers/reimbursements
Portfolio turnover rate
| * | The amount shown for a share outstanding throughout the period may not correlate with the Statement of Operations for the period due to the timing of sales and repurchase of the Fund Shares in relation to income earned and/or fluctuating market value of the investment of the Fund. |
| ** | Annualized. |
| (1) | Less than $(0.005) per share. |
| (2) | Total returns would have been lower had various fees and expenses not been waived and reimbursed during the period. |
| (3) | Total returns for periods of less than one year are not annualized. |
See Notes to Financial Statements.
64 | www.shiplp.com |
Table of Contents
| Financial Highlights* | ||
For the Six Months Ended November 30, 2010 (Unaudited) | For the Year Ended May 31, 2010 | For the Year Ended May 31, 2009 | For the Period August 16, 2007 (Inception) to May 31, 2008 | |||||||||||
| $ | 10.48 | $ | 9.22 | $ | 10.34 | $ | 10.00 | |||||||
| 0.29 | 0.75 | 0.59 | 0.46 | |||||||||||
| 0.80 | 1.44 | (1.18) | 0.58 | |||||||||||
| 1.09 | 2.19 | (0.59) | 1.04 | |||||||||||
| (0.33) | (0.79) | (0.53) | (0.54) | |||||||||||
| – | (0.14) | – | (0.16) | |||||||||||
| – | – | – | (0.00)(1) | |||||||||||
| (0.33) | (0.93) | (0.53) | (0.70) | |||||||||||
| 0.76 | 1.26 | (1.12) | 0.34 | |||||||||||
| $ | 11.24 | $ | 10.48 | $ | 9.22 | $ | 10.34 | |||||||
| 10.38% | 24.25% | (5.10)% | 10.46% | |||||||||||
| $ | 322,448 | $ | 178,026 | $ | 91,753 | $ | 19,587 | |||||||
| 0.75% | ** | 0.75% | 0.75% | 0.75%** | ||||||||||
| 0.81% | ** | 0.91% | 1.33% | 2.27%** | ||||||||||
| 6.09% | ** | 6.80% | 9.32% | 5.91%** | ||||||||||
| 48% | 125% | 84% | 143% | |||||||||||
See Notes to Financial Statements.
Semi-Annual Report (Unaudited) | November 30, 2010 | 65 |
Table of Contents
| Stone Harbor High Yield Bond Fund | ||
For a share outstanding through the period presented |
The financial highlights table is intended to help you understand each Fund’s financial performance for the six-months ended November 30, 2010 and the most recent preceding fiscal years. Certain information reflects financial results for a single Fund share. The total returns in the table represent the rate that an investor would have earned (or lost) on an investment in a Fund (assuming reinvestment of all dividends and distributions).
| Institutional Class Shares |
Net asset value - beginning of period |
Income/(loss) from investment operations: |
Net investment income |
Net realized and unrealized gain/(loss) on investments |
Total income/(loss) from investment operations |
Less distributions to common shareholders: |
From net investment income |
From net realized gain on investments |
From tax return of capital |
Total distributions |
| Net Increase/(Decrease) in Net Asset Value |
| Net asset value - end of period |
Total Return(2)(3)
Ratios/Supplemental Data:
Net assets, end of period (in thousands)
Ratio of expenses to average net assets with fee waivers/reimbursements
Ratio of expenses to average net assets without fee waivers/reimbursements
Ratio of net investment income to average net assets with fee waivers/reimbursements
Portfolio turnover rate
| * | The amount shown for a share outstanding throughout the period may not correlate with the Statement of Operations for the period due to the timing of sales and repurchase of the Fund Shares in relation to income earned and/or fluctuating market value of the investment of the Fund. |
| ** | Annualized. |
| (1) | Less than $(0.005) per share. |
| (2) | Total returns would have been lower had various fees and expenses not been waived and reimbursed during the period. |
| (3) | Total returns for periods of less than one year are not annualized. |
See Notes to Financial Statements.
66 | www.shiplp.com |
Table of Contents
| Financial Highlights* | ||
For the Six Months Ended November 30, 2010 (Unaudited) | For the Year Ended May 31, 2010 | For the Year Ended May 31, 2009 | For the Period August 16, 2007 (Inception) to May 31, 2008 | |||||||||||
| $ | 9.36 | $ | 8.39 | $ | 9.92 | $ | 10.00 | |||||||
| 0.38 | 0.73 | 0.70 | 0.58 | |||||||||||
| 0.42 | 0.96 | (1.53) | (0.08) | |||||||||||
| 0.80 | 1.69 | (0.83) | 0.50 | |||||||||||
| (0.38) | (0.72) | (0.70) | (0.57) | |||||||||||
| – | – | – | (0.01) | |||||||||||
| – | – | – | (0.00)( | 1) | ||||||||||
| (0.38) | (0.72) | (0.70) | (0.58) | |||||||||||
| 0.42 | 0.97 | (1.53) | (0.08) | |||||||||||
| $ | 9.78 | $ | 9.36 | $ | 8.39 | $ | 9.92 | |||||||
| 8.62 | % | 20.53 | % | (7.77) | % | 5.09 | % | |||||||
| $ | 436,849 | $ | 407,964 | $ | 223,210 | $ | 106,912 | |||||||
| 0.55% | ** | 0.55 | % | 0.55 | % | 0.55% | ** | |||||||
| 0.65% | ** | 0.67 | % | 0.88 | % | 1.21% | ** | |||||||
| 7.84% | ** | 8.13 | % | 9.07 | % | 7.81% | ** | |||||||
| 27 | % | 36 | % | 16 | % | 11 | % | |||||||
See Notes to Financial Statements.
Semi-Annual Report (Unaudited) | November 30, 2010 | 67 |
Table of Contents
| Stone Harbor Local Markets Fund | Financial Highlights* | |
| For a share outstanding through the period presented |
The financial highlights table is intended to help you understand each Fund’s financial performance for the six-months ended November 30, 2010 and the most recent preceding fiscal years. Certain information reflects financial results for a single Fund share. The total returns in the table represent the rate that an investor would have earned (or lost) on an investment in a Fund (assuming reinvestment of all dividends and distributions).
| Institutional Class Shares | For the Period June 30, 2010 (Inception) to November 30, 2010 (Unaudited) | |||
Net asset value - beginning of period | $ | 10.00 | ||
Income from investment operations: | ||||
Net investment income | 0.15 | |||
Net realized and unrealized gain on investments | 0.62 | |||
Total income from investment operations | 0.77 | |||
Less distributions to common shareholders: | ||||
From net investment income | (0.16) | |||
Total distributions | (0.16) | |||
Net Increase in Net Asset Value | 0.61 | |||
Net asset value - end of period | $ | 10.61 | ||
Total Return(1)(2) | 7.70% | |||
Ratios/Supplemental Data: | ||||
Net assets, end of period (in thousands) | $ | 159,413 | ||
Ratio of expenses to average net assets with fee waivers/reimbursements | 1.00%** | |||
Ratio of expenses to average net assets without fee waivers/reimbursements | 1.16%** | |||
Ratio of net investment income to average net assets with fee waivers/reimbursements | 4.70%** | |||
Portfolio turnover rate | 68% | |||
| * | The amount shown for a share outstanding throughout the period may not correlate with the Statement of Operations for the period due to the timing of sales and repurchase of the Fund Shares in relation to income earned and/or fluctuating market value of the investment of the Fund. |
| ** | Annualized. |
| (1) | Total returns would have been lower had various fees and expenses not been waived and reimbursed during the period. |
| (2) | Total returns for periods of less than one year are not annualized. |
See Notes to Financial Statements.
68 | www.shiplp.com |
Table of Contents
| Stone Harbor Investment Funds | Notes to Financial Statements | |
November 30, 2010 (Unaudited) |
1. ORGANIZATION AND SIGNIFICANT ACCOUNTING POLICIES
Stone Harbor Investment Funds, which consist of Stone Harbor Emerging Markets Debt Fund, Stone Harbor High Yield Bond Fund and Stone Harbor Local Markets Fund (each, a “Fund and together, the Funds”), is a Massachusetts business trust, organized on February 20, 2007 and registered under the Investment Company Act of 1940, as amended (the “1940 Act”), as an open-end management investment company. Each Fund is a non-diversified portfolio with an investment objective to maximize total return. Shares of each Fund are currently divided into two classes, designated Institutional Class Shares and Distributor Class Shares. As of the date of this report, there were no outstanding shares for the Distributor Class of each Fund. The Declaration of Trust permits the Trustees to create additional funds and share classes.
The following is a summary of significant accounting policies consistently followed by the Funds in the preparation of their financial statements. The policies are in conformity with accounting principles generally accepted in the United States of America (GAAP). The preparation of the financial statements in accordance with GAAP requires management to make estimates and assumptions that affect the reported amounts of assets and liabilities at the date of the financial statements and the reported amounts of income and expenses during the reporting period. Actual results could differ from those estimates.
(a) Investment Valuation: Debt securities, bank loans and linked notes are valued at the mean between the bid and asked prices provided by an independent pricing service that are based on transactions in debt obligations, quotations from dealers, market transactions in comparable securities and various other relationships between securities. Equity securities for which market quotations are available are valued at the last sale price or official closing price on the primary market or exchange on which they trade. Publicly traded foreign government debt securities are typically traded internationally in the over-the-counter market, and are valued at the mean between the bid and asked prices as of the close of business of that market. When prices are not readily available, or are determined not to reflect fair value, such as when the value of a security has been significantly affected by events after the close of the exchange or market on which the security is principally traded, but before the Funds calculate their net asset value, the Funds may value these investments at fair value as determined in accordance with the procedures approved by the Funds’ Board of Trustees. Short-term obligations with maturities of 60 days or less are valued at amortized cost, which approximates market value. Available cash is invested into a money market fund by the custodian.
A three-tier hierarchy has been established to measure fair value based on the extent of use of “observable inputs” as compared to “unobservable inputs” for disclosure purposes and requires additional disclosures about these valuations measurements. Inputs refer broadly to the assumptions that market participants would use in pricing a security. Observable inputs are inputs that reflect the assumptions market participants would use in pricing the security developed based on market data obtained from sources independent of the reporting entity. Unobservable inputs are inputs that reflect the reporting entity’s own assumptions about the assumptions market participants would use in pricing the security developed based on the best information available in the circumstances.
Semi-Annual Report (Unaudited) | November 30, 2010 | 69 |
Table of Contents
| Stone Harbor Investment Funds | Notes to Financial Statements | |
November 30, 2010 (Unaudited) |
The three-tier hierarchy is summarized as follows:
| Level 1 | – | Quoted and Unadjusted Prices in active markets for identical investments | ||
| Level 2 | – | Other Significant Observable Inputs (including quoted prices for similar investments, interest rates, prepayment speeds, credit risk, etc.) | ||
| Level 3 | – | Significant Unobservable Inputs (including the Fund’s own assumptions in determining the fair value of investments). | ||
The following is a summary of the inputs used as of November 30, 2010 in valuing the Funds’ assets:
Investments in Securities at Value* | Level 1 - Quoted and Unadjusted Prices | Level 2 - Other Significant Observable Inputs | Level 3 - Significant Unobservable Inputs | Total | ||||||||||||
Stone Harbor Emerging Markets Debt Fund |
| |||||||||||||||
Sovereign Debt Obligations | $ | – | $ | 218,841,650 | $ | – | $ | 218,841,650 | ||||||||
Bank Loans | – | 1,363,740 | 1,118,000 | 2,481,740 | ||||||||||||
Convertible Corporate Bonds | – | 1,399,973 | – | 1,399,973 | ||||||||||||
Corporate Bonds | – | 73,422,820 | 398,050 | 73,820,870 | ||||||||||||
Credit Linked Notes | – | 10,009,612 | – | 10,009,612 | ||||||||||||
Money Market Mutual Funds | – | 9,698,097 | – | 9,698,097 | ||||||||||||
TOTAL | $ | – | $ | 314,735,892 | $ | 1,516,050 | $ | 316,251,942 | ||||||||
Other Financial Instruments** | ||||||||||||||||
Assets | ||||||||||||||||
Forward Foreign Currency Contracts | $ | – | $ | 462,791 | $ | – | $ | 462,791 | ||||||||
Liabilities | ||||||||||||||||
Forward Foreign Currency Contracts | – | (40,231) | – | (40,231) | ||||||||||||
TOTAL | $ | – | $ | 422,560 | $ | – | $ | 422,560 | ||||||||
70 | www.shiplp.com |
Table of Contents
| Stone Harbor Investment Funds | Notes to Financial Statements | |
November 30, 2010 (Unaudited) |
Investments in Securities at Value* | Level 1 - Quoted and Unadjusted Prices | Level 2 - Other Significant Observable Inputs | Level 3 - Significant Unobservable Inputs | Total | ||||||||||||
Stone Harbor High Yield Bond Fund | ||||||||||||||||
Corporate Bonds | $ | – | $ | 395,959,470 | $ | 2,212,872 | $ | 398,172,342 | ||||||||
Convertible Corporate Bonds | – | 7,452,927 | – | 7,452,927 | ||||||||||||
Bank Loans | – | 9,670,584 | – | 9,670,584 | ||||||||||||
Common Stocks | 1,240,230 | – | – | 1,240,230 | ||||||||||||
Preferred Stocks | – | 1,511,392 | – | 1,511,392 | ||||||||||||
Rights and Warrants | – | 230,580 | – | 230,580 | ||||||||||||
Money Market Mutual Funds | – | 11,177,477 | – | 11,177,477 | ||||||||||||
TOTAL | $ | 1,240,230 | $ | 426,002,430 | $ | 2,212,872 | $ | 429,455,532 | ||||||||
Other Financial Instruments** | ||||||||||||||||
Assets | ||||||||||||||||
Forward Foreign Currency Contracts | $ | – | $ | 11,776 | $ | – | $ | 11,776 | ||||||||
TOTAL | $ | – | $ | 11,776 | $ | – | $ | 11,776 | ||||||||
Investments in Securities at Value* | Level 1 - Quoted and Unadjusted Prices | Level 2 - Other Significant Observable Inputs | Level 3 - Significant Unobservable Inputs | Total | ||||||||||||
Stone Harbor Local Markets Fund |
| |||||||||||||||
Sovereign Debt Obligations | $ | – | $ | 80,998,074 | $ | – | $ | 80,998,074 | ||||||||
Corporate Bonds | – | 12,588,661 | – | 12,588,661 | ||||||||||||
Credit Linked Notes | – | 33,106,707 | – | 33,106,707 | ||||||||||||
Money Market Mutual Funds | – | 33,875,658 | – | 33,875,658 | ||||||||||||
TOTAL | $ | – | $ | 160,569,100 | $ | – | $ | 160,569,100 | ||||||||
Other Financial Instruments** | ||||||||||||||||
Assets | ||||||||||||||||
Forward Foreign Currency Contracts | $ | – | $ | 86,772 | $ | – | $ | 86,772 | ||||||||
Liabilities | ||||||||||||||||
Forward Foreign Currency Contracts | – | (369,021) | – | (369,021) | ||||||||||||
TOTAL | $ | – | $ | (282,249) | $ | – | $ | (282,249) | ||||||||
| * | For detailed Industry/Country descriptions, see accompanying Statement of Investments. |
| ** | Other financial instruments are derivative instruments not reflected in the Statement of Investments. |
Semi-Annual Report (Unaudited) | November 30, 2010 | 71 |
Table of Contents
| Stone Harbor Investment Funds | Notes to Financial Statements | |
November 30, 2010 (Unaudited) |
The following is a reconciliation of assets in which significant unobservable inputs (Level 3) were used in determining fair value:
Investments in Securities at Value | Balance as of May 31, 2010 | Realized Gain/ (Loss)* | Change in Unrealized Appreciation/ (Depreciation)* | Net Purchases/ (Sales) | Transfers in and/or (out) of Level 3 | Balance as of November 30, 2010 | ||||||||||||||||||
Stone Harbor Emerging Markets Debt Fund |
| |||||||||||||||||||||||
Sovereign Debt Obligations | $ | 414,800 | $ | – | $ | 56,257 | $ | 10,093 | $ | (481,150 | ) | $ – | ||||||||||||
Bank Loans | – | – | (2,649 | ) | 1,120,649 | – | 1,118,000 | |||||||||||||||||
Corporate Bonds | 812,778 | – | (4,570 | ) | 1,692,917 | (2,103,075 | ) | 398,050 | ||||||||||||||||
Credit Linked Notes | 10,408,722 | 960,657 | 3,523 | (8,901,435 | ) | (2,471,467 | ) | – | ||||||||||||||||
TOTAL | $ | 11,636,300 | $ | 960,657 | $ | 52,561 | $ | (6,077,776 | ) | $ | (5,055,692 | ) | $1,516,050 | |||||||||||
Stone Harbor High Yield Bond Fund |
| |||||||||||||||||||||||
Corporate Bonds | $ | 2,230,500 | $ | 124,569 | $ | 11,018 | $ | (433,059 | ) | $ | 279,844 | $2,212,872 | ||||||||||||
Bank Loans | 399,936 | 10,046 | (63,807 | ) | (29,546 | ) | (316,629 | ) | – | |||||||||||||||
TOTAL | $ | 2,630,436 | $ | 134,615 | $ | (52,789 | ) | $ | (462,605 | ) | $ | (36,785 | ) | $2,212,872 | ||||||||||
| * | Realized gain and change in unrealized appreciation are included in the related amounts on investments in the Statement of Operations. |
The inputs or methodology used for valuing securities are not necessarily an indication of the risk associated with investing in those securities.
(b) Security Transactions and Investment Income: Security transactions are accounted for on a trade date basis. Interest income, adjusted for amortization of premium and accretion of discount, is recorded on the accrual basis. Dividend income is recorded on the ex-dividend date. Foreign dividend income is recorded on the ex-dividend date or as soon as practical after the Funds determine the existence of a dividend declaration after exercising reasonable due diligence. The cost of investments sold is determined by use of the specific identification method. To the extent any issuer defaults on an expected interest payment, the Funds’ policy is to generally halt any additional interest income accruals and consider the realizability of interest accrued up to the date of default.
(c) Foreign Currency Translation: The books and records of the Fund are maintained in U.S. dollars as follows: (1) the foreign currency market value of investment securities, other assets and liabilities and foreign currency contracts are translated at the exchange rates prevailing at the end of the period; and (2) purchases, sales, income and expenses are translated at the exchange rates from the changes in the market prices of the securities.
(d) Foreign Securities: The Funds may directly purchase securities of foreign issuers. Investing in securities of foreign issuers involves special risks not typically associated with investing in securities of U.S. issuers. The risks include possible revaluation of currencies, the ability to repatriate funds, less complete
72 | www.shiplp.com |
Table of Contents
| Stone Harbor Investment Funds | Notes to Financial Statements | |
November 30, 2010 (Unaudited) |
financial information about companies and possible future adverse political and economic developments. Moreover, securities of many foreign issuers and their markets may be less liquid and their prices more volatile than those of securities of comparable U.S. issuers.
(e) Risk Exposure and the Use of Derivative Instruments: The Funds’ investment objectives not only permit the Funds to purchase investment securities, they also allow the Funds to enter in various types of derivatives contracts. In doing so, the Funds will employ strategies in differing combinations to permit them to increase, decrease, or change the level or types of exposure to market factors. Central to those strategies are features inherent in derivatives that make them more attractive for this purpose than equity or debt securities; they require little or no initial cash investment, they can focus exposure on only certain selected risk factors, and they may not require the ultimate receipt or delivery of the underlying security (or securities) to the contract. This may allow the Funds to pursue their objectives more quickly and efficiently than if they were to make direct purchases or sales of securities capable of effecting a similar response to market factors.
Market Risk Factors. In pursuit of its investment objectives, the Fund’s may seek to use derivatives to increase or decrease its exposure to the following market risk factors:
Interest Rate Risk. Interest rate risk refers to the fluctuations in value of fixed-income securities resulting from the inverse relationship between price and yield. For example, an increase in general interest rates will tend to reduce the make value of already issued fixed-income investments, and a decline in general interest rates will tend to increase their value. In addition, debt securities with longer maturities, which tend to have higher yields, are subject to potentially greater fluctuations in value from changes in interest rates than obligations with shorter maturities.
Credit Risk. Credit risk relates to the ability of the issuer to meet interest and principal payments, or both, as they come due. In general, lower-grade, higher-yield bonds are subject to credit risk to a greater extent than lower-yield, higher-quality bonds.
Foreign Exchange Rate Risk. Foreign exchange rate risk relates to the change in the U.S. dollar value of a security held that is denominated in a foreign currency. The U.S. dollar value of a foreign currency denominated security will decrease as the dollar appreciates against the currency, while the U.S. dollar value will increase as the dollar depreciates against the currency.
Equity Risk. Equity risk relates to the change in value of equity securities as they relate to increases or decreases in the general market.
Risk of Investing in Derivatives. The Funds’ use of derivatives can result in losses due to unanticipated changes in the market risk factors and the overall market. In instances where the Funds are using derivatives to decrease, or hedge, exposures to market risk factors for securities held by the Funds, there are also risks that those derivatives may not perform as expected resulting in losses for the combined or hedged positions.
Derivatives may have little or no initial cash investment relative to their market value exposure and therefore can produce significant gains or losses in excess of their cost. This use of embedded leverage allows the Fund to increase its market value exposure relative to it net assets and can substantially increase the volatility of the Funds’ performance.
Semi-Annual Report (Unaudited) | November 30, 2010 | 73 |
Table of Contents
| Stone Harbor Investment Funds | Notes to Financial Statements | |
November 30, 2010 (Unaudited) |
Additional associated risks from investing in derivatives also exist and potentially could have significant effects on the valuation of the derivative and the Funds. Typically, the associated risks are not the risks that the Funds is attempting to increase or decrease exposure to, per their investment objectives, but are the additional risks from investing in derivatives.
Examples of these associated risks are liquidity risk, which is the risk that the Funds will not be able to sell or close out the derivative in a timely manner, and counterparty credit risk, which is the risk that the counterparty will not fulfill its obligation to the Funds. Associated risks can be different for each type of derivative and are discussed by each derivative type in the notes that follow.
Forward Foreign Currency Contracts: The Funds may engage in currency transactions with counterparties to hedge the value of portfolio securities denominated in particular currencies against fluctuations in relative value, to gain or reduce exposure to certain currencies, or to generate income or gains. A forward foreign currency contract is an agreement between two parties to buy and sell a currency at a set price on a future date. The contract is marked-to-market daily and the change in value is recorded by the Funds as an unrealized gain or loss. When a forward foreign currency contract is extinguished, through either delivery or offset by entering into another forward foreign currency contract, the Funds record a realized gain or loss equal to the difference between the value of the contract at the time it was opened and the value of the contract at the time it was extinguished.
Forward foreign currency contracts involve elements of market risk in excess of the amounts reflected in the Statements of Assets and Liabilities. The Funds bear the risk of an unfavorable change in the foreign exchange rate underlying the forward foreign currency contract. Risks may also arise upon entering into these contracts from the potential inability of the counterparties to meet the terms of their contracts.
Credit Default Swaps: The Funds may enter into credit default swap contracts for hedging purposes, to gain market exposure or to add leverage to their portfolios. When used for hedging purposes, a Fund would be the buyer of a credit default swap contract. In that case, the Fund would be entitled to receive the par (or other agreed-upon) value of a referenced debt obligation, index or other investment from the counterparty to the contract in the event of a default by a third party, such as a U.S. or foreign issuer, on the referenced debt obligation. In return, the Fund would pay to the counterparty a periodic stream of payments over the term of the contract provided that no event of default has occurred. If no default occurs, the Fund would have spent the stream of payments and received no benefit from the contract. When the Fund is the seller of a credit default swap contract, it receives the stream of payments but is obligated to pay upon default of the referenced debt obligation. As the seller, the Fund would effectively add leverage to its portfolio because, in addition to its total assets, the Fund would be subject to investment exposure on the notional amount of the swap.
In addition to the risks applicable to derivatives generally, credit default swaps involve special risks because they are difficult to value, are highly susceptible to liquidity and credit risk, and generally pay a return to the party that has paid the premium only in the event of an actual default by the issuer of the underlying obligation, as opposed to a credit downgrade or other indication of financial difficulty.
No swaps were held in the Funds as of November 30, 2010.
74 | www.shiplp.com |
Table of Contents
| Stone Harbor Investment Funds | Notes to Financial Statements | |
November 30, 2010 (Unaudited) |
The effect of derivative instruments on each Fund’s Balance Sheet as of November 30, 2010 is as follows:
Asset Derivatives | Liability Derivatives | |||||||||
Derivatives Not Accounted for as Hedging Instruments | Balance Sheet Location | Fair Value | Balance Sheet Location | Fair Value | ||||||
Stone Harbor Emerging Markets Debt Fund |
| |||||||||
Foreign Exchange Contracts | Unrealized appreciation on forward foreign currency contracts | $462,791 | Unrealized depreciation on forward foreign currency contracts | $ 40,231 | ||||||
Total | $462,791 | $ 40,231 | ||||||||
Stone Harbor High Yield Bond Fund |
| |||||||||
Foreign Exchange Contracts | Unrealized appreciation on forward foreign currency contracts | $11,776 | Unrealized depreciation on forward foreign currency contracts | $ - | ||||||
Total | $11,776 | $ - | ||||||||
Stone Harbor Local Markets Fund |
| |||||||||
Foreign Exchange Contracts | Unrealized appreciation on forward foreign currency contracts | $86,772 | Unrealized depreciation on forward foreign currency contracts | $369,021 | ||||||
Total | $86,772 | $369,021 | ||||||||
Semi-Annual Report (Unaudited) | November 30, 2010 | 75 |
Table of Contents
| Stone Harbor Investment Funds | Notes to Financial Statements | |
November 30, 2010 (Unaudited) |
The effect of derivative instruments on each Fund’s Statement of Operations for the period ended November 30, 2010 is as follows:
Derivatives Not Accounted for as Hedging Instruments | Location of Gain/(Loss) On Derivatives Recognized in Income | Realized Gain/(Loss) On Derivatives Recognized in Income | Change in Unrealized Gain/(Loss) On Derivatives Recognized in Income | |||||||
Stone Harbor Emerging Markets Debt Fund | ||||||||||
Foreign Exchange Contracts | Net realized gain/(loss) on Foreign currency transactions/Change in unrealized appreciation/(depreciation) on Translation of assets and liabilities denominated in foreign currencies | $(173,873) | $437,261 | |||||||
Total | $(173,873) | $437,261 | ||||||||
Stone Harbor High Yield Bond Fund | ||||||||||
Foreign Exchange Contracts | Net realized gain/(loss) on Foreign currency transactions/Change in unrealized appreciation/(depreciation) on Translation of assets and liabilities denominated in foreign currencies | $(10,138) | $11,776 | |||||||
Total | $(10,138) | $11,776 | ||||||||
Stone Harbor Local Markets Fund | ||||||||||
Foreign Exchange Contracts | Net realized gain/(loss) on Foreign currency transactions/Change in unrealized appreciation/(depreciation) on Translation of assets and liabilities denominated in foreign currencies | $164,662 | $(282,249) | |||||||
Total | $164,662 | $(282,249) | ||||||||
(f) Loan Participations: The High Yield Bond Fund may invest in loans arranged through private negotiation between one or more financial institutions. The Fund’s investment in any such loan may be in the form of a participation in or an assignment of the loan. In connection with purchasing participations, the Fund generally will have no right to enforce compliance by the borrower with the terms of the loan agreement relating to the loan, nor any rights of set-off against the borrower and the Fund may not benefit directly from any collateral supporting the loan in which it has purchased the participation.
76 | www.shiplp.com |
Table of Contents
| Stone Harbor Investment Funds | Notes to Financial Statements | |
November 30, 2010 (Unaudited) |
The Fund assumes the credit risk of the borrower, the lender that is selling the participation and any other persons interpositioned between the Fund and the borrower. In the event of the insolvency of the lender selling the participation, the Fund may be treated as a general creditor of the lender and may not benefit from any set-off between the lender and the borrower.
(g) Credit and Market Risk: The Funds invest in high yield and emerging market instruments that are subject to certain credit and market risks. The yields of high yield and emerging market debt obligations reflect, among other things, perceived credit and market risks. The Funds’ investment in securities rated below investment grade typically involves risks not associated with higher rated securities including, among others, greater risk related to timely and ultimate payment of interest and principal, greater market price volatility and less liquid secondary market trading. The consequences of political, social, economic or diplomatic changes may have disruptive effects on the market prices of investments held by the Funds. The Funds’ investment in non-dollar denominated securities may also result in foreign currency losses caused by devaluations and exchange rate fluctuations.
(h) Distributions to Shareholders: Dividends and distributions to shareholders, which are determined in accordance with income tax regulations, are recorded on the ex-date. Income distributions, if any are declared and paid on a quarterly basis. Capital gain distributions, if any, are declared and paid at least annually.
(i) Classifications of Distributions: Net investment income (loss) and net realized gain (loss) may differ for financial statement and tax purposes. The character of distributions made during the year from net investment income or net realized gains may differ from its ultimate characterization for federal income tax purposes. Also, due to the timing of dividend distributions, the fiscal year in which amounts are distributed may differ from the fiscal year in which the income or realized gain was recorded by a Fund. Stone Harbor Local Markets Fund had not commenced operations as of May 31, 2010 and therefore information relating to the tax classification of its distributions is not shown.
The tax character of the distributions paid by the Funds during the year ended May 31, 2010, was as follows:
Stone Harbor Emerging Markets Debt Fund | Stone Harbor High Yield Bond Fund | |||
Ordinary Income | $ 10,321,834 | $ 28,484,852 | ||
Semi-Annual Report (Unaudited) | November 30, 2010 | 77 |
Table of Contents
| Stone Harbor Investment Funds | Notes to Financial Statements | |
November 30, 2010 (Unaudited) |
As of May 31, 2010, the components of distributable earnings on a tax basis were as follows:
| Stone Harbor Emerging Markets Debt Fund | Stone Harbor High Yield Bond Fund | |||
Undistributed Ordinary Income | $ 2,739,372 | $ 1,853,773 | ||
Accumulated Capital Gains | 2,551,314 | - | ||
Unrealized Appreciation | 5,347,171 | 10,047,152 | ||
Cumulative Effect of Other Timing Differences* | (122,954) | (427,069) | ||
| $ 10,514,903 | $ 11,473,856 | |||
| * | Other temporary differences due to timing, consist primarily of mark-to-market under section 1256 of the Internal Revenue Code and dividends payable. |
The tax components of distributable earnings are determined in accordance with income tax regulations which may differ from the composition of net assets reported under accounting principles generally accepted in the United States. Accordingly, for the period ended May 31, 2010, certain differences were reclassified. These differences were primarily due to the differing tax treatment of certain investments and the amounts reclassified did not affect net assets.
The reclassifications were as follows:
Stone Harbor Emerging Markets Debt Fund | Stone Harbor High Yield Bond Fund | |||
Paid-in Capital | $ - | $ 361,097 | ||
(Over)/Undistributed Income | $ 860,912 | $ (127,724) | ||
Accumulated Net Realized Losses | $ (860,912) | $ (233,373) |
(j) Expenses: Direct expenses are charged to the Funds; general expenses of the Series are allocated to the Funds based on each Fund’s relative net assets.
(k) Federal and Other Taxes: No provision for income taxes is included in the accompanying financial statements, as the Funds intend to distribute to shareholders all taxable investment income and realized gains and otherwise comply with Subchapter M of the Internal Revenue Code applicable to regulated investment companies.
The Funds evaluate tax positions taken (or expected to be taken) in the course of preparing the Funds’ tax returns to determine whether these positions meet a “more-likely-than-not” standard that, based on the technical merits, have a more than fifty percent likelihood of being sustained by a taxing authority upon examination. A tax position that meets the “more-likely-than-not” recognition threshold is measured to determine the amount of benefit to recognize in the financial statements.
Management of the Funds analyzes all open tax years, as defined by the Statute of Limitations, for all major jurisdictions, including federal tax authorities and certain state tax authorities. As of and during the fiscal year ended May 31, 2010, the Funds did not have a liability for any unrecognized tax benefits. The Funds’ federal and state income and federal excise tax returns for tax years since inception are subject to examination by the Internal Revenue Service and state departments of revenue.
78 | www.shiplp.com |
Table of Contents
| Stone Harbor Investment Funds | Notes to Financial Statements | |
November 30, 2010 (Unaudited) |
2. ADVISORY FEES
Stone Harbor Investment Partners LP is the Trust’s investment adviser. Under the investment advisory agreement the Trust pays an investment advisory fee calculated daily and paid monthly of 0.60%, 0.50% and 0.75% of the average daily net assets for Stone Harbor Emerging Markets Debt Fund, Stone Harbor High Yield Bond Fund and Stone Harbor Local Markets Fund, respectively.
The Adviser has contractually agreed to waive fees and reimburse expenses with respect to each of the Funds so that the Net Annual Operating Expenses (exclusive of acquired Fund fees and expenses, brokerage expenses, interest expense, taxes and extraordinary expenses) of the Stone Harbor Emerging Markets Debt Fund Institutional Class, Stone Harbor Emerging Markets Debt Fund Distributor Class, Stone Harbor High Yield Bond Fund Institutional Class, Stone Harbor High Yield Bond Fund Distributor Class, Stone Harbor Local Markets Fund Institutional Class and Stone Harbor Local Markets Fund Distributor Class will not exceed 0.75%, 1.00%, 0.55%, 0.80%, 1.00% and 1.25%, respectively. This undertaking is in effect through September 30, 2011 and is reevaluated on an annual basis.
The Adviser will be permitted to recover, on a class by class basis, expenses it has borne through the undertakings described above to the extent that a Fund’s expenses in later periods fall below the annual rates set forth in the relevant undertaking. A Fund will not be obligated to pay any such deferred fees and expenses more than one year after the end of the fiscal year in which the fee and expense was deferred.
3. INVESTMENTS
During the period ended November 30, 2010 the aggregate cost of purchases and proceeds from sales of investments (excluding short-term investments) were as follows:
| Stone Harbor Emerging Markets Debt Fund | Stone Harbor High Yield Bond Fund | Stone Harbor Local Markets Fund | ||||||
Purchases of investments | $ 221,826,408 | $ | 120,434,053 | $ 181,623,132 | ||||
Sales of investments | $ 115,990,945 | $ | 106,215,218 | $ 53,834,302 | ||||
At November 30, 2010 the aggregate gross unrealized appreciation and depreciation of investments for federal income purposes were substantially as follows:
| Stone Harbor Emerging Markets Debt Fund | Stone Harbor High Yield Bond Fund | Stone Harbor Local Markets Fund | ||||||||
Gross appreciation (excess of value over tax cost) | $ | 15,884,698 | $ | 29,977,606 | $ 1,604,469 | |||||
Gross depreciation (excess of tax cost over value) | (5,789,862) | (8,180,738) | (4,090,378) | |||||||
Net unrealized appreciation/(depreciation) | $ | 10,094,836 | $ | 21,796,868 | $ (2,485,909) | |||||
Cost of investments for income tax purposes | $ | 306,157,106 | $ | 407,658,665 | $ 163,055,009 | |||||
Semi-Annual Report (Unaudited) | November 30, 2010 | 79 |
Table of Contents
| Stone Harbor Investment Funds | Notes to Financial Statements | |
November 30, 2010 (Unaudited) |
4. SHARES OF BENEFICIAL INTEREST
At November 30, 2010, the Trust had an unlimited number of shares of beneficial interest authorized with a par value of $0.001 per share. The Funds have the ability to issue multiple classes of shares. Each share of a class represents an identical interest and has the same rights, except that each class bears certain direct expenses, including those specifically related to the distribution of its shares. Transactions in shares of the Institutional Class can be found shown on the Statement of Changes in Net Assets.
80 | www.shiplp.com |
Table of Contents
| Stone Harbor Investment Funds | Additional Information | |
November 30, 2010 (Unaudited) |
FUND PORTFOLIO HOLDINGS
The SEC has adopted a requirement that all registered investment companies file a complete schedule of portfolio holdings with the SEC for their first and third fiscal quarters on Form N-Q. For the Funds, this would be for the fiscal quarters ending August 31 and February 28. The Form N-Q filing must be made within 60 days of the end of the quarter. The Funds’ Forms N-Q are available on the SEC’s website at http://www.sec.gov., or they may be reviewed and copied at the SEC’s Public Reference Room in Washington, DC (call 1-800-732-0330 for information on the operation of the Public Reference Room).
PROXY VOTING
A description of the policies and procedures that the Funds use to determine how to vote proxies relating to portfolio securities and information regarding how the Funds voted proxies relating to portfolio securities for the 12 month period ended June 30, 2010 is available without a charge, upon request, by contacting Stone Harbor Investment Funds at 1-866-699-8158 or on the SEC website at http://www.sec.gov.
Semi-Annual Report (Unaudited) | November 30, 2010 | 81 |
Table of Contents
| Stone Harbor Investment Funds | Trustees & Officers | |
November 30, 2010 (Unaudited) |
The business and affairs of each Fund are managed under the direction of its Board of Trustees. The Board of Trustees approves all significant agreements between a Fund and the persons or companies that furnish services to the Fund, including agreements with its distributor, investment adviser, administrator, custodian and transfer agent. The day-to-day operations of the Fund are delegated to the Fund’s Adviser and administrator.
The name, age and principal occupations for the past five years of the Trustees and officers of the Funds are listed below, along with the number of portfolios in the Fund complex overseen by and the other directorships held by each Trustee. Except as otherwise noted, the address of each Trustee and officer is c/o Stone Harbor Investment Partners LP, 31 W. 52nd Street, 16th Floor, New York, New York 10019. The Trust’s Statement of Additional Information includes additional information about the Trustees and is available without a charge, upon request, by calling 1-866-699-8158.
INDEPENDENT TRUSTEES
| Name & Age | Position with the Trust | Term of Office and Length of Time Served (1) | Principal Occupation(s) During Past Five Years | Number of Portfolios in Fund Complex Overseen by Trustee(2) | Other Directorships by Trustee | |||||
Alan Brott Age: 67 | Chairman of Audit Committee; Trustee | Since June 21, 2007 | Columbia University Graduate School of Business – Associate Professor, 2000-Present; Consultant, 1991-Present. | 5 | Bank of America – two closed-end registered hedge funds. | |||||
Heath B. McLendon Age: 77 | Trustee | Since June 21, 2007 | Citigroup – Chairman of Equity Research Oversight Committee (retired December 31, 2006). | 5 | None | |||||
Patrick Sheehan Age: 62 | Trustee | Since June 21, 2007 | Retired; formerly, Citigroup Asset Management – Managing Director and Fixed Income Portfolio Manager, 1991-2002. | 5 | None |
| (1) | Officers are typically elected every year, unless an officer early retires, resigns or is removed from office. |
| (2) | For purposes of this table, the Stone Harbor Fund Complex includes each series of the Stone Harbor Investment Funds (the “Funds”) and the Stone Harbor Emerging Markets Income Fund, which shares an investment adviser with the Funds. |
82 | www.shiplp.com |
Table of Contents
| Stone Harbor Investment Funds | Trustees & Officers | |
November 30, 2010 (Unaudited) |
INTERESTED TRUSTEE
Name & Age | Position with the Trust | Term of Office and Length of Time Served(1) | Principal Past Five Years | Number of in Fund | Other Directorships by Trustee | |||||
| Thomas W. Brock* Age: 64 | Chairman; Trustee | Since June 21, 2007 | Stone harbor Investment Partners LP – Chief Executive Officer, 2006-Present; Columbia University Graduate School of Business – Associate Professor, 1998-2006. | 5 | Bank of America – two closed-end registered hedge funds; Liberty All Star Funds – two closed-end funds. |
| * | Mr. Brock is an interested Trustee because of his position with Stone Harbor. |
OFFICERS
Name & Age |
Position with the Trust | Term of Office and Length of Time Served(1) | Principal Occupation(s) During Past Five Years | Other Directorships by Trustee | ||||
| Peter J. Wilby Age: 52 | President | Since June 21, 2007 | Co-portfolio manager of the Funds; since April 3, 2006, Chief Investment Officer of Stone Harbor Investment Partners LP; prior to April 3, 2006, Chief Investment Officer – North American Fixed Income; joined Citigroup or its predecessor firms in 1989. | N/A |
| (1) | Officers are typically elected every year, unless an officer early retires, resigns or is removed from office. |
| (2) | For purposes of this table, the Stone Harbor Fund Complex includes each series of the Stone Harbor Investment Funds (the “Funds”) and the Stone Harbor Emerging Markets Income Fund, which shares an investment adviser with the Funds. |
Semi-Annual Report (Unaudited) | November 30, 2010 | 83 |
Table of Contents
| Stone Harbor Investment Funds | Trustees & Officers | |
November 30, 2010 (Unaudited) |
OFFICERS (CONTINUED)
| Name & Age | Position with the Trust | Term of Office and Length of Time Served(1) | Principal Occupation(s) During Past Five Years | Other Directorships by Trustee | ||||
| Pablo Cisilino Age: 43 | Executive Vice President | Since June 21, 2007 | Co-portfolio manager of Emerging Markets Debt Fund; since July 1, 2006, Senior Portfolio Manager of Stone Harbor Investment Partners LP; from June 1, 2004 to July 1, 2006, Executive Director for Sales and Trading in Emerging Markets at Morgan Stanley Inc; prior to June 1, 2004, Vice President for local markets and FX sales and trading, Goldman Sachs; joined Goldman Sachs in 1994. | N/A | ||||
James E. Craige Age: 43 | Executive Vice President | Since June 21, 2007 | Co-portfolio manager of Emerging Markets Debt Fund; since April 3, 2006, Senior Portfolio Managerof Stone Harbor Investment Partners LP; prior to April 3, 2006, Managing Director and Senior Portfolio Manager at Salomon Brothers Asset Management Inc.; joined Salomon Brothers Asset Management Inc. in 1992. | N/A |
| (1) | Officers are typically elected every year, unless an officer early retires, resigns or is removed from office. |
84 | www.shiplp.com |
Table of Contents
| Stone Harbor Investment Funds | Trustees & Officers | |
November 30, 2010 (Unaudited) |
OFFICERS (CONTINUED)
| Name & Age | Position with the Trust | Term of Office and Length of Time Served(1) | Principal Occupation(s) During Past Five Years | Other Directorships by Trustee | ||||
Thomas K. Flanagan Age: 58 | Executive Vice President | Since June 21, 2007 | Co-portfolio manager of Emerging Markets Debt Fund; since April 3, 2006, Senior Portfolio Manager of Stone Harbor Investment Partners LP; prior to April 3, 2006, Managing Director and Senior Portfolio Manager at Salomon Brothers Asset Management Inc.; joined Salomon Brothers Asset Management Inc. in 1991. | N/A | ||||
David Oliver Age: 51 | Executive Vice President | Since September 29, 2008 | Co-portfolio manager of Emerging Markets Debt Fund; since June 1, 2008 Senior Portfolio Manager of Stone Harbor, from 1986 to June 1, 2008 Managing Director in Emerging Market sales and trading Citigroup. | N/A |
| (1) | Officers are typically elected every year, unless an officer early retires, resigns or is removed from office. |
Semi-Annual Report (Unaudited) | November 30, 2010 | 85 |
Table of Contents
| Stone Harbor Investment Funds | Trustees & Officers | |
November 30, 2010 (Unaudited) |
OFFICERS (CONTINUED)
| Name & Age | Position with the Trust | Term of Office and Length of Time Served(1) | Principal Occupation(s) During Past Five Years | Other Directorships by Trustee | ||||
| Beth A. Semmel Age: 50 | Executive Vice President | Since June 21, 2007 | Co-portfolio manager of High Yield Bond Fund; since April 3, 2006, Senior Portfolio Manager of Stone Harbor Investment Partners LP; Prior to April 3, 2006, Managing Director, Senior Portfolio Manager and Senior Trader for all high yield securities portfolios at Salomon Brothers Asset Management Inc.; joined Salomon Brothers Asset Management Inc. in 1993. | N/A | ||||
| Jeffrey S. Scott Age: 51 | Chief Compliance Officer | Since June 21, 2007 | Since April 3, 2006, Chief Compliance Officer of Stone Harbor Investment Partners LP; from October 2006 to March 2007, Director of Compliance, New York Life Investment Management LLC; from July 1998 to September 2006, Chief Compliance Officer, Salomon Brothers Asset Management Inc. | N/A | ||||
| (1) | Officers are typically elected every year, unless an officer early retires, resigns or is removed from office. |
86 | www.shiplp.com |
Table of Contents
| Stone Harbor Investment Funds | Trustees & Officers | |
November 30, 2010 (Unaudited) |
| OFFICERS (CONTINUED) | ||||||||
| Name & Age | Position with the Trust | Term of Office and Length of Time Served(1) | Principal Occupation(s) During Past Five Years | Other Directorships by Trustee | ||||
James J. Dooley Age: 55 | Treasurer | Since June 21, 2007 | Since April 3, 2006, Head of Operations, Technology and Finance of Stone Harbor Investment Partners LP; from August 2004 to March 2006, Senior Operations Manager of Institutional Asset Management, Citigroup Asset Management; from October 2002 to August 2004, Managing Director, Global Operations & Application Development, AIG Global Investment Group; from May 2001 to September 2002, President and Chief Operating Officer, Financial Technologies International. | N/A | ||||
Adam J. Shapiro Age: 46 | Secretary; Anti-Money Laundering Officer | Since June 21, 2007 | Since April 3, 2006, General Counsel of Stone Harbor Investment Partners LP; from April 2004 to March 2006, General Counsel, North American Fixed Income, Salomon Brothers Asset Management Inc.; from August 1999 to March 2004, Director of Product and Business Development, Citigroup Asset Management. | N/A | ||||
| (1) | Officers are typically elected every year, unless an officer early retires, resigns or is removed from office. |
Semi-Annual Report (Unaudited) | November 30, 2010 | 87 |
Table of Contents
| Stone Harbor Investment Funds | Trustees & Officers | |
November 30, 2010 (Unaudited) |
OFFICERS (CONTINUED) | ||||||||
| Name & Age | Position with the Trust | Term of Office and Length of Time Served(1) | Principal Occupation(s) During Past Five Years | Other Directorships by Trustee | ||||
Patrick D. Buchanan Age: 38 | Assistant Treasurer | Since April 23, 2008 | Since October 15, 2007, Senior Fund Controller for ALPS Fund Services, Inc.; from February 2005 to October 2007, Director of Accounting for Madison Capital Management LLC; from August 2003 to February, 2005, Manager of Fund Accounting for Janus Capital Group | N/A | ||||
| (1) | Officers are typically elected every year, unless an officer early retires, resigns or is removed from office. |
88 | www.shiplp.com |
Table of Contents
| Stone Harbor Investment Funds | Notes | |
Semi-Annual Report (Unaudited) | November 30, 2010 | 89 |
Table of Contents
| Stone Harbor Investment Funds | Notes | |
90 | www.shiplp.com |
Table of Contents
| Stone Harbor Investment Funds | Notes | |
Table of Contents

OFFICERS AND TRUSTEES
Alan Brott, Trustee
Heath B. McLendon, Trustee
Patrick Sheehan, Trustee
Thomas W. Brock, Chairman
Peter J. Wilby, President
Pablo Cisilino, Exec. Vice President
James E. Craige, Exec. Vice President
Thomas K. Flanagan, Exec. Vice President
David Oliver, Exec. Vice President
Beth A. Semmel, Exec. Vice President
Jeffrey S. Scott, Chief Compliance Officer
Adam Shapiro, Secretary/Anti-Money Laundering Officer
James J. Dooley, Treasurer
Patrick Buchanan, Assistant Treasurer
INVESTMENT ADVISER
Stone Harbor Investment Partners LP
31 W. 52nd Street 16th Floor
New York, New York 10019
ADMINISTRATOR & FUND ACCOUNTANT
ALPS Fund Services, Inc.
1290 Broadway, Suite 1100
Denver, Colorado 80203
DISTRIBUTOR
ALPS Distributors, Inc.
1290 Broadway, Suite 1100
Denver, Colorado 80203
TRANSFER AGENT
ALPS Fund Services, Inc.
1290 Broadway, Suite 1100
Denver, Colorado 80203
CUSTODIAN
The Bank of New York Mellon
One Wall Street
New York, New York 10286
LEGAL COUNSEL
Ropes & Gray LLP
1211 Avenue of the Americas
New York, New York 10036
INDEPENDENT REGISTERED
PUBLIC ACCOUNTING FIRM
Deloitte & Touche LLP
555 17th Street, Suite 3600
Denver, Colorado 80202
This report and its financial statements are submitted for the general information of the shareholders of the Funds. The report is not authorized for distribution to prospective investors in the Funds unless preceded or accompanied by a prospectus.
SHF000130 6/11
Table of Contents
| Item 2. | Code of Ethics. |
Not applicable to this Report.
| Item 3. | Audit Committee Financial Expert. |
Not applicable to this Report.
| Item 4. | Principal Accountant Fees and Services. |
Not applicable to this Report.
| Item 5. | Audit Committee of Listed Registrants. |
Not applicable.
| Item 6. | Investments. |
| (a) | Schedule of Investments is included as part of the Report to Stockholders filed under Item 1 of this Form N-CSR. |
| (b) | Not applicable. |
| Item 7. | Disclosure of Proxy Voting Policies and Procedures for Closed-End Management Investment Companies. |
Not applicable to Registrant.
| Item 8. | Portfolio Managers of Closed-End Management Investment Companies. |
Not applicable to Registrant.
Table of Contents
| Item 9. | Purchases of Equity Securities by Closed-End Management Investment Companies and Affiliated Purchasers. |
Not applicable to Registrant.
| Item 10. | Submission of Matters to a Vote of Security Holders. |
There have been no material changes to the procedures by which shareholders may recommend nominees to the Registrant’s Board of Trustees, where those changes were implemented after the Registrant last provided disclosure in response to the requirements of Item 407(c)(2) of Regulation S-K, or this Item.
| Item 11. | Controls and Procedures. |
| (a) | The Registrant’s principal executive officer and principal financial officer have concluded that the Registrant’s disclosure controls and procedures (as defined in Rule 30a-3(c) under the Investment Company Act of 1940, as amended) are effective based on their evaluation of these controls and procedures as of a date within 90 days of the filing date of this report. |
| (b) | There was no change in the Registrant’s internal control over financial reporting (as defined in Rule 30a-3(d) under the Investment Company Act of 1940, as amended) during the second fiscal quarter of the period covered by this report that has materially affected, or is reasonably likely to materially affect, the Registrant’s internal control over financial reporting. |
| Item 12. | Exhibits. |
| (a)(1) | Not applicable to this Report. |
| (a)(2) | The certifications required by Rule 30a-2(a) of the Investment Company Act of 1940, as amended, and Section 302 of the Sarbanes-Oxley Act of 2002 are attached hereto as Exhibit 99.Cert. |
| (a)(3) | Not applicable to Registrant. |
| (b) | The certifications by the Registrant’s principal executive officer and principal financial officer, as required by Rule 30a-2(b) of the Investment Company Act of 1940, as amended, and Section 906 of the Sarbanes-Oxley Act of 2002 are attached hereto as Exhibit 99.906Cert. |
Table of Contents
SIGNATURES
Pursuant to the requirements of the Securities Exchange Act of 1934 and the Investment Company Act of 1940, the Registrant has duly caused this Report to be signed on its behalf by the undersigned, thereunto duly authorized.
| Stone Harbor Investment Funds | ||
| By: | /s/ Peter J. Wilby | |
| Peter J. Wilby | ||
President/Principal Executive Officer | ||
| Date: | February 4, 2011 | |
Pursuant to the requirements of the Securities Exchange Act of 1934 and the Investment Company Act of 1940, this Report has been signed below by the following persons on behalf of the Registrant and in the capacities and on the dates indicated.
| By: | /s/ Peter J. Wilby | |
| Peter J. Wilby | ||
President/Principal Executive Officer | ||
| Date: | February 4, 2011 | |
| By: | /s/ James J. Dooley | |
| James J. Dooley | ||
Treasurer, Chief Financial Officer/ Principal Financial Officer | ||
| Date: | February 4, 2011 | |