Table of Contents
UNITED STATES
SECURITIES AND EXCHANGE COMMISSION
Washington, D.C. 20549
FORM N-CSR
CERTIFIED SHAREHOLDER REPORT OF REGISTERED
MANAGEMENT INVESTMENT COMPANIES
Investment Company Act file number: 811-22037
Stone Harbor Investment Funds
(Exact name of registrant as specified in charter)
1290 Broadway, Suite 1100
Denver, CO 80203
(Address of principal executive offices) (Zip code)
Adam J. Shapiro, Esq.
c/o Stone Harbor Investment Partners LP
31 West 52nd Street, 16th Floor
New York, NY 10019
(Name and address of agent for service)
With copies To:
John M. Loder, Esq.
Ropes & Gray LLP
One International Place
Boston, MA 02110-2624
Registrant’s telephone number, including area code: (303) 623-2577
Date of fiscal year end: May 31
Date of reporting period: June 1, 2011 - November 30, 2011
Table of Contents
Item 1. Report to Stockholders.
Table of Contents

Table of Contents
| Stone Harbor Investment Funds | Table of Contents | |
| November 30, 2011 (Unaudited) |
| 2 | ||
| 7 | ||
| 8 | ||
| 10 | ||
| 14 | ||
| 53 | ||
| 54 | ||
| 55 | ||
| 57 | ||
| 61 | ||
| 71 | ||
Table of Contents
| Stone Harbor Investment Funds | Shareholder Letter | |
| November 30, 2011 (Unaudited) |
Dear Shareholder,
On balance, 2011 was a challenging year for global fixed income markets. Hopes for a continuation of 2010’s economic recovery waned, as convincing signs of a slowdown in global growth surfaced by mid-year. Markets became overwhelmed by the risks of mounting fiscal deficits in developed nations and the inability of politicians to offer acceptable solutions. Fears of European sovereign debt defaults and the capital insufficiency of the Continent’s banks caused markets to become extremely volatile. Investors fled from “risky” assets, seeking the safety of Treasuries and the US dollar. As the year closed, signs of a resolution to the European debt crisis began to surface, and prospects for muted growth in the US economy were revived.
As we look toward 2012, corporate earnings in the US continue to be strong and growth rates in developing nations remain well ahead of those in the developed world. We believe this will provide a favorable backdrop for our specialty asset classes of emerging markets and high yield fixed income. Particularly in these turbulent markets, we thank you for your confidence in Stone Harbor Investment Partners LP, as together we cautiously navigate the shifting currents of global de-leveraging and economic recovery.
Market Overview
The growing contagion in Europe and the inescapable reality of a global economic slowdown dominated the performance of risk assets in the second half of 2011. The inability to resolve a restructuring of Greek debt became the primary catalyst for wider concerns, as official institutions and leaders of the European Union (EU) failed to react with the urgency necessary to contain the crisis. EU governance issues raised doubts of the effectiveness of existing mechanisms like the European Financial Stability Facility (ESFS) to insure the fiscal stability of larger, more meaningful economies like Spain, Italy and France. A deteriorating growth outlook for the region prompted further ratings downgrades to Greece, Portugal, Ireland and Italy, as well as to several prominent French banks, exacerbating global concerns over the health of the European banking system. Expressing evidence of risk aversion, country spreads gapped out significantly. Flight-to-quality moves culminating in a late summer sell-off in global equities coupled with a material spread widening across fixed income sectors to levels not seen since 2009. US Treasury prices surged, rallying nearly 100 basis points (“bps”) in the August-September period. In the fall, plans for a coordinated effort to recapitalize troubled banks materialized, and investors grew cautiously optimistic that Europe might be moving closer to a resolution of its debt crisis. The unveiling of a comprehensive debt deal at the conclusion of the EU summit in October fueled a brief rally, but market momentum dissipated once again at the end of the reporting period, as rescue efforts fell short of expectations.
The outlook for global growth was another key concern throughout the period, with continuing downward revisions contributing to negative market sentiment. The pressure of pending austerity measures taken across the developed economies caused the OECD to lower its growth forecast to 1.9% in 2011 and 1.6% in 2012, from 2.3% and 2.8% predicted in May. In recognition of the global pull-back, the Bundesbank also slashed its estimate of Germany’s economic growth for 2012 from 1.8% to 0.75%. By November, in the latest attempt to provide stimulus and liquidity, the Federal Reserve joined forces with five other central banks to decrease the cost of emergency funds for European banks as part of a globally coordinated response to the sovereign debt crisis. On the same day, China also eased bank reserve requirements for the first time since 2008, hoping to counteract the negative impact on its exports stemming from Europe’s turmoil1.
On the domestic front, the US economy sputtered along on an uneven path, beginning with a soft patch in economic data lasting through mid-year, followed by a downgrade of the US’ credit rating by Standard & Poor’s in August. The downgrade reflected the inability of the US Congress to deal with the nation’s debt problems. By late summer disappointing GDP numbers and a pullback in market momentum led to a downward revision by the Federal Reserve to its outlook for US economic growth in 2012. In September, the Federal Reserve announced QE II, a new version of “Operation Twist2 intended to push down longer term interest rates. Further, it committed to maintaining very low rates “at least until mid-2013”. Market sentiment recovered slightly as the FOMC reported that economic growth in the third quarter “strengthened somewhat” but warned of “significant downside risks to the economic outlook”. From a market perspective, the debt ceiling deadlock also weighed heavily on investors; the failure of the super committee to come to an agreement on budget cuts has triggered $1.2 trillion in automatic cuts to US spending programs beginning in 2013. Considering the slack in economic fundamentals at the beginning of the reporting period, the domestic economy surprisingly remains the one bright spot heading into year-end, as it continues on a path of slow growth with improving unemployment numbers, higher retail sales, positive corporate earnings and better although muted housing starts. Instilling further optimism, US productivity rose in the third quarter for the first time in a year, and consumer confidence in November climbed to its highest level in eight years.
Looking generally at the performance of credit markets during the six-month period ended November 30, risk aversion was the continuous theme. As represented by the Citigroup High Yield Market Index3, high yield spreads began the period at 526 bps and subsequently see-sawed, widening to a level of 873 bps in early October before shedding some losses to end at 748 bps. The average yield during that time increased from 6.79% to 8.57%. Despite the fact that corporate earnings remained strong, default rates continued at low levels, and that refinancing risks had been significantly reduced, investors nonetheless sought the safety of Treasuries and other low risk assets.
| 2 | www.shiplp.com | |
Table of Contents
| Stone Harbor Investment Funds | Shareholder Letter | |
| November 30, 2011 (Unaudited) |
Credit spreads for emerging markets external debt (hard currency) also widened, but due to strong technical factors, this market did not suffer as much as corporate high yield. The yield spread on the JP Morgan Emerging Markets Bond Index (EMBI) Global Diversified4 went from 290 bps to 396 bps during the six months ending November 30, although it reached a period wide of 468 bps on October 4. Returns for external debt were also buoyed by the huge rally in US Treasuries during the period. The emerging local currency debt markets, however, did not fare as well. In late summer investors flocked to dollar assets in risk reduction moves, and investors in local currencies suffered significantly. Even though local interest rates remained stable, the benchmark JP Morgan Emerging Markets Government Bond Index-Emerging Markets (GBI-EM) Global Diversified5 was significantly affected by large currency losses. Emerging markets corporate debt also suffered sharp declines, most notably in the higher yielding component of the index6.
Looking forward into 2012, we are optimistic that European policymakers will eventually solve their debt crisis. We believe that European leaders will conclude that the concept of a common currency is not viable without some form of consolidation of fiscal authority among its member states. We further believe, however, that Europe is headed into a recession, as significant headwinds from deficit reduction and fiscal reform will continue to stifle economic growth in the euro zone in the near-term.
In emerging markets, we think that China’s ability to engineer a soft landing for its economy will be significantly aided by policies that favor continued, unprecedented levels of government investment to support growth, particularly in the upcoming year, which features a transition in political leadership. While we expect growth in other emerging countries to slow from last year’s pace, our forecasts suggest that growth, as well as the policy flexibility in many emerging countries will continue to strongly support the case for investing in emerging debt markets.
In the United States, we believe that the economy is on its way toward a slow recovery. In our view, US interest rates are likely to remain low for an extended period of time; corporate profits should continue to be strong, and the economy may benefit from further monetary accommodation. We believe that these conditions would provide an excellent environment for investing in the high yield asset class.
At Stone Harbor, we will continue to focus on seeking to capture excess return from stable and improving credit situations in corporate and sovereign markets worldwide. We remain vigilant to the credit risks associated with the systematic banking problems in Europe, as well as the slowdown in global growth. To monitor our thinking throughout the year, please visit our website at www.shiplp.com.
Performance Overview
Stone Harbor Emerging Markets Corporate Debt Fund
The Stone Harbor Emerging Markets Corporate Debt Fund return since inception June 1, 2011 to November 30, 2011 was -10.19% (net of expenses) and -9.69% (gross of expenses). This compares to a benchmark return of -2.25% for the JP Morgan Corporate Emerging Markets Bond Index Broad Diversified (CEMBI Broad Diversified) and a return of -8.27% for the high yield segment of the index. During this period, sovereign and corporate debt spreads in most countries widened, reflecting rising macroeconomic risks. The reporting period was marked by significant volatility in fixed income markets, as investors reacted to a global slowdown in growth, an escalating sovereign debt and financial crisis in Europe and fears of a hard landing of the Chinese economy. Emerging market corporate bonds came under significant pressure, particularly in September, as concerns intensified over the solvency of major European banks.
The portfolio favored high yield credits that, in our view, benefit from pricing and rating inefficiencies due, in part, to sovereign ceiling constraints. Many of these companies are also commodity producers in sub-investment grade countries, companies positioned to profit from domestic consumption in higher growth economies, as well as companies which are de-leveraging either organically or via Merger & Acquisition (“M&A”) activity. Throughout the period, the benchmark weighting of investment grade versus non-investment grade securities was approximately 70% investment grade, 30% non-investment grade. At the start of June, approximately 20% of the portfolio was invested in investment grade assets. The portfolio managers increased the investment grade weighting to approximately 30% by the end of June/early July to manager risk. Declining liquidity and the team’s assessments on valuations, however, prevented a further shift into perceived safer assets before the significant market declines in August and September. In August, the sub-investment grade sector of the CEMBI declined by over 4%, and in September it dropped over 10%. Investment grade emerging market corporate bond performance was +0.32% and -3.06% in August and September, respectively.
While a deteriorating fundamental macroeconomic backdrop in developed markets was the most important determinant of market sentiment in emerging market corporates, credit developments in certain sectors and countries also weighed on market sentiment. Reports of declining property prices in tier I cities in China, a result of policies intended to reduce property sales volumes and prices, increased fears of a broader decline in credit quality in the real estate development and management sector. The market also had absorbed significant supply of new issues in this sector earlier in the year, a technical factor that exacerbated downward price movements in less liquid markets. In Kazakhstan, June mid-year reports from BTA bank revealing that the government-supported bank had more aggressive loan loss provisioning and lower recoveries on assets held outside the country than expected by the market triggered a downturn in BTA bonds that continued through the end of the period. Mexico’s cement sector, which relies heavily on the US market, also came under significant pressure as investors factored in the possibility of substantially slowing growth in the US.
Stone Harbor Investment Funds Semi-Annual Report | November 30, 2011 | 3 | |
Table of Contents
| Stone Harbor Investment Funds | Shareholder Letter | |
| November 30, 2011 (Unaudited) |
Technical factors also clearly weighed on the corporate bond market during the period. Year-to-date through November 30, over $180 billion in new corporate bonds were priced and issued7. In addition, proposed regulations on bank trading operations, intended to reduce the systematic importance of large banks, have likely reduced willingness among dealers to participate as actively as they had in the past in supporting two-way markets. These factors, in our view, require a longer time horizon for investing in what we believe is a strong secular improving story in emerging market corporate credit.
Stone Harbor Emerging Markets Debt Fund
The Stone Harbor Emerging Markets Debt Fund return for the six months ended November 30, 2011 was 0.17% (net of expenses) and 0.54% (gross of expenses). This compares to a benchmark return of 2.25% for the JP Morgan Emerging Markets Bond Index Global Diversified. During this period, emerging market sovereign credit spreads in all of the countries within the benchmark widened, reflecting rising macroeconomic risks, but also the move lower in US Treasury yields despite a downgrade by Credit Rating Agency, Standard & Poor’s of the US Treasury debt rating on August 5. The reporting period was marked by significant volatility in fixed income markets as investors reacted to a global slowdown in growth, an escalating sovereign debt and financial crisis in Europe and fears of a hard landing of the Chinese economy. Emerging market currencies and corporate bonds came under significant pressure, particularly in September, as concerns intensified over the solvency of major European banks.
The portfolio continued to favor select high beta sovereigns that, in our opinion, have strong valuation support, as well as both proven capacity and willingness to pay their debts. These countries include Argentina, Iraq and Venezuela, three of the market’s highest beta sovereign credits. In addition, the portfolio has maintained an allocation to local currency debt in several countries where we continue to see potential for outperformance relative to the sovereign US dollar-denominated bonds in our benchmark. The portfolio was also positioned for an improving environment for corporate prosperity in many key emerging markets. Tactical allocations to select corporate bonds increased throughout the period in recognition of attractive corporate debt valuations, and because of our opportunistic view on the potential for spread compression in many corporate credits. The additions to our corporate allocation were made with a long-term perspective, following the market’s sharp corrections in August and September. Corporate investments in the portfolio focused on commodity producers in sub-investment grade countries, on companies positioned to profit from domestic consumption in higher growth economies and on other companies, which are de-leveraging either organically or via M&A activity.
The path of total returns for the three major sectors of the emerging debt markets – external sovereign debt, local currency debt and corporate debt – reflected how markets reconciled the conflicting cross winds of strong fundamental macroeconomic performance in emerging markets with weakening growth and deteriorating fiscal accounts in many advanced economies. External sovereign debt market total returns remained positive for the period until mid-September, when spread widening offset the benefits of falling US Treasury rates. Corporate debt total returns began to fall earlier in the period, particularly at the end of August, as demand for corporate risk globally declined on fears of the possibility for a globally synchronized recession. But it was the local currency markets, and more particularly foreign exchange markets, that absorbed the brunt of the market’s volatility, as investors sharply reduced short US dollar positions in August, seeking liquidity. Importantly, in local currency terms, local bond markets in many countries fared relatively well, as interest rates fell along with the global trend. All three sectors of the market recovered in October but softened again in mid- November on fears that European policymakers would fail to make the difficult decisions required to ensure a more fiscally viable euro zone.
Technical factors also were important during the period, which was marked by high volatility and lower-than-normal liquidity, particularly for corporate debt. The uncertainty posed by the prospect of new regulations intended to reduce the systematic importance of individual large banks forced many trading desks to limit position-taking. In particular, as sellers of corporate debt surfaced after June, the supply was met with little support from dealer desks, further exacerbating downward price movements.
Key contributors to the Fund’s underperformance relative to the benchmark were the allocations to corporate debt and active positions in local currencies in several countries. Security selection supported performance, with particularly good decisions in Argentina and Venezuela. Our overweight in Iraq and our allocation to the Mexican peso were the largest detractors from performance, while our underweight in Hungary was the largest positive contributor.
Stone Harbor Local Markets Fund
The Stone Harbor Local Markets Fund return for the six months ended November 30, 2011 was –5.97% (net of expenses) and –5.53% (gross of expenses). This compares to a benchmark return of –6.32% for the JP Morgan Global Bond Index-Emerging Markets Global Diversified. Emerging local currency debt markets underperformed all other emerging debt markets in US dollar terms except for non-investment grade corporate bonds, with the principal driver of weakness being the depreciation of local currencies relative to the US dollar. Importantly, most local bond market yields
| 4 | www.shiplp.com | |
Table of Contents
| Stone Harbor Investment Funds | Shareholder Letter | |
| November 30, 2011 (Unaudited) |
remained stable or moved lower, and contributed positively to total returns. The reporting period was marked by significant volatility in fixed income markets as investors reacted to a global slowdown in growth, an escalating sovereign debt and financial crisis in Europe and fears of a sharp pullback in China. While we remained optimistic on the ability of emerging market policymakers to navigate the market turbulence, we partially hedged foreign exchange exposure in select countries in August, a move which enhanced returns. At the end of the reporting period, however, all foreign exchange exposure remained unhedged, reflecting a cautiously optimistic outlook for the months ahead.
Throughout the reporting period, the portfolio favored faster growing economies in Latin America and Asia, with overweight allocations in Brazil, Colombia, Mexico, China, Indonesia and Malaysia. The portfolio’s underweight positions have been concentrated in Central and Eastern Europe, where a mix of more limited growth prospects and short-term policymaking have reduced the attractiveness of local debt markets, in our view. Sharp depreciations of the Turkish lira and Hungarian forint, as well as increases in local bond yields in both countries in September led to tactical reductions in our underweights in the local bond markets from both of these countries, with the change in Turkey the most pronounced. While we have disliked the policy mix in Turkey, the Central Bank of Turkey has reversed its policy of cutting rates in the face of rising inflation, lending important support to the lira. The portfolio has also maintained underweights in Thailand and Peru, both countries with difficult politics. In addition to the fallout in tourism revenue due to wide-scale flooding, Thailand’s markets must also contend with a vacuum in leadership should the ageing Thai king die. In Peru, yields are too low, in our estimation, given the possibility that recently elected President Humala tacks toward his populist campaign agenda, limiting growth potential in the key metals and mining industries.
The reporting period was also characterized by rising frustration due to the plodding of leaders of the euro zone toward necessary political and economic integration. The implications of euro zone policies toward this issue are significant not only for Europe, but also for the global economy. As of the end of November, Europeans, with the aid of US policymakers, seem to be on their way, at least, toward recognition of the need for a closer fiscal union in Europe that may stabilize markets. The improvement in local bond markets at the end of November appears to be the result of these developments.
Signs of a deceleration in inflation began mid-year, a significant change from earlier in the reporting period when most local bond markets forecast higher interest rates on the back of rising inflation expectations. Part of this change, we believe, was a function of policy normalization in many key economies, but also due to the global economic slowdown. While several central banks from emerging countries hiked policy rates during the period, the trend toward lowering rates to spur the economy gained traction in August, as Brazil cut rates in a surprise move. In September, Indonesia also lowered its central bank’s overnight lending rate. And, in November, China reduced its reserve requirement ratio for banks to ease liquidity in the banking system. Throughout this period, the fear that central banks had fallen behind the curve in their willingness to ward off inflation with stringent monetary policy significantly diminished, providing support for local bond markets.
The sources of the Fund’s outperformance relative to its benchmark included both country selection and issue selection decisions. The most important positive contributor to performance was our decision to underweight Hungary. Our decision to allocate to long duration bonds in Brazil and Colombia was also a strong contributor to excess returns over the benchmark. The key positions which detracted from performance were our underweight of Peru and Thailand. Our decision to avoid the longest part of the local bond curve in Indonesia also detracted from performance, as Indonesia’s bond yields fell sharply in a bull flattening of the yield curve.
Stone Harbor High Yield Bond Fund
The Stone Harbor High Yield Bond Fund return for the six months ended November 30, 2011 was -4.66% (net of expenses) and -4.39% (gross of expenses). This compares to a benchmark return of -2.69% for the Citigroup High Yield Market Capped Index. The period under review was generally a difficult one for high yield, as well as all fixed income asset classes, as fears of growing contagion in Europe combined with the inability to determine the magnitude of a global economic slowdown led to renewed risk aversion.
A significant downgrade to Greece sovereign debt was the catalyst for deepening concerns of the impact of the debt crisis on the European banking system. Mounting evidence of a slowdown in global growth reflected in a sharp decline in manufacturing activity added to the uneasiness. In July, a bailout package for Greece, including expanded European Financial Stability Facility (EFSF) powers to purchase euro zone sovereign debt and strong domestic corporate earnings restored investor confidence and buffered high yield bond prices. By mid-summer, however, the global financial markets began to experience an extreme rise in overall volatility. Rating agency downgrades to sovereign debt (including the US and Italy) and several prominent French banks, political brinkmanship in the US over the debt ceiling debate, weak economic numbers out of Europe and China and the Federal Reserve’s (“Fed”) warning of “significant downside risks to the economic outlook including strains in global markets” resulted in material price depreciation. Negative market sentiment culminated in a fresh 52-week low for the S&P 500, a US Treasury rally that sent 10-year yields below two percent and material credit spread widening in high yield, to levels not seen since 2009.
A relief rally occurred in the month of October as new initiatives were introduced to contain the European sovereign debt and banking crisis. Improving US economic data and positive corporate earnings rendered further stability to a technically oversold high yield market. Market sentiment soured, as investors began to question the viability of Europe’s latest debt deal in light of continued economic weakness, this time in
Stone Harbor Investment Funds Semi-Annual Report | November 30, 2011 | 5 | |
Table of Contents
| Stone Harbor Investment Funds | Shareholder Letter | |
| November 30, 2011 (Unaudited) |
Italy, the largest of the periphery countries, and to a lesser extent in some core countries. High debt levels and weak growth potential in Italy sparked a sell-off in the country’s debt, with 10-year bond yields trading at unsustainable levels over the long-term. Concerns regarding the world economy intensified as the 34-nation OECD lowered growth forecasts to 1.9% this year and 1.6% next year, down from 2.3% and 2.8% predicted in May1. Unexpectedly, on the last day of the reporting period, the Fed led a globally coordinated central bank response to Europe’s sovereign debt crisis, which, coupled with upside surprise in US economic fundamentals, boosted demand for risk assets.
Looking forward we remain optimistic that the US economy will continue to experience a period of slow expansion. We are encouraged by strong corporate earnings, an improving economic backdrop and the possibility of additional monetary stimulus. On a less positive note, we believe that Europe is headed into a recession, as significant headwinds from deficit reduction and fiscal reform will continue to stifle economic growth in the near-term. We remain vigilant to the sovereign and systematic banking problems in Europe, as well as the slowing of growth worldwide. However, we believe that current spread levels and low default rates continue to favor the high yield market, where companies have conservatively leveraged balance sheets and adequate liquidity after terming out maturities over the past several years.
Sincerely,
Thomas W. Brock
Chairman of the Board of Trustees
1 Source: Bloomberg.
2 Operation Twist is a policy, originally from the 1960’s but revived in September 2011, implemented by the Federal Reserve, which involves the selling of short-term Treasuries by the central bank in exchange for the same amount in longer-term bonds, thereby lowering longer-term interest rates.
3 The Citigroup High Yield Market Index (previously the Salomon Smith Barney High Yield Market Index) is a total rate-of-return index which captures the performance of below investment-grade debt issued by corporations domiciled in the United States or Canada. This index comprises Citigroup’s broadest market measure and includes cash-pay and deferred-interest securities. All the bonds in the high-yield indices are publicly placed, have a fixed coupon and are non-convertible. Source: Citigroup Index LLC.
4 The JP Morgan Emerging Markets Bond Index (EMBI) Global Diversified tracks total returns for U.S. dollar-denominated debt instruments issued by emerging markets sovereign and quasi-sovereign entities: Brady bonds, loans, and Eurobonds. Source: JP Morgan Chase.
5 The JP Morgan Government Bond Index – Emerging Markets (GBI-EM) Global Diversified consists of regularly traded, liquid fixed-rate, domestic currency government bonds to which international investors can gain exposure. The weightings among the countries are more evenly distributed within this index. Although not expected to be a principal investment tool, the Portfolio may make use of derivative securities (including futures and options on securities, securities indices or currencies, options on futures, forward currency contracts, and interest rate, currency or credit default) for the purposes of reducing risk and/or obtaining efficient investment exposure. Source: JP Morgan Chase.
6 Emerging markets corporate debt is represented by JP Morgan Corporate Emerging Markets Bond Index (CEMBI) Broad Diversified. The CEMBI tracks total returns of US dollar-denominated debt instruments issued by corporate entities in Emerging Markets countries. Two variations are available: CEMBI Broad and CEMBI. The CEMBI Broad is the most comprehensive corporate benchmark followed by the CEMBI, which consists of an Investable universe of corporate bonds. Both indices are also available in Diversified version. The JPMorgan CEMBI Broad Diversified limits the current face amount allocations of the bonds. Both indices are also available in outstanding countries with larger debt stocks. Qualifying corporate bonds have a face amount greater than USD 300 million, maturity greater than 5 years, verifiable prices and cash flows, and from countries within Asia ex-Japan, Latin America, Eastern Europe, Middle East, and Africa.
7 Source: Bloomberg, JP Morgan.
Beta - is a measurement of the systematic risk of a security or a portfolio in comparison to the market as a whole or a benchmark. A beta of 1.0 implies up and down movements of roughly the same magnitude as the market or the benchmark. A higher beta indicates that the security or portfolio is more volatile than the market or the respective benchmark.
Contagion - refers to the likelihood that significant economic changes in one country will spread to other countries.
The Deutsche Bundesbank - is the central bank of the Federal Republic of Germany.
The Federal Open Market Committee (FOMC) - is a committee within the Federal Reserve System that is charged under United States law with overseeing the nation’s open market operations.
Investment grade - refers to bonds that have a relatively low risk of default, ranging from highest credit quality to good credit quality. Bonds rated below investment grade are considered to have significant speculative characteristics.
The Organization for Economic Co-operation and Development (OECD) - has 34 member nations worldwide, was established in 1961 to promote policies that will improve the economic and social well-being of people around the world.
Sovereign debt - refers to bonds issued by a national government in order to finance the issuing country’s growth. Sovereign debt described as external is denominated in US dollar, while sovereign debt described as local is issued in a foreign currency.
Spread - refers to the yield spread of a bond over the US Treasury yield curve.
The Standard & Poor’s 500 Index (S&P 500) - is free-float capitalization-weighted index of the prices of 500 large-capitalization common stocks actively traded in the US.
It is not possible to invest directly in an index.
| 6 | www.shiplp.com | |
Table of Contents
| Stone Harbor Investment Funds | Disclosure of Fund Expenses | |
| (Unaudited) |
Example. As a shareholder of a Fund, you incur two types of costs: (1) transaction costs, including sales charges (loads) on purchase payments and/or redemption fees (if applicable) and (2) ongoing costs, including management fees and other Fund expenses. The below examples are intended to help you understand your ongoing costs (in dollars) of investing in a Fund and to compare these costs with the ongoing costs of investing in other mutual funds. The examples are based on an investment of $1,000 invested on June 1, 2011 and held until November 30, 2011.
Actual Expenses. The first line of each table below provides information about actual account values and actual expenses. You may use the information in this line, together with the amount you invested, to estimate the expenses that you paid over the period. Simply divide your account value by $1,000 (for example, an $8,600 account value divided by $1,000 = 8.6), then multiply the result by the number in the first line under the heading “Expenses Paid During Period” to estimate the expenses you paid on your account during this period.
Hypothetical Example for Comparison Purposes. The second line of each table below provides information about hypothetical account values and hypothetical expenses based on the Fund’s actual expense ratio and an assumed rate of return of 5% per year before expenses, which is not the Fund’s actual return. The hypothetical account values and expenses may not be used to estimate the actual ending account balance or expenses you paid for the period. You may use this information to compare the ongoing costs of investing in a Fund and other mutual funds. To do so, compare this 5% hypothetical example with the 5% hypothetical examples that appear in the shareholder reports of the other funds.
Please note that the expenses shown in the table are meant to highlight your ongoing costs only and do not reflect transactional costs, such as redemption fees, sales charges (loads) or exchange fees. Therefore, the second line of the table is useful in comparing ongoing costs only, and will not help you determine the relative total costs of owning different funds. In addition, if these transactional costs were included, your costs would have been higher.
Beginning Account Value 06/01/2011 | Ending Account Value 11/30/2011 | Expense Ratio(1) | Expenses Paid During Period(2) | |||||||||||||
STONE HARBOR EMERGING MARKETS DEBT FUND | ||||||||||||||||
Institutional Class | ||||||||||||||||
Actual | $ | 1,000.00 | $ | 1,001.70 | 0.73 | % | $ | 3.65 | ||||||||
Hypothetical (5% return before expenses) | $ | 1,000.00 | $ | 1,021.35 | 0.73 | % | $ | 3.69 | ||||||||
STONE HARBOR HIGH YIELD BOND FUND | ||||||||||||||||
Institutional Class | ||||||||||||||||
Actual | $ | 1,000.00 | $ | 953.40 | 0.55 | % | $ | 2.69 | ||||||||
Hypothetical (5% return before expenses) | $ | 1,000.00 | $ | 1,022.25 | 0.55 | % | $ | 2.78 | ||||||||
STONE HARBOR LOCAL MARKETS FUND | ||||||||||||||||
Institutional Class | ||||||||||||||||
Actual | $ | 1,000.00 | $ | 940.30 | 0.88 | % | $ | 4.27 | ||||||||
Hypothetical (5% return before expenses) | $ | 1,000.00 | $ | 1,020.60 | 0.88 | % | $ | 4.45 | ||||||||
STONE HARBOR EMERGING MARKETS CORPORATE DEBT FUND | ||||||||||||||||
Institutional Class | ||||||||||||||||
Actual | $ | 1,000.00 | $ | 898.10 | 1.00 | % | $ | 4.75 | ||||||||
Hypothetical (5% return before expenses) | $ | 1,000.00 | $ | 1,020.00 | 1.00 | % | $ | 5.05 | ||||||||
| (1) | Annualized, based on the Fund’s most recent fiscal half-year expenses. |
| (2) | Expenses are equal to the Fund’s annualized ratio multiplied by the average account value over the period, multiplied by the number of days in the most recent fiscal half year (183), divided by 366. Note this expense example is typically based on a six-month period. |
Stone Harbor Investment Funds Semi-Annual Report | November 30, 2011 | 7 | |
Table of Contents
| Stone Harbor Investment Funds | Summaries of Portfolio Holdings | |
| November 30, 2011(Unaudited) |
Under SEC Rules, all funds are required to include in their annual and semi-annual shareholder reports a presentation of portfolio holdings in a table, chart or graph by reasonably identifiable categories. The following tables, which present holdings as a percent of total net assets (“TNA”), are provided in compliance with such requirements.
STONE HARBOR EMERGING MARKETS DEBT FUND
Country Breakdown | % of TNA | |||
Brazil | 10.19% | |||
Russia | 9.37% | |||
Mexico | 8.78% | |||
Argentina | 6.11% | |||
Colombia | 6.03% | |||
Venezuela | 5.56% | |||
South Africa | 5.26% | |||
Malaysia | 4.84% | |||
Indonesia | 4.30% | |||
Poland | 4.16% | |||
Ukraine | 3.23% | |||
Turkey | 3.14% | |||
Iraq | 3.12% | |||
Panama | 3.04% | |||
Kazakhstan | 2.50% | |||
Philippines | 2.44% | |||
Uruguay | 2.21% | |||
Qatar | 1.45% | |||
United Arab Emirates | 1.24% | |||
Peru | 1.23% | |||
Lithuania | 1.22% | |||
China | 1.19% | |||
El Salvador | 0.84% | |||
Chile | 0.80% | |||
Croatia | 0.73% | |||
South Korea | 0.47% | |||
Greece | 0.46% | |||
Jamaica | 0.45% | |||
Hong Kong | 0.39% | |||
India | 0.30% | |||
Ghana | 0.28% | |||
Barbados | 0.16% | |||
Dominican Republic | 0.07% | |||
Singapore | 0.05% | |||
Gabon | 0.01% | |||
Total | 95.62% | |||
Money Market Mutual Funds | 0.86% | |||
Other Assets in Excess of Liabilities | 3.52% | |||
Total Net Assets | 100.00% | |||
STONE HARBOR HIGH YIELD BOND FUND
Industry Breakdown | % of TNA | |||
Healthcare | 8.50% | |||
Electric | 6.86% | |||
Media Cable | 5.56% | |||
Metals/Mining/Steel | 5.33% | |||
Exploration & Production | 4.95% | |||
Technology | 4.80% | |||
Gaming | 4.77% | |||
Wirelines | 4.77% | |||
Drillers/Services | 4.59% | |||
Services Other | 3.93% | |||
Food & Beverage | 3.76% | |||
Containers/Packaging | 3.68% | |||
Paper/Forest Products | 3.28% | |||
Gas Pipelines | 2.93% | |||
Media Other | 2.85% | |||
Chemicals | 2.73% | |||
Retail Non Food/Drug | 2.51% | |||
Wireless | 2.14% | |||
Leisure | 2.09% | |||
Publishing/Printing | 1.74% | |||
Automotive | 1.60% | |||
Aerospace/Defense | 1.48% | |||
Building Products | 1.22% | |||
Industrial Other | 1.13% | |||
Retail Food/Drug | 1.12% | |||
Gas Distributors | 1.07% | |||
Banking | 0.97% | |||
Consumer Products | 0.91% | |||
Textile/Apparel | 0.87% | |||
Construction Machinery | 0.81% | |||
Non Captive Finance | 0.70% | |||
Financial Other | 0.48% | |||
Refining | 0.42% | |||
Transportation - Non Air/Rail | 0.41% | |||
Satellite | 0.29% | |||
Property & Casualty Insurance | 0.27% | |||
Pharmaceuticals | 0.14% | |||
Railroads | 0.06% | |||
Life | 0.05% | |||
Airlines | 0.03% | |||
Lodging | 0.01% | |||
Restaurants | 0.00% | * | ||
Total | 95.81% | |||
Money Market Mutual Funds | 2.04% | |||
Other Assets in Excess of Liabilities | 2.15% | |||
Total Net Assets | 100.00% | |||
*Less Than 0.005% of net assets.
| 8 | www.shiplp.com | |
Table of Contents
| Stone Harbor Investment Funds | Summaries of Portfolio Holdings | |
| November 30, 2011(Unaudited) |
STONE HARBOR LOCAL MARKETS FUND
Country Breakdown | % of TNA | |||
Brazil | 11.31% | |||
Malaysia | 9.94% | |||
South Africa | 9.21% | |||
Mexico | 9.17% | |||
Indonesia | 8.84% | |||
Colombia | 5.58% | |||
Turkey | 4.93% | |||
Poland | 4.74% | |||
Thailand | 4.66% | |||
Russia | 3.96% | |||
European Union | 3.12% | |||
Hungary | 2.11% | |||
Argentina | 0.42% | |||
Philippines | 0.13% | |||
Chile | 0.10% | |||
Total | 78.22% | |||
Money Market Mutual Funds | 6.88% | |||
Other Assets in Excess of Liabilities | 14.90% | |||
Total Net Assets | 100.00% | |||
STONE HARBOR EMERGING MARKETS CORPORATE DEBT FUND
Country Breakdown | % of TNA | |||
Brazil | 19.87% | |||
Russia | 11.20% | |||
United Arab Emirates | 7.37% | |||
Mexico | 6.64% | |||
China | 6.56% | |||
Indonesia | 6.23% | |||
Argentina | 6.14% | |||
South Africa | 4.31% | |||
Jamaica | 3.73% | |||
Hong Kong | 3.72% | |||
Ukraine | 3.65% | |||
Peru | 3.17% | |||
Kazakhstan | 3.08% | |||
India | 2.92% | |||
Qatar | 2.67% | |||
Barbados | 1.54% | |||
Colombia | 1.50% | |||
Turkey | 1.50% | |||
Dominican Republic | 1.03% | |||
Singapore | 0.36% | |||
Total | 97.19% | |||
Money Market Mutual Funds | 0.67% | |||
Other Assets in Excess of Liabilities | 2.14% | |||
Total Net Assets | 100.00% | |||
Stone Harbor Investment Funds Semi-Annual Report | November 30, 2011 | 9 | |
Table of Contents
| Stone Harbor Investment Funds | Growth of $10,000 Investment | |
| November 30, 2011(Unaudited) |
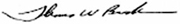
STONE HARBOR EMERGING MARKETS DEBT FUND
Comparison of Change in Value of $10,000 Investment in Stone Harbor Emerging Markets Debt Fund and the JP Morgan Emerging Market Bond Global Diversified Index.
The JP Morgan EMBI Global Diversified Index limits the weights of those index countries with larger debt stocks by only including specified portions of these countries’ eligible current face amounts outstanding. The countries covered in the EMBI Global Diversified are identical to those covered by the EMBI Global.
Average Annual Total Returns
| 1 Year | 3 Years | Since Inception | Inception Date | |||||
Stone Harbor Emerging Markets Debt Fund | 5.45% | 22.83% | 10.21% | 08/16/07 | ||||
JP Morgan EMBI Global Diversified Index | 5.67% | 18.45% | 9.26% |
The performance data quoted represents past performance and does not guarantee future results. Current performance may be lower or higher than the performance quoted. Average annual total returns reflect the reinvestment of dividends and capital gains distributions and include all fee waivers and expense reimbursements. Without the fee waivers and expense reimbursements, total return figures would have been lower. The performance data quoted does not reflect the deduction of taxes that a shareholder would pay on Fund distributions or the redemption of Fund shares. Investment return and principal value will vary, and shares, when redeemed, may be worth more or less than their original cost. Index returns do not include the effects of sales charges, management fees or transaction costs. It is not possible to invest directly in an index.
| 10 | www.shiplp.com | |
Table of Contents
| Stone Harbor Investment Funds | Growth of $10,000 Investment | |
| November 30, 2011(Unaudited) |
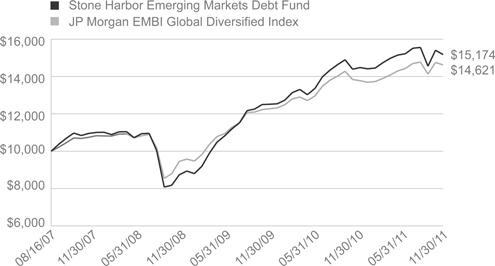
STONE HARBOR HIGH YIELD BOND FUND
Comparison of Change in Value of $10,000 Investment in Stone Harbor High Yield Bond Fund and the Citigroup High Yield Market Capped Index.
The Citigroup High Yield Market Capped Index represents a modified version of the High Yield Market Index by delaying the entry of “fallen angel” issues (corporate or municipal bonds that were investment-grade when issued but have since been downgraded) and capping the par value of individual issuers at US $5 billion par amount outstanding.
Average Annual Total Returns
| 1 Year | 3 Years | Since Inception | Inception Date | |||||||||||||
Stone Harbor High Yield Bond Fund | 2.82% | 18.46% | 6.40% | 08/16/07 | ||||||||||||
Citigroup HY Market Capped Index | 4.77% | 23.65% | 7.66% |
The performance data quoted represents past performance and does not guarantee future results. Current performance may be lower or higher than the performance quoted. Average annual total returns reflect the reinvestment of dividends and capital gains distributions and include all fee waivers and expense reimbursements. Without the fee waivers and expense reimbursements, total return figures would have been lower. The performance data quoted does not reflect the deduction of taxes that a shareholder would pay on Fund distributions or the redemption of Fund shares. Investment return and principal value will vary, and shares, when redeemed, may be worth more or less than their original cost. Index returns do not include the effects of sales charges, management fees or transaction costs. It is not possible to invest directly in an index.
Stone Harbor Investment Funds Semi-Annual Report | November 30, 2011 | 11 | |
Table of Contents
| Stone Harbor Investment Funds | Growth of $10,000 Investment | |
| November 30, 2011(Unaudited) |
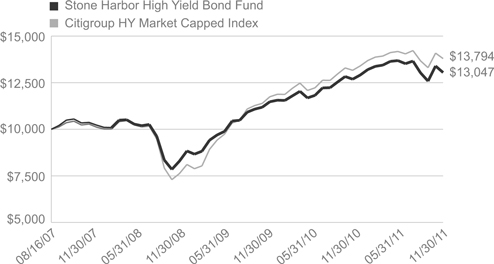
STONE HARBOR LOCAL MARKETS FUND
Comparison of Change in Value of $10,000 Investment in Stone Harbor Local Markets Fund and the JP Morgan GBI-EM Global Diversified Index.
The JP Morgan GBI-EM Global Diversified Index consists of regularly traded, liquid fixed-rate, domestic currency government bonds to which international investors can gain exposure. The weightings among the countries are more evenly distributed within this index.
Average Annual Total Return
| 1 Year | Since Inception | Inception Date | ||||
Stone Harbor Local Markets Fund | 2.00% | 6.84% | 06/30/10 | |||
JP Morgan GBI-EM Global Diversified Index | 2.84% | 8.04% |
The performance data quoted represents past performance and does not guarantee future results. Current performance may be lower or higher than the performance quoted. Average annual total returns reflect the reinvestment of dividends and capital gains distributions and include all fee waivers and expense reimbursements. Without the fee waivers and expense reimbursements, total return figures would have been lower. The performance data quoted does not reflect the deduction of taxes that a shareholder would pay on Fund distributions or the redemption of Fund shares. Investment return and principal value will vary, and shares, when redeemed, may be worth more or less than their original cost. Index returns do not include the effects of sales charges, management fees or transaction costs. It is not possible to invest directly in an index.
| 12 | www.shiplp.com | |
Table of Contents
| Stone Harbor Investment Funds | Growth of $10,000 Investment | |
| November 30, 2011(Unaudited) |
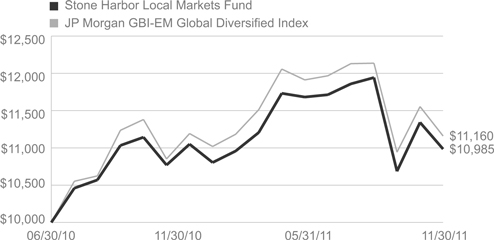
STONE HARBOR EMERGING MARKETS CORPORATE DEBT FUND
Comparison of Change in Value of $10,000 Investment in Stone Harbor Emerging Market Corporate Debt Fund and the JP Morgan CEMBI Broad Diversified.
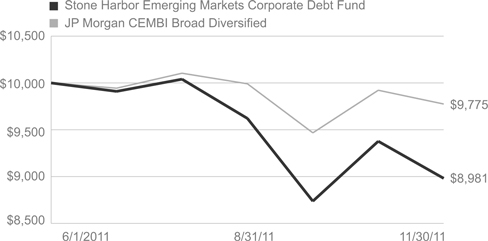
The JP Morgan CEMBI Broad is a market capitalization weighted index that tracks total returns of US dollar-denominated debt instruments issued by corporate entities in Emerging Markets countries. The CEMBI Broad Diversified limits the current face amount allocations of the bonds in the CEMBI Broad by constraining the total face amount outstanding for countries with larger debt stocks.
Cumulative Returns
| 1 Month | 3 Months | Since Inception | Inception Date | |||||||||||||
Stone Harbor Emerging Markets Corporate Debt Fund | -4.22% | -6.65% | -10.19% | 06/01/11 | ||||||||||||
JP Morgan CEMBI Broad Diversified | -1.52% | -2.18% | -2.25% |
The performance data quoted represents past performance and does not guarantee future results. Current performance may be lower or higher than the performance quoted. Average annual total returns reflect the reinvestment of dividends and capital gains distributions and include all fee waivers and expense reimbursements. Without the fee waivers and expense reimbursements, total return figures would have been lower. The performance data quoted does not reflect the deduction of taxes that a shareholder would pay on Fund distributions or the redemption of Fund shares. Investment return and principal value will vary, and shares, when redeemed, may be worth more or less than their original cost. Index returns do not include the effects of sales charges, management fees or transaction costs. It is not possible to invest directly in an index.
Stone Harbor Investment Funds Semi-Annual Report | November 30, 2011 | 13 | |
Table of Contents
| Stone Harbor Emerging Markets Debt Fund | Statements of Investments | |
| November 30, 2011(Unaudited) |
Currency | Rate | Maturity Date | Principal Amount * | Market Value (Expressed in U.S. $) | |||||||||||||||
SOVEREIGN DEBT OBLIGATIONS - 63.99% | |||||||||||||||||||
Argentina - 5.22% | |||||||||||||||||||
Republic of Argentina: | |||||||||||||||||||
| USD | 7.000 | % | 04/17/2017 | 13,527,163 | $ | 10,594,023 | |||||||||||||
| USD | 0.000 | % | 03/31/2023 | 184,000 | 114,080 | (1) | |||||||||||||
| USD | 6.000 | % | 03/31/2023 | 480,000 | 333,600 | (1) | |||||||||||||
| ARS | 5.830 | % | 12/31/2033 | 21,968,850 | 4,605,224 | (2) | |||||||||||||
| EUR | 7.820 | % | 12/31/2033 | 12,289,435 | 9,969,963 | (2) | |||||||||||||
| EUR | 7.820 | % | 12/31/2033 | 19,762,604 | 15,800,311 | (2) | |||||||||||||
| USD | 8.280 | % | 12/31/2033 | 2,496,242 | 1,806,655 | ||||||||||||||
| USD | 8.280 | % | 12/31/2033 | 7,962,772 | 5,573,941 | ||||||||||||||
| EUR | 0.000 | % | 12/15/2035 | 20,252,433 | 2,664,185 | (2) | |||||||||||||
|
| ||||||||||||||||||
| 51,461,982 | |||||||||||||||||||
|
| ||||||||||||||||||
Brazil - 4.40% | |||||||||||||||||||
Nota Do Tesouro Nacional: | |||||||||||||||||||
| BRL | 10.000 | % | 01/01/2014 | | 275,000 152,077 | | |||||||||||||
| BRL | 10.000 | % | 01/01/2021 | 6,205,000 | 3,230,585 | ||||||||||||||
Republic of Brazil: | |||||||||||||||||||
| USD | 5.875 | % | 01/15/2019 | 597,000 | 696,998 | ||||||||||||||
| USD | 8.875 | % | 10/14/2019 | 100,000 | 138,000 | ||||||||||||||
| USD | 4.875 | % | 01/22/2021 | 17,606,000 | 19,520,652 | ||||||||||||||
| USD | 8.750 | % | 02/04/2025 | 3,931,000 | 5,817,880 | ||||||||||||||
| USD | 10.125 | % | 05/15/2027 | 32,000 | 51,880 | ||||||||||||||
| USD | 7.125 | % | 01/20/2037 | 7,391,000 | 9,922,418 | ||||||||||||||
| USD | 5.625 | % | 01/07/2041 | 3,321,000 | 3,766,844 | ||||||||||||||
|
| ||||||||||||||||||
| 43,297,334 | |||||||||||||||||||
|
| ||||||||||||||||||
Colombia - 5.04% | |||||||||||||||||||
Bogota Distrio Capital | COP | 9.750 | % | 07/26/2028 | 7,800,000,000 | 5,466,463 | (3) | ||||||||||||
Republic of Colombia: | |||||||||||||||||||
| USD | 7.375 | % | 01/27/2017 | 7,134,000 | 8,596,470 | ||||||||||||||
| USD | 8.125 | % | 05/21/2024 | 25,000 | 34,250 | ||||||||||||||
| USD | 8.375 | % | 02/15/2027 | 25,000 | 31,500 | ||||||||||||||
| COP | 9.850 | % | 06/28/2027 | 8,375,000,000 | 6,092,750 | ||||||||||||||
| USD | 7.375 | % | 09/18/2037 | 20,914,000 | 28,443,040 | ||||||||||||||
| USD | 6.125 | % | 01/18/2041 | 790,000 | 942,075 | ||||||||||||||
|
| ||||||||||||||||||
| 49,606,548 | |||||||||||||||||||
|
| ||||||||||||||||||
Croatia - 0.73% | |||||||||||||||||||
Croatian Government | USD | 6.375 | % | 03/24/2021 | 8,057,000 | 7,190,873 | (4) | ||||||||||||
|
| ||||||||||||||||||
El Salvador - 0.84% | |||||||||||||||||||
Republic of El Salvador: | |||||||||||||||||||
| USD | 7.375 | % | 12/01/2019 | 220,000 | 240,900 | (4) | |||||||||||||
| USD | 7.375 | % | 12/01/2019 | 2,068,000 | 2,264,460 | (3) | |||||||||||||
| USD | 7.750 | % | 01/24/2023 | 15,000 | 16,425 | (3) | |||||||||||||
| USD | 8.250 | % | 04/10/2032 | 1,000,000 | 1,097,500 | (3) | |||||||||||||
| USD | 7.650 | % | 06/15/2035 | 4,495,000 | 4,652,325 | (3) | |||||||||||||
|
| ||||||||||||||||||
| 8,271,610 | |||||||||||||||||||
|
| ||||||||||||||||||
| See Notes to Financial Statements. | ||
| 14 | www.shiplp.com | |
Table of Contents
Stone Harbor Emerging Markets Debt Fund | Statements of Investments | |
| November 30, 2011(Unaudited) |
| Currency | Rate | Maturity Date | Principal Amount * | Market Value (Expressed in U.S. $) | ||||||||||||||
Gabon - 0.01% | ||||||||||||||||||
Republic of Gabon | USD | 8.200 | % | 12/12/2017 | 50,000 | $ | 57,750 | (4) | ||||||||||
|
| |||||||||||||||||
Ghana - 0.28% | ||||||||||||||||||
Republic of Ghana | USD | 8.500 | % | 10/04/2017 | 2,498,000 | 2,766,535 | (3) | |||||||||||
|
| |||||||||||||||||
Greece - 0.46% | ||||||||||||||||||
Hellenic Republic Government Bond: | ||||||||||||||||||
| EUR | 4.500 | % | 09/20/2037 | 7,832,000 | 2,580,463 | |||||||||||||
| EUR | 4.600 | % | 09/20/2040 | 5,750,000 | 1,920,975 | |||||||||||||
|
| |||||||||||||||||
| 4,501,438 | ||||||||||||||||||
|
| |||||||||||||||||
Indonesia - 3.00% | ||||||||||||||||||
Republic of Indonesia: | ||||||||||||||||||
| USD | 6.875 | % | 01/17/2018 | 1,278,000 | 1,498,455 | (3) | ||||||||||||
| USD | 11.625 | % | 03/04/2019 | 2,170,000 | 3,195,325 | (4) | ||||||||||||
| USD | 11.625 | % | 03/04/2019 | 8,553,000 | 12,594,292 | (3) | ||||||||||||
| USD | 5.875 | % | 03/13/2020 | 2,977,000 | 3,334,240 | (3) | ||||||||||||
| USD | 6.625 | % | 02/17/2037 | 2,050,000 | 2,480,500 | (3) | ||||||||||||
| USD | 7.750 | % | 01/17/2038 | 4,807,000 | 6,465,415 | (3) | ||||||||||||
|
| |||||||||||||||||
| 29,568,227 | ||||||||||||||||||
|
| |||||||||||||||||
Iraq - 2.65% | ||||||||||||||||||
Republic of Iraq | USD | 5.800 | % | 01/15/2028 | 32,012,000 | 26,129,795 | (3) | |||||||||||
|
| |||||||||||||||||
Lithuania - 1.22% | ||||||||||||||||||
Republic of Lithuania: | ||||||||||||||||||
| USD | 7.375 | % | 02/11/2020 | 503,000 | 538,210 | (3) | ||||||||||||
| USD | 6.125 | % | 03/09/2021 | 11,853,000 | 11,497,410 | (3) | ||||||||||||
|
| |||||||||||||||||
| 12,035,620 | ||||||||||||||||||
|
| |||||||||||||||||
Malaysia - 1.60% | ||||||||||||||||||
Malaysian Government: | ||||||||||||||||||
| MYR | 5.094 | % | 04/30/2014 | 12,240,000 | 4,032,827 | |||||||||||||
| MYR | 3.741 | % | 02/27/2015 | 595,000 | 189,722 | |||||||||||||
| MYR | 3.835 | % | 08/12/2015 | 30,204,000 | 9,697,399 | |||||||||||||
| MYR | 4.262 | % | 09/15/2016 | 5,600,000 | 1,837,508 | |||||||||||||
|
| |||||||||||||||||
| 15,757,456 | ||||||||||||||||||
|
| |||||||||||||||||
Mexico - 6.52% | ||||||||||||||||||
Mexican Bonos: | ||||||||||||||||||
| MXN | 7.750 | % | 12/14/2017 | 34,840,000 | 2,860,819 | |||||||||||||
| MXN | 6.500 | % | 06/10/2021 | 175,900,000 | 13,137,569 | |||||||||||||
| MXN | 7.500 | % | 06/03/2027 | 10,000,000 | 765,639 | |||||||||||||
| MXN | 8.500 | % | 05/31/2029 | 22,920,000 | 1,895,022 | |||||||||||||
| MXN | 7.750 | % | 05/29/2031 | 35,900,000 | 2,740,184 | |||||||||||||
| MXN | 8.500 | % | 11/18/2038 | 99,020,000 | 8,033,439 | |||||||||||||
| See Notes to Financial Statements. | ||
Stone Harbor Investment Funds Semi-Annual Report | November 30, 2011 | 15 | |
Table of Contents
| Stone Harbor Emerging Markets Debt Fund | Statements of Investments | |
| November 30, 2011(Unaudited) |
| Currency | Rate | Maturity Date | Principal Amount * | Market Value (Expressed in U.S. $) | ||||||||||||||
United Mexican States: | ||||||||||||||||||
| USD | 5.125 | % | 01/15/2020 | 8,292,000 | $ | 9,289,113 | ||||||||||||
| USD | 8.000 | % | 09/24/2022 | 2,012,000 | 2,786,620 | |||||||||||||
| USD | 8.300 | % | 08/15/2031 | 5,417,000 | 7,976,533 | |||||||||||||
| USD | 7.500 | % | 04/08/2033 | 2,442,000 | 3,363,855 | |||||||||||||
| USD | 6.050 | % | 01/11/2040 | 3,288,000 | 3,904,500 | |||||||||||||
| USD | 5.750 | % | 10/12/2110 | 7,270,000 | 7,488,100 | |||||||||||||
|
| |||||||||||||||||
| 64,241,393 | ||||||||||||||||||
|
| |||||||||||||||||
Panama - 3.04% | ||||||||||||||||||
Republic of Panama: | ||||||||||||||||||
| USD | 5.200 | % | 01/30/2020 | 7,602,000 | 8,590,260 | |||||||||||||
| USD | 9.375 | % | 01/16/2023 | 25,000 | 34,750 | |||||||||||||
| USD | 7.125 | % | 01/29/2026 | 600,000 | 780,000 | |||||||||||||
| USD | 8.875 | % | 09/30/2027 | 4,255,000 | 6,339,950 | |||||||||||||
| USD | 9.375 | % | 04/01/2029 | 8,883,000 | 14,035,140 | |||||||||||||
| USD | 6.700 | % | 01/26/2036 | 100,000 | 130,000 | |||||||||||||
|
| |||||||||||||||||
| 29,910,100 | ||||||||||||||||||
|
| |||||||||||||||||
Peru - 0.90% | ||||||||||||||||||
Republic of Peru | USD | 8.750 | % | 11/21/2033 | 5,990,000 | 8,835,250 | ||||||||||||
|
| |||||||||||||||||
Philippines - 2.44% | ||||||||||||||||||
Republic of Philippines: | ||||||||||||||||||
| PHP | 4.950 | % | 01/15/2021 | 26,000,000 | 590,096 | |||||||||||||
| USD | 10.625 | % | 03/16/2025 | 1,109,000 | 1,754,993 | |||||||||||||
| USD | 5.500 | % | 03/30/2026 | 2,002,000 | 2,229,727 | |||||||||||||
| USD | 9.500 | % | 02/02/2030 | 8,226,000 | 12,606,345 | |||||||||||||
| USD | 7.750 | % | 01/14/2031 | 4,590,000 | 6,150,600 | |||||||||||||
| USD | 6.375 | % | 01/15/2032 | 520,000 | 616,200 | |||||||||||||
| USD | 6.375 | % | 10/23/2034 | 116,000 | 139,200 | |||||||||||||
|
| |||||||||||||||||
| 24,087,161 | ||||||||||||||||||
|
| |||||||||||||||||
Poland - 4.16% | ||||||||||||||||||
Republic of Poland: | ||||||||||||||||||
| USD | 6.375 | % | 07/15/2019 | 20,916,000 | 22,929,165 | |||||||||||||
| EUR | 4.000 | % | 03/23/2021 | 665,000 | 794,277 | |||||||||||||
| USD | 5.125 | % | 04/21/2021 | 10,093,000 | 10,111,924 | |||||||||||||
| USD | 5.000 | % | 03/23/2022 | 7,232,000 | 7,096,400 | |||||||||||||
|
| |||||||||||||||||
| 40,931,766 | ||||||||||||||||||
|
| |||||||||||||||||
Qatar - 0.95% | ||||||||||||||||||
State of Qatar: | ||||||||||||||||||
| USD | 6.550 | % | 04/09/2019 | 4,477,000 | 5,282,860 | (3) | ||||||||||||
| USD | 5.250 | % | 01/20/2020 | 3,730,000 | 4,032,130 | (3) | ||||||||||||
|
| |||||||||||||||||
| 9,314,990 | ||||||||||||||||||
|
| |||||||||||||||||
| See Notes to Financial Statements. | ||
| 16 | www.shiplp.com | |
Table of Contents
| Stone Harbor Emerging Markets Debt Fund | Statements of Investments | |
| November 30, 2011 (Unaudited) |
| Currency | Rate | Maturity Date | Principal Amount * | Market Value (Expressed in U.S. $) | ||||||||||||||
Russia - 7.66% | ||||||||||||||||||
Russian Federation: | ||||||||||||||||||
| USD | 11.000 | % | 07/24/2018 | 437,000 | $ | 604,152 | (3) | |||||||||||
| USD | 5.000 | % | 04/29/2020 | 500,000 | 521,563 | (3) | ||||||||||||
| USD | 12.750 | % | 06/24/2028 | 5,031,000 | 8,766,518 | (3) | ||||||||||||
| USD | 7.500 | % | 03/31/2030 | 55,541,942 | 65,608,919 | (3)(5) | ||||||||||||
|
| |||||||||||||||||
| 75,501,152 | ||||||||||||||||||
|
| |||||||||||||||||
South Africa - 4.60% | ||||||||||||||||||
Republic of South Africa: | ||||||||||||||||||
| USD | 8.500 | % | 06/23/2017 | 45,000 | 54,675 | |||||||||||||
| USD | 6.875 | % | 05/27/2019 | 3,141,000 | 3,773,126 | |||||||||||||
| USD | 5.500 | % | 03/09/2020 | 7,373,000 | 8,220,895 | |||||||||||||
| ZAR | 6.750 | % | 03/31/2021 | 116,660,000 | 13,281,257 | |||||||||||||
| USD | 5.875 | % | 05/30/2022 | 10,515,000 | 12,039,675 | |||||||||||||
| ZAR | 10.500 | % | 12/21/2026 | 31,270,000 | 4,507,969 | |||||||||||||
| USD | 6.250 | % | 03/08/2041 | 3,031,000 | 3,478,073 | |||||||||||||
|
| |||||||||||||||||
| 45,355,670 | ||||||||||||||||||
|
| |||||||||||||||||
Turkey - 2.90% | ||||||||||||||||||
Republic of Turkey: | ||||||||||||||||||
| USD | 7.000 | % | 09/26/2016 | 159,000 | 176,689 | |||||||||||||
| USD | 7.000 | % | 03/11/2019 | 135,000 | 151,031 | |||||||||||||
| USD | 7.500 | % | 11/07/2019 | 15,038,000 | 17,312,497 | |||||||||||||
| USD | 7.000 | % | 06/05/2020 | 372,000 | 416,175 | |||||||||||||
| USD | 5.125 | % | 03/25/2022 | 4,992,000 | 4,842,240 | |||||||||||||
| USD | 7.375 | % | 02/05/2025 | 1,820,000 | 2,102,100 | |||||||||||||
| USD | 6.875 | % | 03/17/2036 | 2,000,000 | 2,152,500 | |||||||||||||
| USD | 7.250 | % | 03/05/2038 | 1,285,000 | 1,444,019 | |||||||||||||
|
| |||||||||||||||||
| 28,597,251 | ||||||||||||||||||
|
| |||||||||||||||||
Ukraine - 1.91% | ||||||||||||||||||
Ukraine Government: | ||||||||||||||||||
| USD | 6.385 | % | 06/26/2012 | 6,505,000 | 6,391,162 | (3) | ||||||||||||
| USD | 7.650 | % | 06/11/2013 | 2,386,000 | 2,308,455 | (3) | ||||||||||||
| USD | 6.875 | % | 09/23/2015 | 1,723,000 | 1,580,853 | (4) | ||||||||||||
| USD | 6.250 | % | 06/17/2016 | 2,600,000 | 2,265,250 | (4) | ||||||||||||
| USD | 6.750 | % | 11/14/2017 | 4,150,000 | 3,589,750 | (3) | ||||||||||||
| USD | 7.750 | % | 09/23/2020 | 3,094,000 | 2,707,250 | (3) | ||||||||||||
|
| |||||||||||||||||
| 18,842,720 | ||||||||||||||||||
|
| |||||||||||||||||
Uruguay - 2.21% | ||||||||||||||||||
Republic of Uruguay: | ||||||||||||||||||
| USD | 9.250 | % | 05/17/2017 | 3,467,000 | 4,541,770 | |||||||||||||
| USD | 8.000 | % | 11/18/2022 | 5,310,497 | 7,116,066 | |||||||||||||
| USD | 6.875 | % | 09/28/2025 | 1,448,650 | 1,847,029 | |||||||||||||
| USD | 7.875 | % | 01/15/2033 | 1,390,800 | 1,891,488 | (6) | ||||||||||||
| USD | 7.625 | % | 03/21/2036 | 4,768,176 | 6,389,356 | |||||||||||||
|
| |||||||||||||||||
| 21,785,709 | ||||||||||||||||||
|
| |||||||||||||||||
| See Notes to Financial Statements. | ||
Stone Harbor Investment Funds Semi-Annual Report | November 30, 2011 | 17 | |
Table of Contents
| Stone Harbor Emerging Markets Debt Fund | Statements of Investments | |
| November 30, 2011 (Unaudited) |
| Currency | Rate | Maturity Date | Principal Amount * | Market Value (Expressed in U.S. $) | ||||||||||||||
Venezuela - 1.25% | ||||||||||||||||||
Republic of Venezuela: | ||||||||||||||||||
| USD | 13.625 | % | 08/15/2018 | 10,000 | $ | 9,700 | ||||||||||||
| USD | 13.625 | % | 08/15/2018 | 1,669,000 | 1,552,170 | (3) | ||||||||||||
| USD | 7.750 | % | 10/13/2019 | 4,611,000 | 3,216,172 | (3) | ||||||||||||
| USD | 12.750 | % | 08/23/2022 | 8,552,400 | 7,526,112 | (3) | ||||||||||||
|
| |||||||||||||||||
| 12,304,154 | ||||||||||||||||||
|
| |||||||||||||||||
TOTAL SOVEREIGN DEBT OBLIGATIONS | 630,352,484 | |||||||||||||||||
|
| |||||||||||||||||
(Cost $624,846,681) | ||||||||||||||||||
BANK LOANS - 0.50%(7) | ||||||||||||||||||
Brazil - 0.09% | ||||||||||||||||||
Virgolino de Oliveira - GVO Loan | USD | 5.273 | % | 03/11/2015 | 941,176 | 905,882 | (2) | |||||||||||
|
| |||||||||||||||||
Indonesia - 0.41% | ||||||||||||||||||
PT Bumi Resources | USD | 11.250 | % | 08/07/2013 | 1,337,000 | 1,358,392 | (2) | |||||||||||
PT Bumi Tranche A | USD | 12.000 | % | 03/02/2012 | 1,777,960 | 1,511,266 | (16) | |||||||||||
PT Bumi Tranche B | USD | 12.000 | % | 03/02/2012 | 1,419,040 | 1,206,184 | (16) | |||||||||||
|
| |||||||||||||||||
| 4,075,842 | ||||||||||||||||||
|
| |||||||||||||||||
TOTAL BANK LOANS | 4,981,724 | |||||||||||||||||
|
| |||||||||||||||||
(Cost $5,466,624) | ||||||||||||||||||
CONVERTIBLE CORPORATE BONDS - 0.02% | ||||||||||||||||||
India - 0.02% | ||||||||||||||||||
Vedanta Resources Jersey II Ltd. | USD | 4.000 | % | 03/30/2017 | 200,000 | 169,000 | ||||||||||||
|
| |||||||||||||||||
TOTAL CONVERTIBLE CORPORATE BONDS | 169,000 | |||||||||||||||||
|
| |||||||||||||||||
(Cost $167,187) | ||||||||||||||||||
CORPORATE BONDS - 26.32% | ||||||||||||||||||
Argentina - 0.39% | ||||||||||||||||||
Capex SA | USD | 10.000 | % | 03/10/2018 | 1,642,000 | 1,338,230 | (4) | |||||||||||
Empresa Distribuidora Y Comercializadora Norte: | ||||||||||||||||||
| USD | 9.750 | % | 10/25/2022 | 500,000 | 410,000 | (3) | ||||||||||||
| USD | 9.750 | % | 10/25/2022 | 1,362,000 | 1,116,840 | (4) | ||||||||||||
Inversiones y Representaciones SA: | ||||||||||||||||||
| USD | 11.500 | % | 07/20/2020 | 100,000 | 102,119 | (3) | ||||||||||||
| USD | 11.500 | % | 07/20/2020 | 636,000 | 648,524 | (4) | ||||||||||||
Tarjeta Naranja SA | USD | 9.000 | % | 01/28/2017 | 209,000 | 201,678 | (4) | |||||||||||
|
| |||||||||||||||||
| 3,817,391 | ||||||||||||||||||
|
| |||||||||||||||||
Barbados - 0.16% | ||||||||||||||||||
Columbus International, Inc. | USD | 11.500 | % | 11/20/2014 | 1,500,000 | 1,560,000 | (3) | |||||||||||
|
| |||||||||||||||||
Brazil - 3.19% | ||||||||||||||||||
Banco Cruzeiro do Sul SA: | ||||||||||||||||||
| USD | 8.875 | % | 09/22/2020 | 984,000 | 669,120 | (4) | ||||||||||||
| USD | 8.875 | % | 09/22/2020 | 1,100,000 | 748,000 | (3) | ||||||||||||
| See Notes to Financial Statements. | ||
| 18 | www.shiplp.com | |
Table of Contents
| Stone Harbor Emerging Markets Debt Fund | Statements of Investments | |
| November 30, 2011 (Unaudited) |
| Currency | Rate | Maturity Date | Principal Amount * | Market Value (Expressed in U.S. $) | ||||||||||||||
BM&FBovespa SA: | ||||||||||||||||||
| USD | 5.500 | % | 07/16/2020 | 842,000 | $ | 863,050 | (4) | |||||||||||
| USD | 5.500 | % | 07/16/2020 | 1,400,000 | 1,435,000 | (3) | ||||||||||||
BR Malls International Finance Ltd.: | ||||||||||||||||||
| USD | 8.500 | % | 01/21/2049 | 260,000 | 269,750 | (3) | ||||||||||||
| USD | 8.500 | % | 01/21/2049 | 482,000 | 500,075 | (4) | ||||||||||||
BR Properties SA: | ||||||||||||||||||
| USD | 9.000 | % | 10/07/2015 | 310,000 | 317,750 | (4) | ||||||||||||
| USD | 9.000 | % | 10/07/2049 | 135,000 | 138,375 | (3) | ||||||||||||
General Shopping Finance Ltd.: | ||||||||||||||||||
| USD | 10.000 | % | 11/09/2015 | 1,824,000 | 1,842,240 | (4) | ||||||||||||
| USD | 10.000 | % | 11/09/2049 | 246,000 | 248,460 | (3) | ||||||||||||
Hypermarcas SA | USD | 6.500 | % | 04/20/2021 | 3,349,000 | 2,947,120 | (4) | |||||||||||
Minerva Overseas II Ltd.: | ||||||||||||||||||
| USD | 10.875 | % | 11/15/2019 | 538,000 | 468,060 | (3) | ||||||||||||
| USD | 10.875 | % | 11/15/2019 | 633,000 | 550,710 | (4) | ||||||||||||
Mirabela Nickel Ltd. | USD | 8.750 | % | 04/15/2018 | 392,000 | 350,840 | (4) | |||||||||||
NET Servicos de Comunicacao SA | USD | 7.500 | % | 01/27/2020 | 3,102,000 | 3,551,790 | ||||||||||||
Odebrecht Drilling Norbe VIII/IX Ltd.: | ||||||||||||||||||
| USD | 6.350 | % | 06/30/2021 | 1,650,000 | 1,691,250 | (3) | ||||||||||||
| USD | 6.350 | % | 06/30/2021 | 1,665,000 | 1,706,625 | (4) | ||||||||||||
Odebrecht Finance Ltd. | USD | 7.000 | % | 04/21/2020 | 350,000 | 375,375 | (3) | |||||||||||
OGX Petroleo e Gas Participacoes SA: | ||||||||||||||||||
| USD | 8.500 | % | 06/01/2018 | 500,000 | 480,000 | (3) | ||||||||||||
| USD | 8.500 | % | 06/01/2018 | 3,732,000 | 3,582,720 | (4) | ||||||||||||
Petrobras International Finance Co. | USD | 5.375 | % | 01/27/2021 | 430,000 | 439,419 | ||||||||||||
QGOG Atlantic / Alaskan Rigs Ltd.: | ||||||||||||||||||
| USD | 5.250 | % | 07/30/2018 | 200,000 | 196,500 | (3) | ||||||||||||
| USD | 5.250 | % | 07/30/2018 | 4,006,000 | 3,935,895 | (4) | ||||||||||||
Telemar Norte Leste SA: | ||||||||||||||||||
| USD | 5.500 | % | 10/23/2020 | 1,006,000 | 990,910 | (3) | ||||||||||||
| USD | 5.500 | % | 10/23/2020 | 2,312,000 | 2,277,320 | (4) | ||||||||||||
Virgolino de Oliveira Finance Ltd. | USD | 10.500 | % | 01/28/2018 | 617,000 | 595,405 | (3) | |||||||||||
Votorantim Cimentos SA | USD | 7.250 | % | 04/05/2041 | 300,000 | 293,250 | (4) | |||||||||||
|
| |||||||||||||||||
| 31,465,009 | ||||||||||||||||||
|
| |||||||||||||||||
Chile - 0.80% | ||||||||||||||||||
Cencosud SA | USD | 5.500 | % | 01/20/2021 | 2,000,000 | 2,042,852 | (4) | |||||||||||
Codelco, Inc.: | ||||||||||||||||||
| USD | 7.500 | % | 01/15/2019 | 450,000 | 570,501 | (3) | ||||||||||||
| USD | 6.150 | % | 10/24/2036 | 4,295,000 | 5,302,637 | (3) | ||||||||||||
|
| |||||||||||||||||
| 7,915,990 | ||||||||||||||||||
|
| |||||||||||||||||
China - 1.19% | ||||||||||||||||||
China Liansu Group Holdings Ltd. | USD | 7.875 | % | 05/13/2016 | 1,468,000 | 1,218,440 | (4) | |||||||||||
Evergrande Real Estate Group Ltd.: | ||||||||||||||||||
| USD | 13.000 | % | 01/27/2015 | 106,000 | 82,150 | (4) | ||||||||||||
| USD | 13.000 | % | 01/27/2015 | 666,000 | 516,150 | (3) | ||||||||||||
Kaisa Group Holdings Ltd. | USD | 13.500 | % | 04/28/2015 | 1,149,000 | 924,945 | (3) | |||||||||||
Mega Advance Investments Ltd. | USD | 5.000 | % | 05/12/2021 | 661,000 | 669,937 | (4) | |||||||||||
MIE Holdings Corp. | USD | 9.750 | % | 05/12/2016 | 1,586,000 | 1,411,540 | (4) | |||||||||||
Sinochem Overseas Capital Co. Ltd. | USD | 4.500 | % | 11/12/2020 | 4,384,000 | 4,229,045 | (4) | |||||||||||
| See Notes to Financial Statements. | ||
Stone Harbor Investment Funds Semi-Annual Report | November 30, 2011 | 19 | |
Table of Contents
| Stone Harbor Emerging Markets Debt Fund | Statements of Investments | |
| November 30, 2011 (Unaudited) |
Currency | Rate | Maturity Date | Principal Amount * | Market Value (Expressed in U.S. $) | ||||||||||||||
Texhong Textile Group Ltd.: | ||||||||||||||||||
| USD | 7.625 | % | 01/19/2016 | 343,000 | $ | 250,390 | (4) | |||||||||||
| USD | 7.625 | % | 01/19/2016 | 858,000 | 626,340 | (3) | ||||||||||||
West China Cement Ltd.: | ||||||||||||||||||
| USD | 7.500 | % | 01/25/2016 | 824,000 | 675,680 | (3) | ||||||||||||
| USD | 7.500 | % | 01/25/2016 | 1,138,000 | 933,160 | (4) | ||||||||||||
Yanlord Land Group Ltd. | USD | 9.500 | % | 05/04/2017 | 235,000 | 177,425 | (3) | |||||||||||
|
| |||||||||||||||||
| 11,715,202 | ||||||||||||||||||
|
| |||||||||||||||||
Colombia - 0.29% | ||||||||||||||||||
Gruposura Finance | USD | 5.700 | % | 05/18/2021 | 2,813,000 | 2,843,943 | (4) | |||||||||||
|
| |||||||||||||||||
Dominican Republic - 0.07% | ||||||||||||||||||
Cap Cana SA: | ||||||||||||||||||
| USD | 10.000 | % | 04/30/2016 | 1,103,320 | 386,162 | (1)(3) | ||||||||||||
| USD | 10.000 | % | 04/30/2016 | 1,343,373 | 268,675 | (1)(3) | ||||||||||||
|
| |||||||||||||||||
| 654,837 | ||||||||||||||||||
|
| |||||||||||||||||
Hong Kong - 0.39% | ||||||||||||||||||
Hutchison Whampoa International 10 Ltd. | USD | 6.000 | % | 10/28/2049 | 1,957,000 | 1,947,215 | (2)(3) | |||||||||||
PCCW- HKT Capital No. 4 Ltd. | USD | 4.250 | % | 02/24/2016 | 1,849,000 | 1,864,717 | ||||||||||||
|
| |||||||||||||||||
| 3,811,932 | ||||||||||||||||||
|
| |||||||||||||||||
India - 0.28% | ||||||||||||||||||
Axis Bank Ltd. | USD | 7.125 | % | 06/28/2022 | 311,000 | 281,455 | (2) | |||||||||||
Bank of India | USD | 6.994 | % | 03/03/2049 | 344,000 | 304,440 | (2) | |||||||||||
ICICI Bank Ltd.: | ||||||||||||||||||
| USD | 5.750 | % | 11/16/2020 | 200,000 | 185,970 | (3) | ||||||||||||
| USD | 5.750 | % | 11/16/2020 | 608,000 | 565,349 | (4) | ||||||||||||
Vedanta Resources PLC | USD | 8.250 | % | 06/07/2021 | 1,715,000 | 1,423,450 | (4) | |||||||||||
|
| |||||||||||||||||
| 2,760,664 | ||||||||||||||||||
|
| |||||||||||||||||
Indonesia - 0.89% | ||||||||||||||||||
Bakrie Telecom Pte Ltd. | USD | 11.500 | % | 05/07/2015 | 1,805,000 | 1,137,150 | (3) | |||||||||||
Berau Capital Resources Pte Ltd. | USD | 12.500 | % | 07/08/2015 | 2,000,000 | 2,140,000 | (3) | |||||||||||
BLT Finance BV | USD | 7.500 | % | 05/15/2014 | 644,000 | 254,380 | (3) | |||||||||||
Bumi Investment Pte Ltd.: | ||||||||||||||||||
| USD | 10.750 | % | 10/06/2017 | 325,000 | 318,500 | (4) | ||||||||||||
| USD | 10.750 | % | 10/06/2017 | 2,400,000 | 2,352,000 | (3) | ||||||||||||
Indosat Palapa Co. BV: | ||||||||||||||||||
| USD | 7.375 | % | 07/29/2020 | 241,000 | 260,280 | (4) | ||||||||||||
| USD | 7.375 | % | 07/29/2020 | 550,000 | 594,000 | (3) | ||||||||||||
PT Adaro Indonesia | USD | 7.625 | % | 10/22/2019 | 1,617,000 | 1,714,020 | (3) | |||||||||||
|
| |||||||||||||||||
| 8,770,330 | ||||||||||||||||||
|
| |||||||||||||||||
Jamaica - 0.45% | ||||||||||||||||||
Digicel Group Ltd.: | ||||||||||||||||||
| USD | 9.125 | % | 01/15/2015 | 1,878,000 | 1,859,220 | (4) | ||||||||||||
| USD | 8.250 | % | 09/01/2017 | 1,160,000 | 1,154,200 | (3) | ||||||||||||
| USD | 10.500 | % | 04/15/2018 | 1,450,000 | 1,457,250 | (3) | ||||||||||||
|
| |||||||||||||||||
| 4,470,670 | ||||||||||||||||||
|
| |||||||||||||||||
| See Notes to Financial Statements. | ||
| 20 | www.shiplp.com | |
Table of Contents
| Stone Harbor Emerging Markets Debt Fund | Statements of Investments | |
| November 30, 2011 (Unaudited) |
| Currency | Rate | Maturity Date | Principal Amount * | Market Value (Expressed in U.S. $) | ||||||||||||||
Kazakhstan - 2.50% | ||||||||||||||||||
BTA Bank JSC: | ||||||||||||||||||
| USD | 10.750 | % | 07/01/2018 | 1,159,562 | $ | 382,656 | (4)(5) | |||||||||||
| USD | 10.750 | % | 07/01/2018 | 4,949,274 | 1,633,260 | (3)(5) | ||||||||||||
| USD | 0.000 | % | 07/01/2020 | 500,000 | 19,375 | (3)(8) | ||||||||||||
| USD | 0.000 | % | 07/01/2020 | 2,515,532 | 97,477 | (2)(4) | ||||||||||||
KazMunayGas National Co.: | ||||||||||||||||||
| USD | 8.375 | % | 07/02/2013 | 5,650,000 | 5,989,000 | (3) | ||||||||||||
| USD | 11.750 | % | 01/23/2015 | 2,300,000 | 2,783,000 | (3) | ||||||||||||
| USD | 9.125 | % | 07/02/2018 | 723,000 | 871,215 | (4) | ||||||||||||
| USD | 7.000 | % | 05/05/2020 | 739,000 | 809,205 | (4) | ||||||||||||
| USD | 7.000 | % | 05/05/2020 | 5,615,000 | 6,148,425 | (3) | ||||||||||||
| USD | 6.375 | % | 04/09/2021 | 2,538,000 | 2,683,935 | (4) | ||||||||||||
Zhaikmunai LLP: | ||||||||||||||||||
| USD | 10.500 | % | 10/19/2015 | 1,037,000 | 1,021,445 | (4) | ||||||||||||
| USD | 10.500 | % | 10/19/2015 | 2,175,000 | 2,142,375 | (3) | ||||||||||||
|
| |||||||||||||||||
| 24,581,368 | ||||||||||||||||||
|
| |||||||||||||||||
Malaysia - 3.24% | ||||||||||||||||||
Penerbangan Malaysia BHD | USD | 5.625 | % | 03/15/2016 | 1,195,000 | 1,323,642 | (3) | |||||||||||
Petroliam Nasional BHD: | ||||||||||||||||||
| USD | 7.750 | % | 08/15/2015 | 335,000 | 397,276 | (4) | ||||||||||||
| USD | 7.625 | % | 10/15/2026 | 840,000 | 1,148,910 | (3) | ||||||||||||
Petronas Capital Ltd.: | ||||||||||||||||||
| USD | 5.250 | % | 08/12/2019 | 630,000 | 701,692 | (4) | ||||||||||||
| USD | 5.250 | % | 08/12/2019 | 2,749,000 | 3,061,830 | (3) | ||||||||||||
| USD | 7.875 | % | 05/22/2022 | 17,019,000 | 22,943,314 | (3) | ||||||||||||
Petronas Global Sukuk Ltd. | USD | 4.250 | % | 08/12/2014 | 2,240,000 | 2,357,488 | (4) | |||||||||||
|
| |||||||||||||||||
| 31,934,152 | ||||||||||||||||||
|
| |||||||||||||||||
Mexico - 2.26% | ||||||||||||||||||
Alestra SA | USD | 11.750 | % | 08/11/2014 | 587,000 | 647,168 | ||||||||||||
America Movil SAB de CV | USD | 2.375 | % | 09/08/2016 | 3,778,000 | 3,708,583 | ||||||||||||
Axtel SAB de CV: | ||||||||||||||||||
| USD | 7.625 | % | 02/01/2017 | 347,000 | 261,985 | (4) | ||||||||||||
| USD | 9.000 | % | 09/22/2019 | 1,171,000 | 884,105 | (3) | ||||||||||||
BBVA Bancomer SA | USD | 4.500 | % | 03/10/2016 | 585,000 | 579,150 | (3) | |||||||||||
Cemex Espana Luxembourg: | ||||||||||||||||||
| EUR | 8.875 | % | 05/12/2017 | 54,000 | 47,527 | (3) | ||||||||||||
| USD | 9.250 | % | 05/12/2020 | 2,250,000 | 1,552,500 | (3) | ||||||||||||
Cemex SAB de CV: | ||||||||||||||||||
| USD | 5.369 | % | 09/30/2015 | 921,000 | 617,070 | (2)(4) | ||||||||||||
| USD | 9.000 | % | 01/11/2018 | 530,000 | 386,900 | (3) | ||||||||||||
| USD | 9.000 | % | 01/11/2018 | 1,047,000 | 764,310 | (4) | ||||||||||||
Desarrolla Homex SAB de CV | USD | 7.500 | % | 09/28/2015 | 215,000 | 213,925 | ||||||||||||
Geo Maquinaria | USD | 9.625 | % | 05/02/2021 | 3,804,253 | 3,423,827 | (4) | |||||||||||
Grupo Bimbo SAB de CV | USD | 4.875 | % | 06/30/2020 | 183,000 | 189,921 | (4) | |||||||||||
Hipotecaria Su Casita SA de CV | USD | 7.500 | % | 06/29/2018 | 113,997 | 59,848 | (4) | |||||||||||
Pemex Finance Ltd. | USD | 9.150 | % | 11/15/2018 | 1,250,000 | 1,545,387 | ||||||||||||
| See Notes to Financial Statements. | ||
Stone Harbor Investment Funds Semi-Annual Report | November 30, 2011 | 21 | |
Table of Contents
| Stone Harbor Emerging Markets Debt Fund | Statements of Investments | |
| November 30, 2011 (Unaudited) |
| Currency | Rate | Maturity Date | Principal Amount * | Market Value (Expressed in U.S. $) | ||||||||||||||
Pemex Project Funding Master Trust: | ||||||||||||||||||
| EUR | 5.500 | % | 02/24/2025 | 2,275,000 | $ | 2,867,632 | (3) | |||||||||||
| USD | 6.625 | % | 06/15/2035 | 3,034,000 | 3,344,985 | |||||||||||||
Telefonos de Mexico SAB de CV | USD | 5.500 | % | 11/15/2019 | 1,100,000 | 1,201,316 | ||||||||||||
|
| |||||||||||||||||
| 22,296,139 | ||||||||||||||||||
|
| |||||||||||||||||
Peru - 0.33% | ||||||||||||||||||
Banco Continental SA via Continental Senior Trustees Cayman Ltd. | USD | 5.500 | % | 11/18/2020 | 766,000 | 743,020 | (4) | |||||||||||
Banco de Credito del Peru/Panama | USD | 5.375 | % | 09/16/2020 | 561,000 | 551,182 | (4) | |||||||||||
Inkia Energy Ltd. | USD | 8.375 | % | 04/04/2021 | 785,000 | 796,775 | (4) | |||||||||||
Southern Copper Corp. | USD | 6.750 | % | 04/16/2040 | 1,117,000 | 1,129,170 | ||||||||||||
|
| |||||||||||||||||
| 3,220,147 | ||||||||||||||||||
|
| |||||||||||||||||
Qatar - 0.50% | ||||||||||||||||||
Qtel International Finance Ltd.: | ||||||||||||||||||
| USD | 7.875 | % | 06/10/2019 | 779,000 | 945,316 | (3) | ||||||||||||
| USD | 4.750 | % | 02/16/2021 | 250,000 | 250,625 | (3) | ||||||||||||
| USD | 4.750 | % | 02/16/2021 | 567,000 | 568,418 | (4) | ||||||||||||
| USD | 5.000 | % | 10/19/2025 | 1,155,000 | 1,103,025 | (4) | ||||||||||||
| USD | 5.000 | % | 10/19/2025 | 2,122,000 | 2,026,510 | (3) | ||||||||||||
|
| |||||||||||||||||
| 4,893,894 | ||||||||||||||||||
|
| |||||||||||||||||
Russia - 1.71% | ||||||||||||||||||
AK Transneft OJSC Via TransCapitalInvest Ltd. | USD | 8.700 | % | 08/07/2018 | 200,000 | 242,500 | (3) | |||||||||||
Alfa Bank OJSC Via Alfa Bond Issuance PLC: | ||||||||||||||||||
| USD | 7.875 | % | 09/25/2017 | 100,000 | 94,500 | (3) | ||||||||||||
| USD | 7.875 | % | 09/25/2017 | 658,000 | 621,810 | (4) | ||||||||||||
Evraz Group SA | USD | 6.750 | % | 04/27/2018 | 2,684,000 | 2,422,310 | (4) | |||||||||||
Metalloinvest Finance Ltd. | USD | 6.500 | % | 07/21/2016 | 3,637,000 | 3,391,503 | (4) | |||||||||||
Novatek Finance Ltd. | USD | 6.604 | % | 02/03/2021 | 3,422,000 | 3,550,325 | (4) | |||||||||||
SCF Capital Ltd. | USD | 5.375 | % | 10/27/2017 | 2,670,000 | 2,396,325 | (4) | |||||||||||
TNK-BP Finance SA | USD | 6.625 | % | 03/20/2017 | 200,000 | 209,750 | (3) | |||||||||||
Vimpel Communications Holdings BV: | ||||||||||||||||||
| USD | 6.255 | % | 03/01/2017 | 1,330,000 | 1,206,975 | (3) | ||||||||||||
| USD | 7.504 | % | 03/01/2022 | 800,000 | 698,000 | (4) | ||||||||||||
Vimpel Communications Via VIP Finance Ireland Ltd. OJSC: | ||||||||||||||||||
| USD | 6.493 | % | 02/02/2016 | 1,000,000 | 940,000 | (3) | ||||||||||||
| USD | 7.748 | % | 02/02/2021 | 1,167,000 | 1,041,547 | (4) | ||||||||||||
|
| |||||||||||||||||
| 16,815,545 | ||||||||||||||||||
|
| |||||||||||||||||
Singapore - 0.05% | ||||||||||||||||||
STATS ChipPAC Ltd. | USD | 5.375 | % | 03/31/2016 | 510,000 | 499,800 | (4) | |||||||||||
|
| |||||||||||||||||
South Africa - 0.66% | ||||||||||||||||||
Gold Fields Orogen Holding BVI Ltd. | USD | 4.875 | % | 10/07/2020 | 2,739,000 | 2,382,930 | (3) | |||||||||||
Myriad International Holding BV: | ||||||||||||||||||
| USD | 6.375 | % | 07/28/2017 | 650,000 | 693,875 | (4) | ||||||||||||
| USD | 6.375 | % | 07/28/2017 | 3,200,000 | 3,416,000 | (3) | ||||||||||||
|
| |||||||||||||||||
| 6,492,805 | ||||||||||||||||||
|
| |||||||||||||||||
| See Notes to Financial Statements. | ||
| 22 | www.shiplp.com | |
Table of Contents
| Stone Harbor Emerging Markets Debt Fund | Statements of Investments | |
| November 30, 2011 (Unaudited) |
Currency | Rate | Maturity Date | Principal Amount * | Market Value (Expressed in U.S. $) | ||||||||||||||
South Korea - 0.47% | ||||||||||||||||||
Export-Import Bank of Korea: | ||||||||||||||||||
| USD | 8.125 | % | 01/21/2014 | 2,447,000 | $ | 2,715,436 | ||||||||||||
| USD | 4.375 | % | 09/15/2021 | 1,913,000 | 1,888,896 | |||||||||||||
|
| |||||||||||||||||
| 4,604,332 | ||||||||||||||||||
|
| |||||||||||||||||
Turkey - 0.24% | ||||||||||||||||||
Yuksel Insaat AS | USD | 9.500 | % | 11/10/2015 | 3,237,000 | 2,379,195 | (3) | |||||||||||
|
| |||||||||||||||||
Ukraine - 0.71% | ||||||||||||||||||
Ferrexpo Finance PLC | USD | 7.875 | % | 04/07/2016 | 2,747,000 | 2,486,035 | (4) | |||||||||||
Metinvest BV | USD | 8.750 | % | 02/14/2018 | 2,582,000 | 2,252,795 | (4) | |||||||||||
MHP SA | USD | 10.250 | % | 04/29/2015 | 1,005,000 | 929,625 | (3) | |||||||||||
Mriya Agro Holding PLC | USD | 10.950 | % | 03/30/2016 | 1,452,000 | 1,321,320 | (4) | |||||||||||
|
| |||||||||||||||||
| 6,989,775 | ||||||||||||||||||
|
| |||||||||||||||||
United Arab Emirates - 1.24% | ||||||||||||||||||
Abu Dhabi National Energy Co. | USD | 6.250 | % | 09/16/2019 | 200,000 | 217,000 | (3) | |||||||||||
Dolphin Energy Ltd. | USD | 5.888 | % | 06/15/2019 | 706,880 | 758,129 | (3) | |||||||||||
DP World Ltd. | USD | 6.850 | % | 07/02/2037 | 2,220,000 | 2,020,200 | (3) | |||||||||||
DP World Sukuk Ltd. | USD | 6.250 | % | 07/02/2017 | 2,990,000 | 3,004,950 | (3) | |||||||||||
Dubai Holding Commercial Operations MTN Ltd.: | ||||||||||||||||||
| EUR | 4.750 | % | 01/30/2014 | 150,000 | 168,299 | |||||||||||||
| GBP | 6.000 | % | 02/01/2017 | 1,800,000 | 2,075,652 | |||||||||||||
IPIC GMTN Ltd. | USD | 3.750 | % | 03/01/2017 | 3,800,000 | 3,781,000 | (4) | |||||||||||
MDC-GMTN BV | USD | 3.750 | % | 04/20/2016 | 200,000 | 204,500 | (3) | |||||||||||
|
| |||||||||||||||||
| 12,229,730 | ||||||||||||||||||
|
| |||||||||||||||||
Venezuela - 4.31% | ||||||||||||||||||
Petroleos de Venezuela SA: | ||||||||||||||||||
| USD | 4.900 | % | 10/28/2014 | 45,547,646 | 35,413,295 | |||||||||||||
| USD | 5.000 | % | 10/28/2015 | 2,669,366 | 1,875,230 | |||||||||||||
| USD | 5.250 | % | 04/12/2017 | 6,000,000 | 3,780,000 | |||||||||||||
| USD | 8.500 | % | 11/02/2017 | 1,919,000 | 1,436,851 | (3) | ||||||||||||
|
| |||||||||||||||||
| 42,505,376 | ||||||||||||||||||
|
| |||||||||||||||||
| TOTAL CORPORATE BONDS | 259,228,226 | |||||||||||||||||
|
| |||||||||||||||||
(Cost $269,503,952) | ||||||||||||||||||
| PARTICIPATION NOTES - 0.77% | ||||||||||||||||||
Argentina - 0.16% | ||||||||||||||||||
Endesa Costanera SA | USD | 11.304 | % | 03/30/2012 | 456,000 | 456,000 | (2) | |||||||||||
Hidroelec el Chocon SA | USD | 8.061 | % | 03/01/2015 | 1,100,000 | 1,100,000 | ||||||||||||
|
| |||||||||||||||||
| 1,556,000 | ||||||||||||||||||
|
| |||||||||||||||||
Ukraine - 0.61% | ||||||||||||||||||
Ukreximbank Biz Finance PLC | USD | 8.375 | % | 04/27/2015 | 6,731,000 | 6,041,073 | (3) | |||||||||||
|
| |||||||||||||||||
| TOTAL PARTICIPATION NOTES | 7,597,073 | |||||||||||||||||
|
| |||||||||||||||||
(Cost $8,219,098) | ||||||||||||||||||
| See Notes to Financial Statements. | ||
Stone Harbor Investment Funds Semi-Annual Report | November 30, 2011 | 23 | |
Table of Contents
| Stone Harbor Emerging Markets Debt Fund | Statements of Investments | |
| November 30, 2011 (Unaudited) |
Currency | Rate | Maturity Date | Principal Amount * | Market Value (Expressed in U.S. $) | ||||||||||||||
CREDIT LINKED NOTES - 4.02% | ||||||||||||||||||
Argentina - 0.34% | ||||||||||||||||||
Cablevision SA | USD | 9.375 | % | 02/12/2018 | 3,618,000 | $ | 3,328,560 | (9) | ||||||||||
|
| |||||||||||||||||
Brazil - 2.51% | ||||||||||||||||||
Nota Do Tesouro Nacional: | ||||||||||||||||||
| BRL | 10.000 | % | 01/01/2015 | 4,400,000 | 2,382,304 | (10) | ||||||||||||
| BRL | 10.000 | % | 01/01/2017 | 600,000 | 321,605 | (11) | ||||||||||||
| BRL | 10.000 | % | 01/01/2017 | 2,000,000 | 1,065,723 | (10) | ||||||||||||
| BRL | 10.000 | % | 01/01/2021 | 3,000,000 | 1,557,276 | (12) | ||||||||||||
| BRL | 10.000 | % | 01/01/2021 | 4,000,000 | 2,082,569 | (13) | ||||||||||||
| BRL | 10.000 | % | 01/01/2021 | 4,200,000 | 2,186,698 | (10) | ||||||||||||
| BRL | 10.000 | % | 01/01/2021 | 5,000,000 | 2,588,824 | (14) | ||||||||||||
| BRL | 10.000 | % | 01/01/2021 | 6,000,000 | 3,122,183 | (9) | ||||||||||||
| BRL | 10.000 | % | 01/01/2021 | 9,000,000 | 4,479,221 | (10) | ||||||||||||
| BRL | 10.000 | % | 01/01/2021 | 9,600,000 | 4,983,283 | (12) | ||||||||||||
|
| |||||||||||||||||
| 24,769,686 | ||||||||||||||||||
|
| |||||||||||||||||
Colombia - 0.70% | ||||||||||||||||||
Titulos de Tesoreria - Series B: | ||||||||||||||||||
| COP | 11.000 | % | 07/24/2020 | 3,500,000,000 | 2,162,673 | (12) | ||||||||||||
| COP | 11.000 | % | 07/24/2020 | 5,700,000,000 | 3,522,068 | (12) | ||||||||||||
| COP | 10.000 | % | 07/24/2024 | 1,952,000,000 | 1,187,154 | (12) | ||||||||||||
|
| |||||||||||||||||
| 6,871,895 | ||||||||||||||||||
|
| |||||||||||||||||
Iraq - 0.47% | ||||||||||||||||||
Republic of Iraq | JPY | 2.447 | % | 01/01/2028 | 554,044,860 | 4,607,516 | (2)(15) | |||||||||||
|
| |||||||||||||||||
| TOTAL CREDIT LINKED NOTES | 39,577,657 | |||||||||||||||||
|
| |||||||||||||||||
(Cost $41,637,150) | ||||||||||||||||||
SHORT TERM INVESTMENTS - 0.86% | ||||||||||||||||||
Money Market Mutual Funds - 0.86% | ||||||||||||||||||
Dreyfus Institutional Cash Advantage Fund - Institutional Advantage Shares (0.077% 7-Day Yield) | USD | 8,434,700 | 8,434,700 | |||||||||||||||
|
| |||||||||||||||||
| TOTAL SHORT TERM INVESTMENTS | 8,434,700 | |||||||||||||||||
|
| |||||||||||||||||
(Cost $8,434,700) | ||||||||||||||||||
| Total Investments - 96.48% | 950,340,864 | |||||||||||||||||
(Cost $958,275,392) | ||||||||||||||||||
| Other Assets In Excess of Liabilities - 3.52% | 34,709,182 | |||||||||||||||||
|
| |||||||||||||||||
| Net Assets - 100.00% | $ | 985,050,046 | ||||||||||||||||
|
| |||||||||||||||||
| See Notes to Financial Statements. | ||
| 24 | www.shiplp.com | |
Table of Contents
| Stone Harbor Emerging Markets Debt Fund | Statements of Investments | |
| November 30, 2011 (Unaudited) |
* The contract/principal/share amounts of each security is stated in the currency in which the security is denominated. See below.
ARS | - | Argentine Peso | ||
BRL | - | Brazilian Real | ||
COP | - | Colombian Peso | ||
EUR | - | Euro Currency | ||
GBP | - | Great Britain Pound | ||
JPY | - | Japanese Yen | ||
MXN | - | Mexican Peso | ||
MYR | - | Malaysian Ringgit | ||
PHP | - | Philippine Peso | ||
USD | - | United States Dollar | ||
ZAR | - | South African Rand |
| (1) | Security is currently in default/non-income producing. |
| (2) | Floating or variable rate security. Interest rate disclosed is that which is in effect at November 30, 2011. |
| (3) | Securities were purchased pursuant to Regulation S under the Securities Act of 1933, which exempts securities offered and sold outside of the United States from registration. Such securities cannot be sold in the United States without either an effective registration statement filed pursuant to the Securities Act of 1933, or pursuant to an exemption from registration. These securities have been deemed liquid under procedures approved by the Fund’s Board of Trustees. As of November 30, 2011, the aggregate market value of those securities was $307,220,716, which represents approximately 31.19% of net assets. |
| (4) | Security exempt from registration under Rule 144A of the Securities Act of 1933. Under procedures approved by the Board of Trustees, such securities have been determined to be liquid by Stone Harbor Investment Partners and may normally be sold to qualified institutional buyers in transactions exempt from registration. Total market value of Rule 144A securities amounts to $99,339,609, which represents approximately 10.09% of net assets as of November 30, 2011. |
| (5) | Step bond. Coupon increases periodically based upon a predetermined schedule. Interest rate disclosed is that which is in effect at November 30, 2011. |
| (6) | Pay-in-kind securities. |
| (7) | Bank loans generally pay interest at rates which are periodically determined by reference to a base lending rate plus a premium. All loans carry a variable rate of interest. These base lending rates are generally (i) the Prime Rate offered by one or more major United States banks, (ii) the lending rate offered by one or more European banks such as the London Interbank Offered Rate (“LIBOR”) or (iii) the Certificate of Deposit rate. Rate shown represents the weighted average rate at November 30, 2011. Bank Loans, while exempt from registration, under the Securities Act of 1933 (the “1933 Act”), contain certain restrictions on resale and cannot be sold publicly. Floating rate bank loans often require prepayments from excess cash flow or permit the borrower to repay at its election. The degree to which borrowers repay, whether as a contractual requirement or at their election, cannot be predicted with accuracy. As a result, the actual remaining maturity may be substantially less than the stated maturity shown. |
| (8) | Zero coupon bond reflects effective yield on the date of purchase. |
| (9) | The underlying security is issued by Deutsche Bank AG London. |
| (10) | The underlying security is issued by JP Morgan Chase. |
| (11) | The underlying security is issued by HSBC Bank. |
| (12) | The underlying security is issued by Citigroup Global Markets. |
| (13) | The underlying security is issued by Barclays Bank PLC. |
| (14) | The underlying security is issued by Credit Suisse First Boston. |
| (15) | The underlying security is issued by Merrill Lynch. |
| (16) | This security has been valued by management at its fair value determined in good faith pursuant to procedures approved by the Board of Trustees. Total market value of fair valued securities amounts to $2,717,450 which represents approximately 0.28% of net assets as of November 30, 2011. |
Common Abbreviations:
AS | - | Anonim Sirket is the Turkish term for Incorporation. | ||
| BHD | - | Berhad is the Malaysian term for public limited company. | ||
| BV | - | Besloten Vennootschap a Dutch private limited liability company. | ||
| GMTN | - | Global Medium Term Note. | ||
| JSC | - | Joint Stock Co. | ||
| LLP | - | Limited Liability Partnership. | ||
| Ltd. | - | Limited. | ||
| MTN | - | Medium Term Note. | ||
| OJSC | - | Open Joint Stock Co. | ||
| PLC | - | Public Limited Co. | ||
| Pte | - | Private. | ||
| SA | - | Generally designates corporations in various countries, mostly those employing the civil law. | ||
| SA de CV | - | A variable capital company. | ||
| SAB de CV | - | A variable capital company. |
| See Notes to Financial Statements. | ||
Stone Harbor Investment Funds Semi-Annual Report | November 30, 2011 | 25 | |
Table of Contents
| Stone Harbor Emerging Markets Debt Fund | Statements of Investments | |
| November 30, 2011 (Unaudited) |
OUTSTANDING FORWARD FOREIGN CURRENCY CONTRACTS
Contract Description | Contracted Amount | Purchase/Sale Contract | Settlement Date | Current Value | Unrealized Appreciation/ (Depreciation) | |||||
BRL | 14,644,064 | Sale | 12/02/2011 | $ 8,093,997 | $ 545,059 | |||||
BRL | 18,058,284 | Purchase | 01/04/2012 | 9,906,168 | 216,168 | |||||
CNY | 54,911,986 | Sale | 05/16/2012 | 8,622,445 | 46,247 | |||||
CNY | 27,703,936 | Purchase | 05/16/2012 | 4,350,156 | 6,514 | |||||
EUR | 29,067,711 | Sale | 12/28/2011 | 39,069,748 | 303,093 | |||||
GBP | 1,440,000 | Sale | 12/28/2011 | 2,258,618 | 23,422 | |||||
JPY | 370,752,000 | Sale | 12/28/2011 | 4,784,212 | 38,014 | |||||
| ||||||||||
| $ 1,178,517 | ||||||||||
| ||||||||||
BRL | 14,644,064 | Purchase | 12/02/2011 | $ 8,093,997 | $ (132,543) | |||||
CNY | 27,208,050 | Purchase | 05/16/2012 | 4,272,290 | (2,009) | |||||
EUR | 1,219,545 | Sale | 05/16/2012 | 1,639,184 | (286) | |||||
| ||||||||||
| $ (134,838) | ||||||||||
| ||||||||||
| See Notes to Financial Statements. | ||
| 26 | www.shiplp.com | |
Table of Contents
| Stone Harbor High Yield Bond Fund | Statements of Investments | |
| November 30, 2011 (Unaudited) |
| Currency | Rate | Maturity Date | Principal Amount* | Market Value (Expressed in U.S. $) | ||||||||||||||
CORPORATE BONDS - 91.11% | ||||||||||||||||||
Aerospace/Defense - 1.48% | ||||||||||||||||||
CPI International, Inc. | USD | 8.000 | % | 02/15/2018 | 2,225,000 | $ | 1,907,937 | |||||||||||
TransDigm, Inc. | USD | 7.750 | % | 12/15/2018 | 2,900,000 | 3,001,500 | ||||||||||||
Triumph Group, Inc. | USD | 8.625 | % | 07/15/2018 | 1,575,000 | 1,724,625 | ||||||||||||
| �� |
|
| ||||||||||||||||
| 6,634,062 | ||||||||||||||||||
|
| |||||||||||||||||
Automotive - 1.40% | ||||||||||||||||||
Allison Transmission, Inc. | USD | 7.125 | % | 05/15/2019 | 1,100,000 | 1,042,250 | (1) | |||||||||||
Chrysler Group LLC: | ||||||||||||||||||
| USD | 8.000 | % | 06/15/2019 | 950,000 | 807,500 | (1) | ||||||||||||
| USD | 8.250 | % | 06/15/2021 | 1,000,000 | 845,000 | (1) | ||||||||||||
Ford Motor Co.: | ||||||||||||||||||
| USD | 7.450 | % | 07/16/2031 | 910,000 | 1,071,525 | |||||||||||||
| USD | 8.900 | % | 01/15/2032 | 25,000 | 30,875 | |||||||||||||
Tomkins LLC | USD | 9.000 | % | 10/01/2018 | 1,745,000 | 1,893,325 | ||||||||||||
UCI International, Inc. | USD | 8.625 | % | 02/15/2019 | 575,000 | 560,625 | ||||||||||||
|
| |||||||||||||||||
| 6,251,100 | ||||||||||||||||||
|
| |||||||||||||||||
Banking - 0.85% | ||||||||||||||||||
E*Trade Financial Corp. | USD | 12.500 | % | 11/30/2017 | 1,670,000 | 1,895,450 | (2) | |||||||||||
Provident Funding Associates LP: | ||||||||||||||||||
| USD | 10.250 | % | 04/15/2017 | 1,025,000 | 978,875 | (1) | ||||||||||||
| USD | 10.125 | % | 02/15/2019 | 1,125,000 | 916,875 | (1) | ||||||||||||
|
| |||||||||||||||||
| 3,791,200 | ||||||||||||||||||
|
| |||||||||||||||||
Building Products - 1.16% | ||||||||||||||||||
American Standard Americas | USD | 10.750 | % | 01/15/2016 | 715,000 | 475,475 | (1) | |||||||||||
Griffon Corp. | USD | 7.125 | % | 04/01/2018 | 2,125,000 | 2,061,250 | ||||||||||||
Interface, Inc. | USD | 7.625 | % | 12/01/2018 | 850,000 | 888,250 | ||||||||||||
Norcraft Cos. LP | USD | 10.500 | % | 12/15/2015 | 1,975,000 | 1,787,375 | ||||||||||||
|
| |||||||||||||||||
| 5,212,350 | ||||||||||||||||||
|
| |||||||||||||||||
Chemicals - 2.70% | ||||||||||||||||||
Ineos Group Holdings Ltd.: | ||||||||||||||||||
| EUR | 7.875 | % | 02/15/2016 | 200,000 | 190,135 | (3) | ||||||||||||
| USD | 8.500 | % | 02/15/2016 | 3,380,000 | 2,653,300 | (1) | ||||||||||||
Koppers, Inc. | USD | 7.875 | % | 12/01/2019 | 1,875,000 | 1,945,313 | ||||||||||||
Lyondell Chemical Co. | USD | 8.375 | % | 08/15/2015 | 945,000 | 0 | (4) | |||||||||||
LyondellBasell Industries NV | USD | 6.000 | % | 11/15/2021 | 120,000 | 123,000 | (1) | |||||||||||
MacDermid, Inc. | USD | 9.500 | % | 04/15/2017 | 1,875,000 | 1,800,000 | (1) | |||||||||||
Momentive Performance Materials, Inc.: | ||||||||||||||||||
| USD | 11.500 | % | 12/01/2016 | 1,375,000 | 990,000 | |||||||||||||
| USD | 9.000 | % | 01/15/2021 | 2,495,000 | 1,790,162 | |||||||||||||
Nova Chemicals Corp. | USD | 8.375 | % | 11/01/2016 | 2,375,000 | 2,576,875 | ||||||||||||
|
| |||||||||||||||||
| 12,068,785 | ||||||||||||||||||
|
| |||||||||||||||||
Construction Machinery - 0.81% | ||||||||||||||||||
Case New Holland, Inc. | USD | 7.875 | % | 12/01/2017 | 950,000 | 1,045,000 | ||||||||||||
| See Notes to Financial Statements. | ||
Stone Harbor Investment Funds Semi-Annual Report | November 30, 2011 | 27 | |
Table of Contents
| Stone Harbor High Yield Bond Fund | Statements of Investments | |
| November 30, 2011 (Unaudited) |
| Currency | Rate | Maturity Date | Principal Amount* | Market Value (Expressed in U.S. $) | ||||||||||||||
The Manitowoc Co., Inc.: | ||||||||||||||||||
| USD | 9.500 | % | 02/15/2018 | 1,975,000 | $ | 2,049,063 | ||||||||||||
| USD | 8.500 | % | 11/01/2020 | 100,000 | 102,500 | |||||||||||||
United Rentals North America, Inc. | USD | 8.375 | % | 09/15/2020 | 450,000 | 445,500 | ||||||||||||
|
| |||||||||||||||||
| 3,642,063 | ||||||||||||||||||
Consumer Products - 0.91% | ||||||||||||||||||
Armored Autogroup, Inc. | USD | 9.250 | % | 11/01/2018 | 1,025,000 | 825,125 | (1) | |||||||||||
Elizabeth Arden, Inc. | USD | 7.375 | % | 03/15/2021 | 950,000 | 995,125 | ||||||||||||
NBTY, Inc. | USD | 9.000 | % | 10/01/2018 | 1,200,000 | 1,284,000 | ||||||||||||
Visant Corp. | USD | 10.000 | % | 10/01/2017 | 1,025,000 | 948,125 | ||||||||||||
|
| |||||||||||||||||
| 4,052,375 | ||||||||||||||||||
|
| |||||||||||||||||
Containers/Packaging - 3.62% | ||||||||||||||||||
ARD Finance SA | USD | 11.125 | % | 06/01/2018 | 825,000 | 730,125 | (1)(2) | |||||||||||
Ardagh Packaging Finance PLC: | ||||||||||||||||||
| USD | 9.125 | % | 10/15/2020 | 1,450,000 | 1,442,750 | (1) | ||||||||||||
| EUR | 9.250 | % | 10/15/2020 | 650,000 | 771,876 | (3) | ||||||||||||
BWAY Holding Co. | USD | 10.000 | % | 06/15/2018 | 1,275,000 | 1,338,750 | ||||||||||||
Pregis Corp. | USD | 12.375 | % | 10/15/2013 | 1,085,000 | 1,014,475 | ||||||||||||
Radnor Holdings Corp. | USD | 11.000 | % | 03/15/2010 | 25,000 | 2 | (4) | |||||||||||
Reynolds Group Issuer, Inc.: | ||||||||||||||||||
| USD | 8.750 | % | 10/15/2016 | 1,850,000 | 1,919,375 | (1) | ||||||||||||
| USD | 9.000 | % | 04/15/2019 | 2,900,000 | 2,624,500 | (1) | ||||||||||||
| USD | 8.250 | % | 02/15/2021 | 650,000 | 555,750 | (1) | ||||||||||||
Reynolds Group, Inc. | USD | 8.500 | % | 05/15/2018 | 975,000 | 892,125 | (1) | |||||||||||
Sealed Air Corp. | USD | 8.375 | % | 09/15/2021 | 3,520,000 | 3,775,200 | (1) | |||||||||||
Solo Cup Co. | USD | 8.500 | % | 02/15/2014 | 1,235,000 | 1,142,375 | ||||||||||||
|
| |||||||||||||||||
| 16,207,303 | ||||||||||||||||||
|
| |||||||||||||||||
Drillers/Services - 4.36% | ||||||||||||||||||
Basic Energy Services, Inc.: | ||||||||||||||||||
| USD | 7.125 | % | 04/15/2016 | 1,150,000 | 1,158,625 | |||||||||||||
| USD | 7.750 | % | 02/15/2019 | 1,025,000 | 1,027,563 | |||||||||||||
CHC Helicopter SA | USD | 9.250 | % | 10/15/2020 | 2,325,000 | 2,011,125 | (1) | |||||||||||
Complete Production Services, Inc. | USD | 8.000 | % | 12/15/2016 | 1,975,000 | 2,063,875 | ||||||||||||
Exterran Holdings, Inc. | USD | 7.250 | % | 12/01/2018 | 850,000 | 811,750 | (1) | |||||||||||
Hercules Offshore LLC | USD | 10.500 | % | 10/15/2017 | 2,255,000 | 2,176,075 | (1) | |||||||||||
Hornbeck Offshore Services, Inc. | USD | 8.000 | % | 09/01/2017 | 1,875,000 | 1,921,875 | ||||||||||||
Offshore Group Investments Ltd. | USD | 11.500 | % | 08/01/2015 | 1,995,000 | 2,149,612 | ||||||||||||
Parker Drilling Co. | USD | 9.125 | % | 04/01/2018 | 525,000 | 551,250 | ||||||||||||
PHI, Inc. | USD | 8.625 | % | 10/15/2018 | 800,000 | 786,000 | ||||||||||||
SESI LLC: | ||||||||||||||||||
| USD | 6.375 | % | 05/01/2019 | 1,915,000 | 1,924,575 | (1) | ||||||||||||
| USD | 7.125 | % | 12/15/2021 | 1,000,000 | 1,020,000 | (1) | ||||||||||||
Trinidad Drilling Ltd. | USD | 7.875 | % | 01/15/2019 | 1,870,000 | 1,916,750 | (1) | |||||||||||
|
| |||||||||||||||||
| 19,519,075 | ||||||||||||||||||
|
| |||||||||||||||||
Electric - 6.08% | ||||||||||||||||||
The AES Corp.: | ||||||||||||||||||
| USD | 9.750 | % | 04/15/2016 | 925,000 | 1,049,875 | |||||||||||||
| USD | 8.000 | % | 10/15/2017 | 2,225,000 | 2,403,000 | |||||||||||||
| USD | 7.375 | % | 07/01/2021 | 2,375,000 | 2,487,813 | (1) | ||||||||||||
Calpine Corp.: | ||||||||||||||||||
| USD | 7.875 | % | 07/31/2020 | 2,250,000 | 2,345,625 | (1) | ||||||||||||
| USD | 7.500 | % | 02/15/2021 | 1,925,000 | 1,973,125 | (1) | ||||||||||||
DPL, Inc. | USD | 7.250 | % | 10/15/2021 | 1,145,000 | 1,207,975 | (1) | |||||||||||
| See Notes to Financial Statements. | ||
| 28 | www.shiplp.com | |
Table of Contents
| Stone Harbor High Yield Bond Fund | Statements of Investments | |
| November 30, 2011 (Unaudited) |
| Currency | Rate | Maturity Date | Principal Amount* | Market Value (Expressed in U.S. $) | ||||||||||||||
Dynegy Holdings LLC: | ||||||||||||||||||
| USD | 8.375 | % | 05/01/2016 | 2,970,000 | $ | 2,153,250 | (4) | |||||||||||
| USD | 7.125 | % | 05/15/2018 | 500,000 | 355,000 | (4) | ||||||||||||
| USD | 7.750 | % | 06/01/2019 | 460,000 | 322,000 | (4) | ||||||||||||
| USD | 7.625 | % | 10/15/2026 | 25,000 | 17,875 | (4) | ||||||||||||
Edison Mission Energy: | ||||||||||||||||||
| USD | 7.750 | % | 06/15/2016 | 1,825,000 | 1,277,500 | |||||||||||||
| USD | 7.000 | % | 05/15/2017 | 150,000 | 94,875 | |||||||||||||
| USD | 7.200 | % | 05/15/2019 | 1,540,000 | 916,300 | |||||||||||||
| USD | 7.625 | % | 05/15/2027 | 1,135,000 | 663,975 | |||||||||||||
GenOn Energy, Inc.: | ||||||||||||||||||
| USD | 9.500 | % | 10/15/2018 | 1,650,000 | 1,674,750 | |||||||||||||
| USD | 9.875 | % | 10/15/2020 | 1,875,000 | 1,870,312 | |||||||||||||
NRG Energy, Inc.: | ||||||||||||||||||
| USD | 7.625 | % | 05/15/2019 | 775,000 | 744,000 | (1) | ||||||||||||
| USD | 8.500 | % | 06/15/2019 | 2,300,000 | 2,300,000 | |||||||||||||
| USD | 8.250 | % | 09/01/2020 | 1,235,000 | 1,222,650 | |||||||||||||
| USD | 7.875 | % | 05/15/2021 | 2,200,000 | 2,101,000 | (1) | ||||||||||||
|
| |||||||||||||||||
| 27,180,900 | ||||||||||||||||||
|
| |||||||||||||||||
Exploration & Production - 4.88% | ||||||||||||||||||
Atlas Pipeline Partners LP | USD | 8.750 | % | 06/15/2018 | 225,000 | 234,000 | ||||||||||||
Concho Resources, Inc. | USD | 7.000 | % | 01/15/2021 | 1,575,000 | 1,645,875 | ||||||||||||
Eagle Rock Energy Partners LP | USD | 8.375 | % | 06/01/2019 | 2,110,000 | 2,099,450 | (1) | |||||||||||
Kodiak Oil & Gas Corp. | USD | 8.125 | % | 12/01/2019 | 1,075,000 | 1,092,469 | (1) | |||||||||||
Linn Energy LLC: | ||||||||||||||||||
| USD | 6.500 | % | 05/15/2019 | 250,000 | 238,750 | (1) | ||||||||||||
| USD | 7.750 | % | 02/01/2021 | 3,225,000 | 3,241,125 | |||||||||||||
MEG Energy Corp. | USD | 6.500 | % | 03/15/2021 | 1,875,000 | 1,893,750 | (1) | |||||||||||
NFR Energy LLC: | ||||||||||||||||||
| USD | 9.750 | % | 02/15/2017 | 225,000 | 194,625 | (1) | ||||||||||||
| USD | 9.750 | % | 02/15/2017 | 1,075,000 | 929,875 | (1) | ||||||||||||
Oasis Petroleum, Inc. | USD | 7.250 | % | 02/01/2019 | 2,150,000 | 2,203,750 | (1) | |||||||||||
Plains Exploration & Production Co.: | ||||||||||||||||||
| USD | 7.625 | % | 06/01/2018 | 800,000 | 844,000 | |||||||||||||
| USD | 7.625 | % | 04/01/2020 | 1,050,000 | 1,123,500 | |||||||||||||
Quicksilver Resources, Inc. | USD | 11.750 | % | 01/01/2016 | 700,000 | 791,000 | ||||||||||||
SandRidge Energy, Inc.: | ||||||||||||||||||
| USD | 8.000 | % | 06/01/2018 | 575,000 | 554,875 | (1) | ||||||||||||
| USD | 8.750 | % | 01/15/2020 | 1,000,000 | 985,000 | |||||||||||||
| USD | 7.500 | % | 03/15/2021 | 2,000,000 | 1,840,000 | |||||||||||||
Venoco, Inc. | USD | 8.875 | % | 02/15/2019 | 1,475,000 | 1,327,500 | ||||||||||||
WPX Energy, Inc. | USD | 6.000 | % | 01/15/2022 | 600,000 | 592,500 | (1) | |||||||||||
|
| |||||||||||||||||
| 21,832,044 | ||||||||||||||||||
|
| |||||||||||||||||
Financial Other - 0.48% | ||||||||||||||||||
International Lease Finance Corp. | USD | 8.250 | % | 12/15/2020 | 2,163,000 | 2,157,592 | ||||||||||||
|
| |||||||||||||||||
Food & Beverage - 3.61% | ||||||||||||||||||
Campofrio Food Group SA | EUR | 8.250 | % | 10/31/2016 | 650,000 | 845,024 | (3) | |||||||||||
Cott Beverages, Inc. | USD | 8.375 | % | 11/15/2017 | 1,150,000 | 1,233,375 | ||||||||||||
Dean Foods Co.: | ||||||||||||||||||
| USD | 7.000 | % | 06/01/2016 | 2,225,000 | 2,169,375 | |||||||||||||
| USD | 9.750 | % | 12/15/2018 | 2,885,000 | 3,043,675 | |||||||||||||
Del Monte Foods Co. | USD | 7.625 | % | 02/15/2019 | 4,655,000 | 4,189,500 | (1) | |||||||||||
Michael Foods, Inc. | USD | 9.750 | % | 07/15/2018 | 725,000 | 750,375 | ||||||||||||
| See Notes to Financial Statements. | ||
Stone Harbor Investment Funds Semi-Annual Report | November 30, 2011 | 29 | |
Table of Contents
| Stone Harbor High Yield Bond Fund | Statements of Investments | |
| November 30, 2011 (Unaudited) |
| Currency | Rate | Maturity Date | Principal Amount* | Market Value (Expressed in U.S. $) | ||||||||||||||
Pinnacle Foods Finance LLC: | ||||||||||||||||||
| USD | 9.250 | % | 04/01/2015 | 1,825,000 | $ | 1,875,187 | ||||||||||||
| USD | 10.625 | % | 04/01/2017 | 425,000 | 442,000 | |||||||||||||
| USD | 8.250 | % | 09/01/2017 | 1,550,000 | 1,584,875 | |||||||||||||
|
| |||||||||||||||||
| 16,133,386 | ||||||||||||||||||
|
| |||||||||||||||||
Gaming - 4.30% | ||||||||||||||||||
American Casino & Entertainment Properties LLC | USD | 11.000 | % | 06/15/2014 | 555,000 | 557,775 | ||||||||||||
Boyd Gaming Corp. | USD | 9.125 | % | 12/01/2018 | 2,435,000 | 2,240,200 | ||||||||||||
Caesars Entertainment Operating Co., Inc. | USD | 12.750 | % | 04/15/2018 | 1,165,000 | 870,838 | ||||||||||||
CCM Merger, Inc. | USD | 8.000 | % | 08/01/2013 | 1,045,000 | 984,912 | (1) | |||||||||||
Harrah’s Operating Co., Inc. | USD | 5.375 | % | 12/15/2013 | 1,100,000 | 932,250 | ||||||||||||
Isle of Capri Casinos, Inc.: | ||||||||||||||||||
| USD | 7.000 | % | 03/01/2014 | 2,300,000 | 2,139,000 | |||||||||||||
| USD | 7.750 | % | 03/15/2019 | 1,225,000 | 1,133,125 | |||||||||||||
Jacobs Entertainment, Inc. | USD | 9.750 | % | 06/15/2014 | 205,000 | 193,725 | ||||||||||||
MGM Resorts International: | ||||||||||||||||||
| USD | 5.875 | % | 02/27/2014 | 2,025,000 | 1,954,125 | |||||||||||||
| USD | 6.875 | % | 04/01/2016 | 1,140,000 | 1,045,950 | |||||||||||||
| USD | 10.000 | % | 11/01/2016 | 1,025,000 | 1,066,000 | |||||||||||||
| USD | 11.125 | % | 11/15/2017 | 800,000 | 899,000 | |||||||||||||
| USD | 9.000 | % | 03/15/2020 | 875,000 | 958,125 | |||||||||||||
Pinnacle Entertainment, Inc.: | ||||||||||||||||||
| USD | 7.500 | % | 06/15/2015 | 2,605,000 | 2,539,875 | |||||||||||||
| USD | 8.625 | % | 08/01/2017 | 775,000 | 817,625 | |||||||||||||
| USD | 8.750 | % | 05/15/2020 | 950,000 | 926,250 | |||||||||||||
|
| |||||||||||||||||
| 19,258,775 | ||||||||||||||||||
|
| |||||||||||||||||
Gas Distributors - 1.07% | ||||||||||||||||||
Inergy LP: | ||||||||||||||||||
| USD | 8.750 | % | 03/01/2015 | 556,000 | 585,190 | |||||||||||||
| USD | 7.000 | % | 10/01/2018 | 300,000 | 295,500 | |||||||||||||
| USD | 6.875 | % | 08/01/2021 | 1,850,000 | 1,766,750 | |||||||||||||
Niska Gas Storage US LLC | USD | 8.875 | % | 03/15/2018 | 2,200,000 | 2,156,000 | ||||||||||||
|
| |||||||||||||||||
| 4,803,440 | ||||||||||||||||||
|
| |||||||||||||||||
Gas Pipelines - 2.93% | ||||||||||||||||||
ANR Pipeline Co.: | ||||||||||||||||||
| USD | 7.375 | % | 02/15/2024 | 60,000 | 75,951 | |||||||||||||
| USD | 7.000 | % | 06/01/2025 | 10,000 | 12,357 | |||||||||||||
Atlas Pipeline Partners LP | USD | 8.750 | % | 06/15/2018 | 1,050,000 | 1,086,750 | (1) | |||||||||||
Copano Energy LLC: | ||||||||||||||||||
| USD | 7.750 | % | 06/01/2018 | 675,000 | 675,000 | |||||||||||||
| USD | 7.125 | % | 04/01/2021 | 1,525,000 | 1,532,625 | |||||||||||||
Crosstex Energy, Inc. | USD | 8.875 | % | 02/15/2018 | 1,950,000 | 2,086,500 | ||||||||||||
El Paso Corp., Series GMTN | USD | 7.800 | % | 08/01/2031 | 1,900,000 | 2,194,500 | ||||||||||||
MarkWest Energy Partners LP: | ||||||||||||||||||
| USD | 6.750 | % | 11/01/2020 | 475,000 | 491,031 | |||||||||||||
| USD | 6.250 | % | 06/15/2022 | 1,100,000 | 1,119,250 | |||||||||||||
Sabine Pass LNG LP | USD | 7.250 | % | 11/30/2013 | 2,175,000 | 2,164,125 | ||||||||||||
Targa Resources Partners LP: | ||||||||||||||||||
| USD | 7.875 | % | 10/15/2018 | 775,000 | 809,875 | |||||||||||||
| USD | 6.875 | % | 02/01/2021 | 850,000 | 854,250 | (1) | ||||||||||||
|
| |||||||||||||||||
| USD | 13,102,214 | |||||||||||||||||
|
| |||||||||||||||||
| See Notes to Financial Statements. | ||
| 30 | www.shiplp.com | |
Table of Contents
| Stone Harbor High Yield Bond Fund | Statements of Investments | |
| November 30, 2011 (Unaudited) |
| Currency | Rate | Maturity Date | Principal Amount* | Market Value (Expressed in U.S. $) | ||||||||||||||
Healthcare - 8.37% | ||||||||||||||||||
American Renal Holdings, Inc. | USD | 8.375 | % | 05/15/2018 | 1,875,000 | $ | 1,940,625 | |||||||||||
Biomet, Inc. | USD | 11.625 | % | 10/15/2017 | 1,925,000 | 2,069,375 | ||||||||||||
Community Health Systems, Inc.: | ||||||||||||||||||
| USD | 8.875 | % | 07/15/2015 | 2,605,000 | 2,683,150 | |||||||||||||
| USD | 8.000 | % | 11/15/2019 | 1,900,000 | 1,847,750 | (1) | ||||||||||||
ConvaTec Healthcare E SA | USD | 10.500 | % | 12/15/2018 | 2,100,000 | 1,905,750 | (1) | |||||||||||
Emergency Medical Services Corp., Series WI | USD | 8.125 | % | 06/01/2019 | 2,200,000 | 2,172,500 | ||||||||||||
HCA Holdings, Inc. | USD | 7.750 | % | 05/15/2021 | 275,000 | 271,562 | ||||||||||||
HCA, Inc. | USD | 7.500 | % | 02/15/2022 | 6,425,000 | 6,344,687 | ||||||||||||
Health Management Associates, Inc. | USD | 7.375 | % | 01/15/2020 | 2,270,000 | 2,289,863 | (1) | |||||||||||
HealthSouth Corp. | USD | 8.125 | % | 02/15/2020 | 3,425,000 | 3,365,063 | ||||||||||||
IASIS Healthcare LLC | USD | 8.375 | % | 05/15/2019 | 2,150,000 | 1,800,625 | (1) | |||||||||||
Radiation Therapy Services, Inc. | USD | 9.875 | % | 04/15/2017 | 2,275,000 | 1,717,625 | ||||||||||||
Surgical Care Affiliates, Inc.: | ||||||||||||||||||
| USD | 8.875 | % | 07/15/2015 | 984,000 | 979,080 | (1)(2) | ||||||||||||
| USD | 10.000 | % | 07/15/2017 | 1,275,000 | 1,230,375 | (1) | ||||||||||||
Tenet Healthcare Corp. | USD | 6.250 | % | 11/01/2018 | 1,000,000 | 987,500 | (1) | |||||||||||
United Surgical Partners International, Inc.: | ||||||||||||||||||
| USD | 8.875 | % | 05/01/2017 | 125,000 | 124,687 | |||||||||||||
| USD | 9.250 | % | 05/01/2017 | 1,370,000 | 1,370,000 | (2) | ||||||||||||
Vanguard Health Holding Co. II LLC | USD | 8.000 | % | 02/01/2018 | 4,525,000 | 4,321,375 | ||||||||||||
Vanguard Health Systems, Inc. | USD | 0.000 | % | 02/01/2016 | 10,000 | 6,450 | (5) | |||||||||||
|
| |||||||||||||||||
| 37,428,042 | ||||||||||||||||||
|
| |||||||||||||||||
Industrial Other - 1.09% | ||||||||||||||||||
Park-Ohio Industries, Inc. | USD | 8.125 | % | 04/01/2021 | 1,250,000 | 1,225,000 | ||||||||||||
RBS Global, Inc. | USD | 8.500 | % | 05/01/2018 | 3,550,000 | 3,656,500 | ||||||||||||
|
| |||||||||||||||||
| 4,881,500 | ||||||||||||||||||
|
| |||||||||||||||||
Leisure - 2.09% | ||||||||||||||||||
AMC Entertainment, Inc.: | ||||||||||||||||||
| USD | 8.000 | % | 03/01/2014 | 550,000 | 534,875 | |||||||||||||
| USD | 9.750 | % | 12/01/2020 | 3,725,000 | 3,408,375 | |||||||||||||
Cinemark USA, Inc.: | ||||||||||||||||||
| USD | 8.625 | % | 06/15/2019 | 1,775,000 | 1,917,000 | |||||||||||||
| USD | 7.375 | % | 06/15/2021 | 1,175,000 | 1,177,938 | |||||||||||||
Regal Cinemas Corp. | USD | 8.625 | % | 07/15/2019 | 1,700,000 | 1,806,250 | ||||||||||||
Regal Entertainment Group | USD | 9.125 | % | 08/15/2018 | 475,000 | 498,750 | ||||||||||||
|
| |||||||||||||||||
| 9,343,188 | ||||||||||||||||||
|
| |||||||||||||||||
Media Cable - 5.19% | ||||||||||||||||||
Atlantic Broadband Finance LLC | USD | 9.375 | % | 01/15/2014 | 1,710,000 | 1,712,138 | ||||||||||||
Cablevision Systems Corp.: | ||||||||||||||||||
| USD | 8.625 | % | 09/15/2017 | 1,725,000 | 1,811,250 | |||||||||||||
| USD | 7.750 | % | 04/15/2018 | 525,000 | 538,125 | |||||||||||||
| USD | 8.000 | % | 04/15/2020 | 1,275,000 | 1,300,500 | |||||||||||||
CCO Holdings LLC | USD | 7.000 | % | 01/15/2019 | 425,000 | 429,781 | ||||||||||||
Cequel Communications Holdings I LLC | USD | 8.625 | % | 11/15/2017 | 1,175,000 | 1,201,437 | (1) | |||||||||||
CSC Holdings LLC: | ||||||||||||||||||
| USD | 7.625 | % | 07/15/2018 | 325,000 | 352,625 | |||||||||||||
| USD | 8.625 | % | 02/15/2019 | 475,000 | 532,000 | |||||||||||||
| See Notes to Financial Statements. | ||
Stone Harbor Investment Funds Semi-Annual Report | November 30, 2011 | 31 | |
Table of Contents
| Stone Harbor High Yield Bond Fund | Statements of Investments | |
| November 30, 2011 (Unaudited) |
| Currency | Rate | Maturity Date | Principal Amount* | Market Value (Expressed in U.S. $) | ||||||||||||||
DISH DBS Corp.: | ||||||||||||||||||
| USD | 7.125 | % | 02/01/2016 | 960,000 | $ | 991,200 | ||||||||||||
| USD | 7.875 | % | 09/01/2019 | 2,750,000 | 2,928,750 | |||||||||||||
| USD | 6.750 | % | 06/01/2021 | 850,000 | 833,000 | |||||||||||||
Nara Cable Funding Ltd. | EUR | 8.875 | % | 12/01/2018 | 700,000 | 806,560 | (3) | |||||||||||
Ono Finance II PLC | USD | 10.875 | % | 07/15/2019 | 805,000 | 672,175 | (1) | |||||||||||
Radio One, Inc. | USD | 15.000 | % | 05/24/2016 | 2,553,996 | 2,158,127 | (2) | |||||||||||
Unitymedia Hesson GmbH & Co. | USD | 8.125 | % | 12/01/2017 | 125,000 | 129,687 | (1) | |||||||||||
UPC Holding BV: | ||||||||||||||||||
| EUR | 9.750 | % | 04/15/2018 | 425,000 | 576,786 | (3) | ||||||||||||
| USD | 9.875 | % | 04/15/2018 | 2,625,000 | 2,716,875 | (1) | ||||||||||||
| EUR | 8.375 | % | 08/15/2020 | 900,000 | 1,124,683 | (3) | ||||||||||||
Virgin Media Finance PLC | USD | 8.375 | % | 10/15/2019 | 275,000 | 295,625 | ||||||||||||
Ziggo Bond Co. BV | EUR | 8.000 | % | 05/15/2018 | 1,600,000 | 2,096,183 | (3) | |||||||||||
|
| |||||||||||||||||
| 23,207,507 | ||||||||||||||||||
|
| |||||||||||||||||
Media Other - 2.84% | ||||||||||||||||||
AMC Networks, Inc. | USD | 7.750 | % | 07/15/2021 | 900,000 | 956,250 | (1) | |||||||||||
Bonten Media Acquisition Co. | USD | 9.000 | % | 06/01/2015 | 539,195 | 423,268 | (1)(2) | |||||||||||
Entravision Communications Corp. | USD | 8.750 | % | 08/01/2017 | 2,805,000 | 2,755,913 | ||||||||||||
Fox Acquisition Sub LLC | USD | 13.375 | % | 07/15/2016 | 1,665,000 | 1,825,256 | (1) | |||||||||||
Interep National Radio Sales, Inc., Series B | USD | 10.000 | % | 07/01/2008 | 4,000 | 0 | (4) | |||||||||||
Lamar Media Corp., Series B | USD | 6.625 | % | 08/15/2015 | 1,680,000 | 1,684,200 | ||||||||||||
Sinclair Television Group, Inc.: | ||||||||||||||||||
| USD | 9.250 | % | 11/01/2017 | 800,000 | 862,000 | (1) | ||||||||||||
| USD | 8.375 | % | 10/15/2018 | 1,325,000 | 1,348,188 | |||||||||||||
Univision Communications, Inc.: | ||||||||||||||||||
| USD | 7.875 | % | 11/01/2020 | 2,205,000 | 2,094,750 | (1) | ||||||||||||
| USD | 8.500 | % | 05/15/2021 | 900,000 | 747,000 | (1) | ||||||||||||
|
| |||||||||||||||||
| 12,696,825 | ||||||||||||||||||
|
| |||||||||||||||||
Metals/Mining/Steel - 5.29% | ||||||||||||||||||
APERAM: | ||||||||||||||||||
| USD | 7.375 | % | 04/01/2016 | 850,000 | 748,000 | (1) | ||||||||||||
| USD | 7.750 | % | 04/01/2018 | 1,425,000 | 1,225,500 | (1) | ||||||||||||
Arch Coal, Inc.: | ||||||||||||||||||
| USD | 7.000 | % | 06/15/2019 | 650,000 | 637,000 | (1) | ||||||||||||
| USD | 7.250 | % | 06/15/2021 | 1,575,000 | 1,535,625 | (1) | ||||||||||||
Atkore International, Inc. | USD | 9.875 | % | 01/01/2018 | 2,074,000 | 2,027,335 | ||||||||||||
Cloud Peak Energy Resources LLC: | ||||||||||||||||||
| USD | 8.250 | % | 12/15/2017 | 400,000 | 424,000 | |||||||||||||
| USD | 8.500 | % | 12/15/2019 | 1,530,000 | 1,644,750 | |||||||||||||
Consol Energy, Inc.: | ||||||||||||||||||
| USD | 8.000 | % | 04/01/2017 | 1,175,000 | 1,257,250 | |||||||||||||
| USD | 8.250 | % | 04/01/2020 | 800,000 | 864,000 | |||||||||||||
FMG Resources August 2006 Pty Ltd. | USD | 8.250 | % | 11/01/2019 | 2,560,000 | 2,524,800 | (1) | |||||||||||
JMC Steel Group | USD | 8.250 | % | 03/15/2018 | 1,600,000 | 1,512,000 | (1) | |||||||||||
Mirabela Nickel Ltd. | USD | 8.750 | % | 04/15/2018 | 2,325,000 | 2,080,875 | (1) | |||||||||||
Novelis, Inc. | USD | 8.375 | % | 12/15/2017 | 1,825,000 | 1,907,125 | ||||||||||||
Peabody Energy Corp. | USD | 6.250 | % | 11/15/2021 | 1,540,000 | 1,559,250 | (1) | |||||||||||
Penn Virginia Resource Partners LP | USD | 8.250 | % | 04/15/2018 | 1,685,000 | 1,676,575 | ||||||||||||
Taseko Mines Ltd. | USD | 7.750 | % | 04/15/2019 | 2,225,000 | 2,024,750 | ||||||||||||
|
| |||||||||||||||||
| 23,648,835 | ||||||||||||||||||
|
| |||||||||||||||||
| See Notes to Financial Statements. | ||
| 32 | www.shiplp.com | |
Table of Contents
| Stone Harbor High Yield Bond Fund | Statements of Investments | |
| November 30, 2011 (Unaudited) |
| Currency | Rate | Maturity Date | Principal Amount* | Market Value (Expressed in U.S. $) | ||||||||||||||
Non Captive Finance - 0.27% | ||||||||||||||||||
Ally Financial, Inc. | USD | 6.250 | % | 12/01/2017 | 790,000 | $ | 728,882 | |||||||||||
PHH Corp. | USD | 9.250 | % | 03/01/2016 | 450,000 | 465,750 | ||||||||||||
|
| |||||||||||||||||
| 1,194,632 | ||||||||||||||||||
|
| |||||||||||||||||
Paper/Forest Products - 3.28% | ||||||||||||||||||
Ainsworth Lumber Co. Ltd. | USD | 11.000 | % | 07/29/2015 | 1,994,906 | 1,256,791 | (1)(2) | |||||||||||
Boise Paper Holdings LLC | USD | 8.000 | % | 04/01/2020 | 2,000,000 | 2,115,000 | ||||||||||||
Cascades, Inc.: | ||||||||||||||||||
| USD | 7.750 | % | 12/15/2017 | 1,750,000 | 1,710,625 | |||||||||||||
| USD | 7.875 | % | 01/15/2020 | 650,000 | 627,250 | |||||||||||||
Catalyst Paper Corp. | USD | 11.000 | % | 12/15/2016 | 1,540,000 | 962,500 | (1) | |||||||||||
Graphic Packaging International, Inc. | USD | 9.500 | % | 06/15/2017 | 2,155,000 | 2,359,725 | ||||||||||||
Mercer International, Inc. | USD | 9.500 | % | 12/01/2017 | 1,990,000 | 2,009,900 | ||||||||||||
NewPage Corp. | USD | 11.375 | % | 12/31/2014 | 1,215,000 | 853,537 | (4) | |||||||||||
Verso Paper Holdings LLC: | ||||||||||||||||||
| USD | 8.750 | % | 02/01/2019 | 595,000 | 389,725 | |||||||||||||
Series B | USD | 11.375 | % | 08/01/2016 | 1,805,000 | 1,092,025 | ||||||||||||
Xerium Technologies, Inc. | USD | 8.875 | % | 06/15/2018 | 1,500,000 | 1,297,500 | (1) | |||||||||||
|
| |||||||||||||||||
| 14,674,578 | ||||||||||||||||||
|
| |||||||||||||||||
Property & Casualty Insurance - 0.26% | ||||||||||||||||||
CNO Financial Group, Inc. | USD | 9.000 | % | 01/15/2018 | 1,100,000 | 1,160,500 | (1) | |||||||||||
|
| |||||||||||||||||
Publishing/Printing - 1.65% | ||||||||||||||||||
Baker & Taylor, Inc. | USD | 11.500 | % | 07/01/2013 | 1,295,000 | 1,018,194 | (1) | |||||||||||
Cenveo Corp.: | ||||||||||||||||||
| USD | 7.875 | % | 12/01/2013 | 3,400,000 | 2,703,000 | |||||||||||||
| USD | 8.375 | % | 06/15/2014 | 650,000 | 490,750 | |||||||||||||
| USD | 10.500 | % | 08/15/2016 | 350,000 | 297,500 | (1) | ||||||||||||
| USD | 8.875 | % | 02/01/2018 | 500,000 | 428,750 | |||||||||||||
IDEARC, Inc. | USD | 8.000 | % | 11/15/2016 | 1,265,000 | 0 | (4) | |||||||||||
The McClatchy Co. | USD | 11.500 | % | 02/15/2017 | 2,635,000 | 2,457,137 | ||||||||||||
|
| |||||||||||||||||
| 7,395,331 | ||||||||||||||||||
|
| |||||||||||||||||
Refining - 0.42% | ||||||||||||||||||
Petroplus Finance Ltd.: | ||||||||||||||||||
| USD | 6.750 | % | 05/01/2014 | 1,585,000 | 1,117,425 | (1) | ||||||||||||
| USD | 7.000 | % | 05/01/2017 | 925,000 | 559,625 | (1) | ||||||||||||
| USD | 9.375 | % | 09/15/2019 | 300,000 | 189,000 | (1) | ||||||||||||
|
| |||||||||||||||||
| 1,866,050 | ||||||||||||||||||
|
| |||||||||||||||||
Restaurants - 0.00%(6) | ||||||||||||||||||
Sbarro, Inc. | USD | 10.375 | % | 02/01/2015 | 225,000 | 2,813 | (4) | |||||||||||
|
| |||||||||||||||||
Retail Food/Drug - 0.75% | ||||||||||||||||||
Albertsons, Inc.: | ||||||||||||||||||
| USD | 8.700 | % | 05/01/2030 | 725,000 | 632,563 | |||||||||||||
| USD | 8.000 | % | 05/01/2031 | 625,000 | 504,687 | |||||||||||||
American Stores Co.: | ||||||||||||||||||
| USD | 7.900 | % | 05/01/2017 | 550,000 | 512,875 | |||||||||||||
| USD | 8.000 | % | 06/01/2026 | 1,465,000 | 1,256,238 | |||||||||||||
Series MTNB | USD | 7.100 | % | 03/20/2028 | 600,000 | 454,500 | ||||||||||||
|
| |||||||||||||||||
| 3,360,863 | ||||||||||||||||||
|
| |||||||||||||||||
| See Notes to Financial Statements. | ||
Stone Harbor Investment Funds Semi-Annual Report | November 30, 2011 | 33 | |
Table of Contents
| Stone Harbor High Yield Bond Fund | Statements of Investments | |
| November 30, 2011 (Unaudited) |
| Currency | Rate | Maturity Date | Principal Amount* | Market Value (Expressed in U.S. $) | ||||||||||||||
Retail Non Food/Drug - 2.48% | ||||||||||||||||||
The Bon-Ton Department Stores, Inc. | USD | 10.250 | % | 03/15/2014 | 1,380,000 | $ | 893,550 | |||||||||||
Claire’s Stores, Inc.: | ||||||||||||||||||
| USD | 9.250 | % | 06/01/2015 | 550,000 | 409,750 | |||||||||||||
| USD | 9.625 | % | 06/01/2015 | 1,308,282 | 977,941 | (2) | ||||||||||||
| USD | 8.875 | % | 03/15/2019 | 1,150,000 | 845,250 | |||||||||||||
Express LLC | USD | 8.750 | % | 03/01/2018 | 1,300,000 | 1,371,500 | ||||||||||||
JC Penney Corp., Inc. | USD | 7.400 | % | 04/01/2037 | 2,100,000 | 1,937,250 | ||||||||||||
Limited Brands, Inc.: | ||||||||||||||||||
| USD | 6.950 | % | 03/01/2033 | 1,350,000 | 1,245,375 | |||||||||||||
| USD | 7.600 | % | 07/15/2037 | 400,000 | 394,000 | |||||||||||||
Michaels Stores, Inc. | USD | 7.750 | % | 11/01/2018 | 725,000 | 712,312 | ||||||||||||
RadioShack Corp. | USD | 6.750 | % | 05/15/2019 | 2,250,000 | 1,951,875 | ||||||||||||
Toys R Us Delaware, Inc. | USD | 7.375 | % | 09/01/2016 | 375,000 | 373,125 | (1) | |||||||||||
|
| |||||||||||||||||
| 11,111,928 | ||||||||||||||||||
|
| |||||||||||||||||
Satellite - 0.29% | ||||||||||||||||||
Intelsat Jackson Holdings SA: | ||||||||||||||||||
| USD | 7.250 | % | 04/01/2019 | 375,000 | 366,562 | (1) | ||||||||||||
| USD | 8.500 | % | 11/01/2019 | 900,000 | 920,250 | |||||||||||||
|
| |||||||||||||||||
| 1,286,812 | ||||||||||||||||||
|
| |||||||||||||||||
Services Other - 3.93% | ||||||||||||||||||
American Residential Services LLC | USD | 12.000 | % | 04/15/2015 | 1,075,000 | 1,075,000 | (1) | |||||||||||
ARAMARK Corp. | USD | 8.500 | % | 02/01/2015 | 1,120,000 | 1,153,600 | ||||||||||||
ARAMARK Holdings Corp. | USD | 8.625 | % | 05/01/2016 | 1,475,000 | 1,504,500 | (1)(2) | |||||||||||
Brickman Group Holdings, Inc. | USD | 9.125 | % | 11/01/2018 | 2,250,000 | 2,013,750 | (1) | |||||||||||
GXS Worldwide, Inc. | USD | 9.750 | % | 06/15/2015 | 2,040,000 | 1,892,100 | ||||||||||||
Interactive Data Corp. | USD | 10.250 | % | 08/01/2018 | 1,875,000 | 2,015,625 | ||||||||||||
Iron Mountain, Inc.: | ||||||||||||||||||
| USD | 8.750 | % | 07/15/2018 | 1,200,000 | 1,242,000 | |||||||||||||
| USD | 8.000 | % | 06/15/2020 | 375,000 | 386,250 | |||||||||||||
| USD | 8.375 | % | 08/15/2021 | 325,000 | 342,875 | |||||||||||||
ServiceMaster Co.: | ||||||||||||||||||
| USD | 10.750 | % | 07/15/2015 | 1,800,000 | 1,845,000 | (1)(2) | ||||||||||||
| USD | 7.450 | % | 08/15/2027 | 325,000 | 249,437 | |||||||||||||
Trans Union LLC | USD | 11.375 | % | 06/15/2018 | 1,925,000 | 2,146,375 | ||||||||||||
West Corp.: | ||||||||||||||||||
| USD | 8.625 | % | 10/01/2018 | 350,000 | 350,875 | |||||||||||||
| USD | 7.875 | % | 01/15/2019 | 1,350,000 | 1,356,750 | |||||||||||||
|
| |||||||||||||||||
| 17,574,137 | ||||||||||||||||||
|
| |||||||||||||||||
Technology - 4.08% | ||||||||||||||||||
CommScope, Inc. | USD | 8.250 | % | 01/15/2019 | 2,350,000 | 2,279,500 | (1) | |||||||||||
First Data Corp. | USD | 12.625 | % | 01/15/2021 | 1,690,000 | 1,402,700 | (1) | |||||||||||
iGate Corp. | USD | 9.000 | % | 05/01/2016 | 2,125,000 | 2,135,625 | (1) | |||||||||||
Lawson Software, Inc. | USD | 11.250 | % | 07/15/2018 | 2,080,000 | 1,991,600 | (1) | |||||||||||
MEMC Electronic Materials, Inc. | USD | 7.750 | % | 04/01/2019 | 1,475,000 | 1,165,250 | ||||||||||||
NXP BV | USD | 9.750 | % | 08/01/2018 | 2,125,000 | 2,321,563 | (1) | |||||||||||
Seagate HDD Cayman | USD | 7.750 | % | 12/15/2018 | 2,075,000 | 2,147,625 | (1) | |||||||||||
Sensata Technologies BV | USD | 6.500 | % | 05/15/2019 | 1,175,000 | 1,145,625 | (1) | |||||||||||
SSI Investments II | USD | �� | 11.125 | % | 06/01/2018 | 1,950,000 | 2,052,375 | |||||||||||
SunGard Data Systems, Inc. | USD | 7.375 | % | 11/15/2018 | 1,625,000 | 1,608,750 | ||||||||||||
|
| |||||||||||||||||
| 18,250,613 | ||||||||||||||||||
|
| |||||||||||||||||
| See Notes to Financial Statements. | ||
| 34 | www.shiplp.com | |
Table of Contents
| Stone Harbor High Yield Bond Fund | Statements of Investments | |
| November 30, 2011 (Unaudited) |
Currency | Rate | Maturity Date | Principal Amount* | Market Value (Expressed in U.S. $) | ||||||||||||||
Textile/Apparel - 0.87% | ||||||||||||||||||
Levi Strauss & Co.: | ||||||||||||||||||
| USD | 8.875 | % | 04/01/2016 | 725,000 | $ | 750,375 | ||||||||||||
| USD | 7.625 | % | 05/15/2020 | 1,550,000 | 1,561,625 | |||||||||||||
Quiksilver, Inc. | USD | 6.875 | % | 04/15/2015 | 1,700,000 | 1,589,500 | ||||||||||||
|
| |||||||||||||||||
| 3,901,500 | ||||||||||||||||||
|
| |||||||||||||||||
Transportation - Non Air/Rail - 0.41% | ||||||||||||||||||
CMA CGM SA | USD | 8.500 | % | 04/15/2017 | 1,525,000 | 541,375 | (1) | |||||||||||
General Maritime Corp. | USD | 12.000 | % | 11/15/2017 | 2,755,000 | 296,163 | (4) | |||||||||||
Teekay Corp. | USD | 8.500 | % | 01/15/2020 | 1,025,000 | 981,437 | ||||||||||||
|
| |||||||||||||||||
| 1,818,975 | ||||||||||||||||||
|
| |||||||||||||||||
Wireless - 2.14% | ||||||||||||||||||
Nextel Communications, Inc., Series D | USD | 7.375 | % | 08/01/2015 | 1,545,000 | 1,367,325 | ||||||||||||
NII Capital Corp. | USD | 7.625 | % | 04/01/2021 | 210,000 | 214,200 | ||||||||||||
Sprint Capital Corp. | USD | 8.750 | % | 03/15/2032 | 4,950,000 | 3,960,000 | ||||||||||||
Sprint Nextel Corp. | USD | 9.000 | % | 11/15/2018 | 1,670,000 | 1,686,700 | (1) | |||||||||||
Wind Acquisition Finance SA | USD | 12.250 | % | 07/15/2017 | 3,003,611 | 2,327,799 | (1)(2) | |||||||||||
|
| |||||||||||||||||
| 9,556,024 | ||||||||||||||||||
|
| |||||||||||||||||
Wirelines - 4.77% | ||||||||||||||||||
Cincinnati Bell, Inc.: | ||||||||||||||||||
| USD | 8.250 | % | 10/15/2017 | 1,150,000 | 1,121,250 | |||||||||||||
| USD | 8.750 | % | 03/15/2018 | 1,545,000 | 1,382,775 | |||||||||||||
| USD | 8.375 | % | 10/15/2020 | 50,000 | 48,750 | |||||||||||||
Citizens Communications Co. | USD | 9.000 | % | 08/15/2031 | 6,563,000 | 5,808,255 | ||||||||||||
Embarq Corp. | USD | 7.995 | % | 06/01/2036 | 1,575,000 | 1,588,173 | ||||||||||||
ITC Deltacom, Inc. | USD | 10.500 | % | 04/01/2016 | 2,000,000 | 2,072,500 | ||||||||||||
Level 3 Financing, Inc. | USD | 10.000 | % | 02/01/2018 | 2,400,000 | 2,472,000 | ||||||||||||
Qwest Corp.: | ||||||||||||||||||
| USD | 7.500 | % | 06/15/2023 | 425,000 | 427,125 | |||||||||||||
| USD | 6.875 | % | 09/15/2033 | 1,750,000 | 1,723,750 | |||||||||||||
Syniverse Holdings, Inc. | USD | 9.125 | % | 01/15/2019 | 1,050,000 | 1,081,500 | ||||||||||||
Windstream Corp.: | ||||||||||||||||||
| USD | 7.875 | % | 11/01/2017 | 675,000 | 708,750 | |||||||||||||
| USD | 7.750 | % | 10/15/2020 | 400,000 | 392,000 | |||||||||||||
| USD | 7.750 | % | 10/01/2021 | 515,000 | 509,850 | |||||||||||||
| USD | 7.500 | % | 04/01/2023 | 2,142,000 | 2,024,190 | |||||||||||||
|
| |||||||||||||||||
| 21,360,868 | ||||||||||||||||||
|
| |||||||||||||||||
TOTAL CORPORATE BONDS | 407,568,185 | |||||||||||||||||
|
| |||||||||||||||||
(Cost $421,467,608) | ||||||||||||||||||
CONVERTIBLE CORPORATE BONDS - 1.84% | ||||||||||||||||||
Airlines - 0.03% | ||||||||||||||||||
AirTran Holdings, Inc. | USD | 5.250 | % | 11/01/2016 | 110,000 | 139,013 | ||||||||||||
|
| |||||||||||||||||
Automotive - 0.20% | ||||||||||||||||||
Cie Generale des Etablissements Michelin, Series ML | EUR | 0.000 | % | 01/01/2017 | 166,631 | 238,352 | (5) | |||||||||||
Suzuki Motor Corp., Series 4 | JPY | 0.000 | % | 03/29/2013 | 25,000,000 | 320,380 | (1)(5) | |||||||||||
TRW Automotive, Inc. | USD | 3.500 | % | 12/01/2015 | 250,000 | 334,375 | ||||||||||||
|
| |||||||||||||||||
| 893,107 | ||||||||||||||||||
|
| |||||||||||||||||
| See Notes to Financial Statements. | ||
Stone Harbor Investment Funds Semi-Annual Report | November 30, 2011 | 35 | |
Table of Contents
| Stone Harbor High Yield Bond Fund | Statements of Investments | |
| November 30, 2011 (Unaudited) |
| Currency | Rate | Maturity Date | Principal Amount* | Market Value (Expressed in U.S. $) | ||||||||||||||
Building Products - 0.02% | ||||||||||||||||||
Cemex SAB de CV: | ||||||||||||||||||
| USD | 3.250 | % | 03/15/2016 | 49,000 | $ | 27,869 | (1) | |||||||||||
| USD | 3.750 | % | 03/15/2018 | 100,000 | 57,125 | (1) | ||||||||||||
|
| |||||||||||||||||
| 84,994 | ||||||||||||||||||
|
| |||||||||||||||||
Containers/Packaging - 0.06% | ||||||||||||||||||
Owens-Brockway Glass Container, Inc. | USD | 3.000 | % | 06/01/2015 | 293,000 | 271,391 | (1) | |||||||||||
|
| |||||||||||||||||
Drillers/Services - 0.23% | ||||||||||||||||||
Hercules Offshore, Inc. | USD | 3.375 | % | 06/01/2038 | 252,000 | 225,540 | (7) | |||||||||||
Hornbeck Offshore Services, Inc. | USD | 1.625 | % | 11/15/2026 | 140,000 | 141,400 | (7) | |||||||||||
Newpark Resources, Inc. | USD | 4.000 | % | 10/01/2017 | 168,000 | 185,010 | ||||||||||||
SESI LLC | USD | 1.500 | % | 12/15/2026 | 170,000 | 170,212 | (7) | |||||||||||
Subsea 7 SA, Series ACY | USD | 2.250 | % | 10/11/2013 | 300,000 | 330,000 | ||||||||||||
|
| |||||||||||||||||
| 1,052,162 | ||||||||||||||||||
|
| |||||||||||||||||
Exploration & Production - 0.00%(6) | ||||||||||||||||||
InterOil Corp. | USD | 2.750 | % | 11/15/2015 | 9,000 | 7,459 | ||||||||||||
|
| |||||||||||||||||
Food & Beverage - 0.13% | ||||||||||||||||||
Smithfield Foods, Inc. | USD | 4.000 | % | 06/30/2013 | 163,000 | 200,286 | ||||||||||||
Tyson Foods, Inc. | USD | 3.250 | % | 10/15/2013 | 280,000 | 368,550 | ||||||||||||
|
| |||||||||||||||||
| 568,836 | ||||||||||||||||||
|
| |||||||||||||||||
Healthcare - 0.13% | ||||||||||||||||||
Amylin Pharmaceuticals, Inc. | USD | 3.000 | % | 06/15/2014 | 122,000 | 107,360 | ||||||||||||
Dendreon Corp. | USD | 2.875 | % | 01/15/2016 | 401,000 | 283,707 | ||||||||||||
Hologic, Inc. | USD | 2.000 | % | 12/15/2037 | 109,000 | 103,550 | (7) | |||||||||||
Integra LifeSciences Holdings Corp. | USD | 1.625 | % | 12/15/2016 | 92,000 | 79,120 | (1) | |||||||||||
|
| |||||||||||||||||
| 573,737 | ||||||||||||||||||
|
| |||||||||||||||||
Industrial Other - 0.04% | ||||||||||||||||||
Altra Holdings, Inc. | USD | 2.750 | % | 03/01/2031 | 214,000 | 198,753 | (1) | |||||||||||
|
| |||||||||||||||||
Lodging - 0.01% | ||||||||||||||||||
Home Inns & Hotels Management, Inc. | USD | 2.000 | % | 12/15/2015 | 56,000 | 48,300 | (1) | |||||||||||
|
| |||||||||||||||||
Metals/Mining/Steel - 0.03% | ||||||||||||||||||
RTI International Metals, Inc. | USD | 3.000 | % | 12/01/2015 | 109,000 | 118,265 | ||||||||||||
|
| |||||||||||||||||
Pharmaceuticals - 0.14% | ||||||||||||||||||
Gilead Sciences, Inc. | USD | 1.000 | % | 05/01/2014 | 207,000 | 223,301 | ||||||||||||
PDL BioPharma, Inc. | USD | 3.750 | % | 05/01/2015 | 111,000 | 111,833 | ||||||||||||
Savient Pharmaceuticals, Inc. | USD | 4.750 | % | 02/01/2018 | 162,000 | 95,377 | ||||||||||||
Teva Pharmaceutical Finance Co. LLC, Series C | USD | 0.250 | % | 02/01/2026 | 175,000 | 182,875 | ||||||||||||
|
| |||||||||||||||||
| 613,386 | ||||||||||||||||||
|
| |||||||||||||||||
Property & Casualty Insurance - 0.01% | ||||||||||||||||||
Radian Group, Inc. | USD | 3.000 | % | 11/15/2017 | 71,000 | 29,820 | ||||||||||||
|
| |||||||||||||||||
Railroads - 0.06% | ||||||||||||||||||
Greenbrier Cos., Inc. | USD | 3.500 | % | 04/01/2018 | 272,000 | 250,580 | (1) | |||||||||||
|
| |||||||||||||||||
| See Notes to Financial Statements. | ||
| 36 | www.shiplp.com | |
Table of Contents
| Stone Harbor High Yield Bond Fund | Statements of Investments | |
| November 30, 2011 (Unaudited) |
| Currency | Rate | Maturity Date | Principal Amount* | Market Value (Expressed in U.S. $) | ||||||||||||||
Retail Non Food/Drug - 0.03% | ||||||||||||||||||
RadioShack Corp. | USD | 2.500 | % | 08/01/2013 | 150,000 | $ | 144,375 | (1) | ||||||||||
Technology - 0.72% | ||||||||||||||||||
Alcatel-Lucent, Series ALU | EUR | 0.162 | % | 01/01/2015 | 2,000,000 | 60,020 | ||||||||||||
Alcatel-Lucent USA, Inc.: | ||||||||||||||||||
Series A | USD | 2.875 | % | 06/15/2023 | 330,000 | 254,512 | ||||||||||||
Series B | USD | 2.750 | % | 06/15/2025 | 90,000 | 78,750 | ||||||||||||
Callidus Software, Inc. | USD | 4.750 | % | 06/01/2016 | 201,000 | 191,453 | (1) | |||||||||||
Ciena Corp. | USD | 4.000 | % | 03/15/2015 | 160,000 | 158,600 | (1) | |||||||||||
Comtech Telecommunications Corp. | USD | 3.000 | % | 05/01/2029 | 159,000 | 171,124 | ||||||||||||
Digital River, Inc. | USD | 2.000 | % | 11/01/2030 | 355,000 | 291,987 | (1) | |||||||||||
Ixia | USD | 3.000 | % | 12/15/2015 | 271,000 | 268,967 | (1) | |||||||||||
Mentor Graphics Corp. | USD | 4.000 | % | 04/01/2031 | 183,000 | 180,484 | (1) | |||||||||||
Micron Technology, Inc.: | ||||||||||||||||||
| USD | 1.875 | % | 06/01/2014 | 167,000 | 161,573 | |||||||||||||
| USD | 1.875 | % | 06/01/2027 | 121,000 | 104,060 | |||||||||||||
Series A | USD | 1.500 | % | 08/01/2031 | 230,000 | 198,662 | (1) | |||||||||||
ON Semiconductor Corp.: | ||||||||||||||||||
| USD | 2.625 | % | 12/15/2026 | 303,000 | 334,058 | |||||||||||||
Series B | USD | 0.000 | % | 04/15/2024 | 375,000 | 382,500 | (5) | |||||||||||
Rudolph Technologies, Inc. | USD | 3.750 | % | 07/15/2016 | 44,000 | 40,095 | (1) | |||||||||||
WebMD Health Corp.: | ||||||||||||||||||
| USD | 2.250 | % | 03/31/2016 | 40,000 | 37,600 | (1) | ||||||||||||
| USD | 2.500 | % | 01/31/2018 | 100,000 | 90,875 | (1) | ||||||||||||
Xilinx, Inc. | USD | 3.125 | % | 03/15/2037 | 177,000 | 206,426 | ||||||||||||
|
| |||||||||||||||||
| 3,211,746 | ||||||||||||||||||
|
| |||||||||||||||||
Transportation - Non Air/Rail -0.00%(6) | ||||||||||||||||||
Ultrapetrol Bahamas Ltd. | USD | 7.250 | % | 01/15/2017 | 31,000 | 23,366 | (1) | |||||||||||
|
| |||||||||||||||||
TOTAL CONVERTIBLE CORPORATE BONDS | 8,229,290 | |||||||||||||||||
|
| |||||||||||||||||
(Cost $8,631,380) | ||||||||||||||||||
BANK LOANS - 2.17%(8) | ||||||||||||||||||
Building Products -0.04% | ||||||||||||||||||
Collins & Aikman Floorcoverings, Inc. - Term Loan B: | ||||||||||||||||||
| USD | 2.748 | % | 12/14/2011 | 146,939 | 137,020 | |||||||||||||
| USD | 2.755 | % | 12/21/2011 | 18,367 | 17,128 | |||||||||||||
| USD | 2.760 | % | 12/30/2011 | 7,113 | 6,633 | |||||||||||||
|
| |||||||||||||||||
| 160,781 | ||||||||||||||||||
|
| |||||||||||||||||
Electric -0.78% | ||||||||||||||||||
Texas Competitive Electric Holdings Co., LLC -2017 | ||||||||||||||||||
Term Loan | USD | 4.748 | % | 12/09/2011 | 5,332,609 | 3,502,857 | ||||||||||||
|
| |||||||||||||||||
Gaming -0.47% | ||||||||||||||||||
Caesers Entertainment Operating Co., Inc. -Term Loan B-2: | ||||||||||||||||||
| USD | 3.257 | % | 12/28/2011 | 865,069 | 737,472 | |||||||||||||
| USD | 3.418 | % | 01/25/2012 | 1,609,931 | 1,372,466 | |||||||||||||
|
| |||||||||||||||||
| 2,109,938 | ||||||||||||||||||
|
| |||||||||||||||||
Non Captive Finance -0.43% | ||||||||||||||||||
iStar Financial, Inc. -Tranche A-2 Loan | USD | 7.000 | % | 12/02/2011 | 2,000,000 | 1,931,250 | ||||||||||||
|
| |||||||||||||||||
| See Notes to Financial Statements. | ||
Stone Harbor Investment Funds Semi-Annual Report | November 30, 2011 | 37 | |
Table of Contents
| Stone Harbor High Yield Bond Fund | Statements of Investments | |
| November 30, 2011 (Unaudited) |
Currency | Rate | Maturity Date | Principal | Market Value (Expressed in U.S. $) | ||||||||||||||
Publishing/Printing - 0.08% | ||||||||||||||||||
Merrill Communications LLC - Term Loan 2L - Second Lien: | ||||||||||||||||||
| USD | 13.750 | % | 12/30/2011 | 150,000 | $ | 140,250 | ||||||||||||
| USD | 14.000 | % | 01/03/2012 | 8,132 | 7,603 | |||||||||||||
R.H. Donnelley, Inc. - Term Loan D3-Exit: | ||||||||||||||||||
| USD | 9.000 | % | 12/30/2011 | 26,046 | 10,158 | |||||||||||||
| USD | 9.000 | % | 01/31/2012 | 111,820 | 43,610 | |||||||||||||
| USD | 9.000 | % | 02/29/2012 | 115,349 | 44,986 | |||||||||||||
Tribune Co. - Tranche X Advance | USD | 5.000 | % | 06/30/2011 | 192,000 | 115,560 | (4) | |||||||||||
|
| |||||||||||||||||
| 362,167 | ||||||||||||||||||
|
| |||||||||||||||||
Retail Food/Drug - 0.37% | ||||||||||||||||||
BJ’s Wholesale Club, Inc. - First Lien | USD | 7.000 | % | 03/30/2012 | 1,650,000 | 1,653,094 | ||||||||||||
|
| |||||||||||||||||
TOTAL BANK LOANS | 9,720,087 | |||||||||||||||||
|
| |||||||||||||||||
(Cost $10,432,573) | ||||||||||||||||||
COMMON STOCKS - 0.43% | ||||||||||||||||||
Chemicals - 0.03% | ||||||||||||||||||
LyondellBasell Industries NV | USD | 4,658 | 152,177 | |||||||||||||||
|
| |||||||||||||||||
Food & Beverage - 0.02% | ||||||||||||||||||
Archer-Daniels-Midland Co. | USD | 2,934 | 88,372 | |||||||||||||||
|
| |||||||||||||||||
Healthcare - 0.00%(6) | ||||||||||||||||||
Life Technologies Corp. | USD | 300 | 11,619 | (9) | ||||||||||||||
|
| |||||||||||||||||
Media Cable - 0.37% | ||||||||||||||||||
Charter Communications, Inc. | USD | 31,035 | 1,640,820 | (9) | ||||||||||||||
|
| |||||||||||||||||
Publishing/Printing - 0.01% | ||||||||||||||||||
Dex One Corp. | USD | 12,498 | 16,373 | (9) | ||||||||||||||
SuperMedia, Inc. | USD | 998 | 1,956 | (9) | ||||||||||||||
|
| |||||||||||||||||
| 18,329 | ||||||||||||||||||
|
| |||||||||||||||||
TOTAL COMMON STOCKS | 1,911,317 | |||||||||||||||||
|
| |||||||||||||||||
(Cost $4,260,663) | ||||||||||||||||||
PREFERRED STOCKS - 0.25% | ||||||||||||||||||
Banking - 0.12% | ||||||||||||||||||
Wells Fargo & Co. | USD | 7.500 | % | 12/31/2049 | 345 | 363,630 | ||||||||||||
Wintrust Financial Corp. | USD | 7.500 | % | 12/15/2013 | 3,450 | 158,700 | ||||||||||||
|
| |||||||||||||||||
| 522,330 | ||||||||||||||||||
|
| |||||||||||||||||
Exploration & Production - 0.07% | ||||||||||||||||||
Apache Corp. | USD | 6.000 | % | 08/01/2013 | 5,540 | 315,115 | ||||||||||||
|
| |||||||||||||||||
Life - 0.05% | ||||||||||||||||||
Hartford Financial Services Group, Inc. | USD | 7.250 | % | 04/01/2013 | 3,400 | 66,470 | ||||||||||||
MetLife, Inc. | USD | 5.000 | % | 09/11/2013 | 2,250 | 136,777 | ||||||||||||
|
| |||||||||||||||||
| 203,247 | ||||||||||||||||||
|
| |||||||||||||||||
| See Notes to Financial Statements. | ||
| 38 | www.shiplp.com | |
Table of Contents
| Stone Harbor High Yield Bond Fund | Statements of Investments | |
| November 30, 2011 (Unaudited) |
Currency | Rate | Maturity Date | Principal Amount* | Market Value (Expressed in U.S. $) | ||||||||||||||
Metals/Mining/Steel - 0.01% | ||||||||||||||||||
Molycorp, Inc. | USD | 5.500 | % | 03/01/2014 | 850 | $ | 58,948 | |||||||||||
|
| |||||||||||||||||
Technology - 0.00%(6) | ||||||||||||||||||
Unisys Corp. | USD | 6.250 | % | 03/01/2014 | 70 | 4,859 | ||||||||||||
|
| |||||||||||||||||
TOTAL PREFERRED STOCKS | 1,104,499 | |||||||||||||||||
|
| |||||||||||||||||
(Cost $1,159,486) | ||||||||||||||||||
WARRANTS - 0.01%(9) | ||||||||||||||||||
Media Other - 0.01% | ||||||||||||||||||
Cumulus Media, Inc. expires 06/03/2030, strike price $0.010 | 12,989 | 39,227 | ||||||||||||||||
|
| |||||||||||||||||
Publishing/Printing - 0.00% | ||||||||||||||||||
Readers Digest expires 02/19/2014 | 1,498 | 0 | ||||||||||||||||
|
| |||||||||||||||||
TOTAL WARRANTS | 39,227 | |||||||||||||||||
|
| |||||||||||||||||
(Cost $490,671) | ||||||||||||||||||
SHORT TERM INVESTMENTS - 2.04% | ||||||||||||||||||
Money Market Mutual Funds - 2.04% | ||||||||||||||||||
Dreyfus Institutional Cash Advantage Fund - Institutional Advantage Shares (0.077% 7-Day Yield) | USD | 9,125,033 | 9,125,033 | |||||||||||||||
|
| |||||||||||||||||
TOTAL SHORT TERM INVESTMENTS | 9,125,033 | |||||||||||||||||
|
| |||||||||||||||||
(Cost $9,125,033) | ||||||||||||||||||
Total Investments - 97.85% | 437,697,638 | |||||||||||||||||
(Cost $455,567,414) | ||||||||||||||||||
Other Assets in Excess of Liabilities - 2.15% | 9,635,161 | |||||||||||||||||
|
| |||||||||||||||||
Net Assets - 100.00% | $ | 447,332,799 | ||||||||||||||||
|
| |||||||||||||||||
* The contract/principal/share amounts of each security is stated in the currency in which the security is denominated. See below.
EUR | - | Euro Currency | ||
JPY | - | Japanese Yen | ||
USD | - | United States Dollar |
| (1) | Security exempt from registration under Rule 144A of the Securities Act of 1933. Under procedures approved by the Board of Trustees, such securities have been determined to be liquid by Stone Harbor Investment Partners and may normally be sold to qualified institutional buyers in transactions exempt from registration. Total market value of Rule 144A securities amounts to $130,432,253, which represents approximately 29.16% of net assets as of November 30, 2011. |
| (2) | Pay-in-kind securities. |
| (3) | Securities were purchased pursuant to Regulation S under the Securities Act of 1933, which exempts securities offered and sold outside of the United States from registration. Such securities cannot be sold in the United States without either an effective registration statement filed pursuant to the Securities Act of 1933, or pursuant to an exemption from registration. These securities have been deemed liquid under procedures approved by the Fund’s Board of Trustees. As of November 30, 2011, the aggregate market value of those securities was $6,411,247, which represents approximately 1.43% of net assets. |
| (4) | Security is currently in default/non-income producing. |
| (5) | Zero coupon bond reflects effective yield on the date of purchase. |
| (6) | Amount represents less than 0.005% of net assets. |
| See Notes to Financial Statements. | ||
Stone Harbor Investment Funds Semi-Annual Report | November 30, 2011 | 39 | |
Table of Contents
| Stone Harbor High Yield Bond Fund | Statements of Investments | |
| November 30, 2011 (Unaudited) |
| (7) | Step bond. Coupon increases periodically based upon a predetermined schedule. Interest rate disclosed is that which is in effect at November 30, 2011. |
| (8) | Bank loans generally pay interest at rates which are periodically determined by reference to a base lending rate plus a premium . All loans carry a variable rate of interest. These base lending rates are generally (i) the Prime Rate offered by one or more major United States banks, (ii) the lending rate offered by one or more European banks such as the London Interbank Offered Rate (“LIBOR”) or (iii) the Certificate of Deposit rate. Rate shown represents the weighted average rate at November 30, 2011. Bank Loans, while exempt from registration, under the Securities Act of 1933 (the “1933 Act”), contain certain restrictions on resale and cannot be sold publicly. Floating rate bank loans often require prepayments from excess cash flow or permit the borrower to repay at its election. The degree to which borrowers repay, whether as a contractual requirement or at their election, cannot be predicted with accuracy. As a result, the actual remaining maturity may be substantially less than the stated maturity shown. |
| (9) | Non-income producing security. |
Common Abbreviations: | ||||
BV | - | Besloten Vennootschap a Dutch private limited liability company. | ||
GmbH | - | Gesellschaft mit bescharankter Haftung is the German term for limited liability company. | ||
GMTN | - | Global Medium Term Note. | ||
LLC | - | Limited Liability Corp. | ||
LP | - | Limited Partnership. | ||
Ltd. | - | Limited. | ||
NV | - | Naamloze Vennootschap is the Dutch term for a public limited liability corporation. | ||
PLC | - | Public Limited Co. | ||
SA | - | Generally designates corporations in various countries, mostly those employing the civil law. | ||
SAB de CV | - | A variable capital company. | ||
OUTSTANDING FORWARD FOREIGN CURRENCY CONTRACTS
Contract Description | Contracted Amount | Purchase/Sale Contract | Settlement Date | Current Value | Unrealized Appreciation/ Depreciation | |||||||||||
| EUR | 4,981,266 | Sale | 12/28/2011 | $ | 6,695,291 | $ | 56,265 | |||||||||
| JPY | 24,842,000 | Sale | 12/28/2011 | 320,563 | 2,547 | |||||||||||
|
| |||||||||||||||
| $ | 58,812 | |||||||||||||||
|
| |||||||||||||||
| EUR | 345,318 | Sale | 12/28/2011 | $ | 464,140 | $ | (2,633 | ) | ||||||||
|
| |||||||||||||||
| $ | (2,633 | ) | ||||||||||||||
|
| |||||||||||||||
| See Notes to Financial Statements. | ||
| 40 | www.shiplp.com | |
Table of Contents
| Stone Harbor Local Markets Fund | Statements of Investments | |
| November 30, 2011 (Unaudited) |
| Currency | Rate | Maturity Date | Principal Amount * | Market Value (Expressed in U.S. $) | ||||||||||||
SOVEREIGN DEBT OBLIGATIONS - 52.98% | ||||||||||||||||
Argentina - 0.42% | ||||||||||||||||
Republic of Argentina: | ||||||||||||||||
| ARS | 5.830 | % | 12/31/2033 | 7,613,250 | $ | 1,595,929 | (1) | |||||||||
| EUR | 7.820 | % | 12/31/2033 | 3,957,040 | 3,163,675 | (1) | ||||||||||
|
| |||||||||||||||
| 4,759,604 | ||||||||||||||||
|
| |||||||||||||||
Brazil - 2.39% | ||||||||||||||||
Nota Do Tesouro Nacional: | ||||||||||||||||
| BRL | 10.000 | % | 01/01/2015 | 5,300,000 | 2,900,680 | |||||||||||
| BRL | 10.000 | % | 01/01/2017 | 44,600,000 | 23,905,273 | |||||||||||
|
| |||||||||||||||
| 26,805,953 | ||||||||||||||||
|
| |||||||||||||||
Chile - 0.10% | ||||||||||||||||
Republic of Chile | CLP | 5.500 | % | 08/05/2020 | 570,000,000 | 1,151,596 | ||||||||||
|
| |||||||||||||||
Colombia - 3.57% | ||||||||||||||||
Bogota Distrio Capital | COP | 9.750 | % | 07/26/2028 | 34,200,000,000 | 23,968,338 | (2) | |||||||||
Republic of Colombia: | ||||||||||||||||
| COP | 12.000 | % | 10/22/2015 | 900,000,000 | 587,624 | |||||||||||
| COP | 7.750 | % | 04/14/2021 | 10,893,000,000 | 6,587,612 | |||||||||||
| COP | 9.850 | % | 06/28/2027 | 12,270,000,000 | 8,926,334 | |||||||||||
|
| |||||||||||||||
| 40,069,908 | ||||||||||||||||
|
| |||||||||||||||
Hungary - 2.11% | ||||||||||||||||
Hungarian Government: | ||||||||||||||||
| HUF | 6.750 | % | 02/12/2013 | 1,307,700,000 | 5,674,910 | |||||||||||
| HUF | 7.500 | % | 10/24/2013 | 520,100,000 | 2,262,906 | |||||||||||
| HUF | 5.500 | % | 02/12/2014 | 610,000,000 | 2,530,340 | |||||||||||
| HUF | 6.750 | % | 08/22/2014 | 866,510,000 | 3,655,305 | |||||||||||
| HUF | 8.000 | % | 02/12/2015 | 2,066,700,000 | 8,960,561 | |||||||||||
| HUF | 6.750 | % | 02/24/2017 | 71,790,000 | 291,705 | |||||||||||
| HUF | 7.500 | % | 11/12/2020 | 71,790,000 | 292,971 | |||||||||||
|
| |||||||||||||||
| 23,668,698 | ||||||||||||||||
|
| |||||||||||||||
Malaysia - 9.94% | ||||||||||||||||
Malaysian Government: | ||||||||||||||||
| MYR | 5.094 | % | 04/30/2014 | 25,000,000 | 8,236,983 | |||||||||||
| MYR | 3.434 | % | 08/15/2014 | 7,500,000 | 2,379,660 | |||||||||||
| MYR | 3.741 | % | 02/27/2015 | 14,000,000 | 4,464,055 | |||||||||||
| MYR | 3.835 | % | 08/12/2015 | 34,320,000 | 11,018,896 | |||||||||||
| MYR | 4.262 | % | 09/15/2016 | 171,790,000 | 56,368,847 | |||||||||||
| MYR | 4.012 | % | 09/15/2017 | 84,830,000 | 27,462,662 | |||||||||||
| MYR | 4.378 | % | 11/29/2019 | 580,000 | 191,600 | |||||||||||
| MYR | 4.160 | % | 07/15/2021 | 5,050,000 | 1,643,613 | |||||||||||
|
| |||||||||||||||
| 111,766,316 | ||||||||||||||||
|
| |||||||||||||||
| See Notes to Financial Statements. | ||
Stone Harbor Investment Funds Semi-Annual Report | November 30, 2011 | 41 | |
Table of Contents
| Stone Harbor Local Markets Fund | Statements of Investments | |
| November 30, 2011 (Unaudited) |
| Currency | Rate | Maturity Date | Principal Amount * | Market Value (Expressed in U.S. $) | ||||||||||||||
Mexico - 9.17% | ||||||||||||||||||
Mexican Bonos: | ||||||||||||||||||
| MXN | 7.750 | % | 12/14/2017 | 109,990,000 | $ | 9,031,614 | ||||||||||||
| MXN | 8.000 | % | 06/11/2020 | 294,905,000 | 24,416,272 | |||||||||||||
| MXN | 6.500 | % | 06/10/2021 | 520,580,000 | 38,880,930 | |||||||||||||
| MXN | 8.500 | % | 05/31/2029 | 47,340,000 | 3,914,065 | |||||||||||||
| MXN | 7.750 | % | 05/29/2031 | 104,850,000 | 8,003,018 | |||||||||||||
| MXN | 8.500 | % | 11/18/2038 | 111,357,000 | 9,034,333 | |||||||||||||
Mexican Udibonos: | ||||||||||||||||||
| MXN | 5.000 | % | 06/16/2016 | 46,271 | 3,921 | |||||||||||||
| MXN | 3.500 | % | 12/14/2017 | 3,516,596 | 282,949 | |||||||||||||
| MXN | 4.000 | % | 06/13/2019 | 23,644,481 | 1,947,496 | |||||||||||||
| MXN | 2.500 | % | 12/10/2020 | 103,924,666 | 7,626,386 | |||||||||||||
|
| |||||||||||||||||
| 103,140,984 | ||||||||||||||||||
|
| |||||||||||||||||
Philippines - 0.13% | ||||||||||||||||||
Republic of Philippines | PHP | 4.950 | % | 01/15/2021 | 64,000,000 | 1,452,545 | ||||||||||||
|
| |||||||||||||||||
Poland - 4.74% | ||||||||||||||||||
Republic of Poland: | ||||||||||||||||||
| PLN | 5.250 | % | 04/25/2013 | 9,700,000 | 2,908,178 | |||||||||||||
| PLN | 5.500 | % | 04/25/2015 | 65,020,000 | 19,646,951 | |||||||||||||
| PLN | 3.000 | % | 08/24/2016 | 50,369,067 | 15,361,093 | |||||||||||||
| PLN | 5.250 | % | 10/25/2017 | 22,062,000 | 6,500,646 | |||||||||||||
| PLN | 5.750 | % | 10/25/2021 | 12,690,000 | 3,700,178 | |||||||||||||
| PLN | 5.750 | % | 09/23/2022 | 17,650,000 | 5,192,477 | |||||||||||||
|
| |||||||||||||||||
| 53,309,523 | ||||||||||||||||||
|
| |||||||||||||||||
Russia - 1.61% | ||||||||||||||||||
Russian Federation | RUB | 7.850 | % | 03/10/2018 | 540,000,000 | 18,113,576 | (2) | |||||||||||
|
| |||||||||||||||||
South Africa - 9.21% | ||||||||||||||||||
Republic of South Africa: | ||||||||||||||||||
| ZAR | 8.000 | % | 12/21/2018 | 23,000,000 | 2,885,963 | |||||||||||||
| ZAR | 7.250 | % | 01/15/2020 | 27,990,000 | 3,322,016 | |||||||||||||
| ZAR | 6.750 | % | 03/31/2021 | 445,020,000 | 50,663,682 | |||||||||||||
| ZAR | 10.500 | % | 12/21/2026 | 220,890,000 | 31,844,110 | |||||||||||||
| ZAR | 7.000 | % | 02/28/2031 | 72,090,000 | 7,371,354 | |||||||||||||
| ZAR | 6.250 | % | 03/31/2036 | 82,000,000 | 7,496,730 | |||||||||||||
|
| |||||||||||||||||
| 103,583,855 | ||||||||||||||||||
|
| |||||||||||||||||
Thailand - 4.66% | ||||||||||||||||||
Thailand Government: | ||||||||||||||||||
| THB | 4.250 | % | 03/13/2013 | 164,900,000 | 5,363,186 | |||||||||||||
| THB | 3.625 | % | 05/22/2015 | 328,700,000 | 10,704,122 | |||||||||||||
| THB | 3.125 | % | 12/11/2015 | 846,000,000 | 27,131,465 | |||||||||||||
| THB | 2.800 | % | 10/10/2017 | 282,600,000 | 8,838,050 | |||||||||||||
| THB | 3.875 | % | 06/13/2019 | 4,775,000 | 158,135 | |||||||||||||
| THB | 1.200 | % | 07/14/2021 | 7,000,000 | 231,237 | |||||||||||||
|
| |||||||||||||||||
| 52,426,195 | ||||||||||||||||||
|
| |||||||||||||||||
| See Notes to Financial Statements. | ||
| 42 | www.shiplp.com | |
Table of Contents
| Stone Harbor Local Markets Fund | Statements of Investments | |
| November 30, 2011 (Unaudited) |
| Currency | Rate | Maturity Date | Principal Amount * | Market Value (Expressed in U.S. $) | ||||||||||||||
Turkey - 4.93% | ||||||||||||||||||
Republic of Turkey: | ||||||||||||||||||
| TRY | 0.000 | % | 08/08/2012 | 1,300,000 | $ | 664,274 | (3) | |||||||||||
| TRY | 0.000 | % | 02/20/2013 | 75,520,000 | 36,630,541 | (3) | ||||||||||||
| TRY | 0.000 | % | 05/15/2013 | 17,380,000 | 8,228,822 | (3) | ||||||||||||
| TRY | 0.000 | % | 07/17/2013 | 13,730,000 | 6,391,737 | (3) | ||||||||||||
| TRY | 8.000 | % | 01/29/2014 | 1,760,000 | 926,316 | |||||||||||||
| TRY | 4.500 | % | 02/11/2015 | 2,827,129 | 1,641,783 | |||||||||||||
| TRY | 10.000 | % | 06/17/2015 | 1,760,000 | 962,406 | |||||||||||||
|
| |||||||||||||||||
| 55,445,879 | ||||||||||||||||||
|
| |||||||||||||||||
TOTAL SOVEREIGN DEBT OBLIGATIONS | 595,694,632 | |||||||||||||||||
|
| |||||||||||||||||
(Cost $630,151,912) | ||||||||||||||||||
CORPORATE BONDS - 3.60% | ||||||||||||||||||
Colombia - 0.48% | ||||||||||||||||||
Emgesa SA ESP: | ||||||||||||||||||
| COP | 8.750 | % | 01/25/2021 | 636,000,000 | 347,246 | (4) | ||||||||||||
| COP | 8.750 | % | 01/25/2021 | 8,043,000,000 | 4,391,342 | (2) | ||||||||||||
Empresas Publicas de Medellin ESP: | ||||||||||||||||||
| COP | 8.375 | % | 02/01/2021 | 450,000,000 | 240,183 | (2) | ||||||||||||
| COP | 8.375 | % | 02/01/2021 | 802,000,000 | 428,059 | (4) | ||||||||||||
|
| |||||||||||||||||
| 5,406,830 | ||||||||||||||||||
|
| |||||||||||||||||
European Union - 3.12% | ||||||||||||||||||
Asian Development Bank | ZAR | 6.500 | % | 09/15/2015 | 4,650,000 | 562,442 | ||||||||||||
European Bank for Reconstruction & Development: | ||||||||||||||||||
| BRL | 9.250 | % | 09/10/2012 | 2,500,000 | 1,401,485 | |||||||||||||
| MXN | 7.300 | % | 05/23/2013 | 8,500,000 | 649,639 | |||||||||||||
| IDR | 7.200 | % | 06/08/2016 | 39,000,000,000 | 4,159,429 | |||||||||||||
European Investment Bank: | ||||||||||||||||||
| ZAR | 8.000 | % | 10/21/2013 | 3,810,000 | 480,451 | |||||||||||||
| ZAR | 9.000 | % | 12/21/2018 | 139,000,000 | 17,408,753 | |||||||||||||
| ZAR | 0.000 | % | 12/31/2018 | 5,280,000 | 350,878 | (3) | ||||||||||||
Inter-American Development Bank | IDR | 0.000 | % | 08/20/2015 | 88,650,000,000 | 7,348,900 | (3) | |||||||||||
International Bank for Reconstruction & Development: | ||||||||||||||||||
| RUB | 10.000 | % | 04/05/2012 | 39,350,000 | 1,293,454 | |||||||||||||
| ZAR | 0.000 | % | 05/14/2012 | 6,500,000 | 778,350 | (3) | ||||||||||||
| RUB | 6.000 | % | 11/29/2012 | 21,500,000 | 691,123 | |||||||||||||
|
| |||||||||||||||||
| 35,124,904 | ||||||||||||||||||
|
| |||||||||||||||||
TOTAL CORPORATE BONDS | 40,531,734 | |||||||||||||||||
|
| |||||||||||||||||
(Cost $45,222,765) | ||||||||||||||||||
| See Notes to Financial Statements. | ||
Stone Harbor Investment Funds Semi-Annual Report | November 30, 2011 | 43 | |
Table of Contents
| Stone Harbor Local Markets Fund | Statements of Investments | |
| November 30, 2011 (Unaudited) |
| Currency | Rate | Maturity Date | Principal Amount * | Market Value (Expressed in U.S. $) | ||||||||||||||
CREDIT LINKED NOTES - 21.64% | ||||||||||||||||||
Brazil - 8.92% | ||||||||||||||||||
Nota Do Tesouro Nacional: | ||||||||||||||||||
| BRL | 10.000 | % | 01/01/2014 | 4,300,000 | $ | 2,357,884 | (5) | |||||||||||
| BRL | 10.000 | % | 01/01/2014 | 5,340,000 | 2,920,190 | (6) | ||||||||||||
| BRL | 10.000 | % | 01/01/2014 | 7,000,000 | 3,863,965 | (6) | ||||||||||||
| BRL | 0.000 | % | 01/01/2015 | 15,300,000 | 5,983,444 | (3)(6) | ||||||||||||
| BRL | 10.000 | % | 01/01/2015 | 3,700,000 | 2,003,301 | (6) | ||||||||||||
| BRL | 10.000 | % | 01/01/2017 | 5,500,000 | 2,930,738 | (6) | ||||||||||||
| BRL | 10.000 | % | 01/01/2017 | 6,900,000 | 3,698,349 | (6) | ||||||||||||
| BRL | 10.000 | % | 01/01/2017 | 13,000,000 | 6,927,199 | (6) | ||||||||||||
| BRL | 10.000 | % | 01/01/2017 | 18,000,000 | 9,647,868 | (7) | ||||||||||||
| BRL | 10.000 | % | 01/01/2021 | 1,000,000 | 519,092 | (8) | ||||||||||||
| BRL | 10.000 | % | 01/01/2021 | 1,100,000 | 565,344 | (8) | ||||||||||||
| BRL | 10.000 | % | 01/01/2021 | 1,200,000 | 621,318 | (5) | ||||||||||||
| BRL | 10.000 | % | 01/01/2021 | 1,800,000 | 937,156 | (7) | ||||||||||||
| BRL | 10.000 | % | 01/01/2021 | 2,000,000 | 1,035,529 | (5) | ||||||||||||
| BRL | 10.000 | % | 01/01/2021 | 2,000,000 | 1,038,184 | (8) | ||||||||||||
| BRL | 10.000 | % | 01/01/2021 | 2,600,000 | 1,353,670 | (8) | ||||||||||||
| BRL | 10.000 | % | 01/01/2021 | 3,000,000 | 1,557,276 | (8) | ||||||||||||
| BRL | 10.000 | % | 01/01/2021 | 5,000,000 | 2,588,824 | (5) | ||||||||||||
| BRL | 10.000 | % | 01/01/2021 | 6,000,000 | 3,114,552 | (8) | ||||||||||||
| BRL | 10.000 | % | 01/01/2021 | 6,500,000 | 3,384,175 | (7) | ||||||||||||
| BRL | 10.000 | % | 01/01/2021 | 6,780,000 | 3,529,954 | (7) | ||||||||||||
| BRL | 10.000 | % | 01/01/2021 | 6,800,000 | 3,540,367 | (7) | ||||||||||||
| BRL | 10.000 | % | 01/01/2021 | 8,000,000 | 3,981,530 | (6) | ||||||||||||
| BRL | 10.000 | % | 01/01/2021 | 8,000,000 | 4,162,911 | (9) | ||||||||||||
| BRL | 10.000 | % | 01/01/2021 | 11,000,000 | 5,695,413 | (5) | ||||||||||||
| BRL | 10.000 | % | 01/01/2021 | 12,000,000 | 6,229,104 | (8) | ||||||||||||
| BRL | 10.000 | % | 01/01/2021 | 31,000,000 | 16,139,910 | (7) | ||||||||||||
|
| |||||||||||||||||
| 100,327,247 | ||||||||||||||||||
|
| |||||||||||||||||
Colombia - 1.53% | ||||||||||||||||||
Titulos de Tesoreria - Series B: | ||||||||||||||||||
| COP | 7.250 | % | 06/15/2016 | 2,200,000,000 | 1,147,743 | (8) | ||||||||||||
| COP | 7.250 | % | 06/15/2016 | 10,000,000,000 | 5,217,013 | (8) | ||||||||||||
| COP | 11.000 | % | 07/24/2020 | 1,300,000,000 | 803,279 | (8) | ||||||||||||
| COP | 11.000 | % | 07/24/2020 | 2,000,000,000 | 1,235,813 | (8) | ||||||||||||
| COP | 11.000 | % | 07/24/2020 | 2,300,000,000 | 1,421,185 | (8) | ||||||||||||
| COP | 11.000 | % | 07/24/2020 | 12,018,000,000 | 7,426,001 | (8) | ||||||||||||
|
| |||||||||||||||||
| 17,251,034 | ||||||||||||||||||
|
| |||||||||||||||||
| See Notes to Financial Statements. | ||
| 44 | www.shiplp.com | |
Table of Contents
| Stone Harbor Local Markets Fund | Statements of Investments | |
| November 30, 2011 (Unaudited) |
| Currency | Rate | Maturity Date | Principal Amount * | Market Value (Expressed in U.S. $) | ||||||||||||
Indonesia - 8.84% | ||||||||||||||||
Republic of Indonesia: | ||||||||||||||||
| IDR | 11.500 | % | 09/15/2019 | 6,800,000,000 | $ | 974,094 | (6) | |||||||||
| IDR | 12.800 | % | 06/15/2021 | 5,800,000,000 | 905,971 | (10) | ||||||||||
| IDR | 12.800 | % | 06/15/2021 | 5,800,000,000 | 902,928 | (9) | ||||||||||
| IDR | 12.800 | % | 06/15/2021 | 8,000,000,000 | 1,249,616 | (10) | ||||||||||
| IDR | 12.800 | % | 06/15/2021 | 8,300,000,000 | 1,296,476 | (10) | ||||||||||
| IDR | 12.800 | % | 06/15/2021 | 10,000,000,000 | 1,562,020 | (10) | ||||||||||
| IDR | 12.800 | % | 06/15/2021 | 10,800,000,000 | 1,698,244 | (7) | ||||||||||
| IDR | 12.800 | % | 06/15/2021 | 12,000,000,000 | 1,874,424 | (10) | ||||||||||
| IDR | 12.800 | % | 06/15/2021 | 16,000,000,000 | 2,561,662 | (5) | ||||||||||
| IDR | 12.800 | % | 06/15/2021 | 17,000,000,000 | 2,721,765 | (5) | ||||||||||
| IDR | 12.800 | % | 06/15/2021 | 19,800,000,000 | 3,082,410 | (9) | ||||||||||
| IDR | 12.800 | % | 06/15/2021 | 30,800,000,000 | 4,794,860 | (9) | ||||||||||
| IDR | 8.250 | % | 07/15/2021 | 25,000,000,000 | 3,054,336 | (10) | ||||||||||
| IDR | 8.250 | % | 07/15/2021 | 25,000,000,000 | 3,098,875 | (5) | ||||||||||
| IDR | 8.250 | % | 07/15/2021 | 90,200,000,000 | 10,871,526 | (6) | ||||||||||
| IDR | 8.250 | % | 07/15/2021 | 161,000,000,000 | 19,428,688 | (9) | ||||||||||
| IDR | 11.000 | % | 09/15/2025 | 7,800,000,000 | 1,143,030 | (10) | ||||||||||
| IDR | 11.000 | % | 09/15/2025 | 8,000,000,000 | 1,172,338 | (10) | ||||||||||
| IDR | 11.000 | % | 09/15/2025 | 16,500,000,000 | 2,417,947 | (10) | ||||||||||
| IDR | 11.000 | % | 09/15/2025 | 19,072,000,000 | 2,802,705 | (6) | ||||||||||
| IDR | 11.000 | % | 09/15/2025 | 23,700,000,000 | 3,473,052 | (10) | ||||||||||
| IDR | 11.000 | % | 09/15/2025 | 55,000,000,000 | 8,059,824 | (10) | ||||||||||
| IDR | 11.000 | % | 09/15/2025 | 62,500,000,000 | 9,158,891 | (10) | ||||||||||
| IDR | 11.000 | % | 09/17/2025 | 33,600,000,000 | 4,857,653 | (9) | ||||||||||
| IDR | 8.250 | % | 06/15/2032 | 21,700,000,000 | 2,566,603 | (6) | ||||||||||
| IDR | 8.250 | % | 06/15/2032 | 31,000,000,000 | 3,666,575 | (9) | ||||||||||
|
| |||||||||||||||
| 99,396,513 | ||||||||||||||||
|
| |||||||||||||||
Russia - 2.35% | ||||||||||||||||
Russian Federation: | ||||||||||||||||
| RUB | 7.000 | % | 06/03/2015 | 429,800,000 | 13,640,223 | (5) | ||||||||||
| RUB | 6.880 | % | 07/15/2015 | 200,000,000 | 6,317,932 | (5) | ||||||||||
| RUB | 7.400 | % | 06/14/2017 | 162,200,000 | 5,084,226 | (5) | ||||||||||
| RUB | 7.500 | % | 03/15/2018 | 42,200,000 | 1,336,519 | (5) | ||||||||||
|
| |||||||||||||||
| 26,378,900 | ||||||||||||||||
|
| |||||||||||||||
TOTAL CREDIT LINKED NOTES | 243,353,694 | |||||||||||||||
|
| |||||||||||||||
(Cost $252,390,774) | ||||||||||||||||
| See Notes to Financial Statements. | ||
Stone Harbor Investment Funds Semi-Annual Report | November 30, 2011 | 45 | |
Table of Contents
| Stone Harbor Local Markets Fund | Statements of Investments | |
| November 30, 2011 (Unaudited) |
| Currency | Rate | Maturity Date | Principal Amount * | Market Value (Expressed in U.S. $) | ||||||||||
SHORT TERM INVESTMENTS - 6.88% | ||||||||||||||
Money Market Mutual Funds - 6.88% | ||||||||||||||
Dreyfus Institutional Cash Advantage Fund - Institutional Advantage Shares (0.077% 7-Day Yield) | USD | 77,308,724 | $ | 77,308,724 | ||||||||||
|
| |||||||||||||
TOTAL SHORT TERM INVESTMENTS | 77,308,724 | |||||||||||||
|
| |||||||||||||
(Cost $77,308,724) | ||||||||||||||
Total Investments - 85.10% | 956,888,784 | |||||||||||||
(Cost $1,005,074,175) | ||||||||||||||
Other Assets In Excess of Liabilities - 14.90% | 167,575,369 | |||||||||||||
|
| |||||||||||||
Net Assets - 100.00% | $ | 1,124,464,153 | ||||||||||||
|
| |||||||||||||
* The contract/principal/share amounts of each security is stated in the currency in which the security is denominated. See below.
ARS | - | Argentine Peso | ||
BRL | - | Brazilian Real | ||
CLP | - | Chilean Peso | ||
COP | - | Colombian Peso | ||
EUR | - | Euro Currency | ||
HUF | - | Hungarian Forint | ||
IDR | - | Indonesian Rupiah | ||
MXN | - | Mexican Peso | ||
MYR | - | Malaysian Ringgit | ||
PHP | - | Philippine Peso | ||
PLN | - | Polish Zloty | ||
RUB | - | Russian Ruble | ||
THB | - | Thai Baht | ||
TRY | - | Turkish Lira | ||
USD | - | United States Dollar | ||
ZAR | - | South African Rand |
| (1) | Floating or variable rate security. Interest rate disclosed is that which is in effect at November 30, 2011. |
| (2) | Securities were purchased pursuant to Regulation S under the Securities Act of 1933, which exempts securities offered and sold outside of the United States from registration. Such securities cannot be sold in the United States without either an effective registration statement filed pursuant to the Securities Act of 1933, or pursuant to an exemption from registration. These securities have been deemed liquid under procedures approved by the Fund’s Board of Trustees. As of November 30, 2011, the aggregate market value of those securities was $46,713,439, which represents approximately 4.15% of net assets. |
| (3) | Zero coupon bond reflects effective yield on the date of purchase. |
| (4) | Security exempt from registration under Rule 144A of the Securities Act of 1933. Under procedures approved by the Board of Trustees, such securities have been determined to be liquid by Stone Harbor Investment Partners and may normally be sold to qualified institutional buyers in transactions exempt from registration. Total market value of Rule 144A securities amounts to $775,305, which represents approximately 0.07% of net assets as of November 30, 2011. |
| (5) | The underlying security is issued by Credit Suisse First Boston. |
| (6) | The underlying security is issued by JP Morgan Chase. |
| (7) | The underlying security is issued by Barclays Bank PLC. |
| (8) | The underlying security is issued by Citigroup Global Markets. |
| (9) | The underlying security is issued by Deutsche Bank AG London. |
| (10) | The underlying security is issued by HSBC Bank. |
| See Notes to Financial Statements. | ||
| 46 | www.shiplp.com | |
Table of Contents
| Stone Harbor Local Markets Fund | Statements of Investments | |
| November 30, 2011 (Unaudited) |
| Common Abbreviations: | ||||
ESP | - | Empresa de Servicios Publicos is the Colombian term for Public Service Company. | ||
SA | - | Generally designates corporations in various countries mostly employing civil law. | ||
| OUTSTANDING FORWARD FOREIGN CURRENCY CONTRACTS |
Contract Description | Contracted Amount | Purchase/Sale Contract | Settlement Date | Current Value | Unrealized Appreciation/ (Depreciation) | |||||||||
| BRL | 41,548,154 | Purchase | 01/04/2012 | $ | 22,791,922 | $ | 470,905 | |||||||
| CNY | 39,782,574 | Purchase | 05/16/2012 | 6,246,779 | 7,806 | |||||||||
| RUB | 1,964,343,848 | Purchase | 12/20/2011 | 63,716,887 | 668,838 | |||||||||
| RUB | 79,823,800 | Sale | 12/20/2011 | 2,589,223 | 777 | |||||||||
| TRY | 82,890,000 | Purchase | 01/03/2012 | 45,003,217 | 3,217 | |||||||||
|
| |||||||||||||
| $ | 1,151,543 | |||||||||||||
|
| |||||||||||||
| BRL | 30,571,550 | Sale | 12/02/2011 | $ | 16,897,361 | $ | (345,358 | ) | ||||||
| BRL | 30,571,550 | Purchase | 12/02/2011 | 16,897,360 | (276,703 | ) | ||||||||
| CNY | 46,148,074 | Sale | 05/16/2012 | 7,246,309 | (9,666 | ) | ||||||||
| EUR | 6,365,500 | Purchase | 05/16/2012 | 999,530 | (470 | ) | ||||||||
| MXN | 294,019,200 | Purchase | 01/03/2012 | 21,502,508 | (97,492 | ) | ||||||||
| PHP | 83,449,300 | Purchase | 01/24/2012 | 1,904,194 | (19,044 | ) | ||||||||
| PLN | 96,812,110 | Purchase | 01/03/2012 | 28,772,193 | (127,807 | ) | ||||||||
| RUB | 291,639,252 | Sale | 12/20/2011 | 9,459,823 | (461,823 | ) | ||||||||
| THB | 204,270,000 | Purchase | 01/03/2012 | 6,539,299 | (60,701 | ) | ||||||||
|
| |||||||||||||
| $ | (1,399,064 | ) | ||||||||||||
|
| |||||||||||||
| See Notes to Financial Statements. | ||
Stone Harbor Investment Funds Semi-Annual Report | November 30, 2011 | 47 | |
Table of Contents
Stone Harbor Emerging Markets Corporate Debt Fund | Statements of Investments | |
| November 30, 2011 (Unaudited) |
| Currency | Rate | Maturity Date | Principal Amount * | Market Value (Expressed in U.S. $) | ||||||||||||
CORPORATE BONDS - 94.80% | ||||||||||||||||
Argentina - 3.75% | ||||||||||||||||
Alto Palermo SA | USD | 7.875 | % | 05/11/2017 | 258,000 | $ | 234,780 | (1) | ||||||||
Capex SA | USD | 10.000 | % | 03/10/2018 | 550,000 | 448,250 | (2) | |||||||||
Empresa Distribuidora Y Comercializadora Norte | USD | 9.750 | % | 10/25/2022 | 300,000 | 246,000 | (1) | |||||||||
Tarjeta Naranja SA | USD | 9.000 | % | 01/28/2017 | 84,000 | 81,130 | (1) | |||||||||
|
| |||||||||||||||
| 1,010,160 | ||||||||||||||||
|
| |||||||||||||||
Barbados - 1.54% | ||||||||||||||||
Columbus International, Inc. | USD | 11.500 | % | 11/20/2014 | 400,000 | 416,000 | (1) | |||||||||
|
| |||||||||||||||
Brazil - 19.87% | ||||||||||||||||
Banco Cruzeiro do Sul SA | USD | 8.875 | % | 09/22/2020 | 325,000 | 221,000 | (1) | |||||||||
BM&FBovespa SA | USD | 5.500 | % | 07/16/2020 | 350,000 | 358,750 | (1) | |||||||||
BR Malls International Finance Ltd. | USD | 8.500 | % | 01/21/2049 | 300,000 | 311,250 | (1) | |||||||||
BR Properties SA | USD | 9.000 | % | 10/07/2049 | 150,000 | 153,750 | (1) | |||||||||
General Shopping Finance Ltd. | USD | 10.000 | % | 11/09/2015 | 294,000 | 296,940 | (2) | |||||||||
Hypermarcas SA | USD | 6.500 | % | 04/20/2021 | 600,000 | 528,000 | (2) | |||||||||
Minerva Overseas II Ltd. | USD | 10.875 | % | 11/15/2019 | 225,000 | 195,750 | (1) | |||||||||
Mirabela Nickel Ltd. | USD | 8.750 | % | 04/15/2018 | 200,000 | 179,000 | (2) | |||||||||
NET Servicos de Comunicacao SA | USD | 7.500 | % | 01/27/2020 | 311,000 | 356,095 | ||||||||||
Odebrecht Drilling Norbe VIII/IX Ltd. | USD | 6.350 | % | 06/30/2021 | 550,000 | 563,750 | (1) | |||||||||
Odebrecht Finance Ltd. | USD | 7.000 | % | 04/21/2020 | 102,000 | 109,395 | (1) | |||||||||
OGX Petroleo e Gas Participacoes SA | USD | 8.500 | % | 06/01/2018 | 700,000 | 672,000 | (2) | |||||||||
Petrobras International Finance Co. | USD | 5.375 | % | 01/27/2021 | 67,000 | 68,468 | ||||||||||
QGOG Atlantic / Alaskan Rigs Ltd.: | ||||||||||||||||
| USD | 5.250 | % | 07/30/2018 | 200,000 | 196,500 | (1) | ||||||||||
| USD | 5.250 | % | 07/30/2018 | 693,000 | 680,872 | (2) | ||||||||||
Telemar Norte Leste SA | USD | 5.500 | % | 10/23/2020 | 473,000 | 465,905 | (1) | |||||||||
|
| |||||||||||||||
| 5,357,425 | ||||||||||||||||
|
| |||||||||||||||
China - 6.56% | ||||||||||||||||
Central China Real Estate Ltd. | USD | 12.250 | % | 10/20/2015 | 200,000 | 171,000 | (1) | |||||||||
China Liansu Group Holdings Ltd. | USD | 7.875 | % | 05/13/2016 | 200,000 | 166,000 | (2) | |||||||||
Evergrande Real Estate Group Ltd. | USD | 13.000 | % | 01/27/2015 | 250,000 | 193,750 | (1) | |||||||||
Kaisa Group Holdings Ltd. | USD | 13.500 | % | 04/28/2015 | 300,000 | 241,500 | (1) | |||||||||
Mega Advance Investments Ltd. | USD | 5.000 | % | 05/12/2021 | 205,000 | 207,772 | (2) | |||||||||
MIE Holdings Corp. | USD | 9.750 | % | 05/12/2016 | 450,000 | 400,500 | (2) | |||||||||
Texhong Textile Group Ltd. | USD | 7.625 | % | 01/19/2016 | 250,000 | 182,500 | (1) | |||||||||
West China Cement Ltd. | USD | 7.500 | % | 01/25/2016 | 250,000 | 205,000 | (1) | |||||||||
|
| |||||||||||||||
| 1,768,022 | ||||||||||||||||
|
| |||||||||||||||
Colombia - 1.50% | ||||||||||||||||
Gruposura Finance | USD | 5.700 | % | 05/18/2021 | 400,000 | 404,400 | (2) | |||||||||
|
| |||||||||||||||
Dominican Republic - 1.03% | ||||||||||||||||
Cap Cana SA: | ||||||||||||||||
| USD | 10.000 | % | 04/30/2016 | 500,000 | 175,000 | (1)(3) | ||||||||||
| USD | 10.000 | % | 04/30/2016 | 509,432 | 101,886 | (1)(3) | ||||||||||
|
| |||||||||||||||
| 276,886 | ||||||||||||||||
|
| |||||||||||||||
| See Notes to Financial Statements. | ||
| 48 | www.shiplp.com | |
Table of Contents
Stone Harbor Emerging Markets Corporate Debt Fund | Statements of Investments | |
| November 30, 2011 (Unaudited) |
| Currency | Rate | Maturity Date | Principal Amount * | Market Value (Expressed in U.S. $) | ||||||||||||||
Hong Kong - 3.72% | ||||||||||||||||||
Hutchison Whampoa International 10 Ltd. | USD | 6.000 | % | 10/28/2049 | 500,000 | $ | 497,500 | (1)(4) | ||||||||||
PCCW-HKT Capital No. 4 Ltd. | USD | 4.250 | % | 02/24/2016 | 500,000 | 504,250 | ||||||||||||
|
| |||||||||||||||||
| 1,001,750 | ||||||||||||||||||
|
| |||||||||||||||||
India - 2.92% | ||||||||||||||||||
ICICI Bank Ltd. | USD | 5.750 | % | 11/16/2020 | 400,000 | 371,940 | (1) | |||||||||||
Vedanta Resources PLC | USD | 8.250 | % | 06/07/2021 | 500,000 | 415,000 | (2) | |||||||||||
|
| |||||||||||||||||
| 786,940 | ||||||||||||||||||
|
| |||||||||||||||||
Indonesia - 6.23% | ||||||||||||||||||
Bakrie Telecom Pte Ltd. | USD | 11.500 | % | 05/07/2015 | 303,000 | 190,890 | (1) | |||||||||||
BLT Finance BV | USD | 7.500 | % | 05/15/2014 | 200,000 | 79,000 | (1) | |||||||||||
Bumi Investment Pte Ltd. | USD | 10.750 | % | 10/06/2017 | 1,000,000 | 980,000 | (1) | |||||||||||
Indosat Palapa Co. BV | USD | 7.375 | % | 07/29/2020 | 200,000 | 216,000 | (1) | |||||||||||
PT Adaro Indonesia | USD | 7.625 | % | 10/22/2019 | 201,000 | 213,060 | (1) | |||||||||||
|
| |||||||||||||||||
| 1,678,950 | ||||||||||||||||||
|
| |||||||||||||||||
Jamaica - 3.73% | ||||||||||||||||||
Digicel Group Ltd. | USD | 10.500 | % | 04/15/2018 | 1,000,000 | 1,005,000 | (1) | |||||||||||
|
| |||||||||||||||||
Kazakhstan - 3.08% | ||||||||||||||||||
BTA Bank JSC: | ||||||||||||||||||
| USD | 10.750 | % | 07/01/2018 | 1,030,326 | 340,008 | (1)(5) | ||||||||||||
| USD | 0.000 | % | 07/01/2020 | 1,000,000 | 38,750 | (1)(6) | ||||||||||||
Zhaikmunai LLP | USD | 10.500 | % | 10/19/2015 | 459,000 | 452,115 | (1) | |||||||||||
|
| |||||||||||||||||
| 830,873 | ||||||||||||||||||
|
| |||||||||||||||||
Mexico - 6.64% | ||||||||||||||||||
Axtel SAB de CV: | ||||||||||||||||||
| USD | 7.625 | % | 02/01/2017 | 80,000 | 60,400 | (2) | ||||||||||||
| USD | 9.000 | % | 09/22/2019 | 300,000 | 226,500 | (1) | ||||||||||||
BBVA Bancomer SA | USD | 4.500 | % | 03/10/2016 | 150,000 | 148,500 | (1) | |||||||||||
Cemex SAB de CV: | ||||||||||||||||||
| USD | 5.369 | % | 09/30/2015 | 450,000 | 301,500 | (2)(4) | ||||||||||||
| USD | 9.000 | % | 01/11/2018 | 500,000 | 365,000 | (1) | ||||||||||||
Geo Maquinaria | USD | 9.625 | % | 05/02/2021 | 645,125 | 580,612 | (2) | |||||||||||
Grupo Bimbo SAB de CV | USD | 4.875 | % | 06/30/2020 | 102,000 | 105,858 | (2) | |||||||||||
|
| |||||||||||||||||
| 1,788,370 | ||||||||||||||||||
|
| |||||||||||||||||
Peru - 3.17% | ||||||||||||||||||
Banco de Credito del Peru | USD | 5.375 | % | 09/16/2020 | 200,000 | 196,500 | (1) | |||||||||||
Inkia Energy Ltd. | USD | 8.375 | % | 04/04/2021 | 350,000 | 355,250 | (2) | |||||||||||
Southern Copper Corp. | USD | 6.750 | % | 04/16/2040 | 300,000 | 303,268 | ||||||||||||
|
| |||||||||||||||||
| 855,018 | ||||||||||||||||||
|
| |||||||||||||||||
Qatar - 2.67% | ||||||||||||||||||
Qtel International Finance Ltd.: | ||||||||||||||||||
| USD | 7.875 | % | 06/10/2019 | 200,000 | 242,700 | (1) | ||||||||||||
| USD | 5.000 | % | 10/19/2025 | 500,000 | 477,500 | (1) | ||||||||||||
|
| |||||||||||||||||
| 720,200 | ||||||||||||||||||
|
| |||||||||||||||||
| See Notes to Financial Statements. | ||
Stone Harbor Investment Funds Semi-Annual Report | November 30, 2011 | 49 | |
Table of Contents
| Stone Harbor Emerging Markets Corporate Debt Fund | Statements of Investments | |
| November 30, 2011 (Unaudited) |
| Currency | Rate | Maturity Date | Principal Amount * | Market Value (Expressed in U.S. $) | ||||||||||||||
Russia - 11.20% | ||||||||||||||||||
Alfa Bank OJSC Via Alfa Bond Issuance PLC | USD | 7.875 | % | 09/25/2017 | 300,000 | $ | 283,500 | (1) | ||||||||||
Evraz Group SA | USD | 6.750 | % | 04/27/2018 | 400,000 | 361,000 | (2) | |||||||||||
Metalloinvest Finance Ltd. | USD | 6.500 | % | 07/21/2016 | 452,000 | 421,490 | (2) | |||||||||||
Novatek Finance Ltd. | USD | 6.604 | % | 02/03/2021 | 850,000 | 881,875 | (2) | |||||||||||
SCF Capital Ltd. | USD | 5.375 | % | 10/27/2017 | 400,000 | 359,000 | (2) | |||||||||||
Vimpel Communications Holdings BV: | ||||||||||||||||||
| USD | 6.255 | % | 03/01/2017 | 200,000 | 181,500 | (1) | ||||||||||||
| USD | 7.504 | % | 03/01/2022 | 200,000 | 174,500 | (2) | ||||||||||||
Vimpel Communications Via VIP Finance Ireland Ltd. OJSC | USD | 7.748 | % | 02/02/2021 | 400,000 | 357,000 | (1) | |||||||||||
|
| |||||||||||||||||
| 3,019,865 | ||||||||||||||||||
|
| |||||||||||||||||
Singapore - 0.36% | ||||||||||||||||||
STATS ChipPAC Ltd. | USD | 5.375 | % | 03/31/2016 | 100,000 | 98,000 | (1) | |||||||||||
|
| |||||||||||||||||
South Africa - 4.31% | ||||||||||||||||||
Gold Fields Orogen Holding BVI Ltd. | USD | 4.875 | % | 10/07/2020 | 500,000 | 435,000 | (1) | |||||||||||
Myriad International Holding BV | USD | 6.375 | % | 07/28/2017 | 680,000 | 725,900 | (1) | |||||||||||
|
| |||||||||||||||||
| 1,160,900 | ||||||||||||||||||
|
| |||||||||||||||||
Turkey - 1.50% | ||||||||||||||||||
Yuksel Insaat AS | USD | 9.500 | % | 11/10/2015 | 550,000 | 404,250 | (1) | |||||||||||
|
| |||||||||||||||||
Ukraine - 3.65% | ||||||||||||||||||
Ferrexpo Finance PLC | USD | 7.875 | % | 04/07/2016 | 200,000 | 181,000 | (2) | |||||||||||
Metinvest BV | USD | 8.750 | % | 02/14/2018 | 500,000 | 436,250 | (2) | |||||||||||
MHP SA | USD | 10.250 | % | 04/29/2015 | 200,000 | 185,000 | (1) | |||||||||||
Mriya Agro Holding PLC | USD | 10.950 | % | 03/30/2016 | 200,000 | 182,000 | (2) | |||||||||||
|
| |||||||||||||||||
| 984,250 | ||||||||||||||||||
|
| |||||||||||||||||
United Arab Emirates - 7.37% | ||||||||||||||||||
DP World Ltd. | USD | 6.850 | % | 07/02/2037 | 500,000 | 455,000 | (1) | |||||||||||
DP World Sukuk Ltd. | USD | 6.250 | % | 07/02/2017 | 490,000 | 492,450 | (1) | |||||||||||
Dubai Holding Commercial Operations MTN Ltd. | GBP | 6.000 | % | 02/01/2017 | 600,000 | 691,884 | ||||||||||||
IPIC GMTN Ltd. | USD | 3.750 | % | 03/01/2017 | 350,000 | 348,250 | (2) | |||||||||||
|
| |||||||||||||||||
| 1,987,584 | ||||||||||||||||||
|
| |||||||||||||||||
TOTAL CORPORATE BONDS (Cost $29,320,681) | 25,554,843 | |||||||||||||||||
|
| |||||||||||||||||
CREDIT LINKED NOTES - 2.39% | ||||||||||||||||||
Argentina - 2.39% | ||||||||||||||||||
Cablevision SA | USD | 9.375 | % | 02/12/2018 | 700,000 | 644,000 | (7) | |||||||||||
|
| |||||||||||||||||
TOTAL CREDIT LINKED NOTES | 644,000 | |||||||||||||||||
|
| |||||||||||||||||
(Cost $702,702) | ||||||||||||||||||
| See Notes to Financial Statements. | ||
| 50 | www.shiplp.com | |
Table of Contents
| Stone Harbor Emerging Markets Corporate Debt Fund | Statements of Investments | |
| November 30, 2011 (Unaudited) |
| Currency | Rate | Maturity Date | Principal Amount * | Market Value (Expressed in U.S. $) | ||||||||
SHORT TERM INVESTMENTS - 0.67% | ||||||||||||
Money Market Mutual Funds - 0.67% | ||||||||||||
Dreyfus Institutional Cash Advantage Fund - Institutional Advantage Shares (0.077% 7-Day Yield) | USD | 182,003 | $ | 182,003 | ||||||||
|
| |||||||||||
TOTAL SHORT TERM INVESTMENTS | 182,003 | |||||||||||
|
| |||||||||||
(Cost $182,003) | ||||||||||||
Total Investments - 97.86% | 26,380,846 | |||||||||||
(Cost $30,205,386) | ||||||||||||
Other Assets In Excess of Liabilities - 2.14% | 576,104 | |||||||||||
|
| |||||||||||
Net Assets - 100.00% | $ | 26,956,950 | ||||||||||
|
| |||||||||||
* The contract/principal/share amounts of each security is stated in the currency in which the security is denominated. See below.
GBP | - | Great Britain Pound | ||
USD | - | United States Dollar |
| (1) | Securities were purchased pursuant to Regulation S under the Securities Act of 1933, which exempts securities offered and sold outside of the United States from registration. Such securities cannot be sold in the United States without either an effective registration statement filed pursuant to the Securities Act of 1933, or pursuant to an exemption from registration. These securities have been deemed liquid under procedures approved by the Fund’s Board of Trustees. As of November 30, 2011, the aggregate market value of those securities was $14,483,159, which represents approximately 53.73% of net assets. |
| (2) | Security exempt from registration under Rule 144A of the Securities Act of 1933. Under procedures approved by the Board of Trustees, such securities have been determined to be liquid by Stone Harbor Investment Partners and may normally be sold to qualified institutional buyers in transactions exempt from registration. Total market value of Rule 144A securities amounts to $9,147,719, which represents approximately 33.93% of net assets as of November 30, 2011. |
| (3) | Security is currently in default/non-income producing. |
| (4) | Floating or variable rate security. Interest rate disclosed is that which is in effect at November 30, 2011. |
| (5) | Step bond. Coupon increases periodically based upon a predetermined schedule. Interest rate disclosed is that which is in effect at November 30, 2011. |
| (6) | Zero coupon bond reflects effective yield on the date of purchase. |
| (7) | The underlying security is issued by Deutsche Bank AG London. |
Common Abbreviations: | ||||
AS | - | Anonim Sirket is the Turkish term for Incorporation. | ||
BV | - | Besloten Vennootschap a Dutch private limited liability company. | ||
GMTN | - | Global Medium Term Note. | ||
JSC | - | Joing Stock Co. | ||
LLP | - | Limited Liability Partnership. | ||
Ltd. | - | Limited. | ||
MTN | - | Medium Term Note. | ||
OJSC | - | Open Joint Stock Co. | ||
PLC | - | Public Limited Co. | ||
Pte | - | Private. | ||
SA | - | Generally designates corporations in various countries, mostly those employing the civil law. | ||
SAB de CV | - | A variable capital company. | ||
| See Notes to Financial Statements. | ||
Stone Harbor Investment Funds Semi-Annual Report | November 30, 2011 | 51 | |
Table of Contents
| Stone Harbor Emerging Markets Corporate Debt Fund | Statements of Investments | |
| November 30, 2011 (Unaudited) |
OUTSTANDING FORWARD FOREIGN CURRENCY CONTRACTS
Contract | Contracted Amount | Purchase/Sale Contract | Settlement Date | Current Value | Unrealized Appreciation | |||||
| GBP | 480,000 | Sale | 12/28/2011 | $752,873 | $ 7,807 | |||||
| ||||||||||
| $ 7,807 | ||||||||||
|
| See Notes to Financial Statements. | ||
| 52 | www.shiplp.com | |
Table of Contents
| Stone Harbor Investment Funds | Statements of Assets & Liabilities | |
| November 30, 2011 (Unaudited) |
| Stone Harbor Emerging Markets Debt Fund | Stone Harbor High Yield Bond Fund | Stone Harbor Local Markets Fund | Stone Harbor Emerging Markets Corporate Debt Fund | |||||||||||||
ASSETS: | ||||||||||||||||
Investments , at value(1) | $ | 950,340,864 | $ | 437,697,638 | $ | 956,888,784 | $ | 26,380,846 | ||||||||
Cash | 12,005,262 | 10,000 | 4,899,779 | 26,150 | ||||||||||||
Foreign currency, at value | ||||||||||||||||
(Cost $25,345, $-0-, $406,519 and | 25,248 | – | 412,139 | – | ||||||||||||
Unrealized appreciation on forward foreign currency contracts | 1,178,517 | 58,812 | 1,151,543 | 7,807 | ||||||||||||
Receivable for investments sold | 3,917,124 | 718,080 | 107,516,415 | 114,102 | ||||||||||||
Receivable for fund shares sold | 3,919,193 | 184,736 | 35,208,904 | – | ||||||||||||
Receivable due from broker | – | – | 1,500,000 | – | ||||||||||||
Interest receivable | 18,183,295 | 10,385,730 | 22,569,683 | 519,473 | ||||||||||||
Dividends receivable | – | 29,345 | – | – | ||||||||||||
Prepaid offering costs | – | – | 1,360 | – | ||||||||||||
Prepaid and other assets | 60,985 | 40,023 | 42,978 | 19,546 | ||||||||||||
Total Assets | 989,630,488 | 449,124,364 | 1,130,191,585 | 27,067,924 | ||||||||||||
LIABILITIES: | ||||||||||||||||
Payable due to broker | 1,180,000 | – | – | �� | – | |||||||||||
Payable for investments purchased | 2,659,371 | 1,475,703 | 3,350,427 | – | ||||||||||||
Payable for fund shares redeemed | – | – | 143,845 | – | ||||||||||||
Unrealized depreciation on forward foreign currency contracts | 134,838 | 2,633 | 1,399,064 | – | ||||||||||||
Payable to advisor | 437,548 | 184,405 | 662,053 | 38,456 | ||||||||||||
Payable to administrator | 42,349 | 28,544 | 46,179 | 1,788 | ||||||||||||
Payable for trustee fees | 8,750 | 3,741 | 3,636 | 3,990 | ||||||||||||
Other payables | 117,586 | 96,539 | 122,228 | 66,740 | ||||||||||||
Total Liabilities | 4,580,442 | 1,791,565 | 5,727,432 | 110,974 | ||||||||||||
Net Assets | $ | 985,050,046 | $ | 447,332,799 | $ | 1,124,464,153 | $ | 26,956,950 | ||||||||
NET ASSETS CONSIST OF: | ||||||||||||||||
Paid-in capital | $ | 982,344,351 | $ | 448,949,678 | $ | 1,190,336,225 | $ | 30,978,512 | ||||||||
Undistributed/(overdistributed) net investment income | 3,028,983 | 1,175,451 | (168,427) | (13,851) | ||||||||||||
Accumulated net realized gain/(loss) on investments and translation of assets and liabilities denominated in foreign currency | 6,765,857 | 15,026,233 | (15,871,710) | (189,596) | ||||||||||||
Net unrealized depreciation on investments and translation of assets and liabilities denominated in foreign currency | (7,089,145) | (17,818,563) | (49,831,935) | (3,818,115) | ||||||||||||
Net Assets | $ | 985,050,046 | $ | 447,332,799 | $ | 1,124,464,153 | $ | 26,956,950 | ||||||||
PRICING OF SHARES: | ||||||||||||||||
Institutional Class | ||||||||||||||||
Net Assets | $ | 985,050,046 | $ | 447,332,799 | $ | 1,124,464,153 | $ | 26,956,950 | ||||||||
Shares of beneficial interest outstanding (unlimited number of shares, par value of $0.001 per share authorized) | 90,241,713 | 48,791,854 | 109,384,504 | 3,108,783 | ||||||||||||
Net assets value, offering and redemption price per share | $ | 10.92 | $ | 9.17 | $ | 10.28 | $ | 8.67 | ||||||||
(1)Cost of Investments | $ | 958,275,392 | $ | 455,567,414 | $ | 1,005,074,175 | $ | 30,205,386 | ||||||||
| See Notes to Financial Statements. | ||
Stone Harbor Investment Funds Semi-Annual Report | November 30, 2011 | 53 | |
Table of Contents
| Stone Harbor Investment Funds | Statements of Operations | |
| For the Six Months Ended November 30, 2011 (Unaudited) |
Stone Harbor Emerging Markets Debt | Stone Harbor High Yield Bond Fund | Stone Harbor Local Markets Fund | Stone Harbor Emerging Markets Corporate Debt Fund(1) | |||||||||||||
INVESTMENT INCOME: | ||||||||||||||||
Interest | $ | 31,040,983 | $ | 19,634,966 | $ | 27,297,571 | $ | 1,096,646 | ||||||||
Dividends | – | 65,607 | – | – | ||||||||||||
Total Investment Income | 31,040,983 | 19,700,573 | 27,297,571 | 1,096,646 | ||||||||||||
EXPENSES: | ||||||||||||||||
Investment advisory fees | 2,731,549 | 1,161,861 | 3,262,699 | 120,688 | ||||||||||||
Administration fees | 245,723 | 154,390 | 232,431 | 9,004 | ||||||||||||
Custodian fees | 87,287 | 17,715 | 172,195 | 11,192 | ||||||||||||
Audit fees | 34,627 | 34,627 | 35,222 | 34,544 | ||||||||||||
Printing fees | 3,243 | 3,208 | 3,668 | 2,896 | ||||||||||||
Legal fees | 29,032 | 29,032 | 29,032 | 27,680 | ||||||||||||
Trustee fees | 12,702 | 7,626 | 7,565 | 8,605 | ||||||||||||
Transfer agent fees | 19,478 | 13,183 | 14,605 | 13,533 | ||||||||||||
Registration fees | 72,390 | 35,494 | 35,225 | – | ||||||||||||
Insurance fees | 8,940 | 11,863 | 3,465 | – | ||||||||||||
Repayment of reimbursed expenses | 83,978 | – | 10,036 | – | ||||||||||||
Other | 2,797 | 2,995 | 2,649 | 1,527 | ||||||||||||
Total expenses before waiver | 3,331,746 | 1,471,994 | 3,808,792 | 229,669 | ||||||||||||
Less fees waived by investment advisor | – | (193,947) | – | (87,684) | ||||||||||||
Total Net Expenses | 3,331,746 | 1,278,047 | 3,808,792 | 141,985 | ||||||||||||
Net Investment Income | 27,709,237 | 18,422,526 | 23,488,779 | 954,661 | ||||||||||||
REALIZED AND UNREALIZED GAIN/(LOSS) ON INVESTMENTS: | ||||||||||||||||
Net realized gain/(loss) on: | ||||||||||||||||
Investments | 3,699,790 | 3,432,154 | (12,046,157) | (213,300) | ||||||||||||
Foreign currency transactions | 2,666,947 | 159,651 | (3,169,883) | 23,704 | ||||||||||||
Net realized gain/(loss) | 6,366, 737 | 3,591,805 | (15,216,040) | (189,596) | ||||||||||||
Change in unrealized appreciation/(depreciation) on: | ||||||||||||||||
Investments | (23,680,167) | (46,184,495) | (5,525,032) | (3,791,156) | ||||||||||||
Translation of assets and liabilities denominated in foreign currencies | (8,366,919) | (147,562) | (61,867,307) | (26,959) | ||||||||||||
Net change | (32,047,086) | (46,332,057) | (67,392,339) | (3,818,115) | ||||||||||||
Net Realized and Unrealized Loss on Investments | (25,680,349) | (42,740,252) | (82,608,379) | (4,007,711) | ||||||||||||
Net Increase/(Decrease) in Net Assets Resulting from Operations | $ | 2,028,888 | $ | (24,317,726) | $ | (59,119,600) | $ | (3,053,050) | ||||||||
| (1) | For the period June 1, 2011 (inception) to November 30, 2011. |
| See Notes to Financial Statements. | ||
| 54 | www.shiplp.com | |
Table of Contents
| Stone Harbor Investment Funds | Statements of Changes in Net Assets | |
| Stone Harbor Emerging Markets Debt Fund | Stone Harbor High Yield Bond Fund | |||||||||||||||
|
| |||||||||||||||
For the Six Months Ended November 30, 2011 | For the Year Ended May 31, 2011 | For the Six Months Ended November 30, 2011 (Unaudited) | For the Year Ended May 31, 2011 | |||||||||||||
| ||||||||||||||||
OPERATIONS: | ||||||||||||||||
Net investment income | $ | 27,709,237 | $ | 23,722,320 | $ | 18,422,526 | $ | 34,681,823 | ||||||||
Net realized gain on investments | 6,366,737 | 6,919,738 | 3,591,805 | 17,313,821 | ||||||||||||
Net change in unrealized appreciation/(depreciation) on investments and foreign currency translations | (32,047,086) | 19,256,880 | (46,332,057) | 17,440,379 | ||||||||||||
| ||||||||||||||||
Net increase/(decrease) in net assets resulting from operations | 2,028,888 | 49,898,938 | (24,317,726) | 69,436,023 | ||||||||||||
| ||||||||||||||||
DISTRIBUTIONS TO SHAREHOLDERS: |
| |||||||||||||||
Institutional Class | ||||||||||||||||
From net investment income | (25,717,520) | (24,375,551) | (17,376,323) | (34,395,574) | ||||||||||||
From net realized gains | – | (9,643,963) | – | (6,870,389) | ||||||||||||
| ||||||||||||||||
Net decrease in net assets from distributions to shareholders | (25,717,520) | (34,019,514) | (17,376,323) | (41,265,963) | ||||||||||||
| ||||||||||||||||
CAPITAL SHARE TRANSACTIONS: | ||||||||||||||||
Institutional Class | ||||||||||||||||
Proceeds from sale of shares | 289,672,525 | 601,352,890 | 22,247,907 | 99,064,977 | ||||||||||||
Issued to shareholders in reinvestment of distributions | 24,085,909 | 32,341,186 | 16,413,575 | 31,596,120 | ||||||||||||
Cost of shares redeemed | (54,367,425) | (78,251,861) | (38,059,891) | (78,370,360) | ||||||||||||
| ||||||||||||||||
Net increase in net assets from capital share transactions | 259,391,009 | 555,442,215 | 601,591 | 52,290,737 | ||||||||||||
| ||||||||||||||||
Net Increase/(Decrease) in Net Assets | 235,702,377 | 571,321,639 | (41,092,458) | 80,460,797 | ||||||||||||
| ||||||||||||||||
NET ASSETS: | ||||||||||||||||
Beginning of period | 749,347,669 | 178,026,030 | 488,425,257 | 407,964,460 | ||||||||||||
| ||||||||||||||||
End of period | $ | 985,050,046 | $ | 749,347,669 | $ | 447,332,799 | $ | 488,425,257 | ||||||||
| ||||||||||||||||
Includes undistributed net investment income of: | $ | 3,028,983 | $ | 1,037,266 | $ | 1,175,451 | $ | 129,248 | ||||||||
OTHER INFORMATION: | ||||||||||||||||
Share Transactions: | ||||||||||||||||
Institutional Class | ||||||||||||||||
Beginning shares | 66,925,355 | 16,992,367 | 48,832,904 | 43,581,412 | ||||||||||||
Shares sold | 25,956,658 | 53,869,983 | 2,334,747 | 9,968,502 | ||||||||||||
Shares reinvested | 2,185,984 | 2,923,915 | 1,790,826 | 3,225,739 | ||||||||||||
Shares redeemed | (4,826,284) | (6,860,910) | (4,166,623) | (7,942,749) | ||||||||||||
| ||||||||||||||||
Shares outstanding - end of period | 90,241,713 | 66,925,355 | 48,791,854 | 48,832,904 | ||||||||||||
| ||||||||||||||||
| See Notes to Financial Statements. | ||
Stone Harbor Investment Funds Semi-Annual Report | November 30, 2011 | 55 | |
Table of Contents
| Stone Harbor Investment Funds | Statements of Changes in Net Assets | |
| Stone Harbor Local Markets Fund | Stone Harbor Emerging Markets Corporate Debt Fund | |||||||||||
|
| |||||||||||
For the Six Months Ended November 30, 2011 (Unaudited) | For the Period June 30, 2010 (Inception) to May 31, 2011 | For the Period June 1, 2011 (Inception) to November 30, 2011 (Unaudited) | ||||||||||
| ||||||||||||
OPERATIONS: | ||||||||||||
Net investment income | $ | 23,488,779 | $ | 9,392,458 | $ | 954,661 | ||||||
Net realized gain/(loss) on investments | (15,216,040) | 622,122 | (189,596) | |||||||||
Net change in unrealized appreciation/(depreciation) on investments and foreign currency translations | (67,392,339) | 17,560,404 | (3,818,115) | |||||||||
| ||||||||||||
Net increase/(decrease) in net assets resulting from operations | (59,119,600) | 27,574,984 | (3,053,050) | |||||||||
| ||||||||||||
DISTRIBUTIONS TO SHAREHOLDERS: |
| |||||||||||
Institutional Class | ||||||||||||
From net investment income | (23,629,644) | (9,743,385) | (968,512) | |||||||||
From net realized gains | – | (954,427) | – | |||||||||
| ||||||||||||
Net decrease in net assets from distributions to shareholders | (23,629,644) | (10,697,812) | (968,512) | |||||||||
| ||||||||||||
CAPITAL SHARE TRANSACTIONS: | ||||||||||||
Institutional Class | ||||||||||||
Proceeds from sale of shares | 605,197,245 | 580,987,585 | 30,010,000 | |||||||||
Issued to shareholders in reinvestment of distributions | 23,465,260 | 10,631,445 | 968,512 | |||||||||
Cost of shares redeemed | (27,242,257) | (2,703,053) | – | |||||||||
| ||||||||||||
Net increase in net assets from capital share transactions | 601,420,248 | 588,915,977 | 30,978,512 | |||||||||
| ||||||||||||
Net Increase in Net Assets | 518,671,004 | 605,793,149 | 26,956,950 | |||||||||
| ||||||||||||
NET ASSETS: | ||||||||||||
Beginning of period | 605,793,149 | – | – | |||||||||
| ||||||||||||
End of period | $ | 1,124,464,153 | $ | 605,793,149 | $ | 26,956,950 | ||||||
| ||||||||||||
Includes overdistributed net investment income of: | $ | (168,427) | $ | (27,562) | $ | (13,851) | ||||||
OTHER INFORMATION: | ||||||||||||
Share Transactions: | ||||||||||||
Institutional Class | ||||||||||||
Beginning shares | 54,032,190 | – | – | |||||||||
Shares sold | 55,655,196 | 53,300,605 | 3,001,005 | |||||||||
Shares reinvested | 2,215,245 | 977,555 | 107,778 | |||||||||
Shares redeemed | (2,518,127) | (245,970) | – | |||||||||
| ||||||||||||
Shares outstanding - end of period | 109,384,504 | 54,032,190 | 3,108,783 | |||||||||
| ||||||||||||
| See Notes to Financial Statements. | ||
| 56 | www.shiplp.com | |
Table of Contents
| Stone Harbor Emerging Markets Debt Fund | Financial Highlights | |
| For a share outstanding through the periods presented. |
| Institutional Class | For the Six Months Ended November 30, 2011 (Unaudited) | For the Year Ended May 31, 2011 | For the Year Ended May 31, 2010 | For the Year Ended May 31, 2009 | For the Period August 16, 2007 (Inception) to May 31, 2008 | |||||||||||||||
| ||||||||||||||||||||
Net asset value - beginning of period | $ | 11.20 | $ | 10.48 | $ | 9.22 | $ | 10.34 | $ | 10.00 | ||||||||||
Income/(loss) from investment operations: |
| |||||||||||||||||||
Net investment income | 0.34 | (1) | 0.67 | (1) | 0.75 | 0.59 | 0.46 | |||||||||||||
Net realized and unrealized gain/(loss) on investments | (0.32 | ) | 1.00 | 1.44 | (1.18 | ) | 0.58 | |||||||||||||
| ||||||||||||||||||||
Total income/(loss) from investment operations | 0.02 | 1.67 | 2.19 | (0.59 | ) | 1.04 | ||||||||||||||
| ||||||||||||||||||||
Less distributions to common shareholders: |
| |||||||||||||||||||
From net investment income | (0.30 | ) | (0.63 | ) | (0.79 | ) | (0.53 | ) | (0.54 | ) | ||||||||||
From net realized gains | – | (0.32 | ) | (0.14 | ) | – | (0.16 | ) | ||||||||||||
From tax return of capital | – | – | – | – | (0.00 | )(2) | ||||||||||||||
| ||||||||||||||||||||
Total distributions | (0.30 | ) | (0.95 | ) | (0.93 | ) | (0.53 | ) | (0.70 | ) | ||||||||||
| ||||||||||||||||||||
Net Increase/(Decrease) in Net Asset Value | (0.28 | ) | 0.72 | 1.26 | (1.12 | ) | 0.34 | |||||||||||||
| ||||||||||||||||||||
Net asset value - end of period | $ | 10.92 | $ | 11.20 | $ | 10.48 | $ | 9.22 | $ | 10.34 | ||||||||||
| ||||||||||||||||||||
Total Return(3)(4) | 0.17 | % | 16.30 | % | 24.25 | % | (5.10 | )% | 10.46 | % | ||||||||||
Ratios/Supplemental Data: | ||||||||||||||||||||
Net assets, end of period (in thousands) | $ | 985,050 | $ | 749,348 | $ | 178,026 | $ | 91,753 | $ | 19,587 | ||||||||||
Ratio of expenses to average net assets with fee waivers/reimbursements | 0.73 | %(5) | 0.75 | % | 0.75 | % | 0.75 | % | 0.75 | %(5) | ||||||||||
Ratio of expenses to average net assets without fee waivers/reimbursements | 0.73 | %(5) | 0.77 | % | 0.91 | % | 1.33 | % | 2.27 | %(5) | ||||||||||
Ratio of net investment income to average net assets with fee waivers/reimbursements | 6.09 | %(5) | 6.02 | % | 6.80 | % | 9.32 | % | 5.91 | %(5) | ||||||||||
Portfolio turnover rate | 28 | % | 82 | % | 125 | % | 84 | % | 143 | % | ||||||||||
| (1) | Calculated using average shares. |
| (2) | Less than $(0.005) per share. |
| (3) | Total returns would have been lower had various fees and expenses not been waived and reimbursed during the period. |
| (4) | Total returns for periods of less than one year are not annualized. |
| (5) | Annualized. |
| See Notes to Financial Statements. | ||
Stone Harbor Investment Funds Semi-Annual Report | November 30, 2011 | 57 | |
Table of Contents
| Stone Harbor High Yield Bond Fund | Financial Highlights | |
| For a share outstanding through the periods presented. |
| Institutional Class | For the Six Months Ended November 30, 2011 (Unaudited) | For the Year Ended May 31, 2011 | For the Year Ended May 31, 2010 | For the Year Ended May 31, 2009 | For the Period August 16, 2007 (Inception) to May 31, 2008 | |||||||||||||||
| ||||||||||||||||||||
Net asset value - beginning of period | $ | 10.00 | $ | 9.36 | $ | 8.39 | $ | 9.92 | $ | 10.00 | ||||||||||
Income/(loss) from investment operations: |
| |||||||||||||||||||
Net investment income | 0.38 | (1) | 0.77 | (1) | 0.73 | 0.70 | 0.58 | |||||||||||||
Net realized and unrealized gain/(loss) on investments | (0.85) | 0.78 | 0.96 | (1.53) | (0.08) | |||||||||||||||
| ||||||||||||||||||||
Total income/(loss) from investment operations | (0.47) | 1.55 | 1.69 | (0.83) | 0.50 | |||||||||||||||
| ||||||||||||||||||||
Less distributions to common shareholders: |
| |||||||||||||||||||
From net investment income | (0.36) | (0.76) | (0.72) | (0.70) | (0.57) | |||||||||||||||
From net realized gains | – | (0.15) | – | – | (0.01) | |||||||||||||||
From tax return of capital | – | – | – | – | (0.00 | )(2) | ||||||||||||||
| ||||||||||||||||||||
Total distributions | (0.36) | (0.91) | (0.72) | (0.70) | (0.58) | |||||||||||||||
| ||||||||||||||||||||
Net Increase/(Decrease) in Net Asset Value | (0.83) | 0.64 | 0.97 | (1.53) | (0.08) | |||||||||||||||
| ||||||||||||||||||||
Net asset value - end of period | $ | 9.17 | $ | 10.00 | $ | 9.36 | $ | 8.39 | $ | 9.92 | ||||||||||
| ||||||||||||||||||||
Total Return(3)(4) | (4.66)% | 17.14% | 20.53% | (7.77)% | 5.09% | |||||||||||||||
Ratios/Supplemental Data: | ||||||||||||||||||||
Net assets, end of period (in thousands) | $ | 447,333 | $ | 488,425 | $ | 407,964 | $ | 223,210 | $ | 106,912 | ||||||||||
Ratio of expenses to average net assets with fee waivers/reimbursements | 0.55 | %(5) | 0.55% | 0.55% | 0.55% | 0.55 | %(5) | |||||||||||||
Ratio of expenses to average net assets without fee waivers/reimbursements | 0.63 | %(5) | 0.65% | 0.67% | 0.88% | 1.21 | %(5) | |||||||||||||
Ratio of net investment income to average net assets with fee waivers/reimbursements | 7.93 | %(5) | 7.78% | 8.13% | 9.07% | 7.81 | %(5) | |||||||||||||
Portfolio turnover rate | 20% | 60% | 36% | 16% | 11% | |||||||||||||||
| (1) | Calculated using average shares throughout the period. |
| (2) | Less than $(0.005) per share. |
| (3) | Total returns would have been lower had various fees and expenses not been waived and reimbursed during the period. The total returns in the table represent the rate that an investor would have earned (or lost) on an investment in a Fund (assuming reinvestment of all dividends and distributions). |
| (4) | Total returns for periods of less than one year are not annualized. |
| (5) | Annualized. |
| See Notes to Financial Statements. | ||
| 58 | www.shiplp.com | |
Table of Contents
| Stone Harbor Local Markets Fund | Financial Highlights | |
| For a share outstanding through the periods presented. |
| Institutional Class | For the Six Months Ended November 30, 2011 (Unaudited) | For the Period June 30, 2010 (Inception) to May 31, 2011 | ||||||
| ||||||||
Net asset value - beginning of period | $ | 11.21 | $ | 10.00 | ||||
Income/(loss) from investment operations: | ||||||||
Net investment income(1) | 0.29 | 0.51 | ||||||
Net realized and unrealized gain/(loss) on investments | (0.95 | ) | 1.14 | |||||
| ||||||||
Total income/(loss) from investment operations | (0.66 | ) | 1.65 | |||||
| ||||||||
Less distributions to common shareholders: | ||||||||
From net investment income | (0.27 | ) | (0.39 | ) | ||||
From net realized gains | – | (0.05 | ) | |||||
| ||||||||
Total distributions | (0.27 | ) | (0.44 | ) | ||||
| ||||||||
Net Increase/(Decrease) in Net Asset Value | (0.93 | ) | 1.21 | |||||
| ||||||||
Net asset value - end of period | $ | 10.28 | $ | 11.21 | ||||
| ||||||||
Total Return(2)(3) | (5.97 | )% | 16.82 | % | ||||
Ratios/Supplemental Data: | ||||||||
Net assets, end of period (in thousands) | $ | 1,124,464 | $ | 605,793 | ||||
Ratio of expenses to average net assets with fee waivers/reimbursements | 0.88 | %(4) | 1.00 | %(4) | ||||
Ratio of expenses to average net assets without fee waivers/reimbursements | 0.88 | %(4) | 1.01 | %(4) | ||||
Ratio of net investment income to average net assets with fee waivers/reimbursements | 5.40 | %(4) | 5.13 | %(4) | ||||
Portfolio turnover rate | 73 | % | 102 | % | ||||
| (1) | Calculated using average shares throughout the period. |
| (2) | Total returns would have been lower had various fees and expenses not been waived and reimbursed during the period. The total returns in the table represent the rate that an investor would have earned (or lost) on an investment in a Fund (assuming reinvestment of all dividends and distributions). |
| (3) | Total returns for periods of less than one year are not annualized. |
| (4) | Annualized. |
| See Notes to Financial Statements. | ||
Stone Harbor Investment Funds Semi-Annual Report | November 30, 2011 | 59 | |
Table of Contents
| Stone Harbor Emerging Markets Corporate Debt Fund | Financial Highlights | |
| For a share outstanding through the period presented. | ||
| Institutional Class | For the Period June 01, 2011 (Inception) to November 30, 2011 (Unaudited) | |||
| ||||
Net asset value - beginning of period | $ | 10.00 | ||
Loss from investment operations: | ||||
Net investment income(1) | 0.32 | |||
Net realized and unrealized loss on investments | (1.33 | ) | ||
| ||||
Total loss from investment operations | (1.01 | ) | ||
| ||||
Less distributions to common shareholders: | ||||
From net investment income | (0.32 | ) | ||
| ||||
Total distributions | (0.32 | ) | ||
| ||||
Net Decrease in Net Asset Value | (1.33 | ) | ||
| ||||
Net asset value - end of period | $ | 8.67 | ||
| ||||
Total Return(2)(3) | (10.19 | )% | ||
Ratios/Supplemental Data: | ||||
Net assets, end of period (in thousands) | $ | 26,957 | ||
Ratio of expenses to average net assets with fee waivers/reimbursements | 1.00 | %(4) | ||
Ratio of expenses to average net assets without fee waivers/reimbursements | 1.62 | %(4) | ||
Ratio of net investment income to average net assets with fee waivers/reimbursements | 6.72 | %(4) | ||
Portfolio turnover rate | 22 | % | ||
| (1) | Calculated using average shares throughout the period. |
| (2) | Total returns would have been lower had various fees and expenses not been waived and reimbursed during the period. The total returns in the table represent the rate that an investor would have earned (or lost) on an investment in a Fund (assuming reinvestment of all dividends and distributions). |
| (3) | Total returns for periods of less than one year are not annualized. |
| (4) | Annualized. |
| See Notes to Financial Statements. | ||
| 60 | www.shiplp.com | |
Table of Contents
| Stone Harbor Investment Funds | Notes to Financial Statements | |
| November 30, 2011 (Unaudited) |
1. ORGANIZATION AND SIGNIFICANT ACCOUNTING POLICIES
Stone Harbor Investment Funds, which consists of Stone Harbor Emerging Markets Debt Fund, Stone Harbor High Yield Bond Fund, Stone Harbor Local Markets Fund and Stone Harbor Emerging Markets Corporate Debt Fund (each, a “Fund” and together, the “Funds”) is a Massachusetts business trust (the “Trust”), organized on February 20, 2007 and registered under the Investment Company Act of 1940, as amended (the “1940 Act”), as an open-end management investment company. Each Fund is a non-diversified portfolio with an investment objective to maximize total return. Shares of each Fund are currently divided into two classes, designated Institutional Class Shares and Distributor Class Shares. As of the date of this report, there were no outstanding shares for the Distributor Class of each Fund. The Declaration of Trust permits the Trustees to create additional funds and share classes.
The following is a summary of significant accounting policies consistently followed by the Funds in the preparation of their financial statements. The policies are in conformity with accounting principles generally accepted in the United States of America (“GAAP”). The preparation of the financial statements in accordance with GAAP requires management to make estimates and assumptions that affect the reported amounts of assets and liabilities at the date of the financial statements and the reported amounts of income and expenses during the reporting period. Actual results could differ from those estimates.
(a) Investment Valuation: Debt securities, including bank loans and linked notes, are generally valued at the mean between the bid and asked prices provided by independent pricing services or brokers that are based on transactions in debt obligations, quotations from dealers, market transactions in comparable securities and various other relationships between securities. Equity securities for which market quotations are available are generally valued at the last sale price or official closing price on the primary market or exchange on which they trade. Publicly traded foreign government debt securities are typically traded internationally in the over-the-counter market, and are valued at the mean between the bid and asked prices as of the close of business of that market. When prices are not readily available, or are determined not to reflect fair value, such as when the value of a security has been significantly affected by events after the close of the exchange or market on which the security is principally traded, but before the Funds calculate their net asset value, the Funds may value these investments at fair value as determined in accordance with the procedures approved by the Funds’ Board of Trustees. Short-term obligations with maturities of 60 days or less are valued at amortized cost, which approximates market value. Money market mutual funds are valued at their net asset value.
A three-tier hierarchy has been established to measure fair value based on the extent of use of “observable inputs” as compared to “unobservable inputs” for disclosure purposes and requires additional disclosures about these valuations measurements. Inputs refer broadly to the assumptions that the market participants would use in pricing a security. Observable inputs are inputs that reflect the assumptions market participants would use in pricing the security developed based on market data obtained from sources independent of the reporting entity. Unobservable inputs are inputs that reflect the reporting entity’s own assumptions about the assumptions market participants would use in pricing the security developed based on the best information available in the circumstances.
| Level 1— | Unadjusted quoted prices in active markets for identical assets or liabilities that the Fund has the ability to access. |
| Level 2— | Observable inputs other than quoted prices included in level 1 that are observable for the asset or liability, either directly or indirectly. These inputs may include quoted prices for the identical instrument on an inactive market, prices for similar instruments, interest rates, prepayment speeds, credit risk, yield curve, rates, and similar data. |
| Level 3— | Unobservable inputs for the asset or liability, to the extent relevant observable inputs are not available, representing the Fund’s own assumptions about the assumptions a market participant would use in valuing the asset or liability, and would be based on the best information available. |
The following is a summary of each Fund’s investments and financial instruments based on the three-tier hierarchy as of November 30, 2011:
| Investments in Securities at Value* | Level 1 - Quoted and Unadjusted Prices | Level 2 - Other Significant Observable Inputs | Level 3 - Significant Unobservable Inputs | Total | ||||||||||||
Stone Harbor Emerging Markets Debt Fund |
| |||||||||||||||
Sovereign Debt Obligations | $ | – | $ | 630,352,484 | $ | – | $ | 630,352,484 | ||||||||
Bank Loans | – | 2,264,274 | 2,717,450 | 4,981,724 | ||||||||||||
Convertible Corporate Bonds | – | 169,000 | – | 169,000 | ||||||||||||
Corporate Bonds | – | 259,228,226 | – | 259,228,226 | ||||||||||||
Participation Notes | – | 7,597,073 | – | 7,597,073 | ||||||||||||
Credit Linked Notes | – | 39,577,657 | – | 39,577,657 | ||||||||||||
Short Term Investments | 8,434,700 | – | – | 8,434,700 | ||||||||||||
Total | $ | 8,434,700 | $ | 939,188,174 | $ | 2,717,450 | $ | 950,340,864 | ||||||||
Stone Harbor Investment Funds Semi-Annual Report | November 30, 2011 | 61 | |
Table of Contents
| Stone Harbor Investment Funds | Notes to Financial Statements | |
| November 30, 2011 (Unaudited) |
| Investments in Securities at Value* | Level 1 - Quoted and Unadjusted Prices | Level 2 - Other Significant Observable Inputs | Level 3 - Significant Unobservable Inputs | Total | ||||||||||||
Other Financial Instruments** |
| |||||||||||||||
Assets | ||||||||||||||||
Forward Foreign Currency Contracts | $ | – | $ | 1,178,517 | $ | – | $ | 1,178,517 | ||||||||
| Liabilities | ||||||||||||||||
Forward Foreign Currency Contracts | – | (134,838) | – | (134,838) | ||||||||||||
Total | $ | – | $ | 1,043,679 | $ | – | $ | 1,043,679 | ||||||||
| Investments in Securities at Value* | Level 1 - Quoted and Unadjusted Prices | Level 2 - Other Significant Observable Inputs | Level 3 - Significant Unobservable Inputs | Total | ||||||||||||
Stone Harbor High Yield Bond Fund |
| |||||||||||||||
Corporate Bonds | $ | – | $ | 407,568,185 | $ | – | $ | 407,568,185 | ||||||||
Convertible Corporate Bonds | – | 8,229,290 | – | 8,229,290 | ||||||||||||
Bank Loans | – | 9,720,087 | – | 9,720,087 | ||||||||||||
Common Stocks | 1,911,317 | – | – | 1,911,317 | ||||||||||||
Preferred Stocks | 1,104,499 | – | – | 1,104,499 | ||||||||||||
Warrants | 39,227 | – | – | 39,227 | ||||||||||||
Short Term Investments | 9,125,033 | – | – | 9,125,033 | ||||||||||||
Total | $ | 12,180,076 | $ | 425,517,562 | $ | – | $ | 437,697,638 | ||||||||
| ||||||||||||||||
| Other Financial Instruments** | ||||||||||||||||
| Assets | ||||||||||||||||
Forward Foreign Currency Contracts | $ | – | $ | 58,812 | $ | – | $ | 58,812 | ||||||||
| Liabilities | ||||||||||||||||
Forward Foreign Currency Contracts | – | (2,633) | – | (2,633) | ||||||||||||
Total | $ | – | $ | 56,179 | $ | – | $ | 56,179 | ||||||||
| Investments in Securities at Value* | Level 1 - Quoted and Unadjusted Prices | Level 2 – Other Significant Observable Inputs | Level 3 - Significant Unobservable Inputs | Total | ||||||||||||
Stone Harbor Local Markets Fund |
| |||||||||||||||
Sovereign Debt Obligations | $ | – | $ | 595,694,632 | $ | – | $ | 595,694,632 | ||||||||
Corporate Bonds | – | 40,531,734 | – | 40,531,734 | ||||||||||||
Credit Linked Notes | – | 243,353,694 | – | 243,353,694 | ||||||||||||
Short Term Investments | 77,308,724 | – | – | 77,308,724 | ||||||||||||
Total | $ | 77,308,724 | $ | 879,580,060 | $ | – | $ | 956,888,784 | ||||||||
| Other Financial Instruments** | ||||||||||||||||
| Assets | ||||||||||||||||
Forward Foreign Currency Contracts | $ | – | $ | 1,151,543 | $ | – | $ | 1,151,543 | ||||||||
| Liabilities | ||||||||||||||||
Forward Foreign Currency Contracts | – | (1,399,064) | – | (1,399,064) | ||||||||||||
Total | $ | – | $ | (247,521) | $ | – | $ | (247,521) | ||||||||
| Investments in Securities at Value* | Level 1 - Quoted and Unadjusted Prices | Level 2 - Other Significant Observable Inputs | Level 3 - Significant Unobservable Inputs | Total | ||||||||||||
Stone Harbor Emerging Markets Corporate Debt Fund | ||||||||||||||||
Corporate Bonds | $ | – | $ | 25,554,843 | $ | – | $ | 25,554,843 | ||||||||
Credit Linked Notes | – | 644,000 | – | 644,000 | ||||||||||||
Short Term Investments | 182,003 | – | – | 182,003 | ||||||||||||
Total | $ | 182,003 | $ | 26,198,843 | $ | – | $ | 26,380,846 | ||||||||
| 62 | www.shiplp.com | |
Table of Contents
| Stone Harbor Investment Funds | Notes to Financial Statements | |
| November 30, 2011 (Unaudited) |
| Investments in Securities at Value* | Level 1 - Quoted and Unadjusted Prices | Level 2 - Other Significant Observable Inputs | Level 3 - Significant Unobservable Inputs | Total | ||||||||||||
| ||||||||||||||||
| Other Financial Instruments** | ||||||||||||||||
| Assets | ||||||||||||||||
Forward Foreign Currency Contracts | $ | – | $ | 7,807 | $ | – | $ | 7,807 | ||||||||
Total | $ | – | $ | 7,807 | $ | – | $ | 7,807 | ||||||||
| * | For detailed Industry/Country descriptions, see accompanying Statement of Investments. |
| ** | Other financial instruments are derivative instruments not reflected in the Statement of Investments. |
There were no significant transfers into or out of Levels 1 and 2 during the period.
Stone Harbor Emerging Markets Corporate Debt Fund was valued using either Level 1 or Level 2 inputs during the six months ended November 30, 2011. Thus a reconciliation of assets in which significant unobservable inputs (Level 3) were used is not applicable for the Fund.
The following is a reconciliation of assets in which significant unobservable inputs (Level 3) were used in determining fair value:
Investments in Securities at Value | Balance as May 31, | Accrued Discount/ Premium | Realized Gain/(Loss)* | Change in unrealized Appreciation/ (Depreciation)* | Net Purchases/ (Sales) | Transfer in and/or (out) Level 3 | Balance as of November 30, 2011 | Net Change in Unrealized Appreciation/ (Depreciation) Attributable to Level 3 Investments Still Held at November 30, 2011 | ||||||||||||||||||||||||
| Stone Harbor Emerging Markets Debt Fund | ||||||||||||||||||||||||||||||||
Sovereign Debt | ||||||||||||||||||||||||||||||||
Obligations | $ | 17,818,730 | $ | (9,472 | ) | $ | (636,146 | ) | $ | (755,012 | ) | $ | (5,844,058 | ) | $ | (10,574,042 | ) | $ | – | $ | – | |||||||||||
Bank Loans | 3,197,000 | – | – | (479,550 | ) | – | – | 2,717,450 | (479,550 | ) | ||||||||||||||||||||||
Corporate Bonds | 4,257,737 | 66,564 | 445 | (1,232,629 | ) | 1,034,074 | (4,126,191 | ) | – | – | ||||||||||||||||||||||
Total | $ | 25,273,467 | $ | 57,092 | $ | (635,701 | ) | $ | (2,467,191 | ) | $ | (4,809,984 | ) | $ | (17,417,683 | ) | $ | – | $ | – | ||||||||||||
Stone Harbor High Yield Bond Fund |
| |||||||||||||||||||||||||||||||
Corporate Bonds | $ | 2 | $ | 49 | $ | – | $ | (49 | ) | – | $ | (2 | ) | $ | – | $ | – | |||||||||||||||
Convertible | ||||||||||||||||||||||||||||||||
Corporate | ||||||||||||||||||||||||||||||||
Bonds | 342,923 | 61,031 | – | (105,582 | ) | – | (298,372 | ) | – | – | ||||||||||||||||||||||
Total | $ | 342,925 | $ | 61,080 | $ | – | $ | (105,631 | ) | $ | – | $ | (298,374 | ) | $ | – | $ | – | ||||||||||||||
Stone Harbor Local Markets Fund |
| |||||||||||||||||||||||||||||||
Sovereign Debt | ||||||||||||||||||||||||||||||||
Obligations | $ | 13,281,491 | $ | (72,685 | ) | $ | (397 | ) | $ | (694,786 | ) | $ | 13,050,644 | $ | (25,564,267 | ) | $ | – | $ | – | ||||||||||||
Total | $ | 13,281,491 | $ | (72,685 | ) | $ | (397 | ) | $ | (694,786 | ) | $ | 13,050,644 | $ | (25,564,267 | ) | $ | – | $ | – | ||||||||||||
* Realized gain/(class) and change in unrealized appreciation/(depreciation) are included in the related amounts on the investment in the Statement of Operations.
The inputs or methodology used for valuing securities are not necessarily an indication of the risk associated with investing in those securities.
(b) Security Transactions and Investment Income: Security transactions are accounted for on a trade date basis. Interest income, adjusted for amortization of premium and accretion of discount, is recorded on the accrual basis. Dividend income is recorded on the ex-dividend date. Foreign dividend income is recorded on the ex-dividend date or as soon as practical after the Funds determine the existence of a dividend declaration after exercising reasonable due diligence. The cost of investments sold is determined by use of the specific identification method. To the extent any issuer defaults on an expected interest payment, the Funds’ policy is to generally halt any additional interest income accruals and consider the realizability of interest accrued up to the date of default.
Stone Harbor Investment Funds Semi-Annual Report | November 30, 2011 | 63 | |
Table of Contents
| Stone Harbor Investment Funds | Notes to Financial Statements | |
| November 30, 2011 (Unaudited) |
(c) Foreign Currency Translation: The books and records of the Funds are maintained in U.S. dollars. Investment valuations and other assets and liabilities initially expressed in foreign currencies are converted each business day into U.S. dollars based upon current exchange rates. Prevailing foreign exchange rates may generally be obtained at the close of the NYSE (normally, 4:00 p.m. Eastern time). The portion of realized and unrealized gains or losses on investments due to fluctuations in foreign currency exchange rates is not separately disclosed and is included in realized and unrealized gains or losses on investments, when applicable.
(d) Foreign Securities: The Funds may directly purchase securities of foreign issuers. Investing in securities of foreign issuers involves special risks not typically associated with investing in securities of U.S. issuers. The risks include possible revaluation of currencies, the ability to repatriate funds, less complete financial information about companies and possible future adverse political and economic developments. Moreover, securities of many foreign issuers and their markets may be less liquid and their prices more volatile than those of securities of comparable U.S. issuers.
(e) Risk Exposure and the Use of Derivative Instruments: The Funds’ investment objectives not only permit the Funds to purchase investment securities, they also allow the Funds to enter in various types of derivatives contracts. In doing so, the Funds employ strategies in differing combinations to permit them to increase, decrease, or change the level or types of exposure to market factors. Central to those strategies are features inherent to derivatives that may make them more attractive for this purpose than equity or debt securities; they require little or no initial cash investment, they can focus exposure on only certain selected risk factors, and they may not require the ultimate receipt or delivery of the underlying security (or securities) to the contract. This may allow the Funds to pursue their objectives more quickly and efficiently than if they were to make direct purchases or sales of securities capable of effecting a similar response to market factors.
Market Risk Factors. In pursuit of their investment objectives, the Funds may seek to use derivatives to increase or decrease their exposure to the following risk factors, among others:
Interest Rate Risk. Interest rate risk refers to the fluctuations in value of fixed-income securities resulting from the inverse relationship between price and yield. For example, an increase in general interest rates will tend to reduce the market value of already issued fixed-income investments, and a decline in general interest rates will tend to increase their value. In addition, debt securities with longer maturities, which tend to have higher yields, are subject to potentially greater fluctuations in value from changes in interest rates than obligations with shorter maturities.
Credit Risk. Credit risk relates to the ability of the issuer to meet interest and principal payments, or both, as they come due. In general, lower-grade, higher-yield bonds are subject to credit risk to a greater extent than lower-yield, higher-quality bonds.
Foreign Exchange Rate Risk. relates to the change in the U.S. dollar value of a security held that is denominated in a foreign currency. The U.S. dollar value of a foreign currency denominated security will decrease as the dollar appreciates against the currency, while the U.S. dollar value will increase as the dollar depreciates against the currency.
Equity Risk. Equity risk relates to the change in value of equity securities as they relate to increases or decreases in the general market.
The Funds’ use of derivatives can result in losses due to unanticipated changes in these risk factors and the overall market. In instances where the Funds are using derivatives to decrease, or hedge, exposures to market risk factors for securities held by the Funds, there are also risks that those derivatives may not perform as expected resulting in losses for the combined or hedged positions.
Derivatives may have little or no initial cash investment relative to their market value exposure and therefore can produce significant gains or losses in excess of their cost. This use of embedded leverage allows the Fund to increase its market value exposure relative to it net assets and can substantially increase the volatility of the Funds’ performance.
Additional associated risks from investing in derivatives also exist and potentially could have significant effects on the valuation of the derivative and the Funds. Typically, the associated risks are not the risks that the Funds are attempting to increase or decrease exposure to, per their investment objectives, but are the additional risks from investing in derivatives.
Examples of these associated risks are liquidity risk, which is the risk that the Funds will not be able to sell the derivative in the open market in a timely manner, and counterparty credit risk, which is the risk that the counterparty will not fulfill its obligation to the Funds. Associated risks can be different for each type of derivative and are discussed by each derivative type in the notes that follow.
Forward Foreign Currency Contracts. The Funds may engage in currency transactions with counterparties to hedge the value of portfolio securities denominated in particular currencies against fluctuations in relative value, to gain or reduce exposure to certain currencies, or to generate income
| See Notes to Financial Statements. | ||
| 64 | www.shiplp.com | |
Table of Contents
| Stone Harbor Investment Funds | Notes to Financial Statements | |
| November 30, 2011 (Unaudited) |
or gains. A forward foreign currency contract is an agreement between two parties to buy and sell a currency at a set price on a future date. The contract is marked-to-market daily and the change in value is recorded by the Funds as an unrealized gain or loss. When a forward foreign currency contract is extinguished, through either delivery or offset by entering into another forward foreign currency contract, the Funds record a realized gain or loss equal to the difference between the value of the contract at the time it was opened and the value of the contract at the time it was extinguished.
Forward foreign currency contracts involve elements of market risk in excess of the amounts reflected in the Statements of Assets and Liabilities. The Funds bear the risk of an unfavorable change in the foreign exchange rate underlying the forward foreign currency contract. Risks may also arise upon entering into these contracts from the potential inability of the counterparties to meet the terms of their contracts.
Credit Linked Notes: The Funds may invest in credit linked notes to obtain economic exposure to high yield, emerging markets or other securities. Investments in a credit linked note typically provide the holder with a return based on the return of an underlying reference instrument, such as an emerging market bond. Like an investment in a bond, investments in credit-linked securities represent the right to receive periodic income payments (in the form of distributions) and payment of principal at the end of the term of the security. In addition to the risks associated with the underlying reference instrument, an investment in a credit linked note is also subject to the risk that the counterparty will be unwilling or unable to meet its obligations under the note. Because credit linked notes are derivatives, an investment in these instruments is generally subject to the risks associated with derivatives.
The following is a summary of the fair valuations of derivative instruments categorized by risk exposure:
Fair values of derivative instruments on the Statement of Assets and Liabilities as of November 30, 2011:
| Foreign Exchange Contracts | ||||
Stone Harbor Emerging Markets Debt Fund Assets: | ||||
Unrealized appreciation on forward foreign currency contracts | $ | 1,178,517 | ||
Liabilities: | ||||
Unrealized depreciation on forward foreign currency contracts | $ | (134,838) | ||
Stone Harbor High Yield Bond Fund Assets: | ||||
Unrealized appreciation on forward foreign currency contracts | $ | 58,812 | ||
Liabilities: | ||||
Unrealized depreciation on forward foreign currency contracts | $ | (2,633) | ||
Stone Harbor Local Markets Fund Assets: | ||||
Unrealized appreciation on forward foreign currency contracts | $ | 1,151,543 | ||
Liabilities: | ||||
Unrealized depreciation on forward foreign currency contracts | $ | (1,399,064) | ||
Stone Harbor Emerging Markets Corporate Debt Fund Assets: | ||||
Unrealized appreciation on forward foreign currency contracts | $ | 7,807 | ||
Liabilities: | ||||
Unrealized depreciation on forward foreign currency contracts | $ | – | ||
| See Notes to Financial Statements. | ||
Stone Harbor Investment Funds Semi-Annual Report | November 30, 2011 | 65 | |
Table of Contents
| Stone Harbor Investment Funds | Notes to Financial Statements | |
| November 30, 2011 (Unaudited) |
The effect of derivative instruments on the Statement of Operations for the period ended November 30, 2011:
| Foreign Exchange Contracts | |||||
Stone Harbor Emerging Markets Debt Fund Net Realized Gain on: | |||||
Foreign currency transactions | $ | 2,259,284 | |||
Change in Unrealized Appreciation on: | |||||
Translation of assets and liabilities denominated in foreign currencies | $ | 852,211 | |||
Stone Harbor High Yield Bond Fund Net Realized Gain on: | |||||
Foreign currency transactions | $ | 172,932 | |||
Change in Unrealized Appreciation on: | |||||
Translation of assets and liabilities denominated in foreign currencies | $ | 58,917 | |||
Stone Harbor Local Markets Fund Net Realized Loss on: | |||||
Foreign currency transactions | $ | (2,993,442 | ) | ||
Change in Unrealized Depreciation on: | |||||
Translation of assets and liabilities denominated in foreign currencies | $ | (3,503,176 | ) | ||
Stone Harbor Emerging Markets Corporate Debt Fund Net Realized Gain on: | |||||
Foreign currency transactions | $ | 24,137 | |||
Change in Unrealized Appreciation on: | |||||
Translation of assets and liabilities denominated in foreign currencies | $ | 6,426 | |||
(f) Loan Participations and Assignments: The Funds may invest in loans arranged through private negotiation between one or more financial institutions. The Funds’ investment in any such loan may be in the form of a participation in or an assignment of the loan. In connection with purchasing participations, the Funds generally will have no right to enforce compliance by the borrower with the terms of the loan agreement relating to the loan, nor any rights of set-off against the borrower and the Funds may not benefit directly from any collateral supporting the loan in which they have purchased the participation.
The Funds assume the credit risk of the borrower, the lender that is selling the participation and any other persons interpositioned between the Funds and the borrower. In the event of the insolvency of the lender selling the participation, the Funds may be treated as a general creditor of the lender and may not benefit from any set-off between the lender and the borrower.
(g) Credit and Market Risk: The Funds invest in high yield and emerging market instruments that are subject to certain credit and market risks. The yields of high yield and emerging market debt obligations reflect, among other things, perceived credit and market risks. The Funds’ investment in securities rated below investment grade typically involves risks not associated with higher rated securities including, among others, greater risk related to timely and ultimate payment of interest and principal, greater market price volatility and less liquid secondary market trading. The consequences of political, social, economic or diplomatic changes may have disruptive effects on the market prices of investments held by the Funds. The Funds’ investment in non-dollar denominated securities may also result in foreign currency losses caused by devaluations and exchange rate fluctuations. Investments in derivatives are also subject to credit and market risks.
(h) Distributions to Shareholders: Dividends and distributions to shareholders, which are determined in accordance with income tax regulations, are recorded on the ex-date. Income distributions, if any are generally declared and paid on a quarterly basis. Capital gain distributions, if any, are declared and paid at least annually.
(i) Classifications of Distributions: Net investment income (loss) and net realized gain (loss) may differ for financial statement and tax purposes. The character of distributions made during the year from net investment income or net realized gains may differ from its ultimate characterization for federal income tax purposes. Also, due to the timing of dividend distributions, the fiscal year in which amounts are distributed may differ from the fiscal year in which the income or realized gain was recorded by a Fund.
| 66 | www.shiplp.com | |
Table of Contents
| Stone Harbor Investment Funds | Notes to Financial Statements | |
| November 30, 2011 (Unaudited) |
The tax character of the distributions paid by the Funds during the years ended May 31, 2011, and May 31, 2010, was as follows:
Stone Harbor Emerging Markets Debt Fund
| For the Year Ended May 31, 2011 | For the Year Ended May 31, 2010 | |||
Ordinary Income | $30,268,192 | $10,321,834 | ||
Long-Term Capital Gain | 3,751,322 | – | ||
Tax Return of Capital | – | – | ||
Total | $34,019,514 | $10,321,834 | ||
Stone Harbor High Yield Bond Fund | ||||
For the Year Ended May 31, 2011 | For the Year Ended May 31, 2010 | |||
Ordinary Income | $37,432,474 | $28,484,852 | ||
Long-Term Capital Gain | 3,833,489 | – | ||
Tax Return of Capital | – | – | ||
Total | $41,265,963 | $28,484,852 | ||
Stone Harbor Local Markets Fund | ||||
| For the Period Ended May 31, 2011 | ||||
Ordinary Income | $10,697,812 | |||
Long-Term Capital Gain | – | |||
Tax Return of Capital | – | |||
Total | $10,697,812 | |||
The Stone Harbor Emerging Markets Corporate Debt Fund commenced operations on June 1, 2011.
As of May 31, 2011, the components of distributable earnings on a tax basis were as follows:
Stone Harbor Emerging Markets Debt Fund | ||||
Undistributed Ordinary Income | $ | 1,827,502 | ||
Accumulated Capital Gains/(Loss) | 899,020 | |||
Unrealized Appreciation/(Depreciation) | 23,682,009 | |||
Cumulative Effect of Other Timing Difference* | (14,204 | ) | ||
Total | $ | 26,394,327 | ||
Stone Harbor High Yield Bond Fund | ||||
Undistributed Ordinary Income | $ | 2,353,392 | ||
Accumulated Capital Gains/(Loss) | 9,217,158 | |||
Unrealized Appreciation/(Depreciation) | 28,506,438 | |||
Cumulative Effect of Other Timing Difference* | 182 | |||
Total | $ | 40,077,170 | ||
Stone Harbor Local Markets Fund | ||||
Undistributed Ordinary Income | $ | 1,530,108 | ||
Accumulated Capital Gains/(Loss) | – | |||
Unrealized Appreciation/(Depreciation) | 16,767,828 | |||
Cumulative Effect of Other Timing Difference* | (1,420,764 | ) | ||
Total | $ | 16,877,172 | ||
The Stone Harbor Emerging Markets Corporate Debt Fund commenced operations on June 1, 2011.
*Other temporary differences due to timing, consist primarily of mark-to-market on forward foreign currency contracts.
Stone Harbor Investment Funds Semi-Annual Report | November 30, 2011 | 67 | |
Table of Contents
| Stone Harbor Investment Funds | Notes to Financial Statements | |
| November 30, 2011 (Unaudited) |
The tax components of distributable earnings are determined in accordance with income tax regulations which may differ from the composition of net assets reported under GAAP. Accordingly, for the period ended May 31, 2011, certain differences were reclassified. These differences were primarily due to the differing tax treatment of certain investments and the amounts reclassified did not affect net assets.
The reclassifications were as follows:
| Stone Harbor Emerging Markets Debt Fund | Stone Harbor High Yield Bond Fund | Stone Harbor Local Markets Fund | ||||||||||
Paid-in Capital | $ | – | $ | 550,704 | $ | – | ||||||
(Over)/Undistributed Income | $ | 1,411,884 | $ | (61,866 | ) | $ | 323,365 | |||||
Accumulated Net Realized Losses | $ | (1,411,884 | ) | $ | (488,838 | ) | $ | (323,365 | ) | |||
The Stone Harbor Emerging Markets Corporate Debt Fund commenced operations on June 1, 2011.
(j) Expenses: Direct expenses are charged to the Funds; general expenses of the Trust are allocated to the Funds based on each Fund’s relative net assets.
(k) Federal and Other Taxes: No provision for income taxes is included in the accompanying financial statements, as the Funds intend to distribute to shareholders all taxable investment income and realized gains and otherwise comply with Subchapter M of the Internal Revenue Code applicable to regulated investment companies.
The Funds evaluate tax positions taken (or expected to be taken) in the course of preparing the Funds’ tax returns to determine whether these positions meet a “more-likely-than-not” standard that, based on the technical merits, have a more than fifty percent likelihood of being sustained by a taxing authority upon examination. A tax position that meets the “more-likely-than-not” recognition threshold is measured to determine the amount of benefit to recognize in the financial statements.
Management of the Funds analyzes all open tax years, as defined by the Statute of Limitations, for all major jurisdictions, including federal tax authorities and certain state tax authorities. As of and during the fiscal year ended May 31, 2011, the Funds did not have a liability for any unrecognized tax benefits. The Funds’ federal and state income and federal excise tax returns for all tax years since inception are subject to examination by the Internal Revenue Service and state departments of revenue.
On December 22, 2010, the Regulated Investment Company Modernization Act of 2010 (the “Modernization Act”) was signed into law. The provisions of the Modernization Act are generally effective for tax years beginning after the date it was signed into law, therefore the enacted provisions will apply to the Funds for the fiscal year ending May 31, 2012. The Modernization Act is the first major piece of legislation affecting regulated investment companies (“RICs”) since 1986 and it modernizes several of the federal income and excise tax provisions related to RICs. Some highlights of the enacted provisions are as follows:
New capital losses may now be carried forward indefinitely, and retain the character of the original loss. Under pre-enactment law, capital losses could be carried forward for eight years, and carried forward as short-term capital losses, irrespective of the character of the original loss.
The Modernization Act contains simplification provisions, which are aimed at preventing disqualification of a RIC for “inadvertent” failures of the asset diversification and/or qualifying income tests. Additionally, the Modernization Act exempts RICs from the preferential dividend rule, and repealed the 60-day designation requirement for certain types of paythrough income and gains.
Finally, the Modernization Act contains several provisions aimed at preserving the character of distributions made by a RIC during the portion of its taxable year ending after October 31 or December 31, reducing the circumstances under which a RIC might be required to file amended Forms 1099 to restate previously reported distributions.
2. APPLICATION OF RECENT ACCOUNTING PRONOUNCEMENTS
In May 2011, the FASB issued ASU No. 2011-04 “Amendments to Achieve Common Fair Value Measurement and Disclosure Requirements” in GAAP and the International Financial Reporting Standards (“IFRSs”). ASU No.2011-04 amends FASB ASC Topic 820, “Fair Value Measurements and Disclosures”, to establish common requirements for measuring fair value and for disclosing information about fair value measurements in accordance with GAAP and IFRSs. ASU No.2011-04 is effective for fiscal years beginning after December 15, 2011 and for interim periods within those fiscal years. Management is currently evaluating the impact these amendments may have on the Funds financial statements.
| 68 | www.shiplp.com | |
Table of Contents
| Stone Harbor Investment Funds | Notes to Financial Statements | |
| November 30, 2011 (Unaudited) |
3. ADVISORY FEES
Stone Harbor Investment Partners LP is the Trust’s investment adviser. Under the investment advisory agreement the Trust pays an investment advisory fee calculated daily and paid monthly of 0.60%, 0.50%, 0.75% and 0.85% of the average daily net assets for Stone Harbor Emerging Markets Debt Fund, Stone Harbor High Yield Bond Fund, and Stone Harbor Local Markets Fund, and Stone Harbor Emerging Markets Corporate Debt Fund, respectively.
The Adviser has contractually agreed to waive fees and reimburse expenses with respect to each of the Funds so that the Net Annual Operating Expenses (exclusive of acquired Fund fees and expenses, brokerage expenses, interest expense, taxes and extraordinary expenses) of the Stone Harbor Emerging Markets Debt Fund Institutional Class, Stone Harbor High Yield Bond Fund Institutional Class, Stone Harbor Local Markets Fund Institutional Class and Stone Harbor Emerging Markets Corporate Debt Fund Institutional Class will not exceed 0.75%, 0.55%, 1.00% and 1.00%, respectively. This undertaking is in effect through September 30, 2012 and is reevaluated on an annual basis.
The Adviser will be permitted to recover, on a class by class basis, expenses it has borne through the undertakings described above to the extent that a Fund’s expenses in later periods fall below the annual rates set forth in the relevant undertaking. A Fund will not be obligated to pay any such deferred fees and expenses more than three years after the end of the fiscal year in which the fee and expense was deferred. As of May 31, 2011, deferred fees and expenses that were eligible to be recovered amounted to $83,978, $423,643 and $10,036 for the Stone Harbor Emerging Markets Debt Fund, Stone Harbor High Yield Bond Fund and Stone Harbor Local Markets Fund, respectively.
4. INVESTMENTS
During the six months, ended November 30, 2011 the aggregate cost of purchases and proceeds from sales of investments (excluding short-term investments) were as follows:
| Purchases of investments | Sales of investments | |||||||
Stone Harbor Emerging Markets Debt Fund | $ | 508,491,015 | $ | 241,952,650 | ||||
Stone Harbor High Yield Bond Fund | $ | 92,596,308 | $ | 90,633,113 | ||||
Stone Harbor Local Markets Fund | $ | 1,020,565,086 | $ | 531,436,599 | ||||
Stone Harbor Emerging Markets Corporate Debt Fund | $ | 35,337,740 | $ | 5,107,261 | ||||
At November 30, 2011 the aggregate gross unrealized appreciation and depreciation of investments for federal income purposes were substantially as follows:
Stone Harbor Emerging Markets Debt Fund | ||||
Gross appreciation on investments (excess of value over tax cost) | $ | 29,802,654 | ||
Gross depreciation on investments (excess of tax cost over value) | (39,982,113 | ) | ||
Net unrealized depreciation | (10,179,459 | ) | ||
Cost of investments for income tax purposes | $ | 960,520,323 | ||
Stone Harbor High Yield Bond Fund | ||||
Gross appreciation on investments (excess of value over tax cost) | $ | 13,568,308 | ||
Gross depreciation on investments (excess of tax cost over value) | (31,446,089 | ) | ||
Net unrealized appreciation | (17,877,781 | ) | ||
Cost of investments for income tax purposes | $ | 455,575,419 | ||
Stone Harbor Local Markets Fund | ||||
Gross depreciation on investments (excess of tax cost over value) | $ | (63,217,389 | ) | |
Net unrealized depreciation | (63,217,389 | ) | ||
Cost of investments for income tax purposes | $ | 1,020,106,173 | ||
Stone Harbor Emerging Markets Corporate Debt Fund | ||||
Gross appreciation on investments (excess of value over tax cost) | $ | 49,947 | ||
Gross depreciation on investments (excess of tax cost over value) | (3,874,487 | ) | ||
Net unrealized appreciation | (3,824,540 | ) | ||
Cost of investments for income tax purposes | $ | 30,205,386 | ||
Stone Harbor Investment Funds Semi-Annual Report | November 30, 2011 | 69 | |
Table of Contents
| Stone Harbor Investment Funds | Notes to Financial Statements | |
| November 30, 2011 (Unaudited) |
Funds elect to defer to the period ending May 31, 2012 the following losses recognized during the period November 1, 2010 through May 31, 2011:
| Capital | Currency | |||||||
Stone Harbor Emerging Markets Debt Fund | – | – | ||||||
Stone Harbor High Yield Bond Fund | – | 9,401 | ||||||
Stone Harbor Local Markets Fund | – | – | ||||||
The Stone Harbor Emerging Markets Corporate Debt Fund commenced operations on June 1, 2011.
5. SHARES OF BENEFICIAL INTEREST
At November 30, 2011, the Trust had an unlimited number of shares of beneficial interest authorized with a par value of $0.001 per share. The Funds have the ability to issue multiple classes of shares. Each share of a class represents an identical interest and has the same rights, except that each class bears certain direct expenses, including those specifically related to the distribution of its shares. Transactions in shares of the Institutional Class can be found on the Statement of Changes in Net Assets.
| 70 | www.shiplp.com | |
Table of Contents
| Stone Harbor Investment Funds | Additional Information | |
| November 30, 2011 (Unaudited) |
Stone Harbor
FUND PORTFOLIO HOLDINGS
The SEC has adopted the requirement that all registered investment companies file a complete schedule of portfolio holdings with the SEC for their first and third fiscal quarters on Form N-Q. For the Funds, this would be for the fiscal quarters ending August 31 and February 28. The Form N-Q filing must be made within 60 days of the end of the quarter. The Funds’ Forms N-Q will be available on the SEC’s website at http://www.sec.gov, or they may be reviewed and copied at the SEC’s Public Reference Room in Washington, DC (call 1-800-732-0330 for information on the operation of the Public Reference Room).
PROXY VOTING
A description of the policies and procedures that the Funds use to determine how to vote proxies relating to portfolio securities and information regarding how the Funds voted proxies relating to portfolio securities for the period ending June 30, 2011 will be available without a charge, upon request, by contacting Stone Harbor Investment Funds at 1-866-699-8158 or on the SEC website at http://www.sec.gov.
SHAREHOLDER TAX INFORMATION
Certain tax information regarding the Trust is required to be provided to shareholders based upon each Fund’s income and distributions for the year ended May 31, 2011.
Stone Harbor Emerging Markets Debt Fund | Stone Harbor High Yield Bond Fund | Stone Harbor Local Markets Fund | ||||||||||
Dividends Received Deduction Percentage | 0.00 | % | 0.18 | % | 0.00 | % | ||||||
Qualified Dividend Income Percentage | 0.00 | % | 0.18 | % | 0.00 | % | ||||||
Pursuant to Section 852(b)(3) of the Internal Revenue Code, the Stone Harbor Emerging Markets Debt Fund and the Stone Harbor High Yield Bond Fund designate $3,751,322 and $3,833,489, respectively, as long term capital gain dividends.
Stone Harbor Investment Funds Semi-Annual Report | November 30, 2011 | 71 |
Table of Contents
| Stone Harbor Investment Funds | Notes | |
| November 30, 2011 (Unaudited) |
| 72 | www.shiplp.com |
Table of Contents

INVESTMENT ADVISER
Stone Harbor Investment Partners LP
31 W. 52nd Street 16th Floor
New York, New York 10019
ADMINISTRATOR & FUND ACCOUNTANT
ALPS Fund Services, Inc.
1290 Broadway, Suite 1100
Denver, Colorado 80203
TRANSFER AGENT & CUSTODIAN
The Bank of New York Mellon
One Wall Street
New York, New York 10286
LEGAL COUNSEL
Ropes & Gray LLP
1211 Avenue of the Americas
New York, New York 10036
INDEPENDENT REGISTERED PUBLIC ACCOUNTING FIRM
Deloitte & Touche LLP
555 17th Street, Suite 3600
Denver, Colorado 80202
This report and its financial statements are submitted for the general information of the shareholders of the Funds. The report is not authorized for distribution to prospective investors in the Funds unless preceded or accompanied by a prospectus.
Table of Contents
| Item 2. | Code of Ethics. |
Not applicable to this Report.
| Item 3. | Audit Committee Financial Expert. |
Not applicable to this Report.
| Item 4. | Principal Accountant Fees and Services. |
Not applicable to this Report.
| Item 5. | Audit Committee of Listed Registrants. |
Not applicable.
| Item 6. | Investments. |
| (a) | Schedule of Investments is included as part of the Report to Stockholders filed under Item 1 of this Form N-CSR. |
| (b) | Not applicable. |
| Item 7. | Disclosure of Proxy Voting Policies and Procedures for Closed-End Management Investment Companies. |
Not applicable to Registrant.
| Item 8. | Portfolio Managers of Closed-End Management Investment Companies. |
Not applicable to Registrant.
Table of Contents
| Item 9. | Purchases of Equity Securities by Closed-End Management Investment Companies and Affiliated Purchasers. |
Not applicable to Registrant.
| Item 10. | Submission of Matters to a Vote of Security Holders. |
There have been no material changes to the procedures by which shareholders may recommend nominees to the Registrant’s Board of Trustees, where those changes were implemented after the Registrant last provided disclosure in response to the requirements of Item 407(c)(2) of Regulation S-K, or this Item.
| Item 11. | Controls and Procedures. |
| (a) | The Registrant’s principal executive officer and principal financial officer have concluded that the Registrant’s disclosure controls and procedures (as defined in Rule 30a-3(c) under the Investment Company Act of 1940, as amended) are effective based on their evaluation of these controls and procedures as of a date within 90 days of the filing date of this report. |
| (b) | There was no change in the Registrant’s internal control over financial reporting (as defined in Rule 30a-3(d) under the Investment Company Act of 1940, as amended) during the second fiscal quarter of the period covered by this report that has materially affected, or is reasonably likely to materially affect, the Registrant’s internal control over financial reporting. |
| Item 12. | Exhibits. |
| (a)(1) | Not applicable to this Report. |
| (a)(2) | The certifications required by Rule 30a-2(a) of the Investment Company Act of 1940, as amended, and Section 302 of the Sarbanes-Oxley Act of 2002 are attached hereto as Exhibit 99.Cert. |
(a)(3) Not applicable to Registrant.
| (b) | The certifications by the Registrant’s principal executive officer and principal financial officer, as required by Rule 30a-2(b) of the Investment Company Act of 1940, as amended, and Section 906 of the Sarbanes-Oxley Act of 2002 are attached hereto as Exhibit 99.906Cert. |
Table of Contents
SIGNATURES
Pursuant to the requirements of the Securities Exchange Act of 1934 and the Investment Company Act of 1940, the Registrant has duly caused this Report to be signed on its behalf by the undersigned, thereunto duly authorized.
| Stone Harbor Investment Funds | ||
| By: | /s/ Peter J. Wilby | |
| Peter J. Wilby | ||
President/Principal Executive Officer | ||
| Date: | February 3, 2012 | |
Pursuant to the requirements of the Securities Exchange Act of 1934 and the Investment Company Act of 1940, this Report has been signed below by the following persons on behalf of the Registrant and in the capacities and on the dates indicated.
| By: | /s/ Peter J. Wilby | |
| Peter J. Wilby | ||
President/Principal Executive Officer | ||
| Date: | February 3, 2012 | |
| By: | /s/ James J. Dooley | |
| James J. Dooley | ||
Treasurer, Chief Financial Officer/ Principal Financial Officer | ||
| Date: | February 3, 2012 | |