Preliminary Confidential Draft – Not for Reliance; Subject to Change and Further Review Exhibit (c)(10) Background Analyses December 2018Preliminary Confidential Draft – Not for Reliance; Subject to Change and Further Review Exhibit (c)(10) Background Analyses December 2018

Preliminary Confidential Draft – Not for Reliance; Subject to Change and Further Review Table of Contents I. Historical Exchange Ratio Review II. Market and Precedent Multiple Analysis III. Liquidity Mechanism Analysis IV. Impact of Annual Liquidity Cap V. TRA Summary Appendix 2Preliminary Confidential Draft – Not for Reliance; Subject to Change and Further Review Table of Contents I. Historical Exchange Ratio Review II. Market and Precedent Multiple Analysis III. Liquidity Mechanism Analysis IV. Impact of Annual Liquidity Cap V. TRA Summary Appendix 2
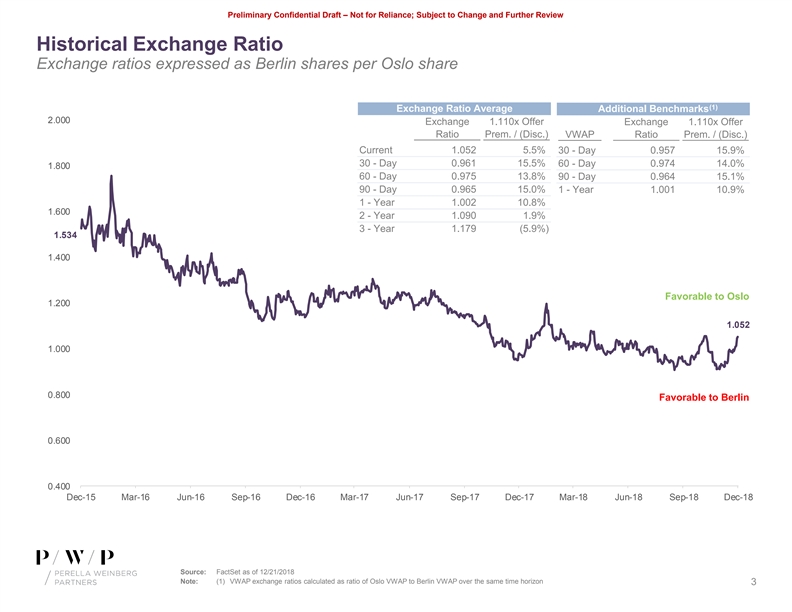
Preliminary Confidential Draft – Not for Reliance; Subject to Change and Further Review Historical Exchange Ratio Exchange ratios expressed as Berlin shares per Oslo share (1) Exchange Ratio Average Additional Additional Benchmarks Benchmarks 2.000 Exchange 1.110x Offer Exchange 1.110x Offer Ratio Prem. / (Disc.) VWAP Ratio Prem. / (Disc.) Current 1.052 5.5% 30 - Day 0.957 15.9% 30 - Day 0.961 15.5% 60 - Day 0.974 14.0% 1.800 60 - Day 0.975 13.8% 90 - Day 0.964 15.1% 90 - Day 0.965 15.0% 1 - Year 1.001 10.9% 1 - Year 1.002 10.8% 1.600 2 - Year 1.090 1.9% 3 - Year 1.179 (5.9%) 1.534 1.400 Favorable to Oslo 1.200 1.052 1.000 0.800 Favorable to Berlin 0.600 0.400 Dec-15 Mar-16 Jun-16 Sep-16 Dec-16 Mar-17 Jun-17 Sep-17 Dec-17 Mar-18 Jun-18 Sep-18 Dec-18 Source: FactSet as of 12/21/2018 Note: (1) VWAP exchange ratios calculated as ratio of Oslo VWAP to Berlin VWAP over the same time horizon 3Preliminary Confidential Draft – Not for Reliance; Subject to Change and Further Review Historical Exchange Ratio Exchange ratios expressed as Berlin shares per Oslo share (1) Exchange Ratio Average Additional Additional Benchmarks Benchmarks 2.000 Exchange 1.110x Offer Exchange 1.110x Offer Ratio Prem. / (Disc.) VWAP Ratio Prem. / (Disc.) Current 1.052 5.5% 30 - Day 0.957 15.9% 30 - Day 0.961 15.5% 60 - Day 0.974 14.0% 1.800 60 - Day 0.975 13.8% 90 - Day 0.964 15.1% 90 - Day 0.965 15.0% 1 - Year 1.001 10.9% 1 - Year 1.002 10.8% 1.600 2 - Year 1.090 1.9% 3 - Year 1.179 (5.9%) 1.534 1.400 Favorable to Oslo 1.200 1.052 1.000 0.800 Favorable to Berlin 0.600 0.400 Dec-15 Mar-16 Jun-16 Sep-16 Dec-16 Mar-17 Jun-17 Sep-17 Dec-17 Mar-18 Jun-18 Sep-18 Dec-18 Source: FactSet as of 12/21/2018 Note: (1) VWAP exchange ratios calculated as ratio of Oslo VWAP to Berlin VWAP over the same time horizon 3
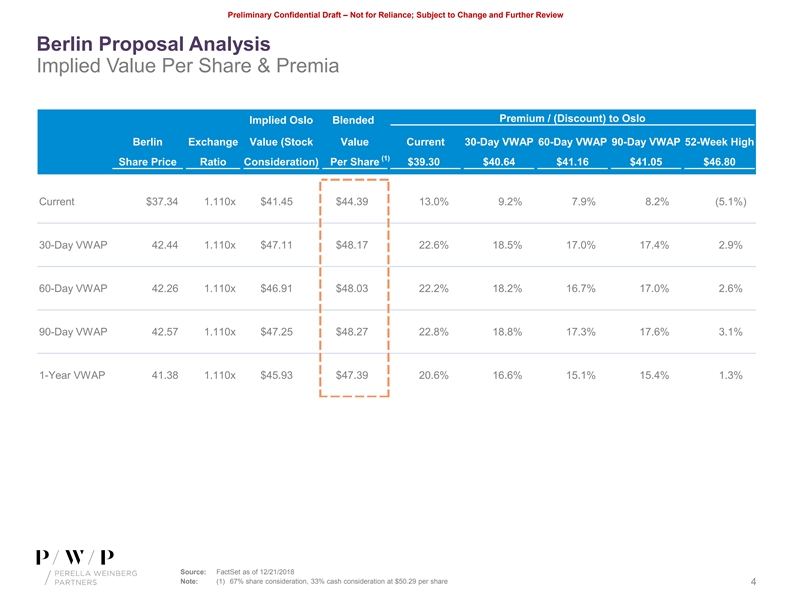
Preliminary Confidential Draft – Not for Reliance; Subject to Change and Further Review Berlin Proposal Analysis Implied Value Per Share & Premia Premium / (Discount) to Oslo Implied Oslo Blended Berlin Exchange Value (Stock Value Current 30-Day VWAP 60-Day VWAP 90-Day VWAP 52-Week High (1) Share Price Ratio Consideration) Per Share $39.30 $40.64 $41.16 $41.05 $46.80 Current $37.34 1.110x $41.45 $44.39 13.0% 9.2% 7.9% 8.2% (5.1%) 30-Day VWAP 42.44 1.110x $47.11 $48.17 22.6% 18.5% 17.0% 17.4% 2.9% 60-Day VWAP 42.26 1.110x $46.91 $48.03 22.2% 18.2% 16.7% 17.0% 2.6% 90-Day VWAP 42.57 1.110x $47.25 $48.27 22.8% 18.8% 17.3% 17.6% 3.1% 1-Year VWAP 41.38 1.110x $45.93 $47.39 20.6% 16.6% 15.1% 15.4% 1.3% Source: FactSet as of 12/21/2018 Note: (1) 67% share consideration, 33% cash consideration at $50.29 per share 4Preliminary Confidential Draft – Not for Reliance; Subject to Change and Further Review Berlin Proposal Analysis Implied Value Per Share & Premia Premium / (Discount) to Oslo Implied Oslo Blended Berlin Exchange Value (Stock Value Current 30-Day VWAP 60-Day VWAP 90-Day VWAP 52-Week High (1) Share Price Ratio Consideration) Per Share $39.30 $40.64 $41.16 $41.05 $46.80 Current $37.34 1.110x $41.45 $44.39 13.0% 9.2% 7.9% 8.2% (5.1%) 30-Day VWAP 42.44 1.110x $47.11 $48.17 22.6% 18.5% 17.0% 17.4% 2.9% 60-Day VWAP 42.26 1.110x $46.91 $48.03 22.2% 18.2% 16.7% 17.0% 2.6% 90-Day VWAP 42.57 1.110x $47.25 $48.27 22.8% 18.8% 17.3% 17.6% 3.1% 1-Year VWAP 41.38 1.110x $45.93 $47.39 20.6% 16.6% 15.1% 15.4% 1.3% Source: FactSet as of 12/21/2018 Note: (1) 67% share consideration, 33% cash consideration at $50.29 per share 4
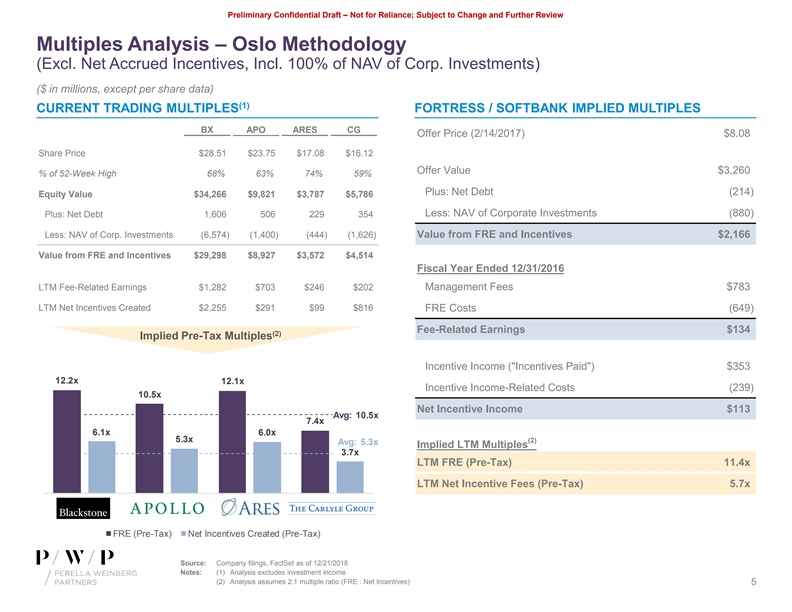
Preliminary Confidential Draft – Not for Reliance; Subject to Change and Further Review Multiples Analysis – Oslo Methodology (Excl. Net Accrued Incentives, Incl. 100% of NAV of Corp. Investments) ($ in millions, except per share data) (1) CURRENT TRADING MULTIPLES FORTRESS / SOFTBANK IMPLIED MULTIPLES BX APO ARES CG Offer Price (2/14/2017) $8.08 Share Price $28.51 $23.75 $17.08 $16.12 Offer Value $3,260 % of 52-Week High 68% 63% 74% 59% Plus: Net Debt (214) Equity Value $34,266 $9,821 $3,787 $5,786 Less: NAV of Corporate Investments (880) Plus: Net Debt 1,606 506 229 354 Less: NAV of Corp. Investments (6,574) (1,400) (444) (1,626) Value from FRE and Incentives $2,166 Value from FRE and Incentives $29,298 $8,927 $3,572 $4,514 Fiscal Year Ended 12/31/2016 LTM Fee-Related Earnings $1,282 $703 $246 $202 Management Fees $783 LTM Net Incentives Created $2,255 $291 $99 $816 FRE Costs (649) Fee-Related Earnings $134 (2) Implied Pre-Tax Multiples Incentive Income ( Incentives Paid ) $353 12.2x 12.1x Incentive Income-Related Costs (239) 10.5x Net Incentive Income $113 Avg: 10.5x 7.4x 6.1x 6.0x 5.3x (2) Avg: 5.3x Implied LTM Multiples 3.7x LTM FRE (Pre-Tax) 11.4x LTM Net Incentive Fees (Pre-Tax) 5.7x FRE (Pre-Tax) Net Incentives Created (Pre-Tax) Source: Company filings, FactSet as of 12/21/2018 Notes: (1) Analysis excludes investment income (2) Analysis assumes 2:1 multiple ratio (FRE : Net Incentives) 5Preliminary Confidential Draft – Not for Reliance; Subject to Change and Further Review Multiples Analysis – Oslo Methodology (Excl. Net Accrued Incentives, Incl. 100% of NAV of Corp. Investments) ($ in millions, except per share data) (1) CURRENT TRADING MULTIPLES FORTRESS / SOFTBANK IMPLIED MULTIPLES BX APO ARES CG Offer Price (2/14/2017) $8.08 Share Price $28.51 $23.75 $17.08 $16.12 Offer Value $3,260 % of 52-Week High 68% 63% 74% 59% Plus: Net Debt (214) Equity Value $34,266 $9,821 $3,787 $5,786 Less: NAV of Corporate Investments (880) Plus: Net Debt 1,606 506 229 354 Less: NAV of Corp. Investments (6,574) (1,400) (444) (1,626) Value from FRE and Incentives $2,166 Value from FRE and Incentives $29,298 $8,927 $3,572 $4,514 Fiscal Year Ended 12/31/2016 LTM Fee-Related Earnings $1,282 $703 $246 $202 Management Fees $783 LTM Net Incentives Created $2,255 $291 $99 $816 FRE Costs (649) Fee-Related Earnings $134 (2) Implied Pre-Tax Multiples Incentive Income ( Incentives Paid ) $353 12.2x 12.1x Incentive Income-Related Costs (239) 10.5x Net Incentive Income $113 Avg: 10.5x 7.4x 6.1x 6.0x 5.3x (2) Avg: 5.3x Implied LTM Multiples 3.7x LTM FRE (Pre-Tax) 11.4x LTM Net Incentive Fees (Pre-Tax) 5.7x FRE (Pre-Tax) Net Incentives Created (Pre-Tax) Source: Company filings, FactSet as of 12/21/2018 Notes: (1) Analysis excludes investment income (2) Analysis assumes 2:1 multiple ratio (FRE : Net Incentives) 5
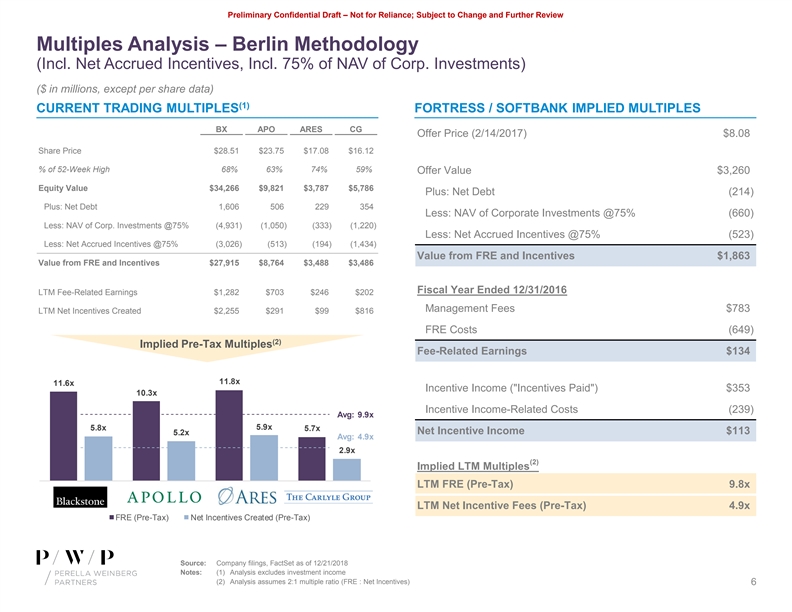
Preliminary Confidential Draft – Not for Reliance; Subject to Change and Further Review Multiples Analysis – Berlin Methodology (Incl. Net Accrued Incentives, Incl. 75% of NAV of Corp. Investments) ($ in millions, except per share data) (1) CURRENT TRADING MULTIPLES FORTRESS / SOFTBANK IMPLIED MULTIPLES BX APO ARES CG Offer Price (2/14/2017) $8.08 Share Price $28.51 $23.75 $17.08 $16.12 % of 52-Week High 68% 63% 74% 59% Offer Value $3,260 Equity Value $34,266 $9,821 $3,787 $5,786 Plus: Net Debt (214) Plus: Net Debt 1,606 506 229 354 Less: NAV of Corporate Investments @75% (660) Less: NAV of Corp. Investments @75% (4,931) (1,050) (333) (1,220) Less: Net Accrued Incentives @75% (523) Less: Net Accrued Incentives @75% (3,026) (513) (194) (1,434) Value from FRE and Incentives $1,863 Value from FRE and Incentives $27,915 $8,764 $3,488 $3,486 Fiscal Year Ended 12/31/2016 LTM Fee-Related Earnings $1,282 $703 $246 $202 Management Fees $783 LTM Net Incentives Created $2,255 $291 $99 $816 FRE Costs (649) (2) Implied Pre-Tax Multiples Fee-Related Earnings $134 11.8x 11.6x Incentive Income ( Incentives Paid ) $353 10.3x Incentive Income-Related Costs (239) Avg: 9.9x 5.9x 5.8x 5.7x Net Incentive Income $113 5.2x Avg: 4.9x 2.9x (2) Implied LTM Multiples LTM FRE (Pre-Tax) 9.8x LTM Net Incentive Fees (Pre-Tax) 4.9x FRE (Pre-Tax) Net Incentives Created (Pre-Tax) Source: Company filings, FactSet as of 12/21/2018 Notes: (1) Analysis excludes investment income (2) Analysis assumes 2:1 multiple ratio (FRE : Net Incentives) 6Preliminary Confidential Draft – Not for Reliance; Subject to Change and Further Review Multiples Analysis – Berlin Methodology (Incl. Net Accrued Incentives, Incl. 75% of NAV of Corp. Investments) ($ in millions, except per share data) (1) CURRENT TRADING MULTIPLES FORTRESS / SOFTBANK IMPLIED MULTIPLES BX APO ARES CG Offer Price (2/14/2017) $8.08 Share Price $28.51 $23.75 $17.08 $16.12 % of 52-Week High 68% 63% 74% 59% Offer Value $3,260 Equity Value $34,266 $9,821 $3,787 $5,786 Plus: Net Debt (214) Plus: Net Debt 1,606 506 229 354 Less: NAV of Corporate Investments @75% (660) Less: NAV of Corp. Investments @75% (4,931) (1,050) (333) (1,220) Less: Net Accrued Incentives @75% (523) Less: Net Accrued Incentives @75% (3,026) (513) (194) (1,434) Value from FRE and Incentives $1,863 Value from FRE and Incentives $27,915 $8,764 $3,488 $3,486 Fiscal Year Ended 12/31/2016 LTM Fee-Related Earnings $1,282 $703 $246 $202 Management Fees $783 LTM Net Incentives Created $2,255 $291 $99 $816 FRE Costs (649) (2) Implied Pre-Tax Multiples Fee-Related Earnings $134 11.8x 11.6x Incentive Income ( Incentives Paid ) $353 10.3x Incentive Income-Related Costs (239) Avg: 9.9x 5.9x 5.8x 5.7x Net Incentive Income $113 5.2x Avg: 4.9x 2.9x (2) Implied LTM Multiples LTM FRE (Pre-Tax) 9.8x LTM Net Incentive Fees (Pre-Tax) 4.9x FRE (Pre-Tax) Net Incentives Created (Pre-Tax) Source: Company filings, FactSet as of 12/21/2018 Notes: (1) Analysis excludes investment income (2) Analysis assumes 2:1 multiple ratio (FRE : Net Incentives) 6
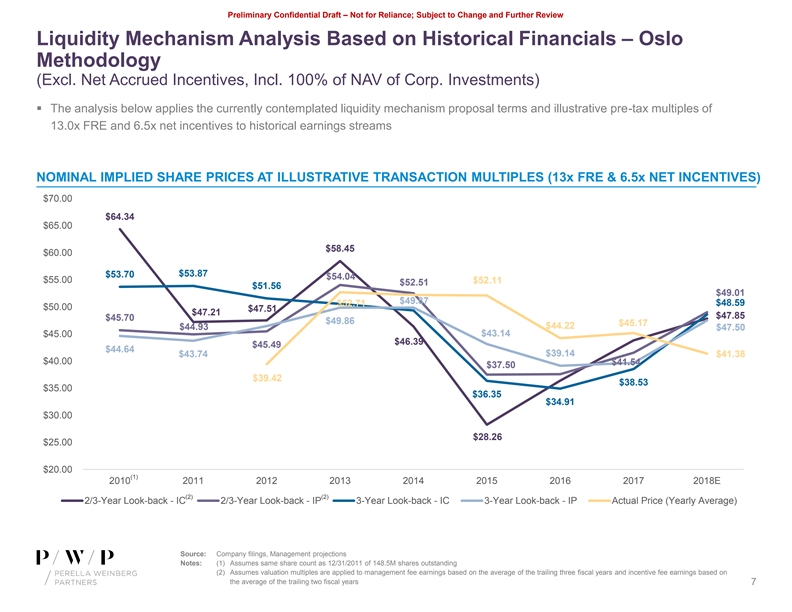
Preliminary Confidential Draft – Not for Reliance; Subject to Change and Further Review Liquidity Mechanism Analysis Based on Historical Financials – Oslo Methodology (Excl. Net Accrued Incentives, Incl. 100% of NAV of Corp. Investments) § The analysis below applies the currently contemplated liquidity mechanism proposal terms and illustrative pre-tax multiples of 13.0x FRE and 6.5x net incentives to historical earnings streams NOMINAL IMPLIED SHARE PRICES AT ILLUSTRATIVE TRANSACTION MULTIPLES (13x FRE & 6.5x NET INCENTIVES) $70.00 $64.34 $65.00 $58.45 $60.00 $53.87 $53.70 $54.04 $55.00 $52.11 $52.51 $51.56 $49.01 $49.87 $52.71 $48.59 $50.00 $47.51 $47.21 $47.85 $45.70 $49.86 $45.17 $44.22 $44.93 $47.50 $43.14 $45.00 $46.39 $45.49 $44.64 $39.14 $43.74 $41.38 $40.00 $41.54 $37.50 $39.42 $38.53 $35.00 $36.35 $34.91 $30.00 $28.26 $25.00 $20.00 (1) 2010 2011 2012 2013 2014 2015 2016 2017 2018E (2) (2) 2/3-Year Look-back - IC 2/3-Year Look-back - IP 3-Year Look-back - IC 3-Year Look-back - IP Actual Price (Yearly Average) Source: Company filings, Management projections Notes: (1) Assumes same share count as 12/31/2011 of 148.5M shares outstanding (2) Assumes valuation multiples are applied to management fee earnings based on the average of the trailing three fiscal years and incentive fee earnings based on the average of the trailing two fiscal years 7Preliminary Confidential Draft – Not for Reliance; Subject to Change and Further Review Liquidity Mechanism Analysis Based on Historical Financials – Oslo Methodology (Excl. Net Accrued Incentives, Incl. 100% of NAV of Corp. Investments) § The analysis below applies the currently contemplated liquidity mechanism proposal terms and illustrative pre-tax multiples of 13.0x FRE and 6.5x net incentives to historical earnings streams NOMINAL IMPLIED SHARE PRICES AT ILLUSTRATIVE TRANSACTION MULTIPLES (13x FRE & 6.5x NET INCENTIVES) $70.00 $64.34 $65.00 $58.45 $60.00 $53.87 $53.70 $54.04 $55.00 $52.11 $52.51 $51.56 $49.01 $49.87 $52.71 $48.59 $50.00 $47.51 $47.21 $47.85 $45.70 $49.86 $45.17 $44.22 $44.93 $47.50 $43.14 $45.00 $46.39 $45.49 $44.64 $39.14 $43.74 $41.38 $40.00 $41.54 $37.50 $39.42 $38.53 $35.00 $36.35 $34.91 $30.00 $28.26 $25.00 $20.00 (1) 2010 2011 2012 2013 2014 2015 2016 2017 2018E (2) (2) 2/3-Year Look-back - IC 2/3-Year Look-back - IP 3-Year Look-back - IC 3-Year Look-back - IP Actual Price (Yearly Average) Source: Company filings, Management projections Notes: (1) Assumes same share count as 12/31/2011 of 148.5M shares outstanding (2) Assumes valuation multiples are applied to management fee earnings based on the average of the trailing three fiscal years and incentive fee earnings based on the average of the trailing two fiscal years 7
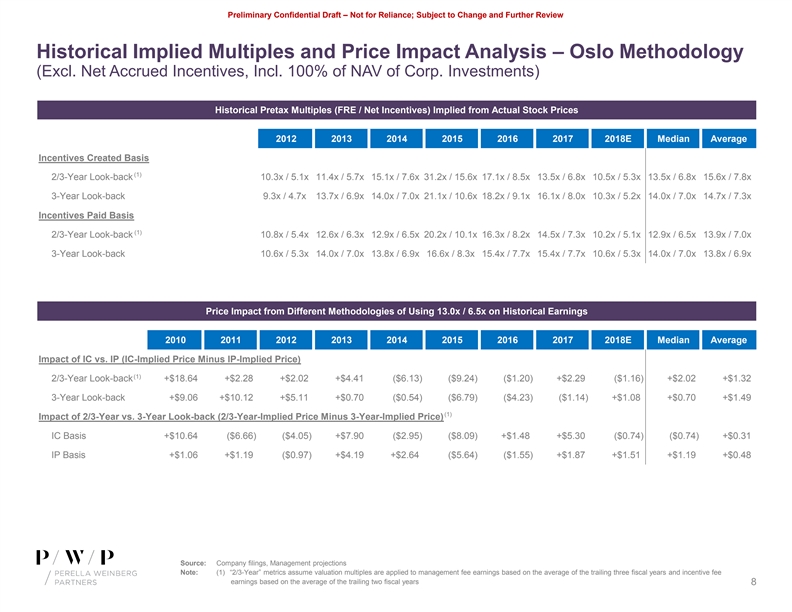
Preliminary Confidential Draft – Not for Reliance; Subject to Change and Further Review Historical Implied Multiples and Price Impact Analysis – Oslo Methodology (Excl. Net Accrued Incentives, Incl. 100% of NAV of Corp. Investments) Historical Pretax Multiples (FRE / Net Incentives) Implied from Actual Stock Prices 2012 2013 2014 2015 2016 2017 2018E Median Average Incentives Created Basis (1) 2/3-Year Look-back 10.3x / 5.1x 11.4x / 5.7x 15.1x / 7.6x 31.2x / 15.6x 17.1x / 8.5x 13.5x / 6.8x 10.5x / 5.3x 13.5x / 6.8x 15.6x / 7.8x 3-Year Look-back 9.3x / 4.7x 13.7x / 6.9x 14.0x / 7.0x 21.1x / 10.6x 18.2x / 9.1x 16.1x / 8.0x 10.3x / 5.2x 14.0x / 7.0x 14.7x / 7.3x Incentives Paid Basis (1) 2/3-Year Look-back 10.8x / 5.4x 12.6x / 6.3x 12.9x / 6.5x 20.2x / 10.1x 16.3x / 8.2x 14.5x / 7.3x 10.2x / 5.1x 12.9x / 6.5x 13.9x / 7.0x 3-Year Look-back 10.6x / 5.3x 14.0x / 7.0x 13.8x / 6.9x 16.6x / 8.3x 15.4x / 7.7x 15.4x / 7.7x 10.6x / 5.3x 14.0x / 7.0x 13.8x / 6.9x Price Impact from Different Methodologies of Using 13.0x / 6.5x on Historical Earnings 2010 2011 2012 2013 2014 2015 2016 2017 2018E Median Average Impact of IC vs. IP (IC-Implied Price Minus IP-Implied Price) (1) 2/3-Year Look-back +$18.64 +$2.28 +$2.02 +$4.41 ($6.13) ($9.24) ($1.20) +$2.29 ($1.16) +$2.02 +$1.32 3-Year Look-back +$9.06 +$10.12 +$5.11 +$0.70 ($0.54) ($6.79) ($4.23) ($1.14) +$1.08 +$0.70 +$1.49 (1) Impact of 2/3-Year vs. 3-Year Look-back (2/3-Year-Implied Price Minus 3-Year-Implied Price) IC Basis +$10.64 ($6.66) ($4.05) +$7.90 ($2.95) ($8.09) +$1.48 +$5.30 ($0.74) ($0.74) +$0.31 IP Basis +$1.06 +$1.19 ($0.97) +$4.19 +$2.64 ($5.64) ($1.55) +$1.87 +$1.51 +$1.19 +$0.48 Source: Company filings, Management projections Note: (1) “2/3-Year” metrics assume valuation multiples are applied to management fee earnings based on the average of the trailing three fiscal years and incentive fee earnings based on the average of the trailing two fiscal years 8Preliminary Confidential Draft – Not for Reliance; Subject to Change and Further Review Historical Implied Multiples and Price Impact Analysis – Oslo Methodology (Excl. Net Accrued Incentives, Incl. 100% of NAV of Corp. Investments) Historical Pretax Multiples (FRE / Net Incentives) Implied from Actual Stock Prices 2012 2013 2014 2015 2016 2017 2018E Median Average Incentives Created Basis (1) 2/3-Year Look-back 10.3x / 5.1x 11.4x / 5.7x 15.1x / 7.6x 31.2x / 15.6x 17.1x / 8.5x 13.5x / 6.8x 10.5x / 5.3x 13.5x / 6.8x 15.6x / 7.8x 3-Year Look-back 9.3x / 4.7x 13.7x / 6.9x 14.0x / 7.0x 21.1x / 10.6x 18.2x / 9.1x 16.1x / 8.0x 10.3x / 5.2x 14.0x / 7.0x 14.7x / 7.3x Incentives Paid Basis (1) 2/3-Year Look-back 10.8x / 5.4x 12.6x / 6.3x 12.9x / 6.5x 20.2x / 10.1x 16.3x / 8.2x 14.5x / 7.3x 10.2x / 5.1x 12.9x / 6.5x 13.9x / 7.0x 3-Year Look-back 10.6x / 5.3x 14.0x / 7.0x 13.8x / 6.9x 16.6x / 8.3x 15.4x / 7.7x 15.4x / 7.7x 10.6x / 5.3x 14.0x / 7.0x 13.8x / 6.9x Price Impact from Different Methodologies of Using 13.0x / 6.5x on Historical Earnings 2010 2011 2012 2013 2014 2015 2016 2017 2018E Median Average Impact of IC vs. IP (IC-Implied Price Minus IP-Implied Price) (1) 2/3-Year Look-back +$18.64 +$2.28 +$2.02 +$4.41 ($6.13) ($9.24) ($1.20) +$2.29 ($1.16) +$2.02 +$1.32 3-Year Look-back +$9.06 +$10.12 +$5.11 +$0.70 ($0.54) ($6.79) ($4.23) ($1.14) +$1.08 +$0.70 +$1.49 (1) Impact of 2/3-Year vs. 3-Year Look-back (2/3-Year-Implied Price Minus 3-Year-Implied Price) IC Basis +$10.64 ($6.66) ($4.05) +$7.90 ($2.95) ($8.09) +$1.48 +$5.30 ($0.74) ($0.74) +$0.31 IP Basis +$1.06 +$1.19 ($0.97) +$4.19 +$2.64 ($5.64) ($1.55) +$1.87 +$1.51 +$1.19 +$0.48 Source: Company filings, Management projections Note: (1) “2/3-Year” metrics assume valuation multiples are applied to management fee earnings based on the average of the trailing three fiscal years and incentive fee earnings based on the average of the trailing two fiscal years 8
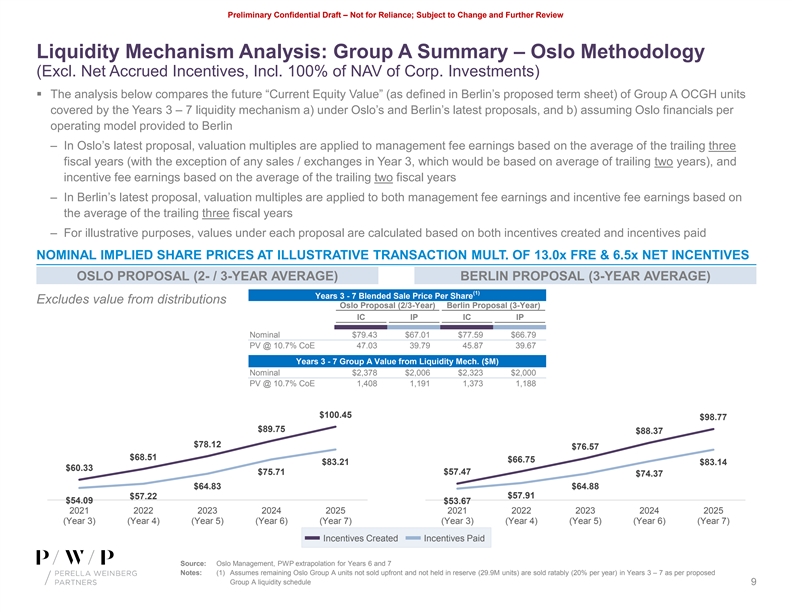
Preliminary Confidential Draft – Not for Reliance; Subject to Change and Further Review Liquidity Mechanism Analysis: Group A Summary – Oslo Methodology (Excl. Net Accrued Incentives, Incl. 100% of NAV of Corp. Investments) § The analysis below compares the future “Current Equity Value” (as defined in Berlin’s proposed term sheet) of Group A OCGH units covered by the Years 3 – 7 liquidity mechanism a) under Oslo’s and Berlin’s latest proposals, and b) assuming Oslo financials per operating model provided to Berlin – In Oslo’s latest proposal, valuation multiples are applied to management fee earnings based on the average of the trailing three fiscal years (with the exception of any sales / exchanges in Year 3, which would be based on average of trailing two years), and incentive fee earnings based on the average of the trailing two fiscal years – In Berlin’s latest proposal, valuation multiples are applied to both management fee earnings and incentive fee earnings based on the average of the trailing three fiscal years – For illustrative purposes, values under each proposal are calculated based on both incentives created and incentives paid NOMINAL IMPLIED SHARE PRICES AT ILLUSTRATIVE TRANSACTION MULT. OF 13.0x FRE & 6.5x NET INCENTIVES OSLO PROPOSAL (2- / 3-YEAR AVERAGE) BERLIN PROPOSAL (3-YEAR AVERAGE) (1) Years 3 - 7 Blended Sale Price Per Share Excludes value from distributions Oslo Proposal (2/3-Year) Berlin Proposal (3-Year) IC IP IC IP Nominal $79.43 $67.01 $77.59 $66.79 PV @ 10.7% CoE 47.03 39.79 45.87 39.67 Years 3 - 7 Group A Value from Liquidity Mech. ($M) Nominal $2,378 $2,006 $2,323 $2,000 PV @ 10.7% CoE 1,408 1,191 1,373 1,188 $100.45 $98.77 $89.75 $88.37 $78.12 $76.57 $68.51 $66.75 $83.21 $83.14 $60.33 $75.71 $57.47 $74.37 $64.83 $64.88 $57.22 $57.91 $54.09 $53.67 2021 2022 2023 2024 2025 2021 2022 2023 2024 2025 (Year 3) (Year 4) (Year 5) (Year 6) (Year 7) (Year 3) (Year 4) (Year 5) (Year 6) (Year 7) Incentives Created Incentives Paid Source: Oslo Management, PWP extrapolation for Years 6 and 7 Notes: (1) Assumes remaining Oslo Group A units not sold upfront and not held in reserve (29.9M units) are sold ratably (20% per year) in Years 3 – 7 as per proposed Group A liquidity schedule 9Preliminary Confidential Draft – Not for Reliance; Subject to Change and Further Review Liquidity Mechanism Analysis: Group A Summary – Oslo Methodology (Excl. Net Accrued Incentives, Incl. 100% of NAV of Corp. Investments) § The analysis below compares the future “Current Equity Value” (as defined in Berlin’s proposed term sheet) of Group A OCGH units covered by the Years 3 – 7 liquidity mechanism a) under Oslo’s and Berlin’s latest proposals, and b) assuming Oslo financials per operating model provided to Berlin – In Oslo’s latest proposal, valuation multiples are applied to management fee earnings based on the average of the trailing three fiscal years (with the exception of any sales / exchanges in Year 3, which would be based on average of trailing two years), and incentive fee earnings based on the average of the trailing two fiscal years – In Berlin’s latest proposal, valuation multiples are applied to both management fee earnings and incentive fee earnings based on the average of the trailing three fiscal years – For illustrative purposes, values under each proposal are calculated based on both incentives created and incentives paid NOMINAL IMPLIED SHARE PRICES AT ILLUSTRATIVE TRANSACTION MULT. OF 13.0x FRE & 6.5x NET INCENTIVES OSLO PROPOSAL (2- / 3-YEAR AVERAGE) BERLIN PROPOSAL (3-YEAR AVERAGE) (1) Years 3 - 7 Blended Sale Price Per Share Excludes value from distributions Oslo Proposal (2/3-Year) Berlin Proposal (3-Year) IC IP IC IP Nominal $79.43 $67.01 $77.59 $66.79 PV @ 10.7% CoE 47.03 39.79 45.87 39.67 Years 3 - 7 Group A Value from Liquidity Mech. ($M) Nominal $2,378 $2,006 $2,323 $2,000 PV @ 10.7% CoE 1,408 1,191 1,373 1,188 $100.45 $98.77 $89.75 $88.37 $78.12 $76.57 $68.51 $66.75 $83.21 $83.14 $60.33 $75.71 $57.47 $74.37 $64.83 $64.88 $57.22 $57.91 $54.09 $53.67 2021 2022 2023 2024 2025 2021 2022 2023 2024 2025 (Year 3) (Year 4) (Year 5) (Year 6) (Year 7) (Year 3) (Year 4) (Year 5) (Year 6) (Year 7) Incentives Created Incentives Paid Source: Oslo Management, PWP extrapolation for Years 6 and 7 Notes: (1) Assumes remaining Oslo Group A units not sold upfront and not held in reserve (29.9M units) are sold ratably (20% per year) in Years 3 – 7 as per proposed Group A liquidity schedule 9
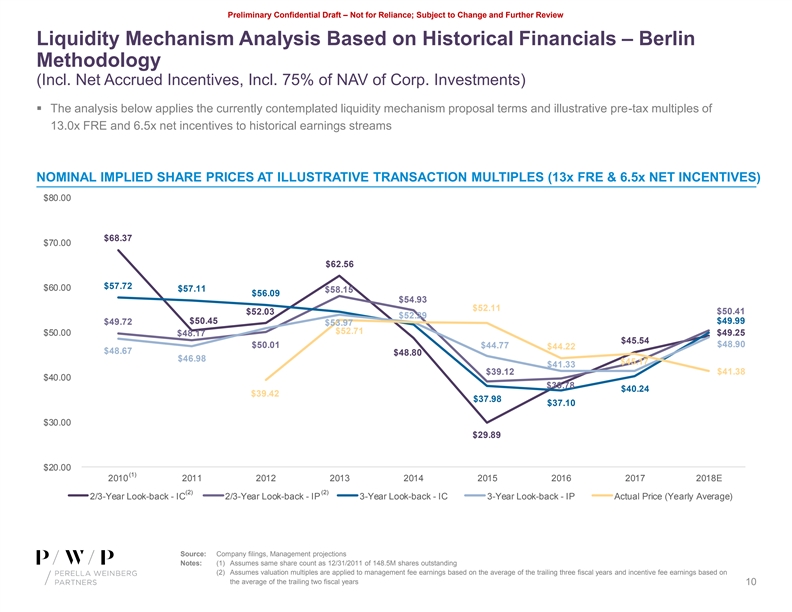
Preliminary Confidential Draft – Not for Reliance; Subject to Change and Further Review Liquidity Mechanism Analysis Based on Historical Financials – Berlin Methodology (Incl. Net Accrued Incentives, Incl. 75% of NAV of Corp. Investments) § The analysis below applies the currently contemplated liquidity mechanism proposal terms and illustrative pre-tax multiples of 13.0x FRE and 6.5x net incentives to historical earnings streams NOMINAL IMPLIED SHARE PRICES AT ILLUSTRATIVE TRANSACTION MULTIPLES (13x FRE & 6.5x NET INCENTIVES) $80.00 $68.37 $70.00 $62.56 $57.72 $60.00 $57.11 $58.15 $56.09 $54.93 $52.11 $50.41 $52.03 $52.29 $50.45 $49.99 $49.72 $53.97 $52.71 $50.00 $48.17 $49.25 $45.54 $48.90 $50.01 $44.77 $44.22 $48.67 $48.80 $46.98 $45.17 $41.33 $39.12 $41.38 $40.00 $39.78 $40.24 $39.42 $37.98 $37.10 $30.00 $29.89 $20.00 (1) 2010 2011 2012 2013 2014 2015 2016 2017 2018E (2) (2) 2/3-Year Look-back - IC 2/3-Year Look-back - IP 3-Year Look-back - IC 3-Year Look-back - IP Actual Price (Yearly Average) Source: Company filings, Management projections Notes: (1) Assumes same share count as 12/31/2011 of 148.5M shares outstanding (2) Assumes valuation multiples are applied to management fee earnings based on the average of the trailing three fiscal years and incentive fee earnings based on the average of the trailing two fiscal years 10Preliminary Confidential Draft – Not for Reliance; Subject to Change and Further Review Liquidity Mechanism Analysis Based on Historical Financials – Berlin Methodology (Incl. Net Accrued Incentives, Incl. 75% of NAV of Corp. Investments) § The analysis below applies the currently contemplated liquidity mechanism proposal terms and illustrative pre-tax multiples of 13.0x FRE and 6.5x net incentives to historical earnings streams NOMINAL IMPLIED SHARE PRICES AT ILLUSTRATIVE TRANSACTION MULTIPLES (13x FRE & 6.5x NET INCENTIVES) $80.00 $68.37 $70.00 $62.56 $57.72 $60.00 $57.11 $58.15 $56.09 $54.93 $52.11 $50.41 $52.03 $52.29 $50.45 $49.99 $49.72 $53.97 $52.71 $50.00 $48.17 $49.25 $45.54 $48.90 $50.01 $44.77 $44.22 $48.67 $48.80 $46.98 $45.17 $41.33 $39.12 $41.38 $40.00 $39.78 $40.24 $39.42 $37.98 $37.10 $30.00 $29.89 $20.00 (1) 2010 2011 2012 2013 2014 2015 2016 2017 2018E (2) (2) 2/3-Year Look-back - IC 2/3-Year Look-back - IP 3-Year Look-back - IC 3-Year Look-back - IP Actual Price (Yearly Average) Source: Company filings, Management projections Notes: (1) Assumes same share count as 12/31/2011 of 148.5M shares outstanding (2) Assumes valuation multiples are applied to management fee earnings based on the average of the trailing three fiscal years and incentive fee earnings based on the average of the trailing two fiscal years 10
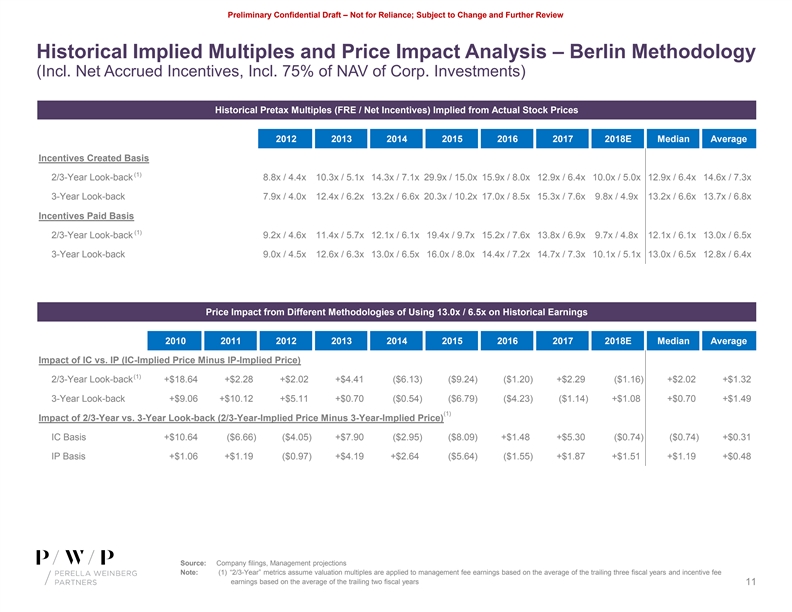
Preliminary Confidential Draft – Not for Reliance; Subject to Change and Further Review Historical Implied Multiples and Price Impact Analysis – Berlin Methodology (Incl. Net Accrued Incentives, Incl. 75% of NAV of Corp. Investments) Historical Pretax Multiples (FRE / Net Incentives) Implied from Actual Stock Prices 2012 2013 2014 2015 2016 2017 2018E Median Average Incentives Created Basis (1) 2/3-Year Look-back 8.8x / 4.4x 10.3x / 5.1x 14.3x / 7.1x 29.9x / 15.0x 15.9x / 8.0x 12.9x / 6.4x 10.0x / 5.0x 12.9x / 6.4x 14.6x / 7.3x 3-Year Look-back 7.9x / 4.0x 12.4x / 6.2x 13.2x / 6.6x 20.3x / 10.2x 17.0x / 8.5x 15.3x / 7.6x 9.8x / 4.9x 13.2x / 6.6x 13.7x / 6.8x Incentives Paid Basis (1) 2/3-Year Look-back 9.2x / 4.6x 11.4x / 5.7x 12.1x / 6.1x 19.4x / 9.7x 15.2x / 7.6x 13.8x / 6.9x 9.7x / 4.8x 12.1x / 6.1x 13.0x / 6.5x 3-Year Look-back 9.0x / 4.5x 12.6x / 6.3x 13.0x / 6.5x 16.0x / 8.0x 14.4x / 7.2x 14.7x / 7.3x 10.1x / 5.1x 13.0x / 6.5x 12.8x / 6.4x Price Impact from Different Methodologies of Using 13.0x / 6.5x on Historical Earnings 2010 2011 2012 2013 2014 2015 2016 2017 2018E Median Average Impact of IC vs. IP (IC-Implied Price Minus IP-Implied Price) (1) 2/3-Year Look-back +$18.64 +$2.28 +$2.02 +$4.41 ($6.13) ($9.24) ($1.20) +$2.29 ($1.16) +$2.02 +$1.32 3-Year Look-back +$9.06 +$10.12 +$5.11 +$0.70 ($0.54) ($6.79) ($4.23) ($1.14) +$1.08 +$0.70 +$1.49 (1) Impact of 2/3-Year vs. 3-Year Look-back (2/3-Year-Implied Price Minus 3-Year-Implied Price) IC Basis +$10.64 ($6.66) ($4.05) +$7.90 ($2.95) ($8.09) +$1.48 +$5.30 ($0.74) ($0.74) +$0.31 IP Basis +$1.06 +$1.19 ($0.97) +$4.19 +$2.64 ($5.64) ($1.55) +$1.87 +$1.51 +$1.19 +$0.48 Source: Company filings, Management projections Note: (1) “2/3-Year” metrics assume valuation multiples are applied to management fee earnings based on the average of the trailing three fiscal years and incentive fee earnings based on the average of the trailing two fiscal years 11Preliminary Confidential Draft – Not for Reliance; Subject to Change and Further Review Historical Implied Multiples and Price Impact Analysis – Berlin Methodology (Incl. Net Accrued Incentives, Incl. 75% of NAV of Corp. Investments) Historical Pretax Multiples (FRE / Net Incentives) Implied from Actual Stock Prices 2012 2013 2014 2015 2016 2017 2018E Median Average Incentives Created Basis (1) 2/3-Year Look-back 8.8x / 4.4x 10.3x / 5.1x 14.3x / 7.1x 29.9x / 15.0x 15.9x / 8.0x 12.9x / 6.4x 10.0x / 5.0x 12.9x / 6.4x 14.6x / 7.3x 3-Year Look-back 7.9x / 4.0x 12.4x / 6.2x 13.2x / 6.6x 20.3x / 10.2x 17.0x / 8.5x 15.3x / 7.6x 9.8x / 4.9x 13.2x / 6.6x 13.7x / 6.8x Incentives Paid Basis (1) 2/3-Year Look-back 9.2x / 4.6x 11.4x / 5.7x 12.1x / 6.1x 19.4x / 9.7x 15.2x / 7.6x 13.8x / 6.9x 9.7x / 4.8x 12.1x / 6.1x 13.0x / 6.5x 3-Year Look-back 9.0x / 4.5x 12.6x / 6.3x 13.0x / 6.5x 16.0x / 8.0x 14.4x / 7.2x 14.7x / 7.3x 10.1x / 5.1x 13.0x / 6.5x 12.8x / 6.4x Price Impact from Different Methodologies of Using 13.0x / 6.5x on Historical Earnings 2010 2011 2012 2013 2014 2015 2016 2017 2018E Median Average Impact of IC vs. IP (IC-Implied Price Minus IP-Implied Price) (1) 2/3-Year Look-back +$18.64 +$2.28 +$2.02 +$4.41 ($6.13) ($9.24) ($1.20) +$2.29 ($1.16) +$2.02 +$1.32 3-Year Look-back +$9.06 +$10.12 +$5.11 +$0.70 ($0.54) ($6.79) ($4.23) ($1.14) +$1.08 +$0.70 +$1.49 (1) Impact of 2/3-Year vs. 3-Year Look-back (2/3-Year-Implied Price Minus 3-Year-Implied Price) IC Basis +$10.64 ($6.66) ($4.05) +$7.90 ($2.95) ($8.09) +$1.48 +$5.30 ($0.74) ($0.74) +$0.31 IP Basis +$1.06 +$1.19 ($0.97) +$4.19 +$2.64 ($5.64) ($1.55) +$1.87 +$1.51 +$1.19 +$0.48 Source: Company filings, Management projections Note: (1) “2/3-Year” metrics assume valuation multiples are applied to management fee earnings based on the average of the trailing three fiscal years and incentive fee earnings based on the average of the trailing two fiscal years 11
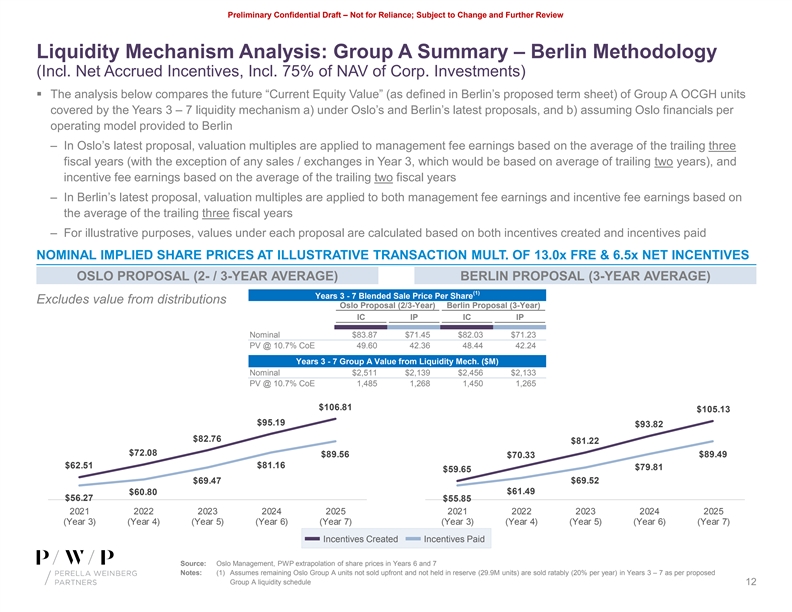
Preliminary Confidential Draft – Not for Reliance; Subject to Change and Further Review Liquidity Mechanism Analysis: Group A Summary – Berlin Methodology (Incl. Net Accrued Incentives, Incl. 75% of NAV of Corp. Investments) § The analysis below compares the future “Current Equity Value” (as defined in Berlin’s proposed term sheet) of Group A OCGH units covered by the Years 3 – 7 liquidity mechanism a) under Oslo’s and Berlin’s latest proposals, and b) assuming Oslo financials per operating model provided to Berlin – In Oslo’s latest proposal, valuation multiples are applied to management fee earnings based on the average of the trailing three fiscal years (with the exception of any sales / exchanges in Year 3, which would be based on average of trailing two years), and incentive fee earnings based on the average of the trailing two fiscal years – In Berlin’s latest proposal, valuation multiples are applied to both management fee earnings and incentive fee earnings based on the average of the trailing three fiscal years – For illustrative purposes, values under each proposal are calculated based on both incentives created and incentives paid NOMINAL IMPLIED SHARE PRICES AT ILLUSTRATIVE TRANSACTION MULT. OF 13.0x FRE & 6.5x NET INCENTIVES OSLO PROPOSAL (2- / 3-YEAR AVERAGE) BERLIN PROPOSAL (3-YEAR AVERAGE) (1) Years 3 - 7 Blended Sale Price Per Share Excludes value from distributions Oslo Proposal (2/3-Year) Berlin Proposal (3-Year) IC IP IC IP Nominal $83.87 $71.45 $82.03 $71.23 PV @ 10.7% CoE 49.60 42.36 48.44 42.24 Years 3 - 7 Group A Value from Liquidity Mech. ($M) Nominal $2,511 $2,139 $2,456 $2,133 PV @ 10.7% CoE 1,485 1,268 1,450 1,265 $106.81 $105.13 $95.19 $93.82 $82.76 $81.22 $72.08 $89.56 $89.49 $70.33 $81.16 $62.51 $79.81 $59.65 $69.47 $69.52 $61.49 $60.80 $56.27 $55.85 2021 2022 2023 2024 2025 2021 2022 2023 2024 2025 (Year 3) (Year 4) (Year 5) (Year 6) (Year 7) (Year 3) (Year 4) (Year 5) (Year 6) (Year 7) Incentives Created Incentives Paid Source: Oslo Management, PWP extrapolation of share prices in Years 6 and 7 Notes: (1) Assumes remaining Oslo Group A units not sold upfront and not held in reserve (29.9M units) are sold ratably (20% per year) in Years 3 – 7 as per proposed Group A liquidity schedule 12Preliminary Confidential Draft – Not for Reliance; Subject to Change and Further Review Liquidity Mechanism Analysis: Group A Summary – Berlin Methodology (Incl. Net Accrued Incentives, Incl. 75% of NAV of Corp. Investments) § The analysis below compares the future “Current Equity Value” (as defined in Berlin’s proposed term sheet) of Group A OCGH units covered by the Years 3 – 7 liquidity mechanism a) under Oslo’s and Berlin’s latest proposals, and b) assuming Oslo financials per operating model provided to Berlin – In Oslo’s latest proposal, valuation multiples are applied to management fee earnings based on the average of the trailing three fiscal years (with the exception of any sales / exchanges in Year 3, which would be based on average of trailing two years), and incentive fee earnings based on the average of the trailing two fiscal years – In Berlin’s latest proposal, valuation multiples are applied to both management fee earnings and incentive fee earnings based on the average of the trailing three fiscal years – For illustrative purposes, values under each proposal are calculated based on both incentives created and incentives paid NOMINAL IMPLIED SHARE PRICES AT ILLUSTRATIVE TRANSACTION MULT. OF 13.0x FRE & 6.5x NET INCENTIVES OSLO PROPOSAL (2- / 3-YEAR AVERAGE) BERLIN PROPOSAL (3-YEAR AVERAGE) (1) Years 3 - 7 Blended Sale Price Per Share Excludes value from distributions Oslo Proposal (2/3-Year) Berlin Proposal (3-Year) IC IP IC IP Nominal $83.87 $71.45 $82.03 $71.23 PV @ 10.7% CoE 49.60 42.36 48.44 42.24 Years 3 - 7 Group A Value from Liquidity Mech. ($M) Nominal $2,511 $2,139 $2,456 $2,133 PV @ 10.7% CoE 1,485 1,268 1,450 1,265 $106.81 $105.13 $95.19 $93.82 $82.76 $81.22 $72.08 $89.56 $89.49 $70.33 $81.16 $62.51 $79.81 $59.65 $69.47 $69.52 $61.49 $60.80 $56.27 $55.85 2021 2022 2023 2024 2025 2021 2022 2023 2024 2025 (Year 3) (Year 4) (Year 5) (Year 6) (Year 7) (Year 3) (Year 4) (Year 5) (Year 6) (Year 7) Incentives Created Incentives Paid Source: Oslo Management, PWP extrapolation of share prices in Years 6 and 7 Notes: (1) Assumes remaining Oslo Group A units not sold upfront and not held in reserve (29.9M units) are sold ratably (20% per year) in Years 3 – 7 as per proposed Group A liquidity schedule 12
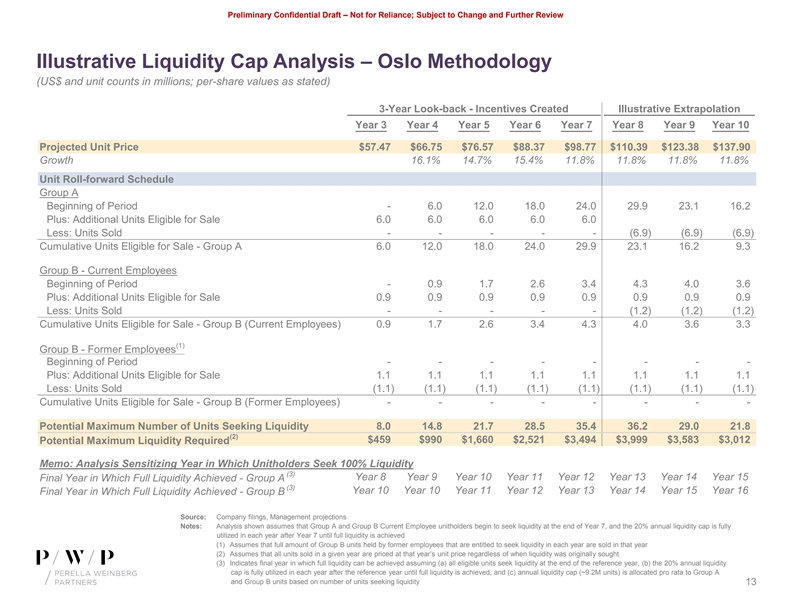
Preliminary Confidential Draft – Not for Reliance; Subject to Change and Further Review Illustrative Liquidity Cap Analysis – Oslo Methodology (US$ and unit counts in millions; per-share values as stated) 3-Year Look-back - Incentives Created Illustrative Extrapolation Year 3 Year 4 Year 5 Year 6 Year 7 Year 8 Year 9 Year 10 Projected Unit Price $57.47 $66.75 $76.57 $88.37 $98.77 $110.39 $123.38 $137.90 Growth 16.1% 14.7% 15.4% 11.8% 11.8% 11.8% 11.8% Unit Roll-forward Schedule Group A Beginning of Period - 6.0 12.0 18.0 24.0 29.9 23.1 16.2 Plus: Additional Units Eligible for Sale 6.0 6.0 6.0 6.0 6.0 Less: Units Sold - - - - - (6.9) (6.9) (6.9) Cumulative Units Eligible for Sale - Group A 6.0 12.0 18.0 24.0 29.9 23.1 16.2 9.3 Group B - Current Employees Beginning of Period - 0.9 1.7 2.6 3.4 4.3 4.0 3.6 Plus: Additional Units Eligible for Sale 0.9 0.9 0.9 0.9 0.9 0.9 0.9 0.9 Less: Units Sold - - - - - (1.2) (1.2) (1.2) Cumulative Units Eligible for Sale - Group B (Current Employees) 0.9 1.7 2.6 3.4 4.3 4.0 3.6 3.3 (1) Group B - Former Employees Beginning of Period - - - - - - - - Plus: Additional Units Eligible for Sale 1.1 1.1 1.1 1.1 1.1 1.1 1.1 1.1 Less: Units Sold (1.1) (1.1) (1.1) (1.1) (1.1) (1.1) (1.1) (1.1) Cumulative Units Eligible for Sale - Group B (Former Employees) - - - - - - - - Potential Maximum Number of Units Seeking Liquidity 8.0 14.8 21.7 28.5 35.4 36.2 29.0 21.8 (2) $459 $990 $1,660 $2,521 $3,494 $3,999 $3,583 $3,012 Potential Maximum Liquidity Required Memo: Analysis Sensitizing Year in Which Unitholders Seek 100% Liquidity (3) Year 8 Year 9 Year 10 Year 11 Year 12 Year 13 Year 14 Year 15 Final Year in Which Full Liquidity Achieved - Group A (3) Year 10 Year 10 Year 11 Year 12 Year 13 Year 14 Year 15 Year 16 Final Year in Which Full Liquidity Achieved - Group B Source: Company filings, Management projections Notes: Analysis shown assumes that Group A and Group B Current Employee unitholders begin to seek liquidity at the end of Year 7, and the 20% annual liquidity cap is fully utilized in each year after Year 7 until full liquidity is achieved (1) Assumes that full amount of Group B units held by former employees that are entitled to seek liquidity in each year are sold in that year (2) Assumes that all units sold in a given year are priced at that year’s unit price regardless of when liquidity was originally sought (3) Indicates final year in which full liquidity can be achieved assuming (a) all eligible units seek liquidity at the end of the reference year, (b) the 20% annual liquidity cap is fully utilized in each year after the reference year until full liquidity is achieved, and (c) annual liquidity cap (~9.2M units) is allocated pro rata to Group A and Group B units based on number of units seeking liquidity 13Preliminary Confidential Draft – Not for Reliance; Subject to Change and Further Review Illustrative Liquidity Cap Analysis – Oslo Methodology (US$ and unit counts in millions; per-share values as stated) 3-Year Look-back - Incentives Created Illustrative Extrapolation Year 3 Year 4 Year 5 Year 6 Year 7 Year 8 Year 9 Year 10 Projected Unit Price $57.47 $66.75 $76.57 $88.37 $98.77 $110.39 $123.38 $137.90 Growth 16.1% 14.7% 15.4% 11.8% 11.8% 11.8% 11.8% Unit Roll-forward Schedule Group A Beginning of Period - 6.0 12.0 18.0 24.0 29.9 23.1 16.2 Plus: Additional Units Eligible for Sale 6.0 6.0 6.0 6.0 6.0 Less: Units Sold - - - - - (6.9) (6.9) (6.9) Cumulative Units Eligible for Sale - Group A 6.0 12.0 18.0 24.0 29.9 23.1 16.2 9.3 Group B - Current Employees Beginning of Period - 0.9 1.7 2.6 3.4 4.3 4.0 3.6 Plus: Additional Units Eligible for Sale 0.9 0.9 0.9 0.9 0.9 0.9 0.9 0.9 Less: Units Sold - - - - - (1.2) (1.2) (1.2) Cumulative Units Eligible for Sale - Group B (Current Employees) 0.9 1.7 2.6 3.4 4.3 4.0 3.6 3.3 (1) Group B - Former Employees Beginning of Period - - - - - - - - Plus: Additional Units Eligible for Sale 1.1 1.1 1.1 1.1 1.1 1.1 1.1 1.1 Less: Units Sold (1.1) (1.1) (1.1) (1.1) (1.1) (1.1) (1.1) (1.1) Cumulative Units Eligible for Sale - Group B (Former Employees) - - - - - - - - Potential Maximum Number of Units Seeking Liquidity 8.0 14.8 21.7 28.5 35.4 36.2 29.0 21.8 (2) $459 $990 $1,660 $2,521 $3,494 $3,999 $3,583 $3,012 Potential Maximum Liquidity Required Memo: Analysis Sensitizing Year in Which Unitholders Seek 100% Liquidity (3) Year 8 Year 9 Year 10 Year 11 Year 12 Year 13 Year 14 Year 15 Final Year in Which Full Liquidity Achieved - Group A (3) Year 10 Year 10 Year 11 Year 12 Year 13 Year 14 Year 15 Year 16 Final Year in Which Full Liquidity Achieved - Group B Source: Company filings, Management projections Notes: Analysis shown assumes that Group A and Group B Current Employee unitholders begin to seek liquidity at the end of Year 7, and the 20% annual liquidity cap is fully utilized in each year after Year 7 until full liquidity is achieved (1) Assumes that full amount of Group B units held by former employees that are entitled to seek liquidity in each year are sold in that year (2) Assumes that all units sold in a given year are priced at that year’s unit price regardless of when liquidity was originally sought (3) Indicates final year in which full liquidity can be achieved assuming (a) all eligible units seek liquidity at the end of the reference year, (b) the 20% annual liquidity cap is fully utilized in each year after the reference year until full liquidity is achieved, and (c) annual liquidity cap (~9.2M units) is allocated pro rata to Group A and Group B units based on number of units seeking liquidity 13
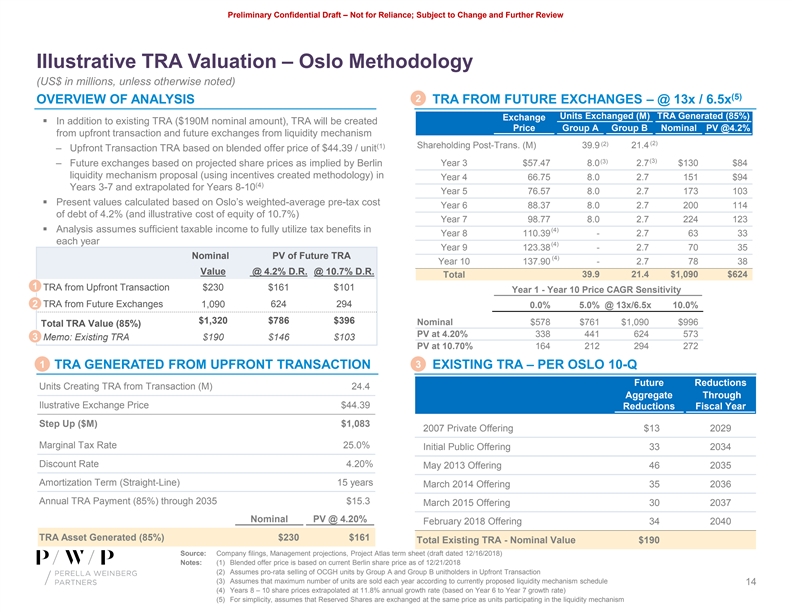
Preliminary Confidential Draft – Not for Reliance; Subject to Change and Further Review Illustrative TRA Valuation – Oslo Methodology (US$ in millions, unless otherwise noted) (5) 2 OVERVIEW OF ANALYSIS TRA FROM FUTURE EXCHANGES – @ 13x / 6.5x Units Exchanged (M) TRA Generated (85%) Exchange § In addition to existing TRA ($190M nominal amount), TRA will be created Price Group A Group B Nominal PV @4.2% from upfront transaction and future exchanges from liquidity mechanism (2) (2) (1) Shareholding Post-Trans. (M) 39.9 21.4 ‒ Upfront Transaction TRA based on blended offer price of $44.39 / unit (3) (3) ‒ Future exchanges based on projected share prices as implied by Berlin Year 3 $57.47 8.0 2.7 $130 $84 liquidity mechanism proposal (using incentives created methodology) in Year 4 66.75 8.0 2.7 151 $94 (4) Years 3-7 and extrapolated for Years 8-10 Year 5 76.57 8.0 2.7 173 103 § Present values calculated based on Oslo’s weighted-average pre-tax cost Year 6 88.37 8.0 2.7 200 114 of debt of 4.2% (and illustrative cost of equity of 10.7%) Year 7 98.77 8.0 2.7 224 123 § Analysis assumes sufficient taxable income to fully utilize tax benefits in (4) Year 8 110.39 - 2.7 63 33 each year (4) Year 9 123.38 - 2.7 70 35 Nominal PV of Future TRA (4) Year 10 137.90 - 2.7 78 38 Value @ 4.2% D.R. @ 10.7% D.R. 39.9 21.4 $1,090 $624 Total 1 TRA from Upfront Transaction $230 $161 $101 Year 1 - Year 10 Price CAGR Sensitivity 2 TRA from Future Exchanges 1,090 624 294 0.0% 5.0% @ 13x/6.5x 10.0% $1,320 $786 $396 Nominal $578 $761 $1,090 $996 Total TRA Value (85%) PV at 4.20% 338 441 624 573 3 Memo: Existing TRA $190 $146 $103 PV at 10.70% 164 212 294 272 1 3 TRA GENERATED FROM UPFRONT TRANSACTION EXISTING TRA – PER OSLO 10-Q Future Reductions Units Creating TRA from Transaction (M) 24.4 Aggregate Through Ilustrative Exchange Price $44.39 Reductions Fiscal Year Step Up ($M) $1,083 2007 Private Offering $13 2029 Marginal Tax Rate 25.0% Initial Public Offering 33 2034 Discount Rate 4.20% May 2013 Offering 46 2035 Amortization Term (Straight-Line) 15 years March 2014 Offering 35 2036 Annual TRA Payment (85%) through 2035 $15.3 March 2015 Offering 30 2037 Nominal PV @ 4.20% February 2018 Offering 34 2040 TRA Asset Generated (85%) $230 $161 Total Existing TRA - Nominal Value $190 Source: Company filings, Management projections, Project Atlas term sheet (draft dated 12/16/2018) Notes: (1) Blended offer price is based on current Berlin share price as of 12/21/2018 (2) Assumes pro-rata selling of OCGH units by Group A and Group B unitholders in Upfront Transaction (3) Assumes that maximum number of units are sold each year according to currently proposed liquidity mechanism schedule 14 (4) Years 8 – 10 share prices extrapolated at 11.8% annual growth rate (based on Year 6 to Year 7 growth rate) (5) For simplicity, assumes that Reserved Shares are exchanged at the same price as units participating in the liquidity mechanismPreliminary Confidential Draft – Not for Reliance; Subject to Change and Further Review Illustrative TRA Valuation – Oslo Methodology (US$ in millions, unless otherwise noted) (5) 2 OVERVIEW OF ANALYSIS TRA FROM FUTURE EXCHANGES – @ 13x / 6.5x Units Exchanged (M) TRA Generated (85%) Exchange § In addition to existing TRA ($190M nominal amount), TRA will be created Price Group A Group B Nominal PV @4.2% from upfront transaction and future exchanges from liquidity mechanism (2) (2) (1) Shareholding Post-Trans. (M) 39.9 21.4 ‒ Upfront Transaction TRA based on blended offer price of $44.39 / unit (3) (3) ‒ Future exchanges based on projected share prices as implied by Berlin Year 3 $57.47 8.0 2.7 $130 $84 liquidity mechanism proposal (using incentives created methodology) in Year 4 66.75 8.0 2.7 151 $94 (4) Years 3-7 and extrapolated for Years 8-10 Year 5 76.57 8.0 2.7 173 103 § Present values calculated based on Oslo’s weighted-average pre-tax cost Year 6 88.37 8.0 2.7 200 114 of debt of 4.2% (and illustrative cost of equity of 10.7%) Year 7 98.77 8.0 2.7 224 123 § Analysis assumes sufficient taxable income to fully utilize tax benefits in (4) Year 8 110.39 - 2.7 63 33 each year (4) Year 9 123.38 - 2.7 70 35 Nominal PV of Future TRA (4) Year 10 137.90 - 2.7 78 38 Value @ 4.2% D.R. @ 10.7% D.R. 39.9 21.4 $1,090 $624 Total 1 TRA from Upfront Transaction $230 $161 $101 Year 1 - Year 10 Price CAGR Sensitivity 2 TRA from Future Exchanges 1,090 624 294 0.0% 5.0% @ 13x/6.5x 10.0% $1,320 $786 $396 Nominal $578 $761 $1,090 $996 Total TRA Value (85%) PV at 4.20% 338 441 624 573 3 Memo: Existing TRA $190 $146 $103 PV at 10.70% 164 212 294 272 1 3 TRA GENERATED FROM UPFRONT TRANSACTION EXISTING TRA – PER OSLO 10-Q Future Reductions Units Creating TRA from Transaction (M) 24.4 Aggregate Through Ilustrative Exchange Price $44.39 Reductions Fiscal Year Step Up ($M) $1,083 2007 Private Offering $13 2029 Marginal Tax Rate 25.0% Initial Public Offering 33 2034 Discount Rate 4.20% May 2013 Offering 46 2035 Amortization Term (Straight-Line) 15 years March 2014 Offering 35 2036 Annual TRA Payment (85%) through 2035 $15.3 March 2015 Offering 30 2037 Nominal PV @ 4.20% February 2018 Offering 34 2040 TRA Asset Generated (85%) $230 $161 Total Existing TRA - Nominal Value $190 Source: Company filings, Management projections, Project Atlas term sheet (draft dated 12/16/2018) Notes: (1) Blended offer price is based on current Berlin share price as of 12/21/2018 (2) Assumes pro-rata selling of OCGH units by Group A and Group B unitholders in Upfront Transaction (3) Assumes that maximum number of units are sold each year according to currently proposed liquidity mechanism schedule 14 (4) Years 8 – 10 share prices extrapolated at 11.8% annual growth rate (based on Year 6 to Year 7 growth rate) (5) For simplicity, assumes that Reserved Shares are exchanged at the same price as units participating in the liquidity mechanism
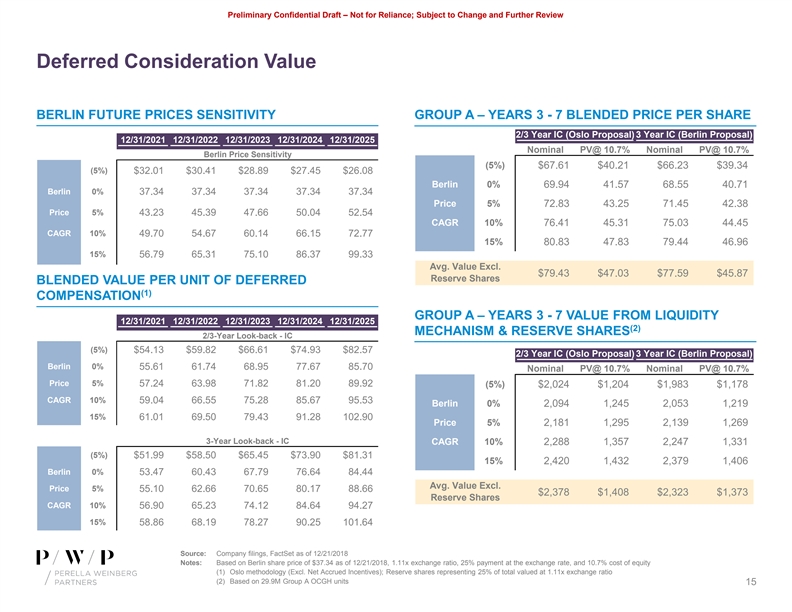
Preliminary Confidential Draft – Not for Reliance; Subject to Change and Further Review Deferred Consideration Value BERLIN FUTURE PRICES SENSITIVITY GROUP A – YEARS 3 - 7 BLENDED PRICE PER SHARE 2/3 Year IC (Oslo Proposal) 3 Year IC (Berlin Proposal) 12/31/2021 12/31/2022 12/31/2023 12/31/2024 12/31/2025 Nominal PV@ 10.7% Nominal PV@ 10.7% Berlin Price Sensitivity (5%) $67.61 $40.21 $66.23 $39.34 (5%) $32.01 $30.41 $28.89 $27.45 $26.08 Berlin 0% 69.94 41.57 68.55 40.71 Berlin 0% 37.34 37.34 37.34 37.34 37.34 Price 5% 72.83 43.25 71.45 42.38 Price 5% 43.23 45.39 47.66 50.04 52.54 CAGR 10% 76.41 45.31 75.03 44.45 CAGR 10% 49.70 54.67 60.14 66.15 72.77 15% 80.83 47.83 79.44 46.96 15% 56.79 65.31 75.10 86.37 99.33 Avg. Value Excl. $79.43 $47.03 $77.59 $45.87 Reserve Shares BLENDED VALUE PER UNIT OF DEFERRED (1) COMPENSATION GROUP A – YEARS 3 - 7 VALUE FROM LIQUIDITY 12/31/2021 12/31/2022 12/31/2023 12/31/2024 12/31/2025 (2) MECHANISM & RESERVE SHARES 2/3-Year Look-back - IC (5%) $54.13 $59.82 $66.61 $74.93 $82.57 2/3 Year IC (Oslo Proposal) 3 Year IC (Berlin Proposal) Berlin 0% 55.61 61.74 68.95 77.67 85.70 Nominal PV@ 10.7% Nominal PV@ 10.7% Price 5% 57.24 63.98 71.82 81.20 89.92 (5%) $2,024 $1,204 $1,983 $1,178 CAGR 10% 59.04 66.55 75.28 85.67 95.53 Berlin 0% 2,094 1,245 2,053 1,219 15% 61.01 69.50 79.43 91.28 102.90 Price 5% 2,181 1,295 2,139 1,269 3-Year Look-back - IC CAGR 10% 2,288 1,357 2,247 1,331 (5%) $51.99 $58.50 $65.45 $73.90 $81.31 15% 2,420 1,432 2,379 1,406 Berlin 0% 53.47 60.43 67.79 76.64 84.44 Avg. Value Excl. Price 5% 55.10 62.66 70.65 80.17 88.66 $2,378 $1,408 $2,323 $1,373 Reserve Shares CAGR 10% 56.90 65.23 74.12 84.64 94.27 15% 58.86 68.19 78.27 90.25 101.64 Source: Company filings, FactSet as of 12/21/2018 Notes: Based on Berlin share price of $37.34 as of 12/21/2018, 1.11x exchange ratio, 25% payment at the exchange rate, and 10.7% cost of equity (1) Oslo methodology (Excl. Net Accrued Incentives); Reserve shares representing 25% of total valued at 1.11x exchange ratio (2) Based on 29.9M Group A OCGH units 15Preliminary Confidential Draft – Not for Reliance; Subject to Change and Further Review Deferred Consideration Value BERLIN FUTURE PRICES SENSITIVITY GROUP A – YEARS 3 - 7 BLENDED PRICE PER SHARE 2/3 Year IC (Oslo Proposal) 3 Year IC (Berlin Proposal) 12/31/2021 12/31/2022 12/31/2023 12/31/2024 12/31/2025 Nominal PV@ 10.7% Nominal PV@ 10.7% Berlin Price Sensitivity (5%) $67.61 $40.21 $66.23 $39.34 (5%) $32.01 $30.41 $28.89 $27.45 $26.08 Berlin 0% 69.94 41.57 68.55 40.71 Berlin 0% 37.34 37.34 37.34 37.34 37.34 Price 5% 72.83 43.25 71.45 42.38 Price 5% 43.23 45.39 47.66 50.04 52.54 CAGR 10% 76.41 45.31 75.03 44.45 CAGR 10% 49.70 54.67 60.14 66.15 72.77 15% 80.83 47.83 79.44 46.96 15% 56.79 65.31 75.10 86.37 99.33 Avg. Value Excl. $79.43 $47.03 $77.59 $45.87 Reserve Shares BLENDED VALUE PER UNIT OF DEFERRED (1) COMPENSATION GROUP A – YEARS 3 - 7 VALUE FROM LIQUIDITY 12/31/2021 12/31/2022 12/31/2023 12/31/2024 12/31/2025 (2) MECHANISM & RESERVE SHARES 2/3-Year Look-back - IC (5%) $54.13 $59.82 $66.61 $74.93 $82.57 2/3 Year IC (Oslo Proposal) 3 Year IC (Berlin Proposal) Berlin 0% 55.61 61.74 68.95 77.67 85.70 Nominal PV@ 10.7% Nominal PV@ 10.7% Price 5% 57.24 63.98 71.82 81.20 89.92 (5%) $2,024 $1,204 $1,983 $1,178 CAGR 10% 59.04 66.55 75.28 85.67 95.53 Berlin 0% 2,094 1,245 2,053 1,219 15% 61.01 69.50 79.43 91.28 102.90 Price 5% 2,181 1,295 2,139 1,269 3-Year Look-back - IC CAGR 10% 2,288 1,357 2,247 1,331 (5%) $51.99 $58.50 $65.45 $73.90 $81.31 15% 2,420 1,432 2,379 1,406 Berlin 0% 53.47 60.43 67.79 76.64 84.44 Avg. Value Excl. Price 5% 55.10 62.66 70.65 80.17 88.66 $2,378 $1,408 $2,323 $1,373 Reserve Shares CAGR 10% 56.90 65.23 74.12 84.64 94.27 15% 58.86 68.19 78.27 90.25 101.64 Source: Company filings, FactSet as of 12/21/2018 Notes: Based on Berlin share price of $37.34 as of 12/21/2018, 1.11x exchange ratio, 25% payment at the exchange rate, and 10.7% cost of equity (1) Oslo methodology (Excl. Net Accrued Incentives); Reserve shares representing 25% of total valued at 1.11x exchange ratio (2) Based on 29.9M Group A OCGH units 15
Preliminary Confidential Draft – Not for Reliance; Subject to Change and Further Review AppendixPreliminary Confidential Draft – Not for Reliance; Subject to Change and Further Review Appendix
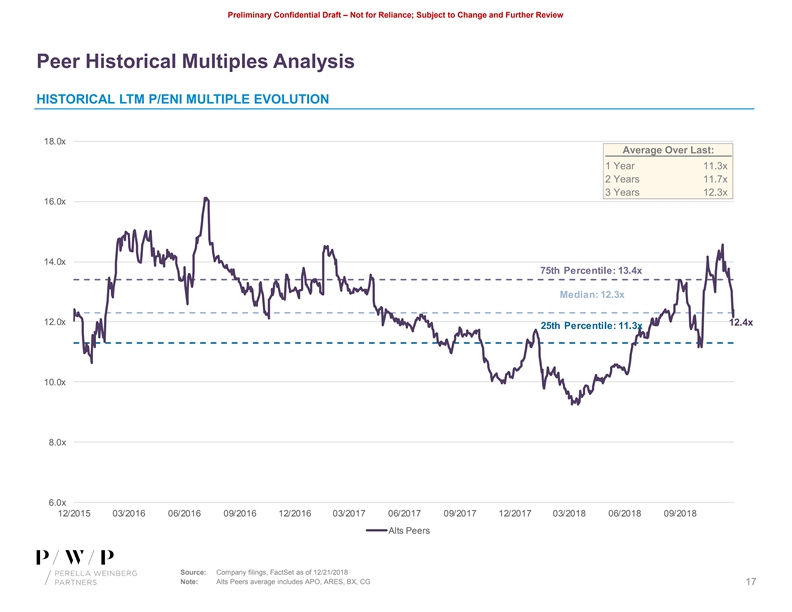
Preliminary Confidential Draft – Not for Reliance; Subject to Change and Further Review Peer Historical Multiples Analysis HISTORICAL LTM P/ENI MULTIPLE EVOLUTION 18.0x Average Over Last: 1 Year 11.3x 2 Years 11.7x 3 Years 12.3x 16.0x 14.0x 75th Percentile: 13.4x Median: 12.3x 12.0x 12.4x 25th Percentile: 11.3x 10.0x 8.0x 6.0x 12/2015 03/2016 06/2016 09/2016 12/2016 03/2017 06/2017 09/2017 12/2017 03/2018 06/2018 09/2018 Alts Peers Source: Company filings, FactSet as of 12/21/2018 Note: Alts Peers average includes APO, ARES, BX, CG 17Preliminary Confidential Draft – Not for Reliance; Subject to Change and Further Review Peer Historical Multiples Analysis HISTORICAL LTM P/ENI MULTIPLE EVOLUTION 18.0x Average Over Last: 1 Year 11.3x 2 Years 11.7x 3 Years 12.3x 16.0x 14.0x 75th Percentile: 13.4x Median: 12.3x 12.0x 12.4x 25th Percentile: 11.3x 10.0x 8.0x 6.0x 12/2015 03/2016 06/2016 09/2016 12/2016 03/2017 06/2017 09/2017 12/2017 03/2018 06/2018 09/2018 Alts Peers Source: Company filings, FactSet as of 12/21/2018 Note: Alts Peers average includes APO, ARES, BX, CG 17

Preliminary Confidential Draft – Not for Reliance; Subject to Change and Further Review Historical Financials ($ in millions) Historical Projected 2010 2011 2012 2013 2014 2015 2016 2017 2018E Fee Related Earnings (Pre-Tax) $375 $315 $308 $260 $248 $129 $317 $291 $223 Net Incentives Created (Pre-Tax) 516 (31) 498 553 24 (66) 325 307 236 Net Incentives Paid (Pre-Tax) 254 127 246 598 269 126 190 332 267 Net Cash 115 27 214 488 211 287 303 (88) 377 Corporate Investments (Incl. REIT Loans) 1,109 1,159 1,116 1,197 1,515 1,434 1,481 1,692 1,788 (1) Fully Diluted Shares Outstanding (M) 148.5 148.5 151.0 152.7 153.9 153.7 154.8 156.3 157.4 Net Accrued Incentives 1,167 1,028 1,282 1,235 1,000 812 947 921 890 Oslo Proposal Fee Related Earnings (3-Yr Trailing Averages) $337 $327 $333 $294 $272 $212 $231 $246 $277 Net Incentives Created (2-Yr Trailing Averages) 608 243 234 526 289 (21) 130 316 271 Net Incentives Paid (2-Yr Trailing Averages) 182 191 187 422 434 198 158 261 299 Berlin Proposal Fee Related Earnings (3-Yr Trailing Averages) $337 $327 $333 $294 $272 $212 $231 $246 $277 Net Incentives Created (3-Yr Trailing Averages) 364 395 328 340 358 170 94 189 289 Net Incentives Paid (3-Yr Trailing Averages) 157 163 209 324 371 331 195 216 263 Source: Company filings, Management projections Note: (1) Assumes same share count as 12/31/2011 18Preliminary Confidential Draft – Not for Reliance; Subject to Change and Further Review Historical Financials ($ in millions) Historical Projected 2010 2011 2012 2013 2014 2015 2016 2017 2018E Fee Related Earnings (Pre-Tax) $375 $315 $308 $260 $248 $129 $317 $291 $223 Net Incentives Created (Pre-Tax) 516 (31) 498 553 24 (66) 325 307 236 Net Incentives Paid (Pre-Tax) 254 127 246 598 269 126 190 332 267 Net Cash 115 27 214 488 211 287 303 (88) 377 Corporate Investments (Incl. REIT Loans) 1,109 1,159 1,116 1,197 1,515 1,434 1,481 1,692 1,788 (1) Fully Diluted Shares Outstanding (M) 148.5 148.5 151.0 152.7 153.9 153.7 154.8 156.3 157.4 Net Accrued Incentives 1,167 1,028 1,282 1,235 1,000 812 947 921 890 Oslo Proposal Fee Related Earnings (3-Yr Trailing Averages) $337 $327 $333 $294 $272 $212 $231 $246 $277 Net Incentives Created (2-Yr Trailing Averages) 608 243 234 526 289 (21) 130 316 271 Net Incentives Paid (2-Yr Trailing Averages) 182 191 187 422 434 198 158 261 299 Berlin Proposal Fee Related Earnings (3-Yr Trailing Averages) $337 $327 $333 $294 $272 $212 $231 $246 $277 Net Incentives Created (3-Yr Trailing Averages) 364 395 328 340 358 170 94 189 289 Net Incentives Paid (3-Yr Trailing Averages) 157 163 209 324 371 331 195 216 263 Source: Company filings, Management projections Note: (1) Assumes same share count as 12/31/2011 18
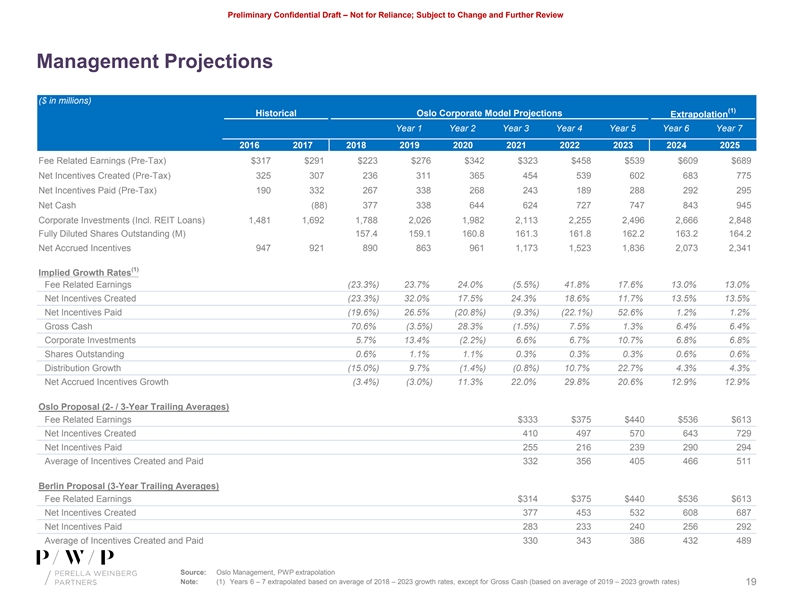
Preliminary Confidential Draft – Not for Reliance; Subject to Change and Further Review Management Projections ($ in millions) (1) Historical Oslo Corporate Model Projections Extrapolation Year 1 Year 2 Year 3 Year 4 Year 5 Year 6 Year 7 2016 2017 2018 2019 2020 2021 2022 2023 2024 2025 Fee Related Earnings (Pre-Tax) $317 $291 $223 $276 $342 $323 $458 $539 $609 $689 Net Incentives Created (Pre-Tax) 325 307 236 311 365 454 539 602 683 775 Net Incentives Paid (Pre-Tax) 190 332 267 338 268 243 189 288 292 295 Net Cash (88) 377 338 644 624 727 747 843 945 Corporate Investments (Incl. REIT Loans) 1,481 1,692 1,788 2,026 1,982 2,113 2,255 2,496 2,666 2,848 Fully Diluted Shares Outstanding (M) 157.4 159.1 160.8 161.3 161.8 162.2 163.2 164.2 Net Accrued Incentives 947 921 890 863 961 1,173 1,523 1,836 2,073 2,341 (1) Implied Growth Rates Fee Related Earnings (23.3%) 23.7% 24.0% (5.5%) 41.8% 17.6% 13.0% 13.0% Net Incentives Created (23.3%) 32.0% 17.5% 24.3% 18.6% 11.7% 13.5% 13.5% Net Incentives Paid (19.6%) 26.5% (20.8%) (9.3%) (22.1%) 52.6% 1.2% 1.2% Gross Cash 70.6% (3.5%) 28.3% (1.5%) 7.5% 1.3% 6.4% 6.4% Corporate Investments 5.7% 13.4% (2.2%) 6.6% 6.7% 10.7% 6.8% 6.8% Shares Outstanding 0.6% 1.1% 1.1% 0.3% 0.3% 0.3% 0.6% 0.6% Distribution Growth (15.0%) 9.7% (1.4%) (0.8%) 10.7% 22.7% 4.3% 4.3% Net Accrued Incentives Growth (3.4%) (3.0%) 11.3% 22.0% 29.8% 20.6% 12.9% 12.9% Oslo Proposal (2- / 3-Year Trailing Averages) Fee Related Earnings $333 $375 $440 $536 $613 Net Incentives Created 410 497 570 643 729 Net Incentives Paid 255 216 239 290 294 Average of Incentives Created and Paid 332 356 405 466 511 Berlin Proposal (3-Year Trailing Averages) Fee Related Earnings $314 $375 $440 $536 $613 Net Incentives Created 377 453 532 608 687 Net Incentives Paid 283 233 240 256 292 Average of Incentives Created and Paid 330 343 386 432 489 Source: Oslo Management, PWP extrapolation Note: (1) Years 6 – 7 extrapolated based on average of 2018 – 2023 growth rates, except for Gross Cash (based on average of 2019 – 2023 growth rates) 19Preliminary Confidential Draft – Not for Reliance; Subject to Change and Further Review Management Projections ($ in millions) (1) Historical Oslo Corporate Model Projections Extrapolation Year 1 Year 2 Year 3 Year 4 Year 5 Year 6 Year 7 2016 2017 2018 2019 2020 2021 2022 2023 2024 2025 Fee Related Earnings (Pre-Tax) $317 $291 $223 $276 $342 $323 $458 $539 $609 $689 Net Incentives Created (Pre-Tax) 325 307 236 311 365 454 539 602 683 775 Net Incentives Paid (Pre-Tax) 190 332 267 338 268 243 189 288 292 295 Net Cash (88) 377 338 644 624 727 747 843 945 Corporate Investments (Incl. REIT Loans) 1,481 1,692 1,788 2,026 1,982 2,113 2,255 2,496 2,666 2,848 Fully Diluted Shares Outstanding (M) 157.4 159.1 160.8 161.3 161.8 162.2 163.2 164.2 Net Accrued Incentives 947 921 890 863 961 1,173 1,523 1,836 2,073 2,341 (1) Implied Growth Rates Fee Related Earnings (23.3%) 23.7% 24.0% (5.5%) 41.8% 17.6% 13.0% 13.0% Net Incentives Created (23.3%) 32.0% 17.5% 24.3% 18.6% 11.7% 13.5% 13.5% Net Incentives Paid (19.6%) 26.5% (20.8%) (9.3%) (22.1%) 52.6% 1.2% 1.2% Gross Cash 70.6% (3.5%) 28.3% (1.5%) 7.5% 1.3% 6.4% 6.4% Corporate Investments 5.7% 13.4% (2.2%) 6.6% 6.7% 10.7% 6.8% 6.8% Shares Outstanding 0.6% 1.1% 1.1% 0.3% 0.3% 0.3% 0.6% 0.6% Distribution Growth (15.0%) 9.7% (1.4%) (0.8%) 10.7% 22.7% 4.3% 4.3% Net Accrued Incentives Growth (3.4%) (3.0%) 11.3% 22.0% 29.8% 20.6% 12.9% 12.9% Oslo Proposal (2- / 3-Year Trailing Averages) Fee Related Earnings $333 $375 $440 $536 $613 Net Incentives Created 410 497 570 643 729 Net Incentives Paid 255 216 239 290 294 Average of Incentives Created and Paid 332 356 405 466 511 Berlin Proposal (3-Year Trailing Averages) Fee Related Earnings $314 $375 $440 $536 $613 Net Incentives Created 377 453 532 608 687 Net Incentives Paid 283 233 240 256 292 Average of Incentives Created and Paid 330 343 386 432 489 Source: Oslo Management, PWP extrapolation Note: (1) Years 6 – 7 extrapolated based on average of 2018 – 2023 growth rates, except for Gross Cash (based on average of 2019 – 2023 growth rates) 19
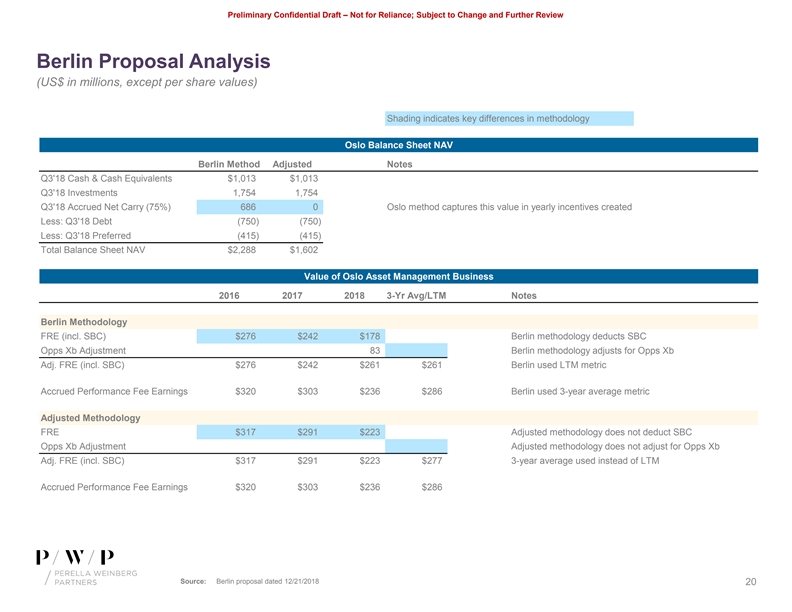
Preliminary Confidential Draft – Not for Reliance; Subject to Change and Further Review Berlin Proposal Analysis (US$ in millions, except per share values) (1) Shading indicates key differences in methodology Oslo Balance Sheet NAV Berlin Method Adjusted Notes Q3'18 Cash & Cash Equivalents $1,013 $1,013 Q3'18 Investments 1,754 1,754 Q3'18 Accrued Net Carry (75%) 686 0 Oslo method captures this value in yearly incentives created Less: Q3'18 Debt (750) (750) Less: Q3'18 Preferred (415) (415) Total Balance Sheet NAV $2,288 $1,602 Value of Oslo Asset Management Business 2016 2017 2018 3-Yr Avg/LTM Notes Berlin Methodology FRE (incl. SBC) $276 $242 $178 Berlin methodology deducts SBC Opps Xb Adjustment 83 Berlin methodology adjusts for Opps Xb Adj. FRE (incl. SBC) $276 $242 $261 $261 Berlin used LTM metric Accrued Performance Fee Earnings $320 $303 $236 $286 Berlin used 3-year average metric Adjusted Methodology FRE $317 $291 $223 Adjusted methodology does not deduct SBC Opps Xb Adjustment Adjusted methodology does not adjust for Opps Xb Adj. FRE (incl. SBC) $317 $291 $223 $277 3-year average used instead of LTM Accrued Performance Fee Earnings $320 $303 $236 $286 Source: Berlin proposal dated 12/21/2018 20Preliminary Confidential Draft – Not for Reliance; Subject to Change and Further Review Berlin Proposal Analysis (US$ in millions, except per share values) (1) Shading indicates key differences in methodology Oslo Balance Sheet NAV Berlin Method Adjusted Notes Q3'18 Cash & Cash Equivalents $1,013 $1,013 Q3'18 Investments 1,754 1,754 Q3'18 Accrued Net Carry (75%) 686 0 Oslo method captures this value in yearly incentives created Less: Q3'18 Debt (750) (750) Less: Q3'18 Preferred (415) (415) Total Balance Sheet NAV $2,288 $1,602 Value of Oslo Asset Management Business 2016 2017 2018 3-Yr Avg/LTM Notes Berlin Methodology FRE (incl. SBC) $276 $242 $178 Berlin methodology deducts SBC Opps Xb Adjustment 83 Berlin methodology adjusts for Opps Xb Adj. FRE (incl. SBC) $276 $242 $261 $261 Berlin used LTM metric Accrued Performance Fee Earnings $320 $303 $236 $286 Berlin used 3-year average metric Adjusted Methodology FRE $317 $291 $223 Adjusted methodology does not deduct SBC Opps Xb Adjustment Adjusted methodology does not adjust for Opps Xb Adj. FRE (incl. SBC) $317 $291 $223 $277 3-year average used instead of LTM Accrued Performance Fee Earnings $320 $303 $236 $286 Source: Berlin proposal dated 12/21/2018 20
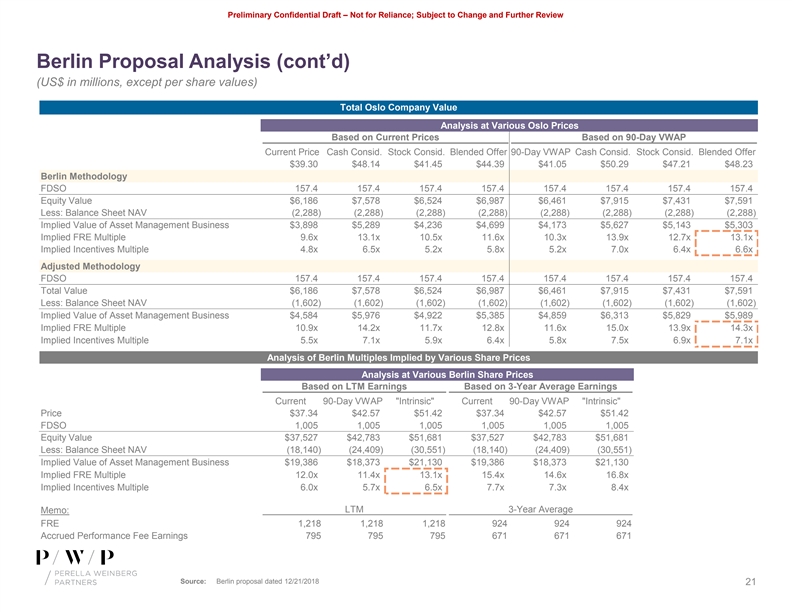
Preliminary Confidential Draft – Not for Reliance; Subject to Change and Further Review Berlin Proposal Analysis (cont’d) (US$ in millions, except per share values) (1) Total Oslo Company Value Analysis at Various Oslo Prices Based on Current Prices Based on 90-Day VWAP Current Price Cash Consid. Stock Consid. Blended Offer 90-Day VWAP Cash Consid. Stock Consid. Blended Offer $39.30 $48.14 $41.45 $44.39 $41.05 $50.29 $47.21 $48.23 Berlin Methodology FDSO 157.4 157.4 157.4 157.4 157.4 157.4 157.4 157.4 Equity Value $6,186 $7,578 $6,524 $6,987 $6,461 $7,915 $7,431 $7,591 Less: Balance Sheet NAV (2,288) (2,288) (2,288) (2,288) (2,288) (2,288) (2,288) (2,288) Implied Value of Asset Management Business $3,898 $5,289 $4,236 $4,699 $4,173 $5,627 $5,143 $5,303 Implied FRE Multiple 9.6x 13.1x 10.5x 11.6x 10.3x 13.9x 12.7x 13.1x Implied Incentives Multiple 4.8x 6.5x 5.2x 5.8x 5.2x 7.0x 6.4x 6.6x Adjusted Methodology FDSO 157.4 157.4 157.4 157.4 157.4 157.4 157.4 157.4 Total Value $6,186 $7,578 $6,524 $6,987 $6,461 $7,915 $7,431 $7,591 Less: Balance Sheet NAV (1,602) (1,602) (1,602) (1,602) (1,602) (1,602) (1,602) (1,602) Implied Value of Asset Management Business $4,584 $5,976 $4,922 $5,385 $4,859 $6,313 $5,829 $5,989 Implied FRE Multiple 10.9x 14.2x 11.7x 12.8x 11.6x 15.0x 13.9x 14.3x Implied Incentives Multiple 5.5x 7.1x 5.9x 6.4x 5.8x 7.5x 6.9x 7.1x Analysis of Berlin Multiples Implied by Various Share Prices Analysis at Various Berlin Share Prices Based on LTM Earnings Based on 3-Year Average Earnings Current 90-Day VWAP Intrinsic Current 90-Day VWAP Intrinsic Price $37.34 $42.57 $51.42 $37.34 $42.57 $51.42 FDSO 1,005 1,005 1,005 1,005 1,005 1,005 Equity Value $37,527 $42,783 $51,681 $37,527 $42,783 $51,681 Less: Balance Sheet NAV (18,140) (24,409) (30,551) (18,140) (24,409) (30,551) Implied Value of Asset Management Business $19,386 $18,373 $21,130 $19,386 $18,373 $21,130 Implied FRE Multiple 12.0x 11.4x 13.1x 15.4x 14.6x 16.8x Implied Incentives Multiple 6.0x 5.7x 6.5x 7.7x 7.3x 8.4x LTM 3-Year Average Memo: FRE 1,218 1,218 1,218 924 924 924 Accrued Performance Fee Earnings 795 795 795 671 671 671 Source: Berlin proposal dated 12/21/2018 21Preliminary Confidential Draft – Not for Reliance; Subject to Change and Further Review Berlin Proposal Analysis (cont’d) (US$ in millions, except per share values) (1) Total Oslo Company Value Analysis at Various Oslo Prices Based on Current Prices Based on 90-Day VWAP Current Price Cash Consid. Stock Consid. Blended Offer 90-Day VWAP Cash Consid. Stock Consid. Blended Offer $39.30 $48.14 $41.45 $44.39 $41.05 $50.29 $47.21 $48.23 Berlin Methodology FDSO 157.4 157.4 157.4 157.4 157.4 157.4 157.4 157.4 Equity Value $6,186 $7,578 $6,524 $6,987 $6,461 $7,915 $7,431 $7,591 Less: Balance Sheet NAV (2,288) (2,288) (2,288) (2,288) (2,288) (2,288) (2,288) (2,288) Implied Value of Asset Management Business $3,898 $5,289 $4,236 $4,699 $4,173 $5,627 $5,143 $5,303 Implied FRE Multiple 9.6x 13.1x 10.5x 11.6x 10.3x 13.9x 12.7x 13.1x Implied Incentives Multiple 4.8x 6.5x 5.2x 5.8x 5.2x 7.0x 6.4x 6.6x Adjusted Methodology FDSO 157.4 157.4 157.4 157.4 157.4 157.4 157.4 157.4 Total Value $6,186 $7,578 $6,524 $6,987 $6,461 $7,915 $7,431 $7,591 Less: Balance Sheet NAV (1,602) (1,602) (1,602) (1,602) (1,602) (1,602) (1,602) (1,602) Implied Value of Asset Management Business $4,584 $5,976 $4,922 $5,385 $4,859 $6,313 $5,829 $5,989 Implied FRE Multiple 10.9x 14.2x 11.7x 12.8x 11.6x 15.0x 13.9x 14.3x Implied Incentives Multiple 5.5x 7.1x 5.9x 6.4x 5.8x 7.5x 6.9x 7.1x Analysis of Berlin Multiples Implied by Various Share Prices Analysis at Various Berlin Share Prices Based on LTM Earnings Based on 3-Year Average Earnings Current 90-Day VWAP Intrinsic Current 90-Day VWAP Intrinsic Price $37.34 $42.57 $51.42 $37.34 $42.57 $51.42 FDSO 1,005 1,005 1,005 1,005 1,005 1,005 Equity Value $37,527 $42,783 $51,681 $37,527 $42,783 $51,681 Less: Balance Sheet NAV (18,140) (24,409) (30,551) (18,140) (24,409) (30,551) Implied Value of Asset Management Business $19,386 $18,373 $21,130 $19,386 $18,373 $21,130 Implied FRE Multiple 12.0x 11.4x 13.1x 15.4x 14.6x 16.8x Implied Incentives Multiple 6.0x 5.7x 6.5x 7.7x 7.3x 8.4x LTM 3-Year Average Memo: FRE 1,218 1,218 1,218 924 924 924 Accrued Performance Fee Earnings 795 795 795 671 671 671 Source: Berlin proposal dated 12/21/2018 21

Preliminary Confidential Draft – Not for Reliance; Subject to Change and Further Review Legal Disclosures This Presentation has been prepared and provided to exclusively to Oaktree Capital Group, LLC (the “Company”), (including its officers and members of its board of directors, in their capacities as such and not in any individual capacity), by Perella Weinberg Partners LP (“Perella Weinberg Partners” and, together with its affiliates, the “Firm”) in its capacity as financial advisor to the Company and may not be relied upon by any other person or entity or used for any other purpose without the written consent of Perella Weinberg Partners. The information contained herein and any information provided orally in connection therewith (the “Information”) is confidential. By accepting this Information, the board of directors agrees that its and its attorney(s), agents and representatives shall use it for informational purposes only and will not divulge any such Information to any other party, except as required by law. Reproduction of this Information, in whole or in part, is prohibited, except as required by law. These contents are proprietary and a product of Perella Weinberg Partners. The Information contained herein is not an offer to buy or sell or a solicitation of an offer to buy or sell any corporate advisory services or security or to participate in any corporate advisory services or trading strategy. Any decision regarding corporate advisory services or to invest in the investments described herein should be made after, as applicable, reviewing such definitive offering memorandum, conducting such investigations as you deem necessary and consulting the investor’s own investment, legal, accounting and tax advisors in order to make an independent determination of the suitability and consequences of an investment or service. The information used in preparing these materials may have been obtained from or through the Company or its representatives or from public sources or other parties to the transactions described herein. Perella Weinberg Partners assumes no responsibility for independent verification of such information and has relied on such information being complete and accurate in all material respects. To the extent such information includes estimates and/or forecasts of future financial performance (including estimates of potential cost savings and synergies) prepared by or reviewed or discussed with the managements of your company and/or other potential transaction participants or obtained from public sources, we have assumed that such estimates and forecasts have been reasonably prepared on bases reflecting the best currently available estimates and judgments of such managements (or, with respect to estimates and forecasts obtained from public sources, represent reasonable estimates). The Firm has no obligation (express or implied) to update any or all of the Information or to advise you of any changes; nor do we make any express or implied warranties or representations as to the completeness or accuracy or accept responsibility for errors. Perella Weinberg Partners has not been asked to consider any alternatives that may be available to the Company. Nothing contained herein should be construed as tax, accounting or legal advice. The Company (and each of its employees, representatives or other agents) may disclose to any and all persons, without limitation of any kind, the tax treatment and tax structure of the transactions contemplated by these materials and all materials of any kind (including opinions or other tax analyses) that are provided to you relating to such tax treatment and structure. For this purpose, the tax treatment of a transaction is the purported or claimed U.S. federal income tax treatment of the transaction and the tax structure of a transaction is any fact that may be relevant to understanding the purported or claimed U.S. federal income tax treatment of the transaction. In the ordinary course of our business activities, Perella Weinberg Partners or its affiliates may at any time hold long or short positions, and may trade or otherwise effect transactions, for our own account or the accounts of customers, in debt or equity or other securities (or related derivative securities) or financial instruments (including bank loans or other obligations) of the Company, potential counterparties, or any other company that may be involved in a transaction or any of their respective affiliates. These materials were not prepared with a view to public disclosure under state or federal securities laws or otherwise and are designed for use by specific persons familiar with the business and affairs of the Company and are being furnished and should be considered only in connection with other information, oral or written, being provided by, and with an understanding of the assumptions (and the limitations therein) employed by, Perella Weinberg Partners in connection herewith. These materials are not intended to be relied on for evaluating, and should not be considered a recommendation with respect to, any transaction or other matter. Prior to entering into any transaction the Company should determine, without reliance on Perella Weinberg Partners or its affiliates, the economic risks and merits as well as the legal, tax and accounting characterizations and consequences of any such transaction. Perella Weinberg Partners is not acting in any other capacity or as a fiduciary to the Company the board of directors or the Company’s shareholders. 22Preliminary Confidential Draft – Not for Reliance; Subject to Change and Further Review Legal Disclosures This Presentation has been prepared and provided to exclusively to Oaktree Capital Group, LLC (the “Company”), (including its officers and members of its board of directors, in their capacities as such and not in any individual capacity), by Perella Weinberg Partners LP (“Perella Weinberg Partners” and, together with its affiliates, the “Firm”) in its capacity as financial advisor to the Company and may not be relied upon by any other person or entity or used for any other purpose without the written consent of Perella Weinberg Partners. The information contained herein and any information provided orally in connection therewith (the “Information”) is confidential. By accepting this Information, the board of directors agrees that its and its attorney(s), agents and representatives shall use it for informational purposes only and will not divulge any such Information to any other party, except as required by law. Reproduction of this Information, in whole or in part, is prohibited, except as required by law. These contents are proprietary and a product of Perella Weinberg Partners. The Information contained herein is not an offer to buy or sell or a solicitation of an offer to buy or sell any corporate advisory services or security or to participate in any corporate advisory services or trading strategy. Any decision regarding corporate advisory services or to invest in the investments described herein should be made after, as applicable, reviewing such definitive offering memorandum, conducting such investigations as you deem necessary and consulting the investor’s own investment, legal, accounting and tax advisors in order to make an independent determination of the suitability and consequences of an investment or service. The information used in preparing these materials may have been obtained from or through the Company or its representatives or from public sources or other parties to the transactions described herein. Perella Weinberg Partners assumes no responsibility for independent verification of such information and has relied on such information being complete and accurate in all material respects. To the extent such information includes estimates and/or forecasts of future financial performance (including estimates of potential cost savings and synergies) prepared by or reviewed or discussed with the managements of your company and/or other potential transaction participants or obtained from public sources, we have assumed that such estimates and forecasts have been reasonably prepared on bases reflecting the best currently available estimates and judgments of such managements (or, with respect to estimates and forecasts obtained from public sources, represent reasonable estimates). The Firm has no obligation (express or implied) to update any or all of the Information or to advise you of any changes; nor do we make any express or implied warranties or representations as to the completeness or accuracy or accept responsibility for errors. Perella Weinberg Partners has not been asked to consider any alternatives that may be available to the Company. Nothing contained herein should be construed as tax, accounting or legal advice. The Company (and each of its employees, representatives or other agents) may disclose to any and all persons, without limitation of any kind, the tax treatment and tax structure of the transactions contemplated by these materials and all materials of any kind (including opinions or other tax analyses) that are provided to you relating to such tax treatment and structure. For this purpose, the tax treatment of a transaction is the purported or claimed U.S. federal income tax treatment of the transaction and the tax structure of a transaction is any fact that may be relevant to understanding the purported or claimed U.S. federal income tax treatment of the transaction. In the ordinary course of our business activities, Perella Weinberg Partners or its affiliates may at any time hold long or short positions, and may trade or otherwise effect transactions, for our own account or the accounts of customers, in debt or equity or other securities (or related derivative securities) or financial instruments (including bank loans or other obligations) of the Company, potential counterparties, or any other company that may be involved in a transaction or any of their respective affiliates. These materials were not prepared with a view to public disclosure under state or federal securities laws or otherwise and are designed for use by specific persons familiar with the business and affairs of the Company and are being furnished and should be considered only in connection with other information, oral or written, being provided by, and with an understanding of the assumptions (and the limitations therein) employed by, Perella Weinberg Partners in connection herewith. These materials are not intended to be relied on for evaluating, and should not be considered a recommendation with respect to, any transaction or other matter. Prior to entering into any transaction the Company should determine, without reliance on Perella Weinberg Partners or its affiliates, the economic risks and merits as well as the legal, tax and accounting characterizations and consequences of any such transaction. Perella Weinberg Partners is not acting in any other capacity or as a fiduciary to the Company the board of directors or the Company’s shareholders. 22


