UNITED STATES
SECURITIES AND EXCHANGE COMMISSION
Washington, D.C. 20549
FORM N-CSR
CERTIFIED SHAREHOLDER REPORT
OF
REGISTERED MANAGEMENT INVESTMENT COMPANIES
Investment Company Act file number: 811-22114
Name of Registrant: Vanguard Montgomery Funds
Address of Registrant:
P.O. Box 2600
Valley Forge, PA 19482
Name and address of agent for service: |
Heidi Stam, Esquire
P.O. Box 876
Valley Forge, PA 19482
Registrant’s telephone number, including area code: (610) 669-1000
Date of fiscal year end: March 31
Date of reporting period: April 1, 2007–March 31, 2008
Item 1: Reports to Shareholders
> For the fiscal year ended March 31, 2008, Vanguard Market Neutral Fund returned 10.2% for Investor Shares and 10.5% for Institutional Shares.
> In a volatile year in the financial markets, the broad U.S. stock market advanced—then retreated—to finish the fiscal period down –5.8%.
> In the fund’s long portfolio, energy and industrials stocks were leading contributors; in the short portfolio, the beleaguered financials sector led returns.
Contents |
|
|
|
Your Fund’s Total Returns | 1 |
Chairman’s Letter | 2 |
Advisors’ Report | 7 |
Fund Profile | 10 |
Performance Summary | 13 |
Financial Statements | 15 |
Your Fund’s After-Tax Returns | 40 |
About Your Fund’s Expenses | 41 |
Trustees Approve Advisory Arrangements | 43 |
Glossary | 45 |
Please note: The opinions expressed in this report are just that—informed opinions. They should not be considered promises or advice. Also, please keep in mind that the information and opinions cover the period through the date on the cover of this report. Of course, the risks of investing in your fund are spelled out in the prospectus.
Your Fund’s Total Returns
Fiscal Year Ended March 31, 2008 |
|
|
| Ticker | Total |
| Symbol | Returns |
Vanguard Market Neutral Fund |
|
|
Investor Shares | VMNFX | 10.2% |
Institutional Shares | VMNIX | 10.5 |
Citigroup 3-Month Treasury Bill Index |
| 4.2 |
Average Equity Market Neutral Fund1 |
| 0.3 |
Your Fund’s Performance at a Glance | ||||
March 31, 2007–March 31, 2008 | ||||
|
|
| Distributions Per Share | |
| Starting | Ending | Income | Capital |
| Share Price | Share Price | Dividends | Gains |
Vanguard Market Neutral Fund |
|
|
|
|
Investor Shares | $12.19 | $12.45 | $0.607 | $0.353 |
Institutional Shares | 12.14 | 12.39 | 0.651 | 0.353 |
1 Derived from data provided by Lipper Inc.
1

Chairman’s Letter
Dear Shareholder,
We are pleased to present the first annual report to shareholders of Vanguard Market Neutral Fund (formerly the Laudus Rosenberg U.S. Large/Mid Capitalization Long/Short Equity Fund). During the fiscal year ended March 31, 2008, the Market Neutral Fund returned 10.2% for Investor Shares. The fund’s Institutional Shares returned 10.5%.
The fund’s advisors, AXA Rosenberg Investment Management and Vanguard Quantitative Equity Group, navigated a fast-changing investment environment to deliver solid returns that outpaced both the average return of the fund’s peers and the return of its benchmark, the Citigroup 3-Month Treasury Bill Index (the most appropriate benchmark for a fund that seeks to eliminate its exposure to the stock market’s ups and downs).
Stocks of all sorts sank amid credit-market concerns
The broad U.S. stock market declined –5.8% for the fiscal year ended March 31 as sentiment turned bearish in the second half. Investors grew increasingly concerned about the prospects of a U.S. recession, the weakening U.S. dollar, and the tightening of global credit markets in reaction to the subprime-mortgage crisis that began in midsummer 2007.
Large-capitalization stocks outperformed small-caps, and growth stocks outpaced their value-oriented counterparts. International stocks managed a modest gain during the year, largely owing to exchange-rate gains produced by the weak U.S. dollar.
2
Bond markets were roiled by subprime-mortgage woes
Credit markets seized up as trouble spread from subprime-mortgage-backed securities to other issues. Investors flocked to higher-quality government and corporate bonds, driving U.S. Treasury bond prices higher.
Unlike stocks, the broad taxable bond market pushed forward, posting a total return of 7.7% for the 12-month period as lower interest rates depressed yields and bumped up prices. By contrast, tax-exempt municipal bonds returned only 1.9% as fixed income investors moved in droves to Treasuries in search of the highest-quality, most-liquid securities. This, combined with concerns about the financial strength of the insurers backing some of the highest-quality municipal bonds, pushed municipal yields above those of Treasuries.
In response to the tumult in the credit markets and the deteriorating economic outlook, the Federal Reserve Board reduced its target for the federal funds rate aggressively. The Fed continued a series of rate cuts that began late last summer, ending with a 0.75-percentage-point cut in March. The target rate stood at 2.25% at the end of the period, the lowest level since early 2005.
Fund performed well in up-and-down market
Vanguard Market Neutral Fund’s long/short strategy is intended to capture positive absolute returns during good times—and
Market Barometer |
|
|
|
| Average Annual Total Returns | ||
| Periods Ended March 31, 2008 | ||
| One Year | Three Years | Five Years |
Stocks |
|
|
|
Russell 1000 Index (Large-caps) | –5.4% | 6.2% | 11.9% |
Russell 2000 Index (Small-caps) | –13.0 | 5.1 | 14.9 |
Dow Jones Wilshire 5000 Index (Entire market) | –5.8 | 6.5 | 12.5 |
MSCI All Country World Index ex USA (International) | 2.6 | 16.5 | 24.0 |
|
|
|
|
|
|
|
|
Bonds |
|
|
|
Lehman U.S. Aggregate Bond Index (Broad taxable market) | 7.7% | 5.5% | 4.6% |
Lehman Municipal Bond Index | 1.9 | 3.7 | 3.9 |
Citigroup 3-Month Treasury Bill Index | 4.2 | 4.2 | 3.0 |
|
|
|
|
|
|
|
|
CPI |
|
|
|
Consumer Price Index | 4.0% | 3.4% | 3.0% |
3
bad times—in the financial markets. The past 12 months provided plenty of both. The fund consists of two portfolios: a long portfolio, in which the advisors buy and hold stocks they consider to be undervalued, and a short portfolio, in which the advisors borrow and sell short stocks they consider to be overvalued. (Note that each advisor independently manages a long and a short portfolio.) Together, these portfolios produced a 10.2% return for the fund’s Investor Shares (and 10.5% for Institutional Shares) during the fund’s fiscal year.
Within the fund’s long portfolio, five of the ten industry sectors had positive returns, four were negative, and one (health care) was essentially flat. The energy sector, which returned 40%, was the largest positive contributor to the long portfolio.
Industrials stocks (+15%) and the relatively small materials sector (+43%) also contributed to total return.
The long portfolio’s two largest sectors—information technology and financials—were also two of its poorest performers. Financials returned –17%, and while weakness in the sector was broad-based, much of the portfolio’s declines came from regional banks and insurers. In the technology sector, which returned –3%, gains from select hardware and storage companies were offset by weakness among data processors and application software firms. The smaller-weighted utilities sector also posted poor results (–15%) for the period.
Total Returns |
|
November 11, 1998,1 Through March 31, 2008 |
|
| Average |
| Annual Return |
Market Neutral Fund Investor Shares | 5.3% |
Citigroup 3-Month Treasury Bill Index | 3.7 |
Average Equity Market Neutral Fund2 | 3.5 |
The figures shown represent past performance, which is not a guarantee of future results. (Current performance may be lower or higher than the performance data cited. For performance data current to the most recent month-end, visit our website at www.vanguard.com/performance.) Note, too, that both investment returns and principal value can fluctuate widely, so an investor’s shares, when sold, could be worth more or less than their original cost.
1 Fund inception date.
2 Derived from data provided by Lipper Inc.
4
In the fund’s short portfolio, returns were enhanced by the stock market’s downdraft in the second half of the fiscal year. Not surprisingly, the strongest results came from the troubled financials sector. The largest single contributor was Bear Stearns, the investment bank that nearly collapsed in mid-March. The fund also benefited from short sales of generally weak real estate investment trusts. Meanwhile, broader investor concerns about the slowing economy were reflected in the consumer discretionary and information technology sectors, which added to the short portfolio’s return. Strength among energy and consumer staples stocks hampered performance in the short portfolio.
For more details on each advisor’s approach, please see the Advisors’ Report beginning on page 7.
Complementary approaches build on a solid history
Although the Market Neutral Fund has a brief history at Vanguard—we adopted the fund in December 2007—it has a long and solid performance record under its former name. Since its inception in 1998, the fund’s Investor Shares have produced an annual average return of 5.3%, outpacing not only the fund’s benchmark index but the average return of peer funds and the broad U.S. stock market (as measured by the 4.4% return of the Dow Jones Wilshire 5000 Index).
That performance is a tribute to AXA Rosenberg Investment Management, which has advised the fund since inception and will continue to build upon that record as one of two advisors for Vanguard Market Neutral Fund. The fund’s other advisor, Vanguard Quantitative Equity Group, began advising the fund in January 2008.
Both advisors employ quantitative strategies that focus on individual stock selection, but each has a different approach to managing its respective portion of the portfolio. AXA Rosenberg uses a two-part model that analyzes valuations and earnings forecasts. Vanguard Quantitative Equity Group, which has managed long-only portfolios prior to advising this fund, uses a model that is driven by three primary factors: valuation, market sentiment, and earnings quality. Both advisors have established admirable track records over time. We believe that their different but complementary styles will serve shareholders well.
A powerful tool for sophisticated investors
The Market Neutral Fund is not without its own special risks. But its aim to produce returns in excess of 3-month U.S. Treasury bills while maintaining low correlation to the stock and bond markets can enhance the diversification of an investment portfolio.
5
Still, as with any investment, we feel that it is very important for investors to understand how the Market Neutral Fund works, know the role it plays in the context of a long-term investment strategy, and have realistic expectations for risk and returns. Because a market-neutral strategy is more complex than traditional long-only portfolios, thorough due diligence is essential.
Vanguard names a new president
As I close this report to you, it’s my pleasure to introduce the fund’s new president, F. William McNabb III. Bill is a man of great character and integrity who is intimately familiar with all aspects of Vanguard—from how we serve our clients to how we invest for our clients.
Bill and I have worked together very closely for more than two decades. I’m thrilled that the fund’s board elected him president, effective March 1, and designated him to succeed me as chief executive officer, a role he will assume within a year, after an orderly transition. Bill and the rest of our team will serve you and our other clients extremely well in the years ahead.
Thank you for investing with Vanguard.
Sincerely,

John J. Brennan
Chairman and Chief Executive Officer
April 15, 2008
6
Advisors’ Report
For the fiscal year ended March 31, 2008, the Investor Shares of Vanguard Market Neutral Fund returned 10.2% and the Institutional Shares returned 10.5%. This performance reflects the combined efforts of two independent advisors: AXA Rosenberg Investment Management LLC and, starting in January 2008, Vanguard Quantitative Equity Group. The use of multiple advisors provides exposure to distinct, yet complementary, investment approaches.
The advisors, the amount and percentage of fund assets each manages, and brief descriptions of their investment strategies are presented in the table below. Each advisor has also prepared a discussion of the investment environment and of how the portfolio’s positioning reflects this assessment. This report was prepared on April 18, 2008.
Vanguard Quantitative Equity Group
Portfolio Manager:
James D. Troyer, CFA, Principal
Vanguard’s Quantitative Equity Group began managing its portion of the Market Neutral Fund in January 2008, the last quarter of the fund’s fiscal year. Our investment process begins with our stock selection model, which has three components: valuation, market sentiment, and earnings quality. We evaluate each stock relative to its market capitalization and industry peers, based on the three component measures; then we aggregate these components into a composite score for each stock, which determines its overall attractiveness. We create a portfolio that is “long” on our most attractive stocks and “short” on the securities we rate least attractive. We intend to make many small bets on individual
Vanguard Market Neutral Fund Investment Advisors | |||
|
|
|
|
| Fund Assets Managed |
| |
Investment Advisor | % | $ Million | Investment Strategy |
Vanguard Quantitative | 50 | 28 | Conducts quantitative management using models that |
Equity Group |
|
| assess valuation, marketplace sentiment, and balance- |
|
|
| sheet characteristics of companies as compared with |
|
|
| their peers. |
AXA Rosenberg Investment | 49 | 28 | Builds a portfolio based on fundamental analysis |
Management LLC |
|
| using a two-part quantitative model that considers |
|
|
| valuations and earnings forecasts. |
Cash Investments1 | 1 | 1 | — |
1 The fund’s daily cash balance may be invested in one or more Vanguard CMT Funds, which are very-low-cost money market funds. Each advisor may also maintain a modest cash position.
7
securities, and not on large factors, so that we manage the portfolio to be neutral to industry, market cap, and style exposures. For example, if we are long $1 million in an industry, we will have a short position of roughly $1 million in the same industry.
During the brief time we have managed our portion of the fund, we have seen remarkable volatility in the stock market. We are pleased that our risk-control process has largely insulated the portfolio from the fluctuations.
For such a short period, performance numbers are close to meaningless, but our best performance was in the materials industry sector, while health care equipment stocks detracted from the fund’s return.
We thank you for your investment, and we look forward to reporting to you over the new fiscal year.
AXA Rosenberg Investment Management LLC
Portfolio Manager:
William E. Ricks, Americas Chief Executive
and Chief Investment Officer
It is our firm conviction that a company’s fundamentals drive its earnings and that the price paid for those earnings will ultimately drive investment performance. We seek to capture both short-term earnings growth as well as superior long-term cumulative earnings through the use of our proprietary, bottom-up stock-selection models. We believe that by employing rigorous security-level analysis, we can uncover stocks with an earnings advantage—that is, stocks that produce superior earnings per dollar of cost in the period following their purchase. We take long positions in the stocks we believe have the most attractive valuations and earnings prospects, and we short the stocks in which we believe the opposite is true. Although this approach can lead to net industry and style exposures, we seek to add value primarily through intra-industry stock selection.
The previous 12 months have been an unnerving period for many U.S. equity investors as stocks experienced a dramatic transition from an up- to a down-market environment. By year’s end the continuing turmoil in the credit markets and deepening fear of a recession in the United States had pushed equity returns deep into the red and ushered back levels of volatility not seen in some time. The fund’s U.S. large-cap long/short strategy generated strong returns over the year, thanks to style differences between the long and short halves of the portfolio and strong stock picking.
The portfolio was well-positioned to take advantage of investors’ distaste for operating leverage, especially toward the end of 2007 and in the first few months of 2008. Following the credit crisis that was kicked off by the massive de-levering of multi-strategy hedge funds in August, and sensing dark times ahead for the economy, investors actively shied away from leverage of any sort. Several of the fund’s best-performing positions for the period were shorts on names with significant exposure to this source of risk: Ford Motor, Bear Stearns, American Express, and General Growth Properties. The use of operating leverage among these high-profile companies proved to be a red flag that investors applied across all equities in general. The fund also benefited from its long bias toward stocks with strong trailing price momentum. Our search for companies with robust earnings-growth prospects typically results in a momentum bias. Although the portfolio was a bit whipsawed in January 2008 as we experienced hefty reversals in some of these higher-momentum names, for the year as a whole the characteristic worked to significantly boost return. The portfolio’s mild net value bias—the result of our bottom-up search for stocks
8
that appear fundamentally undervalued relative to their peers—detracted from returns for the year, somewhat offsetting gains made elsewhere in the fund.
From the standpoint of net industry exposure, results were a mixed bag for the year. The best positioning resulted from our shorting of stocks in industries related to financial services (banks, financial investments) as well as of names within the consumer discretionary industries that are tied to the economic cycle. For example, our short on Starbucks was among the best positions for the period as investors seem to be actively grappling with whether patrons will continue to pay $3 for a latte during unsettling economic times. Similarly successful were net long exposures to basic materials and energy industries such as metals and mining, oil drilling, and chemicals. Despite substantial volatility in commodities prices over the past year, oil and other natural resources prices reached record highs, and production and extraction companies benefited accordingly. Our models saw significant opportunity in companies within these industries, primarily because of their earnings-growth prospects. Other industry exposures were less successful; for instance, the largest net long industry exposure for the year was to insurance, a category that struggled throughout the period.
At the individual stock level, several short positions were among the largest contributors to return for the year. As mentioned earlier, a short on Starbucks was high on the list, as were shorts on Motorola and several banking and finance names, including E*TRADE Financial and Fannie Mae. Far and away the best long position was on Apple. Topping the worst-positions list were long positions on Amazon.com and Regions Financial.
We believe our focus on earnings will serve us well in coming months. In most market environments, investors actively reconcile the earnings generated by stocks with the price paid to participate in those earnings. Our focus on creating an earnings advantage in the portfolio should keep us in good standing as the market works through the challenges that appear on the horizon.
9
Fund Profile
As of March 31, 2008
Portfolio Characteristics |
|
|
|
Yield1 |
|
Investor Shares | 1.8% |
Institutional Shares | 1.9% |
Foreign Holdings | 1.2% |
Short-Term Reserves | 3.9% |
Investment Characteristics |
|
|
| Long | Short |
| Portfolio | Portfolio |
Number of Stocks | 367 | 361 |
Median Market Cap | $26.2B | $31.1B |
Price/Earnings Ratio | 13.9x | 22.1x |
Price/Book Ratio | 2.0x | 2.4x |
Return on Equity | 17.1% | 18.0% |
Earnings Growth Rate | 22.7% | 16.3% |
Turnover Rate | 214% | — |
Estimated Expense Ratios2 |
|
|
| Investor | Institutional |
| Shares | Shares |
Management and |
|
|
Administrative Expenses | 0.50% | 0.40% |
Dividend Expense on |
|
|
Securities Sold Short | 1.50 | 1.50 |
Total | 2.00% | 1.90% |
Sector Diversification (% of equity exposure) | ||
| Long | Short |
| Portfolio | Portfolio |
Consumer Discretionary | 15.6% | 13.7% |
Consumer Staples | 5.8 | 7.0 |
Energy | 7.2 | 8.6 |
Financials | 17.7 | 21.9 |
Health Care | 12.5 | 13.2 |
Industrials | 14.9 | 10.5 |
Information Technology | 8.3 | 8.2 |
Materials | 6.4 | 5.3 |
Telecommunication Services | 3.4 | 3.0 |
Utilities | 8.2 | 8.6 |
10
Volatility Measures3 |
|
| Fund Versus |
| S&P 500 Index |
R-Squared | 0.00 |
Beta | 0.05 |
1 30-day SEC yield for the fund. See the Glossary on pages 45–46.
2 The expense ratios shown in the table are based on estimated amounts for the fiscal year beginning April 1, 2008. Prior to December 1, 2007, the fund was known as the Laudus Rosenberg U.S. Large/Mid Capitalization Long/Short Equity Fund and was not part of the Vanguard family of mutual funds. The actual expense ratios (net of expenses waived or reimbursed) for the fiscal year ended March 31, 2008, were: for Investor Shares, 2.79% (1.16% management and administrative expenses plus 1.63% dividend expense on securities sold short); for Institutional Shares, 2.56% (0.93% management and administrative expenses plus 1.63% dividend expense on securities sold short).
3 For an explanation of R-squared, beta, and other terms used here, see the Glossary on pages 45–46.
11
Ten Largest Holdings1 | (% of total net assets): | |
Long Portfolio |
|
|
|
|
|
Pfizer Inc. | pharmaceuticals | 1.5% |
International Business |
|
|
Machines Corp. | computer hardware | 1.4 |
Verizon | integrated |
|
Communications Inc. | telecommunication |
|
| services | 1.1 |
The Hartford Financial |
|
|
Services Group Inc. | multi-line insurance | 1.1 |
Prudential Financial, Inc. | life and |
|
| health insurance | 1.1 |
AT&T Inc. | integrated |
|
| telecommunication |
|
| services | 1.1 |
MetLife, Inc. | life and |
|
| health insurance | 1.1 |
ACE Ltd. | property and |
|
| casualty insurance | 1.0 |
Ingersoll-Rand Co. | industrial machinery | 0.9 |
Biogen Idec Inc. | biotechnology | 0.9 |
Top Ten |
| 11.2% |
Ten Largest Holdings1 | (% of total net assets): | |
Short Portfolio |
|
|
|
|
|
American |
|
|
International Group, Inc. | multi-line insurance | 1.2% |
The Procter & Gamble Co. | household products | 1.2 |
American Express Co. | consumer finance | 1.2 |
Genentech, Inc. | biotechnology | 1.2 |
Baker Hughes, Inc. | oil and gas |
|
| equipment and |
|
| services | 1.1 |
General Electric Co. | industrial |
|
| conglomerate | 1.1 |
Merrill Lynch & Co., Inc. | investment banking |
|
| and brokerage | 1.1 |
Southern Co. | electric utilities | 1.0 |
FPL Group, Inc. | electric utilities | 1.0 |
Celgene Corp. | biotechnology | 1.0 |
Top Ten |
| 11.1% |
1 “Ten Largest Holdings” excludes any temporary cash investments and equity index products. See pages 36–37 for a glossary of investment terms.
12
Performance Summary
All of the returns in this report represent past performance, which is not a guarantee of future results that may be achieved by the fund. (Current performance may be lower or higher than the performance data cited. For performance data current to the most recent month-end, visit our website at www.vanguard.com/performance.) Note, too, that both investment returns and principal value can fluctuate widely, so an investor’s shares, when sold, could be worth more or less than their original cost. The returns shown do not reflect taxes that a shareholder would pay on fund distributions or on the sale of fund shares.
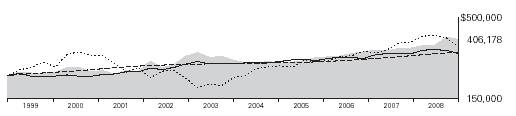
Cumulative Performance: November 11, 1998–March 31, 2008
Initial Investment of $250,000
|
|
|
| |
| Average Annual Total Returns |
| ||
| Periods Ended March 31, 2008 | Final Value of | ||
|
|
| Since | a $250,000 |
| One Year | Five Years | Inception1 | Investment |
Market Neutral Fund Investor Shares2 | 10.15% | 4.04% | 5.31% | $406,178 |
Dow Jones Wilshire 5000 Index | –5.82 | 12.49 | 4.36 | 373,212 |
Citigroup 3-Month Treasury Bill Index | 4.19 | 3.03 | 3.67 | 350,546 |
Average Equity Market Neutral Fund3 | 0.31 | 2.75 | 3.50 | 345,398 |
|
|
|
| Final Value of |
|
|
| Since | a $5,000,000 |
| One Year | Five Years | Inception1 | Investment |
Market Neutral Fund Institutional Shares2 | 10.49% | 4.34% | 5.62% | $8,382,253 |
Dow Jones Wilshire 5000 Index | –5.82 | 12.49 | 5.07 | 7,980,845 |
Citigroup 3-Month Treasury Bill Index | 4.19 | 3.03 | 3.47 | 6,899,026 |
1 Performance for the fund and its comparative standards is calculated since the following inception dates: November 11, 1998, for Investor Shares; October 19, 1998, for Institutional Shares.
2 Total returns do not reflect the 2% fee assessed until November 30, 2007, on redemptions of shares purchased within 30 days or the 1% fee assessed beginning December 1, 2007, on redemptions of shares held less than one year.
3 Derived from data provided by Lipper Inc.
13
Fiscal-Year Total Returns (%): November 11, 1998–March 31, 2008

Note: See Financial Highlights tables on pages 34–35 for dividend and capital gains information.
14
Financial Statements
Statement of Net Assets
As of March 31, 2008
The fund provides a complete list of its holdings four times in each fiscal year, at the quarter-ends. For the second and fourth fiscal quarters, the lists appear in the fund’s semiannual and annual reports to shareholders. For the first and third fiscal quarters, the fund files the lists with the Securities and Exchange Commission on Form N-Q. Shareholders can look up the fund’s Forms N-Q on the SEC’s website at www.sec.gov. Forms N-Q may also be reviewed and copied at the SEC’s Public Reference Room (see the back cover of this report for further information).
|
| Market |
|
| Value• |
| Shares | ($000) |
Common Stocks—Long Positions (92.1%) |
|
|
Consumer Discretionary (14.4%) |
|
|
*† Amazon.com, Inc. | 6,690 | 477 |
*† DIRECTV Group, Inc. | 17,450 | 432 |
† TJX Cos., Inc. | 11,873 | 393 |
† Time Warner, Inc. | 27,980 | 392 |
† Yum! Brands, Inc. | 9,500 | 353 |
† Whirlpool Corp. | 3,830 | 332 |
*† AutoZone Inc. | 2,590 | 295 |
† Royal Caribbean Cruises, Ltd. | 8,500 | 280 |
† McDonald’s Corp. | 4,531 | 253 |
† Gannett Co., Inc. | 7,600 | 221 |
† Sherwin-Williams Co. | 4,250 | 217 |
† Mattel, Inc. | 10,770 | 214 |
† Abercrombie & Fitch Co. | 2,700 | 197 |
*† The Goodyear |
|
|
Tire & Rubber Co. | 6,660 | 172 |
*† Big Lots Inc. | 6,600 | 147 |
*† Hanesbrands Inc. | 5,000 | 146 |
*† GameStop Corp. Class A | 2,800 | 145 |
† Barnes & Noble, Inc. | 4,700 | 144 |
*† Dollar Tree, Inc. | 5,100 | 141 |
† Home Depot, Inc. | 5,000 | 140 |
† Black & Decker Corp. | 2,100 | 139 |
*† Viacom Inc. Class B | 3,500 | 139 |
† The Stanley Works | 2,900 | 138 |
† CBS Corp. | 6,100 | 135 |
† Best Buy Co., Inc. | 3,200 | 133 |
† International Speedway Corp. | 3,200 | 132 |
† RadioShack Corp. | 8,100 | 132 |
† Service Corp. International | 12,900 | 131 |
† Comcast Corp. Class A | 6,700 | 130 |
† The Gap, Inc. | 6,600 | 130 |
† Burger King Holdings Inc. | 4,600 | 127 |
† Wyndham Worldwide Corp. | 5,900 | 122 |
† Autoliv, Inc. | 2,400 | 120 |
† E.W. Scripps Co. Class A | 2,600 | 109 |
*† Mohawk Industries, Inc. | 1,500 | 107 |
15
*† | Expedia, Inc. | 4,600 | 101 |
��� | Regal Entertainment |
|
|
| Group Class A | 4,600 | 89 |
† | Wendy’s International, Inc. | 3,600 | 83 |
† | New York Times Co. Class A | 4,300 | 81 |
† | Snap-On Inc. | 1,600 | 81 |
*† | ITT Educational Services, Inc. | 1,700 | 78 |
† | BorgWarner, Inc. | 1,800 | 77 |
*† | Clear Channel |
|
|
| Outdoor Holdings, Inc. |
|
|
| Class A | 3,700 | 70 |
† | Johnson Controls, Inc. | 1,800 | 61 |
*† | NVR, Inc. | 100 | 60 |
† | Omnicom Group Inc. | 1,300 | 57 |
† | Jones Apparel Group, Inc. | 4,000 | 54 |
† | Eastman Kodak Co. | 3,000 | 53 |
† | John Wiley & Sons Class A | 1,000 | 40 |
*† | DISH Network Corp. | 1,100 | 32 |
*† | DreamWorks |
|
|
| Animation SKG, Inc. | 1,100 | 28 |
† | Choice Hotels International, Inc. | 800 | 27 |
† | Tiffany & Co. | 600 | 25 |
| Idearc Inc. | 6,200 | 22 |
*† | Ford Motor Co. | 3,800 | 22 |
* | Crocs, Inc. | 1,000 | 17 |
| Garmin Ltd. | 200 | 11 |
† | Hasbro, Inc. | 400 | 11 |
| Darden Restaurants Inc. | 300 | 10 |
|
|
| 8,205 |
Consumer Staples (5.3%) |
|
| |
† | Sara Lee Corp. | 21,370 | 299 |
† | Avon Products, Inc. | 5,700 | 225 |
| General Mills, Inc. | 3,743 | 224 |
† | Colgate-Palmolive Co. | 1,870 | 146 |
† | The Pepsi Bottling Group, Inc. | 4,300 | 146 |
† | Coca-Cola Enterprises, Inc. | 6,010 | 145 |
† | Herbalife Ltd. | 2,900 | 138 |
† | Molson Coors |
|
|
| Brewing Co. Class B | 2,600 | 137 |
† | Alberto-Culver Co. | 4,900 | 134 |
† | Wal-Mart Stores, Inc. | 2,500 | 132 |
† | Corn Products International, Inc. | 3,500 | 130 |
† | Reynolds American Inc. | 2,200 | 130 |
† | The Kroger Co. | 4,800 | 122 |
† | Archer-Daniels-Midland Co. | 2,600 | 107 |
*† | NBTY, Inc. | 3,400 | 102 |
| Philip Morris International Inc. | 1,900 | 96 |
† | PepsiAmericas, Inc. | 3,600 | 92 |
*† | Energizer Holdings, Inc. | 1,000 | 90 |
† | Carolina Group | 1,100 | 80 |
| UST, Inc. | 1,414 | 77 |
† | ConAgra Foods, Inc. | 2,700 | 65 |
† | SuperValu Inc. | 2,100 | 63 |
| The Estee Lauder Cos. Inc. |
|
|
| Class A | 1,190 | 54 |
16
† | Altria Group, Inc. | 1,900 | 42 |
† | The Procter & Gamble Co. | 600 | 42 |
† | Church & Dwight, Inc. | 100 | 5 |
| CVS/Caremark Corp. | 130 | 5 |
|
|
| 3,028 |
Energy (6.6%) |
|
| |
† | Noble Corp. | 7,600 | 377 |
† | Pioneer Natural Resources Co. | 5,840 | 287 |
† | Chevron Corp. | 2,600 | 222 |
† | Diamond Offshore Drilling, Inc. | 1,370 | 159 |
† | Rowan Cos., Inc. | 3,700 | 152 |
† | Frontline Ltd. | 3,000 | 139 |
† | ENSCO International, Inc. | 2,200 | 138 |
† | Patterson-UTI Energy, Inc. | 5,100 | 134 |
† | Apache Corp. | 1,100 | 133 |
† | Murphy Oil Corp. | 1,620 | 133 |
† | Hess Corp. | 1,500 | 132 |
† | ConocoPhillips Co. | 1,700 | 130 |
† | Helmerich & Payne, Inc. | 2,600 | 122 |
† | Cimarex Energy Co. | 2,200 | 120 |
*† | Forest Oil Corp. | 2,300 | 113 |
† | Noble Energy, Inc. | 1,500 | 109 |
*† | FMC Technologies Inc. | 1,800 | 102 |
*† | SEACOR Holdings Inc. | 1,200 | 102 |
† | El Paso Corp. | 5,960 | 99 |
*† | National Oilwell Varco Inc. | 1,700 | 99 |
† | Schlumberger Ltd. | 1,100 | 96 |
† | Tidewater Inc. | 1,600 | 88 |
† | Occidental Petroleum Corp. | 1,100 | 80 |
† | Marathon Oil Corp. | 1,700 | 77 |
*† | Global Industries Ltd. | 4,800 | 77 |
* | Cameron International Corp. | 1,600 | 67 |
† | Frontier Oil Corp. | 2,200 | 60 |
* | Pride International, Inc. | 1,600 | 56 |
† | Overseas Shipholding Group Inc. | 500 | 35 |
*† | Superior Energy Services, Inc. | 800 | 32 |
† | Chesapeake Energy Corp. | 600 | 28 |
† | St. Mary Land & Exploration Co. | 700 | 27 |
*† | Denbury Resources, Inc. | 900 | 26 |
* | Transocean, Inc. | 172 | 23 |
|
|
| 3,774 |
Financials (16.2%) |
|
| |
† | The Hartford |
|
|
| Financial Services Group Inc. | 8,380 | 635 |
† | Prudential Financial, Inc. | 8,080 | 632 |
† | MetLife, Inc. | 10,100 | 609 |
† | ACE Ltd. | 9,900 | 545 |
† | Loews Corp. | 10,720 | 431 |
† | Regions Financial Corp. | 20,450 | 404 |
† | Unum Group | 16,420 | 361 |
† | BlackRock, Inc. | 1,600 | 327 |
† | Fifth Third Bancorp | 15,370 | 322 |
† | State Street Corp. | 3,500 | 276 |
| Assurant, Inc. | 3,770 | 229 |
† | PartnerRe Ltd. | 1,900 | 145 |
17
† | Invesco, Ltd. | 5,800 | 141 |
† | RenaissanceRe Holdings Ltd. | 2,700 | 140 |
† | Allied World |
|
|
| Assurance Holdings, Ltd. | 3,500 | 139 |
† | Endurance |
|
|
| Specialty Holdings Ltd. | 3,800 | 139 |
† | The Travelers Cos., Inc. | 2,900 | 139 |
† | Capital One Financial Corp. | 2,800 | 138 |
† | Discover Financial Services | 8,400 | 138 |
*† | Arch Capital Group Ltd. | 2,000 | 137 |
† | Ameriprise Financial, Inc. | 2,600 | 135 |
† | Cullen/Frost Bankers, Inc. | 2,500 | 133 |
† | The Goldman Sachs Group, Inc. | 800 | 132 |
† | Bank of Hawaii Corp. | 2,600 | 129 |
† | JPMorgan Chase & Co. | 3,000 | 129 |
† | U.S. Bancorp | 4,000 | 129 |
† | BB&T Corp. | 3,900 | 125 |
† | BOK Financial Corp. | 2,400 | 125 |
† | Popular, Inc. | 10,600 | 123 |
† | Axis Capital Holdings Ltd. | 3,600 | 122 |
| Commerce Bancshares, Inc. | 2,600 | 109 |
† | Torchmark Corp. | 1,800 | 108 |
† | New York |
|
|
| Community Bancorp, Inc. | 5,800 | 106 |
† | The Chubb Corp. | 2,100 | 104 |
*† | TD Ameritrade Holding Corp. | 6,200 | 102 |
† | Northern Trust Corp. | 1,500 | 100 |
† | American National Insurance Co. | 900 | 96 |
*† | MSCI, Inc.–Class A Shares | 3,000 | 89 |
† | Associated Banc-Corp. | 3,000 | 80 |
† | XL Capital Ltd. Class A | 2,700 | 80 |
| National City Corp. | 7,122 | 71 |
*† | Alleghany Corp. | 204 | 70 |
† | Everest Re Group, Ltd. | 700 | 63 |
† | CNA Financial Corp. | 2,400 | 62 |
† | Raymond James Financial, Inc. | 2,700 | 62 |
† | Colonial BancGroup, Inc. | 6,100 | 59 |
| Genworth Financial Inc. | 2,511 | 57 |
† | Bank of New York Mellon Corp. | 1,300 | 54 |
*† | Nasdaq Stock Market Inc. | 1,400 | 54 |
† | PNC Financial Services Group | 800 | 52 |
† | Eaton Vance Corp. | 1,600 | 49 |
† | East West Bancorp, Inc. | 2,700 | 48 |
† | TCF Financial Corp. | 2,500 | 45 |
† | Wachovia Corp. | 1,500 | 41 |
† | OneBeacon |
|
|
| Insurance Group Ltd. | 2,100 | 40 |
| Janus Capital Group Inc. | 1,600 | 37 |
*† | MF Global Ltd. | 3,300 | 33 |
| Lazard Ltd. Class A | 800 | 31 |
| Synovus Financial Corp. | 2,600 | 29 |
† | HCC Insurance Holdings, Inc. | 900 | 20 |
*† | Affiliated Managers Group, Inc. | 200 | 18 |
|
|
| 9,278 |
Health Care (11.5%) |
|
| |
18
† | Pfizer Inc. | 41,880 | 877 |
*† | Biogen Idec Inc. | 8,100 | 500 |
† | CIGNA Corp. | 11,800 | 479 |
† | Bristol-Myers Squibb Co. | 22,200 | 473 |
*† | Genzyme Corp. | 5,600 | 417 |
*† | Humana Inc. | 8,200 | 368 |
*† | Gilead Sciences, Inc. | 6,600 | 340 |
† | Wyeth | 6,600 | 276 |
*† | Warner Chilcott Ltd. | 8,000 | 144 |
*† | Cephalon, Inc. | 2,200 | 142 |
*† | Express Scripts Inc. | 2,200 | 142 |
*† | Waters Corp. | 2,500 | 139 |
† | Beckman Coulter, Inc. | 2,100 | 136 |
† | Aetna Inc. | 3,200 | 135 |
* | Laboratory Corp. |
|
|
| of America Holdings | 1,800 | 133 |
*† | WellPoint Inc. | 3,000 | 132 |
*† | Invitrogen Corp. | 1,500 | 128 |
*† | Thermo Fisher Scientific, Inc. | 2,200 | 125 |
† | Johnson & Johnson | 1,900 | 123 |
*† | St. Jude Medical, Inc. | 2,800 | 121 |
*† | Watson Pharmaceuticals, Inc. | 4,100 | 120 |
*† | Lincare Holdings, Inc. | 3,900 | 110 |
*† | Henry Schein, Inc. | 1,900 | 109 |
*† | Endo |
|
|
| Pharmaceuticals Holdings, Inc. | 4,400 | 105 |
*† | Forest Laboratories, Inc. | 2,400 | 96 |
*† | Kinetic Concepts, Inc. | 2,000 | 92 |
*† | Medco Health Solutions, Inc. | 1,900 | 83 |
*† | PDL BioPharma Inc. | 6,400 | 68 |
*† | Intuitive Surgical, Inc. | 200 | 65 |
*† | Charles River Laboratories, Inc. | 1,000 | 59 |
*† | LifePoint Hospitals, Inc. | 2,000 | 55 |
*† | Tenet Healthcare Corp. | 9,100 | 52 |
*† | Health Management |
|
|
| Associates Class A | 9,100 | 48 |
† | Eli Lilly & Co. | 700 | 36 |
† | AmerisourceBergen Corp. | 800 | 33 |
*† DaVita, Inc. | 700 | 33 | |
† Applera Corp.–Applied |
|
| |
Biosystems Group | 600 | 20 | |
*† King Pharmaceuticals, Inc. | 2,200 | 19 | |
† Becton, Dickinson & Co. | 100 | 9 | |
*† Millennium Pharmaceuticals, Inc. | 500 | 8 | |
|
| 6,550 | |
Industrials (13.7%) |
|
| |
† Ingersoll-Rand Co. | 11,400 | 508 | |
† L-3 Communications |
|
| |
Holdings, Inc. | 3,600 | 394 | |
† Caterpillar, Inc. | 4,900 | 384 | |
*† Terex Corp. | 5,390 | 337 | |
† Union Pacific Corp. | 2,600 | 326 | |
† The Manitowoc Co., Inc. | 7,690 | 314 | |
† Dover Corp. | 7,240 | 302 | |
† SPX Corp. | 2,400 | 252 | |
19
† Cummins Inc. | 5,200 | 243 | |
*† AGCO Corp. | 3,870 | 232 | |
*† First Solar, Inc. | 1,000 | 231 | |
† Northrop Grumman Corp. | 2,680 | 209 | |
† W.W. Grainger, Inc. | 2,300 | 176 | |
Fastenal Co. | 3,430 | 158 | |
† Lockheed Martin Corp. | 1,550 | 154 | |
* McDermott International, Inc. | 2,800 | 153 | |
*† United Rentals, Inc. | 7,800 | 147 | |
† Parker Hannifin Corp. | 2,100 | 145 | |
*† Allied Waste Industries, Inc. | 13,200 | 143 | |
Rockwell Collins, Inc. | 2,500 | 143 | |
† Manpower Inc. | 2,500 | 141 | |
† Waste Management, Inc. | 4,100 | 138 | |
† Raytheon Co. | 2,100 | 136 | |
† Ryder System, Inc. | 2,200 | 134 | |
† Harsco Corp. | 2,400 | 133 | |
† The Brink’s Co. | 1,900 | 128 | |
† HNI Corp. | 4,600 | 124 | |
† Textron, Inc. | 2,200 | 122 | |
† Deere & Co. | 1,500 | 121 | |
† GATX Corp. | 3,000 | 117 | |
† Cooper Industries, Inc. Class A | 2,800 | 112 | |
*† Gardner Denver Inc. | 3,000 | 111 | |
† Steelcase Inc. | 9,200 | 102 | |
† Trinity Industries, Inc. | 3,700 | 99 | |
† Hubbell Inc. Class B | 2,200 | 96 | |
*† Copa Holdings SA Class A | 2,300 | 88 | |
† Goodrich Corp. | 1,500 | 86 | |
† UAL Corp. | 4,000 | 86 | |
*† Northwest Airlines Corp. | 9,200 | 83 | |
*† Avis Budget Group, Inc. | 7,200 | 76 | |
† CSX Corp. | 1,300 | 73 | |
*† US Airways Group Inc. | 7,200 | 64 | |
* Jacobs Engineering Group Inc. | 800 | 59 | |
† Alexander & Baldwin, Inc. | 1,300 | 56 | |
† Kennametal, Inc. | 1,900 | 56 | |
*† Hertz Global Holdings Inc. | 4,500 | 54 | |
PACCAR, Inc. | 1,160 | 52 | |
† | Pentair, Inc. | 1,600 | 51 |
† | Carlisle Co., Inc. | 1,000 | 33 |
| C.H. Robinson Worldwide Inc. | 500 | 27 |
† | Rockwell Automation, Inc. | 400 | 23 |
† | Republic Services, Inc. Class A | 700 | 20 |
† | Tyco International, Ltd. | 400 | 18 |
| J.B. Hunt Transport Services, Inc. | 400 | 13 |
† | The Toro Co. | 300 | 12 |
| General Dynamics Corp. | 100 | 8 |
| MSC Industrial Direct Co., Inc. |
|
|
| Class A | 100 | 4 |
| Southwest Airlines Co. | 200 | 2 |
|
|
| 7,809 |
Information Technology (7.7%) |
|
| |
† | International Business |
|
|
| Machines Corp. | 6,840 | 788 |
20
† | Accenture Ltd. | 12,800 | 450 |
*† | Apple Inc. | 3,100 | 445 |
*† | MEMC |
|
|
| Electronic Materials, Inc. | 6,100 | 432 |
† | Xerox Corp. | 25,150 | 376 |
† | Electronic Data Systems Corp. | 16,050 | 267 |
† | CA, Inc. | 10,800 | 243 |
*† | Computer Sciences Corp. | 5,430 | 221 |
† | Harris Corp. | 4,100 | 199 |
*† | Western Digital Corp. | 7,350 | 199 |
*† | BMC Software, Inc. | 6,100 | 198 |
*† | Avnet, Inc. | 4,700 | 154 |
* | Activision, Inc. | 5,300 | 145 |
* | Affiliated Computer |
|
|
| Services, Inc. Class A | 1,430 | 72 |
| Amphenol Corp. | 1,770 | 66 |
* | Oracle Corp. | 3,320 | 65 |
* | Cadence Design Systems, Inc. | 3,400 | 36 |
| Hewlett-Packard Co. | 220 | 10 |
* | Juniper Networks, Inc. | 129 | 3 |
|
|
| 4,369 |
Materials (5.9%) |
|
| |
† | Freeport-McMoRan |
|
|
| Copper & Gold, Inc. Class B | 4,970 | 478 |
† | PPG Industries, Inc. | 6,100 | 369 |
*† | Owens-Illinois, Inc. | 5,500 | 310 |
† | Celanese Corp. Series A | 7,480 | 292 |
† | AK Steel Holding Corp. | 2,700 | 147 |
† | Reliance Steel & Aluminum Co. | 2,400 | 144 |
*† | The Mosaic Co. | 1,400 | 144 |
† | Eastman Chemical Co. | 2,200 | 137 |
† | RPM International, Inc. | 6,500 | 136 |
† | Carpenter Technology Corp. | 2,300 | 129 |
† | Cytec Industries, Inc. | 2,400 | 129 |
† | Alcoa Inc. | 3,500 | 126 |
† | Lubrizol Corp. | 2,200 | 122 |
† | Sonoco Products Co. | 4,000 | 115 |
† | Monsanto Co. | 1,000 | 112 |
| MeadWestvaco Corp. | 3,500 | 95 |
† | Airgas, Inc. | 1,700 | 77 |
† | Steel Dynamics, Inc. | 2,200 | 73 |
† | International Paper Co. | 2,200 | 60 |
† | United States Steel Corp. | 400 | 51 |
† | Southern Peru |
|
|
| Copper Corp. (U.S. Shares) | 410 | 43 |
* | Pactiv Corp. | 1,400 | 37 |
† | Allegheny Technologies Inc. | 400 | 29 |
† | Ball Corp. | 600 | 28 |
|
|
| 3,383 |
Telecommunication Services (3.2%) |
|
| |
† | Verizon Communications Inc. | 17,680 | 644 |
† | AT&T Inc. | 16,330 | 625 |
*† | U.S. Cellular Corp. | 2,100 | 116 |
† | Windstream Corp. | 9,100 | 109 |
† | Telephone & |
|
|
21
| Data Systems, Inc. | 2,200 | 86 | |
† | Embarq Corp. | 2,100 | 84 | |
† | Qwest Communications |
|
| |
| International Inc. | 13,100 | 59 | |
* | Crown Castle |
|
| |
| International Corp. | 1,130 | 39 | |
*† | American Tower Corp. Class A | 900 | 35 | |
| CenturyTel, Inc. | 300 | 10 | |
|
|
| 1,807 | |
Utilities (7.6%) |
|
| ||
| Consolidated Edison Inc. | 10,100 | 401 | |
† | American |
|
| |
| Electric Power Co., Inc. | 9,600 | 400 | |
† | PG&E Corp. | 9,820 | 362 | |
† | DTE Energy Co. | 8,200 | 319 | |
*† | Reliant Energy, Inc. | 13,290 | 314 | |
*† | NRG Energy, Inc. | 8,000 | 312 | |
*† | AES Corp. | 15,900 | 265 | |
† | Xcel Energy, Inc. | 12,046 | 240 | |
† | Pepco Holdings, Inc. | 9,410 | 233 | |
† | Wisconsin Energy Corp. | 5,200 | 229 | |
† | Alliant Energy Corp. | 3,900 | 137 | |
† | ONEOK, Inc. | 3,000 | 134 | |
† | Vectren Corp. | 4,800 | 129 | |
*† | Mirant Corp. | 3,500 | 127 | |
† | Public Service |
|
| |
| Enterprise Group, Inc. | 3,100 | 125 | |
† | SCANA Corp. | 3,400 | 124 | |
† | Southern Co. | 3,400 | 121 | |
† | Atmos Energy Corp. | 3,900 | 99 | |
† | MDU Resources Group, Inc. | 3,300 | 81 | |
† | Edison International | 1,300 | 64 | |
† | UGI Corp. Holding Co. | 2,500 | 62 | |
† | Energen Corp. | 600 | 37 | |
| CenterPoint Energy Inc. | 290 | 4 | |
|
|
| 4,319 | |
Total Common Stocks—Long Positions |
|
| ||
(Cost $53,375) |
| 52,522 | ||
Common Stocks Sold Short (–91.4%) |
|
| ||
Consumer Discretionary (–12.6%) |
|
| ||
* | Starbucks Corp. | (28,300) | (495) | |
| Home Depot, Inc. | (15,200) | (425) | |
| Starwood Hotels & |
|
| |
| Resorts Worldwide, Inc. | (5,670) | (293) | |
* | Las Vegas Sands Corp. | (3,400) | (250) | |
* | Ford Motor Co. | (37,600) | (215) | |
| J.C. Penney Co., Inc. |
|
| |
| (Holding Co.) | (4,800) | (181) | |
* | MGM Mirage, Inc. | (3,011) | (177) | |
| Virgin Media Inc. | (12,200) | (172) | |
| Newell Rubbermaid, Inc. | (7,400) | (169) | |
| Foot Locker, Inc. | (12,400) | (146) | |
| Gentex Corp. | (8,300) | (142) | |
| Marriott International, Inc. |
|
| |
22
| Class A | (4,100) | (141) |
| Wynn Resorts Ltd. | (1,400) | (141) |
| Liz Claiborne, Inc. | (7,600) | (138) |
* | Kohl’s Corp. | (3,200) | (137) |
* | Lamar Advertising Co. Class A | (3,800) | (137) |
| Limited Brands, Inc. | (7,977) | (136) |
| Harley-Davidson, Inc. | (3,600) | (135) |
* | Interpublic Group of Cos., Inc. | (15,700) | (132) |
* | IAC/InterActiveCorp | (6,300) | (131) |
| Eastman Kodak Co. | (7,290) | (129) |
| Tim Hortons, Inc. | (3,800) | (129) |
* | Time Warner Cable, Inc. | (5,000) | (125) |
* | Chico’s FAS, Inc. | (17,100) | (122) |
| The McGraw-Hill Cos., Inc. | (3,300) | (122) |
* | Bed Bath & Beyond, Inc. | (3,800) | (112) |
| Orient-Express Hotel Ltd. | (2,600) | (112) |
| OfficeMax, Inc. | (5,800) | (111) |
* | DIRECTV Group, Inc. | (4,200) | (104) |
| Nordstrom, Inc. | (3,200) | (104) |
| Mattel, Inc. | (5,200) | (103) |
| Leggett & Platt, Inc. | (6,500) | (99) |
| Circuit City Stores, Inc. | (23,300) | (93) |
* | Jarden Corp. | (4,300) | (93) |
| International Game Technology | (2,300) | (92) |
| Staples, Inc. | (4,100) | (91) |
* | Cablevision Systems |
|
|
| NY Group Class A | (4,100) | (88) |
* | Toll Brothers, Inc. | (3,700) | (87) |
* | Tractor Supply Co. | (2,200) | (87) |
| Williams-Sonoma, Inc. | (3,600) | (87) |
* | O’Reilly Automotive, Inc. | (2,900) | (83) |
| PetSmart, Inc. | (3,600) | (74) |
| Genuine Parts Co. | (1,800) | (72) |
| H & R Block, Inc. | (3,400) | (71) |
| Harman |
|
|
| International Industries, Inc. | (1,600) | (70) |
* | Central European Media |
|
|
| Enterprises Ltd. Class A | (800) | (68) |
| Brunswick Corp. | (3,900) | (62) |
* | Viacom Inc. Class B | (1,520) | (60) |
| Pulte Homes, Inc. | (3,800) | (55) |
* | Coach, Inc. | (1,800) | (54) |
| General Motors Corp. | (2,400) | (46) |
| Centex Corp. | (1,800) | (44) |
| Macy’s Inc. | (1,900) | (44) |
* | Coldwater Creek Inc. | (8,000) | (40) |
| Comcast Corp. Class A | (1,900) | (37) |
| WABCO Holdings Inc. | (800) | (36) |
| American Eagle Outfitters, Inc. | (2,000) | (35) |
| D. R. Horton, Inc. | (2,200) | (35) |
| MDC Holdings, Inc. | (800) | (35) |
| Weight Watchers |
|
|
| International, Inc. | (700) | (32) |
| Lennar Corp. Class A | (1,600) | (30) |
23
| Abercrombie & Fitch Co. | (400) | (29) |
* | Scientific Games Corp. | (1,000) | (21) |
* | TRW Automotive |
|
|
| Holdings Corp. | (900) | (21) |
| Target Corp. | (300) | (15) |
| Best Buy Co., Inc. | (300) | (12) |
|
|
| (7,164) |
Consumer Staples (–6.4%) |
|
| |
| The Procter & Gamble Co. | (9,850) | (690) |
| Wm. Wrigley Jr. Co. | (8,375) | (526) |
| Wal-Mart Stores, Inc. | (7,000) | (369) |
| The Hershey Co. | (8,900) | (335) |
| Walgreen Co. | (3,700) | (141) |
| Avon Products, Inc. | (3,500) | (138) |
| Kellogg Co. | (2,600) | (137) |
| PepsiCo, Inc. | (1,900) | (137) |
| Campbell Soup Co. | (4,000) | (136) |
* | Smithfield Foods, Inc. | (5,100) | (131) |
| Kimberly-Clark Corp. | (2,000) | (129) |
| McCormick & Co., Inc. | (3,500) | (129) |
* | Energizer Holdings, Inc. | (1,300) | (118) |
| Reynolds American Inc. | (2,000) | (118) |
| Anheuser-Busch Cos., Inc. | (2,000) | (95) |
| Costco Wholesale Corp. | (1,300) | (84) |
| Whole Foods Market, Inc. | (2,000) | (66) |
| CVS/Caremark Corp. | (1,600) | (65) |
| Dean Foods Co. | (2,600) | (52) |
* | BJ’s Wholesale Club, Inc. | (900) | (32) |
| The Coca-Cola Co. | (400) | (24) |
| The Clorox Co. | (300) | (17) |
| Archer-Daniels-Midland Co. | (130) | (5) |
|
|
| (3,674) |
Energy (–7.8%) |
|
| |
| Baker Hughes, Inc. | (9,100) | (623) |
| Valero Energy Corp. | (11,400) | (560) |
| Peabody Energy Corp. | (10,300) | (525) |
| XTO Energy, Inc. | (5,420) | (335) |
| Teekay Shipping Corp. | (3,500) | (149) |
* | Continental Resources, Inc. | (4,600) | (147) |
| Range Resources Corp. | (2,300) | (146) |
| CONSOL Energy, Inc. | (2,100) | (145) |
* | SandRidge Energy, Inc. | (3,700) | (145) |
| BJ Services Co. | (4,400) | (125) |
* | TETRA Technologies, Inc. | (7,800) | (124) |
| Halliburton Co. | (3,100) | (122) |
| Schlumberger Ltd. | (1,400) | (122) |
* | Southwestern Energy Co. | (3,600) | (121) |
| Cabot Oil & Gas Corp. | (2,300) | (117) |
| Diamond Offshore Drilling, Inc. | (1,000) | (116) |
| Spectra Energy Corp. | (5,000) | (114) |
| Tesoro Corp. | (3,451) | (104) |
* | Patriot Coal Corp. | (2,200) | (103) |
| Arch Coal, Inc. | (2,000) | (87) |
| Holly Corp. | (2,000) | (87) |
| ExxonMobil Corp. | (900) | (76) |
24
| EOG Resources, Inc. | (600) | (72) |
| Foundation Coal Holdings, Inc. | (900) | (45) |
* | Plains Exploration & |
|
|
| Production Co. | (600) | (32) |
* | Dresser Rand Group, Inc. | (1,000) | (31) |
* | Newfield Exploration Co. | (500) | (26) |
| Anadarko Petroleum Corp. | (400) | (25) |
| Western Refining, Inc. | (1,400) | (19) |
* | Quicksilver Resources, Inc. | (300) | (11) |
* | Nabors Industries, Inc. | (120) | (4) |
|
|
| (4,458) |
Financials (–19.9%) |
|
| |
| American |
|
|
| International Group, Inc. | (16,100) | (696) |
| American Express Co. | (15,700) | (686) |
| Merrill Lynch & Co., Inc. | (15,000) | (611) |
| Fannie Mae | (20,100) | (529) |
| Simon Property Group, Inc. |
|
|
| REIT | (5,400) | (502) |
| Moody’s Corp. | (11,000) | (383) |
| Progressive Corp. of Ohio | (22,820) | (367) |
| Public Storage, Inc. REIT | (3,800) | (337) |
| Vornado Realty Trust REIT | (3,800) | (328) |
| Equity Residential REIT | (7,800) | (324) |
| M & T Bank Corp. | (3,700) | (298) |
| Boston Properties, Inc. REIT | (3,200) | (295) |
| Morgan Stanley | (6,400) | (292) |
| Zions Bancorp | (5,500) | (251) |
| Avalonbay Communities, Inc. |
|
|
| REIT | (2,300) | (222) |
| Plum Creek Timber Co. Inc. |
|
|
| REIT | (5,400) | (220) |
| New York |
|
|
| Community Bancorp, Inc. | (10,800) | (197) |
| General Growth Properties Inc. |
|
|
| REIT | (5,100) | (195) |
| Ventas, Inc. REIT | (4,200) | (189) |
| Washington Mutual, Inc. | (17,000) | (175) |
* | IntercontinentalExchange Inc. | (1,100) | (144) |
| Mercury General Corp. | (3,200) | (142) |
| Jefferies Group, Inc. | (8,700) | (140) |
| Lincoln National Corp. | (2,500) | (130) |
| SL Green Realty Corp. REIT | (1,600) | (130) |
| T. Rowe Price Group Inc. | (2,600) | (130) |
| Brown & Brown, Inc. | (7,400) | (129) |
| Arthur J. Gallagher & Co. | (5,400) | (128) |
| The Principal |
|
|
| Financial Group, Inc. | (2,300) | (128) |
| KeyCorp | (5,800) | (127) |
| Marsh & McLennan Cos., Inc. | (5,200) | (127) |
| City National Corp. | (2,500) | (124) |
| Aon Corp. | (3,000) | (121) |
| Wesco Financial Corp. | (300) | (121) |
| Fifth Third Bancorp | (5,500) | (115) |
| The Allstate Corp. | (2,300) | (111) |
25
| The PMI Group Inc. | (19,100) | (111) |
| Marshall & Ilsley Corp. | (4,400) | (102) |
| Student Loan Corp. | (1,000) | (99) |
| The Macerich Co. REIT | (1,400) | (98) |
| Bank of America Corp. | (2,500) | (95) |
| Huntington Bancshares Inc. | (8,600) | (92) |
| AFLAC Inc. | (1,400) | (91) |
* | Conseco, Inc. | (8,800) | (90) |
| Leucadia National Corp. | (1,900) | (86) |
| Fulton Financial Corp. | (6,900) | (85) |
| Capitol Federal Financial | (2,100) | (79) |
| First American Corp. | (2,300) | (78) |
| Charles Schwab Corp. | (4,000) | (75) |
| Old Republic International Corp. | (5,600) | (72) |
| Unitrin, Inc. | (2,000) | (71) |
| Washington Federal Inc. | (3,000) | (69) |
| Whitney Holdings Corp. | (2,700) | (67) |
| Comerica, Inc. | (1,882) | (66) |
| Fidelity National Financial, Inc. |
|
|
| Class A | (3,600) | (66) |
| Citigroup, Inc. | (2,630) | (56) |
| Legg Mason Inc. | (1,000) | (56) |
| The Goldman Sachs Group, Inc. | (300) | (50) |
| Developers Diversified |
|
|
| Realty Corp. REIT | (1,100) | (46) |
| Protective Life Corp. | (1,100) | (45) |
* | Investment |
|
|
| Technology Group, Inc. | (900) | (42) |
| Wilmington Trust Corp. | (1,300) | (40) |
| People’s United Financial Inc. | (2,000) | (35) |
* | SLM Corp. | (2,300) | (35) |
| Prudential Financial, Inc. | (400) | (31) |
| Lehman Brothers Holdings, Inc. | (800) | (30) |
| Franklin Resources Corp. | (300) | (29) |
| Sovereign Bancorp, Inc. | (3,000) | (28) |
| Valley National Bancorp | (1,400) | (27) |
| Freddie Mac | (900) | (23) |
| SEI Investments Co. | (900) | (22) |
* | Nasdaq Stock Market Inc. | (470) | (18) |
| Astoria Financial Corp. | (500) | (14) |
| Hudson City Bancorp, Inc. | (400) | (7) |
| MetLife, Inc. | (100) | (6) |
| Reinsurance Group |
|
|
| of America, Inc. | (100) | (5) |
|
|
| (11,381) |
Health Care (–12.1%) |
|
| |
* | Genentech, Inc. | (8,100) | (658) |
* | Celgene Corp. | (9,204) | (564) |
* | Zimmer Holdings, Inc. | (5,800) | (452) |
| Schering-Plough Corp. | (30,720) | (443) |
| Medtronic, Inc. | (8,900) | (430) |
* | Forest Laboratories, Inc. | (9,300) | (372) |
| Quest Diagnostics, Inc. | (5,000) | (226) |
* | Varian Medical Systems, Inc. | (4,495) | (211) |
* | Vertex Pharmaceuticals, Inc. | (8,800) | (210) |
26
* | Patterson Cos. | (5,700) | (207) |
* | Hospira, Inc. | (4,500) | (192) |
* | Amylin Pharmaceuticals, Inc. | (6,000) | (175) |
* | Barr Pharmaceuticals Inc. | (3,419) | (165) |
| Eli Lilly & Co. | (2,900) | (150) |
| Mylan Inc. | (12,500) | (145) |
| Covidien Ltd. | (3,200) | (142) |
* | Community |
|
|
| Health Systems, Inc. | (4,200) | (141) |
| Cooper Cos., Inc. | (4,100) | (141) |
| Cardinal Health, Inc. | (2,600) | (137) |
* | Boston Scientific Corp. | (10,400) | (134) |
* | Edwards Lifesciences Corp. | (3,000) | (134) |
| McKesson Corp. | (2,500) | (131) |
* | ResMed Inc. | (3,100) | (131) |
* | Waters Corp. | (2,200) | (123) |
| Allergan, Inc. | (2,170) | (122) |
| Stryker Corp. | (1,800) | (117) |
* | ImClone Systems, Inc. | (2,700) | (115) |
| Bristol-Myers Squibb Co. | (5,300) | (113) |
| Brookdale Senior Living Inc. | (4,700) | (112) |
* | Advanced Medical Optics, Inc. | (4,600) | (93) |
| IMS Health, Inc. | (4,100) | (86) |
* | Genzyme Corp. | (1,000) | (75) |
| C.R. Bard, Inc. | (700) | (67) |
* | Gen-Probe Inc. | (1,100) | (53) |
* | Covance, Inc. | (600) | (50) |
| Wyeth | (600) | (25) |
| AmerisourceBergen Corp. | (284) | (12) |
| Abbott Laboratories | (200) | (11) |
* | Gilead Sciences, Inc. | (200) | (10) |
| UnitedHealth Group Inc. | (300) | (10) |
* | Amgen, Inc. | (200) | (8) |
|
|
| (6,893) |
Industrials (–9.6%) |
|
| |
| General Electric Co. | (16,540) | (612) |
| Masco Corp. | (18,300) | (363) |
| Expeditors International |
|
|
| of Washington, Inc. | (7,000) | (316) |
| UTI Worldwide, Inc. | (7,800) | (157) |
| Fastenal Co. | (3,200) | (147) |
* | Quanta Services, Inc. | (6,300) | (146) |
| IDEX Corp. | (4,700) | (144) |
* | URS Corp. | (4,300) | (141) |
* | Owens Corning Inc. | (7,700) | (140) |
| Danaher Corp. | (1,800) | (137) |
| C.H. Robinson Worldwide Inc. | (2,500) | (136) |
| 3M Co. | (1,700) | (135) |
| Avery Dennison Corp. | (2,700) | (133) |
| Illinois Tool Works, Inc. | (2,700) | (130) |
| Pall Corp. | (3,700) | (130) |
| Pitney Bowes, Inc. | (3,700) | (130) |
| The Dun & Bradstreet Corp. | (1,500) | (122) |
* | Corrections Corp. of America | (4,400) | (121) |
| FedEx Corp. | (1,300) | (120) |
27
| Southwest Airlines Co. | (9,700) | (120) |
| PACCAR, Inc. | (2,600) | (117) |
* | Covanta Holding Corp. | (4,200) | (116) |
| Emerson Electric Co. | (2,200) | (113) |
| Cintas Corp. | (3,900) | (111) |
* | Spirit |
|
|
| Aerosystems Holdings Inc. | (4,600) | (102) |
| Donaldson Co., Inc. | (2,500) | (101) |
| Roper Industries Inc. | (1,700) | (101) |
| Teleflex Inc. | (2,100) | (100) |
| Lincoln Electric Holdings, Inc. | (1,500) | (97) |
* | Monster Worldwide Inc. | (3,900) | (94) |
| Ametek, Inc. | (2,000) | (88) |
| The Timken Co. | (2,800) | (83) |
| Rockwell Collins, Inc. | (1,400) | (80) |
* | AMR Corp. | (7,300) | (66) |
| KBR Inc. | (2,300) | (64) |
| Landstar System, Inc. | (1,000) | (52) |
| United Parcel Service, Inc. | (700) | (51) |
| Graco, Inc. | (1,300) | (47) |
| Burlington Northern |
|
|
| Santa Fe Corp. | (500) | (46) |
| General Dynamics Corp. | (500) | (42) |
| Eaton Corp. | (500) | (40) |
| ITT Industries, Inc. | (700) | (36) |
| Oshkosh Truck Corp. | (1,000) | (36) |
* | BE Aerospace, Inc. | (900) | (31) |
| W.W. Grainger, Inc. | (400) | (31) |
* | WESCO International, Inc. | (700) | (26) |
| United Technologies Corp. | (300) | (21) |
|
|
| (5,472) |
Information Technology (–7.5%) |
|
| |
* | Adobe Systems, Inc. | (13,500) | (480) |
| Automatic |
|
|
| Data Processing, Inc. | (10,060) | (426) |
| Paychex, Inc. | (9,700) | (332) |
| QUALCOMM Inc. | (7,900) | (324) |
| Intel Corp. | (14,000) | (297) |
* | Cognizant |
|
|
| Technology Solutions Corp. | (9,100) | (262) |
| Microchip Technology, Inc. | (6,600) | (216) |
* | Google Inc. | (480) | (211) |
* | Intuit, Inc. | (7,700) | (208) |
* | Cisco Systems, Inc. | (8,400) | (202) |
| Altera Corp. | (10,900) | (201) |
* | Citrix Systems, Inc. | (6,200) | (182) |
* | Electronic Arts Inc. | (3,590) | (179) |
* | NetApp, Inc. | (7,800) | (156) |
| Linear Technology Corp. | (4,200) | (129) |
* | Marvell |
|
|
| Technology Group Ltd. | (11,400) | (124) |
| Motorola, Inc. | (11,696) | (109) |
| Maxim |
|
|
| Integrated Products, Inc. | (4,400) | (90) |
| Xilinx, Inc. | (2,334) | (55) |
28
* | Broadcom Corp. | (2,500) | (48) |
| Fidelity National |
|
|
| Information Services, Inc. | (539) | (21) |
| Applied Materials, Inc. | (1,000) | (20) |
|
|
| (4,272) |
Materials (–4.9%) |
|
| |
| Weyerhaeuser Co. | (7,900) | (514) |
| Allegheny Technologies Inc. | (2,700) | (193) |
| Louisiana-Pacific Corp. | (16,000) | (147) |
| Dow Chemical Co. | (3,800) | (140) |
* | Smurfit-Stone Container Corp. | (18,200) | (140) |
| Vulcan Materials Co. | (2,100) | (139) |
| Ashland, Inc. | (2,800) | (132) |
| Ecolab, Inc. | (2,900) | (126) |
| Praxair, Inc. | (1,500) | (126) |
| Chemtura Corp. | (17,000) | (125) |
| Newmont Mining Corp. |
|
|
| (Holding Co.) | (2,700) | (122) |
| International Flavors & |
|
|
| Fragrances, Inc. | (2,700) | (119) |
* | Crown Holdings, Inc. | (4,700) | (118) |
| Titanium Metals Corp. | (7,800) | (117) |
| Sigma-Aldrich Corp. | (1,700) | (101) |
| Sealed Air Corp. | (3,400) | (86) |
| Albemarle Corp. | (2,300) | (84) |
| Cabot Corp. | (2,200) | (62) |
| Bemis Co., Inc. | (1,800) | (46) |
| Eagle Materials, Inc. | (1,300) | (46) |
| Westlake Chemical Corp. | (2,500) | (33) |
| Rohm & Haas Co. | (500) | (27) |
| Nalco Holding Co. | (1,100) | (23) |
| E.I. du Pont de Nemours & Co. | (300) | (14) |
|
|
| (2,780) |
Telecommunication Services (–2.7%) |
| ||
* | American Tower Corp. |
|
|
| Class A | (11,200) | (439) |
| Sprint Nextel Corp. | (48,500) | (324) |
* | NII Holdings Inc. | (4,942) | (157) |
| Qwest Communications |
|
|
| International Inc. | (34,680) | (157) |
* | Metropcs |
|
|
| Communications Inc. | (9,100) | (155) |
* | Crown Castle |
|
|
| International Corp. | (2,900) | (100) |
| Citizens Communications Co. | (8,700) | (91) |
* | Level 3 Communications, Inc. | (25,500) | (54) |
| Verizon Communications Inc. | (900) | (33) |
* | SBA Communications Corp. | (600) | (18) |
* | Leap Wireless International, Inc. | (300) | (14) |
|
|
| (1,542) |
Utilities (–7.9%) |
|
| |
| Southern Co. | (16,400) | (584) |
| FPL Group, Inc. | (9,200) | (577) |
| FirstEnergy Corp. | (8,100) | (556) |
| PPL Corp. | (10,000) | (459) |
29
| Exelon Corp. | (4,000) | (325) |
| Allegheny Energy, Inc. | (4,900) | (247) |
| Integrys Energy Group, Inc. | (3,100) | (145) |
| Equitable Resources, Inc. | (2,400) | (141) |
| Aqua America, Inc. | (7,400) | (139) |
* | Dynegy, Inc. | (16,800) | (133) |
| NSTAR | (4,300) | (131) |
| Northeast Utilities | (5,300) | (130) |
| Pinnacle West Capital Corp. | (3,700) | (130) |
| Sierra Pacific Resources | (9,800) | (124) |
| Southern Union Co. | (4,800) | (112) |
| Sempra Energy | (2,000) | (107) |
* | AES Corp. | (5,200) | (87) |
| AGL Resources Inc. | (2,200) | (76) |
| DPL Inc. | (2,600) | (67) |
| PG&E Corp. | (1,800) | (66) |
| TECO Energy, Inc. | (4,000) | (64) |
| Constellation Energy Group, Inc. | (400) | (35) |
| Progress Energy, Inc. | (600) | (25) |
| OGE Energy Corp. | (700) | (22) |
| CMS Energy Corp. | (1,000) | (14) |
| NiSource, Inc. | (400) | (7) |
|
|
| (4,503) |
Total Common Stocks Sold Short |
|
| |
(Proceeds $54,307) |
| (52,139) | |
Temporary Cash Investment (3.9%) |
|
| |
1 Vanguard Market |
|
| |
Liquidity Fund, 2.800% |
|
| |
(Cost $2,226) | 2,226,103 | 2,226 | |
†Other Assets and |
|
| |
Liabilities—Net (95.4%) |
| 54,441 | |
Net Assets (100%) |
| 57,050 | |
|
|
| |
|
|
| |
Statement of Assets and Liabilities |
|
| |
Assets |
|
| |
Investment in Securities, |
|
| |
Long Positions at Value |
| 54,748 | |
Cash Deposited with Broker |
|
| |
for Short Positions |
| 52,582 | |
Receivables for Investment |
|
| |
Securities Sold |
| 2,027 | |
Other Assets—Note D |
| 1,171 | |
Total Assets |
| 110,528 | |
Liabilities |
|
| |
Securities Sold Short, at Value |
| 52,139 | |
Payables for Investment |
|
| |
Securities Purchased |
| 1,235 | |
Other Liabilities |
| 104 | |
Total Liabilities |
| 53,478 | |
Net Assets (100%) |
| 57,050 | |
30
At March 31, 2008, net assets consisted of:2 | |
| Amount |
| ($000) |
Paid-in Capital | 55,608 |
Undistributed Net Investment Income | 244 |
Accumulated Net Realized Losses | (117) |
Unrealized Appreciation (Depreciation) |
|
Investment Securities—Long Positions | (853) |
Investment Securities Sold Short | 2,168 |
Net Assets | 57,050 |
|
|
|
|
Investor Shares—Net Assets |
|
Applicable to 3,588,049 outstanding |
|
$.001 par value shares of beneficial |
|
interest (unlimited authorization) | 44,688 |
Net Asset Value Per Share— |
|
Investor Shares | $12.45 |
|
|
|
|
Institutional Shares—Net Assets |
|
Applicable to 998,037 outstanding |
|
$.001 par value shares of beneficial |
|
interest (unlimited authorization) | 12,362 |
Net Asset Value Per Share— |
|
Institutional Shares | $12.39 |
• See Note A in Notes to Financial Statements.
* Non-income-producing security.
† Long security positions with a value of $39,186,000 and cash of $52,582,000 have been segregated in connection with securities sold short.
1 Affiliated money market fund available only to Vanguard funds and certain trusts and accounts managed by Vanguard. Rate shown is the 7-day yield.
2 See Note E in Notes to Financial Statements for the tax-basis components of net assets.
REIT—Real Estate Investment Trust.
31
Statement of Operations
| Year Ended |
| March 31, 2008 |
| ($000) |
Investment Income |
|
Income |
|
Dividends | 333 |
Interest1 | 926 |
Total Income | 1,259 |
Expenses |
|
Investment Advisory Fees—Note B | 150 |
Fund Accounting and Administrative Fees—Note C | 69 |
Transfer Agency Fees—Note C | 19 |
Sub-accounting Fees—Investor Shares—Note C | 9 |
Distribution and Shareholder Service Fees—Investor Shares—Note C | 15 |
The Vanguard Group—Note D |
|
Management and Administrative |
|
Investor Shares | 3 |
Institutional Shares | — |
Custodian Fees | 7 |
Auditing Fees | 40 |
Shareholders’ Reports |
|
Investor Shares | 5 |
Institutional Shares | 1 |
Trustees’ Fees and Expenses | 6 |
Dividend Expense on Securities Sold Short | 375 |
Total Expenses | 699 |
Expense Waivers and Reimbursements—Notes B and C | (78) |
Net Expenses | 621 |
Net Investment Income | 638 |
Realized Net Gain (Loss) |
|
Investment Securities—Long Positions | 2,190 |
Investment Securities Sold Short | (131) |
Realized Net Gain (Loss) | 2,059 |
Change in Unrealized Appreciation (Depreciation) |
|
Investment Securities—Long Positions | (3,455) |
Investment Securities Sold Short | 2,164 |
Change in Unrealized Appreciation (Depreciation) | (1,291) |
Net Increase (Decrease) in Net Assets Resulting from Operations | 1,406 |
1 Interest income from an affiliated company of the fund was $40,000.
32
Statement of Changes in Net Assets
| Year Ended March 31, | |
| 2008 | 2007 |
| ($000) | ($000) |
Increase (Decrease) in Net Assets |
|
|
Operations |
|
|
Net Investment Income | 638 | 993 |
Realized Net Gain (Loss) | 2,059 | 594 |
Change in Unrealized Appreciation (Depreciation) | (1,291) | (363) |
Net Increase (Decrease) in Net Assets Resulting from Operations | 1,406 | 1,224 |
Distributions |
|
|
Net Investment Income |
|
|
Investor Shares | (344) | (405) |
Institutional Shares | (206) | (606) |
Realized Capital Gain |
|
|
Investor Shares | (200) | — |
Institutional Shares | (112) | — |
Total Distributions | (862) | (1,011) |
Capital Share Transactions—Note G |
|
|
Investor Shares | 35,479 | (2,689) |
Institutional Shares | 1,704 | (9,469) |
Net Increase (Decrease) from Capital Share Transactions | 37,183 | (12,158) |
Total Increase (Decrease) | 37,727 | (11,945) |
Net Assets |
|
|
Beginning of Period | 19,323 | 31,268 |
End of Period1 | 57,050 | 19,323 |
1 Net Assets—End of Period includes undistributed net investment income of $244,000 and $153,000. See accompanying Notes, which are an integral part of the Financial Statements.
33
Financial Highlights
Investor Shares |
|
|
|
|
|
|
|
|
|
|
|
|
|
|
|
| |
For a Share Outstanding | Year Ended March 31, | ||||
Throughout Each Period | 20081 | 2007 | 2006 | 2005 | 2004 |
Net Asset Value, Beginning of Period | $12.19 | $12.12 | $11.46 | $10.86 | $11.61 |
Investment Operations |
|
|
|
|
|
Net Investment Income (Loss) | .3112 | .50 | .22 | (.04)2 | (.10)2 |
Net Realized and Unrealized Gain (Loss) |
|
|
|
|
|
on Investments | .909 | .06 | .59 | .64 | (.65) |
Total from Investment Operations | 1.220 | .56 | .81 | .60 | (.75) |
Distributions |
|
|
|
|
|
Dividends from Net Investment Income | (.607) | (.49) | (.15) | — | — |
Distributions from Realized Capital Gains | (.353) | — | — | — | — |
Total Distributions | (.960) | (.49) | (.15) | — | — |
Net Asset Value, End of Period | $12.45 | $12.19 | $12.12 | $11.46 | $10.86 |
|
|
|
|
|
|
|
|
|
|
|
|
Total Return3 | 10.15% | 4.68% | 7.09% | 5.52% | –6.46% |
|
|
|
|
|
|
|
|
|
|
|
|
Ratios/Supplemental Data |
|
|
|
|
|
Net Assets, End of Period (Millions) | $45 | $9 | $12 | $13 | $9 |
Ratio of Expenses to Average Net Assets |
|
|
|
|
|
Based on Total Expenses | 3.09% | 3.46% | 3.31% | 3.55% | 3.51% |
Net of Expenses |
|
|
|
|
|
Waived/Reimbursed—Notes B and C | 2.79% | 2.98% | 3.02% | 3.26% | 3.12% |
Net of Expenses Waived/Reimbursed and |
|
|
|
|
|
Dividend Expense on Securities Sold Short— |
|
|
|
|
|
Notes B and C | 1.16% | 1.54% | 1.59% | 1.61% | 1.55% |
Ratio of Net Investment Income (Loss) |
|
|
|
|
|
to Average Net Assets—Net of Expenses |
|
|
|
|
|
Waived/Reimbursed—Notes B and C | 2.69% | 3.40% | 2.14% | (0.33%) | (0.93%) |
Portfolio Turnover Rate | 214% | 169% | 213% | 180% | 189% |
1 Laudus Rosenberg U.S. Large/Mid Capitalization Long/Short Equity Fund reorganized into Vanguard Market Neutral Fund effective December 1, 2007.
2 Calculated based on average shares outstanding.
3 Total returns do not reflect the 2% fee assessed until November 30, 2007, on redemptions of shares purchased within 30 days; the 1% fee assessed beginning December 1, 2007, on redemptions of shares held less than one year; or the account service fee that may be applicable to certain accounts with balances below $10,000.
34
Institutional Shares |
|
|
|
|
|
|
|
|
|
|
|
|
|
|
|
| |
For a Share Outstanding | Year Ended March 31, | ||||
Throughout Each Period | 20081 | 2007 | 2006 | 2005 | 2004 |
Net Asset Value, Beginning of Period | $12.14 | $12.08 | $11.44 | $10.80 | $11.51 |
Investment Operations |
|
|
|
|
|
Net Investment Income (Loss) | .3902 | .60 | .25 | (.01)2 | (.06)2 |
Net Realized and Unrealized Gain (Loss) |
|
|
|
|
|
on Investments | .864 | — | .58 | .65 | (.65) |
Total from Investment Operations | 1.254 | .60 | .83 | .64 | (.71) |
Distributions |
|
|
|
|
|
Dividends from Net Investment Income | (.651) | (.54) | (.19) | — | — |
Distributions from Realized Capital Gains | (.353) | — | — | — | — |
Total Distributions | (1.004) | (.54) | (.19) | — | — |
Net Asset Value, End of Period | $12.39 | $12.14 | $12.08 | $11.44 | $10.80 |
|
|
|
|
|
|
|
|
|
|
|
|
Total Return3 | 10.49% | 4.98% | 7.29% | 5.93% | –6.17% |
|
|
|
|
|
|
|
|
|
|
|
|
Ratios/Supplemental Data |
|
|
|
|
|
Net Assets, End of Period (Millions) | $12 | $10 | $20 | $12 | $20 |
Ratio of Expenses to Average Net Assets |
|
|
|
|
|
Based on Total Expenses | 2.97% | 3.07% | 3.01% | 3.23% | 3.22% |
Net of Expenses |
|
|
|
|
|
Waived/Reimbursed—Notes B and C | 2.56% | 2.67% | 2.71% | 2.94% | 2.82% |
Net of Expenses Waived/Reimbursed and |
|
|
|
|
|
Dividend Expense on Securities Sold Short— |
|
|
|
|
|
Notes B and C | 0.93% | 1.24% | 1.24% | 1.24% | 1.25% |
Ratio of Net Investment Income (Loss) |
|
|
|
|
|
to Average Net Assets—Net of Expenses |
|
|
|
|
|
Waived/Reimbursed—Notes B and C | 2.92% | 3.68% | 2.50% | (0.13%) | (0.57%) |
Portfolio Turnover Rate | 214% | 169% | 213% | 180% | 189% |
1 Laudus Rosenberg U.S. Large/Mid Capitalization Long/Short Equity Fund reorganized into Vanguard Market Neutral Fund effective December 1, 2007.
2 Calculated based on average shares outstanding.
3 Total returns do not reflect the 2% fee assessed until November 30, 2007, on redemptions of shares purchased within 30 days or the 1% fee assessed beginning December 1, 2007, on redemptions of shares held less than one year.
See accompanying Notes, which are an integral part of the Financial Statements.
35
Notes to Financial Statements
Vanguard Market Neutral Fund (formerly Laudus Rosenberg U.S. Large/Mid Capitalization Long/Short Equity Fund) is registered under the Investment Company Act of 1940 as an open-end investment company, or mutual fund. On November 21, 2007, Laudus Rosenberg U.S. Large/Mid Capitalization Long/Short Equity Fund shareholders approved its reorganization into Vanguard Market Neutral Fund, effective December 1, 2007. The fund files reports with the SEC under the company name Vanguard Montgomery Funds. The fund offers two classes of shares, Investor Shares and Institutional Shares. Investor Shares are available to any investor who meets the fund’s minimum purchase requirements. Institutional Shares are available to investors who invest a minimum amount of $5 million.
A. The following significant accounting policies conform to generally accepted accounting principles for U.S. mutual funds. The fund consistently follows such policies in preparing its financial statements.
1. Security Valuation: Securities are valued as of the close of trading on the New York Stock Exchange (generally 4 p.m., Eastern time) on the valuation date. Equity securities are valued at the latest quoted sales prices or official closing prices taken from the primary market in which each security trades; such securities not traded on the valuation date are valued at the mean of the latest quoted bid and asked prices. Securities for which market quotations are not readily available, or whose values have been materially affected by events occurring before the fund’s pricing time but after the close of the securities’ primary markets, are valued by methods deemed by the board of trustees to represent fair value. Investments in Vanguard Market Liquidity Fund are valued at that fund’s net asset value.
2. Short Sales: Short sales are the sales of securities that the fund does not own. The fund may sell a security it does not own in anticipation of a decline in the value of that security. In order to deliver the security to the purchaser, the fund borrows the security from a broker-dealer. The fund must segregate, as collateral for its obligation to return the borrowed security, an amount of cash and long security positions at least equal to the market value of the security sold short. The fund later closes out the position by returning the security to the lender, typically by purchasing the security in the open market. A gain, limited to the price at which the fund sold the security short, or a loss, theoretically unlimited in size, is recognized upon the termination of the short sale. Dividends on securities sold short are reported as an expense in the Statement of Operations.
Cash collateral segregated for securities sold short is recorded as an asset in the Statement of Assets and Liabilities. Long security positions segregated as collateral are shown in the Statement of Net Assets.
3. Federal Income Taxes: The fund intends to continue to qualify as a regulated investment company and distribute all of its taxable income. Accordingly, no provision for federal income taxes is required in the financial statements.
4. Distributions: Distributions to shareholders are recorded on the ex-dividend date.
5. Other: Dividend income (or dividend expense on short positions) is recorded on the ex-dividend date. Interest income includes income distributions received from Vanguard Market Liquidity Fund and is accrued daily. Security transactions are accounted for on the date securities are bought or sold. Costs used to determine realized gains (losses) on the sale of investment securities are those of the specific securities sold. Fees assessed on redemptions of capital shares are credited to paid-in capital.
Each class of shares has equal rights as to assets and earnings, except that each class separately bears certain class-specific expenses related to marketing and distribution, maintenance of shareholder accounts, and shareholder reporting. Income, other non-class-specific expenses, and gains and losses on investments are allocated to each class of shares
36
based on its relative net assets.
B. For the period March 31, 2007, through November 30, 2007, Charles Schwab Investment Management, Inc. (CSIM), provided investment advisory services to the fund. CSIM, not the fund, paid AXA Rosenberg Investment Management LLC, the fund’s sub-advisor, a portion of the fee it received for portfolio management services. Advisory fees represented 0.67% of the fund’s average net assets for that time period.
Beginning December 1, 2007, AXA Rosenberg Investment Management LLC provides investment advisory services to a portion of the fund for a fee calculated at an annual percentage rate of average net assets managed by the advisor. In accordance with the advisory contract entered into with AXA Rosenberg Investment Management LLC in December 2007, beginning October 1, 2008, the investment advisory fee will be subject to quarterly adjustments based on performance since January 1, 2008, relative to the Citigroup 3-Month Treasury Bill Index.
Effective January 7, 2008, The Vanguard Group manages a portion of the fund. The Vanguard Group also manages the cash reserves of the fund on an at-cost basis.
For the year ended March 31, 2008, the aggregate investment advisory fee represented an effective annual rate of 0.65% of the fund’s average net assets.
C. Prior to December 1, 2007, CSIM contractually agreed to reimburse the fund for certain expenses to limit Investor Shares’ and Institutional Shares’ annual expenses (excluding dividends on securities sold short) to 1.54% and 1.24%, respectively, of average net assets. Accordingly, CSIM waived $72,000 of its fee, representing 0.40% of the fund’s average net assets for that time period.
Prior to December 1, 2007, State Street Bank & Trust Company provided fund accounting and certain administrative services to the fund. ALPS Distributors, Inc., provided distribution and shareholder services to the fund’s Investor Shares under a plan adopted in accordance with Rule 12b-1 under the Investment Company Act of 1940. Boston Financial Data Services, Inc., provided transfer agent services to the fund and sub-accounting services to the Investor Shares. For the period March 31, 2007, to November 30, 2007, CSIM reimbursed the Investor Shares $6,000 for sub-accounting services, representing 0.07% of the Investor Shares’ average net assets for the period.
D. Effective December 1, 2007, The Vanguard Group furnishes at cost corporate management, administrative, marketing, and distribution services. The costs of such services are allocated to the fund under methods approved by the board of trustees. The fund has committed to provide up to 0.40% of its net assets in capital contributions to Vanguard. At March 31, 2008, the fund had contributed capital of $4,000 to Vanguard (included in Other Assets), representing 0.010% of the fund’s net assets and 0.004% of Vanguard’s capitalization. The fund’s trustees and officers are also directors and officers of Vanguard.
E. Distributions are determined on a tax basis and may differ from net investment income and realized capital gains for financial reporting purposes. Differences may be permanent or temporary. Permanent differences are reclassified among capital accounts in the financial statements to reflect their tax character. Temporary differences arise when certain items of income, expense, gain, or loss are recognized in different periods for financial statement and tax purposes; these differences will reverse at some time in the future. Differences in classification may also result from the treatment of short-term gains as ordinary income for tax purposes.
For tax purposes, at March 31, 2008, the fund had $484,000 of ordinary income and $41,000 of long-term gains available for distribution.
37
At March 31, 2008, the cost of long security positions for tax purposes was $55,855,000. Net unrealized depreciation of long security positions for tax purposes was $1,107,000, consisting of unrealized gains of $1,524,000 on securities that had risen in value since their purchase and $2,631,000 in unrealized losses on securities that had fallen in value since their purchase. Tax-basis net unrealized appreciation on securities sold short was $2,024,000, consisting of unrealized gains of $3,269,000 on securities that had fallen in value since their sale and $1,245,000 in unrealized losses on securities that had risen in value since their sale. The difference between book- and tax-basis unrealized appreciation (depreciation) is attributable primarily to the tax deferral of losses on wash sales.
F. During the year ended March 31, 2008, the fund purchased $82,954,000 of investment securities and sold $47,661,000 of investment securities, other than temporary cash investments. The proceeds of short sales and the cost of purchases to cover short sales were $75,993,000 and $40,145,000 respectively.
G. Capital shares issued and redeemed were:
| Year Ended March 31, | ||||
|
| 2008 |
|
| 2007 |
| Amount | Shares |
| Amount | Shares |
| ($000) | (000) |
| ($000) | (000) |
Investor Shares |
|
|
|
|
|
Issued | 42,479 | 3,395 |
| 6,488 | 528 |
Issued in Lieu of Cash Distributions | 436 | 36 |
| 378 | 31 |
Redeemed1 | (7,436) | (593) |
| (9,555) | (779) |
Net Increase (Decrease)—Investor Shares | 35,479 | 2,838 |
| (2,689) | (220) |
Institutional Shares |
|
|
|
|
|
Issued | 9,106 | 742 |
| 4,377 | 359 |
Issued in Lieu of Cash Distributions | 318 | 26 |
| 597 | 49 |
Redeemed1 | (7,720) | (608) |
| (14,443) | (1,185) |
Net Increase (Decrease)—Institutional Shares | 1,704 | 160 |
| (9,469) | (777) |
H. In June 2006, the Financial Accounting Standards Board issued Interpretation No. 48 (“FIN 48”), “Accounting for Uncertainty in Income Taxes.” FIN 48 establishes the minimum threshold for recognizing, and a system for measuring, the benefits of tax-return positions in financial statements, effective for the fund’s current fiscal year. Management has analyzed the fund’s tax positions taken on federal income tax returns for all open tax years (tax years ended March 31, 2005–2008) for purposes of implementing FIN 48, and has concluded that no provision for income tax is required in the fund’s financial statements.
1 Net of redemption fees of $4,000 and $9,000 (fund totals).
38
Report of Independent Registered
Public Accounting Firm
To the Board of Trustees of the Vanguard Montgomery Funds and the Shareholders of the Vanguard Market Neutral Fund:
In our opinion, the accompanying statements of assets and liabilities, including the schedules of investments, and the related statements of operations and of changes in net assets and the financial highlights present fairly, in all material respects, the financial position of Vanguard Market Neutral Fund (formerly Laudus Rosenberg U.S. Large/Mid Capitalization Long/Short Equity Fund, hereafter referred to as the “Fund”) at March 31, 2008, the results of its operations for the year then ended, the changes in its net assets for each of the two years in the period then ended and the financial highlights for each of the five years in the period then ended, in conformity with accounting principles generally accepted in the United States of America. These financial statements and financial highlights (hereafter referred to as “financial statements”) are the responsibility of the Fund’s management; our responsibility is to express an opinion on these financial statements based on our audits. We conducted our audits of these financial statements in accordance with the standards of the Public Company Accounting Oversight Board (United States). Those standards require that we plan and perform the audit to obtain reasonable assurance about whether the financial statements are free of material misstatement. An audit includes examining, on a test basis, evidence supporting the amounts and disclosures in the financial statements, assessing the accounting principles used and significant estimates made by management, and evaluating the overall financial statement presentation. We believe that our audits, which included confirmation of securities at March 31, 2008 by correspondence with the custodians and brokers and by agreement to the underlying ownership records for Vanguard Market Liquidity Fund, provide a reasonable basis for our opinion.
PricewaterhouseCoopers LLP
Philadelphia, Pennsylvania
May 13, 2008
Special 2007 tax information (unaudited) for Vanguard Market Neutral Fund
This information for the period December 1, 2007, through March 31, 2008, is included pursuant to provisions of the Internal Revenue Code.
For corporate shareholders, 33.0% of investment income (dividend income plus short-term gains, if any) qualifies for the dividends-received deduction.
39
Your Fund’s After-Tax Returns
This table presents returns for your fund both before and after taxes. The after-tax returns are shown in two ways: (1) assuming that an investor owned the fund during the entire period and paid taxes on the fund’s distributions, and (2) assuming that an investor paid taxes on the fund’s distributions and sold all shares at the end of each period.
Calculations are based on the highest individual federal income tax and capital gains tax rates in effect at the times of the distributions and the hypothetical sales. State and local taxes were not considered. After-tax returns reflect any qualified dividend income. (In the example, returns after the sale of fund shares may be higher than those assuming no sale. This occurs when the sale would have produced a capital loss. The calculation assumes that the investor received a tax deduction for the loss.)
The table shows returns for Investor Shares only; returns for other share classes will differ. Please note that your actual after-tax returns will depend on your tax situation and may differ from those shown. Also note that if you own the fund in a tax-deferred account, such as an individual retirement account or a 401(k) plan, this information does not apply to you. Such accounts are not subject to current taxes.
Finally, keep in mind that a fund’s performance—whether before or after taxes—does not guarantee future results.
Average Annual Total Returns: Market Neutral Fund Investor Shares | |||
Periods Ended March 31, 2008 |
|
|
|
| One | Five | Since |
| Year | Years | Inception1 |
Returns Before Taxes | 10.15% | 4.04% | 5.31% |
Returns After Taxes on Distributions | 8.36 | 3.32 | 4.32 |
Returns After Taxes on Distributions and Sale of Fund Shares | 7.57 | 3.12 | 4.01 |
1 November 11, 1998.
40
About Your Fund’s Expenses
As a shareholder of the fund, you incur ongoing costs, which include costs for portfolio management, administrative services, and shareholder reports (like this one), among others. Operating expenses, which are deducted from a fund’s gross income, directly reduce the investment return of the fund.
A fund’s expenses are expressed as a percentage of its average net assets. This figure is known as the expense ratio. The following examples are intended to help you understand the ongoing costs (in dollars) of investing in your fund and to compare these costs with those of other mutual funds. The examples are based on an investment of $1,000 made at the beginning of the period shown and held for the entire period.
The table below illustrates your fund’s costs in two ways:
• Based on actual fund return. This section helps you to estimate the actual expenses that you paid over the period. The “Ending Account Value” shown is derived from the fund’s actual return, and the third column shows the dollar amount that would have been paid by an investor who started with $1,000 in the fund. You may use the information here, together with the amount you invested, to estimate the expenses that you paid over the period.
To do so, simply divide your account value by $1,000 (for example, an $8,600 account value divided by $1,000 = 8.6), then multiply the result by the number given for your fund under the heading “Expenses Paid During Period.”
• Based on hypothetical 5% yearly return. This section is intended to help you compare your fund’s costs with those of other mutual funds. It assumes that the fund had a yearly return of 5% before expenses, but that the expense ratio is unchanged. In this case—because the return used is not the fund’s actual return—the results do not apply to your investment. The example is useful in making comparisons because the Securities and Exchange Commission requires all mutual funds to calculate expenses based on a 5% return. You can assess your fund’s costs by comparing this hypothetical example with the hypothetical examples that appear in shareholder reports of other funds.
Six Months Ended March 31, 2008 |
|
|
|
| Beginning | Ending | Expenses |
| Account Value | Account Value | Paid During |
Market Neutral Fund | 9/30/2007 | 3/31/2008 | Period1 |
Based on Actual Fund Return |
|
|
|
Investor Shares | $1,000.00 | $1,063.15 | $13.00 |
Institutional Shares | 1,000.00 | 1,064.55 | 11.92 |
Based on Hypothetical 5% Yearly Return |
|
|
|
Investor Shares | $1,000.00 | $1,012.40 | $12.68 |
Institutional Shares | 1,000.00 | 1,013.45 | 11.63 |
1 The calculations are based on expenses incurred in the most recent six-month period. The fund’s annualized six-month expense ratios (net of waivers and reimbursements) for that period are 2.52% for Investor Shares and 2.31% for Institutional Shares. The dollar amounts shown as “Expenses Paid” are equal to the annualized expense ratio multiplied by the average account value over the period, multiplied by the number of days in the most recent six-month period, then divided by the number of days in the most recent 12-month period.
41
Note that the expenses shown in the table on page 32 are meant to highlight and help you compare ongoing costs only and do not reflect transaction costs incurred by the fund for buying and selling securities. Further, the expenses do not include the 2% fee assessed until November 30, 2007, on redemptions of shares purchased within 30 days or the 1% fee assessed beginning December 1, 2007, on redemptions of shares held for less than one year.
The calculations assume no shares were bought or sold during the period. Your actual costs may have been higher or lower, depending on the amount of your investment and the timing of any purchases or redemptions.
You can find more information about the fund’s expenses, including annual expense ratios, in the Financial Statements section of this report. For additional information on operating expenses and other shareholder costs, please refer to your fund’s current prospectus.
42
Trustees Approve Advisory Arrangements
The board of trustees of Vanguard Market Neutral Fund approved the fund’s investment advisory arrangements with AXA Rosenberg Investment Management LLC (AXA Rosenberg) and The Vanguard Group, Inc., through its Quantitative Equity Group (QEG), prior to the reorganization of the Laudus Rosenberg U.S. Large/Mid Capitalization Long/Short Equity Fund (Laudus Fund) into Vanguard Market Neutral Fund. The board determined that retaining AXA Rosenberg and adding Vanguard to manage a portion of the fund would be in the best interests of the fund and its shareholders.
The board based its decisions upon an evaluation of each advisor’s investment staff, portfolio management process, and performance with similar mandates. The trustees considered the factors discussed below, among others. However, no single factor determined whether the board approved the arrangements. Rather, it was the totality of the circumstances that drove the board’s decision.
Nature, extent, and quality of services
The board considered the benefits to shareholders of selecting AXA Rosenberg and QEG as advisors to the fund, particularly in light of the nature, extent, and quality of services to be provided by each advisor. The board noted the following:
AXA Rosenberg Investment Management. AXA Rosenberg was founded in 1985 by Barr Rosenberg and Ken Reid, who are still involved with the firm’s research and portfolio management efforts. The firm has had low turnover among senior management, with key investment professionals having been with the firm for 10 to 20 years. The Portfolio Management, Research, and Trading teams each have more than 15 years’ investment experience, on average. Portfolio Manager William E. Ricks has managed the Laudus Fund since its inception in 1998. AXA Rosenberg’s investment philosophy is grounded upon fundamental analysis using a two-part quantitative model—a valuation model and an earnings forecast model—and has achieved solid performance results.
The Vanguard Group. Vanguard has been managing investments for more than two decades. George U. Sauter, Vanguard managing director and chief investment officer, has been in the investment management business since 1985. Mr. Sauter has led the Quantitative Equity Group since 1987. James D. Troyer, the manager primarily responsible for the day-to-day management of the Vanguard portion of the fund, has worked in investment management since 1979. The team has a track record of success and disciplined investment processes.
The board concluded that each advisor’s experience, stability, depth, and performance, among other factors, warranted approval of the advisory arrangements.
Investment performance
The board considered the short- and long-term performance of the Laudus Fund, including any periods of outperformance or underperformance of a relevant benchmark. The board noted that the Laudus Fund, under AXA Rosenberg’s management, has outperformed its benchmark, the Citigroup 3-Month Treasury Bill Index, over the last one-, three-, and five-year periods. The board concluded that AXA Rosenberg has carried out the Laudus Fund’s investment strategy in disciplined fashion.
The board further concluded that QEG, in its management of other Vanguard funds, has a track record of consistent performance and disciplined investment management processes.
43
Cost
The board evaluated the cost of services to be provided, including consideration of competitive fee rates, and concluded that the fund’s advisory expense ratio would be well below the average advisory expense ratio for its peer group. Information about the fund’s expense ratio appears in the Financial Statements section of this report.
The board did not consider profitability of AXA Rosenberg in determining whether to approve the advisory fee, because AXA Rosenberg is independent of Vanguard, and the advisory fee is the result of arm’slength negotiations.
The board does not conduct a profitability analysis of Vanguard, because of Vanguard’s unique “at-cost” structure. Unlike most other mutual fund management companies, Vanguard is owned by the funds it oversees, and produces “profits” only in the form of reduced expenses for fund shareholders.
The benefit of economies of scale
The board concluded that the fund’s shareholders benefit from economies of scale because of breakpoints in the advisory fee schedule for AXA Rosenberg. The breakpoints reduce the effective rate of the fees as the fund’s assets managed by AXA Rosenberg increase. The board also concluded that the fund’s low-cost arrangement with Vanguard ensures that the fund will realize economies of scale as it grows, with the cost to shareholders declining as fund assets managed by Vanguard increase.
The board will consider whether to renew the advisory arrangements after a one-year period.
44
Glossary
Beta. A measure of the magnitude of a fund’s past share-price fluctuations in relation to the ups and downs of a given market index. The index is assigned a beta of 1.00. Compared with a given index, a fund with a beta of 1.20 typically would have seen its share price rise or fall by 12% when the index rose or fell by 10%. For this report, beta is based on returns over the past 36 months for both the fund and the index. Note that a fund’s beta should be reviewed in conjunction with its R-squared (see definition below). The lower the R-squared, the less correlation there is between the fund and the index, and the less reliable beta is as an indicator of volatility.
Earnings Growth Rate. The average annual rate of growth in earnings over the past five years for the stocks now in a fund.
Equity Exposure. A measure that reflects a fund’s investments in stocks and stock futures. Any holdings in short-term reserves are excluded.
Expense Ratio. The percentage of a fund’s average net assets used to pay its annual administrative and advisory expenses. These expenses directly reduce returns to investors.
Foreign Holdings. The percentage of a fund represented by stocks or depositary receipts of companies based outside the United States.
Inception Date. The date on which the assets of a fund (or one of its share classes) are first invested in accordance with the fund’s investment objective. For funds with a subscription period, the inception date is the day after that period ends. Investment performance is measured from the inception date.
Median Market Cap. An indicator of the size of companies in which a fund invests; the midpoint of market capitalization (market price x shares outstanding) of a fund’s stocks, weighted by the proportion of the fund’s assets invested in each stock. Stocks representing half of the fund’s assets have market capitalizations above the median, and the rest are below it.
Price/Book Ratio. The share price of a stock divided by its net worth, or book value, per share. For a fund, the weighted average price/book ratio of the stocks it holds.
Price/Earnings Ratio. The ratio of a stock’s current price to its per-share earnings over the past year. For a fund, the weighted average P/E of the stocks it holds. P/E is an indicator of market expectations about corporate prospects; the higher the P/E, the greater the expectations for a company’s future growth.
R-Squared. A measure of how much of a fund’s past returns can be explained by the returns from the market in general, as measured by a given index. If a fund’s total returns were precisely synchronized with an index’s returns, its R-squared would be 1.00. If the fund’s returns bore no relationship to the index’s returns, its R-squared would be 0. For this report, R-squared is based on returns over the past 36 months for both the fund and the index.
Return on Equity. The annual average rate of return generated by a company during the past five years for each dollar of shareholder’s equity (net income divided by shareholder’s equity). For a fund, the weighted average return on equity for the companies whose stocks it holds.
Short-Term Reserves. The percentage of a fund invested in highly liquid, short-term securities that can be readily converted to cash.
45
Turnover Rate. An indication of the fund’s trading activity. Funds with high turnover rates incur higher transaction costs and may be more likely to distribute capital gains (which may be taxable to investors). The turnover rate excludes in-kind transactions, which have minimal impact on costs.
Yield. A fund’s 30-day SEC yield is derived using a formula specified by the U.S. Securities and Exchange Commission. Under the formula, data related to the fund’s security holdings in the previous 30 days are used to calculate the fund’s hypothetical net income for that period, which is then annualized and divided by the fund’s estimated average net assets over the calculation period. For the purposes of this calculation, a security’s income is based on its current market yield to maturity (in the case of bonds) or its projected dividend yield (for stocks). Because the SEC yield represents hypothetical annualized income, it will differ—at times significantly—from the fund’s actual experience. As a result, the fund’s income distributions may be higher or lower than implied by the SEC yield.
46
This page intentionally left blank.
This page intentionally left blank.
The People Who Govern Your Fund
The trustees of your mutual fund are there to see that the fund is operated and managed in your best interests since, as a shareholder, you are a part owner of the fund. Your fund’s trustees also serve on the board of directors of The Vanguard Group, Inc., which is owned by the Vanguard funds and provides services to them on an at-cost basis.
A majority of Vanguard’s board members are independent, meaning that they have no affiliation with Vanguard or the funds they oversee, apart from the sizable personal investments they have made as private individuals.
Our independent board members bring distinguished backgrounds in business, academia, and public service to their task of working with Vanguard officers to establish the policies and oversee the activities of the funds. Among board members’ responsibilities are selecting investment advisors for the funds; monitoring fund operations, performance, and costs; reviewing contracts; nominating and selecting new trustees/directors; and electing Vanguard officers.
Each trustee serves a fund until its termination; or until the trustee’s retirement, resignation, or death; or otherwise as specified in the fund’s organizational documents. Any trustee may be removed at a shareholders’ meeting by a vote representing two-thirds of the net asset value of all shares of the fund together with shares of other Vanguard funds organized within the same trust. The table on these two pages shows information for each trustee and executive officer of the fund. The mailing address of the trustees and officers is P.O. Box 876, Valley Forge, PA 19482.
Chairman of the Board, Chief Executive Officer, and Trustee | |
|
|
John J. Brennan1 |
|
Born 1954 | Principal Occupation(s) During the Past Five Years: Chairman of the Board, Chief Executive |
Trustee since May 1987; | Officer, and Director/Trustee of The Vanguard Group, Inc., and of each of the investment |
Chairman of the Board and | companies served by The Vanguard Group; Director of Vanguard Marketing Corporation. |
Chief Executive Officer |
|
155 Vanguard Funds Overseen |
|
|
|
Independent Trustees |
|
|
|
Charles D. Ellis |
|
Born 1937 | Principal Occupation(s) During the Past Five Years: Applecore Partners (pro bono ventures |
Trustee since January 2001 | in education); Senior Advisor to Greenwich Associates (international business strategy |
155 Vanguard Funds Overseen | consulting); Successor Trustee of Yale University; Overseer of the Stern School of Business |
| at New York University; Trustee of the Whitehead Institute for Biomedical Research. |
|
|
Emerson U. Fullwood |
|
Born 1948 | Principal Occupation(s) During the Past Five Years: Executive Chief Staff and Marketing |
Trustee since January 2008 | Officer for North America since 2004 and Corporate Vice President of Xerox Corporation |
155 Vanguard Funds Overseen | (photocopiers and printers); Director of SPX Corporation (multi-industry manufacturing), |
| of the United Way of Rochester, and of the Boy Scouts of America. |
|
|
Rajiv L. Gupta |
|
Born 1945 | Principal Occupation(s) During the Past Five Years: Chairman, President, and |
Trustee since December 20012 | Chief Executive Officer of Rohm and Haas Co. (chemicals); Board Member of |
155 Vanguard Funds Overseen | the American Chemistry Council; Director of Tyco International, Ltd. (diversified |
| manufacturing and services) since 2005. |
|
|
Amy Gutmann |
|
Born 1949 | Principal Occupation(s) During the Past Five Years: President of the University of |
Trustee since June 2006 | Pennsylvania since 2004; Professor in the School of Arts and Sciences, Annenberg School |
155 Vanguard Funds Overseen | for Communication, and Graduate School of Education of the University of Pennsylvania |
| since 2004; Provost (2001–2004) and Laurance S. Rockefeller Professor of Politics and |
| the University Center for Human Values (1990–2004), Princeton University; Director of |
| Carnegie Corporation of New York since 2005 and of Schuylkill River Development |
| Corporation and Greater Philadelphia Chamber of Commerce since 2004; Trustee of |
| the National Constitution Center since 2007. |
JoAnn Heffernan Heisen |
|
Born 1950 | Principal Occupation(s) During the Past Five Years: Corporate Vice President and |
Trustee since July 1998 | Chief Global Diversity Officer since 2006, Vice President and Chief Information |
155 Vanguard Funds Overseen | Officer (1997–2005), and Member of the Executive Committee of Johnson & |
| Johnson (pharmaceuticals/consumer products); Director of the University Medical |
| Center at Princeton and Women’s Research and Education Institute. |
|
|
André F. Perold |
|
Born 1952 | Principal Occupation(s) During the Past Five Years: George Gund Professor of Finance |
Trustee since December 2004 | and Banking, Harvard Business School; Senior Associate Dean and Director of Faculty |
155 Vanguard Funds Overseen | Recruiting, Harvard Business School; Director and Chairman of UNX, Inc. (equities |
| trading firm); Chair of the Investment Committee of HighVista Strategies LLC (private |
| investment firm) since 2005. |
|
|
Alfred M. Rankin, Jr. |
|
Born 1941 | Principal Occupation(s) During the Past Five Years: Chairman, President, Chief Executive |
Trustee since January 1993 | Officer, and Director of NACCO Industries, Inc. (forklift trucks/housewares/lignite); Director |
155 Vanguard Funds Overseen | of Goodrich Corporation (industrial products/aircraft systems and services). |
|
|
|
|
J. Lawrence Wilson |
|
Born 1936 | Principal Occupation(s) During the Past Five Years: Retired Chairman and Chief Executive |
Trustee since April 1985 | Officer of Rohm and Haas Co. (chemicals); Director of Cummins Inc. (diesel engines) and |
155 Vanguard Funds Overseen | AmerisourceBergen Corp. (pharmaceutical distribution); Trustee of Vanderbilt University |
| and of Culver Educational Foundation. |
|
|
|
|
Executive Officers1 |
|
|
|
Thomas J. Higgins |
|
Born 1957 | Principal Occupation(s) During the Past Five Years: Principal of The Vanguard Group, Inc.; |
Treasurer since July 1998 | Treasurer of each of the investment companies served by The Vanguard Group. |
155 Vanguard Funds Overseen |
|
|
|
|
|
F. William McNabb III |
|
Born 1957 | Principal Occupation(s) During the Past Five Years: President of The Vanguard Group, Inc., |
President since March 2008 | and of each of the investment companies served by The Vanguard Group since 2008; |
155 Vanguard Funds Overseen | Director of Vanguard Marketing Corporation; Managing Director of The Vanguard Group |
| (1995–2008). |
|
|
Heidi Stam |
|
Born 1956 | Principal Occupation(s) During the Past Five Years: Managing Director of The Vanguard |
Secretary since July 2005 | Group, Inc., since 2006; General Counsel of The Vanguard Group since 2005; Secretary of |
155 Vanguard Funds Overseen | The Vanguard Group, and of each of the investment companies served by The Vanguard |
| Group, since 2005; Director and Senior Vice President of Vanguard Marketing Corporation |
| since 2005; Principal of The Vanguard Group (1997–2006). |
Vanguard Senior Management Team |
|
| |
|
|
|
|
R. Gregory Barton | Kathleen C. Gubanich | Michael S. Miller | George U. Sauter |
Mortimer J. Buckley | Paul A. Heller | Ralph K. Packard |
|
Founder |
|
John C. Bogle |
Chairman and Chief Executive Officer, 1974–1996 |
1 Officers of the funds are “interested persons” as defined in the Investment Company Act of 1940.
2 December 2002 for Vanguard Equity Income Fund, Vanguard Growth Equity Fund, the Vanguard Municipal Bond Funds, and the Vanguard State Tax-Exempt Funds.
More information about the trustees is in the Statement of Additional Information, available from The Vanguard Group.

P.O. Box 2600
Valley Forge, PA 19482-2600
Connect with Vanguard® > www.vanguard.com
Fund Information > 800-662-7447 | Vanguard, Connect with Vanguard, and the ship logo are |
| trademarks of The Vanguard Group, Inc. |
Direct Investor Account Services > 800-662-2739 |
|
| All other marks are the exclusive property of their |
Institutional Investor Services > 800-523-1036 | respective owners. |
|
|
Text Telephone for People |
|
With Hearing Impairment > 800-952-3335 | All comparative mutual fund data are from Lipper Inc. |
| or Morningstar, Inc., unless otherwise noted. |
|
|
|
|
| You can obtain a free copy of Vanguard’s proxy voting |
| guidelines by visiting our website, www.vanguard.com, |
This material may be used in conjunction | and searching for “proxy voting guidelines,” or by |
with the offering of shares of any Vanguard | calling Vanguard at 800-662-2739. The guidelines are |
fund only if preceded or accompanied by | also available from the SEC’s website, www.sec.gov. |
the fund’s current prospectus. | In addition, you may obtain a free report on how your |
| fund voted the proxies for securities it owned during |
| the 12 months ended June 30. To get the report, visit |
| either www.vanguard.com or www.sec.gov. |
|
|
|
|
|
|
| You can review and copy information about your fund |
| at the SEC’s Public Reference Room in Washington, D.C. |
| To find out more about this public service, call the SEC |
| at 202-551-8090. Information about your fund is also |
| available on the SEC’s website, and you can receive |
| copies of this information, for a fee, by sending a |
| request in either of two ways: via e-mail addressed to |
| publicinfo@sec.gov or via regular mail addressed to the |
| Public Reference Section, Securities and Exchange |
| Commission, Washington, DC 20549-0102. |
|
|
|
|
|
|
|
|
|
|
| © 2008 The Vanguard Group, Inc. |
| All rights reserved. |
| Vanguard Marketing Corporation, Distributor. |
|
|
| Q6340 052008 |
Item 2: Code of Ethics. The Registrant has adopted a code of ethics that applies to the Registrant’s principal executive officer, principal financial officer, principal accounting officer or controller or persons performing similar functions. The Code of Ethics was amended during the reporting period covered by this report to make certain technical, non-material changes.
Item 3: Audit Committee Financial Expert. The following members of the Audit Committee have been determined by the Registrant’s Board of Trustees to be Audit Committee Financial Experts serving on its Audit Committee, and to be independent: Charles D. Ellis, Rajiv L. Gupta, JoAnn Heffernan Heisen, André F. Perold, Alfred M. Rankin, Jr., and J. Lawrence Wilson.
Item 4: Principal Accountant Fees and Services.
(a) Audit Fees.
Audit Fees of the Registrant
Fiscal Year Ended March 31, 2008: $40,000
Fiscal Year Ended March 31, 2007: N/A
Aggregate Audit Fees of Registered Investment Companies in the Vanguard Group.
Fiscal Year Ended March 31, 2008: $2,835,320
Fiscal Year Ended March 31, 2007: $2,347,620
(b) Audit-Related Fees.
Fiscal Year Ended March 31, 2008: $630,400
Fiscal Year Ended March 31, 2007: $530,000
Includes fees billed in connection with assurance and related services provided to the Registrant, The Vanguard Group, Inc., Vanguard Marketing Corporation, and other registered investment companies in the Vanguard Group.
(c) Tax Fees.
Fiscal Year Ended March 31, 2008: $215,900
Fiscal Year Ended March 31, 2007: $101,300
Includes fees billed in connection with tax compliance, planning and advice services provided to the Registrant, The Vanguard Group, Inc., Vanguard Marketing Corporation, and other registered investment companies in the Vanguard Group and related to income and excise taxes.
(d) All Other Fees.
Fiscal Year Ended March 31, 2008: $0
Fiscal Year Ended March 31, 2007: $0
Includes fees billed for services related to risk management and privacy matters. Services were provided to the Registrant, The Vanguard Group, Inc., Vanguard Marketing Corporation, and other registered investment companies in the Vanguard Group.
(e) (1) Pre-Approval Policies. The policy of the Registrant’s Audit Committee is to consider and, if appropriate, approve before the principal accountant is engaged for such services, all specific audit and non-audit services provided to: (1) the Registrant; (2) The Vanguard Group, Inc.; (3) other entities controlled by The Vanguard Group, Inc. that provide ongoing services to the Registrant; and (4) other registered investment companies in the Vanguard Group. In making a determination, the Audit
Committee considers whether the services are consistent with maintaining the principal accountant’s independence.
In the event of a contingency situation in which the principal accountant is needed to provide services in between scheduled Audit Committee meetings, the Chairman of the Audit Committee would be called on to consider and, if appropriate, pre-approve audit or permitted non-audit services in an amount sufficient to complete services through the next Audit Committee meeting, and to determine if such services would be consistent with maintaining the accountant’s independence. At the next scheduled Audit Committee meeting, services and fees would be presented to the Audit Committee for formal consideration, and, if appropriate, approval by the entire Audit Committee. The Audit Committee would again consider whether such services and fees are consistent with maintaining the principal accountant’s independence.
The Registrant’s Audit Committee is informed at least annually of all audit and non-audit services provided by the principal accountant to the Vanguard complex, whether such services are provided to: (1) the Registrant; (2) The Vanguard Group, Inc.; (3) other entities controlled by The Vanguard Group, Inc. that provide ongoing services to the Registrant; or (4) other registered investment companies in the Vanguard Group.
(2) No percentage of the principal accountant’s fees or services were approved pursuant to the waiver provision of paragraph (c)(7)(i)(C) of Rule 2-01 of Regulation S-X.
(f) For the most recent fiscal year, over 50% of the hours worked under the principal accountant’s engagement were not performed by persons other than full-time, permanent employees of the principal accountant.
(g) Aggregate Non-Audit Fees.
Fiscal Year Ended March 31, 2008: $215,900
Fiscal Year Ended March 31, 2007: $101,300
Includes fees billed for non-audit services provided to the Registrant, The Vanguard Group, Inc., Vanguard Marketing Corporation, and other registered investment companies in the Vanguard Group.
(h) For the most recent fiscal year, the Audit Committee has determined that the provision of all non-audit services was consistent with maintaining the principal accountant’s independence.
Item 5: Not Applicable.
Item 6: Not Applicable.
Item 7: Not Applicable.
Item 8: Not Applicable.
Item 9: Not Applicable.
Item 10: Not Applicable.
Item 11: Controls and Procedures.
(a) Disclosure Controls and Procedures. The Principal Executive and Financial Officers concluded that the Registrant's Disclosure Controls and Procedures are effective based on their evaluation of the Disclosure Controls and Procedures as of a date within 90 days of the filing date of this report.
(b) Internal Control Over Financial Reporting. There were no significant changes in Registrant’s Internal Control Over Financial Reporting or in other factors that could significantly affect this control
subsequent to the date of the evaluation, including any corrective actions with regard to significant deficiencies and material weaknesses.
Item 12: Exhibits.
(a) Code of Ethics.
(b) Certifications.
Pursuant to the requirements of the Securities Exchange Act of 1934 and the Investment Company Act of 1940, the registrant has duly caused this report to be signed on its behalf by the undersigned, thereunto duly authorized.
| VANGUARD MONTGOMERY FUNDS |
|
|
By: | (signature) |
| (HEIDI STAM) |
| JOHN J. BRENNAN* |
| CHIEF EXECUTIVE OFFICER |
Date: May 13, 2008
Pursuant to the requirements of the Securities Exchange Act of 1934 and the Investment Company Act of 1940, this report has been signed below by the following persons on behalf of the registrant and in the capacities and on the dates indicated.
| VANGUARD MONTGOMERY FUNDS |
|
|
By: | (signature) |
| (HEIDI STAM) |
| JOHN J. BRENNAN* |
| CHIEF EXECUTIVE OFFICER |
Date: May 13, 2008
| VANGUARD MONTGOMERY FUNDS |
|
|
By: | (signature) |
| (HEIDI STAM) |
| THOMAS J. HIGGINS * |
| TREASURER |
Date: May 13, 2008
*By Power of Attorney. Filed on January 18, 2008, see File Number 2-29601. Incorporated by Reference.