UNITED STATES
SECURITIES AND EXCHANGE COMMISSION
Washington, D.C. 20549
FORM N-CSR
CERTIFIED SHAREHOLDER REPORT
OF
REGISTERED MANAGEMENT INVESTMENT COMPANIES
| Investment Company Act file number: | 811-22114 | |
| Name of Registrant: | Vanguard Montgomery Funds | |
| Address of Registrant: | P.O. Box 2600 | |
| Valley Forge, PA 19482 | ||
| Name and address of agent for service: | Heidi Stam, Esquire | |
| P.O. Box 876 | ||
| Valley Forge, PA 19482 | ||
| Registrant’s telephone number, including area code: (610) 669-1000 | ||
| Date of fiscal year end: December 31 | ||
| Date of reporting period: January 1, 2010 – December 31, 2010 | ||
| Item 1: Reports to Shareholders | ||
![]()
| Vanguard Market Neutral Fund |
| Annual Report |
| December 31, 2010 |

- As stocks generally continued a stair-step climb, the Russell 1000 Index, which represents the advisor’s primary stock-selection universe, returned about 16% for the year ended December 31, 2010.
- Vanguard Market Neutral Fund returned about –1%, compared with the near-zero return of its Three-Month U.S. Treasury Bill Index benchmark.
- Most of the shortfall to Treasury bill returns came from industrials and financials, as stocks sold short increased in price more than those held in the long portfolio.
| Contents | |
| Your Fund’s Total Returns. | 1 |
| Chairman’s Letter. | 2 |
| Advisors’ Report. | 7 |
| Fund Profile. | 9 |
| Performance Summary. | 11 |
| Financial Statements. | 13 |
| Your Fund’s After-Tax Returns. | 29 |
| About Your Fund’s Expenses. | 30 |
| Glossary. | 32 |
Please note: The opinions expressed in this report are just that—informed opinions. They should not be considered promises or advice
Also, please keep in mind that the information and opinions cover the period through the date on the front of this report. Of course,
risks of investing in your fund are spelled out in the prospectus.
See the Glossary for definitions of investment terms used in this report.
Cover photograph: Jean Maher.
Your Fund’s Total Returns
| Fiscal Year Ended December 31, 2010 | |
| Total | |
| Returns | |
| Vanguard Market Neutral Fund | |
| Investor Shares | -1.03% |
| Institutional Shares | -0.93 |
| Citigroup Three-Month U.S. Treasury Bill Index | 0.13 |
| Equity Market Neutral Funds Average | 1.59 |
| Equity Market Neutral Funds Average: Derived from data provided by Lipper Inc. | |
| Institutional Shares are available to certain institutional investors who meet specific administrative, service, and account-size criteria. | |
Your Fund’s Performance at a Glance
December 31, 2009 , Through December 31, 2010
| Distributions Per Share | ||||
| Starting | Ending | Income | Capital | |
| Share Price | Share Price | Dividends | Gains | |
| Vanguard Market Neutral Fund | ||||
| Investor Shares | $9.71 | $9.61 | $0.000 | $0.000 |
| Institutional Shares | 9.66 | 9.57 | 0.000 | 0.000 |
1

Chairman’s Letter
Dear Shareholder,
For most equity investment strategies, years like 2009 and 2010—when many stocks rode a rising tide—would be welcomed. But such years can pose a challenge for market-neutral strategies, whose advisors not only buy and hold selected stocks but also sell short other stocks they don’t own. The hope is that they can buy back the stocks they sold at a lower price in the future or that the stocks they sold will increase in price less than the stocks they owned. This two-pronged approach can create more opportunities for gain or loss on both sides of the overall portfolio.
Also posing a challenge in 2010 was the fact that macroeconomic trends—such as the improving economy and rising investor confidence—tended to overwhelm some of the finer distinctions among stocks.
For 2010, Vanguard Market Neutral Fund returned –1.03% for Investor Shares (–0.93% for Institutional Shares), trailing the results of its comparative standards but significantly ahead of its return for 2009. Most of the fund’s shortfall relative to the 0.13% return of the Citigroup Three-Month Treasury Bill Index came from disappointing stock selection among industrials and financials. Stocks that were sold short increased in price more than the long positions. Good stock selection among consumer staples companies was a notable bright spot.
2
Please note: In August, as we announced previously, Vanguard Quantitative Equity Group became the fund’s sole advisor after assuming responsibility for the portion of fund assets managed by AXA Rosenberg Investment Management. On February 3, AXA Rosenberg announced that it had reached a settlement with the U.S. Securities and Exchange Commission related to a coding error in its quantitative investment process. Under the terms of the settlement, AXA Rosenberg is required to compensate clients that were harmed by the coding error in accordance with an SEC-approved plan of allocation. When detailed information becomes available, we will take appropriate steps to recover settlement proceeds to the extent that Vanguard Market Neutral Fund is covered by the settlement.
Stocks rallied as the forecast seemed to brighten
After a series of false starts, hesitations, and retreats, global stock markets finished 2010 with powerful gains. As the prospect of a double-dip recession faded, the broad U.S. stock market clambered higher, shrugging off high unemployment and distress in Europe’s debt markets to return 17.70%. Small- and mid-capitalization stocks did even better.
Outside the United States, gains were more muted, in part because Europe’s sovereign-debt challenges continued to reverberate through local stock markets. Emerging markets were the best performers. Asia’s developed markets performed weakly, though the strength
| Market Barometer | |||
| Average Annual Total Returns | |||
| Periods Ended December 31, 2010 | |||
| One | Three | Five | |
| Year | Years | Years | |
| Stocks | |||
| Russell 1000 Index (Large-caps) | 16.10% | -2.37% | 2.59% |
| Russell 2000 Index (Small-caps) | 26.86 | 2.22 | 4.47 |
| Dow Jones U.S. Total Stock Market Index | 17.70 | -1.56 | 3.17 |
| MSCI All Country World Index ex USA (International) | 11.60 | -4.58 | 5.29 |
| Bonds | |||
| Barclays Capital U.S. Aggregate Bond Index (Broad | |||
| taxable market) | 6.54% | 5.90% | 5.80% |
| Barclays Capital Municipal Bond Index (Broad | |||
| tax-exempt market) | 2.38 | 4.08 | 4.09 |
| Citigroup Three-Month U.S. Treasury Bill Index | 0.13 | 0.69 | 2.29 |
| CPI | |||
| Consumer Price Index | 1.50% | 1.43% | 2.18% |
3
of the yen, the Australian dollar, and other regional currencies bolstered returns for U.S.-based investors.
The fixed income market reprised a familiar theme
Although U.S. Treasury securities rallied through the summer, total return tables were dominated by riskier bonds for the full 12 months, a pattern we also saw in 2009. Low interest rates and a sense that the economic recovery was gathering momentum prompted investors to seek higher yields in both high-quality and below-investment-grade corporate bonds. The broad U.S. bond market returned 6.54%. Late in the year, yields bounced off summer lows, putting pressure on bond prices. The dynamic was especially pronounced among municipal bonds.
As it has since December 2008, the Fed held its target for short-term interest rates near 0%, keeping the returns available from money market instruments such as the 3-month Treasury bill in the same neighborhood.
A few missteps held back otherwise good results
Simply put, the investment strategy followed by Vanguard Quantitative Equity Group, the fund’s advisor, is designed to produce a portfolio that is neutral in terms of general stock market risk and to provide long-term capital appreciation through individual stock selection. The advisor uses computer models to try to
identify stocks that are likely to appreciate in price, then buys and holds them in the long portfolio. The advisor also borrows and then sells short other stocks that its models suggest are overvalued.
The advisor selects stocks for both the long and short portfolios primarily from the Russell 1000 Index of large-capitalization companies. In 2010, the total return of the stocks in the long portfolio was several percentage points higher than the approximately 16% return of the index—indicating successful stock selection. In most of the ten industry sectors, the fund’s holdings outperformed the stocks in the index, notably in energy, consumer staples, and health care.
Offsetting these strengths, however, was the fact that those stocks sold short also returned several percentage points more than the Russell 1000 Index, and some of the individual stocks in the short portfolio had especially strong gains. (In the upside-down dynamics of short-selling, these gains work against the investor.) For example, in the financial and industrial sectors, the fund’s short positions had considerably higher returns than its long positions, contributing to a negative total return for the combined portfolio. In particular, commercial banks, real estate investment trusts, and insurance companies, along with some industrial machinery firms, performed contrary to expectations, thwarting the advisor’s short-selling strategy.
4
For more about the advisor’s strategy and the fund’s positioning during the year, please see the Advisor’s Report that follows.
Time is on the fund’s side
We always encourage investors to evaluate fund performance over longer time periods, and this advice applies to Vanguard Market Neutral Fund. For the ten years ended December 31, 2010, the fund’s 2.69% average annual return lagged that of its peer group but met its goal of exceeding the performance of its Treasury bill benchmark index. And the fund’s result was ahead of the 2.64% average annual return of the Dow Jones U.S. Total Stock Market Index. Of course, neither index incurs any expenses.
Providing another tool for your diversification toolbox
For many investors, a portfolio made up of broadly diversified U.S. and international stock and bond funds can offer substantial diversification. But such a portfolio is still exposed to traditional market forces—including economic growth, corporate profits, and interest rates—in generating returns. As was painfully evident during the recent financial crisis, diversification does not ensure a positive return. And while very short-term investments such as money market funds and U.S. Treasury bills can provide some protection from down markets, they can’t do much to increase the value of your portfolio.
| Total Returns | |
| Ten Years Ended December 31, 2010 | |
| Average | |
| Annual Return | |
| Market Neutral Fund Investor Shares | 2.69% |
| Citigroup Three-Month U.S. Treasury Bill Index | 2.25 |
| Equity Market Neutral Funds Average | 3.16 |
| Equity Market Neutral Funds Average: Derived from data provided by Lipper Inc. | |
The figures shown represent past performance, which is not a guarantee of future results. (Current performance may be lower or higher than the performance data cited. For performance data current to the most recent month-end, visit our website at vanguard.com/performance.) Note, too, that both investment returns and principal value can fluctuate widely, so an investor’s shares, when sold, could be worth more or less than their original cost.
5
Because a market-neutral strategy is intended to produce returns that are independent of traditional market forces, it can provide a different form of portfolio diversification. By its nature, this strategy is more likely to be successful in markets where there is greater variability in the returns of individual stocks and hence more opportunity for successful stock selection—not in more one-directional markets such as the severe bear market in 2008 or the dramatic rebound in 2009. Stock pickers may have less opportunity to distinguish themselves when the overall market is pushed to and fro.
For sophisticated investors, the Market Neutral Fund—with Vanguard’s low management expenses—can play a role in adding another dimension to your portfolio’s diversification.
Thank you for entrusting your assets to Vanguard.
Sincerely,

F. William McNabb III
Chairman and Chief Executive Officer
February 4, 2011
6
Advisors’ Report
For 2010, Vanguard Market Neutral Fund returned about –1%. The return of the fund’s benchmark index, the Citigroup Three-Month U.S. Treasury Bill Index, was slightly above zero.
The investment environment
The market environment during the year was dominated by economic news, particularly the Eurozone crisis and concerns about growth in the United States. This created an investment climate in which investors were frequently modifying their expectations, causing rapid changes in returns.
One result of this climate was a relatively high level of correlation among stocks. When correlations are high, market-neutral strategies tend to struggle: High correlation implies that investors are focused on a few systematic factors as they invest rather than on individual differences among stocks. Since our portfolio is broadly neutral to market-wide factors, our results reflect the market’s indifference to our stock-selection criteria.
Management of the fund
To select stocks for both our long and short portfolios, we use a model with five components: valuation, market sentiment, earnings quality, earnings growth, and management decisions. Each component is itself a model, with several underlying parts. Each of the five models can yield superior stock selections, but combining them creates a stronger indicator than any individual signal. Each individual model goes through periods of over-or underperformance; combining them
dampens the cyclicality and improves the overall results, although our overall model also experiences periods when it does not match the benchmark return.
The frequent changes in investor expectations affected the performance of each model component from month to month—a signal that performed well in one month would be a poor performer during the next. Being whipsawed this way is difficult to overcome.
Overall, the most benefit came from our management signal, which measures the decisions made by company management; this performed well for the entire period. Our valuation model, which measures the price we pay for earnings and cash flows, also performed well. Both our market sentiment and earnings growth models were neutral. However, our quality model—which measures balance-sheet strength and the sustainability of earnings—was weak throughout the year.
For the total fund, as well as for each model, our returns for the year came equally from our long and our short positions. Among our best-performing positions were our long holdings in TRW Automotive Holdings and Ford Motor, which returned 121% and 68% for the fund, respectively. In addition, Limited Brands returned 86%, and Walter Energy added 71%. Among the stocks that hurt our return most for the year were Abercrombie & Fitch and Roper Industries. We were short both stocks, which rose significantly in 2010.
7
Outlook
Although signs of a stable economic recovery are beginning to show, market uncertainty and volatility may be with us for some time. Looking forward, we are confident that our strategy to capture the spread between attractively valued stocks and their more overvalued brethren is a useful part of a diversified portfolio. We thank you for your investment and look forward to the new year.
James D. Troyer, CFA,
Principal and Portfolio Manager
Vanguard Quantitative Equity Group
January 18, 2011
8
Market Neutral Fund
Fund Profile
As of December 31, 2010
| Share-Class Characteristics | ||
| Investor | Institutional | |
| Shares | Shares | |
| Ticker Symbol | VMNFX | VMNIX |
| Total Expense Ratio1 | 2.80% | 2.73% |
| Management Expenses | 0.21% | 0.14% |
| Dividend Expenses on | ||
| Securities Sold Short2 | 1.42% | 1.42% |
| Borrowing Expenses on | ||
| Securities Sold Short2 | 0.99% | 0.99% |
| Other Expenses | 0.18% | 0.18% |
| Portfolio Characteristics | ||
| Long | Short | |
| Portfolio | Portfolio | |
| Number of Stocks | 247 | 246 |
| Median Market Cap | $4.5B | $4.6B |
| Price/Earnings Ratio | 15.6x | 35.5x |
| Price/Book Ratio | 2.2x | 2.1x |
| Return on Equity | 14.2% | 14.0% |
| Earnings Growth Rate | 4.2% | 3.6% |
| Foreign Holdings | 2.1% | 0.0% |
| Fund Characteristics | |
| Turnover Rate | 153% |
| Short-Term Reserves | 2.0% |
| Volatility Measures | ||
| Citigroup | DJ | |
| Three-Month | U.S. Total | |
| U.S. Treasury | Market | |
| Bill Index | Index | |
| R-Squared | 0.02 | 0.02 |
| Beta | -2.62 | 0.03 |
| These measures show the degree and timing of the fund’s fluctuations compared with the index over 36 months. | ||
| Sector Diversification (% of equity exposure) | ||
| Long | Short | |
| Portfolio | Portfolio | |
| Consumer Discretionary | 14.9% | 14.5% |
| Consumer Staples | 5.0 | 5.4 |
| Energy | 7.9 | 7.9 |
| Financials | 19.5 | 18.5 |
| Health Care | 10.9 | 10.7 |
| Industrials | 14.4 | 14.4 |
| Information Technology | 14.5 | 14.9 |
| Materials | 6.5 | 6.7 |
| Telecommunication | ||
| Services | 1.6 | 1.6 |
| Utilities | 4.8 | 5.4 |
1 The expense ratios shown are from the prospectus dated October 14, 2010, and represent estimated costs for the current fiscal year. For the
fiscal year ended December 31, 2010, the total expense ratios were 1.84% for Investor Shares and 1.74% for Institutional Shares.
2 In connection with a short sale, the fund may receive income or be charged a fee based on the market value of the borrowed stock. When a
cash dividend is declared on a stock the fund has sold short, the fund is required to pay an amount equal to that dividend to the party from which
the fund borrowed the stock and to record the payment of the dividend as an expense.
9
Market Neutral Fund
| Ten Largest Holdings1 (% of total net assets) | ||
| Long Portfolio | ||
| KeyCorp | Regional Banks | 0.5% |
| Walter Energy Inc. | Diversified Metals & Mining | 0.5 |
| Holly Corp. | Oil & Gas Refining & Marketing | 0.5 |
| CIT Group Inc. | Regional Banks | 0.5 |
| AGCO Corp. | Construction & Farm Machinery & Heavy Trucks | 0.5 |
| Agilent Technologies Inc. | Life Sciences Tools & Services | 0.5 |
| Regeneron Pharmaceuticals Inc. | Biotechnology | 0.5 |
| Dillard's Inc. Class A | Department Stores | 0.5 |
| Apartment Investment & Management Co. | Residential REITs | 0.5 |
| AmerisourceBergen Corp. Class A | Health Care Distributors | 0.5 |
| Top Ten | 5.0% | |
| Ten Largest Holdings1 (% of total net assets) | ||
| Short Portfolio | ||
| SandRidge Energy Inc. | Oil & Gas Exploration & Production | 0.6% |
| AK Steel Holding Corp. | Steel | 0.6 |
| Adobe Systems Inc. | Application Software | 0.6 |
| TFS Financial Corp. | Thrifts & Mortgage Finance | 0.5 |
| FLIR Systems Inc. | Electronic Equipment & Instruments | 0.5 |
| Jacobs Engineering Group Inc. | Construction & Engineering | 0.5 |
| Fluor Corp. | Construction & Engineering | 0.5 |
| Beckman Coulter Inc. | Health Care Equipment | 0.5 |
| Atheros Communications Inc. | Semiconductors | 0.5 |
| Range Resources Corp. | Oil & Gas Exploration & Production | 0.5 |
| Top Ten | 5.3% | |
1 The holdings listed exclude any temporary cash investments and equity index products.
10
Market Neutral Fund
Performance Summary
All of the returns in this report represent past performance, which is not a guarantee of future results that may be achieved by the fund. (Current performance may be lower or higher than the performance data cited. For performance data current to the most recent month-end, visit our website at vanguard.com/performance.) Note, too, that both investment returns and principal value can fluctuate widely, so an investor’s shares, when sold, could be worth more or less than their original cost. The returns shown do not reflect taxes that a shareholder would pay on fund distributions or on the sale of fund shares.
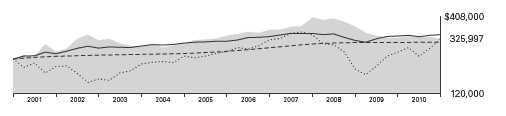
Cumulative Performance: December 31, 2000, Through December 31, 2010
Initial Investment of $250,000
| Average Annual Total Returns | |||||
| Periods Ended December 31, 2010 | |||||
| Final Value | |||||
| One | Five | Ten | of a $250,000 | ||
| Year | Years | Years | Investment | ||
| Market Neutral Fund Investor Shares | -1.03% | -0.67% | 2.69% | $325,997 | |
| •••••••• | Dow Jones U.S. Total Stock Market | ||||
| Index | 17.70 | 3.17 | 2.64 | 324,519 | |
| – – – – | Citigroup Three-Month U.S. Treasury | ||||
| Bill Index | 0.13 | 2.29 | 2.25 | 312,446 | |
| Equity Market Neutral Funds Average | 1.59 | 1.51 | 3.16 | 341,183 | |
| Equity Market Neutral Funds Average: Derived from data provided by Lipper Inc. | |||||
| Final Value | ||||
| One | Five | Ten | of a $5,000,000 | |
| Year | Years | Years | Investment | |
| Market Neutral Fund Institutional Shares | -0.93% | -0.53% | 2.92% | $6,665,849 |
| Dow Jones U.S. Total Stock Market | ||||
| Index | 17.70 | 3.17 | 2.64 | 6,490,386 |
| Citigroup Three-Month U.S. Treasury Bill | ||||
| Index | 0.13 | 2.29 | 2.25 | 6,248,912 |
Vanguard fund returns do not reflect the 1% fee on redemptions of shares held for less than one year.
See Financial Highlights for dividend and capital gains information.
11
Market Neutral Fund
Fiscal-Year Total Returns (%): December 31, 2000, Through December 31, 2010

Vanguard fund returns do not reflect the 1% fee on redemptions of shares held for less than one year.
12
Market Neutral Fund
Financial Statements
Statement of Net Assets
As of December 31, 2010
The fund reports a complete list of its holdings in regulatory filings four times in each fiscal year, at the quarter-ends. For the second and fourth fiscal quarters, the lists appear in the fund’s semiannual and annual reports to shareholders. For the first and third fiscal quarters, the fund files the lists with the Securities and Exchange Commission on Form N-Q. Shareholders can look up the fund’s Forms N-Q on the SEC’s website at sec.gov. Forms N-Q may also be reviewed and copied at the SEC’s Public Reference Room (see the back cover of this report for further information).
| Market | |||
| Value | |||
| Shares | ($000) | ||
| Common Stocks—Long Positions (97.5%) | |||
| Consumer Discretionary (14.5%) | |||
| † | Dillard’s Inc. Class A | 16,600 | 630 |
| † | Brunswick Corp. | 32,900 | 617 |
| † | Brinker International Inc. | 29,400 | 614 |
| * † | Ford Motor Co. | 35,800 | 601 |
| † | Sotheby’s | 13,300 | 598 |
| * † | TRW Automotive | ||
| Holdings Corp. | 11,300 | 595 | |
| † | CBS Corp. Class B | 31,200 | 594 |
| VF Corp. | 6,800 | 586 | |
| * † | Signet Jewelers Ltd. | 13,100 | 568 |
| * | Saks Inc. | 51,700 | 553 |
| * | Deckers Outdoor Corp. | 6,900 | 550 |
| * † | Fossil Inc. | 7,800 | 550 |
| * † | Valassis Communications Inc. | 16,600 | 537 |
| † | Macy’s Inc. | 21,100 | 534 |
| † | Williams-Sonoma Inc. | 14,800 | 528 |
| † | Cablevision Systems Corp. | ||
| Class A | 15,500 | 524 | |
| † | Advance Auto Parts Inc. | 7,900 | 523 |
| † | Ross Stores Inc. | 8,200 | 519 |
| * † | AutoZone Inc. | 1,900 | 518 |
| † | Polaris Industries Inc. | 6,600 | 515 |
| † | Starbucks Corp. | 15,800 | 508 |
| † | Limited Brands Inc. | 16,200 | 498 |
| * † | Panera Bread Co. Class A | 4,800 | 486 |
| * † | Cheesecake Factory Inc. | 15,100 | 463 |
| * | Liberty Global Inc. Class A | 13,000 | 460 |
| † | Time Warner Cable Inc. | 6,900 | 456 |
| † | Wyndham Worldwide Corp. | 14,900 | 446 |
| † | Whirlpool Corp. | 5,000 | 444 |
| † | Gannett Co. Inc. | 29,000 | 438 |
| † | TJX Cos. Inc. | 9,300 | 413 |
| † | Darden Restaurants Inc. | 7,700 | 358 |
| Leggett & Platt Inc. | 14,800 | 337 | |
| * † | DISH Network Corp. Class A | 15,400 | 303 |
| * | ITT Educational Services Inc. | 2,800 | 178 |
| DeVry Inc. | 3,100 | 149 | |
| * | Tenneco Inc. | 3,400 | 140 |
| 17,331 | |||
| Consumer Staples (4.8%) | |||
| * † | Energizer Holdings Inc. | 8,500 | 620 |
| * | Constellation Brands Inc. | ||
| Class A | 27,000 | 598 | |
| † | Tyson Foods Inc. Class A | 33,800 | 582 |
| † | Coca-Cola Enterprises Inc. | 23,200 | 581 |
| † | Herbalife Ltd. | 8,000 | 547 |
| † | Kroger Co. | 23,200 | 519 |
| † | Hershey Co. | 10,900 | 514 |
| † | Corn Products | ||
| International Inc. | 11,100 | 511 | |
| * † | Smithfield Foods Inc. | 22,000 | 454 |
| † | Ruddick Corp. | 12,200 | 449 |
| † | Dr Pepper Snapple Group Inc. | 9,667 | 340 |
| Sara Lee Corp. | 3,800 | 66 | |
| 5,781 | |||
| Energy (7.7%) | |||
| † | Holly Corp. | 15,900 | 648 |
| † | Peabody Energy Corp. | 9,800 | 627 |
| † | ConocoPhillips | 9,100 | 620 |
| * † | Oil States International Inc. | 9,600 | 615 |
| * † | Complete Production | ||
| Services Inc. | 20,600 | 609 | |
| † | Cimarex Energy Co. | 6,800 | 602 |
| † | RPC Inc. | 32,000 | 580 |
| † | SM Energy Co. | 9,700 | 572 |
| † | Core Laboratories NV | 6,300 | 561 |
| † | Pioneer Natural | ||
| Resources Co. | 6,400 | 556 | |
| † | Sunoco Inc. | 13,500 | 544 |
| * † | Whiting Petroleum Corp. | 4,500 | 527 |
| † | Chevron Corp. | 5,600 | 511 |
| * | Newfield Exploration Co. | 6,360 | 459 |
| † | Ship Finance | ||
| International Ltd. | 20,300 | 437 | |
13
Market Neutral Fund
| Market | |||
| Value | |||
| Shares | ($000) | ||
| * | McMoRan Exploration Co. | 17,000 | 291 |
| * | Forest Oil Corp. | 6,800 | 258 |
| Southern Union Co. | 4,900 | 118 | |
| Devon Energy Corp. | 700 | 55 | |
| 9,190 | |||
| Financials (19.1%) | |||
| † | KeyCorp | 73,900 | 654 |
| * † | CIT Group Inc. | 13,700 | 645 |
| † | Apartment Investment & | ||
| Management Co. | 24,300 | 628 | |
| * † | Signature Bank | 12,500 | 625 |
| * † | Forest City Enterprises Inc. | ||
| Class A | 37,400 | 624 | |
| † | JPMorgan Chase & Co. | 14,700 | 624 |
| Validus Holdings Ltd. | 20,300 | 621 | |
| Plum Creek Timber Co. Inc. | 16,500 | 618 | |
| † | Vornado Realty Trust | 7,400 | 617 |
| † | CBL & Associates | ||
| Properties Inc. | 35,200 | 616 | |
| † | Ameriprise Financial Inc. | 10,700 | 616 |
| † | Fifth Third Bancorp | 41,800 | 614 |
| Rayonier Inc. | 11,600 | 609 | |
| Piedmont Office Realty | |||
| Trust Inc. Class A | 30,200 | 608 | |
| * † | Credit Acceptance Corp. | 9,600 | 603 |
| † | Endurance Specialty | ||
| Holdings Ltd. | 13,000 | 599 | |
| † | Developers Diversified | ||
| Realty Corp. | 39,300 | 554 | |
| † | Torchmark Corp. | 8,900 | 532 |
| † | Axis Capital Holdings Ltd. | 14,600 | 524 |
| † | Allied World Assurance Co. | ||
| Holdings Ltd. | 8,700 | 517 | |
| Discover Financial Services | 27,500 | 510 | |
| † | Raymond James | ||
| Financial Inc. | 15,200 | 497 | |
| † | East West Bancorp Inc. | 25,100 | 491 |
| † | American Express Co. | 11,000 | 472 |
| † | PNC Financial Services | ||
| Group Inc. | 7,600 | 461 | |
| † | Capital One Financial Corp. | 10,800 | 460 |
| † | RenaissanceRe Holdings Ltd. | 7,000 | 446 |
| † | Franklin Resources Inc. | 3,900 | 434 |
| † | M&T Bank Corp. | 4,800 | 418 |
| † | BOK Financial Corp. | 7,700 | 411 |
| † | Assurant Inc. | 10,500 | 404 |
| † | American Financial Group Inc. | 12,500 | 404 |
| † | First Citizens BancShares Inc. | ||
| Class A | 2,100 | 397 | |
| * † | Arch Capital Group Ltd. | 4,400 | 387 |
| † | Unitrin Inc. | 15,600 | 383 |
| † | Chubb Corp. | 6,400 | 382 |
| † | Travelers Cos. Inc. | 6,700 | 373 |
| Platinum Underwriters | |||
| Holdings Ltd. | 7,800 | 351 | |
| * † | St. Joe Co. | 15,300 | 334 |
| Ventas Inc. | 6,200 | 325 | |
| * | NASDAQ OMX Group Inc. | 12,400 | 294 |
| Ares Capital Corp. | 17,800 | 293 | |
| Huntington Bancshares Inc. | 41,500 | 285 | |
| Duke Realty Corp. | 21,400 | 267 | |
| Hospitality Properties Trust | 11,400 | 263 | |
| † | Prudential Financial Inc. | 3,900 | 229 |
| International | |||
| Bancshares Corp. | 9,500 | 190 | |
| † | Macerich Co. | 4,000 | 189 |
| Montpelier Re Holdings Ltd. | 8,100 | 161 | |
| † | Camden Property Trust | 2,300 | 124 |
| Protective Life Corp. | 3,800 | 101 | |
| 22,784 | |||
| Health Care (10.6%) | |||
| * † | Agilent Technologies Inc. | 15,400 | 638 |
| * † | Regeneron | ||
| Pharmaceuticals Inc. | 19,400 | 637 | |
| † | AmerisourceBergen Corp. | ||
| Class A | 18,400 | 628 | |
| * † | Biogen Idec Inc. | 9,000 | 603 |
| † | UnitedHealth Group Inc. | 16,700 | 603 |
| * † | Health Management | ||
| Associates Inc. Class A | 62,800 | 599 | |
| * † | Humana Inc. | 10,900 | 597 |
| † | Cooper Cos. Inc. | 10,200 | 575 |
| * † | Bruker Corp. | 34,100 | 566 |
| * † | AMERIGROUP Corp. | 11,900 | 523 |
| * | Forest Laboratories Inc. | 16,200 | 518 |
| * † | Sirona Dental Systems Inc. | 12,300 | 514 |
| * † | Endo Pharmaceuticals | ||
| Holdings Inc. | 13,500 | 482 | |
| † | Hill-Rom Holdings Inc. | 12,000 | 472 |
| * † | Incyte Corp. Ltd. | 28,300 | 469 |
| † | Cardinal Health Inc. | 11,500 | 441 |
| † | Lincare Holdings Inc. | 15,650 | 420 |
| † | Perrigo Co. | 6,500 | 412 |
| * † | Cephalon Inc. | 6,400 | 395 |
| * † | Mylan Inc. | 18,500 | 391 |
| † | CIGNA Corp. | 10,500 | 385 |
| * † | LifePoint Hospitals Inc. | 10,100 | 371 |
| * | Health Net Inc. | 12,600 | 344 |
| * † | Community Health | ||
| Systems Inc. | 8,400 | 314 | |
| Medicis Pharmaceutical Corp. | |||
| Class A | 9,100 | 244 | |
| Eli Lilly & Co. | 6,800 | 238 | |
| * | Magellan Health Services Inc. | 4,200 | 199 |
| STERIS Corp. | 4,100 | 149 | |
| 12,727 | |||
| Industrials (14.0%) | |||
| * † | AGCO Corp. | 12,700 | 643 |
| † | Eaton Corp. | 6,000 | 609 |
14
Market Neutral Fund
| Market | |||
| Value | |||
| Shares | ($000) | ||
| * | Esterline Technologies Corp. | 8,800 | 604 |
| † | Avery Dennison Corp. | 14,200 | 601 |
| † | Caterpillar Inc. | 6,400 | 599 |
| † | Northrop Grumman Corp. | 9,200 | 596 |
| * † | Chicago Bridge & Iron Co. NV | 18,100 | 595 |
| † | RR Donnelley & Sons Co. | 34,000 | 594 |
| Pitney Bowes Inc. | 24,500 | 592 | |
| * † | United Continental | ||
| Holdings Inc. | 24,800 | 591 | |
| * † | Navistar International Corp. | 10,100 | 585 |
| * † | US Airways Group Inc. | 58,400 | 585 |
| † | KBR Inc. | 19,100 | 582 |
| † | Timken Co. | 11,900 | 568 |
| * † | Amerco Inc. | 5,900 | 567 |
| † | Parker Hannifin Corp. | 6,500 | 561 |
| † | Joy Global Inc. | 6,400 | 555 |
| † | Toro Co. | 9,000 | 555 |
| † | Cummins Inc. | 5,000 | 550 |
| * † | Alaska Air Group Inc. | 9,700 | 550 |
| † | Nordson Corp. | 5,700 | 524 |
| † | Waste Connections Inc. | 19,000 | 523 |
| † | Rockwell Automation Inc. | 7,200 | 516 |
| * † | Oshkosh Corp. | 14,000 | 493 |
| * | Atlas Air Worldwide | ||
| Holdings Inc. | 8,800 | 491 | |
| † | Deere & Co. | 5,900 | 490 |
| † | Seaboard Corp. | 243 | 484 |
| † | Southwest Airlines Co. | 34,300 | 445 |
| * † | Delta Air Lines Inc. | 34,100 | 430 |
| † | Crane Co. | 8,400 | 345 |
| † | 3M Co. | 3,500 | 302 |
| * | Sauer-Danfoss Inc. | 600 | 17 |
| 16,742 | |||
| Information Technology (14.1%) | |||
| * † | JDS Uniphase Corp. | 42,700 | 618 |
| * † | Atmel Corp. | 50,100 | 617 |
| * | Fairchild Semiconductor | ||
| International Inc. Class A | 39,500 | 617 | |
| * † | VMware Inc. Class A | 6,900 | 613 |
| * † | NCR Corp. | 39,900 | 613 |
| * † | Advanced Micro Devices Inc. | 73,800 | 604 |
| † | Anixter International Inc. | 10,000 | 597 |
| * † | Autodesk Inc. | 15,500 | 592 |
| * † | Lexmark International Inc. | ||
| Class A | 17,000 | 592 | |
| * † | Novellus Systems Inc. | 18,300 | 591 |
| * † | Lam Research Corp. | 11,400 | 590 |
| * † | IAC/InterActiveCorp | 20,100 | 577 |
| † | Avago Technologies Ltd. | 20,100 | 572 |
| * † | Teradata Corp. | 13,800 | 568 |
| * † | VeriFone Systems Inc. | 14,680 | 566 |
| * † | Itron Inc. | 9,800 | 543 |
| * † | Fiserv Inc. | 9,000 | 527 |
| * | Motorola Solutions Inc. | 57,900 | 525 |
| † | Altera Corp. | 14,600 | 519 |
| * † | Rovi Corp. | 8,200 | 508 |
| * † | MICROS Systems Inc. | 11,500 | 504 |
| † | Broadcom Corp. Class A | 11,500 | 501 |
| * † | Teradyne Inc. | 34,900 | 490 |
| * † | NetApp Inc. | 8,800 | 484 |
| * † | TIBCO Software Inc. | 24,300 | 479 |
| * † | Veeco Instruments Inc. | 10,500 | 451 |
| † | International Business | ||
| Machines Corp. | 2,900 | 426 | |
| * † | Tech Data Corp. | 9,200 | 405 |
| † | Computer Sciences Corp. | 7,400 | 367 |
| † | Lender Processing | ||
| Services Inc. | 11,500 | 339 | |
| † | Plantronics Inc. | 8,700 | 324 |
| Accenture plc Class A | 5,800 | 281 | |
| DST Systems Inc. | 5,300 | 235 | |
| National Instruments Corp. | 1,000 | 38 | |
| 16,873 | |||
| Materials (6.4%) | |||
| † | Walter Energy Inc. | 5,100 | 652 |
| † | Lubrizol Corp. | 5,500 | 588 |
| † | Ashland Inc. | 11,400 | 580 |
| † | Domtar Corp. | 7,600 | 577 |
| † | Cabot Corp. | 15,000 | 565 |
| † | PPG Industries Inc. | 6,700 | 563 |
| † | Albemarle Corp. | 9,900 | 552 |
| * † | Rockwood Holdings Inc. | 14,000 | 548 |
| † | Eastman Chemical Co. | 6,100 | 513 |
| † | Cytec Industries Inc. | 8,400 | 446 |
| † | Valspar Corp. | 12,900 | 445 |
| Cliffs Natural Resources Inc. | 5,500 | 429 | |
| † | EI du Pont de Nemours & Co. | 8,100 | 404 |
| † | International Paper Co. | 14,200 | 387 |
| Ball Corp. | 3,000 | 204 | |
| * | Solutia Inc. | 7,700 | 178 |
| 7,631 | |||
| Telecommunication Services (1.6%) | |||
| * | MetroPCS | ||
| Communications Inc. | 48,800 | 616 | |
| * | NII Holdings Inc. | 11,750 | 525 |
| † | Telephone & | ||
| Data Systems Inc. | 10,100 | 369 | |
| † | AT&T Inc. | 11,900 | 350 |
| 1,860 | |||
| Utilities (4.7%) | |||
| † | Oneok Inc. | 11,000 | 610 |
| Northeast Utilities | 18,900 | 602 | |
| † | Southwest Gas Corp. | 16,400 | 601 |
| † | CMS Energy Corp. | 31,400 | 584 |
| UGI Corp. | 18,400 | 581 | |
| † | Pinnacle West Capital Corp. | 10,500 | 435 |
| IDACORP Inc. | 11,700 | 433 | |
| † | Pepco Holdings Inc. | 22,900 | 418 |
| † | Integrys Energy Group Inc. | 8,500 | 412 |
15
Market Neutral Fund
| Market | |||
| Value | |||
| Shares | ($000) | ||
| † | Atmos Energy Corp. | 11,500 | 359 |
| NiSource Inc. | 14,800 | 261 | |
| † | TECO Energy Inc. | 6,200 | 110 |
| DPL Inc. | 3,100 | 80 | |
| Questar Corp. | 4,000 | 70 | |
| Hawaiian Electric | |||
| Industries Inc. | 1,600 | 36 | |
| 5,592 | |||
| Total Common Stocks—Long Positions | |||
| (Cost $98,011) | 116,511 | ||
| Common Stocks Sold Short (-98.5%) | |||
| Consumer Discretionary (-14.3%) | |||
| * | NVR Inc. | (900) | (622) |
| Stanley Black & Decker Inc. | (9,300) | (622) | |
| Thor Industries Inc. | (18,200) | (618) | |
| * | Amazon.com Inc. | (3,400) | (612) |
| * | Toll Brothers Inc. | (32,100) | (610) |
| * | WMS Industries Inc. | (13,400) | (606) |
| Gentex Corp. | (20,500) | (606) | |
| Morningstar Inc. | (11,400) | (605) | |
| * | Live Nation | ||
| Entertainment Inc. | (52,200) | (596) | |
| * | Vail Resorts Inc. | (11,400) | (593) |
| * | LKQ Corp. | (25,900) | (588) |
| * | DreamWorks Animation | ||
| SKG Inc. Class A | (19,800) | (584) | |
| * | J Crew Group Inc. | (13,500) | (582) |
| * | Bally Technologies Inc. | (13,700) | (578) |
| Lowe’s Cos. Inc. | (23,000) | (577) | |
| Abercrombie & Fitch Co. | (9,500) | (547) | |
| Lennar Corp. Class A | (28,400) | (533) | |
| International Game | |||
| Technology | (30,000) | (531) | |
| * | Penn National Gaming Inc. | (14,700) | (517) |
| Harley-Davidson Inc. | (14,500) | (503) | |
| Genuine Parts Co. | (9,400) | (483) | |
| JC Penney Co. Inc. | (14,600) | (472) | |
| * | Kohl’s Corp. | (8,600) | (467) |
| Staples Inc. | (20,300) | (462) | |
| Walt Disney Co. | (10,600) | (398) | |
| * | Pulte Group Inc. | (51,500) | (387) |
| Fortune Brands Inc. | (6,300) | (380) | |
| * | MGM Resorts International | (24,300) | (361) |
| * | Urban Outfitters Inc. | (9,700) | (347) |
| * | Lamar Advertising Co. | ||
| Class A | (7,300) | (291) | |
| Marriott International Inc. | |||
| Class A | (6,800) | (282) | |
| Scripps Networks | |||
| Interactive Inc. Class A | (4,700) | (243) | |
| * | GameStop Corp. Class A | (10,300) | (236) |
| * | Hyatt Hotels Corp. Class A | (4,800) | (220) |
| * | Scientific Games Corp. | ||
| Class A | (20,600) | (205) | |
| * | BorgWarner Inc. | (2,200) | (159) |
| Tiffany & Co. | (800) | (50) | |
| (17,073) | |||
| Consumer Staples (-5.3%) | |||
| Church & Dwight Co. Inc. | (8,700) | (600) | |
| Kellogg Co. | (11,600) | (593) | |
| Kraft Foods Inc. | (18,800) | (592) | |
| Avon Products Inc. | (20,300) | (590) | |
| Archer-Daniels-Midland Co. | (19,600) | (590) | |
| CVS Caremark Corp. | (16,900) | (588) | |
| Coca-Cola Co. | (8,400) | (552) | |
| * | United Natural Foods Inc. | (14,300) | (525) |
| * | Ralcorp Holdings Inc. | (7,000) | (455) |
| PepsiCo Inc. | (6,500) | (425) | |
| * | Central European | ||
| Distribution Corp. | (18,400) | (421) | |
| * | Dean Foods Co. | (39,100) | (346) |
| Brown-Forman Corp. Class B | (1,500) | (104) | |
| (6,381) | |||
| Energy (-7.7%) | |||
| * | SandRidge Energy Inc. | (92,600) | (678) |
| Range Resources Corp. | (14,100) | (634) | |
| Massey Energy Co. | (11,800) | (633) | |
| Consol Energy Inc. | (12,400) | (604) | |
| EOG Resources Inc. | (6,600) | (603) | |
| * | Cobalt International | ||
| Energy Inc. | (48,300) | (590) | |
| Baker Hughes Inc. | (10,200) | (583) | |
| * | Petrohawk Energy Corp. | (31,900) | (582) |
| Cabot Oil & Gas Corp. | (15,100) | (572) | |
| * | Cameron International Corp. | (11,100) | (563) |
| Schlumberger Ltd. | (6,700) | (559) | |
| EQT Corp. | (11,900) | (534) | |
| * | Plains Exploration & | ||
| Production Co. | (16,600) | (534) | |
| Tidewater Inc. | (9,800) | (528) | |
| * | Pride International Inc. | (15,900) | (525) |
| * | Comstock Resources Inc. | (17,900) | (440) |
| * | Northern Oil and Gas Inc. | (3,100) | (84) |
| (9,246) | |||
| Financials (-18.3%) | |||
| TFS Financial Corp. | (72,700) | (656) | |
| Weyerhaeuser Co. | (33,300) | (630) | |
| Alexandria Real Estate | |||
| Equities Inc. | (8,600) | (630) | |
| * | MSCI Inc. Class A | (16,100) | (627) |
| Corporate Office | |||
| Properties Trust | (17,700) | (619) | |
| LaSalle Hotel Properties | (23,400) | (618) | |
| AON Corp. | (13,400) | (617) | |
| People’s United Financial Inc. (44,000) | (616) | ||
| * | Stifel Financial Corp. | (9,900) | (614) |
| FirstMerit Corp. | (30,900) | (612) | |
16
Market Neutral Fund
| Market | |||
| Value | |||
| Shares | ($000) | ||
| * | Genworth Financial Inc. | ||
| Class A | (46,400) | (610) | |
| Jones Lang LaSalle Inc. | (7,200) | (604) | |
| Charles Schwab Corp. | (35,300) | (604) | |
| Marsh & | |||
| McLennan Cos. Inc. | (22,000) | (601) | |
| Old Republic | |||
| International Corp. | (44,100) | (601) | |
| Greenhill & Co. Inc. | (7,300) | (596) | |
| Associated Banc-Corp | (38,900) | (589) | |
| Kilroy Realty Corp. | (15,300) | (558) | |
| BB&T Corp. | (20,700) | (544) | |
| White Mountains Insurance | |||
| Group Ltd. | (1,600) | (537) | |
| Hartford Financial Services | |||
| Group Inc. | (20,200) | (535) | |
| AMB Property Corp. | (16,100) | (511) | |
| Brown & Brown Inc. | (21,200) | (508) | |
| Lazard Ltd. Class A | (12,800) | (505) | |
| First Niagara Financial | |||
| Group Inc. | (36,100) | (505) | |
| Alexander’s Inc. | (1,200) | (495) | |
| * | Markel Corp. | (1,300) | (492) |
| Janus Capital Group Inc. | (37,700) | (489) | |
| Invesco Ltd. | (20,100) | (484) | |
| ProLogis | (33,400) | (482) | |
| HCC Insurance Holdings Inc. | (16,300) | (472) | |
| Equity One Inc. | (25,500) | (464) | |
| Principal Financial Group Inc. | (14,100) | (459) | |
| Health Care REIT Inc. | (9,200) | (438) | |
| Arthur J Gallagher & Co. | (14,000) | (407) | |
| Zions Bancorporation | (16,600) | (402) | |
| Regions Financial Corp. | (52,900) | (370) | |
| Northern Trust Corp. | (6,600) | (366) | |
| Assured Guaranty Ltd. | (18,500) | (327) | |
| BRE Properties Inc. | (5,100) | (222) | |
| Synovus Financial Corp. | (53,500) | (141) | |
| Radian Group Inc. | (17,200) | (139) | |
| Apollo Investment Corp. | (11,900) | (132) | |
| American National | |||
| Insurance Co. | (1,200) | (103) | |
| Leucadia National Corp. | (3,400) | (99) | |
| Comerica Inc. | (1,900) | (80) | |
| * | E*Trade Financial Corp. | (3,000) | (48) |
| Mercury General Corp. | (900) | (39) | |
| (21,797) | |||
| Health Care (-10.6%) | |||
| Beckman Coulter Inc. | (8,500) | (639) | |
| * | Gen-Probe Inc. | (10,600) | (619) |
| * | Allscripts Healthcare | ||
| Solutions Inc. | (31,700) | (611) | |
| * | Vertex Pharmaceuticals Inc. | (17,200) | (603) |
| * | Onyx Pharmaceuticals Inc. | (16,300) | (601) |
| Techne Corp. | (9,100) | (598) | |
| * | Tenet Healthcare Corp. | (89,200) | (597) |
| * | Henry Schein Inc. | (9,700) | (595) |
| * | Human Genome | ||
| Sciences Inc. | (24,800) | (592) | |
| * | Dendreon Corp. | (16,300) | (569) |
| DENTSPLY International Inc. | (16,600) | (567) | |
| * | Boston Scientific Corp. | (73,300) | (555) |
| * | VCA Antech Inc. | (23,500) | (547) |
| * | Mednax Inc. | (8,100) | (545) |
| * | Myriad Genetics Inc. | (23,500) | (537) |
| * | Brookdale Senior Living Inc. | ||
| Class A | (25,000) | (535) | |
| * | Intuitive Surgical Inc. | (1,900) | (490) |
| * | Celgene Corp. | (7,800) | (461) |
| Pfizer Inc. | (26,200) | (459) | |
| Patterson Cos. Inc. | (14,300) | (438) | |
| Stryker Corp. | (6,500) | (349) | |
| Pharmaceutical Product | |||
| Development Inc. | (11,100) | (301) | |
| * | Alexion Pharmaceuticals Inc. | (3,700) | (298) |
| * | NuVasive Inc. | (9,800) | (251) |
| Medtronic Inc. | (4,700) | (174) | |
| CR Bard Inc. | (700) | (64) | |
| (12,595) | |||
| Industrials (-14.2%) | |||
| * | Jacobs Engineering | ||
| Group Inc. | (14,100) | (646) | |
| Fluor Corp. | (9,700) | (643) | |
| Con-way Inc. | (17,000) | (622) | |
| Harsco Corp. | (21,900) | (620) | |
| Landstar System Inc. | (15,100) | (618) | |
| JB Hunt Transport | |||
| Services Inc. | (15,100) | (616) | |
| Flowserve Corp. | (5,100) | (608) | |
| * | Hertz Global Holdings Inc. | (41,900) | (607) |
| Covanta Holding Corp. | (35,200) | (605) | |
| * | Spirit Aerosystems | ||
| Holdings Inc. Class A | (28,900) | (601) | |
| Precision Castparts Corp. | (4,300) | (599) | |
| * | Copart Inc. | (16,000) | (598) |
| Lincoln Electric Holdings Inc. | (9,000) | (587) | |
| Lennox International Inc. | (12,400) | (586) | |
| * | Quanta Services Inc. | (29,400) | (586) |
| Masco Corp. | (45,100) | (571) | |
| Valmont Industries Inc. | (6,400) | (568) | |
| Manpower Inc. | (8,500) | (533) | |
| CH Robinson Worldwide Inc. | (6,600) | (529) | |
| Carlisle Cos. Inc. | (13,200) | (525) | |
| Robert Half International Inc. | (17,000) | (520) | |
| Roper Industries Inc. | (6,800) | (520) | |
| Goodrich Corp. | (5,900) | (520) | |
| Knight Transportation Inc. | (26,500) | (504) | |
| Armstrong World | |||
| Industries Inc. | (11,100) | (477) | |
| * | Aecom Technology Corp. | (16,700) | (467) |
| Wabtec Corp. | (8,800) | (465) | |
17
Market Neutral Fund
| Market | |||
| Value | |||
| Shares | ($000) | ||
| * | AMR Corp. | (58,500) | (456) |
| Danaher Corp. | (8,900) | (420) | |
| * | FTI Consulting Inc. | (8,800) | (328) |
| * | Verisk Analytics Inc. Class A | (6,200) | (211) |
| * | BE Aerospace Inc. | (4,100) | (152) |
| * | Kansas City Southern | (1,900) | (91) |
| (16,999) | |||
| Information Technology (-14.7%) | |||
| * | Adobe Systems Inc. | (21,400) | (659) |
| * | FLIR Systems Inc. | (21,800) | (649) |
| * | Atheros | ||
| Communications Inc. | (17,700) | (636) | |
| * | PMC - Sierra Inc. | (73,000) | (627) |
| * | Cisco Systems Inc. | (30,400) | (615) |
| Global Payments Inc. | (13,300) | (615) | |
| Corning Inc. | (31,800) | (614) | |
| * | Viasat Inc. | (13,600) | (604) |
| * | Genpact Ltd. | (39,700) | (603) |
| * | NVIDIA Corp. | (38,600) | (594) |
| Intersil Corp. Class A | (38,700) | (591) | |
| * | Silicon Laboratories Inc. | (12,800) | (589) |
| * | Netlogic Microsystems Inc. | (18,300) | (575) |
| * | Nuance Communications Inc. | (31,400) | (571) |
| * | Monster Worldwide Inc. | (23,600) | (558) |
| QUALCOMM Inc. | (11,200) | (554) | |
| * | Cree Inc. | (8,400) | (553) |
| * | Compuware Corp. | (47,300) | (552) |
| * | Arrow Electronics Inc. | (15,600) | (534) |
| * | Varian Semiconductor | ||
| Equipment Associates Inc. | (14,300) | (529) | |
| * | Rambus Inc. | (25,400) | (520) |
| * | Concur Technologies Inc. | (9,900) | (514) |
| * | Equinix Inc. | (6,300) | (512) |
| Paychex Inc. | (16,200) | (501) | |
| * | ANSYS Inc. | (9,600) | (500) |
| * | MEMC Electronic | ||
| Materials Inc. | (37,000) | (417) | |
| Automatic Data | |||
| Processing Inc. | (9,000) | (417) | |
| * | Juniper Networks Inc. | (10,800) | (399) |
| * | ON Semiconductor Corp. | (39,900) | (394) |
| * | Salesforce.com Inc. | (2,800) | (370) |
| * | eBay Inc. | (12,700) | (353) |
| Mastercard Inc. Class A | (1,300) | (291) | |
| Total System Services Inc. | (12,900) | (198) | |
| * | EMC Corp. | (8,300) | (190) |
| Amphenol Corp. Class A | (3,100) | (164) | |
| (17,562) | |||
| Materials (-6.6%) | |||
| AK Steel Holding Corp. | (41,100) | (673) | |
| Allegheny Technologies Inc. | (11,300) | (624) | |
| United States Steel Corp. | (10,600) | (619) | |
| Royal Gold Inc. | (11,100) | (606) | |
| Nucor Corp. | (13,700) | (600) | |
| * | Coeur d’Alene Mines Corp. | (21,600) | (590) |
| Monsanto Co. | (8,400) | (585) | |
| Vulcan Materials Co. | (12,800) | (568) | |
| CF Industries Holdings Inc. | (4,200) | (568) | |
| Mosaic Co. | (7,300) | (557) | |
| Praxair Inc. | (5,200) | (496) | |
| Bemis Co. Inc. | (15,200) | (496) | |
| Steel Dynamics Inc. | (17,300) | (317) | |
| Commercial Metals Co. | (12,100) | (201) | |
| Southern Copper Corp. | (3,300) | (161) | |
| Eagle Materials Inc. | (4,300) | (121) | |
| Air Products & | |||
| Chemicals Inc. | (1,100) | (100) | |
| (7,882) | |||
| Telecommunication Services (-1.5%) | |||
| * | Crown Castle | ||
| International Corp. | (14,100) | (618) | |
| Frontier | |||
| Communications Corp. | (56,300) | (548) | |
| * | SBA Communications Corp. | ||
| Class A | (10,700) | (438) | |
| * | Leap Wireless | ||
| International Inc. | (18,300) | (224) | |
| (1,828) | |||
| Utilities (-5.3%) | |||
| PG&E Corp. | (12,600) | (603) | |
| MDU Resources Group Inc. | (29,700) | (602) | |
| SCANA Corp. | (14,700) | (597) | |
| National Fuel Gas Co. | (8,500) | (558) | |
| * | Calpine Corp. | (40,500) | (540) |
| Sempra Energy | (10,100) | (530) | |
| Aqua America Inc. | (22,600) | (508) | |
| AGL Resources Inc. | (13,500) | (484) | |
| * | AES Corp. | (39,400) | (480) |
| Southern Co. | (10,900) | (417) | |
| Great Plains Energy Inc. | (17,800) | (345) | |
| * | NRG Energy Inc. | (14,200) | (277) |
| Consolidated Edison Inc. | (2,900) | (144) | |
| Progress Energy Inc. | (3,000) | (130) | |
| American Water | |||
| Works Co. Inc. | (3,000) | (76) | |
| ITC Holdings Corp. | (900) | (56) | |
| (6,347) | |||
| Total Common Stocks Sold Short | |||
| (Proceeds $103,132) | (117,710) | ||
18
Market Neutral Fund
| Market | ||
| Value | ||
| Shares | ($000) | |
| Temporary Cash Investment (1.2%) | ||
| Money Market Fund (1.2%) | ||
| 1 Vanguard Market | ||
| Liquidity Fund, 0.211% | ||
| (Cost $1,470) | 1,469,879 | 1,470 |
| †Other Assets and Liabilities— | ||
| Net (99.8%) | 119,184 | |
| Net Assets (100%) | 119,455 | |
| Statement of Assets and Liabilities | ||
| Assets | ||
| Investment in Securities, | ||
| Long Positions at Value | ||
| Common Stocks | 116,511 | |
| Temporary Cash Investments | 1,470 | |
| Cash Segregated for Short Positions | 118,409 | |
| Receivables for Capital Shares Issued | 900 | |
| Other Assets | 71 | |
| Total Assets | 237,361 | |
| Liabilities | ||
| Securities Sold Short, at Value | 117,710 | |
| Payables for Capital Shares Redeemed | 19 | |
| Other Liabilities | 177 | |
| Total Liabilities | 117,906 | |
| Net Assets (100%) | 119,455 | |
| At December 31, 2010, net assets consisted of: | |
| Amount | |
| ($000) | |
| Paid-in Capital | 142,085 |
| Accumulated Net Investment Losses | (65) |
| Accumulated Net Realized Losses | (26,487) |
| Unrealized Appreciation (Depreciation) | |
| Investment Securities--Long Positions | 18,500 |
| Investment Securities Sold Short | (14,578) |
| Net Assets | 119,455 |
| Investor Shares—Net Assets | |
| Applicable to 12,107,939 outstanding | |
| $.001 par value shares of beneficial | |
| interest (unlimited authorization) | 116,325 |
| Net Asset Value Per Share— | |
| Investor Shares | $9.61 |
| Institutional Shares—Net Assets | |
| Applicable to 327,191 outstanding | |
| $.001 par value shares of beneficial | |
| interest (unlimited authorization) | 3,130 |
| Net Asset Value Per Share— | |
| Institutional Shares | $9.57 |
See Note A in Notes to Financial Statements.
* Non-income-producing security.
† Long security positions with a value of $72,085,000 and cash of $118,409,000 are held in a segregated account at the fund’s custodian bank
and pledged to a broker-dealer as collateral for the fund’s obligation to return borrowed securities. For so long as such obligations continue,
the fund’s access to these assets is subject to authorization from the broker-dealer.
1 Affiliated money market fund available only to Vanguard funds and certain trusts and accounts managed by Vanguard. Rate shown
is the 7-day yield.
See accompanying Notes, which are an integral part of the Financial Statements.
19
Market Neutral Fund
Statement of Operations
| Year Ended | |
| December 31, 2010 | |
| ($000) | |
| Investment Income | |
| Income | |
| Dividends | 1,175 |
| Interest1 | 13 |
| Total Income | 1,188 |
| Expenses | |
| Investment Advisory Fees—Note B | |
| Basic Fee | 96 |
| Performance Adjustment | (58) |
| The Vanguard Group—Note C | |
| Management and Administrative—Investor Shares | 94 |
| Management and Administrative—Institutional Shares | 2 |
| Marketing and Distribution—Investor Shares | 19 |
| Marketing and Distribution—Institutional Shares | 3 |
| Custodian Fees | 29 |
| Auditing Fees | 44 |
| Shareholders’ Reports—Investor Shares | 4 |
| Shareholders’ Reports—Institutional Shares | — |
| Dividend Expense on Securities Sold Short | 1,214 |
| Borrowing Expense on Securities Sold Short | 43 |
| Total Expenses | 1,490 |
| Net Investment Income (Loss) | (302) |
| Realized Net Gain (Loss) | |
| Investment Securities—Long Positions | 6,792 |
| Investment Securities Sold Short | (11,276) |
| Realized Net Gain (Loss) | (4,484) |
| Change in Unrealized Appreciation (Depreciation) | |
| Investment Securities—Long Positions | 10,554 |
| Investment Securities Sold Short | (7,704) |
| Change in Unrealized Appreciation (Depreciation) | 2,850 |
| Net Increase (Decrease) in Net Assets Resulting from Operations | (1,936) |
| 1 Interest income from an affiliated company of the fund was $13,000. | |
See accompanying Notes, which are an integral part of the Financial Statements.
20
Market Neutral Fund
Statement of Changes in Net Assets
| Year Ended December 31, | ||
| 2010 | 2009 | |
| ($000) | ($000) | |
| Increase (Decrease) In Net Assets | ||
| Operations | ||
| Net Investment Income (Loss) | (302) | (719) |
| Realized Net Gain (Loss) | (4,484) | (15,526) |
| Change in Unrealized Appreciation (Depreciation) | 2,850 | 6,224 |
| Net Increase (Decrease) in Net Assets Resulting from Operations | (1,936) | (10,021) |
| Distributions | ||
| Net Investment Income | ||
| Investor Shares | — | (76) |
| Institutional Shares | — | (12) |
| Realized Capital Gain | ||
| Investor Shares | — | — |
| Institutional Shares | — | — |
| Total Distributions | — | (88) |
| Capital Share Transactions | ||
| Investor Shares | 65,485 | (11,487) |
| Institutional Shares | (12,484) | 206 |
| Net Increase (Decrease) from Capital Share Transactions | 53,001 | (11,281) |
| Total Increase (Decrease) | 51,065 | (21,390) |
| Net Assets | ||
| Beginning of Period | 68,390 | 89,780 |
| End of Period1 | 119,455 | 68,390 |
| 1 Net Assets—End of Period includes undistributed (overdistributed) net investment income of ($65,000) and ($50,000). | ||
See accompanying Notes, which are an integral part of the Financial Statements.
21
Market Neutral Fund
Financial Highlights
| Investor Shares | ||||||
| Year | Year | April 1, | ||||
| Ended | Ended | 2008, to | ||||
| For a Share Outstanding | Dec. 31, | Dec. 31, | Dec. 31, | Year Ended March 31, | ||
| Throughout Each Period | 2010 | 2009 | 20081 | 20082 | 2007 | 2006 |
| Net Asset Value, Beginning of Period | $9.71 | $10.97 | $12.45 | $12.19 | $12.12 | $11.46 |
| Investment Operations | ||||||
| Net Investment Income (Loss) | (.038)3 | (.105) | .084 | .3113 | .500 | .220 |
| Net Realized and Unrealized Gain (Loss) | ||||||
| on Investments4 | (.062) | (1.143) | (.838) | .909 | .060 | .590 |
| Total from Investment Operations | (.100) | (1.248) | (.754) | 1.220 | .560 | .810 |
| Distributions | ||||||
| Dividends from Net Investment Income | — | (.012) | (.132) | (.607) | (.490) | (.150) |
| Distributions from Realized Capital Gains | — | — | (.594) | (.353) | — | — |
| Total Distributions | — | (.012) | (.726) | (.960) | (.490) | (.150) |
| Net Asset Value, End of Period | $9.61 | $9.71 | $10.97 | $12.45 | $12.19 | $12.12 |
| Total Return5 | -1.03% | -11.38% | -6.11% | 10.15% | 4.68% | 7.09% |
| Ratios/Supplemental Data | ||||||
| Net Assets, End of Period (Millions) | $116 | $53 | $73 | $45 | $9 | $12 |
| Ratio of Expenses to | ||||||
| Average Net Assets | ||||||
| Based on Total Expenses8 | 1.84%7 | 2.80%7 | 2.13%6 | 3.09% | 3.46% | 3.31% |
| Net of Expenses Waived/Reimbursed2,8 | 1.84%7 | 2.80%7 | 2.13%6 | 2.79% | 2.98% | 3.02% |
| Net of Expenses Waived/Reimbursed | ||||||
| and Dividend and Borrowing | ||||||
| Expense on Securities Sold Short8 | 0.30% | 0.39% | 0.46%6 | 1.16% | 1.54% | 1.59% |
| Ratio of Net Investment Income (Loss) | ||||||
| to Average Net Assets | (0.38%) | (0.97%) | 1.15%6 | 2.69% | 3.40% | 2.14% |
| Portfolio Turnover Rate | 153% | 142% | 161% | 214% | 169% | 213% |
1 The fund’s fiscal year-end changed from March 31 to December 31, effective December 31, 2008.
2 Laudus Rosenberg U.S. Large/Mid Capitalization Long/Short Equity Fund reorganized into Vanguard Market Neutral Fund effective
December 1, 2007. Prior to December 1, 2007, the fund’s advisor and other service providers waived or reimbursed certain fund expenses.
3 Calculated based on average shares outstanding.
4 Includes increases from redemption fees of $.00, $.04, $.00, $.00, $.01, and $.00.
5 Total returns do not include transaction or account service fees that may have applied in the periods shown. Fund prospectuses provide
information about any applicable transaction and account service fees.
6 Annualized.
7 Includes 2010 dividend and borrowing expense on securities sold short of 1.49% and 0.05%, respectively. Includes 2009 dividend and
borrowing expense on securities sold short of 1.42% and 0.99%, respectively.
8 Includes performance-based investment advisory fee increases (decreases) of (0.07%) for fiscal 2010, (0.10%) for fiscal 2009, and (0.02%)
for fiscal 2008. Performance-based investment advisory fees did not apply prior to fiscal 2008.
See accompanying Notes, which are an integral part of the Financial Statements.
22
Market Neutral Fund
Financial Highlights
| Institutional Shares | ||||||
| Year | Year | April 1, | ||||
| Ended | Ended | 2008, to | ||||
| For a Share Outstanding | Dec. 31, | Dec. 31, | Dec. 31, | Year Ended March 31, | ||
| Throughout Each Period | 2010 | 2009 | 20081 | 20082 | 2007 | 2006 |
| Net Asset Value, Beginning of Period | $9.66 | $10.90 | $12.39 | $12.14 | $12.08 | $11.44 |
| Investment Operations | ||||||
| Net Investment Income (Loss) | (.015)3 | (.093) | .085 | .3903 | .600 | .250 |
| Net Realized and Unrealized Gain (Loss) | ||||||
| on Investments4 | (.075) | (1.139) | (.846) | .864 | — | .580 |
| Total from Investment Operations | (.090) | (1.232) | (.761) | 1.254 | .600 | .830 |
| Distributions | ||||||
| Dividends from Net Investment Income | — | (.008) | (.138) | (.651) | (.540) | (.190) |
| Distributions from Realized Capital Gains | — | — | (.591) | (.353) | — | — |
| Total Distributions | — | (.008) | (.729) | (1.004) | (.540) | (.190) |
| Net Asset Value, End of Period | $9.57 | $9.66 | $10.90 | $12.39 | $12.14 | $12.08 |
| Total Return5 | -0.93% | -11.31% | -6.20% | 10.49% | 4.98% | 7.29% |
| Ratios/Supplemental Data | ||||||
| Net Assets, End of Period (Millions) | $3 | $16 | $17 | $12 | $10 | $20 |
| Ratio of Expenses to | ||||||
| Average Net Assets | ||||||
| Based on Total Expenses8 | 1.74%7 | 2.73%7 | 2.08%6 | 2.97% | 3.07% | 3.01% |
| Net of Expenses Waived/Reimbursed2,8 | 1.74%7 | 2.73%7 | 2.08%6 | 2.56% | 2.67% | 2.71% |
| Net of Expenses Waived/Reimbursed | ||||||
| and Dividend and Borrowing | ||||||
| Expense on Securities Sold Short8 | 0.20% | 0.32% | 0.41%6 | 0.93% | 1.24% | 1.24% |
| Ratio of Net Investment Income (Loss) | ||||||
| to Average Net Assets | (0.28%) | (0.90%) | 1.20%6 | 2.92% | 3.68% | 2.50% |
| Portfolio Turnover Rate | 153% | 142% | 161% | 214% | 169% | 213% |
1 The fund’s fiscal year-end changed from March 31 to December 31, effective December 31, 2008.
2 Laudus Rosenberg U.S. Large/Mid Capitalization Long/Short Equity Fund reorganized into Vanguard Market Neutral Fund effective
December 1, 2007. Prior to December 1, 2007, the fund’s advisor and other service providers waived or reimbursed certain fund expenses.
3 Calculated based on average shares outstanding.
4 Includes increases from redemption fees of $.00, $.03, $.00, $.00, $.00, and $.00.
5 Total returns do not include transaction fees that may have applied in the periods shown. Fund prospectuses provide information about any
applicable transaction fees.
6 Annualized.
7 Includes 2010 dividend and borrowing expense on securities sold short of 1.49% and 0.05%, respectively. Includes 2009 dividend and
borrowing expense on securities sold short of 1.42% and 0.99%, respectively.
8 Includes performance-based investment advisory fee increases (decreases) of (0.07%) for fiscal 2010, (0.10%) for fiscal 2009, and (0.02%)
for fiscal 2008. Performance-based investment advisory fees did not apply prior to fiscal 2008.
See accompanying Notes, which are an integral part of the Financial Statements.
23
Market Neutral Fund
Notes to Financial Statements
Vanguard Market Neutral Fund is registered under the Investment Company Act of 1940 as an open-end investment company, or mutual fund. The fund offers two classes of shares, Investor Shares and Institutional Shares. Investor Shares are available to any investor who meets the fund’s minimum purchase requirements. Institutional Shares are designed for investors who meet certain administrative, service, and account-size criteria.
A. The following significant accounting policies conform to generally accepted accounting principles for U.S. mutual funds. The fund consistently follows such policies in preparing its financial statements.
1. Security Valuation: Securities are valued as of the close of trading on the New York Stock Exchange (generally 4 p.m., Eastern time) on the valuation date. Equity securities are valued at the latest quoted sales prices or official closing prices taken from the primary market in which each security trades; such securities not traded on the valuation date are valued at the mean of the latest quoted bid and asked prices. Securities for which market quotations are not readily available, or whose values have been affected by events occurring before the fund’s pricing time but after the close of the securities’ primary markets, are valued at their fair values calculated according to procedures adopted by the board of trustees. These procedures include obtaining quotations from an independent pricing service, monitoring news to identify significant market- or security-specific events, and evaluating changes in the va lues of foreign market proxies (for example, ADRs, futures contracts, or exchange-traded funds), between the time the foreign markets close and the fund’s pricing time. When fair-value pricing is employed, the prices of securities used by a fund to calculate its net asset value may differ from quoted or published prices for the same securities. Investments in Vanguard Market Liquidity Fund are valued at that fund’s net asset value.
2. Short Sales: Short sales are the sales of securities that the fund does not own. The fund may sell a security it does not own in anticipation of a decline in the value of that security. In order to deliver the security to the purchaser, the fund borrows the security from a broker-dealer. The fund must segregate, as collateral for its obligation to return the borrowed security, an amount of cash and long security positions at least equal to the market value of the security sold short. This results in the fund holding a significant portion of its assets in cash. The fund later closes out the position by returning the security to the lender, typically by purchasing the security in the open market. A gain, limited to the price at which the fund sold the security short, or a loss, theoretically unlimited in size, is recognized upon the termination of the short sale. The fund may receive a portion of the income from the inves tment of collateral, or be charged a fee on borrowed securities, based on the market value of each borrowed security and a variable rate that is dependent upon the availability of such security. The net amounts of income or fees are recorded as interest income (for net income received) or borrowing expense on securities sold short (for net fees charged) in the Statement of Operations. Dividends on securities sold short are reported as an expense in the Statement of Operations.
Cash collateral segregated for securities sold short is recorded as an asset in the Statement of Assets and Liabilities. Long security positions segregated as collateral are shown in the Statement of Net Assets.
3. Federal Income Taxes: The fund intends to continue to qualify as a regulated investment company and distribute all of its taxable income. Management has analyzed the fund’s tax positions taken for all open federal income tax years (March 31, 2007–December 31, 2010), and has concluded that no provision for federal income tax is required in the fund’s financial statements.
4. Distributions: Distributions to shareholders are recorded on the ex-dividend date.
24
Market Neutral Fund
5. Other: Dividend income (or dividend expense on short positions) is recorded on the ex-dividend date. Interest income includes income distributions received from Vanguard Market Liquidity Fund and is accrued daily. Security transactions are accounted for on the date securities are bought or sold. Costs used to determine realized gains (losses) on the sale of investment securities are those of the specific securities sold. Fees assessed on redemptions of capital shares are credited to paid-in capital.
Each class of shares has equal rights as to assets and earnings, except that each class separately bears certain class-specific expenses related to maintenance of shareholder accounts (included in Management and Administrative expenses) and shareholder reporting. Marketing and distribution expenses are allocated to each class of shares based on a method approved by the board of trustees. Income, other non-class-specific expenses, and gains and losses on investments are allocated to each class of shares based on its relative net assets.
B. AXA Rosenberg Investment Management LLC (AXA) provided investment advisory services to a portion of the fund for part of the fiscal year for a fee calculated at an annual percentage rate of average net assets managed by the advisor. The basic fee for AXA was subject to quarterly adjustments based on performance since December 31, 2007, relative to the Citigroup Three-Month Treasury Bill Index. In August 2010, the board of trustees restructured the advisory arrangement for the fund. The Vanguard Group became the sole investment advisor to the fund.
The Vanguard Group provides investment advisory services to the fund (a portion of the fund prior to August 2010) on an at-cost basis.
For the year ended December 31, 2010, the aggregate investment advisory fee represented an effective annual basic rate of 0.12% of the fund’s average net assets, before a decrease of $58,000 (0.07%) based on performance.
C. The Vanguard Group furnishes at cost investment advisory, corporate management, administrative, marketing, and distribution services. The costs of such services are allocated to the fund under methods approved by the board of trustees. The fund has committed to provide up to 0.40% of its net assets in capital contributions to Vanguard. At December 31, 2010, the fund had contributed capital of $18,000 to Vanguard (included in Other Assets), representing 0.02% of the fund’s net assets and 0.01% of Vanguard’s capitalization. The fund’s trustees and officers are also directors and officers of Vanguard.
D. Various inputs may be used to determine the value of the fund’s investments. These inputs are summarized in three broad levels for financial statement purposes. The inputs or methodologies used to value securities are not necessarily an indication of the risk associated with investing in those securities.
Level 1—Quoted prices in active markets for identical securities.
Level 2—Other significant observable inputs (including quoted prices for similar securities, interest rates, prepayment speeds, credit risk, etc.).
Level 3—Significant unobservable inputs (including the fund’s own assumptions used to determine the fair value of investments).
At December 31, 2010, 100% of the fund’s investments were valued based on Level 1 inputs.
25
Market Neutral Fund
E. Distributions are determined on a tax basis and may differ from net investment income and realized capital gains for financial reporting purposes. Differences may be permanent or temporary. Permanent differences are reclassified among capital accounts in the financial statements to reflect their tax character. Temporary differences arise when certain items of income, expense, gain, or loss are recognized in different periods for financial statement and tax purposes; these differences will reverse at some time in the future. Differences in classification may also result from the treatment of short-term gains as ordinary income for tax purposes.
Certain of the fund’s borrowing expenses are treated as realized capital losses for tax purposes. For the year ended December 31, 2010, borrowing expenses of $40,000 have been reclassified from accumulated net investment losses to accumulated net realized losses.
For tax purposes, the fund had a net operating loss of $229,000 for the year ended December 31, 2010. This amount has been reclassified from accumulated net investment losses to paid-in capital. At December 31, 2010, the fund had no ordinary income available for distribution. The fund had available capital loss carryforwards totaling $24,465,000 to offset future net capital gains of $19,593,000 through December 31, 2017, and $4,872,000 through December 31, 2018. In addition, the fund realized losses of $1,643,000 during the period from November 1, 2010, through December 31, 2010, which are deferred and will be treated as realized for tax purposes in fiscal 2011.
The fund had realized losses totaling $353,000 through December 31, 2010, which are deferred for tax purposes and reduce the amount of unrealized appreciation on investment securities for tax purposes.
At December 31, 2010, the cost of long security positions for tax purposes was $99,551,000. Net unrealized appreciation of long security positions for tax purposes was $18,430,000, consisting of unrealized gains of $18,896,000 on securities that had risen in value since their purchase and $466,000 in unrealized losses on securities that had fallen in value since their purchase. Tax-basis net unrealized depreciation on securities sold short was $14,886,000, consisting of unrealized gains of $1,005,000 on securities that had fallen in value since their sale and $15,891,000 in unrealized losses on securities that had risen in value since their sale.
F. During the year ended December 31, 2010, the fund purchased $154,338,000 of investment securities and sold $115,495,000 of investment securities, other than temporary cash investments. The proceeds of short sales and the cost of purchases to cover short sales were $190,643,000 and $138,237,000 respectively.
26
Market Neutral Fund
G. Capital share transactions for each class of shares were:
| Year Ended December 31, | ||||
| 2010 | 2009 | |||
| Amount | Shares | Amount | Shares | |
| ($000) | (000) | ($000) | (000) | |
| Investor Shares | ||||
| Issued | 87,156 | 8,885 | 45,232 | 4,547 |
| Issued in Lieu of Cash Distributions | — | — | 68 | 7 |
| Redeemed1 | (21,671) | (2,219) | (56,787) | (5,725) |
| Net Increase (Decrease)—Investor Shares | 65,485 | 6,666 | (11,487) | (1,171) |
| Institutional Shares | ||||
| Issued | 1,379 | 141 | 7,875 | 804 |
| Issued in Lieu of Cash Distributions | — | — | 12 | 1 |
| Redeemed1 | (13,863) | (1,422) | (7,681) | (781) |
| Net Increase (Decrease)—Institutional Shares | (12,484) | (1,281) | 206 | 24 |
| 1 Net of redemption fees of $3,000 and $257,000 (fund totals). | ||||
H. In preparing the financial statements as of December 31, 2010, management considered the impact of subsequent events for potential recognition or disclosure in these financial statements.
27
Report of Independent Registered
Public Accounting Firm
To the Trustees of Vanguard Montgomery Funds and the Shareholders of Vanguard Market Neutral Fund:
In our opinion, the accompanying statement of net assets and the statement of assets and liabilities and the related statements of operations and of changes in net assets and the financial highlights present fairly, in all material respects, the financial position of Vanguard Market Neutral Fund (constituting Vanguard Montgomery Funds, hereafter referred to as the “Fund”) at December 31, 2010, the results of its operations for the year then ended, the changes in its net assets for each of the two years in the period then ended and the financial highlights for each of the periods indicated, in conformity with accounting principles generally accepted in the United States of America. These financial statements and financial highlights (hereafter referred to as “financial statements”) are the responsibility of the Fund’s management; our responsibility is to express an opinion on these financial stateme nts based on our audits. We conducted our audits of these financial statements in accordance with the standards of the Public Company Accounting Oversight Board (United States). Those standards require that we plan and perform the audit to obtain reasonable assurance about whether the financial statements are free of material misstatement. An audit includes examining, on a test basis, evidence supporting the amounts and disclosures in the financial statements, assessing the accounting principles used and significant estimates made by management, and evaluating the overall financial statement presentation. We believe that our audits, which included confirmation of securities at December 31, 2010 by correspondence with the custodian and broker and by agreement to the underlying ownership records of Vanguard Market Liquidity Fund, provide a reasonable basis for our opinion.
PricewaterhouseCoopers LLP
Philadelphia, Pennsylvania
February 14, 2011
Your Fund’s After-Tax Returns
This table presents returns for your fund both before and after taxes. The after-tax returns are shown in two ways: (1) assuming that an investor owned the fund during the entire period and paid taxes on the fund’s distributions, and (2) assuming that an investor paid taxes on the fund’s distributions and sold all shares at the end of each period.
Calculations are based on the highest individual federal income tax and capital gains tax rates in effect at the times of the distributions and the hypothetical sales. State and local taxes were not considered. After-tax returns reflect any qualified dividend income . (In the example, returns after the sale of fund shares may be higher than those assuming no sale. This occurs when the sale would have produced a capital loss. The calculation assumes that the investor received a tax deduction for the loss.) The table shows returns for Investor Shares only; returns for other share classes will differ. Please note that your actual after-tax returns will depend on your tax situation and may differ from those shown. Also note that if you own the fund in a tax-deferred account, such as an individual retirement account or a 401(k) plan, this information does not apply to you. Such accounts are not subject to current taxes.
Finally, keep in mind that a fund’s performance—whether before or after taxes—does not guarantee future results.
| Average Annual Total Returns: Market Neutral Fund Investor Shares | |||
| Periods Ended December 31, 2010 | |||
| One | Five | Ten | |
| Year | Years | Years | |
| Returns Before Taxes | -1.03% | -0.67% | 2.69% |
| Returns After Taxes on Distributions | -1.03 | -1.62 | 2.04 |
| Returns After Taxes on Distributions and Sale of Fund Shares | -0.67 | -0.93 | 2.03 |
Returns do not reflect the 1% fee on redemptions of shares held for less than one year.
29
About Your Fund’s Expenses
As a shareholder of the fund, you incur ongoing costs, which include costs for portfolio management, administrative services, and shareholder reports (like this one), among others. Operating expenses, which are deducted from a fund’s gross income, directly reduce the investment return of the fund.
A fund’s expenses are expressed as a percentage of its average net assets. This figure is known as the expense ratio. The following examples are intended to help you understand the ongoing costs (in dollars) of investing in your fund and to compare these costs with those of other mutual funds. The examples are based on an investment of $1,000 made at the beginning of the period shown and held for the entire period.
The accompanying table illustrates your fund’s costs in two ways:
• Based on actual fund return. This section helps you to estimate the actual expenses that you paid over the period. The ”Ending Account Value“ shown is derived from the fund‘s actual return, and the third column shows the dollar amount that would have been paid by an investor who started with $1,000 in the fund. You may use the information here, together with the amount you invested, to estimate the expenses that you paid over the period.
To do so, simply divide your account value by $1,000 (for example, an $8,600 account value divided by $1,000 = 8.6), then multiply the result by the number given for your fund under the heading ”Expenses Paid During Period.“
• Based on hypothetical 5% yearly return. This section is intended to help you compare your fund‘s costs with those of other mutual funds. It assumes that the fund had a yearly return of 5% before expenses, but that the expense ratio is unchanged. In this case—because the return used is not the fund’s actual return—the results do not apply to your investment. The example is useful in making comparisons because the Securities and Exchange Commission requires all mutual funds to calculate expenses based on a 5% return. You can assess your fund’s costs by comparing this hypothetical example with the hypothetical examples that appear in shareholder reports of other funds.
Note that the expenses shown in the table are meant to highlight and help you compare ongoing costs only and do not reflect transaction costs incurred by the fund for buying and selling securities. Further, the expenses do not include the 1% fee assessed on redemptions of shares held for less than one year, nor do they include the account service fee described in the prospectus. If such fees were applied to your account, your costs would be higher. Your fund does not carry a “sales load.” The calculations assume no shares were bought or sold during the period. Your actual costs may have been higher or lower, depending on the amount of your investment and the timing of any purchases or redemptions.
You can find more information about the fund’s expenses, including annual expense ratios, in the Financial Statements section of this report. For additional information on operating expenses and other shareholder costs, please refer to your fund’s current prospectus.
30
| Six Months Ended December 31, 2010 | |||
| Beginning | Ending | Expenses | |
| Account Value | Account Value | Paid During | |
| Market Neutral Fund | 6/30/2010 | 12/31/2010 | Period |
| Based on Actual Fund Return | |||
| Investor Shares | $1,000.00 | $982.62 | $9.49 |
| Institutional Shares | 1,000.00 | 982.55 | 8.99 |
| Based on Hypothetical 5% Yearly Return | |||
| Investor Shares | $1,000.00 | $1,015.63 | $9.65 |
| Institutional Shares | 1,000.00 | 1,016.13 | 9.15 |
The calculations are based on expenses incurred in the most recent six-month period. The fund’s annualized six-month expense ratios for that
period are 1.90% for Investor Shares and 1.80% for Institutional Shares. The dollar amounts shown as “Expenses Paid” are equal to the
annualized expense ratio multiplied by the average account value over the period, multiplied by the number of days in the most recent
six-month period, then divided by the number of days in the most recent 12-month period.
Glossary
Beta. A measure of the magnitude of a fund’s past share-price fluctuations in relation to the ups and downs of a given market index. The index is assigned a beta of 1.00. Compared with a given index, a fund with a beta of 1.20 typically would have seen its share price rise or fall by 12% when the index rose or fell by 10%. For this report, beta is based on returns over the past 36 months for both the fund and the index. Note that a fund’s beta should be reviewed in conjunction with its R-squared (see definition). The lower the R-squared, the less correlation there is between the fund and the index, and the less reliable beta is as an indicator of volatility.
Earnings Growth Rate. The average annual rate of growth in earnings over the past five years for the stocks now in a fund.
Equity Exposure. A measure that reflects a fund’s investments in stocks and stock futures. Any holdings in short-term reserves are excluded.
Expense Ratio. The percentage of a fund’s average net assets used to pay its annual administrative and advisory expenses. These expenses directly reduce returns to investors.
Foreign Holdings. The percentage of a fund represented by stocks or depositary receipts of companies based outside the United States.
Inception Date. The date on which the assets of a fund (or one of its share classes) are first invested in accordance with the fund’s investment objective. For funds with a subscription period, the inception date is the day after that period ends. Investment performance is measured from the inception date.
Median Market Cap. An indicator of the size of companies in which a fund invests; the midpoint of market capitalization (market price x shares outstanding) of a fund’s stocks, weighted by the proportion of the fund’s assets invested in each stock. Stocks representing half of the fund’s assets have market capitalizations above the median, and the rest are below it.
Price/Book Ratio. The share price of a stock divided by its net worth, or book value, per share. For a fund, the weighted average price/book ratio of the stocks it holds.
Price/Earnings Ratio. The ratio of a stock’s current price to its per-share earnings over the past year. For a fund, the weighted average P/E of the stocks it holds. P/E is an indicator of market expectations about corporate prospects; the higher the P/E, the greater the expectations for a company’s future growth.
R-Squared. A measure of how much of a fund’s past returns can be explained by the returns from the market in general, as measured by a given index. If a fund’s total returns were precisely synchronized with an index’s returns, its R-squared would be 1.00. If the fund’s returns bore no relationship to the index’s returns, its R-squared would be 0. For this report, R-squared is based on returns over the past 36 months for both the fund and the index.
Return on Equity. The annual average rate of return generated by a company during the past five years for each dollar of shareholder’s equity (net income divided by shareholder’s equity). For a fund, the weighted average return on equity for the companies whose stocks it holds.
Short-Term Reserves. The percentage of a fund invested in highly liquid, short-term securities that can be readily converted to cash.
32
Turnover Rate. An indication of the fund’s trading activity. Funds with high turnover rates incur higher transaction costs and may be more likely to distribute capital gains (which may be taxable to investors). The turnover rate excludes in-kind transactions, which have minimal impact on costs.
33
This page intentionally left blank.
This page intentionally left blank.
The People Who Govern Your Fund
The trustees of your mutual fund are there to see that the fund is operated and managed in your best interests since, as a shareholder, you are a part owner of the fund. Your fund’s trustees also serve on the board of directors of The Vanguard Group, Inc., which is owned by the Vanguard funds and provides services to them on an at-cost basis.
A majority of Vanguard’s board members are independent, meaning that they have no affiliation with Vanguard or the funds they oversee, apart from the sizable personal investments they have made as private individuals. The independent board members have distinguished backgrounds in business, academia, and public service. Each of the trustees and executive officers oversees 179 Vanguard funds.
The following table provides information for each trustee and executive officer of the fund. More information about the trustees is in the Statement of Additional Information, which can be obtained, without charge, by contacting Vanguard at 800-662-7447, or online at vanguard.com.
| Interested Trustee1 | Amy Gutmann |
| Born 1949. Trustee Since June 2006. Principal | |
| F. William McNabb III | Occupation(s) During the Past Five Years: President |
| Born 1957. Trustee Since July 2009. Chairman of the | of the University of Pennsylvania; Christopher H. |
| Board. Principal Occupation(s) During the Past Five | Browne Distinguished Professor of Political Science |
| Years: Chairman of the Board of The Vanguard Group, | in the School of Arts and Sciences with secondary |
| Inc., and of each of the investment companies served | appointments at the Annenberg School for Commu- |
| by The Vanguard Group, since January 2010; Director | nication and the Graduate School of Education |
| of The Vanguard Group since 2008; Chief Executive | of the University of Pennsylvania; Director of |
| Officer and President of The Vanguard Group and of | Carnegie Corporation of New York, Schuylkill River |
| each of the investment companies served by The | Development Corporation, and Greater Philadelphia |
| Vanguard Group since 2008; Director of Vanguard | Chamber of Commerce; Trustee of the National |
| Marketing Corporation; Managing Director of The | Constitution Center; Chair of the Presidential |
| Vanguard Group (1995–2008) . | Commission for the Study of Bioethical Issues. |
| JoAnn Heffernan Heisen | |
| Independent Trustees | Born 1950. Trustee Since July 1998. Principal |
| Occupation(s) During the Past Five Years: Corporate | |
| Emerson U. Fullwood | Vice President and Chief Global Diversity Officer |
| Born 1948. Trustee Since January 2008. Principal | since 2006 (retired 2008) and Member of the |
| Occupation(s) During the Past Five Years: Executive | Executive Committee (retired 2008) of Johnson & |
| Chief Staff and Marketing Officer for North America | Johnson (pharmaceuticals/consumer products); Vice |
| and Corporate Vice President (retired 2008) of Xerox | President and Chief Information Officer of Johnson & |
| Corporation (document management products and | Johnson (1997–2005); Director of the University |
| services); Director of SPX Corporation (multi-industry | Medical Center at Princeton and Women’s Research |
| manufacturing), the United Way of Rochester, | and Education Institute; Member of the Advisory |
| Amerigroup Corporation (managed health care), | Board of the Maxwell School of Citizenship and Public |
| the University of Rochester Medical Center, and | Affairs at Syracuse University. |
| Monroe Community College Foundation. | |
| F. Joseph Loughrey | |
| Rajiv L. Gupta | Born 1949. Trustee Since October 2009. Principal |
| Born 1945. Trustee Since December 2001.2 | Occupation(s) During the Past Five Years: President |
| Principal Occupation(s) During the Past Five Years: | and Chief Operating Officer since 2005 (retired 2009) |
| Chairman and Chief Executive Officer (retired 2009) | and Vice Chairman of the Board (2008–2009) of |
| and President (2006–2008) of Rohm and Haas Co. | Cummins Inc. (industrial machinery); Director of |
| (chemicals); Director of Tyco International, Ltd. | SKF AB (industrial machinery), Hillenbrand, Inc. |
| (diversified manufacturing and services) and Hewlett- | (specialized consumer services), Sauer-Danfoss Inc. |
| Packard Co. (electronic computer manufacturing); | (machinery), the Lumina Foundation for Education, |
| Trustee of The Conference Board; Member of the | and Oxfam America; Chairman of the Advisory |
| Board of Managers of Delphi Automotive LLP | Council for the College of Arts and Letters at the |
| (automotive components) . | University of Notre Dame. |
| André F. Perold | Kathryn J. Hyatt | |
| Born 1952. Trustee Since December 2004. Principal | Born 1955. Treasurer Since November 2008. Principal | |
| Occupation(s) During the Past Five Years: George | Occupation(s) During the Past Five Years: Principal | |
| Gund Professor of Finance and Banking at the Harvard | of The Vanguard Group, Inc.; Treasurer of each of | |
| Business School; Chair of the Investment Committee | the investment companies served by The Vanguard | |
| of HighVista Strategies LLC (private investment firm) . | Group since 2008; Assistant Treasurer of each of the | |
| investment companies served by The Vanguard Group | ||
| Alfred M. Rankin, Jr. | (1988–2008) . | |
| Born 1941. Trustee Since January 1993. Principal | ||
| Occupation(s) During the Past Five Years: Chairman, | Heidi Stam | |
| President, and Chief Executive Officer of NACCO | Born 1956. Secretary Since July 2005. Principal | |
| Industries, Inc. (forklift trucks/housewares/lignite); | Occupation(s) During the Past Five Years: Managing | |
| Director of Goodrich Corporation (industrial products/ | Director of The Vanguard Group, Inc., since 2006; | |
| aircraft systems and services); Chairman of the | General Counsel of The Vanguard Group since 2005; | |
| Federal Reserve Bank of Cleveland; Trustee of The | Secretary of The Vanguard Group and of each of the | |
| Cleveland Museum of Art. | investment companies served by The Vanguard Group | |
| since 2005; Director and Senior Vice President of | ||
| Peter F. Volanakis | Vanguard Marketing Corporation since 2005; | |
| Born 1955. Trustee Since July 2009. Principal | Principal of The Vanguard Group (1997–2006). | |
| Occupation(s) During the Past Five Years: President | ||
| since 2007 and Chief Operating Officer since 2005 | ||
| of Corning Incorporated (communications equipment); | Vanguard Senior Management Team | |
| President of Corning Technologies (2001–2005); | ||
| Director of Corning Incorporated and Dow Corning; | R. Gregory Barton | Michael S. Miller |
| Trustee of the Corning Incorporated Foundation and | Mortimer J. Buckley | James M. Norris |
| the Corning Museum of Glass; Overseer of the | Kathleen C. Gubanich | Glenn W. Reed |
| Amos Tuck School of Business Administration at | Paul A. Heller | George U. Sauter |
| Dartmouth College. | ||
| Chairman Emeritus and Senior Advisor | ||
| Executive Officers | ||
| John J. Brennan | ||
| Glenn Booraem | Chairman, 1996–2009 | |
| Born 1967. Controller Since July 2010. Principal | Chief Executive Officer and President, 1996–2008 | |
| Occupation(s) During the Past Five Years: Principal | ||
| of The Vanguard Group, Inc.; Controller of each of | ||
| the investment companies served by The Vanguard | ||
| Group since 2010; Assistant Controller of each of | Founder | |
| the investment companies served by The Vanguard | John C. Bogle | |
| Group (2001–2010) . | Chairman and Chief Executive Officer, 1974–1996 | |
| Thomas J. Higgins | ||
| Born 1957. Chief Financial Officer Since September | ||
| 2008. Principal Occupation(s) During the Past Five | ||
| Years: Principal of The Vanguard Group, Inc.; Chief | ||
| Financial Officer of each of the investment companies | ||
| served by The Vanguard Group since 2008; Treasurer | ||
| of each of the investment companies served by The | ||
| Vanguard Group (1998–2008) . | ||
1 Mr. McNabb is considered an “interested person,” as defined in the Investment Company Act of 1940, because he is an officer of the
Vanguard funds.
2 December 2002 for Vanguard Equity Income Fund, Vanguard Growth Equity Fund, the Vanguard Municipal Bond Funds, and the
Vanguard State Tax-Exempt Funds.

| P.O. Box 2600 | |
| Valley Forge, PA 19482-2600 | |
| Connect with Vanguard® > vanguard.com | |
| Fund Information > 800-662-7447 | CFA® is a trademark owned by CFA Institute. |
| Direct Investor Account Services > 800-662-2739 | |
| Institutional Investor Services > 800-523-1036 | |
| Text Telephone for People | |
| With Hearing Impairment > 800-749-7273 | |
| This material may be used in conjunction | |
| with the offering of shares of any Vanguard | |
| fund only if preceded or accompanied by | |
| the fund’s current prospectus. | |
| All comparative mutual fund data are from Lipper Inc. or | |
| Morningstar, Inc., unless otherwise noted. | |
| You can obtain a free copy of Vanguard’s proxy voting | |
| guidelines by visiting vanguard.com/proxyreporting or by | |
| calling Vanguard at 800-662-2739. The guidelines are | |
| also available from the SEC’s website, sec.gov. In | |
| addition, you may obtain a free report on how your fund | |
| voted the proxies for securities it owned during the 12 | |
| months ended June 30. To get the report, visit either | |
| vanguard.com/proxyreporting or sec.gov. | |
| You can review and copy information about your fund at | |
| the SEC’s Public Reference Room in Washington, D.C. To | |
| find out more about this public service, call the SEC at | |
| 202-551-8090. Information about your fund is also | |
| available on the SEC’s website, and you can receive | |
| copies of this information, for a fee, by sending a | |
| request in either of two ways: via e-mail addressed to | |
| publicinfo@sec.gov or via regular mail addressed to the | |
| Public Reference Section, Securities and Exchange | |
| Commission, Washington, DC 20549-1520. | |
| © 2011 The Vanguard Group, Inc. | |
| All rights reserved. | |
| Vanguard Marketing Corporation, Distributor. | |
| Q6340 022011 | |
Item 2: Code of Ethics. The Registrant has adopted a code of ethics that applies to the Registrant’s principal executive officer, principal financial officer, principal accounting officer or controller or persons performing similar functions. The Code of Ethics was amended during the reporting period covered by this report to make certain technical, non-material changes.
Item 3: Audit Committee Financial Expert. The following members of the Audit Committee have been determined by the Registrant’s Board of Trustees to be Audit Committee Financial Experts serving on its Audit Committee, and to be independent: Charles D. Ellis, Rajiv L. Gupta, JoAnn Heffernan Heisen, André F. Perold, and Alfred M. Rankin, Jr.
Item 4: Principal Accountant Fees and Services.
(a) Audit Fees.
Audit Fees of the Registrant
Fiscal Year Ended December 31, 2010: $44,000
Fiscal Year Ended December 31, 2009: $42,000
Aggregate Audit Fees of Registered Investment Companies in the Vanguard Group.
Fiscal Year Ended December 31, 2010: $3,607,060
Fiscal Year Ended December 31, 2009: $3,354,640
(b) Audit-Related Fees.
Fiscal Year Ended December 31, 2010: $791,350
Fiscal Year Ended December 31, 2009: $876,210
Includes fees billed in connection with assurance and related services provided to the Registrant, The Vanguard Group, Inc., Vanguard Marketing Corporation, and other registered investment companies in the Vanguard Group.
(c) Tax Fees.
Fiscal Year Ended December 31, 2010: $336,090
Fiscal Year Ended December 31, 2009: $423,070
Includes fees billed in connection with tax compliance, planning and advice services provided to the Registrant, The Vanguard Group, Inc., Vanguard Marketing Corporation, and other registered investment companies in the Vanguard Group and related to income and excise taxes.
(d) All Other Fees.
Fiscal Year Ended December 31, 2010: $16,000
Fiscal Year Ended December 31, 2009: $0
Includes fees billed for services related to risk management and privacy matters. Services were provided to the Registrant, The Vanguard Group, Inc., Vanguard Marketing Corporation, and other registered investment companies in the Vanguard Group.
(e) (1) Pre-Approval Policies. The policy of the Registrant’s Audit Committee is to consider and, if appropriate, approve before the principal accountant is engaged for such services, all specific audit and non-audit services provided to: (1) the Registrant; (2) The Vanguard Group, Inc.; (3) other entities controlled by The Vanguard Group, Inc. that provide ongoing services to the Registrant; and (4) other registered investment companies in the Vanguard Group. In making a determination, the Audit Committee considers whether the services are consistent with maintaining the principal accountant’s independence.
In the event of a contingency situation in which the principal accountant is needed to provide services in between scheduled Audit Committee meetings, the Chairman of the Audit Committee would be called on to consider and, if appropriate, pre-approve audit or permitted non-audit services in an amount sufficient to complete services through the next Audit Committee meeting, and to determine if such services would be consistent with maintaining the accountant’s independence. At the next scheduled Audit Committee meeting, services and fees would be presented to the Audit Committee for formal consideration, and, if appropriate, approval by the entire Audit Committee. The Audit Committee would again consider whether such services and fees are consistent with maintaining the principal accountant’s independence.
The Registrant’s Audit Committee is informed at least annually of all audit and non-audit services provided by the principal accountant to the Vanguard complex, whether such services are provided to: (1) the Registrant; (2) The Vanguard Group, Inc.; (3) other entities controlled by The Vanguard Group, Inc. that provide ongoing services to the Registrant; or (4) other registered investment companies in the Vanguard Group.
(2) No percentage of the principal accountant’s fees or services were approved pursuant to the waiver provision of paragraph (c)(7)(i)(C) of Rule 2-01 of Regulation S-X.
(f) For the most recent fiscal year, over 50% of the hours worked under the principal accountant’s engagement were not performed by persons other than full-time, permanent employees of the principal accountant.
(g) Aggregate Non-Audit Fees.
Fiscal Year Ended December 31, 2010: $352,090
Fiscal Year Ended December 31, 2009: $423,070
Includes fees billed for non-audit services provided to the Registrant, The Vanguard Group, Inc., Vanguard Marketing Corporation, and other registered investment companies in the Vanguard Group.
(h) For the most recent fiscal year, the Audit Committee has determined that the provision of all non-audit services was consistent with maintaining the principal accountant’s independence.
Item 5: Audit Committee of Listed Registrants.
Not Applicable.
Item 6: Investments.
Not Applicable.
Item 7: Disclosure of Proxy Voting Policies and Procedures for Closed-End Management Investment Companies.
Not Applicable.
Item 8: Portfolio Managers of Closed-End Management Investment Companies.
Not Applicable.
Item 9: Purchase of Equity Securities by Closed-End Management Investment Company and Affiliated Purchasers.
Not Applicable.
Item 10: Submission of Matters to a Vote of Security Holders.
Not Applicable.
Item 11: Controls and Procedures.
(a) Disclosure Controls and Procedures. The Principal Executive and Financial Officers concluded that the Registrant's Disclosure Controls and Procedures are effective based on their evaluation of the Disclosure Controls and Procedures as of a date within 90 days of the filing date of this report.
(b) Internal Control Over Financial Reporting. There were no significant changes in Registrant’s Internal Control Over Financial Reporting or in other factors that could significantly affect this control subsequent to the date of the evaluation, including any corrective actions with regard to significant deficiencies and material weaknesses.
Item 12: Exhibits.
(a) Code of Ethics.
(b) Certifications.
Pursuant to the requirements of the Securities Exchange Act of 1934 and the Investment Company Act of 1940, the registrant has duly caused this report to be signed on its behalf by the undersigned, thereunto duly authorized.
| VANGUARD MONTGOMERY FUNDS | |
| BY: | /s/ F. WILLIAM MCNABB III* |
| F. WILLIAM MCNABB III | |
| CHIEF EXECUTIVE OFFICER | |
| Date: February 17, 2011 | |
Pursuant to the requirements of the Securities Exchange Act of 1934 and the Investment Company Act of 1940, this report has been signed below by the following persons on behalf of the registrant and in the capacities and on the dates indicated.
| VANGUARD MONTGOMERY FUNDS | |
| BY: | /s/ F. WILLIAM MCNABB III* |
| F. WILLIAM MCNABB III | |
| CHIEF EXECUTIVE OFFICER | |
| Date: February 17, 2011 | |
| VANGUARD MONTGOMERY FUNDS | |
| BY: | /s/ THOMAS J. HIGGINS* |
| THOMAS J. HIGGINS | |
| CHIEF FINANCIAL OFFICER | |
| Date: February 17, 2011 | |
* By: /s/ Heidi Stam
Heidi Stam, pursuant to a Power of Attorney filed on April 26, 2010, see file Number
33-53683, Incorporated by Reference.