UNITED STATES
SECURITIES AND EXCHANGE COMMISSION
Washington, D.C. 20549
FORM N-CSR
CERTIFIED SHAREHOLDER REPORT
OF
REGISTERED MANAGEMENT INVESTMENT COMPANIES
Investment Company Act file number: 811-22114
Name of Registrant: Vanguard Montgomery Funds
Address of Registrant:
P.O. Box 2600
Valley Forge, PA 19482
Name and address of agent for service:
Heidi Stam, Esquire
P.O. Box 876
Valley Forge, PA 19482
Registrant’s telephone number, including area code: (610) 669-1000
Date of fiscal year end: December 31
Date of reporting period: January 1, 2012 – December 31, 2012
Item 1: Reports to Shareholders

|
| Annual Report | December 31, 2012 |
| Vanguard Market Neutral Fund |
 |
> For the year ended December 31, 2012, Investor Shares of Vanguard Market Neutral Fund returned –1.50%.
> The fund trailed its benchmark index and its peer group.
> The financial sector was a major source of disappointing returns.
| |
| Contents | |
| Your Fund’s Total Returns. | 1 |
| Chairman’s Letter. | 2 |
| Advisor’s Report. | 8 |
| Fund Profile. | 11 |
| Performance Summary. | 13 |
| Financial Statements. | 15 |
| Your Fund’s After-Tax Returns. | 30 |
| About Your Fund’s Expenses. | 31 |
| Glossary. | 33 |
Please note: The opinions expressed in this report are just that—informed opinions. They should not be considered promises or advice. Also, please keep in mind that the information and opinions cover the period through the date on the front of this report. Of course, the risks of investing in your fund are spelled out in the prospectus.
See the Glossary for definitions of investment terms used in this report.
About the cover: Our cover photograph shows rigging on the HMSSurprise, a replica of an 18th-century Royal Navy frigate. It was featured in the 2003 movie Master and Commander: The Far Side of the World, which was based on Patrick O’Brian’s sea novels, set amid the Napoleonic Wars. Vanguard was named for another ship of that era, the HMSVanguard, which was the flagship of British Admiral Horatio Nelson at the Battle of the Nile.
Your Fund’s Total Returns
| |
| Fiscal Year Ended December 31, 2012 | |
| | Total |
| | Returns |
| Vanguard Market Neutral Fund | |
| Investor Shares | -1.50% |
| Institutional Shares | -1.39 |
| Citigroup Three-Month U.S. Treasury Bill Index | 0.07 |
| Equity Market Neutral Funds Average | 0.98 |
Equity Market Neutral Funds Average: Derived from data provided by Lipper Inc.
Institutional Shares are available to certain institutional investors who meet specific administrative, service, and account-size criteria.
| | | | |
| Your Fund’s Performance at a Glance | | | | |
| December 31, 2011, Through December 31, 2012 | | | | |
| | | | Distributions Per Share |
| | Starting | Ending | Income | Capital |
| | Share Price | Share Price | Dividends | Gains |
| Vanguard Market Neutral Fund | | | | |
| Investor Shares | $10.36 | $10.16 | $0.045 | $0.000 |
| Institutional Shares | 10.33 | 10.10 | 0.086 | 0.000 |
1

Chairman’s Letter
Dear Shareholder,
Investor Shares of Vanguard Market Neutral Fund returned –1.50% in 2012, and Institutional Shares returned –1.39%. The fund’s results trailed the return of its benchmark index (0.07%) and the average return of its peer group (0.98%).
The fund relies on computer models to identify the most and least attractive stocks in each sector and industry group. On balance, these models worked well in 2012. The fund’s subpar return reflected poor stock selection in the financial sector, which undermined an otherwise solid performance.
If you own the fund in a taxable account, you may wish to view the information on after-tax returns that appears later in this report.
With help from central banks, stocks posted strong results
Stocks around the world recorded double-digit gains for the 12 months ended December 31, with international stocks faring even better than their U.S. counterparts.
European stocks shook off investors’ concerns to deliver some of the best results, rising about 19% compared with about 16% for U.S. stocks. The rally came as European central bankers moved to address worries about the finances of governments and banks. Still, Vanguard economists expect Europe to remain a trouble spot, with
2
occasional spikes in market volatility, as fiscal tightening persists in the face of weak economic growth.
In the United States, the Federal Reserve continued buying bonds and mortgage-backed securities to try to stimulate growth. The Fed’s actions seemed to buoy both stock and bond returns.
Attention to the nation’s considerable budget challenges intensified as 2012 drew to a close. The focus on the “fiscal cliff” led to nervousness in the markets before policymakers reached a limited tax-rate agreement on the cusp of the new year. The compromise legislation, which President Barack Obama signed into law on January 2, addressed some immediate concerns, but a credible long-term deficit-reduction strategy had yet to be crafted to resolve the nation’s fiscal imbalance and open the way for growth.
Bond returns were solid, but challenges lie ahead
The broad U.S. taxable bond market returned about 4% for the 12 months. Municipal bonds performed especially well, returning more than 6%.
As bond prices rose, the yield of the 10-year U.S. Treasury note slipped to a record low in July, closing below 1.5%. (Bond yields and prices move in opposite directions.) By the end of the period, the yield had climbed, but it remained exceptionally low by historical standards.
| | | |
| Market Barometer | | | |
| |
| | | Average Annual Total Returns |
| | Periods Ended December 31, 2012 |
| | One | Three | Five |
| | Year | Years | Years |
| Stocks | | | |
| Russell 1000 Index (Large-caps) | 16.42% | 11.12% | 1.92% |
| Russell 2000 Index (Small-caps) | 16.35 | 12.25 | 3.56 |
| Russell 3000 Index (Broad U.S. market) | 16.42 | 11.20 | 2.04 |
| MSCI All Country World Index ex USA (International) | 16.83 | 3.87 | -2.89 |
| |
| Bonds | | | |
| Barclays U.S. Aggregate Bond Index (Broad taxable market) | 4.21% | 6.19% | 5.95% |
| Barclays Municipal Bond Index (Broad tax-exempt market) | 6.78 | 6.57 | 5.91 |
| Citigroup Three-Month U.S. Treasury Bill Index | 0.07 | 0.08 | 0.44 |
| |
| CPI | | | |
| Consumer Price Index | 1.74% | 2.06% | 1.80% |
3
Although bonds can provide critical diversification benefits to a portfolio, their prospects look much less promising than they had in recent years. As yields have tumbled, the opportunity for future bond price appreciation has greatly diminished. (You can read more about our expectations for bond and stock returns in Vanguard’s Economic and Investment Outlook, available at vanguard.com/research.)
As it has since late 2008, the Fed held its target for short-term interest rates between 0% and 0.25%, which kept a tight lid on returns from money market funds and savings accounts.
Financial sector stock selections had a major impact on performance
The Market Neutral Fund is essentially two portfolios of equal value: a portfolio of stocks that the fund owns (its “long” portfolio) and another of stocks that it borrows and then sells (its “short” portfolio).
The fund’s advisor, Vanguard Equity Investment Group, uses quantitative models to identify the most attractive candidates for purchase and for sale. For the long portfolio, it seeks to buy undervalued stocks in the expectation that their prices will rise. For the short portfolio, it looks for stocks that it expects to decline in price. The advisor then borrows these stocks and sells them, hoping to repurchase them later at a lower price. When all goes according to plan, the difference between the higher sale price and the lower purchase price produces a positive return for the short portfolio.
The goal of this approach is to insulate the fund from broad market movements, which are “neutralized” by the combination of longs and shorts. Returns are driven strictly by the advisor’s success in identifying the most undervalued and overvalued stocks in each sector and industry.
During the year, the advisor’s stock-selection method worked well for materials and energy stocks, especially in the fund’s long holdings. In the materials sector, these included stocks of chemical and fertilizer companies. Bright spots in the energy sector included stocks of energy exploration and production companies.
The fund’s short holdings of information technology stocks, especially firms in the software and services business, hurt returns. The largest detractor, however, was the financial sector, where the fund’s performance was hurt by outsized moves in the prices of two holdings in particular, one in the long portfolio and one in the short portfolio. The Advisor’s Report discusses this and other 2012 results in more detail.
4
Short-term results curb long-term results
The fund’s 2012 results weighed on its long-term performance. Its ten-year average annual return of 0.79% for Investor Shares trailed those of its benchmark (1.69%) and its peers (1.65%).
Over time, we’re confident that the fund’s results will be driven primarily by successful implementation of its long-short strategy. We also expect that unfavorable events—such as those that affected 2012’s fund return—and favorable events will balance each other out.
Gus Sauter united traditional values with pioneering investment acumen
When I was interviewing for a job at Vanguard in the mid-1980s, Jack Brennan, who would go on to become our chairman and CEO and is now chairman emeritus, described Vanguard as “a company with the intellectual rigor of Wall Street but with Midwestern values.”
I’m reminded of that when I think about Gus Sauter’s 25-year career at Vanguard. Gus retired as our chief investment officer at the end of December, having set the highest of standards for both intellectual achievement and devotion to doing the right thing for clients, colleagues, and community.
| |
| Total Returns | |
| Ten Years Ended December 31, 2012 | |
| | Average |
| | Annual Return |
| Market Neutral Fund Investor Shares | 0.79% |
| Citigroup Three-Month U.S. Treasury Bill Index | 1.69 |
| Equity Market Neutral Funds Average | 1.65 |
| Equity Market Neutral Funds Average: Derived from data provided by Lipper Inc. | |
The figures shown represent past performance, which is not a guarantee of future results. (Current performance may be lower or higher than the performance data cited. For performance data current to the most recent month-end, visit our website at vanguard.com/performance.) Note, too, that both investment returns and principal value can fluctuate widely, so an investor’s shares, when sold, could be worth more or less than their original cost.
5
Gus played a pivotal role in transforming indexing from a novelty to an investing mainstay, a change that has benefited all investors. In addition, he developed our active quantitative equity strategies, oversaw the growth of our industry-leading expertise in fixed income, and ultimately helped Vanguard to become a global investment manager responsible for $2 trillion in client assets.
As for the Midwestern values, Gus—a native of Ohio, incidentally—served our clients with a dedication to thrift, candor, and common sense that has helped make Vanguard what it is. His colleagues knew that in any situation they could count on him to keep a level-headed, long-term outlook. Just two weeks after he started at Vanguard, he helped guide us through
Investment insight
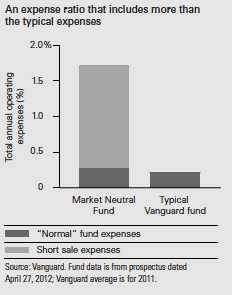
That doesn’t look like a Vanguard expense ratio! The average expense ratio for Vanguard funds is a slender 0.20% of assets. Vanguard Market Neutral Fund’s expense ratio weighs in at an un-Vanguard-like 1.71%. Much of the difference reflects the unusual costs associated with short sales. The fund’s day-to-day operating costs remain modest.
In its short portfolio, as explained in the accompanying Chairman’s Letter, the Market Neutral Fund sells borrowed shares. It may have to pay fees associated with borrowing those shares. The biggest expense, however, is payments the fund must make to the lenders for any dividends paid by those stocks, which the lenders are entitled to while the stocks are on loan. The advisor’s expectation, of course, is that the profits earned from its short sales will more than compensate for the costs of executing them. In the meantime, these payments are tallied as fund expenses, amplifying the expense ratio.
Competing funds must follow the same practice. The chart below breaks the expense ratio into two components: expenses associated with short sales and the more familiar operating costs.
6
the stock market crash of 1987. Some 20 years later, he helped us navigate the financial crisis of 2008–2009.
An important aspect of Gus’s legacy is the team of world-class investment professionals that he cultivated at Vanguard. That team is now led by Tim Buckley, who oversaw our services for individual investors before becoming chief investment officer. I am confident that Tim will not only carry on Gus��s legacy, but also—as Gus himself put it—take Vanguard investment management to the next level.
As always, thank you for investing with Vanguard.
Sincerely,
F. William McNabb III
Chairman and Chief Executive Officer
January 18, 2013
7
Advisor’s Report
For the fiscal year, Vanguard Market Neutral Fund returned –1.50%, underperforming its benchmark, the Citigroup Three-Month U.S. Treasury Bill Index. Of course, the fund’s portfolio is fundamentally different from an investment in 3-month Treasury bills, which are deemed safe, fixed-return securities backed by the full faith and credit of the U.S. government. The fund invests in equity market securities and therefore will be substantially more volatile than an investment in Treasury bills. Although its 12-month return is disappointing, the fund’s shortfall is within an expected variation range given its risk profile.
To better understand the fund’s performance for the year, it helps to review our process. The quantitative approach to investing that we apply focuses on specific stock fundamentals. Because we believe there is no single indicator for identifying outperforming stocks, we diversify across multiple factors:
• Valuation, which measures the price we pay for earnings and cash flows.
• Growth, which considers the growth of earnings when evaluating how much we pay for them.
• Management decisions, which looks at the actions taken by company managers who, privy to their knowledge of a firm’s prospects and earnings, signal their opinions of its future.
• Market sentiment or momentum, which captures how investors reflect their opinions of a company through their activity in the market.
• Quality, which measures balance sheet strength and the sustainability of earnings.
Our portfolio construction approach to the Market Neutral Fund uses these indicators to buy (go “long” on) stocks that we believe are undervalued and to sell (“short”) those that we believe to be overvalued.
Through this process, we strive to create a portfolio that is neutral with respect to overall stock market risk. One factor we monitor to control this neutrality is beta, which is a measure of a stock’s volatility relative to that of the broad stock market. While a traditional long-only equity portfolio that does not seek to achieve market neutrality can typically be expected to produce a beta that would on average be centered on 1.0, our process balances our long and short positions to target a beta of 0.0 (market neutrality). The fund has been successful in achieving this goal.
8
As of the end of the most recent fiscal year, the three-year beta for the fund relative to a broad equity benchmark (the Russell 1000 Index) was 0.02.
Our analysis for the 12-month period reveals that our stock selection model was effective as a whole: Our Quality, Management decisions, Growth, and Valuation models were positive, while the Market sentiment (momentum) model detracted.
Our negative performance was attributable mainly to shorter-term idiosyncratic effects. For example, the largest detractor on the short side was Ocwen Financial Corp., a mortgage-servicing firm. Our model identified it as having poor fundamentals, as revealed by both its balance sheet and income statement, but the stock gained more than 100% for the year. The company’s performance was affected more by acquisitions that were viewed favorably by investors than by the fundamental factors we analyze.
On the long side, our largest loss was Knight Capital Group. The firm, which provides trade execution services, has historically been a leader in its industry and was attractively ranked relative to its peers. But it experienced a drop in price of more than 70% over the course of a few days in the aftermath of a software glitch in its systems. These two names had a disproportionate effect on a portfolio of more than 200 securities.
We expect that, over longer time horizons, the portfolio’s performance will balance out such company-specific events and better reflect our ability to select attractive stocks on an aggregate level. For this reason, we generally use a longer time period for performance evaluation, such as three or more years. For the three years ended December 31, the fund outperformed its benchmark by 1.59 percentage points on an average annual basis.
Our overall stock selection was mixed across sectors. We saw the greatest value added in the materials and energy sectors, where our long positions outpaced the short positions by 2.43 and 2.37 percentage points, respectively. In materials, top contributions came from a long position in Westlake Chemical Corp. and a short holding in Stillwater Mining Co. In energy, a long position in Western Refining and a short holding in Cobalt International Energy helped most.
We underperformed in financials and information technology, as our short positions outpaced our long holdings by 1.57 and 0.70 percentage points, respectively. The results in financials can largely be attributed to Ocwen Financial and Knight Capital, as indicated above.
Since the end of the 2008 market decline, investors have been rewarded with attractive returns across asset classes. However, even with the recent avoidance
9
of the “fiscal cliff” at year-end, many serious issues remain. Sluggish economic growth here or abroad, unresolved fiscal deficit and debt levels, high unemployment, and an ambiguous corporate profit picture may leave us with low investor confidence and higher volatility for the near term. While we cannot predict the impact of broad economic or political events on the markets, we are confident that our strategy to capture the spread between undervalued and overvalued stocks will produce worthwhile returns for long-term investors and continue to play an important role in a diversified investment plan.
We thank you for your investment and look forward to the new fiscal year.
James D. Troyer, CFA, Principal, Portfolio Manager
James P. Stetler, Principal, Portfolio Manager
Michael R. Roach, CFA, Portfolio Manager
Vanguard Equity Investment Group
January 9, 2013
10
Market Neutral Fund
Fund Profile
As of December 31, 2012
| | |
| Share-Class Characteristics | | |
| | Investor | Institutional |
| | Shares | Shares |
| Ticker Symbol | VMNFX | VMNIX |
| Total Expense Ratio1 | 1.71% | 1.61% |
| Management Expenses | 0.18% | 0.10% |
| Dividend Expenses on | | |
| Securities Sold Short2 | 1.30% | 1.30% |
| Borrowing Expenses on | | |
| Securities Sold Short2 | 0.14% | 0.14% |
| Other Expenses | 0.09% | 0.07% |
| | |
| Portfolio Characteristics | |
| | Long | Short |
| | Portfolio | Portfolio |
| Number of Stocks | 240 | 233 |
| Median Market Cap | $3.6B | $4.1B |
| Price/Earnings Ratio | 13.7x | 25.2x |
| Price/Book Ratio | 1.9x | 1.9x |
| Return on Equity | 10.9% | 13.4% |
| Earnings Growth Rate | 10.0% | 4.0% |
| Foreign Holdings | 2.3% | 1.8% |
| |
| Fund Characteristics | |
| Turnover Rate | 89% |
| Short-Term Reserves | 5.2% |
| | |
| Volatility Measures | | |
| | | DJ U.S. |
| | Citigroup | Total |
| | Three-Month | Market |
| | U.S. Treasury | FA |
| | Bill Index | Index |
| R-Squared | 0.00 | 0.01 |
| Beta | -11.07 | 0.02 |
These measures show the degree and timing of the fund’s fluctuations compared with the index over 36 months.
| | |
| Sector Diversification (% of equity exposure) |
| | Long | Short |
| | Portfolio | Portfolio |
| Consumer Discretionary | 16.0% | 15.0% |
| Consumer Staples | 4.7 | 5.2 |
| Energy | 6.9 | 7.3 |
| Financials | 15.7 | 15.3 |
| Health Care | 8.6 | 7.8 |
| Industrials | 16.9 | 16.7 |
| Information Technology | 18.1 | 19.0 |
| Materials | 7.0 | 7.1 |
| Telecommunication Services | 1.2 | 1.1 |
| Utilities | 4.9 | 5.5 |
1 The total expense ratios shown are from the prospectus dated April 27, 2012, and represent estimated costs for the current fiscal year. For the fiscal year ended December 31, 2012, the total expense ratios were 1.88% for Investor Shares and 1.78% for Institutional Shares.
2 In connection with a short sale, the fund may receive income or be charged a fee based on the market value of the borrowed stock. When a cash dividend is declared on a stock the fund has sold short, the fund is required to pay an amount equal to that dividend to the party from which the fund borrowed the stock and to record the payment of the dividend as an expense.
11
Market Neutral Fund
| | |
| Ten Largest Holdings1 (% of total net assets) |
| Long Portfolio | | |
| Brunswick Corp. | Leisure Equipment & | |
| | Products | 0.6% |
| Terex Corp. | Construction & Farm | |
| | Machinery & Heavy | |
| | Trucks | 0.6 |
| Western Digital Corp. | Computer Storage & | |
| | Peripherals | 0.6 |
| PPG Industries Inc. | Diversified Chemicals | 0.6 |
| Marathon Petroleum | Oil & Gas Refining & | |
| Corp. | Marketing | 0.6 |
| Mine Safety Appliances | Office Services & | |
| Co. | Supplies | 0.6 |
| Amerco Inc. | Trucking | 0.6 |
| Tesoro Corp. | Oil & Gas Refining & | |
| | Marketing | 0.6 |
| Valero Energy Corp. | Oil & Gas Refining & | |
| | Marketing | 0.6 |
| Helix Energy Solutions | Oil & Gas Equipment | |
| Group Inc. | & Services | 0.6 |
| Top Ten | | 6.0% |
| | |
| Ten Largest Holdings1 (% of total net assets) |
| Short Portfolio | | |
| Compuware Corp. | Application | |
| | Software | 0.6% |
| Visteon Corp. | Auto Parts & | |
| | Equipment | 0.6 |
| CoStar Group Inc. | Internet Software & | |
| | Services | 0.6 |
| TFS Financial Corp. | Thrifts & Mortgage | |
| | Finance | 0.6 |
| FleetCor Technologies | Data Processing & | |
| Inc. | Outsourced | |
| | Services | 0.6 |
| Genworth Financial Inc. | Multi-line Insurance | |
| Class A | | 0.6 |
| FLIR Systems Inc. | Electronic | |
| | Equipment & | |
| | Instruments | 0.6 |
| Sealed Air Corp. | Paper Packaging | 0.6 |
| Precision Castparts Corp. | Aerospace & | |
| | Defense | 0.6 |
| Chipotle Mexican Grill | Restaurants | |
| Inc. Class A | | 0.6 |
| Top Ten | | 6.0% |
1 The holdings listed exclude any temporary cash investments and equity index products.
12
Market Neutral Fund
Performance Summary
All of the returns in this report represent past performance, which is not a guarantee of future results that may be achieved by the fund. (Current performance may be lower or higher than the performance data cited. For performance data current to the most recent month-end, visit our website at vanguard.com/performance.) Note, too, that both investment returns and principal value can fluctuate widely, so an investor’s shares, when sold, could be worth more or less than their original cost. The returns shown do not reflect taxes that a shareholder would pay on fund distributions or on the sale of fund shares.
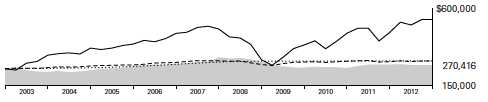
Cumulative Performance: December 31, 2002, Through December 31, 2012
Initial Investment of $250,000
| | | | |
| | | Average Annual Total Returns | |
| | Periods Ended December 31, 2012 | |
| | | | | Final Value |
| | One | Five | Ten | of a $250,000 |
| | Year | Years | Years | Investment |
| Market Neutral Fund Investor Shares | -1.50% | -3.09% | 0.79% | $270,416 |
| Citigroup Three-Month U.S. Treasury | | | | |
| Bill Index | 0.07 | 0.44 | 1.69 | 295,602 |
| Equity Market Neutral Funds Average | 0.98 | -0.19 | 1.65 | 294,409 |
| Dow Jones U.S. Total Stock Market | | | | |
| Float Adjusted Index | 16.38 | 2.21 | 7.95 | 537,101 |
Equity Market Neutral Funds Average: Derived from data provided by Lipper Inc.
| | | | |
| | | | | Final Value |
| | One | Five | Ten | of a $5,000,000 |
| | Year | Years | Years | Investment |
| Market Neutral Fund Institutional Shares | -1.39% | -3.02% | 0.98% | $5,511,738 |
| Citigroup Three-Month U.S. Treasury Bill | | | | |
| Index | 0.07 | 0.44 | 1.69 | 5,912,043 |
| Dow Jones U.S. Total Stock Market Float | | | | |
| Adjusted Index | 16.38 | 2.21 | 7.95 | 10,742,011 |
See Financial Highlights for dividend and capital gains information.
13
Market Neutral Fund
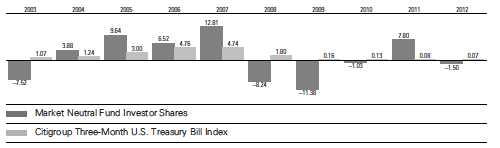
Fiscal-Year Total Returns (%): December 31, 2002, Through December 31, 2012
14
Market Neutral Fund
Financial Statements
Statement of Net Assets
As of December 31, 2012
The fund reports a complete list of its holdings in regulatory filings four times in each fiscal year, at the quarter-ends. For the second and fourth fiscal quarters, the lists appear in the fund’s semiannual and annual reports to shareholders. For the first and third fiscal quarters, the fund files the lists with the Securities and Exchange Commission on Form N-Q. Shareholders can look up the fund’s Forms N-Q on the SEC’s website at sec.gov. Forms N-Q may also be reviewed and copied at the SEC’s Public Reference Room (see the back cover of this report for further information).
| | | |
| | | | Market |
| | | | Value |
| | | Shares | ($000) |
| Common Stocks—Long Positions (95.2%) | |
| Consumer Discretionary (15.3%) | | |
| † | Brunswick Corp. | 38,200 | 1,111 |
| * † | PulteGroup Inc. | 56,150 | 1,020 |
| † | Cooper Tire & Rubber Co. | 40,075 | 1,016 |
| † | Cinemark Holdings Inc. | 37,700 | 979 |
| † | Comcast Corp. Class A | 26,100 | 976 |
| * † | Marriott Vacations | | |
| | Worldwide Corp. | 23,300 | 971 |
| † | Macy’s Inc. | 24,600 | 960 |
| * | Papa John’s | | |
| | International Inc. | 17,400 | 956 |
| † | Gannett Co. Inc. | 52,600 | 947 |
| | Expedia Inc. | 15,200 | 934 |
| † | Cracker Barrel Old | | |
| | Country Store Inc. | 14,500 | 932 |
| † | Dillard’s Inc. Class A | 10,970 | 919 |
| * † | O’Reilly Automotive Inc. | 10,200 | 912 |
| † | Marriott International Inc. | | |
| | Class A | 24,200 | 902 |
| | American Eagle | | |
| | Outfitters Inc. | 42,700 | 876 |
| † | Brinker International Inc. | 28,000 | 868 |
| † | Buckle Inc. | 19,300 | 862 |
| * † | Coinstar Inc. | 16,350 | 850 |
| † | Foot Locker Inc. | 26,400 | 848 |
| † | Polaris Industries Inc. | 9,990 | 841 |
| | Thor Industries Inc. | 22,455 | 840 |
| | Wyndham Worldwide Corp. | 14,240 | 758 |
| | Dana Holding Corp. | 48,480 | 757 |
| * | Jarden Corp. | 13,500 | 698 |
| | TJX Cos. Inc. | 16,100 | 683 |
| † | Domino’s Pizza Inc. | 13,950 | 608 |
| | Virgin Media Inc. | 16,200 | 595 |
| * | Delphi Automotive plc | 13,800 | 528 |
| * | ANN Inc. | 15,100 | 511 |
| | Gap Inc. | 14,600 | 453 |
| * | Goodyear Tire & Rubber Co. | 31,500 | 435 |
| | Churchill Downs Inc. | 5,300 | 352 |
| | | |
| | | | Market |
| | | | Value |
| | | Shares | ($000) |
| | Harley-Davidson Inc. | 6,500 | 317 |
| | PetSmart Inc. | 3,100 | 212 |
| | Chico’s FAS Inc. | 11,000 | 203 |
| | Valassis Communications Inc. | 7,800 | 201 |
| * | Hanesbrands Inc. | 5,600 | 201 |
| | PVH Corp. | 1,800 | 200 |
| * | Grand Canyon Education Inc. | 8,200 | 192 |
| * | Lamar Advertising Co. | | |
| | Class A | 3,800 | 147 |
| * | Vitamin Shoppe Inc. | 2,300 | 132 |
| * | Genesco Inc. | 2,000 | 110 |
| | | | 27,813 |
| Consumer Staples (4.5%) | | |
| * † | Pilgrim’s Pride Corp. | 139,600 | 1,012 |
| † | CVS Caremark Corp. | 19,800 | 957 |
| † | Universal Corp. | 18,800 | 938 |
| * † | Dean Foods Co. | 56,400 | 931 |
| † | Reynolds American Inc. | 22,400 | 928 |
| † | Philip Morris | | |
| | International Inc. | 10,700 | 895 |
| † | Nu Skin Enterprises Inc. | | |
| | Class A | 20,400 | 756 |
| | Ingredion Inc. | 7,700 | 496 |
| * | Rite Aid Corp. | 331,500 | 451 |
| * | Harbinger Group Inc. | 57,700 | 444 |
| | Energizer Holdings Inc. | 2,900 | 232 |
| | Campbell Soup Co. | 3,900 | 136 |
| | | | 8,176 |
| Energy (6.5%) | | |
| † | Marathon Petroleum Corp. | 16,940 | 1,067 |
| † | Tesoro Corp. | 23,900 | 1,053 |
| † | Valero Energy Corp. | 30,700 | 1,048 |
| * † | Helix Energy Solutions | | |
| | Group Inc. | 50,613 | 1,045 |
| † | Ship Finance | | |
| | International Ltd. | 61,100 | 1,016 |
| † | HollyFrontier Corp. | 21,350 | 994 |
| † | Western Refining Inc. | 31,980 | 902 |
| † | Delek US Holdings Inc. | 35,600 | 901 |
15
Market Neutral Fund
| | | |
| | | | Market |
| | | | Value |
| | | Shares | ($000) |
| † | Energy XXI Bermuda Ltd. | 26,500 | 853 |
| † | Chevron Corp. | 7,700 | 833 |
| † | Helmerich & Payne Inc. | 14,000 | 784 |
| † | Phillips 66 | 9,300 | 494 |
| † | ConocoPhillips | 6,400 | 371 |
| * | Exterran Holdings Inc. | 10,800 | 237 |
| | Marathon Oil Corp. | 4,580 | 140 |
| | Exxon Mobil Corp. | 1,400 | 121 |
| | | | 11,859 |
| Financials (14.9%) | | |
| † | Invesco Ltd. | 38,700 | 1,010 |
| * † | American Capital Ltd. | 83,200 | 998 |
| † | JPMorgan Chase & Co. | 22,700 | 998 |
| * † | American International | | |
| | Group Inc. | 28,100 | 992 |
| † | Everest Re Group Ltd. | 8,900 | 979 |
| † | Torchmark Corp. | 18,850 | 974 |
| † | American Express Co. | 16,900 | 971 |
| | Montpelier Re Holdings Ltd. | 41,300 | 944 |
| † | Protective Life Corp. | 32,950 | 942 |
| † | Allied World Assurance Co. | | |
| | Holdings AG | 11,900 | 938 |
| † | White Mountains | | |
| | Insurance Group Ltd. | 1,800 | 927 |
| † | Fifth Third Bancorp | 60,900 | 925 |
| † | KeyCorp | 109,700 | 924 |
| † | CNO Financial Group Inc. | 98,300 | 917 |
| | SunTrust Banks Inc. | 32,200 | 913 |
| † | Discover Financial Services | 23,600 | 910 |
| † | Allstate Corp. | 22,500 | 904 |
| † | US Bancorp | 27,900 | 891 |
| † | PrivateBancorp Inc. | 57,900 | 887 |
| | PartnerRe Ltd. | 11,000 | 885 |
| † | Assurant Inc. | 25,400 | 881 |
| | Regions Financial Corp. | 121,500 | 865 |
| * | Nationstar Mortgage | | |
| | Holdings Inc. | 27,000 | 836 |
| | Federated Investors Inc. | | |
| | Class B | 40,100 | 811 |
| | Primerica Inc. | 26,100 | 783 |
| | Umpqua Holdings Corp. | 63,800 | 752 |
| | First American | | |
| | Financial Corp. | 31,200 | 752 |
| * † | Credit Acceptance Corp. | 6,684 | 680 |
| | CapitalSource Inc. | 80,600 | 611 |
| | HCC Insurance Holdings Inc. | 15,500 | 577 |
| | Goldman Sachs Group Inc. | 3,100 | 395 |
| | Huntington Bancshares Inc. | 29,400 | 188 |
| | Wells Fargo & Co. | 5,400 | 185 |
| | Cathay General Bancorp | 5,800 | 113 |
| | | | 27,258 |
| Health Care (8.2%) | | |
| * † | Mylan Inc. | 36,500 | 1,003 |
| † | Omnicare Inc. | 27,200 | 982 |
| | | |
| | | | Market |
| | | | Value |
| | | Shares | ($000) |
| * † | HealthSouth Corp. | 43,975 | 928 |
| † | Abbott Laboratories | 14,100 | 924 |
| * † | Charles River Laboratories | | |
| | International Inc. | 24,600 | 922 |
| * † | PAREXEL International Corp. | 30,800 | 911 |
| † | Eli Lilly & Co. | 18,000 | 888 |
| † | Analogic Corp. | 11,900 | 884 |
| * | Pharmacyclics Inc. | 14,750 | 854 |
| † | Select Medical | | |
| | Holdings Corp. | 87,500 | 825 |
| * | Edwards Lifesciences Corp. | 8,100 | 730 |
| * | Isis Pharmaceuticals Inc. | 64,900 | 679 |
| | Chemed Corp. | 9,600 | 658 |
| | West Pharmaceutical | | |
| | Services Inc. | 11,000 | 602 |
| | HCA Holdings Inc. | 17,155 | 518 |
| | Warner Chilcott plc Class A | 40,900 | 492 |
| * | Nektar Therapeutics | 60,700 | 450 |
| * † | Magellan Health | | |
| | Services Inc. | 7,900 | 387 |
| * | Bruker Corp. | 24,300 | 371 |
| * | Auxilium | | |
| | Pharmaceuticals Inc. | 16,800 | 311 |
| * | Sirona Dental Systems Inc. | 3,100 | 200 |
| * | Thoratec Corp. | 5,300 | 199 |
| * | Watson Pharmaceuticals Inc. | 2,300 | 198 |
| | | | 14,916 |
| Industrials (16.1%) | | |
| * † | Terex Corp. | 39,300 | 1,105 |
| † | Mine Safety Appliances Co. | 24,950 | 1,066 |
| † | Amerco Inc. | 8,350 | 1,059 |
| * † | US Airways Group Inc. | 75,800 | 1,023 |
| * † | Hertz Global Holdings Inc. | 62,600 | 1,019 |
| * † | USG Corp. | 36,000 | 1,011 |
| * † | Delta Air Lines Inc. | 84,600 | 1,004 |
| * † | Alaska Air Group Inc. | 23,200 | 1,000 |
| † | Huntington Ingalls | | |
| | Industries Inc. | 22,433 | 972 |
| † | Mueller Industries Inc. | 19,400 | 971 |
| † | Union Pacific Corp. | 7,700 | 968 |
| * † | EnerSys Inc. | 25,700 | 967 |
| † | Northrop Grumman Corp. | 14,230 | 962 |
| | Trinity Industries Inc. | 26,820 | 961 |
| † | Lockheed Martin Corp. | 10,400 | 960 |
| † | Ingersoll-Rand plc | 20,000 | 959 |
| † | Triumph Group Inc. | 14,600 | 953 |
| † | Cintas Corp. | 23,000 | 941 |
| | Raytheon Co. | 15,900 | 915 |
| | Lincoln Electric Holdings Inc. | 18,600 | 905 |
| † | Chicago Bridge | | |
| | & Iron Co. NV | 19,300 | 895 |
| | General Electric Co. | 42,600 | 894 |
| † | GATX Corp. | 20,600 | 892 |
| † | Textron Inc. | 35,800 | 887 |
| † | Manitowoc Co. Inc. | 53,900 | 845 |
16
Market Neutral Fund
| | | |
| | | | Market |
| | | | Value |
| | | Shares | ($000) |
| | Equifax Inc. | 15,400 | 833 |
| * | Copart Inc. | 28,026 | 827 |
| | Dun & Bradstreet Corp. | 8,800 | 692 |
| * † | Old Dominion | | |
| | Freight Line Inc. | 17,550 | 602 |
| | Robert Half International Inc. | 15,870 | 505 |
| | RR Donnelley & Sons Co. | 48,400 | 436 |
| | Copa Holdings SA Class A | 2,500 | 249 |
| | Allegiant Travel Co. Class A | 3,100 | 228 |
| | Lennox International Inc. | 4,200 | 221 |
| | ITT Corp. | 8,900 | 209 |
| | Exelis Inc. | 18,500 | 208 |
| * | JetBlue Airways Corp. | 24,300 | 139 |
| | | | 29,283 |
| Information Technology (17.2%) | |
| † | Western Digital Corp. | 25,200 | 1,071 |
| * † | CoreLogic Inc. | 38,300 | 1,031 |
| † | Anixter International Inc. | 16,000 | 1,024 |
| * † | CommVault Systems Inc. | 14,600 | 1,018 |
| † | Motorola Solutions Inc. | 18,200 | 1,013 |
| † | MAXIMUS Inc. | 16,000 | 1,012 |
| * † | Ciena Corp. | 64,000 | 1,005 |
| * † | Alliance Data Systems Corp. | 6,900 | 999 |
| * † | Cadence Design | | |
| | Systems Inc. | 73,900 | 998 |
| * † | SYNNEX Corp. | 28,006 | 963 |
| * | Freescale | | |
| | Semiconductor Ltd. | 87,210 | 960 |
| * † | Parametric | | |
| | Technology Corp. | 42,400 | 954 |
| * † | Gartner Inc. | 20,200 | 930 |
| * † | Tech Data Corp. | 20,400 | 929 |
| * † | LSI Corp. | 129,900 | 920 |
| | Lender Processing | | |
| | Services Inc. | 37,000 | 911 |
| † | Heartland Payment | | |
| | Systems Inc. | 30,700 | 906 |
| * | Vantiv Inc. Class A | 43,900 | 896 |
| | NVIDIA Corp. | 72,400 | 890 |
| † | Booz Allen Hamilton | | |
| | Holding Corp. | 63,900 | 889 |
| * † | CACI International Inc. | | |
| | Class A | 16,000 | 880 |
| † | Total System Services Inc. | 40,900 | 876 |
| † | IAC/InterActiveCorp | 18,200 | 861 |
| * | EchoStar Corp. Class A | 24,800 | 849 |
| * | Brocade Communications | | |
| | Systems Inc. | 158,200 | 843 |
| † | Diebold Inc. | 27,000 | 826 |
| * † | Plexus Corp. | 30,600 | 789 |
| * | Itron Inc. | 17,700 | 789 |
| | AOL Inc. | 23,100 | 684 |
| | Genpact Ltd. | 43,050 | 667 |
| * | Unisys Corp. | 30,700 | 531 |
| | | |
| | | | Market |
| | | | Value |
| | | Shares | ($000) |
| * | Advanced Micro | | |
| | Devices Inc. | 217,530 | 522 |
| | Molex Inc. | 18,500 | 506 |
| † | KLA-Tencor Corp. | 10,050 | 480 |
| * | NCR Corp. | 10,800 | 275 |
| * | Avnet Inc. | 7,900 | 242 |
| | Computer Sciences Corp. | 5,900 | 236 |
| * | Aspen Technology Inc. | 8,300 | 229 |
| * | Symantec Corp. | 11,500 | 216 |
| * | Acxiom Corp. | 11,500 | 201 |
| | Broadridge Financial | | |
| | Solutions Inc. | 8,500 | 194 |
| | Harris Corp. | 2,500 | 122 |
| * | Manhattan Associates Inc. | 1,700 | 103 |
| | Maxim Integrated | | |
| | Products Inc. | 3,400 | 100 |
| | | | 31,340 |
| Materials (6.7%) | | |
| † | PPG Industries Inc. | 7,900 | 1,069 |
| * † | Chemtura Corp. | 48,420 | 1,029 |
| † | Eastman Chemical Co. | 14,875 | 1,012 |
| † | Westlake Chemical Corp. | 12,580 | 998 |
| † | LyondellBasell | | |
| | Industries NV Class A | 17,300 | 988 |
| † | Valspar Corp. | 15,600 | 973 |
| † | NewMarket Corp. | 3,600 | 944 |
| † | Huntsman Corp. | 59,100 | 940 |
| † | Georgia Gulf Corp. | 22,200 | 916 |
| † | CF Industries Holdings Inc. | 4,300 | 874 |
| | Worthington Industries Inc. | 24,300 | 632 |
| † | Cytec Industries Inc. | 7,500 | 516 |
| | Sherwin-Williams Co. | 2,300 | 354 |
| | Eagle Materials Inc. | 4,700 | 275 |
| * | SunCoke Energy Inc. | 13,500 | 210 |
| * | Resolute Forest Products | 15,500 | 205 |
| | Minerals Technologies Inc. | 3,400 | 136 |
| | Kaiser Aluminum Corp. | 1,700 | 105 |
| | | | 12,176 |
| Telecommunication Services (1.1%) | |
| † | AT&T Inc. | 26,000 | 876 |
| * | MetroPCS | | |
| | Communications Inc. | 76,390 | 759 |
| † | Verizon Communications Inc. | 10,800 | 467 |
| | | | 2,102 |
| Utilities (4.7%) | | |
| † | Pinnacle West Capital Corp. | 18,800 | 958 |
| † | NV Energy Inc. | 52,600 | 954 |
| † | American Water Works Co. | | |
| | Inc. | 25,400 | 943 |
| † | Ameren Corp. | 30,000 | 922 |
| † | DTE Energy Co. | 15,200 | 913 |
| | Portland General Electric Co. | 33,200 | 908 |
| † | PNM Resources Inc. | 43,935 | 901 |
17
Market Neutral Fund
| | | |
| | | | Market |
| | | | Value |
| | | Shares | ($000) |
| † | Public Service Enterprise | | |
| | Group Inc. | 26,200 | 802 |
| † | Atmos Energy Corp. | 14,000 | 492 |
| | Vectren Corp. | 13,900 | 409 |
| | Wisconsin Energy Corp. | 9,700 | 357 |
| | | | 8,559 |
| Total Common Stocks—Long Positions | |
| (Cost $150,600) | | 173,482 |
| Common Stocks Sold Short (-95.2%) | |
| Consumer Discretionary (-14.3%) | |
| * | Visteon Corp. | (19,500) | (1,049) |
| * | Chipotle Mexican Grill Inc. | | |
| | Class A | (3,500) | (1,041) |
| | Gentex Corp. | (55,300) | (1,041) |
| * | Liberty Media Corp. - | | |
| | Liberty Capital Class A | (8,800) | (1,021) |
| * | CarMax Inc. | (27,171) | (1,020) |
| | Johnson Controls Inc. | (33,000) | (1,013) |
| | Wendy’s Co. | (215,400) | (1,012) |
| * | TripAdvisor Inc. | (24,000) | (1,007) |
| * | Fossil Inc. | (10,600) | (987) |
| * | LKQ Corp. | (46,000) | (971) |
| * | Hyatt Hotels Corp. Class A | (25,100) | (968) |
| * | Amazon.com Inc. | (3,800) | (954) |
| | Vail Resorts Inc. | (17,500) | (947) |
| | Monro Muffler Brake Inc. | (27,000) | (944) |
| * | Shutterfly Inc. | (29,800) | (890) |
| * | Jos A Bank Clothiers Inc. | (19,800) | (843) |
| | Tiffany & Co. | (14,523) | (833) |
| | Cablevision Systems Corp. | | |
| | Class A | (54,700) | (817) |
| * | WMS Industries Inc. | (44,600) | (781) |
| * | Under Armour Inc. Class A | (15,500) | (752) |
| | Ralph Lauren Corp. Class A | (4,800) | (720) |
| * | BJ’s Restaurants Inc. | (21,500) | (707) |
| | Guess? Inc. | (26,500) | (650) |
| * | MGM Resorts International | (55,400) | (645) |
| | Family Dollar Stores Inc. | (9,500) | (602) |
| * | NVR Inc. | (550) | (506) |
| | Morningstar Inc. | (7,650) | (481) |
| | Sotheby’s | (12,400) | (417) |
| * | Liberty Ventures Class A | (5,300) | (359) |
| | DeVry Inc. | (15,000) | (356) |
| | Sirius XM Radio Inc. | (108,900) | (315) |
| * | Penn National Gaming Inc. | (6,400) | (314) |
| | Staples Inc. | (22,900) | (261) |
| | Interpublic Group of Cos. | | |
| | Inc. | (22,000) | (243) |
| * | Discovery Communications | | |
| | Inc. Class A | (3,700) | (235) |
| | Las Vegas Sands Corp. | (4,500) | (208) |
| * | Scientific Games Corp. | | |
| | Class A | (23,500) | (204) |
| | | | (26,114) |
| | | |
| | | | Market |
| | | | Value |
| | | Shares | ($000) |
| Consumer Staples (-4.9%) | | |
| | Flowers Foods Inc. | (42,170) | (981) |
| | Kellogg Co. | (17,500) | (977) |
| | Sysco Corp. | (30,750) | (974) |
| | Clorox Co. | (13,200) | (967) |
| | Mead Johnson Nutrition Co. | (14,300) | (942) |
| | Coca-Cola Co. | (25,500) | (924) |
| | Avon Products Inc. | (50,900) | (731) |
| | Archer-Daniels-Midland Co. | (20,600) | (564) |
| | PriceSmart Inc. | (6,200) | (478) |
| | Walgreen Co. | (12,700) | (470) |
| | Estee Lauder Cos. Inc. | | |
| | Class A | (4,300) | (257) |
| * | Monster Beverage Corp. | (4,800) | (254) |
| | Molson Coors Brewing Co. | | |
| | Class B | (5,500) | (235) |
| * | Elizabeth Arden Inc. | (5,100) | (230) |
| | | | (8,984) |
| Energy (-6.9%) | | |
| * | Kosmos Energy Ltd. | (82,900) | (1,024) |
| * | FMC Technologies Inc. | (22,200) | (951) |
| | EQT Corp. | (15,800) | (932) |
| | Peabody Energy Corp. | (34,000) | (905) |
| | Kinder Morgan Inc. | (25,200) | (890) |
| * | Bill Barrett Corp. | (49,200) | (875) |
| | SM Energy Co. | (16,700) | (872) |
| | Range Resources Corp. | (13,750) | (864) |
| | CONSOL Energy Inc. | (26,800) | (860) |
| * | Laredo Petroleum Holdings | | |
| | Inc. | (42,500) | (772) |
| * | Concho Resources Inc. | (9,200) | (741) |
| * | Dresser-Rand Group Inc. | (9,850) | (553) |
| | Cimarex Energy Co. | (9,400) | (543) |
| * | Approach Resources Inc. | (20,000) | (500) |
| | QEP Resources Inc. | (15,900) | (481) |
| * | Halcon Resources Corp. | (61,300) | (424) |
| * | Gulfport Energy Corp. | (5,800) | (222) |
| * | PDC Energy Inc. | (6,200) | (206) |
| | | | (12,615) |
| Financials (-14.6%) | | |
| * | TFS Financial Corp. | (108,600) | (1,045) |
| * | Genworth Financial Inc. | | |
| | Class A | (138,800) | (1,042) |
| | Charles Schwab Corp. | (69,600) | (999) |
| | Erie Indemnity Co. Class A | (14,400) | (997) |
| | Leucadia National Corp. | (41,500) | (987) |
| * | Berkshire Hathaway Inc. | | |
| | Class B | (11,000) | (987) |
| | Hartford Financial | | |
| | Services Group Inc. | (43,800) | (983) |
| | Lazard Ltd. Class A | (32,800) | (979) |
| | TCF Financial Corp. | (80,550) | (979) |
| | Hancock Holding Co. | (30,700) | (974) |
| | Iberiabank Corp. | (19,500) | (958) |
18
Market Neutral Fund
| | | |
| | | | Market |
| | | | Value |
| | | Shares | ($000) |
| | Endurance Specialty | | |
| | Holdings Ltd. | (24,100) | (957) |
| * | E*TRADE Financial Corp. | (106,870) | (956) |
| | Aon plc | (17,100) | (951) |
| | Mercury General Corp. | (23,900) | (949) |
| * | Alleghany Corp. | (2,800) | (939) |
| * | CIT Group Inc. | (24,300) | (939) |
| | First Niagara Financial | | |
| | Group Inc. | (116,800) | (926) |
| | Community Bank | | |
| | System Inc. | (33,500) | (917) |
| | Hanover Insurance | | |
| | Group Inc. | (23,600) | (914) |
| | Progressive Corp. | (42,200) | (890) |
| | CME Group Inc. | (17,500) | (887) |
| | Loews Corp. | (21,700) | (884) |
| | Bank of the Ozarks Inc. | (26,000) | (870) |
| | LPL Financial Holdings Inc. | (30,900) | (870) |
| | TD Ameritrade Holding | | |
| | Corp. | (42,600) | (716) |
| | RLI Corp. | (8,700) | (563) |
| * | Markel Corp. | (1,200) | (520) |
| | Old Republic | | |
| | International Corp. | (39,500) | (421) |
| | Cullen/Frost Bankers Inc. | (5,600) | (304) |
| | MetLife Inc. | (6,100) | (201) |
| | Reinsurance Group | | |
| | of America Inc. Class A | (2,000) | (107) |
| | | | (26,611) |
| Health Care (-7.4%) | | |
| * | BioMarin | | |
| | Pharmaceutical Inc. | (20,700) | (1,019) |
| * | Waters Corp. | (11,600) | (1,011) |
| * | MEDNAX Inc. | (12,500) | (994) |
| * | HMS Holdings Corp. | (37,600) | (975) |
| | DENTSPLY | | |
| | International Inc. | (24,600) | (974) |
| * | Forest Laboratories Inc. | (26,800) | (947) |
| | Johnson & Johnson | (13,200) | (925) |
| * | Catamaran Corp. | (19,500) | (919) |
| * | QIAGEN NV | (50,600) | (918) |
| | CR Bard Inc. | (9,000) | (880) |
| * | Ariad Pharmaceuticals Inc. | (40,400) | (775) |
| * | Alexion Pharmaceuticals Inc. | (6,750) | (633) |
| | Becton Dickinson and Co. | (6,800) | (532) |
| | Thermo Fisher Scientific Inc. | (7,850) | (501) |
| * | Express Scripts Holding Co. | (8,600) | (464) |
| * | Cepheid Inc. | (11,600) | (392) |
| * | WellCare Health Plans Inc. | (7,400) | (360) |
| * | Hologic Inc. | (11,200) | (224) |
| * | Volcano Corp. | (4,400) | (104) |
| | | | (13,547) |
| | | |
| | | | Market |
| | | | Value |
| | | Shares | ($000) |
| Industrials (-16.0%) | | |
| | Precision Castparts Corp. | (5,500) | (1,042) |
| | Expeditors International | | |
| | of Washington Inc. | (26,300) | (1,040) |
| | Watsco Inc. | (13,635) | (1,021) |
| | Xylem Inc. | (37,600) | (1,019) |
| | Nordson Corp. | (16,100) | (1,016) |
| * | Kirby Corp. | (16,400) | (1,015) |
| | SPX Corp. | (14,300) | (1,003) |
| | Simpson Manufacturing | | |
| | Co. Inc. | (30,400) | (997) |
| | CH Robinson | | |
| | Worldwide Inc. | (15,700) | (993) |
| | Graco Inc. | (19,200) | (989) |
| | Joy Global Inc. | (15,100) | (963) |
| * | Stericycle Inc. | (10,300) | (961) |
| | URS Corp. | (24,300) | (954) |
| * | Clean Harbors Inc. | (17,000) | (935) |
| | Woodward Inc. | (24,350) | (928) |
| | MSC Industrial | | |
| | Direct Co. Inc. Class A | (12,300) | (927) |
| | Knight Transportation Inc. | (63,140) | (924) |
| * | Acacia Research Corp. | (35,700) | (916) |
| * | II-VI Inc. | (49,900) | (912) |
| | Waste Management Inc. | (26,500) | (894) |
| * | IHS Inc. Class A | (9,200) | (883) |
| | UTi Worldwide Inc. | (64,700) | (867) |
| * | GrafTech International Ltd. | (90,900) | (854) |
| * | Owens Corning | (22,700) | (840) |
| * | Genesee & Wyoming Inc. | | |
| | Class A | (10,900) | (829) |
| | Deere & Co. | (9,300) | (804) |
| * | Atlas Air Worldwide | | |
| | Holdings Inc. | (17,700) | (784) |
| | Fluor Corp. | (12,450) | (731) |
| | Heartland Express Inc. | (45,800) | (599) |
| | Waste Connections Inc. | (14,650) | (495) |
| * | Hub Group Inc. Class A | (14,550) | (489) |
| | WW Grainger Inc. | (2,100) | (425) |
| | Fastenal Co. | (5,700) | (266) |
| * | Colfax Corp. | (5,400) | (218) |
| | Pentair Ltd. | (4,300) | (211) |
| | KAR Auction Services Inc. | (7,900) | (160) |
| * | FTI Consulting Inc. | (4,500) | (149) |
| | | | (29,053) |
| Information Technology (-18.1%) | |
| * | Compuware Corp. | (97,600) | (1,061) |
| * | CoStar Group Inc. | (11,700) | (1,046) |
| * | FleetCor Technologies Inc. | (19,450) | (1,043) |
| | FLIR Systems Inc. | (46,700) | (1,042) |
| | AVX Corp. | (96,500) | (1,040) |
| * | Hittite Microwave Corp. | (16,200) | (1,006) |
| | Solera Holdings Inc. | (18,700) | (1,000) |
19
Market Neutral Fund
| | | |
| | | | Market |
| | | | Value |
| | | Shares | ($000) |
| * | Acme Packet Inc. | (44,550) | (985) |
| * | Lam Research Corp. | (27,100) | (979) |
| | Cognex Corp. | (26,500) | (976) |
| * | Bankrate Inc. | (77,560) | (966) |
| * | Salesforce.com Inc. | (5,670) | (953) |
| * | ViaSat Inc. | (24,500) | (953) |
| | QUALCOMM Inc. | (15,300) | (949) |
| * | Fortinet Inc. | (44,900) | (946) |
| * | SanDisk Corp. | (21,400) | (932) |
| * | Google Inc. Class A | (1,300) | (922) |
| * | VeriFone Systems Inc. | (31,000) | (920) |
| | Corning Inc. | (72,500) | (915) |
| | Blackbaud Inc. | (39,900) | (911) |
| * | Take-Two Interactive | | |
| | Software Inc. | (81,795) | (901) |
| * | Concur Technologies Inc. | (13,200) | (891) |
| | Paychex Inc. | (28,600) | (891) |
| * | QLIK Technologies Inc. | (41,000) | (891) |
| * | Informatica Corp. | (27,000) | (819) |
| * | Juniper Networks Inc. | (40,869) | (804) |
| * | Polycom Inc. | (76,300) | (798) |
| * | Finisar Corp. | (46,800) | (763) |
| * | International Rectifier Corp. | (43,000) | (762) |
| * | Semtech Corp. | (25,300) | (732) |
| * | Diodes Inc. | (40,200) | (698) |
| * | ANSYS Inc. | (10,000) | (673) |
| * | SS&C Technologies | | |
| | Holdings Inc. | (26,400) | (610) |
| * | Rovi Corp. | (37,150) | (573) |
| * | F5 Networks Inc. | (5,300) | (515) |
| | Altera Corp. | (12,700) | (437) |
| * | Nuance | | |
| | Communications Inc. | (19,300) | (431) |
| * | Dealertrack | | |
| | Technologies Inc. | (9,300) | (267) |
| | Dolby Laboratories Inc. | | |
| | Class A | (7,300) | (214) |
| * | Red Hat Inc. | (3,800) | (201) |
| | Dell Inc. | (18,300) | (185) |
| | Microchip Technology Inc. | (4,300) | (140) |
| * | TiVo Inc. | (10,400) | (128) |
| | MKS Instruments Inc. | (4,400) | (114) |
| | | | (32,983) |
| Materials (-6.8%) | | |
| | Sealed Air Corp. | (59,500) | (1,042) |
| * | Stillwater Mining Co. | (80,600) | (1,030) |
| | Nucor Corp. | (23,600) | (1,019) |
| | Ecolab Inc. | (14,100) | (1,014) |
| | Compass Minerals | | |
| | International Inc. | (12,100) | (904) |
| | Sonoco Products Co. | (30,000) | (892) |
| | Southern Copper Corp. | (23,100) | (875) |
| | Globe Specialty Metals Inc. | (63,500) | (873) |
| | | |
| | | | Market |
| | | | Value |
| | | Shares | ($000) |
| | Hecla Mining Co. | (146,000) | (851) |
| | Royal Gold Inc. | (10,100) | (821) |
| | Aptargroup Inc. | (17,100) | (816) |
| | Walter Energy Inc. | (21,000) | (753) |
| * | Allied Nevada Gold Corp. | (24,800) | (747) |
| | Cliffs Natural Resources Inc. | (8,300) | (320) |
| | Newmont Mining Corp. | (4,500) | (209) |
| * | Tahoe Resources Inc. | (7,900) | (145) |
| | | | (12,311) |
| |
| Telecommunication Services (-1.0%) | |
| * | SBA Communications Corp. | | |
| | Class A | (13,510) | (959) |
| | Cogent Communications | | |
| | Group Inc. | (21,860) | (495) |
| * | Level 3 | | |
| | Communications Inc. | (17,700) | (409) |
| | | | (1,863) |
| Utilities (-5.2%) | | |
| | Dominion Resources Inc. | (18,500) | (958) |
| | AGL Resources Inc. | (23,900) | (955) |
| | Northeast Utilities | (24,400) | (954) |
| | ITC Holdings Corp. | (12,300) | (946) |
| | National Fuel Gas Co. | (18,500) | (938) |
| | South Jersey Industries Inc. | (18,400) | (926) |
| | Pepco Holdings Inc. | (45,760) | (897) |
| | Exelon Corp. | (27,800) | (827) |
| | New Jersey Resources | | |
| | Corp. | (20,500) | (812) |
| | Duke Energy Corp. | (6,900) | (440) |
| | MDU Resources Group Inc. | (14,400) | (306) |
| | NiSource Inc. | (11,200) | (279) |
| | Westar Energy Inc. | (8,200) | (235) |
| | | | (9,473) |
| Total Common Stocks Sold Short | |
| (Proceeds $170,013) | | (173,554) |
| Temporary Cash Investment (5.1%) | |
| Money Market Fund (5.1%) | | |
| 1 | Vanguard Market Liquidity | | |
| | Fund, 0.162% | | |
| | (Cost $9,387) | 9,387,091 | 9,387 |
| †Other Assets and Liabilities— | | |
| Net (94.9%) | | 172,912 |
| Net Assets (100%) | | 182,227 |
20
Market Neutral Fund
| |
| | Market |
| | Value• |
| | ($000) |
| Statement of Assets and Liabilities | |
| Assets | |
| Investment in Securities, | |
| Long Positions, at Value | |
| Unaffiliated Issuers | 173,482 |
| Affiliated Vanguard Funds | 9,387 |
| Total Long Positions | 182,869 |
| Cash Segregated for Short Positions | 172,613 |
| Other Assets | 750 |
| Total Assets | 356,232 |
| Liabilities | |
| Securities Sold Short, at Value | 173,554 |
| Other Liabilities | 451 |
| Total Liabilities | 174,005 |
| Net Assets (100%) | 182,227 |
| |
| At December 31, 2012, net assets consisted of: |
| | Amount |
| | ($000) |
| Paid-in Capital | 198,867 |
| Overdistributed Net Investment Income | (54) |
| Accumulated Net Realized Losses | (35,927) |
| Unrealized Appreciation (Depreciation) | |
| Investment Securities—Long Positions | 22,882 |
| Investment Securities Sold Short | (3,541) |
| Net Assets | 182,227 |
| |
| Investor Shares—Net Assets | |
| Applicable to 14,869,619 outstanding | |
| $.001 par value shares of beneficial | |
| interest (unlimited authorization) | 151,109 |
| Net Asset Value Per Share— | |
| Investor Shares | $10.16 |
| |
| Institutional Shares—Net Assets | |
| Applicable to 3,081,337 outstanding | |
| $.001 par value shares of beneficial | |
| interest (unlimited authorization) | 31,118 |
| Net Asset Value Per Share— | |
| Institutional Shares | $10.10 |
See Note A in Notes to Financial Statements.
* Non-income-producing security.
† Long security positions with a value of $111,137,000 and cash of $172,613,000 are held in a segregated account at the fund’s custodian bank and pledged to a broker-dealer as collateral for the fund’s obligation to return borrowed securities. For so long as such obligations continue, the fund’s access to these assets is subject to authorization from the broker-dealer.
1 Affiliated money market fund available only to Vanguard funds and certain trusts and accounts managed by Vanguard. Rate shown is the 7-day yield.
See accompanying Notes, which are an integral part of the Financial Statements.
21
Market Neutral Fund
| |
| Statement of Operations | |
| |
| | Year Ended |
| | December 31, 2012 |
| | ($000) |
| Investment Income | |
| Income | |
| Dividends1 | 4,559 |
| Interest2 | 9 |
| Total Income | 4,568 |
| Expenses | |
| The Vanguard Group—Note B | |
| Investment Advisory Services | 177 |
| Management and Administrative—Investor Shares | 162 |
| Management and Administrative—Institutional Shares | 1 |
| Marketing and Distribution—Investor Shares | 50 |
| Marketing and Distribution—Institutional Shares | 5 |
| Custodian Fees | 25 |
| Audit Fees | 45 |
| Shareholders’ Reports—Investor Shares | 2 |
| Shareholders’ Reports—Institutional Shares | — |
| Dividend Expense on Securities Sold Short | 2,997 |
| Borrowing Expense on Securities Sold Short | 211 |
| Total Expenses | 3,675 |
| Net Investment Income | 893 |
| Realized Net Gain (Loss) | |
| Investment Securities—Long Positions | 16,360 |
| Investment Securities Sold Short | (23,411) |
| Realized Net Gain (Loss) | (7,051) |
| Change in Unrealized Appreciation (Depreciation) | |
| Investment Securities—Long Positions | 10,609 |
| Investment Securities Sold Short | (7,852) |
| Change in Unrealized Appreciation (Depreciation) | 2,757 |
| Net Increase (Decrease) in Net Assets Resulting from Operations | (3,401) |
1 Dividends are net of foreign withholding taxes of $12,000.
2 Interest income from an affiliated company of the fund was $9,000.
See accompanying Notes, which are an integral part of the Financial Statements.
22
Market Neutral Fund
| | |
| Statement of Changes in Net Assets | | |
| |
| | Year Ended December 31, |
| | 2012 | 2011 |
| | ($000) | ($000) |
| Increase (Decrease) In Net Assets | | |
| Operations | | |
| Net Investment Income (Loss) | 893 | (323) |
| Realized Net Gain (Loss) | (7,051) | (2,319) |
| Change in Unrealized Appreciation (Depreciation) | 2,757 | 12,662 |
| Net Increase (Decrease) in Net Assets Resulting from Operations | (3,401) | 10,020 |
| Distributions | | |
| Net Investment Income | | |
| Investor Shares | (666) | — |
| Institutional Shares | (263) | — |
| Realized Capital Gain | | |
| Investor Shares | — | — |
| Institutional Shares | — | — |
| Total Distributions | (929) | — |
| Capital Share Transactions | | |
| Investor Shares | (3,519) | 32,263 |
| Institutional Shares | 16,089 | 12,249 |
| Net Increase (Decrease) from Capital Share Transactions | 12,570 | 44,512 |
| Total Increase (Decrease) | 8,240 | 54,532 |
| Net Assets | | |
| Beginning of Period | 173,987 | 119,455 |
| End of Period1 | 182,227 | 173,987 |
| 1 Net Assets—End of Period includes overdistributed net investment income/accumulated net investment losses of ($54,000) and ($77,000). |
See accompanying Notes, which are an integral part of the Financial Statements.
23
Market Neutral Fund
Financial Highlights
| | | | | | |
| Investor Shares | | | | | | |
| | | | | | April 1, | Year |
| | | | | | 2008, to | Ended |
| For a Share Outstanding | Year Ended December 31, | Dec. 31, | Mar. 31, |
| Throughout Each Period | 2012 | 2011 | 2010 | 2009 | 20081 | 20082 |
| Net Asset Value, Beginning of Period | $10.36 | $9.61 | $9.71 | $10.97 | $12.45 | $12.19 |
| Investment Operations | | | | | | |
| Net Investment Income (Loss) | .045 | (.024) | (.038)3 | (.105) | .084 | .3113 |
| Net Realized and Unrealized Gain (Loss) | | | | | | |
| on Investments4 | (.200) | .774 | (.062) | (1.143) | (.838) | .909 |
| Total from Investment Operations | (.155) | .750 | (.100) | (1.248) | (.754) | 1.220 |
| Distributions | | | | | | |
| Dividends from Net Investment Income | (.045) | — | — | (.012) | (.132) | (.607) |
| Distributions from Realized Capital Gains | — | — | — | — | (.594) | (.353) |
| Total Distributions | (.045) | — | — | (.012) | (.726) | (.960) |
| Net Asset Value, End of Period | $10.16 | $10.36 | $9.61 | $9.71 | $10.97 | $12.45 |
| |
| Total Return5 | -1.50% | 7.80% | -1.03% | -11.38% | -6.11% | 10.15% |
| |
| Ratios/Supplemental Data | | | | | | |
| Net Assets, End of Period (Millions) | $151 | $158 | $116 | $53 | $73 | $45 |
| Ratio of Expenses to | | | | | | |
| Average Net Assets | | | | | | |
| Based on Total Expenses6 | 1.88%7 | 1.69%7 | 1.84%7 | 2.80%7 | 2.13%8 | 3.09% |
| Net of Expenses Waived/Reimbursed2,6 | 1.88%7 | 1.69%7 | 1.84%7 | 2.80%7 | 2.13%8 | 2.79% |
| Net of Expenses Waived/Reimbursed | | | | | | |
| and Dividend and Borrowing Expense | | | | | | |
| on Securities Sold Short6 | 0.25% | 0.25% | 0.30% | 0.39% | .046%8 | 1.16% |
| Ratio of Net Investment Income (Loss) | | | | | | |
| to Average Net Assets | 0.44% | (0.22%) | (0.38%) | (0.97%) | 1.15%8 | 2.69% |
| Portfolio Turnover Rate | 89% | 91% | 153% | 142% | 161% | 214% |
1 The fund’s fiscal year-end changed from March 31 to December 31, effective December 31, 2008.
2 Laudus Rosenberg U.S. Large/Mid Capitalization Long/Short Equity Fund reorganized into Vanguard Market Neutral Fund effective December 1, 2007. Prior to December 1, 2007, the fund’s advisor and other service providers waived or reimbursed certain fund expenses.
3 Calculated based on average shares outstanding.
4 Includes increases from redemption fees of $.00, $.00, $.00, $.04, $.00, and $.00. Effective May 23, 2012, the redemption fee was eliminated.
5 Total returns do not include transaction or account service fees that may have applied in the periods shown. Fund prospectuses provide information about any applicable transaction and account service fees.
6 Includes performance-based advisory fee increases (decreases) of (0.07%) for fiscal 2010, (0.10%) for fiscal 2009, and (0.02%) for fiscal 2008. Performance-based investment advisory fees did not apply prior to 2008 and after fiscal 2010.
7 Includes 2012 dividend and borrowing expense on securities sold short of 1.52% and 0.11%, respectively. Includes 2011 dividend and borrowing expense on securities sold short of 1.30% and 0.14%, respectively. Includes 2010 dividend and borrowing expense on securities sold short of 1.49% and 0.05%, respectively. Includes 2009 dividend and borrowing expense on securities sold short of 1.42% and 0.99%,
respectively.
8 Annualized.
See accompanying Notes, which are an integral part of the Financial Statements.
24
Market Neutral Fund
Financial Highlights
| | | | | | |
| Institutional Shares | | | | | | |
| | | | | | April 1, | Year |
| | | | | | 2008, to | Ended |
| For a Share Outstanding | Year Ended December 31, | Dec. 31, | Mar. 31, |
| Throughout Each Period | 2012 | 2011 | 2010 | 2009 | 20081 | 20082 |
| Net Asset Value, Beginning of Period | $10.33 | $9.57 | $9.66 | $10.90 | $12.39 | $12.14 |
| Investment Operations | | | | | | |
| Net Investment Income (Loss) | .071 | (.010) | (.015)3 | (.093) | .085 | .3903 |
| Net Realized and Unrealized Gain (Loss) | | | | | | |
| on Investments4 | (.215) | .770 | (.075) | (1.139) | (.846) | .864 |
| Total from Investment Operations | (.144) | .760 | (.090) | (1.232) | (.761) | 1.254 |
| Distributions | | | | | | |
| Dividends from Net Investment Income | (.086) | — | — | (.008) | (.138) | (.651) |
| Distributions from Realized Capital Gains | — | — | — | — | (.591) | (.353) |
| Total Distributions | (.086) | — | — | (.008) | (.729) | (1.004) |
| Net Asset Value, End of Period | $10.10 | $10.33 | $9.57 | $9.66 | $10.90 | $12.39 |
| |
| Total Return5 | -1.39% | 7.94% | -0.93% | -11.31% | -6.20% | 10.49% |
| |
| Ratios/Supplemental Data | | | | | | |
| Net Assets, End of Period (Millions) | $31 | $16 | $3 | $16 | $17 | $12 |
| Ratio of Expenses to | | | | | | |
| Average Net Assets | | | | | | |
| Based on Total Expenses6 | 1.78%7 | 1.59%7 | 1.74%7 | 2.73%7 | 2.08%8 | 2.97% |
| Net of Expenses Waved/Reimbursed2,6 | 1.78%7 | 1.59%7 | 1.74%7 | 2.73%7 | 2.08%8 | 2.56% |
| Net of Expenses Waved/Reimbursed | | | | | | |
| and Dividend and Borrowing | | | | | | |
| Expense on Securities Sold Short6 | 0.15% | 0.15% | 0.20% | 0.32% | 0.41%8 | 0.93% |
| Ratio of Net Investment Income (Loss) | | | | | | |
| to Average Net Assets | 0.54% | (0.12%) | (0.28%) | (0.90%) | 1.20%8 | 2.92% |
| Portfolio Turnover Rate | 89% | 91% | 153% | 142% | 161% | 214% |
1 The fund’s fiscal year-end changed from March 31 to December 31, effective December 31, 2008.
2 Laudus Rosenberg U.S. Large/Mid Capitalization Long/Short Equity Fund reorganized into Vanguard Market Neutral Fund effective December 1, 2007. Prior to December 1, 2007, the fund’s advisor and other service providers waived or reimbursed certain fund expenses.
3 Calculated based on average shares outstanding.
4 Includes increases from redemption fees of $.00, $.00, $.00, $.03, $.00, and $.00. Effective May 23, 2012, the redemption fee was eliminated.
5 Total returns do not include transaction fees that may have applied in the periods shown. Fund prospectuses provide information about any applicable transaction fees.
6 Includes performance-based advisory fee increases (decreases) of (0.07%) for fiscal 2010, (0.10%) for fiscal 2009, and (0.02%) for fiscal 2008. Performance-based investment advisory fees did not apply prior to 2008 and after fiscal 2010.
7 Includes 2012 dividend and borrowing expense on securities sold short of 1.52% and 0.11%, respectively. Includes 2011 dividend and borrowing expense on securities sold short of 1.30% and 0.14%, respectively. Includes 2010 dividend and borrowing expense on securities sold short of 1.49% and 0.05%, respectively. Includes 2009 dividend and borrowing expense on securities sold short of 1.42% and 0.99%, respectively.
8 Annualized.
See accompanying Notes, which are an integral part of the Financial Statements.
25
Market Neutral Fund
Notes to Financial Statements
Vanguard Market Neutral Fund is registered under the Investment Company Act of 1940 as an open-end investment company, or mutual fund. The fund offers two classes of shares, Investor Shares and Institutional Shares. Investor Shares are available to any investor who meets the fund’s minimum purchase requirements. Institutional Shares are designed for investors who meet certain administrative, service, and account-size criteria.
A. The following significant accounting policies conform to generally accepted accounting principles for U.S. mutual funds. The fund consistently follows such policies in preparing its financial statements.
1. Security Valuation: Securities are valued as of the close of trading on the New York Stock Exchange (generally 4 p.m., Eastern time) on the valuation date. Equity securities are valued at the latest quoted sales prices or official closing prices taken from the primary market in which each security trades; such securities not traded on the valuation date are valued at the mean of the latest quoted bid and asked prices. Securities for which market quotations are not readily available, or whose values have been materially affected by events occurring before the fund’s pricing time but after the close of the securities’ primary markets, are valued by methods deemed by the board of trustees to represent fair value. Investments in Vanguard Market Liquidity Fund are valued at that fund’s net asset value.
2. Short Sales: Short sales are the sales of securities that the fund does not own. The fund may sell a security it does not own in anticipation of a decline in the value of that security. In order to deliver the security to the purchaser, the fund borrows the security from a broker-dealer. The fund must segregate, as collateral for its obligation to return the borrowed security, an amount of cash and long security positions at least equal to the market value of the security sold short. This results in the fund holding a significant portion of its assets in cash. The fund later closes out the position by returning the security to the lender, typically by purchasing the security in the open market. A gain, limited to the price at which the fund sold the security short, or a loss, theoretically unlimited in size, is recognized upon the termination of the short sale. The fund may receive a portion of the income from the investment of collateral, or be charged a fee on borrowed securities, based on the market value of each borrowed security and a variable rate that is dependent upon the availability of such security. The net amounts of income or fees are recorded as interest income (for net income received) or borrowing expense on securities sold short (for net fees charged) on the Statement of Operations. Dividends on securities sold short are reported as an expense in the Statement of Operations.
Cash collateral segregated for securities sold short is recorded as an asset in the Statement of Assets and Liabilities. Long security positions segregated as collateral are shown in the Statement of Net Assets.
3. Federal Income Taxes: The fund intends to continue to qualify as a regulated investment company and distribute all of its taxable income. Management has analyzed the fund’s tax positions taken for all open federal income tax years (December 31, 2009–2012), and has concluded that no provision for federal income tax is required in the fund’s financial statements.
4. Distributions: Distributions to shareholders are recorded on the ex-dividend date.
5. Other: Dividend income (or dividend expense on short positions) is recorded on the ex-dividend date. Interest income includes income distributions received from Vanguard Market Liquidity Fund and is accrued daily. Security transactions are accounted for on the date securities are bought or sold. Costs used to determine realized gains (losses) on the sale of investment securities are those of the specific securities sold. Fees assessed on redemptions of capital shares prior to May 23, 2012, were credited to paid-in capital.
26
Market Neutral Fund
Each class of shares has equal rights as to assets and earnings, except that each class separately bears certain class-specific expenses related to maintenance of shareholder accounts (included in Management and Administrative expenses) and shareholder reporting. Marketing and distribution expenses are allocated to each class of shares based on a method approved by the board of trustees. Income, other non-class-specific expenses, and gains and losses on investments are allocated to each class of shares based on its relative net assets.
B. The Vanguard Group furnishes at cost investment advisory, corporate management, administrative, marketing, and distribution services. The costs of such services are allocated to the fund under methods approved by the board of trustees. The fund has committed to provide up to 0.40% of its net assets in capital contributions to Vanguard. At December 31, 2012, the fund had contributed capital of $25,000 to Vanguard (included in Other Assets), representing 0.01% of the fund’s net assets and 0.01% of Vanguard’s capitalization. The fund’s trustees and officers are also directors and officers of Vanguard.
C. Various inputs may be used to determine the value of the fund’s investments. These inputs are summarized in three broad levels for financial statement purposes. The inputs or methodologies used to value securities are not necessarily an indication of the risk associated with investing in those securities.
Level 1—Quoted prices in active markets for identical securities.
Level 2—Other significant observable inputs (including quoted prices for similar securities, interest rates, prepayment speeds, credit risk, etc.).
Level 3—Significant unobservable inputs (including the fund’s own assumptions used to determine the fair value of investments).
At December 31, 2012, 100% of the market value of the fund’s investments was based on Level 1 inputs.
D. Distributions are determined on a tax basis and may differ from net investment income and realized capital gains for financial reporting purposes. Differences may be permanent or temporary. Permanent differences are reclassified among capital accounts in the financial statements to reflect their tax character. Temporary differences arise when certain items of income, expense, gain, or loss are recognized in different periods for financial statement and tax purposes; these differences will reverse at some time in the future. Differences in classification may also result from the treatment of short-term gains as ordinary income for tax purposes.
For tax purposes, at December 31, 2012, the fund has $41,000 of ordinary income available for distribution. The fund had available capital losses totaling $35,902,000 to offset future net capital gains. Of this amount, $24,465,000 is subject to expiration dates; $19,593,000 may be used to offset future net capital gains through December 31, 2017, and $4,872,000 through December 31, 2018. Capital losses of $11,437,000 realized beginning in fiscal 2011 may be carried forward indefinitely under the Regulated Investment Company Modernization Act of 2010, but must be used before any expiring loss carryforwards.
At December 31, 2012, the cost of long security positions for tax purposes was $160,012,000. Net unrealized appreciation of long security positions for tax purposes was $22,857,000, consisting of unrealized gains of $26,485,000 on securities that had risen in value since their purchase and $3,628,000 in unrealized losses on securities that had fallen in value since their purchase. Tax-basis
27
Market Neutral Fund
net unrealized depreciation on securities sold short was $3,541,000, consisting of unrealized gains of $9,290,000 on securities that had fallen in value since their sale and $12,831,000 in unrealized losses on securities that had risen in value since their sale.
E. During the year ended December 31, 2012, the fund purchased $169,329,000 of investment securities and sold $189,819,000 of investment securities, other than temporary cash investments. The proceeds of short sales and the cost of purchases to cover short sales were $227,987,000 and $253,482,000 respectively.
F. Capital share transactions for each class of shares were:
| | | | |
| | | Year Ended | | Year Ended |
| | December 31, 2012 | December 31, 2011 |
| | Amount | Shares | Amount | Shares |
| | ($000) | (000) | ($000) | (000) |
| Investor Shares | | | | |
| Issued | 57,126 | 5,525 | 76,944 | 7,539 |
| Issued in Lieu of Cash Distributions | 664 | 66 | — | — |
| Redeemed1 | (61,309) | (5,998) | (44,681) | (4,371) |
| Net Increase (Decrease)—Investor Shares | (3,519) | (407) | 32,263 | 3,168 |
| Institutional Shares | | | | |
| Issued | 16,536 | 1,608 | 13,291 | 1,293 |
| Issued in Lieu of Cash Distributions | 262 | 26 | — | — |
| Redeemed1 | (709) | (68) | (1,042) | (104) |
| Net Increase (Decrease)—Institutional Shares | 16,089 | 1,566 | 12,249 | 1,189 |
1 Net of redemption fees for fiscal 2012 and 2011 of $8,000 and $15,000, respectively (fund totals). Effective May 23, 2012, the redemption fee was eliminated.
At December 31, 2012, the Vanguard Managed Payout Distribution Focus Fund was the record or beneficial owner of 53% of the fund’s net assets. If the shareholder were to redeem its investment in the fund, the redemption might result in an increase in the fund’s expense ratio, cause the fund to incur higher transaction costs, or lead to the realization of taxable capital gains.
G. In preparing the financial statements as of December 31, 2012, management considered the impact of subsequent events for potential recognition or disclosure in these financial statements.
28
Report of Independent Registered Public Accounting Firm
To the Trustees of Vanguard Montgomery Funds and the Shareholders of Vanguard Market Neutral Fund:
In our opinion, the accompanying statements of net assets and of assets and liabilities and the related statements of operations and of changes in net assets and the financial highlights present fairly, in all material respects, the financial position of Vanguard Market Neutral Fund (constituting Vanguard Montgomery Funds, hereafter referred to as the “Fund”) at December 31, 2012, the results of its operations for the year then ended, the changes in its net assets for each of the two years in the period then ended and the financial highlights for each of the periods indicated, in conformity with accounting principles generally accepted in the United States of America. These financial statements and financial highlights (hereafter referred to as “financial statements”) are the responsibility of the Fund’s management; our responsibility is to express an opinion on these financial statements based on our audits. We conducted our audits of these financial statements in accordance with the standards of the Public Company Accounting Oversight Board (United States). Those standards require that we plan and perform the audit to obtain reasonable assurance about whether the financial statements are free of material misstatement. An audit includes examining, on a test basis, evidence supporting the amounts and disclosures in the financial statements, assessing the accounting principles used and significant estimates made by management, and evaluating the overall financial statement presentation. We believe that our audits, which included confirmation of securities at December 31, 2012 by correspondence with the custodian and broker and by agreement to the underlying ownership records of the transfer agent, provide a reasonable basis for our opinion.
PricewaterhouseCoopers LLP
Philadelphia, Pennsylvania
February 14, 2013
|
| Special 2012 tax information (unaudited) for Vanguard Market Neutral Fund |
This information for the fiscal year ended December 31, 2012, is included pursuant to provisions of the Internal Revenue Code.
The fund distributed $929,000 of qualified dividend income to shareholders during the fiscal year.
For corporate shareholders, 100% of investment income (dividend income plus short-term gain, if any) qualifies for the dividends-received deduction.
29
Your Fund’s After-Tax Returns
This table presents returns for your fund both before and after taxes. The after-tax returns are shown in two ways: (1) assuming that an investor owned the fund during the entire period and paid taxes on the fund’s distributions, and (2) assuming that an investor paid taxes on the fund’s distributions and sold all shares at the end of each period.
Calculations are based on the highest individual federal income tax and capital gains tax rates in effect at the times of the distributions and the hypothetical sales. State and local taxes were not considered. After-tax returns reflect any qualified dividend income. (In the example, returns after the sale of fund shares may be higher than those assuming no sale. This occurs when the sale would have produced a capital loss. The calculation assumes that the investor received a tax deduction for the loss.)
The table shows returns for Investor Shares only; returns for other share classes will differ. Please note that your actual after-tax returns will depend on your tax situation and may differ from those shown. Also note that if you own the fund in a tax-deferred account, such as an individual retirement account or a 401(k) plan, this information does not apply to you. Such accounts are not subject to current taxes.
Finally, keep in mind that a fund’s performance—whether before or after taxes—does not guarantee future results.
| | | |
| Average Annual Total Returns: Market Neutral Fund Investor Shares | | |
| Periods Ended December 31, 2012 | | | |
| | One | Five | Ten |
| | Year | Years | Years |
| Returns Before Taxes | -1.50% | -3.09% | 0.79% |
| Returns After Taxes on Distributions | -1.56 | -3.46 | 0.25 |
| Returns After Taxes on Distributions and Sale of Fund Shares | -0.89 | -2.76 | 0.45 |
30
About Your Fund’s Expenses
As a shareholder of the fund, you incur ongoing costs, which include costs for portfolio management, administrative services, and shareholder reports (like this one), among others. Operating expenses, which are deducted from a fund’s gross income, directly reduce the investment return of the fund.
A fund’s expenses are expressed as a percentage of its average net assets. This figure is known as the expense ratio. The following examples are intended to help you understand the ongoing costs (in dollars) of investing in your fund and to compare these costs with those of other mutual funds. The examples are based on an investment of $1,000 made at the beginning of the period shown and held for the entire period.
The accompanying table illustrates your fund’s costs in two ways:
• Based on actual fund return. This section helps you to estimate the actual expenses that you paid over the period. The ”Ending Account Value“ shown is derived from the fund‘s actual return, and the third column shows the dollar amount that would have been paid by an investor who started with $1,000 in the fund. You may use the information here, together with the amount you invested, to estimate the expenses that you paid over the period.
To do so, simply divide your account value by $1,000 (for example, an $8,600 account value divided by $1,000 = 8.6), then multiply the result by the number given for your fund under the heading ”Expenses Paid During Period.“
• Based on hypothetical 5% yearly return. This section is intended to help you compare your fund‘s costs with those of other mutual funds. It assumes that the fund had a yearly return of 5% before expenses, but that the expense ratio is unchanged. In this case—because the return used is not the fund’s actual return—the results do not apply to your investment. The example is useful in making comparisons because the Securities and Exchange Commission requires all mutual funds to calculate expenses based on a 5% return. You can assess your fund’s costs by comparing this hypothetical example with the hypothetical examples that appear in shareholder reports of other funds.
Note that the expenses shown in the table are meant to highlight and help you compare ongoing costs only and do not reflect transaction costs incurred by the fund for buying and selling securities. Further, the expenses do not include any purchase, redemption, or account service fees described in the fund prospectus. If such fees were applied to your account, your costs would be higher. Your fund does not carry a “sales load.”
The calculations assume no shares were bought or sold during the period. Your actual costs may have been higher or lower, depending on the amount of your investment and the timing of any purchases or redemptions.
You can find more information about the fund’s expenses, including annual expense ratios, in the Financial Statements section of this report. For additional information on operating expenses and other shareholder costs, please refer to your fund’s current prospectus.
31
| | | |
| Six Months Ended December 31, 2012 | | | |
| | Beginning | Ending | Expenses |
| | Account Value | Account Value | Paid During |
| Market Neutral Fund | 6/30/2012 | 12/31/2012 | Period |
| Based on Actual Fund Return | | | |
| Investor Shares | $1,000.00 | $995.62 | $10.11 |
| Institutional Shares | 1,000.00 | 995.72 | 9.36 |
| Based on Hypothetical 5% Yearly Return | | | |
| Investor Shares | $1,000.00 | $1,015.07 | $10.21 |
| Institutional Shares | 1,000.00 | 1,015.83 | 9.45 |
The calculations are based on expenses incurred in the most recent six-month period. The fund’s annualized six-month expense ratios for that period are 2.01% for Investor Shares and 1.86% for Institutional Shares. The dollar amounts shown as “Expenses Paid” are equal to the annualized expense ratio multiplied by the average account value over the period, multiplied by the number of days in the most recent six-month period, then divided by the number of days in the most recent 12-month period.
32
Glossary
Beta. A measure of the magnitude of a fund’s past share-price fluctuations in relation to the ups and downs of a given market index. The index is assigned a beta of 1.00. Compared with a given index, a fund with a beta of 1.20 typically would have seen its share price rise or fall by 12% when the index rose or fell by 10%. For this report, beta is based on returns over the past 36 months for both the fund and the index. Note that a fund’s beta should be reviewed in conjunction with its R-squared (see definition). The lower the R-squared, the less correlation there is between the fund and the index, and the less reliable beta is as an indicator of volatility.
Earnings Growth Rate. The average annual rate of growth in earnings over the past five years for the stocks now in a fund.
Equity Exposure. A measure that reflects a fund’s investments in stocks and stock futures. Any holdings in short-term reserves are excluded.
Expense Ratio. The percentage of a fund’s average net assets used to pay its annual administrative and advisory expenses. These expenses directly reduce returns to investors.
Foreign Holdings. The percentage of a fund represented by securities or depositary receipts of companies based outside the United States.
Inception Date. The date on which the assets of a fund (or one of its share classes) are first invested in accordance with the fund’s investment objective. For funds with a subscription period, the inception date is the day after that period ends. Investment performance is measured from the inception date.
Median Market Cap. An indicator of the size of companies in which a fund invests; the midpoint of market capitalization (market price x shares outstanding) of a fund’s stocks, weighted by the proportion of the fund’s assets invested in each stock. Stocks representing half of the fund’s assets have market capitalizations above the median, and the rest are below it.
Price/Book Ratio. The share price of a stock divided by its net worth, or book value, per share. For a fund, the weighted average price/book ratio of the stocks it holds.
Price/Earnings Ratio. The ratio of a stock’s current price to its per-share earnings over the past year. For a fund, the weighted average P/E of the stocks it holds. P/E is an indicator of market expectations about corporate prospects; the higher the P/E, the greater the expectations for a company’s future growth.
R-Squared. A measure of how much of a fund’s past returns can be explained by the returns from the market in general, as measured by a given index. If a fund’s total returns were precisely synchronized with an index’s returns, its R-squared would be 1.00. If the fund’s returns bore no relationship to the index’s returns, its R-squared would be 0. For this report, R-squared is based on returns over the past 36 months for both the fund and the index.
Return on Equity. The annual average rate of return generated by a company during the past five years for each dollar of shareholder’s equity (net income divided by shareholder’s equity). For a fund, the weighted average return on equity for the companies whose stocks it holds.
Short-Term Reserves. The percentage of a fund invested in highly liquid, short-term securities that can be readily converted to cash.
33
Turnover Rate. An indication of the fund’s trading activity. Funds with high turnover rates incur higher transaction costs and may be more likely to distribute capital gains (which may be taxable to investors). The turnover rate excludes in-kind transactions, which have minimal impact on costs.
34
This page intentionally left blank.
The People Who Govern Your Fund
The trustees of your mutual fund are there to see that the fund is operated and managed in your best interests since, as a shareholder, you are a part owner of the fund. Your fund’s trustees also serve on the board of directors of The Vanguard Group, Inc., which is owned by the Vanguard funds and provides services to them on an at-cost basis.
A majority of Vanguard’s board members are independent, meaning that they have no affiliation with Vanguard or the funds they oversee, apart from the sizable personal investments they have made as private individuals. The independent board members have distinguished backgrounds in business, academia, and public service. Each of the trustees and executive officers oversees 180 Vanguard funds.
The following table provides information for each trustee and executive officer of the fund. More information about the trustees is in the Statement of Additional Information, which can be obtained, without charge, by contacting Vanguard at 800-662-7447, or online at vanguard.com.
| |
| InterestedTrustee1 | and Delphi Automotive LLP (automotive components); |
| Senior Advisor at New Mountain Capital; Trustee of |
| F. William McNabb III | The Conference Board. |
| Born 1957. Trustee Since July 2009. Chairman of the | |
| Board. Principal Occupation(s) During the Past Five | Amy Gutmann |
| Years: Chairman of the Board of The Vanguard Group, | Born 1949. Trustee Since June 2006. Principal |
| Inc., and of each of the investment companies served | Occupation(s) During the Past Five Years: President |
| by The Vanguard Group, since January 2010; Director | of the University of Pennsylvania; Christopher H. |
| of The Vanguard Group since 2008; Chief Executive | Browne Distinguished Professor of Political Science |
| Officer and President of The Vanguard Group and of | in the School of Arts and Sciences with secondary |
| each of the investment companies served by The | appointments at the Annenberg School for |
| Vanguard Group since 2008; Director of Vanguard | Communication and the Graduate School of Education |
| Marketing Corporation; Managing Director of The | of the University of Pennsylvania; Member of the |
| Vanguard Group (1995–2008). | National Commission on the Humanities and Social |
| | Sciences; Trustee of Carnegie Corporation of New |
| | York and of the National Constitution Center; Chair |
| IndependentTrustees | of the U. S. Presidential Commission for the Study |
| of Bioethical Issues. |
|
| Emerson U. Fullwood | |
| Born 1948. Trustee Since January 2008. Principal | JoAnn Heffernan Heisen |
| Occupation(s) During the Past Five Years: Executive | Born 1950. Trustee Since July 1998. Principal |
| Chief Staff and Marketing Officer for North America | Occupation(s) During the Past Five Years: Corporate |
| and Corporate Vice President (retired 2008) of Xerox | Vice President and Chief Global Diversity Officer |
| Corporation (document management products and | (retired 2008) and Member of the Executive |
| services); Executive in Residence and 2010 | Committee (1997–2008) of Johnson & Johnson |
| Distinguished Minett Professor at the Rochester | (pharmaceuticals/medical devices/consumer |
| Institute of Technology; Director of SPX Corporation | products); Director of Skytop Lodge Corporation |
| (multi-industry manufacturing), the United Way of | (hotels), the University Medical Center at Princeton, |
| Rochester, Amerigroup Corporation (managed health | the Robert Wood Johnson Foundation, and the Center |
| care), the University of Rochester Medical Center, | for Talent Innovation; Member of the Advisory Board |
| Monroe Community College Foundation, and North | of the Maxwell School of Citizenship and Public Affairs |
| Carolina A&T University. | at Syracuse University. |
| | |
| |
| Rajiv L. Gupta | F. Joseph Loughrey |
| Born 1945. Trustee Since December 2001.2 | Born 1949. Trustee Since October 2009. Principal |
| Principal Occupation(s) During the Past Five Years: | Occupation(s) During the Past Five Years: President |
| Chairman and Chief Executive Officer (retired 2009) | and Chief Operating Officer (retired 2009) of Cummins |
| and President (2006–2008) of Rohm and Haas Co. | Inc. (industrial machinery); Director of SKF AB |
| (chemicals); Director of Tyco International, Ltd. | (industrial machinery), Hillenbrand, Inc. (specialized |
| (diversified manufacturing and services), Hewlett- | consumer services), the Lumina Foundation for |
| Packard Co. (electronic computer manufacturing), | |
| | |
| Education, and Oxfam America; Chairman of the | Executive Officers | |
| Advisory Council for the College of Arts and Letters | | |
| and Member of the Advisory Board to the Kellogg | Glenn Booraem | |
| Institute for International Studies at the University | Born 1967. Controller Since July 2010. Principal |
| of Notre Dame. | Occupation(s) During the Past Five Years: Principal |
| | of The Vanguard Group, Inc.; Controller of each of |
| Mark Loughridge | the investment companies served by The Vanguard |
| Born 1953. Trustee Since March 2012. Principal | Group; Assistant Controller of each of the investment |
| Occupation(s) During the Past Five Years: Senior Vice | companies served by The Vanguard Group (2001–2010). |
| President and Chief Financial Officer at IBM (information | | |
| technology services); Fiduciary Member of IBM’s | Thomas J. Higgins | |
| Retirement Plan Committee. | Born 1957. Chief Financial Officer Since September |
| | 2008. Principal Occupation(s) During the Past Five |
| Scott C. Malpass | Years: Principal of The Vanguard Group, Inc.; Chief |
| Born 1962. Trustee Since March 2012. Principal | Financial Officer of each of the investment companies |
| Occupation(s) During the Past Five Years: Chief | served by The Vanguard Group; Treasurer of each of |
| Investment Officer and Vice President at the University | the investment companies served by The Vanguard |
| of Notre Dame; Assistant Professor of Finance at the | Group (1998–2008). | |
| Mendoza College of Business at Notre Dame; Member | | |
| of the Notre Dame 403(b) Investment Committee; | Kathryn J. Hyatt | |
| Director of TIFF Advisory Services, Inc. (investment | Born 1955. Treasurer Since November 2008. Principal |
| advisor); Member of the Investment Advisory | Occupation(s) During the Past Five Years: Principal of |
| Committees of the Financial Industry Regulatory | The Vanguard Group, Inc.; Treasurer of each of the |
| Authority (FINRA) and of Major League Baseball. | investment companies served by The Vanguard |
| | Group; Assistant Treasurer of each of the investment |
| André F. Perold | companies served by The Vanguard Group (1988–2008). |
| Born 1952. Trustee Since December 2004. Principal | | |
| Occupation(s) During the Past Five Years: George | Heidi Stam | |
| Gund Professor of Finance and Banking at the Harvard | Born 1956. Secretary Since July 2005. Principal |
| Business School (retired 2011); Chief Investment | Occupation(s) During the Past Five Years: Managing |
| Officer and Managing Partner of HighVista Strategies | Director of The Vanguard Group, Inc.; General Counsel |
| LLC (private investment firm); Director of Rand | of The Vanguard Group; Secretary of The Vanguard |
| Merchant Bank; Overseer of the Museum of Fine | Group and of each of the investment companies |
| Arts Boston. | served by The Vanguard Group; Director and Senior |
| | Vice President of Vanguard Marketing Corporation. |
| | |
| Alfred M. Rankin, Jr. | | |
| Born 1941. Trustee Since January 1993. Principal | Vanguard Senior ManagementTeam |
| Occupation(s) During the Past Five Years: Chairman, | | |
| President, and Chief Executive Officer of NACCO | Mortimer J. Buckley | Michael S. Miller |
| Industries, Inc. (forklift trucks/housewares/lignite); | Kathleen C. Gubanich | James M. Norris |
| Director of Goodrich Corporation (industrial products/ | Paul A. Heller | Glenn W. Reed |
| aircraft systems and services) and the National | Martha G. King | George U. Sauter |
| Association of Manufacturers; Chairman of the Board | Chris D. McIsaac | |
| of the Federal Reserve Bank of Cleveland and of | | |
| University Hospitals of Cleveland; Advisory Chairman | | |
| of the Board of The Cleveland Museum of Art. | Chairman Emeritus and Senior Advisor |
| | |
| John J. Brennan | |
| Peter F. Volanakis | Chairman, 1996–2009 | |
| Born 1955. Trustee Since July 2009. Principal | Chief Executive Officer and President, 1996–2008 |
| Occupation(s) During the Past Five Years: President | | |
| and Chief Operating Officer (retired 2010) of Corning | | |
| Incorporated (communications equipment); Director | Founder | |
| of SPX Corporation (multi-industry manufacturing); | John C. Bogle | |
| Overseer of the Amos Tuck School of Business | Chairman and Chief Executive Officer, 1974–1996 |
| Administration at Dartmouth College; Advisor to the | | |
| Norris Cotton Cancer Center. | | |
1 Mr. McNabb is considered an “interested person,” as defined in the Investment Company Act of 1940, because he is an officer of the Vanguard funds.
2 December 2002 for Vanguard Equity Income Fund, Vanguard Growth Equity Fund, the Vanguard Municipal Bond Funds, and the Vanguard State Tax-Exempt Funds.
|  |
| P.O. Box 2600 |
| Valley Forge, PA 19482-2600 |
Connect with Vanguard® > vanguard.com
| |
| Fund Information > 800-662-7447 | CFA® is a trademark owned by CFA Institute. |
| Direct Investor Account Services > 800-662-2739 | |
| Institutional Investor Services > 800-523-1036 | |
| Text Telephone for People | |
| With Hearing Impairment > 800-749-7273 | |
| |
| This material may be used in conjunction | |
| with the offering of shares of any Vanguard | |
| fund only if preceded or accompanied by | |
| the fund’s current prospectus. | |
| |
| All comparative mutual fund data are from Lipper Inc. or | |
| Morningstar, Inc., unless otherwise noted. | |
| |
| You can obtain a free copy of Vanguard’s proxy voting | |
| guidelines by visiting vanguard.com/proxyreporting or by | |
| calling Vanguard at 800-662-2739. The guidelines are | |
| also available from the SEC’s website, sec.gov. In | |
| addition, you may obtain a free report on how your fund | |
| voted the proxies for securities it owned during the 12 | |
| months ended June 30. To get the report, visit either | |
| vanguard.com/proxyreporting or sec.gov. | |
| |
| You can review and copy information about your fund at | |
| the SEC’s Public Reference Room in Washington, D.C. To | |
| find out more about this public service, call the SEC at | |
| 202-551-8090. Information about your fund is also | |
| available on the SEC’s website, and you can receive | |
| copies of this information, for a fee, by sending a | |
| request in either of two ways: via e-mail addressed to | |
| publicinfo@sec.gov or via regular mail addressed to the | |
| Public Reference Section, Securities and Exchange | |
| Commission, Washington, DC 20549-1520. | |
| | © 2013 The Vanguard Group, Inc. |
| | All rights reserved. |
| | Vanguard Marketing Corporation, Distributor. |
| |
| | Q6340 022013 |
Item 2: Code of Ethics. The Registrant has adopted a code of ethics that applies to the Registrant’s principal executive officer, principal financial officer, principal accounting officer or controller or persons performing similar functions. The Code of Ethics was amended during the reporting period covered by this report to make certain technical, non-material changes.
Item 3: Audit Committee Financial Expert. The following members of the Audit Committee have been determined by the Registrant’s Board of Trustees to be Audit Committee Financial Experts serving on its Audit Committee, and to be independent: Rajiv L. Gupta, Amy Gutmann, JoAnn Heffernan Heisen, F. Joseph Loughrey, Mark Loughridge, Scott C. Malpass, André F. Perold, and Alfred M. Rankin, Jr.
Item 4: Principal Accountant Fees and Services.
(a) Audit Fees.
Audit Fees of the Registrant
Fiscal Year Ended December 31, 2012: $45,000
Fiscal Year Ended December 31, 2011: $45,000
Aggregate Audit Fees of Registered Investment Companies in the Vanguard Group.
Fiscal Year Ended December 31, 2012: $4,809,780
Fiscal Year Ended December 31, 2011: $3,978,540
(b) Audit-Related Fees.
Fiscal Year Ended December 31, 2012: $1,812,565
Fiscal Year Ended December 31, 2011: $1,341,750
Includes fees billed in connection with assurance and related services provided to the Registrant, The Vanguard Group, Inc., Vanguard Marketing Corporation, and other registered investment companies in the Vanguard Group.
(c) Tax Fees.
Fiscal Year Ended December 31, 2012: $490,518
Fiscal Year Ended December 31, 2011: $373,830
Includes fees billed in connection with tax compliance, planning and advice services provided to the Registrant, The Vanguard Group, Inc., Vanguard Marketing Corporation, and other registered investment companies in the Vanguard Group and related to income and excise taxes.
(d) All Other Fees.
Fiscal Year Ended December 31, 2012: $16,000
Fiscal Year Ended December 31, 2011: $16,000
Includes fees billed for services related to risk management and privacy matters. Services were provided to the Registrant, The Vanguard Group, Inc., Vanguard Marketing Corporation, and other registered investment companies in the Vanguard Group.
(e) (1) Pre-Approval Policies. The policy of the Registrant’s Audit Committee is to consider and, if appropriate, approve before the principal accountant is engaged for such services, all specific audit and non-audit services provided to: (1) the Registrant; (2) The Vanguard Group, Inc.; (3) other entities controlled by The Vanguard Group, Inc. that provide ongoing services to the Registrant; and (4) other registered investment companies in the Vanguard Group. In making a determination, the Audit Committee considers whether the services are consistent with maintaining the principal accountant’s independence.
In the event of a contingency situation in which the principal accountant is needed to provide services in between scheduled Audit Committee meetings, the Chairman of the Audit Committee would be called on to consider and, if appropriate, pre-approve audit or permitted non-audit services in an amount sufficient to complete services through the next Audit Committee meeting, and to determine if such services would be consistent with maintaining the accountant’s independence. At the next scheduled Audit Committee meeting, services and fees would be presented to the Audit Committee for formal consideration, and, if appropriate, approval by the entire Audit Committee. The Audit Committee would again consider whether such services and fees are consistent with maintaining the principal accountant’s independence.
The Registrant’s Audit Committee is informed at least annually of all audit and non-audit services provided by the principal accountant to the Vanguard complex, whether such services are provided to: (1) the Registrant; (2) The Vanguard Group, Inc.; (3) other entities controlled by The Vanguard Group, Inc. that provide ongoing services to the Registrant; or (4) other registered investment companies in the Vanguard Group.
(2) No percentage of the principal accountant’s fees or services were approved pursuant to the waiver provision of paragraph (c)(7)(i)(C) of Rule 2-01 of Regulation S-X.
(f) For the most recent fiscal year, over 50% of the hours worked under the principal accountant’s engagement were not performed by persons other than full-time, permanent employees of the principal accountant.
(g) Aggregate Non-Audit Fees.
Fiscal Year Ended December 31, 2012: $506,518
Fiscal Year Ended December 31, 2011: $389,830
Includes fees billed for non-audit services provided to the Registrant, The Vanguard Group, Inc., Vanguard Marketing Corporation, and other registered investment companies in the Vanguard Group.
(h) For the most recent fiscal year, the Audit Committee has determined that the provision of all non-audit services was consistent with maintaining the principal accountant’s independence.
Item 5: Audit Committee of Listed Registrants.
Not Applicable.
Item 6: Investments.
Not Applicable.
Item 7: Disclosure of Proxy Voting Policies and Procedures for Closed-End Management Investment Companies.
Not Applicable.
Item 8: Portfolio Managers of Closed-End Management Investment Companies.
Not Applicable.
Item 9: Purchase of Equity Securities by Closed-End Management Investment Company and Affiliated Purchasers.
Not Applicable.
Item 10: Submission of Matters to a Vote of Security Holders.
Not Applicable.
Item 11: Controls and Procedures.
(a) Disclosure Controls and Procedures. The Principal Executive and Financial Officers concluded that the Registrant’s Disclosure Controls and Procedures are effective based on their evaluation of the Disclosure Controls and Procedures as of a date within 90 days of the filing date of this report.
(b) Internal Control Over Financial Reporting. There were no significant changes in Registrant’s Internal Control Over Financial Reporting or in other factors that could significantly affect this control subsequent to the date of the evaluation, including any corrective actions with regard to significant deficiencies and material weaknesses.
Item 12: Exhibits.
(a) Code of Ethics.
(b) Certifications.
Pursuant to the requirements of the Securities Exchange Act of 1934 and the Investment Company Act of 1940, the registrant has duly caused this report to be signed on its behalf by the undersigned, thereunto duly authorized.
| |
| | VANGUARD MONTGOMERY FUNDS |
| |
| By: | /s/ F. WILLIAM MCNABB III* |
| | F. WILLIAM MCNABB III |
| | CHIEF EXECUTIVE OFFICER |
| |
| Date: February 14, 2013 |
Pursuant to the requirements of the Securities Exchange Act of 1934 and the Investment Company Act of 1940, this report has been signed below by the following persons on behalf of the registrant and in the capacities and on the dates indicated.
| |
| | VANGUARD MONTGOMERY FUNDS |
| |
| By: | /s/ F. WILLIAM MCNABB III* |
| | F. WILLIAM MCNABB III |
| | CHIEF EXECUTIVE OFFICER |
| |
| Date: February 14, 2013 |
| |
| | VANGUARD MONTGOMERY FUNDS |
| |
| By: | /s/ THOMAS J. HIGGINS* |
| | THOMAS J. HIGGINS |
| | CHIEF FINANCIAL OFFICER |
| |
| Date: February 14, 2013 |
* By: /s/ Heidi Stam
Heidi Stam, pursuant to a Power of Attorney filed on March 27, 2012 see file Number 2-11444, Incorporated by Reference.